UNITED STATES
SECURITIES AND EXCHANGE COMMISSION
Washington, D.C. 20549
FORM N-CSR
CERTIFIED SHAREHOLDER REPORT OF REGISTERED
MANAGEMENT INVESTMENT COMPANIES
| Investment Company Act file number | 811-08690 |
| |
| MassMutual Premier Funds |
| (Exact name of registrant as specified in charter) |
| | |
| 1295 State Street, Springfield, MA | 01111 |
| (Address of principal executive offices) | (Zip code) |
| |
| Paul LaPiana |
| 1295 State Street, Springfield, MA 01111 |
| (Name and address of agent for service) |
| | | |
| Registrant's telephone number, including area code: | (413) 744-1000 | |
| | | |
| Date of fiscal year end: | 9/30/2022 | |
| | | |
| Date of reporting period: | 9/30/2022 | |
| | |
| | |
| |
| | | | | | | | |
Item 1. Reports to Stockholders.
| (a) | The Report to Stockholders is attached herewith. |
This material must be preceded or accompanied by a current prospectus (or summary prospectus, if available) for the applicable MassMutual Funds. Investors should consider a Fund’s investment objective, risks, and charges and expenses carefully before investing. This and other information about the investment company is available in the prospectus (or summary prospectus, if available). Read it carefully before investing.
[THIS PAGE INTENTIONALLY LEFT BLANK]
MassMutual Funds Annual Report – President’s Letter to Shareholders (Unaudited) |
To Our Shareholders

Paul LaPiana
“At MassMutual, our goal is to help you build the future you want for yourself and your family. We want to help you with your retirement plans today, so you can feel more comfortable about tomorrow.”
September 30, 2022
Continued market volatility challenges retirement investors
I am pleased to present you with the MassMutual Funds Annual Report. During the fiscal year ended September 30, 2022, U.S. stocks were down over 15%, with investors concerned that stimulus-fueled recovery from the COVID-19 pandemic was over and that domestic monetary policy had turned toward combating heightened inflation. Stocks in foreign developed markets and emerging markets also experienced significant losses in the fiscal year, hurt by elevated energy prices, a strengthening U.S. dollar, and concerns that consumer spending and corporate earnings growth would slow. U.S. bond investors experienced negative returns in the rising interest rate environment, fueled by aggressive interest rate hikes by the U.S. Federal Reserve Board that were aimed at reducing demand-driven inflationary pressures.
Suggestions for retirement investors under any market conditions
● | You are likely in it for the long term. Retirement planning involves what financial professionals refer to as “long-term investing,” since most people save and invest for retirement throughout their working years. Even in retirement, many individuals will systematically withdraw their retirement savings over a number of years, keeping a portion of their funds invested. Although the financial markets will go up and down, individuals who take a long-term approach to investing don’t focus on current headlines – because they realize that they have time to ride out the downturns. |
● | Keep contributing. While you have no control over the investment markets, you can control how often and how much you contribute to your retirement account. Saving as much as possible and increasing your contributions regularly is one way retirement investors can help boost their retirement savings, regardless of the performance of the stock and bond markets. |
● | Invest continually.1 Financial professionals often advise their clients to stay in the market, regardless of short-term results. Here’s why: Those who can invest in all market conditions have the potential to be rewarded even during market downturns, when more favorable prices may enable them to accumulate larger positions. |
● | Monitor your asset allocation and diversify. Stocks, bonds, and short-term/money market investments are asset classes that tend to behave differently, depending upon the economic and market environment. These broad asset classes contain an even greater array of asset sub-categories (such as small-cap stocks, international stocks, and high-yield bonds). Most financial professionals agree that investors can take advantage of different opportunities in the market and reduce the risk of over-exposure to one or two poorly performing asset types by selecting a number of investments that represent a mix of asset classes and sub-categories. |
1 | Systematic investing and asset allocation do not ensure a profit or protect against loss in a declining market. Systematic investing involves continuous investment in securities regardless of fluctuating price levels. Investors should consider their ability to continue investing through periods of low price levels. |
1
MassMutual Funds Annual Report – President’s Letter to Shareholders (Unaudited) (Continued) |
Is this a good time to track your progress?
If you work with a financial professional, you may wish to consider checking in with him or her to help you determine if:
● | you are saving enough for retirement – and, if in retirement, you are withdrawing an appropriate amount each year, based on your personal circumstances; |
● | your retirement account is invested appropriately for all market conditions, based on your goals and objectives, as well as your investment time horizon; and |
● | you are taking steps to help reduce your longevity risk, which is the chance that you could “run out” of retirement savings during your lifetime. |
Get to where you want to be
At MassMutual, our goal is to help you build the future you want for yourself and your family. We want to help you with your retirement plans today, so you can feel more comfortable about tomorrow. That’s why we continue to encourage you to maintain perspective when it comes to retirement investing, regardless of any headline-making events. MassMutual’s view is that changing market conditions have the potential to reward patient investors. Thank you for your continued confidence and trust in MassMutual.
Sincerely,

Paul LaPiana
President
MassMutual Funds
MML Investment Advisers, LLC
© 2022 Massachusetts Mutual Life Insurance Company (MassMutual®), Springfield, MA 01111-0001. All rights reserved. www.MassMutual.com.
The MassMutual High Yield Fund and MassMutual Short-Duration Bond Fund are distributed by ALPS Distributors, Inc. (ADI). MML Distributors, LLC (MMLD) serves as the exclusive wholesale marketing agent for all MassMutual Funds, as well as the distributor for all other MassMutual Funds, except the MassMutual Global Floating Rate Fund, MassMutual Global Credit Income Opportunities Fund, MassMutual Emerging Markets Debt Blended Total Return Fund, and MassMutual Global Emerging Markets Equity Fund. MMLD Member FINRA and SIPC (www.FINRA.org and www.SIPC.org), 1295 State Street, Springfield, MA 01111-0001. Investment advisory services are provided to all MassMutual Funds by MML Investment Advisers, LLC (MML Advisers). MMLD and MML Advisers are subsidiaries of MassMutual, Springfield, MA 01111-0001. ADI is not affiliated with MMLD, MML Advisers, or MassMutual.
The information provided is the opinion of MML Advisers and is subject to change without notice. It is not to be construed as tax, legal, or investment advice. Of course, past performance does not guarantee future results.
MM202310-303203
2
MassMutual Funds Annual Report – Economic and Market Overview (Unaudited) |
September 30, 2022
Continued market volatility challenges retirement investors
During the fiscal year ended September 30, 2022, U.S. stocks were down over 15%, with investors concerned that stimulus-fueled recovery from the COVID-19 pandemic was over and that domestic monetary policy had turned toward combating heightened inflation. Stocks in foreign developed markets and emerging markets also experienced significant losses in the fiscal year, hurt by elevated energy prices, a strengthening U.S. dollar, and concerns that consumer spending and corporate earnings growth would slow. U.S. bond investors experienced negative returns in the rising interest rate environment, fueled by aggressive interest rate hikes by the U.S. Federal Reserve Board (the “Fed”) that were aimed at reducing demand-driven inflationary pressures.
Market Highlights
● | For the reporting period from October 1, 2021 through September 30, 2022, U.S. stocks were down over 15%, in a market environment where the Fed aggressively raised interest rates in an effort to combat heightened inflation. |
● | In the fourth quarter of 2021, expectations for strong economic and earnings growth in 2022, bolstered by the possibility of a $2 trillion economic stimulus and social spending plan, allowed investors to look past sharp increases in COVID-19 Omicron variant cases and heightened inflationary pressures. |
● | In the first quarter of 2022, investors in both stocks and bonds were challenged by a sharp rise in energy prices after Russia’s invasion of Ukraine, a stalled domestic economic stimulus plan, and the Fed raising interest rates for the first time since 2018. |
● | The second quarter of 2022 was another difficult quarter, as Fed interest rate hikes, investor concerns over high inflation, and concern about the potential of an impending global recession dominated the narrative. |
● | The third quarter of 2022 was an extension of the difficult second quarter, with continued inflationary pressures, weakening economic data, and aggressive Fed interest rate hikes. |
● | Foreign stocks in developed markets and emerging markets also experienced losses in the fiscal year, against the backdrop of Russia’s invasion of Ukraine (and the resulting economic sanctions that kept energy prices elevated), the strengthening U.S. dollar, and threatened consumer spending and corporate earnings growth. |
● | U.S. bond investors experienced negative returns in the rising interest rate environment, fueled by an increase in short-term interest rates, heighted inflationary pressures, and the reversal of monetary and fiscal policy support. |
Market Environment
For the fiscal year beginning on October 1, 2021, global stock investors experienced significant losses. U.S. stocks fell sharply in the period in response, with the S&P 500 Index® (“S&P 500”)1 entering bear market territory after declining more than 20% from its previous highs. Investors sought safety from high inflation, rising interest rates, and the increasing possibility of a recession. Consumer sentiment fell sharply, down 17.2% in the period2, as high inflation – driven by rising energy, food, and housing costs – overwhelmed low unemployment and strong wage growth. As of August 2022, more Americans are borrowing to make ends meet in these inflationary times, resulting in consumer loan levels at record highs, having increased by 12.4% year-over-year.3
1 The S&P 500 Index measures the performance of 500 widely held stocks in the U.S. equity market. Standard and Poor’s chooses member companies for the index based on market size, liquidity, and industry group representation. Included are the stocks of industrial, financial, utility, and transportation companies. Since mid-1989, this composition has been more flexible and the number of issues in each sector has varied. It is market capitalization-weighted. The Index does not reflect any deduction for fees, expenses, or taxes and cannot be purchased directly by investors.
2 June 24, 2022, University of Michigan: Consumer Sentiment (UMCSENT), retrieved from FRED, Federal Reserve Bank of St. Louis; https://fred.stlouisfed.org/series/UMCSENT
3 Board of Governors of the Federal Reserve System (US), Consumer Loans, All Commercial Banks [CONSUMER], retrieved from FRED, Federal Reserve Bank of St. Louis; https://fred.stlouisfed.org/series/CONSUMER, October 11, 2022.
3
MassMutual Funds Annual Report – Economic and Market Overview (Unaudited) (Continued) |
As a result, the broad market S&P 500 fell 15.47% for the period. The technology-heavy NASDAQ Composite Index4 performed even worse, dropping 26.25%. The more economically sensitive Dow Jones Industrial AverageSM5 was down 13.40%. During the reporting period, small-cap stocks underperformed their larger-cap peers, while value stocks outperformed their growth brethren. The communication services, consumer discretionary, and information technology sectors were all down by 20% or more. The energy sector was the strongest performer for the fiscal year, up 45.70%, aided by an 18% increase in the price of West Texas Intermediate (WTI) crude oil. The utilities sector also ended the period positively, gaining 5.58% for the period.
Developed international markets, as measured by the MSCI EAFE® Index6, trailed their domestic peers, ending the fiscal year down 25.13%. Emerging-market stocks, as measured by the MSCI Emerging Markets Index7, also fell sharply, ending down 28.11% for the period. Investors sold off developed international and emerging-market stocks on concerns that higher interest rates and commodity prices would impair consumer spending and corporate earnings growth.
Bond yields rose sharply during the fiscal year, with the 10-year U.S. Treasury bond yield rising from a low of 1.52% on October 1, 2021 to close the period at 3.83%. Rising yields generally produce falling bond prices; consequently, bond index returns suffered. The Bloomberg U.S. Aggregate Bond Index8 ended the period down 14.60%. Investment-grade corporate bonds fared even worse. The Bloomberg U.S. Corporate Bond Index9, which tracks investment-grade corporate bonds, ended the period with an 18.53% loss. The Bloomberg U.S. Corporate High-Yield Bond Index10 also ended in negative territory, declining 14.14% for the period.
Review and maintain your strategy
MassMutual is committed to helping people secure their long-term future and protect the ones they love. While the current market volatility, including the reality of market sell-offs, can test an investor’s mettle, we’d like to remind you that, as a retirement investor, it’s important to maintain perspective and have realistic expectations about the future performance of your investment accounts. As described in this report, financial markets can reverse suddenly with little or no notice. That’s why we continue to believe that retirement investors should create and maintain a plan that focuses on their goals, how long they have to invest, and how comfortable they are with market volatility. Our multi-managed and sub-advised mutual funds tap into the deep expertise of seasoned asset managers who are committed to helping long-term investors prepare for retirement – in all market conditions.
4 The NASDAQ Composite Index measures the performance of all domestic and international based common type stocks listed on the NASDAQ Stock Market. It includes common stocks, ordinary shares, ADRs, shares of beneficial interest or limited partnership interests and tracking stocks. The index is market capitalization-weighted. The Index does not reflect any deduction for fees, expenses, or taxes and cannot be purchased directly by investors.
5 The Dow Jones Industrial Average Index measures the performance of stocks of 30 U.S. blue-chip companies covering all industries with the exception of transportation and utilities. It is price-weighted. The Index does not reflect any deduction for fees or expenses and cannot be purchased directly by investors.
6 The MSCI EAFE Index measures the performance of the large- and mid-cap segments of developed markets, excluding the U.S. and Canada equity securities. It is free float-adjusted market-capitalization weighted. The Index does not reflect any deduction for fees or expenses and cannot be purchased directly by investors.
7 The MSCI Emerging Markets Index measures the performance of the large- and mid-cap segments of emerging market equity securities. It is free float-adjusted market-capitalization weighted. The Index does not reflect any deduction for fees or expenses and cannot be purchased directly by investors.
8 The Bloomberg U.S. Aggregate Bond Index measures the performance of investment grade, U.S. dollar-denominated, fixed-rate taxable bond market securities, including Treasuries, government-related and corporate securities, mortgage-backed securities (MBS) (agency fixed-rate and hybrid ARM pass-throughs), asset-backed securities (ABS), and commercial mortgage-backed securities (CMBS). It rolls up into other Bloomberg flagship indexes, such as the multi-currency Global Aggregate Index and the U.S. Universal Index, which includes high yield and emerging markets debt. The Index does not reflect any deduction for fees, expenses, or taxes and cannot be purchased directly by investors.
9 The Bloomberg U.S. Corporate Bond Index measures the performance of the investment grade, U.S. dollar-denominated, fixed-rate, taxable corporate bond market. It includes U.S. dollar-denominated securities publicly issued by U.S. and non-U.S. industrial, utility, and financial issuers that meet specified maturity, liquidity, and quality requirements. The Index does not reflect any deduction for fees, expenses, or taxes and cannot be purchased directly by investors.
10 The Bloomberg U.S. Corporate High-Yield Bond Index measures the performance of U.S. dollar-denominated, non-investment grade, fixed-rate, taxable corporate bonds, including corporate bonds, fixed-rate bullet, putable, and callable bonds, SEC Rule 144A securities, original issue zeros, pay-in-kind bonds, fixed-rate and fixed-to-floating capital securities. The Index does not reflect any deduction for fees, expenses, or taxes and cannot be purchased directly by investors.
4
MassMutual Funds Annual Report – Economic and Market Overview (Unaudited) (Continued) |
As always, we recommend that you work with a personal financial professional, who can help you define an investment strategy that aligns with your comfort level with respect to market volatility, how long you have to save and invest, and your specific financial goals. Thank you for your confidence in MassMutual.
© 2022 Massachusetts Mutual Life Insurance Company (MassMutual®), Springfield, MA 01111-0001. All rights reserved. www.MassMutual.com.
The MassMutual High Yield Fund and MassMutual Short-Duration Bond Fund are distributed by ALPS Distributors, Inc. (ADI). MML Distributors, LLC (MMLD) serves as the exclusive wholesale marketing agent for all MassMutual Funds, as well as the distributor for all other MassMutual Funds, except the MassMutual Global Floating Rate Fund, MassMutual Global Credit Income Opportunities Fund, MassMutual Emerging Markets Debt Blended Total Return Fund, and MassMutual Global Emerging Markets Equity Fund. MMLD Member FINRA and SIPC (www.FINRA.org and www.SIPC.org), 1295 State Street, Springfield, MA 01111-0001. Investment advisory services are provided to all MassMutual Funds by MML Investment Advisers, LLC (MML Advisers). MMLD and MML Advisers are subsidiaries of MassMutual, Springfield, MA 01111-0001. ADI is not affiliated with MMLD, MML Advisers, or MassMutual.
The information provided is the opinion of MML Advisers and is subject to change without notice. It is not to be construed as tax, legal, or investment advice. Of course, past performance does not guarantee future results.
5
MassMutual U.S. Government Money Market Fund – Portfolio Manager Report (Unaudited) |
What is the investment approach of MassMutual U.S. Government Money Market Fund, and who is the Fund’s subadviser?
The Fund seeks current income consistent with preservation of capital and liquidity. The Fund normally invests at least 99.5% of its total assets in cash, U.S. Government securities, and/or repurchase agreements fully collateralized by cash or U.S. Government securities. Under normal circumstances, the Fund invests at least 80% of its net assets in U.S. Government securities and repurchase agreements that are fully collateralized by U.S. Government securities. The Fund’s subadviser is Barings LLC (Barings). The Fund seeks to maintain, but does not guarantee, a stable $1.00 share price. You could lose money by investing in the Fund. Although the Fund seeks to preserve the value of your investment at $1.00 per share, it cannot guarantee it will do so. An investment in the Fund is not insured or guaranteed by the Federal Deposit Insurance Corporation or any other government agency. The Fund’s sponsor has no legal obligation to provide financial support to the Fund, and you should not expect that the sponsor will provide financial support to the Fund at any time.
How did the Fund perform during the 12 months ended September 30, 2022?
The Fund’s Class R5 shares returned 0.44%, underperforming the 0.63% return of the FTSE 3-Month U.S. T Bill Index (the “benchmark”), which measures the performance of the last three three-month Treasury bill month-end rates.
For a discussion on the economic and market environment during the 12-month period ended September 30, 2022, please see the Economic and Market Overview, beginning on page 3.
Subadviser discussion of factors that contributed to the Fund’s performance
The U.S. Federal Reserve (the “Fed”) embarked on its most aggressive rate hiking cycle in many decades, raising the federal funds rate – the Fed’s overnight bank lending rate – to a range from 0.00%-0.25% to 3.00%-3.25% over the course of the year, in an effort to combat “sticky” inflation. At the end of the third quarter in 2021, there was little thought that inflation would stay so entrenched in the economy, and markets were pricing in little chance of Fed tightening in 2022. By mid-to-late fourth quarter 2021, the Fed started reporting that inflation was being a little stickier than previously anticipated. At that point, the Fund started positioning for rate hikes, keeping fixed-rate paper short and increasing the allocation to floating-rate securities. The rate hikes were far more frequent and much larger than was anticipated originally. In a government money market fund, frequent, large rate hikes are a significant fear in regard to such a fund’s net asset value (“NAV”) erosion. Fortunately, the Fund was well positioned from a weighted average maturity (“WAM”) perspective, and these rate hikes did little to erode the Fund’s NAV. To illustrate short-term rate movement, Secured Overnight Financing Rates (“SOFR”) was at 0.05% as of September 30, 2021 and ended at 2.98% as of September 30, 2022. SOFR is an interest rate used in the short-term international interbank market.
The increase in SOFR throughout the fiscal year had a positive effect on the Fund’s performance, as the Fund owned a large percentage of floating-rate paper. At fiscal year-end, the Fund’s exposure to floating-rate paper was 68%. The Fund did make a few small, longer-dated fixed-rate purchases in late 2021, which detracted from performance. Additionally, the Fund did not have access to the Fed’s reverse repo program, which also hampered the Fund’s results over the course of the fiscal year. Currently, the yield curve out to one year is pricing in another 1.25% of tightening, which, in Barings’ view, still might be much less than the Fed needs to do to fight inflation. (The yield curve is a graph showing the term structure of interest rates by plotting the yields of all bonds of comparable quality with maturities ranging from the shortest – typically one month – to the longest – typically 30 years – available. The resulting curve shows whether short-term interest rates are higher or lower than long-term rates.) Consequently, as the fiscal year came to a close, there was little incentive to extend the duration of the Fund until Fund management sees evidence that the Fed’s efforts at squashing inflation are taking hold. (Duration is a measure of a bond fund’s sensitivity to interest rates. The longer the duration, the greater the price impact on the bond or portfolio when interest rates rise or fall.)
Subadviser outlook
Fed Chair Powell has stated unequivocally that the Fed will do everything in its power to tame inflation – even if it means throwing the U.S. economy into recession. Currently, markets are generally pricing in another 0.75% to 1.25% of tightening by the end of calendar year 2022. Barings expects that this would put the federal funds rate in a range of 3.75% to 4.50%. Several Fed Governors have indicated that they would like to get to that level and then potentially pause, to let the effects of the rapid tightening seep into the economy, since their policy actions typically take several months to take effect. In Barings’ view, there
6
MassMutual U.S. Government Money Market Fund – Portfolio Manager Report (Unaudited) (Continued) |
is the possibility that the Fed could pause in tightening in the first part of 2023 and then, if inflation persists, resume tightening later in the year. Currently, Barings believes that the market is pricing in very little chance of any rate cuts in 2023 – although that could change, depending upon how the economy reacts and if the United States goes into a deep or shallow recession. At this time, in Barings’ opinion, some type of domestic recession seems highly likely.
Moving forward, the Fund plans to keep a short WAM until Fund management sees evidence that the Fed is looking to pivot – or at least until the pace of tightening slows down meaningfully or stops altogether. Barings plans to monitor Fed language carefully and act accordingly if they see signs of changing policy in 2023. While there are still unknowns leading into the fourth quarter of 2022, the Fund expects to maintain a defensive stance and Fund management remains diligent to its fundamental bottom-up process of capital preservation.
MassMutual
U.S. Government Money Market Fund
Portfolio Characteristics
(% of Net Assets) on 9/30/22 |
Discount Notes | 85.4% |
Repurchase Agreement | 14.6% |
U.S. Treasury Bill | 1.5% |
Total Short-Term Investments | 101.5% |
Other Assets & Liabilities | (1.5)% |
Net Assets | 100.0% |
| | |
7
MassMutual U.S. Government Money Market Fund – Portfolio Manager Report (Unaudited) (Continued) |
GROWTH OF $10,000 INVESTMENT - Class R5

The graph above illustrates the Fund’s historical performance for the past 10 fiscal years or since inception (for Funds lacking 10-year records) in comparison to its benchmark index, as well as one or more additional indexes, if applicable.
Average Annual Total Returns (for the periods ended 09/30/2022) | | |
| Inception Date
of Class | 1 Year | 5 Years | 10 Years |
Class R5 | 10/03/1994 | 0.44% | 0.78% | 0.42% |
FTSE 3-Month Treasury Bill Index | | 0.63% | 1.13% | 0.66% |
Generally accepted accounting principles require adjustments to be made to the net assets of the Fund at period end for financial reporting purposes only, and as such, the total return based on the unadjusted net asset value per share may differ from the total return reported in the financial highlights.
Performance results in the graph and table are shown both with and without the imposition of the maximum applicable sales charge (if applicable) and reflect the percentage change in net asset value, including reinvestment of dividends and capital gains distributions. Investors should note that the Fund is a professionally managed mutual fund, while the index or indexes shown above are unmanaged, cannot be purchased directly, and, with the exception of any peer group index, do not incur expenses.
Performance data quoted in the graph and table represents past performance; past performance is not predictive of future results. The investment return and principal value of shares of the Fund fluctuate, so your shares, when sold, may be worth more or less than their original cost. Current performance of the Fund may be lower or higher than the performance quoted. The performance shown does not reflect the deduction of taxes, if any, that a shareholder would pay on Fund distributions or the redemption of Fund shares. Performance data current to the most recent month end may be obtained by calling 1-888-309-3539.
Investors should read the Fund’s prospectus with regard to the Fund’s investment objectives, risks, and charges and expenses in conjunction with these financial statements. Employee retirement benefit plans that invest plan assets in the Separate Investment Accounts (SIAs) may be subject to certain charges as set forth in their respective Plan Documents. Total return figures would be lower for the periods presented if they reflected these charges.
8
MassMutual Short-Duration Bond Fund – Portfolio Manager Report (Unaudited) |
What is the investment approach of MassMutual Short-Duration Bond Fund, and who is the Fund’s subadviser?
The Fund seeks to achieve a high total rate of return primarily from current income while minimizing fluctuations in capital values by investing primarily in a diversified portfolio of short-term investment grade fixed income securities. Under normal circumstances, the Fund invests at least 80% of its net assets (plus the amount of any borrowings for investment purposes) in investment grade fixed income securities (rated Baa3 or higher by Moody’s, BBB- or higher by Standard & Poor’s or the equivalent by any nationally recognized statistical rating organization, or, if unrated, determined to be of comparable quality by the subadviser or sub-subadviser). The Fund’s subadviser is Barings LLC (Barings) and its sub-subadviser is Baring International Investment Limited (BIIL).
How did the Fund perform during the 12 months ended September 30, 2022?
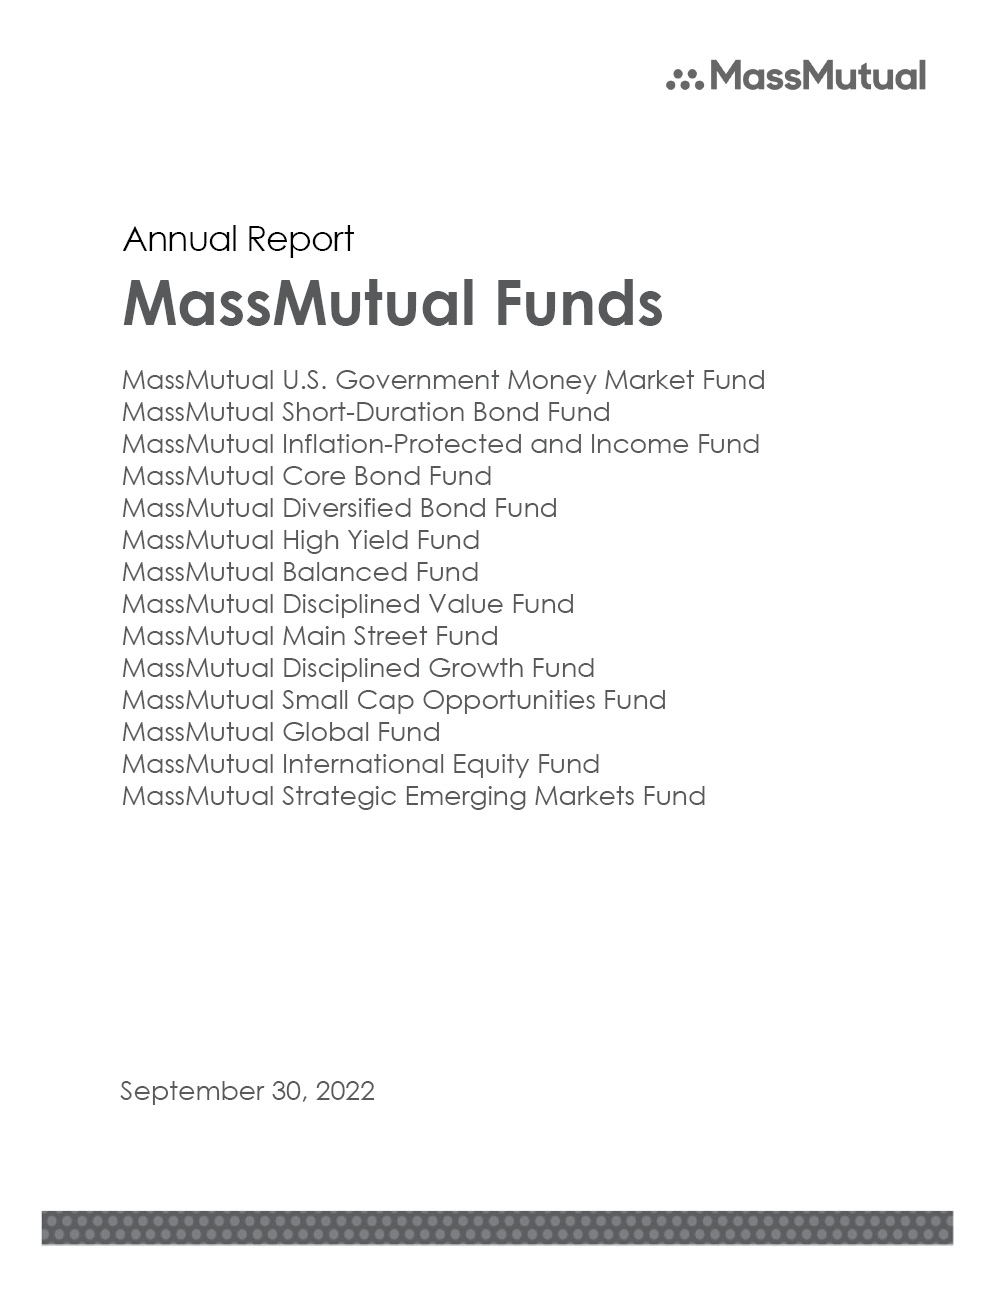
The Fund’s Class R5 shares returned -10.27%, significantly underperforming the -5.11% return of the Bloomberg U.S. Aggregate 1-3 Year Bond Index (the “benchmark”), which measures the performance of investment grade, U.S. dollar-denominated, fixed-rate taxable bond market securities with maturities of 1-3 years, including Treasuries, government-related and corporate securities, mortgage-backed securities (MBS) (agency fixed-rate and hybrid ARM pass-throughs), asset-backed securities (ABS), and commercial mortgage-backed securities (CMBS). (“Agency” refers to debt issued by U.S. federal government agencies or government-sponsored entities for financing purposes.)
For a discussion on the economic and market environment during the 12-month period ended September 30, 2022, please see the Economic and Market Overview, beginning on page 3.
Subadviser discussion of factors that contributed to the Fund’s performance
Over the course of the year ended September 30, 2022, the U.S. Treasury curve between 3 months and 3 years rose significantly as a result of interest rate hikes from the U.S Federal Reserve (the “Fed”). (The yield curve is a graph showing the term structure of interest rates by plotting the yields of all bonds of comparable quality with maturities ranging from the shortest – typically one month – to the longest – typically 30 years – available. The resulting curve shows whether short-term interest rates are higher or lower than long-term rates.) The Fund held a longer duration compared to the benchmark for a majority of the period, as front-end rates rose. (Duration is a measure of a bond fund’s sensitivity to interest rates. The longer the duration, the greater the price impact on the bond or portfolio when interest rates rise or fall.) Bond duration and maturity positioning detracted from the Fund’s performance over the reporting period as a result. The effective duration of the Fund finished the period at 0.96 years. An underweight to U.S. Treasuries detracted from Fund performance.
The Fund’s overweight allocation to investment-grade corporates hampered its returns. Investment-grade and BB-rated high yield holdings also detracted from performance. Fund holdings in food/beverage/tobacco, upstream/refining, and P&C insurance were among the top detractors. Fund holdings in finance-other, secondary oil & gas producers, and leasing were among the top-performing industry holdings. The Fund expects to continue to favor industries less susceptible to merger and acquisition (M&A) risk, such as banking and diversified industrial industries.
ABS, where the Fund had an overweight allocation to the sector relative to the benchmark, also detracted from performance. The asset class saw significant spread widening over the period as a result of the market’s risk-off tone amid the backdrop of increased rate volatility. Despite this, Barings believes that consumer fundamentals coming out of the COVID-19 pandemic period remain healthy. At fiscal year-end, the market observed a weakening in ABS liquidity, as dealers continued to indicate a desire to keep balance sheets low heading into year-end. Selling has produced a trend wider in spreads across many collateral segments. CMBS and residential mortgage-backed securities (RMBS) both detracted from relative performance over the period. The Fund’s underweight allocation to MBS contributed positively to performance.
The Fund uses derivative instruments on occasion for yield curve, duration, downside risk management and to gain exposures. Performance from derivatives contributed positively to performance over the period. Derivatives are securities that derive their value from the performance of one or more other investments and take the form of a contract between two or more parties. Derivatives can be used for hedging, speculation, or both.
9
MassMutual Short-Duration Bond Fund – Portfolio Manager Report (Unaudited) (Continued) |
Subadviser outlook
Fed Chair Powell has stated unequivocally that the Fed will do everything in its power to tame inflation – even if it means throwing the U.S. economy into recession. Currently, markets are generally pricing in another 0.75% to 1.25% of tightening by the end of calendar year 2022. Barings expects that this would put the federal funds rate – the Fed’s overnight bank lending rate – in a range of 3.75% to 4.50%. Several Fed Governors have indicated that they would like to get to that level and then potentially pause, to let the effects of the rapid tightening seep into the economy, since their policy actions typically take several months to take effect. In Barings’ view, there is the possibility that the Fed could pause in tightening in the first part of 2023 and then, if inflation persists, resume tightening later in the year. Currently, Barings believes that the market is pricing in very little chance of any rate cuts in 2023 – although that could change, depending upon how the economy reacts and if the United States goes into a deep or shallow recession. At this time, in Barings’ opinion, some type of domestic recession seems highly likely. While the hawkish tone from the Fed has not changed, many market participants are remaining diligent and data-dependent, to see the effects of recent monetary intervention. Without any concrete trends developed, Barings believes volatility could remain elevated entering the fourth quarter. The Fund expects to maintain its overweight allocations to sectors such as corporates and securitized, relative to liquid products such as governments and agencies.
MassMutual
Short-Duration Bond Fund
Portfolio Characteristics
(% of Net Assets) on 9/30/22 |
Corporate Debt | 50.1% |
Non-U.S. Government Agency Obligations | 45.6% |
Mutual Funds | 1.2% |
U.S. Government Agency Obligations and Instrumentalities* | 0.0% |
Total Long-Term Investments | 96.9% |
Short-Term Investments and Other Assets and Liabilities | 3.1% |
Net Assets | 100.0% |
| | |
* | May contain securities that are issued by a U.S. Government Agency, but are unsecured and are not guaranteed by a U.S. Government Agency. |
10
MassMutual Short-Duration Bond Fund – Portfolio Manager Report (Unaudited) (Continued) |
GROWTH OF $10,000 INVESTMENT - Class R5
The graph above illustrates a representative class of the Fund’s historical performance for the past 10 fiscal years or since inception (for Funds lacking 10-year records) in comparison to its benchmark index, as well as one or more additional indexes, if applicable. The performance of other share classes will be greater than or less than the class depicted above.
Average Annual Total Returns (for the periods ended 09/30/2022) | | | | |
| Inception Date
of Class | 1 Year | 5 Years | 10 Years | Since Inception
04/01/2014 | Since Inception
12/13/2021 |
Class I | 12/03/2010 | -10.11% | 0.16% | 1.04% | | |
Class R5 | 10/03/1994 | -10.27% | 0.05% | 0.92% | | |
Service Class | 01/01/1998 | -10.31% | -0.05% | 0.82% | | |
Administrative Class | 05/03/1999 | -10.38% | -0.14% | 0.74% | | |
Class R4 | 04/01/2014 | -10.46% | -0.27% | | 0.51% | |
Class A | 01/01/1998 | -10.63% | -0.38% | 0.48% | | |
Class A (sales load deducted)* | 01/01/1998 | -12.87% | -0.88% | 0.22% | | |
Class R3 | 12/31/2002 | -10.80% | -0.55% | 0.30% | | |
Class Y | 12/13/2021 | | | | | -11.88% |
Class L | 12/13/2021 | | | | | -11.54% |
Class L (sales load deducted)* | 12/13/2021 | | | | | -12.07% |
Class C | 12/13/2021 | | | | | -12.39% |
Class C (CDSC fees deducted)* | 12/13/2021 | | | | | -12.93% |
Bloomberg U.S. Aggregate 1-3 Year Bond Index | | -5.11% | 0.64% | 0.78% | 0.80% | -4.54% |
* | Class A (sales load deducted) returns include the 2.50% maximum sales charge, Class L (sales load deducted) returns include the 2.00% maximum sales charge and Class C (CDSC fees deducted) returns include the 1.00% maximum contingent deferred sales charge for the first 12 months shown. |
Generally accepted accounting principles require adjustments to be made to the net assets of the Fund at period end for financial reporting purposes only, and as such, the total return based on the unadjusted net asset value per share may differ from the total return reported in the financial highlights.
Performance results in the graph and table are shown both with and without the imposition of the maximum applicable sales charge (if applicable) and reflect the percentage change in net asset value, including reinvestment of dividends and capital gains distributions. Investors should note that the Fund is a professionally managed mutual fund, while the index or indexes shown above are unmanaged, cannot be purchased directly, and, with the exception of any peer group index, do not incur expenses.
Performance data quoted in the graph and table represents past performance; past performance is not predictive of future results. The investment return and principal value of shares of the Fund fluctuate, so your shares, when sold, may be worth more or less than their original cost. Current performance of the Fund may be lower or higher than the performance quoted. The performance shown does not reflect the deduction of taxes, if any, that a shareholder would pay on Fund distributions or the redemption of Fund shares. Performance data current to the most recent month end may be obtained by calling 1-888-309-3539.
Investors should read the Fund’s prospectus with regard to the Fund’s investment objectives, risks, and charges and expenses in conjunction with these financial statements. Employee retirement benefit plans that invest plan assets in the Separate Investment Accounts (SIAs) may be subject to certain charges as set forth in their respective Plan Documents. Total return figures would be lower for the periods presented if they reflected these charges.
11
MassMutual Inflation-Protected and Income Fund– Portfolio Manager Report (Unaudited) |
What is the investment approach of MassMutual Inflation-Protected and Income Fund, and who is the Fund’s subadviser?
The Fund seeks to achieve as high a total rate of real return on an annual basis as is considered consistent with prudent investment risk and the preservation of capital by investing, under normal circumstances, at least 80% of its net assets (plus the amount of any borrowings for investment purposes) in inflation-indexed bonds and other income-producing securities. The Fund’s subadviser is Barings LLC (Barings) and its sub-subadviser is Baring International Investment Limited (BIIL).
How did the Fund perform during the 12 months ended September 30, 2022?
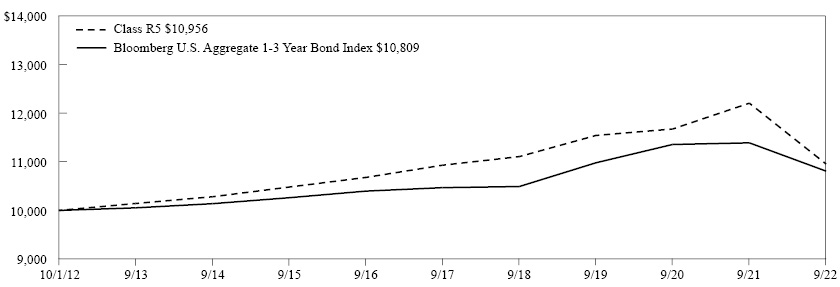
The Fund’s Class R5 shares returned -12.44%, underperforming the -11.57% return of the Bloomberg U.S. Treasury Inflation Protected Securities (TIPS) Index (Series-L) (the “benchmark”), which measures the performance of rules-based, market value-weighted inflation-protected securities issued by the U.S. Treasury. It is a subset of the Global Inflation-Linked Index (Series-L).
How do inflation-indexed bonds protect against inflation?
Like many other fixed-income securities, inflation-indexed bonds pay income twice a year, based on a stated coupon rate. However, both the principal and the interest payment are adjusted for the level of inflation. The inflation rate – as measured by the Consumer Price Index for All Urban Consumers (“CPI-U”) – results in an adjustment to the principal amount of an inflation-protected security. The coupon rate is then applied to the adjusted principal amount to determine the interest payment. For example, assuming an inflation rate of 3%, a security with a par value of $1,000 and an annual coupon rate of 1.75%, the adjusted principal amount after one year would be $1,030 ($1,000 increased by 3%). The semi-annual interest payment would be calculated by multiplying $1,030 by 1.75% and dividing by 2 instead of using the original $1,000 par value to calculate the amount of interest.
For a discussion on the economic and market environment during the 12-month period ended September 30, 2022, please see the Economic and Market Overview, beginning on page 3.
Subadviser discussion of factors that contributed to the Fund’s performance
Consumer prices, as measured by the U.S. Bureau of Labor Statistics, were up for the year-to-date 2022, as unadjusted Headline Consumer Price Index (CPI) came in at 8.3% for the month of August (year over year), up from 7.0% at year-end 2021. (The CPI measures changes in the price of a market basket of consumer goods and services; core CPI does not include food and energy prices. Headline CPI includes food and energy.) Core CPI increased to 6.3% for the same period, up from 5.5% at year-end 2021. As of September 30, 2022, core CPI was running well above the 2% inflation objective of the Federal Open Market Committee (FOMC).
TIPS positioning in aggregate detracted from Fund performance during the period led by duration and curve impacted by higher interest rates. In addition to TIPS, the Fund also invested in high-quality income-producing securities, including asset-backed and money market securities. The income earned by these asset classes contributed positively to the Fund’s returns over the last 12 months. Allocations to asset-backed securities improved the Fund’s performance. Security selection in auto loans within the asset-backed securities (ABS) sector was one of the primary contributors. Other government and residential mortgage-backed securities detracted from performance. Overall, the largest detractor was duration and curve.
The Fund may use derivative instruments for yield curve and duration management, as well as for replicating cash bonds and gaining market exposure in order to implement manager views. (Duration is a measure of a bond fund’s sensitivity to interest rates. The longer the duration, the greater the price impact on the bond or portfolio when interest rates rise or fall. Derivatives are securities that derive their value from the performance of one or more other investments and take the form of a contract between two or more parties. Derivatives can be used for hedging, speculation, or both.) During the fiscal year, derivatives detracted from performance.
12
MassMutual Inflation-Protected and Income Fund– Portfolio Manager Report (Unaudited) (Continued) |
Subadviser outlook
The Federal Reserve (the “Fed”) hiked interest rates by 0.75% for a third time at their September meeting – the largest rate increase since 1994. Fed Chair Powell signaled that the Fed would continue to raise interest rates for the rest of the calendar year to combat inflation and cool the job market. Officials have forecast that rates would reach 4.4% by the end of 2022 and 4.6% in 2023 – in an effort to bring inflation back down to the Fed’s 2% target. Given the current market volatility, the Fund has been positioned close to the duration of the benchmark. Barings believes that inflation expectations will begin to moderate as the recent Fed actions filter through the economy in the coming months.
MassMutual
Inflation-Protected and Income Fund
Portfolio Characteristics
(% of Net Assets) on 9/30/22 |
Non-U.S. Government Agency Obligations | 56.9% |
U.S. Treasury Obligations | 21.6% |
U.S. Government Agency Obligations and Instrumentalities* | 12.4% |
Mutual Funds | 0.9% |
Total Long-Term Investments | 91.8% |
Short-Term Investments and Other Assets and Liabilities | 8.2% |
Net Assets | 100.0% |
| | |
* | May contain securities that are issued by a U.S. Government Agency, but are unsecured and are not guaranteed by a U.S. Government Agency. |
13
MassMutual Inflation-Protected and Income Fund– Portfolio Manager Report (Unaudited) (Continued) |
GROWTH OF $10,000 INVESTMENT - Class R5
The graph above illustrates a representative class of the Fund’s historical performance for the past 10 fiscal years or since inception (for Funds lacking 10-year records) in comparison to its benchmark index, as well as one or more additional indexes, if applicable. The performance of other share classes will be greater than or less than the class depicted above.
Average Annual Total Returns (for the periods ended 09/30/2022) | | | |
| Inception Date
of Class | 1 Year | 5 Years | 10 Years | Since Inception
04/01/2014 |
Class I | 03/01/2011 | -12.28% | 1.94% | 1.06% | |
Class R5 | 12/31/2003 | -12.44% | 1.84% | 0.95% | |
Service Class | 12/31/2003 | -12.51% | 1.73% | 0.84% | |
Administrative Class | 12/31/2003 | -12.59% | 1.62% | 0.75% | |
Class R4 | 04/01/2014 | -12.75% | 1.48% | | 1.54% |
Class A | 12/31/2003 | -12.81% | 1.38% | 0.51% | |
Class A (sales load deducted)* | 12/31/2003 | -16.51% | 0.50% | 0.07% | |
Class R3 | 12/31/2003 | -12.98% | 1.22% | 0.33% | |
Bloomberg U.S. Treasury Inflation Protected Securities (TIPS) Index (Series-L) | | -11.57% | 1.95% | 0.98% | 1.92% |
* | Class A (sales load deducted) returns include the 4.25% maximum sales charge. |
Generally accepted accounting principles require adjustments to be made to the net assets of the Fund at period end for financial reporting purposes only, and as such, the total return based on the unadjusted net asset value per share may differ from the total return reported in the financial highlights.
Performance results in the graph and table are shown both with and without the imposition of the maximum applicable sales charge (if applicable) and reflect the percentage change in net asset value, including reinvestment of dividends and capital gains distributions. Investors should note that the Fund is a professionally managed mutual fund, while the index or indexes shown above are unmanaged, cannot be purchased directly, and, with the exception of any peer group index, do not incur expenses.
Performance data quoted in the graph and table represents past performance; past performance is not predictive of future results. The investment return and principal value of shares of the Fund fluctuate, so your shares, when sold, may be worth more or less than their original cost. Current performance of the Fund may be lower or higher than the performance quoted. The performance shown does not reflect the deduction of taxes, if any, that a shareholder would pay on Fund distributions or the redemption of Fund shares. Performance data current to the most recent month end may be obtained by calling 1-888-309-3539.
Investors should read the Fund’s prospectus with regard to the Fund’s investment objectives, risks, and charges and expenses in conjunction with these financial statements. Employee retirement benefit plans that invest plan assets in the Separate Investment Accounts (SIAs) may be subject to certain charges as set forth in their respective Plan Documents. Total return figures would be lower for the periods presented if they reflected these charges.
14
MassMutual Core Bond Fund – Portfolio Manager Report (Unaudited) |
What is the investment approach of MassMutual Core Bond Fund, and who is the Fund’s subadviser?
The Fund seeks to achieve a high total rate of return consistent with prudent investment risk and the preservation of capital by investing primarily in a diversified portfolio of investment grade fixed income securities. Under normal circumstances, the Fund invests at least 80% of its net assets (plus the amount of any borrowings for investment purposes) in investment grade fixed income securities (rated Baa3 or higher by Moody’s, BBB- or higher by Standard & Poor’s or the equivalent by any nationally recognized statistical rating organization, or, if unrated, determined to be of comparable quality by the subadviser or sub-subadviser). The Fund’s subadviser is Barings LLC (Barings) and its sub-subadviser is Baring International Investment Limited (BIIL).
How did the Fund perform during the 12 months ended September 30, 2022?
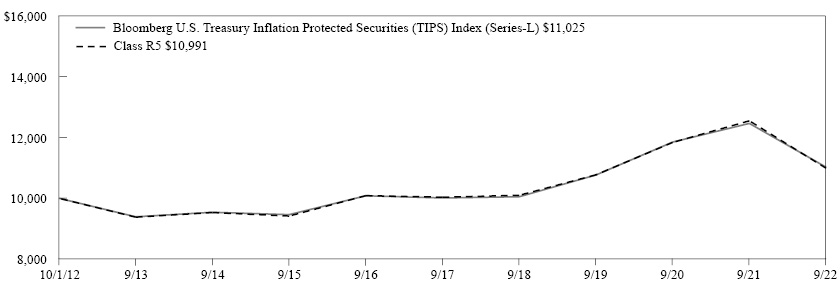
The Fund’s Class R5 shares returned -16.60%, underperforming the -14.60% return of the Bloomberg U.S. Aggregate Bond Index (the “benchmark”), which measures the performance of investment grade, U.S. dollar-denominated, fixed-rate taxable bond market securities, including Treasuries, government-related and corporate securities, mortgage-backed securities (MBS) (agency fixed-rate and hybrid ARM pass-throughs), asset-backed securities (ABS), and commercial mortgage-backed securities (CMBS). (“Agency” refers to debt issued by U.S. federal government agencies or government-sponsored entities for financing purposes.)
For a discussion on the economic and market environment during the 12-month period ended September 30, 2022, please see the Economic and Market Overview, beginning on page 3.
Subadviser discussion of factors that contributed to the Fund’s performance
For the one-year period ended September 30, 2022, the Fund’s overweight allocation to investment-grade corporates was a negative contributor to performance. The Fund’s holdings in the life insurance, banks/brokers, and other finance industries detracted from returns over the period, whereas its holdings in midstream/pipes, technology, and chemicals were top-performing industry positions.
ABS, where the Fund had an overweight allocation to the sector relative to the benchmark, detracted from the Fund’s performance. The asset class saw significant spread widening over the period as a result of the market’s risk-off tone amid the backdrop of increased rate volatility. Despite this, Barings believes that consumer fundamentals coming out of the COVID-19 pandemic period remain healthy. At fiscal year-end, the market observed a weakening in ABS liquidity, as dealers continued to indicate a desire to keep balance sheets low heading into year-end. Selling has produced a trend wider in spreads across many collateral segments. CMBS and residential mortgage-backed securities (RMBS) both detracted from relative performance over the period. The Fund finished the fiscal year with overweight positions in these two sectors.
The Fund’s allocation to high-yield corporate bonds and its underweight allocation to MBS contributed positively to performance. An allocation to high-quality short-weighted average life collateralized loan obligations (CLOs) detracted from performance. The Fund’s underweight allocation to Treasuries detracted from performance over the period.
The Fund uses derivative instruments for yield curve, duration, downside hedging, and to gain exposures. They may also be used as a substitute as a direct investment. In aggregate, these positions contributed positively to performance over the period. Derivatives are securities that derive their value from the performance of one or more other investments and take the form of a contract between two or more parties. Derivatives can be used for hedging, speculation, or both.
Subadviser outlook
Federal Reserve (the “Fed”) Chair Powell has stated unequivocally that the Fed will do everything in its power to tame inflation – even if it means throwing the U.S. economy into recession. Currently, markets are generally pricing in another 0.75% to 1.25% of tightening by the end of calendar year 2022. Barings expects that this would put the federal funds rate – the Fed’s overnight bank lending rate – in a range of 3.75% to 4.50%. Several Fed Governors have indicated that they would like to get to that level and then potentially pause, to let the effects of the rapid tightening seep into the economy, since their policy actions typically take several months to take effect. In Barings’ view, there is the possibility that the Fed could pause in tightening in the first part
15
MassMutual Core Bond Fund – Portfolio Manager Report (Unaudited) (Continued) |
of 2023 and then, if inflation persists, resume tightening later in the year. Currently, Barings believes that the market is pricing in very little chance of any rate cuts in 2023 – although that could change, depending upon how the economy reacts and if the United States goes into a deep or shallow recession. At this time, in Barings’ opinion, some type of domestic recession seems highly likely. While the hawkish tone from the Fed has not changed, many market participants are remaining diligent and data-dependent, to see the effects of recent monetary intervention. Without any concrete trends developed, Barings believes volatility could remain elevated entering the fourth quarter. The Fund expects to maintain its overweight allocations to sectors such as corporates and securitized, relative to liquid products such as governments and agencies.
MassMutual
Core Bond Fund
Portfolio Characteristics
(% of Net Assets) on 9/30/22 |
Corporate Debt | 38.8% |
Non-U.S. Government Agency Obligations | 29.8% |
U.S. Government Agency Obligations and Instrumentalities* | 24.9% |
U.S. Treasury Obligations | 4.4% |
Sovereign Debt Obligations | 0.5% |
Mutual Funds | 0.1% |
Total Long-Term Investments | 98.5% |
Short-Term Investments and Other Assets and Liabilities | 1.5% |
Net Assets | 100.0% |
| | |
* | May contain securities that are issued by a U.S. Government Agency, but are unsecured and are not guaranteed by a U.S. Government Agency. |
16
MassMutual Core Bond Fund – Portfolio Manager Report (Unaudited) (Continued) |
GROWTH OF $10,000 INVESTMENT - Class R5

The graph above illustrates a representative class of the Fund’s historical performance for the past 10 fiscal years or since inception (for Funds lacking 10-year records) in comparison to its benchmark index, as well as one or more additional indexes, if applicable. The performance of other share classes will be greater than or less than the class depicted above.
Average Annual Total Returns (for the periods ended 09/30/2022) | | | |
| Inception Date
of Class | 1 Year | 5 Years | 10 Years | Since Inception
04/01/2014 |
Class I | 12/03/2010 | -16.47% | 0.08% | 1.21% | |
Class R5 | 10/03/1994 | -16.60% | -0.03% | 1.09% | |
Service Class | 01/01/1998 | -16.72% | -0.16% | 0.98% | |
Administrative Class | 05/03/1999 | -16.75% | -0.23% | 0.89% | |
Class R4 | 04/01/2014 | -16.92% | -0.39% | | 0.77% |
Class A | 01/01/1998 | -16.91% | -0.48% | 0.65% | |
Class A (sales load deducted)* | 01/01/1998 | -20.44% | -1.34% | 0.21% | |
Class R3 | 12/31/2002 | -17.05% | -0.62% | 0.48% | |
Bloomberg U.S. Aggregate Bond Index | | -14.60% | -0.27% | 0.89% | 1.27% |
* | Class A (sales load deducted) returns include the 4.25% maximum sales charge. |
Generally accepted accounting principles require adjustments to be made to the net assets of the Fund at period end for financial reporting purposes only, and as such, the total return based on the unadjusted net asset value per share may differ from the total return reported in the financial highlights.
Performance results in the graph and table are shown both with and without the imposition of the maximum applicable sales charge (if applicable) and reflect the percentage change in net asset value, including reinvestment of dividends and capital gains distributions. Investors should note that the Fund is a professionally managed mutual fund, while the index or indexes shown above are unmanaged, cannot be purchased directly, and, with the exception of any peer group index, do not incur expenses.
Performance data quoted in the graph and table represents past performance; past performance is not predictive of future results. The investment return and principal value of shares of the Fund fluctuate, so your shares, when sold, may be worth more or less than their original cost. Current performance of the Fund may be lower or higher than the performance quoted. The performance shown does not reflect the deduction of taxes, if any, that a shareholder would pay on Fund distributions or the redemption of Fund shares. Performance data current to the most recent month end may be obtained by calling 1-888-309-3539.
Investors should read the Fund’s prospectus with regard to the Fund’s investment objectives, risks, and charges and expenses in conjunction with these financial statements. Employee retirement benefit plans that invest plan assets in the Separate Investment Accounts (SIAs) may be subject to certain charges as set forth in their respective Plan Documents. Total return figures would be lower for the periods presented if they reflected these charges.
17
MassMutual Diversified Bond Fund – Portfolio Manager Report (Unaudited) |
What is the investment approach of MassMutual Diversified Bond Fund, and who is the Fund’s subadviser?
The Fund seeks a superior total rate of return by investing in fixed income instruments. Under normal circumstances, the Fund invests at least 80% of its net assets (plus the amount of any borrowings for investment purposes) in fixed income securities. The Fund’s subadviser is Barings LLC (Barings) and its sub-subadviser is Baring International Investment Limited (BIIL).
How did the Fund perform during the 12 months ended September 30, 2022?
The Fund’s Class R5 shares returned -18.05%, underperforming the -14.60% return of the Bloomberg U.S. Aggregate Bond Index (the “benchmark”), which measures the performance of investment grade, U.S. dollar-denominated, fixed-rate taxable bond market securities, including Treasuries, government-related and corporate securities, mortgage-backed securities (MBS) (agency fixed-rate and hybrid ARM pass-throughs), asset-backed securities (ABS), and commercial mortgage-backed securities (CMBS). (“Agency” refers to debt issued by U.S. federal government agencies or government-sponsored entities for financing purposes.)
For a discussion on the economic and market environment during the 12-month period ended September 30, 2022, please see the Economic and Market Overview, beginning on page 3.
Subadviser discussion of factors that contributed to the Fund’s performance
For the one-year period ended September 30, 2022, the Fund’s overweight allocation to investment-grade corporates was a negative contributor to performance. The Fund’s holdings in the banks/brokers, pharmaceuticals, and cable/media industries detracted from returns over the period, whereas its holdings in midstream/pipes, health care, and transportation/waste were the top-performing industry positions.
Credit spreads – which represent the difference in yields between nearly identical bonds with comparable maturities but different quality ratings – moved marginally wider, as the U.S. Federal Reserve (the “Fed”) continued its more hawkish monetary policy. Following the move wider, spreads are now closer to longer-term averages after a very benign 2021, which saw a narrow trading range well inside of long-term averages. An overweight allocation to high- yield corporates detracted from the Fund’s performance over the period.
ABS, where the Fund had an overweight allocation to the sector relative to the benchmark, also detracted from the Fund’s performance. The asset class saw significant spread widening over the period as a result of the market’s risk-off tone amid the backdrop of increased rate volatility. Despite this, consumer fundamentals coming out of the COVID-19 pandemic period remain healthy. At fiscal year-end, the market observed a weakening in ABS liquidity, as dealers continued to indicate a desire to keep balance sheets low heading into year-end. Selling has produced a trend wider in spreads across many collateral segments. CMBS and residential mortgage-backed securities (RMBS) both detracted from relative performance over the period. The Fund’s underweight allocation to MBS contributed positively to performance.
The Fund’s allocation to high-quality short-weighted average life collateralized loan obligations (CLOs) detracted from performance. Its underweight allocation to Treasuries also hampered performance over the period.
The Fund uses derivative instruments for yield curve, duration, downside hedging, and to gain exposures. They may also be used as a substitute as a direct investment. In aggregate, these positions contributed positively to performance over the period. Derivatives are securities that derive their value from the performance of one or more other investments and take the form of a contract between two or more parties. Derivatives can be used for hedging, speculation, or both.
Subadviser outlook
Fed Chair Powell has stated unequivocally that the Fed will do everything in its power to tame inflation – even if it means throwing the U.S. economy into recession. Currently, markets are generally pricing in another 0.75% to 1.25% of tightening by the end of calendar year 2022. Barings expects that this would put the federal funds rate – the Fed’s overnight bank lending rate – in a range of 3.75% to 4.50%. Several Fed Governors have indicated that they would like to get to that level and then potentially pause, to let the effects of the rapid tightening seep into the economy, since their policy actions typically take several
18
MassMutual Diversified Bond Fund – Portfolio Manager Report (Unaudited) (Continued) |
months to take effect. In Barings’ view, there is the possibility that the Fed could pause in tightening in the first part of 2023 and then, if inflation persists, resume tightening later in the year. Currently, Barings believes that the market is pricing in very little chance of any rate cuts in 2023 – although that could change, depending upon how the economy reacts and if the United States goes into a deep or shallow recession. At this time, in Barings’ opinion, some type of domestic recession seems highly likely. While the hawkish tone from the Fed has not changed, many market participants are remaining diligent and data-dependent, to see the effects of recent monetary intervention. Without any concrete trends developed, Barings believes volatility could remain elevated entering the fourth quarter.
MassMutual
Diversified Bond Fund
Portfolio Characteristics
(% of Net Assets) on 9/30/22 |
Corporate Debt | 45.0% |
Non-U.S. Government Agency Obligations | 30.9% |
U.S. Government Agency Obligations and Instrumentalities* | 15.4% |
U.S. Treasury Obligations | 3.3% |
Mutual Funds | 0.9% |
Preferred Stock | 0.7% |
Sovereign Debt Obligations | 0.3% |
Warrants | 0.0% |
Purchased Options | 0.0% |
Total Long-Term Investments | 96.5% |
Short-Term Investments and Other Assets and Liabilities | 3.5% |
Net Assets | 100.0% |
| | |
* | May contain securities that are issued by a U.S. Government Agency, but are unsecured and are not guaranteed by a U.S. Government Agency. |
19
MassMutual Diversified Bond Fund – Portfolio Manager Report (Unaudited) (Continued) |
GROWTH OF $10,000 INVESTMENT - Class R5
The graph above illustrates a representative class of the Fund’s historical performance for the past 10 fiscal years or since inception (for Funds lacking 10-year records) in comparison to its benchmark index, as well as one or more additional indexes, if applicable. The performance of other share classes will be greater than or less than the class depicted above.
Average Annual Total Returns (for the periods ended 09/30/2022) | | | |
| Inception Date
of Class | 1 Year | 5 Years | 10 Years | Since Inception
04/01/2014 |
Class I | 12/03/2010 | -18.00% | 0.02% | 1.57% | |
Class R5 | 05/03/1999 | -18.05% | -0.06% | 1.37% | |
Service Class | 05/03/1999 | -18.11% | -0.14% | 1.28% | |
Administrative Class | 05/03/1999 | -18.21% | -0.25% | 1.17% | |
Class R4 | 04/01/2014 | -18.37% | -0.40% | | 0.89% |
Class A | 05/03/1999 | -18.40% | -0.49% | 0.92% | |
Class A (sales load deducted)* | 05/03/1999 | -21.87% | -1.35% | 0.49% | |
Class R3 | 04/01/2014 | -18.45% | -0.63% | | 0.65% |
Bloomberg U.S. Aggregate Bond Index | | -14.60% | -0.27% | 0.89% | 1.27% |
* | Class A (sales load deducted) returns include the 4.25% maximum sales charge. |
Generally accepted accounting principles require adjustments to be made to the net assets of the Fund at period end for financial reporting purposes only, and as such, the total return based on the unadjusted net asset value per share may differ from the total return reported in the financial highlights.
Performance results in the graph and table are shown both with and without the imposition of the maximum applicable sales charge (if applicable) and reflect the percentage change in net asset value, including reinvestment of dividends and capital gains distributions. Investors should note that the Fund is a professionally managed mutual fund, while the index or indexes shown above are unmanaged, cannot be purchased directly, and, with the exception of any peer group index, do not incur expenses.
Performance data quoted in the graph and table represents past performance; past performance is not predictive of future results. The investment return and principal value of shares of the Fund fluctuate, so your shares, when sold, may be worth more or less than their original cost. Current performance of the Fund may be lower or higher than the performance quoted. The performance shown does not reflect the deduction of taxes, if any, that a shareholder would pay on Fund distributions or the redemption of Fund shares. Performance data current to the most recent month end may be obtained by calling 1-888-309-3539.
Investors should read the Fund’s prospectus with regard to the Fund’s investment objectives, risks, and charges and expenses in conjunction with these financial statements. Employee retirement benefit plans that invest plan assets in the Separate Investment Accounts (SIAs) may be subject to certain charges as set forth in their respective Plan Documents. Total return figures would be lower for the periods presented if they reflected these charges.
20
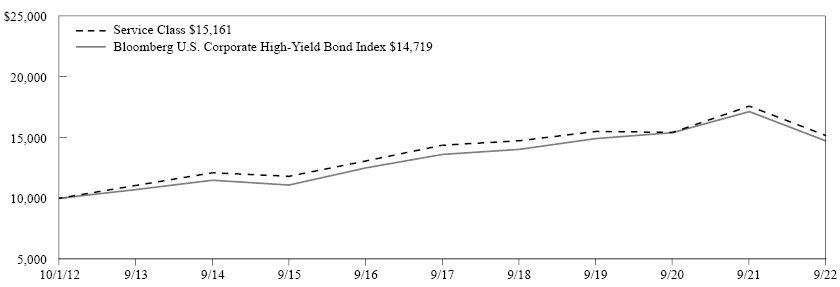
MassMutual High Yield Fund – Portfolio Manager Report (Unaudited) |
What is the investment approach of MassMutual High Yield Fund, and who is the Fund’s subadviser?
The Fund seeks to achieve a high level of total return, with an emphasis on current income, by investing primarily in high yield debt and related securities. The Fund invests primarily in lower rated U.S. debt securities (“junk” or “high yield” bonds), including securities in default. Under normal circumstances, the Fund invests at least 80% of its net assets (plus the amount of any borrowings for investment purposes) in lower rated fixed income securities (rated below Baa3 by Moody’s, below BBB- by Standard & Poor’s or the equivalent by any nationally recognized statistical rating organization (using the lower rating) or, if unrated, determined to be of below investment grade quality by the Fund’s subadviser or sub-subadviser). The Fund’s subadviser is Barings LLC (Barings). In addition, Baring International Investment Limited (BIIL) serves as a sub-subadviser for the Fund.
How did the Fund perform during the 12 months ended September 30, 2022?
The Fund’s Service Class shares returned -13.81%, outperforming the -14.14% return of the Bloomberg U.S. Corporate High-Yield Bond Index (the “benchmark”), which measures the performance of U.S. dollar-denominated, non-investment grade, fixed-rate, taxable corporate bonds, including corporate bonds, fixed-rate bullet, putable, and callable bonds, SEC Rule 144A securities, original issue zeros, pay-in-kind bonds, fixed-rate and fixed-to-floating capital securities.
For a discussion on the economic and market environment during the 12-month period ended September 30, 2022, please see the Economic and Market Overview, beginning on page 3.
Subadviser discussion of factors that contributed to the Fund’s performance
The U.S. high yield bond market finished the fiscal year with negative performance due to the combination of rising interest rates and widening credit spreads, as investors priced the impact of rising inflation and tightening monetary policy.
Returns were negative across all industry sectors. Elevated oil and gas prices continued to drive strong returns within the energy sector relative to the benchmark for the second consecutive year. Meanwhile, the consumer non-cyclical sector lagged, primarily due to weakness among pharmaceutical and health care companies. The communications sector also underperformed the benchmark. In a reversal from the prior year, lower-rated bonds underperformed higher-rated securities, given pressure on spreads and an increase in volatility in the latter half of the period.
As it relates to the Fund, both allocation decisions as well as credit selection contributed to outperformance. By sector, the overweight allocation to, as well as credit selection within, energy was the primary driver of the Fund’s relative performance. Strong security selection within the communications and basic industry sectors also contributed to the Fund’s outperformance, offsetting weak selection within the consumer non-cyclical and cyclical market segments. Cash balances at the higher end of normal ranges also benefited relative returns given the elevated market volatility. By rating, security selection within lower and non-rated cohorts more than offset adverse selection within double-B and single-B bonds; an overweight to triple-C-rated securities negatively impacted the Fund’s performance.
With respect to Fund holdings, the Fund’s top-performing credits for the fiscal period were Tourmaline Oil Corp., an independent oil exploration and production firm; Peabody Energy, a coal company; and Carlson Travel, a business travel management company. The largest detractors were Global Aircraft Leasing, an aircraft lessor; Radiology Partners, a hospital-based, physician-owned radiology practice; and Avaya, which produces solutions for IP telephony and other communication services.
Subadviser outlook
Barings notes that, in their view, inflation remains top of mind for most market participants – both with respect to its direct impact on consumers and corporate margins, as well as indirectly, with respect to economic growth, as the Federal Reserve tightens policy at an historic pace. While Barings’ view is that growth will weaken, their analysis indicates default rates in the next economic cycle could remain modest compared to prior economic cycles. Borrowers raised record levels of capital in calendar year 2020 to refinance near-term maturities, providing flexibility to navigate uncertainty over the next year. Meanwhile, the brevity of the current economic cycle following the COVID-induced drawdown in 2020 has prevented excesses from amassing in any particular sector; to wit, energy, an area of stress in prior cycles, remained a source of strength in the market for the fiscal period. While volatility remains elevated across both Treasuries and risk assets, Barings believes that dollar prices and yield levels are consistent, with strong prospective returns based on similar periods in prior cycles.
21
MassMutual High Yield Fund – Portfolio Manager Report (Unaudited) (Continued) |
MassMutual
High Yield Fund
Portfolio Characteristics
(% of Net Assets) on 9/30/22 |
Corporate Debt | 94.4% |
Mutual Funds | 3.7% |
Bank Loans | 2.6% |
Total Long-Term Investments | 100.7% |
Short-Term Investments and Other Assets and Liabilities | (0.7)% |
Net Assets | 100.0% |
| | |
22
MassMutual High Yield Fund – Portfolio Manager Report (Unaudited) (Continued) |
GROWTH OF $10,000 INVESTMENT - Service Class
The graph above illustrates a representative class of the Fund’s historical performance for the past 10 fiscal years or since inception (for Funds lacking 10-year records) in comparison to its benchmark index, as well as one or more additional indexes, if applicable. The performance of other share classes will be greater than or less than the class depicted above.
Average Annual Total Returns (for the periods ended 09/30/2022) | | | | |
| Inception Date
of Class | 1 Year | 5 Years | 10 Years | Since Inception
04/01/2014 | Since Inception
12/13/2021 |
Class I | 03/01/2011 | -13.71% | 1.27% | 4.45% | | |
Class R5 | 11/01/2004 | -13.86% | 1.16% | 4.33% | | |
Service Class | 09/05/2000 | -13.81% | 1.07% | 4.25% | | |
Administrative Class | 11/01/2004 | -13.85% | 0.99% | 4.14% | | |
Class R4 | 04/01/2014 | -14.05% | 0.82% | | 2.60% | |
Class A | 11/01/2004 | -14.22% | 0.72% | 3.87% | | |
Class A (sales load deducted)* | 11/01/2004 | -18.94% | -0.41% | 3.29% | | |
Class R3 | 11/01/2004 | -14.27% | 0.57% | 3.70% | | |
Class Y | 12/13/2021 | | | | | -16.81% |
Class C | 12/13/2021 | | | | | -17.18% |
Class C (CDSC fees deducted)* | 12/13/2021 | | | | | -18.18% |
Bloomberg U.S. Corporate High-Yield Bond Index | -14.14% | 1.57% | 3.94% | 3.02% | 4.86% |
* | Class A (sales load deducted) returns include the 5.50% maximum sales charge and Class C (CDSC fees deducted) returns include the 1.00% maximum contingent deferred sales charge for the first 12 months shown. |
Generally accepted accounting principles require adjustments to be made to the net assets of the Fund at period end for financial reporting purposes only, and as such, the total return based on the unadjusted net asset value per share may differ from the total return reported in the financial highlights.
Performance results in the graph and table are shown both with and without the imposition of the maximum applicable sales charge (if applicable) and reflect the percentage change in net asset value, including reinvestment of dividends and capital gains distributions. Investors should note that the Fund is a professionally managed mutual fund, while the index or indexes shown above are unmanaged, cannot be purchased directly, and, with the exception of any peer group index, do not incur expenses.
Performance data quoted in the graph and table represents past performance; past performance is not predictive of future results. The investment return and principal value of shares of the Fund fluctuate, so your shares, when sold, may be worth more or less than their original cost. Current performance of the Fund may be lower or higher than the performance quoted. The performance shown does not reflect the deduction of taxes, if any, that a shareholder would pay on Fund distributions or the redemption of Fund shares. Performance data current to the most recent month end may be obtained by calling 1-888-309-3539.
Investors should read the Fund’s prospectus with regard to the Fund’s investment objectives, risks, and charges and expenses in conjunction with these financial statements. Employee retirement benefit plans that invest plan assets in the Separate Investment Accounts (SIAs) may be subject to certain charges as set forth in their respective Plan Documents. Total return figures would be lower for the periods presented if they reflected these charges.
23
MassMutual Balanced Fund – Portfolio Manager Report (Unaudited) |
What is the investment approach of MassMutual Balanced Fund, and who is the Fund’s subadviser?
The Fund seeks a high total return by investing across different asset classes (U.S. equity securities and fixed income securities) each represented by a different segment of the Fund’s portfolio. Under normal market conditions, the Fund’s subadviser and sub-subadviser expect that 55%-75% of the Fund’s net assets will be invested in U.S. equity securities (the “U.S. Equity Segment”) and 25%-45% of the Fund’s net assets will be invested in fixed income securities (the “Bond Segment”) that meet certain environmental, social, and governance (“ESG”) criteria. The Fund will target a long term strategic allocation of 65% to the U.S. Equity Segment and 35% to the Bond Segment. The Fund’s subadviser is Invesco Advisers, Inc., and its sub-subadviser is Invesco Capital Management LLC (together with Invesco Advisers, Inc., “Invesco”).
How did the Fund perform during the 12 months ended September 30, 2022?
The Fund’s Class R5 shares returned -13.74%, outperforming the -15.47% return of the S&P 500® Index (the “stock component’s benchmark”), which measures the performance of 500 widely held stocks in the U.S. equity market The Fund’s Class R5 shares outperformed the -14.60% return of the Bloomberg U.S. Aggregate Bond Index (the “bond component’s benchmark”), which measures the performance of investment grade, U.S. dollar-denominated, fixed-rate taxable bond market securities, including Treasuries, government-related and corporate securities, mortgage-backed securities (MBS) (agency fixed-rate and hybrid ARM pass-throughs), asset-backed securities (ABS), and commercial mortgage-backed securities (CMBS). (“Agency” refers to debt issued by U.S. federal government agencies or government-sponsored entities for financing purposes.) Additionally, the Fund’s Class R5 shares outperformed the -15.90% return of the Lipper Balanced Fund Index, an unmanaged, equally weighted index of the 30 largest mutual funds within the Lipper Balanced Category; and outperformed the -14.91% return of the Custom Balanced Index, which comprises the stock component’s benchmark and the bond component’s benchmark. The weightings of each index in the Custom Balanced Index are 65% and 35%, respectively.
For a discussion on the economic and market environment during the 12-month period ended September 30, 2022, please see the Economic and Market Overview, beginning on page 3.
Subadviser discussion of factors that contributed to the Fund’s stock component performance
The Fund’s equity component (what Invesco refers to as the “equity sleeve”) is passively managed and seeks to closely track the investment results, before fees and expenses, of the Invesco US Large Cap Total Balanced Multi-Factor ESG Index (“the Index”). The Index employs a security-ranking model applied to U.S. large-capitalization equities with best-in-class Environmental, Social, and Governance (ESG) scores, while excluding certain industries (e.g., tobacco, aerospace, coal, and pipelines) and controversial companies. The model is based on four well-established factors, which are equally weighted: quality, value, price momentum, and low volatility.
Over the reporting period, the equity sleeve outperformed the stock component’s benchmark. With equity volatility rising over the reporting period, significant contributors to performance from the equity sleeve were made from both quality and low volatility factors, while value and price momentum factors modestly detracted. With respect to Fund holdings, the majority of the equity sleeve’s contribution to performance came from the technology and consumer cyclicals sectors. The exclusion of securities with high controversy scores made a slight contribution to returns during the reporting period.
Subadviser discussion of factors that contributed to the Fund’s bond component performance
The Fund’s fixed income component (what Invesco refers to as the “fixed income sleeve”) is an actively managed, Intermediate Core ESG fixed income strategy that seeks to deliver income, growth potential, and serve as a ballast to other risk assets. The strategy integrates ESG factors into the fundamental evaluation of investment opportunities where such factors are material and relevant to the credit quality of the investment opportunity. The strategy has exclusionary rules to exclude issuers in certain industries in line with Index rules that screen poorly on ESG factors or have high controversy scores. Certain industries that may be excluded include alcohol producers, tobacco producers, gambling operators, nuclear power companies, conventional weapons manufacturers, cluster bomb manufacturers, and civilian firearm producers. The Invesco Fixed Income team applies an ESG rating and fundamental credit rating to each bond they review. The investable universe for the Fund is limited to bonds that are top-rated on both ESG and fundamental pillars.
24
MassMutual Balanced Fund – Portfolio Manager Report (Unaudited) (Continued) |
For the one-year period ended September 30, 2022, the Fund’s fixed income sleeve underperformed the bond component’s benchmark. The Fund’s overweight allocation to credit risk was the primary detractor, with risk assets weaker in response to aggressive policy tightening by the Federal Reserve, which seeks to lower historically high inflation in the U.S. The allocation to corporate credit served as the key headwind, with banking being the key industry detractor, given the Fund’s overweight allocation to, and weaker results in, this highly liquid sector. Down-in-quality investment-grade issues lagged higher-quality bonds over the period, which weighed on relative returns, given the Fund’s overweight focus on BBB-rated securities. Relative contributions were primarily derived from duration posturing, with a slightly underweight duration position serving as a key tailwind amid the rising interest rate environment. (Duration is a measure of a bond fund’s sensitivity to interest rates. The longer the duration, the greater the price impact on the bond or portfolio when interest rates rise or fall.) Within structured credit, the Fund’s underweight allocation to MBS was a positive contributor to the Fund’s performance for the period, while security selection in ABS and CMBS were minor detractors.
The Fund’s derivative usage did not have a material effect on performance during the reporting period. While Fund management may use derivatives to manage currency, cash, or duration positioning, derivatives are not a key component of the Fund’s investment process. Derivatives are securities that derive their value from the performance of one or more other investments and take the form of a contract between two or more parties. Derivatives can be used for hedging, speculation, or both.
Subadviser outlook
In Invesco’s view, leading economic indicators have continued to weaken as of the end of the fiscal year, suggesting growth is likely to be below trend across regions; consequently, Invesco expects the global economy to continue to slow. In Invesco’s view, the fate of developed market economies – the depth and length of such economies’ respective economic downturns – is largely dependent on the path of monetary policy going forward, which is largely dependent on inflation.
From a relative asset allocation perspective, Invesco’s base-case expectations lead them to a defensive bias in the shorter term. They anticipate fixed income could outperform equities in coming months, with investment-grade credit and duration in government bonds potentially performing better. Within equities, they anticipate defensive, quality, and low-volatility securities have the potential to perform better.
MassMutual
Balanced Fund
Portfolio Characteristics
(% of Net Assets) on 9/30/22 |
Common Stock | 64.0% |
U.S. Treasury Obligations | 14.4% |
Corporate Debt | 12.3% |
U.S. Government Agency Obligations and Instrumentalities* | 10.1% |
Non-U.S. Government Agency Obligations | 4.0% |
Total Long-Term Investments | 104.8% |
Short-Term Investments and Other Assets and Liabilities | (4.8)% |
Net Assets | 100.0% |
| | |
* | May contain securities that are issued by a U.S. Government Agency, but are unsecured and are not guaranteed by a U.S. Government Agency. |
25
MassMutual Balanced Fund – Portfolio Manager Report (Unaudited) (Continued) |
GROWTH OF $10,000 INVESTMENT - Class R5

The graph above illustrates a representative class of the Fund’s historical performance for the past 10 fiscal years or since inception (for Funds lacking 10-year records) in comparison to its benchmark index, as well as one or more additional indexes, if applicable. The performance of other share classes will be greater than or less than the class depicted above.
Average Annual Total Returns (for the periods ended 09/30/2022) | | | |
| Inception Date
of Class | 1 Year | 5 Years | 10 Years | Since Inception
04/01/2014 |
Class I | 04/01/2014 | -13.65% | 4.90% | | 5.80% |
Class R5 | 10/03/1994 | -13.74% | 4.79% | 6.76% | |
Service Class | 01/01/1998 | -13.87% | 4.67% | 6.62% | |
Administrative Class | 05/03/1999 | -13.95% | 4.58% | 6.51% | |
Class R4 | 04/01/2014 | -14.06% | 4.41% | | 5.30% |
Class A | 01/01/1998 | -14.22% | 4.30% | 6.25% | |
Class A (sales load deducted)* | 01/01/1998 | -18.94% | 3.12% | 5.65% | |
Class R3 | 04/01/2014 | -14.27% | 4.15% | | 5.05% |
S&P 500 Index# | | -15.47% | 9.24% | 11.70% | 10.02% |
Bloomberg U.S. Aggregate Bond Index | | -14.60% | -0.27% | 0.89% | 1.05% |
Lipper Balanced Fund Index | | -15.90% | 4.06% | 6.12% | 4.97% |
Custom Balanced Index | | -14.91% | 6.16% | 8.04% | 7.06% |
* | Class A (sales load deducted) returns include the 5.50% maximum sales charge. |
Generally accepted accounting principles require adjustments to be made to the net assets of the Fund at period end for financial reporting purposes only, and as such, the total return based on the unadjusted net asset value per share may differ from the total return reported in the financial highlights.
Performance results in the graph and table are shown both with and without the imposition of the maximum applicable sales charge (if applicable) and reflect the percentage change in net asset value, including reinvestment of dividends and capital gains distributions. Investors should note that the Fund is a professionally managed mutual fund, while the index or indexes shown above are unmanaged, cannot be purchased directly, and, with the exception of any peer group index, do not incur expenses.
Performance data quoted in the graph and table represents past performance; past performance is not predictive of future results. The investment return and principal value of shares of the Fund fluctuate, so your shares, when sold, may be worth more or less than their original cost. Current performance of the Fund may be lower or higher than the performance quoted. The performance shown does not reflect the deduction of taxes, if any, that a shareholder would pay on Fund distributions or the redemption of Fund shares. Performance data current to the most recent month end may be obtained by calling 1-888-309-3539.
Investors should read the Fund’s prospectus with regard to the Fund’s investment objectives, risks, and charges and expenses in conjunction with these financial statements. Employee retirement benefit plans that invest plan assets in the Separate Investment Accounts (SIAs) may be subject to certain charges as set forth in their respective Plan Documents. Total return figures would be lower for the periods presented if they reflected these charges.
26
MassMutual Disciplined Value Fund – Portfolio Manager Report (Unaudited) |
What is the investment approach of MassMutual Disciplined Value Fund, and who is the Fund’s subadviser?
The Fund seeks long-term total return by investing primarily in equity securities of U.S. large- and mid-cap companies. The Fund currently invests substantially all of its assets in companies represented in the Russell 1000® Value Index at the time of purchase, although the Fund is actively managed and is not an index fund or a passively managed investment. Constituents of the Russell 1000 Value Index are companies that exhibit certain value characteristics, as defined by the index providers, such as lower price-to-book ratios, lower prices relative to forecasted earnings, and higher dividend yields. The Fund’s subadviser is Wellington Management Company LLP (Wellington Management).
How did the Fund perform during the 12 months ended September 30, 2022?
The Fund’s Service Class shares returned -10.38%, outperforming the -11.36% return of the Russell 1000 Value Index (the “benchmark”), which measures the performance of the large-cap value segment of U.S. equity securities. It includes the Russell 1000 Index companies with lower price-to-book ratios and lower expected growth values. It is market-capitalization weighted.
For a discussion on the economic and market environment during the 12-month period ended September 30, 2022, please see the Economic and Market Overview, beginning on page 3.
Subadviser discussion of factors that contributed to the Fund’s performance
For the one-year period ended September 30, 2022, strong security selection was the primary driver of the Fund’s outperformance of its benchmark, while sector allocation detracted from results. The impact of security selection, which is a byproduct of Wellington Management’s systematic factor construction process, was positive for the period, led by strong selection in the health care, energy, and information technology sectors. This was only partially offset by weaker stock choices in the financial sector.
Sector allocation is a fallout of Wellington Management’s factor implementation process, and factors will rotate in and out of sectors over time. During the period, sector allocation detracted from performance, led by underweight allocations to the energy and utilities sectors. This was partially offset by the Fund’s underweight exposure to the communication services sector and its overweight allocation to the consumer staples sector, which contributed to relative results.
The Fund’s overweight allocations to Devon Energy (in the energy sector) and Marathon Oil (energy) were the two largest contributors to relative performance during the period. The Fund continued to own both Devon Energy and Marathon Oil as of the end of the period. This was partially offset by not owning stronger-performing stocks, including Exxon Mobil and Chevron (both in the energy sector), which were the two largest relative detractors during the period. The Fund continued to not own both stocks as of the end of the fiscal year.
Subadviser outlook
Wellington Management observes that the U.S. equity market remains volatile, as inflation pressures endure, the Federal Reserve (the “Fed”) continues to raise interest rates, and recession fears persist. In the midst of this heighted uncertainty, Fund management is focused on the factor exposures and related risks to the Fund’s portfolio. They continue to make efforts to avoid expressions of deep value that have an increased risk of becoming insolvent, given weaker fundamentals and higher sensitivity to macro signals such as Fed rhetoric, widening credit spreads, or oil prices. Instead, Fund management generally favor expressions of higher-quality value, which they believe have attractive fundamentals and are less exposed to the risks facing deeper value names. In screening for value names with fundamental momentum, Fund management seeks companies with high profitability. Along with generally having better valuations than more speculative stocks, Wellington Management’s experience and research has shown that these profitable companies are generally less sensitive to high interest rate environments. Finally, Fund management expects to maintain the Fund’s exposure to more defensive value stocks, both in an effort to provide a defensive ballast in the portfolio and because they believe there is unrealized alpha potential in these high-quality names.
27
MassMutual Disciplined Value Fund – Portfolio Manager Report (Unaudited) (Continued) |
MassMutual
Disciplined Value Fund
Largest Holdings
(% of Net Assets) on 9/30/22 |
Berkshire Hathaway, Inc. Class B | 2.7% |
JP Morgan Chase & Co. | 2.5% |
Pfizer, Inc. | 2.4% |
Walmart, Inc. | 2.1% |
Meta Platforms, Inc. Class A | 2.0% |
Thermo Fisher Scientific, Inc. | 2.0% |
The Procter & Gamble Co. | 1.9% |
ConocoPhillips | 1.9% |
Danaher Corp. | 1.9% |
Bristol-Myers Squibb Co. | 1.9% |
| | 21.3% |
| | |
MassMutual
Disciplined Value Fund
Sector Table
(% of Net Assets) on 9/30/22 |
Consumer, Non-cyclical | 30.1% |
Financial | 26.8% |
Industrial | 10.4% |
Technology | 9.3% |
Consumer, Cyclical | 6.0% |
Communications | 5.8% |
Energy | 5.7% |
Basic Materials | 3.6% |
Utilities | 1.8% |
Mutual Funds | 0.0% |
Total Long-Term Investments | 99.5% |
Short-Term Investments and Other Assets and Liabilities | 0.5% |
Net Assets | 100.0% |
| | |
28
MassMutual Disciplined Value Fund – Portfolio Manager Report (Unaudited) (Continued) |
GROWTH OF $10,000 INVESTMENT - Service Class
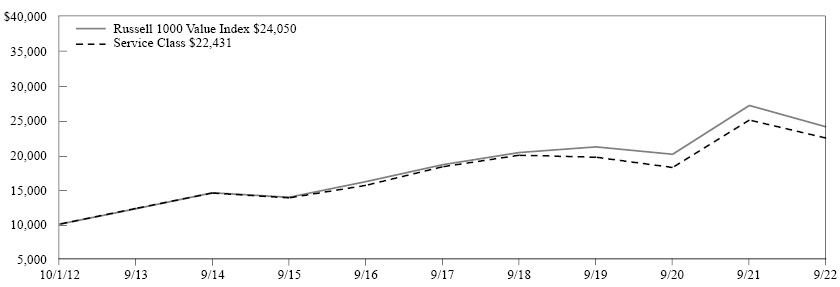
The graph above illustrates a representative class of the Fund’s historical performance for the past 10 fiscal years or since inception (for Funds lacking 10-year records) in comparison to its benchmark index, as well as one or more additional indexes, if applicable. The performance of other share classes will be greater than or less than the class depicted above.
Average Annual Total Returns (for the periods ended 09/30/2022) | | | |
| Inception Date
of Class | 1 Year | 5 Years | 10 Years | Since Inception
04/01/2014 |
Class I | 04/01/2014 | -10.19% | 4.38% | | 5.94% |
Class R5 | 11/01/2004 | -10.28% | 4.27% | 8.52% | |
Service Class | 12/19/2000 | -10.38% | 4.16% | 8.41% | |
Administrative Class | 11/01/2004 | -10.45% | 4.05% | 8.29% | |
Class R4 | 04/01/2014 | -10.62% | 3.89% | | 5.46% |
Class A | 11/01/2004 | -10.68% | 3.82% | 8.03% | |
Class A (sales load deducted)* | 11/01/2004 | -15.59% | 2.65% | 7.42% | |
Class R3 | 11/01/2004 | -10.86% | 3.64% | 7.84% | |
Russell 1000 Value Index | | -11.36% | 5.29% | 9.17% | 6.70% |
* | Class A (sales load deducted) returns include the 5.50% maximum sales charge. |
Generally accepted accounting principles require adjustments to be made to the net assets of the Fund at period end for financial reporting purposes only, and as such, the total return based on the unadjusted net asset value per share may differ from the total return reported in the financial highlights.
Performance results in the graph and table are shown both with and without the imposition of the maximum applicable sales charge (if applicable) and reflect the percentage change in net asset value, including reinvestment of dividends and capital gains distributions. Investors should note that the Fund is a professionally managed mutual fund, while the index or indexes shown above are unmanaged, cannot be purchased directly, and, with the exception of any peer group index, do not incur expenses.
Performance data quoted in the graph and table represents past performance; past performance is not predictive of future results. The investment return and principal value of shares of the Fund fluctuate, so your shares, when sold, may be worth more or less than their original cost. Current performance of the Fund may be lower or higher than the performance quoted. The performance shown does not reflect the deduction of taxes, if any, that a shareholder would pay on Fund distributions or the redemption of Fund shares. Performance data current to the most recent month end may be obtained by calling 1-888-309-3539.
Investors should read the Fund’s prospectus with regard to the Fund’s investment objectives, risks, and charges and expenses in conjunction with these financial statements. Employee retirement benefit plans that invest plan assets in the Separate Investment Accounts (SIAs) may be subject to certain charges as set forth in their respective Plan Documents. Total return figures would be lower for the periods presented if they reflected these charges.
29
MassMutual Main Street Fund – Portfolio Manager Report (Unaudited) |
What is the investment approach of MassMutual Main Street Fund, and who is the Fund’s subadviser?
The Fund seeks a high total return by investing primarily in common stocks of U.S. companies of different capitalization ranges. The Fund’s subadviser currently focuses on “large capitalization” issuers, which are considered to be companies with market capitalizations at the time of purchase within the market capitalization range of companies included within the Russell 1000® Index, although it may purchase stocks of companies with any market capitalization. The Fund’s subadviser is Invesco Advisers, Inc. (Invesco Advisers).
How did the Fund perform during the 12 months ended September 30, 2022?
The Fund’s Class R5 shares returned -18.91%, underperforming the -15.47% return of the S&P 500® Index (the “benchmark”), which measures the performance of 500 widely held stocks in the U.S. equity market.
For a discussion on the economic and market environment during the 12-month period ended September 30, 2022, please see the Economic and Market Overview, beginning on page 3.
Subadviser discussion of factors that contributed to the Fund’s performance
For the one-year period ended September 30, 2022, stock selection in the consumer discretionary, information technology, and financial sectors drove the Fund’s underperformance of the benchmark. This was partially offset by stronger stock selection in the industrial, health care, and materials sectors.
With respect to Fund holdings, the largest individual detractor from relative performance was the Fund’s underweight allocation to technology giant Apple. Other significant detractors included Salesforce and Amazon. During the fiscal year, Apple outperformed the benchmark and was the largest weighting in the S&P 500 Index, causing the Fund’s underweight position in the name to detract from relative results. Salesforce, an American cloud-based software company that provides customer relationship management (CRM) software and applications, was negatively impacted by the broad-based sell-off of higher-growth software names. Amazon, an American multinational technology company, reported a string of quarters with disappointing profitability, which weighed on investor sentiment. The company dealt with inflation and operating inefficiencies during the fiscal year.
The Fund holdings that were the top individual contributors to relative returns included Eli Lilly, UnitedHealth, and CVS. Pharmaceutical company Eli Lilly performed well after receiving approval for a drug to treat type 2 diabetes, while also reporting favorable obesity data related to the drug’s usage for weight loss. Furthermore, pharmaceutical companies as a group were viewed as a defensive industry during the market downturn. During the period, managed health care and insurance company UnitedHealth continued to report strong quarterly revenue and net income results; managed care companies have also outperformed as a group during the market sell-off. CVS, another health care company (that also owns a retail pharmacy chain), benefited from vaccines and testing related to COVID-19 and used an improved free cash flow profile to pay down debt.
Subadviser outlook
In Invesco Advisers’ view, the monetary situation has changed dramatically over the past year. Central banks no longer view inflation as “transitory,” but rather as a significant threat that needs to be mitigated. In addition, interest rates have risen materially. Between inflation eating away at consumers’ discretionary income, higher interest rates making large purchases more expensive, and a normalization of services consumption, Invesco Advisers observed material weakness in consumer discretionary spending. Invesco Advisers believes that, whether these factors lead to a recession in the coming year remains an open question, but their view is that a recession is more likely than not. Either way, Fund management notes that, in their view, there is little doubt that rising interest rates are having the Federal Reserve’s intended effect of slowing the U.S. economy.
Invesco Advisers plans to continue to maintain its discipline around valuation and focus on companies with competitive advantages and skilled management teams that are out-executing their peers, as evidenced by high returns on invested capital, consistently strong pricing power, and/or rising market share.
30
MassMutual Main Street Fund – Portfolio Manager Report (Unaudited) (Continued) |
MassMutual
Main Street Fund
Largest Holdings
(% of Net Assets) on 9/30/22 |
Microsoft Corp. | 7.0% |
Apple, Inc. | 6.0% |
UnitedHealth Group, Inc. | 3.5% |
Eli Lilly & Co. | 3.3% |
Alphabet, Inc. Class A | 2.9% |
Amazon.com, Inc. | 2.8% |
Prologis, Inc. | 2.7% |
United Parcel Service, Inc. Class B | 2.6% |
Exxon Mobil Corp. | 2.5% |
JP Morgan Chase & Co. | 2.2% |
| | 35.5% |
| | |
MassMutual
Main Street Fund
Sector Table
(% of Net Assets) on 9/30/22 |
Technology | 24.5% |
Consumer, Non-cyclical | 21.8% |
Communications | 13.1% |
Financial | 13.1% |
Industrial | 11.5% |
Energy | 5.2% |
Consumer, Cyclical | 4.9% |
Utilities | 2.8% |
Basic Materials | 0.8% |
Total Long-Term Investments | 97.7% |
Short-Term Investments and Other Assets and Liabilities | 2.3% |
Net Assets | 100.0% |
| | |
31
MassMutual Main Street Fund – Portfolio Manager Report (Unaudited) (Continued) |
GROWTH OF $10,000 INVESTMENT - Class R5

The graph above illustrates a representative class of the Fund’s historical performance for the past 10 fiscal years or since inception (for Funds lacking 10-year records) in comparison to its benchmark index, as well as one or more additional indexes, if applicable. The performance of other share classes will be greater than or less than the class depicted above.
Average Annual Total Returns (for the periods ended 09/30/2022) | | | |
| Inception Date
of Class | 1 Year | 5 Years | 10 Years | Since Inception
04/01/2014 |
Class I | 04/01/2014 | -18.81% | 6.12% | | 8.14% |
Class R5 | 12/31/2004 | -18.91% | 6.01% | 9.84% | |
Service Class | 12/31/2004 | -19.00% | 5.89% | 9.74% | |
Administrative Class | 12/31/2004 | -19.11% | 5.79% | 9.63% | |
Class R4 | 04/01/2014 | -19.16% | 5.64% | | 7.65% |
Class A | 12/31/2004 | -19.22% | 5.54% | 9.35% | |
Class A (sales load deducted)* | 12/31/2004 | -23.67% | 4.35% | 8.74% | |
Class R3 | 12/31/2004 | -19.46% | 5.36% | 9.17% | |
S&P 500 Index | | -15.47% | 9.24% | 11.70% | 10.02% |
* | Class A (sales load deducted) returns include the 5.50% maximum sales charge. |
Generally accepted accounting principles require adjustments to be made to the net assets of the Fund at period end for financial reporting purposes only, and as such, the total return based on the unadjusted net asset value per share may differ from the total return reported in the financial highlights.
Performance results in the graph and table are shown both with and without the imposition of the maximum applicable sales charge (if applicable) and reflect the percentage change in net asset value, including reinvestment of dividends and capital gains distributions. Investors should note that the Fund is a professionally managed mutual fund, while the index or indexes shown above are unmanaged, cannot be purchased directly, and, with the exception of any peer group index, do not incur expenses.
Performance data quoted in the graph and table represents past performance; past performance is not predictive of future results. The investment return and principal value of shares of the Fund fluctuate, so your shares, when sold, may be worth more or less than their original cost. Current performance of the Fund may be lower or higher than the performance quoted. The performance shown does not reflect the deduction of taxes, if any, that a shareholder would pay on Fund distributions or the redemption of Fund shares. Performance data current to the most recent month end may be obtained by calling 1-888-309-3539.
Investors should read the Fund’s prospectus with regard to the Fund’s investment objectives, risks, and charges and expenses in conjunction with these financial statements. Employee retirement benefit plans that invest plan assets in the Separate Investment Accounts (SIAs) may be subject to certain charges as set forth in their respective Plan Documents. Total return figures would be lower for the periods presented if they reflected these charges.
32
MassMutual Disciplined Growth Fund – Portfolio Manager Report (Unaudited) |
What is the investment approach of MassMutual Disciplined Growth Fund, and who is the Fund’s subadviser?
The Fund seeks long-term total return by investing primarily in equity securities of U.S. large- and mid-cap companies. The Fund currently invests substantially all of its assets in companies represented in the Russell 1000® Growth Index at the time of purchase, although the Fund is actively managed and is not an index fund or a passively managed investment. Constituents of the Russell 1000 Growth Index are companies that exhibit certain growth characteristics, as defined by the index providers, such as historical and predicted future earnings per share growth rates and trends, historical sales per share growth trends, and internal growth rate. The Fund’s subadviser is Wellington Management Company LLP (Wellington Management).
How did the Fund perform during the 12 months ended September 30, 2022?
The Fund’s Service Class shares returned -25.04%, underperforming the -22.59% return of the Russell 1000 Growth Index (the “benchmark”), which measures the performance of the large-cap growth segment of U.S. equity securities. It includes the Russell 1000 Index companies with higher price-to-book ratios and higher forecasted growth values. It is market-capitalization weighted.
For a discussion on the economic and market environment during the 12-month period ended September 30, 2022, please see the Economic and Market Overview, beginning on page 3.
Subadviser discussion of factors that contributed to the Fund’s performance
For the one-year period ended September 30, 2022, security selection was the primary driver of the Fund’s underperformance, while sector allocation positively contributed to the Fund’s full-year returns. The impact of security selection, which is a byproduct of Wellington Management’s systematic factor construction process, was negative for the period, led by weak stock selection in the information technology, consumer discretionary, and communication services sectors. This was only partially offset by stronger stock choices in the health care, materials, and financial sectors.
Sector allocation is a fallout of Wellington Management’s factor implementation process, and factors will rotate in and out of sectors over time. During the reporting period, sector allocation contributed to performance, led by overweight allocations to the health care and financial sectors. This was partially offset by underweight exposures to the industrial and energy sectors, which detracted from the Fund’s relative results.
With respect to specific Fund holdings, an underweight allocation to Apple (in the information technology sector) and Fund management’s decision not to own Eli Lilly & Co. (health care) were the two largest relative detractors. Fund management increased its allocation to Apple, but the Fund remained underweight in Apple, relative to the benchmark, as of the end of the period. The Fund continued to not own Eli Lilly & Co. as of the end of the period. On the other hand, the Fund’s overweight allocations to UnitedHealth and Vertex Pharmaceuticals (both in the health care sector) were the two largest contributors to relative results during the period. Fund management increased the Fund’s overweight positions in both UnitedHealth and Vertex Pharmaceuticals during the fiscal year.
Subadviser outlook
Wellington Management observes that the U.S. equity market remains volatile, as inflation pressures endure, the Federal Reserve continues to raise interest rates, and recession fears persist. In the midst of this heighted uncertainty, Fund management is focused on the factor exposures and related risks to the Fund’s portfolio. They continue to avoid highly speculative growth stocks that have a larger portion of their value coming from assumed future cash flows on non-existent assets, as Wellington Management experience and research has shown generally that rising interest rates can have an outsized impact on these names compared to the rest of the growth universe. Instead, Fund management generally expects to favor companies characterized by growing profitability; Management’s research has shown that such companies generally tend to be less sensitive to rising interest rates. Within the Fund’s exposure to stocks priced at lower valuations, Fund management anticipates using company fundamentals to identify what they believe to be attractively valued growth stocks, while seeking to manage the macro risks that these names may introduce into the Fund’s portfolio. Management aims to balance these positions with exposure to quality growth companies in an effort to provide a defensive ballast in the Fund’s portfolio.
33
MassMutual Disciplined Growth Fund – Portfolio Manager Report (Unaudited) (Continued) |
MassMutual
Disciplined Growth Fund
Largest Holdings
(% of Net Assets) on 9/30/22 |
Apple, Inc. | 12.1% |
Microsoft Corp. | 10.6% |
Amazon.com, Inc. | 5.6% |
Tesla, Inc. | 4.2% |
UnitedHealth Group, Inc. | 3.5% |
Alphabet, Inc. Class A | 3.5% |
Visa, Inc. Class A | 2.7% |
Mastercard, Inc. Class A | 2.4% |
Alphabet, Inc. Class C | 2.1% |
Broadcom, Inc. | 2.0% |
| | 48.7% |
| | |
MassMutual
Disciplined Growth Fund
Sector Table
(% of Net Assets) on 9/30/22 |
Technology | 36.2% |
Consumer, Non-cyclical | 19.1% |
Communications | 15.5% |
Consumer, Cyclical | 11.5% |
Financial | 8.8% |
Industrial | 5.7% |
Energy | 1.9% |
Basic Materials | 1.0% |
Mutual Funds | 0.4% |
Total Long-Term Investments | 100.1% |
Short-Term Investments and Other Assets and Liabilities | (0.1)% |
Net Assets | 100.0% |
| | |
34
MassMutual Disciplined Growth Fund – Portfolio Manager Report (Unaudited) (Continued) |
GROWTH OF $10,000 INVESTMENT - Service Class
The graph above illustrates a representative class of the Fund’s historical performance for the past 10 fiscal years or since inception (for Funds lacking 10-year records) in comparison to its benchmark index, as well as one or more additional indexes, if applicable. The performance of other share classes will be greater than or less than the class depicted above.
Average Annual Total Returns (for the periods ended 09/30/2022) | | | |
| Inception Date
of Class | 1 Year | 5 Years | 10 Years | Since Inception
04/01/2014 |
Class I | 04/01/2014 | -24.92% | 9.58% | | 10.45% |
Class R5 | 11/01/2004 | -24.96% | 9.46% | 12.13% | |
Service Class | 12/19/2000 | -25.04% | 9.34% | 12.01% | |
Administrative Class | 11/01/2004 | -25.13% | 9.25% | 11.90% | |
Class R4 | 04/01/2014 | -25.23% | 9.07% | | 9.94% |
Class A | 11/01/2004 | -25.29% | 8.98% | 11.62% | |
Class A (sales load deducted)* | 11/01/2004 | -29.40% | 7.76% | 10.99% | |
Class R3 | 04/01/2014 | -25.46% | 8.80% | | 9.66% |
Russell 1000 Growth Index | | -22.59% | 12.17% | 13.70% | 12.45% |
* | Class A (sales load deducted) returns include the 5.50% maximum sales charge. |
Generally accepted accounting principles require adjustments to be made to the net assets of the Fund at period end for financial reporting purposes only, and as such, the total return based on the unadjusted net asset value per share may differ from the total return reported in the financial highlights.
Performance results in the graph and table are shown both with and without the imposition of the maximum applicable sales charge (if applicable) and reflect the percentage change in net asset value, including reinvestment of dividends and capital gains distributions. Investors should note that the Fund is a professionally managed mutual fund, while the index or indexes shown above are unmanaged, cannot be purchased directly, and, with the exception of any peer group index, do not incur expenses.
Performance data quoted in the graph and table represents past performance; past performance is not predictive of future results. The investment return and principal value of shares of the Fund fluctuate, so your shares, when sold, may be worth more or less than their original cost. Current performance of the Fund may be lower or higher than the performance quoted. The performance shown does not reflect the deduction of taxes, if any, that a shareholder would pay on Fund distributions or the redemption of Fund shares. Performance data current to the most recent month end may be obtained by calling 1-888-309-3539.
Investors should read the Fund’s prospectus with regard to the Fund’s investment objectives, risks, and charges and expenses in conjunction with these financial statements. Employee retirement benefit plans that invest plan assets in the Separate Investment Accounts (SIAs) may be subject to certain charges as set forth in their respective Plan Documents. Total return figures would be lower for the periods presented if they reflected these charges.
35
MassMutual Small Cap Opportunities Fund – Portfolio Manager Report (Unaudited) |
What is the investment approach of MassMutual Small Cap Opportunities Fund, and who is the Fund’s subadviser?
The Fund seeks capital appreciation by investing primarily in common stocks of small-capitalization U.S. companies that the Fund’s subadviser believes have favorable business trends or prospects based on fundamental analysis. Under normal circumstances, the Fund invests at least 80% of its net assets (plus the amount of any borrowings for investment purposes) in securities of small-cap companies. The Fund’s subadviser is Invesco Advisers, Inc. (Invesco Advisers).
How did the Fund perform during the 12 months ended September 30, 2022?
The Fund’s Class A shares returned -19.04%, outperforming the -23.50% return of the Russell 2000® Index (the “benchmark”), which measures the performance of the small-cap segment of the U.S. equity universe. It is a subset of the Russell 3000 Index and includes approximately 2000 of the smallest securities based on a combination of their market cap and current index membership.
For a discussion on the economic and market environment during the 12-month period ended September 30, 2022, please see the Economic and Market Overview, beginning on page 3.
Subadviser discussion of factors that contributed to the Fund’s performance
Strong stock selection in the consumer discretionary, industrial, and financial sectors drove the Fund’s outperformance for the one-year period ended September 30, 2022. This was partially offset by weaker stock selection in the materials and information technology sectors, and an underweight allocation to the energy sector.
Fund holdings that were the top individual contributors to relative performance included Acadia Healthcare, BJ’s Wholesale Club Holdings, Inc., and Chesapeake Energy. Acadia, a provider of behavioral health care services, reported a strong quarter and raised guidance for the full year. During that period, the company continued to benefit from strong demand for mental health services and favorable pricing trends. BJ’s Wholesale Club’s model fared well in an inflationary period, as the company gained market share with a growing number of members. Chesapeake Energy benefited from an increase in natural gas prices and performance leadership from the energy sector as a whole.
On the downside, Fund holdings that were the top individual detractors from relative performance included Azenta, Inc., Q2, and CryoPort. Azenta, which distributes automation, vacuum, and instrumentation equipment – and manufactures semiconductors and technology devices – preannounced a below-expectations quarter due to COVID headwinds, including lockdowns in China and foreign exchange pressures. Company management also lowered its guidance for the rest of the year. Q2, a provider of digital banking solutions, was negatively impacted by the sharp sell-off in higher-growth stocks. Additionally, this general sell-off was exacerbated by company-specific headwinds, as budgets for back-office (versus front-office) software solutions were deprioritized. CryoPort, which provides supply chain solutions for the life sciences industry, experienced a fire at one of its facilities during the first quarter of 2022, which negatively impacted sales, as the facility was not operating at full production capacity. The company also dealt with supply constraints that impacted revenue.
Subadviser outlook
In Invesco Advisers’ view, the world and markets have largely moved on from COVID, but are still dealing with the hangover from all the financial actions taken to fight the pandemic. During the height of the pandemic, governments around the world engaged in high deficit spending to stimulate their economies, and central banks lowered interest rates to maintain financial stability and spur demand. Meanwhile, COVID lockdowns and related supply chain disruptions caused fewer goods to be produced. The goods that were produced were also relatively more expensive than before, thanks to a reversal of the offshoring phenomenon. More money in the world chasing relatively fewer and more expensively produced goods led to a generational high in inflation rates. The Russia/Ukraine war exacerbated the scarcity of goods and inflation rates.
In Invesco Advisers’ view, the monetary situation changed dramatically in 2022. Central banks no longer view inflation as “transitory,” but rather as a significant threat that needs to be mitigated, and interest rates have risen materially. Between inflation eating away at consumers’ discretionary income, higher interest rates making large purchases more expensive, and a normalization of services consumption, Invesco Advisers observed material weakness in consumer discretionary spending. Invesco Advisers believes that, whether these factors lead to a recession in the coming year remains an open question, but Invesco Advisers believes it is more likely than not. Either way, Fund management notes that, in their view, there is little doubt that rising interest rates are having the Federal Reserve’s intended effect of slowing the U.S. economy.
36
MassMutual Small Cap Opportunities Fund – Portfolio Manager Report (Unaudited) (Continued) |
MassMutual
Small Cap Opportunities Fund
Largest Holdings
(% of Net Assets) on 9/30/22 |
Acadia Healthcare Co., Inc. | 2.2% |
BJ’s Wholesale Club Holdings, Inc. | 2.1% |
AutoNation, Inc. | 2.0% |
Stifel Financial Corp. | 1.8% |
ASGN, Inc. | 1.7% |
Paycor HCM, Inc. | 1.7% |
Inspire Medical Systems, Inc. | 1.6% |
Ziff Davis, Inc. | 1.6% |
Four Corners Property Trust, Inc. | 1.6% |
CACI International, Inc. Class A | 1.5% |
| | 17.8% |
| | |
MassMutual
Small Cap Opportunities Fund
Sector Table
(% of Net Assets) on 9/30/22 |
Financial | 22.1% |
Consumer, Non-cyclical | 19.7% |
Industrial | 18.4% |
Consumer, Cyclical | 13.9% |
Technology | 11.0% |
Energy | 5.1% |
Utilities | 3.8% |
Communications | 2.6% |
Basic Materials | 2.3% |
Mutual Funds | 1.6% |
Total Long-Term Investments | 100.5% |
Short-Term Investments and Other Assets and Liabilities | (0.5)% |
Net Assets | 100.0% |
| | |
37
MassMutual Small Cap Opportunities Fund – Portfolio Manager Report (Unaudited) (Continued) |
GROWTH OF $10,000 INVESTMENT - Class A

The graph above illustrates a representative class of the Fund’s historical performance for the past 10 fiscal years or since inception (for Funds lacking 10-year records) in comparison to its benchmark index, as well as one or more additional indexes, if applicable. The performance of other share classes will be greater than or less than the class depicted above.
Average Annual Total Returns (for the periods ended 09/30/2022) | | | |
| Inception Date
of Class | 1 Year | 5 Years | 10 Years | Since Inception
04/01/2014 |
Class I | 04/01/2014 | -18.57% | 5.69% | | 7.04% |
Class R5 | 11/01/2004 | -18.68% | 5.57% | 10.40% | |
Service Class | 11/01/2004 | -18.78% | 5.47% | 10.29% | |
Administrative Class | 11/01/2004 | -18.88% | 5.35% | 10.18% | |
Class R4 | 04/01/2014 | -18.99% | 5.20% | | 6.54% |
Class A | 07/20/1998 | -19.04% | 5.11% | 9.92% | |
Class A (sales load deducted)* | 07/20/1998 | -23.49% | 3.93% | 9.30% | |
Class R3 | 04/01/2014 | -19.19% | 4.94% | | 6.27% |
Russell 2000 Index | | -23.50% | 3.55% | 8.55% | 5.60% |
* | Class A (sales load deducted) returns include the 5.50% maximum sales charge. |
Generally accepted accounting principles require adjustments to be made to the net assets of the Fund at period end for financial reporting purposes only, and as such, the total return based on the unadjusted net asset value per share may differ from the total return reported in the financial highlights.
Performance results in the graph and table are shown both with and without the imposition of the maximum applicable sales charge (if applicable) and reflect the percentage change in net asset value, including reinvestment of dividends and capital gains distributions. Investors should note that the Fund is a professionally managed mutual fund, while the index or indexes shown above are unmanaged, cannot be purchased directly, and, with the exception of any peer group index, do not incur expenses.
Performance data quoted in the graph and table represents past performance; past performance is not predictive of future results. The investment return and principal value of shares of the Fund fluctuate, so your shares, when sold, may be worth more or less than their original cost. Current performance of the Fund may be lower or higher than the performance quoted. The performance shown does not reflect the deduction of taxes, if any, that a shareholder would pay on Fund distributions or the redemption of Fund shares. Performance data current to the most recent month end may be obtained by calling 1-888-309-3539.
Investors should read the Fund’s prospectus with regard to the Fund’s investment objectives, risks, and charges and expenses in conjunction with these financial statements. Employee retirement benefit plans that invest plan assets in the Separate Investment Accounts (SIAs) may be subject to certain charges as set forth in their respective Plan Documents. Total return figures would be lower for the periods presented if they reflected these charges.
38
MassMutual Global Fund – Portfolio Manager Report (Unaudited) |
What is the investment approach of MassMutual Global Fund, and who is the Fund’s subadviser?
The Fund seeks long-term capital appreciation by investing primarily in common stocks of companies in the U.S. and foreign countries. The Fund can invest without limit in foreign securities, including American Depositary Receipts (ADRs), and can invest in any country, including developing or emerging market countries. However, the Fund currently emphasizes investments in developed markets such as the United States, Western European countries, and Japan. As a fundamental policy, the Fund normally will invest in at least three countries (one of which may be the United States). Typically, the Fund invests in a number of different countries. The Fund’s subadviser is Invesco Advisers, Inc. (Invesco Advisers).
How did the Fund perform during the 12 months ended September 30, 2022?
The Fund’s Class R5 shares returned -36.39%, significantly underperforming the -20.66% return of the MSCI All Country World Index (ACWI) (the “benchmark”), which measures the performance of the large- and mid-cap segments of all country markets. It is free float-adjusted market-capitalization weighted.
For a discussion on the economic and market environment during the 12-month period ended September 30, 2022, please see the Economic and Market Overview, beginning on page 3.
Subadviser discussion of factors that contributed to the Fund’s performance
For the one-year period ended September 30, 2022, stock selection was the primary driver of the Fund’s underperformance of the benchmark. The portfolio outperformed slightly due to its holdings in the real estate sector. For the reporting period, the Fund underperformed the most as a result of its holdings in the information technology, health care, and industrial sectors. Historically, the Fund is perennially underweight in areas like energy – the only sector of the benchmark to post positive returns for the fiscal year – and materials. Fund management does not believe they can predict either energy or materials prices consistently; consequently, they invest relatively little in those sectors, or in other commodity-based business models.
Fund holdings that were the three major detractors from performance for the reporting period were Alphabet Inc., Meta Platforms, Inc., and Adobe Incorporated. Alphabet (the parent company of Google) has long been the Fund’s largest holding. Invesco Advisers believes that Alphabet has a collection of businesses that possess large competitive moats and that are well positioned for the future. Alphabet’s shares experienced significant profit-taking during the fiscal year. Meta Platforms (formerly known as Facebook) performed relatively poorly during the fiscal year, as it grappled with slower ad spending and Apple’s privacy protocols. Adobe experienced difficulties during the fiscal year, as e-commerce slowed from its significant pandemic growth rate. Fund management trimmed its position in Adobe to reflect the company’s lower growth trajectory during the period.
The Fund holdings that were the three major positive contributors to performance for the reporting period were ICICI Bank Limited in India, Capcom Co., Ltd., and Amadeus IT Group SA. As of September 30, 2022, ICICI Bank Limited was the second-largest private bank company in India. In Invesco Advisers’ view, banking in a place where demographics are good and credit penetration is low – which describes portions of India well – is helpful. Capcom is a Japanese video gaming company whose shares the Fund first acquired early in 2018. By late 2021, Capcom’s returns more than doubled. However, during the fiscal year, sales of some of Capcom’s bigger titles had slowed and its expansion into emerging markets was lowering margins, so Fund management exited the position. Amadeus IT Group is a new holding for the Fund in the last fiscal year. Amadeus IT Group is a software platform that processes transactions for the global travel and tourism industry. The price dropped in recent months due to weakening economic conditions in Europe; consequently, Fund management took the opportunity to add the stock to the Fund’s portfolio.
Subadviser outlook
Since the start of calendar year 2022, equity markets have given up the gains they made throughout all of 2021, as central banks have begun to tighten monetary policy aggressively. One could argue that the 2021 gains were in turn driven by high amounts of COVID-related fiscal and monetary stimulus. In Invesco Advisers’ view, many investors are now applying higher policy rates, higher discount rates, and lower near-term growth assumptions when valuing financial assets. Valuation multiples for equities, especially growth equities, have fallen this year. Invesco Advisers has begun to see earnings forecasts lowered as well.
39
MassMutual Global Fund – Portfolio Manager Report (Unaudited) (Continued) |
Fund management typically invests in companies that it believes can profitably monetize structural growth trends in the global economy for many years, funding their own growth without recourse to debt leverage. In Invesco Advisers’ view, share prices are volatile now as investors strive to determine key valuation variables. Invesco Advisers notes that if we are indeed entering – or have already entered – a global slowdown, growth could become harder to find. In Invesco Advisers’ view, companies that can provide profitable growth should be more valuable than those that cannot, particularly if capital costs rise beyond the de minimis levels of the past several years.
MassMutual
Global Fund
Largest Holdings
(% of Net Assets) on 9/30/22 |
Alphabet, Inc. Class A | 12.0% |
LVMH Moet Hennessy Louis Vuitton SE | 5.7% |
Intuit, Inc. | 5.6% |
S&P Global, Inc. | 5.2% |
Analog Devices, Inc. | 4.8% |
JD.com, Inc. ADR | 4.5% |
DLF Ltd. | 3.7% |
Airbus SE | 3.7% |
Meta Platforms, Inc. Class A | 3.7% |
Novo Nordisk A/S Class B | 3.0% |
| | 51.9% |
| | |
MassMutual
Global Fund
Sector Table
(% of Net Assets) on 9/30/22 |
Communications | 22.9% |
Technology | 20.7% |
Industrial | 20.2% |
Consumer, Non-cyclical | 17.7% |
Consumer, Cyclical | 9.5% |
Financial | 8.0% |
Basic Materials | 0.3% |
Mutual Funds | 0.1% |
Total Long-Term Investments | 99.4% |
Short-Term Investments and Other Assets and Liabilities | 0.6% |
Net Assets | 100.0% |
| | |
40
MassMutual Global Fund – Portfolio Manager Report (Unaudited) (Continued) |
GROWTH OF $10,000 INVESTMENT - Class R5
The graph above illustrates a representative class of the Fund’s historical performance for the past 10 fiscal years or since inception (for Funds lacking 10-year records) in comparison to its benchmark index, as well as one or more additional indexes, if applicable. The performance of other share classes will be greater than or less than the class depicted above.
Average Annual Total Returns (for the periods ended 09/30/2022) | | | |
| Inception Date
of Class | 1 Year | 5 Years | 10 Years | Since Inception
04/01/2014 |
Class I | 04/01/2014 | -36.28% | 2.18% | | 4.85% |
Class R5 | 12/31/2004 | -36.39% | 2.05% | 7.35% | |
Service Class | 12/31/2004 | -36.43% | 1.96% | 7.23% | |
Administrative Class | 12/31/2004 | -36.52% | 1.85% | 7.12% | |
Class R4 | 04/01/2014 | -36.54% | 1.72% | | 4.38% |
Class A | 12/31/2004 | -36.64% | 1.60% | 6.85% | |
Class A (sales load deducted)* | 12/31/2004 | -40.13% | 0.46% | 6.25% | |
Class R3 | 12/31/2004 | -36.73% | 1.45% | 6.71% | |
MSCI ACWI | | -20.66% | 4.44% | 7.28% | 5.54% |
* | Class A (sales load deducted) returns include the 5.50% maximum sales charge. |
Generally accepted accounting principles require adjustments to be made to the net assets of the Fund at period end for financial reporting purposes only, and as such, the total return based on the unadjusted net asset value per share may differ from the total return reported in the financial highlights.
Performance results in the graph and table are shown both with and without the imposition of the maximum applicable sales charge (if applicable) and reflect the percentage change in net asset value, including reinvestment of dividends and capital gains distributions. Investors should note that the Fund is a professionally managed mutual fund, while the index or indexes shown above are unmanaged, cannot be purchased directly, and, with the exception of any peer group index, do not incur expenses.
Performance data quoted in the graph and table represents past performance; past performance is not predictive of future results. The investment return and principal value of shares of the Fund fluctuate, so your shares, when sold, may be worth more or less than their original cost. Current performance of the Fund may be lower or higher than the performance quoted. The performance shown does not reflect the deduction of taxes, if any, that a shareholder would pay on Fund distributions or the redemption of Fund shares. Performance data current to the most recent month end may be obtained by calling 1-888-309-3539.
Investors should read the Fund’s prospectus with regard to the Fund’s investment objectives, risks, and charges and expenses in conjunction with these financial statements. Employee retirement benefit plans that invest plan assets in the Separate Investment Accounts (SIAs) may be subject to certain charges as set forth in their respective Plan Documents. Total return figures would be lower for the periods presented if they reflected these charges.
41
MassMutual International Equity Fund – Portfolio Manager Report (Unaudited) |
What is the investment approach of MassMutual International Equity Fund, and who are the Fund’s subadvisers?
The Fund seeks to achieve long-term capital appreciation by investing primarily in common stock of foreign companies. The Fund invests primarily in the common stock of companies that are domiciled or that have their primary operations outside of the United States. Under normal circumstances, the Fund invests at least 80% of its net assets (plus the amount of any borrowings for investment purposes) in securities of foreign companies. The Fund may invest up to 100% of its total assets in such securities. The Fund may invest in emerging markets as well as in developed markets throughout the world. From time to time, the Fund may place greater emphasis on investing in one or more particular regions (such as Asia, Europe, or Latin America). The Fund’s subadvisers are Wellington Management Company LLP (Wellington Management), which managed approximately 76% of the Fund’s portfolio; and Thompson, Siegel & Walmsley LLC (TSW), which was responsible for approximately 24% of the Fund’s portfolio, as of September 30, 2022.
How did the Fund perform during the 12 months ended September 30, 2022?
The Fund’s Class R5 shares returned -19.47%, significantly outperforming the -25.17% return of the MSCI All Country World Index (ACWI) ex USA (the “benchmark”), which measures the performance of the large- and mid-cap segments of the particular regions, excluding U.S. equity securities, including developed and emerging markets. It is free float-adjusted market-capitalization weighted.
For a discussion on the economic and market environment during the 12-month period ended September 30, 2022, please see the Economic and Market Overview, beginning on page 3.
Subadviser discussion of factors that contributed to the Fund’s performance
For the one-year period ended September 30, 2022, within the TSW component of the Fund, Fund component holdings in Europe contributed the most to performance. French energy company ENGIE SA reported a series of strong results. The company benefited from higher power prices exacerbated by the Russia-Ukraine war. Swiss bank UBS Group reported a series of robust results driven by cost controls and topline growth in its Global Wealth Management and Investment Banking divisions. On the other hand, Persimmon Plc, a Fund component holding in the United Kingdom, was one of the Fund component’s greatest detractors from relative returns for the fiscal year. Persimmon and its home-building peers sold off after the U.K. housing secretary announced U.K. developers would be responsible for an estimated £4 billion of cladding remediation costs. Investor concerns over near-term liquidity and the U.K. economy weighed on Persimmon’s share price as well.
Within the Wellington Management Fund component, strong stock selection drove relative results, particularly within the industrial, utilities, and communication services sectors. This was partially offset by weaker stock choices within the health care and consumer staples sectors. Sector allocation, a result of Wellington Management’s bottom-up stock selection process, also contributed to relative performance – with underweight allocations to the information technology and consumer discretionary sectors and an overweight allocation to the consumer staples sector contributing the most. This was partially offset by an underweight allocation to the financial sector and an overweight allocation to the industrial sector. With respect to Fund component holdings, top contributors to relative returns included BAE Systems (in the industrial sector) and Intact Financial (in the financial sector). The share price of BAE Systems rose during the period after the British defense contractor won a $12 billion U.S. Air Force contract for work related to intercontinental ballistic missile systems. Shares of property and casualty insurance provider Intact Financial advanced during the fiscal year, as the company reported second-quarter earnings that beat consensus estimates on the back of meaningful accretion from the acquisition of RSA, which drove a 36% increase in operating direct premiums written. On the downside, Fund component holdings that were top detractors from relative performance during the period included Koninklijke Philips (in the health care sector) and Shiseido (in the consumer staples sector). Shares of Koninklijke Philips fell when the U.S. Food and Drug Administration expressed concern about a polyester-based polyurethane foam in the company’s ventilator, which had been recalled in June 2021. Outside review concluded that the foam degradation will not likely cause long-term health issues, but the recall guidance remained unchanged. Shares of Japanese cosmetics group Shiseido fell over the fiscal period. The company’s first-quarter 2022 results were marred by disappointing sales in its two main markets in Japan and China. COVID-19 restrictions in both countries lowered consumer spending.
42
MassMutual International Equity Fund – Portfolio Manager Report (Unaudited) (Continued) |
Subadviser outlook
In TSW’s observation, well-publicized headwinds – interest rates, inflation, war, and sentiment – remain in place, leaving the outlook for markets mixed. In TSW’s view, corporate profit guidance could be cautious going into 2023, but Fund management notes that balance sheets are generally healthy across many sectors. TSW believes that investor sentiment is likely to improve as monetary authorities gain the upper hand over inflation. In Fund management’s view, current valuation levels are favorable for U.S. dollar-based investors.
Wellington Management observes that, while inflation may have peaked for the moment (as many commodity prices have rolled over), longer-term inflationary inertia may have taken hold, which suggests that inflation may not come down as quickly or as completely as the Federal Reserve would like. Therefore, monetary tightening continues in the U.S., which, as of the end of the fiscal year, started to create liquidity challenges in parts of the market that were vulnerable. With respect to the Wellington Management Fund component, Fund management has been trimming recent winners (primarily more defensive stocks) and adding to those stocks that have suffered the most so far in 2022. If the market weakness continues, Fund management expects to continue to add to its Fund component’s growth-focused and more cyclical holdings at the expense of its more defensive holdings.
MassMutual
International Equity Fund
Largest Holdings
(% of Net Assets) on 9/30/22 |
Roche Holding AG | 3.3% |
Novartis AG Registered | 3.0% |
Nestle SA Registered | 3.0% |
Reckitt Benckiser Group PLC | 2.9% |
KDDI Corp. | 2.7% |
Heineken NV | 2.7% |
Intact Financial Corp. | 2.7% |
BAE Systems PLC | 2.6% |
AIA Group Ltd. | 2.5% |
Canadian National Railway Co. | 2.5% |
| | 27.9% |
| | |
MassMutual
International Equity Fund
Sector Table
(% of Net Assets) on 9/30/22 |
Consumer, Non-cyclical | 41.3% |
Industrial | 15.3% |
Financial | 14.0% |
Consumer, Cyclical | 5.9% |
Energy | 4.7% |
Technology | 4.3% |
Basic Materials | 4.0% |
Communications | 3.5% |
Utilities | 3.1% |
Mutual Funds | 0.1% |
Total Long-Term Investments | 96.2% |
Short-Term Investments and Other Assets and Liabilities | 3.8% |
Net Assets | 100.0% |
| | |
43
MassMutual International Equity Fund – Portfolio Manager Report (Unaudited) (Continued) |
GROWTH OF $10,000 INVESTMENT - Class R5

The graph above illustrates a representative class of the Fund’s historical performance for the past 10 fiscal years or since inception (for Funds lacking 10-year records) in comparison to its benchmark index, as well as one or more additional indexes, if applicable. The performance of other share classes will be greater than or less than the class depicted above.
Average Annual Total Returns (for the periods ended 09/30/2022) | | | |
| Inception Date
of Class | 1 Year | 5 Years | 10 Years | Since Inception
04/01/2014 |
Class I | 04/01/2014 | -19.37% | 0.54% | | 1.82% |
Class R5 | 10/03/1994 | -19.47% | 0.41% | 4.56% | |
Service Class | 01/01/1998 | -19.52% | 0.33% | 4.48% | |
Administrative Class | 05/03/1999 | -19.60% | 0.22% | 4.36% | |
Class R4 | 04/01/2014 | -19.69% | 0.08% | | 1.36% |
Class A | 01/01/1998 | -19.79% | -0.02% | 4.11% | |
Class A (sales load deducted)* | 01/01/1998 | -24.20% | -1.14% | 3.52% | |
Class R3 | 04/01/2014 | -19.87% | -0.18% | | 1.11% |
MSCI ACWI ex USA | | -25.17% | -0.81% | 3.01% | 1.09% |
* | Class A (sales load deducted) returns include the 5.50% maximum sales charge. |
Generally accepted accounting principles require adjustments to be made to the net assets of the Fund at period end for financial reporting purposes only, and as such, the total return based on the unadjusted net asset value per share may differ from the total return reported in the financial highlights.
Performance results in the graph and table are shown both with and without the imposition of the maximum applicable sales charge (if applicable) and reflect the percentage change in net asset value, including reinvestment of dividends and capital gains distributions. Investors should note that the Fund is a professionally managed mutual fund, while the index or indexes shown above are unmanaged, cannot be purchased directly, and, with the exception of any peer group index, do not incur expenses.
Performance data quoted in the graph and table represents past performance; past performance is not predictive of future results. The investment return and principal value of shares of the Fund fluctuate, so your shares, when sold, may be worth more or less than their original cost. Current performance of the Fund may be lower or higher than the performance quoted. The performance shown does not reflect the deduction of taxes, if any, that a shareholder would pay on Fund distributions or the redemption of Fund shares. Performance data current to the most recent month end may be obtained by calling 1-888-309-3539.
Investors should read the Fund’s prospectus with regard to the Fund’s investment objectives, risks, and charges and expenses in conjunction with these financial statements. Employee retirement benefit plans that invest plan assets in the Separate Investment Accounts (SIAs) may be subject to certain charges as set forth in their respective Plan Documents. Total return figures would be lower for the periods presented if they reflected these charges.
44
MassMutual Strategic Emerging Markets Fund – Portfolio Manager Report (Unaudited) |
What is the investment approach of MassMutual Strategic Emerging Markets Fund, and who is the Fund’s subadviser?
The Fund seeks long-term capital growth by investing mainly in common stocks of issuers in developing and emerging markets throughout the world and at times it may invest up to 100% of its total assets in foreign securities. Under normal market conditions, the Fund will invest at least 80% of its net assets (plus the amount of any borrowings for investment purposes) in equity securities of issuers whose principal activities are in a developing (or emerging) market, i.e., are in a developing market or are economically tied to a developing market country. The Fund will invest in at least three developing markets. In general, countries may be considered developing or emerging markets if they are included in any one of the MSCI emerging markets indexes, classified as a developing or emerging market, or classified under a similar or corresponding classification, by organizations such as the World Bank and the International Monetary Fund, or have economies, industries, and stock markets with similar characteristics. The Fund’s subadviser is Invesco Advisers, Inc. (Invesco Advisers).
How did the Fund perform during the 12 months ended September 30, 2022?
The Fund’s Class R5 shares returned -35.80%, significantly underperforming the -28.11% return of the MSCI Emerging Markets Index (the “benchmark”), which measures the performance of the large- and mid-cap segments of emerging market equity securities. It is free float-adjusted market-capitalization weighted.
For a discussion on the economic and market environment during the 12-month period ended September 30, 2022, please see the Economic and Market Overview, beginning on page 3.
Subadviser discussion of factors that contributed to the Fund’s performance
For the period ended September 30, 2022, the largest detractor from the Fund’s performance, relative to the benchmark, was stock selection and an underweight allocation in the energy sector. Stock selection in the communication services and financial sectors also detracted from relative returns. Fund holdings that were the top absolute detractors included Novatek, Taiwan Semiconductor Manufacturing Co. (TSMC), and Yandex. As of September 30, 2022, Novatek was Russia’s second-largest natural gas producer, with competitively advantaged liquefied natural gas (LNG) projects on the Yamal Peninsula. Invesco Advisers believes that demand for Novatek’s LNG projects is fundamentally supported by the global push to develop sources of cleaner energy. Nevertheless, due to ongoing market closures, lack of trading partners, low liquidity, settlement concerns, and future uncertainty, Invesco priced all Russian equity holdings at zero valuation as of March 2, 2022 and continued to hold that pricing throughout the remainder of the fiscal year. As of September 30, 2022, TSMC was, in Invesco Advisers’ view, a leading semiconductor foundry and a key enabler of the new computing revolution in the semiconductor industry, with multiple architectures, chip platforms, and design teams competing to push computing and artificial intelligence innovation. During the fiscal year, however, TSMC was challenged by softening demand in the smartphone and consumer electronic segments. As of September 30, 2022, Yandex was one of the dominant internet companies in Russia’s transforming digital landscape, holding leading positions in several categories – including Russia’s search, shared mobility, food delivery, ecommerce, and others. During the fiscal year, Yandex was affected by the economic impact of sanctions following the invasion of Ukraine. Similar to Novatek, Yandex underperformed during the fiscal year. As noted above, Invesco priced all Russian equity holdings at zero valuation as of March 2, 2022 and continued to hold that pricing throughout the remainder of the fiscal year. On a regional basis, the largest detractor from relative performance was the Fund’s stock selection in, and an overweight allocation to, Russia. Stock selection in India, along with an underweight allocation to Saudi Arabia, also detracted from the Fund’s relative performance for the fiscal year.
Turning to the positive, from a sector perspective, stock selection in consumer discretionary was the largest contributor to relative performance. Stock selection and an overweight allocation to the consumer staples sector also aided the Fund’s relative results, as did stock selection in the materials sector. Geographically, the largest contributor to relative performance was an underweight allocation to, and stock selection in, South Korea. An underweight allocation to China and an overweight allocation to Switzerland also contributed to relative results.
With respect to Fund holdings, the top absolute contributors for the fiscal year were Vale, Coupang, and PT Bank Central Asia. As of September 30, 2022, the largest iron ore and nickel producer globally was Vale, a Brazilian multinational company with expertise in mining, logistics, energy, and steel-making. Coupang is a South Korean e-commerce company. In Invesco Advisers’ view, the company’s investments in physical and technology infrastructure have created a dynamic end-to-end platform that
45
MassMutual Strategic Emerging Markets Fund – Portfolio Manager Report (Unaudited) (Continued) |
delivers in speed, cost saving, and product assortment. As of September 30, 2022, PT Bank Central Asia (BBCA) is one of Indonesia’s largest lenders. Invesco Advisers believes that BBCA has a leading, low-cost liability franchise and has demonstrated over many business cycles a conservative credit underwriting culture. In Invesco Advisers’ observation, BBCA is also investing to transform its mobile banking into a super app ecosystem that can offer e-commerce, lifestyle, and digital transactional capabilities to customers.
Subadviser outlook
When Invesco Advisers looks to the longer term, they note that, in Invesco Advisers’ view, many emerging market companies seem to be embarking on a new era – including cutting back on oversized ambitions and focusing on opportunities that are profitable and cash generative. In Fund management’s view, this could lead to improved earnings and returns in these businesses as they become more rational and disciplined. Fund management typically aims to focus on finding investments in opportunities where the visible risks are well understood, have been deeply digested, and have led to discounts in prices – and is wary of circumstances where the risk has not yet been widely perceived.
MassMutual
Strategic Emerging Markets Fund
Largest Holdings
(% of Net Assets) on 9/30/22 |
Housing Development Finance Corp. Ltd. | 7.9% |
Taiwan Semiconductor Manufacturing Co. Ltd. | 6.6% |
Yum China Holdings, Inc. | 5.8% |
Kotak Mahindra Bank Ltd. | 5.7% |
Tata Consultancy Services Ltd. | 4.7% |
Pernod Ricard SA | 4.0% |
Grupo Mexico SAB de CV Series B | 4.0% |
H World Group Ltd. ADR | 3.6% |
NetEase, Inc. ADR | 3.5% |
Meituan Class B | 3.4% |
| | 49.2% |
| | |
MassMutual
Strategic Emerging Markets Fund
Sector Table
(% of Net Assets) on 9/30/22 |
Technology | 21.9% |
Financial | 21.1% |
Consumer, Cyclical | 17.3% |
Consumer, Non-cyclical | 13.5% |
Communications | 8.0% |
Basic Materials | 7.9% |
Industrial | 4.7% |
Energy | 0.5% |
Mutual Funds | 0.2% |
Total Long-Term Investments | 95.1% |
Short-Term Investments and Other Assets and Liabilities | 4.9% |
Net Assets | 100.0% |
| | |
46
MassMutual Strategic Emerging Markets Fund – Portfolio Manager Report (Unaudited) (Continued) |
GROWTH OF $10,000 INVESTMENT - Class R5
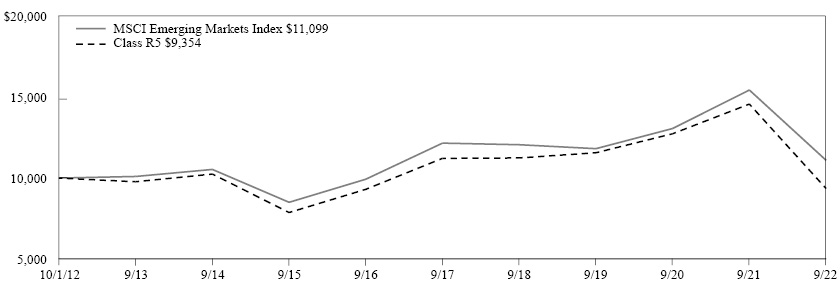
The graph above illustrates a representative class of the Fund’s historical performance for the past 10 fiscal years or since inception (for Funds lacking 10-year records) in comparison to its benchmark index, as well as one or more additional indexes, if applicable. The performance of other share classes will be greater than or less than the class depicted above.
Average Annual Total Returns (for the periods ended 09/30/2022) | | | |
| Inception Date
of Class | 1 Year | 5 Years | 10 Years | Since Inception
04/01/2014 |
Class I | 03/01/2011 | -35.75% | -3.48% | -0.55% | |
Class R5 | 11/03/2008 | -35.80% | -3.57% | -0.67% | |
Service Class | 11/03/2008 | -35.79% | -3.64% | -0.74% | |
Administrative Class | 11/03/2008 | -35.85% | -3.74% | -0.85% | |
Class R4 | 04/01/2014 | -35.99% | -3.90% | | -0.97% |
Class A | 11/03/2008 | -36.07% | -4.00% | -1.10% | |
Class A (sales load deducted)* | 11/03/2008 | -39.58% | -5.08% | -1.66% | |
Class R3 | 04/01/2014 | -36.19% | -4.16% | | -1.23% |
MSCI Emerging Markets Index | | -28.11% | -1.81% | 1.05% | 0.95% |
* | Class A (sales load deducted) returns include the 5.50% maximum sales charge. |
Generally accepted accounting principles require adjustments to be made to the net assets of the Fund at period end for financial reporting purposes only, and as such, the total return based on the unadjusted net asset value per share may differ from the total return reported in the financial highlights.
Performance results in the graph and table are shown both with and without the imposition of the maximum applicable sales charge (if applicable) and reflect the percentage change in net asset value, including reinvestment of dividends and capital gains distributions. Investors should note that the Fund is a professionally managed mutual fund, while the index or indexes shown above are unmanaged, cannot be purchased directly, and, with the exception of any peer group index, do not incur expenses.
Performance data quoted in the graph and table represents past performance; past performance is not predictive of future results. The investment return and principal value of shares of the Fund fluctuate, so your shares, when sold, may be worth more or less than their original cost. Current performance of the Fund may be lower or higher than the performance quoted. The performance shown does not reflect the deduction of taxes, if any, that a shareholder would pay on Fund distributions or the redemption of Fund shares. Performance data current to the most recent month end may be obtained by calling 1-888-309-3539.
Investors should read the Fund’s prospectus with regard to the Fund’s investment objectives, risks, and charges and expenses in conjunction with these financial statements. Employee retirement benefit plans that invest plan assets in the Separate Investment Accounts (SIAs) may be subject to certain charges as set forth in their respective Plan Documents. Total return figures would be lower for the periods presented if they reflected these charges.
47
MassMutual U.S. Government Money Market Fund – Portfolio of Investments |
September 30, 2022 |
| | | Principal
Amount | | | Value | |
SHORT-TERM INVESTMENTS — 101.5% |
Discount Notes — 85.4% |
Federal Home Loan Bank | | | | | | | | |
SOFR + 0.055% 3.015% FRN 10/03/22, 5/24/23 (a) | | $ | 15,000,000 | | | $ | 15,000,000 | |
SOFR + 0.030% 2.990% FRN 10/03/22, 10/20/22 (a) | | | 10,000,000 | | | | 10,000,000 | |
SOFR + 0.030% 2.990% FRN 10/03/22, 1/19/23 (a) | | | 13,000,000 | | | | 13,000,000 | |
SOFR + 0.040% 3.000% FRN 10/03/22, 12/30/22 (a) | | | 10,000,000 | | | | 10,000,000 | |
SOFR + 0.005% 2.965% FRN 10/03/22, 10/21/22 (a) | | | 15,825,000 | | | | 15,825,000 | |
3.051% 11/03/22, 11/03/22 (a) | | | 15,000,000 | | | | 14,958,750 | |
3.020% 10/28/22, 10/28/22 (a) | | | 15,000,000 | | | | 14,966,587 | |
3.010% 10/03/22, 6/28/23 (a) | | | 17,000,000 | | | | 17,000,000 | |
2.990% 10/03/22, 12/05/22 (a) | | | 13,000,000 | | | | 13,000,000 | |
2.990% 10/03/22, 3/21/23 (a) | | | 16,000,000 | | | | 16,000,000 | |
2.988% 10/21/22, 10/21/22 (a) | | | 7,000,000 | | | | 6,988,567 | |
2.970% 10/03/22, 1/17/23 (a) | | | 11,000,000 | | | | 11,000,000 | |
2.967% 10/21/22, 10/21/22 (a) | | | 10,000,000 | | | | 9,983,778 | |
2.957% 10/24/22, 10/24/22 (a) | | | 1,100,000 | | | | 1,097,955 | |
2.948% 10/28/22, 10/28/22 (a) | | | 1,500,000 | | | | 1,496,737 | |
2.312%, 10/03/22,10/03/22 (a) | | | 5,100,000 | | | | 5,099,354 | |
| | | | | | | | 175,416,728 | |
Repurchase Agreement — 14.6% |
HSBC Securities (USA) Inc., Tri-Party Repurchase Agreement, dated 9/30/22, 2.960%, due 10/03/22 (b) | | | 30,000,000 | | | | 30,000,000 | |
| | | Principal
Amount | | | Value | |
U.S. Treasury Bill — 1.5% |
U.S. Treasury Bill | | | | | | | | |
0.116% 10/06/22 (c) | | $ | 3,000,000 | | | $ | 2,999,953 | |
| | | | | | | | | |
TOTAL SHORT-TERM INVESTMENTS (Cost $208,416,681) | | | | | | | 208,416,681 | |
| | | | | | | | | |
TOTAL INVESTMENTS — 101.5% (Cost $208,416,681) (d) | | | | | | | 208,416,681 | |
| | | | | | | | | |
Other Assets/(Liabilities) — (1.5)% | | | | | | | (3,088,360 | ) |
| | | | | | | | | |
NET ASSETS — 100.0% | | | | | | $ | 205,328,321 | |
Abbreviation Legend
Notes to Portfolio of Investments
Percentages are stated as a percent of net assets.
(a) | The stated maturity dates reflect reset date and final maturity date, respectively. |
(b) | Maturity value of $30,007,400. Collateralized by U.S. Government Agency obligations with rates ranging from 0.250% - 2.500%, maturity dates ranging from 4/15/23 - 5/15/24, and an aggregate market value, including accrued interest, of $30,600,025. |
(c) | The rate shown represents yield-to-maturity. |
(d) | See Note 6 for aggregate cost for federal tax purposes. |
The accompanying notes are an integral part of the financial statements.
48
MassMutual Short-Duration Bond Fund – Portfolio of Investments |
September 30, 2022 |
| | | Principal
Amount | | | Value | |
BONDS & NOTES — 95.7% |
CORPORATE DEBT — 50.1% |
Aerospace & Defense — 0.4% |
The Boeing Co. | | | | | | | | |
2.196% 2/04/26 | | $ | 2,200,000 | | | $ | 1,956,116 | |
Agriculture — 2.0% |
BAT Capital Corp. | | | | | | | | |
4.700% 4/02/27 | | | 4,470,000 | | | | 4,169,960 | |
Imperial Brands Finance PLC | | | | | | | | |
3.125% 7/26/24 (a) | | | 1,520,000 | | | | 1,454,261 | |
Wens Foodstuffs Group Co. Ltd. | | | | | | | | |
2.349% 10/29/25 (a) | | | 5,225,000 | | | | 4,548,348 | |
| | | | | | | | 10,172,569 | |
Auto Manufacturers — 3.0% |
Ford Motor Credit Co. LLC | | | | | | | | |
2.300% 2/10/25 (b) | | | 5,470,000 | | | | 4,848,479 | |
General Motors Co. | | | | | | | | |
6.125% 10/01/25 | | | 2,607,000 | | | | 2,608,524 | |
Hyundai Capital America | | | | | | | | |
1.500% 6/15/26 (a) | | | 3,960,000 | | | | 3,364,954 | |
Nissan Motor Acceptance Co. LLC | | | | | | | | |
1.850% 9/16/26 (a) | | | 5,170,000 | | | | 4,200,585 | |
| | | | | | | | 15,022,542 | |
Banks — 7.0% |
ABN AMRO Bank NV | | | | | | | | |
4.750% 7/28/25 (a) | | | 2,685,000 | | | | 2,582,691 | |
Barclays PLC | | | | | | | | |
5.200% 5/12/26 | | | 4,340,000 | | | | 4,125,478 | |
BPCE SA | | | | | | | | |
4.625% 7/11/24 (a) | | | 1,200,000 | | | | 1,162,203 | |
Burgan Bank SAK 5 year CMT + 2.229% | | | | | | | | |
2.750% VRN 12/15/31 (a) | | | 2,000,000 | | | | 1,585,000 | |
Credit Suisse AG | | | | | | | | |
6.500% 8/08/23 (a) | | | 3,910,000 | | | | 3,859,170 | |
Credit Suisse Group AG SOFR + .980% | | | | | | | | |
1.305% VRN 2/02/27 (a) | | | 1,610,000 | | | | 1,307,062 | |
Danske Bank A/S 1 year CMT + .730% | | | | | | | | |
1.549% VRN 9/10/27 (a) | | | 1,850,000 | | | | 1,552,158 | |
Deutsche Bank AG | | | | | | | | |
SOFR + 1.219% 2.311% VRN 11/16/27 | | | 2,415,000 | | | | 1,959,765 | |
SOFR + 1.318% 2.552% VRN 1/07/28 | | | 3,670,000 | | | | 2,980,713 | |
FNB Corp. | | | | | | | | |
5.150% 8/25/25 | | | 690,000 | | | | 680,699 | |
| | | Principal
Amount | | | Value | |
HSBC Holdings PLC | | | | | | | | |
4.375% 11/23/26 | | $ | 3,264,000 | | | $ | 3,039,444 | |
Macquarie Group Ltd. SOFR + 1.069% | | | | | | | | |
1.340% VRN 1/12/27 (a) | | | 3,000,000 | | | | 2,568,482 | |
Mitsubishi UFJ Financial Group, Inc. 1 year CMT + 1.550% | | | | | | | | |
5.063% VRN 9/12/25 | | | 1,345,000 | | | | 1,330,904 | |
Natwest Group PLC 1 year CMT + .900% | | | | | | | | |
1.642% VRN 6/14/27 | | | 1,565,000 | | | | 1,314,397 | |
Santander UK Group Holdings PLC SOFR + 1.220% | | | | | | | | |
2.469% VRN 1/11/28 | | | 2,000,000 | | | | 1,665,456 | |
Societe Generale SA | | | | | | | | |
1 year CMT + 1.100% 1.488% VRN 12/14/26 (a) | | | 1,210,000 | | | | 1,024,273 | |
1 year CMT + 1.000% 1.792% VRN 6/09/27 (a) | | | 245,000 | | | | 204,045 | |
1 year CMT + 1.300% 2.797% VRN 1/19/28 (a) | | | 1,200,000 | | | | 1,012,050 | |
Synovus Financial Corp. | | | | | | | | |
5.200% 8/11/25 | | | 1,173,000 | | | | 1,150,927 | |
| | | | | | | | 35,104,917 | |
Beverages — 0.3% |
JDE Peet’s NV | | | | | | | | |
1.375% 1/15/27 (a) | | | 1,529,000 | | | | 1,263,845 | |
Chemicals — 2.0% |
Celanese US Holdings LLC | | | | | | | | |
6.050% 3/15/25 | | | 1,855,000 | | | | 1,812,818 | |
MEGlobal Canada ULC | | | | | | | | |
5.000% 5/18/25 (a) | | | 4,400,000 | | | | 4,296,838 | |
Syngenta Finance NV | | | | | | | | |
4.892% 4/24/25 (a) | | | 765,000 | | | | 739,686 | |
Yara International ASA | | | | | | | | |
3.800% 6/06/26 (a) | | | 1,125,000 | | | | 1,032,343 | |
4.750% 6/01/28 (a) | | | 2,125,000 | | | | 1,935,481 | |
| | | | | | | | 9,817,166 | |
Commercial Services — 0.6% |
Triton Container International Ltd. | | | | | | | | |
2.050% 4/15/26 (a) | | | 3,300,000 | | | | 2,802,033 | |
Distribution & Wholesale — 1.2% |
Ferguson Finance PLC | | | | | | | | |
4.250% 4/20/27 (a) | | | 2,225,000 | | | | 2,084,297 | |
Li & Fung Ltd. | | | | | | | | |
4.500% STEP 8/18/25 (a) | | | 4,750,000 | | | | 4,090,282 | |
| | | | | | | | 6,174,579 | |
The accompanying notes are an integral part of the financial statements.
49
MassMutual Short-Duration Bond Fund – Portfolio of Investments (Continued) |
| | | Principal
Amount | | | Value | |
Diversified Financial Services — 5.3% |
AerCap Ireland Capital DAC / AerCap Global Aviation Trust | | | | | | | | |
2.450% 10/29/26 | | $ | 3,090,000 | | | $ | 2,607,777 | |
6.500% 7/15/25 | | | 2,200,000 | | | | 2,196,347 | |
Aircastle Ltd. | | | | | | | | |
4.125% 5/01/24 | | | 3,290,000 | | | | 3,162,140 | |
Antares Holdings LP | | | | | | | | |
2.750% 1/15/27 (a) | | | 2,785,000 | | | | 2,218,351 | |
3.950% 7/15/26 (a) | | | 4,980,000 | | | | 4,259,485 | |
Avolon Holdings Funding Ltd. | | | | | | | | |
2.875% 2/15/25 (a) | | | 4,545,000 | | | | 4,111,937 | |
BGC Partners, Inc. | | | | | | | | |
4.375% 12/15/25 | | | 3,690,000 | | | | 3,447,070 | |
SPARC EM SPC Panama Metro Line 2 SP | | | | | | | | |
0.000% 12/05/22 (a) | | | 547,192 | | | | 541,721 | |
Synchrony Financial | | | | | | | | |
3.950% 12/01/27 | | | 4,400,000 | | | | 3,818,551 | |
| | | | | | | | 26,363,379 | |
Electric — 1.1% |
Alliant Energy Finance LLC | | | | | | | | |
1.400% 3/15/26 (a) | | | 1,630,000 | | | | 1,390,794 | |
Enel Finance International NV | | | | | | | | |
4.625% 6/15/27 (a) | | | 2,079,000 | | | | 1,932,532 | |
Pacific Gas and Electric Co. | | | | | | | | |
4.950% 6/08/25 | | | 2,110,000 | | | | 2,048,508 | |
| | | | | | | | 5,371,834 | |
Electronics — 0.2% |
Jabil, Inc. | | | | | | | | |
4.250% 5/15/27 | | | 1,165,000 | | | | 1,086,421 | |
Entertainment — 0.5% |
Warnermedia Holdings, Inc. | | | | | | | | |
3.638% 3/15/25 (a) | | | 2,630,000 | | | | 2,490,997 | |
Food — 1.5% |
JBS USA LUX SA/JBS USA Food Co./JBS USA Finance, Inc. | | | | | | | | |
2.500% 1/15/27 (a) | | | 3,025,000 | | | | 2,592,667 | |
Pilgrim’s Pride Corp. | | | | | | | | |
5.875% 9/30/27 (a) | | | 709,000 | | | | 689,502 | |
Smithfield Foods, Inc. | | | | | | | | |
4.250% 2/01/27 (a) | | | 4,625,000 | | | | 4,285,625 | |
| | | | | | | | 7,567,794 | |
Health Care – Services — 0.3% |
HCA, Inc. | | | | | | | | |
5.375% 2/01/25 | | | 1,285,000 | | | | 1,269,309 | |
| | | Principal
Amount | | | Value | |
Home Builders — 0.3% |
Toll Brothers Finance Corp. | | | | | | | | |
4.875% 3/15/27 | | $ | 1,450,000 | | | $ | 1,331,472 | |
Housewares — 0.2% |
Newell Brands, Inc. | | | | | | | | |
6.375% 9/15/27 | | | 780,000 | | | | 772,379 | |
Insurance — 2.5% |
AmTrust Financial Services, Inc. | | | | | | | | |
6.125% 8/15/23 | | | 4,810,000 | | | | 4,753,017 | |
Athene Global Funding | | | | | | | | |
1.730% 10/02/26 (a) | | | 2,835,000 | | | | 2,406,089 | |
Jackson Financial, Inc. | | | | | | | | |
5.170% 6/08/27 | | | 999,000 | | | | 958,531 | |
Sammons Financial Group, Inc. | | | | | | | | |
4.450% 5/12/27 (a) | | | 4,515,000 | | | | 4,126,917 | |
| | | | | | | | 12,244,554 | |
Internet — 0.6% |
Expedia Group, Inc. | | | | | | | | |
4.625% 8/01/27 | | | 1,645,000 | | | | 1,540,347 | |
Netflix, Inc. | | | | | | | | |
5.875% 11/15/28 | | | 1,557,000 | | | | 1,515,770 | |
| | | | | | | | 3,056,117 | |
Investment Companies — 4.0% |
Ares Capital Corp. | | | | | | | | |
3.875% 1/15/26 | | | 3,035,000 | | | | 2,762,170 | |
Blackstone Private Credit Fund | | | | | | | | |
2.625% 12/15/26 | | | 9,045,000 | | | | 7,428,235 | |
Golub Capital BDC, Inc. | | | | | | | | |
2.500% 8/24/26 | | | 1,965,000 | | | | 1,647,803 | |
3.375% 4/15/24 | | | 1,483,000 | | | | 1,423,569 | |
Icahn Enterprises LP/ Icahn Enterprises Finance Corp. | | | | | | | | |
4.750% 9/15/24 | | | 1,410,000 | | | | 1,318,262 | |
OWL Rock Core Income Corp. | | | | | | | | |
4.700% 2/08/27 | | | 4,035,000 | | | | 3,535,625 | |
Sixth Street Specialty Lending, Inc. | | | | | | | | |
3.875% 11/01/24 | | | 2,090,000 | | | | 1,989,140 | |
| | | | | | | | 20,104,804 | |
Iron & Steel — 0.7% |
Vale Overseas Ltd. | | | | | | | | |
6.250% 8/10/26 (b) | | | 3,549,000 | | | | 3,579,372 | |
Lodging — 0.7% |
Las Vegas Sands Corp. | | | | | | | | |
3.200% 8/08/24 | | | 3,780,000 | | | | 3,564,201 | |
Machinery – Construction & Mining — 1.1% |
The Weir Group PLC | | | | | | | | |
2.200% 5/13/26 (a) | | | 6,750,000 | | | | 5,673,134 | |
The accompanying notes are an integral part of the financial statements.
50
MassMutual Short-Duration Bond Fund – Portfolio of Investments (Continued) |
| | | Principal
Amount | | | Value | |
Media — 0.9% |
Cable Onda SA | | | | | | | | |
4.500% 1/30/30 (a) | | $ | 5,550,000 | | | $ | 4,369,191 | |
Mining — 1.0% |
Alcoa Nederland Holding BV | | | | | | | | |
6.125% 5/15/28 (a) | | | 3,295,000 | | | | 3,113,754 | |
Glencore Funding LLC | | | | | | | | |
1.625% 4/27/26 (a) | | | 1,925,000 | | | | 1,664,816 | |
| | | | | | | | 4,778,570 | |
Multi-National — 2.2% |
Africa Finance Corp. | | | | | | | | |
3.125% 6/16/25 (a) | | | 5,973,000 | | | | 5,384,659 | |
The Eastern & Southern African Trade & Development Bank | | | | | | | | |
4.875% 5/23/24 (a) | | | 6,000,000 | | | | 5,631,000 | |
| | | | | | | | 11,015,659 | |
Oil & Gas — 1.7% |
EQT Corp. | | | | | | | | |
6.125% STEP 2/01/25 | | | 3,398,000 | | | | 3,402,350 | |
Ovintiv Exploration, Inc. | | | | | | | | |
5.375% 1/01/26 | | | 1,500,000 | | | | 1,484,045 | |
Patterson-UTI Energy, Inc. | | | | | | | | |
3.950% 2/01/28 (b) | | | 4,130,000 | | | | 3,388,637 | |
| | | | | | | | 8,275,032 | |
Pharmaceuticals — 0.6% |
Viatris, Inc. | | | | | | | | |
2.300% 6/22/27 | | | 3,855,000 | | | | 3,149,049 | |
Pipelines — 1.1% |
Energy Transfer LP | | | | | | | | |
4.950% 6/15/28 | | | 3,775,000 | | | | 3,517,844 | |
Plains All American Pipeline LP/PAA Finance Corp. | | | | | | | | |
4.500% 12/15/26 | | | 960,000 | | | | 906,960 | |
4.650% 10/15/25 | | | 1,145,000 | | | | 1,104,399 | |
| | | | | | | | 5,529,203 | |
Private Equity — 0.8% |
Hercules Capital, Inc. | | | | | | | | |
2.625% 9/16/26 | | | 3,488,000 | | | | 2,855,391 | |
3.375% 1/20/27 | | | 1,390,000 | | | | 1,166,597 | |
| | | | | | | | 4,021,988 | |
Real Estate — 1.4% |
Country Garden Holdings Co. Ltd. | | | | | | | | |
8.000% 1/27/24 (a) | | | 2,858,000 | | | | 1,100,205 | |
MAF Sukuk Ltd. | | | | | | | | |
4.500% 11/03/25 (a) | | | 4,525,000 | | | | 4,389,250 | |
Shimao Group Holdings Ltd. | | | | | | | | |
6.125% 2/21/24 (a) | | | 14,600,000 | | | | 1,756,963 | |
| | | | | | | | 7,246,418 | |
| | | Principal
Amount | | | Value | |
Real Estate Investment Trusts (REITS) — 2.5% |
Global Net Lease, Inc./Global Net Lease Operating Partnership LP | | | | | | | | |
3.750% 12/15/27 (a) | | $ | 1,925,000 | | | $ | 1,502,272 | |
Omega Healthcare Investors, Inc. | | | | | | | | |
4.750% 1/15/28 | | | 3,069,000 | | | | 2,814,461 | |
Service Properties Trust | | | | | | | | |
4.350% 10/01/24 | | | 8,315,000 | | | | 7,312,737 | |
Vornado Realty LP | | | | | | | | |
2.150% 6/01/26 | | | 1,200,000 | | | | 1,004,629 | |
| | | | | | | | 12,634,099 | |
Retail — 0.5% |
Nordstrom, Inc. | | | | | | | | |
2.300% 4/08/24 | | | 2,051,000 | | | | 1,907,430 | |
4.000% 3/15/27 (b) | | | 740,000 | | | | 616,502 | |
| | | | | | | | 2,523,932 | |
Telecommunications — 1.4% |
Telecom Italia SpA | | | | | | | | |
5.303% 5/30/24 (a) | | | 2,610,000 | | | | 2,464,708 | |
Tower Bersama Infrastructure Tbk PT | | | | | | | | |
4.250% 1/21/25 (a) | | | 5,000,000 | | | | 4,728,087 | |
| | | | | | | | 7,192,795 | |
Toys, Games & Hobbies — 0.5% |
Mattel, Inc. | | | | | | | | |
3.375% 4/01/26 (a) | | | 3,010,000 | | | | 2,686,238 | |
| | | | | | | | | |
TOTAL CORPORATE DEBT (Cost $298,545,463) | | | | | | | 250,211,708 | |
| | | | | | | | | |
NON-U.S. GOVERNMENT AGENCY OBLIGATIONS — 45.6% |
Automobile Asset-Backed Securities — 0.3% |
AmeriCredit Automobile Receivables Trust, Series 2020-3, Class D | | | | | | | | |
1.490% 9/18/26 | | | 339,000 | | | | 317,271 | |
Carmax Auto Owner Trust, Series 2019-2, Class D, ABS | | | | | | | | |
3.410% 10/15/25 | | | 615,000 | | | | 610,645 | |
Santander Drive Auto Receivables Trust, Series 2020-4, Class D | | | | | | | | |
1.480% 1/15/27 | | | 401,000 | | | | 385,451 | |
| | | | | | | | 1,313,367 | |
Commercial Mortgage-Backed Securities — 5.1% |
Banc of America Merrill Lynch Trust | | | | | | | | |
Series 2019-BPR, Class CMP, 4.024% VRN 11/05/32 (a) (c) | | | 2,280,000 | | | | 1,985,123 | |
Series 2019-BPR, Class DMP, 4.024% VRN 11/05/32 (a) (c) | | | 3,050,000 | | | | 2,633,855 | |
The accompanying notes are an integral part of the financial statements.
51
MassMutual Short-Duration Bond Fund – Portfolio of Investments (Continued) |
| | | Principal
Amount | | | Value | |
Series 2018-DSNY, Class C, 1 mo. USD LIBOR + 1.350% 4.168% FRN 9/15/34 (a) | | $ | 570,000 | | | $ | 545,120 | |
CAMB Commercial Mortgage Trust, Series 2019-LIFE, Class E, 1 mo. USD LIBOR + 2.150% | | | | | | | | |
4.968% FRN 12/15/37 (a) | | | 2,835,008 | | | | 2,675,610 | |
JP Morgan Chase Commercial Mortgage Securities Trust, Series 2013-LC11, Class C, | | | | | | | | |
3.958% VRN 4/15/46 (c) | | | 1,015,000 | | | | 984,642 | |
KIND Trust, Series 2021-KIND, Class C, 1 mo. USD LIBOR + 1.750% | | | | | | | | |
4.568% FRN 8/15/38 (a) | | | 4,368,428 | | | | 4,163,612 | |
KNDL Mortgage Trust, Series 2019-KNSQ, Class E, 1 mo. USD LIBOR + 1.800% | | | | | | | | |
4.618% FRN 5/15/36 (a) | | | 1,604,000 | | | | 1,537,394 | |
Life Mortgage Trust, Series 2021-BMR, Class E, 1 mo. USD LIBOR + 1.750% | | | | | | | | |
4.568% FRN 3/15/38 (a) | | | 2,667,781 | | | | 2,462,794 | |
Morgan Stanley Bank of America Merrill Lynch Trust, Series 2013-C7, Class B | | | | | | | | |
3.769% 2/15/46 | | | 2,340,000 | | | | 2,312,504 | |
One New York Plaza Trust | | | | | | | | |
Series 2020-1NYP, Class C, 1 mo. USD LIBOR + 2.200% 5.018% FRN 1/15/36 (a) | | | 4,106,000 | | | | 3,891,185 | |
Series 2020-1NYP, Class D, 1 mo. USD LIBOR + 2.750% 5.568% FRN 1/15/36 (a) | | | 2,760,000 | | | | 2,582,399 | |
| | | | | | | | 25,774,238 | |
Home Equity Asset-Backed Securities — 0.0% |
Credit Suisse Seasoned Loan Trust, Series 2006-1, Class A, 1 mo. USD LIBOR + .480% | | | | | | | | |
3.564% FRN 10/25/34 (a) | | | 43,024 | | | | 43,136 | |
Other Asset-Backed Securities — 20.9% |
321 Henderson Receivables LLC | | | | | | | | |
Series 2006-1A, Class A1, 1 mo. USD LIBOR + .200% 3.018% FRN 3/15/41 (a) | | | 19,829 | | | | 19,688 | |
Series 2006-3A, Class A1, 1 mo. USD LIBOR + .200% 3.018% FRN 9/15/41 (a) | | | 48,011 | | | | 47,170 | |
522 Funding CLO Ltd., Series 2018-3A, Class BR, 3 mo. USD LIBOR + 1.550% | | | | | | | | |
4.260% FRN 10/20/31 (a) | | | 2,352,000 | | | | 2,202,196 | |
| | | Principal
Amount | | | Value | |
Adams Outdoor Advertising LP, Series 2018-1, Class A | | | | | | | | |
4.810% 11/15/48 (a) | | $ | 1,744,335 | | | $ | 1,650,514 | |
AIMCO CLO 10 Ltd., Series 2019-10A, Class AR, 3 mo. USD LIBOR + 1.060% | | | | | | | | |
3.819% FRN 7/22/32 (a) | | | 5,000,000 | | | | 4,820,560 | |
Apollo Aviation Securitization AASET Trust, Series 2020-1A, Class B | | | | | | | | |
4.335% 1/16/40 (a) | | | 832,574 | | | | 351,363 | |
Argent Securities, Inc. Asset-Backed Pass-Through Certificates, Series 2004-W10, Class M1, 1 mo. USD LIBOR + .900% | | | | | | | | |
3.984% FRN 10/25/34 | | | 103,157 | | | | 95,317 | |
Ballyrock CLO Ltd., Series 2020-2A, Class A2R, 3 mo. USD LIBOR + 1.550% | | | | | | | | |
4.260% FRN 10/20/31 (a) | | | 4,700,000 | | | | 4,422,362 | |
Bankers Healthcare Group Securitization Trust, Series 2021-B, Class C | | | | | | | | |
2.240% 10/17/34 (a) | | | 3,736,000 | | | | 3,205,212 | |
BRE Grand Islander Timeshare Issuer LLC | | | | | | | | |
Series 2017-1A, Class A, 2.940% 5/25/29 (a) | | | 185,505 | | | | 179,872 | |
Series 2017-1A, Class B, 3.240% 5/25/29 (a) | | | 53,001 | | | | 51,384 | |
Series 2019-A, Class B, 3.780% 9/26/33 (a) | | | 951,430 | | | | 905,933 | |
Business Jet Securities LLC, Series 2021-1A, Class A | | | | | | | | |
2.162% 4/15/36 (a) | | | 2,993,922 | | | | 2,628,930 | |
Canyon Capital CLO Ltd., Series 2017-1A, Class CR, 3 mo. USD LIBOR + 2.000% | | | | | | | | |
4.512% FRN 7/15/30 (a) | | | 1,540,000 | | | | 1,415,944 | |
Capital Automotive REIT, Series 2020-1A, Class B1 | | | | | | | | |
4.170% 2/15/50 (a) | | | 3,289,000 | | | | 3,004,518 | |
Castlelake Aircraft Securitization, Series 2019-1A, Class B | | | | | | | | |
5.095% 4/15/39 (a) | | | 707,996 | | | | 539,553 | |
Castlelake Aircraft Structured Trust, Series 2018-1, Class A | | | | | | | | |
4.125% 6/15/43 (a) | | | 1,303,808 | | | | 1,140,781 | |
Cedar Funding IX CLO Ltd., Series 2018-9A, Class A1, 3 mo. USD LIBOR + .980% | | | | | | | | |
3.690% FRN 4/20/31 (a) | | | 900,000 | | | | 878,325 | |
The accompanying notes are an integral part of the financial statements.
52
MassMutual Short-Duration Bond Fund – Portfolio of Investments (Continued) |
| | | Principal
Amount | | | Value | |
CF Hippolyta Issuer LLC, Series 2020-1, Class B1 | | | | | | | | |
2.280% 7/15/60 (a) | | $ | 590,963 | | | $ | 524,880 | |
CIFC Funding Ltd., Series 2017-2A, Class BR, 3 mo. USD LIBOR + 1.500% | | | | | | | | |
4.210% FRN 4/20/30 (a) | | | 1,750,000 | | | | 1,664,913 | |
Diamond Resorts Owner Trust | | | | | | | | |
Series 2021-1A, Class B, 2.050% 11/21/33 (a) | | | 2,949,883 | | | | 2,781,764 | |
Series 2018-1, Class A, 3.700% 1/21/31 (a) | | | 110,052 | | | | 107,229 | |
Elara HGV Timeshare Issuer LLC | | | | | | | | |
Series 2017-A, Class A, 2.690% 3/25/30 (a) | | | 231,370 | | | | 224,290 | |
Series 2016-A, Class A, 2.730% 4/25/28 (a) | | | 327,831 | | | | 315,759 | |
Series 2017-A, Class B, 2.960% 3/25/30 (a) | | | 568,785 | | | | 549,516 | |
Series 2016-A, Class B, 3.220% 4/25/28 (a) | | | 226,050 | | | | 220,544 | |
Series 2019-A, Class C, 3.450% 1/25/34 (a) | | | 2,107,932 | | | | 2,017,278 | |
FCI Funding LLC, Series 2019-1A, Class A | | | | | | | | |
3.630% 2/18/31 (a) | | | 59,230 | | | | 59,201 | |
Goodgreen Trust | | | | | | | | |
Series 2019-2A, Class A, 2.760% 4/15/55 (a) | | | 2,312,746 | | | | 1,960,779 | |
Series 2016-1A, Class A, 3.230% 10/15/52 (a) | | | 862,797 | | | | 774,994 | |
Series 2019-1A, Class A, 3.860% 10/15/54 (a) | | | 1,947,686 | | | | 1,794,076 | |
Series 2018-1A, Class A, 3.930% VRN 10/15/53 (a) (c) | | | 2,674,692 | | | | 2,440,801 | |
Gracie Point International Funding, Series 2021-1A, Class B, 1 mo. USD LIBOR + 1.400% | | | | | | | | |
3.964% FRN 11/01/23 (a) | | | 1,750,000 | | | | 1,738,667 | |
Hero Funding Trust | | | | | | | | |
Series 2017-3A, Class A1, 3.190% 9/20/48 (a) | | | 638,397 | | | | 575,733 | |
Series 2017-2A, Class A1, 3.280% 9/20/48 (a) | | | 125,033 | | | | 114,798 | |
Series 2016-4A, Class A1, 3.570% 9/20/47 (a) | | | 312,177 | | | | 296,274 | |
Series 2015-1A, Class A, 3.840% 9/21/40 (a) | | | 209,831 | | | | 206,004 | |
Series 2017-2A, Class A2, 4.070% 9/20/48 (a) | | | 101,591 | | | | 94,284 | |
Series 2018-1A, Class A2, 4.670% 9/20/48 (a) | | | 828,680 | | | | 791,004 | |
| | | Principal
Amount | | | Value | |
Hilton Grand Vacations Trust | | | | | | | | |
Series 2019-AA, Class C, 2.840% 7/25/33 (a) | | $ | 974,956 | | | $ | 917,589 | |
Series 2017-AA, Class B, 2.960% 12/26/28 (a) | | | 189,470 | | | | 185,853 | |
Series 2018-AA, Class A, ABS, 144A, 3.540% 2/25/32 (a) | | | 122,948 | | | | 120,518 | |
Horizon Aircraft Finance I Ltd., Series 2018-1, Class A | | | | | | | | |
4.458% 12/15/38 (a) | | | 813,508 | | | | 655,110 | |
Horizon Aircraft Finance II Ltd, Series 2019-1, Class A | | | | | | | | |
3.721% 7/15/39 (a) | | | 2,548,581 | | | | 2,129,457 | |
Horizon Aircraft Finance III Ltd. | | | | | | | | |
Series 2019-2, Class A, 3.425% 11/15/39 (a) | | | 2,145,677 | | | | 1,796,439 | |
Series 2019-2, Class B, 4.458% 11/15/39 (a) | | | 1,757,143 | | | | 1,204,423 | |
Hotwire Funding LLC, Series 2021-1, Class B | | | | | | | | |
2.658% 11/20/51 (a) | | | 3,753,000 | | | | 3,188,466 | |
Kestrel Aircraft Fundig Limited, Series 2018-1A, Class A | | | | | | | | |
4.250% 12/15/38 (a) | | | 3,103,213 | | | | 2,614,542 | |
MACH 1 Cayman Ltd., Series 2019-1, Class A | | | | | | | | |
3.474% 10/15/39 (a) | | | 1,773,584 | | | | 1,559,181 | |
Mosaic Solar Loans LLC | | | | | | | | |
Series 2018-2GS, Class A, 4.200% 2/22/44 (a) | | | 655,767 | | | | 606,594 | |
Series 2017-1A, Class A, 4.450% 6/20/42 (a) | | | 117,650 | | | | 112,193 | |
Neuberger Berman Loan Advisers CLO Ltd. | | | | | | | | |
Series 2017-25A, Class BR, 3 mo. USD LIBOR + 1.350% 4.090% FRN 10/18/29 (a) | | | 6,950,000 | | | | 6,556,157 | |
Series 2017-24A, Class BR, 3 mo. USD LIBOR + 1.500% 4.238% FRN 4/19/30 (a) | | | 500,000 | | | | 476,536 | |
New Residential Advance Receivables Trust, Series 2020-T1, Class ET1 | | | | | | | | |
5.467% 8/15/53 (a) | | | 1,651,000 | | | | 1,571,711 | |
New Residential Advance Receivables Trust, Series 2020-T3, Class DT3 | | | | | | | | |
2.458% 10/15/52 (a) | | | 1,034,800 | | | | 1,030,578 | |
Newark BSL CLO 2 Ltd., Series 2017-1A, Class A2R, 3 mo. USD LIBOR + 1.400% | | | | | | | | |
4.183% FRN 7/25/30 (a) | | | 1,375,000 | | | | 1,305,927 | |
The accompanying notes are an integral part of the financial statements.
53
MassMutual Short-Duration Bond Fund – Portfolio of Investments (Continued) |
| | | Principal
Amount | | | Value | |
Orange Lake Timeshare Trust | | | | | | | | |
Series 2016-A, Class B, 2.910% 3/08/29 (a) | | $ | 261,111 | | | $ | 261,063 | |
Series 2018-A, Class C, 3.740% 11/08/30 (a) | | | 219,626 | | | | 214,192 | |
Oxford Finance Funding LLC, Series 2020-1A, Class B | | | | | | | | |
4.037% 2/15/28 (a) | | | 995,402 | | | | 989,106 | |
Pioneer Aircraft Finance Ltd., Series 2019-1, Class A | | | | | | | | |
3.967% 6/15/44 (a) | | | 1,403,707 | | | | 1,261,143 | |
Rad CLO 1 Ltd., Series 2018-1A, Class BR, 3 mo. USD LIBOR + 1.400% | | | | | | | | |
3.912% FRN 7/15/31 (a) | | | 2,650,000 | | | | 2,509,004 | |
Residential Asset Mortgage Pro Trust, Series 2005-EFC1, Class M5, 1 mo. USD LIBOR + .650% | | | | | | | | |
4.059% FRN 5/25/35 | | | 2,196,010 | | | | 2,166,332 | |
Rockford Tower CLO Ltd., Series 2017-2A, Class BR, 3 mo. USD LIBOR + 1.500% | | | | | | | | |
4.012% FRN 10/15/29 (a) | | | 2,250,000 | | | | 2,141,127 | |
Sierra Receivables Funding LLC | | | | | | | | |
Series 2021-1A, Class C, 1.790% 11/20/37 (a) | | | 796,245 | | | | 738,702 | |
Series 2019-3A, Class C, 3.000% 8/20/36 (a) | | | 1,326,517 | | | | 1,260,089 | |
Series 2020-2A, Class C, 3.510% 7/20/37 (a) | | | 279,893 | | | | 261,609 | |
Series 2019-1A, Class C, 3.770% 1/20/36 (a) | | | 365,820 | | | | 354,122 | |
Structured Asset Investment Loan Trust, Series 2004-11, Class M1, 1 mo. USD LIBOR + .930% | | | | | | | | |
4.014% FRN 1/25/35 | | | 4,665,632 | | | | 4,450,048 | |
TAL Advantage VII LLC, Series 2020-1A, Class B | | | | | | | | |
3.290% 9/20/45 (a) | | | 2,686,000 | | | | 2,461,527 | |
Terwin Mortgage Trust, Series 2006-5, Class 1A2B, 1 mo. USD LIBOR + .420% | | | | | | | | |
3.504% FRN 7/25/37 (a) | | | 1,411,958 | | | | 1,389,821 | |
Thrust Engine Leasing, Series 2021-1A, Class A | | | | | | | | |
4.163% 7/15/40 (a) | | | 4,094,842 | | | | 3,421,117 | |
Trafigura Securitisation Finance PLC, Series 2021-1A, Class B | | | | | | | | |
1.780% 1/15/25 (a) | | | 7,048,000 | | | | 6,321,450 | |
Welk Resorts LLC, Series 2017-AA, Class B | | | | | | | | |
3.410% 6/15/33 (a) | | | 525,216 | | | | 522,776 | |
| | | Principal
Amount | | | Value | |
Willis Engine Structured Trust IV, Series 2018-A, Class A, | | | | | | | | |
4.750% STEP 9/15/43 (a) | | $ | 1,475,548 | | | $ | 1,060,493 | |
| | | | | | | | 104,627,405 | |
Student Loans Asset-Backed Securities — 8.9% |
Access Group, Inc. | | | | | | | | |
Series 2002-A, Class A2, 1.955% FRN 9/25/37 (c) | | | 50,000 | | | | 49,742 | |
Series 2015-1, Class B, 1 mo. USD LIBOR + 1.500% 4.584% FRN 7/25/58 (a) | | | 630,000 | | | | 576,694 | |
Chase Education Loan Trust, Series 2007-A, Class B, 3 mo. USD LIBOR + .220% | | | | | | | | |
3.861% FRN 3/28/68 | | | 433,745 | | | | 397,964 | |
College Avenue Student Loans LLC | | | | | | | | |
Series 2021-A, Class B, 2.320% 7/25/51 (a) | | | 8,353,299 | | | | 7,595,125 | |
Series 2019-A, Class B, 3.810% 12/28/48 (a) | | | 1,547,490 | | | | 1,448,651 | |
Series 2017-A, Class A1, 1 mo. USD LIBOR + 1.650% 4.734% FRN 11/26/46 (a) | | | 473,327 | | | | 446,059 | |
College Loan Corp. Trust, Series 2005-2, Class B, 3 mo. USD LIBOR + .490% | | | | | | | | |
3.002% FRN 1/15/37 | | | 450,170 | | | | 389,703 | |
Commonbond Student Loan Trust | | | | | | | | |
Series 2017-AGS, Class B, 3.470% 5/25/41 (a) | | | 387,197 | | | | 357,388 | |
Series 2018-AGS, Class C, 3.820% 2/25/44 (a) | | | 111,535 | | | | 98,232 | |
Series 2018-BGS, Class C, 4.120% 9/25/45 (a) | | | 89,362 | | | | 79,427 | |
Series 2018-CGS, Class C, 4.350% 2/25/46 (a) | | | 42,358 | | | | 37,867 | |
Series 2017-AGS, Class C, 5.280% 5/25/41 (a) | | | 149,221 | | | | 137,028 | |
Credit Suisse ABS Repackaging Trust, Series 2013-A, Class B | | | | | | | | |
2.500% 1/25/30 (a) | | | 140,905 | | | | 132,714 | |
DRB Prime Student Loan Trust | | | | | | | | |
Series 2017-C, Class B, 2.950% 11/25/42 (a) | | | 689,625 | | | | 668,128 | |
Series 2017-B, Class CFX, 3.610% 8/25/42 (a) | | | 688,402 | | | | 660,819 | |
ELFI Graduate Loan Program LLC, Series 2018-A, Class B | | | | | | | | |
4.000% 8/25/42 (a) | | | 214,648 | | | | 198,982 | |
The accompanying notes are an integral part of the financial statements.
54
MassMutual Short-Duration Bond Fund – Portfolio of Investments (Continued) |
| | | Principal
Amount | | | Value | |
Goal Capital Funding Trust | | | | | | | | |
Series 2010-1, Class A, 3 mo. USD LIBOR + .700% 3.697% FRN 8/25/48 (a) | | $ | 60,897 | | | $ | 60,785 | |
Series 2015-1, Class B, ABS, 144A, 1 mo. USD LIBOR + 1.500% 4.584% FRN 9/25/43 (a) | | | 100,000 | | | | 99,115 | |
Higher Education Funding I, Series 2004-1, Class B1, 0.000% | | | | | | | | |
FRN 1/01/44 (a) (c) | | | 950,000 | | | | 855,320 | |
Laurel Road Prime Student Loan Trust | | | | | | | | |
Series 2019-A, Class BFX, 3.000% 10/25/48 (a) | | | 1,210,820 | | | | 1,150,432 | |
Series 2018-B, Class BFX, 3.720% 5/26/43 (a) | | | 546,147 | | | | 517,494 | |
Navient Private Education Refi Loan Trust, Series 2020-BA, Class B | | | | | | | | |
2.770% 1/15/69 (a) | | | 6,200,000 | | | | 5,287,466 | |
Nelnet Private Education Loan Trust, Series 2016-A, Class A1A, 1 mo. USD LIBOR + 1.750% | | | | | | | | |
4.834% FRN 12/26/40 (a) | | | 28,347 | | | | 28,339 | |
Nelnet Student Loan Trust | | | | | | | | |
Series 2006-2, Class B, 3 mo. USD LIBOR + .200% 2.983% FRN 1/25/38 | | | 714,206 | | | | 632,899 | |
Series 2006-3, Class B, 3 mo. USD LIBOR + .250% 3.891% FRN 6/25/41 | | | 1,145,414 | | | | 1,039,154 | |
Series 2012-4A, Class B, 1 mo. USD LIBOR + 1.000% 4.084% FRN 7/26/49 (a) | | | 900,000 | | | | 848,488 | |
Series 2018-5A, Class B, 1 mo. USD LIBOR + 1.450% 4.534% FRN 2/25/67 (a) | | | 1,000,000 | | | | 958,654 | |
Series 2015-3A, Class B, 1 mo. USD LIBOR + 1.500% 4.584% FRN 6/25/54 (a) | | | 395,000 | | | | 377,853 | |
SLC Student Loan Trust | | | | | | | | |
Series 2005-1, Class B, 3 mo. USD LIBOR + .200% 3.105% FRN 2/15/45 | | | 420,554 | | | | 391,801 | |
Series 2006-1, Class B, ABS, 3 mo. USD LIBOR + .210% 3.503% FRN 3/15/55 | | | 1,475,771 | | | | 1,355,611 | |
Series 2006-2, Class B, 3 mo. USD LIBOR + .230% 3.523% FRN 12/15/39 | | | 1,119,472 | | | | 1,016,359 | |
Series 2005-3, Class B, 3 mo. USD LIBOR + .250% 3.543% FRN 6/15/55 | | | 917,102 | | | | 845,636 | |
| | | Principal
Amount | | | Value | |
SLM Student Loan Trust | | | | | | | | |
Series 2005-4, Class B, 3 mo. USD LIBOR + .180% 2.963% FRN 7/25/55 | | $ | 484,384 | | | $ | 445,044 | |
Series 2006-7, Class B, 3 mo. USD LIBOR + .200% 2.983% FRN 1/27/42 | | | 2,568,749 | | | | 2,340,071 | |
Series 2006-5, Class B, 3 mo. USD LIBOR + .210% 2.993% FRN 10/25/40 | | | 429,119 | | | | 402,366 | |
Series 2005-5, Class B, ABS, 3 mo. USD LIBOR + .250% 3.033% FRN 10/25/40 | | | 488,621 | | | | 452,869 | |
Series 2005-6, Class B, 3 mo. USD LIBOR + .290% 3.073% FRN 1/25/44 | | | 2,335,900 | | | | 2,128,337 | |
Series 2003-14, Class A6, 3 mo. USD LIBOR + .300% 3.083% FRN 7/25/25 | | | 5,084 | | | | 5,081 | |
Series 2005-9, Class B, 3 mo. USD LIBOR + .300% 3.083% FRN 1/25/41 | | | 1,288,822 | | | | 1,209,472 | |
Series 2005-8, Class B, 3 mo. USD LIBOR + .310% 3.093% FRN 1/25/55 | | | 346,931 | | | | 329,150 | |
Series 2004-8, Class B, 3 mo. USD LIBOR + .460% 3.243% FRN 1/25/40 | | | 750,621 | | | | 709,110 | |
Series 2004-1 Class B, 3 mo. USD LIBOR + .500% 3.283% FRN 7/25/39 | | | 351,413 | | | | 330,433 | |
Series 2003-4, Class B, 3 mo. USD LIBOR + .650% 3.943% FRN 6/15/38 | | | 240,068 | | | | 225,300 | |
Series 2003-11, Class B, 3 mo. USD LIBOR + .650% 3.943% FRN 12/15/38 | | | 888,243 | | | | 846,271 | |
SMB Private Education Loan Trust | | | | | | | | |
Series 2016-C, Class A2B, 1 mo. USD LIBOR + 1.100% 3.918% FRN 9/15/34 (a) | | | 77,169 | | | | 77,455 | |
Series 2014-A, Class B, 4.000% 9/15/42 (a) | | | 1,250,000 | | | | 1,192,379 | |
Series 2015-C, Class C, 4.500% 9/17/46 (a) | | | 1,710,000 | | | | 1,612,891 | |
SoFi Alternative Trust, Series 2019-C, Class PT, | | | | | | | | |
5.511% VRN 1/25/45 (a) (c) | | | 2,120,487 | | | | 2,023,956 | |
SoFi Professional Loan Program LLC | | | | | | | | |
Series 2016-D, Class A1, 1 mo. USD LIBOR + .950% 4.034% FRN 1/25/39 (a) | | | 9,935 | | | | 9,906 | |
Series 2019-A, Class BFX, ABS, 144A, 4.110% 6/15/48 (a) | | | 870,000 | | | | 805,215 | |
The accompanying notes are an integral part of the financial statements.
55
MassMutual Short-Duration Bond Fund – Portfolio of Investments (Continued) |
| | | Principal
Amount | | | Value | |
Series 2016-B, Class A1, 1 mo. USD LIBOR + 1.200% 4.284% FRN 6/25/33 (a) | | $ | 52,903 | | | $ | 52,914 | |
Wachovia Student Loan Trust, Series 2005-1, Class B, ABS, 3 mo. USD LIBOR + .300% | | | | | | | | |
3.083% FRN 10/25/40 | | | 376,743 | | | | 346,303 | |
| | | | | | | | 44,284,452 | |
Whole Loan Collateral Collateralized Mortgage Obligations — 10.4% |
Angel Oak Mortgage Trust | | | | | | | | |
Series 2020-5, Class A3, 2.041% VRN 5/25/65 (a) (c) | | | 623,037 | | | | 559,605 | |
Series 2021-1, Class M1, 2.215% VRN 1/25/66 (a) (c) | | | 2,290,000 | | | | 1,939,843 | |
Series 2021-3, Class M1, 2.479% VRN 5/25/66 (a) (c) | | | 6,583,000 | | | | 4,534,341 | |
Bank of America Mortgage Securities, Series 2004-G, Class 2A7, | | | | | | | | |
3.986% VRN 8/25/34 (c) | | | 9,033 | | | | 8,578 | |
Credit Suisse Mortgage Capital Certificates, Series 2021-NQM4, Class M1, | | | | | | | | |
2.472% VRN 5/25/66 (a) (c) | | | 7,095,350 | | | | 5,076,037 | |
Deephaven Residential Mortgage Trust, Series 2021-1, Class A3, | | | | | | | | |
1.128% VRN 5/25/65 (a) (c) | | | 1,139,114 | | | | 1,071,821 | |
FWD Securitization Trust, Series 2020-INV1, Class M1, | | | | | | | | |
2.850% VRN 1/25/50 (a) (c) | | | 1,804,000 | | | | 1,612,301 | |
Merrill Lynch Mortgage Investors, Inc., Series 2004-A1, Class IIA2, | | | | | | | | |
2.726% VRN 2/25/34 (c) | | | 40,844 | | | | 38,013 | |
MFRA Trust | | | | | | | | |
Series 2021-NQM2, Class A3, 1.472% VRN 11/25/64 (a) (c) | | | 2,694,017 | | | | 2,165,504 | |
Series 2020-NQM1, Class A3, 2.300% VRN 8/25/49 (a) (c) | | | 503,025 | | | | 468,121 | |
New Residential Mortgage Loan Trust, Series 2020-NQM1, Class M1, | | | | | | | | |
3.207% VRN 1/26/60 (a) (c) | | | 2,252,000 | | | | 1,878,276 | |
NMLT Trust, Series 2021-INV2, Class A3, | | | | | | | | |
1.520% VRN 8/25/56 (a) (c) | | | 6,424,898 | | | | 5,267,881 | |
Oceanview Trust, Series 2021-1, Class M3 | | | | | | | | |
3.090% 12/29/51 (a) | | | 5,000,000 | | | | 4,788,732 | |
Onslow Bay Financial LLC | | | | | | | | |
Series 2021-NQM3, Class A3, 1.362% VRN 7/25/61 (a) (c) | | | 5,596,522 | | | | 4,150,797 | |
Series 2021-NQM1, Class M1, 2.219% VRN 2/25/66 (a) (c) | | | 2,501,000 | | | | 1,944,503 | |
| | | Principal
Amount | | | Value | |
Series 2020-INV1, Class A21, 3.500% VRN 12/25/49 (a) (c) | | $ | 1,028,996 | | | $ | 917,512 | |
Shellpoint Co-Originator Trust, Series 2016-1, Class 2A3, | | | | | | | | |
3.000% VRN 10/25/31 (a) (c) | | | 217,901 | | | | 198,551 | |
Starwood Mortgage Residential Trust | | | | | | | | |
Series 2021-3, Class M1, 2.491% VRN 6/25/56 (a) (c) | | | 5,582,000 | | | | 3,906,191 | |
Series 2020-INV1, Class M1, 2.501% 11/25/55 (a) | | | 2,500,000 | | | | 2,186,329 | |
Toorak Mortgage Corp., Series 2021-INV1, Class M1, | | | | | | | | |
2.585% VRN 7/25/56 (a) (c) | | | 1,222,000 | | | | 918,992 | |
Verus Securitization Trust | | | | | | | | |
Series 2021-5, Class A3, 1.373% VRN 9/25/66 (a) (c) | | | 2,050,169 | | | | 1,590,725 | |
Series 2021-1, Class M1, 1.968% VRN 1/25/66 (a) (c) | | | 2,247,000 | | | | 1,798,838 | |
Series 2019-INV3, Class M1, 3.279% VRN 11/25/59 (a) (c) | | | 2,129,000 | | | | 2,018,093 | |
Series 2020-4, Class M1, 3.291% VRN 5/25/65 (a) (c) | | | 3,602,000 | | | | 3,070,214 | |
| | | | | | | | 52,109,798 | |
| | | | | | | | | |
TOTAL NON-U.S. GOVERNMENT AGENCY OBLIGATIONS (Cost $256,627,465) | | | | | | | 228,152,396 | |
| | | | | | | | | |
U.S. GOVERNMENT AGENCY OBLIGATIONS AND INSTRUMENTALITIES (d) — 0.0% |
Pass-Through Securities — 0.0% |
Federal Home Loan Mortgage Corp. Pool #1Q0239, 1 year CMT + 2.189% 2.399% FRN 3/01/37 | | | 72,357 | | | | 74,076 | |
Federal National Mortgage Association Pool #775539 12 mo. USD LIBOR + 1.641% 3.391% FRN 5/01/34 | | | 14,088 | | | | 14,274 | |
Government National Mortgage Association Pool #507545 7.500% 8/15/29 | | | 19,747 | | | | 20,723 | |
| | | | | | | | 109,073 | |
| | | | | | | | | |
TOTAL U.S. GOVERNMENT AGENCY OBLIGATIONS AND INSTRUMENTALITIES (Cost $107,666) | | | | | | | 109,073 | |
| | | | | | | | | |
TOTAL BONDS & NOTES (Cost $555,280,594) | | | | | | | 478,473,177 | |
The accompanying notes are an integral part of the financial statements.
56
MassMutual Short-Duration Bond Fund – Portfolio of Investments (Continued) |
| | | Number of
Shares | | | Value | |
MUTUAL FUNDS — 1.2% |
Diversified Financial Services — 1.2% |
State Street Navigator Securities Lending Government Money Market Portfolio (e) | | | 5,908,650 | | | $ | 5,908,650 | |
| | | | | | | | | |
TOTAL MUTUAL FUNDS (Cost $5,908,650) | | | | | | | 5,908,650 | |
| | | | | | | | | |
TOTAL LONG-TERM INVESTMENTS (Cost $561,189,244) | | | | | | | 484,381,827 | |
| | | | | | | | | |
| | | Principal
Amount | | | | | |
SHORT-TERM INVESTMENTS — 2.6% |
Commercial Paper — 1.6% |
Evergy Kansas Central, Inc. | | | | | | | | |
3.766% 11/03/22 (a) | | $ | 3,000,000 | | | | 2,989,936 | |
HP, Inc. | | | | | | | | |
3.711% 10/24/22 (a) | | | 3,000,000 | | | | 2,993,160 | |
Nutrien Ltd. | | | | | | | | |
3.719% 11/10/22 (a) | | | 2,000,000 | | | | 1,991,841 | |
| | | | | | | | 7,974,937 | |
Repurchase Agreement — 1.0% |
Fixed Income Clearing Corp., Repurchase Agreement, dated 9/30/22, 0.830%, due 10/03/22 (f) | | | 4,918,793 | | | | 4,918,793 | |
| | | | | | | | | |
TOTAL SHORT-TERM INVESTMENTS (Cost $12,893,511) | | | | | | | 12,893,730 | |
| | | | | | | | | |
TOTAL INVESTMENTS — 99.5% (Cost $574,082,755) (g) | | | | | | | 497,275,557 | |
| | | | | | | | | |
Other Assets/(Liabilities) — 0.5% | | | | | | | 2,348,965 | |
| | | | | | | | | |
NET ASSETS — 100.0% | | | | | | $ | 499,624,522 | |
Abbreviation Legend
CLO | Collateralized Loan Obligation |
Notes to Portfolio of Investments
Percentages are stated as a percent of net assets.
(a) | Security is exempt from registration under Regulation S or Rule 144A of the Securities Act of 1933. These securities are considered restricted and may be resold in transactions exempt from registration. At September 30, 2022, the aggregate market value of these securities amounted to $333,050,837 or 66.66% of net assets. |
(b) | Denotes all or a portion of security on loan. The total value of securities on loan as of September 30, 2022, was $5,790,018 or 1.16% of net assets. (Note 2). |
(c) | Certain variable rate securities are not based on a published reference rate and spread but are determined by the issuer or agent and are based on current market conditions. These securities do not indicate a reference rate and spread in their description above. The rates shown are the current interest rates at September 30, 2022. |
(d) | May contain securities that are issued by a U.S. Government Agency, but are unsecured and are not guaranteed by a U.S. Government Agency. |
(e) | Represents investment of security lending cash collateral. (Note 2). |
(f) | Maturity value of $4,919,133. Collateralized by U.S. Government Agency obligations with a rate of 0.000%, maturity date of 3/30/23, and an aggregate market value, including accrued interest, of $5,017,225. |
(g) | See Note 6 for aggregate cost for federal tax purposes. |
Country weightings, as a percentage of net assets, is as follows:
United States | | | 65.2 | % |
Cayman Islands | | | 10.6 | % |
United Kingdom | | | 3.9 | % |
Ireland | | | 3.4 | % |
Bermuda | | | 2.0 | % |
Netherlands | | | 1.9 | % |
Nigeria | | | 1.1 | % |
Switzerland | | | 1.0 | % |
Germany | | | 1.0 | % |
Indonesia | | | 0.9 | % |
China | | | 0.9 | % |
Panama | | | 0.9 | % |
Canada | | | 0.9 | % |
France | | | 0.7 | % |
Norway | | | 0.6 | % |
Australia | | | 0.5 | % |
Italy | | | 0.5 | % |
Kuwait | | | 0.3 | % |
Denmark | | | 0.3 | % |
Japan | | | 0.3 | % |
Total Long-Term Investments | | | 96.9 | % |
Short-Term Investments and Other Assets and Liabilities | | | 3.1 | % |
Net Assets | | | 100.0 | % |
The accompanying notes are an integral part of the financial statements.
57
MassMutual Short-Duration Bond Fund – Portfolio of Investments (Continued) |
Futures contracts
| | Expiration
Date | | | Number of
Contracts | | | Notional
Amount | | | Value/ Net
Unrealized
Appreciation/
(Depreciation) | |
Short | | | | | | | | | | | | | | | | |
U.S. Treasury Ultra 10 Year | | | 12/20/22 | | | | 30 | | | $ | (3,780,137 | ) | | $ | 225,606 | |
U.S. Treasury Note 2 Year | | | 12/30/22 | | | | 528 | | | | (110,107,645 | ) | | | 1,661,394 | |
U.S. Treasury Note 5 Year | | | 12/30/22 | | | | 1,262 | | | | (140,545,915 | ) | | | 4,871,055 | |
| | | | | | | | | | | | | | $ | 6,758,055 | |
Centrally Cleared Interest Rate Swaps
Paid by the Fund | Received by the Fund | | | | | | | | | | | | | | | | | | | | | | | | |
Rate/ Reference | | Frequency | | Rate/ Reference | | Frequency | | | Termination
Date | | | Notional
Amount | | | Value | | | Upfront
Premium
Paid/
(Received) | | | Unrealized
Appreciation
(Depreciation) | |
3-Month USD LIBOR BBA | | | Quarterly | | Fixed 1.047% | | | Semi-Annually | | | | 11/22/24 | | | | USD | | | | 60,500,000 | | | $ | (4,140,728 | ) | | $ | — | | | $ | (4,140,728 | ) |
Currency Legend
The accompanying notes are an integral part of the financial statements.
58
MassMutual Inflation-Protected and Income Fund — Portfolio of Investments |
September 30, 2022 |
| | | Principal
Amount | | | Value | |
BONDS & NOTES — 90.9% |
NON-U.S. GOVERNMENT AGENCY OBLIGATIONS — 56.9% |
Automobile Asset-Backed Securities — 7.9% |
Avis Budget Rental Car Funding, Series 2017-2A, Class D | | | | | | | | |
4.560% 3/20/24 (a) | | $ | 5,000,000 | | | $ | 4,981,002 | |
Carvana Auto Receivables Trust, Series 2020-N3, Class B | | | | | | | | |
0.660% 6/12/28 | | | 3,009,926 | | | | 2,890,718 | |
Drive Auto Receivables Trust, Series 2021-1, Class C | | | | | | | | |
1.020% 6/15/27 | | | 2,700,000 | | | | 2,614,921 | |
Hertz Vehicle Financing LLC, Series 2021-1A, Class D | | | | | | | | |
3.980% 12/26/25 (a) | | | 4,600,000 | | | | 4,021,695 | |
Onemain Direct Auto Receivable Trust, Series 2022-1A, Class C | | | | | | | | |
5.310% 6/14/29 (a) | | | 1,100,000 | | | | 1,070,448 | |
Santander Drive Auto Receivables Trust, Series 2021-2, Class D | | | | | | | | |
1.350% 7/15/27 | | | 5,000,000 | | | | 4,720,319 | |
Westlake Automobile Receivables Trust, Series 2020-3A, Class D | | | | | | | | |
1.650% 2/17/26 (a) | | | 2,779,000 | | | | 2,650,072 | |
| | | | | | | | 22,949,175 | |
Commercial Mortgage-Backed Securities — 3.3% |
BHMS Mortgage Trust, Series 2018-ATLS, Class B, 1 mo. USD LIBOR + 1.500% | | | | | | | | |
4.318% FRN 7/15/35 (a) | | | 1,150,000 | | | | 1,092,839 | |
BX Commercial Mortgage Trust, Series 2019-XL, Class F, 1 mo. USD LIBOR + 2.000% | | | | | | | | |
4.818% FRN 10/15/36 (a) | | | 2,082,500 | | | | 2,011,360 | |
CAMB Commercial Mortgage Trust, Series 2019-LIFE, Class D, 1 mo. USD LIBOR + 1.750% | | | | | | | | |
4.568% FRN 12/15/37 (a) | | | 250,836 | | | | 238,065 | |
Credit Suisse Mortgage Capital Certificates, Series 2019-ICE4, Class D, 1 mo. USD LIBOR + 1.600% | | | | | | | | |
4.418% FRN 5/15/36 (a) | | | 6,000,000 | | | | 5,741,489 | |
KNDL Mortgage Trust, Series 2019-KNSQ, Class E, 1 mo. USD LIBOR + 1.800% | | | | | | | | |
4.618% FRN 5/15/36 (a) | | | 389,000 | | | | 372,847 | |
| | | | | | | | 9,456,600 | |
| | | Principal
Amount | | | Value | |
Home Equity Asset-Backed Securities — 0.7% |
Centex Home Equity Loan Trust, Series 2006-A, Class M1, 1 mo. USD LIBOR + .450% | | | | | | | | |
3.534% FRN 6/25/36 | | $ | 273,507 | | | $ | 271,118 | |
Home Equity Asset Trust, Series 2005-9, Class M1, 1 mo. USD LIBOR + .615% | | | | | | | | |
3.699% FRN 4/25/36 | | | 1,797,064 | | | | 1,756,178 | |
| | | | | | | | 2,027,296 | |
Other Asset-Backed Securities — 25.7% |
321 Henderson Receivables LLC, Series 2006-3A, Class A1, 1 mo. USD LIBOR + .200% | | | | | | | | |
3.018% FRN 9/15/41 (a) | | | 51,611 | | | | 50,708 | |
Affirm Asset Securitization Trust | | | | | �� | | | |
Series 2021-Z1, Class A, 1.070% 8/15/25 (a) | | | 8,485,082 | | | | 8,231,005 | |
Series 2021-Z2, Class A, 1.170% 11/16/26 (a) | | | 1,284,084 | | | | 1,237,471 | |
Series 2022-X1, Class A, 1.750% 2/15/27 (a) | | | 1,527,946 | | | | 1,494,428 | |
Series 2020-Z2, Class A, 1.900% 1/15/25 (a) | | | 1,353,018 | | | | 1,327,370 | |
Series 2021-A, Class D, 3.490% 8/15/25 (a) | | | 2,100,000 | | | | 2,057,055 | |
BHG Securitization Trust | | | | | | | | |
Series 2021-B, Class A, 0.900% 10/17/34 (a) | | | 1,377,411 | | | | 1,307,250 | |
Series 2022-C, Class A, 5.320% 10/17/35 (a) | | | 1,800,000 | | | | 1,799,951 | |
Cascade Funding Mortgage Trust, Series 2021-EBO1, Class A, | | | | | | | | |
0.985% VRN 11/25/50 (a) (b) | | | 1,812,188 | | | | 1,728,723 | |
Citigroup Mortgage Loan Trust, Series 2006-WFH2, Class M1, 1 mo. USD LIBOR + .405% | | | | | | | | |
3.489% FRN 8/25/36 | | | 346,875 | | | | 346,704 | |
Crossroads Asset Trust, Series 2021-A, Class A2 | | | | | | | | |
0.820% 3/20/24 (a) | | | 223,413 | | | | 221,446 | |
FCI Funding LLC | | | | | | | | |
Series 2021-1A, Class A, 1.130% 4/15/33 (a) | | | 2,028,716 | | | | 1,967,535 | |
Series 2021-1A, Class B, 1.530% 4/15/33 (a) | | | 1,352,335 | | | | 1,313,003 | |
First Franklin Mortgage Loan Trust | | | | | | | | |
Series 2006-FF15, Class A5, 1 mo. USD LIBOR + .160% 3.244% FRN 11/25/36 | | | 476,452 | | | | 468,424 | |
The accompanying notes are an integral part of the financial statements.
59
MassMutual Inflation-Protected and Income Fund — Portfolio of Investments (Continued) |
| | | Principal
Amount | | | Value | |
Series 2005-FF9, Class A4, 1 mo. USD LIBOR + .720% 3.804% FRN 10/25/35 | | $ | 211,289 | | | $ | 211,082 | |
FNA VI LLC, Series 21-1A, Class A | | | | | | | | |
1.350% 1/10/32 (a) | | | 3,476,858 | | | | 3,178,770 | |
FREED ABS Trust, Series 2021-2, Class B | | | | | | | | |
1.030% 6/19/28 (a) | | | 1,223,465 | | | | 1,218,215 | |
Gracie Point International Funding | | | | | | | | |
Series 2021-1A, Class A, 1 mo. USD LIBOR + .750% 3.314% FRN 11/01/23 (a) | | | 7,164,245 | | | | 7,113,725 | |
Series 2022-1A, Class C, 30 day SOFR + 3.500% 5.947% FRN 4/01/24 (a) | | | 2,300,000 | | | | 2,299,995 | |
Series 2022-1A, Class E, 30 day SOFR + 5.750% 8.197% FRN 4/01/24 (a) | | | 1,287,000 | | | | 1,286,995 | |
Hilton Grand Vacations Trust, Series 2022-2A, Class C | | | | | | | | |
5.570% 1/25/37 (a) | | | 1,498,397 | | | | 1,438,616 | |
JP Morgan Mortgage Acquisition Trust, Series 2007-CH3, Class A5, 1 mo. USD LIBOR + .260% | | | | | | | | |
3.344% FRN 3/25/37 | | | 289,330 | | | | 284,929 | |
KREF Ltd., Series 2021-FL2, Class D, 1 mo. USD LIBOR + 2.200% | | | | | | | | |
5.139% FRN 2/15/39 (a) | | | 900,000 | | | | 843,917 | |
LCM Ltd., Series 19A, Class AR, 3 mo. USD LIBOR + 1.240% | | | | | | | | |
3.752% FRN 7/15/27 (a) | | | 347,469 | | | | 345,032 | |
Lendingpoint Asset Securitization, Series 2021-A, Class B | | | | | | | | |
1.110% 2/15/29 (a) | | | 1,624,993 | | | | 1,595,000 | |
Lendmark Funding Trust, Series 2019-2A, Class A | | | | | | | | |
2.780% 4/20/28 (a) | | | 3,655,000 | | | | 3,567,342 | |
New Residential Advance Receivables Trust Advance Receivables Backed | | | | | | | | |
Series 2020-T1, Class BT1, 1.823% 8/15/53 (a) | | | 1,000,000 | | | | 951,626 | |
Series 2020-T1, Class DT1, 3.011% 8/15/53 (a) | | | 1,510,000 | | | | 1,434,632 | |
NP SPE II LP, Series 2019-1A, Class A1 | | | | | | | | |
2.574% 9/20/49 (a) | | | 183,753 | | | | 172,848 | |
NRZ Advance Receivables Trust, Series 2020-T3, Class CT3 | | | | | | | | |
1.814% 10/15/52 (a) | | | 386,000 | | | | 384,566 | |
Oportun Funding LLC, Series 2022-1, Class A | | | | | | | | |
3.250% 6/15/29 (a) | | | 2,409,775 | | | | 2,373,503 | |
| | | Principal
Amount | | | Value | |
Orange Lake Timeshare Trust | | | | | | | | |
Series 2016-A, Class A, 2.610% 3/08/29 (a) | | $ | 274,765 | | | $ | 274,183 | |
Series 2016-A, Class B, 2.910% 3/08/29 (a) | | | 364,003 | | | | 363,935 | |
Pagaya AI Debt Selection Trust | | | | | | | | |
Series 2021-3, Class A, 1.150% 5/15/29 (a) | | | 3,188,130 | | | | 3,106,129 | |
Series 2022-1, Class A, 2.030% 10/15/29 (a) | | | 11,250,608 | | | | 10,857,694 | |
Sierra Receivables Funding LLC | | | | | | | | |
Series 2019-3A, Class C, 3.000% 8/20/36 (a) | | | 777,821 | | | | 738,870 | |
Series 2019-2A, Class C, 3.120% 5/20/36 (a) | | | 691,703 | | | | 659,785 | |
Series 2019-1A, Class C, 3.770% 1/20/36 (a) | | | 225,120 | | | | 217,921 | |
Series 2018-1A, Class B, 4.036% 4/20/35 | | | 243,270 | | | | 237,472 | |
Series 2019-3A, Class D, 4.180% 8/20/36 (a) | | | 195,119 | | | | 187,977 | |
Series 2019-1A, Class D, 4.750% 1/20/36 (a) | | | 144,452 | | | | 139,883 | |
Structured Asset Investment Loan Trust, Series 2005-2, Class M2, 1 mo. USD LIBOR + .735% | | | | | | | | |
3.819% FRN 3/25/35 | | | 536,722 | | | | 533,020 | |
Structured Asset Securities Corp. Mortgage Loan Trust | | | | | | | | |
Series 2006-BC6, Class A4, 1 mo. USD LIBOR + .170% 3.254% FRN 1/25/37 | | | 204,974 | | | | 199,740 | |
Series 2006-WF1, Class M4, 1 mo. USD LIBOR + .645% 3.729% FRN 2/25/36 | | | 329,984 | | | | 329,549 | |
Upstart Securitization Trust | | | | | | | | |
Series 2021-4, Class A, 0.840% 9/20/31 (a) | | | 4,519,020 | | | | 4,337,561 | |
Series 2020-3, Class A, 1.702% 11/20/30 (a) | | | 122,307 | | | | 122,100 | |
| | | | | | | | 74,557,685 | |
Student Loans Asset-Backed Securities — 6.9% |
Chase Education Loan Trust, Series 2007-A, Class A4, 3 mo. USD LIBOR + .100% | | | | | | | | |
3.741% FRN 3/28/68 | | | 1,662,158 | | | | 1,613,964 | |
College Loan Corp. Trust, Series 2005-2, Class B, 3 mo. USD LIBOR + .490% | | | | | | | | |
3.002% FRN 1/15/37 | | | 227,454 | | | | 196,903 | |
The accompanying notes are an integral part of the financial statements.
60
MassMutual Inflation-Protected and Income Fund — Portfolio of Investments (Continued) |
| | | Principal
Amount | | | Value | |
Commonbond Student Loan Trust | | | | | | | | |
Series 2021-AGS, Class B, 1.400% 3/25/52 (a) | | $ | 170,134 | | | $ | 143,707 | |
Series 2019-AGS, Class A2, 1 mo. USD LIBOR + .900% 3.984% FRN 1/25/47 (a) | | | 492,870 | | | | 492,143 | |
Series 2018-CGS, Class C, 4.350% 2/25/46 (a) | | | 10,973 | | | | 9,810 | |
DRB Prime Student Loan Trust, Series 2017-A, Class A1, 1 mo. USD LIBOR + .850% | | | | | | | | |
3.934% FRN 5/27/42 (a) | | | 533,515 | | | | 533,658 | |
Edsouth Indenture, No.10 LLC, Series 2015-2, Class B, 1 mo. USD LIBOR + 1.500% | | | | | | | | |
4.584% FRN 12/25/58 (a) | | | 750,000 | | | | 749,247 | |
ELFI Graduate Loan Program LLC, Series 2018-A, Class A1, 1 mo. USD LIBOR + .750% | | | | | | | | |
3.834% FRN 8/25/42 (a) | | | 714,060 | | | | 712,069 | |
Goal Capital Funding Trust, Series 2010-1, Class A, 3 mo. USD LIBOR + .700% | | | | | | | | |
3.697% FRN 8/25/48 (a) | | | 110,485 | | | | 110,282 | |
JP Morgan Student Loan Trust, Series 2007-A, Class B, 3 mo. USD LIBOR + .350% | | | | | | | | |
3.143% FRN 6/28/39 (a) | | | 216,285 | | | | 197,708 | |
KeyCorp Student Loan Trust, Series 2005-A, Class 2B, 3 mo. USD LIBOR + .730% | | | | | | | | |
4.358% FRN 9/27/38 | | | 99,992 | | | | 99,812 | |
Laurel Road Prime Student Loan Trust | | | | | | | | |
Series 2019-A, Class A1FX, 2.340% 10/25/48 (a) | | | 131,232 | | | | 128,990 | |
Series 2018-B, Class A2FX, 3.540% 5/26/43 (a) | | | 484,368 | | | | 475,752 | |
Series 2017-C, Class A1, 1 mo. USD LIBOR + .550% 3.634% FRN 11/25/42 (a) | | | 55,762 | | | | 55,444 | |
Navient Private Education Refi Loan Trust | | | | | | | | |
Series 2021-A, Class A, 0.840% 5/15/69 (a) | | | 5,654,182 | | | | 5,002,712 | |
Series 2020-HA, Class A, 1.310% 1/15/69 (a) | | | 1,441,303 | | | | 1,294,342 | |
Navient Student Loan Trust, Series 2016-7A, Class A, 1 mo. USD LIBOR + 1.150% | | | | | | | | |
4.234% FRN 3/25/66 (a) | | | 1,322,218 | | | | 1,309,028 | |
| | | Principal
Amount | | | Value | |
Nelnet Private Education Loan Trust, Series 2016-A, Class A1A, 1 mo. USD LIBOR + 1.750% | | | | | | | | |
4.834% FRN 12/26/40 (a) | | $ | 15,073 | | | $ | 15,069 | |
Nelnet Student Loan Trust | | | | | | | | |
Series 2006-2, Class B, 3 mo. USD LIBOR + .200% 2.983% FRN 1/25/38 | | | 294,085 | | | | 260,605 | |
Series 2004-3, Class B, 3 mo. USD LIBOR + .350% 3.133% FRN 10/25/40 | | | 545,845 | | | | 506,022 | |
Series 2005-2, Class B, 3 mo. USD LIBOR + .170% 3.772% FRN 3/23/37 | | | 523,365 | | | | 476,171 | |
Series 2006-3, Class B, 3 mo. USD LIBOR + .250% 3.891% FRN 6/25/41 | | | 186,130 | | | | 168,863 | |
Series 2014-2A, Class B, 1 mo. USD LIBOR + 1.500% 4.584% FRN 6/25/41 (a) | | | 295,000 | | | | 294,997 | |
SLC Student Loan Trust | | | | | | | | |
Series 2006-2, Class B, 3 mo. USD LIBOR + .230% 3.523% FRN 12/15/39 | | | 237,464 | | | | 215,591 | |
Series 2005-2, Class B, 3 mo. USD LIBOR + .280% 3.573% FRN 3/15/40 | | | 791,517 | | | | 740,466 | |
SLM Student Loan Trust | | | | | | | | |
Series 2005-5, Class A4, 3 mo. USD LIBOR + .140% 2.923% FRN 10/25/28 | | | 516,592 | | | | 511,410 | |
Series 2006-4, Class B, 3 mo. USD LIBOR + .200% 2.983% FRN 1/25/70 | | | 160,910 | | | | 151,198 | |
Series 2006-5, Class B, 3 mo. USD LIBOR + .210% 2.993% FRN 10/25/40 | | | 221,556 | | | | 207,743 | |
Series 2006-2, Class B, 3 mo. USD LIBOR + .220% 3.003% FRN 1/25/41 | | | 233,112 | | | | 218,652 | |
Series 2005-8, Class B, 3 mo. USD LIBOR + .310% 3.093% FRN 1/25/55 | | | 208,159 | | | | 197,490 | |
Series 2004-3, Class B, 3 mo. USD LIBOR + .470% 3.253% FRN 10/25/64 | | | 161,391 | | | | 154,141 | |
Series 2003-11, Class B, 3 mo. USD LIBOR + .650% 3.943% FRN 12/15/38 | | | 180,049 | | | | 171,541 | |
SMB Private Education Loan Trust, Series 2019-A, Class A2B, 1 mo. USD LIBOR + .870% | | | | | | | | |
3.688% FRN 7/15/36 (a) | | | 1,009,978 | | | | 995,292 | |
The accompanying notes are an integral part of the financial statements.
61
MassMutual Inflation-Protected and Income Fund — Portfolio of Investments (Continued) |
| | | Principal
Amount | | | Value | |
SoFi Alternative Trust, Series 2019-C, Class PT, | | | | | | | | |
5.511% VRN 1/25/45 (a) (b) | | $ | 536,154 | | | $ | 511,746 | |
SoFi Professional Loan Program LLC | | | | | | | | |
Series 2016-B, Class A2B, 2.740% 10/25/32 (a) | | | 282,578 | | | | 282,140 | |
Series 2018-D, Class A2FX, 3.600% 2/25/48 (a) | | | 875,188 | | | | 853,554 | |
| | | | | | | | 20,058,262 | |
Whole Loan Collateral Collateralized Mortgage Obligations — 12.4% |
Angel Oak Mortgage Trust, Series 2022-2, Class A1, | | | | | | | | |
3.353% VRN 1/25/67 (a) (b) | | | 2,287,405 | | | | 2,042,447 | |
BRAVO Residential Funding Trust, Series 2021-NQM2, Class A3, | | | | | | | | |
1.435% VRN 3/25/60 (a) (b) | | | 891,964 | | | | 842,588 | |
CIM Trust, Series 2019-INV3, Class A11, 1 mo. USD LIBOR + 1.000% | | | | | | | | |
3.394% FRN 8/25/49 (a) | | | 762,429 | | | | 728,211 | |
COLT Mortgage Loan Trust, Series 2022-1, Class A1, | | | | | | | | |
2.284% VRN 12/27/66 (a) (b) | | | 8,803,936 | | | | 7,573,483 | |
Deephaven Residential Mortgage Trust, Series 2021-1, Class A3, | | | | | | | | |
1.128% VRN 5/25/65 (a) (b) | | | 470,579 | | | | 442,779 | |
Lakeview Trust | | | | | | | | |
Series 2022-1, Class M3, 4.585% 4/25/52 (a) | | | 1,400,000 | | | | 1,346,911 | |
Series 2022-3, Class M3, 5.437% 5/29/52 (a) | | | 3,300,000 | | | | 3,211,890 | |
NewRez Warehouse Securitization Trust, Series 2021-1, Class A, 1 mo. USD LIBOR + .750% | | | | | | | | |
3.834% FRN 5/25/55 (a) | | | 5,333,000 | | | | 5,226,556 | |
Oceanview Trust | | | | | | | | |
Series 2021-1, Class A, 1.219% 12/29/51 (a) | | | 3,099,078 | | | | 3,007,514 | |
Series 2021-1, Class M3, 3.090% 12/29/51 (a) | | | 2,906,000 | | | | 2,783,211 | |
Onslow Bay Financial LLC | | | | | | | | |
Series 2021-NQM2, Class A2, 1.357% VRN 5/25/61 (a) (b) | | | 662,652 | | | | 527,229 | |
Series 2020-EXP1, Class 2A2, 1 mo. USD LIBOR + .950% 4.034% FRN 2/25/60 (a) | | | 371,247 | | | | 353,091 | |
PNMAC GMSR Issuer Trust, Series 2018-GT1, Class A, 1 mo. USD LIBOR + 2.850% | | | | | | | | |
5.934% FRN 2/25/23 (a) | | | 270,000 | | | | 267,267 | |
PSMC Trust, Series 2020-2, Class A2, | | | | | | | | |
3.000% VRN 5/25/50 (a) (b) | | | 909,288 | | | | 846,557 | |
| | | Principal
Amount | | | Value | |
Starwood Mortgage Residential Trust | | | | | | | | |
Series 2020-1, Class M1, 2.878% VRN 2/25/50 (a) (b) | | $ | 1,000,000 | | | $ | 908,727 | |
Series 2019-INV1, Class A3, 2.916% VRN 9/27/49 (a) (b) | | | 1,126,290 | | | | 1,074,410 | |
Starwood Residential Mortgage Trust, Series 2021-1, Class A3, | | | | | | | | |
1.528% VRN 5/25/65 (a) (b) | | | 4,008,264 | | | | 3,600,234 | |
Verus Securitization Trust | | | | | | | | |
Series 2021-3, Class A3, 1.437% VRN 6/25/66 (a) (b) | | | 1,026,547 | | | | 831,392 | |
Series 2019-INV2, Class A3, 3.219% VRN 7/25/59 (a) (b) | | | 508,176 | | | | 494,980 | |
| | | | | | | | 36,109,477 | |
| | | | | | | | | |
TOTAL NON-U.S. GOVERNMENT AGENCY OBLIGATIONS (Cost $171,071,859) | | | | | | | 165,158,495 | |
| | | | | | | | | |
U.S. Government Agency Obligations and Instrumentalities (c) — 12.4% |
Collateralized Mortgage Obligations — 1.2% |
Federal Home Loan Mortgage Corp. Structured Agency Credit Risk Debt Notes, Series 2022-DNA5, Class M1A, 30 day SOFR + 2.950% | | | | | | | | |
5.231% FRN 6/25/42 (a) | | | 3,461,214 | | | | 3,460,316 | |
Whole Loans — 11.2% |
Federal Home Loan Mortgage Corp. | | | | | | | | |
Series 2021-DNA7, Class M1, 30 day SOFR + .850% 3.131% FRN 11/25/41 (a) | | | 2,300,000 | | | | 2,239,377 | |
Series 2022-DNA3, Class M1A, 30 day SOFR + 2.000% 4.281% FRN 4/25/42 (a) | | | 3,542,575 | | | | 3,516,036 | |
Federal Home Loan Mortgage Corp. Structured Agency Credit Risk Debt Notes | | | | | | | | |
Series 2021-DNA6, Class M1, 30 day SOFR + .800% 3.081% FRN 10/25/41 (a) | | | 6,950,000 | | | | 6,813,213 | |
Series 2021-HQA3, Class M1, 30 day SOFR + .850% 3.131% FRN 9/25/41 (a) | | | 8,910,185 | | | | 8,661,408 | |
Series 2022-DNA1, Class M1A, 30 day SOFR + 1.000% 3.281% FRN 1/25/42 (a) | | | 700,236 | | | | 678,987 | |
Series 2020-DNA1, Class M2, 1 mo. USD LIBOR + 1.700% 4.784% FRN 1/25/50 (a) | | | 1,380,804 | | | | 1,369,550 | |
Series 2020-DNA5, Class M2, 30 day SOFR + 2.800% 5.081% FRN 10/25/50 (a) | | | 661,975 | | | | 662,346 | |
The accompanying notes are an integral part of the financial statements.
62
MassMutual Inflation-Protected and Income Fund — Portfolio of Investments (Continued) |
| | | Principal
Amount | | | Value | |
Series 2018-DNA3, Class M2A, 1 mo. USD LIBOR + 2.100% 5.184% FRN 9/25/48 (a) | | $ | 997,009 | | | $ | 998,543 | |
Federal National Mortgage Association Connecticut Avenue Securities Trust | | | | | | | | |
Series 2019-R03, Class 1M2, 1 mo. USD LIBOR + 2.150% 5.234% FRN 9/25/31 (a) | | | 1,198,922 | | | | 1,191,971 | |
Series 2022-R07, Class 1M1, 30 day SOFR + 2.950% 5.255% FRN 6/25/42 (a) | | | 5,627,631 | | | | 5,663,706 | |
Series 2019-R02, Class 1M2, 1 mo. USD LIBOR + 2.300% 5.384% FRN 8/25/31 (a) | | | 603,006 | | | | 601,512 | |
| | | | | | | | 32,396,649 | |
| | | | | | | | | |
TOTAL U.S. GOVERNMENT AGENCY OBLIGATIONS AND INSTRUMENTALITIES (Cost $36,543,874) | | | | | | | 35,856,965 | |
| | | | | | | | | |
U.S. TREASURY OBLIGATIONS — 21.6% |
U.S. Treasury Bonds & Notes — 21.6% |
U.S. Treasury Inflation Index | | | | | | | | |
0.125% 2/15/52 | | | 1,170,741 | | | | 735,783 | |
U.S. Treasury Inflation Index | | | | | | | | |
0.125% 4/15/25 | | | 2,953,577 | | | | 2,802,667 | |
0.125% 10/15/25 | | | 4,025,057 | | | | 3,804,858 | |
0.125% 4/15/26 | | | 2,033,550 | | | | 1,899,145 | |
0.125% 7/15/26 | | | 2,311,376 | | | | 2,161,257 | |
0.125% 10/15/26 | | | 1,246,876 | | | | 1,161,543 | |
0.125% 4/15/27 (d) | | | 2,833,218 | | | | 2,613,385 | |
0.125% 1/15/30 | | | 1,842,496 | | | | 1,628,558 | |
0.125% 7/15/30 | | | 3,004,482 | | | | 2,643,788 | |
0.125% 1/15/31 | | | 3,186,792 | | | | 2,780,269 | |
0.125% 7/15/31 | | | 1,575,238 | | | | 1,371,236 | |
0.125% 1/15/32 | | | 3,313,311 | | | | 2,861,419 | |
0.125% 2/15/51 | | | 1,194,890 | | | | 745,546 | |
0.250% 1/15/25 | | | 4,002,848 | | | | 3,830,929 | |
0.250% 7/15/29 | | | 2,229,670 | | | | 2,009,054 | |
0.250% 2/15/50 | | | 1,613,360 | | | | 1,051,898 | |
0.375% 7/15/25 (e) | | | 1,905,274 | | | | 1,821,509 | |
0.375% 1/15/27 | | | 1,901,106 | | | | 1,778,314 | |
0.375% 7/15/27 | | | 1,635,093 | | | | 1,525,597 | |
0.500% 1/15/28 | | | 1,681,582 | | | | 1,560,499 | |
0.625% 1/15/26 | | | 1,246,900 | | | | 1,190,173 | |
0.625% 7/15/32 | | | 917,748 | | | | 831,835 | |
0.625% 2/15/43 | | | 1,030,928 | | | | 789,734 | |
0.750% 7/15/28 | | | 2,797,335 | | | | 2,628,001 | |
0.750% 2/15/42 | | | 1,901,226 | | | | 1,523,431 | |
| | | Principal
Amount | | | Value | |
0.750% 2/15/45 | | $ | 1,056,871 | | | $ | 811,465 | |
0.875% 1/15/29 | | | 2,024,046 | | | | 1,902,814 | |
0.875% 2/15/47 | | | 1,166,002 | | | | 910,134 | |
1.000% 2/15/46 | | | 625,205 | | | | 504,682 | |
1.000% 2/15/49 | | | 476,851 | | | | 386,386 | |
1.375% 2/15/44 | | | 762,750 | | | | 676,176 | |
1.750% 1/15/28 | | | 989,961 | | | | 980,061 | |
2.000% 1/15/26 | | | 746,375 | | | | 744,290 | |
2.125% 2/15/40 | | | 685,385 | | | | 711,033 | |
2.125% 2/15/41 | | | 689,989 | | | | 709,638 | |
2.375% 1/15/25 | | | 2,121,917 | | | | 2,130,537 | |
2.500% 1/15/29 | | | 896,974 | | | | 927,691 | |
3.375% 4/15/32 | | | 834,585 | | | | 949,829 | |
3.625% 4/15/28 | | | 1,694,424 | | | | 1,842,124 | |
3.875% 4/15/29 | | | 540,675 | | | | 605,535 | |
| | | | | | | | 62,542,823 | |
| | | | | | | | | |
TOTAL U.S. TREASURY OBLIGATIONS (Cost $74,907,214) | | | | | | | 62,542,823 | |
| | | | | | | | | |
TOTAL BONDS & NOTES (Cost $282,522,947) | | | | | | | 263,558,283 | |
| | | | | | | | | |
MUTUAL FUNDS — 0.9% |
Diversified Financial Services — 0.9% |
State Street Navigator Securities Lending Prime Portfolio (f) | | | 2,676,375 | | | | 2,676,375 | |
| | | | | | | | | |
TOTAL MUTUAL FUNDS (Cost $2,676,375) | | | | | | | 2,676,375 | |
| | | | | | | | | |
TOTAL LONG-TERM INVESTMENTS (Cost $285,199,322) | | | | | | | 266,234,658 | |
| | | | | | | | | |
SHORT-TERM INVESTMENTS — 11.9% |
Commercial Paper — 10.0% |
Amcor Flexibles North America, Inc. | | | | | | | | |
3.632% 11/01/22 (a) | | | 4,000,000 | | | | 3,987,609 | |
American Electric Power Co., Inc. | | | | | | | | |
3.787% 11/03/22 (a) | | | 2,000,000 | | | | 1,993,291 | |
Cox Enterprises, Inc. | | | | | | | | |
3.348% 10/05/22 (a) | | | 5,000,000 | | | | 4,997,699 | |
Entergy Corp. | | | | | | | | |
3.166% 10/24/22 (a) | | | 3,000,000 | | | | 2,993,256 | |
Penske Truck Leasing Co. LP | | | | | | | | |
3.450% 10/07/22 | | | 4,000,000 | | | | 3,997,292 | |
Raytheon Technologies Corp. | | | | | | | | |
3.583% 11/03/22 (a) | | | 5,000,000 | | | | 4,983,227 | |
The accompanying notes are an integral part of the financial statements.
63
MassMutual Inflation-Protected and Income Fund — Portfolio of Investments (Continued) |
| | | Principal
Amount | | | Value | |
Southern Power Co. | | | | | | | | |
3.607% 10/21/22 | | $ | 2,000,000 | | | $ | 1,995,971 | |
Suncor Energy, Inc. | | | | | | | | |
3.713% 10/31/22 (a) | | | 4,000,000 | | | | 3,987,848 | |
| | | | | | | | 28,936,193 | |
Repurchase Agreement — 1.9% |
Fixed Income Clearing Corp., Repurchase Agreement, dated 9/30/22, 0.830%, due 10/03/22 (g) | | | 5,583,754 | | | | 5,583,754 | |
| | | | | | | | | |
TOTAL SHORT-TERM INVESTMENTS (Cost $34,522,443) | | | | | | | 34,519,947 | |
| | | | | | | | | |
TOTAL INVESTMENTS — 103.7% (Cost $319,721,765) (h) | | | | | | | 300,754,605 | |
| | | | | | | | | |
Other Assets/(Liabilities) — (3.7)% | | | | | | | (10,839,085 | ) |
| | | | | | | | | |
NET ASSETS — 100.0% | | | | | | $ | 289,915,520 | |
Abbreviation Legend
Notes to Portfolio of Investments
Percentages are stated as a percent of net assets.
(a) | Security is exempt from registration under Regulation S or Rule 144A of the Securities Act of 1933. These securities are considered restricted and may be resold in transactions exempt from registration. At September 30, 2022, the aggregate market value of these securities amounted to $203,203,644 or 70.09% of net assets. |
(b) | Certain variable rate securities are not based on a published reference rate and spread but are determined by the issuer or agent and are based on current market conditions. These securities do not indicate a reference rate and spread in their description above. The rates shown are the current interest rates at September 30, 2022. |
(c) | May contain securities that are issued by a U.S. Government Agency, but are unsecured and are not guaranteed by a U.S. Government Agency. |
(d) | Denotes all or a portion of security on loan. The total value of securities on loan as of September 30, 2022, was $2,622,956 or 0.90% of net assets. (Note 2). |
(e) | All or a portion of this security is pledged/held as collateral for open derivatives. (Note 2). |
(f) | Represents investment of security lending cash collateral. (Note 2). |
(g) | Maturity value of $5,584,141. Collateralized by U.S. Government Agency obligations with a rate of 3.500%, maturity date of 9/15/25, and an aggregate market value, including accrued interest, of $5,695,433. |
(h) | See Note 6 for aggregate cost for federal tax purposes. |
The accompanying notes are an integral part of the financial statements.
64
MassMutual Inflation-Protected and Income Fund — Portfolio of Investments (Continued) |
Futures contracts
| | Expiration
Date | | | Number of
Contracts | | | Notional
Amount | | | Value/ Net
Unrealized
Appreciation/
(Depreciation) | |
Long | | | | | | | | | | | | | | | | |
U.S. Treasury Long Bond | | | 12/20/22 | | | | 10 | | | $ | 1,358,843 | | | $ | (94,780 | ) |
U.S. Treasury Ultra 10 Year | | | 12/20/22 | | | | 1 | | | | 118,909 | | | | (425 | ) |
U.S. Treasury Ultra Bond | | | 12/20/22 | | | | 5 | | | | 693,767 | | | | (8,767 | ) |
U.S. Treasury Note 5 Year | | | 12/30/22 | | | | 14 | | | | 1,509,486 | | | | (4,377 | ) |
| | | | | | | | | | | | | | $ | (108,349 | ) |
Short | | | | | | | | | | | | | | | | |
U.S. Treasury Note 2 Year | | | 12/30/22 | | | | 450 | | | $ | (93,999,389 | ) | | $ | 1,573,607 | |
Centrally Cleared Interest Rate Swaps
Paid by the Fund | Received by the Fund | | | | | | | | | | | | | | | | | | | | | | | | |
Rate/ Reference | | Frequency | | Rate/ Reference | | Frequency | | | Termination
Date | | | Notional
Amount | | | Value | | | Upfront
Premium
Paid/
(Received) | | | Unrealized
Appreciation
(Depreciation) | |
12-Month SOFR | | | Annually | | Fixed 3.552% | | | Annually | | | | 12/07/24 | | | | USD | | | | 10,000,000 | | | $ | (128,898 | ) | | $ | — | | | $ | (128,898 | ) |
12-Month SOFR | | | Annually | | Fixed 4.062% | | | Annually | | | | 12/22/24 | | | | USD | | | | 10,000,000 | | | | (30,841 | ) | | | — | | | | (30,841 | ) |
Fixed 3.082% | | | Annually | | 12-Month SOFR | | | Annually | | | | 12/07/32 | | | | USD | | | | 2,241,000 | | | | 90,549 | | | | — | | | | 90,549 | |
Fixed 3.352% | | | Annually | | 12-Month SOFR | | | Annually | | | | 12/22/32 | | | | USD | | | | 2,259,000 | | | | 40,155 | | | | — | | | | 40,155 | |
| | | | | | | | | | | | | | | | | | | | | | | | $ | (29,035 | ) | | $ | — | | | $ | (29,035 | ) |
OTC Total Return Swaps
Paid by the Fund | | Received by the Fund | | | | | | | | | | | | | | | | | | | | | | | | | |
Rate/
Reference | | Frequency | | | Rate/
Reference | | | Frequency | | | Counterparty | | | Termination
Date | | | No. of
Contracts/
Notional | | | Value | | | Upfront
Premium
Received
(Paid)/
Received | | | Unrealized
Appreciation
(Depreciation) | |
3.120% | | | Maturity | | | | Bloomberg Barclays US Treasury Inflation Notes TR Index | | | | Maturity | | | | Barclays Bank PLC* | | | | 11/30/22 | | | | 60,225,031 | | | $ | (4,905,350 | ) | | $ | — | | | $ | (4,905,350 | ) |
3.170% | | | Maturity | | | | Bloomberg Barclays US Treasury Inflation Notes TR Index | | | | Maturity | | | | BNP Paribas SA* | | | | 10/31/22 | | | | 50,357,539 | | | | (4,560,542 | ) | | | — | | | | (4,560,542 | ) |
3.170% | | | Maturity | | | | Bloomberg Barclays US Treasury Inflation Notes TR Index | | | | Maturity | | | | BNP Paribas SA* | | | | 1/31/23 | | | | 4,038,655 | | | | (367,543 | ) | | | — | | | | (367,543 | ) |
3.165% | | | Maturity | | | | Bloomberg Barclays US Treasury Inflation Notes TR Index | | | | Maturity | | | | BNP Paribas SA* | | | | 2/28/23 | | | | 19,954,732 | | | | (1,320,436 | ) | | | — | | | | (1,320,436 | ) |
3.170% | | | Maturity | | | | Bloomberg Barclays US Treasury Inflation Notes TR Index | | | | Maturity | | | | Goldman Sachs International* | | | | 10/31/22 | | | | 50,085,111 | | | | (4,535,870 | ) | | | — | | | | (4,535,870 | ) |
The accompanying notes are an integral part of the financial statements.
65
MassMutual Inflation-Protected and Income Fund — Portfolio of Investments (Continued) |
Paid by the Fund | | Received by the Fund | | | | | | | | | | | | | | | | | | | | | | | | | |
Rate/
Reference | | Frequency | | | Rate/
Reference | | | Frequency | | | Counterparty | | | Termination
Date | | | No. of
Contracts/
Notional | | | Value | | | Upfront
Premium
Received
(Paid)/
Received | | | Unrealized
Appreciation
(Depreciation) | |
3.170% | | | Maturity | | | | Bloomberg Barclays US Treasury Inflation Notes TR Index | | | | Maturity | | | | Goldman Sachs International* | | | | 1/31/23 | | | | 2,633,427 | | | $ | (239,658 | ) | | $ | — | | | $ | (239,658 | ) |
3.165% | | | Maturity | | | | Bloomberg Barclays US Treasury Inflation Notes TR Index | | | | Maturity | | | | Goldman Sachs International* | | | | 2/28/23 | | | | 31,473,123 | | | | (2,082,626 | ) | | | — | | | | (2,082,626 | ) |
| | | | | | | | | | | | | | | | | | | | | | | | | | | $ | (18,012,025 | ) | | $ | — | | | $ | (18,012,025 | ) |
* | Contracts are subject to a Master Netting Agreement. |
Currency Legend
The accompanying notes are an integral part of the financial statements.
66
MassMutual Core Bond Fund — Portfolio of Investments |
September 30, 2022 |
| | | Principal
Amount | | | Value | |
BONDS & NOTES — 98.4% |
CORPORATE DEBT — 38.8% |
Aerospace & Defense — 0.4% |
The Boeing Co. | | | | | | | | |
5.150% 5/01/30 | | $ | 2,275,000 | | | $ | 2,101,844 | |
5.930% 5/01/60 | | | 710,000 | | | | 607,421 | |
| | | | | | | | 2,709,265 | |
Agriculture — 1.2% |
Altria Group, Inc. | | | | | | | | |
5.800% 2/14/39 | | | 1,425,000 | | | | 1,244,432 | |
BAT Capital Corp. | | | | | | | | |
3.462% 9/06/29 | | | 1,125,000 | | | | 916,287 | |
4.700% 4/02/27 | | | 2,855,000 | | | | 2,663,364 | |
4.758% 9/06/49 | | | 805,000 | | | | 548,672 | |
Imperial Brands Finance PLC | | | | | | | | |
3.875% 7/26/29 (a) | | | 1,627,000 | | | | 1,381,148 | |
Reynolds American, Inc. | | | | | | | | |
5.850% 8/15/45 | | | 1,025,000 | | | | 804,198 | |
Viterra Finance BV | | | | | | | | |
3.200% 4/21/31 (a) | | | 1,540,000 | | | | 1,145,950 | |
| | | | | | | | 8,704,051 | |
Airlines — 0.2% |
Spirit Airlines Pass-Through Trust, Series 2015-1, Class A, | | | | | | | | |
4.100% 4/01/28 | | | 1,096,517 | | | | 948,614 | |
United Airlines Pass-Through Trust, Series 2018-1, Class B, | | | | | | | | |
4.600% 3/01/26 | | | 344,857 | | | | 314,259 | |
| | | | | | | | 1,262,873 | |
Auto Manufacturers — 0.7% |
Ford Motor Co. | | | | | | | | |
6.100% 8/19/32 | | | 1,130,000 | | | | 996,208 | |
General Motors Co. | | | | | | | | |
5.150% 4/01/38 | | | 785,000 | | | | 631,691 | |
6.800% 10/01/27 | | | 1,995,000 | | | | 2,015,742 | |
General Motors Financial Co., Inc. | | | | | | | | |
3.100% 1/12/32 (b) | | | 1,815,000 | | | | 1,368,297 | |
| | | | | | | | 5,011,938 | |
Auto Parts & Equipment — 0.1% |
Lear Corp. | | | | | | | | |
3.550% 1/15/52 | | | 1,470,000 | | | | 873,344 | |
Banks — 6.5% |
ABN AMRO Bank NV | | | | | | | | |
4.750% 7/28/25 (a) | | | 2,100,000 | | | | 2,019,982 | |
Bank Hapoalim BM 5 year CMT + 2.155% | | | | | | | | |
3.255% VRN 1/21/32 (a) | | | 2,800,000 | | | | 2,323,882 | |
| | | Principal
Amount | | | Value | |
Bank of America Corp. | | | | | | | | |
5 year CMT + 1.200% 2.482% VRN 9/21/36 | | $ | 2,930,000 | | | $ | 2,117,890 | |
5 year CMT + 2.000% 3.846% VRN 3/08/37 | | | 2,225,000 | | | | 1,794,684 | |
3 mo. USD LIBOR + 1.310% 4.271% VRN 7/23/29 | | | 615,000 | | | | 558,837 | |
6.110% 1/29/37 | | | 1,275,000 | | | | 1,227,744 | |
7.750% 5/14/38 | | | 1,055,000 | | | | 1,170,365 | |
The Bank of Nova Scotia 3 mo. USD LIBOR + 2.648% | | | | | | | | |
4.650% VRN (c) | | | 3,550,000 | | | | 3,042,721 | |
Barclays PLC | | | | | | | | |
4.337% 1/10/28 | | | 1,600,000 | | | | 1,426,274 | |
5.200% 5/12/26 | | | 1,035,000 | | | | 983,841 | |
5 year CMT + 5.431% 8.000% VRN (c) | | | 1,368,000 | | | | 1,197,274 | |
BPCE SA SOFR + 1.730% | | | | | | | | |
3.116% VRN 10/19/32 (a) | | | 2,080,000 | | | | 1,477,210 | |
Citigroup, Inc. | | | | | | | | |
4.450% 9/29/27 | | | 1,075,000 | | | | 994,776 | |
3 mo. USD LIBOR + 4.068% 5.950% VRN 12/31/99 (c) | | | 865,000 | | | | 854,724 | |
6.625% 6/15/32 | | | 500,000 | | | | 505,340 | |
Credit Suisse Group AG | | | | | | | | |
SOFR + .980% 1.305% VRN 2/02/27 (a) | | | 2,600,000 | | | | 2,110,784 | |
SOFR + 3.340% 6.373% VRN 7/15/26 (a) | | | 863,000 | | | | 833,982 | |
Deutsche Bank AG SOFR + 1.318% | | | | | | | | |
2.552% VRN 1/07/28 | | | 2,685,000 | | | | 2,180,713 | |
Discover Bank 5 year USD Swap + 1.730% | | | | | | | | |
4.682% VRN 8/09/28 | | | 2,175,000 | | | | 2,085,282 | |
First Republic Bank | | | | | | | | |
4.375% 8/01/46 | | | 1,970,000 | | | | 1,530,980 | |
The Goldman Sachs Group, Inc. | | | | | | | | |
SOFR + 1.410% 3.102% VRN 2/24/33 | | | 1,550,000 | | | | 1,229,951 | |
6.750% 10/01/37 | | | 1,565,000 | | | | 1,559,117 | |
HSBC Holdings PLC | | | | | | | | |
SOFR + 1.285% 2.206% VRN 8/17/29 | | | 1,355,000 | | | | 1,049,000 | |
4.375% 11/23/26 | | | 2,151,000 | | | | 2,003,016 | |
JP Morgan Chase & Co. | | | | | | | | |
SOFR + 2.515% 2.956% VRN 5/13/31 | | | 1,350,000 | | | | 1,068,799 | |
5.600% 7/15/41 | | | 1,225,000 | | | | 1,161,775 | |
Mizrahi Tefahot Bank Ltd. 5 year CMT + 2.250% | | | | | | | | |
3.077% VRN 4/07/31 (a) | | | 3,585,000 | | | | 3,006,919 | |
The accompanying notes are an integral part of the financial statements.
67
MassMutual Core Bond Fund — Portfolio of Investments (Continued) |
| | | Principal
Amount | | | Value | |
Morgan Stanley | | | | | | | | |
SOFR + 1.360% 2.484% VRN 9/16/36 | | $ | 1,410,000 | | | $ | 1,009,927 | |
SOFR + 2.620% 5.297% VRN 4/20/37 | | | 2,110,000 | | | | 1,892,272 | |
National Australia Bank Ltd. 5 year CMT + 1.700% | | | | | | | | |
3.347% VRN 1/12/37 (a) (b) | | | 3,060,000 | | | | 2,348,100 | |
| | | | | | | | 46,766,161 | |
Beverages — 0.5% |
Anheuser-Busch Cos. LLC/Anheuser-Busch InBev Worldwide, Inc. | | | | | | | | |
4.900% 2/01/46 | | | 2,725,000 | | | | 2,361,634 | |
Molson Coors Beverage Co. | | | | | | | | |
4.200% 7/15/46 | | | 1,479,000 | | | | 1,096,617 | |
5.000% 5/01/42 | | | 350,000 | | | | 293,949 | |
| | | | | | | | 3,752,200 | |
Biotechnology — 0.1% |
Amgen, Inc. | | | | | | | | |
3.000% 1/15/52 | | | 945,000 | | | | 593,715 | |
Chemicals — 0.6% |
Celanese US Holdings LLC | | | | | | | | |
6.050% 3/15/25 | | | 1,945,000 | | | | 1,900,772 | |
DuPont de Nemours, Inc. | | | | | | | | |
5.319% 11/15/38 | | | 1,350,000 | | | | 1,224,139 | |
Syngenta Finance NV | | | | | | | | |
4.441% 4/24/23 (a) | | | 1,375,000 | | | | 1,366,926 | |
| | | | | | | | 4,491,837 | |
Computers — 0.1% |
Dell International LLC / EMC Corp. | | | | | | | | |
8.100% 7/15/36 | | | 450,000 | | | | 474,713 | |
Diversified Financial Services — 3.5% |
AerCap Ireland Capital DAC / AerCap Global Aviation Trust | | | | | | | | |
3.300% 1/30/32 | | | 4,560,000 | | | | 3,424,714 | |
Antares Holdings LP | | | | | | | | |
2.750% 1/15/27 (a) | | | 985,000 | | | | 784,587 | |
3.950% 7/15/26 (a) | | | 2,725,000 | | | | 2,330,742 | |
8.500% 5/18/25 (a) | | | 1,185,000 | | | | 1,209,543 | |
Ares Finance Co. III LLC 5 year CMT + 3.237% | | | | | | | | |
4.125% VRN 6/30/51 (a) | | | 1,875,000 | | | | 1,461,900 | |
Ares Finance Co. LLC | | | | | | | | |
4.000% 10/08/24 (a) | | | 2,380,000 | | | | 2,281,468 | |
Avolon Holdings Funding Ltd. | | | | | | | | |
2.528% 11/18/27 (a) | | | 2,970,000 | | | | 2,333,765 | |
3.250% 2/15/27 (a) | | | 1,945,000 | | | | 1,629,525 | |
4.250% 4/15/26 (a) | | | 3,296,000 | | | | 2,956,444 | |
| | | Principal
Amount | | | Value | |
5.500% 1/15/26 (a) | | $ | 205,000 | | | $ | 192,863 | |
Blue Owl Finance LLC | | | | | | | | |
3.125% 6/10/31 (a) | | | 3,455,000 | | | | 2,452,476 | |
4.125% 10/07/51 (a) | | | 1,875,000 | | | | 1,083,417 | |
Global Aircraft Leasing Co. Ltd. | | | | | | | | |
6.500% 9/15/24 (a) | | | 1,919,474 | | | | 1,444,404 | |
Synchrony Financial | | | | | | | | |
3.950% 12/01/27 | | | 1,450,000 | | | | 1,258,386 | |
| | | | | | | | 24,844,234 | |
Electric — 1.1% |
The Cleveland Electric Illuminating Co. | | | | | | | | |
5.950% 12/15/36 | | | 589,000 | | | | 580,741 | |
CMS Energy Corp. | | | | | | | | |
4.700% 3/31/43 | | | 655,000 | | | | 528,216 | |
4.875% 3/01/44 | | | 700,000 | | | | 604,479 | |
Enel Finance International NV | | | | | | | | |
5.000% 6/15/32 (a) | | | 1,650,000 | | | | 1,407,285 | |
NextEra Energy Capital Holdings, Inc. 5 year CMT + 2.547% | | | | | | | | |
3.800% VRN 3/15/82 | | | 1,275,000 | | | | 1,001,167 | |
Pacific Gas and Electric Co. | | | | | | | | |
2.500% 2/01/31 | | | 1,035,000 | | | | 752,794 | |
PG&E Wildfire Recovery Funding LLC | | | | | | | | |
4.674% 12/01/51 | | | 1,200,000 | | | | 1,061,150 | |
Texas Electric Market Stabilization Funding N LLC | | | | | | | | |
5.167% 2/01/50 (a) | | | 2,000,000 | | | | 1,972,160 | |
| | | | | | | | 7,907,992 | |
Entertainment — 0.2% |
Warnermedia Holdings, Inc. | | | | | | | | |
4.279% 3/15/32 (a) | | | 2,080,000 | | | | 1,710,853 | |
Food — 1.1% |
JBS USA Food Co. | | | | | | | | |
3.625% 1/15/32 (a) | | | 4,750,000 | | | | 3,710,937 | |
JBS USA LUX SA/JBS USA Food Co./JBS USA Finance, Inc. | | | | | | | | |
5.500% 1/15/30 (a) | | | 928,000 | | | | 855,171 | |
Kraft Heinz Foods Co. | | | | | | | | |
4.875% 10/01/49 | | | 1,490,000 | | | | 1,228,202 | |
Smithfield Foods, Inc. | | | | | | | | |
2.625% 9/13/31 (a) | | | 1,555,000 | | | | 1,142,947 | |
3.000% 10/15/30 (a) | | | 1,208,000 | | | | 932,361 | |
| | | | | | | | 7,869,618 | |
The accompanying notes are an integral part of the financial statements.
68
MassMutual Core Bond Fund — Portfolio of Investments (Continued) |
| | | Principal
Amount | | | Value | |
Gas — 0.4% |
CenterPoint Energy Resources Corp. | | | | | | | | |
6.625% 11/01/37 | | $ | 1,500,000 | | | $ | 1,504,911 | |
NiSource, Inc. | | | | | | | | |
4.800% 2/15/44 | | | 1,350,000 | | | | 1,124,876 | |
| | | | | | | | 2,629,787 | |
Housewares — 0.1% |
Newell Brands, Inc. | | | | | | | | |
6.375% 9/15/27 | | | 1,125,000 | | | | 1,114,009 | |
Insurance — 7.3% |
Allianz SE 5 year CMT + 2.973% | | | | | | | | |
3.500% VRN (a) (c) | | | 4,400,000 | | | | 3,367,936 | |
The Allstate Corp. 3 mo. USD LIBOR + 2.938% | | | | | | | | |
5.750% VRN 8/15/53 | | | 3,220,000 | | | | 2,964,596 | |
American International Group, Inc. 3 mo. USD LIBOR + 2.868% | | | | | | | | |
5.750% VRN 4/01/48 (b) | | | 2,454,000 | | | | 2,261,380 | |
AmTrust Financial Services, Inc. | | | | | | | | |
6.125% 8/15/23 | | | 4,330,000 | | | | 4,278,703 | |
Ascot Group Ltd. | | | | | | | | |
4.250% 12/15/30 (a) | | | 2,215,000 | | | | 1,847,317 | |
Athene Global Funding | | | | | | | | |
2.673% 6/07/31 (a) | | | 3,080,000 | | | | 2,302,798 | |
AXIS Specialty Finance LLC 5 year CMT + 3.186% | | | | | | | | |
4.900% VRN 1/15/40 | | | 1,670,000 | | | | 1,356,875 | |
Brighthouse Financial, Inc. | | | | | | | | |
4.700% 6/22/47 | | | 1,525,000 | | | | 1,079,993 | |
5.625% 5/15/30 | | | 2,074,000 | | | | 1,943,317 | |
CNO Financial Group, Inc. | | | | | | | | |
5.250% 5/30/29 | | | 2,801,000 | | | | 2,607,480 | |
Corebridge Financial, Inc. 5 year CMT + 3.846% | | | | | | | | |
6.875% VRN 12/15/52 (a) | | | 559,000 | | | | 509,868 | |
Enstar Finance LLC 5 year CMT + 5.468% | | | | | | | | |
5.750% VRN 9/01/40 | | | 2,700,000 | | | | 2,407,145 | |
Enstar Group Ltd. | | | | | | | | |
4.950% 6/01/29 | | | 2,050,000 | | | | 1,839,645 | |
Global Atlantic Fin Co. | | | | | | | | |
3.125% 6/15/31 (a) | | | 4,161,000 | | | | 3,045,837 | |
5 year CMT + 3.796% 4.700% VRN 10/15/51 (a) | | | 3,580,000 | | | | 2,693,137 | |
Hanwha Life Insurance Co. Ltd. 5 year CMT + 1.850% | | | | | | | | |
3.379% VRN 2/04/32 (a) | | | 2,585,000 | | | | 2,159,296 | |
Hill City Funding Trust | | | | | | | | |
4.046% 8/15/41 (a) | | | 4,055,000 | | | | 2,729,342 | |
| | | Principal
Amount | | | Value | |
Jackson Financial, Inc. | | | | | | | | |
3.125% 11/23/31 | | $ | 1,034,000 | | | $ | 777,615 | |
Liberty Mutual Group, Inc. 5 year CMT + 3.315% | | | | | | | | |
4.125% VRN 12/15/51 (a) | | | 1,225,000 | | | | 949,858 | |
Markel Corp. 5 year CMT + 5.662% | | | | | | | | |
6.000% VRN (c) | | | 1,755,000 | | | | 1,703,596 | |
MetLife Capital Trust IV | | | | | | | | |
7.875% 12/15/37 (a) | | | 925,000 | | | | 987,437 | |
Prudential Financial, Inc. | | | | | | | | |
3 mo. USD LIBOR + 3.920% 5.625% VRN 6/15/43 | | | 1,300,000 | | | | 1,280,838 | |
3 mo. USD LIBOR + 2.665% 5.700% VRN 9/15/48 (b) | | | 1,396,000 | | | | 1,303,515 | |
Sammons Financial Group, Inc. | | | | | | | | |
3.350% 4/16/31 (a) | | | 4,980,000 | | | | 3,733,774 | |
4.450% 5/12/27 (a) | | | 80,000 | | | | 73,124 | |
4.750% 4/08/32 (a) | | | 90,000 | | | | 73,415 | |
Teachers Insurance & Annuity Association of America | | | | | | | | |
4.270% 5/15/47 (a) | | | 1,025,000 | | | | 832,482 | |
USF&G Capital I | | | | | | | | |
8.500% 12/15/45 (a) | | | 1,015,000 | | | | 1,159,185 | |
| | | | | | | | 52,269,504 | |
Internet — 0.2% |
Netflix, Inc. | | | | | | | | |
5.875% 11/15/28 | | | 1,855,000 | | | | 1,805,880 | |
Investment Companies — 2.0% |
Ares Capital Corp. | | | | | | | | |
2.150% 7/15/26 | | | 2,275,000 | | | | 1,907,345 | |
BlackRock TCP Capital Corp. | | | | | | | | |
3.900% 8/23/24 | | | 1,137,000 | | | | 1,089,031 | |
Blackstone Private Credit Fund | | | | | | | | |
1.750% 9/15/24 | | | 370,000 | | | | 337,267 | |
2.625% 12/15/26 | | | 3,660,000 | | | | 3,005,787 | |
Golub Capital BDC, Inc. | | | | | | | | |
2.500% 8/24/26 | | | 1,165,000 | | | | 976,942 | |
3.375% 4/15/24 | | | 2,745,000 | | | | 2,634,995 | |
OWL Rock Core Income Corp. | | | | | | | | |
4.700% 2/08/27 | | | 2,025,000 | | | | 1,774,384 | |
Sixth Street Specialty Lending, Inc. | | | | | | | | |
3.875% 11/01/24 | | | 2,705,000 | | | | 2,574,461 | |
| | | | | | | | 14,300,212 | |
Iron & Steel — 0.1% |
Vale Overseas Ltd. | | | | | | | | |
6.875% 11/21/36 | | | 1,100,000 | | | | 1,044,037 | |
Lodging — 0.3% |
Las Vegas Sands Corp. | | | | | | | | |
3.200% 8/08/24 | | | 2,305,000 | | | | 2,173,408 | |
The accompanying notes are an integral part of the financial statements.
69
MassMutual Core Bond Fund — Portfolio of Investments (Continued) |
| | | Principal
Amount | | | Value | |
Media — 0.7% |
Charter Communications Operating LLC/Charter Communications Operating Capital | | | | | | | | |
3.900% 6/01/52 | | $ | 750,000 | | | $ | 464,398 | |
6.484% 10/23/45 | | | 1,905,000 | | | | 1,674,349 | |
Comcast Corp. | | | | | | | | |
2.937% 11/01/56 | | | 1,244,000 | | | | 742,639 | |
3.969% 11/01/47 | | | 660,000 | | | | 504,711 | |
Discovery Communications LLC | | | | | | | | |
4.000% 9/15/55 | | | 1,186,000 | | | | 699,254 | |
4.650% 5/15/50 | | | 705,000 | | | | 482,451 | |
Time Warner Cable, Inc. | | | | | | | | |
6.750% 6/15/39 | | | 655,000 | | | | 585,570 | |
| | | | | | | | 5,153,372 | |
Metal Fabricate & Hardware — 0.2% |
The Timken Co. | | | | | | | | |
4.500% 12/15/28 | | | 1,580,000 | | | | 1,443,663 | |
Mining — 0.2% |
Glencore Finance Canada Ltd. | | | | | | | | |
5.550% STEP 10/25/42 (a) | | | 857,000 | | | | 726,496 | |
Teck Resources Ltd. | | | | | | | | |
6.000% 8/15/40 | | | 1,022,000 | | | | 901,478 | |
| | | | | | | | 1,627,974 | |
Oil & Gas — 2.4% |
BP Capital Markets PLC | | | | | | | | |
5 year CMT + 4.036% 4.375% VRN (c) | | | 2,675,000 | | | | 2,474,375 | |
5 year CMT + 4.398% 4.875% VRN (c) | | | 1,540,000 | | | | 1,320,185 | |
Cenovus Energy, Inc. | | | | | | | | |
6.750% 11/15/39 | | | 1,176,000 | | | | 1,167,908 | |
Devon Energy Corp. | | | | | | | | |
5.600% 7/15/41 | | | 1,075,000 | | | | 962,750 | |
EQT Corp. | | | | | | | | |
3.900% 10/01/27 | | | 1,870,000 | | | | 1,701,940 | |
7.000% STEP 2/01/30 | | | 1,965,000 | | | | 2,027,684 | |
Occidental Petroleum Corp. | | | | | | | | |
6.600% 3/15/46 | | | 1,228,000 | | | | 1,264,840 | |
Ovintiv, Inc. | | | | | | | | |
6.500% 8/15/34 | | | 1,110,000 | | | | 1,080,694 | |
6.500% 2/01/38 | | | 530,000 | | | | 514,396 | |
Patterson-UTI Energy, Inc. | | | | | | | | |
3.950% 2/01/28 | | | 2,415,000 | | | | 1,981,491 | |
5.150% 11/15/29 | | | 1,350,000 | | | | 1,114,281 | |
Petroleos Mexicanos | | | | | | | | |
5.350% 2/12/28 | | | 925,000 | | | | 703,638 | |
6.375% 1/23/45 | | | 640,000 | | | | 353,600 | |
6.500% 3/13/27 | | | 295,000 | | | | 247,063 | |
| | | Principal
Amount | | | Value | |
6.625% 6/15/38 | | $ | 202,000 | | | $ | 118,550 | |
| | | | | | | | 17,033,395 | |
Oil & Gas Services — 0.6% |
NOV, Inc. | | | | | | | | |
3.600% 12/01/29 | | | 3,570,000 | | | | 3,017,008 | |
3.950% 12/01/42 | | | 1,778,000 | | | | 1,183,732 | |
| | | | | | | | 4,200,740 | |
Pharmaceuticals — 0.8% |
AbbVie, Inc. | | | | | | | | |
4.700% 5/14/45 | | | 815,000 | | | | 689,452 | |
Cigna Corp. | | | | | | | | |
4.800% 7/15/46 | | | 1,105,000 | | | | 945,905 | |
CVS Health Corp. | | | | | | | | |
5.050% 3/25/48 | | | 370,000 | | | | 324,608 | |
6.125% 9/15/39 | | | 895,000 | | | | 913,303 | |
CVS Pass-Through Trust | | | | | | | | |
5.926% 1/10/34 (a) | | | 1,609,832 | | | | 1,592,375 | |
Utah Acquisition Sub, Inc. | | | | | | | | |
5.250% 6/15/46 | | | 1,750,000 | | | | 1,233,882 | |
| | | | | | | | 5,699,525 | |
Pipelines — 2.2% |
Energy Transfer LP | | | | | | | | |
6.125% 12/15/45 | | | 1,235,000 | | | | 1,083,205 | |
3 mo. USD LIBOR + 4.028% 6.250% VRN (c) | | | 2,635,000 | | | | 2,160,700 | |
EnLink Midstream Partners LP | | | | | | | | |
4.150% 6/01/25 | | | 1,181,000 | | | | 1,096,263 | |
4.850% 7/15/26 | | | 996,000 | | | | 915,775 | |
Enterprise Products Operating LLC 3 mo. USD LIBOR + 3.033% | | | | | | | | |
5.250% VRN 8/16/77 | | | 2,550,000 | | | | 2,130,771 | |
MPLX LP 3 mo. USD LIBOR + 4.652% | | | | | | | | |
6.875% VRN (c) | | | 2,425,000 | | | | 2,382,562 | |
Plains All American Pipeline LP 3 mo. USD LIBOR + 4.110% | | | | | | | | |
6.125% VRN (c) | | | 2,590,000 | | | | 2,111,391 | |
Plains All American Pipeline LP/PAA Finance Corp. | | | | | | | | |
3.800% 9/15/30 | | | 770,000 | | | | 645,396 | |
4.700% 6/15/44 | | | 1,525,000 | | | | 1,092,776 | |
6.650% 1/15/37 | | | 475,000 | | | | 441,044 | |
Targa Resources Partners LP/Targa Resources Partners Finance Corp. | | | | | | | | |
6.875% 1/15/29 | | | 1,692,000 | | | | 1,670,021 | |
| | | | | | | | 15,729,904 | |
The accompanying notes are an integral part of the financial statements.
70
MassMutual Core Bond Fund — Portfolio of Investments (Continued) |
| | | Principal
Amount | | | Value | |
Private Equity — 0.4% |
Apollo Management Holdings LP 5 year CMT + 3.266% | | | | | | | | |
4.950% VRN 1/14/50 (a) | | $ | 1,970,000 | | | $ | 1,674,500 | |
KKR Group Finance Co. VIII LLC | | | | | | | | |
3.500% 8/25/50 (a) | | | 920,000 | | | | 631,615 | |
KKR Group Finance Co. X LLC | | | | | | | | |
3.250% 12/15/51 (a) | | | 1,135,000 | | | | 738,553 | |
| | | | | | | | 3,044,668 | |
Real Estate Investment Trusts (REITS) — 2.3% |
Broadstone Net Lease LLC | | | | | | | | |
2.600% 9/15/31 | | | 2,050,000 | | | | 1,508,548 | |
Global Net Lease, Inc./Global Net Lease Operating Partnership LP | | | | | | | | |
3.750% 12/15/27 (a) | | | 2,675,000 | | | | 2,087,572 | |
Host Hotels & Resorts LP | | | | | | | | |
2.900% 12/15/31 | | | 640,000 | | | | 469,468 | |
3.500% 9/15/30 | | | 2,756,000 | | | | 2,197,071 | |
Invitation Homes Operating Partnership LP | | | | | | | | |
4.150% 4/15/32 | | | 520,000 | | | | 439,232 | |
Kimco Realty Corp. | | | | | | | | |
4.125% 12/01/46 | | | 855,000 | | | | 636,318 | |
4.450% 9/01/47 | | | 1,055,000 | | | | 820,868 | |
Omega Healthcare Investors, Inc. | | | | | | | | |
3.375% 2/01/31 | | | 1,800,000 | | | | 1,371,820 | |
Piedmont Operating Partnership LP | | | | | | | | |
2.750% 4/01/32 | | | 1,155,000 | | | | 821,978 | |
Rexford Industrial Realty LP | | | | | | | | |
2.125% 12/01/30 | | | 1,175,000 | | | | 895,502 | |
Service Properties Trust | | | | | | | | |
4.500% 6/15/23 | | | 953,000 | | | | 930,366 | |
4.950% 10/01/29 | | | 1,445,000 | | | | 989,666 | |
Spirit Realty LP | | | | | | | | |
2.700% 2/15/32 | | | 715,000 | | | | 516,339 | |
3.200% 1/15/27 | | | 425,000 | | | | 372,973 | |
3.400% 1/15/30 | | | 490,000 | | | | 397,983 | |
4.000% 7/15/29 | | | 2,405,000 | | | | 2,070,204 | |
| | | | | | | | 16,525,908 | |
Software — 0.3% |
Electronic Arts, Inc. | | | | | | | | |
2.950% 2/15/51 (b) | | | 1,150,000 | | | | 751,476 | |
Microsoft Corp. | | | | | | | | |
2.921% 3/17/52 | | | 1,560,000 | | | | 1,101,822 | |
| | | | | | | | 1,853,298 | |
| | | Principal
Amount | | | Value | |
Telecommunications — 1.4% |
AT&T, Inc. | | | | | | | | |
3.550% 9/15/55 | | $ | 4,675,000 | | | $ | 3,066,310 | |
British Telecommunications PLC | | | | | | | | |
9.625% STEP 12/15/30 | | | 725,000 | | | | 837,335 | |
Crown Castle Towers LLC | | | | | | | | |
4.241% 7/15/28 (a) | | | 1,750,000 | | | | 1,597,696 | |
Sprint Capital Corp. | | | | | | | | |
8.750% 3/15/32 | | | 1,550,000 | | | | 1,796,062 | |
Verizon Communications, Inc. | | | | | | | | |
2.987% 10/30/56 | | | 2,599,000 | | | | 1,545,165 | |
Vodafone Group PLC | | | | | | | | |
5.250% 5/30/48 | | | 1,245,000 | | | | 1,031,031 | |
| | | | | | | | 9,873,599 | |
Venture Capital — 0.6% |
Hercules Capital, Inc. | | | | | | | | |
2.625% 9/16/26 | | | 3,662,000 | | | | 2,997,833 | |
3.375% 1/20/27 | | | 1,415,000 | | | | 1,187,579 | |
| | | | | | | | 4,185,412 | |
| | | | | | | | | |
TOTAL CORPORATE DEBT (Cost $338,876,968) | | | | | | | 278,681,089 | |
| | | | | | | | | |
NON-U.S. GOVERNMENT AGENCY OBLIGATIONS — 29.8% |
Commercial Mortgage-Backed Securities — 10.0% |
Banc of America Merrill Lynch Trust, Series 2018-DSNY, Class C, 1 mo. USD LIBOR + 1.350% | | | | | | | | |
4.168% FRN 9/15/34 (a) | | | 760,000 | | | | 726,826 | |
BANK, Series 2020-BN30, Class MCDF, | | | | | | | | |
3.016% VRN 12/15/53 (d) | | | 3,165,000 | | | | 2,116,321 | |
BBCMS Mortgage Trust | | | | | | | | |
Series 2018-CHRS, Class B, 4.409% VRN 8/05/38 (a) (d) | | | 2,200,000 | | | | 1,937,491 | |
Series 2018-CHRS, Class C, 4.409% VRN 8/05/38 (a) (d) | | | 1,590,000 | | | | 1,351,283 | |
Series 2018-CHRS, Class D, 4.409% VRN 8/05/38 (a) (d) | | | 1,220,000 | | | | 975,693 | |
Benchmark Mortgage Trust | | | | | | | | |
Series 2021-B23, Class 360A, 2.852% VRN 2/15/54 (a) (d) | | | 3,150,000 | | | | 2,381,339 | |
Series 2021-B23, Class 360B, 2.852% VRN 2/15/54 (a) (d) | | | 4,800,000 | | | | 3,395,452 | |
Series 2021-B25, Class 300C, 3.094% VRN 4/15/54 (a) (d) | | | 3,100,000 | | | | 2,284,914 | |
BGME Trust | | | | | | | | |
Series 2021-VR, Class C, 3.094% VRN 1/10/43 (a) (d) | | | 16,248,000 | | | | 12,927,071 | |
The accompanying notes are an integral part of the financial statements.
71
MassMutual Core Bond Fund — Portfolio of Investments (Continued) |
| | | Principal
Amount | | | Value | |
Series 2021-VR, Class D, 3.094% VRN 1/10/43 (a) (d) | | $ | 3,790,000 | | | $ | 2,915,599 | |
BX Commercial Mortgage Trust | | | | | | | | |
Series 2021-VOLT, Class E, 1 mo. USD LIBOR + 2.000% 4.818% FRN 9/15/36 (a) | | | 5,343,000 | | | | 4,927,423 | |
Series 2019-XL, Class F, 1 mo. USD LIBOR + 2.000% 4.818% FRN 10/15/36 (a) | | | 2,221,900 | | | | 2,145,998 | |
Citigroup Commercial Mortgage Trust, Series 2019-GC41, Class C | | | | | | | | |
3.502% 8/10/56 | | | 1,259,000 | | | | 996,406 | |
COLEM Mortgage Trust, Series 2022-HLNE, | | | | | | | | |
2.543% VRN 4/12/42 (a) (d) | | | 1,900,000 | | | | 1,488,635 | |
Commercial Mortgage Pass-Through Certificates | | | | | | | | |
Series 2015-CR23, Class B, 4.183% VRN 5/10/48 (d) | | | 1,200,000 | | | | 1,132,842 | |
Series 2015-CR23, Class C, 4.428% VRN 5/10/48 (d) | | | 1,050,000 | | | | 980,774 | |
Credit Suisse Mortgage Capital Certificates, Series 2019-ICE4, Class E, 1 mo. USD LIBOR + 2.150% | | | | | | | | |
4.968% FRN 5/15/36 (a) | | | 750,000 | | | | 729,394 | |
DROP Mortgage Trust | | | | | | | | |
Series 2021-FILE, Class C, 1 mo. USD LIBOR + 2.250% 5.070% FRN 10/15/43 (a) | | | 3,365,000 | | | | 3,198,704 | |
Series 2021-FILE, Class D, 1 mo. USD LIBOR + 2.750% 5.570% FRN 10/15/43 (a) | | | 1,162,000 | | | | 1,087,795 | |
GS Mortgage Securities Trust, Series 2019-GC39, Class C, | | | | | | | | |
4.005% VRN 5/10/52 (d) | | | 1,357,000 | | | | 1,140,848 | |
KIND Trust, Series 2021-KIND, Class C, 1 mo. USD LIBOR + 1.750% | | | | | | | | |
4.568% FRN 8/15/38 (a) | | | 3,077,756 | | | | 2,933,454 | |
KNDL Mortgage Trust, Series 2019-KNSQ, Class E, 1 mo. USD LIBOR + 1.800% | | | | | | | | |
4.618% FRN 5/15/36 (a) | | | 1,730,000 | | | | 1,658,162 | |
Life Mortgage Trust, Series 2021-BMR, Class E, 1 mo. USD LIBOR + 1.750% | | | | | | | | |
4.568% FRN 3/15/38 (a) | | | 2,505,591 | | | | 2,313,066 | |
MFT Trust | | | | | | | | |
Series 2020-ABC, Class A, 3.358% 2/10/42 (a) | | | 1,185,000 | | | | 942,515 | |
Series 2020-ABC, Class B, 3.593% VRN 2/10/42 (a) (d) | | | 1,278,000 | | | | 991,606 | |
| | | Principal
Amount | | | Value | |
MHC Commercial Mortgage Trust, Series 2021-MHC, Class E, 1 mo. USD LIBOR + 2.101% | | | | | | | | |
4.919% FRN 4/15/38 (a) | | $ | 5,140,000 | | | $ | 4,785,179 | |
MKT Mortgage Trust | | | | | | | | |
Series 2020-525M, Class D, 3.039% VRN 2/12/40 (a) (d) | | | 595,000 | | | | 427,142 | |
Series 2020-525M, Class E, 3.039% VRN 2/12/40 (a) (d) | | | 1,220,000 | | | | 904,674 | |
VASA Trust, Series 2021-VASA, Class D, 1 mo. USD LIBOR + 2.100% | | | | | | | | |
4.918% FRN 7/15/39 (a) | | | 4,879,000 | | | | 4,591,670 | |
Wells Fargo Commercial Mortgage Trust | | | | | | | | |
Series 2018-C45, Class B, 4.556% 6/16/51 | | | 390,000 | | | | 347,540 | |
Series 2021-FCMT, Class B, 1 mo. USD LIBOR + 1.850% 4.668% FRN 5/15/31 (a) | | | 3,000,000 | | | | 2,882,249 | |
| | | | | | | | 71,618,065 | |
Other Asset-Backed Securities — 13.7% |
522 Funding CLO Ltd., Series 2018-3A, Class CR, 3 mo. USD LIBOR + 2.050% | | | | | | | | |
4.760% FRN 10/20/31 (a) | | | 1,250,000 | | | | 1,139,492 | |
AASET Trust | | | | | | | | |
Series 2020-1A, Class A, 3.351% 1/16/40 (a) | | | 1,075,389 | | | | 867,630 | |
Series 2021-2A, Class B, 3.538% 1/15/47 (a) | | | 1,133,019 | | | | 853,300 | |
Anchorage Capital CLO 9 Ltd., Series 2016-9A, Class CR2, 3 mo. USD LIBOR + 2.250% | | | | | | | | |
4.762% FRN 7/15/32 (a) | | | 830,000 | | | | 756,725 | |
Apidos CLO XXV, Series 2016-25A, Class A2R, 3 mo. USD LIBOR + 1.700% | | | | | | | | |
4.410% FRN 10/20/31 (a) | | | 2,610,000 | | | | 2,485,905 | |
Ballyrock CLO Ltd., Series 2019-2A, Class CR, 3 mo. USD LIBOR + 3.150% | | | | | | | | |
6.134% FRN 11/20/30 (a) | | | 800,000 | | | | 709,083 | |
Benefit Street Partners CLO V-B Ltd., Series 2018-5BA, Class A1A, 3 mo. USD LIBOR + 1.090% | | | | | | | | |
3.800% FRN 4/20/31 (a) | | | 1,920,000 | | | | 1,873,427 | |
BRE Grand Islander Timeshare Issuer LLC, Series 2017-1A, Class A | | | | | | | | |
2.940% 5/25/29 (a) | | | 251,757 | | | | 244,113 | |
The accompanying notes are an integral part of the financial statements.
72
MassMutual Core Bond Fund — Portfolio of Investments (Continued) |
| | | Principal
Amount | | | Value | |
Business Jet Securities LLC, Series 2021-1A, Class C | | | | | | | | |
5.067% 4/15/36 (a) | | $ | 1,061,395 | | | $ | 967,696 | |
Canyon Capital CLO Ltd., Series 2019-2A, Class CR, 3 mo. USD LIBOR + 2.150% | | | | | | | | |
4.662% FRN 10/15/34 (a) | | | 800,000 | | | | 713,541 | |
Capital Automotive REIT | | | | | | | | |
Series 2020-1A, Class A3, 3.250% 2/15/50 (a) | | | 557,168 | | | | 484,228 | |
Series 2020-1A, Class A6, 3.810% 2/15/50 (a) | | | 489,816 | | | | 431,022 | |
Castlelake Aircraft Securitization Trust, Series 2019-1A, Class A | | | | | | | | |
3.967% 4/15/39 (a) | | | 652,005 | | | | 562,414 | |
CBAM Ltd., Series 2018-6A, Class B1R, 3 mo. TSFR + 2.362% | | | | | | | | |
4.690% FRN 1/15/31 (a) | | | 1,200,000 | | | | 1,176,292 | |
Cedar Funding IX CLO Ltd., Series 2018-9A, Class A1, 3 mo. USD LIBOR + .980% | | | | | | | | |
3.690% FRN 4/20/31 (a) | | | 1,000,000 | | | | 975,917 | |
Eaton Vance CLO Ltd. | | | | | | | | |
Series 2018-1A, Class B, 3 mo. USD LIBOR + 1.750% 4.262% FRN 10/15/30 (a) | | | 1,700,000 | | | | 1,614,801 | |
Series 2020-1A, Class CR, 3 mo. USD LIBOR + 2.050% 4.562% FRN 10/15/34 (a) | | | 400,000 | | | | 361,269 | |
Elmwood CLO III Ltd., Series 2019-3A, Class BR, 3 mo. USD LIBOR + 1.650% | | | | | | | | |
4.360% FRN 10/20/34 (a) | | | 1,300,000 | | | | 1,218,121 | |
Elmwood CLO IV Ltd., Series 2020-1A, Class A, 3 mo. USD LIBOR + 1.240% | | | | | | | | |
3.752% FRN 4/15/33 (a) | | | 1,000,000 | | | | 966,961 | |
FCI Funding LLC, Series 2019-1A, Class A | | | | | | | | |
3.630% 2/18/31 (a) | | | 32,320 | | | | 32,304 | |
Flexential Issuer | | | | | | | | |
Series 2021-1A, Class B, 3.720% 11/27/51 (a) | | | 4,000,000 | | | | 3,500,449 | |
Series 2021-1A, Class C, 6.930% 11/27/51 (a) | | | 4,000,000 | | | | 3,440,851 | |
Goldentree Loan Management US CLO Ltd., Series 2019-5A, Class CR, 3 mo. USD LIBOR + 2.050% | | | | | | | | |
4.760% FRN 10/20/32 (a) | | | 800,000 | | | | 738,102 | |
Goodgreen Trust | | | | | | | | |
Series 2019-2A, Class A, 2.760% 4/15/55 (a) | | | 2,449,724 | | | | 2,076,911 | |
| | | Principal
Amount | | | Value | |
Series 2016-1A, Class A, 3.230% 10/15/52 (a) | | $ | 954,114 | | | $ | 857,019 | |
Series 2017-1A, Class A, 3.740% 10/15/52 (a) | | | 463,043 | | | | 425,776 | |
Series 2019-1A, Class A, 3.860% 10/15/54 (a) | | | 978,744 | | | | 901,553 | |
Series 2018-1A, Class A, 3.930% VRN 10/15/53 (a) (d) | | | 1,224,706 | | | | 1,117,610 | |
Hero Funding Trust | | | | | | | | |
Series 2016-3A, Class A1, 3.080% 9/20/42 (a) | | | 398,439 | | | | 374,420 | |
Series 2017-3A, Class A1, 3.190% 9/20/48 (a) | | | 446,003 | | | | 402,224 | |
Series 2017-2A, Class A1, 3.280% 9/20/48 (a) | | | 132,848 | | | | 121,973 | |
Series 2016-4A, Class A1, 3.570% 9/20/47 (a) | | | 421,860 | | | | 400,371 | |
Series 2017-2A, Class A2, 4.070% 9/20/48 (a) | | | 106,801 | | | | 99,119 | |
Series 2018-1A, Class A2, 4.670% 9/20/48 (a) | | | 788,028 | | | | 752,200 | |
Highbridge Loan Management Ltd., Series 13A-18, Class C, 3 mo. USD LIBOR + 2.150% | | | | | | | | |
4.662% FRN 10/15/30 (a) | | | 1,000,000 | | | | 908,921 | |
Horizon Aircraft Finance I Ltd., Series 2018-1, Class A | | | | | | | | |
4.458% 12/15/38 (a) | | | 1,004,921 | | | | 809,253 | |
Horizon Aircraft Finance II Ltd, Series 2019-1, Class A | | | | | | | | |
3.721% 7/15/39 (a) | | | 1,343,349 | | | | 1,122,430 | |
Horizon Aircraft Finance III Ltd., Series 2019-2, Class A | | | | | | | | |
3.425% 11/15/39 (a) | | | 3,328,482 | | | | 2,786,726 | |
KREF Ltd. | | | | | | | | |
Series 2021-FL2, Class B, 1 mo. USD LIBOR + 1.650% 4.589% FRN 2/15/39 (a) | | | 3,500,000 | | | | 3,328,551 | |
Series 2021-FL2, Class C, 1 mo. USD LIBOR + 2.000% 4.939% FRN 2/15/39 (a) | | | 5,800,000 | | | | 5,514,461 | |
Series 2021-FL2, Class D, 1 mo. USD LIBOR + 2.200% 5.139% FRN 2/15/39 (a) | | | 3,200,000 | | | | 3,000,595 | |
Labrador Aviation Finance Ltd., Series 2016-1A, Class A1 | | | | | | | | |
4.300% 1/15/42 (a) | | | 1,809,171 | | | | 1,411,153 | |
MACH 1 Cayman Ltd., Series 2019-1, Class A | | | | | | | | |
3.474% 10/15/39 (a) | | | 1,915,112 | | | | 1,683,599 | |
The accompanying notes are an integral part of the financial statements.
73
MassMutual Core Bond Fund — Portfolio of Investments (Continued) |
| | | Principal
Amount | | | Value | |
Madison Park Funding Ltd. | | | | | | | | |
Series 2018-28A, Class B, 3 mo. USD LIBOR + 1.600% 4.112% FRN 7/15/30 (a) | | $ | 2,090,000 | | | $ | 1,990,131 | |
Series 2018-32A, Class CR, 3 mo. USD LIBOR + 2.000% 4.759% FRN 1/22/31 (a) | | | 1,750,000 | | | | 1,614,884 | |
Series 2018-29A, Class C, 3 mo. USD LIBOR + 2.200% 4.940% FRN 10/18/30 (a) | | | 680,000 | | | | 633,968 | |
Mariner Finance Issuance Trust | | | | | | | | |
Series 2021-AA, Class B, 2.330% 3/20/36 (a) | | | 1,771,000 | | | | 1,573,872 | |
Series 2021-AA, Class C, 2.960% 3/20/36 (a) | | | 835,000 | | | | 725,062 | |
Mosaic Solar Loans LLC | | | | | | | | |
Series 2017-2A, Class A, 3.820% 6/22/43 (a) | | | 363,750 | | | | 333,208 | |
Series 2018-1A, Class A, 4.010% 6/22/43 (a) | | | 163,517 | | | | 153,901 | |
Series 2017-1A, Class A, 4.450% 6/20/42 (a) | | | 159,827 | | | | 152,413 | |
Neuberger Berman Loan Advisers CLO Ltd., Series 2015-45A, Class B, 3 mo. USD LIBOR + 1.650% | | | | | | | | |
4.133% FRN 10/14/35 (a) | | | 1,350,000 | | | | 1,265,564 | |
New Residential Advance Receivables Trust, Series 2020-T1, Class ET1 | | | | | | | | |
5.467% 8/15/53 (a) | | | 2,495,000 | | | | 2,375,178 | |
Octagon Investment Partners 39 Ltd., Series 2018-3A, Class C, 3 mo. USD LIBOR + 2.200% | | | | | | | | |
4.910% FRN 10/20/30 (a) | | | 1,180,000 | | | | 1,100,074 | |
Parallel Ltd., Series 2021-2A, Class A2, 3 mo. USD LIBOR + 1.850% | | | | | | | | |
4.560% FRN 10/20/34 (a) | | | 550,000 | | | | 505,784 | |
Pioneer Aircraft Finance Ltd., Series 2019-1, Class A | | | | | | | | |
3.967% 6/15/44 (a) | | | 1,530,381 | | | | 1,374,951 | |
Rad CLO 12 Ltd., Series 2021-12A, Class A, 3 mo. USD LIBOR + 1.170% | | | | | | | | |
3.952% FRN 10/30/34 (a) | | | 2,000,000 | | | | 1,906,178 | |
Rad CLO 15 Ltd., Series 2021-15A, Class C, 3 mo. USD LIBOR + 2.050% | | | | | | | | |
4.760% FRN 1/20/34 (a) | | | 1,000,000 | | | | 909,658 | |
Regatta XIV Funding Ltd., Series 2018-3A, Class B, 3 mo. USD LIBOR + 1.850% | | | | | | | | |
4.633% FRN 10/25/31 (a) | | | 1,030,000 | | | | 965,152 | |
| | | Principal
Amount | | | Value | |
Sierra Receivables Funding LLC | | | | | | | | |
Series 2021-1A, Class D, 3.170% 11/20/37 (a) | | $ | 933,304 | | | $ | 863,718 | |
Series 2018-3A, Class D, 5.200% 9/20/35 (a) | | | 399,319 | | | | 392,125 | |
Steele Creek CLO Ltd., Series 2018-2A, Class C, 3 mo. USD LIBOR + 2.300% | | | | | | | | |
5.261% FRN 8/18/31 (a) | | | 1,660,000 | | | | 1,502,549 | |
Structured Asset Securities Corp. Mortgage Loan Trust, Series 2006-GEL1, Class M2, 1 mo. USD LIBOR + 1.200% | | | | | | | | |
4.284% FRN 11/25/35 (a) | | | 552,357 | | | | 537,563 | |
Structured Receivables Finance LLC, Series 2010-B, Class A | | | | | | | | |
3.730% 8/15/36 (a) | | | 108,369 | | | | 104,001 | |
Sunnova Helios II Issuer LLC, Series 2018-1A, Class A | | | | | | | | |
4.870% 7/20/48 (a) | | | 571,410 | | | | 520,022 | |
SuttonPark Structured Settlements LLC, Series 2017-1A, Class A | | | | | | | | |
4.190% 1/15/71 (a) | | | 1,715,403 | | | | 1,521,941 | |
THL Credit Wind River CLO Ltd., Series 2018-3A, Class B, 3 mo. USD LIBOR + 1.700% | | | | | | | | |
4.410% FRN 1/20/31 (a) | | | 2,440,000 | | | | 2,298,134 | |
Thrust Engine Leasing | | | | | | | | |
Series 2021-1A, Class A, 4.163% 7/15/40 (a) | | | 3,523,468 | | | | 2,943,752 | |
Series 2021-1A, Class B, 6.121% 7/15/40 (a) | | | 1,599,845 | | | | 1,293,398 | |
Series 2021-1A, Class C, 7.386% 7/15/40 (a) | | | 1,111,021 | | | | 912,197 | |
TICP CLO XIV Ltd., Series 2019-14A, Class A2R, 3 mo. USD LIBOR + 1.650% | | | | | | | | |
4.360% FRN 10/20/32 (a) | | | 1,100,000 | | | | 1,041,850 | |
TICP CLO XV Ltd., Series 2020-15A, Class A, 3 mo. USD LIBOR + 1.280% | | | | | | | | |
3.990% FRN 4/20/33 (a) | | | 4,200,000 | | | | 4,070,959 | |
Vivint Solar Financing V LLC, Series 2018-1A, Class B | | | | | | | | |
7.370% 4/30/48 (a) | | | 2,214,338 | | | | 2,051,289 | |
Voya CLO Ltd., Series 2015-3A, Class A3R, 3 mo. USD LIBOR + 1.700% | | | | | | | | |
4.410% FRN 10/20/31 (a) | | | 1,500,000 | | | | 1,405,366 | |
WAVE LLC | | | | | | | | |
Series 2019-1A, Class A, 3.597% 9/15/44 (a) | | | 4,262,905 | | | | 3,372,862 | |
The accompanying notes are an integral part of the financial statements.
74
MassMutual Core Bond Fund — Portfolio of Investments (Continued) |
| | | Principal
Amount | | | Value | |
Series 2017-1A, Class A, 3.844% 11/15/42 (a) | | $ | 364,457 | | | $ | 277,753 | |
Series 2017-1A, Class C, 6.656% 11/15/42 (a) | | | 2,006,491 | | | | 651,889 | |
Willis Engine Structured Trust IV, Series 2018-A, Class A, | | | | | | | | |
4.750% STEP 9/15/43 (a) | | | 1,026,799 | | | | 737,972 | |
| | | | | | | | 98,287,826 | |
Student Loans Asset-Backed Securities — 3.2% |
College Avenue Student Loans LLC | | | | | | | | |
Series 2019-A, Class B, 3.810% 12/28/48 (a) | | | 1,703,599 | | | | 1,594,789 | |
Series 2019-A, Class C, 4.460% 12/28/48 (a) | | | 1,138,783 | | | | 1,080,806 | |
Education Loan Asset-Backed Trust I | | | | | | | | |
Series 2003-1, Class A2, 0.000%FRN 2/01/43 (a) (d) | | | 1,300,000 | | | | 1,201,567 | |
Series 2003-2, Class 2A1, 0.000%FRN 8/01/43 (a) (d) | | | 1,950,000 | | | | 1,810,396 | |
Series 2013-1, Class B1, 1 mo. USD LIBOR + 1.000% 4.084% FRN 11/25/33 (a) | | | 766,413 | | | | 736,226 | |
Higher Education Funding I | | | | | | | | |
Series 2004-1, Class B2, 0.000%FRN 1/01/44 (a) (d) | | | 600,000 | | | | 522,938 | |
Series 2004-1, Class B1, 1.796% FRN 1/01/44 (a) (d) | | | 600,000 | | | | 540,202 | |
Laurel Road Prime Student Loan Trust | | | | | | | | |
Series 2017-B, Class BFX, 3.020% 8/25/42 (a) | | | 538,731 | | | | 525,859 | |
Series 2018-B, Class BFX, 3.720% 5/26/43 (a) | | | 436,918 | | | | 413,995 | |
Navient Student Loan Trust | | | | | | | | |
Series 2018-EA, Class B, 4.440% 12/15/59 (a) | | | 730,000 | | | | 682,007 | |
Series 2015-3, Class B, 1 mo. USD LIBOR + 1.500% 4.584% FRN 10/25/58 | | | 1,200,000 | | | | 1,187,639 | |
Nelnet Student Loan Trust | | | | | | | | |
Series 2019-5, Class B, 3.450% 10/25/67 (a) | | | 2,850,000 | | | | 2,387,186 | |
Series 2014-3A, Class B, 1 mo. USD LIBOR + 1.500% 4.584% FRN 10/25/50 (a) | | | 975,000 | | | | 974,986 | |
Series 2014-5A, Class B, 1 mo. USD LIBOR + 1.500% 4.584% FRN 5/26/54 (a) | | | 1,300,000 | | | | 1,299,990 | |
Series 2015-2A, Class B, 1 mo. USD LIBOR + 1.500% 4.584% FRN 5/26/54 (a) | | | 1,130,000 | | | | 1,129,991 | |
Series 2015-3A, Class B, 1 mo. USD LIBOR + 1.500% 4.584% FRN 6/25/54 (a) | | | 1,100,000 | | | | 1,052,250 | |
| | | Principal
Amount | | | Value | |
SLC Student Loan Trust, Series 2005-1, Class B, 3 mo. USD LIBOR + .200% | | | | | | | | |
3.105% FRN 2/15/45 | | $ | 1,126,974 | | | $ | 1,049,924 | |
SLM Student Loan Trust | | | | | | | | |
Series 2006-5, Class B, 3 mo. USD LIBOR + .210% 2.993% FRN 10/25/40 | | | 1,554,780 | | | | 1,457,848 | |
Series 2005-8, Class B, 3 mo. USD LIBOR + .310% 3.093% FRN 1/25/55 | | | 1,009,254 | | | | 957,527 | |
SoFi Alternative Trust, Series 2019-C, Class PT, | | | | | | | | |
5.511% VRN 1/25/45 (a) (d) | | | 2,490,443 | | | | 2,377,071 | |
| | | | | | | | 22,983,197 | |
Whole Loan Collateral Collateralized Mortgage Obligations — 2.8% |
Bank of America Mortgage Securities, Series 2004-G, Class 2A7, | | | | | | | | |
3.986% VRN 8/25/34 (d) | | | 31,321 | | | | 29,741 | |
CSMC, Series 2021-NQM3, Class M1, | | | | | | | | |
2.317% VRN 4/25/66 (a) (d) | | | 1,670,000 | | | | 1,233,129 | |
Flagstar Mortgage Trust, Series 2021-6INV, Class A18, | | | | | | | | |
2.500% VRN 8/25/51 (a) (d) | | | 4,795,797 | | | | 3,707,002 | |
New Residential Mortgage Loan Trust, Series 2021-INV1, Class A4, | | | | | | | | |
2.500% VRN 6/25/51 (a) (d) | | | 2,887,257 | | | | 2,231,759 | |
NewRez Warehouse Securitization Trust, Series 2021-1, Class D, 1 mo. USD LIBOR + 1.400% | | | | | | | | |
4.484% FRN 5/25/55 (a) | | | 3,340,000 | | | | 3,208,327 | |
NMLT Trust, Series 2021-INV1, Class M1, | | | | | | | | |
2.711% VRN 5/25/56 (a) (d) | | | 3,723,000 | | | | 2,749,878 | |
Sequoia Mortgage Trust, Series 2018-CH2, Class A3, | | | | | | | | |
4.000% VRN 6/25/48 (a) (d) | | | 226,560 | | | | 216,653 | |
STAR Trust, Series 2021-1, Class M1, | | | | | | | | |
2.363% VRN 5/25/65 (a) (d) | | | 5,273,000 | | | | 4,432,252 | |
Starwood Mortgage Residential Trust, Series 2021-3, Class M1, | | | | | | | | |
2.491% VRN 6/25/56 (a) (d) | | | 1,840,000 | | | | 1,287,601 | |
Verus Securitization Trust, Series 2021-R3, Class M1, | | | | | | | | |
2.411% VRN 4/25/64 (a) (d) | | | 1,491,000 | | | | 1,375,774 | |
Wells Fargo Mortgage Backed Securities Trust, Series 2019-1, Class A1, | | | | | | | | |
3.946% VRN 11/25/48 (a) (d) | | | 46,894 | | | | 46,013 | |
| | | | | | | | 20,518,129 | |
The accompanying notes are an integral part of the financial statements.
75
MassMutual Core Bond Fund — Portfolio of Investments (Continued) |
| | | Principal
Amount | | | Value | |
Whole Loan Collateral Support Collateralized Mortgage Obligations — 0.1% |
JP Morgan Mortgage Trust, Series 2017-1, Class A11, | | | | | | | | |
3.450% VRN 1/25/47 (a) (d) | | $ | 529,325 | | | $ | 475,947 | |
| | | | | | | | | |
TOTAL NON-U.S. GOVERNMENT AGENCY OBLIGATIONS (Cost $242,661,644) | | | | | | | 213,883,164 | |
| | | | | | | | | |
SOVEREIGN DEBT OBLIGATIONS — 0.5% |
Mexico Government International Bond | | | | | | | | |
3.500% 2/12/34 | | | 2,030,000 | | | | 1,543,916 | |
4.750% 3/08/44 | | | 3,028,000 | | | | 2,318,219 | |
| | | | | | | | 3,862,135 | |
| | | | | | | | | |
TOTAL SOVEREIGN DEBT OBLIGATIONS (Cost $5,060,264) | | | | | | | 3,862,135 | |
| | | | | | | | | |
U.S. GOVERNMENT AGENCY OBLIGATIONS AND INSTRUMENTALITIES (e) — 24.9% |
Collateralized Mortgage Obligations — 0.0% |
Federal Home Loan Mortgage Corp. Series 2178, Class PB 7.000% 8/15/29 | | | 70,767 | | | | 72,675 | |
Pass-Through Securities — 24.9% |
Federal Home Loan Mortgage Corp. | | | | | | | | |
Pool #RA4245 2.000% 12/01/50 | | | 4,586,788 | | | | 3,741,212 | |
Pool #RA4255 2.000% 1/01/51 | | | 9,587,853 | | | | 7,826,321 | |
Pool #SD0905 3.000% 3/01/52 | | | 3,789,818 | | | | 3,317,365 | |
Pool #RA2483 3.500% 6/01/50 | | | 5,736,171 | | | | 5,211,423 | |
Pool #Z40047 4.000% 10/01/41 | | | 74,565 | | | | 72,070 | |
Pool #SD1523 4.000% 8/01/52 | | | 5,287,969 | | | | 4,931,020 | |
Pool #SD1603 4.000% 9/01/52 | | | 3,275,000 | | | | 3,041,240 | |
Federal National Mortgage Association | | | | | | | | |
Pool #FM8596 2.500% 9/01/51 | | | 2,456,151 | | | | 2,078,973 | |
Pool #MA3029 3.000% 6/01/32 | | | 1,886,105 | | | | 1,779,881 | |
Pool #MA3090 3.000% 8/01/32 | | | 633,721 | | | | 598,030 | |
Pool #FS1075 3.000% 3/01/52 | | | 3,828,408 | | | | 3,354,733 | |
Pool #CB3304 3.000% 4/01/52 | | | 5,744,873 | | | | 5,034,081 | |
Pool #CB3305 3.000% 4/01/52 | | | 6,810,117 | | | | 5,959,014 | |
Pool #775539 12 mo. USD LIBOR + 1.641% 3.391% FRN 5/01/34 | | | 42,317 | | | | 42,877 | |
Pool #AS1304 3.500% 12/01/28 | | | 523,021 | | | | 498,895 | |
Pool #MA1356 3.500% 2/01/43 | | | 3,755,044 | | | | 3,439,400 | |
Pool #CA6096 3.500% 6/01/50 | | | 7,248,569 | | | | 6,583,201 | |
Pool #FM4017 3.500% 8/01/50 | | | 394,173 | | | | 357,744 | |
Pool #CB3842 3.500% 6/01/52 | | | 10,678,332 | | | | 9,644,745 | |
| | | Principal
Amount | | | Value | |
Pool #CA1909 4.500% 6/01/48 | | $ | 2,321,184 | | | $ | 2,246,102 | |
Pool #CB3866 4.500% 6/01/52 | | | 5,965,621 | | | | 5,696,220 | |
Pool #CB4129 4.500% 7/01/52 | | | 5,352,402 | | | | 5,109,020 | |
Pool #AD6437 5.000% 6/01/40 | | | 226,240 | | | | 227,270 | |
Pool #AD6996 5.000% 7/01/40 | | | 1,392,906 | | | | 1,399,823 | |
Pool #AL8173 5.000% 2/01/44 | | | 458,679 | | | | 462,737 | |
Government National Mortgage Association | | | | | | | | |
Pool #781038 6.500% 5/15/29 | | | 21,412 | | | | 22,068 | |
Pool #781468 6.500% 7/15/32 | | | 1,588 | | | | 1,655 | |
Pool #781496 6.500% 9/15/32 | | | 7,538 | | | | 7,829 | |
Pool #345964 7.000% 11/15/23 | | | 28 | | | | 28 | |
Pool #380866 7.000% 3/15/24 | | | 149 | | | | 150 | |
Pool #781124 7.000% 12/15/29 | | | 2,883 | | | | 2,991 | |
Pool #781319 7.000% 7/15/31 | | | 56,172 | | | | 58,655 | |
Pool #581417 7.000% 7/15/32 | | | 8,792 | | | | 9,110 | |
Pool #565982 7.000% 7/15/32 | | | 11,327 | | | | 11,927 | |
Pool #357262 7.500% 9/15/23 | | | 111 | | | | 112 | |
Pool #441009 8.000% 11/15/26 | | | 433 | | | | 450 | |
Pool #522777 8.000% 12/15/29 | | | 3,351 | | | | 3,512 | |
Pool #523043 8.000% 3/15/30 | | | 114 | | | | 120 | |
Pool #529134 8.000% 3/15/30 | | | 1,218 | | | | 1,292 | |
Pool #477036 8.000% 4/15/30 | | | 129 | | | | 136 | |
Pool #503157 8.000% 4/15/30 | | | 10,394 | | | | 11,022 | |
Pool #528714 8.000% 4/15/30 | | | 961 | | | | 1,021 | |
Pool #544640 8.000% 11/15/30 | | | 8,342 | | | | 8,877 | |
Pool #531298 8.500% 8/15/30 | | | 605 | | | | 641 | |
Government National Mortgage Association II | | | | | | | | |
Pool #MA6038 3.000% 7/20/49 | | | 2,948,834 | | | | 2,648,542 | |
Pool #MA6283 3.000% 11/20/49 | | | 5,268,124 | | | | 4,716,010 | |
Pool #MA6409 3.000% 1/20/50 | | | 5,468,344 | | | | 4,887,984 | |
Pool #MA4321 3.500% 3/20/47 | | | 3,280,401 | | | | 3,022,517 | |
Government National Mortgage Association II TBA | | | | | | | | |
2.500% 12/01/51 (f) | | | 2,000,000 | | | | 1,718,594 | |
3.000% 1/01/52 (f) | | | 4,100,000 | | | | 3,621,453 | |
3.500% 3/01/52 (f) | | | 5,280,000 | | | | 4,799,025 | |
4.500% 6/01/52 (f) | | | 2,000,000 | | | | 1,912,656 | |
Uniform Mortgage Backed Securities TBA | | | | | | | | |
2.500% 12/01/51 (f) | | | 16,750,000 | | | | 14,066,074 | |
3.000% 2/01/52 (f) | | | 11,225,000 | | | | 9,765,750 | |
3.500% 3/01/52 (f) | | | 2,150,000 | | | | 1,934,328 | |
4.000% 5/01/52 (f) | | | 23,625,000 | | | | 21,908,497 | |
4.500% 6/01/52 (f) | | | 15,225,000 | | | | 14,492,297 | |
The accompanying notes are an integral part of the financial statements.
76
MassMutual Core Bond Fund — Portfolio of Investments (Continued) |
| | | Principal
Amount | | | Value | |
5.000% 7/01/52 (f) | | $ | 6,575,000 | | | $ | 6,400,352 | |
| | | | | | | | 178,689,072 | |
| | | | | | | | | |
TOTAL U.S. GOVERNMENT AGENCY OBLIGATIONS AND INSTRUMENTALITIES (Cost $195,145,840) | | | | | | | 178,761,747 | |
| | | | | | | | | |
U.S. TREASURY OBLIGATIONS — 4.4% |
U.S. Treasury Bonds & Notes — 4.4% |
U.S. Treasury Bond | | | | | | | | |
2.250% 8/15/49 (g) | | | 34,400,000 | | | | 25,171,127 | |
3.500% 2/15/39 | | | 3,700,000 | | | | 3,520,203 | |
U.S. Treasury Note | | | | | | | | |
3.000% 7/31/24 | | | 3,000,000 | | | | 2,933,906 | |
| | | | | | | | 31,625,236 | |
| | | | | | | | | |
TOTAL U.S. TREASURY OBLIGATIONS (Cost $40,571,516) | | | | | | | 31,625,236 | |
| | | | | | | | | |
TOTAL BONDS & NOTES (Cost $822,316,232) | | | | | | | 706,813,371 | |
| | | | | | | | | |
| | | Number of
Shares | | | | | |
MUTUAL FUNDS — 0.1% |
Diversified Financial Services — 0.1% |
State Street Navigator Securities Lending Government Money Market Portfolio (h) | | | 832,510 | | | | 832,510 | |
| | | | | | | | | |
TOTAL MUTUAL FUNDS (Cost $832,510) | | | | | | | 832,510 | |
| | | | | | | | | |
TOTAL LONG-TERM INVESTMENTS (Cost $823,148,742) | | | | | | | 707,645,881 | |
| | | | | | | | | |
| | | Principal
Amount | | | | | |
SHORT-TERM INVESTMENTS — 12.7% |
Commercial Paper — 12.2% |
Amcor Flexibles North America, Inc. | | | | | | | | |
3.632% 11/01/22 (a) | | | 2,000,000 | | | | 1,993,805 | |
American Electric Power Co., Inc. | | | | | | | | |
3.787% 11/03/22 (a) | | | 4,000,000 | | | | 3,986,581 | |
Cox Enterprises, Inc. | | | | | | | | |
3.348% 10/05/22 (a) | | | 8,000,000 | | | | 7,996,319 | |
| | | Principal
Amount | | | Value | |
Dentsply Sirona, Inc. | | | | | | | | |
3.662% 10/17/22 (a) | | $ | 5,000,000 | | | $ | 4,991,618 | |
4.018% 10/26/22 (a) | | | 10,000,000 | | | | 9,974,108 | |
Penske Truck Leasing Co. LP | | | | | | | | |
3.450% 10/07/22 | | | 10,000,000 | | | | 9,993,230 | |
Raytheon Technologies Corp. | | | | | | | | |
3.583% 11/03/22 (a) | | | 18,000,000 | | | | 17,939,616 | |
Rogers Communications | | | | | | | | |
4.024% 11/03/22 (a) | | | 3,000,000 | | | | 2,989,936 | |
4.054% 11/03/22 (a) | | | 12,000,000 | | | | 11,959,744 | |
Southern Power Co. | | | | | | | | |
3.607% 10/21/22 | | | 3,000,000 | | | | 2,993,957 | |
Tampa Electric Co. | | | | | | | | |
3.508% 10/14/22 (a) | | | 6,000,000 | | | | 5,992,825 | |
Waste Management, Inc. | | | | | | | | |
0.417% 11/09/22 (a) | | | 7,000,000 | | | | 6,972,521 | |
| | | | | | | | 87,784,260 | |
Repurchase Agreement — 0.5% |
Fixed Income Clearing Corp., Repurchase Agreement, dated 9/30/22, 0.830%, due 10/03/22 (i) | | | 3,700,190 | | | | 3,700,190 | |
| | | | | | | | | |
TOTAL SHORT-TERM INVESTMENTS (Cost $91,507,477) | | | | | | | 91,484,450 | |
| | | | | | | | | |
TOTAL INVESTMENTS — 111.2% (Cost $914,656,219) (j) | | | | | | | 799,130,331 | |
| | | | | | | | | |
Other Assets/(Liabilities) — (11.2)% | | | | | | | (80,641,555 | ) |
| | | | | | | | | |
NET ASSETS — 100.0% | | | | | | $ | 718,488,776 | |
Abbreviation Legend
CLO | Collateralized Loan Obligation |
The accompanying notes are an integral part of the financial statements.
77
MassMutual Core Bond Fund — Portfolio of Investments (Continued) |
Notes to Portfolio of Investments
Percentages are stated as a percent of net assets.
(a) | Security is exempt from registration under Regulation S or Rule 144A of the Securities Act of 1933. These securities are considered restricted and may be resold in transactions exempt from registration. At September 30, 2022, the aggregate market value of these securities amounted to $362,704,171 or 50.48% of net assets. |
(b) | Denotes all or a portion of security on loan. The total value of securities on loan as of September 30, 2022, was $2,101,652 or 0.29% of net assets. The Fund received $1,324,616 of non-cash collateral (U.S. Treasury and/or Agency obligations) related to securities lending activity. This amount is not reflected on either the Portfolio of Investments or the Statement of Assets and Liabilities. (Note 2). |
(c) | Security is perpetual and has no stated maturity date. |
(d) | Certain variable rate securities are not based on a published reference rate and spread but are determined by the issuer or agent and are based on current market conditions. These securities do not indicate a reference rate and spread in their description above. The rates shown are the current interest rates at September 30, 2022. |
(e) | May contain securities that are issued by a U.S. Government Agency, but are unsecured and are not guaranteed by a U.S. Government Agency. |
(f) | A portion of this security is purchased on a when-issued, delayed-delivery or forward commitment basis. (Note 2). |
(g) | All or a portion of this security is pledged/held as collateral for open derivatives. (Note 2). |
(h) | Represents investment of security lending cash collateral. (Note 2). |
(i) | Maturity value of $3,700,445. Collateralized by U.S. Government Agency obligations with a rate of 0.000%, maturity date of 3/30/23, and an aggregate market value, including accrued interest, of $3,774,249. |
(j) | See Note 6 for aggregate cost for federal tax purposes. |
Country weightings, as a percentage of net assets, is as follows:
United States | | | 80.5 | % |
Cayman Islands | | | 9.3 | % |
United Kingdom | | | 1.9 | % |
Netherlands | | | 1.0 | % |
Canada | | | 0.9 | % |
Germany | | | 0.8 | % |
Israel | | | 0.7 | % |
Mexico | | | 0.7 | % |
Luxembourg | | | 0.5 | % |
Bermuda | | | 0.5 | % |
Ireland | | | 0.5 | % |
Switzerland | | | 0.4 | % |
Australia | | | 0.3 | % |
Republic of Korea | | | 0.3 | % |
France | | | 0.2 | % |
Total Long-Term Investments | | | 98.5 | % |
Short-Term Investments and Other Assets and Liabilities | | | 1.5 | % |
Net Assets | | | 100.0 | % |
The accompanying notes are an integral part of the financial statements.
78
MassMutual Core Bond Fund — Portfolio of Investments (Continued) |
Futures contracts
| | Expiration
Date | | | Number of
Contracts | | | Notional
Amount | | | Value/ Net
Unrealized
Appreciation/
(Depreciation) | |
Long | | | | | | | | | | | | | | | | |
U.S. Treasury Long Bond | | | 12/20/22 | | | | 207 | | | $ | 28,128,044 | | | $ | (1,961,950 | ) |
U.S. Treasury Ultra Bond | | | 12/20/22 | | | | 109 | | | | 16,102,561 | | | | (1,169,561 | ) |
U.S. Treasury Note 2 Year | | | 12/30/22 | | | | 468 | | | | 97,381,270 | | | | (1,258,457 | ) |
U.S. Treasury Note 5 Year | | | 12/30/22 | | | | 303 | | | | 33,578,497 | | | | (1,003,630 | ) |
| | | | | | | | | | | | | | $ | (5,393,598 | ) |
Short | | | | | | | | | | | | | | | | |
U.S. Treasury Ultra 10 Year | | | 12/20/22 | | | | 195 | | | $ | (24,374,261 | ) | | $ | 1,269,808 | |
The accompanying notes are an integral part of the financial statements.
79
MassMutual Diversified Bond Fund — Portfolio of Investments |
September 30, 2022 |
| | | Number of
Shares | | | Value | |
EQUITIES — 0.7% |
PREFERRED STOCK — 0.7% |
Financial — 0.7% |
Insurance — 0.7% |
Equitable Holdings, Inc. | | | | | | | | |
4.300% (a) | | | 45,600 | | | $ | 763,800 | |
Selective Insurance Group, Inc. 4.600% | | | 18,825 | | | | 328,873 | |
| | | | | | | | 1,092,673 | |
| | | | | | | | | |
TOTAL PREFERRED STOCK (Cost $1,610,625) | | | | | | | 1,092,673 | |
| | | | | | | | | |
TOTAL EQUITIES (Cost $1,610,625) | | | | | | | 1,092,673 | |
| | | | | | | | | |
| | | Principal
Amount | | | | | |
BONDS & NOTES — 94.9% |
CORPORATE DEBT — 45.0% |
Aerospace & Defense — 0.4% |
The Boeing Co. | | | | | | | | |
5.930% 5/01/60 | | $ | 140,000 | | | | 119,773 | |
TransDigm, Inc. | | | | | | | | |
5.500% 11/15/27 | | | 250,000 | | | | 217,425 | |
6.375% 6/15/26 | | | 225,000 | | | | 212,572 | |
| | | | | | | | 549,770 | |
Agriculture — 1.0% |
Altria Group, Inc. | | | | | | | | |
5.800% 2/14/39 | | | 300,000 | | | | 261,986 | |
BAT Capital Corp. | | | | | | | | |
4.700% 4/02/27 | | | 510,000 | | | | 475,767 | |
4.758% 9/06/49 | | | 165,000 | | | | 112,461 | |
Imperial Brands Finance PLC | | | | | | | | |
3.875% 7/26/29 (b) | | | 545,000 | | | | 462,646 | |
Reynolds American, Inc. | | | | | | | | |
5.850% 8/15/45 | | | 150,000 | | | | 117,688 | |
Viterra Finance BV | | | | | | | | |
3.200% 4/21/31 (b) | | | 280,000 | | | | 208,354 | |
| | | | | | | | 1,638,902 | |
Airlines — 0.3% |
Alaska Airlines Pass Through Trust, 2020-1 Class A, | | | | | | | | |
4.800% 2/15/29 (b) | | | 380,294 | | | | 358,038 | |
| | | Principal
Amount | | | Value | |
United Airlines Pass-Through Trust, Series 2018-1, Class B, | | | | | | | | |
4.600% 9/01/27 | | $ | 63,276 | | | $ | 57,662 | |
| | | | | | | | 415,700 | |
Auto Manufacturers — 0.4% |
General Motors Co. | | | | | | | | |
5.150% 4/01/38 | | | 230,000 | | | | 185,082 | |
5.200% 4/01/45 | | | 225,000 | | | | 171,344 | |
6.800% 10/01/27 | | | 335,000 | | | | 338,483 | |
| | | | | | | | 694,909 | |
Auto Parts & Equipment — 0.1% |
Lear Corp. | | | | | | | | |
3.550% 1/15/52 | | | 305,000 | | | | 181,204 | |
Banks — 6.2% |
Bank Hapoalim BM 5 year CMT + 2.155% | | | | | | | | |
3.255% VRN 1/21/32 (b) | | | 600,000 | | | | 497,975 | |
Bank of America Corp. | | | | | | | | |
5 year CMT + 1.200% 2.482% VRN 9/21/36 | | | 380,000 | | | | 274,675 | |
5 year CMT + 2.000% 3.846% VRN 3/08/37 | | | 460,000 | | | | 371,036 | |
3 mo. USD LIBOR + 1.310% 4.271% VRN 7/23/29 | | | 200,000 | | | | 181,735 | |
6.110% 1/29/37 | | | 190,000 | | | | 182,958 | |
7.750% 5/14/38 | | | 125,000 | | | | 138,669 | |
The Bank of Nova Scotia 3 mo. USD LIBOR + 2.648% | | | | | | | | |
4.650% VRN (c) | | | 575,000 | | | | 492,835 | |
Barclays PLC | | | | | | | | |
5 year CMT + 3.410% 4.375% VRN (c) | | | 375,000 | | | | 231,113 | |
5.200% 5/12/26 | | | 410,000 | | | | 389,734 | |
5 year CMT + 5.431% 8.000% VRN (c) | | | 290,000 | | | | 253,808 | |
BNP Paribas SA 5 year CMT + 3.340% | | | | | | | | |
4.625% VRN (b) (c) | | | 375,000 | | | | 240,073 | |
BPCE SA SOFR + 1.730% | | | | | | | | |
3.116% VRN 10/19/32 (b) | | | 450,000 | | | | 319,589 | |
Citigroup, Inc. | | | | | | | | |
4.450% 9/29/27 | | | 260,000 | | | | 240,597 | |
3 mo. USD LIBOR + 4.068% 5.950% VRN 12/31/99 (c) | | | 185,000 | | | | 182,802 | |
Credit Suisse Group AG SOFR + .980% | | | | | | | | |
1.305% VRN 2/02/27 (b) | | | 550,000 | | | | 446,512 | |
First Republic Bank | | | | | | | | |
4.375% 8/01/46 | | | 210,000 | | | | 163,201 | |
The Goldman Sachs Group, Inc. | | | | | | | | |
5.150% 5/22/45 | | | 290,000 | | | | 240,935 | |
The accompanying notes are an integral part of the financial statements.
80
MassMutual Diversified Bond Fund — Portfolio of Investments (Continued) |
| | | Principal
Amount | | | Value | |
6.750% 10/01/37 | | $ | 165,000 | | | $ | 164,380 | |
HSBC Holdings PLC | | | | | | | | |
6.500% 9/15/37 | | | 125,000 | | | | 117,176 | |
7.350% 11/27/32 | | | 415,000 | | | | 418,983 | |
Huntington Bancshares, Inc. 3 mo. USD LIBOR + 2.880% | | | | | | | | |
5.700% VRN (c) | | | 510,000 | | | | 464,370 | |
JP Morgan Chase & Co. | | | | | | | | |
SOFR + 2.515% 2.956% VRN 5/13/31 | | | 235,000 | | | | 186,050 | |
4.950% 6/01/45 | | | 170,000 | | | | 141,828 | |
Mizrahi Tefahot Bank Ltd. 5 year CMT + 2.250% | | | | | | | | |
3.077% VRN 4/07/31 (b) | | | 1,225,000 | | | | 1,027,469 | |
Morgan Stanley | | | | | | | | |
SOFR + 1.360% 2.484% VRN 9/16/36 | | | 280,000 | | | | 200,553 | |
SOFR + 1.485% 3.217% VRN 4/22/42 | | | 310,000 | | | | 216,080 | |
SOFR + 2.620% 5.297% VRN 4/20/37 | | | 185,000 | | | | 165,910 | |
NBK Tier 1 Financing 2 Ltd. 6 year CMT + 2.832% | | | | | | | | |
4.500% VRN (b) (c) | | | 685,000 | | | | 612,219 | |
Nordea Bank Abp 5 year CMT + 4.110% | | | | | | | | |
6.625% VRN (b) (c) | | | 275,000 | | | | 253,963 | |
Standard Chartered PLC 5 year CMT + 3.805% | | | | | | | | |
4.750% VRN (b) (c) | | | 550,000 | | | | 363,660 | |
SVB Financial Group | | | | | | | | |
10 year CMT + 3.064% 4.100% VRN (c) | | | 210,000 | | | | 143,058 | |
5 year CMT + 3.074% 4.250% VRN (c) | �� | | 590,000 | | | | 434,622 | |
| | | | | | | | 9,758,568 | |
Beverages — 0.5% |
Anheuser-Busch InBev Worldwide, Inc. | | | | | | | | |
8.200% 1/15/39 | | | 250,000 | | | | 301,864 | |
Bacardi Ltd. | | | | | | | | |
5.150% 5/15/38 (b) | | | 200,000 | | | | 171,328 | |
Molson Coors Beverage Co. | | | | | | | | |
4.200% 7/15/46 | | | 366,000 | | | | 271,374 | |
5.000% 5/01/42 | | | 135,000 | | | | 113,380 | |
| | | | | | | | 857,946 | |
Biotechnology — 0.1% |
Amgen, Inc. | | | | | | | | |
3.000% 1/15/52 | | | 190,000 | | | | 119,371 | |
| | | Principal
Amount | | | Value | |
Building Materials — 0.2% |
Standard Industries, Inc. | | | | | | | | |
4.375% 7/15/30 (b) | | $ | 200,000 | | | $ | 153,000 | |
4.750% 1/15/28 (b) | | | 151,000 | | | | 127,577 | |
| | | | | | | | 280,577 | |
Chemicals — 0.7% |
Alpek SAB de CV | | | | | | | | |
3.250% 2/25/31 (b) | | | 560,000 | | | | 414,351 | |
DuPont de Nemours, Inc. | | | | | | | | |
5.319% 11/15/38 | | | 270,000 | | | | 244,828 | |
Syngenta Finance NV | | | | | | | | |
4.892% 4/24/25 (b) | | | 500,000 | | | | 483,454 | |
| | | | | | | | 1,142,633 | |
Commercial Services — 0.0% |
ERAC USA Finance LLC | | | | | | | | |
7.000% 10/15/37 (b) | | | 50,000 | | | | 52,186 | |
Computers — 0.4% |
Dell International LLC / EMC Corp. | | | | | | | | |
8.100% 7/15/36 | | | 100,000 | | | | 105,492 | |
8.350% 7/15/46 | | | 275,000 | | | | 296,648 | |
Leidos, Inc. | | | | | | | | |
5.500% 7/01/33 | | | 226,000 | | | | 200,801 | |
| | | | | | | | 602,941 | |
Distribution & Wholesale — 0.3% |
H&E Equipment Services, Inc. | | | | | | | | |
3.875% 12/15/28 (b) | | | 600,000 | | | | 471,000 | |
Diversified Financial Services — 4.7% |
AerCap Ireland Capital DAC / AerCap Global Aviation Trust | | | | | | | | |
3.400% 10/29/33 | | | 935,000 | | | | 678,025 | |
Ally Financial, Inc. | | | | | | | | |
8.000% 11/01/31 | | | 376,000 | | | | 394,029 | |
Antares Holdings LP | | | | | | | | |
2.750% 1/15/27 (b) | | | 645,000 | | | | 513,765 | |
3.750% 7/15/27 (b) | | | 605,000 | | | | 490,170 | |
8.500% 5/18/25 (b) | | | 330,000 | | | | 336,835 | |
Ares Finance Co. III LLC 5 year CMT + 3.237% | | | | | | | | |
4.125% VRN 6/30/51 (b) | | | 360,000 | | | | 280,685 | |
Ares Finance Co. LLC | | | | | | | | |
4.000% 10/08/24 (b) | | | 375,000 | | | | 359,475 | |
Avolon Holdings Funding Ltd. | | | | | | | | |
2.528% 11/18/27 (b) | | | 375,000 | | | | 294,667 | |
3.250% 2/15/27 (b) | | | 175,000 | | | | 146,615 | |
4.250% 4/15/26 (b) | | | 485,000 | | | | 435,035 | |
4.375% 5/01/26 (b) | | | 480,000 | | | | 429,531 | |
5.500% 1/15/26 (b) | | | 135,000 | | | | 127,007 | |
The accompanying notes are an integral part of the financial statements.
81
MassMutual Diversified Bond Fund — Portfolio of Investments (Continued) |
| | | Principal
Amount | | | Value | |
BGC Partners, Inc. | | | | | | | | |
4.375% 12/15/25 | | $ | 585,000 | | | $ | 546,487 | |
Blue Owl Finance LLC | | | | | | | | |
3.125% 6/10/31 (b) | | | 910,000 | | | | 645,949 | |
4.125% 10/07/51 (b) | | | 375,000 | | | | 216,683 | |
Bread Financial Holdings, Inc. | | | | | | | | |
7.000% 1/15/26 (b) | | | 200,000 | | | | 175,500 | |
Coinbase Global, Inc. | | | | | | | | |
3.625% 10/01/31 (b) | | | 734,000 | | | | 407,002 | |
Global Aircraft Leasing Co. Ltd. | | | | | | | | |
6.500% 9/15/24 (b) | | | 662,078 | | | | 498,214 | |
OneMain Finance Corp. | | | | | | | | |
4.000% 9/15/30 (a) | | | 220,000 | | | | 154,376 | |
Synchrony Financial | | | | | | | | |
3.950% 12/01/27 | | | 300,000 | | | | 260,356 | |
| | | | | | | | 7,390,406 | |
Electric — 1.1% |
Berkshire Hathaway Energy Co. | | | | | | | | |
5.950% 5/15/37 | | | 120,000 | | | | 119,574 | |
The Cleveland Electric Illuminating Co. | | | | | | | | |
5.950% 12/15/36 | | | 175,000 | | | | 172,546 | |
CMS Energy Corp. | | | | | | | | |
4.700% 3/31/43 | | | 115,000 | | | | 92,740 | |
4.875% 3/01/44 | | | 180,000 | | | | 155,437 | |
Elwood Energy LLC | | | | | | | | |
8.159% 7/05/26 | | | 90,875 | | | | 89,512 | |
Enel Finance International NV | | | | | | | | |
6.000% 10/07/39 (b) | | | 175,000 | | | | 151,128 | |
NextEra Energy Capital Holdings, Inc. 5 year CMT + 2.547% | | | | | | | | |
3.800% VRN 3/15/82 | | | 580,000 | | | | 455,433 | |
Pacific Gas and Electric Co. | | | | | | | | |
3.750% 7/01/28 | | | 320,000 | | | | 269,561 | |
4.300% 3/15/45 | | | 195,000 | | | | 129,495 | |
Virginia Electric & Power Co. | | | | | | | | |
6.000% 1/15/36 | | | 100,000 | | | | 100,941 | |
| | | | | | | | 1,736,367 | |
Entertainment — 0.2% |
Live Nation Entertainment, Inc. | | | | | | | | |
5.625% 3/15/26 (b) | | | 77,000 | | | | 73,184 | |
Warnermedia Holdings, Inc. | | | | | | | | |
4.279% 3/15/32 (b) | | | 200,000 | | | | 164,505 | |
| | | | | | | | 237,689 | |
Food — 0.9% |
JBS USA LUX SA/JBS USA Food Co./JBS USA Finance, Inc. | | | | | | | | |
5.500% 1/15/30 (b) | | | 700,000 | | | | 645,064 | |
| | | Principal
Amount | | | Value | |
Kraft Heinz Foods Co. | | | | | | | | |
4.875% 10/01/49 | | $ | 315,000 | | | $ | 259,654 | |
Smithfield Foods, Inc. | | | | | | | | |
2.625% 9/13/31 (b) | | | 375,000 | | | | 275,630 | |
3.000% 10/15/30 (b) | | | 206,000 | | | | 158,995 | |
| | | | | | | | 1,339,343 | |
Gas — 0.2% |
NiSource, Inc. | | | | | | | | |
4.800% 2/15/44 | | | 295,000 | | | | 245,806 | |
Home Builders — 0.4% |
Mattamy Group Corp. | | | | | | | | |
4.625% 3/01/30 (b) | | | 35,000 | | | | 26,730 | |
5.250% 12/15/27 (b) | | | 227,000 | | | | 188,155 | |
Taylor Morrison Communities, Inc. | | | | | | | | |
5.750% 1/15/28 (b) | | | 500,000 | | | | 438,180 | |
| | | | | | | | 653,065 | |
Insurance — 7.9% |
Allianz SE 5 year CMT + 2.973% | | | | | | | | |
3.500% VRN (b) (c) | | | 1,176,000 | | | | 900,157 | |
The Allstate Corp. 3 mo. USD LIBOR + 2.938% | | | | | | | | |
5.750% VRN 8/15/53 | | | 640,000 | | | | 589,236 | |
American International Group, Inc. 3 mo. USD LIBOR + 2.868% | | | | | | | | |
5.750% VRN 4/01/48 | | | 485,000 | | | | 446,931 | |
Ascot Group Ltd. | | | | | | | | |
4.250% 12/15/30 (b) | | | 450,000 | | | | 375,301 | |
AXIS Specialty Finance LLC 5 year CMT + 3.186% | | | | | | | | |
4.900% VRN 1/15/40 | | | 490,000 | | | | 398,125 | |
Brighthouse Financial, Inc. | | | | | | | | |
3.850% 12/22/51 | | | 575,000 | | | | 348,184 | |
4.700% 6/22/47 | | | 500,000 | | | | 354,096 | |
CNO Financial Group, Inc. | | | | | | | | |
5.250% 5/30/29 | | | 791,000 | | | | 736,350 | |
Enstar Finance LLC 5 year CMT + 5.468% | | | | | | | | |
5.750% VRN 9/01/40 | | | 1,060,000 | | | | 945,027 | |
Enstar Group Ltd. | | | | | | | | |
4.950% 6/01/29 | | | 350,000 | | | | 314,086 | |
Equitable Holdings, Inc. 5 year CMT + 4.736% | | | | | | | | |
4.950% VRN (c) | | | 505,000 | | | | 473,438 | |
Global Atlantic Fin Co. | | | | | | | | |
3.125% 6/15/31 (b) | | | 380,000 | | | | 278,159 | |
5 year CMT + 3.796% 4.700% VRN 10/15/51 (b) | | | 1,170,000 | | | | 880,159 | |
The accompanying notes are an integral part of the financial statements.
82
MassMutual Diversified Bond Fund — Portfolio of Investments (Continued) |
| | | Principal
Amount | | | Value | |
Hanwha Life Insurance Co. Ltd. 5 year CMT + 1.850% | | | | | | | | |
3.379% VRN 2/04/32 (b) | | $ | 520,000 | | | $ | 434,365 | |
Hill City Funding Trust | | | | | | | | |
4.046% 8/15/41 (b) | | | 490,000 | | | | 329,809 | |
Jackson Financial, Inc. | | | | | | | | |
3.125% 11/23/31 | | | 550,000 | | | | 413,625 | |
Kyobo Life Insurance Co. 5 year CMT + 2.887% | | | | | | | | |
5.900% VRN 6/15/52 (b) | | | 461,000 | | | | 447,170 | |
Liberty Mutual Group, Inc. 5 year CMT + 3.315% | | | | | | | | |
4.125% VRN 12/15/51 (b) | | | 265,000 | | | | 205,480 | |
Markel Corp. 5 year CMT + 5.662% | | | | | | | | |
6.000% VRN (c) | | | 735,000 | | | | 713,472 | |
MetLife Capital Trust IV | | | | | | | | |
7.875% 12/15/67 (b) | | | 325,000 | | | | 346,938 | |
Prudential Financial, Inc. | | | | | | | | |
5 year CMT + 3.162% 5.125% VRN 3/01/52 | | | 565,000 | | | | 489,821 | |
3 mo. USD LIBOR + 3.920% 5.625% VRN 6/15/43 | | | 200,000 | | | | 197,052 | |
Sammons Financial Group, Inc. | | | | | | | | |
3.350% 4/16/31 (b) | | | 570,000 | | | | 427,360 | |
4.750% 4/08/32 (b) | | | 790,000 | | | | 644,425 | |
Unum Group | | | | | | | | |
4.125% 6/15/51 | | | 460,000 | | | | 306,563 | |
USF&G Capital I | | | | | | | | |
8.500% 12/15/45 (b) | | | 95,000 | | | | 108,495 | |
XLIT Ltd. | | | | | | | | |
5.500% 3/31/45 | | | 200,000 | | | | 184,901 | |
| | | | | | | | 12,288,725 | |
Internet — 0.1% |
Expedia Group, Inc. | | | | | | | | |
2.950% 3/15/31 | | | 178,000 | | | | 138,029 | |
Investment Companies — 3.1% |
Ares Capital Corp. | | | | | | | | |
2.150% 7/15/26 | | | 560,000 | | | | 469,500 | |
Blackstone Private Credit Fund | | | | | | | | |
1.750% 9/15/24 | | | 625,000 | | | | 569,709 | |
2.625% 12/15/26 | | | 330,000 | | | | 271,014 | |
4.000% 1/15/29 | | | 630,000 | | | | 504,877 | |
Golub Capital BDC, Inc. | | | | | | | | |
2.500% 8/24/26 | | | 195,000 | | | | 163,522 | |
3.375% 4/15/24 | | | 562,000 | | | | 539,478 | |
Icahn Enterprises LP/ Icahn Enterprises Finance Corp. | | | | | | | | |
4.750% 9/15/24 | | | 500,000 | | | | 467,469 | |
6.250% 5/15/26 | | | 1,000,000 | | | | 929,224 | |
| | | Principal
Amount | | | Value | |
OWL Rock Core Income Corp. | | | | | | | | |
4.700% 2/08/27 | | $ | 410,000 | | | $ | 359,258 | |
5.500% 3/21/25 | | | 535,000 | | | | 503,396 | |
| | | | | | | | 4,777,447 | |
Iron & Steel — 0.1% |
Vale Overseas Ltd. | | | | | | | | |
6.875% 11/21/36 | | | 225,000 | | | | 213,553 | |
Leisure Time — 0.2% |
Royal Caribbean Cruises Ltd. | | | | | | | | |
5.500% 8/31/26 (a) (b) | | | 485,000 | | | | 367,313 | |
Lodging — 0.7% |
Las Vegas Sands Corp. | | | | | | | | |
3.900% 8/08/29 | | | 525,000 | | | | 433,907 | |
Travel & Leisure Co. | | | | | | | | |
4.500% 12/01/29 (b) | | | 917,000 | | | | 707,778 | |
| | | | | | | | 1,141,685 | |
Media — 1.6% |
CCO Holdings LLC/CCO Holdings Capital Corp. | | | | | | | | |
5.000% 2/01/28 (b) | | | 250,000 | | | | 219,325 | |
Charter Communications Operating LLC/Charter Communications Operating Capital | | | | | | | | |
3.900% 6/01/52 | | | 150,000 | | | | 92,880 | |
Comcast Corp. | | | | | | | | |
4.600% 8/15/45 | | | 300,000 | | | | 250,456 | |
CSC Holdings LLC | | | | | | | | |
4.625% 12/01/30 (b) | | | 250,000 | | | | 169,712 | |
5.000% 11/15/31 (b) | | | 325,000 | | | | 214,676 | |
5.750% 1/15/30 (b) | | | 200,000 | | | | 142,153 | |
Discovery Communications LLC | | | | | | | | |
4.000% 9/15/55 | | | 235,000 | | | | 138,554 | |
4.650% 5/15/50 | | | 55,000 | | | | 37,638 | |
DISH DBS Corp. | | | | | | | | |
7.375% 7/01/28 | | | 1,123,000 | | | | 756,168 | |
Radiate Holdco LLC / Radiate Finance, Inc. | | | | | | | | |
6.500% 9/15/28 (b) | | | 231,000 | | | | 161,122 | |
Time Warner Cable, Inc. | | | | | | | | |
4.500% 9/15/42 | | | 250,000 | | | | 172,626 | |
6.750% 6/15/39 | | | 115,000 | | | | 102,810 | |
| | | | | | | | 2,458,120 | |
Mining — 1.7% |
AngloGold Ashanti Holdings PLC | | | | | | | | |
3.375% 11/01/28 | | | 585,000 | | | | 474,637 | |
First Quantum Minerals Ltd. | | | | | | | | |
6.875% 3/01/26 (b) | | | 1,000,000 | | | | 922,730 | |
The accompanying notes are an integral part of the financial statements.
83
MassMutual Diversified Bond Fund — Portfolio of Investments (Continued) |
| | | Principal
Amount | | | Value | |
Freeport-McMoRan, Inc. | | | | | | | | |
5.400% 11/14/34 | | $ | 350,000 | | | $ | 311,084 | |
Glencore Finance Canada Ltd. | | | | | | | | |
5.550% STEP 10/25/42 (b) | | | 149,000 | | | | 126,310 | |
Novelis Corp. | | | | | | | | |
3.875% 8/15/31 (b) | | | 533,000 | | | | 397,575 | |
Perenti Finance Pty Ltd. | | | | | | | | |
6.500% 10/07/25 (a) (b) | | | 325,000 | | | | 297,538 | |
Teck Resources Ltd. | | | | | | | | |
5.200% 3/01/42 | | | 97,000 | | | | 77,656 | |
| | | | | | | | 2,607,530 | |
Oil & Gas — 3.1% |
Antero Resources Corp. | | | | | | | | |
7.625% 2/01/29 (b) | | | 74,000 | | | | 74,000 | |
BP Capital Markets PLC | | | | | | | | |
5 year CMT + 4.036% 4.375% VRN (c) | | | 530,000 | | | | 490,250 | |
5 year CMT + 4.398% 4.875% VRN (c) | | | 310,000 | | | | 265,752 | |
Cenovus Energy, Inc. | | | | | | | | |
6.750% 11/15/39 | | | 175,000 | | | | 173,796 | |
Devon Energy Corp. | | | | | | | | |
5.000% 6/15/45 | | | 289,000 | | | | 240,523 | |
EQT Corp. | | | | | | | | |
7.000% STEP 2/01/30 | | | 695,000 | | | | 717,170 | |
Nabors Industries, Inc. | | | | | | | | |
7.375% 5/15/27 (b) | | | 564,000 | | | | 520,544 | |
Occidental Petroleum Corp. | | | | | | | | |
6.600% 3/15/46 | | | 235,000 | | | | 242,050 | |
Ovintiv, Inc. | | | | | | | | |
6.500% 8/15/34 | | | 185,000 | | | | 180,116 | |
6.500% 2/01/38 | | | 160,000 | | | | 155,289 | |
Patterson-UTI Energy, Inc. | | | | | | | | |
3.950% 2/01/28 | | | 540,000 | | | | 443,066 | |
5.150% 11/15/29 | | | 615,000 | | | | 507,617 | |
Petroleos Mexicanos | | | | | | | | |
4.625% 9/21/23 | | | 575,000 | | | | 559,156 | |
5.350% 2/12/28 | | | 190,000 | | | | 144,531 | |
6.375% 1/23/45 | | | 35,000 | | | | 19,338 | |
6.500% 3/13/27 | | | 65,000 | | | | 54,437 | |
6.625% 6/15/38 | | | 51,000 | | | | 29,931 | |
| | | | | | | | 4,817,566 | |
Oil & Gas Services — 0.7% |
NOV, Inc. | | | | | | | | |
3.600% 12/01/29 (a) | | | 467,000 | | | | 394,662 | |
3.950% 12/01/42 | | | 314,000 | | | | 209,051 | |
| | | Principal
Amount | | | Value | |
Weatherford International Ltd. | | | | | | | | |
8.625% 4/30/30 (b) | | $ | 483,000 | | | $ | 421,108 | |
| | | | | | | | 1,024,821 | |
Packaging & Containers — 0.0% |
Mauser Packaging Solutions Holding Co. | | | | | | | | |
5.500% 4/15/24 (b) | | | 49,000 | | | | 46,550 | |
Pharmaceuticals — 1.0% |
1375209 BC Ltd. | | | | | | | | |
9.000% 1/30/28 | | | 124,810 | | | | 123,562 | |
AbbVie, Inc. | | | | | | | | |
4.700% 5/14/45 | | | 150,000 | | | | 126,893 | |
Bausch Health Cos., Inc. | | | | | | | | |
5.250% 1/30/30 (b) | | | 250,000 | | | | 93,243 | |
11.000% 9/30/28 | | | 221,763 | | | | 176,856 | |
14.000% 10/15/30 | | | 44,026 | | | | 25,535 | |
Cigna Corp. | | | | | | | | |
4.800% 7/15/46 | | | 185,000 | | | | 158,364 | |
CVS Health Corp. | | | | | | | | |
5.050% 3/25/48 | | | 115,000 | | | | 100,892 | |
6.125% 9/15/39 | | | 25,000 | | | | 25,511 | |
CVS Pass-Through Trust | | | | | | | | |
5.926% 1/10/34 (b) | | | 167,691 | | | | 165,872 | |
7.507% 1/10/32 (b) | | | 12,122 | | | | 12,825 | |
Utah Acquisition Sub, Inc. | | | | | | | | |
3.950% 6/15/26 | | | 350,000 | | | | 319,205 | |
5.250% 6/15/46 | | | 350,000 | | | | 246,777 | |
| | | | | | | | 1,575,535 | |
Pipelines — 1.6% |
Energy Transfer LP | | | | | | | | |
6.125% 12/15/45 | | | 230,000 | | | | 201,730 | |
3 mo. USD LIBOR + 4.028% 6.250% VRN (c) | | | 615,000 | | | | 504,300 | |
5 year CMT + 5.134% 6.750% VRN (c) | | | 270,000 | | | | 232,381 | |
EnLink Midstream Partners LP 3 mo. USD LIBOR + 4.110% | | | | | | | | |
6.000% VRN (c) | | | 375,000 | | | | 280,264 | |
MPLX LP 3 mo. USD LIBOR + 4.652% | | | | | | | | |
6.875% VRN (c) | | | 525,000 | | | | 515,813 | |
Plains All American Pipeline LP/PAA Finance Corp. | | | | | | | | |
3.800% 9/15/30 | | | 265,000 | | | | 222,117 | |
4.700% 6/15/44 | | | 260,000 | | | | 186,309 | |
6.650% 1/15/37 | | | 175,000 | | | | 162,490 | |
The accompanying notes are an integral part of the financial statements.
84
MassMutual Diversified Bond Fund — Portfolio of Investments (Continued) |
| | | Principal
Amount | | | Value | |
Targa Resources Partners LP/Targa Resources Partners Finance Corp. | | | | | | | | |
6.875% 1/15/29 | | $ | 246,000 | | | $ | 242,804 | |
| | | | | | | | 2,548,208 | |
Private Equity — 0.9% |
Apollo Management Holdings LP 5 year CMT + 3.266% | | | | | | | | |
4.950% VRN 1/14/50 (b) | | | 325,000 | | | | 276,250 | |
Hercules Capital, Inc. | | | | | | | | |
2.625% 9/16/26 | | | 738,000 | | | | 604,151 | |
3.375% 1/20/27 | | | 340,000 | | | | 285,354 | |
KKR Group Finance Co. VIII LLC | | | | | | | | |
3.500% 8/25/50 (b) | | | 160,000 | | | | 109,846 | |
KKR Group Finance Co. X LLC | | | | | | | | |
3.250% 12/15/51 (b) | | | 230,000 | | | | 149,663 | |
| | | | | | | | 1,425,264 | |
Real Estate Investment Trusts (REITS) — 2.0% |
Broadstone Net Lease LLC | | | | | | | | |
2.600% 9/15/31 | | | 405,000 | | | | 298,030 | |
Host Hotels & Resorts LP | | | | | | | | |
2.900% 12/15/31 | | | 130,000 | | | | 95,361 | |
3.500% 9/15/30 | | | 476,000 | | | | 379,465 | |
Invitation Homes Operating Partnership LP | | | | | | | | |
4.150% 4/15/32 | | | 110,000 | | | | 92,915 | |
Iron Mountain, Inc. | | | | | | | | |
5.250% 7/15/30 (b) | | | 250,000 | | | | 206,868 | |
Omega Healthcare Investors, Inc. | | | | | | | | |
3.625% 10/01/29 | | | 640,000 | | | | 520,777 | |
4.750% 1/15/28 | | | 202,000 | | | | 185,246 | |
Piedmont Operating Partnership LP | | | | | | | | |
2.750% 4/01/32 | | | 235,000 | | | | 167,242 | |
Rexford Industrial Realty LP | | | | | | | | |
2.125% 12/01/30 | | | 246,000 | | | | 187,484 | |
Service Properties Trust | | | | | | | | |
4.950% 10/01/29 | | | 590,000 | | | | 404,085 | |
Spirit Realty LP | | | | | | | | |
2.700% 2/15/32 | | | 120,000 | | | | 86,658 | |
3.200% 1/15/27 | | | 220,000 | | | | 193,068 | |
3.400% 1/15/30 | | | 325,000 | | | | 263,968 | |
Ventas Realty LP | | | | | | | | |
5.700% 9/30/43 | | | 85,000 | | | | 77,012 | |
| | | | | | | | 3,158,179 | |
Retail — 0.2% |
Nordstrom, Inc. | | | | | | | | |
4.250% 8/01/31 | | | 440,000 | | | | 300,084 | |
| | | Principal
Amount | | | Value | |
Telecommunications — 1.6% |
Altice France SA | | | | | | | | |
5.125% 7/15/29 (b) | | $ | 442,000 | | | $ | 330,222 | |
AT&T, Inc. | | | | | | | | |
3.550% 9/15/55 | | | 814,000 | | | | 533,899 | |
British Telecommunications PLC | | | | | | | | |
9.625% STEP 12/15/30 | | | 150,000 | | | | 173,242 | |
Hughes Satellite Systems Corp. | | | | | | | | |
6.625% 8/01/26 | | | 444,000 | | | | 402,884 | |
Sprint Capital Corp. | | | | | | | | |
6.875% 11/15/28 | | | 500,000 | | | | 513,750 | |
8.750% 3/15/32 | | | 141,000 | | | | 163,384 | |
Verizon Communications, Inc. | | | | | | | | |
2.875% 11/20/50 | | | 160,000 | | | | 97,855 | |
2.987% 10/30/56 | | | 233,000 | | | | 138,524 | |
Vodafone Group PLC | | | | | | | | |
5.250% 5/30/48 | | | 255,000 | | | | 211,175 | |
| | | | | | | | 2,564,935 | |
Trucking & Leasing — 0.4% |
AerCap Global Aviation Trust 3 mo. USD LIBOR + 4.300% | | | | | | | | |
6.500% VRN 6/15/45 (a) (b) | | | 600,000 | | | | 547,500 | |
| | | | | | | | | |
TOTAL CORPORATE DEBT (Cost $86,370,097) | | | | | | | 70,369,427 | |
| | | | | | | | | |
NON-U.S. GOVERNMENT AGENCY OBLIGATIONS — 30.9% |
Commercial Mortgage-Backed Securities — 12.8% |
Aventura Mall Trust, Series 2018-AVM, Class D, | | | | | | | | |
4.249% VRN 7/05/40 (b) (e) | | | 530,000 | | | | 440,247 | |
Banc of America Merrill Lynch Trust | | | | | | | | |
Series 2019-BPR, Class CMP, 4.024% VRN 11/05/32 (b) (e) | | | 440,000 | | | | 383,094 | |
Series 2019-BPR, Class DMP, 4.024% VRN 11/05/32 (b) (e) | | | 540,000 | | | | 466,322 | |
Series 2018-DSNY, Class C, 1 mo. USD LIBOR + 1.350% 4.168% FRN 9/15/34 (b) | | | 150,000 | | | | 143,452 | |
BANK | | | | | | | | |
Series 2020-BN30, Class MCDF, 3.016% VRN 12/15/53 (e) | | | 500,000 | | | | 334,332 | |
Series 2019-BN17, Class C, 4.669% VRN 4/15/52 (e) | | | 331,000 | | | | 287,054 | |
BBCMS Mortgage Trust | | | | | | | | |
Series 2018-CHRS, Class D, 4.409% VRN 8/05/38 (b) (e) | | | 270,000 | | | | 215,932 | |
Series 2018-CHRS, Class B, 4.409% VRN 8/05/38 (b) (e) | | | 400,000 | | | | 352,271 | |
The accompanying notes are an integral part of the financial statements.
85
MassMutual Diversified Bond Fund — Portfolio of Investments (Continued) |
| | | Principal
Amount | | | Value | |
Series 2018-CHRS, Class C, 4.409% VRN 8/05/38 (b) (e) | | $ | 280,000 | | | $ | 237,962 | |
Benchmark Mortgage Trust | | | | | | | | |
Series 2021-B25, Class 300C, 3.094% VRN 4/15/54 (b) (e) | | | 500,000 | | | | 368,534 | |
Series 2020-IG1, Class D, 3.347% VRN 9/15/43 (e) | | | 400,000 | | | | 264,311 | |
BGME Trust, Series 2021-VR, Class D, | | | | | | | | |
3.094% VRN 1/10/43 (b) (e) | | | 3,100,000 | | | | 2,384,791 | |
BX Commercial Mortgage Trust | | | | | | | | |
Series 2021-BXMF, Class E, 1 mo. USD LIBOR + 2.427% 5.245% FRN 10/15/26 (b) | | | 1,500,000 | | | | 1,361,311 | |
Series 2021-VOLT, Class G, 1 mo. USD LIBOR + 2.850% 5.668% FRN 9/15/36 (b) | | | 2,004,000 | | | | 1,833,806 | |
CAMB Commercial Mortgage Trust, Series 2019-LIFE, Class E, 1 mo. USD LIBOR + 2.150% | | | | | | | | |
4.968% FRN 12/15/37 (b) | | | 572,453 | | | | 540,267 | |
Citigroup Commercial Mortgage Trust, Series 2019-GC41, Class C | | | | | | | | |
3.502% 8/10/56 | | | 222,000 | | | | 175,697 | |
Cold Storage Trust, Series 2020-ICE5, Class E, 1 mo. USD LIBOR + 2.766% | | | | | | | | |
5.583% FRN 11/15/37 (b) | | | 589,794 | | | | 568,469 | |
Commercial Mortgage Pass-Through Certificates, Series 2015-CR23, Class C, | | | | | | | | |
4.428% VRN 5/10/48 (e) | | | 110,000 | | | | 102,748 | |
DC Office Trust | | | | | | | | |
Series 2019-MTC, Class D, 3.174% VRN 9/15/45 (b) (e) | | | 357,000 | | | | 278,419 | |
Series 2019-MTC, Class E, 3.174% VRN 9/15/45 (b) (e) | | | 622,000 | | | | 468,221 | |
DROP Mortgage Trust, Series 2021-FILE, Class D, 1 mo. USD LIBOR + 2.750% | | | | | | | | |
5.570% FRN 10/15/43 (b) | | | 998,000 | | | | 934,268 | |
GS Mortgage Securities Corp. II, Series 2018-GS10, Class D | | | | | | | | |
3.000% 7/10/51 (b) | | | 599,000 | | | | 418,366 | |
Hudson Yards Mortgage Trust, Series 2019-30HY, Class E, | | | | | | | | |
3.558% VRN 7/10/39 (b) (e) | | | 630,000 | | | | 499,163 | |
Jackson Park Trust, Series 2019-LIC, Class D, | | | | | | | | |
3.351% VRN 10/14/39 (b) (e) | | | 686,000 | | | | 525,031 | |
| | | Principal
Amount | | | Value | |
JP Morgan Chase Commercial Mortgage Securities Trust | | | | | | | | |
Series 2022-OPO, Class C, 3.565% VRN 1/05/39 (b) (e) | | $ | 700,000 | | | $ | 574,927 | |
Series 2019-OSB, Class E, 3.909% VRN 6/05/39 (b) (e) | | | 553,000 | | | | 458,901 | |
JPMBB Commercial Mortgage Securities Trust, Series 2014-C21, Class C, | | | | | | | | |
4.795% VRN 8/15/47 (e) | | | 300,000 | | | | 278,094 | |
KIND Trust, Series 2021-KIND, Class C, 1 mo. USD LIBOR + 1.750% | | | | | | | | |
4.568% FRN 8/15/38 (b) | | | 893,542 | | | | 851,648 | |
KNDL Mortgage Trust, Series 2019-KNSQ, Class E, 1 mo. USD LIBOR + 1.800% | | | | | | | | |
4.618% FRN 5/15/36 (b) | | | 263,000 | | | | 252,079 | |
Life Mortgage Trust, Series 2021-BMR, Class E, 1 mo. USD LIBOR + 1.750% | | | | | | | | |
4.568% FRN 3/15/38 (b) | | | 424,643 | | | | 392,014 | |
Med Trust 2021-MDLN, Series 2021-MDLN, Class F, 1 mo. USD LIBOR + 4.000% | | | | | | | | |
6.818% FRN 11/15/38 (b) | | | 2,000,000 | | | | 1,840,145 | |
MFT Trust | | | | | | | | |
Series 2020-ABC, Class A, 3.358% 2/10/42 (b) | | | 205,000 | | | | 163,051 | |
Series 2020-ABC, Class B, 3.593% VRN 2/10/42 (b) (e) | | | 215,000 | | | | 166,819 | |
MKT Mortgage Trust, Series 2020-525M, Class E, | | | | | | | | |
3.039% VRN 2/12/40 (b) (e) | | | 213,000 | | | | 157,947 | |
VASA Trust, Series 2021-VASA, Class D, 1 mo. USD LIBOR + 2.100% | | | | | | | | |
4.918% FRN 7/15/39 (b) | | | 864,000 | | | | 813,118 | |
Wells Fargo Commercial Mortgage Trust | | | | | | | | |
Series 2015-NXS1, Class C, 3.848% VRN 5/15/48 (e) | | | 140,000 | | | | 125,983 | |
Series 2021-FCMT, Class C, 1 mo. USD LIBOR + 2.400% 5.218% FRN 5/15/31 (b) | | | 461,000 | | | | 440,260 | |
| | | | | | | | 20,099,054 | |
Home Equity Asset-Backed Securities — 0.0% |
Credit Suisse Seasoned Loan Trust, Series 2006-1, Class A, 1 mo. USD LIBOR + .480% | | | | | | | | |
3.564% FRN 10/25/34 (b) | | | 13,317 | | | | 13,352 | |
The accompanying notes are an integral part of the financial statements.
86
MassMutual Diversified Bond Fund — Portfolio of Investments (Continued) |
| | | Principal
Amount | | | Value | |
Other Asset-Backed Securities — 12.6% |
522 Funding CLO Ltd., Series 2018-3A, Class CR, 3 mo. USD LIBOR + 2.050% | | | | | | | | |
4.760% FRN 10/20/31 (b) | | $ | $250,000 | | | $ | 227,899 | |
AASET Trust, Series 2019-2, Class C | | | | | | | | |
6.413% 10/16/39 (b) | | | 1,240,212 | | | | 489,049 | |
AIMCO CLO Series Ltd., Series 2018-AA, Class B, 3 mo. USD LIBOR + 1.400% | | | | | | | | |
4.140% FRN 4/17/31 (b) | | | 250,000 | | | | 236,767 | |
Anchorage Capital CLO Ltd., Series 2021-19A, Class A, 3 mo. USD LIBOR + 1.210% | | | | | | | | |
3.722% FRN 10/15/34 (b) | | | 1,000,000 | | | | 956,536 | |
Argent Securities, Inc. Asset-Backed Pass-Through Certificates, Series 2004-W10, Class M1, 1 mo. USD LIBOR + .900% | | | | | | | | |
3.984% FRN 10/25/34 | | | 136,167 | | | | 125,818 | |
Atrium XV, Series 15A, Class B, 3 mo. USD LIBOR + 1.750% | | | | | | | | |
4.533% FRN 1/23/31 (b) | | | 250,000 | | | | 238,473 | |
Ballyrock CLO Ltd., Series 2021-17A, Class A1A, 3 mo. USD LIBOR + 1.150% | | | | | | | | |
3.860% FRN 10/20/34 (b) | | | 250,000 | | | | 238,613 | |
Blackbird Capital Aircraft Lease Securitization Ltd., Series 2016-1A, Class A, | | | | | | | | |
4.213% STEP 12/16/41 (b) | | | 333,556 | | | | 283,347 | |
BRE Grand Islander Timeshare Issuer LLC | | | | | | | | |
Series 2017-1A, Class A, 2.940% 5/25/29 (b) | | | 43,537 | | | | 42,215 | |
Series 2017-1A, Class B, 3.240% 5/25/29 (b) | | | 35,965 | | | | 34,868 | |
Business Jet Securities LLC, Series 2021-1A, Class C | | | | | | | | |
5.067% 4/15/36 (b) | | | 1,243,311 | | | | 1,133,553 | |
Canyon Capital CLO Ltd., Series 2019-2A, Class CR, 3 mo. USD LIBOR + 2.150% | | | | | | | | |
4.662% FRN 10/15/34 (b) | | | 250,000 | | | | 222,982 | |
Capital Automotive REIT, Series 2020-1A, Class B3 | | | | | | | | |
4.950% 2/15/50 (b) | | | 671,000 | | | | 552,032 | |
Castlelake Aircraft Securitization Trust, Series 2019-1A, Class A | | | | | | | | |
3.967% 4/15/39 (b) | | | 153,630 | | | | 132,520 | |
| | | Principal
Amount | | | Value | |
DataBank Issuer, Series 2021-1A, Class B | | | | | | | | |
2.650% 2/27/51 (b) | | $ | 300,000 | | | $ | 259,039 | |
Diameter Capital CLO Ltd., Series 2021-2A, Class A1, 3 mo. USD LIBOR + 1.220% | | | | | | | | |
3.732% FRN 10/15/36 (b) | | | 500,000 | | | | 476,183 | |
Elara HGV Timeshare Issuer LLC | | | | | | | | |
Series 2016-A, Class A, 2.730% 4/25/28 (b) | | | 48,524 | | | | 46,737 | |
Series 2016-A, Class B, 3.220% 4/25/28 (b) | | | 29,588 | | | | 28,867 | |
Falcon Aerospace Ltd., Series 2019-1, Class C | | | | | | | | |
6.656% 9/15/39 (b) | | | 324,811 | | | | 191,249 | |
FCI Funding LLC, Series 2019-1A, Class A | | | | | | | | |
3.630% 2/18/31 (b) | | | 4,712 | | | | 4,710 | |
Goldentree Loan Management US CLO Ltd., Series 2019-5A, Class CR, 3 mo. USD LIBOR + 2.050% | | | | | | | | |
4.760% FRN 10/20/32 (b) | | | 250,000 | | | | 230,657 | |
Goodgreen Trust | | | | | | | | |
Series 2016-1A, Class A, 3.230% 10/15/52 (b) | | | 154,296 | | | | 138,594 | |
Series 2017-1A, Class A, 3.740% 10/15/52 (b) | | | 85,485 | | | | 78,605 | |
Series 2019-2A, Class B, 3.860% 4/15/55 (b) | | | 117,942 | | | | 102,702 | |
Series 2021-1A, Class C, 5.740% 10/15/56 (b) | | | 488,681 | | | | 427,342 | |
Gracie Point International Funding, Series 2021-1A, Class C, 1 mo. USD LIBOR + 2.400% | | | | | | | | |
4.964% FRN 11/01/23 (b) | | | 610,000 | | | | 605,380 | |
Gulf Stream Meridian 6 Ltd., Series 2021-6A, Class A2, 3 mo. USD LIBOR + 1.750% | | | | | | | | |
4.262% FRN 1/15/37 (b) | | | 250,000 | | | | 233,715 | |
Harbor Park CLO Ltd., Series 2018-1A, Class B1, 3 mo. USD LIBOR + 1.700% | | | | | | | | |
4.410% FRN 1/20/31 (b) | | | 280,000 | | | | 266,113 | |
Hero Funding Trust | | | | | | | | |
Series 2016-3A, Class A1, 3.080% 9/20/42 (b) | | | 54,174 | | | | 50,908 | |
Series 2017-3A, Class A1, 3.190% 9/20/48 (b) | | | 75,791 | | | | 68,352 | |
Series 2017-2A, Class A1, 3.280% 9/20/48 (b) | | | 28,653 | | | | 26,308 | |
Series 2016-4A, Class A2, 4.290% 9/20/47 (b) | | | 56,951 | | | | 54,569 | |
The accompanying notes are an integral part of the financial statements.
87
MassMutual Diversified Bond Fund — Portfolio of Investments (Continued) |
| | | Principal
Amount | | | Value | |
Horizon Aircraft Finance I Ltd., Series 2018-1, Class B | | | | | | | | |
5.270% 12/15/38 (b) | | $ | 225,200 | | | $ | 148,625 | |
Horizon Aircraft Finance II Ltd., Series 2019-1, Class B | | | | | | | | |
4.703% 7/15/39 (b) | | | 273,167 | | | | 188,369 | |
Horizon Aircraft Finance III Ltd., Series 2019-2, Class A | | | | | | | | |
3.425% 11/15/39 (b) | | | 468,473 | | | | 392,222 | |
J.G. Wentworth XLIII LLC, Series 2019-1A, Class B | | | | | | | | |
4.510% 8/15/73 (b) | | | 138,000 | | | | 125,654 | |
KDAC Aviation Finance Ltd., Series 2017-1A, Class A | | | | | | | | |
4.212% 12/15/42 (b) | | | 271,442 | | | | 207,767 | |
Kestrel Aircraft Fundig Limited, Series 2018-1A, Class A | | | | | | | | |
4.250% 12/15/38 (b) | | | 348,320 | | | | 293,469 | |
Labrador Aviation Finance Ltd., Series 2016-1A, Class A1 | | | | | | | | |
4.300% 1/15/42 (b) | | | 312,614 | | | | 243,839 | |
LoanCore Issuer Ltd., Series 2022-CRE7, Class E, 30 day SOFR + 3.750% | | | | | | | | |
6.034% FRN 1/17/37 (b) | | | 1,000,000 | | | | 947,089 | |
Lunar Aircraft Ltd. | | | | | | | | |
Series 2020-1A, Class B, 4.335% 2/15/45 (b) | | | 117,424 | | | | 86,589 | |
Series 2020-1A, Class C, 6.413% 2/15/45 (b) | | | 217,468 | | | | 163,871 | |
MACH 1, Series 2019-1, Class B | | | | | | | | |
4.335% 10/15/39 (b) | | | 319,562 | | | | 250,622 | |
Madison Park Funding Ltd. | | | | | | | | |
Series 2018-28A, Class B, 3 mo. USD LIBOR + 1.600% 4.112% FRN 7/15/30 (b) | | | 950,000 | | | | 904,605 | |
Series 2018-32A, Class CR, 3 mo. USD LIBOR + 2.000% 4.759% FRN 1/22/31 (b) | | | 300,000 | | | | 276,837 | |
Mariner Finance Issuance Trust, Series 2021-AA, Class D | | | | | | | | |
3.830% 3/20/36 (b) | | | 381,000 | | | | 334,854 | |
Mosaic Solar Loans LLC, Series 2017-1A, Class A | | | | | | | | |
4.450% 6/20/42 (b) | | | 26,638 | | | | 25,402 | |
Neuberger Berman CLO Ltd., Series 2015-20A, Class BRR, 3 mo. USD LIBOR + 1.650% | | | | | | | | |
4.162% FRN 7/15/34 (b) | | | 500,000 | | | | 468,820 | |
| | | Principal
Amount | | | Value | |
OHA Credit Funding Ltd., Series 2015-11A, Class CR, 3 mo. USD LIBOR + 2.150% | | | | | | | | |
4.860% FRN 1/20/32 (b) | | $ | 300,000 | | | $ | 278,344 | |
Parallel Ltd., Series 2021-2A, Class A2, 3 mo. USD LIBOR + 1.850% | | | | | | | | |
4.560% FRN 10/20/34 (b) | | | 250,000 | | | | 229,902 | |
Park Place Securities, Inc., Series 2005-WCW3, Class M1, 1 mo. USD LIBOR + .720% | | | | | | | | |
3.804% FRN 8/25/35 | | | 1,634 | | | | 1,632 | |
Pioneer Aircraft Finance Ltd., Series 2019-1, Class B | | | | | | | | |
4.948% 6/15/44 (b) | | | 341,661 | | | | 232,803 | |
Rad CLO 12 Ltd., Series 2021-12A, Class A, 3 mo. USD LIBOR + 1.170% | | | | | | | | |
3.952% FRN 10/30/34 (b) | | | 500,000 | | | | 476,544 | |
Rad CLO 15 Ltd., Series 2021-15A, Class C, 3 mo. USD LIBOR + 2.050% | | | | | | | | |
4.760% FRN 1/20/34 (b) | | | 250,000 | | | | 227,415 | |
Rad CLO 4 Ltd., Series 2019-4A, Class B1, 3 mo. USD LIBOR + 2.100% | | | | | | | | |
4.883% FRN 4/25/32 (b) | | | 250,000 | | | | 241,213 | |
Renew, Series 2021-1, Class M | | | | | | | | |
3.210% 11/20/56 (b) | | | 186,342 | | | | 161,651 | |
Rockford Tower CLO Ltd., Series 2018-1A, Class B, 3 mo. USD LIBOR + 1.720% | | | | | | | | |
4.704% FRN 5/20/31 (b) | | | 250,000 | | | | 236,345 | |
Sierra Receivables Funding LLC, Series 2020-2A, Class C | | | | | | | | |
3.510% 7/20/37 (b) | | | 52,830 | | | | 49,379 | |
Slam Ltd., Series 2021-1A, Class B | | | | | | | | |
3.422% 6/15/46 (b) | | | 270,117 | | | | 214,326 | |
Steele Creek CLO Ltd., Series 2018-2A, Class C, 3 mo. USD LIBOR + 2.300% | | | | | | | | |
5.261% FRN 8/18/31 (b) | | | 490,000 | | | | 443,523 | |
Store Master Funding I-VII and XIV, Series 2019-1, Class A4 | | | | | | | | |
4.490% 11/20/49 (b) | | | 759,092 | | | | 619,941 | |
Sunnova Helios II Issuer LLC, Series 2018-1A, Class A | | | | | | | | |
4.870% 7/20/48 (b) | | | 105,057 | | | | 95,609 | |
SuttonPark Structured Settlements LLC, Series 2017-1A, Class A | | | | | | | | |
4.190% 1/15/71 (b) | | | 271,314 | | | | 240,715 | |
The accompanying notes are an integral part of the financial statements.
88
MassMutual Diversified Bond Fund — Portfolio of Investments (Continued) |
| | | Principal
Amount | | | Value | |
THL Credit Wind River CLO Ltd., Series 2018-3A, Class B, 3 mo. USD LIBOR + 1.700% | | | | | | | | |
4.410% FRN 1/20/31 (b) | | $ | 490,000 | | | $ | 461,510 | |
Thrust Engine Leasing | | | | | | | | |
Series 2021-1A, Class B, 6.121% 7/15/40 (b) | | | 1,118,939 | | | | 904,608 | |
Series 2021-1A, Class C, 7.386% 7/15/40 (b) | | | 370,340 | | | | 304,066 | |
TICP CLO XIV Ltd., Series 2019-14A, Class A2R, 3 mo. USD LIBOR + 1.650% | | | | | | | | |
4.360% FRN 10/20/32 (b) | | | 250,000 | | | | 236,784 | |
WAVE LLC, Series 2019-1, Class B | | | | | | | | |
4.581% 9/15/44 (b) | | | 608,521 | | | | 393,721 | |
Willis Engine Structured Trust III, Series 2017-A, Class A, | | | | | | | | |
4.690% STEP 8/15/42 (b) | | | 329,891 | | | | 272,948 | |
Willis Engine Structured Trust IV, Series 2018-A, Class A, | | | | | | | | |
4.750% STEP 9/15/43 (b) | | | 197,754 | | | | 142,128 | |
| | | | | | | | 19,728,443 | |
Student Loans Asset-Backed Securities — 3.3% |
Access Group, Inc., Series 2015-1, Class B, 1 mo. USD LIBOR + 1.500% | | | | | | | | |
4.584% FRN 7/25/58 (b) | | | 130,000 | | | | 119,000 | |
College Avenue Student Loans LLC | | | | | | | | |
Series 2021-A, Class C, 2.920% 7/25/51 (b) | | | 576,000 | | | | 513,781 | |
Series 2021-A, Class D, 4.120% 7/25/51 (b) | | | 284,000 | | | | 252,724 | |
Series 2019-A, Class C, 4.460% 12/28/48 (b) | | | 170,250 | | | | 161,582 | |
Series 2019-A, Class D, 5.500% 12/28/48 (b) | | | 119,633 | | | | 113,390 | |
Commonbond Student Loan Trust, Series 2017-AGS, Class C | | | | | | | | |
5.280% 5/25/41 (b) | | | 33,079 | | | | 30,376 | |
Credit Suisse ABS Repackaging Trust, Series 2013-A, Class B | | | | | | | | |
2.500% 1/25/30 (b) | | | 60,446 | | | | 56,933 | |
EDvestinU Private Education Loan Issue No 3 LLC, Series 2021-A, Class B | | | | | | | | |
3.500% 11/25/50 (b) | | | 600,000 | | | | 483,403 | |
Goal Capital Funding Trust, Series 2006-1, Class B, 3 mo. USD LIBOR + .450% | | | | | | | | |
3.447% FRN 8/25/42 | | | 457,916 | | | | 438,557 | |
| | | Principal
Amount | | | Value | |
Navient Student Loan Trust | | | | | | | | |
Series 2018-1A, Class B, 1 mo. USD LIBOR + 1.200% 4.284% FRN 3/25/67 (b) | | $ | 250,000 | | | $ | 239,063 | |
Series 2018-EA, Class B, 4.440% 12/15/59 (b) | | | 140,000 | | | | 130,796 | |
Nelnet Private Education Loan Trust, Series 2016-A, Class A1A, 1 mo. USD LIBOR + 1.750% | | | | | | | | |
4.834% FRN 12/26/40 (b) | | | 5,624 | | | | 5,623 | |
Nelnet Student Loan Trust | | | | | | | | |
Series 2005-4, Class A4R2, 1.191% FRN 3/22/32 (e) | | | 120,000 | | | | 118,532 | |
Series 2006-3, Class B, 3 mo. USD LIBOR + .250% 3.891% FRN 6/25/41 | | | 88,770 | | | | 80,534 | |
Series 2012-2A, Class B, 1 mo. USD LIBOR + 1.000% 4.084% FRN 11/25/36 (b) | | | 200,000 | | | | 196,944 | |
Series 2012-1A, Class B, 1 mo. USD LIBOR + 1.000% 4.084% FRN 6/25/42 (b) | | | 150,000 | | | | 148,291 | |
Series 2012-4A, Class B, 1 mo. USD LIBOR + 1.000% 4.084% FRN 7/26/49 (b) | | | 350,000 | | | | 329,967 | |
Series 2014-2A, Class B, 1 mo. USD LIBOR + 1.500% 4.584% FRN 6/25/41 (b) | | | 100,000 | | | | 99,999 | |
Series 2014-5A, Class B, 1 mo. USD LIBOR + 1.500% 4.584% FRN 5/26/54 (b) | | | 100,000 | | | | 99,999 | |
SLM Student Loan Trust | | | | | | | | |
Series 2006-7, Class B, 3 mo. USD LIBOR + .200% 2.983% FRN 1/27/42 | | | 229,645 | | | | 209,202 | |
Series 2006-4, Class B, 3 mo. USD LIBOR + .200% 2.983% FRN 1/25/70 | | | 125,152 | | | | 117,598 | |
Series 2006-5, Class B, 3 mo. USD LIBOR + .210% 2.993% FRN 10/25/40 | | | 116,609 | | | | 109,339 | |
Series 2005-6, Class B, 3 mo. USD LIBOR + .290% 3.073% FRN 1/25/44 | | | 244,757 | | | | 223,009 | |
Series 2005-9, Class B, 3 mo. USD LIBOR + .300% 3.083% FRN 1/25/41 | | | 313,290 | | | | 294,001 | |
Series 2004-3, Class B, 3 mo. USD LIBOR + .470% 3.253% FRN 10/25/64 | | | 83,386 | | | | 79,639 | |
SMB Private Education Loan Trust, Series 2019-A, Class B | | | | | | | | |
4.000% 11/17/42 (b) | | | 185,000 | | | | 170,983 | |
The accompanying notes are an integral part of the financial statements.
89
MassMutual Diversified Bond Fund — Portfolio of Investments (Continued) |
| | | Principal
Amount | | | Value | |
SoFi Professional Loan Program LLC | | | | | | | | |
Series 2017-C, Class C, 4.210% VRN 7/25/40 (b) (e) | | $ | 180,000 | | | $ | 163,016 | |
Series 2017-A, Class C, 4.430% VRN 3/26/40 (b) (e) | | | 170,000 | | | | 157,607 | |
South Carolina Student Loan Corp., Series 2015-A, Class A, 1 mo. USD LIBOR + 1.500% | | | | | | | | |
4.584% FRN 1/25/36 | | | 51,292 | | | | 51,320 | |
| | | | | | | | 5,195,208 | |
Whole Loan Collateral Collateralized Mortgage Obligations — 2.1% |
Angel Oak Mortgage Trust I LLC | | | | | | | | |
Series 2019-4, Class M1, 3.459% VRN 7/26/49 (b) (e) | | | 492,000 | | | | 478,952 | |
Series 2019-2, Class M1, 4.065% VRN 3/25/49 (b) (e) | | | 260,000 | | | | 256,416 | |
Bank of America Mortgage Securities, Series 2004-G, Class 2A7, | | | | | | | | |
3.986% VRN 8/25/34 (e) | | | 5,009 | | | | 4,757 | |
New Residential Mortgage Loan Trust, Series 2021-NQM3, Class B1, | | | | | | | | |
3.398% VRN 11/27/56 (b) (e) | | | 3,600,000 | | | | 2,543,248 | |
| | | | | | | | 3,283,373 | |
Whole Loan Collateral Support Collateralized Mortgage Obligations — 0.1% |
JP Morgan Mortgage Trust, Series 2017-1, Class A11, | | | | | | | | |
3.450% VRN 1/25/47 (b) (e) | | | 84,385 | | | | 75,875 | |
| | | | | | | | | |
TOTAL NON-U.S. GOVERNMENT AGENCY OBLIGATIONS (Cost $56,173,698) | | | | | | | 48,395,305 | |
| | | | | | | | | |
SOVEREIGN DEBT OBLIGATIONS — 0.3% |
Mexico Government International Bond | | | | | | | | |
3.500% 2/12/34 | | | 415,000 | | | | 315,628 | |
4.750% 3/08/44 | | | 214,000 | | | | 163,837 | |
| | | | | | | | 479,465 | |
| | | | | | | | | |
TOTAL SOVEREIGN DEBT OBLIGATIONS (Cost $654,439) | | | | | | | 479,465 | |
| | | | | | | | | |
U.S. GOVERNMENT AGENCY OBLIGATIONS AND INSTRUMENTALITIES (f) — 15.4% |
Collateralized Mortgage Obligations — 0.0% |
Federal Home Loan Mortgage Corp. Series 2178, Class PB 7.000% 8/15/29 | | | 3,846 | | | | 3,950 | |
| | | Principal
Amount | | | Value | |
Pass-Through Securities — 15.4% |
Federal Home Loan Mortgage Corp. | | | | | | | | |
Pool #RA4245 2.000% 12/01/50 | | $ | 488,408 | | | $ | 398,370 | |
Pool #RA4255 2.000% 1/01/51 | | | 1,013,694 | | | | 827,453 | |
Pool #SD0905 3.000% 3/01/52 | | | 767,558 | | | | 671,871 | |
Pool #SD1523 4.000% 8/01/52 | | | 1,117,177 | | | | 1,041,765 | |
Pool #SD1603 4.000% 9/01/52 | | | 700,000 | | | | 650,036 | |
Federal National Mortgage Association | | | | | | | | |
Pool #FM8596 2.500% 9/01/51 | | | 495,953 | | | | 419,793 | |
Pool #MA3029 3.000% 6/01/32 | | | 267,107 | | | | 252,064 | |
Pool #MA3090 3.000% 8/01/32 | | | 107,410 | | | | 101,361 | |
Pool #AR3007 3.000% 2/01/43 | | | 88,836 | | | | 79,475 | |
Pool #FS1075 3.000% 3/01/52 | | | 775,374 | | | | 679,440 | |
Pool #CB3304 3.000% 4/01/52 | | | 1,168,449 | | | | 1,023,881 | |
Pool #CB3305 3.000% 4/01/52 | | | 1,420,816 | | | | 1,243,247 | |
Pool #AS1304 3.500% 12/01/28 | | | 71,604 | | | | 68,301 | |
Pool #MA1356 3.500% 2/01/43 | | | 497,393 | | | | 455,583 | |
Pool #CA6096 3.500% 6/01/50 | | | 1,024,004 | | | | 930,008 | |
Pool #FM4017 3.500% 8/01/50 | | | 67,093 | | | | 60,893 | |
Pool #CB3842 3.500% 6/01/52 | | | 2,264,434 | | | | 2,045,253 | |
Pool #CA1909 4.500% 6/01/48 | | | 377,653 | | | | 365,437 | |
Pool #CB3866 4.500% 6/01/52 | | | 880,174 | | | | 840,426 | |
Pool #CB4129 4.500% 7/01/52 | | | 1,129,406 | | | | 1,078,050 | |
Pool #AD6437 5.000% 6/01/40 | | | 29,447 | | | | 29,581 | |
Pool #AD6996 5.000% 7/01/40 | | | 182,006 | | | | 182,910 | |
Pool #AL8173 5.000% 2/01/44 | | | 60,611 | | | | 61,147 | |
Government National Mortgage Association | | | | | | | | |
Pool #579140 6.500% 1/15/32 | | | 438 | | | | 454 | |
Pool #587280 6.500% 9/15/32 | | | 654 | | | | 674 | |
Pool #550659 6.500% 9/15/35 | | | 47,843 | | | | 50,312 | |
Pool #538689 6.500% 12/15/35 | | | 7,331 | | | | 7,733 | |
Pool #780651 7.000% 10/15/27 | | | 354 | | | | 364 | |
Pool #462384 7.000% 11/15/27 | | | 198 | | | | 205 | |
Pool #482668 7.000% 8/15/28 | | | 586 | | | | 605 | |
Pool #581417 7.000% 7/15/32 | | | 535 | | | | 554 | |
Pool #423836 8.000% 8/15/26 | | | 233 | | | | 241 | |
Government National Mortgage Association II | | | | | | | | |
Pool #MA6038 3.000% 7/20/49 | | | 495,602 | | | | 445,133 | |
Pool #MA6283 3.000% 11/20/49 | | | 882,222 | | | | 789,762 | |
Pool #MA6409 3.000% 1/20/50 | | | 919,277 | | | | 821,713 | |
Pool #MA4321 3.500% 3/20/47 | | | 580,904 | | | | 535,237 | |
Government National Mortgage Association II TBA 3.000% 10/20/52 (d) | | | 975,000 | | | | 861,199 | |
The accompanying notes are an integral part of the financial statements.
90
MassMutual Diversified Bond Fund — Portfolio of Investments (Continued) |
| | | Principal
Amount | | | Value | |
Uniform Mortgage Backed Securities TBA | | | | | | | | |
3.000% 10/13/52 (d) | | $ | 1,450,000 | | | $ | 1,261,500 | |
3.500% 10/13/52 (d) | | | 1,600,000 | | | | 1,439,500 | |
4.000% 10/13/52 (d) | | | 4,775,000 | | | | 4,428,067 | |
| | | | | | | | 24,149,598 | |
| | | | | | | | | |
TOTAL U.S. GOVERNMENT AGENCY OBLIGATIONS AND INSTRUMENTALITIES (Cost $26,468,224) | | | | | | | 24,153,548 | |
| | | | | | | | | |
U.S. TREASURY OBLIGATIONS — 3.3% |
U.S. Treasury Bonds & Notes — 3.3% |
U.S. Treasury Bond | | | | | | | | |
2.250% 8/15/49 (g) | | | 3,130,000 | | | | 2,290,280 | |
U.S. Treasury Note | | | | | | | | |
1.875% 2/28/27 | | | 1,000,000 | | | | 911,250 | |
3.000% 7/15/25 | | | 2,000,000 | | | | 1,933,438 | |
| | | | | | | | 5,134,968 | |
| | | | | | | | | |
TOTAL U.S. TREASURY OBLIGATIONS (Cost $5,606,819) | | | | | | | 5,134,968 | |
| | | | | | | | | |
TOTAL BONDS & NOTES (Cost $175,273,277) | | | | | | | 148,532,713 | |
| | | | | | | | | |
TOTAL PURCHASED OPTIONS (#) — 0.0% (Cost $4,746) | | | | | | | 274 | |
| | | | | | | | | |
| | | Number of
Shares | | | | | |
WARRANTS — 0.0% |
Consumer, Non-cyclical — 0.0% |
Chemicals — 0.0% |
Hercules LLC, Expires 3/31/29, Strike 0.09 (h) (i) (j) | | | 150 | | | | 4,115 | |
| | | | | | | | | |
TOTAL WARRANTS (Cost $0) | | | | | | | 4,115 | |
| | | | | | | | | |
| | | Number of
Shares | | | Value | |
MUTUAL FUNDS — 0.9% |
Diversified Financial Services — 0.9% |
State Street Navigator Securities Lending Government Money Market Portfolio (k) | | | 1,347,973 | | | $ | 1,347,973 | |
| | | | | | | | | |
TOTAL MUTUAL FUNDS (Cost $1,347,973) | | | | | | | 1,347,973 | |
| | | | | | | | | |
TOTAL LONG-TERM INVESTMENTS (Cost $178,236,621) | | | | | | | 150,977,748 | |
| | | | | | | | | |
| | | Principal
Amount | | | | | |
SHORT-TERM INVESTMENTS — 9.1% |
Commercial Paper — 7.0% |
Amcor Flexibles North America, Inc. | | | | | | | | |
3.722% 10/20/22 (b) | | $ | 2,000,000 | | | | 1,996,200 | |
American Electric Power Co., Inc. | | | | | | | | |
3.766% 11/03/22 (b) | | | 2,000,000 | | | | 1,993,290 | |
Evergy Kansas Central, Inc. | | | | | | | | |
3.766% 11/03/22 (b) | | | 2,000,000 | | | | 1,993,291 | |
HP, Inc. | | | | | | | | |
3.711% 10/24/22 (b) | | | 2,000,000 | | | | 1,995,440 | |
National Grid PLC, JP Morgan Chase Bank N.A., | | | | | | | | |
3.026% 10/14/22 (b) | | | 2,000,000 | | | | 1,997,354 | |
WPP CP LLC | | | | | | | | |
3.761% 10/14/22 (b) | | | 1,000,000 | | | | 998,677 | |
| | | | | | | | 10,974,252 | |
Repurchase Agreement — 2.1% |
Fixed Income Clearing Corp., Repurchase Agreement, dated 9/30/22, 0.830%, due 10/03/22 (l) | | | 3,312,134 | | | | 3,312,134 | |
| | | | | | | | | |
TOTAL SHORT-TERM INVESTMENTS (Cost $14,286,559) | | | | | | | 14,286,386 | |
| | | | | | | | | |
TOTAL INVESTMENTS — 105.6% (Cost $192,523,180) (m) | | | | | | | 165,264,134 | |
| | | | | | | | | |
Other Assets/(Liabilities) — (5.6)% | | | | | | | (8,715,952 | ) |
| | | | | | | | | |
NET ASSETS — 100.0% | | | | | | $ | 156,548,182 | |
The accompanying notes are an integral part of the financial statements.
91
MassMutual Diversified Bond Fund — Portfolio of Investments (Continued) |
Abbreviation Legend
CLO | Collateralized Loan Obligation |
Notes to Portfolio of Investments
Percentages are stated as a percent of net assets.
(a) | Denotes all or a portion of security on loan. The total value of securities on loan as of September 30, 2022, was $1,553,980 or 0.99% of net assets. The Fund received $240,969 of non-cash collateral (U.S. Treasury and/or Agency obligations) related to securities lending activity. This amount is not reflected on either the Portfolio of Investments or the Statement of Assets and Liabilities. (Note 2). |
(b) | Security is exempt from registration under Regulation S or Rule 144A of the Securities Act of 1933. These securities are considered restricted and may be resold in transactions exempt from registration. At September 30, 2022, the aggregate market value of these securities amounted to $82,148,039 or 52.47% of net assets. |
(c) | Security is perpetual and has no stated maturity date. |
(d) | A portion of this security is purchased on a when-issued, delayed-delivery or forward commitment basis. (Note 2). |
(e) | Certain variable rate securities are not based on a published reference rate and spread but are determined by the issuer or agent and are based on current market conditions. These securities do not indicate a reference rate and spread in their description above. The rates shown are the current interest rates at September 30, 2022. |
(f) | May contain securities that are issued by a U.S. Government Agency, but are unsecured and are not guaranteed by a U.S. Government Agency. |
(g) | All or a portion of this security is pledged/held as collateral for open derivatives. (Note 2). |
(h) | Investment is valued using significant unobservable inputs. |
(i) | This security is fair valued in good faith in accordance with procedures approved by the Board of Trustees. At September 30, 2022, these securities amounted to a value of $4,115 or 0.00% of net assets. |
(j) | Non-income producing security. |
(k) | Represents investment of security lending cash collateral. (Note 2). |
(l) | Maturity value of $3,312,363. Collateralized by U.S. Government Agency obligations with a rate of 0.000%, maturity date of 3/30/23, and an aggregate market value, including accrued interest, of $3,378,401. |
(m) | See Note 6 for aggregate cost for federal tax purposes. |
Country weightings, as a percentage of net assets, is as follows:
United States | | | 77.3 | % |
Cayman Islands | | | 7.8 | % |
United Kingdom | | | 2.2 | % |
Canada | | | 1.6 | % |
Mexico | | | 1.1 | % |
Israel | | | 1.0 | % |
Netherlands | | | 0.9 | % |
Bermuda | | | 0.8 | % |
Germany | | | 0.6 | % |
France | | | 0.6 | % |
Republic of Korea | | | 0.6 | % |
Ireland | | | 0.4 | % |
United Arab Emirates | | | 0.4 | % |
South Africa | | | 0.3 | % |
Switzerland | | | 0.3 | % |
Liberia | | | 0.2 | % |
Australia | | | 0.2 | % |
Finland | | | 0.2 | % |
Total Long-Term Investments | | | 96.5 | % |
Short-Term Investments and Other Assets and Liabilities | | | 3.5 | % |
Net Assets | | | 100.0 | % |
The accompanying notes are an integral part of the financial statements.
92
MassMutual Diversified Bond Fund — Portfolio of Investments (Continued) |
(#) OTC Options Purchased
Description | Counterparty | | Expiration
Date | | | Exercise
Price | | | No. of
Contracts | | | Notional
Amount | | | Value | | | Premiums
Paid
(Received) | | | Unrealized
Appreciation/
(Depreciation) | |
Put | | | | | | | | | | | | | | | | | | | | | | | | | | | | | | | | | |
USD Put JPY Call | Goldman Sachs International | | | 10/21/22 | | | | 132.05 | | | | 560,000 | | | | USD | | | | 560,000 | | | $ | 274 | | | $ | 4,746 | | | $ | (4,472 | ) |
OTC Options Written
Description | Counterparty | | Expiration
Date | | | Exercise
Price | | | No. of
Contracts | | | Notional
Amount | | | Value | | | Premiums
Paid
(Received) | | | Unrealized
Appreciation/
(Depreciation) | |
Call | | | | | | | | | | | | | | | | | | | | | | | | | | | | | | | | | |
USD Call JPY Put | Goldman Sachs International | | | 10/21/22 | | | | 142.55 | | | | 560,000 | | | | USD | | | | 560,000 | | | $ | (11,185 | ) | | $ | (4,523 | ) | | $ | (6,662 | ) |
The accompanying notes are an integral part of the financial statements.
93
MassMutual Diversified Bond Fund — Portfolio of Investments (Continued) |
Forward contracts
Counterparty | | Settlement
Date | | | Currency Purchased | | | Currency Sold | | | Unrealized
Appreciation
(Depreciation) | |
Bank of America N.A.* | | | 10/18/22 | | | | NOK | | | | 1,062,376 | | | | USD | | | | 104,326 | | | $ | (6,754 | ) |
Bank of America N.A.* | | | 10/18/22 | | | | USD | | | | 103,697 | | | | NOK | | | | 1,062,376 | | | | 6,125 | |
Bank of America N.A.* | | | 11/15/22 | | | | TRY | | | | 2,933,903 | | | | USD | | | | 155,179 | | | | (5,752 | ) |
Bank of America N.A.* | | | 11/15/22 | | | | USD | | | | 143,369 | | | | TRY | | | | 2,933,903 | | | | (6,058 | ) |
Bank of America N.A.* | | | 11/15/22 | | | | USD | | | | 18,615 | | | | RON | | | | 90,373 | | | | 825 | |
Bank of America N.A.* | | | 11/22/22 | | | | USD | | | | 484,442 | | | | CNH | | | | 3,284,470 | | | | 24,100 | |
Bank of America N.A.* | | | 11/22/22 | | | | USD | | | | 158,574 | | | | PHP | | | | 8,929,309 | | | | 6,426 | |
BNP Paribas SA* | | | 10/25/22 | | | | USD | | | | 319,000 | | | | INR | | | | 25,577,420 | | | | 5,268 | |
BNP Paribas SA* | | | 10/25/22 | | | | USD | | | | 309,423 | | | | CNH | | | | 2,084,735 | | | | 17,363 | |
BNP Paribas SA* | | | 11/15/22 | | | | PLN | | | | 745,805 | | | | USD | | | | 159,000 | | | | (9,544 | ) |
BNP Paribas SA* | | | 11/22/22 | | | | USD | | | | 265,000 | | | | SGD | | | | 371,207 | | | | 6,409 | |
Citibank N.A.* | | | 10/11/22 | | | | COP | | | | 250,030,500 | | | | USD | | | | 57,000 | | | | (2,835 | ) |
Citibank N.A.* | | | 10/11/22 | | | | USD | | | | 123,173 | | | | COP | | | | 539,399,400 | | | | 6,320 | |
Citibank N.A.* | | | 10/18/22 | | | | NOK | | | | 4,325,003 | | | | USD | | | | 427,000 | | | | (29,777 | ) |
Citibank N.A.* | | | 11/08/22 | | | | CLP | | | | 231,295,350 | | | | USD | | | | 254,618 | | | | (17,000 | ) |
Citibank N.A.* | | | 11/08/22 | | | | USD | | | | 76,779 | | | | ARS | | | | 13,490,000 | | | | (5,521 | ) |
Citibank N.A.* | | | 11/08/22 | | | | USD | | | | 36,392 | | | | COP | | | | 159,438,815 | | | | 2,042 | |
Citibank N.A.* | | | 11/08/22 | | | | USD | | | | 249,062 | | | | CLP | | | | 231,295,350 | | | | 11,443 | |
Citibank N.A.* | | | 11/15/22 | | | | USD | | | | 74,548 | | | | EUR | | | | 74,026 | | | | 1,788 | |
Citibank N.A.* | | | 12/15/22 | | | | USD | | | | 156,000 | | | | EGP | | | | 2,746,682 | | | | 27,876 | |
HSBC Bank USA* | | | 10/11/22 | | | | PEN | | | | 404,323 | | | | USD | | | | 103,588 | | | | (2,194 | ) |
HSBC Bank USA* | | | 10/11/22 | | | | USD | | | | 100,551 | | | | PEN | | | | 395,258 | | | | 1,431 | |
HSBC Bank USA* | | | 10/18/22 | | | | TRY | | | | 4,672,907 | | | | USD | | | | 250,597 | | | | (3,606 | ) |
HSBC Bank USA* | | | 10/18/22 | | | | USD | | | | 133,436 | | | | RON | | | | 666,311 | | | | 1,723 | |
HSBC Bank USA* | | | 10/18/22 | | | | USD | | | | 236,000 | | | | TRY | | | | 4,672,907 | | | | (10,991 | ) |
HSBC Bank USA* | | | 10/25/22 | | | | THB | | | | 5,336,145 | | | | USD | | | | 145,844 | | | | (4,234 | ) |
HSBC Bank USA* | | | 10/25/22 | | | | USD | | | | 145,000 | | | | THB | | | | 5,336,145 | | | | 3,390 | |
HSBC Bank USA* | | | 11/15/22 | | | | ILS | | | | 914,455 | | | | USD | | | | 278,776 | | | | (21,476 | ) |
HSBC Bank USA* | | | 11/15/22 | | | | CZK | | | | 6,376,112 | | | | USD | | | | 265,000 | | | | (12,027 | ) |
HSBC Bank USA* | | | 11/15/22 | | | | USD | | | | 272,847 | | | | HUF | | | | 108,238,241 | | | | 25,151 | |
HSBC Bank USA* | | | 11/15/22 | | | | USD | | | | 147,267 | | | | CHF | | | | 139,006 | | | | 5,845 | |
HSBC Bank USA* | | | 11/22/22 | | | | KRW | | | | 509,196,130 | | | | USD | | | | 388,788 | | | | (32,475 | ) |
HSBC Bank USA* | | | 11/22/22 | | | | THB | | | | 4,376,015 | | | | USD | | | | 119,856 | | | | (3,522 | ) |
HSBC Bank USA* | | | 11/22/22 | | | | USD | | | | 209,294 | | | | INR | | | | 16,750,850 | | | | 4,379 | |
HSBC Bank USA* | | | 11/22/22 | | | | USD | | | | 124,107 | | | | THB | | | | 4,376,015 | | | | 7,773 | |
JP Morgan Chase Bank N.A.* | | | 10/18/22 | | | | RON | | | | 666,311 | | | | USD | | | | 137,725 | | | | (6,012 | ) |
JP Morgan Chase Bank N.A.* | | | 10/18/22 | | | | USD | | | | 382,293 | | | | CHF | | | | 372,870 | | | | 3,934 | |
JP Morgan Chase Bank N.A.* | | | 11/15/22 | | | | RON | | | | 90,373 | | | | USD | | | | 18,614 | | | | (824 | ) |
JP Morgan Chase Bank N.A.* | | | 11/15/22 | | | | USD | | | | 387,000 | | | | EUR | | | | 378,138 | | | | 15,330 | |
Morgan Stanley & Co. LLC* | | | 11/15/22 | | | | EUR | | | | 268,733 | | | | USD | | | | 277,029 | | | | (12,893 | ) |
Morgan Stanley & Co. LLC* | | | 11/15/22 | | | | USD | | | | 71,452 | | | | EUR | | | | 71,106 | | | | 1,562 | |
Morgan Stanley & Co. LLC* | | | 11/22/22 | | | | MYR | | | | 1,759,734 | | | | USD | | | | 395,179 | | | | (15,117 | ) |
Morgan Stanley & Co. LLC* | | | 11/22/22 | | | | JPY | | | | 67,741,432 | | | | USD | | | | 507,674 | | | | (37,334 | ) |
Morgan Stanley & Co. LLC* | | | 11/22/22 | | | | USD | | | | 138,000 | | | | MYR | | | | 618,930 | | | | 4,325 | |
| | | | | | | | | | | | | | | | | | | | | | | $ | (55,118 | ) |
The accompanying notes are an integral part of the financial statements.
94
MassMutual Diversified Bond Fund — Portfolio of Investments (Continued) |
Futures contracts
| | Expiration
Date | | | Number of
Contracts | | | Notional
Amount | | | Value/ Net
Unrealized
Appreciation/
(Depreciation) | |
Long | | | | | | | | | | | | | | | | |
U.S. Treasury Long Bond | | | 12/20/22 | | | | 54 | | | $ | 7,345,590 | | | $ | (519,652 | ) |
U.S. Treasury Ultra Bond | | | 12/20/22 | | | | 67 | | | | 9,897,905 | | | | (718,905 | ) |
U.S. Treasury Note 2 Year | | | 12/30/22 | | | | 84 | | | | 17,524,428 | | | | (271,615 | ) |
U.S. Treasury Note 5 Year | | | 12/30/22 | | | | 36 | | | | 4,011,300 | | | | (141,019 | ) |
| | | | | | | | | | | | | | $ | (1,651,191 | ) |
Short | | | | | | | | | | | | | | | | |
U.S. Treasury Ultra 10 Year | | | 12/20/22 | | | | 18 | | | $ | (2,269,231 | ) | | $ | 136,512 | |
* Contracts are subject to a master netting agreement or similar agreement.
��
Currency Legend
The accompanying notes are an integral part of the financial statements.
95
MassMutual High Yield Fund — Portfolio of Investments |
September 30, 2022 |
| | | Principal
Amount | | | Value | |
BONDS & NOTES — 97.0% |
BANK LOANS — 2.6% |
Computers — 0.0% |
SonicWall US Holdings, Inc., 2nd Lien Term Loan, 3 mo. USD LIBOR + 7.500% | | | | | | | | |
10.480% VRN 5/18/26 | | $ | 51,897 | | | $ | 48,212 | |
Food — 0.3% |
Florida Food Products, LLC, Term Loan, 1 mo. USD LIBOR + 5.000% | | | | | | | | |
8.115% VRN 10/18/28 | | | 1,227,527 | | | | 1,123,187 | |
Internet — 0.4% |
TouchTunes Interactive Networks, Inc., 2022 Term Loan, 6 mo. USD SOFR CME + 5.000% | | | | | | | | |
8.981% VRN 4/02/29 | | | 1,551,590 | | | | 1,485,648 | |
Packaging & Containers — 0.2% |
Clydesdale Acquisition Holdings, Inc., Term Loan B, 1 mo. USD SOFR CME + 4.175% | | | | | | | | |
7.309% VRN 4/13/29 | | | 654,129 | | | | 616,066 | |
Pharmaceuticals — 0.2% |
Perrigo Investments, LLC, Term Loan B, 1 mo. USD SOFR CME + 2.500% | | | | | | | | |
5.634% VRN 4/20/29 | | | 806,209 | | | | 792,100 | |
Software — 1.5% |
Finastra USA, Inc., USD 2nd Lien Term Loan, 3 mo. USD LIBOR + 7.250% | | | | | | | | |
8.489% VRN 6/13/25 | | | 4,430,158 | | | | 3,574,605 | |
Ivanti Software, Inc., 2021 Term Loan B, 3 mo. USD LIBOR + 4.250% | | | | | | | | |
7.332% VRN 12/01/27 | | | 1,223,850 | | | | 947,725 | |
Quest Software US Holdings, Inc., 2022 2nd Lien Term Loan, 3 mo. USD SOFR + 7.500% | | | | | | | | |
10.227% VRN 2/01/30 | | | 2,522,327 | | | | 1,447,185 | |
| | | | | | | | 5,969,515 | |
| | | | | | | | | |
TOTAL BANK LOANS (Cost $12,127,004) | | | | | | | 10,034,728 | |
| | | | | | | | | |
CORPORATE DEBT — 94.4% |
Advertising — 0.8% |
CMG Media Corp. | | | | | | | | |
8.875% 12/15/27 (a) | | | 2,314,000 | | | | 1,767,815 | |
Stagwell Global LLC | | | | | | | | |
5.625% 8/15/29 (a) | | | 1,514,000 | | | | 1,245,371 | |
| | | | | | | | 3,013,186 | |
| | | Principal
Amount | | | Value | |
Aerospace & Defense — 0.1% |
TransDigm, Inc. | | | | | | | | |
8.000% 12/15/25 (a) | | $ | 221,000 | | | $ | 224,140 | |
Agriculture — 0.2% |
Darling Ingredients, Inc. | | | | | | | | |
6.000% 6/15/30 (a) | | | 938,000 | | | | 892,685 | |
Airlines — 2.6% |
American Airlines, Inc. | | | | | | | | |
11.750% 7/15/25 (a) | | | 2,318,000 | | | | 2,420,780 | |
American Airlines, Inc. /AAdvantage Loyalty IP Ltd. | | | | | | | | |
5.500% 4/20/26 (a) | | | 3,925,000 | | | | 3,686,242 | |
5.750% 4/20/29 (a) | | | 1,488,000 | | | | 1,298,280 | |
Mileage Plus Holdings LLC / Mileage Plus Intellectual Property Assets Ltd. | | | | | | | | |
6.500% 6/20/27 (a) | | | 1,222,650 | | | | 1,192,591 | |
United Airlines, Inc. | | | | | | | | |
4.375% 4/15/26 (a) | | | 758,000 | | | | 676,515 | |
4.625% 4/15/29 (a) | | | 795,000 | | | | 659,850 | |
| | | | | | | | 9,934,258 | |
Auto Manufacturers — 1.6% |
Ford Motor Co. | | | | | | | | |
3.250% 2/12/32 | | | 2,869,000 | | | | 2,059,942 | |
Ford Motor Credit Co. LLC | | | | | | | | |
4.000% 11/13/30 | | | 2,330,000 | | | | 1,817,400 | |
4.125% 8/17/27 | | | 1,560,000 | | | | 1,344,096 | |
4.389% 1/08/26 | | | 712,000 | | | | 644,809 | |
5.113% 5/03/29 | | | 322,000 | | | | 279,399 | |
| | | | | | | | 6,145,646 | |
Auto Parts & Equipment — 0.4% |
Adient Global Holdings Ltd. | | | | | | | | |
4.875% 8/15/26 (a) | | | 1,734,000 | | | | 1,519,730 | |
Biotechnology — 0.4% |
Emergent BioSolutions, Inc. | | | | | | | | |
3.875% 8/15/28 (a) | | | 2,529,000 | | | | 1,681,785 | |
Building Materials — 1.4% |
Jeld-Wen, Inc. | | | | | | | | |
4.875% 12/15/27 (a) | | | 474,000 | | | | 337,725 | |
New Enterprise Stone & Lime Co., Inc. | | | | | | | | |
5.250% 7/15/28 (a) | | | 2,072,000 | | | | 1,697,817 | |
9.750% 7/15/28 (a) | | | 3,764,000 | | | | 3,174,989 | |
| | | | | | | | 5,210,531 | |
Chemicals — 4.8% |
Celanese US Holdings LLC | | | | | | | | |
6.379% 7/15/32 (b) | | | 4,728,000 | | | | 4,387,946 | |
Consolidated Energy Finance SA | | | | | | | | |
5.625% 10/15/28 (a) | | | 4,296,000 | | | | 3,446,248 | |
The accompanying notes are an integral part of the financial statements.
96
MassMutual High Yield Fund — Portfolio of Investments (Continued) |
| | | Principal
Amount | | | Value | |
LSF11 A5 HoldCo LLC | | | | | | | | |
6.625% 10/15/29 (a) (b) | | $ | 2,205,000 | | | $ | 1,653,750 | |
Methanex Corp. | | | | | | | | |
5.125% 10/15/27 | | | 2,056,000 | | | | 1,727,040 | |
5.250% 12/15/29 | | | 1,618,000 | | | | 1,286,156 | |
Olympus Water US Holding Corp. | | | | | | | | |
4.250% 10/01/28 (a) | | | 2,503,000 | | | | 1,924,181 | |
6.250% 10/01/29 (a) (b) | | | 1,772,000 | | | | 1,213,820 | |
Polar US Borrower LLC / Schenectady International Group, Inc. | | | | | | | | |
6.750% 5/15/26 (a) | | | 1,334,000 | | | | 733,687 | |
Tronox, Inc. | | | | | | | | |
4.625% 3/15/29 (a) | | | 1,296,000 | | | | 959,040 | |
Vibrantz Technologies, Inc. | | | | | | | | |
9.000% 2/15/30 (a) | | | 1,743,000 | | | | 1,134,165 | |
| | | | | | | | 18,466,033 | |
Coal — 0.6% |
Coronado Finance Pty Ltd. | | | | | | | | |
10.750% 5/15/26 (a) | | | 2,339,000 | | | | 2,432,537 | |
Commercial Services — 4.2% |
Alta Equipment Group, Inc. | | | | | | | | |
5.625% 4/15/26 (a) | | | 2,194,000 | | | | 1,838,506 | |
APi Group DE, Inc. | | | | | | | | |
4.750% 10/15/29 (a) | | | 1,278,000 | | | | 1,071,386 | |
Ashtead Capital, Inc. | | | | | | | | |
4.000% 5/01/28 (a) | | | 306,000 | | | | 267,531 | |
5.500% 8/11/32 (a) | | | 1,261,000 | | | | 1,161,303 | |
CoreLogic, Inc. | | | | | | | | |
4.500% 5/01/28 (a) | | | 1,254,000 | | | | 896,610 | |
The Hertz Corp. | | | | | | | | |
5.000% 12/01/29 (a) | | | 1,347,000 | | | | 1,004,875 | |
Prime Security Services Borrower LLC / Prime Finance, Inc. | | | | | | | | |
6.250% 1/15/28 (a) | | | 2,865,000 | | | | 2,447,473 | |
PROG Holdings, Inc. | | | | | | | | |
6.000% 11/15/29 (a) | | | 3,302,000 | | | | 2,638,348 | |
Rent-A-Center, Inc. | | | | | | | | |
6.375% 2/15/29 (a) (b) | | | 499,000 | | | | 389,220 | |
Sabre GLBL, Inc. | | | | | | | | |
7.375% 9/01/25 (a) | | | 1,138,000 | | | | 1,019,260 | |
9.250% 4/15/25 (a) | | | 3,672,000 | | | | 3,515,610 | |
| | | | | | | | 16,250,122 | |
Computers — 1.4% |
Condor Merger Sub, Inc. | | | | | | | | |
7.375% 2/15/30 (a) | | | 3,092,000 | | | | 2,489,060 | |
Presidio Holdings, Inc. | | | | | | | | |
8.250% 2/01/28 (a) | | | 2,787,000 | | | | 2,401,657 | |
| | | Principal
Amount | | | Value | |
Seagate HDD Cayman | | | | | | | | |
3.125% 7/15/29 | | $ | 960,000 | | | $ | 703,421 | |
| | | | | | | | 5,594,138 | |
Cosmetics & Personal Care — 0.7% |
Coty, Inc. /HFC Prestige Products, Inc. /HFC Prestige International US LLC | | | | | | | | |
4.750% 1/15/29 (a) | | | 3,086,000 | | | | 2,642,850 | |
Distribution & Wholesale — 0.9% |
American Builders & Contractors Supply Co., Inc. | | | | | | | | |
3.875% 11/15/29 (a) | | | 1,527,000 | | | | 1,196,325 | |
Resideo Funding, Inc. | | | | | | | | |
4.000% 9/01/29 (a) | | | 2,600,000 | | | | 2,095,548 | |
Univar Solutions USA, Inc. | | | | | | | | |
5.125% 12/01/27 (a) | | | 177,000 | | | | 157,530 | |
| | | | | | | | 3,449,403 | |
Diversified Financial Services — 5.4% |
Coinbase Global, Inc. | | | | | | | | |
3.375% 10/01/28 (a) (b) | | | 1,255,000 | | | | 784,946 | |
3.625% 10/01/31 (a) | | | 1,018,000 | | | | 564,479 | |
Global Aircraft Leasing Co. Ltd. | | | | | | | | |
6.500% 9/15/24 (a) | | | 9,512,514 | | | | 7,158,167 | |
Jefferson Capital Holdings LLC | | | | | | | | |
6.000% 8/15/26 (a) | | | 2,664,000 | | | | 2,217,780 | |
Midcap Financial Issuer Trust | | | | | | | | |
5.625% 1/15/30 (a) | | | 723,000 | | | | 553,623 | |
6.500% 5/01/28 (a) | | | 2,875,000 | | | | 2,456,831 | |
OneMain Finance Corp. | | | | | | | | |
4.000% 9/15/30 | | | 1,207,000 | | | | 846,964 | |
5.375% 11/15/29 | | | 2,695,000 | | | | 2,088,625 | |
PRA Group, Inc. | | | | | | | | |
5.000% 10/01/29 (a) | | | 4,020,000 | | | | 3,250,339 | |
7.375% 9/01/25 (a) | | | 1,113,000 | | | | 1,073,265 | |
| | | | | | | | 20,995,019 | |
Electric — 1.4% |
PG&E Corp. | | | | | | | | |
5.000% 7/01/28 (b) | | | 3,644,000 | | | | 3,133,510 | |
5.250% 7/01/30 | | | 583,000 | | | | 502,459 | |
Pike Corp. | | | | | | | | |
5.500% 9/01/28 (a) | | | 2,213,000 | | | | 1,792,530 | |
| | | | | | | | 5,428,499 | |
Electronics — 0.8% |
Atkore, Inc. | | | | | | | | |
4.250% 6/01/31 (a) | | | 3,884,000 | | | | 3,106,035 | |
Engineering & Construction — 1.6% |
Arcosa, Inc. | | | | | | | | |
4.375% 4/15/29 (a) | | | 2,691,000 | | | | 2,287,350 | |
The accompanying notes are an integral part of the financial statements.
97
MassMutual High Yield Fund — Portfolio of Investments (Continued) |
| | | Principal
Amount | | | Value | |
Dycom Industries, Inc. | | | | | | | | |
4.500% 4/15/29 (a) | | $ | 721,000 | | | $ | 607,567 | |
Global Infrastructure Solutions, Inc. | | | | | | | | |
5.625% 6/01/29 (a) | | | 488,000 | | | | 360,739 | |
7.500% 4/15/32 (a) | | | 1,457,000 | | | | 1,107,320 | |
MasTec, Inc. | | | | | | | | |
4.500% 8/15/28 (a) | | | 938,000 | | | | 819,185 | |
Railworks Holdings LP / Railworks Rally, Inc. | | | | | | | | |
8.250% 11/15/28 (a) | | | 879,000 | | | | 817,741 | |
| | | | | | | | 5,999,902 | |
Entertainment — 0.2% |
Everi Holdings, Inc. | | | | | | | | |
5.000% 7/15/29 (a) | | | 31,000 | | | | 25,418 | |
Midwest Gaming Borrower LLC/Midwest Gaming Finance Corp. | | | | | | | | |
4.875% 5/01/29 (a) | | | 987,000 | | | | 813,066 | |
| | | | | | | | 838,484 | |
Environmental Controls — 0.2% |
Harsco Corp. | | | | | | | | |
5.750% 7/31/27 (a) | | | 1,245,000 | | | | 777,862 | |
Food — 0.7% |
JBS USA Food Co. | | | | | | | | |
3.625% 1/15/32 (a) | | | 2,474,000 | | | | 1,932,812 | |
3.750% 12/01/31 (a) | | | 400,000 | | | | 320,216 | |
Simmons Foods, Inc. /Simmons Prepared Foods, Inc. /Simmons Pet Food, Inc. /Simmons Feed | | | | | | | | |
4.625% 3/01/29 (a) | | | 766,000 | | | | 626,205 | |
| | | | | | | | 2,879,233 | |
Forest Products & Paper — 0.2% |
Clearwater Paper Corp. | | | | | | | | |
4.750% 8/15/28 (a) | | | 717,000 | | | | 627,822 | |
Health Care – Products — 0.5% |
Garden Spinco Corp. | | | | | | | | |
8.625% 7/20/30 (a) | | | 1,861,000 | | | | 1,922,655 | |
Health Care – Services — 5.4% |
Centene Corp. | | | | | | | | |
4.625% 12/15/29 | | | 4,327,000 | | | | 3,888,242 | |
Charles River Laboratories International, Inc. | | | | | | | | |
3.750% 3/15/29 (a) | | | 280,000 | | | | 232,907 | |
4.250% 5/01/28 (a) | | | 2,190,000 | | | | 1,907,205 | |
CHS/Community Health Systems, Inc. | | | | | | | | |
4.750% 2/15/31 (a) | | | 1,356,000 | | | | 908,520 | |
5.625% 3/15/27 (a) | | | 556,000 | | | | 427,953 | |
6.000% 1/15/29 (a) | | | 1,492,000 | | | | 1,096,351 | |
6.125% 4/01/30 (a) | | | 1,361,000 | | | | 641,848 | |
6.875% 4/15/29 (a) | | | 472,000 | | | | 227,805 | |
| | | Principal
Amount | | | Value | |
HCA, Inc. | | | | | | | | |
3.500% 9/01/30 | | $ | 5,131,000 | | | $ | 4,236,769 | |
ModivCare, Inc. | | | | | | | | |
5.875% 11/15/25 (a) | | | 125,000 | | | | 115,364 | |
Molina Healthcare, Inc. | | | | | | | | |
4.375% 6/15/28 (a) | | | 1,253,000 | | | | 1,130,833 | |
Radiology Partners, Inc. | | | | | | | | |
9.250% 2/01/28 (a) | | | 4,598,000 | | | | 2,997,369 | |
Tenet Healthcare Corp. | | | | | | | | |
4.375% 1/15/30 (a) | | | 1,178,000 | | | | 983,277 | |
6.125% 6/15/30 (a) | | | 2,081,000 | | | | 1,911,295 | |
| | | | | | | | 20,705,738 | |
Home Builders — 1.5% |
Ashton Woods USA LLC / Ashton Woods Finance Co. | | | | | | | | |
4.625% 8/01/29 (a) | | | 1,339,000 | | | | 972,184 | |
M/I Homes, Inc. | | | | | | | | |
4.950% 2/01/28 | | | 1,544,000 | | | | 1,285,727 | |
Mattamy Group Corp. | | | | | | | | |
4.625% 3/01/30 (a) | | | 4,544,000 | | | | 3,470,230 | |
5.250% 12/15/27 (a) | | | 25,000 | | | | 20,722 | |
| | | | | | | | 5,748,863 | |
Insurance — 0.6% |
Highlands Holdings Bond Issuer Ltd. / Highlands Holdings Bond Co-Issuer, Inc. | | | | | | | | |
7.625% 10/15/25 (a) | | | 2,333,066 | | | | 2,198,915 | |
Internet — 2.1% |
Acuris Finance Us, Inc. / Acuris Finance SARL | | | | | | | | |
5.000% 5/01/28 (a) | | | 540,000 | | | | 450,900 | |
Getty Images, Inc. | | | | | | | | |
9.750% 3/01/27 (a) | | | 2,165,000 | | | | 2,148,762 | |
ION Trading Technologies Sarl | | | | | | | | |
5.750% 5/15/28 (a) | | | 1,728,000 | | | | 1,408,320 | |
Millennium Escrow Corp. | | | | | | | | |
6.625% 8/01/26 (a) | | | 2,284,000 | | | | 1,805,602 | |
Twitter, Inc. | | | | | | | | |
5.000% 3/01/30 (a) | | | 1,902,000 | | | | 1,825,920 | |
Uber Technologies, Inc. | | | | | | | | |
4.500% 8/15/29 (a) | | | 558,000 | | | | 469,069 | |
| | | | | | | | 8,108,573 | |
Investment Companies — 1.2% |
Icahn Enterprises LP/ Icahn Enterprises Finance Corp. | | | | | | | | |
4.750% 9/15/24 | | | 1,179,000 | | | | 1,102,291 | |
5.250% 5/15/27 | | | 2,581,000 | | | | 2,264,957 | |
6.250% 5/15/26 | | | 1,500,000 | | | | 1,393,837 | |
| | | | | | | | 4,761,085 | |
The accompanying notes are an integral part of the financial statements.
98
MassMutual High Yield Fund — Portfolio of Investments (Continued) |
| | | Principal
Amount | | | Value | |
Leisure Time — 1.5% |
Carnival Corp. | | | | | | | | |
7.625% 3/01/26 (a) | | $ | 651,000 | | | $ | 503,539 | |
5.750% 3/01/27 (a) | | | 2,737,000 | | | | 1,915,900 | |
6.000% 5/01/29 (a) | | | 312,000 | | | | 210,600 | |
NCL Corp. Ltd. | | | | | | | | |
5.875% 3/15/26 (a) | | | 781,000 | | | | 598,933 | |
5.875% 2/15/27 (a) | | | 224,000 | | | | 186,664 | |
NCL Finance Ltd. | | | | | | | | |
6.125% 3/15/28 (a) (b) | | | 620,000 | | | | 458,666 | |
Royal Caribbean Cruises Ltd. | | | | | | | | |
Convertible, 4.250% 6/15/23 | | | 143,000 | | | | 139,067 | |
5.500% 8/31/26 (a) | | | 2,384,000 | | | | 1,805,514 | |
| | | | | | | | 5,818,883 | |
Lodging — 1.8% |
Hilton Grand Vacations Borrower Escrow LLC / Hilton Grand Vacations Borrower Esc | | | | | | | | |
4.875% 7/01/31 (a) | | | 1,266,000 | | | | 966,667 | |
Sugarhouse HSP Gaming Prop Mezz LP / Sugarhouse HSP Gaming Finance Corp. | | | | | | | | |
5.875% 5/15/25 (a) | | | 1,698,000 | | | | 1,570,705 | |
Travel & Leisure Co. | | | | | | | | |
4.500% 12/01/29 (a) | | | 1,000,000 | | | | 771,840 | |
4.625% 3/01/30 (a) | | | 800,000 | | | | 632,350 | |
6.000% STEP 4/01/27 | | | 419,000 | | | | 377,578 | |
6.625% 7/31/26 (a) | | | 1,839,000 | | | | 1,721,983 | |
Wyndham Hotels & Resorts, Inc. | | | | | | | | |
4.375% 8/15/28 (a) | | | 968,000 | | | | 850,896 | |
| | | | | | | | 6,892,019 | |
Machinery – Diversified — 0.2% |
OT Merger Corp. | | | | | | | | |
7.875% 10/15/29 (a) | | | 1,410,000 | | | | 955,275 | |
Media — 8.4% |
Altice Financing SA | | | | | | | | |
5.000% 1/15/28 (a) | | | 1,105,000 | | | | 851,159 | |
CCO Holdings LLC/CCO Holdings Capital Corp. | | | | | | | | |
4.250% 1/15/34 (a) | | | 3,376,000 | | | | 2,418,060 | |
4.500% 5/01/32 | | | 215,000 | | | | 163,974 | |
5.000% 2/01/28 (a) | | | 939,000 | | | | 823,785 | |
5.375% 6/01/29 (a) | | | 279,000 | | | | 244,214 | |
6.375% 9/01/29 (a) | | | 926,000 | | | | 850,161 | |
CSC Holdings LLC | | | | | | | | |
4.625% 12/01/30 (a) | | | 1,843,000 | | | | 1,251,121 | |
5.750% 1/15/30 (a) | | | 670,000 | | | | 476,213 | |
| | | Principal
Amount | | | Value | |
Cumulus Media New Holdings, Inc. | | | | | | | | |
6.750% 7/01/26 (a) (b) | | $ | 2,614,000 | | | $ | 2,205,404 | |
DIRECTV Financing LLC / DIRECTV Financing Co-Obligor, Inc. | | | | | | | | |
5.875% 8/15/27 (a) | | | 3,511,000 | | | | 3,026,868 | |
DISH DBS Corp. | | | | | | | | |
5.250% 12/01/26 (a) | | | 392,000 | | | | 320,992 | |
5.750% 12/01/28 (a) | | | 504,000 | | | | 379,794 | |
5.875% 11/15/24 | | | 981,000 | | | | 875,543 | |
7.375% 7/01/28 | | | 918,000 | | | | 618,132 | |
DISH Network Corp. | | | | | | | | |
3.375% 8/15/26 | | | 3,231,000 | | | | 2,222,928 | |
Gray Escrow II, Inc. | | | | | | | | |
5.375% 11/15/31 (a) | | | 1,881,000 | | | | 1,475,503 | |
iHeartCommunications, Inc. | | | | | | | | |
8.375% 5/01/27 (b) | | | 1,265,114 | | | | 1,067,411 | |
LCPR Senior Secured Financing DAC | | | | | | | | |
5.125% 7/15/29 (a) | | | 1,526,000 | | | | 1,149,180 | |
6.750% 10/15/27 (a) | | | 2,216,000 | | | | 1,839,280 | |
Radiate Holdco LLC / Radiate Finance, Inc. | | | | | | | | |
6.500% 9/15/28 (a) | | | 2,534,000 | | | | 1,767,465 | |
Sinclair Television Group Inc | | | | | | | | |
5.125% 2/15/27 (a) (b) | | | 1,350,000 | | | | 1,116,566 | |
Sirius XM Radio, Inc. | | | | | | | | |
3.875% 9/01/31 (a) | | | 4,092,000 | | | | 3,173,100 | |
Univision Communications, Inc. | | | | | | | | |
7.375% 6/30/30 (a) | | | 514,000 | | | | 490,508 | |
Virgin Media Secured Finance PLC | | | | | | | | |
4.500% 8/15/30 (a) | | | 250,000 | | | | 195,113 | |
5.500% 5/15/29 (a) | | | 4,137,000 | | | | 3,541,928 | |
| | | | | | | | 32,544,402 | |
Mining — 3.2% |
Arconic Corp. | | | | | | | | |
6.125% 2/15/28 (a) | | | 1,627,000 | | | | 1,437,178 | |
Compass Minerals International, Inc. | | | | | | | | |
4.875% 7/15/24 (a) | | | 1,164,000 | | | | 1,094,173 | |
6.750% 12/01/27 (a) | | | 1,018,000 | | | | 956,691 | |
First Quantum Minerals Ltd. | | | | | | | | |
6.500% 3/01/24 (a) | | | 2,110,000 | | | | 2,067,800 | |
6.875% 3/01/26 (a) | | | 1,420,000 | | | | 1,310,277 | |
7.500% 4/01/25 (a) | | | 2,954,000 | | | | 2,843,018 | |
Hecla Mining Co. | | | | | | | | |
7.250% 2/15/28 | | | 2,345,000 | | | | 2,175,456 | |
Novelis Corp. | | | | | | | | |
3.250% 11/15/26 (a) | | | 304,000 | | | | 255,740 | |
3.875% 8/15/31 (a) | | | 313,000 | | | | 233,473 | |
| | | | | | | | 12,373,806 | |
The accompanying notes are an integral part of the financial statements.
99
MassMutual High Yield Fund — Portfolio of Investments (Continued) |
| | | Principal
Amount | | | Value | |
Miscellaneous - Manufacturing — 0.6% |
Amsted Industries, Inc. | | | | | | | | |
5.625% 7/01/27 (a) | | $ | 2,435,000 | | | $ | 2,240,200 | |
Oil & Gas — 10.1% |
Apache Corp. | | | | | | | | |
4.750% 4/15/43 | | | 816,000 | | | | 607,748 | |
5.100% 9/01/40 | | | 607,000 | | | | 493,946 | |
5.350% 7/01/49 | | | 910,000 | | | | 714,350 | |
Chesapeake Energy Corp. | | | | | | | | |
5.500% 2/01/26 (a) | | | 633,000 | | | | 606,098 | |
5.875% 2/01/29 (a) | | | 1,359,000 | | | | 1,259,965 | |
Comstock Resources, Inc. | | | | | | | | |
5.875% 1/15/30 (a) | | | 733,000 | | | | 638,410 | |
6.750% 3/01/29 (a) | | | 1,512,000 | | | | 1,394,643 | |
CVR Energy, Inc. | | | | | | | | |
5.250% 2/15/25 (a) | | | 1,318,000 | | | | 1,186,358 | |
5.750% 2/15/28 (a) | | | 1,222,000 | | | | 1,043,822 | |
Hilcorp Energy I LP / Hilcorp Finance Co. | | | | | | | | |
5.750% 2/01/29 (a) | | | 513,000 | | | | 448,882 | |
6.000% 4/15/30 (a) | | | 443,000 | | | | 386,050 | |
6.000% 2/01/31 (a) | | | 1,607,000 | | | | 1,393,402 | |
6.250% 11/01/28 (a) | | | 2,052,000 | | | | 1,893,339 | |
Murphy Oil Corp. | | | | | | | | |
6.375% 7/15/28 | | | 1,190,000 | | | | 1,124,550 | |
Nabors Industries Ltd. | | | | | | | | |
7.250% 1/15/26 (a) | | | 2,399,000 | | | | 2,087,486 | |
7.500% 1/15/28 (a) | | | 909,000 | | | | 741,953 | |
Nabors Industries, Inc. | | | | | | | | |
5.750% 2/01/25 | | | 387,000 | | | | 351,842 | |
7.375% 5/15/27 (a) | | | 2,040,000 | | | | 1,882,818 | |
Neptune Energy Bondco PLC | | | | | | | | |
6.625% 5/15/25 (a) | | | 6,763,000 | | | | 6,358,487 | |
Occidental Petroleum Corp. | | | | | | | | |
6.125% 1/01/31 (b) | | | 1,607,000 | | | | 1,585,177 | |
6.200% 3/15/40 | | | 1,570,000 | | | | 1,518,975 | |
6.375% 9/01/28 | | | 2,015,000 | | | | 2,020,837 | |
6.450% 9/15/36 | | | 1,040,000 | | | | 1,036,100 | |
6.600% 3/15/46 | | | 801,000 | | | | 825,030 | |
Parkland Corp. | | | | | | | | |
4.625% 5/01/30 (a) | | | 795,000 | | | | 643,227 | |
5.875% 7/15/27 (a) | | | 1,856,000 | | | | 1,720,512 | |
Range Resources Corp. Co. | | | | | | | | |
8.250% 1/15/29 | | | 846,000 | | | | 860,805 | |
Southwestern Energy Co. | | | | | | | | |
4.750% 2/01/32 | | | 380,000 | | | | 318,478 | |
5.375% 3/15/30 | | | 366,000 | | | | 329,784 | |
Sunoco LP/Sunoco Finance Corp. | | | | | | | | |
6.000% 4/15/27 | | | 1,137,000 | | | | 1,083,771 | |
| | | Principal
Amount | | | Value | |
Transocean Guardian Ltd. | | | | | | | | |
5.875% 1/15/24 (a) | | $ | 169,895 | | | $ | 159,974 | |
Transocean Poseidon Ltd. | | | | | | | | |
6.875% 2/01/27 (a) | | | 171,500 | | | | 156,923 | |
Transocean, Inc. | | | | | | | | |
7.250% 11/01/25 (a) | | | 1,205,000 | | | | 923,078 | |
7.500% 1/15/26 (a) | | | 1,662,000 | | | | 1,229,880 | |
| | | | | | | | 39,026,700 | |
Oil & Gas Services — 0.9% |
Weatherford International Ltd. | | | | | | | | |
6.500% 9/15/28 (a) | | | 964,000 | | | | 870,010 | |
8.625% 4/30/30 (a) | | | 2,835,000 | | | | 2,471,724 | |
| | | | | | | | 3,341,734 | |
Packaging & Containers — 1.9% |
Clydesdale Acquisition Holdings, Inc. | | | | | | | | |
6.625% 4/15/29 (a) | | | 538,000 | | | | 489,548 | |
8.750% 4/15/30 (a) | | | 1,799,000 | | | | 1,487,827 | |
Graphic Packaging International LLC | | | | | | | | |
3.500% 3/01/29 (a) | | | 754,000 | | | | 620,254 | |
Mauser Packaging Solutions Holding Co. | | | | | | | | |
5.500% 4/15/24 (a) | | | 2,384,000 | | | | 2,264,800 | |
Trident TPI Holdings, Inc. | | | | | | | | |
9.250% 8/01/24 (a) | | | 2,752,000 | | | | 2,525,382 | |
| | | | | | | | 7,387,811 | |
Pharmaceuticals — 2.1% |
1375209 BC Ltd. | | | | | | | | |
9.000% 1/30/28 | | | 508,851 | | | | 503,762 | |
Bausch Health Cos., Inc. | | | | | | | | |
4.875% 6/01/28 (a) | | | 1,347,000 | | | | 868,411 | |
5.000% 1/30/28 (a) | | | 569,000 | | | | 212,275 | |
5.000% 2/15/29 (a) | | | 1,301,000 | | | | 504,411 | |
5.250% 1/30/30 (a) | | | 138,000 | | | | 51,470 | |
9.000% 12/15/25 (a) | | | 870,000 | | | | 546,246 | |
11.000% 9/30/28 | | | 904,157 | | | | 721,065 | |
14.000% 10/15/30 | | | 179,791 | | | | 104,279 | |
Jazz Securities DAC | | | | | | | | |
4.375% 1/15/29 (a) | | | 1,247,000 | | | | 1,077,096 | |
Organon & Co. / Organon Foreign Debt Co-Issuer BV | | | | | | | | |
4.125% 4/30/28 (a) | | | 1,491,000 | | | | 1,268,140 | |
5.125% 4/30/31 (a) | | | 1,230,000 | | | | 1,010,642 | |
Perrigo Finance Unlimited Co. | | | | | | | | |
4.400% STEP 6/15/30 | | | 1,262,000 | | | | 1,047,750 | |
| | | | | | | | 7,915,547 | |
Pipelines — 6.7% |
Antero Midstream Partners LP / Antero Midstream Finance Corp. | | | | | | | | |
5.375% 6/15/29 (a) | | | 5,376,000 | | | | 4,746,470 | |
The accompanying notes are an integral part of the financial statements.
100
MassMutual High Yield Fund — Portfolio of Investments (Continued) |
| | | Principal
Amount | | | Value | |
CQP Holdco LP / BIP-V Chinook Holdco LLC | | | | | | | | |
5.500% 6/15/31 (a) | | $ | 2,124,000 | | | $ | 1,798,444 | |
EnLink Midstream LLC | | | | | | | | |
5.375% 6/01/29 | | | 786,000 | | | | 719,190 | |
5.625% 1/15/28 (a) | | | 449,000 | | | | 420,376 | |
EnLink Midstream Partners LP | | | | | | | | |
4.150% 6/01/25 | | | 27,000 | | | | 25,063 | |
4.850% 7/15/26 | | | 277,000 | | | | 254,688 | |
5.050% 4/01/45 | | | 160,000 | | | | 112,086 | |
5.450% 6/01/47 | | | 706,000 | | | | 515,705 | |
5.600% 4/01/44 | | | 3,122,000 | | | | 2,374,974 | |
EQM Midstream Partners LP | | | | | | | | |
4.500% 1/15/29 (a) | | | 1,111,000 | | | | 894,670 | |
4.750% 1/15/31 (a) | | | 1,001,000 | | | | 794,544 | |
6.000% 7/01/25 (a) | | | 339,000 | | | | 313,561 | |
6.500% 7/01/27 (a) | | | 763,000 | | | | 705,073 | |
7.500% 6/01/27 (a) | | | 832,000 | | | | 792,996 | |
7.500% 6/01/30 (a) | | | 176,000 | | | | 165,648 | |
Genesis Energy LP/Genesis Energy Finance Corp. | | | | | | | | |
5.625% 6/15/24 | | | 666,000 | | | | 626,049 | |
6.250% 5/15/26 | | | 290,000 | | | | 251,649 | |
6.500% 10/01/25 | | | 2,411,000 | | | | 2,182,027 | |
ITT Holdings LLC | | | | | | | | |
6.500% 8/01/29 (a) | | | 4,327,000 | | | | 3,356,696 | |
NGL Energy Operating LLC / NGL Energy Finance Corp. | | | | | | | | |
7.500% 2/01/26 (a) | | | 2,530,000 | | | | 2,250,713 | |
Targa Resources Partners LP/Targa Resources Partners Finance Corp. | | | | | | | | |
5.500% 3/01/30 | | | 128,000 | | | | 115,507 | |
Venture Global Calcasieu Pass LLC | | | | | | | | |
3.875% 8/15/29 (a) | | | 869,000 | | | | 745,498 | |
4.125% 8/15/31 (a) | | | 994,000 | | | | 824,493 | |
Western Midstream Operating LP | | | | | | | | |
5.450% 4/01/44 | | | 929,000 | | | | 762,098 | |
| | | | | | | | 25,748,218 | |
Real Estate — 0.5% |
Realogy Group LLC / Realogy Co-Issuer Corp. | | | | | | | | |
5.750% 1/15/29 (a) | | | 2,591,000 | | | | 1,868,759 | |
Real Estate Investment Trusts (REITS) — 2.0% |
Ladder Capital Finance Holdings LLLP / Ladder Capital Finance Corp. | | | | | | | | |
4.750% 6/15/29 (a) | | | 2,804,000 | | | | 2,099,215 | |
RHP Hotel Properties LP/RHP Finance Corp. | | | | | | | | |
4.750% 10/15/27 | | | 760,000 | | | | 661,200 | |
| | | Principal
Amount | | | Value | |
RLJ Lodging Trust LP | | | | | | | | |
3.750% 7/01/26 (a) | | $ | 1,238,000 | | | $ | 1,057,326 | |
4.000% 9/15/29 (a) | | | 829,000 | | | | 649,415 | |
Service Properties Trust | | | | | | | | |
3.950% 1/15/28 | | | 359,000 | | | | 243,899 | |
4.375% 2/15/30 | | | 568,000 | | | | 372,729 | |
4.950% 2/15/27 | | | 284,000 | | | | 210,525 | |
5.500% 12/15/27 | | | 949,000 | | | | 770,891 | |
Uniti Group LP / Uniti Fiber Holdings, Inc. / CSL Capital LLC | | | | | | | | |
4.750% 4/15/28 (a) | | | 1,162,000 | | | | 917,945 | |
6.500% 2/15/29 (a) | | | 560,000 | | | | 375,317 | |
7.875% 2/15/25 (a) | | | 166,000 | | | | 162,016 | |
| | | | | | | | 7,520,478 | |
Retail — 3.5% |
Asbury Automotive Group, Inc. | | | | | | | | |
4.625% 11/15/29 (a) | | | 993,000 | | | | 793,774 | |
Bath & Body Works, Inc. | | | | | | | | |
6.750% 7/01/36 | | | 658,000 | | | | 542,185 | |
6.875% 11/01/35 | | | 2,029,000 | | | | 1,694,986 | |
BCPE Ulysses Intermediate, Inc. | | | | | | | | |
7.750% 4/01/27 (a) | | | 3,207,000 | | | | 2,181,907 | |
Macy’s Retail Holdings LLC | | | | | | | | |
5.875% 4/01/29 (a) | | | 261,000 | | | | 212,872 | |
5.875% 3/15/30 (a) (b) | | | 500,000 | | | | 395,475 | |
6.125% 3/15/32 (a) | | | 553,000 | | | | 423,059 | |
Nordstrom, Inc. | | | | | | | | |
5.000% 1/15/44 (b) | | | 2,262,000 | | | | 1,399,612 | |
Sonic Automotive, Inc. | | | | | | | | |
4.625% 11/15/29 (a) | | | 1,085,000 | | | | 851,725 | |
4.875% 11/15/31 (a) (b) | | | 448,000 | | | | 339,360 | |
Staples, Inc. | | | | | | | | |
7.500% 4/15/26 (a) | | | 1,049,000 | | | | 878,475 | |
10.750% 4/15/27 (a) (b) | | | 1,421,000 | | | | 1,051,540 | |
Suburban Propane Partners LP / Suburban Energy Finance Corp. | | | | | | | | |
5.000% 6/01/31 (a) | | | 1,271,000 | | | | 1,039,054 | |
Superior Plus LP / Superior General Partner, Inc. | | | | | | | | |
4.500% 3/15/29 (a) | | | 2,169,000 | | | | 1,780,318 | |
| | | | | | | | 13,584,342 | |
Semiconductors — 0.4% |
Entegris Escrow Corp. | | | | | | | | |
5.950% 6/15/30 (a) | | | 1,567,000 | | | | 1,430,217 | |
Software — 1.4% |
Avaya Holdings Corp., Convertible, | | | | | | | | |
2.250% 6/15/23 | | | 1,776,000 | | | | 759,240 | |
The accompanying notes are an integral part of the financial statements.
101
MassMutual High Yield Fund — Portfolio of Investments (Continued) |
| | | Principal
Amount | | | Value | |
Boxer Parent Co., Inc. | | | | | | | | |
9.125% 3/01/26 (a) | | $ | 158,000 | | | $ | 151,838 | |
Consensus Cloud Solutions, Inc. | | | | | | | | |
6.000% 10/15/26 (a) | | | 702,000 | | | | 618,599 | |
CWT Travel Group, Inc. | | | | | | | | |
8.500% 11/19/26 (a) | | | 696 | | | | 599 | |
Open Text Corp. | | | | | | | | |
3.875% 2/15/28 (a) | | | 302,000 | | | | 249,760 | |
Open Text Holdings, Inc. | | | | | | | | |
4.125% 2/15/30 (a) | | | 1,297,000 | | | | 1,035,797 | |
4.125% 12/01/31 (a) | | | 504,000 | | | | 382,707 | |
Veritas US, Inc./Veritas Bermuda Ltd. | | | | | | | | |
7.500% 9/01/25 (a) | | | 2,925,000 | | | | 2,240,097 | |
| | | | | | | | 5,438,637 | |
Telecommunications — 5.7% |
Altice France SA | | | | | | | | |
5.125% 7/15/29 (a) | | | 2,356,000 | | | | 1,760,191 | |
Connect Finco SARL / Connect US Finco LLC | | | | | | | | |
6.750% 10/01/26 (a) | | | 2,300,000 | | | | 2,012,104 | |
Consolidated Communications, Inc. | | | | | | | | |
6.500% 10/01/28 (a) | | | 2,299,000 | | | | 1,719,008 | |
Frontier Communications Holdings LLC | | | | | | | | |
5.000% 5/01/28 (a) | | | 3,081,000 | | | | 2,644,114 | |
6.000% 1/15/30 (a) (b) | | | 819,000 | | | | 643,742 | |
6.750% 5/01/29 (a) | | | 902,000 | | | | 744,150 | |
GoTo Group, Inc. | | | | | | | | |
5.500% 9/01/27 (a) | | | 1,559,000 | | | | 956,119 | |
Hughes Satellite Systems Corp. | | | | | | | | |
6.625% 8/01/26 | | | 2,280,000 | | | | 2,068,865 | |
Sprint Capital Corp. | | | | | | | | |
6.875% 11/15/28 | | | 3,131,000 | | | | 3,217,103 | |
8.750% 3/15/32 | | | 4,688,000 | | | | 5,432,220 | |
T-Mobile USA, Inc. | | | | | | | | |
3.375% 4/15/29 | | | 804,000 | | | | 694,065 | |
| | | | | | | | 21,891,681 | |
Transportation — 1.6% |
Carriage Purchaser, Inc. | | | | | | | | |
7.875% 10/15/29 (a) | | | 1,473,000 | | | | 1,097,120 | |
| | | Principal
Amount | | | Value | |
First Student Bidco, Inc./First Transit Parent, Inc. | | | | | | | | |
4.000% 7/31/29 (a) | | $ | 2,525,000 | | | $ | 2,045,758 | |
Seaspan Corp. | | | | | | | | |
5.500% 8/01/29 (a) | | | 3,997,000 | | | | 3,077,954 | |
| | | | | | | | 6,220,832 | |
| | | | | | | | | |
TOTAL CORPORATE DEBT (Cost $431,790,055) | | | | | | | 363,755,270 | |
| | | | | | | | | |
TOTAL BONDS & NOTES (Cost $443,917,059) | | | | | | | 373,789,998 | |
| | | | | | | | | |
| | | Number of
Shares | | | | | |
MUTUAL FUNDS — 3.7% |
Diversified Financial Services — 3.7% |
State Street Navigator Securities Lending Government Money Market Portfolio (c) | | | 14,173,193 | | | | 14,173,193 | |
| | | | | | | | | |
TOTAL MUTUAL FUNDS (Cost $14,173,193) | | | | | | | 14,173,193 | |
| | | | | | | | | |
TOTAL LONG-TERM INVESTMENTS (Cost $458,090,252) | | | | | | | 387,963,191 | |
| | | | | | | | | |
SHORT-TERM INVESTMENTS — 1.0% |
Repurchase Agreement — 1.0% |
Fixed Income Clearing Corp., Repurchase Agreement, dated 9/30/22, 0.830%, due 10/03/22 (d) | | | 3,652,062 | | | | 3,652,062 | |
| | | | | | | | | |
TOTAL SHORT-TERM INVESTMENTS (Cost $3,652,062) | | | | | | | 3,652,062 | |
| | | | | | | | | |
TOTAL INVESTMENTS — 101.7% (Cost $461,742,314) (e) | | | | | | | 391,615,253 | |
| | | | | | | | | |
Other Assets/(Liabilities) — (1.7)% | | | | | | | (6,461,995 | ) |
| | | | | | | | | |
NET ASSETS — 100.0% | | | | | | $ | 385,153,258 | |
Abbreviation Legend
The accompanying notes are an integral part of the financial statements.
102
MassMutual High Yield Fund — Portfolio of Investments (Continued) |
Notes to Portfolio of Investments
Percentages are stated as a percent of net assets.
(a) | Security is exempt from registration under Regulation S or Rule 144A of the Securities Act of 1933. These securities are considered restricted and may be resold in transactions exempt from registration. At September 30, 2022, the aggregate market value of these securities amounted to $279,866,786 or 72.66% of net assets. |
(b) | Denotes all or a portion of security on loan. The total value of securities on loan as of September 30, 2022, was $15,766,389 or 4.09% of net assets. The Fund received $1,938,941 of non-cash collateral (U.S. Treasury and/or Agency obligations) related to securities lending activity. This amount is not reflected on either the Portfolio of Investments or the Statement of Assets and Liabilities. (Note 2). |
(c) | Represents investment of security lending cash collateral. (Note 2). |
(d) | Maturity value of $3,652,315. Collateralized by U.S. Government Agency obligations with a rate of 0.000%, maturity date of 3/30/23, and an aggregate market value, including accrued interest, of $3,725,197. |
(e) | See Note 6 for aggregate cost for federal tax purposes. |
Country weightings, as a percentage of net assets, is as follows:
United States | | | 81.3 | % |
Canada | | | 5.4 | % |
United Kingdom | | | 3.0 | % |
Cayman Islands | | | 2.7 | % |
Luxembourg | | | 2.0 | % |
Bermuda | | | 1.9 | % |
Ireland | | | 1.3 | % |
Marshall Islands | | | 0.8 | % |
Panama | | | 0.7 | % |
Australia | | | 0.6 | % |
Liberia | | | 0.5 | % |
France | | | 0.5 | % |
Total Long-Term Investments | | | 100.7 | % |
Short-Term Investments and Other Assets and Liabilities | | | (0.7 | )% |
Net Assets | | | 100.0 | % |
The accompanying notes are an integral part of the financial statements.
103
MassMutual Balanced Fund — Portfolio of Investments |
September 30, 2022 |
| | | Number of
Shares | | | Value | |
EQUITIES — 64.0% |
COMMON STOCK — 64.0% |
Basic Materials — 1.2% |
Chemicals — 1.1% |
Air Products & Chemicals, Inc. | | | 385 | | | $ | 89,601 | |
Albemarle Corp. | | | 58 | | | | 15,338 | |
Celanese Corp. | | | 314 | | | | 28,367 | |
Dow, Inc. | | | 3,295 | | | | 144,749 | |
DuPont de Nemours, Inc. | | | 2,018 | | | | 101,707 | |
Ecolab, Inc. | | | 401 | | | | 57,912 | |
International Flavors & Fragrances, Inc. | | | 132 | | | | 11,990 | |
Linde PLC | | | 2,051 | | | | 552,929 | |
LyondellBasell Industries NV Class A | | | 2,643 | | | | 198,965 | |
PPG Industries, Inc. | | | 311 | | | | 34,425 | |
The Sherwin-Williams Co. | | | 276 | | | | 56,511 | |
| | | | | | | | 1,292,494 | |
Forest Products & Paper — 0.0% |
International Paper Co. | | | 1,565 | | | | 49,610 | |
Mining — 0.1% |
Newmont Corp. | | | 1,595 | | | | 67,038 | |
| | | | | | | | 1,409,142 | |
Communications — 5.1% |
Advertising — 0.1% |
Omnicom Group, Inc. | | | 1,688 | | | | 106,496 | |
Internet — 0.8% |
Booking Holdings, Inc. (a) | | | 236 | | | | 387,797 | |
CDW Corp. | | | 293 | | | | 45,731 | |
eBay, Inc. | | | 2,045 | | | | 75,276 | |
MercadoLibre, Inc. (a) | | | 52 | | | | 43,045 | |
Netflix, Inc. (a) | | | 314 | | | | 73,928 | |
NortonLifeLock, Inc. | | | 1,825 | | | | 36,755 | |
Okta, Inc. (a) | | | 80 | | | | 4,550 | |
Palo Alto Networks, Inc. (a) | | | 864 | | | | 141,515 | |
Twitter, Inc. (a) | | | 765 | | | | 33,538 | |
VeriSign, Inc. (a) | | | 519 | | | | 90,150 | |
| | | | | | | | 932,285 | |
Media — 0.5% |
Fox Corp. Class A | | | 4,944 | | | | 151,682 | |
Liberty Media Corp-Liberty Formula One Class C (a) | | | 2,513 | | | | 147,011 | |
Paramount Global Class B | | | 1,137 | | | | 21,648 | |
The Walt Disney Co. (a) | | | 2,948 | | | | 278,085 | |
| | | | | | | | 598,426 | |
Telecommunications — 3.7% |
Arista Networks, Inc. (a) | | | 620 | | | | 69,992 | |
AT&T, Inc. | | | 76,910 | | | | 1,179,800 | |
| | | Number of
Shares | | | Value | |
Cisco Systems, Inc. | | | 17,565 | | | $ | 702,600 | |
Corning, Inc. | | | 2,108 | | | | 61,174 | |
Motorola Solutions, Inc. | | | 498 | | | | 111,537 | |
Verizon Communications, Inc. | | | 55,655 | | | | 2,113,220 | |
| | | | | | | | 4,238,323 | |
| | | | | | | | 5,875,530 | |
Consumer, Cyclical — 7.6% |
Apparel — 0.3% |
NIKE, Inc. Class B | | | 3,843 | | | | 319,430 | |
VF Corp. | | | 837 | | | | 25,035 | |
| | | | | | | | 344,465 | |
Auto Manufacturers — 0.2% |
Cummins, Inc. | | | 912 | | | | 185,601 | |
Auto Parts & Equipment — 0.0% |
Aptiv PLC (a) | | | 605 | | | | 47,317 | |
Distribution & Wholesale — 0.2% |
Copart, Inc. (a) | | | 622 | | | | 66,181 | |
W.W. Grainger, Inc. | | | 221 | | | | 108,111 | |
| | | | | | | | 174,292 | |
Leisure Time — 0.0% |
Carnival Corp. (a) | | | 510 | | | | 3,585 | |
Lodging — 0.2% |
Hilton Worldwide Holdings, Inc. | | | 702 | | | | 84,675 | |
Las Vegas Sands Corp. (a) | | | 1,440 | | | | 54,029 | |
Marriott International, Inc. Class A | | | 792 | | | | 110,991 | |
| | | | | | | | 249,695 | |
Retail — 6.7% |
AutoZone, Inc. (a) | | | 424 | | | | 908,178 | |
Best Buy Co., Inc. | | | 986 | | | | 62,453 | |
CarMax, Inc. (a) | | | 181 | | | | 11,950 | |
Chipotle Mexican Grill, Inc. (a) | | | 69 | | | | 103,691 | |
Costco Wholesale Corp. | | | 4,699 | | | | 2,219,197 | |
Dollar General Corp. | | | 2,078 | | | | 498,429 | |
Dollar Tree, Inc. (a) | | | 1,296 | | | | 176,386 | |
Genuine Parts Co. | | | 1,060 | | | | 158,279 | |
The Home Depot, Inc. | | | 5,546 | | | | 1,530,363 | |
Lowe’s Cos., Inc. | | | 4,152 | | | | 779,787 | |
Lululemon Athletica, Inc. (a) | | | 413 | | | | 115,458 | |
Ross Stores, Inc. | | | 938 | | | | 79,045 | |
Target Corp. | | | 2,660 | | | | 394,718 | |
The TJX Cos., Inc. | | | 4,489 | | | | 278,857 | |
Ulta Beauty, Inc. (a) | | | 304 | | | | 121,962 | |
Walgreens Boots Alliance, Inc. | | | 2,536 | | | | 79,630 | |
Yum! Brands, Inc. | | | 1,589 | | | | 168,974 | |
| | | | | | | | 7,687,357 | |
| | | | | | | | 8,692,312 | |
The accompanying notes are an integral part of the financial statements.
104
MassMutual Balanced Fund — Portfolio of Investments (Continued) |
| | | Number of
Shares | | | Value | |
Consumer, Non-cyclical — 17.4% |
Beverages — 1.8% |
Brown-Forman Corp. Class B | | | 630 | | | $ | 41,939 | |
The Coca-Cola Co. | | | 12,890 | | | | 722,098 | |
Constellation Brands, Inc. Class A | | | 644 | | | | 147,914 | |
Keurig Dr Pepper, Inc. | | | 2,649 | | | | 94,887 | |
Monster Beverage Corp. (a) | | | 366 | | | | 31,827 | |
PepsiCo, Inc. | | | 6,562 | | | | 1,071,312 | |
| | | | | | | | 2,109,977 | |
Biotechnology — 1.4% |
Amgen, Inc. | | | 2,223 | | | | 501,064 | |
Biogen, Inc. (a) | | | 289 | | | | 77,163 | |
BioMarin Pharmaceutical, Inc. (a) | | | 218 | | | | 18,480 | |
Gilead Sciences, Inc. | | | 5,558 | | | | 342,873 | |
Illumina, Inc. (a) | | | 56 | | | | 10,684 | |
Incyte Corp. (a) | | | 411 | | | | 27,389 | |
Regeneron Pharmaceuticals, Inc. (a) | | | 463 | | | | 318,947 | |
Vertex Pharmaceuticals, Inc. (a) | | | 1,137 | | | | 329,207 | |
| | | | | | | | 1,625,807 | |
Commercial Services — 1.0% |
Automatic Data Processing, Inc. | | | 1,420 | | | | 321,190 | |
Block, Inc. (a) | | | 479 | | | | 26,340 | |
Cintas Corp. | | | 216 | | | | 83,849 | |
Global Payments, Inc. | | | 762 | | | | 82,334 | |
Moody’s Corp. | | | 416 | | | | 101,134 | |
PayPal Holdings, Inc. (a) | | | 1,225 | | | | 105,436 | |
S&P Global, Inc. | | | 880 | | | | 268,708 | |
Verisk Analytics, Inc. | | | 568 | | | | 96,861 | |
| | | | | | | | 1,085,852 | |
Cosmetics & Personal Care — 2.5% |
Colgate-Palmolive Co. | | | 6,409 | | | | 450,232 | |
The Estee Lauder Cos., Inc. Class A | | | 269 | | | | 58,077 | |
The Procter & Gamble Co. | | | 18,655 | | | | 2,355,194 | |
| | | | | | | | 2,863,503 | |
Food — 1.4% |
Campbell Soup Co. | | | 1,065 | | | | 50,183 | |
General Mills, Inc. | | | 4,877 | | | | 373,627 | |
The Hershey Co. | | | 1,322 | | | | 291,461 | |
Hormel Foods Corp. | | | 1,760 | | | | 79,974 | |
Kellogg Co. | | | 1,836 | | | | 127,896 | |
The Kroger Co. | | | 4,035 | | | | 176,531 | |
McCormick & Co., Inc. | | | 663 | | | | 47,252 | |
Mondelez International, Inc. Class A | | | 7,067 | | | | 387,484 | |
Sysco Corp. | | | 439 | | | | 31,042 | |
| | | | | | | | 1,565,450 | |
Health Care – Products — 1.8% |
Abbott Laboratories | | | 5,130 | | | | 496,379 | |
| | | Number of
Shares | | | Value | |
Align Technology, Inc. (a) | | | 51 | | | $ | 10,563 | |
Baxter International, Inc. | | | 1,513 | | | | 81,490 | |
Boston Scientific Corp. (a) | | | 2,571 | | | | 99,575 | |
Danaher Corp. | | | 1,115 | | | | 287,993 | |
Edwards Lifesciences Corp. (a) | | | 1,029 | | | | 85,026 | |
IDEXX Laboratories, Inc. (a) | | | 78 | | | | 25,412 | |
Intuitive Surgical, Inc. (a) | | | 289 | | | | 54,170 | |
Medtronic PLC | | | 3,589 | | | | 289,812 | |
ResMed, Inc. | | | 125 | | | | 27,288 | |
Thermo Fisher Scientific, Inc. | | | 1,051 | | | | 533,057 | |
Waters Corp. (a) | | | 76 | | | | 20,484 | |
West Pharmaceutical Services, Inc. | | | 68 | | | | 16,733 | |
Zimmer Biomet Holdings, Inc. | | | 469 | | | | 49,034 | |
| | | | | | | | 2,077,016 | |
Health Care – Services — 2.2% |
Centene Corp. (a) | | | 1,024 | | | | 79,677 | |
Elevance Health, Inc. | | | 951 | | | | 431,982 | |
HCA Healthcare, Inc. | | | 469 | | | | 86,198 | |
Humana, Inc. | | | 277 | | | | 134,398 | |
IQVIA Holdings, Inc. (a) | | | 282 | | | | 51,081 | |
Laboratory Corp. of America Holdings | | | 217 | | | | 44,444 | |
Quest Diagnostics, Inc. | | | 314 | | | | 38,525 | |
UnitedHealth Group, Inc. | | | 3,195 | | | | 1,613,603 | |
| | | | | | | | 2,479,908 | |
Household Products & Wares — 0.2% |
Church & Dwight Co., Inc. | | | 1,035 | | | | 73,940 | |
The Clorox Co. | | | 278 | | | | 35,692 | |
Kimberly-Clark Corp. | | | 1,103 | | | | 124,132 | |
| | | | | | | | 233,764 | |
Pharmaceuticals — 5.1% |
AbbVie, Inc. | | | 5,729 | | | | 768,889 | |
AmerisourceBergen Corp. | | | 764 | | | | 103,392 | |
Becton Dickinson and Co. | | | 817 | | | | 182,052 | |
Bristol-Myers Squibb Co. | | | 10,483 | | | | 745,236 | |
Cardinal Health, Inc. | | | 428 | | | | 28,539 | |
Cigna Corp. | | | 2,006 | | | | 556,605 | |
CVS Health Corp. | | | 11,388 | | | | 1,086,074 | |
DexCom, Inc. (a) | | | 221 | | | | 17,799 | |
McKesson Corp. | | | 1,632 | | | | 554,668 | |
Merck & Co., Inc. | | | 11,698 | | | | 1,007,432 | |
Pfizer, Inc. | | | 17,046 | | | | 745,933 | |
Zoetis, Inc. | | | 658 | | | | 97,575 | |
| | | | | | | | 5,894,194 | |
| | | | | | | | 19,935,471 | |
Energy — 2.5% |
Energy – Alternate Sources — 0.1% |
Enphase Energy, Inc. (a) | | | 271 | | | | 75,194 | |
The accompanying notes are an integral part of the financial statements.
105
MassMutual Balanced Fund — Portfolio of Investments (Continued) |
| | | Number of
Shares | | | Value | |
Oil & Gas — 1.2% |
Hess Corp. | | | 1,248 | | | $ | 136,019 | |
Marathon Petroleum Corp. | | | 5,833 | | | | 579,392 | |
Phillips 66 | | | 3,498 | | | | 282,359 | |
Valero Energy Corp. | | | 3,734 | | | | 398,978 | |
| | | | | | | | 1,396,748 | |
Oil & Gas Services — 0.3% |
Baker Hughes Co. | | | 4,564 | | | | 95,661 | |
Halliburton Co. | | | 3,503 | | | | 86,244 | |
Schlumberger NV | | | 5,715 | | | | 205,169 | |
| | | | | | | | 387,074 | |
Pipelines — 0.9% |
Cheniere Energy, Inc. | | | 758 | | | | 125,760 | |
Kinder Morgan, Inc. | | | 29,396 | | | | 489,150 | |
ONEOK, Inc. | | | 2,081 | | | | 106,630 | |
The Williams Cos., Inc. | | | 12,535 | | | | 358,877 | |
| | | | | | | | 1,080,417 | |
| | | | | | | | 2,939,433 | |
Financial — 8.5% |
Banks — 1.0% |
The Bank of New York Mellon Corp. | | | 3,870 | | | | 149,072 | |
Fifth Third Bancorp | | | 1,989 | | | | 63,568 | |
First Republic Bank | | | 209 | | | | 27,285 | |
The Goldman Sachs Group, Inc. | | | 951 | | | | 278,691 | |
KeyCorp. | | | 3,869 | | | | 61,981 | |
Morgan Stanley | | | 2,266 | | | | 179,037 | |
Northern Trust Corp. | | | 561 | | | | 47,999 | |
The PNC Financial Services Group, Inc. | | | 938 | | | | 140,156 | |
Regions Financial Corp. | | | 3,876 | | | | 77,791 | |
State Street Corp. | | | 517 | | | | 31,439 | |
Truist Financial Corp. | | | 2,488 | | | | 108,328 | |
| | | | | | | | 1,165,347 | |
Diversified Financial Services — 2.2% |
American Express Co. | | | 2,725 | | | | 367,630 | |
Ameriprise Financial, Inc. | | | 454 | | | | 114,385 | |
BlackRock, Inc. | | | 215 | | | | 118,310 | |
The Charles Schwab Corp. | | | 1,118 | | | | 80,351 | |
CME Group, Inc. | | | 904 | | | | 160,125 | |
Discover Financial Services | | | 1,392 | | | | 126,561 | |
Franklin Resources, Inc. | | | 782 | | | | 16,829 | |
Intercontinental Exchange, Inc. | | | 1,487 | | | | 134,350 | |
Nasdaq, Inc. | | | 989 | | | | 56,057 | |
Synchrony Financial | | | 5,199 | | | | 146,560 | |
T. Rowe Price Group, Inc. | | | 638 | | | | 66,996 | |
Visa, Inc. Class A | | | 6,633 | | | | 1,178,352 | |
| | | | | | | | 2,566,506 | |
| | | Number of
Shares | | | Value | |
Insurance — 3.1% |
Aflac, Inc. | | | 3,855 | | | $ | 216,651 | |
The Allstate Corp. | | | 1,731 | | | | 215,562 | |
American International Group, Inc. | | | 4,050 | | | | 192,294 | |
Aon PLC Class A | | | 721 | | | | 193,134 | |
Arthur J Gallagher & Co. | | | 1,002 | | | | 171,563 | |
Chubb Ltd. | | | 2,608 | | | | 474,343 | |
The Hartford Financial Services Group, Inc. | | | 1,752 | | | | 108,519 | |
Marsh & McLennan Cos., Inc. | | | 2,318 | | | | 346,054 | |
MetLife, Inc. | | | 6,207 | | | | 377,262 | |
Principal Financial Group, Inc. | | | 856 | | | | 61,760 | |
The Progressive Corp. | | | 4,610 | | | | 535,728 | |
Prudential Financial, Inc. | | | 2,768 | | | | 237,439 | |
The Travelers Cos., Inc. | | | 2,065 | | | | 316,358 | |
Willis Towers Watson PLC | | | 747 | | | | 150,102 | |
| | | | | | | | 3,596,769 | |
Private Equity — 0.0% |
KKR & Co., Inc. | | | 502 | | | | 21,586 | |
Real Estate — 0.1% |
CBRE Group, Inc. Class A (a) | | | 740 | | | | 49,957 | |
Real Estate Investment Trusts (REITS) — 2.1% |
Alexandria Real Estate Equities, Inc. | | | 684 | | | | 95,890 | |
American Tower Corp. | | | 993 | | | | 213,197 | |
AvalonBay Communities, Inc. | | | 656 | | | | 120,829 | |
Boston Properties, Inc. | | | 512 | | | | 38,385 | |
Crown Castle, Inc. | | | 1,349 | | | | 194,998 | |
Digital Realty Trust, Inc. | | | 710 | | | | 70,418 | |
Equinix, Inc. | | | 289 | | | | 164,395 | |
Equity Residential | | | 1,456 | | | | 97,872 | |
Essex Property Trust, Inc. | | | 285 | | | | 69,035 | |
Extra Space Storage, Inc. | | | 514 | | | | 88,773 | |
Healthpeak Properties, Inc. | | | 1,389 | | | | 31,836 | |
Prologis, Inc. | | | 3,428 | | | | 348,285 | |
Public Storage | | | 1,340 | | | | 392,365 | |
Realty Income Corp. | | | 1,765 | | | | 102,723 | |
SBA Communications Corp. | | | 338 | | | | 96,212 | |
Simon Property Group, Inc. | | | 536 | | | | 48,106 | |
Ventas, Inc. | | | 677 | | | | 27,195 | |
VICI Properties, Inc. | | | 2,699 | | | | 80,565 | |
Welltower, Inc. | | | 1,179 | | | | 75,833 | |
| | | | | | | | 2,356,912 | |
| | | | | | | | 9,757,077 | |
Industrial — 4.0% |
Building Materials — 0.2% |
Carrier Global Corp. | | | 1,727 | | | | 61,412 | |
Johnson Controls International PLC | | | 3,087 | | | | 151,942 | |
Vulcan Materials Co. | | | 380 | | | | 59,930 | |
| | | | | | | | 273,284 | |
The accompanying notes are an integral part of the financial statements.
106
MassMutual Balanced Fund — Portfolio of Investments (Continued) |
| | | Number of
Shares | | | Value | |
Electrical Components & Equipment — 0.1% |
AMETEK, Inc. | | | 690 | | | $ | 78,253 | |
Electronics — 0.6% |
Agilent Technologies, Inc. | | | 352 | | | | 42,786 | |
Amphenol Corp. Class A | | | 1,502 | | | | 100,574 | |
Garmin Ltd. | | | 240 | | | | 19,275 | |
Honeywell International, Inc. | | | 1,227 | | | | 204,872 | |
Keysight Technologies, Inc. (a) | | | 587 | | | | 92,370 | |
Mettler-Toledo International, Inc. (a) | | | 61 | | | | 66,131 | |
TE Connectivity Ltd. | | | 998 | | | | 110,139 | |
| | | | | | | | 636,147 | |
Environmental Controls — 0.5% |
Republic Services, Inc. | | | 1,070 | | | | 145,563 | |
Waste Connections, Inc. | | | 1,176 | | | | 158,913 | |
Waste Management, Inc. | | | 1,914 | | | | 306,642 | |
| | | | | | | | 611,118 | |
Hand & Machine Tools — 0.0% |
Stanley Black & Decker, Inc. | | | 167 | | | | 12,560 | |
Machinery – Diversified — 0.4% |
Deere & Co. | | | 929 | | | | 310,184 | |
Dover Corp. | | | 311 | | | | 36,256 | |
Otis Worldwide Corp. | | | 1,529 | | | | 97,550 | |
Rockwell Automation, Inc. | | | 215 | | | | 46,249 | |
| | | | | | | | 490,239 | |
Miscellaneous - Manufacturing — 0.3% |
Eaton Corp. PLC | | | 1,010 | | | | 134,694 | |
Illinois Tool Works, Inc. | | | 654 | | | | 118,145 | |
Trane Technologies PLC | | | 427 | | | | 61,834 | |
| | | | | | | | 314,673 | |
Packaging & Containers — 0.1% |
Amcor PLC | | | 6,346 | | | | 68,093 | |
Ball Corp. | | | 608 | | | | 29,378 | |
| | | | | | | | 97,471 | |
Transportation — 1.8% |
C.H. Robinson Worldwide, Inc. | | | 497 | | | | 47,866 | |
CSX Corp. | | | 12,551 | | | | 334,359 | |
Expeditors International of Washington, Inc. | | | 628 | | | | 55,459 | |
FedEx Corp. | | | 774 | | | | 114,916 | |
Norfolk Southern Corp. | | | 1,196 | | | | 250,741 | |
Union Pacific Corp. | | | 3,755 | | | | 731,549 | |
United Parcel Service, Inc. Class B | | | 3,216 | | | | 519,512 | |
| | | | | | | | 2,054,402 | |
| | | | | | | | 4,568,147 | |
Technology — 15.5% |
Computers — 6.3% |
Accenture PLC Class A | | | 2,226 | | | | 572,750 | |
| | | Number of
Shares | | | Value | |
Apple, Inc. | | | 39,526 | | | $ | 5,462,493 | |
Cognizant Technology Solutions Corp. Class A | | | 2,781 | | | | 159,741 | |
Crowdstrike Holdings, Inc. Class A (a) | | | 236 | | | | 38,895 | |
Fortinet, Inc. (a) | | | 1,691 | | | | 83,079 | |
Hewlett Packard Enterprise Co. | | | 8,195 | | | | 98,176 | |
HP, Inc. | | | 7,601 | | | | 189,417 | |
International Business Machines Corp. | | | 4,305 | | | | 511,477 | |
NetApp, Inc. | | | 794 | | | | 49,109 | |
Seagate Technology Holdings PLC | | | 1,081 | | | | 57,541 | |
Western Digital Corp. (a) | | | 816 | | | | 26,561 | |
| | | | | | | | 7,249,239 | |
Office & Business Equipment — 0.0% |
Zebra Technologies Corp. Class A (a) | | | 93 | | | | 24,367 | |
Semiconductors — 3.2% |
Advanced Micro Devices, Inc. (a) | | | 2,569 | | | | 162,772 | |
Applied Materials, Inc. | | | 2,961 | | | | 242,594 | |
Broadcom, Inc. | | | 1,916 | | | | 850,723 | |
Intel Corp. | | | 21,188 | | | | 546,015 | |
KLA Corp. | | | 607 | | | | 183,696 | |
Lam Research Corp. | | | 372 | | | | 136,152 | |
Micron Technology, Inc. | | | 4,668 | | | | 233,867 | |
NVIDIA Corp. | | | 4,061 | | | | 492,965 | |
Texas Instruments, Inc. | | | 4,878 | | | | 755,017 | |
| | | | | | | | 3,603,801 | |
Software — 6.0% |
Adobe, Inc. (a) | | | 1,107 | | | | 304,646 | |
Akamai Technologies, Inc. (a) | | | 927 | | | | 74,457 | |
ANSYS, Inc. (a) | | | 173 | | | | 38,354 | |
Autodesk, Inc. (a) | | | 367 | | | | 68,556 | |
Cadence Design Systems, Inc. (a) | | | 1,005 | | | | 164,247 | |
Citrix Systems, Inc. (b) | | | 321 | | | | 33,352 | |
DocuSign, Inc. (a) | | | 158 | | | | 8,448 | |
Electronic Arts, Inc. | | | 1,542 | | | | 178,425 | |
Fidelity National Information Services, Inc. | | | 1,229 | | | | 92,875 | |
Fiserv, Inc. (a) | | | 1,123 | | | | 105,079 | |
HubSpot, Inc. (a) | | | 43 | | | | 11,615 | |
Intuit, Inc. | | | 701 | | | | 271,511 | |
Microsoft Corp. | | | 18,033 | | | | 4,199,886 | |
MSCI, Inc. | | | 144 | | | | 60,738 | |
Oracle Corp. | | | 6,127 | | | | 374,176 | |
Paychex, Inc. | | | 1,196 | | | | 134,203 | |
Salesforce, Inc. (a) | | | 1,376 | | | | 197,924 | |
ServiceNow, Inc. (a) | | | 481 | | | | 181,630 | |
Snowflake, Inc. Class A (a) | | | 201 | | | | 34,162 | |
Splunk, Inc. (a) | | | 107 | | | | 8,046 | |
Synopsys, Inc. (a) | | | 505 | | | | 154,283 | |
The accompanying notes are an integral part of the financial statements.
107
MassMutual Balanced Fund — Portfolio of Investments (Continued) |
| | | Number of
Shares | | | Value | |
Unity Software, Inc. (a) | | | 120 | | | $ | 3,823 | |
Veeva Systems, Inc. Class A (a) | | | 128 | | | | 21,105 | |
VMware, Inc. Class A | | | 604 | | | | 64,302 | |
Workday, Inc. Class A (a) | | | 558 | | | | 84,939 | |
Zoom Video Communications, Inc. Class A (a) | | | 178 | | | | 13,099 | |
| | | | | | | | 6,883,881 | |
| | | | | | | | 17,761,288 | |
Utilities — 2.2% |
Electric — 2.2% |
Ameren Corp. | | | 772 | | | | 62,185 | |
American Electric Power Co., Inc. | | | 2,293 | | | | 198,230 | |
Avangrid, Inc. | | | 89 | | | | 3,711 | |
CMS Energy Corp. | | | 1,117 | | | | 65,054 | |
Consolidated Edison, Inc. | | | 2,097 | | | | 179,839 | |
Dominion Energy, Inc. | | | 2,674 | | | | 184,800 | |
DTE Energy Co. | | | 736 | | | | 84,677 | |
Duke Energy Corp. | | | 3,263 | | | | 303,524 | |
Edison International | | | 633 | | | | 35,815 | |
Entergy Corp. | | | 438 | | | | 44,076 | |
Eversource Energy | | | 911 | | | | 71,022 | |
Exelon Corp. | | | 10,711 | | | | 401,234 | |
FirstEnergy Corp. | | | 2,337 | | | | 86,469 | |
NextEra Energy, Inc. | | | 3,351 | | | | 262,752 | |
Public Service Enterprise Group, Inc. | | | 1,410 | | | | 79,284 | |
Sempra Energy | | | 1,248 | | | | 187,125 | |
WEC Energy Group, Inc. | | | 1,960 | | | | 175,283 | |
Xcel Energy, Inc. | | | 1,822 | | | | 116,608 | |
| | | | | | | | 2,541,688 | |
Water — 0.0% |
American Water Works Co., Inc. | | | 358 | | | | 46,597 | |
| | | | | | | | 2,588,285 | |
| | | | | | | | | |
TOTAL COMMON STOCK (Cost $80,784,749) | | | | | | | 73,526,685 | |
| | | | | | | | | |
TOTAL EQUITIES (Cost $80,784,749) | | | | | | | 73,526,685 | |
| | | | | | | | | |
| | | Principal
Amount | | | | | |
BONDS & NOTES — 40.8% |
CORPORATE DEBT — 12.3% |
Agriculture — 0.1% |
Archer-Daniels-Midland Co. | | | | | | | | |
2.700% 9/15/51 | | $ | 49,000 | | | | 32,283 | |
Bunge Ltd. Finance Corp. | | | | | | | | |
1.630% 8/17/25 | | | 13,000 | | | | 11,696 | |
3.250% 8/15/26 | | | 47,000 | | | | 43,221 | |
| | | Principal
Amount | | | Value | |
Cargill, Inc. | | | | | | | | |
3.125% 5/25/51 (c) | | $ | 74,000 | | | $ | 50,805 | |
| | | | | | | | 138,005 | |
Airlines — 0.1% |
American Airlines 2021-1 Class A Pass Through Trust | | | | | | | | |
2.875% 1/11/36 | | | 69,000 | | | | 56,046 | |
Delta Air Lines, Inc./SkyMiles IP Ltd. | | | | | | | | |
4.500% 10/20/25 (c) | | | 82,995 | | | | 80,567 | |
| | | | | | | | 136,613 | |
Banks — 2.9% |
Australia & New Zealand Banking Group Ltd. 5 year CMT + 1.700% | | | | | | | | |
2.570% VRN 11/25/35 (c) | | | 225,000 | | | | 163,268 | |
Bank of America Corp. | | | | | | | | |
5 year CMT + 1.200% 2.482% VRN 9/21/36 | | | 162,000 | | | | 117,098 | |
SOFR + 1.330% 2.972% VRN 2/04/33 | | | 66,000 | | | | 51,571 | |
SOFR + 1.580% 3.311% VRN 4/22/42 | | | 135,000 | | | | 95,202 | |
4.183% 11/25/27 | | | 41,000 | | | | 38,003 | |
3 mo. USD LIBOR + 1.814% 4.244% VRN 4/24/38 | | | 23,000 | | | | 18,937 | |
3 mo. USD LIBOR + 1.310% 4.271% VRN 7/23/29 | | | 18,000 | | | | 16,356 | |
4.750% 4/21/45 | | | 63,000 | | | | 50,764 | |
5 year CMT + 3.231% 6.125% VRN (d) | | | 162,000 | | | | 153,090 | |
7.750% 5/14/38 | | | 20,000 | | | | 22,187 | |
The Bank of New York Mellon Corp. 5 year CMT + 2.630% | | | | | | | | |
3.750% VRN (d) | | | 156,000 | | | | 120,510 | |
The Bank of Nova Scotia | | | | | | | | |
4.500% 12/16/25 | | | 36,000 | | | | 34,744 | |
Citigroup, Inc. | | | | | | | | |
SOFR + .528% 1.281% VRN 11/03/25 | | | 55,000 | | | | 50,258 | |
4.450% 9/29/27 | | | 27,000 | | | | 24,985 | |
SOFR + 2.086% 4.910% VRN 5/24/33 | | | 71,000 | | | | 65,362 | |
5.500% 9/13/25 | | | 54,000 | | | | 53,833 | |
5.875% 1/30/42 | | | 18,000 | | | | 17,231 | |
6.000% 10/31/33 | | | 16,000 | | | | 15,404 | |
6.625% 6/15/32 | | | 14,000 | | | | 14,150 | |
8.125% 7/15/39 | | | 14,000 | | | | 16,582 | |
Cooperatieve Rabobank UA 1 year CMT + .550% | | | | | | | | |
1.106% VRN 2/24/27 (c) | | | 250,000 | | | | 214,088 | |
The accompanying notes are an integral part of the financial statements.
108
MassMutual Balanced Fund — Portfolio of Investments (Continued) |
| | | Principal
Amount | | | Value | |
The Goldman Sachs Group, Inc. | | | | | | | | |
SOFR + .798% 1.431% VRN 3/09/27 | | $ | 227,000 | | | $ | 195,223 | |
SOFR + 1.090% 1.992% VRN 1/27/32 | | | 135,000 | | | | 99,763 | |
SOFR + 1.248% 2.383% VRN 7/21/32 | | | 76,000 | | | | 57,277 | |
SOFR + 1.410% 3.102% VRN 2/24/33 | | | 66,000 | | | | 52,372 | |
4.250% 10/21/25 | | | 32,000 | | | | 30,874 | |
5.950% 1/15/27 | | | 72,000 | | | | 72,448 | |
6.750% 10/01/37 | | | 32,000 | | | | 31,880 | |
JP Morgan Chase & Co. | | | | | | | | |
3 mo. USD LIBOR + 1.160% 3.702% VRN 5/06/30 | | | 320,000 | | | | 279,258 | |
5.600% 7/15/41 | | | 41,000 | | | | 38,884 | |
KeyBank NA/Cleveland OH | | | | | | | | |
3.900% 4/13/29 | | | 356,000 | | | | 312,177 | |
Mizuho Financial Group, Inc. | | | | | | | | |
2.564% 9/13/31 | | | 200,000 | | | | 146,805 | |
Morgan Stanley | | | | | | | | |
SOFR + 1.360% 2.484% VRN 9/16/36 | | | 203,000 | | | | 145,401 | |
SOFR + 1.485% 3.217% VRN 4/22/42 | | | 44,000 | | | | 30,669 | |
3 mo. USD LIBOR + 1.628% 4.431% VRN 1/23/30 | | | 154,000 | | | | 141,520 | |
The PNC Financial Services Group, Inc. SOFR + 1.850% | | | | | | | | |
4.626% VRN 6/06/33 | | | 108,000 | | | | 96,300 | |
SVB Financial Group | | | | | | | | |
1.800% 2/02/31 | | | 189,000 | | | | 134,116 | |
2.100% 5/15/28 | | | 87,000 | | | | 70,525 | |
3.125% 6/05/30 | | | 18,000 | | | | 14,494 | |
3.500% 1/29/25 | | | 77,000 | | | | 73,662 | |
| | | | | | | | 3,377,271 | |
Biotechnology — 0.5% |
Amgen, Inc. | | | | | | | | |
2.200% 2/21/27 | | | 347,000 | | | | 308,245 | |
CSL Finance PLC | | | | | | | | |
4.250% 4/27/32 (c) | | | 65,000 | | | | 59,313 | |
4.750% 4/27/52 (c) | | | 27,000 | | | | 23,231 | |
Illumina, Inc. | | | | | | | | |
0.550% 3/23/23 | | | 194,000 | | | | 189,974 | |
| | | | | | | | 580,763 | |
Commercial Services — 0.3% |
Element Fleet Management Corp. | | | | | | | | |
1.600% 4/06/24 (c) | | | 21,000 | | | | 19,766 | |
Moody’s Corp. | | | | | | | | |
4.250% 2/01/29 | | | 209,000 | | | | 197,363 | |
| | | Principal
Amount | | | Value | |
PayPal Holdings, Inc. | | | | | | | | |
3.250% 6/01/50 | | $ | 27,000 | | | $ | 18,245 | |
Triton Container International Ltd. | | | | | | | | |
3.150% 6/15/31 (c) | | | 100,000 | | | | 73,208 | |
| | | | | | | | 308,582 | |
Computers — 0.5% |
Apple, Inc. | | | | | | | | |
1.650% 5/11/30 | | | 46,000 | | | | 37,016 | |
2.650% 5/11/50 | | | 27,000 | | | | 17,724 | |
3.000% 6/20/27 | | | 177,000 | | | | 166,356 | |
Dell International LLC/EMC Corp. | | | | | | | | |
4.000% 7/15/24 | | | 336,000 | | | | 329,899 | |
| | | | | | | | 550,995 | |
Diversified Financial Services — 0.5% |
Air Lease Corp. | | | | | | | | |
2.200% 1/15/27 | | | 64,000 | | | | 54,211 | |
Ally Financial, Inc. | | | | | | | | |
2.200% 11/02/28 | | | 112,000 | | | | 86,579 | |
Brookfield Finance, Inc. | | | | | | | | |
3.900% 1/25/28 | | | 99,000 | | | | 89,204 | |
The Charles Schwab Corp. 10 year CMT + 3.079% | | | | | | | | |
4.000% VRN (d) | | | 93,000 | | | | 68,314 | |
CI Financial Corp. | | | | | | | | |
3.200% 12/17/30 | | | 65,000 | | | | 47,094 | |
LSEGA Financing PLC | | | | | | | | |
1.375% 4/06/26 (c) | | | 218,000 | | | | 191,069 | |
| | | | | | | | 536,471 | |
Electric — 0.1% |
Nevada Power Co. | | | | | | | | |
6.650% 4/01/36 | | | 20,000 | | | | 21,152 | |
Xcel Energy, Inc. | | | | | | | | |
6.500% 7/01/36 | | | 99,000 | | | | 103,528 | |
| | | | | | | | 124,680 | |
Electronics — 0.1% |
Vontier Corp. | | | | | | | | |
2.400% 4/01/28 | | | 219,000 | | | | 171,011 | |
Entertainment — 0.1% |
Magallanes, Inc. Co. | | | | | | | | |
5.391% 3/15/62 (c) | | | 37,000 | | | | 26,825 | |
Warnermedia Holdings, Inc. | | | | | | | | |
5.141% 3/15/52 (c) | | | 49,000 | | | | 35,552 | |
| | | | | | | | 62,377 | |
Food — 0.3% |
Conagra Brands, Inc. | | | | | | | | |
4.850% 11/01/28 | | | 170,000 | | | | 160,484 | |
General Mills, Inc. | | | | | | | | |
3.000% 2/01/51 | | | 112,000 | | | | 72,621 | |
The accompanying notes are an integral part of the financial statements.
109
MassMutual Balanced Fund — Portfolio of Investments (Continued) |
| | | Principal
Amount | | | Value | |
Ingredion, Inc. | | | | | | | | |
3.200% 10/01/26 | | $ | 25,000 | | | $ | 23,064 | |
Mars, Inc. | | | | | | | | |
3.950% 4/01/49 (c) | | | 67,000 | | | | 53,607 | |
| | | | | | | | 309,776 | |
Health Care – Services — 0.6% |
HCA, Inc. | | | | | | | | |
5.000% 3/15/24 | | | 328,000 | | | | 325,834 | |
Kaiser Foundation Hospitals | | | | | | | | |
2.810% 6/01/41 | | | 110,000 | | | | 76,779 | |
3.002% 6/01/51 | | | 80,000 | | | | 52,742 | |
Mayo Clinic | | | | | | | | |
3.196% 11/15/61 | | | 106,000 | | | | 68,844 | |
Providence St Joseph Health Obligated Group | | | | | | | | |
2.700% 10/01/51 | | | 93,000 | | | | 55,830 | |
UnitedHealth Group, Inc. | | | | | | | | |
3.125% 5/15/60 | | | 36,000 | | | | 23,055 | |
4.750% 5/15/52 | | | 33,000 | | | | 29,569 | |
| | | | | | | | 632,653 | |
Insurance — 0.8% |
The Allstate Corp. 3 mo. USD LIBOR + 2.938% | | | | | | | | |
5.750% VRN 8/15/53 | | | 158,000 | | | | 145,468 | |
American International Group, Inc. 3 mo. USD LIBOR + 2.868% | | | | | | | | |
5.750% VRN 4/01/48 | | | 104,000 | | | | 95,837 | |
Arch Capital Finance LLC | | | | | | | | |
5.031% 12/15/46 | | | 27,000 | | | | 22,855 | |
Arch Capital Group Ltd. | | | | | | | | |
3.635% 6/30/50 | | | 49,000 | | | | 33,363 | |
Athene Global Funding | | | | | | | | |
1.450% 1/08/26 (c) | | | 117,000 | | | | 101,761 | |
Athene Holding Ltd. | | | | | | | | |
3.950% 5/25/51 | | | 16,000 | | | | 10,658 | |
Brighthouse Financial, Inc. | | | | | | | | |
3.850% 12/22/51 | | | 168,000 | | | | 101,730 | |
GA Global Funding Trust | | | | | | | | |
1.625% 1/15/26 (c) | | | 37,000 | | | | 32,444 | |
Global Atlantic Fin Co. | | | | | | | | |
3.125% 6/15/31 (c) | | | 72,000 | | | | 52,704 | |
Jackson Financial, Inc. | | | | | | | | |
5.170% 6/08/27 | | | 78,000 | | | | 74,840 | |
New York Life Insurance Co. | | | | | | | | |
3.750% 5/15/50 (c) | | | 23,000 | | | | 17,009 | |
Prudential Financial, Inc. | | | | | | | | |
5 year CMT + 3.035% 3.700% VRN 10/01/50 | | | 18,000 | | | | 14,216 | |
| | | Principal
Amount | | | Value | |
3 mo. USD LIBOR + 3.920% 5.625% VRN 6/15/43 | | $ | 41,000 | | | $ | 40,396 | |
3 mo. USD LIBOR + 2.665% 5.700% VRN 9/15/48 | | | 99,000 | | | | 92,441 | |
Reinsurance Group of America, Inc. | | | | | | | | |
3.150% 6/15/30 | | | 49,000 | | | | 40,791 | |
3.900% 5/15/29 | | | 54,000 | | | | 48,089 | |
USF&G Capital I | | | | | | | | |
8.500% 12/15/45 (c) | | | 35,000 | | | | 39,972 | |
| | | | | | | | 964,574 | |
Internet — 0.1% |
Alphabet, Inc. | | | | | | | | |
2.250% 8/15/60 | | | 32,000 | | | | 17,994 | |
Expedia Group, Inc. | | | | | | | | |
2.950% 3/15/31 | | | 11,000 | | | | 8,530 | |
Prosus NV | | | | | | | | |
3.832% 2/08/51 (c) | | | 233,000 | | | | 129,313 | |
| | | | | | | | 155,837 | |
Investment Companies — 0.2% |
Ares Capital Corp. | | | | | | | | |
3.200% 11/15/31 | | | 161,000 | | | | 114,266 | |
Blackstone Secured Lending Fund | | | | | | | | |
2.750% 9/16/26 | | | 158,000 | | | | 135,679 | |
| | | | | | | | 249,945 | |
Media — 0.6% |
Charter Communications Operating LLC/Charter Communications Operating Capital | | | | | | | | |
3.500% 6/01/41 | | | 119,000 | | | | 76,057 | |
3.750% 2/15/28 | | | 191,000 | | | | 168,806 | |
3.850% 4/01/61 | | | 80,000 | | | | 46,711 | |
6.484% 10/23/45 | | | 32,000 | | | | 28,126 | |
Comcast Corp. | | | | | | | | |
2.937% 11/01/56 | | | 43,000 | | | | 25,670 | |
3.400% 7/15/46 | | | 41,000 | | | | 28,870 | |
3.750% 4/01/40 | | | 151,000 | | | | 118,721 | |
3.969% 11/01/47 | | | 23,000 | | | | 17,588 | |
Discovery Communications LLC | | | | | | | | |
3.950% 3/20/28 | | | 56,000 | | | | 49,115 | |
FactSet Research Systems, Inc. | | | | | | | | |
3.450% 3/01/32 | | | 67,000 | | | | 54,576 | |
Time Warner Cable, Inc. | | | | | | | | |
6.750% 6/15/39 | | | 27,000 | | | | 24,138 | |
The Walt Disney Co. | | | | | | | | |
3.600% 1/13/51 | | | 58,000 | | | | 42,966 | |
| | | | | | | | 681,344 | |
The accompanying notes are an integral part of the financial statements.
110
MassMutual Balanced Fund — Portfolio of Investments (Continued) |
| | | Principal
Amount | | | Value | |
Mining — 0.0% |
Teck Resources Ltd. | | | | | | | | |
6.000% 8/15/40 | | $ | 32,000 | | | $ | 28,226 | |
Miscellaneous - Manufacturing — 0.1% |
Eaton Corp. | | | | | | | | |
4.150% 3/15/33 | | | 82,000 | | | | 74,050 | |
Oil & Gas — 0.1% |
BP Capital Markets America, Inc. | | | | | | | | |
3.379% 2/08/61 | | | 95,000 | | | | 61,913 | |
BP Capital Markets PLC 5 year CMT + 4.036% | | | | | | | | |
4.375% VRN (d) | | | 58,000 | | | | 53,650 | |
| | | | | | | | 115,563 | |
Packaging & Containers — 0.3% |
Berry Global, Inc. | | | | | | | | |
1.570% 1/15/26 | | | 48,000 | | | | 41,832 | |
Sealed Air Corp. | | | | | | | | |
1.573% 10/15/26 (c) | | | 44,000 | | | | 36,853 | |
Silgan Holdings, Inc. | | | | | | | | |
1.400% 4/01/26 (c) | | | 49,000 | | | | 41,843 | |
WRKCo, Inc. | | | | | | | | |
3.000% 6/15/33 | | | 27,000 | | | | 20,880 | |
4.650% 3/15/26 | | | 192,000 | | | | 187,853 | |
| | | | | | | | 329,261 | |
Pharmaceuticals — 0.4% |
AbbVie, Inc. | | | | | | | | |
4.700% 5/14/45 | | | 67,000 | | | | 56,679 | |
Becton Dickinson and Co. | | | | | | | | |
4.685% 12/15/44 | | | 21,000 | | | | 17,937 | |
Bristol-Myers Squibb Co. | | | | | | | | |
4.350% 11/15/47 | | | 27,000 | | | | 23,061 | |
Cigna Corp. | | | | | | | | |
2.400% 3/15/30 | | | 249,000 | | | | 202,707 | |
3.400% 3/15/51 | | | 47,000 | | | | 32,054 | |
4.800% 7/15/46 | | | 27,000 | | | | 23,113 | |
CVS Health Corp. | | | | | | | | |
4.300% 3/25/28 | | | 10,000 | | | | 9,453 | |
5.050% 3/25/48 | | | 25,000 | | | | 21,933 | |
6.125% 9/15/39 | | | 8,000 | | | | 8,164 | |
Merck & Co., Inc. | | | | | | | | |
1.900% 12/10/28 | | | 40,000 | | | | 33,573 | |
| | | | | | | | 428,674 | |
Pipelines — 1.0% |
Enbridge, Inc. | | | | | | | | |
2.500% 8/01/33 | | | 190,000 | | | | 142,209 | |
Enterprise Products Operating LLC | | | | | | | | |
3 mo. USD LIBOR + 3.033% 5.250% VRN 8/16/77 | | | 41,000 | | | | 34,260 | |
| | | Principal
Amount | | | Value | |
3 mo. USD LIBOR + 2.570% 5.375% VRN 2/15/78 | | $ | 27,000 | | | $ | 20,272 | |
Kinder Morgan, Inc. | | | | | | | | |
3.250% 8/01/50 | | | 100,000 | | | | 62,538 | |
4.800% 2/01/33 | | | 137,000 | | | | 122,581 | |
MPLX LP | | | | | | | | |
1.750% 3/01/26 | | | 365,000 | | | | 319,481 | |
4.500% 4/15/38 | | | 27,000 | | | | 21,727 | |
ONEOK, Inc. | | | | | | | | |
6.350% 1/15/31 | | | 200,000 | | | | 196,022 | |
Sabine Pass Liquefaction LLC | | | | | | | | |
4.500% 5/15/30 | | | 100,000 | | | | 91,063 | |
The Williams Cos., Inc. | | | | | | | | |
3.500% 10/15/51 | | | 45,000 | | | | 29,948 | |
4.650% 8/15/32 | | | 84,000 | | | | 76,207 | |
5.300% 8/15/52 | | | 40,000 | | | | 34,820 | |
| | | | | | | | 1,151,128 | |
Real Estate — 0.2% |
CBRE Services, Inc. | | | | | | | | |
2.500% 4/01/31 | | | 243,000 | | | | 184,802 | |
Real Estate Investment Trusts (REITS) — 0.9% |
Alexandria Real Estate Equities, Inc. | | | | | | | | |
2.950% 3/15/34 | | | 78,000 | | | | 60,240 | |
American Tower Corp. | | | | | | | | |
1.600% 4/15/26 | | | 96,000 | | | | 83,755 | |
2.700% 4/15/31 | | | 119,000 | | | | 93,339 | |
Brixmor Operating Partnership LP | | | | | | | | |
2.250% 4/01/28 | | | 24,000 | | | | 19,383 | |
Crown Castle International Corp. | | | | | | | | |
2.500% 7/15/31 | | | 88,000 | | | | 67,781 | |
3.700% 6/15/26 | | | 243,000 | | | | 228,316 | |
Crown Castle, Inc. | | | | | | | | |
5.200% 2/15/49 | | | 11,000 | | | | 9,471 | |
Equinix, Inc. | | | | | | | | |
3.900% 4/15/32 | | | 118,000 | | | | 100,191 | |
Extra Space Storage LP | | | | | | | | |
2.350% 3/15/32 | | | 65,000 | | | | 47,868 | |
2.550% 6/01/31 | | | 89,000 | | | | 68,391 | |
Host Hotels & Resorts LP | | | | | | | | |
3.500% 9/15/30 | | | 84,000 | | | | 66,964 | |
Kimco Realty Corp. | | | | | | | | |
2.250% 12/01/31 | | | 58,000 | | | | 43,489 | |
Kite Realty Group LP | | | | | | | | |
4.000% 10/01/26 | | | 110,000 | | | | 101,184 | |
| | | | | | | | 990,372 | |
Retail — 0.7% |
Advance Auto Parts, Inc. | | | | | | | | |
1.750% 10/01/27 | | | 13,000 | | | | 10,727 | |
The accompanying notes are an integral part of the financial statements.
111
MassMutual Balanced Fund — Portfolio of Investments (Continued) |
| |
| | | Principal
Amount | | | Value | |
3.900% 4/15/30 | | $ | 323,000 | | | $ | 277,169 | |
Alimentation Couche-Tard, Inc. | | | | | | | | |
3.625% 5/13/51 (c) | | | 71,000 | | | | 45,834 | |
AutoZone, Inc. | | | | | | | | |
1.650% 1/15/31 | | | 41,000 | | | | 30,443 | |
Dollar General Corp. | | | | | | | | |
4.250% 9/20/24 | | | 83,000 | | | | 82,027 | |
The Home Depot, Inc. | | | | | | | | |
2.375% 3/15/51 | | | 48,000 | | | | 28,081 | |
2.700% 4/15/30 | | | 97,000 | | | | 82,819 | |
Lowe’s Cos., Inc. | | | | | | | | |
3.000% 10/15/50 | | | 90,000 | | | | 55,183 | |
McDonald’s Corp. | | | | | | | | |
3.300% 7/01/25 | | | 182,000 | | | | 175,131 | |
Starbucks Corp. | | | | | | | | |
4.450% 8/15/49 | | | 86,000 | | | | 70,285 | |
| | | | | | | | 857,699 | |
Semiconductors — 0.4% |
Microchip Technology, Inc. | | | | | | | | |
0.983% 9/01/24 | | | 49,000 | | | | 45,116 | |
Micron Technology, Inc. | | | | | | | | |
2.703% 4/15/32 | | | 75,000 | | | | 54,472 | |
4.185% 2/15/27 | | | 322,000 | | | | 300,737 | |
Skyworks Solutions, Inc. | | | | | | | | |
1.800% 6/01/26 | | | 36,000 | | | | 31,186 | |
| | | | | | | | 431,511 | |
Software — 0.2% |
Electronic Arts, Inc. | | | | | | | | |
2.950% 2/15/51 | | | 42,000 | | | | 27,445 | |
Microsoft Corp. | | | | | | | | |
2.921% 3/17/52 | | | 80,000 | | | | 56,504 | |
Oracle Corp. | | | | | | | | |
3.600% 4/01/40 | | | 197,000 | | | | 133,725 | |
Workday, Inc. | | | | | | | | |
3.800% 4/01/32 | | | 50,000 | | | | 43,448 | |
| | | | | | | | 261,122 | |
Telecommunications — 0.2% |
Verizon Communications, Inc. | | | | | | | | |
3.550% 3/22/51 | | | 47,000 | | | | 33,054 | |
3.700% 3/22/61 | | | 47,000 | | | | 31,912 | |
3.875% 2/08/29 | | | 180,000 | | | | 164,264 | |
| | | | | | | | 229,230 | |
Transportation — 0.0% |
CSX Corp. | | | | | | | | |
4.750% 11/15/48 | | | 18,000 | | | | 15,848 | |
| | | | | | | | | |
TOTAL CORPORATE DEBT (Cost $17,560,370) | | | | | | | 14,078,383 | |
| | | Principal
Amount | | | Value | |
| | | | | | | | | |
NON-U.S. GOVERNMENT AGENCY OBLIGATIONS — 4.0% |
Automobile Asset-Backed Securities — 0.5% |
Avis Budget Rental Car Funding AESOP LLC, Series 2021-2A, Class A | | | | | | | | |
1.660% 2/20/28 (c) | | $ | 150,000 | | | $ | 128,795 | |
Enterprise Fleet Financing LLC, Series 2021-3, Class A3 | | | | | | | | |
1.220% 8/20/27 (c) | | | 234,000 | | | | 211,015 | |
Hyundai Auto Receivables Trust, Series 2021-C, Class A4 | | | | | | | | |
1.030% 12/15/27 | | | 140,000 | | | | 127,858 | |
Toyota Auto Receivables Owner Trust, Series 2021-D, Class A4 | | | | | | | | |
1.020% 3/15/27 | | | 70,000 | | | | 63,421 | |
| | | | | | | | 531,089 | |
Commercial Mortgage-Backed Securities — 1.1% |
Bank | | | | | | | | |
Series 2019-BN17, Class B, 4.128% VRN 4/15/52 (e) | | | 29,000 | | | | 25,590 | |
Series 2019-BN16, Class AS, 4.267% 2/15/52 | | | 31,333 | | | | 28,152 | |
Series 2019-BN16, Class B, 4.438% VRN 2/15/52 (e) | | | 24,330 | | | | 21,852 | |
BBCMS Mortgage Trust, Series 2020-C7, Class AS | | | | | | | | |
2.444% 4/15/53 | | | 57,000 | | | | 44,817 | |
Benchmark Mortgage Trust | | | | | | | | |
Series 2019-B14, Class AS, 3.352% 12/15/62 | | | 150,000 | | | | 126,905 | |
Series 2019-B9, Class AAB, 3.933% 3/15/52 | | | 274,000 | | | | 258,906 | |
BX Commercial Mortgage Trust | | | | | | | | |
Class A, 1 mo. USD LIBOR + .700% 3.518% FRN 9/15/36 (c) | | | 115,000 | | | | 109,791 | |
Class C, 1 mo. USD LIBOR + 1.100% 3.918% FRN 9/15/36 (c) | | | 100,000 | | | | 92,597 | |
Citigroup Commercial Mortgage Trust, Series 2017-C4, Class C, | | | | | | | | |
4.346% VRN 10/12/50 (e) | | | 70,000 | | | | 60,441 | |
Commercial Mortgage Pass-Through Certificates, Series 2014-LC17, Class C, | | | | | | | | |
4.696% VRN 10/10/47 (e) | | | 100,000 | | | | 93,997 | |
GS Mortgage Securities Trust | | | | | | | | |
Series 2020-GC45, Class A5, 2.911% 2/13/53 | | | 140,000 | | | | 119,379 | |
Series 2017-GS6, Class B, 3.869% 5/10/50 | | | 79,000 | | | | 70,239 | |
The accompanying notes are an integral part of the financial statements.
112
MassMutual Balanced Fund — Portfolio of Investments (Continued) |
| | | Principal
Amount | | | Value | |
Life Mortgage Trust | | | | | | | | |
Class A, 1 mo. USD LIBOR + .700% 3.518% FRN 3/15/38 (c) | | $ | 98,297 | | | $ | 94,490 | |
Class B, 1 mo. USD LIBOR + .880% 3.698% FRN 3/15/38 (c) | | | 98,297 | | | | 93,108 | |
Morgan Stanley Capital I Trust, Series 2018-H3, Class B, | | | | | | | | |
4.620% VRN 7/15/51 (e) | | | 20,000 | | | | 18,152 | |
Wells Fargo Commercial Mortgage Trust | | | | | | | | |
Series 2018-C45, Class AS, 4.405% VRN 6/15/51 (e) | | | 30,000 | | | | 27,164 | |
Series 2018-C45, Class B, 4.556% 6/16/51 | | | 10,000 | | | | 8,911 | |
| | | | | | | | 1,294,491 | |
Other Asset-Backed Securities — 0.5% |
AMSR Trust, Series 2021-SFR3, Class B | | | | | | | | |
1.726% 10/17/38 (c) | | | 130,000 | | | | 111,759 | |
Dllmt LLC, Series 2021-1A, Class A4 | | | | | | | | |
1.240% 6/20/29 (c) | | | 150,000 | | | | 137,146 | |
MVW LLC, Series 2021-2A, Class A | | | | | | | | |
1.430% 5/20/39 (c) | | | 237,435 | | | | 212,566 | |
Progress Residential Trust, Series 2021-SFR10, Class A | | | | | | | | |
2.393% 12/17/40 (c) | | | 100,000 | | | | 83,659 | |
| | | | | | | | 545,130 | |
Whole Loan Collateral Collateralized Mortgage Obligations — 1.9% |
Angel Oak Mortgage Trust | | | | | | | | |
Series 2021-8, Class A1, 1.820% VRN 11/25/66 (c) (e) | | | 248,281 | | | | 214,940 | |
Series 2022-1, Class A1, 2.881% STEP 12/25/66 (c) | | | 248,714 | | | | 216,503 | |
Bayview MSR Opportunity Master Fund Trust | | | | | | | | |
Series 2021-5, Class A2, 2.500% VRN 11/25/51 (c) (e) | | | 137,211 | | | | 108,847 | |
Series 2021-5, Class A1, 3.000% VRN 11/25/51 (c) (e) | | | 112,527 | | | | 92,870 | |
Ellington Financial Mortgage Trust, Series 2022-3, Class A1, | | | | | | | | |
5.000% STEP 8/25/67 (c) | | | 225,561 | | | | 217,880 | |
Flagstar Mortgage Trust, Series 2021-11IN, Class A6, | | | | | | | | |
2.500% VRN 11/25/51 (c) (e) | | | 236,962 | | | | 203,037 | |
Imperial Fund Mortgage Trust, Series 2021-NQM3, Class A1, | | | | | | | | |
1.595% VRN 11/25/56 (c) (e) | | | 152,929 | | | | 126,175 | |
JP Morgan Mortgage Trust | | | | | | | | |
Series 2021-LTV2, Class A1, 2.520% VRN 5/25/52 (c) (e) | | | 254,441 | | | | 213,114 | |
| | | Principal
Amount | | | Value | |
Series 2022-8, Class A4A, 4.000% VRN 1/25/53 (c) (e) | | $ | 159,961 | | | $ | 149,763 | |
Onslow Bay Financial LLC, Series 2022-NQM1, Class A1, | | | | | | | | |
2.305% VRN 11/25/61 (c) (e) | | | 234,447 | | | | 195,516 | |
Starwood Mortgage Residential Trust | | | | | | | | |
Series 2021-6, Class A1, 1.920% VRN 11/25/66 (c) (e) | | | 261,951 | | | | 219,915 | |
Series 2022-1, Class A1, 2.447% VRN 12/25/66 (c) (e) | | | 284,239 | | | | 238,552 | |
| | | | | | | | 2,197,112 | |
| | | | | | | | | |
TOTAL NON-U.S. GOVERNMENT AGENCY OBLIGATIONS (Cost $5,248,331) | | | | | | | 4,567,822 | |
| | | | | | | | | |
U.S. GOVERNMENT AGENCY OBLIGATIONS AND INSTRUMENTALITIES (f) — 10.1% |
Pass-Through Securities — 10.1% |
Federal Home Loan Mortgage Corp. | | | | | | | | |
Pool #RA6233 2.000% 11/01/51 | | | 521,403 | | | | 422,675 | |
Pool #SD8174 3.000% 10/01/51 | | | 439,086 | | | | 383,096 | |
Pool #RA7484 4.000% 6/01/52 | | | 464,113 | | | | 430,935 | |
Pool #SD1351 4.500% 7/01/52 | | | 435,404 | | | | 415,197 | |
Federal National Mortgage Association | | | | | | | | |
Pool #CB1787 2.000% 10/01/51 | | | 506,697 | | | | 410,912 | |
Pool #CB1782 2.000% 10/01/51 | | | 761,227 | | | | 617,326 | |
Pool #MA4361 2.500% 6/01/36 | | | 314,344 | | | | 285,484 | |
Pool #CB2074 2.500% 11/01/51 | | | 397,385 | | | | 334,715 | |
Pool #FS2635 2.500% 5/01/52 | | | 481,129 | | | | 406,004 | |
Pool #BO7245 3.000% 1/01/50 | | | 296,955 | | | | 260,493 | |
Pool #BU8819 3.500% 5/01/52 | | | 495,722 | | | | 446,810 | |
Pool #CB3859 4.000% 6/01/52 | | | 244,637 | | | | 227,225 | |
Pool #CB4404 5.000% 8/01/52 | | | 418,658 | | | | 408,363 | |
Uniform Mortgage Backed Securities TBA | | | | | | | | |
2.000% 10/18/37 (g) | | | 1,500,000 | | | | 1,321,055 | |
2.000% 10/13/52 (g) | | | 1,129,000 | | | | 914,137 | |
2.500% 10/13/52 (g) | | | 1,760,000 | | | | 1,477,987 | |
3.000% 10/13/52 (g) | | | 850,000 | | | | 739,500 | |
3.500% 10/13/52 (g) | | | 1,000,000 | | | | 899,688 | |
4.000% 10/13/52 (g) | | | 750,000 | | | | 695,508 | |
4.500% 10/13/52 (g) | | | 511,000 | | | | 486,408 | |
| | | | | | | | 11,583,518 | |
| | | | | | | | | |
TOTAL U.S. GOVERNMENT AGENCY OBLIGATIONS AND INSTRUMENTALITIES (Cost $12,624,254) | | | | | | | 11,583,518 | |
| | | | | | | | | |
The accompanying notes are an integral part of the financial statements.
113
MassMutual Balanced Fund — Portfolio of Investments (Continued) |
| |
| | | Principal
Amount | | | Value | |
U.S. TREASURY OBLIGATIONS — 14.4% |
U.S. Treasury Bonds & Notes — 14.4% |
U.S. Treasury Bond | | | | | | | | |
2.250% 8/15/49 | | $ | 873,900 | | | $ | 639,449 | |
2.875% 5/15/52 | | | 1,052,600 | | | | 883,033 | |
3.375% 8/15/42 | | | 1,423,200 | | | | 1,289,775 | |
U.S. Treasury Note | | | | | | | | |
0.125% 5/15/23 | | | 1,000,000 | | | | 975,977 | |
0.250% 11/15/23 | | | 2,000,000 | | | | 1,911,719 | |
0.375% 4/30/25 | | | 1,543,600 | | | | 1,398,043 | |
2.250% 4/30/24 | | | 750,000 | | | | 726,152 | |
2.750% 4/30/27 | | | 700,000 | | | | 661,008 | |
2.750% 8/15/32 | | | 855,200 | | | | 781,706 | |
2.875% 4/30/29 | | | 150,000 | | | | 140,063 | |
3.125% 8/31/27 | | | 1,820,500 | | | | 1,747,253 | |
3.125% 8/31/29 | | | 1,974,400 | | | | 1,874,446 | |
3.250% 8/31/24 | | | 1,945,600 | | | | 1,911,020 | |
3.500% 9/15/25 | | | 1,626,400 | | | | 1,593,618 | |
| | | | | | | | 16,533,262 | |
| | | | | | | | | |
TOTAL U.S. TREASURY OBLIGATIONS (Cost $17,732,781) | | | | | | | 16,533,262 | |
| | | | | | | | | |
TOTAL BONDS & NOTES (Cost $53,165,736) | | | | | | | 46,762,985 | |
| | | | | | | | | |
TOTAL LONG-TERM INVESTMENTS (Cost $133,950,485) | | | | | | | 120,289,670 | |
| | | | | | | | | |
SHORT-TERM INVESTMENTS — 1.1% |
Repurchase Agreement — 1.0% |
Fixed Income Clearing Corp., Repurchase Agreement, dated 9/30/22, 0.830%, due 10/03/22 (h) | | | 1,134,559 | | | | 1,134,559 | |
| | | Principal
Amount | | | Value | |
U.S. Treasury Bill — 0.1% |
U.S. Treasury Bill | | | | | | | | |
1.482% 11/17/22 (i) (j) | | $ | 87,000 | | | $ | 86,693 | |
2.005% 11/17/22 (i) (j) | | | 1,000 | | | | 997 | |
2.041% 11/17/22 (i) (j) | | | 4,000 | | | | 3,986 | |
2.134% 11/17/22 (i) (j) | | | 3,000 | | | | 2,989 | |
| | | | | | | | 94,665 | |
| | | | | | | | | |
TOTAL SHORT-TERM INVESTMENTS (Cost $1,229,373) | | | | | | | 1,229,224 | |
| | | | | | | | | |
TOTAL INVESTMENTS — 105.9% (Cost $135,179,858) (k) | | | | | | | 121,518,894 | |
| | | | | | | | | |
Other Assets/(Liabilities) — (5.9)% | | | | | | | (6,729,401 | ) |
| | | | | | | | | |
NET ASSETS — 100.0% | | | | | | $ | 114,789,493 | |
Abbreviation Legend
Notes to Portfolio of Investments
Percentages are stated as a percent of net assets.
(a) | Non-income producing security. |
(b) | This security is fair valued in good faith in accordance with procedures approved by the Board of Trustees. At September 30, 2022, these securities amounted to a value of $33,352 or 0.03% of net assets. |
(c) | Security is exempt from registration under Regulation S or Rule 144A of the Securities Act of 1933. These securities are considered restricted and may be resold in transactions exempt from registration. At September 30, 2022, the aggregate market value of these securities amounted to $4,961,070 or 4.32% of net assets. |
(d) | Security is perpetual and has no stated maturity date. |
(e) | Certain variable rate securities are not based on a published reference rate and spread but are determined by the issuer or agent and are based on current market conditions. These securities do not indicate a reference rate and spread in their description above. The rates shown are the current interest rates at September 30, 2022. |
(f) | May contain securities that are issued by a U.S. Government Agency, but are unsecured and are not guaranteed by a U.S. Government Agency. |
(g) | A portion of this security is purchased on a when-issued, delayed-delivery or forward commitment basis. (Note 2). |
(h) | Maturity value of $1,134,638. Collateralized by U.S. Government Agency obligations with a rate of 3.500%, maturity date of 9/15/25, and an aggregate market value, including accrued interest, of $1,157,328. |
The accompanying notes are an integral part of the financial statements.
114
MassMutual Balanced Fund — Portfolio of Investments (Continued) |
Notes to Portfolio of Investments (Continued)
(i) | All or a portion of this security is pledged/held as collateral for open derivatives. (Note 2). |
(j) | The rate shown represents yield-to-maturity. |
(k) | See Note 6 for aggregate cost for federal tax purposes. |
Futures contracts
| | Expiration
Date | | | Number of
Contracts | | | Notional
Amount | | | Value/ Net
Unrealized
Appreciation/
(Depreciation) | |
Short | | | | | | | | | | | | | | | | |
U.S. Treasury Note 10 Year | | | 12/20/22 | | | | 17 | | | $ | (2,003,393 | ) | | $ | 98,330 | |
U.S. Treasury Ultra 10 Year | | | 12/20/22 | | | | 11 | | | | (1,389,844 | ) | | | 86,516 | |
U.S. Treasury Note 2 Year | | | 12/30/22 | | | | 7 | | | | (1,460,798 | ) | | | 23,064 | |
U.S. Treasury Note 5 Year | | | 12/30/22 | | | | 9 | | | | (1,002,216 | ) | | | 34,646 | |
| | | | | | | | | | | | | | $ | 242,556 | |
The accompanying notes are an integral part of the financial statements.
115
MassMutual Disciplined Value Fund — Portfolio of Investments |
September 30, 2022 |
| | | Number of
Shares | | | Value | |
EQUITIES — 99.5% |
COMMON STOCK — 99.5% |
Basic Materials — 3.6% |
Chemicals — 2.2% |
International Flavors & Fragrances, Inc. | | | 5,840 | | | $ | 530,447 | |
LyondellBasell Industries NV Class A | | | 8,293 | | | | 624,297 | |
The Mosaic Co. | | | 971 | | | | 46,929 | |
Westlake Corp. | | | 3,240 | | | | 281,491 | |
| | | | | | | | 1,483,164 | |
Iron & Steel — 1.4% |
Nucor Corp. | | | 2,481 | | | | 265,442 | |
Reliance Steel & Aluminum Co. | | | 1,107 | | | | 193,072 | |
Steel Dynamics, Inc. | | | 7,095 | | | | 503,390 | |
United States Steel Corp. | | | 375 | | | | 6,795 | |
| | | | | | | | 968,699 | |
| | | | | | | | 2,451,863 | |
Communications — 5.8% |
Advertising — 1.1% |
Omnicom Group, Inc. | | | 12,074 | | | | 761,749 | |
Internet — 3.5% |
Alphabet, Inc. Class A (a) | | | 5,111 | | | | 488,867 | |
Alphabet, Inc. Class C (a) | | | 3,129 | | | | 300,853 | |
F5, Inc. (a) | | | 266 | | | | 38,498 | |
GoDaddy, Inc. Class A (a) | | | 1,772 | | | | 125,600 | |
Meta Platforms, Inc. Class A (a) | | | 10,099 | | | | 1,370,232 | |
| | | | | | | | 2,324,050 | |
Media — 0.8% |
Paramount Global Class A (b) | | | 813 | | | | 17,512 | |
Paramount Global Class B (b) | | | 7,309 | | | | 139,163 | |
Warner Bros Discovery, Inc. (a) | | | 30,915 | | | | 355,523 | |
| | | | | | | | 512,198 | |
Telecommunications — 0.4% |
Lumen Technologies, Inc. | | | 39,788 | | | | 289,657 | |
| | | | | | | | 3,887,654 | |
Consumer, Cyclical — 6.0% |
Auto Parts & Equipment — 0.4% |
BorgWarner, Inc. | | | 7,775 | | | | 244,135 | |
Distribution & Wholesale — 0.1% |
Core & Main, Inc. Class A (a) | | | 3,841 | | | | 87,345 | |
Home Builders — 1.2% |
D.R. Horton, Inc. | | | 6,352 | | | | 427,807 | |
NVR, Inc. (a) | | | 37 | | | | 147,522 | |
Thor Industries, Inc. | | | 2,749 | | | | 192,375 | |
| | | | | | | | 767,704 | |
| | | Number of
Shares | | | Value | |
Home Furnishing — 0.3% |
Tempur Sealy International, Inc. | | | 8,459 | | | $ | 204,200 | |
Leisure Time — 0.2% |
Brunswick Corp. | | | 1,007 | | | | 65,908 | |
Polaris, Inc. | | | 855 | | | | 81,781 | |
| | | | | | | | 147,689 | |
Retail — 3.8% |
AutoNation, Inc. (a) | | | 1,687 | | | | 171,855 | |
Lithia Motors, Inc. | | | 423 | | | | 90,755 | |
McDonald’s Corp. | | | 3,174 | | | | 732,369 | |
Ollie’s Bargain Outlet Holdings, Inc. (a) | | | 2,052 | | | | 105,883 | |
RH (a) | | | 293 | | | | 72,098 | |
Walmart, Inc. | | | 10,822 | | | | 1,403,613 | |
| | | | | | | | 2,576,573 | |
| | | | | | | | 4,027,646 | |
Consumer, Non-cyclical — 30.1% |
Agriculture — 1.6% |
Philip Morris International, Inc. | | | 13,327 | | | | 1,106,274 | |
Beverages — 2.2% |
The Coca-Cola Co. | | | 280 | | | | 15,685 | |
Monster Beverage Corp. (a) | | | 7,257 | | | | 631,069 | |
PepsiCo, Inc. | | | 5,014 | | | | 818,586 | |
| | | | | | | | 1,465,340 | |
Biotechnology — 1.8% |
Certara, Inc. (a) | | | 684 | | | | 9,083 | |
Moderna, Inc. (a) | | | 1,839 | | | | 217,462 | |
Regeneron Pharmaceuticals, Inc. (a) | | | 708 | | | | 487,720 | |
Vertex Pharmaceuticals, Inc. (a) | | | 1,746 | | | | 505,537 | |
| | | | | | | | 1,219,802 | |
Commercial Services — 3.5% |
Clarivate PLC (a) | | | 9,024 | | | | 84,735 | |
Dun & Bradstreet Holdings, Inc. | | | 8,684 | | | | 107,595 | |
Equifax, Inc. | | | 2,343 | | | | 401,660 | |
Global Payments, Inc. | | | 4,093 | | | | 442,249 | |
Moody’s Corp. | | | 996 | | | | 242,137 | |
Rollins, Inc. | | | 1,282 | | | | 44,460 | |
S&P Global, Inc. | | | 3,468 | | | | 1,058,954 | |
| | | | | | | | 2,381,790 | |
Cosmetics & Personal Care — 2.0% |
The Procter & Gamble Co. | | | 10,375 | | | | 1,309,844 | |
Food — 3.1% |
Campbell Soup Co. | | | 4,663 | | | | 219,721 | |
General Mills, Inc. | | | 6,982 | | | | 534,891 | |
Kellogg Co. | | | 10,731 | | | | 747,521 | |
The accompanying notes are an integral part of the financial statements.
116
MassMutual Disciplined Value Fund — Portfolio of Investments (Continued) |
| | | Number of
Shares | | | Value | |
Mondelez International, Inc. Class A | | | 10,750 | | | $ | 589,423 | |
| | | | | | | | 2,091,556 | |
Health Care – Products — 6.6% |
Abbott Laboratories | | | 7,597 | | | | 735,086 | |
Align Technology, Inc. (a) | | | 1,510 | | | | 312,736 | |
Avantor, Inc. (a) | | | 398 | | | | 7,801 | |
Danaher Corp. | | | 4,904 | | | | 1,266,654 | |
Henry Schein, Inc. (a) | | | 3,929 | | | | 258,410 | |
Hologic, Inc. (a) | | | 7,300 | | | | 470,996 | |
Quidelortho Corp. (a) | | | 547 | | | | 39,100 | |
Thermo Fisher Scientific, Inc. | | | 2,649 | | | | 1,343,546 | |
| | | | | | | | 4,434,329 | |
Health Care – Services — 2.6% |
Centene Corp. (a) | | | 1,908 | | | | 148,461 | |
Elevance Health, Inc. | | | 1,119 | | | | 508,295 | |
Quest Diagnostics, Inc. | | | 427 | | | | 52,389 | |
Syneos Health, Inc. (a) | | | 2,844 | | | | 134,095 | |
UnitedHealth Group, Inc. | | | 1,780 | | | | 898,971 | |
| | | | | | | | 1,742,211 | |
Household Products & Wares — 0.7% |
Kimberly-Clark Corp. | | | 3,063 | | | | 344,710 | |
Reynolds Consumer Products, Inc. | | | 3,977 | | | | 103,442 | |
| | | | | | | | 448,152 | |
Pharmaceuticals — 6.0% |
Bristol-Myers Squibb Co. | | | 17,677 | | | | 1,256,658 | |
Jazz Pharmaceuticals PLC (a) | | | 2,837 | | | | 378,144 | |
McKesson Corp. | | | 2,344 | | | | 796,655 | |
Pfizer, Inc. | | | 36,773 | | | | 1,609,186 | |
| | | | | | | | 4,040,643 | |
| | | | | | | | 20,239,941 | |
Energy — 5.7% |
Oil & Gas — 5.7% |
APA Corp. | | | 5,807 | | | | 198,541 | |
ConocoPhillips | | | 12,635 | | | | 1,293,066 | |
Coterra Energy, Inc. | | | 8,127 | | | | 212,277 | |
Devon Energy Corp. | | | 12,838 | | | | 771,949 | |
HF Sinclair Corp. | | | 7,972 | | | | 429,213 | |
Marathon Oil Corp. | | | 28,634 | | | | 646,556 | |
PDC Energy, Inc. | | | 1,298 | | | | 75,011 | |
Pioneer Natural Resources Co. | | | 823 | | | | 178,204 | |
| | | | | | | | 3,804,817 | |
| | | | | | | | 3,804,817 | |
Financial — 26.8% |
Banks — 5.5% |
The Bank of New York Mellon Corp. | | | 9,030 | | | | 347,836 | |
Citigroup, Inc. | | | 21,320 | | | | 888,404 | |
JP Morgan Chase & Co. | | | 16,136 | | | | 1,686,212 | |
| | | Number of
Shares | | | Value | |
KeyCorp. | | | 31,882 | | | $ | 510,750 | |
US Bancorp | | | 7,038 | | | | 283,772 | |
| | | | | | | | 3,716,974 | |
Diversified Financial Services — 6.5% |
Affiliated Managers Group, Inc. | | | 4,490 | | | | 502,206 | |
Apollo Global Management, Inc. | | | 3,256 | | | | 151,404 | |
BlackRock, Inc. | | | 1,536 | | | | 845,230 | |
Capital One Financial Corp. | | | 746 | | | | 68,759 | |
The Charles Schwab Corp. | | | 3,025 | | | | 217,407 | |
CME Group, Inc. | | | 638 | | | | 113,009 | |
Coinbase Global, Inc. Class A (a) | | | 1,650 | | | | 106,408 | |
Discover Financial Services | | | 3,339 | | | | 303,582 | |
Franklin Resources, Inc. | | | 4,106 | | | | 88,361 | |
Intercontinental Exchange, Inc. | | | 3,436 | | | | 310,443 | |
Nasdaq, Inc. | | | 14,490 | | | | 821,293 | |
OneMain Holdings, Inc. | | | 9,148 | | | | 270,049 | |
Rocket Cos., Inc. Class A | | | 7,886 | | | | 49,839 | |
Synchrony Financial | | | 2,719 | | | | 76,649 | |
Tradeweb Markets, Inc. Class A | | | 1,604 | | | | 90,498 | |
Upstart Holdings, Inc. (a) (b) | | | 560 | | | | 11,642 | |
Virtu Financial, Inc. Class A | | | 17,401 | | | | 361,419 | |
| | | | | | | | 4,388,198 | |
Insurance — 10.7% |
Aflac, Inc. | | | 15,608 | | | | 877,169 | |
American International Group, Inc. | | | 2,935 | | | | 139,354 | |
Arthur J Gallagher & Co. | | | 5,151 | | | | 881,954 | |
Berkshire Hathaway, Inc. Class B (a) | | | 6,681 | | | | 1,783,961 | |
Brown & Brown, Inc. | | | 12,807 | | | | 774,567 | |
Equitable Holdings, Inc. | | | 5,200 | | | | 137,020 | |
Fidelity National Financial, Inc. | | | 19,770 | | | | 715,674 | |
Globe Life, Inc. | | | 2,466 | | | | 245,860 | |
Lincoln National Corp. | | | 547 | | | | 24,019 | |
Loews Corp. | | | 8,314 | | | | 414,370 | |
MetLife, Inc. | | | 9,658 | | | | 587,013 | |
The Progressive Corp. | | | 2,122 | | | | 246,598 | |
Reinsurance Group of America, Inc. | | | 790 | | | | 99,390 | |
Voya Financial, Inc. | | | 3,766 | | | | 227,843 | |
| | | | | | | | 7,154,792 | |
Real Estate — 0.9% |
CBRE Group, Inc. Class A (a) | | | 9,004 | | | | 607,860 | |
Real Estate Investment Trusts (REITS) — 3.0% |
Healthcare Realty Trust, Inc. | | | 22,452 | | | | 468,124 | |
Highwoods Properties, Inc. | | | 8,082 | | | | 217,891 | |
Omega Healthcare Investors, Inc. | | | 5,564 | | | | 164,082 | |
Realty Income Corp. | | | 2,652 | | | | 154,347 | |
SBA Communications Corp. | | | 1,828 | | | | 520,340 | |
SL Green Realty Corp. (b) | | | 927 | | | | 37,228 | |
STORE Capital Corp. | | | 9,970 | | | | 312,360 | |
The accompanying notes are an integral part of the financial statements.
117
MassMutual Disciplined Value Fund — Portfolio of Investments (Continued) |
| | | Number of
Shares | | | Value | |
Vornado Realty Trust | | | 248 | | | $ | 5,744 | |
WP Carey, Inc. | | | 1,928 | | | | 134,574 | |
| | | | | | | | 2,014,690 | |
Savings & Loans — 0.2% |
New York Community Bancorp, Inc. (b) | | | 16,477 | | | | 140,549 | |
| | | | | | | | 18,023,063 | |
Industrial — 10.4% |
Aerospace & Defense — 3.0% |
General Dynamics Corp. | | | 2,787 | | | | 591,318 | |
Raytheon Technologies Corp. | | | 12,543 | | | | 1,026,770 | |
Teledyne Technologies, Inc. (a) | | | 755 | | | | 254,790 | |
TransDigm Group, Inc. | | | 260 | | | | 136,453 | |
| | | | | | | | 2,009,331 | |
Building Materials — 0.1% |
Hayward Holdings, Inc. (a) | | | 10,362 | | | | 91,911 | |
Electrical Components & Equipment — 0.9% |
Emerson Electric Co. | | | 8,103 | | | | 593,301 | |
Electronics — 1.2% |
Arrow Electronics, Inc. (a) | | | 6,363 | | | | 586,605 | |
nVent Electric PLC | | | 5,236 | | | | 165,510 | |
Vontier Corp. | | | 2,889 | | | | 48,275 | |
| | | | | | | | 800,390 | |
Hand & Machine Tools — 1.0% |
Regal Rexnord Corp. | | | 1,947 | | | | 273,281 | |
Stanley Black & Decker, Inc. | | | 5,085 | | | | 382,443 | |
| | | | | | | | 655,724 | |
Machinery – Diversified — 1.0% |
Dover Corp. | | | 152 | | | | 17,720 | |
Enovis Corp. (a) | | | 168 | | | | 7,740 | |
Ingersoll Rand, Inc. | | | 12,988 | | | | 561,861 | |
The Middleby Corp. (a) | | | 606 | | | | 77,671 | |
| | | | | | | | 664,992 | |
Miscellaneous - Manufacturing — 0.6% |
3M Co. | | | 3,848 | | | | 425,204 | |
Transportation — 2.6% |
C.H. Robinson Worldwide, Inc. | | | 5,469 | | | | 526,719 | |
Expeditors International of Washington, Inc. | | | 3,292 | | | | 290,717 | |
Knight-Swift Transportation Holdings, Inc. | | | 5,056 | | | | 247,390 | |
Landstar System, Inc. | | | 4,765 | | | | 687,923 | |
| | | | | | | | 1,752,749 | |
| | | | | | | | 6,993,602 | |
| | | Number of
Shares | | | Value | |
Technology — 9.3% |
Computers — 2.1% |
CACI International, Inc. Class A (a) | | | 387 | | | $ | 101,030 | |
Dell Technologies, Inc. | | | 5,927 | | | | 202,526 | |
International Business Machines Corp. | | | 1,688 | | | | 200,551 | |
Leidos Holdings, Inc. | | | 2,548 | | | | 222,874 | |
Science Applications International Corp. | | | 7,957 | | | | 703,637 | |
| | | | | | | | 1,430,618 | |
Office & Business Equipment — 0.3% |
Zebra Technologies Corp. Class A (a) | | | 650 | | | | 170,307 | |
Semiconductors — 3.2% |
Analog Devices, Inc. | | | 6,423 | | | | 894,981 | |
Micron Technology, Inc. | | | 1,485 | | | | 74,399 | |
Skyworks Solutions, Inc. | | | 2,883 | | | | 245,833 | |
Texas Instruments, Inc. | | | 5,853 | | | | 905,927 | |
| | | | | | | | 2,121,140 | |
Software — 3.7% |
Activision Blizzard, Inc. | | | 7,748 | | | | 575,986 | |
Black Knight, Inc. (a) | | | 3,697 | | | | 239,307 | |
Definitive Healthcare Corp. (a) | | | 1,956 | | | | 30,396 | |
Doximity, Inc. Class A (a) (b) | | | 2,318 | | | | 70,050 | |
Fidelity National Information Services, Inc. | | | 5,586 | | | | 422,134 | |
Fiserv, Inc. (a) | | | 6,306 | | | | 590,053 | |
Oracle Corp. | | | 3,213 | | | | 196,218 | |
Playtika Holding Corp. (a) | | | 5,049 | | | | 47,410 | |
Take-Two Interactive Software, Inc. (a) | | | 463 | | | | 50,467 | |
Tyler Technologies, Inc. (a) | | | 139 | | | | 48,303 | |
VMware, Inc. Class A | | | 1,942 | | | | 206,745 | |
Zoom Video Communications, Inc. Class A (a) | | | 348 | | | | 25,609 | |
| | | | | | | | 2,502,678 | |
| | | | | | | | 6,224,743 | |
Utilities — 1.8% |
Electric — 0.8% |
NRG Energy, Inc. | | | 13,604 | | | | 520,625 | |
Gas — 1.0% |
National Fuel Gas Co. | | | 11,133 | | | | 685,236 | |
| | | | | | | | 1,205,861 | |
| | | | | | | | | |
TOTAL COMMON STOCK (Cost $73,108,085) | | | | | | | 66,859,190 | |
| | | | | | | | | |
TOTAL EQUITIES (Cost $73,108,085) | | | | | | | 66,859,190 | |
| | | | | | | | | |
The accompanying notes are an integral part of the financial statements.
118
MassMutual Disciplined Value Fund — Portfolio of Investments (Continued) |
| | | Number of
Shares | | | Value | |
MUTUAL FUNDS — 0.0% |
Diversified Financial Services — 0.0% |
State Street Navigator Securities Lending Government Money Market Portfolio (c) | | | 29,461 | | | $ | 29,461 | |
| | | | | | | | | |
TOTAL MUTUAL FUNDS (Cost $29,461) | | | | | | | 29,461 | |
| | | | | | | | | |
TOTAL LONG-TERM INVESTMENTS (Cost $73,137,546) | | | | | | | 66,888,651 | |
| | | | | | | | | |
| | | Principal
Amount | | | | | |
SHORT-TERM INVESTMENTS — 0.7% |
Repurchase Agreement — 0.7% |
Fixed Income Clearing Corp., Repurchase Agreement, dated 9/30/22, 0.830%, due 10/03/22 (d) | | $ | 468,997 | | | | 468,997 | |
| | | | | | | | | |
TOTAL SHORT-TERM INVESTMENTS (Cost $468,997) | | | | | | | 468,997 | |
| | | | | | | | | |
TOTAL INVESTMENTS — 100.2% (Cost $73,606,543) (e) | | | | | | | 67,357,648 | |
| | | | | | | | | |
Other Assets/(Liabilities) — (0.2)% | | | | | | | (163,125 | ) |
| | | | | | | | | |
NET ASSETS — 100.0% | | | | | | $ | 67,194,523 | |
Notes to Portfolio of Investments
Percentages are stated as a percent of net assets.
(a) | Non-income producing security. |
(b) | Denotes all or a portion of security on loan. The total value of securities on loan as of September 30, 2022, was $415,531 or 0.62% of net assets. The Fund received $397,108 of non-cash collateral (U.S. Treasury and/or Agency obligations) related to securities lending activity. This amount is not reflected on either the Portfolio of Investments or the Statement of Assets and Liabilities. (Note 2). |
(c) | Represents investment of security lending cash collateral. (Note 2). |
(d) | Maturity value of $469,029. Collateralized by U.S. Government Agency obligations with a rate of 3.500%, maturity date of 9/15/25, and an aggregate market value, including accrued interest, of $478,387. |
(e) | See Note 6 for aggregate cost for federal tax purposes. |
The accompanying notes are an integral part of the financial statements.
119
MassMutual Main Street Fund — Portfolio of Investments |
September 30, 2022 |
| | | Number of
Shares | | | Value | |
EQUITIES — 97.7% |
COMMON STOCK — 97.7% |
Basic Materials — 0.8% |
Chemicals — 0.8% |
Valvoline, Inc. | | | 20,177 | | | $ | 511,285 | |
Communications — 13.1% |
Internet — 10.5% |
Airbnb, Inc. Class A (a) | | | 8,223 | | | | 863,744 | |
Alphabet, Inc. Class A (a) | | | 20,123 | | | | 1,924,765 | |
Amazon.com, Inc. (a) | | | 16,604 | | | | 1,876,252 | |
Meta Platforms, Inc. Class A (a) | | | 7,930 | | | | 1,075,942 | |
Netflix, Inc. (a) | | | 5,485 | | | | 1,291,389 | |
| | | | | | | | 7,032,092 | |
Telecommunications — 2.6% |
Motorola Solutions, Inc. | | | 4,217 | | | | 944,481 | |
Verizon Communications, Inc. | | | 21,465 | | | | 815,026 | |
| | | | | | | | 1,759,507 | |
| | | | | | | | 8,791,599 | |
Consumer, Cyclical — 4.9% |
Auto Manufacturers — 1.8% |
General Motors Co. | | | 18,772 | | | | 602,394 | |
Tesla, Inc. (a) | | | 2,325 | | | | 616,706 | |
| | | | | | | | 1,219,100 | |
Home Builders — 0.3% |
D.R. Horton, Inc. | | | 2,704 | | | | 182,114 | |
Retail — 2.8% |
AutoZone, Inc. (a) | | | 82 | | | | 175,638 | |
Dollar General Corp. | | | 2,079 | | | | 498,669 | |
O’Reilly Automotive, Inc. (a) | | | 1,711 | | | | 1,203,432 | |
| | | | | | | | 1,877,739 | |
| | | | | | | | 3,278,953 | |
Consumer, Non-cyclical — 21.8% |
Beverages — 4.0% |
The Coca-Cola Co. | | | 19,109 | | | | 1,070,486 | |
Constellation Brands, Inc. Class A | | | 3,726 | | | | 855,788 | |
PepsiCo, Inc. | | �� | 4,636 | | | | 756,873 | |
| | | | | | | | 2,683,147 | |
Biotechnology — 0.8% |
Seagen, Inc. (a) | | | 4,020 | | | | 550,057 | |
Cosmetics & Personal Care — 1.3% |
Coty, Inc. Class A (a) | | | 18,666 | | | | 117,969 | |
The Procter & Gamble Co. | | | 6,030 | | | | 761,288 | |
| | | | | | | | 879,257 | |
Food — 0.7% |
Sysco Corp. | | | 6,683 | | | | 472,555 | |
| | | Number of
Shares | | | Value | |
Health Care – Products — 0.2% |
The Cooper Cos., Inc. | | | 405 | | | $ | 106,880 | |
Health Care – Services — 5.7% |
HCA Healthcare, Inc. | | | 4,178 | | | | 767,875 | |
Tenet Healthcare Corp. (a) | | | 14,466 | | | | 746,156 | |
UnitedHealth Group, Inc. | | | 4,583 | | | | 2,314,598 | |
| | | | | | | | 3,828,629 | |
Household Products & Wares — 0.3% |
Church & Dwight Co., Inc. | | | 2,916 | | | | 208,319 | |
Pharmaceuticals — 8.8% |
AstraZeneca PLC Sponsored ADR | | | 20,037 | | | | 1,098,829 | |
Bayer AG Registered | | | 9,848 | | | | 454,465 | |
Bristol-Myers Squibb Co. | | | 11,330 | | | | 805,449 | |
CVS Health Corp. | | | 13,843 | | | | 1,320,207 | |
Eli Lilly & Co. | | | 6,817 | | | | 2,204,277 | |
| | | | | | | | 5,883,227 | |
| | | | | | | | 14,612,071 | |
Energy — 5.2% |
Oil & Gas — 3.5% |
APA Corp. | | | 19,925 | | | | 681,236 | |
Exxon Mobil Corp. | | | 18,883 | | | | 1,648,675 | |
| | | | | | | | 2,329,911 | |
Pipelines — 1.7% |
Cheniere Energy, Inc. | | | 5,150 | | | | 854,436 | |
Magellan Midstream Partners LP (b) | | | 6,847 | | | | 325,301 | |
| | | | | | | | 1,179,737 | |
| | | | | | | | 3,509,648 | |
Financial — 13.1% |
Banks — 3.4% |
First Citizens BancShares, Inc. Class A | | | 1,037 | | | | 826,935 | |
JP Morgan Chase & Co. | | | 14,252 | | | | 1,489,334 | |
| | | | | | | | 2,316,269 | |
Diversified Financial Services — 3.4% |
American Express Co. | | | 7,946 | | | | 1,071,995 | |
The Charles Schwab Corp. | | | 7,575 | | | | 544,415 | |
Intercontinental Exchange, Inc. | | | 4,495 | | | | 406,123 | |
Rocket Cos., Inc. Class A | | | 40,884 | | | | 258,387 | |
| | | | | | | | 2,280,920 | |
Insurance — 3.6% |
The Allstate Corp. | | | 8,644 | | | | 1,076,437 | |
Equitable Holdings, Inc. | | | 50,113 | | | | 1,320,478 | |
| | | | | | | | 2,396,915 | |
Real Estate Investment Trusts (REITS) — 2.7% |
Prologis, Inc. | | | 17,676 | | | | 1,795,882 | |
| | | | | | | | 8,789,986 | |
The accompanying notes are an integral part of the financial statements.
120
MassMutual Main Street Fund — Portfolio of Investments (Continued) |
| | | Number of
Shares | | | Value | |
Industrial — 11.5% |
Aerospace & Defense — 1.6% |
Lockheed Martin Corp. | | | 829 | | | $ | 320,234 | |
Raytheon Technologies Corp. | | | 9,558 | | | | 782,418 | |
| | | | | | | | 1,102,652 | |
Building Materials — 1.4% |
Vulcan Materials Co. | | | 5,938 | | | | 936,482 | |
Electronics — 0.9% |
Honeywell International, Inc. | | | 3,568 | | | | 595,749 | |
Environmental Controls — 1.2% |
Republic Services, Inc. | | | 1,222 | | | | 166,241 | |
Waste Connections, Inc. | | | 4,819 | | | | 651,191 | |
| | | | | | | | 817,432 | |
Machinery – Diversified — 2.7% |
Deere & Co. | | | 2,881 | | | | 961,937 | |
Otis Worldwide Corp. | | | 12,846 | | | | 819,575 | |
| | | | | | | | 1,781,512 | |
Transportation — 3.7% |
Union Pacific Corp. | | | 3,673 | | | | 715,574 | |
United Parcel Service, Inc. Class B | | | 10,755 | | | | 1,737,363 | |
| | | | | | | | 2,452,937 | |
| | | | | | | | 7,686,764 | |
Technology — 24.5% |
Computers — 7.0% |
Amdocs Ltd. | | | 5,323 | | | | 422,912 | |
Apple, Inc. | | | 29,193 | | | | 4,034,473 | |
Crowdstrike Holdings, Inc. Class A (a) | | | 1,379 | | | | 227,273 | |
| | | | | | | | 4,684,658 | |
Semiconductors — 3.7% |
Advanced Micro Devices, Inc. (a) | | | 13,851 | | | | 877,599 | |
Applied Materials, Inc. | | | 8,807 | | | | 721,558 | |
QUALCOMM, Inc. | | | 7,881 | | | | 890,395 | |
| | | | | | | | 2,489,552 | |
Software — 13.8% |
Electronic Arts, Inc. | | | 6,971 | | | | 806,614 | |
Fiserv, Inc. (a) | | | 9,999 | | | | 935,606 | |
Manhattan Associates, Inc. (a) | | | 3,186 | | | | 423,834 | |
Microsoft Corp. | | | 20,224 | | | | 4,710,170 | |
MongoDB, Inc. (a) | | | 786 | | | | 156,068 | |
ServiceNow, Inc. (a) | | | 1,386 | | | | 523,367 | |
Synopsys, Inc. (a) | | | 1,529 | | | | 467,125 | |
VMware, Inc. Class A | | | 11,030 | | | | 1,174,254 | |
| | | | | | | | 9,197,038 | |
| | | | | | | | 16,371,248 | |
| | | Number of
Shares | | | Value | |
Utilities — 2.8% |
Electric — 2.8% |
FirstEnergy Corp. | | | 33,404 | | | $ | 1,235,948 | |
The Southern Co. | | | 9,817 | | | | 667,556 | |
| | | | | | | | 1,903,504 | |
| | | | | | | | 1,903,504 | |
| | | | | | | | | |
TOTAL COMMON STOCK (Cost $64,975,192) | | | | | | | 65,455,058 | |
| | | | | | | | | |
TOTAL EQUITIES (Cost $64,975,192) | | | | | | | 65,455,058 | |
| | | | | | | | | |
TOTAL LONG-TERM INVESTMENTS (Cost $64,975,192) | | | | | | | 65,455,058 | |
| | | | | | | | | |
| | | Principal
Amount | | | | | |
SHORT-TERM INVESTMENTS — 2.5% |
Repurchase Agreement — 2.5% |
Fixed Income Clearing Corp., Repurchase Agreement, dated 9/30/22, 0.830%, due 10/03/22 (c) | | $ | 1,666,661 | | | | 1,666,661 | |
| | | | | | | | | |
TOTAL SHORT-TERM INVESTMENTS (Cost $1,666,661) | | | | | | | 1,666,661 | |
| | | | | | | | | |
TOTAL INVESTMENTS — 100.2% (Cost $66,641,853) (d) | | | | | | | 67,121,719 | |
| | | | | | | | | |
Other Assets/(Liabilities) — (0.2)% | | | | | | | (158,230 | ) |
| | | | | | | | | |
NET ASSETS — 100.0% | | | | | | $ | 66,963,489 | |
Abbreviation Legend
ADR | American Depositary Receipt |
Notes to Portfolio of Investments
Percentages are stated as a percent of net assets.
(a) | Non-income producing security. |
(b) | Security is a Master Limited Partnership. |
(c) | Maturity value of $1,666,776. Collateralized by U.S. Government Agency obligations with a rate of 3.500%, maturity date of 9/15/25, and an aggregate market value, including accrued interest, of $1,700,049. |
(d) | See Note 6 for aggregate cost for federal tax purposes. |
The accompanying notes are an integral part of the financial statements.
121
MassMutual Disciplined Growth Fund — Portfolio of Investments |
September 30, 2022 |
| | | Number of
Shares | | | Value | |
EQUITIES — 99.7% |
COMMON STOCK — 99.7% |
Basic Materials — 1.0% |
Chemicals — 1.0% |
Albemarle Corp. | | | 2,425 | | | $ | 641,267 | |
CF Industries Holdings, Inc. | | | 4,359 | | | | 419,554 | |
The Mosaic Co. | | | 11,256 | | | | 544,003 | |
| | | | | | | | 1,604,824 | |
| | | | | | | | 1,604,824 | |
Communications — 15.5% |
Internet — 14.2% |
Airbnb, Inc. Class A (a) | | | 4,906 | | | | 515,326 | |
Alphabet, Inc. Class A (a) | | | 56,526 | | | | 5,406,712 | |
Alphabet, Inc. Class C (a) | | | 33,786 | | | | 3,248,524 | |
Amazon.com, Inc. (a) | | | 76,734 | | | | 8,670,942 | |
CDW Corp. | | | 11,238 | | | | 1,754,027 | |
eBay, Inc. | | | 17,382 | | | | 639,831 | |
Meta Platforms, Inc. Class A (a) | | | 7,704 | | | | 1,045,279 | |
Netflix, Inc. (a) | | | 2,020 | | | | 475,589 | |
Opendoor Technologies, Inc. (a) | | | 49,959 | | | | 155,373 | |
| | | | | | | | 21,911,603 | |
Media — 1.0% |
Charter Communications, Inc. Class A (a) | | | 1,462 | | | | 443,498 | |
FactSet Research Systems, Inc. | | | 2,810 | | | | 1,124,309 | |
| | | | | | | | 1,567,807 | |
Telecommunications — 0.3% |
Arista Networks, Inc. (a) | | | 4,170 | | | | 470,751 | |
| | | | | | | | 23,950,161 | |
Consumer, Cyclical — 11.5% |
Auto Manufacturers — 4.2% |
Tesla, Inc. (a) | | | 24,566 | | | | 6,516,131 | |
Auto Parts & Equipment — 0.2% |
Allison Transmission Holdings, Inc. | | | 7,361 | | | | 248,507 | |
Distribution & Wholesale — 1.7% |
Core & Main, Inc. Class A (a) | | | 36,871 | | | | 838,446 | |
Pool Corp. | | | 4,861 | | | | 1,546,819 | |
Watsco, Inc. | | | 774 | | | | 199,274 | |
| | | | | | | | 2,584,539 | |
Entertainment — 0.2% |
DraftKings, Inc. Class A (a) | | | 15,601 | | | | 236,199 | |
Home Builders — 0.8% |
D.R. Horton, Inc. | | | 17,880 | | | | 1,204,218 | |
Leisure Time — 0.4% |
Brunswick Corp. | | | 5,978 | | | | 391,260 | |
YETI Holdings, Inc. (a) | | | 9,705 | | | | 276,787 | |
| | | | | | | | 668,047 | |
| | | Number of
Shares | | | Value | |
Lodging — 0.8% |
Marriott International, Inc. Class A | | | 9,326 | | | $ | 1,306,946 | |
Retail — 3.2% |
AutoZone, Inc. (a) | | | 342 | | | | 732,540 | |
Costco Wholesale Corp. | | | 4,101 | | | | 1,936,779 | |
Lowe’s Cos., Inc. | | | 2,985 | | | | 560,613 | |
Lululemon Athletica, Inc. (a) | | | 3,398 | | | | 949,945 | |
RH (a) | | | 1,051 | | | | 258,620 | |
Williams-Sonoma, Inc. | | | 4,494 | | | | 529,618 | |
| | | | | | | | 4,968,115 | |
| | | | | | | | 17,732,702 | |
Consumer, Non-cyclical — 19.1% |
Beverages — 1.9% |
The Coca-Cola Co. | | | 27,058 | | | | 1,515,789 | |
PepsiCo, Inc. | | | 9,209 | | | | 1,503,462 | |
| | | | | | | | 3,019,251 | |
Biotechnology — 2.1% |
Exelixis, Inc. (a) | | | 24,149 | | | | 378,656 | |
Maravai LifeSciences Holdings, Inc. Class A (a) | | | 22,465 | | | | 573,531 | |
Moderna, Inc. (a) | | | 3,575 | | | | 422,744 | |
Novavax, Inc. (a),(b) | | | 7,878 | | | | 143,380 | |
Regeneron Pharmaceuticals, Inc. (a) | | | 921 | | | | 634,449 | |
Vertex Pharmaceuticals, Inc. (a) | | | 3,999 | | | | 1,157,871 | |
| | | | | | | | 3,310,631 | |
Commercial Services — 3.8% |
Automatic Data Processing, Inc. | | | 1,311 | | | | 296,535 | |
FleetCor Technologies, Inc. (a) | | | 6,728 | | | | 1,185,272 | |
Gartner, Inc. (a) | | | 5,157 | | | | 1,426,891 | |
MarketAxess Holdings, Inc. | | | 721 | | | | 160,415 | |
Paylocity Holding Corp. (a) | | | 654 | | | | 157,993 | |
Robert Half International, Inc. | | | 7,942 | | | | 607,563 | |
United Rentals, Inc. (a) | | | 2,410 | | | | 650,989 | |
Verisk Analytics, Inc. | | | 6,918 | | | | 1,179,727 | |
WEX, Inc. (a) | | | 1,246 | | | | 158,167 | |
| | | | | | | | 5,823,552 | |
Cosmetics & Personal Care — 1.3% |
Colgate-Palmolive Co. | | | 6,298 | | | | 442,435 | |
Olaplex Holdings, Inc. (a) | | | 31,379 | | | | 299,669 | |
The Procter & Gamble Co. | | | 9,966 | | | | 1,258,207 | |
| | | | | | | | 2,000,311 | |
Food — 0.2% |
The Hershey Co. | | | 1,636 | | | | 360,689 | |
Health Care – Products — 2.4% |
Align Technology, Inc. (a) | | | 1,414 | | | | 292,853 | |
The accompanying notes are an integral part of the financial statements.
122
MassMutual Disciplined Growth Fund — Portfolio of Investments (Continued) |
| | | Number of
Shares | | | Value | |
Avantor, Inc. (a) | | | 14,186 | | | $ | 278,046 | |
Danaher Corp. | | | 2,728 | | | | 704,615 | |
ICU Medical, Inc. (a) | | | 8,336 | | | | 1,255,402 | |
Thermo Fisher Scientific, Inc. | | | 2,213 | | | | 1,122,411 | |
| | | | | | | | 3,653,327 | |
Health Care – Services — 4.5% |
Elevance Health, Inc. | | | 2,043 | | | | 928,012 | |
Ginkgo Bioworks Holdings, Inc. (a) | | | 98,115 | | | | 306,119 | |
Syneos Health, Inc. (a) | | | 4,882 | | | | 230,186 | |
UnitedHealth Group, Inc. | | | 10,850 | | | | 5,479,684 | |
| | | | | | | | 6,944,001 | |
Household Products & Wares — 0.4% |
Church & Dwight Co., Inc. | | | 8,435 | | | | 602,596 | |
Pharmaceuticals — 2.5% |
AbbVie, Inc. | | | 18,533 | | | | 2,487,314 | |
AmerisourceBergen Corp. | | | 9,938 | | | | 1,344,910 | |
| | | | | | | | 3,832,224 | |
| | | | | | | | 29,546,582 | |
Energy — 1.9% |
Energy – Alternate Sources — 0.3% |
Enphase Energy, Inc. (a) | | | 1,792 | | | | 497,226 | |
Oil & Gas — 1.6% |
Antero Resources Corp. (a) | | | 6,995 | | | | 213,557 | |
Coterra Energy, Inc. | | | 15,264 | | | | 398,696 | |
PDC Energy, Inc. | | | 5,115 | | | | 295,596 | |
Pioneer Natural Resources Co. | | | 3,958 | | | | 857,026 | |
Texas Pacific Land Corp. | | | 411 | | | | 730,441 | |
| | | | | | | | 2,495,316 | |
| | | | | | | | 2,992,542 | |
Financial — 8.8% |
Diversified Financial Services — 5.5% |
Mastercard, Inc. Class A | | | 13,134 | | | | 3,734,522 | |
Tradeweb Markets, Inc. Class A | | | 6,746 | | | | 380,609 | |
Upstart Holdings, Inc. (a),(b) | | | 7,422 | | | | 154,303 | |
Visa, Inc. Class A | | | 23,854 | | | | 4,237,663 | |
| | | | | | | | 8,507,097 | |
Insurance — 2.1% |
Arthur J Gallagher & Co. | | | 9,517 | | | | 1,629,501 | |
Brown & Brown, Inc. | | | 26,718 | | | | 1,615,905 | |
| | | | | | | | 3,245,406 | |
Private Equity — 0.9% |
Blackstone, Inc. | | | 17,405 | | | | 1,456,799 | |
Real Estate — 0.3% |
CBRE Group, Inc. Class A (a) | | | 5,732 | | | | 386,967 | |
| | | | | | | | 13,596,269 | |
| | | Number of
Shares | | | Value | |
Industrial — 5.7% |
Aerospace & Defense — 1.0% |
Lockheed Martin Corp. | | | 3,982 | | | $ | 1,538,207 | |
Electrical Components & Equipment — 0.2% |
Generac Holdings, Inc. (a) | | | 1,660 | | | | 295,712 | |
Electronics — 0.9% |
Arrow Electronics, Inc. (a) | | | 12,413 | | | | 1,144,354 | |
National Instruments Corp. | | | 8,428 | | | | 318,073 | |
| | | | | | | | 1,462,427 | |
Machinery – Diversified — 0.4% |
Graco, Inc. | | | 7,733 | | | | 463,593 | |
IDEX Corp. | | | 795 | | | | 158,881 | |
| | | | | | | | 622,474 | |
Miscellaneous - Manufacturing — 1.1% |
Carlisle Cos., Inc. | | | 6,145 | | | | 1,723,119 | |
Transportation — 2.1% |
C.H. Robinson Worldwide, Inc. | | | 11,721 | | | | 1,128,849 | |
Expeditors International of Washington, Inc. | | | 4,663 | | | | 411,790 | |
Landstar System, Inc. | | | 11,315 | | | | 1,633,547 | |
| | | | | | | | 3,174,186 | |
| | | | | | | | 8,816,125 | |
Technology — 36.2% |
Computers — 14.8% |
Accenture PLC Class A | | | 11,904 | | | | 3,062,899 | |
Apple, Inc. | | | 135,400 | | | | 18,712,280 | |
EPAM Systems, Inc. (a) | | | 648 | | | | 234,699 | |
Fortinet, Inc. (a) | | | 18,820 | | | | 924,627 | |
| | | | | | | | 22,934,505 | |
Semiconductors — 6.7% |
Advanced Micro Devices, Inc. (a) | | | 18,187 | | | | 1,152,328 | |
Analog Devices, Inc. | | | 10,591 | | | | 1,475,750 | |
Broadcom, Inc. | | | 6,990 | | | | 3,103,630 | |
KLA Corp. | | | 2,639 | | | | 798,641 | |
Monolithic Power Systems, Inc. | | | 1,218 | | | | 442,621 | |
NVIDIA Corp. | | | 11,788 | | | | 1,430,945 | |
QUALCOMM, Inc. | | | 12,007 | | | | 1,356,551 | |
Texas Instruments, Inc. | | | 4,526 | | | | 700,534 | |
| | | | | | | | 10,461,000 | |
Software — 14.7% |
Adobe, Inc. (a) | | | 8,676 | | | | 2,387,635 | |
AppLovin Corp. (a),(b) | | | 9,878 | | | | 192,522 | |
Bentley Systems, Inc. | | | 5,928 | | | | 181,338 | |
Doximity, Inc. Class A (a),(b) | | | 7,974 | | | | 240,974 | |
Dynatrace, Inc. (a) | | | 5,710 | | | | 198,765 | |
Fair Isaac Corp. (a) | | | 970 | | | | 399,650 | |
Intuit, Inc. | | | 4,136 | | | | 1,601,956 | |
The accompanying notes are an integral part of the financial statements.
123
MassMutual Disciplined Growth Fund — Portfolio of Investments (Continued) |
| | | Number of
Shares | | | Value | |
Microsoft Corp. | | | 70,608 | | | $ | 16,444,603 | |
Paychex, Inc. | | | 4,850 | | | | 544,219 | |
Synopsys, Inc. (a) | | | 516 | | | | 157,643 | |
ZoomInfo Technologies, Inc. (a) | | | 8,237 | | | | 343,153 | |
| | | | | | | | 22,692,458 | |
| | | | | | | | 56,087,963 | |
| | | | | | | | | |
TOTAL COMMON STOCK (Cost $167,735,582) | | | | | | | 154,327,168 | |
| | | | | | | | | |
TOTAL EQUITIES (Cost $167,735,582) | | | | | | | 154,327,168 | |
| | | | | | | | | |
MUTUAL FUNDS — 0.4% |
Diversified Financial Services — 0.4% |
State Street Navigator Securities Lending Prime Portfolio (c) | | | 664,115 | | | | 664,115 | |
| | | | | | | | | |
TOTAL MUTUAL FUNDS (Cost $664,115) | | | | | | | 664,115 | |
| | | | | | | | | |
TOTAL LONG-TERM INVESTMENTS (Cost $168,399,697) | | | | | | | 154,991,283 | |
| | | | | | | | | |
| | | Principal
Amount | | | | | |
SHORT-TERM INVESTMENTS — 0.4% |
Repurchase Agreement — 0.4% |
Fixed Income Clearing Corp., Repurchase Agreement, dated 9/30/22, 0.830%, due 10/03/22 (d) | | $ | 622,516 | | | | 622,516 | |
| | | | | | | | | |
TOTAL SHORT-TERM INVESTMENTS (Cost $622,516) | | | | | | | 622,516 | |
| | | | | | | | | |
TOTAL INVESTMENTS — 100.5% (Cost $169,022,213) (e) | | | | | | | 155,613,799 | |
| | | | | | | | | |
Other Assets/(Liabilities) — (0.5)% | | | | | | | (850,151 | ) |
| | | | | | | | | |
NET ASSETS — 100.0% | | | | | | $ | 154,763,648 | |
Notes to Portfolio of Investments
Percentages are stated as a percent of net assets.
(a) | Non-income producing security. |
(b) | Denotes all or a portion of security on loan. The total value of securities on loan as of September 30, 2022, was $988,118 or 0.64% of net assets. The Fund received $354,996 of non-cash collateral (U.S. Treasury and/or Agency obligations) related to securities lending activity. This amount is not reflected on either the Portfolio of Investments or the Statement of Assets and Liabilities. (Note 2). |
(c) | Represents investment of security lending cash collateral. (Note 2). |
(d) | Maturity value of $622,559. Collateralized by U.S. Government Agency obligations with a rate of 0.000%, maturity date of 3/30/23, and an aggregate market value, including accrued interest, of $635,026. |
(e) | See Note 6 for aggregate cost for federal tax purposes. |
The accompanying notes are an integral part of the financial statements.
124
MassMutual Small Cap Opportunities Fund — Portfolio of Investments |
September 30, 2022 |
| | | Number of
Shares | | | Value | |
EQUITIES — 98.9% |
COMMON STOCK — 98.9% |
Basic Materials — 2.3% |
Chemicals — 0.7% |
NewMarket Corp. | | | 6,414 | | | $ | 1,929,524 | |
Mining — 1.6% |
Compass Minerals International, Inc. | | | 65,073 | | | | 2,507,262 | |
Kaiser Aluminum Corp. | | | 36,434 | | | | 2,235,226 | |
| | | | | | | | 4,742,488 | |
| | | | | | | | 6,672,012 | |
Communications — 2.6% |
Internet — 2.6% |
Q2 Holdings, Inc. (a) | | | 87,661 | | | | 2,822,684 | |
Ziff Davis, Inc. (a) | | | 68,915 | | | | 4,719,300 | |
| | | | | | | | 7,541,984 | |
| | | | | | | | 7,541,984 | |
Consumer, Cyclical — 13.9% |
Airlines — 0.6% |
Spirit Airlines, Inc. (a) | | | 90,552 | | | | 1,704,189 | |
Auto Parts & Equipment — 3.3% |
Allison Transmission Holdings, Inc. | | | 61,850 | | | | 2,088,056 | |
Dorman Products, Inc. (a) | | | 45,492 | | | | 3,735,803 | |
Visteon Corp. (a) | | | 36,564 | | | | 3,877,978 | |
| | | | | | | | 9,701,837 | |
Entertainment — 1.0% |
Cedar Fair LP (b) | | | 72,580 | | | | 2,986,667 | |
Home Builders — 0.6% |
Skyline Champion Corp. (a) | | | 33,335 | | | | 1,762,421 | |
Home Furnishing — 0.5% |
Tempur Sealy International, Inc. | | | 59,856 | | | | 1,444,924 | |
Leisure Time — 0.6% |
Topgolf Callaway Brands Corp. (a),(c) | | | 90,040 | | | | 1,734,170 | |
Lodging — 0.8% |
Boyd Gaming Corp. | | | 47,858 | | | | 2,280,434 | |
Retail — 6.5% |
AutoNation, Inc. (a) | | | 55,627 | | | | 5,666,722 | |
BJ’s Wholesale Club Holdings, Inc. (a) | | | 85,063 | | | | 6,193,437 | |
Suburban Propane Partners LP (b) | | | 203,515 | | | | 3,062,901 | |
Texas Roadhouse, Inc. | | | 43,142 | | | | 3,764,571 | |
| | | | | | | | 18,687,631 | |
| | | | | | | | 40,302,273 | |
Consumer, Non-cyclical — 19.7% |
Biotechnology — 2.7% |
ADMA Biologics, Inc. (a) | | | 363,812 | | | | 884,063 | |
Avid Bioservices, Inc. (a) | | | 159,650 | | | | 3,052,508 | |
| | | Number of
Shares | | | Value | |
Gossamer Bio, Inc. (a),(c) | | | 67,610 | | | $ | 809,968 | |
Intra-Cellular Therapies, Inc. (a) | | | 47,296 | | | | 2,200,683 | |
TransMedics Group, Inc. (a) | | | 21,166 | | | | 883,469 | |
| | | | | | | | 7,830,691 | |
Commercial Services — 4.6% |
ASGN, Inc. (a) | | | 55,841 | | | | 5,046,351 | |
Korn Ferry | | | 88,370 | | | | 4,148,972 | |
Paya Holdings, Inc. (a) | | | 235,308 | | | | 1,437,732 | |
Payoneer Global, Inc. (a) | | | 437,839 | | | | 2,648,926 | |
| | | | | | | | 13,281,981 | |
Food — 0.5% |
Lancaster Colony Corp. | | | 10,597 | | | | 1,592,517 | |
Health Care – Products — 4.7% |
AtriCure, Inc. (a) | | | 69,227 | | | | 2,706,776 | |
Azenta, Inc. | | | 72,514 | | | | 3,107,950 | |
BioLife Solutions, Inc. (a) | | | 71,560 | | | | 1,627,990 | |
Inspire Medical Systems, Inc. (a) | | | 26,837 | | | | 4,760,078 | |
Tandem Diabetes Care, Inc. (a) | | | 30,362 | | | | 1,452,822 | |
| | | | | | | | 13,655,616 | |
Health Care – Services — 5.0% |
Acadia Healthcare Co., Inc. (a) | | | 83,017 | | | | 6,490,269 | |
Addus HomeCare Corp. (a) | | | 44,312 | | | | 4,220,275 | |
Tenet Healthcare Corp. (a) | | | 70,979 | | | | 3,661,097 | |
| | | | | | | | 14,371,641 | |
Pharmaceuticals — 2.2% |
BellRing Brands, Inc. (a) | | | 164,919 | | | | 3,398,980 | |
Collegium Pharmaceutical, Inc. (a) | | | 91,847 | | | | 1,471,389 | |
Heska Corp. (a) | | | 4,205 | | | | 306,629 | |
Prometheus Biosciences, Inc. (a) | | | 21,035 | | | | 1,241,275 | |
| | | | | | | | 6,418,273 | |
| | | | | | | | 57,150,719 | |
Energy — 5.1% |
Oil & Gas — 3.6% |
Chesapeake Energy Corp. (c) | | | 42,135 | | | | 3,969,538 | |
CNX Resources Corp. (a) | | | 248,064 | | | | 3,852,434 | |
Helmerich & Payne, Inc. | | | 71,804 | | | | 2,654,594 | |
| | | | | | | | 10,476,566 | |
Oil & Gas Services — 0.8% |
Nov, Inc. | | | 151,944 | | | | 2,458,454 | |
Pipelines — 0.7% |
Equitrans Midstream Corp. | | | 254,699 | | | | 1,905,149 | |
| | | | | | | | 14,840,169 | |
Financial — 22.1% |
Banks — 7.1% |
The Bank of NT Butterfield & Son Ltd. | | | 52,431 | | | | 1,701,910 | |
BankUnited, Inc. | | | 110,947 | | | | 3,791,059 | |
The accompanying notes are an integral part of the financial statements.
125
MassMutual Small Cap Opportunities Fund — Portfolio of Investments (Continued) |
| | | Number of
Shares | | | Value | |
Cathay General Bancorp | | | 92,875 | | | $ | 3,571,973 | |
Columbia Banking System, Inc. | | | 87,036 | | | | 2,514,470 | |
FB Financial Corp. | | | 37,379 | | | | 1,428,252 | |
Heritage Financial Corp. | | | 84,138 | | | | 2,227,133 | |
Silvergate Capital Corp. Class A (a) | | | 16,247 | | | | 1,224,211 | |
Webster Financial Corp. | | | 91,775 | | | | 4,148,230 | |
| | | | | | | | 20,607,238 | |
Diversified Financial Services — 4.1% |
Federated Hermes, Inc. | | | 108,362 | | | | 3,588,949 | |
Focus Financial Partners, Inc. Class A (a) | | | 94,719 | | | | 2,984,596 | |
Stifel Financial Corp. | | | 100,883 | | | | 5,236,836 | |
| | | | | | | | 11,810,381 | |
Insurance — 1.5% |
Definity Financial Corp. (c) | | | 153,516 | | | | 4,314,251 | |
Real Estate Investment Trusts (REITS) — 5.1% |
DiamondRock Hospitality Co. | | | 458,934 | | | | 3,446,594 | |
Four Corners Property Trust, Inc. | | | 192,055 | | | | 4,645,811 | |
National Storage Affiliates Trust | | | 106,604 | | | | 4,432,594 | |
Sabra Health Care REIT, Inc. | | | 176,388 | | | | 2,314,211 | |
| | | | | | | | 14,839,210 | |
Savings & Loans — 4.3% |
Berkshire Hills Bancorp, Inc. | | | 93,480 | | | | 2,552,004 | |
OceanFirst Financial Corp. | | | 110,922 | | | | 2,067,586 | |
Pacific Premier Bancorp, Inc. | | | 115,489 | | | | 3,575,540 | |
WSFS Financial Corp. | | | 90,942 | | | | 4,225,165 | |
| | | | | | | | 12,420,295 | |
| | | | | | | | 63,991,375 | |
Industrial — 18.4% |
Aerospace & Defense — 1.5% |
Curtiss-Wright Corp. | | | 31,702 | | | | 4,411,650 | |
Building Materials — 2.2% |
Masonite International Corp. (a) | | | 38,167 | | | | 2,720,926 | |
Summit Materials, Inc. Class A (a) | | | 157,620 | | | | 3,776,575 | |
| | | | | | | | 6,497,501 | |
Electrical Components & Equipment — 0.7% |
Belden, Inc. | | | 35,607 | | | | 2,137,132 | |
Electronics — 1.8% |
Atkore, Inc. (a) | | | 46,384 | | | | 3,609,139 | |
Itron, Inc. (a) | | | 38,333 | | | | 1,614,203 | |
| | | | | | | | 5,223,342 | |
Engineering & Construction — 1.8% |
Primoris Services Corp. | | | 80,561 | | | | 1,309,116 | |
TopBuild Corp. (a) | | | 24,397 | | | | 4,020,138 | |
| | | | | | | | 5,329,254 | |
Environmental Controls — 1.3% |
Evoqua Water Technologies Corp. (a) | | | 108,901 | | | | 3,601,356 | |
| | | Number of
Shares | | | Value | |
Hand & Machine Tools — 1.3% |
Regal Rexnord Corp. | | | 26,218 | | | $ | 3,679,958 | |
Machinery – Construction & Mining — 1.2% |
BWX Technologies, Inc. | | | 43,156 | | | | 2,173,768 | |
Vertiv Holdings Co. | | | 140,879 | | | | 1,369,344 | |
| | | | | | | | 3,543,112 | |
Machinery – Diversified — 1.3% |
Zurn Elkay Water Solutions Corp. | | | 147,333 | | | | 3,609,659 | |
Metal Fabricate & Hardware — 1.3% |
Valmont Industries, Inc. | | | 13,449 | | | | 3,612,670 | |
Miscellaneous - Manufacturing — 1.3% |
EnPro Industries, Inc. | | | 42,418 | | | | 3,604,682 | |
Packaging & Containers — 1.0% |
Silgan Holdings, Inc. | | | 70,004 | | | | 2,942,968 | |
Transportation — 1.7% |
CryoPort, Inc. (a) | | | 96,645 | | | | 2,354,272 | |
Hub Group, Inc. Class A (a) | | | 37,441 | | | | 2,582,680 | |
| | | | | | | | 4,936,952 | |
| | | | | | | | 53,130,236 | |
Technology — 11.0% |
Computers — 3.0% |
CACI International, Inc. Class A (a) | | | 17,032 | | | | 4,446,374 | |
KBR, Inc. | | | 98,052 | | | | 4,237,807 | |
| | | | | | | | 8,684,181 | |
Semiconductors — 2.7% |
Allegro MicroSystems, Inc. (a) | | | 96,059 | | | | 2,098,889 | |
Ambarella, Inc. (a) | | | 27,515 | | | | 1,545,793 | |
MACOM Technology Solutions Holdings, Inc. (a) | | | 38,260 | | | | 1,981,485 | |
MKS Instruments, Inc. | | | 27,878 | | | | 2,303,838 | |
| | | | | | | | 7,930,005 | |
Software — 5.3% |
Consensus Cloud Solutions, Inc. (a) | | | 36,180 | | | | 1,711,314 | |
Coupa Software, Inc. (a) | | | 22,208 | | | | 1,305,830 | |
Envestnet, Inc. (a) | | | 31,795 | | | | 1,411,698 | |
HashiCorp, Inc. Class A (a),(c) | | | 50,647 | | | | 1,630,327 | |
Paycor HCM, Inc. (a) | | | 164,276 | | | | 4,855,999 | |
Progress Software Corp. | | | 41,931 | | | | 1,784,164 | |
Sprout Social, Inc. Class A (a) | | | 43,154 | | | | 2,618,585 | |
| | | | | | | | 15,317,917 | |
| | | | | | | | 31,932,103 | |
Utilities — 3.8% |
Electric — 1.2% |
Avista Corp. | | | 93,303 | | | | 3,456,876 | |
The accompanying notes are an integral part of the financial statements.
126
MassMutual Small Cap Opportunities Fund — Portfolio of Investments (Continued) |
| | | Number of
Shares | | | Value | |
Gas — 2.6% |
National Fuel Gas Co. | | | 71,035 | | | $ | 4,372,204 | |
Northwest Natural Holding Co. | | | 70,371 | | | | 3,052,694 | |
| | | | | | | | 7,424,898 | |
| | | | | | | | 10,881,774 | |
| | | | | | | | | |
TOTAL COMMON STOCK (Cost $282,068,339) | | | | | | | 286,442,645 | |
| | | | | | | | | |
TOTAL EQUITIES (Cost $282,068,339) | | | | | | | 286,442,645 | |
| | | | | | | | | |
MUTUAL FUNDS — 1.6% |
Diversified Financial Services — 1.6% |
State Street Navigator Securities Lending Government Money Market Portfolio (d) | | | 4,743,749 | | | | 4,743,749 | |
| | | | | | | | | |
TOTAL MUTUAL FUNDS (Cost $4,743,749) | | | | | | | 4,743,749 | |
| | | | | | | | | |
TOTAL LONG-TERM INVESTMENTS (Cost $286,812,088) | | | | | | | 291,186,394 | |
| | | | | | | | | |
| | | Principal
Amount | | | | | |
SHORT-TERM INVESTMENTS — 1.8% |
Repurchase Agreement — 1.8% |
Fixed Income Clearing Corp., Repurchase Agreement, dated 9/30/22, 0.830%, due 10/03/22 (e) | | $ | 5,142,970 | | | | 5,142,970 | |
| | | | | | | | | |
TOTAL SHORT-TERM INVESTMENTS (Cost $5,142,970) | | | | | | | 5,142,970 | |
| | | | | | | | | |
TOTAL INVESTMENTS — 102.3% (Cost $291,955,058) (f) | | | | | | | 296,329,364 | |
| | | | | | | | | |
Other Assets/(Liabilities) — (2.3)% | | | | | | | (6,639,617 | ) |
| | | | | | | | | |
NET ASSETS — 100.0% | | | | | | $ | 289,689,747 | |
Notes to Portfolio of Investments
Percentages are stated as a percent of net assets.
(a) | Non-income producing security. |
(b) | Security is a Master Limited Partnership. |
(c) | Denotes all or a portion of security on loan. The total value of securities on loan as of September 30, 2022, was $9,526,629 or 3.29% of net assets. The Fund received $5,073,727 of non-cash collateral (U.S. Treasury and/or Agency obligations) related to securities lending activity. This amount is not reflected on either the Portfolio of Investments or the Statement of Assets and Liabilities. (Note 2). |
(d) | Represents investment of security lending cash collateral. (Note 2). |
(e) | Maturity value of $5,143,326. Collateralized by U.S. Government Agency obligations with a rate of 3.500%, maturity date of 9/15/25, and an aggregate market value, including accrued interest, of $5,245,878. |
(f) | See Note 6 for aggregate cost for federal tax purposes. |
The accompanying notes are an integral part of the financial statements.
127
MassMutual Global Fund — Portfolio of Investments |
September 30, 2022 |
| | | Number of
Shares | | | Value | |
EQUITIES — 99.3% |
COMMON STOCK — 99.3% |
Cayman Islands — 6.0% |
Farfetch Ltd. Class A (a),(b) | | | 93,418 | | | $ | 695,964 | |
JD.com, Inc. ADR | | | 171,168 | | | | 8,609,750 | |
Meituan Class B (b),(c) | | | 63,200 | | | | 1,324,614 | |
StoneCo Ltd. Class A (b) | | | 47,945 | | | | 456,916 | |
Tencent Holdings Ltd. | | | 15,300 | | | | 516,712 | |
| | | | | | | | 11,603,956 | |
Denmark — 3.0% |
Novo Nordisk A/S Class B | | | 58,427 | | | | 5,823,653 | |
France — 9.2% |
Dassault Systemes SE | | | 22,682 | | | | 779,664 | |
EssilorLuxottica SA | | | 4,577 | | | | 620,163 | |
Kering SA | | | 12,315 | | | | 5,445,924 | |
LVMH Moet Hennessy Louis Vuitton SE | | | 18,543 | | | | 10,900,225 | |
| | | | | | | | 17,745,976 | |
Germany — 1.4% |
SAP SE | | | 32,091 | | | | 2,645,415 | |
India — 6.1% |
DLF Ltd. | | | 1,651,258 | | | | 7,177,967 | |
ICICI Bank Ltd. Sponsored ADR | | | 215,252 | | | | 4,513,835 | |
| | | | | | | | 11,691,802 | |
Italy — 0.5% |
Brunello Cucinelli SpA | | | 19,667 | | | | 957,422 | |
Japan — 8.5% |
FANUC Corp. | | | 3,300 | | | | 456,515 | |
Keyence Corp. | | | 16,600 | | | | 5,511,249 | |
Murata Manufacturing Co. Ltd. | | | 110,130 | | | | 5,058,814 | |
Nidec Corp. | | | 32,200 | | | | 1,813,891 | |
Omron Corp. | | | 19,000 | | | | 865,976 | |
TDK Corp. | | | 86,200 | | | | 2,615,835 | |
| | | | | | | | 16,322,280 | |
Netherlands — 4.5% |
Airbus SE | | | 81,946 | | | | 7,079,502 | |
ASML Holding NV | | | 4,134 | | | | 1,714,747 | |
| | | | | | | | 8,794,249 | |
Spain — 0.3% |
Amadeus IT Group SA (b) | | | 12,807 | | | | 592,823 | |
Sweden — 3.5% |
Assa Abloy AB Class B | | | 162,844 | | | | 3,043,130 | |
Atlas Copco AB | | | 406,901 | | | | 3,767,981 | |
| | | | | | | | 6,811,111 | |
Switzerland — 0.8% |
Lonza Group AG Registered | | | 3,116 | | | | 1,515,338 | |
| | | Number of
Shares | | | Value | |
United States — 55.5% |
Adobe, Inc. (b) | | | 19,135 | | | $ | 5,265,952 | |
Agilent Technologies, Inc. | | | 27,598 | | | | 3,354,537 | |
Alphabet, Inc. Class A (b) | | | 242,140 | | | | 23,160,691 | |
Amazon.com, Inc. (b) | | | 18,667 | | | | 2,109,371 | |
Analog Devices, Inc. | | | 66,763 | | | | 9,302,756 | |
Avantor, Inc. (b) | | | 105,112 | | | | 2,060,195 | |
Boston Scientific Corp. (b) | | | 14,130 | | | | 547,255 | |
Charles River Laboratories International, Inc. (b) | | | 4,796 | | | | 943,853 | |
Charter Communications, Inc. Class A (b) | | | 1,269 | | | | 384,951 | |
Danaher Corp. | | | 4,493 | | | | 1,160,497 | |
Datadog, Inc. Class A (b) | | | 5,469 | | | | 485,538 | |
Dun & Bradstreet Holdings, Inc. | | | 25,516 | | | | 316,143 | |
Ecolab, Inc. | | | 3,643 | | | | 526,122 | |
Equifax, Inc. | | | 22,517 | | | | 3,860,089 | |
Fidelity National Information Services, Inc. | | | 12,134 | | | | 916,966 | |
IDEXX Laboratories, Inc. (b) | | | 1,623 | | | | 528,773 | |
Illumina, Inc. (b) | | | 7,580 | | | | 1,446,188 | |
Intuit, Inc. | | | 27,823 | | | | 10,776,404 | |
Intuitive Surgical, Inc. (b) | | | 6,688 | | | | 1,253,599 | |
IQVIA Holdings, Inc. (b) | | | 9,740 | | | | 1,764,304 | |
Lam Research Corp. | | | 522 | | | | 191,052 | |
Marriott International, Inc. Class A | | | 7,346 | | | | 1,029,469 | |
Marvell Technology, Inc. | | | 61,487 | | | | 2,638,407 | |
Meta Platforms, Inc. Class A (b) | | | 52,159 | | | | 7,076,933 | |
Microsoft Corp. | | | 12,444 | | | | 2,898,208 | |
NVIDIA Corp. | | | 6,490 | | | | 787,821 | |
Omnicell, Inc. (b) | | | 8,671 | | | | 754,637 | |
Phathom Pharmaceuticals, Inc. (a),(b) | | | 28,578 | | | | 316,644 | |
Qualtrics International Inc (b) | | | 49,587 | | | | 504,796 | |
S&P Global, Inc. | | | 32,957 | | | | 10,063,420 | |
Splunk, Inc. (b) | | | 13,340 | | | | 1,003,168 | |
United Parcel Service, Inc. Class B | | | 33,718 | | | | 5,446,806 | |
Veracyte, Inc. (b) | | | 731 | | | | 12,135 | |
Visa, Inc. Class A | | | 20,702 | | | | 3,677,710 | |
The Walt Disney Co. (b) | | | 4,305 | | | | 406,091 | |
| | | | | | | | 106,971,481 | |
| | | | | | | | | |
TOTAL COMMON STOCK (Cost $142,896,429) | | | | | | | 191,475,506 | |
| | | | | | | | | |
TOTAL EQUITIES (Cost $142,896,429) | | | | | | | 191,475,506 | |
| | | | | | | | | |
The accompanying notes are an integral part of the financial statements.
128
MassMutual Global Fund — Portfolio of Investments (Continued) |
| | | Number of
Shares | | | Value | |
MUTUAL FUNDS — 0.1% |
United States — 0.1% |
State Street Navigator Securities Lending Government Money Market Portfolio (d) | | | 201,984 | | | $ | 201,984 | |
| | | | | | | | | |
TOTAL MUTUAL FUNDS (Cost $201,984) | | | | | | | 201,984 | |
| | | | | | | | | |
TOTAL LONG-TERM INVESTMENTS (Cost $143,098,413) | | | | | | | 191,677,490 | |
| | | | | | | | | |
| | | Principal
Amount | | | | | |
SHORT-TERM INVESTMENTS — 0.6% |
Repurchase Agreement — 0.6% |
Fixed Income Clearing Corp., Repurchase Agreement, dated 9/30/22, 0.830%, due 10/03/22 (e) | | $ | 1,125,632 | | | | 1,125,632 | |
| | | | | | | | | |
TOTAL SHORT-TERM INVESTMENTS (Cost $1,125,632) | | | | | | | 1,125,632 | |
| | | | | | | | | |
TOTAL INVESTMENTS — 100.0% (Cost $144,224,045) (f) | | | | | | | 192,803,122 | |
| | | | | | | | | |
Other Assets/(Liabilities) — 0.0% | | | | | | | (43,823 | ) |
| | | | | | | | | |
NET ASSETS — 100.0% | | | | | | $ | 192,759,299 | |
Abbreviation Legend
ADR | American Depositary Receipt |
Notes to Portfolio of Investments
Percentages are stated as a percent of net assets.
(a) | Denotes all or a portion of security on loan. The total value of securities on loan as of September 30, 2022, was $318,368 or 0.17% of net assets. The Fund received $127,495 of non-cash collateral (U.S. Treasury and/or Agency obligations) related to securities lending activity. This amount is not reflected on either the Portfolio of Investments or the Statement of Assets and Liabilities. (Note 2). |
(b) | Non-income producing security. |
(c) | Security is exempt from registration under Regulation S or Rule 144A of the Securities Act of 1933. These securities are considered restricted and may be resold in transactions exempt from registration. At September 30, 2022, the aggregate market value of these securities amounted to $1,324,614 or 0.69% of net assets. |
(d) | Represents investment of security lending cash collateral. (Note 2). |
(e) | Maturity value of $1,125,709. Collateralized by U.S. Government Agency obligations with a rate of 0.000%, maturity date of 3/30/23, and an aggregate market value, including accrued interest, of $1,148,207. |
(f) | See Note 6 for aggregate cost for federal tax purposes. |
Sector weightings, as a percentage of net assets, is as follows:
Communications | | | 22.9 | % |
Technology | | | 20.7 | % |
Industrial | | | 20.2 | % |
Consumer, Non-cyclical | | | 17.7 | % |
Consumer, Cyclical | | | 9.5 | % |
Financial | | | 8.0 | % |
Basic Materials | | | 0.3 | % |
Mutual Funds | | | 0.1 | % |
Total Long-Term Investments | | | 99.4 | % |
Short-Term Investments and Other Assets and Liabilities | | | 0.6 | % |
Net Assets | | | 100.0 | % |
The accompanying notes are an integral part of the financial statements.
129
MassMutual International Equity Fund — Portfolio of Investments |
September 30, 2022 |
| | | Number of
Shares | | | Value | |
EQUITIES — 96.1% |
COMMON STOCK — 96.1% |
Australia — 0.9% |
BHP Group Ltd. Sponsored ADR (a) | | | 2,000 | | | $ | 100,080 | |
BHP Group Ltd. | | | 3,900 | | | | 97,129 | |
Lendlease Corp Ltd. | | | 27,700 | | | | 156,659 | |
Macquarie Group Ltd. | | | 2,700 | | | | 262,021 | |
Santos Ltd. | | | 71,700 | | | | 324,749 | |
Woodside Energy Group Ltd. | | | 6,126 | | | | 124,625 | |
| | | | | | | | 1,065,263 | |
Austria — 0.0% |
ams-OSRAM AG (b) | | | 6,466 | | | | 40,243 | |
Belgium — 0.7% |
Anheuser-Busch InBev SA | | | 9,700 | | | | 438,808 | |
Groupe Bruxelles Lambert NV | | | 2,000 | | | | 138,982 | |
KBC Group NV | | | 5,300 | | | | 248,616 | |
| | | | | | | | 826,406 | |
Canada — 6.6% |
The Bank of Nova Scotia | | | 30,058 | | | | 1,429,624 | |
Canadian National Railway Co. | | | 26,798 | | | | 2,894,072 | |
Intact Financial Corp. | | | 21,422 | | | | 3,031,662 | |
TFI International, Inc. | | | 1,800 | | | | 162,897 | |
| | | | | | | | 7,518,255 | |
Cayman Islands — 0.6% |
CK Asset Holdings Ltd. | | | 57,000 | | | | 342,032 | |
CK Hutchison Holdings Ltd. | | | 67,700 | | | | 371,777 | |
| | | | | | | | 713,809 | |
Finland — 1.5% |
Kone OYJ Class B | | | 35,754 | | | | 1,376,837 | |
Nokia OYJ | | | 78,800 | | | | 336,487 | |
| | | | | | | | 1,713,324 | |
France — 12.0% |
Amundi SA (c) | | | 3,292 | | | | 136,504 | |
AXA SA | | | 75,764 | | | | 1,658,834 | |
Capgemini SE | | | 16,356 | | | | 2,613,862 | |
Cie de Saint-Gobain | | | 3,400 | | | | 121,257 | |
Dassault Aviation SA | | | 900 | | | | 102,216 | |
Engie SA | | | 45,500 | | | | 522,060 | |
LVMH Moet Hennessy Louis Vuitton SE | | | 1,664 | | | | 978,158 | |
Rexel SA (b) | | | 6,900 | | | | 102,628 | |
Sanofi | | | 5,000 | | | | 381,601 | |
Schneider Electric SE | | | 18,734 | | | | 2,101,785 | |
Societe Generale SA | | | 7,800 | | | | 154,762 | |
TotalEnergies SE | | | 37,809 | | | | 1,779,666 | |
Ubisoft Entertainment SA (b) | | | 3,200 | | | | 87,855 | |
Veolia Environnement SA | | | 19,392 | | | | 367,927 | |
| | | Number of
Shares | | | Value | |
Vinci SA | | | 32,238 | | | $ | 2,589,531 | |
| | | | | | | | 13,698,646 | |
Germany — 4.9% |
Allianz SE Registered | | | 1,960 | | | | 310,171 | |
BASF SE | | | 7,000 | | | | 271,277 | |
Bayer AG Registered | | | 2,100 | | | | 96,911 | |
Deutsche Boerse AG | | | 1,636 | | | | 269,346 | |
Deutsche Post AG Registered | | | 10,400 | | | | 316,455 | |
HeidelbergCement AG | | | 6,800 | | | | 272,386 | |
Infineon Technologies AG | | | 10,500 | | | | 232,686 | |
Merck KGaA | | | 17,002 | | | | 2,774,785 | |
SAP SE | | | 5,300 | | | | 436,905 | |
Siemens AG Registered | | | 3,460 | | | | 342,448 | |
Siemens Energy AG (b) | | | 12,834 | | | | 142,856 | |
Talanx AG (b) | | | 3,100 | | | | 110,669 | |
| | | | | | | | 5,576,895 | |
Hong Kong — 2.6% |
AIA Group Ltd. | | | 349,684 | | | | 2,903,271 | |
Ireland — 3.5% |
AIB Group PLC | | | 93,300 | | | | 224,716 | |
DCC PLC | | | 4,900 | | | | 254,920 | |
Linde PLC (b) | | | 10,258 | | | | 2,805,223 | |
Linde PLC | | | 1,270 | | | | 342,379 | |
Ryanair Holdings PLC Sponsored ADR (b) | | | 300 | | | | 17,526 | |
Smurfit Kappa Group PLC | | | 10,600 | | | | 299,466 | |
| | | | | | | | 3,944,230 | |
Israel — 0.2% |
Check Point Software Technologies Ltd. (b) | | | 2,390 | | | | 267,728 | |
Italy — 0.1% |
Prysmian SpA | | | 3,300 | | | | 94,524 | |
Japan — 15.1% |
Astellas Pharma, Inc. | | | 179,310 | | | | 2,370,184 | |
Chugai Pharmaceutical Co. Ltd. | | | 63,201 | | | | 1,578,070 | |
Denka Co. Ltd. | | | 7,800 | | | | 171,437 | |
FANUC Corp. | | | 1,500 | | | | 207,507 | |
Fujitsu Ltd. | | | 2,000 | | | | 215,685 | |
Hitachi Ltd. | | | 7,600 | | | | 321,801 | |
Kao Corp. | | | 59,186 | | | | 2,399,897 | |
KDDI Corp. | | | 105,314 | | | | 3,088,853 | |
Kirin Holdings Co. Ltd. | | | 105,635 | | | | 1,626,904 | |
Kyocera Corp. | | | 6,200 | | | | 313,402 | |
Nintendo Co. Ltd. | | | 4,000 | | | | 161,971 | |
Olympus Corp. | | | 8,500 | | | | 163,589 | |
ORIX Corp. | | | 23,500 | | | | 330,504 | |
Rakuten Group, Inc. | | | 42,500 | | | | 182,326 | |
SBI Holdings, Inc. | | | 13,400 | | | | 240,803 | |
The accompanying notes are an integral part of the financial statements.
130
MassMutual International Equity Fund — Portfolio of Investments (Continued) |
| | | Number of
Shares | | | Value | |
Sega Sammy Holdings, Inc. | | | 7,900 | | | $ | 107,663 | |
Seven & i Holdings Co. Ltd. | | | 11,900 | | | | 478,010 | |
Shiseido Co. Ltd. | | | 45,492 | | | | 1,592,349 | |
Sony Group Corp. | | | 7,400 | | | | 476,281 | |
Square Enix Holdings Co. Ltd. | | | 3,300 | | | | 141,521 | |
Sumitomo Mitsui Financial Group, Inc. | | | 14,000 | | | | 389,587 | |
Toshiba Corp. | | | 6,900 | | | | 245,759 | |
Toyota Industries Corp. | | | 7,100 | | | | 338,287 | |
| | | | | | | | 17,142,390 | |
Luxembourg — 0.2% |
ArcelorMittal SA | | | 10,100 | | | | 201,981 | |
Netherlands — 5.0% |
AerCap Holdings NV (b) | | | 6,981 | | | | 295,506 | |
ASML Holding NV | | | 590 | | | | 244,727 | |
CNH Industrial NV | | | 20,400 | | | | 227,747 | |
EXOR NV (b) (d) | | | 1,300 | | | | 83,426 | |
Heineken Holding NV | | | 4,700 | | | | 320,895 | |
Heineken NV | | | 34,687 | | | | 3,040,888 | |
Koninklijke Philips NV | | | 79,802 | | | | 1,232,665 | |
NXP Semiconductor NV | | | 1,300 | | | | 191,763 | |
| | | | | | | | 5,637,617 | |
Norway — 0.4% |
Aker BP ASA (a) | | | 4,413 | | | | 126,538 | |
DNB Bank ASA | | | 15,500 | | | | 245,395 | |
Mowi ASA | | | 5,400 | | | | 68,425 | |
| | | | | | | | 440,358 | |
Republic of Korea — 0.3% |
Samsung Electronics Co. Ltd. | | | 9,100 | | | | 334,364 | |
Singapore — 0.3% |
DBS Group Holdings, Ltd. | | | 16,200 | | | | 374,543 | |
Spain — 3.5% |
Iberdrola SA | | | 201,971 | | | | 1,877,599 | |
Industria de Diseno Textil SA | | | 103,929 | | | | 2,146,695 | |
| | | | | | | | 4,024,294 | |
Sweden — 2.4% |
Assa Abloy AB Class B | | | 113,383 | | | | 2,118,833 | |
Essity AB Class B | | | 13,100 | | | | 258,584 | |
Husqvarna AB Class B | | | 9,700 | | | | 53,460 | |
Investor AB Class B | | | 10,600 | | | | 154,514 | |
Volvo AB Class B | | | 13,800 | | | | 194,721 | |
| | | | | | | | 2,780,112 | |
Switzerland — 10.3% |
ABB Ltd. Registered | | | 12,900 | | | | 332,188 | |
Alcon, Inc. | | | 1,400 | | | | 81,074 | |
Cie Financiere Richemont SA Registered | | | 2,500 | | | | 234,583 | |
| | | Number of
Shares | | | Value | |
Nestle SA Registered | | | 31,030 | | | $ | 3,359,917 | |
Novartis AG Registered | | | 44,832 | | | | 3,417,689 | |
Roche Holding AG | | | 11,656 | | | | 3,800,544 | |
UBS Group AG Registered | | | 32,900 | | | | 475,272 | |
| | | | | | | | 11,701,267 | |
United Kingdom — 25.0% |
Ashtead Group PLC | | | 5,600 | | | | 250,017 | |
AstraZeneca PLC | | | 23,183 | | | | 2,549,436 | |
Aviva PLC | | | 31,084 | | | | 133,512 | |
BAE Systems PLC | | | 332,003 | | | | 2,916,922 | |
Barratt Developments PLC | | | 21,100 | | | | 79,927 | |
BP PLC | | | 75,300 | | | | 358,078 | |
Bunzl PLC | | | 7,300 | | | | 222,154 | |
Burberry Group PLC | | | 7,300 | | | | 145,570 | |
Compass Group PLC | | | 51,721 | | | | 1,033,862 | |
Diageo PLC | | | 61,303 | | | | 2,569,561 | |
Entain PLC | | | 8,600 | | | | 103,275 | |
Experian PLC | | | 77,580 | | | | 2,274,429 | |
GlaxoSmithKline PLC | | | 18,320 | | | | 267,215 | |
Glencore PLC | | | 40,900 | | | | 215,974 | |
Imperial Brands PLC | | | 2,600 | | | | 53,653 | |
Inchcape PLC | | | 16,056 | | | | 120,827 | |
Informa PLC | | | 33,000 | | | | 190,116 | |
Kingfisher PLC | | | 93,700 | | | | 227,615 | |
Legal & General Group PLC | | | 56,700 | | | | 135,684 | |
Liberty Global PLC Class C (b) | | | 13,900 | | | | 229,350 | |
Lloyds Banking Group PLC | | | 728,100 | | | | 332,643 | |
Melrose Industries PLC | | | 108,821 | | | | 121,502 | |
National Grid PLC | | | 75,309 | | | | 777,177 | |
Persimmon PLC | | | 10,200 | | | | 140,423 | |
Prudential PLC | | | 138,318 | | | | 1,358,985 | |
Reckitt Benckiser Group PLC | | | 50,542 | | | | 3,340,392 | |
Shell PLC | | | 96,836 | | | | 2,409,308 | |
Smith & Nephew PLC | | | 224,895 | | | | 2,594,578 | |
Tesco PLC | | | 121,000 | | | | 277,056 | |
Unilever PLC | | | 57,872 | | | | 2,552,365 | |
Unilever PLC | | | 10,300 | | | | 453,198 | |
| | | | | | | | 28,434,804 | |
| | | | | | | | | |
TOTAL COMMON STOCK (Cost $130,115,153) | | | | | | | 109,434,324 | |
| | | | | | | | | |
TOTAL EQUITIES (Cost $130,115,153) | | | | | | | 109,434,324 | |
| | | | | | | | | |
The accompanying notes are an integral part of the financial statements.
131
MassMutual International Equity Fund — Portfolio of Investments (Continued) |
| | | Number of
Shares | | | Value | |
MUTUAL FUNDS — 0.1% |
United States — 0.1% |
State Street Navigator Securities Lending Government Money Market Portfolio (e) | | | 101,475 | | | $ | 101,475 | |
| | | | | | | | | |
TOTAL MUTUAL FUNDS (Cost $101,475) | | | | | | | 101,475 | |
| | | | | | | | | |
TOTAL LONG-TERM INVESTMENTS (Cost $130,216,628) | | | | | | | 109,535,799 | |
| | | | | | | | | |
| | | Principal
Amount | | | | | |
SHORT-TERM INVESTMENTS — 4.3% |
Repurchase Agreement — 4.3% |
Fixed Income Clearing Corp., Repurchase Agreement, dated 9/30/22, 0.830%, due 10/03/22 (f) | | $ | 4,869,256 | | | | 4,869,256 | |
| | | | | | | | | |
TOTAL SHORT-TERM INVESTMENTS (Cost $4,869,256) | | | | | | | 4,869,256 | |
| | | | | | | | | |
TOTAL INVESTMENTS — 100.5% (Cost $135,085,884) (g) | | | | | | | 114,405,055 | |
| | | | | | | | | |
Other Assets/(Liabilities) — (0.5)% | | | | | | | (542,269 | ) |
| | | | | | | | | |
NET ASSETS — 100.0% | | | | | | $ | 113,862,786 | |
Abbreviation Legend
ADR | American Depositary Receipt |
Notes to Portfolio of Investments
Percentages are stated as a percent of net assets.
(a) | Denotes all or a portion of security on loan. The total value of securities on loan as of September 30, 2022, was $223,627 or 0.20% of net assets. The Fund received $138,840 of non-cash collateral (U.S. Treasury and/or Agency obligations) related to securities lending activity. This amount is not reflected on either the Portfolio of Investments or the Statement of Assets and Liabilities. (Note 2). |
(b) | Non-income producing security. |
(c) | Security is exempt from registration under Regulation S or Rule 144A of the Securities Act of 1933. These securities are considered restricted and may be resold in transactions exempt from registration. At September 30, 2022, the aggregate market value of these securities amounted to $136,504 or 0.12% of net assets. |
(d) | This security is fair valued in good faith in accordance with procedures approved by the Board of Trustees. At September 30, 2022, these securities amounted to a value of $83,426 or 0.07% of net assets. |
(e) | Represents investment of security lending cash collateral. (Note 2). |
(f) | Maturity value of $4,869,593. Collateralized by U.S. Government Agency obligations with a rate of 0.000%, maturity date of 3/30/23, and an aggregate market value, including accrued interest, of $4,966,701. |
(g) | See Note 6 for aggregate cost for federal tax purposes. |
Sector weightings, as a percentage of net assets, is as follows:
Consumer, Non-cyclical | | | 41.3 | % |
Industrial | | | 15.3 | % |
Financial | | | 14.0 | % |
Consumer, Cyclical | | | 5.9 | % |
Energy | | | 4.7 | % |
Technology | | | 4.3 | % |
Basic Materials | | | 4.0 | % |
Communications | | | 3.5 | % |
Utilities | | | 3.1 | % |
Mutual Funds | | | 0.1 | % |
Total Long-Term Investments | | | 96.2 | % |
Short-Term Investments and Other Assets and Liabilities | | | 3.8 | % |
Net Assets | | | 100.0 | % |
The accompanying notes are an integral part of the financial statements.
132
MassMutual Strategic Emerging Markets Fund — Portfolio of Investments |
September 30, 2022 |
| | | Number of
Shares | | | Value | |
EQUITIES — 94.9% |
COMMON STOCK — 93.2% |
Belgium — 0.2% |
Anheuser-Busch InBev SA | | | 5,274 | | | $ | 238,585 | |
Bermuda — 0.7% |
Credicorp Ltd. | | | 5,871 | | | | 720,959 | |
Brazil — 4.3% |
Ambev SA | | | 618,963 | | | | 1,783,104 | |
Lojas Renner SA | | | 153,133 | | | | 790,596 | |
Vale SA Sponsored ADR | | | 133,938 | | | | 1,784,054 | |
WEG SA | | | 44,737 | | | | 266,547 | |
| | | | | | | | 4,624,301 | |
Cayman Islands — 20.7% |
BeiGene Ltd. ADR (a) | | | 9,951 | | | | 1,341,594 | |
Brii Biosciences Ltd. (a) | | | 170,000 | | | | 113,989 | |
H World Group Ltd. | | | 9,000 | | | | 30,647 | |
H World Group Ltd. ADR | | | 116,141 | | | | 3,895,369 | |
JD.com, Inc. ADR | | | 3,032 | | | | 152,510 | |
Meituan Class B (a) (b) | | | 175,900 | | | | 3,686,702 | |
NetEase, Inc. ADR | | | 49,610 | | | | 3,750,516 | |
New Horizon Health Ltd. (a) (b) | | | 57,500 | | | | 106,033 | |
NU Holdings Ltd/Cayman Islands Class A (a) | | | 181,383 | | | | 798,085 | |
Silergy Corp. | | | 37,000 | | | | 485,009 | |
Sunny Optical Technology Group Co. Ltd. | | | 46,300 | | | | 435,181 | |
Tencent Holdings Ltd. | | | 38,390 | | | | 1,296,507 | |
Wuxi Biologics Cayman, Inc. (a) (b) | | | 217,000 | | | | 1,300,144 | |
Zai Lab Ltd. ADR (a) | | | 32,253 | | | | 1,103,053 | |
ZTO Express Cayman, Inc. | | | 11,070 | | | | 266,922 | |
ZTO Express Cayman, Inc. ADR | | | 149,844 | | | | 3,600,751 | |
| | | | | | | | 22,363,012 | |
Chile — 0.1% |
Banco Santander Chile | | | 2,892,742 | | | | 101,066 | |
China — 0.0% |
MicroTech Medical Hangzhou Co. Ltd. Class H (a) (b) | | | 33,600 | | | | 30,962 | |
Cyprus — 0.0% |
TCS Group Holding, PLC (a) (c) (d) | | | 10,040 | | | | — | |
France — 5.9% |
Kering SA | | | 3,063 | | | | 1,354,516 | |
L’Oreal SA | | | 222 | | | | 70,689 | |
Pernod Ricard SA | | | 23,852 | | | | 4,359,740 | |
TotalEnergies SE (e) | | | 11,786 | | | | 554,766 | |
| | | | | | | | 6,339,711 | |
Hong Kong — 1.9% |
AIA Group Ltd. | | | 246,600 | | | | 2,047,411 | |
| | | Number of
Shares | | | Value | |
India — 22.2% |
Housing Development Finance Corp. Ltd. | | | 305,049 | | | $ | 8,497,775 | |
Infosys Ltd. | | | 137,341 | | | | 2,354,003 | |
Kotak Mahindra Bank Ltd. | | | 280,059 | | | | 6,194,709 | |
Oberoi Realty Ltd. | | | 65,694 | | | | 732,550 | |
Tata Consultancy Services Ltd. | | | 138,333 | | | | 5,063,066 | |
Zee Entertainment Enterprises Ltd. | | | 353,109 | | | | 1,112,754 | |
| | | | | | | | 23,954,857 | |
Indonesia — 0.8% |
Bank Central Asia Tbk PT | | | 1,564,200 | | | | 873,196 | |
Italy — 1.4% |
PRADA SpA | | | 325,400 | | | | 1,493,792 | |
Japan — 0.1% |
Daiichi Sankyo Co. Ltd. | | | 3,600 | | | | 100,141 | |
Mexico — 8.2% |
America Movil SAB de CV Class L Sponsored ADR | | | 75,816 | | | | 1,248,690 | |
Fomento Economico Mexicano SAB de CV | | | 76,261 | | | | 478,328 | |
Grupo Mexico SAB de CV Series B | | | 1,267,609 | | | | 4,281,276 | |
Wal-Mart de Mexico SAB de CV | | | 806,168 | | | | 2,831,265 | |
| | | | | | | | 8,839,559 | |
Netherlands — 0.0% |
Yandex N.V. (a) (c) (d) | | | 83,348 | | | | — | |
Philippines — 1.3% |
SM Investments Corp. | | | 117,210 | | | | 1,445,211 | |
SM Prime Holdings, Inc. | | | 42,093 | | | | 21,651 | |
| | | | | | | | 1,466,862 | |
Republic of Korea — 7.6% |
LG Chem Ltd. | | | 5,781 | | | | 2,142,294 | |
LG H&H Co. Ltd. | | | 451 | | | | 197,801 | |
NAVER Corp. | | | 6,862 | | | | 914,542 | |
Samsung Biologics Co. Ltd. (a) (b) | | | 3,233 | | | | 1,810,631 | |
Samsung Electronics Co. Ltd. | | | 85,372 | | | | 3,136,852 | |
| | | | | | | | 8,202,120 | |
Russia — 0.0% |
Novatek PJSC (a) (c) (d) | | | 28,473 | | | | — | |
Novatek PJSC (a) (c) (d) | | | 172 | | | | — | |
Polyus PJSC (a) (c) (d) | | | 2,111 | | | | — | |
Polyus PJSC GDR (a) (c) (d) | | | 454 | | | | — | |
Polyus PJSC GDR (a) (c) (d) | | | 4,390 | | | | — | |
Sberbank of Russia PJSC (a) (c) (d) | | | 18,062 | | | | — | |
| | | | | | | | — | |
South Africa — 1.0% |
FirstRand Ltd. | | | 314,863 | | | | 1,047,675 | |
The accompanying notes are an integral part of the financial statements.
133
MassMutual Strategic Emerging Markets Fund — Portfolio of Investments (Continued) |
| | | Number of
Shares | | | Value | |
Switzerland — 1.8% |
Cie Financiere Richemont SA Registered | | | 21,262 | | | $ | 1,995,084 | |
Taiwan — 8.6% |
MediaTek, Inc. | | | 127,000 | | | | 2,210,327 | |
Taiwan Semiconductor Manufacturing Co. Ltd. | | | 541,000 | | | | 7,111,058 | |
| | | | | | | | 9,321,385 | |
United Kingdom — 0.4% |
Antofagasta PLC | | | 27,640 | | | | 340,946 | |
AstraZeneca PLC Sponsored ADR | | | 1,854 | | | | 101,674 | |
| | | | | | | | 442,620 | |
United States — 6.0% |
Coupang, Inc. (a) | | | 16,002 | | | | 266,753 | |
Yum China Holdings, Inc. | | | 132,532 | | | | 6,272,740 | |
| | | | | | | | 6,539,493 | |
| | | | | | | | | |
TOTAL COMMON STOCK (Cost $129,716,900) | | | | | | | 100,742,791 | |
| | | | | | | | | |
PREFERRED STOCK — 1.7% |
Brazil — 1.7% |
Banco Bradesco SA 3.340% | | | 486,614 | | | | 1,789,728 | |
| | | | | | | | | |
TOTAL PREFERRED STOCK (Cost $1,757,961) | | | | | | | 1,789,728 | |
| | | | | | | | | |
TOTAL EQUITIES (Cost $131,474,861) | | | | | | | 102,532,519 | |
| | | | | | | | | |
MUTUAL FUNDS — 0.2% |
United States — 0.2% |
State Street Navigator Securities Lending Government Money Market Portfolio (f) | | | 199,697 | | | | 199,697 | |
| | | | | | | | | |
TOTAL MUTUAL FUNDS (Cost $199,697) | | | | | | | 199,697 | |
| | | | | | | | | |
WARRANTS — 0.0% |
Switzerland — 0.0% |
Cie Financiere Richemont SA, Expires 11/22/23, Strike 67.00 (a) | | | 53,937 | | | | 24,052 | |
| | | | | | | | | |
TOTAL WARRANTS (Cost $0) | | | | | | | 24,052 | |
| | | | | | | | | |
TOTAL LONG-TERM INVESTMENTS (Cost $131,674,558) | | | | | | | 102,756,268 | |
| | | Principal
Amount | | | Value | |
SHORT-TERM INVESTMENTS — 5.0% |
Repurchase Agreement — 5.0% |
Fixed Income Clearing Corp., Repurchase Agreement, dated 9/30/22, 0.830%, due 10/03/22 (g) | | $ | 5,387,475 | | | $ | 5,387,475 | |
| | | | | | | | | |
TOTAL SHORT-TERM INVESTMENTS (Cost $5,387,475) | | | | | | | 5,387,475 | |
| | | | | | | | | |
TOTAL INVESTMENTS — 100.1% (Cost $137,062,033) (h) | | | | | | | 108,143,743 | |
| | | | | | | | | |
Other Assets/(Liabilities) — (0.1)% | | | | | | | (93,377 | ) |
| | | | | | | | | |
NET ASSETS — 100.0% | | | | | | $ | 108,050,366 | |
Abbreviation Legend
ADR | American Depositary Receipt |
GDR | Global Depositary Receipt |
Notes to Portfolio of Investments
Percentages are stated as a percent of net assets.
(a) | Non-income producing security. |
(b) | Security is exempt from registration under Regulation S or Rule 144A of the Securities Act of 1933. These securities are considered restricted and may be resold in transactions exempt from registration. At September 30, 2022, the aggregate market value of these securities amounted to $6,934,472 or 6.42% of net assets. |
(c) | This security is fair valued in good faith in accordance with procedures approved by the Board of Trustees. At September 30, 2022, these securities amounted to a value of $0 or 0.00% of net assets. |
(d) | Investment is valued using significant unobservable inputs. |
(e) | Denotes all or a portion of security on loan. The total value of securities on loan as of September 30, 2022, was $190,104 or 0.18% of net assets.(Note 2). |
(f) | Represents investment of security lending cash collateral. (Note 2). |
(g) | Maturity value of $5,387,847. Collateralized by U.S. Government Agency obligations with a rate of 0.000%, maturity date of 3/30/23, and an aggregate market value, including accrued interest, of $5,495,284. |
(h) | See Note 6 for aggregate cost for federal tax purposes. |
The accompanying notes are an integral part of the financial statements.
134
MassMutual Strategic Emerging Markets Fund — Portfolio of Investments (Continued) |
Sector weightings, as a percentage of net assets, is as follows:
Technology | | | 21.9 | % |
Financial | | | 21.1 | % |
Consumer, Cyclical | | | 17.3 | % |
Consumer, Non-cyclical | | | 13.5 | % |
Communications | | | 8.0 | % |
Basic Materials | | | 7.9 | % |
Industrial | | | 4.7 | % |
Energy | | | 0.5 | % |
Mutual Funds | | | 0.2 | % |
Total Long-Term Investments | | | 95.1 | % |
Short-Term Investments and Other Assets and Liabilities | | | 4.9 | % |
Net Assets | | | 100.0 | % |
The accompanying notes are an integral part of the financial statements.
135
MassMutual Funds – Financial Statements |
Statements of Assets and Liabilities
September 30, 2022 |
| | | MassMutual
U.S. Government
Money Market
Fund | | | MassMutual
Short-Duration
Bond Fund | |
Assets: | | | | | | | | |
Investments, at value (Note 2) (a) | | $ | 178,416,681 | | | $ | 492,356,764 | |
Repurchase agreements, at value (Note 2) (b) | | | 30,000,000 | | | | 4,918,793 | |
Total investments (c) | | | 208,416,681 | | | | 497,275,557 | |
Cash | | | 24,267 | | | | 97,952 | |
Foreign currency, at value (d) | | | — | | | | — | |
Receivables from: | | | | | | | | |
Investments sold | | | | | | | | |
Regular delivery | | | — | | | | 1,890,540 | |
Delayed delivery | | | — | | | | — | |
Open forward contracts (Note 2) | | | — | | | | — | |
Fund shares sold | | | 381,568 | | | | 480,152 | |
Cash collateral pledged for open derivatives (Note 2) | | | — | | | | 4,092,000 | |
| Receivable due from broker | | | — | | | | — | |
Investment adviser (Note 3) | | | — | | | | 87,747 | |
Variation margin on open derivative instruments (Note 2) | | | — | | | | 428,172 | |
Interest and dividends | | | 312,814 | | | | 4,081,368 | |
Foreign tax reclaims | | | — | | | | — | |
Prepaid expenses | | | 10,255 | | | | 73,545 | |
Total assets | | | 209,145,585 | | | | 508,507,033 | |
Liabilities: | | | | | | | | |
Payables for: | | | | | | | | |
Investments purchased | | | | | | | | |
Regular delivery | | | — | | | | — | |
Delayed delivery | | | — | | | | — | |
Written options outstanding, at value (Note 2) (e) | | | — | | | | — | |
Dividends (Note 2) | | | 109 | | | | 74,702 | |
Open forward contracts (Note 2) | | | — | | | | — | |
Foreign currency overdraft | | | — | | | | — | |
Fund shares repurchased | | | 3,588,235 | | | | 2,507,002 | |
Cash collateral held for securities on loan (Note 2) | | | — | | | | 5,908,650 | |
Open swap agreements, at value (Note 2) | | | — | | | | — | |
Trustees’ fees and expenses (Note 3) | | | 45,598 | | | | 55,469 | |
Variation margin on open derivative instruments (Note 2) | | | — | | | | 34,009 | |
Affiliates (Note 3): | | | | | | | | |
Administration fees | | | 60,841 | | | | 83,643 | |
Investment advisory fees | | | 55,583 | | | | 149,691 | |
Service fees | | | — | | | | 21,570 | |
Distribution fees | | | — | | | | 1,841 | |
Due to custodian | | | — | | | | — | |
Accrued expense and other liabilities | | | 66,898 | | | | 45,934 | |
Total liabilities | | | 3,817,264 | | | | 8,882,511 | |
Net assets | | $ | 205,328,321 | | | $ | 499,624,522 | |
Net assets consist of: | | | | | | | | |
Paid-in capital | | $ | 205,372,970 | | | $ | 673,352,585 | |
Accumulated earnings (loss) | | | (44,649 | ) | | | (173,728,063 | ) |
Net assets | | $ | 205,328,321 | | | $ | 499,624,522 | |
(a) | Cost of investments: | | $ | 178,416,681 | | | $ | 569,163,962 | |
(b) | Cost of repurchase agreements: | | $ | 30,000,000 | | | $ | 4,918,793 | |
(c) | Securities on loan with market value of: | | $ | — | | | $ | 5,790,018 | |
(d) | Cost of foreign currency: | | $ | — | | | $ | — | |
(e) | Premiums on written options: | | $ | — | | | $ | — | |
The accompanying notes are an integral part of the financial statements.
136
| | MassMutual
Inflation-
Protected and
Income Fund | | | MassMutual
Core Bond
Fund | | | MassMutual
Diversified Bond
Fund | | | MassMutual
High Yield
Fund | | | MassMutual
Balanced
Fund | |
| | | | | | | | | | | | | | | | | | | | |
| | $ | 295,170,851 | | | $ | 795,430,141 | | | $ | 161,952,000 | | | $ | 387,963,191 | | | $ | 120,384,335 | |
| | | 5,583,754 | | | | 3,700,190 | | | | 3,312,134 | | | | 3,652,062 | | | | 1,134,559 | |
| | | 300,754,605 | | | | 799,130,331 | | | | 165,264,134 | | | | 391,615,253 | | | | 121,518,894 | |
| | | — | | | | 10,965 | | | | 17 | | | | 44 | | | | 289 | |
| | | — | | | | — | | | | 3,495 | | | | — | | | | — | |
| | | | | | | | | | | | | | | | | | | | |
| | | | | | | | | | | | | | | | | | | | |
| | | — | | | | — | | | | 474,890 | | | | 4,461,325 | | | | — | |
| | | — | | | | 37,656,986 | | | | 7,741,207 | | | | — | | | | 875,642 | |
| | | — | | | | — | | | | 190,828 | | | | — | | | | — | |
| | | 157,652 | | | | 226,066 | | | | 83,316 | | | | 211,320 | | | | 101,461 | |
| | | 18,600,000 | | | | — | | | | — | | | | — | | | | — | |
| | | 1,880,000 | | | | — | | | | — | | | | — | | | | — | |
| | | 1 | | | | — | | | | — | | | | — | | | | — | |
| | | 56,015 | | | | — | | | | — | | | | — | | | | 15,594 | |
| | | 353,995 | | | | 5,031,611 | | | | 1,327,088 | | | | 7,011,851 | | | | 296,030 | |
| | | — | | | | 2,620 | | | | 13,911 | | | | 451,622 | | | | — | |
| | | 35,033 | | | | 35,512 | | | | 37,080 | | | | 52,850 | | | | 37,105 | |
| | | 321,837,301 | | | | 842,094,091 | | | | 175,135,966 | | | | 403,804,265 | | | | 122,845,015 | |
| | | | | | | | | | | | | | | | | | | | |
| | | | | | | | | | | | | | | | | | | | |
| | | | | | | | | | | | | | | | | | | | |
| | | 7,022,432 | | | | — | | | | 472,976 | | | | 2,363,435 | | | | 85,762 | |
| | | — | | | | 121,524,145 | | | | 16,100,613 | | | | — | | | | 7,727,418 | |
| | | — | | | | — | | | | 11,185 | | | | — | | | | — | |
| | | — | | | | — | | | | — | | | | — | | | | — | |
| | | — | | | | — | | | | 245,946 | | | | — | | | | — | |
| | | — | | | | 2 | | | | — | | | | — | | | | — | |
| | | 157,972 | | | | 255,491 | | | | 12,335 | | | | 1,798,722 | | | | 816 | |
| | | 2,676,375 | | | | 832,510 | | | | 1,347,973 | | | | 14,173,193 | | | | — | |
| | | 18,012,025 | | | | — | | | | — | | | | — | | | | — | |
| | | 28,414 | | | | 136,337 | | | | 18,387 | | | | 31,421 | | | | 15,059 | |
| | | — | | | | 372,422 | | | | 157,502 | | | | — | | | | — | |
| | | | | | | | | | | | | | | | | | | | |
| | | 50,962 | | | | 93,527 | | | | 62,337 | | | | 36,214 | | | | 46,988 | |
| | | 94,975 | | | | 235,129 | | | | 52,257 | | | | 168,080 | | | | 48,063 | |
| | | 10,562 | | | | 18,036 | | | | 6,721 | | | | 13,646 | | | | 18,964 | |
| | | 1,779 | | | | 140 | | | | 885 | | | | 5,310 | | | | 6,724 | |
| | | 3,772,488 | | | | — | | | | — | | | | — | | | | — | |
| | | 93,797 | | | | 137,576 | | | | 98,667 | | | | 60,986 | | | | 105,728 | |
| | | 31,921,781 | | | | 123,605,315 | | | | 18,587,784 | | | | 18,651,007 | | | | 8,055,522 | |
| | $ | 289,915,520 | | | $ | 718,488,776 | | | $ | 156,548,182 | | | $ | 385,153,258 | | | $ | 114,789,493 | |
| | | | | | | | | | | | | | | | | | | | |
| | $ | 326,985,711 | | | $ | 869,205,707 | | | $ | 190,465,793 | | | $ | 496,657,544 | | | $ | 128,980,304 | |
| | | (37,070,191 | ) | | | (150,716,931 | ) | | | (33,917,611 | ) | | | (111,504,286 | ) | | | (14,190,811 | ) |
| | $ | 289,915,520 | | | $ | 718,488,776 | | | $ | 156,548,182 | | | $ | 385,153,258 | | | $ | 114,789,493 | |
| | $ | 314,138,011 | | | $ | 910,956,029 | | | $ | 189,211,046 | | | $ | 458,090,252 | | | $ | 134,045,299 | |
| | $ | 5,583,754 | | | $ | 3,700,190 | | | $ | 3,312,134 | | | $ | 3,652,062 | | | $ | 1,134,559 | |
| | $ | 2,622,956 | | | $ | 2,101,652 | | | $ | 1,553,980 | | | $ | 15,766,389 | | | $ | — | |
| | $ | — | | | $ | — | | | $ | 3,837 | | | $ | — | | | $ | — | |
| | $ | — | | | $ | — | | | $ | 4,523 | | | $ | — | | | $ | — | |
The accompanying notes are an integral part of the financial statements.
137
MassMutual Funds – Financial Statements (Continued) |
Statements of Assets and Liabilities
September 30, 2022 |
| | | MassMutual
U.S. Government
Money Market
Fund | | | MassMutual
Short-Duration
Bond Fund | |
Class I shares: | | | | | | | | |
Net assets | | $ | — | | | $ | 131,483,694 | |
Shares outstanding (a) | | | — | | | | 15,164,906 | |
Net asset value, offering price and redemption price per share | | $ | — | | | $ | 8.67 | |
Class R5 shares: | | | | | | | | |
Net assets | | $ | 205,328,321 | | | $ | 30,546,369 | |
Shares outstanding (a) | | | 205,530,593 | | | | 3,509,385 | |
Net asset value, offering price and redemption price per share | | $ | 1.00 | | | $ | 8.70 | |
Service Class shares: | | | | | | | | |
Net assets | | $ | — | | | $ | 2,980,706 | |
Shares outstanding (a) | | | — | | | | 344,749 | |
Net asset value, offering price and redemption price per share | | $ | — | | | $ | 8.65 | |
Administrative Class shares: | | | | | | | | |
Net assets | | $ | — | | | $ | 10,581,864 | |
Shares outstanding (a) | | | — | | | | 1,227,943 | |
Net asset value, offering price and redemption price per share | | $ | — | | | $ | 8.62 | |
Class R4 shares: | | | | | | | | |
Net assets | | $ | — | | | $ | 8,687,927 | |
Shares outstanding (a) | | | — | | | | 1,000,086 | |
Net asset value, offering price and redemption price per share | | $ | — | | | $ | 8.69 | |
Class A shares: | | | | | | | | |
Net assets | | $ | — | | | $ | 7,588,428 | |
Shares outstanding (a) | | | — | | | | 884,470 | |
Net asset value, and redemption price per share | | $ | — | | | $ | 8.58 | |
Offering price per share (100/[100-maximum sales charge] of net asset value) | | $ | — | | | $ | 8.80 | |
Class R3 shares: | | | | | | | | |
Net assets | | $ | — | | | $ | 7,664,842 | |
Shares outstanding (a) | | | — | | | | 890,218 | |
Net asset value, offering price and redemption price per share | | $ | — | | | $ | 8.61 | |
Class Y shares: (b) | | | | | | | | |
Net assets | | $ | — | | | $ | 222,384,915 | |
Shares outstanding (a) | | | — | | | | 25,624,065 | |
Net asset value, offering price and redemption price per share | | $ | — | | | $ | 8.68 | |
Class L shares: (b) | | | | | | | | |
Net assets | | $ | — | | | $ | 76,608,878 | |
Shares outstanding (a) | | | — | | | | 8,864,552 | |
Net asset value, offering price and redemption price per share | | $ | — | | | $ | 8.64 | |
Offering price per share (100/[100-maximum sales charge] of net asset value) | | $ | — | | | $ | 8.82 | |
Class C shares: (b) | | | | | | | | |
Net assets | | $ | — | | | $ | 1,096,899 | |
Shares outstanding (a) | | | — | | | | 125,901 | |
Net asset value, offering price and redemption price per share | | $ | — | | | $ | 8.71 | |
(a) | Authorized unlimited number of shares with no par value. |
(b) | Commenced operations on December 13, 2021. |
The accompanying notes are an integral part of the financial statements.
138
| | MassMutual
Inflation-
Protected and
Income Fund | | | MassMutual
Core Bond
Fund | | | MassMutual
Diversified Bond
Fund | | | MassMutual
High Yield
Fund | | | MassMutual
Balanced
Fund | |
| | | | | | | | | | | | | | | | | | | | |
| | $ | 169,362,417 | | | $ | 485,216,349 | | | $ | 75,454,918 | | | $ | 228,970,196 | | | $ | 44,531,827 | |
| | | 18,118,974 | | | | 53,345,575 | | | | 8,447,152 | | | | 31,466,961 | | | | 4,654,194 | |
| | $ | 9.35 | | | $ | 9.10 | | | $ | 8.93 | | | $ | 7.28 | | | $ | 9.57 | |
| | | | | | | | | | | | | | | | | | | | |
| | $ | 66,135,959 | | | $ | 135,050,114 | | | $ | 57,774,337 | | | $ | 34,164,173 | | | $ | 28,960,188 | |
| | | 7,073,353 | | | | 14,796,585 | | | | 7,105,524 | | | | 4,662,219 | | | | 3,027,650 | |
| | $ | 9.35 | | | $ | 9.13 | | | $ | 8.13 | | | $ | 7.33 | | | $ | 9.57 | |
| | | | | | | | | | | | | | | | | | | | |
| | $ | 31,068,532 | | | $ | 36,797,156 | | | $ | 4,963,433 | | | $ | 22,158,034 | | | $ | 7,659,474 | |
| | | 3,335,856 | | | | 4,055,452 | | | | 600,468 | | | | 3,021,650 | | | | 742,694 | |
| | $ | 9.31 | | | $ | 9.07 | | | $ | 8.27 | | | $ | 7.33 | | | $ | 10.31 | |
| | | | | | | | | | | | | | | | | | | | |
| | $ | 7,758,868 | | | $ | 35,207,204 | | | $ | 8,149,087 | | | $ | 12,693,207 | | | $ | 6,317,563 | |
| | | 822,735 | | | | 3,917,079 | | | | 987,480 | | | | 1,762,977 | | | | 657,357 | |
| | $ | 9.43 | | | $ | 8.99 | | | $ | 8.25 | | | $ | 7.20 | | | $ | 9.61 | |
| | | | | | | | | | | | | | | | | | | | |
| | $ | 4,315,913 | | | $ | 2,295,148 | | | $ | 3,753,510 | | | $ | 30,615,058 | | | $ | 4,554,194 | |
| | | 475,085 | | | | 259,533 | | | | 461,997 | | | | 4,328,567 | | | | 501,043 | |
| | $ | 9.08 | | | $ | 8.84 | | | $ | 8.12 | | | $ | 7.07 | | | $ | 9.09 | |
| | | | | | | | | | | | | | | | | | | | |
| | $ | 8,860,121 | | | $ | 23,746,047 | | | $ | 5,106,019 | | | $ | 8,334,895 | | | $ | 13,123,379 | |
| | | 966,208 | | | | 2,666,466 | | | | 618,107 | | | | 1,158,147 | | | | 1,424,390 | |
| | $ | 9.17 | | | $ | 8.91 | | | $ | 8.26 | | | $ | 7.20 | | | $ | 9.21 | |
| | $ | 9.58 | | | $ | 9.31 | | | $ | 8.63 | | | $ | 7.62 | | | $ | 9.75 | |
| | | | | | | | | | | | | | | | | | | | |
| | $ | 2,413,710 | | | $ | 176,758 | | | $ | 1,346,878 | | | $ | 24,740,302 | | | $ | 9,642,868 | |
| | | 265,419 | | | | 19,257 | | | | 164,266 | | | | 3,393,419 | | | | 1,070,491 | |
| | $ | 9.09 | | | $ | 9.18 | | | $ | 8.20 | | | $ | 7.29 | | | $ | 9.01 | |
| | | | | | | | | | | | | | | | | | | | |
| | $ | — | | | $ | — | | | $ | — | | | $ | 23,396,675 | | | $ | — | |
| | | — | | | | — | | | | — | | | | 3,205,847 | | | | — | |
| | $ | — | | | $ | — | | | $ | — | | | $ | 7.30 | | | $ | — | |
| | | | | | | | | | | | | | | | | | | | |
| | $ | — | | | $ | — | | | $ | — | | | $ | — | | | $ | — | |
| | | — | | | | — | | | | — | | | | — | | | | — | |
| | $ | — | | | $ | — | | | $ | — | | | $ | — | | | $ | — | |
| | $ | — | | | $ | — | | | $ | — | | | $ | — | | | $ | — | |
| | | | | | | | | | | | | | | | | | | | |
| | $ | — | | | $ | — | | | $ | — | | | $ | 80,718 | | | $ | — | |
| | | — | | | | — | | | | — | | | | 11,017 | | | | — | |
| | $ | — | | | $ | — | | | $ | — | | | $ | 7.33 | | | $ | — | |
The accompanying notes are an integral part of the financial statements.
139
MassMutual Funds – Financial Statements (Continued) |
Statements of Assets and Liabilities
September 30, 2022 |
| | | MassMutual
Disciplined
Value Fund | | | MassMutual
Main Street
Fund | |
Assets: | | | | | | | | |
Investments, at value (Note 2) (a) | | $ | 66,888,651 | | | $ | 65,455,058 | |
Repurchase agreements, at value (Note 2) (b) | | | 468,997 | | | | 1,666,661 | |
Total investments (c) | | | 67,357,648 | | | | 67,121,719 | |
Cash | | | — | | | | — | |
Foreign currency, at value (d) | | | — | | | | — | |
Receivables from: | | | | | | | | |
Investments sold | | | | | | | | |
Regular delivery | | | — | | | | 204,194 | |
Fund shares sold | | | 22,736 | | | | 59,958 | |
Investment adviser (Note 3) | | | — | | | | — | |
Interest and dividends | | | 85,484 | | | | 27,554 | |
Foreign tax reclaims | | | — | | | | 4,097 | |
Prepaid expenses | | | 32,466 | | | | 29,887 | |
Total assets | | | 67,498,334 | | | | 67,447,409 | |
Liabilities: | | | | | | | | |
Payables for: | | | | | | | | |
Investments purchased | | | | | | | | |
Regular delivery | | | — | | | | 314,127 | |
Fund shares repurchased | | | 88,014 | | | | 9,928 | |
Cash collateral held for securities on loan (Note 2) | | | 29,461 | | | | — | |
Trustees’ fees and expenses (Note 3) | | | 22,464 | | | | 14,330 | |
Affiliates (Note 3): | | | | | | | | |
Administration fees | | | 25,696 | | | | 29,851 | |
Investment advisory fees | | | 26,724 | | | | 32,602 | |
Service fees | | | 6,342 | | | | 10,216 | |
Distribution fees | | | 2,553 | | | | 525 | |
Accrued expense and other liabilities | | | 102,557 | | | | 72,341 | |
Total liabilities | | | 303,811 | | | | 483,920 | |
Net assets | | $ | 67,194,523 | | | $ | 66,963,489 | |
Net assets consist of: | | | | | | | | |
Paid-in capital | | $ | 66,478,657 | | | $ | 58,090,720 | |
Accumulated earnings (loss) | | | 715,866 | | | | 8,872,769 | |
Net assets | | $ | 67,194,523 | | | $ | 66,963,489 | |
(a) | Cost of investments: | | $ | 73,137,546 | | | $ | 64,975,192 | |
(b) | Cost of repurchase agreements: | | $ | 468,997 | | | $ | 1,666,661 | |
(c) | Securities on loan with market value of: | | $ | 415,531 | | | $ | — | |
(d) | Cost of foreign currency: | | $ | — | | | $ | — | |
The accompanying notes are an integral part of the financial statements.
140
| | MassMutual
Disciplined
Growth Fund | | | MassMutual
Small Cap
Opportunities
Fund | | | MassMutual
Global Fund | | | MassMutual
International
Equity Fund | | | MassMutual
Strategic
Emerging
Markets Fund | |
| | | | | | | | | | | | | | | | | | | | |
| | $ | 154,991,283 | | | $ | 291,186,394 | | | $ | 191,677,490 | | | $ | 109,535,799 | | | $ | 102,756,268 | |
| | | 622,516 | | | | 5,142,970 | | | | 1,125,632 | | | | 4,869,256 | | | | 5,387,475 | |
| | | 155,613,799 | | | | 296,329,364 | | | | 192,803,122 | | | | 114,405,055 | | | | 108,143,743 | |
| | | — | | | | — | | | | — | | | | 6,971 | | | | 2,633 | |
| | | — | | | | — | | | | 230,035 | | | | 64,376 | | | | 121,460 | |
| | | | | | | | | | | | | | | | | | | | |
| | | | | | | | | | | | | | | | | | | | |
| | | — | | | | 281,487 | | | | 86,543 | | | | 249,801 | | | | 227,405 | |
| | | 41,990 | | | | 115,903 | | | | 69,947 | | | | 29,423 | | | | 8,465 | |
| | | — | | | | — | | | | — | | | | — | | | | 49,505 | |
| | | 11,610 | | | | 185,949 | | | | 106,823 | | | | 222,225 | | | | 145,736 | |
| | | — | | | | — | | | | 268,672 | | | | 710,040 | | | | 41,491 | |
| | | 33,388 | | | | 42,308 | | | | 30,314 | | | | 48,681 | | | | 37,895 | |
| | | 155,700,787 | | | | 296,955,011 | | | | 193,595,456 | | | | 115,736,572 | | | | 108,778,333 | |
| | | | | | | | | | | | | | | | | | | | |
| | | | | | | | | | | | | | | | | | | | |
| | | | | | | | | | | | | | | | | | | | |
| | | — | | | | 2,080,465 | | | | — | | | | 1,448,499 | | | | 142 | |
| | | 18,616 | | | | 99,990 | | | | 2,902 | | | | 5,472 | | | | 14,221 | |
| | | 664,115 | | | | 4,743,749 | | | | 201,984 | | | | 101,475 | | | | 199,697 | |
| | | 28,550 | | | | 23,041 | | | | 33,052 | | | | 52,500 | | | | 14,554 | |
| | | | | | | | | | | | | | | | | | | | |
| | | 41,300 | | | | 50,826 | | | | 50,996 | | | | 35,846 | | | | 26,288 | |
| | | 62,084 | | | | 147,476 | | | | 130,415 | | | | 81,699 | | | | 95,470 | |
| | | 17,386 | | | | 39,978 | | | | 18,640 | | | | 8,129 | | | | 687 | |
| | | 2,758 | | | | 4,958 | | | | 5,750 | | | | 1,376 | | | | 375 | |
| | | 102,330 | | | | 74,781 | | | | 392,418 | | | | 138,790 | | | | 376,533 | |
| | | 937,139 | | | | 7,265,264 | | | | 836,157 | | | | 1,873,786 | | | | 727,967 | |
| | $ | 154,763,648 | | | $ | 289,689,747 | | | $ | 192,759,299 | | | $ | 113,862,786 | | | $ | 108,050,366 | |
| | | | | | | | | | | | | | | | | | | | |
| | $ | 160,905,820 | | | $ | 281,446,519 | | | $ | 102,300,461 | | | $ | 128,930,768 | | | $ | 152,415,756 | |
| | | (6,142,172 | ) | | | 8,243,228 | | | | 90,458,838 | | | | (15,067,982 | ) | | | (44,365,390 | ) |
| | $ | 154,763,648 | | | $ | 289,689,747 | | | $ | 192,759,299 | | | $ | 113,862,786 | | | $ | 108,050,366 | |
| | $ | 168,399,697 | | | $ | 286,812,088 | | | $ | 143,098,413 | | | $ | 130,216,628 | | | $ | 131,674,558 | |
| | $ | 622,516 | | | $ | 5,142,970 | | | $ | 1,125,632 | | | $ | 4,869,256 | | | $ | 5,387,475 | |
| | $ | 988,118 | | | $ | 9,526,629 | | | $ | 318,368 | | | $ | 223,627 | | | $ | 190,104 | |
| | $ | — | | | $ | — | | | $ | 229,931 | | | $ | 65,622 | | | $ | 124,231 | |
The accompanying notes are an integral part of the financial statements.
141
MassMutual Funds – Financial Statements (Continued) |
Statements of Assets and Liabilities
September 30, 2022 |
| | | MassMutual
Disciplined
Value Fund | | | MassMutual
Main Street
Fund | |
Class I shares: | | | | | | | | |
Net assets | | $ | 24,938,405 | | | $ | 3,153,774 | |
Shares outstanding (a) | | | 2,029,079 | | | | 345,986 | |
Net asset value, offering price and redemption price per share | | $ | 12.29 | | | $ | 9.12 | |
Class R5 shares: | | | | | | | | |
Net assets | | $ | 19,907,157 | | | $ | 31,307,014 | |
Shares outstanding (a) | | | 1,614,465 | | | | 3,433,125 | |
Net asset value, offering price and redemption price per share | | $ | 12.33 | | | $ | 9.12 | |
Service Class shares: | | | | | | | | |
Net assets | | $ | 11,924,865 | | | $ | 107,013 | |
Shares outstanding (a) | | | 978,462 | | | | 11,110 | |
Net asset value, offering price and redemption price per share | | $ | 12.19 | | | $ | 9.63 | |
Administrative Class shares: | | | | | | | | |
Net assets | | $ | 1,154,182 | | | $ | 17,867,430 | |
Shares outstanding (a) | | | 91,960 | | | | 1,962,765 | |
Net asset value, offering price and redemption price per share | | $ | 12.55 | | | $ | 9.10 | |
Class R4 shares: | | | | | | | | |
Net assets | | $ | 1,292,509 | | | $ | 5,888,830 | |
Shares outstanding (a) | | | 108,667 | | | | 670,697 | |
Net asset value, offering price and redemption price per share | | $ | 11.89 | | | $ | 8.78 | |
Class A shares: | | | | | | | | |
Net assets | | $ | 4,245,098 | | | $ | 7,887,153 | |
Shares outstanding (a) | | | 353,534 | | | | 886,474 | |
Net asset value, and redemption price per share | | $ | 12.01 | | | $ | 8.90 | |
Offering price per share (100/[100-maximum sales charge] of net asset value) | | $ | 12.71 | | | $ | 9.42 | |
Class R3 shares: | | | | | | | | |
Net assets | | $ | 3,732,307 | | | $ | 752,275 | |
Shares outstanding (a) | | | 307,602 | | | | 84,285 | |
Net asset value, offering price and redemption price per share | | $ | 12.13 | | | $ | 8.93 | |
(a) | Authorized unlimited number of shares with no par value. |
The accompanying notes are an integral part of the financial statements.
142
| | MassMutual
Disciplined
Growth Fund | | | MassMutual
Small Cap
Opportunities
Fund | | | MassMutual
Global Fund | | | MassMutual
International
Equity Fund | | | MassMutual
Strategic
Emerging
Markets Fund | |
| | | | | | | | | | | | | | | | | | | | |
| | $ | 18,482,705 | | | $ | 95,435,741 | | | $ | 56,930,671 | | | $ | 66,354,989 | | | $ | 105,253,099 | |
| | | 2,467,025 | | | | 6,722,238 | | | | 5,312,301 | | | | 9,291,709 | | | | 12,807,751 | |
| | $ | 7.49 | | | $ | 14.20 | | | $ | 10.72 | | | $ | 7.14 | | | $ | 8.22 | |
| | | | | | | | | | | | | | | | | | | | |
| | $ | 73,290,546 | | | $ | 100,585,322 | | | $ | 58,808,205 | | | $ | 30,826,579 | | | $ | 225,243 | |
| | | 9,787,806 | | | | 7,113,341 | | | | 5,494,567 | | | | 4,316,024 | | | | 26,935 | |
| | $ | 7.49 | | | $ | 14.14 | | | $ | 10.70 | | | $ | 7.14 | | | $ | 8.36 | |
| | | | | | | | | | | | | | | | | | | | |
| | $ | 14,308,536 | | | $ | 15,850,578 | | | $ | 5,578,638 | | | $ | 2,623,893 | | | $ | 1,346,006 | |
| | | 1,898,207 | | | | 1,125,595 | | | | 528,242 | | | | 368,510 | | | | 163,763 | |
| | $ | 7.54 | | | $ | 14.08 | | | $ | 10.56 | | | $ | 7.12 | | | $ | 8.22 | |
| | | | | | | | | | | | | | | | | | | | |
| | $ | 24,021,281 | | | $ | 20,099,957 | | | $ | 45,831,175 | | | $ | 2,272,928 | | | $ | 232,786 | |
| | | 3,116,003 | | | | 1,440,368 | | | | 4,305,902 | | | | 322,444 | | | | 28,248 | |
| | $ | 7.71 | | | $ | 13.95 | | | $ | 10.64 | | | $ | 7.05 | | | $ | 8.24 | |
| | | | | | | | | | | | | | | | | | | | |
| | $ | 6,348,106 | | | $ | 11,835,297 | | | $ | 8,675,775 | | | $ | 710,654 | | | $ | 306,799 | |
| | | 896,671 | | | | 885,065 | | | | 846,845 | | | | 108,571 | | | | 37,728 | |
| | $ | 7.08 | | | $ | 13.37 | | | $ | 10.24 | | | $ | 6.55 | | | $ | 8.13 | |
| | | | | | | | | | | | | | | | | | | | |
| | $ | 14,353,620 | | | $ | 38,730,194 | | | $ | 9,014,420 | | | $ | 9,014,115 | | | $ | 140,206 | |
| | | 1,994,494 | | | | 2,878,330 | | | | 865,917 | | | | 1,356,171 | | | | 17,084 | |
| | $ | 7.20 | | | $ | 13.46 | | | $ | 10.41 | | | $ | 6.65 | | | $ | 8.21 | |
| | $ | 7.62 | | | $ | 14.24 | | | $ | 11.02 | | | $ | 7.04 | | | $ | 8.69 | |
| | | | | | | | | | | | | | | | | | | | |
| | $ | 3,958,854 | | | $ | 7,152,658 | | | $ | 7,920,415 | | | $ | 2,059,628 | | | $ | 546,227 | |
| | | 564,431 | | | | 543,439 | | | | 769,011 | | | | 318,936 | | | | 68,039 | |
| | $ | 7.01 | | | $ | 13.16 | | | $ | 10.30 | | | $ | 6.46 | | | $ | 8.03 | |
The accompanying notes are an integral part of the financial statements.
143
MassMutual Funds – Financial Statements (Continued) |
Statements of Operations
For the Year Ended September 30, 2022 |
| | | MassMutual
U.S. Government
Money Market
Fund | | | MassMutual
Short-Duration
Bond Fund+ | |
Investment income (Note 2): | | | | | | | | |
Dividends (a) | | $ | — | | | $ | — | |
Interest | | | 1,414,659 | | | | 20,699,491 | |
Securities lending net income | | | — | | | | 17,417 | |
Total investment income | | | 1,414,659 | | | | 20,716,908 | |
Expenses (Note 3): | | | | | | | | |
Investment advisory fees | | | 749,721 | | | | 2,767,030 | |
Custody fees | | | 30,607 | | | | 15,124 | |
Commitment & Service Expenses | | | — | | | | 30,374 | |
Audit fees | | | 47,104 | | | | 25,221 | |
Legal fees | | | 5,723 | | | | 12,565 | |
Proxy fees | | | 1,337 | | | | 1,337 | |
Accounting & Administration fees | | | 60,276 | | | | 55,648 | |
Shareholder reporting fees | | | 10,740 | | | | 30,864 | |
Trustees’ fees | | | 10,013 | | | | 99,336 | |
Registration and filing fees | | | 23,328 | | | | 169,102 | |
Transfer agent fees | | | 2,970 | | | | 40,386 | |
| | | | 941,819 | | | | 3,246,987 | |
Administration fees: | | | | | | | | |
Class R5 | | | 214,206 | | | | 50,174 | |
Service Class | | | — | | | | 12,269 | |
Administrative Class | | | — | | | | 40,345 | |
Class R4 | | | — | | | | 18,059 | |
Class A | | | — | | | | 48,276 | |
Class R3 | | | — | | | | 20,449 | |
Class Y | | | — | | | | 491,014 | |
Class L | | | — | | | | 38,954 | |
Class C | | | — | | | | 489 | |
Distribution and Service fees: | | | | | | | | |
Class R4 | | | — | | | | 22,573 | |
Class A | | | — | | | | 40,230 | |
Class R3 | | | — | | | | 51,122 | |
Class L | | | — | | | | 194,770 | |
Class C | | | — | | | | 4,892 | |
Total expenses | | | 1,156,025 | | | | 4,280,603 | |
Expenses waived (Note 3): | | | | | | | | |
Class I fees reimbursed by adviser | | | — | | | | (23,115 | ) |
Class R5 fees reimbursed by adviser | | | (579,463 | ) | | | — | |
Class Y fees reimbursed by adviser | | | — | | | | (370,955 | ) |
Class L fees reimbursed by adviser | | | — | | | | (31,525 | ) |
Class C fees reimbursed by adviser | | | — | | | | (476 | ) |
Net expenses: | | | 576,562 | | | | 3,854,532 | |
Net investment income (loss) | | | 838,097 | | | | 16,862,376 | |
+ | Effective December 13, 2021, the Barings Active Short Duration Bond Fund reorganized into the MassMutual Short-Duration Bond Fund. Prior to December 13, 2021, information provided reflects MassMutual Short-Duration Bond Fund, which was the accounting and performance survivor of the reorganization. Please reference Note 7 “Acquisition of Barings Active Short Duration Bond Fund and Barings U.S. High Yield Fund” in the Notes to the Financial Statements for additional information. |
++ | Effective December 13, 2021, the Barings U.S. High Yield Fund reorganized into the MassMutual High Yield Fund. Prior to December 13, 2021, information provided reflects MassMutual High Yield Fund, which was the accounting and performance survivor of the reorganization. Please reference Note 7 “Acquisition of Barings Active Short Duration Bond Fund and Barings U.S. High Yield Fund” in the Notes to the Financial Statements for additional information. |
The accompanying notes are an integral part of the financial statements.
144
| | MassMutual
Inflation-
Protected and
Income Fund | | | MassMutual
Core Bond
Fund | | | MassMutual
Diversified Bond
Fund | | | MassMutual
High Yield
Fund++ | | | MassMutual
Balanced
Fund | |
| | | | | | | | | | | | | | | | | | | | |
| | $ | — | | | $ | — | | | $ | 70,669 | | | $ | 196,239 | | | $ | 1,709,834 | |
| | | 10,383,353 | | | | 28,604,890 | | | | 7,051,287 | | | | 30,491,162 | | | | 1,182,321 | |
| | | 1,459 | | | | 10,307 | | | | 15,365 | | | | 101,333 | | | | 8,564 | |
| | | 10,384,812 | | | | 28,615,197 | | | | 7,137,321 | | | | 30,788,734 | | | | 2,900,719 | |
| | | | | | | | | | | | | | | | | | | | |
| | | 1,306,626 | | | | 3,605,606 | | | | 743,083 | | | | 2,330,607 | | | | 676,064 | |
| | | 49,306 | | | | 77,484 | | | | 47,353 | | | | 75,026 | | | | 66,313 | |
| | | — | | | | — | | | | — | | | | 26,772 | | | | — | |
| | | 60,153 | | | | 60,657 | | | | 61,007 | | | | 17,493 | | | | 57,798 | |
| | | 9,088 | | | | 25,156 | | | | 6,516 | | | | 11,990 | | | | 3,836 | |
| | | 1,337 | | | | 1,337 | | | | 1,337 | | | | 1,337 | | | | 1,337 | |
| | | 47,989 | | | | 75,163 | | | | 71,737 | | | | 39,217 | | | | 46,025 | |
| | | 28,745 | | | | 37,756 | | | | 24,155 | | | | 40,874 | | | | 23,269 | |
| | | 14,234 | | | | 42,428 | | | | 8,503 | | | | 17,878 | | | | 5,941 | |
| | | 101,394 | | | | 103,864 | | | | 100,790 | | | | 139,004 | | | | 99,912 | |
| | | 2,971 | | | | 2,971 | | | | 2,971 | | | | 25,316 | | | | 2,971 | |
| | | 1,621,843 | | | | 4,032,422 | | | | 1,067,452 | | | | 2,725,514 | | | | 983,466 | |
| | | | | | | | | | | | | | | | | | | | |
| | | 81,481 | | | | 207,725 | | | | 68,269 | | | | 39,893 | | | | 36,247 | |
| | | 86,150 | | | | 88,071 | | | | 14,177 | | | | 53,071 | | | | 18,525 | |
| | | 33,359 | | | | 133,444 | | | | 30,811 | | | | 51,812 | | | | 22,469 | |
| | | 9,600 | | | | 9,736 | | | | 8,606 | | | | 70,977 | | | | 11,044 | |
| | | 33,662 | | | | 115,441 | | | | 22,237 | | | | 33,215 | | | | 50,889 | |
| | | 5,818 | | | | 542 | | | | 3,106 | | | | 58,723 | | | | 24,615 | |
| | | — | | | | — | | | | — | | | | 17,811 | | | | — | |
| | | — | | | | — | | | | — | | | | — | | | | — | |
| | | — | | | | — | | | | — | | | | — | | | | — | |
| | | | | | | | | | | | | | | | | | | | |
| | | 12,000 | | | | 12,170 | | | | 10,757 | | | | 88,722 | | | | 13,805 | |
| | | 28,052 | | | | 96,200 | | | | 18,530 | | | | 27,679 | | | | 42,408 | |
| | | 14,546 | | | | 1,354 | | | | 7,765 | | | | 146,808 | | | | 61,538 | |
| | | — | | | | — | | | | — | | | | — | | | | — | |
| | | — | | | | — | | | | — | | | | 728 | | | | — | |
| | | 1,926,511 | | | | 4,697,105 | | | | 1,251,710 | | | | 3,314,953 | | | | 1,265,006 | |
| | | | | | | | | | | | | | | | | | | | |
| | | — | | | | — | | | | — | | | | — | | | | — | |
| | | — | | | | — | | | | — | | | | — | | | | — | |
| | | — | | | | — | | | | — | | | | — | | | | — | |
| | | — | | | | — | | | | — | | | | — | | | | — | |
| | | — | | | | — | | | | — | | | | — | | | | — | |
| | | 1,926,511 | | | | 4,697,105 | | | | 1,251,710 | | | | 3,314,953 | | | | 1,265,006 | |
| | | 8,458,301 | | | | 23,918,092 | | | | 5,885,611 | | | | 27,473,781 | | | | 1,635,713 | |
The accompanying notes are an integral part of the financial statements.
145
MassMutual Funds – Financial Statements (Continued) |
Statements of Operations
For the Year Ended September 30, 2022 |
| | | MassMutual
U.S. Government
Money Market
Fund | | | MassMutual
Short-Duration
Bond Fund+ | |
Realized and unrealized gain (loss): | | | | | | | | |
Net realized gain (loss) on: | | | | | | | | |
Investment transactions | | $ | 1,133 | | | $ | (45,762,560 | ) |
Futures contracts | | | — | | | | 18,876,718 | |
Written options | | | — | | | | �� | |
Swap agreements | | | — | | | | (24,419,336 | ) |
Foreign currency transactions | | | — | | | | — | |
Forward contracts | | | — | | | | — | |
Net realized gain (loss) | | | 1,133 | | | | (51,305,178 | ) |
Net change in unrealized appreciation (depreciation) on: | | | | | | | | |
Investment transactions | | | — | | | | (73,451,249 | ) |
Futures contracts | | | — | | | | 6,152,287 | |
Written options | | | — | | | | — | |
Swap agreements | | | — | | | | (4,140,728 | ) |
Translation of assets and liabilities in foreign currencies | | | — | | | | — | |
Forward contracts | | | — | | | | — | |
Net change in unrealized appreciation (depreciation) | | | — | | | | (71,439,690 | ) |
Net realized gain (loss) and change in unrealized appreciation (depreciation) | | | 1,133 | | | | (122,744,868 | ) |
Net increase (decrease) in net assets resulting from operations | | $ | 839,230 | | | $ | (105,882,492 | ) |
(a) | Net of foreign withholding tax of: | | $ | — | | | $ | — | |
+ | Effective December 13, 2021, the Barings Active Short Duration Bond Fund reorganized into the MassMutual Short-Duration Bond Fund. Prior to December 13, 2021, information provided reflects MassMutual Short-Duration Bond Fund, which was the accounting and performance survivor of the reorganization. Please reference Note 7 “Acquisition of Barings Active Short Duration Bond Fund and Barings U.S. High Yield Fund” in the Notes to the Financial Statements for additional information. |
++ | Effective December 13, 2021, the Barings U.S. High Yield Fund reorganized into the MassMutual High Yield Fund. Prior to December 13, 2021, information provided reflects MassMutual High Yield Fund, which was the accounting and performance survivor of the reorganization. Please reference Note 7 “Acquisition of Barings Active Short Duration Bond Fund and Barings U.S. High Yield Fund” in the Notes to the Financial Statements for additional information. |
The accompanying notes are an integral part of the financial statements.
146
| | MassMutual
Inflation-
Protected and
Income Fund | | | MassMutual
Core Bond
Fund | | | MassMutual
Diversified Bond
Fund | | | MassMutual
High Yield
Fund++ | | | MassMutual
Balanced
Fund | |
| | | | | | | | | | | | | | | | | | | | |
| | | | | | | | | | | | | | | | | | | | |
| | $ | (4,504,342 | ) | | $ | (27,534,722 | ) | | $ | (3,798,047 | ) | | $ | (309,990 | ) | | $ | (1,788,616 | ) |
| | | (20,988 | ) | | | (16,214,744 | ) | | | (5,012,811 | ) | | | — | | | | 596,675 | |
| | | — | | | | — | | | | 51,584 | | | | — | | | | — | |
| | | (3,827,341 | ) | | | — | | | | — | | | | — | | | | — | |
| | | — | | | | — | | | | 2,925 | | | | (2,732 | ) | | | 3 | |
| | | — | | | | — | | | | (120,990 | ) | | | — | | | | — | |
| | | (8,352,671 | ) | | | (43,749,466 | ) | | | (8,877,339 | ) | | | (312,722 | ) | | | (1,191,938 | ) |
| | | | | | | | | | | | | | | | | | | | |
| | | (20,936,600 | ) | | | (140,685,899 | ) | | | (33,370,986 | ) | | | (96,077,856 | ) | | | (19,264,338 | ) |
| | | 1,352,400 | | | | (1,324,221 | ) | | | (961,606 | ) | | | — | | | | 189,070 | |
| | | — | | | | — | | | | (35,651 | ) | | | — | | | | — | |
| | | (22,737,276 | ) | | | — | | | | — | | | | — | | | | — | |
| | | — | | | | — | | | | (18,241 | ) | | | (35,822 | ) | | | — | |
| | | — | | | | — | | | | (51,589 | ) | | | — | | | | — | |
| | | (42,321,476 | ) | | | (142,010,120 | ) | | | (34,438,073 | ) | | | (96,113,678 | ) | | | (19,075,268 | ) |
| | | (50,674,147 | ) | | | (185,759,586 | ) | | | (43,315,412 | ) | | | (96,426,400 | ) | | | (20,267,206 | ) |
| | $ | (42,215,846 | ) | | $ | (161,841,494 | ) | | $ | (37,429,801 | ) | | $ | (68,952,619 | ) | | $ | (18,631,493 | ) |
The accompanying notes are an integral part of the financial statements.
147
MassMutual Funds – Financial Statements (Continued) |
Statements of Operations
For the Year Ended September 30, 2022 |
| | | MassMutual
Disciplined
Value Fund | | | MassMutual
Main Street
Fund | |
Investment income (Note 2): | | | | | | | | |
Dividends (a) | | $ | 1,855,203 | | | $ | 1,609,820 | |
Interest | | | 622 | | | | 1,021 | |
Securities lending net income | | | 1,184 | | | | 7,163 | |
Non cash income | | | 6,379 | | | | — | |
Total investment income | | | 1,863,388 | | | | 1,618,004 | |
Expenses (Note 3): | | | | | | | | |
Investment advisory fees | | | 391,217 | | | | 578,977 | |
Custody fees | | | 23,456 | | | | 29,153 | |
Audit fees | | | 55,651 | | | | 54,619 | |
Legal fees | | | 2,348 | | | | 2,935 | |
Proxy fees | | | 1,337 | | | | 1,337 | |
Accounting & Administration fees | | | 28,385 | | | | 26,943 | |
Shareholder reporting fees | | | 47,691 | | | | 21,234 | |
Trustees’ fees | | | 3,995 | | | | 4,749 | |
Registration and filing fees | | | 100,514 | | | | 100,076 | |
Transfer agent fees | | | 2,971 | | | | 2,971 | |
| | | | 657,565 | | | | 822,994 | |
Administration fees: | | | | | | | | |
Class R5 | | | 26,377 | | | | 42,279 | |
Service Class | | | 30,072 | | | | 271 | |
Administrative Class | | | 5,001 | | | | 68,780 | |
Class R4 | | | 3,727 | | | | 15,235 | |
Class A | | | 17,834 | | | | 29,678 | |
Class R3 | | | 8,995 | | | | 1,958 | |
Distribution and Service fees: | | | | | | | | |
Class R4 | | | 4,659 | | | | 19,045 | |
Class A | | | 14,862 | | | | 24,732 | |
Class R3 | | | 22,488 | | | | 4,896 | |
Total expenses | | | 791,580 | | | | 1,029,868 | |
Expenses waived (Note 3): | | | | | | | | |
Class I fees reimbursed by adviser | | | — | | | | — | |
Class R5 fees reimbursed by adviser | | | — | | | | — | |
Service Class fees reimbursed by adviser | | | — | | | | — | |
Administrative Class fees reimbursed by adviser | | | — | | | | — | |
Class R4 fees reimbursed by adviser | | | — | | | | — | |
Class A fees reimbursed by adviser | | | — | | | | — | |
Class R3 fees reimbursed by adviser | | | — | | | | — | |
Advisory fees waived | | | — | | | | — | |
Net expenses: | | | 791,580 | | | | 1,029,868 | |
Net investment income (loss) | | | 1,071,808 | | | | 588,136 | |
The accompanying notes are an integral part of the financial statements.
148
| | MassMutual
Disciplined
Growth Fund | | | MassMutual
Small Cap
Opportunities
Fund | | | MassMutual
Global Fund | | | MassMutual
International
Equity Fund | | | MassMutual
Strategic
Emerging
Markets Fund | |
| | | | | | | | | | | | | | | | | | | | |
| | $ | 1,625,402 | | | $ | 3,688,209 | | | $ | 2,175,215 | | | $ | 3,334,618 | | | $ | 2,062,334 | |
| | | 1,134 | | | | 6,188 | | | | 999 | | | | 5,053 | | | | — | |
| | | 6,497 | | | | 14,702 | | | | 8,973 | | | | 21,740 | | | | 14,429 | |
| | | — | | | | — | | | | 79,494 | | | | 130,619 | | | | 151,071 | |
| | | 1,633,033 | | | | 3,709,099 | | | | 2,264,681 | | | | 3,492,030 | | | | 2,227,834 | |
| | | | | | | | | | | | | | | | | | | | |
| | | 963,176 | | | | 1,923,907 | | | | 2,142,324 | | | | 1,165,318 | | | | 1,409,379 | |
| | | 22,550 | | | | 26,122 | | | | 67,557 | | | | 103,052 | | | | 214,846 | |
| | | 55,755 | | | | 55,031 | | | | 69,005 | | | | 69,295 | | | | 93,697 | |
| | | 5,670 | | | | 8,729 | | | | 7,790 | | | | 1,923 | | | | 16,810 | |
| | | 1,337 | | | | 1,337 | | | | 1,337 | | | | 1,337 | | | | 1,337 | |
| | | 29,256 | | | | 28,217 | | | | 38,295 | | | | 34,606 | | | | 35,624 | |
| | | 49,595 | | | | 26,978 | | | | 24,389 | | | | 40,694 | | | | 29,352 | |
| | | 9,481 | | | | 13,545 | | | | 12,902 | | | | 6,688 | | | | 6,114 | |
| | | 100,383 | | | | 104,406 | | | | 101,933 | | | | 100,859 | | | | 99,463 | |
| | | 2,971 | | | | 2,971 | | | | 2,971 | | | | 2,954 | | | | 2,971 | |
| | | 1,240,174 | | | | 2,191,243 | | | | 2,468,503 | | | | 1,526,726 | | | | 1,909,593 | |
| | | | | | | | | | | | | | | | | | | | |
| | | 94,206 | | | | 125,536 | | | | 89,912 | | | | 41,494 | | | | 1,926 | |
| | | 42,483 | | | | 40,456 | | | | 14,368 | | | | 6,458 | | | | 3,999 | |
| | | 97,714 | | | | 73,231 | | | | 204,256 | | | | 7,482 | | | | 1,585 | |
| | | 18,028 | | | | 28,443 | | | | 25,043 | | | | 2,265 | | | | 759 | |
| | | 65,141 | | | | 146,518 | | | | 43,100 | | | | 34,168 | | | | 1,441 | |
| | | 9,690 | | | | 17,184 | | | | 22,175 | | | | 4,555 | | | | 1,829 | |
| | | | | | | | | | | | | | | | | | | | |
| | | 22,535 | | | | 35,554 | | | | 31,303 | | | | 2,831 | | | | 950 | |
| | | 54,284 | | | | 122,098 | | | | 35,917 | | | | 28,473 | | | | 1,200 | |
| | | 24,226 | | | | 42,960 | | | | 55,436 | | | | 11,387 | | | | 4,572 | |
| | | 1,668,481 | | | | 2,823,223 | | | | 2,990,013 | | | | 1,665,839 | | | | 1,927,854 | |
| | | | | | | | | | | | | | | | | | | | |
| | | — | | | | — | | | | — | | | | — | | | | (275,568 | ) |
| | | — | | | | — | | | | — | | | | — | | | | (4,168 | ) |
| | | — | | | �� | — | | | | — | | | | — | | | | (4,018 | ) |
| | | — | | | | — | | | | — | | | | — | | | | (1,064 | ) |
| | | — | | | | — | | | | — | | | | — | | | | (744 | ) |
| | | — | | | | — | | | | — | | | | — | | | | (1,046 | ) |
| | | — | | | | — | | | | — | | | | — | | | | (1,860 | ) |
| | | — | | | | — | | | | — | | | | (70,200 | ) | | | — | |
| | | 1,668,481 | | | | 2,823,223 | | | | 2,990,013 | | | | 1,595,639 | | | | 1,639,386 | |
| | | (35,448 | ) | | | 885,876 | | | | (725,332 | ) | | | 1,896,391 | | | | 588,448 | |
The accompanying notes are an integral part of the financial statements.
149
MassMutual Funds – Financial Statements (Continued) |
Statements of Operations
For the Year Ended September 30, 2022 |
| | | MassMutual
Disciplined
Value Fund | | | MassMutual
Main Street
Fund | |
Realized and unrealized gain (loss): | | | | | | | | |
Net realized gain (loss) on: | | | | | | | | |
Investment transactions | | $ | 6,346,433 | | | $ | 10,796,289 | |
Foreign currency transactions | | | — | | | | (828 | ) |
Forward contracts | | | — | | | | — | |
Net realized gain (loss) | | | 6,346,433 | | | | 10,795,461 | |
Net change in unrealized appreciation (depreciation) on: | | | | | | | | |
Investment transactions | | | (14,330,342 | ) | | | (30,006,887 | ) |
Translation of assets and liabilities in foreign currencies | | | — | | | | (452 | ) |
Net change in unrealized appreciation (depreciation) | | | (14,330,342 | ) | | | (30,007,339 | ) |
Net realized gain (loss) and change in unrealized appreciation (depreciation) | | | (7,983,909 | ) | | | (19,211,878 | ) |
Net increase (decrease) in net assets resulting from operations | | $ | (6,912,101 | ) | | $ | (18,623,742 | ) |
(a) | Net of foreign withholding tax of: | | $ | — | | | $ | 4,053 | |
* | Net of net increase (decrease) in accrued foreign capital gains tax of: | | $ | — | | | $ | — | |
The accompanying notes are an integral part of the financial statements.
150
| | MassMutual
Disciplined
Growth Fund | | | MassMutual
Small Cap
Opportunities
Fund | | | MassMutual
Global Fund | | | MassMutual
International
Equity Fund | | | MassMutual
Strategic
Emerging
Markets Fund | |
| | | | | | | | | | | | | | | | | | | | |
| | | | | | | | | | | | | | | | | | | | |
| | $ | 12,038,599 | | | $ | 5,628,612 | | | $ | 48,345,468 | | | $ | 5,877,066 | | | $ | (9,974,327 | ) |
| | | — | | | | 2,980 | | | | (35,370 | ) | | | (44,780 | ) | | | (123,284 | ) |
| | | — | | | | — | | | | — | | | | — | | | | — | |
| | | 12,038,599 | | | | 5,631,592 | | | | 48,310,098 | | | | 5,832,286 | | | | (10,097,611 | ) |
| | | | | | | | | | | | | | | | | | | | |
| | | (66,271,366 | ) | | | (72,344,667 | ) | | | (164,141,812 | )* | | | (34,352,459 | ) | | | (50,107,741 | )* |
| | | — | | | | — | | | | (47,187 | ) | | | (91,128 | ) | | | (10,820 | ) |
| | | (66,271,366 | ) | | | (72,344,667 | ) | | | (164,188,999 | ) | | | (34,443,587 | ) | | | (50,118,561 | ) |
| | | (54,232,767 | ) | | | (66,713,075 | ) | | | (115,878,901 | ) | | | (28,611,301 | ) | | | (60,216,172 | ) |
| | $ | (54,268,215 | ) | | $ | (65,827,199 | ) | | $ | (116,604,233 | ) | | $ | (26,714,910 | ) | | $ | (59,627,724 | ) |
| | $ | — | | | $ | 7,125 | | | $ | 191,607 | | | $ | 341,138 | | | $ | 288,328 | |
| | $ | — | | | $ | — | | | $ | 229,811 | | | $ | — | | | $ | 673,578 | |
The accompanying notes are an integral part of the financial statements.
151
MassMutual Funds – Financial Statements (Continued) |
Statements of Changes in Net Assets |
| | | MassMutual
U.S. Government
Money Market
Fund | |
| | | Year
Ended
September 30, 2022 | | | Year
Ended
September 30, 2021 | |
Increase (Decrease) in Net Assets: | | | | | | | | |
Operations: | | | | | | | | |
Net investment income (loss) | | $ | 838,097 | | | $ | (24 | ) |
Net realized gain (loss) | | | 1,133 | | | | 2,160 | |
Net change in unrealized appreciation (depreciation) | | | — | | | | — | |
Net increase (decrease) in net assets resulting from operations | | | 839,230 | | | | 2,136 | |
Distributions to shareholders (Note 2): | | | | | | | | |
Class I | | | — | | | | — | |
Class R5 | | | (837,585 | ) | | | — | |
Service Class | | | — | | | | — | |
Administrative Class | | | — | | | | — | |
Class R4 | | | — | | | | — | |
Class A | | | — | | | | — | |
Class R3 | | | — | | | | — | |
Class Y (a) | | | — | | | | — | |
Class L (a) | | | — | | | | — | |
Class C (a) | | | — | | | | — | |
Total distributions | | | (837,585 | ) | | | — | |
Net fund share transactions (Note 5): | | | | | | | | |
Class I | | | — | | | | — | |
Class R5 | | | (30,251,189 | ) | | | (42,415,521 | ) |
Service Class | | | — | | | | — | |
Administrative Class | | | — | | | | — | |
Class R4 | | | — | | | | — | |
Class A | | | — | | | | — | |
Class R3 | | | — | | | | — | |
Class Y (a) | | | — | | | | — | |
Class L (a) | | | — | | | | — | |
Class C (a) | | | — | | | | — | |
Increase (decrease) in net assets from fund share transactions | | | (30,251,189 | ) | | | (42,415,521 | ) |
Total increase (decrease) in net assets | | | (30,249,544 | ) | | | (42,413,385 | ) |
Net assets | | | | | | | | |
Beginning of year | | | 235,577,865 | | | | 277,991,250 | |
End of year | | $ | 205,328,321 | | | $ | 235,577,865 | |
(a) | Class Y, L, and C commenced operations on December 13, 2021. |
The accompanying notes are an integral part of the financial statements.
152
| | MassMutual
Short-Duration
Bond Fund | | | MassMutual
Inflation-Protected
and Income Fund | |
| | Year
Ended
September 30, 2022 | | | Year
Ended
September 30, 2021 | | | Year
Ended
September 30, 2022 | | | Year
Ended
September 30, 2021 | |
| | | | | | | | | | | | | | | | |
| | | | | | | | | | | | | | | | |
| | $ | 16,862,376 | | | $ | 9,112,520 | | | $ | 8,458,301 | | | $ | 6,092,415 | |
| | | (51,305,178 | ) | | | 4,369,016 | | | | (8,352,671 | ) | | | 20,097,312 | |
| | | (71,439,690 | ) | | | 4,648,167 | | | | (42,321,476 | ) | | | (4,625,721 | ) |
| | | (105,882,492 | ) | | | 18,129,703 | | | | (42,215,846 | ) | | | 21,564,006 | |
| | | | | | | | | | | | | | | | |
| | | (8,176,968 | ) | | | (7,873,751 | ) | | | (13,578,868 | ) | | | (9,795,008 | ) |
| | | (2,345,636 | ) | | | (4,984,608 | ) | | | (6,527,752 | ) | | | (4,785,258 | ) |
| | | (395,204 | ) | | | (1,102,450 | ) | | | (3,706,567 | ) | | | (2,728,473 | ) |
| | | (553,757 | ) | | | (1,110,963 | ) | | | (804,115 | ) | | | (731,102 | ) |
| | | (318,830 | ) | | | (429,664 | ) | | | (342,973 | ) | | | (251,270 | ) |
| | | (543,636 | ) | | | (1,786,717 | ) | | | (821,349 | ) | | | (1,177,744 | ) |
| | | (353,332 | ) | | | (286,518 | ) | | | (193,469 | ) | | | (150,543 | ) |
| | | (15,100,528 | ) | | | — | | | | — | | | | — | |
| | | (2,275,179 | ) | | | — | | | | — | | | | — | |
| | | (26,497 | ) | | | — | | | | — | | | | — | |
| | | (30,089,567 | ) | | | (17,574,671 | ) | | | (25,975,093 | ) | | | (19,619,398 | ) |
| | | | | | | | | | | | | | | | |
| | | (54,326,839 | ) | | | 20,984,515 | | | | 19,908,736 | | | | 9,538,688 | |
| | | (28,772,555 | ) | | | (43,188,428 | ) | | | (11,102,681 | ) | | | 6,543,433 | |
| | | (12,469,357 | ) | | | (22,341,386 | ) | | | (16,566,770 | ) | | | 758,594 | |
| | | (4,366,692 | ) | | | (10,748,987 | ) | | | (4,258,691 | ) | | | (1,287,500 | ) |
| | | (1,706,884 | ) | | | 184,725 | | | | 41,523 | | | | 851,299 | |
| | | (26,537,179 | ) | | | (5,748,981 | ) | | | (2,189,251 | ) | | | (8,627,870 | ) |
| | | (2,434,467 | ) | | | 3,871,255 | | | | 48,895 | | | | (323,906 | ) |
| | | 304,155,402 | | | | — | | | | — | | | | — | |
| | | 89,252,476 | | | | — | | | | — | | | | — | |
| | | 1,255,306 | | | | — | | | | — | | | | — | |
| | | 264,049,211 | | | | (56,987,287 | ) | | | (14,118,239 | ) | | | 7,452,738 | |
| | | 128,077,152 | | | | (56,432,255 | ) | | | (82,309,178 | ) | | | 9,397,346 | |
| | | | | | | | | | | | | | | | |
| | | 371,547,370 | | | | 427,979,625 | | | | 372,224,698 | | | | 362,827,352 | |
| | $ | 499,624,522 | | | $ | 371,547,370 | | | $ | 289,915,520 | | | $ | 372,224,698 | |
The accompanying notes are an integral part of the financial statements.
153
MassMutual Funds – Financial Statements (Continued) |
Statements of Changes in Net Assets |
| | | MassMutual
Core Bond Fund | |
| | | Year
Ended
September 30, 2022 | | | Year
Ended
September 30, 2021 | |
Increase (Decrease) in Net Assets: | | | | | | | | |
Operations: | | | | | | | | |
Net investment income (loss) | | $ | 23,918,092 | | | $ | 29,502,553 | |
Net realized gain (loss) | | | (43,749,466 | ) | | | 13,634,319 | |
Net change in unrealized appreciation (depreciation) | | | (142,010,120 | ) | | | (2,276,905 | ) |
Net increase (decrease) in net assets resulting from operations | | | (161,841,494 | ) | | | 40,859,967 | |
Distributions to shareholders (Note 2): | | | | | | | | |
Class I | | | (25,515,199 | ) | | | (46,632,100 | ) |
Class R5 | | | (10,426,152 | ) | | | (20,107,290 | ) |
Service Class | | | (1,734,027 | ) | | | (3,177,296 | ) |
Administrative Class | | | (1,712,376 | ) | | | (4,484,059 | ) |
Class R4 | | | (221,532 | ) | | | (599,635 | ) |
Class A | | | (1,693,205 | ) | | | (3,188,483 | ) |
Class R3 | | | (7,500 | ) | | | (45,768 | ) |
Class Y (a) | | | — | | | | — | |
Class C (a) | | | — | | | | — | |
Total distributions | | | (41,309,991 | ) | | | (78,234,631 | ) |
Net fund share transactions (Note 5): | | | | | | | | |
Class I | | | (61,675,638 | ) | | | (85,408,525 | ) |
Class R5 | | | (128,317,277 | ) | | | 48,682 | |
Service Class | | | (12,042,889 | ) | | | (24,582,773 | ) |
Administrative Class | | | (10,574,132 | ) | | | (18,924,313 | ) |
Class R4 | | | (5,244,362 | ) | | | (1,559,456 | ) |
Class A | | | (25,553,805 | ) | | | 388,482 | |
Class R3 | | | (120,752 | ) | | | (494,140 | ) |
Class Y (a) | | | — | | | | — | |
Class C (a) | | | — | | | | — | |
Increase (decrease) in net assets from fund share transactions | | | (243,528,855 | ) | | | (130,532,043 | ) |
Total increase (decrease) in net assets | | | (446,680,340 | ) | | | (167,906,707 | ) |
Net assets | | | | | | | | |
Beginning of year | | | 1,165,169,116 | | | | 1,333,075,823 | |
End of year | | $ | 718,488,776 | | | $ | 1,165,169,116 | |
(a) | Class Y, and C commenced operations on December 13, 2021. |
The accompanying notes are an integral part of the financial statements.
154
| | MassMutual
Diversified Bond
Fund | | | MassMutual
High Yield Fund | |
| | Year
Ended
September 30, 2022 | | | Year
Ended
September 30, 2021 | | | Year
Ended
September 30, 2022 | | | Year
Ended
September 30, 2021 | |
| | | | | | | | | | | | | | | | |
| | | | | | | | | | | | | | | | |
| | $ | 5,885,611 | | | $ | 6,230,125 | | | $ | 27,473,781 | | | $ | 30,984,747 | |
| | | (8,877,339 | ) | | | 2,360,487 | | | | (312,722 | ) | | | 7,858,390 | |
| | | (34,438,073 | ) | | | 4,074,119 | | | | (96,113,678 | ) | | | 38,379,827 | |
| | | (37,429,801 | ) | | | 12,664,731 | | | | (68,952,619 | ) | | | 77,222,964 | |
| | | | | | | | | | | | | | | | |
| | | (4,290,758 | ) | | | (6,953,342 | ) | | | (32,453,576 | ) | | | (20,884,324 | ) |
| | | (3,344,900 | ) | | | (5,506,098 | ) | | | (4,191,590 | ) | | | (2,613,072 | ) |
| | | (343,585 | ) | | | (846,408 | ) | | | (2,714,386 | ) | | | (1,719,188 | ) |
| | | (445,350 | ) | | | (993,842 | ) | | | (1,894,451 | ) | | | (1,271,060 | ) |
| | | (171,228 | ) | | | (453,530 | ) | | | (3,481,151 | ) | | | (2,023,612 | ) |
| | | (296,362 | ) | | | (900,019 | ) | | | (1,074,744 | ) | | | (1,209,194 | ) |
| | | (27,352 | ) | | | (226,697 | ) | | | (2,769,060 | ) | | | (1,607,669 | ) |
| | | — | | | | — | | | | (2,074,928 | ) | | | — | |
| | | — | | | | — | | | | (3,484 | ) | | | — | |
| | | (8,919,535 | ) | | | (15,879,936 | ) | | | (50,657,370 | ) | | | (31,328,119 | ) |
| | | | | | | | | | | | | | | | |
| | | (12,764,525 | ) | | | 15,252,132 | | | | (49,627,752 | ) | | | (53,596,204 | ) |
| | | (6,119,459 | ) | | | 3,162,707 | | | | (2,641,378 | ) | | | (6,507,926 | ) |
| | | (5,368,513 | ) | | | (25,402 | ) | | | (421,728 | ) | | | (7,438,407 | ) |
| | | (2,063,333 | ) | | | (4,291,888 | ) | | | (6,329,003 | ) | | | (2,270,950 | ) |
| | | (489,076 | ) | | | (848,001 | ) | | | 128,460 | | | | (4,285,383 | ) |
| | | (2,541,380 | ) | | | (5,128,099 | ) | | | (2,465,320 | ) | | | (12,822,571 | ) |
| | | (1,609,268 | ) | | | (569,909 | ) | | | (1,554,968 | ) | | | (4,435,045 | ) |
| | | — | | | | — | | | | 30,906,122 | | | | — | |
| | | — | | | | — | | | | 97,944 | | | | — | |
| | | (30,955,554 | ) | | | 7,551,540 | | | | (31,907,623 | ) | | | (91,356,486 | ) |
| | | (77,304,890 | ) | | | 4,336,335 | | | | (151,517,612 | ) | | | (45,461,641 | ) |
| | | | | | | | | | | | | | | | |
| | | 233,853,072 | | | | 229,516,737 | | | | 536,670,870 | | | | 582,132,511 | |
| | $ | 156,548,182 | | | $ | 233,853,072 | | | $ | 385,153,258 | | | $ | 536,670,870 | |
The accompanying notes are an integral part of the financial statements.
155
MassMutual Funds – Financial Statements (Continued) |
Statements of Changes in Net Assets |
| | | MassMutual
Balanced Fund | |
| | | Year
Ended
September 30, 2022 | | | Year
Ended
September 30, 2021 | |
Increase (Decrease) in Net Assets: | | | | | | | | |
Operations: | | | | | | | | |
Net investment income (loss) | | $ | 1,635,713 | | | $ | 1,538,040 | |
Net realized gain (loss) | | | (1,191,938 | ) | | | 34,273,373 | |
Net change in unrealized appreciation (depreciation) | | | (19,075,268 | ) | | | (8,654,500 | ) |
Net increase (decrease) in net assets resulting from operations | | | (18,631,493 | ) | | | 27,156,913 | |
Distributions to shareholders (Note 2): | | | | | | | | |
Class I | | | (13,083,127 | ) | | | (1,547,830 | ) |
Class R5 | | | (9,442,345 | ) | | | (1,408,864 | ) |
Service Class | | | (2,211,487 | ) | | | (269,648 | ) |
Administrative Class | | | (1,821,814 | ) | | | (195,297 | ) |
Class R4 | | | (1,404,186 | ) | | | (96,702 | ) |
Class A | | | (4,696,408 | ) | | | (806,699 | ) |
Class R3 | | | (3,309,059 | ) | | | (201,693 | ) |
Total distributions | | | (35,968,426 | ) | | | (4,526,733 | ) |
Net fund share transactions (Note 5): | | | | | | | | |
Class I | | | 10,110,475 | | | | 4,470,229 | |
Class R5 | | | 3,322,395 | | | | (8,596,195 | ) |
Service Class | | | 789,167 | | | | 299,183 | |
Administrative Class | | | 1,800,181 | | | | 589,285 | |
Class R4 | | | 711,476 | | | | 2,102,933 | |
Class A | | | (1,126,786 | ) | | | (9,669,596 | ) |
Class R3 | | | 2,314,446 | | | | 3,378,738 | |
Increase (decrease) in net assets from fund share transactions | | | 17,921,354 | | | | (7,425,423 | ) |
Total increase (decrease) in net assets | | | (36,678,565 | ) | | | 15,204,757 | |
Net assets | | | | | | | | |
Beginning of year | | | 151,468,058 | | | | 136,263,301 | |
End of year | | $ | 114,789,493 | | | $ | 151,468,058 | |
The accompanying notes are an integral part of the financial statements.
156
| | MassMutual
Disciplined Value
Fund | | | MassMutual
Main Street Fund | |
| | Year
Ended
September 30, 2022 | | | Year
Ended
September 30, 2021 | | | Year
Ended
September 30, 2022 | | | Year
Ended
September 30, 2021 | |
| | | | | | | | | | | | | | | | |
| | | | | | | | | | | | | | | | |
| | $ | 1,071,808 | | | $ | 1,270,497 | | | $ | 588,136 | | | $ | 788,514 | |
| | | 6,346,433 | | | | 16,505,330 | | | | 10,795,461 | | | | 22,083,519 | |
| | | (14,330,342 | ) | | | 11,731,401 | | | | (30,007,339 | ) | | | 6,724,955 | |
| | | (6,912,101 | ) | | | 29,507,228 | | | | (18,623,742 | ) | | | 29,596,988 | |
| | | | | | | | | | | | | | | | |
| | | (5,421,119 | ) | | | (527,416 | ) | | | (5,755,032 | ) | | | (1,017,015 | ) |
| | | (5,073,685 | ) | | | (675,986 | ) | | | (9,637,008 | ) | | | (1,482,317 | ) |
| | | (2,728,368 | ) | | | (236,749 | ) | | | (32,408 | ) | | | (3,852 | ) |
| | | (272,646 | ) | | | (82,862 | ) | | | (5,132,204 | ) | | | (656,288 | ) |
| | | (465,386 | ) | | | (50,170 | ) | | | (1,737,533 | ) | | | (207,357 | ) |
| | | (1,100,034 | ) | | | (96,647 | ) | | | (2,187,355 | ) | | | (323,920 | ) |
| | | (745,764 | ) | | | (63,371 | ) | | | (210,581 | ) | | | (33,250 | ) |
| | | (15,807,002 | ) | | | (1,733,201 | ) | | | (24,692,121 | ) | | | (3,723,999 | ) |
| | | | | | | | | | | | | | | | |
| | | 1,138,722 | | | | 3,278,085 | | | | (15,434,178 | ) | | | (8,549,909 | ) |
| | | (8,801,030 | ) | | | (7,634,620 | ) | | | 896,476 | | | | (8,291,185 | ) |
| | | (142,040 | ) | | | 436,690 | | | | 2,400 | | | | (56,793 | ) |
| | | (81,412 | ) | | | (3,541,997 | ) | | | 2,862,256 | | | | (1,778,664 | ) |
| | | (897,583 | ) | | | (858,803 | ) | | | 760,267 | | | | 207,757 | |
| | | (921,129 | ) | | | (662,378 | ) | | | 1,322,681 | | | | (3,959,621 | ) |
| | | 45,564 | | | | (381,326 | ) | | | (140,863 | ) | | | (234,641 | ) |
| | | (9,658,908 | ) | | | (9,364,349 | ) | | | (9,730,961 | ) | | | (22,663,056 | ) |
| | | (32,378,011 | ) | | | 18,409,678 | | | | (53,046,824 | ) | | | 3,209,933 | |
| | | | | | | | | | | | | | | | |
| | | 99,572,534 | | | | 81,162,856 | | | | 120,010,313 | | | | 116,800,380 | |
| | $ | 67,194,523 | | | $ | 99,572,534 | | | $ | 66,963,489 | | | $ | 120,010,313 | |
The accompanying notes are an integral part of the financial statements.
157
MassMutual Funds – Financial Statements (Continued) |
Statements of Changes in Net Assets |
| | | MassMutual
Disciplined
Growth Fund | |
| | | Year
Ended
September 30, 2022 | | | Year
Ended
September 30, 2021 | |
Increase (Decrease) in Net Assets: | | | | | | | | |
Operations: | | | | | | | | |
Net investment income (loss) | | $ | (35,448 | ) | | $ | 76,831 | |
Net realized gain (loss) | | | 12,038,599 | | | | 93,484,305 | |
Net change in unrealized appreciation (depreciation) | | | (66,271,366 | ) | | | (32,540,319 | ) |
Net increase (decrease) in net assets resulting from operations | | | (54,268,215 | ) | | | 61,020,817 | |
Distributions to shareholders (Note 2): | | | | | | | | |
Class I | | | (14,211,876 | ) | | | (1,624,765 | ) |
Class R5 | | | (39,812,555 | ) | | | (4,826,119 | ) |
Service Class | | | (10,037,758 | ) | | | (1,123,937 | ) |
Administrative Class | | | (14,282,484 | ) | | | (1,558,139 | ) |
Class R4 | | | (4,483,496 | ) | | | (1,039,743 | ) |
Class A | | | (11,937,715 | ) | | | (1,133,688 | ) |
Class R3 | | | (2,151,233 | ) | | | (248,888 | ) |
Total distributions | | | (96,917,117 | ) | | | (11,555,279 | ) |
Net fund share transactions (Note 5): | | | | | | | | |
Class I | | | 8,472,666 | | | | (10,738,871 | ) |
Class R5 | | | 28,861,519 | | | | (12,382,678 | ) |
Service Class | | | 4,209,156 | | | | (5,172,127 | ) |
Administrative Class | | | 10,471,389 | | | | (7,796,715 | ) |
Class R4 | | | 54,641 | | | | (20,840,548 | ) |
Class A | | | 5,223,921 | | | | (6,616,967 | ) |
Class R3 | | | 2,400,935 | | | | (2,151,560 | ) |
Increase (decrease) in net assets from fund share transactions | | | 59,694,227 | | | | (65,699,466 | ) |
Total increase (decrease) in net assets | | | (91,491,105 | ) | | | (16,233,928 | ) |
Net assets | | | | | | | | |
Beginning of year | | | 246,254,753 | | | | 262,488,681 | |
End of year | | $ | 154,763,648 | | | $ | 246,254,753 | |
The accompanying notes are an integral part of the financial statements.
158
| | MassMutual
Small Cap
Opportunities
Fund | | | MassMutual
Global Fund | |
| | Year
Ended
September 30, 2022 | | | Year
Ended
September 30, 2021 | | | Year
Ended
September 30, 2022 | | | Year
Ended
September 30, 2021 | |
| | | | | | | | | | | | | | | | |
| | | | | | | | | | | | | | | | |
| | $ | 885,876 | | | $ | 504,184 | | | $ | (725,332 | ) | | $ | (1,711,008 | ) |
| | | 5,631,592 | | | | 32,725,919 | | | | 48,310,098 | | | | 35,327,407 | |
| | | (72,344,667 | ) | | | 76,358,450 | | | | (164,188,999 | ) | | | 60,583,247 | |
| | | (65,827,199 | ) | | | 109,588,553 | | | | (116,604,233 | ) | | | 94,199,646 | |
| | | | | | | | | | | | | | | | |
| | | (8,099,573 | ) | | | (3,764,337 | ) | | | (10,688,280 | ) | | | (4,141,170 | ) |
| | | (12,813,268 | ) | | | (8,238,297 | ) | | | (12,739,313 | ) | | | (6,060,786 | ) |
| | | (2,089,184 | ) | | | (1,528,937 | ) | | | (859,154 | ) | | | (336,406 | ) |
| | | (2,480,508 | ) | | | (1,730,097 | ) | | | (9,271,798 | ) | | | (4,196,349 | ) |
| | | (1,502,600 | ) | | | (881,116 | ) | | | (1,722,056 | ) | | | (507,173 | ) |
| | | (5,263,635 | ) | | | (3,793,992 | ) | | | (2,023,520 | ) | | | (1,270,495 | ) |
| | | (937,828 | ) | | | (478,467 | ) | | | (1,492,945 | ) | | | (540,776 | ) |
| | | (33,186,596 | ) | | | (20,415,243 | ) | | | (38,797,066 | ) | | | (17,053,155 | ) |
| | | | | | | | | | | | | | | | |
| | | 38,224,027 | | | | 27,209,426 | | | | 1,752,106 | | | | 4,382,095 | |
| | | 106,568 | | | | 9,323,960 | | | | (18,913,065 | ) | | | (11,981,787 | ) |
| | | (3,074,459 | ) | | | 833,952 | | | | 1,650,364 | | | | 178,731 | |
| | | 976,007 | | | | 681,127 | | | | (5,268,106 | ) | | | (11,341,827 | ) |
| | | 415,445 | | | | 2,320,602 | | | | (402,757 | ) | | | 4,831,165 | |
| | | (1,765,134 | ) | | | (3,111,884 | ) | | | (2,426,872 | ) | | | (8,962,168 | ) |
| | | 52,755 | | | | 1,388,860 | | | | 550,289 | | | | 1,689,495 | |
| | | 34,935,209 | | | | 38,646,043 | | | | (23,058,041 | ) | | | (21,204,296 | ) |
| | | (64,078,586 | ) | | | 127,819,353 | | | | (178,459,340 | ) | | | 55,942,195 | |
| | | | | | | | | | | | | | | | |
| | | 353,768,333 | | | | 225,948,980 | | | | 371,218,639 | | | | 315,276,444 | |
| | $ | 289,689,747 | | | $ | 353,768,333 | | | $ | 192,759,299 | | | $ | 371,218,639 | |
The accompanying notes are an integral part of the financial statements.
159
MassMutual Funds – Financial Statements (Continued) |
Statements of Changes in Net Assets |
| | | MassMutual
International
Equity Fund | |
| | | Year
Ended
September 30, 2022 | | | Year
Ended
September 30, 2021 | |
Increase (Decrease) in Net Assets: | | | | | | | | |
Operations: | | | | | | | | |
Net investment income (loss) | | $ | 1,896,391 | | | $ | 2,160,396 | |
Net realized gain (loss) | | | 5,832,286 | | | | 15,303,576 | |
Net change in unrealized appreciation (depreciation) | | | (34,443,587 | ) | | | 13,893,738 | |
Net increase (decrease) in net assets resulting from operations | | | (26,714,910 | ) | | | 31,357,710 | |
Distributions to shareholders (Note 2): | | | | | | | | |
Class I | | | (10,922,947 | ) | | | (36,392,504 | ) |
Class R5 | | | (5,465,065 | ) | | | (21,915,668 | ) |
Service Class | | | (410,850 | ) | | | (1,504,920 | ) |
Administrative Class | | | (292,378 | ) | | | (1,216,848 | ) |
Class R4 | | | (176,442 | ) | | | (756,235 | ) |
Class A | | | (1,478,546 | ) | | | (7,088,870 | ) |
Class R3 | | | (290,312 | ) | | | (861,510 | ) |
Total distributions | | | (19,036,540 | ) | | | (69,736,555 | ) |
Net fund share transactions (Note 5): | | | | | | | | |
Class I | | | 2,298,162 | | | | 13,818,712 | |
Class R5 | | | (6,677,826 | ) | | | 1,150,924 | |
Service Class | | | 209,261 | | | | (284,454 | ) |
Administrative Class | | | 661,945 | | | | (491,326 | ) |
Class R4 | | | (574,574 | ) | | | 129,679 | |
Class A | | | (1,097,342 | ) | | | (940,117 | ) |
Class R3 | | | 561,594 | | | | 338,450 | |
Increase (decrease) in net assets from fund share transactions | | | (4,618,780 | ) | | | 13,721,868 | |
Total increase (decrease) in net assets | | | (50,370,230 | ) | | | (24,656,977 | ) |
Net assets | | | | | | | | |
Beginning of year | | | 164,233,016 | | | | 188,889,993 | |
End of year | | $ | 113,862,786 | | | $ | 164,233,016 | |
The accompanying notes are an integral part of the financial statements.
160
| | MassMutual
Strategic
Emerging Markets
Fund | |
| | Year
Ended
September 30, 2022 | | | Year
Ended
September 30, 2021 | |
| | | | | | | | |
| | | | | | | | |
| | $ | 588,448 | | | $ | 434,711 | |
| | | (10,097,611 | ) | | | 22,083,910 | |
| | | (50,118,561 | ) | | | 5,667,502 | |
| | | (59,627,724 | ) | | | 28,186,123 | |
| | | | | | | | |
| | | (21,234,316 | ) | | | (2,772,142 | ) |
| | | (372,025 | ) | | | (51,087 | ) |
| | | (315,974 | ) | | | (38,555 | ) |
| | | (142,830 | ) | | | (16,503 | ) |
| | | (57,377 | ) | | | (21,224 | ) |
| | | (77,403 | ) | | | (34,506 | ) |
| | | (149,473 | ) | | | (17,356 | ) |
| | | (22,349,398 | ) | | | (2,951,373 | ) |
| | | | | | | | |
| | | 26,336,462 | | | | (35,988,590 | ) |
| | | (1,189,987 | ) | | | (919,812 | ) |
| | | 343,704 | | | | (579,986 | ) |
| | | (463,387 | ) | | | (99,310 | ) |
| | | 85,854 | | | | (960,985 | ) |
| | | (204,486 | ) | | | (1,809,172 | ) |
| | | (10,684 | ) | | | 2,130 | |
| | | 24,897,476 | | | | (40,355,725 | ) |
| | | (57,079,646 | ) | | | (15,120,975 | ) |
| | | | | | | | |
| | | 165,130,012 | | | | 180,250,987 | |
| | $ | 108,050,366 | | | $ | 165,130,012 | |
The accompanying notes are an integral part of the financial statements.
161
[THIS PAGE INTENTIONALLY LEFT BLANK]
MassMutual U.S. Government Money Market Fund – Financial Statements (Continued) |
Financial Highlights (For a share outstanding throughout each period) |
| | | Income (loss) from investment
operations | Less distributions to shareholders | | | Ratios / Supplemental Data |
| | Net
asset
value,
beginning
of the
period | Net
investment
income
(loss)c,j | Net
realized
and
unrealized
gain (loss)
on
investments | Total
income
(loss) from
investment
operations | From net
investment
income | From net
realized
gains | Total
distributions | Net
asset
value,
end of
the
period | Total
returnl | Net
assets,
end of
the
period
(000’s) | Ratio of
expenses
to average
daily net
assets
before
expense
waivers | Ratio of
expenses
to average
daily net
assets
after
expense
waiversj | Net
investment
income
(loss) to
average
daily net
assets |
Class R5 | | | | | | | | | | | | | |
9/30/22 | $ 1.00 | $ 0.00d | $ 0.00d | $ 0.00d | $ (0.00)d | $ — | $ (0.00)d | $ 1.00 | 0.44% | $ 205,328 | 0.54% | 0.27% | 0.39% |
9/30/21 | 1.00 | (0.00)d | 0.00d | 0.00d | — | — | — | 1.00 | 0.00%e | 235,578 | 0.51% | 0.07% | 0.00%e |
9/30/20 | 1.00 | 0.01 | 0.00d | 0.01 | (0.01) | — | (0.01) | 1.00 | 0.56% | 277,991 | 0.51% | 0.40% | 0.59% |
9/30/19 | 1.00 | 0.02 | 0.00d | 0.02 | (0.02) | (0.00)d | (0.02) | 1.00 | 1.85% | 333,574 | 0.52% | N/A | 1.83% |
9/30/18 | 1.00 | 0.01 | 0.00d | 0.01 | (0.01) | (0.00)d | (0.01) | 1.00 | 1.08% | 339,551 | 0.50% | N/A | 1.04% |
c | Per share amount calculated on the average shares method. |
d | Amount is less than $0.005 per share. |
e | Amount is less than 0.005%. |
j | Computed after giving effect to an agreement by MML Advisers to waive certain fees and expenses of the Fund. |
l | Employee retirement benefit plans that invest plan assets in the Separate Investment Accounts (SIAs) may be subject to certain charges as set forth in their respective Plan Documents. Total return figures would be lower for the periods presented if they reflected these charges. |
The accompanying notes are an integral part of the financial statements.
163
MassMutual Short-Duration Bond Fund – Financial Statements (Continued) |
Financial Highlights (For a share outstanding throughout each period) |
| | | Income (loss) from investment
operations | Less distributions to shareholders | | | Ratios / Supplemental Data |
| | Net
asset
value,
beginning
of the
period | Net
investment
income
(loss)c,j | Net
realized
and
unrealized
gain (loss)
on
investments | Total
income
(loss) from
investment
operations | From net
investment
income | From net
realized
gains | Total
distributions | Net
asset
value,
end of
the
period | Total
returnl,m | Net
assets,
end of
the
period
(000’s) | Ratio of
expenses
to average
daily net
assets before
expense
waivers | Ratio of
expenses to
average daily
net assets
after expense
waiversj | Net
investment
income
(loss) to
average
daily net
assets |
Class I | | | | | | | | | | | | | |
9/30/22 | $ 10.10 | $ 0.20 | $ (1.19) | $ (0.99) | $ (0.44) | $ — | $ (0.44) | $ 8.67 | (10.11%) | $ 131,484 | 0.40% | 0.39% | 2.08% |
9/30/21 | 10.09 | 0.24 | 0.22 | 0.46 | (0.45) | — | (0.45) | 10.10 | 4.69% | 211,826 | 0.44% | N/A | 2.41% |
9/30/20 | 10.31 | 0.34 | (0.21) | 0.13 | (0.35) | — | (0.35) | 10.09 | 1.26% | 189,805 | 0.42% | N/A | 3.41% |
9/30/19 | 10.30 | 0.32 | 0.08 | 0.40 | (0.39) | — | (0.39) | 10.31 | 4.05% | 204,282 | 0.43% | N/A | 3.13% |
9/30/18 | 10.40 | 0.27 | (0.10) | 0.17 | (0.27) | — | (0.27) | 10.30 | 1.65% | 163,465 | 0.39% | N/A | 2.64% |
Class R5 | | | | | | | | | | | | | |
9/30/22 | $ 10.13 | $ 0.19 | $ (1.20) | $ (1.01) | $ (0.42) | $ — | $ (0.42) | $ 8.70 | (10.26%) | $ 30,546 | 0.50% | N/A | 1.95% |
9/30/21 | 10.12 | 0.24 | 0.21 | 0.45 | (0.44) | — | (0.44) | 10.13 | 4.56% | 66,938 | 0.54% | N/A | 2.34% |
9/30/20 | 10.34 | 0.33 | (0.21) | 0.12 | (0.34) | — | (0.34) | 10.12 | 1.15% | 110,813 | 0.52% | N/A | 3.31% |
9/30/19 | 10.33 | 0.31 | 0.08 | 0.39 | (0.38) | — | (0.38) | 10.34 | 3.92% | 158,895 | 0.53% | N/A | 3.03% |
9/30/18 | 10.42 | 0.26 | (0.09) | 0.17 | (0.26) | — | (0.26) | 10.33 | 1.63% | 135,411 | 0.49% | N/A | 2.55% |
Service Class | | | | | | | | | | | | |
9/30/22 | $ 10.06 | $ 0.17 | $ (1.18) | $ (1.01) | $ (0.40) | $ — | $ (0.40) | $ 8.65 | (10.30%) | $ 2,981 | 0.62% | N/A | 1.82% |
9/30/21 | 10.04 | 0.23 | 0.21 | 0.44 | (0.42) | — | (0.42) | 10.06 | 4.51% | 16,282 | 0.64% | N/A | 2.25% |
9/30/20 | 10.26 | 0.32 | (0.22) | 0.10 | (0.32) | — | (0.32) | 10.04 | 1.00% | 38,559 | 0.62% | N/A | 3.19% |
9/30/19 | 10.25 | 0.30 | 0.08 | 0.38 | (0.37) | — | (0.37) | 10.26 | 3.82% | 51,201 | 0.63% | N/A | 2.92% |
9/30/18 | 10.35 | 0.25 | (0.10) | 0.15 | (0.25) | — | (0.25) | 10.25 | 1.50% | 72,408 | 0.59% | N/A | 2.45% |
| | Year ended September 30 |
| | 2022 | 2021 | 2020 | 2019 | 2018 |
Portfolio turnover rate | 20% | 72% | 37% | 55% | 68% |
b | Percentage represents the results for the period and is not annualized. |
c | Per share amount calculated on the average shares method. |
g | For the period December 13, 2021 (commencement of operations) through September 30, 2022. |
j | Computed after giving effect to an agreement by MML Advisers and/or MassMutual to waive certain fees and expenses of the Fund. |
l | Employee retirement benefit plans that invest plan assets in the Separate Investment Accounts (SIAs) may be subject to certain charges as set forth in their respective Plan Documents. Total return figures would be lower for the periods presented if they reflected these charges. |
m | Total return excludes sales charges, if any, and would be lower for the period presented if it reflected these charges. |
The accompanying notes are an integral part of the financial statements.
164
| | | Income (loss) from investment
operations | Less distributions to shareholders | | | Ratios / Supplemental Data |
| | Net
asset
value,
beginning
of the
period | Net
investment
income
(loss)c,j | Net
realized
and
unrealized
gain (loss)
on
investments | Total
income
(loss) from
investment
operations | From net
investment
income | From net
realized
gains | Total
distributions | Net
asset
value,
end of
the
period | Total
returnl,m | Net
assets,
end of
the
period
(000’s) | Ratio of
expenses
to average
daily net
assets before
expense
waivers | Ratio of
expenses to
average daily
net assets
after expense
waiversj | Net
investment
income
(loss) to
average
daily net
assets |
Administrative Class | | | | | | | | | | | |
9/30/22 | $ 10.01 | $ 0.17 | $ (1.18) | $ (1.01) | $ (0.38) | $ — | $ (0.38) | $ 8.62 | (10.38%) | $ 10,582 | 0.70% | N/A | 1.78% |
9/30/21 | 10.00 | 0.21 | 0.22 | 0.43 | (0.42) | — | (0.42) | 10.01 | 4.40% | 16,920 | 0.74% | N/A | 2.16% |
9/30/20 | 10.22 | 0.31 | (0.21) | 0.10 | (0.32) | — | (0.32) | 10.00 | 0.94% | 27,628 | 0.72% | N/A | 3.12% |
9/30/19 | 10.21 | 0.29 | 0.08 | 0.37 | (0.36) | — | (0.36) | 10.22 | 3.76% | 31,270 | 0.73% | N/A | 2.83% |
9/30/18 | 10.31 | 0.24 | (0.10) | 0.14 | (0.24) | — | (0.24) | 10.21 | 1.35% | 34,342 | 0.69% | N/A | 2.37% |
Class R4 | | | | | | | | | | | | | |
9/30/22 | $ 10.07 | $ 0.15 | $ (1.18) | $ (1.03) | $ (0.35) | $ — | $ (0.35) | $ 8.69 | (10.46%) | $ 8,688 | 0.85% | N/A | 1.63% |
9/30/21 | 10.05 | 0.20 | 0.22 | 0.42 | (0.40) | — | (0.40) | 10.07 | 4.30% | 11,743 | 0.89% | N/A | 1.97% |
9/30/20 | 10.27 | 0.29 | (0.21) | 0.08 | (0.30) | — | (0.30) | 10.05 | 0.79% | 11,525 | 0.87% | N/A | 2.96% |
9/30/19 | 10.26 | 0.27 | 0.08 | 0.35 | (0.34) | — | (0.34) | 10.27 | 3.57% | 12,494 | 0.88% | N/A | 2.67% |
9/30/18 | 10.36 | 0.23 | (0.11) | 0.12 | (0.22) | — | (0.22) | 10.26 | 1.21% | 13,691 | 0.84% | N/A | 2.21% |
Class A | | | | | | | | | | | | | |
9/30/22 | $ 9.93 | $ 0.14 | $ (1.18) | $ (1.04) | $ (0.31) | $ — | $ (0.31) | $ 8.58 | (10.63%) | $ 7,588 | 0.95% | N/A | 1.44% |
9/30/21 | 9.92 | 0.19 | 0.21 | 0.40 | (0.39) | — | (0.39) | 9.93 | 4.15% | 36,186 | 0.99% | N/A | 1.90% |
9/30/20 | 10.14 | 0.28 | (0.21) | 0.07 | (0.29) | — | (0.29) | 9.92 | 0.71% | 41,913 | 0.97% | N/A | 2.87% |
9/30/19 | 10.14 | 0.26 | 0.08 | 0.34 | (0.34) | — | (0.34) | 10.14 | 3.44% | 55,315 | 0.98% | N/A | 2.58% |
9/30/18 | 10.24 | 0.21 | (0.10) | 0.11 | (0.21) | — | (0.21) | 10.14 | 1.10% | 53,188 | 0.94% | N/A | 2.11% |
Class R3 | | | | | | | | | | | | | |
9/30/22 | $ 9.99 | $ 0.13 | $ (1.19) | $ (1.06) | $ (0.32) | $ — | $ (0.32) | $ 8.61 | (10.80%) | $ 7,665 | 1.10% | N/A | 1.37% |
9/30/21 | 9.98 | 0.17 | 0.22 | 0.39 | (0.38) | — | (0.38) | 9.99 | 4.04% | 11,652 | 1.14% | N/A | 1.70% |
9/30/20 | 10.20 | 0.27 | (0.22) | 0.05 | (0.27) | — | (0.27) | 9.98 | 0.53% | 7,737 | 1.12% | N/A | 2.72% |
9/30/19 | 10.20 | 0.24 | 0.09 | 0.33 | (0.33) | — | (0.33) | 10.20 | 3.29% | 7,040 | 1.13% | N/A | 2.43% |
9/30/18 | 10.30 | 0.20 | (0.10) | 0.10 | (0.20) | — | (0.20) | 10.20 | 0.97% | 7,980 | 1.09% | N/A | 1.97% |
Class Y | | | | | | | | | | | | | |
9/30/22g | $ 9.86 | $ 0.15 | $ (1.09) | $ (0.94) | $ (0.24) | $ — | $ (0.24) | $ 8.68 | (9.66%)b | $ 222,385 | 0.48%a | 0.40%a | 2.05%a |
Class L | | | | | | | | | | | | | |
9/30/22g | $ 9.82 | $ 0.14 | $ (1.10) | $ (0.96) | $ (0.22) | $ — | $ (0.22) | $ 8.64 | (9.87%)b | $ 76,609 | 0.69%a | 0.65%a | 1.86%a |
Class C | | | | | | | | | | | | | |
9/30/22g | $ 9.90 | $ 0.12 | $ (1.11) | $ (0.99) | $ (0.20) | $ — | $ (0.20) | $ 8.71 | (10.07%)b | $ 1,097 | 0.94%a | 0.90%a | 1.64%a |
The accompanying notes are an integral part of the financial statements.
165
MassMutual Inflation-Protected and Income Fund – Financial Statements (Continued) |
Financial Highlights (For a share outstanding throughout each period) |
| | | Income (loss) from investment
operations | Less distributions to shareholders | | | Ratios / Supplemental Data |
| | Net
asset
value,
beginning
of the
period | Net
investment
income
(loss)c,j | Net
realized
and
unrealized
gain (loss)
on
investments | Total
income
(loss) from
investment
operations | From net
investment
income | From net
realized
gains | Total
distributions | Net
asset
value,
end of
the
period | Total
returnl,m | Net
assets,
end of
the
period
(000’s) | Ratio of
expenses
to average
daily net
assets
before
expense
waivers
(including
interest
expense)p | Ratio of
expenses
to average
daily net
assets
after
expense
waivers
(including
interest
expense)j,p | Ratio of
expenses
to average
daily net
assets
after
expense
waivers
(excluding
interest
expense)j | Net
investment
income
(loss) to
average
daily net
assets
(including
interest
expense)p |
Class I | | | | | | | | | | | | | | |
9/30/22 | $ 11.46 | $ 0.27 | $ (1.57) | $ (1.30) | $ (0.20) | $ (0.61) | $ (0.81) | $ 9.35 | (12.28%) | $ 169,362 | 0.47% | N/A | N/A | 2.60% |
9/30/21 | 11.40 | 0.19 | 0.48 | 0.67 | (0.12) | (0.49) | (0.61) | 11.46 | 6.12% | 187,579 | 0.47% | 0.47%n | 0.47%n | 1.73% |
9/30/20 | 10.59 | 0.20 | 0.83 | 1.03 | (0.22) | — | (0.22) | 11.40 | 9.93% | 176,809 | 0.47% | 0.47%n | 0.47%n | 1.86% |
9/30/19 | 10.24 | 0.25 | 0.42 | 0.67 | (0.32) | — | (0.32) | 10.59 | 6.80% | 154,260 | 0.50% | 0.49% | 0.46% | 2.40% |
9/30/18 | 10.46 | 0.34 | (0.26) | 0.08 | (0.30) | — | (0.30) | 10.24 | 0.74% | 133,153 | 1.74% | 1.71% | 0.45% | 3.33% |
Class R5 | | | | | | | | | | | | | | |
9/30/22 | $ 11.47 | $ 0.25 | $ (1.57) | $ (1.32) | $ (0.19) | $ (0.61) | $ (0.80) | $ 9.35 | (12.44%) | $ 66,136 | 0.57% | N/A | N/A | 2.40% |
9/30/21 | 11.41 | 0.18 | 0.48 | 0.66 | (0.11) | (0.49) | (0.60) | 11.47 | 6.01% | 93,318 | 0.57% | 0.57%n | 0.57%n | 1.63% |
9/30/20 | 10.59 | 0.19 | 0.84 | 1.03 | (0.21) | — | (0.21) | 11.41 | 9.92% | 86,369 | 0.57% | 0.57%n | 0.57%n | 1.75% |
9/30/19 | 10.24 | 0.24 | 0.42 | 0.66 | (0.31) | — | (0.31) | 10.59 | 6.68% | 73,365 | 0.60% | 0.59% | 0.56% | 2.30% |
9/30/18 | 10.46 | 0.34 | (0.27) | 0.07 | (0.29) | — | (0.29) | 10.24 | 0.63% | 60,121 | 1.84% | 1.81% | 0.55% | 3.29% |
Service Class | | | | | | | | | | | | | |
9/30/22 | $ 11.42 | $ 0.23 | $ (1.55) | $ (1.32) | $ (0.18) | $ (0.61) | $ (0.79) | $ 9.31 | (12.51%) | $ 31,069 | 0.67% | N/A | N/A | 2.19% |
9/30/21 | 11.37 | 0.17 | 0.47 | 0.64 | (0.10) | (0.49) | (0.59) | 11.42 | 5.84% | 55,836 | 0.67% | 0.67%n | 0.67%n | 1.53% |
9/30/20 | 10.55 | 0.18 | 0.84 | 1.02 | (0.20) | — | (0.20) | 11.37 | 9.82% | 54,729 | 0.67% | 0.67%n | 0.67%n | 1.66% |
9/30/19 | 10.20 | 0.22 | 0.43 | 0.65 | (0.30) | — | (0.30) | 10.55 | 6.60% | 50,873 | 0.71% | 0.70% | 0.67% | 2.17% |
9/30/18 | 10.42 | 0.32 | (0.27) | 0.05 | (0.27) | — | (0.27) | 10.20 | 0.51% | 50,449 | 1.94% | 1.91% | 0.65% | 3.16% |
| | Year ended September 30 |
| | 2022 | 2021 | 2020 | 2019 | 2018 |
Portfolio turnover rate | 77% | 100% | 110% | 42% | 62% |
c | Per share amount calculated on the average shares method. |
d | Amount is less than $0.005 per share. |
j | Computed after giving effect to an agreement by MML Advisers to waive certain fees and expenses of the Fund. |
l | Employee retirement benefit plans that invest plan assets in the Separate Investment Accounts (SIAs) may be subject to certain charges as set forth in their respective Plan Documents. Total return figures would be lower for the periods presented if they reflected these charges. |
m | Total return excludes sales charges, if any, and would be lower for the period presented if it reflected these charges. |
n | Expenses incurred during the period fell under the expense cap. |
p | Interest expense incurred as a result of entering into reverse repurchase agreements and Treasury roll transactions is included in the Fund’s net expenses in the Statements of Operations. Income earned on investing proceeds from reverse repurchase agreements and Treasury roll transactions is included in interest income in the Statements of Operations. |
The accompanying notes are an integral part of the financial statements.
166
| | | Income (loss) from investment
operations | Less distributions to shareholders | | | Ratios / Supplemental Data |
| | Net
asset
value,
beginning
of the
period | Net
investment
income
(loss)c,j | Net
realized
and
unrealized
gain (loss)
on
investments | Total
income
(loss) from
investment
operations | From net
investment
income | From net
realized
gains | Total
distributions | Net
asset
value,
end of
the
period | Total
returnl,m | Net
assets,
end of
the
period
(000’s) | Ratio of
expenses
to average
daily net
assets
before
expense
waivers
(including
interest
expense)p | Ratio of
expenses
to average
daily net
assets
after
expense
waivers
(including
interest
expense)j,p | Ratio of
expenses
to average
daily net
assets
after
expense
waivers
(excluding
interest
expense)j | Net
investment
income
(loss) to
average
daily net
assets
(including
interest
expense)p |
Administrative Class | | | | | | | | | | | | |
9/30/22 | $ 11.55 | $ 0.23 | $ (1.58) | $ (1.35) | $ (0.16) | $ (0.61) | $ (0.77) | $ 9.43 | (12.59%) | $ 7,759 | 0.77% | N/A | N/A | 2.15% |
9/30/21 | 11.49 | 0.16 | 0.48 | 0.64 | (0.09) | (0.49) | (0.58) | 11.55 | 5.74% | 14,073 | 0.77% | 0.77%n | 0.77%n | 1.42% |
9/30/20 | 10.66 | 0.17 | 0.85 | 1.02 | (0.19) | — | (0.19) | 11.49 | 9.70% | 15,288 | 0.77% | 0.77%n | 0.77%n | 1.56% |
9/30/19 | 10.30 | 0.21 | 0.44 | 0.65 | (0.29) | — | (0.29) | 10.66 | 6.53% | 16,168 | 0.80% | 0.79% | 0.76% | 2.03% |
9/30/18 | 10.53 | 0.31 | (0.28) | 0.03 | (0.26) | — | (0.26) | 10.30 | 0.31% | 14,744 | 2.04% | 2.01% | 0.75% | 3.02% |
Class R4 | | | | | | | | | | | | | | |
9/30/22 | $ 11.16 | $ 0.22 | $ (1.54) | $ (1.32) | $ (0.15) | $ (0.61) | $ (0.76) | $ 9.08 | (12.75%) | $ 4,316 | 0.92% | N/A | N/A | 2.10% |
9/30/21 | 11.12 | 0.14 | 0.47 | 0.61 | (0.08) | (0.49) | (0.57) | 11.16 | 5.65% | 5,234 | 0.92% | 0.92%n | 0.92%n | 1.31% |
9/30/20 | 10.33 | 0.15 | 0.82 | 0.97 | (0.18) | — | (0.18) | 11.12 | 9.51% | 4,358 | 0.92% | 0.92%n | 0.92%n | 1.40% |
9/30/19 | 10.00 | 0.19 | 0.42 | 0.61 | (0.28) | — | (0.28) | 10.33 | 6.27% | 6,949 | 0.96% | 0.95% | 0.92% | 1.95% |
9/30/18 | 10.22 | 0.29 | (0.26) | 0.03 | (0.25) | — | (0.25) | 10.00 | 0.31% | 6,840 | 2.19% | 2.16% | 0.90% | 2.87% |
Class A | | | | | | | | | | | | | | |
9/30/22 | $ 11.23 | $ 0.20 | $ (1.54) | $ (1.34) | $ (0.11) | $ (0.61) | $ (0.72) | $ 9.17 | (12.81%) | $ 8,860 | 1.02% | N/A | N/A | 1.94% |
9/30/21 | 11.19 | 0.12 | 0.48 | 0.60 | (0.07) | (0.49) | (0.56) | 11.23 | 5.54% | 13,244 | 1.02% | 1.02%n | 1.02%n | 1.12% |
9/30/20 | 10.39 | 0.14 | 0.82 | 0.96 | (0.16) | — | (0.16) | 11.19 | 9.42% | 22,018 | 1.02% | 1.02%n | 1.02%n | 1.30% |
9/30/19 | 10.05 | 0.18 | 0.42 | 0.60 | (0.26) | — | (0.26) | 10.39 | 6.16% | 16,136 | 1.06% | 1.05% | 1.02% | 1.78% |
9/30/18 | 10.27 | 0.28 | (0.26) | 0.02 | (0.24) | — | (0.24) | 10.05 | 0.16% | 20,582 | 2.29% | 2.26% | 1.00% | 2.80% |
Class R3 | | | | | | | | | | | | | | |
9/30/22 | $ 11.17 | $ 0.19 | $ (1.54) | $ (1.35) | $ (0.12) | $ (0.61) | $ (0.73) | $ 9.09 | (12.98%) | $ 2,414 | 1.17% | N/A | N/A | 1.89% |
9/30/21 | 11.12 | 0.11 | 0.47 | 0.58 | (0.04) | (0.49) | (0.53) | 11.17 | 5.40% | 2,940 | 1.17% | 1.17%n | 1.17%n | 1.02% |
9/30/20 | 10.33 | 0.12 | 0.82 | 0.94 | (0.15) | — | (0.15) | 11.12 | 9.20% | 3,256 | 1.17% | 1.17%n | 1.17%n | 1.16% |
9/30/19 | 9.99 | 0.17 | 0.41 | 0.58 | (0.24) | — | (0.24) | 10.33 | 6.03% | 4,297 | 1.21% | 1.20% | 1.17% | 1.68% |
9/30/18 | 10.22 | 0.27 | (0.27) | 0.00d | (0.23) | — | (0.23) | 9.99 | 0.03% | 4,569 | 2.44% | 2.41% | 1.15% | 2.69% |
The accompanying notes are an integral part of the financial statements.
167
MassMutual Core Bond Fund – Financial Statements (Continued) |
Financial Highlights (For a share outstanding throughout each period) |
| | | Income (loss) from investment
operations | Less distributions to shareholders | | | Ratios / Supplemental Data |
| | Net
asset
value,
beginning
of the
period | Net
investment
income
(loss)c | Net
realized
and
unrealized
gain (loss)
on
investments | Total
income
(loss) from
investment
operations | From net
investment
income | From net
realized
gains | Total
distributions | Net
asset
value,
end of
the
period | Total
returnl,m | Net
assets,
end of
the
period
(000’s) | Ratio of
expenses
to average
daily net
assets | Net
investment
income
(loss) to
average
daily net
assets |
Class I | | | | | | | | | | | | |
9/30/22 | $ 11.33 | $ 0.27 | $ (2.07) | $ (1.80) | $ (0.26) | $ (0.17) | (0.43) | $ 9.10 | (16.47%) | $ 485,216 | 0.42% | 2.62% |
9/30/21 | 11.64 | 0.27 | 0.11 | 0.38 | (0.43) | (0.26) | (0.69) | 11.33 | 3.31% | 679,036 | 0.42% | 2.39% |
9/30/20 | 11.33 | 0.37 | 0.32 | 0.69 | (0.38) | — | (0.38) | 11.64 | 6.28% | 786,360 | 0.42% | 3.27% |
9/30/19 | 10.66 | 0.37 | 0.66 | 1.03 | (0.36) | — | (0.36) | 11.33 | 9.98% | 847,736 | 0.43% | 3.42% |
9/30/18 | 11.04 | 0.34 | (0.39) | (0.05) | (0.33) | — | (0.33) | 10.66 | (0.46%) | 695,501 | 0.42% | 3.19% |
Class R5 | | | | | | | | | | | | |
9/30/22 | $ 11.37 | $ 0.25 | $ (2.07) | $ (1.82) | $ (0.25) | $ (0.17) | $ (0.42) | $ 9.13 | (16.60%) | $ 135,050 | 0.52% | 2.43% |
9/30/21 | 11.68 | 0.26 | 0.11 | 0.37 | (0.42) | (0.26) | (0.68) | 11.37 | 3.19% | 306,648 | 0.52% | 2.29% |
9/30/20 | 11.37 | 0.36 | 0.32 | 0.68 | (0.37) | — | (0.37) | 11.68 | 6.16% | 316,359 | 0.52% | 3.17% |
9/30/19 | 10.69 | 0.36 | 0.67 | 1.03 | (0.35) | — | (0.35) | 11.37 | 9.92% | 317,805 | 0.53% | 3.32% |
9/30/18 | 11.07 | 0.33 | (0.39) | (0.06) | (0.32) | — | (0.32) | 10.69 | (0.57%) | 294,370 | 0.52% | 3.07% |
Service Class | | | | | | | | | | | |
9/30/22 | $ 11.30 | $ 0.25 | $ (2.07) | $ (1.82) | $ (0.24) | $ (0.17) | $ (0.41) | $ 9.07 | (16.72%) | $ 36,797 | 0.62% | 2.40% |
9/30/21 | 11.60 | 0.25 | 0.10 | 0.35 | (0.39) | (0.26) | (0.65) | 11.30 | 3.11% | 58,047 | 0.62% | 2.19% |
9/30/20 | 11.29 | 0.35 | 0.31 | 0.66 | (0.35) | — | (0.35) | 11.60 | 6.06% | 83,876 | 0.62% | 3.08% |
9/30/19 | 10.63 | 0.35 | 0.64 | 0.99 | (0.33) | — | (0.33) | 11.29 | 9.67% | 86,988 | 0.63% | 3.22% |
9/30/18 | 11.01 | 0.32 | (0.39) | (0.07) | (0.31) | — | (0.31) | 10.63 | (0.66%) | 101,502 | 0.62% | 2.98% |
| | Year ended September 30 |
| | 2022 | 2021 | 2020 | 2019 | 2018 |
Portfolio turnover rate | 239% | 256% | 231% | 261% | 140% |
c | Per share amount calculated on the average shares method. |
l | Employee retirement benefit plans that invest plan assets in the Separate Investment Accounts (SIAs) may be subject to certain charges as set forth in their respective Plan Documents. Total return figures would be lower for the periods presented if they reflected these charges. |
m | Total return excludes sales charges, if any, and would be lower for the period presented if it reflected these charges. |
The accompanying notes are an integral part of the financial statements.
168
| | | Income (loss) from investment
operations | Less distributions to shareholders | | | Ratios / Supplemental Data |
| | Net
asset
value,
beginning
of the
period | Net
investment
income
(loss)c | Net
realized
and
unrealized
gain (loss)
on
investments | Total
income
(loss) from
investment
operations | From net
investment
income | From net
realized
gains | Total
distributions | Net
asset
value,
end of
the
period | Total
returnl,m | Net
assets,
end of
the
period
(000’s) | Ratio of
expenses
to average
daily net
assets | Net
investment
income
(loss) to
average
daily net
assets |
Administrative Class | | | | | | | | | | |
9/30/22 | $ 11.19 | $ 0.24 | $ (2.05) | $ (1.81) | $ (0.22) | $ (0.17) | $ (0.39) | $ 8.99 | (16.75%) | $ 35,207 | 0.72% | 2.30% |
9/30/21 | 11.51 | 0.24 | 0.10 | 0.34 | (0.40) | (0.26) | (0.66) | 11.19 | 2.97% | 55,178 | 0.72% | 2.11% |
9/30/20 | 11.21 | 0.33 | 0.32 | 0.65 | (0.35) | — | (0.35) | 11.51 | 5.94% | 76,597 | 0.72% | 2.97% |
9/30/19 | 10.55 | 0.33 | 0.66 | 0.99 | (0.33) | — | (0.33) | 11.21 | 9.65% | 67,239 | 0.73% | 3.13% |
9/30/18 | 10.92 | 0.31 | (0.38) | (0.07) | (0.30) | — | (0.30) | 10.55 | (0.70%) | 69,478 | 0.72% | 2.88% |
Class R4 | | | | | | | | | | | | |
9/30/22 | $ 11.01 | $ 0.20 | $ (2.00) | $ (1.80) | $ (0.20) | $ (0.17) | $ (0.37) | $ 8.84 | (16.92%) | $ 2,295 | 0.87% | 1.99% |
9/30/21 | 11.33 | 0.21 | 0.10 | 0.31 | (0.37) | (0.26) | (0.63) | 11.01 | 2.82% | 8,557 | 0.87% | 1.95% |
9/30/20 | 11.04 | 0.31 | 0.31 | 0.62 | (0.33) | — | (0.33) | 11.33 | 5.80% | 10,444 | 0.87% | 2.80% |
9/30/19 | 10.39 | 0.31 | 0.64 | 0.95 | (0.30) | — | (0.30) | 11.04 | 9.47% | 14,011 | 0.88% | 2.98% |
9/30/18 | 10.78 | 0.29 | (0.39) | (0.10) | (0.29) | — | (0.29) | 10.39 | (0.97%) | 10,624 | 0.87% | 2.72% |
Class A | | | | | | | | | | | | |
9/30/22 | $ 11.09 | $ 0.20 | $ (2.01) | $ (1.81) | $ (0.20) | $ (0.17) | $ (0.37) | $ 8.91 | (16.91%) | $ 23,746 | 0.97% | 1.97% |
9/30/21 | 11.40 | 0.21 | 0.09 | 0.30 | (0.35) | (0.26) | (0.61) | 11.09 | 2.70% | 57,351 | 0.97% | 1.83% |
9/30/20 | 11.10 | 0.30 | 0.32 | 0.62 | (0.32) | — | (0.32) | 11.40 | 5.70% | 58,572 | 0.97% | 2.72% |
9/30/19 | 10.45 | 0.30 | 0.65 | 0.95 | (0.30) | — | (0.30) | 11.10 | 9.32% | 97,070 | 0.98% | 2.87% |
9/30/18 | 10.82 | 0.28 | (0.38) | (0.10) | (0.27) | — | (0.27) | 10.45 | (1.00%) | 106,562 | 0.97% | 2.63% |
Class R3 | | | | | | | | | | | | |
9/30/22 | $ 11.34 | $ 0.20 | $ (2.09) | $ (1.89) | $ (0.10) | $ (0.17) | $ (0.27) | $ 9.18 | (17.05%) | $ 177 | 1.12% | 1.88% |
9/30/21 | 11.63 | 0.19 | 0.10 | 0.29 | (0.32) | (0.26) | (0.58) | 11.34 | 2.54% | 352 | 1.12% | 1.70% |
9/30/20 | 11.34 | 0.29 | 0.32 | 0.61 | (0.32) | — | (0.32) | 11.63 | 5.54% | 867 | 1.12% | 2.57% |
9/30/19 | 10.67 | 0.29 | 0.67 | 0.96 | (0.29) | — | (0.29) | 11.34 | 9.24% | 1,225 | 1.13% | 2.72% |
9/30/18 | 11.02 | 0.27 | (0.39) | (0.12) | (0.23) | — | (0.23) | 10.67 | (1.13%) | 803 | 1.12% | 2.49% |
The accompanying notes are an integral part of the financial statements.
169
MassMutual Diversified Bond Fund – Financial Statements (Continued) |
Financial Highlights (For a share outstanding throughout each period) |
| | | Income (loss) from investment
operations | Less distributions to shareholders | | | Ratios / Supplemental Data |
| | Net
asset
value,
beginning
of the
period | Net
investment
income
(loss)c,j | Net
realized
and
unrealized
gain (loss)
on
investments | Total
income
(loss) from
investment
operations | From net
investment
income | From net
realized
gains | Total
distributions | Net
asset
value,
end of
the
period | Total
returnl,m | Net
assets,
end
of the
period
(000’s) | Ratio of
expenses
to average
daily net
assets
before
expense
waivers | Ratio of
expenses
to average
daily net
assets
after
expense
waiversj | Net
investment
income
(loss) to
average
daily net
assets |
Class I | | | | | | | | | | | | | |
9/30/22 | $ 11.33 | $ 0.31 | $ (2.27) | $ (1.96) | $ (0.30) | $ (0.14) | $ (0.44) | $ 8.93 | (18.00%) | $ 75,455 | 0.54% | N/A | 3.07% |
9/30/21 | 11.51 | 0.32 | 0.33 | 0.65 | (0.46) | (0.37) | (0.83) | 11.33 | 5.89% | 111,411 | 0.52% | N/A | 2.85% |
9/30/20 | 11.28 | 0.39 | 0.20 | 0.59 | (0.36) | (0.00)d | (0.36) | 11.51 | 5.43% | 97,183 | 0.51% | N/A | 3.54% |
9/30/19 | 10.59 | 0.38 | 0.64 | 1.02 | (0.33) | — | (0.33) | 11.28 | 9.98% | 60,965 | 0.55% | 0.55%n | 3.54% |
9/30/18 | 10.97 | 0.35 | (0.41) | (0.06) | (0.32) | — | (0.32) | 10.59 | (0.55%) | 21,746 | 0.50% | 0.50%n | 3.33% |
Class R5 | | | | | | | | | | | | | |
9/30/22 | $ 10.35 | $ 0.28 | $ (2.07) | $ (1.79) | $ (0.29) | $ (0.14) | $ (0.43) | $ 8.13 | (18.05%) | $ 57,774 | 0.64% | N/A | 2.99% |
9/30/21 | 10.58 | 0.28 | 0.31 | 0.59 | (0.45) | (0.37) | (0.82) | 10.35 | 5.79% | 80,079 | 0.62% | N/A | 2.75% |
9/30/20 | 10.40 | 0.35 | 0.18 | 0.53 | (0.35) | (0.00)d | (0.35) | 10.58 | 5.30% | 78,289 | 0.61% | N/A | 3.46% |
9/30/19 | 9.78 | 0.34 | 0.60 | 0.94 | (0.32) | — | (0.32) | 10.40 | 9.99% | 109,659 | 0.65% | 0.65%n | 3.46% |
9/30/18 | 10.16 | 0.32 | (0.39) | (0.07) | (0.31) | — | (0.31) | 9.78 | (0.69%) | 98,402 | 0.60% | 0.60%n | 3.24% |
Service Class | | | | | | | | | | | | |
9/30/22 | $ 10.51 | $ 0.27 | $ (2.10) | $ (1.83) | $ (0.27) | $ (0.14) | $ (0.41) | $ 8.27 | (18.11%) | $ 4,963 | 0.74% | N/A | 2.81% |
9/30/21 | 10.73 | 0.28 | 0.31 | 0.59 | (0.44) | (0.37) | (0.81) | 10.51 | 5.71% | 11,853 | 0.72% | N/A | 2.66% |
9/30/20 | 10.54 | 0.35 | 0.18 | 0.53 | (0.34) | (0.00)d | (0.34) | 10.73 | 5.20% | 12,067 | 0.71% | N/A | 3.36% |
9/30/19 | 9.91 | 0.33 | 0.61 | 0.94 | (0.31) | — | (0.31) | 10.54 | 9.80% | 12,976 | 0.75% | 0.75%n | 3.35% |
9/30/18 | 10.28 | 0.31 | (0.38) | (0.07) | (0.30) | — | (0.30) | 9.91 | (0.69%) | 18,946 | 0.70% | 0.70%n | 3.14% |
| | Year ended September 30 |
| | 2022 | 2021 | 2020 | 2019 | 2018 |
Portfolio turnover rate | 198% | 192% | 186% | 236% | 142% |
c | Per share amount calculated on the average shares method. |
d | Amount is less than $0.005 per share. |
j | Computed after giving effect to an agreement by MML Advisers to waive certain fees and expenses of the Fund. |
l | Employee retirement benefit plans that invest plan assets in the Separate Investment Accounts (SIAs) may be subject to certain charges as set forth in their respective Plan Documents. Total return figures would be lower for the periods presented if they reflected these charges. |
m | Total return excludes sales charges, if any, and would be lower for the period presented if it reflected these charges. |
n | Expenses incurred during the period fell under the expense cap. |
The accompanying notes are an integral part of the financial statements.
170
| | | Income (loss) from investment
operations | Less distributions to shareholders | | | Ratios / Supplemental Data |
| | Net
asset
value,
beginning
of the
period | Net
investment
income
(loss)c,j | Net
realized
and
unrealized
gain (loss)
on
investments | Total
income
(loss) from
investment
operations | From net
investment
income | From net
realized
gains | Total
distributions | Net
asset
value,
end of
the
period | Total
returnl,m | Net
assets,
end
of the
period
(000’s) | Ratio of
expenses
to average
daily net
assets
before
expense
waivers | Ratio of
expenses
to average
daily net
assets
after
expense
waiversj | Net
investment
income
(loss) to
average
daily net
assets |
Administrative Class | | | | | | | | | | | |
9/30/22 | $ 10.49 | $ 0.26 | $ (2.10) | $ (1.84) | $ (0.26) | $ (0.14) | $ (0.40) | $ 8.25 | (18.21%) | $ 8,149 | 0.84% | N/A | 2.76% |
9/30/21 | 10.71 | 0.27 | 0.30 | 0.57 | (0.42) | (0.37) | (0.79) | 10.49 | 5.52% | 12,621 | 0.82% | N/A | 2.57% |
9/30/20 | 10.52 | 0.34 | 0.18 | 0.52 | (0.33) | (0.00)d | (0.33) | 10.71 | 5.10% | 17,108 | 0.81% | N/A | 3.25% |
9/30/19 | 9.88 | 0.32 | 0.62 | 0.94 | (0.30) | — | (0.30) | 10.52 | 9.79% | 21,870 | 0.85% | 0.85%n | 3.25% |
9/30/18 | 10.25 | 0.30 | (0.38) | (0.08) | (0.29) | — | (0.29) | 9.88 | (0.83%) | 27,039 | 0.80% | 0.80%n | 3.03% |
Class R4 | | | | | | | | | | | | | |
9/30/22 | $ 10.33 | $ 0.25 | $ (2.08) | $ (1.83) | $ (0.24) | $ (0.14) | $ (0.38) | $ 8.12 | (18.37%) | $ 3,754 | 0.99% | N/A | 2.63% |
9/30/21 | 10.57 | 0.25 | 0.29 | 0.54 | (0.41) | (0.37) | (0.78) | 10.33 | 5.35% | 5,253 | 0.97% | N/A | 2.42% |
9/30/20 | 10.38 | 0.32 | 0.19 | 0.51 | (0.32) | (0.00)d | (0.32) | 10.57 | 5.05% | 6,233 | 0.96% | N/A | 3.10% |
9/30/19 | 9.78 | 0.31 | 0.59 | 0.90 | (0.30) | — | (0.30) | 10.38 | 9.49% | 6,925 | 1.00% | 1.00%n | 3.12% |
9/30/18 | 10.16 | 0.28 | (0.38) | (0.10) | (0.28) | — | (0.28) | 9.78 | (1.01%) | 4,730 | 0.95% | 0.95%n | 2.87% |
Class A | | | | | | | | | | | | | |
9/30/22 | $ 10.49 | $ 0.24 | $ (2.10) | $ (1.86) | $ (0.23) | $ (0.14) | $ (0.37) | $ 8.26 | (18.40%) | $ 5,106 | 1.09% | N/A | 2.46% |
9/30/21 | 10.69 | 0.24 | 0.30 | 0.54 | (0.37) | (0.37) | (0.74) | 10.49 | 5.23% | 9,381 | 1.07% | N/A | 2.33% |
9/30/20 | 10.48 | 0.31 | 0.20 | 0.51 | (0.30) | (0.00)d | (0.30) | 10.69 | 4.96% | 14,756 | 1.06% | N/A | 2.99% |
9/30/19 | 9.85 | 0.30 | 0.60 | 0.90 | (0.27) | — | (0.27) | 10.48 | 9.45% | 28,973 | 1.10% | 1.10%n | 3.01% |
9/30/18 | 10.23 | 0.28 | (0.40) | (0.12) | (0.26) | — | (0.26) | 9.85 | (1.17%) | 32,456 | 1.05% | 1.05%n | 2.78% |
Class R3 | | | | | | | | | | | | | |
9/30/22 | $ 10.30 | $ 0.22 | $ (2.08) | $ (1.86) | $ (0.10) | $ (0.14) | $ (0.24) | $ 8.20 | (18.45%) | $ 1,347 | 1.24% | N/A | 2.35% |
9/30/21 | 10.53 | 0.22 | 0.30 | 0.52 | (0.38) | (0.37) | (0.75) | 10.30 | 5.14% | 3,255 | 1.22% | N/A | 2.16% |
9/30/20 | 10.34 | 0.29 | 0.17 | 0.46 | (0.27) | (0.00)d | (0.27) | 10.53 | 4.61% | 3,881 | 1.21% | N/A | 2.85% |
9/30/19 | 9.72 | 0.28 | 0.60 | 0.88 | (0.26) | — | (0.26) | 10.34 | 9.35% | 3,553 | 1.25% | 1.25%n | 2.85% |
9/30/18 | 10.10 | 0.26 | (0.38) | (0.12) | (0.26) | — | (0.26) | 9.72 | (1.24%) | 4,530 | 1.20% | 1.20%n | 2.64% |
The accompanying notes are an integral part of the financial statements.
171
MassMutual High Yield Fund – Financial Statements (Continued) |
Financial Highlights (For a share outstanding throughout each period) |
| | | Income (loss) from investment
operations | Less distributions to shareholders | | | Ratios / Supplemental Data |
| | Net
asset
value,
beginning
of the
period | Net
investment
income
(loss)c,j | Net
realized
and
unrealized
gain (loss)
on
investments | Total
income
(loss) from
investment
operations | From net
investment
income | From net
realized
gains | Total
distributions | Net
asset
value,
end of
the
period | Total
returnl,m | Net
assets,
end
of the
period
(000’s) | Ratio of
expenses
to average
daily net
assets
before
expense
waivers | Ratio of
expenses
to average
daily net
assets
after
expense
waiversj | Net
investment
income
(loss) to
average
daily net
assets |
Class I | | | | | | | | | | | | | |
9/30/22 | $ 9.34 | $ 0.47 | $ (1.64) | $ (1.17) | $ (0.89) | $ — | $ (0.89) | $ 7.28 | (13.59%) | $ 228,970 | 0.55% | N/A | 5.61% |
9/30/21 | 8.63 | 0.49 | 0.70 | 1.19 | (0.48) | — | (0.48) | 9.34 | 14.20% | 351,942 | 0.54% | N/A | 5.50% |
9/30/20 | 9.21 | 0.50 | (0.52) | (0.02) | (0.56) | — | (0.56) | 8.63 | (0.28%) | 375,807 | 0.53% | N/A | 5.79% |
9/30/19 | 9.27 | 0.56 | (0.10) | 0.46 | (0.52) | — | (0.52) | 9.21 | 5.45% | 326,836 | 0.54% | 0.54%n | 6.31% |
9/30/18 | 9.62 | 0.58 | (0.33) | 0.25 | (0.60) | — | (0.60) | 9.27 | 2.78% | 382,927 | 0.54% | 0.54%n | 6.32% |
Class R5 | | | | | | | | | | | | | |
9/30/22 | $ 9.40 | $ 0.47 | $ (1.66) | $ (1.19) | $ (0.88) | $ — | $ (0.88) | $ 7.33 | (13.74%) | $ 34,164 | 0.65% | N/A | 5.52% |
9/30/21 | 8.68 | 0.49 | 0.70 | 1.19 | (0.47) | — | (0.47) | 9.40 | 14.13% | 46,518 | 0.64% | N/A | 5.39% |
9/30/20 | 9.25 | 0.49 | (0.51) | (0.02) | (0.55) | — | (0.55) | 8.68 | (0.28%) | 49,116 | 0.63% | N/A | 5.69% |
9/30/19 | 9.31 | 0.56 | (0.11) | 0.45 | (0.51) | — | (0.51) | 9.25 | 5.29% | 41,369 | 0.64% | 0.64%n | 6.23% |
9/30/18 | 9.66 | 0.57 | (0.33) | 0.24 | (0.59) | — | (0.59) | 9.31 | 2.65% | 43,613 | 0.64% | 0.64%n | 6.20% |
Service Class | | | | | | | | | | | | |
9/30/22 | $ 9.39 | $ 0.46 | $ (1.66) | $ (1.20) | $ (0.86) | $ — | $ (0.86) | $ 7.33 | (13.81%) | $ 22,158 | 0.75% | N/A | 5.44% |
9/30/21 | 8.67 | 0.48 | 0.70 | 1.18 | (0.46) | — | (0.46) | 9.39 | 14.00% | 29,097 | 0.74% | N/A | 5.31% |
9/30/20 | 9.25 | 0.48 | (0.52) | (0.04) | (0.54) | — | (0.54) | 8.67 | (0.48%) | 33,897 | 0.73% | N/A | 5.58% |
9/30/19 | 9.31 | 0.55 | (0.11) | 0.44 | (0.50) | — | (0.50) | 9.25 | 5.20% | 49,174 | 0.74% | 0.74%n | 6.13% |
9/30/18 | 9.66 | 0.56 | (0.33) | 0.23 | (0.58) | — | (0.58) | 9.31 | 2.55% | 45,296 | 0.74% | 0.74%n | 6.11% |
| | Year ended September 30 |
| | 2022 | 2021 | 2020 | 2019 | 2018 |
Portfolio turnover rate | 53% | 68% | 79% | 54% | 38% |
b | Percentage represents the results for the period and is not annualized. |
c | Per share amount calculated on the average shares method. |
g | For the period December 13, 2021 (commencement of operations) through September 30, 2022. |
j | Computed after giving effect to an agreement by MML Advisers to waive certain fees and expenses of the Fund. |
l | Employee retirement benefit plans that invest plan assets in the Separate Investment Accounts (SIAs) may be subject to certain charges as set forth in their respective Plan Documents. Total return figures would be lower for the periods presented if they reflected these charges. |
m | Total return excludes sales charges, if any, and would be lower for the period presented if it reflected these charges. |
n | Expenses incurred during the period fell under the expense cap. |
The accompanying notes are an integral part of the financial statements.
172
| | | Income (loss) from investment
operations | Less distributions to shareholders | | | Ratios / Supplemental Data |
| | Net
asset
value,
beginning
of the
period | Net
investment
income
(loss)c,j | Net
realized
and
unrealized
gain (loss)
on
investments | Total
income
(loss) from
investment
operations | From net
investment
income | From net
realized
gains | Total
distributions | Net
asset
value,
end of
the
period | Total
returnl,m | Net
assets,
end
of the
period
(000’s) | Ratio of
expenses
to average
daily net
assets
before
expense
waivers | Ratio of
expenses
to average
daily net
assets
after
expense
waiversj | Net
investment
income
(loss) to
average
daily net
assets |
Administrative Class | | | | | | | | | | | |
9/30/22 | $ 9.22 | $ 0.44 | $ (1.62) | $ (1.18) | $ (0.84) | $ — | $ (0.84) | $ 7.20 | (13.85%) | $ 12,693 | 0.85% | N/A | 5.28% |
9/30/21 | 8.53 | 0.46 | 0.68 | 1.14 | (0.45) | — | (0.45) | 9.22 | 13.79% | 23,211 | 0.84% | N/A | 5.20% |
9/30/20 | 9.10 | 0.47 | (0.51) | (0.04) | (0.53) | — | (0.53) | 8.53 | (0.55%) | 23,549 | 0.83% | N/A | 5.49% |
9/30/19 | 9.16 | 0.53 | (0.10) | 0.43 | (0.49) | — | (0.49) | 9.10 | 5.13% | 25,980 | 0.84% | 0.84%n | 6.03% |
9/30/18 | 9.51 | 0.55 | (0.33) | 0.22 | (0.57) | — | (0.57) | 9.16 | 2.49% | 31,250 | 0.84% | 0.84%n | 6.01% |
Class R4 | | | | | | | | | | | | | |
9/30/22 | $ 9.06 | $ 0.42 | $ (1.60) | $ (1.18) | $ (0.81) | $ — | $ (0.81) | $ 7.07 | (14.05%) | $ 30,615 | 1.00% | N/A | 5.19% |
9/30/21 | 8.38 | 0.44 | 0.68 | 1.12 | (0.44) | — | (0.44) | 9.06 | 13.73% | 39,125 | 0.99% | N/A | 5.05% |
9/30/20 | 8.97 | 0.45 | (0.51) | (0.06) | (0.53) | — | (0.53) | 8.38 | (0.75%) | 40,160 | 0.98% | N/A | 5.34% |
9/30/19 | 9.04 | 0.51 | (0.10) | 0.41 | (0.48) | — | (0.48) | 8.97 | 4.97% | 47,055 | 0.99% | 0.99%n | 5.88% |
9/30/18 | 9.40 | 0.53 | (0.33) | 0.20 | (0.56) | — | (0.56) | 9.04 | 2.30% | 35,011 | 0.99% | 0.99%n | 5.87% |
Class A | | | | | | | | | | | | | |
9/30/22 | $ 9.19 | $ 0.42 | $ (1.63) | $ (1.21) | $ (0.78) | $ — | $ (0.78) | $ 7.20 | (14.10%) | $ 8,335 | 1.10% | N/A | 5.06% |
9/30/21 | 8.49 | 0.44 | 0.69 | 1.13 | (0.43) | — | (0.43) | 9.19 | 13.65% | 13,444 | 1.09% | N/A | 4.97% |
9/30/20 | 9.07 | 0.44 | (0.50) | (0.06) | (0.52) | — | (0.52) | 8.49 | (0.81%) | 24,556 | 1.08% | N/A | 5.24% |
9/30/19 | 9.13 | 0.51 | (0.10) | 0.41 | (0.47) | — | (0.47) | 9.07 | 4.89% | 31,392 | 1.09% | 1.09%n | 5.77% |
9/30/18 | 9.49 | 0.52 | (0.33) | 0.19 | (0.55) | — | (0.55) | 9.13 | 2.10% | 27,393 | 1.09% | 1.09%n | 5.76% |
Class R3 | | | | | | | | | | | | | |
9/30/22 | $ 9.31 | $ 0.41 | $ (1.65) | $ (1.24) | $ (0.78) | $ — | $ (0.78) | $ 7.29 | (14.27%) | $ 24,740 | 1.25% | N/A | 4.93% |
9/30/21 | 8.60 | 0.43 | 0.69 | 1.12 | (0.41) | — | (0.41) | 9.31 | 13.41% | 33,334 | 1.24% | N/A | 4.79% |
9/30/20 | 9.17 | 0.44 | (0.52) | (0.08) | (0.49) | — | (0.49) | 8.60 | (0.96%) | 35,047 | 1.23% | N/A | 5.09% |
9/30/19 | 9.23 | 0.50 | (0.10) | 0.40 | (0.46) | — | (0.46) | 9.17 | 4.71% | 42,509 | 1.24% | 1.24%n | 5.63% |
9/30/18 | 9.60 | 0.51 | (0.33) | 0.18 | (0.55) | — | (0.55) | 9.23 | 2.04% | 44,944 | 1.24% | 1.24%n | 5.62% |
Class Y | | | | | | | | | | | | | |
9/30/22g | $ 8.86 | $ 0.38 | $ (1.56) | $ (1.18) | $ (0.38) | $ — | $ (0.38) | $ 7.30 | (13.66%)b | $ 23,397 | 0.60%a | N/A | 5.81%a |
Class C | | | | | | | | | | | | | |
9/30/22g | $ 8.89 | $ 0.32 | $ (1.56) | $ (1.24) | $ (0.32) | $ — | $ (0.32) | $ 7.33 | (14.28%)b | $ 81 | 1.55%a | N/A | 4.78%a |
The accompanying notes are an integral part of the financial statements.
173
MassMutual Balanced Fund – Financial Statements (Continued) |
Financial Highlights (For a share outstanding throughout each period) |
| | | Income (loss) from investment
operations | Less distributions to shareholders | | | Ratios / Supplemental Data |
| | Net
asset
value,
beginning
of the
period | Net
investment
income
(loss)c,j | Net
realized
and
unrealized
gain (loss)
on
investments | Total
income
(loss) from
investment
operations | From net
investment
income | From net
realized
gains | Total
distributions | Net
asset
value,
end of
the
period | Total
returnl,m | Net
assets,
end
of the
period
(000’s) | Ratio of
expenses
to average
daily net
assets
before
expense
waivers | Ratio of
expenses
to average
daily net
assets
after
expense
waiversj | Net
investment
income
(loss) to
average
daily net
assets |
Class I | | | | | | | | | | | | | |
9/30/22 | $ 14.34 | $ 0.16 | $ (1.45) | $ (1.29) | $ (0.22) | $ (3.26) | $ (3.48) | $ 9.57 | (13.65%) | $ 44,532 | 0.70% | N/A | 1.37% |
9/30/21 | 12.40 | 0.16 | 2.21 | 2.37 | (0.21) | (0.22) | (0.43) | 14.34 | 19.60% | 54,692 | 0.69% | N/A | 1.21% |
9/30/20 | 12.07 | 0.21 | 0.90 | 1.11 | (0.27) | (0.51) | (0.78) | 12.40 | 9.49% | 42,455 | 0.71% | N/A | 1.75% |
9/30/19 | 12.86 | 0.24 | (0.09)aa | 0.15 | (0.22) | (0.72) | (0.94) | 12.07 | 1.91% | 31,567 | 0.76% | 0.74% | 2.06% |
9/30/18 | 12.53 | 0.22 | 1.02 | 1.24 | (0.24) | (0.67) | (0.91) | 12.86 | 10.21% | 11,637 | 0.70% | 0.60% | 1.79% |
Class R5 | | | | | | | | | | | | | |
9/30/22 | $ 14.34 | $ 0.15 | $ (1.46) | $ (1.31) | $ (0.20) | $ (3.26) | $ (3.46) | $ 9.57 | (13.74%) | $ 28,960 | 0.80% | N/A | 1.26% |
9/30/21 | 12.39 | 0.15 | 2.22 | 2.37 | (0.20) | (0.22) | (0.42) | 14.34 | 19.58% | 39,742 | 0.79% | N/A | 1.10% |
9/30/20 | 12.07 | 0.20 | 0.89 | 1.09 | (0.26) | (0.51) | (0.77) | 12.39 | 9.29% | 42,199 | 0.81% | N/A | 1.66% |
9/30/19 | 12.85 | 0.23 | (0.09)aa | 0.14 | (0.20) | (0.72) | (0.92) | 12.07 | 1.88% | 45,321 | 0.86% | 0.83% | 1.94% |
9/30/18 | 12.53 | 0.21 | 1.01 | 1.22 | (0.23) | (0.67) | (0.90) | 12.85 | 10.01% | 45,211 | 0.80% | 0.70% | 1.67% |
Service Class | | | | | | | | | | | | |
9/30/22 | $ 15.20 | $ 0.14 | $ (1.58) | $ (1.44) | $ (0.19) | $ (3.26) | $ (3.45) | $ 10.31 | (13.87%) | $ 7,659 | 0.90% | N/A | 1.16% |
9/30/21 | 13.12 | 0.14 | 2.35 | 2.49 | (0.19) | (0.22) | (0.41) | 15.20 | 19.40% | 10,330 | 0.89% | N/A | 1.00% |
9/30/20 | 12.73 | 0.19 | 0.95 | 1.14 | (0.24) | (0.51) | (0.75) | 13.12 | 9.22% | 8,637 | 0.91% | N/A | 1.56% |
9/30/19 | 13.50 | 0.23 | (0.09)aa | 0.14 | (0.19) | (0.72) | (0.91) | 12.73 | 1.73% | 6,045 | 0.96% | 0.92% | 1.84% |
9/30/18 | 13.11 | 0.21 | 1.06 | 1.27 | (0.21) | (0.67) | (0.88) | 13.50 | 9.94% | 7,243 | 0.90% | 0.80% | 1.58% |
| | Year ended September 30 |
| | 2022 | 2021 | 2020 | 2019 | 2018 |
Portfolio turnover rate | 215% | 343% | 113% | 161% | 77% |
c | Per share amount calculated on the average shares method. |
j | Computed after giving effect to an agreement by MML Advisers to waive certain fees and expenses of the Fund. |
l | Employee retirement benefit plans that invest plan assets in the Separate Investment Accounts (SIAs) may be subject to certain charges as set forth in their respective Plan Documents. Total return figures would be lower for the periods presented if they reflected these charges. |
m | Total return excludes sales charges, if any, and would be lower for the period presented if it reflected these charges. |
aa | The amount shown for a share outstanding does not correspond with the aggregate net realized and unrealized gain (loss) for the period due to the timing of purchases and redemptions of Fund shares in relation to the fluctuating market values of the Fund. |
The accompanying notes are an integral part of the financial statements.
174
| | | Income (loss) from investment
operations | Less distributions to shareholders | | | Ratios / Supplemental Data |
| | Net
asset
value,
beginning
of the
period | Net
investment
income
(loss)c,j | Net
realized
and
unrealized
gain (loss)
on
investments | Total
income
(loss) from
investment
operations | From net
investment
income | From net
realized
gains | Total
distributions | Net
asset
value,
end of
the
period | Total
returnl,m | Net
assets,
end
of the
period
(000’s) | Ratio of
expenses
to average
daily net
assets
before
expense
waivers | Ratio of
expenses
to average
daily net
assets
after
expense
waiversj | Net
investment
income
(loss) to
average
daily net
assets |
Administrative Class | | | | | | | | | | | |
9/30/22 | $ 14.39 | $ 0.12 | $ (1.46) | $ (1.34) | $ (0.18) | $ (3.26) | $ (3.44) | $ 9.61 | (13.95%) | $ 6,318 | 1.00% | N/A | 1.07% |
9/30/21 | 12.44 | 0.12 | 2.23 | 2.35 | (0.18) | (0.22) | (0.40) | 14.39 | 19.30% | 7,411 | 0.99% | N/A | 0.90% |
9/30/20 | 12.11 | 0.17 | 0.90 | 1.07 | (0.23) | (0.51) | (0.74) | 12.44 | 9.13% | 5,849 | 1.01% | N/A | 1.44% |
9/30/19 | 12.89 | 0.20 | (0.09)aa | 0.11 | (0.17) | (0.72) | (0.89) | 12.11 | 1.62% | 6,981 | 1.06% | 1.02% | 1.73% |
9/30/18 | 12.55 | 0.18 | 1.02 | 1.20 | (0.19) | (0.67) | (0.86) | 12.89 | 9.88% | 8,129 | 1.00% | 0.90% | 1.47% |
Class R4 | | | | | | | | | | | | | |
9/30/22 | $ 13.77 | $ 0.10 | $ (1.37) | $ (1.27) | $ (0.15) | $ (3.26) | $ (3.41) | $ 9.09 | (14.06%) | $ 4,554 | 1.15% | N/A | 0.92% |
9/30/21 | 11.92 | 0.10 | 2.13 | 2.23 | (0.16) | (0.22) | (0.38) | 13.77 | 19.12% | 5,984 | 1.14% | N/A | 0.76% |
9/30/20 | 11.64 | 0.15 | 0.86 | 1.01 | (0.22) | (0.51) | (0.73) | 11.92 | 8.94% | 2,994 | 1.16% | N/A | 1.31% |
9/30/19 | 12.42 | 0.18 | (0.08)aa | 0.10 | (0.16) | (0.72) | (0.88) | 11.64 | 1.52% | 2,853 | 1.21% | 1.17% | 1.59% |
9/30/18 | 12.15 | 0.16 | 0.97 | 1.13 | (0.19) | (0.67) | (0.86) | 12.42 | 9.58% | 3,499 | 1.15% | 1.05% | 1.34% |
Class A | | | | | | | | | | | | | |
9/30/22 | $ 13.91 | $ 0.09 | $ (1.41) | $ (1.32) | $ (0.12) | $ (3.26) | $ (3.38) | $ 9.21 | (14.22%) | $ 13,123 | 1.25% | N/A | 0.80% |
9/30/21 | 12.03 | 0.09 | 2.16 | 2.25 | (0.15) | (0.22) | (0.37) | 13.91 | 19.07% | 20,919 | 1.24% | N/A | 0.67% |
9/30/20 | 11.74 | 0.14 | 0.86 | 1.00 | (0.20) | (0.51) | (0.71) | 12.03 | 8.80% | 26,626 | 1.26% | N/A | 1.21% |
9/30/19 | 12.51 | 0.17 | (0.08)aa | 0.09 | (0.14) | (0.72) | (0.86) | 11.74 | 1.44% | 26,981 | 1.31% | 1.27% | 1.49% |
9/30/18 | 12.22 | 0.15 | 0.98 | 1.13 | (0.17) | (0.67) | (0.84) | 12.51 | 9.48% | 30,517 | 1.25% | 1.15% | 1.22% |
Class R3 | | | | | | | | | | | | | |
9/30/22 | $ 13.69 | $ 0.07 | $ (1.36) | $ (1.29) | $ (0.13) | $ (3.26) | $ (3.39) | $ 9.01 | (14.27%) | $ 9,643 | 1.40% | N/A | 0.66% |
9/30/21 | 11.85 | 0.07 | 2.11 | 2.18 | (0.12) | (0.22) | (0.34) | 13.69 | 18.81% | 12,390 | 1.39% | N/A | 0.50% |
9/30/20 | 11.57 | 0.12 | 0.85 | 0.97 | (0.18) | (0.51) | (0.69) | 11.85 | 8.66% | 7,503 | 1.41% | N/A | 1.06% |
9/30/19 | 12.36 | 0.15 | (0.08)aa | 0.07 | (0.14) | (0.72) | (0.86) | 11.57 | 1.27% | 7,236 | 1.46% | 1.42% | 1.35% |
9/30/18 | 12.09 | 0.13 | 0.97 | 1.10 | (0.16) | (0.67) | (0.83) | 12.36 | 9.32% | 8,002 | 1.40% | 1.30% | 1.08% |
The accompanying notes are an integral part of the financial statements.
175
MassMutual Disciplined Value Fund – Financial Statements (Continued) |
Financial Highlights (For a share outstanding throughout each period) |
| | | Income (loss) from investment
operations | Less distributions to shareholders | | | Ratios / Supplemental Data |
| | Net
asset
value,
beginning
of the
period | Net
investment
income
(loss)c | Net
realized
and
unrealized
gain (loss)
on
investments | Total
income
(loss) from
investment
operations | From net
investment
income | From net
realized
gains | Total
distributions | Net
asset
value,
end of
the
period | Total
returnl,m | Net
assets,
end of
the
period
(000’s) | Ratio of
expenses
to average
daily net
assets | Net
investment
income
(loss) to
average
daily net
assets |
Class I | | | | | | | | | | | | |
9/30/22 | $ 16.30 | $ 0.20 | $ (1.43) | $ (1.23) | $ (0.22) | $ (2.56) | $ (2.78) | $ 12.29 | (10.19%) | $ 24,938 | 0.76% | 1.40% |
9/30/21 | 12.08 | 0.22 | 4.28 | 4.50 | (0.28) | — | (0.28) | 16.30 | 37.75% | 31,848 | 0.74% | 1.46% |
9/30/20 | 13.98 | 0.28 | (1.16) | (0.88) | (0.31) | (0.71) | (1.02) | 12.08 | (7.26%) | 20,650 | 0.72% | 2.20% |
9/30/19 | 17.06 | 0.28 | (0.76) | (0.48) | (0.40) | (2.20) | (2.60) | 13.98 | (1.20%) | 16,781 | 0.64% | 2.03% |
9/30/18 | 17.67 | 0.29 | 1.28 | 1.57 | (0.36) | (1.82) | (2.18) | 17.06 | 9.34% | 19,546 | 0.57% | 1.74% |
Class R5 | | | | | | | | | | | | |
9/30/22 | $ 16.34 | $ 0.19 | $ (1.44) | $ (1.25) | $ (0.20) | $ (2.56) | $ (2.76) | $ 12.33 | (10.28%) | $ 19,907 | 0.85% | 1.27% |
9/30/21 | 12.11 | 0.21 | 4.28 | 4.49 | (0.26) | — | (0.26) | 16.34 | 37.57% | 35,564 | 0.84% | 1.39% |
9/30/20 | 14.01 | 0.27 | (1.17) | (0.90) | (0.29) | (0.71) | (1.00) | 12.11 | (7.34%) | 32,418 | 0.82% | 2.10% |
9/30/19 | 17.09 | 0.27 | (0.76) | (0.49) | (0.39) | (2.20) | (2.59) | 14.01 | (1.32%) | 53,709 | 0.74% | 1.92% |
9/30/18 | 17.69 | 0.28 | 1.28 | 1.56 | (0.34) | (1.82) | (2.16) | 17.09 | 9.27% | 59,987 | 0.67% | 1.65% |
Service Class | | | | | | | | | | | |
9/30/22 | $ 16.19 | $ 0.17 | $ (1.43) | $ (1.26) | $ (0.18) | $ (2.56) | $ (2.74) | $ 12.19 | (10.38%) | $ 11,925 | 0.96% | 1.20% |
9/30/21 | 12.00 | 0.19 | 4.25 | 4.44 | (0.25) | — | (0.25) | 16.19 | 37.48% | 16,120 | 0.94% | 1.27% |
9/30/20 | 13.88 | 0.25 | (1.16) | (0.91) | (0.26) | (0.71) | (0.97) | 12.00 | (7.46%) | 11,618 | 0.92% | 1.98% |
9/30/19 | 16.95 | 0.25 | (0.76) | (0.51) | (0.36) | (2.20) | (2.56) | 13.88 | (1.43%) | 20,401 | 0.84% | 1.82% |
9/30/18 | 17.57 | 0.26 | 1.26 | 1.52 | (0.32) | (1.82) | (2.14) | 16.95 | 9.10% | 50,102 | 0.77% | 1.55% |
| | Year ended September 30 |
| | 2022 | 2021 | 2020 | 2019 | 2018 |
Portfolio turnover rate | 40% | 189% | 57% | 53% | 80% |
c | Per share amount calculated on the average shares method. |
l | Employee retirement benefit plans that invest plan assets in the Separate Investment Accounts (SIAs) may be subject to certain charges as set forth in their respective Plan Documents. Total return figures would be lower for the periods presented if they reflected these charges. |
m | Total return excludes sales charges, if any, and would be lower for the period presented if it reflected these charges. |
The accompanying notes are an integral part of the financial statements.
176
| | | Income (loss) from investment
operations | Less distributions to shareholders | | | Ratios / Supplemental Data |
| | Net
asset
value,
beginning
of the
period | Net
investment
income
(loss)c | Net
realized
and
unrealized
gain (loss)
on
investments | Total
income
(loss) from
investment
operations | From net
investment
income | From net
realized
gains | Total
distributions | Net
asset
value,
end of
the
period | Total
returnl,m | Net
assets,
end of
the
period
(000’s) | Ratio of
expenses
to average
daily net
assets | Net
investment
income
(loss) to
average
daily net
assets |
Administrative Class | | | | | | | | | | |
9/30/22 | $ 16.57 | $ 0.16 | $ (1.47) | $ (1.31) | $ (0.15) | $ (2.56) | $ (2.71) | $ 12.55 | (10.45%) | $ 1,154 | 1.06% | 1.10% |
9/30/21 | 12.28 | 0.18 | 4.35 | 4.53 | (0.24) | — | (0.24) | 16.57 | 37.32% | 1,652 | 1.04% | 1.23% |
9/30/20 | 14.20 | 0.24 | (1.20) | (0.96) | (0.25) | (0.71) | (0.96) | 12.28 | (7.62%) | 4,214 | 1.02% | 1.88% |
9/30/19 | 17.27 | 0.25 | (0.76) | (0.51) | (0.36) | (2.20) | (2.56) | 14.20 | (1.46%) | 5,731 | 0.94% | 1.72% |
9/30/18 | 17.86 | 0.25 | 1.29 | 1.54 | (0.31) | (1.82) | (2.13) | 17.27 | 9.02% | 9,147 | 0.87% | 1.46% |
Class R4 | | | | | | | | | | | | |
9/30/22 | $ 15.85 | $ 0.13 | $ (1.39) | $ (1.26) | $ (0.14) | $ (2.56) | $ (2.70) | $ 11.89 | (10.62%) | $ 1,293 | 1.20% | 0.87% |
9/30/21 | 11.76 | 0.15 | 4.16 | 4.31 | (0.22) | — | (0.22) | 15.85 | 37.08% | 2,731 | 1.19% | 1.06% |
9/30/20 | 13.63 | 0.21 | (1.13) | (0.92) | (0.24) | (0.71) | (0.95) | 11.76 | (7.70%) | 2,707 | 1.17% | 1.73% |
9/30/19 | 16.67 | 0.22 | (0.75) | (0.53) | (0.31) | (2.20) | (2.51) | 13.63 | (1.65%) | 4,039 | 1.09% | 1.58% |
9/30/18 | 17.32 | 0.22 | 1.24 | 1.46 | (0.29) | (1.82) | (2.11) | 16.67 | 8.84% | 6,428 | 1.02% | 1.30% |
Class A | | | | | | | | | | | | |
9/30/22 | $ 15.98 | $ 0.12 | $ (1.41) | $ (1.29) | $ (0.12) | $ (2.56) | $ (2.68) | $ 12.01 | (10.68%) | $ 4,245 | 1.30% | 0.83% |
9/30/21 | 11.85 | 0.14 | 4.20 | 4.34 | (0.21) | — | (0.21) | 15.98 | 37.00% | 6,784 | 1.29% | 0.93% |
9/30/20 | 13.73 | 0.21 | (1.15) | (0.94) | (0.23) | (0.71) | (0.94) | 11.85 | (7.77%) | 5,569 | 1.27% | 1.66% |
9/30/19 | 16.78 | 0.20 | (0.74) | (0.54) | (0.31) | (2.20) | (2.51) | 13.73 | (1.75%) | 6,012 | 1.19% | 1.48% |
9/30/18 | 17.39 | 0.20 | 1.25 | 1.45 | (0.24) | (1.82) | (2.06) | 16.78 | 8.74% | 8,886 | 1.12% | 1.20% |
Class R3 | | | | | | | | | | | | |
9/30/22 | $ 16.12 | $ 0.10 | $ (1.43) | $ (1.33) | $ (0.10) | $ (2.56) | $ (2.66) | $ 12.13 | (10.86%) | $ 3,732 | 1.46% | 0.72% |
9/30/21 | 11.95 | 0.12 | 4.24 | 4.36 | (0.19) | — | (0.19) | 16.12 | 36.87% | 4,873 | 1.44% | 0.79% |
9/30/20 | 13.85 | 0.19 | (1.17) | (0.98) | (0.21) | (0.71) | (0.92) | 11.95 | (7.98%) | 3,988 | 1.42% | 1.50% |
9/30/19 | 16.90 | 0.18 | (0.74) | (0.56) | (0.29) | (2.20) | (2.49) | 13.85 | (1.85%) | 4,346 | 1.34% | 1.33% |
9/30/18 | 17.56 | 0.18 | 1.25 | 1.43 | (0.27) | (1.82) | (2.09) | 16.90 | 8.53% | 4,196 | 1.27% | 1.05% |
The accompanying notes are an integral part of the financial statements.
177
MassMutual Main Street Fund – Financial Statements (Continued) |
Financial Highlights (For a share outstanding throughout each period) |
| | | Income (loss) from investment
operations | Less distributions to shareholders | | | Ratios / Supplemental Data |
| | Net
asset
value,
beginning
of the
period | Net
investment
income
(loss)c | Net
realized
and
unrealized
gain (loss)
on
investments | Total
income
(loss) from
investment
operations | From net
investment
income | From net
realized
gains | Total
distributions | Net
asset
value,
end of
the
period | Total
returnl,m | Net
assets,
end of
the
period
(000’s) | Ratio of
expenses
to average
daily net
assets | Net
investment
income
(loss) to
average
daily net
assets |
Class I | | | | | | | | | | | | |
9/30/22 | $ 14.00 | $ 0.09 | $ (1.98) | $ (1.89) | $ (0.11) | $ (2.88) | $ (2.99) | $ 9.12 | (18.90%) | $ 3,154 | 0.78% | 0.75% |
9/30/21 | 11.28 | 0.11 | 3.00 | 3.11 | (0.12) | (0.27) | (0.39) | 14.00 | 28.21% | 27,948 | 0.75% | 0.84% |
9/30/20 | 11.07 | 0.11 | 1.19 | 1.30 | (0.13) | (0.96) | (1.09) | 11.28 | 12.22% | 30,273 | 0.74% | 1.03% |
9/30/19 | 12.04 | 0.14 | 0.30 | 0.44 | (0.13) | (1.28) | (1.41) | 11.07 | 5.60% | 24,639 | 0.73% | 1.29% |
9/30/18 | 11.94 | 0.14 | 0.89 | 1.03 | (0.14) | (0.79) | (0.93) | 12.04 | 9.11% | 24,123 | 0.71% | 1.17% |
Class R5 | | | | | | | | | | | | |
9/30/22 | $ 13.99 | $ 0.08 | $ (1.97) | $ (1.89) | $ (0.10) | $ (2.88) | $ (2.98) | $ 9.12 | (18.90%) | $ 31,307 | 0.88% | 0.66% |
9/30/21 | 11.27 | 0.10 | 2.99 | 3.09 | (0.10) | (0.27) | (0.37) | 13.99 | 28.11% | 47,342 | 0.85% | 0.74% |
9/30/20 | 11.06 | 0.10 | 1.18 | 1.28 | (0.11) | (0.96) | (1.07) | 11.27 | 12.10% | 45,358 | 0.84% | 0.93% |
9/30/19 | 12.03 | 0.13 | 0.29 | 0.42 | (0.11) | (1.28) | (1.39) | 11.06 | 5.47% | 48,226 | 0.83% | 1.19% |
9/30/18 | 11.93 | 0.12 | 0.90 | 1.02 | (0.13) | (0.79) | (0.92) | 12.03 | 9.00% | 67,695 | 0.81% | 1.04% |
Service Class | | | | | | | | | | | |
9/30/22 | $ 14.62 | $ 0.07 | $ (2.09) | $ (2.02) | $ (0.09) | $ (2.88) | $ (2.97) | $ 9.63 | (19.00%) | $ 107 | 0.98% | 0.57% |
9/30/21 | 11.75 | 0.08 | 3.14 | 3.22 | (0.08) | (0.27) | (0.35) | 14.62 | 28.00% | 160 | 0.95% | 0.62% |
9/30/20 | 11.50 | 0.09 | 1.22 | 1.31 | (0.10) | (0.96) | (1.06) | 11.75 | 11.88% | 182 | 0.94% | 0.82% |
9/30/19 | 12.44 | 0.12 | 0.32 | 0.44 | (0.10) | (1.28) | (1.38) | 11.50 | 5.38% | 652 | 0.93% | 1.08% |
9/30/18 | 12.30 | 0.11 | 0.93 | 1.04 | (0.11) | (0.79) | (0.90) | 12.44 | 8.94% | 738 | 0.91% | 0.95% |
| | Year ended September 30 |
| | 2022 | 2021 | 2020 | 2019 | 2018 |
Portfolio turnover rate | 48% | 46% | 38% | 55% | 64% |
c | Per share amount calculated on the average shares method. |
l | Employee retirement benefit plans that invest plan assets in the Separate Investment Accounts (SIAs) may be subject to certain charges as set forth in their respective Plan Documents. Total return figures would be lower for the periods presented if they reflected these charges |
m | Total return excludes sales charges, if any, and would be lower for the period presented if it reflected these charges. |
The accompanying notes are an integral part of the financial statements.
178
| | | Income (loss) from investment
operations | Less distributions to shareholders | | | Ratios / Supplemental Data |
| | Net
asset
value,
beginning
of the
period | Net
investment
income
(loss)c | Net
realized
and
unrealized
gain (loss)
on
investments | Total
income
(loss) from
investment
operations | From net
investment
income | From net
realized
gains | Total
distributions | Net
asset
value,
end of
the
period | Total
returnl,m | Net
assets,
end of
the
period
(000’s) | Ratio of
expenses
to average
daily net
assets | Net
investment
income
(loss) to
average
daily net
assets |
Administrative Class | | | | | | | | | | |
9/30/22 | $ 13.97 | $ 0.05 | $ (1.97) | $ (1.92) | $ (0.07) | $ (2.88) | $ (2.95) | $ 9.10 | (19.11%) | $ 17,867 | 1.08% | 0.45% |
9/30/21 | 11.25 | 0.07 | 3.00 | 3.07 | (0.08) | (0.27) | (0.35) | 13.97 | 27.91% | 24,389 | 1.05% | 0.53% |
9/30/20 | 11.05 | 0.08 | 1.17 | 1.25 | (0.09) | (0.96) | (1.05) | 11.25 | 11.79% | 21,264 | 1.04% | 0.73% |
9/30/19 | 12.01 | 0.10 | 0.31 | 0.41 | (0.09) | (1.28) | (1.37) | 11.05 | 5.30% | 24,458 | 1.03% | 0.98% |
9/30/18 | 11.91 | 0.10 | 0.89 | 0.99 | (0.10) | (0.79) | (0.89) | 12.01 | 8.79% | 28,295 | 1.01% | 0.84% |
Class R4 | | | | | | | | | | | | |
9/30/22 | $ 13.56 | $ 0.03 | $ (1.88) | $ (1.85) | $ (0.05) | $ (2.88) | $ (2.93) | $ 8.78 | (19.16%) | $ 5,889 | 1.23% | 0.31% |
9/30/21 | 10.94 | 0.05 | 2.91 | 2.96 | (0.07) | (0.27) | (0.34) | 13.56 | 27.64% | 8,266 | 1.20% | 0.38% |
9/30/20 | 10.77 | 0.06 | 1.15 | 1.21 | (0.08) | (0.96) | (1.04) | 10.94 | 11.68% | 6,418 | 1.19% | 0.58% |
9/30/19 | 11.75 | 0.09 | 0.29 | 0.38 | (0.08) | (1.28) | (1.36) | 10.77 | 5.08% | 6,379 | 1.18% | 0.83% |
9/30/18 | 11.67 | 0.08 | 0.87 | 0.95 | (0.08) | (0.79) | (0.87) | 11.75 | 8.63% | 6,394 | 1.16% | 0.70% |
Class A | | | | | | | | | | | | |
9/30/22 | $ 13.70 | $ 0.02 | $ (1.91) | $ (1.89) | $ (0.03) | $ (2.88) | $ (2.91) | $ 8.90 | (19.22%) | $ 7,887 | 1.33% | 0.21% |
9/30/21 | 11.04 | 0.04 | 2.94 | 2.98 | (0.05) | (0.27) | (0.32) | 13.70 | 27.56% | 10,628 | 1.30% | 0.31% |
9/30/20 | 10.86 | 0.05 | 1.15 | 1.20 | (0.06) | (0.96) | (1.02) | 11.04 | 11.53% | 12,086 | 1.29% | 0.48% |
9/30/19 | 11.83 | 0.08 | 0.29 | 0.37 | (0.06) | (1.28) | (1.34) | 10.86 | 5.01% | 12,843 | 1.28% | 0.74% |
9/30/18 | 11.75 | 0.07 | 0.88 | 0.95 | (0.08) | (0.79) | (0.87) | 11.83 | 8.49% | 14,495 | 1.26% | 0.60% |
Class R3 | | | | | | | | | | | | |
9/30/22 | $ 13.73 | $ 0.01 | $ (1.93) | $ (1.92) | $ — | $ (2.88) | $ (2.88) | $ 8.93 | (19.37%) | $ 752 | 1.48% | 0.06% |
9/30/21 | 11.07 | 0.02 | 2.95 | 2.97 | (0.04) | (0.27) | (0.31) | 13.73 | 27.36% | 1,277 | 1.45% | 0.14% |
9/30/20 | 10.88 | 0.03 | 1.16 | 1.19 | (0.04) | (0.96) | (1.00) | 11.07 | 11.41% | 1,219 | 1.44% | 0.33% |
9/30/19 | 11.85 | 0.06 | 0.30 | 0.36 | (0.05) | (1.28) | (1.33) | 10.88 | 4.87% | 1,239 | 1.43% | 0.61% |
9/30/18 | 11.76 | 0.05 | 0.88 | 0.93 | (0.05) | (0.79) | (0.84) | 11.85 | 8.34% | 1,813 | 1.41% | 0.45% |
The accompanying notes are an integral part of the financial statements.
179
MassMutual Disciplined Growth Fund – Financial Statements (Continued) |
Financial Highlights (For a share outstanding throughout each period) |
| | | Income (loss) from investment
operations | Less distributions to shareholders | | | Ratios / Supplemental Data |
| | Net
asset
value,
beginning
of the
period | Net
investment
income
(loss)c | Net
realized
and
unrealized
gain (loss)
on
investments | Total
income
(loss) from
investment
operations | From net
investment
income | From net
realized
gains | Total
distributions | Net
asset
value,
end of
the
period | Total
returnl,m | Net
assets,
end of
the
period
(000’s) | Ratio of
expenses
to average
daily net
assets | Net
investment
income
(loss) to
average
daily net
assets |
Class I | | | | | | | | | | | | |
9/30/22 | $ 15.56 | $ 0.02bb | $ (1.93) | $ (1.91) | $ — | $ (6.16) | $ (6.16) | $ 7.49 | (24.92%) | $ 18,483 | 0.58% | 0.18% |
9/30/21 | 12.85 | 0.04 | 3.27 | 3.31 | (0.06) | (0.54) | (0.60) | 15.56 | 26.75% | 31,388 | 0.57% | 0.26% |
9/30/20 | 11.00 | 0.09 | 3.18 | 3.27 | (0.11) | (1.31) | (1.42) | 12.85 | 32.63% | 35,702 | 0.56% | 0.77% |
9/30/19 | 14.37 | 0.10 | (0.47) | (0.37) | (0.15) | (2.85) | (3.00) | 11.00 | 0.99% | 28,367 | 0.55% | 0.89% |
9/30/18 | 13.13 | 0.10 | 2.81 | 2.91 | (0.12) | (1.55) | (1.67) | 14.37 | 23.95% | 30,279 | 0.52% | 0.78% |
Class R5 | | | | | | | | | | | | |
9/30/22 | $ 15.57 | $ 0.01bb | $ (1.93) | $ (1.92) | $ — | $ (6.16) | $ (6.16) | $ 7.49 | (24.92%) | $ 73,291 | 0.68% | 0.09% |
9/30/21 | 12.85 | 0.02 | 3.29 | 3.31 | (0.05) | (0.54) | (0.59) | 15.57 | 26.72% | 108,948 | 0.67% | 0.15% |
9/30/20 | 11.00 | 0.07 | 3.19 | 3.26 | (0.10) | (1.31) | (1.41) | 12.85 | 32.48% | 101,466 | 0.66% | 0.67% |
9/30/19 | 14.37 | 0.09 | (0.48) | (0.39) | (0.13) | (2.85) | (2.98) | 11.00 | 0.85% | 100,651 | 0.65% | 0.79% |
9/30/18 | 13.14 | 0.09 | 2.80 | 2.89 | (0.11) | (1.55) | (1.66) | 14.37 | 23.72% | 112,178 | 0.62% | 0.69% |
Service Class | | | | | | | | | | | |
9/30/22 | $ 15.65 | $ (0.00)d | $ (1.95) | $ (1.95) | $ — | $ (6.16) | $ (6.16) | $ 7.54 | (25.04%) | $ 14,309 | 0.78% | (0.02%) |
9/30/21 | 12.92 | 0.01 | 3.30 | 3.31 | (0.04) | (0.54) | (0.58) | 15.65 | 26.53% | 25,505 | 0.77% | 0.05% |
9/30/20 | 11.04 | 0.06 | 3.20 | 3.26 | (0.07) | (1.31) | (1.38) | 12.92 | 32.33% | 25,668 | 0.76% | 0.57% |
9/30/19 | 14.40 | 0.08 | (0.47) | (0.39) | (0.12) | (2.85) | (2.97) | 11.04 | 0.79% | 31,895 | 0.75% | 0.71% |
9/30/18 | 13.17 | 0.08 | 2.80 | 2.88 | (0.10) | (1.55) | (1.65) | 14.40 | 23.54% | 74,294 | 0.72% | 0.59% |
| | Year ended September 30 |
| | 2022 | 2021 | 2020 | 2019 | 2018 |
Portfolio turnover rate | 60% | 110% | 50% | 49% | 73% |
c | Per share amount calculated on the average shares method. |
d | Amount is less than $0.005 per share. |
l | Employee retirement benefit plans that invest plan assets in the Separate Investment Accounts (SIAs) may be subject to certain charges as set forth in their respective Plan Documents. Total return figures would be lower for the periods presented if they reflected these charges. |
m | Total return excludes sales charges, if any, and would be lower for the period presented if it reflected these charges. |
bb | The amount shown for a share outstanding does not correspond with the aggregate net investment income (loss) as shown on the Statement of Operations for the period due to the timing of class-specific expenses. See Note 3 for each fund’s expense structure. |
The accompanying notes are an integral part of the financial statements.
180
| | | Income (loss) from investment
operations | Less distributions to shareholders | | | Ratios / Supplemental Data |
| | Net
asset
value,
beginning
of the
period | Net
investment
income
(loss)c | Net
realized
and
unrealized
gain (loss)
on
investments | Total
income
(loss) from
investment
operations | From net
investment
income | From net
realized
gains | Total
distributions | Net
asset
value,
end of
the
period | Total
returnl,m | Net
assets,
end of
the
period
(000’s) | Ratio of
expenses
to average
daily net
assets | Net
investment
income
(loss) to
average
daily net
assets |
Administrative Class | | | | | | | | | | |
9/30/22 | $ 15.89 | $ (0.01) | $ (2.01) | $ (2.02) | $ — | $ (6.16) | $ (6.16) | $ 7.71 | (25.13%) | $ 24,021 | 0.88% | (0.11%) |
9/30/21 | 13.10 | (0.01) | 3.36 | 3.35 | (0.02) | (0.54) | (0.56) | 15.89 | 26.46% | 36,207 | 0.87% | (0.05%) |
9/30/20 | 11.19 | 0.05 | 3.25 | 3.30 | (0.08) | (1.31) | (1.39) | 13.10 | 32.19% | 36,957 | 0.86% | 0.47% |
9/30/19 | 14.55 | 0.07 | (0.47) | (0.40) | (0.11) | (2.85) | (2.96) | 11.19 | 0.66% | 37,316 | 0.85% | 0.60% |
9/30/18 | 13.28 | 0.07 | 2.83 | 2.90 | (0.08) | (1.55) | (1.63) | 14.55 | 23.51% | 42,622 | 0.82% | 0.49% |
Class R4 | | | | | | | | | | | | |
9/30/22 | $ 15.06 | $ (0.03) | $ (1.79) | $ (1.82) | $ — | $ (6.16) | $ (6.16) | $ 7.08 | (25.23%) | $ 6,348 | 1.03% | (0.28%) |
9/30/21 | 12.45 | (0.03) | 3.18 | 3.15 | — | (0.54) | (0.54) | 15.06 | 26.20% | 12,613 | 1.02% | (0.22%) |
9/30/20 | 10.70 | 0.03 | 3.09 | 3.12 | (0.06) | (1.31) | (1.37) | 12.45 | 31.97% | 28,832 | 1.01% | 0.31% |
9/30/19 | 14.05 | 0.05 | (0.46) | (0.41) | (0.09) | (2.85) | (2.94) | 10.70 | 0.59% | 24,049 | 1.00% | 0.45% |
9/30/18 | 12.89 | 0.04 | 2.74 | 2.78 | (0.07) | (1.55) | (1.62) | 14.05 | 23.26% | 31,265 | 0.97% | 0.34% |
Class A | | | | | | | | | | | | |
9/30/22 | $ 15.23 | $ (0.04) | $ (1.83) | $ (1.87) | $ — | $ (6.16) | $ (6.16) | $ 7.20 | (25.29%) | $ 14,354 | 1.13% | (0.38%) |
9/30/21 | 12.59 | (0.04) | 3.22 | 3.18 | — | (0.54) | (0.54) | 15.23 | 26.12% | 26,591 | 1.12% | (0.30%) |
9/30/20 | 10.80 | 0.02 | 3.13 | 3.15 | (0.05) | (1.31) | (1.36) | 12.59 | 31.87% | 27,988 | 1.11% | 0.22% |
9/30/19 | 14.15 | 0.04 | (0.47) | (0.43) | (0.07) | (2.85) | (2.92) | 10.80 | 0.42% | 29,210 | 1.10% | 0.35% |
9/30/18 | 12.95 | 0.03 | 2.77 | 2.80 | (0.05) | (1.55) | (1.60) | 14.15 | 23.22% | 39,399 | 1.07% | 0.24% |
Class R3 | | | | | | | | | | | | |
9/30/22 | $ 15.00 | $ (0.05) | $ (1.78) | $ (1.83) | $ — | $ (6.16) | $ (6.16) | $ 7.01 | (25.46%) | $ 3,959 | 1.28% | (0.51%) |
9/30/21 | 12.43 | (0.06) | 3.17 | 3.11 | — | (0.54) | (0.54) | 15.00 | 25.88% | 5,002 | 1.27% | (0.46%) |
9/30/20 | 10.66 | 0.01 | 3.09 | 3.10 | (0.02) | (1.31) | (1.33) | 12.43 | 31.78% | 5,875 | 1.26% | 0.05% |
9/30/19 | 14.02 | 0.02 | (0.47) | (0.45) | (0.06) | (2.85) | (2.91) | 10.66 | 0.23% | 6,015 | 1.25% | 0.20% |
9/30/18 | 12.86 | 0.01 | 2.74 | 2.75 | (0.04) | (1.55) | (1.59) | 14.02 | 23.01% | 7,119 | 1.22% | 0.10% |
The accompanying notes are an integral part of the financial statements.
181
MassMutual Small Cap Opportunities Fund – Financial Statements (Continued) |
Financial Highlights (For a share outstanding throughout each period) |
| | | Income (loss) from investment
operations | Less distributions to shareholders | | | Ratios / Supplemental Data |
| | Net
asset
value,
beginning
of the
period | Net
investment
income
(loss)c | Net
realized
and
unrealized
gain (loss)
on
investments | Total
income
(loss) from
investment
operations | From net
investment
income | From net
realized
gains | Total
distributions | Net
asset
value,
end of
the
period | Total
returnl,m | Net
assets,
end of
the
period
(000’s) | Ratio of
expenses
to average
daily net
assets | Net
investment
income
(loss) to
average
daily net
assets |
Class I | | | | | | | | | | | | |
9/30/22 | $ 19.21 | $ 0.08 | $ (3.28) | $ (3.20) | $ — | $ (1.81) | $ (1.81) | $ 14.20 | (18.57%) | $ 95,436 | 0.66% | 0.48% |
9/30/21 | 13.96 | 0.06 | 6.51 | 6.57 | (0.11) | (1.21) | (1.32) | 19.21 | 48.95% | 85,183 | 0.66% | 0.35% |
9/30/20 | 13.72 | 0.10 | 0.27 | 0.37 | (0.06) | (0.07) | (0.13) | 13.96 | 2.62% | 39,988 | 0.69% | 0.77% |
9/30/19 | 16.47 | 0.11 | (1.43) | (1.32) | (0.07) | (1.36) | (1.43) | 13.72 | (7.01%) | 35,326 | 0.70% | 0.82% |
9/30/18 | 16.41 | 0.11 | 1.96 | 2.07 | (0.07) | (1.94) | (2.01) | 16.47 | 13.93% | 40,439 | 0.69% | 0.73% |
Class R5 | | | | | | | | | | | | |
9/30/22 | $ 19.16 | $ 0.06 | $ (3.27) | $ (3.21) | $ — | $ (1.81) | $ (1.81) | $ 14.14 | (18.68%) | $ 100,585 | 0.75% | 0.35% |
9/30/21 | 13.93 | 0.05 | 6.48 | 6.53 | (0.09) | (1.21) | (1.30) | 19.16 | 48.78% | 137,127 | 0.76% | 0.26% |
9/30/20 | 13.69 | 0.09 | 0.27 | 0.36 | (0.05) | (0.07) | (0.12) | 13.93 | 2.56% | 92,440 | 0.79% | 0.68% |
9/30/19 | 16.44 | 0.10 | (1.43) | (1.33) | (0.06) | (1.36) | (1.42) | 13.69 | (7.14%) | 61,826 | 0.80% | 0.71% |
9/30/18 | 16.38 | 0.10 | 1.96 | 2.06 | (0.06) | (1.94) | (2.00) | 16.44 | 13.82% | 77,025 | 0.79% | 0.62% |
Service Class | | | | | | | | | | | |
9/30/22 | $ 19.11 | $ 0.04 | $ (3.26) | $ (3.22) | $ — | $ (1.81) | $ (1.81) | $ 14.08 | (18.78%) | $ 15,851 | 0.85% | 0.24% |
9/30/21 | 13.89 | 0.03 | 6.48 | 6.51 | (0.08) | (1.21) | (1.29) | 19.11 | 48.72% | 24,560 | 0.86% | 0.17% |
9/30/20 | 13.66 | 0.08 | 0.25 | 0.33 | (0.03) | (0.07) | (0.10) | 13.89 | 2.37% | 17,146 | 0.89% | 0.58% |
9/30/19 | 16.39 | 0.08 | (1.41) | (1.33) | (0.04) | (1.36) | (1.40) | 13.66 | (7.16%) | 17,073 | 0.90% | 0.61% |
9/30/18 | 16.34 | 0.08 | 1.95 | 2.03 | (0.04) | (1.94) | (1.98) | 16.39 | 13.68% | 18,192 | 0.89% | 0.52% |
| | Year ended September 30 |
| | 2022 | 2021 | 2020 | 2019 | 2018 |
Portfolio turnover rate | 39% | 40% | 47% | 34% | 57% |
c | Per share amount calculated on the average shares method. |
d | Amount is less than $0.005 per share. |
e | Amount is less than 0.005%. |
l | Employee retirement benefit plans that invest plan assets in the Separate Investment Accounts (SIAs) may be subject to certain charges as set forth in their respective Plan Documents. Total return figures would be lower for the periods presented if they reflected these charges. |
m | Total return excludes sales charges, if any, and would be lower for the period presented if it reflected these charges. |
bb | The amount shown for a share outstanding does not correspond with the aggregate net investment income (loss) as shown on the Statement of Operations for the period due to the timing of class-specific expenses. See Note 3 for each fund’s expense structure. |
The accompanying notes are an integral part of the financial statements.
182
| | | Income (loss) from investment
operations | Less distributions to shareholders | | | Ratios / Supplemental Data |
| | Net
asset
value,
beginning
of the
period | Net
investment
income
(loss)c | Net
realized
and
unrealized
gain (loss)
on
investments | Total
income
(loss) from
investment
operations | From net
investment
income | From net
realized
gains | Total
distributions | Net
asset
value,
end of
the
period | Total
returnl,m | Net
assets,
end of
the
period
(000’s) | Ratio of
expenses
to average
daily net
assets | Net
investment
income
(loss) to
average
daily net
assets |
Administrative Class | | | | | | | | | | | |
9/30/22 | $ 18.97 | $ 0.02 | $ (3.23) | $ (3.21) | $ — | $ (1.81) | $ (1.81) | $ 13.95 | (18.88%) | $ 20,100 | 0.95% | 0.15% |
9/30/21 | 13.80 | 0.01 | 6.44 | 6.45 | (0.07) | (1.21) | (1.28) | 18.97 | 48.54% | 26,314 | 0.96% | 0.07% |
9/30/20 | 13.57 | 0.06 | 0.26 | 0.32 | (0.02) | (0.07) | (0.09) | 13.80 | 2.27% | 18,422 | 0.99% | 0.48% |
9/30/19 | 16.29 | 0.07 | (1.41) | (1.34) | (0.02) | (1.36) | (1.38) | 13.57 | (7.28%) | 20,377 | 1.00% | 0.51% |
9/30/18 | 16.25 | 0.07 | 1.94 | 2.01 | (0.03) | (1.94) | (1.97) | 16.29 | 13.59% | 26,503 | 0.99% | 0.42% |
Class R4 | | | | | | | | | | | | |
9/30/22 | $ 18.28 | $ (0.00)bb,d | $ (3.10) | $ (3.10) | $ — | $ (1.81) | $ (1.81) | $ 13.37 | (18.99%) | $ 11,835 | 1.10% | (0.00%)e |
9/30/21 | 13.34 | (0.02) | 6.22 | 6.20 | (0.05) | (1.21) | (1.26) | 18.28 | 48.31% | 15,682 | 1.11% | (0.09%) |
9/30/20 | 13.12 | 0.04 | 0.25 | 0.29 | — | (0.07) | (0.07) | 13.34 | 2.16% | 9,413 | 1.14% | 0.32% |
9/30/19 | 15.81 | 0.05 | (1.38) | (1.33) | (0.00)d | (1.36) | (1.36) | 13.12 | (7.43%) | 10,591 | 1.15% | 0.36% |
9/30/18 | 15.83 | 0.04 | 1.89 | 1.93 | (0.01) | (1.94) | (1.95) | 15.81 | 13.42% | 11,773 | 1.14% | 0.26% |
Class A | | | | | | | | | | | | |
9/30/22 | $ 18.40 | $ (0.02)bb | $ (3.11) | $ (3.13) | $ — | $ (1.81) | $ (1.81) | $ 13.46 | (19.04%) | $ 38,730 | 1.20% | (0.11%) |
9/30/21 | 13.42 | (0.03) | 6.25 | 6.22 | (0.03) | (1.21) | (1.24) | 18.40 | 48.15% | 55,207 | 1.21% | (0.18%) |
9/30/20 | 13.21 | 0.03 | 0.25 | 0.28 | — | (0.07) | (0.07) | 13.42 | 2.07% | 42,491 | 1.24% | 0.22% |
9/30/19 | 15.92 | 0.03 | (1.38) | (1.35) | — | (1.36) | (1.36) | 13.21 | (7.54%) | 50,524 | 1.25% | 0.26% |
9/30/18 | 15.93 | 0.03 | 1.90 | 1.93 | — | (1.94) | (1.94) | 15.92 | 13.34% | 69,157 | 1.24% | 0.17% |
Class R3 | | | | | | | | | | | | |
9/30/22 | $ 18.06 | $ (0.04)bb | $ (3.05) | $ (3.09) | $ — | $ (1.81) | $ (1.81) | $ 13.16 | (19.19%) | $ 7,153 | 1.35% | (0.26%) |
9/30/21 | 13.18 | (0.06) | 6.15 | 6.09 | — | (1.21) | (1.21) | 18.06 | 48.00% | 9,695 | 1.36% | (0.34%) |
9/30/20 | 13.00 | 0.01 | 0.24 | 0.25 | — | (0.07) | (0.07) | 13.18 | 1.87% | 6,048 | 1.39% | 0.07% |
9/30/19 | 15.71 | 0.01 | (1.36) | (1.35) | — | (1.36) | (1.36) | 13.00 | (7.66%) | 8,551 | 1.40% | 0.11% |
9/30/18 | 15.77 | 0.00d | 1.88 | 1.88 | — | (1.94) | (1.94) | 15.71 | 13.14% | 10,564 | 1.39% | 0.02% |
The accompanying notes are an integral part of the financial statements.
183
MassMutual Global Fund – Financial Statements (Continued) |
Financial Highlights (For a share outstanding throughout each period) |
| | | Income (loss) from investment
operations | Less distributions to shareholders | | | Ratios / Supplemental Data |
| | Net
asset
value,
beginning
of the
period | Net
investment
income
(loss)c | Net
realized
and
unrealized
gain (loss)
on
investments | Total
income
(loss) from
investment
operations | From net
investment
income | From net
realized
gains | Total
distributions | Net
asset
value,
end of
the
period | Total
returnl,m | Net
assets,
end of
the
period
(000’s) | Ratio of
expenses
to average
daily net
assets | Net
investment
income
(loss) to
average
daily net
assets |
Class I | | | | | | | | | | | | |
9/30/22 | $ 18.79 | $ (0.01) | $ (6.02) | $ (6.03) | $ — | $ (2.04) | $ (2.04) | $ 10.72 | (36.28%) | $ 56,931 | 0.86% | (0.06%) |
9/30/21 | 15.04 | (0.05) | 4.64 | 4.59 | — | (0.84) | (0.84) | 18.79 | 31.36% | 99,959 | 0.84% | (0.29%) |
9/30/20 | 12.35 | 0.00d | 2.81 | 2.81 | (0.09) | (0.03) | (0.12) | 15.04 | 22.90% | 75,893 | 0.85% | 0.00%e |
9/30/19 | 16.08 | 0.10 | (0.83) | (0.73) | (0.11) | (2.89) | (3.00) | 12.35 | (1.93%) | 70,159 | 0.84% | 0.79% |
9/30/18 | 16.46 | 0.13 | 1.52 | 1.65 | (0.16) | (1.87) | (2.03) | 16.08 | 10.39% | 50,503 | 0.86% | 0.79% |
Class R5 | | | | | | | | | | | | |
9/30/22 | $ 18.78 | $ (0.03) | $ (6.01) | $ (6.04) | $ — | $ (2.04) | $ (2.04) | $ 10.70 | 36.36% | $ 58,808 | 0.96% | (0.17%) |
9/30/21 | 15.05 | (0.07) | 4.64 | 4.57 | — | (0.84) | (0.84) | 18.78 | 31.20% | 126,049 | 0.94% | (0.39%) |
9/30/20 | 12.36 | (0.01) | 2.81 | 2.80 | (0.08) | (0.03) | (0.11) | 15.05 | 22.77% | 111,038 | 0.95% | (0.09%) |
9/30/19 | 16.09 | 0.08 | (0.83) | (0.75) | (0.09) | (2.89) | (2.98) | 12.36 | (2.07%) | 98,379 | 0.94% | 0.66% |
9/30/18 | 16.47 | 0.11 | 1.53 | 1.64 | (0.15) | (1.87) | (2.02) | 16.09 | 10.28% | 101,536 | 0.96% | 0.65% |
Service Class | | | | | | | | | | | |
9/30/22 | $ 18.58 | $ (0.04) | $ (5.94) | $ (5.98) | $ — | $ (2.04) | $ (2.04) | $ 10.56 | (36.43%) | $ 5,579 | 1.06% | (0.24%) |
9/30/21 | 14.91 | (0.08) | 4.59 | 4.51 | — | (0.84) | (0.84) | 18.58 | 31.09% | 7,892 | 1.04% | (0.49%) |
9/30/20 | 12.23 | (0.03) | 2.80 | 2.77 | (0.06) | (0.03) | (0.09) | 14.91 | 22.75% | 6,166 | 1.05% | (0.19%) |
9/30/19 | 15.94 | 0.06 | (0.82) | (0.76) | (0.06) | (2.89) | (2.95) | 12.23 | (2.23%) | 6,361 | 1.04% | 0.43% |
9/30/18 | 16.33 | 0.10 | 1.51 | 1.61 | (0.13) | (1.87) | (2.00) | 15.94 | 10.17% | 16,104 | 1.06% | 0.60% |
| | Year ended September 30 |
| | 2022 | 2021 | 2020 | 2019 | 2018 |
Portfolio turnover rate | 10% | 10% | 12% | 32% | 42% |
c | Per share amount calculated on the average shares method. |
d | Amount is less than $0.005 per share. |
e | Amount is less than 0.005%. |
l | Employee retirement benefit plans that invest plan assets in the Separate Investment Accounts (SIAs) may be subject to certain charges as set forth in their respective Plan Documents. Total return figures would be lower for the periods presented if they reflected these charges. |
m | Total return excludes sales charges, if any, and would be lower for the period presented if it reflected these charges. |
The accompanying notes are an integral part of the financial statements.
184
| | | Income (loss) from investment
operations | Less distributions to shareholders | | | Ratios / Supplemental Data |
| | Net
asset
value,
beginning
of the
period | Net
investment
income
(loss)c | Net
realized
and
unrealized
gain (loss)
on
investments | Total
income
(loss) from
investment
operations | From net
investment
income | From net
realized
gains | Total
distributions | Net
asset
value,
end of
the
period | Total
returnl,m | Net
assets,
end of
the
period
(000’s) | Ratio of
expenses
to average
daily net
assets | Net
investment
income
(loss) to
average
daily net
assets |
Administrative Class | | | | | | | | | | | |
9/30/22 | $ 18.73 | $ (0.06) | $ (5.99) | $ (6.05) | $ — | $ (2.04) | $ (2.04) | $ 10.64 | (36.52%) | $ 45,831 | 1.16% | (0.38%) |
9/30/21 | 15.03 | (0.10) | 4.64 | 4.54 | — | (0.84) | (0.84) | 18.73 | 31.03% | 88,387 | 1.14% | (0.59%) |
9/30/20 | 12.34 | (0.04) | 2.81 | 2.77 | (0.05) | (0.03) | (0.08) | 15.03 | 22.56% | 80,607 | 1.15% | (0.29%) |
9/30/19 | 16.06 | 0.06 | (0.83) | (0.77) | (0.06) | (2.89) | (2.95) | 12.34 | (2.30%) | 77,097 | 1.14% | 0.45% |
9/30/18 | 16.44 | 0.07 | 1.53 | 1.60 | (0.11) | (1.87) | (1.98) | 16.06 | 10.07% | 90,239 | 1.16% | 0.46% |
Class R4 | | | | | | | | | | | | |
9/30/22 | $ 18.12 | $ (0.07) | $ (5.77) | $ (5.84) | $ — | $ (2.04) | $ (2.04) | $ 10.24 | (36.60%) | $ 8,676 | 1.31% | (0.52%) |
9/30/21 | 14.59 | (0.12) | 4.49 | 4.37 | — | (0.84) | (0.84) | 18.12 | 30.79% | 15,975 | 1.29% | (0.72%) |
9/30/20 | 11.98 | (0.06) | 2.73 | 2.67 | (0.03) | (0.03) | (0.06) | 14.59 | 22.36% | 8,878 | 1.30% | (0.45%) |
9/30/19 | 15.71 | 0.04 | (0.82) | (0.78) | (0.06) | (2.89) | (2.95) | 11.98 | (2.45%) | 7,531 | 1.29% | 0.32% |
9/30/18 | 16.13 | 0.04 | 1.51 | 1.55 | (0.10) | (1.87) | (1.97) | 15.71 | 9.90% | 7,790 | 1.31% | 0.27% |
Class A | | | | | | | | | | | | |
9/30/22 | $ 18.40 | $ (0.09) | $ (5.86) | $ (5.95) | $ — | $ (2.04) | $ (2.04) | $ 10.41 | (36.64%) | $ 9,014 | 1.41% | (0.63%) |
9/30/21 | 14.82 | (0.14) | 4.56 | 4.42 | — | (0.84) | (0.84) | 18.40 | 30.65% | 19,415 | 1.39% | (0.84%) |
9/30/20 | 12.17 | (0.07) | 2.77 | 2.70 | (0.02) | (0.03) | (0.05) | 14.82 | 22.22% | 22,903 | 1.40% | (0.55%) |
9/30/19 | 15.87 | 0.03 | (0.82) | (0.79) | (0.02) | (2.89) | (2.91) | 12.17 | (2.48%) | 24,676 | 1.39% | 0.20% |
9/30/18 | 16.27 | 0.03 | 1.51 | 1.54 | (0.07) | (1.87) | (1.94) | 15.87 | 9.74% | 31,725 | 1.41% | 0.21% |
Class R3 | | | | | | | | | | | | |
9/30/22 | $ 18.25 | $ (0.11) | $ (5.80) | $ (5.91) | $ — | $ (2.04) | $ (2.04) | $ 10.30 | (36.73%) | $ 7,920 | 1.56% | (0.77%) |
9/30/21 | 14.72 | (0.17) | 4.54 | 4.37 | — | (0.84) | (0.84) | 18.25 | 30.51% | 13,541 | 1.54% | (0.98%) |
9/30/20 | 12.10 | (0.09) | 2.75 | 2.66 | (0.01) | (0.03) | (0.04) | 14.72 | 21.99% | 9,792 | 1.55% | (0.69%) |
9/30/19 | 15.80 | 0.01 | (0.82) | (0.81) | — | (2.89) | (2.89) | 12.10 | (2.69%) | 10,226 | 1.54% | 0.06% |
9/30/18 | 16.21 | 0.01 | 1.51 | 1.52 | (0.06) | (1.87) | (1.93) | 15.80 | 9.64% | 11,029 | 1.56% | 0.06% |
The accompanying notes are an integral part of the financial statements.
185
MassMutual International Equity Fund – Financial Statements (Continued) |
Financial Highlights (For a share outstanding throughout each period) |
| | | Income (loss) from investment
operations | Less distributions to shareholders | | | Ratios / Supplemental Data |
| | Net
asset
value,
beginning
of the
period | Net
investment
income
(loss)c,j | Net
realized
and
unrealized
gain (loss)
on
investments | Total
income
(loss) from
investment
operations | From net
investment
income | From net
realized
gains | Total
distributions | Net
asset
value,
end of
the
period | Total
returnl,m | Net
assets,
end of
the
period
(000’s) | Ratio of
expenses
to average
daily net
assets
before
expense
waiver | Ratio of
expenses
to average
daily net
assets
after
expense
waiversj | Net
investment
income
(loss) to
average
daily net
assets |
Class I | | | | | | | | | | | | | |
9/30/22 | $ 10.08 | $ 0.12 | $ (1.83) | $ (1.71) | $ (0.21) | $ (1.02) | $ (1.23) | $ 7.14 | (19.37%) | $ 66,355 | 1.09% | 1.04% | 1.41% |
9/30/21 | 13.08 | 0.14 | 1.84 | 1.98 | (0.04) | (4.94) | (4.98) | 10.08 | 17.97% | 89,913 | 1.02% | 1.00% | 1.31% |
9/30/20 | 12.01 | 0.03 | 1.54 | 1.57 | (0.13) | (0.37) | (0.50) | 13.08 | 13.17% | 96,308 | 1.02% | 1.00% | 0.26% |
9/30/19 | 12.99 | 0.09 | (0.49) | (0.40) | (0.12) | (0.46) | (0.58) | 12.01 | (2.49%) | 149,979 | 0.93% | 0.92% | 0.81% |
9/30/18 | 13.44 | 0.14 | (0.42) | (0.28) | (0.17) | — | (0.17) | 12.99 | (2.14%) | 293,575 | 0.96% | 0.94% | 1.01% |
Class R5 | | | | | | | | | | | | | |
9/30/22 | $ 10.08 | $ 0.12 | $ (1.85) | $ (1.73) | $ (0.19) | $ (1.02) | $ (1.21) | $ 7.14 | (19.47%) | $ 30,827 | 1.19% | 1.14% | 1.38% |
9/30/21 | 13.08 | 0.14 | 1.83 | 1.97 | (0.03) | (4.94) | (4.97) | 10.08 | 17.79% | 50,688 | 1.12% | 1.10% | 1.27% |
9/30/20 | 12.00 | 0.02 | 1.55 | 1.57 | (0.12) | (0.37) | (0.49) | 13.08 | 13.14% | 61,444 | 1.12% | 1.10% | 0.20% |
9/30/19 | 12.98 | 0.10 | (0.51) | (0.41) | (0.11) | (0.46) | (0.57) | 12.00 | (2.63%) | 94,827 | 1.03% | 1.02% | 0.89% |
9/30/18 | 13.44 | 0.12 | (0.42) | (0.30) | (0.16) | — | (0.16) | 12.98 | (2.32%) | 147,654 | 1.06% | 1.04% | 0.85% |
Service Class | | | | | | | | | | | | |
9/30/22 | $ 10.05 | $ 0.12 | $ (1.85) | $ (1.73) | $ (0.18) | $ (1.02) | $ (1.20) | $ 7.12 | (19.52%) | $ 2,624 | 1.29% | 1.24% | 1.35% |
9/30/21 | 13.04 | 0.12 | 1.84 | 1.96 | (0.01) | (4.94) | (4.95) | 10.05 | 17.72% | 3,469 | 1.22% | 1.20% | 1.16% |
9/30/20 | 11.97 | 0.00d | 1.54 | 1.54 | (0.10) | (0.37) | (0.47) | 13.04 | 12.94% | 4,524 | 1.22% | 1.20% | 0.00%e |
9/30/19 | 12.94 | 0.07 | (0.49) | (0.42) | (0.09) | (0.46) | (0.55) | 11.97 | (2.74%) | 9,393 | 1.13% | 1.12% | 0.60% |
9/30/18 | 13.39 | 0.11 | (0.41) | (0.30) | (0.15) | — | (0.15) | 12.94 | (2.33%) | 23,069 | 1.16% | 1.14% | 0.79% |
| | Year ended September 30 |
| | 2022 | 2021 | 2020 | 2019 | 2018 |
Portfolio turnover rate | 22% | 30% | 106% | 52% | 70% |
c | Per share amount calculated on the average shares method. |
d | Amount is less than $0.005 per share. |
e | Amount is less than 0.005%. |
j | Computed after giving effect to an agreement by MML Advisers to waive certain fees and expenses of the Fund. |
l | Employee retirement benefit plans that invest plan assets in the Separate Investment Accounts (SIAs) may be subject to certain charges as set forth in their respective Plan Documents. Total return figures would be lower for the periods presented if they reflected these charges. |
m | Total return excludes sales charges, if any, and would be lower for the period presented if it reflected these charges. |
The accompanying notes are an integral part of the financial statements.
186
| | | Income (loss) from investment
operations | Less distributions to shareholders | | | Ratios / Supplemental Data |
| | Net
asset
value,
beginning
of the
period | Net
investment
income
(loss)c,j | Net
realized
and
unrealized
gain (loss)
on
investments | Total
income
(loss) from
investment
operations | From net
investment
income | From net
realized
gains | Total
distributions | Net
asset
value,
end of
the
period | Total
returnl,m | Net
assets,
end of
the
period
(000’s) | Ratio of
expenses
to average
daily net
assets
before
expense
waivers | Ratio of
expenses
to average
daily net
assets
after
expense
waiversj | Net
investment
income
(loss) to
average
daily net
assets |
Administrative Class | | | | | | | | | | | |
9/30/22 | $ 9.96 | $ 0.11 | $ (1.83) | $ (1.72) | $ (0.17) | $ (1.02) | $ (1.19) | $ 7.05 | (19.60%) | $ 2,273 | 1.39% | 1.34% | 1.26% |
9/30/21 | 12.97 | 0.11 | 1.82 | 1.93 | — | (4.94) | (4.94) | 9.96 | 17.59% | 2,436 | 1.32% | 1.30% | 1.03% |
9/30/20 | 11.91 | (0.00)d | 1.52 | 1.52 | (0.09) | (0.37) | (0.46) | 12.97 | 12.81% | 3,565 | 1.32% | 1.30% | (0.02%) |
9/30/19 | 12.87 | 0.08 | (0.51) | (0.43) | (0.07) | (0.46) | (0.53) | 11.91 | (2.77%) | 5,465 | 1.23% | 1.22% | 0.65% |
9/30/18 | 13.32 | 0.08 | (0.40) | (0.32) | (0.13) | — | (0.13) | 12.87 | (2.49%) | 11,908 | 1.26% | 1.24% | 0.58% |
Class R4 | | | | | | | | | | | | | |
9/30/22 | $ 9.33 | $ 0.08 | $ (1.69) | $ (1.61) | $ (0.15) | $ (1.02) | $ (1.17) | $ 6.55 | (19.69%) | $ 711 | 1.53% | 1.48% | 0.93% |
9/30/21 | 12.45 | 0.09 | 1.73 | 1.82 | — | (4.94) | (4.94) | 9.33 | 17.41% | 1,639 | 1.47% | 1.45% | 0.88% |
9/30/20 | 11.43 | (0.04) | 1.48 | 1.44 | (0.05) | (0.37) | (0.42) | 12.45 | 12.70% | 1,951 | 1.47% | 1.45% | (0.31%) |
9/30/19 | 12.38 | 0.05 | (0.48) | (0.43) | (0.06) | (0.46) | (0.52) | 11.43 | (2.95%) | 4,895 | 1.38% | 1.37% | 0.48% |
9/30/18 | 12.84 | 0.07 | (0.40) | (0.33) | (0.13) | — | (0.13) | 12.38 | (2.63%) | 10,673 | 1.41% | 1.39% | 0.54% |
Class A | | | | | | | | | | | | | |
9/30/22 | $ 9.45 | $ 0.08 | $ (1.72) | $ (1.64) | $ (0.14) | $ (1.02) | $ (1.16) | $ 6.65 | (19.79%) | $ 9,014 | 1.64% | 1.59% | 0.95% |
9/30/21 | 12.56 | 0.08 | 1.75 | 1.83 | — | (4.94) | (4.94) | 9.45 | 17.30% | 13,793 | 1.57% | 1.55% | 0.82% |
9/30/20 | 11.54 | (0.03) | 1.48 | 1.45 | (0.06) | (0.37) | (0.43) | 12.56 | 12.61% | 18,670 | 1.57% | 1.55% | (0.22%) |
9/30/19 | 12.49 | 0.05 | (0.50) | (0.45) | (0.04) | (0.46) | (0.50) | 11.54 | (3.09%) | 22,004 | 1.48% | 1.47% | 0.46% |
9/30/18 | 12.93 | 0.05 | (0.39) | (0.34) | (0.10) | — | (0.10) | 12.49 | (2.70%) | 30,719 | 1.51% | 1.49% | 0.41% |
Class R3 | | | | | | | | | | | | | |
9/30/22 | $ 9.22 | $ 0.07 | $ (1.67) | $ (1.60) | $ (0.14) | $ (1.02) | $ (1.16) | $ 6.46 | (19.87%) | $ 2,060 | 1.79% | 1.74% | 0.89% |
9/30/21 | 12.38 | 0.07 | 1.71 | 1.78 | — | (4.94) | (4.94) | 9.22 | 17.07% | 2,294 | 1.72% | 1.70% | 0.74% |
9/30/20 | 11.38 | (0.06) | 1.47 | 1.41 | (0.04) | (0.37) | (0.41) | 12.38 | 12.42% | 2,427 | 1.72% | 1.70% | (0.49%) |
9/30/19 | 12.34 | 0.02 | (0.48) | (0.46) | (0.04) | (0.46) | (0.50) | 11.38 | (3.24%) | 5,415 | 1.63% | 1.62% | 0.21% |
9/30/18 | 12.79 | 0.03 | (0.39) | (0.36) | (0.09) | — | (0.09) | 12.34 | (2.88%) | 9,024 | 1.66% | 1.64% | 0.25% |
The accompanying notes are an integral part of the financial statements.
187
MassMutual Strategic Emerging Markets Fund – Financial Statements (Continued) |
Financial Highlights (For a share outstanding throughout each period) |
| | | Income (loss) from investment
operations | Less distributions to shareholders | | | Ratios / Supplemental Data |
| | Net
asset
value,
beginning
of the
period | Net
investment
income
(loss)c,j | Net
realized
and
unrealized
gain (loss)
on
investments | Total
income
(loss) from
investment
operations | From net
investment
income | From net
realized
gains | Total
distributions | Net
asset
value,
end of
the
period | Total
returnl,m | Net
assets,
end of
the
period
(000’s) | Ratio of
expenses
to average
daily net
assets
before
expense
waivers | Ratio of
expenses
to average
daily net
assets
after
expense
waiversj | Net
investment
income
(loss) to
average
daily net
assets |
Class I | | | | | | | | | | | | | |
9/30/22 | $ 14.93 | $ 0.05 | $ (4.73) | $ (4.68) | $ (0.20) | $ (1.83) | $ (2.03) | $ 8.22 | (35.67%) | $ 105,253 | 1.35% | 1.15% | 0.43% |
9/30/21 | 13.23 | 0.04 | 1.88 | 1.92 | — | (0.22) | (0.22) | 14.93 | 14.53% | 156,998 | 1.22% | 1.15% | 0.25% |
9/30/20 | 13.02 | 0.02 | 1.33 | 1.35 | (0.08) | (1.06) | (1.14) | 13.23 | 10.33% | 169,366 | 1.27% | 1.15% | 0.12% |
9/30/19 | 12.75 | 0.07 | 0.28 | 0.35 | (0.08) | — | (0.08) | 13.02 | 2.85% | 141,988 | 1.21% | 1.10% | 0.55% |
9/30/18 | 12.88 | 0.08 | (0.04) | 0.04 | (0.17) | — | (0.17) | 12.75 | 0.31% | 216,085 | 1.27% | 1.05% | 0.62% |
Class R5 | | | | | | | | | | | | | |
9/30/22 | $ 15.14 | $ 0.03 | $ (4.80) | $ (4.77) | $ (0.18) | $ (1.83) | $ (2.01) | $ 8.36 | (35.72%) | $ 225 | 1.45% | 1.23% | 0.25% |
9/30/21 | 13.43 | 0.03 | 1.90 | 1.93 | — | (0.22) | (0.22) | 15.14 | 14.38% | 2,703 | 1.32% | 1.25% | 0.16% |
9/30/20 | 13.20 | 0.00d | 1.35 | 1.35 | (0.06) | (1.06) | (1.12) | 13.43 | 10.23% | 3,165 | 1.37% | 1.25% | 0.02% |
9/30/19 | 12.92 | 0.06 | 0.29 | 0.35 | (0.07) | — | (0.07) | 13.20 | 2.78% | 4,295 | 1.31% | 1.22% | 0.45% |
9/30/18 | 13.05 | 0.07 | (0.04) | 0.03 | (0.16) | — | (0.16) | 12.92 | 0.21% | 4,047 | 1.37% | 1.15% | 0.53% |
Service Class | | | | | | | | | | | | |
9/30/22 | $ 14.93 | $ 0.02 | $ (4.73) | $ (4.71) | $ (0.17) | $ (1.83) | $ (2.00) | $ 8.22 | (35.83%) | $ 1,346 | 1.55% | 1.35% | 0.22% |
9/30/21 | 13.25 | 0.01 | 1.89 | 1.90 | — | (0.22) | (0.22) | 14.93 | 14.35% | 2,216 | 1.42% | 1.35% | 0.05% |
9/30/20 | 13.05 | (0.01) | 1.33 | 1.32 | (0.06) | (1.06) | (1.12) | 13.25 | 10.12% | 2,473 | 1.47% | 1.35% | (0.05%) |
9/30/19 | 12.73 | 0.05 | 0.29 | 0.34 | (0.02) | — | (0.02) | 13.05 | 2.71% | 419 | 1.41% | 1.31% | 0.42% |
9/30/18 | 12.85 | 0.05 | (0.03) | 0.02 | (0.14) | — | (0.14) | 12.73 | 0.10% | 230 | 1.47% | 1.25% | 0.41% |
| | Year ended September 30 |
| | 2022 | 2021 | 2020 | 2019 | 2018 |
Portfolio turnover rate | 55% | 48% | 71% | 32% | 38% |
c | Per share amount calculated on the average shares method. |
d | Amount is less than $0.005 per share. |
j | Computed after giving effect to an agreement by MML Advisers to waive certain fees and expenses of the Fund. |
l | Employee retirement benefit plans that invest plan assets in the Separate Investment Accounts (SIAs) may be subject to certain charges as set forth in their respective Plan Documents. Total return figures would be lower for the periods presented if they reflected these charges. |
m | Total return excludes sales charges, if any, and would be lower for the period presented if it reflected these charges. |
bb | The amount shown for a share outstanding does not correspond with the aggregate net investment income (loss) as shown on the Statement of Operations for the period due to the timing of class-specific expenses. See Note 3 for each fund’s expense structure. |
The accompanying notes are an integral part of the financial statements.
188
| | | Income (loss) from investment
operations | Less distributions to shareholders | | | Ratios / Supplemental Data |
| | Net
asset
value,
beginning
of the
period | Net
investment
income
(loss)c,j | Net
realized
and
unrealized
gain (loss)
on
investments | Total
income
(loss) from
investment
operations | From net
investment
income | From net
realized
gains | Total
distributions | Net
asset
value,
end of
the
period | Total
returnl,m | Net
assets,
end of
the
period
(000’s) | Ratio of
expenses
to average
daily net
assets
before
expense
waivers | Ratio of
expenses
to average
daily net
assets
after
expense
waiversj | Net
investment
income
(loss) to
average
daily net
assets |
Administrative Class | | | | | | | | | | | |
9/30/22 | $ 14.96 | $ (0.01)bb | $ (4.72) | $ (4.73) | $ (0.16) | $ (1.83) | $ (1.99) | $ 8.24 | (35.90%) | $ 233 | 1.65% | 1.45% | (0.06%) |
9/30/21 | 13.29 | (0.01) | 1.90 | 1.89 | — | (0.22) | (0.22) | 14.96 | 14.23% | 1,017 | 1.52% | 1.45% | (0.03%) |
9/30/20 | 13.08 | (0.02) | 1.33 | 1.31 | (0.04) | (1.06) | (1.10) | 13.29 | 9.96% | 989 | 1.57% | 1.45% | (0.16%) |
9/30/19 | 12.78 | 0.03 | 0.30 | 0.33 | (0.03) | — | (0.03) | 13.08 | 2.61% | 927 | 1.51% | 1.41% | 0.24% |
9/30/18 | 12.91 | 0.04 | (0.03) | 0.01 | (0.14) | — | (0.14) | 12.78 | 0.02% | 879 | 1.57% | 1.35% | 0.33% |
Class R4 | | | | | | | | | | | | | |
9/30/22 | $ 14.71 | $ (0.00)bb,d | $ (4.69) | $ (4.69) | $ (0.06) | $ (1.83) | $ (1.89) | $ 8.13 | (35.99%) | $ 307 | 1.80% | 1.60% | (0.02%) |
9/30/21 | 13.10 | (0.05) | 1.88 | 1.83 | — | (0.22) | (0.22) | 14.71 | 13.98% | 443 | 1.67% | 1.60% | (0.32%) |
9/30/20 | 12.90 | (0.04) | 1.32 | 1.28 | (0.02) | (1.06) | (1.08) | 13.10 | 9.84% | 1,237 | 1.72% | 1.60% | (0.30%) |
9/30/19 | 12.63 | 0.01 | 0.29 | 0.30 | (0.03) | — | (0.03) | 12.90 | 2.38% | 1,337 | 1.66% | 1.57% | 0.05% |
9/30/18 | 12.76 | 0.03 | (0.04) | (0.01) | (0.12) | — | (0.12) | 12.63 | (0.10%) | 1,295 | 1.72% | 1.50% | 0.22% |
Class A | | | | | | | | | | | | | |
9/30/22 | $ 14.77 | $ (0.02)bb | $ (4.71) | $ (4.73) | $ — | $ (1.83) | $ (1.83) | $ 8.21 | (35.99%) | $ 140 | 1.90% | 1.68% | (0.15%) |
9/30/21 | 13.17 | (0.06) | 1.88 | 1.82 | — | (0.22) | (0.22) | 14.77 | 13.83% | 635 | 1.77% | 1.70% | (0.36%) |
9/30/20 | 12.98 | (0.05) | 1.32 | 1.27 | (0.02) | (1.06) | (1.08) | 13.17 | 9.75% | 2,029 | 1.82% | 1.70% | (0.42%) |
9/30/19 | 12.73 | 0.01 | 0.28 | 0.29 | (0.04) | — | (0.04) | 12.98 | 2.32% | 885 | 1.76% | 1.68% | 0.09% |
9/30/18 | 12.88 | 0.04 | (0.07) | (0.03) | (0.12) | — | (0.12) | 12.73 | (0.23%) | 386 | 1.82% | 1.60% | 0.30% |
Class R3 | | | | | | | | | | | | | |
9/30/22 | $ 14.62 | $ (0.03)bb | $ (4.64) | $ (4.67) | $ (0.09) | $ (1.83) | $ (1.92) | $ 8.03 | (36.15%) | $ 546 | 2.05% | 1.85% | (0.29%) |
9/30/21 | 13.05 | (0.06) | 1.85 | 1.79 | — | (0.22) | (0.22) | 14.62 | 13.72% | 1,120 | 1.92% | 1.85% | (0.42%) |
9/30/20 | 12.87 | (0.07) | 1.31 | 1.24 | (0.00)d | (1.06) | (1.06) | 13.05 | 9.57% | 992 | 1.97% | 1.85% | (0.58%) |
9/30/19 | 12.60 | (0.02) | 0.29 | 0.27 | — | — | — | 12.87 | 2.14% | 750 | 1.91% | 1.81% | (0.15%) |
9/30/18 | 12.73 | (0.01) | (0.04) | (0.05) | (0.08) | — | (0.08) | 12.60 | (0.39%) | 761 | 1.97% | 1.75% | (0.09%) |
The accompanying notes are an integral part of the financial statements.
189
Notes to Financial Statements |
MassMutual Premier Funds (the “Trust”) is registered under the Investment Company Act of 1940, as amended (the “1940 Act”), as an open-end management investment company. The Trust is organized under the laws of the Commonwealth of Massachusetts as a Massachusetts business trust pursuant to an Agreement and Declaration of Trust dated August 1, 1994, as amended and restated as of November 21, 2011, as it may be further amended from time to time. The Trust consists of the following series (each individually referred to as a “Fund” or collectively as the “Funds”):
MassMutual U.S. Government Money Market Fund (“U.S. Government Money Market Fund”)
MassMutual Short-Duration Bond Fund (“Short-Duration Bond Fund”)
MassMutual Inflation-Protected and Income Fund (“Inflation-Protected and Income Fund”)
MassMutual Core Bond Fund (“Core Bond Fund”)
MassMutual Diversified Bond Fund (“Diversified Bond Fund”)
MassMutual High Yield Fund (“High Yield Fund”)
MassMutual Balanced Fund (“Balanced Fund”)
MassMutual Disciplined Value Fund (“Disciplined Value Fund”)
MassMutual Main Street Fund (“Main Street Fund”)
MassMutual Disciplined Growth Fund (“Disciplined Growth Fund”)
MassMutual Small Cap Opportunities Fund (“Small Cap Opportunities Fund”)
MassMutual Global Fund (“Global Fund”)
MassMutual International Equity Fund (“International Equity Fund”)
MassMutual Strategic Emerging Markets Fund (“Strategic Emerging Markets Fund”)
Each share class of a Fund represents an interest in the same portfolio of assets. The principal difference among the classes is the level of service and administration fees, and shareholder and distribution service expenses borne by the classes. Because each class will have different fees and expenses, performance and share prices will vary between the classes. The classes of shares are offered to different types of investors, as outlined in the Funds’ Prospectuses.
2. | Significant Accounting Policies |
The following is a summary of significant accounting policies followed consistently by each Fund in the preparation of the financial statements in conformity with accounting principles generally accepted in the United States of America (“generally accepted accounting principles”). The preparation of the financial statements in accordance with generally accepted accounting principles requires management to make estimates and assumptions that affect the reported amounts and disclosures in the financial statements. Actual results could differ from those estimates.
Each Fund is an investment company and accordingly follows the investment company accounting and reporting guidance of the Financial Accounting Standards Board (“FASB”) Accounting Standards Codification Topic 946, Financial Services – Investment Companies.
Investment Valuation
The net asset value of each Fund’s shares is determined once daily as of the close of regular trading on the New York Stock Exchange (“NYSE”), on each day the NYSE is open for trading (a “business day”). The NYSE normally closes at 4:00 p.m. Eastern Time, but may close earlier on some days. If the NYSE is scheduled to close early, the business day will be considered to end as of the time of the NYSE’s scheduled close. A Fund will not treat an intraday disruption in NYSE trading or other event that causes an unscheduled closing of the NYSE as a close of business of the NYSE for these purposes; instead, MML Investment Advisers, LLC (“MML Advisers”) will determine the fair value of a Fund’s securities in accordance with MML Advisers’ fair valuation policy and procedures. On holidays and other days when the NYSE is closed, each Fund’s net asset value generally is not calculated and the Funds do not anticipate accepting buy or sell orders. However, the value of each Fund’s assets may still be affected on such days to the extent that a Fund holds foreign securities that trade on days that foreign securities markets are open.
190
Notes to Financial Statements (Continued) |
Equity securities and derivative contracts that are actively traded on a national securities exchange or contract market are valued on the basis of information furnished by a pricing service, which provides the last reported sale price, or, in the case of futures contracts, the settlement price, for securities or derivatives listed on the exchange or contract market or the official closing price on the NASDAQ National Market System (“NASDAQ System”), or in the case of over-the-counter (“OTC”) securities for which an official closing price is unavailable or not reported on the NASDAQ System, the last reported bid price. Portfolio securities traded on more than one national securities exchange are valued at the last price at the close of the exchange representing the principal market for such securities. Debt securities (with the exception of debt securities held by the U.S. Government Money Market Fund) are valued on the basis of valuations furnished by a pricing service, which generally determines valuations taking into account factors such as institutional-size trading in similar securities, yield, quality, coupon rate, maturity, type of issue, trading characteristics, and other market data. Shares of other open-end mutual funds are valued at their closing net asset values as reported on each business day. The U.S. Government Money Market Fund’s debt securities are typically valued at amortized cost, but may be valued using a vendor quote if MML Advisers determines it more closely approximates current market value, in accordance with Rule 2a-7 under the 1940 Act pursuant to which the U.S. Government Money Market Fund must adhere to certain conditions. It is the intention of the U.S. Government Money Market Fund to maintain a stable net asset value per share of $1.00, although this cannot be assured.
Investments for which market quotations are readily available are marked to market daily based on those quotations. Market quotations may be provided by third-party vendors or market makers, and may be determined on the basis of a variety of factors, such as broker quotations, financial modeling, and other market data, such as market indexes and yield curves, counterparty information, and foreign exchange rates. U.S. Government and agency securities may be valued on the basis of market quotations or using a model that may incorporate market observable data such as reported sales of similar securities, broker quotes, yields, bids, offers, quoted market prices, and reference data. The fair values of OTC derivative contracts, including forward, swap, and option contracts related to interest rates, foreign currencies, credit standing of reference entities, equity prices, or commodity prices, may be based on market quotations or may be modeled using a series of techniques, including simulation models, depending on the contract and the terms of the transaction. The fair values of asset-backed securities and mortgage-backed securities are estimated based on models that consider the estimated cash flows of each debt tranche of the issuer, established benchmark yield, and estimated tranche-specific spread to the benchmark yield based on the unique attributes of the tranche, including, but not limited to, prepayment speed assumptions and attributes of the collateral.
The Board of Trustees (“Trustees”) have designated MML Advisers as the Funds’ “valuation designee,” responsible for determining the fair value, in good faith, of securities and other instruments held by the Funds for which market quotations are not readily available or for which such market quotations or values are considered by MML Advisers or a subadviser to be unreliable (including, for example, certain foreign securities, thinly-traded securities, certain restricted securities, certain initial public offerings, or securities whose values may have been affected by a significant event). It is possible that a significant amount of a Fund’s assets will be subject to fair valuation in accordance with MML Advisers’ fair valuation policy and procedures. The fair value determined for an investment by MML Advisers may differ from recent market prices for the investment and may be significantly different from the value realized upon the sale of such investment.
The Funds may invest in securities that are traded principally in foreign markets and that trade on weekends and other days when the Funds do not price their shares. As a result, the values of the Funds’ portfolio securities may change on days when the prices of the Funds’ shares are not calculated. The prices of the Funds’ shares will reflect any such changes when the prices of the Funds’ shares are next calculated, which is the next business day. The Funds may use fair value pricing more frequently for securities primarily traded in foreign markets because, among other things, most foreign markets close well before the Funds value their securities. The earlier close of these foreign markets gives rise to the possibility that significant events, including broad market moves, may have occurred in the interim. The Funds’ investments may be priced based on fair values provided by a third-party vendor, based on certain factors and methodologies applied by such vendor, in the event that there is movement in the U.S. market, between the close of the foreign market and the time the Funds calculate their net asset values. All assets and liabilities expressed in foreign currencies are converted into U.S. dollars at the mean between the buying and selling rates of such currencies against the U.S. dollar at the end of each business day.
191
Notes to Financial Statements (Continued) |
Investments in equity or debt issued by privately held companies or funds (“Private Company” or collectively, the “Private Companies”) and any other investments fair valued using significant unobservable inputs may be fair valued using one or a combination of, but not limited to, the following inputs:
Market approach: (i) recent market transactions, including subsequent rounds of financing, in the underlying investment or comparable issuers; (ii) recapitalizations and other transactions across the capital structure; and (iii) market multiples of comparable issuers.
Income approach: (i) future cash flows discounted to present value and adjusted as appropriate for liquidity, credit, and/or market risks; (ii) quoted prices for similar investments or assets in active markets; and (iii) other risk factors, such as interest rates, yield curves, volatilities, prepayment speeds, loss severities, credit risks, recovery rates, liquidation amounts, and/or default rates.
Cost approach: (i) audited or unaudited financial statements, investor communications, and financial or operational metrics issued by the Private Company; (ii) changes in the valuation of relevant indexes or publicly traded companies comparable to the Private Company; (iii) relevant news and other public sources; and (iv) known secondary market transactions in the Private Company’s interests and merger or acquisition activity in companies comparable to the Private Company.
Investments in series of preferred stock issued by Private Companies are typically valued utilizing the Market approach in determining the enterprise value of the company. Such investments often contain rights and preferences that differ from other series of preferred and common stock of the same issuer. Valuation techniques such as the current value method (“CVM”), an option pricing model (“OPM”), a probability weighted expected return model (“PWERM”), or a hybrid of those techniques are used in allocating enterprise value of the company, as deemed appropriate under the circumstances. The CVM allocates value among the various parts of a company’s capital structure assuming that the value of convertible preferred stock is represented by the most favorable claim the preferred stockholders have on the enterprise value as of the valuation date. The use of OPM and PWERM techniques involve a determination of the exit scenarios of the investment in order to appropriately allocate the enterprise value of the company among the various parts of its capital structure.
The Private Companies are not subject to the public company disclosure, timing, and reporting standards as other investments held by a Fund. Typically, the most recently available information for a Private Company is as of a date that is earlier than the date a Fund is calculating its net asset value. This factor may result in a difference between the value of the investment and the price a Fund could receive upon the sale of the investment.
Fair value is defined as the price that would be received to sell an asset or paid to transfer a liability in an orderly transaction between market participants at the measurement date. A three-tier hierarchy is utilized to maximize the use of observable market data inputs and minimize the use of unobservable inputs and to establish classification of fair value measurements for disclosure purposes. Inputs refer broadly to the assumptions that market participants would use in pricing the asset or liability, including assumptions about risk, for example, the risk inherent in a particular valuation technique used to measure fair value (such as a pricing model) and/or the risk inherent in the inputs to the valuation technique. Inputs may be observable or unobservable. Observable inputs are inputs that reflect the assumptions market participants would use in pricing the asset or liability and are developed based on market data obtained from sources independent of the reporting entity. Unobservable inputs are inputs that reflect the reporting entity’s own assumptions about the assumptions market participants would use in pricing the asset or liability and are developed based on the best information available in the circumstances. The three-tier hierarchy of inputs is summarized in the three broad Levels listed below. The inputs or methodology used for valuing investments are not necessarily an indication of the risk associated with investing in those investments and the determination of the significance of a particular input to the fair value measurement in its entirety requires judgment and consideration of factors specific to each security.
Level 1 – quoted prices (unadjusted) in active markets for identical investments that the Funds can access at the measurement date
Level 2 – other significant observable inputs (including quoted prices for similar investments, interest rates, prepayment speeds, credit risk, etc.)
Level 3 – significant unobservable inputs, to the extent observable inputs are not available (including the Funds’ own assumptions in determining the fair value of investments)
192
Notes to Financial Statements (Continued) |
The availability of observable inputs can vary from security to security and is affected by a wide variety of factors, including, for example, the type of security, whether the security is new and not yet established in the marketplace, the liquidity of markets, and other characteristics particular to the security. To the extent that valuation is based on models or inputs that are less observable or unobservable in the market, the determination of fair value requires more judgment. Accordingly, the degree of judgment exercised in determining fair value is greatest for instruments categorized in Level 3.
Changes in valuation techniques may result in transfers in or out of an investment’s assigned Level within the hierarchy. In addition, in periods of market dislocation, the observability of prices and inputs may be reduced for many instruments. This condition, as well as changes related to liquidity of investments, could cause a security to be reclassified between Levels.
In certain cases, the inputs used to measure fair value may fall into different Levels of the fair value hierarchy. In such cases, for disclosure purposes, the Level in the fair value hierarchy within which the fair value measurement falls is determined based on the lowest Level input that is significant to the overall fair value measurement.
The U.S. Government Money Market Fund characterized all investments at Level 2, as of September 30, 2022. The Disciplined Value Fund, Disciplined Growth Fund, and Small Cap Opportunities Fund characterized all long-term investments at Level 1, and all short-term investments at Level 2, as of September 30, 2022. For each Fund noted in the preceding sentences, the level classification by major category of investments is the same as the category presentation in the Portfolio of Investments.
The following is the aggregate value by input level, as of September 30, 2022, for the remaining Funds’ investments:
| | | Level 1 | | | Level 2 | | | Level 3 | | | Total | |
Short-Duration Bond Fund | | | | | | | | | | | | | | | | |
Asset Investments | | | | | | | | | | | | | | | | |
Corporate Debt | | $ | — | | | $ | 250,211,708 | | | $ | — | | | $ | 250,211,708 | |
Non-U.S. Government Agency Obligations | | | — | | | | 228,152,396 | | | | — | | | | 228,152,396 | |
U.S. Government Agency Obligations and Instrumentalities | | | — | | | | 109,073 | | | | — | | | | 109,073 | |
Mutual Funds | | | 5,908,650 | | | | — | | | | — | | | | 5,908,650 | |
Short-Term Investments | | | — | | | | 12,893,730 | | | | — | | | | 12,893,730 | |
Total Investments | | $ | 5,908,650 | | | $ | 491,366,907 | | | $ | — | | | $ | 497,275,557 | |
Asset Derivatives | | | | | | | | | | | | | | | | |
Futures Contracts | | $ | 6,758,055 | | | $ | — | | | $ | — | | | $ | 6,758,055 | |
Liability Derivatives | | | | | | | | | | | | | | | | |
Swap Agreements | | $ | — | | | $ | (4,140,728 | ) | | $ | — | | | $ | (4,140,728 | ) |
| | | | | | | | | | | | | | | | | |
Inflation-Protected and Income Fund | | | | | | | | | | | | | | | | |
Asset Investments | | | | | | | | | | | | | | | | |
Non-U.S. Government Agency Obligations | | $ | — | | | $ | 165,158,495 | | | $ | — | | | $ | 165,158,495 | |
U.S. Government Agency Obligations and Instrumentalities | | | — | | | | 35,856,965 | | | | — | | | | 35,856,965 | |
U.S. Treasury Obligations | | | — | | | | 62,542,823 | | | | — | | | | 62,542,823 | |
Mutual Funds | | | 2,676,375 | | | | — | | | | — | | | | 2,676,375 | |
Short-Term Investments | | | — | | | | 34,519,947 | | | | — | | | | 34,519,947 | |
Total Investments | | $ | 2,676,375 | | | $ | 298,078,230 | | | $ | — | | | $ | 300,754,605 | |
Asset Derivatives | | | | | | | | | | | | | | | | |
Futures Contracts | | $ | 1,573,607 | | | $ | — | | | $ | — | | | $ | 1,573,607 | |
Swap Agreements | | | — | | | | 130,704 | | | | — | | | | 130,704 | |
Total | | $ | 1,573,607 | | | $ | 130,704 | | | $ | — | | | $ | 1,704,311 | |
Liability Derivatives | | | | | | | | | | | | | | | | |
Futures Contracts | | $ | (108,349 | ) | | $ | — | | | $ | — | | | $ | (108,349 | ) |
Swap Agreements | | | — | | | | (18,171,764 | ) | | | — | | | | (18,171,764 | ) |
Total | | $ | (108,349 | ) | | $ | (18,171,764 | ) | | $ | — | | | $ | (18,280,113 | ) |
| | | | | | | | | | | | | | | | | |
193
Notes to Financial Statements (Continued) |
| | | Level 1 | | | Level 2 | | | Level 3 | | | Total | |
Core Bond Fund | | | | | | | | | | | | | | | | |
Asset Investments | | | | | | | | | | | | | | | | |
Corporate Debt | | $ | — | | | $ | 278,681,089 | | | $ | — | | | $ | 278,681,089 | |
Non-U.S. Government Agency Obligations | | | — | | | | 213,883,164 | | | | — | | | | 213,883,164 | |
Sovereign Debt Obligations | | | — | | | | 3,862,135 | | | | — | | | | 3,862,135 | |
U.S. Government Agency Obligations and Instrumentalities | | | — | | | | 178,761,747 | | | | — | | | | 178,761,747 | |
U.S. Treasury Obligations | | | — | | | | 31,625,236 | | | | — | | | | 31,625,236 | |
Mutual Funds | | | 832,510 | | | | — | | | | — | | | | 832,510 | |
Short-Term Investments | | | — | | | | 91,484,450 | | | | — | | | | 91,484,450 | |
Total Investments | | $ | 832,510 | | | $ | 798,297,821 | | | $ | — | | | $ | 799,130,331 | |
Asset Derivatives | | | | | | | | | | | | | | | | |
Futures Contracts | | $ | 1,269,808 | | | $ | — | | | $ | — | | | $ | 1,269,808 | |
Liability Derivatives | | | | | | | | | | | | | | | | |
Futures Contracts | | $ | (5,393,598 | ) | | $ | — | | | $ | — | | | $ | (5,393,598 | ) |
| | | | | | | | | | | | | | | | | |
Diversified Bond Fund | | | | | | | | | | | | | | | | |
Asset Investments | | | | | | | | | | | | | | | | |
Preferred Stock | | $ | 1,092,673 | | | $ | — | | | $ | — | | | $ | 1,092,673 | |
Corporate Debt | | | — | | | | 70,369,427 | | | | — | | | | 70,369,427 | |
Non-U.S. Government Agency Obligations | | | — | | | | 48,395,305 | | | | — | | | | 48,395,305 | |
Sovereign Debt Obligations | | | — | | | | 479,465 | | | | — | | | | 479,465 | |
U.S. Government Agency Obligations and Instrumentalities | | | — | | | | 24,153,548 | | | | — | | | | 24,153,548 | |
U.S. Treasury Obligations | | | — | | | | 5,134,968 | | | | — | | | | 5,134,968 | |
Purchased Options | | | — | | | | 274 | | | | — | | | | 274 | |
Warrants | | | — | | | | — | | | | 4,115 | ** | | | 4,115 | |
Mutual Funds | | | 1,347,973 | | | | — | | | | — | | | | 1,347,973 | |
Short-Term Investments | | | — | | | | 14,286,386 | | | | — | | | | 14,286,386 | |
Total Investments | | $ | 2,440,646 | | | $ | 162,819,373 | | | $ | 4,115 | | | $ | 165,264,134 | |
Asset Derivatives | | | | | | | | | | | | | | | | |
Forward Contracts | | $ | — | | | $ | 190,828 | | | $ | — | | | $ | 190,828 | |
Futures Contracts | | | 136,512 | | | | — | | | | — | | | | 136,512 | |
Total | | $ | 136,512 | | | $ | 190,828 | | | $ | — | | | $ | 327,340 | |
Liability Derivatives | | | | | | | | | | | | | | | | |
Forward Contracts | | $ | — | | | $ | (245,946 | ) | | $ | — | | | $ | (245,946 | ) |
Futures Contracts | | | (1,651,191 | ) | | | — | | | | — | | | | (1,651,191 | ) |
Written Options | | | — | | | | (11,185 | ) | | | — | | | | (11,185 | ) |
Total | | $ | (1,651,191 | ) | | $ | (257,131 | ) | | $ | — | | | $ | (1,908,322 | ) |
| | | | | | | | | | | | | | | | | |
High Yield Fund | | | | | | | | | | | | | | | | |
Asset Investments | | | | | | | | | | | | | | | | |
Bank Loans | | $ | — | | | $ | 10,034,728 | | | $ | — | | | $ | 10,034,728 | |
Corporate Debt | | | — | | | | 363,755,270 | | | | — | | | | 363,755,270 | |
Mutual Funds | | | 14,173,193 | | | | — | | | | — | | | | 14,173,193 | |
Short-Term Investments | | | — | | | | 3,652,062 | | | | — | | | | 3,652,062 | |
Total Investments | | $ | 14,173,193 | | | $ | 377,442,060 | | | $ | — | | | $ | 391,615,253 | |
| | | | | | | | | | | | | | | | | |
Balanced Fund | | | | | | | | | | | | | | | | |
Asset Investments | | | | | | | | | | | | | | | | |
Common Stock | | $ | 73,493,333 | | | $ | 33,352 | | | $ | — | | | $ | 73,526,685 | |
Corporate Debt | | | — | | | | 14,078,383 | | | | — | | | | 14,078,383 | |
Non-U.S. Government Agency Obligations | | | — | | | | 4,567,822 | | | | — | | | | 4,567,822 | |
U.S. Government Agency Obligations and Instrumentalities | | | — | | | | 11,583,518 | | | | — | | | | 11,583,518 | |
194
Notes to Financial Statements (Continued) |
| | | Level 1 | | | Level 2 | | | Level 3 | | | Total | |
Balanced Fund (Continued) | | | | | | | | | | | | | | | | |
Asset Investments (Continued) | | | | | | | | | | | | | | | | |
U.S. Treasury Obligations | | $ | — | | | $ | 16,533,262 | | | $ | — | | | $ | 16,533,262 | |
Short-Term Investments | | | — | | | | 1,229,224 | | | | — | | | | 1,229,224 | |
Total Investments | | $ | 73,493,333 | | | $ | 48,025,561 | | | $ | — | | | $ | 121,518,894 | |
Asset Derivatives | | | | | | | | | | | | | | | | |
Futures Contracts | | $ | 242,556 | | | $ | — | | | $ | — | | | $ | 242,556 | |
| | | | | | | | | | | | | | | | | |
Main Street Fund | | | | | | | | | | | | | | | | |
Asset Investments | | | | | | | | | | | | | | | | |
Common Stock | | $ | 65,000,593 | | | $ | 454,465 | * | | $ | — | | | $ | 65,455,058 | |
Short-Term Investments | | | — | | | | 1,666,661 | | | | — | | | | 1,666,661 | |
Total Investments | | $ | 65,000,593 | | | $ | 2,121,126 | | | $ | — | | | $ | 67,121,719 | |
| | | | | | | | | | | | | | | | | |
Global Fund | | | | | | | | | | | | | | | | |
Asset Investments | | | | | | | | | | | | | | | | |
Common Stock* | | | | | | | | | | | | | | | | |
Cayman Islands | | $ | 9,762,630 | | | $ | 1,841,326 | | | $ | — | | | $ | 11,603,956 | |
Denmark | | | — | | | | 5,823,653 | | | | — | | | | 5,823,653 | |
France | | | — | | | | 17,745,976 | | | | — | | | | 17,745,976 | |
Germany | | | — | | | | 2,645,415 | | | | — | | | | 2,645,415 | |
India | | | 4,513,835 | | | | 7,177,967 | | | | — | | | | 11,691,802 | |
Italy | | | — | | | | 957,422 | | | | — | | | | 957,422 | |
Japan | | | — | | | | 16,322,280 | | | | — | | | | 16,322,280 | |
Netherlands | | | — | | | | 8,794,249 | | | | — | | | | 8,794,249 | |
Spain | | | — | | | | 592,823 | | | | — | | | | 592,823 | |
Sweden | | | — | | | | 6,811,111 | | | | — | | | | 6,811,111 | |
Switzerland | | | — | | | | 1,515,338 | | | | — | | | | 1,515,338 | |
United States | | | 106,971,481 | | | | — | | | | — | | | | 106,971,481 | |
Mutual Funds | | | 201,984 | | | | — | | | | — | | | | 201,984 | |
Short-Term Investments | | | — | | | | 1,125,632 | | | | — | | | | 1,125,632 | |
Total Investments | | $ | 121,449,930 | | | $ | 71,353,192 | | | $ | — | | | $ | 192,803,122 | |
| | | | | | | | | | | | | | | | | |
International Equity Fund | | | | | | | | | | | | | | | | |
Asset Investments | | | | | | | | | | | | | | | | |
Common Stock* | | | | | | | | | | | | | | | | |
Australia | | $ | 100,080 | | | $ | 965,183 | | | $ | — | | | $ | 1,065,263 | |
Austria | | | — | | | | 40,243 | | | | — | | | | 40,243 | |
Belgium | | | — | | | | 826,406 | | | | — | | | | 826,406 | |
Canada | | | 7,518,255 | | | | — | | | | — | | | | 7,518,255 | |
Cayman Islands | | | — | | | | 713,809 | | | | — | | | | 713,809 | |
Finland | | | — | | | | 1,713,324 | | | | — | | | | 1,713,324 | |
France | | | — | | | | 13,698,646 | | | | — | | | | 13,698,646 | |
Germany | | | — | | | | 5,576,895 | | | | — | | | | 5,576,895 | |
Hong Kong | | | — | | | | 2,903,271 | | | | — | | | | 2,903,271 | |
Ireland | | | 359,905 | | | | 3,584,325 | | | | — | | | | 3,944,230 | |
Israel | | | 267,728 | | | | — | | | | — | | | | 267,728 | |
Italy | | | — | | | | 94,524 | | | | — | | | | 94,524 | |
Japan | | | — | | | | 17,142,390 | | | | — | | | | 17,142,390 | |
Luxembourg | | | — | | | | 201,981 | | | | — | | | | 201,981 | |
Netherlands | | | 487,269 | | | | 5,150,348 | | | | — | | | | 5,637,617 | |
Norway | | | — | | | | 440,358 | | | | — | | | | 440,358 | |
Republic of Korea | | | — | | | | 334,364 | | | | — | | | | 334,364 | |
195
Notes to Financial Statements (Continued) |
| | | Level 1 | | | Level 2 | | | Level 3 | | | Total | |
International Equity Fund (Continued) | | | | | | | | | | | | | | | | |
Asset Investments (Continued) | | | | | | | | | | | | | | | | |
Singapore | | $ | — | | | $ | 374,543 | | | $ | — | | | $ | 374,543 | |
Spain | | | — | | | | 4,024,294 | | | | — | | | | 4,024,294 | |
Sweden | | | — | | | | 2,780,112 | | | | — | | | | 2,780,112 | |
Switzerland | | | — | | | | 11,701,267 | | | | — | | | | 11,701,267 | |
United Kingdom | | | 229,350 | | | | 28,205,454 | | | | — | | | | 28,434,804 | |
Mutual Funds | | | 101,475 | | | | — | | | | — | | | | 101,475 | |
Short-Term Investments | | | — | | | | 4,869,256 | | | | — | | | | 4,869,256 | |
Total Investments | | $ | 9,064,062 | | | $ | 105,340,993 | | | $ | — | | | $ | 114,405,055 | |
| | | | | | | | | | | | | | | | | |
Strategic Emerging Markets Fund | | | | | | | | | | | | | | | | |
Asset Investments | | | | | | | | | | | | | | | | |
Common Stock* | | | | | | | | | | | | | | | | |
Belgium | | $ | — | | | $ | 238,585 | | | $ | — | | | $ | 238,585 | |
Bermuda | | | 720,959 | | | | — | | | | — | | | | 720,959 | |
Brazil | | | 4,624,301 | | | | — | | | | — | | | | 4,624,301 | |
Cayman Islands | | | 14,641,878 | | | | 7,721,134 | | | | — | | | | 22,363,012 | |
Chile | | | 101,066 | | | | — | | | | — | | | | 101,066 | |
China | | | — | | | | 30,962 | | | | — | | | | 30,962 | |
Cyprus | | | — | | | | — | | | | — | +,** | | | — | |
France | | | — | | | | 6,339,711 | | | | — | | | | 6,339,711 | |
Hong Kong | | | — | | | | 2,047,411 | | | | — | | | | 2,047,411 | |
India | | | — | | | | 23,954,857 | | | | — | | | | 23,954,857 | |
Indonesia | | | — | | | | 873,196 | | | | — | | | | 873,196 | |
Italy | | | — | | | | 1,493,792 | | | | — | | | | 1,493,792 | |
Japan | | | — | | | | 100,141 | | | | — | | | | 100,141 | |
Mexico | | | 8,839,559 | | | | — | | | | — | | | | 8,839,559 | |
Netherlands | | | — | | | | — | | | | — | +,** | | | — | |
Philippines | | | — | | | | 1,466,862 | | | | — | | | | 1,466,862 | |
Republic of Korea | | | — | | | | 8,202,120 | | | | — | | | | 8,202,120 | |
Russia | | | — | | | | — | | | | — | +,** | | | — | |
South Africa | | | — | | | | 1,047,675 | | | | — | | | | 1,047,675 | |
Switzerland | | | — | | | | 1,995,084 | | | | — | | | | 1,995,084 | |
Taiwan | | | — | | | | 9,321,385 | | | | — | | | | 9,321,385 | |
United Kingdom | | | 101,674 | | | | 340,946 | | | | — | | | | 442,620 | |
United States | | | 6,539,493 | | | | — | | | | — | | | | 6,539,493 | |
Preferred Stock* | | | | | | | | | | | | | | | | |
Brazil | | | 1,789,728 | | | | — | | | | — | | | | 1,789,728 | |
Mutual Funds | | | 199,697 | | | | — | | | | — | | | | 199,697 | |
Warrants | | | 24,052 | | | | — | | | | — | | | | 24,052 | |
Short-Term Investments | | | — | | | | 5,387,475 | | | | — | | | | 5,387,475 | |
Total Investments | | $ | 37,582,407 | | | $ | 70,561,336 | | | $ | — | | | $ | 108,143,743 | |
* | Includes foreign equity securities whose values were adjusted to reflect market trading of comparable securities or other correlated instruments after the close of trading in their respective foreign markets, as applicable. |
** | Level 3 investments at September 30, 2022 in relation to net assets were not significant. |
+ | Represents a security at $0 value as of September 30, 2022. |
For certain Fund(s) the Statement of Assets and Liabilities shows receivables from investments sold on a delayed delivery basis, cash collateral pledged for derivatives, as well as, any applicable liabilities for investments purchased on a delayed delivery basis, amounts due to custodian, and cash collateral held for securities on loan. These amounts approximate fair value and would be categorized at Level 2 for each applicable Fund as of September 30, 2022.
196
Notes to Financial Statements (Continued) |
The Funds, with the exception of the Strategic Emerging Markets Fund, had no Level 3 transfers during the year ended September 30, 2022.
| | | Transfers In * | | | Transfers Out * | |
| | | Level 3 -
Significant
Unobservable
Inputs | | | Level 1 -
Other
Significant
Observable
Inputs | | | Level 2 -
Other Significant
Observable
Inputs | |
Strategic Emerging Markets Fund | | $ | 16,750,547 | | | $ | (6,093,568 | ) | | $ | (10,656,979 | ) |
* | Transfers into Level 3 were attributable to a lack of observable market data. |
Derivative Instruments
Derivatives are financial instruments whose values are based on the values of one or more underlying indicators, such as a security, asset, currency, interest rate, or index. Derivative transactions can create investment leverage and may be highly volatile. Losses from derivatives can be substantially greater than the derivatives’ original cost and can sometimes be unlimited. A Fund may not be able to close out a derivative transaction at a favorable time or price.
At September 30, 2022, and during the year then ended, the Fund(s) had the following derivatives and transactions in derivatives, grouped into the indicated risk categories:
| | | Equity
Risk | | | Foreign
Exchange
Risk | | | Interest/
Inflation
Rate Risk | | | Total | |
Short-Duration Bond Fund | | | | | | | | | | | | | | | | |
Asset Derivatives | | | | | | | | | | | | | | | | |
Futures Contracts^^ | | $ | — | | | $ | — | | | $ | 6,758,055 | | | $ | 6,758,055 | |
Liability Derivatives | | | | | | | | | | | | | | | | |
Swap Agreements^^,^^^ | | $ | — | | | $ | — | | | $ | (4,140,728 | ) | | $ | (4,140,728 | ) |
Realized Gain (Loss)# | | | | | | | | | | | | | | | | |
Purchased Options | | $ | — | | | $ | — | | | $ | 808,665 | | | $ | 808,665 | |
Futures Contracts | | | — | | | | — | | | | 18,876,718 | | | | 18,876,718 | |
Swap Agreements | | | — | | | | — | | | | (24,419,336 | ) | | | (24,419,336 | ) |
Total Realized Gain (Loss) | | $ | — | | | $ | — | | | $ | (4,733,953 | ) | | $ | (4,733,953 | ) |
Change in Appreciation (Depreciation)## | | | | | | | | | | | | | | | | |
Purchased Options | | $ | — | | | $ | — | | | $ | 144,312 | | | $ | 144,312 | |
Futures Contracts | | | — | | | | — | | | | 6,152,287 | | | | 6,152,287 | |
Swap Agreements | | | — | | | | — | | | | (4,140,728 | ) | | | (4,140,728 | ) |
Total Change in Appreciation (Depreciation) | | $ | — | | | $ | — | | | $ | 2,155,871 | | | $ | 2,155,871 | |
| | | | | | | | | | | | | | | | | |
197
Notes to Financial Statements (Continued) |
| | | Equity
Risk | | | Foreign
Exchange
Risk | | | Interest/
Inflation
Rate Risk | | | Total | |
Inflation-Protected and Income Fund | | | | | | | | | | | | | | | | |
Asset Derivatives | | | | | | | | | | | | | | | | |
Futures Contracts^^ | | $ | — | | | $ | — | | | $ | 1,573,607 | | | $ | 1,573,607 | |
Swap Agreements^^,^^^ | | | — | | | | — | | | | 130,704 | | | | 130,704 | |
Total Value | | $ | — | | | $ | — | | | $ | 1,704,311 | | | $ | 1,704,311 | |
Liability Derivatives | | | | | | | | | | | | | | | | |
Futures Contracts^^ | | $ | — | | | $ | — | | | $ | (108,349 | ) | | $ | (108,349 | ) |
Swap Agreements^ | | | — | | | | — | | | | (18,012,025 | ) | | | (18,012,025 | ) |
Swap Agreements^^,^^^ | | | — | | | | — | | | | (159,739 | ) | | | (159,739 | ) |
Total Value | | $ | — | | | $ | — | | | $ | (18,280,113 | ) | | $ | (18,280,113 | ) |
Realized Gain (Loss)# | | | | | | | | | | | | | | | | |
Purchased Options | | $ | — | | | $ | — | | | $ | 237,027 | | | $ | 237,027 | |
Futures Contracts | | | — | | | | — | | | | (20,988 | ) | | | (20,988 | ) |
Swap Agreements | | | — | | | | — | | | | (3,827,341 | ) | | | (3,827,341 | ) |
Total Realized Gain (Loss) | | $ | — | | | $ | — | | | $ | (3,611,302 | ) | | $ | (3,611,302 | ) |
Change in Appreciation (Depreciation)## | | | | | | | | | | | | | | | | |
Purchased Options | | $ | — | | | $ | — | | | $ | 249,898 | | | $ | 249,898 | |
Futures Contracts | | | — | | | | — | | | | 1,352,400 | | | | 1,352,400 | |
Swap Agreements | | | (4,263,676 | ) | | | — | | | | (18,473,600 | ) | | | (22,737,276 | ) |
Total Change in Appreciation (Depreciation) | | $ | (4,263,676 | ) | | $ | — | | | $ | (16,871,302 | ) | | $ | (21,134,978 | ) |
| | | | | | | | | | | | | | | | | |
Core Bond Fund | | | | | | | | | | | | | | | | |
Asset Derivatives | | | | | | | | | | | | | | | | |
Futures Contracts^^ | | $ | — | | | $ | — | | | $ | 1,269,808 | | | $ | 1,269,808 | |
Liability Derivatives | | | | | | | | | | | | | | | | |
Futures Contracts^^ | | $ | — | | | $ | — | | | $ | (5,393,598 | ) | | $ | (5,393,598 | ) |
Realized Gain (Loss)# | | | | | | | | | | | | | | | | |
Purchased Options | | $ | — | | | $ | — | | | $ | 844,460 | | | $ | 844,460 | |
Futures Contracts | | | — | | | | — | | | | (16,214,744 | ) | | | (16,214,744 | ) |
Total Realized Gain (Loss) | | $ | — | | | $ | — | | | $ | (15,370,284 | ) | | $ | (15,370,284 | ) |
Change in Appreciation (Depreciation)## | | | | | | | | | | | | | | | | |
Purchased Options | | $ | — | | | $ | — | | | $ | 647,917 | | | $ | 647,917 | |
Futures Contracts | | | — | | | | — | | | | (1,324,221 | ) | | | (1,324,221 | ) |
Total Change in Appreciation (Depreciation) | | $ | — | | | $ | — | | | $ | (676,304 | ) | | $ | (676,304 | ) |
| | | | | | | | | | | | | | | | | |
Diversified Bond Fund | | | | | | | | | | | | | | | | |
Asset Derivatives | | | | | | | | | | | | | | | | |
Purchased Options*,^^^ | | $ | — | | | $ | 274 | | | $ | — | | | $ | 274 | |
Forward Contracts* | | | — | | | | 190,828 | | | | — | | | | 190,828 | |
Futures Contracts^^ | | | — | | | | — | | | | 136,512 | | | | 136,512 | |
Total Value | | $ | — | | | $ | 191,102 | | | $ | 136,512 | | | $ | 327,614 | |
198
Notes to Financial Statements (Continued) |
| | | Equity
Risk | | | Foreign
Exchange
Risk | | | Interest/
Inflation
Rate Risk | | | Total | |
Diversified Bond Fund (Continued) | | | | | | | | | | | | | | | | |
Liability Derivatives | | | | | | | | | | | | | | | | |
Forward Contracts^ | | $ | — | | | $ | (245,946 | ) | | $ | — | | | $ | (245,946 | ) |
Futures Contracts^^ | | | — | | | | — | | | | (1,651,191 | ) | | | (1,651,191 | ) |
Written Options^,^^^ | | | — | | | | (11,185 | ) | | | — | | | | (11,185 | ) |
Total Value | | $ | — | | | $ | (257,131 | ) | | $ | (1,651,191 | ) | | $ | (1,908,322 | ) |
Realized Gain (Loss)# | | | | | | | | | | | | | | | | |
Purchased Options | | $ | — | | | $ | 7,248 | | | $ | 179,581 | | | $ | 186,829 | |
Forward Contracts | | | — | | | | (120,990 | ) | | | — | | | | (120,990 | ) |
Futures Contracts | | | — | | | | — | | | | (5,012,811 | ) | | | (5,012,811 | ) |
Written Options | | | — | | | | 51,584 | | | | — | | | | 51,584 | |
Total Realized Gain (Loss) | | $ | — | | | $ | (62,158 | ) | | $ | (4,833,230 | ) | | $ | (4,895,388 | ) |
Change in Appreciation (Depreciation)## | | | | | | | | | | | | | | | | |
Purchased Options | | $ | — | | | $ | (3,045 | ) | | $ | 144,346 | | | $ | 141,301 | |
Forward Contracts | | | — | | | | (51,589 | ) | | | — | | | | (51,589 | ) |
Futures Contracts | | | — | | | | — | | | | (961,606 | ) | | | (961,606 | ) |
Written Options | | | — | | | | (35,651 | ) | | | — | | | | (35,651 | ) |
Total Change in Appreciation (Depreciation) | | $ | — | | | $ | (90,285 | ) | | $ | (817,260 | ) | | $ | (907,545 | ) |
| | | | | | | | | | | | | | | | | |
Balanced Fund | | | | | | | | | | | | | | | | |
Asset Derivatives | | | | | | | | | | | | | | | | |
Futures Contracts^^ | | $ | — | | | $ | — | | | $ | 242,556 | | | $ | 242,556 | |
Realized Gain (Loss)# | | | | | | | | | | | | | | | | |
Futures Contracts | | $ | — | | | $ | — | | | $ | 596,675 | | | $ | 596,675 | |
Change in Appreciation (Depreciation)## | | | | | | | | | | | | | | | | |
Futures Contracts | | $ | — | | | $ | — | | | $ | 189,070 | | | $ | 189,070 | |
* | Statements of Assets and Liabilities location: Investments, at value, or Receivables from: open forward contracts as applicable. |
^ | Statements of Assets and Liabilities location: Payables for: open forward contracts, open swap agreements, at value, or written options outstanding, at value, as applicable. |
^^ | Cumulative appreciation (depreciation) on futures contracts and centrally cleared swaps is reported in “Futures Contracts” and “Swap Agreements” in each applicable Fund’s Portfolio of Investments. Only current day’s variation margin, if any, is reported within the Statements of Assets and Liabilities. |
^^^ | Represents centrally cleared swaps and OTC purchased and written options, which are not subject to a master netting agreement or similar agreement. |
# | Statements of Operations location: Amounts are included in net realized gain (loss) on: investment transactions, forward contracts, futures contracts, swap agreements, or written options, as applicable. |
## | Statements of Operations location: Amounts are included in net change in unrealized appreciation (depreciation) on: investment transactions, forward contracts, futures contracts, swap agreements, or written options, as applicable. |
199
Notes to Financial Statements (Continued) |
For the year ended September 30, 2022, the average number of contracts, notional amounts, or shares/units for each derivative type was as follows:
| | | Average Number of Contracts, Notional Amounts, or Shares/Units† | |
Fund Name | | Futures
Contracts | | | Forward
Contracts | | | Swap
Agreements | | | Purchased
Options | | | Purchased
Swaptions | | | Written
Options | |
Short-Duration Bond Fund | | | 3,297 | | | $ | — | | | $ | 389,681,818 | | | | — | | | $ | 35,714,464 | | | | — | |
Inflation-Protected and Income Fund | | | 211 | | | | — | | | | 306,731,314 | | | | — | | | | 23,079,750 | | | | — | |
Core Bond Fund | | | 1,136 | | | | — | | | | — | | | | — | | | | 70,131,000 | | | | — | |
Diversified Bond Fund | | | 279 | | | | 7,549,770 | | | | — | | | | 369,375 | | | | 14,210,000 | | | | 892,375 | |
Balanced Fund | | | 43 | | | | — | | | | — | | | | — | | | | — | | | | — | |
† | Amount(s) disclosed represent average number of contracts for futures contracts, notional amounts for forward contracts, swap agreements, and purchased swaptions, or shares/units outstanding for purchased options and written options, based on absolute values, which is indicative of volume of this derivative type, for the months that the Fund held such derivatives during the year ended September 30, 2022. |
The Portfolio of Investments included in a Fund’s financial statements shows the assets or liabilities of the Fund associated with individual derivatives transactions. The terms of many of those transactions contemplate that derivatives receivables and payables between the same two parties may be netted and that the parties will collateralize certain obligations. The following tables provide an illustration of the possible effect of netting provisions and of collateral (delivered or received) on a Fund’s derivatives exposure as of September 30, 2022. Netting arrangements vary among different counterparties, and the actual disposition of derivatives receivables and payables, and of collateral, in a bankruptcy or insolvency can be complicated and difficult to predict.
The following table presents derivative assets by counterparty net of amounts available for offset under a master netting agreement (“MNA”) or similar agreement and net of the related collateral received by the Fund(s) as of September 30, 2022.
Counterparty | | Derivative
Assets Subject
to an MNA by
Counterparty† | | | Financial
Instruments
Available for
Offset | | | Collateral
Received*** | | | Net Amount* | |
Diversified Bond Fund | | | | | | | | | | | | | | | | |
Bank of America N.A. | | $ | 37,476 | | | $ | (18,564 | ) | | $ | — | | | $ | 18,912 | |
BNP Paribas SA | | | 29,040 | | | | (9,544 | ) | | | — | | | | 19,496 | |
Citibank N.A. | | | 49,469 | | | | (49,469 | ) | | | — | | | | — | |
HSBC Bank USA | | | 49,692 | | | | (49,692 | ) | | | — | | | | — | |
JP Morgan Chase Bank N.A. | | | 19,264 | | | | (6,836 | ) | | | — | | | | 12,428 | |
Morgan Stanley & Co. LLC | | | 5,887 | | | | (5,887 | ) | | | — | | | | — | |
| | | $ | 190,828 | | | $ | (139,992 | ) | | $ | — | | | $ | 50,836 | |
200
Notes to Financial Statements (Continued) |
The following table presents derivative liabilities by counterparty net of amounts available for offset under an MNA or similar agreement and net of the related collateral pledged by the Fund(s) as of September 30, 2022.
Counterparty | | Derivative
Liabilities Subject
to an MNA by
Counterparty† | | | Financial
Instruments
Available for
Offset | | | Collateral
Pledged*** | | | Net Amount** | |
Inflation-Protected and Income Fund | | | | | | | | | | | | | | | | |
Barclays Bank PLC | | $ | (4,905,350 | ) | | $ | — | | | $ | 4,905,350 | | | $ | — | |
BNP Paribas SA | | | (6,248,521 | ) | | | — | | | | 6,248,521 | | | | — | |
Goldman Sachs International | | | (6,858,154 | ) | | | — | | | | 6,858,154 | | | | — | |
| | | $ | (18,012,025 | ) | | $ | — | | | $ | 18,012,025 | | | $ | — | |
Diversified Bond Fund | | | | | | | | | | | | | | | | |
Bank of America N.A. | | $ | (18,564 | ) | | $ | 18,564 | | | $ | — | | | $ | — | |
BNP Paribas SA | | | (9,544 | ) | | | 9,544 | | | | — | | | | — | |
Citibank N.A. | | | (55,133 | ) | | | 49,469 | | | | — | | | | (5,664 | ) |
HSBC Bank USA | | | (90,525 | ) | | | 49,692 | | | | — | | | | (40,833 | ) |
JP Morgan Chase Bank N.A. | | | (6,836 | ) | | | 6,836 | | | | — | | | | — | |
Morgan Stanley & Co. LLC | | | (65,344 | ) | | | 5,887 | | | | — | | | | (59,457 | ) |
| | | $ | (245,946 | ) | | $ | 139,992 | | | $ | — | | | $ | (105,954 | ) |
* | Represents the net amount receivable from the counterparty in the event of default. |
** | Represents the net amount payable to the counterparty in the event of default. |
*** | The amount presented here may be less than the total amount of collateral received/pledged as the net amount of derivative assets and liabilities for a counterparty cannot be less than $0. |
† | The amount presented here may be less than the total amount shown in the Statements of Assets and Liabilities as some derivatives held by the counterparty are not covered within an MNA or similar agreement. |
Such agreements typically permit a single net payment in the event of default, including the bankruptcy or insolvency of the counterparty. The Fund(s) and counterparties may not be permitted to sell, re-pledge, or use the collateral they receive. In the event that cash collateral is restricted for use, the balance will be reflected as restricted cash within the Statement of Assets and Liabilities.
Further details regarding the derivatives and other investments held by the Fund(s) during the year ended September 30, 2022, are discussed below.
Foreign Currency Exchange Transactions
A Fund may enter into foreign currency exchange transactions for hedging purposes in order to protect against uncertainty in the level of future foreign currency exchange rates, or for other, non-hedging purposes.
A Fund may enter into foreign currency exchange transactions, including foreign currency forward contracts. These contracts call for the Fund to deliver in the future an amount of one currency in return for an amount of another currency, at an exchange rate determined at the time the contract is entered into. Forward contracts are private contractual arrangements and a Fund is subject to the risk that its counterparty will not, or will not be able to, perform its obligations. This type of arrangement may require the Fund to post margin. A Fund may also buy and sell options on currencies. When the Fund buys an option, its loss should generally be limited to the amount of the premium paid and any transaction costs. If a Fund sells an option on a currency, it is subject generally to the same risks as if it had entered into a futures contract or forward contract with respect to that currency. A Fund may enter into foreign currency exchange transactions in order to hedge against changes in the values of the assets or liabilities denominated in one or more foreign currencies, or otherwise to increase or reduce a Fund’s exposure to various foreign currencies. The use of foreign currency exchange transactions may create investment leverage.
201
Notes to Financial Statements (Continued) |
Whenever a Fund enters into a foreign currency exchange transaction, it is subject to the risk that the value of the transaction will move in a direction unfavorable to it. When the Fund uses the transactions for hedging purposes, it is likely that the Fund will have an asset or liability that will offset any loss (or gain) on the transactions, at least in part. If a Fund enters into foreign currency exchange transactions other than for hedging purposes (for example, seeking to profit from an anticipated change in the values of currencies by creating directional exposures in the portfolio with respect to one or more currencies), it will generally be subject to the same risks, but is less likely to have assets or liabilities that will offset any losses on the transactions. There can be no assurance that a Fund will be able to terminate any foreign currency exchange transaction prior to its maturity in order to limit its loss on the transaction.
Forward foreign currency contracts are marked to market daily and the change in their value is recorded by the Funds as an unrealized gain or loss. Forward foreign currency contracts are valued at the settlement price established through dealers or other market sources on the day which they are traded. When a forward foreign currency contract is extinguished, through delivery or offset by entering into another forward foreign currency contract, the Funds record a realized gain or loss equal to the difference between the value of the contract at the time it was opened and the value of the contract at the time it was extinguished or offset. The notional or contractual amounts of these instruments do not necessarily represent the amounts potentially subject to risk. The measurement of the risk associated with these instruments is meaningful only when all related and offsetting transactions and counterparty risks are considered. For information regarding the accounting treatment of options, see “Options, Rights, and Warrants” below.
A Fund’s current exposure to a counterparty is the unrealized appreciation/(depreciation) on the contract.
Futures Contracts
A Fund may seek to manage a variety of different risks, such as interest rate risk, equity price risk, and currency risk, through the use of futures contracts.
A Fund may use interest rate futures contracts to adjust the interest rate sensitivity (duration) of its portfolio or the credit exposure of the portfolio. Interest rate futures contracts obligate the long or short holder to take or make delivery of a specified quantity of a financial instrument, such as a specific fixed income security, during a specified future period at a specified price. A Fund may use index futures contracts to hedge against broad market risks to its portfolio or to gain broad market exposure when it holds uninvested cash or as an inexpensive substitute for cash investments directly in securities or other assets, including commodities and precious metals. Securities index futures contracts are contracts to buy or sell units of a securities index at a specified future date at a price agreed upon when the contract is made and are settled in cash. Positions in futures contracts may be closed out only on an exchange or board of trade which provides a market for such futures. Because futures contracts are exchange-traded, they typically have minimal exposure to counterparty risk.
Parties to a futures contract are not required to post the entire notional amount of the contract, but rather a small percentage of that amount (by way of margin), both at the time they enter into futures transactions, and then on a daily basis if their positions decline in value; as a result, futures contracts are highly leveraged. Such payments are known as variation margin and are recorded by the Funds as unrealized gains or losses. Because futures markets are highly leveraged, they can be extremely volatile, and there can be no assurance that the pricing of a futures contract will correlate precisely with the pricing of the asset or index underlying it or the asset or liability of the Fund that is the subject of the hedge. It may not always be possible for a Fund to enter into a closing transaction with respect to a futures contract it has entered into, at a favorable time or price. When a Fund enters into a futures transaction, it is subject to the risk that the value of the futures contract will move in a direction unfavorable to it. When a Fund uses futures contracts for hedging purposes, it is likely that the Fund will have an asset or liability that will offset any loss (or gain) on the transactions, at least in part.
When a futures contract is closed, the Fund records a realized gain or loss equal to the difference between the value of the contract at the time it was opened and the value at the time it was closed. Futures contracts are valued at the settlement price established each day by the board of trade or exchange on which they are traded.
202
Notes to Financial Statements (Continued) |
Swap Agreements
Swap agreements are typically two-party contracts entered into primarily by institutional investors. In a standard “swap” transaction, two parties agree to exchange the returns (or differentials in rates of return) earned or realized on particular predetermined investments or instruments or rates, which may be adjusted for an interest factor. The gross returns to be exchanged or “swapped” between the parties are generally calculated with respect to a “notional amount,” (i.e., the return on or increase in value of a particular dollar amount invested at a particular interest rate or in a “basket” of securities representing a particular index).
Interest Rate Swaps. When a Fund enters into an interest rate swap, it typically agrees to make payments to its counterparty based on a specified long- or short-term interest rate, and will receive payments from its counterparty based on another interest rate. Other forms of interest rate swap agreements include, among others, interest rate caps, under which, in return for a specified payment stream, one party agrees to make payments to the other to the extent that interest rates exceed a specified rate, or “cap”; interest rate floors, under which, in return for a specified payment stream, one party agrees to make payments to the other to the extent that interest rates fall below a specified rate, or “floor”; and interest rate collars, under which a party sells a cap and purchases a floor or vice versa in an attempt to protect itself against interest rate movements exceeding given minimum or maximum levels. A Fund may enter into an interest rate swap in order, for example, to hedge against the effect of interest rate changes on the value of specific securities in its portfolio, or to adjust the interest rate sensitivity (duration) or the credit exposure of its portfolio overall, or otherwise as a substitute for a direct investment in debt securities.
Total Return Swaps. A Fund also may enter into total return swaps. In a total return swap, one party typically agrees to pay to the other a short-term interest rate in return for a payment at one or more times in the future based on the increase in the value of an underlying security or other asset, or index of securities or assets; if the underlying security, asset, or index declines in value, the party that pays the short-term interest rate must also pay to its counterparty a payment based on the amount of the decline. A Fund may take either side of such a swap, and so may take a long or short position in the underlying security, asset, or index. A Fund may enter into a total return swap to hedge against an exposure in its portfolio — such as interest rate risk (including to adjust the duration or credit quality of a Fund’s bond portfolio), equity risk, or credit risk — or generally to put cash to work efficiently in the markets in anticipation of, or as a replacement for, cash investments. A Fund may also enter into a total return swap to gain exposure to securities or markets in which it might not be able to invest directly (in so-called market access transactions).
Whenever a Fund enters into a swap agreement, it takes on counterparty risk — the risk that its counterparty will be unable or unwilling to meet its obligations under the swap agreement. The Fund also takes the risk that the market will move against its position in the swap agreement. In the case of an interest rate swap, the value of the swap may increase or decrease depending on changes in interest rates. In the case of a total return swap, the swap will change in value depending on the change in value of the asset or index on which the swap is written. When the Fund enters into any type of swap for hedging purposes, it is likely that the Fund will have an asset or liability that will offset any loss (or gain) on the swap, at least in part. Swap agreements may be non-transferable or otherwise highly illiquid, and a Fund may not be able to terminate or transfer a swap agreement at any particular time or at an acceptable price.
Swaptions. A Fund may also enter into options on swap agreements (“swaptions”). A swaption is a contract that gives a counterparty the right (but not the obligation) to enter into a new swap agreement or to shorten, extend, cancel, or otherwise modify an existing swap agreement, at some designated future time on specified terms. A Fund may write (sell) and purchase put and call swaptions. Depending on the terms of the particular option agreement, a Fund will generally incur a greater degree of risk when it writes a swaption than it will incur when it purchases a swaption. When a Fund purchases a swaption, it risks losing only the amount of the premium it has paid should it decide to let the option expire unexercised. However, when a Fund writes a swaption, upon exercise of the option the Fund will become obligated according to the terms of the underlying agreement. A Fund may enter into swaptions for the same purposes as swaps. For information regarding the accounting treatment of options, see “Options, Rights, and Warrants” below.
Centrally Cleared Swaps. Certain clearinghouses currently offer clearing for limited types of derivatives transactions, principally certain interest rate swaps, certain index swaps, and credit derivatives. In a cleared derivative transaction, a Fund typically enters into the transaction with a financial institution counterparty, and performance of the transaction is effectively guaranteed by a central clearinghouse, thereby reducing or eliminating the Fund’s exposure to the credit risk of its original counterparty.
203
Notes to Financial Statements (Continued) |
The Fund will be required to post amounts (“initial margin”) with the clearinghouse or at the instruction of the clearinghouse. The initial margin required by a clearinghouse may be greater than the initial margin the Fund would be required to post in an uncleared transaction. If cash is deposited as the initial margin, it is shown as collateral on a Fund’s Statement of Assets and Liabilities. Swap agreements are marked-to-market daily and subsequent payments (“variation margin”) are made or received by a Fund depending on whether unrealized gains or losses are incurred. These amounts are reflected as receivables or payables on a Fund’s Statement of Assets and Liabilities (“Variation margin on open derivative instruments”) and as a component of net change in unrealized appreciation (depreciation) on a Fund’s Statement of Operations. Only a limited number of transaction types are currently eligible for clearing.
During the term of a swap transaction, changes in the value of the swap are recognized as unrealized gains or losses by marking to market to reflect the market value of the swap. When the swap is terminated, a Fund will record a realized gain or loss equal to the difference, if any, between the proceeds from (or cost of) the closing transaction and a Fund’s basis in the agreement. Upfront swap premium payments paid or received by a Fund, if any, are recorded within the value of the open swap agreement on the Fund’s Statement of Assets and Liabilities and represent payments paid or received upon entering into the swap agreement to compensate for differences between stated terms of the swap agreement and prevailing market conditions (credit spreads, currency exchange rates, and other relevant factors). These upfront payments are recorded as realized gain or loss on the Fund’s Statement of Operations upon termination or maturity of the swap agreement.
During the term of a swap transaction, the periodic net payments can be made for a set period of time or may be triggered by a predetermined credit event. The net periodic payments may be based on a fixed or variable interest rate, the change in market value of a specified security, basket of securities or index, or the return generated by a security. These periodic payments received or made by the Funds are recorded in the accompanying Statements of Operations as realized gains and losses, respectively.
A Fund’s current exposure to a counterparty is the fair value of the transaction.
Options, Rights, and Warrants
A Fund may purchase and sell put and call options on portfolio securities or an index of securities to enhance investment performance or to protect against changes in market prices. A Fund that invests in debt securities may also purchase and sell put and call options to adjust the interest rate sensitivity of its portfolio or the credit exposure of the portfolio.
Call Options. A call option gives the holder the right to purchase, and obligates the writer to sell, a security at the strike price at any time before the expiration date in the case of an American-style option or only on the expiration date in the case of a European-style option.
Put Options. A put option gives the holder the right to sell, and obligates the writer to buy, a security at the exercise price.
Writing put and call options. A Fund may write call options on a security it owns, in a “directional” strategy hoping to realize a greater current return through the receipt of premiums. In return for the option premium, the Fund takes the risk that it will have to forego any increase in the value of the security over the strike price. When a Fund has written a call option on a security it does not own, its exposure on such an option is theoretically unlimited. A Fund may enter into closing purchase transactions in order to realize a profit or limit a loss on a previously written call option or, in the case of a call option on a security it owns, to free itself to sell the underlying security or to write another call on the security, or protect a security from being called in an unexpected market rise. Any profits from a closing purchase transaction in the case of a call option on a security a Fund owns may be offset by a decline in the value of the underlying security. Conversely, because increases in the market price of a call option will generally reflect increases in the market price of the underlying security, any loss resulting from a closing purchase transaction relating to a call option on a security a Fund owns is likely to be offset in whole or in part by unrealized appreciation of the underlying security owned by the Fund. A Fund may not be able to close out a call option that it has previously written. A Fund may write put options in order to enhance its current return by taking a long directional position as to a security or index of securities. By writing a put option, the Fund assumes the risk that it may be required to purchase the underlying security for an exercise price higher than its then current market value, resulting in a potential capital loss unless the security later appreciates
204
Notes to Financial Statements (Continued) |
in value. A Fund may terminate a put option that it has written before it expires by entering into a closing purchase transaction. Any loss from this transaction may be partially or entirely offset by the premium received on the terminated option. A Fund may not be able to close out a put option that it has previously written.
When a Fund writes a call or put option, an amount equal to the premium received is recorded as a liability. Premiums received from writing options which expire are treated as realized gains. Premiums received from writing options which are exercised or closed are added to the proceeds or offset against the amount paid on the underlying investment to determine the realized gain or loss.
Purchasing put and call options. A Fund may purchase put options to protect portfolio holdings against a decline in market value of a security or securities held by it. A Fund may also purchase a put option hoping to profit from an anticipated decline in the value of the underlying security. If the Fund holds the security underlying the option, the option premium and any transaction costs will reduce any profit the Fund might have realized had it sold the underlying security instead of buying the put option. A Fund may purchase call options to hedge against an increase in the price of securities that the Fund wants ultimately to buy. A Fund may also purchase a call option as a long directional investment hoping to profit from an anticipated increase in the value of the underlying security. In order for a call option to be profitable, the market price of the underlying security must rise sufficiently above the exercise price to cover the premium and transaction costs. These costs will reduce any profit the Fund might have realized had it bought the underlying security at the time it purchased the call option.
When a Fund purchases an option, it runs the risk that it will lose its entire investment in the option in a relatively short period of time, unless the Fund exercises the option or enters into a closing sale transaction before the option’s expiration. If the price of the underlying security does not rise (in the case of a call) or fall (in the case of a put) to an extent sufficient to cover the option premium and transaction costs, the Fund will lose part or all of its investment in the option. This contrasts with an investment by a Fund in the underlying security, since the Fund will not realize a loss if the security’s price does not change. Premiums paid for purchasing options that expire are treated as realized losses.
OTC Options. OTC options purchased or sold by a Fund are not traded on securities or options exchanges or backed by clearinghouses. Rather, they are entered into directly between a Fund and the counterparty to the option. In the case of an OTC option purchased by the Fund, the value of the option to the Fund will depend on the willingness and ability of the option writer to perform its obligations to the Fund. In addition, OTC options may not be transferable and there may be little or no secondary market for them, so they may be considered illiquid. It may not be possible to enter into closing transactions with respect to OTC options or otherwise to terminate such options, and as a result a Fund may be required to remain obligated on an unfavorable OTC option until its expiration. OTC options are valued using prices supplied by a primary pricing source, selected pursuant to procedures approved by the Trustees.
Rights and Warrants. A Fund may purchase or hold warrants or rights in order to gain exposure to the underlying security without owning the security, including, for example, cases where the Fund hopes to lock in the price today of a security it may wish to purchase in the future. Warrants generally give the holder the right, but not the obligation, to buy a security at a stated price. In order for a warrant to be profitable, the market price of the underlying security must rise sufficiently above the exercise price to cover any premium and transaction costs. Rights may similarly confer on the holder the right to purchase or acquire securities, including through participation in a so-called rights offering. Bonds may be issued with warrants or other rights attached to purchase or acquire equity or other debt securities, typically of the bond issuer. The market prices of bonds with warrants or rights attached to purchase equity securities or bonds may, to some degree, reflect changes in the values of the underlying securities.
When a Fund purchases or otherwise acquires warrants or other rights, it runs the risk that it will lose its entire investment in the warrants or rights, unless the Fund exercises the warrant or right, acquires the underlying securities, or enters into a closing transaction before expiration. If the price of the underlying security does not rise to an extent sufficient to cover any premium and transaction costs, the Fund will lose part or all of its investment. Any premiums or purchase price paid for warrants or other rights that expire are treated as realized losses. Warrants and similar rights differ from options in that they are typically written by the issuer of the security underlying the warrant or right. Although some warrants and rights may be non-transferable, others may be traded over-the-counter or on an exchange.
205
Notes to Financial Statements (Continued) |
Hybrid Instruments
A hybrid instrument may be a debt security, preferred stock, warrant, convertible security, certificate of deposit, or other evidence of indebtedness on which a portion of or all interest payments, and/or the principal or stated amount payable at maturity, redemption, or retirement, is determined by reference to one or more underlying assets, indexes, economic factors, or other benchmarks. Because hybrid instruments may be designed to provide indirect exposures to virtually any type of derivative instrument, a Fund may invest in a hybrid instrument for any purpose it might engage in derivatives transactions. Hybrid instruments may take a number of forms, including, for example, debt instruments with interest or principal payments or redemption terms determined by reference to the value of an index, security, or other measure at a future time, preferred stock with dividend rates determined by reference to the value of a currency, or convertible securities where the conversion terms relate to a particular commodity. The risks of investing in a hybrid instrument may, depending on the nature of the instrument, reflect a combination of the risks of investing in securities, options, futures, currencies or other types of investments, and will depend upon the terms of the instrument. Such risks generally depend upon factors unrelated to the operations or credit quality of the issuer of the hybrid instrument, and may not be foreseen by the purchaser, such as financial or market developments, economic and political events, the supply and demand of the underlying assets, and interest rate movements. Hybrid instruments may be highly volatile and their use by a Fund may not be successful. The terms of a hybrid instrument may create investment leverage. Hybrid instruments are typically privately issued, presenting credit risk of the issuer, and may be highly illiquid and difficult to value.
Inflation-Linked Securities
Inflation-linked securities are typically fixed income securities whose principal values are periodically adjusted according to a measure of inflation. If the index measuring inflation falls, the principal value of an inflation-linked security will be adjusted downward, and consequently the interest payable on the security (calculated with respect to a smaller principal amount) will be reduced. Repayment of the original principal of the security upon maturity (as adjusted for inflation) is guaranteed in the case of U.S. Treasury inflation-linked securities. For securities that do not provide a similar guarantee, the adjusted principal value of the security repaid at maturity may be less than the original principal.
Alternatively, the interest rates payable on certain inflation-linked securities may be adjusted according to a measure of inflation. As a result, the principal values of such securities do not adjust according to the rate of inflation, although the interest payable on such securities may decline during times of falling inflation.
The values of inflation-linked securities are expected to change in response to changes in real interest rates. Real interest rates are tied to the relationship between nominal interest rates and the rate of inflation. If nominal interest rates increase at a faster rate than inflation, real interest rates may rise, leading to a decrease in value of inflation-linked securities. Inflation-linked securities may cause a potential cash flow mismatch to investors, because an increase in the principal amount of an inflation-linked security will be treated as interest income currently subject to tax at ordinary income rates even though investors will not receive repayment of principal until maturity. If a Fund invests in such securities, it will be required to distribute such interest income in order to qualify for treatment as a regulated investment company and eliminate the Fund-level tax, without a corresponding receipt of cash, and therefore may be required to dispose of portfolio securities at a time when it may not be advantageous to do so in order to make such distributions.
Bank Loans
A Fund may invest in bank loans including, for example, corporate loans, loan participations, direct debt, bank debt, and bridge debt. A Fund may invest in a loan by lending money to a borrower directly as part of a syndicate of lenders. In a syndicated loan, the agent that originated and structured the loan typically administers and enforces the loan on behalf of the syndicate. Failure by the agent to fulfill its obligations may delay or adversely affect receipt of payment by a Fund. A Fund may also invest in loans through novations, assignments, and participation interests. In a novation, a Fund typically assumes all of the rights of a lending institution in a loan, including the right to receive payments of principal and interest and other amounts directly from the borrower and to enforce its rights as a lender directly against the borrower. When a Fund takes an assignment of a loan, the Fund acquires some or all of the interest of another lender (or assignee) in the loan. In such cases, the Fund may be required generally to rely upon the assignor to demand payment and enforce rights under the loan. If a Fund acquires a participation in the loan, the
206
Notes to Financial Statements (Continued) |
Fund purchases an indirect interest in a loan held by a third party and the Fund typically will have a contractual relationship only with the third party loan investor, not with the borrower. As a result, a Fund may have the right to receive payments of principal, interest, and any fees to which it is entitled only from the loan investor selling the participation and only upon receipt by such loan investor of such payments from the borrower. In such cases, a Fund assumes the credit risk of both the borrower and the loan investor selling the participation, and the Fund may be unable to realize some or all of the value of its interest in the loan in the event of the insolvency of the third party.
Changes in the financial condition of the borrower or economic conditions or other circumstances may reduce the capacity of the borrower to make principal and interest payments on such instruments and may lead to defaults. The value of any collateral securing a bank loan may decline after the Fund invests, and there is a risk that the value of the collateral may not be sufficient to cover the amount owed to the Fund.
At September 30, 2022, the Funds had no unfunded loan commitments.
Repurchase Agreements
Each Fund may enter into repurchase agreements with certain banks and broker-dealers whereby a Fund acquires a security for cash and obtains a simultaneous commitment from the seller to repurchase the security at an agreed upon price and date. A Fund, through its custodian, takes possession of the securities collateralizing the repurchase agreement in a segregated account. Repurchase agreements must be fully collateralized at all times, but involve some risk to a Fund if the other party should default on its obligation and the Fund is delayed or prevented from recovering the collateral, or if the Fund is required to return collateral to a borrower at a time when it may realize a loss on the investment of that collateral. Collateral for certain tri-party repurchase agreements is held at the Fund’s custodian or sub-custodian in a segregated account for the benefit of the Fund and the counterparty.
When-Issued, Delayed-Delivery, Forward Commitment, and To-Be-Announced Transactions
A Fund may enter into when-issued, delayed-delivery, forward commitment, or to-be-announced (“TBA”) transactions (collectively, the “Forward Transactions”) in order to lock in the purchase price of the underlying security, or in order to adjust the interest rate exposure of the Fund’s existing portfolio. In Forward Transactions, a Fund commits to purchase or sell particular securities, with payment and delivery to take place at a future date. In the case of TBA purchase commitments, the unit price and the estimated principal amount are established when the Fund enters into a commitment, with the actual principal amount being within a specified range of the estimate. Although a Fund does not typically pay for the securities in these types of transactions until they are delivered, it immediately assumes the risks of ownership, including the risk of price fluctuation. As a result, each of these types of transactions may create investment leverage in a Fund’s portfolio and increase the volatility of the Fund. If a Fund’s counterparty fails to deliver a security purchased in a Forward Transaction, there may be a loss, and the Fund may have missed an opportunity to make an alternative investment.
These securities are valued on the basis of valuations furnished by a pricing service, selected pursuant to procedures approved by the Trustees, which determines valuations taking into account appropriate factors such as institutional-size trading in similar groups of securities, yield, quality, coupon rate, maturity, type of issue, trading characteristics, and other market data. Securities for which no market quotation is available are valued at fair value in accordance with procedures approved by the Trustees. The Funds record on a daily basis the unrealized appreciation (depreciation) based upon changes in the values of these securities. When a Forward Transaction is closed, the Funds record a realized gain or loss equal to the difference between the value of the transaction at the time it was opened and the value of the transaction at the time it was closed.
Dollar Roll Transactions
A Fund may enter into dollar roll transactions, in which the Fund sells mortgage-backed securities for delivery in the current month and simultaneously contracts to purchase substantially similar securities on a specified future date from the same party. A Fund may invest in dollar rolls in order to benefit from anticipated changes in pricing for the mortgage-backed securities during the term of the transaction, or for the purpose of creating investment leverage. In a dollar roll, the securities that are to be purchased will be of the same type as the securities sold, but will be supported by different pools of mortgages.
207
Notes to Financial Statements (Continued) |
Dollar rolls involve the risk that the Fund’s counterparty will be unable to deliver the mortgage-backed securities underlying the dollar roll at the fixed time. If the counterparty files for bankruptcy or becomes insolvent, a Fund’s use of the transaction proceeds may be restricted pending a determination by the counterparty or its representative, whether to enforce the Fund’s obligation to repurchase the securities. A Fund can incur a loss on a dollar roll transaction (either because its counterparty fails to perform or because the value of the mortgages subject to the transaction declines) and on the investments made by the Fund with the proceeds of the dollar roll transaction.
A Fund accounts for a dollar roll transaction as a purchase and sale whereby the difference in the sales price and purchase price of the security sold is recorded as a realized gain (loss). If certain criteria are met, these dollar roll transactions may be considered financing transactions, whereby the difference in the sales price and the future purchase price is recorded as an adjustment to interest income. Dollar roll transactions generally have the effect of creating leverage in a Fund’s portfolio.
Securities Lending
Each Fund, other than the U.S. Government Money Market Fund, may lend its securities; however, lending cannot exceed 33% of the total assets of the Fund taken at current value. The Funds’ securities lending activities are governed by a Securities Lending Agency Agreement (“Lending Agreement”) between each Fund and the lending agent (“Agent”). The Lending Agreement authorizes the Agent to lend portfolio securities held by a Fund to approved borrowers (each, a “Borrower”).
Each Fund expects that in connection with any securities on loan, the loan will be secured continuously by collateral consisting of cash (U.S. currency) and/or securities (U.S. Treasury and Agency obligations) adjusted daily to have value at least equal to the current market value of the securities loaned. The market value of the loaned securities is determined at the close of business of a Fund and any additional collateral is delivered to the Fund the next business day. The Funds bear the risk of loss with respect to the investment of cash collateral. As with other extensions of credit, the Funds may bear the risk of delay in recovery of the loaned securities or even loss of rights in the collateral should the Borrower of the securities fail financially. Pursuant to the Lending Agreement, the Agent has provided indemnification to the Funds in the event of default by a Borrower with respect to a loan. The Funds receive compensation for lending their securities in the form of a securities loan fee paid by the Borrower, as well as a share of the income earned on investment of the cash collateral received for the loaned securities. At September 30, 2022, the Funds’ collateral was equal to or greater than 100% of the market value of securities on loan and all of the Funds’ cash collateral was invested in the State Street Navigator Securities Lending Government Money Market Portfolio.
Subject to the terms of the Lending Agreement and the agreement between the Agent and the applicable Borrower (“Borrowing Agreement”), security loans can be terminated by the Agent, the Fund, or the Borrower and the related securities must be returned within the earlier of the customary settlement period for such securities or the period of time specified in the Borrowing Agreement.
The Funds employ the Agent to implement their securities lending program and the Agent receives a fee from the Funds for its services. In addition, the Funds may be required to pay a rebate to the Borrower. Accordingly, a Fund’s compensation for lending its securities is reduced by any such fees or rebate paid to the Agent or Borrower, respectively. Income received by the Funds in securities lending transactions during the year ended September 30, 2022, is reflected as securities lending income on the Statement of Operations.
Accounting for Investment Transactions
Investment transactions are accounted for on the trade date. Realized gains and losses on sales of investments and unrealized appreciation and depreciation of investments are computed by the specific identification cost method. Proceeds received from litigation, if any, are included in realized gains on investment transactions for any investments that are no longer held in the portfolio and as a reduction in cost for investments that continue to be held in the portfolio. Interest income, adjusted for amortization of discounts and premiums on debt securities, is earned from the settlement date and is recorded on the accrual basis. Dividend income and realized capital gain distributions are recorded on the ex-dividend date. Withholding taxes on foreign interest, dividends, and capital gains have been provided for in accordance with the applicable country’s tax rules and rates.
208
Notes to Financial Statements (Continued) |
Foreign dividend income is recorded on the ex-dividend date or as soon as practicable after the Fund determines the existence of a dividend declaration after exercising reasonable due diligence. Distributions received on securities that represent a return of capital or capital gains are recorded as a reduction of cost of investments and/or as a realized gain.
Foreign Currency Translation
The books and records of the Funds are maintained in U.S. dollars. The market values of foreign currencies, foreign securities, and other assets and liabilities denominated in foreign currencies are translated into U.S. dollars at the mean of the buying and selling rates of such currencies against the U.S. dollar at the end of each business day. Purchases and sales of foreign securities and income and expense items are translated at the rates of exchange prevailing on the respective dates of such transactions. The Funds do not isolate that portion of the results of operations arising from changes in the exchange rates from that portion arising from changes in the market prices of securities. Net realized foreign currency gains and losses resulting from changes in exchange rates include foreign currency gains and losses between trade date and settlement date on investment securities transactions, foreign currency transactions, and the difference between the amounts of dividends or interest recorded on the books of the Funds and the amount actually received.
Allocation of Operating Activity
In maintaining the records for the Funds, the income and expense accounts are allocated daily to each class of shares. Investment income and loss, and unrealized and realized gains or losses are prorated among the classes of shares based on the relative net assets of each. Expenses are allocated to each class of shares depending on the nature of the expenditures. Administration and service fees, if any, which are directly attributable to a class of shares, are charged to that class’s operations. Expenses of a Fund not directly attributable to the operations of any specific class of shares of the Fund are prorated among the classes to which the expense relates based on relative net assets or another alternative method.
Foreign Securities
The Global Fund invests a significant amount of its assets in foreign securities and each of the International Equity Fund and Strategic Emerging Markets Fund invests substantially all of its assets in foreign securities. The other Funds may also invest in foreign securities. Foreign securities, including American Depositary Receipts, are subject to additional risks compared to securities of U.S. issuers, including international trade, currency, political, regulatory, public health, and diplomatic risks. In addition, fluctuations in currency exchange rates may favorably or unfavorably affect the values of foreign securities and the price of a Fund’s shares. Emerging markets securities are subject to greater risks than securities issued in developed foreign markets, including less liquidity, less stringent investor protection and disclosure standards, less reliable settlement practices, greater price volatility, higher relative rates of inflation, greater political, economic, and social instability, greater custody and operational risks, greater risk of new or inconsistent government treatment of or restrictions on issuers and instruments, and greater volatility in currency exchange rates, and are more susceptible to environmental problems.
Federal Income Tax
It is each Fund’s intent to continue to comply with the provisions of Subchapter M of the Internal Revenue Code of 1986, as amended (the “Code”), applicable to a regulated investment company. Under such provisions, the Funds would not be subject to federal income taxes on their ordinary income and net realized capital gains to the extent they are distributed or deemed to have been distributed to their shareholders. Therefore, the Funds have not made any provision for federal income tax.
Dividends and Distributions to Shareholders
Dividends from net investment income are either declared daily and paid monthly or declared and paid annually depending on the requirements of each Fund. Dividends from net investment income may also be distributed at other times throughout the year as required to satisfy tax or regulatory requirements. Distributions of any net realized capital gains of each Fund are declared and paid annually and at other times as may be required to satisfy tax or regulatory requirements.
209
Notes to Financial Statements (Continued) |
Distributions to shareholders are recorded on the ex-dividend date. Income and capital gain distributions are determined in accordance with income tax regulations, which may differ from generally accepted accounting principles. As a result, net investment income and net realized capital gains on investment transactions for a reporting period may differ significantly from distributions during such period.
3. Advisory Fees and Other Transactions
Investment Advisory Fees and Investment Subadvisers
MML Investment Advisers, LLC (“MML Advisers”), a wholly-owned subsidiary of Massachusetts Mutual Life Insurance Company (“MassMutual”), serves as investment adviser to each Fund. Under the investment advisory agreements between MML Advisers and the Trust on behalf of each Fund, MML Advisers is responsible for providing investment management services for each Fund. In return for these services, MML Advisers receives advisory fees, based upon each Fund’s average daily net assets, computed and accrued daily and payable monthly, at the following annual rates:
Fund | Investment Advisory Fee |
U.S. Government Money Market Fund | 0.35% on the first $1 billion; and |
| | 0.33% on any excess over $1 billion |
Short-Duration Bond Fund | 0.35% on the first $500 million; and |
| | 0.30% on any excess over $500 million |
Inflation-Protected and Income Fund | 0.38% on the first $350 million; and |
| | 0.33% on any excess over $350 million |
Core Bond Fund | 0.38% on the first $1.5 billion; |
| | 0.33% on the next $500 million; and |
| | 0.28% on any excess over $2 billion |
Diversified Bond Fund | 0.40% on the first $150 million; and |
| | 0.30% on any excess over $150 million |
High Yield Fund | 0.48% on the first $250 million; and |
| | 0.455% on any excess over $250 million |
Balanced Fund | 0.48% on the first $300 million; and |
| | 0.43% on any excess over $300 million |
Disciplined Value Fund | 0.45% on the first $400 million; and |
| | 0.40% on any excess over $400 million |
Main Street Fund | 0.55% on the first $300 million; and |
| | 0.50% on any excess over $300 million |
Disciplined Growth Fund | 0.45% on the first $400 million; and |
| | 0.40% on any excess over $400 million |
Small Cap Opportunities Fund | 0.58% on the first $300 million; and |
| | 0.53% on any excess over $300 million |
Global Fund | 0.75% on the first $400 million; and |
| | 0.70% on any excess over $400 million |
International Equity Fund | 0.83% on the first $500 million; |
| | 0.78% on the next $500 million; and |
| | 0.73% on any excess over $1 billion |
Strategic Emerging Markets Fund | 1.00% on the first $350 million; and |
| | 0.95% on any excess over $350 million |
210
Notes to Financial Statements (Continued) |
MML Advisers has entered into investment subadvisory agreements with Barings LLC (“Barings”), a wholly-owned subsidiary of MM Asset Management Holding LLC, itself a wholly-owned subsidiary of MassMutual Holding LLC, a controlled subsidiary of MassMutual, on behalf of certain Funds. These agreements provide that Barings manage the investment and reinvestment of assets of these Funds. Barings receives a subadvisory fee from MML Advisers, based upon each Fund’s average daily net assets, at the following annual rates:
U.S. Government Money Market Fund | 0.05% |
Short-Duration Bond Fund* | 0.08% |
Inflation-Protected and Income Fund* | 0.08% |
Core Bond Fund* | 0.10% |
Diversified Bond Fund* | 0.10% |
High Yield Fund* | 0.20% |
* | Baring International Investment Limited (“BIIL”) serves as a sub-subadviser of the Fund. BIIL does not receive a fee from Barings under the sub-subadvisory agreement with Barings. |
MML Advisers has also entered into investment subadvisory agreements for certain Funds with the unaffiliated investment subadviser(s) shown in the following table. MML Advisers pays a subadvisory fee to each of these subadvisers based upon the aggregate net assets under management which include (1) the average daily net assets of the specified Fund which it manages, and, if applicable, (2) the average daily net assets of other Funds or accounts of MML Advisers or its affiliates for which the subadviser provides subadvisory services.
Balanced Fund* | Invesco Advisers, Inc. |
Disciplined Value Fund | Wellington Management Company LLP |
Main Street Fund | Invesco Advisers, Inc. |
Disciplined Growth Fund | Wellington Management Company LLP |
Small Cap Opportunities Fund | Invesco Advisers, Inc. |
Global Fund | Invesco Advisers, Inc. |
International Equity Fund | Thompson, Siegel & Walmsley LLC; and |
| | Wellington Management Company LLP |
Strategic Emerging Markets Fund | Invesco Advisers, Inc. |
* | Invesco Capital Management LLC serves as a sub-subadviser of the Fund. |
The Funds’ subadvisory fees are paid monthly by MML Advisers out of the investment advisory fees previously disclosed above.
211
Notes to Financial Statements (Continued) |
Administration Fees
Under an Administrative and Shareholder Services Agreement between the Trust and MML Advisers, on behalf of each Fund, MML Advisers is obligated to provide certain administrative and shareholder services. In return for these services, MML Advisers receives an administrative services fee, based upon the average daily net assets of the applicable class of shares of the Funds, at the following annual rates:
| | Class
I | Class
R5 | Service
Class | Administrative
Class | Class
R4 | Class
A | Class
R3 | Class
Y | Class
L | Class
C |
U.S. Government Money Market Fund | N/A | 0.10% | N/A | N/A | N/A | N/A | N/A | N/A | N/A | N/A |
Short-Duration Bond Fund * | None | 0.10% | 0.20% | 0.30% | 0.20% | 0.30% | 0.20% | 0.10% | 0.05% | 0.05% |
Inflation-Protected and Income Fund | None | 0.10% | 0.20% | 0.30% | 0.20% | 0.30% | 0.20% | N/A | N/A | N/A |
Core Bond Fund | None | 0.10% | 0.20% | 0.30% | 0.20% | 0.30% | 0.20% | N/A | N/A | N/A |
Diversified Bond Fund | None | 0.10% | 0.20% | 0.30% | 0.20% | 0.30% | 0.20% | N/A | N/A | N/A |
High Yield Fund ** | None | 0.10% | 0.20% | 0.30% | 0.20% | 0.30% | 0.20% | 0.05% | N/A | None |
Balanced Fund | None | 0.10% | 0.20% | 0.30% | 0.20% | 0.30% | 0.20% | N/A | N/A | N/A |
Disciplined Value Fund | None | 0.10% | 0.20% | 0.30% | 0.20% | 0.30% | 0.20% | N/A | N/A | N/A |
Main Street Fund | None | 0.10% | 0.20% | 0.30% | 0.20% | 0.30% | 0.20% | N/A | N/A | N/A |
Disciplined Growth Fund | None | 0.10% | 0.20% | 0.30% | 0.20% | 0.30% | 0.20% | N/A | N/A | N/A |
Small Cap Opportunities Fund | None | 0.10% | 0.20% | 0.30% | 0.20% | 0.30% | 0.20% | N/A | N/A | N/A |
Global Fund | None | 0.10% | 0.20% | 0.30% | 0.20% | 0.30% | 0.20% | N/A | N/A | N/A |
International Equity Fund | None | 0.10% | 0.20% | 0.30% | 0.20% | 0.30% | 0.20% | N/A | N/A | N/A |
Strategic Emerging Markets Fund | None | 0.10% | 0.20% | 0.30% | 0.20% | 0.30% | 0.20% | N/A | N/A | N/A |
* | Effective 12/13/2021, Class Y, Class L, and Class C were added to the Short-Duration Bond Fund. |
** | Effective 12/13/2021, Class Y and Class C were added to the High Yield Fund. |
Distribution and Service Fees
MML Distributors, LLC acted as distributor to each Fund through December 9, 2021. Effective December 10, 2021, MML Distributors, LLC (the “Distributor”) acts as distributor to each Fund except the Short-Duration Bond Fund and High Yield Fund. Pursuant to a 12b-1 Plan adopted by the Trust, Class R4 shares and Class A shares of each Fund except the Short-Duration Bond Fund and High Yield Fund pay an annual fee of 0.25% of the average daily net assets of the class; and Class R3 shares of each Fund pay an annual fee of 0.50% of the average daily net assets of the class, to the Distributor. Such payments compensate the Distributor for services provided and expenses incurred by it for purposes of promoting the sale of the relevant class of shares, reducing redemptions of shares, or maintaining or improving services provided to each Fund’s shareholders. The Distributor is a wholly-owned subsidiary of MassMutual.
Effective December 10, 2021, ALPS Distributors, Inc. (the “ALPS Distributor”) acts as distributor to the Short-Duration Bond Fund and High Yield Fund. Pursuant to a 12b-1 Plan adopted by the Trust, Class R4 shares and Class A shares of each Fund pay an annual fee of 0.25% of the average daily net assets of the class; Class L shares of the Short-Duration Bond Fund pay an annual fee of 0.25% of the average daily net assets of the class; Class R3 shares of each Fund pay an annual fee of 0.50% of the average daily net assets of the class; Class C shares of the Short-Duration Bond Fund pay an annual fee of 0.50% of the average daily net assets of the class; and Class C shares of the High Yield Fund pay an annual fee of 1.00% of the average daily net assets of the class, to the ALPS Distributor. Such payments compensate the ALPS Distributor for services provided and expenses incurred by it for purposes of promoting the sale of the relevant class of shares, reducing redemptions of shares, or maintaining or improving services provided to the Short-Duration Bond and High Yield Funds’ shareholders.
212
Notes to Financial Statements (Continued) |
Expense Caps and Waivers
MML Advisers agreed to cap the fees and expenses of the Fund noted below (other than extraordinary legal and other expenses, Acquired Fund Fees and Expenses#, interest expense, expenses related to borrowings, securities lending, leverage, taxes, and brokerage, short sale dividend and loan expense, or other non-recurring or unusual expenses such as organizational expenses and shareholder meeting expenses, as applicable) through January 31, 2023, based upon the average daily net assets of the applicable class of shares of the Fund, as follows:
| | Class I | Class R5 | Service
Class | Administrative
Class | Class R4 | Class A | Class R3 |
Strategic Emerging Markets Fund | 1.15% | 1.25% | 1.35% | 1.45% | 1.60% | 1.70% | 1.85% |
# | Acquired Fund Fees and Expenses are borne indirectly by a Fund through investments in other pooled investment vehicles. |
Effective December 13, 2021, MML Advisers agreed to cap the Fees and Expenses of the Fund noted below (other than extraordinary legal and other expenses, Acquired Fund Fees and Expenses#, interest expense, expenses related to borrowings, securities lending, leverage, taxes, and brokerage, short sale dividend and loan expense, or other non-recurring or unusual expenses such as organizational expenses and shareholder meeting expenses, as applicable) through January 31, 2023, based upon the average daily net assets of the applicable class of shares of the Fund, as follows:
| | Class Y | Class L | Class C |
Short-Duration Bond Fund | 0.40% | 0.65% | 0.90% |
# | Acquired Fund Fees and Expenses are borne indirectly by a Fund through investments in other pooled investment vehicles. |
Effective February 1, 2022, MML Advisers agreed to cap the Fees and Expenses of the Fund noted below (other than extraordinary legal and other expenses, Acquired Fund Fees and Expenses#, interest expense, expenses related to borrowings, securities lending, leverage, taxes, and brokerage, short sale dividend and loan expense, or other non-recurring or unusual expenses such as organizational expenses and shareholder meeting expenses, as applicable) through January 31, 2023, based upon the average daily net assets of the applicable class of shares of the Fund, as follows:
| | Class I |
Short-Duration Bond Fund | 0.40% |
# | Acquired Fund Fees and Expenses are borne indirectly by a Fund through investments in other pooled investment vehicles. |
MML Advisers has agreed to waive 0.05% of the investment advisory fee of the International Equity Fund through January 31, 2023.
For the U.S. Government Money Market Fund, MML Advisers has agreed to voluntarily waive some or all of its fees in an attempt to allow the Fund to avoid a negative yield. There is no guarantee that the Fund will be able to avoid a negative yield. Payments made to intermediaries will be unaffected. MML Advisers may amend or discontinue this waiver at any time without advance notice.
Expense caps and waiver amounts are reflected as a reduction of expenses on the Statements of Operations.
213
Notes to Financial Statements (Continued) |
Rebated Brokerage Commissions
The Funds listed below have entered into agreements with certain brokers whereby the brokers will rebate to the Funds, in cash, a portion of brokerage commissions. Rebated brokerage commissions are amounts earned by the Funds and are included with realized gain or loss on investment transactions presented in the Statements of Operations. For the year ended September 30, 2022, brokerage commissions rebated under these agreements were as follows:
| | | Rebated
Commissions | |
Main Street Fund | | $ | 691 | |
Small Cap Opportunities Fund | | | 8,011 | |
Global Fund | | | 540 | |
International Equity Fund | | | 952 | |
Strategic Emerging Markets Fund | | | 703 | |
Deferred Compensation
Trustees of the Funds who are not officers or employees of MassMutual may elect to defer receipt of their annual fees in accordance with terms of a Non-Qualified Deferred Compensation Plan. Amounts deferred shall accrue interest or earnings and shall be recorded on the Funds’ books as other liabilities. Deferred compensation is included within Trustees’ fees and expenses in the Statements of Assets and Liabilities.
Other
Certain officers and trustees of the Funds may also be employees of MassMutual. The compensation of a trustee who is not an employee of MassMutual is borne by the Funds.
The following table shows beneficial ownership of Funds’ shares by related parties at September 30, 2022:
| | Total % Ownership
by Related Party |
U.S. Government Money Market Fund | 84.1% |
Short-Duration Bond Fund | 81.5% |
Inflation-Protected and Income Fund | 77.9% |
Core Bond Fund | 94.6% |
Diversified Bond Fund | 87.6% |
High Yield Fund | 72.3% |
Balanced Fund | 92.6% |
Disciplined Value Fund | 97.6% |
Main Street Fund | 88.5% |
Disciplined Growth Fund | 97.5% |
Small Cap Opportunities Fund | 68.1% |
Global Fund | 93.7% |
International Equity Fund | 91.5% |
Strategic Emerging Markets Fund | 96.5% |
214
Notes to Financial Statements (Continued) |
4. | Purchases and Sales of Investments |
Cost of purchases and proceeds from sales of investment securities (excluding short-term investments) for the year ended September 30, 2022, were as follows:
| | | Purchases | | | Sales | |
| | | Long-Term U.S.
Government
Securities | | | Other Long-
Term Securities | | | Long-Term U.S.
Government
Securities | | | Other Long-
Term Securities | |
Short-Duration Bond Fund | | $ | 2,288,000 | | | $ | 153,430,552 | | | $ | 24,281,094 | | | $ | 1,004,987,463 | |
Inflation-Protected and Income Fund | | | 135,302,963 | | | | 102,173,436 | | | | 148,656,233 | | | | 130,415,185 | |
Core Bond Fund | | | 2,102,215,372 | | | | 156,546,360 | | | | 2,223,121,953 | | | | 313,276,327 | |
Diversified Bond Fund | | | 330,564,025 | | | | 45,356,459 | | | | 337,625,044 | | | | 78,177,557 | |
High Yield Fund | | | — | | | | 247,404,825 | | | | — | | | | 350,321,572 | |
Balanced Fund | | | 263,040,809 | | | | 50,232,014 | | | | 270,552,692 | | | | 62,645,808 | |
Disciplined Value Fund | | | — | | | | 34,113,198 | | | | — | | | | 57,817,548 | |
Main Street Fund | | | — | | | | 49,696,722 | | | | — | | | | 83,763,292 | |
Disciplined Growth Fund | | | — | | | | 127,952,911 | | | | — | | | | 164,729,533 | |
Small Cap Opportunities Fund | | | — | | | | 131,265,675 | | | | — | | | | 127,592,457 | |
Global Fund | | | — | | | | 29,693,393 | | | | — | | | | 92,777,463 | |
International Equity Fund | | | — | | | | 29,979,903 | | | | — | | | | 50,243,250 | |
Strategic Emerging Markets Fund | | | — | | | | 78,312,671 | | | | — | | | | 74,718,790 | |
The Funds may purchase from, or sell securities to, other affiliated Funds under procedures adopted by the Trustees. These procedures have been designed to ensure that cross trades conducted by the Funds comply with Rule 17a-7 under the 1940 Act. The cross trades disclosed in the table below are included within the respective purchases and sales amounts shown in the table above, as applicable.
| | | Purchases | | | Sales | | | Realized Gain
(Loss) | |
Main Street Fund | | $ | 152,336 | | | $ | 29,792 | | | $ | (8,926 | ) |
5. | Capital Share Transactions |
Changes in shares outstanding for each Fund were as follows:
| | | Year Ended September 30, 2022 | | | Year Ended September 30, 2021 | |
| | | Shares | | | Amount | | | Shares | | | Amount | |
U.S. Government Money Market Fund Class R5 | | | | | | | | | | | | | | | | |
Sold | | | 781,822,127 | | | $ | 781,822,127 | | | | 1,368,358,165 | | | $ | 1,368,358,165 | |
Issued as reinvestment of dividends | | | 837,353 | | | | 837,353 | | | | — | | | | — | |
Redeemed | | | (812,910,669 | ) | | | (812,910,669 | ) | | | (1,410,773,686 | ) | | | (1,410,773,686 | ) |
Net increase (decrease) | | | (30,251,189 | ) | | $ | (30,251,189 | ) | | | (42,415,521 | ) | | $ | (42,415,521 | ) |
Short-Duration Bond Fund Class I | | | | | | | | | | | | | | | | |
Sold | | | 9,538,592 | | | $ | 89,594,012 | | | | 11,314,327 | | | $ | 113,134,595 | |
Issued as reinvestment of dividends | | | 839,827 | | | | 7,959,704 | | | | 801,172 | | | | 7,859,494 | |
Redeemed | | | (16,183,012 | ) | | | (151,880,555 | ) | | | (9,964,157 | ) | | | (100,009,574 | ) |
Net increase (decrease) | | | (5,804,593 | ) | | $ | (54,326,839 | ) | | | 2,151,342 | | | $ | 20,984,515 | |
215
Notes to Financial Statements (Continued) |
| | | Year Ended September 30, 2022 | | | Year Ended September 30, 2021 | |
| | | Shares | | | Amount | | | Shares | | | Amount | |
Short-Duration Bond Fund Class R5 | | | | | | | | | | | | | | | | |
Sold | | | 2,387,996 | | | $ | 22,523,442 | | | | 9,461,236 | | | $ | 95,545,701 | |
Issued as reinvestment of dividends | | | 245,574 | | | | 2,345,192 | | | | 506,052 | | | | 4,984,608 | |
Redeemed | | | (5,729,275 | ) | | | (53,641,189 | ) | | | (14,315,626 | ) | | | (143,718,737 | ) |
Net increase (decrease) | | | (3,095,705 | ) | | $ | (28,772,555 | ) | | | (4,348,338 | ) | | $ | (43,188,428 | ) |
Short-Duration Bond Fund Service Class | | | | | | | | | | | | | | | | |
Sold | | | 628,491 | | | $ | 5,882,695 | | | | 1,168,072 | | | $ | 11,645,542 | |
Issued as reinvestment of dividends | | | 40,893 | | | | 394,970 | | | | 112,610 | | | | 1,102,450 | |
Redeemed | | | (1,942,862 | ) | | | (18,747,022 | ) | | | (3,501,666 | ) | | | (35,089,378 | ) |
Net increase (decrease) | | | (1,273,478 | ) | | $ | (12,469,357 | ) | | | (2,220,984 | ) | | $ | (22,341,386 | ) |
Short-Duration Bond Fund Administrative Class | | | | | | | | | | | | | | | | |
Sold | | | 321,393 | | | $ | 3,009,507 | | | | 908,251 | | | $ | 8,959,333 | |
Issued as reinvestment of dividends | | | 58,960 | | | | 553,825 | | | | 114,062 | | | | 1,110,963 | |
Redeemed | | | (842,402 | ) | | | (7,930,024 | ) | | | (2,095,558 | ) | | | (20,819,283 | ) |
Net increase (decrease) | | | (462,049 | ) | | $ | (4,366,692 | ) | | | (1,073,245 | ) | | $ | (10,748,987 | ) |
Short-Duration Bond Fund Class R4 | | | | | | | | | | | | | | | | |
Sold | | | 470,842 | | | $ | 4,437,635 | | | | 289,584 | | | $ | 2,897,293 | |
Issued as reinvestment of dividends | | | 33,891 | | | | 319,038 | | | | 43,799 | | | | 429,664 | |
Redeemed | | | (671,014 | ) | | | (6,463,557 | ) | | | (313,688 | ) | | | (3,142,232 | ) |
Net increase (decrease) | | | (166,281 | ) | | $ | (1,706,884 | ) | | | 19,695 | | | $ | 184,725 | |
Short-Duration Bond Fund Class A | | | | | | | | | | | | | | | | |
Sold | | | 115,731 | | | $ | 1,062,337 | | | | 1,269,827 | | | $ | 12,555,970 | |
Issued as reinvestment of dividends | | | 57,342 | | | | 543,782 | | | | 184,578 | | | | 1,786,717 | |
Redeemed | | | (2,933,172 | ) | | | (28,143,298 | ) | | | (2,036,583 | ) | | | (20,091,668 | ) |
Net increase (decrease) | | | (2,760,099 | ) | | $ | (26,537,179 | ) | | | (582,178 | ) | | $ | (5,748,981 | ) |
Short-Duration Bond Fund Class R3 | | | | | | | | | | | | | | | | |
Sold | | | 542,009 | | | $ | 5,222,216 | | | | 746,864 | | | $ | 7,411,939 | |
Issued as reinvestment of dividends | | | 37,642 | | | | 352,911 | | | | 29,386 | | | | 286,518 | |
Redeemed | | | (856,233 | ) | | | (8,009,594 | ) | | | (384,832 | ) | | | (3,827,202 | ) |
Net increase (decrease) | | | (276,582 | ) | | $ | (2,434,467 | ) | | | 391,418 | | | $ | 3,871,255 | |
Short-Duration Bond Fund Class Y(a) | | | | | | | | | | | | | | | | |
Sold | | | 7,740,000 | | | $ | 73,743,410 | | | | — | | | $ | — | |
Issued - merger | | | 105,963,965 | | | | 1,044,804,693 | | | | — | | | | — | |
Issued as reinvestment of dividends | | | 1,459,461 | | | | 13,490,384 | | | | — | | | | — | |
Redeemed | | | (89,539,361 | ) | | | (827,883,085 | ) | | | — | | | | — | |
Net increase (decrease) | | | 25,624,065 | | | $ | 304,155,402 | | | | — | | | $ | — | |
Short-Duration Bond Fund Class L(a) | | | | | | | | | | | | | | | | |
Sold | | | 315,609 | | | $ | 2,867,463 | | | | — | | | $ | — | |
Issued - merger | | | 12,595,489 | | | | 123,687,701 | | | | — | | | | — | |
Issued as reinvestment of dividends | | | 244,541 | | | | 2,228,252 | | | | — | | | | — | |
Redeemed | | | (4,291,087 | ) | | | (39,530,940 | ) | | | — | | | | — | |
Net increase (decrease) | | | 8,864,552 | | | $ | 89,252,476 | | | | — | | | $ | — | |
Short-Duration Bond Fund Class C(a) | | | | | | | | | | | | | | | | |
Sold | | | 15,238 | | | $ | 145,518 | | | | — | | | $ | — | |
Issued - merger | | | 129,438 | | | | 1,281,438 | | | | — | | | | — | |
Issued as reinvestment of dividends | | | 2,853 | | | | 26,124 | | | | — | | | | — | |
Redeemed | | | (21,628 | ) | | | (197,774 | ) | | | — | | | | — | |
Net increase (decrease) | | | 125,901 | | | $ | 1,255,306 | | | | — | | | $ | — | |
216
Notes to Financial Statements (Continued) |
| | | Year Ended September 30, 2022 | | | Year Ended September 30, 2021 | |
| | | Shares | | | Amount | | | Shares | | | Amount | |
Inflation-Protected and Income Fund Class I | | | | | | | | | | | | | | | | |
Sold | | | 7,415,765 | | | $ | 78,507,396 | | | | 5,851,897 | | | $ | 65,454,841 | |
Issued as reinvestment of dividends | | | 1,259,144 | | | | 13,548,394 | | | | 895,339 | | | | 9,795,008 | |
Redeemed | | | (6,919,257 | ) | | | (72,147,054 | ) | | | (5,887,606 | ) | | | (65,711,161 | ) |
Net increase (decrease) | | | 1,755,652 | | | $ | 19,908,736 | | | | 859,630 | | | $ | 9,538,688 | |
Inflation-Protected and Income Fund Class R5 | | | | | | | | | | | | | | | | |
Sold | | | 1,404,620 | | | $ | 15,038,201 | | | | 3,809,440 | | | $ | 43,055,817 | |
Issued as reinvestment of dividends | | | 606,105 | | | | 6,527,752 | | | | 437,010 | | | | 4,785,258 | |
Redeemed | | | (3,075,577 | ) | | | (32,668,634 | ) | | | (3,679,591 | ) | | | (41,297,642 | ) |
Net increase (decrease) | | | (1,064,852 | ) | | $ | (11,102,681 | ) | | | 566,859 | | | $ | 6,543,433 | |
Inflation-Protected and Income Fund Service Class | | | | | | | | | | | | | | | | |
Sold | | | 858,555 | | | $ | 8,950,632 | | | | 1,738,766 | | | $ | 19,359,727 | |
Issued as reinvestment of dividends | | | 345,118 | | | | 3,706,567 | | | | 249,860 | | | | 2,728,473 | |
Redeemed | | | (2,755,874 | ) | | | (29,223,969 | ) | | | (1,915,535 | ) | | | (21,329,606 | ) |
Net increase (decrease) | | | (1,552,201 | ) | | $ | (16,566,770 | ) | | | 73,091 | | | $ | 758,594 | |
Inflation-Protected and Income Fund Administrative Class | | | | | | | | | | | | | | | | |
Sold | | | 278,563 | | | $ | 2,974,650 | | | | 403,849 | | | $ | 4,518,081 | |
Issued as reinvestment of dividends | | | 73,908 | | | | 804,115 | | | | 66,163 | | | | 731,102 | |
Redeemed | | | (748,050 | ) | | | (8,037,456 | ) | | | (582,687 | ) | | | (6,536,683 | ) |
Net increase (decrease) | | | (395,579 | ) | | $ | (4,258,691 | ) | | | (112,675 | ) | | $ | (1,287,500 | ) |
Inflation-Protected and Income Fund Class R4 | | | | | | | | | | | | | | | | |
Sold | | | 185,840 | | | $ | 1,899,650 | | | | 245,284 | | | $ | 2,688,088 | |
Issued as reinvestment of dividends | | | 32,695 | | | | 342,973 | | | | 23,505 | | | | 251,270 | |
Redeemed | | | (212,414 | ) | | | (2,201,100 | ) | | | (191,655 | ) | | | (2,088,059 | ) |
Net increase (decrease) | | | 6,121 | | | $ | 41,523 | | | | 77,134 | | | $ | 851,299 | |
Inflation-Protected and Income Fund Class A | | | | | | | | | | | | | | | | |
Sold | | | 258,612 | | | $ | 2,697,801 | | | | 802,187 | | | $ | 8,812,023 | |
Issued as reinvestment of dividends | | | 77,312 | | | | 819,512 | | | | 109,424 | | | | 1,177,400 | |
Redeemed | | | (549,032 | ) | | | (5,706,564 | ) | | | (1,700,291 | ) | | | (18,617,293 | ) |
Net increase (decrease) | | | (213,108 | ) | | $ | (2,189,251 | ) | | | (788,680 | ) | | $ | (8,627,870 | ) |
Inflation-Protected and Income Fund Class R3 | | | | | | | | | | | | | | | | |
Sold | | | 82,014 | | | $ | 845,857 | | | | 83,435 | | | $ | 907,659 | |
Issued as reinvestment of dividends | | | 18,391 | | | | 193,469 | | | | 14,043 | | | | 150,543 | |
Redeemed | | | (98,190 | ) | | | (990,431 | ) | | | (126,997 | ) | | | (1,382,108 | ) |
Net increase (decrease) | | | 2,215 | | | $ | 48,895 | | | | (29,519 | ) | | $ | (323,906 | ) |
Core Bond Fund Class I | | | | | | | | | | | | | | | | |
Sold | | | 13,413,455 | | | $ | 137,803,193 | | | | 16,653,807 | | | $ | 188,190,430 | |
Issued as reinvestment of dividends | | | 2,182,908 | | | | 23,771,867 | | | | 4,167,301 | | | | 46,632,100 | |
Redeemed | | | (22,184,007 | ) | | | (223,250,698 | ) | | | (28,439,937 | ) | | | (320,231,055 | ) |
Net increase (decrease) | | | (6,587,644 | ) | | $ | (61,675,638 | ) | | | (7,618,829 | ) | | $ | (85,408,525 | ) |
Core Bond Fund Class R5 | | | | | | | | | | | | | | | | |
Sold | | | 1,178,969 | | | $ | 12,370,552 | | | | 10,236,824 | | | $ | 117,437,456 | |
Issued as reinvestment of dividends | | | 953,902 | | | | 10,426,152 | | | | 1,788,905 | | | | 20,107,290 | |
Redeemed | | | (14,315,674 | ) | | | (151,113,981 | ) | | | (12,140,353 | ) | | | (137,496,064 | ) |
Net increase (decrease) | | | (12,182,803 | ) | | $ | (128,317,277 | ) | | | (114,624 | ) | | $ | 48,682 | |
Core Bond Fund Service Class | | | | | | | | | | | | | | | | |
Sold | | | 571,827 | | | $ | 5,798,981 | | | | 1,069,398 | | | $ | 12,063,952 | |
Issued as reinvestment of dividends | | | 159,377 | | | | 1,734,027 | | | | 284,195 | | | | 3,177,296 | |
Redeemed | | | (1,812,863 | ) | | | (19,575,897 | ) | | | (3,444,936 | ) | | | (39,824,021 | ) |
Net increase (decrease) | | | (1,081,659 | ) | | $ | (12,042,889 | ) | | | (2,091,343 | ) | | $ | (24,582,773 | ) |
217
Notes to Financial Statements (Continued) |
| | | Year Ended September 30, 2022 | | | Year Ended September 30, 2021 | |
| | | Shares | | | Amount | | | Shares | | | Amount | |
Core Bond Fund Administrative Class | | | | | | | | | | | | | | | | |
Sold | | | 528,630 | | | $ | 5,307,581 | | | | 2,297,149 | | | $ | 25,464,680 | |
Issued as reinvestment of dividends | | | 158,847 | | | | 1,712,376 | | | | 404,698 | | | | 4,484,059 | |
Redeemed | | | (1,701,690 | ) | | | (17,594,089 | ) | | | (4,427,609 | ) | | | (48,873,052 | ) |
Net increase (decrease) | | | (1,014,213 | ) | | $ | (10,574,132 | ) | | | (1,725,762 | ) | | $ | (18,924,313 | ) |
Core Bond Fund Class R4 | | | | | | | | | | | | | | | | |
Sold | | | 151,850 | | | $ | 1,570,249 | | | | 291,135 | | | $ | 3,207,885 | |
Issued as reinvestment of dividends | | | 20,840 | | | | 221,532 | | | | 54,912 | | | | 599,635 | |
Redeemed | | | (690,167 | ) | | | (7,036,143 | ) | | | (490,668 | ) | | | (5,366,976 | ) |
Net increase (decrease) | | | (517,477 | ) | | $ | (5,244,362 | ) | | | (144,621 | ) | | $ | (1,559,456 | ) |
Core Bond Fund Class A | | | | | | | | | | | | | | | | |
Sold | | | 230,904 | | | $ | 2,331,378 | | | | 731,994 | | | $ | 8,141,366 | |
Issued as reinvestment of dividends | | | 157,953 | | | | 1,691,678 | | | | 289,572 | | | | 3,188,192 | |
Redeemed | | | (2,891,546 | ) | | | (29,576,861 | ) | | | (989,634 | ) | | | (10,941,076 | ) |
Net increase (decrease) | | | (2,502,689 | ) | | $ | (25,553,805 | ) | | | 31,932 | | | $ | 388,482 | |
Core Bond Fund Class R3 | | | | | | | | | | | | | | | | |
Sold | | | 3,672 | | | $ | 37,851 | | | | 16,348 | | | $ | 185,825 | |
Issued as reinvestment of dividends | | | 679 | | | | 7,500 | | | | 4,061 | | | | 45,768 | |
Redeemed | | | (16,151 | ) | | | (166,103 | ) | | | (63,921 | ) | | | (725,733 | ) |
Net increase (decrease) | | | (11,800 | ) | | $ | (120,752 | ) | | | (43,512 | ) | | $ | (494,140 | ) |
Diversified Bond Fund Class I | | | | | | | | | | | | | | | | |
Sold | | | 1,369,276 | | | $ | 14,673,711 | | | | 2,703,078 | | | $ | 30,083,341 | |
Issued as reinvestment of dividends | | | 394,734 | | | | 4,290,758 | | | | 630,975 | | | | 6,953,342 | |
Redeemed | | | (3,154,152 | ) | | | (31,728,994 | ) | | | (1,941,314 | ) | | | (21,784,551 | ) |
Net increase (decrease) | | | (1,390,142 | ) | | $ | (12,764,525 | ) | | | 1,392,739 | | | $ | 15,252,132 | |
Diversified Bond Fund Class R5 | | | | | | | | | | | | | | | | |
Sold | | | 2,196,079 | | | $ | 20,968,172 | | | | 2,025,031 | | | $ | 20,776,714 | |
Issued as reinvestment of dividends | | | 337,528 | | | | 3,344,900 | | | | 546,240 | | | | 5,506,098 | |
Redeemed | | | (3,165,698 | ) | | | (30,432,531 | ) | | | (2,232,048 | ) | | | (23,120,105 | ) |
Net increase (decrease) | | | (632,091 | ) | | $ | (6,119,459 | ) | | | 339,223 | | | $ | 3,162,707 | |
Diversified Bond Fund Service Class | | | | | | | | | | | | | | | | |
Sold | | | 105,984 | | | $ | 1,024,332 | | | | 236,456 | | | $ | 2,444,587 | |
Issued as reinvestment of dividends | | | 34,086 | | | | 343,585 | | | | 82,657 | | | | 846,408 | |
Redeemed | | | (667,746 | ) | | | (6,736,430 | ) | | | (315,320 | ) | | | (3,316,397 | ) |
Net increase (decrease) | | | (527,676 | ) | | $ | (5,368,513 | ) | | | 3,793 | | | $ | (25,402 | ) |
Diversified Bond Fund Administrative Class | | | | | | | | | | | | | | | | |
Sold | | | 129,265 | | | $ | 1,218,744 | | | | 268,813 | | | $ | 2,789,223 | |
Issued as reinvestment of dividends | | | 44,225 | | | | 445,350 | | | | 97,055 | | | | 993,842 | |
Redeemed | | | (389,043 | ) | | | (3,727,427 | ) | | | (760,386 | ) | | | (8,074,953 | ) |
Net increase (decrease) | | | (215,553 | ) | | $ | (2,063,333 | ) | | | (394,518 | ) | | $ | (4,291,888 | ) |
Diversified Bond Fund Class R4 | | | | | | | | | | | | | | | | |
Sold | | | 159,970 | | | $ | 1,493,701 | | | | 96,925 | | | $ | 997,128 | |
Issued as reinvestment of dividends | | | 17,243 | | | | 171,228 | | | | 44,948 | | | | 453,530 | |
Redeemed | | | (223,721 | ) | | | (2,154,005 | ) | | | (223,278 | ) | | | (2,298,659 | ) |
Net increase (decrease) | | | (46,508 | ) | | $ | (489,076 | ) | | | (81,405 | ) | | $ | (848,001 | ) |
Diversified Bond Fund Class A | | | | | | | | | | | | | | | | |
Sold | | | 221,388 | | | $ | 2,162,082 | | | | 112,929 | | | $ | 1,178,645 | |
Issued as reinvestment of dividends | | | 29,304 | | | | 295,969 | | | | 87,721 | | | | 900,019 | |
Redeemed | | | (526,725 | ) | | | (4,999,431 | ) | | | (687,447 | ) | | | (7,206,763 | ) |
Net increase (decrease) | | | (276,033 | ) | | $ | (2,541,380 | ) | | | (486,797 | ) | | $ | (5,128,099 | ) |
218
Notes to Financial Statements (Continued) |
| | | Year Ended September 30, 2022 | | | Year Ended September 30, 2021 | |
| | | Shares | | | Amount | | | Shares | | | Amount | |
Diversified Bond Fund Class R3 | | | | | | | | | | | | | | | | |
Sold | | | 99,675 | | | $ | 956,648 | | | | 104,551 | | | $ | 1,067,685 | |
Issued as reinvestment of dividends | | | 2,724 | | | | 27,352 | | | | 22,490 | | | | 226,697 | |
Redeemed | | | (254,107 | ) | | | (2,593,268 | ) | | | (179,500 | ) | | | (1,864,291 | ) |
Net increase (decrease) | | | (151,708 | ) | | $ | (1,609,268 | ) | | | (52,459 | ) | | $ | (569,909 | ) |
High Yield Fund Class I | | | | | | | | | | | | | | | | |
Sold | | | 8,169,260 | | | $ | 69,464,603 | | | | 7,404,898 | | | $ | 66,535,958 | |
Issued - merger | | | 1,375,342 | | | | 12,144,267 | | | | — | | | | — | |
Issued as reinvestment of dividends | | | 3,809,711 | | | | 32,354,339 | | | | 2,408,156 | | | | 20,878,712 | |
Redeemed | | | (19,569,351 | ) | | | (163,590,961 | ) | | | (15,685,768 | ) | | | (141,010,874 | ) |
Net increase (decrease) | | | (6,215,038 | ) | | $ | (49,627,752 | ) | | | (5,872,714 | ) | | $ | (53,596,204 | ) |
High Yield Fund Class R5 | | | | | | | | | | | | | | | | |
Sold | | | 755,587 | | | $ | 6,391,190 | | | | 1,146,409 | | | $ | 10,403,455 | |
Issued as reinvestment of dividends | | | 490,843 | | | | 4,191,445 | | | | 299,321 | | | | 2,613,072 | |
Redeemed | | | (1,535,247 | ) | | | (13,224,013 | ) | | | (2,154,177 | ) | | | (19,524,453 | ) |
Net increase (decrease) | | | (288,817 | ) | | $ | (2,641,378 | ) | | | (708,447 | ) | | $ | (6,507,926 | ) |
High Yield Fund Service Class | | | | | | | | | | | | | | | | |
Sold | | | 600,486 | | | $ | 5,052,275 | | | | 698,534 | | | $ | 6,339,574 | |
Issued as reinvestment of dividends | | | 318,088 | | | | 2,713,910 | | | | 196,929 | | | | 1,719,188 | |
Redeemed | | | (994,693 | ) | | | (8,187,913 | ) | | | (1,705,873 | ) | | | (15,497,169 | ) |
Net increase (decrease) | | | (76,119 | ) | | $ | (421,728 | ) | | | (810,410 | ) | | $ | (7,438,407 | ) |
High Yield Fund Administrative Class | | | | | | | | | | | | | | | | |
Sold | | | 450,640 | | | $ | 3,844,496 | | | | 834,873 | | | $ | 7,437,069 | |
Issued as reinvestment of dividends | | | 224,352 | | | | 1,894,628 | | | | 148,142 | | | | 1,271,060 | |
Redeemed | | | (1,428,590 | ) | | | (12,068,127 | ) | | | (1,228,296 | ) | | | (10,979,079 | ) |
Net increase (decrease) | | | (753,598 | ) | | $ | (6,329,003 | ) | | | (245,281 | ) | | $ | (2,270,950 | ) |
High Yield Fund Class R4 | | | | | | | | | | | | | | | | |
Sold | | | 1,059,130 | | | $ | 8,615,794 | | | | 1,020,482 | | | $ | 8,864,340 | |
Issued as reinvestment of dividends | | | 423,083 | | | | 3,481,037 | | | | 239,764 | | | | 2,023,612 | |
Redeemed | | | (1,471,523 | ) | | | (11,968,371 | ) | | | (1,733,360 | ) | | | (15,173,335 | ) |
Net increase (decrease) | | | 10,690 | | | $ | 128,460 | | | | (473,114 | ) | | $ | (4,285,383 | ) |
High Yield Fund Class A | | | | | | | | | | | | | | | | |
Sold | | | 154,580 | | | $ | 1,292,526 | | | | 403,114 | | | $ | 3,549,679 | |
Issued as reinvestment of dividends | | | 127,369 | | | | 1,069,955 | | | | 141,016 | | | | 1,207,095 | |
Redeemed | | | (587,082 | ) | | | (4,827,801 | ) | | | (1,973,127 | ) | | | (17,579,345 | ) |
Net increase (decrease) | | | (305,133 | ) | | $ | (2,465,320 | ) | | | (1,428,997 | ) | | $ | (12,822,571 | ) |
High Yield Fund Class R3 | | | | | | | | | | | | | | | | |
Sold | | | 634,901 | | | $ | 5,415,398 | | | | 665,488 | | | $ | 5,949,785 | |
Issued as reinvestment of dividends | | | 325,984 | | | | 2,769,029 | | | | 185,002 | | | | 1,607,669 | |
Redeemed | | | (1,148,996 | ) | | | (9,739,395 | ) | | | (1,345,596 | ) | | | (11,992,499 | ) |
Net increase (decrease) | | | (188,111 | ) | | $ | (1,554,968 | ) | | | (495,106 | ) | | $ | (4,435,045 | ) |
High Yield Fund Class Y(a) | | | | | | | | | | | | | | | | |
Sold | | | 6,369,339 | | | $ | 50,378,585 | | | | — | | | $ | — | |
Issued - merger | | | 4,511,139 | | | | 39,968,695 | | | | — | | | | — | |
Issued as reinvestment of dividends | | | 247,832 | | | | 1,952,871 | | | | — | | | | — | |
Redeemed | | | (7,922,463 | ) | | | (61,394,029 | ) | | | — | | | | — | |
Net increase (decrease) | | | 3,205,847 | | | $ | 30,906,122 | | | | — | | | $ | — | |
219
Notes to Financial Statements (Continued) |
| | | Year Ended September 30, 2022 | | | Year Ended September 30, 2021 | |
| | | Shares | | | Amount | | | Shares | | | Amount | |
High Yield Fund Class C(a) | | | | | | | | | | | | | | | | |
Sold | | | — | | | $ | — | | | | — | | | $ | — | |
Issued - merger | | | 11,017 | | | | 97,945 | | | | — | | | | — | |
Issued as reinvestment of dividends | | | — | | | | — | | | | — | | | | — | |
Redeemed | | | — | | | | (1 | ) | | | — | | | | — | |
Net increase (decrease) | | | 11,017 | | | $ | 97,944 | | | | — | | | $ | — | |
Balanced Fund Class I | | | | | | | | | | | | | | | | |
Sold | | | 583,329 | | | $ | 6,761,538 | | | | 1,406,473 | | | $ | 18,789,282 | |
Issued as reinvestment of dividends | | | 1,105,928 | | | | 13,083,127 | | | | 121,303 | | | | 1,547,830 | |
Redeemed | | | (848,442 | ) | | | (9,734,190 | ) | | | (1,138,785 | ) | | | (15,866,883 | ) |
Net increase (decrease) | | | 840,815 | | | $ | 10,110,475 | | | | 388,991 | | | $ | 4,470,229 | |
Balanced Fund Class R5 | | | | | | | | | | | | | | | | |
Sold | | | 259,267 | | | $ | 2,881,039 | | | | 201,850 | | | $ | 2,720,179 | |
Issued as reinvestment of dividends | | | 798,169 | | | | 9,442,345 | | | | 110,326 | | | | 1,408,864 | |
Redeemed | | | (801,604 | ) | | | (9,000,989 | ) | | | (945,182 | ) | | | (12,725,238 | ) |
Net increase (decrease) | | | 255,832 | | | $ | 3,322,395 | | | | (633,006 | ) | | $ | (8,596,195 | ) |
Balanced Fund Service Class | | | | | | | | | | | | | | | | |
Sold | | | 47,848 | | | $ | 603,506 | | | | 66,513 | | | $ | 1,002,028 | |
Issued as reinvestment of dividends | | | 173,178 | | | | 2,211,487 | | | | 19,900 | | | | 269,648 | |
Redeemed | | | (157,905 | ) | | | (2,025,826 | ) | | | (65,078 | ) | | | (972,493 | ) |
Net increase (decrease) | | | 63,121 | | | $ | 789,167 | | | | 21,335 | | | $ | 299,183 | |
Balanced Fund Administrative Class | | | | | | | | | | | | | | | | |
Sold | | | 124,349 | | | $ | 1,402,315 | | | | 80,825 | | | $ | 1,102,359 | |
Issued as reinvestment of dividends | | | 152,965 | | | | 1,821,814 | | | | 15,210 | | | | 195,297 | |
Redeemed | | | (135,040 | ) | | | (1,423,948 | ) | | | (51,126 | ) | | | (708,371 | ) |
Net increase (decrease) | | | 142,274 | | | $ | 1,800,181 | | | | 44,909 | | | $ | 589,285 | |
Balanced Fund Class R4 | | | | | | | | | | | | | | | | |
Sold | | | 84,911 | | | $ | 911,710 | | | | 546,980 | | | $ | 6,991,241 | |
Issued as reinvestment of dividends | | | 124,485 | | | | 1,404,186 | | | | 7,862 | | | | 96,702 | |
Redeemed | | | (142,875 | ) | | | (1,604,420 | ) | | | (371,485 | ) | | | (4,985,010 | ) |
Net increase (decrease) | | | 66,521 | | | $ | 711,476 | | | | 183,357 | | | $ | 2,102,933 | |
Balanced Fund Class A | | | | | | | | | | | | | | | | |
Sold | | | 97,156 | | | $ | 1,084,955 | | | | 120,375 | | | $ | 1,567,683 | |
Issued as reinvestment of dividends | | | 410,371 | | | | 4,694,644 | | | | 64,884 | | | | 806,506 | |
Redeemed | | | (587,529 | ) | | | (6,906,385 | ) | | | (893,475 | ) | | | (12,043,785 | ) |
Net increase (decrease) | | | (80,002 | ) | | $ | (1,126,786 | ) | | | (708,216 | ) | | $ | (9,669,596 | ) |
Balanced Fund Class R3 | | | | | | | | | | | | | | | | |
Sold | | | 188,466 | | | $ | 2,328,158 | | | | 488,069 | | | $ | 6,203,935 | |
Issued as reinvestment of dividends | | | 295,452 | | | | 3,309,059 | | | | 16,465 | | | | 201,693 | |
Redeemed | | | (318,552 | ) | | | (3,322,771 | ) | | | (232,545 | ) | | | (3,026,890 | ) |
Net increase (decrease) | | | 165,366 | | | $ | 2,314,446 | | | | 271,989 | | | $ | 3,378,738 | |
Disciplined Value Fund Class I | | | | | | | | | | | | | | | | |
Sold | | | 325,438 | | | $ | 5,227,257 | | | | 392,553 | | | $ | 5,437,291 | |
Issued as reinvestment of dividends | | | 372,842 | | | | 5,421,119 | | | | 39,626 | | | | 527,416 | |
Redeemed | | | (622,780 | ) | | | (9,509,654 | ) | | | (188,241 | ) | | | (2,686,622 | ) |
Net increase (decrease) | | | 75,500 | | | $ | 1,138,722 | | | | 243,938 | | | $ | 3,278,085 | |
220
Notes to Financial Statements (Continued) |
| | | Year Ended September 30, 2022 | | | Year Ended September 30, 2021 | |
| | | Shares | | | Amount | | | Shares | | | Amount | |
Disciplined Value Fund Class R5 | | | | | | | | | | | | | | | | |
Sold | | | 95,062 | | | $ | 1,410,856 | | | | 179,709 | | | $ | 2,702,284 | |
Issued as reinvestment of dividends | | | 347,513 | | | | 5,073,685 | | | | 50,636 | | | | 675,986 | |
Redeemed | | | (1,004,293 | ) | | | (15,285,571 | ) | | | (732,062 | ) | | | (11,012,890 | ) |
Net increase (decrease) | | | (561,718 | ) | | $ | (8,801,030 | ) | | | (501,717 | ) | | $ | (7,634,620 | ) |
Disciplined Value Fund Service Class | | | | | | | | | | | | | | | | |
Sold | | | 250,124 | | | $ | 3,522,837 | | | | 137,085 | | | $ | 2,044,539 | |
Issued as reinvestment of dividends | | | 188,945 | | | | 2,728,368 | | | | 17,881 | | | | 236,749 | |
Redeemed | | | (456,463 | ) | | | (6,393,245 | ) | | | (127,639 | ) | | | (1,844,598 | ) |
Net increase (decrease) | | | (17,394 | ) | | $ | (142,040 | ) | | | 27,327 | | | $ | 436,690 | |
Disciplined Value Fund Administrative Class | | | | | | | | | | | | | | | | |
Sold | | | 17,324 | | | $ | 250,635 | | | | 29,152 | | | $ | 434,407 | |
Issued as reinvestment of dividends | | | 18,323 | | | | 272,646 | | | | 6,106 | | | | 82,862 | |
Redeemed | | | (43,375 | ) | | | (604,693 | ) | | | (278,629 | ) | | | (4,059,266 | ) |
Net increase (decrease) | | | (7,728 | ) | | $ | (81,412 | ) | | | (243,371 | ) | | $ | (3,541,997 | ) |
Disciplined Value Fund Class R4 | | | | | | | | | | | | | | | | |
Sold | | | 19,082 | | | $ | 270,387 | | | | 37,896 | | | $ | 581,902 | |
Issued as reinvestment of dividends | | | 32,959 | | | | 465,386 | | | | 3,862 | | | | 50,170 | |
Redeemed | | | (115,640 | ) | | | (1,633,356 | ) | | | (99,745 | ) | | | (1,490,875 | ) |
Net increase (decrease) | | | (63,599 | ) | | $ | (897,583 | ) | | | (57,987 | ) | | $ | (858,803 | ) |
Disciplined Value Fund Class A | | | | | | | | | | | | | | | | |
Sold | | | 55,112 | | | $ | 778,313 | | | | 71,172 | | | $ | 1,036,315 | |
Issued as reinvestment of dividends | | | 77,138 | | | | 1,099,990 | | | | 7,378 | | | | 96,647 | |
Redeemed | | | (203,328 | ) | | | (2,799,432 | ) | | | (124,043 | ) | | | (1,795,340 | ) |
Net increase (decrease) | | | (71,078 | ) | | $ | (921,129 | ) | | | (45,493 | ) | | $ | (662,378 | ) |
Disciplined Value Fund Class R3 | | | | | | | | | | | | | | | | |
Sold | | | 125,204 | | | $ | 1,739,808 | | | | 74,425 | | | $ | 1,142,069 | |
Issued as reinvestment of dividends | | | 51,681 | | | | 745,764 | | | | 4,790 | | | | 63,371 | |
Redeemed | | | (171,632 | ) | | | (2,440,008 | ) | | | (110,516 | ) | | | (1,586,766 | ) |
Net increase (decrease) | | | 5,253 | | | $ | 45,564 | | | | (31,301 | ) | | $ | (381,326 | ) |
Main Street Fund Class I | | | | | | | | | | | | | | | | |
Sold | | | 360,142 | | | $ | 4,220,935 | | | | 479,639 | | | $ | 6,194,516 | |
Issued as reinvestment of dividends | | | 470,567 | | | | 5,755,032 | | | | 86,188 | | | | 1,017,015 | |
Redeemed | | | (2,480,929 | ) | | | (25,410,145 | ) | | | (1,253,441 | ) | | | (15,761,440 | ) |
Net increase (decrease) | | | (1,650,220 | ) | | $ | (15,434,178 | ) | | | (687,614 | ) | | $ | (8,549,909 | ) |
Main Street Fund Class R5 | | | | | | | | | | | | | | | | |
Sold | | | 301,020 | | | $ | 3,654,303 | | | | 459,010 | | | $ | 5,868,428 | |
Issued as reinvestment of dividends | | | 788,626 | | | | 9,637,008 | | | | 125,727 | | | | 1,482,317 | |
Redeemed | | | (1,041,366 | ) | | | (12,394,835 | ) | | | (1,224,918 | ) | | | (15,641,930 | ) |
Net increase (decrease) | | | 48,280 | | | $ | 896,476 | | | | (640,181 | ) | | $ | (8,291,185 | ) |
Main Street Fund Service Class | | | | | | | | | | | | | | | | |
Sold | | | 58 | | | $ | 691 | | | | 4,528 | | | $ | 56,415 | |
Issued as reinvestment of dividends | | | 204 | | | | 2,635 | | | | 24 | | | | 297 | |
Redeemed | | | (74 | ) | | | (926 | ) | | | (9,095 | ) | | | (113,505 | ) |
Net increase (decrease) | | | 188 | | | $ | 2,400 | | | | (4,543 | ) | | $ | (56,793 | ) |
Main Street Fund Administrative Class | | | | | | | | | | | | | | | | |
Sold | | | 112,656 | | | $ | 1,304,153 | | | | 146,525 | | | $ | 1,944,962 | |
Issued as reinvestment of dividends | | | 419,984 | | | | 5,132,204 | | | | 55,665 | | | | 656,288 | |
Redeemed | | | (316,305 | ) | | | (3,574,101 | ) | | | (345,355 | ) | | | (4,379,914 | ) |
Net increase (decrease) | | | 216,335 | | | $ | 2,862,256 | | | | (143,165 | ) | | $ | (1,778,664 | ) |
221
Notes to Financial Statements (Continued) |
| | | Year Ended September 30, 2022 | | | Year Ended September 30, 2021 | |
| | | Shares | | | Amount | | | Shares | | | Amount | |
Main Street Fund Class R4 | | | | | | | | | | | | | | | | |
Sold | | | 44,028 | | | $ | 502,890 | | | | 109,189 | | | $ | 1,272,793 | |
Issued as reinvestment of dividends | | | 147,249 | | | | 1,737,533 | | | | 18,078 | | | | 207,357 | |
Redeemed | | | (130,016 | ) | | | (1,480,156 | ) | | | (104,309 | ) | | | (1,272,393 | ) |
Net increase (decrease) | | | 61,261 | | | $ | 760,267 | | | | 22,958 | | | $ | 207,757 | |
Main Street Fund Class A | | | | | | | | | | | | | | | | |
Sold | | | 72,249 | | | $ | 815,139 | | | | 66,238 | | | $ | 833,409 | |
Issued as reinvestment of dividends | | | 182,736 | | | | 2,187,353 | | | | 27,948 | | | | 323,920 | |
Redeemed | | | (144,179 | ) | | | (1,679,811 | ) | | | (412,780 | ) | | | (5,116,950 | ) |
Net increase (decrease) | | | 110,806 | | | $ | 1,322,681 | | | | (318,594 | ) | | $ | (3,959,621 | ) |
Main Street Fund Class R3 | | | | | | | | | | | | | | | | |
Sold | | | 3,180 | | | $ | 35,989 | | | | 4,781 | | | $ | 60,525 | |
Issued as reinvestment of dividends | | | 17,519 | | | | 210,581 | | | | 2,859 | | | | 33,250 | |
Redeemed | | | (29,486 | ) | | | (387,433 | ) | | | (24,726 | ) | | | (328,416 | ) |
Net increase (decrease) | | | (8,787 | ) | | $ | (140,863 | ) | | | (17,086 | ) | | $ | (234,641 | ) |
Disciplined Growth Fund Class I | | | | | | | | | | | | | | | | |
Sold | | | 797,183 | | | $ | 10,205,610 | | | | 639,324 | | | $ | 9,007,085 | |
Issued as reinvestment of dividends | | | 1,290,815 | | | | 14,211,876 | | | | 124,790 | | | | 1,624,765 | |
Redeemed | | | (1,637,958 | ) | | | (15,944,820 | ) | | | (1,526,392 | ) | | | (21,370,721 | ) |
Net increase (decrease) | | | 450,040 | | | $ | 8,472,666 | | | | (762,278 | ) | | $ | (10,738,871 | ) |
Disciplined Growth Fund Class R5 | | | | | | | | | | | | | | | | |
Sold | | | 3,073,807 | | | $ | 28,138,273 | | | | 1,274,661 | | | $ | 18,226,325 | |
Issued as reinvestment of dividends | | | 3,616,036 | | | | 39,812,555 | | | | 370,101 | | | | 4,826,119 | |
Redeemed | | | (3,900,357 | ) | | | (39,089,309 | ) | | | (2,541,615 | ) | | | (35,435,122 | ) |
Net increase (decrease) | | | 2,789,486 | | | $ | 28,861,519 | | | | (896,853 | ) | | $ | (12,382,678 | ) |
Disciplined Growth Fund Service Class | | | | | | | | | | | | | | | | |
Sold | | | 188,135 | | | $ | 1,893,234 | | | | 154,566 | | | $ | 2,147,853 | |
Issued as reinvestment of dividends | | | 905,118 | | | | 10,037,758 | | | | 85,731 | | | | 1,123,937 | |
Redeemed | | | (825,060 | ) | | | (7,721,836 | ) | | | (597,590 | ) | | | (8,443,917 | ) |
Net increase (decrease) | | | 268,193 | | | $ | 4,209,156 | | | | (357,293 | ) | | $ | (5,172,127 | ) |
Disciplined Growth Fund Administrative Class | | | | | | | | | | | | | | | | |
Sold | | | 270,634 | | | $ | 3,100,929 | | | | 292,361 | | | $ | 4,323,669 | |
Issued as reinvestment of dividends | | | 1,258,369 | | | | 14,282,484 | | | | 116,977 | | | | 1,558,139 | |
Redeemed | | | (692,074 | ) | | | (6,912,024 | ) | | | (951,357 | ) | | | (13,678,523 | ) |
Net increase (decrease) | | | 836,929 | | | $ | 10,471,389 | | | | (542,019 | ) | | $ | (7,796,715 | ) |
Disciplined Growth Fund Class R4 | | | | | | | | | | | | | | | | |
Sold | | | 120,870 | | | $ | 1,151,991 | | | | 115,803 | | | $ | 1,556,859 | |
Issued as reinvestment of dividends | | | 429,454 | | | | 4,483,496 | | | | 82,193 | | | | 1,039,743 | |
Redeemed | | | (491,209 | ) | | | (5,580,846 | ) | | | (1,676,574 | ) | | | (23,437,150 | ) |
Net increase (decrease) | | | 59,115 | | | $ | 54,641 | | | | (1,478,578 | ) | | $ | (20,840,548 | ) |
Disciplined Growth Fund Class A | | | | | | | | | | | | | | | | |
Sold | | | 575,956 | | | $ | 7,817,737 | | | | 135,936 | | | $ | 1,926,946 | |
Issued as reinvestment of dividends | | | 1,124,079 | | | | 11,937,715 | | | | 88,569 | | | | 1,133,688 | |
Redeemed | | | (1,451,871 | ) | | | (14,531,531 | ) | | | (701,696 | ) | | | (9,677,601 | ) |
Net increase (decrease) | | | 248,164 | | | $ | 5,223,921 | | | | (477,191 | ) | | $ | (6,616,967 | ) |
Disciplined Growth Fund Class R3 | | | | | | | | | | | | | | | | |
Sold | | | 117,386 | | | $ | 1,129,542 | | | | 80,112 | | | $ | 1,127,584 | |
Issued as reinvestment of dividends | | | 207,648 | | | | 2,151,233 | | | | 19,722 | | | | 248,888 | |
Redeemed | | | (94,087 | ) | | | (879,840 | ) | | | (239,158 | ) | | | (3,528,032 | ) |
Net increase (decrease) | | | 230,947 | | | $ | 2,400,935 | | | | (139,324 | ) | | $ | (2,151,560 | ) |
222
Notes to Financial Statements (Continued) |
| | | Year Ended September 30, 2022 | | | Year Ended September 30, 2021 | |
| | | Shares | | | Amount | | | Shares | | | Amount | |
Small Cap Opportunities Fund Class I | | | | | | | | | | | | | | | | |
Sold | | | 3,560,465 | | | $ | 59,039,950 | | | | 2,152,649 | | | $ | 38,139,924 | |
Issued as reinvestment of dividends | | | 441,840 | | | | 7,864,749 | | | | 230,205 | | | | 3,678,677 | |
Redeemed | | | (1,713,538 | ) | | | (28,680,672 | ) | | | (813,878 | ) | | | (14,609,175 | ) |
Net increase (decrease) | | | 2,288,767 | | | $ | 38,224,027 | | | | 1,568,976 | | | $ | 27,209,426 | |
Small Cap Opportunities Fund Class R5 | | | | | | | | | | | | | | | | |
Sold | | | 1,630,887 | | | $ | 26,809,693 | | | | 1,782,293 | | | $ | 32,569,439 | |
Issued as reinvestment of dividends | | | 722,281 | | | | 12,813,268 | | | | 516,508 | | | | 8,238,297 | |
Redeemed | | | (2,395,956 | ) | | | (39,516,393 | ) | | | (1,780,475 | ) | | | (31,483,776 | ) |
Net increase (decrease) | | | (42,788 | ) | | $ | 106,568 | | | | 518,326 | | | $ | 9,323,960 | |
Small Cap Opportunities Fund Service Class | | | | | | | | | | | | | | | | |
Sold | | | 228,524 | | | $ | 4,005,208 | | | | 265,393 | | | $ | 4,861,794 | |
Issued as reinvestment of dividends | | | 118,166 | | | | 2,089,184 | | | | 96,039 | | | | 1,528,937 | |
Redeemed | | | (506,435 | ) | | | (9,168,851 | ) | | | (310,359 | ) | | | (5,556,779 | ) |
Net increase (decrease) | | | (159,745 | ) | | $ | (3,074,459 | ) | | | 51,073 | | | $ | 833,952 | |
Small Cap Opportunities Fund Administrative Class | | | | | | | | | | | | | | | | |
Sold | | | 204,033 | | | $ | 3,351,154 | | | | 439,053 | | | $ | 7,704,558 | |
Issued as reinvestment of dividends | | | 141,420 | | | | 2,480,508 | | | | 109,361 | | | | 1,730,097 | |
Redeemed | | | (292,309 | ) | | | (4,855,655 | ) | | | (496,159 | ) | | | (8,753,528 | ) |
Net increase (decrease) | | | 53,144 | | | $ | 976,007 | | | | 52,255 | | | $ | 681,127 | |
Small Cap Opportunities Fund Class R4 | | | | | | | | | | | | | | | | |
Sold | | | 196,508 | | | $ | 3,132,036 | | | | 271,003 | | | $ | 4,374,138 | |
Issued as reinvestment of dividends | | | 89,334 | | | | 1,502,600 | | | | 57,740 | | | | 881,116 | |
Redeemed | | | (258,800 | ) | | | (4,219,191 | ) | | | (176,521 | ) | | | (2,934,652 | ) |
Net increase (decrease) | | | 27,042 | | | $ | 415,445 | | | | 152,222 | | | $ | 2,320,602 | |
Small Cap Opportunities Fund Class A | | | | | | | | | | | | | | | | |
Sold | | | 286,957 | | | $ | 4,805,462 | | | | 686,520 | | | $ | 12,099,261 | |
Issued as reinvestment of dividends | | | 310,701 | | | | 5,263,274 | | | | 246,828 | | | | 3,793,745 | |
Redeemed | | | (720,194 | ) | | | (11,833,870 | ) | | | (1,099,614 | ) | | | (19,004,890 | ) |
Net increase (decrease) | | | (122,536 | ) | | $ | (1,765,134 | ) | | | (166,266 | ) | | $ | (3,111,884 | ) |
Small Cap Opportunities Fund Class R3 | | | | | | | | | | | | | | | | |
Sold | | | 136,352 | | | $ | 2,130,193 | | | | 326,200 | | | $ | 5,702,286 | |
Issued as reinvestment of dividends | | | 56,530 | | | | 937,828 | | | | 31,666 | | | | 478,467 | |
Redeemed | | | (186,320 | ) | | | (3,015,266 | ) | | | (279,793 | ) | | | (4,791,893 | ) |
Net increase (decrease) | | | 6,562 | | | $ | 52,755 | | | | 78,073 | | | $ | 1,388,860 | |
Global Fund Class I | | | | | | | | | | | | | | | | |
Sold | | | 848,523 | | | $ | 13,579,794 | | | | 1,313,419 | | | $ | 22,920,566 | |
Issued as reinvestment of dividends | | | 613,916 | | | | 10,688,280 | | | | 254,998 | | | | 4,141,170 | |
Redeemed | | | (1,470,123 | ) | | | (22,515,968 | ) | | | (1,295,254 | ) | | | (22,679,641 | ) |
Net increase (decrease) | | | (7,684 | ) | | $ | 1,752,106 | | | | 273,163 | | | $ | 4,382,095 | |
Global Fund Class R5 | | | | | | | | | | | | | | | | |
Sold | | | 418,509 | | | $ | 6,237,265 | | | | 401,475 | | | $ | 6,972,197 | |
Issued as reinvestment of dividends | | | 732,144 | | | | 12,739,313 | | | | 372,971 | | | | 6,060,786 | |
Redeemed | | | (2,366,211 | ) | | | (37,889,643 | ) | | | (1,442,933 | ) | | | (25,014,770 | ) |
Net increase (decrease) | | | (1,215,558 | ) | | $ | (18,913,065 | ) | | | (668,487 | ) | | $ | (11,981,787 | ) |
Global Fund Service Class | | | | | | | | | | | | | | | | |
Sold | | | 137,949 | | | $ | 1,951,020 | | | | 74,171 | | | $ | 1,259,308 | |
Issued as reinvestment of dividends | | | 49,980 | | | | 859,154 | | | | 20,921 | | | | 336,406 | |
Redeemed | | | (84,470 | ) | | | (1,159,810 | ) | | | (83,980 | ) | | | (1,416,983 | ) |
Net increase (decrease) | | | 103,459 | | | $ | 1,650,364 | | | | 11,112 | | | $ | 178,731 | |
223
Notes to Financial Statements (Continued) |
| | | Year Ended September 30, 2022 | | | Year Ended September 30, 2021 | |
| | | Shares | | | Amount | | | Shares | | | Amount | |
Global Fund Administrative Class | | | | | | | | | | | | | | | | |
Sold | | | 259,119 | | | $ | 3,956,938 | | | | 442,561 | | | $ | 7,686,685 | |
Issued as reinvestment of dividends | | | 534,705 | | | | 9,271,798 | | | | 258,714 | | | | 4,196,349 | |
Redeemed | | | (1,207,946 | ) | | | (18,496,842 | ) | | | (1,343,322 | ) | | | (23,224,861 | ) |
Net increase (decrease) | | | (414,122 | ) | | $ | (5,268,106 | ) | | | (642,047 | ) | | $ | (11,341,827 | ) |
Global Fund Class R4 | | | | | | | | | | | | | | | | |
Sold | | | 128,917 | | | $ | 1,796,658 | | | | 400,107 | | | $ | 7,058,217 | |
Issued as reinvestment of dividends | | | 103,055 | | | | 1,722,056 | | | | 32,263 | | | | 507,173 | |
Redeemed | | | (266,655 | ) | | | (3,921,471 | ) | | | (159,210 | ) | | | (2,734,225 | ) |
Net increase (decrease) | | | (34,683 | ) | | $ | (402,757 | ) | | | 273,160 | | | $ | 4,831,165 | |
Global Fund Class A | | | | | | | | | | | | | | | | |
Sold | | | 46,511 | | | $ | 665,076 | | | | 169,535 | | | $ | 2,824,043 | |
Issued as reinvestment of dividends | | | 119,045 | | | | 2,022,576 | | | | 79,531 | | | | 1,270,108 | |
Redeemed | | | (354,684 | ) | | | (5,114,524 | ) | | | (739,313 | ) | | | (13,056,319 | ) |
Net increase (decrease) | | | (189,128 | ) | | $ | (2,426,872 | ) | | | (490,247 | ) | | $ | (8,962,168 | ) |
Global Fund Class R3 | | | | | | | | | | | | | | | | |
Sold | | | 145,257 | | | $ | 2,028,145 | | | | 395,700 | | | $ | 7,355,077 | |
Issued as reinvestment of dividends | | | 88,708 | | | | 1,492,945 | | | | 34,097 | | | | 540,776 | |
Redeemed | | | (206,905 | ) | | | (2,970,801 | ) | | | (352,878 | ) | | | (6,206,358 | ) |
Net increase (decrease) | | | 27,060 | | | $ | 550,289 | | | | 76,919 | | | $ | 1,689,495 | |
International Equity Fund Class I | | | | | | | | | | | | | | | | |
Sold | | | 3,627,614 | | | $ | 30,778,331 | | | | 4,384,179 | | | $ | 45,420,608 | |
Issued as reinvestment of dividends | | | 1,228,678 | | | | 10,922,947 | | | | 3,875,666 | | | | 36,392,504 | |
Redeemed | | | (4,482,020 | ) | | | (39,403,116 | ) | | | (6,703,534 | ) | | | (67,994,400 | ) |
Net increase (decrease) | | | 374,272 | | | $ | 2,298,162 | | | | 1,556,311 | | | $ | 13,818,712 | |
International Equity Fund Class R5 | | | | | | | | | | | | | | | | |
Sold | | | 190,346 | | | $ | 1,652,319 | | | | 358,016 | | | $ | 3,796,054 | |
Issued as reinvestment of dividends | | | 614,052 | | | | 5,465,065 | | | | 2,331,454 | | | | 21,915,668 | |
Redeemed | | | (1,516,465 | ) | | | (13,795,210 | ) | | | (2,360,681 | ) | | | (24,560,798 | ) |
Net increase (decrease) | | | (712,067 | ) | | $ | (6,677,826 | ) | | | 328,789 | | | $ | 1,150,924 | |
International Equity Fund Service Class | | | | | | | | | | | | | | | | |
Sold | | | 23,291 | | | $ | 205,086 | | | | 27,728 | | | $ | 298,533 | |
Issued as reinvestment of dividends | | | 46,267 | | | | 410,850 | | | | 160,439 | | | | 1,504,920 | |
Redeemed | | | (46,201 | ) | | | (406,675 | ) | | | (189,874 | ) | | | (2,087,907 | ) |
Net increase (decrease) | | | 23,357 | | | $ | 209,261 | | | | (1,707 | ) | | $ | (284,454 | ) |
International Equity Fund Administrative Class | | | | | | | | | | | | | | | | |
Sold | | | 78,185 | | | $ | 670,999 | | | | 24,694 | | | $ | 274,716 | |
Issued as reinvestment of dividends | | | 33,225 | | | | 292,378 | | | | 130,844 | | | | 1,216,848 | |
Redeemed | | | (33,577 | ) | | | (301,432 | ) | | | (185,817 | ) | | | (1,982,890 | ) |
Net increase (decrease) | | | 77,833 | | | $ | 661,945 | | | | (30,279 | ) | | $ | (491,326 | ) |
International Equity Fund Class R4 | | | | | | | | | | | | | | | | |
Sold | | | 5,923 | | | $ | 48,552 | | | | 15,293 | | | $ | 149,199 | |
Issued as reinvestment of dividends | | | 21,570 | | | | 176,442 | | | | 86,724 | | | | 756,235 | |
Redeemed | | | (94,644 | ) | | | (799,568 | ) | | | (83,038 | ) | | | (775,755 | ) |
Net increase (decrease) | | | (67,151 | ) | | $ | (574,574 | ) | | | 18,979 | | | $ | 129,679 | |
International Equity Fund Class A | | | | | | | | | | | | | | | | |
Sold | | | 94,579 | | | $ | 772,548 | | | | 186,950 | | | $ | 1,995,323 | |
Issued as reinvestment of dividends | | | 177,714 | | | | 1,476,804 | | | | 801,741 | | | | 7,087,390 | |
Redeemed | | | (376,008 | ) | | | (3,346,694 | ) | | | (1,015,711 | ) | | | (10,022,830 | ) |
Net increase (decrease) | | | (103,715 | ) | | $ | (1,097,342 | ) | | | (27,020 | ) | | $ | (940,117 | ) |
224
Notes to Financial Statements (Continued) |
| | | Year Ended September 30, 2022 | | | Year Ended September 30, 2021 | |
| | | Shares | | | Amount | | | Shares | | | Amount | |
International Equity Fund Class R3 | | | | | | | | | | | | | | | | |
Sold | | | 115,011 | | | $ | 909,339 | | | | 28,888 | | | $ | 274,012 | |
Issued as reinvestment of dividends | | | 35,930 | | | | 290,312 | | | | 99,712 | | | | 861,510 | |
Redeemed | | | (80,736 | ) | | | (638,057 | ) | | | (75,969 | ) | | | (797,072 | ) |
Net increase (decrease) | | | 70,205 | | | $ | 561,594 | | | | 52,631 | | | $ | 338,450 | |
Strategic Emerging Markets Fund Class I | | | | | | | | | | | | | | | | |
Sold | | | 3,501,599 | | | $ | 37,016,801 | | | | 2,622,168 | | | $ | 41,148,451 | |
Issued as reinvestment of dividends | | | 1,756,354 | | | | 21,234,316 | | | | 183,464 | | | | 2,772,142 | |
Redeemed | | | (2,964,568 | ) | | | (31,914,655 | ) | | | (5,090,734 | ) | | | (79,909,183 | ) |
Net increase (decrease) | | | 2,293,385 | | | $ | 26,336,462 | | | | (2,285,102 | ) | | $ | (35,988,590 | ) |
Strategic Emerging Markets Fund Class R5 | | | | | | | | | | | | | | | | |
Sold | | | 49,571 | | | $ | 589,756 | | | | 14,440 | | | $ | 232,990 | |
Issued as reinvestment of dividends | | | 29,044 | | | | 357,246 | | | | 3,223 | | | | 49,442 | |
Redeemed | | | (230,169 | ) | | | (2,136,989 | ) | | | (74,842 | ) | | | (1,202,244 | ) |
Net increase (decrease) | | | (151,554 | ) | | $ | (1,189,987 | ) | | | (57,179 | ) | | $ | (919,812 | ) |
Strategic Emerging Markets Fund Service Class | | | | | | | | | | | | | | | | |
Sold | | | 62,038 | | | $ | 687,884 | | | | 14,307 | | | $ | 224,109 | |
Issued as reinvestment of dividends | | | 26,092 | | | | 315,974 | | | | 2,548 | | | | 38,555 | |
Redeemed | | | (72,795 | ) | | | (660,154 | ) | | | (54,988 | ) | | | (842,650 | ) |
Net increase (decrease) | | | 15,335 | | | $ | 343,704 | | | | (38,133 | ) | | $ | (579,986 | ) |
Strategic Emerging Markets Fund Administrative Class | | | | | | | | | | | | | | | | |
Sold | | | 24,125 | | | $ | 279,637 | | | | 12,632 | | | $ | 196,725 | |
Issued as reinvestment of dividends | | | 11,756 | | | | 142,830 | | | | 1,087 | | | | 16,503 | |
Redeemed | | | (75,597 | ) | | | (885,854 | ) | | | (20,157 | ) | | | (312,538 | ) |
Net increase (decrease) | | | (39,716 | ) | | $ | (463,387 | ) | | | (6,438 | ) | | $ | (99,310 | ) |
Strategic Emerging Markets Fund Class R4 | | | | | | | | | | | | | | | | |
Sold | | | 4,015 | | | $ | 40,960 | | | | 11,717 | | | $ | 181,454 | |
Issued as reinvestment of dividends | | | 4,781 | | | | 57,377 | | | | 1,420 | | | | 21,224 | |
Redeemed | | | (1,146 | ) | | | (12,483 | ) | | | (77,503 | ) | | | (1,163,663 | ) |
Net increase (decrease) | | | 7,650 | | | $ | 85,854 | | | | (64,366 | ) | | $ | (960,985 | ) |
Strategic Emerging Markets Fund Class A | | | | | | | | | | | | | | | | |
Sold | | | 23,059 | | | $ | 251,192 | | | | 38,039 | | | $ | 591,287 | |
Issued as reinvestment of dividends | | | 6,386 | | | | 77,403 | | | | 2,297 | | | | 34,506 | |
Redeemed | | | (55,338 | ) | | | (533,081 | ) | | | (151,455 | ) | | | (2,434,965 | ) |
Net increase (decrease) | | | (25,893 | ) | | $ | (204,486 | ) | | | (111,119 | ) | | $ | (1,809,172 | ) |
Strategic Emerging Markets Fund Class R3 | | | | | | | | | | | | | | | | |
Sold | | | 32,520 | | | $ | 340,196 | | | | 17,182 | | | $ | 256,630 | |
Issued as reinvestment of dividends | | | 12,582 | | | | 149,473 | | | | 1,166 | | | | 17,356 | |
Redeemed | | | (53,655 | ) | | | (500,353 | ) | | | (17,804 | ) | | | (271,856 | ) |
Net increase (decrease) | | | (8,553 | ) | | $ | (10,684 | ) | | | 544 | | | $ | 2,130 | |
(a) | Commenced operations on December 13, 2021. |
225
Notes to Financial Statements (Continued) |
Unless waived, purchases of Class A and Class L shares are subject to a front-end sales charge of up to 5.50% and 2.00%, respectively, of the amount purchased. A portion of the front-end sales charge may be retained by the Distributor or ALPS Distributor, as applicable. The Distributor and/or ALPS Distributor, as applicable, retained the following amounts during the period ended September 30, 2022:
| | | Front-End
Sales Charges
Retained by
Distributor | |
Inflation-Protected and Income Fund | | $ | 113 | |
Main Street Fund | | | 209 | |
Disciplined Growth Fund | | | 6 | |
Small Cap Opportunities Fund | | | 100 | |
Global Fund | | | 174 | |
Unless waived, redemptions of Class A and Class L shares made within 18 months of purchase from initial investments of $1 million or more, or $250,000 or more, respectively, are subject to a contingent deferred sales charge of 1.00% and 0.50% of the amount redeemed, and redemptions of Class C shares made within 12 months of purchase are subject to a contingent deferred sales charge of 0.50% or 1.00% of the amount redeemed. The Distributor and/or ALPS Distributor, as applicable, receives all contingent deferred sales charges. For the year ended September 30, 2022, no amounts have been retained by the Distributor or ALPS Distributor.
With respect to Class A, Class L, and Class C shares, the Distributor and ALPS Distributor, as applicable, may pay an up-front concession or commission to financial intermediaries through which sales are made as described in the Funds’ Prospectus.
6. | Federal Income Tax Information |
At September 30, 2022, the aggregate cost of investments and the unrealized appreciation (depreciation) in the value of all investments owned by the Fund(s), as computed on a federal income tax basis, were as follows:
| | | Federal Income
Tax Cost | | | Tax Basis
Unrealized
Appreciation | | | Tax Basis
Unrealized
(Depreciation) | | | Net Unrealized
Appreciation
(Depreciation) | |
U.S. Government Money Market Fund | | $ | 208,416,681 | | | $ | — | | | $ | — | | | $ | — | |
Short-Duration Bond Fund | | | 583,596,553 | | | | 816,598 | | | | (84,520,267 | ) | | | (83,703,669 | ) |
Inflation-Protected and Income Fund | | | 322,897,466 | | | | 1,220,242 | | | | (21,897,845 | ) | | | (20,677,603 | ) |
Core Bond Fund | | | 914,966,568 | | | | 1,946,631 | | | | (121,906,658 | ) | | | (119,960,027 | ) |
Diversified Bond Fund | | | 191,635,256 | | | | 336,957 | | | | (28,284,538 | ) | | | (27,947,581 | ) |
High Yield Fund | | | 461,932,138 | | | | 623,643 | | | | (70,940,528 | ) | | | (70,316,885 | ) |
Balanced Fund | | | 136,260,294 | | | | 2,635,558 | | | | (17,134,402 | ) | | | (14,498,844 | ) |
Disciplined Value Fund | | | 73,774,838 | | | | 4,513,111 | | | | (10,930,301 | ) | | | (6,417,190 | ) |
Main Street Fund | | | 66,672,093 | | | | 7,565,508 | | | | (7,115,882 | ) | | | 449,626 | |
Disciplined Growth Fund | | | 169,220,056 | | | | 6,184,860 | | | | (19,791,117 | ) | | | (13,606,257 | ) |
Small Cap Opportunities Fund | | | 291,900,312 | | | | 31,734,508 | | | | (27,305,456 | ) | | | 4,429,052 | |
Global Fund | | | 145,214,997 | | | | 62,969,461 | | | | (15,381,336 | ) | | | 47,588,125 | |
International Equity Fund | | | 136,494,414 | | | | 2,867,524 | | | | (24,956,883 | ) | | | (22,089,359 | ) |
Strategic Emerging Markets Fund | | | 140,873,390 | | | | 1,662,756 | | | | (34,392,403 | ) | | | (32,729,647 | ) |
Note: The aggregate cost for investments for the U.S. Government Money Market Fund at September 30, 2022, is the same for financial reporting and federal income tax purposes.
226
Notes to Financial Statements (Continued) |
Net capital loss carryforwards may be applied against any net realized taxable gains in succeeding years, subject to the carryforward period limitations, where applicable. Capital losses may be carried forward indefinitely, and retain the character of the original loss.
At September 30, 2022, the following Fund(s) had accumulated capital loss carryforwards:
| | | Short Term
Capital Loss
Carryforward | | | Long Term
Capital Loss
Carryforward | |
Short-Duration Bond Fund | | $ | 49,199,763 | | | $ | 41,158,444 | |
Inflation-Protected and Income Fund | | | 6,846,961 | | | | — | |
Diversified Bond Fund | | | 5,436,055 | | | | 4,716,603 | |
High Yield Fund | | | 7,608,905 | | | | 33,726,295 | |
Balanced Fund | | | 232,692 | | | | 777,617 | |
The following Fund(s) elected to defer to the fiscal year beginning October 1, 2022, post-October capital losses:
| | | Post-October
Loss | | | Post-October
Currency
Loss | |
Core Bond Fund | | $ | 50,365,314 | | | $ | — | |
Strategic Emerging Markets Fund | | | 10,572,096 | | | | — | |
The following Fund(s) elected to defer to the fiscal year beginning October 1, 2022, late year ordinary losses:
| | | Amount | |
Global Fund | | $ | 189,342 | |
Strategic Emerging Markets Fund | | | 849,349 | |
Generally accepted accounting principles in the United States of America require that only distributions in excess of tax basis earnings and profits be reported in the financial statements as a return of capital.
227
Notes to Financial Statements (Continued) |
The tax character of distributions (including capital gain dividends, if any, designated pursuant to Section 852 of the Code) paid during the year ended September 30, 2022, was as follows:
| | | Ordinary
Income | | | Long Term
Capital Gain | |
U.S. Government Money Market Fund | | $ | 837,585 | | | $ | — | |
Short-Duration Bond Fund | | | 30,089,567 | | | | — | |
Inflation-Protected and Income Fund | | | 23,613,797 | | | | 2,361,296 | |
Core Bond Fund | | | 24,656,188 | | | | 16,653,803 | |
Diversified Bond Fund | | | 6,737,343 | | | | 2,182,192 | |
High Yield Fund | | | 50,657,370 | | | | — | |
Balanced Fund | | | 18,681,318 | | | | 17,287,108 | |
Disciplined Value Fund | | | 15,760,578 | | | | 46,424 | |
Main Street Fund | | | 4,247,162 | | | | 20,444,959 | |
Disciplined Growth Fund | | | 26,973,675 | | | | 69,943,442 | |
Small Cap Opportunities Fund | | | 6,448,984 | | | | 26,737,612 | |
Global Fund | | | — | | | | 38,797,066 | |
International Equity Fund | | | 13,655,842 | | | | 5,380,698 | |
Strategic Emerging Markets Fund | | | 2,721,355 | | | | 19,628,043 | |
The tax character of distributions (including capital gain dividends, if any, designated pursuant to Section 852 of the Code) paid during the year ended September 30, 2021, was as follows:
| | | Ordinary
Income | | | Long Term
Capital Gain | |
Short-Duration Bond Fund | | $ | 17,574,671 | | | $ | — | |
Inflation-Protected and Income Fund | | | 19,482,741 | | | | 136,657 | |
Core Bond Fund | | | 73,365,061 | | | | 4,869,570 | |
Diversified Bond Fund | | | 12,237,128 | | | | 3,642,808 | |
High Yield Fund | | | 31,328,119 | | | | — | |
Balanced Fund | | | 2,378,437 | | | | 2,148,296 | |
Disciplined Value Fund | | | 1,733,201 | | | | — | |
Main Street Fund | | | 1,282,705 | | | | 2,441,294 | |
Disciplined Growth Fund | | | 959,344 | | | | 10,595,935 | |
Small Cap Opportunities Fund | | | 1,308,592 | | | | 19,106,651 | |
Global Fund | | | — | | | | 17,053,155 | |
International Equity Fund | | | 12,178,079 | | | | 57,558,476 | |
Strategic Emerging Markets Fund | | | — | | | | 2,951,373 | |
The following Fund(s) have elected to pass through the foreign tax credit for the year ended September 30, 2022:
| | | Amount | |
International Equity Fund | | $ | 212,246 | |
Strategic Emerging Markets Fund | | | 402,908 | |
228
Notes to Financial Statements (Continued) |
Capital accounts within the financial statements are periodically adjusted for permanent differences between book and tax accounting. These adjustments have no impact on net assets or the results of operations. Temporary book and tax accounting differences will reverse in subsequent periods. At September 30, 2022, temporary book and tax accounting differences were primarily attributable to the deferral of wash sale losses, deferred Trustee compensation, and other temporary basis adjustments.
At September 30, 2022, the components of distributable earnings on a tax basis were as follows:
| | | Undistributed
Ordinary
Income | | | Undistributed
Long Term
Capital Gain
(Capital Loss
Carryover) | | | Other
Temporary
Differences | | | Unrealized
Appreciation
(Depreciation) | | | Total | |
U.S. Government Money Market Fund | | $ | — | | | $ | — | | | $ | (44,649 | ) | | $ | — | | | $ | (44,649 | ) |
Short-Duration Bond Fund | | | 384,318 | | | | (90,358,207 | ) | | | (50,505 | ) | | | (83,703,669 | ) | | | (173,728,063 | ) |
Inflation-Protected and Income Fund | | | 8,522,311 | | | | (6,846,961 | ) | | | (26,878 | ) | | | (38,718,663 | ) | | | (37,070,191 | ) |
Core Bond Fund | | | 19,740,472 | | | | — | | | | (50,497,376 | ) | | | (119,960,027 | ) | | | (150,716,931 | ) |
Diversified Bond Fund | | | 4,225,369 | | | | (10,152,658 | ) | | | (17,501 | ) | | | (27,972,821 | ) | | | (33,917,611 | ) |
High Yield Fund | | | 212,718 | | | | (41,335,200 | ) | | | (29,293 | ) | | | (70,352,511 | ) | | | (111,504,286 | ) |
Balanced Fund | | | 1,332,769 | | | | (1,010,309 | ) | | | (14,427 | ) | | | (14,498,844 | ) | | | (14,190,811 | ) |
Disciplined Value Fund | | | 4,176,210 | | | | 2,978,922 | | | | (22,076 | ) | | | (6,417,190 | ) | | | 715,866 | |
Main Street Fund | | | 473,949 | | | | 7,963,401 | | | | (13,832 | ) | | | 449,251 | | | | 8,872,769 | |
Disciplined Growth Fund | | | 32,612 | | | | 7,459,036 | | | | (27,563 | ) | | | (13,606,257 | ) | | | (6,142,172 | ) |
Small Cap Opportunities Fund | | | 2,365,235 | | | | 1,470,540 | | | | (21,599 | ) | | | 4,429,052 | | | | 8,243,228 | |
Global Fund | | | — | | | | 43,426,642 | | | | (221,084 | ) | | | 47,253,280 | | | | 90,458,838 | |
International Equity Fund | | | 1,563,956 | | | | 5,591,169 | | | | (51,863 | ) | | | (22,171,244 | ) | | | (15,067,982 | ) |
Strategic Emerging Markets Fund | | | — | | | | — | | | | (11,435,372 | ) | | | (32,930,018 | ) | | | (44,365,390 | ) |
During the year ended September 30, 2022, the following amounts were reclassified due to permanent differences between book and tax accounting:
| | | Paid-in
Capital | | | Accumulated
Net Realized
Gain (Loss) on
Investments | | | Undistributed
Net Investment
Income (Loss) | |
U.S. Government Money Market Fund | | $ | (294 | ) | | $ | (1,133 | ) | | $ | 1,427 | |
Short-Duration Bond Fund | | | 11,519,205 | | | | (20,657,468 | ) | | | 9,138,263 | |
Inflation-Protected and Income Fund | | | 16,916 | | | | (904,988 | ) | | | 888,072 | |
Core Bond Fund | | | — | | | | (2,262,765 | ) | | | 2,262,765 | |
Diversified Bond Fund | | | 1 | | | | 395,740 | | | | (395,741 | ) |
High Yield Fund | | | 2,783,792 | | | | (2,880,024 | ) | | | 96,232 | |
Balanced Fund | | | 42,920 | | | | (190,729 | ) | | | 147,809 | |
Disciplined Value Fund | | | — | | | | (10,635 | ) | | | 10,635 | |
Main Street Fund | | | (100 | ) | | | (95,523 | ) | | | 95,623 | |
Disciplined Growth Fund | | | — | | | | (68,757 | ) | | | 68,757 | |
Small Cap Opportunities Fund | | | (51,320 | ) | | | (1,395,690 | ) | | | 1,447,010 | |
Global Fund | | | (1,831,094 | ) | | | (62,544 | ) | | | 1,893,638 | |
International Equity Fund | | | — | | | | (126,289 | ) | | | 126,289 | |
Strategic Emerging Markets Fund | | | 684,469 | | | | (985,921 | ) | | | 301,452 | |
229
Notes to Financial Statements (Continued) |
The Funds did not have any unrecognized tax benefits at September 30, 2022, nor were there any increases or decreases in unrecognized tax benefits for the year then ended. The Funds recognize interest and penalties, if any, related to unrecognized tax benefits as an income tax expense in the Statements of Operations. During the year ended September 30, 2022, the Funds did not incur any such interest or penalties. The Funds are subject to examination by U.S. federal and state tax authorities for returns filed for the prior three fiscal years. Foreign taxes are provided for based on the Funds’ understanding of the tax rules and rates that exist in the foreign markets in which they invest.
7. Acquisition of Barings Active Short Duration Bond Fund and Barings U.S. High Yield Fund
Effective December 13, 2021, the Barings Active Short Duration Bond Fund and Barings U.S. High Yield Fund merged into the Short-Duration Bond Fund and the High Yield Fund, respectively, pursuant to the terms of an Agreement and Plan of Reorganization.
The Barings Active Short Duration Bond Fund’s assets and liabilities were transferred to the Short-Duration Bond Fund in return for shares of the Short-Duration Bond Fund. The acquisition was accomplished by a tax-free exchange of the Short-Duration Bond Fund in the following amounts:
Barings Active Short
Duration Bond Fund
Share Class | | Shares of the
Barings Active
Short Duration
Bond Fund Prior
to Reorganization | | | Conversion
Ratio | | | Value of Shares
Issued by the
Barings Active
Short Duration
Bond Fund | | | Short-Duration Bond Fund
Share Class | | | Shares
Issued by the
Short-Duration
Bond Fund | |
Class A* | | | 4,392,646 | | | | — | | | $ | — | | | | — | | | | — | |
Class Y | | | 106,455,197 | | | | 0.99538555 | | | | 1,044,804,693 | | | | Class Y | | | | 105,963,965 | |
Class L* | | | 8,198,861 | | | | 1.00024649 | | | | 123,687,701 | | | | Class L | | | | 12,595,489 | |
Class C | | | 130,547 | | | | 0.99150687 | | | | 1,281,438 | | | | Class C | | | | 129,438 | |
| | | | 119,177,251 | | | | | | | $ | 1,169,773,832 | | | | | | | | 118,688,892 | |
* | Class A shares were merged into Class L at 1.00044637 rate. |
The investment portfolio of the Barings Active Short Duration Bond Fund, with a value of $1,112,388,771 in investments at December 10, 2021, was the principal asset acquired by the Short-Duration Bond Fund.
The Barings U.S. High Yield Fund’s assets and liabilities were transferred to the High Yield Fund in return for shares of the High Yield Fund. The acquisition was accomplished by a tax-free exchange of the High Yield Fund in the following amounts:
Barings U.S. High Yield
Fund Share Class | | Shares of the
Barings U.S.
High Yield Fund
Prior to the
Reorganization | | | Conversion
Ratio | | | Value of Shares
Issued by the
Barings U.S. High
Yield Fund | | | High Yield Fund
Share Class | | | Shares
Issued by the
High Yield Fund | |
Class I | | | 1,240,000 | | | | 1.10914654 | | | $ | 12,144,267 | | | | Class I | | | | 1,375,342 | |
Class Y | | | 4,081,196 | | | | 1.10534733 | | | | 39,968,695 | | | | Class Y | | | | 4,511,139 | |
Class C | | | 10,000 | | | | 1.10172925 | | | | 97,945 | | | | Class C | | | | 11,017 | |
| | | | 5,331,196 | | | | | | | $ | 52,210,907 | | | | | | | | 5,897,498 | |
The investment portfolio of the Barings U.S. High Yield, with a value of $49,712,194 in investments at December 10, 2021, was the principal asset acquired by the High Yield Fund.
230
Notes to Financial Statements (Continued) |
For financial reporting purposes, assets received and shares issued by the Short-Duration Bond Fund and High Yield Fund were recorded at fair value; however, the cost basis of the investments received from the Barings Active Short Duration Bond Fund and Barings U.S. High Yield Fund were carried forward to align ongoing reporting of the Short-Duration Bond Fund’s and High Yield Fund’s realized and unrealized gains and losses with amounts distributable to shareholders for federal income tax purposes. Immediately prior to the acquisition, the Short-Duration Bond Fund’s and High Yield Fund’s net assets were $338,900,558 and $525,616,144, respectively.
Assuming the acquisition had been completed on October 1, 2021, the beginning of the annual reporting period of the Short-Duration Bond Fund and High Yield Fund, the Short-Duration Bond Fund’s and High Yield Fund’s pro forma results of operations for the twelve month period ended September 30, 2022, would have been as follows:
| | Short-Duration
Bond Fund | | | High Yield
Fund | |
Net investment income | | $ | 25,922,596 | | | $ | 27,944,989 | |
Net realized and unrealized gain (loss) on investments | | | (134.297,264 | ) | | | (97,029,747 | ) |
Net increase (decrease) in net assets resulting from operations | | | (108,374,668 | ) | | | (69,084,758 | ) |
Because both the acquired and surviving funds continuously sold and redeemed shares throughout the period, it is not practicable to provide pro-forma information on a per-share basis.
Because the combined investment portfolios have been managed as a single integrated portfolio since the acquisitions were completed, it is also not practicable to separate the amounts of revenue and earnings of the Barings Active Short Duration Bond Fund and Barings U.S. High Yield Fund that have been included in the Short-Duration Bond Fund’s and High Yield Fund’s Statements of Operations since December 13, 2021.
See Note 5, Capital Share Transactions, for the changes in shares outstanding for the Short-Duration Bond Fund and High Yield Fund during the period.
The Trust (the “Borrower”) on behalf of the Short-Duration Bond Fund and High Yield Fund has entered into a Credit Agreement (the “Credit Agreement”) with State Street Bank and Trust Company (the “Bank”). The Credit Agreement provides for a revolving credit facility of $150,000,000 (the “Facility Amount”) to be utilized for temporary or emergency purposes to fund shareholder redemptions or for other short-term liquidity purposes. Per the Credit Agreement, outstanding principal on the loan shall bear interest at a variable rate per annum equal to the higher of (a) the Federal Funds Rate as in effect on the day of the borrowing plus 1.25% and (b) the Overnight Bank Funding Rate as in effect on the day of the borrowing plus 1.25%. In addition, the Borrower shall pay to the Bank a commitment fee at the rate of 0.25% per annum on the daily unused portion of the Facility Amount.
For the year ended September 30, 2022, the Short-Duration Bond Fund and High Yield Fund did not utilize the Facility Amount. The commitment fees made by the Funds are recorded in the accompanying Statement of Operations as Commitment & Service Expenses.
Under the Funds’ organizational documents, current and former Trustees and Officers are provided with specified rights to indemnification against liabilities arising in connection with the performance of their duties to the Funds, and shareholders are indemnified against personal liability for obligations of the Funds. In the normal course of business, the Funds may also enter into contracts that provide general indemnifications. The Funds’ maximum exposure under these arrangements is unknown as this would be dependent on future claims that may be made against the Funds. The risk of material loss from such claims is considered remote.
231
Notes to Financial Statements (Continued) |
10. | New Accounting Pronouncements |
In January 2021, FASB issued Accounting Standards Update 2021-01 — Reference Rate Reform (Topic 848) — Scope (“ASU 2021-01”) as an update to Accounting Standards Update 2020-04 — Reference Rate Reform (Topic 848) — Facilitation of the Effects of Reference Rate Reform on Financial Reporting (“ASU 2020-04”) in order to make certain clarifications. ASU 2020-04 and ASU 2021-01 provide optional temporary financial reporting relief from the effect of certain types of contract modifications due to the planned discontinuation of the London Interbank Offered Rate (“LIBOR”) and other interbank-offered based reference rates. The temporary relief provided by ASU 2020-04 and ASU 2021-01 is effective for certain reference rate-related contract modifications that occur during the period March 12, 2020 through December 31, 2022. Management does not believe the impact of adopting ASU 2020-04 and ASU 2021-01 will have a material impact on the financial statements.
In June 2022, FASB issued Accounting Standards Update 2022-03 -- Fair Value Measurement (Topic 820) -- Fair Value Measurement of Equity Securities Subject to Contractual Sale Restrictions (“ASU 2022-03”). ASU 2022-03 clarifies the guidance in Topic 820 to indicate that a contractual sale restriction should not be considered in the fair value of an equity security subject to such a restriction, and requires entities with investments in equity securities subject to contractual sale restrictions to disclose certain qualitative and quantitative information about such securities. ASU 2022-03 is effective for fiscal years, and interim periods within those fiscal years, beginning after December 15, 2023, and allows for early adoption. ASU 2022-03 will only be applicable to an equity security in which the contractual arrangement that restricts its sale is executed or modified on or after the adoption date. Management is currently evaluating the impact of applying this update.
11. | Coronavirus (COVID-19) Pandemic |
The global pandemic outbreak of the novel coronavirus known as COVID-19 and efforts to contain its spread have produced, and will likely continue to produce, substantial market volatility, severe market dislocations and liquidity constraints in many markets, exchange trading suspensions and closures, higher default rates, and global business disruption, and they may result in future significant adverse effects, such as declines in global financial markets and a substantial economic downturn or recession throughout the world. Such factors may have a significant adverse effect on a Fund’s performance and have the potential to impair the ability of a Fund’s investment adviser, subadviser, or other service providers to serve the Fund and could lead to disruptions that negatively impact the Fund.
In February 2022, Russia commenced a large-scale military attack on Ukraine. The outbreak of hostilities between the two countries could result in more widespread conflict and could have a severe adverse effect on the regional and the global financial markets and economies. One or more of the Funds hold positions in securities or other instruments that are economically tied to Russia. Investments in Russia are subject to political, economic, legal, market, and currency risks, as well as the risks related to the economic sanctions on Russia, Russian individuals, and Russian corporate and banking entities imposed by the United States and/or other countries. Such sanctions — which affect companies in many sectors, including energy, financial services, and defense, among others — could adversely affect the global energy and financial markets and, thus, could affect the value of a Fund’s investments, even beyond any direct exposure the Fund may have to Russian issuers or the adjoining geographic regions. Such sanctions may also result in a decline in the value and liquidity of Russian securities and a weakening of the ruble, and will impair a Fund’s ability to buy, sell, receive, or deliver Russian securities. In addition, certain transactions have been or may be prohibited and/or existing investments have or may become illiquid (e.g., because transacting in certain existing investments is prohibited), which could cause a Fund to sell other portfolio holdings at a disadvantageous time or price in order to meet shareholder redemptions.
232
Report of Independent Registered Public Accounting Firm |
To the Board of Trustees of MassMutual Premier Funds and Shareholders of MassMutual U.S. Government Money Market Fund, MassMutual Short-Duration Bond Fund, MassMutual Inflation-Protected and Income Fund, MassMutual Core Bond Fund, MassMutual Diversified Bond Fund, MassMutual High Yield Fund, MassMutual Balanced Fund, MassMutual Disciplined Value Fund, MassMutual Main Street Fund, MassMutual Disciplined Growth Fund, MassMutual Small Cap Opportunities Fund, MassMutual Global Fund, MassMutual International Equity Fund, and MassMutual Strategic Emerging Markets Fund (collectively, the “Funds”):
Opinion on the Financial Statements and Financial Highlights
We have audited the accompanying statements of assets and liabilities of the Funds, including the portfolios of investments, as of September 30, 2022, the related statements of operations for the year then ended, the statements of changes in net assets for each of the two years in the period then ended, the financial highlights for each of the five years in the period then ended, and the related notes. In our opinion, the financial statements and financial highlights present fairly, in all material respects, the financial position of each of the Funds as of September 30, 2022, and the results of their operations for the year then ended, the changes in their net assets for each of the two years in the period then ended, and the financial highlights for each of the five years in the period then ended, in conformity with accounting principles generally accepted in the United States of America.
Basis for Opinion
These financial statements and financial highlights are the responsibility of the Funds’ management. Our responsibility is to express an opinion on the Funds’ financial statements and financial highlights based on our audits. We are a public accounting firm registered with the Public Company Accounting Oversight Board (United States) (PCAOB) and are required to be independent with respect to the Funds in accordance with the U.S. federal securities laws and the applicable rules and regulations of the Securities and Exchange Commission and the PCAOB.
We conducted our audits in accordance with the standards of the PCAOB. Those standards require that we plan and perform the audit to obtain reasonable assurance about whether the financial statements and financial highlights are free of material misstatement, whether due to error or fraud. The Funds are not required to have, nor were we engaged to perform, an audit of their internal control over financial reporting. As part of our audits we are required to obtain an understanding of internal control over financial reporting but not for the purpose of expressing an opinion on the effectiveness of the Funds’ internal control over financial reporting. Accordingly, we express no such opinion.
Our audits included performing procedures to assess the risks of material misstatement of the financial statements and financial highlights, whether due to error or fraud, and performing procedures that respond to those risks. Such procedures included examining, on a test basis, evidence regarding the amounts and disclosures in the financial statements and financial highlights. Our audits also included evaluating the accounting principles used and significant estimates made by management, as well as evaluating the overall presentation of the financial statements and financial highlights. Our procedures included confirmation of securities owned as of September 30, 2022, by correspondence with the custodian, brokers and agent banks; when replies were not received from brokers or agent banks, we performed other auditing procedures. We believe that our audits provide a reasonable basis for our opinion.
/s/ Deloitte & Touche LLP
Boston, Massachusetts
November 28, 2022
We have served as the auditor of one or more MassMutual investment companies since 1995.
233
Trustees and Principal Officers (Unaudited) |
The following table lists the Trust’s Trustees and Principal Officers; their address and year of birth; their position with the Trust; the length of time holding that position with the Trust; their principal occupation(s) during at least the past five years; the number of portfolios in the fund complex they oversee; and other directorships they hold in companies subject to registration or reporting requirements of the Securities Exchange Act of 1934 (generally called “public companies”) or in registered investment companies. The Trust’s Statement of Additional Information includes additional information about the Trust’s Trustees and is available, without charge, upon request by calling 1-888-309-3539 or by writing MassMutual Premier Funds, c/o Massachusetts Mutual Life Insurance Company, 1295 State Street, Springfield, Massachusetts 01111-0001, Attention: Investment Management Solutions.
Independent Trustees
Name, Address*,
and Year of Birth | Position(s)
Held with
Trust | Term of
Office** and
Length of
Time Served | Principal Occupation(s)
During Past 5 Years | Number of
Portfolios in
Fund Complex
Overseen by
Trustee | Other Directorships
Held by Trustee |
Allan W. Blair Year of birth: 1948 | Trustee | Since 2012 | Retired. | 108 | Trustee (since 2003), MassMutual Select Funds (open-end investment company); Trustee (since 2021), MassMutual Advantage Funds (open-end investment company); Trustee (since 2003), MML Series Investment Fund (open-end investment company); Trustee (since 2012), MML Series Investment Fund II (open-end investment company). |
Nabil N. El-Hage Year of birth: 1958 | Trustee Chairman | Since 2003 2006- 2012 | Founder and CEO (since 2018), AEE International LLC (a Puerto Rico LLC); Founder and sole member (2016-2018), PR Academy of Executive Education LLC (a Puerto Rico LLC). | 108 | Trustee (since 2012), MassMutual Select Funds (open-end investment company); Trustee (since 2021), MassMutual Advantage Funds (open-end investment company); Trustee (since 2012), MML Series Investment Fund (open-end investment company); Trustee (since 2005), Chairman (2006-2012), MML Series Investment Fund II (open-end investment company). |
Maria D. Furman Year of birth: 1954 | Trustee | Since 2004 | Retired. | 108 | Trustee (since 2012), MassMutual Select Funds (open-end investment company); Trustee (since 2021), MassMutual Advantage Funds (open-end investment company); Trustee (since 2012), MML Series Investment Fund (open-end investment company); Trustee (since 2005), MML Series Investment Fund II (open-end investment company). |
R. Bradford Malt Year of birth: 1954 | Trustee | Since 2022 | Chairman (2004-2019), Management Committee (1993-2019), Partner (1987-2019), Associate (1979-1987), Ropes & Gray LLP (counsel to the Trust and MassMutual). | 108 | Trustee (since 2022), MassMutual Select Funds (open-end investment company); Trustee (since 2022), MassMutual Advantage Funds (open-end investment company); Trustee (since 2022), MML Series Investment Fund (open-end investment company); Trustee (since 2022), MML Series Investment Fund II (open-end investment company). |
234
Trustees and Principal Officers (Unaudited) (Continued) |
Name, Address*,
and Year of Birth | Position(s)
Held with
Trust | Term of
Office** and
Length of
Time Served | Principal Occupation(s)
During Past 5 Years | Number of
Portfolios in
Fund Complex
Overseen by
Trustee | Other Directorships
Held by Trustee |
C. Ann Merrifield Year of birth: 1951 | Trustee | Since 2004 | Retired. | 108 | Director (since 2020), Lead Director (2020-2022), Chairperson (since 2020) of the Nominating and Governance Committee, Member (since 2020) and Chairperson (2020-2022) of the Compensation Committee, and Member (2020-2022) of the Audit Committee, Lyra Therapeutics (a clinical-stage specialty pharmaceutical company); Chairperson (since 2017), Director (since 2014), InVivo Therapeutics (research and clinical-stage biomaterials and biotechnology company); Trustee (since 2012), MassMutual Select Funds (open-end investment company); Trustee (since 2021), MassMutual Advantage Funds (open-end investment company); Trustee (since 2012), MML Series Investment Fund (open-end investment company); Trustee (since 2005), MML Series Investment Fund II (open-end investment company). |
Cynthia R. Plouché Year of birth: 1957 | Trustee | Since 2022 | Retired; Assessor (2014-2018), Moraine Township (property assessment). | 108 | Trustee (since 2014), Northern Trust Funds (open-end investment companies); Trustee (since 2022), MassMutual Select Funds (open-end investment company); Trustee (since 2022), MassMutual Advantage Funds (open-end investment company); Trustee (since 2022), MML Series Investment Fund (open-end investment company); Trustee (since 2022), MML Series Investment Fund II (open-end investment company). |
Jason J. Price Year of birth: 1973 | Trustee | Since 2022 | Co-Founder and Chairman of the Board (2017-2021), NXTHVN (arts organization); Principal (2012-2017), Exaltare Capital Partners, LLC (private equity firm). | 108 | Trustee (since 2022), MassMutual Select Funds (open-end investment company); Trustee (since 2022), MassMutual Advantage Funds (open-end investment company); Trustee (since 2022), MML Series Investment Fund (open-end investment company); Trustee (since 2022), MML Series Investment Fund II (open-end investment company). |
235
Trustees and Principal Officers (Unaudited) (Continued) |
Name, Address*,
and Year of Birth | Position(s)
Held with
Trust | Term of
Office** and
Length of
Time Served | Principal Occupation(s)
During Past 5 Years | Number of
Portfolios in
Fund Complex
Overseen by
Trustee | Other Directorships
Held by Trustee |
Susan B. Sweeney Year of birth: 1952 | Chairperson Trustee | Since 2022 Since 2012 | Retired. | 110^ | Trustee (since 2012), Barings Corporate Investors (closed-end investment company); Trustee (since 2012), Barings Participation Investors (closed-end investment company); Chairperson (since 2022), Trustee (since 2009), MassMutual Select Funds (open-end investment company); Chairperson (since 2022), Trustee (since 2021), MassMutual Advantage Funds (open-end investment company); Chairperson (since 2022), Trustee (since 2009), MML Series Investment Fund (open-end investment company); Chairperson (since 2022), Trustee (since 2012), MML Series Investment Fund II (open-end investment company). |
Interested Trustees
Name, Address*,
and Year of Birth | Position(s)
Held with
Trust | Term of
Office** and
Length of
Time Served | Principal Occupation(s)
During Past 5 Years | Number of
Portfolios in
Fund Complex
Overseen by
Trustee | Other Directorships
Held by Trustee |
Michael R. Fanning^^
Year of birth: 1963 | Trustee | Since 2021 | Head of MassMutual U.S. (since 2016), Executive Vice President (2016-2018), Member of MassMutual’s Executive Leadership Team (since 2008), MassMutual. | 108 | Director (since 2016), MML Advisers; Trustee (since 2021), MassMutual Select Funds (open-end investment company); Trustee (since 2021), MassMutual Advantage Funds (open-end investment company); Trustee (since 2021), MML Series Investment Fund (open-end investment company); Trustee (since 2021), MML Series Investment Fund II (open-end investment company). |
Clifford M, Noreen^^^
Year of birth: 1957 | Trustee | Since 2021 | Head of Global Investment Strategy (since 2019), Deputy Chief Investment Officer and Managing Director (2016-2018), MassMutual; President (2008-2016), Vice Chairman (2007-2008), Member of the Board of Managers (2006-2016), Managing Director (2000-2016), Barings LLC. | 110^ | Chairman (since 2009), Trustee (since 2005), President (2005-2009), CI Subsidiary Trust and PI Subsidiary Trust; Chairman and Trustee (since 2009), Barings Corporate Investors (closed-end investment company); Chairman and Trustee (since 2009), Barings Participation Investors (closed-end investment company); Trustee (since 2021), MassMutual Select Funds (open-end investment company); Trustee (since 2021), MassMutual Advantage Funds (open-end investment company); Trustee (since 2021), MML Series Investment Fund (open-end investment company); Trustee (since 2021), MML Series Investment Fund II (open-end investment company). |
236
Trustees and Principal Officers (Unaudited) (Continued) |
Principal Officers
Name, Address*,
and Year of Birth | Position(s)
Held with
Trust | Term of
Office# and
Length of
Time Served | Principal Occupation(s)
During Past 5 Years | Number of
Portfolios in
Fund Complex
Overseen by
Officer |
Andrea Anastasio Year of birth: 1974 | Vice President | Since 2021 | Vice President (since 2021), MML Advisers; Head of Investment Management Solutions (since 2021), MassMutual; Head of Investment Strategy and Research, North America (2019-2021), Head of Investment Product Management (2016- 2019), State Street Global Advisors; Vice President (since 2021), MassMutual Select Funds (open-end investment company); Vice President (since 2021), MassMutual Advantage Funds (open-end investment company); Vice President (since 2021), MML Series Investment Fund (open-end investment company); Vice President (since 2021), MML Series Investment Fund II (open-end investment company). | 108 |
Andrew M. Goldberg Year of birth: 1966 | Vice President, Secretary, and Chief Legal Officer Assistant Secretary (formerly known as “Clerk”) | Since 2008 2004- 2008 | Lead Counsel, Investment Adviser & Mutual Funds (since 2018), Assistant Vice President and Counsel (2004-2018), MassMutual; Secretary (since 2015), Assistant Secretary (2013-2015), MML Advisers; Vice President, Secretary, and Chief Legal Officer (since 2008), Assistant Secretary (2001-2008), MassMutual Select Funds (open-end investment company); Vice President, Secretary, and Chief Legal Officer (since 2021), MassMutual Advantage Funds (open-end investment company); Vice President, Secretary, and Chief Legal Officer (since 2008), Assistant Secretary (2001-2008), MML Series Investment Fund (open-end investment company); Vice President, Secretary (formerly known as “Clerk”), and Chief Legal Officer (since 2008), Assistant Clerk (2005-2008), MML Series Investment Fund II (open-end investment company). | 108 |
Renee Hitchcock Year of birth: 1970 | Chief Financial Officer and Treasurer Assistant Treasurer | Since 2016 2007- 2016 | Head of Mutual Fund Administration (since 2018), Assistant Vice President (2015-2018), MassMutual; Chief Financial Officer and Treasurer (since 2016), Assistant Treasurer (2007-2016), MassMutual Select Funds (open-end investment company); Chief Financial Officer and Treasurer (since 2021), MassMutual Advantage Funds (open-end investment company); Chief Financial Officer and Treasurer (since 2016), Assistant Treasurer (2007-2016), MML Series Investment Fund (open-end investment company); Chief Financial Officer and Treasurer (since 2016), Assistant Treasurer (2007-2016), MML Series Investment Fund II (open-end investment company). | 108 |
Paul LaPiana
Year of birth: 1969 | President | Since 2021 | President (since 2021), MML Advisers; Head of MassMutual U.S. Product (since 2019), Head of Field Management (2016-2019), MassMutual; President (since 2021), MassMutual Select Funds (open-end investment company); President (since 2021), MassMutual Advantage Funds (open-end investment company); President (since 2021), MML Series Investment Fund (open-end investment company); President (since 2021), MML Series Investment Fund II (open-end investment company). | 108 |
Jill Nareau Robert Year of birth: 1972 | Vice President and Assistant Secretary Assistant Secretary (formerly known as “Assistant Clerk”) | Since 2017 2008- 2017 | Lead Counsel, Investment Adviser & Mutual Funds (since 2018), Assistant Vice President and Counsel (2009-2018), MassMutual; Assistant Secretary (since 2015), MML Advisers; Vice President and Assistant Secretary (since 2017), Assistant Secretary (2008-2017), MassMutual Select Funds (open-end investment company); Vice President and Assistant Secretary (since 2021), MassMutual Advantage Funds (open-end investment company); Vice President and Assistant Secretary (since 2017), Assistant Secretary (2008-2017), MML Series Investment Fund (open-end investment company); Vice President and Assistant Secretary (since 2017), Assistant Secretary (formerly known as “Assistant Clerk”) (2008-2017), MML Series Investment Fund II (open-end investment company). | 108 |
237
Trustees and Principal Officers (Unaudited) (Continued) |
Name, Address*,
and Year of Birth | Position(s)
Held with
Trust | Term of
Office# and
Length of
Time Served | Principal Occupation(s)
During Past 5 Years | Number of
Portfolios in
Fund Complex
Overseen by
Officer |
Douglas Steele Year of birth: 1975 | Vice President | Since 2016 | Head of Product Management (since 2021), Vice President (since 2017), Head of Investment Management (2017-2021), Head of Investment Due Diligence (2016-2017), MML Advisers; Head of Product Management (since 2021), Head of Manager Research (2021), Head of Investment Management (2017-2021), Assistant Vice President (2013-2017), MassMutual; Vice President (since 2016), MassMutual Select Funds (open-end investment company); Vice President (since 2021), MassMutual Advantage Funds (open-end investment company); Vice President (since 2016), MML Series Investment Fund (open-end investment company); Vice President (since 2016), MML Series Investment Fund II (open-end investment company). | 108 |
Philip S. Wellman Year of birth: 1964 | Vice President and Chief Compliance Officer | Since 2007 | Vice President and Chief Compliance Officer (since 2013), MML Advisers; Head of Mutual Funds & RIA Compliance (since 2018), Vice President, Associate General Counsel, and Chief Compliance Officer (Mutual Funds) (2014-2018), MassMutual; Vice President and Chief Compliance Officer (since 2007), MassMutual Select Funds (open-end investment company); Vice President and Chief Compliance Officer (since 2021), MassMutual Advantage Funds (open-end investment company); Vice President and Chief Compliance Officer (since 2007), MML Series Investment Fund (open-end investment company); Vice President and Chief Compliance Officer (since 2007), MML Series Investment Fund II (open-end investment company). | 108 |
* | The address of each Trustee and Principal Officer is the same as that for the Trust; 1295 State Street, Springfield, Massachusetts 01111-0001. |
** | Each Trustee of the Trust serves until the next meeting of shareholders called for the purpose of electing Trustees and until the election and qualification of his or her successor or until he or she dies, resigns, or is removed. Notwithstanding the foregoing, unless the Trustees determine that it is desirable and in the best interest of the Trust that an exception to the retirement policy of the Trust be made, a Trustee shall retire and cease to serve as a Trustee upon the conclusion of the calendar year in which such Trustee attains the age of seventy-five years, however, an interested Trustee of the Trust shall no longer serve as a Trustee if or when they are no longer an employee of MassMutual or an affiliate. |
| The Chairperson is elected to hold such office for a term of three years or until their successor is elected and qualified to carry out the duties and responsibilities of their office, or until he or she retires, dies, resigns, is removed, or becomes disqualified, and any such Chairperson may not serve more than two consecutive terms. The Chairperson shall hold office at the pleasure of the Trustees. |
^ | Barings Participation Investors and Barings Corporate Investors are deemed to be a part of the Fund Complex, because they are managed by Barings LLC, an affiliate of MML Advisers. |
^^ | Mr. Fanning is an “Interested Person,” as that term is defined in the 1940 Act, as an employee of MassMutual. |
^^^ | Mr. Noreen is an “Interested Person,” as that term is defined in the 1940 Act, as an employee of MassMutual. |
# | The President, Treasurer, and Secretary and such other officers as the Trustees may in their discretion from time to time elect are elected to hold such office until their successor is elected and qualified to carry out the duties and responsibilities of their office, or until he or she dies, resigns, is removed, or becomes disqualified. Each officer shall hold office at the pleasure of the Trustees. |
238
Federal Tax Information (Unaudited) |
For corporate shareholders, a portion of the ordinary dividends paid during the Fund(s)’ year ended September 30, 2022, qualified for the dividends received deduction, as follows:
| | | Dividends
Received
Deductions | |
Diversified Bond Fund | | | 0.85 | % |
Balanced Fund | | | 11.75 | % |
Disciplined Value Fund | | | 13.06 | % |
Main Street Fund | | | 38.96 | % |
Disciplined Growth Fund | | | 7.02 | % |
Small Cap Opportunities Fund | | | 34.95 | % |
Strategic Emerging Markets Fund | | | 3.13 | % |
For the year ended September 30, 2022, the following Fund(s) earned the following foreign sources of income:
| | | Amount | |
International Equity Fund | | $ | 2,075,749 | |
Strategic Emerging Markets Fund | | | 1,397,415 | |
Under Section 854(b)(2) of the Code, the Fund(s) hereby designate the maximum amounts as qualified dividends for purposes of the maximum rate under Section 1(h)(11) of the Code for the year ended September 30, 2022.
The Fund(s) intend to pass through the maximum amount allowable as Section 163(j) Interest Dividends as defined in the Treasury Regulations §1.163(j)-1(b).
239
Other Information (Unaudited) |
Proxy Voting
A description of the policies and procedures that each Fund’s investment adviser and subadvisers use to vote proxies relating to the Fund’s portfolio securities is available, without charge, upon request, by calling 1-888-309-3539, and on the Securities and Exchange Commission’s (“SEC”) EDGAR database on its website at http://www.sec.gov.
Information regarding how the Funds voted proxies relating to portfolio securities during the most recent 12-month period ended June 30 is available, without charge, upon request, on the MassMutual website at http://www.massmutual.com/funds and on the SEC’s EDGAR database on its website at http://www.sec.gov.
Monthly Reporting
The U.S. Government Money Market Fund files its complete schedule of portfolio holdings with the SEC monthly on Form N-MFP. The U.S. Government Money Market Fund’s reports on Form N-MFP are available on the SEC’s EDGAR database on its website at http://www.sec.gov. In addition, the U.S. Government Money Market Fund makes portfolio holdings information available to shareholders at http://www.massmutual.com/funds.
Quarterly Reporting
The Funds, except for the U.S. Government Money Market Fund, file their complete schedule of portfolio holdings with the SEC for the first and third quarters of each fiscal year as an exhibit to their reports on Form N-PORT. The Funds’ Forms N-PORT are available on the SEC’s EDGAR database on its website at http://www.sec.gov. In addition, the Funds make the complete schedule of portfolio holdings from their filings on Form N-PORT available to shareholders at http://www.massmutual.com/funds.
Trustees’ Approval of Investment Advisory Contracts
At their meetings in May and June 2022, the Contract Committee (the “Committee”) and the Trustees, including the Trustees who are not “interested persons” (as such term is defined in the 1940 Act) of the Trust, MML Advisers, or the subadvisers (the “Independent Trustees”), re-approved the existing advisory and subadvisory agreements (collectively, the “Contracts”) for each of the U.S. Government Money Market Fund, Short-Duration Bond Fund, Inflation-Protected and Income Fund, Core Bond Fund, Diversified Bond Fund, High Yield Fund, Balanced Fund, Disciplined Value Fund, Main Street Fund, Disciplined Growth Fund, Small Cap Opportunities Fund, Global Fund, International Equity Fund, and Strategic Emerging Markets Fund. In preparation for the meetings, the Trustees requested, and MML Advisers and the subadvisers provided in advance, certain materials relevant to the consideration of the Contracts (the “Meeting Materials”). In all of their deliberations, the Trustees were advised by independent counsel.
The Committee received in advance of the meetings (i) a memorandum from MML Advisers discussing the nature and quality of the services it provides as investment adviser to the Funds; (ii) a profitability analysis prepared by MML Advisers; and (iii) a fee and performance study report (the “Third-Party Report”) with respect to each Fund prepared by an independent third-party vendor (the “Third-Party”). The Third-Party Report provided detailed comparative advisory fee, total expense, and performance information for each Fund to assist the Committee in its evaluation of the Contracts. The Committee also considered information presented to it throughout the year regarding MML Advisers and each of the subadvisers.
The Committee considered the nature, scope, and quality of services MML Advisers provides to the Funds, including: (i) the financial condition, stability, and business strategy of MML Advisers; (ii) the capabilities of MML Advisers with respect to regulatory compliance and its ability to monitor compliance with the investment policies of the Funds; (iii) MML Advisers’ ability to provide investment oversight and provide for administrative and shareholder services to the Funds; and (iv) the experience and qualifications of the personnel of MML Advisers that perform, or oversee the performance of, the services provided to the Funds, and the needs of the Funds for administrative and shareholder services. The Committee noted that it had received in the Meeting Materials or during the course of the past year: (i) detailed information regarding MML Advisers’ ability to provide investment oversight and provide for administrative and shareholder services to the Funds; and (ii) a wide range of information about the
240
Other Information (Unaudited) (Continued) |
subadvisers and their personnel with responsibility for providing services to the Funds and the fees payable to each subadviser by MML Advisers. MML Advisers reviewed with the Committee in detail the work MML Advisers does in its oversight roles, the expertise it brings to these roles, the size of its teams, and the financial commitment it has made to provide those services.
The Committee then reviewed and considered, for each Fund separately, the detailed information presented in the Third-Party Report regarding: (i) Fund expenses, including, among other things, both the Fund’s net advisory fee and total net expense ratio against peer funds; and (ii) the Fund’s relative performance (over various time periods against funds in its “category” and a benchmark index). In connection with the Committee’s review, MML Advisers provided commentary and analysis regarding each Fund’s expenses and performance and a recommendation as to the action to be taken by the Committee. Throughout the discussion, MML Advisers responded to Committee members’ questions and provided additional information concerning each Fund.
The Committee reviewed the expense and performance information for each Fund. (References to any one- or three-year period below are to periods ended December 31, 2021. In all cases, the comparative expense information is that of a Fund’s “peer group” and the comparative performance information is that of a Fund’s “performance category.”)
The Committee considered that the total net expense ratios for all but four of the Funds were within the top fifty percent of their peer groups, and in many cases in the top forty percent. Of the four with higher expense ratios, two had total net expense ratios at the 60th comparative percentile of their peer groups. All of the Funds with total net expense ratios at or below the 60th comparative percentile of their peer groups had net advisory fees at or below the medians of their peer groups, or within the top three comparative quintiles of their peer groups, except the Strategic Emerging Markets Fund and Inflation-Protected and Income Fund, the levels of whose net advisory fees the Committee did not consider to be inconsistent with the advisory agreements’ continuation, in light of the Funds’ generally acceptable total net expense ratios and/or general favorable investment performance over time. The Committee also took into account the expense caps currently in place for the Strategic Emerging Markets Fund.
The Funds with total net expense ratios higher than the 60th comparative percentile of their peer groups were the Diversified Bond Fund and International Equity Fund.
As to the Diversified Bond Fund, the Committee considered MML Advisers’ statement that the Fund’s total net expense ratio, at the 65th percentile of its peer group, was competitive at only four basis points above the peer group median, and that the Fund’s net advisory fee was at the 58th percentile of its peer group, which was likewise competitive at only one basis point above the peer group median. As to the International Equity Fund, the Committee considered MML Advisers’ statement that the Fund’s total net expense ratio and net advisory fee, each at the 79th percentile of its peer group, were competitive at eight and six basis points above the peer group median, respectively, and that the Fund’s performance has been generally favorable over the long term. The Committee also considered MML Advisers’ statement that the Fund’s net assets are approximately half the level of the median of the Fund’s peer group, and that with growth, the Fund may achieve improved scale and reduced expenses.
The Committee determined on the basis of these factors that the levels of the Funds’ net advisory fees, and the total net expenses of the Funds generally, were consistent with the continuation of their advisory agreements.
The Committee considered that most of the Funds achieved three-year investment performance above the medians of their performance categories, or within the top sixty percent of their performance categories, except those Funds referred to below.
As to the Disciplined Value Fund, the Committee considered that the Fund experienced three-year investment performance outside the top sixty percent of its performance category, but experienced improved performance for the one-year period to the 13th comparative percentile of its performance category under a new subadviser appointed in November 2020.
As to the Global Fund, the Committee noted that the Fund had experienced performance for the one- and three-year periods in the 54th and 64th comparative percentiles of its performance category, respectively. The Committee considered MML Advisers’ statements that the Fund has outperformed its benchmark for the trailing three-, five-, and ten-year periods, and that MML Advisers remains confident in the subadviser, considering it to have been consistent and steadfast in its investment process, and delivering attractive levels of shareholder value.
241
Other Information (Unaudited) (Continued) |
As to the Strategic Emerging Markets Fund, the Committee noted that the Fund had experienced performance for the one- and three- year periods in the 85th and 72nd percentiles of its performance category, respectively. The Committee considered MML Advisers’ statement that the Fund had achieved above-median performance in its performance category in two of the past four years; MML Advisers noted, however, that the Fund underperformed its performance category substantially in the second half of 2020 and in 2021, seeking higher quality stocks with stable franchises in a momentum-driven market. The Committee considered that MML Advisers has placed the Fund under review in light of recent underperformance.
The Committee also reviewed and considered information included in the Meeting Materials, or discussed at the meeting and during the course of the year, concerning economies of scale and the profitability of MML Advisers’ advisory relationship with the various Funds, including: (i) a description of MML Advisers’ revenues from the Funds (including advisory fees and administrative and shareholder services fees, as applicable) and the expense allocation methodology employed by MML Advisers; and (ii) profitability information for each individual Fund. The discussions included consideration of the intangible benefits derived by MML Advisers and its affiliates resulting from their relationships with the Funds and any so-called “fallout benefits” to MML Advisers (which were not considered to be substantial in any event), such as any reputational value derived from serving as investment adviser to the Funds, and benefits accruing to subadvisers due to so-called “soft-dollar arrangements.”
Prior to the votes being taken to approve the Contracts, the Committee met separately in executive session to discuss the appropriateness of such contracts. The Committee weighed the foregoing matters in light of the advice given to them by their independent legal counsel as to the law applicable to the review of investment advisory contracts. In arriving at a decision, the Committee did not identify any single matter as all-important or controlling. The foregoing summary does not detail all of the matters considered.
As to each of the Funds, the Committee concluded that: (i) overall, it was satisfied with the nature, extent, and quality of services provided, and expected to be provided in the future, under the Contracts, including the level of MML Advisers’ oversight of each Fund and the subadvisory process; (ii) MML Advisers’ levels of profitability from its relationship with the various Funds are not excessive and the advisory fees payable under the advisory agreements and each Fund’s total net expenses are fair and reasonable; (iii) the investment processes, research capabilities, and philosophies of the subadvisers generally appear well suited to the Funds, given their investment objectives and policies; (iv) either the relative or absolute performance of a Fund (in each case, taking into account the applicable investment strategy and risk profile of the Fund), or the steps MML Advisers has proposed in respect of the underperformance of a Fund, are sufficient to warrant continuation of the Contracts for each of the Funds; and (v) the terms of the Contracts are fair and reasonable with respect to each Fund and are in the best interests of each Fund’s shareholders.
242
Other Information (Unaudited) (Continued) |
Submission of Matters to a Vote of Security Holders
A Special Meeting of Shareholders of the Trust was held on May 25, 2022 and on the adjournment dates of June 9, 2022 and July 28, 2022. The Notice of Meeting of Shareholders, and a Proxy Statement and voting instruction card, were first mailed, or otherwise made available, on or about April 8, 2022 to shareholders of record as of February 25, 2022. The results of the vote on the matters submitted to shareholders at the Special Meeting are as follows:
Proposal 1: | To elect Allan W. Blair, Nabil N. El-Hage, Michael R. Fanning, Maria D. Furman, R. Bradford Malt, C. Ann Merrifield, Clifford M. Noreen, Cynthia R. Plouché, Jason J. Price, and Susan B. Sweeney as Trustees of each Trust of which the Funds are series for an indefinite term of office.* |
This matter was approved by the Trust’s shareholders on June 9, 2022. The results of the votes were as follows:
| | Shares Voted | Shares For | % of Shares
Outstanding | Withhold | % of Shares
Outstanding |
Allan W. Blair | 221,938,292.902 | 213,988,415.419 | 32.333% | 7,949,877.483 | 1.201% |
Nabil N. El-Hage | 221,938,292.902 | 213,794,035.976 | 32.304% | 8,144,256.926 | 1.230% |
Michael R. Fanning | 221,938,292.902 | 220,117,671.632 | 33.259% | 1,820,621.270 | 0.275% |
Maria D. Furman | 221,938,292.902 | 219,986,275.811 | 33.240% | 1,952,017.091 | 0.294% |
R. Bradford Malt | 221,938,292.902 | 219,993,123.684 | 33.241% | 1,945,169.218 | 0.293% |
C. Ann Merrifield | 221,938,292.902 | 220,000,201.866 | 33.242% | 1,938,091.036 | 0.292% |
Clifford M. Noreen | 221,938,292.902 | 220,116,348.702 | 33.259% | 1,821,944.200 | 0.275% |
Cynthia R. Plouché | 221,938,292.902 | 219,989,744.321 | 33.240% | 1,948,548.581 | 0.294% |
Jason J. Price | 221,938,292.902 | 219,980,326.959 | 33.239% | 1,957,965.943 | 0.295% |
Susan B. Sweeney | 221,938,292.902 | 219,792,678.725 | 33.210% | 2,145,614.177 | 0.324% |
* | Denotes Trust-wide proposal and voting results. |
Proposal 2: | To change the status of certain Funds from diversified funds to non-diversified funds. |
This matter was approved by the following Fund’s shareholders on July 28, 2022. The results of the votes were as follows:
| | | Shares Voted | | | Shares For | | | % of Shares
Outstanding | | | Against | | | % of Shares
Outstanding | | | Abstain | | | % of Shares
Outstanding | | | Broker
Non-Vote | | | % of Shares
Outstanding | |
Disciplined Growth Fund | | | 12,128,984.941 | | | | 11,686,618.630 | | | | 51.126 | % | | | 378,389.311 | | | | 1.655 | % | | | 0.000 | | | | 0.000 | % | | | 63,977.000 | | | | 0.279 | % |
243
Other Information (Unaudited) (Continued) |
Fund Expenses September 30, 2022
Expense Examples:
The following information is in regards to expenses for the six months ended September 30, 2022:
As a shareholder of the Funds, you may incur two types of costs: (1) transaction costs, including sales charges (loads) on purchase payments or redemptions; and (2) ongoing costs, including advisory fees, distribution and/or service (12b-1) fees, and other Fund expenses. These examples are intended to help you understand your ongoing costs (in dollars) of investing in the Funds and to compare these costs with the ongoing costs of investing in other mutual funds. These examples are based on an investment of $1,000 invested for the six months ended September 30, 2022.
Actual Expenses:
The first four columns of the table below provide information about actual account values and actual expenses. You may use this information, together with the amount you invested, to estimate the expenses that you paid over the period. Simply divide your account value by $1,000 (for example, an $8,600 account value divided by $1,000 = 8.6), then multiply the result by the number under the heading entitled “Operating Expenses Incurred” to estimate the expenses you paid on your account during this period.
Hypothetical Example for Comparison Purposes:
The last two columns of the table below provide information about hypothetical account values and hypothetical expenses based on the Fund’s actual expense ratio and an assumed rate of return of 5% per year before expenses, which is not the Fund’s actual return. The hypothetical account values and expenses may not be used to estimate the actual ending account balance or expenses you paid for the period. You may use this information to compare the ongoing costs of investing in the Fund and other funds. To do so, compare this 5% hypothetical example with the 5% hypothetical examples that appear in the shareholder reports of the other funds.
Please note that the expenses shown in the table are meant to highlight your ongoing costs only and do not reflect any transactional costs. Therefore, the last two columns of the table are useful in comparing ongoing costs only, and will not help you determine the relative total costs of owning different funds. In addition, if these transactional costs were included, your costs would have been higher.
| | Beginning
Value | Annualized
Expense
Ratio | Ending
Value (Based
on Actual
Returns and
Expenses) | Operating
Expenses
Incurred* | Ending Value
(Based on
Hypothetical
Returns and
Expenses) | Operating
Expenses
Incurred* |
U.S. Government Money Market Fund | | | | | | |
Class R5 | $1,000 | 0.49% | $1,004.40 | $2.46 | $1,022.60 | $2.48 |
Short-Duration Bond Fund | | | | | | |
Class I | 1,000 | 0.38% | 954.50 | 1.86 | 1,023.20 | 1.93 |
Class R5 | 1,000 | 0.51% | 953.10 | 2.50 | 1,022.50 | 2.59 |
Service Class | 1,000 | 0.62% | 953.30 | 3.04 | 1,022.00 | 3.14 |
Administrative Class | 1,000 | 0.72% | 953.60 | 3.53 | 1,021.50 | 3.65 |
Class R4 | 1,000 | 0.87% | 952.30 | 4.26 | 1,020.70 | 4.41 |
Class A | 1,000 | 0.97% | 952.20 | 4.75 | 1,020.20 | 4.91 |
Class R3 | 1,000 | 1.11% | 950.60 | 5.43 | 1,019.50 | 5.62 |
Class Y | 1,000 | 0.40% | 954.50 | 1.86 | 1,023.20 | 1.93 |
Class L | 1,000 | 0.65% | 953.00 | 1.86 | 1,023.20 | 1.93 |
Class C | 1,000 | 0.90% | 951.30 | 1.86 | 1,023.20 | 1.93 |
244
Other Information (Unaudited) (Continued) |
| | Beginning
Value | Annualized
Expense
Ratio | Ending
Value (Based
on Actual
Returns and
Expenses) | Operating
Expenses
Incurred* | Ending Value
(Based on
Hypothetical
Returns and
Expenses) | Operating
Expenses
Incurred* |
Inflation-Protected and Income Fund | | | | | | |
Class I | $1,000 | 0.48% | $888.80 | $2.27 | $1,022.70 | $2.43 |
Class R5 | 1,000 | 0.58% | 887.90 | 2.74 | 1,022.20 | 2.94 |
Service Class | 1,000 | 0.68% | 886.70 | 3.22 | 1,021.70 | 3.45 |
Administrative Class | 1,000 | 0.78% | 887.10 | 3.69 | 1,021.20 | 3.95 |
Class R4 | 1,000 | 0.93% | 885.90 | 4.40 | 1,020.40 | 4.71 |
Class A | 1,000 | 1.03% | 886.00 | 4.87 | 1,019.90 | 5.22 |
Class R3 | 1,000 | 1.18% | 885.10 | 5.58 | 1,019.20 | 5.97 |
Core Bond Fund | | | | | | |
Class I | 1,000 | 0.43% | 891.30 | 2.04 | 1,022.90 | 2.18 |
Class R5 | 1,000 | 0.53% | 889.90 | 2.51 | 1,022.40 | 2.69 |
Service Class | 1,000 | 0.63% | 889.20 | 2.98 | 1,021.90 | 3.19 |
Administrative Class | 1,000 | 0.73% | 889.20 | 3.46 | 1,021.40 | 3.70 |
Class R4 | 1,000 | 0.88% | 887.60 | 4.16 | 1,020.70 | 4.46 |
Class A | 1,000 | 0.98% | 888.30 | 4.64 | 1,020.20 | 4.96 |
Class R3 | 1,000 | 1.13% | 887.80 | 5.35 | 1,019.40 | 5.72 |
Diversified Bond Fund | | | | | | |
Class I | 1,000 | 0.57% | 877.20 | 2.68 | 1,022.20 | 2.89 |
Class R5 | 1,000 | 0.67% | 877.00 | 3.15 | 1,021.70 | 3.40 |
Service Class | 1,000 | 0.77% | 877.00 | 3.62 | 1,021.20 | 3.90 |
Administrative Class | 1,000 | 0.87% | 875.80 | 4.09 | 1,020.70 | 4.41 |
Class R4 | 1,000 | 1.02% | 875.00 | 4.79 | 1,020.00 | 5.17 |
Class A | 1,000 | 1.12% | 875.00 | 5.26 | 1,019.50 | 5.67 |
Class R3 | 1,000 | 1.27% | 874.20 | 5.97 | 1,018.70 | 6.43 |
High Yield Fund | | | | | | |
Class I | 1,000 | 0.54% | 885.70 | 2.55 | 1,022.40 | 2.74 |
Class R5 | 1,000 | 0.65% | 885.10 | 3.07 | 1,021.80 | 3.29 |
Service Class | 1,000 | 0.75% | 884.80 | 3.54 | 1,021.30 | 3.80 |
Administrative Class | 1,000 | 0.85% | 885.30 | 4.02 | 1,020.80 | 4.31 |
Class R4 | 1,000 | 1.00% | 884.50 | 4.72 | 1,020.10 | 5.06 |
Class A | 1,000 | 1.09% | 883.00 | 5.15 | 1,019.60 | 5.52 |
Class R3 | 1,000 | 1.25% | 882.90 | 5.90 | 1,018.80 | 6.33 |
Class Y | 1,000 | 0.60% | 884.80 | 2.55 | 1,022.40 | 2.74 |
Class C | 1,000 | 1.54% | 881.10 | 2.55 | 1,022.40 | 2.74 |
Balanced Fund | | | | | | |
Class I | 1,000 | 0.73% | 846.90 | 3.38 | 1,021.40 | 3.70 |
Class R5 | 1,000 | 0.83% | 846.90 | 3.84 | 1,020.90 | 4.20 |
Service Class | 1,000 | 0.93% | 845.80 | 4.30 | 1,020.40 | 4.71 |
Administrative Class | 1,000 | 1.03% | 846.00 | 4.77 | 1,019.90 | 5.22 |
Class R4 | 1,000 | 1.18% | 844.80 | 5.46 | 1,019.20 | 5.97 |
Class A | 1,000 | 1.28% | 844.20 | 5.92 | 1,018.70 | 6.48 |
Class R3 | 1,000 | 1.43% | 844.40 | 6.61 | 1,017.90 | 7.23 |
Disciplined Value Fund | | | | | | |
Class I | 1,000 | 0.80% | 844.70 | 3.70 | 1,021.10 | 4.05 |
Class R5 | 1,000 | 0.90% | 844.50 | 4.16 | 1,020.60 | 4.56 |
Service Class | 1,000 | 1.00% | 844.20 | 4.62 | 1,020.10 | 5.06 |
Administrative Class | 1,000 | 1.10% | 843.40 | 5.08 | 1,019.60 | 5.57 |
Class R4 | 1,000 | 1.25% | 842.70 | 5.77 | 1,018.80 | 6.33 |
Class A | 1,000 | 1.35% | 842.80 | 6.24 | 1,018.30 | 6.83 |
Class R3 | 1,000 | 1.50% | 841.80 | 6.93 | 1,017.50 | 7.59 |
245
Other Information (Unaudited) (Continued) |
| | Beginning
Value | Annualized
Expense
Ratio | Ending
Value (Based
on Actual
Returns and
Expenses) | Operating
Expenses
Incurred* | Ending Value
(Based on
Hypothetical
Returns and
Expenses) | Operating
Expenses
Incurred* |
Main Street Fund | | | | | | |
Class I | $1,000 | 0.84% | $787.10 | $3.76 | $1,020.90 | $4.26 |
Class R5 | 1,000 | 0.94% | 786.90 | 4.21 | 1,020.40 | 4.76 |
Service Class | 1,000 | 1.03% | 786.10 | 4.61 | 1,019.90 | 5.22 |
Administrative Class | 1,000 | 1.14% | 785.80 | 5.10 | 1,019.40 | 5.77 |
Class R4 | 1,000 | 1.29% | 785.30 | 5.77 | 1,018.60 | 6.53 |
Class A | 1,000 | 1.39% | 785.50 | 6.22 | 1,018.10 | 7.03 |
Class R3 | 1,000 | 1.54% | 783.80 | 6.89 | 1,017.30 | 7.79 |
Disciplined Growth Fund | | | | | | |
Class I | 1,000 | 0.60% | 757.30 | 2.64 | 1,022.10 | 3.04 |
Class R5 | 1,000 | 0.70% | 757.30 | 3.08 | 1,021.60 | 3.55 |
Service Class | 1,000 | 0.80% | 757.00 | 3.52 | 1,021.10 | 4.05 |
Administrative Class | 1,000 | 0.90% | 756.60 | 3.96 | 1,020.60 | 4.56 |
Class R4 | 1,000 | 1.06% | 755.60 | 4.67 | 1,019.80 | 5.37 |
Class A | 1,000 | 1.15% | 755.50 | 5.06 | 1,019.30 | 5.82 |
Class R3 | 1,000 | 1.31% | 754.60 | 5.76 | 1,018.50 | 6.63 |
Small Cap Opportunities Fund | | | | | | |
Class I | 1,000 | 0.67% | 824.60 | 3.06 | 1,021.70 | 3.40 |
Class R5 | 1,000 | 0.76% | 824.00 | 3.48 | 1,021.30 | 3.85 |
Service Class | 1,000 | 0.86% | 823.40 | 3.93 | 1,020.80 | 4.36 |
Administrative Class | 1,000 | 0.96% | 823.00 | 4.39 | 1,020.30 | 4.86 |
Class R4 | 1,000 | 1.11% | 822.30 | 5.07 | 1,019.50 | 5.62 |
Class A | 1,000 | 1.21% | 822.20 | 5.53 | 1,019.00 | 6.12 |
Class R3 | 1,000 | 1.36% | 821.50 | 6.21 | 1,018.20 | 6.88 |
Global Fund | | | | | | |
Class I | 1,000 | 0.89% | 737.30 | 3.88 | 1,020.60 | 4.51 |
Class R5 | 1,000 | 1.00% | 736.40 | 4.35 | 1,020.10 | 5.06 |
Service Class | 1,000 | 1.09% | 736.40 | 4.74 | 1,019.60 | 5.52 |
Administrative Class | 1,000 | 1.20% | 735.80 | 5.22 | 1,019.10 | 6.07 |
Class R4 | 1,000 | 1.35% | 735.80 | 5.87 | 1,018.30 | 6.83 |
Class A | 1,000 | 1.45% | 735.20 | 6.31 | 1,017.80 | 7.33 |
Class R3 | 1,000 | 1.60% | 734.70 | 6.96 | 1,017.00 | 8.09 |
International Equity Fund | | | | | | |
Class I | 1,000 | 1.09% | 819.70 | 4.97 | 1,019.60 | 5.52 |
Class R5 | 1,000 | 1.18% | 818.80 | 5.38 | 1,019.20 | 5.97 |
Service Class | 1,000 | 1.29% | 819.30 | 5.88 | 1,018.60 | 6.53 |
Administrative Class | 1,000 | 1.39% | 818.80 | 6.34 | 1,018.10 | 7.03 |
Class R4 | 1,000 | 1.53% | 818.70 | 6.98 | 1,017.40 | 7.74 |
Class A | 1,000 | 1.64% | 818.00 | 7.47 | 1,016.80 | 8.29 |
Class R3 | 1,000 | 1.79% | 817.70 | 8.16 | 1,016.10 | 9.05 |
Strategic Emerging Markets Fund | | | | | | |
Class I | 1,000 | 1.15% | 795.50 | 5.18 | 1,019.30 | 5.82 |
Class R5 | 1,000 | 1.18% | 795.20 | 5.31 | 1,019.20 | 5.97 |
Service Class | 1,000 | 1.35% | 795.70 | 6.08 | 1,018.30 | 6.83 |
Administrative Class | 1,000 | 1.45% | 795.40 | 6.53 | 1,017.80 | 7.33 |
Class R4 | 1,000 | 1.61% | 794.70 | 7.24 | 1,017.00 | 8.14 |
Class A | 1,000 | 1.64% | 793.80 | 7.37 | 1,016.80 | 8.29 |
Class R3 | 1,000 | 1.85% | 792.50 | 8.31 | 1,015.80 | 9.35 |
* | Expenses are calculated using the annualized expense ratio for the six months ended September 30, 2022, multiplied by the average account value over the period, multiplied by 183 days in the period, divided by 365 days in the year, unless stated otherwise. |
246
[THIS PAGE INTENTIONALLY LEFT BLANK]
Underwriter:
MML Distributors, LLC
1295 State Street
Springfield, Massachusetts 01111-0001
Underwriter: (MassMutual High Yield Fund and
MassMutual Short-Duration Bond Fund)
ALPS Distributors, Inc. (ADI)
1290 Broadway
Suite 1000
Denver, Colorado 80203

© 2022 Massachusetts Mutual Life Insurance Company (MassMutual®), Springfield, MA 01111-0001. All rights reserved. www.MassMutual.com. Investment Adviser: MML Investment Advisers, LLC | MM202311-303386 |
| (b) | Not applicable to this filing. |
Item 2. Code of Ethics.
As of September 30, 2022, the Registrant adopted a Code of Ethics that applies to the Principal Executive Officer, Principal Financial Officer, and other senior financial officers pursuant to the Sarbanes-Oxley Act of 2002. For the year ended September 30, 2022, the Code of Ethics was amended to i) cover new registrants and ii) remove a registrant no longer subject to the Code of Ethics, and the Registrant did not grant any waivers, including implicit waivers, from any provisions of the Code of Ethics. A copy of its Code of Ethics is filed with this Form N-CSR under Item 13(a)(1).
Item 3. Audit Committee Financial Expert.
The Registrant’s Board of Trustees has determined that Nabil N. El-Hage, a member of the Audit Committee, is an audit committee financial expert as defined by the Securities and Exchange Commission (the “SEC”). Mr. El-Hage is “independent” as defined by the SEC for purposes of audit committee financial expert determinations.
Item 4. Principal Accountant Fees and Services.
References below to Deloitte & Touche LLP include its affiliates where applicable.
| (a) | AUDIT FEES: The aggregate fees billed to the Registrant for professional services rendered by its independent auditors, Deloitte & Touche LLP, for the audit of the Registrant’s annual financial statements for the fiscal years ended 2022 and 2021 were $494,231 and $484,921, respectively. |
| (b) | AUDIT-RELATED FEES: No such fees were billed to the Registrant by Deloitte & Touche LLP for the fiscal years ended 2022 and 2021. No such fees were billed to the Registrant’s adviser and any entity controlling, controlled by, or under common control with the adviser that provides ongoing services to the Registrant by Deloitte & Touche LLP* for the fiscal years ended 2022 and 2021. |
| (c) | TAX FEES: The aggregate fees billed to the Registrant for professional services rendered by Deloitte & Touche LLP for the review of Form 1120-RIC, Form 8613, excise distribution projections, distribution calculation and reasonable out of pocket expenses for the fiscal years ended 2022 and 2021 were $67,361 and $31,209, respectively. No such fees were billed to the Registrant’s adviser and any entity controlling, controlled by, or under common control with the adviser that provides ongoing services to the Registrant by Deloitte & Touche LLP* for the fiscal years ended 2022 and 2021. |
| (d) | ALL OTHER FEES: No such fees were billed to the Registrant by Deloitte & Touche LLP for the fiscal years ended 2022 and 2021. No such fees were billed to the Registrant’s adviser and any entity controlling, controlled by, or under common control with the adviser that provides ongoing services to the Registrant by Deloitte & Touche LLP* for the fiscal years ended 2022 and 2021. |
| (e) | (1) AUDIT COMMITTEE PRE-APPROVAL POLICY: All services to be performed for the Registrant by Deloitte & Touche LLP must be pre-approved by the audit committee. All services performed during the fiscal years ended 2022 and 2021 were pre-approved by the committee. |
(2) Not applicable.
| (g) | The aggregate non-audit fees billed by Deloitte & Touche LLP for services rendered to the Registrant, the Registrant’s adviser and any entity controlling, controlled by, or under common control with the adviser that provides ongoing services to the Registrant, for the fiscal years ended 2022 and 2021 were $1,285,023 and $2,383,144, respectively. |
| (h) | The audit committee considers whether the provision of non-audit services by Deloitte & Touche LLP to the Registrant's adviser and any entity controlling, controlled by, or under common control with the adviser that provides ongoing services to the Registrant that were not pre-approved pursuant to paragraph (c)(7)(ii) of Rule 2-01 of Regulation S-X is compatible with maintaining Deloitte & Touche LLP's independence. |
| | * | Refers to fees that were required to be approved by the audit committee for services that relate directly to the operations and financial reporting of the Registrant. |
Item 5. Audit Committee of Listed Registrants.
Not applicable to this filing.
Item 6. Investments.
(a) Please see portfolio of investments contained in the Report to Stockholders included under Item 1 of this form N-CSR.
(b) Not applicable to this filing.
Item 7. Disclosure of Proxy Voting Policies and Procedures for Closed-End Management Investment Companies.
Not applicable to this filing.
Item 8. Portfolio Managers of Closed-End Management Investment Companies.
Not applicable to this filing.
Item 9. Purchases of Equity Securities by Closed-End Management Investment Company and Affiliated Purchasers.
Not applicable to this filing.
Item 10. Submission of Matters to a Vote of Security Holders.
Not applicable to this filing.
Item 11. Controls and Procedures.
(a) The Registrant’s Principal Executive Officer and Principal Financial Officer have concluded that the Registrant’s disclosure controls and procedures (as defined in Rule 30a-3(c) under the Investment Company Act of 1940, as amended (the “1940 Act”) (17 CFR 270.30a-3(c))) are effective, as of a date within 90 days of the filing date of this Form N-CSR, to provide reasonable assurance that the information required to be disclosed by the Registrant on Form N-CSR is recorded, processed, summarized, and reported within the time periods specified in the SEC’s rules and forms, based on their evaluation of these disclosure controls and procedures required by Rule 30a-3(b) under the 1940 Act (17 CFR 270.30a-3(b)) and Rules 13a-15(b) or 15d-15(b) under the Securities Exchange Act of 1934 (17 CFR 240.13a-15(b) or 240.15d-15(b)).
(b) There were no changes in the Registrant’s internal control over financial reporting (as defined in Rule 30a-3(d) under the 1940 Act (17 CFR 270.30a-3(d))) that occurred during the period covered by this report that has materially affected, or is reasonably likely to materially affect, the Registrant’s internal control over financial reporting.
Item 12. Disclosure of Securities Lending Activities for Closed-End Management Investment Companies
Not applicable to this filing.
Item 13. Exhibits.
(a)(1) Code of Ethics (Item 2) is attached.
(a)(2) Certifications of the Principal Executive Officer and Principal Financial Officer of the Registrant as required by Rule 30a-2(a) under the 1940 Act (17 CFR 270.30a-2(a)) are attached hereto as Exhibit 99CERT.
(a)(3) Not applicable to this filing.
(a)(4) Not applicable to this filing.
(b) Certifications pursuant to Section 906 of the Sarbanes-Oxley Act of 2002 as required by Rule 30a-2(b), under the 1940 Act (17 CFR 270.30a-2(b)), Rule 15d-14(b) under the Securities Exchange Act of 1934 (17 CFR 240.15d-14(b)) and Section 1350 of Chapter 63 of Title 18 of the United States Code (18 U.S.C. 1350) are attached hereto as Exhibit 99.906CERT.
SIGNATURES
Pursuant to the requirements of the Securities Exchange Act of 1934 and the Investment Company Act of 1940, the registrant has duly caused this report to be signed on its behalf by the undersigned, thereunto duly authorized.
| (Registrant) | MassMutual Premier Funds | |
| | | |
| By (Signature and Title) | /s/ Paul LaPiana | |
| | Paul LaPiana, President and Principal Executive Officer | |
| | | |
| Date | 11/28/2022 | |
Pursuant to the requirements of the Securities Exchange Act of 1934 and the Investment Company Act of 1940, this report has been signed below by the following persons on behalf of the registrant and in the capacities and on the dates indicated.
| By (Signature and Title) | /s/ Paul LaPiana | |
| | Paul LaPiana, President and Principal Executive Officer | |
| | | |
| Date | 11/28/2022 | |
| | | |
| By (Signature and Title) | /s/ Renee Hitchcock | |
| | Renée Hitchcock, Treasurer and Principal Financial Officer | |
| | | |
| Date | 11/28/2022 | |