UNITED STATES
SECURITIES AND EXCHANGE COMMISSION
Washington, D.C. 20549
FORMN-CSR
CERTIFIED SHAREHOLDER REPORT OF REGISTERED
MANAGEMENT INVESTMENT COMPANIES
|
| Investment Company Act file number 811-08690 |
|
| MassMutual Premier Funds |
| (Exact name of registrant as specified in charter) |
| | |
| 100 Bright Meadow Blvd., Enfield, CT | | 06082 |
| (Address of principal executive offices) | | (Zip code) |
| Eric Wietsma | | |
| 100 Bright Meadow Blvd., Enfield, CT | | 06082 |
| (Name and address of agent for service) |
Registrant’s telephone number, including area code: (860) 562-1000
Date of fiscal year end: 9/30/2019
Date of reporting period: 9/30/2019
Item 1. Reports to Stockholders.

Table of Contents
This material must be preceded or accompanied by a current prospectus (or summary prospectus, if available) for the MassMutual Premier Funds. Investors should consider a Fund’s investment objective, risks, and charges and expenses carefully before investing. This and other information about the investment company is available in the prospectus (or summary prospectus, if available). Read it carefully before investing.
Important Notice: Beginning on January 1, 2021, as permitted by regulations adopted by the Securities and Exchange Commission, paper copies of the Fund’s annual and semi-annual reports will no longer be sent by mail, unless you specifically request paper copies of the reports from the Fund (or from your financial intermediary, such as a broker-dealer, bank, or retirement plan recordkeeper). Instead, the reports will be made available on the Fund’s website (http://www.massmutual.com/funds), and you will be notified by mail each time a report is posted and provided with a website link to access the report. If you already elected to receive shareholder reports electronically, you will not be affected by this change and you need not take any action. If you would like to receive shareholder reports and other communications electronically from the Fund and are either a direct investor in the Fund or MassMutual serves as your retirement plan recordkeeper, please call (800) 767-1000 extension 43012 or send your request to enroll to RSProspectusFulfillment@massmutual.com. If you have invested in the Fund through another financial intermediary (such as a broker-dealer, bank, or retirement plan recordkeeper), you can request electronic delivery by contacting that financial intermediary. Beginning on January 1, 2019, you may elect to receive all future reports in paper free of charge. If you invest directly with the MassMutual Funds or MassMutual serves as your retirement plan recordkeeper, you can call (800) 767-1000 extension 43012 or send an email request to RSProspectusFulfillment@massmutual.com to inform the Funds or MassMutual that you wish to continue receiving paper copies of your shareholder reports. If you invest through a financial intermediary other than MassMutual, you can contact that financial intermediary to request that you continue to receive paper copies of your shareholder reports. Your election to receive reports in paper will apply to all funds held in your account if you invest through your financial intermediary or all funds held within the fund complex if you invest directly with a Fund.
MassMutual Premier Funds – President’s Letter to Shareholders (Unaudited)
To Our Shareholders

Eric Wietsma
“When it comes to retirement planning, MassMutual focuses on the long term and encourages all retirement investors to do the same. We believe that those who invest with an approach that’s designed to help their retirement savings withstand all market conditions have the potential to enjoy more financial security in retirement.”
September 30, 2019
Despite economic slowdowns and political tensions, markets remained strong
I am pleased to present you with the MassMutual Premier Funds Annual Report, covering the year ended September 30, 2019 (the “fiscal year” or the “period”). During the first three quarters of 2019, U.S. stocks experienced a good deal of volatility, as the White House led a protracted trade war against China, with tariffs being imposed on both sides. Nevertheless, total returns for domestic equities during the period were positive, although gains were more muted than in the prior fiscal year.
Recently, we have seen indications that the global economy appears to be slowing down. For example, Chinese industrial production dropped to its lowest level since 2002 in August 2019, while the country’s retail sales slowed by more than 2%. The European Union also showed signs of weakness, with the German economy contracting by 0.1% in the second quarter of 2019. Foreign stocks in developed markets trailed their domestic counterparts for the period and lost a bit of traction for the year, but generally outpaced their emerging-market competitors.
U.S. consumer spending, which is key for the U.S.’sconsumption-led economy, remained a bright spot, as retail sales continued to post strong gains throughout the year. Nevertheless, the temporary inversion of the U.S. yield curve troubled investors. That is because historically, yield curve inversions, which occur when short-term interest rates are higher than their long-term counterparts, have often signaled an impending recession.
In a turnaround from 2018, bond investors in the United States experienced strong returns during fiscal year 2019, outperforming stocks for the first time in years. This was largely due to the U.S. Federal Reserve’s actions on interest rates, with its Federal Open Market Committee lowering rates twice in 2019 in an effort to stabilize the economy.
In MassMutual’s view, savvy retirement investors maintain a long-term perspective when planning for the future. As a result, they understand that current headlines ordinarily have limited impact on their retirement planning. We also believe that individuals who follow certain investment guidelines, such as the ones below, may help themselves prepare for a stronger financial future.
Suggestions for retirement investors underany market conditions
View time as your ally
Investing for retirement is a decades-long process for most people. The financial markets will be volatile from time to time, but many patient investors who have taken a long-term approach have managed to ride out the downturns and have successfully grown their account balances and reached their retirement goals over time.
Save as much as possible
Of course, you cannot control – or predict the direction of – the investment markets. But youcan control how often and how much you contribute to your retirement savings account. Saving as much as possible and increasing your contributions regularly is one way smart retirement investors know they can help themselves reach their retirement income goals,regardless of how markets perform.
(Continued)
1
MassMutual Premier Funds – President’s Letter to Shareholders (Unaudited)(Continued)
Continue to invest
Seasoned investors believe that “down” markets offer the potential to be rewarded by amassing larger positions at more favorable prices, as compared to investors who do not continue to invest when the market is down. That is why many financial professionals believe it is important to stay in the market, regardless of near-term results.
Monitor your asset allocation and diversify*
Stocks, bonds, and short-term/money market investments typically behave differently from one another depending upon the economic and market environment. Those broad investment types contain an even greater array ofsub-categories (such assmall-cap stocks, international stocks, high-yield bonds, etc.). Many financial experts believe that investors can take advantage of different opportunities in the market and reduce the risk of over-exposure to one or two poorly performing investment types by maintaining a portfolio that includes a mix of investment types andsub-categories.
Choose the investments you feel are right for you – and seek professional guidance
Many financial advisors suggest that retirement savers who select an appropriate combination of investments that aligns with both their retirement income goals and how they feel about investing can help them withstand the inevitable ups and downs of the markets.
If you work with a financial professional, you may wish to consider reaching out to him or her to help ensure:
| | • | | you are saving enough for retirement; |
| | • | | your retirement account is invested properly for all market conditions, based on your goals and objectives, as well as on your investment time horizon; and |
| | • | | you are taking the right steps to help reduce your longevity risk, which is related to the chance that your retirement savings could “run out” during your lifetime. |
Retirement is a moment you plan for
MassMutual believes that retirement planning is not about crunching numbers – it’s about those moments when it all pays off. The more you plan for life’s greatest moments, the more you can relax and enjoy them. That is why our ongoing commitment is to help people financially protect their familiestoday, so they can put themselves on the path to a more secure retirement. When it comes to retirement planning, MassMutual focuses on the long term and encourages all retirement investors to do the same. We believe that those who invest with an approach that is designed to help their retirement savings withstand all market conditions have the potential to enjoy more financial security in retirement. Thank you for your continued confidence and trust in MassMutual.
Sincerely,

Eric Wietsma
President
© 2019 Massachusetts Mutual Life Insurance Company (MassMutual), Springfield, MA. All rights reserved. www.massmutual.com Underwriter: MML Distributors, LLC (MMLD) Member FINRA and SIPC (www.FINRA.org and www.SIPC.org), 100 Bright Meadow Blvd., Enfield, CT 06082. MMLD is a wholly-owned subsidiary of MassMutual. Investment advisory services provided to the Funds by MML Investment Advisers, LLC (MML Advisers), a wholly-owned subsidiary of MassMutual. The information provided is the opinion of MML Advisers as of 10/1/19 and is subject to change without notice. It is not to be construed as tax, legal, or investment advice. Of course, past performance does not guarantee future results.
The information provided is the opinion of MassMutual Funds Investment Management Group as of 10/1/19 and is subject to change without notice. It is not to be construed as tax, legal, or investment advice. Of course, past performance does not guarantee future results.
* Diversification and asset allocation do not ensure a profit or protect against loss in a declining market.
2
MassMutual Premier Funds Annual Report – Economic and Market Overview (Unaudited)
September 30, 2019
Market Highlights
| • | | For the reporting period from October 1, 2018 through September 30, 2019, U.S. stocks ended slightly higher, though they hit record levels in late July. |
| • | | Global economic optimism faded during the period under the weight of global and domestic political tensions, mixed economic results, and the impact of existing tariffs and rhetoric threatening additional tariffs. |
| • | | The Federal Open Market Committee (FOMC), in response to slowing global growth, announced two rate decreases in 2019 after one rate hike in December 2018. |
| • | | Foreign stocks in developed markets and emerging markets saw losses over the reporting period, aggravated by a strengthening U.S. dollar. |
| • | | U.S. bond investors enjoyed positive returns in a falling yield environment fueled by rate decreases and supportive central bank policy. |
Market Environment
U.S. equity investors watched stock markets move mostly sideways for the fiscal year beginning October 1, 2018. U.S. stocks fell sharply in the first quarter of the period, suffering their worst quarterly decline in nearly a decade. They rebounded during the remaining quarters and crossed into record territory in late July 2019, but succumbed to volatility and uncertainty fueled by slowing global economic growth indicators and ongoing trade war acrimony between the U.S. and China. Both the S&P 500® Index* (S&P 500) and the Dow Jones Industrial AverageSM (Dow) ended the fiscal year only slightly ahead of where they started.
Global economic growth seemed to slow with less synchronized and more restrained economic indicators than in the recent past. The U.S. economy has shown signs that it may be in the late stages of the current business cycle. For example, a tightening labor market typically results in low unemployment rates, but tends to drive up wage growth, putting pressure on corporate earnings. Declining unemployment claims may point to a nearer-term plateau in employment growth. Mixed signals in housing data also tend to be consistent with late cycle trends. As a result, pundits’ speculation about recession has begun to emerge. Consensus still deems the risk of near-term recession to be low, but more possible than in recent years.
Global and domestic political tensions fueled market volatility throughout 2019. The U.S. threatened and imposed tariffs on Chinese goods, which prompted retaliatory responses from China.On-again,off-again trade talks added further turbulence. In Great Britain, negotiations for a Brexit deal broke down threatening a“no-deal” Brexit, which could create serious trade obstacles in Europe. (“Brexit” – an abbreviation for “British exit” – refers to the United Kingdom’s referendum to leave the European Union.) At the end of the reporting period, parties were no closer to a deal, despite the looming October 31, 2019 deadline. Domestically, political rancor between the White House and theDemocratic-led House of Representatives culminated in a call for the launch of a formal impeachment inquiry at the end of September. There does not appear to be an end in sight for the current political battles.
With these various tensions at play, the FOMC not only halted their previously announced calendar of rate hikes, but tapped the brakes and reduced rates twice during the period. Bond investors enjoyed some of the best returns they have seen in recent years, as bond indexes generally outperformed stock indexes for the period.
The broad market S&P 500 delivered a modest 4.25% return for the fiscal year. The Dow followed a similar pattern to end the period with a 4.21% advance. The technology-heavy NASDAQ Composite Index, which led returns in the last fiscal year, rose just overone-half of one percent for the period. Small- andmid-cap stocks underperformed their larger peers, as small-caps lagged significantly. Growth stocks outperformed their value counterparts during the period, although value investors enjoyed a resurgence toward the end of the fiscal year.
Six of 11 sectors in the S&P 500 delivered positive returns for the reporting period, led by the utilities, real estate, and consumer staples sectors, which all enjoyed double-digit growth and beat the S&P 500. The energy sector was the worst laggard for the fiscal year. The financials, materials, industrials, and health care sectors also ended in negative territory.
| * | Indexes referenced, other than the MSCI Indexes, are unmanaged, do not incur fees, expenses, or taxes, and cannot be purchased directly for investment. The MSCI Indexes are unmanaged, do not incur fees or expenses, and cannot be purchased directly for investment. |
3
MassMutual Premier Funds Annual Report – Economic and Market Overview (Unaudited)(Continued)
Developed international markets, as measured by the MSCI EAFE® Index, not only trailed their domestic peers during the period, but also ended the fiscal year in negative territory, down 1.34%. Developed international markets struggled to gain traction under the weight of a strengthening U.S. dollar, widespread local political issues, including floundering Brexit negotiations, and trade war rhetoric. Emerging-market stocks, as measured by the MSCI Emerging Markets Index, ended down 2.02% for the period.
Bond yields rose during the fiscal year, with the10-year U.S. Treasury bond crossing the 3.00% threshold for a short period in November 2018 before dropping back to 1.68% at the close of the period. Falling yields generally produce rising bond prices; therefore, bond index returns benefited. The Bloomberg Barclays U.S. Aggregate Bond Index ended the period up 10.30%.High-yield corporate bonds did not fare as well, but ended in positive territory. The Bloomberg Barclays U.S. Corporate High Yield Index advanced 6.36% by the end of the fiscal year.
Review and maintain your strategy
At MassMutual, we help people look out for those they love. We believe planning and saving for retirement continues to be an important and urgent challenge for many of our customers. Investing in stock and bond mutual funds can play an important role in helping build a stable source of retirement income that allows investors the freedom to retire any way they’d like. Maintaining a long-term perspective and setting realistic expectations about the future performance of your investment portfolio is very important. Financial markets can behave unpredictably. Our multi-managed and subadvised mutual funds tap into the deep expertise of seasoned asset managers who are committed to helping long-term investors prepare for retirement – in all market conditions. As always, we recommend that you work with a personal financial professional, who can help you define an investment strategy that aligns with your comfort level in changing markets, with how long you have to save and invest, and with your specific financial goals and risk tolerance. Thank you for your confidence in MassMutual.
The information provided is the opinion of MML Investment Advisers, LLC as of 10/1/19 and is subject to change without notice. It is not to be construed as tax, legal, or investment advice. Of course, past performance does not guarantee future results.
4
MassMutual Premier U.S. Government Money Market Fund – Portfolio Manager Report (Unaudited)
What is the investment approach of MassMutual Premier U.S. Government Money Market Fund, and who is the Fund’s subadviser?
The Fund seeks current income consistent with preservation of capital and liquidity. The Fund normally invests at least 99.5% of its total assets in cash, U.S. Government securities, and/or repurchase agreements fully collateralized by cash or U.S. Government securities. Under normal circumstances, the Fund invests at least 80% of its net assets in U.S. Government securities and repurchase agreements that are fully collateralized by U.S. Government securities. The Fund’s subadviser is Barings LLC (Barings). The Fund seeks to maintain, but does not guarantee, a stable $1.00 share price.You could lose money by investing in the Fund. Although the Fund seeks to preserve the value of your investment at $1.00 per share, it cannot guarantee it will do so. An investment in the Fund is not insured or guaranteed by the Federal Deposit Insurance Corporation or any other government agency. The Fund’s sponsor has no legal obligation to provide financial support to the Fund, and you should not expect that the sponsor will provide financial support to the Fund at any time.
How did the Fund perform during the 12 months ended September 30, 2019?
The Fund’s Class R5 shares returned 1.85%, underperforming the 2.36% return of the FTSE3-Month Treasury Bill Index (the “benchmark”), which measures the performance of the last three three-month Treasury billmonth-end rates.
For a discussion on the economic and market environment during the12-month period ended September 30, 2019, please see the Economic and Market Overview, beginning on page 3.
Subadviser discussion of factors that contributed to the Fund’s performance
The U.S. Federal Reserve Board (the Fed) increased the federal funds target rate in December 2018 and then reversed course twice in the third quarter of 2019 by lowering the target rate as fears of slowing global growth affecting the United States continued to gain traction. (The federal funds rate is the interest rate that banks and financial institutions charge each other for borrowing funds overnight.)
December 2018 saw the highest short-term rates in more than 10 years, but short-term rates responded to the Fed’s recent actions by moving lower, as monetary policy continued to ease. LIBOR (London Interbank Offered Rate, which is an interest rate used in the short-term international interbank market) rates decreased, with1-month LIBOR down 0.24% to 2.02% over the year – and3-month LIBOR down 0.31% to 2.09% over the12-month period. During 2019, LIBOR rates dropped 0.72%. While the Fund benefited from the purchase of longer-dated Treasuries in December 2018, when yields were at their highest, the sharp drop in LIBOR dragged on Fund results due to the large percentage of adjustable-rate issues that were negatively affected by the unexpected drop.
Subadviser outlook
Barings believes that global growth remains positive, though it continues to weaken from quite strong levels. While investors have been worried about the “end of the cycle” in the United States for some time, the economy seems stubbornly robust. Fund management would be surprised to see corporate spreads tighten much throughout the remainder of 2019, and believes it is more likely that they could revisit long-term averages.
As Barings believes that the Fed’s easing policy may persist, Fund management has been buying longer-dated fixed-rate paper that Fund management believes has the potential to look very attractive in the short term. While they need to buy some adjustable-rate issues due to the more stringent Weighted Average Maturity rules imposed by the Securities and Exchange Commission (SEC) a few years ago, Fund management plans to focus more on longer-dated fixed-rate purchases in the near future until they are confident that this mini-easing cycle is coming to an end.
5
MassMutual Premier U.S. Government Money Market Fund – Portfolio Manager Report (Unaudited)(Continued)
| | | | |
| |
MassMutual Premier
U.S. Government Money Market Fund
Portfolio Characteristics
(% of Net Assets) on 9/30/19 | |
| | |
Discount Notes | | | 83.6 | % |
Repurchase Agreement | | | 13.5 | % |
U.S. Treasury Bonds & Notes | | | 10.0 | % |
| | | | | |
Total Short-Term Investments | | | 107.1 | % |
Other Assets and Liabilities | | | (7.1 | )% |
| | | | | |
Net Assets | | | 100.0 | % |
| | | | | |
6
MassMutual Premier U.S. Government Money Market Fund – Portfolio Manager Report (Unaudited)(Continued)
GROWTH OF $10,000 INVESTMENT
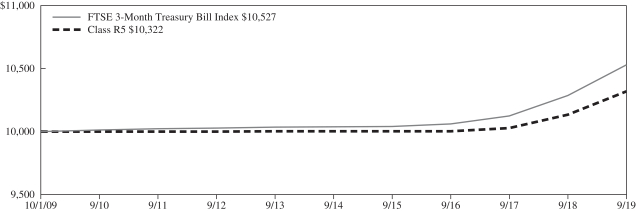
The graph above illustrates the Fund’s historical performance for the past 10 fiscal years or since inception (for Funds lacking 10-year records) in comparison to its benchmark index, as well as one or more additional indexes, if applicable.
| | | | | | | | |
| Average Annual Total Returns(for the periods ended 09/30/2019) |
| | | | | |
| | | Inception Date
of Class | | 1 Year | | 5 Years | | 10 Years |
| Class R5 | | 10/03/1994 | | 1.85% | | 0.63% | | 0.32% |
| FTSE 3-Month Treasury Bill Index | | 2.36% | | 0.96% | | 0.52% |
Generally accepted accounting principles require adjustments to be made to the net assets of the Fund at period end for financial reporting purposes only, and as such, the total return based on the unadjusted net asset value per share may differ from the total return reported in the financial highlights.
Performance results in the graph and table are shown both with and without the imposition of the maximum applicable sales charge (if applicable) and reflect the percentage change in net asset value, including reinvestment of dividends and capital gains distributions. Investors should note that the Fund is a professionally managed mutual fund, while the index or indexes shown above are unmanaged, cannot be purchased directly, and, with the exception of any peer group index, do not incur expenses.
Performance data quoted in the graph and table represents past performance; past performance is not predictive of future results. The investment return and principal value of shares of the Fund fluctuate, so your shares, when sold, may be worth more or less than their original cost. Current performance of the Fund may be lower or higher than the performance quoted. The performance shown does not reflect the deduction of taxes, if any, that a shareholder would pay on Fund distributions or the redemption of Fund shares. Performance data current to the most recent month end may be obtained by calling1-888-309-3539.
Investors should read the Fund’s prospectus with regard to the Fund’s investment objectives, risks, and charges and expenses in conjunction with these financial statements. Employee retirement benefit plans that invest plan assets in the Separate Investment Accounts (SIAs) may be subject to certain charges as set forth in their respective Plan Documents. Total return figures would be lower for the periods presented if they reflected these charges.
7
MassMutual Premier Short-Duration Bond Fund – Portfolio Manager Report (Unaudited)
What is the investment approach of MassMutual Premier Short-Duration Bond Fund, and who is the Fund’s subadviser?
The Fund seeks to achieve a high total rate of return primarily from current income while minimizing fluctuations in capital values by investing primarily in a diversified portfolio of short-term investment grade fixed income securities. Under normal circumstances, the Fund invests at least 80% of its net assets (plus the amount of any borrowings for investment purposes) in investment grade fixed income securities (rated Baa3 or higher by Moody’s,BBB- or higher by Standard & Poor’s or the equivalent by any NRSRO, or, if unrated, determined to be of comparable quality by the subadviser). The Fund’s subadviser is Barings LLC (Barings).
How did the Fund perform during the 12 months ended September 30, 2019?
The Fund’s Class R5 shares returned 3.92%, underperforming the 4.42% return of the Bloomberg Barclays U.S.1-3 Year Government Bond Index (the “benchmark”), which measures the performance of the U.S. Treasury and U.S. Agency Indexes with maturities of1-3 years, including Treasuries and U.S. agency debentures. It is a component of the U.S. Government/Credit Index and the U.S. Aggregate Index.
For a discussion on the economic and market environment during the12-month period ended September 30, 2019, please see the Economic and Market Overview, beginning on page 3.
Subadviser discussion of factors that contributed to the Fund’s performance
The U.S. Treasury yield curve between 3 months and 3 years inverted, causing short-dated yields to rise above longer-dated yields. The U.S. Federal Reserve lowered rates at its July and September 2019 Federal Open Market Committee (FOMC) meetings. As a result of anticipation of the interest rate cuts, earlier in the year the short end of the yield curve between 3 months and 3 years flattened, as expectations for higher growth and inflation dissipated. The yield curve is a graph showing the term structure of interest rates by plotting the yields of all bonds of comparable quality with maturities ranging from the shortest – typically one month – to the longest – typically 30 years – available. The resulting curve shows whether short-term interest rates are higher or lower than long-term rates.
Bond duration and maturity positioning detracted from the Fund’s performance, as the Fund shifted duration in accordance with its duration management process. (Duration is a measure of a bond fund’s sensitivity to interest rates. The longer the duration, the greater the price impact on the fund when interest rates rise or fall.) Duration of the Fund ended the period at 0.26 years. An underweight to U.S. Agency debentures, relative to the benchmark, also detracted from Fund performance. (“Agency” refers to debt issued by U.S. federal government agencies or government-sponsored entities for financing purposes.) The sector offers little income and the Fund held an underweight stake throughout the period.
An allocation to corporate credit was the primary positive contributor to Fund performance. Investment-grade and high-yield bonds rated BB contributed. Fund holdings in the banking, leasing and chemical companiessub-sectors were the best performers. The Fund continued to favor industries less susceptible to merger and acquisition (M&A) risk. Secondary oil & gas producers, service, and gaming companies underperformed the most of any of thesub-sectors.
The Fund’s allocation to asset-backed securities was a positive contributor to performance. (Bond issuers create securitized bonds by pooling various types of contractual debt – such as mortgages, auto loans, or credit card debt.) Fund management continued to find value across both traditional consumer and commercial deals, where there was strong market demand for those investments. The Fund’s modest overweight position in commercial mortgage-backed securities also contributed positively to performance during the period.
The Fund uses derivative instruments on occasion for yield curve, duration, downside risk management and to gain exposures. (Derivatives are securities that derive their value from the performance of one or more other investments and take the form of a contract between two or more parties. Most derivatives are used for hedging, speculation, or both.) Overall, derivatives contributed positively to performance over the last year.
8
MassMutual Premier Short-Duration Bond Fund – Portfolio Manager Report (Unaudited)(Continued)
Subadviser outlook
Barings believes that global growth remains positive, though it continues to weaken from quite strong levels. While investors have been worried about the “end of the cycle” in the United States for some time, the economy seems stubbornly robust. Fund management would be surprised to see corporate spreads tighten much throughout the remainder of 2019, and believes it is more likely that they could revisit long-term averages. Fund management continues to overweight the Fund’s allocation to securitized credit as a late-cycle defensive allocation, as securitized credit provides broad exposure to the positively trending consumer market.
As of September 30, 2019, the Fund maintained overweights in sectors such as corporates and securitized products, relative to liquid products, such as governments and agencies. In addition, Fund management will continue to focus onbottom-up security selection.
| | | | |
| |
MassMutual Premier
Short-Duration Bond Fund
Portfolio Characteristics
(% of Net Assets) on 9/30/19 | |
| | |
Non-U.S. Government Agency Obligations | | | 54.3 | % |
Corporate Debt | | | 39.8 | % |
U.S. Government Agency Obligations and Instrumentalities | | | 1.2 | % |
Purchased Options | | | 0.8 | % |
U.S. Treasury Obligations | | | 0.3 | % |
Municipal Obligations | | | 0.2 | % |
| | | | | |
Total Long-Term Investments | | | 96.6 | % |
Short-Term Investments and Other Assets and Liabilities | | | 3.4 | % |
| | | | | |
Net Assets | | | 100.0 | % |
| | | | | |
9
MassMutual Premier Short-Duration Bond Fund – Portfolio Manager Report (Unaudited)(Continued)
GROWTH OF $10,000 INVESTMENT
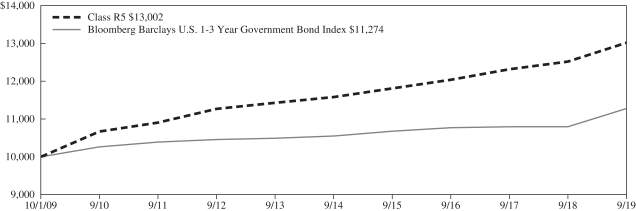
The graph above illustrates a representative class of the Fund’s historical performance for the past 10 fiscal years or since inception (for Funds lacking 10-year records) in comparison to its benchmark index, as well as one or more additional indexes, if applicable. The performance of other share classes will be greater than or less than the class depicted above.
| | | | | | | | | | | | |
| Average Annual Total Returns(for the periods ended 09/30/2019) |
| | | | | | | |
| | | Inception Date
of Class | | 1 Year | | 5 Years | | 10 Years | | Since Inception
12/03/2010 | | Since Inception
04/01/2014 |
| Class I | | 12/03/2010 | | 4.05% | | 2.45% | | | | 2.44% | | |
| Class R5 | | 10/03/1994 | | 3.92% | | 2.34% | | 2.66% | | | | |
| Service Class | | 01/01/1998 | | 3.82% | | 2.24% | | 2.57% | | | | |
| Administrative Class | | 05/03/1999 | | 3.76% | | 2.14% | | 2.48% | | | | |
| Class R4 | | 04/01/2014 | | 3.57% | | 1.99% | | | | | | 1.90% |
| Class A | | 01/01/1998 | | 3.44% | | 1.89% | | 2.23% | | | | |
| Class A (sales load deducted)* | | 01/01/1998 | | 0.86% | | 1.38% | | 1.97% | | | | |
| Class R3 | | 12/31/2002 | | 3.29% | | 1.72% | | 1.99% | | | | |
| Bloomberg Barclays U.S. 1-3 Year Government Bond Index | | 4.42% | | 1.34% | | 1.21% | | 1.09% | | 1.27% |
* Class A (sales load deducted) returns include the 2.50% maximum sales charge.
Generally accepted accounting principles require adjustments to be made to the net assets of the Fund at period end for financial reporting purposes only, and as such, the total return based on the unadjusted net asset value per share may differ from the total return reported in the financial highlights.
Performance results in the graph and table are shown both with and without the imposition of the maximum applicable sales charge (if applicable) and reflect the percentage change in net asset value, including reinvestment of dividends and capital gains distributions. Investors should note that the Fund is a professionally managed mutual fund, while the index or indexes shown above are unmanaged, cannot be purchased directly, and, with the exception of any peer group index, do not incur expenses.
Performance data quoted in the graph and table represents past performance; past performance is not predictive of future results. The investment return and principal value of shares of the Fund fluctuate, so your shares, when sold, may be worth more or less than their original cost. Current performance of the Fund may be lower or higher than the performance quoted. The performance shown does not reflect the deduction of taxes, if any, that a shareholder would pay on Fund distributions or the redemption of Fund shares. Performance data current to the most recent month end may be obtained by calling1-888-309-3539.
Investors should read the Fund’s prospectus with regard to the Fund’s investment objectives, risks, and charges and expenses in conjunction with these financial statements. Employee retirement benefit plans that invest plan assets in the Separate Investment Accounts (SIAs) may be subject to certain charges as set forth in their respective Plan Documents. Total return figures would be lower for the periods presented if they reflected these charges.
10
MassMutual Premier Inflation-Protected and Income Fund – Portfolio Manager Report (Unaudited)
What is the investment approach of MassMutual Premier Inflation-Protected and Income Fund, and who is the Fund’s subadviser?
The Fund seeks to achieve as high a total rate of real return on an annual basis as is considered consistent with prudent investment risk and the preservation of capital by investing, under normal circumstances, at least 80% of its net assets (plus the amount of any borrowings for investment purposes) in inflation-indexed bonds and other income-producing securities. The Fund’s subadviser is Barings LLC (Barings).
How did the Fund perform during the 12 months ended September 30, 2019?
The Fund’s Class R5 shares returned 6.68%, underperforming the 7.13% return of the Bloomberg Barclays U.S. Treasury Inflation Protected Securities (TIPS) Index(Series-L) (the “benchmark”), which measures the performance of rules-based, market value-weighted inflation-protected securities issued by the U.S. Treasury. It is a subset of the Global Inflation-Linked Index(Series-L).
How do inflation-indexed bonds protect against inflation?
Like many other fixed-income securities, inflation-indexed bonds pay income twice a year, based on a stated coupon rate. However, both the principal and the interest payment are adjusted for the level of inflation. The inflation rate – as measured by the Consumer Price Index for All Urban Consumers(“CPI-U”) – results in an adjustment to the principal amount of an inflation-protected security. The coupon rate is then applied to the adjusted principal amount to determine the interest payment. For example, assuming an inflation rate of 3%, a security with a par value of $1,000 and an annual coupon rate of 1.75%, the adjusted principal amount after one year would be $1,030 ($1,000 increased by 3%). The semi-annual interest payment would be calculated by multiplying $1,030 by 1.75% and dividing by 2 instead of using the original $1,000 par value to calculate the amount of interest.
For a discussion on the economic and market environment during the12-month period ended September 30, 2019, please see the Economic and Market Overview, beginning on page 3.
Subadviser discussion of factors that contributed to the Fund’s performance
The rate of consumer price increases, as measured by the U.S. Bureau of Labor Statistics, were down foryear-to-date 2019 as unadjusted Headline CPI came in at 1.7% in the third quarter of 2019, down from 1.9% atyear-end 2018. (The Consumer Price Index [CPI] measures changes in the price of a market basket of consumer goods and services; Core CPI does not include food and energy prices. Headline CPI includes food and energy.) While shelter costs continued to be a major driver of inflation, the headlineyear-to-date increase was driven in large part by service prices. Core CPI increased to 2.4% in the third quarter of 2019, up from 2.2% atyear-end 2018. Core CPI is running modestly above the 2% inflation objective of the Federal Open Market Committee (FOMC).
In addition to TIPS, the Fund also invested in high-quality, income-producing securities, including asset-backed and money market securities. The income earned by these asset classes contributed positively over the reporting period. Allocations to asset-backed securities (ABS) and high-quality commercial paper were the main drivers of performance. (Bond issuers create securitized bonds by pooling various types of contractual debt – such as mortgages, auto loans, and credit card debt. Commercial paper is the commonly used name for short-term unsecured promissory notes sold by banks and corporations to meet short-term debt obligations.) Security selections in auto loans and student loans within the ABS sector were the primary contributors to the Fund’s performance during the period.
The Fund may use derivative instruments for yield curve and duration management, as well as for replicating cash bonds and gaining market exposure in order to implement Fund manager views. (Derivatives are securities that derive their value from the performance of one or more other investments and take the form of a contract between two or more parties. Most derivatives are used for hedging, speculation, or both.) During the period, Fund management used repurchase agreements, Treasury futures, CPI swaps, credit default swaps to hedge whole business ABS exposure, CMBX as a proxy for commercial mortgage-backed
11
MassMutual Premier Inflation-Protected and Income Fund – Portfolio Manager Report (Unaudited)(Continued)
securities, and interest rate swaptions. (An interest rate swaption is anover-the-counter option that grants its owner the right but not the obligation to enter an underlying interest rate swap.) The Fund’s use of derivatives marginally contributed to its performance over the reporting period.
Subadviser outlook
Inflation markets underperformed the nominal Treasury market again during the third quarter of 2019, as the overall spike in interest rate volatility dampened returns. The Federal Reserve (the Fed) delivered on the expected 0.25% cut. While the Fed raised the bar for future easing, Barings expects a dovish tilt and attention to funding markets to remain in focus through the end of 2019. Inflation markets have been volatile along with the broader rates market, and data has been mixed as the market trades from one headline to the next. Barings’ inflation outlook is constructive, given the Fed’s commitment to 2% inflation; however, Barings believes that recent weaker-than-expected economic data could create a drag on prices in the fourth quarter of 2019.
| | | | |
| |
MassMutual Premier
Inflation-Protected and Income Fund
Portfolio Characteristics
(% of Net Assets) on 9/30/19 | |
| | |
U.S. Treasury Obligations | | | 52.4 | % |
Non-U.S. Government Agency Obligations | | | 29.7 | % |
Corporate Debt | | | 0.3 | % |
Purchased Options | | | 0.4 | % |
U.S. Government Agency Obligations and Instrumentalities | | | 0.2 | % |
| | | | | |
Total Long-Term Investments | | | 83.0 | % |
Short-Term Investments and Other Assets and Liabilities | | | 17.0 | % |
| | | | | |
Net Assets | | | 100.0 | % |
| | | | | |
12
MassMutual Premier Inflation-Protected and Income Fund – Portfolio Manager Report (Unaudited)(Continued)
GROWTH OF $10,000 INVESTMENT
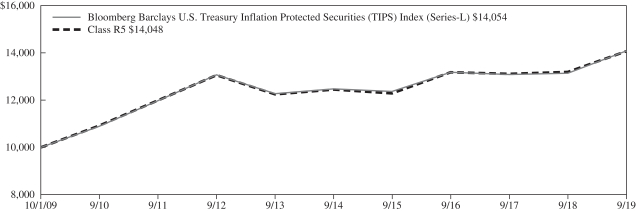
The graph above illustrates a representative class of the Fund’s historical performance for the past 10 fiscal years or since inception (for Funds lacking 10-year records) in comparison to its benchmark index, as well as one or more additional indexes, if applicable. The performance of other share classes will be greater than or less than the class depicted above.
| | | | | | | | | | | | |
| Average Annual Total Returns(for the periods ended 09/30/2019) |
| | | | | | | |
| | | Inception Date
of Class | | 1 Year | | 5 Years | | 10 Years | | Since Inception
03/01/2011 | | Since Inception
04/01/2014 |
| Class I | | 03/01/2011 | | 6.80% | | 2.59% | | | | 3.09% | | |
| Class R5 | | 12/31/2003 | | 6.68% | | 2.48% | | 3.46% | | | | |
| Service Class | | 12/31/2003 | | 6.60% | | 2.38% | | 3.35% | | | | |
| Administrative Class | | 12/31/2003 | | 6.53% | | 2.29% | | 3.23% | | | | |
| Class R4 | | 04/01/2014 | | 6.27% | | 2.15% | | | | | | 2.22% |
| Class A | | 12/31/2003 | | 6.16% | | 2.03% | | 3.01% | | | | |
| Class A (sales load deducted)* | | 12/31/2003 | | 1.65% | | 1.15% | | 2.56% | | | | |
| Class R3 | | 12/31/2003 | | 6.03% | | 1.87% | | 2.78% | | | | |
| Bloomberg Barclays U.S. Treasury Inflation Protected Securities (TIPS) Index (Series-L) | | 7.13% | | 2.45% | | 3.46% | | 2.97% | | 2.54% |
* Class A (sales load deducted) returns include the 4.25% maximum sales charge.
Generally accepted accounting principles require adjustments to be made to the net assets of the Fund at period end for financial reporting purposes only, and as such, the total return based on the unadjusted net asset value per share may differ from the total return reported in the financial highlights.
Performance results in the graph and table are shown both with and without the imposition of the maximum applicable sales charge (if applicable) and reflect the percentage change in net asset value, including reinvestment of dividends and capital gains distributions. Investors should note that the Fund is a professionally managed mutual fund, while the index or indexes shown above are unmanaged, cannot be purchased directly, and, with the exception of any peer group index, do not incur expenses.
Performance data quoted in the graph and table represents past performance; past performance is not predictive of future results. The investment return and principal value of shares of the Fund fluctuate, so your shares, when sold, may be worth more or less than their original cost. Current performance of the Fund may be lower or higher than the performance quoted. The performance shown does not reflect the deduction of taxes, if any, that a shareholder would pay on Fund distributions or the redemption of Fund shares. Performance data current to the most recent month end may be obtained by calling1-888-309-3539.
Investors should read the Fund’s prospectus with regard to the Fund’s investment objectives, risks, and charges and expenses in conjunction with these financial statements. Employee retirement benefit plans that invest plan assets in the Separate Investment Accounts (SIAs) may be subject to certain charges as set forth in their respective Plan Documents. Total return figures would be lower for the periods presented if they reflected these charges.
13
MassMutual Premier Core Bond Fund – Portfolio Manager Report (Unaudited)
What is the investment approach of MassMutual Premier Core Bond Fund, and who is the Fund’s subadviser?
The Fund seeks to achieve a high total rate of return consistent with prudent investment risk and the preservation of capital by investing primarily in a diversified portfolio of investment grade fixed income securities. Under normal circumstances, the Fund invests at least 80% of its net assets (plus the amount of any borrowings for investment purposes) in investment grade fixed income securities (rated Baa3 or higher by Moody’s,BBB- or higher by Standard & Poor’s or the equivalent by any NRSRO, or, if unrated, determined to be of comparable quality by the subadviser). The Fund’s subadviser is Barings LLC (Barings).
How did the Fund perform during the 12 months ended September 30, 2019?
The Fund’s Class R5 shares returned 9.92%, underperforming the 10.30% return of the Bloomberg Barclays U.S. Aggregate Bond Index (the “benchmark”), which measures the performance of the investment grade, U.S. dollar-denominated, fixed-rate taxable bond market, including Treasuries, government-related and corporate securities, agency mortgage-backed securities (MBS) (agency fixed-rate and hybrid ARM pass-throughs), asset-backed securities (ABS), and commercial mortgage-backed securities (CMBS). (“Agency” refers to debt issued by U.S. federal government agencies or government-sponsored entities for financing purposes.)
For a discussion on the economic and market environment during the12-month period ended September 30, 2019, please see the Economic and Market Overview, beginning on page 3.
Subadviser discussion of factors that contributed to the Fund’s performance
Securitized asset classes such as MBS detracted from performance. The Fund had an underweight allocation to the sector, relative to the benchmark. Within MBS, an overweight stake in30-year securities versus15-year securities hampered performance. Fund holdings in30-year securities issued by Fannie Mae detracted from MBS performance. On the other hand, CMBS holdings contributed to performance.
The Fund’s overweight to investment-grade corporate bonds was the primary contributor to performance. Corporate fundamentals were positive over the year, which proved positive for the sector. As many global investment-grade markets are returning negative yields and U.S. interest rates are falling, U.S. corporate bonds have outperformed.
Credit selection also benefited performance. Investments in the banking and property & casualty insurance industries helped the most. The electronics and secondary oil & gas producing industries detracted from performance over the period.
The ABS sector was the second top contributor to performance, and the Fund held an overweight stake in the sector. The asset class is generally shorter in duration and, as a result, less sensitive to increases in interest rates that can hurt a bond’s performance. (Duration is a measure of a bond fund’s sensitivity to interest rates. The longer the duration, the greater the price impact on the fund when interest rates rise or fall.) Somesub-sectors, such as student loans, are adjustable-rate bonds tied to3-month LIBOR (London Interbank Offered Rate), where their coupons reset on a quarterly basis. (LIBOR is an interest rate used in the short-term international interbank market.) The student loans segment was the largest positive contributor within the ABS sector. An allocation to high-quality, short-weighted average life collateralized loan obligations contributed to Fund performance during the year. The Fund has a modest allocation in theout-of-benchmark sector.
The Fund uses derivative instruments for yield curve, duration, downside hedging and to gain exposures. Derivatives are securities that derive their value from the performance of one or more other investments and take the form of a contract between two or more parties. Most derivatives are used for hedging, speculation, or both. They may also be used as a substitute for a direct investment. In aggregate, these positions positively contributed to performance over the year.
Subadviser outlook
Barings believes that global growth remains positive, though it continues to weaken from quite strong levels. While investors have been worried about the “end of the cycle” in the United States for some time, the economy seems stubbornly robust. Fund management would be surprised to see corporate spreads tighten much throughout the remainder of 2019, and believes it is more
14
MassMutual Premier Core Bond Fund – Portfolio Manager Report (Unaudited)(Continued)
likely that they could revisit long-term averages. Fund management continues to overweight the Fund’s allocation to securitized credit as a late-cycle defensive allocation, as securitized credit provides broad exposure to the positively trending consumer market.
Going into the next reporting period, the Fund maintains overweight allocations in sectors such as corporates and securitized products, relative to liquid products, such as governments and agencies. In addition, Fund management continues to focus onbottom-up security selection.
| | | | |
| |
MassMutual Premier
Core Bond Fund
Portfolio Characteristics
(% of Net Assets) on 9/30/19 | |
| | |
Corporate Debt | | | 34.6 | % |
Non-U.S. Government Agency Obligations | | | 32.1 | % |
U.S. Government Agency Obligations and Instrumentalities | | | 25.9 | % |
U.S. Treasury Obligations | | | 5.2 | % |
Sovereign Debt Obligations | | | 0.7 | % |
Municipal Obligations | | | 0.6 | % |
Purchased Options | | | 0.5 | % |
Mutual Funds | | | 0.3 | % |
Preferred Stock | | | 0.2 | % |
| | | | | |
Total Long-Term Investments | | | 100.1 | % |
Short-Term Investments and Other Assets and Liabilities | | | (0.1 | )% |
| | | | | |
Net Assets | | | 100.0 | % |
| | | | | |
15
MassMutual Premier Core Bond Fund – Portfolio Manager Report (Unaudited)(Continued)
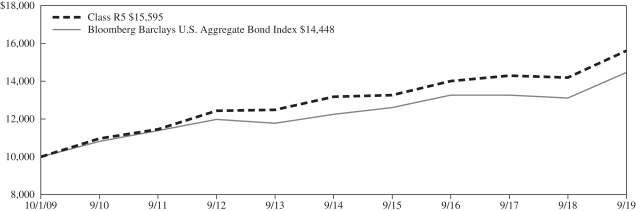
GROWTH OF $10,000 INVESTMENT
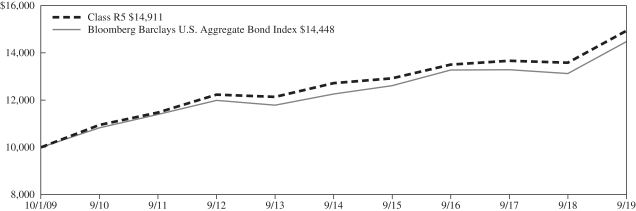
The graph above illustrates a representative class of the Fund’s historical performance for the past 10 fiscal years or since inception (for Funds lacking 10-year records) in comparison to its benchmark index, as well as one or more additional indexes, if applicable. The performance of other share classes will be greater than or less than the class depicted above.
| | | | | | | | | | | | |
| Average Annual Total Returns(for the periods ended 09/30/2019) |
| | | | | | | |
| | | Inception Date
of Class | | 1 Year | | 5 Years | | 10 Years | | Since Inception
12/03/2010 | | Since Inception
04/01/2014 |
| Class I | | 12/03/2010 | | 9.98% | | 3.36% | | | | 3.83% | | |
| Class R5 | | 10/03/1994 | | 9.92% | | 3.27% | | 4.08% | | | | |
| Service Class | | 01/01/1998 | | 9.67% | | 3.16% | | 3.98% | | | | |
| Administrative Class | | 05/03/1999 | | 9.65% | | 3.06% | | 3.90% | | | | |
| Class R4 | | 04/01/2014 | | 9.47% | | 2.92% | | | | | | 3.07% |
| Class A | | 01/01/1998 | | 9.32% | | 2.80% | | 3.64% | | | | |
| Class A (sales load deducted)* | | 01/01/1998 | | 4.67% | | 1.91% | | 3.19% | | | | |
| Class R3 | | 12/31/2002 | | 9.24% | | 2.67% | | 3.41% | | | | |
| Bloomberg Barclays U.S. Aggregate Bond Index | | 10.30% | | 3.38% | | 3.75% | | 3.45% | | 3.48% |
* Class A (sales load deducted) returns include the 4.25% maximum sales charge.
Generally accepted accounting principles require adjustments to be made to the net assets of the Fund at period end for financial reporting purposes only, and as such, the total return based on the unadjusted net asset value per share may differ from the total return reported in the financial highlights.
Performance results in the graph and table are shown both with and without the imposition of the maximum applicable sales charge (if applicable) and reflect the percentage change in net asset value, including reinvestment of dividends and capital gains distributions. Investors should note that the Fund is a professionally managed mutual fund, while the index or indexes shown above are unmanaged, cannot be purchased directly, and, with the exception of any peer group index, do not incur expenses.
Performance data quoted in the graph and table represents past performance; past performance is not predictive of future results. The investment return and principal value of shares of the Fund fluctuate, so your shares, when sold, may be worth more or less than their original cost. Current performance of the Fund may be lower or higher than the performance quoted. The performance shown does not reflect the deduction of taxes, if any, that a shareholder would pay on Fund distributions or the redemption of Fund shares. Performance data current to the most recent month end may be obtained by calling1-888-309-3539.
Investors should read the Fund’s prospectus with regard to the Fund’s investment objectives, risks, and charges and expenses in conjunction with these financial statements. Employee retirement benefit plans that invest plan assets in the Separate Investment Accounts (SIAs) may be subject to certain charges as set forth in their respective Plan Documents. Total return figures would be lower for the periods presented if they reflected these charges.
16
MassMutual Premier Diversified Bond Fund – Portfolio Manager Report (Unaudited)
What is the investment approach of MassMutual Premier Diversified Bond Fund, and who is the Fund’s subadviser?
The Fund seeks a superior total rate of return by investing in fixed income instruments. Under normal circumstances, the Fund invests at least 80% of its net assets (plus the amount of any borrowings for investment purposes) in fixed income securities. The Fund’s subadviser is Barings LLC (Barings).
How did the Fund perform during the 12 months ended September 30, 2019?
The Fund’s Class R5 shares returned 9.99%, underperforming the 10.30% return of the Bloomberg Barclays U.S. Aggregate Bond Index (the “benchmark”), which measures the performance of the investment grade, U.S. dollar-denominated, fixed-rate taxable bond market, including Treasuries, government-related and corporate securities, agency mortgage-backed securities (MBS) (agency fixed-rate and hybrid ARM pass-throughs), asset-backed securities (ABS), and commercial mortgage-backed securities (CMBS). (“Agency” refers to debt issued by U.S. federal government agencies or government-sponsored entities for financing purposes.)
For a discussion on the economic and market environment during the12-month period ended September 30, 2019, please see the Economic and Market Overview, beginning on page 3.
Subadviser discussion of factors that contributed to the Fund’s performance
Securitized asset classes such as MBS detracted from Fund performance. The Fund had an underweight allocation to the sector, relative to the benchmark. Within MBS, an overweight stake in30-year securities versus15-year securities hampered performance. Fund holdings in30-year securities issued by Fannie Mae detracted from MBS performance. On the other hand, CMBS holdings contributed to performance.
The Fund’s overweight to investment-grade corporate bonds was the primary contributor to performance. Corporate fundamentals were positive over the year, which proved positive for the sector. Demand from foreign investors remains strong in the U.S. corporate bond market, which is positive for the sector. As many global investment-grade markets are returning negative yields and U.S. interest rates are falling, U.S. corporate bonds have outperformed.
Credit selection also benefited performance. Allocations within the financial and industrial sectors contributed positively to returns, while allocations within the utility sector detracted slightly. The Fund’s higher allocation to high yield bonds detracted from performance.
The ABS sector was the second top contributor to performance, and the Fund held an overweight stake in the sector. The asset class is generally shorter in duration and, as a result, less sensitive to increases in interest rates that can hurt a bond’s performance. (Duration is a measure of a bond fund’s sensitivity to interest rates. The longer the duration, the greater the price impact on the fund when interest rates rise or fall.) Somesub-sectors, such as student loans, are adjustable-rate bonds tied to3-month LIBOR, where their coupons reset on a quarterly basis. (LIBOR, the London Interbank Offered Rate, is an interest rate used in the short-term international interbank market.) The student loans segment was the largest positive contributor within the ABS sector. An allocation to high-quality, short-weighted average life collateralized loan obligations contributed to Fund performance during the year. The Fund has a modest allocation in thisout-of-benchmark sector. However, an underweight to Treasuries detracted from performance.
The Fund uses derivative instruments for yield curve, duration, downside hedging and to gain exposures. Derivatives are securities that derive their value from the performance of one or more other investments and take the form of a contract between two or more parties. Most derivatives are used for hedging, speculation, or both. They may also be used as a substitute for a direct investment. In aggregate, these positions positively contributed to performance over the year.
Subadviser outlook
Barings believes that global growth remains positive, though it continues to weaken from quite strong levels. While investors have been worried about the “end of the cycle” in the United States for some time, the economy seems stubbornly robust. Fund
17
MassMutual Premier Diversified Bond Fund – Portfolio Manager Report (Unaudited)(Continued)
management would be surprised to see corporate spreads tighten much throughout the remainder of 2019, and believes it is more likely that they could revisit long-term averages. Fund management continues to overweight the Fund’s allocation to securitized credit as a late-cycle defensive allocation, as securitized credit provides broad exposure to the positively trending consumer market.
Going into the next reporting period, the Fund maintains overweight allocations in sectors such as corporates and securitized products, relative to liquid products, such as governments and agencies. In addition, Fund management continues to focus onbottom-up security selection.
| | | | |
| |
MassMutual Premier
Diversified Bond Fund
Portfolio Characteristics
(% of Net Assets) on 9/30/19 | |
| | |
Corporate Debt | | | 41.3 | % |
Non-U.S. Government Agency Obligations | | | 30.2 | % |
U.S. Government Agency Obligations and Instrumentalities | | | 20.9 | % |
U.S. Treasury Obligations | | | 2.9 | % |
Mutual Funds | | | 1.2 | % |
Purchased Options | | | 0.8 | % |
Sovereign Debt Obligations | | | 0.7 | % |
Municipal Obligations | | | 0.3 | % |
Preferred Stock | | | 0.1 | % |
Common Stock | | | 0.0 | % |
Warrants | | | 0.0 | % |
| | | | | |
Total Long-Term Investments | | | 98.4 | % |
Short-Term Investments and Other Assets and Liabilities | | | 1.6 | % |
| | | | | |
Net Assets | | | 100.0 | % |
| | | | | |
18
MassMutual Premier Diversified Bond Fund – Portfolio Manager Report (Unaudited)(Continued)
GROWTH OF $10,000 INVESTMENT
The graph above illustrates a representative class of the Fund’s historical performance for the past 10 fiscal years or since inception (for Funds lacking 10-year records) in comparison to its benchmark index, as well as one or more additional indexes, if applicable. The performance of other share classes will be greater than or less than the class depicted above.
| | | | | | | | | | | | |
| Average Annual Total Returns(for the periods ended 09/30/2019) |
| | | | | | | |
| | | Inception Date
of Class | | 1 Year | | 5 Years | | 10 Years | | Since Inception
12/03/2010 | | Since Inception
04/01/2014 |
| Class I | | 12/03/2010 | | 10.08% | | 3.55% | | | | 4.54% | | |
| Class R5 | | 05/03/1999 | | 9.99% | | 3.45% | | 4.54% | | | | |
| Service Class | | 05/03/1999 | | 9.80% | | 3.36% | | 4.47% | | | | |
| Administrative Class | | 05/03/1999 | | 9.79% | | 3.26% | | 4.40% | | | | |
| Class R4 | | 04/01/2014 | | 9.49% | | 3.08% | | | | | | 3.27% |
| Class A | | 05/03/1999 | | 9.45% | | 2.99% | | 4.13% | | | | |
| Class A (sales load deducted)* | | 05/03/1999 | | 4.80% | | 2.10% | | 3.68% | | | | |
| Class R3 | | 04/01/2014 | | 9.35% | | 2.85% | | | | | | 3.02% |
| Bloomberg Barclays U.S. Aggregate Bond Index | | 10.30% | | 3.38% | | 3.75% | | 3.45% | | 3.48% |
* Class A (sales load deducted) returns include the 4.25% maximum sales charge.
Generally accepted accounting principles require adjustments to be made to the net assets of the Fund at period end for financial reporting purposes only, and as such, the total return based on the unadjusted net asset value per share may differ from the total return reported in the financial highlights.
Performance results in the graph and table are shown both with and without the imposition of the maximum applicable sales charge (if applicable) and reflect the percentage change in net asset value, including reinvestment of dividends and capital gains distributions. Investors should note that the Fund is a professionally managed mutual fund, while the index or indexes shown above are unmanaged, cannot be purchased directly, and, with the exception of any peer group index, do not incur expenses.
Performance data quoted in the graph and table represents past performance; past performance is not predictive of future results. The investment return and principal value of shares of the Fund fluctuate, so your shares, when sold, may be worth more or less than their original cost. Current performance of the Fund may be lower or higher than the performance quoted. The performance shown does not reflect the deduction of taxes, if any, that a shareholder would pay on Fund distributions or the redemption of Fund shares. Performance data current to the most recent month end may be obtained by calling1-888-309-3539.
Investors should read the Fund’s prospectus with regard to the Fund’s investment objectives, risks, and charges and expenses in conjunction with these financial statements. Employee retirement benefit plans that invest plan assets in the Separate Investment Accounts (SIAs) may be subject to certain charges as set forth in their respective Plan Documents. Total return figures would be lower for the periods presented if they reflected these charges.
19
MassMutual Premier High Yield Fund – Portfolio Manager Report (Unaudited)
What is the investment approach of MassMutual Premier High Yield Fund, and who is the Fund’s subadviser?
The Fund seeks to achieve a high level of total return, with an emphasis on current income, by investing primarily in high yield debt and related securities. Under normal circumstances, the Fund invests at least 80% of its net assets (plus the amount of any borrowings for investment purposes) in lower rated fixed income securities (rated below Baa3 by Moody’s, below BBB- by Standard & Poor’s or the equivalent by any NRSRO (using the lower rating) or, if unrated, determined to be of below investment grade quality by the Fund’s subadviser). The Fund’s subadviser is Barings LLC (Barings).
How did the Fund perform during the 12 months ended September 30, 2019?
The Fund’s Service Class shares returned 5.20%, underperforming the 6.36% return of the Bloomberg Barclays U.S. Corporate High-Yield Bond Index (the “benchmark”), which measures the performance of U.S. dollar-denominated,non-investment grade, fixed-rate, taxable corporate bonds, including corporate bonds, fixed-rate bullet, puttable, and callable bonds, SEC Rule 144A securities, original issue zeros,pay-in-kind bonds, fixed-rate andfixed-to-floating capital securities.
For a discussion on the economic and market environment during the12-month period ended September 30, 2019, please see the Economic and Market Overview, beginning on page 3.
Subadviser discussion of factors that contributed to the Fund’s performance
The U.S. high-yield bond market turned in positive absolute performance for the period, driven by stable corporate fundamentals, accommodative central bank policies, and subdued inflationary pressures, despite a bout of extreme volatility in the fourth quarter of 2018.
Returns were mostly positive across industries, led by the banking sector, and followed by the electric and consumer cyclical sectors. The energy sector was the lone detractor from performance in the high-yield market, driven by substantial volatility in crude oil prices throughout much of the year. Much of that volatility was focused within the oil field services and independent subsectors, which saw double-digit declines during the course of the year.
As previously mentioned, the fourth quarter of 2018 saw significant instability and declines across the high-yield market, only to rally throughout the first three quarters of 2019, recouping more than its losses from the end of the prior year. However, the extent of the rally was bifurcated between the higher and lower ends of the credit quality spectrum. Issues rated BB returned almost twice that of whatCCC-rated issues did through September 30, 2019, as high-yield investors remained wary of riskier assets going into what Barings believes may be a late- toend-of-cycle period. Bonds rated B also advanced, modestly lagging their counterparts rated BB during the period.
As it relates to the Fund, credit selection was the primary driver of the Fund’s benchmark-relative performance. Bonds within the Fund’s portfolio rated B and CCC outperformed the benchmark due to strong selection, although an overweight allocation (relative to the benchmark) to bonds rated CCC offset much of the contribution. Fund holdings rated BB lagged the benchmark due to an overweight allocation within the Fund’s portfolio, although credit selection, again, proved positive. The Fund had a modest allocation to holdings rated BBB, which benefited performance due to both prudent credit selection and an overweight allocation.
Across industries, the Fund outperformed relative to the benchmark in the communications and capital goods sectors, due to credit selection, while specific Fund holdings within the consumernon-cyclical and basic industry sectors drove the Fund to lag in these areas. Similar to the broader market, energy was the only industry sector within the Fund to generate a negative return during the year.
The Fund’stop-performing holdings were JBS, an American protein producer that mainly processes beef and pork; Bausch Health Companies, a specialty pharmaceutical manufacturer; and Sprint, a wireless operator in the United States. Fund holdings that proved to be the largest detractors from performance were EP Energy, a public, independent energy exploration and production firm; Mallinckrodt, a global specialty pharmaceutical company; and Envision Healthcare, a leading national provider of outsourced physician services and ambulatory surgery centers.
20
MassMutual Premier High Yield Fund – Portfolio Manager Report (Unaudited)(Continued)
Subadviser outlook
Driven by a reasonably strong economic backdrop over the past few years, corporate earnings have been solid and leverage levels largely stable. In Barings’ view, corporate fundamentals overall remain relatively healthy. Growth appears to be slowing, but measured, and Barings believes most companies have capital structures in place that can withstand and adjust to a slowdown. Additionally, due in part to lower financing costs over the last decade, Barings believes interest coverage ratios appear relatively healthy. As a result, defaults – the biggest potential risk for high-yield investors – continue to remain slightly below long-term historical averages. While an increase in defaults across more challenged sectors – namely, energy, and retail – has contributed to a slight uptick in overall defaults over the past year, Fund management does not expect to see a widespread or material increase in defaults in the near term.
| | | | |
| |
MassMutual Premier
High Yield Fund
Portfolio Characteristics
(% of Net Assets) on 9/30/19 | |
| | |
Corporate Debt | | | 92.8 | % |
Bank Loans | | | 5.2 | % |
Mutual Funds | | | 3.8 | % |
Common Stock | | | 0.4 | % |
Preferred Stock | | | 0.0 | % |
Warrants | | | 0.0 | % |
| | | | | |
Total Long-Term Investments | | | 102.2 | % |
Short-Term Investments and Other Assets and Liabilities | | | (2.2 | )% |
| | | | | |
Net Assets | | | 100.0 | % |
| | | | | |
21
MassMutual Premier High Yield Fund – Portfolio Manager Report (Unaudited)(Continued)
GROWTH OF $10,000 INVESTMENT
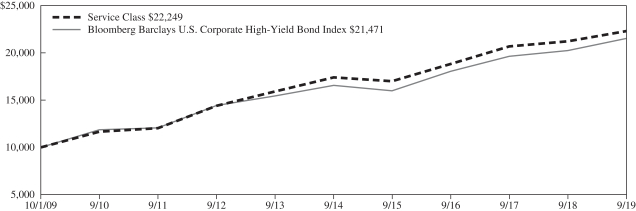
The graph above illustrates a representative class of the Fund’s historical performance for the past 10 fiscal years or since inception (for Funds lacking 10-year records) in comparison to its benchmark index, as well as one or more additional indexes, if applicable. The performance of other share classes will be greater than or less than the class depicted above.
| | | | | | | | | | | | |
| Average Annual Total Returns(for the periods ended 09/30/2019) |
| | | | | | | |
| | | Inception Date
of Class | | 1 Year | | 5 Years | | 10 Years | | Since Inception
03/01/2011 | | Since Inception
04/01/2014 |
| Class I | | 03/01/2011 | | 5.45% | | 5.29% | | | | 7.18% | | |
| Class R5 | | 11/01/2004 | | 5.29% | | 5.17% | | 8.39% | | | | |
| Service Class | | 09/05/2000 | | 5.20% | | 5.08% | | 8.33% | | | | |
| Administrative Class | | 11/01/2004 | | 5.13% | | 4.98% | | 8.19% | | | | |
| Class R4 | | 04/01/2014 | | 4.97% | | 4.83% | | | | | | 4.62% |
| Class A | | 11/01/2004 | | 4.89% | | 4.72% | | 7.92% | | | | |
| Class A (sales load deducted)* | | 11/01/2004 | | -0.88% | | 3.54% | | 7.31% | | | | |
| Class R3 | | 11/01/2004 | | 4.71% | | 4.57% | | 7.70% | | | | |
| Bloomberg Barclays U.S. Corporate High-Yield Bond Index | | 6.36% | | 5.37% | | 7.94% | | 6.35% | | 4.97% |
* Class A (sales load deducted) returns include the 5.50% maximum sales charge.
Generally accepted accounting principles require adjustments to be made to the net assets of the Fund at period end for financial reporting purposes only, and as such, the total return based on the unadjusted net asset value per share may differ from the total return reported in the financial highlights.
Performance results in the graph and table are shown both with and without the imposition of the maximum applicable sales charge (if applicable) and reflect the percentage change in net asset value, including reinvestment of dividends and capital gains distributions. Investors should note that the Fund is a professionally managed mutual fund, while the index or indexes shown above are unmanaged, cannot be purchased directly, and, with the exception of any peer group index, do not incur expenses.
Performance data quoted in the graph and table represents past performance; past performance is not predictive of future results. The investment return and principal value of shares of the Fund fluctuate, so your shares, when sold, may be worth more or less than their original cost. Current performance of the Fund may be lower or higher than the performance quoted. The performance shown does not reflect the deduction of taxes, if any, that a shareholder would pay on Fund distributions or the redemption of Fund shares. Performance data current to the most recent month end may be obtained by calling1-888-309-3539.
Investors should read the Fund’s prospectus with regard to the Fund’s investment objectives, risks, and charges and expenses in conjunction with these financial statements. Employee retirement benefit plans that invest plan assets in the Separate Investment Accounts (SIAs) may be subject to certain charges as set forth in their respective Plan Documents. Total return figures would be lower for the periods presented if they reflected these charges.
22
MassMutual Premier Balanced Fund – Portfolio Manager Report (Unaudited)
What is the investment approach of MassMutual Premier Balanced Fund, and who is the Fund’s subadviser?
The Fund seeks to achieve a high total rate of return over an extended period of time consistent with the preservation of capital by investing in a diversified portfolio of equity securities, fixed income securities, and money market instruments. The Fund invests across different asset classes (U.S. equity securities, international equity securities, fixed income securities, including bank loans and Rule 144A securities, and money market instruments), each represented by a different segment of the Fund’s portfolio. The subadviser typically adjusts the allocation among the four segments, based on its judgment about each segment’s potential for returns in comparison with those of other segments and corresponding risk. The Fund’s subadviser is Barings LLC (Barings).
How did the Fund perform during the 12 months ended September 30, 2019?
The Fund’s Class R5 shares returned 1.88%, underperforming the 4.25% return of the S&P 500® Index (“the Fund’s benchmark”), which measures the performance of 500 widely held stocks in the U.S. equity market, and outperforming the-1.34% return of the MSCI EAFE Index (“the international component’s benchmark”), which measures the performance of thelarge-andmid-cap segments of developed markets, excluding the U.S. and Canada equity securities. It is free float-adjusted market-capitalization weighted. The Fund substantially underperformed the 10.30% return of the Bloomberg Barclays U.S. Aggregate Bond Index (“the bond component’s benchmark”), which measures the performance of the investment grade, U.S. dollar-denominated, fixed-rate taxable bond market, including Treasuries, government-related and corporate securities, mortgage-backed securities (MBS) (agency fixed-rate and hybrid ARM pass-throughs), asset-backed securities (ABS), and commercial mortgage-backed securities (CMBS). Additionally, the Fund’s Class R5 shares underperformed the 4.94% return of the Lipper Balanced Fund Index, an unmanaged, equally weighted index of the 30 largest mutual funds within the Lipper Balanced Category; and underperformed the 6.49% return of the Custom Balanced Index, which comprises the stock component’s benchmark, the bond component’s benchmark, and the international component’s benchmark. The weightings of each index in the Custom Balanced Index are 50%, 40% and 10%, respectively.
For a discussion on the economic and market environment during the12-month period ended September 30, 2019, please see the Economic and Market Overview, beginning on page 3.
Subadviser discussion of factors that contributed to the Fund’s stock component performance
U.S. stocks outperformed the international component’s benchmark, but underperformed the bond component’s benchmark. The Fund held an overweight allocation in domestic equities, relative to bonds, and this dragged on the Fund’s performance. Even though the trade war, rising rates and a hangover from the previous year’s tax cut contributed to slowing growth and caused stocks to plunge in the fourth quarter of 2018, equities recouped most of their losses early in 2019 on the expectation of easier monetary policy. However, stocks significantly underperformed bonds for the fiscal year.
Foreign stocks underperformed their U.S. counterparts for the year. The Fund held an underweight stake in foreign stocks, which helped performance. Because profits generated by stocks relative to their prices were unusually high as compared to profit potential from fixed income alternatives, Fund management chose to overweight stocks relative to bonds. However, based on the belief that those earnings may not hold up in a recession, Fund management moved money from stocks to bonds. While this proved to be a correct move, the Fund was still overweight equities, which ultimately hindered performance.
With respect to specific Fund holdings, having an underweight stake in NVIDIA, a semiconductor company, relative to the stock component’s benchmark, helped the Fund’s returns, as NVIDIA’s shares fell 38% during the period. However, the Fund’s overweight allocation to department store Nordstrom’s hampered returns, as it fell 41% during the year.
Subadviser discussion of factors that contributed to the Fund’s bond component performance
In the fixed income component, an overweight allocation to investment-grade corporate bonds, relative to the bond component’s benchmark, was the primary contributor to performance. The Fund’s allocation to asset-backed securities (ABS) was also a strong contributor, while its mortgage-backed securities (MBS) allocation detracted from performance.
23
MassMutual Premier Balanced Fund – Portfolio Manager Report (Unaudited)(Continued)
The Fund occasionally uses derivatives. In the stock component of the Fund, this detracted from performance. Derivatives are securities that derive their value from the performance of one or more other investments and take the form of a contract between two or more parties. Most derivatives are used for hedging, speculation, or both.
Subadviser outlook
U.S. equities have returned 13.2% per year, on average, over the past 10 years – far surpassing all other major asset classes. The10-year cumulative earnings yield on stocks was 94%, compared to the10-year cumulative yield on U.S.10-year Treasuries of 38%. In past market cycles, investors who were concerned that stocks were in a bubble sought the safety of bonds and other lower-risk investments. Today, investors are facing slowing economic growth, a trade war, and a variety of other issues.
Fund management observes that their mix of stocks and bonds has been very effective at delivering returns over the past 20 years. Going into the next reporting period, the Fund holds an overweight to stocks, based on Fund management’s belief that the U.S. economy is dynamic and has weathered worse storms than this. The Fund’s bond allocation is designed to help smooth out the bumps if Fund management is wrong.
| | | | |
| |
MassMutual Premier
Balanced Fund
Portfolio Characteristics
(% of Net Assets) on 9/30/19 | |
| | |
Common Stock | | | 48.4 | % |
Corporate Debt | | | 12.9 | % |
Non-U.S. Government Agency Obligations | | | 11.6 | % |
U.S. Government Agency Obligations and Instrumentalities | | | 9.8 | % |
Mutual Funds | | | 9.2 | % |
U.S. Treasury Obligations | | | 1.3 | % |
Municipal Obligations | | | 0.3 | % |
Sovereign Debt Obligations | | | 0.2 | % |
Purchased Options | | | 0.1 | % |
Preferred Stock | | | 0.1 | % |
| | | | | |
Total Long-Term Investments | | | 93.9 | % |
Short-Term Investments and Other Assets and Liabilities | | | 6.1 | % |
| | | | | |
Net Assets | | | 100.0 | % |
| | | | | |
24
MassMutual Premier Balanced Fund – Portfolio Manager Report (Unaudited)(Continued)
GROWTH OF $10,000 INVESTMENT
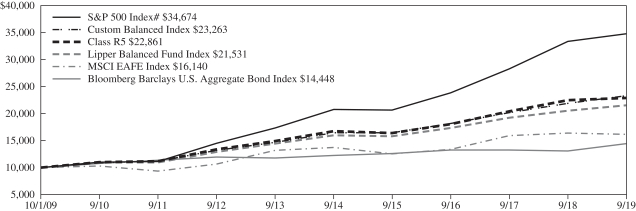
The graph above illustrates a representative class of the Fund’s historical performance for the past 10 fiscal years or since inception (for Funds lacking 10-year records) in comparison to its benchmark index, as well as one or more additional indexes, if applicable. The performance of other share classes will be greater than or less than the class depicted above.
| | | | | | | | | | |
| Average Annual Total Returns (for the periods ended 09/30/2019) |
| | | | | | |
| | | Inception Date
of Class | | 1 Year | | 5 Years | | 10 Years | | Since Inception
04/01/2014 |
| Class I | | 04/01/2014 | | 1.91% | | 6.54% | | | | 6.69% |
| Class R5 | | 10/03/1994 | | 1.88% | | 6.44% | | 8.62% | | |
| Service Class | | 01/01/1998 | | 1.73% | | 6.32% | | 8.47% | | |
| Administrative Class | | 05/03/1999 | | 1.62% | | 6.22% | | 8.33% | | |
| Class R4 | | 04/01/2014 | | 1.52% | | 6.05% | | | | 6.19% |
| Class A | | 01/01/1998 | | 1.44% | | 5.96% | | 8.08% | | |
| Class A (sales load deducted)* | | 01/01/1998 | | -4.14% | | 4.77% | | 7.47% | | |
| Class R3 | | 04/01/2014 | | 1.27% | | 5.81% | | | | 5.94% |
| S&P 500 Index# | | 4.25% | | 10.84% | | 13.24% | | 11.05% |
| MSCI EAFE Index | | -1.34% | | 3.27% | | 4.90% | | 2.59% |
| Bloomberg Barclays U.S. Aggregate Bond Index | | 10.30% | | 3.38% | | 3.75% | | 3.48% |
| Lipper Balanced Fund Index | | 4.94% | | 6.18% | | 7.97% | | 6.16% |
| Custom Balanced Index | | 6.49% | | 7.22% | | 8.81% | | 7.29% |
* Class A (sales load deducted) returns include the 5.50% maximum sales charge.
# Benchmark.
Generally accepted accounting principles require adjustments to be made to the net assets of the Fund at period end for financial reporting purposes only, and as such, the total return based on the unadjusted net asset value per share may differ from the total return reported in the financial highlights.
Performance results in the graph and table are shown both with and without the imposition of the maximum applicable sales charge (if applicable) and reflect the percentage change in net asset value, including reinvestment of dividends and capital gains distributions. Investors should note that the Fund is a professionally managed mutual fund, while the index or indexes shown above are unmanaged, cannot be purchased directly, and, with the exception of any peer group index, do not incur expenses.
Performance data quoted in the graph and table represents past performance; past performance is not predictive of future results. The investment return and principal value of shares of the Fund fluctuate, so your shares, when sold, may be worth more or less than their original cost. Current performance of the Fund may be lower or higher than the performance quoted. The performance shown does not reflect the deduction of taxes, if any, that a shareholder would pay on Fund distributions or the redemption of Fund shares. Performance data current to the most recent month end may be obtained by calling1-888-309-3539.
Investors should read the Fund’s prospectus with regard to the Fund’s investment objectives, risks, and charges and expenses in conjunction with these financial statements. Employee retirement benefit plans that invest plan assets in the Separate Investment Accounts (SIAs) may be subject to certain charges as set forth in their respective Plan Documents. Total return figures would be lower for the periods presented if they reflected these charges.
25
MassMutual Premier Disciplined Value Fund – Portfolio Manager Report (Unaudited)
What is the investment approach of MassMutual Premier Disciplined Value Fund, and who is the Fund’s subadviser?
The Fund seeks to create a diversified portfolio of equity securities in order to outperform the total return performance of its benchmark, the Russell 1000®Value Index*. Under normal circumstances, the Fund invests mainly in common stocks of companies that the Fund’s subadviser considers to be undervalued. The Fund will normally invest in common stocks of companies with market capitalizations of at least $200 million at the time of purchase. The Fund’s subadviser is Barings LLC (Barings).
* The Fund is not promoted, sponsored, or endorsed by, nor in any way affiliated with Russell Investment Group (“Russell”). Russell is not responsible for and has not reviewed the Fund nor any associated literature or publications and Russell makes no representation or warranty, express or implied, as to their accuracy, or completeness, or otherwise. The Russell 1000® Value Index and Russell® are trademarks of the Frank Russell Company.
How did the Fund perform during the 12 months ended September 30, 2019?
The Fund’s Service Class shares returned-1.43%, underperforming, by a wide margin, the 4.00% return of the Russell 1000 Value Index (the “benchmark”), which measures the performance of thelarge-cap value segment of U.S. equity securities. It includes the Russell 1000 Index companies with lowerprice-to-book ratios and lower expected growth values. It is market-capitalization weighted.
For a discussion on the economic and market environment during the12-month period ended September 30, 2019, please see the Economic and Market Overview, beginning on page 3.
Subadviser discussion of factors that contributed to the Fund’s performance
Large-cap value stocks finally outperformed their growth counterparts during this reporting period, but it was anticlimactic, since the margin of outperformance was a mere 0.27% (following the 16.8% underperformance in the 2018 fiscal year). Value stocks tend to be cyclicals, banks, and energy companies, all of which have been out of favor as the trade war has roiled global growth.
During the period, within the value universe, the most expensive stocks performed best, and since the Fund focuses on stocks that are cheaper than average, this dragged on Fund performance. For example, the Fund held an underweight stake, relative to the benchmark, in Thermo Fisher Scientific, the maker of scientific equipment. The company was up 19.6% during the year, which detracted from the Fund’s benchmark-relative performance. Companies that investors perceived as immune to slowing economic activity, such as McDonald’s and Procter & Gamble, did particularly well, and both were up over 30% for the year. Since both were trading at a substantial premium to the market, the Fund held underweight stakes in them, which detracted from performance.
The energy sector was down 20% during the period, by far the worst-performing sector in the value benchmark. The Fund’s underweight allocation to the energy sector and stocks like Halliburton, an oil service company, which fell 52%, helped performance. In the value benchmark, semiconductors was one of the few areas where cheap stocks outperformed expensive issues. The Fund held an overweight allocation to semiconductors and stocks like Lam Research, a semiconductor equipment manufacturer, which helped performance.
The Fund used derivatives to facilitate Fund flows and this added modestly to performance during the year. Derivatives are securities that derive their value from the performance of one or more other investments and take the form of a contract between two or more parties. Most derivatives are used for hedging, speculation, or both.
Subadviser outlook
Since growth stocks have significantly outperformed value for over 10 years, much is being written about the death of value investing. Fund management is sympathetic to some of the arguments, namely that growth stocks are so profitable that they are compounding their advantage and creating a virtuous cycle of more and more profits. The poster child for this is Amazon, the internet retailer. Amazon has been so good at what it does that it has put much of its competition out of business, thus compounding its advantage.
26
MassMutual Premier Disciplined Value Fund – Portfolio Manager Report (Unaudited)(Continued)
Fund management’s view, however, is that as with most investment insights, there is a tendency of taking a good idea too far. For the past 10 years, investors underpriced the advantage of compounding high profit margins. The price of that advantage, though, is not unlimited. The same holds for the capital-heavy cyclicals that have been out of favor; Barings believes these industries are important and although their growth has been muted, Barings believes that the introduction of robotics may boost margins in the years to come, potentially giving those companies margins that are closer to the growth stock darlings in today’s market.
| | | | |
| |
MassMutual Premier
Disciplined Value Fund
Largest Holdings
(% of Net Assets) on 9/30/19 | |
| | |
Johnson & Johnson | | | 2.8 | % |
Verizon Communications, Inc. | | | 2.4 | % |
JPMorgan Chase & Co. | | | 2.4 | % |
Berkshire Hathaway, Inc. Class B | | | 2.4 | % |
Citigroup, Inc. | | | 2.0 | % |
Intel Corp. | | | 1.9 | % |
The Procter & Gamble Co. | | | 1.9 | % |
Pfizer, Inc. | | | 1.9 | % |
Bank of America Corp. | | | 1.8 | % |
Chevron Corp. | | | 1.8 | % |
| | | | | |
| | | | 21.3 | % |
| | | | | |
| | | | |
| |
MassMutual Premier
Disciplined Value Fund
Sector Table
(% of Net Assets) on 9/30/19 | |
| | |
Financial | | | 30.4 | % |
Consumer,Non-cyclical | | | 20.7 | % |
Industrial | | | 9.3 | % |
Communications | | | 8.7 | % |
Consumer, Cyclical | | | 7.7 | % |
Energy | | | 7.0 | % |
Utilities | | | 6.3 | % |
Technology | | | 6.1 | % |
Basic Materials | | | 3.6 | % |
Mutual Funds | | | 0.5 | % |
| | | | | |
Total Long-Term Investments | | | 100.3 | % |
Short-Term Investments and Other Assets and Liabilities | | | (0.3 | )% |
| | | | | |
Net Assets | | | 100.0 | % |
| | | | | |
27
MassMutual Premier Disciplined Value Fund – Portfolio Manager Report (Unaudited)(Continued)
GROWTH OF $10,000 INVESTMENT
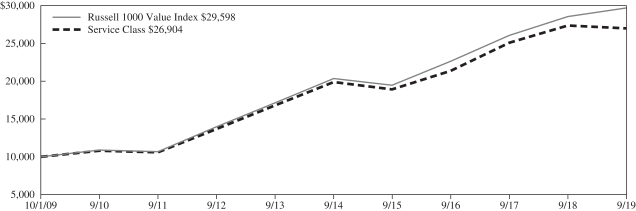
The graph above illustrates a representative class of the Fund’s historical performance for the past 10 fiscal years or since inception (for Funds lacking 10-year records) in comparison to its benchmark index, as well as one or more additional indexes, if applicable. The performance of other share classes will be greater than or less than the class depicted above.
| | | | | | | | | | |
| Average Annual Total Returns(for the periods ended 09/30/2019) |
| | | | | | |
| | | Inception Date
of Class | | 1 Year | | 5 Years | | 10 Years | | Since Inception
04/01/2014 |
| Class I | | 04/01/2014 | | -1.20% | | 6.49% | | | | 6.63% |
| Class R5 | | 11/01/2004 | | -1.32% | | 6.39% | | 10.53% | | |
| Service Class | | 12/19/2000 | | -1.43% | | 6.27% | | 10.40% | | |
| Administrative Class | | 11/01/2004 | | -1.46% | | 6.18% | | 10.30% | | |
| Class R4 | | 04/01/2014 | | -1.65% | | 6.02% | | | | 6.16% |
| Class A | | 11/01/2004 | | -1.75% | | 5.92% | | 10.00% | | |
| Class A (sales load deducted)* | | 11/01/2004 | | -7.15% | | 4.73% | | 9.38% | | |
| Class R3 | | 11/01/2004 | | -1.85% | | 5.76% | | 9.78% | | |
| Russell 1000 Value Index | | 4.00% | | 7.79% | | 11.46% | | 7.99% |
* Class A (sales load deducted) returns include the 5.50% maximum sales charge.
Generally accepted accounting principles require adjustments to be made to the net assets of the Fund at period end for financial reporting purposes only, and as such, the total return based on the unadjusted net asset value per share may differ from the total return reported in the financial highlights.
Performance results in the graph and table are shown both with and without the imposition of the maximum applicable sales charge (if applicable) and reflect the percentage change in net asset value, including reinvestment of dividends and capital gains distributions. Investors should note that the Fund is a professionally managed mutual fund, while the index or indexes shown above are unmanaged, cannot be purchased directly, and, with the exception of any peer group index, do not incur expenses.
Performance data quoted in the graph and table represents past performance; past performance is not predictive of future results. The investment return and principal value of shares of the Fund fluctuate, so your shares, when sold, may be worth more or less than their original cost. Current performance of the Fund may be lower or higher than the performance quoted. The performance shown does not reflect the deduction of taxes, if any, that a shareholder would pay on Fund distributions or the redemption of Fund shares. Performance data current to the most recent month end may be obtained by calling1-888-309-3539.
Investors should read the Fund’s prospectus with regard to the Fund’s investment objectives, risks, and charges and expenses in conjunction with these financial statements. Employee retirement benefit plans that invest plan assets in the Separate Investment Accounts (SIAs) may be subject to certain charges as set forth in their respective Plan Documents. Total return figures would be lower for the periods presented if they reflected these charges.
28
MassMutual Premier Main Street Fund – Portfolio Manager Report (Unaudited)
What is the investment approach of MassMutual Premier Main Street Fund, and who is the Fund’s subadviser?
The Fund seeks a high total return by investing primarily in common stocks of U.S. companies of different capitalization ranges. The Fund’s subadviser currently focuses on “large capitalization” issuers, which are considered to be companies with market capitalizations at the time of purchase within the market capitalization range of companies included within the Russell 1000® Index, although it may purchase stocks of companies with any market capitalization. At the close of business on May 24, 2019, Invesco Advisers, Inc. (Invesco) replaced OFI Global Institutional, Inc. (OFI Global) as the subadviser of the Fund. The portfolio management team at OFI Global with responsibility for the Fund became employees of Invesco and there was no change in the Fund’s investment process or philosophies.
How did the Fund perform during the 12 months ended September 30, 2019?
The Fund’s Class R5 shares returned 5.47%, outperforming the 4.25% return of the S&P 500® Index (the “benchmark”), which measures the performance of 500 widely held stocks in the U.S. equity market.
For a discussion on the economic and market environment during the12-month period ended September 30, 2019, please see the Economic and Market Overview, beginning on page 3.
Subadviser discussion of factors that contributed to the Fund’s performance
Strong stock selection within the financials and industrials sectors drove the Fund’s outperformance during the reporting period, although this was partially offset by less-than-favorable stock selection within the consumer staples sector and a modest underweight allocation, relative to the benchmark, to the utilities sector.
The threetop-performing Fund holdings during the reporting period were Motorola Solutions, Prologis, and Microsoft. Motorola Solutions provides communication infrastructure, devices, and services. The company has displayed strong execution and its market fundamentals have been healthy. On the competitive front, intellectual property-related issues and China trade tensions have significantly impacted its China-based competitors, leaving Motorola with near monopoly status in some markets. Prologis, an industrial real estate investment trust, performed strongly during the reporting period, outpacing both the real estate sector and the overall market. Prologis benefited from solid demand for its warehouse properties, which translated to strong rent growth from both new and renewing tenants. In addition, Prologis successfully completed two important acquisitions during the period, which increased its density and competitive positioning in key U.S. distribution markets. The growth ofe-commerce, led by Amazon, has been a key demand driver, with the push for ever-faster delivery times forcing traditional retailers and their suppliers to reconfigure their warehouse “footprints” to be closer to their end customers. Software giant Microsoft continued to see strength across its business lines, which led to both strongtop-line growth and margin expansion.
The Fund holdings that detracted from relative performance during the period included DXC Technology, UnitedHealth, and Suncor. DXC provides technology consulting, outsourcing, and support services. Shares of DXC were under pressure due to concerns over the company’s ability to execute on its plan to deliver organictop-line growth. In order to more quickly pivot towards this initiative, the company announced its intention to increase spending on hiring in its digital business. This pushed operating margin expansion over the near term, affecting profits. Fund managers eliminated DXC from the Fund’s portfolio. UnitedHealth, a pharmacy benefit provider, was dragged down with the sector due to single-payer rhetoric by one of the leading presidential candidates. Additionally, the company reported mediocre second-quarter 2019 earnings and lowered revenue guidance. Suncor is an integrated energy company headquartered in Alberta, Canada. The company’s exposure to falling oil prices was the primary driver of weakness in Suncor’s share price. The CEO’s retirement announcement in late 2018 and mandatory oil production curtailments for the sector announced by the Alberta government were also headwinds.
Subadviser outlook
In the short term, Invesco expects the U.S. economy to continue to show economic growth, albeit at slower rates than experienced in 2018, driven by favorable consumer confidence, falling regulatory hurdles, and technological innovation. However, Fund management believes there are several warning signs on the horizon – including global growth becoming less synchronized, weakening transport volumes, elevated levels of inventories as companies hedge their risk of tariffs, and the flattening or
29
MassMutual Premier Main Street Fund – Portfolio Manager Report (Unaudited)(Continued)
inversion of the yield curve implying a slowing economy. While a recession later this year or early next would not surprise Fund management, it is not their base case assumption as they head into the next fiscal year.
Fund management continues to focus on the fundamentals of each company to drive their investment decisions, rather than getting caught up in the temporary emotions of the market. Their philosophy is to focus on companies with sustainable competitive advantages that they believe have the potential to outperform in most market environments.
| | | | |
| |
MassMutual Premier
Main Street Fund
Largest Holdings
(% of Net Assets) on 9/30/19 | |
| | |
Microsoft Corp. | | | 7.5 | % |
JP Morgan Chase & Co. | | | 4.8 | % |
The Procter & Gamble Co. | | | 4.1 | % |
Amazon.com, Inc. | | | 3.6 | % |
Facebook, Inc. Class A | | | 3.5 | % |
Berkshire Hathaway, Inc. Class B | | | 3.3 | % |
Prologis, Inc. | | | 3.4 | % |
UnitedHealth Group, Inc. | | | 3.3 | % |
Merck & Co., Inc. | | | 3.2 | % |
Lockheed Martin Corp. | | | 3.1 | % |
| | | | | |
| | | | 39.8 | % |
| | | | | |
| | | | |
| |
MassMutual Premier
Main Street Fund
Sector Table
(% of Net Assets) on 9/30/19 | |
| | |
Consumer,Non-cyclical | | | 25.2 | % |
Financial | | | 22.5 | % |
Communications | | | 14.1 | % |
Technology | | | 13.8 | % |
Consumer, Cyclical | | | 8.8 | % |
Industrial | | | 7.4 | % |
Energy | | | 5.3 | % |
Utilities | | | 1.5 | % |
Basic Materials | | | 0.6 | % |
| | | | | |
Total Long-Term Investments | | | 99.2 | % |
Short-Term Investments and Other Assets and Liabilities | | | 0.8 | % |
| | | | | |
Net Assets | | | 100.0 | % |
| | | | | |
30
MassMutual Premier Main Street Fund – Portfolio Manager Report (Unaudited)(Continued)
GROWTH OF $10,000 INVESTMENT
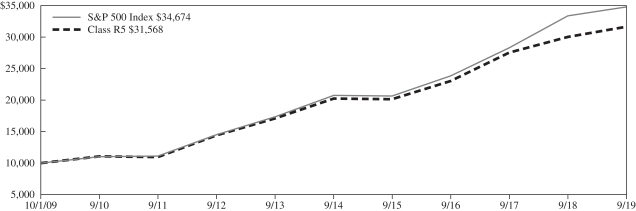
The graph above illustrates a representative class of the Fund’s historical performance for the past 10 fiscal years or since inception (for Funds lacking 10-year records) in comparison to its benchmark index, as well as one or more additional indexes, if applicable. The performance of other share classes will be greater than or less than the class depicted above.
| | | | | | | | | | |
| Average Annual Total Returns(for the periods ended 09/30/2019) |
| | | | | | |
| | | Inception Date
of Class | | 1 Year | | 5 Years | | 10 Years | | Since Inception
04/01/2014 |
| Class I | | 04/01/2014 | | 5.60% | | 9.42% | | | | 9.71% |
| Class R5 | | 12/31/2004 | | 5.47% | | 9.31% | | 12.18% | | |
| Service Class | | 12/31/2004 | | 5.38% | | 9.22% | | 12.10% | | |
| Administrative Class | | 12/31/2004 | | 5.30% | | 9.11% | | 11.96% | | |
| Class R4 | | 04/01/2014 | | 5.08% | | 8.94% | | | | 9.22% |
| Class A | | 12/31/2004 | | 5.01% | | 8.82% | | 11.68% | | |
| Class A (sales load deducted)* | | 12/31/2004 | | -0.76% | | 7.60% | | 11.05% | | |
| Class R3 | | 12/31/2004 | | 4.87% | | 8.67% | | 11.44% | | |
| S&P 500 Index | | 4.25% | | 10.84% | | 13.24% | | 11.05% |
* Class A (sales load deducted) returns include the 5.50% maximum sales charge.
Generally accepted accounting principles require adjustments to be made to the net assets of the Fund at period end for financial reporting purposes only, and as such, the total return based on the unadjusted net asset value per share may differ from the total return reported in the financial highlights.
Performance results in the graph and table are shown both with and without the imposition of the maximum applicable sales charge (if applicable) and reflect the percentage change in net asset value, including reinvestment of dividends and capital gains distributions. Investors should note that the Fund is a professionally managed mutual fund, while the index or indexes shown above are unmanaged, cannot be purchased directly, and, with the exception of any peer group index, do not incur expenses.
Performance data quoted in the graph and table represents past performance; past performance is not predictive of future results. The investment return and principal value of shares of the Fund fluctuate, so your shares, when sold, may be worth more or less than their original cost. Current performance of the Fund may be lower or higher than the performance quoted. The performance shown does not reflect the deduction of taxes, if any, that a shareholder would pay on Fund distributions or the redemption of Fund shares. Performance data current to the most recent month end may be obtained by calling1-888-309-3539.
Investors should read the Fund’s prospectus with regard to the Fund’s investment objectives, risks, and charges and expenses in conjunction with these financial statements. Employee retirement benefit plans that invest plan assets in the Separate Investment Accounts (SIAs) may be subject to certain charges as set forth in their respective Plan Documents. Total return figures would be lower for the periods presented if they reflected these charges.
31
MassMutual Premier Disciplined Growth Fund – Portfolio Manager Report (Unaudited)
What is the investment approach of MassMutual Premier Disciplined Growth Fund, and who is the Fund’s subadviser?
The Fund seeks to create a diversified portfolio of equity securities in order to outperform the total return performance of its benchmark, the Russell 1000®Growth Index*. Under normal circumstances, the Fund invests mainly in common stocks of companies that the Fund’s subadviser believes offer the potential for long-term growth. The Fund will normally invest in common stocks of companies with market capitalizations of at least $200 million at the time of purchase. The Fund’s subadviser is Barings LLC (Barings).
* The Fund is not promoted, sponsored, or endorsed by, nor in any way affiliated with Russell Investment Group (“Russell”). Russell is not responsible for and has not reviewed the Fund nor any associated literature or publications and Russell makes no representation or warranty, express or implied, as to their accuracy, or completeness, or otherwise. The Russell 1000® Growth Index and Russell® are trademarks of the Frank Russell Company.
How did the Fund perform during the 12 months ended September 30, 2019?
The Fund’s Service Class shares returned 0.79%, underperforming the 3.71% return of the Russell 1000 Growth Index (the “benchmark”), which measures the performance of thelarge-cap growth segment of U.S. equity securities. It includes the Russell 1000 Index companies with higherprice-to-book ratios and higher forecasted growth values. It is market-capitalization weighted.
For a discussion on the economic and market environment during the12-month period ended September 30, 2019, please see the Economic and Market Overview, beginning on page 3.
Subadviser discussion of factors that contributed to the Fund’s performance
Large-cap growth stocks outperformed their value counterparts in 2018 by the widest margin since 1990. The only other comparable period was during the technology stock bubble in 1999 – and value issues outperformed their growth brethren the following year by 36%. For this reporting period, value outperformed growth, but only by 0.27%.
The Fund incurred most of its relative underperformance due to its underweight allocation, relative to the benchmark, to consumer staples. Consumer staples companies like Coca-Cola and Pepsi did well last year as investors looked for stability and for stocks that had less exposure to the trade war. Fund management believed that investors were paying too much for this safety, so the Fund held an underweight allocation to consumer staples. The largest holding in the Fund’s portfolio was Apple Inc., and it rose less than 1% for the year, which also dragged on performance.
The energy sector was down 27% during the period, making it the worst-performing sector in the benchmark. The Fund held an underweight stake in the energy sector, as stocks like Halliburton, an oil service company, fell 52%. This underweight allocation helped relative performance. Holding an underweight stake in NVIDIA, a semiconductor manufacturer, also helped the Fund’s returns, as NVIDIA’s shares fell 38% during the period.
The Fund used derivatives to facilitate Fund flows and this added modestly to performance during the period. Derivatives are securities that derive their value from the performance of one or more other investments and take the form of a contract between two or more parties. Most derivatives are used for hedging, speculation, or both.
Subadviser outlook
The largest growth stocks in the U.S. have growth rates three times that of the smallest growth stocks. This advantage is unusual, since smaller, newer companies often grow faster. Currently, the largest growth companies tend to be light on assets and have very high margins. The raw material for many is data, and some even obtain that data free of charge. This is a tremendous advantage, and it has allowed them to accrue a disproportionate share of profits. The market has noticed, and the largest growth stocks have outperformed the average growth stocks by 4% per year for the past four years.
Fund management believes that, early on in this cycle, the market did not give growth companies enough credit for their high margins. Thinking the advantage might be cyclical, investors did not want to overpay for cyclically high margins. In Barings’ view, the narrative has now changed, and many investors see the large growth companies’ advantage as permanent. Fund management falls somewhere in the middle. They believe that large growth companies certainly do have an advantage, but Fund management does not want to overpay for that advantage as some investors did in the late 1990s.
32
MassMutual Premier Disciplined Growth Fund – Portfolio Manager Report (Unaudited)(Continued)
| | | | |
| |
MassMutual Premier
Disciplined Growth Fund
Largest Holdings
(% of Net Assets) on 9/30/19 | |
| | |
Microsoft Corp. | | | 8.6 | % |
Apple, Inc. | | | 8.1 | % |
Amazon.com, Inc. | | | 5.3 | % |
Facebook, Inc. Class A | | | 3.4 | % |
Alphabet, Inc. Class A | | | 3.0 | % |
Alphabet, Inc. Class C | | | 2.8 | % |
Cisco Systems, Inc. | | | 2.1 | % |
Mastercard, Inc. Class A | | | 2.1 | % |
Merck & Co., Inc. | | | 2.0 | % |
Visa, Inc. Class A | | | 1.9 | % |
| | | | | |
| | | | 39.3 | % |
| | | | | |
| | | | |
| |
MassMutual Premier
Disciplined Growth Fund
Sector Table
(% of Net Assets) on 9/30/19 | |
| | |
Technology | | | 30.7 | % |
Communications | | | 22.1 | % |
Consumer,Non-cyclical | | | 20.4 | % |
Consumer, Cyclical | | | 9.1 | % |
Financial | | | 8.6 | % |
Industrial | | | 8.1 | % |
Basic Materials | | | 0.7 | % |
Energy | | | 0.2 | % |
Mutual Funds | | | 0.1 | % |
| | | | | |
Total Long-Term Investments | | | 100.0 | % |
Short-Term Investments and Other Assets and Liabilities | | | 0.0 | % |
| | | | | |
Net Assets | | | 100.0 | % |
| | | | | |
33
MassMutual Premier Disciplined Growth Fund – Portfolio Manager Report (Unaudited)(Continued)
GROWTH OF $10,000 INVESTMENT
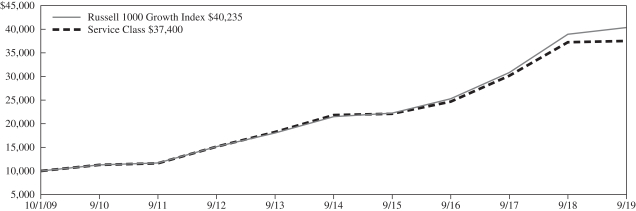
The graph above illustrates a representative class of the Fund’s historical performance for the past 10 fiscal years or since inception (for Funds lacking 10-year records) in comparison to its benchmark index, as well as one or more additional indexes, if applicable. The performance of other share classes will be greater than or less than the class depicted above.
| | | | | | | | | | |
| Average Annual Total Returns(for the periods ended 09/30/2019) |
| | | | | | |
| | | Inception Date
of Class | | 1 Year | | 5 Years | | 10 Years | | Since Inception
04/01/2014 |
| Class I | | 04/01/2014 | | 0.99% | | 11.67% | | | | 11.76% |
| Class R5 | | 11/01/2004 | | 0.85% | | 11.54% | | 14.20% | | |
| Service Class | | 12/19/2000 | | 0.79% | | 11.42% | | 14.10% | | |
| Administrative Class | | 11/01/2004 | | 0.66% | | 11.33% | | 13.99% | | |
| Class R4 | | 04/01/2014 | | 0.59% | | 11.17% | | | | 11.25% |
| Class A | | 11/01/2004 | | 0.42% | | 11.04% | | 13.69% | | |
| Class A (sales load deducted)* | | 11/01/2004 | | -5.10% | | 9.79% | | 13.05% | | |
| Class R3 | | 04/01/2014 | | 0.23% | | 10.86% | | | | 10.95% |
| Russell 1000 Growth Index | | 3.71% | | 13.39% | | 14.94% | | 13.43% |
* Class A (sales load deducted) returns include the 5.50% maximum sales charge.
Generally accepted accounting principles require adjustments to be made to the net assets of the Fund at period end for financial reporting purposes only, and as such, the total return based on the unadjusted net asset value per share may differ from the total return reported in the financial highlights.
Performance results in the graph and table are shown both with and without the imposition of the maximum applicable sales charge (if applicable) and reflect the percentage change in net asset value, including reinvestment of dividends and capital gains distributions. Investors should note that the Fund is a professionally managed mutual fund, while the index or indexes shown above are unmanaged, cannot be purchased directly, and, with the exception of any peer group index, do not incur expenses.
Performance data quoted in the graph and table represents past performance; past performance is not predictive of future results. The investment return and principal value of shares of the Fund fluctuate, so your shares, when sold, may be worth more or less than their original cost. Current performance of the Fund may be lower or higher than the performance quoted. The performance shown does not reflect the deduction of taxes, if any, that a shareholder would pay on Fund distributions or the redemption of Fund shares. Performance data current to the most recent month end may be obtained by calling1-888-309-3539.
Investors should read the Fund’s prospectus with regard to the Fund’s investment objectives, risks, and charges and expenses in conjunction with these financial statements. Employee retirement benefit plans that invest plan assets in the Separate Investment Accounts (SIAs) may be subject to certain charges as set forth in their respective Plan Documents. Total return figures would be lower for the periods presented if they reflected these charges.
34
MassMutual Premier Small Cap Opportunities Fund – Portfolio Manager Report (Unaudited)
What is the investment approach of MassMutual Premier Small Cap Opportunities Fund, and who is the Fund’s subadviser?
The Fund seeks capital appreciation by investing primarily in common stocks of small-capitalization U.S. companies that the Fund’s subadviser believes have favorable business trends or prospects based on fundamental analysis. Under normal circumstances, the Fund invests at least 80% of its net assets (plus the amount of any borrowings for investment purposes) in securities ofsmall-cap companies. At the close of business on May 24, 2019, Invesco Advisers, Inc. (Invesco) replaced OFI Global Institutional, Inc. (OFI Global) as the subadviser of the Fund. The portfolio management team at OFI Global with responsibility for the Fund became employees of Invesco and there was no change in the Fund’s investment process or philosophies.
How did the Fund perform during the 12 months ended September 30, 2019?
The Fund’s Class A shares returned-7.54%, outperforming the-8.89% return of the Russell 2000®Index (the “benchmark”), which measures the performance of thesmall-cap segment of the U.S. equity universe. It is a subset of the Russell 3000 Index and includes approximately 2000 of the smallest securities based on a combination of their market cap and current index membership.
For a discussion on the economic and market environment during the12-month period ended September 30, 2019, please see the Economic and Market Overview, beginning on page 3.
Subadviser discussion of factors that contributed to the Fund’s performance
Strong stock selection within the communication services, information technology, and materials sectors drove the Fund’s outperformance during the period, although this was partially offset by less-than-favorable stock selection within the consumer staples, financials, and industrials sectors.
Thetop-performing Fund holdings were Zynga, CACI International, and Generac. American social game developer Zynga posted strong results during the reporting period. The company has a strong pipeline of upcoming title launches through 2019 and 2020, while its core franchise titles continue to show growth. CACI is an information solutions and services company that supports national defense and government-related customers. The company also delivered organic growth and margin expansion. Shares of Generac moved higher, as investors considered new and emerging growth opportunities for the company in California. As a leader in the U.S. home standby (HSB) generator market, Generac appears to be well positioned to benefit from the troubles of California’s PG&E utility, which has implemented rolling blackouts to a large portion of its customer base in an effort to avoid the kind of sparking wildfires that have occurred over the last several years. HSBs are only 1% penetrated in California, well below the national average, so the opportunity for Generac to increase share there over time appears to be substantial.
Fund holdings that were key individual detractors from the Fund’s relative performance during the period included Weight Watchers International, Matador Resources, and Ligand Pharmaceuticals. Weight Watchers saw its membership growth decelerate dramatically year-over-year in the first quarter of 2019, a time frame that ordinarily accounts for 40% of their membership acquisition. Weight Watchers management did not pull back on spending in response, resulting in a dramatically lowerearnings-per-share outlook for 2019 versus the prior year. Matador Resources’ exposure to falling oil prices drove its weakness over this period. Matador is an energy company engaged in the exploration, development, production, and acquisition of oil and natural gas. Ligand, a biopharmaceutical company, had concerns around the durability of one of its key royalty products, based on a recent competitor entering the market albeit with seemingly inferior data. There are also concerns around the patent of this product, which should remain in force until at least 2023. Fund managers sold both Weight Watchers and Ligand during the reporting period.
Subadviser outlook
In the short term, Invesco expects the U.S. economy to continue to show economic growth, albeit at slower rates than experienced in 2018, driven by favorable consumer confidence, falling regulatory hurdles, and technological innovation. However, Fund management believes there are several warning signs on the horizon – including global growth becoming less synchronized, weakening transport volumes, elevated levels of inventories as companies hedge their risk of tariffs, and the flattening or
35
MassMutual Premier Small Cap Opportunities Fund – Portfolio Manager Report (Unaudited)(Continued)
inversion of the yield curve implying a slowing economy. While a recession later this year or early next would not surprise Fund management, it is not their base case assumption as they head into the next fiscal year.
Fund management continues to focus on the fundamentals of each company to drive their investment decisions, rather than getting caught up in the temporary emotions of the market. Their philosophy is to focus on companies with superior execution that they believe have the potential to outperform in most market environments. They combine that approach with their valuation discipline to seek a margin of safety, with limiting downside risk always being an important consideration.
| | | | |
| |
MassMutual Premier
Small Cap Opportunities Fund
Largest Holdings
(% of Net Assets) on 9/30/19 | |
| | |
Zynga, Inc. Class A | | | 2.4 | % |
CACI International, Inc. Class A | | | 2.3 | % |
ASGN, Inc. | | | 2.2 | % |
WSFS Financial Corp. | | | 2.2 | % |
j2 Global, Inc. | | | 2.0 | % |
Korn Ferry | | | 2.0 | % |
Visteon Corp. | | | 2.0 | % |
Four Corners Property Trust, Inc. | | | 1.9 | % |
MKS Instruments, Inc. | | | 1.9 | % |
Generac Holdings, Inc. | | | 1.8 | % |
| | | | | |
| | | | 20.7 | % |
| | | | | |
| | | | |
| |
MassMutual Premier
Small Cap Opportunities Fund
Sector Table
(% of Net Assets) on 9/30/19 | |
| | |
Financial | | | 22.7 | % |
Consumer,Non-cyclical | | | 18.6 | % |
Industrial | | | 16.3 | % |
Technology | | | 14.2 | % |
Consumer, Cyclical | | | 13.5 | % |
Basic Materials | | | 3.7 | % |
Energy | | | 3.4 | % |
Utilities | | | 3.3 | % |
Mutual Funds | | | 3.0 | % |
Communications | | | 2.9 | % |
| | | | | |
Total Long-Term Investments | | | 101.6 | % |
Short-Term Investments and Other Assets and Liabilities | | | (1.6 | )% |
| | | | | |
Net Assets | | | 100.0 | % |
| | | | | |
36
MassMutual Premier Small Cap Opportunities Fund – Portfolio Manager Report (Unaudited)(Continued)
GROWTH OF $10,000 INVESTMENT
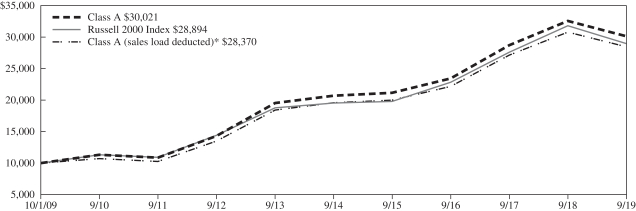
The graph above illustrates a representative class of the Fund’s historical performance for the past 10 fiscal years or since inception (for Funds lacking 10-year records) in comparison to its benchmark index, as well as one or more additional indexes, if applicable. The performance of other share classes will be greater than or less than the class depicted above.
| | | | | | | | | | |
| Average Annual Total Returns(for the periods ended 09/30/2019) |
| | | | | | |
| | | Inception Date
of Class | | 1 Year | | 5 Years | | 10 Years | | Since Inception
04/01/2014 |
| Class I | | 04/01/2014 | | -7.01% | | 8.35% | | | | 6.75% |
| Class R5 | | 11/01/2004 | | -7.14% | | 8.21% | | 12.11% | | |
| Service Class | | 11/01/2004 | | -7.16% | | 8.12% | | 12.02% | | |
| Administrative Class | | 11/01/2004 | | -7.28% | | 8.00% | | 11.90% | | |
| Class R4 | | 04/01/2014 | | -7.43% | | 7.85% | | | | 6.25% |
| Class A | | 07/20/1998 | | -7.54% | | 7.74% | | 11.62% | | |
| Class A (sales load deducted)* | | 07/20/1998 | | -12.63% | | 6.52% | | 10.99% | | |
| Class R3 | | 04/01/2014 | | -7.66% | | 7.58% | | | | 5.99% |
| Russell 2000 Index | | -8.89% | | 8.19% | | 11.19% | | 6.32% |
* Class A (sales load deducted) returns include the 5.50% maximum sales charge.
Generally accepted accounting principles require adjustments to be made to the net assets of the Fund at period end for financial reporting purposes only, and as such, the total return based on the unadjusted net asset value per share may differ from the total return reported in the financial highlights.
Performance results in the graph and table are shown both with and without the imposition of the maximum applicable sales charge (if applicable) and reflect the percentage change in net asset value, including reinvestment of dividends and capital gains distributions. Investors should note that the Fund is a professionally managed mutual fund, while the index or indexes shown above are unmanaged, cannot be purchased directly, and, with the exception of any peer group index, do not incur expenses.
Performance data quoted in the graph and table represents past performance; past performance is not predictive of future results. The investment return and principal value of shares of the Fund fluctuate, so your shares, when sold, may be worth more or less than their original cost. Current performance of the Fund may be lower or higher than the performance quoted. The performance shown does not reflect the deduction of taxes, if any, that a shareholder would pay on Fund distributions or the redemption of Fund shares. Performance data current to the most recent month end may be obtained by calling1-888-309-3539.
Investors should read the Fund’s prospectus with regard to the Fund’s investment objectives, risks, and charges and expenses in conjunction with these financial statements. Employee retirement benefit plans that invest plan assets in the Separate Investment Accounts (SIAs) may be subject to certain charges as set forth in their respective Plan Documents. Total return figures would be lower for the periods presented if they reflected these charges.
37
MassMutual Premier Global Fund – Portfolio Manager Report (Unaudited)
What is the investment approach of MassMutual Premier Global Fund, and who is the Fund’s subadviser?
The Fund seeks long-term capital appreciation by investing primarily in common stocks of companies in the U.S. and foreign countries. The Fund can invest without limit in foreign securities, including American Depositary Receipts (ADRs), and can invest in any country, including developing or emerging market countries. However, the Fund currently emphasizes investments in developed markets such as the United States, Western European countries, and Japan. As a fundamental policy, the Fund normally will invest in at least three countries (one of which may be the United States) and typically invests in a number of different countries. At the close of business on May 24, 2019, Invesco Advisers, Inc. (Invesco) replaced OppenheimerFunds, Inc. (OFI) as the subadviser of the Fund. The portfolio management team at OFI with responsibility for the Fund became employees of Invesco and there was no change in the Fund’s investment process or philosophies.
How did the Fund perform during the 12 months ended September 30, 2019?
The Fund’s Class R5 shares returned-2.07%, underperforming the 1.38% return of the MSCI All Country World Index(ACWI)(the “benchmark”), which measures the performance of the large- andmid-cap segments of all country markets. It is free float-adjusted market-capitalization weighted.
For a discussion on the economic and market environment during the12-month period ended September 30, 2019, please see the Economic and Market Overview, beginning on page 3.
Subadviser discussion of factors that contributed to the Fund’s performance
Stock selection in the health care and consumer discretionary sectors drove the Fund’s underperformance relative to the benchmark during the reporting period. The Fund outperformed the benchmark in the technology and energy sectors, due to an overweight allocation, relative to the benchmark, to technology, and a significantly underweight position in energy.
The Fund holdings that detracted from performance for the reporting period were Baidu, Inc.; Centene Corp.; and Tiffany & Co. Baidu, the Chinese internet search leader, reported weak financial results, which underscored surprising deterioration in its core search business. Worse yet, company management’s lack of direction on what they were going to do about it led Fund management to eliminate this position from the Fund’s portfolio. Centene, a health care company that provides services to government-sponsored health care programs, declined over the reporting period. In March 2019, Centene announced a $17.5 billion buyout of competitor WellCare Health Plans in a deal intended to create the world’s largest Medicare managed care company, serving more than 12.3 million customers. Centene’s stock has been down partly due to uncertainty around the acquisition, although Centene posted solid second-quarter 2019 results. Tiffany & Co. disappointed investors with its third-quarter 2018 earnings report, which showed positive but decelerating year-over-year comparisons, particularly with respect to sales at its 5th Avenue New York City flagship store. Further, the strength of the U.S. dollar is dampening sales to international tourists, especially from China.
The Fund holdings that contributed to performance for the reporting period were S&P Global Inc., LVMH, and ICICI Bank Limited. In Invesco’s view, S&P Global has a very good business model. Its ratings business is one of a very few similar businesses who benefit when debt is either being issued or refinanced. S&P Global also earns a royalty stream from its suite of index offerings, such as the S&P 500® Index, and passive investment trends have been quite beneficial for the company. LVMH has continued to post impressive results. It is a unique,best-of-breed luxury goods company. Though cyclical at times, it has a powerful economic moat, supported by exceptional brand stewardship. ICICI Bank Limited continues to see improvements in itsnon-performing loan book. Furthermore, the loan book has seen growth at amid-teens rate and its net interest margin has been steady.
Subadviser outlook
Invesco notes that the past 12 months were mixed for global equities. The ACWI was just slightly better than flat, though the muted overall performance masked significant volatility along the way. An undertone of stress caused by global trade tensions appeared to be weighing on manufacturing and other economic activity. However, after a difficult fourth quarter 2018, markets in aggregate have done extremely well inyear-to-date 2019. The NASDAQ 100 Index is up close to 20% on the year, and even
38
MassMutual Premier Global Fund – Portfolio Manager Report (Unaudited)(Continued)
across Europe, most bourses have postedmid-teen returns. Interest rates are, in Fund management’s view, an important reason for these positive developments. Though investing in a negative-yielding bond is purely speculation, investors are doing so, and that makes future dividends and cash flow all the more valuable. France, Germany, Sweden, the Netherlands, Switzerland, and Japan all have negative long-term bond yields. In such an environment, Fund management prefers to purchase stocks, especially those companies that appear to be growing, rather than paying for the privilege of loaning money to a sovereign.
Invesco’s thematic, long-term, investment style leads Fund management toward quality businesses that demonstrate sustainability of both their enterprise and their market advantage. This, they believe, could be an important buffer against the rising chatter of protectionist trade policies. They select Fund holdings for the sustainability of their business purpose and the sensibility of their price. In Fund management’s view, if they have that combination well calibrated, then the Fund could have the potential to weather most transient controversies relatively well, and possibly create meaningful economic value for its clients.
| | | | |
| |
MassMutual Premier
Global Fund
Largest Holdings
(% of Net Assets) on 9/30/19 | |
| | |
Alphabet, Inc. Class A | | | 7.2 | % |
LVMH Moet Hennessy Louis Vuitton SE | | | 4.0 | % |
Airbus SE | | | 3.9 | % |
S&P Global, Inc. | | | 3.6 | % |
Intuit, Inc. | | | 3.5 | % |
Facebook, Inc. Class A | | | 3.3 | % |
Adobe, Inc. | | | 3.2 | % |
SAP SE | | | 2.7 | % |
Nidec Corp. | | | 2.5 | % |
Citigroup, Inc. | | | 2.5 | % |
| | | | | |
| | | | 36.4 | % |
| | | | | |
| | | | |
| |
MassMutual Premier
Global Fund
Sector Table
(% of Net Assets) on 9/30/19 | |
| | |
Consumer,Non-cyclical | | | 24.2 | % |
Industrial | | | 21.0 | % |
Communications | | | 14.9 | % |
Technology | | | 14.0 | % |
Financial | | | 12.7 | % |
Consumer, Cyclical | | | 11.4 | % |
Mutual Funds | | | 0.8 | % |
Energy | | | 0.3 | % |
| | | | | |
Total Long-Term Investments | | | 99.3 | % |
Short-Term Investments and Other Assets and Liabilities | | | 0.7 | % |
| | | | | |
Net Assets | | | 100.0 | % |
| | | | | |
39
MassMutual Premier Global Fund – Portfolio Manager Report (Unaudited)(Continued)
GROWTH OF $10,000 INVESTMENT
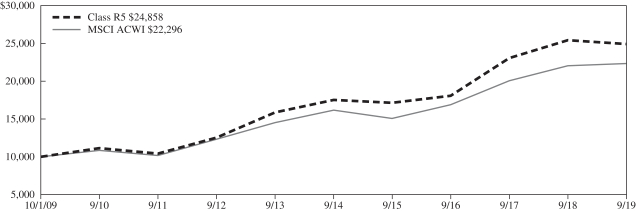
The graph above illustrates a representative class of the Fund’s historical performance for the past 10 fiscal years or since inception (for Funds lacking 10-year records) in comparison to its benchmark index, as well as one or more additional indexes, if applicable. The performance of other share classes will be greater than or less than the class depicted above.
| | | | | | | | | | |
| Average Annual Total Returns(for the periods ended 09/30/2019) |
| | | | | | |
| | | Inception Date
of Class | | 1 Year | | 5 Years | | 10 Years | | Since Inception
04/01/2014 |
| Class I | | 04/01/2014 | | -1.93% | | 7.39% | | | | 7.04% |
| Class R5 | | 12/31/2004 | | -2.07% | | 7.29% | | 9.53% | | |
| Service Class | | 12/31/2004 | | -2.23% | | 7.16% | | 9.40% | | |
| Administrative Class | | 12/31/2004 | | -2.30% | | 7.06% | | 9.28% | | |
| Class R4 | | 04/01/2014 | | -2.45% | | 6.90% | | | | 6.55% |
| Class A | | 12/31/2004 | | -2.48% | | 6.81% | | 8.99% | | |
| Class A (sales load deducted)* | | 12/31/2004 | | -7.85% | | 5.61% | | 8.38% | | |
| Class R3 | | 12/31/2004 | | -2.69% | | 6.65% | | 8.87% | | |
| MSCI ACWI | | 1.38% | | 6.65% | | 8.35% | | 6.53% |
* Class A (sales load deducted) returns include the 5.50% maximum sales charge.
Generally accepted accounting principles require adjustments to be made to the net assets of the Fund at period end for financial reporting purposes only, and as such, the total return based on the unadjusted net asset value per share may differ from the total return reported in the financial highlights.
Performance results in the graph and table are shown both with and without the imposition of the maximum applicable sales charge (if applicable) and reflect the percentage change in net asset value, including reinvestment of dividends and capital gains distributions. Investors should note that the Fund is a professionally managed mutual fund, while the index or indexes shown above are unmanaged, cannot be purchased directly, and, with the exception of any peer group index, do not incur expenses.
Performance data quoted in the graph and table represents past performance; past performance is not predictive of future results. The investment return and principal value of shares of the Fund fluctuate, so your shares, when sold, may be worth more or less than their original cost. Current performance of the Fund may be lower or higher than the performance quoted. The performance shown does not reflect the deduction of taxes, if any, that a shareholder would pay on Fund distributions or the redemption of Fund shares. Performance data current to the most recent month end may be obtained by calling1-888-309-3539.
Investors should read the Fund’s prospectus with regard to the Fund’s investment objectives, risks, and charges and expenses in conjunction with these financial statements. Employee retirement benefit plans that invest plan assets in the Separate Investment Accounts (SIAs) may be subject to certain charges as set forth in their respective Plan Documents. Total return figures would be lower for the periods presented if they reflected these charges.
40
MassMutual Premier International Equity Fund – Portfolio Manager Report (Unaudited)
What is the investment approach of MassMutual Premier International Equity Fund, and who is the Fund’s subadviser?
The Fund seeks to achieve long-term capital appreciation by investing primarily in common stock of foreign companies. The Fund invests primarily in the common stock of growth companies that are domiciled or that have their primary operations outside of the United States. Under normal circumstances, the Fund invests at least 80% of its net assets (plus the amount of any borrowings for investment purposes) in securities of foreign companies. At the close of business on May 24, 2019, Invesco Advisers, Inc. (Invesco) replaced OFI Global Institutional, Inc. (OFI Global) as the subadviser of the Fund. The portfolio management team at OFI Global with responsibility for the Fund became employees of Invesco and there was no change in the Fund’s investment process or philosophies.
How did the Fund perform during the 12 months ended September 30, 2019?
The Fund’s Class R5 shares returned-2.63%, underperforming the -1.23% return of the MSCI All Country World Index (ACWI) ex USA(the “benchmark”), which measures the performance of the large- andmid-cap segments of the particular regions, excluding U.S. equity securities, including developed and emerging markets. It is free float-adjusted market-capitalization weighted.
For a discussion on the economic and market environment during the12-month period ended September 30, 2019, please see the Economic and Market Overview, beginning on page 3.
Subadviser discussion of factors that contributed to the Fund’s performance
From a sector perspective, Fund holdings within the information technology, consumer discretionary, and communication services sectors detracted the most from the Fund’s full-year returns. The individual Fund holdings that detracted the most from performance during the reporting period were Infineon Technologies AG, Baidu, Inc., and ams AG. Infineon Technologies, a German semiconductor company, is the dominant provider to the automotive industry. Fund management added it to the portfolio in late 2014 as part of the Fund’s investment theme focused on the evolution of the car. Over the years, the Fund has enjoyed significant gains from the stock. Fund management’s thesis for Infineon remains intact, but Infineon’s end clients are adjusting their supply chains to what may be the “new normal” in global trade relations. The cost of this adjustment may put some pressure on volumes and pricing on even the premier players within that chain. Therefore, Fund management trimmed the Fund’s position in this holding during the period. Baidu, the Chinese internet search company, was added to the portfolio inmid-2017, based on the growth of the Chinese consumer market and Baidu’s nascent artificial intelligence development. Recently, Baidu announced guidance for revenue growth of 2% to 3%, which is roughly half of the rate of the general economy in which it is operating. Fund management sold the Fund’s stake in Baidu following this announcement. ams AG is an Austrian company that produces 3D sensors. Demand for 3D sensors is growing, as they are increasingly required for facial recognition, factory process automation, and augmented reality applications. Although Fund management believes that the company’s particular 3D sensing technology is well placed within this growing area, they were disappointed by the company’s recent decision to acquire Osram Licht AG – a move they viewed as somewhat illogical, with a price that was too high. Fund management sold the Fund’s stake in ams AG.
The companies that contributed most to Fund performance were ICICI Bank Limited, ASML Holding NV, and Hoya Corp. ICICI Bank is one of the leadingnon-state-owned banks in India. The banking sector in general in India has been benefiting from the growing financial integration of the 1.3 billion population. Within that context, ICICI is, in Fund management’s view, a well-capitalized and well-managed bank. ASML Holding, a Dutch company, makes the equipment needed for producing semiconductors. ASML is the only supplier of the extreme ultraviolet lithography equipment that is required to produce the next generation of semiconductor chips. Finally, HOYA Corp, a Japanese company, is a world leader in glass technology. Its two largest markets are in the health care and information technology sectors. In the corrective lens market, this Fund holding shares global market dominance with arch-rival Essilor Luxottica. Hoya also makes the mask blanks needed for semiconductor manufacturing, and the glass substrates needed in hard disk drives, and dominates the markets for both. The secular demand drivers in Hoya’s end markets are strong and that is reflected in the share price performance.
41
MassMutual Premier International Equity Fund – Portfolio Manager Report (Unaudited)(Continued)
Subadviser outlook
Invesco believes that investors’ fears over trade tensions having the potential to slow the world’s average growth rates will continue to produce equity market volatility. However, Fund management has always invested in companies that they believe can grow at a better-than-average rate because of the secular forces that drive them, and their unique ability to potentially monetize those forces for many years.
| | | | |
| |
MassMutual Premier
International Equity Fund
Largest Holdings
(% of Net Assets) on 9/30/19 | |
| | |
ASML Holding NV | | | 2.9 | % |
Hitachi Ltd. | | | 2.7 | % |
Hermes International | | | 2.6 | % |
SAP SE | | | 2.6 | % |
Hoya Corp. | | | 2.3 | % |
Edenred | | | 2.3 | % |
Nokia OYJ | | | 2.3 | % |
Grifols SA | | | 2.2 | % |
Keyence Corp. | | | 2.1 | % |
ICICI Bank Ltd. Sponsored ADR | | | 2.1 | % |
| | | | | |
| | | | 24.1 | % |
| | | | | |
| | | | |
| |
MassMutual Premier
International Equity Fund
Sector Table
(% of Net Assets) on 9/30/19 | |
| | |
Consumer,Non-cyclical | | | 28.5 | % |
Industrial | | | 23.8 | % |
Technology | | | 18.7 | % |
Consumer, Cyclical | | | 17.8 | % |
Financial | | | 5.3 | % |
Communications | | | 3.5 | % |
Energy | | | 1.4 | % |
Mutual Funds | | | 0.6 | % |
| | | | | |
Total Long-Term Investments | | | 99.6 | % |
Short-Term Investments and Other Assets and Liabilities | | | 0.4 | % |
| | | | | |
Net Assets | | | 100.0 | % |
| | | | | |
42
MassMutual Premier International Equity Fund – Portfolio Manager Report (Unaudited)(Continued)
GROWTH OF $10,000 INVESTMENT
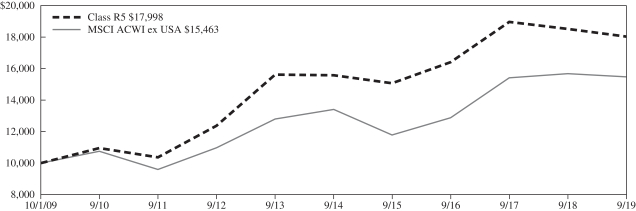
The graph above illustrates a representative class of the Fund’s historical performance for the past 10 fiscal years or since inception (for Funds lacking 10-year records) in comparison to its benchmark index, as well as one or more additional indexes, if applicable. The performance of other share classes will be greater than or less than the class depicted above.
| | | | | | | | | | |
| Average Annual Total Returns(for the periods ended 09/30/2019) |
| | | | | | |
| | | Inception Date
of Class | | 1 Year | | 5 Years | | 10 Years | | Since Inception
04/01/2014 |
| Class I | | 04/01/2014 | | -2.49% | | 3.09% | | | | 1.46% |
| Class R5 | | 10/03/1994 | | -2.63% | | 2.96% | | 6.05% | | |
| Service Class | | 01/01/1998 | | -2.74% | | 2.88% | | 5.98% | | |
| Administrative Class | | 05/03/1999 | | -2.77% | | 2.78% | | 5.85% | | |
| Class R4 | | 04/01/2014 | | -2.95% | | 2.63% | | | | 0.99% |
| Class A | | 01/01/1998 | | -3.09% | | 2.51% | | 5.58% | | |
| Class A (sales load deducted)* | | 01/01/1998 | | -8.42% | | 1.35% | | 4.99% | | |
| Class R3 | | 04/01/2014 | | -3.24% | | 2.35% | | | | 0.74% |
| MSCI ACWI ex USA | | -1.23% | | 2.90% | | 4.45% | | 2.54% |
* Class A (sales load deducted) returns include the 5.50% maximum sales charge.
Generally accepted accounting principles require adjustments to be made to the net assets of the Fund at period end for financial reporting purposes only, and as such, the total return based on the unadjusted net asset value per share may differ from the total return reported in the financial highlights.
Performance results in the graph and table are shown both with and without the imposition of the maximum applicable sales charge (if applicable) and reflect the percentage change in net asset value, including reinvestment of dividends and capital gains distributions. Investors should note that the Fund is a professionally managed mutual fund, while the index or indexes shown above are unmanaged, cannot be purchased directly, and, with the exception of any peer group index, do not incur expenses.
Performance data quoted in the graph and table represents past performance; past performance is not predictive of future results. The investment return and principal value of shares of the Fund fluctuate, so your shares, when sold, may be worth more or less than their original cost. Current performance of the Fund may be lower or higher than the performance quoted. The performance shown does not reflect the deduction of taxes, if any, that a shareholder would pay on Fund distributions or the redemption of Fund shares. Performance data current to the most recent month end may be obtained by calling1-888-309-3539.
Investors should read the Fund’s prospectus with regard to the Fund’s investment objectives, risks, and charges and expenses in conjunction with these financial statements. Employee retirement benefit plans that invest plan assets in the Separate Investment Accounts (SIAs) may be subject to certain charges as set forth in their respective Plan Documents. Total return figures would be lower for the periods presented if they reflected these charges.
43
MassMutual Premier Strategic Emerging Markets Fund – Portfolio Manager Report (Unaudited)
What is the investment approach of MassMutual Premier Strategic Emerging Markets Fund, and who is the Fund’s subadviser?
The Fund seeks long-term capital growth by investing mainly in common stocks of issuers in developing and emerging markets throughout the world and at times may invest up to 100% of its total assets in foreign securities. Under normal market conditions, the Fund will invest at least 80% of its net assets (plus the amount of any borrowings for investment purposes) in equity securities of issuers whose principal activities are in a developing (or emerging) market, i.e., are in a developing market or are economically tied to a developing market country. The Fund will invest in at least three developing markets. In general, countries may be considered developing or emerging markets if they are included in any one of the MSCI emerging markets indices, classified as a developing or emerging market, or classified under a similar or corresponding classification, by organizations such as the World Bank and the International Monetary Fund, or have economies, industries and stock markets with similar characteristics. At the close of business on May 24, 2019, Invesco Advisers, Inc. (Invesco) replaced OFI Global Institutional, Inc. (OFI Global) as the subadviser of the Fund. The portfolio management team at OFI Global with responsibility for the Fund became employees of Invesco and there was no change in the Fund’s investment process or philosophies.
How did the Fund perform during the 12 months ended September 30, 2019?
The Fund’s Class R5 shares returned 2.86%, outperforming the-2.02% return of the MSCI Emerging Markets (EM) Index (the “benchmark”), which measures the performance of the large- andmid-cap segments of emerging market equity securities. It is free float-adjusted market-capitalization weighted.
For a discussion on the economic and market environment during the12-month period ended September 30, 2019, please see the Economic and Market Overview, beginning on page 3.
Subadviser discussion of factors that contributed to the Fund’s performance
From a sector perspective, favorable stock selection led the Fund to outperform the benchmark, primarily due to Fund holdings in the financials and energy sectors. An overweight allocation, relative to the benchmark, and stock selection within the consumer discretionary sector also contributed to the Fund’s relative performance. Stock selection in the consumer staples sector and an underweight to the utilities sector detracted from performance. With regard to country exposure, stock selection in China and India contributed positively to the Fund’s relative performance, as did an overweight allocation to the United States. Stock selection in the United Kingdom, South Africa, and Chile detracted from relative returns.
Fund holdings that contributed positively to the Fund’s absolute performance during the reporting period included Kotak Mahindra Bank, Jiangsu Hengrui Medicine Co., and Meituan Dianping. Kotak Mahindra Bank is the fourth-largest private bank in India. Kotak has about 1,400 branches, and owns 100% of its various subsidiaries, which enables it to provide a full range of financial services. Fund management expects Kotak’s growth to be supported by structural changes occurring in the Indian banking sector, namely the continuedpublic-to-private shift of assets. Nearly 70% of assets in India’s banking system are controlled by poorly run, undercapitalized public sector banks. Jiangsu Hengrui Medicine Co. is a Chinese pharmaceutical company that is quickly becoming a leading player in the development of innovative drugs. Hengrui boasts a diversified drug portfolio, a strong research and development product pipeline, and a knowledgeable sales force. The company has begun to reap the benefits of its innovative pipeline as newly launched drugs in three significant markets – anesthetics, contrast agents, and the still under-penetrated cancer drug market – started to contribute profits. Meituan Dianping is a Chinese technology company that facilitates delivery, shopping, and bookings in a multitude of service categories through itsweb-based platform, including food delivery, restaurant reservations, beauty services, and hotel and travel reservations. Since its initial listing in December 2018, Meituan has succeeded in improving several key operational metrics and reported revenue ahead of expectations, leading to strong performance.
Fund holdings that detracted from performance included Glencore, Prada, and Samsung BioLogics. Glencore is one of the world’s leading producers and marketers of commodities and one of the most diversified. Invesco believes that the company has the potential to benefit from more stable commodity prices as well as material growth in the electric vehicle market over the next several years – which is expected to drive strong demand for copper, cobalt, and nickel – commodities of which Glencore is one of the leading producers. However, in the short term, base metals have continued to face headwinds from the United States/China
44
MassMutual Premier Strategic Emerging Markets Fund – Portfolio Manager Report (Unaudited)(Continued)
trade war, leading to an environment of uncertainty that has created a drag on global growth. Glencore’s copper holdings have also been impacted by operational challenges in the African arm of their business, similar to the operational issues that have been impacting their nickel production. Italian luxury goods company Prada operates in an industry with high barriers to entry, strong secular tailwinds, and strong pricing power for their brands. Prada reported weaker-than-anticipated sales numbers, which led to a drop in its share price. Samsung BioLogics, a South Korean manufacturer ofbio-health care products, has evolved from being a leading contract manufacturing organization (CMO) in the country to one of the fastest-growing in the world. Samsung BioLogics owns a 50% stake in the biosimilar producer Samsung Bioepis with U.S. biotech giant Biogen, which currently has seven products in the pipeline. Still, Samsung BioLogics has been facing several headwinds that have been negatively impacting its share price, including major geopolitical issues involving South Korea and Japan, as well as deteriorating relations with North Korea.
Subadviser outlook
Invesco continues to believe that emerging markets (EM) should be an increasingly core allocation for global investors. EM now represents a meaningful portion of global gross domestic product and is the largest contributor to global growth. Fund management believes that most investors are still under-allocated to the asset class and, especially for those who invest through passive vehicles, to the areas of EM that Fund management believes exhibit potentially the most attractive growth characteristics.
Fund management’s approach to investing and the positioning of the Fund remain unchanged. The Fund managers are long-term investors who seek extraordinary companies that they believe have competitive advantages that manifest themselves over many years. The Fund has exposure to sectors and industries in which Fund management perceives dynamic change and real value being extracted – including ecommerce, cloud computing, internet services, health care, travel, and education.
| | | | |
| |
MassMutual Premier
Strategic Emerging Markets Fund
Largest Holdings
(% of Net Assets) on 9/30/19 | |
| | |
Alibaba Group Holding Ltd. Sponsored ADR | | | 7.1 | % |
Novatek PJSC Sponsored GDR Registered | | | 4.8 | % |
Taiwan Semiconductor Manufacturing Co. Ltd. | | | 4.5 | % |
Kering SA | | | 4.0 | % |
Housing Development Finance Corp. Ltd. | | | 3.6 | % |
Kotak Mahindra Bank Ltd. | | | 3.4 | % |
Tencent Holdings Ltd. | | | 3.4 | % |
AIA Group Ltd. | | | 2.9 | % |
Yum China Holdings, Inc. | | | 2.7 | % |
Glencore PLC | | | 2.6 | % |
| | | | | |
| | | | 39.0 | % |
| | | | | |
| | | | |
| |
MassMutual Premier
Strategic Emerging Markets Fund
Sector Table
(% of Net Assets) on 9/30/19 | |
| | |
Financial | | | 25.9 | % |
Consumer, Cyclical | | | 17.2 | % |
Consumer,Non-cyclical | | | 15.7 | % |
Communications | | | 14.8 | % |
Technology | | | 6.3 | % |
Energy | | | 6.2 | % |
Basic Materials | | | 5.8 | % |
Industrial | | | 4.3 | % |
Mutual Funds | | | 2.1 | % |
| | | | | |
Total Long-Term Investments | | | 98.3 | % |
Short-Term Investments and Other Assets and Liabilities | | | 1.7 | % |
| | | | | |
Net Assets | | | 100.0 | % |
| | | | | |
45
MassMutual Premier Strategic Emerging Markets Fund – Portfolio Manager Report (Unaudited)(Continued)
GROWTH OF $10,000 INVESTMENT
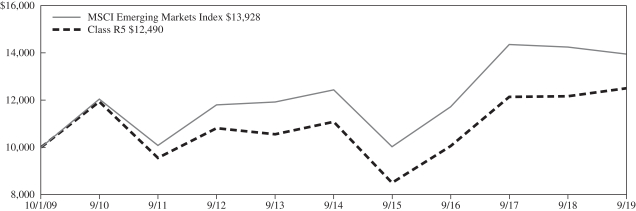
The graph above illustrates a representative class of the Fund’s historical performance for the past 10 fiscal years or since inception (for Funds lacking 10-year records) in comparison to its benchmark index, as well as one or more additional indexes, if applicable. The performance of other share classes will be greater than or less than the class depicted above.
| | | | | | | | | | | | |
| Average Annual Total Returns(for the periods ended 09/30/2019) |
| | | | | | | |
| | | Inception Date
of Class | | 1 Year | | 5 Years | | 10 Years | | Since Inception
03/01/2011 | | Since Inception
04/01/2014 |
| Class I | | 03/01/2011 | | 2.93% | | 2.57% | | | | 0.60% | | |
| Class R5 | | 11/03/2008 | | 2.86% | | 2.45% | | 2.25% | | | | |
| Service Class | | 11/03/2008 | | 2.79% | | 2.36% | | 2.16% | | | | |
| Administrative Class | | 11/03/2008 | | 2.68% | | 2.27% | | 2.04% | | | | |
| Class R4 | | 04/01/2014 | | 2.46% | | 2.12% | | | | | | 2.56% |
| Class A | | 11/03/2008 | | 2.40% | | 2.03% | | 1.79% | | | | |
| Class A (sales load deducted)* | | 11/03/2008 | | -3.23% | | 0.88% | | 1.21% | | | | |
| Class R3 | | 04/01/2014 | | 2.22% | | 1.86% | | | | | | 2.30% |
| MSCI Emerging Markets Index | | -2.02% | | 2.33% | | 3.37% | | 1.33% | | 2.64% |
* Class A (sales load deducted) returns include the 5.50% maximum sales charge.
Generally accepted accounting principles require adjustments to be made to the net assets of the Fund at period end for financial reporting purposes only, and as such, the total return based on the unadjusted net asset value per share may differ from the total return reported in the financial highlights.
Performance results in the graph and table are shown both with and without the imposition of the maximum applicable sales charge (if applicable) and reflect the percentage change in net asset value, including reinvestment of dividends and capital gains distributions. Investors should note that the Fund is a professionally managed mutual fund, while the index or indexes shown above are unmanaged, cannot be purchased directly, and, with the exception of any peer group index, do not incur expenses.
Performance data quoted in the graph and table represents past performance; past performance is not predictive of future results. The investment return and principal value of shares of the Fund fluctuate, so your shares, when sold, may be worth more or less than their original cost. Current performance of the Fund may be lower or higher than the performance quoted. The performance shown does not reflect the deduction of taxes, if any, that a shareholder would pay on Fund distributions or the redemption of Fund shares. Performance data current to the most recent month end may be obtained by calling1-888-309-3539.
Investors should read the Fund’s prospectus with regard to the Fund’s investment objectives, risks, and charges and expenses in conjunction with these financial statements. Employee retirement benefit plans that invest plan assets in the Separate Investment Accounts (SIAs) may be subject to certain charges as set forth in their respective Plan Documents. Total return figures would be lower for the periods presented if they reflected these charges.
46
MassMutual Premier U.S. Government Money Market Fund – Portfolio of Investments
September 30, 2019
| | | | | | | | |
| | | Principal
Amount | | | Value | |
| SHORT-TERM INVESTMENTS — 107.1% | |
| Discount Notes — 83.6% | |
Federal Farm Credit Bank
1.764% 10/03/19, 10/03/19 (a) | | $ | 970,000 | | | $ | 969,906 | |
1.893% 2/20/20, 2/20/20 (a) | | | 3,471,000 | | | | 3,445,671 | |
1 mo. USD LIBOR - .080%,
1.970% FRN 10/11/19, 5/11/20 (a) | | | 1,330,000 | | | | 1,329,446 | |
2.009% 10/01/19, 10/01/19 (a) | | | 1,100,000 | | | | 1,100,000 | |
1 mo. USD LIBOR + .050%
2.099% FRN 10/10/19, 2/10/20 (a) | | | 5,260,000 | | | | 5,261,538 | |
2.729% 10/22/19, 10/22/19 (a) | | | 1,300,000 | | | | 1,298,006 | |
Federal Home Loan Bank
1.826% 10/08/19, 10/08/19 (a) | | | 6,600,000 | | | | 6,597,690 | |
SOFR + .010%,
1.830% FRN 10/01/19, 11/13/19 (a) | | | 19,300,000 | | | | 19,299,514 | |
SOFR + .030%
1.850% FRN 10/01/19, 1/12/21 (a) | | | 12,000,000 | | | | 12,000,000 | |
SOFR + .040%
1.860% FRN 10/01/19, 8/25/20 (a) | | | 3,000,000 | | | | 3,000,000 | |
SOFR + .050%
1.870% FRN 10/01/19, 1/28/21 (a) | | | 4,600,000 | | | | 4,600,000 | |
SOFR + .030%,
1.880% FRN 10/01/19, 10/09/19 (a) | | | 8,000,000 | | | | 8,000,000 | |
SOFR + .065%,
1.885% FRN 10/01/19, 3/27/20 (a) | | | 14,485,000 | | | | 14,487,038 | |
SOFR + .065%
1.885% FRN 10/01/19, 2/26/21 (a) | | | 13,000,000 | | | | 13,000,000 | |
SOFR + .100%
1.920% FRN 10/01/19, 12/23/20 (a) | | | 7,000,000 | | | | 7,000,000 | |
1 mo. USD LIBOR - .055%
1.973% FRN 10/14/19, 1/14/20 (a) | | | 8,500,000 | | | | 8,497,860 | |
1 mo. USD LIBOR - .050%
1.975% FRN 10/17/19, 1/17/20 (a) | | | 10,500,000 | | | | 10,500,000 | |
1.994% 11/15/19, 11/15/19 (a) | | | 8,400,000 | | | | 8,379,420 | |
1.997% 12/04/19, 12/04/19 (a) | | | 370,000 | | | | 368,711 | |
1.997% 12/04/19, 12/04/19 (a) | | | 6,000,000 | | | | 5,979,093 | |
2.004% 10/01/19, 10/01/19 (a) | | | 1,000,000 | | | | 1,000,000 | |
2.008% 11/06/19, 11/06/19 (a) | | | 5,000,000 | | | | 4,990,125 | |
2.015% 11/01/19, 11/01/19 (a) | | | 3,800,000 | | | | 3,793,521 | |
2.015% 12/04/19, 12/04/19 (a) | | | 1,500,000 | | | | 1,494,733 | |
2.016% 10/11/19, 10/11/19 (a) | | | 2,500,000 | | | | 2,498,622 | |
2.024% 11/01/19, 11/01/19 (a) | | | 1,100,000 | | | | 1,098,115 | |
2.024% 10/16/19, 10/16/19 (a) | | | 750,000 | | | | 749,378 | |
2.044% 10/18/19, 10/18/19 (a) | | | 6,800,000 | | | | 6,793,546 | |
2.051% 10/08/19, 10/08/19 (a) | | | 750,000 | | | | 749,705 | |
2.053% 10/11/19, 10/11/19 (a) | | | 600,000 | | | | 599,663 | |
2.054% 10/18/19, 10/18/19 (a) | | | 13,700,000 | | | | 13,686,932 | |
2.055% 10/23/19, 10/23/19 (a) | | | 9,750,000 | | | | 9,737,964 | |
2.058% 10/18/19, 10/18/19 (a) | | | 1,400,000 | | | | 1,398,661 | |
2.059% 10/25/19, 10/25/19 (a) | | | 7,000,000 | | | | 6,990,550 | |
2.060% 10/30/19, 10/30/19 (a) | | | 3,650,000 | | | | 3,644,046 | |
2.064% 10/23/19, 10/23/19 (a) | | | 1,315,000 | | | | 1,313,369 | |
| | | | | | | | |
| | | Principal
Amount | | | Value | |
2.064% 10/23/19, 10/23/19 (a) | | $ | 5,000,000 | | | $ | 4,993,797 | |
2.065% 10/09/19, 10/09/19 (a) | | | 6,540,000 | | | | 6,537,050 | |
2.067% 10/02/19, 10/02/19 (a) | | | 500,000 | | | | 499,972 | |
3 mo. USD LIBOR - .260%
2.081% FRN 10/11/19, 10/11/19 (a) | | | 25,000,000 | | | | 24,999,343 | |
2.090% 1/29/20, 1/29/20 (a) | | | 770,000 | | | | 764,764 | |
2.090% 10/02/19, 10/02/19 (a) | | | 1,200,000 | | | | 1,199,931 | |
2.095% 12/18/19, 12/18/19 (a) | | | 2,000,000 | | | | 1,991,117 | |
2.113% 11/26/19, 11/26/19 (a) | | | 2,700,000 | | | | 2,691,306 | |
2.115% 11/01/19, 11/01/19 (a) | | | 6,000,000 | | | | 5,989,279 | |
2.121% 11/01/19, 11/01/19 (a) | | | 8,200,000 | | | | 8,185,306 | |
3 mo. USD LIBOR - .140%,
2.136% FRN 10/25/19, 10/25/19 (a) | | | 6,800,000 | | | | 6,800,000 | |
2.140% 10/25/19, 10/25/19 (a) | | | 4,350,000 | | | | 4,343,910 | |
1 mo. USD LIBOR + .150%
2.194% FRN 10/28/19, 9/28/20 (a) | | | 650,000 | | | | 650,841 | |
2.421% 11/20/19, 11/20/19 (a) | | | 1,530,000 | | | | 1,524,985 | |
2.752% 10/16/19, 10/16/19 (a) | | | 1,000,000 | | | | 998,896 | |
Federal National Mortgage Association
1.775% 10/04/19, 10/04/19 (a) | | | 5,400,000 | | | | 5,399,213 | |
SOFR + .075%
1.895% FRN 10/01/19, 10/30/20 (a) | | | 1,000,000 | | | | 1,000,425 | |
SOFR + .160%
1.980% FRN 10/01/19, 1/30/20 (a) | | | 1,600,000 | | | | 1,600,841 | |
2.031% 10/04/19, 10/04/19 (a) | | | 3,210,000 | | | | 3,209,465 | |
| | | | | | | | |
| | |
TOTAL DISCOUNT NOTES
(Cost $279,033,264) | | | | | | | 279,033,264 | |
| | | | | |
| Repurchase Agreement — 13.5% | |
HSBC Securities (USA) Inc.,Tri-Party Repurchase Agreement, dated 9/30/19,
2.320%, due 10/01/19 (b) | | | 45,000,000 | | | | 45,000,000 | |
| | | | | | | | |
| U.S. Treasury Bonds & Notes — 10.0% | |
U.S. Treasury Bill
0.000% 2/06/20 | | | 8,700,000 | | | | 8,641,505 | |
0.000% 2/13/20 | | | 8,300,000 | | | | 8,242,995 | |
U.S. Treasury Note
1.375% 3/31/20 | | | 7,700,000 | | | | 7,682,071 | |
1.500% 4/15/20 | | | 8,800,000 | | | | 8,784,951 | |
| | | | | | | | |
| | | | | | | 33,351,522 | |
| | | | | | | | |
| | |
TOTAL SHORT-TERM INVESTMENTS
(Cost $357,384,786) | | | | | | | 357,384,786 | |
| | | | | |
| | |
TOTAL INVESTMENTS — 107.1%
(Cost $357,384,786) (c) | | | | | | | 357,384,786 | |
| | |
| Other Assets/(Liabilities) — (7.1)% | | | | | | | (23,811,149 | ) |
| | | | | |
| | |
| NET ASSETS — 100.0% | | | | | | $ | 333,573,637 | |
| | | | | |
The accompanying notes are an integral part of the financial statements.
47
MassMutual Premier U.S. Government Money Market Fund – Portfolio of Investments(Continued)
Abbreviation Legend
| SOFR | Secured Overnight Financing Rate |
Notes to Portfolio of Investments
Percentages are stated as a percent of net assets.
| (a) | The stated maturity dates reflect demand date and stated maturity date, respectively. |
| (b) | Maturity value of $45,002,900. Collateralized by U.S. Government Agency obligations with a rate of 0.000%, maturity dates ranging from 5/15/42 - 11/15/47, and an aggregate market value, including accrued interest, of $45,900,035. |
| (c) | See Note 6 for aggregate cost for federal tax purposes. |
The accompanying notes are an integral part of the financial statements.
48
MassMutual Premier Short-Duration Bond Fund – Portfolio of Investments
September 30, 2019
| | | | | | | | |
| | | Principal
Amount | | | Value | |
| BONDS & NOTES — 95.8% | |
|
| CORPORATE DEBT — 39.8% | |
| Advertising — 0.1% | |
The Interpublic Group of Cos., Inc.
3.750% 10/01/21 | | $ | 560,000 | | | $ | 574,091 | |
| | | | | | | | |
| Aerospace & Defense — 0.3% | |
L3Harris Technologies, Inc.
2.700% 4/27/20 | | | 1,550,000 | | | | 1,553,103 | |
| | | | | | | | |
| Agriculture — 1.3% | |
BAT Capital Corp.
3.222% 8/15/24 | | | 1,100,000 | | | | 1,112,044 | |
Bunge Ltd. Finance Corp.
3.500% 11/24/20 | | | 2,040,000 | | | | 2,062,072 | |
Imperial Brands Finance PLC
3.125% 7/26/24 (a) | | | 1,043,000 | | | | 1,045,105 | |
3.500% 2/11/23 (a) | | | 979,000 | | | | 998,883 | |
Reynolds American, Inc.
4.000% 6/12/22 | | | 1,500,000 | | | | 1,562,655 | |
| | | | | | | | |
| | | | | | | 6,780,759 | |
| | | | | | | | |
| Airlines — 0.0% | |
American Airlines Pass-Through Trust,Series 2014-1, Class B,
4.375% 4/01/24 | | | 69,828 | | | | 71,658 | |
| | | | | | | | |
| Auto Manufacturers — 1.1% | |
Ford Motor Credit Co. LLC
3 mo. USD LIBOR + .810%
3.099% FRN 4/05/21 | | | 660,000 | | | | 652,271 | |
3.350% 11/01/22 | | | 935,000 | | | | 935,126 | |
3 mo. USD LIBOR + 1.235%
3.393% FRN 2/15/23 | | | 1,130,000 | | | | 1,095,625 | |
General Motors Financial Co., Inc.
3.250% 1/05/23 | | | 2,715,000 | | | | 2,743,951 | |
Nissan Motor Acceptance Corp.
1.900% 9/14/21 (a) | | | 485,000 | | | | 479,296 | |
| | | | | | | | |
| | | | | | | 5,906,269 | |
| | | | | | | | |
| Banks — 7.3% | |
Banco Santander SA
3.500% 4/11/22 | | | 1,600,000 | | | | 1,641,980 | |
Bank of America Corp. 3 mo. USD LIBOR + .930%
2.816% VRN 7/21/23 | | | 5,830,000 | | | | 5,918,598 | |
Barclays Bank PLC
10.179% 6/12/21 (a) | | | 907,000 | | | | 1,014,422 | |
Barclays PLC 3 mo. USD LIBOR + 1.380%
3.548% FRN 5/16/24 | | | 945,000 | | | | 940,234 | |
Citigroup, Inc. 3 mo. USD LIBOR + .722%
3.142% VRN 1/24/23 | | | 3,120,000 | | | | 3,176,847 | |
| | | | | | | | |
| | | Principal
Amount | | | Value | |
Credit Suisse AG
6.500% 8/08/23 (a) | | $ | 2,400,000 | | | $ | 2,670,000 | |
Discover Bank
3.350% 2/06/23 | | | 1,832,000 | | | | 1,888,433 | |
4.200% 8/08/23 | | | 1,000,000 | | | | 1,063,080 | |
First Horizon National Corp.
3.500% 12/15/20 | | | 1,290,000 | | | | 1,304,227 | |
The Goldman Sachs Group, Inc.
3.200% 2/23/23 | | | 6,280,000 | | | | 6,448,012 | |
HSBC Holdings PLC
4.250% 3/14/24 | | | 730,000 | | | | 768,109 | |
JP Morgan Chase & Co.
4.500% 1/24/22 | | | 3,000,000 | | | | 3,164,806 | |
Mitsubishi UFJ Financial Group, Inc.
2.665% 7/25/22 | | | 2,150,000 | | | | 2,172,206 | |
Morgan Stanley
3.750% 2/25/23 | | | 3,075,000 | | | | 3,215,039 | |
Sumitomo Mitsui Financial Group, Inc.
2.448% 9/27/24 | | | 1,305,000 | | | | 1,303,550 | |
SVB Financial Group
5.375% 9/15/20 | | | 225,000 | | | | 231,721 | |
Synchrony Bank
3.000% 6/15/22 | | | 1,250,000 | | | | 1,267,177 | |
| | | | | | | | |
| | | | | | | 38,188,441 | |
| | | | | | | | |
| Beverages — 1.1% | |
Anheuser-Busch InBev Worldwide, Inc.
3.500% 1/12/24 | | | 2,675,000 | | | | 2,823,460 | |
Bacardi Ltd.
4.450% 5/15/25 (a) | | | 206,000 | | | | 220,314 | |
Keurig Dr Pepper, Inc.
4.057% 5/25/23 | | | 1,450,000 | | | | 1,533,446 | |
Molson Coors Brewing Co.
2.100% 7/15/21 | | | 310,000 | | | | 309,987 | |
3.500% 5/01/22 | | | 720,000 | | | | 741,354 | |
| | | | | | | | |
| | | | | | | 5,628,561 | |
| | | | | | | | |
| Biotechnology — 0.1% | |
Celgene Corp.
4.000% 8/15/23 | | | 474,000 | | | | 503,774 | |
| | | | | | | | |
| Building Materials — 0.9% | |
Holcim US Finance Sarl & Cie SCS
6.000% 12/30/19 (a) | | | 2,029,000 | | | | 2,045,042 | |
Martin Marietta Materials, Inc. 3 mo. USD LIBOR + .650%
2.800% FRN 5/22/20 | | | 780,000 | | | | 781,071 | |
Masco Corp.
3.500% 4/01/21 | | | 270,000 | | | | 273,710 | |
7.125% 3/15/20 | | | 225,000 | | | | 229,456 | |
Standard Industries, Inc.
5.500% 2/15/23 (a) | | | 1,472,000 | | | | 1,501,440 | |
| | | | | | | | |
| | | | | | | 4,830,719 | |
| | | | | | | | |
The accompanying notes are an integral part of the financial statements.
49
MassMutual Premier Short-Duration Bond Fund – Portfolio of Investments(Continued)
| | | | | | | | |
| | | Principal
Amount | | | Value | |
| Chemicals — 2.2% | |
CF Industries, Inc.
7.125% 5/01/20 | | $ | 94,000 | | | $ | 96,585 | |
DuPont de Nemours, Inc.
4.205% 11/15/23 | | | 1,265,000 | | | | 1,355,593 | |
Huntsman International LLC
5.125% 11/15/22 | | | 2,410,000 | | | | 2,569,445 | |
Incitec Pivot Finance LLC
6.000% 12/10/19 (a) | | | 2,227,000 | | | | 2,241,104 | |
RPM International, Inc.
3.450% 11/15/22 | | | 43,000 | | | | 44,141 | |
6.125% 10/15/19 | | | 1,722,000 | | | | 1,724,210 | |
The Sherwin-Williams Co.
2.750% 6/01/22 | | | 558,000 | | | | 565,534 | |
Syngenta Finance NV
3.698% 4/24/20 (a) | | | 1,165,000 | | | | 1,168,871 | |
4.441% 4/24/23 (a) | | | 1,460,000 | | | | 1,525,721 | |
| | | | | | | | |
| | | | | | | 11,291,204 | |
| | | | | | | | |
| Computers — 0.8% | |
Dell International LLC/EMC Corp.
4.000% 7/15/24 (a) | | | 1,113,000 | | | | 1,164,044 | |
Genpact Luxembourg Sarl
3.700% STEP 4/01/22 | | | 1,480,000 | | | | 1,502,427 | |
Leidos Holdings, Inc.
4.450% 12/01/20 | | | 1,511,000 | | | | 1,533,665 | |
| | | | | | | | |
| | | | | | | 4,200,136 | |
| | | | | | | | |
| Diversified Financial Services — 2.7% | |
AerCap Ireland Capital DAC / AerCap Global Aviation Trust
2.875% 8/14/24 | | | 2,190,000 | | | | 2,192,121 | |
Aircastle Ltd.
5.000% 4/01/23 | | | 2,790,000 | | | | 2,987,834 | |
Ameriprise Financial, Inc.
3.000% 3/22/22 | | | 405,000 | | | | 412,509 | |
3.700% 10/15/24 | | | 285,000 | | | | 304,717 | |
4.000% 10/15/23 | | | 255,000 | | | | 272,292 | |
Antares Holdings LP
6.000% 8/15/23 (a) | | | 1,172,000 | | | | 1,214,187 | |
Brookfield Finance, Inc.
4.000% 4/01/24 | | | 1,520,000 | | | | 1,617,771 | |
Park Aerospace Holdings Ltd.
5.250% 8/15/22 (a) | | | 3,310,000 | | | | 3,488,409 | |
Synchrony Financial
2.850% 7/25/22 | | | 1,540,000 | | | | 1,552,959 | |
| | | | | | | | |
| | | | | | | 14,042,799 | |
| | | | | | | | |
| Electric — 1.0% | |
Ameren Corp.
2.500% 9/15/24 | | | 865,000 | | | | 869,295 | |
2.700% 11/15/20 | | | 815,000 | | | | 819,262 | |
EDP Finance BV
4.125% 1/15/20 (a) | | | 795,000 | | | | 796,987 | |
| | | | | | | | |
| | | Principal
Amount | | | Value | |
Enel Finance International NV
2.875% 5/25/22 (a) | | $ | 755,000 | | | $ | 764,981 | |
Entergy Texas, Inc.
2.550% 6/01/21 | | | 605,000 | | | | 604,063 | |
Puget Energy, Inc.
6.000% 9/01/21 | | | 740,000 | | | | 787,184 | |
6.500% 12/15/20 | | | 334,000 | | | | 349,699 | |
| | | | | | | | |
| | | | | | | 4,991,471 | |
| | | | | | | | |
| Electronics — 0.5% | |
The ADT Security Corp.
6.250% 10/15/21 | | | 1,260,000 | | | | 1,341,900 | |
FLIR Systems, Inc.
3.125% 6/15/21 | | | 650,000 | | | | 657,042 | |
Tech Data Corp.
3.700% 2/15/22 | | | 580,000 | | | | 593,006 | |
| | | | | | | | |
| | | | | | | 2,591,948 | |
| | | | | | | | |
| Foods — 0.3% | |
McCormick & Co., Inc.
2.700% 8/15/22 | | | 1,570,000 | | | | 1,591,589 | |
| | | | | | | | |
| Health Care – Products — 0.2% | |
Becton Dickinson and Co. 3 mo. USD LIBOR + .875%
2.979% FRN 12/29/20 | | | 1,227,000 | | | | 1,227,410 | |
| | | | | | | | |
| Health Care – Services — 0.2% | |
Cigna Holding Co.
4.000% 2/15/22 | | | 971,000 | | | | 1,004,970 | |
| | | | | | | | |
| Home Builders — 0.4% | |
Lennar Corp.
4.500% 11/15/19 | | | 2,253,000 | | | | 2,253,000 | |
| | | | | | | | |
| Household Products & Wares — 0.4% | |
Church & Dwight Co., Inc.
2.875% 10/01/22 | | | 1,993,000 | | | | 2,022,238 | |
| | | | | | | | |
| Housewares — 0.3% | |
Newell Brands, Inc.
3.850% 4/01/23 | | | 1,730,000 | | | | 1,780,862 | |
| | | | | | | | |
| Insurance — 2.5% | |
AmTrust Financial Services, Inc.
6.125% 8/15/23 | | | 1,505,000 | | | | 1,502,444 | |
Athene Global Funding
2.750% 6/25/24 (a) | | | 2,650,000 | | | | 2,668,218 | |
CNA Financial Corp.
5.750% 8/15/21 | | | 901,000 | | | | 956,963 | |
Enstar Group Ltd.
4.500% 3/10/22 | | | 1,800,000 | | | | 1,866,885 | |
Jackson National Life Global Funding
2.500% 6/27/22 (a) | | | 1,540,000 | | | | 1,553,958 | |
Lincoln National Corp.
4.000% 9/01/23 | | | 310,000 | | | | 328,379 | |
6.250% 2/15/20 | | | 740,000 | | | | 750,241 | |
The accompanying notes are an integral part of the financial statements.
50
MassMutual Premier Short-Duration Bond Fund – Portfolio of Investments(Continued)
| | | | | | | | |
| | | Principal
Amount | | | Value | |
Reinsurance Group of America, Inc.
5.000% 6/01/21 | | $ | 1,015,000 | | | $ | 1,060,714 | |
Trinity Acquisition PLC
3.500% 9/15/21 | | | 1,215,000 | | | | 1,236,644 | |
Willis Towers Watson PLC
5.750% 3/15/21 | | | 840,000 | | | | 880,559 | |
| | | | | | | | |
| | | | | | | 12,805,005 | |
| | | | | | | | |
| Investment Companies — 1.0% | |
Ares Capital Corp.
4.200% 6/10/24 | | | 2,499,000 | | | | 2,561,488 | |
BlackRock TCP Capital Corp.
3.900% 8/23/24 | | | 835,000 | | | | 824,175 | |
4.125% 8/11/22 | | | 1,805,000 | | | | 1,809,579 | |
| | | | | | | | |
| | | | | | | 5,195,242 | |
| | | | | | | | |
| Lodging — 0.5% | |
Las Vegas Sands Corp.
3.200% 8/08/24 | | | 2,665,000 | | | | 2,714,390 | |
| | | | | | | | |
| Machinery – Diversified — 0.5% | |
CNH Industrial Capital LLC
3.875% 10/15/21 | | | 1,015,000 | | | | 1,041,309 | |
4.875% 4/01/21 | | | 590,000 | | | | 610,756 | |
Wabtec Corp.
4.400% STEP 3/15/24 | | | 1,021,000 | | | | 1,087,393 | |
| | | | | | | | |
| | | | | | | 2,739,458 | |
| | | | | | | | |
| Media — 0.9% | |
Charter Communications Operating LLC/Charter Communications Operating Capital
3.579% 7/23/20 | | | 745,000 | | | | 751,672 | |
Discovery Communications LLC
2.950% 3/20/23 | | | 1,170,000 | | | | 1,188,707 | |
Sirius XM Radio, Inc.
3.875% 8/01/22 (a) | | | 2,600,000 | | | | 2,639,813 | |
| | | | | | | | |
| | | | | | | 4,580,192 | |
| | | | | | | | |
| Mining — 1.1% | |
Glencore Funding LLC
4.125% 5/30/23 (a) | | | 1,480,000 | | | | 1,548,846 | |
Kinross Gold Corp.
5.125% 9/01/21 | | | 550,000 | | | | 570,625 | |
5.950% 3/15/24 | | | 1,950,000 | | | | 2,170,448 | |
Newcrest Finance Pty Ltd.
4.200% 10/01/22 (a) | | | 1,170,000 | | | | 1,222,404 | |
| | | | | | | | |
| | | | | | | 5,512,323 | |
| | | | | | | | |
| Office Equipment/Supplies — 0.2% | |
Pitney Bowes, Inc.
4.125% STEP 10/01/21 | | | 1,210,000 | | | | 1,216,050 | |
| | | | | | | | |
| Oil & Gas — 1.0% | |
Antero Resources Corp.
5.375% 11/01/21 | | | 2,699,000 | | | | 2,604,535 | |
| | | | | | | | |
| | | Principal
Amount | | | Value | |
Continental Resources, Inc.
5.000% 9/15/22 | | $ | 1,017,000 | | | $ | 1,025,922 | |
EQT Corp.
3.000% 10/01/22 | | | 1,610,000 | | | | 1,549,870 | |
| | | | | | | | |
| | | | | | | 5,180,327 | |
| | | | | | | | |
| Packaging & Containers — 0.4% | |
Graphic Packaging International LLC
4.750% 4/15/21 | | | 1,860,000 | | | | 1,920,450 | |
| | | | | | | | |
| Pharmaceuticals — 2.4% | |
Bayer US Finance II LLC 3 mo. USD LIBOR + 1.010%
3.129% FRN 12/15/23 (a) | | | 2,055,000 | | | | 2,056,251 | |
Cardinal Health, Inc. 3 mo. USD LIBOR + .770%
2.889% FRN 6/15/22 | | | 2,095,000 | | | | 2,087,923 | |
CVS Health Corp.
2.625% 8/15/24 | | | 455,000 | | | | 457,023 | |
3.700% 3/09/23 | | | 1,065,000 | | | | 1,108,599 | |
Express Scripts Holding Co.
3.300% 2/25/21 | | | 1,645,000 | | | | 1,666,674 | |
Mylan, Inc.
3.125% 1/15/23 (a) | | | 1,375,000 | | | | 1,389,202 | |
Shire Acquisitions Investments Ireland DAC
2.400% 9/23/21 | | | 335,000 | | | | 336,552 | |
2.875% 9/23/23 | | | 1,000,000 | | | | 1,019,450 | |
Teva Pharmaceutical Finance Netherlands III BV
2.200% 7/21/21 | | | 2,525,000 | | | | 2,310,375 | |
| | | | | | | | |
| | | | | | | 12,432,049 | |
| | | | | | | | |
| Pipelines — 1.5% | |
Energy Transfer Operating LP
4.200% 9/15/23 | | | 2,370,000 | | | | 2,490,698 | |
EnLink Midstream Partners LP
4.400% 4/01/24 | | | 1,340,000 | | | | 1,290,487 | |
EQM Midstream Partners LP
4.750% 7/15/23 | | | 1,305,000 | | | | 1,309,026 | |
MPLX LP 3 mo. USD LIBOR + 1.100%
3.202% FRN 9/09/22 | | | 2,605,000 | | | | 2,613,219 | |
| | | | | | | | |
| | | | | | | 7,703,430 | |
| | | | | | | | |
| Private Equity — 0.3% | |
Hercules Capital, Inc.
4.625% 10/23/22 | | | 1,495,000 | | | | 1,495,282 | |
| | | | | | | | |
| Real Estate Investment Trusts (REITS) — 2.1% | |
American Tower Corp.
2.250% 1/15/22 | | | 465,000 | | | | 465,611 | |
3.000% 6/15/23 | | | 1,520,000 | | | | 1,554,854 | |
3.300% 2/15/21 | | | 505,000 | | | | 512,215 | |
Crown Castle International Corp.
3.400% 2/15/21 | | | 1,319,000 | | | | 1,337,086 | |
The accompanying notes are an integral part of the financial statements.
51
MassMutual Premier Short-Duration Bond Fund – Portfolio of Investments(Continued)
| | | | | | | | |
| | | Principal
Amount | | | Value | |
SBA Tower Trust
2.836% 1/15/25 (a) | | $ | 3,350,000 | | | $ | 3,354,302 | |
3.168% 4/09/47 (a) | | | 880,000 | | | | 888,543 | |
Tanger Properties LP
3.875% 12/01/23 | | | 1,325,000 | | | | 1,364,177 | |
VEREIT Operating Partnership LP
4.600% 2/06/24 | | | 1,410,000 | | | | 1,514,327 | |
| | | | | | | | |
| | | | | | | 10,991,115 | |
| | | | | | | | |
| Retail — 1.7% | |
Advance Auto Parts, Inc.
4.500% 12/01/23 | | | 990,000 | | | | 1,068,977 | |
Dollar Tree, Inc.
3.700% 5/15/23 | | | 2,620,000 | | | | 2,717,198 | |
O’Reilly Automotive, Inc.
3.800% 9/01/22 | | | 191,000 | | | | 198,198 | |
3.850% 6/15/23 | | | 2,206,000 | | | | 2,315,524 | |
QVC, Inc.
4.375% 3/15/23 | | | 2,500,000 | | | | 2,587,717 | |
| | | | | | | | |
| | | | | | | 8,887,614 | |
| | | | | | | | |
| Semiconductors — 0.7% | |
Broadcom Corp./Broadcom Cayman Finance Ltd.
3.000% 1/15/22 | | | 1,215,000 | | | | 1,226,755 | |
Microchip Technology, Inc.
3.922% 6/01/21 | | | 905,000 | | | | 924,345 | |
NXP BV/NXP Funding LLC
4.125% 6/01/21 (a) | | | 1,225,000 | | | | 1,256,885 | |
| | | | | | | | |
| | | | | | | 3,407,985 | |
| | | | | | | | |
| Telecommunications — 0.8% | |
Qwest Corp
6.750% 12/01/21 | | | 1,255,000 | | | | 1,356,354 | |
Sprint Communications, Inc.
9.250% 4/15/22 | | | 800,000 | | | | 927,000 | |
Telefonaktiebolaget LM Ericsson
4.125% 5/15/22 | | | 1,870,000 | | | | 1,925,819 | |
| | | | | | | | |
| | | | | | | 4,209,173 | |
| | | | | | | | |
| Transportation — 0.4% | |
Ryder System, Inc.
2.250% 9/01/21 | | | 170,000 | | | | 169,974 | |
2.500% 9/01/22 | | | 40,000 | | | | 40,283 | |
3.400% 3/01/23 | | | 485,000 | | | | 501,057 | |
3.750% 6/09/23 | | | 1,370,000 | | | | 1,437,311 | |
| | | | | | | | |
| | | | | | | 2,148,625 | |
| | | | | | | | |
| Trucking & Leasing — 0.6% | |
DAE Funding LLC
4.000% 8/01/20 (a) | | | 522,000 | | | | 525,262 | |
Penske Truck Leasing Co. LP/PTL Finance Corp.
3.375% 2/01/22 (a) | | | 50,000 | | | | 51,031 | |
| | | | | | | | |
| | | Principal
Amount | | | Value | |
4.875% 7/11/22 (a) | | $ | 2,300,000 | | | $ | 2,450,461 | |
| | | | | | | | |
| | | | | | | 3,026,754 | |
| | | | | | | | |
| | |
TOTAL CORPORATE DEBT
(Cost $203,773,503) | | | | | | | 207,200,466 | |
| | | | | |
|
| MUNICIPAL OBLIGATIONS — 0.2% | |
Louisiana State Public Facilities Authority,Series 2011-A, Class A2, 3 mo. USD LIBOR + .900%,
3.176% FRN 4/26/27 | | | 69,567 | | | | 69,603 | |
| | | | | | | | |
Pennsylvania Higher Education Assistance Agency, 28 day ARS
3.110% FRN 10/25/42 | | | 850,000 | | | | 837,301 | |
| | | | | | | | |
| | |
TOTAL MUNICIPAL OBLIGATIONS
(Cost $907,880) | | | | | | | 906,904 | |
| | | | | |
|
| NON-U.S. GOVERNMENT AGENCY OBLIGATIONS — 54.3% | |
| Auto Floor Plan ABS — 0.5% | |
Navistar Financial Dealer Note Master Owner Trust II
Series 2019-1, Class C, 1 mo. USD LIBOR + .950%
2.968% FRN 5/25/24 (a) | | | 856,000 | | | | 856,696 | |
Series 2018-1, Class C, 1 mo. USD LIBOR + 1.050%
3.068% FRN 9/25/23 (a) | | | 280,000 | | | | 280,321 | |
Series 2019-1, Class D, 1 mo. USD LIBOR + 1.450%
3.468% FRN 5/25/24 (a) | | | 768,000 | | | | 767,999 | |
Series 2018-1, Class D, 1 mo. USD LIBOR + 1.550%
3.568% FRN 9/25/23 (a) | | | 471,000 | | | | 471,589 | |
| | | | | | | | |
| | | | | | | 2,376,605 | |
| | | | | | | | |
| Automobile ABS — 6.3% | |
American Credit Acceptance Receivables Trust,Series 2019-1, Class C
3.500% 4/14/25 (a) | | | 1,625,000 | | | | 1,655,347 | |
AmeriCredit Automobile Receivables Trust2019-3,Series 2019-3, Class D
2.580% 9/18/25 | | | 1,425,000 | | | | 1,426,262 | |
Avis Budget Rental Car Funding AESOP LLC
Series 2019-3A, Class B,
2.650% 3/20/26 (a) | | | 4,150,000 | | | | 4,146,058 | |
Series 2019-3A, Class C,
3.150% 3/20/26 (a) | | | 2,764,000 | | | | 2,752,471 | |
Series 2019-1A, Class B,
3.700% 3/20/23 (a) | | | 295,000 | | | | 302,712 | |
The accompanying notes are an integral part of the financial statements.
52
MassMutual Premier Short-Duration Bond Fund – Portfolio of Investments(Continued)
| | | | | | | | |
| | | Principal
Amount | | | Value | |
Series 2019-1A, Class C,
4.530% 3/20/23 (a) | | $ | 633,000 | | | $ | 643,052 | |
Bank of The West Auto Trust,Series 2019-1, Class C
2.900% 4/15/25 (a) | | | 818,000 | | | | 825,742 | |
Canadian Pacer Auto Receivables Trust,Series 2018-2A, Class B
3.630% 1/19/24 (a) | | | 460,000 | | | | 476,526 | |
Drive Auto Receivables Trust
Series 2018-4, Class C,
3.660% 11/15/24 | | | 660,000 | | | | 667,769 | |
Series 2019-1, Class C,
3.780% 4/15/25 | | | 1,050,000 | | | | 1,070,204 | |
Drive Auto Receivables Trust2019-4,Series 2019-4, Class D
2.700% 2/16/27 | | | 1,333,000 | | | | 1,329,879 | |
DT Auto Owner Trust,Series 2019-1A, Class C
3.610% 11/15/24 (a) | | | 240,000 | | | | 243,894 | |
Exeter Automobile Receivables Trust
Series 2018-4A, Class A,
3.050% 12/15/21 (a) | | | 148,322 | | | | 148,541 | |
Series 2019-1A, Class B,
3.450% 2/15/23 (a) | | | 400,000 | | | | 404,126 | |
Exeter Automobile Receivables Trust
2019-3,Series 2019-3A, Class D
3.110% 8/15/25 (a) | | | 985,000 | | | | 995,467 | |
First Investors Auto Owner Trust,
Series 2017-3A, Class B
2.720% 4/17/23 (a) | | | 890,000 | | | | 894,636 | |
Flagship Credit Auto Trust,
Series 2017-4, Class C
2.920% 11/15/23 (a) | | | 1,800,000 | | | | 1,813,498 | |
GLS Auto Receivables Trust,
Series 2018-3A, Class A
3.350% 8/15/22 (a) | | | 427,626 | | | | 429,590 | |
Hertz Fleet Lease Funding LP,
Series 2019-1, Class D
3.440% 1/10/33 (a) | | | 1,976,000 | | | | 1,997,771 | |
Hertz Vehicle Financing II LP
Series 2018-1A, Class A,
3.290% 2/25/24 (a) | | | 4,120,000 | | | | 4,220,601 | |
Series 2017-1A, Class B,
3.560% 10/25/21 (a) | | | 1,430,000 | | | | 1,440,351 | |
Series 2018-1A, Class B,
3.600% 2/25/24 (a) | | | 1,420,000 | | | | 1,457,781 | |
Hertz Vehicle Financing LLC,Series 2018-3A, Class B
4.370% 7/25/24 (a) | | | 950,000 | | | | 996,656 | |
OneMain Direct Auto Receivables Trust,
Series 2017-2A, Class C
2.820% 7/15/24 (a) | | | 885,000 | | | | 886,470 | |
| | | | | | | | |
| | | Principal
Amount | | | Value | |
Oscar US Funding Trust II,
Series 2015-1A, Class A4
2.440% 6/15/22 (a) | | $ | 105,621 | | | $ | 105,620 | |
Oscar US Funding X LLC,
Series 2019-1A, Class A4
3.270% 5/11/26 (a) | | | 1,200,000 | | | | 1,236,188 | |
| | | | | | | | |
| | | | | | | 32,567,212 | |
| | | | | | | | |
| Commercial MBS — 3.5% | |
BAMLL Commercial Mortgage Securities Trust, Series 2018-DSNY, Class C, 1 mo. USD LIBOR + 1.350%
3.378% FRN 9/15/34 (a) | | | 300,000 | | | | 299,740 | |
Bear Stearns Commercial Mortgage Securities,Series 2007-T26, Class AM,
5.513% VRN 1/12/45 (b) | | | 172,031 | | | | 172,187 | |
BHMS Mortgage Trust
Series 2018-ATLS, Class A, 1 mo. USD LIBOR + 1.250%
3.278% FRN 7/15/35 (a) | | | 1,880,000 | | | | 1,880,011 | |
Series 2018-ATLS, Class B, 1 mo. USD LIBOR + 1.500%
3.528% FRN 7/15/35 (a) | | | 2,600,000 | | | | 2,600,803 | |
BX Commercial Mortgage Trust,Series 2018-IND, Class E, 1 mo. USD LIBOR + 1.700%
3.728% FRN 11/15/35 (a) | | | 2,080,989 | | | | 2,086,179 | |
CAMB Commercial Mortgage Trust, Series 2019-LIFE, Class E, 1 mo. USD LIBOR + 2.150%
4.178% FRN 12/15/37 (a) | | | 1,335,725 | | | | 1,345,732 | |
COMM Mortgage Trust,Series 2015-DC1, Class B,
4.035% VRN 2/10/48 (b) | | | 797,000 | | | | 836,791 | |
Credit Suisse Mortgage Capital Certificates, Series 2019-ICE4, Class D, 1 mo. USD LIBOR + 1.600%
3.628% FRN 5/15/36 (a) | | | 820,000 | | | | 821,036 | |
GCCFC Commercial Mortgage Trust,Series 2006-GG7, Class AM,
5.825% VRN 7/10/38 (b) | | | 217,760 | | | | 219,577 | |
GS Mortgage Securities Trust, Series 2015-GC34, Class C,
4.808% VRN 10/10/48 (b) | | | 1,100,000 | | | | 1,176,744 | |
JP Morgan Chase Commercial Mortgage Securities Corp.,Series 2018-LAQ, Class A, 1 mo. USD LIBOR + 1.000%
3.028% FRN 6/15/32 (a) | | | 3,695,691 | | | | 3,692,270 | |
The accompanying notes are an integral part of the financial statements.
53
MassMutual Premier Short-Duration Bond Fund – Portfolio of Investments(Continued)
| | | | | | | | |
| | | Principal
Amount | | | Value | |
KNDL Mortgage Trust,Series 2019-KNSQ, Class E, 1 mo. USD LIBOR + 1.800%
3.828% FRN 5/15/36 (a) | | $ | 739,000 | | | $ | 739,021 | |
Morgan Stanley Bank of America Merrill Lynch Trust,Series 2013-C7, Class B
3.769% 2/15/46 | | | 1,000,000 | | | | 1,033,095 | |
Morgan Stanley Capital I Trust, Series 2012-STAR, Class D
4.057% 8/05/34 (a) | | | 1,000,000 | | | | 1,032,180 | |
MSCG Trust, Series 2018-SELF, Class C, 1 mo. USD LIBOR + 1.180%
3.208% FRN 10/15/37 (a) | | | 185,000 | | | | 184,998 | |
TIAA Seasoned Commercial Mortgage Trust,Series 2007-C4, Class AJ,
5.483% VRN 8/15/39 (b) | | | 15,713 | | | | 15,779 | |
Velocity Commercial Capital Loan Trust,Series 2016-2, Class AFX,
2.997% VRN 10/25/46 (b) | | | 224,676 | | | | 225,595 | |
| | | | | | | | |
| | | | | | | 18,361,738 | |
| | | | | | | | |
| Home Equity ABS — 0.0% | |
Credit Suisse Seasoned Loan Trust,Series 2006-1, Class A, 1 mo. USD LIBOR + .240%
2.258% FRN 10/25/34 (a) | | | 246,913 | | | | 246,366 | |
| | | | | | | | |
| Other ABS — 23.1% | |
321 Henderson Receivables I LLC
Series 2006-1A, Class A1, 1 mo. USD LIBOR + .200%
2.228% FRN 3/15/41 (a) | | | 157,280 | | | | 154,912 | |
Series 2006-2A, Class A1, 1 mo. USD LIBOR + .200%
2.228% FRN 6/15/41 (a) | | | 278,353 | | | | 272,426 | |
AASET Trust,Series 2017-1A, Class A
3.967% 5/16/42 (a) | | | 514,938 | | | | 521,097 | |
AASET US Ltd.,Series 2018-2A, Class A
4.454% 11/18/38 (a) | | | 1,608,187 | | | | 1,649,701 | |
Adams Outdoor Advertising LP,Series 2018-1, Class A
4.810% 11/15/48 (a) | | | 810,217 | | | | 840,847 | |
American Tower Trust #1, Series 13, Class 2A
3.070% 3/15/48 (a) | | | 1,400,000 | | | | 1,422,871 | |
Arbor Realty Commercial Real Estate Notes,Series 2018-FL1, Class A, 1 mo. USD LIBOR + 1.150%
3.178% FRN 6/15/28 (a) | | | 880,000 | | | | 880,822 | |
Arbys Funding LLC,Series 2015-1A, Class A2
4.969% 10/30/45 (a) | | | 818,125 | | | | 881,259 | |
| | | | | | | | |
| | | Principal
Amount | | | Value | |
Ares XXXIV CLO Ltd.,Series 2015-2A, Class BR, 3 mo. USD LIBOR + 1.500%
3.756% FRN 7/29/26 (a) | | $ | 500,000 | | | $ | 499,422 | |
Ascentium Equipment Receivables,Series 2019-1A, Class D
3.470% 5/12/25 (a) | | | 392,000 | | | | 403,464 | |
Ascentium Equipment Receivables Trust
Series 2019-1A, Class E,
4.310% 4/12/27 (a) | | | 320,000 | | | | 329,160 | |
Series 2018-2A, Class E,
5.180% 7/10/26 (a) | | | 2,286,000 | | | | 2,373,690 | |
Avant Loans Funding Trust,Series 2019-A, Class A
3.480% 7/15/22 (a) | | | 924,834 | | | | 928,931 | |
Bain Capital Credit CLO2016-2 Ltd.,Series 2016-2A, Class BR, 3 mo. USD LIBOR + 1.800%
3.924% FRN 1/15/29 (a) | | | 500,000 | | | | 499,984 | |
Benefit Street Partners CLO X Ltd.,Series 2016-10A, Class A2R, 3 mo. USD LIBOR + 1.750%
4.053% FRN 1/15/29 (a) | | | 1,500,000 | | | | 1,496,547 | |
BlueMountain CLO2013-1 Ltd.,Series 2013-1A, Class A1R2, 3 mo. USD LIBOR + 1.230%
3.508% FRN 1/20/29 (a) | | | 1,000,000 | | | | 1,000,487 | |
BRE Grand Islander Timeshare Issuer LLC
Series 2017-1A, Class A,
2.940% 5/25/29 (a) | | | 315,244 | | | | 318,496 | |
Series 2019-A, Class B,
3.780% 9/26/33 (a) | | | 823,390 | | | | 842,472 | |
CAL Funding II Ltd.,Series 2018-2A, Class A
4.340% 9/25/43 (a) | | | 711,000 | | | | 727,765 | |
Capital Automotive LLC,Series 2012-1A, Class A1
3.870% 4/15/47 (a) | | | 587,962 | | | | 592,354 | |
Castlelake Aircraft Structured Trust
Series 2019-1A, Class A,
3.967% 4/15/39 (a) | | | 451,508 | | | | 458,371 | |
Series 2018-1, Class A,
4.125% 6/15/43 (a) | | | 756,101 | | | | 773,949 | |
Cazenovia Creek Funding I LLC,Series 2015-1A, Class A
2.000% 12/10/23 (a) | | | 17,605 | | | | 17,590 | |
CLI Funding V LLC,Series 2014-1A, Class A
3.290% 6/18/29 (a) | | | 987,935 | | | | 990,607 | |
CLI Funding VI LLC
Series 2017-1A, Class A,
3.620% 5/18/42 (a) | | | 824,204 | | | | 826,520 | |
The accompanying notes are an integral part of the financial statements.
54
MassMutual Premier Short-Duration Bond Fund – Portfolio of Investments(Continued)
| | | | | | | | |
| | | Principal
Amount | | | Value | |
Series 2019-1A, Class A,
3.710% 5/18/44 (a) | | $ | 785,312 | | | $ | 791,096 | |
Countrywide Asset-Backed Certificates,Series 2004-5, Class 3A, 1 mo. USD LIBOR + .460%
2.478% FRN 9/25/34 | | | 11,073 | | | | 10,540 | |
DB Master Finance LLC
Series 2019-1A, Class A2I,
3.787% 5/20/49 (a) | | | 630,420 | | | | 651,990 | |
Series 2019-1A, Class A2II,
4.021% 5/20/49 (a) | | | 744,135 | | | | 760,202 | |
Denali Capital CLO X LLC,Series 2013-1A, Class A1, 3 mo. USD LIBOR + 1.050%
3.317% FRN 10/26/27 (a) | | | 1,850,000 | | | | 1,847,971 | |
Diamond Resorts Owner Trust
Series 2019-1A, Class A,
2.890% 2/20/32 (a) | | | 1,565,865 | | | | 1,569,692 | |
Series 2016-1, Class A,
3.080% 11/20/28 (a) | | | 566,322 | | | | 568,840 | |
Domino’s Pizza Master Issuer LLC
Series 2017-1A, Class A2II,
3.082% 7/25/47 (a) | | | 2,793,000 | | | | 2,805,746 | |
Series 2018-1A, Class A2I,
4.116% 7/25/48 (a) | | | 957,875 | | | | 999,731 | |
Drug Royalty II LP,Series 2014-1, Class A1, 3 mo. USD LIBOR + 2.850%
5.153% FRN 7/15/23 (a) | | | 53,710 | | | | 53,817 | |
Elara HGV Timeshare Issuer2019-A LLC,Series 2019-A, Class C
3.450% 1/25/34 (a) | | | 2,182,685 | | | | 2,178,292 | |
Elara HGV Timeshare Issuer LLC
Series 2017-A, Class A,
2.690% 3/25/30 (a) | | | 365,797 | | | | 367,083 | |
Series 2014-A, Class B,
3.020% VRN 2/25/27 (a) (b) | | | 146,673 | | | | 145,317 | |
Elmwood CLO II Ltd.,Series 2019-2A, Class A, 3 mo. USD LIBOR + 1.450%
3.995% FRN 4/20/31 (a) | | | 1,250,000 | | | | 1,250,915 | |
FCI Funding LLC,Series 2019-1A, Class A
3.630% 2/18/31 (a) | | | 437,004 | | | | 440,168 | |
Galaxy XX CLO Ltd.,Series 2015-20A, Class AR, 3 mo. USD LIBOR + 1.000%
3.278% FRN 4/20/31 (a) | | | 1,500,000 | | | | 1,485,169 | |
Gallatin CLO IX Ltd.,Series 2018-1A, Class A, 3 mo. USD LIBOR + 1.050%
3.328% FRN 1/21/28 (a) | | | 2,200,000 | | | | 2,195,010 | |
Global SC Finance IV Ltd.,Series 2017-1A, Class A
3.850% 4/15/37 (a) | | | 670,477 | | | | 689,889 | |
| | | | | | | | |
| | | Principal
Amount | | | Value | |
Goodgreen Trust
Series 2016-1A, Class A,
3.230% 10/15/52 (a) | | $ | 900,523 | | | $ | 922,945 | |
Series 2019-1A, Class A,
3.860% 10/15/54 (a) | | | 706,644 | | | | 748,335 | |
Series 2018-1A, Class A,
3.930% VRN 10/15/53 (a) (b) | | | 1,496,559 | | | | 1,579,193 | |
Hero Funding Trust
Series 2017-3A, Class A1,
3.190% 9/20/48 (a) | | | 965,955 | | | | 985,917 | |
Series 2017-2A, Class A1,
3.280% 9/20/48 (a) | | | 222,021 | | | | 223,960 | |
Series 2016-4A, Class A1,
3.570% 9/20/47 (a) | | | 551,935 | | | | 567,684 | |
Series 2017-2A, Class A2,
4.070% 9/20/48 (a) | | | 182,841 | | | | 189,278 | |
Series 2018-1A, Class A2,
4.670% 9/20/48 (a) | | | 1,086,973 | | | | 1,148,277 | |
Hilton Grand Vacations Trust,Series 2017-AA, Class B
2.960% 12/26/28 (a) | | | 425,038 | | | | 427,512 | |
Hilton Grand Vacations Trust2019-A,Series 2019-AA, Class C
2.840% 7/25/33 (a) | | | 1,903,114 | | | | 1,900,467 | |
Horizon Aircraft Finance I Ltd.,Series 2018-1, Class A
4.458% 12/15/38 (a) | | | 484,570 | | | | 503,309 | |
KDAC Aircraft Finance Ltd.,Series 2017-1A, Class A
4.212% 12/15/42 (a) | | | 609,642 | | | | 624,462 | |
KREF Ltd.,Series 2018-FL1, Class AS, 1 mo. USD LIBOR + 1.350%
3.375% FRN 6/15/36 (a) | | | 2,600,000 | | | | 2,614,380 | |
Lendmark Funding Trust
Series 2017-2A, Class A,
2.800% 5/20/26 (a) | | | 819,957 | | | | 819,621 | |
Series 2018-1A, Class A,
3.810% 12/21/26 (a) | | | 930,000 | | | | 940,984 | |
Madison Park Funding Ltd.,Series 2015-19A, Class A2R
4.026% 1/22/28 (a) | | | 2,000,000 | | | | 1,999,012 | |
Madison Park Funding XXIII Ltd.,Series 2017-23A, Class B, 3 mo. USD LIBOR + 1.700%
3.956% FRN 7/27/30 (a) | | | 1,000,000 | | | | 997,190 | |
Mariner Finance Issuance Trust
Series 2017-BA, Class A,
2.920% 12/20/29 (a) | | | 3,150,000 | | | | 3,154,832 | |
Series 2018-AA, Class A,
4.200% 11/20/30 (a) | | | 2,063,000 | | | | 2,111,288 | |
Marlette Funding Trust
Series 2019-2A, Class A,
3.130% 7/16/29 (a) | | | 601,936 | | | | 606,414 | |
The accompanying notes are an integral part of the financial statements.
55
MassMutual Premier Short-Duration Bond Fund – Portfolio of Investments(Continued)
| | | | | | | | |
| | | Principal
Amount | | | Value | |
Series 2019-1A, Class A,
3.440% 4/16/29 (a) | | $ | 160,775 | | | $ | 162,186 | |
Series 2019-2A, Class B,
3.530% 7/16/29 (a) | | | 540,000 | | | | 549,184 | |
Mosaic Solar Loans LLC
Series 2018-2GS, Class A,
4.200% 2/22/44 (a) | | | 777,613 | | | | 805,326 | |
Series 2017-1A, Class A,
4.450% 6/20/42 (a) | | | 180,204 | | | | 188,120 | |
MVW Owner Trust,Series 2013-1A, Class A
2.150% 4/22/30 (a) | | | 138,358 | | | | 138,080 | |
Neuberger Berman CLO XX Ltd.,Series 2015-20A, Class BR, 3 mo. USD LIBOR + 1.250%
3.553% FRN 1/15/28 (a) | | | 750,000 | | | | 739,081 | |
New Residential Advance Receivables Trust,Series 2019-T2, Class DT2
3.060% 8/15/53 (a) | | | 579,000 | | | | 577,503 | |
New Residential Advance Receivables Trust Advance Receivables Backed2019-T3
Series 2019-T3, Class CT3,
2.710% 10/20/52 (a) | | | 887,000 | | | | 888,857 | |
Series 2019-T3, Class DT3,
3.055% 10/20/52 (a) | | | 1,500,000 | | | | 1,503,018 | |
NP SPE II LLC
Series 2019-1A, Class A1,
2.574% 9/20/49 (a) | | | 577,000 | | | | 577,171 | |
Series 2017-1A, Class A1,
3.372% 10/21/47 (a) | | | 440,429 | | | | 452,628 | |
OCP CLO Ltd.,Series 2015-8A, Class A2AR, 3 mo. USD LIBOR + 1.450%
3.753% FRN 4/17/27 (a) | | | 2,150,000 | | | | 2,149,757 | |
OneMain Financial Issuance Trust
Series 2019-2A, Class A,
3.140% 10/14/36 (a) | | | 3,650,000 | | | | 3,650,909 | |
Series 2019-2A, Class C,
3.660% 10/14/36 (a) | | | 1,550,000 | | | | 1,550,077 | |
Orange Lake Timeshare Trust
Series 2016-A, Class B,
2.910% 3/08/29 (a) | | | 598,483 | | | | 592,537 | |
Series 2019-A, Class D,
4.930% 4/09/38 (a) | | | 1,886,928 | | | | 1,906,033 | |
Oxford Finance Funding Trust,Series 2016-1A, Class A
3.968% 6/17/24 (a) | | | 336,635 | | | | 338,766 | |
Palmer Square CLO Ltd., Series 2015-1A, Class A2R2 3 mo. USD LIBOR + 1.650%
3.802% FRN 5/21/29 (a) | | | 1,250,000 | | | | 1,249,970 | |
Pioneer Aircraft Finance Ltd.,Series 2019-1, Class A
3.967% 6/15/44 (a) | | | 723,839 | | | | 745,975 | |
| | | | | | | | |
| | | Principal
Amount | | | Value | |
PNMAC GMSR Issuer Trust,Series 2018-GT1, Class A
5.340% 2/25/23 (a) | | $ | 670,000 | | | $ | 670,399 | |
Riserva Clo Ltd.,Series 2016-3A, Class BR, 3 mo. USD LIBOR + 1.700%
4.000% FRN 10/18/28 (a) | | | 250,000 | | | | 249,401 | |
RR 3 Ltd.,Series 2018-3A, Class A1R2, 3 mo. USD LIBOR + 1.090%
3.393% FRN 1/15/30 (a) | | | 1,250,000 | | | | 1,243,284 | |
SBA Tower Trust,Series 2014-2A, Class C,
3.869% STEP 10/15/49 (a) | | | 1,030,000 | | | | 1,072,437 | |
Securitized Equipment Receivable
3.760% 10/11/24 | | | 890,000 | | | | 891,176 | |
4.200% 10/11/24 | | | 845,000 | | | | 847,812 | |
Sierra Receivables Funding LLC
Series 2015-3A, Class A,
2.580% 9/20/32 (a) | | | 116,083 | | | | 116,085 | |
Series 2016-3A, Class B,
2.630% 10/20/33 (a) | | | 659,506 | | | | 659,055 | |
Series 2016-2A, Class B,
2.780% 7/20/33 (a) | | | 1,075,075 | | | | 1,082,221 | |
Series 2015-1A, Class B,
3.050% 3/22/32 (a) | | | 555,820 | | | | 556,002 | |
Series 2015-3A, Class B,
3.080% 9/20/32 (a) | | | 43,531 | | | | 43,734 | |
Series 2019-2A, Class C,
3.120% 5/20/36 (a) | | | 257,151 | | | | 259,401 | |
Series 2018-1A, Class B,
4.236% 4/20/35 | | | 1,612,247 | | | | 1,647,333 | |
Series 2019-2A, Class D,
4.540% 5/20/36 (a) | | | 1,062,584 | | | | 1,071,307 | |
Series 2019-1A, Class D,
4.750% 1/20/36 (a) | | | 978,074 | | | | 1,000,543 | |
SoFi Consumer Loan Program LLC,Series 2018-3, Class A1
3.200% 8/25/27 (a) | | | 255,687 | | | | 256,301 | |
SoFi Consumer Loan Program Trust,Series 2019-3, Class D
3.890% 5/25/28 (a) | | | 2,981,000 | | | | 3,039,297 | |
Store Master FundingI-VII,Series 2018-1A, Class A3
4.400% 10/20/48 (a) | | | 1,244,271 | | | | 1,322,867 | |
Structured Asset Securities Corp. Mortgage Loan Trust,Series 2006-GEL1, Class M2, 1 mo. USD LIBOR + .800%
2.818% FRN 11/25/35 (a) | | | 1,300,000 | | | | 1,269,079 | |
Taco Bell Funding LLC,Series 2018-1A, Class A2I
4.318% 11/25/48 (a) | | | 2,302,600 | | | | 2,381,978 | |
The accompanying notes are an integral part of the financial statements.
56
MassMutual Premier Short-Duration Bond Fund – Portfolio of Investments(Continued)
| | | | | | | | |
| | | Principal
Amount | | | Value | |
TAL Advantage V LLC,Series 2014-2A, Class A2
3.330% 5/20/39 (a) | | $ | 699,111 | | | $ | 706,587 | |
TAL Advantage VI LLC,Series 2017-1A, Class A
4.500% 4/20/42 (a) | | | 953,022 | | | | 982,453 | |
TLF National Tax Lien Trust,Series 2017-1A, Class A
3.090% 12/15/29 (a) | | | 1,495,562 | | | | 1,495,598 | |
Trafigura Securitisation Finance PLC
Series 2018-1A, Class A1, 1 mo. USD LIBOR + .730%
2.758% FRN 3/15/22 (a) | | | 1,340,000 | | | | 1,336,028 | |
Series 2017-1A, Class B,
4.184% 12/15/20 (a) | | | 670,000 | | | | 670,759 | |
Series 2018-1A, Class B,
4.290% 3/15/22 (a) | | | 1,870,000 | | | | 1,914,012 | |
Treman Park CLO Ltd.,Series 2015-1A, Class ARR, 3 mo. USD LIBOR + 1.070%
3.348% FRN 10/20/28 (a) | | | 1,100,000 | | | | 1,101,503 | |
Trinity Rail Leasing LP
Series 2018-1A, Class A1,
3.820% 6/17/48 (a) | | | 1,312,236 | | | | 1,323,202 | |
Series 2019-1A, Class A,
3.820% 4/17/49 (a) | | | 1,634,570 | | | | 1,697,308 | |
Trip Rail Master Funding LLC
Series 2017-1A, Class A1,
2.709% 8/15/47 (a) | | | 265,536 | | | | 265,658 | |
Series 2011-1A, Class A2,
6.024% 7/15/41 (a) | | | 2,246,612 | | | | 2,366,673 | |
Triton Container Finance IV LLC,Series 2017-2A, Class A
3.620% 8/20/42 (a) | | | 2,004,865 | | | | 1,997,779 | |
Triton Container Finance VI LLC,Series 2018-2A, Class A
4.190% 6/22/43 (a) | | | 1,295,000 | | | | 1,337,862 | |
VSE VOI Mortgage LLC
Series 2016-A, Class B,
2.740% 7/20/33 (a) | | | 541,014 | | | | 541,534 | |
Series 2018-A, Class C,
4.020% 2/20/36 (a) | | | 584,033 | | | | 602,268 | |
Welk Resorts LLC
Series 2015-AA, Class A,
2.790% 6/16/31 (a) | | | 139,680 | | | | 138,708 | |
Series 2017-AA, Class B,
3.410% 6/15/33 (a) | | | 924,797 | | | | 919,135 | |
Westgate Resorts LLC,Series 2015-2A, Class A
3.200% 7/20/28 (a) | | | 156,131 | | | | 155,918 | |
| | | | | | | | |
| | | Principal
Amount | | | Value | |
Willis Engine Structured Trust IV,Series 2018-A, Class A,
4.750% STEP 9/15/43 (a) | | $ | 677,076 | | | $ | 704,994 | |
| | | | | | | | |
| | | | | | | 120,283,141 | |
| | | | | | | | |
| Student Loans ABS — 13.6% | |
Academic Loan Funding Trust,Series 2013-1A, Class A
2.945% 12/26/44 (a) | | | 192,683 | | | | 192,577 | |
Access Group,Series 2003-A, Class A3
3.260% 7/01/38 | | | 84,995 | | | | 84,028 | |
Access Group, Inc.
Series 2015-1, Class A,
2.845% 7/25/56 (a) | | | 611,959 | | | | 605,852 | |
Series 2015-1, Class B,
3.645% 7/25/58 (a) | | | 530,000 | | | | 498,139 | |
College Avenue Student Loans LLC
Series 2018-A, Class A1, 1 mo. USD LIBOR + 1.200%
3.218% FRN 12/26/47 (a) | | | 1,460,536 | | | | 1,443,874 | |
Series 2019-A, Class B,
3.810% 12/28/48 (a) | | | 1,038,000 | | | | 1,053,829 | |
College Loan Corp. Trust I,Series 2005-2, Class B, 3 mo. USD LIBOR + .490%
2.793% FRN 1/15/37 | | | 566,838 | | | | 529,686 | |
Commonbond Student Loan Trust
Series 2016-B, Class A1,
2.730% 10/25/40 (a) | | | 347,139 | | | | 350,314 | |
Series 2018-AGS, Class C,
3.820% 2/25/44 (a) | | | 648,592 | | | | 661,056 | |
Series 2018-BGS, Class C,
4.120% 9/25/45 (a) | | | 525,096 | | | | 535,058 | |
Series 2018-CGS, Class C,
4.350% 2/25/46 (a) | | | 406,399 | | | | 412,535 | |
Series 2017-AGS, Class C,
5.280% 5/25/41 (a) | | | 333,798 | | | | 347,649 | |
Credit Suisse ABS Repackaging Trust,Series 2013-A, Class B
2.500% 1/25/30 (a) | | | 214,667 | | | | 209,301 | |
Earnest Student Loan Program LLC
Series 2016-C, Class A2,
2.680% 7/25/35 (a) | | | 706,569 | | | | 709,253 | |
Series 2016-B, Class A1, 1 mo. USD LIBOR + 2.050%
4.068% FRN 2/26/35 (a) | | | 288,249 | | | | 291,484 | |
ECMC Group Student Loan Trust
Series 2018-2A, Class A, 1 mo. USD LIBOR + .800%
2.818% FRN 9/25/68 (a) | | | 2,128,359 | | | | 2,126,467 | |
Series 2017-1A, Class A, 1 mo. USD LIBOR + 1.200%
3.218% FRN 12/27/66 (a) | | | 2,006,450 | | | | 2,026,678 | |
The accompanying notes are an integral part of the financial statements.
57
MassMutual Premier Short-Duration Bond Fund – Portfolio of Investments(Continued)
| | | | | | | | |
| | | Principal
Amount | | | Value | |
Series 2018-1A, Class A,
3.240% 2/27/68 (a) | | $ | 1,772,995 | | | $ | 1,761,099 | |
EdLinc Student Loan Funding,Series 2017-A, Class A,PRIME - 1.150%
4.350% FRN 12/01/47 (a) | | | 1,720,114 | | | | 1,713,245 | |
ELFI Graduate Loan Program LLC
Series 2018-A, Class A1, 1 mo. USD LIBOR + .750%
2.768% FRN 8/25/42 (a) | | | 909,983 | | | | 907,204 | |
Series 2018-A, Class B,
4.000% 8/25/42 (a) | | | 630,000 | | | | 653,442 | |
Laurel Road Prime Student Loan Trust
Series 2017-C, Class B,
2.950% 11/25/42 (a) | | | 590,148 | | | | 595,761 | |
Series 2017-B, Class CFX,
3.610% 8/25/42 (a) | | | 633,704 | | | | 639,028 | |
Series 2018-B, Class BFX,
3.720% 5/26/43 (a) | | | 774,452 | | | | 793,193 | |
Laurel Road Prime Student Loan Trust2019-A,Series 2019-A, Class BFX
3.000% 10/25/48 (a) | | | 650,000 | | | | 655,710 | |
Navient Private Education Refi Loan Trust,Series 2019-A, Class A2A
3.420% 1/15/43 (a) | | | 570,000 | | | | 592,154 | |
Navient Student Loan Trust
Series 2018-2A, Class A3, 1 mo. USD LIBOR + .750%
2.768% FRN 3/25/67 (a) | | | 1,830,000 | | | | 1,829,404 | |
Series 2018-3A, Class A3, 1 mo. USD LIBOR + .800%
2.818% FRN 3/25/67 (a) | | | 2,500,000 | | | | 2,489,259 | |
Series 2019-2A, Class A2, 1 mo. USD LIBOR + 1.000%
3.018% FRN 2/27/68 (a) | | | 919,000 | | | | 927,054 | |
Series 2017-1A, Class A3, 1 mo. USD LIBOR + 1.150%
3.168% FRN 7/26/66 (a) | | | 1,800,000 | | | | 1,826,446 | |
Nelnet Private Education Loan Trust
Series 2016-A, Class A1B,
3.600% 12/26/40 (a) | | | 312,385 | | | | 315,936 | |
Series 2016-A, Class A1A, 1 mo. USD LIBOR + 1.750%
3.768% FRN 12/26/40 (a) | | | 260,862 | | | | 259,581 | |
Nelnet Student Loan Trust
Series 2013-5A, Class A, 1 mo. USD LIBOR + .630%
2.648% FRN 1/25/37 (a) | | | 417,763 | | | | 414,737 | |
Series 2012-1A, Class A, 1 mo. USD LIBOR + .800%
2.818% FRN 12/27/39 (a) | | | 1,410,626 | | | | 1,409,480 | |
Series 2018-3A, Class A3,
3.240% 9/27/66 (a) | | | 1,950,000 | | | | 1,936,643 | |
| | | | | | | | |
| | | Principal
Amount | | | Value | |
Series 2007-2A, Class A4A2, 28 day ARS
3.366% FRN 6/25/35 (a) | | $ | 2,800,000 | | | $ | 2,783,266 | |
Series 2015-3A, Class B, 1 mo. USD LIBOR + 1.500%
3.518% FRN 6/25/54 (a) | | | 395,000 | | | | 387,901 | |
Series 2018-5A, Class B, 1 mo. USD LIBOR + 1.450%
3.595% FRN 2/25/67 (a) | | | 1,000,000 | | | | 988,432 | |
North Carolina State Education Assistance Authority,Series 2011-2, Class A2, 3 mo. USD LIBOR + .800%
3.076% FRN 7/25/25 | | | 180,346 | | | | 180,858 | |
PHEAA Student Loan Trust,Series 2016-2A, Class A, 1 mo. USD LIBOR + .950%
2.968% FRN 11/25/65 (a) | | | 1,115,545 | | | | 1,118,352 | |
SLC Student Loan Trust,Series 2005-3, Class B, 3 mo. USD LIBOR + .250%
2.369% FRN 6/15/55 | | | 1,388,667 | | | | 1,290,316 | |
SLM Student Loan Trust
Series 2006-2, Class R,
0.000% 1/25/41 | | | 3,391 | | | | 1,661,721 | |
Series 2006-7, Class B, 3 mo. USD LIBOR + .200%
2.476% FRN 1/27/42 | | | 3,281,424 | | | | 3,015,933 | |
Series 2006-10, Class B, 3 mo. USD LIBOR + .220%
2.496% FRN 3/25/44 | | | 2,178,924 | | | | 2,049,140 | |
Series 2005-6, Class B, 3 mo. USD LIBOR + .290%
2.566% FRN 1/25/44 | | | 1,414,583 | | | | 1,321,634 | |
Series 2003-14, Class A6, 3 mo. USD LIBOR + .300%
2.576% FRN 7/25/25 | | | 415,144 | | | | 414,507 | |
Series 2005-9, Class B, 3 mo. USD LIBOR + .300%
2.576% FRN 1/25/41 | | | 1,035,488 | | | | 968,458 | |
Series 2005-8, Class B, 3 mo. USD LIBOR + .310%
2.586% FRN 1/25/55 | | | 508,184 | | | | 474,694 | |
Series 2003-11, Class B, 3 mo. USD LIBOR + .650%
2.769% FRN 12/15/38 | | | 401,610 | | | | 382,440 | |
Series 2004-3A, Class A6A, 3 mo. USD LIBOR + .550%
2.826% FRN 10/25/64 (a) | | | 2,300,000 | | | | 2,261,815 | |
Series 2005-9, Class A7A, 3 mo. EURIBOR + .600%
2.876% FRN 1/25/41 | | | 1,720,243 | | | | 1,696,866 | |
Series 2003-5, Class A7, 28 day ARS
4.490% FRN 6/15/30 | | | 100,000 | | | | 100,000 | |
The accompanying notes are an integral part of the financial statements.
58
MassMutual Premier Short-Duration Bond Fund – Portfolio of Investments(Continued)
| | | | | | | | |
| | | Principal
Amount | | | Value | |
SMB Private Education Loan Trust
Series 2018-C, Class A2B, 1 mo. USD LIBOR + .750%
2.778% FRN 11/15/35 (a) | | $ | 1,200,000 | | | $ | 1,194,005 | |
Series 2018-A, Class A2B, 1 mo. USD LIBOR + .800%
2.828% FRN 2/15/36 (a) | | | 900,000 | | | | 899,161 | |
Series 2019-A, Class A2B, 1 mo. USD LIBOR + .870%
2.898% FRN 7/15/36 (a) | | | 1,211,000 | | | | 1,206,163 | |
Series 2019-B, Class A2B, 1 mo. USD LIBOR + 1.000%
3.028% FRN 6/15/37 (a) | | | 3,400,000 | | | | 3,404,195 | |
Series 2016-B, Class A2B, 1 mo. USD LIBOR + 1.450%
3.478% FRN 2/17/32 (a) | | | 317,687 | | | | 321,167 | |
Series 2015-C, Class A3, 1 mo. USD LIBOR + 1.950%
3.978% FRN 8/16/32 (a) | | | 1,350,000 | | | | 1,380,055 | |
SoFi Alternative Trust,Series 2019-C, Class PT,
4.683% VRN 1/25/45 (a) (b) | | | 3,345,407 | | | | 3,475,768 | |
SoFi Professional Loan Program LLC
Series 2015-A, Class RC, 0.000% 3/25/33 (a) | | | 500 | | | | 437,500 | |
Series 2018-A, Class R1,
0.000% 2/25/42 | | | 1,928,100 | | | | 1,508,545 | |
Series 2017-D, Class R1,
0.000% 9/25/40 (a) | | | 2,333,800 | | | | 1,266,553 | |
Series 2018-B, Class R1,
0.000% 8/26/47 (a) | | | 1,727,800 | | | | 1,031,805 | |
Series 2018-D, Class R1,
0.000% 2/25/48 (a) | | | 2,069,700 | | | | 714,047 | |
Series 2019-A, Class R1,
0.000% 6/15/48 (a) | | | 3,162,200 | | | | 948,660 | |
Series 2016-C, Class A2B,
2.360% 12/27/32 (a) | | | 200,213 | | | | 200,587 | |
| | | | | | | | |
| | | | | | | 70,881,700 | |
| | | | | | | | |
| WL Collateral CMO — 7.3% | |
Angel Oak Mortgage Trust,Series 2018-3, Class A3,
3.238% VRN 5/25/59 (a) (b) | | | 2,833,134 | | | | 2,856,797 | |
Angel Oak Mortgage Trust LLC,Series 2017-3, Class M1,
3.900% VRN 11/25/47 (a) (b) | | | 650,000 | | | | 657,706 | |
Bank of America Mortgage Securities,Series 2004-G, Class 2A7,
4.639% VRN 8/25/34 (b) | | | 31,220 | | | | 30,877 | |
CIM Trust 2019-INV3,Series 2019-INV3, Class A11, 1 mo. USD LIBOR + 1.000%
2.994% FRN 8/25/49 (a) | | | 4,800,000 | | | | 4,792,962 | |
| | | | | | | | |
| | | Principal
Amount | | | Value | |
Citigroup Mortgage Loan Trust2019-IMC1
Series 2019-IMC1, Class A3,
3.030% VRN 7/25/49 (a) (b) | | $ | 1,430,510 | | | $ | 1,428,954 | |
Series 2019-IMC1, Class M1,
3.170% VRN 7/25/49 (a) (b) | | | 1,798,000 | | | | 1,788,870 | |
Countrywide Home Loans, Inc.
Series 2003-42, Class 1A1,
3.991% VRN 9/25/33 (b) | | | 4,951 | | | | 4,768 | |
Series 2004-2, Class 1A1,
4.612% VRN 2/25/34 (b) | | | 23,071 | | | | 21,737 | |
Deephaven Residential Mortgage Trust
Series 2018-1A, Class A2,
3.027% VRN 12/25/57 (a) (b) | | | 720,650 | | | | 721,782 | |
Series 2018-2A, Class A3,
3.684% VRN 4/25/58 (a) (b) | | | 1,446,670 | | | | 1,471,624 | |
Series 2018-3A, Class A3,
3.963% VRN 8/25/58 (a) (b) | | | 414,340 | | | | 424,368 | |
Series 2018-4A, Class A3,
4.285% VRN 10/25/58 (a) (b) | | | 1,528,929 | | | | 1,564,395 | |
GSR Mortgage Loan Trust,Series 2004-9, Class 2A1,
4.308% VRN 8/25/34 (b) | | | 7,409 | | | | 7,393 | |
IndyMac Index Mortgage Loan Trust,Series 2004-AR4, Class 1A,
4.086% VRN 8/25/34 (b) | | | 51,319 | | | | 49,927 | |
JP Morgan Mortgage Trust
Series 2018-1, Class A5,
3.500% VRN 6/25/48 (a) (b) | | | 844,436 | | | | 857,431 | |
Series 2018-3, Class A5,
3.500% VRN 9/25/48 (a) (b) | | | 1,404,341 | | | | 1,421,569 | |
Series 2018-4, Class A15,
3.500% VRN 10/25/48 (a) (b) | | | 1,122,627 | | | | 1,135,478 | |
Series 2017-6, Class A5,
3.500% VRN 12/25/48 (a) (b) | | | 1,295,596 | | | | 1,317,197 | |
Merrill Lynch Mortgage Investors, Inc.
Series 2004-A1, Class IA,
3.250% VRN 2/25/34 (b) | | | 2,473 | | | | 2,391 | |
Series 2004-A1, Class IIA2,
4.448% VRN 2/25/34 (b) | | | 95,118 | | | | 94,885 | |
Series 2003-A4, Class IA,
4.764% VRN 7/25/33 (b) | | | 2,560 | | | | 2,493 | |
New Residential Mortgage Loan Trust
Series 2016-4A, Class A1,
3.750% VRN 11/25/56 (a) (b) | | | 687,467 | | | | 714,476 | |
Series 2019-NQM2, Class A3, 3.752% 4/25/49 (a) | | | 916,688 | | | | 934,182 | |
Series 2019-NQM1, Class A3, 3.928% VRN 1/25/49 (a) (b) | | | 1,816,415 | | | | 1,872,306 | |
PSMC Trust
Series 2018-1, Class A3,
3.500% VRN 2/25/48 (a) (b) | | | 1,359,526 | | | | 1,378,061 | |
The accompanying notes are an integral part of the financial statements.
59
MassMutual Premier Short-Duration Bond Fund – Portfolio of Investments(Continued)
| | | | | | | | |
| | | Principal
Amount | | | Value | |
Series 2018-2, Class A3,
3.500% VRN 6/25/48 (a) (b) | | $ | 1,369,412 | | | $ | 1,394,072 | |
Sequoia Mortgage Trust
Series 2015-1, Class A6,
2.500% VRN 1/25/45 (a) (b) | | | 924,272 | | | | 923,981 | |
Series 2018-3, Class A4,
3.500% VRN 3/25/48 (a) (b) | | | 1,580,900 | | | | 1,607,177 | |
Series 2018-5, Class A4,
3.500% VRN 5/25/48 (a) (b) | | | 1,157,855 | | | | 1,175,503 | |
Series 2018-CH1, Class A10,
4.000% VRN 2/25/48 (a) (b) | | | 865,853 | | | | 885,928 | |
Series 2018-CH2, Class A12,
4.000% VRN 6/25/48 (a) (b) | | | 1,696,390 | | | | 1,728,308 | |
Series 2018-CH3, Class A11,
4.000% VRN 8/25/48 (a) (b) | | | 1,035,714 | | | | 1,059,037 | |
Series 2018-7, Class A4,
4.000% VRN 9/25/48 (a) (b) | | | 551,144 | | | | 563,840 | |
Series 2019-1, Class A4,
4.000% VRN 2/25/49 (a) (b) | | | 291,225 | | | | 296,791 | |
Structured Adjustable Rate Mortgage Loan Trust,Series 2004-2, Class 2A,
4.266% VRN 3/25/34 (b) | | | 26,209 | | | | 25,612 | |
TIAA Bank Mortgage Loan Trust,Series 2018-2, Class A4,
3.500% VRN 7/25/48 (a) (b) | | | 688,238 | | | | 699,362 | |
Verus Securitization Trust 2019-INV2, Series 2019-INV2, Class A3,
3.219% VRN 7/25/59 (a) (b) | | | 1,805,550 | | | | 1,798,715 | |
Washington Mutual Mortgage Pass-Through Certificates,Series 2004-AR2, Class A, 12 mo. MTA + 1.400%
3.846% FRN 4/25/44 | | | 67,438 | | | | 66,606 | |
| | | | | | | | |
| | | | | | | 37,777,561 | |
| | | | | | | | |
| | |
TOTALNON-U.S. GOVERNMENT AGENCY OBLIGATIONS
(Cost $280,323,785) | | | | | | | 282,494,323 | |
| | | | | |
|
| U.S. GOVERNMENT AGENCY OBLIGATIONS AND INSTRUMENTALITIES — 1.2% | |
| Collateralized Mortgage Obligations — 0.5% | |
Federal Home Loan Mortgage Corp. Series 4720, Class A
3.000% 3/15/41 | | | 804,389 | | | | 808,837 | |
Federal National Mortgage AssociationSeries 2015-80, Class CA
3.000% 4/25/40 | | | 1,349,453 | | | | 1,360,241 | |
| | | | | | | | |
| | | Principal
Amount | | | Value | |
Government National Mortgage Association (b)
Series 2014-131, Class BW
4.098% 5/20/41 | | $ | 308,114 | | | $ | 327,718 | |
| | | | | | | | |
| | | | | | | 2,496,796 | |
| | | | | | | | |
| Pass-Through Securities — 0.1% | |
Federal Home Loan Mortgage Corp.
Pool #1Q0239, 1 year CMT + 2.227%
4.853% 3/01/37 | | | 184,858 | | | | 194,625 | |
Federal National Mortgage Association
Pool #725692 1 year CMT + 2.137%
4.473% FRN 10/01/33 | | | 43,343 | | | | 45,633 | |
Pool #775539 12 mo. USD LIBOR + 1.636%
4.511% FRN 5/01/34 | | | 33,451 | | | | 35,004 | |
Pool #888586 1 year CMT + 2.197%
4.548% FRN 10/01/34 | | | 108,607 | | | | 114,345 | |
Pool #844564 5.500% 12/01/20 | | | 12,873 | | | | 13,036 | |
Government National Mortgage Association
Pool #507545 7.500% 8/15/29 | | | 26,138 | | | | 30,125 | |
| | | | | | | | |
| | | | | | | 432,768 | |
| | | | | | | | |
| Whole Loans — 0.6% | |
Federal Home Loan Mortgage Corp. Structured Agency Credit Risk Debt Notes, Series 2019-DNA3, Class M2
4.350% 7/25/49 (a) | | | 398,000 | | | | 397,999 | |
Federal National Mortgage Association Connecticut Avenue Securities Trust
Series 2018-C03, Class 1M1, 1 mo. USD LIBOR + .680%
2.698% FRN 10/25/30 | | | 781,586 | | | | 781,202 | |
Series 2018-C05, Class 1M1, 1 mo. USD LIBOR + .720%
2.738% FRN 1/25/31 | | | 867,879 | | | | 867,712 | |
Series 2019-R03, Class 1M2, 1 mo. USD LIBOR + 2.150%
4.168% FRN 9/25/31 (a) | | | 143,000 | | | | 143,664 | |
Series 2019-R02, Class 1M2, 1 mo. USD LIBOR + 2.300%
4.318% FRN 8/25/31 (a) | | | 1,000,000 | | | | 1,006,474 | |
| | | | | | | | |
| | | | | | | 3,197,051 | |
| | | | | | | | |
| | |
TOTAL U.S. GOVERNMENT AGENCY OBLIGATIONS AND INSTRUMENTALITIES
(Cost $6,117,490) | | | | | | | 6,126,615 | |
| | | | | |
The accompanying notes are an integral part of the financial statements.
60
MassMutual Premier Short-Duration Bond Fund – Portfolio of Investments(Continued)
| | | | | | | | |
| | | Principal
Amount | | | Value | |
|
| U.S. TREASURY OBLIGATIONS — 0.3% | |
| U.S. Treasury Bonds & Notes — 0.3% | |
U.S. Treasury Note
8.000% 11/15/21 (c) | | $ | 1,720,000 | | | $ | 1,944,675 | |
| | | | | | | | |
| | |
TOTAL U.S. TREASURY OBLIGATIONS
(Cost $1,962,681) | | | | | | | 1,944,675 | |
| | | | | |
| | |
TOTAL BONDS & NOTES
(Cost $493,085,339) | | | | | | | 498,672,983 | |
| | | | | |
| | |
TOTAL PURCHASED OPTIONS (#) — 0.8%
(Cost $4,334,731) | | | | | | | 4,189,081 | |
| | | | | |
| | |
TOTAL LONG-TERM INVESTMENTS
(Cost $497,420,070) | | | | | | | 502,862,064 | |
| | | | | |
|
| SHORT-TERM INVESTMENTS — 4.9% | |
| Commercial Paper — 4.9% | |
BAT International Finance PLC
2.350% 11/08/19 (a) | | | 5,000,000 | | | | 4,987,672 | |
Ei Dupont
2.291% 12/04/19 (a) | | | 5,000,000 | | | | 4,979,480 | |
FMC Tech, Inc.
2.393% 11/21/19 (a) | | | 1,000,000 | | | | 996,699 | |
General Electric Co.
2.278% 1/02/20 | | | 4,000,000 | | | | 3,976,051 | |
Marriott Internation
2.346% 12/23/19 (a) | | | 5,000,000 | | | | 4,973,283 | |
Vodafone Group PLC
2.273% 12/03/19 (a) | | | 500,000 | | | | 498,000 | |
VW Credit, Inc.
2.297% 1/14/20 (a) | | | 5,000,000 | | | | 4,966,124 | |
| | | | | | | | |
| | | | | | | 25,377,309 | |
| | | | | | | | |
| | |
TOTAL SHORT-TERM INVESTMENTS
(Cost $25,380,158) | | | | | | | 25,377,309 | |
| | | | | |
| | |
TOTAL INVESTMENTS — 101.5%
(Cost $522,800,228) (d) | | | | | | | 528,239,373 | |
| | |
| Other Assets/(Liabilities) — (1.5)% | | | | | | | (7,742,408 | ) |
| | | | | |
| | |
| NET ASSETS — 100.0% | | | | | | $ | 520,496,965 | |
| | | | | |
Abbreviation Legend
| CLO | Collateralized Loan Obligation |
| CMO | Collateralized Mortgage Obligation |
| CMT | Constant Maturity Treasury Index |
| MBS | Mortgage-Backed Security |
| MTA | Monthly Treasury Average Index |
Notes to Portfolio of Investments
Percentages are stated as a percent of net assets.
| (a) | Security is exempt from registration under Regulation S or Rule 144A of the Securities Act of 1933. These securities are considered restricted and may be resold in transactions exempt from registration. At September 30, 2019, the aggregate market value of these securities amounted to $321,831,442 or 61.83% of net assets. |
| (b) | Certain variable rate securities are not based on a published reference rate and spread but are determined by the issuer or agent and are based on current market conditions. These securities do not indicate a reference rate and spread in their description above. The rates shown are the current interest rates at September 30, 2019. |
| (c) | A portion of this security is pledged/held as collateral for open futures contracts.(Note 2). |
| (d) | See Note 6 for aggregate cost for federal tax purposes. |
The accompanying notes are an integral part of the financial statements.
61
MassMutual Premier Short-Duration Bond Fund – Portfolio of Investments(Continued)
(#) Interest Rate Swaptions Purchased
| | | | | | | | | | | | | | | | | | | | | | | | | | | | | | |
| | | | Paid by Fund | | Received by Fund | | | |
| Description | | Counterparty | | Expiration
Date | | | Rate | | Frequency | | Rate | | Frequency | | Notional
Amount | | | Value | | | Premiums
Paid
(Received) | | | Unrealized
Appreciation/
(Depreciation) | |
| Call | | | | | | | | | | | | | | | | | | | | | | | | | | | | | | |
10-Year Interest Rate Swap, 12/15/42 | | Barclays Bank PLC* | | | 12/13/32 | | | 3-Month USD LIBOR BBA | | Quarterly | | 2.44% | | Semi-Annually | | | USD 8,330,000 | | | $ | 775,252 | | | $ | 416,436 | | | $ | 358,816 | |
| | | | | | | | | | |
10-Year Interest Rate Swap, 2/02/43 | | Credit Suisse International* | | | 1/31/33 | | | 3-Month USD LIBOR BBA | | Quarterly | | 2.61% | | Semi-Annually | | | USD 9,300,000 | | | | 949,777 | | | | 446,400 | | | | 503,377 | |
| | | | | | | | | | | | | | | | | | | | | | | | | | | | | | |
| | | | 1,725,029 | | | | 862,836 | | | | 862,193 | |
| | | | | | | | | | | | | | | | | | | | | | | | | | | | | | |
| Put | | | | | | | | | | | | | | | | | | | | | | | | | | | | | | |
10-Year Interest Rate Swap, 12/15/42 | | Barclays Bank PLC* | | | 12/13/32 | | | 2.94% | | Semi-Annually | | 3-Month USD LIBOR BBA | | Quarterly | | | USD 33,920,000 | | | $ | 1,232,241 | | | $ | 1,695,763 | | | $ | (463,522 | ) |
| | | | | | | | | | |
10-Year Interest Rate Swap, 2/02/43 | | Credit Suisse International* | | | 1/31/33 | | | 3.11% | | Semi-Annually | | 3-Month USD LIBOR BBA | | Quarterly | | | USD 37,080,000 | | | | 1,231,811 | | | | 1,776,132 | | | | (544,321 | ) |
| | | | | | | | | | | | | | | | | | | | | | | | | | | | | | |
| | | | 2,464,052 | | | | 3,471,895 | | | | (1,007,843 | ) |
| | | | | | | | | | | | | | | | | | | | | | | | | | | | | | |
| | | | | | $ | 4,189,081 | | | $ | 4,334,731 | | | $ | (145,650 | ) |
| | | | | | | | | | | | | | | | | | | | | | | | | | | | | | |
| * | Contracts are subject to a Master Netting Agreement. |
Futures contracts
| | | | | | | | | | | | | | | | |
| | | Expiration
Date | | | Number of
Contracts | | | Notional
Amount | | | Value/ Net
Unrealized
Appreciation/
(Depreciation) | |
| Long | | | | | | | | | | | | |
U.S. Treasury Note 10 Year | | | 12/19/19 | | | | 380 | | | $ | 49,947,474 | | | $ | (428,724 | ) |
| | | | | | | | | | | | | | | | |
| Short | | | | | | | | | | | | |
90 Day Eurodollar | | | 12/16/19 | | | | 7 | | | $ | (1,703,514 | ) | | $ | (12,186 | ) |
U.S. Treasury Ultra 10 Year | | | 12/19/19 | | | | 214 | | | | (30,823,679 | ) | | | 348,741 | |
U.S. Treasury Note 2 Year | | | 12/31/19 | | | | 367 | | | | (79,325,410 | ) | | | 236,910 | |
U.S. Treasury Note 5 Year | | | 12/31/19 | | | | 1,374 | | | | (164,475,051 | ) | | | 765,097 | |
90 Day Eurodollar | | | 3/16/20 | | | | 5 | | | | (1,217,733 | ) | | | (11,392 | ) |
90 Day Eurodollar | | | 6/15/20 | | | | 5 | | | | (1,218,453 | ) | | | (12,110 | ) |
90 Day Eurodollar | | | 9/14/20 | | | | 5 | | | | (1,218,984 | ) | | | (12,579 | ) |
90 Day Eurodollar | | | 12/14/20 | | | | 5 | | | | (1,218,921 | ) | | | (12,642 | ) |
90 Day Eurodollar | | | 3/15/21 | | | | 4 | | | | (975,487 | ) | | | (10,563 | ) |
90 Day Eurodollar | | | 9/13/21 | | | | 8 | | | | (1,951,273 | ) | | | (21,327 | ) |
90 Day Eurodollar | | | 3/14/22 | | | | 7 | | | | (1,706,839 | ) | | | (19,011 | ) |
90 Day Eurodollar | | | 9/19/22 | | | | 6 | | | | (1,462,405 | ) | | | (16,445 | ) |
90 Day Eurodollar | | | 3/13/23 | | | | 5 | | | | (1,217,921 | ) | | | (14,079 | ) |
90 Day Eurodollar | | | 12/18/23 | | | | 7 | | | | (1,703,515 | ) | | | (20,323 | ) |
90 Day Eurodollar | | | 12/16/24 | | | | 19 | | | | (4,618,125 | ) | | | (56,588 | ) |
| | | | | | | | | | | | | | | | |
| | | $ | 1,131,503 | |
| | | | | | | | | | | | | | | | |
The accompanying notes are an integral part of the financial statements.
62
MassMutual Premier Short-Duration Bond Fund – Portfolio of Investments(Continued)
Currency Legend
Country weightings, as a percentage of net assets, is as follows:
| | | | |
United States | | | 81.6 | % |
Cayman Islands | | | 6.0 | % |
Ireland | | | 1.6 | % |
Netherlands | | | 1.5 | % |
United Kingdom | | | 1.2 | % |
Bermuda | | | 1.1 | % |
Japan | | | 0.9 | % |
Luxembourg | | | 0.7 | % |
Canada | | | 0.6 | % |
Switzerland | | | 0.5 | % |
Sweden | | | 0.4 | % |
Spain | | | 0.3 | % |
Australia | | | 0.2 | % |
| | | | |
Total Long-Term Investments | | | 96.6 | % |
Short-Term Investments and Other Assets and Liabilities | | | 3.4 | % |
| | | | |
Net Assets | | | 100.0 | % |
| | | | |
The accompanying notes are an integral part of the financial statements.
63
MassMutual Premier Inflation-Protected and Income Fund – Portfolio of Investments
September 30, 2019
| | | | | | | | |
| | | Principal
Amount | | | Value | |
| BONDS & NOTES — 82.6% | |
|
| CORPORATE DEBT — 0.3% | |
| Health Care – Products — 0.3% | |
Becton Dickinson and Co. 3 mo. USD LIBOR + .875%
2.979% FRN 12/29/20 | | $ | 1,020,000 | | | $ | 1,020,341 | |
| | | | | | | | |
| | |
TOTAL CORPORATE DEBT
(Cost $1,023,168) | | | | | | | 1,020,341 | |
| | | | | |
|
| NON-U.S. GOVERNMENT AGENCY OBLIGATIONS — 29.7% | |
| Automobile ABS — 2.1% | |
Avis Budget Rental Car Funding AESOP LLC
Series 2019-1A, Class C, 4.530% 3/20/23 (a) | | | 322,000 | | | | 327,114 | |
Series 2016-1A, Class C, 4.940% 6/20/22 (a) | | | 1,150,000 | | | | 1,173,002 | |
Exeter Automobile Receivables Trust2019-3,Series 2019-3A, Class A
2.590% 9/15/22 (a) | | | 773,533 | | | | 774,578 | |
Hertz Vehicle Financing II LP
Series 2016-4A, Class B, 3.290% 7/25/22 (a) | | | 2,000,000 | | | | 2,015,422 | |
Series 2017-1A, Class B, 3.560% 10/25/21 (a) | | | 530,000 | | | | 533,836 | |
Series 2019-1A, Class B, 4.100% 3/25/23 (a) | | | 2,000,000 | | | | 2,057,926 | |
| | | | | | | | |
| | | | | | | 6,881,878 | |
| | | | | | | | |
| Commercial MBS — 1.5% | |
BHMS Mortgage Trust, Series 2018-ATLS, Class B, 1 mo. USD LIBOR + 1.500%
3.528% FRN 7/15/35 (a) | | | 1,150,000 | | | | 1,150,355 | |
BX Commercial Mortgage Trust,Series 2018-IND, Class E, 1 mo. USD LIBOR + 1.700%
3.728% FRN 11/15/35 (a) | | | 1,625,527 | | | | 1,629,581 | |
CAMB Commercial Mortgage Trust, Series 2019-LIFE, Class D, 1 mo. USD LIBOR + 1.750%
3.778% FRN 12/15/37 (a) | | | 250,836 | | | | 252,086 | |
GCCFC Commercial Mortgage Trust,Series 2006-GG7, Class AM,
5.825% VRN 7/10/38 (b) | | | 132,627 | | | | 133,734 | |
JP Morgan Chase Commercial Mortgage Securities Corp.,Series 2018-LAQ, Class A, 1 mo. USD LIBOR + 1.000%
3.028% FRN 6/15/32 (a) | | | 1,007,916 | | | | 1,006,983 | |
| | | | | | | | |
| | | Principal
Amount | | | Value | |
KNDL Mortgage Trust, Series 2019-KNSQ, Class E, 1 mo. USD LIBOR + 1.800%
3.828% FRN 5/15/36 (a) | | $ | 389,000 | | | $ | 389,011 | |
VMC Finance LLC,Series 2018-FL1, Class A, 1 mo. USD LIBOR + .820%
2.845% FRN 3/15/35 (a) | | | 323,627 | | | | 324,030 | |
| | | | | | | | |
| | | | | | | 4,885,780 | |
| | | | | | | | |
| Other ABS — 11.3% | |
321 Henderson Receivables I LLC
Series 2006-2A, Class A1, 1 mo. USD LIBOR + .200%
2.228% FRN 6/15/41 (a) | | | 1,078,479 | | | | 1,055,516 | |
Series 2007-1A, Class A1, 1 mo. USD LIBOR + .200%
2.228% FRN 3/15/42 (a) | | | 485,780 | | | | 468,372 | |
321 Henderson Receivables II LLC,Series 2006-3A, Class A1, 1 mo. USD LIBOR + .200%
2.228% FRN 9/15/41 (a) | | | 117,292 | | | | 114,769 | |
AASET Trust,Series 2017-1A, Class A
3.967% 5/16/42 (a) | | | 304,282 | | | | 307,921 | |
AASET US Ltd.,Series 2018-2A, Class A
4.454% 11/18/38 (a) | | | 1,367,883 | | | | 1,403,194 | |
AIMCO CLO,Series 2015-AA, Class AR, 3 mo. USD LIBOR + .850%
3.153% FRN 1/15/28 (a) | | | 1,450,000 | | | | 1,447,216 | |
Ameriquest Mortgage Securities, Inc. Asset-Backed Pass-Through CtfsSer 2005-R10,Series 2005-R10, Class M1, 1 mo. USD LIBOR + .410%
2.428% FRN 1/25/36 | | | 2,813,406 | | | | 2,808,095 | |
Arbor Realty Commercial Real Estate Notes,Series 2018-FL1, Class A, 1 mo. USD LIBOR + 1.150%
3.178% FRN 6/15/28 (a) | | | 920,000 | | | | 920,860 | |
Avant Loans Funding Trust2019-B,Series 2019-B, Class A
2.720% 10/15/26 (a) | | | 2,543,000 | | | | 2,544,638 | |
Avery Point IV CLO Ltd.,Series 2014-1A, Class AR, 3 mo. USD LIBOR + 1.100%
3.376% FRN 4/25/26 (a) | | | 786,701 | | | | 786,815 | |
Cazenovia Creek Funding I LLC,Series 2015-1A, Class A
2.000% 12/10/23 (a) | | | 18,738 | | | | 18,722 | |
CIFC Funding II Ltd.,Series 2015-2A, Class AR, 3 mo. USD LIBOR + .780% 3.083% FRN 4/15/27 (a) | | | 1,436,712 | | | | 1,433,259 | |
The accompanying notes are an integral part of the financial statements.
64
MassMutual Premier Inflation-Protected and Income Fund – Portfolio of Investments(Continued)
| | | | | | | | |
| | | Principal
Amount | | | Value | |
Citigroup Mortgage Loan Trust, Inc., Series 2006-WFH3, Class M1, 1 mo. USD LIBOR + ..290%
2.308% FRN 10/25/36 | | $ | 2,449,455 | | | $ | 2,440,636 | |
CLI Funding V LLC,Series 2013-1A
2.830% 3/18/28 (a) | | | 1,164,900 | | | | 1,167,552 | |
Countrywide Asset-Backed Certificates,Series 2004-5, Class 3A, 1 mo. USD LIBOR + .460%
2.478% FRN 9/25/34 | | | 6,807 | | | | 6,479 | |
Drug Royalty II LP,Series 2014-1, Class A1, 3 mo. USD LIBOR + 2.850%
5.153% FRN 7/15/23 (a) | | | 45,850 | | | | 45,942 | |
KREF Ltd.
Series 2018-FL1, Class AS, 1 mo. USD LIBOR + 1.350%
3.375% FRN 6/15/36 (a) | | | 1,520,000 | | | | 1,528,406 | |
Series 2018-FL1, Class D, 1 mo. USD LIBOR + 2.550%
4.575% FRN 6/15/36 (a) | | | 2,110,000 | | | | 2,129,395 | |
LCM Ltd., 3 mo. USD LIBOR + 1.240%
3.543% FRN 7/15/27 (a) | | | 1,200,000 | | | | 1,200,001 | |
Lendmark Funding Trust,
Series 2018-1A, Class A
3.810% 12/21/26 (a) | | | 410,000 | | | | 414,843 | |
Mariner Finance Issuance Trust,Series 2017-BA, Class A
2.920% 12/20/29 (a) | | | 2,200,000 | | | | 2,203,375 | |
Neuberger Berman CLO XX Ltd.,Series 2015-20A, Class AR, 3 mo. USD LIBOR + .800%
3.103% FRN 1/15/28 (a) | | | 1,500,000 | | | | 1,498,464 | |
NP SPE II LLC,Series 2019-1A, Class A1
2.574% 9/20/49 (a) | | | 367,000 | | | | 367,108 | |
OCP CLO Ltd.,Series 2015-10A, Class A1R, 3 mo. USD LIBOR + .820%
3.087% FRN 10/26/27 (a) | | | 1,450,000 | | | | 1,448,253 | |
Orange Lake Timeshare Trust,Series 2016-A, Class A
2.610% 3/08/29 (a) | | | 181,024 | | | | 182,126 | |
Oxford Finance Funding Trust,Series 2016-1A, Class A
3.968% 6/17/24 (a) | | | 192,363 | | | | 193,580 | |
PNMAC GMSR Issuer Trust,Series 2018-GT1, Class A
4.868% 2/25/23 (a) | | | 270,000 | | | | 270,161 | |
Securitized Equipment Receivable
3.760% 10/11/24 | | | 350,000 | | | | 350,462 | |
4.200% 10/11/24 | | | 370,000 | | | | 371,231 | |
| | | | | | | | |
| | | Principal
Amount | | | Value | |
Sierra Receivables Funding LLC
Series 2015-1A, Class B, 3.050% 3/22/32 (a) | | $ | 228,562 | | | $ | 228,636 | |
Series 2019-1A, Class C, 3.770% 1/20/36 (a) | | | 889,158 | | | | 913,973 | |
Series 2018-1A, Class B, 4.236% 4/20/35 | | | 877,252 | | | | 896,343 | |
Series 2019-1A, Class D, 4.750% 1/20/36 (a) | | | 570,543 | | | | 583,650 | |
Textainer Marine Containers VII Ltd.,Series 2018-1A, Class A
4.110% 7/20/43 (a) | | | 732,800 | | | | 741,344 | |
Trafigura Securitisation Finance PLC
Series 2017-1A, Class A1, 3.130% 12/15/20 (a) | | | 2,600,000 | | | | 2,602,348 | |
Series 2018-1A, Class A2, 3.730% 3/15/22 (a) | | | 1,000,000 | | | | 1,019,170 | |
Series 2017-1A, Class B, 4.184% 12/15/20 (a) | | | 300,000 | | | | 300,340 | |
| | | | | | | | |
| | | | | | | 36,413,195 | |
| | | | | | | | |
| Student Loans ABS — 10.2% | |
Academic Loan Funding Trust,Series 2013-1A, Class A
3.752% 12/26/44 (a) | | | 1,380,892 | | | | 1,380,137 | |
Access Group, Inc.,Series 2005-1, Class B, 3 mo. USD LIBOR + .570%
2.729% FRN 9/22/37 | | | 405,674 | | | | 389,387 | |
Brazos Higher Education Authority, Inc. 3.537% 6/25/42 | | | 1,050,000 | | | | 1,031,748 | |
College Loan Corp. Trust I,Series 2005-2, Class B, 3 mo. USD LIBOR + .490%
2.793% FRN 1/15/37 | | | 362,776 | | | | 338,999 | |
Commonbond Student Loan Trust,Series 2018-CGS, Class C
4.350% 2/25/46 (a) | | | 203,199 | | | | 206,268 | |
DRB Prime Student Loan Trust,Series 2015-B, Class A3
2.540% 4/27/26 (a) | | | 8,324 | | | | 8,305 | |
ECMC Group Student Loan Trust
Series 2017-1A, Class A, 1 mo. USD LIBOR + 1.200%
3.218% FRN 12/27/66 (a) | | | 1,003,225 | | | | 1,013,339 | |
Series 2018-1A, Class A, 3.240% 2/27/68 (a) | | | 2,031,557 | | | | 2,017,926 | |
Series 2016-1A, Class A, 1 mo. USD LIBOR + 1.350%
3.368% FRN 7/26/66 (a) | | | 1,485,729 | | | | 1,496,442 | |
EdLinc Student Loan Funding Trust,Series 2017-A, Class A, PRIME -1.150%
4.350% FRN 12/01/47 (a) | | | 537,536 | | | | 535,389 | |
The accompanying notes are an integral part of the financial statements.
65
MassMutual Premier Inflation-Protected and Income Fund – Portfolio of Investments(Continued)
| | | | | | | | |
| | | Principal
Amount | | | Value | |
Edsouth Indenture, No.10 LLC,Series 2015-2, Class B, 1 mo. USD LIBOR + 1.500%
3.518% FRN 12/25/58 (a) | | $ | 750,000 | | | $ | 757,257 | |
Goal Capital Funding Trust,Series 2010-1, Class A, 3 mo. USD LIBOR + .700%
2.832% FRN 8/25/48 (a) | | | 241,870 | | | | 242,679 | |
JP Morgan Student Loan Trust,Series 2007-A, Class B, 3 mo. USD LIBOR + .350%
2.606% FRN 6/28/39 (a) | | | 329,891 | | | | 312,723 | |
Navient Student Loan Trust
Series 2017-5A, Class A,
1 mo. USD LIBOR + .800%
2.818% FRN 7/26/66 (a) | | | 2,402,232 | | | | 2,393,139 | |
Series 2019-2A, Class A2,
1 mo. USD LIBOR + 1.000%
3.018% FRN 2/27/68 (a) | | | 2,758,000 | | | | 2,782,170 | |
Series 2016-5A, Class A,
1 mo. USD LIBOR + 1.250%
3.268% FRN 6/25/65 (a) | | | 1,668,471 | | | | 1,685,303 | |
Series 2019-3A, Class B,
1 mo. USD LIBOR + 1.550%
3.607% FRN 7/25/68 (a) | | | 2,550,000 | | | | 2,550,043 | |
Nelnet Private Education Loan Trust,Series 2016-A, Class A1A,
1 mo. USD LIBOR + 1.750%
3.768% FRN 12/26/40 (a) | | | 229,970 | | | | 228,841 | |
Nelnet Student Loan Trust
Series 2005-2, Class B,
3 mo. USD LIBOR + .170%
2.329% FRN 3/23/37 | | | 542,216 | | | | 521,385 | |
Series 2006-3, Class B,
3 mo. USD LIBOR + .250%
2.356% FRN 6/25/41 | | | 281,632 | | | | 260,865 | |
Series 2006-2, Class B,
3 mo. USD LIBOR + .200%
2.476% FRN 1/25/38 | | | 482,013 | | | | 461,625 | |
Series 2004-3, Class B,
3 mo. USD LIBOR + .350%
2.626% FRN 10/25/40 | | | 749,793 | | | | 708,856 | |
Series 2014-2A, Class B,
1 mo. USD LIBOR + 1.500%
3.518% FRN 6/25/41 (a) | | | 295,000 | | | | 293,486 | |
North Carolina State Education Assistance Authority,Series 2011-2, Class A2, 3 mo. USD LIBOR + .800%
3.076% FRN 7/25/25 | | | 1,780,918 | | | | 1,785,972 | |
SLC Student Loan Trust
Series 2006-2, Class B,
3 mo. USD LIBOR + .230%
2.349% FRN 12/15/39 | | | 356,942 | | | | 333,436 | |
| | | | | | | | |
| | | Principal
Amount | | | Value | |
Series 2005-2, Class B,
3 mo. USD LIBOR + .280%
2.399% FRN 3/15/40 | | $ | 1,184,607 | | | $ | 1,099,933 | |
SLM Student Loan Trust
Series 2002-7, Class A11,
28 day ARS
1.836% FRN 3/15/28 | | | 100,000 | | | | 100,000 | |
Series 2006-4, Class B,
3 mo. USD LIBOR + .200%
2.476% FRN 1/25/70 | | | 230,230 | | | | 214,194 | |
Series 2006-5, Class B,
3 mo. USD LIBOR + .210%
2.486% FRN 10/25/40 | | | 286,270 | | | | 266,701 | |
Series 2006-2, Class B,
3 mo. USD LIBOR + .220%
2.496% FRN 1/25/41 | | | 335,332 | | | | 313,443 | |
Series 2006-10, Class B,
3 mo. USD LIBOR + .220%
2.496% FRN 3/25/44 | | | 576,851 | | | | 542,492 | |
Series 2005-8, Class B,
3 mo. USD LIBOR + .310%
2.586% FRN 1/25/55 | | | 304,910 | | | | 284,817 | |
Series 2004-3, Class B,
3 mo. USD LIBOR + .470%
2.746% FRN 10/25/64 | | | 236,205 | | | | 223,598 | |
Series 2003-11, Class B,
3 mo. USD LIBOR + .650%
2.769% FRN 12/15/38 | | | 273,825 | | | | 260,755 | |
Series 2003-2, Class A7,
28 day ARS
3.237% FRN 9/15/28 | | | 900,000 | | | | 900,000 | |
Series 2003-5, Class A9,
28 day ARS
3.434% FRN 6/15/30 | | | 600,000 | | | | 600,000 | |
Series 2003-5, Class A7,
28 day ARS
4.490% FRN 6/15/30 | | | 500,000 | | | | 500,000 | |
SMB Private Education Loan Trust,Series 2019-A, Class A2B,
1 mo. USD LIBOR + .870%
2.898% FRN 7/15/36 (a) | | | 1,740,000 | | | | 1,733,050 | |
SoFi Alternative Trust,Series 2019-C, Class PT,
4.683% VRN 1/25/45 (a) (b) | | | 1,939,366 | | | | 2,014,938 | |
SoFi Professional Loan Program LLC,Series 2015-A, Class A1, 1 mo. USD LIBOR + 1.200%
3.218% FRN 3/25/33 (a) | | | 57,481 | | | | 57,579 | |
| | | | | | | | |
| | | | | | | 32,847,220 | |
| | | | | | | | |
| WL Collateral CMO — 4.6% | |
Angel Oak Mortgage Trust,Series 2018-3, Class A3,
3.238% VRN 5/25/59 (a) (b) | | | 1,218,248 | | | | 1,228,423 | |
The accompanying notes are an integral part of the financial statements.
66
MassMutual Premier Inflation-Protected and Income Fund – Portfolio of Investments(Continued)
| | | | | | | | |
| | | Principal
Amount | | | Value | |
BRAVO Residential Funding Trust 2019-NQM1, Series 2019-NQM1, Class A1,
2.666% VRN 7/25/59 (a) (b) | | $ | 1,149,458 | | | $ | 1,144,242 | |
CIM Trust 2019-INV3, Series 2019-INV3, Class A11, 1 mo. USD LIBOR + 1.000%
2.994% FRN 8/25/49 (a) | | | 4,200,000 | | | | 4,193,841 | |
Citigroup Mortgage Loan Trust 2019-IMC1, Series 2019-IMC1, Class A3,
3.030% VRN 7/25/49 (a) (b) | | | 1,276,042 | | | | 1,274,654 | |
Deephaven Residential Mortgage Trust,Series 2018-4A, Class A3,
4.285% VRN 10/25/58 (a) (b) | | | 1,639,122 | | | | 1,677,144 | |
JP Morgan Mortgage Trust
Series 2018-1, Class A5,
3.500% VRN 6/25/48 (a) (b) | | | 383,835 | | | | 389,741 | |
Series 2018-3, Class A5,
3.500% VRN 9/25/48 (a) (b) | | | 569,877 | | | | 576,869 | |
Series 2017-6, Class A5,
3.500% VRN 12/25/48 (a) (b) | | | 547,543 | | | | 556,673 | |
New Residential Mortgage Loan Trust
Series 2019-NQM2, Class A3,
3.752% 4/25/49 (a) | | | 510,726 | | | | 520,473 | |
Series 2019-NQM1, Class A3,
3.928% VRN 1/25/49 (a) (b) | | | 1,159,414 | | | | 1,195,089 | |
PSMC Trust,Series 2018-1, Class A3,
3.500% VRN 2/25/48 (a) (b) | | | 517,915 | | | | 524,975 | |
Sequoia Mortgage Trust,Series 2018-3, Class A4,
3.500% VRN 3/25/48 (a) (b) | | | 474,270 | | | | 482,153 | |
Verus Securitization Trust 2019-INV2, Series 2019-INV2, Class A3,
3.219% VRN 7/25/59 (a) (b) | | | 878,376 | | | | 875,051 | |
| | | | | | | | |
| | | | | | | 14,639,328 | |
| | | | | | | | |
| | |
TOTALNON-U.S. GOVERNMENT AGENCY OBLIGATIONS
(Cost $94,213,283) | | | | | | | 95,667,401 | |
| | | | | |
|
| U.S. GOVERNMENT AGENCY OBLIGATIONS AND INSTRUMENTALITIES — 0.2% | |
| Whole Loans — 0.2% | |
Federal National Mortgage Association Connecticut Avenue Securities Trust,Series 2018-C06, Class 1M1, 1 mo. USD LIBOR + .550%
2.568% FRN 3/25/31 | | | 586,908 | | | | 586,511 | |
| | | | | | | | |
| | |
TOTAL U.S. GOVERNMENT AGENCY OBLIGATIONS AND INSTRUMENTALITIES
(Cost $586,736) | | | | | | | 586,511 | |
| | | | | |
| | | | | | | | |
| | | Principal
Amount | | | Value | |
|
| U.S. TREASURY OBLIGATIONS — 52.4% | |
| U.S. Treasury Bonds & Notes — 52.4% | |
U.S. Treasury Inflation Index
0.125% 1/15/23 | | $ | 12,665,429 | | | $ | 12,555,003 | |
0.125% 7/15/24 | | | 11,836,658 | | | | 11,821,814 | |
0.125% 7/15/26 | | | 9,921,866 | | | | 9,890,170 | |
0.250% 1/15/25 | | | 11,942,060 | | | | 11,966,032 | |
0.250% 7/15/29 | | | 2,056,109 | | | | 2,071,813 | |
0.375% 7/15/25 (c) | | | 9,520,368 | | | | 9,639,790 | |
0.375% 7/15/27 | | | 10,199,580 | | | | 10,352,477 | |
0.500% 4/15/24 | | | 8,875,419 | | | | 8,981,647 | |
0.500% 1/15/28 | | | 10,140,975 | | | | 10,365,745 | |
0.625% 4/15/23 | | | 11,743,732 | | | | 11,836,216 | |
0.625% 2/15/43 | | | 4,831,847 | | | | 4,923,232 | |
0.750% 7/15/28 | | | 9,474,589 | | | | 9,940,227 | |
0.750% 2/15/45 | | | 8,269,305 | | | | 8,631,424 | |
0.875% 1/15/29 | | | 9,931,987 | | | | 10,533,289 | |
0.875% 2/15/47 | | | 743,974 | | | | 802,387 | |
1.000% 2/15/48 | | | 4,780,592 | | | | 5,326,475 | |
1.000% 2/15/49 | | | 5,561,740 | | | | 6,241,338 | |
1.375% 2/15/44 | | | 2,262,185 | | | | 2,693,972 | |
1.750% 1/15/28 | | | 1,469,568 | | | | 1,649,468 | |
2.000% 1/15/26 | | | 1,641,627 | | | | 1,820,443 | |
2.125% 2/15/41 | | | 3,409,181 | | | | 4,551,410 | |
2.375% 1/15/25 | | | 4,205,706 | | | | 4,678,135 | |
2.375% 1/15/27 | | | 2,391,736 | | | | 2,760,084 | |
3.375% 4/15/32 | | | 758,830 | | | | 1,045,810 | |
3.625% 4/15/28 | | | 1,110,361 | | | | 1,422,858 | |
3.875% 4/15/29 | | | 1,685,480 | | | | 2,257,343 | |
| | | | | | | | |
| | | | | | | 168,758,602 | |
| | | | | | | | |
| | |
TOTAL U.S. TREASURY OBLIGATIONS
(Cost $163,332,377) | | | | | | | 168,758,602 | |
| | | | | | | | |
| | |
TOTAL BONDS & NOTES
(Cost $259,155,564) | | | | | | | 266,032,855 | |
| | | | | | | | |
| | |
TOTAL PURCHASED OPTIONS (#) — 0.4%
(Cost $1,343,417) | | | | | | | 1,291,226 | |
| | | | | | | | |
| | |
TOTAL LONG-TERM INVESTMENTS
(Cost $260,498,981) | | | | | | | 267,324,081 | |
| | | | | |
|
| SHORT-TERM INVESTMENTS — 17.9% | |
| Commercial Paper — 17.7% | |
American Electric Power Co., Inc.
2.296% 10/25/19 | | | 3,100,000 | | | | 3,095,134 | |
CRH America Finance, Inc.
2.311% 11/26/19 | | | 4,000,000 | | | | 3,985,509 | |
The accompanying notes are an integral part of the financial statements.
67
MassMutual Premier Inflation-Protected and Income Fund – Portfolio of Investments(Continued)
| | | | | | | | |
| | | Principal
Amount | | | Value | |
Enbridge (US), Inc.
2.325% 12/11/19 | | $ | 1,700,000 | | | $ | 1,692,214 | |
2.375% 10/07/19 | | | 300,000 | | | | 299,863 | |
Equifax, Inc.
2.308% 10/08/19 | | | 2,600,000 | | | | 2,598,649 | |
Experian Finance PLC
2.342% 11/22/19 | | | 1,300,000 | | | | 1,295,487 | |
FMC Tech, Inc.
2.362% 10/30/19 | | | 4,000,000 | | | | 3,992,433 | |
Fortive Corp.
2.387% 10/16/19 | | | 4,000,000 | | | | 3,995,984 | |
Harley-Davidson, Inc.
2.439% 10/23/19 | | | 4,000,000 | | | | 3,994,235 | |
Marriott Internation
2.430% 10/30/19 | | | 3,800,000 | | | | 3,792,812 | |
Mckesson Corp.
2.589% 10/09/19 | | | 4,000,000 | | | | 3,997,673 | |
Mondelez Intl, Inc.
2.796% 10/22/19 | | | 4,000,000 | | | | 3,994,490 | |
OGE Energy Corp.
2.294% 10/15/19 | | | 4,000,000 | | | | 3,996,233 | |
Public Service Enterprise Group, Inc.
2.541% 10/21/19 | | | 4,000,000 | | | | 3,994,745 | |
The Clorox Company
2.337% 10/23/19 | | | 2,300,000 | | | | 2,296,685 | |
Transcanada Pipelines Ltd.
2.263% 12/04/19 | | | 2,000,000 | | | | 1,991,731 | |
Volkswagen Credit, Inc.
2.421% 1/17/20 | | | 4,000,000 | | | | 3,972,108 | |
Walgreens Boots
2.360% 3/31/20 | | | 4,000,000 | | | | 3,953,396 | |
| | | | | | | | |
| | | | | | | 56,939,381 | |
| | | | | | | | |
| Repurchase Agreement — 0.2% | |
Fixed Income Clearing Corp., Repurchase Agreement, dated 9/30/19, 0.950%, due 10/01/19 (d) | | | 678,944 | | | | 678,944 | |
| | | | | | | | |
| | |
TOTAL SHORT-TERM INVESTMENTS
(Cost $57,618,514) | | | | | | | 57,618,325 | |
| | | | | | | | |
| | |
| TOTAL INVESTMENTS — 100.9% (Cost $318,117,495) (e) | | | | | | | 324,942,406 | |
| | |
| Other Assets/(Liabilities) — (0.9)% | | | | | | | (2,894,664 | ) |
| | | | | | | | |
| | |
| NET ASSETS — 100.0% | | | | | | $ | 322,047,742 | |
| | | | | |
Abbreviation Legend
| CLO | Collateralized Loan Obligation |
| CMO | Collateralized Mortgage Obligation |
| MBS | Mortgage-Backed Security |
Notes to Portfolio of Investments
Percentages are stated as a percent of net assets.
| (a) | Security is exempt from registration under Regulation S or Rule 144A of the Securities Act of 1933. These securities are considered restricted and may be resold in transactions exempt from registration. At September 30, 2019, the aggregate market value of these securities amounted to $77,522,215 or 24.07% of net assets. |
| (b) | Certain variable rate securities are not based on a published reference rate and spread but are determined by the issuer or agent and are based on current market conditions. These securities do not indicate a reference rate and spread in their description above. The rates shown are the current interest rates at September 30, 2019. |
| (c) | A portion of this security is pledged/held as collateral for open futures contracts and open swap agreements.(Note 2). |
| (d) | Maturity value of $678,962. Collateralized by U.S. Government Agency obligations with a rate of 2.000%, maturity date of 2/15/23, and an aggregate market value, including accrued interest, of $696,078. |
| (e) | See Note 6 for aggregate cost for federal tax purposes. |
The accompanying notes are an integral part of the financial statements.
68
MassMutual Premier Inflation-Protected and Income Fund – Portfolio of Investments(Continued)
(#) Interest Rate Swaptions Purchased
| | | | | | | | | | | | | | | | | | | | | | | | | | | | | | | | |
| | | | | | | | Paid by Fund | | | Received by Fund | | | | | | | | | | | | |
| Description | | Counterparty | | Expiration
Date | | | Rate | | Frequency | | | Rate | | Frequency | | Notional
Amount | | | Value | | | Premiums
Paid
(Received) | | | Unrealized
Appreciation/
(Depreciation) | |
| Call | |
| 10-Year Interest Rate Swap, 12/15/42 | | Barclays Bank
PLC* | | | 12/13/32 | | | 3-Month
USD LIBOR
BBA | | | Quarterly | | | 2.44% | | Semi-
Annually | | | USD 3,485,000 | | | $ | 324,340 | | | $ | 174,223 | | | $ | 150,117 | |
| | | | | | | | | | |
| 10-Year Interest Rate Swap, 2/02/43 | | Credit Suisse
International* | | | 1/31/33 | | | 3-Month
USD LIBOR
BBA | | | Quarterly | | | 2.61% | | Semi-
Annually | | | USD 1,925,000 | | | | 196,594 | | | | 92,400 | | | | 104,194 | |
| | | | | | | | | | | | | | | | | | | | | | | | | | | | | | | | |
| | | | 520,934 | | | | 266,623 | | | | 254,311 | |
| | | | | | | | | | | | | |
| Put | |
| 10-Year Interest Rate Swap, 12/15/42 | | Barclays Bank
PLC* | | | 12/13/32 | | | 2.94% | |
| Semi-
Annually |
| | 3-Month USD LIBOR BBA | | Quarterly | | | USD 14,190,000 | | | $ | 515,492 | | | $ | 709,401 | | | $ | (193,909 | ) |
| | | | | | | | | | |
| 10-Year Interest Rate Swap, 2/02/43 | | Credit Suisse
International* | | | 1/31/33 | | | 3.11% | |
| Semi-
Annually |
| | 3-Month USD LIBOR BBA | | Quarterly | | | USD 7,670,000 | | | | 254,800 | | | | 367,393 | | | | (112,593 | ) |
| | | | | | | | | | | | | | | | | | | | | | | | | | | | | | | | |
| | | | 770,292 | | | | 1,076,794 | | | | (306,502 | ) |
| | | | | | | | | | | | | |
| | | | | | $ | 1,291,226 | | | $ | 1,343,417 | | | $ | (52,191 | ) |
| | | | | | | | | | | | | | | | |
| * | Contracts are subject to a Master Netting Agreement. |
Futures contracts
| | | | | | | | | | | | | | | | |
| | | Expiration
Date | | | Number of
Contracts | | | Notional
Amount | | | Value/ Net
Unrealized
Appreciation/
(Depreciation) | |
| Long | | | | | | | | | | | | |
U.S. Treasury Long Bond | | | 12/19/19 | | | | 56 | | | $ | 9,189,861 | | | $ | (100,361 | ) |
U.S. Treasury Note 2 Year | | | 12/31/19 | | | | 38 | | | | 8,173,992 | | | | 15,008 | |
| | | | | | | | | | | | | | | | |
| | | $ | (85,353 | ) |
| | | | | |
| Short | | | | | | | | | | | | |
U.S. Treasury Ultra 10 Year | | | 12/19/19 | | | | 26 | | | $ | (3,649,261 | ) | | $ | (53,302 | ) |
U.S. Treasury Ultra Bond | | | 12/19/19 | | | | 23 | | | | (4,472,295 | ) | | | 58,451 | |
U.S. Treasury Note 5 Year | | | 12/31/19 | | | | 30 | | | | (3,558,032 | ) | | | (16,421 | ) |
| | | | | | | | | | | | | | | | |
| | | $ | (11,272 | ) |
| | | | | |
| | | | | | | | | | | | | | | | | | | | | | | | | | |
| Centrally Cleared Interest Rate Swaps | | | | | | | | | | | | | | | |
Paid by the Fund | | Received by the Fund | | | | | | | | | | | | | |
Rate/
Reference | | Frequency | | Rate/
Reference | | | Frequency | | Termination
Date | | Notional
Amount | | Value | | | Upfront
Premium
Paid/
(Received) | | | Unrealized
Appreciation
(Depreciation) | |
| | | | | | | | | |
| 3-Month USD LIBOR BBA | | Quarterly | | | 2.775% | | | Semi-Annually | | 7/02/20 | | USD | | 12,300,000 | | $ | 79,050 | | | $ | �� — | | | $ | 79,050 | |
| | | | | | | | | | | | | | | | | | | | | | | | | | |
The accompanying notes are an integral part of the financial statements.
69
MassMutual Premier Inflation-Protected and Income Fund – Portfolio of Investments(Continued)
| | | | | | | | | | | | | | | | | | | | | | | | | | | | | | |
| OTC Interest Rate Swaps | |
| Paid by the Fund | | Received by the Fund | | | | | | | | | | | | | | | | | | | |
Rate/
Reference | | Frequency | | Rate/
Reference | | Frequency | | | Counterparty | | Termination
Date | | Notional
Amount | | | Value | | | Upfront
Premium
Paid/
(Received) | | | Unrealized
Appreciation
(Depreciation) | |
| | | | | | | | | | |
| 2.325% | | Maturity | | U.S. Consumer Price Index | | | Maturity | | | Bank of America N.A.* | | 10/02/21 | | USD | | | 2,000,000 | | | $ | (45,891 | ) | | $ | — | | | $ | (45,891 | ) |
| | | | | | | | | | |
| 1.740% | | Maturity | | U.S. Consumer Price Index | | | Maturity | | | Bank of America N.A.* | | 8/02/22 | | USD | | | 12,000,000 | | | | (85,642 | ) | | | — | | | | (85,642 | ) |
| | | | | | | | | | |
| 1.790% | | Maturity | | U.S. Consumer Price Index | | | Maturity | | | BNP Paribas SA* | | 1/22/22 | | USD | | | 4,400,000 | | | | (32,232 | ) | | | — | | | | (32,232 | ) |
| | | | | | | | | | |
| 1.823% | | Maturity | | U.S. Consumer Price Index | | | Maturity | | | BNP Paribas SA* | | 2/04/22 | | USD | | | 5,500,000 | | | | (40,017 | ) | | | — | | | | (40,017 | ) |
| | | | | | | | | | | | | | | | | | | | | | | | | | | | | | |
| | | |
| | | $ | (203,782 | ) | | $ | — | | | $ | (203,782 | ) |
| | | | | | | | | | | | | |
| | | | | | | | | | | | | | | | | | | | | | | | | | | | |
| OTC Total Return Swaps | |
| Paid by the Fund | | Received by the Fund | | | | | | | | | | | | | | | | | |
Rate/
Reference | | Notional | | Rate/
Reference | | No. of
Contracts | | Frequency | | | Counterparty | | Termination
Date | | | Value | | | Upfront
Premium
Received/
(Paid) | | | Unrealized
Appreciation
(Depreciation) | |
| | | | | | | | | |
| 2.21% | | USD 25,000,000 | | Bloomberg Barclays US Treasury Inflation Notes TR Index | | 79,532 | | | Maturity | | | Barclays Bank PLC* | | | 1/31/20 | | | $ | 92,973 | | | $ | 313 | | | $ | 92,660 | |
| | | | | | | | | |
| 2.41% | | USD 6,000,000 | | Bloomberg Barclays US Treasury Inflation Notes TR Index | | 19,302 | | | Maturity | | | BNP Paribas SA* | | | 10/31/19 | | | | 89,935 | | | | — | | | | 89,935 | |
| | | | | | | | | |
| 2.33 | | USD 6,000,000 | | Bloomberg Barclays US Treasury Inflation Notes TR Index | | 19,321 | | | Maturity | | | BNP Paribas SA* | | | 11/29/19 | | | | 96,046 | | | | — | | | | 96,046 | |
| | | | | | | | | |
| 2.33% | | USD 9,000,000 | | Bloomberg Barclays US Treasury Inflation Notes TR Index | | 28,872 | | | Maturity | | | BNP Paribas SA* | | | 11/29/19 | | | | 109,244 | | | | — | | | | 109,244 | |
| | | | | | | | | |
| 2.26% | | USD 2,042,128 | | Bloomberg Barclays US Treasury Inflation Notes TR Index | | 6,487 | | | Maturity | | | BNP Paribas SA* | | | 11/29/19 | | | | 4,494 | | | | — | | | | 4,494 | |
| | | | | | | | | |
| 2.24% | | USD 3,000,000 | | Bloomberg Barclays US Treasury Inflation Notes TR Index | | 9,453 | | | Maturity | | | BNP Paribas SA* | | | 11/29/19 | | | | (17,558 | ) | | | — | | | | (17,558 | ) |
| | | | | | | | | |
| 2.27% | | USD 15,000,000 | | Bloomberg Barclays US Treasury Inflation Notes TR Index | | 47,452 | | | Maturity | | | BNP Paribas SA* | | | 11/29/19 | | | | (28,674 | ) | | | — | | | | (28,674 | ) |
| | | | | | | | | |
| 2.22% | | USD 25,000,000 | | Bloomberg Barclays US Treasury Inflation Notes TR Index | | 79,532 | | | Maturity | | | Goldman Sachs International* | | | 1/31/20 | | | | 92,973 | | | | — | | | | 92,973 | |
| | | | | | | | | |
| 2.19% | | USD 15,000,000 | | Bloomberg Barclays US Treasury Inflation Notes TR Index | | 47,211 | | | Maturity | | | Morgan Stanley & Co. LLC* | | | 11/29/19 | | | | (104,698 | ) | | | — | | | | (104,698 | ) |
| | | | | | | | | | | | | | | | | | | | | | | | | | | | |
| | | | |
| | | | | $ | 334,735 | | | $ | 313 | | | $ | 334,422 | |
| | | | | | | | | | | | | | | |
The accompanying notes are an integral part of the financial statements.
70
MassMutual Premier Inflation-Protected and Income Fund – Portfolio of Investments(Continued)
Collateral for swap agreements held by Credit Suisse International amounted to $52,681 in securities at September 30, 2019. Collateral for swap agreements held by Bank of America N.A. and Credit Suisse International amounted to $170,000 and $10,000 in cash, respectively, at September 30, 2019. Collateral for swap agreements pledged by BNP Paribas S.A. amounted to $140,000 in cash at September 30, 2019.
| * | Contracts are subject to a Master Netting Agreement. |
Currency Legend
The accompanying notes are an integral part of the financial statements.
71
MassMutual Premier Core Bond Fund – Portfolio of Investments
September 30, 2019
| | | | | | | | |
| | | Number of
Shares | | | Value | |
| EQUITIES — 0.2% | |
|
| PREFERRED STOCK — 0.2% | |
| Financial — 0.2% | |
| Insurance — 0.2% | |
The Allstate Corp., 3 mo. USD
LIBOR + 3.165%
5.100% VRN 1/15/53 | | | 130,000 | | | $ | 3,451,500 | |
| | | | | | | | |
| | |
TOTAL PREFERRED STOCK
(Cost $3,250,000) | | | | | | | 3,451,500 | |
| | | | | |
| | |
TOTAL EQUITIES
(Cost $3,250,000) | | | | | | | 3,451,500 | |
| | | | | |
| | |
| | | Principal
Amount | | | | |
| BONDS & NOTES — 99.1% | |
|
| CORPORATE DEBT — 34.6% | |
| Aerospace & Defense — 0.0% | |
United Technologies Corp.
6.125% 7/15/38 | | $ | 465,000 | | | | 639,111 | |
| | | | | | | | |
| Agriculture — 0.7% | |
BAT Capital Corp.
4.758% 9/06/49 | | | 805,000 | | | | 790,393 | |
Bunge Ltd. Finance Corp.
3.250% 8/15/26 | | | 1,383,000 | | | | 1,382,994 | |
4.350% 3/15/24 | | | 2,120,000 | | | | 2,233,059 | |
Imperial Brands Finance PLC
3.500% 7/26/26 (a) | | | 1,675,000 | | �� | | 1,674,954 | |
3.875% 7/26/29 (a) | | | 1,842,000 | | | | 1,855,469 | |
Reynolds American, Inc.
4.450% 6/12/25 | | | 1,320,000 | | | | 1,407,846 | |
5.850% 8/15/45 | | | 1,025,000 | | | | 1,134,240 | |
| | | | | | | | |
| | | | | | | 10,478,955 | |
| | | | | | | | |
| Airlines — 0.1% | |
American Airlines Pass-Through Trust,Series 2014-1, Class B,
4.375% 4/01/24 | | | 191,269 | | | | 196,280 | |
Spirit Airlines Pass-Through Trust,Series 2015-1, Class A,
4.100% 10/01/29 | | | 1,376,684 | | | | 1,448,960 | |
United Airlines Pass-Through Trust,Series 2018-1, Class B,
4.600% 9/01/27 | | | 500,763 | | | | 521,988 | |
| | | | | | | | |
| | | | | | | 2,167,228 | |
| | | | | | | | |
| Auto Manufacturers — 1.5% | |
Ford Motor Co.
5.291% 12/08/46 | | | 500,000 | | | | 461,943 | |
| | | | | | | | |
| | |
| | | Principal
Amount | | | Value | |
Ford Motor Credit Co. LLC
3.336% 3/18/21 | | $ | 3,275,000 | | | $ | 3,290,297 | |
4.140% 2/15/23 | | | 3,705,000 | | | | 3,761,800 | |
4.375% 8/06/23 | | | 1,154,000 | | | | 1,178,923 | |
5.085% 1/07/21 | | | 1,163,000 | | | | 1,192,663 | |
General Motors Co.
4.200% 10/01/27 | | | 1,290,000 | | | | 1,314,532 | |
5.150% 4/01/38 | | | 785,000 | | | | 792,574 | |
General Motors Financial Co., Inc.
3.500% 11/07/24 | | | 4,340,000 | | | | 4,389,130 | |
4.150% 6/19/23 | | | 3,064,000 | | | | 3,184,478 | |
4.200% 11/06/21 | | | 1,466,000 | | | | 1,512,407 | |
| | | | | | | | |
| | | | | | | 21,078,747 | |
| | | | | | | | |
| Banks — 5.5% | |
Associated Banc-Corp.
4.250% 1/15/25 | | | 2,580,000 | | | | 2,730,026 | |
Bank of America Corp.
4.183% 11/25/27 | | | 2,580,000 | | | | 2,785,151 | |
3 mo. USD LIBOR + 1.814%
4.244% VRN 4/24/38 | | | 1,125,000 | | | | 1,285,301 | |
6.110% 1/29/37 | | | 1,275,000 | | | | 1,669,928 | |
7.750% 5/14/38 | | | 1,055,000 | | | | 1,607,989 | |
Bank of Montreal 5 year USD Swap + 1.432%
3.803% VRN 12/15/32 | | | 2,860,000 | | | | 2,966,192 | |
The Bank of Nova Scotia
4.500% 12/16/25 | | | 1,885,000 | | | | 2,050,376 | |
3 mo. USD LIBOR + 2.648%
4.650% VRN 12/31/99 (b) | | | 3,550,000 | | | | 3,524,262 | |
Barclays Bank PLC
10.179% 6/12/21 (a) | | | 5,444,000 | | | | 6,088,768 | |
Barclays PLC
3 mo. USD LIBOR + 1.380%
3.548% FRN 5/16/24 | | | 2,290,000 | | | | 2,278,451 | |
4.337% 1/10/28 | | | 1,600,000 | | | | 1,681,187 | |
BPCE SA
4.625% 7/11/24 (a) | | | 1,600,000 | | | | 1,705,074 | |
Citigroup, Inc.
3.875% 3/26/25 | | | 1,846,000 | | | | 1,942,517 | |
8.125% 7/15/39 | | | 225,000 | | | | 368,886 | |
Credit Suisse AG
6.500% 8/08/23 (a) | | | 3,806,000 | | | | 4,234,175 | |
Deutsche Bank AG
3.150% 1/22/21 | | | 2,050,000 | | | | 2,048,575 | |
Discover Bank 5 year USD Swap + 1.730%
4.682% VRN 8/09/28 | | | 3,275,000 | | | | 3,423,996 | |
First Republic Bank
4.375% 8/01/46 | | | 4,530,000 | | | | 5,031,415 | |
Fulton Financial Corp.
3.600% 3/16/22 | | | 1,485,000 | | | | 1,506,687 | |
The accompanying notes are an integral part of the financial statements.
72
MassMutual Premier Core Bond Fund – Portfolio of Investments(Continued)
| | | | | | | | |
| | |
| | | Principal
Amount | | | Value | |
The Goldman Sachs Group, Inc.
4.250% 10/21/25 | | $ | 375,000 | | | $ | 401,288 | |
5.950% 1/15/27 | | | 1,333,000 | | | | 1,584,439 | |
6.250% 2/01/41 | | | 440,000 | | | | 607,523 | |
6.750% 10/01/37 | | | 1,065,000 | | | | 1,437,627 | |
HSBC Holdings PLC
4.250% 3/14/24 | | | 1,800,000 | | | | 1,893,967 | |
3 mo. USD LIBOR + 1.535%
4.583% VRN 6/19/29 | | | 1,495,000 | | | | 1,655,821 | |
ING Groep NV
3.550% 4/09/24 | | | 1,465,000 | | | | 1,530,484 | |
4.100% 10/02/23 | | | 3,145,000 | | | | 3,338,427 | |
JP Morgan Chase & Co.
5.600% 7/15/41 | | | 1,225,000 | | | | 1,663,326 | |
Morgan Stanley
4.350% 9/08/26 | | | 3,925,000 | | | | 4,250,482 | |
5.000% 11/24/25 | | | 1,250,000 | | | | 1,400,737 | |
Royal Bank of Scotland Group PLC 3 mo. USD LIBOR + 1.480%
3.498% VRN 5/15/23 | | | 3,325,000 | | | | 3,369,256 | |
Turkiye Garanti Bankasi AS
4.750% 10/17/19 (a) | | | 2,955,000 | | | | 2,955,000 | |
Valley National Bancorp
5.125% 9/27/23 | | | 1,710,000 | | | | 1,825,991 | |
Wells Fargo & Co.
5.375% 11/02/43 | | | 851,000 | | | | 1,067,614 | |
5.606% 1/15/44 | | | 620,000 | | | | 802,431 | |
| | | | | | | | |
| | | | | | | 78,713,369 | |
| | | | | | | | |
| Beverages — 0.6% | |
Anheuser-Busch Cos. LLC/Anheuser-Busch InBev Worldwide, Inc.
4.900% 2/01/46 | | | 4,975,000 | | | | 5,936,304 | |
Molson Coors Brewing Co.
4.200% 7/15/46 | | | 1,689,000 | | | | 1,706,772 | |
5.000% 5/01/42 | | | 350,000 | | | | 386,552 | |
| | | | | | | | |
| | | | | | | 8,029,628 | |
| | | | | | | | |
| Biotechnology — 0.2% | |
Celgene Corp.
3.450% 11/15/27 | | | 1,300,000 | | | | 1,377,352 | |
4.350% 11/15/47 | | | 1,150,000 | | | | 1,333,088 | |
| | | | | | | | |
| | | | | | | 2,710,440 | |
| | | | | | | | |
| Building Materials — 0.2% | |
Standard Industries, Inc.
5.375% 11/15/24 (a) | | | 1,612,000 | | | | 1,660,360 | |
5.500% 2/15/23 (a) | | | 1,207,000 | | | | 1,231,140 | |
| | | | | | | | |
| | | | | | | 2,891,500 | |
| | | | | | | | |
| Chemicals — 1.1% | |
Ashland, Inc.
6.875% 5/15/43 | | | 406,000 | | | | 464,870 | |
CF Industries, Inc.
3.400% 12/01/21 (a) | | | 1,300,000 | | | | 1,322,593 | |
| | | | | | | | |
| | |
| | | Principal
Amount | | | Value | |
DuPont de Nemours, Inc.
5.319% 11/15/38 | | $ | 2,075,000 | | | $ | 2,532,676 | |
Huntsman International LLC
5.125% 11/15/22 | | | 1,137,000 | | | | 1,212,223 | |
Incitec Pivot Finance LLC
6.000% 12/10/19 (a) | | | 1,130,000 | | | | 1,137,157 | |
The Sherwin-Williams Co.
4.500% 6/01/47 | | | 685,000 | | | | 767,625 | |
Syngenta Finance NV
3.698% 4/24/20 (a) | | | 2,040,000 | | | | 2,046,779 | |
4.441% 4/24/23 (a) | | | 2,400,000 | | | | 2,508,034 | |
Yara International ASA
4.750% 6/01/28 (a) | | | 3,932,000 | | | | 4,283,813 | |
| | | | | | | | |
| | | | | | | 16,275,770 | |
| | | | | | | | |
| Commercial Services — 0.0% | |
ERAC USA Finance LLC
6.700% 6/01/34 (a) | | | 355,000 | | | | 484,697 | |
| | | | | | | | |
| Computers — 0.4% | |
Dell International LLC/EMC Corp.
6.020% 6/15/26 (a) | | | 3,164,000 | | | | 3,558,167 | |
Genpact Luxembourg Sarl
3.700% STEP 4/01/22 | | | 2,295,000 | | | | 2,329,777 | |
| | | | | | | | |
| | | | | | | 5,887,944 | |
| | | | | | | | |
| Diversified Financial Services — 2.5% | |
AerCap Ireland Capital DAC/AerCap Global Aviation Trust
3.875% 1/23/28 | | | 4,325,000 | | | | 4,465,260 | |
Aircastle Ltd.
4.400% 9/25/23 | | | 3,835,000 | | | | 4,034,118 | |
5.000% 4/01/23 | | | 1,950,000 | | | | 2,088,271 | |
Antares Holdings LP
6.000% 8/15/23 (a) | | | 3,935,000 | | | | 4,076,643 | |
Ares Finance Co. LLC
4.000% 10/08/24 (a) | | | 2,380,000 | | | | 2,343,305 | |
Brookfield Finance, Inc.
4.850% 3/29/29 | | | 2,168,000 | | | | 2,453,624 | |
GE Capital International Funding Co. Unlimited Co.
4.418% 11/15/35 | | | 1,790,000 | | | | 1,873,268 | |
Lazard Group LLC
3.625% 3/01/27 | | | 1,209,000 | | | | 1,241,134 | |
4.500% 9/19/28 | | | 2,055,000 | | | | 2,241,288 | |
Legg Mason, Inc.
5.625% 1/15/44 | | | 1,161,000 | | | | 1,295,449 | |
Park Aerospace Holdings Ltd.
4.500% 3/15/23 (a) | | | 2,225,000 | | | | 2,302,430 | |
5.250% 8/15/22 (a) | | | 6,015,000 | | | | 6,339,209 | |
5.500% 2/15/24 (a) | | | 685,000 | | | | 740,074 | |
Synchrony Financial
4.375% 3/19/24 | | | 590,000 | | | | 626,065 | |
| | | | | | | | |
| | | | | | | 36,120,138 | |
| | | | | | | | |
The accompanying notes are an integral part of the financial statements.
73
MassMutual Premier Core Bond Fund – Portfolio of Investments(Continued)
| | | | | | | | |
| | |
| | | Principal
Amount | | | Value | |
| Electric — 1.7% | |
Avangrid, Inc.
3.800% 6/01/29 | | $ | 2,260,000 | | | $ | 2,427,907 | |
CenterPoint Energy, Inc.
4.250% 11/01/28 | | | 2,000,000 | | | | 2,197,036 | |
The Cleveland Electric Illuminating Co.
3.500% 4/01/28 (a) | | | 925,000 | | | | 965,140 | |
5.950% 12/15/36 | | | 589,000 | | | | 751,120 | |
CMS Energy Corp.
4.700% 3/31/43 | | | 655,000 | | | | 751,970 | |
4.875% 3/01/44 | | | 700,000 | | | | 850,546 | |
Duke Energy Corp.
3.750% 9/01/46 | | | 1,340,000 | | | | 1,379,606 | |
Duke Energy Progress, Inc.
6.125% 9/15/33 | | | 37,000 | | | | 48,273 | |
Infraestructura Energetica Nova SAB de CV
3.750% 1/14/28 (a) | | | 1,505,000 | | | | 1,480,544 | |
IPALCO Enterprises, Inc.
3.450% 7/15/20 | | | 4,085,000 | | | | 4,108,544 | |
3.700% 9/01/24 | | | 2,040,000 | | | | 2,112,406 | |
Nevada Power Co., Series N,
6.650% 4/01/36 | | | 1,000,000 | | | | 1,405,215 | |
Oncor Electric Delivery Co.
7.500% 9/01/38 | | | 130,000 | | | | 209,516 | |
Pennsylvania Electric Co.
4.150% 4/15/25 (a) | | | 2,090,000 | | | | 2,214,314 | |
PPL Capital Funding, Inc.
4.000% 9/15/47 | | | 1,050,000 | | | | 1,089,711 | |
Southwestern Electric Power Co.
6.200% 3/15/40 | | | 1,815,000 | | | | 2,442,369 | |
| | | | | | | | |
| | | | | | | 24,434,217 | |
| | | | | | | | |
| Electronics — 0.2% | |
Arrow Electronics, Inc.
3.250% 9/08/24 | | | 945,000 | | | | 960,565 | |
3.875% 1/12/28 | | | 970,000 | | | | 994,352 | |
5.125% 3/01/21 | | | 750,000 | | | | 774,161 | |
| | | | | | | | |
| | | | | | | 2,729,078 | |
| | | | | | | | |
| Foods — 0.4% | |
Ingredion, Inc.
3.200% 10/01/26 | | | 765,000 | | | | 775,902 | |
JBS USA LUX SA / JBS USA Food Co. / JBS USA Finance, Inc.
5.500% 1/15/30 (a) | | | 928,000 | | | | 983,661 | |
Kraft Heinz Foods Co.
4.625% 10/01/39 (a) | | | 1,925,000 | | | | 1,934,984 | |
Mars, Inc.
3.950% 4/01/49 (a) | | | 2,185,000 | | | | 2,490,625 | |
| | | | | | | | |
| | | | | | | 6,185,172 | |
| | | | | | | | |
| | | | | | | | |
| | |
| | | Principal
Amount | | | Value | |
| Forest Products & Paper — 0.1% | |
Fibria Overseas Finance Ltd.
4.000% 1/14/25 | | $ | 1,225,000 | | | $ | 1,243,387 | |
| | | | | | | | |
| Gas — 0.1% | |
NiSource, Inc.
4.800% 2/15/44 | | | 1,350,000 | | | | 1,573,289 | |
| | | | | | | | |
| Health Care – Products — 0.1% | |
Becton Dickinson and Co.
4.685% 12/15/44 | | | 800,000 | | | | 928,759 | |
| | | | | | | | |
| Health Care – Services — 0.2% | |
Advocate Health & Hospitals Corp.
3.829% 8/15/28 | | | 960,000 | | | | 1,058,846 | |
City of Hope
4.378% 8/15/48 | | | 1,275,000 | | | | 1,540,568 | |
Humana, Inc.
4.800% 3/15/47 | | | 780,000 | | | | 897,613 | |
| | | | | | | | |
| | | | | | | 3,497,027 | |
| | | | | | | | |
| Housewares — 0.3% | |
Newell Brands, Inc.
3.850% 4/01/23 | | | 3,558,000 | | | | 3,662,605 | |
| | | | | | | | |
| Insurance — 3.9% | |
The Allstate Corp. 3 mo. USD
LIBOR + 2.938%
5.750% VRN 8/15/53 | | | 4,970,000 | | | | 5,305,475 | |
American International Group, Inc.
4.200% 4/01/28 | | | 2,725,000 | | | | 2,972,699 | |
4.500% 7/16/44 | | | 1,200,000 | | | | 1,336,983 | |
4.750% 4/01/48 | | | 450,000 | | | | 525,535 | |
3 mo. USD LIBOR + 2.868%
5.750% VRN 4/01/48 | | | 3,395,000 | | | | 3,630,817 | |
AmTrust Financial Services, Inc.
6.125% 8/15/23 (c) | | | 2,965,000 | | | | 2,959,964 | |
Arch Capital Group US, Inc.
5.144% 11/01/43 | | | 1,150,000 | | | | 1,436,559 | |
Athene Holding Ltd.
4.125% 1/12/28 | | | 8,157,000 | | | | 8,386,581 | |
AXA Equitable Holdings, Inc.
4.350% 4/20/28 | | | 1,050,000 | | | | 1,118,968 | |
AXIS Specialty Finance LLC
3.900% 7/15/29 | | | 1,115,000 | | | | 1,166,183 | |
4.000% 12/06/27 | | | 2,760,000 | | | | 2,908,414 | |
Brown & Brown, Inc.
4.200% 9/15/24 | | | 1,278,000 | | | | 1,352,246 | |
CNO Financial Group, Inc.
5.250% 5/30/25 | | | 3,264,000 | | | | 3,508,147 | |
Enstar Group Ltd.
4.500% 3/10/22 | | | 1,815,000 | | | | 1,882,442 | |
Markel Corp.
3.350% 9/17/29 | | | 715,000 | | | | 722,396 | |
The Progressive Corp. 3 mo. USD LIBOR + 2.539%
5.375% VRN 12/31/99 (b) | | | 1,950,000 | | | | 2,013,375 | |
The accompanying notes are an integral part of the financial statements.
74
MassMutual Premier Core Bond Fund – Portfolio of Investments(Continued)
| | | | | | | | |
| | |
| | | Principal
Amount | | | Value | |
Prudential Financial, Inc.
3 mo. USD LIBOR + 2.665%
5.700% VRN 9/15/48 | | $ | 2,730,000 | | | $ | 3,025,932 | |
3 mo. USD LIBOR + 4.175%
5.875% VRN 9/15/42 | | | 650,000 | | | | 700,473 | |
Reinsurance Group of America, Inc.
3.900% 5/15/29 | | | 1,645,000 | | | | 1,750,293 | |
USF&G Capital I
8.500% 12/15/45 (a) | | | 1,015,000 | | | | 1,486,771 | |
Voya Financial, Inc. 3 mo. USD LIBOR + 2.084%
4.700% VRN 1/23/48 | | | 1,010,000 | | | | 947,628 | |
Willis North America, Inc.
2.950% 9/15/29 | | | 1,200,000 | | | | 1,181,086 | |
4.500% 9/15/28 | | | 2,135,000 | | | | 2,366,389 | |
XLIT Ltd.
4.450% 3/31/25 | | | 2,564,000 | | | | 2,784,510 | |
| | | | | | | | |
| | | | | | | 55,469,866 | |
| | | | | | | | |
| Internet — 0.2% | |
Amazon.com, Inc.
4.050% 8/22/47 | | | 2,055,000 | | | | 2,468,905 | |
| | | | | | | | |
| Investment Companies — 0.7% | |
Ares Capital Corp.
3.500% 2/10/23 | | | 3,465,000 | | | | 3,486,638 | |
BlackRock TCP Capital Corp.
3.900% 8/23/24 | | | 4,215,000 | | | | 4,160,353 | |
4.125% 8/11/22 | | | 2,810,000 | | | | 2,817,129 | |
| | | | | | | | |
| | | | | | | 10,464,120 | |
| | | | | | | | |
| Iron & Steel — 0.3% | |
ArcelorMittal
6.250% STEP 2/25/22 | | | 755,000 | | | | 815,815 | |
Vale Overseas Ltd.
6.250% 8/10/26 | | | 1,550,000 | | | | 1,786,375 | |
6.875% 11/21/36 | | | 825,000 | | | | 1,045,275 | |
| | | | | | | | |
| | | | | | | 3,647,465 | |
| | | | | | | | |
| Lodging — 0.1% | |
Las Vegas Sands Corp.
3.900% 8/08/29 | | | 1,085,000 | | | | 1,112,882 | |
| | | | | | | | |
| Machinery – Diversified — 0.2% | |
CNH Industrial Capital LLC
3.875% 10/15/21 | | | 2,870,000 | | | | 2,944,390 | |
| | | | | | | | |
| Media — 0.9% | |
CCO Holdings LLC/CCO Holdings Capital Corp.
5.125% 5/01/27 (a) | | | 1,200,000 | | | | 1,252,500 | |
Charter Communications Operating LLC/Charter Communications Operating Capital
6.484% 10/23/45 | | | 1,905,000 | | | | 2,318,055 | |
Comcast Corp.
3.400% 7/15/46 | | | 1,450,000 | | | | 1,482,799 | |
| | | | | | | | |
| | |
| | | Principal
Amount | | | Value | |
3.969% 11/01/47 | | $ | 660,000 | | | $ | 724,821 | |
4.750% 3/01/44 | | | 925,000 | | | | 1,123,061 | |
Discovery Communications LLC
3.950% 3/20/28 | | | 1,325,000 | | | | 1,375,369 | |
5.000% 9/20/37 | | | 975,000 | | | | 1,048,127 | |
Grupo Televisa SAB
6.625% 3/18/25 | | | 2,637,000 | | | | 3,084,580 | |
Time Warner Cable, Inc.
6.750% 6/15/39 | | | 655,000 | | | | 800,694 | |
| | | | | | | | |
| | | | | | | 13,210,006 | |
| | | | | | | | |
| Mining — 0.9% | |
Glencore Finance Canada Ltd.
5.550% STEP 10/25/42 (a) | | | 857,000 | | | | 929,245 | |
Glencore Funding LLC
3.875% 10/27/27 (a) | | | 950,000 | | | | 967,195 | |
4.000% 4/16/25 (a) | | | 2,150,000 | | | | 2,236,723 | |
4.625% 4/29/24 (a) | | | 4,085,000 | | | | 4,364,863 | |
Kinross Gold Corp.
4.500% 7/15/27 | | | 996,000 | | | | 1,044,535 | |
5.125% 9/01/21 | | | 3,325,000 | | | | 3,449,688 | |
| | | | | | | | |
| | | | | | | 12,992,249 | |
| | | | | | | | |
| Miscellaneous – Manufacturing — 0.0% | |
General Electric Co.
6.875% 1/10/39 | | | 429,000 | | | | 567,541 | |
| | | | | | | | |
| Office Equipment/Supplies — 0.3% | |
Pitney Bowes, Inc.
4.125% STEP 9/15/20 | | | 830,000 | | | | 836,225 | |
4.125% STEP 10/01/21 | | | 2,825,000 | | | | 2,839,125 | |
| | | | | | | | |
| | | | | | | 3,675,350 | |
| | | | | | | | |
| Oil & Gas — 2.6% | |
Antero Resources Corp.
5.375% 11/01/21 | | | 6,265,000 | | | | 6,045,725 | |
Cenovus Energy, Inc.
3.000% 8/15/22 | | | 1,225,000 | | | | 1,232,887 | |
4.250% 4/15/27 | | | 1,475,000 | | | | 1,533,530 | |
6.750% 11/15/39 | | | 1,000,000 | | | | 1,222,608 | |
Diamondback Energy, Inc.
4.750% 11/01/24 | | | 2,174,000 | | | | 2,225,632 | |
Encana Corp.
6.500% 2/01/38 | | | 530,000 | | | | 638,340 | |
EQT Corp.
3.000% 10/01/22 | | | 1,840,000 | | | | 1,771,280 | |
3.900% 10/01/27 (c) | | | 5,620,000 | | | | 4,871,587 | |
Helmerich & Payne, Inc.
4.650% 3/15/25 | | | 1,415,000 | | | | 1,529,282 | |
Marathon Petroleum Corp.
4.500% 4/01/48 | | | 495,000 | | | | 517,131 | |
4.750% 9/15/44 | | | 625,000 | | | | 671,692 | |
6.500% 3/01/41 | | | 1,060,000 | | | | 1,319,352 | |
Newfield Exploration Co.
5.375% 1/01/26 | | | 1,875,000 | | | | 2,036,783 | |
The accompanying notes are an integral part of the financial statements.
75
MassMutual Premier Core Bond Fund – Portfolio of Investments(Continued)
| | | | | | | | |
| | |
| | | Principal
Amount | | | Value | |
5.625% 7/01/24 | | $ | 1,200,000 | | | $ | 1,323,767 | |
5.750% 1/30/22 | | | 2,110,000 | | | | 2,252,431 | |
Occidental Petroleum Corp.
6.600% 3/15/46 | | | 1,228,000 | | | | 1,601,837 | |
PBF Holding Co. LLC/PBF Finance Corp.
7.000% 11/15/23 | | | 1,150,000 | | | | 1,185,946 | |
Petroleos Mexicanos
5.350% 2/12/28 | | | 1,925,000 | | | | 1,839,588 | |
6.375% 1/23/45 | | | 640,000 | | | | 593,600 | |
6.500% 3/13/27 | | | 295,000 | | | | 306,505 | |
6.625% 6/15/38 | | | 202,000 | | | | 192,152 | |
Saudi Arabian Oil Co.
4.250% 4/16/39 (a) | | | 2,580,000 | | | | 2,781,336 | |
| | | | | | | | |
| | | | | | | 37,692,991 | |
| | | | | | | | |
| Oil & Gas Services — 0.3% | |
National Oilwell Varco, Inc.
3.950% 12/01/42 | | | 1,778,000 | | | | 1,629,514 | |
Patterson-UTI Energy, Inc.
3.950% 2/01/28 | | | 2,060,000 | | | | 2,075,055 | |
| | | | | | | | |
| | | | | | | 3,704,569 | |
| | | | | | | | |
| Packaging & Containers — 0.3% | |
Amcor Finance USA, Inc.
3.625% 4/28/26 (a) | | | 3,960,000 | | | | 4,074,824 | |
| | | | | | | | |
| Pharmaceuticals — 1.7% | |
AbbVie, Inc.
4.700% 5/14/45 | | | 2,465,000 | | | | 2,636,971 | |
Allergan Funding SCS
3.800% 3/15/25 | | | 1,700,000 | | | | 1,780,119 | |
Bayer US Finance II LLC
4.400% 7/15/44 (a) | | | 1,625,000 | | | | 1,639,662 | |
4.625% 6/25/38 (a) | | | 1,145,000 | | | | 1,238,740 | |
CVS Health Corp.
3.000% 8/15/26 | | | 695,000 | | | | 698,445 | |
4.300% 3/25/28 | | | 1,325,000 | | | | 1,432,769 | |
5.050% 3/25/48 | | | 1,370,000 | | | | 1,554,852 | |
6.125% 9/15/39 | | | 895,000 | | | | 1,110,616 | |
CVS Pass-Through Trust
5.926% 1/10/34 (a) | | | 1,884,383 | | | | 2,191,926 | |
Express Scripts Holding Co.
4.800% 7/15/46 | | | 1,105,000 | | | | 1,237,006 | |
McKesson Corp.
4.883% 3/15/44 | | | 800,000 | | | | 883,639 | |
Mylan NV
3.950% 6/15/26 | | | 2,765,000 | | | | 2,857,111 | |
Teva Pharmaceutical Finance Netherlands III BV
2.200% 7/21/21 | | | 5,219,000 | | | | 4,775,385 | |
4.100% 10/01/46 (c) | | | 510,000 | | | | 320,025 | |
| | | | | | | | |
| | | | | | | 24,357,266 | |
| | | | | | | | |
| | | | | | | | |
| | |
| | | Principal
Amount | | | Value | |
| Pipelines — 2.2% | |
Alliance Pipeline LP
6.996% 12/31/19 (a) | | $ | 61,845 | | | $ | 62,328 | |
Energy Transfer Operating LP
4.200% 4/15/27 | | | 2,425,000 | | | | 2,554,765 | |
5.875% 1/15/24 | | | 1,125,000 | | | | 1,250,616 | |
6.125% 12/15/45 | | | 1,385,000 | | | | 1,624,869 | |
3 mo. USD LIBOR + 4.028%
6.250% VRN 12/31/99 (b) | | | 2,635,000 | | | | 2,443,963 | |
7.500% 10/15/20 | | | 1,075,000 | | | | 1,129,713 | |
EnLink Midstream Partners LP
4.150% 6/01/25 | | | 2,972,000 | | | | 2,756,530 | |
4.850% 7/15/26 | | | 996,000 | | | | 946,200 | |
Enterprise Products Operating LLC
3 mo. USD LIBOR + 3.033%
5.250% VRN 8/16/77 | | | 1,000,000 | | | | 991,464 | |
3 mo. USD LIBOR + 2.570%
5.375% VRN 2/15/78 | | | 1,120,000 | | | | 1,080,832 | |
EQM Midstream Partners LP
4.750% 7/15/23 | | | 2,870,000 | | | | 2,878,854 | |
Kinder Morgan Energy Partners LP
6.375% 3/01/41 | | | 400,000 | | | | 490,345 | |
6.500% 2/01/37 | | | 571,000 | | | | 709,210 | |
6.550% 9/15/40 | | | 535,000 | | | | 663,363 | |
6.950% 1/15/38 | | | 65,000 | | | | 84,852 | |
MPLX LP
4.500% 4/15/38 | | | 1,115,000 | | | | 1,155,771 | |
6.250% 10/15/22 (a) | | | 624,000 | | | | 639,624 | |
3 mo. USD LIBOR + 4.652%
6.875% VRN 12/31/99 (b) | | | 3,125,000 | | | | 3,121,250 | |
Plains All American Pipeline LP 3 mo. USD LIBOR + 4.110%
6.125% VRN 12/31/99 (b) | | | 2,590,000 | | | | 2,439,676 | |
Plains All American Pipeline LP/PAA Finance Corp.
4.500% 12/15/26 | | | 1,089,000 | | | | 1,154,786 | |
4.700% 6/15/44 | | | 650,000 | | | | 634,515 | |
Sunoco Logistics Partners Operations LP
4.000% 10/01/27 | | | 1,370,000 | | | | 1,418,188 | |
5.300% 4/01/44 | | | 500,000 | | | | 528,189 | |
Western Midstream Operating LP
4.500% 3/01/28 | | | 615,000 | | | | 593,846 | |
| | | | | | | | |
| | | | | | | 31,353,749 | |
| | | | | | | | |
| Private Equity — 0.4% | |
Carlyle Finance Subsidiary LLC
3.500% 9/19/29 (a) | | | 1,345,000 | | | | 1,332,046 | |
Hercules Capital, Inc.
4.625% 10/23/22 | | | 3,220,000 | | | | 3,220,607 | |
KKR Group Finance Co. VI LLC
3.750% 7/01/29 (a) | | | 1,480,000 | | | | 1,559,729 | |
| | | | | | | | |
| | | | | | | 6,112,382 | |
| | | | | | | | |
The accompanying notes are an integral part of the financial statements.
76
MassMutual Premier Core Bond Fund – Portfolio of Investments(Continued)
| | | | | | | | |
| | |
| | | Principal
Amount | | | Value | |
| Real Estate Investment Trusts (REITS) — 1.5% | |
Alexandria Real Estate Equities, Inc.
2.750% 12/15/29 | | $ | 1,035,000 | | | $ | 1,020,018 | |
American Tower Trust #1
3.652% 3/15/48 (a) | | | 1,810,000 | | | | 1,946,647 | |
Crown Castle International Corp.
5.200% 2/15/49 | | | 729,000 | | | | 900,545 | |
Healthcare Trust of America Holdings LP
3.500% 8/01/26 | | | 2,375,000 | | | | 2,447,918 | |
Mid-America Apartments LP
3.600% 6/01/27 | | | 1,090,000 | | | | 1,152,944 | |
SBA Tower Trust
3.156% 10/10/45 (a) | | | 1,500,000 | | | | 1,501,609 | |
3.168% 4/09/47 (a) | | | 1,840,000 | | | | 1,857,863 | |
Spirit Realty LP
3.200% 1/15/27 | | | 1,220,000 | | | | 1,210,711 | |
4.000% 7/15/29 | | | 1,765,000 | | | | 1,846,827 | |
STORE Capital Corp.
4.625% 3/15/29 | | | 1,360,000 | | | | 1,495,477 | |
Tanger Properties LP
3.875% 12/01/23 | | | 1,777,000 | | | | 1,829,542 | |
UDR, Inc.
3.200% 1/15/30 | | | 950,000 | | | | 978,345 | |
VEREIT Operating Partnership LP
4.625% 11/01/25 | | | 2,525,000 | | | | 2,756,330 | |
Weingarten Realty Investors
3.250% 8/15/26 | | | 580,000 | | | | 583,242 | |
| | | | | | | | |
| | | | | | | 21,528,018 | |
| | | | | | | | |
| Retail — 0.9% | |
Dollar Tree, Inc.
4.000% 5/15/25 | | | 3,295,000 | | | | 3,491,295 | |
4.200% 5/15/28 | | | 3,280,000 | | | | 3,524,442 | |
El Puerto de Liverpool SAB de CV
3.950% 10/02/24 (a) | | | 3,375,000 | | | | 3,455,190 | |
The Home Depot, Inc.
4.250% 4/01/46 | | | 1,484,000 | | | | 1,777,232 | |
| | | | | | | | |
| | | | | | | 12,248,159 | |
| | | | | | | | |
| Semiconductors — 0.1% | |
Microchip Technology, Inc.
3.922% 6/01/21 | | | 955,000 | | | | 975,414 | |
| | | | | | | | |
| Software — 0.2% | |
Microsoft Corp.
4.450% 11/03/45 | | | 2,560,000 | | | | 3,232,946 | |
| | | | | | | | |
| Telecommunications — 0.8% | |
AT&T, Inc.
4.750% 5/15/46 | | | 4,225,000 | | | | 4,685,382 | |
5.250% 3/01/37 | | | 638,000 | | | | 750,872 | |
6.250% 3/29/41 | | | 15,000 | | | | 18,948 | |
Crown Castle Towers LLC
4.241% 7/15/48 (a) | | | 1,750,000 | | | | 1,925,158 | |
| | | | | | | | |
| | |
| | | Principal
Amount | | | Value | |
Embarq Corp.
7.995% 6/01/36 | | $ | 200,000 | | | $ | 197,750 | |
Telecom Italia SpA
5.303% 5/30/24 (a) | | | 600,000 | | | | 647,070 | |
Telefonica Emisiones SAU
4.665% 3/06/38 | | | 1,040,000 | | | | 1,140,800 | |
Verizon Communications, Inc.
6.550% 9/15/43 | | | 996,000 | | | | 1,466,964 | |
| | | | | | | | |
| | | | | | | 10,832,944 | |
| | | | | | | | |
| Transportation — 0.2% | |
Autoridad del Canal de Panama
4.950% 7/29/35 (a) | | | 1,340,000 | | | | 1,538,333 | |
CSX Corp.
4.750% 11/15/48 | | | 820,000 | | | | 988,692 | |
Pacific National Finance Pty Ltd.
4.625% 9/23/20 (a) | | | 845,000 | | | | 861,303 | |
| | | | | | | | |
| | | | | | | 3,388,328 | |
| | | | | | | | |
| | |
TOTAL CORPORATE DEBT
(Cost $471,506,183) | | | | | | | 495,785,425 | |
| | | | | |
|
| MUNICIPAL OBLIGATIONS — 0.6% | |
JobsOhio Beverage System Series B
4.532% 1/01/35 | | | 3,050,000 | | | | 3,675,006 | |
New York City Water & Sewer System
5.882% 6/15/44 | | | 390,000 | | | | 575,480 | |
State of California BAB
7.550% 4/01/39 | | | 1,405,000 | | | | 2,324,516 | |
7.600% 11/01/40 | | | 900,000 | | | | 1,522,557 | |
| | | | | | | | |
| | | | | | | 8,097,559 | |
| | | | | | | | |
| | |
TOTAL MUNICIPAL OBLIGATIONS
(Cost $7,026,628) | | | | | | | 8,097,559 | |
| | | | | |
|
| NON-U.S. GOVERNMENT AGENCY OBLIGATIONS — 32.1% | |
| Automobile ABS — 0.6% | |
Avis Budget Rental Car Funding AESOP LLC
Series 2019-1A, Class B,
3.700% 3/20/23 (a) | | | 958,000 | | | | 983,044 | |
Series 2019-1A, Class C,
4.530% 3/20/23 (a) | | | 1,577,000 | | | | 1,602,044 | |
Hertz Vehicle Financing II LP,Series 2018-1A, Class B
3.600% 2/25/24 (a) | | | 3,610,000 | | | | 3,706,048 | |
OneMain Direct Auto Receivables Trust,Series 2019-1A, Class B
3.950% 11/14/28 (a) | | | 2,383,000 | | | | 2,497,848 | |
| | | | | | | | |
| | | | | | | 8,788,984 | |
| | | | | | | | |
The accompanying notes are an integral part of the financial statements.
77
MassMutual Premier Core Bond Fund – Portfolio of Investments(Continued)
| | | | | | | | |
| | |
| | | Principal
Amount | | | Value | |
| Commercial MBS — 3.6% | |
Aventura Mall Trust,Series 2018-AVM, Class C,
4.249% VRN 7/05/40 (a) (d) | | $ | 4,140,000 | | | $ | 4,534,910 | |
BAMLL Commercial Mortgage Securities Trust, Series 2018-DSNY, Class C, 1 mo. USD LIBOR + 1.350%
3.378% FRN 9/15/34 (a) | | | 760,000 | | | | 759,342 | |
BANK
Series 2019-BN17, Class B, 4.128% VRN 4/15/52 (d) | | | 917,000 | | | | 1,011,346 | |
Series 2019-BN16, Class AS, 4.267% 2/15/52 | | | 822,500 | | | | 922,371 | |
Series 2019-BN16, Class B, 4.438% VRN 2/15/52 (d) | | | 684,276 | | | | 769,203 | |
BBCMS Mortgage Trust
Series 2018-CHRS, Class B, 4.409% VRN 8/05/38 (a) (d) | | | 2,200,000 | | | | 2,420,329 | |
Series 2018-CHRS, Class C, 4.409% VRN 8/05/38 (a) (d) | | | 1,590,000 | | | | 1,723,786 | |
Series 2018-CHRS, Class D, 4.409% VRN 8/05/38 (a) (d) | | | 1,220,000 | | | | 1,293,986 | |
BHMS Mortgage Trust
Series 2018-ATLS, Class A, 1 mo. USD LIBOR + 1.250%
3.278% FRN 7/15/35 (a) | | | 5,180,000 | | | | 5,180,030 | |
Series 2018-ATLS, Class B, 1 mo. USD LIBOR + 1.500%
3.528% FRN 7/15/35 (a) | | | 4,800,000 | | | | 4,801,483 | |
BX Commercial Mortgage Trust
Series 2018-IND, Class B, 1 mo. USD LIBOR + .900%
2.928% FRN 11/15/35 (a) | | | 863,807 | | | | 863,267 | |
Series 2018-IND, Class E, 1 mo. USD LIBOR + 1.700%
3.728% FRN 11/15/35 (a) | | | 2,402,953 | | | | 2,408,946 | |
CAMB Commercial Mortgage Trust, Series 2019-LIFE, Class D, 1 mo. USD LIBOR + 1.750%
3.778% FRN 12/15/37 (a) | | | 1,104,426 | | | | 1,109,932 | |
Citigroup Commercial Mortgage Trust, Series 2019-GC41, Class C
3.502% 8/10/56 | | | 1,259,000 | | | | 1,292,217 | |
Commercial Mortgage Pass-Through Certificates
Series 2015-CR23, Class B, 4.183% VRN 5/10/48 (d) | | | 1,200,000 | | | | 1,291,007 | |
Series 2015-CR23, Class C, 4.392% VRN 5/10/48 (d) | | | 1,050,000 | | | | 1,092,771 | |
DBUBS Mortgage Trust, Series 2011-LC1A, Class B,
5.471% VRN 11/10/46 (a) (d) | | | 860,000 | | | | 893,484 | |
| | | | | | | | |
| | |
| | | Principal
Amount | | | Value | |
GCCFC Commercial Mortgage Trust,Series 2006-GG7, Class AM,
5.825% VRN 7/10/38 (d) | | $ | 645,214 | | | $ | 650,599 | |
GS Mortgage Securities Corp.
Series 2019-GC39, Class C, 4.005% VRN 5/10/52 (d) | | | 1,357,000 | | | | 1,429,505 | |
Series 2012-GC6, Class AS, 4.948% 1/10/45 (a) | | | 800,000 | | | | 843,272 | |
JPMBB Commercial Mortgage Securities Trust,Series 2015-C27, Class B
3.898% 2/15/48 | | | 2,800,000 | | | | 2,933,989 | |
JPMDB Commercial Mortgage Securities Trust,Series 2017-C7, Class C,
4.324% VRN 10/15/50 (d) | | | 2,900,000 | | | | 3,116,288 | |
KNDL Mortgage Trust, Series 2019-KNSQ, Class E, 1 mo. USD LIBOR + 1.800%
3.828% FRN 5/15/36 (a) | | | 1,730,000 | | | | 1,730,048 | |
Morgan Stanley Capital I Trust
Series 2019-L2, Class AS, 4.272% 3/15/52 | | | 2,450,000 | | | | 2,765,489 | |
Series 2018-H3, Class B, 4.620% VRN 7/15/51 (d) | | | 740,000 | | | | 831,694 | |
Series 2011-C2, Class B, 5.200% VRN 6/15/44 (a) (d) | | | 825,000 | | | | 841,681 | |
MSCG Trust, Series 2018-SELF, Class C, 1 mo. USD LIBOR + 1.180%
3.208% FRN 10/15/37 (a) | | | 505,000 | | | | 504,995 | |
TIAA Seasoned Commercial Mortgage Trust,Series 2007-C4, Class AJ,
5.483% VRN 8/15/39 (d) | | | 53,250 | | | | 53,472 | |
Wells Fargo Commercial Mortgage Trust
Series 2019-C49, Class AS, 4.244% 3/15/52 | | | 1,492,000 | | | | 1,678,078 | |
Series 2018-C45, Class AS, 4.405% VRN 6/15/51 (d) | | | 1,400,000 | | | | 1,578,901 | |
Series 2018-C45, Class B, 4.556% 6/15/51 | | | 390,000 | | | | 444,371 | |
| | | | | | | | |
| | | | | | | 51,770,792 | |
| | | | | | | | |
| Home Equity ABS — 0.1% | |
Countrywide Partnership Trust,Series 2004-EC1, Class M1, 1 mo. USD LIBOR + .900%
2.918% FRN 2/25/35 | | | 773,329 | | | | 759,894 | |
| | | | | | | | |
| Other ABS — 14.7% | |
321 Henderson Receivables LLC,Series 2015-1A, Class A
3.260% 9/15/72 (a) | | | 485,375 | | | | 511,035 | |
The accompanying notes are an integral part of the financial statements.
78
MassMutual Premier Core Bond Fund – Portfolio of Investments(Continued)
| | | | | | | | |
| | |
| | | Principal
Amount | | | Value | |
AASET Trust,Series 2019-1, Class A
3.844% 5/15/39 (a) | | $ | 2,651,160 | | | $ | 2,655,970 | |
AASET US Ltd.,Series 2018-2A, Class A
4.454% 11/18/38 (a) | | | 1,866,975 | | | | 1,915,170 | |
Adams Outdoor Advertising LP,Series 2018-1, Class A
4.810% 11/15/48 (a) | | | 2,371,367 | | | | 2,461,016 | |
Anchorage Capital CLO 9 Ltd.,Series 2016-9A, Class CR, 3 mo. USD LIBOR + 2.850%
5.153% FRN 7/15/32 (a) | | | 1,000,000 | | | | 998,763 | |
Apidos CLO XXV,Series 2016-25A, Class A2R, 3 mo. USD LIBOR + 1.700%
3.978% FRN 10/20/31 (a) | | | 2,610,000 | | | | 2,592,625 | |
Arbys Funding LLC,Series 2015-1A, Class A2
4.969% 10/30/45 (a) | | | 2,117,500 | | | | 2,280,907 | |
Ascentium Equipment Receivables Trust
Series 2018-2A, Class D, 4.150% 7/10/24 (a) | | | 2,834,000 | | | | 2,912,147 | |
Series 2019-1A, Class E, 4.310% 4/12/27 (a) | | | 1,506,000 | | | | 1,549,108 | |
Assurant CLO III Ltd.,Series 2018-2A, Class C, 3 mo. USD LIBOR + 2.250%
4.528% FRN 10/20/31 (a) | | | 1,400,000 | | | | 1,393,169 | |
Atlas Senior Loan Fund VII Ltd.,Series 2016-7A, Class A1R, 3 mo. USD LIBOR + 1.280%
3.412% FRN 11/27/31 (a) | | | 2,400,000 | | | | 2,398,726 | |
Avery Point VII CLO Ltd.,Series 2015-7A, Class DR, 3 mo. USD LIBOR + 3.600%
5.903% FRN 1/15/28 (a) | | | 1,000,000 | | | | 999,296 | |
Benefit Street Partners CLOV-B Ltd.,Series 2018-5BA, Class A1A, 3 mo. USD LIBOR + 1.090%
3.368% FRN 4/20/31 (a) | | | 1,920,000 | | | | 1,906,725 | |
Benefit Street Partners CLO X Ltd.,Series 2016-10A, Class CR, 3 mo. USD LIBOR + 3.500%
5.803% FRN 1/15/29 (a) | | | 700,000 | | | | 695,507 | |
BlueMountain CLO XXV Ltd.,Series 2019-25A, Class B, 3 mo. USD LIBOR + 1.800%
4.086% FRN 7/15/32 (a) | | | 2,750,000 | | | | 2,749,642 | |
BRE Grand Islander Timeshare Issuer LLC,Series 2017-1A, Class A
2.940% 5/25/29 (a) | | | 655,117 | | | | 661,874 | |
CAL Funding II Ltd.,Series 2018-2A, Class A
4.340% 9/25/43 (a) | | | 1,332,000 | | | | 1,363,408 | |
| | | | | | | | |
| | |
| | | Principal
Amount | | | Value | |
Canyon Capital CLO Ltd.,Series 2019-2A, Class C, 3 mo. USD LIBOR + 2.750%
4.894% FRN 10/15/32 (a) | | $ | 400,000 | | | $ | 400,000 | |
Capital Automotive LLC,Series 2017-1A, Class A2
4.180% 4/15/47 (a) | | | 910,393 | | | | 930,846 | |
Capital Automotive REIT,Series 2014-1A, Class A
3.660% 10/15/44 (a) | | | 1,057,619 | | | | 1,071,061 | |
Carlyle Global Market Strategies CLO Ltd.
Series 2018-4A, Class A2, 3 mo. USD LIBOR + 1.800%
4.078% FRN 1/20/31 (a) | | | 1,080,000 | | | | 1,076,301 | |
Series 2015-3A, Class CR, 3 mo. USD LIBOR + 2.850%
5.106% FRN 7/28/28 (a) | | | 310,000 | | | | 301,153 | |
Castlelake Aircraft Structured Trust
Series 2019-1A, Class A, 3.967% 4/15/39 (a) | | | 1,198,567 | | | | 1,216,785 | |
Series 2018-1, Class A, 4.125% 6/15/43 (a) | | | 3,264,980 | | | | 3,342,053 | |
Cazenovia Creek Funding I LLC,Series 2015-1A, Class A
2.000% 12/10/23 (a) | | | 17,430 | | | | 17,416 | |
CIFC Funding V Ltd.,Series 2017-5A, Class A1, 3 mo. USD LIBOR + 1.180%
3.483% FRN 11/16/30 (a) | | | 2,100,000 | | | | 2,098,154 | |
Clear Creek CLO Ltd.,Series 2015-1A, Class AR, 3 mo. USD LIBOR + 1.200%
3.478% FRN 10/20/30 (a) | | | 2,120,000 | | | | 2,119,970 | |
CLI Funding V LLC,Series 2014-1A, Class A
3.290% 6/18/29 (a) | | | 905,607 | | | | 908,056 | |
CLI Funding VI LLC,Series 2017-1A, Class A
3.620% 5/18/42 (a) | | | 2,259,067 | | | | 2,265,416 | |
Countrywide Asset-Backed Certificates,Series 2004-5, Class 3A, 1 mo. USD LIBOR + .460%
2.478% FRN 9/25/34 | | | 33,877 | | | | 32,246 | |
Crestline Denali CLO XIV Ltd.,Series 2016-1A, Class A1R, 3 mo. USD LIBOR + 1.280%
3.539% FRN 10/23/31 (a) | | | 1,300,000 | | | | 1,299,321 | |
Cronos Containers Program I Ltd.,Series 2014-2A, Class A
3.270% 11/18/29 (a) | | | 509,259 | | | | 510,024 | |
The accompanying notes are an integral part of the financial statements.
79
MassMutual Premier Core Bond Fund – Portfolio of Investments(Continued)
| | | | | | | | |
| | |
| | | Principal
Amount | | | Value | |
DB Master Finance LLC
Series 2019-1A, Class A2II, 4.021% 5/20/49 (a) | | $ | 2,138,640 | | | $ | 2,184,815 | |
Series 2019-1A, Class A23, 4.352% 5/20/49 (a) | | | 1,932,158 | | | | 2,045,614 | |
Diamond Resorts Owner Trust,Series 2016-1, Class A
3.080% 11/20/28 (a) | | | 1,093,587 | | | | 1,098,449 | |
Domino’s Pizza Master Issuer LLC
Series 2018-1A, Class A2I, 4.116% 7/25/48 (a) | | | 1,491,125 | | | | 1,556,282 | |
Series 2017-1A, Class A23, 4.118% 7/25/47 (a) | | | 656,600 | | | | 693,209 | |
Series 2015-1A, Class A2II, 4.474% 10/25/45 (a) | | | 3,628,125 | | | | 3,793,553 | |
Drug Royalty II LP,Series 2014-1, Class A2
3.484% 7/15/23 (a) | | | 52,400 | | | | 52,333 | |
Dryden 72 CLO Ltd.,Series 2019-72A, Class B, 3 mo. USD LIBOR + 1.900%
4.332% FRN 5/15/32 (a) | | | 1,700,000 | | | | 1,697,491 | |
Eaton Vance CLO Ltd.,Series 2018-1A, Class B, 3 mo. USD LIBOR + 1.750%
4.053% FRN 10/15/30 (a) | | | 1,700,000 | | | | 1,692,149 | |
Elmwood CLO II Ltd.,Series 2019-2A, Class A, 3 mo. USD LIBOR + 1.450%
3.995% FRN 4/20/31 (a) | | | 3,500,000 | | | | 3,502,562 | |
FCI Funding LLC,Series 2019-1A, Class A
3.630% 2/18/31 (a) | | | 601,286 | | | | 605,640 | |
Galaxy XX CLO Ltd.,Series 2015-20A, Class AR, 3 mo. USD LIBOR + 1.000%
3.278% FRN 4/20/31 (a) | | | 1,100,000 | | | | 1,089,124 | |
Global Container Assets Ltd.,Series 2015-1A, Class A2
3.450% 2/05/30 (a) | | | 988,992 | | | | 991,987 | |
Global SC Finance II SRL,Series 2014-1A, Class A1
3.190% 7/17/29 (a) | | | 241,667 | | | | 241,153 | |
Goldentree Loan Management US CLO Ltd.
Series 2017-2A, Class A, 3 mo. USD LIBOR + 1.150%
3.428% FRN 11/28/30 (a) | | | 2,250,000 | | | | 2,247,919 | |
Series 2019-5A, Class C, 3 mo. USD LIBOR + 2.700%
4.888% FRN 10/20/32 (a) | | | 500,000 | | | | 499,961 | |
Goodgreen Trust
Series 2016-1A, Class A, 3.230% 10/15/52 (a) | | | 1,921,538 | | | | 1,969,384 | |
Series 2017-1A, Class A, 3.740% 10/15/52 (a) | | | 907,117 | | | | 944,023 | |
| | | | | | | | |
| | |
| | | Principal
Amount | | | Value | |
Series 2019-1A, Class A, 3.860% 10/15/54 (a) | | $ | 1,796,921 | | | $ | 1,902,937 | |
Series 2018-1A, Class A, 3.930% VRN 10/15/53 (a) (d) | | | 2,342,781 | | | | 2,472,141 | |
Helios Issuer LLC,Series 2017-1A, Class A
4.940% 9/20/49 (a) | | | 1,499,022 | | | | 1,570,120 | |
Hero Funding Trust
Series 2016-3A, Class A1, 3.080% 9/20/42 (a) | | | 1,082,405 | | | | 1,099,928 | |
Series 2017-3A, Class A1, 3.190% 9/20/48 (a) | �� | | 1,102,919 | | | | 1,125,712 | |
Series 2017-2A, Class A1, 3.280% 9/20/48 (a) | | | 333,031 | | | | 335,941 | |
Series 2016-4A, Class A1, 3.570% 9/20/47 (a) | | | 1,071,718 | | | | 1,102,299 | |
Series 2017-2A, Class A2, 4.070% 9/20/48 (a) | | | 267,731 | | | | 277,157 | |
Series 2018-1A, Class A2, 4.670% 9/20/48 (a) | | | 1,956,551 | | | | 2,066,899 | |
Highbridge Loan Management Ltd.
Series 12A-18, Class B, 3 mo. USD LIBOR + 1.850%
4.150% FRN 7/18/31 (a) | | | 1,700,000 | | | | 1,639,063 | |
Series 13A-18, Class C, 4.747% 10/15/30 (a) | | | 1,000,000 | | | | 984,133 | |
Hilton Grand Vacations Trust,Series 2018-AA, Class C
4.000% 2/25/32 (a) | | | 595,347 | | | | 616,649 | |
Horizon Aircraft Finance I Ltd.,Series 2018-1, Class A
4.458% 12/15/38 (a) | | | 1,174,151 | | | | 1,219,556 | |
Horizon Aircraft Finance II Ltd.,Series 2019-1, Class A
3.721% 7/15/39 (a) | | | 1,613,051 | | | | 1,619,225 | |
ICG US CLO Ltd.,Series 2019-1A, Class A1A, 3 mo. USD LIBOR + 1.380%
3.496% FRN 10/26/32 (a) | | | 900,000 | | | | 899,978 | |
J.G. Wentworth XLII LLC,Series 2018-2A, Class A
3.960% 10/15/75 (a) | | | 1,678,555 | | | | 1,840,260 | |
J.G. Wentworth XXXV LLC,Series 2015-2A, Class A
3.870% 3/15/58 (a) | | | 678,906 | | | | 759,625 | |
KKR Financial CLO Ltd.
Series 24, Class A1, 3 mo. USD LIBOR + 1.360%
3.991% FRN 4/20/32 (a) | | | 1,800,000 | | | | 1,800,742 | |
Series 25, Class B1, 3 mo. USD LIBOR + 2.000%
4.496% FRN 4/15/32 (a) | | | 1,500,000 | | | | 1,499,953 | |
The accompanying notes are an integral part of the financial statements.
80
MassMutual Premier Core Bond Fund – Portfolio of Investments(Continued)
| | | | | | | | |
| | |
| | | Principal
Amount | | | Value | |
Labrador Aviation Finance Ltd.,Series 2016-1A, Class A1
4.300% 1/15/42 (a) | | $ | 2,266,667 | | | $ | 2,317,347 | |
Lendmark Funding Trust,Series 2018-1A, Class A
3.810% 12/21/26 (a) | | | 1,650,000 | | | | 1,669,489 | |
Madison Park Funding XIV Ltd.,Series 2014-14A, Class CRR, 3 mo. USD LIBOR + 2.200%
4.478% FRN 10/22/30 (a) | | | 790,000 | | | | 786,118 | |
Madison Park Funding XXIX Ltd.,Series 2018-29A, Class C, 3 mo. USD LIBOR + 2.200%
4.500% FRN 10/18/30 (a) | | | 680,000 | | | | 673,349 | |
Madison Park Funding XXVIII Ltd.,Series 2018-28A, Class B, 3 mo. USD LIBOR + 1.600%
3.903% FRN 7/15/30 (a) | | | 2,090,000 | | | | 2,067,681 | |
Madison Park Funding XXXI Ltd.,Series 2018-31A, Class B, 3 mo. USD LIBOR + 1.700%
3.959% FRN 1/23/31 (a) | | | 1,000,000 | | | | 991,888 | |
Magnetite XV Ltd.,Series 2015-15A, Class CR, 3 mo. USD LIBOR + 1.800%
4.076% FRN 7/25/31 (a) | | | 2,830,000 | | | | 2,742,358 | |
Marble Point CLO XI Ltd.,Series 2017-2A, Class A, 3 mo. USD LIBOR + 1.180%
3.480% FRN 12/18/30 (a) | | | 2,000,000 | | | | 1,990,118 | |
Mariner Finance Issuance Trust,Series 2018-AA, Class A
4.200% 11/20/30 (a) | | | 2,235,000 | | | | 2,287,314 | |
Milos CLO Ltd.,Series 2017-1A, Class A, 3 mo. USD LIBOR + 1.250%
3.528% FRN 10/20/30 (a) | | | 940,000 | | | | 939,986 | |
Mosaic Solar Loans LLC
Series 2017-2A, Class A, 3.820% 6/22/43 (a) | | | 724,012 | | | | 739,512 | |
Series 2018-1A, Class A, 4.010% 6/22/43 (a) | | | 318,981 | | | | 330,788 | |
Series 2017-1A, Class A, 4.450% 6/20/42 (a) | | | 350,668 | | | | 366,071 | |
MP CLO III Ltd.,Series 2013-1A, Class AR, 3 mo. USD LIBOR + 1.250%
3.528% FRN 10/20/30 (a) | | | 1,850,000 | | | | 1,848,370 | |
MVW Owner Trust
Series 2014-2, Class A, 2.250% 9/22/31 (a) | | | 576,790 | | | | 575,528 | |
Series 2017-1A, Class A, 2.420% 12/20/34 (a) | | | 296,460 | | | | 296,897 | |
| | | | | | | | |
| | |
| | | Principal
Amount | | | Value | |
Series 2015-1A, Class A, 2.520% 12/20/32 (a) | | $ | 425,367 | | | $ | 425,394 | |
NP SPE II LLC,Series 2017-1A, Class A2
4.219% 10/21/47 (a) | | | 2,190,000 | | | | 2,324,470 | |
NRZ Advance Receivables Trust,Series 2016-T3, Class AT3
2.833% 10/15/51 (a) | | | 10,300,000 | | | | 10,291,561 | |
Octagon Investment Partners 39 Ltd.,Series 2018-3A, Class C, 3 mo. USD LIBOR + 2.200%
4.478% FRN 10/20/30 (a) | | | 1,180,000 | | | | 1,167,629 | |
OHA Credit Funding 4 Ltd.
Series 2019-4A, Class A1, 3 mo. USD LIBOR + 1.330%
1.000% FRN 10/22/32 (a) (e) | | | 1,250,000 | | | | 1,250,000 | |
Series 2019-4A, Class C, 3 mo. USD LIBOR + 2.650%
1.000% FRN 10/22/32 (a) (e) | | | 1,000,000 | | | | 1,000,000 | |
OneMain Financial Issuance Trust,Series 2019-2A, Class A
3.140% 10/14/36 (a) | | | 10,200,000 | | | | 10,202,540 | |
Orange Lake Timeshare Trust
Series 2014-AA, Class A, 2.290% 7/09/29 (a) | | | 130,318 | | | | 130,086 | |
Series 2016-A, Class B, 2.910% 3/08/29 (a) | | | 598,483 | | | | 592,537 | |
Oxford Finance Funding Trust,Series 2016-1A, Class A
3.968% 6/17/24 (a) | | | 721,360 | | | | 725,927 | |
Pioneer Aircraft Finance Ltd.,Series 2019-1, Class A
3.967% 6/15/44 (a) | | | 1,898,482 | | | | 1,956,539 | |
PNMAC GMSR Issuer Trust,Series 2018-GT1, Class A
4.995% 2/25/23 (a) | | | 1,180,000 | | | | 1,180,703 | |
Regatta XIV Funding Ltd.,Series 2018-3A, Class B
4.430% 10/25/31 (a) | | | 1,030,000 | | | | 1,028,630 | |
SBA Tower Trust,Series 2014-2A, Class C,
3.869% STEP 10/15/49 (a) | | | 2,900,000 | | | | 3,019,484 | |
Sierra Receivables Funding LLC
Series 2015-3A, Class B, 3.080% 9/20/32 (a) | | | 123,338 | | | | 123,912 | |
Series 2018-2A, Class C, 3.940% 6/20/35 (a) | | | 901,758 | | | | 916,421 | |
Series 2019-1A, Class D, 4.750% 1/20/36 (a) | | | 2,682,294 | | | | 2,743,913 | |
Series 2018-3A, Class D, 5.200% 9/20/35 (a) | | | 1,521,979 | | | | 1,543,280 | |
The accompanying notes are an integral part of the financial statements.
81
MassMutual Premier Core Bond Fund – Portfolio of Investments(Continued)
| | | | | | | | |
| | |
| | | Principal
Amount | | | Value | |
Steele Creek CLO Ltd.,Series 2018-2A, Class C, 3 mo. USD LIBOR + 2.300%
4.424% FRN 8/18/31 (a) | | $ | 1,660,000 | | | $ | 1,604,221 | |
Store Master FundingI-VII,Series 2018-1A, Class A2
4.290% 10/20/48 (a) | | | 1,491,212 | | | | 1,620,167 | |
Structured Asset Securities Corp. Mortgage Loan Trust, Series 2006-GEL1, Class M2, 1 mo. USD LIBOR + .800%
2.818% FRN 11/25/35 (a) | | | 1,625,000 | | | | 1,586,349 | |
Structured Receivables Finance LLC,Series 2010-B, Class A
3.730% 8/15/36 (a) | | | 256,653 | | | | 259,143 | |
Sunnova Helios II Issuer LLC,Series 2018-1A, Class A
4.870% 7/20/48 (a) | | | 652,969 | | | | 713,843 | |
SuttonPark Structured Settlements LLC,Series 2017-1A, Class A
4.190% 1/15/71 (a) | | | 1,903,212 | | | | 2,092,317 | |
Taco Bell Funding LLC
Series 2018-1A, Class A2II, 4.940% 11/25/48 (a) | | | 1,429,200 | | | | 1,520,084 | |
Series 2016-1A, Class A23, 4.970% 5/25/46 (a) | | | 1,955,000 | | | | 2,080,609 | |
TAL Advantage VI LLC,Series 2017-1A, Class A
4.500% 4/20/42 (a) | | | 1,913,607 | | | | 1,972,703 | |
Textainer Marine Containers VII Ltd.,Series 2019-1A, Class A
3.960% 4/20/44 (a) | | | 522,000 | | | | 531,008 | |
THL Credit Wind River CLO Ltd.,Series 2018-3A, Class B, 3 mo. USD LIBOR + 1.700%
3.978% FRN 1/20/31 (a) | | | 2,440,000 | | | | 2,427,807 | |
TICP CLO XIV Ltd.,Series 2019-14A, Class A2, 3 mo. USD LIBOR + 1.900%
4.021% FRN 10/20/32 (a) | | | 250,000 | | | | 249,992 | |
Trinity Rail Leasing LP
Series 2019-1A, Class A, 3.820% 4/17/49 (a) | | | 4,500,989 | | | | 4,673,747 | |
Series 2018-1A, Class A2, 4.620% 6/17/48 (a) | | | 2,370,000 | | | | 2,544,908 | |
Trip Rail Master Funding LLC
Series 2017-1A, Class A1, 2.709% 8/15/47 (a) | | | 357,896 | | | | 358,060 | |
Series 2017-1A, Class A2, 3.736% 8/15/47 (a) | | | 820,000 | | | | 846,080 | |
Triton Container Finance IV LLC,Series 2017-2A, Class A
3.620% 8/20/42 (a) | | | 2,732,437 | | | | 2,722,779 | |
| | | | | | | | |
| | |
| | | Principal
Amount | | | Value | |
Triton Container Finance VI LLC,Series 2017-1A, Class A
3.520% 6/20/42 (a) | | $ | 730,993 | | | $ | 729,052 | |
Vivint Solar Financing V LLC,Series 2018-1A, Class B
7.370% 4/30/48 (a) | | | 2,697,903 | | | | 2,798,674 | |
Voya CLO Ltd.
Series 2019-3A, Class B1, 3 mo. USD LIBOR + 1.850%
1.000% FRN 10/17/32 (a) (e) | | | 1,500,000 | | | | 1,499,998 | |
Series 2015-3A, Class A3R, 3 mo. USD LIBOR + 1.700%
3.978% FRN 10/20/31 (a) | | | 1,500,000 | | | | 1,478,311 | |
WAVE Trust
Series 2017-1A, Class A, 3.844% 11/15/42 (a) | | | 3,288,160 | | | | 3,308,930 | |
Series 2017-1A, Class C, 6.656% 11/15/42 (a) | | | 1,902,653 | | | | 1,918,358 | |
Wave USA,Series 2019-1A
3.597% 9/15/44 (e) | | | 5,120,000 | | | | 5,119,775 | |
Wendy’s Funding LLC,Series 2015-1A, Class A23
4.497% 6/15/45 (a) | | | 3,072,000 | | | | 3,110,583 | |
Westgate Resorts LLC,Series 2017-1A, Class A
3.050% 12/20/30 (a) | | | 771,846 | | | | 775,052 | |
Willis Engine Structured Trust IV,Series 2018-A, Class A,
4.750% STEP 9/15/43 (a) | | | 1,287,397 | | | | 1,340,481 | |
| | | | | | | | |
| | | | | | | 210,500,727 | |
| | | | | | | | |
| Student Loans ABS — 12.0% | |
Academic Loan Funding Trust,Series 2012-1A, Class A2, 1 mo. USD LIBOR + 1.100%
3.118% FRN 12/27/44 (a) | | | 1,072,971 | | | | 1,072,970 | |
AccessLex Institute,Series 2003-A, Class A3
3.200% 7/01/38 | | | 94,102 | | | | 93,031 | |
College Avenue Student Loans LLC
Series 2019-A, Class B, 3.810% 12/28/48 (a) | | | 2,630,000 | | | | 2,670,107 | |
Series 2019-A, Class C, 4.460% 12/28/48 (a) | | | 1,505,000 | | | | 1,529,381 | |
College Loan Corp. Trust I,Series 2007-1, Class B2, 28 day ARS
FRN 1/25/47 | | | 875,000 | | | | 693,060 | |
Earnest Student Loan Program LLC,Series 2016-B, Class A2
3.020% 5/25/34 (a) | | | 638,317 | | | | 641,764 | |
The accompanying notes are an integral part of the financial statements.
82
MassMutual Premier Core Bond Fund – Portfolio of Investments(Continued)
| | | | | | | | |
| | |
| | | Principal
Amount | | | Value | |
ECMC Group Student Loan Trust
Series 2018-2A, Class A, 1 mo. USD LIBOR + .800%
2.818% FRN 9/25/68 (a) | | $ | 5,559,795 | | | $ | 5,554,852 | |
Series 2017-1A, Class A, 1 mo. USD LIBOR + 1.200%
3.218% FRN 12/27/66 (a) | | | 2,214,014 | | | | 2,236,334 | |
Series 2016-1A, Class A, 1 mo. USD LIBOR + 1.350%
3.368% FRN 7/26/66 (a) | | | 3,078,861 | | | | 3,101,061 | |
EdLinc Student Loan Funding,Series 2017-A, Class A, PRIME - 1.150%
4.350% FRN 12/01/47 (a) | | | 2,452,506 | | | | 2,442,713 | |
Education Loan Asset-Backed Trust I
Series 2003-1, Class A2, 28 day ARS
0.000% FRN 2/01/43 (a) | | | 1,300,000 | | | | 1,214,701 | |
Series 2003-2, Class 2A1, 28 day ARS 0.000% FRN 8/01/43 (a) | | | 1,950,000 | | | | 1,818,459 | |
Series 2013-1, Class B1, 1 mo. USD LIBOR + 1.000%
3.018% FRN 11/25/33 (a) | | | 1,249,464 | | | | 1,213,252 | |
Higher Education Funding I
Series 2004-1, Class B1, 28 day ARS
0.000% FRN 1/01/44 (a) | | | 600,000 | | | | 530,228 | |
Series 2004-1, Class B2, 28 day ARS
0.000% FRN 1/01/44 (a) | | | 600,000 | | | | 510,627 | |
Laurel Road Prime Student Loan Trust
Series 2017-B, Class BFX, 3.020% 8/25/42 (a) | | | 753,863 | | | | 769,249 | |
Series 2018-B, Class BFX, 3.720% 5/26/43 (a) | | | 619,562 | | | | 634,554 | |
Navient Private Education Loan Trust,Series 2018-BA, Class A2B, 1 mo. USD LIBOR + .720%
2.748% FRN 12/15/59 (a) | | | 850,000 | | | | 847,045 | |
Navient Private Education Refi Loan Trust
Series 2019-A, Class A2A, 3.420% 1/15/43 (a) | | | 1,013,000 | | | | 1,052,372 | |
Series 2019-CA, Class B, 3.670% 2/15/68 (a) | | | 1,512,000 | | | | 1,580,123 | |
Series 2019-A, Class B, 3.900% 1/15/43 (a) | | | 1,500,000 | | | | 1,623,487 | |
Series 2018-CA, Class B, 4.220% 6/16/42 (a) | | | 1,480,000 | | | | 1,520,404 | |
Navient Student Loan Trust
Series 2016-1A, Class A, 1 mo. USD LIBOR + .700%
2.718% FRN 2/25/70 (a) | | | 2,923,993 | | | | 2,890,160 | |
Series 2018-2A, Class A3, 1 mo. USD LIBOR + .750%
2.768% FRN 3/25/67 (a) | | | 3,320,000 | | | | 3,318,919 | |
| | | | | | | | |
| | |
| | | Principal
Amount | | | Value | |
Series 2017-5A, Class A, 1 mo. USD LIBOR + .800%
2.818% FRN 7/26/66 (a) | | $ | 1,472,336 | | | $ | 1,466,762 | |
Series 2018-3A, Class A3, 1 mo. USD LIBOR + .800%
2.818% FRN 3/25/67 (a) | | | 4,650,000 | | | | 4,630,021 | |
Series 2019-1A, Class A2, 1 mo. USD LIBOR + .900%
2.918% FRN 12/27/67 (a) | | | 3,100,000 | | | | 3,099,997 | |
Series 2019-2A, Class A2, 1 mo. USD LIBOR + 1.000%
3.018% FRN 2/27/68 (a) | | | 1,548,000 | | | | 1,561,566 | |
Series 2016-5A, Class A, 1 mo. USD LIBOR + 1.250%
3.268% FRN 6/25/65 (a) | | | 2,522,890 | | | | 2,548,341 | |
Series 2016-6A, Class A3, 1 mo. USD LIBOR + 1.300%
3.318% FRN 3/25/66 (a) | | | 6,800,000 | | | | 6,917,238 | |
Series 2014-8, Class B, 1 mo. USD LIBOR + 1.500%
3.518% FRN 7/26/49 | | | 2,500,000 | | | | 2,492,554 | |
Series 2015-3, Class B, 1 mo. USD LIBOR + 1.500%
3.518% FRN 10/25/58 | | | 1,200,000 | | | | 1,208,367 | |
Series 2019-BA, Class B,
4.040% 12/15/59 (a) | | | 3,700,000 | | | | 3,949,651 | |
Series 2018-EA, Class B,
4.440% 12/15/59 (a) | | | 730,000 | | | | 801,562 | |
Nelnet Private Education Loan Trust,Series 2016-A, Class A1B
3.600% 12/26/40 (a) | | | 597,308 | | | | 604,098 | |
Nelnet Student Loan Trust
Series 2005-2, Class A5, 3 mo. USD LIBOR + .100%
2.259% FRN 3/23/37 | | | 1,011,532 | | | | 997,690 | |
Series 2005-1, Class A5, 3 mo. USD LIBOR + .110%
2.386% FRN 10/25/33 | | | 943,084 | | | | 926,590 | |
Series 2019-5, Class A,
2.530% 10/25/67 (a) | | | 10,450,000 | | | | 10,481,288 | |
Series 2013-5A, Class A, 1 mo. USD LIBOR + .630%
2.648% FRN 1/25/37 (a) | | | 1,671,050 | | | | 1,658,948 | |
Series 2018-3A, Class A3,
2.895% 9/27/66 (a) | | | 4,500,000 | | | | 4,469,175 | |
Series 2019-5, Class B,
3.450% 10/25/67 (a) | | | 2,850,000 | | | | 2,848,930 | |
Series 2014-3A, Class B, 1 mo. USD LIBOR + 1.500%
3.518% FRN 10/25/50 (a) | | | 975,000 | | | | 952,041 | |
Series 2014-5A, Class B, 1 mo. USD LIBOR + 1.500%
3.518% FRN 5/26/54 (a) | | | 1,300,000 | | | | 1,255,455 | |
The accompanying notes are an integral part of the financial statements.
83
MassMutual Premier Core Bond Fund – Portfolio of Investments(Continued)
| | | | | | | | |
| | |
| | | Principal
Amount | | | Value | |
Series 2015-2A, Class B, 1 mo. USD LIBOR + 1.500%
3.518% FRN 5/26/54 (a) | | $ | 1,130,000 | | | $ | 1,117,530 | |
Series 2015-3A, Class B, 1 mo. USD LIBOR + 1.500%
3.518% FRN 6/25/54 (a) | | | 1,100,000 | | | | 1,080,231 | |
Series 2019-4A, Class B, 1 mo. USD LIBOR + 1.650%
3.819% FRN 9/26/67 (a) | | | 3,800,000 | | | | 3,800,758 | |
PHEAA Student Loan Trust,Series 2016-2A, Class A, 1 mo. USD LIBOR + .950%
2.968% FRN 11/25/65 (a) | | | 2,136,268 | | | | 2,141,645 | |
SLC Student Loan Trust,Series 2005-1, Class B, 3 mo. USD LIBOR + .200%
2.358% FRN 2/15/45 | | | 1,715,851 | | | | 1,613,795 | |
SLM Student Loan Trust
Series 2006-2, Class R,
0.000% 1/25/41 | | | 9,078 | | | | 4,448,569 | |
Series 2002-7, Class A11,
28 day ARS
1.836% FRN 3/15/28 | | | 150,000 | | | | 150,000 | |
Series 2006-10, Class A6, 3 mo. USD LIBOR + .150%
2.426% FRN 3/25/44 | | | 9,980,000 | | | | 9,507,885 | |
Series 2005-4, Class A4, 3 mo. USD LIBOR + .170%
2.446% FRN 7/25/40 | | | 5,500,000 | | | | 5,202,597 | |
Series 2006-5, Class B, 3 mo. USD LIBOR + .210%
2.486% FRN 10/25/40 | | | 2,008,913 | | | | 1,871,585 | |
Series 2005-8, Class B, 3 mo. USD LIBOR + .310%
2.586% FRN 1/25/55 | | | 1,478,352 | | | | 1,380,929 | |
Series 2003-14, Class A7, 3 mo. USD LIBOR + .600%
2.876% FRN 10/25/65 (a) | | | 5,900,000 | | | | 5,819,105 | |
Series 2003-2, Class A7,
28 day ARS
3.237% FRN 9/15/28 | | | 600,000 | | | | 600,000 | |
Series 2013-2, Class B, 1 mo. USD LIBOR + 1.500%
3.518% FRN 6/25/43 | | | 2,090,000 | | | | 2,049,634 | |
Series 2003-5, Class A7,
28 day ARS
4.490% FRN 6/15/30 | | | 450,000 | | | | 450,000 | |
Series 2002-7, Class B,
28 day ARS
5.550% FRN 12/15/39 | | | 3,800,000 | | | | 3,795,778 | |
SMB Private Education Loan Trust
Series 2018-C, Class A2B, 1 mo. USD LIBOR + .750%
2.778% FRN 11/15/35 (a) | | | 3,300,000 | | | | 3,283,514 | |
| | | | | | | | |
| | |
| | | Principal
Amount | | | Value | |
Series 2017-A, Class B,
3.500% 6/17/41 (a) | | $ | 1,800,000 | | | $ | 1,880,894 | |
SoFi Alternative Trust,
Series 2019-C, Class PT,
4.683% VRN 1/25/45 (a) (d) | | | 9,008,394 | | | | 9,359,424 | |
SoFi Professional Loan Program LLC
Series 2015-A, Class RC,
0.000% 3/25/33 (a) | | | 1,200 | | | | 1,050,000 | |
Series 2017-D, Class R1,
0.000% 9/25/40 (a) | | | 4,647,800 | | | | 2,522,361 | |
Series 2018-A, Class R1,
0.000% 2/25/42 (a) | | | 3,470,600 | | | | 2,715,397 | |
Series 2018-B, Class R1,
0.000% 8/26/47 (a) | | | 3,139,900 | | | | 1,875,082 | |
Series 2018-D, Class R1,
0.000% 2/25/48 (a) | | | 5,678,800 | | | | 1,959,186 | |
Series 2019-A, Class R1,
0.000% 6/15/48 (a) | | | 8,126,500 | | | | 2,437,950 | |
South Carolina Student Loan Corp.
Series 2014-1, Class A2, 1 mo. USD LIBOR + 1.000%
3.100% FRN 1/03/33 | | | 2,030,000 | | | | 2,048,938 | |
Series 2014-1, Class B, 1 mo. USD LIBOR + 1.500%
3.600% FRN 8/01/35 | | | 3,025,000 | | | | 3,048,935 | |
South Texas Higher Education Authority, Inc.,Series 2012-1, Class A3, 3 mo. USD LIBOR + .850%
3.169% FRN 10/01/46 | | | 2,000,000 | | | | 2,010,967 | |
| | | | | | | | |
| | | | | | | 171,651,816 | |
| | | | | | | | |
| WL Collateral CMO — 1.1% | |
Bank of America Mortgage Securities,Series 2004-G, Class 2A7,
4.639% VRN 8/25/34 (d) | | | 108,250 | | | | 107,058 | |
Citigroup Mortgage Loan Trust 2019-IMC1, Series 2019-IMC1, Class M1,
3.170% VRN 7/25/49 (a) (d) | | | 1,188,500 | | | | 1,182,465 | |
Countrywide Home Loans, Inc.
Series 2003-42, Class 1A1,
3.991% VRN 9/25/33 (d) | | | 17,950 | | | | 17,285 | |
Series 2004-2, Class 1A1,
4.612% VRN 2/25/34 (d) | | | 81,243 | | | | 76,545 | |
Deephaven Residential Mortgage TrustSeries 2018-1A, Class A3,
3.202% VRN 12/25/57 (a) (d) | | | 477,779 | | | | 479,725 | |
Series 2019-1A, Class A3,
3.948% VRN 1/25/59 (a) (d) | | | 1,393,040 | | | | 1,415,502 | |
GSR Mortgage Loan Trust,Series 2004-9, Class 2A1,
4.308% VRN 8/25/34 (d) | | | 25,300 | | | | 25,244 | |
The accompanying notes are an integral part of the financial statements.
84
MassMutual Premier Core Bond Fund – Portfolio of Investments(Continued)
| | | | | | | | |
| | |
| | | Principal
Amount | | | Value | |
IndyMac Index Mortgage Loan Trust,Series 2004-AR4, Class 1A,
4.086% VRN 8/25/34 (d) | | $ | 158,223 | | | $ | 153,932 | |
JP Morgan Mortgage Trust,Series 2017-1, Class A11,
3.500% VRN 1/25/47 (a) (d) | | | 2,733,234 | | | | 2,729,156 | |
Merrill Lynch Mortgage Investors, Inc.Series 2004-A1, Class IA,
3.250% VRN 2/25/34 (d) | | | 9,386 | | | | 9,074 | |
Series 2003-A4, Class IA,
4.764% VRN 7/25/33 (d) | | | 6,384 | | | | 6,215 | |
PSMC Trust,Series 2018-2, Class A1,
3.500% VRN 6/25/48 (a) (d) | | | 3,228,101 | | | | 3,266,606 | |
Sequoia Mortgage Trust
Series 2018-CH2, Class A3,
4.000% VRN 6/25/48 (a) (d) | | | 2,584,639 | | | | 2,642,863 | |
Series 2018-CH4, Class A2,
4.000% VRN 10/25/48 (a) (d) | | | 1,371,928 | | | | 1,436,655 | |
Series 2019-1, Class A1,
4.000% VRN 2/25/49 (a) (d) | | | 460,477 | | | | 473,525 | |
Structured Adjustable Rate Mortgage Loan Trust,Series 2004-2, Class 2A,
4.266% VRN 3/25/34 (d) | | | 93,978 | | | | 91,839 | |
Washington Mutual MortgagePass-Through Certificates,Series 2004-AR2, Class A, 12 mo. MTA + 1.400%
3.846% FRN 4/25/44 | | | 231,987 | | | | 229,124 | |
Wells Fargo Mortgage Backed Securities Trust,Series 2019-1, Class A1,
4.000% VRN 11/25/48 (a) (d) | | | 1,732,462 | | | | 1,758,854 | |
| | | | | | | | |
| | | | | | | 16,101,667 | |
| | | | | | | | |
| | |
TOTALNON-U.S. GOVERNMENT AGENCY OBLIGATIONS
(Cost $453,114,436) | | | | | | | 459,573,880 | |
| | | | | |
|
| SOVEREIGN DEBT OBLIGATIONS — 0.7% | |
Colombia Government International Bond
6.125% 1/18/41 | | | 2,980,000 | | | | 3,881,480 | |
Mexico Government International Bond
4.750% 3/08/44 | | | 4,328,000 | | | | 4,685,060 | |
6.750% 9/27/34 | | | 950,000 | | | | 1,277,750 | |
| | | | | | | | |
| | | | | | | 9,844,290 | |
| | | | | | | | |
| | |
TOTAL SOVEREIGN DEBT OBLIGATIONS
(Cost $8,551,708) | | | | | | | 9,844,290 | |
| | | | | |
| | | | | | | | |
| | |
| | | Principal
Amount | | | Value | |
|
| U.S. GOVERNMENT AGENCY OBLIGATIONS AND INSTRUMENTALITIES — 25.9% | |
| Collateralized Mortgage Obligations — 0.3% | |
Federal Home Loan Mortgage Corp.
Series 2617, Class Z,
5.500% 5/15/33 | | $ | 1,187,542 | | | $ | 1,328,659 | |
Series 2693, Class Z,
5.500% 10/15/33 | | | 2,099,385 | | | | 2,290,827 | |
Series 2178, Class PB,
7.000% 8/15/29 | | | 169,078 | | | | 186,250 | |
| | | | | | | | |
| | | | | | | 3,805,736 | |
| | | | | | | | |
| Pass-Through Securities — 25.1% | |
Federal Home Loan Mortgage Corp.
Pool #SB8013 2.500% 9/01/34 | | | 8,926,206 | | | | 9,004,817 | |
Pool #Z40047 4.000% 10/01/41 | | | 232,246 | | | | 248,393 | |
Pool #C00836 7.000% 7/01/29 | | | 7,593 | | | | 8,638 | |
Pool #C49314 7.000% 4/01/31 | | | 4,420 | | | | 5,126 | |
Pool #C51422 7.000% 5/01/31 | | | 1,675 | | | | 1,945 | |
Pool #C53034 7.000% 6/01/31 | | | 11,558 | | | | 13,297 | |
Pool #G01311 7.000% 9/01/31 | | | 38,865 | | | | 44,669 | |
Pool #G01317 7.000% 10/01/31 | | | 23,761 | | | | 27,276 | |
Pool #G00143 7.500% 6/01/23 | | | 209 | | | | 223 | |
Pool #C55867 7.500% 2/01/30 | | | 16,507 | | | | 18,442 | |
Pool #C41497 7.500% 9/01/30 | | | 66 | | | | 77 | |
Pool #C44830 7.500% 11/01/30 | | | 21 | | | | 24 | |
Pool #C45235 7.500% 12/01/30 | | | 14,144 | | | | 16,339 | |
Pool #C46038 7.500% 12/01/30 | | | 574 | | | | 663 | |
Pool #C46309 7.500% 1/01/31 | | | 448 | | | | 518 | |
Pool #C46810 7.500% 1/01/31 | | | 114 | | | | 132 | |
Pool #C47063 7.500% 1/01/31 | | | 2,477 | | | | 2,875 | |
Pool #C47060 7.500% 1/01/31 | | | 608 | | | | 710 | |
Pool #C01116 7.500% 1/01/31 | | | 780 | | | | 906 | |
Pool #G00653 8.500% 11/01/25 | | | 11,308 | | | | 12,441 | |
Federal National Mortgage Association
Pool #MA3797 2.500% 10/01/34 (e) | | | 16,800,000 | | | | 16,947,953 | |
Pool #AS1304 3.500% 12/01/28 | | | 1,358,244 | | | | 1,415,051 | |
Pool #AV1897 3.500% 12/01/28 | | | 253,294 | | | | 263,888 | |
Pool #AV2325 3.500% 12/01/28 | | | 690,749 | | | | 719,638 | |
Pool #BF0196 3.500% 2/01/41 | | | 1,601,419 | | | | 1,680,084 | |
Pool #MA1356 3.500% 2/01/43 | | | 8,952,353 | | | | 9,378,125 | |
Pool #CA1073 3.500% 1/01/48 | | | 17,430,585 | | | | 18,019,910 | |
Pool #BJ0686 4.000% 4/01/48 | | | 5,265,056 | | | | 5,496,352 | |
Pool #CA2039 4.000% 7/01/48 | | | 4,399,481 | | | | 4,581,754 | |
Pool #CA1951 4.000% 7/01/48 | | | 3,807,770 | | | | 3,979,807 | |
Pool #BN5342 4.000% 3/01/49 | | | 35,280,327 | | | | 36,587,657 | |
Pool #MA3638 4.000% 4/01/49 | | | 11,352,165 | | | | 11,775,486 | |
Pool #725692 1 year CMT + 2.137% 4.473% FRN 10/01/33 | | | 147,118 | | | | 154,891 | |
Pool #CA1909 4.500% 6/01/48 | | | 10,119,105 | | | | 10,708,620 | |
The accompanying notes are an integral part of the financial statements.
85
MassMutual Premier Core Bond Fund – Portfolio of Investments(Continued)
| | | | | | | | |
| | |
| | | Principal
Amount | | | Value | |
Pool #CA1952 4.500% 6/01/48 | | $ | 2,674,942 | | | $ | 2,832,449 | |
Pool #MA3522 4.500% 11/01/48 | | | 6,703,782 | | | | 7,069,713 | |
Pool #MA3537 4.500% 12/01/48 | | | 6,974,019 | | | | 7,348,162 | |
Pool #MA3564 4.500% 1/01/49 | | | 6,581,337 | | | | 6,926,187 | |
Pool #BN5241 4.500% 2/01/49 | | | 25,310,784 | | | | 26,629,114 | |
Pool #MA3639 4.500% 4/01/49 | | | 14,106,060 | | | | 14,845,192 | |
Pool #775539 12 mo. USD LIBOR + 1.636%
4.511% FRN 5/01/34 | | | 100,481 | | | | 105,149 | |
Pool #888586 1 year CMT + 2.197%
4.548% FRN 10/01/34 | | | 331,406 | | | | 348,916 | |
Pool #AD6437 5.000% 6/01/40 | | | 511,964 | | | | 562,657 | |
Pool #AD6996 5.000% 7/01/40 | | | 3,331,911 | | | | 3,661,824 | |
Pool #AL8173 5.000% 2/01/44 | | | 1,291,504 | | | | 1,411,715 | |
Pool #254379 7.000% 7/01/32 | | | 26,056 | | | | 30,181 | |
Pool #252717 7.500% 9/01/29 | | | 1,377 | | | | 1,590 | |
Pool #535996 7.500% 6/01/31 | | | 5,286 | | | | 6,113 | |
Pool #254009 7.500% 10/01/31 | | | 14,153 | | | | 16,386 | |
Pool #253394 8.000% 7/01/20 | | | 195 | | | | 196 | |
Pool #323992 8.000% 11/01/29 | | | 1,106 | | | | 1,267 | |
Pool #525725 8.000% 2/01/30 | | | 2,991 | | | | 3,476 | |
Pool #537433 8.000% 5/01/30 | | | 1,211 | | | | 1,414 | |
Pool #253266 8.000% 5/01/30 | | | 3,423 | | | | 3,968 | |
Pool #253347 8.000% 6/01/30 | | | 3,367 | | | | 3,906 | |
Pool #544976 8.000% 7/01/30 | | | 369 | | | | 426 | |
Pool #535428 8.000% 8/01/30 | | | 3,964 | | | | 4,595 | |
Pool #547786 8.000% 9/01/30 | | | 1,573 | | | | 1,802 | |
Pool #550767 8.000% 9/01/30 | | | 1,813 | | | | 2,121 | |
Pool #553061 8.000% 9/01/30 | | | 1,735 | | | | 1,958 | |
Pool #543290 8.000% 9/01/30 | | | 51 | | | | 59 | |
Pool #535533 8.000% 10/01/30 | | | 3,462 | | | | 4,022 | |
Pool #253481 8.000% 10/01/30 | | | 3,461 | | | | 4,020 | |
Pool #253644 8.000% 2/01/31 | | | 1,789 | | | | 2,080 | |
Pool #581170 8.000% 5/01/31 | | | 1,209 | | | | 1,381 | |
Pool #593848 8.000% 7/01/31 | | | 837 | | | | 979 | |
Pool #190317 8.000% 8/01/31 | | | 20,749 | | | | 24,052 | |
Pool #545240 8.000% 9/01/31 | | | 1,953 | | | | 2,268 | |
Pool #541202 8.500% 8/01/26 | | | 4,994 | | | | 5,304 | |
Government National Mortgage Association
Pool #404246 6.500% 8/15/28 | | | 186 | | | | 207 | |
Pool #781038 6.500% 5/15/29 | | | 43,849 | | | | 48,817 | |
Pool #781468 6.500% 7/15/32 | | | 2,959 | | | | 3,365 | |
Pool #781496 6.500% 9/15/32 | | | 14,664 | | | | 16,568 | |
Pool #363066 7.000% 8/15/23 | | | 1,728 | | | | 1,831 | |
Pool #352049 7.000% 10/15/23 | | | 1,054 | | | | 1,122 | |
Pool #354674 7.000% 10/15/23 | | | 1,601 | | | | 1,698 | |
Pool #345964 7.000% 11/15/23 | | | 657 | | | | 700 | |
Pool #380866 7.000% 3/15/24 | | | 544 | | | | 581 | |
Pool #781124 7.000% 12/15/29 | | | 5,373 | | | | 6,074 | |
Pool #781319 7.000% 7/15/31 | | | 102,742 | | | | 117,200 | |
| | | | | | | | |
| | |
| | | Principal
Amount | | | Value | |
Pool #581417 7.000% 7/15/32 | | $ | 28,936 | | | $ | 33,062 | |
Pool #565982 7.000% 7/15/32 | | | 13,423 | | | | 15,526 | |
Pool #357262 7.500% 9/15/23 | | | 817 | | | | 875 | |
Pool #441009 8.000% 11/15/26 | | | 710 | | | | 797 | |
Pool #522777 8.000% 12/15/29 | | | 4,721 | | | | 5,379 | |
Pool #523043 8.000% 3/15/30 | | | 252 | | | | 288 | |
Pool #529134 8.000% 3/15/30 | | | 1,536 | | | | 1,772 | |
Pool #477036 8.000% 4/15/30 | | | 616 | | | | 711 | |
Pool #503157 8.000% 4/15/30 | | | 13,268 | | | | 15,320 | |
Pool #528714 8.000% 4/15/30 | | | 1,626 | | | | 1,878 | |
Pool #544640 8.000% 11/15/30 | | | 10,263 | | | | 11,897 | |
Pool #531298 8.500% 8/15/30 | | | 936 | | | | 1,075 | |
Government National Mortgage Association II TBA
Pool #1635 3.500% 10/01/48 (e) | | | 82,025,000 | | | | 84,979,180 | |
Pool #1367 4.000% 10/01/48 (e) | | | 45,900,000 | | | | 47,728,830 | |
Uniform Mortgage Backed Securities TBA
Pool #7180 3.000% 8/01/33 (e) | | | 7,100,000 | | | | 7,256,421 | |
Pool #21133 4.500% 10/01/48 (e) | | | 15,275,000 | | | | 16,082,904 | |
| | | | | | | | |
| | | | | | | 359,315,447 | |
| | | | | | | | |
| Whole Loans — 0.5% | |
Federal Home Loan Mortgage Corp. Structured Agency Credit Risk Debt Notes
Series 2016-HQA3, Class M2, 1 mo. USD LIBOR + 1.350%
3.368% FRN 3/25/29 | | | 607,386 | | | | 609,497 | |
Series 2019-DNA3, Class M2, 4.195% 7/25/49 | | | 4,094,000 | | | | 4,093,991 | |
Federal National Mortgage Association Connecticut Avenue Securities Trust,Series 2019-R01, Class 2M2, 1 mo. USD LIBOR + 2.450%
4.468% FRN 7/25/31 (a) | | | 2,700,000 | | | | 2,717,672 | |
| | | | | | | | |
| | | | | | | 7,421,160 | |
| | | | | | | | |
| | |
TOTAL U.S. GOVERNMENT AGENCY OBLIGATIONS AND INSTRUMENTALITIES
(Cost $368,396,614) | | | | | | | 370,542,343 | |
| | | | | |
|
| U.S. TREASURY OBLIGATIONS — 5.2% | |
| U.S. Treasury Bonds & Notes — 5.2% | |
U.S. Treasury Bond
2.500% 5/15/46 (f) | | | 18,500,000 | | | | 19,922,911 | |
3.500% 2/15/39 (f) | | | 2,600,000 | | | | 3,256,602 | |
U.S. Treasury Note
2.125% 3/31/24 | | | 1,700,000 | | | | 1,740,973 | |
2.250% 4/15/22 | | | 30,000,000 | | | | 30,469,335 | |
The accompanying notes are an integral part of the financial statements.
86
MassMutual Premier Core Bond Fund – Portfolio of Investments(Continued)
| | | | | | | | |
| | |
| | | Principal
Amount | | | Value | |
2.250% 8/15/49 | | $ | 3,800,000 | | | $ | 3,908,804 | |
2.875% 8/15/28 | | | 13,500,000 | | | | 14,844,990 | |
| | | | | | | | |
| | | | | | | 74,143,615 | |
| | | | | | | | |
| | |
TOTAL U.S. TREASURY OBLIGATIONS
(Cost $71,495,976) | | | | | | | 74,143,615 | |
| | | | | |
| | |
TOTAL BONDS & NOTES
(Cost $1,380,091,545) | | | | | | | 1,417,987,112 | |
| | | | | |
| | |
TOTAL PURCHASED OPTIONS (#) — 0.5%
(Cost $8,050,545) | | | | | | | 7,777,030 | |
| | | | | |
| | |
| | | Number of
Shares | | | | |
|
| MUTUAL FUNDS — 0.3% | |
| Diversified Financial Services — 0.3% | |
State Street Navigator Securities Lending Prime Portfolio (g) | | | 4,658,310 | | | | 4,658,310 | |
| | | | | | | | |
| | |
TOTAL MUTUAL FUNDS
(Cost $4,658,310) | | | | | | | 4,658,310 | |
| | | | | |
| | |
TOTAL LONG-TERM INVESTMENTS
(Cost $1,396,050,400) | | | | | | | 1,433,873,952 | |
| | | | | |
| | |
| | | Principal
Amount | | | | |
|
| SHORT-TERM INVESTMENTS — 12.0% | |
| Commercial Paper — 12.0% | |
AT&T, Inc.
2.398% 11/12/19 | | $ | 2,000,000 | | | | 1,994,556 | |
2.787% 12/10/19 (a) | | | 12,000,000 | | | | 11,945,093 | |
BAT International Finance PLC
2.500% 11/04/19 | | | 3,500,000 | | | | 3,492,266 | |
Bell Canada
2.339% 2/12/20 | | | 3,000,000 | | | | 2,974,069 | |
2.438% 11/01/19 | | | 3,500,000 | | | | 3,492,686 | |
2.551% 10/10/19 | | | 7,000,000 | | | | 6,995,250 | |
COX Enterprises, Inc.
2.231% 10/01/19 | | | 7,500,000 | | | | 7,499,489 | |
CRH America Finance, Inc.
2.310% 11/26/19 | | | 7,000,000 | | | | 6,974,641 | |
Dowdupont, Inc.
2.372% 10/17/19 | | | 5,000,000 | | | | 4,994,742 | |
Enbridge (US), Inc.
2.375% 10/07/19 | | | 1,800,000 | | | | 1,799,178 | |
2.418% 11/21/19 | | | 4,000,000 | | | | 3,986,798 | |
2.592% 10/22/19 | | | 2,500,000 | | | | 2,496,556 | |
Entergy Corp.
2.316% 11/26/19 | | | 4,000,000 | | | | 3,984,363 | |
2.475% 10/09/19 | | | 2,000,000 | | | | 1,998,868 | |
| | | | | | | | |
| | |
| | | Principal
Amount | | | Value | |
2.520% 10/18/19 | | $ | 4,000,000 | | | $ | 3,995,202 | |
2.550% 10/04/19 | | | 3,800,000 | | | | 3,799,080 | |
FMC Tech, Inc.
2.362% 10/30/19 | | | 6,000,000 | | | | 5,988,650 | |
General Electric Co.
2.282% 1/30/20 | | | 6,000,000 | | | | 5,953,050 | |
2.282% 1/30/20 | | | 1,800,000 | | | | 1,785,915 | |
Keurig Dr Pepper, Inc.
2.340% 10/07/19 | | | 3,000,000 | | | | 2,998,629 | |
Marriott International, Inc.
2.298% 12/18/19 | | | 4,000,000 | | | | 3,979,899 | |
2.350% 10/16/19 | | | 5,000,000 | | | | 4,994,980 | |
Nisource, Inc.
2.272% 10/03/19 | | | 5,000,000 | | | | 4,999,002 | |
Nissan Motor Acceptance Corp.
2.273% 12/05/19 | | | 4,000,000 | | | | 3,983,837 | |
2.784% 10/21/19 (a) | | | 10,000,000 | | | | 9,987,645 | |
OGE Energy Corp.
2.294% 10/15/19 | | | 6,100,000 | | | | 6,094,256 | |
Parker-Hannifin Corp.
2.305% 12/03/19 | | | 2,000,000 | | | | 1,992,156 | |
2.306% 12/18/19 | | | 3,000,000 | | | | 2,985,576 | |
2.314% 11/20/19 | | | 2,000,000 | | | | 1,993,747 | |
Reckitt Benckiser Treasury Services
2.367% 4/02/20 | | | 3,000,000 | | | | 2,966,469 | |
2.458% 4/02/20 | | | 4,000,000 | | | | 3,955,292 | |
2.492% 5/14/20 | | | 4,050,000 | | | | 3,992,796 | |
Suncor Energy, Inc.
2.294% 12/06/19 | | | 5,000,000 | | | | 4,978,690 | |
2.337% 12/03/19 | | | 4,500,000 | | | | 4,481,680 | |
2.346% 11/19/19 | | | 4,000,000 | | | | 3,987,317 | |
Vodafone Group PLC
2.273% 12/03/19 | | | 2,053,000 | | | | 2,044,788 | |
Volkswagen Credit, Inc.
2.345% 11/20/19 | | | 1,700,000 | | | | 1,694,499 | |
Walgreens Boots
2.361% 2/25/20 | | | 4,000,000 | | | | 3,962,161 | |
2.516% 1/22/20 | | | 6,000,000 | | | | 5,956,186 | |
2.555% 11/07/19 | | | 3,000,000 | | | | 2,992,796 | |
| | | | | | | | |
| | | | | | | 171,172,853 | |
| | | | | | | | |
| | |
TOTAL SHORT-TERM INVESTMENTS
(Cost $171,158,270) | | | | | | | 171,172,853 | |
| | | | | |
| | |
TOTAL INVESTMENTS — 112.1%
(Cost $1,567,208,670) (h) | | | | | | | 1,605,046,805 | |
| | |
| Other Assets/(Liabilities) — (12.1)% | | | | | | | (172,972,009 | ) |
| | | | | |
| | |
| NET ASSETS — 100.0% | | | | | | $ | 1,432,074,796 | |
| | | | | | | | |
The accompanying notes are an integral part of the financial statements.
87
MassMutual Premier Core Bond Fund – Portfolio of Investments(Continued)
Abbreviation Legend
| CLO | Collateralized Loan Obligation |
| CMO | Collateralized Mortgage Obligation |
| CMT | Constant Maturity Treasury Index |
| MBS | Mortgage-Backed Security |
| MTA | Monthly Treasury Average Index |
Notes to Portfolio of Investments
Percentages are stated as a percent of net assets.
| (a) | Security is exempt from registration under Regulation S or Rule 144A of the Securities Act of 1933. These securities are considered restricted and may be resold in transactions exempt from registration. At September 30, 2019, the |
| | aggregate market value of these securities amounted to $514,251,648 or 35.91% of net assets. |
| (b) | Security is perpetual and has no stated maturity date. |
| (c) | Denotes all or a portion of security on loan. The total value of securities on loan as of September 30, 2019, was $4,561,318 or 0.32% of net assets. Total securities on loan may be less than the amounts identified in the Portfolio of Investments.(Note 2). |
| (d) | Certain variable rate securities are not based on a published reference rate and spread but are determined by the issuer or agent and are based on current market conditions. These securities do not indicate a reference rate and spread in their description above. The rates shown are the current interest rates at September 30, 2019. |
| (e) | A portion of this security is purchased on a when-issued, delayed-delivery or forward commitment basis.(Note 2). |
| (f) | A portion of this security is pledged/held as collateral for open futures contracts.(Note 2). |
| (g) | Represents investment of security lending collateral.(Note 2). |
| (h) | See Note 6 for aggregate cost for federal tax purposes. |
(#) Interest Rate Swaptions Purchased
| | | | | | | | | | | | | | | | | | | | | | | | | | | | | | | | | | | | | | |
| | | | | | | | | Paid by Fund | | | Received by Fund | | | | | | | | | | | | | |
| Description | | Counterparty | | | Expiration
Date | | | Rate | | | Frequency | | | Rate | | Frequency | | | Notional
Amount | | | Value | | | Premiums
Paid
(Received) | | | Unrealized
Appreciation/
(Depreciation) | |
| Call | | | | | | | | | | | | | | | | | | | | | | | | | | | | | | | | | | | | | | |
| 10-Year Interest Rate Swap, 12/15/42 | |
| Barclays
Bank PLC* |
| | | 12/13/32 | | |
| 3-Month
USD LIBOR
BBA |
| | | Quarterly | | | 2.44% | |
| Semi-
Annually |
| | | USD 15,860,000 | | | $ | 1,476,049 | | | $ | 792,878 | | | $ | 683,171 | |
| | | | | | | | | | |
| 10-Year Interest Rate Swap, 2/02/43 | |
| Credit
Suisse
International* |
| | | 1/31/33 | | |
| 3-Month
USD LIBOR
BBA |
| | | Quarterly | | | 2.61% | |
| Semi-
Annually |
| | | USD 16,860,000 | | | | 1,721,855 | | | | 809,280 | | | | 912,575 | |
| | | | | | | | | | | | | | | | | | | | | | | | | | | | | | | | | | | | | | |
| | | | 3,197,904 | | | | 1,602,158 | | | | 1,595,746 | |
| | | | | | | | | | | | | | | | | | | | | | | | | | | | | | | | | | | | | | |
| Put | | | | | | | | | | | | | | | | | | | | | | | | | | | | | | | | | | | | | | |
| 10-Year Interest Rate Swap, 12/15/42 | |
| Barclays
Bank PLC* |
| | | 12/13/32 | | | | 2.94% | | |
| Semi-
Annually |
| | 3-Month USD LIBOR BBA | | | Quarterly | | | | USD 64,580,000 | | | $ | 2,346,054 | | | $ | 3,228,549 | | | $ | (882,495 | ) |
| | | | | | | | | | |
| 10-Year Interest Rate Swap, 2/02/43 | |
| Credit
Suisse
International* |
| | | 1/31/33 | | | | 3.11% | | |
| Semi-
Annually |
| | 3-Month USD LIBOR BBA | | | Quarterly | | | | USD 67,220,000 | | | | 2,233,072 | | | | 3,219,838 | | | | (986,766 | ) |
| | | | | | | | | | | | | | | | | | | | | | | | | | | | | | | | | | | | | | |
| | | | 4,579,126 | | | | 6,448,387 | | | | (1,869,261 | ) |
| | | | | | | | | | | | | | | | | | | | | | | | | | | | | | | | | | | | | | |
| | | | | | | $ | 7,777,030 | | | $ | 8,050,545 | | | $ | (273,515 | ) |
| | | | | | | | | | | | | | | | | | | | | | | | | | | | | | | | | | | | | | |
| * | Contracts are subject to a Master Netting Agreement. |
The accompanying notes are an integral part of the financial statements.
88
MassMutual Premier Core Bond Fund – Portfolio of Investments(Continued)
Futures contracts
| | | | | | | | | | | | | | | | |
| | | Expiration
Date | | | Number of
Contracts | | | Notional
Amount | | | Value/ Net
Unrealized
Appreciation/
(Depreciation) | |
| Long | | | | | | | | | | | | |
U.S. Treasury Ultra Bond | | | 12/19/19 | | | | 464 | | | $ | 90,858,494 | | | $ | (1,813,994 | ) |
U.S. Treasury Note 2 Year | | | 12/31/19 | | | | 459 | | | | 99,136,611 | | | | (222,111 | ) |
U.S. Treasury Note 5 Year | | | 12/31/19 | | | | 517 | | | | 61,932,577 | | | | (332,835 | ) |
| | | | | | | | | | | | | | | | |
| | | $ | (2,368,940 | ) |
| | | | | | | | | | | | | | | | |
| Short | | | | | | | | | | | | |
90 Day Eurodollar | | | 12/16/19 | | | | 18 | | | $ | (4,380,465 | ) | | $ | (31,335 | ) |
U.S. Treasury Long Bond | | | 12/19/19 | | | | 139 | | | | (22,784,197 | ) | | | 222,759 | |
U.S. Treasury Ultra 10 Year | | | 12/19/19 | | | | 17 | | | | (2,431,742 | ) | | | 10,836 | |
90 Day Eurodollar | | | 3/16/20 | | | | 14 | | | | (3,409,654 | ) | | | (31,896 | ) |
90 Day Eurodollar | | | 6/15/20 | | | | 13 | | | | (3,167,976 | ) | | | (31,487 | ) |
90 Day Eurodollar | | | 9/14/20 | | | | 13 | | | | (3,169,357 | ) | | | (32,706 | ) |
90 Day Eurodollar | | | 12/14/20 | | | | 12 | | | | (2,925,410 | ) | | | (30,340 | ) |
90 Day Eurodollar | | | 3/15/21 | | | | 12 | | | | (2,926,460 | ) | | | (31,690 | ) |
90 Day Eurodollar | | | 9/13/21 | | | | 21 | | | | (5,122,093 | ) | | | (55,982 | ) |
90 Day Eurodollar | | | 3/14/22 | | | | 19 | | | | (4,632,849 | ) | | | (51,601 | ) |
90 Day Eurodollar | | | 9/19/22 | | | | 17 | | | | (4,143,481 | ) | | | (46,594 | ) |
90 Day Eurodollar | | | 3/13/23 | | | | 14 | | | | (3,410,179 | ) | | | (39,421 | ) |
90 Day Eurodollar | | | 12/18/23 | | | | 19 | | | | (4,623,825 | ) | | | (55,163 | ) |
90 Day Eurodollar | | | 12/16/24 | | | | 50 | | | | (12,152,959 | ) | | | (148,916 | ) |
| | | | | | | | | | | | | | | | |
| | | $ | (353,536 | ) |
| | | | | | | | | | | | | | | | |
Country weightings, as a percentage of net assets, is as follows:
| | | | |
United States | | | 84.8 | % |
Cayman Islands | | | 5.9 | % |
United Kingdom | | | 1.6 | % |
Canada | | | 1.5 | % |
Bermuda | | | 1.4 | % |
Netherlands | | | 1.2 | % |
Mexico | | | 1.2 | % |
Ireland | | | 0.4 | % |
Luxembourg | | | 0.3 | % |
Norway | | | 0.3 | % |
Switzerland | | | 0.3 | % |
Colombia | | | 0.3 | % |
Turkey | | | 0.2 | % |
Saudi Arabia | | | 0.2 | % |
Germany | | | 0.1 | % |
France | | | 0.1 | % |
Panama | | | 0.1 | % |
Spain | | | 0.1 | % |
Australia | | | 0.1 | % |
Italy | | | 0.0 | % |
Barbados | | | 0.0 | % |
| | | | |
Total Long-Term Investments | | | 100.1 | % |
Short-Term Investments and Other Assets and Liabilities | | | (0.1 | )% |
| | | | |
Net Assets | | | 100.0 | % |
| | | | |
The accompanying notes are an integral part of the financial statements.
89
MassMutual Premier Diversified Bond Fund – Portfolio of Investments
September 30, 2019
| | | | | | | | |
| | | Number of
Shares | | | Value | |
| EQUITIES — 0.1% | |
|
| COMMON STOCK — 0.0% | |
| Basic Materials — 0.0% | |
| Forest Products & Paper — 0.0% | |
The Newark Group, Inc. (a) (b) (c) | | | 26,904 | | | $ | 807 | |
| | | | | | | | |
| Energy — 0.0% | |
| Oil & Gas — 0.0% | |
Jupiter Resources, Inc. (c) | | | 18,661 | | | | 27,991 | |
| | | | | | | | |
| | |
TOTAL COMMON STOCK
(Cost $92,228) | | | | | | | 28,798 | |
| | | | | |
|
| PREFERRED STOCK — 0.1% | |
| Financial — 0.1% | |
| Insurance — 0.1% | |
The Allstate Corp., 3 mo. USD LIBOR + 3.165%
5.100% VRN 1/15/53 | | | 10,000 | | | | 265,500 | |
| | | | | | | | |
| | |
TOTAL PREFERRED STOCK
(Cost $250,000) | | | | | | | 265,500 | |
| | | | | |
| | |
TOTAL EQUITIES
(Cost $342,228) | | | | | | | 294,298 | |
| | | | | |
| | |
| | | Principal
Amount | | | | |
| BONDS & NOTES — 96.3% | |
|
| CORPORATE DEBT — 41.3% | |
| Aerospace & Defense — 0.2% | |
Moog, Inc.
5.250% 12/01/22 (d) | | $ | 173,000 | | | | 175,811 | |
TransDigm, Inc.
6.375% 6/15/26 (d) | | | 225,000 | | | | 236,813 | |
United Technologies Corp.
6.125% 7/15/38 | | | 105,000 | | | | 144,315 | |
| | | | | | | | |
| | | | | | | 556,939 | |
| | | | | | | | |
| Agriculture — 0.7% | |
BAT Capital Corp.
4.758% 9/06/49 | | | 165,000 | | | | 162,006 | |
Bunge Ltd. Finance Corp.
3.250% 8/15/26 | | | 220,000 | | | | 219,999 | |
4.350% 3/15/24 | | | 360,000 | | | | 379,199 | |
Imperial Brands Finance PLC
3.500% 7/26/26 (d) | | | 300,000 | | | | 299,992 | |
3.875% 7/26/29 (d) | | | 320,000 | | | | 322,340 | |
Reynolds American, Inc.
4.450% 6/12/25 | | | 200,000 | | | | 213,310 | |
5.850% 8/15/45 | | | 150,000 | | | | 165,986 | |
| | | | | | | | |
| | | | | | | 1,762,832 | |
| | | | | | | | |
| | | | | | | | |
| | | Principal
Amount | | | Value | |
| Airlines — 0.1% | |
American Airlines Pass-Through Trust,Series 2014-1, Class B,
4.375% 4/01/24 | | $ | 15,180 | | | $ | 15,578 | |
Guanay Finance Ltd.
6.000% 12/15/20 (d) | | | 70,198 | | | | 70,900 | |
United Airlines Pass-Through Trust,Series 2018-1, Class B,
4.600% 9/01/27 | | | 91,883 | | | | 95,778 | |
WestJet Airlines Ltd.
3.500% 6/16/21 (d) | | | 98,000 | | | | 99,658 | |
| | | | | | | | |
| | | | | | | 281,914 | |
| | | | | | | | |
| Auto Manufacturers — 1.5% | |
Ford Motor Co.
7.450% 7/16/31 | | | 270,000 | | | | 310,107 | |
Ford Motor Credit Co. LLC
3.336% 3/18/21 | | | 625,000 | | | | 627,919 | |
4.140% 2/15/23 | | | 285,000 | | | | 289,369 | |
4.375% 8/06/23 | | | 550,000 | | | | 561,878 | |
5.085% 1/07/21 | | | 200,000 | | | | 205,101 | |
General Motors Co.
4.200% 10/01/27 | | | 215,000 | | | | 219,089 | |
5.150% 4/01/38 | | | 230,000 | | | | 232,219 | |
5.200% 4/01/45 | | | 225,000 | | | | 222,198 | |
General Motors Financial Co., Inc.
3.500% 11/07/24 | | | 315,000 | | | | 318,566 | |
3.550% 4/09/21 | | | 200,000 | | | | 202,913 | |
4.150% 6/19/23 | | | 255,000 | | | | 265,027 | |
4.200% 11/06/21 | | | 245,000 | | | | 252,756 | |
| | | | | | | | |
| | | | | | | 3,707,142 | |
| | | | | | | | |
| Banks — 6.3% | |
Associated Banc-Corp.
4.250% 1/15/25 | | | 413,000 | | | | 437,016 | |
Banco General SA
4.125% 8/07/27 (d) | | | 260,000 | | | | 272,514 | |
Bank of America Corp.
4.183% 11/25/27 | | | 200,000 | | | | 215,903 | |
3 mo. USD LIBOR + 1.814%
4.244% VRN 4/24/38 | | | 210,000 | | | | 239,923 | |
6.110% 1/29/37 | | | 190,000 | | | | 248,852 | |
7.750% 5/14/38 | | | 125,000 | | | | 190,520 | |
Bank of Montreal 5 year USD Swap + 1.432%
3.803% VRN 12/15/32 | | | 250,000 | | | | 259,283 | |
The Bank of Nova Scotia
4.500% 12/16/25 | | | 300,000 | | | | 326,320 | |
3 mo. USD LIBOR + 2.648%
4.650% VRN 12/31/99 (e) | | | 550,000 | | | | 546,012 | |
Barclays Bank PLC
10.179% 6/12/21 (d) | | | 800,000 | | | | 894,749 | |
The accompanying notes are an integral part of the financial statements.
90
MassMutual Premier Diversified Bond Fund – Portfolio of Investments(Continued)
| | | | | | | | |
| | | Principal
Amount | | | Value | |
Barclays PLC
3 mo. USD LIBOR + 1.380%
3.548% FRN 5/16/24 | | $ | 365,000 | | | $ | 363,159 | |
4.337% 1/10/28 | | | 230,000 | | | | 241,671 | |
4.375% 9/11/24 | | | 600,000 | | | | 620,365 | |
BPCE SA
4.625% 7/11/24 (d) | | | 200,000 | | | | 213,134 | |
CIT Group, Inc.
5.250% 3/07/25 | | | 500,000 | | | | 545,000 | |
6.125% 3/09/28 | | | 484,000 | | | | 566,280 | |
Citigroup, Inc.
4.600% 3/09/26 | | | 495,000 | | | | 540,831 | |
5.875% 1/30/42 | | | 100,000 | | | | 136,344 | |
Credit Suisse AG
6.500% 8/08/23 (d) | | | 775,000 | | | | 862,187 | |
Danske Bank A/S 3 mo. USD LIBOR + 1.249%
3.001% VRN 9/20/22 (d) | | | 370,000 | | | | 371,356 | |
Deutsche Bank AG
3.150% 1/22/21 | | | 505,000 | | | | 504,649 | |
First Republic Bank
4.375% 8/01/46 | | | 810,000 | | | | 899,657 | |
Fulton Financial Corp.
3.600% 3/16/22 | | | 240,000 | | | | 243,505 | |
The Goldman Sachs Group, Inc.
5.150% 5/22/45 | | | 290,000 | | | | 344,172 | |
5.950% 1/15/27 | | | 370,000 | | | | 439,792 | |
6.250% 2/01/41 | | | 35,000 | | | | 48,326 | |
6.750% 10/01/37 | | | 165,000 | | | | 222,731 | |
HSBC Holdings PLC
4.250% 3/14/24 | | | 200,000 | | | | 210,441 | |
3 mo. USD LIBOR + 1.535%
4.583% VRN 6/19/29 | | | 275,000 | | | | 304,582 | |
6.500% 9/15/37 | | | 125,000 | | | | 167,927 | |
Huntington Bancshares, Inc. 3 mo. USD LIBOR + 2.880%
5.700% VRN 12/31/99 (e) | | | 510,000 | | | | 519,471 | |
JP Morgan Chase & Co.
4.950% 6/01/45 | | | 170,000 | | | | 211,753 | |
Morgan Stanley
4.350% 9/08/26 | | | 450,000 | | | | 487,316 | |
5.000% 11/24/25 | | | 175,000 | | | | 196,103 | |
Nordea Bank Abp
5 year USD Swap + 1.690%
4.625% VRN 9/13/33 (d) | | | 600,000 | | | | 657,939 | |
5 year CMT + 4.110%
6.625% VRN 12/31/99 (d) (e) | | | 405,000 | | | | 435,881 | |
Royal Bank of Scotland Group PLC 3 mo. USD LIBOR + 1.480%
3.498% VRN 5/15/23 | | | 525,000 | | | | 531,988 | |
Valley National Bancorp
5.125% 9/27/23 | | | 110,000 | | | | 117,461 | |
| | | | | | | | |
| | | Principal
Amount | | | Value | |
Wells Fargo & Co.
5.606% 1/15/44 (d) | | $ | 105,000 | | | $ | 135,896 | |
Westpac Banking Corp. 5 year CMT + 2.000%
4.110% VRN 7/24/34 | | | 575,000 | | | | 600,287 | |
| | | | | | | | |
| | | | | | | 15,371,296 | |
| | | | | | | | |
| Beverages — 0.6% | |
Anheuser-Busch InBev Worldwide, Inc.
4.600% 4/15/48 | | | 255,000 | | | | 294,102 | |
8.200% 1/15/39 (d) | | | 250,000 | | | | 397,211 | |
Becle SAB de CV
3.750% 5/13/25 (d) | | | 350,000 | | | | 360,157 | |
Molson Coors Brewing Co.
4.200% 7/15/46 | | | 291,000 | | | | 294,062 | |
5.000% 5/01/42 | | | 135,000 | | | | 149,098 | |
| | | | | | | | |
| | | | | | | 1,494,630 | |
| | | | | | | | |
| Biotechnology — 0.2% | |
Celgene Corp.
3.450% 11/15/27 | | | 215,000 | | | | 227,793 | |
4.350% 11/15/47 | | | 205,000 | | | | 237,637 | |
| | | | | | | | |
| | | | | | | 465,430 | |
| | | | | | | | |
| Building Materials — 0.3% | |
Standard Industries, Inc.
4.750% 1/15/28 (d) | | | 282,000 | | | | 291,492 | |
5.000% 2/15/27 (d) | | | 490,000 | | | | 507,297 | |
| | | | | | | | |
| | | | | | | 798,789 | |
| | | | | | | | |
| Chemicals — 1.4% | |
DuPont de Nemours, Inc.
5.319% 11/15/38 | | | 345,000 | | | | 421,096 | |
Incitec Pivot Finance LLC
6.000% 12/10/19 (d) | | | 190,000 | | | | 191,203 | |
LYB International Finance BV
5.250% 7/15/43 | | | 250,000 | | | | 284,829 | |
Methanex Corp.
5.250% 3/01/22 | | | 40,000 | | | | 41,569 | |
The Sherwin-Williams Co.
4.500% 6/01/47 | | | 115,000 | | | | 128,871 | |
Syngenta Finance NV
3.698% 4/24/20 (d) | | | 325,000 | | | | 326,080 | |
3.933% 4/23/21 (d) | | | 325,000 | | | | 330,953 | |
4.441% 4/24/23 (d) | | | 425,000 | | | | 444,131 | |
4.892% 4/24/25 (d) | | | 500,000 | | | | 529,528 | |
Yara International ASA
4.750% 6/01/28 (d) | | | 690,000 | | | | 751,737 | |
| | | | | | | | |
| | | | | | | 3,449,997 | |
| | | | | | | | |
| Commercial Services — 0.1% | |
ERAC USA Finance LLC
7.000% 10/15/37 (d) | | | 50,000 | | | | 70,802 | |
United Rentals North America, Inc.
6.500% 12/15/26 | | | 254,000 | | | | 276,733 | |
| | | | | | | | |
| | | | | | | 347,535 | |
| | | | | | | | |
The accompanying notes are an integral part of the financial statements.
91
MassMutual Premier Diversified Bond Fund – Portfolio of Investments(Continued)
| | | | | | | | |
| | | Principal
Amount | | | Value | |
| Computers — 0.7% | |
Dell International LLC/EMC Corp.
6.020% 6/15/26 (d) | | $ | 375,000 | | | $ | 421,717 | |
8.350% 7/15/46 (d) | | | 275,000 | | | | 362,710 | |
Genpact Luxembourg Sarl
3.700% STEP 4/01/22 (d) | | | 435,000 | | | | 441,592 | |
Leidos Holdings, Inc.
4.450% 12/01/20 (d) | | | 530,000 | | | | 537,950 | |
| | | | | | | | |
| | | | | | | 1,763,969 | |
| | | | | | | | |
| Diversified Financial Services — 3.5% | |
AerCap Ireland Capital DAC/AerCap Global Aviation Trust
3.500% 1/15/25 | | | 865,000 | | | | 882,728 | |
Aircastle Ltd.
4.125% 5/01/24 | | | 200,000 | | | | 208,366 | |
4.400% 9/25/23 | | | 275,000 | | | | 289,278 | |
5.000% 4/01/23 | | | 186,000 | | | | 199,189 | |
Ally Financial, Inc.
5.125% 9/30/24 | | | 317,000 | | | | 346,323 | |
8.000% 11/01/31 (d) | | | 651,000 | | | | 900,007 | |
Antares Holdings LP
6.000% 8/15/23 (d) | | | 790,000 | | | | 818,437 | |
Ares Finance Co. LLC
4.000% 10/08/24 (d) | | | 375,000 | | | | 369,218 | |
Avolon Holdings Funding Ltd.
4.375% 5/01/26 (d) | | | 205,000 | | | | 212,032 | |
Brookfield Finance, Inc.
4.250% 6/02/26 | | | 280,000 | | | | 298,173 | |
4.850% 3/29/29 | | | 608,000 | | | | 688,101 | |
GE Capital International Funding Co. Unlimited Co.
4.418% 11/15/35 (d) | | | 230,000 | | | | 240,699 | |
Global Aircraft Leasing Co. Ltd.
6.500% 9/15/24 (d) | | | 595,000 | | | | 602,438 | |
Lazard Group LLC
3.625% 3/01/27 | | | 196,000 | | | | 201,209 | |
4.500% 9/19/28 | | | 275,000 | | | | 299,929 | |
Legg Mason, Inc.
5.625% 1/15/44 | | | 235,000 | | | | 262,214 | |
Park Aerospace Holdings Ltd.
4.500% 3/15/23 (d) | | | 500,000 | | | | 517,400 | |
5.250% 8/15/22 (d) | | | 940,000 | | | | 990,666 | |
5.500% 2/15/24 (d) | | | 100,000 | | | | 108,040 | |
Synchrony Financial
4.375% 3/19/24 | | | 90,000 | | | | 95,502 | |
| | | | | | | | |
| | | | | | | 8,529,949 | |
| | | | | | | | |
| Electric — 1.5% | |
Berkshire Hathaway Energy Co.
5.950% 5/15/37 (d) | | | 120,000 | | | | 165,261 | |
The Cleveland Electric Illuminating Co.
3.500% 4/01/28 (d) | | | 155,000 | | | | 161,726 | |
5.950% 12/15/36 | | | 175,000 | | | | 223,168 | |
| | | | | | | | |
| | | Principal
Amount | | | Value | |
CMS Energy Corp.
4.700% 3/31/43 | | $ | 115,000 | | | $ | 132,025 | |
4.875% 3/01/44 | | | 80,000 | | | | 97,205 | |
Duke Energy Corp.
3.750% 9/01/46 | | | 175,000 | | | | 180,172 | |
Elwood Energy LLC
8.159% 7/05/26 (d) | | | 199,206 | | | | 217,593 | |
Entergy Louisiana LLC
4.950% 1/15/45 | | | 110,000 | | | | 118,955 | |
Indianapolis Power & Light Co.
4.050% 5/01/46 (d) | | | 110,000 | | | | 121,796 | |
Infraestructura Energetica Nova SAB de CV
3.750% 1/14/28 (d) | | | 200,000 | | | | 196,750 | |
IPALCO Enterprises, Inc.
3.450% 7/15/20 (d) | | | 290,000 | | | | 291,671 | |
3.700% 9/01/24 (d) | | | 175,000 | | | | 181,211 | |
Pennsylvania Electric Co.
4.150% 4/15/25 (d) | | | 150,000 | | | | 158,922 | |
PPL Capital Funding, Inc.
4.000% 9/15/47 | | | 175,000 | | | | 181,618 | |
Puget Energy, Inc.
3.650% 5/15/25 (d) | | | 300,000 | | | | 307,064 | |
Southwestern Electric Power Co.
6.200% 3/15/40 | | | 100,000 | | | | 134,566 | |
Tri-State Pass-Through Trust, Series 2003, Class B,
7.144% 7/31/33 (d) | | | 169,565 | | | | 205,428 | |
Virginia Electric & Power Co.
6.000% 1/15/36 | | | 100,000 | | | | 133,206 | |
Xcel Energy, Inc.
6.500% 7/01/36 | | | 270,000 | | | | 373,453 | |
| | | | | | | | |
| | | | | | | 3,581,790 | |
| | | | | | | | |
| Electronics — 0.4% | |
The ADT Security Corp.
6.250% 10/15/21 (d) | | | 593,000 | | | | 631,545 | |
Ingram Micro, Inc.
5.450% STEP 12/15/24 | | | 335,000 | | | | 347,045 | |
| | | | | | | | |
| | | | | | | 978,590 | |
| | | | | | | | |
| Entertainment — 0.2% | |
Wynn Resorts Finance LLC/Wynn Resorts Capital Corp.
5.125% 10/01/29 (d) | | | 382,000 | | | | 400,298 | |
| | | | | | | | |
| Foods — 0.5% | |
JBS USA LUX SA / JBS USA Food Co./JBS USA Finance, Inc.
5.500% 1/15/30 (d) | | | 500,000 | | | | 529,990 | |
Kraft Heinz Foods Co.
4.625% 10/01/39 (d) | | | 340,000 | | | | 341,763 | |
Mars, Inc.
3.950% 4/01/49 (d) | | | 330,000 | | | | 376,159 | |
| | | | | | | | |
| | | | | | | 1,247,912 | |
| | | | | | | | |
The accompanying notes are an integral part of the financial statements.
92
MassMutual Premier Diversified Bond Fund – Portfolio of Investments(Continued)
| | | | | | | | |
| | | Principal
Amount | | | Value | |
| Forest Products & Paper — 0.1% | |
Fibria Overseas Finance Ltd.
4.000% 1/14/25 | | $ | 225,000 | | | $ | 228,377 | |
| | | | | | | | |
| Gas — 0.2% | |
NiSource, Inc.
4.800% 2/15/44 | | | 370,000 | | | | 431,198 | |
| | | | | | | | |
| Health Care – Products — 0.3% | |
Becton Dickinson and Co.
4.685% 12/15/44 | | | 125,000 | | | | 145,119 | |
Ortho-Clinical Diagnostics, Inc./Ortho-Clinical Diagnostics SA
6.625% 5/15/22 (d) | | | 702,000 | | | | 685,643 | |
| | | | | | | | |
| | | | | | | 830,762 | |
| | | | | | | | |
| Health Care – Services — 0.4% | |
HCA, Inc.
5.375% 2/01/25 | | | 350,000 | | | | 382,375 | |
5.875% 2/01/29 | | | 140,000 | | | | 157,252 | |
Humana, Inc.
4.800% 3/15/47 | | | 130,000 | | | | 149,602 | |
IHC Health Services, Inc.
4.131% 5/15/48 | | | 275,000 | | | | 324,975 | |
| | | | | | | | |
| | | | | | | 1,014,204 | |
| | | | | | | | |
| Home Builders — 0.8% | |
Lennar Corp.
4.750% 11/29/27 (d) | | | 592,000 | | | | 634,920 | |
PulteGroup, Inc.
5.000% 1/15/27 | | | 198,000 | | | | 213,840 | |
5.500% 3/01/26 | | | 441,000 | | | | 481,793 | |
Taylor Morrison Communities, Inc.
5.750% 1/15/28 (d) | | | 500,000 | | | | 542,500 | |
| | | | | | | | |
| | | | | | | 1,873,053 | |
| | | | | | | | |
| Housewares — 0.4% | |
Newell Brands, Inc.
3.850% 4/01/23 | | | 495,000 | | | | 509,553 | |
4.200% 4/01/26 | | | 200,000 | | | | 209,248 | |
The Toro Co.
7.800% 6/15/27 | | | 170,000 | | | | 212,757 | |
| | | | | | | | |
| | | | | | | 931,558 | |
| | | | | | | | |
| Insurance — 4.0% | |
The Allstate Corp. 3 mo. USD LIBOR + 2.938%
5.750% VRN 8/15/53 | | | 890,000 | | | | 950,075 | |
American International Group, Inc.
3.900% 4/01/26 | | | 135,000 | | | | 143,824 | |
4.200% 4/01/28 | | | 220,000 | | | | 239,998 | |
4.750% 4/01/48 | | | 95,000 | | | | 110,946 | |
3 mo. USD LIBOR + 2.868%
5.750% VRN 4/01/48 | | | 755,000 | | | | 807,442 | |
AmTrust Financial Services, Inc.
6.125% 8/15/23 (f) | | | 490,000 | | | | 489,168 | |
| | | | | | | | |
| | | Principal
Amount | | | Value | |
Arch Capital Group US, Inc.
5.144% 11/01/43 | | $ | 80,000 | | | $ | 99,935 | |
Athene Holding Ltd.
4.125% 1/12/28 | | | 1,029,000 | | | | 1,057,962 | |
AXIS Specialty Finance LLC
3.900% 7/15/29 | | | 375,000 | | | | 392,214 | |
4.000% 12/06/27 | | | 420,000 | | | | 442,585 | |
CNO Financial Group, Inc.
5.250% 5/30/25 | | | 535,000 | | | | 575,018 | |
Enstar Group Ltd.
4.500% 3/10/22 | | | 495,000 | | | | 513,393 | |
4.950% 6/01/29 | | | 275,000 | | | | 290,332 | |
Markel Corp.
3.350% 9/17/29 | | | 125,000 | | | | 126,293 | |
MetLife Capital Trust IV
7.875% 12/15/67 (d) | | | 225,000 | | | | 295,875 | |
The Progressive Corp. 3 mo. USD LIBOR + 2.539%
5.375% VRN 12/31/99 (e) | | | 573,000 | | | | 591,622 | |
Prudential Financial, Inc.
3 mo. USD LIBOR + 3.920%
5.625% VRN 6/15/43 | | | 200,000 | | | | 214,982 | |
3 mo. USD LIBOR + 2.665%
5.700% VRN 9/15/48 | | | 650,000 | | | | 720,460 | |
6.200% 11/15/40 | | | 125,000 | | | | 166,467 | |
Reinsurance Group of America, Inc.
3.900% 5/15/29 | | | 350,000 | | | | 372,403 | |
Trinity Acquisition PLC
4.400% 3/15/26 | | | 140,000 | | | | 151,822 | |
Unum Group
4.000% 6/15/29 | | | 155,000 | | | | 161,114 | |
USF&G Capital I
8.500% 12/15/45 (d) | | | 95,000 | | | | 139,156 | |
Willis North America, Inc.
2.950% 9/15/29 | | | 315,000 | | | | 310,035 | |
XLIT Ltd.
4.450% 3/31/25 | | | 185,000 | | | | 200,910 | |
5.500% 3/31/45 | | | 200,000 | | | | 252,664 | |
| | | | | | | | |
| | | | | | | 9,816,695 | |
| | | | | | | | |
| Internet — 0.2% | |
Amazon.com, Inc.
4.050% 8/22/47 (d) | | | 350,000 | | | | 420,495 | |
| | | | | | | | |
| Investment Companies — 1.3% | |
Ares Capital Corp.
3.500% 2/10/23 | | | 610,000 | | | | 613,809 | |
4.200% 6/10/24 | | | 525,000 | | | | 538,128 | |
BlackRock TCP Capital Corp.
3.900% 8/23/24 | | | 370,000 | | | | 365,203 | |
4.125% 8/11/22 | | | 845,000 | | | | 847,144 | |
Icahn Enterprises LP/ Icahn Enterprises Finance Corp.
4.750% 9/15/24 (d) | | | 500,000 | | | | 499,500 | |
The accompanying notes are an integral part of the financial statements.
93
MassMutual Premier Diversified Bond Fund – Portfolio of Investments(Continued)
| | | | | | | | |
| | | Principal
Amount | | | Value | |
6.750% 2/01/24 (d) | | $ | 200,000 | | | $ | 208,000 | |
| | | | | | | | |
| | | | | | | 3,071,784 | |
| | | | | | | | |
| Iron & Steel — 0.2% | |
Vale Overseas Ltd.
6.250% 8/10/26 | | | 275,000 | | | | 316,938 | |
6.875% 11/21/36 | | | 150,000 | | | | 190,050 | |
| | | | | | | | |
| | | | | | | 506,988 | |
| | | | | | | | |
| Lodging — 0.3% | |
Las Vegas Sands Corp.
3.900% 8/08/29 | | | 190,000 | | | | 194,883 | |
MGM Resorts International
4.625% 9/01/26 | | | 534,000 | | | | 556,764 | |
| | | | | | | | |
| | | | | | | 751,647 | |
| | | | | | | | |
| Media — 2.2% | |
Altice Financing SA
6.625% 2/15/23 (d) | | | 200,000 | | | | 205,250 | |
CCO Holdings LLC/CCO Holdings Capital Corp.
5.000% 2/01/28 (d) | | | 250,000 | | | | 258,438 | |
5.750% 1/15/24 | | | 600,000 | | | | 613,500 | |
Comcast Corp.
3.400% 7/15/46 | | | 140,000 | | | | 143,167 | |
4.600% 8/15/45 | | | 400,000 | | | | 479,604 | |
Diamond Sports Group LLC / Diamond Sports Finance Co.
5.375% 8/15/26 (d) | | | 250,000 | | | | 259,375 | |
6.625% 8/15/27 (d) (f) | | | 250,000 | | | | 259,375 | |
Discovery Communications LLC
4.125% 5/15/29 | | | 150,000 | | | | 157,885 | |
4.875% 4/01/43 | | | 200,000 | | | | 208,102 | |
5.000% 9/20/37 | | | 165,000 | | | | 177,375 | |
Grupo Televisa SAB
6.625% 3/18/25 (d) | | | 475,000 | | | | 555,622 | |
Sirius XM Radio, Inc.
5.375% 4/15/25 (d) | | | 1,000,000 | | | | 1,036,250 | |
TEGNA, Inc.
5.125% 7/15/20 (d) | | | 500,000 | | | | 500,625 | |
Time Warner Cable, Inc.
4.500% 9/15/42 | | | 250,000 | | | | 246,012 | |
6.750% 6/15/39 | | | 275,000 | | | | 336,170 | |
| | | | | | | | |
| | | | | | | 5,436,750 | |
| | | | | | | | |
| Mining — 1.2% | |
First Quantum Minerals Ltd.
6.875% 3/01/26 (d) | | | 1,000,000 | | | | 952,500 | |
Glencore Finance Canada Ltd.
5.550% STEP 10/25/42 (d) | | | 149,000 | | | | 161,561 | |
Glencore Funding LLC
3.875% 10/27/27 (d) | | | 260,000 | | | | 264,706 | |
4.000% 4/16/25 (d) | | | 380,000 | | | | 395,328 | |
4.625% 4/29/24 (d) | | | 200,000 | | | | 213,702 | |
| | | | | | | | |
| | | Principal
Amount | | | Value | |
Kinross Gold Corp.
4.500% 7/15/27 (d) | | $ | 225,000 | | | $ | 235,964 | |
5.125% 9/01/21 (d) | | | 175,000 | | | | 181,562 | |
5.950% 3/15/24 (d) | | | 200,000 | | | | 222,610 | |
Teck Resources Ltd.
5.200% 3/01/42 | | | 97,000 | | | | 96,434 | |
6.250% 7/15/41 | | | 143,000 | | | | 158,935 | |
| | | | | | | | |
| | | | | | | 2,883,302 | |
| | | | | | | | |
| Miscellaneous – Manufacturing — 0.0% | |
General Electric Co.
4.125% 10/09/42 | | | 12,000 | | | | 12,007 | |
6.875% 1/10/39 | | | 72,000 | | | | 95,252 | |
| | | | | | | | |
| | | | | | | 107,259 | |
| | | | | | | | |
| Office Equipment/Supplies — 0.4% | |
CDW LLC / CDW Finance Corp.
4.250% 4/01/28 | | | 206,000 | | | | 210,141 | |
Pitney Bowes, Inc.
4.125% STEP 9/15/20 | | | 140,000 | | | | 141,050 | |
4.125% STEP 10/01/21 | | | 675,000 | | | | 678,375 | |
| | | | | | | | |
| | | | | | | 1,029,566 | |
| | | | | | | | |
| Oil & Gas — 1.8% | |
Calumet Specialty Products partners LP / Calumet Finalnce Corp
11.000% 4/15/25 (g) | | | 250,000 | | | | 250,000 | |
Cenovus Energy, Inc.
4.250% 4/15/27 (f) | | | 350,000 | | | | 363,888 | |
6.750% 11/15/39 (d) | | | 175,000 | | | | 213,956 | |
Continental Resources, Inc.
5.000% 9/15/22 (d) | | | 137,000 | | | | 138,202 | |
Encana Corp.
6.500% 2/01/38 | | | 160,000 | | | | 192,707 | |
EQT Corp.
3.000% 10/01/22 (f) | | | 625,000 | | | | 601,658 | |
3.900% 10/01/27 (f) | | | 860,000 | | | | 745,474 | |
Marathon Petroleum Corp.
4.500% 4/01/48 (d) | | | 85,000 | | | | 88,800 | |
6.500% 3/01/41 (d) | | | 175,000 | | | | 217,817 | |
Occidental Petroleum Corp.
6.600% 3/15/46 | | | 235,000 | | | | 306,540 | |
PBF Holding Co. LLC/PBF Finance Corp.
7.000% 11/15/23 (d) | | | 200,000 | | | | 206,251 | |
Petroleos Mexicanos
5.350% 2/12/28 (d) | | | 190,000 | | | | 181,570 | |
6.375% 1/23/45 (d) | | | 35,000 | | | | 32,463 | |
6.500% 3/13/27 | | | 65,000 | | | | 67,535 | |
6.625% 6/15/38 (d) | | | 51,000 | | | | 48,514 | |
Saudi Arabian Oil Co.
4.250% 4/16/39 (d) | | | 585,000 | | | | 630,652 | |
Vine Oil & Gas LP/Vine Oil & Gas Finance Corp.
8.750% 4/15/23 (d) | | | 200,000 | | | | 91,000 | |
| | | | | | | | |
| | | | | | | 4,377,027 | |
| | | | | | | | |
The accompanying notes are an integral part of the financial statements.
94
MassMutual Premier Diversified Bond Fund – Portfolio of Investments(Continued)
| | | | | | | | |
| | | Principal
Amount | | | Value | |
| Oil & Gas Services — 0.3% | |
National Oilwell Varco, Inc.
3.950% 12/01/42 | | $ | 314,000 | | | $ | 287,777 | |
Patterson-UTI Energy, Inc.
3.950% 2/01/28 (d) | | | 350,000 | | | | 352,558 | |
| | | | | | | | |
| | | | | | | 640,335 | |
| | | | | | | | |
| Packaging & Containers — 0.1% | |
Mauser Packaging Solutions Holding Co.
5.500% 4/15/24 (d) | | | 138,000 | | | | 141,788 | |
| | | | | | | | |
| Pharmaceuticals — 1.8% | |
AbbVie, Inc.
4.700% 5/14/45 | | | 350,000 | | | | 374,418 | |
Allergan Funding SCS
3.800% 3/15/25 | | | 300,000 | | | | 314,139 | |
Bausch Health Americas, Inc.
9.250% 4/01/26 (d) | | | 400,000 | | | | 454,496 | |
Bausch Health Cos., Inc.
6.125% 4/15/25 (d) | | | 113,000 | | | | 117,096 | |
7.000% 3/15/24 (d) | | | 115,000 | | | | 120,860 | |
Bayer US Finance II LLC
4.400% 7/15/44 (d) | | | 100,000 | | | | 100,902 | |
4.625% 6/25/38 (d) | | | 215,000 | | | | 232,602 | |
CVS Health Corp.
3.000% 8/15/26 | | | 120,000 | | | | 120,595 | |
4.300% 3/25/28 | | | 200,000 | | | | 216,267 | |
5.050% 3/25/48 | | | 415,000 | | | | 470,995 | |
6.125% 9/15/39 | | | 25,000 | | | | 31,023 | |
CVS Pass-Through Trust
5.926% 1/10/34 (d) | | | 196,290 | | | | 228,326 | |
7.507% 1/10/32 (d) | | | 14,615 | | | | 18,044 | |
Express Scripts Holding Co.
4.800% 7/15/46 | | | 185,000 | | | | 207,101 | |
McKesson Corp.
4.883% 3/15/44 | | | 70,000 | | | | 77,318 | |
Mylan NV
3.950% 6/15/26 (d) | | | 240,000 | | | | 247,995 | |
5.250% 6/15/46 (d) | | | 350,000 | | | | 372,929 | |
Par Pharmaceutical, Inc.
7.500% 4/01/27 (d) | | | 488,000 | | | | 447,130 | |
Teva Pharmaceutical Finance Netherlands III BV
2.200% 7/21/21 | | | 190,000 | | | | 173,850 | |
4.100% 10/01/46 (f) | | | 85,000 | | | | 53,337 | |
| | | | | | | | |
| | | | | | | 4,379,423 | |
| | | | | | | | |
| Pipelines — 2.6% | |
Cheniere Energy Partners LP
4.500% 10/01/29 (d) | | | 138,000 | | | | 141,278 | |
Energy Transfer Operating LP
4.200% 4/15/27 | | | 320,000 | | | | 337,124 | |
4.750% 1/15/26 | | | 200,000 | | | | 216,831 | |
6.125% 12/15/45 | | | 280,000 | | | | 328,493 | |
3 mo. USD LIBOR + 4.028%
6.250% VRN 12/31/99 (e) | | | 740,000 | | | | 686,350 | |
| | | | | | | | |
| | | Principal
Amount | | | Value | |
EnLink Midstream Partners LP
4.150% 6/01/25 | | $ | 339,000 | | | $ | 314,422 | |
4.850% 7/15/26 | | | 154,000 | | | | 146,300 | |
3 mo. USD LIBOR + 4.110%
6.000% VRN 12/31/99 (e) | | | 375,000 | | | | 268,125 | |
Enterprise Products Operating LLC 3 mo. USD LIBOR + 2.570%
5.375% VRN 2/15/78 | | | 200,000 | | | | 193,006 | |
EQM Midstream Partners LP
4.750% 7/15/23 | | | 375,000 | | | | 376,157 | |
Kinder Morgan Energy Partners LP
6.375% 3/01/41 | | | 65,000 | | | | 79,681 | |
6.500% 2/01/37 | | | 85,000 | | | | 105,574 | |
6.550% 9/15/40 | | | 80,000 | | | | 99,194 | |
6.950% 1/15/38 | | | 15,000 | | | | 19,581 | |
MPLX LP
4.500% 4/15/38 | | | 195,000 | | | | 202,130 | |
3 mo. USD LIBOR + 4.652%
6.875% VRN 12/31/99 (e) | | | 850,000 | | | | 848,980 | |
Plains All American Pipeline LP/PAA Finance Corp.
4.500% 12/15/26 | | | 431,000 | | | | 457,037 | |
4.700% 6/15/44 | | | 230,000 | | | | 224,521 | |
Sabine Pass Liquefaction LLC
5.625% STEP 4/15/23 | | | 325,000 | | | | 353,136 | |
5.625% 3/01/25 | | | 200,000 | | | | 224,568 | |
Sunoco Logistics Partners Operations LP
4.000% 10/01/27 (d) | | | 120,000 | | | | 124,221 | |
5.300% 4/01/44 (d) | | | 175,000 | | | | 184,866 | |
Western Gas Partners LP
4.000% 7/01/22 | | | 350,000 | | | | 354,229 | |
Western Midstream Operating LP
4.500% 3/01/28 | | | 110,000 | | | | 106,216 | |
| | | | | | | | |
| | | | | | | 6,392,020 | |
| | | | | | | | |
| Private Equity — 0.6% | |
Carlyle Finance Subsidiary LLC
3.500% 9/19/29 (d) | | | 230,000 | | | | 227,785 | |
Hercules Capital, Inc.
4.625% 10/23/22 | | | 945,000 | | | | 945,178 | |
KKR Group Finance Co. VI LLC
3.750% 7/01/29 (d) | | | 280,000 | | | | 295,084 | |
| | | | | | | | |
| | | | | | | 1,468,047 | |
| | | | | | | | |
| Real Estate Investment Trusts (REITS) — 1.3% | |
Alexandria Real Estate Equities, Inc.
2.750% 12/15/29 | | | 175,000 | | | | 172,467 | |
Crown Castle International Corp.
4.750% 5/15/47 | | | 70,000 | | | | 80,972 | |
5.200% 2/15/49 | | | 120,000 | | | | 148,238 | |
ESH Hospitality, Inc.
4.625% 10/01/27 (d) | | | 363,000 | | | | 364,361 | |
Healthcare Trust of America Holdings LP
3.500% 8/01/26 | | | 175,000 | | | | 180,373 | |
3.750% 7/01/27 | | | 240,000 | | | | 251,251 | |
The accompanying notes are an integral part of the financial statements.
95
MassMutual Premier Diversified Bond Fund – Portfolio of Investments(Continued)
| | | | | | | | |
| | | Principal
Amount | | | Value | |
SBA Tower Trust
2.877% 7/15/46 (d) | | $ | 180,000 | | | $ | 180,608 | |
3.156% 10/10/45 (d) | | | 180,000 | | | | 180,193 | |
Spirit Realty LP
4.000% 7/15/29 | | | 275,000 | | | | 287,749 | |
STORE Capital Corp.
4.625% 3/15/29 | | | 250,000 | | | | 274,904 | |
Tanger Properties LP
3.750% 12/01/24 | | | 300,000 | | | | 306,567 | |
UDR, Inc.
3.200% 1/15/30 | | | 145,000 | | | | 149,326 | |
VEREIT Operating Partnership LP
4.625% 11/01/25 | | | 495,000 | | | | 540,350 | |
Weingarten Realty Investors
3.250% 8/15/26 | | | 75,000 | | | | 75,419 | |
| | | | | | | | |
| | | | | | | 3,192,778 | |
| | | | | | | | |
| Retail — 0.6% | |
Dollar Tree, Inc.
4.200% 5/15/28 | | | 530,000 | | | | 569,498 | |
El Puerto de Liverpool SAB de CV
3.950% 10/02/24 (d) | | | 280,000 | | | | 286,653 | |
The Home Depot, Inc.
5.950% 4/01/41 | | | 100,000 | | | | 143,158 | |
Penske Automotive Group, Inc.
5.500% 5/15/26 | | | 500,000 | | | | 522,925 | |
| | | | | | | | |
| | | | | | | 1,522,234 | |
| | | | | | | | |
| Semiconductors — 0.2% | |
Microchip Technology, Inc.
3.922% 6/01/21 (d) | | | 525,000 | | | | 536,222 | |
| | | | | | | | |
| Telecommunications — 1.5% | |
AT&T, Inc.
4.750% 5/15/46 | | | 340,000 | | | | 377,049 | |
5.250% 3/01/37 | | | 308,000 | | | | 362,490 | |
CommScope, Inc.
8.250% 3/01/27 (d) | | | 350,000 | | | | 340,703 | |
Embarq Corp.
7.995% 6/01/36 | | | 45,000 | | | | 44,494 | |
Empresa Nacional de Telecomunicaciones SA
4.875% 10/30/24 (d) | | | 200,000 | | | | 211,365 | |
Hughes Satellite Systems Corp.
6.625% 8/01/26 (d) | | | 444,000 | | | | 481,944 | |
Sprint Capital Corp.
6.875% 11/15/28 | | | 500,000 | | | | 545,100 | |
Sprint Corp.
7.125% 6/15/24 (d) | | | 400,000 | | | | 431,120 | |
T-Mobile USA, Inc.
5.375% 4/15/27 | | | 165,000 | | | | 177,375 | |
Telefonica Emisiones SAU
4.665% 3/06/38 | | | 335,000 | | | | 367,469 | |
Verizon Communications, Inc.
6.550% 9/15/43 | | | 157,000 | | | | 231,238 | |
| | | | | | | | |
| | | | | | | 3,570,347 | |
| | | | | | | | |
| | | | | | | | |
| | | Principal
Amount | | | Value | |
| Transportation — 0.3% | |
CSX Corp.
4.750% 11/15/48 | | $ | 145,000 | | | $ | 174,830 | |
The Kenan Advantage Group, Inc.
7.875% 7/31/23 (d) (f) | | | 720,000 | | | | 646,200 | |
Pacific National Finance Pty Ltd.
4.625% 9/23/20 (d) | | | 45,000 | | | | 45,868 | |
| | | | | | | | |
| | | | | | | 866,898 | |
| | | | | | | | |
| | |
TOTAL CORPORATE DEBT
(Cost $96,725,534) | | | | | | | 101,159,769 | |
| | | | | |
|
| MUNICIPAL OBLIGATIONS — 0.3% | |
State of California BAB
7.550% 4/01/39 | | | 275,000 | | | | 454,976 | |
7.600% 11/01/40 | | | 150,000 | | | | 253,760 | |
| | | | | | | | |
| | | | | | | 708,736 | |
| | | | | | | | |
| | |
TOTAL MUNICIPAL OBLIGATIONS
(Cost $574,223) | | | | | | | 708,736 | |
| | | | | |
|
| NON-U.S. GOVERNMENT AGENCY OBLIGATIONS — 30.2% | |
| Automobile ABS — 1.4% | |
Avis Budget Rental Car Funding AESOP LLC,Series 2019-1A, Class C
4.530% 3/20/23 (d) | | | 222,000 | | | | 225,525 | |
Hertz Vehicle Financing II LP
Series 2018-1A, Class B,
3.600% 2/25/24 (d) | | | 650,000 | | | | 667,294 | |
Series 2019-2A, Class C,
4.260% 5/25/25 (d) | | | 730,000 | | | | 753,577 | |
Series 2018-1A, Class C,
4.390% 2/25/24 (d) | | | 330,000 | | | | 340,634 | |
Series 2017-2A, Class C,
5.310% 10/25/23 (d) | | | 100,000 | | | | 105,348 | |
OneMain Direct Auto Receivables Trust
Series 2019-1A, Class C,
4.190% 11/14/28 (d) | | | 888,000 | | | | 936,946 | |
Series 2019-1A, Class D,
4.680% 4/14/31 (d) | | | 422,000 | | | | 444,597 | |
| | | | | | | | |
| | | | | | | 3,473,921 | |
| | | | | | | | |
| Commercial MBS — 3.9% | |
Aventura Mall Trust,Series 2018-AVM, Class D,
4.249% VRN 7/05/40 (d) (h) | | | 530,000 | | | | 567,963 | |
BAMLL Commercial Mortgage Securities Trust, Series 2018-DSNY, Class C, 1 mo. USD LIBOR + 1.350% 3.378% FRN 9/15/34 (d) | | | 150,000 | | | | 149,870 | |
The accompanying notes are an integral part of the financial statements.
96
MassMutual Premier Diversified Bond Fund – Portfolio of Investments(Continued)
| | | | | | | | |
| | | Principal
Amount | | | Value | |
BANK, Series 2019-BN17, Class C,
4.671% VRN 4/15/52 (h) | | $ | 135,000 | | | $ | 149,176 | |
BBCMS Mortgage Trust
Series 2018-CHRS, Class D,
4.409% VRN 8/05/38 (d) (h) | | | 270,000 | | | | 286,374 | |
Series 2018-CHRS, Class C,
4.409% VRN 8/05/38 (d) (h) | | | 280,000 | | | | 303,560 | |
Series 2018-CHRS, Class B,
4.409% VRN 8/05/38 (d) (h) | | | 400,000 | | | | 440,060 | |
BHMS Mortgage Trust, Series 2018-ATLS, Class B, 1 mo. USD LIBOR + 1.500%
3.528% FRN 7/15/35 (d) | | | 900,000 | | | | 900,278 | |
BX Commercial Mortgage Trust,Series 2018-IND, Class E, 1 mo. USD LIBOR + 1.700%
3.728% FRN 11/15/35 (d) | | | 565,401 | | | | 566,811 | |
CAMB Commercial Mortgage Trust, Series 2019-LIFE, Class E, 1 mo. USD LIBOR + 2.150%
4.178% FRN 12/15/37 (d) | | | 572,453 | | | | 576,742 | |
Citigroup Commercial Mortgage Trust, Series 2019-GC41, Class C
3.502% 8/10/56 | | | 222,000 | | | | 227,857 | |
Citigroup COmmercial Mortgage Trust, Series 2019-SMRT, Class C
4.682% 1/10/36 (d) | | | 225,000 | | | | 241,314 | |
Commercial Mortgage Pass-Through Certificates
Series 2014-UBS2, Class A5,
3.961% 3/10/47 | | | 152,000 | | | | 161,767 | |
Series 2014-UBS2, Class AM,
4.199% 3/10/47 | | | 100,000 | | | | 106,266 | |
Series 2015-CR23, Class C,
4.392% VRN 5/10/48 (h) | | | 110,000 | | | | 114,481 | |
Credit Suisse Mortgage Capital Certificates, Series 2019-ICE4, Class D, 1 mo. USD LIBOR + 1.600%
3.628% FRN 5/15/36 (d) | | | 260,000 | | | | 260,329 | |
GCCFC Commercial Mortgage Trust,Series 2006-GG7, Class AM,
5.825% VRN 7/10/38 (h) | | | 65,418 | | | | 65,964 | |
GS Mortgage Securities Corp. II, Series 2018-GS10, Class D
3.000% 7/10/51 (d) | | | 499,000 | | | | 458,818 | |
Hudson Yards Mortgage Trust,
Series 2019-30HY, Class E,
3.558% VRN 7/10/39 (d) (h) | | | 630,000 | | | | 632,039 | |
JP Morgan Chase Commercial Mortgage Securities Trust,Series 2019-OSB, Class E,
3.909% VRN 6/05/39 (d) (h) | | | 553,000 | | | | 573,073 | |
| | | | | | | | |
| | | Principal
Amount | | | Value | |
JPMBB Commercial Mortgage Securities Trust
Series 2015-C27, Class C,
4.486% VRN 2/15/48 (h) | | $ | 1,065,400 | | | $ | 1,110,637 | |
Series 2014-C21, Class C,
4.813% VRN 8/15/47 (h) | | | 200,000 | | | | 210,416 | |
KNDL Mortgage Trust, Series 2019-KNSQ, Class E, 1 mo. USD LIBOR + 1.800%
3.828% FRN 5/15/36 (d) | | | 263,000 | | | | 263,007 | |
Morgan Stanley Capital I Trust,Series 2019-L2, Class AS
4.272% 3/15/52 | | | 400,000 | | | | 451,508 | |
MSCG Trust, Series 2018-SELF, Class C, 1 mo. USD LIBOR + 1.180%
3.208% FRN 10/15/37 (d) | | | 100,000 | | | | 99,999 | |
TIAA Seasoned Commercial Mortgage Trust,Series 2007-C4, Class AJ,
5.483% VRN 8/15/39 (h) | | | 3,492 | | | | 3,506 | |
Wells Fargo Commercial Mortgage Trust, Series 2015-NXS1, Class C,
3.848% VRN 5/15/48 (h) | | | 140,000 | | | | 144,124 | |
WF-RBS Commercial Mortgage Trust
Series 2012-C8, Class C,
5.049% VRN 8/15/45 (h) | | | 100,000 | | | | 104,627 | |
Series 2011-C5, Class D,
5.858% VRN 11/15/44 (d) (h) | | | 115,000 | | | | 119,257 | |
Series 2011-C5, Class C,
5.858% VRN 11/15/44 (d) (h) | | | 170,000 | | | | 179,370 | |
| | | | | | | | |
| | | | | | | 9,469,193 | |
| | | | | | | | |
| Home Equity ABS — 0.1% | |
Countrywide Partnership Trust,Series 2004-EC1, Class M1, 1 mo. USD LIBOR + .900%
2.918% FRN 2/25/35 | | | 193,391 | | | | 190,031 | |
Credit Suisse Seasoned Loan Trust,Series 2006-1, Class A, 1 mo. USD LIBOR + .240%
2.258% FRN 10/25/34 (d) | | | 76,425 | | | | 76,256 | |
Mastr Asset-Backed Securities Trust, Series 2005, Class NC1 M1, 1 mo. USD LIBOR + .720%
2.738% FRN 12/25/34 | | | 99,504 | | | | 97,668 | |
| | | | | | | | |
| | | | | | | 363,955 | |
| | | | | | | | |
| Other ABS — 14.6% | |
321 Henderson Receivables LLC,Series 2015-1A, Class A
3.260% 9/15/72 (d) | | | 74,673 | | | | 78,621 | |
AASET Trust,Series 2019-1, Class A
3.844% 5/15/39 (d) | | | 403,395 | | | | 404,127 | |
The accompanying notes are an integral part of the financial statements.
97
MassMutual Premier Diversified Bond Fund – Portfolio of Investments(Continued)
| | | | | | | | |
| | | Principal
Amount | | | Value | |
AASET US Ltd.,Series 2018-2A, Class A
4.454% 11/18/38 (d) | | $ | 656,214 | | | $ | 673,154 | |
AIMCO CLO Series Ltd.,
Series2018-AA, Class B, 3 mo.
USD LIBOR + 1.400%
3.703% FRN 4/17/31 (d) | | | 250,000 | | | | 244,321 | |
Anchorage Capital Clo 11 Ltd.,Series 2019-11A, Class C, 3 mo. USD LIBOR + 3.000%
5.144% FRN 7/22/32 (d) | | | 250,000 | | | | 250,200 | |
Anchorage Capital CLO Ltd.,Series 2019-11A, Class A, 3 mo. USD LIBOR + 1.390%
3.534% FRN 7/22/32 (d) | | | 500,000 | | | | 499,982 | |
Arbys Funding LLC,Series 2015-1A, Class A2
4.969% 10/30/45 (d) | | | 259,875 | | | | 279,929 | |
Argent Securities, Inc. Asset-Backed Pass-Through Certificates,Series 2004-W10, Class M1, 1 mo. USD LIBOR + .900%
2.918% FRN 10/25/34 | | | 294,373 | | | | 293,488 | |
Ascentium Equipment Receivables Trust
Series 2019-1A, Class E,
4.310% 4/12/27 (d) | | | 228,000 | | | | 234,526 | |
Series 2018-2A, Class E,
5.180% 7/10/26 (d) | | | 998,000 | | | | 1,036,283 | |
Atrium XV, Series 15A, Class B, 3 mo. USD LIBOR + 1.750%
4.009% FRN 1/23/31 (d) | | | 250,000 | | | | 248,799 | |
Avery Point VII CLO Ltd.,Series 2015-7A, Class DR, 3 mo. USD LIBOR + 3.600%
5.903% FRN 1/15/28 (d) | | | 250,000 | | | | 249,824 | |
Benefit Street Partners CLO X Ltd.,Series 2016-10A, Class CR, 3 mo. USD LIBOR + 3.500%
5.803% FRN 1/15/29 (d) | | | 250,000 | | | | 248,396 | |
Blackbird Capital Aircraft Lease Securitization Ltd.,Series 2016-1A, Class A,
4.213% STEP 12/16/41 (d) | | | 416,667 | | | | 429,746 | |
BRE Grand Islander Timeshare Issuer LLC
Series 2017-1A, Class A,
2.940% 5/25/29 (d) | | | 113,291 | | | | 114,460 | |
Series 2017-1A, Class B,
3.240% 5/25/29 (d) | | | 93,588 | | | | 93,915 | |
Canyon Capital CLO Ltd.,Series 2019-2A, Class C, 3 mo. USD LIBOR + 2.750%
4.894% FRN 10/15/32 (d) | | | 250,000 | | | | 250,000 | |
Capital Automotive LLC,Series 2017-1A, Class A2
4.180% 4/15/47 (d) | | | 151,732 | | | | 155,141 | |
| | | | | | | | |
| | | Principal
Amount | | | Value | |
Capital Automotive REIT,Series 2014-1A, Class A
3.660% 10/15/44 (d) | | $ | 96,147 | | | $ | 97,369 | |
Castlelake Aircraft Securitization,Series 2019-1A, Class B
5.095% 4/15/39 (d) | | | 250,303 | | | | 253,695 | |
Castlelake Aircraft Structured Trust,Series 2019-1A, Class A
3.967% 4/15/39 (d) | | | 240,676 | | | | 244,334 | |
CIFC Funding V Ltd.,Series 2017-5A, Class A1, 3 mo. USD LIBOR + 1.180%
3.483% FRN 11/16/30 (d) | | | 250,000 | | | | 249,780 | |
CLI Funding V LLC,Series 2014-2A, Class A
3.380% 10/18/29 (d) | | | 46,459 | | | | 47,232 | |
CLI Funding VI LLC
Series 2017-1A, Class A,
3.620% 5/18/42 (d) | | | 284,725 | | | | 285,525 | |
Series 2019-1A, Class B,
4.640% 5/18/44 (d) | | | 123,339 | | | | 127,355 | |
Countrywide Asset-Backed Certificates,Series 2004-5, Class 3A, 1 mo. USD LIBOR + .460%
2.478% FRN 9/25/34 | | | 7,261 | | | | 6,911 | |
Crestline Denali CLO XIV Ltd.
Series 2016-1A, Class A1R, 3 mo. USD LIBOR + 1.280%
3.539% FRN 10/23/31 (d) | | | 350,000 | | | | 349,817 | |
Series 2016-1A, Class BR, 3 mo. USD LIBOR + 1.800%
4.059% FRN 10/23/31 (d) | | | 250,000 | | | | 247,532 | |
CWABS Asset-Backed Certificates Trust,Series 2005-4, Class MV5, 1 mo. USD LIBOR + 1.005%
3.023% FRN 10/25/35 | | | 440,000 | | | | 437,230 | |
DB Master Finance LLC
Series 2019-1A, Class A2II,
4.021% 5/20/49 (d) | | | 325,185 | | | | 332,206 | |
Series 2019-1A, Class A23,
4.352% 5/20/49 (d) | | | 294,263 | | | | 311,542 | |
Domino’s Pizza Master Issuer LLC
Series 2018-1A, Class A2I,
4.116% 7/25/48 (d) | | | 266,625 | | | | 278,276 | |
Series 2017-1A, Class A23,
4.118% 7/25/47 (d) | | | 166,600 | | | | 175,889 | |
Series 2015-1A, Class A2II,
4.474% 10/25/45 (d) | | | 599,850 | | | | 627,201 | |
Eaton Vance CLO Ltd.,Series 2013-1A, Class BRR, 3 mo. USD LIBOR + 2.800%
5.017% FRN 1/15/28 (d) | | | 250,000 | | | | 250,051 | |
Elara HGV Timeshare Issuer LLC
Series 2016-A, Class A,
2.730% 4/25/28 (d) | | | 146,723 | | | | 146,929 | |
The accompanying notes are an integral part of the financial statements.
98
MassMutual Premier Diversified Bond Fund – Portfolio of Investments(Continued)
| | | | | | | | |
| | | Principal
Amount | | | Value | |
Series 2016-A, Class B,
3.220% 4/25/28 (d) | | $ | 89,465 | | | $ | 89,344 | |
Elmwood CLO II Ltd.,Series 2019-2A, Class A, 3 mo. USD LIBOR + 1.450%
3.995% FRN 4/20/31 (d) | | | 450,000 | | | | 450,329 | |
FCI Funding LLC,Series 2019-1A, Class A
3.630% 2/18/31 (d) | | | 87,660 | | | | 88,295 | |
Fremont Home Loan Trust,Series 2005-2, Class M2, 1 mo. USD LIBOR + .720%
2.738% FRN 6/25/35 | | | 15,879 | | | | 15,866 | |
Galaxy XX CLO Ltd.,Series 2015-20A, Class AR, 3 mo. USD LIBOR + 1.000%
3.278% FRN 4/20/31 (d) | | | 250,000 | | | | 247,528 | |
Global SC Finance IV Ltd.,Series 2017-1A, Class A
3.850% 4/15/37 (d) | | | 223,492 | | | | 229,963 | |
Goldentree Loan Management US CLO Ltd.,Series 2019-5A, Class C, 3 mo. USD LIBOR + 2.700%
4.888% FRN 10/20/32 (d) | | | 250,000 | | | | 249,981 | |
Goodgreen Trust
Series 2016-1A, Class A,
3.230% 10/15/52 (d) | | | 310,744 | | | | 318,481 | |
Series 2017-1A, Class A,
3.740% 10/15/52 (d) | | | 167,468 | | | | 174,281 | |
Harbor Park CLO Ltd.,Series 2018-1A, Class B1, 3 mo. USD LIBOR + 1.700%
3.978% FRN 1/20/31 (d) | | | 280,000 | | | | 278,289 | |
Helios Issuer LLC,Series 2017-1A, Class A
4.940% 9/20/49 (d) | | | 264,533 | | | | 277,080 | |
Hero Funding Trust
Series 2016-3A, Class A1,
3.080% 9/20/42 (d) | | | 147,169 | | | | 149,552 | |
Series 2017-3A, Class A1,
3.190% 9/20/48 (d) | | | 187,424 | | | | 191,297 | |
Series 2017-2A, Class A1,
3.280% 9/20/48 (d) | | | 71,830 | | | | 72,458 | |
Series 2016-4A, Class A2,
4.290% 9/20/47 (d) | | | 144,682 | | | | 151,085 | |
Hilton Grand Vacations Trust,Series 2014-AA, Class A
1.770% 11/25/26 (d) | | | 20,832 | | | | 20,747 | |
Horizon Aircraft Finance I Ltd.,Series 2018-1, Class B
5.270% 12/15/38 (d) | | | 234,551 | | | | 240,026 | |
Horizon Aircraft Finance II Ltd.,Series 2019-1, Class B
4.703% 7/15/39 (d) | | | 284,167 | | | | 284,635 | |
HPS Loan Management Ltd.,Series 15A-19, Class C, 3 mo. USD LIBOR + 2.700%
4.866% FRN 7/22/32 (d) | | | 250,000 | | | | 249,997 | |
ICG US CLO Ltd.,Series 2019-1A, Class A1A, 3 mo. USD LIBOR + 1.380%
3.496% FRN 10/26/32 (d) | | | 250,000 | | | | 249,994 | |
| | | | | | | | |
| | | Principal
Amount | | | Value | |
J.G. Wentworth XLII LLC,Series 2018-2A, Class B
4.700% 10/15/77 (d) | | $ | 90,000 | | | $ | 99,008 | |
J.G. Wentworth XLIII LLC,Series 2019-1A, Class B
4.510% 8/15/73 (d) | | | 138,000 | | | | 145,193 | |
JP Morgan Mortgage Acquisition Trust,Series 2006-CH1, Class A5, 1 mo. USD LIBOR + .230%
2.248% FRN 7/25/36 | | | 12,500 | | | | 12,471 | |
Kayne CLO 4 Ltd.,Series 2019-4A, Class B1, 3 mo. USD LIBOR + 2.100%
FRN 4/25/32 (d) | | | 250,000 | | | | 249,983 | |
KDAC Aircraft Finance Ltd.,Series 2017-1A, Class A
4.212% 12/15/42 (d) | | | 560,871 | | | | 574,505 | |
Kestrel Aircraft Funding Limited,Series 2018-1A, Class A
4.250% 12/15/38 (d) | | | 414,345 | | | | 424,270 | |
KKR CLO Ltd., Series 26, Class B1, 3 mo. USD LIBOR + 2.050%
4.230% FRN 7/15/32 (d) | | | 250,000 | | | | 249,983 | |
KREF Ltd,Series 2018-FL1, Class D, 1 mo. USD LIBOR + 2.550%
4.575% FRN 6/15/36 (d) | | | 450,000 | | | | 454,136 | |
Labrador Aviation Finance Ltd.,Series 2016-1A, Class A1
4.300% 1/15/42 (d) | | | 391,667 | | | | 400,424 | |
Madison Park Funding XXVIII Ltd.,Series 2018-28A, Class B, 3 mo. USD LIBOR + 1.600%
3.903% FRN 7/15/30 (d) | | | 950,000 | | | | 939,855 | |
Madison Park Funding XXXI Ltd.,Series 2018-31A, Class B, 3 mo. USD LIBOR + 1.700%
3.959% FRN 1/23/31 (d) | | | 250,000 | | | | 247,972 | |
Magnetite XV Ltd.,Series 2015-15A, Class CR, 3 mo.
USD LIBOR + 1.800%
4.076% FRN 7/25/31 (d) | | | 490,000 | | | | 474,825 | |
Marble Point CLO XI Ltd.,Series 2017-2A, Class A, 3 mo. USD LIBOR + 1.180%
3.480% FRN 12/18/30 (d) | | | 250,000 | | | | 248,765 | |
Mosaic Solar Loans LLC,Series 2017-1A, Class A
4.450% 6/20/42 (d) | | | 58,445 | | | | 61,012 | |
MP CLO III Ltd.,Series 2013-1A, Class AR, 3 mo.
USD LIBOR + 1.250%
3.528% FRN 10/20/30 (d) | | | 250,000 | | | | 249,780 | |
MVW Owner Trust,Series 2013-1A, Class A
2.150% 4/22/30 (d) | | | 22,682 | | | | 22,636 | |
The accompanying notes are an integral part of the financial statements.
99
MassMutual Premier Diversified Bond Fund – Portfolio of Investments(Continued)
| | | | | | | | |
| | | Principal
Amount | | | Value | |
New Residential Advance Receivables Trust,Series 2019-T2, Class DT2
3.060% 8/15/53 (d) | | $ | 262,000 | | | $ | 261,322 | |
NP SPE II LLC,Series 2017-1A,
Class A2
4.219% 10/21/47 (d) | | | 380,000 | | | | 403,333 | |
NRZ Advance Receivables Trust,Series 2016-T3, Class AT3
2.833% 10/15/51 (d) | | | 1,700,000 | | | | 1,698,607 | |
OHA Credit Funding 4 Ltd.,Series 2019-4A, Class A1, 3 mo. USD LIBOR + 1.330%
1.000% FRN 10/22/32 (d) (g) | | | 250,000 | | | | 250,000 | |
OHA Credit Partners XI Ltd.,Series 2015-11A, Class CR, 3 mo. USD LIBOR + 2.150%
4.428% FRN 1/20/32 (d) | | | 300,000 | | | | 293,460 | |
OneMain Financial Issuance Trust
Series 2019-2A, Class A,
3.140% 10/14/36 (d) | | | 1,700,000 | | | | 1,700,423 | |
Series 2019-2A, Class C,
3.660% 10/14/36 (d) | | | 400,000 | | | | 400,020 | |
Orange Lake Timeshare Trust
Series 2014-AA, Class A,
2.290% 7/09/29 (d) | | | 15,332 | | | | 15,304 | |
Series 2016-A, Class B,
2.910% 3/08/29 (d) | | | 96,053 | | | | 95,099 | |
Series 2019-A, Class D,
4.930% 4/09/38 (d) | | | 775,438 | | | | 783,289 | |
Park Place Securities, Inc.
Series 2005-WCW3, Class M1, 1 mo. USD LIBOR + .480%
2.498% FRN 8/25/35 | | | 53,180 | | | | 53,102 | |
Series 2005-WCW2, Class M1, 1 mo. USD LIBOR + .750%
2.768% FRN 7/25/35 | | | 10,131 | | | | 10,124 | |
Pioneer Aircraft Finance Ltd.,Series 2019-1, Class B
4.948% 6/15/44 (d) | | | 356,702 | | | | 367,431 | |
PNMAC GMSR Issuer Trust,Series 2018-GT1, Class A
5.340% 2/25/23 (d) | | | 210,000 | | | | 210,125 | |
Popular ABS Mortgage Pass-Through Trust,Series 2006-B, Class A3, 1 mo. USD LIBOR + .280%
2.298% FRN 5/25/36 | | | 28,358 | | | | 28,195 | |
Primose Funding LLC,Series 2019-1A, Class A2
4.475% 7/30/49 (d) | | | 229,000 | | | | 227,789 | |
Rockford Tower CLO Ltd.,Series 2018-1A, Class B, 3 mo. USD LIBOR + 1.720%
3.856% FRN 5/20/31 (d) | | | 250,000 | | | | 248,764 | |
| | | | | | | | |
| | | Principal
Amount | | | Value | |
RR 3 Ltd.,Series 2018-3A, Class A1R2, 3 mo. USD LIBOR + 1.090%
3.393% FRN 1/15/30 (d) | | $ | 500,000 | | | $ | 497,313 | |
Sierra Receivables Funding LLC
Series 2019-1A, Class D,
4.750% 1/20/36 (d) | | | 592,772 | | | | 606,390 | |
Sierra Timeshare Receivables Funding LLC
Series 2015-3A, Class A,
2.580% 9/20/32 (d) | | | 36,276 | | | | 36,277 | |
Series 2015-3A, Class B,
3.080% 9/20/32 (d) | | | 15,961 | | | | 16,036 | |
Series 2019-2A, Class C,
3.120% 5/20/36 (d) | | | 183,679 | | | | 185,286 | |
Series 2016-1A, Class B,
3.670% 3/21/33 (d) | | | 39,651 | | | | 40,029 | |
Steele Creek CLO Ltd.,Series 2018-2A, Class C, 3 mo. USD LIBOR + 2.300%
4.424% FRN 8/18/31 (d) | | | 490,000 | | | | 473,535 | |
Store Master Funding LLC
Series 2013-3A, Class A1,
4.240% 11/20/43 (d) | | | 108,309 | | | | 108,267 | |
Series 2018-1A, Class A4,
4.740% 10/20/48 (d) | | | 238,900 | | | | 257,787 | |
Sunnova Helios II Issuer LLC,Series 2018-1A, Class A
4.870% 7/20/48 (d) | | | 120,053 | | | | 131,245 | |
SuttonPark Structured Settlements LLC,Series 2017-1A, Class A
4.190% 1/15/71 (d) | | | 301,018 | | | | 330,928 | |
Taco Bell Funding LLC
Series 2018-1A, Class A2II,
4.940% 11/25/48 (d) | | | 307,675 | | | | 327,240 | |
Series 2016-1A, Class A23,
4.970% 5/25/46 (d) | | | 430,100 | | | | 457,734 | |
Textainer Marine Containers V Ltd.
Series 2017-2A, Class A,
3.520% 6/20/42 (d) | | | 188,257 | | | | 190,458 | |
Series 2017-1A, Class A,
3.720% 5/20/42 (d) | | | 238,189 | | | | 242,887 | |
Textainer Marine Containers VII Ltd.
Series 2018-1A, Class A,
4.110% 7/20/43 (d) | | | 366,400 | | | | 370,672 | |
Series 2019-1A, Class B,
5.280% 4/20/44 (d) | | | 206,867 | | | | 215,283 | |
THL Credit Wind River CLO Ltd.,Series 2018-3A, Class B, 3 mo. USD LIBOR + 1.700%
3.978% FRN 1/20/31 (d) | | | 490,000 | | | | 487,551 | |
TICP CLO VI Ltd,Series 2016-6A,
Class DR, 3 mo. USD LIBOR + 3.300%
5.603% FRN 1/15/29 (d) | | | 350,000 | | | | 345,324 | |
The accompanying notes are an integral part of the financial statements.
100
MassMutual Premier Diversified Bond Fund – Portfolio of Investments(Continued)
| | | | | | | | |
| | | Principal
Amount | | | Value | |
TICP CLO XIV Ltd.,Series 2019-14A, Class A2, 3 mo. USD LIBOR + 1.900%
4.021% FRN 10/20/32 (d) | | $ | 250,000 | | | $ | 249,992 | |
Trafigura Securitisation Finance PLC,Series 2017-1A, Class B
4.184% 12/15/20 (d) | | | 230,000 | | | | 230,261 | |
Trinity Rail Leasing LP
Series 2019-1A, Class A,
3.820% 4/17/49 (d) | | | 686,993 | | | | 713,361 | |
Series 2018-1A, Class A2,
4.620% 6/17/48 (d) | | | 430,000 | | | | 461,734 | |
Trip Rail Master Funding LLC,Series 2017-1A, Class A2
3.736% 8/15/47 (d) | | | 140,000 | | | | 144,453 | |
Triton Container Finance IV LLC,Series 2017-2A, Class A
3.620% 8/20/42 (d) | | | 476,964 | | | | 475,278 | |
Triton Container Finance VI LLC,Series 2017-1A, Class A
3.520% 6/20/42 (d) | | | 147,754 | | | | 147,362 | |
VSE VOI Mortgage LLC,Series 2016-A, Class B
2.740% 7/20/33 (d) | | | 47,339 | | | | 47,384 | |
Wave Usa Waav
4.581% 9/15/44 (d) (g) | | | 635,000 | | | | 634,999 | |
Wendy’s Funding LLC,Series 2015-1A, Class A23
4.497% 6/15/45 (d) | | | 336,000 | | | | 340,220 | |
Westgate Resorts LLC,Series 2017-1A, Class A
3.050% 12/20/30 (d) | | | 123,313 | | | | 123,825 | |
Willis Engine Structured Trust III,Series 2017-A, Class A,
4.690% STEP 8/15/42 (d) | | | 402,812 | | | | 417,155 | |
Willis Engine Structured Trust IV,Series 2018-A, Class A,
4.750% STEP 9/15/43 (d) | | | 247,943 | | | | 258,167 | |
| | | | | | | | |
| | | | | | | 35,748,652 | |
| | | | | | | | |
| Student Loans ABS — 9.2% | |
Academic Loan Funding Trust,Series 2012-1A, Class A2, 1 mo. USD LIBOR + 1.100%
3.118% FRN 12/27/44 (d) | | | 373,553 | | | | 373,553 | |
Access Group, Inc.
Series 2005-1, Class B, 3 mo. USD LIBOR + .570%
2.729% FRN 9/22/37 | | | 304,255 | | | | 292,040 | |
Series 2006-1, Class B, 3 mo. USD LIBOR + .450%
2.582% FRN 8/25/37 | | | 477,101 | | | | 462,900 | |
Series 2015-1, Class B,
3.645% 7/25/58 (d) | | | 130,000 | | | | 122,185 | |
| | | | | | | | |
| | | Principal
Amount | | | Value | |
AccessLex Institute
Series 2004-A, Class A3, 28 day ARS, 1.699% FRN 7/01/39 | | $ | 500,000 | | | $ | 492,749 | |
Series 2003-A, Class A3,
3.260% 7/01/38 | | | 6,071 | | | | 6,002 | |
Brazos Higher Education Authority, Inc. 3.518% FRN 6/25/42 (h) | | | 450,000 | | | | 444,923 | |
College Avenue Student Loans LLC
Series 2019-A, Class C,
4.460% 12/28/48 (d) | | | 225,000 | | | | 228,645 | |
Series 2019-A, Class D,
5.500% 12/28/48 (d) | | | 174,000 | | | | 176,381 | |
Commonbond Student Loan Trust,Series 2017-AGS, Class C
5.280% 5/25/41 (d) | | | 113,795 | | | | 118,517 | |
Credit Suisse ABS Repackaging Trust,Series 2013-A, Class B
2.500% 1/25/30 (d) | | | 106,972 | | | | 104,298 | |
DRB Prime Student Loan Trust,Series 2015-A, Class A2
3.060% 7/25/31 (d) | | | 57,928 | | | | 59,023 | |
Earnest Student Loan Program LLC,Series 2016-D, Class A2
2.720% 1/25/41 (d) | | | 122,739 | | | | 122,944 | |
ECMC Group Student Loan Trust,Series 2016-1A, Class A, 1 mo. USD LIBOR + 1.350%
3.368% FRN 7/26/66 (d) | | | 411,708 | | | | 414,677 | |
EdLinc Student Loan Funding Trust,Series 2017-A, Class A, Prime 1.150% 4.350% FRN 12/01/47 (d) | | | 403,152 | | | | 401,542 | |
Goal Capital Funding Trust,Series 2006-1, Class B, 3 mo. USD LIBOR + .450%
2.582% FRN 8/25/42 | | | 566,081 | | | | 518,972 | |
KeyCorp Student Loan Trust,Series 1999-B, Class CTFS, 3 mo. USD LIBOR + .900%
3.032% FRN 11/25/36 | | | 19,725 | | | | 19,728 | |
Navient Private Education Refi Loan Trust,Series 2018-CA, Class B
4.220% 6/16/42 (d) | | | 530,000 | | | | 544,469 | |
Navient Student Loan Trust
Series 2017-5A, Class A, 1 mo. USD LIBOR + .800%
2.818% FRN 7/26/66 (d) | | | 274,742 | | | | 273,702 | |
Series 2019-1A, Class A2, 1 mo. USD LIBOR + .900%
2.918% FRN 12/27/67 (d) | | | 700,000 | | | | 699,999 | |
Series 2019-BA, Class A2B, 1 mo. USD LIBOR + .980%
3.008% FRN 12/15/59 (d) | | | 1,000,000 | | | | 996,081 | |
Series 2018-1A, Class B, 1 mo. USD LIBOR + 1.200%
3.218% FRN 3/25/67 (d) | | | 250,000 | | | | 247,356 | |
The accompanying notes are an integral part of the financial statements.
101
MassMutual Premier Diversified Bond Fund – Portfolio of Investments(Continued)
| | | | | | | | |
| | | Principal
Amount | | | Value | |
Series 2016-6A, Class A3, 1 mo. USD LIBOR + 1.300%
3.318% FRN 3/25/66 (d) | | $ | 1,030,000 | | | $ | 1,047,758 | |
Series 2015-2, Class B, 1 mo. USD LIBOR + 1.500%
3.518% FRN 8/25/50 | | | 700,000 | | | | 697,294 | |
Series 2018-EA, Class B,
4.440% 12/15/59 (d) | | | 140,000 | | | | 153,724 | |
Nelnet Private Education Loan Trust
Series 2016-A, Class A1B,
3.600% 12/26/40 (d) | | | 96,119 | | | | 97,211 | |
Series 2016-A, Class A1A, 1 mo. USD LIBOR + 1.750%
3.768% FRN 12/26/40 (d) | | | 85,810 | | | | 85,388 | |
Nelnet Student Loan Trust
Series 2006-3, Class B, 3 mo. USD LIBOR + .250%
2.356% FRN 6/25/41 | | | 134,317 | | | | 124,413 | |
Series 2012-2A, Class B, 1 mo. USD LIBOR + 1.000%
3.018% FRN 11/25/36 (d) | | | 200,000 | | | | 190,212 | |
Series 2012-1A, Class B, 1 mo. USD LIBOR + 1.000%
3.018% FRN 6/25/42 (d) | | | 150,000 | | | | 142,060 | |
Series 2012-4A, Class B, 1 mo. USD LIBOR + 1.000%
3.018% FRN 7/26/49 (d) | | | 350,000 | | | | 335,043 | |
Series 2005-4, Class A4R2, 28 day ARS
3.089% FRN 3/22/32 | | | 150,000 | | | | 142,103 | |
Series 2014-2A, Class B, 1 mo. USD LIBOR + 1.500%
3.518% FRN 6/25/41 (d) | | | 100,000 | | | | 99,487 | |
Series 2014-1A, Class B, 1 mo. USD LIBOR + 1.500%
3.518% FRN 10/25/47 (d) | | | 440,000 | | | | 422,150 | |
Series 2014-5A, Class B, 1 mo. USD LIBOR + 1.500%
3.518% FRN 5/26/54 (d) | | | 100,000 | | | | 96,573 | |
Series 2018-5A, Class B, 1 mo. USD LIBOR + 1.450%
3.595% FRN 2/25/67 (d) | | | 500,000 | | | | 494,216 | |
Pennsylvania Higher Education Assistance Agency,Series 2015-1A, Class B, 1 mo. USD LIBOR + 1.500%
3.518% FRN 4/25/45 (d) | | | 130,000 | | | | 121,553 | |
PHEAA Student Loan Trust,Series 2016-2A, Class A, 1 mo. USD LIBOR + .950%
2.968% FRN 11/25/65 (d) | | | 356,974 | | | | 357,873 | |
SLM Student Loan Trust
Series 2006-2, Class R, 0.000% 1/25/41 | | | 1,363 | | | | 667,922 | |
Series 2002-7, Class A11, 28 day ARS 1.836% FRN 3/15/28 | | | 50,000 | | | | 50,000 | |
| | | | | | | | |
| | | Principal
Amount | | | Value | |
Series 2007-1, Class A6, 3 mo. USD LIBOR + .140%
2.416% FRN 1/27/42 | | $ | 100,000 | | | $ | 94,113 | |
Series 2005-3, Class B, 3 mo. USD LIBOR + .150%
2.426% FRN 4/25/40 | | | 133,059 | | | | 123,135 | |
Series 2005-4, Class A4, 3 mo. USD LIBOR + .170%
2.446% FRN 7/25/40 | | | 700,000 | | | | 662,149 | |
Series 2006-7, Class B, 3 mo. USD LIBOR + .200%
2.476% FRN 1/27/42 | | | 341,307 | | | | 313,693 | |
Series 2006-4, Class B, 3 mo. USD LIBOR + .200%
2.476% FRN 1/25/70 | | | 179,068 | | | | 166,595 | |
Series 2006-5, Class B, 3 mo. USD LIBOR + .210%
2.486% FRN 10/25/40 | | | 150,669 | | | | 140,369 | |
Series 2006-10, Class B, 3 mo. USD LIBOR + .220%
2.496% FRN 3/25/44 | | | 367,087 | | | | 345,222 | |
Series 2005-6, Class B, 3 mo. USD LIBOR + .290%
2.566% FRN 1/25/44 | | | 365,054 | | | | 341,067 | |
Series 2005-9, Class B, 3 mo. USD LIBOR + .300%
2.576% FRN 1/25/41 | | | 449,173 | | | | 420,097 | |
Series 2004-3, Class B, 3 mo. USD LIBOR + .470%
2.746% FRN 10/25/64 | | | 122,039 | | | | 115,526 | |
Series 2003-14, Class A7, 3 mo. USD LIBOR + .600%
2.876% FRN 10/25/65 (d) | | | 910,000 | | | | 897,523 | |
Series 2013-2, Class B, 1 mo. USD LIBOR + 1.500%
3.518% FRN 6/25/43 | | | 310,000 | | | | 304,013 | |
Series 2013-4, Class B, 1 mo. USD LIBOR + 1.500%
3.518% FRN 12/28/70 | | | 605,000 | | | | 586,025 | |
Series 2013-1, Class B,, 1 mo. USD LIBOR + 1.800%
3.818% FRN 11/25/70 | | | 381,000 | | | | 380,412 | |
Series 2003-5, Class A7, 28 day ARS
4.490% FRN 6/15/30 | | | 50,000 | | | | 50,000 | |
Series 2002-7, Class B, 28 day ARS
5.550% FRN 12/15/39 | | | 600,000 | | | | 599,333 | |
SMB Private Education Loan Trust
Series 2016-B, Class A2A, 2.430% 2/17/32 (d) | | | 150,901 | | | | 151,560 | |
Series 2019-A, Class A2B, 1 mo. USD LIBOR + .870%
2.898% FRN 7/15/36 (d) | | | 101,000 | | | | 100,597 | |
Series 2019-A, Class B,
4.000% 11/17/42 (d) | | | 185,000 | | | | 199,912 | |
The accompanying notes are an integral part of the financial statements.
102
MassMutual Premier Diversified Bond Fund – Portfolio of Investments(Continued)
| | | | | | | | |
| | | Principal
Amount | | | Value | |
Series 2015-C, Class C,
4.500% 9/17/46 (d) | | $ | 350,000 | | | $ | 370,089 | |
SoFi Professional Loan Program LLC
Series 2015-A, Class RC,
0.000% 3/25/33 (d) | | | 200 | | | | 175,000 | |
Series 2018-A, Class R1, 0.000% 2/25/42 (d) | | | 1,000,000 | | | | 782,400 | |
Series 2019-A, Class R1, 0.000% 6/15/48 (d) | | | 1,361,200 | | | | 408,360 | |
Series 2017-D, Class R1,
0.000% 9/25/40 (d) | | | 1,000,000 | | | | 542,700 | |
Series 2018-D, Class R1,
0.000% 2/25/48 (d) | | | 911,500 | | | | 314,467 | |
Series 2017-D, Class BFX,
3.610% 9/25/40 (d) | | | 500,000 | | | | 536,569 | |
Series 2017-C, Class C,
4.210% VRN 7/25/40 (d) (h) | | | 180,000 | | | | 192,352 | |
Series 2017-A, Class C,
4.430% VRN 3/26/40 (d) (h) | | | 170,000 | | | | 186,877 | |
South Carolina Student Loan Corp.
Series 2015-A, Class A, 1 mo. USD LIBOR + 1.500%
3.518% FRN 1/25/36 | | | 108,241 | | | | 108,793 | |
Series 2014-1, Class B, 1 mo. USD LIBOR + 1.500%
3.600% FRN 8/01/35 | | | 550,000 | | | | 554,352 | |
| | | | | | | | |
| | | | | | | 22,608,966 | |
| | | | | | | | |
| WL Collateral CMO — 1.0% | |
Angel Oak Mortgage Trust I LLC
Series 2019-4, Class M1,
3.459% VRN 7/26/49 (d) (h) | | | 492,000 | | | | 495,498 | |
Series 2019-2, Class M1,
4.065% VRN 3/25/49 (d) (h) | | | 260,000 | | | | 268,381 | |
Bank of America Mortgage Securities,Series 2004-G, Class 2A7,
4.639% VRN 8/25/34 (h) | | | 17,313 | | | | 17,123 | |
Countrywide Home Loans, Inc.
Series 2003-42, Class 1A1,
3.991% VRN 9/25/33 (h) | | | 2,336 | | | | 2,250 | |
Series 2004-2, Class 1A1,
4.612% VRN 2/25/34 (h) | | | 10,167 | | | | 9,579 | |
Deephaven Residential Mortgage Trust
Series 2019-3A, Class M1,
3.405% VRN 7/25/59 (d) (h) | | | 800,000 | | | | 801,208 | |
Series 2019-1A, Class M1,
4.402% VRN 1/25/59 (d) (h) | | | 250,000 | | | | 260,515 | |
GSR Mortgage Loan Trust,Series 2004-9, Class 2A1,
4.308% VRN 8/25/34 (h) | | | 3,705 | | | | 3,696 | |
IndyMac Index Mortgage Loan Trust,Series 2004-AR4, Class 1A,
4.086% VRN 8/25/34 (h) | | | 24,697 | | | | 24,028 | |
| | | | | | | | |
| | | Principal
Amount | | | Value | |
JP Morgan Mortgage Trust,Series 2017-1, Class A11,
3.500% VRN 1/25/47 (d) (h) | | $ | 435,733 | | | $ | 435,083 | |
Merrill Lynch Mortgage Investors, Inc.
Series 2004-A1, Class IA,
3.250% VRN 2/25/34 (h) | | | 1,046 | | | | 1,012 | |
Series 2003-A4, Class IA,
4.764% VRN 7/25/33 (h) | | | 1,120 | | | | 1,090 | |
Structured Adjustable Rate Mortgage Loan Trust,Series 2004-2, Class 2A,
4.266% VRN 3/25/34 (h) | | | 10,577 | | | | 10,336 | |
Washington Mutual Mortgage Pass-Through Certificates,Series 2004-AR2, Class A, 12 mo. MTA + 1.400%
3.846% FRN 4/25/44 | | | 29,843 | | | | 29,474 | |
| | | | | | | | |
| | | | | | | 2,359,273 | |
| | | | | | | | |
| | |
TOTALNON-U.S. GOVERNMENT AGENCY OBLIGATIONS
(Cost $72,827,355) | | | | | | | 74,023,960 | |
| | | | | |
|
| SOVEREIGN DEBT OBLIGATIONS — 0.7% | |
Colombia Government International Bond
6.125% 1/18/41 | | | 440,000 | | | | 573,104 | |
Mexico Government International Bond 4.750% 3/08/44 | | | 554,000 | | | | 599,705 | |
6.750% 9/27/34 | | | 375,000 | | | | 504,375 | |
| | | | | | | | |
| | | | | | | 1,677,184 | |
| | | | | | | | |
| | |
TOTAL SOVEREIGN DEBT OBLIGATIONS
(Cost $1,545,958) | | | | | | | 1,677,184 | |
| | | | | |
|
U.S. GOVERNMENT AGENCY OBLIGATIONS
AND INSTRUMENTALITIES — 20.9% | |
| Collateralized Mortgage Obligations — 0.3% | |
Federal Home Loan Mortgage Corp.
Series 2019-DNA3, Class M2, 4.350% 7/25/49 (d) | | | 439,000 | | | | 438,999 | |
Series 2617, Class Z,
5.500% 5/15/33 | | | 86,449 | | | | 96,722 | |
Series 2693, Class Z,
5.500% 10/15/33 | | | 155,085 | | | | 169,227 | |
Series 2178, Class PB,
7.000% 8/15/29 | | | 9,189 | | | | 10,122 | |
| | | | | | | | |
| | | | | | | 715,070 | |
| | | | | | | | |
| Pass-Through Securities — 20.3% | |
Federal Home Loan Mortgage Corp.
Pool #SB8013 2.500% 9/01/34 | | | 1,537,291 | | | | 1,550,830 | |
Pool #B18677 5.000% 1/01/20 | | | 24 | | | | 24 | |
Pool #G01311 7.000% 9/01/31 | | | 820 | | | | 942 | |
The accompanying notes are an integral part of the financial statements.
103
MassMutual Premier Diversified Bond Fund – Portfolio of Investments(Continued)
| | | | | | | | |
| | | Principal
Amount | | | Value | |
Pool #C80207 7.500% 9/01/24 | | $ | 587 | | | $ | 640 | |
Pool #C00530 7.500% 7/01/27 | | | 600 | | | | 677 | |
Pool #C00563 7.500% 11/01/27 | | | 2,157 | | | | 2,447 | |
Pool #C00612 7.500% 4/01/28 | | | 85 | | | | 97 | |
Pool #C55867 7.500% 2/01/30 | | | 2,492 | | | | 2,784 | |
Federal National Mortgage Association
Pool #MA3797 2.500% 10/01/34 (g) | | | 2,900,000 | | | | 2,925,539 | |
Pool #AR3007 3.000% 2/01/43 | | | 196,450 | | | | 202,220 | |
Pool #AV2325 3.500% 12/01/28 | | | 95,276 | | | | 99,261 | |
Pool #AV1897 3.500% 12/01/28 | | | 31,662 | | | | 32,986 | |
Pool #AS1304 3.500% 12/01/28 | | | 185,950 | | | | 193,727 | |
Pool #BF0196 3.500% 2/01/41 | | | 250,825 | | | | 263,146 | |
Pool #MA1356 3.500% 2/01/43 | | | 1,185,828 | | | | 1,242,226 | |
Pool #BJ0686 4.000% 4/01/48 | | | 1,140,762 | | | | 1,190,876 | |
Pool #CA2039 4.000% 7/01/48 | | | 1,056,738 | | | | 1,100,519 | |
Pool #CA1951 4.000% 7/01/48 | | | 565,726 | | | | 591,286 | |
Pool #BN5342 4.000% 3/01/49 | | | 5,490,051 | | | | 5,693,487 | |
Pool #MA3638 4.000% 4/01/49 | | | 1,530,372 | | | | 1,587,440 | |
Pool #725692 1 year CMT + 2.137%
4.473% FRN 10/01/33 | | | 38,277 | | | | 40,299 | |
Pool #CA1909 4.500% 6/01/48 | | | 1,646,362 | | | | 1,742,275 | |
Pool #CA1952 4.500% 6/01/48 | | | 701,759 | | | | 743,081 | |
Pool #BK7877 4.500% 7/01/48 | | | 419,672 | | | | 444,384 | |
Pool #MA3522 4.500% 11/01/48 | | | 613,151 | | | | 646,620 | |
Pool #MA3537 4.500% 12/01/48 | | | 592,693 | | | | 624,490 | |
Pool #MA3564 4.500% 1/01/49 | | | 580,706 | | | | 611,134 | |
Pool #BN5241 4.500% 2/01/49 | | | 4,139,815 | | | | 4,355,440 | |
Pool #MA3639 4.500% 4/01/49 | | | 1,834,014 | | | | 1,930,113 | |
Pool #888586 1 year CMT + 2.197%
4.548% FRN 10/01/34 | | | 100,339 | | | | 105,640 | |
Pool #735010 5.000% 11/01/19 | | | 21 | | | | 21 | |
Pool #AD6437 5.000% 6/01/40 | | | 66,637 | | | | 73,235 | |
Pool #AD6996 5.000% 7/01/40 | | | 435,370 | | | | 478,478 | |
Pool #AL8173 5.000% 2/01/44 | | | 170,663 | | | | 186,548 | |
Pool #575579 7.500% 4/01/31 | | | 4,514 | | | | 5,226 | |
Pool #535996 7.500% 6/01/31 | | | 731 | | | | 846 | |
Government National Mortgage Association
Pool #581417 7.000% 7/15/32 | | | 1,760 | | | | 2,012 | |
Government National Mortgage Association I
Pool #579140 6.500% 1/15/32 | | | 635 | | | | 716 | |
Pool #587280 6.500% 9/15/32 | | | 996 | | | | 1,114 | |
Pool #550659 6.500% 9/15/35 | | | 67,963 | | | | 78,400 | |
Pool #538689 6.500% 12/15/35 | | | 15,513 | | | | 17,843 | |
Pool #780651 7.000% 10/15/27 | | | 878 | | | | 974 | |
Pool #462384 7.000% 11/15/27 | | | 449 | | | | 498 | |
Pool #482668 7.000% 8/15/28 | | | 848 | | | | 953 | |
Pool #506804 7.000% 5/15/29 | | | 5,015 | | | | 5,487 | |
Pool #423836 8.000% 8/15/26 | | | 575 | | | | 641 | |
Pool #444619 8.000% 3/15/27 | | | 5,706 | | | | 6,320 | |
| | | | | | | | |
| | | Principal
Amount | | | Value | |
Government National Mortgage Association II TBA
Pool #1635 3.500% 10/01/48 (g) | | $ | 11,100,000 | | | $ | 11,499,773 | |
Pool #1367 4.000% 10/01/48 (g) | | | 5,325,000 | | | | 5,537,168 | |
Uniform Mortgage Backed Securities TBA
Pool #7180 3.000% 8/01/33 (g) | | | 1,225,000 | | | | 1,251,988 | |
Pool #21133 4.500% 10/01/48 (g) | | | 2,460,000 | | | | 2,590,111 | |
| | | | | | | | |
| | | | | | | 49,662,982 | |
| | | | | | | | |
| Whole Loans — 0.3% | |
Federal National Mortgage Association Connecticut Avenue Securities Trust
Series 2019-R03, Class 1M2, 1 mo. USD LIBOR + 2.150%
4.168% FRN 9/25/31 (d) | | | 150,000 | | | | 150,696 | |
Series 2019-R02, Class 1M2, 1 mo. USD LIBOR + 2.300%
4.318% FRN 8/25/31 (d) | | | 531,000 | | | | 534,438 | |
Series 2019-R04, Class 2M2, 1 mo. USD LIBOR + 2.100%
4.504% FRN 6/25/39 (d) | | | 200,000 | | | | 200,484 | |
| | | | | | | | |
| | | | | | | 885,618 | |
| | | | | | | | |
| | |
TOTAL U.S. GOVERNMENT AGENCY OBLIGATIONS AND INSTRUMENTALITIES
(Cost $50,940,726) | | | | | | | 51,263,670 | |
| | | | | |
|
| U.S. TREASURY OBLIGATIONS — 2.9% | |
| U.S. Treasury Bonds & Notes — 2.9% | |
U.S. Treasury Bond
2.500% 5/15/46 (i) | | | 3,800,000 | | | | 4,092,273 | |
3.500% 2/15/39 | | | 275,000 | | | | 344,448 | |
U.S. Treasury Note
1.500% 8/15/22 | | | 2,000,000 | | | | 1,995,469 | |
2.250% 8/15/49 | | | 600,000 | | | | 617,180 | |
| | | | | | | | |
| | | | | | | 7,049,370 | |
| | | | | | | | |
| | |
TOTAL U.S. TREASURY OBLIGATIONS
(Cost $6,723,805) | | | | | | | 7,049,370 | |
| | | | | |
| | |
TOTAL BONDS & NOTES
(Cost $229,337,601) | | | | | | | 235,882,689 | |
| | | | | |
| | |
TOTAL PURCHASED
OPTIONS (#) — 0.8%
(Cost $2,088,627) | | | | | | | 2,018,057 | |
| | | | | |
The accompanying notes are an integral part of the financial statements.
104
MassMutual Premier Diversified Bond Fund – Portfolio of Investments(Continued)
| | | | | | | | |
| | |
| | | Number of
Shares | | | Value | |
| WARRANTS — 0.0% | |
| Consumer,Non-cyclical — 0.0% | |
| Chemicals — 0.0% | |
Hercules LLC, Expires 3/31/29, Strike 0.09 (a) (b) (c) | | | 150 | | | $ | 3,812 | |
| | | | | | | | |
| | |
TOTAL WARRANTS
(Cost $0) | | | | | | | 3,812 | |
| | | | | |
|
| MUTUAL FUNDS — 1.2% | |
| Diversified Financial Services — 1.2% | |
State Street Navigator Securities Lending Prime Portfolio (j) | | | 2,921,048 | | | | 2,921,048 | |
| | | | | | | | |
| | |
TOTAL MUTUAL FUNDS
(Cost $2,921,048) | | | | | | | 2,921,048 | |
| | | | | |
| | |
TOTAL LONG-TERM INVESTMENTS
(Cost $234,689,504) | | | | | | | 241,119,904 | |
| | | | | |
| | |
| | | Principal
Amount | | | | |
| SHORT-TERM INVESTMENTS — 11.2% | |
| Commercial Paper — 11.2% | |
AT&T, Inc.
2.398% 11/12/19 (d) | | $ | 2,000,000 | | | | 1,994,556 | |
DowDuPont, Inc.
2.383% 10/21/19 (d) | | | 2,000,000 | | | | 1,997,408 | |
EI Dupont
2.362% 10/15/19 (d) | | | 2,000,000 | | | | 1,998,142 | |
Entergy Corp.
2.480% 10/28/19 (d) | | | 1,000,000 | | | | 998,122 | |
2.496% 10/08/19 (d) | | | 1,000,000 | | | | 999,500 | |
ERAC USA Finance LLC
2.317% 10/03/19 (d) | | | 2,500,000 | | | | 2,499,501 | |
FMC Tech, Inc.
2.286% 10/08/19 (d) | | | 2,000,000 | | | | 1,998,960 | |
General Electric Co.
2.273% 11/18/19 | | | 1,000,000 | | | | 996,893 | |
2.278% 1/02/20 | | | 1,000,000 | | | | 994,013 | |
Mondelez International, Inc.
2.320% 10/17/19 (d) | | | 1,000,000 | | | | 998,934 | |
Parker-Hannifin Corp.
2.292% 11/07/19 (d) | | | 3,000,000 | | | | 2,993,024 | |
Reckitt Benckiser Group PLC
2.483% 1/24/20 (d) | | | 1,000,000 | | | | 992,669 | |
Vodafone Group PLC
2.273% 12/03/19 (d) | | | 3,000,000 | | | | 2,988,000 | |
Volkswagen Credit, Inc.
2.314% 11/21/19 (d) | | | 2,500,000 | | | | 2,491,749 | |
| | | | | | | | |
| | |
| | | Principal
Amount | | | Value | |
Walgreens Boots Alliance, Inc.
2.305% 3/05/20 | | $ | 2,500,000 | | | $ | 2,474,945 | |
| | | | | | | | |
| | | | | | | 27,416,416 | |
| | | | | | | | |
| | |
TOTAL SHORT-TERM INVESTMENTS
(Cost $27,418,084) | | | | | | | 27,416,416 | |
| | | | | |
| | |
TOTAL INVESTMENTS — 109.6%
(Cost $262,107,588) (k) | | | | | | | 268,536,320 | |
| | |
| Other Assets/(Liabilities) — (9.6)% | | | | | | | (23,615,567 | ) |
| | | | | |
| | |
| NET ASSETS — 100.0% | | | | | | $ | 244,920,753 | |
| | | | | |
Abbreviation Legend
| CLO | Collateralized Loan Obligation |
| CMO | Collateralized Mortgage Obligation |
| CMT | Constant Maturity Treasury Index |
| MBS | Mortgage-Backed Security |
| MTA | Monthly Treasury Average Index |
Notes to Portfolio of Investments
Percentages are stated as a percent of net assets.
| (a) | Investment was valued using significant unobservable inputs. |
| (b) | This security is fair valued in good faith in accordance with procedures approved by the Board of Trustees. At September 30, 2019, these securities amounted to a value of $4,619 or 0.00% of net assets. |
| (c) | Non-income producing security. |
| (d) | Security is exempt from registration under Regulation S or Rule 144A of the Securities Act of 1933. These securities are considered restricted and may be resold in transactions exempt from registration. At September 30, 2019, the aggregate market value of these securities amounted to $123,532,422 or 50.44% of net assets. |
| (e) | Security is perpetual and has no stated maturity date. |
| (f) | Denotes all or a portion of security on loan. The total value of securities on loan as of September 30, 2019, was $2,860,876 or 1.17% of net assets. Total securities on loan may be less than the amounts identified in the Portfolio of Investments.(Note 2). |
| (g) | A portion of this security is purchased on a when-issued, delayed-delivery or forward commitment basis.(Note 2). |
| (h) | Certain variable rate securities are not based on a published reference rate and spread but are determined by the issuer or agent and are based on current market conditions. These |
The accompanying notes are an integral part of the financial statements.
105
MassMutual Premier Diversified Bond Fund – Portfolio of Investments(Continued)
Notes to Portfolio of Investments (Continued)
| | securities do not indicate a reference rate and spread in their description above. The rates shown are the current interest rates at September 30, 2019. |
| (i) | A portion of this security is pledged/held as collateral for open futures contracts.(Note 2). |
| (j) | Represents investment of security lending collateral.(Note 2). |
| (k) | See Note 6 for aggregate cost for federal tax purposes. |
(#) Interest Rate Swaptions Purchased
| | | | | | | | | | | | | | | | | | | | | | | | | | | | | | |
| | | | | | | | Paid by Fund | | Received by Fund | | | | | | | | | | | | |
| Description | | Counterparty | | Expiration
Date | | | Rate | | Frequency | | Rate | | Frequency | | Notional
Amount | | | Value | | | Premiums
Paid
(Received) | | | Unrealized
Appreciation/
(Depreciation) | |
| Call | | | | | | | | | | | | | | | | | | | | | | | | | | | | | | |
| 10-Year Interest Rate Swap, 12/15/42 | | Barclays Bank PLC* | | | 12/13/32 | | | 3-Month USD LIBOR BBA | | Quarterly | | 2.44% | | Semi-Annually | | | USD 4,035,000 | | | $ | 375,527 | | | $ | 201,719 | | | $ | 173,808 | |
| | | | | | | | | | |
| 10-Year Interest Rate Swap, 2/02/43 | | Credit Suisse International* | | | 1/31/33 | | | 3-Month USD LIBOR BBA | | Quarterly | | 2.61% | | Semi-Annually | | | USD 4,455,000 | | | | 454,974 | | | | 213,840 | | | | 241,134 | |
| | | | | | | | | | | | | | | | | | | | | | | | | | | | | | |
| | | | 830,501 | | | | 415,559 | | | | 414,942 | |
| | | | | | | | | | | | | | | | | | | | | | | | | | | | | | |
| Put | |
| 10-Year Interest Rate Swap, 12/15/42 | | Barclays Bank PLC* | | | 12/13/32 | | | 2.94% | | Semi-Annually | | 3-Month USD LIBOR BBA | | Quarterly | | | USD 16,440,000 | | | $ | 597,230 | | | $ | 821,885 | | | $ | (224,655 | ) |
| | | | | | | | | | |
| 10-Year Interest Rate Swap, 2/02/43 | | Credit Suisse International* | | | 1/31/33 | | | 3.11% | | Semi-Annually | | 3-Month USD LIBOR BBA | | Quarterly | | | USD 17,770,000 | | | | 590,326 | | | | 851,183 | | | | (260,857 | ) |
| | | | | | | | | | | | | | | | | | | | | | | | | | | | | | |
| | | | 1,187,556 | | | | 1,673,068 | | | | (485,512 | ) |
| | | | | | | | | | | | | | | | | | | | | | | | | | | | | | |
| | | $ | 2,018,057 | | | $ | 2,088,627 | | | $ | (70,570 | ) |
| | | | | | | | | | | | | | | | | | | | | | | | | | | | | | |
| * | Contracts are subject to a Master Netting Agreement. |
Forward contracts
| | | | | | | | | | | | | | | | | | | | |
| Counterparty | | Settlement
Date | | | Currency
Purchased | | | Currency
Sold | | | Unrealized
Appreciation
(Depreciation) | |
Bank of America N.A.* | | | 10/16/19 | | | EUR | | | 89,230 | | | CZK | | | 2,290,460 | | | $ | 558 | |
Bank of America N.A.* | | | 10/16/19 | | | EUR | | | 221,000 | | | HUF | | | 72,162,357 | | | | 6,053 | |
Bank of America N.A.* | | | 10/16/19 | | | EUR | | | 46,657 | | | USD | | | 52,000 | | | | (1,093 | ) |
Bank of America N.A.* | | | 10/16/19 | | | USD | | | 100,720 | | | SEK | | | 952,470 | | | | 3,876 | |
Bank of America N.A.* | | | 10/22/19 | | | AUD | | | 360,122 | | | USD | | | 252,840 | | | | (9,603 | ) |
Bank of America N.A.* | | | 10/22/19 | | | CNH | | | 859,611 | | | USD | | | 121,565 | | | | (1,220 | ) |
Bank of America N.A.* | | | 10/22/19 | | | USD | | | 124,876 | | | CNH | | | 859,611 | | | | 4,531 | |
Bank of America N.A.* | | | 10/29/19 | | | ARS | | | 4,085,058 | | | USD | | | 78,375 | | | | (13,935 | ) |
Bank of America N.A.* | | | 11/12/19 | | | USD | | | 142,000 | | | EUR | | | 129,832 | | | | 58 | |
Bank of America N.A.* | | | 11/12/19 | | | USD | | | 150,655 | | | ILS | | | 521,653 | | | | 277 | |
Barclays Bank PLC* | | | 10/09/19 | | | MXN | | | 1,980,784 | | | USD | | | 98,000 | | | | 2,255 | |
Barclays Bank PLC* | | | 10/16/19 | | | CZK | | | 2,290,460 | | | EUR | | | 88,901 | | | | (198 | ) |
Barclays Bank PLC* | | | 10/16/19 | | | EUR | | | 438,742 | | | USD | | | 497,511 | | | | (18,799 | ) |
Barclays Bank PLC* | | | 10/16/19 | | | RUB | | | 6,769,970 | | | USD | | | 106,346 | | | | (2,145 | ) |
The accompanying notes are an integral part of the financial statements.
106
MassMutual Premier Diversified Bond Fund – Portfolio of Investments(Continued)
| | | | | | | | | | | | | | | | | | | | |
| Counterparty | | Settlement
Date | | | Currency
Purchased | | | Currency
Sold | | | Unrealized
Appreciation
(Depreciation) | |
Barclays Bank PLC* | | | 10/16/19 | | | SEK | | | 952,470 | | | USD | | | 102,124 | | | $ | (5,280 | ) |
Barclays Bank PLC* | | | 10/16/19 | | | USD | | | 132,000 | | | RUB | | | 8,525,880 | | | | 772 | |
Barclays Bank PLC* | | | 10/16/19 | | | USD | | | 101,147 | | | ZAR | | | 1,424,300 | | | | 7,275 | |
Barclays Bank PLC* | | | 10/16/19 | | | ZAR | | | 1,424,300 | | | USD | | | 94,296 | | | | (424 | ) |
Barclays Bank PLC* | | | 10/22/19 | | | INR | | | 10,342,280 | | | USD | | | 148,788 | | | | (3,145 | ) |
Barclays Bank PLC* | | | 10/22/19 | | | MYR | | | 826,646 | | | USD | | | 201,033 | | | | (3,652 | ) |
Barclays Bank PLC* | | | 10/22/19 | | | USD | | | 100,000 | | | MYR | | | 412,750 | | | | 1,446 | |
Barclays Bank PLC* | | | 10/22/19 | | | USD | | | 101,815 | | | SGD | | | 138,453 | | | | 1,621 | |
Barclays Bank PLC* | | | 10/29/19 | | | ARS | | | 951,569 | | | USD | | | 19,000 | | | | (3,990 | ) |
Barclays Bank PLC* | | | 11/19/19 | | | USD | | | 96,000 | | | IDR | | | 1,364,352,000 | | | | 368 | |
Barclays Bank PLC* | | | 11/19/19 | | | USD | | | 174,000 | | | SGD | | | 240,398 | | | | (26 | ) |
BNP Paribas SA* | | | 10/09/19 | | | USD | | | 98,618 | | | CLP | | | 67,114,500 | | | | 6,562 | |
BNP Paribas SA* | | | 10/22/19 | | | USD | | | 253,786 | | | THB | | | 7,835,390 | | | | (2,482 | ) |
BNP Paribas SA* | | | 10/29/19 | | | ARS | | | 8,662,882 | | | USD | | | 163,000 | | | | (26,348 | ) |
Citibank N.A.* | | | 10/09/19 | | | BRL | | | 981,628 | | | USD | | | 251,525 | | | | (15,387 | ) |
Citibank N.A.* | | | 10/09/19 | | | CLP | | | 67,114,500 | | | USD | | | 93,919 | | | | (1,863 | ) |
Citibank N.A.* | | | 10/09/19 | | | COP | | | 335,895,000 | | | USD | | | 98,000 | | | | (1,509 | ) |
Citibank N.A.* | | | 10/09/19 | | | USD | | | 41,000 | | | BRL | | | 170,978 | | | | (130 | ) |
Citibank N.A.* | | | 10/09/19 | | | USD | | | 245,000 | | | CLP | | | 173,925,500 | | | | 6,440 | |
Citibank N.A.* | | | 10/16/19 | | | HUF | | | 28,212,800 | | | EUR | | | 86,281 | | | | (2,234 | ) |
Citibank N.A.* | | | 10/16/19 | | | PLN | | | 1,904,384 | | | EUR | | | 443,848 | | | | (9,308 | ) |
Citibank N.A.* | | | 10/16/19 | | | EUR | | | 86,401 | | | HUF | | | 28,212,800 | | | | 2,364 | |
Citibank N.A.* | | | 10/16/19 | | | ILS | | | 24,627 | | | USD | | | 7,000 | | | | 89 | |
Citibank N.A.* | | | 10/16/19 | | | USD | | | 292,000 | | | EUR | | | 260,873 | | | | 7,360 | |
Citibank N.A.* | | | 10/16/19 | | | USD | | | 102,565 | | | ILS | | | 362,300 | | | | (1,729 | ) |
Citibank N.A.* | | | 10/22/19 | | | NZD | | | 74,735 | | | USD | | | 48,926 | | | | (2,106 | ) |
Citibank N.A.* | | | 10/22/19 | | | PHP | | | 5,303,145 | | | USD | | | 102,084 | | | | 176 | |
Citibank N.A.* | | | 10/22/19 | | | THB | | | 7,835,390 | | | USD | | | 253,826 | | | | 2,442 | |
Citibank N.A.* | | | 10/22/19 | | | USD | | | 99,701 | | | IDR | | | 1,411,134,000 | | | | 500 | |
Citibank N.A.* | | | 10/22/19 | | | USD | | | 103,337 | | | PHP | | | 5,303,145 | | | | 1,077 | |
Citibank N.A.* | | | 10/22/19 | | | USD | | | 245,000 | | | THB | | | 7,579,810 | | | | (2,909 | ) |
Citibank N.A.* | | | 10/23/19 | | | USD | | | 100,834 | | | JPY | | | 10,836,650 | | | | 474 | |
Citibank N.A.* | | | 10/29/19 | | | USD | | | 8,105 | | | ARS | | | 526,800 | | | | (205 | ) |
Citibank N.A.* | | | 11/05/19 | | | CLP | | | 108,567,140 | | | USD | | | 151,987 | | | | (2,995 | ) |
Citibank N.A.* | | | 11/05/19 | | | USD | | | 161,875 | | | CLP | | | 113,654,390 | | | | 5,902 | |
Citibank N.A.* | | | 11/12/19 | | | PLN | | | 35,066 | | | EUR | | | 8,000 | | | | 3 | |
Citibank N.A.* | | | 11/12/19 | | | PLN | | | 35,225 | | | EUR | | | 8,000 | | | | 43 | |
Citibank N.A.* | | | 11/19/19 | | | USD | | | 95,581 | | | SGD | | | 132,570 | | | | (388 | ) |
Goldman Sachs International* | | | 10/16/19 | | | RUB | | | 9,725,080 | | | USD | | | 148,000 | | | | 1,685 | |
Goldman Sachs International* | | | 10/29/19 | | | ARS | | | 507,150 | | | USD | | | 9,000 | | | | (1,000 | ) |
JP Morgan Chase Bank N.A.* | | | 10/09/19 | | | USD | | | 48,000 | | | BRL | | | 196,994 | | | | 612 | |
JP Morgan Chase Bank N.A.* | | | 10/16/19 | | | HUF | | | 41,855,829 | | | EUR | | | 125,000 | | | | (35 | ) |
JP Morgan Chase Bank N.A.* | | | 10/16/19 | | | USD | | | 101,613 | | | CHF | | | 99,609 | | | | 1,688 | |
JP Morgan Chase Bank N.A.* | | | 10/16/19 | | | USD | | | 248,531 | | | EUR | | | 224,525 | | | | 3,551 | |
JP Morgan Chase Bank N.A.* | | | 10/16/19 | | | USD | | | 147,000 | | | KZT | | | 57,728,189 | | | | (1,363 | ) |
JP Morgan Chase Bank N.A.* | | | 10/22/19 | | | PKR | | | 3,550,762 | | | USD | | | 21,941 | | | | 642 | |
JP Morgan Chase Bank N.A.* | | | 10/22/19 | | | USD | | | 148,506 | | | INR | | | 10,342,280 | | | | 2,863 | |
JP Morgan Chase Bank N.A.* | | | 10/22/19 | | | USD | | | 50,316 | | | NZD | | | 74,735 | | | | 3,496 | |
The accompanying notes are an integral part of the financial statements.
107
MassMutual Premier Diversified Bond Fund – Portfolio of Investments(Continued)
| | | | | | | | | | | | | | | | | | | | |
| Counterparty | | Settlement
Date | | | Currency
Purchased | | | Currency
Sold | | | Unrealized
Appreciation
(Depreciation) | |
JP Morgan Chase Bank N.A.* | | | 10/29/19 | | | ARS | | | 4,867,858 | | | USD | | | 87,441 | | | $ | (10,653 | ) |
JP Morgan Chase Bank N.A.* | | | 11/19/19 | | | PKR | | | 763,105 | | | USD | | | 4,740 | | | | 78 | |
JP Morgan Chase Bank N.A.* | | | 11/19/19 | | | USD | | | 50,000 | | | IDR | | | 710,350,000 | | | | 209 | |
JP Morgan Chase Bank N.A.* | | | 12/17/19 | | | PKR | | | 1,271,842 | | | USD | | | 7,900 | | | | 76 | |
| | | | | | | | | | | | | | | | | | | | |
| | | $ | (68,732 | ) |
| | | | | |
| * | Contracts are subject to a Master Netting Agreement. |
Futures contracts
| | | | | | | | | | | | | | | | |
| | | Expiration
Date | | | Number of
Contracts | | | Notional
Amount | | | Value/ Net
Unrealized
Appreciation/
(Depreciation) | |
| Long | | | | | | | | | | | | |
U.S. Treasury Ultra Bond | | | 12/19/19 | | | | 80 | | | $ | 15,665,257 | | | $ | (312,757 | ) |
U.S. Treasury Note 2 Year | | | 12/31/19 | | | | 112 | | | | 24,204,652 | | | | (68,652 | ) |
U.S. Treasury Note 5 Year | | | 12/31/19 | | | | 47 | | | | 5,630,235 | | | | (30,258 | ) |
| | | | | | | | | | | | | | | | |
| | | $ | (411,667 | ) |
| | | | | | | | | | | | | | | | |
| Short | | | | | | | | | | | | |
90 Day Eurodollar | | | 12/16/19 | | | | 3 | | | $ | (730,078 | ) | | $ | (5,222 | ) |
U.S. Treasury Long Bond | | | 12/19/19 | | | | 25 | | | | (4,107,536 | ) | | | 49,723 | |
U.S. Treasury Ultra 10 Year | | | 12/19/19 | | | | 11 | | | | (1,566,824 | ) | | | 355 | |
90 Day Eurodollar | | | 3/16/20 | | | | 2 | | | | (487,093 | ) | | | (4,557 | ) |
90 Day Eurodollar | | | 6/15/20 | | | | 2 | | | | (487,381 | ) | | | (4,844 | ) |
90 Day Eurodollar | | | 9/14/20 | | | | 2 | | | | (487,593 | ) | | | (5,032 | ) |
90 Day Eurodollar | | | 12/14/20 | | | | 2 | | | | (487,568 | ) | | | (5,057 | ) |
90 Day Eurodollar | | | 3/15/21 | | | | 2 | | | | (487,743 | ) | | | (5,282 | ) |
90 Day Eurodollar | | | 9/13/21 | | | | 3 | | | | (731,728 | ) | | | (7,997 | ) |
90 Day Eurodollar | | | 3/14/22 | | | | 3 | | | | (731,503 | ) | | | (8,147 | ) |
90 Day Eurodollar | | | 9/19/22 | | | | 3 | | | | (731,203 | ) | | | (8,222 | ) |
90 Day Eurodollar | | | 3/13/23 | | | | 2 | | | | (487,168 | ) | | | (5,632 | ) |
90 Day Eurodollar | | | 12/18/23 | | | | 3 | | | | (730,078 | ) | | | (8,710 | ) |
90 Day Eurodollar | | | 12/16/24 | | | | 6 | | | | (1,458,355 | ) | | | (17,870 | ) |
| | | | | | | | | | | | | | | | |
| | | $ | (36,494 | ) |
| | | | | | | | | | | | | | | | |
Currency Legend
The accompanying notes are an integral part of the financial statements.
108
MassMutual Premier Diversified Bond Fund – Portfolio of Investments(Continued)
Currency Legend (Continued)
Country weightings, as a percentage of net assets, is as follows:
| | | | |
United States | | | 81.1 | % |
Cayman Islands | | | 6.1 | % |
Canada | | | 2.2 | % |
United Kingdom | | | 1.9 | % |
Mexico | | | 1.1 | % |
Bermuda | | | 1.1 | % |
Netherlands | | | 1.1 | % |
Ireland | | | 0.6 | % |
Finland | | | 0.4 | % |
Luxembourg | | | 0.4 | % |
Switzerland | | | 0.4 | % |
Norway | | | 0.3 | % |
Australia | | | 0.3 | % |
Saudi Arabia | | | 0.3 | % |
Colombia | | | 0.2 | % |
Germany | | | 0.2 | % |
Denmark | | | 0.2 | % |
Spain | | | 0.2 | % |
Panama | | | 0.1 | % |
France | | | 0.1 | % |
Chile | | | 0.1 | % |
| | | | |
Total Long-Term Investments | | | 98.4 | % |
Short-Term Investments and Other Assets and Liabilities | | | 1.6 | % |
| | | | |
Net Assets | | | 100.0 | % |
| | | | |
The accompanying notes are an integral part of the financial statements.
109
MassMutual Premier High Yield Fund – Portfolio of Investments
September 30, 2019
| | | | | | | | |
| | | Number of
Shares | | | Value | |
| EQUITIES — 0.4% | |
|
| COMMON STOCK — 0.4% | |
| Basic Materials — 0.0% | |
| Forest Products & Paper — 0.0% | |
Appvion Inc. (Escrow Shares) (a) (b) (c) | | | 5,428,000 | | | $ | - | |
The Newark Group, Inc. (a) (b) (c) | | | 329,969 | | | | 9,899 | |
| | | | | | | | |
| | | | | | | 9,899 | |
| | | | | | | | |
| Energy — 0.4% | |
| Oil & Gas — 0.4% | |
Fieldwood Energy LLC (c) | | | 44,668 | | | | 1,105,533 | |
Fieldwood Energy LLC (c) | | | 10,960 | | | | 271,260 | |
Jupiter Resources, Inc. (c) | | | 610,239 | | | | 915,359 | |
| | | | | | | | |
| | | | | | | 2,292,152 | |
| | | | | | | | |
| | |
TOTAL COMMON STOCK
(Cost $9,535,130) | | | | | | | 2,302,051 | |
| | | | | |
|
| PREFERRED STOCK — 0.0% | |
| Consumer,Non-cyclical — 0.0% | |
| Agriculture — 0.0% | |
Pinnacle Agriculture Holdings LLC (c) | | | 2,011,244 | | | | 93,120 | |
| | | | | | | | |
| | |
TOTAL PREFERRED STOCK
(Cost $1,282,343) | | | | | | | 93,120 | |
| | | | | |
| | |
TOTAL EQUITIES
(Cost $10,817,473) | | | | | | | 2,395,171 | |
| | | | | |
| | |
| | | Principal
Amount | | | | |
| BONDS & NOTES — 98.0% | |
|
| BANK LOANS — 5.2% | |
| Aerospace & Defense — 1.1% | |
TransDigm, Inc., 2018 Term Loan F, 1 mo. LIBOR + 2.500%
4.544% VRN 6/09/23 | | $ | 4,042,222 | | | | 4,028,882 | |
Veritas Bermuda Ltd., USD Repriced Term Loan B, 1 mo. LIBOR + 4.500%
6.604% VRN 1/27/23 | | | 2,480,916 | | | | 2,339,033 | |
| | | | | | | | |
| | | | | | | 6,367,915 | |
| | | | | | | | |
| Electronics — 0.1% | |
Vertafore, Inc., 2018 1st Lien Term Loan, 1 mo. LIBOR + 3.250%
5.294% VRN 7/02/25 | | | 416,850 | | | | 404,503 | |
| | | | | | | | |
| Health Care – Services — 0.4% | |
Banff Merger Sub, Inc., 2018 USD Term Loan B, 1 mo. LIBOR + 4.250%
6.294% VRN 10/02/25 | | | 2,259,907 | | | | 2,172,426 | |
| | | | | | | | |
| | | | | | | | |
| | |
| | | Principal
Amount | | | Value | |
| Oil & Gas — 0.7% | |
Fieldwood Energy LLC
Exit 1st Lien Term Loan, 3 mo. LIBOR + 5.250%
7.506% VRN 4/11/22 | | $ | 2,255,879 | | | $ | 1,950,072 | |
Exit 2nd Lien Term Loan, 3 mo. LIBOR + 7.250% 9.506% VRN 4/11/23 | | | 3,084,695 | | | | 2,282,674 | |
| | | | | | | | |
| | | | | | | 4,232,746 | |
| | | | | | | | |
| Packaging & Containers — 1.9% | |
BWAY Holding Co., 2017 Term Loan B, 3 mo. LIBOR + 3.250%
5.590% VRN 4/03/24 | | | 5,166,719 | | | | 5,053,361 | |
Consolidated Energy Finance, SA, Term Loan B, 3 mo. LIBOR + 2.500%
4.547% VRN 5/07/25 | | | 3,166,644 | | | | 3,063,729 | |
Reynolds Group Holdings, Inc., USD 2017 Term Loan, 1 mo. LIBOR + 2.750%
4.794% VRN 2/05/23 | | | 2,359,387 | | | | 2,362,336 | |
| | | | | | | | |
| | | | | | | 10,479,426 | |
| | | | | | | | |
| Telecommunications — 1.0% | |
CenturyLink, Inc., 2017 Term Loan B, 1 mo. LIBOR + 2.750%
4.794% VRN 1/31/25 | | | 5,924,623 | | | | 5,881,847 | |
| | | | | | | | |
| | |
TOTAL BANK LOANS
(Cost $29,651,769) | | | | | | | 29,538,863 | |
| | | | | |
|
| CORPORATE DEBT — 92.8% | |
| Aerospace & Defense — 2.1% | |
Moog, Inc.
5.250% 12/01/22 (d) | | | 874,000 | | | | 888,204 | |
TransDigm, Inc.
6.375% 6/15/26 | | | 1,510,000 | | | | 1,589,275 | |
Triumph Group, Inc.
4.875% 4/01/21 | | | 1,886,000 | | | | 1,887,509 | |
5.250% 6/01/22 | | | 1,825,000 | | | | 1,815,145 | |
6.250% 9/15/24 (d) | | | 1,347,000 | | | | 1,401,149 | |
7.750% 8/15/25 (e) | | | 4,319,000 | | | | 4,358,087 | |
| | | | | | | | |
| | | | | | | 11,939,369 | |
| | | | | | | | |
| Agriculture — 0.5% | |
JBS Investments II GmbH
7.000% 1/15/26 (d) | | | 1,574,000 | | | | 1,698,330 | |
Pinnacle Operating Corp.
9.000% 5/15/23 (d) | | | 2,930,270 | | | | 1,025,595 | |
| | | | | | | | |
| | | | | | | 2,723,925 | |
| | | | | | | | |
| Airlines — 2.4% | |
American Airlines Group, Inc.
5.500% 10/01/19 (d) | | | 6,233,000 | | | | 6,233,000 | |
4.625% 3/01/20 (d) | | | 4,556,000 | | | | 4,584,475 | |
The accompanying notes are an integral part of the financial statements.
110
MassMutual Premier High Yield Fund – Portfolio of Investments(Continued)
| | | | | | | | |
| | |
| | | Principal
Amount | | | Value | |
5.000% 6/01/22 (d) | | $ | 2,466,000 | | | $ | 2,560,571 | |
| | | | | | | | |
| | | | | | | 13,378,046 | |
| | | | | | | | |
| Auto Manufacturers — 0.7% | |
Allison Transmission, Inc.
4.750% 10/01/27 (d) | | | 2,473,000 | | | | 2,537,916 | |
5.875% 6/01/29 (d) | | | 1,113,000 | | | | 1,207,605 | |
| | | | | | | | |
| | | | | | | 3,745,521 | |
| | | | | | | | |
| Building Materials — 1.7% | |
James Hardie International Finance DAC
4.750% 1/15/25 (d) | | | 1,027,000 | | | | 1,057,810 | |
5.000% 1/15/28 (d) | | | 1,668,000 | | | | 1,730,550 | |
PGT Escrow Issuer, Inc.
6.750% 8/01/26 (d) | | | 1,279,000 | | | | 1,378,123 | |
Standard Industries, Inc.
4.750% 1/15/28 (d) | | | 5,235,000 | | | | 5,411,210 | |
| | | | | | | | |
| | | | | | | 9,577,693 | |
| | | | | | | | |
| Chemicals — 1.4% | |
CF Industries, Inc.
5.375% 3/15/44 | | | 894,000 | | | | 900,283 | |
Consolidated Energy Finance SA
6.875% 6/15/25 (d) | | | 3,146,000 | | | | 3,153,865 | |
Kissner Holdings LP/Kissner Milling Co. Ltd./BSC Holding, Inc./Kissner USA
8.375% 12/01/22 (d) | | | 3,800,000 | | | | 3,961,500 | |
| | | | | | | | |
| | | | | | | 8,015,648 | |
| | | | | | | | |
| Coal — 3.1% | |
Alliance Resource Operating Partners LP/Alliance Resource Finance Corp.
7.500% 5/01/25 (d) | | | 1,701,000 | | | | 1,679,737 | |
Peabody Energy Corp.
6.000% 3/31/22 (d) | | | 8,054,000 | | | | 8,094,270 | |
SunCoke Energy Partners LP/SunCoke Energy Partners Finance Corp.
7.500% 6/15/25 (d) | | | 5,145,000 | | | | 4,579,050 | |
Warrior Met Coal, Inc.
8.000% 11/01/24 (d) | | | 2,960,000 | | | | 3,078,400 | |
| | | | | | | | |
| | | | | | | 17,431,457 | |
| | | | | | | | |
| Commercial Services — 1.6% | |
Nielsen Finance LLC/Nielsen Finance Co.
5.000% 4/15/22 (d) | | | 3,874,000 | | | | 3,884,847 | |
Prime Security Services Borrower LLC/Prime Finance, Inc.
9.250% 5/15/23 (d) | | | 2,214,000 | | | | 2,327,578 | |
Service Corp. International
5.125% 6/01/29 | | | 1,625,000 | | | | 1,736,719 | |
TMS International Holding Corp.
7.250% 8/15/25 (d) | | | 1,046,000 | | | | 896,945 | |
| | | | | | | | |
| | | | | | | 8,846,089 | |
| | | | | | | | |
| | | | | | | | |
| | |
| | | Principal
Amount | | | Value | |
| Computers — 0.5% | |
Dell International LLC/EMC Corp.
7.125% 6/15/24 (d) | | $ | 1,819,000 | | | $ | 1,917,226 | |
MTS Systems Corp.
5.750% 8/15/27 (d) | | | 579,000 | | | | 602,160 | |
Western Digital Corp.
4.750% 2/15/26 | | | 447,000 | | | | 459,851 | |
| | | | | | | | |
| | | | | | | 2,979,237 | |
| | | | | | | | |
| Distribution & Wholesale — 0.1% | |
Performance Food Group, Inc.
5.500% 10/15/27 (d) | | | 551,000 | | | | 579,928 | |
| | | | | | | | |
| Diversified Financial Services — 3.8% | |
Ally Financial, Inc.
3.875% 5/21/24 | | | 1,850,000 | | | | 1,914,380 | |
Avolon Holdings Funding Ltd.
5.125% 10/01/23 (d) | | | 1,531,000 | | | | 1,624,391 | |
Global Aircraft Leasing Co. Ltd.
6.500% 9/15/24 (d) | | | 6,000,000 | | | | 6,075,000 | |
LPL Holdings, Inc.
5.750% 9/15/25 (d) | | | 4,012,000 | | | | 4,172,480 | |
Park Aerospace Holdings Ltd.
5.500% 2/15/24 (d) | | | 1,000,000 | | | | 1,080,400 | |
VFH Parent LLC/OrchestraCo-Issuer, Inc.
6.750% 6/15/22 (d) | | | 6,576,000 | | | | 6,801,557 | |
| | | | | | | | |
| | | | | | | 21,668,208 | |
| | | | | | | | |
| Electric — 2.8% | |
NextEra Energy Operating Partners LP
4.250% 7/15/24 (d) | | | 1,750,000 | | | | 1,802,500 | |
NRG Energy, Inc.
5.250% 6/15/29 (d) | | | 1,660,000 | | | | 1,784,998 | |
7.250% 5/15/26 | | | 3,737,000 | | | | 4,092,949 | |
Vistra Operations Co. LLC
3.550% 7/15/24 (d) | | | 2,302,000 | | | | 2,317,279 | |
4.300% 7/15/29 (d) | | | 2,779,000 | | | | 2,851,274 | |
5.000% 7/31/27 (d) | | | 2,691,000 | | | | 2,770,869 | |
| | | | | | | | |
| | | | | | | 15,619,869 | |
| | | | | | | | |
| Electrical Components & Equipment — 0.3% | |
Energizer Holdings, Inc.
7.750% 1/15/27 (d) | | | 1,753,000 | | | | 1,953,193 | |
| | | | | | | | |
| Entertainment — 0.4% | |
Boyne USA, Inc.
7.250% 5/01/25 (d) | | | 632,000 | | | | 688,627 | |
Cedar Fair LP
5.250% 7/15/29 (d) | | | 632,000 | | | | 676,240 | |
WMG Acquisition Corp.
5.000% 8/01/23 (d) | | | 614,000 | | | | 627,815 | |
| | | | | | | | |
| | | | | | | 1,992,682 | |
| | | | | | | | |
The accompanying notes are an integral part of the financial statements.
111
MassMutual Premier High Yield Fund – Portfolio of Investments(Continued)
| | | | | | | | |
| | |
| | | Principal
Amount | | | Value | |
| Environmental Controls — 0.2% | |
Clean Harbors, Inc.
4.875% 7/15/27 (d) | | $ | 638,000 | | | $ | 665,912 | |
5.125% 7/15/29 (d) | | | 325,000 | | | | 344,500 | |
| | | | | | | | |
| | | | | | | 1,010,412 | |
| | | | | | | | |
| Foods — 5.5% | |
Albertsons Cos., Inc. / Safeway, Inc. / New Albertsons LP / Albertson’s LLC
7.500% 3/15/26 (d) | | | 1,430,000 | | | | 1,590,875 | |
Albertsons Cos., Inc. / Safeway, Inc. / New Albertsons LP / Albertson’s LLC
5.875% 2/15/28 (d) | | | 1,136,000 | | | | 1,202,388 | |
JBS USA LUX SA / JBS USA Food Co. / JBS USA Finance, Inc.
5.500% 1/15/30 (d) | | | 3,745,000 | | | | 3,969,625 | |
JBS USA LUX SA/JBS USA Finance, Inc.
5.750% 6/15/25 (d) | | | 1,329,000 | | | | 1,384,579 | |
5.875% 7/15/24 (d) | | | 2,060,000 | | | | 2,121,903 | |
6.500% 4/15/29 (d) | | | 4,969,000 | | | | 5,515,491 | |
6.750% 2/15/28 (d) | | | 2,816,000 | | | | 3,118,720 | |
Kraft Heinz Foods Co.
3.750% 4/01/30 (d) | | | 801,000 | | | | 808,479 | |
Pilgrim’s Pride Corp.
5.750% 3/15/25 (d) | | | 815,000 | | | | 843,525 | |
5.875% 9/30/27 (d) | | | 1,756,000 | | | | 1,885,944 | |
Post Holdings, Inc.
5.500% 3/01/25 (d) | | | 1,003,000 | | | | 1,050,643 | |
5.500% 12/15/29 (d) | | | 2,185,000 | | | | 2,277,862 | |
5.625% 1/15/28 (d) | | | 1,513,000 | | | | 1,603,780 | |
5.750% 3/01/27 (d) | | | 1,241,000 | | | | 1,315,708 | |
Simmons Foods, Inc.
7.750% 1/15/24 (d) | | | 1,051,000 | | | | 1,137,707 | |
Smithfield Foods, Inc.
5.200% 4/01/29 (d) | | | 1,063,000 | | | | 1,169,834 | |
| | | | | | | | |
| | | | | | | 30,997,063 | |
| | | | | | | | |
| Hand & Machine Tools — 1.1% | |
Apex Tool Group LLC/BC Mountain Finance, Inc.
9.000% 2/15/23 (d) | | | 5,236,000 | | | | 4,646,950 | |
Colfax Corp.
6.000% 2/15/24 (d) | | | 677,000 | | | | 716,503 | |
6.375% 2/15/26 (d) | | | 723,000 | | | | 777,903 | |
| | | | | | | | |
| | | | | | | 6,141,356 | |
| | | | | | | | |
| Health Care – Products — 2.9% | |
Avanos Medical, Inc.
6.250% 10/15/22 | | | 3,824,000 | | | | 3,886,140 | |
Avantor, Inc.
6.000% 10/01/24 (d) | | | 260,000 | | | | 278,598 | |
| | | | | | | | |
| | |
| | | Principal
Amount | | | Value | |
Ortho-Clinical Diagnostics, Inc./Ortho-Clinical Diagnostics SA
6.625% 5/15/22 (d) | | $ | 12,295,000 | | | $ | 12,008,526 | |
| | | | | | | | |
| | | | | | | 16,173,264 | |
| | | | | | | | |
| Health Care – Services — 4.0% | |
Catalent Pharma Solutions, Inc.
5.000% 7/15/27 (d) | | | 751,000 | | | | 779,163 | |
Centene Corp.
5.375% 6/01/26 (d) | | | 226,000 | | | | 236,453 | |
Envision Healthcare Corp.
8.750% 10/15/26 (d) | | | 5,174,000 | | | | 3,156,140 | |
HCA, Inc.
5.875% 2/15/26 | | | 3,067,000 | | | | 3,428,293 | |
RegionalCare Hospital Partners Holdings, Inc.
8.250% 5/01/23 (d) | | | 4,006,000 | | | | 4,261,382 | |
Tenet Healthcare Corp.
4.625% 9/01/24 (d) | | | 806,000 | | | | 829,116 | |
4.875% 1/01/26 (d) | | | 2,600,000 | | | | 2,668,250 | |
5.125% 11/01/27 (d) | | | 2,600,000 | | | | 2,686,710 | |
6.250% 2/01/27 (d) | | | 2,633,000 | | | | 2,742,401 | |
8.125% 4/01/22 | | | 968,000 | | | | 1,046,940 | |
WellCare Health Plans, Inc.
5.250% 4/01/25 | | | 902,000 | | | | 939,207 | |
| | | | | | | | |
| | | | | | | 22,774,055 | |
| | | | | | | | |
| Home Builders — 1.8% | |
Brookfield Residential Properties, Inc.
6.375% 5/15/25 (d) | | | 827,000 | | | | 843,540 | |
6.500% 12/15/20 (d) (e) | | | 2,057,000 | | | | 2,057,617 | |
M/I Homes, Inc.
5.625% 8/01/25 | | | 1,629,000 | | | | 1,677,870 | |
6.750% 1/15/21 | | | 1,262,000 | | | | 1,274,620 | |
Mattamy Group Corp.
6.500% 10/01/25 (d) | | | 3,597,000 | | | | 3,776,850 | |
6.875% 12/15/23 (d) | | | 676,000 | | | | 703,040 | |
| | | | | | | | |
| | | | | | | 10,333,537 | |
| | | | | | | | |
| Household Products & Wares — 0.1% | |
Spectrum Brands, Inc.
5.000% 10/01/29 (d) | | | 359,000 | | | | 365,283 | |
| | | | | | | | |
| Housewares — 0.3% | |
Newell Brands, Inc.
4.200% 4/01/26 | | | 1,491,000 | | | | 1,559,941 | |
| | | | | | | | |
| Insurance — 1.5% | |
Acrisure LLC/Acrisure Finance, Inc.
7.000% 11/15/25 (d) | | | 3,199,000 | | | | 2,982,428 | |
8.125% 2/15/24 (d) | | | 448,000 | | | | 482,720 | |
CNO Financial Group, Inc.
5.250% 5/30/29 | | | 4,144,000 | | | | 4,537,680 | |
York Risk Services Holding Corp.
8.500% 10/01/22 (d) | | | 617,000 | | | | 630,111 | |
| | | | | | | | |
| | | | | | | 8,632,939 | |
| | | | | | | | |
The accompanying notes are an integral part of the financial statements.
112
MassMutual Premier High Yield Fund – Portfolio of Investments(Continued)
| | | | | | | | |
| | |
| | | Principal
Amount | | | Value | |
| Internet — 1.1% | |
Go Daddy Operating Co. LLC/GD Finance Co., Inc.
5.250% 12/01/27 (d) | | $ | 1,519,000 | | | $ | 1,596,849 | |
Netflix, Inc.
5.375% 11/15/29 (d) | | | 2,115,000 | | | | 2,204,887 | |
5.875% 2/15/25 | | | 368,000 | | | | 404,116 | |
5.875% 11/15/28 | | | 1,961,000 | | | | 2,130,234 | |
| | | | | | | | |
| | | | | | | 6,336,086 | |
| | | | | | | | |
| Investment Companies — 0.8% | |
Icahn Enterprises LP/Icahn Enterprises Finance Corp.
6.375% 12/15/25 | | | 4,385,000 | | | | 4,610,882 | |
| | | | | | | | |
| Iron & Steel — 0.4% | |
Allegheny Technologies, Inc.
5.950% 1/15/21 | | | 2,166,000 | | | | 2,213,381 | |
| | | | | | | | |
| Leisure Time — 1.9% | |
Brunswick Corp.
7.375% 9/01/23 | | | 650,000 | | | | 740,205 | |
7.125% 8/01/27 | | | 4,494,000 | | | | 5,324,043 | |
Carlson Travel, Inc.
6.750% 12/15/23 (d) | | | 1,198,000 | | | | 1,224,955 | |
9.500% 12/15/24 (d) | | | 3,108,000 | | | | 3,131,310 | |
| | | | | | | | |
| | | | | | | 10,420,513 | |
| | | | | | | | |
| Lodging — 1.4% | |
Marriott Ownership Resorts, Inc.
5.625% 4/15/23 | | | 2,917,000 | | | | 3,001,301 | |
Wynn Las Vegas LLC/Wynn Las Vegas Capital Corp.
5.250% 5/15/27 (d) | | | 1,526,000 | | | | 1,567,965 | |
5.500% 3/01/25 (d) | | | 3,361,000 | | | | 3,538,461 | |
| | | | | | | | |
| | | | | | | 8,107,727 | |
| | | | | | | | |
| Machinery – Diversified — 0.9% | |
Wabtec Corp.
3.450% 11/15/26 | | | 5,032,000 | | | | 5,085,473 | |
| | | | | | | | |
| Media — 13.3% | |
Altice Financing SA
6.625% 2/15/23 (d) | | | 2,100,000 | | | | 2,155,124 | |
7.500% 5/15/26 (d) | | | 3,289,000 | | | | 3,494,530 | |
Block Communications, Inc.
6.875% 2/15/25 (d) | | | 1,933,000 | | | | 2,015,153 | |
CCO Holdings LLC / CCO Holdings Capital Corp.
4.750% 3/01/30 (d) (f) | | | 4,242,000 | | | | 4,306,521 | |
CCO Holdings LLC/CCO Holdings Capital Corp.
5.375% 6/01/29 (d) | | | 2,500,000 | | | | 2,662,500 | |
5.750% 1/15/24 | | | 811,000 | | | | 829,248 | |
5.875% 4/01/24 (d) | | | 2,490,000 | | | | 2,598,215 | |
5.875% 5/01/27 (d) | | | 6,402,000 | | | | 6,770,115 | |
| | | | | | | | |
| | |
| | | Principal
Amount | | | Value | |
Clear Channel Worldwide Holdings, Inc.
5.125% 8/15/27 (d) | | $ | 1,740,000 | | | $ | 1,812,819 | |
9.250% 2/15/24 (d) | | | 865,000 | | | | 950,341 | |
CSC Holdings LLC
5.750% 1/15/30 (d) (f) | | | 3,360,000 | | | | 3,511,603 | |
7.500% 4/01/28 (d) | | | 2,001,000 | | | | 2,253,426 | |
Diamond Sports Group LLC / Diamond Sports Finance Co.
5.375% 8/15/26 (d) | | | 2,574,000 | | | | 2,670,525 | |
6.625% 8/15/27 (d) (e) | | | 1,344,000 | | | | 1,394,400 | |
DISH DBS Corp.
5.000% 3/15/23 | | | 902,000 | | | | 911,291 | |
7.750% 7/01/26 | | | 3,033,000 | | | | 3,086,077 | |
GCI LLC
6.625% 6/15/24 (d) | | | 1,207,000 | | | | 1,302,051 | |
6.875% 4/15/25 | | | 2,767,000 | | | | 2,912,268 | |
Midcontinent Communications / Midcontinent Finance Corp.
5.375% 8/15/27 (d) | | | 930,000 | | | | 978,825 | |
Neptune Finco Corp.
6.625% 10/15/25 (d) | | | 269,000 | | | | 287,911 | |
Nexstar Broadcasting, Inc.
5.875% 11/15/22 | | | 2,767,000 | | | | 2,829,258 | |
Nexstar Escrow, Inc.
5.625% 7/15/27 (d) | | | 1,166,000 | | | | 1,221,385 | |
Scripps Escrow, Inc.
5.875% 7/15/27 (d) | | | 728,000 | | | | 739,830 | |
Sirius XM Radio, Inc.
4.625% 7/15/24 (d) | | | 3,046,000 | | | | 3,158,184 | |
5.375% 4/15/25 (d) | | | 1,799,000 | | | | 1,864,214 | |
5.375% 7/15/26 (d) | | | 2,668,000 | | | | 2,801,026 | |
5.500% 7/01/29 (d) | | | 4,802,000 | | | | 5,126,135 | |
Videotron Ltd.
5.125% 4/15/27 (d) | | | 280,000 | | | | 296,100 | |
Virgin Media Secured Finance PLC
5.500% 8/15/26 (d) | | | 647,000 | | | | 678,735 | |
5.500% 5/15/29 (d) | | | 7,354,000 | | | | 7,675,737 | |
Ziggo BV
5.500% 1/15/27 (d) | | | 1,611,000 | | | | 1,678,984 | |
| | | | | | | | |
| | | | | | | 74,972,531 | |
| | | | | | | | |
| Mining — 4.8% | |
Compass Minerals International, Inc.
4.875% 7/15/24 (d) | | | 1,040,000 | | | | 1,024,400 | |
First Quantum Minerals Ltd.
6.500% 3/01/24 (d) | | | 2,110,000 | | | | 2,012,412 | |
6.875% 3/01/26 (d) | | | 1,191,000 | | | | 1,134,428 | |
7.500% 4/01/25 (d) | | | 4,796,000 | | | | 4,712,070 | |
Hecla Mining Co.
6.875% 5/01/21 | | | 6,442,000 | | | | 6,377,580 | |
Kinross Gold Corp.
4.500% 7/15/27 | | | 2,042,000 | | | | 2,141,507 | |
The accompanying notes are an integral part of the financial statements.
113
MassMutual Premier High Yield Fund – Portfolio of Investments(Continued)
| | | | | | | | |
| | |
| | | Principal
Amount | | | Value | |
5.950% 3/15/24 | | $ | 1,733,000 | | | $ | 1,928,916 | |
6.875% 9/01/41 | | | 1,177,000 | | | | 1,360,906 | |
New Gold, Inc.
6.250% 11/15/22 (d) | | | 2,665,000 | | | | 2,672,195 | |
6.375% 5/15/25 (d) | | | 1,608,000 | | | | 1,500,827 | |
Northwest Acquisitions ULC/Dominion Finco, Inc.
7.125% 11/01/22 (d) | | | 3,748,000 | | | | 2,201,950 | |
| | | | | | | | |
| | | | | | | 27,067,191 | |
| | | | | | | | |
| Miscellaneous – Manufacturing — 0.9% | |
Amsted Industries, Inc.
5.375% 9/15/24 (d) | | | 2,263,000 | | | | 2,311,089 | |
5.625% 7/01/27 (d) | | | 2,783,000 | | | | 2,936,065 | |
| | | | | | | | |
| Office Equipment/Supplies — 0.3% | |
Xerox Corp.
4.125% STEP 3/15/23 | | | 1,543,000 | | | | 1,568,074 | |
| | | | | | | | |
| Oil & Gas — 4.9% | |
Calumet Specialty Products Partners LP/Calumet Finance Corp.
7.625% 1/15/22 (e) | | | 3,441,000 | | | | 3,320,565 | |
7.750% 4/15/23 | | | 660,000 | | | | 612,150 | |
Jonah Energy LLC/Jonah Energy Finance Corp.
7.250% 10/15/25 (d) | | | 3,278,000 | | | | 1,098,130 | |
Laredo Petroleum, Inc.
5.625% 1/15/22 | | | 3,050,000 | | | | 2,867,000 | |
Neptune Energy Bondco PLC
6.625% 5/15/25 (d) | | | 2,750,000 | | | | 2,825,625 | |
Oasis Petroleum, Inc.
Convertible, 2.625% 9/15/23 | | | 431,000 | | | | 319,092 | |
6.875% 1/15/23 | | | 1,447,000 | | | | 1,324,005 | |
Parkland Fuel Corp.
5.875% 7/15/27 (d) | | | 1,149,000 | | | | 1,205,657 | |
PBF Holding Co. LLC/PBF Finance Corp.
7.000% 11/15/23 | | | 2,247,000 | | | | 2,317,236 | |
7.250% 6/15/25 | | | 2,184,000 | | | | 2,263,170 | |
SM Energy Co.
6.625% 1/15/27 | | | 667,000 | | | | 575,288 | |
6.750% 9/15/26 | | | 2,832,000 | | | | 2,478,000 | |
Tullow Oil PLC
6.250% 4/15/22 (d) | | | 5,203,000 | | | | 5,257,631 | |
Whiting Petroleum Corp.
6.625% 1/15/26 | | | 1,783,000 | | | | 1,203,525 | |
| | | | | | | | |
| | | | | | | 27,667,074 | |
| | | | | | | | |
| Oil & Gas Services — 0.4% | |
Welltec A/S
9.500% 12/01/22 (d) | | | 2,492,000 | | | | 2,442,160 | |
| | | | | | | | |
| Packaging & Containers — 1.1% | |
Mauser Packaging Solutions Holding Co.
7.250% 4/15/25 (d) | | | 3,211,000 | | | | 3,035,358 | |
| | | | | | | | |
| | |
| | | Principal
Amount | | | Value | |
Trident TPI Holdings, Inc.
9.250% 8/01/24 (d) | | $ | 1,614,000 | | | $ | 1,581,720 | |
Trivium Packaging Finance BV
5.500% 8/15/26 (d) | | | 1,366,000 | | | | 1,435,939 | |
| | | | | | | | |
| | | | | | | 6,053,017 | |
| | | | | | | | |
| Pharmaceuticals — 2.2% | |
Bausch Health Americas, Inc.
9.250% 4/01/26 (d) | | | 4,611,000 | | | | 5,239,203 | |
Bausch Health Cos., Inc.
5.500% 3/01/23 (d) | | | 535,000 | | | | 541,687 | |
5.875% 5/15/23 (d) | | | 258,000 | | | | 261,225 | |
6.125% 4/15/25 (d) | | | 250,000 | | | | 259,063 | |
9.000% 12/15/25 (d) | | | 870,000 | | | | 976,575 | |
Horizon Pharma USA, Inc.
5.500% 8/01/27 (d) | | | 1,152,000 | | | | 1,198,080 | |
Mallinckrodt International Finance SA/Mallinckrodt CB LLC
5.500% 4/15/25 (d) | | | 1,301,000 | | | | 384,185 | |
5.625% 10/15/23 (d) (e) | | | 517,000 | | | | 170,610 | |
5.750% 8/01/22 (d) | | | 484,000 | | | | 181,500 | |
Par Pharmaceutical, Inc.
7.500% 4/01/27 (d) | | | 2,647,000 | | | | 2,425,314 | |
Teva Pharmaceutical Finance Netherlands III BV
6.000% 4/15/24 (e) | | | 1,006,000 | | | | 867,046 | |
| | | | | | | | |
| | | | | | | 12,504,488 | |
| | | | | | | | |
| Pipelines — 1.2% | |
Cheniere Energy Partners LP
4.500% 10/01/29 (d) | | | 1,184,000 | | | | 1,212,120 | |
5.625% 10/01/26 | | | 2,397,000 | | | | 2,543,577 | |
Genesis Energy LP/Genesis Energy Finance Corp.
6.000% 5/15/23 | | | 635,000 | | | | 637,381 | |
6.250% 5/15/26 | | | 290,000 | | | | 279,850 | |
6.500% 10/01/25 | | | 2,243,000 | | | | 2,186,925 | |
| | | | | | | | |
| | | | | | | 6,859,853 | |
| | | | | | | | |
| Real Estate — 0.1% | |
Realogy Group LLC/RealogyCo-Issuer Corp.
9.375% 4/01/27 (d) (e) | | | 742,000 | | | | 689,333 | |
| | | | | | | | |
| Real Estate Investment Trusts (REITS) — 1.5% | |
ESH Hospitality, Inc.
4.625% 10/01/27 (d) | | | 1,689,000 | | | | 1,695,334 | |
Iron Mountain, Inc.
6.000% 8/15/23 | | | 1,000,000 | | | | 1,023,600 | |
MPT Operating Partnership LP/MPT Finance Corp.
5.000% 10/15/27 | | | 1,778,000 | | | | 1,862,455 | |
6.375% 3/01/24 | | | 430,000 | | | | 450,765 | |
RHP Hotel Properties LP/RHP Finance Corp.
5.000% 4/15/23 | | | 1,315,000 | | | | 1,341,300 | |
The accompanying notes are an integral part of the financial statements.
114
MassMutual Premier High Yield Fund – Portfolio of Investments(Continued)
| | | | | | | | |
| | |
| | | Principal
Amount | | | Value | |
Ryman Hospitality Properties, Inc.
4.750% 10/15/27 (d) | | $ | 1,850,000 | | | $ | 1,903,261 | |
| | | | | | | | |
| | | | | | | 8,276,715 | |
| | | | | | | | |
| Retail — 2.2% | |
Ferrellgas Partners LP/Ferrellgas Partners Finance Corp.
8.625% 6/15/20 | | | 3,484,000 | | | | 2,621,710 | |
Golden Nugget, Inc.
8.750% 10/01/25 (d) | | | 2,257,000 | | | | 2,352,922 | |
KGA Escrow LLC
7.500% 8/15/23 (d) | | | 1,402,000 | | | | 1,468,595 | |
Murphy Oil USA, Inc.
4.750% 9/15/29 | | | 1,194,000 | | | | 1,220,865 | |
Penske Automotive Group, Inc.
5.500% 5/15/26 | | | 3,689,000 | | | | 3,858,141 | |
Sonic Automotive, Inc.
5.000% 5/15/23 | | | 293,000 | | | | 296,662 | |
Yum! Brands, Inc.
4.750% 1/15/30 (d) | | | 786,000 | | | | 811,671 | |
| | | | | | | | |
| | | | | | | 12,630,566 | |
| | | | | | | | |
| Software — 3.9% | |
RP Crown Parent LLC
7.375% 10/15/24 (d) | | | 1,073,000 | | | | 1,115,920 | |
SS&C Technologies, Inc.
5.500% 9/30/27 (d) | | | 3,873,000 | | | | 4,047,382 | |
TIBCO Software, Inc.
11.375% 12/01/21 (d) | | | 10,653,000 | | | | 11,115,740 | |
Veritas US, Inc./Veritas Bermuda Ltd.
10.500% 2/01/24 (d) (e) | | | 6,327,000 | | | | 5,979,015 | |
| | | | | | | | |
| | | | | | | 22,258,057 | |
| | | | | | | | |
| Storage/Warehousing — 0.6% | |
LBC Tank Terminals Holding Netherlands BV
6.875% 5/15/23 (d) | | | 3,188,000 | | | | 3,247,775 | |
| | | | | | | | |
| Telecommunications — 7.7% | |
CenturyLink, Inc.
6.750% 12/01/23 (e) | | | 2,447,000 | | | | 2,679,465 | |
CommScope Technologies Finance LLC
6.000% 6/15/25 (d) | | | 582,000 | | | | 526,710 | |
CommScope, Inc.
6.000% 3/01/26 (d) | | | 617,000 | | | | 638,472 | |
8.250% 3/01/27 (d) | | | 1,466,000 | | | | 1,427,059 | |
Hughes Satellite Systems Corp.
5.250% 8/01/26 | | | 2,809,000 | | | | 3,005,630 | |
6.625% 8/01/26 | | | 4,144,000 | | | | 4,498,146 | |
Inmarsat Finance PLC
6.500% 10/01/24 (d) | | | 207,000 | | | | 217,350 | |
Intelsat Connect Finance SA
9.500% 2/15/23 (d) | | | 2,204,000 | | | | 2,038,017 | |
Intelsat Jackson Holdings SA
8.500% 10/15/24 (d) | | | 3,689,000 | | | | 3,715,524 | |
9.750% 7/15/25 (d) | | | 2,276,000 | | | | 2,377,282 | |
| | | | | | | | |
| | |
| | | Principal
Amount | | | Value | |
Sprint Capital Corp.
8.750% 3/15/32 | | $ | 1,845,000 | | | $ | 2,275,715 | |
Sprint Corp.
7.250% 9/15/21 | | | 885,000 | | | | 944,384 | |
7.625% 3/01/26 | | | 3,856,000 | | | | 4,256,060 | |
7.875% 9/15/23 | | | 4,646,000 | | | | 5,103,445 | |
T-Mobile USA, Inc.
4.500% 2/01/26 | | | 488,000 | | | | 502,298 | |
4.750% 2/01/28 | | | 1,328,000 | | | | 1,389,752 | |
5.375% 4/15/27 | | | 1,038,000 | | | | 1,115,850 | |
6.000% 4/15/24 | | | 877,000 | | | | 909,888 | |
6.500% 1/15/26 | | | 1,216,000 | | | | 1,307,431 | |
Telecom Italia SpA
5.303% 5/30/24 (d) | | | 2,027,000 | | | | 2,186,018 | |
ViaSat, Inc.
5.625% 9/15/25 (d) | | | 1,272,000 | | | | 1,281,540 | |
5.625% 4/15/27 (d) | | | 796,000 | | | | 835,800 | |
| | | | | | | | |
| | | | | | | 43,231,836 | |
| | | | | | | | |
| Toys, Games & Hobbies — 0.5% | |
Mattel, Inc.
2.350% 8/15/21 | | | 192,000 | | | | 186,720 | |
6.750% 12/31/25 (d) | | | 2,428,000 | | | | 2,533,472 | |
| | | | | | | | |
| | | | | | | 2,720,192 | |
| | | | | | | | |
| Transportation — 1.9% | |
The Kenan Advantage Group, Inc.
7.875% 7/31/23 (d) (e) | | | 6,737,000 | | | | 6,046,457 | |
XPO Logistics, Inc.
6.750% 8/15/24 (d) | | | 4,277,000 | | | | 4,640,545 | |
| | | | | | | | |
| | | | | | | 10,687,002 | |
| | | | | | | | |
| | |
TOTAL CORPORATE DEBT
(Cost $518,416,360) | | | | | | | 523,335,795 | |
| | | | | |
| | |
TOTAL BONDS & NOTES
(Cost $548,068,129) | | | | | | | 552,874,658 | |
| | | | | |
| | |
| | | Number
of Shares | | | | |
| WARRANTS — 0.0% | |
| Basic Materials — 0.0% | |
| Forest Products & Paper — 0.0% | |
Appvion Holding Corp. Tranche A, Expires 6/13/23, Strike price 31.25 (a) (b) (c) | | | 5,301 | | | | 2,651 | |
Appvion Holding Corp. Tranche B, Expires 6/13/23, Strike price 31.25 (a) (b) (c) | | | 5,301 | | | | 663 | |
| | | | | | | | |
| | | | | | | 3,314 | |
| | | | | | | | |
| | |
TOTAL WARRANTS
(Cost $0) | | | | | | | 3,314 | |
| | | | | |
The accompanying notes are an integral part of the financial statements.
115
MassMutual Premier High Yield Fund – Portfolio of Investments(Continued)
| | | | | | | | |
| | |
| | | Number of
Shares | | | Value | |
| MUTUAL FUNDS — 3.8% | |
| Diversified Financial Services — 3.8% | |
State Street Navigator Securities Lending Prime Portfolio (g) | | | 21,256,820 | | | $ | 21,256,820 | |
| | | | | | | | |
| | |
TOTAL MUTUAL FUNDS
(Cost $21,256,820) | | | | | | | 21,256,820 | |
| | | | | |
| | |
TOTAL LONG-TERM INVESTMENTS
(Cost $580,142,422) | | | | | | | 576,529,963 | |
| | | | | |
| | |
| | | Principal
Amount | | | | |
| SHORT-TERM INVESTMENTS — 0.7% | |
| Commercial Paper — 0.7% | |
Entergy Corp.
2.291% 11/20/19 (d) | | $ | 4,000,000 | | | | 3,986,020 | |
| | | | | | | | |
| | |
TOTAL SHORT-TERM INVESTMENTS
(Cost $3,987,500) | | | | | | | 3,986,020 | |
| | | | | |
| | |
TOTAL INVESTMENTS — 102.9%
(Cost $584,129,922) (h) | | | | | | | 580,515,983 | |
| | |
| Other Assets/(Liabilities) —(2.9)% | | | | | | | (16,199,406 | ) |
| | | | | |
| | |
| NET ASSETS — 100.0% | | | | | | $ | 564,316,577 | |
| | | | | |
Abbreviation Legend
Notes to Portfolio of Investments
Percentages are stated as a percent of net assets.
| (a) | Investment was valued using significant unobservable inputs. |
| (b) | This security is fair valued in good faith in accordance with procedures approved by the Board of Trustees. At September 30, 2019, these securities amounted to a value of $13,213 or 0.00% of net assets. |
| (c) | Non-income producing security. |
| (d) | Security is exempt from registration under Regulation S or Rule 144A of the Securities Act of 1933. These securities are considered restricted and may be resold in transactions exempt from registration. At September 30, 2019, the aggregate market value of these securities amounted to $378,117,074 or 67.00% of net assets. |
| (e) | Denotes all or a portion of security on loan. The total value of securities on loan as of September 30, 2019, was $20,816,499 or 3.69% of net assets. Total securities on loan may be less than the amounts identified in the Portfolio of Investments.(Note 2). |
| (f) | A portion of this security is purchased on a when-issued, delayed-delivery or forward commitment basis.(Note 2). |
| (g) | Represents investment of security lending collateral.(Note 2). |
| (h) | See Note 6 for aggregate cost for federal tax purposes. |
Country weightings, as a percentage of net assets, is as follows:
| | | | |
United States | | | 85.3 | % |
Canada | | | 6.3 | % |
Luxembourg | | | 3.1 | % |
United Kingdom | | | 3.0 | % |
Cayman Islands | | | 1.6 | % |
Netherlands | | | 1.3 | % |
Ireland | | | 0.5 | % |
Denmark | | | 0.4 | % |
Italy | | | 0.4 | % |
Austria | | | 0.3 | % |
| | | | |
Total Long-Term Investments | | | 102.2 | % |
Short-Term Investments and Other Assets and Liabilities | | | (2.2 | )% |
| | | | |
Net Assets | | | 100.0 | % |
| | | | |
The accompanying notes are an integral part of the financial statements.
116
MassMutual Premier Balanced Fund – Portfolio of Investments
September 30, 2019
| | | | | | | | |
| | | Number of
Shares | | | Value | |
| EQUITIES — 48.5% | |
|
| COMMON STOCK — 48.4% | |
| Basic Materials — 1.0% | |
| Chemicals — 0.7% | |
Air Products & Chemicals, Inc. | | | 10 | | | $ | 2,219 | |
Celanese Corp. | | | 720 | | | | 88,049 | |
CF Industries Holdings, Inc. | | | 1,525 | | | | 75,030 | |
Dow, Inc. (a) | | | 1,720 | | | | 81,958 | |
DuPont de Nemours, Inc. | | | 2,320 | | | | 165,439 | |
Eastman Chemical Co. | | | 894 | | | | 66,004 | |
Ecolab, Inc. | | | 4 | | | | 792 | |
International Flavors & Fragrances, Inc. (b) | | | 3 | | | | 368 | |
Linde PLC | | | 1,324 | | | | 256,485 | |
LyondellBasell Industries NV Class A | | | 1,180 | | | | 105,575 | |
The Mosaic Co. | | | 1,000 | | | | 20,500 | |
PPG Industries, Inc. | | | 388 | | | | 45,982 | |
The Sherwin-Williams Co. | | | 7 | | | | 3,849 | |
| | | | | | | | |
| | | | | | | 912,250 | |
| | | | | | | | |
| Forest Products & Paper — 0.1% | |
International Paper Co. | | | 2,707 | | | | 113,207 | |
| | | | | | | | |
| Iron & Steel — 0.1% | |
Nucor Corp. | | | 3,061 | | | | 155,835 | |
| | | | | | | | |
| Mining — 0.1% | |
Freeport-McMoRan, Inc. | | | 2,748 | | | | 26,299 | |
Newmont Goldcorp Corp. | | | 684 | | | | 25,937 | |
| | | | | | | | |
| | | | | | | 52,236 | |
| | | | | | | | |
| | | | | | | 1,233,528 | |
| | | | | | | | |
| Communications — 8.2% | |
| Advertising — 0.1% | |
The Interpublic Group of Cos., Inc. | | | 3,133 | | | | 67,548 | |
Omnicom Group, Inc. | | | 1,198 | | | | 93,803 | |
| | | | | | | | |
| | | | | | | 161,351 | |
| | | | | | | | |
| Internet — 5.1% | |
Alphabet, Inc. Class A (a) | | | 914 | | | | 1,116,122 | |
Alphabet, Inc. Class C (a) | | | 796 | | | | 970,324 | |
Amazon.com, Inc. (a) | | | 1,106 | | | | 1,919,917 | |
Booking Holdings, Inc. (a) | | | 234 | | | | 459,251 | |
eBay, Inc. | | | 3,165 | | | | 123,372 | |
Expedia Group, Inc. | | | 103 | | | | 13,844 | |
F5 Networks, Inc. (a) | | | 200 | | | | 28,084 | |
Facebook, Inc. Class A (a) | | | 8,830 | | | | 1,572,446 | |
Netflix, Inc. (a) | | | 792 | | | | 211,955 | |
Symantec Corp. | | | 79 | | | | 1,867 | |
TripAdvisor, Inc. (a) | | | 43 | | | | 1,663 | |
VeriSign, Inc. (a) | | | 229 | | | | 43,196 | |
| | | | | | | | |
| | | | | | | 6,462,041 | |
| | | | | | | | |
| | | | | | | | |
| | | Number of
Shares | | | Value | |
| Media — 1.1% | |
CBS Corp. Class B | | | 1,070 | | | $ | 43,196 | |
Charter Communications, Inc. Class A (a) | | | 96 | | | | 39,563 | |
Comcast Corp. Class A | | | 18,962 | | | | 854,807 | |
Discovery, Inc. Class A (a) (b) | | | 6,600 | | | | 175,758 | |
Discovery, Inc. Class C (a) | | | 3,095 | | | | 76,199 | |
DISH Network Corp. Class A (a) | | | 1,000 | | | | 34,070 | |
Fox Corp. Class A | | | 273 | | | | 8,609 | |
Fox Corp. Class B (a) | | | 433 | | | | 13,657 | |
News Corp. Class A | | | 1,130 | | | | 15,729 | |
Viacom, Inc. Class B | | | 2,990 | | | | 71,850 | |
The Walt Disney Co. | | | 597 | | | | 77,801 | |
| | | | | | | | |
| | | | | | | 1,411,239 | |
| | | | | | | | |
| Telecommunications — 1.9% | |
AT&T, Inc. | | | 7,435 | | | | 281,340 | |
CenturyLink, Inc. | | | 14,154 | | | | 176,642 | |
Cisco Systems, Inc. | | | 19,124 | | | | 944,917 | |
Corning, Inc. | | | 1,174 | | | | 33,482 | |
Juniper Networks, Inc. | | | 1,048 | | | | 25,938 | |
Motorola Solutions, Inc. | | | 764 | | | | 130,193 | |
Verizon Communications, Inc. | | | 13,132 | | | | 792,648 | |
| | | | | | | | |
| | | | | | | 2,385,160 | |
| | | | | | | | |
| | | | | | | 10,419,791 | |
| | | | | | | | |
| Consumer, Cyclical — 4.1% | |
| Airlines — 0.4% | |
Alaska Air Group, Inc. | | | 100 | | | | 6,491 | |
American Airlines Group, Inc. | | | 400 | | | | 10,788 | |
Delta Air Lines, Inc. | | | 3,300 | | | | 190,080 | |
Southwest Airlines Co. | | | 2,066 | | | | 111,585 | |
United Airlines Holdings, Inc. (a) | | | 1,700 | | | | 150,297 | |
| | | | | | | | |
| | | | | | | 469,241 | |
| | | | | | | | |
| Apparel — 0.4% | |
Capri Holdings Ltd. (a) | | | 400 | | | | 13,264 | |
Hanesbrands, Inc. | | | 1,200 | | | | 18,384 | |
NIKE, Inc. Class B | | | 3,884 | | | | 364,786 | |
PVH Corp. | | | 240 | | | | 21,175 | |
Ralph Lauren Corp. | | | 400 | | | | 38,188 | |
Tapestry, Inc. | | | 84 | | | | 2,188 | |
Under Armour, Inc. Class C (a) | | | 300 | | | | 5,439 | |
VF Corp. | | | 400 | | | | 35,596 | |
| | | | | | | | |
| | | | | | | 499,020 | |
| | | | | | | | |
| Auto Manufacturers — 0.3% | |
Ford Motor Co. | | | 10,362 | | | | 94,916 | |
General Motors Co. | | | 4,600 | | | | 172,408 | |
PACCAR, Inc. | | | 1,834 | | | | 128,398 | |
| | | | | | | | �� |
| | | | | | | 395,722 | |
| | | | | | | | |
| Auto Parts & Equipment — 0.0% | |
BorgWarner, Inc. | | | 700 | | | | 25,676 | |
| | | | | | | | |
The accompanying notes are an integral part of the financial statements.
117
MassMutual Premier Balanced Fund – Portfolio of Investments(Continued)
| | | | | | | | |
| | | Number of
Shares | | | Value | |
| Distribution & Wholesale — 0.1% | |
Copart, Inc. (a) | | | 600 | | | $ | 48,198 | |
Fastenal Co. | | | 140 | | | | 4,574 | |
W.W. Grainger, Inc. | | | 164 | | | | 48,732 | |
| | | | | | | | |
| | | | | | | 101,504 | |
| | | | | | | | |
| Home Builders — 0.1% | |
D.R. Horton, Inc. | | | 759 | | | | 40,007 | |
PulteGroup, Inc. | | | 3,074 | | | | 112,354 | |
| | | | | | | | |
| | | | | | | 152,361 | |
| | | | | | | | |
| Home Furnishing — 0.1% | |
Leggett & Platt, Inc. | | | 95 | | | | 3,889 | |
Whirlpool Corp. | | | 414 | | | | 65,561 | |
| | | | | | | | |
| | | | | | | 69,450 | |
| | | | | | | | |
| Housewares — 0.0% | |
Newell Brands, Inc. | | | 683 | | | | 12,786 | |
| | | | | | | | |
| Leisure Time — 0.2% | |
Harley-Davidson, Inc. | | | 508 | | | | 18,273 | |
Norwegian Cruise Line Holdings Ltd. (a) | | | 2,300 | | | | 119,071 | |
Royal Caribbean Cruises Ltd. | | | 680 | | | | 73,664 | |
| | | | | | | | |
| | | | | | | 211,008 | |
| | | | | | | | |
| Lodging — 0.1% | |
Hilton Worldwide Holdings, Inc. | | | 1,800 | | | | 167,598 | |
Marriott International, Inc. Class A | | | 141 | | | | 17,536 | |
Wynn Resorts Ltd. | | | 9 | | | | 979 | |
| | | | | | | | |
| | | | | | | 186,113 | |
| | | | | | | | |
| Retail — 2.4% | |
Advance Auto Parts, Inc. | | | 140 | | | | 23,156 | |
AutoZone, Inc. (a) | | | 126 | | | | 136,662 | |
Best Buy Co., Inc. | | | 1,108 | | | | 76,441 | |
Chipotle Mexican Grill, Inc. (a) | | | 50 | | | | 42,023 | |
Costco Wholesale Corp. | | | 858 | | | | 247,198 | |
Darden Restaurants, Inc. | | | 373 | | | | 44,096 | |
Dollar Tree, Inc. (a) | | | 71 | | | | 8,105 | |
Foot Locker, Inc. | | | 2,300 | | | | 99,268 | |
The Gap, Inc. | | | 1,705 | | | | 29,599 | |
Genuine Parts Co. | | | 446 | | | | 44,417 | |
The Home Depot, Inc. | | | 2,080 | | | | 482,602 | |
Kohl’s Corp. | | | 1,261 | | | | 62,621 | |
L Brands, Inc. | | | 600 | | | | 11,754 | |
Lowe’s Cos., Inc. | | | 349 | | | | 38,376 | |
Macy’s, Inc. | | | 1,440 | | | | 22,378 | |
McDonald’s Corp. | | | 35 | | | | 7,515 | |
Nordstrom, Inc. (b) | | | 1,511 | | | | 50,875 | |
O’Reilly Automotive, Inc. (a) | | | 314 | | | | 125,132 | |
Ross Stores, Inc. | | | 762 | | | | 83,706 | |
Starbucks Corp. | | | 6,390 | | | | 565,004 | |
Target Corp. | | | 2,067 | | | | 220,983 | |
Tiffany & Co. | | | 111 | | | | 10,282 | |
The TJX Cos., Inc. | | | 2,280 | | | | 127,087 | |
| | | | | | | | |
| | | Number of
Shares | | | Value | |
Walgreens Boots Alliance, Inc. | | | 1,606 | | | $ | 88,828 | |
Walmart, Inc. | | | 2,773 | | | | 329,100 | |
Yum! Brands, Inc. | | | 506 | | | | 57,396 | |
| | | | | | | | |
| | | | | | | 3,034,604 | |
| | | | | | | | |
| Toys, Games & Hobbies — 0.0% | |
Hasbro, Inc. | | | 387 | | | | 45,933 | |
| | | | | | | | |
| | | | | | | 5,203,418 | |
| | | | | | | | |
| Consumer,Non-cyclical — 10.2% | |
| Agriculture — 0.5% | |
Altria Group, Inc. | | | 9,341 | | | | 382,047 | |
Archer-Daniels-Midland Co. | | | 26 | | | | 1,068 | |
Philip Morris International, Inc. | | | 3,646 | | | | 276,841 | |
| | | | | | | | |
| | | | | | | 659,956 | |
| | | | | | | | |
| Beverages — 0.6% | |
Brown-Forman Corp. Class B | | | 2 | | | | 126 | |
The Coca-Cola Co. | | | 4,224 | | | | 229,954 | |
Constellation Brands, Inc. Class A | | | 82 | | | | 16,997 | |
Molson Coors Brewing Co. Class B | | | 236 | | | | 13,570 | |
Monster Beverage Corp. (a) | | | 750 | | | | 43,545 | |
PepsiCo, Inc. | | | 3,352 | | | | 459,559 | |
| | | | | | | | |
| | | | | | | 763,751 | |
| | | | | | | | |
| Biotechnology — 1.3% | |
Alexion Pharmaceuticals, Inc. (a) | | | 390 | | | | 38,197 | |
Amgen, Inc. | | | 2,515 | | | | 486,678 | |
Biogen, Inc. (a) | | | 884 | | | | 205,813 | |
Celgene Corp. (a) | | | 3,598 | | | | 357,281 | |
Corteva, Inc. (a) | | | 20 | | | | 560 | |
Gilead Sciences, Inc. | | | 4,052 | | | | 256,816 | |
Incyte Corp. (a) | | | 400 | | | | 29,692 | |
Regeneron Pharmaceuticals, Inc. (a) | | | 290 | | | | 80,446 | |
Vertex Pharmaceuticals, Inc. (a) | | | 730 | | | | 123,676 | |
| | | | | | | | |
| | | | | | | 1,579,159 | |
| | | | | | | | |
| Commercial Services — 1.0% | |
Automatic Data Processing, Inc. | | | 271 | | | | 43,745 | |
Cintas Corp. | | | 9 | | | | 2,413 | |
Equifax, Inc. | | | 6 | | | | 844 | |
Gartner, Inc. (a) | | | 490 | | | | 70,065 | |
Global Payments, Inc. | | | 260 | | | | 41,340 | |
H&R Block, Inc. | | | 5,642 | | | | 133,264 | |
Moody’s Corp. | | | 695 | | | | 142,357 | |
Nielsen Holdings PLC | | | 3,200 | | | | 68,000 | |
PayPal Holdings, Inc. (a) | | | 2,545 | | | | 263,637 | |
Quanta Services, Inc. | | | 2,224 | | | | 84,067 | |
Robert Half International, Inc. | | | 835 | | | | 46,476 | |
S&P Global, Inc. | | | 879 | | | | 215,337 | |
United Rentals, Inc. (a) | | | 850 | | | | 105,944 | |
Verisk Analytics, Inc. | | | 380 | | | | 60,093 | |
| | | | | | | | |
| | | | | | | 1,277,582 | |
| | | | | | | | |
| Cosmetics & Personal Care — 0.7% | |
Colgate-Palmolive Co. | | | 2,906 | | | | 213,620 | |
The accompanying notes are an integral part of the financial statements.
118
MassMutual Premier Balanced Fund – Portfolio of Investments(Continued)
| | | | | | | | |
| | | Number of
Shares | | | Value | |
The Estee Lauder Cos., Inc. Class A | | | 426 | | | $ | 84,753 | |
The Procter & Gamble Co. | | | 5,143 | | | | 639,686 | |
| | | | | | | | |
| | | | | | | 938,059 | |
| | | | | | | | |
| Foods — 0.7% | |
Campbell Soup Co. | | | 1,265 | | | | 59,354 | |
Conagra Brands, Inc. | | | 1,184 | | | | 36,325 | |
General Mills, Inc. | | | 2,594 | | | | 142,981 | |
The Hershey Co. | | | 1,109 | | | | 171,884 | |
Hormel Foods Corp. | | | 488 | | | | 21,340 | |
The J.M. Smucker Co. | | | 274 | | | | 30,146 | |
Kellogg Co. | | | 135 | | | | 8,687 | |
The Kraft Heinz Co. | | | 173 | | | | 4,833 | |
The Kroger Co. | | | 3,368 | | | | 86,827 | |
McCormick & Co., Inc. | | | 303 | | | | 47,359 | |
Mondelez International, Inc. Class A | | | 221 | | | | 12,226 | |
Sysco Corp. | | | 2,066 | | | | 164,040 | |
Tyson Foods, Inc. Class A | | | 720 | | | | 62,021 | |
| | | | | | | | |
| | | | | | | 848,023 | |
| | | | | | | | |
| Health Care – Products — 1.0% | |
Abbott Laboratories | | | 2,689 | | | | 224,989 | |
Baxter International, Inc. | | | 122 | | | | 10,671 | |
Becton Dickinson and Co. | | | 8 | | | | 2,024 | |
Boston Scientific Corp. (a) | | | 1,621 | | | | 65,958 | |
The Cooper Cos., Inc. | | | 190 | | | | 56,430 | |
Danaher Corp. | | | 402 | | | | 58,061 | |
Edwards Lifesciences Corp. (a) | | | 240 | | | | 52,778 | |
Henry Schein, Inc. (a) | | | 1,800 | | | | 114,300 | |
IDEXX Laboratories, Inc. (a) | | | 250 | | | | 67,983 | |
Intuitive Surgical, Inc. (a) | | | 162 | | | | 87,469 | |
Medtronic PLC | | | 1,816 | | | | 197,254 | |
ResMed, Inc. | | | 300 | | | | 40,533 | |
Stryker Corp. | | | 389 | | | | 84,141 | |
Thermo Fisher Scientific, Inc. | | | 638 | | | | 185,830 | |
Varian Medical Systems, Inc. (a) | | | 4 | | | | 476 | |
Zimmer Biomet Holdings, Inc. | | | 364 | | | | 49,966 | |
| | | | | | | | |
| | | | | | | 1,298,863 | |
| | | | | | | | |
| Health Care – Services — 0.5% | |
Anthem, Inc. | | | 58 | | | | 13,926 | |
Centene Corp. (a) | | | 1,480 | | | | 64,025 | |
DaVita, Inc. (a) | | | 1,146 | | | | 65,402 | |
HCA Healthcare, Inc. | | | 1,360 | | | | 163,771 | |
Humana, Inc. | | | 45 | | | | 11,505 | |
Laboratory Corp. of America Holdings (a) | | | 1 | | | | 168 | |
Quest Diagnostics, Inc. | | | 95 | | | | 10,168 | |
UnitedHealth Group, Inc. | | | 1,321 | | | | 287,080 | |
Universal Health Services, Inc. Class B | | | 10 | | | | 1,487 | |
| | | | | | | | |
| | | | | | | 617,532 | |
| | | | | | | | |
| Household Products & Wares — 0.2% | |
Avery Dennison Corp. | | | 382 | | | | 43,384 | |
| | | | | | | | |
| | | Number of
Shares | | | Value | |
Church & Dwight Co., Inc. | | | 400 | | | $ | 30,096 | |
The Clorox Co. | | | 587 | | | | 89,148 | |
Dentsply Sirona, Inc. | | | 61 | | | | 3,252 | |
Kimberly-Clark Corp. | | | 710 | | | | 100,855 | |
Spectrum Brands Holdings, Inc. (f) | | | 1 | | | | 47 | |
| | | | | | | | |
| | | | | | | 266,782 | |
| | | | | | | | |
| Pharmaceuticals — 3.7% | |
AbbVie, Inc. | | | 6,504 | | | | 492,483 | |
Align Technology, Inc. (a) | | | 190 | | | | 34,375 | |
Allergan PLC | | | 179 | | | | 30,124 | |
AmerisourceBergen Corp. | | | 1,630 | | | | 134,198 | |
Bristol-Myers Squibb Co. | | | 7,312 | | | | 370,792 | |
Cardinal Health, Inc. | | | 2,755 | | | | 130,008 | |
Cigna Corp. (a) | | | 74 | | | | 11,232 | |
CVS Health Corp. | | | 4,946 | | | | 311,944 | |
Eli Lilly & Co. | | | 3,787 | | | | 423,500 | |
Johnson & Johnson | | | 8,679 | | | | 1,122,889 | |
McKesson Corp. | | | 1,361 | | | | 185,994 | |
Merck & Co., Inc. | | | 9,729 | | | | 818,987 | |
Mylan NV (a) | | | 2,659 | | | | 52,595 | |
Perrigo Co. PLC | | | 200 | | | | 11,178 | |
Pfizer, Inc. | | | 14,122 | | | | 507,404 | |
Zoetis, Inc. | | | 610 | | | | 76,000 | |
| | | | | | | | |
| | | | | | | 4,713,703 | |
| | | | | | | | |
| | | | | | | 12,963,410 | |
| | | | | | | | |
| Energy — 1.8% | |
| Oil & Gas — 1.7% | |
Apache Corp. | | | 98 | | | | 2,509 | |
Cabot Oil & Gas Corp. | | | 1,892 | | | | 33,242 | |
Chevron Corp. | | | 5,650 | | | | 670,090 | |
Cimarex Energy Co. | | | 1,500 | | | | 71,910 | |
ConocoPhillips | | | 8,310 | | | | 473,504 | |
Devon Energy Corp. | | | 917 | | | | 22,063 | |
Diamondback Energy, Inc. | | | 340 | | | | 30,569 | |
EOG Resources, Inc. | | | 702 | | | | 52,103 | |
Exxon Mobil Corp. | | | 4,349 | | | | 307,083 | |
Helmerich & Payne, Inc. | | | 40 | | | | 1,603 | |
Hess Corp. | | | 447 | | | | 27,035 | |
HollyFrontier Corp. | | | 1,000 | | | | 53,640 | |
Marathon Oil Corp. | | | 1,085 | | | | 13,313 | |
Marathon Petroleum Corp. | | | 375 | | | | 22,781 | |
Noble Energy, Inc. | | | 66 | | | | 1,482 | |
Occidental Petroleum Corp. | | | 5,058 | | | | 224,929 | |
Phillips 66 | | | 1,195 | | | | 122,368 | |
Pioneer Natural Resources Co. | | | 3 | | | | 377 | |
Valero Energy Corp. | | | 530 | | | | 45,177 | |
| | | | | | | | |
| | | | | | | 2,175,778 | |
| | | | | | | | |
| Oil & Gas Services — 0.1% | |
Baker Hughes a GE Co. | | | 74 | | | | 1,717 | |
Halliburton Co. | | | 2,271 | | | | 42,808 | |
National Oilwell Varco, Inc. | | | 1,009 | | | | 21,391 | |
The accompanying notes are an integral part of the financial statements.
119
MassMutual Premier Balanced Fund – Portfolio of Investments(Continued)
| | | | | | | | |
| | | Number of
Shares | | | Value | |
Schlumberger Ltd. | | | 687 | | | $ | 23,475 | |
TechnipFMC PLC | | | 1,272 | | | | 30,706 | |
| | | | | | | | |
| | | | | | | 120,097 | |
| | | | | | | | |
| Pipelines — 0.0% | |
Kinder Morgan, Inc. | | | 60 | | | | 1,237 | |
The Williams Cos., Inc. | | | 33 | | | | 794 | |
| | | | | | | | |
| | | | | | | 2,031 | |
| | | | | | | | |
| | | | | | | 2,297,906 | |
| | | | | | | | |
| Financial — 9.0% | |
| Banks — 3.2% | |
Bank of America Corp. | | | 25,542 | | | | 745,060 | |
The Bank of New York Mellon Corp. | | | 895 | | | | 40,463 | |
BB&T Corp. | | | 512 | | | | 27,325 | |
Citigroup, Inc. | | | 9,584 | | | | 662,063 | |
Citizens Financial Group, Inc. | | | 3,300 | | | | 116,721 | |
Comerica, Inc. | | | 2,424 | | | | 159,960 | |
Fifth Third Bancorp | | | 1,621 | | | | 44,383 | |
The Goldman Sachs Group, Inc. | | | 1,058 | | | | 219,249 | |
Huntington Bancshares, Inc. | | | 1,110 | | | | 15,840 | |
JP Morgan Chase & Co. | | | 9,575 | | | | 1,126,882 | |
KeyCorp | | | 2,272 | | | | 40,533 | |
M&T Bank Corp. | | | 361 | | | | 57,027 | |
Morgan Stanley | | | 6,096 | | | | 260,116 | |
Northern Trust Corp. | | | 511 | | | | 47,687 | |
The PNC Financial Services Group, Inc. | | | 545 | | | | 76,387 | |
Regions Financial Corp. | | | 3,743 | | | | 59,214 | |
State Street Corp. | | | 185 | | | | 10,950 | |
SunTrust Banks, Inc. | | | 1,200 | | | | 82,560 | |
SVB Financial Group (a) | | | 290 | | | | 60,596 | |
US Bancorp | | | 1,129 | | | | 62,479 | |
Wells Fargo & Co. | | | 3,064 | | | | 154,548 | |
Zions Bancorp NA | | | 349 | | | | 15,537 | |
| | | | | | | | |
| | | | | | | 4,085,580 | |
| | | | | | | | |
| Diversified Financial Services — 2.4% | |
Alliance Data Systems Corp. | | | 200 | | | | 25,626 | |
American Express Co. | | | 818 | | | | 96,753 | |
Ameriprise Financial, Inc. | | | 1,085 | | | | 159,603 | |
BlackRock, Inc. | | | 200 | | | | 89,128 | |
Capital One Financial Corp. | | | 1,275 | | | | 115,999 | |
The Charles Schwab Corp. | | | 3,022 | | | | 126,410 | |
CME Group, Inc. | | | 5 | | | | 1,057 | |
Discover Financial Services | | | 2,395 | | | | 194,211 | |
E*TRADE Financial Corp. | | | 4,193 | | | | 183,192 | |
Franklin Resources, Inc. | | | 3,848 | | | | 111,053 | |
Intercontinental Exchange, Inc. | | | 310 | | | | 28,604 | |
Invesco Ltd. | | | 5,923 | | | | 100,336 | |
Jefferies Financial Group, Inc. | | | 36 | | | | 662 | |
Mastercard, Inc. Class A | | | 2,630 | | | | 714,229 | |
Nasdaq, Inc. | | | 22 | | | | 2,186 | |
Raymond James Financial, Inc. | | | 1,200 | | | | 98,952 | |
| | | | | | | | |
| | | Number of
Shares | | | Value | |
Synchrony Financial | | | 4,100 | | | $ | 139,769 | |
T. Rowe Price Group, Inc. | | | 686 | | | | 78,376 | |
Visa, Inc. Class A | | | 4,410 | | | | 758,564 | |
The Western Union Co. | | | 107 | | | | 2,479 | |
| | | | | | | | |
| | | | | | | 3,027,189 | |
| | | | | | | | |
| Insurance — 2.1% | |
Aflac, Inc. | | | 1,990 | | | | 104,117 | |
The Allstate Corp. | | | 586 | | | | 63,686 | |
American International Group, Inc. | | | 3,211 | | | | 178,853 | |
Aon PLC | | | 456 | | | | 88,268 | |
Assurant, Inc. | | | 30 | | | | 3,775 | |
Berkshire Hathaway, Inc. Class B (a) | | | 3,733 | | | | 776,539 | |
Chubb Ltd. | | | 174 | | | | 28,091 | |
Cincinnati Financial Corp. | | | 334 | | | | 38,968 | |
Everest Re Group Ltd. | | | 450 | | | | 119,740 | |
Globe Life, Inc. (a) | | | 480 | | | | 45,965 | |
The Hartford Financial Services Group, Inc. | | | 790 | | | | 47,882 | |
Lincoln National Corp. | | | 2,458 | | | | 148,267 | |
Loews Corp. | | | 1,934 | | | | 99,562 | |
Marsh & McLennan Cos., Inc. | | | 230 | | | | 23,011 | |
MetLife, Inc. | | | 4,729 | | | | 223,020 | |
Principal Financial Group, Inc. | | | 1,235 | | | | 70,568 | |
The Progressive Corp. | | | 2,834 | | | | 218,926 | |
Prudential Financial, Inc. | | | 1,795 | | | | 161,460 | |
The Travelers Cos., Inc. | | | 797 | | | | 118,506 | |
Unum Group | | | 1,535 | | | | 45,620 | |
| | | | | | | | |
| | | | | | | 2,604,824 | |
| | | | | | | | |
| Real Estate — 0.1% | |
CBRE Group, Inc. Class A (a) | | | 1,098 | | | | 58,205 | |
| | | | | | | | |
| Real Estate Investment Trusts (REITS) — 1.2% | |
Alexandria Real Estate Equities, Inc. | | | 360 | | | | 55,454 | |
American Tower Corp. | | | 428 | | | | 94,644 | |
Apartment Investment & Management Co. Class A | | | 63 | | | | 3,285 | |
AvalonBay Communities, Inc. | | | 54 | | | | 11,628 | |
Boston Properties, Inc. | | | 527 | | | | 68,331 | |
Crown Castle International Corp. | | | 210 | | | | 29,192 | |
Digital Realty Trust, Inc. | | | 50 | | | | 6,491 | |
Duke Realty Corp. | | | 1,400 | | | | 47,558 | |
Equinix, Inc. | | | 20 | | | | 11,536 | |
Equity Residential | | | 1,201 | | | | 103,598 | |
Essex Property Trust, Inc. | | | 30 | | | | 9,799 | |
Extra Space Storage, Inc. | | | 800 | | | | 93,456 | |
Federal Realty Investment Trust | | | 10 | | | | 1,361 | |
HCP, Inc. | | | 676 | | | | 24,086 | |
Host Hotels & Resorts, Inc. | | | 6,030 | | | | 104,259 | |
Iron Mountain, Inc. | | | 73 | | | | 2,364 | |
Kimco Realty Corp. | | | 6,710 | | | | 140,105 | |
The Macerich Co. | | | 1,300 | | | | 41,067 | |
Mid-America Apartment Communities, Inc. | | | 300 | | | | 39,003 | |
The accompanying notes are an integral part of the financial statements.
120
MassMutual Premier Balanced Fund – Portfolio of Investments(Continued)
| | | | | | | | |
| | | Number of
Shares | | | Value | |
Prologis, Inc. | | | 1,716 | | | $ | 146,238 | |
Public Storage | | | 427 | | | | 104,730 | |
Realty Income Corp. | | | 1,000 | | | | 76,680 | |
Regency Centers Corp. | | | 500 | | | | 34,745 | |
Simon Property Group, Inc. | | | 1,074 | | | | 167,168 | |
SL Green Realty Corp. | | | 410 | | | | 33,517 | |
Ventas, Inc. | | | 1,136 | | | | 82,962 | |
Vornado Realty Trust | | | 265 | | | | 16,873 | |
Welltower, Inc. | | | 274 | | | | 24,838 | |
Weyerhaeuser Co. | | | 93 | | | | 2,576 | |
| | | | | | | | |
| | | | | | | 1,577,544 | |
| | | | | | | | |
| Savings & Loans — 0.0% | |
People’s United Financial, Inc. | | | 1,159 | | | | 18,121 | |
| | | | | | | | |
| | | | | | | 11,371,463 | |
| | | | | | | | |
| Industrial — 3.4% | |
| Aerospace & Defense — 0.7% | |
Arconic, Inc. | | | 4,915 | | | | 127,790 | |
The Boeing Co. | | | 536 | | | | 203,932 | |
General Dynamics Corp. | | | 88 | | | | 16,080 | |
L3 Harris Technologies, Inc. | | | 736 | | | | 153,559 | |
Lockheed Martin Corp. | | | 621 | | | | 242,227 | |
Northrop Grumman Corp. | | | 53 | | | | 19,864 | |
Raytheon Co. | | | 456 | | | | 89,463 | |
United Technologies Corp. | | | 294 | | | | 40,137 | |
| | | | | | | | |
| | | | | | | 893,052 | |
| | | | | | | | |
| Building Materials — 0.1% | |
Johnson Controls International PLC | | | 426 | | | | 18,697 | |
Masco Corp. | | | 2,794 | | | | 116,454 | |
Vulcan Materials Co. | | | 8 | | | | 1,210 | |
| | | | | | | | |
| | | | | | | 136,361 | |
| | | | | | | | |
| Electrical Components & Equipment — 0.0% | |
AMETEK, Inc. | | | 400 | | | | 36,728 | |
Emerson Electric Co. | | | 43 | | | | 2,875 | |
| | | | | | | | |
| | | | | | | 39,603 | |
| | | | | | | | |
| Electronics — 0.7% | |
Agilent Technologies, Inc. | | | 173 | | | | 13,257 | |
Allegion PLC | | | 300 | | | | 31,095 | |
Amphenol Corp. Class A | | | 72 | | | | 6,948 | |
FLIR Systems, Inc. | | | 435 | | | | 22,877 | |
Fortive Corp. | | | 836 | | | | 57,316 | |
Garmin Ltd. | | | 400 | | | | 33,876 | |
Honeywell International, Inc. | | | 2,775 | | | | 469,530 | |
Keysight Technologies, Inc. (a) | | | 600 | | | | 58,350 | |
Mettler-Toledo International, Inc. (a) | | | 100 | | | | 70,440 | |
PerkinElmer, Inc. | | | 24 | | | | 2,044 | |
TE Connectivity Ltd. | | | 1,100 | | | | 102,498 | |
Waters Corp. (a) | | | 300 | | | | 66,969 | |
| | | | | | | | |
| | | | | | | 935,200 | |
| | | | | | | | |
| Engineering & Construction — 0.0% | |
Jacobs Engineering Group, Inc. | | | 124 | | | | 11,346 | |
| | | | | | | | |
| | | | | | | | |
| | | Number of
Shares | | | Value | |
| Environmental Controls — 0.1% | |
Pentair PLC | | | 400 | | | $ | 15,120 | |
Republic Services, Inc. | | | 87 | | | | 7,530 | |
Waste Management, Inc. | | | 1,305 | | | | 150,075 | |
| | | | | | | | |
| | | | | | | 172,725 | |
| | | | | | | | |
| Hand & Machine Tools — 0.1% | |
Snap-on, Inc. | | | 165 | | | | 25,829 | |
Stanley Black & Decker, Inc. | | | 332 | | | | 47,944 | |
| | | | | | | | |
| | | | | | | 73,773 | |
| | | | | | | | |
| Machinery – Construction & Mining — 0.0% | |
Caterpillar, Inc. | | | 270 | | | | 34,104 | |
| | | | | | | | |
| Machinery – Diversified — 0.3% | |
Cummins, Inc. | | | 773 | | | | 125,744 | |
Deere & Co. | | | 1 | | | | 169 | |
Dover Corp. | | | 1,403 | | | | 139,683 | |
Flowserve Corp. | | | 291 | | | | 13,592 | |
Rockwell Automation, Inc. | | | 236 | | | | 38,893 | |
Roper Technologies, Inc. | | | 184 | | | | 65,614 | |
Xylem, Inc. | | | 1 | | | | 80 | |
| | | | | | | | |
| | | | | | | 383,775 | |
| | | | | | | | |
| Manufacturing — 0.3% | |
3M Co. | | | 1,425 | | | | 234,270 | |
Illinois Tool Works, Inc. | | | 990 | | | | 154,925 | |
| | | | | | | | |
| | | | | | | 389,195 | |
| | | | | | | | |
| Miscellaneous – Manufacturing — 0.2% | |
Eaton Corp. PLC | | | 1,082 | | | | 89,968 | |
General Electric Co. | | | 86 | | | | 769 | |
Ingersoll-Rand PLC | | | 690 | | | | 85,015 | |
Parker-Hannifin Corp. | | | 320 | | | | 57,795 | |
Textron, Inc. | | | 485 | | | | 23,746 | |
| | | | | | | | |
| | | | | | | 257,293 | |
| | | | | | | | |
| Packaging & Containers — 0.1% | |
Ball Corp. | | | 40 | | | | 2,912 | |
Packaging Corp. of America | | | 410 | | | | 43,501 | |
Sealed Air Corp. | | | 47 | | | | 1,951 | |
WestRock Co. | | | 1,105 | | | | 40,277 | |
| | | | | | | | |
| | | | | | | 88,641 | |
| | | | | | | | |
| Shipbuilding — 0.1% | |
Huntington Ingalls Industries, Inc. | | | 600 | | | | 127,074 | |
| | | | | | | | |
| Transportation — 0.7% | |
C.H. Robinson Worldwide, Inc. | | | 254 | | | | 21,534 | |
CSX Corp. | | | 2,673 | | | | 185,159 | |
Expeditors International of Washington, Inc. | | | 84 | | | | 6,240 | |
FedEx Corp. | | | 6 | | | | 873 | |
Norfolk Southern Corp. | | | 1,213 | | | | 217,928 | |
Union Pacific Corp. | | | 1,810 | | | | 293,184 | |
United Parcel Service, Inc. Class B | | | 795 | | | | 95,257 | |
| | | | | | | | |
| | | | | | | 820,175 | |
| | | | | | | | |
| | | | | | | 4,362,317 | |
| | | | | | | | |
The accompanying notes are an integral part of the financial statements.
121
MassMutual Premier Balanced Fund – Portfolio of Investments(Continued)
| | | | | | | | |
| | | Number of
Shares | | | Value | |
| Technology — 9.2% | |
| Computers — 3.2% | |
Accenture PLC Class A | | | 1,700 | | | $ | 326,995 | |
Apple, Inc. | | | 12,656 | | | | 2,834,564 | |
Cognizant Technology Solutions Corp. Class A | | | 418 | | | | 25,191 | |
DXC Technology Co. | | | 1,145 | | | | 33,777 | |
Fortinet, Inc. (a) | | | 1,000 | | | | 76,760 | |
Hewlett Packard Enterprise Co. | | | 7,163 | | | | 108,663 | |
HP, Inc. | | | 6,163 | | | | 116,604 | |
International Business Machines Corp. | | | 2,290 | | | | 333,012 | |
NetApp, Inc. | | | 1,309 | | | | 68,735 | |
Seagate Technology PLC | | | 2,200 | | | | 118,338 | |
Western Digital Corp. | | | 1,120 | | | | 66,797 | |
| | | | | | | | |
| | | | | | | 4,109,436 | |
| | | | | | | | |
| Office & Business Equipment — 0.1% | |
Xerox Holdings Corp. (a) | | | 5,443 | | | | 162,800 | |
| | | | | | | | |
| Semiconductors — 1.9% | |
Analog Devices, Inc. | | | 217 | | | | 24,245 | |
Applied Materials, Inc. | | | 2,167 | | | | 108,133 | |
Broadcom, Inc. | | | 854 | | | | 235,764 | |
Intel Corp. | | | 7,711 | | | | 397,348 | |
KLA Corp. | | | 308 | | | | 49,111 | |
Lam Research Corp. | | | 863 | | | | 199,448 | |
Maxim Integrated Products, Inc. | | | 900 | | | | 52,119 | |
Microchip Technology, Inc. | | | 24 | | | | 2,230 | |
Micron Technology, Inc. (a) | | | 4,433 | | | | 189,954 | |
NVIDIA Corp. | | | 265 | | | | 46,129 | |
QUALCOMM, Inc. | | | 4,588 | | | | 349,973 | |
Skyworks Solutions, Inc. | | | 190 | | | | 15,057 | |
Texas Instruments, Inc. | | | 5,305 | | | | 685,618 | |
Xilinx, Inc. | | | 561 | | | | 53,800 | |
| | | | | | | | |
| | | | | | | 2,408,929 | |
| | | | | | | | |
| Software — 4.0% | |
Activision Blizzard, Inc. | | | 100 | | | | 5,292 | |
Adobe, Inc. (a) | | | 675 | | | | 186,469 | |
Akamai Technologies, Inc. (a) | | | 310 | | | | 28,328 | |
Autodesk, Inc. (a) | | | 407 | | | | 60,114 | |
Broadridge Financial Solutions, Inc. | | | 100 | | | | 12,443 | |
Cadence Design Systems, Inc. (a) | | | 1,400 | | | | 92,512 | |
Cerner Corp. | | | 2,200 | | | | 149,974 | |
Citrix Systems, Inc. | | | 695 | | | | 67,081 | |
Electronic Arts, Inc. (a) | | | 436 | | | | 42,650 | |
Fidelity National Information Services, Inc. | | | 150 | | | | 19,914 | |
Fiserv, Inc. (a) | | | 588 | | | | 60,911 | |
Intuit, Inc. | | | 859 | | | | 228,442 | |
Microsoft Corp. | | | 22,961 | | | | 3,192,268 | |
MSCI, Inc. | | | 230 | | | | 50,082 | |
Oracle Corp. | | | 12,488 | | | | 687,215 | |
Paychex, Inc. | | | 813 | | | | 67,292 | |
| | | | | | | | |
| | | Number of
Shares | | | Value | |
salesforce.com, Inc. (a) | | | 220 | | | $ | 32,657 | |
Synopsys, Inc. (a) | | | 360 | | | | 49,410 | |
| | | | | | | | |
| | | | | | | 5,033,054 | |
| | | | | | | | |
| | | | | | | 11,714,219 | |
| | | | | | | | |
| Utilities — 1.5% | |
| Electric — 1.5% | |
AES Corp. | | | 7,577 | | | | 123,808 | |
Alliant Energy Corp. | | | 700 | | | | 37,751 | |
Ameren Corp. | | | 1,072 | | | | 85,814 | |
American Electric Power Co., Inc. | | | 1,096 | | | | 102,684 | |
CenterPoint Energy, Inc. | | | 635 | | | | 19,164 | |
CMS Energy Corp. | | | 1,110 | | | | 70,985 | |
Consolidated Edison, Inc. | | | 909 | | | | 85,873 | |
Dominion Energy, Inc. | | | 410 | | | | 33,226 | |
DTE Energy Co. | | | 452 | | | | 60,098 | |
Duke Energy Corp. | | | 2,186 | | | | 209,550 | |
Edison International | | | 134 | | | | 10,106 | |
Entergy Corp. | | | 711 | | | | 83,443 | |
Evergy, Inc. | | | 700 | | | | 46,592 | |
Eversource Energy | | | 1,022 | | | | 87,350 | |
Exelon Corp. | | | 2,923 | | | | 141,210 | |
FirstEnergy Corp. | | | 666 | | | | 32,121 | |
NextEra Energy, Inc. | | | 26 | | | | 6,058 | |
NRG Energy, Inc. | | | 1,120 | | | | 44,352 | |
Pinnacle West Capital Corp. | | | 250 | | | | 24,268 | |
PPL Corp. | | | 4,484 | | | | 141,201 | |
Public Service Enterprise Group, Inc. | | | 1,209 | | | | 75,055 | |
Sempra Energy | | | 652 | | | | 96,242 | |
The Southern Co. | | | 2,634 | | | | 162,702 | |
WEC Energy Group, Inc. | | | 364 | | | | 34,617 | |
Xcel Energy, Inc. | | | 1,145 | | | | 74,299 | |
| | | | | | | | |
| | | | | | | 1,888,569 | |
| | | | | | | | |
| Gas — 0.0% | |
NiSource, Inc. | | | 172 | | | | 5,146 | |
| | | | | | | | |
| | | | | | | 1,893,715 | |
| | | | | | | | |
| | |
TOTAL COMMON STOCK
(Cost $55,981,168) | | | | | | | 61,459,767 | |
| | | | | |
|
| PREFERRED STOCK — 0.1% | |
| Financial — 0.1% | |
| Insurance — 0.1% | |
The Allstate Corp.,
3 mo. USD LIBOR + 3.165%
5.100% VRN 1/15/53 | | | 5,000 | | | | 132,750 | |
| | | | | | | | |
| | |
TOTAL PREFERRED STOCK
(Cost $125,000) | | | | | | | 132,750 | |
| | | | | |
| | |
TOTAL EQUITIES
(Cost $56,106,168) | | | | | | | 61,592,517 | |
| | | | | |
The accompanying notes are an integral part of the financial statements.
122
MassMutual Premier Balanced Fund – Portfolio of Investments(Continued)
| | | | | | | | |
| | |
| | | Principal
Amount | | | Value | |
| BONDS & NOTES — 36.1% | |
|
| CORPORATE DEBT — 12.9% | |
| Aerospace & Defense — 0.0% | |
United Technologies Corp.
6.125% 7/15/38 | | $ | 15,000 | | | $ | 20,616 | |
| | | | | | | | |
| Agriculture — 0.2% | |
BAT Capital Corp.
4.758% 9/06/49 | | | 25,000 | | | | 24,546 | |
Bunge Ltd. Finance Corp.
3.250% 8/15/26 | | | 51,000 | | | | 51,000 | |
4.350% 3/15/24 | | | 85,000 | | | | 89,533 | |
Reynolds American, Inc.
4.450% 6/12/25 | | | 45,000 | | | | 47,995 | |
5.850% 8/15/45 | | | 35,000 | | | | 38,730 | |
| | | | | | | | |
| | | | | | | 251,804 | |
| | | | | | | | |
| Airlines — 0.3% | |
American Airlines Group, Inc.
5.500% 10/01/19 (c) | | | 202,000 | | | | 202,000 | |
American Airlines Pass-Through Trust,
Series 2014-1, Class B,
4.375% 4/01/24 | | | 9,108 | | | | 9,347 | |
Spirit Airlines Pass-Through Trust,
Series 2015-1, Class A,
4.100% 10/01/29 | | | 67,837 | | | | 71,398 | |
United Airlines Pass-Through Trust,
Series 2018-1, Class B,
4.600% 9/01/27 | | | 13,782 | | | | 14,367 | |
WestJet Airlines Ltd.
3.500% 6/16/21 (c) | | | 22,000 | | | | 22,372 | |
| | | | | | | | |
| | | | | | | 319,484 | |
| | | | | | | | |
| Auto Manufacturers — 0.5% | |
Ford Motor Co.
4.346% 12/08/26 (b) | | | 50,000 | | | | 50,133 | |
5.291% 12/08/46 | | | 15,000 | | | | 13,858 | |
Ford Motor Credit Co. LLC
3.810% 1/09/24 | | | 200,000 | | | | 199,286 | |
General Motors Co.
4.200% 10/01/27 | | | 30,000 | | | | 30,571 | |
5.150% 4/01/38 | | | 20,000 | | | | 20,193 | |
General Motors Financial Co., Inc.
3.500% 11/07/24 | | | 100,000 | | | | 101,132 | |
3.550% 4/09/21 | | | 25,000 | | | | 25,364 | |
4.150% 6/19/23 | | | 78,000 | | | | 81,067 | |
4.200% 11/06/21 | | | 52,000 | | | | 53,646 | |
| | | | | | | | |
| | | | | | | 575,250 | |
| | | | | | | | |
| Banks — 1.3% | |
Bank of America Corp.
4.183% 11/25/27 | | | 45,000 | | | | 48,578 | |
3 mo. USD LIBOR + 1.814%
4.244% VRN 4/24/38 | | | 25,000 | | | | 28,562 | |
4.750% 4/21/45 | | | 70,000 | | | | 84,259 | |
7.750% 5/14/38 | | | 20,000 | | | | 30,483 | |
| | | | | | | | |
| | |
| | | Principal
Amount | | | Value | |
Bank of Montreal
5 year USD Swap + 1.432%
3.803% VRN 12/15/32 | | $ | 60,000 | | | $ | 62,228 | |
The Bank of Nova Scotia
4.500% 12/16/25 | | | 40,000 | | | | 43,509 | |
3 mo. USD LIBOR + 2.648%
4.650% VRN 12/31/99 (d) | | | 125,000 | | | | 124,094 | |
Barclays Bank PLC
10.179% 6/12/21 (c) | | | 160,000 | | | | 178,950 | |
Citigroup, Inc.
5.500% 9/13/25 | | | 60,000 | | | | 68,021 | |
5.875% 1/30/42 | | | 20,000 | | | | 27,269 | |
8.125% 7/15/39 | | | 15,000 | | | | 24,592 | |
First Republic Bank
4.375% 8/01/46 | | | 250,000 | | | | 277,672 | |
Fulton Financial Corp.
3.600% 3/16/22 | | | 45,000 | | | | 45,657 | |
The Goldman Sachs Group, Inc.
4.250% 10/21/25 | | | 35,000 | | | | 37,454 | |
5.950% 1/15/27 | | | 80,000 | | | | 95,090 | |
6.750% 10/01/37 | | | 35,000 | | | | 47,246 | |
JP Morgan Chase & Co.
5.600% 7/15/41 | | | 45,000 | | | | 61,102 | |
Morgan Stanley
4.350% 9/08/26 | | | 135,000 | | | | 146,195 | |
5.000% 11/24/25 | | | 40,000 | | | | 44,824 | |
SVB Financial Group
3.500% 1/29/25 | | | 85,000 | | | | 87,561 | |
Valley National Bancorp
5.125% 9/27/23 | | | 50,000 | | | | 53,391 | |
Wells Fargo & Co.
5.375% 11/02/43 | | | 14,000 | | | | 17,563 | |
5.606% 1/15/44 | | | 15,000 | | | | 19,414 | |
| | | | | | | | |
| | | | | | | 1,653,714 | |
| | | | | | | | |
| Beverages — 0.2% | |
Anheuser-Busch Cos. LLC/Anheuser-Busch InBev Worldwide, Inc.
4.900% 2/01/46 | | | 170,000 | | | | 202,849 | |
Molson Coors Brewing Co.
4.200% 7/15/46 | | | 39,000 | | | | 39,410 | |
5.000% 5/01/42 | | | 5,000 | | | | 5,522 | |
| | | | | | | | |
| | | | | | | 247,781 | |
| | | | | | | | |
| Biotechnology — 0.1% | |
Celgene Corp.
3.450% 11/15/27 | | | 45,000 | | | | 47,678 | |
4.350% 11/15/47 | | | 30,000 | | | | 34,776 | |
| | | | | | | | |
| | | | | | | 82,454 | |
| | | | | | | | |
| Building Materials — 0.2% | |
Standard Industries, Inc.
5.000% 2/15/27 (c) | | | 156,000 | | | | 161,507 | |
5.375% 11/15/24 (c) | | | 38,000 | | | | 39,140 | |
The accompanying notes are an integral part of the financial statements.
123
MassMutual Premier Balanced Fund – Portfolio of Investments(Continued)
| | | | | | | | |
| | |
| | | Principal
Amount | | | Value | |
5.500% 2/15/23 (c) | | $ | 32,000 | | | $ | 32,640 | |
| | | | | | | | |
| | | | | | | 233,287 | |
| | | | | | | | |
| Chemicals — 0.4% | |
Ashland, Inc.
6.875% 5/15/43 | | | 11,000 | | | | 12,595 | |
DuPont de Nemours, Inc.
5.319% 11/15/38 | | | 55,000 | | | | 67,131 | |
Huntsman International LLC
5.125% 11/15/22 | | | 30,000 | | | | 31,985 | |
Incitec Pivot Finance LLC
6.000% 12/10/19 (c) | | | 30,000 | | | | 30,190 | |
The Sherwin-Williams Co.
4.500% 6/01/47 | | | 20,000 | | | | 22,412 | |
Syngenta Finance NV
3.698% 4/24/20 (c) | | | 200,000 | | | | 200,665 | |
Yara International ASA
4.750% 6/01/28 (c) | | | 132,000 | | | | 143,811 | |
| | | | | | | | |
| | | | | | | 508,789 | |
| | | | | | | | |
| Computers — 0.3% | |
Dell International LLC/EMC Corp.
6.020% 6/15/26 (c) | | | 113,000 | | | | 127,077 | |
Genpact Luxembourg Sarl
3.700% STEP 4/01/22 | | | 65,000 | | | | 65,985 | |
Leidos Holdings, Inc.
4.450% 12/01/20 | | | 200,000 | | | | 203,000 | |
| | | | | | | | |
| | | | | | | 396,062 | |
| | | | | | | | |
| Diversified Financial Services — 1.2% | |
AerCap Ireland Capital DAC/AerCap Global Aviation Trust
3.875% 1/23/28 | | | 150,000 | | | | 154,864 | |
4.500% 5/15/21 | | | 105,000 | | | | 108,400 | |
Aircastle Ltd.
4.400% 9/25/23 | | | 25,000 | | | | 26,298 | |
5.000% 4/01/23 | | | 100,000 | | | | 107,091 | |
Ally Financial, Inc.
4.125% 2/13/22 | | | 65,000 | | | | 66,463 | |
Antares Holdings LP
6.000% 8/15/23 (c) | | | 250,000 | | | | 258,999 | |
Ares Finance Co. LLC
4.000% 10/08/24 (c) | | | 85,000 | | | | 83,689 | |
Brookfield Finance, Inc.
4.850% 3/29/29 | | | 75,000 | | | | 84,881 | |
Global Aircraft Leasing Co. Ltd.
6.500% 9/15/24 (c) | | | 60,000 | | | | 60,750 | |
Lazard Group LLC
3.625% 3/01/27 | | | 34,000 | | | | 34,904 | |
4.500% 9/19/28 | | | 60,000 | | | | 65,439 | |
Legg Mason, Inc.
5.625% 1/15/44 | | | 35,000 | | | | 39,053 | |
Park Aerospace Holdings Ltd.
4.500% 3/15/23 (c) | | | 50,000 | | | | 51,740 | |
| | | | | | | | |
| | |
| | | Principal
Amount | | | Value | |
5.250% 8/15/22 (c) | | $ | 260,000 | | | $ | 274,014 | |
5.500% 2/15/24 (c) | | | 25,000 | | | | 27,010 | |
Synchrony Financial
4.375% 3/19/24 | | | 120,000 | | | | 127,335 | |
| | | | | | | | |
| | | | | | | 1,570,930 | |
| | | | | | | | |
| Electric — 0.8% | |
Avangrid, Inc.
3.800% 6/01/29 | | | 75,000 | | | | 80,572 | |
The Cleveland Electric Illuminating Co.
3.500% 4/01/28 (c) | | | 25,000 | | | | 26,085 | |
CMS Energy Corp.
4.700% 3/31/43 | | | 25,000 | | | | 28,701 | |
4.875% 3/01/44 | | | 130,000 | | | | 157,959 | |
Entergy Louisiana LLC
4.950% 1/15/45 | | | 40,000 | | | | 43,256 | |
IPALCO Enterprises, Inc.
3.450% 7/15/20 | | | 115,000 | | | | 115,663 | |
3.700% 9/01/24 | | | 75,000 | | | | 77,662 | |
Metropolitan Edison Co.
4.300% 1/15/29 (c) | | | 56,000 | | | | 63,171 | |
Nevada Power Co., Series N,
6.650% 4/01/36 | | | 20,000 | | | | 28,104 | |
Pennsylvania Electric Co.
4.150% 4/15/25 (c) | | | 70,000 | | | | 74,164 | |
Puget Energy, Inc.
3.650% 5/15/25 | | | 5,000 | | | | 5,118 | |
Southwestern Electric Power Co.
6.200% 3/15/40 | | | 100,000 | | | | 134,566 | |
Xcel Energy, Inc.
6.500% 7/01/36 | | | 110,000 | | | | 152,147 | |
| | | | | | | | |
| | | | | | | 987,168 | |
| | | | | | | | |
| Electronics — 0.2% | |
The ADT Security Corp.
6.250% 10/15/21 | | | 140,000 | | | | 149,100 | |
Arrow Electronics, Inc.
3.250% 9/08/24 | | | 75,000 | | | | 76,235 | |
3.875% 1/12/28 | | | 25,000 | | | | 25,628 | |
| | | | | | | | |
| | | | | | | 250,963 | |
| | | | | | | | |
| Foods — 0.2% | |
Ingredion, Inc.
3.200% 10/01/26 | | | 27,000 | | | | 27,385 | |
JBS USA LUX SA / JBS USA Food Co. / JBS USA Finance, Inc.
5.500% 1/15/30 (c) | | | 32,000 | | | | 33,919 | |
Kraft Heinz Foods Co.
4.625% 10/01/39 (c) | | | 65,000 | | | | 65,337 | |
Mars, Inc.
3.950% 4/01/49 (c) | | | 75,000 | | | | 85,491 | |
| | | | | | | | |
| | | | | | | 212,132 | |
| | | | | | | | |
The accompanying notes are an integral part of the financial statements.
124
MassMutual Premier Balanced Fund – Portfolio of Investments(Continued)
| | | | | | | | |
| | |
| | | Principal
Amount | | | Value | |
| Forest Products & Paper — 0.0% | |
Fibria Overseas Finance Ltd.
4.000% 1/14/25 (b) | | $ | 35,000 | | | $ | 35,525 | |
| | | | | | | | |
| Gas — 0.0% | |
CenterPoint Energy Resources Corp.
6.250% 2/01/37 | | | 35,000 | | | | 45,241 | |
| | | | | | | | |
| Health Care – Products — 0.0% | |
Becton Dickinson and Co.
4.685% 12/15/44 | | | 25,000 | | | | 29,024 | |
| | | | | | | | |
| Health Care – Services — 0.1% | |
Advocate Health & Hospitals Corp.
3.829% 8/15/28 | | | 25,000 | | | | 27,574 | |
HCA, Inc.
4.750% 5/01/23 | | | 70,000 | | | | 74,979 | |
Humana, Inc.
4.800% 3/15/47 | | | 25,000 | | | | 28,770 | |
| | | | | | | | |
| | | | | | | 131,323 | |
| | | | | | | | |
| Home Builders — 0.1% | |
Lennar Corp.
4.500% 11/15/19 | | | 100,000 | | | | 100,000 | |
4.750% 5/30/25 | | | 30,000 | | | | 32,019 | |
PulteGroup, Inc.
5.000% 1/15/27 | | | 40,000 | | | | 43,200 | |
| | | | | | | | |
| | | | | | | 175,219 | |
| | | | | | | | |
| Housewares — 0.1% | |
Newell Brands, Inc.
3.850% 4/01/23 | | | 89,000 | | | | 91,617 | |
| | | | | | | | |
| Insurance — 1.5% | |
The Allstate Corp.
3 mo. USD LIBOR + 2.938%
5.750% VRN 8/15/53 | | | 175,000 | | | | 186,812 | |
American International Group, Inc.
3.900% 4/01/26 | | | 100,000 | | | | 106,536 | |
4.200% 4/01/28 | | | 90,000 | | | | 98,181 | |
4.500% 7/16/44 | | | 25,000 | | | | 27,854 | |
4.750% 4/01/48 | | | 15,000 | | | | 17,518 | |
3 mo. USD LIBOR + 2.868%
5.750% VRN 4/01/48 | | | 115,000 | | | | 122,988 | |
AmTrust Financial Services, Inc.
6.125% 8/15/23 (b) | | | 75,000 | | | | 74,873 | |
Arch Capital Finance LLC
5.031% 12/15/46 | | | 30,000 | | | | 37,646 | |
Athene Holding Ltd.
4.125% 1/12/28 | | | 240,000 | | | | 246,755 | |
AXA Equitable Holdings, Inc.
4.350% 4/20/28 | | | 40,000 | | | | 42,627 | |
AXIS Specialty Finance LLC
3.900% 7/15/29 | | | 55,000 | | | | 57,525 | |
4.000% 12/06/27 | | | 60,000 | | | | 63,226 | |
Brown & Brown, Inc.
4.200% 9/15/24 | | | 42,000 | | | | 44,440 | |
| | | | | | | | |
| | |
| | | Principal
Amount | | | Value | |
CNO Financial Group, Inc.
5.250% 5/30/25 | | $ | 107,000 | | | $ | 115,003 | |
Enstar Group Ltd.
4.500% 3/10/22 | | | 70,000 | | | | 72,601 | |
Markel Corp.
3.350% 9/17/29 | | | 25,000 | | | | 25,259 | |
The Progressive Corp.
3 mo. USD LIBOR + 2.539%
5.375% VRN 12/31/99 (d) | | | 70,000 | | | | 72,275 | |
Prudential Financial, Inc.
3 mo. USD LIBOR + 2.665%
5.700% VRN 9/15/48 | | | 65,000 | | | | 72,046 | |
3 mo. USD LIBOR + 4.175%
5.875% VRN 9/15/42 | | | 25,000 | | | | 26,941 | |
Reinsurance Group of America, Inc.
3.900% 5/15/29 | | | 60,000 | | | | 63,840 | |
USF&G Capital I
8.500% 12/15/45 (c) | | | 35,000 | | | | 51,268 | |
Voya Financial, Inc.
3 mo. USD LIBOR + 2.084%
4.700% VRN 1/23/48 | | | 25,000 | | | | 23,456 | |
Willis North America, Inc.
2.950% 9/15/29 | | | 45,000 | | | | 44,291 | |
4.500% 9/15/28 | | | 65,000 | | | | 72,045 | |
XLIT Ltd.
4.450% 3/31/25 | | | 89,000 | | | | 96,654 | |
| | | | | | | | |
| | | | | | | 1,862,660 | |
| | | | | | | | |
| Internet — 0.0% | |
Amazon.com, Inc.
4.050% 8/22/47 | | | 45,000 | | | | 54,064 | |
| | | | | | | | |
| Investment Companies — 0.4% | |
Ares Capital Corp.
3.500% 2/10/23 | | | 125,000 | | | | 125,781 | |
BlackRock TCP Capital Corp.
3.900% 8/23/24 | | | 180,000 | | | | 177,666 | |
4.125% 8/11/22 | | | 70,000 | | | | 70,178 | |
Icahn Enterprises LP/Icahn Enterprises Finance Corp.
6.250% 2/01/22 | | | 105,000 | | | | 107,730 | |
| | | | | | | | |
| | | | | | | 481,355 | |
| | | | | | | | |
| Iron & Steel — 0.1% | |
Vale Overseas Ltd.
6.250% 8/10/26 | | | 50,000 | | | | 57,625 | |
6.875% 11/21/36 | | | 35,000 | | | | 44,345 | |
| | | | | | | | |
| | | | | | | 101,970 | |
| | | | | | | | |
| Lodging — 0.1% | |
Las Vegas Sands Corp.
3.900% 8/08/29 | | | 40,000 | | | | 41,028 | |
MGM Resorts International
6.625% 12/15/21 | | | 54,000 | | | | 58,501 | |
| | | | | | | | |
| | | | | | | 99,529 | |
| | | | | | | | |
The accompanying notes are an integral part of the financial statements.
125
MassMutual Premier Balanced Fund – Portfolio of Investments(Continued)
| | | | | | | | |
| | |
| | | Principal
Amount | | | Value | |
| Machinery – Diversified — 0.1% | |
CNH Industrial Capital LLC
3.875% 10/15/21 | | $ | 95,000 | | | $ | 97,462 | |
| | | | | | | | |
| Media — 0.3% | |
CCO Holdings LLC/CCO Holdings Capital Corp.
5.125% 5/01/27 (c) | | | 30,000 | | | | 31,313 | |
Charter Communications Operating LLC/Charter Communications Operating Capital
6.484% 10/23/45 | | | 35,000 | | | | 42,589 | |
Comcast Corp.
3.400% 7/15/46 | | | 45,000 | | | | 46,018 | |
3.969% 11/01/47 | | | 25,000 | | | | 27,455 | |
4.750% 3/01/44 | | | 35,000 | | | | 42,494 | |
Discovery Communications LLC
3.950% 3/20/28 | | | 45,000 | | | | 46,711 | |
5.000% 9/20/37 | | | 25,000 | | | | 26,875 | |
Grupo Televisa SAB
6.625% 3/18/25 | | | 100,000 | | | | 116,973 | |
Time Warner Cable, Inc.
6.750% 6/15/39 | | | 30,000 | | | | 36,673 | |
| | | | | | | | |
| | | | | | | 417,101 | |
| | | | | | | | |
| Mining — 0.2% | |
Glencore Finance Canada Ltd.
5.550% STEP 10/25/42 (c) | | | 23,000 | | | | 24,939 | |
Glencore Funding LLC
3.875% 10/27/27 (c) | | | 25,000 | | | | 25,453 | |
4.625% 4/29/24 (c) | | | 85,000 | | | | 90,823 | |
Kinross Gold Corp.
4.500% 7/15/27 | | | 31,000 | | | | 32,511 | |
5.125% 9/01/21 | | | 135,000 | | | | 140,062 | |
| | | | | | | | |
| | | | | | | 313,788 | |
| | | | | | | | |
| Miscellaneous – Manufacturing — 0.0% | |
General Electric Co.
4.125% 10/09/42 | | | 5,000 | | | | 5,003 | |
| | | | | | | | |
| Office Equipment/Supplies — 0.1% | |
Pitney Bowes, Inc.
4.125% STEP 9/15/20 | | | 20,000 | | | | 20,150 | |
4.125% STEP 10/01/21 | | | 80,000 | | | | 80,400 | |
| | | | | | | | |
| | | | | | | 100,550 | |
| | | | | | | | |
| Oil & Gas — 0.9% | |
Antero Resources Corp.
5.375% 11/01/21 | | | 223,000 | | | | 215,195 | |
Cenovus Energy, Inc.
3.000% 8/15/22 | | | 30,000 | | | | 30,193 | |
4.250% 4/15/27 | | | 50,000 | | | | 51,984 | |
6.750% 11/15/39 | | | 15,000 | | | | 18,339 | |
Diamondback Energy, Inc.
4.750% 11/01/24 | | | 58,000 | | | | 59,378 | |
| | | | | | | | |
| | |
| | | Principal
Amount | | | Value | |
Encana Corp.
6.500% 2/01/38 | | $ | 15,000 | | | $ | 18,066 | |
EQT Corp.
3.000% 10/01/22 | | | 65,000 | | | | 62,572 | |
3.900% 10/01/27 (b) | | | 195,000 | | | | 169,032 | |
Helmerich & Payne, Inc.
4.650% 3/15/25 | | | 45,000 | | | | 48,634 | |
Marathon Petroleum Corp.
4.500% 4/01/48 | | | 10,000 | | | | 10,447 | |
6.500% 3/01/41 | | | 35,000 | | | | 43,564 | |
Newfield Exploration Co.
5.375% 1/01/26 | | | 60,000 | | | | 65,177 | |
5.625% 7/01/24 | | | 40,000 | | | | 44,126 | |
5.750% 1/30/22 | | | 66,000 | | | | 70,455 | |
Occidental Petroleum Corp.
6.600% 3/15/46 | | | 81,000 | | | | 105,659 | |
PBF Holding Co. LLC/PBF Finance Corp.
7.000% 11/15/23 | | | 25,000 | | | | 25,781 | |
Petroleos Mexicanos
5.350% 2/12/28 | | | 30,000 | | | | 28,669 | |
6.375% 1/23/45 | | | 15,000 | | | | 13,913 | |
6.500% 3/13/27 | | | 10,000 | | | | 10,390 | |
6.625% 6/15/38 | | | 5,000 | | | | 4,756 | |
| | | | | | | | |
| | | | | | | 1,096,330 | |
| | | | | | | | |
| Oil & Gas Services — 0.1% | |
National Oilwell Varco, Inc.
3.950% 12/01/42 | | | 60,000 | | | | 54,989 | |
Patterson-UTI Energy, Inc.
3.950% 2/01/28 | | | 72,000 | | | | 72,526 | |
| | | | | | | | |
| | | | | | | 127,515 | |
| | | | | | | | |
| Packaging & Containers — 0.1% | |
Amcor Finance USA, Inc.
3.625% 4/28/26 (c) | | | 95,000 | | | | 97,755 | |
| | | | | | | | |
| Pharmaceuticals — 0.6% | |
AbbVie, Inc.
4.700% 5/14/45 | | | 75,000 | | | | 80,232 | |
Allergan Funding SCS
3.800% 3/15/25 | | | 55,000 | | | | 57,592 | |
Bayer US Finance II LLC
4.400% 7/15/44 (c) | | | 80,000 | | | | 80,722 | |
CVS Health Corp.
3.000% 8/15/26 | | | 25,000 | | | | 25,124 | |
4.300% 3/25/28 | | | 45,000 | | | | 48,660 | |
5.050% 3/25/48 | | | 20,000 | | | | 22,699 | |
6.125% 9/15/39 | | | 10,000 | | | | 12,409 | |
CVS Pass-Through Trust
5.926% 1/10/34 (c) | | | 47,110 | | | | 54,798 | |
Express Scripts Holding Co.
4.800% 7/15/46 | | | 30,000 | | | | 33,584 | |
McKesson Corp.
4.883% 3/15/44 | | | 10,000 | | | | 11,045 | |
6.000% 3/01/41 | | | 30,000 | | | | 37,171 | |
The accompanying notes are an integral part of the financial statements.
126
MassMutual Premier Balanced Fund – Portfolio of Investments(Continued)
| | | | | | | | |
| | |
| | | Principal
Amount | | | Value | |
Mylan NV
3.950% 6/15/26 | | $ | 90,000 | | | $ | 92,998 | |
Teva Pharmaceutical Finance IV LLC
2.250% 3/18/20 | | | 30,000 | | | | 29,588 | |
Teva Pharmaceutical Finance Netherlands III BV
2.200% 7/21/21 | | | 224,000 | | | | 204,960 | |
4.100% 10/01/46 (b) | | | 15,000 | | | | 9,413 | |
| | | | | | | | |
| | | | | | | 800,995 | |
| | | | | | | | |
| Pipelines — 0.9% | |
Energy Transfer Operating LP
4.200% 4/15/27 | | | 30,000 | | | | 31,605 | |
5.875% 1/15/24 | | | 30,000 | | | | 33,350 | |
6.125% 12/15/45 | | | 40,000 | | | | 46,928 | |
3 mo. USD LIBOR + 4.028%
6.250% VRN 12/31/99 (d) | | | 95,000 | | | | 88,113 | |
7.500% 10/15/20 | | | 40,000 | | | | 42,036 | |
EnLink Midstream Partners LP
4.150% 6/01/25 | | | 125,000 | | | | 115,937 | |
4.850% 7/15/26 | | | 24,000 | | | | 22,800 | |
Enterprise Products Operating LLC
3 mo. USD LIBOR + 3.033%
5.250% VRN 8/16/77 | | | 45,000 | | | | 44,616 | |
3 mo. USD LIBOR + 2.570%
5.375% VRN 2/15/78 | | | 30,000 | | | | 28,951 | |
EQM Midstream Partners LP
4.750% 7/15/23 | | | 70,000 | | | | 70,216 | |
Kinder Morgan Energy Partners LP
6.375% 3/01/41 | | | 10,000 | | | | 12,259 | |
6.500% 2/01/37 | | | 25,000 | | | | 31,051 | |
6.550% 9/15/40 | | | 15,000 | | | | 18,599 | |
6.950% 1/15/38 | | | 5,000 | | | | 6,527 | |
MPLX LP
4.500% 4/15/38 | | | 30,000 | | | | 31,097 | |
6.250% 10/15/22 (c) | | | 19,000 | | | | 19,476 | |
3 mo. USD LIBOR + 4.652%
6.875% VRN 12/31/99 (d) | | | 90,000 | | | | 89,892 | |
Plains All American Pipeline LP
3 mo. USD LIBOR + 4.110%
6.125% VRN 12/31/99 (d) | | | 105,000 | | | | 98,906 | |
Plains All American Pipeline LP/PAA Finance Corp.
4.500% 12/15/26 | | | 67,000 | | | | 71,047 | |
4.700% 6/15/44 | | | 25,000 | | | | 24,404 | |
Sunoco Logistics Partners Operations LP
4.000% 10/01/27 | | | 30,000 | | | | 31,055 | |
5.300% 4/01/44 | | | 25,000 | | | | 26,409 | |
Western Gas Partners LP
4.000% 7/01/22 | | | 85,000 | | | | 86,027 | |
Western Midstream Operating LP
4.500% 3/01/28 | | | 15,000 | | | | 14,484 | |
| | | | | | | | |
| | | | | | | 1,085,785 | |
| | | | | | | | |
| | | | | | | | |
| | |
| | | Principal
Amount | | | Value | |
| Private Equity — 0.1% | |
Carlyle Finance Subsidiary LLC
3.500% 9/19/29 (c) | | $ | 45,000 | | | $ | 44,567 | |
Hercules Capital, Inc.
4.625% 10/23/22 | | | 70,000 | | | | 70,013 | |
KKR Group Finance Co. VI LLC
3.750% 7/01/29 (c) | | | 50,000 | | | | 52,693 | |
| | | | | | | | |
| | | | | | | 167,273 | |
| | | | | | | | |
| Real Estate Investment Trusts (REITS) — 0.6% | |
Alexandria Real Estate Equities, Inc.
2.750% 12/15/29 | | | 35,000 | | | | 34,493 | |
American Tower Trust #1
3.652% 3/15/48 (c) | | | 50,000 | | | | 53,775 | |
Crown Castle International Corp.
5.200% 2/15/49 | | | 26,000 | | | | 32,118 | |
Healthcare Trust of America Holdings LP
3.500% 8/01/26 | | | 75,000 | | | | 77,303 | |
Host Hotels & Resorts LP
3.875% 4/01/24 | | | 45,000 | | | | 47,394 | |
Mid-America Apartments LP
3.600% 6/01/27 | | | 75,000 | | | | 79,331 | |
SBA Tower Trust
2.877% 7/15/46 (c) | | | 40,000 | | | | 40,135 | |
3.168% 4/09/47 (c) | | | 90,000 | | | | 90,874 | |
Spirit Realty LP
3.200% 1/15/27 | | | 55,000 | | | | 54,581 | |
4.000% 7/15/29 | | | 35,000 | | | | 36,623 | |
STORE Capital Corp.
4.625% 3/15/29 | | | 50,000 | | | | 54,981 | |
Tanger Properties LP
3.875% 12/01/23 | | | 58,000 | | | | 59,715 | |
UDR, Inc.
3.200% 1/15/30 | | | 35,000 | | | | 36,044 | |
VEREIT Operating Partnership LP
4.625% 11/01/25 | | | 85,000 | | | | 92,787 | |
Weingarten Realty Investors
3.250% 8/15/26 | | | 15,000 | | | | 15,084 | |
| | | | | | | | |
| | | | | | | 805,238 | |
| | | | | | | | |
| Retail — 0.1% | |
Dollar Tree, Inc.
4.000% 5/15/25 | | | 50,000 | | | | 52,979 | |
4.200% 5/15/28 | | | 45,000 | | | | 48,354 | |
The Home Depot, Inc.
5.950% 4/01/41 | | | 30,000 | | | | 42,947 | |
| | | | | | | | |
| | | | | | | 144,280 | |
| | | | | | | | |
| Semiconductors — 0.0% | |
Microchip Technology, Inc.
3.922% 6/01/21 | | | 25,000 | | | | 25,534 | |
| | | | | | | | |
| Software — 0.1% | |
Microsoft Corp.
4.450% 11/03/45 | | | 89,000 | | | | 112,395 | |
| | | | | | | | |
The accompanying notes are an integral part of the financial statements.
127
MassMutual Premier Balanced Fund – Portfolio of Investments(Continued)
| | | | | | | | |
| | |
| | | Principal
Amount | | | Value | |
| Telecommunications — 0.4% | |
AT&T, Inc.
4.750% 5/15/46 | | $ | 90,000 | | | $ | 99,807 | |
5.250% 3/01/37 | | | 35,000 | | | | 41,192 | |
6.250% 3/29/41 | | | 5,000 | | | | 6,316 | |
Crown Castle Towers LLC
4.241% 7/15/48 (c) | | | 40,000 | | | | 44,004 | |
Sprint Communications, Inc.
9.250% 4/15/22 | | | 65,000 | | | | 75,319 | |
Telefonaktiebolaget LM Ericsson
4.125% 5/15/22 | | | 145,000 | | | | 149,328 | |
Verizon Communications, Inc.
6.550% 9/15/43 | | | 34,000 | | | | 50,077 | |
| | | | | | | | |
| | | | | | | 466,043 | |
| | | | | | | | |
| Transportation — 0.0% | |
CSX Corp.
4.750% 11/15/48 | | | 20,000 | | | | 24,114 | |
Pacific National Finance Pty Ltd.
4.625% 9/23/20 (c) | | | 20,000 | | | | 20,386 | |
| | | | | | | | |
| | | | | | | 44,500 | |
| | | | | | | | |
| Trucking & Leasing — 0.0% | |
DAE Funding LLC
4.000% 8/01/20 (c) | | | 25,000 | | | | 25,156 | |
| | | | | | | | |
| | |
TOTAL CORPORATE DEBT
(Cost $15,451,300) | | | | | | | 16,350,664 | |
| | | | | |
|
| MUNICIPAL OBLIGATIONS — 0.3% | |
JobsOhio Beverage System Series B
4.532% 1/01/35 | | | 150,000 | | | | 180,738 | |
State of California BAB
7.550% 4/01/39 | | | 120,000 | | | | 198,535 | |
7.600% 11/01/40 | | | 10,000 | | | | 16,918 | |
| | | | | | | | |
| | | | | | | 396,191 | |
| | | | | | | | |
| | |
TOTAL MUNICIPAL OBLIGATIONS
(Cost $335,822) | | | | | | | 396,191 | |
| | | | | |
|
| NON-U.S. GOVERNMENT AGENCY OBLIGATIONS — 11.6% | |
| Automobile ABS — 0.6% | |
Avis Budget Rental Car Funding AESOP LLC,Series 2019-1A, Class C
4.530% 3/20/23 (c) | | | 100,000 | | | | 101,588 | |
Hertz Vehicle Financing II LP
Series 2018-1A, Class A,
3.290% 2/25/24 (c) | | | 150,000 | | | | 153,663 | |
Series 2019-2A, Class B,
3.670% 5/25/25 (c) | | | 170,000 | | | | 175,033 | |
Hertz Vehicle Financing LLC,Series 2018-3A, Class A
4.030% 7/25/24 (c) | | | 250,000 | | | | 263,759 | |
| | | | | | | | |
| | | | | | | 694,043 | |
| | | | | | | | |
| | | | | | | | |
| | |
| | | Principal
Amount | | | Value | |
| Commercial MBS — 1.5% | |
Aventura Mall Trust,
Series 2018-AVM, Class C,
4.249% VRN 7/05/40 (c) (e) | | $ | 190,000 | | | $ | 208,124 | |
BANK
Series 2019-BN17, Class B,
4.128% VRN 4/15/52 (e) | | | 29,000 | | | | 31,984 | |
Series 2019-BN16, Class AS,
4.267% 2/15/52 | | | 31,333 | | | | 35,137 | |
Series 2019-BN16, Class B,
4.438% VRN 2/15/52 (e) | | | 24,330 | | | | 27,350 | |
BBCMS Mortgage Trust,
Series 2018-CHRS, Class B,
4.409% VRN 8/05/38 (c) (e) | | | 100,000 | | | | 110,015 | |
BHMS Mortgage Trust
Series 2018-ATLS, Class A,
1 mo. USD LIBOR + 1.250%
3.278% FRN 7/15/35 (c) | | | 150,000 | | | | 150,001 | |
Series 2018-ATLS, Class B,
1 mo. USD LIBOR + 1.500%
3.528% FRN 7/15/35 (c) | | | 100,000 | | | | 100,031 | |
BX Commercial Mortgage Trust,Series 2018-IND, Class B,
1 mo. USD LIBOR + .900%
2.928% FRN 11/15/35 (c) | | | 78,528 | | | | 78,479 | |
CD Commercial Mortgage Trust
Series 2019-CD8, Class B,
3.366% 8/15/57 | | | 78,000 | | | | 81,131 | |
Series 2019-CD8, Class C,
3.719% 8/15/57 | | | 94,000 | | | | 97,596 | |
Citigroup Commercial Mortgage Trust,
Series 2017-C4, Class C,
4.341% VRN 10/12/50 (e) | | | 70,000 | | | | 74,038 | |
Commercial Mortgage Pass-Through Certificates
Series 2013-GAM, Class A1,
1.705% 2/10/28 (c) | | | 27,891 | | | | 27,731 | |
Series 2012-CR4, Class B,
3.703% 10/15/45 (c) | | | 35,000 | | | | 33,837 | |
Series 2015-CR23, Class C,
4.392% VRN 5/10/48 (e) | | | 35,000 | | | | 36,426 | |
Series 2014-UBS5, Class B,
4.514% VRN 9/10/47 (e) | | | 50,000 | | | | 53,204 | |
Series 2014-LC17, Class C,
4.721% VRN 10/10/47 (e) | | | 100,000 | | | | 106,085 | |
GCCFC Commercial Mortgage Trust,
Series 2006-GG7, Class AM,
5.825% VRN 7/10/38 (e) | | | 17,923 | | | | 18,072 | |
JP Morgan Chase Commercial Mortgage Securities Trust,
Series 2016-JP2, Class AS
3.056% 8/15/49 | | | 140,000 | | | | 143,432 | |
The accompanying notes are an integral part of the financial statements.
128
MassMutual Premier Balanced Fund – Portfolio of Investments(Continued)
| | | | | | | | |
| | |
| | | Principal
Amount | | | Value | |
JPMDB Commercial Mortgage Securities Trust,Series 2017-C7, Class C,
4.324% VRN 10/15/50 (e) | | $ | 100,000 | | | $ | 107,458 | |
Morgan Stanley Capital I Trust
Series 2019-L2, Class AS,
4.272% 3/15/52 | | | 100,000 | | | | 112,877 | |
Series 2018-H3, Class B,
4.620% VRN 7/15/51 (e) | | | 20,000 | | | | 22,478 | |
Series 2011-C2, Class B,
5.200% VRN 6/15/44 (c) (e) | | | 100,000 | | | | 102,022 | |
TIAA Seasoned Commercial Mortgage Trust,
Series 2007-C4, Class AJ,
5.483% VRN 8/15/39 (e) | | | 1,746 | | | | 1,753 | |
Wells Fargo Commercial Mortgage Trust
Series 2018-C45, Class AS,
4.405% VRN 6/15/51 (e) | | | 30,000 | | | | 33,833 | |
Series 2018-C45, Class B,
4.556% 6/15/51 | | | 10,000 | | | | 11,394 | |
WF-RBS Commercial Mortgage Trust
Series 2012-C8, Class B,
4.311% 8/15/45 | | | 40,000 | | | | 41,787 | |
Series 2011-C3, Class B,
4.740% 3/15/44 (c) | | | 50,000 | | | | 51,364 | |
| | | | | | | | |
| | | | | | | 1,897,639 | |
| | | | | | | | |
| Other ABS — 5.0% | |
321 Henderson Receivables LLC,
Series 2015-1A, Class A
3.260% 9/15/72 (c) | | | 112,010 | | | | 117,931 | |
AASET Trust,
Series 2017-1A, Class A
3.967% 5/16/42 (c) | | | 117,031 | | | | 118,431 | |
Adams Outdoor Advertising LP,
Series 2018-1, Class A
4.810% 11/15/48 (c) | | | 98,807 | | | | 102,542 | |
American Tower Trust #1,
Series 13, Class 2A
3.070% 3/15/48 (c) | | | 50,000 | | | | 50,817 | |
Anchorage Capital CLO Ltd.,
Series 2019-11A, Class A,
3 mo. USD LIBOR + 1.390%
3.534% FRN 7/22/32 (c) | | | 250,000 | | | | 249,991 | |
Arbys Funding LLC,
Series 2015-1A, Class A2
4.969% 10/30/45 (c) | | | 67,375 | | | | 72,574 | |
Ascentium Equipment Receivables Trust,
Series 2018-2A, Class D
4.150% 7/10/24 (c) | | | 71,000 | | | | 72,958 | |
BlueMountain CLO XXV Ltd.,
Series 2019-25A, Class B,
3 mo. USD LIBOR + 1.800%
4.086% FRN 7/15/32 (c) | | | 250,000 | | | | 249,968 | |
| | | | | | | | |
| | |
| | | Principal
Amount | | | Value | |
Cazenovia Creek Funding I LLC,
Series 2015-1A, Class A
2.000% 12/10/23 (c) | | $ | 872 | | | $ | 871 | |
CLI Funding V LLC,
Series 2014-1A, Class A
3.290% 6/18/29 (c) | | | 47,045 | | | | 47,172 | |
Countrywide Asset-Backed Certificates,
Series 2004-5, Class 3A,
1 mo. USD LIBOR + .460%
2.478% FRN 9/25/34 | | | 1,180 | | | | 1,123 | |
DB Master Finance LLC
Series 2019-1A, Class A2II,
4.021% 5/20/49 (c) | | | 74,813 | | | | 76,428 | |
Series 2019-1A, Class A23,
4.352% 5/20/49 (c) | | | 66,833 | | | | 70,757 | |
Diamond Resorts Owner Trust
Series 2019-1A, Class A,
2.890% 2/20/32 (c) | | | 147,723 | | | | 148,084 | |
Series 2016-1, Class A,
3.080% 11/20/28 (c) | | | 39,057 | | | | 39,230 | |
Domino’s Pizza Master Issuer LLC,
Series 2015-1A, Class A2II
4.474% 10/25/45 (c) | | | 106,425 | | | | 111,278 | |
Eaton Vance CLO Ltd.,
Series 2018-1A, Class B, 3 mo. USD LIBOR + 1.750%
4.053% FRN 10/15/30 (c) | | | 250,000 | | | | 248,846 | |
Elara HGV Timeshare Issuer LLC,
Series 2016-A, Class A
2.730% 4/25/28 (c) | | | 35,786 | | | | 35,836 | |
Elmwood CLO II Ltd.,
Series 2019-2A, Class A, 3 mo. USD LIBOR + 1.450%
3.995% FRN 4/20/31 (c) | | | 250,000 | | | | 250,183 | |
First Franklin Mortgage Loan Trust,
Series 2004-FFH4, Class M6, 1 mo. USD LIBOR + 1.725%
3.743% FRN 1/25/35 | | | 80,000 | | | | 80,905 | |
Goodgreen Trust
Series 2016-1A, Class A,
3.230% 10/15/52 (c) | | | 63,417 | | | | 64,996 | |
Series 2017-1A, Class A,
3.740% 10/15/52 (c) | | | 104,667 | | | | 108,926 | |
Series 2019-1A, Class A,
3.860% 10/15/54 (c) | | | 142,087 | | | | 150,469 | |
Helios Issuer LLC,
Series 2017-1A, Class A
4.940% 9/20/49 (c) | | | 88,178 | | | | 92,360 | |
Hero Funding Trust
Series 2016-4A, Class A1,
3.570% 9/20/47 (c) | | | 69,662 | | | | 71,649 | |
Series 2018-1A, Class A2,
4.670% 9/20/48 (c) | | | 85,405 | | | | 90,222 | |
The accompanying notes are an integral part of the financial statements.
129
MassMutual Premier Balanced Fund – Portfolio of Investments(Continued)
| | | | | | | | |
| | |
| | | Principal
Amount | | | Value | |
Highbridge Loan Management Ltd.,
Series 13A-18, Class C
4.586% 10/15/30 (c) (e) | | $ | 250,000 | | | $ | 246,033 | |
J.G. Wentworth XLII LLC,
Series 2018-2A, Class A
3.960% 10/15/75 (c) | | | 67,528 | | | | 74,033 | |
J.G. Wentworth XXXVIII LLC,
Series 2017-1A, Class B
5.430% 8/15/62 (c) | | | 200,000 | | | | 226,799 | |
KKR Financial CLO Ltd.,
Series 24, Class A1, 3 mo. USD LIBOR + 1.360%
3.991% FRN 4/20/32 (c) | | | 250,000 | | | | 250,103 | |
Series 24, Class C, 3 mo. USD
LIBOR + 2.700%
5.331% FRN 4/20/32 (c) | | | 250,000 | | | | 250,320 | |
Mariner Finance Issuance Trust,
Series 2017-BA, Class A
2.920% 12/20/29 (c) | | | 100,000 | | | | 100,153 | |
MP CLO III Ltd.,
Series 2013-1A, Class AR, 3 mo. USD LIBOR + 1.250%
3.528% FRN 10/20/30 (c) | | | 250,000 | | | | 249,780 | |
OneMain Financial Issuance Trust,
Series 2019-2A, Class A
3.140% 10/14/36 (c) | | | 330,000 | | | | 330,082 | |
Orange Lake Timeshare Trust
Series 2016-A, Class A,
2.610% 3/08/29 (c) | | | 22,166 | | | | 22,301 | |
Series 2016-A, Class B,
2.910% 3/08/29 (c) | | | 18,472 | | | | 18,288 | |
Oxford Finance Funding Trust,
Series 2016-1A, Class A
3.968% 6/17/24 (c) | | | 24,045 | | | | 24,198 | |
Rockford Tower CLO Ltd.,
Series 2019-1A, Class B1, 3 mo. USD LIBOR + 2.050%
4.667% FRN 4/20/32 (c) | | | 300,000 | | | | 300,210 | |
SBA Tower Trust,
Series 2014-2A, Class C,
3.869% STEP 10/15/49 (c) | | | 100,000 | | | | 104,120 | |
Sierra Receivables Funding LLC
Series 2015-3A, Class B,
3.080% 9/20/32 (c) | | | 14,510 | | | | 14,578 | |
Series 2018-3A, Class C,
4.170% 9/20/35 (c) | | | 158,662 | | | | 161,742 | |
Taco Bell Funding LLC
Series 2018-1A, Class A2II,
4.940% 11/25/48 (c) | | | 39,700 | | | | 42,225 | |
Series 2016-1A, Class A23,
4.970% 5/25/46 (c) | | | 219,938 | | | | 234,069 | |
| | | | | | | | |
| | |
| | | Principal
Amount | | | Value | |
Textainer Marine Containers V Ltd.
Series 2017-2A, Class A,
3.520% 6/20/42 (c) | | $ | 122,776 | | | $ | 124,212 | |
Series 2017-1A, Class A,
3.720% 5/20/42 (c) | | | 78,095 | | | | 79,635 | |
Textainer Marine Containers VII Ltd.,
Series 2018-1A, Class A
4.110% 7/20/43 (c) | | | 91,600 | | | | 92,668 | |
Trinity Rail Leasing LP
Series 2019-1A, Class A,
3.820% 4/17/49 (c) | | | 157,929 | | | | 163,991 | |
Series 2018-1A, Class A2,
4.620% 6/17/48 (c) | | | 230,000 | | | | 246,974 | |
Welk Resorts LLC,
Series 2015-AA, Class A
2.790% 6/16/31 (c) | | | 12,933 | | | | 12,843 | |
Wendy’s Funding LLC,
Series 2015-1A, Class A23
4.497% 6/15/45 (c) | | | 72,000 | | | | 72,904 | |
Willis Engine Structured Trust III,Series 2017-A, Class A,
4.690% STEP 8/15/42 (c) | | | 223,784 | | | | 231,753 | |
| | | | | | | | |
| | | | | | | 6,398,561 | |
| | | | | | | | |
| Student Loans ABS — 4.2% | | | | | | | | |
Access Group,
Series 2003-A, Class A3
3.260% 7/01/38 | | | 3,036 | | | | 3,001 | |
Access Group, Inc.,
Series 2015-1, Class B
3.645% 7/25/58 (c) (e) | | | 100,000 | | | | 93,988 | |
AccessLex Institute,
Series 2004-A, Class A3, 28 day ARS,
1.699% FRN 7/01/39 | | | 100,000 | | | | 98,550 | |
College Loan Corp. Trust I,
Series 2007-1, Class B2, 28 day ARS
FRN 1/25/47 | | | 35,000 | | | | 27,722 | |
Commonbond Student Loan Trust,Series 2017-AGS, Class B
3.470% 5/25/41 (c) | | | 106,187 | | | | 108,293 | |
Earnest Student Loan Program LLC,
Series 2016-B, Class A1, 1 mo. USD LIBOR + 2.050%
4.068% FRN 2/26/35 (c) | | | 17,139 | | | | 17,332 | |
ECMC Group Student Loan Trust
Series 2018-2A, Class A, 1 mo. USD LIBOR + .800%
2.818% FRN 9/25/68 (c) | | | 86,872 | | | | 86,795 | |
Series 2017-1A, Class A, 1 mo. USD LIBOR + 1.200%
3.218% FRN 12/27/66 (c) | | | 69,188 | | | | 69,886 | |
Series 2016-1A, Class A, 1 mo. USD LIBOR + 1.350%
3.368% FRN 7/26/66 (c) | | | 83,535 | | | | 84,137 | |
The accompanying notes are an integral part of the financial statements.
130
MassMutual Premier Balanced Fund – Portfolio of Investments(Continued)
| | | | | | | | |
| | |
| | | Principal
Amount | | | Value | |
EdLinc Student Loan Funding Trust
Series 2017-A, Class A,
PRIME - 1.150%
4.350% FRN 12/01/47 (c) | | $ | 67,192 | | | $ | 66,924 | |
Series 2012-1, Class B, 1 mo. USD LIBOR + 4.240%
6.258% FRN 11/26/40 (c) | | | 65,000 | | | | 76,490 | |
Education Loan Asset-Backed Trust I,
Series 2003-2, Class 2A1, 28 day ARS
FRN 8/01/43 (c) | | | 50,000 | | | | 46,627 | |
KnowledgeWorks Foundation,Series 2010-1, Class A, 3 mo. USD LIBOR + .950%
3.082% FRN 2/25/42 | | | 24,519 | | | | 24,491 | |
Navient Private Education Refi Loan Trust
Series 2019-EA, Class A2B, 1 mo. USD LIBOR + .920%
2.948% FRN 5/15/68 (c) | | | 100,000 | | | | 99,952 | |
Series 2019-EA, Class B,
3.390% 5/15/68 (c) | | | 156,000 | | | | 158,367 | |
Navient Student Loan Trust
Series 2015-2, Class A3, 1 mo. USD LIBOR + .570%
2.588% FRN 11/26/40 | | | 235,000 | | | | 232,614 | |
Series 2016-1A, Class A, 1 mo. USD LIBOR + .700%
2.718% FRN 2/25/70 (c) | | | 64,978 | | | | 64,226 | |
Series 2018-3A, Class A3, 1 mo. USD LIBOR + .800%
2.818% FRN 3/25/67 (c) | | | 100,000 | | | | 99,570 | |
Series 2016-5A, Class A, 1 mo. USD LIBOR + 1.250%
3.268% FRN 6/25/65 (c) | | | 74,005 | | | | 74,751 | |
Series 2016-6A, Class A3, 1 mo. USD LIBOR + 1.300%
3.318% FRN 3/25/66 (c) | | | 210,000 | | | | 213,621 | |
Series 2018-4A, Class B, 1 mo. USD LIBOR + 1.300%
3.318% FRN 6/27/67 (c) | | | 100,000 | | | | 98,887 | |
Series 2015-2, Class B, 1 mo. USD LIBOR + 1.500%
3.518% FRN 8/25/50 | | | 150,000 | | | | 149,420 | |
Series 2015-3, Class B, 1 mo. USD LIBOR + 1.500%
3.518% FRN 10/25/58 | | | 40,000 | | | | 40,279 | |
Series 2016-2, Class A3, 1 mo. USD LIBOR + 1.500%
3.518% FRN 6/25/65 (c) | | | 200,000 | | | | 207,731 | |
Series 2019-BA, Class B,
4.040% 12/15/59 (c) | | | 150,000 | | | | 160,121 | |
| | | | | | | | |
| | |
| | | Principal
Amount | | | Value | |
Nelnet Private Education Loan Trust
Series 2016-A, Class A1B, 3.600% 12/26/40 (c) | | $ | 34,328 | | | $ | 34,718 | |
Series 2016-A, Class A1A, 1 mo. USD LIBOR + 1.750%
3.768% FRN 12/26/40 (c) | | | 34,324 | | | | 34,155 | |
Nelnet Student Loan Trust
Series 2005-2, Class A5, 3 mo. USD LIBOR + .100%
2.259% FRN 3/23/37 | | | 67,435 | | | | 66,513 | |
Series 2019-5, Class A,
2.530% 10/25/67 (c) | | | 300,000 | | | | 300,898 | |
Series 2013-5A, Class A, 1 mo. USD LIBOR + .630%
2.648% FRN 1/25/37 (c) | | | 34,814 | | | | 34,561 | |
Series 2018-1A, Class A2, 1 mo. USD LIBOR + .760%
2.778% FRN 5/25/66 (c) | | | 100,000 | | | | 98,920 | |
Series 2018-3A, Class A3, 3.240% 9/27/66 (c) (e) | | | 100,000 | | | | 99,315 | |
Series 2018-5A, Class B, 1 mo. USD LIBOR + 1.450%
3.595% FRN 2/25/67 (c) | | | 200,000 | | | | 197,686 | |
PHEAA Student Loan Trust,Series 2016-2A, Class A, 1 mo. USD LIBOR + .950%
2.968% FRN 11/25/65 (c) | | | 66,933 | | | | 67,101 | |
SLC Student Loan Trust,Series 2005-1, Class B, 3 mo. USD LIBOR + .200%
2.358% FRN 2/15/45 | | | 41,850 | | | | 39,361 | |
SLM Student Loan Trust
Series 2005-4, Class B, 3 mo. USD LIBOR + .180%
2.456% FRN 7/25/55 | | | 238,421 | | | | 223,197 | |
Series 2006-5, Class B, 3 mo. USD LIBOR + .210%
2.486% FRN 10/25/40 | | | 140,122 | | | | 130,543 | |
Series 2006-2, Class B, 3 mo. USD LIBOR + .220%
2.496% FRN 1/25/41 | | | 59,494 | | | | 55,611 | |
Series 2006-10, Class B, 3 mo. USD LIBOR + .220%
2.496% FRN 3/25/44 | | | 52,441 | | | | 49,318 | |
Series 2006-8, Class B, 3 mo. USD LIBOR + .230%
2.506% FRN 1/25/41 | | | 97,773 | | | | 90,632 | |
Series 2005-6, Class B, 3 mo. USD LIBOR + .290%
2.566% FRN 1/25/44 | | | 82,137 | | | | 76,740 | |
Series 2005-8, Class B, 3 mo. USD LIBOR + .310%
2.586% FRN 1/25/55 | | | 46,199 | | | | 43,154 | |
The accompanying notes are an integral part of the financial statements.
131
MassMutual Premier Balanced Fund – Portfolio of Investments(Continued)
| | | | | | | | |
| | |
| | | Principal
Amount | | | Value | |
Series 2003-11, Class B, 3 mo. USD LIBOR + .650%
2.769% FRN 12/15/38 | | $ | 91,275 | | | $ | 86,918 | |
Series 2004-1 Class B, 3 mo. USD LIBOR + .500%
2.776% FRN 7/25/39 | | | 42,941 | | | | 40,664 | |
Series 2006-5, Class A6B, 3 mo. USD LIBOR + .750%
3.026% FRN 10/25/40 | | | 100,000 | | | | 100,000 | |
Series 2003-5, Class A9, 28 day ARS
3.434% FRN 6/15/30 | | | 50,000 | | | | 50,000 | |
Series 2014-2, Class B, 1 mo. USD LIBOR + 1.500%
3.518% FRN 1/25/72 | | | 300,000 | | | | 298,607 | |
Series 2003-5, Class A7, 28 day ARS
4.490% FRN 6/15/30 | | | 50,000 | | | | 50,000 | |
SMB Private Education Loan Trust
Series 2018-C, Class A2B, 1 mo. USD LIBOR + .750%
2.778% FRN 11/15/35 (c) | | | 100,000 | | | | 99,500 | |
Series 2019-B, Class A2B, 1 mo. USD LIBOR + 1.000%
3.028% FRN 6/15/37 (c) | | | 250,000 | | | | 250,309 | |
Series 2017-A, Class B,
3.500% 6/17/41 (c) | | | 100,000 | | | | 104,494 | |
SoFi Professional Loan Program LLC
Series 2019-C, Class BFX,
3.050% 11/16/48 (c) | | | 123,000 | | | | 123,235 | |
Series 2016-B, Class A1, 1 mo. USD LIBOR + 1.200%
3.218% FRN 6/25/33 (c) | | | 20,047 | | | | 20,219 | |
South Carolina Student Loan Corp.,Series 2010-1, Class A3, 3 mo. USD LIBOR + 1.050%
3.326% FRN 10/27/36 | | | 100,000 | | | | 100,653 | |
| | | | | | | | |
| | | | | | | 5,370,797 | |
| | | | | | | | |
| WL Collateral CMO — 0.3% | | | | | | | | |
Countrywide Home Loans, Inc.
Series 2003-42, Class 1A1,
3.991% VRN 9/25/33 (e) | | | 1,083 | | | | 1,043 | |
Series 2004-2, Class 1A1,
4.612% VRN 2/25/34 (e) | | | 5,084 | | | | 4,790 | |
Deephaven Residential Mortgage Trust,
Series 2018-1A, Class A1,
2.976% VRN 12/25/57 (c) (e) | | | 47,778 | | | | 47,818 | |
GSR Mortgage Loan Trust,
Series 2004-9, Class 2A1,
4.308% VRN 8/25/34 (e) | | | 1,570 | | | | 1,566 | |
IndyMac Index Mortgage Loan Trust,Series 2004-AR4, Class 1A,
4.086% VRN 8/25/34 (e) | | | 11,226 | | | | 10,922 | |
| | | | | | | | |
| | |
| | | Principal
Amount | | | Value | |
JP Morgan Mortgage Trust,
Series 2017-1, Class A11,
3.500% VRN 1/25/47 (c) (e) | | $ | 79,224 | | | $ | 79,106 | |
Merrill Lynch Mortgage Investors, Inc.
Series 2004-A1, Class IA,
3.250% VRN 2/25/34 (e) | | | 571 | | | | 552 | |
Series 2003-A4, Class IA,
4.764% VRN 7/25/33 (e) | | | 640 | | | | 623 | |
PSMC Trust,
Series 2018-2, Class A1,
3.500% VRN 6/25/48 (c) (e) | | | 87,246 | | | | 88,287 | |
Structured Adjustable Rate Mortgage Loan Trust,Series 2004-2, Class 2A,
4.266% VRN 3/25/34 (e) | | | 5,850 | | | | 5,717 | |
Washington Mutual Mortgage Pass-Through Certificates,
Series 2004-AR2, Class A, 12 mo. MTA + 1.400%
3.846% FRN 4/25/44 | | | 14,337 | | | | 14,160 | |
Wells Fargo Mortgage Backed Securities Trust,Series 2019-1, Class A1,
4.000% VRN 11/25/48 (c) (e) | | | 80,580 | | | | 81,807 | |
| | | | | | | | |
| | | | | | | 336,391 | |
| | | | | | | | |
| | |
TOTALNON-U.S. GOVERNMENT AGENCY OBLIGATIONS
(Cost $14,387,121) | | | | | | | 14,697,431 | |
| | | | | |
|
| SOVEREIGN DEBT OBLIGATIONS — 0.2% | |
Colombia Government International Bond
6.125% 1/18/41 | | | 100,000 | | | | 130,251 | |
Mexico Government International Bond
4.750% 3/08/44 | | | 163,000 | | | | 176,448 | |
| | | | | | | | |
| | | | | | | 306,699 | |
| | | | | | | | |
| | |
TOTAL SOVEREIGN
DEBT OBLIGATIONS
(Cost $262,980) | | | | | | | 306,699 | |
| | | | | |
|
U.S. GOVERNMENT AGENCY OBLIGATIONS
AND INSTRUMENTALITIES — 9.8% | |
| Collateralized Mortgage Obligations — 0.1% | | | | | |
Federal Home Loan Mortgage Corp.
Series 2617, Class Z,
5.500% 5/15/33 | | | 39,433 | | | | 44,119 | |
Series 2693, Class Z,
5.500% 10/15/33 | | | 71,798 | | | | 78,346 | |
| | | | | | | | |
| | | | | | | 122,465 | |
| | | | | | | | |
| Pass-Through Securities — 9.4% | | | | | | | | |
Federal Home Loan Mortgage Corp.
Pool #SB8013 2.500% 9/01/34 | | | 272,745 | | | | 275,147 | |
Pool #G05253 5.000% 2/01/39 | | | 6,239 | | | | 6,909 | |
Pool #G00729 8.000% 6/01/27 | | | 8,236 | | | | 9,328 | |
The accompanying notes are an integral part of the financial statements.
132
MassMutual Premier Balanced Fund – Portfolio of Investments(Continued)
| | | | | | | | |
| | |
| | | Principal
Amount | | | Value | |
Federal National Mortgage Association
Pool #MA3797 2.500% 10/01/34 (f) | | $ | 525,000 | | | $ | 529,623 | |
Pool #AS1304 3.500% 12/01/28 | | | 32,339 | | | | 33,692 | |
Pool #AV2325 3.500% 12/01/28 | | | 15,879 | | | | 16,543 | |
Pool #BF0196 3.500% 2/01/41 | | | 38,588 | | | | 40,484 | |
Pool #MA1356 3.500% 2/01/43 | | | 260,622 | | | | 273,017 | |
Pool #CA1073 3.500% 1/01/48 | | | 214,662 | | | | 221,920 | |
Pool #BJ0686 4.000% 4/01/48 | | | 96,526 | | | | 100,766 | |
Pool #CA2039 4.000% 7/01/48 | | | 172,529 | | | | 179,677 | |
Pool #CA1951 4.000% 7/01/48 | | | 108,793 | | | | 113,709 | |
Pool #BN5342 4.000% 3/01/49 | | | 1,215,011 | | | | 1,260,034 | |
Pool #MA3638 4.000% 4/01/49 | | | 411,145 | | | | 426,476 | |
Pool #725692 1 year CMT + 2.137%
4.473% FRN 10/01/33 | | | 5,629 | | | | 5,926 | |
Pool #CA1952 4.500% 6/01/48 | | | 41,280 | | | | 43,711 | |
Pool #CA1909 4.500% 6/01/48 | | | 240,931 | | | | 254,967 | |
Pool #MA3522 4.500% 11/01/48 | | | 204,384 | | | | 215,540 | |
Pool #MA3537 4.500% 12/01/48 | | | 217,321 | | | | 228,979 | |
Pool #MA3564 4.500% 1/01/49 | | | 193,569 | | | | 203,711 | |
Pool #BN5241 4.500% 2/01/49 | | | 750,744 | | | | 789,847 | |
Pool #MA3639 4.500% 4/01/49 | | | 384,917 | | | | 405,085 | |
Pool #888586 1 year CMT + 2.197%
4.548% FRN 10/01/34 | | | 12,210 | | | | 12,855 | |
Pool #AD6437 5.000% 6/01/40 | | | 13,002 | | | | 14,290 | |
Pool #AD6996 5.000% 7/01/40 | | | 88,851 | | | | 97,649 | |
Pool #AL8173 5.000% 2/01/44 | | | 32,288 | | | | 35,293 | |
Pool #564594 7.000% 1/01/31 | | | 6,113 | | | | 6,929 | |
Pool #253795 7.000% 5/01/31 | | | 3,079 | | | | 3,527 | |
Pool #507061 7.500% 10/01/29 | | | 503 | | | | 577 | |
Pool #527761 7.500% 2/01/30 | | | 760 | | | | 806 | |
Pool #531196 7.500% 2/01/30 | | | 684 | | | | 785 | |
Pool #253183 7.500% 4/01/30 | | | 1,446 | | | | 1,669 | |
Pool #253265 7.500% 5/01/30 | | | 806 | | | | 924 | |
Pool #535248 8.000% 4/01/30 | | | 85 | | | | 99 | |
Pool #539460 8.000% 5/01/30 | | | 1,020 | | | | 1,188 | |
Pool #190317 8.000% 8/01/31 | | | 1,052 | | | | 1,219 | |
Government National Mortgage Association
Pool #352049 7.000% 10/15/23 | | | 353 | | | | 376 | |
Government National Mortgage Association II TBA
Pool #1635 3.500% 10/01/48 (f) | | | 3,015,000 | | | | 3,123,587 | |
Pool #1367 4.000% 10/01/48 (f) | | | 1,500,000 | | | | 1,559,766 | |
Uniform Mortgage Backed Securities TBA
Pool #7180 3.000% 8/01/23 (f) | | | 225,000 | | | | 229,957 | |
Pool #21133 4.500% 10/01/48 (f) | | | 1,180,000 | | | | 1,242,411 | |
| | | | | | | | |
| | | | | | | 11,968,998 | |
| | | | | | | | |
| Whole Loans — 0.3% | | | | | | | | |
Federal Home Loan Mortgage Corp. Structured Agency Credit Risk Debt Notes, Series 2019-DNA3, Class M2
4.350% 7/25/49 (c) | | | 140,000 | | | | 140,000 | |
| | | | | | | | |
| | |
| | | Principal
Amount | | | Value | |
Federal National Mortgage Association Connecticut Avenue Securities Trust,Series 2019-R01, Class 2M2, 1 mo. USD LIBOR + 2.450%
4.468% FRN 7/25/31 (c) | | $ | 190,000 | | | $ | 191,243 | |
| | | | | | | | |
| | | | | | | 331,243 | |
| | | | | | | | |
| | |
TOTAL U.S. GOVERNMENT AGENCY OBLIGATIONS AND INSTRUMENTALITIES
(Cost $12,357,940) | | | | | | | 12,422,706 | |
| | | | | |
|
| U.S. TREASURY OBLIGATIONS — 1.3% | |
| U.S. Treasury Bonds & Notes — 1.3% | |
U.S. Treasury Bond
2.500% 5/15/46 (g) | | | 985,000 | | | | 1,060,761 | |
U.S. Treasury Note
1.500% 8/15/22 | | | 350,000 | | | | 349,207 | |
1.625% 8/15/29 | | | 100,000 | | | | 99,570 | |
2.250% 8/15/49 | | | 100,000 | | | | 102,863 | |
| | | | | | | | |
| | | | | | | 1,612,401 | |
| | | | | | | | |
| | |
TOTAL U.S. TREASURY OBLIGATIONS
(Cost $1,519,877) | | | | | | | 1,612,401 | |
| | | | | | | | |
| | |
TOTAL BONDS & NOTES
(Cost $44,315,040) | | | | | | | 45,786,092 | |
| | | | | | | | |
| | |
TOTAL PURCHASED OPTIONS (#) — 0.1%
(Cost $204,962) | | | | | | | 197,841 | |
| | | | | | | | |
| | |
| | | Number of
Shares | | | | |
|
| MUTUAL FUNDS — 9.2% | |
| Diversified Financial Services — 9.2% | |
iShares ChinaLarge-Cap ETF | | | 2,800 | | | | 111,440 | |
iShares MSCI Australia ETF (b) | | | 7,000 | | | | 155,750 | |
iShares MSCI EAFE ETF | | | 43,430 | | | | 2,832,070 | |
iShares MSCI France ETF | | | 8,500 | | | | 256,190 | |
iShares MSCI Germany ETF (b) | | | 7,200 | | | | 193,752 | |
iShares MSCI India ETF | | | 13,000 | | | | 436,410 | |
iShares MSCI Italy ETF (b) | | | 2,900 | | | | 79,953 | |
iShares MSCI Japan ETF (b) | | | 10,300 | | | | 584,422 | |
iShares MSCI Singapore ETF (b) | | | 1,150 | | | | 26,680 | |
iShares MSCI South Korea ETF | | | 1,800 | | | | 101,412 | |
iShares MSCI Spain ETF (b) | | | 3,400 | | | | 94,656 | |
iShares MSCI Sweden ETF | | | 2,100 | | | | 61,845 | |
iShares MSCI Switzerland Capped ETF (b) | | | 6,400 | | | | 241,280 | |
iShares MSCI Turkey Investable Market ETF (b) | | | 1,700 | | | | 45,424 | |
iShares MSCI United Kingdom ETF | | | 10,500 | | | | 330,015 | |
State Street Navigator Securities Lending Prime Portfolio (h) | | | 1,586,959 | | | | 1,586,959 | |
The accompanying notes are an integral part of the financial statements.
133
MassMutual Premier Balanced Fund – Portfolio of Investments(Continued)
| | | | | | | | |
| | |
| | | Number of
Shares | | | Value | |
Vanguard FTSE Developed Markets ETF | | | 74,840 | | | $ | 3,074,427 | |
Vanguard FTSE Emerging Markets ETF | | | 35,200 | | | | 1,417,152 | |
| | | | | | | | |
| | |
TOTAL MUTUAL FUNDS
(Cost $10,862,184) | | | | | | | 11,629,837 | |
| | | | | | | | |
| | |
TOTAL LONG-TERM INVESTMENTS
(Cost $111,488,354) | | | | | | | 119,206,287 | |
| | | | | | | | |
| | |
| | | Principal
Amount | | | | |
|
| SHORT-TERM INVESTMENTS — 5.3% | |
| Commercial Paper — 3.9% | |
Entergy Corp.
2.476% 10/11/19 (c) | | $ | 1,000,000 | | | | 999,297 | |
FMC Tech, Inc.
2.290% 10/29/19 (c) | | | 1,000,000 | | | | 998,173 | |
Mondelez International, Inc.
2.320% 10/17/19 (c) | | | 1,000,000 | | | | 998,934 | |
Parker-Hannifin Corp.
2.292% 11/07/19 (c) | | | 1,000,000 | | | | 997,675 | |
Reckitt Benckiser Treasury Services PLC
2.526% 4/01/20 (c) | | | 500,000 | | | | 494,439 | |
TELUS Corp.
2.400% 11/22/19 (c) | | | 500,000 | | | | 498,318 | |
| | | | | | | | |
| | | | | | | 4,986,836 | |
| | | | | | | | |
| Repurchase Agreement — 1.4% | |
Fixed Income Clearing Corp., Repurchase Agreement, dated 9/30/19, 0.950%, due 10/01/19 (i) | | | 1,786,010 | | | | 1,786,010 | |
| | | | | | | | |
| | |
TOTAL SHORT-TERM INVESTMENTS
(Cost $6,772,335) | | | | | | | 6,772,846 | |
| | | | | |
| | |
TOTAL INVESTMENTS — 99.2%
(Cost $118,260,689) (j) | | | | | | | 125,979,133 | |
| | |
| Other Assets/(Liabilities) — 0.8% | | | | | | | 1,004,877 | |
| | | | | |
| | |
| NET ASSETS — 100.0% | | | | | | $ | 126,984,010 | |
| | | | | |
Abbreviation Legend
| CLO | Collateralized Loan Obligation |
| CMO | Collateralized Mortgage Obligation |
| CMT | Constant Maturity Treasury Index |
| MBS | Mortgage-Backed Security |
| MTA | Monthly Treasury Average Index |
Notes to Portfolio of Investments
Percentages are stated as a percent of net assets.
| (a) | Non-income producing security. |
| (b) | Denotes all or a portion of security on loan. The total value of securities on loan as of September 30, 2019, was $1,552,277 or 1.22% of net assets. Total securities on loan may be less than the amounts identified in the Portfolio of Investments.(Note 2). |
| (c) | Security is exempt from registration under Regulation S or Rule 144A of the Securities Act of 1933. These securities are considered restricted and may be resold in transactions exempt from registration. At September 30, 2019, the aggregate market value of these securities amounted to $19,870,944 or 15.65% of net assets. |
| (d) | Security is perpetual and has no stated maturity date. |
| (e) | Certain variable rate securities are not based on a published reference rate and spread but are determined by the issuer or agent and are based on current market conditions. These securities do not indicate a reference rate and spread in their description above. The rates shown are the current interest rates at September 30, 2019. |
| (f) | A portion of this security is purchased on a when-issued, delayed-delivery or forward commitment basis.(Note 2). |
| (g) | A portion of this security is pledged/held as collateral for open futures contracts.(Note 2). |
| (h) | Represents investment of security lending collateral.(Note 2). |
| (i) | Maturity value of $1,786,057. Collateralized by U.S. Government Agency obligations with a rate of 2.500%, maturity date of 3/31/23, and an aggregate market value, including accrued interest, of $1,826,143. |
| (j) | See Note 6 for aggregate cost for federal tax purposes. |
The accompanying notes are an integral part of the financial statements.
134
MassMutual Premier Balanced Fund – Portfolio of Investments(Continued)
(#) Interest Rate Swaptions Purchased
| | | | | | | | | | | | | | | | | | | | | | | | | | | | | | | | | | | | | | |
| | | | | | | | | Paid by Fund | | | Received by Fund | | | | | | | | | | | | | |
| Description | | Counterparty | | | Expiration
Date | | | Rate | | | Frequency | | | Rate | | Frequency | | | Notional
Amount | | | Value | | | Premiums
Paid
(Received) | | | Unrealized
Appreciation/
(Depreciation) | |
| Call | | | | | | | | | | | | | | | | | | | | | | | | | | | | | | | | | | | | | | |
| 10-Year Interest Rate Swap 12/15/42 | |
| Barclays
Bank PLC* |
| | | 12/13/32 | | |
| 3-Month
USD LIBOR
BBA |
| | | Quarterly | | | 2.44% | | | Semi-Annually | | | USD | 395,000 | | | $ | 36,762 | | | $ | 19,747 | | | $ | 17,015 | |
| | | | | | | | | | |
| 10-Year Interest Rate Swap, 2/02/43 | |
| Credit
Suisse
International* |
| | | 1/31/33 | | |
| 3-Month
USD
LIBOR BBA |
| | | Quarterly | | | 2.61% | | | Semi-Annually | | | USD | 435,000 | | | | 44,425 | | | | 20,880 | | | | 23,545 | |
| | | | | | | | | | | | | | | | | | | | | | | | | | | | | | | | | | | | | | |
| | | | 81,187 | | | | 40,627 | | | | 40,560 | |
| | | | | | | | | | | | | | | | | | | | | | | | | | | | | | | | | | | | | | |
| Put | | | | | | | | | | | | | | | | | | | | | | | | | | | | | | | | | | | | | | |
10-Year Interest Rate Swap, 12/15/42 | |
| Barclays
Bank PLC* |
| | | 12/13/32 | | | | 2.94% | | | | Semi-Annually | | | 3-Month USD LIBOR BBA | | | Quarterly | | | USD | 1,620,000 | | | $ | 58,851 | | | $ | 80,989 | | | $ | (22,138 | ) |
| | | | | | | | | | |
| 10-Year Interest Rate Swap 2/02/43 | |
| Credit
Suisse
International* |
| | | 1/31/33 | | | | 3.11% | | | | Semi-Annually | | | 3-Month USD LIBOR BBA | | | Quarterly | | | USD | 1,740,000 | | | | 57,803 | | | | 83,346 | | | | (25,543 | ) |
| | | | | | | | | | | | | | | | | | | | | | | | | | | | | | | | | | | | | | |
| | | | 116,654 | | | | 164,335 | | | | (47,681 | ) |
| | | | | | | | | | | | | | | | | | | | | | | | | | | | | | | | | | | | | | |
| | | | | | | $ | 197,841 | | | $ | 204,962 | | | $ | (7,121 | ) |
| | | | | | | | | | | | | | | | | | | | | | | | | | | | | | | | | | | | | | |
| * | Contracts are subject to a Master Netting Agreement. |
Futures contracts
| | | | | | | | | | | | | | | | |
| | | Expiration
Date | | | Number of
Contracts | | | Notional
Amount | | | Value/ Net
Unrealized
Appreciation/
(Depreciation) | |
| Long | | | | | | | | | | | | |
U.S. Treasury Note 10 Year | | | 12/19/19 | | | | 4 | | | $ | 520,013 | | | $ | 1,237 | |
U.S. Treasury Ultra Bond | | | 12/19/19 | | | | 13 | | | | 2,545,604 | | | | (50,823 | ) |
MSCI EAFEE-Mini Index | | | 12/20/19 | | | | 17 | | | | 1,622,533 | | | | (8,893 | ) |
S&P 500 E Mini Index | | | 12/20/19 | | | | 40 | | | | 6,003,309 | | | | (46,309 | ) |
U.S. Treasury Note 2 Year | | | 12/31/19 | | | | 18 | | | | 3,890,648 | | | | (11,648 | ) |
U.S. Treasury Note 5 Year | | | 12/31/19 | | | | 15 | | | | 1,796,883 | | | | (9,656 | ) |
| | | | | | | | | | | | | | | | |
| | | $ | (126,092 | ) |
| | | | | |
| Short | | | | | | | | | | | | |
U.S. Treasury Long Bond | | | 12/19/19 | | | | 3 | | | $ | (492,904 | ) | | $ | 5,966 | |
| | | | | | | | | | | | | | | | |
Currency Legend
The accompanying notes are an integral part of the financial statements.
135
MassMutual Premier Disciplined Value Fund – Portfolio of Investments
September 30, 2019
| | | | | | | | |
| | | Number of
Shares | | | Value | |
| EQUITIES — 99.8% | |
|
| COMMON STOCK — 99.8% | |
| Basic Materials — 3.6% | |
| Chemicals — 2.6% | |
Air Products & Chemicals, Inc. | | | 520 | | | $ | 115,367 | |
Albemarle Corp. (a) | | | 10 | | | | 695 | |
Cabot Corp. | | | 200 | | | | 9,064 | |
Celanese Corp. | | | 1,070 | | | | 130,851 | |
CF Industries Holdings, Inc. | | | 1,700 | | | | 83,640 | |
The Chemours Co. | | | 3,600 | | | | 53,784 | |
Dow, Inc. (b) | | | 4,803 | | | | 228,863 | |
DuPont de Nemours, Inc. | | | 8,303 | | | | 592,087 | |
Eastman Chemical Co. | | | 360 | | | | 26,579 | |
Element Solutions, Inc. (b) | | | 1,800 | | | | 18,324 | |
FMC Corp. | | | 500 | | | | 43,840 | |
Huntsman Corp. | | | 13,700 | | | | 318,662 | |
Linde PLC | | | 3,710 | | | | 718,701 | |
LyondellBasell Industries NV Class A | | | 3,700 | | | | 331,039 | |
The Mosaic Co. | | | 200 | | | | 4,100 | |
Olin Corp. | | | 3,000 | | | | 56,160 | |
PPG Industries, Inc. | | | 1,320 | | | | 156,433 | |
Westlake Chemical Corp. | | | 260 | | | | 17,035 | |
| | | | | | | | |
| | | | | | | 2,905,224 | |
| | | | | | | | |
| Forest Products & Paper — 0.3% | |
Domtar Corp. | | | 1,237 | | | | 44,297 | |
International Paper Co. | | | 5,800 | | | | 242,556 | |
| | | | | | | | |
| | | | | | | 286,853 | |
| | | | | | | | |
| Iron & Steel — 0.6% | |
Nucor Corp. | | | 3,500 | | | | 178,185 | |
Reliance Steel & Aluminum Co. | | | 2,600 | | | | 259,116 | |
Steel Dynamics, Inc. | | | 4,800 | | | | 143,040 | |
United States Steel Corp. (a) | | | 4,390 | | | | 50,704 | |
| | | | | | | | |
| | | | | | | 631,045 | |
| | | | | | | | |
| Mining — 0.1% | |
Alcoa Corp. (b) | | | 1,500 | | | | 30,105 | |
Freeport-McMoRan, Inc. | | | 5,031 | | | | 48,147 | |
Newmont Goldcorp Corp. | | | 1,400 | | | | 53,088 | |
Southern Copper Corp. | | | 1,200 | | | | 40,956 | |
| | | | | | | | |
| | | | | | | 172,296 | |
| | | | | | | | |
| | | | | | | 3,995,418 | |
| | | | | | | | |
| Communications — 8.7% | |
| Advertising — 0.2% | |
The Interpublic Group of Cos., Inc. | | | 5,200 | | | | 112,112 | |
Omnicom Group, Inc. | | | 1,800 | | | | 140,940 | |
| | | | | | | | |
| | | | | | | 253,052 | |
| | | | | | | | |
| Internet — 0.3% | |
F5 Networks, Inc. (b) | | | 340 | | | | 47,743 | |
IAC/InterActiveCorp (b) | | | 380 | | | | 82,828 | |
| | | | | | | | |
| | | Number of
Shares | | | Value | |
Symantec Corp. | | | 1,900 | | | $ | 44,897 | |
TripAdvisor, Inc. (b) | | | 2,900 | | | | 112,172 | |
VeriSign, Inc. (b) | | | 490 | | | | 92,429 | |
| | | | | | | | |
| | | | | | | 380,069 | |
| | | | | | | | |
| Media — 3.6% | |
CBS Corp. Class B | | | 1,600 | | | | 64,592 | |
Charter Communications, Inc. Class A (b) | | | 100 | | | | 41,212 | |
Comcast Corp. Class A | | | 37,700 | | | | 1,699,516 | |
Discovery, Inc. Class A (a) (b) | | | 8,400 | | | | 223,692 | |
Discovery, Inc. Class C (b) | | | 4,928 | | | | 121,327 | |
DISH Network Corp. Class A (b) | | | 2,241 | | | | 76,351 | |
Fox Corp. Class A | | | 2,033 | | | | 64,111 | |
Fox Corp. Class B (b) | | | 1,433 | | | | 45,197 | |
John Wiley & Sons, Inc. Class A | | | 700 | | | | 30,758 | |
Liberty Media Corp-Liberty SiriusXM Class A (b) | | | 2,700 | | | | 112,239 | |
Liberty Media Corp-Liberty SiriusXM Class C (b) | | | 2,100 | | | | 88,116 | |
The New York Times Co. Class A | | | 1,100 | | | | 31,328 | |
News Corp. Class A | | | 2,800 | | | | 38,976 | |
Nexstar Media Group, Inc. Class A | | | 2,040 | | | | 208,712 | |
Sinclair Broadcast Group, Inc. Class A | | | 6,200 | | | | 264,988 | |
Viacom, Inc. Class A (a) | | | 1,500 | | | | 39,390 | |
Viacom, Inc. Class B | | | 5,300 | | | | 127,359 | |
The Walt Disney Co. | | | 5,928 | | | | 772,537 | |
| | | | | | | | |
| | | | | | | 4,050,401 | |
| | | | | | | | |
| Telecommunications — 4.6% | |
AT&T, Inc. | | | 36,436 | | | | 1,378,738 | |
CenturyLink, Inc. | | | 13,007 | | | | 162,327 | |
Ciena Corp. (b) | | | 1,400 | | | | 54,922 | |
CommScope Holding Co., Inc. (b) | | | 4,200 | | | | 49,392 | |
EchoStar Corp. Class A (b) | | | 600 | | | | 23,772 | |
Juniper Networks, Inc. | | | 3,600 | | | | 89,100 | |
LogMeIn, Inc. | | | 20 | | | | 1,419 | |
Motorola Solutions, Inc. | | | 1,420 | | | | 241,982 | |
Sprint Corp. (b) | | | 12,400 | | | | 76,508 | |
T-Mobile US, Inc. (b) | | | 2,850 | | | | 224,495 | |
Telephone & Data Systems, Inc. | | | 1,918 | | | | 49,485 | |
Verizon Communications, Inc. | | | 44,700 | | | | 2,698,092 | |
| | | | | | | | |
| | | | | | | 5,050,232 | |
| | | | | | | | |
| | | | | | | 9,733,754 | |
| | | | | | | | |
| Consumer, Cyclical — 7.7% | |
| Airlines — 0.8% | |
Alaska Air Group, Inc. | | | 500 | | | | 32,455 | |
American Airlines Group, Inc. | | | 1,000 | | | | 26,970 | |
Copa Holdings SA Class A | | | 80 | | | | 7,900 | |
Delta Air Lines, Inc. | | | 6,100 | | | | 351,360 | |
JetBlue Airways Corp. (b) | | | 1,900 | | | | 31,825 | |
Southwest Airlines Co. | | | 2,800 | | | | 151,228 | |
The accompanying notes are an integral part of the financial statements.
136
MassMutual Premier Disciplined Value Fund – Portfolio of Investments(Continued)
| | | | | | | | |
| | | Number of
Shares | | | Value | |
United Airlines Holdings, Inc. (b) | | | 3,000 | | | $ | 265,230 | |
| | | | | | | | |
| | | | | | | 866,968 | |
| | | | | | | | |
| Apparel — 0.1% | |
Capri Holdings Ltd. (b) | | | 700 | | | | 23,212 | |
Columbia Sportswear Co. | | | 100 | | | | 9,689 | |
Hanesbrands, Inc. | | | 2,200 | | | | 33,704 | |
PVH Corp. | | | 400 | | | | 35,292 | |
Ralph Lauren Corp. | | | 80 | | | | 7,638 | |
Skechers U.S.A., Inc. Class A (b) | | | 100 | | | | 3,735 | |
Tapestry, Inc. | | | 600 | | | | 15,630 | |
| | | | | | | | |
| | | | | | | 128,900 | |
| | | | | | | | |
| Auto Manufacturers — 1.0% | |
Ford Motor Co. | | | 38,600 | | | | 353,576 | |
General Motors Co. | | | 11,300 | | | | 423,524 | |
PACCAR, Inc. | | | 4,900 | | | | 343,049 | |
| | | | | | | | |
| | | | | | | 1,120,149 | |
| | | | | | | | |
| Auto Parts & Equipment — 0.2% | |
BorgWarner, Inc. | | | 800 | | | | 29,344 | |
Lear Corp. | | | 480 | | | | 56,592 | |
The The Goodyear Tire & Rubber Co. | | | 3,400 | | | | 48,977 | |
| | | | | | | | |
| | | | | | | 134,913 | |
| | | | | | | | |
| Distribution & Wholesale — 0.1% | |
Fastenal Co. | | | 1,400 | | | | 45,738 | |
HD Supply Holdings, Inc. (b) | | | 1,100 | | | | 43,093 | |
Resideo Technologies, Inc. (b) | | | 3,118 | | | | 44,743 | |
WESCO International, Inc. (b) | | | 500 | | | | 23,885 | |
| | | | | | | | |
| | | | | | | 157,459 | |
| | | | | | | | |
| Entertainment — 0.3% | |
Cinemark Holdings, Inc. | | | 7,800 | | | | 301,392 | |
| | | | | | | | |
| Food Services — 0.1% | |
Aramark | | | 1,400 | | | | 61,012 | |
| | | | | | | | |
| Home Builders — 0.2% | |
D.R. Horton, Inc. | | | 100 | | | | 5,271 | |
Lennar Corp. Class A | | | 70 | | | | 3,910 | |
Lennar Corp. Class B | | | 49 | | | | 2,174 | |
PulteGroup, Inc. | | | 4,200 | | | | 153,510 | |
Toll Brothers, Inc. | | | 1,200 | | | | 49,260 | |
| | | | | | | | |
| | | | | | | 214,125 | |
| | | | | | | | |
| Home Furnishing — 0.1% | |
Dolby Laboratories, Inc. Class A | | | 300 | | | | 19,392 | |
Whirlpool Corp. | | | 570 | | | | 90,265 | |
| | | | | | | | |
| | | | | | | 109,657 | |
| | | | | | | | |
| Housewares — 0.0% | |
Newell Brands, Inc. | | | 1,700 | | | | 31,824 | |
| | | | | | | | |
| Leisure Time — 0.5% | |
Carnival Corp. | | | 1,900 | | | | 83,049 | |
Harley-Davidson, Inc. | | | 1,200 | | | | 43,164 | |
| | | | | | | | |
| | | Number of
Shares | | | Value | |
Norwegian Cruise Line Holdings Ltd. (b) | | | 3,800 | | | $ | 196,726 | |
Royal Caribbean Cruises Ltd. | | | 2,800 | | | | 303,324 | |
| | | | | | | | |
| | | | | | | 626,263 | |
| | | | | | | | |
| Lodging — 0.5% | |
Caesars Entertainment Corp. (b) | | | 11,400 | | | | 132,924 | |
Extended Stay America, Inc. | | | 300 | | | | 4,392 | |
Hyatt Hotels Corp. Class A | | | 800 | | | | 58,936 | |
Las Vegas Sands Corp. | | | 2,400 | | | | 138,624 | |
MGM Resorts International | | | 100 | | | | 2,772 | |
Wyndham Destinations, Inc. | | | 5,300 | | | | 243,906 | |
| | | | | | | | |
| | | | | | | 581,554 | |
| | | | | | | | |
| Retail — 3.8% | |
Advance Auto Parts, Inc. | | | 450 | | | | 74,430 | |
AutoNation, Inc. (b) | | | 800 | | | | 40,560 | |
Best Buy Co., Inc. | | | 2,600 | | | | 179,374 | |
Casey’s General Stores, Inc. | | | 290 | | | | 46,736 | |
Dick’s Sporting Goods, Inc. | | | 2,300 | | | | 93,863 | |
Foot Locker, Inc. | | | 5,000 | | | | 215,800 | |
The Gap, Inc. | | | 4,300 | | | | 74,648 | |
Genuine Parts Co. | | | 1,000 | | | | 99,590 | |
The Home Depot, Inc. | | | 2,870 | | | | 665,897 | |
Kohl’s Corp. | | | 1,900 | | | | 94,354 | |
Macy’s, Inc. | | | 2,244 | | | | 34,872 | |
McDonald’s Corp. | | | 1,680 | | | | 360,713 | |
Penske Automotive Group, Inc. | | | 200 | | | | 9,456 | |
Qurate Retail, Inc. (b) | | | 16,600 | | | | 171,229 | |
Target Corp. | | | 7,400 | | | | 791,134 | |
Tiffany & Co. | | | 100 | | | | 9,263 | |
Walgreens Boots Alliance, Inc. | | | 6,439 | | | | 356,141 | |
Walmart, Inc. | | | 6,080 | | | | 721,574 | |
Williams-Sonoma, Inc. | | | 300 | | | | 20,394 | |
Yum China Holdings, Inc. | | | 2,300 | | | | 104,489 | |
Yum! Brands, Inc. | | | 590 | | | | 66,924 | |
| | | | | | | | |
| | | | | | | 4,231,441 | |
| | | | | | | | |
| | | | | | | 8,565,657 | |
| | | | | | | | |
| Consumer,Non-cyclical — 20.7% | |
| Agriculture — 1.7% | |
Altria Group, Inc. | | | 19,800 | | | | 809,820 | |
Bunge Ltd. | | | 300 | | | | 16,986 | |
Philip Morris International, Inc. | | | 13,760 | | | | 1,044,797 | |
| | | | | | | | |
| | | | | | | 1,871,603 | |
| | | | | | | | |
| Beverages — 0.9% | |
Brown-Forman Corp. Class A | | | 1,500 | | | | 89,625 | |
Brown-Forman Corp. Class B | | | 1,500 | | | | 94,170 | |
The Coca-Cola Co. | | | 8,500 | | | | 462,740 | |
Keurig Dr Pepper, Inc. | | | 2,300 | | | | 62,836 | |
Molson Coors Brewing Co. Class B | | | 360 | | | | 20,700 | |
PepsiCo, Inc. | | | 1,680 | | | | 230,328 | |
| | | | | | | | |
| | | | | | | 960,399 | |
| | | | | | | | |
The accompanying notes are an integral part of the financial statements.
137
MassMutual Premier Disciplined Value Fund – Portfolio of Investments(Continued)
| | | | | | | | |
| | | Number of
Shares | | | Value | |
| Biotechnology — 2.3% | |
Alexion Pharmaceuticals, Inc. (b) | | | 900 | | | $ | 88,146 | |
Amgen, Inc. | | | 1,910 | | | | 369,604 | |
Biogen, Inc. (b) | | | 1,970 | | | | 458,655 | |
Corteva, Inc. (b) | | | 4,803 | | | | 134,484 | |
Exelixis, Inc. (b) | | | 12,400 | | | | 219,294 | |
Gilead Sciences, Inc. | | | 13,700 | | | | 868,306 | |
Regeneron Pharmaceuticals, Inc. (b) | | | 710 | | | | 196,954 | |
United Therapeutics Corp. (b) | | | 2,590 | | | | 206,553 | |
| | | | | | | | |
| | | | | | | 2,541,996 | |
| | | | | | | | |
| Commercial Services — 0.6% | |
AMERCO | | | 70 | | | | 27,303 | |
CoreLogic, Inc. (b) | | | 400 | | | | 18,508 | |
Graham Holdings Co. Class B | | | 6 | | | | 3,981 | |
H&R Block, Inc. | | | 11,000 | | | | 259,820 | |
ManpowerGroup, Inc. | | | 930 | | | | 78,343 | |
Nielsen Holdings PLC | | | 3,700 | | | | 78,625 | |
Quanta Services, Inc. | | | 600 | | | | 22,680 | |
Sabre Corp. | | | 2,000 | | | | 44,790 | |
United Rentals, Inc. (b) | | | 1,390 | | | | 173,249 | |
| | | | | | | | |
| | | | | | | 707,299 | |
| | | | | | | | |
| Cosmetics & Personal Care — 2.5% | |
Colgate-Palmolive Co. | | | 9,500 | | | | 698,345 | |
The Procter & Gamble Co. | | | 16,900 | | | | 2,102,022 | |
| | | | | | | | |
| | | | | | | 2,800,367 | |
| | | | | | | | |
| Foods — 1.7% | |
Campbell Soup Co. | | | 2,400 | | | | 112,608 | |
Conagra Brands, Inc. | | | 64 | | | | 1,964 | |
Flowers Foods, Inc. | | | 1,900 | | | | 43,947 | |
General Mills, Inc. | | | 4,800 | | | | 264,576 | |
The Hershey Co. | | | 1,930 | | | | 299,131 | |
Ingredion, Inc. | | | 160 | | | | 13,078 | |
The J.M. Smucker Co. | | | 830 | | | | 91,317 | |
The Kraft Heinz Co. | | | 400 | | | | 11,174 | |
The Kroger Co. | | | 12,600 | | | | 324,828 | |
Lamb Weston Holdings, Inc. | | | 33 | | | | 2,400 | |
McCormick & Co., Inc. | | | 60 | | | | 9,378 | |
Mondelez International, Inc. Class A | | | 2,050 | | | | 113,406 | |
Pilgrim’s Pride Corp. (b) | | | 1,500 | | | | 48,067 | |
Post Holdings, Inc. (b) | | | 260 | | | | 27,518 | |
Seaboard Corp. | | | 10 | | | | 43,750 | |
Sprouts Farmers Market, Inc. (b) | | | 11,100 | | | | 214,674 | |
TreeHouse Foods, Inc. (b) | | | 500 | | | | 27,725 | |
Tyson Foods, Inc. Class A | | | 2,000 | | | | 172,280 | |
US Foods Holding Corp. (b) | | | 400 | | | | 16,440 | |
| | | | | | | | |
| | | | | | | 1,838,261 | |
| | | | | | | | |
| Health Care – Products — 2.2% | |
Abbott Laboratories | | | 7,300 | | | | 610,791 | |
Baxter International, Inc. | | | 700 | | | | 61,229 | |
The Cooper Cos., Inc. | | | 290 | | | | 86,130 | |
Danaher Corp. | | | 1,140 | | | | 164,650 | |
| | | | | | | | |
| | | Number of
Shares | | | Value | |
Henry Schein, Inc. (b) | | | 2,400 | | | $ | 152,400 | |
Medtronic PLC | | | 7,369 | | | | 800,421 | |
QIAGEN NV (b) | | | 500 | | | | 16,485 | |
Steris PLC | | | 630 | | | | 91,029 | |
Thermo Fisher Scientific, Inc. | | | 1,030 | | | | 300,008 | |
Zimmer Biomet Holdings, Inc. | | | 1,410 | | | | 193,550 | |
| | | | | | | | |
| | | | | | | 2,476,693 | |
| | | | | | | | |
| Health Care – Services — 0.8% | |
Anthem, Inc. | | | 230 | | | | 55,223 | |
Centene Corp. (b) | | | 1,920 | | | | 83,059 | |
DaVita, Inc. (b) | | | 1,900 | | | | 108,433 | |
Encompass Health Corp. | | | 3,100 | | | | 196,168 | |
HCA Healthcare, Inc. | | | 1,210 | | | | 145,708 | |
Humana, Inc. | | | 200 | | | | 51,134 | |
IQVIA Holdings, Inc. (b) | | | 120 | | | | 17,926 | |
MEDNAX, Inc. (b) | | | 1,600 | | | | 36,192 | |
Molina Healthcare, Inc. (b) | | | 850 | | | | 93,262 | |
Quest Diagnostics, Inc. | | | 10 | | | | 1,070 | |
Universal Health Services, Inc. Class B | | | 690 | | | | 102,638 | |
WellCare Health Plans, Inc. (b) | | | 70 | | | | 18,142 | |
| | | | | | | | |
| | | | | | | 908,955 | |
| | | | | | | | |
| Household Products & Wares — 0.4% | |
The Clorox Co. | | | 760 | | | | 115,421 | |
Kimberly-Clark Corp. | | | 2,410 | | | | 342,341 | |
Spectrum Brands Holdings, Inc. | | | 100 | | | | 5,272 | |
| | | | | | | | |
| | | | | | | 463,034 | |
| | | | | | | | |
| Pharmaceuticals — 7.6% | |
Allergan PLC | | | 2,090 | | | | 351,726 | |
Bristol-Myers Squibb Co. | | | 13,400 | | | | 679,514 | |
Cardinal Health, Inc. | | | 5,600 | | | | 264,264 | |
Cigna Corp. (b) | | | 173 | | | | 26,260 | |
CVS Health Corp. | | | 10,789 | | | | 680,462 | |
Herbalife Nutrition Ltd. (b) | | | 500 | | | | 18,930 | |
Horizon Therapeutics PLC (b) | | | 1,900 | | | | 51,737 | |
Jazz Pharmaceuticals PLC (b) | | | 1,280 | | | | 164,019 | |
Johnson & Johnson | | | 23,840 | | | | 3,084,419 | |
McKesson Corp. | | | 3,040 | | | | 415,447 | |
Merck & Co., Inc. | | | 4,528 | | | | 381,167 | |
Mylan NV (b) | | | 5,500 | | | | 108,790 | |
Perrigo Co. PLC | | | 1,300 | | | | 72,657 | |
Pfizer, Inc. | | | 58,315 | | | | 2,095,258 | |
| | | | | | | | |
| | | | | | | 8,394,650 | |
| | | | | | | | |
| | | | | | | 22,963,257 | |
| | | | | | | | |
| Energy — 7.0% | |
| Oil & Gas — 6.5% | |
Apache Corp. | | | 1,828 | | | | 46,797 | |
Cabot Oil & Gas Corp. | | | 3,800 | | | | 66,766 | |
Centennial Resource Development, Inc. Class A (b) | | | 5,400 | | | | 24,381 | |
Chesapeake Energy Corp. (a) (b) | | | 47,100 | | | | 66,411 | |
The accompanying notes are an integral part of the financial statements.
138
MassMutual Premier Disciplined Value Fund – Portfolio of Investments(Continued)
| | | | | | | | |
| | | Number of
Shares | | | Value | |
Chevron Corp. | | | 16,655 | | | $ | 1,975,283 | |
Cimarex Energy Co. | | | 2,900 | | | | 139,026 | |
ConocoPhillips | | | 17,248 | | | | 982,791 | |
Devon Energy Corp. | | | 50 | | | | 1,203 | |
Diamondback Energy, Inc. | | | 670 | | | | 60,239 | |
EOG Resources, Inc. | | | 1,990 | | | | 147,698 | |
EQT Corp. | | | 2,800 | | | | 29,792 | |
Exxon Mobil Corp. | | | 24,490 | | | | 1,729,239 | |
Hess Corp. | | | 1,200 | | | | 72,576 | |
HollyFrontier Corp. | | | 3,800 | | | | 203,832 | |
Marathon Oil Corp. | | | 2,900 | | | | 35,583 | |
Marathon Petroleum Corp. | | | 1,577 | | | | 95,803 | |
Murphy Oil Corp. | | | 1,700 | | | | 37,587 | |
Noble Energy, Inc. | | | 80 | | | | 1,797 | |
Occidental Petroleum Corp. | | | 11,588 | | | | 515,318 | |
Parsley Energy, Inc. Class A | | | 12,100 | | | | 203,280 | |
PBF Energy, Inc. Class A | | | 5,600 | | | | 152,264 | |
Phillips 66 | | | 3,460 | | | | 354,304 | |
Transocean Ltd. (b) | | | 1,100 | | | | 4,917 | |
Valero Energy Corp. | | | 2,734 | | | | 233,046 | |
WPX Energy, Inc. (b) | | | 66 | | | | 699 | |
| | | | | | | | |
| | | | | | | 7,180,632 | |
| | | | | | | | |
| Oil & Gas Services — 0.4% | |
Apergy Corp. (b) | | | 50 | | | | 1,352 | |
Baker Hughes a GE Co. | | | 6,203 | | | | 143,910 | |
Halliburton Co. | | | 10,300 | | | | 194,155 | |
Patterson-UTI Energy, Inc. | | | 6,700 | | | | 57,285 | |
Schlumberger Ltd. | | | 2,740 | | | | 93,626 | |
| | | | | | | | |
| | | | | | | 490,328 | |
| | | | | | | | |
| Pipelines — 0.1% | |
Kinder Morgan, Inc. | | | 900 | | | | 18,549 | |
ONEOK, Inc. | | | 800 | | | | 58,952 | |
| | | | | | | | |
| | | | | | | 77,501 | |
| | | | | | | | |
| | | | | | | 7,748,461 | |
| | | | | | | | |
| Financial — 30.4% | |
| Banks — 12.0% | |
Associated Banc-Corp. | | | 1,350 | | | | 27,337 | |
Bank of America Corp. | | | 69,473 | | | | 2,026,527 | |
Bank of Hawaii Corp. | | | 820 | | | | 70,463 | |
The Bank of New York Mellon Corp. | | | 4,050 | | | | 183,100 | |
Bank OZK | | | 2,500 | | | | 68,175 | |
BankUnited, Inc. | | | 200 | | | | 6,724 | |
BB&T Corp. | | | 1,419 | | | | 75,732 | |
BOK Financial Corp. | | | 100 | | | | 7,915 | |
CIT Group, Inc. | | | 5,100 | | | | 231,081 | |
Citigroup, Inc. | | | 32,671 | | | | 2,256,913 | |
Citizens Financial Group, Inc. | | | 6,300 | | | | 222,831 | |
Comerica, Inc. | | | 3,000 | | | | 197,970 | |
Commerce Bancshares, Inc. | | | 319 | | | | 19,347 | |
Cullen/Frost Bankers, Inc. | | | 70 | | | | 6,199 | |
East West Bancorp, Inc. | | | 1,600 | | | | 70,864 | |
| | | | | | | | |
| | | Number of
Shares | | | Value | |
F.N.B. Corp. | | | 23,800 | | | $ | 274,414 | |
Fifth Third Bancorp | | | 4,560 | | | | 124,853 | |
First Horizon National Corp. | | | 3,016 | | | | 48,859 | |
The Goldman Sachs Group, Inc. | | | 3,400 | | | | 704,582 | |
Huntington Bancshares, Inc. | | | 5,871 | | | | 83,779 | |
JPMorgan Chase & Co. | | | 22,837 | | | | 2,687,687 | |
KeyCorp | | | 5,896 | | | | 105,185 | |
M&T Bank Corp. | | | 1,255 | | | | 198,252 | |
Morgan Stanley | | | 17,500 | | | | 746,725 | |
Northern Trust Corp. | | | 630 | | | | 58,792 | |
PacWest Bancorp | | | 2,400 | | | | 87,216 | |
The PNC Financial Services Group, Inc. | | | 1,866 | | | | 261,539 | |
Popular, Inc. | | | 5,300 | | | | 286,624 | |
Prosperity Bancshares, Inc. | | | 900 | | | | 63,567 | |
Regions Financial Corp. | | | 10,560 | | | | 167,059 | |
State Street Corp. | | | 1,500 | | | | 88,785 | |
SunTrust Banks, Inc. | | | 2,900 | | | | 199,520 | |
SVB Financial Group (b) | | | 490 | | | | 102,385 | |
Synovus Financial Corp. | | | 6,471 | | | | 231,403 | |
TCF Financial Corp. | | | 609 | | | | 23,185 | |
Umpqua Holdings Corp. | | | 3,300 | | | | 54,318 | |
US Bancorp | | | 4,290 | | | | 237,409 | |
Webster Financial Corp. | | | 600 | | | | 28,122 | |
Wells Fargo & Co. | | | 15,353 | | | | 774,405 | |
Western Alliance Bancorp | | | 4,000 | | | | 184,320 | |
Zions Bancorp NA | | | 350 | | | | 15,582 | |
| | | | | | | | |
| | | | | | | 13,309,745 | |
| | | | | | | | |
| Diversified Financial Services — 4.7% | |
Air Lease Corp. | | | 800 | | | | 33,456 | |
Alliance Data Systems Corp. | | | 500 | | | | 64,065 | |
Ally Financial, Inc. | | | 6,900 | | | | 228,804 | |
American Express Co. | | | 2,920 | | | | 345,378 | |
Ameriprise Financial, Inc. | | | 3,290 | | | | 483,959 | |
BGC Partners, Inc. Class A | | | 13,800 | | | | 75,900 | |
BlackRock, Inc. | | | 510 | | | | 227,276 | |
Capital One Financial Corp. | | | 3,150 | | | | 286,587 | |
The Charles Schwab Corp. | | | 3,100 | | | | 129,673 | |
CME Group, Inc. | | | 870 | | | | 183,866 | |
Credit Acceptance Corp. (b) | | | 350 | | | | 161,458 | |
Discover Financial Services | | | 4,200 | | | | 340,578 | |
E*TRADE Financial Corp. | | | 4,400 | | | | 192,236 | |
Eaton Vance Corp. | | | 3,700 | | | | 166,241 | |
Evercore, Inc. Class A | | | 800 | | | | 64,080 | |
Franklin Resources, Inc. | | | 2,600 | | | | 75,036 | |
Intercontinental Exchange, Inc. | | | 335 | | | | 30,910 | |
Invesco Ltd. | | | 7,700 | | | | 130,438 | |
Janus Henderson Group PLC | | | 5,700 | | | | 128,022 | |
Lazard Ltd. Class A | | | 3,800 | | | | 133,000 | |
Legg Mason, Inc. | | | 6,300 | | | | 240,597 | |
Navient Corp. | | | 25,100 | | | | 321,280 | |
OneMain Holdings, Inc. | | | 2,900 | | | | 106,372 | |
The accompanying notes are an integral part of the financial statements.
139
MassMutual Premier Disciplined Value Fund – Portfolio of Investments(Continued)
| | | | | | | | |
| | | Number of
Shares | | | Value | |
Raymond James Financial, Inc. | | | 1,700 | | | $ | 140,182 | |
Santander Consumer USA Holdings, Inc. | | | 4,200 | | | | 107,142 | |
SEI Investments Co. | | | 1,500 | | | | 88,883 | |
SLM Corp. | | | 12,300 | | | | 108,548 | |
Synchrony Financial | | | 6,100 | | | | 207,949 | |
T. Rowe Price Group, Inc. | | | 2,800 | | | | 319,900 | |
TD Ameritrade Holding Corp. | | | 1,700 | | | | 79,390 | |
The Western Union Co. | | | 400 | | | | 9,268 | |
| | | | | | | | |
| | | | | | | 5,210,474 | |
| | | | | | | | |
| Insurance — 8.6% | |
Aflac, Inc. | | | 5,600 | | | | 292,992 | |
Alleghany Corp. (b) | | | 75 | | | | 59,832 | |
The Allstate Corp. | | | 1,980 | | | | 215,186 | |
American Financial Group, Inc. | | | 250 | | | | 26,963 | |
American International Group, Inc. | | | 8,302 | | | | 462,421 | |
American National Insurance Co. | | | 450 | | | | 55,679 | |
Arch Capital Group Ltd. (b) | | | 3,400 | | | | 142,732 | |
Arthur J Gallagher & Co. | | | 400 | | | | 35,828 | |
Assurant, Inc. | | | 50 | | | | 6,291 | |
Assured Guaranty Ltd. | | | 1,600 | | | | 71,136 | |
Athene Holding Ltd. Class A (b) | | | 1,800 | | | | 75,708 | |
AXA Equitable Holdings, Inc. | | | 10,900 | | | | 241,544 | |
Axis Capital Holdings Ltd. | | | 400 | | | | 26,688 | |
Berkshire Hathaway, Inc. Class B (b) | | | 12,890 | | | | 2,681,378 | |
Brighthouse Financial, Inc. (b) | | | 2,430 | | | | 98,342 | |
Chubb Ltd. | | | 751 | | | | 121,241 | |
Cincinnati Financial Corp. | | | 1,160 | | | | 135,337 | |
CNA Financial Corp. | | | 400 | | | | 19,700 | |
Erie Indemnity Co. Class A | | | 350 | | | | 64,978 | |
Everest Re Group Ltd. | | | 770 | | | | 204,889 | |
Fidelity National Financial, Inc. | | | 2,557 | | | | 113,556 | |
First American Financial Corp. | | | 2,700 | | | | 159,327 | |
The Hanover Insurance Group, Inc. | | | 430 | | | | 58,282 | |
The Hartford Financial Services Group, Inc. | | | 2,690 | | | | 163,041 | |
Kemper Corp. | | | 400 | | | | 31,180 | |
Lincoln National Corp. | | | 3,398 | | | | 204,967 | |
Loews Corp. | | | 4,220 | | | | 217,246 | |
Markel Corp. (b) | | | 5 | | | | 5,910 | |
Marsh & McLennan Cos., Inc. | | | 500 | | | | 50,025 | |
Mercury General Corp. | | | 590 | | | | 32,969 | |
MetLife, Inc. | | | 11,440 | | | | 539,510 | |
MGIC Investment Corp. | | | 27,800 | | | | 349,724 | |
Old Republic International Corp. | | | 7,200 | | | | 169,704 | |
Primerica, Inc. | | | 580 | | | | 73,793 | |
Principal Financial Group, Inc. | | | 3,200 | | | | 182,848 | |
The Progressive Corp. | | | 6,700 | | | | 517,575 | |
Prudential Financial, Inc. | | | 5,160 | | | | 464,142 | |
Reinsurance Group of America, Inc. Class A | | | 770 | | | | 123,108 | |
RenaissanceRe Holdings Ltd. | | | 510 | | | | 98,659 | |
| | | | | | | | |
| | | Number of
Shares | | | Value | |
The Travelers Cos., Inc. | | | 1,969 | | | $ | 292,771 | |
Unum Group | | | 2,600 | | | | 77,272 | |
Voya Financial, Inc. | | | 8,800 | | | | 479,072 | |
W.R. Berkley Corp. | | | 450 | | | | 32,504 | |
White Mountains Insurance Group Ltd. | | | 53 | | | | 57,240 | |
| | | | | | | | |
| | | | | | | 9,533,290 | |
| | | | | | | | |
| Real Estate — 0.2% | |
CBRE Group, Inc. Class A (b) | | | 2,700 | | | | 143,127 | |
Jones Lang LaSalle, Inc. | | | 670 | | | | 93,170 | |
| | | | | | | | |
| | | | | | | 236,297 | |
| | | | | | | | |
| Real Estate Investment Trusts (REITS) — 4.6% | |
AGNC Investment Corp. | | | 3,400 | | | | 54,706 | |
Alexandria Real Estate Equities, Inc. | | | 20 | | | | 3,081 | |
American Campus Communities, Inc. | | | 100 | | | | 4,808 | |
Annaly Capital Management, Inc. | | | 4,260 | | | | 37,488 | |
Apartment Investment & Management Co. Class A | | | 899 | | | | 46,874 | |
Apple Hospitality REIT, Inc. | | | 4,700 | | | | 77,926 | |
AvalonBay Communities, Inc. | | | 324 | | | | 69,767 | |
Boston Properties, Inc. | | | 1,460 | | | | 189,304 | |
Brixmor Property Group, Inc. | | | 3,300 | | | | 66,957 | |
Camden Property Trust | | | 100 | | | | 11,101 | |
Chimera Investment Corp. | | | 16,620 | | | | 325,087 | |
Columbia Property Trust, Inc. | | | 1,900 | | | | 40,185 | |
CubeSmart | | | 200 | | | | 6,980 | |
Digital Realty Trust, Inc. | | | 30 | | | | 3,894 | |
Douglas Emmett, Inc. | | | 1,200 | | | | 51,396 | |
Duke Realty Corp. | | | 2,400 | | | | 81,528 | |
EPR Properties | | | 500 | | | | 38,430 | |
Equity Commonwealth | | | 1,567 | | | | 53,670 | |
Equity Residential | | | 2,700 | | | | 232,902 | |
Essex Property Trust, Inc. | | | 113 | | | | 36,911 | |
Extra Space Storage, Inc. | | | 370 | | | | 43,223 | |
Federal Realty Investment Trust | | | 720 | | | | 98,021 | |
Gaming and Leisure Properties, Inc. | | | 1,000 | | | | 38,240 | |
HCP, Inc. | | | 2,700 | | | | 96,201 | |
Highwoods Properties, Inc. | | | 800 | | | | 35,952 | |
Host Hotels & Resorts, Inc. | | | 7,703 | | | | 133,185 | |
Hudson Pacific Properties, Inc. | | | 300 | | | | 10,038 | |
Iron Mountain, Inc. | | | 4,400 | | | | 142,516 | |
JBG SMITH Properties | | | 19 | | | | 745 | |
Kilroy Realty Corp. | | | 100 | | | | 7,789 | |
Kimco Realty Corp. | | | 4,900 | | | | 102,312 | |
Liberty Property Trust | | | 2,170 | | | | 111,386 | |
Life Storage, Inc. | | | 400 | | | | 42,164 | |
The Macerich Co. | | | 882 | | | | 27,862 | |
Medical Properties Trust, Inc. | | | 5,900 | | | | 115,404 | |
MFA Financial, Inc. | | | 10,100 | | | | 74,336 | |
Mid-America Apartment Communities, Inc. | | | 183 | | | | 23,792 | |
National Retail Properties, Inc. | | | 300 | | | | 16,920 | |
The accompanying notes are an integral part of the financial statements.
140
MassMutual Premier Disciplined Value Fund – Portfolio of Investments(Continued)
| | | | | | | | |
| | | Number of
Shares | | | Value | |
New Residential Investment Corp. | | | 5,800 | | | $ | 90,944 | |
Omega Healthcare Investors, Inc. | | | 2,000 | | | | 83,580 | |
Outfront Media, Inc. | | | 8,800 | | | | 244,464 | |
Paramount Group, Inc. | | | 10,600 | | | | 141,510 | |
Park Hotels & Resorts, Inc. | | | 2,900 | | | | 72,413 | |
Prologis, Inc. | | | 3,393 | | | | 289,151 | |
Public Storage | | | 510 | | | | 125,088 | |
Realty Income Corp. | | | 2,200 | | | | 168,696 | |
Retail Properties of America, Inc. Class A | | | 3,300 | | | | 40,656 | |
Service Properties Trust | | | 3,140 | | | | 80,981 | |
Simon Property Group, Inc. | | | 1,920 | | | | 298,848 | |
SL Green Realty Corp. | | | 180 | | | | 14,715 | |
Spirit Realty Capital, Inc. | | | 3,540 | | | | 169,424 | |
Starwood Property Trust, Inc. | | | 1,300 | | | | 31,486 | |
STORE Capital Corp. | | | 500 | | | | 18,705 | |
Sun Communities, Inc. | | | 100 | | | | 14,845 | |
Two Harbors Investment Corp. | | | 3,450 | | | | 45,299 | |
UDR, Inc. | | | 400 | | | | 19,392 | |
Ventas, Inc. | | | 2,200 | | | | 160,666 | |
VEREIT, Inc. | | | 14,400 | | | | 140,832 | |
VICI Properties, Inc. | | | 4,200 | | | | 95,130 | |
Vornado Realty Trust | | | 38 | | | | 2,419 | |
Weingarten Realty Investors | | | 3,100 | | | | 90,303 | |
Welltower, Inc. | | | 1,100 | | | | 99,715 | |
WP Carey, Inc. | | | 800 | | | | 71,600 | |
| | | | | | | | |
| | | | | | | 5,163,943 | |
| | | | | | | | |
| Savings & Loans — 0.3% | |
New York Community Bancorp, Inc. | | | 7,690 | | | | 96,510 | |
People’s United Financial, Inc. | | | 600 | | | | 9,381 | |
Sterling Bancorp | | | 10,500 | | | | 210,630 | |
| | | | | | | | |
| | | | | | | 316,521 | |
| | | | | | | | |
| | | | | | | 33,770,270 | |
| | | | | | | | |
| Industrial — 9.3% | |
| Aerospace & Defense — 1.0% | |
Arconic, Inc. | | | 7,200 | | | | 187,200 | |
L3 Harris Technologies, Inc. | | | 2,767 | | | | 577,307 | |
Raytheon Co. | | | 370 | | | | 72,590 | |
Spirit AeroSystems Holdings, Inc. Class A | | | 500 | | | | 41,120 | |
United Technologies Corp. | | | 1,650 | | | | 225,258 | |
| | | | | | | | |
| | | | | | | 1,103,475 | |
| | | | | | | | |
| Building Materials — 0.5% | |
Fortune Brands Home & Security, Inc. | | | 200 | | | | 10,940 | |
Johnson Controls International PLC | | | 3,329 | | | | 146,110 | |
Lennox International, Inc. | | | 770 | | | | 187,087 | |
Masco Corp. | | | 3,000 | | | | 125,040 | |
MDU Resources Group, Inc. | | | 2,400 | | | | 67,656 | |
Owens Corning | | | 200 | | | | 12,640 | |
| | | | | | | | |
| | | | | | | 549,473 | |
| | | | | | | | |
| | | | | | | | |
| | | Number of
Shares | | | Value | |
| Electrical Components & Equipment — 0.4% | |
Acuity Brands, Inc. | | | 250 | | | $ | 33,697 | |
AMETEK, Inc. | | | 300 | | | | 27,546 | |
Emerson Electric Co. | | | 2,300 | | | | 153,778 | |
Hubbell, Inc. Class B | | | 1,820 | | | | 239,148 | |
| | | | | | | | |
| | | | | | | 454,169 | |
| | | | | | | | |
| Electronics — 1.9% | |
ADT, Inc. (a) | | | 19,100 | | | | 119,757 | |
Agilent Technologies, Inc. | | | 1,100 | | | | 84,293 | |
Allegion PLC | | | 910 | | | | 94,321 | |
Arrow Electronics, Inc. (b) | | | 500 | | | | 37,290 | |
Avnet, Inc. | | | 1,700 | | | | 75,624 | |
FLIR Systems, Inc. | | | 500 | | | | 26,295 | |
Fortive Corp. | | | 1,300 | | | | 89,128 | |
Garmin Ltd. | | | 1,400 | | | | 118,566 | |
Gentex Corp. | | | 9,600 | | | | 264,336 | |
Honeywell International, Inc. | | | 4,400 | | | | 744,480 | |
Jabil, Inc. | | | 8,000 | | | | 286,160 | |
National Instruments Corp. | | | 1,500 | | | | 62,985 | |
nVent Electric PLC | | | 1,519 | | | | 33,479 | |
PerkinElmer, Inc. | | | 10 | | | | 852 | |
Trimble, Inc. (b) | | | 2,200 | | | | 85,382 | |
| | | | | | | | |
| | | | | | | 2,122,948 | |
| | | | | | | | |
| Engineering & Construction — 0.2% | |
AECOM (b) | | | 2,311 | | | | 86,801 | |
Fluor Corp. | | | 800 | | | | 15,304 | |
frontdoor, Inc. (b) | | | 3,000 | | | | 145,710 | |
Jacobs Engineering Group, Inc. | | | 100 | | | | 9,150 | |
| | | | | | | | |
| | | | | | | 256,965 | |
| | | | | | | | |
| Environmental Controls — 0.3% | |
Clean Harbors, Inc. (b) | | | 600 | | | | 46,320 | |
Pentair PLC | | | 1,019 | | | | 38,518 | |
Republic Services, Inc. | | | 290 | | | | 25,100 | |
Waste Management, Inc. | | | 2,170 | | | | 249,550 | |
| | | | | | | | |
| | | | | | | 359,488 | |
| | | | | | | | |
| Hand & Machine Tools — 0.3% | |
Regal Beloit Corp. | | | 600 | | | | 43,710 | |
Snap-on, Inc. | | | 360 | | | | 56,354 | |
Stanley Black & Decker, Inc. | | | 1,285 | | | | 185,567 | |
| | | | | | | | |
| | | | | | | 285,631 | |
| | | | | | | | |
| Machinery – Construction & Mining — 0.3% | |
Caterpillar, Inc. | | | 2,350 | | | | 296,829 | |
Oshkosh Corp. | | | 300 | | | | 22,740 | |
| | | | | | | | |
| | | | | | | 319,569 | |
| | | | | | | | |
| Machinery – Diversified — 1.2% | |
AGCO Corp. | | | 2,966 | | | | 224,526 | |
Crane Co. | | | 120 | | | | 9,676 | |
Cummins, Inc. | | | 2,570 | | | | 418,062 | |
Curtiss-Wright Corp. | | | 220 | | | | 28,461 | |
Dover Corp. | | | 2,900 | | | | 288,724 | |
The accompanying notes are an integral part of the financial statements.
141
MassMutual Premier Disciplined Value Fund – Portfolio of Investments(Continued)
| | | | | | | | |
| | | Number of
Shares | | | Value | |
Flowserve Corp. | | | 600 | | | $ | 28,026 | |
Gardner Denver Holdings, Inc. (b) | | | 1,800 | | | | 50,922 | |
GrafTech International Ltd. | | | 1,200 | | | | 15,360 | |
IDEX Corp. | | | 810 | | | | 132,743 | |
Roper Technologies, Inc. | | | 530 | | | | 188,998 | |
| | | | | | | | |
| | | | | | | 1,385,498 | |
| | | | | | | | |
| Manufacturing — 0.4% | |
3M Co. | | | 2,340 | | | | 384,696 | |
AptarGroup, Inc. | | | 600 | | | | 71,070 | |
| | | | | | | | |
| | | | | | | 455,766 | |
| | | | | | | | |
| Metal Fabricate & Hardware — 0.1% | |
The Timken Co. | | | 1,700 | | | | 73,967 | |
| | | | | | | | |
| Miscellaneous – Manufacturing — 0.8% | |
Carlisle Cos., Inc. | | | 60 | | | | 8,732 | |
Eaton Corp. PLC | | | 3,072 | | | | 255,437 | |
General Electric Co. | | | 22,490 | | | | 201,061 | |
Hexcel Corp. | | | 1,100 | | | | 90,343 | |
Ingersoll-Rand PLC | | | 240 | | | | 29,570 | |
ITT, Inc. | | | 400 | | | | 24,476 | |
Parker-Hannifin Corp. | | | 1,200 | | | | 216,732 | |
Textron, Inc. | | | 200 | | | | 9,792 | |
Trinity Industries, Inc. | | | 800 | | | | 15,744 | |
| | | | | | | | |
| | | | | | | 851,887 | |
| | | | | | | | |
| Packaging & Containers — 0.4% | |
Ardagh Group SA | | | 400 | | | | 6,272 | |
Berry Global Group, Inc. (b) | | | 2,100 | | | | 82,467 | |
Crown Holdings, Inc. (b) | | | 600 | | | | 39,636 | |
Graphic Packaging Holding Co. | | | 2,900 | | | | 42,775 | |
Owens-Illinois, Inc. | | | 3,000 | | | | 30,810 | |
Packaging Corp. of America | | | 300 | | | | 31,830 | |
Silgan Holdings, Inc. | | | 5,800 | | | | 174,203 | |
Sonoco Products Co. | | | 800 | | | | 46,568 | |
WestRock Co. | | | 1,440 | | | | 52,488 | |
| | | | | | | | |
| | | | | | | 507,049 | |
| | | | | | | | |
| Shipbuilding — 0.2% | |
Huntington Ingalls Industries, Inc. | | | 950 | | | | 201,201 | |
| | | | | | | | |
| Transportation — 1.3% | |
C.H. Robinson Worldwide, Inc. | | | 700 | | | | 59,346 | |
CSX Corp. | | | 4,100 | | | | 284,007 | |
Expeditors International of Washington, Inc. | | | 600 | | | | 44,574 | |
FedEx Corp. | | | 900 | | | | 131,013 | |
Landstar System, Inc. | | | 1,010 | | | | 113,706 | |
Norfolk Southern Corp. | | | 2,540 | | | | 456,336 | |
Ryder System, Inc. | | | 790 | | | | 40,898 | |
XPO Logistics, Inc. (b) | | | 4,000 | | | | 286,280 | |
| | | | | | | | |
| | | | | | | 1,416,160 | |
| | | | | | | | |
| | | | | | | 10,343,246 | |
| | | | | | | | |
| | | | | | | | |
| | | Number of
Shares | | | Value | |
| Technology — 6.1% | |
| Computers — 1.9% | |
Amdocs Ltd. | | | 3,100 | | | $ | 204,941 | |
CACI International, Inc. Class A (b) | | | 210 | | | | 48,565 | |
Cognizant Technology Solutions Corp. Class A | | | 2,700 | | | | 162,715 | |
Dell Technologies C (b) | | | 6,693 | | | | 347,099 | |
DXC Technology Co. | | | 2,700 | | | | 79,650 | |
Hewlett Packard Enterprise Co. | | | 16,800 | | | | 254,856 | |
HP, Inc. | | | 18,300 | | | | 346,236 | |
International Business Machines Corp. | | | 3,590 | | | | 522,058 | |
Leidos Holdings, Inc. | | | 1,650 | | | | 141,702 | |
Western Digital Corp. | | | 36 | | | | 2,147 | |
| | | | | | | | |
| | | | | | | 2,109,969 | |
| | | | | | | | |
| Office & Business Equipment — 0.2% | |
Xerox Holdings Corp. (b) | | | 7,114 | | | | 212,780 | |
| | | | | | | | |
| Semiconductors — 3.5% | |
Analog Devices, Inc. | | | 1,700 | | | | 189,941 | |
Applied Materials, Inc. | | | 5,500 | | | | 274,450 | |
Cypress Semiconductor Corp. | | | 1,700 | | | | 39,678 | |
Intel Corp. | | | 41,200 | | | | 2,123,036 | |
Lam Research Corp. | | | 1,840 | | | | 425,242 | |
Maxim Integrated Products, Inc. | | | 1,700 | | | | 98,447 | |
Micron Technology, Inc. (b) | | | 14,400 | | | | 617,040 | |
ON Semiconductor Corp. (b) | | | 2,700 | | | | 51,867 | |
Qorvo, Inc. (b) | | | 1,000 | | | | 74,140 | |
Skyworks Solutions, Inc. | | | 400 | | | | 31,700 | |
| | | | | | | | |
| | | | | | | 3,925,541 | |
| | | | | | | | |
| Software — 0.5% | |
Activision Blizzard, Inc. | | | 2,200 | | | | 116,424 | |
Akamai Technologies, Inc. (b) | | | 600 | | | | 54,828 | |
Autodesk, Inc. (b) | | | 530 | | | | 78,281 | |
Citrix Systems, Inc. | | | 1,100 | | | | 106,172 | |
Electronic Arts, Inc. (b) | | | 800 | | | | 78,256 | |
Fidelity National Information Services, Inc. | | | 430 | | | | 57,087 | |
Nuance Communications, Inc. (b) | | | 600 | | | | 9,786 | |
SS&C Technologies Holdings, Inc | | | 100 | | | | 5,157 | |
Zynga, Inc. Class A (b) | | | 2,700 | | | | 15,714 | |
| | | | | | | | |
| | | | | | | 521,705 | |
| | | | | | | | |
| | | | | | | 6,769,995 | |
| | | | | | | | |
| Utilities — 6.3% | |
| Electric — 6.1% | |
AES Corp. | | | 20,700 | | | | 338,238 | |
Alliant Energy Corp. | | | 1,000 | | | | 53,930 | |
Ameren Corp. | | | 2,360 | | | | 188,918 | |
American Electric Power Co., Inc. | | | 4,230 | | | | 396,309 | |
Avangrid, Inc. | | | 900 | | | | 47,025 | |
CenterPoint Energy, Inc. | | | 2,000 | | | | 60,360 | |
CMS Energy Corp. | | | 3,100 | | | | 198,245 | |
Consolidated Edison, Inc. | | | 1,760 | | | | 166,267 | |
The accompanying notes are an integral part of the financial statements.
142
MassMutual Premier Disciplined Value Fund – Portfolio of Investments(Continued)
| | | | | | | | |
| | | Number of
Shares | | | Value | |
Dominion Energy, Inc. | | | 1,185 | | | $ | 96,032 | |
DTE Energy Co. | | | 2,260 | | | | 300,490 | |
Duke Energy Corp. | | | 7,714 | | | | 739,464 | |
Edison International | | | 1,180 | | | | 88,996 | |
Entergy Corp. | | | 1,580 | | | | 185,429 | |
Evergy, Inc. | | | 2,360 | | | | 157,082 | |
Eversource Energy | | | 3,481 | | | | 297,521 | |
Exelon Corp. | | | 3,775 | | | | 182,370 | |
FirstEnergy Corp. | | | 4,627 | | | | 223,160 | |
Hawaiian Electric Industries, Inc. | | | 2,200 | | | | 100,342 | |
IDACORP, Inc. | | | 400 | | | | 45,068 | |
NextEra Energy, Inc. | | | 582 | | | | 135,600 | |
NRG Energy, Inc. | | | 3,500 | | | | 138,600 | |
OGE Energy Corp. | | | 600 | | | | 27,228 | |
PG&E Corp. (b) | | | 4,200 | | | | 42,000 | |
Pinnacle West Capital Corp. | | | 1,260 | | | | 122,308 | |
PPL Corp. | | | 15,600 | | | | 491,244 | |
Public Service Enterprise Group, Inc. | | | 5,400 | | | | 335,232 | |
Sempra Energy | | | 2,380 | | | | 351,312 | |
The Southern Co. | | | 7,350 | | | | 454,009 | |
Vistra Energy Corp. | | | 12,600 | | | | 336,798 | |
WEC Energy Group, Inc. | | | 1,120 | | | | 106,512 | |
Xcel Energy, Inc. | | | 5,720 | | | | 371,171 | |
| | | | | | | | |
| | | | | | | 6,777,260 | |
| | | | | | | | |
| Gas — 0.2% | |
Atmos Energy Corp. | | | 250 | | | | 28,473 | |
National Fuel Gas Co. | | | 2,250 | | | | 105,570 | |
NiSource, Inc. | | | 490 | | | | 14,661 | |
UGI Corp. | | | 435 | | | | 21,867 | |
| | | | | | | | |
| | | | | | | 170,571 | |
| | | | | | | | |
| Water — 0.0% | |
American Water Works Co., Inc. | | | 180 | | | | 22,361 | |
Aqua America, Inc. | | | 25 | | | | 1,121 | |
| | | | | | | | |
| | | | | | | 23,482 | |
| | | | | | | | |
| | | | | | | 6,971,313 | |
| | | | | | | | |
| | |
TOTAL COMMON STOCK
(Cost $108,074,608) | | | | | | | 110,861,371 | |
| | | | | |
| | |
TOTAL EQUITIES
(Cost $108,074,608) | | | | | | | 110,861,371 | |
| | | | | |
|
| MUTUAL FUNDS — 0.5% | |
| Diversified Financial Services — 0.5% | |
State Street Navigator Securities Lending Prime Portfolio (c) | | | 512,349 | | | | 512,349 | |
| | | | | | | | |
| | |
TOTAL MUTUAL FUNDS
(Cost $512,349) | | | | | | | 512,349 | |
| | | | | |
| |
TOTAL LONG-TERM INVESTMENTS
(Cost $108,586,957) | | | | 111,373,720 | |
| | | | | |
| | | | | | | | |
| | | Principal
Amount | | | Value | |
| SHORT-TERM INVESTMENTS — 0.2% | |
| Repurchase Agreement — 0.2% | |
Fixed Income Clearing Corp., Repurchase Agreement, dated 9/30/19, 0.950%, due 10/01/19 (d) | | $ | 202,717 | | | $ | 202,717 | |
| | | | | | | | |
| | |
TOTAL SHORT-TERM INVESTMENTS
(Cost $202,717) | | | | | | | 202,717 | |
| | | | | |
| | |
TOTAL INVESTMENTS — 100.5%
(Cost $108,789,674) (e) | | | | | | | 111,576,437 | |
| | |
| Other Assets/(Liabilities) — (0.5)% | | | | | | | (557,170 | ) |
| | | | | |
| | |
| NET ASSETS — 100.0% | | | | | | $ | 111,019,267 | |
| | | | | |
Notes to Portfolio of Investments
Percentages are stated as a percent of net assets.
| (a) | Denotes all or a portion of security on loan. The total value of securities on loan as of September 30, 2019, was $495,579 or 0.45% of net assets. Total securities on loan may be less than the amounts identified in the Portfolio of Investments.(Note2). |
| (b) | Non-income producing security. |
| (c) | Represents investment of security lending collateral.(Note 2). |
| (d) | Maturity value of $202,722. Collateralized by U.S. Government Agency obligations with a rate of 2.000%, maturity date of 2/15/23, and an aggregate market value, including accrued interest, of $208,315. |
| (e) | See Note 6 for aggregate cost for federal tax purposes. |
The accompanying notes are an integral part of the financial statements.
143
MassMutual Premier Main Street Fund – Portfolio of Investments
September 30, 2019
| | | | | | | | |
| | | Number of
Shares | | | Value | |
| EQUITIES — 99.2% | |
|
| COMMON STOCK — 99.2% | |
| Basic Materials — 0.6% | |
| Chemicals — 0.6% | |
Ecolab, Inc. | | | 3,560 | | | $ | 705,022 | |
| | | | | | | | |
| Communications — 14.1% | |
| Internet — 9.3% | |
Amazon.com, Inc. (a) | | | 2,425 | | | | 4,209,582 | |
Booking Holdings, Inc. (a) | | | 1,380 | | | | 2,708,402 | |
Facebook, Inc. Class A (a) | | | 23,016 | | | | 4,098,689 | |
| | | | | | | | |
| | | | | | | 11,016,673 | |
| | | | | | | | |
| Telecommunications — 4.8% | |
Motorola Solutions, Inc. | | | 19,286 | | | | 3,286,527 | |
Verizon Communications, Inc. | | | 40,280 | | | | 2,431,301 | |
| | | | | | | | |
| | | | | | | 5,717,828 | |
| | | | | | | | |
| | | | | | | 16,734,501 | |
| | | | | | | | |
| Consumer, Cyclical — 8.8% | |
| Auto Manufacturers — 0.7% | |
General Motors Co. | | | 21,070 | | | | 789,704 | |
| | | | | | | | |
| Distribution & Wholesale — 1.1% | |
Fastenal Co. | | | 39,700 | | | | 1,296,999 | |
| | | | | | | | |
| Home Builders — 0.6% | |
D.R. Horton, Inc. | | | 14,450 | | | | 761,659 | |
| | | | | | | | |
| Retail — 6.4% | |
Best Buy Co., Inc. | | | 20,410 | | | | 1,408,086 | |
The Home Depot, Inc. | | | 12,650 | | | | 2,935,053 | |
O’Reilly Automotive, Inc. (a) | | | 2,620 | | | | 1,044,096 | |
Starbucks Corp. | | | 16,809 | | | | 1,486,252 | |
Ulta Salon Cosmetics & Fragrance, Inc. (a) | | | 2,690 | | | | 674,248 | |
| | | | | | | | |
| | | | | | | 7,547,735 | |
| | | | | | | | |
| | | | | | | 10,396,097 | |
| | | | | | | | |
| Consumer,Non-cyclical — 25.2% | |
| Beverages — 1.9% | |
Anheuser-Busch InBev SA/NV | | | 12,564 | | | | 1,196,093 | |
Constellation Brands, Inc. Class A | | | 5,220 | | | | 1,082,001 | |
| | | | | | | | |
| | | | | | | 2,278,094 | |
| | | | | | | | |
| Biotechnology — 0.8% | |
Gilead Sciences, Inc. | | | 14,270 | | | | 904,433 | |
| | | | | | | | |
| Commercial Services — 2.6% | |
Cintas Corp. | | | 2,382 | | | | 638,614 | |
Nielsen Holdings PLC | | | 9,591 | | | | 203,809 | |
S&P Global, Inc. | | | 9,286 | | | | 2,274,884 | |
| | | | | | | | |
| | | | | | | 3,117,307 | |
| | | | | | | | |
| Cosmetics & Personal Care — 4.1% | |
The Procter & Gamble Co. | | | 38,570 | | | | 4,797,337 | |
| | | | | | | | |
| | | | | | | | |
| | | Number of
Shares | | | Value | |
| Health Care – Products — 4.0% | |
Boston Scientific Corp. (a) | | | 18,804 | | | $ | 765,135 | |
Thermo Fisher Scientific, Inc. | | | 6,270 | | | | 1,826,263 | |
Zimmer Biomet Holdings, Inc. | | | 15,950 | | | | 2,189,456 | |
| | | | | | | | |
| | | | | | | 4,780,854 | |
| | | | | | | | |
| Health Care – Services — 3.8% | |
Laboratory Corp. of America Holdings (a) | | | 3,150 | | | | 529,200 | |
UnitedHealth Group, Inc. | | | 18,199 | | | | 3,955,007 | |
| | | | | | | | |
| | | | | | | 4,484,207 | |
| | | | | | | | |
| Household Products & Wares — 1.4% | |
Church & Dwight Co., Inc. | | | 21,800 | | | | 1,640,232 | |
| | | | | | | | |
| Pharmaceuticals — 6.6% | |
AstraZeneca PLC Sponsored ADR | | | 44,370 | | | | 1,977,571 | |
Elanco Animal Health, Inc. (a) | | | 75,880 | | | | 2,017,649 | |
Merck & Co., Inc. | | | 45,451 | | | | 3,826,065 | |
| | | | | | | | |
| | | | | | | 7,821,285 | |
| | | | | | | | |
| | | | | | | 29,823,749 | |
| | | | | | | | |
| Energy — 5.3% | |
| Oil & Gas — 2.6% | |
Suncor Energy, Inc. | | | 97,998 | | | | 3,094,777 | |
| | | | | | | | |
| Oil & Gas Services — 1.1% | |
Schlumberger Ltd. | | | 40,078 | | | | 1,369,465 | |
| | | | | | | | |
| Pipelines — 1.6% | |
Magellan Midstream Partners LP (b) | | | 27,939 | | | | 1,851,518 | |
| | | | | | | | |
| | | | | | | 6,315,760 | |
| | | | | | | | |
| Financial — 22.5% | |
| Banks — 6.4% | |
Danske Bank A/S | | | 52,451 | | | | 730,204 | |
JP Morgan Chase & Co. | | | 48,480 | | | | 5,705,611 | |
SVB Financial Group (a) | | | 5,680 | | | | 1,186,836 | |
| | | | | | | | |
| | | | | | | 7,622,651 | |
| | | | | | | | |
| Diversified Financial Services — 5.8% | |
Capital One Financial Corp. | | | 33,453 | | | | 3,043,554 | |
Intercontinental Exchange, Inc. | | | 20,952 | | | | 1,933,241 | |
Mastercard, Inc. Class A | | | 5,849 | | | | 1,588,413 | |
Tradeweb Markets, Inc. Class A | | | 8,897 | | | | 329,011 | |
| | | | | | | | |
| | | | | | | 6,894,219 | |
| | | | | | | | |
| Insurance — 6.9% | |
AXA Equitable Holdings, Inc. | | | 108,115 | | | | 2,395,829 | |
Berkshire Hathaway, Inc. Class B (a) | | | 19,040 | | | | 3,960,701 | |
The Progressive Corp. | | | 23,552 | | | | 1,819,392 | |
| | | | | | | | |
| | | | | | | 8,175,922 | |
| | | | | | | | |
| Real Estate Investment Trusts (REITS) — 3.4% | |
Prologis, Inc. | | | 46,437 | | | | 3,957,361 | |
| | | | | | | | |
| | | | | | | 26,650,153 | |
| | | | | | | | |
The accompanying notes are an integral part of the financial statements.
144
MassMutual Premier Main Street Fund – Portfolio of Investments(Continued)
| | | | | | | | |
| | | Number of
Shares | | | Value | |
| Industrial — 7.4% | |
| Aerospace & Defense — 3.1% | |
Lockheed Martin Corp. | | | 9,503 | | | $ | 3,706,740 | |
| | | | | | | | |
| Electronics — 1.4% | |
Honeywell International, Inc. | | | 9,624 | | | | 1,628,381 | |
| | | | | | | | |
| Environmental Controls — 1.2% | |
Republic Services, Inc. | | | 16,715 | | | | 1,446,683 | |
| | | | | | | | |
| Transportation — 1.7% | |
Union Pacific Corp. | | | 12,061 | | | | 1,953,641 | |
| | | | | | | | |
| | | | | | | 8,735,445 | |
| | | | | | | | |
| Technology — 13.8% | |
| Computers — 1.1% | |
Amdocs Ltd. | | | 19,917 | | | | 1,316,713 | |
| | | | | | | | |
| Semiconductors — 4.3% | |
Applied Materials, Inc. | | | 45,113 | | | | 2,251,139 | |
QUALCOMM, Inc. | | | 25,540 | | | | 1,948,191 | |
Texas Instruments, Inc. | | | 6,680 | | | | 863,323 | |
| | | | | | | | |
| | | | | | | 5,062,653 | |
| | | | | | | | |
| Software — 8.4% | |
Microsoft Corp. | | | 64,124 | | | | 8,915,160 | |
ServiceNow, Inc. (a) | | | 4,100 | | | | 1,040,785 | |
| | | | | | | | |
| | | | | | | 9,955,945 | |
| | | | | | | | |
| | | | | | | 16,335,311 | |
| | | | | | | | |
| Utilities — 1.5% | |
| Electric — 1.5% | |
Duke Energy Corp. | | | 19,070 | | | | 1,828,050 | |
| | | | | | | | |
| | |
TOTAL COMMON STOCK
(Cost $102,735,959) | | | | | | | 117,524,088 | |
| | | | | |
| | |
TOTAL EQUITIES
(Cost $102,735,959) | | | | | | | 117,524,088 | |
| | | | | |
| | |
TOTAL LONG-TERM INVESTMENTS
(Cost $102,735,959) | | | | | | | 117,524,088 | |
| | | | | |
| | |
TOTAL INVESTMENTS — 99.2%
(Cost $102,735,959) (c) | | | | | | | 117,524,088 | |
| | |
| Other Assets/(Liabilities) — 0.8% | | | | | | | 910,614 | |
| | | | | |
| | |
| NET ASSETS — 100.0% | | | | | | $ | 118,434,702 | |
| | | | | |
Abbreviation Legend
| ADR | American Depositary Receipt |
Notes to Portfolio of Investments
Percentages are stated as a percent of net assets.
| (a) | Non-income producing security. |
| (b) | Security is a Master Limited Partnership. |
| (c) | See Note 6 for aggregate cost for federal tax purposes. |
The accompanying notes are an integral part of the financial statements.
145
MassMutual Premier Disciplined Growth Fund – Portfolio of Investments
September 30, 2019
| | | | | | | | |
| | | Number of
Shares | | | Value | |
| EQUITIES — 99.9% | |
|
| COMMON STOCK — 99.9% | |
| Basic Materials — 0.7% | |
| Chemicals — 0.7% | |
Axalta Coating Systems Ltd. (a) | | | 2,500 | | | $ | 75,375 | |
CF Industries Holdings, Inc. | | | 9,700 | | | | 477,240 | |
Ecolab, Inc. | | | 728 | | | | 144,173 | |
Element Solutions, Inc. (a) | | | 46,100 | | | | 469,298 | |
NewMarket Corp. | | | 210 | | | | 99,139 | |
PPG Industries, Inc. | | | 1,310 | | | | 155,248 | |
The Sherwin-Williams Co. | | | 390 | | | | 214,449 | |
Versum Materials, Inc. | | | 1,520 | | | | 80,454 | |
| | | | | | | | |
| | | | | | | 1,715,376 | |
| | | | | | | | |
| Mining — 0.0% | |
Southern Copper Corp. | | | 2,802 | | | | 95,632 | |
| | | | | | | | |
| | | | | | | 1,811,008 | |
| | | | | | | | |
| Communications — 22.1% | |
| Advertising — 0.2% | |
The Interpublic Group of Cos., Inc. | | | 6,800 | | | | 146,608 | |
Omnicom Group, Inc. | | | 3,900 | | | | 305,370 | |
| | | | | | | | |
| | | | | | | 451,978 | |
| | | | | | | | |
| Internet — 17.4% | |
Alphabet, Inc. Class A (a) | | | 6,299 | | | | 7,691,961 | |
Alphabet, Inc. Class C (a) | | | 5,979 | | | | 7,288,401 | |
Amazon.com, Inc. (a) | | | 7,931 | | | | 13,767,502 | |
Booking Holdings, Inc. (a) | | | 1,265 | | | | 2,482,702 | |
CDW Corp. | | | 4,500 | | | | 554,580 | |
eBay, Inc. | | | 16,600 | | | | 647,068 | |
Etsy, Inc. (a) | | | 2,500 | | | | 141,250 | |
Expedia Group, Inc. | | | 2,052 | | | | 275,809 | |
F5 Networks, Inc. (a) | | | 1,450 | | | | 203,609 | |
Facebook, Inc. Class A (a) | | | 49,040 | | | | 8,733,043 | |
GoDaddy, Inc. Class A (a) | | | 1,800 | | | | 118,764 | |
IAC/InterActiveCorp (a) | | | 240 | | | | 52,313 | |
Match Group, Inc. | | | 4,300 | | | | 307,192 | |
Netflix, Inc. (a) | | | 6,567 | | | | 1,757,461 | |
Okta, Inc. (a) | | | 600 | | | | 59,076 | |
Palo Alto Networks, Inc. (a) | | | 240 | | | | 48,919 | |
RingCentral, Inc. Class A (a) | | | 1,100 | | | | 138,226 | |
TripAdvisor, Inc. (a) | | | 2,200 | | | | 85,096 | |
Twitter, Inc. (a) | | | 6,600 | | | | 271,920 | |
VeriSign, Inc. (a) | | | 1,270 | | | | 239,560 | |
Zendesk, Inc. (a) | | | 400 | | | | 29,152 | |
| | | | | | | | |
| | | | | | | 44,893,604 | |
| | | | | | | | |
| Media — 1.9% | |
Altice USA, Inc. Class A (a) | | | 10,000 | | | | 286,800 | |
AMC Networks, Inc. Class A (a) | | | 8,600 | | | | 422,776 | |
CBS Corp. Class B | | | 6,300 | | | | 254,331 | |
Charter Communications, Inc. Class A (a) | | | 140 | | | | 57,697 | |
| | | | | | | | |
| | | Number of
Shares | | | Value | |
Comcast Corp. Class A | | | 61,200 | | | $ | 2,758,896 | |
FactSet Research Systems, Inc. | | | 370 | | | | 89,899 | |
Nexstar Media Group, Inc. Class A | | | 3,630 | | | | 371,385 | |
Sinclair Broadcast Group, Inc. Class A | | | 10,400 | | | | 444,496 | |
Sirius XM Holdings, Inc. (b) | | | 20,300 | | | | 126,976 | |
| | | | | | | | |
| | | | | | | 4,813,256 | |
| | | | | | | | |
| Telecommunications — 2.6% | |
Arista Networks, Inc. (a) | | | 780 | | | | 186,358 | |
Cisco Systems, Inc. | | | 111,900 | | | | 5,528,979 | |
Corning, Inc. | | | 2,900 | | | | 82,708 | |
Motorola Solutions, Inc. | | | 3,000 | | | | 511,230 | |
T-Mobile US, Inc. (a) | | | 4,200 | | | | 330,834 | |
Ubiquiti, Inc. (a) | | | 670 | | | | 79,234 | |
| | | | | | | | |
| | | | | | | 6,719,343 | |
| | | | | | | | |
| | | | | | | 56,878,181 | |
| | | | | | | | |
| Consumer, Cyclical — 9.1% | |
| Airlines — 0.5% | |
Alaska Air Group, Inc. | | | 1,500 | | | | 97,365 | |
Delta Air Lines, Inc. | | | 7,500 | | | | 432,000 | |
Southwest Airlines Co. | | | 6,300 | | | | 340,263 | |
United Airlines Holdings, Inc. (a) | | | 4,600 | | | | 406,686 | |
| | | | | | | | |
| | | | | | | 1,276,314 | |
| | | | | | | | |
| Apparel — 1.0% | |
Capri Holdings Ltd. (a) | | | 2,400 | | | | 79,584 | |
Carter’s, Inc. | | | 100 | | | | 9,121 | |
Hanesbrands, Inc. | | | 8,900 | | | | 136,348 | |
NIKE, Inc. Class B | | | 19,680 | | | | 1,848,346 | |
Skechers U.S.A., Inc. Class A (a) | | | 4,210 | | | | 157,243 | |
VF Corp. | | | 2,800 | | | | 249,172 | |
| | | | | | | | |
| | | | | | | 2,479,814 | |
| | | | | | | | |
| Auto Parts & Equipment — 0.2% | |
Allison Transmission Holdings, Inc. | | | 10,900 | | | | 512,845 | |
Aptiv PLC | | | 300 | | | | 26,226 | |
| | | | | | | | |
| | | | | | | 539,071 | |
| | | | | | | | |
| Distribution & Wholesale — 0.3% | |
Copart, Inc. (a) | | | 3,300 | | | | 265,089 | |
Fastenal Co. | | | 3,600 | | | | 117,612 | |
IAA, Inc. (a) | | | 4,200 | | | | 175,266 | |
KAR Auction Services, Inc. | | | 700 | | | | 17,185 | |
W.W. Grainger, Inc. | | | 200 | | | | 59,430 | |
| | | | | | | | |
| | | | | | | 634,582 | |
| | | | | | | | |
| Entertainment — 0.0% | |
Live Nation Entertainment, Inc. (a) | | | 500 | | | | 33,170 | |
The Madison Square Garden Co. Class A (a) | | | 3 | | | | 791 | |
| | | | | | | | |
| | | | | | | 33,961 | |
| | | | | | | | |
The accompanying notes are an integral part of the financial statements.
146
MassMutual Premier Disciplined Growth Fund – Portfolio of Investments(Continued)
| | | | | | | | |
| | | Number of
Shares | | | Value | |
| Home Builders — 0.3% | |
Lennar Corp. Class A | | | 400 | | | $ | 22,340 | |
NVR, Inc. (a) | | | 180 | | | | 669,123 | |
| | | | | | | | |
| | | | | | | 691,463 | |
| | | | | | | | |
| Home Furnishing — 0.0% | |
Tempur Sealy International, Inc. (a) | | | 1,200 | | | | 92,640 | |
| | | | | | | | |
| Housewares — 0.0% | |
The ScottsMiracle-Gro Co. | | | 800 | | | | 81,456 | |
The Toro Co. | | | 60 | | | | 4,398 | |
| | | | | | | | |
| | | | | | | 85,854 | |
| | | | | | | | |
| Leisure Time — 0.2% | |
Norwegian Cruise Line Holdings Ltd. (a) | | | 7,100 | | | | 367,567 | |
Planet Fitness, Inc. Class A (a) | | | 1,400 | | | | 81,018 | |
Polaris, Inc. | | | 1,500 | | | | 132,015 | |
| | | | | | | | |
| | | | | | | 580,600 | |
| | | | | | | | |
| Lodging — 0.6% | |
Choice Hotels International, Inc. | | | 700 | | | | 62,272 | |
Hilton Worldwide Holdings, Inc. | | | 9,700 | | | | 903,167 | |
Las Vegas Sands Corp. | | | 6,400 | | | | 369,664 | |
Marriott International, Inc. Class A | | | 977 | | | | 121,509 | |
MGM Resorts International | | | 400 | | | | 11,088 | |
Wyndham Hotels & Resorts, Inc. | | | 50 | | | | 2,587 | |
Wynn Resorts Ltd. | | | 750 | | | | 81,540 | |
| | | | | | | | |
| | | | | | | 1,551,827 | |
| | | | | | | | |
| Retail — 5.8% | |
Advance Auto Parts, Inc. | | | 1,660 | | | | 274,564 | |
AutoZone, Inc. (a) | | | 738 | | | | 800,450 | |
Best Buy Co., Inc. | | | 4,000 | | | | 275,960 | |
Burlington Stores, Inc. (a) | | | 10 | | | | 1,998 | |
CarMax, Inc. (a) | | | 1,100 | | | | 96,800 | |
Chipotle Mexican Grill, Inc. (a) | | | 403 | | | | 338,709 | |
Costco Wholesale Corp. | | | 6,350 | | | | 1,829,498 | |
Darden Restaurants, Inc. | | | 2,080 | | | | 245,898 | |
Dollar General Corp. | | | 1,620 | | | | 257,483 | |
Dollar Tree, Inc. (a) | | | 27 | | | | 3,082 | |
Domino’s Pizza, Inc. | | | 20 | | | | 4,892 | |
Dunkin’ Brands Group, Inc. | | | 700 | | | | 55,552 | |
The Home Depot, Inc. | | | 9,580 | | | | 2,222,752 | |
L Brands, Inc. | | | 1,300 | | | | 25,467 | |
Lowe’s Cos., Inc. | | | 5,000 | | | | 549,800 | |
Lululemon Athletica, Inc. (a) | | | 2,450 | | | | 471,698 | |
McDonald’s Corp. | | | 780 | | | | 167,474 | |
Nordstrom, Inc. (b) | | | 4,900 | | | | 164,983 | |
O’Reilly Automotive, Inc. (a) | | | 1,590 | | | | 633,631 | |
Ross Stores, Inc. | | | 6,480 | | | | 711,828 | |
Starbucks Corp. | | | 36,300 | | | | 3,209,646 | |
Target Corp. | | | 5,100 | | | | 545,241 | |
The TJX Cos., Inc. | | | 20,540 | | | | 1,144,900 | |
Tractor Supply Co. | | | 1,530 | | | | 138,373 | |
| | | | | | | | |
| | | Number of
Shares | | | Value | |
The Wendy’s Co. | | | 5,300 | | | $ | 105,894 | |
Williams-Sonoma, Inc. | | | 1,200 | | | | 81,576 | |
Yum China Holdings, Inc. | | | 5,200 | | | | 236,236 | |
Yum! Brands, Inc. | | | 3,670 | | | | 416,288 | |
| | | | | | | | |
| | | | | | | 15,010,673 | |
| | | | | | | | |
| Toys, Games & Hobbies — 0.2% | |
Hasbro, Inc. | | | 3,290 | | | | 390,490 | |
| | | | | | | | |
| | | | | | | 23,367,289 | |
| | | | | | | | |
| Consumer,Non-cyclical — 20.4% | |
| Agriculture — 0.4% | |
Altria Group, Inc. | | | 25,270 | | | | 1,033,543 | |
| | | | | | | | |
| Beverages — 1.7% | |
Brown-Forman Corp. Class A | | | 1,600 | | | | 95,600 | |
Brown-Forman Corp. Class B | | | 1,717 | | | | 107,793 | |
The Coca-Cola Co. | | | 12,160 | | | | 661,991 | |
Monster Beverage Corp. (a) | | | 6,550 | | | | 380,293 | |
PepsiCo, Inc. | | | 22,539 | | | | 3,090,097 | |
| | | | | | | | |
| | | | | | | 4,335,774 | |
| | | | | | | | |
| Biotechnology — 3.3% | |
Alexion Pharmaceuticals, Inc. (a) | | | 3,730 | | | | 365,316 | |
Amgen, Inc. | | | 15,560 | | | | 3,011,016 | |
Biogen, Inc. (a) | | | 2,290 | | | | 533,158 | |
Celgene Corp. (a) | | | 20,000 | | | | 1,986,000 | |
Exelixis, Inc. (a) | | | 25,000 | | | | 442,125 | |
Gilead Sciences, Inc. | | | 6,220 | | | | 394,224 | |
Illumina, Inc. (a) | | | 320 | | | | 97,350 | |
Incyte Corp. (a) | | | 3,200 | | | | 237,536 | |
Ionis Pharmaceuticals, Inc. (a) | | | 1,300 | | | | 77,883 | |
Regeneron Pharmaceuticals, Inc. (a) | | | 1,060 | | | | 294,044 | |
Vertex Pharmaceuticals, Inc. (a) | | | 6,470 | | | | 1,096,147 | |
| | | | | | | | |
| | | | | | | 8,534,799 | |
| | | | | | | | |
| Commercial Services — 3.0% | |
Automatic Data Processing, Inc. | | | 3,040 | | | | 490,717 | |
Booz Allen Hamilton Holding Corp. | | | 6,100 | | | | 433,222 | |
Cintas Corp. | | | 770 | | | | 206,437 | |
CoreLogic, Inc. (a) | | | 500 | | | | 23,135 | |
CoStar Group, Inc. (a) | | | 590 | | | | 349,988 | |
Euronet Worldwide, Inc. (a) | | | 1,340 | | | | 196,042 | |
FleetCor Technologies, Inc. (a) | | | 1,170 | | | | 335,533 | |
Gartner, Inc. (a) | | | 2,480 | | | | 354,615 | |
Global Payments, Inc. | | | 591 | | | | 93,969 | |
H&R Block, Inc. | | | 14,600 | | | | 344,852 | |
IHS Markit Ltd. (a) | | | 2,400 | | | | 160,512 | |
Moody’s Corp. | | | 1,740 | | | | 356,404 | |
Nielsen Holdings PLC | | | 11,900 | | | | 252,875 | |
PayPal Holdings, Inc. (a) | | | 20,370 | | | | 2,110,128 | |
Quanta Services, Inc. | | | 1,200 | | | | 45,360 | |
Robert Half International, Inc. | | | 3,500 | | | | 194,810 | |
Rollins, Inc. | | | 1,500 | | | | 51,105 | |
S&P Global, Inc. | | | 2,170 | | | | 531,607 | |
The accompanying notes are an integral part of the financial statements.
147
MassMutual Premier Disciplined Growth Fund – Portfolio of Investments(Continued)
| | | | | | | | |
| | | Number of
Shares | | | Value | |
Sabre Corp. | | | 3,700 | | | $ | 82,862 | |
Service Corp. International | | | 800 | | | | 38,248 | |
ServiceMaster Global Holdings, Inc. (a) | | | 100 | | | | 5,590 | |
Square, Inc. Class A (a) | | | 100 | | | | 6,195 | |
TransUnion | | | 500 | | | | 40,555 | |
United Rentals, Inc. (a) | | | 3,700 | | | | 461,168 | |
Verisk Analytics, Inc. | | | 2,830 | | | | 447,536 | |
WEX, Inc. (a) | | | 650 | | | | 131,345 | |
| | | | | | | | |
| | | | | | | 7,744,810 | |
| | | | | | | | |
| Cosmetics & Personal Care — 0.2% | |
The Estee Lauder Cos., Inc. Class A | | | 610 | | | | 121,360 | |
The Procter & Gamble Co. | | | 2,580 | | | | 320,900 | |
| | | | | | | | |
| | | | | | | 442,260 | |
| | | | | | | | |
| Foods — 1.1% | |
Campbell Soup Co. | | | 2,600 | | | | 121,992 | |
The Hershey Co. | | | 4,970 | | | | 770,300 | |
Kellogg Co. | | | 2,840 | | | | 182,754 | |
McCormick & Co., Inc. | | | 1,690 | | | | 264,147 | |
Pilgrim’s Pride Corp. (a) | | | 4,500 | | | | 144,203 | |
Post Holdings, Inc. (a) | | | 880 | | | | 93,139 | |
Sprouts Farmers Market, Inc. (a) | | | 20,500 | | | | 396,470 | |
Sysco Corp. | | | 12,100 | | | | 960,740 | |
| | | | | | | | |
| | | | | | | 2,933,745 | |
| | | | | | | | |
| Health Care – Products — 2.3% | |
Abbott Laboratories | | | 12,500 | | | | 1,045,875 | |
ABIOMED, Inc. (a) | | | 400 | | | | 71,156 | |
Baxter International, Inc. | | | 2,620 | | | | 229,171 | |
Becton Dickinson and Co. | | | 13 | | | | 3,288 | |
Boston Scientific Corp. (a) | | | 100 | | | | 4,069 | |
Bruker Corp. | | | 1,800 | | | | 79,074 | |
Edwards Lifesciences Corp. (a) | | | 2,630 | | | | 578,363 | |
Henry Schein, Inc. (a) | | | 3,280 | | | | 208,280 | |
Hill-Rom Holdings, Inc. | | | 720 | | | | 75,766 | |
ICU Medical, Inc. (a) | | | 10 | | | | 1,596 | |
IDEXX Laboratories, Inc. (a) | | | 1,520 | | | | 413,334 | |
Intuitive Surgical, Inc. (a) | | | 1,108 | | | | 598,242 | |
ResMed, Inc. | | | 1,860 | | | | 251,305 | |
Stryker Corp. | | | 3,590 | | | | 776,517 | |
Teleflex, Inc. | | | 190 | | | | 64,552 | |
Thermo Fisher Scientific, Inc. | | | 4,810 | | | | 1,401,009 | |
Varian Medical Systems, Inc. (a) | | | 310 | | | | 36,918 | |
| | | | | | | | |
| | | | | | | 5,838,515 | |
| | | | | | | | |
| Health Care – Services — 1.7% | |
Centene Corp. (a) | | | 6,202 | | | | 268,299 | |
Charles River Laboratories International, Inc. (a) | | | 800 | | | | 105,896 | |
Chemed Corp. | | | 440 | | | | 183,731 | |
Encompass Health Corp. | | | 2,100 | | | | 132,888 | |
HCA Healthcare, Inc. | | | 2,420 | | | | 291,416 | |
Humana, Inc. | | | 480 | | | | 122,722 | |
| | | | | | | | |
| | | Number of
Shares | | | Value | |
IQVIA Holdings, Inc. (a) | | | 40 | | | $ | 5,975 | |
Molina Healthcare, Inc. (a) | | | 1,460 | | | | 160,191 | |
UnitedHealth Group, Inc. | | | 13,760 | | | | 2,990,323 | |
WellCare Health Plans, Inc. (a) | | | 310 | | | | 80,343 | |
| | | | | | | | |
| | | | | | | 4,341,784 | |
| | | | | | | | |
| Household Products & Wares — 0.3% | |
Avery Dennison Corp. | | | 380 | | | | 43,157 | |
Church & Dwight Co., Inc. | | | 2,820 | | | | 212,177 | |
The Clorox Co. | | | 3,180 | | | | 482,946 | |
| | | | | | | | |
| | | | | | | 738,280 | |
| | | | | | | | |
| Pharmaceuticals — 6.4% | |
AbbVie, Inc. | | | 41,883 | | | | 3,171,381 | |
Align Technology, Inc. (a) | | | 1,480 | | | | 267,761 | |
AmerisourceBergen Corp. | | | 5,060 | | | | 416,590 | |
Bristol-Myers Squibb Co. | | | 22,100 | | | | 1,120,691 | |
Cigna Corp. (a) | | | 201 | | | | 30,510 | |
Eli Lilly & Co. | | | 24,380 | | | | 2,726,415 | |
Herbalife Nutrition Ltd. (a) | | | 760 | | | | 28,774 | |
Horizon Therapeutics PLC (a) | | | 4,200 | | | | 114,366 | |
Jazz Pharmaceuticals PLC (a) | | | 2,280 | | | | 292,159 | |
Johnson & Johnson | | | 13,700 | | | | 1,772,506 | |
McKesson Corp. | | | 3,590 | | | | 490,609 | |
Merck & Co., Inc. | | | 59,900 | | | | 5,042,382 | |
PRA Health Sciences, Inc. (a) | | | 1,700 | | | | 168,691 | |
Zoetis, Inc. | | | 8,100 | | | | 1,009,179 | |
| | | | | | | | |
| | | | | | | 16,652,014 | |
| | | | | | | | |
| | | | | | | 52,595,524 | |
| | | | | | | | |
| Energy — 0.2% | |
| Oil & Gas — 0.2% | |
Cabot Oil & Gas Corp. | | | 9,700 | | | | 170,429 | |
Occidental Petroleum Corp. | | | 146 | | | | 6,493 | |
Parsley Energy, Inc. Class A | | | 18,400 | | | | 309,120 | |
Pioneer Natural Resources Co. | | | 600 | | | | 75,462 | |
| | | | | | | | |
| | | | | | | 561,504 | |
| | | | | | | | |
| Pipelines — 0.0% | |
ONEOK, Inc. | | | 1,300 | | | | 95,797 | |
| | | | | | | | |
| | | | | | | 657,301 | |
| | | | | | | | |
| Financial — 8.6% | |
| Banks — 0.1% | |
CIT Group, Inc. | | | 1,700 | | | | 77,027 | |
Comerica, Inc. | | | 900 | | | | 59,391 | |
SVB Financial Group (a) | | | 80 | | | | 16,716 | |
Synovus Financial Corp. | | | 2,200 | | | | 78,672 | |
Western Alliance Bancorp | | | 1,600 | | | | 73,728 | |
| | | | | | | | |
| | | | | | | 305,534 | |
| | | | | | | | |
| Diversified Financial Services — 5.6% | |
Air Lease Corp. | | | 100 | | | | 4,182 | |
Alliance Data Systems Corp. | | | 640 | | | | 82,003 | |
American Express Co. | | | 1,270 | | | | 150,216 | |
The accompanying notes are an integral part of the financial statements.
148
MassMutual Premier Disciplined Growth Fund – Portfolio of Investments(Continued)
| | | | | | | | |
| | | Number of
Shares | | | Value | |
Ameriprise Financial, Inc. | | | 3,470 | | | $ | 510,437 | |
The Charles Schwab Corp. | | | 9,200 | | | | 384,836 | |
Credit Acceptance Corp. (a) | | | 70 | | | | 32,292 | |
Discover Financial Services | | | 4,700 | | | | 381,123 | |
E*TRADE Financial Corp. | | | 9,400 | | | | 410,686 | |
Evercore, Inc. Class A | | | 700 | | | | 56,070 | |
Intercontinental Exchange, Inc. | | | 1,250 | | | | 115,338 | |
Lazard Ltd. Class A | | | 3,200 | | | | 112,000 | |
LPL Financial Holdings, Inc. | | | 6,000 | | | | 491,400 | |
Mastercard, Inc. Class A | | | 20,160 | | | | 5,474,851 | |
Raymond James Financial, Inc. | | | 4,800 | | | | 395,808 | |
SEI Investments Co. | | | 400 | | | | 23,702 | |
Synchrony Financial | | | 12,000 | | | | 409,080 | |
T. Rowe Price Group, Inc. | | | 1,850 | | | | 211,362 | |
TD Ameritrade Holding Corp. | | | 2,100 | | | | 98,070 | |
Visa, Inc. Class A | | | 28,860 | | | | 4,964,209 | |
The Western Union Co. | | | 320 | | | | 7,414 | |
| | | | | | | | |
| | | | | | | 14,315,079 | |
| | | | | | | | |
| Insurance — 0.7% | |
Alleghany Corp. (a) | | | 50 | | | | 39,888 | |
Aon PLC | | | 1,120 | | | | 216,798 | |
Arch Capital Group Ltd. (a) | | | 3,800 | | | | 159,524 | |
Athene Holding Ltd. Class A (a) | | | 1,700 | | | | 71,502 | |
Axis Capital Holdings Ltd. | | | 400 | | | | 26,688 | |
Erie Indemnity Co. Class A | | | 70 | | | | 12,996 | |
Everest Re Group Ltd. | | | 1,690 | | | | 449,692 | |
Marsh & McLennan Cos., Inc. | | | 1,200 | | | | 120,060 | |
Primerica, Inc. | | | 670 | | | | 85,244 | |
The Progressive Corp. | | | 6,500 | | | | 502,125 | |
RenaissanceRe Holdings Ltd. | | | 90 | | | | 17,411 | |
The Travelers Cos., Inc. | | | 1,390 | | | | 206,679 | |
Voya Financial, Inc. | | | 300 | | | | 16,332 | |
| | | | | | | | |
| | | | | | | 1,924,939 | |
| | | | | | | | |
| Real Estate — 0.1% | |
CBRE Group, Inc. Class A (a) | | | 3,500 | | | | 185,535 | |
| | | | | | | | |
| Real Estate Investment Trusts (REITS) — 2.1% | |
American Tower Corp. | | | 4,315 | | | | 954,176 | |
Brookfield Property REIT, Inc. Class A | | | 4,700 | | | | 95,833 | |
CoreSite Realty Corp. | | | 1,660 | | | | 202,271 | |
Crown Castle International Corp. | | | 9,290 | | | | 1,291,403 | |
Equinix, Inc. | | | 607 | | | | 350,118 | |
Equity LifeStyle Properties, Inc. | | | 100 | | | | 13,360 | |
Extra Space Storage, Inc. | | | 1,760 | | | | 205,603 | |
Lamar Advertising Co. Class A | | | 2,000 | | | | 163,860 | |
Outfront Media, Inc. | | | 17,700 | | | | 491,706 | |
Public Storage | | | 3,020 | | | | 740,715 | |
Simon Property Group, Inc. | | | 4,579 | | | | 712,721 | |
Sun Communities, Inc. | | | 580 | | | | 86,101 | |
| | | | | | | | |
| | | | | | | 5,307,867 | |
| | | | | | | | |
| | | | | | | 22,038,954 | |
| | | | | | | | |
| | | | | | | | |
| | | Number of
Shares | | | Value | |
| Industrial — 8.1% | |
| Aerospace & Defense — 2.0% | |
The Boeing Co. | | | 4,940 | | | $ | 1,879,522 | |
General Dynamics Corp. | | | 470 | | | | 85,883 | |
HEICO Corp. | | | 642 | | | | 80,173 | |
HEICO Corp. Class A | | | 1,288 | | | | 125,335 | |
L3 Harris Technologies, Inc. | | | 2,690 | | | | 561,242 | |
Lockheed Martin Corp. | | | 4,460 | | | | 1,739,667 | |
Northrop Grumman Corp. | | | 90 | | | | 33,731 | |
Raytheon Co. | | | 1,790 | | | | 351,180 | |
Spirit AeroSystems Holdings, Inc. Class A | | | 3,400 | | | | 279,616 | |
| | | | | | | | |
| | | | | | | 5,136,349 | |
| | | | | | | | |
| Building Materials — 0.3% | |
Armstrong World Industries, Inc. | | | 4,700 | | | | 454,490 | |
Eagle Materials, Inc. | | | 3,410 | | | | 306,934 | |
Fortune Brands Home & Security, Inc. | | | 200 | | | | 10,940 | |
Lennox International, Inc. | | | 10 | | | | 2,430 | |
| | | | | | | | |
| | | | | | | 774,794 | |
| | | | | | | | |
| Electrical Components & Equipment — 0.3% | |
Acuity Brands, Inc. | | | 400 | | | | 53,916 | |
AMETEK, Inc. | | | 1,175 | | | | 107,888 | |
Emerson Electric Co. | | | 110 | | | | 7,355 | |
Hubbell, Inc. Class B | | | 3,610 | | | | 474,354 | |
Universal Display Corp. | | | 1,040 | | | | 174,616 | |
| | | | | | | | |
| | | | | | | 818,129 | |
| | | | | | | | |
| Electronics — 1.3% | |
Allegion PLC | | | 1,570 | | | | 162,730 | |
Amphenol Corp. Class A | | | 100 | | | | 9,650 | |
Fortive Corp. | | | 960 | | | | 65,818 | |
Honeywell International, Inc. | | | 7,470 | | | | 1,263,924 | |
Jabil, Inc. | | | 15,200 | | | | 543,704 | |
Keysight Technologies, Inc. (a) | | | 3,800 | | | | 369,550 | |
Mettler-Toledo International, Inc. (a) | | | 600 | | | | 422,640 | |
National Instruments Corp. | | | 600 | | | | 25,194 | |
Sensata Technologies Holding PLC (a) | | | 1,300 | | | | 65,078 | |
Waters Corp. (a) | | | 1,360 | | | | 303,593 | |
| | | | | | | | |
| | | | | | | 3,231,881 | |
| | | | | | | | |
| Environmental Controls — 0.3% | |
Waste Management, Inc. | | | 6,320 | | | | 726,800 | |
| | | | | | | | |
| Hand & Machine Tools — 0.0% | |
Lincoln Electric Holdings, Inc. | | | 500 | | | | 43,380 | |
| | | | | | | | |
| Machinery – Construction & Mining — 0.1% | |
Caterpillar, Inc. | | | 2,150 | | | | 271,566 | |
| | | | | | | | |
| Machinery – Diversified — 0.4% | |
Dover Corp. | | | 3,700 | | | | 368,372 | |
Graco, Inc. | | | 3,390 | | | | 156,075 | |
IDEX Corp. | | | 520 | | | | 85,218 | |
Nordson Corp. | | | 10 | | | | 1,463 | |
Rockwell Automation, Inc. | | | 1,650 | | | | 271,920 | |
The accompanying notes are an integral part of the financial statements.
149
MassMutual Premier Disciplined Growth Fund – Portfolio of Investments(Continued)
| | | | | | | | |
| | | Number of
Shares | | | Value | |
Roper Technologies, Inc. | | | 130 | | | $ | 46,358 | |
Xylem, Inc. | | | 500 | | | | 39,810 | |
| | | | | | | | |
| | | | | | | 969,216 | |
| | | | | | | | |
| Manufacturing — 0.9% | |
3M Co. | | | 7,740 | | | | 1,272,456 | |
Illinois Tool Works, Inc. | | | 7,110 | | | | 1,112,644 | |
| | | | | | | | |
| | | | | | | 2,385,100 | |
| | | | | | | | |
| Miscellaneous – Manufacturing — 0.3% | |
Carlisle Cos., Inc. | | | 690 | | | | 100,423 | |
Hexcel Corp. | | | 1,800 | | | | 147,834 | |
Ingersoll-Rand PLC | | | 4,900 | | | | 603,729 | |
| | | | | | | | |
| | | | | | | 851,986 | |
| | | | | | | | |
| Packaging & Containers — 0.2% | |
Ball Corp. | | | 1,700 | | | | 123,777 | |
Berry Global Group, Inc. (a) | | | 3,800 | | | | 149,226 | |
Crown Holdings, Inc. (a) | | | 2,600 | | | | 171,756 | |
Sealed Air Corp. | | | 1,400 | | | | 58,114 | |
| | | | | | | | |
| | | | | | | 502,873 | |
| | | | | | | | |
| Shipbuilding — 0.1% | |
Huntington Ingalls Industries, Inc. | | | 1,240 | | | | 262,620 | |
| | | | | | | | |
| Transportation — 1.9% | |
C.H. Robinson Worldwide, Inc. | | | 1,900 | | | | 161,082 | |
CSX Corp. | | | 6,200 | | | | 429,474 | |
Expeditors International of Washington, Inc. | | | 2,000 | | | | 148,580 | |
Landstar System, Inc. | | | 1,360 | | | | 153,109 | |
Norfolk Southern Corp. | | | 1,450 | | | | 260,507 | |
Old Dominion Freight Line, Inc. | | | 300 | | | | 50,991 | |
Union Pacific Corp. | | | 14,840 | | | | 2,403,783 | |
United Parcel Service, Inc. Class B | | | 7,050 | | | | 844,731 | |
XPO Logistics, Inc. (a) | | | 6,900 | | | | 493,833 | |
| | | | | | | | |
| | | | | | | 4,946,090 | |
| | | | | | | | |
| | | | | | | 20,920,784 | |
| | | | | | | | |
| Technology — 30.7% | |
| Computers — 11.0% | |
Accenture PLC Class A | | | 16,480 | | | | 3,169,928 | |
Apple, Inc. | | | 93,543 | | | | 20,950,826 | |
Cognizant Technology Solutions Corp. Class A | | | 500 | | | | 30,132 | |
Dell Technologies C (a) | | | 16,848 | | | | 873,737 | |
EPAM Systems, Inc. (a) | | | 1,150 | | | | 209,668 | |
Fortinet, Inc. (a) | | | 3,800 | | | | 291,688 | |
Genpact Ltd. | | | 1,700 | | | | 65,875 | |
HP, Inc. | | | 18,200 | | | | 344,344 | |
International Business Machines Corp. | | | 12,150 | | | | 1,766,853 | |
NCR Corp. (a) | | | 5,600 | | | | 176,736 | |
NetApp, Inc. | | | 5,900 | | | | 309,809 | |
Zscaler, Inc. (a) | | | 1,200 | | | | 56,712 | |
| | | | | | | | |
| | | | | | | 28,246,308 | |
| | | | | | | | |
| | | | | | | | |
| | | Number of
Shares | | | Value | |
| Office & Business Equipment — 0.2% | |
Zebra Technologies Corp. Class A (a) | | | 2,470 | | | $ | 509,734 | |
| | | | | | | | |
| Semiconductors — 4.6% | |
Analog Devices, Inc. | | | 395 | | | | 44,133 | |
Applied Materials, Inc. | | | 12,100 | | | | 603,790 | |
Broadcom, Inc. | | | 5,990 | | | | 1,653,659 | |
KLA Corp. | | | 990 | | | | 157,856 | |
Lam Research Corp. | | | 4,380 | | | | 1,012,262 | |
Maxim Integrated Products, Inc. | | | 2,400 | | | | 138,984 | |
NVIDIA Corp. | | | 6,450 | | | | 1,122,752 | |
QUALCOMM, Inc. | | | 25,700 | | | | 1,960,396 | |
Skyworks Solutions, Inc. | | | 520 | | | | 41,210 | |
Teradyne, Inc. | | | 9,700 | | | | 561,727 | |
Texas Instruments, Inc. | | | 31,880 | | | | 4,120,171 | |
Xilinx, Inc. | | | 6,230 | | | | 597,457 | |
| | | | | | | | |
| | | | | | | 12,014,397 | |
| | | | | | | | |
| Software — 14.9% | |
Adobe, Inc. (a) | | | 6,250 | | | | 1,726,562 | |
Akamai Technologies, Inc. (a) | | | 2,100 | | | | 191,898 | |
ANSYS, Inc. (a) | | | 450 | | | | 99,612 | |
Aspen Technology, Inc. (a) | | | 890 | | | | 109,541 | |
Atlassian Corp. PLC Class A (a) | | | 660 | | | | 82,790 | |
Autodesk, Inc. (a) | | | 2,590 | | | | 382,543 | |
Broadridge Financial Solutions, Inc. | | | 2,000 | | | | 248,860 | |
Cadence Design Systems, Inc. (a) | | | 9,500 | | | | 627,760 | |
CDK Global, Inc. | | | 200 | | | | 9,618 | |
Cerner Corp. | | | 9,100 | | | | 620,347 | |
Citrix Systems, Inc. | | | 3,580 | | | | 345,542 | |
Dropbox, Inc. Class A (a) | | | 4,000 | | | | 80,680 | |
Electronic Arts, Inc. (a) | | | 3,710 | | | | 362,912 | |
Fair Isaac Corp. (a) | | | 1,190 | | | | 361,189 | |
Fidelity National Information Services, Inc. | | | 3,097 | | | | 411,158 | |
Fiserv, Inc. (a) | | | 9,334 | | | | 966,909 | |
Intuit, Inc. | | | 5,770 | | | | 1,534,474 | |
Jack Henry & Associates, Inc. | | | 260 | | | | 37,952 | |
Manhattan Associates, Inc. (a) | | | 3,900 | | | | 314,613 | |
Microsoft Corp. | | | 158,980 | | | | 22,102,989 | |
MSCI, Inc. | | | 1,080 | | | | 235,170 | |
Oracle Corp. | | | 60,700 | | | | 3,340,321 | |
Paychex, Inc. | | | 6,500 | | | | 538,005 | |
Paycom Software, Inc. (a) | | | 1,020 | | | | 213,680 | |
salesforce.com, Inc. (a) | | | 2,230 | | | | 331,021 | |
ServiceNow, Inc. (a) | | | 2,910 | | | | 738,704 | |
Splunk, Inc. (a) | | | 790 | | | | 93,109 | |
Synopsys, Inc. (a) | | | 2,890 | | | | 396,653 | |
Take-Two Interactive Software, Inc. (a) | | | 230 | | | | 28,828 | |
Teradata Corp. (a) | | | 900 | | | | 27,900 | |
Twilio, Inc. Class A (a) | | | 560 | | | | 61,578 | |
Veeva Systems, Inc. Class A (a) | | | 4,780 | | | | 729,858 | |
VMware, Inc. Class A | | | 3,400 | | | | 510,204 | |
The accompanying notes are an integral part of the financial statements.
150
MassMutual Premier Disciplined Growth Fund – Portfolio of Investments(Continued)
| | | | | | | | |
| | | Number of
Shares | | | Value | |
Workday, Inc. Class A (a) | | | 1,950 | | | $ | 331,422 | |
Zynga, Inc. Class A (a) | | | 15,500 | | | | 90,210 | |
| | | | | | | | |
| | | | | | | 38,284,612 | |
| | | | | | | | |
| | | | | | | 79,055,051 | |
| | | | | | | | |
| | |
TOTAL COMMON STOCK
(Cost $221,808,039) | | | | | | | 257,324,092 | |
| | | | | |
| | |
TOTAL EQUITIES
(Cost $221,808,039) | | | | | | | 257,324,092 | |
| | | | | |
|
| MUTUAL FUNDS — 0.1% | |
| Diversified Financial Services — 0.1% | |
State Street Navigator Securities Lending Prime Portfolio (c) | | | 297,990 | | | | 297,990 | |
| | | | | | | | |
| | |
TOTAL MUTUAL FUNDS
(Cost $297,990) | | | | | | | 297,990 | |
| | | | | |
| | |
TOTAL LONG-TERM INVESTMENTS
(Cost $222,106,029) | | | | | | | 257,622,082 | |
| | | | | |
| | |
| | | Principal
Amount | | | | |
| SHORT-TERM INVESTMENTS — 0.1% | |
| Repurchase Agreement — 0.1% | |
Fixed Income Clearing Corp., Repurchase Agreement, dated 9/30/19, 0.950%, due 10/01/19 (d) | | $ | 258,637 | | | | 258,637 | |
| | | | | | | | |
| | |
TOTAL SHORT-TERM INVESTMENTS
(Cost $258,637) | | | | | | | 258,637 | |
| | | | | |
| | |
| TOTAL INVESTMENTS — 100.1% (Cost $222,364,666) (e) | | | | | | | 257,880,719 | |
| | |
| Other Assets/(Liabilities) — (0.1)% | | | | | | | (376,571 | ) |
| | | | | |
| | |
| NET ASSETS — 100.0% | | | | | | $ | 257,504,148 | |
| | | | | |
Notes to Portfolio of Investments
Percentages are stated as a percent of net assets.
| (a) | Non-income producing security. |
| (b) | Denotes all or a portion of security on loan. The total value of securities on loan as of September 30, 2019, was $289,040 or 0.11% of net assets. Total securities on loan may be less than the amounts identified in the Portfolio of investments.(Note 2). |
| (c) | Represents investment of security lending collateral.(Note 2). |
| (d) | Maturity value of $258,643. Collateralized by U.S. Government Agency obligations with a rate of 2.000%, maturity date of 2/15/23, and an aggregate market value, including accrued interest, of $264,205. |
| (e) | See Note 6 for aggregate cost for federal tax purposes. |
The accompanying notes are an integral part of the financial statements.
151
MassMutual Premier Small Cap Opportunities Fund – Portfolio of Investments
September 30, 2019
| | | | | | | | |
| | | Number of
Shares | | | Value | |
| EQUITIES — 98.6% | |
|
| COMMON STOCK — 98.6% | |
| Basic Materials — 3.7% | |
| Iron & Steel — 1.0% | |
Allegheny Technologies, Inc. (a) | | | 102,879 | | | $ | 2,083,300 | |
| | | | | | | | |
| Mining — 2.7% | |
Compass Minerals International, Inc. | | | 38,530 | | | | 2,176,560 | |
Kaiser Aluminum Corp. | | | 33,124 | | | | 3,278,282 | |
| | | | | | | | |
| | | | | | | 5,454,842 | |
| | | | | | | | |
| | | | | | | 7,538,142 | |
| | | | | | | | |
| Communications — 2.9% | |
| Internet — 2.0% | |
Etsy, Inc. (a) | | | 32,060 | | | | 1,811,390 | |
Q2 Holdings, Inc. (a) | | | 29,280 | | | | 2,309,313 | |
| | | | | | | | |
| | | | | | | 4,120,703 | |
| | | | | | | | |
| Media — 0.9% | |
Houghton Mifflin Harcourt Co. (a) | | | 321,993 | | | | 1,716,223 | |
| | | | | | | | |
| | | | | | | 5,836,926 | |
| | | | | | | | |
| Consumer, Cyclical — 13.5% | |
| Airlines — 0.9% | |
Spirit Airlines, Inc. (a) | | | 51,860 | | | | 1,882,518 | |
| | | | | | | | |
| Auto Manufacturers — 0.7% | |
Navistar International Corp. (a) | | | 48,460 | | | | 1,362,210 | |
| | | | | | | | |
| Auto Parts & Equipment — 3.2% | |
Dorman Products, Inc. (a) | | | 31,230 | | | | 2,484,034 | |
Visteon Corp. (a) | | | 49,100 | | | | 4,052,714 | |
| | | | | | | | |
| | | | | | | 6,536,748 | |
| | | | | | | | |
| Retail — 8.7% | |
AutoNation, Inc. (a) | | | 52,130 | | | | 2,642,991 | |
BJ’s Wholesale Club Holdings, Inc. (a) | | | 119,470 | | | | 3,090,689 | |
Jack in the Box, Inc. | | | 34,000 | | | | 3,098,080 | |
Suburban Propane Partners LP (b) | | | 152,860 | | | | 3,612,082 | |
Texas Roadhouse, Inc. | | | 57,170 | | | | 3,002,568 | |
The Wendy’s Co. | | | 119,720 | | | | 2,392,006 | |
| | | | | | | | |
| | | | | | | 17,838,416 | |
| | | | | | | | |
| | | | | | | 27,619,892 | |
| | | | | | | | |
| Consumer,Non-cyclical — 18.6% | |
| Biotechnology — 1.1% | |
Emergent BioSolutions, Inc. (a) | | | 41,440 | | | | 2,166,483 | |
| | | | | | | | |
| Commercial Services — 6.7% | |
ASGN, Inc. (a) | | | 69,972 | | | | 4,398,440 | |
Korn Ferry | | | 106,561 | | | | 4,117,517 | |
Monro, Inc. | | | 43,630 | | | | 3,447,206 | |
Paylocity Holding Corp. (a) | | | 17,570 | | | | 1,714,481 | |
| | | | | | | | |
| | | | | | | 13,677,644 | |
| | | | | | | | |
| | | | | | | | |
| | | Number of
Shares | | | Value | |
| Health Care – Products — 4.4% | |
Adaptive Biotechnologies Corp. (a) | | | 11,372 | | | $ | 351,395 | |
AtriCure, Inc. (a) | | | 41,300 | | | | 1,030,022 | |
Inspire Medical Systems, Inc. (a) | | | 35,990 | | | | 2,196,110 | |
Intersect ENT, Inc. (a) | | | 48,800 | | | | 830,088 | |
Quidel Corp. (a) | | | 32,940 | | | | 2,020,869 | |
Repligen Corp. (a) | | | 34,180 | | | | 2,621,264 | |
| | | | | | | | |
| | | | | | | 9,049,748 | |
| | | | | | | | |
| Health Care – Services — 4.0% | |
Addus HomeCare Corp. (a) | | | 25,626 | | | | 2,031,629 | |
LHC Group, Inc. (a) | | | 31,200 | | | | 3,543,072 | |
Teladoc Health, Inc. (a) (c) | | | 38,180 | | | | 2,585,550 | |
| | | | | | | | |
| | | | | | | 8,160,251 | |
| | | | | | | | |
| Household Products & Wares — 1.4% | |
Acco Brands Corp. | | | 286,690 | | | | 2,829,630 | |
| | | | | | | | |
| Pharmaceuticals — 1.0% | |
G1 Therapeutics, Inc. (a) | | | 13,420 | | | | 305,708 | |
Senseonics Holdings, Inc. (a) (c) | | | 237,181 | | | | 234,453 | |
TherapeuticsMD, Inc. (a) (c) | | | 232,820 | | | | 845,136 | |
uniQure NV (a) | | | 18,460 | | | | 726,586 | |
| | | | | | | | |
| | | | | | | 2,111,883 | |
| | | | | | | | |
| | | | | | | 37,995,639 | |
| | | | | | | | |
| Energy — 3.4% | |
| Energy – Alternate Sources — 0.8% | |
Renewable Energy Group, Inc. (a) | | | 115,854 | | | | 1,738,389 | |
| | | | | | | | |
| Oil & Gas — 2.0% | |
Matador Resources Co. (a) | | | 211,235 | | | | 3,491,714 | |
Range Resources Corp. (c) | | | 132,740 | | | | 507,067 | |
| | | | | | | | |
| | | | | | | 3,998,781 | |
| | | | | | | | |
| Pipelines — 0.6% | |
Noble Midstream Partners LP (b) | | | 54,790 | | | | 1,321,535 | |
| | | | | | | | |
| | | | | | | 7,058,705 | |
| | | | | | | | |
| Financial — 22.7% | |
| Banks — 5.1% | |
The Bank of NT Butterfield & Son Ltd. | | | 73,510 | | | | 2,178,836 | |
BankUnited, Inc. | | | 31,808 | | | | 1,069,385 | |
Cathay General Bancorp | | | 39,450 | | | | 1,370,296 | |
CrossFirst Bankshares, Inc. (a) | | | 34,740 | | | | 496,956 | |
Customers Bancorp, Inc. (a) | | | 54,790 | | | | 1,136,345 | |
Heritage Financial Corp. | | | 59,265 | | | | 1,597,784 | |
IBERIABANK Corp. | | | 34,260 | | | | 2,588,000 | |
| | | | | | | | |
| | | | | | | 10,437,602 | |
| | | | | | | | |
| Diversified Financial Services — 2.7% | |
Federated Investors, Inc. Class B | | | 50,760 | | | | 1,645,132 | |
Focus Financial Partners, Inc. Class A (a) | | | 31,360 | | | | 746,368 | |
Stifel Financial Corp. | | | 53,960 | | | | 3,096,225 | |
| | | | | | | | |
| | | | | | | 5,487,725 | |
| | | | | | | | |
The accompanying notes are an integral part of the financial statements.
152
MassMutual Premier Small Cap Opportunities Fund – Portfolio of Investments(Continued)
| | | | | | | | |
| | | Number of
Shares | | | Value | |
| Insurance — 2.4% | |
James River Group Holdings Ltd. | | | 33,272 | | | $ | 1,704,857 | |
ProAssurance Corp. | | | 56,430 | | | | 2,272,436 | |
ProSight Global, Inc. (a) | | | 55,450 | | | | 1,073,512 | |
| | | | | | | | |
| | | | | | | 5,050,805 | |
| | | | | | | | |
| Real Estate Investment Trusts (REITS) — 7.2% | |
Brandywine Realty Trust | | | 193,450 | | | | 2,930,767 | |
DiamondRock Hospitality Co. | | | 208,270 | | | | 2,134,767 | |
EPR Properties | | | 27,210 | | | | 2,091,361 | |
Four Corners Property Trust, Inc. | | | 140,370 | | | | 3,969,664 | |
National Storage Affiliates Trust | | | 107,645 | | | | 3,592,114 | |
| | | | | | | | |
| | | | | �� | | 14,718,673 | |
| | | | | | | | |
| Savings & Loans — 5.3% | |
Berkshire Hills Bancorp, Inc. | | | 55,920 | | | | 1,637,897 | |
OceanFirst Financial Corp. | | | 79,253 | | | | 1,870,371 | |
Pacific Premier Bancorp, Inc. | | | 42,360 | | | | 1,321,208 | |
Sterling Bancorp | | | 77,240 | | | | 1,549,435 | |
WSFS Financial Corp. | | | 99,593 | | | | 4,392,051 | |
| | | | | | | | |
| | | | | | | 10,770,962 | |
| | | | | | | | |
| | | | | | | 46,465,767 | |
| | | | | | | | |
| Industrial — 16.3% | |
| Building Materials — 2.9% | |
Masonite International Corp. (a) | | | 48,048 | | | | 2,786,784 | |
Summit Materials, Inc. Class A (a) | | | 141,120 | | | | 3,132,864 | |
| | | | | | | | |
| | | | | | | 5,919,648 | |
| | | | | | | | |
| Electrical Components & Equipment — 3.2% | |
Energizer Holdings, Inc. (c) | | | 65,440 | | | | 2,851,875 | |
Generac Holdings, Inc. (a) | | | 46,489 | | | | 3,641,948 | |
| | | | | | | | |
| | | | | | | 6,493,823 | |
| | | | | | | | |
| Electronics — 1.0% | |
Atkore International Group, Inc. (a) | | | 66,640 | | | | 2,022,524 | |
| | | | | | | | |
| Engineering & Construction — 2.9% | |
Comfort Systems USA, Inc. | | | 19,980 | | | | 883,716 | |
KBR, Inc. | | | 109,778 | | | | 2,693,952 | |
TopBuild Corp. (a) | | | 25,040 | | | | 2,414,607 | |
| | | | | | | | |
| | | | | | | 5,992,275 | |
| | | | | | | | |
| Environmental Controls — 1.4% | |
Evoqua Water Technologies Corp. (a) | | | 164,710 | | | | 2,803,364 | |
| | | | | | | | |
| Machinery – Diversified — 0.1% | |
The Manitowoc Co., Inc. (a) | | | 17,508 | | | | 218,850 | |
| | | | | | | | |
| Manufacturing — 1.0% | |
EnPro Industries, Inc. | | | 29,210 | | | | 2,005,267 | |
| | | | | | | | |
| Metal Fabricate & Hardware — 1.8% | |
Mayville Engineering Co., Inc. (a) | | | 64,110 | | | | 845,611 | |
Rexnord Corp. (a) | | | 105,910 | | | | 2,864,865 | |
| | | | | | | | |
| | | | | | | 3,710,476 | |
| | | | | | | | |
| | | | | | | | |
| | | Number of
Shares | | | Value | |
| Transportation — 1.5% | |
CryoPort, Inc. (a) (c) | | | 50,600 | | | $ | 827,563 | |
Genesee & Wyoming, Inc. Class A (a) | | | 19,470 | | | | 2,151,630 | |
| | | | | | | | |
| | | | | | | 2,979,193 | |
| | | | | | | | |
| Trucking & Leasing — 0.5% | |
The Greenbrier Cos., Inc. | | | 36,230 | | | | 1,091,248 | |
| | | | | | | | |
| | | | | | | 33,236,668 | |
| | | | | | | | |
| Technology — 14.2% | |
| Computers — 3.6% | |
CACI International, Inc. Class A (a) | | | 19,906 | | | | 4,603,462 | |
Perspecta, Inc. | | | 103,920 | | | | 2,714,390 | |
| | | | | | | | |
| | | | | | | 7,317,852 | |
| | | | | | | | |
| Semiconductors — 4.6% | |
Brooks Automation, Inc. | | | 73,420 | | | | 2,718,743 | |
MKS Instruments, Inc. | | | 42,830 | | | | 3,952,352 | |
Semtech Corp. (a) | | | 57,070 | | | | 2,774,173 | |
| | | | | | | | |
| | | | | | | 9,445,268 | |
| | | | | | | | |
| Software — 6.0% | |
Bottomline Technologies de, Inc. (a) | | | 36,760 | | | | 1,446,506 | |
Envestnet, Inc. (a) | | | 28,000 | | | | 1,587,600 | |
j2 Global, Inc. | | | 46,086 | | | | 4,185,530 | |
Zynga, Inc. Class A (a) | | | 856,991 | | | | 4,987,688 | |
| | | | | | | | |
| | | | | | | 12,207,324 | |
| | | | | | | | |
| | | | | | | 28,970,444 | |
| | | | | | | | |
| Utilities — 3.3% | |
| Electric — 1.6% | |
Avista Corp. | | | 66,260 | | | | 3,209,635 | |
| | | | | | | | |
| Gas — 1.7% | |
South Jersey Industries, Inc. | | | 107,330 | | | | 3,532,230 | |
| | | | | | | | |
| | | | | | | 6,741,865 | |
| | | | | | | | |
| | |
TOTAL COMMON STOCK
(Cost $186,886,698) | | | | | | | 201,464,048 | |
| | | | | |
| | |
TOTAL EQUITIES
(Cost $186,886,698) | | | | | | | 201,464,048 | |
| | | | | |
|
| MUTUAL FUNDS — 3.0% | |
| Diversified Financial Services — 3.0% | |
State Street Navigator Securities Lending Prime Portfolio (d) | | | 6,119,086 | | | | 6,119,086 | |
| | | | | | | | |
| | |
TOTAL MUTUAL FUNDS
(Cost $6,119,086) | | | | | | | 6,119,086 | |
| | | | | |
| | |
TOTAL LONG-TERM INVESTMENTS
(Cost $193,005,784) | | | | | | | 207,583,134 | |
| | | | | |
The accompanying notes are an integral part of the financial statements.
153
MassMutual Premier Small Cap Opportunities Fund – Portfolio of Investments(Continued)
| | | | | | | | |
| | | Principal
Amount | | | Value | |
| SHORT-TERM INVESTMENTS — 1.5% | |
| Repurchase Agreement — 1.5% | |
Fixed Income Clearing Corp., Repurchase Agreement, dated 9/30/19, 0.950%, due 10/01/19 (e) | | $ | 3,073,487 | | | $ | 3,073,487 | |
| | | | | | | | |
| | |
TOTAL SHORT-TERM INVESTMENTS
(Cost $3,073,487) | | | | | | | 3,073,487 | |
| | | | | |
| | |
| TOTAL INVESTMENTS — 103.1% (Cost $196,079,271) (f) | | | | | | | 210,656,621 | |
| | |
| Other Assets/(Liabilities) — (3.1)% | | | | | | | (6,389,382 | ) |
| | | | | |
| | |
| NET ASSETS — 100.0% | | | | | | $ | 204,267,239 | |
| | | | | |
Notes to Portfolio of Investments
Percentages are stated as a percent of net assets.
| (a) | Non-income producing security. |
| (b) | Security is a Master Limited Partnership. |
| (c) | Denotes all or a portion of security on loan. The total value of securities on loan as of September 30, 2019, was $5,908,513 or 2.89% of net assets. Total securities on loan may be less than the amounts identified in the Portfolio of Investments.(Note 2). |
| (d) | Represents investment of security lending collateral.(Note 2). |
| (e) | Maturity value of $3,073,568. Collateralized by U.S. Government Agency obligations with a rate of 2.000%, maturity date of 2/15/23, and an aggregate market value, including accrued interest, of $3,139,971. |
| (f) | See Note 6 for aggregate cost for federal tax purposes. |
The accompanying notes are an integral part of the financial statements.
154
MassMutual Premier Global Fund – Portfolio of Investments
September 30, 2019
| | | | | | | | |
| | | Number of
Shares | | | Value | |
| EQUITIES — 98.5% | |
|
| COMMON STOCK — 97.9% | |
| Cayman Islands — 2.3% | |
Farfetch Ltd. Class A (a) | | | 88,490 | | | $ | 764,554 | |
JD.com, Inc. ADR (a) | | | 155,109 | | | | 4,375,625 | |
StoneCo Ltd. Class A (a) | | | 45,900 | | | | 1,596,402 | |
| | | | | | | | |
| | | | | | | 6,736,581 | |
| | | | | | | | |
| France — 7.0% | |
Kering SA | | | 12,900 | | | | 6,585,603 | |
LVMH Moet Hennessy Louis Vuitton SE | | | 29,510 | | | | 11,747,034 | |
Societe Generale SA | | | 76,870 | | | | 2,108,943 | |
| | | | | | | | |
| | | | | | | 20,441,580 | |
| | | | | | | | |
| Germany — 5.7% | |
Allianz SE Registered | | | 25,611 | | | | 5,972,380 | |
Bayer AG Registered | | | 31,972 | | | | 2,254,247 | |
SAP SE | | | 68,118 | | | | 8,008,254 | |
Siemens AG Registered | | | 5,741 | | | | 615,226 | |
| | | | | | | | |
| | | | | | | 16,850,107 | |
| | | | | | | | |
| India — 3.6% | |
DLF Ltd. | | | 2,548,732 | | | | 5,596,553 | |
ICICI Bank Ltd. Sponsored ADR | | | 413,560 | | | | 5,037,161 | |
| | | | | | | | |
| | | | | | | 10,633,714 | |
| | | | | | | | |
| Italy — 0.2% | |
Brunello Cucinelli SpA | | | 21,740 | | | | 677,501 | |
| | | | | | | | |
| Japan — 13.7% | |
Capcom Co. Ltd. | | | 80,200 | | | | 2,122,517 | |
FANUC Corp. | | | 16,900 | | | | 3,205,925 | |
Keyence Corp. | | | 9,300 | | | | 5,794,246 | |
MinebeaMitsumi, Inc. | | | 67,800 | | | | 1,083,404 | |
Murata Manufacturing Co. Ltd. | | | 121,830 | | | | 5,898,134 | |
Nidec Corp. | | | 53,700 | | | | 7,276,813 | |
Nintendo Co. Ltd. | | | 8,100 | | | | 3,015,721 | |
Omron Corp. | | | 63,100 | | | | 3,482,163 | |
Takeda Pharmaceutical Co. Ltd. | | | 74,108 | | | | 2,539,109 | |
TDK Corp. | | | 65,600 | | | | 5,929,761 | |
| | | | | | | | |
| | | | | | | 40,347,793 | |
| | | | | | | | |
| Netherlands — 4.3% | |
Airbus SE | | | 88,780 | | | | 11,544,529 | |
uniQure NV (a) | | | 29,201 | | | | 1,149,351 | |
| | | | | | | | |
| | | | | | | 12,693,880 | |
| | | | | | | | |
| Spain — 1.7% | |
Industria de Diseno Textil SA | | | 156,171 | | | | 4,837,593 | |
| | | | | | | | |
| Sweden — 2.3% | |
Assa Abloy AB Class B | | | 180,009 | | | | 4,010,040 | |
Atlas Copco AB Class A | | | 87,555 | | | | 2,695,431 | |
| | | | | | | | |
| | | | | | | 6,705,471 | |
| | | | | | | | |
| | | | | | | | |
| | | Number of
Shares | | | Value | |
| Switzerland — 1.7% | |
Credit Suisse Group AG Registered | | | 241,041 | | | $ | 2,959,485 | |
UBS Group AG Registered | | | 190,678 | | | | 2,167,659 | |
| | | | | | | | |
| | | | | | | 5,127,144 | |
| | | | | | | | |
| United Kingdom — 4.5% | |
International Game Technology PLC (b) | | | 95,682 | | | | 1,359,641 | |
Prudential PLC | | | 240,312 | | | | 4,364,295 | |
TechnipFMC PLC | | | 32,651 | | | | 779,957 | |
Unilever PLC | | | 114,166 | | | | 6,864,619 | |
| | | | | | | | |
| | | | | | | 13,368,512 | |
| | | | | | | | |
| United States — 50.9% | |
3M Co. | | | 12,475 | | | | 2,050,890 | |
ACADIA Pharmaceuticals, Inc. (a) | | | 55,140 | | | | 1,984,489 | |
Adobe, Inc. (a) | | | 34,460 | | | | 9,519,575 | |
Agilent Technologies, Inc. | | | 52,210 | | | | 4,000,852 | |
Alphabet, Inc. Class A (a) | | | 17,290 | | | | 21,113,511 | |
Amazon.com, Inc. (a) | | | 1,509 | | | | 2,619,488 | |
AnaptysBio, Inc. (a) | | | 5,102 | | | | 178,519 | |
Anthem, Inc. | | | 29,250 | | | | 7,022,925 | |
Bluebird Bio, Inc. (a) (b) | | | 12,400 | | | | 1,138,568 | |
Blueprint Medicines Corp. (a) | | | 22,890 | | | | 1,681,728 | |
Centene Corp. (a) | | | 47,960 | | | | 2,074,750 | |
Citigroup, Inc. | | | 105,050 | | | | 7,256,854 | |
Colgate-Palmolive Co. | | | 83,970 | | | | 6,172,635 | |
Electronic Arts, Inc. (a) | | | 22,377 | | | | 2,188,918 | |
Equifax, Inc. | | | 27,630 | | | | 3,886,712 | |
Facebook, Inc. Class A (a) | | | 53,830 | | | | 9,586,046 | |
GlycoMimetics, Inc. (a) | | | 71,950 | | | | 310,105 | |
The Goldman Sachs Group, Inc. | | | 9,757 | | | | 2,021,943 | |
Incyte Corp. (a) | | | 26,240 | | | | 1,947,795 | |
Intuit, Inc. | | | 38,940 | | | | 10,355,704 | |
Ionis Pharmaceuticals, Inc. (a) | | | 35,170 | | | | 2,107,035 | |
MacroGenics, Inc. (a) | | | 67,530 | | | | 861,683 | |
Maxim Integrated Products, Inc. | | | 118,670 | | | | 6,872,180 | |
Microsoft Corp. | | | 16,212 | | | | 2,253,954 | |
Mirati Therapeutics, Inc. (a) | | | 12,396 | | | | 965,772 | |
PayPal Holdings, Inc. (a) | | | 66,448 | | | | 6,883,348 | |
Ra Pharmaceuticals, Inc. (a) | | | 33,130 | | | | 783,525 | |
resTORbio, Inc. (a) (b) | | | 65,290 | | | | 577,164 | |
S&P Global, Inc. | | | 42,740 | | | | 10,470,445 | |
Sage Therapeutics, Inc. (a) | | | 19,712 | | | | 2,765,396 | |
Sarepta Therapeutics, Inc. (a) | | | 14,823 | | | | 1,116,468 | |
Tiffany & Co. | | | 38,530 | | | | 3,569,034 | |
United Parcel Service, Inc. Class B | | | 35,510 | | | | 4,254,808 | |
Veracyte, Inc. (a) | | | 37,010 | | | | 888,240 | |
The Walt Disney Co. | | | 40,710 | | | | 5,305,327 | |
Zimmer Biomet Holdings, Inc. | | | 21,930 | | | | 3,010,331 | |
| | | | | | | | |
| | | | | | | 149,796,717 | |
| | | | | | | | |
| | |
TOTAL COMMON STOCK
(Cost $179,826,330) | | | | | | | 288,216,593 | |
| | | | | |
The accompanying notes are an integral part of the financial statements.
155
MassMutual Premier Global Fund – Portfolio of Investments(Continued)
| | | | | | | | |
| | | Number of
Shares | | | Value | |
|
| PREFERRED STOCK — 0.6% | |
| Germany — 0.6% | |
Bayerische Motoren Werke AG 7.110% | | | 31,005 | | | $ | 1,720,463 | |
| | | | | | | | |
| India — 0.0% | |
Zee Entertainment Enterprises Ltd. 6.000% | | | 573,050 | | | | 42,452 | |
| | | | | | | | |
| | |
TOTAL PREFERRED STOCK
(Cost $2,209,986) | | | | | | | 1,762,915 | |
| | | | | |
| | |
TOTAL EQUITIES
(Cost $182,036,316) | | | | | | | 289,979,508 | |
| | | | | |
|
| MUTUAL FUNDS — 0.8% | |
| United States — 0.8% | |
State Street Navigator Securities Lending Prime Portfolio (c) | | | 2,433,703 | | | | 2,433,703 | |
| | | | | | | | |
| | |
TOTAL MUTUAL FUNDS
(Cost $2,433,703) | | | | | | | 2,433,703 | |
| | | | | |
| | |
TOTAL LONG-TERM INVESTMENTS
(Cost $184,470,019) | | | | | | | 292,413,211 | |
| | | | | |
| | |
| | | Principal
Amount | | | | |
| SHORT-TERM INVESTMENTS — 1.0% | |
| Repurchase Agreement — 1.0% | |
Fixed Income Clearing Corp., Repurchase Agreement, dated 9/30/19, 0.950%, due 10/01/19 (d) | | $ | 2,958,022 | | | | 2,958,022 | |
| | | | | | | | |
| | |
TOTAL SHORT-TERM INVESTMENTS
(Cost $2,958,022) | | | | | | | 2,958,022 | |
| | | | | |
| | |
| TOTAL INVESTMENTS — 100.3% (Cost $187,428,041) (e) | | | | | | | 295,371,233 | |
| | |
| Other Assets/(Liabilities) — (0.3)% | | | | | | | (941,980 | ) |
| | | | | |
| | |
| NET ASSETS — 100.0% | | | | | | $ | 294,429,253 | |
| | | | | |
Abbreviation Legend
| ADR | American Depositary Receipt |
Notes to Portfolio of Investments
Percentages are stated as a percent of net assets.
| (a) | Non-income producing security. |
| (b) | Denotes all or a portion of security on loan. The total value of securities on loan as of September 30, 2019, was $2,370,849 |
| | or 0.81% of net assets. Total securities on loan may be less than the amounts identified in the Portfolio of Investments.(Note 2). |
| (c) | Represents investment of security lending collateral.(Note 2). |
| (d) | Maturity value of $2,958,100. Collateralized by U.S. Government Agency obligations with a rate of 2.500%, maturity date of 3/31/23, and an aggregate market value, including accrued interest, of $3,017,778. |
| (e) | See Note 6 for aggregate cost for federal tax purposes. |
Sector weightings, as a percentage of net assets, is as follows:
| | | | |
Consumer,Non-cyclical | | | 24.2 | % |
Industrial | | | 21.0 | % |
Communications | | | 14.9 | % |
Technology | | | 14.0 | % |
Financial | | | 12.7 | % |
Consumer, Cyclical | | | 11.4 | % |
Mutual Funds | | | 0.8 | % |
Energy | | | 0.3 | % |
| | | | |
Total Long-Term Investments | | | 99.3 | % |
Short-Term Investments and Other Assets and Liabilities | | | 0.7 | % |
| | | | |
Net Assets | | | 100.0 | % |
| | | | |
The accompanying notes are an integral part of the financial statements.
156
MassMutual Premier International Equity Fund – Portfolio of Investments
September 30, 2019
| | | | | | | | |
| | | Number of
Shares | | | Value | |
| EQUITIES — 99.0% | |
|
| COMMON STOCK — 99.0% | |
| Australia — 1.7% | |
CSL Ltd. | | | 31,530 | | | $ | 4,982,344 | |
| | | | | | | | |
| Belgium — 0.5% | |
Galapagos NV (a) | | | 9,101 | | | | 1,389,561 | |
| | | | | | | | |
| Canada — 5.9% | |
Alimentation Couche-Tard, Inc. Class B | | | 187,382 | | | | 5,742,317 | |
CCL Industries, Inc. Class B | | | 113,945 | | | | 4,596,159 | |
Dollarama, Inc. | | | 101,764 | | | | 3,643,179 | |
Saputo, Inc. | | | 105,361 | | | | 3,238,329 | |
| | | | | | | | |
| | | | | | | 17,219,984 | |
| | | | | | | | |
| Cayman Islands — 2.1% | |
Alibaba Group Holding Ltd. Sponsored ADR (a) | | | 22,102 | | | | 3,696,118 | |
WH Group Ltd. (b) | | | 2,557,000 | | | | 2,313,886 | |
| | | | | | | | |
| | | | | | | 6,010,004 | |
| | | | | | | | |
| Denmark — 2.3% | |
Ascendis Pharma A/S ADR (a) | | | 8,320 | | | | 801,382 | |
Novo Nordisk A/S Class B | | | 113,962 | | | | 5,884,431 | |
| | | | | | | | |
| | | | | | | 6,685,813 | |
| | | | | | | | |
| Finland — 2.3% | |
Nokia OYJ | | | 1,301,942 | | | | 6,597,918 | |
| | | | | | | | |
| France — 14.7% | |
Dassault Systemes SE | | | 23,031 | | | | 3,280,937 | |
Edenred | | | 138,773 | | | | 6,664,023 | |
Hermes International | | | 11,156 | | | | 7,716,253 | |
Legrand SA | | | 59,290 | | | | 4,234,910 | |
LVMH Moet Hennessy Louis Vuitton SE | | | 11,210 | | | | 4,462,360 | |
Pernod Ricard SA | | | 25,285 | | | | 4,501,237 | |
SEB SA (a) (c) | | | 32,437 | | | | 4,924,912 | |
Ubisoft Entertainment SA (a) | | | 44,360 | | | | 3,208,271 | |
Valeo SA | | | 63,144 | | | | 2,051,063 | |
Worldline SA (a) (b) | | | 31,916 | | | | 2,015,933 | |
| | | | | | | | |
| | | | | | | 43,059,899 | |
| | | | | | | | |
| Germany — 7.3% | |
Bayer AG Registered | | | 14,841 | | | | 1,046,393 | |
Continental AG | | | 8,697 | | | | 1,116,470 | |
Fresenius Medical Care AG & Co. KGaA | | | 49,788 | | | | 3,346,137 | |
Infineon Technologies AG | | | 228,537 | | | | 4,108,186 | |
SAP SE | | | 65,297 | | | | 7,676,606 | |
Siemens Healthineers AG (b) | | | 105,906 | | | | 4,166,482 | |
| | | | | | | | |
| | | | | | | 21,460,274 | |
| | | | | | | | |
| India — 2.1% | |
ICICI Bank Ltd. Sponsored ADR | | | 495,638 | | | | 6,036,871 | |
| | | | | | | | |
| | | | | | | | |
| | | Number of
Shares | | | Value | |
| Ireland — 2.5% | |
Flutter Entertainment PLC | | | 14,761 | | | $ | 1,381,639 | |
James Hardie Industries PLC | | | 170,444 | | | | 2,862,484 | |
Medtronic PLC | | | 27,920 | | | | 3,032,670 | |
| | | | | | | | |
| | | | | | | 7,276,793 | |
| | | | | | | | |
| Japan — 12.4% | |
Daikin Industries Ltd. | | | 7,300 | | | | 958,561 | |
Hitachi Ltd. | | | 208,800 | | | | 7,819,391 | |
Hoya Corp. | | | 83,900 | | | | 6,849,323 | |
Keyence Corp. | | | 9,700 | | | | 6,043,460 | |
Koito Manufacturing Co. Ltd. | | | 63,400 | | | | 3,125,805 | |
Kubota Corp. | | | 88,500 | | | | 1,346,099 | |
Nidec Corp. | | | 39,300 | | | | 5,325,489 | |
Nitori Holdings Co. Ltd. | | | 31,600 | | | | 4,623,295 | |
| | | | | | | | |
| | | | | | | 36,091,423 | |
| | | | | | | | |
| Netherlands — 8.9% | |
Aalberts NV | | | 83,436 | | | | 3,310,014 | |
Airbus SE | | | 34,060 | | | | 4,429,000 | |
ASML Holding NV | | | 34,603 | | | | 8,588,532 | |
Boskalis Westminster (d) | | | 58,410 | | | | 1,219,438 | |
Heineken NV | | | 29,152 | | | | 3,152,343 | |
STMicroelectronics NV | | | 271,380 | | | | 5,258,131 | |
| | | | | | | | |
| | | | | | | 25,957,458 | |
| | | | | | | | |
| New Zealand — 1.7% | |
Xero Ltd. (a) | | | 117,286 | | | | 4,941,768 | |
| | | | | | | | |
| Panama — 0.7% | |
Carnival Corp. | | | 44,826 | | | | 1,959,344 | |
| | | | | | | | |
| Spain — 4.6% | |
Amadeus IT Group SA | | | 45,732 | | | | 3,279,598 | |
Grifols SA | | | 214,848 | | | | 6,330,510 | |
Prosegur Cash SA (b) | | | 949,141 | | | | 1,362,687 | |
Prosegur Cia de Seguridad SA | | | 633,866 | | | | 2,471,074 | |
| | | | | | | | |
| | | | | | | 13,443,869 | |
| | | | | | | | |
| Sweden — 3.6% | |
Atlas Copco AB Class A | | | 160,585 | | | | 4,943,702 | |
Epiroc AB Class A | | | 283,708 | | | | 3,080,112 | |
Swedish Match AB | | | 62,975 | | | | 2,605,123 | |
| | | | | | | | |
| | | | | | | 10,628,937 | |
| | | | | | | | |
| Switzerland — 11.6% | |
Barry Callebaut AG Registered | | | 2,170 | | | | 4,482,447 | |
Cie Financiere Richemont SA Registered | | | 40,398 | | | | 2,968,910 | |
Lonza Group AG Registered | | | 16,525 | | | | 5,591,820 | |
Roche Holding AG | | | 16,032 | | | | 4,675,334 | |
Sika AG Registered | | | 33,703 | | | | 4,933,052 | |
Temenos Group AG Registered | | | 35,601 | | | | 5,966,014 | |
VAT Group AG (b) | | | 41,686 | | | | 5,263,840 | |
| | | | | | | | |
| | | | | | | 33,881,417 | |
| | | | | | | | |
The accompanying notes are an integral part of the financial statements.
157
MassMutual Premier International Equity Fund – Portfolio of Investments(Continued)
| | | | | | | | |
| | | Number of
Shares | | | Value | |
| Taiwan — 1.1% | |
Taiwan Semiconductor Manufacturing Co. Ltd. (c) | | | 376,000 | | | $ | 3,312,348 | |
| | | | | | | | |
| Thailand — 1.0% | |
CP ALL PCL | | | 1,126,600 | | | | 2,983,639 | |
| | | | | | | | |
| United Kingdom — 9.4% | |
Atlassian Corp. PLC Class A (a) | | | 8,660 | | | | 1,086,310 | |
Blue Prism Group PLC (a) (d) | | | 38,710 | | | | 452,844 | |
Britvic PLC | | | 54,081 | | | | 653,945 | |
Bunzl PLC | | | 81,350 | | | | 2,126,852 | |
Ferguson PLC | | | 33,316 | | | | 2,434,082 | |
Intertek Group PLC | | | 44,590 | | | | 3,002,377 | |
Legal & General Group PLC | | | 908,565 | | | | 2,774,165 | |
LivaNova PLC (a) | | | 18,420 | | | | 1,359,212 | |
Melrose Industries PLC | | | 1,209,522 | | | | 2,996,371 | |
Next PLC | | | 8,337 | | | | 634,133 | |
Prudential PLC | | | 201,906 | | | | 3,666,806 | |
TechnipFMC PLC | | | 168,304 | | | | 4,020,392 | |
The Weir Group PLC | | | 127,291 | | | | 2,233,823 | |
| | | | | | | | |
| | | | | | | 27,441,312 | |
| | | | | | | | |
| United States — 2.6% | |
EPAM Systems, Inc. (a) | | | 25,340 | | | | 4,619,989 | |
ResMed, Inc. | | | 22,650 | | | | 3,060,241 | |
| | | | | | | | |
| | | | | | | 7,680,230 | |
| | | | | | | | |
| | |
TOTAL COMMON STOCK
(Cost $248,435,721) | | | | | | | 289,041,206 | |
| | | | | |
|
| PREFERRED STOCK — 0.0% | |
| India — 0.0% | |
Zee Entertainment Enterprises Ltd. 6.000% | | | 653,347 | | | | 48,400 | |
| | | | | | | | |
| | |
TOTAL PREFERRED STOCK
(Cost $19,494) | | | | | | | 48,400 | |
| | | | | |
| | |
TOTAL EQUITIES
(Cost $248,455,215) | | | | | | | 289,089,606 | |
| | | | | |
|
| MUTUAL FUNDS — 0.6% | |
| United States — 0.6% | |
State Street Navigator Securities Lending Prime Portfolio (e) | | | 1,621,105 | | | | 1,621,105 | |
| | | | | | | | |
| | |
TOTAL MUTUAL FUNDS
(Cost $1,621,105) | | | | | | | 1,621,105 | |
| | | | | |
| | |
TOTAL LONG-TERM INVESTMENTS
(Cost $250,076,320) | | | | | | | 290,710,711 | |
| | | | | |
| | | | | | | | |
| | | Principal
Amount | | | Value | |
| SHORT-TERM INVESTMENTS — 0.7% | |
| Repurchase Agreement — 0.7% | |
Fixed Income Clearing Corp., Repurchase Agreement, dated 9/30/19, 0.950%, due 10/01/19 (f) | | $ | 2,181,720 | | | $ | 2,181,720 | |
| | | | | | | | |
| | |
TOTAL SHORT-TERM INVESTMENTS
(Cost $2,181,720) | | | | | | | 2,181,720 | |
| | | | | |
| | |
| TOTAL INVESTMENTS — 100.3% (Cost $252,258,040) (g) | | | | | | | 292,892,431 | |
| | |
| Other Assets/(Liabilities) — (0.3)% | | | | | | | (913,858 | ) |
| | | | | |
| | |
| NET ASSETS — 100.0% | | | | | | $ | 291,978,573 | |
| | | | | |
Abbreviation Legend
| ADR | American Depositary Receipt |
Notes to Portfolio of Investments
Percentages are stated as a percent of net assets.
| (a) | Non-income producing security. |
| (b) | Security is exempt from registration under Regulation S or Rule 144A of the Securities Act of 1933. These securities are considered restricted and may be resold in transactions exempt from registration. At September 30, 2019, the aggregate market value of these securities amounted to $15,122,828 or 5.18% of net assets. |
| (c) | This security is fair valued in good faith in accordance with procedures approved by the Board of Trustees. At September 30, 2019, these securities amounted to a value of $8,237,260 or 2.82% of net assets. |
| (d) | Denotes all or a portion of security on loan. The total value of securities on loan as of September 30, 2019, was $1,541,191 or 0.53% of net assets. Total securities on loan may be less than the amounts identified in the Portfolio of Investments.(Note 2). |
| (e) | Represents investment of security lending collateral.(Note 2). |
| (f) | Maturity value of $2,181,777. Collateralized by U.S. Government Agency obligations with a rate of 2.500%, maturity date of 3/31/23, and an aggregate market value, including accrued interest, of $2,228,513. |
| (g) | See Note 6 for aggregate cost for federal tax purposes. |
The accompanying notes are an integral part of the financial statements.
158
MassMutual Premier International Equity Fund – Portfolio of Investments(Continued)
Sector weightings, as a percentage of net assets, is as follows:
| | | | |
Consumer,Non-cyclical | | | 28.5 | % |
Industrial | | | 23.8 | % |
Technology | | | 18.7 | % |
Consumer, Cyclical | | | 17.8 | % |
Financial | | | 5.3 | % |
Communications | | | 3.5 | % |
Energy | | | 1.4 | % |
Mutual Funds | | | 0.6 | % |
| | | | |
Total Long-Term Investments | | | 99.6 | % |
Short-Term Investments and Other Assets and Liabilities | | | 0.4 | % |
| | | | |
Net Assets | | | 100.0 | % |
| | | | |
The accompanying notes are an integral part of the financial statements.
159
MassMutual Premier Strategic Emerging Markets Fund – Portfolio of Investments
September 30, 2019
| | | | | | | | |
| | | Number of
Shares | | | Value | |
| EQUITIES — 96.2% | |
|
| COMMON STOCK — 93.2% | |
| Bermuda — 3.0% | |
Credicorp Ltd. | | | 14,240 | | | $ | 2,968,185 | |
Jardine Strategic Holdings Ltd. | | | 51,571 | | | | 1,543,914 | |
| | | | | | | | |
| | | | | | | 4,512,099 | |
| | | | | | | | |
| Brazil — 3.9% | |
Atacadao SA | | | 257,500 | | | | 1,304,558 | |
B3 SA - Brasil Bolsa Balcao | | | 145,388 | | | | 1,526,680 | |
Itau Unibanco Holding SA Sponsored ADR | | | 78,965 | | | | 664,096 | |
Natura Cosmeticos SA | | | 133,000 | | | | 1,083,859 | |
Vale SA Sponsored ADR | | | 116,410 | | | | 1,338,715 | |
| | | | | | | | |
| | | | | | | 5,917,908 | |
| | | | | | | | |
| Cayman Islands — 20.5% | |
Alibaba Group Holding Ltd. Sponsored ADR (a) | | | 63,880 | | | | 10,682,652 | |
Baozun, Inc. ADR (a) (b) | | | 14,244 | | | | 608,219 | |
Budweiser Brewing Co. APAC Ltd. (a) (c) | | | 818,300 | | | | 2,933,798 | |
Huazhu Group Ltd. ADR | | | 116,276 | | | | 3,839,434 | |
Hutchison China MediTech Ltd. ADR (a) | | | 14,170 | | | | 252,793 | |
Innovent Biologics, Inc. (a) (c) | | | 220,500 | | | | 700,532 | |
Meituan Dianping Class B (a) | | | 265,400 | | | | 2,706,339 | |
Ping An Healthcare and Technology Co. Ltd. (a) (c) | | | 10,450 | | | | 61,236 | |
StoneCo Ltd. Class A (a) | | | 18,350 | | | | 638,213 | |
Tencent Holdings Ltd. | | | 120,093 | | | | 5,096,711 | |
Tencent Music Entertainment Group ADR (a) (b) | | | 37 | | | | 472 | |
Wuxi Biologics Cayman, Inc. (a) (c) | | | 101,500 | | | | 1,037,245 | |
ZTO Express Cayman, Inc. ADR | | | 106,630 | | | | 2,274,418 | |
| | | | | | | | |
| | | | | | | 30,832,062 | |
| | | | | | | | |
| Chile — 1.1% | |
SACI Falabella | | | 285,213 | | | | 1,593,970 | |
| | | | | | | | |
| China — 5.3% | |
China International Capital Corp. Ltd. Class H (c) | | | 327,600 | | | | 639,912 | |
Jiangsu Hengrui Medicine Co. Ltd. Class A | | | 345,263 | | | | 3,915,833 | |
Ping An Insurance Group Co. of China Ltd. Class A | | | 186,272 | | | | 2,283,009 | |
Shanghai Junshi Bioscience Class H (a) (c) | | | 33,800 | | | | 124,498 | |
Sinopharm Group Co. Ltd. Class H | | | 315,793 | | | | 992,715 | |
| | | | | | | | |
| | | | | | | 7,955,967 | |
| | | | | | | | |
| Colombia — 0.5% | |
Grupo Aval Acciones y Valores SA ADR | | | 103,720 | | | | 773,751 | |
| | | | | | | | |
| | | | | | | | |
| | | Number of
Shares | | | Value | |
| Egypt — 0.6% | |
Commercial International Bank Egypt SAE | | | 175,526 | | | $ | 840,999 | |
| | | | | | | | |
| France — 5.3% | |
Kering SA | | | 11,923 | | | | 6,086,833 | |
LVMH Moet Hennessy Louis Vuitton SE | | | 4,558 | | | | 1,814,401 | |
| | | | | | | | |
| | | | | | | 7,901,234 | |
| | | | | | | | |
| Hong Kong — 4.6% | |
AIA Group Ltd. | | | 468,400 | | | | 4,395,072 | |
Hang Lung Properties Ltd. | | | 94,000 | | | | 213,663 | |
Hansoh Pharmaceutical Group Co. Ltd. (a) (c) | | | 142,000 | | | | 435,468 | |
Hong Kong Exchanges & Clearing Ltd. | | | 61,278 | | | | 1,808,752 | |
| | | | | | | | |
| | | | | | | 6,852,955 | |
| | | | | | | | |
| India — 9.9% | |
Bandhan Bank Ltd. (c) | | | 34,590 | | | | 239,761 | |
Biocon Ltd. | | | 8,970 | | | | 28,379 | |
Cholamandalam Investment and Finance Co. Ltd. | | | 133,304 | | | | 579,350 | |
Dalmia Bharat Ltd. (a) | | | 11,888 | | | | 137,558 | |
Housing Development Finance Corp. Ltd. | | | 194,121 | | | | 5,419,583 | |
Kotak Mahindra Bank Ltd. | | | 221,991 | | | | 5,143,174 | |
Oberoi Realty Ltd. | | | 57,903 | | | | 413,373 | |
Tata Consultancy Services Ltd. | | | 64,038 | | | | 1,894,389 | |
Zee Entertainment Enterprises Ltd. | | | 290,702 | | | | 1,085,507 | |
| | | | | | | | |
| | | | | | | 14,941,074 | |
| | | | | | | | |
| Indonesia — 1.0% | |
Bank Central Asia Tbk PT | | | 314,000 | | | | 671,633 | |
Indocement Tunggal Prakarsa Tbk PT | | | 434,100 | | | | 574,406 | |
Semen Indonesia Persero Tbk PT | | | 379,000 | | | | 308,523 | |
| | | | | | | | |
| | | | | | | 1,554,562 | |
| | | | | | | | |
| Italy — 1.4% | |
Moncler SpA | | | 22,260 | | | | 794,013 | |
PRADA SpA | | | 457,800 | | | | 1,333,501 | |
| | | | | | | | |
| | | | | | | 2,127,514 | |
| | | | | | | | |
| Mexico — 6.8% | |
Alsea SAB de CV (a) | | | 277,228 | | | | 646,219 | |
Fomento Economico Mexicano SAB de CV | | | 386,612 | | | | 3,542,866 | |
Fomento Economico Mexicano SAB de CV Sponsored ADR | | | 11,850 | | | | 1,085,223 | |
Grupo Aeroportuario del Sureste SAB de CV Class B | | | 46,243 | | | | 705,057 | |
Grupo Financiero Banorte SAB de CV Class O | | | 105,344 | | | | 567,771 | |
The accompanying notes are an integral part of the financial statements.
160
MassMutual Premier Strategic Emerging Markets Fund – Portfolio of Investments(Continued)
| | | | | | | | |
| | | Number of
Shares | | | Value | |
Grupo Financiero Inbursa SAB de CV Class O | | | 792,374 | | | $ | 1,009,841 | |
Grupo Mexico SAB de CV Series B | | | 886,467 | | | | 2,078,485 | |
Wal-Mart de Mexico SAB de CV | | | 213,999 | | | | 634,276 | |
| | | | | | | | |
| | | | | | | 10,269,738 | |
| | | | | | | | |
| Netherlands — 1.0% | |
Steinhoff International Holdings NV (a) (b) | | | 453,046 | | | | 29,321 | |
Yandex NV Class A (a) | | | 44,038 | | | | 1,541,770 | |
| | | | | | | | |
| | | | | | | 1,571,091 | |
| | | | | | | | |
| Philippines — 2.5% | |
Ayala Corp. | | | 13,123 | | | | 223,720 | |
Ayala Land, Inc. | | | 1,216,600 | | | | 1,161,346 | |
SM Investments Corp. | | | 102,305 | | | | 1,914,497 | |
SM Prime Holdings, Inc. | | | 639,057 | | | | 458,851 | |
| | | | | | | | |
| | | | | | | 3,758,414 | |
| | | | | | | | |
| Republic of Korea — 2.8% | |
Amorepacific Corp. | | | 5,548 | | | | 654,553 | |
AMOREPACIFIC Group | | | 5,882 | | | | 321,747 | |
LG Household & Health Care Ltd. | | | 929 | | | | 1,016,815 | |
Samsung Biologics Co. Ltd. (a) (c) | | | 5,906 | | | | 1,523,261 | |
Samsung Electronics Co. Ltd. | | | 18,473 | | | | 753,697 | |
| | | | | | | | |
| | | | | | | 4,270,073 | |
| | | | | | | | |
| Russia — 7.6% | |
LUKOIL PJSC Sponsored ADR | | | 8,556 | | | | 707,838 | |
LUKOIL PJSC Sponsored ADR | | | 13,981 | | | | 1,154,499 | |
MMC Norilsk Nickel PJSC ADR | | | 3,599 | | | | 92,098 | |
MMC Norilsk Nickel PJSC | | | 1,198 | | | | 308,083 | |
MMC Norilsk Nickel PJSC ADR (Russia) | | | 24,574 | | | | 628,946 | |
Novatek PJSC Sponsored GDR Registered (c) | | | 1,201 | | | | 243,563 | |
Novatek PJSC Sponsored GDR Registered (c) | | | 35,732 | | | | 7,231,630 | |
Polyus PJSC GDR (c) (d) | | | 5,075 | | | | 293,081 | |
Sberbank of Russia PJSC | | | 224,881 | | | | 790,222 | |
| | | | | | | | |
| | | | | | | 11,449,960 | |
| | | | | | | | |
| South Africa — 2.6% | |
FirstRand Ltd. (b) | | | 747,841 | | | | 3,076,689 | |
Shoprite Holdings Ltd. | | | 95,198 | | | | 772,250 | |
| | | | | | | | |
| | | | | | | 3,848,939 | |
| | | | | | | | |
| Spain — 0.4% | |
Banco Santander S.A. (a) | | | 153,862 | | | | 626,083 | |
| | | | | | | | |
| Taiwan — 4.5% | |
Taiwan Semiconductor Manufacturing Co. Ltd. (d) | | | 769,000 | | | | 6,774,456 | |
| | | | | | | | |
| Thailand — 0.4% | |
Siam Commercial Bank PCL | | | 165,800 | | | | 639,673 | |
| | | | | | | | |
| | | | | | | | |
| | | Number of
Shares | | | Value | |
| Turkey — 1.5% | |
Akbank T.A.S. (a) | | | 905,619 | | | $ | 1,304,902 | |
Anadolu Efes Biracilik Ve Malt Sanayii AS | | | 146,735 | | | | 568,722 | |
BIM Birlesik Magazalar AS | | | 50,680 | | | | 441,404 | |
| | | | | | | | |
| | | | | | | 2,315,028 | |
| | | | | | | | |
| United Arab Emirates — 0.4% | |
Emaar Properties PJSC | | | 483,513 | | | | 607,201 | |
| | | | | | | | |
| United Kingdom — 2.6% | |
Glencore PLC | | | 1,304,645 | | | | 3,930,576 | |
| | | | | | | | |
| United States — 3.0% | |
MercadoLibre, Inc. (a) | | | 840 | | | | 463,033 | |
Yum China Holdings, Inc. | | | 88,890 | | | | 4,038,273 | |
| | | | | | | | |
| | | | | | | 4,501,306 | |
| | | | | | | | |
| | |
TOTAL COMMON STOCK
(Cost $129,749,979) | | | | | | | 140,366,633 | |
| | | | | |
|
| PREFERRED STOCK — 3.0% | |
| Brazil — 1.3% | |
Lojas Americanas SA 0.350% | | | 416,020 | | | | 1,998,522 | |
| | | | | | | | |
| India — 0.1% | |
Zee Entertainment Enterprises Ltd. 6.000% | | | 742,906 | | | | 55,035 | |
| | | | | | | | |
| Singapore — 1.6% | |
Grab Holdings, Inc. (a) (d) (e) | | | 395,658 | | | | 2,438,401 | |
| | | | | | | | |
| | |
TOTAL PREFERRED STOCK
(Cost $4,614,930) | | | | | | | 4,491,958 | |
| | | | | |
| | |
TOTAL EQUITIES
(Cost $134,364,909) | | | | | | | 144,858,591 | |
| | | | | |
|
| MUTUAL FUNDS — 2.1% | |
| United States — 2.1% | |
State Street Navigator Securities Lending Prime Portfolio (f) | | | 3,245,885 | | | | 3,245,885 | |
| | | | | | | | |
| | |
TOTAL MUTUAL FUNDS
(Cost $3,245,885) | | | | | | | 3,245,885 | |
| | | | | |
| | |
TOTAL LONG-TERM INVESTMENTS
(Cost $137,610,794) | | | | | | | 148,104,476 | |
| | | | | |
The accompanying notes are an integral part of the financial statements.
161
MassMutual Premier Strategic Emerging Markets Fund – Portfolio of Investments(Continued)
| | | | | | | | |
| | | Principal
Amount | | | Value | |
| SHORT-TERM INVESTMENTS — 4.0% | |
| Repurchase Agreement — 4.0% | |
Fixed Income Clearing Corp., Repurchase Agreement, dated 9/30/19, 0.950%, due 10/01/19 (g) | | $ | 5,989,895 | | | $ | 5,989,895 | |
| | | | | | | | |
| | |
TOTAL SHORT-TERM INVESTMENTS
(Cost $5,989,895) | | | | | | | 5,989,895 | |
| | | | | |
| | |
| TOTAL INVESTMENTS — 102.3% (Cost $143,600,689) (h) | | | | | | | 154,094,371 | |
| | |
| Other Assets/(Liabilities) — (2.3)% | | | | | | | (3,493,078 | ) |
| | | | | |
| | |
| NET ASSETS — 100.0% | | | | | | $ | 150,601,293 | |
| | | | | |
Abbreviation Legend
| ADR | American Depositary Receipt |
| GDR | Global Depositary Receipt |
| PJSC | Public Joint Stock Company |
Notes to Portfolio of Investments
Percentages are stated as a percent of net assets.
| (a) | Non-income producing security. |
| (b) | Denotes all or a portion of security on loan. The total value of securities on loan as of September 30, 2019, was $3,071,504 or 2.04% of net assets. Total securities on loan may be less than the amounts identified in the Portfolio of Investments.(Note 2). |
| (c) | Security is exempt from registration under Regulation S or Rule 144A of the Securities Act of 1933. These securities are considered restricted and may be resold in transactions exempt from registration. At September 30, 2019, the aggregate market value of these securities amounted to $15,463,985 or 10.27% of net assets. |
| (d) | This security is fair valued in good faith in accordance with procedures approved by the Board of Trustees. At September 30, 2019, these securities amounted to a value of $9,505,938 or 6.31% of net assets. |
| (e) | Investment was valued using significant unobservable inputs. |
| (f) | Represents investment of security lending collateral.(Note 2). |
| (g) | Maturity value of $5,990,053. Collateralized by U.S. Government Agency obligations with a rate of 2.500%, maturity date of 3/31/23, and an aggregate market value, including accrued interest, of $6,112,935. |
| (h) | See Note 6 for aggregate cost for federal tax purposes. |
Sector weightings, as a percentage of net assets, is as follows:
| | | | |
Financial | | | 25.9 | % |
Consumer, Cyclical | | | 17.2 | % |
Consumer,Non-cyclical | | | 15.7 | % |
Communications | | | 14.8 | % |
Technology | | | 6.3 | % |
Energy | | | 6.2 | % |
Basic Materials | | | 5.8 | % |
Industrial | | | 4.3 | % |
Mutual Funds | | | 2.1 | % |
| | | | |
Total Long-Term Investments | | | 98.3 | % |
Short-Term Investments and Other Assets and Liabilities | | | 1.7 | % |
| | | | |
Net Assets | | | 100.0 | % |
| | | | |
The accompanying notes are an integral part of the financial statements.
162
THIS PAGE INTENTIONALLY LEFT BLANK
163
MassMutual Premier Funds – Financial Statements
Statements of Assets and Liabilities
September 30, 2019
| | | | | | | | |
| | | MassMutual
Premier
U.S. Government
Money Market
Fund | | | MassMutual
Premier Short-
Duration
Bond Fund | |
| Assets: | | | | | | | | |
Investments, at value(Note 2) (a) | | $ | - | | | $ | 502,862,064 | |
Repurchase agreements, at value(Note 2) (b) | | | 45,000,000 | | | | - | |
Other short-term investments, at value(Note 2) (c) | | | 312,384,786 | | | | 25,377,309 | |
| | | | | | | | |
Total investments (d) | | | 357,384,786 | | | | 528,239,373 | |
| | | | | | | | |
Cash | | | 113,158 | | | | 2,084,170 | |
Foreign currency, at value (e) | | | - | | | | - | |
Receivables from: | | | | | | | | |
Investments sold | | | - | | | | 22,369 | |
Open forward contracts(Note 2) | | | - | | | | - | |
Investment adviser(Note 3) | | | - | | | | - | |
Fund shares sold | | | 878,804 | | | | 28,910 | |
Collateral pledged for open swaps agreements(Note 2) | | | - | | | | - | |
Variation margin on open derivative instruments(Note 2) | | | - | | | | 54,004 | |
Interest and dividends | | | 461,140 | | | | 2,615,361 | |
Interest tax reclaim receivable | | | - | | | | 2,384 | |
Open swap agreements, at value(Note 2) | | | - | | | | - | |
Prepaid expenses | | | 10,767 | | | | 35,322 | |
| | | | | | | | |
Total assets | | | 358,848,655 | | | | 533,081,893 | |
| | | | | | | | |
| Liabilities: | | | | | | | | |
Payables for: | | | | | | | | |
Investments purchased | | | - | | | | 1,149,795 | |
Collateral held for open purchased options(Note 2) | | | - | | | | 3,989,000 | |
Collateral held for when-issued securities(Note 2) | | | - | | | | - | |
Collateral held for open swap agreements(Note 2) | | | - | | | | - | |
Dividends(Note 2) | | | 29 | | | | - | |
Open forward contracts(Note 2) | | | - | | | | - | |
Interest and dividends | | | - | | | | - | |
Investments purchased on a when-issued basis(Note 2) | | | - | | | | - | |
Fund shares repurchased | | | 24,947,325 | | | | 6,969,300 | |
Securities on loan(Note 2) | | | - | | | | - | |
Open swap agreements, at value(Note 2) | | | - | | | | - | |
Trustees’ fees and expenses(Note 3) | | | 68,355 | | | | 73,500 | |
Variation margin on open derivative instruments(Note 2) | | | - | | | | - | |
Affiliates(Note 3): | | | | | | | | |
Investment advisory fees | | | 103,866 | | | | 153,607 | |
Administration fees | | | 74,347 | | | | 72,923 | |
Service fees | | | - | | | | 48,524 | |
Shareholder service fees | | | - | | | | 13,345 | |
Distribution fees | | | - | | | | 4,439 | |
Due to custodian | | | - | | | | - | |
Commitment and Contingent Liabilities(Note 10) | | | - | | | | - | |
Accrued expense and other liabilities | | | 81,096 | | | | 110,495 | |
| | | | | | | | |
Total liabilities | | | 25,275,018 | | | | 12,584,928 | |
| | | | | | | | |
Net assets | | $ | 333,573,637 | | | $ | 520,496,965 | |
| | | | | | | | |
| Net assets consist of: | | | | | | | | |
Paid-in capital | | $ | 333,639,040 | | | $ | 526,474,888 | |
Accumulated Gain (Loss) | | | (65,403 | ) | | | (5,977,923 | ) |
| | | | | | | | |
Net assets | | $ | 333,573,637 | | | $ | 520,496,965 | |
| | | | | | | | |
| | | | | | | | |
(a) Cost of investments: | | $ | - | | | $ | 497,420,070 | |
(b) Cost of repurchase agreements: | | $ | 45,000,000 | | | $ | - | |
(c) Cost of other short-term investments: | | $ | 312,384,786 | | | $ | 25,380,158 | |
(d) Securities on loan with market value of: | | $ | - | | | $ | - | |
(e) Cost of foreign currency: | | $ | - | | | $ | - | |
The accompanying notes are an integral part of the financial statements.
164
| | | | | | | | | | | | | | | | | | |
MassMutual
Premier
Inflation-
Protected and
Income Fund | | | MassMutual
Premier
Core Bond
Fund | | | MassMutual
Premier
Diversified
Bond Fund | | | MassMutual
Premier
High Yield
Fund | | | MassMutual
Premier
Balanced
Fund | |
| | | | | | | | | | | | | | | | | | |
| $ | 267,324,081 | | | $ | 1,433,873,952 | | | $ | 241,119,904 | | | $ | 576,529,963 | | | $ | 119,206,287 | |
| | 678,944 | | | | - | | | | - | | | | - | | | | 1,786,010 | |
| | 56,939,381 | | | | 171,172,853 | | | | 27,416,416 | | | | 3,986,020 | | | | 4,986,836 | |
| | | | | | | | | | | | | | | | | | |
| | 324,942,406 | | | | 1,605,046,805 | | | | 268,536,320 | | | | 580,515,983 | | | | 125,979,133 | |
| | | | | | | | | | | | | | | | | | |
| | - | | | | 1,943,390 | | | | 2,428,751 | | | | 3,299,281 | | | | 8,923,796 | |
| | - | | | | - | | | | 2,951 | | | | - | | | | - | |
| | | | | | | | | | | | | | | | | | |
| | - | | | | 10,150,163 | | | | 3,000,340 | | | | 1,864,073 | | | | 374,671 | |
| | - | | | | - | | | | 77,422 | | | | - | | | | - | |
| | 1 | | | | 1 | | | | - | | | | - | | | | 3 | |
| | 286,293 | | | | 302,590 | | | | 160,547 | | | | 644,760 | | | | 63,518 | |
| | 180,000 | | | | - | | | | - | | | | - | | | | - | |
| | - | | | | - | | | | 393 | | | | - | | | | 396,335 | |
| | 459,404 | | | | 8,354,435 | | | | 1,545,519 | | | | 10,102,774 | | | | 349,327 | |
| | - | | | | - | | | | 3,508 | | | | - | | | | - | |
| | 485,665 | | | | - | | | | - | | | | - | | | | - | |
| | 33,877 | | | | 41,526 | | | | 38,103 | | | | 41,236 | | | | 34,695 | |
| | | | | | | | | | | | | | | | | | |
| | 326,387,646 | | | | 1,625,838,910 | | | | 275,793,854 | | | | 596,468,107 | | | | 136,121,478 | |
| | | | | | | | | | | | | | | | | | |
| | | | | | | | | | | | | | | | | | |
| | | | | | | | | | | | | | | | | | |
| | 918,022 | | | | 12,137,688 | | | | 3,091,589 | | | | 2,117,738 | | | | 637,000 | |
| | 1,490,000 | | | | 7,409,000 | | | | 1,950,000 | | | | - | | | | 270,000 | |
| | - | | | | 137,183 | | | | - | | | | - | | | | - | |
| | 140,000 | | | | - | | | | - | | | | - | | | | - | |
| | - | | | | - | | | | - | | | | - | | | | - | |
| | - | | | | - | | | | 146,154 | | | | - | | | | - | |
| | 38,056 | | | | - | | | | - | | | | - | | | | - | |
| | - | | | | 164,605,573 | | | | 21,973,976 | | | | 4,242,000 | | | | 6,144,230 | |
| | 999,729 | | | | 3,715,195 | | | | 492,582 | | | | 3,969,270 | | | | 259,749 | |
| | - | | | | 4,658,310 | | | | 2,921,048 | | | | 21,256,820 | | | | 1,586,959 | |
| | 354,712 | | | | - | | | | - | | | | - | | | | - | |
| | 39,192 | | | | 198,578 | | | | 25,750 | | | | 41,585 | | | | 21,464 | |
| | 39,877 | | | | 43,889 | | | | - | | | | - | | | | 672 | |
| | | | | | | | | | | | | | | | | | |
| | 104,164 | | | | 456,324 | | | | 75,019 | | | | 227,011 | | | | 51,727 | |
| | 44,091 | | | | 118,244 | | | | 54,801 | | | | 62,468 | | | | 42,606 | |
| | 17,503 | | | | 73,912 | | | | 25,534 | | | | 77,458 | | | | 23,950 | |
| | 6,289 | | | | 24,806 | | | | 6,997 | | | | 9,403 | | | | 4,596 | |
| | 2,809 | | | | 594 | | | | 2,620 | | | | 27,716 | | | | 4,644 | |
| | 58,754 | | | | - | | | | - | | | | - | | | | - | |
| | - | | | | - | | | | - | | | | - | | | | - | |
| | 86,706 | | | | 184,818 | | | | 107,031 | | | | 120,061 | | | | 89,871 | |
| | | | | | | | | | | | | | | | | | |
| | 4,339,904 | | | | 193,764,114 | | | | 30,873,101 | | | | 32,151,530 | | | | 9,137,468 | |
| | | | | | | | | | | | | | | | | | |
| $ | 322,047,742 | | | $ | 1,432,074,796 | | | $ | 244,920,753 | | | $ | 564,316,577 | | | $ | 126,984,010 | |
| | | | | | | | | | | | | | | | | | |
| | | | | | | | | | | | | | | | | | |
| $ | 317,831,851 | | | $ | 1,375,151,243 | | | $ | 232,980,855 | | | $ | 559,363,307 | | | $ | 112,425,622 | |
| | 4,215,891 | | | | 56,923,553 | | | | 11,939,898 | | | | 4,953,270 | | | | 14,558,388 | |
| | | | | | | | | | | | | | | | | | |
| $ | 322,047,742 | | | $ | 1,432,074,796 | | | $ | 244,920,753 | | | $ | 564,316,577 | | | $ | 126,984,010 | |
| | | | | | | | | | | | | | | | | | |
| | | | | | | | | | | | | | | | | | |
| $ | 260,498,981 | | | $ | 1,396,050,400 | | | $ | 234,689,504 | | | $ | 580,142,422 | | | $ | 111,488,354 | |
| $ | 678,944 | | | $ | - | | | $ | - | | | $ | - | | | $ | 1,786,010 | |
| $ | 56,939,570 | | | $ | 171,158,270 | | | $ | 27,418,084 | | | $ | 3,987,500 | | | $ | 4,986,325 | |
| $ | - | | | $ | 4,561,318 | | | $ | 2,860,876 | | | $ | 20,816,499 | | | $ | 1,552,277 | |
| $ | - | | | $ | - | | | $ | 2,977 | | | $ | - | | | $ | - | |
165
MassMutual Premier Funds – Financial Statements(Continued)
Statements of Assets and Liabilities
September 30, 2019
| | | | | | | | |
| | | MassMutual
Premier
U.S. Government
Money Market
Fund | | | MassMutual
Premier Short-
Duration Bond
Fund | |
| Class I shares: | | | | | | | | |
Net assets | | $ | - | | | $ | 204,282,023 | |
| | | | | | | | |
Shares outstanding (a) | | | - | | | | 19,821,269 | |
| | | | | | | | |
Net asset value, offering price and redemption price per share | | $ | - | | | $ | 10.31 | |
| | | | | | | | |
| Class R5 shares: | | | | | | | | |
Net assets | | $ | 333,573,637 | | | $ | 158,895,013 | |
| | | | | | | | |
Shares outstanding (a) | | | 333,801,153 | | | | 15,371,479 | |
| | | | | | | | |
Net asset value, offering price and redemption price per share | | $ | 1.00 | | | $ | 10.34 | |
| | | | | | | | |
| Service Class shares: | | | | | | | | |
Net assets | | $ | - | | | $ | 51,200,683 | |
| | | | | | | | |
Shares outstanding (a) | | | - | | | | 4,990,477 | |
| | | | | | | | |
Net asset value, offering price and redemption price per share | | $ | - | | | $ | 10.26 | |
| | | | | | | | |
| Administrative Class shares: | | | | | | | | |
Net assets | | $ | - | | | $ | 31,270,495 | |
| | | | | | | | |
Shares outstanding (a) | | | - | | | | 3,060,563 | |
| | | | | | | | |
Net asset value, offering price and redemption price per share | | $ | - | | | $ | 10.22 | |
| | | | | | | | |
| Class A shares: | | | | | | | | |
Net assets | | $ | - | | | $ | 55,314,781 | |
| | | | | | | | |
Shares outstanding (a) | | | - | | | | 5,456,252 | |
| | | | | | | | |
Net asset value, and redemption price per share | | $ | - | | | $ | 10.14 | |
| | | | | | | | |
Offering price per share(100/[100-maximum sales charge] of net asset value) | | $ | - | | | $ | 10.40 | |
| | | | | | | | |
| Class R4 shares: | | | | | | | | |
Net assets | | $ | - | | | $ | 12,493,675 | |
| | | | | | | | |
Shares outstanding (a) | | | - | | | | 1,216,528 | |
| | | | | | | | |
Net asset value, offering price and redemption price per share | | $ | - | | | $ | 10.27 | |
| | | | | | | | |
| Class R3 shares: | | | | | | | | |
Net assets | | $ | - | | | $ | 7,040,295 | |
| | | | | | | | |
Shares outstanding (a) | | | - | | | | 690,442 | |
| | | | | | | | |
Net asset value, offering price and redemption price per share | | $ | - | | | $ | 10.20 | |
| | | | | | | | |
| (a) | Authorized unlimited number of shares with no par value. |
The accompanying notes are an integral part of the financial statements.
166
| | | | | | | | | | | | | | | | | | |
MassMutual
Premier
Inflation-
Protected and
Income Fund | | | MassMutual
Premier
Core Bond
Fund | | | MassMutual
Premier
Diversified
Bond Fund | | | MassMutual
Premier
High Yield
Fund | | | MassMutual
Premier
Balanced
Fund | |
| | | | | | | | | | | | | | | | | | |
| $ | 154,259,939 | | | $ | 847,736,103 | | | $ | 60,964,855 | | | $ | 326,836,298 | | | $ | 31,566,688 | |
| | | | | | | | | | | | | | | | | | |
| | 14,571,484 | | | | 74,798,173 | | | | 5,405,586 | | | | 35,504,918 | | | | 2,614,569 | |
| | | | | | | | | | | | | | | | | | |
| $ | 10.59 | | | $ | 11.33 | | | $ | 11.28 | | | $ | 9.21 | | | $ | 12.07 | |
| | | | | | | | | | | | | | | | | | |
| | | | | | | | | | | | | | | | | | |
| $ | 73,365,308 | | | $ | 317,804,801 | | | $ | 109,658,682 | | | $ | 41,369,341 | | | $ | 45,320,743 | |
| | | | | | | | | | | | | | | | | | |
| | 6,927,871 | | | | 27,956,249 | | | | 10,544,709 | | | | 4,470,098 | | | | 3,755,094 | |
| | | | | | | | | | | | | | | | | | |
| $ | 10.59 | | | $ | 11.37 | | | $ | 10.40 | | | $ | 9.25 | | | $ | 12.07 | |
| | | | | | | | | | | | | | | | | | |
| | | | | | | | | | | | | | | | | | |
| $ | 50,872,995 | | | $ | 86,988,356 | | | $ | 12,975,795 | | | $ | 49,173,622 | | | $ | 6,045,182 | |
| | | | | | | | | | | | | | | | | | |
| | 4,821,845 | | | | 7,701,789 | | | | 1,231,184 | | | | 5,315,276 | | | | 474,823 | |
| | | | | | | | | | | | | | | | | | |
| $ | 10.55 | | | $ | 11.29 | | | $ | 10.54 | | | $ | 9.25 | | | $ | 12.73 | |
| | | | | | | | | | | | | | | | | | |
| | | | | | | | | | | | | | | | | | |
| $ | 16,167,781 | | | $ | 67,239,484 | | | $ | 21,870,259 | | | $ | 25,980,355 | | | $ | 6,980,795 | |
| | | | | | | | | | | | | | | | | | |
| | 1,516,816 | | | | 5,999,392 | | | | 2,079,657 | | | | 2,856,239 | | | | 576,412 | |
| | | | | | | | | | | | | | | | | | |
| $ | 10.66 | | | $ | 11.21 | | | $ | 10.52 | | | $ | 9.10 | | | $ | 12.11 | |
| | | | | | | | | | | | | | | | | | |
| | | | | | | | | | | | | | | | | | |
| $ | 16,136,368 | | | $ | 97,069,565 | | | $ | 28,973,079 | | | $ | 31,392,433 | | | $ | 26,981,334 | |
| | | | | | | | | | | | | | | | | | |
| | 1,553,087 | | | | 8,741,449 | | | | 2,763,515 | | | | 3,461,292 | | | | 2,298,439 | |
| | | | | | | | | | | | | | | | | | |
| $ | 10.39 | | | $ | 11.10 | | | $ | 10.48 | | | $ | 9.07 | | | $ | 11.74 | |
| | | | | | | | | | | | | | | | | | |
| $ | 10.85 | | | $ | 11.59 | | | $ | 10.95 | | | $ | 9.60 | | | $ | 12.42 | |
| | | | | | | | | | | | | | | | | | |
| | | | | | | | | | | | | | | | | | |
| $ | 6,948,685 | | | $ | 14,011,355 | | | $ | 6,924,999 | | | $ | 47,055,353 | | | $ | 2,853,144 | |
| | | | | | | | | | | | | | | | | | |
| | 672,715 | | | | 1,268,773 | | | | 666,843 | | | | 5,246,868 | | | | 245,111 | |
| | | | | | | | | | | | | | | | | | |
| $ | 10.33 | | | $ | 11.04 | | | $ | 10.38 | | | $ | 8.97 | | | $ | 11.64 | |
| | | | | | | | | | | | | | | | | | |
| | | | | | | | | | | | | | | | | | |
| $ | 4,296,666 | | | $ | 1,225,132 | | | $ | 3,553,084 | | | $ | 42,509,175 | | | $ | 7,236,124 | |
| | | | | | | | | | | | | | | | | | |
| | 415,923 | | | | 108,054 | | | | 343,789 | | | | 4,637,602 | | | | 625,485 | |
| | | | | | | | | | | | | | | | | | |
| $ | 10.33 | | | $ | 11.34 | | | $ | 10.34 | | | $ | 9.17 | | | $ | 11.57 | |
| | | | | | | | | | | | | | | | | | |
167
MassMutual Premier Funds – Financial Statements(Continued)
Statements of Assets and Liabilities
September 30, 2019
| | | | | | | | |
| | |
MassMutual
Premier
Disciplined
Value Fund | | | MassMutual
Premier
Main Street
Fund | |
| Assets: | | | | | | | | |
Investments, at value(Note 2) (a) | | $ | 111,373,720 | | | $ | 117,524,088 | |
Repurchase agreements, at value(Note 2) (b) | | | 202,717 | | | | - | |
| | | | | | | | |
Total investments (c) | | | 111,576,437 | | | | 117,524,088 | |
| | | | | | | | |
Cash | | | 1,189 | | | | 30,252 | |
Foreign currency, at value (d) | | | - | | | | - | |
Receivables from: | | | | | | | | |
Investments sold | | | - | | | | 782,077 | |
Investment adviser(Note 3) | | | - | | | | - | |
Fund shares sold | | | 8,735 | | | | 187,565 | |
Interest and dividends | | | 167,231 | | | | 83,373 | |
Foreign taxes withheld | | | - | | | | - | |
Prepaid expenses | | | 35,211 | | | | 28,394 | |
| | | | | | | | |
Total assets | | | 111,788,803 | | | | 118,635,749 | |
| | | | | | | | |
| Liabilities: | | | | | | | | |
Payables for: | | | | | | | | |
Investments purchased | | | - | | | | - | |
Foreign currency overdraft | | | - | | | | - | |
Fund shares repurchased | | | 80,783 | | | | 15,520 | |
Securities on loan(Note 2) | | | 512,349 | | | | - | |
Trustees’ fees and expenses(Note 3) | | | 33,837 | | | | 20,837 | |
Affiliates(Note 3): | | | | | | | | |
Investment advisory fees | | | 42,922 | | | | 56,289 | |
Administration fees | | | 29,662 | | | | 29,393 | |
Service fees | | | 9,439 | | | | 13,243 | |
Shareholder service fees | | | 2,464 | | | | 4,979 | |
Distribution fees | | | 2,652 | | | | 808 | |
Due to custodian | | | 815 | | | | - | |
Commitment and Contingent Liabilities(Note 10) | | | - | | | | - | |
Accrued expense and other liabilities | | | 54,613 | | | | 59,978 | |
| | | | | | | | |
Total liabilities | | | 769,536 | | | | 201,047 | |
| | | | | | | | |
Net assets | | $ | 111,019,267 | | | $ | 118,434,702 | |
| | | | | | | | |
| Net assets consist of: | | | | | | | | |
Paid-in capital | | $ | 101,474,633 | | | $ | 93,907,914 | |
Accumulated Gain (Loss) | | | 9,544,634 | | | | 24,526,788 | |
| | | | | | | | |
Net assets | | $ | 111,019,267 | | | $ | 118,434,702 | |
| | | | | | | | |
| | | | | | | | |
(a) Cost of investments: | | $ | 108,586,957 | | | $ | 102,735,959 | |
(b) Cost of repurchase agreements: | | $ | 202,717 | | | $ | - | |
(c) Securities on loan with market value of: | | $ | 495,579 | | | $ | - | |
(d) Cost of foreign currency: | | $ | - | | | $ | - | |
The accompanying notes are an integral part of the financial statements.
168
| | | | | | | | | | | | | | | | | | |
MassMutual
Premier
Disciplined
Growth Fund | | | MassMutual
Premier
Small Cap
Opportunities
Fund | | | MassMutual
Premier
Global Fund | | | MassMutual
Premier
International
Equity Fund | | | MassMutual
Premier
Strategic
Emerging
Markets Fund | |
| | | | | | | | | | | | | | | | | | |
| $ | 257,622,082 | | | $ | 207,583,134 | | | $ | 292,413,211 | | | $ | 290,710,711 | | | $ | 148,104,476 | |
| | 258,637 | | | | 3,073,487 | | | | 2,958,022 | | | | 2,181,720 | | | | 5,989,895 | |
| | | | | | | | | | | | | | | | | | |
| | 257,880,719 | | | | 210,656,621 | | | | 295,371,233 | | | | 292,892,431 | | | | 154,094,371 | |
| | | | | | | | | | | | | | | | | | |
| | 233,656 | | | | - | | | | 9 | | | | 19 | | | | - | |
| | - | | | | - | | | | - | | | | 17,995 | | | | 142,067 | |
| | | | | | | | | | | | | | | | | | |
| | - | | | | 72,505 | | | | 510,034 | | | | 531,519 | | | | 287,677 | |
| | - | | | | - | | | | - | | | | - | | | | 96 | |
| | 104,458 | | | | 61,209 | | | | 1,765,859 | | | | 656,789 | | | | 24,284 | |
| | 138,398 | | | | 182,039 | | | | 287,495 | | | | 311,807 | | | | 254,612 | |
| | - | | | | - | | | | 370,740 | | | | 914,101 | | | | 241 | |
| | 35,301 | | | | 38,308 | | | | 28,386 | | | | 35,611 | | | | 41,980 | |
| | | | | | | | | | | | | | | | | | |
| | 258,392,532 | | | | 211,010,682 | | | | 298,333,756 | | | | 295,360,272 | | | | 154,845,328 | |
| | | | | | | | | | | | | | | | | | |
| | | | | | | | | | | | | | | | | | |
| | | | | | | | | | | | | | | | | | |
| | - | | | | - | | | | 612,628 | | | | 79,022 | | | | 15,957 | |
| | - | | | | - | | | | 13 | | | | - | | | | - | |
| | 283,861 | | | | 329,578 | | | | 423,248 | | | | 971,244 | | | | 268,466 | |
| | 297,990 | | | | 6,119,086 | | | | 2,433,703 | | | | 1,621,105 | | | | 3,245,885 | |
| | 41,522 | | | | 31,179 | | | | 47,251 | | | | 80,439 | | | | 20,665 | |
| | | | | | | | | | | | | | | | | | |
| | 99,871 | | | | 100,913 | | | | 190,126 | | | | 217,395 | | | | 130,657 | |
| | 47,485 | | | | 38,769 | | | | 51,477 | | | | 43,558 | | | | 27,132 | |
| | 38,930 | | | | 45,029 | | | | 28,900 | | | | 22,420 | | | | 1,868 | |
| | 10,019 | | | | 9,785 | | | | 13,542 | | | | 3,965 | | | | 247 | |
| | 4,105 | | | | 5,653 | | | | 7,012 | | | | 3,697 | | | | 480 | |
| | - | | | | - | | | | - | | | | - | | | | - | |
| | - | | | | - | | | | - | | | | - | | | | - | |
| | 64,601 | | | | 63,451 | | | | 96,603 | | | | 338,854 | | | | 532,678 | |
| | | | | | | | | | | | | | | | | | |
| | 888,384 | | | | 6,743,443 | | | | 3,904,503 | | | | 3,381,699 | | | | 4,244,035 | |
| | | | | | | | | | | | | | | | | | |
| $ | 257,504,148 | | | $ | 204,267,239 | | | $ | 294,429,253 | | | $ | 291,978,573 | | | $ | 150,601,293 | |
| | | | | | | | | | | | | | | | | | |
| | | | | | | | | | | | | | | | | | |
| $ | 198,999,294 | | | $ | 187,805,663 | | | $ | 186,699,646 | | | $ | 243,743,865 | | | $ | 128,887,082 | |
| | 58,504,854 | | | | 16,461,576 | | | | 107,729,607 | | | | 48,234,708 | | | | 21,714,211 | |
| | | | | | | | | | | | | | | | | | |
| $ | 257,504,148 | | | $ | 204,267,239 | | | $ | 294,429,253 | | | $ | 291,978,573 | | | $ | 150,601,293 | |
| | | | | | | | | | | | | | | | | | |
| | | | | | | | | | | | | | | | | | |
| $ | 222,106,029 | | | $ | 193,005,784 | | | $ | 184,470,019 | | | $ | 250,076,320 | | | $ | 137,610,794 | |
| $ | 258,637 | | | $ | 3,073,487 | | | $ | 2,958,022 | | | $ | 2,181,720 | | | $ | 5,989,895 | |
| $ | 289,040 | | | $ | 5,908,513 | | | $ | 2,370,849 | | | $ | 1,541,191 | | | $ | 3,071,504 | |
| $ | - | | | $ | - | | | $ | - | | | $ | 17,999 | | | $ | 142,022 | |
169
MassMutual Premier Funds – Financial Statements (Continued)
Statements of Assets and Liabilities
September 30, 2019
| | | | | | | | |
| | | MassMutual
Premier
Disciplined
Value Fund | | | MassMutual
Premier
Main Street
Fund | |
| Class I shares: | | | | | | | | |
Net assets | | $ | 16,781,050 | | | $ | 24,638,687 | |
| | | | | | | | |
Shares outstanding (a) | | | 1,200,133 | | | | 2,226,186 | |
| | | | | | | | |
Net asset value, offering price and redemption price per share | | $ | 13.98 | | | $ | 11.07 | |
| | | | | | | | |
| Class R5 shares: | | | | | | | | |
Net assets | | $ | 53,708,903 | | | $ | 48,225,711 | |
| | | | | | | | |
Shares outstanding (a) | | | 3,832,780 | | | | 4,360,056 | |
| | | | | | | | |
Net asset value, offering price and redemption price per share | | $ | 14.01 | | | $ | 11.06 | |
| | | | | | | | |
| Service Class shares: | | | | | | | | |
Net assets | | $ | 20,401,105 | | | $ | 651,963 | |
| | | | | | | | |
Shares outstanding (a) | | | 1,469,500 | | | | 56,717 | |
| | | | | | | | |
Net asset value, offering price and redemption price per share | | $ | 13.88 | | | $ | 11.50 | |
| | | | | | | | |
| Administrative Class shares: | | | | | | | | |
Net assets | | $ | 5,731,041 | | | $ | 24,457,721 | |
| | | | | | | | |
Shares outstanding (a) | | | 403,594 | | | | 2,214,340 | |
| | | | | | | | |
Net asset value, offering price and redemption price per share | | $ | 14.20 | | | $ | 11.05 | |
| | | | | | | | |
| Class A shares: | | | | | | | | |
Net assets | | $ | 6,012,042 | | | $ | 12,842,923 | |
| | | | | | | | |
Shares outstanding (a) | | | 437,765 | | | | 1,182,654 | |
| | | | | | | | |
Net asset value, and redemption price per share | | $ | 13.73 | | | $ | 10.86 | |
| | | | | | | | |
Offering price per share(100/[100-maximum sales charge] of net asset value) | | $ | 14.53 | | | $ | 11.49 | |
| | | | | | | | |
| Class R4 shares: | | | | | | | | |
Net assets | | $ | 4,039,126 | | | $ | 6,378,800 | |
| | | | | | | | |
Shares outstanding (a) | | | 296,336 | | | | 592,178 | |
| | | | | | | | |
Net asset value, offering price and redemption price per share | | $ | 13.63 | | | $ | 10.77 | |
| | | | | | | | |
| Class R3 shares: | | | | | | | | |
Net assets | | $ | 4,346,000 | | | $ | 1,238,897 | |
| | | | | | | | |
Shares outstanding (a) | | | 313,797 | | | | 113,883 | |
| | | | | | | | |
Net asset value, offering price and redemption price per share | | $ | 13.85 | | | $ | 10.88 | |
| | | | | | | | |
| (a) | Authorized unlimited number of shares with no par value. |
The accompanying notes are an integral part of the financial statements.
170
| | | | | | | | | | | | | | | | | | |
MassMutual
Premier
Disciplined
Growth Fund | | | MassMutual
Premier
Small Cap
Opportunities
Fund | | | MassMutual
Premier
Global Fund | | | MassMutual
Premier
International
Equity Fund | | | MassMutual
Premier
Strategic
Emerging
Markets Fund | |
| | | | | | | | | | | | | | | | | | |
| $ | 28,366,858 | | | $ | 35,325,805 | | | $ | 70,159,496 | | | $ | 149,979,400 | | | $ | 141,987,728 | |
| | | | | | | | | | | | | | | | | | |
| | 2,578,926 | | | | 2,574,534 | | | | 5,683,035 | | | | 12,486,960 | | | | 10,903,429 | |
| | | | | | | | | | | | | | | | | | |
| $ | 11.00 | | | $ | 13.72 | | | $ | 12.35 | | | $ | 12.01 | | | $ | 13.02 | |
| | | | | | | | | | | | | | | | | | |
| | | | | | | | | | | | | | | | | | |
| $ | 100,651,014 | | | $ | 61,825,538 | | | $ | 98,379,017 | | | $ | 94,826,518 | | | $ | 4,295,398 | |
| | | | | | | | | | | | | | | | | | |
| | 9,147,776 | | | | 4,514,934 | | | | 7,962,676 | | | | 7,900,221 | | | | 325,331 | |
| | | | | | | | | | | | | | | | | | |
| $ | 11.00 | | | $ | 13.69 | | | $ | 12.36 | | | $ | 12.00 | | | $ | 13.20 | |
| | | | | | | | | | | | | | | | | | |
| | | | | | | | | | | | | | | | | | |
| $ | 31,895,439 | | | $ | 17,072,813 | | | $ | 6,361,184 | | | $ | 9,393,106 | | | $ | 419,232 | |
| | | | | | | | | | | | | | | | | | |
| | 2,889,509 | | | | 1,250,127 | | | | 520,014 | | | | 784,840 | | | | 32,115 | |
| | | | | | | | | | | | | | | | | | |
| $ | 11.04 | | | $ | 13.66 | | | $ | 12.23 | | | $ | 11.97 | | | $ | 13.05 | |
| | | | | | | | | | | | | | | | | | |
| | | | | | | | | | | | | | | | | | |
| $ | 37,316,360 | | | $ | 20,376,858 | | | $ | 77,096,941 | | | $ | 5,465,195 | | | $ | 926,865 | |
| | | | | | | | | | | | | | | | | | |
| | 3,335,126 | | | | 1,502,036 | | | | 6,246,613 | | | | 459,052 | | | | 70,863 | |
| | | | | | | | | | | | | | | | | | |
| $ | 11.19 | | | $ | 13.57 | | | $ | 12.34 | | | $ | 11.91 | | | $ | 13.08 | |
| | | | | | | | | | | | | | | | | | |
| | | | | | | | | | | | | | | | | | |
| $ | 29,209,930 | | | $ | 50,524,491 | | | $ | 24,675,865 | | | $ | 22,004,462 | | | $ | 885,225 | |
| | | | | | | | | | | | | | | | | | |
| | 2,705,083 | | | | 3,824,944 | | | | 2,027,984 | | | | 1,906,502 | | | | 68,200 | |
| | | | | | | | | | | | | | | | | | |
| $ | 10.80 | | | $ | 13.21 | | | $ | 12.17 | | | $ | 11.54 | | | $ | 12.98 | |
| | | | | | | | | | | | | | | | | | |
| $ | 11.43 | | | $ | 13.98 | | | $ | 12.88 | | | $ | 12.21 | | | $ | 13.74 | |
| | | | | | | | | | | | | | | | | | |
| | | | | | | | | | | | | | | | | | |
| $ | 24,049,238 | | | $ | 10,590,569 | | | $ | 7,530,669 | | | $ | 4,894,739 | | | $ | 1,337,280 | |
| | | | | | | | | | | | | | | | | | |
| | 2,248,405 | | | | 807,309 | | | | 628,572 | | | | 428,400 | | | | 103,653 | |
| | | | | | | | | | | | | | | | | | |
| $ | 10.70 | | | $ | 13.12 | | | $ | 11.98 | | | $ | 11.43 | | | $ | 12.90 | |
| | | | | | | | | | | | | | | | | | |
| | | | | | | | | | | | | | | | | | |
| $ | 6,015,309 | | | $ | 8,551,165 | | | $ | 10,226,081 | | | $ | 5,415,153 | | | $ | 749,565 | |
| | | | | | | | | | | | | | | | | | |
| | 564,034 | | | | 657,792 | | | | 845,336 | | | | 475,748 | | | | 58,231 | |
| | | | | | | | | | | | | | | | | | |
| $ | 10.66 | | | $ | 13.00 | | | $ | 12.10 | | | $ | 11.38 | | | $ | 12.87 | |
| | | | | | | | | | | | | | | | | | |
171
MassMutual Premier Funds – Financial Statements(Continued)
Statements of Operations
For the Year Ended September 30, 2019
| | | | | | | | |
| | | MassMutual
Premier
U.S. Government
Money
Market Fund | | | MassMutual
Premier
Short-Duration
Bond Fund | |
| Investment income (Note 2): | | | | | | | | |
Dividends (a) | | $ | - | | | $ | 9,929 | |
Interest (b) | | | 7,991,640 | | | | 17,793,847 | |
Securities lending net income | | | - | | | | 158 | |
| | | | | | | | |
Total investment income | | | 7,991,640 | | | | 17,803,934 | |
| | | | | | | | |
| Expenses (Note 3): | | | | | | | | |
Investment advisory fees | | | 1,194,357 | | | | 1,747,768 | |
Custody fees | | | 42,553 | | | | 61,048 | |
Interest expense | | | - | | | | - | |
Audit fees | | | 33,654 | | | | 39,550 | |
Legal fees | | | 10,568 | | | | 23,019 | |
Proxy fees | | | 1,365 | | | | 1,365 | |
Accounting & Administration fees | | | 71,482 | | | | 94,094 | |
Shareholder reporting fees | | | 19,007 | | | | 40,127 | |
Trustees’ fees | | | 16,745 | | | | 25,230 | |
Registration and filing fees | | | 26,680 | | | | 102,234 | |
Transfer agent fees | | | 3,000 | | | | 3,000 | |
| | | | | | | | |
| | | 1,419,411 | | | | 2,137,435 | |
Administration fees: | | | | | | | | |
Class R5 | | | 341,245 | | | | 139,080 | |
Service Class | | | - | | | | 95,618 | |
Administrative Class | | | - | | | | 48,632 | |
Class A | | | - | | | | 83,834 | |
Class R4 | | | - | | | | 25,860 | |
Class R3 | | | - | | | | 14,869 | |
Distribution fees: | | | | | | | | |
Class R3 | | | - | | | | 18,586 | |
Distribution and Service fees: | | | | | | | | |
Class A | | | - | | | | 139,724 | |
Class R4 | | | - | | | | 32,325 | |
Class R3 | | | - | | | | 18,586 | |
Shareholder service fees: | | | | | | | | |
Service Class | | | - | | | | 31,873 | |
Administrative Class | | | - | | | | 48,632 | |
Class A | | | - | | | | 83,834 | |
| | | | | | | | |
Total expenses | | | 1,760,656 | | | | 2,918,888 | |
Expenses waived(Note 3): | | | | | | | | |
Class I fees reimbursed by adviser | | | - | | | | - | |
Class R5 fees reimbursed by adviser | | | - | | | | - | |
Service Class fees reimbursed by adviser | | | - | | | | - | |
Administrative Class fees reimbursed by adviser | | | - | | | | - | |
Class A fees reimbursed by adviser | | | - | | | | - | |
Class R4 fees reimbursed by adviser | | | - | | | | - | |
Class R3 fees reimbursed by adviser | | | - | | | | - | |
Class I advisory fees waived | | | - | | | | - | |
Class R5 advisory fees waived | | | - | | | | - | |
Service Class advisory fees waived | | | - | | | | - | |
Administrative Class advisory fees waived | | | - | | | | - | |
Class A advisory fees waived | | | - | | | | - | |
Class R4 advisory fees waived | | | - | | | | - | |
Class R3 advisory fees waived | | | - | | | | - | |
| | | | | | | | |
Net expenses: | | | 1,760,656 | | | | 2,918,888 | |
| | | | | | | | |
Net investment income (loss) | | | 6,230,984 | | | | 14,885,046 | |
| | | | | | | | |
The accompanying notes are an integral part of the financial statements.
172
| | | | | | | | | | | | | | | | | | |
MassMutual
Premier
Inflation-
Protected and
Income Fund | | | MassMutual
Premier
Core Bond
Fund | | | MassMutual
Premier
Diversified
Bond Fund | | | MassMutual
Premier
High Yield
Fund | | | MassMutual
Premier
Balanced
Fund | |
| | | | | | | | | | | | | | | | | | |
| $ | - | | | $ | 192,334 | | | $ | 16,741 | | | $ | - | | | $ | 1,589,069 | |
| | 8,655,594 | | | | 50,723,336 | | | | 8,768,391 | | | | 37,493,147 | | | | 1,662,022 | |
| | 1,636 | | | | 8,928 | | | | 3,706 | | | | 283,851 | | | | 9,083 | |
| | | | | | | | | | | | | | | | | | |
| | 8,657,230 | | | | 50,924,598 | | | | 8,788,838 | | | | 37,776,998 | | | | 3,260,174 | |
| | | | | | | | | | | | | | | | | | |
| | | | | | | | | | | | | | | | | | |
| | 1,141,105 | | | | 5,025,081 | | | | 793,028 | | | | 2,569,909 | | | | 565,408 | |
| | 27,540 | | | | 143,273 | | | | 74,661 | | | | 96,663 | | | | 63,239 | |
| | 86,165 | | | | - | | | | - | | | | - | | | | 5 | |
| | 39,855 | | | | 40,874 | | | | 40,737 | | | | 38,665 | | | | 40,730 | |
| | 9,681 | | | | 54,588 | | | | 14,448 | | | | 13,930 | | | | 4,812 | |
| | 1,365 | | | | 1,365 | | | | 1,365 | | | | 1,365 | | | | 1,365 | |
| | 56,874 | | | | 145,393 | | | | 105,351 | | | | 66,323 | | | | 83,671 | |
| | 32,240 | | | | 66,660 | | | | 27,217 | | | | 39,349 | | | | 24,031 | |
| | 15,038 | | | | 66,156 | | | | 10,581 | | | | 27,670 | | | | 5,900 | |
| | 103,779 | | | | 103,604 | | | | 100,432 | | | | 101,992 | | | | 100,490 | |
| | 3,000 | | | | 3,000 | | | | 3,000 | | | | 3,000 | | | | 3,000 | |
| | | | | | | | | | | | | | | | | | |
| | 1,516,642 | | | | 5,649,994 | | | | 1,170,820 | | | | 2,958,866 | | | | 892,651 | |
| | | | | | | | | | | | | | | | | | |
| | 66,184 | | | | 286,535 | | | | 102,018 | | | | 40,913 | | | | 45,768 | |
| | 73,813 | | | | 139,872 | | | | 21,405 | | | | 68,277 | | | | 9,743 | |
| | 23,328 | | | | 99,228 | | | | 35,472 | | | | 39,961 | | | | 10,484 | |
| | 26,059 | | | | 148,438 | | | | 46,309 | | | | 41,830 | | | | 39,988 | |
| | 12,854 | | | | 25,967 | | | | 12,664 | | | | 82,372 | | | | 5,823 | |
| | 8,392 | | | | 1,660 | | | | 8,252 | | | | 86,398 | | | | 15,758 | |
| | | | | | | | | | | | | | | | | | |
| | 10,490 | | | | 2,076 | | | | 10,315 | | | | 107,998 | | | | 19,697 | |
| | | | | | | | | | | | | | | | | | |
| | 43,432 | | | | 247,396 | | | | 77,181 | | | | 69,716 | | | | 66,647 | |
| | 16,068 | | | | 32,458 | | | | 15,830 | | | | 102,965 | | | | 7,279 | |
| | 10,490 | | | | 2,076 | | | | 10,315 | | | | 107,998 | | | | 19,697 | |
| | | | | | | | | | | �� | | | | | | | |
| | 24,604 | | | | 46,624 | | | | 7,135 | | | | 22,759 | | | | 3,248 | |
| | 23,328 | | | | 99,228 | | | | 35,472 | | | | 39,961 | | | | 10,484 | |
| | 26,059 | | | | 148,438 | | | | 46,309 | | | | 41,830 | | | | 39,988 | |
| | | | | | | | | | | | | | | | | | |
| | 1,881,743 | | | | 6,929,990 | | | | 1,599,497 | | | | 3,811,844 | | | | 1,187,255 | |
| | | | | | | | | | | | | | | | | | |
| | - | | | | - | | | | - | | | | - | | | | (4,834 | ) |
| | - | | | | - | | | | - | | | | - | | | | (15,159 | ) |
| | - | | | | - | | | | - | | | | - | | | | (2,223 | ) |
| | - | | | | - | | | | - | | | | - | | | | (2,453 | ) |
| | - | | | | - | | | | - | | | | - | | | | (8,851 | ) |
| | - | | | | - | | | | - | | | | - | | | | (1,058 | ) |
| | - | | | | - | | | | - | | | | - | | | | (2,808 | ) |
| | (13,481 | ) | | | - | | | | - | | | | - | | | | - | |
| | (6,201 | ) | | | - | | | | - | | | | - | | | | - | |
| | (4,907 | ) | | | - | | | | - | | | | - | | | | - | |
| | (1,537 | ) | | | - | | | | - | | | | - | | | | - | |
| | (1,871 | ) | | | - | | | | - | | | | - | | | | - | |
| | (629 | ) | | | - | | | | - | | | | - | | | | - | |
| | (430 | ) | | | - | | | | - | | | | - | | | | - | |
| | | | | | | | | | | | | | | | | | |
| | 1,852,687 | | | | 6,929,990 | | | | 1,599,497 | | | | 3,811,844 | | | | 1,149,869 | |
| | | | | | | | | | | | | | | | | | |
| | 6,804,543 | | | | 43,994,608 | | | | 7,189,341 | | | | 33,965,154 | | | | 2,110,305 | |
| | | | | | | | | | | | | | | | | | |
173
MassMutual Premier Funds – Financial Statements(Continued)
Statements of Operations (Continued)
For the Year Ended September 30, 2019
| | | | | | | | |
| | | MassMutual
Premier
U.S. Government
Money
Market Fund | | | MassMutual
Premier
Short-Duration
Bond Fund | |
| Realized and unrealized gain (loss): | | | | | | | | |
Net realized gain (loss) on: | | | | | | | | |
Investment transactions | | $ | 19,866 | | | $ | 1,193,696 | |
Futures contracts | | | - | | | | (7,582,266 | ) |
Swap agreements | | | - | | | | (33,361 | ) |
Foreign currency transactions | | | - | | | | - | |
Forward contracts | | | - | | | | - | |
| | | | | | | | |
Net realized gain (loss) | | | 19,866 | | | | (6,421,931 | ) |
| | | | | | | | |
Net change in unrealized appreciation (depreciation) on: | | | | | | | | |
Investment transactions | | | - | | | | 10,192,830 | |
Futures contracts | | | - | | | | 116,415 | |
Swap agreements | | | - | | | | 228,036 | |
Translation of assets and liabilities in foreign currencies | | | - | | | | - | |
Forward contracts | | | - | | | | - | |
| | | | | | | | |
Net change in unrealized appreciation (depreciation) | | | - | | | | 10,537,281 | |
| | | | | | | | |
Net realized gain (loss) and change in unrealized appreciation (depreciation) | | | 19,866 | | | | 4,115,350 | |
| | | | | | | | |
Net increase (decrease) in net assets resulting from operations | | $ | 6,250,850 | | | $ | 19,000,396 | |
| | | | | | | | |
| | | | | | | | |
(a) Net of foreign withholding tax of: | | $ | - | | | $ | - | |
(b) Net of foreign withholding tax of: | | $ | - | | | $ | 4,351 | |
The accompanying notes are an integral part of the financial statements.
174
| | | | | | | | | | | | | | | | | | |
MassMutual
Premier
Inflation-
Protected and
Income Fund | | | MassMutual
Premier
Core Bond
Fund | | | MassMutual
Premier
Diversified
Bond Fund | | | MassMutual
Premier
High Yield
Fund | | | MassMutual
Premier
Balanced
Fund | |
| | | | | | | | | | | | | | | | | | |
| | | | | | | | | | | | | | | | | | |
| $ | 2,634,327 | | | $ | 8,764,494 | | | $ | 785,240 | | | $ | (11,039,887 | ) | | $ | 4,859,775 | |
| | 534,020 | | | | 18,343,788 | | | | 2,806,937 | | | | - | | | | 450,497 | |
| | (775,275 | ) | | | (67,305 | ) | | | 693 | | | | - | | | | (8,636 | ) |
| | - | | | | - | | | | 2,516 | | | | (224 | ) | | | - | |
| | - | | | | - | | | | (33,655 | ) | | | - | | | | - | |
| | | | | | | | | | | | | | | | | | |
| | 2,393,072 | | | | 27,040,977 | | | | 3,561,731 | | | | (11,040,111 | ) | | | 5,301,636 | |
| | | | | | | | | | | | | | | | | | |
| | | | | | | | | | | | | | | | | | |
| | 10,371,758 | | | | 54,530,094 | | | | 9,323,682 | | | | 3,399,787 | | | | (4,933,232 | ) |
| | (140,861 | ) | | | (278,544 | ) | | | 9,541 | | | | - | | | | (68,275 | ) |
| | 116,208 | | | | 475,660 | | | | 70,546 | | | | - | | | | 17,353 | |
| | - | | | | - | | | | (5,279 | ) | | | - | | | | - | |
| | - | | | | - | | | | (4,899 | ) | | | - | | | | - | |
| | | | | | | | | | | | | | | | | | |
| | 10,347,105 | | | | 54,727,210 | | | | 9,393,591 | | | | 3,399,787 | | | | (4,984,154 | ) |
| | | | | | | | | | | | | | | | | | |
| | 12,740,177 | | | | 81,768,187 | | | | 12,955,322 | | | | (7,640,324 | ) | | | 317,482 | |
| | | | | | | | | | | | | | | | | | |
| $ | 19,544,720 | | | $ | 125,762,795 | | | $ | 20,144,663 | | | $ | 26,324,830 | | | $ | 2,427,787 | |
| | | | | | | | | | | | | | | | | | |
| | | | | | | | | | | | | | | | | | |
| $ | - | | | $ | - | | | $ | - | | | $ | - | | | $ | 68 | |
| $ | - | | | $ | - | | | $ | 5,237 | | | $ | - | | | $ | - | |
175
MassMutual Premier Funds – Financial Statements(Continued)
Statements of Operations
For the Year Ended September 30, 2019
| | | | | | | | |
| | |
MassMutual
Premier
Disciplined
Value Fund | | | MassMutual
Premier
Main Street
Fund | |
| Investment income (Note 2): | |
Dividends — unaffiliated issuers (a) | | $ | 3,491,098 | | | $ | 2,502,266 | |
Dividends — affiliated issuers(Note 7) | | | - | | | | - | |
Interest | | | 7,329 | | | | 31,508 | |
Securities lending net income | | | 33,785 | | | | 23,935 | |
| | | | | | | | |
Total investment income | | | 3,532,212 | | | | 2,557,709 | |
| | | | | | | | |
| Expenses (Note 3): | |
Investment advisory fees | | | 595,484 | | | | 696,054 | |
Custody fees | | | 21,144 | | | | 31,667 | |
Audit fees | | | 39,232 | | | | 36,582 | |
Legal fees | | | 4,256 | | | | 5,337 | |
Proxy fees | | | 1,365 | | | | 1,365 | |
Accounting & Administration fees | | | 31,053 | | | | 24,991 | |
Shareholder reporting fees | | | 49,686 | | | | 20,040 | |
Trustees’ fees | | | 6,851 | | | | 6,405 | |
Registration and filing fees | | | 101,094 | | | | 101,411 | |
Transfer agent fees | | | 3,000 | | | | 3,000 | |
| | | | | | | | |
| | | 853,165 | | | | 926,852 | |
Administration fees: | | | | | | | | |
Class R5 | | | 54,396 | | | | 56,787 | |
Service Class | | | 54,231 | | | | 952 | |
Administrative Class | | | 11,221 | | | | 38,633 | |
Class A | | | 11,148 | | | | 19,668 | |
Class R4 | | | 10,015 | | | | 12,104 | |
Class R3 | | | 8,093 | | | | 2,709 | |
Distribution fees: | | | | | | | | |
Class R3 | | | 10,116 | | | | 3,386 | |
Distribution and Service fees: | | | | | | | | |
Class A | | | 18,581 | | | | 32,779 | |
Class R4 | | | 12,519 | | | | 15,129 | |
Class R3 | | | 10,116 | | | | 3,386 | |
Shareholder service fees: | | | | | | | | |
Service Class | | | 18,077 | | | | 317 | |
Administrative Class | | | 11,221 | | | | 38,633 | |
Class A | | | 11,148 | | | | 19,668 | |
| | | | | | | | |
Total expenses | | | 1,094,047 | | | | 1,171,003 | |
Expenses waived(Note 3): | | | | | | | | |
Class I fees reimbursed by adviser | | | - | | | | - | |
Class R5 fees reimbursed by adviser | | | - | | | | - | |
Service Class fees reimbursed by adviser | | | - | | | | - | |
Administrative Class fees reimbursed by adviser | | | - | | | | - | |
Class A fees reimbursed by adviser | | | - | | | | - | |
Class R4 fees reimbursed by adviser | | | - | | | | - | |
Class R3 fees reimbursed by adviser | | | - | | | | - | |
Class I advisory fees waived | | | - | | | | - | |
Class R5 advisory fees waived | | | - | | | | - | |
Service Class advisory fees waived | | | - | | | | - | |
Administrative Class advisory fees waived | | | - | | | | - | |
Class A advisory fees waived | | | - | | | | - | |
Class R4 advisory fees waived | | | - | | | | - | |
Class R3 advisory fees waived | | | - | | | | - | |
| | | | | | | | |
Net expenses: | | | 1,094,047 | | | | 1,171,003 | |
| | | | | | | | |
Net investment income (loss) | | | 2,438,165 | | | | 1,386,706 | |
| | | | | | | | |
The accompanying notes are an integral part of the financial statements.
176
| | | | | | | | | | | | | | | | | | |
MassMutual
Premier
Disciplined
Growth Fund | | | MassMutual
Premier
Small Cap
Opportunities
Fund | | | MassMutual
Premier
Global Fund | | | MassMutual
Premier
International
Equity Fund | | | MassMutual
Premier
Strategic
Emerging
Markets Fund | |
| | | | | | | | | | | | | | | | | | |
| $ | 4,164,237 | | | $ | 3,087,869 | | | $ | 4,577,274 | | | $ | 6,438,732 | | | $ | 2,992,829 | |
| | - | | | | - | | | | 113,609 | | | | 354,956 | | | | - | |
| | 13,925 | | | | 44,332 | | | | 5,278 | | | | 13,707 | | | | 87,369 | |
| | 37,326 | | | | 72,121 | | | | 40,683 | | | | 89,491 | | | | 47,423 | |
| | | | | | | | | | | | | | | | | | |
| | 4,215,488 | | | | 3,204,322 | | | | 4,736,844 | | | | 6,896,886 | | | | 3,127,621 | |
| | | | | | | | | | | | | | | | | | |
| | | | | | | | | | | | | | | | | | |
| | 1,314,637 | | | | 1,234,405 | | | | 2,224,679 | | | | 3,259,083 | | | | 1,894,993 | |
| | 21,769 | | | | 24,726 | | | | 12,643 | | | | 35,713 | | | | 153,467 | |
| | 39,221 | | | | 37,595 | | | | 47,508 | | | | 47,087 | | | | 62,987 | |
| | 8,901 | | | | 9,805 | | | | 12,130 | | | | 17,608 | | | | 11,865 | |
| | 1,365 | | | | 1,365 | | | | 1,365 | | | | 1,365 | | | | 1,365 | |
| | 32,631 | | | | 28,129 | | | | 39,536 | | | | 40,628 | | | | 37,345 | |
| | 55,826 | | | | 26,471 | | | | 28,246 | | | | 33,945 | | | | 20,446 | |
| | 14,960 | | | | 10,768 | | | | 14,918 | | | | 20,015 | | | | 9,770 | |
| | 101,800 | | | | 105,253 | | | | 101,115 | | | | 103,554 | | | | 101,888 | |
| | 3,000 | | | | 3,000 | | | | 3,000 | | | | 3,000 | | | | 3,000 | |
| | | | | | | | | | | | | | | | | | |
| | 1,594,110 | | | | 1,481,517 | | | | 2,485,140 | | | | 3,561,998 | | | | 2,297,126 | |
| | | | | | | | | | | | | | | | | | |
| | 99,116 | | | | 66,142 | | | | 97,667 | | | | 116,010 | | | | 4,097 | |
| | 89,492 | | | | 24,162 | | | | 14,374 | | | | 20,072 | | | | 249 | |
| | 58,324 | | | | 32,179 | | | | 121,881 | | | | 11,773 | | | | 1,363 | |
| | 49,126 | | | | 81,010 | | | | 41,495 | | | | 37,051 | | | | 1,038 | |
| | 51,823 | | | | 20,962 | | | | 16,500 | | | | 16,261 | | | | 2,734 | |
| | 12,874 | | | | 17,867 | | | | 21,321 | | | | 13,036 | | | | 1,477 | |
| | | | | | | | | | | | | | | | | | |
| | 16,093 | | | | 22,334 | | | | 26,651 | | | | 16,295 | | | | 1,846 | |
| | | | | | | | | | | | | | | | | | |
| | 81,877 | | | | 135,017 | | | | 69,159 | | | | 61,752 | | | | 1,730 | |
| | 64,779 | | | | 26,203 | | | | 20,626 | | | | 20,326 | | | | 3,417 | |
| | 16,093 | | | | 22,334 | | | | 26,651 | | | | 16,295 | | | | 1,846 | |
| | | | | | | | | | | | | | | | | | |
| | 29,831 | | | | 8,054 | | | | 4,791 | | | | 6,691 | | | | 83 | |
| | 58,324 | | | | 32,179 | | | | 121,881 | | | | 11,773 | | | | 1,363 | |
| | 49,126 | | | | 81,010 | | | | 41,495 | | | | 37,051 | | | | 1,038 | |
| | | | | | | | | | | | | | | | | | |
| | 2,270,988 | | | | 2,050,970 | | | | 3,109,632 | | | | 3,946,384 | | | | 2,319,407 | |
| | | | | | | | | | | | | | | | | | |
| | - | | | | - | | | | - | | | | - | | | | (197,120 | ) |
| | - | | | | - | | | | - | | | | - | | | | (3,888 | ) |
| | - | | | | - | | | | - | | | | - | | | | (165 | ) |
| | - | | | | - | | | | - | | | | - | | | | (886 | ) |
| | - | | | | - | | | | - | | | | - | | | | (597 | ) |
| | - | | | | - | | | | - | | | | - | | | | (1,329 | ) |
| | - | | | | - | | | | - | | | | - | | | | (727 | ) |
| | - | | | | - | | | | - | | | | (25,799 | ) | | | - | |
| | - | | | | - | | | | - | | | | (13,562 | ) | | | - | |
| | - | | | | - | | | | - | | | | (1,669 | ) | | | - | |
| | - | | | | - | | | | - | | | | (945 | ) | | | - | |
| | - | | | | - | | | | - | | | | (2,925 | ) | | | - | |
| | - | | | | - | | | | - | | | | (955 | ) | | | - | |
| | - | | | | - | | | | - | | | | (799 | ) | | | - | |
| | | | | | | | | | | | | | | | | | |
| | 2,270,988 | | | | 2,050,970 | | | | 3,109,632 | | | | 3,899,730 | | | | 2,114,695 | |
| | | | | | | | | | | | | | | | | | |
| | 1,944,500 | | | | 1,153,352 | | | | 1,627,212 | | | | 2,997,156 | | | | 1,012,926 | |
| | | | | | | | | | | | | | | | | | |
177
MassMutual Premier Funds – Financial Statements(Continued)
Statements of Operations (Continued)
For the Year Ended September 30, 2019
| | | | | | | | |
| | |
MassMutual
Premier
Disciplined
Value Fund | | | MassMutual
Premier
Main Street
Fund | |
| Realized and unrealized gain (loss): | |
Net realized gain (loss) on: | | | | | | | | |
Investment transactions — unaffiliated issuers | | $ | 6,389,271 | | | $ | 10,437,495 | |
Futures contracts | | | 107,452 | | | | - | |
Foreign currency transactions | | | - | | | | (3,165 | ) |
| | | | | | | | |
Net realized gain (loss) | | | 6,496,723 | | | | 10,434,330 | |
| | | | | | | | |
Net change in unrealized appreciation (depreciation) on: | | | | | | | | |
Investment transactions — unaffiliated issuers | | | (11,828,423 | ) | | | (6,202,846 | ) |
Translation of assets and liabilities in foreign currencies | | | - | | | | - | |
| | | | | | | | |
Net change in unrealized appreciation (depreciation) | | | (11,828,423 | ) | | | (6,202,846 | ) |
| | | | | | | | |
Net realized gain (loss) and change in unrealized appreciation (depreciation) | | | (5,331,700 | ) | | | 4,231,484 | |
| | | | | | | | |
Net increase (decrease) in net assets resulting from operations | | $ | (2,893,535 | ) | | $ | 5,618,190 | |
| | | | | | | | |
| | | | | | | | |
(a) Net of foreign withholding tax of: | | $ | 1,730 | | | $ | 17,019 | |
* Net of net increase (decrease) in accrued foreign capital gains tax of: | | $ | - | | | $ | - | |
The accompanying notes are an integral part of the financial statements.
178
| | | | | | | | | | | | | | | | | | |
MassMutual
Premier
Disciplined
Growth Fund | | | MassMutual
Premier
Small Cap
Opportunities
Fund | | | MassMutual
Premier
Global Fund | | | MassMutual
Premier
International
Equity Fund | | | MassMutual
Premier
Strategic
Emerging
Markets Fund | |
| | | | | | | | | | | | | | | | | | |
| | | | | | | | | | | | | | | | | | |
| $ | 23,316,368 | | | $ | 4,354,988 | | | $ | 3,890,036 | | | $ | 14,055,869 | | | $ | 20,674,810 | |
| | 230,909 | | | | - | | | | - | | | | - | | | | - | |
| | - | | | | - | | | | (11,423 | ) | | | (192,813 | ) | | | (38,093 | ) |
| | | | | | | | | | | | | | | | | | |
| | 23,547,277 | | | | 4,354,988 | | | | 3,878,613 | | | | 13,863,056 | | | | 20,636,717 | |
| | | | | | | | | | | | | | | | | | |
| | | | | | | | | | | | | | | | | | |
| | (25,336,115 | ) | | | (25,144,927 | ) | | | (11,111,021 | ) | | | (37,359,040 | )* | | | (18,191,232 | )* |
| | - | | | | - | | | | (16,361 | ) | | | (33,295 | ) | | | 618 | |
| | | | | | | | | | | | | | | | | | |
| | (25,336,115 | ) | | | (25,144,927 | ) | | | (11,127,382 | ) | | | (37,392,335 | ) | | | (18,190,614 | ) |
| | | | | | | | | | | | | | | | | | |
| | (1,788,838 | ) | | | (20,789,939 | ) | | | (7,248,769 | ) | | | (23,529,279 | ) | | | 2,446,103 | |
| | | | | | | | | | | | | | | | | | |
| $ | 155,662 | | | $ | (19,636,587 | ) | | $ | (5,621,557 | ) | | $ | (20,532,123 | ) | | $ | 3,459,029 | |
| | | | | | | | | | | | | | | | | | |
| | | | | | | | | | | | | | | | | | |
| $ | 798 | | | $ | - | | | $ | 363,309 | | | $ | 649,051 | | | $ | 325,858 | |
| $ | - | | | $ | - | | | $ | - | | | $ | 53,885 | | | $ | 8,649 | |
179
MassMutual Premier Funds – Financial Statements(Continued)
Statements of Changes in Net Assets
| | | | | | | | |
| | | MassMutual Premier
U.S. Government Money Market Fund | |
| | | Year
Ended
September 30, 2019 | | | Year
Ended
September 30, 2018 | |
| Increase (Decrease) in Net Assets: | | | | | | | | |
| Operations: | | | | | | | | |
Net investment income (loss) | | $ | 6,230,984 | | | $ | 4,030,620 | |
Net realized gain (loss) | | | 19,866 | | | | 2,060 | |
Net change in unrealized appreciation (depreciation) | | | - | | | | - | |
| | | | | | | | |
Net increase (decrease) in net assets resulting from operations | | | 6,250,850 | | | | 4,032,680 | |
| | | | | | | | |
| Distributions to shareholders (Note 2): | | | | | | | | |
Class I | | | - | | | | - | |
Class R5 | | | (6,235,386 | ) | | | (4,051,516 | )* |
Service Class | | | - | | | | - | |
Administrative Class | | | - | | | | - | |
Class A | | | - | | | | - | |
Class R4 | | | - | | | | - | |
Class R3 | | | - | | | | - | |
| | | | | | | | |
Total distributions | | | (6,235,386 | ) | | | (4,051,516 | ) |
| | | | | | | | |
| Net fund share transactions (Note 5): | | | | | | | | |
Class I | | | - | | | | - | |
Class R5 | | | (5,992,795 | ) | | | (12,746,760 | ) |
Service Class | | | - | | | | - | |
Administrative Class | | | - | | | | - | |
Class A | | | - | | | | - | |
Class R4 | | | - | | | | - | |
Class R3 | | | - | | | | - | |
| | | | | | | | |
Increase (decrease) in net assets from fund share transactions | | | (5,992,795 | ) | | | (12,746,760 | ) |
| | | | | | | | |
Total increase (decrease) in net assets | | | (5,977,331 | ) | | | (12,765,596 | ) |
| Net assets* | | | | | | | | |
Beginning of year | | | 339,550,968 | | | | 352,316,564 | |
| | | | | | | | |
End of year | | $ | 333,573,637 | | | $ | 339,550,968 | |
| | | | | | | | |
| * | Prior year distribution character information and undistributed net investment income has been modified or removed to conform with current yearRegulation S-X presentation changes. Refer to Note 2 for this prior year information. |
The accompanying notes are an integral part of the financial statements.
180
| | | | | | | | | | | | | | |
MassMutual Premier
Short-Duration Bond Fund | | | MassMutual Premier
Inflation-Protected and Income Fund | |
Year
Ended
September 30, 2019 | | | Year
Ended
September 30, 2018 | | | Year
Ended
September 30, 2019 | | | Year
Ended
September 30, 2018 | |
| | | | | | | | | | | | | | |
| | | | | | | | | | | | | | |
| $ | 14,885,046 | | | $ | 15,822,600 | | | $ | 6,804,543 | | | $ | 8,688,321 | |
| | (6,421,931 | ) | | | 1,190,636 | | | | 2,393,072 | | | | (1,125,799 | ) |
| | 10,537,281 | | | | (7,591,821 | ) | | | 10,347,105 | | | | (5,931,489 | ) |
| | | | | | | | | | | | | | |
| | 19,000,396 | | | | 9,421,415 | | | | 19,544,720 | | | | 1,631,033 | |
| | | | | | | | | | | | | | |
| | | | | | | | | | | | | | |
| | (7,202,599 | ) | | | (7,691,067 | )* | | | (4,218,564 | ) | | | (2,927,040 | )* |
| | (4,696,245 | ) | | | (3,581,314 | )* | | �� | (1,880,006 | ) | | | (1,630,948 | )* |
| | (2,172,717 | ) | | | (1,800,199 | )* | | | (1,448,100 | ) | | | (1,365,911 | )* |
| | (1,112,224 | ) | | | (675,313 | )* | | | (423,256 | ) | | | (362,670 | )* |
| | (1,926,511 | ) | | | (1,139,950 | )* | | | (494,124 | ) | | | (495,760 | )* |
| | (442,706 | ) | | | (295,883 | )* | | | (173,122 | ) | | | (157,975 | )* |
| | (256,012 | ) | | | (127,705 | )* | | | (110,088 | ) | | | (112,214 | )* |
| | | | | | | | | | | | | | |
| | (17,809,014 | ) | | | (15,311,431 | ) | | | (8,747,260 | ) | | | (7,052,518 | ) |
| | | | | | | | | | | | | | |
| | | | | | | | | | | | | | |
| | 40,461,522 | | | | (133,404,809 | ) | | | 15,862,514 | | | | 37,219,643 | |
| | 22,850,387 | | | | (18,465,362 | ) | | | 10,753,653 | | | | 1,064,004 | |
| | (21,398,810 | ) | | | (2,398,278 | ) | | | (1,240,989 | ) | | | (6,220,838 | ) |
| | (3,125,703 | ) | | | 5,826,575 | | | | 859,652 | | | | 529,779 | |
| | 2,157,648 | | | | 2,813,673 | | | | (4,935,725 | ) | | | (1,140,259 | ) |
| | (1,201,825 | ) | | | 126,583 | | | | (106,040 | ) | | | 755,178 | |
| | (922,444 | ) | | | 1,346,594 | | | | (401,142 | ) | | | (12,607 | ) |
| | | | | | | | | | | | | | |
| | 38,820,775 | | | | (144,155,024 | ) | | | 20,791,923 | | | | 32,194,900 | |
| | | | | | | | | | | | | | |
| | 40,012,157 | | | | (150,045,040 | ) | | | 31,589,383 | | | | 26,773,415 | |
| | | | | | | | | | | | | | |
| | 480,484,808 | | | | 630,529,848 | | | | 290,458,359 | | | | 263,684,944 | |
| | | | | | | | | | | | | | |
| $ | 520,496,965 | | | $ | 480,484,808 | | | $ | 322,047,742 | | | $ | 290,458,359 | |
| | | | | | | | | | | | | | |
181
MassMutual Premier Funds – Financial Statements(Continued)
Statements of Changes in Net Assets
| | | | | | | | |
| | | MassMutual
Premier Core Bond Fund | |
| | | Year
Ended
September 30, 2019 | | | Year
Ended
September 30, 2018 | |
| Increase (Decrease) in Net Assets: | | | | | | | | |
| Operations: | | | | | | | | |
Net investment income (loss) | | $ | 43,994,608 | | | $ | 35,656,066 | |
Net realized gain (loss) | | | 27,040,977 | | | | (10,024,895 | ) |
Net change in unrealized appreciation (depreciation) | | | 54,727,210 | | | | (31,892,369 | ) |
| | | | | | | | |
Net increase (decrease) in net assets resulting from operations | | | 125,762,795 | | | | (6,261,198 | ) |
| | | | | | | | |
| Distributions to shareholders (Note 2): | | | | | | | | |
Class I | | | (23,843,483 | ) | | | (16,298,876 | )* |
Class R5 | | | (8,771,104 | ) | | | (10,042,498 | )* |
Service Class | | | (2,820,260 | ) | | | (2,847,221 | )* |
Administrative Class | | | (2,086,599 | ) | | | (1,969,162 | )* |
Class A | | | (2,821,022 | ) | | | (2,716,702 | )* |
Class R4 | | | (348,493 | ) | | | (452,049 | )* |
Class R3 | | | (21,641 | ) | | | (12,415 | )* |
| | | | | | | | |
Total distributions | | | (40,712,602 | ) | | | (34,338,923 | ) |
| | | | | | | | |
| Net fund share transactions (Note 5): | | | | | | | | |
Class I | | | 101,765,720 | | | | 166,983,933 | |
Class R5 | | | 5,469,665 | | | | (52,188,665 | ) |
Service Class | | | (20,315,656 | ) | | | 4,056,318 | |
Administrative Class | | | (6,188,523 | ) | | | 433,553 | |
Class A | | | (15,445,413 | ) | | | (3,930,113 | ) |
Class R4 | | | 2,525,433 | | | | (3,486,576 | ) |
Class R3 | | | 373,534 | | | | (5,723 | ) |
| | | | | | | | |
Increase (decrease) in net assets from fund share transactions | | | 68,184,760 | | | | 111,862,727 | |
| | | | | | | | |
Total increase (decrease) in net assets | | | 153,234,953 | | | | 71,262,606 | |
| Net assets* | | | | | | | | |
Beginning of year | | | 1,278,839,843 | | | | 1,207,577,237 | |
| | | | | | | | |
End of year | | $ | 1,432,074,796 | | | $ | 1,278,839,843 | |
| | | | | | | | |
| * | Prior year distribution character information and undistributed net investment income has been modified or removed to conform with current yearRegulation S-X presentation changes. Refer to Note 2 for this prior year information. |
The accompanying notes are an integral part of the financial statements.
182
| | | | | | | | | | | | | | |
MassMutual
Premier Diversified Bond Fund | | | MassMutual
Premier High Yield Fund | |
Year
Ended
September 30, 2019 | | | Year
Ended
September 30, 2018 | | | Year
Ended
September 30, 2019 | | | Year
Ended
September 30, 2018 | |
| | | | | | | | | | | | | | |
| | | | | | | | | | | | | | |
| $ | 7,189,341 | | | $ | 6,476,140 | | | $ | 33,965,154 | | | $ | 29,569,037 | |
| | 3,561,731 | | | | (1,595,073 | ) | | | (11,040,111 | ) | | | (1,816,793 | ) |
| | 9,393,591 | | | | (6,335,876 | ) | | | 3,399,787 | | | | (15,726,783 | ) |
| | | | | | | | | | | | | | |
| | 20,144,663 | | | | (1,454,809 | ) | | | 26,324,830 | | | | 12,025,461 | |
| | | | | | | | | | | | | | |
| | | | | | | | | | | | | | |
| | (803,296 | ) | | | (843,981 | )* | | | (19,353,739 | ) | | | (15,260,676 | )* |
| | (3,456,741 | ) | | | (2,762,770 | )* | | | (2,275,582 | ) | | | (3,402,827 | )* |
| | (472,306 | ) | | | (455,302 | )* | | | (2,454,456 | ) | | | (2,834,872 | )* |
| | (665,828 | ) | | | (738,553 | )* | | | (1,468,139 | ) | | | (1,983,745 | )* |
| | (858,563 | ) | | | (874,975 | )* | | | (1,360,141 | ) | | | (1,668,415 | )* |
| | (193,130 | ) | | | (142,412 | )* | | | (1,787,546 | ) | | | (1,876,196 | )* |
| | (114,013 | ) | | | (101,773 | )* | | | (2,230,290 | ) | | | (2,304,959 | )* |
| | | | | | | | | | | | | | |
| | (6,563,877 | ) | | | (5,919,766 | ) | | | (30,929,893 | ) | | | (29,331,690 | ) |
| | | | | | | | | | | | | | |
| | | | | | | | | | | | | | |
| | 36,705,887 | | | | (4,798,803 | ) | | | (52,274,023 | ) | | | 148,669,885 | |
| | 4,937,951 | | | | 12,969,568 | | | | (1,906,593 | ) | | | (9,672,854 | ) |
| | (6,688,264 | ) | | | 3,407,027 | | | | 4,024,313 | | | | (2,569,351 | ) |
| | (6,599,351 | ) | | | 1,403,086 | | | | (4,907,364 | ) | | | (371,889 | ) |
| | (5,421,141 | ) | | | (427,770 | ) | | | 4,042,626 | | | | (878,585 | ) |
| | 1,770,981 | | | | (114,082 | ) | | | 11,588,566 | | | | 5,484,715 | |
| | (1,217,048 | ) | | | 811,774 | | | | (2,079,165 | ) | | | 9,740,791 | |
| | | | | | | | | | | | | | |
| | 23,489,015 | | | | 13,250,800 | | | | (41,511,640 | ) | | | 150,402,712 | |
| | | | | | | | | | | | | | |
| | 37,069,801 | | | | 5,876,225 | | | | (46,116,703 | ) | | | 133,096,483 | |
| | | | | | | | | | | | | | |
| | 207,850,952 | | | | 201,974,727 | | | | 610,433,280 | | | | 477,336,797 | |
| | | | | | | | | | | | | | |
| $ | 244,920,753 | | | $ | 207,850,952 | | | $ | 564,316,577 | | | $ | 610,433,280 | |
| | | | | | | | | | | | | | |
183
MassMutual Premier Funds – Financial Statements(Continued)
Statements of Changes in Net Assets
| | | | | | | | |
| | | MassMutual
Premier Balanced Fund | |
| | | Year
Ended
September 30, 2019 | | | Year
Ended
September 30, 2018 | |
| Increase (Decrease) in Net Assets: | | | | | | | | |
| Operations: | | | | | | | | |
Net investment income (loss) | | $ | 2,110,305 | | | $ | 1,706,700 | |
Net realized gain (loss) | | | 5,301,636 | | | | 8,275,176 | |
Net change in unrealized appreciation (depreciation) | | | (4,984,154 | ) | | | 861,824 | |
| | | | | | | | |
Net increase (decrease) in net assets resulting from operations | | | 2,427,787 | | | | 10,843,700 | |
| | | | | | | | |
| Distributions to shareholders (Note 2): | | | | | | | | |
Class I | | | (1,128,296 | ) | | | (570,403 | )* |
Class R5 | | | (3,512,186 | ) | | | (3,267,180 | )* |
Service Class | | | (470,839 | ) | | | (475,648 | )* |
Administrative Class | | | (535,122 | ) | | | (631,984 | )* |
Class A | | | (1,935,646 | ) | | | (2,104,455 | )* |
Class R4 | | | (231,293 | ) | | | (212,627 | )* |
Class R3 | | | (645,997 | ) | | | (503,588 | )* |
| | | | | | | | |
Total distributions | | | (8,459,379 | ) | | | (7,765,885 | ) |
| | | | | | | | |
| Net fund share transactions (Note 5): | | | | | | | | |
Class I | | | 20,038,802 | | | | 2,964,193 | |
Class R5 | | | 2,754,926 | | | | (5,395,557 | ) |
Service Class | | | (834,845 | ) | | | 54,703 | |
Administrative Class | | | (653,383 | ) | | | (1,477,601 | ) |
Class A | | | (1,884,375 | ) | | | (2,896,428 | ) |
Class R4 | | | (410,358 | ) | | | 594,136 | |
Class R3 | | | (233,401 | ) | | | 564,095 | |
| | | | | | | | |
Increase (decrease) in net assets from fund share transactions | | | 18,777,366 | | | | (5,592,459 | ) |
| | | | | | | | |
Total increase (decrease) in net assets | | | 12,745,774 | | | | (2,514,644 | ) |
| Net assets* | | | | | | | | |
Beginning of year | | | 114,238,236 | | | | 116,752,880 | |
| | | | | | | | |
End of year | | $ | 126,984,010 | | | $ | 114,238,236 | |
| | | | | | | | |
| * | Prior year distribution character information and undistributed net investment income has been modified or removed to conform with current yearRegulation S-X presentation changes. Refer to Note 2 for this prior year information. |
The accompanying notes are an integral part of the financial statements.
184
| | | | | | | | | | | | | | |
MassMutual
Premier Disciplined Value Fund | | | MassMutual
Premier Main Street Fund | |
Year
Ended
September 30, 2019 | | | Year
Ended
September 30, 2018 | | | Year
Ended
September 30, 2019 | | | Year
Ended
September 30, 2018 | |
| | | | | | | | | | | | | | |
| | | | | | | | | | | | | | |
| $ | 2,438,165 | | | $ | 3,392,153 | | | $ | 1,386,706 | | | $ | 1,290,624 | |
| | 6,496,723 | | | | 21,705,524 | | | | 10,434,330 | | | | 14,623,145 | |
| | (11,828,423 | ) | | | (5,052,593 | ) | | | (6,202,846 | ) | | | (4,089,513 | ) |
| | | | | | | | | | | | | | |
| | (2,893,535 | ) | | | 20,045,084 | | | | 5,618,190 | | | | 11,824,256 | |
| | | | | | | | | | | | | | |
| | | | | | | | | | | | | | |
| | (2,950,659 | ) | | | (9,680,041 | )* | | | (2,939,489 | ) | | | (819,412 | )* |
| | (8,804,772 | ) | | | (5,425,465 | )* | | | (7,652,907 | ) | | | (5,802,095 | )* |
| | (6,451,380 | ) | | | (5,847,242 | )* | | | (74,980 | ) | | | (82,970 | )* |
| | (1,338,400 | ) | | | (716,916 | )* | | | (3,133,171 | ) | | | (2,404,098 | )* |
| | (1,275,458 | ) | | | (1,011,450 | )* | | | (1,597,880 | ) | | | (996,490 | )* |
| | (948,544 | ) | | | (1,140,657 | )* | | | (719,840 | ) | | | (375,529 | )* |
| | (634,881 | ) | | | (450,486 | )* | | | (205,497 | ) | | | (78,877 | )* |
| | | | | | | | | | | | | | |
| | (22,404,094 | ) | | | (24,272,257 | ) | | | (16,323,764 | ) | | | (10,559,471 | ) |
| | | | | | | | | | | | | | |
| | | | | | | | | | | | | | |
| | 439,475 | | | | (58,258,893 | ) | | | 2,210,454 | | | | 15,084,689 | |
| | 3,498,339 | | | | 13,626,961 | | | | (14,185,696 | ) | | | (11,236,498 | ) |
| | (22,292,084 | ) | | | 2,124,271 | | | | (43,915 | ) | | | (360,590 | ) |
| | (1,787,052 | ) | | | 3,202,911 | | | | (1,861,173 | ) | | | (2,799,613 | ) |
| | (1,408,783 | ) | | | (13,134 | ) | | | (596,316 | ) | | | 1,231,559 | |
| | (1,284,893 | ) | | | (3,240,465 | ) | | | 415,047 | | | | 1,001,065 | |
| | 859,475 | | | | 502,778 | | | | (350,994 | ) | | | 634,542 | |
| | | | | | | | | | | | | | |
| | (21,975,523 | ) | | | (42,055,571 | ) | | | (14,412,593 | ) | | | 3,555,154 | |
| | | | | | | | | | | | | | |
| | (47,273,152 | ) | | | (46,282,744 | ) | | | (25,118,167 | ) | | | 4,819,939 | |
| | | | | | | | | | | | | | |
| | 158,292,419 | | | | 204,575,163 | | | | 143,552,869 | | | | 138,732,930 | |
| | | | | | | | | | | | | | |
| $ | 111,019,267 | | | $ | 158,292,419 | | | $ | 118,434,702 | | | $ | 143,552,869 | |
| | | | | | | | | | | | | | |
185
MassMutual Premier Funds – Financial Statements(Continued)
Statements of Changes in Net Assets
| | | | | | | | |
| | | MassMutual Premier
Disciplined Growth Fund | |
| | | Year
Ended
September 30, 2019 | | | Year
Ended
September 30, 2018 | |
| Increase (Decrease) in Net Assets: | | | | | | | | |
| Operations: | | | | | | | | |
Net investment income (loss) | | $ | 1,944,500 | | | $ | 2,405,549 | |
Net realized gain (loss) | | | 23,547,277 | | | | 71,761,027 | |
Net change in unrealized appreciation (depreciation) | | | (25,336,115 | ) | | | 10,477,180 | |
| | | | | | | | |
Net increase (decrease) in net assets resulting from operations | | | 155,662 | | | | 84,643,756 | |
| | | | | | | | |
| Distributions to shareholders (Note 2): | | | | | | | | |
Class I | | | (6,509,520 | ) | | | (14,032,308 | )* |
Class R5 | | | (22,374,835 | ) | | | (10,881,489 | )* |
Service Class | | | (15,117,227 | ) | | | (9,022,986 | )* |
Administrative Class | | | (8,539,033 | ) | | | (4,816,360 | )* |
Class A | | | (7,985,405 | ) | | | (4,301,252 | )* |
Class R4 | | | (6,472,019 | ) | | | (3,310,635 | )* |
Class R3 | | | (1,501,736 | ) | | | (542,147 | )* |
| | | | | | | | |
Total distributions | | | (68,499,775 | ) | | | (46,907,177 | ) |
| | | | | | | | |
| Net fund share transactions (Note 5): | | | | | | | | |
Class I | | | 4,404,455 | | | | (93,351,991 | ) |
Class R5 | | | 10,887,227 | | | | 14,764,969 | |
Service Class | | | (27,992,682 | ) | | | (5,939,826 | ) |
Administrative Class | | | 3,128,965 | | | | (2,914,451 | ) |
Class A | | | (1,612,036 | ) | | | (663,139 | ) |
Class R4 | | | (546,976 | ) | | | 1,753,320 | |
Class R3 | | | 423,218 | | | | 2,177,229 | |
| | | | | | | | |
Increase (decrease) in net assets from fund share transactions | | | (11,307,829 | ) | | | (84,173,889 | ) |
| | | | | | | | |
Total increase (decrease) in net assets | | | (79,651,942 | ) | | | (46,437,310 | ) |
| Net assets* | | | | | | | | |
Beginning of year | | | 337,156,090 | | | | 383,593,400 | |
| | | | | | | | |
End of year | | $ | 257,504,148 | | | $ | 337,156,090 | |
| | | | | | | | |
| * | Prior year distribution character information and undistributed net investment income has been modified or removed to conform with current year RegulationS-X presentation changes. Refer to Note 2 for this prior year information. |
The accompanying notes are an integral part of the financial statements.
186
| | | | | | | | | | | | | | |
MassMutual
Premier Small Cap Opportunities Fund | | | MassMutual
Premier Global Fund | |
Year
Ended
September 30, 2019
| | | Year
Ended
September 30, 2018 | | | Year
Ended
September 30, 2019 | | | Year
Ended
September 30, 2018
| |
| | | | | | | | | | | | | | |
| | | | | | | | | | | | | | |
| $ | 1,153,352 | | | $ | 954,339 | | | $ | 1,627,212 | | | $ | 1,749,598 | |
| | 4,354,988 | | | | 21,006,245 | | | | 3,878,613 | | | | 55,196,198 | |
| | (25,144,927 | ) | | | 7,502,778 | | | | (11,127,382 | ) | | | (24,694,348 | ) |
| | | | | | | | | | | | | | |
| | (19,636,587 | ) | | | 29,463,362 | | | | (5,621,557 | ) | | | 32,251,448 | |
| | | | | | | | | | | | | | |
| | | | | | | | | | | | | | |
| | (3,656,500 | ) | | | (2,211,437 | )* | | | (10,142,807 | ) | | | (4,605,510 | )* |
| | (6,499,034 | ) | | | (7,689,329 | )* | | | (18,881,920 | ) | | | (13,413,879 | )* |
| | (1,491,884 | ) | | | (1,807,666 | )* | | | (2,220,861 | ) | | | (2,318,231 | )* |
| | (1,983,912 | ) | | | (2,862,352 | )* | | | (16,324,130 | ) | | | (12,154,069 | )* |
| | (5,673,440 | ) | | | (8,525,904 | )* | | | (5,808,841 | ) | | | (3,533,854 | )* |
| | (1,018,771 | ) | | | (1,172,634 | )* | | | (1,601,209 | ) | | | (695,087 | )* |
| | (886,852 | ) | | | (1,100,523 | )* | | | (2,011,068 | ) | | | (1,257,987 | )* |
| | | | | | | | | | | | | | |
| | (21,210,393 | ) | | | (25,369,845 | ) | | | (56,990,836 | ) | | | (37,978,617 | ) |
| | | | | | | | | | | | | | |
| | | | | | | | | | | | | | |
| | 859,274 | | | | 23,997,096 | | | | 29,493,708 | | | | 16,911,349 | |
| | (2,681,256 | ) | | | 10,569,424 | | | | 17,371,070 | | | | (17,243,489 | ) |
| | 1,700,754 | | | | 2,989,994 | | | | (6,812,076 | ) | | | (2,649,614 | ) |
| | (1,928,523 | ) | | | 2,296,458 | | | | 5,597,866 | | | | (11,029,054 | ) |
| | (6,923,243 | ) | | | (4,373,792 | ) | | | (414,975 | ) | | | 1,512,000 | |
| | 728,250 | | | | 1,742,077 | | | | 1,437,489 | | | | 2,389,927 | |
| | (294,957 | ) | | | 1,463,944 | | | | 1,442,706 | | | | 622,053 | |
| | | | | | | | | | | | | | |
| | (8,539,701 | ) | | | 38,685,201 | | | | 48,115,788 | | | | (9,486,828 | ) |
| | | | | | | | | | | | | | |
| | (49,386,681 | ) | | | 42,778,718 | | | | (14,496,605 | ) | | | (15,213,997 | ) |
| | | | | | | | | | | | | | |
| | 253,653,920 | | | | 210,875,202 | | | | 308,925,858 | | | | 324,139,855 | |
| | | | | | | | | | | | | | |
| $ | 204,267,239 | | | $ | 253,653,920 | | | $ | 294,429,253 | | | $ | 308,925,858 | |
| | | | | | | | | | | | | | |
187
MassMutual Premier Funds – Financial Statements(Continued)
Statements of Changes in Net Assets
| | | | | | | | |
| | | MassMutual
Premier International Equity Fund | |
| | | Year
Ended
September 30, 2019 | | | Year
Ended
September 30, 2018 | |
| Increase (Decrease) in Net Assets: | | | | | | | | |
| Operations: | | | | | | | | |
Net investment income (loss) | | $ | 2,997,156 | | | $ | 4,617,250 | |
Net realized gain (loss) | | | 13,863,056 | | | | 19,074,185 | |
Net change in unrealized appreciation (depreciation) | | | (37,392,335 | ) | | | (33,524,775 | ) |
| | | | | | | | |
Net increase (decrease) in net assets resulting from operations | | | (20,532,123 | ) | | | (9,833,340 | ) |
| | | | | | | | |
| Distributions to shareholders (Note 2): | | | | | | | | |
Class I | | | (13,156,184 | ) | | | (3,222,891 | )* |
Class R5 | | | (6,231,478 | ) | | | (2,165,164 | )* |
Service Class | | | (718,289 | ) | | | (228,348 | )* |
Administrative Class | | | (460,669 | ) | | | (161,875 | )* |
Class A | | | (1,213,354 | ) | | | (277,389 | )* |
Class R4 | | | (451,336 | ) | | | (124,071 | )* |
Class R3 | | | (377,140 | ) | | | (57,228 | )* |
| | | | | | | | |
Total distributions | | | (22,608,450 | ) | | | (6,236,966 | ) |
| | | | | | | | |
| Net fund share transactions (Note 5): | | | | | | | | |
Class I | | | (119,556,080 | ) | | | 55,812,142 | |
Class R5 | | | (41,389,928 | ) | | | (43,165,875 | ) |
Service Class | | | (11,670,069 | ) | | | 2,530,771 | |
Administrative Class | | | (5,312,397 | ) | | | (5,901,391 | ) |
Class A | | | (6,051,775 | ) | | | (8,005,463 | ) |
Class R4 | | | (4,928,933 | ) | | | 176,900 | |
Class R3 | | | (2,594,867 | ) | | | 307,655 | |
| | | | | | | | |
Increase (decrease) in net assets from fund share transactions | | | (191,504,049 | ) | | | 1,754,739 | |
| | | | | | | | |
Total increase (decrease) in net assets | | | (234,644,622 | ) | | | (14,315,567 | ) |
| Net assets* | | | | | | | | |
Beginning of year | | | 526,623,195 | | | | 540,938,762 | |
| | | | | | | | |
End of year | | $ | 291,978,573 | | | $ | 526,623,195 | |
| | | | | | | | |
| * | Prior year distribution character information and undistributed net investment income has been modified or removed to conform with current year RegulationS-X presentation changes. Refer to Note 2 for this prior year information. |
The accompanying notes are an integral part of the financial statements.
188
| | | | | | |
MassMutual
Premier Strategic Emerging Markets Fund | |
Year
Ended
September 30, 2019
| | | Year
Ended
September 30, 2018
| |
| | | | | | |
| | | | | | |
| $ | 1,012,926 | | | $ | 1,609,759 | |
| | 20,636,717 | | | | 16,653,712 | |
| | (18,190,614 | ) | | | (17,678,853 | ) |
| | | | | | |
| | 3,459,029 | | | | 584,618 | |
| | | | | | |
| | | | | | |
| | (1,339,579 | ) | | | (3,266,714 | )* |
| | (22,332 | ) | | | (48,833 | )* |
| | (247 | ) | | | (4,633 | )* |
| | (2,174 | ) | | | (15,720 | )* |
| | (1,818 | ) | | | (1,765 | )* |
| | (2,905 | ) | | | (9,767 | )* |
| | - | | | | (5,088 | )* |
| | | | | | |
| | (1,369,055 | ) | | | (3,352,520 | ) |
| | | | | | |
| | | | | | |
| | (75,951,493 | ) | | | (18,248,392 | ) |
| | 157,072 | | | | 209,650 | |
| | 185,417 | | | | (209,251 | ) |
| | 23,815 | | | | (679,287 | ) |
| | 461,858 | | | | 286,103 | |
| | (24,886 | ) | | | 310,852 | |
| | (24,279 | ) | | | (53,744 | ) |
| | | | | | |
| | (75,172,496 | ) | | | (18,384,069 | ) |
| | | | | | |
| | (73,082,522 | ) | | | (21,151,971 | ) |
| | | | | | |
| | 223,683,815 | | | | 244,835,786 | |
| | | | | | |
| $ | 150,601,293 | | | $ | 223,683,815 | |
| | | | | | |
189
THIS PAGE INTENTIONALLY LEFT BLANK
190
MassMutual Premier U.S. Government Money Market Fund – Financial Statements(Continued)
Financial Highlights(For a share outstanding throughout each period)
| | | | | | | | | | | | | | | | | | | | | | | | | | | | | | | | | | | | | | | | | | | | | | | | | | | | |
| | | | | | Income (loss) from investment
operations | | | Less distributions to shareholders | | | | | | | | |
Ratios / Supplemental Data | |
| | | Net
asset
value,
beginning
of the
period | | | Net
investment
income
(loss)c,j | | | Net
realized
and
unrealized
gain (loss)
on
investments | | | Total
income
(loss) from
investment
operations | | | From net
investment
income | | | From net
realized
gains | | | Total
distributions | | | Net
asset
value,
end of
the
period | | | Total
returnl | | | Net
assets,
end of
the
period
(000’s) | | | Ratio of
expenses
to average
daily net
assets
before
expense
waivers | | | Ratio of
expenses
to average
daily net
assets
after
expense
waiversj | | | Net
investment
income
(loss) to
average
daily net
assets | |
Class R5 | | | | | | | | | | | | | | | | | | | | | | | | | | | | | | | | | | | | | | | | | | | | | |
| 9/30/19 | | $ | 1.00 | | | $ | 0.02 | | | $ | 0.00 | d | | $ | 0.02 | | | $ | (0.02 | ) | | $ | (0.00 | )d | | $ | (0.02 | ) | | $ | 1.00 | | | | 1.85% | | | $ | 333,574 | | | | 0.52% | | | | N/A | | | | 1.83% | |
| 9/30/18 | | | 1.00 | | | | 0.01 | | | | 0.00 | d | | | 0.01 | | | | (0.01 | ) | | | (0.00 | )d | | | (0.01 | ) | | | 1.00 | | | | 1.08% | | | | 339,551 | | | | 0.50% | | | | N/A | | | | 1.04% | |
| 9/30/17 | | | 1.00 | | | | 0.00 | d | | | 0.00 | d | | | 0.00 | d | | | (0.00 | )d | | | - | | | | (0.00 | )d | | | 1.00 | | | | 0.23% | | | | 352,317 | | | | 0.52% | | | | 0.51% | | | | 0.22% | |
| 9/30/16 | | | 1.00 | | | | 0.00 | d | | | 0.00 | d | | | 0.00 | d | | | (0.00 | )d | | | - | | | | (0.00 | )d | | | 1.00 | | | | 0.00% | e | | | 334,720 | | | | 0.51% | | | | 0.36% | | | | 0.00% | e |
| 9/30/15 | | | 1.00 | | | | 0.00 | d | | | 0.00 | d | | | 0.00 | d | | | (0.00 | )d | | | - | | | | (0.00 | )d | | | 1.00 | | | | 0.01% | | | | 400,017 | | | | 0.50% | | | | 0.14% | | | | 0.00% | e |
| c | Per share amount calculated on the average shares method. |
| d | Amount is less than $0.005 per share. |
| e | Amount is less than 0.005%. |
| j | Computed after giving effect to an agreement by MML Advisers and/or MassMutual to waive certain fees and expenses of the Fund. |
| l | Employee retirement benefit plans that invest plan assets in the Separate Investment Accounts (SIAs) may be subject to certain charges as set forth in their respective Plan Documents. Total return figures would be lower for the periods presented if they reflected these charges. |
The accompanying notes are an integral part of the financial statements.
191
MassMutual Premier Short-Duration Bond Fund – Financial Statements(Continued)
Financial Highlights(For a share outstanding throughout each period)
| | | | | | | | | | | | | | | | | | | | | | | | | | | | | | | | | | | | | | | | | | | | | | | | |
| | | | | | Income (loss) from investment
operations | | | Less distributions to shareholders | | | | | | | | |
Ratios / Supplemental Data | |
| | | Net
asset
value,
beginning
of the
period | | | Net
investment
income
(loss)c | | | Net
realized
and
unrealized
gain (loss)
on
investments | | | Total
income
(loss) from
investment
operations | | | From net
investment
income | | | From net
realized
gains | | | Total
distributions | | | Net
asset
value,
end of
the
period | | | Total
returnl,m | | | Net
assets,
end of
the
period
(000’s) | | | Ratio of
expenses
to average
daily net
assets | | | Net
investment
income
(loss) to
average
daily net
assets | |
Class I | | | | | | | | | | | | | | | | | | | | | | | | | | | | | | | | | | | | | | | | | |
9/30/19 | | $ | 10.30 | | | $ | 0.32 | | | $ | 0.08 | | | $ | 0.40 | | | $ | (0.39 | ) | | $ | - | | | $ | (0.39 | ) | | $ | 10.31 | | | | 4.05% | | | $ | 204,282 | | | | 0.43% | | | | 3.13% | |
| 9/30/18 | | | 10.40 | | | | 0.27 | | | | (0.10 | ) | | | 0.17 | | | | (0.27 | ) | | | - | | | | (0.27 | ) | | | 10.30 | | | | 1.65% | | | | 163,465 | | | | 0.39% | | | | 2.64% | |
| 9/30/17 | | | 10.39 | | | | 0.23 | | | | 0.03 | | | | 0.26 | | | | (0.25 | ) | | | - | | | | (0.25 | ) | | | 10.40 | | | | 2.57% | | | | 299,768 | | | | 0.40% | | | | 2.20% | |
| 9/30/16 | | | 10.46 | | | | 0.20 | | | | 0.00 | d | | | 0.20 | | | | (0.27 | ) | | | - | | | | (0.27 | ) | | | 10.39 | | | | 1.98% | | | | 166,281 | | | | 0.40% | | | | 1.97% | |
| 9/30/15 | | | 10.50 | | | | 0.19 | | | | 0.01 | | | | 0.20 | | | | (0.24 | ) | | | (0.00 | )d | | | (0.24 | ) | | | 10.46 | | | | 2.00% | | | | 154,219 | | | | 0.40% | | | | 1.83% | |
Class R5 | | | | | | | | | | | | | | | | | | | | | | | | | | | | | | | | | | | | | | | | | |
9/30/19 | | $ | 10.33 | | | $ | 0.31 | | | $ | 0.08 | | | $ | 0.39 | | | $ | (0.38 | ) | | $ | - | | | $ | (0.38 | ) | | $ | 10.34 | | | | 3.92% | | | $ | 158,895 | | | | 0.53% | | | | 3.03% | |
| 9/30/18 | | | 10.42 | | | | 0.26 | | | | (0.09 | ) | | | 0.17 | | | | (0.26 | ) | | | - | | | | (0.26 | ) | | | 10.33 | | | | 1.63% | | | | 135,411 | | | | 0.49% | | | | 2.55% | |
| 9/30/17 | | | 10.42 | | | | 0.22 | | | | 0.02 | | | | 0.24 | | | | (0.24 | ) | | | - | | | | (0.24 | ) | | | 10.42 | | | | 2.36% | | | | 155,172 | | | | 0.50% | | | | 2.09% | |
| 9/30/16 | | | 10.49 | | | | 0.19 | | | | 0.00 | d | | | 0.19 | | | | (0.26 | ) | | | - | | | | (0.26 | ) | | | 10.42 | | | | 1.88% | | | | 199,354 | | | | 0.50% | | | | 1.87% | |
| 9/30/15 | | | 10.52 | | | | 0.18 | | | | 0.02 | | | | 0.20 | | | | (0.23 | ) | | | (0.00 | )d | | | (0.23 | ) | | | 10.49 | | | | 1.95% | | | | 159,429 | | | | 0.50% | | | | 1.73% | |
Service Class | | | | | | | | | | | | | | | | | | | | | | | | | | | | | | | | | | | | | | | | | |
9/30/19 | | $ | 10.25 | | | $ | 0.30 | | | $ | 0.08 | | | $ | 0.38 | | | $ | (0.37 | ) | | $ | - | | | $ | (0.37 | ) | | $ | 10.26 | | | | 3.82% | | | $ | 51,201 | | | | 0.63% | | | | 2.92% | |
| 9/30/18 | | | 10.35 | | | | 0.25 | | | | (0.10 | ) | | | 0.15 | | | | (0.25 | ) | | | - | | | | (0.25 | ) | | | 10.25 | | | | 1.50% | | | | 72,408 | | | | 0.59% | | | | 2.45% | |
| 9/30/17 | | | 10.35 | | | | 0.21 | | | | 0.02 | | | | 0.23 | | | | (0.23 | ) | | | - | | | | (0.23 | ) | | | 10.35 | | | | 2.24% | | | | 75,544 | | | | 0.60% | | | | 2.00% | |
| 9/30/16 | | | 10.42 | | | | 0.18 | | | | 0.00 | d | | | 0.18 | | | | (0.25 | ) | | | - | | | | (0.25 | ) | | | 10.35 | | | | 1.78% | | | | 55,309 | | | | 0.60% | | | | 1.75% | |
| 9/30/15 | | | 10.45 | | | | 0.17 | | | | 0.02 | | | | 0.19 | | | | (0.22 | ) | | | (0.00 | )d | | | (0.22 | ) | | | 10.42 | | | | 1.87% | | | | 86,058 | | | | 0.60% | | | | 1.64% | |
| | | | | | | | | | | | | | | | | | | | |
| | | Year ended September 30 | |
| | | 2019 | | | 2018 | | | 2017 | | | 2016 | | | 2015 | |
Portfolio turnover rate | | | 55 | % | | | 68 | % | | | 72 | % | | | 87 | % | | | 59 | % |
| c | Per share amount calculated on the average shares method. |
| d | Amount is less than $0.005 per share. |
| l | Employee retirement benefit plans that invest plan assets in the Separate Investment Accounts (SIAs) may be subject to certain charges as set forth in their respective Plan Documents. Total return figures would be lower for the periods presented if they reflected these charges. |
| m | Total return excludes sales charges, if any, and would be lower for the period presented if it reflected these charges. |
The accompanying notes are an integral part of the financial statements.
192
| | | | | | | | | | | | | | | | | | | | | | | | | | | | | | | | | | | | | | | | | | | | | | | | |
| | | | | | Income (loss) from investment
operations | | | Less distributions to shareholders | | | | | | | | |
Ratios / Supplemental Data | |
| | | Net
asset
value,
beginning
of the
period | | | Net
investment
income
(loss)c | | | Net
realized
and
unrealized
gain (loss)
on
investments | | | Total
income
(loss) from
investment
operations | | | From net
investment
income | | | From net
realized
gains | | | Total
distributions | | | Net
asset
value,
end of
the
period | | | Total
returnl,m | | | Net
assets,
end of
the
period
(000’s) | | | Ratio of
expenses
to average
daily net
assets | | | Net
investment
income
(loss) to
average
daily net
assets | |
Administrative Class | | | | | | | | | | | | | | | | | | | | | | | | | | | | | | | | | | | | | | | | | |
9/30/19 | | $ | 10.21 | | | $ | 0.29 | | | $ | 0.08 | | | $ | 0.37 | | | $ | (0.36 | ) | | $ | - | | | $ | (0.36 | ) | | $ | 10.22 | | | | 3.76% | | | $ | 31,270 | | | | 0.73% | | | | 2.83% | |
| 9/30/18 | | | 10.31 | | | | 0.24 | | | | (0.10 | ) | | | 0.14 | | | | (0.24 | ) | | | - | | | | (0.24 | ) | | | 10.21 | | | | 1.35% | | | | 34,342 | | | | 0.69% | | | | 2.37% | |
| 9/30/17 | | | 10.30 | | | | 0.19 | | | | 0.04 | | | | 0.23 | | | | (0.22 | ) | | | - | | | | (0.22 | ) | | | 10.31 | | | | 2.24% | | | | 28,771 | | | | 0.70% | | | | 1.89% | |
| 9/30/16 | | | 10.37 | | | | 0.17 | | | | 0.00 | d | | | 0.17 | | | | (0.24 | ) | | | - | | | | (0.24 | ) | | | 10.30 | | | | 1.69% | | | | 32,906 | | | | 0.70% | | | | 1.66% | |
| 9/30/15 | | | 10.41 | | | | 0.16 | | | | 0.01 | | | | 0.17 | | | | (0.21 | ) | | | (0.00 | )d | | | (0.21 | ) | | | 10.37 | | | | 1.69% | | | | 36,789 | | | | 0.70% | | | | 1.53% | |
Class A | | | | | | | | | | | | | | | | | | | | | | | | | | | | | | | | | | | | | | | | | |
9/30/19 | | $ | 10.14 | | | $ | 0.26 | | | $ | 0.08 | | | $ | 0.34 | | | $ | (0.34 | ) | | $ | - | | | $ | (0.34 | ) | | $ | 10.14 | | | | 3.44% | | | $ | 55,315 | | | | 0.98% | | | | 2.58% | |
| 9/30/18 | | | 10.24 | | | | 0.21 | | | | (0.10 | ) | | | 0.11 | | | | (0.21 | ) | | | - | | | | (0.21 | ) | | | 10.14 | | | | 1.10% | | | | 53,188 | | | | 0.94% | | | | 2.11% | |
| 9/30/17 | | | 10.23 | | | | 0.16 | | | | 0.04 | | | | 0.20 | | | | (0.19 | ) | | | - | | | | (0.19 | ) | | | 10.24 | | | | 2.00% | | | | 50,893 | | | | 0.95% | | | | 1.62% | |
| 9/30/16 | | | 10.30 | | | | 0.14 | | | | 0.00 | d | | | 0.14 | | | | (0.21 | ) | | | - | | | | (0.21 | ) | | | 10.23 | | | | 1.49% | | | | 87,598 | | | | 0.95% | | | | 1.42% | |
| 9/30/15 | | | 10.34 | | | | 0.13 | | | | 0.02 | | | | 0.15 | | | | (0.19 | ) | | | (0.00 | )d | | | (0.19 | ) | | | 10.30 | | | | 1.44% | | | | 75,507 | | | | 0.95% | | | | 1.28% | |
Class R4 | | | | | | | | | | | | | | | | | | | | | | | | | | | | | | | | | | | | | | | | | | | | | | | | |
9/30/19 | | $ | 10.26 | | | $ | 0.27 | | | $ | 0.08 | | | $ | 0.35 | | | $ | (0.34 | ) | | $ | - | | | $ | (0.34 | ) | | $ | 10.27 | | | | 3.57% | | | $ | 12,494 | | | | 0.88% | | | | 2.67% | |
| 9/30/18 | | | 10.36 | | | | 0.23 | | | | (0.11 | ) | | | 0.12 | | | | (0.22 | ) | | | - | | | | (0.22 | ) | | | 10.26 | | | | 1.21% | | | | 13,691 | | | | 0.84% | | | | 2.21% | |
| 9/30/17 | | | 10.36 | | | | 0.18 | | | | 0.03 | | | | 0.21 | | | | (0.21 | ) | | | - | | | | (0.21 | ) | | | 10.36 | | | | 2.05% | | | | 13,693 | | | | 0.85% | | | | 1.75% | |
| 9/30/16 | | | 10.45 | | | | 0.16 | | | | 0.00 | d | | | 0.16 | | | | (0.25 | ) | | | - | | | | (0.25 | ) | | | 10.36 | | | | 1.59% | | | | 9,446 | | | | 0.85% | | | | 1.53% | |
| 9/30/15 | | | 10.50 | | | | 0.14 | | | | 0.02 | | | | 0.16 | | | | (0.21 | ) | | | (0.00 | )d | | | (0.21 | ) | | | 10.45 | | | | 1.57% | | | | 5,881 | | | | 0.85% | | | | 1.39% | |
Class R3 | | | | | | | | | | | | | | | | | | | | | | | | | | | | | | | | | | | | | | | | | |
9/30/19 | | $ | 10.20 | | | $ | 0.24 | | | $ | 0.09 | | | $ | 0.33 | | | $ | (0.33 | ) | | $ | - | | | $ | (0.33 | ) | | $ | 10.20 | | | | 3.29% | | | $ | 7,040 | | | | 1.13% | | | | 2.43% | |
| 9/30/18 | | | 10.30 | | | | 0.20 | | | | (0.10 | ) | | | 0.10 | | | | (0.20 | ) | | | - | | | | (0.20 | ) | | | 10.20 | | | | 0.97% | | | | 7,980 | | | | 1.09% | | | | 1.97% | |
| 9/30/17 | | | 10.31 | | | | 0.15 | | | | 0.03 | | | | 0.18 | | | | (0.19 | ) | | | - | | | | (0.19 | ) | | | 10.30 | | | | 1.79% | | | | 6,689 | | | | 1.10% | | | | 1.50% | |
| 9/30/16 | | | 10.42 | | | | 0.13 | | | | 0.00 | d | | | 0.13 | | | | (0.24 | ) | | | - | | | | (0.24 | ) | | | 10.31 | | | | 1.27% | | | | 3,661 | | | | 1.10% | | | | 1.29% | |
| 9/30/15 | | | 10.46 | | | | 0.12 | | | | 0.01 | | | | 0.13 | | | | (0.17 | ) | | | (0.00 | )d | | | (0.17 | ) | | | 10.42 | | | | 1.27% | | | | 1,561 | | | | 1.10% | | | | 1.15% | |
193
MassMutual Premier Inflation-Protected and Income Fund – Financial Statements (Continued)
Financial Highlights(For a share outstanding throughout each period)
| | | | | | | | | | | | | | | | | | | | | | | | | | | | | | | | | | | | | | | | | | | | | | | | | | | | | | | | | | | | |
| | | | | | Income (loss) from investment
operations | | | Less distributions to shareholders | | | | | | | | | Ratios / Supplemental Data | |
| | | Net
asset
value,
beginning
of the
period | | | Net
investment
income
(loss)c,j | | | Net
realized
and
unrealized
gain (loss)
on
investments | | | Total
income
(loss) from
investment
operations | | | From net
investment
income | | | From net
realized
gains | | | Total
distributions | | | Net
asset
value,
end of
the
period | | | Total
returnl,m | | | Net
assets,
end of
the
period
(000’s) | | | Ratio of
expenses
to average
daily net
assets
before
expense
waivers
(including
interest
expense)p | | | Ratio of
expenses
to average
daily net
assets
after
expense
waivers
(including
interest
expense)j,p | | | | | | Ratio of
expenses
to average
daily net
assets
after
expense
waivers
(excluding
interest
expense)j | | | Net
investment
income
(loss) to
average
daily net
assets
(including
interest
expense)p | |
Class I | | | | | | | | | | | | | | | | | | | | | | | | | | | | | | | | | | | | | | | | | | | | | | | | | |
| 9/30/19 | | $ | 10.24 | | | $ | 0.25 | | | $ | 0.42 | | | $ | 0.67 | | | $ | (0.32 | ) | | $ | - | | | $ | (0.32 | ) | | $ | 10.59 | | | | 6.80% | | | $ | 154,260 | | | | 0.50% | | | | 0.49% | | | | | | | | 0.46% | | | | 2.40% | |
| 9/30/18 | | | 10.46 | | | | 0.34 | | | | (0.26 | ) | | | 0.08 | | | | (0.30 | ) | | | - | | | | (0.30 | ) | | | 10.24 | | | | 0.74% | | | | 133,153 | | | | 1.74% | | | | 1.71% | | | | | | | | 0.45% | | | | 3.33% | |
| 9/30/17 | | | 10.79 | | | | 0.23 | | | | (0.27 | ) | | | (0.04 | ) | | | (0.29 | ) | | | - | | | | (0.29 | ) | | | 10.46 | | | | (0.32% | ) | | | 98,194 | | | | 1.26% | | | | 1.23% | | | | | | | | 0.45% | | | | 2.24% | |
| 9/30/16 | | | 10.19 | | | | 0.13 | | | | 0.59 | | | | 0.72 | | | | (0.12 | ) | | | - | | | | (0.12 | ) | | | 10.79 | | | | 7.16% | | | | 122,515 | | | | 0.91% | | | | 0.90% | | | | | | | | 0.46% | | | | 1.23% | |
| 9/30/15 | | | 10.56 | | | | 0.06 | | | | (0.17 | ) | | | (0.11 | ) | | | (0.26 | ) | | | - | | | | (0.26 | ) | | | 10.19 | | | | (1.12% | ) | | | 153,421 | | | | 0.67% | | | | N/A | | | | | | | | 0.47% | | | | 0.56% | |
Class R5 | | | | | | | | | | | | | | | | | | | | | | | | | | | | | | | | | | | | | | | | | | | | | | | | | | | | | | | | | |
| 9/30/19 | | $ | 10.24 | | | $ | 0.24 | | | $ | 0.42 | | | $ | 0.66 | | | $ | (0.31 | ) | | $ | - | | | $ | (0.31 | ) | | $ | 10.59 | | | | 6.68% | | | $ | 73,365 | | | | 0.60% | | | | 0.59% | | | | | | | | 0.56% | | | | 2.30% | |
| 9/30/18 | | | 10.46 | | | | 0.34 | | | | (0.27 | ) | | | 0.07 | | | | (0.29 | ) | | | - | | | | (0.29 | ) | | | 10.24 | | | | 0.63% | | | | 60,121 | | | | 1.84% | | | | 1.81% | | | | | | | | 0.55% | | | | 3.29% | |
| 9/30/17 | | | 10.80 | | | | 0.22 | | | | (0.28 | ) | | | (0.06 | ) | | | (0.28 | ) | | | - | | | | (0.28 | ) | | | 10.46 | | | | (0.51% | ) | | | 60,155 | | | | 1.36% | | | | 1.33% | | | | | | | | 0.55% | | | | 2.07% | |
| 9/30/16 | | | 10.19 | | | | 0.13 | | | | 0.59 | | | | 0.72 | | | | (0.11 | ) | | | - | | | | (0.11 | ) | | | 10.80 | | | | 7.14% | | | | 65,361 | | | | 1.01% | | | | 1.00% | | | | | | | | 0.56% | | | | 1.22% | |
| 9/30/15 | | | 10.56 | | | | 0.05 | | | | (0.18 | ) | | | (0.13 | ) | | | (0.24 | ) | | | - | | | | (0.24 | ) | | | 10.19 | | | | (1.22% | ) | | | 60,285 | | | | 0.77% | | | | N/A | | | | | | | | 0.57% | | | | 0.48% | |
Service Class | | | | | | | | | | | | | | | | | | | | | | | | | | | | | | | | | | | | | | | | | | | | | | | | | | | | | |
| 9/30/19 | | $ | 10.20 | | | $ | 0.22 | | | $ | 0.43 | | | $ | 0.65 | | | $ | (0.30 | ) | | $ | - | | | $ | (0.30 | ) | | $ | 10.55 | | | | 6.60% | | | $ | 50,873 | | | | 0.71% | | | | 0.70% | | | | | | | | 0.67% | | | | 2.17% | |
| 9/30/18 | | | 10.42 | | | | 0.32 | | | | (0.27 | ) | | | 0.05 | | | | (0.27 | ) | | | - | | | | (0.27 | ) | | | 10.20 | | | | 0.51% | | | | 50,449 | | | | 1.94% | | | | 1.91% | | | | | | | | 0.65% | | | | 3.16% | |
| 9/30/17 | | | 10.76 | | | | 0.21 | | | | (0.29 | ) | | | (0.08 | ) | | | (0.26 | ) | | | - | | | | (0.26 | ) | | | 10.42 | | | | (0.63% | ) | | | 57,719 | | | | 1.46% | | | | 1.43% | | | | | | | | 0.65% | | | | 2.00% | |
| 9/30/16 | | | 10.16 | | | | 0.10 | | | | 0.60 | | | | 0.70 | | | | (0.10 | ) | | | - | | | | (0.10 | ) | | | 10.76 | | | | 6.96% | | | | 71,040 | | | | 1.11% | | | | 1.10% | | | | | | | | 0.66% | | | | 0.95% | |
| 9/30/15 | | | 10.52 | | | | 0.04 | | | | (0.17 | ) | | | (0.13 | ) | | | (0.23 | ) | | | - | | | | (0.23 | ) | | | 10.16 | | | | (1.23% | ) | | | 77,147 | | | | 0.87% | | | | N/A | | | | | | | | 0.67% | | | | 0.37% | |
| | | | | | | | | | | | | | | | | | | | |
| | | Year ended September 30 | |
| | | 2019 | | | 2018 | | | 2017 | | | 2016 | | | 2015 | |
Portfolio turnover rate | | | 42 | % | | | 62 | % | | | 25 | % | | | 46 | % | | | 59 | % |
| c | Per share amount calculated on the average shares method. |
| d | Amount is less than $0.005 per share. |
| j | Computed after giving effect to an agreement by MML Advisers and/or MassMutual to waive certain fees and expenses of the Fund. |
| l | Employee retirement benefit plans that invest plan assets in the Separate Investment Accounts (SIAs) may be subject to certain charges as set forth in their respective Plan Documents. Total return figures would be lower for the periods presented if they reflected these charges. |
| m | Total return excludes sales charges, if any, and would be lower for the period presented if it reflected these charges. |
| p | Interest expense incurred as a result of entering into reverse repurchase agreements and Treasury roll transactions is included in the Fund’s net expenses in the Statements of Operations. Income earned on investing proceeds from reverse repurchase agreements and Treasury roll transactions is included in interest income in the Statements of Operations. |
The accompanying notes are an integral part of the financial statements.
194
| | | | | | | | | | | | | | | | | | | | | | | | | | | | | | | | | | | | | | | | | | | | | | | | | | | | | | | | | | | | |
| | | | | | Income (loss) from investment
operations | | | Less distributions to shareholders | | | | | | | | | Ratios / Supplemental Data | |
| | | Net
asset
value,
beginning
of the
period | | | Net
investment
income
(loss)c,j | | | Net
realized
and
unrealized
gain (loss)
on
investments | | | Total
income
(loss) from
investment
operations | | | From net
investment
income | | | From net
realized
gains | | | Total
distributions | | | Net
asset
value,
end of
the
period | | | Total
returnl,m | | | Net
assets,
end of
the
period
(000’s) | | | Ratio of
expenses
to average
daily net
assets
before
expense
waivers
(including
interest
expense)p | | | Ratio of
expenses
to average
daily net
assets
after
expense
waivers
(including
interest
expense)j,p | | | | | | Ratio of
expenses
to average
daily net
assets
after
expense
waivers
(excluding
interest
expense)j | | | Net
investment
income
(loss) to
average
daily net
assets
(including
interest
expense)p | |
Administrative Class | | | | | | | | | | | | | | | | | | | | | | | | | | | | | | | | | | | | | | | | | | | | | | | | | | | | | |
| 9/30/19 | | $ | 10.30 | | | $ | 0.21 | | | $ | 0.44 | | | $ | 0.65 | | | $ | (0.29 | ) | | $ | - | | | $ | (0.29 | ) | | $ | 10.66 | | | | 6.53% | | | $ | 16,168 | | | | 0.80% | | | | 0.79% | | | | | | | | 0.76% | | | | 2.03% | |
| 9/30/18 | | | 10.53 | | | | 0.31 | | | | (0.28 | ) | | | 0.03 | | | | (0.26 | ) | | | - | | | | (0.26 | ) | | | 10.30 | | | | 0.31% | | | | 14,744 | | | | 2.04% | | | | 2.01% | | | | | | | | 0.75% | | | | 3.02% | |
| 9/30/17 | | | 10.86 | | | | 0.20 | | | | (0.27 | ) | | | (0.07 | ) | | | (0.26 | ) | | | - | | | | (0.26 | ) | | | 10.53 | | | | (0.58% | ) | | | 14,519 | | | | 1.56% | | | | 1.53% | | | | | | | | 0.75% | | | | 1.94% | |
| 9/30/16 | | | 10.26 | | | | 0.10 | | | | 0.59 | | | | 0.69 | | | | (0.09 | ) | | | - | | | | (0.09 | ) | | | 10.86 | | | | 6.80% | | | | 14,408 | | | | 1.21% | | | | 1.20% | | | | | | | | 0.76% | | | | 0.96% | |
| 9/30/15 | | | 10.62 | | | | 0.04 | | | | (0.17 | ) | | | (0.13 | ) | | | (0.23 | ) | | | - | | | | (0.23 | ) | | | 10.26 | | | | (1.30% | ) | | | 11,859 | | | | 0.97% | | | | N/A | | | | | | | | 0.77% | | | | 0.36% | |
Class A | | | | | | | | | | | | | | | | | | | | | | | | | | | | | | | | | | | | | | | | | | | | | | | | | | | | | |
| 9/30/19 | | $ | 10.05 | | | $ | 0.18 | | | $ | 0.42 | | | $ | 0.60 | | | $ | (0.26 | ) | | $ | - | | | $ | (0.26 | ) | | $ | 10.39 | | | | 6.16% | | | $ | 16,136 | | | | 1.06% | | | | 1.05% | | | | | | | | 1.02% | | | | 1.78% | |
| 9/30/18 | | | 10.27 | | | | 0.28 | | | | (0.26 | ) | | | 0.02 | | | | (0.24 | ) | | | - | | | | (0.24 | ) | | | 10.05 | | | | 0.16% | | | | 20,582 | | | | 2.29% | | | | 2.26% | | | | | | | | 1.00% | | | | 2.80% | |
| 9/30/17 | | | 10.60 | | | | 0.17 | | | | (0.27 | ) | | | (0.10 | ) | | | (0.23 | ) | | | - | | | | (0.23 | ) | | | 10.27 | | | | (0.92% | ) | | | 22,180 | | | | 1.81% | | | | 1.78% | | | | | | | | 1.00% | | | | 1.67% | |
| 9/30/16 | | | 10.00 | | | | 0.08 | | | | 0.58 | | | | 0.66 | | | | (0.06 | ) | | | - | | | | (0.06 | ) | | | 10.60 | | | | 6.65% | | | | 23,476 | | | | 1.46% | | | | 1.45% | | | | | | | | 1.01% | | | | 0.76% | |
| 9/30/15 | | | 10.36 | | | | (0.00 | )d | | | (0.16 | ) | | | (0.16 | ) | | | (0.20 | ) | | | - | | | | (0.20 | ) | | | 10.00 | | | | (1.58% | ) | | | 22,320 | | | | 1.22% | | | | N/A | | | | | | | | 1.02% | | | | (0.02% | ) |
Class R4 | | | | | | | | | | | | | | | | | | | | | | | | | | | | | | | | | | | | | | | | | | | | | | | | | | | | | | | | | | | | |
| 9/30/19 | | $ | 10.00 | | | $ | 0.19 | | | $ | 0.42 | | | $ | 0.61 | | | $ | (0.28 | ) | | $ | - | | | $ | (0.28 | ) | | $ | 10.33 | | | | 6.27% | | | $ | 6,949 | | | | 0.96% | | | | 0.95% | | | | | | | | 0.92% | | | | 1.95% | |
| 9/30/18 | | | 10.22 | | | | 0.29 | | | | (0.26 | ) | | | 0.03 | | | | (0.25 | ) | | | - | | | | (0.25 | ) | | | 10.00 | | | | 0.31% | | | | 6,840 | | | | 2.19% | | | | 2.16% | | | | | | | | 0.90% | | | | 2.87% | |
| 9/30/17 | | | 10.57 | | | | 0.18 | | | | (0.28 | ) | | | (0.10 | ) | | | (0.25 | ) | | | - | | | | (0.25 | ) | | | 10.22 | | | | (0.84% | ) | | | 6,231 | | | | 1.71% | | | | 1.68% | | | | | | | | 0.90% | | | | 1.78% | |
| 9/30/16 | | | 10.00 | | | | 0.12 | | | | 0.55 | | | | 0.67 | | | | (0.10 | ) | | | - | | | | (0.10 | ) | | | 10.57 | | | | 6.77% | | | | 5,352 | | | | 1.36% | | | | 1.35% | | | | | | | | 0.91% | | | | 1.21% | |
| 9/30/15 | | | 10.37 | | | | 0.14 | | | | (0.29 | ) | | | (0.15 | ) | | | (0.22 | ) | | | - | | | | (0.22 | ) | | | 10.00 | | | | (1.47% | ) | | | 996 | | | | 1.12% | | | | N/A | | | | | | | | 0.92% | | | | 1.42% | |
Class R3 | | | | | | | | | | | | | | | | | | | | | | | | | | | | | | | | | | | | | | | | | | | | | | | | | | | | | |
| 9/30/19 | | $ | 9.99 | | | $ | 0.17 | | | $ | 0.41 | | | $ | 0.58 | | | $ | (0.24 | ) | | $ | - | | | $ | (0.24 | ) | | $ | 10.33 | | | | 6.03% | | | $ | 4,297 | | | | 1.21% | | | | 1.20% | | | | | | | | 1.17% | | | | 1.68% | |
| 9/30/18 | | | 10.22 | | | | 0.27 | | | | (0.27 | ) | | | 0.00 | d | | | (0.23 | ) | | | - | | | | (0.23 | ) | | | 9.99 | | | | 0.03% | | | | 4,569 | | | | 2.44% | | | | 2.41% | | | | | | | | 1.15% | | | | 2.69% | |
| 9/30/17 | | | 10.57 | | | | 0.16 | | | | (0.27 | ) | | | (0.11 | ) | | | (0.24 | ) | | | - | | | | (0.24 | ) | | | 10.22 | | | | (1.00% | ) | | | 4,686 | | | | 1.97% | | | | 1.94% | | | | | | | | 1.16% | | | | 1.54% | |
| 9/30/16 | | | 10.01 | | | | 0.15 | | | | 0.48 | | | | 0.63 | | | | (0.07 | ) | | | - | | | | (0.07 | ) | | | 10.57 | | | | 6.37% | | | | 2,792 | | | | 1.61% | | | | 1.60% | | | | | | | | 1.16% | | | | 1.46% | |
| 9/30/15 | | | 10.37 | | | | (0.03 | ) | | | (0.15 | ) | | | (0.18 | ) | | | (0.18 | ) | | | - | | | | (0.18 | ) | | | 10.01 | | | | (1.76% | ) | | | 386 | | | | 1.37% | | | | N/A | | | | | | | | 1.17% | | | | (0.30% | ) |
195
MassMutual Premier Core Bond Fund – Financial Statements(Continued)
Financial Highlights(For a share outstanding throughout each period)
| | | | | | | | | | | | | | | | | | | | | | | | | | | | | | | | | | | | | | | | | | | | | | | | |
| | | | | |
| Income (loss) from
investment operations |
| |
| Less distributions to
shareholders |
| | | | | | | | | |
|
Ratios / Supplemental Data |
|
| | | Net
asset
value,
beginning
of the
period | | | Net
investment
income
(loss)c | | | Net
realized
and
unrealized
gain (loss)
on
investments | | | Total
income
(loss) from
investment
operations | | | From net
investment
income | | | From net
realized
gains | | | Total
distributions | | | Net
asset
value,
end of
the
period | | | Total
returnl,m | | | Net
assets,
end of
the
period
(000’s) | | | Ratio of
expenses
to average
daily net
assets | | | Net
investment
income
(loss) to
average
daily net
assets | |
Class I | | | | | | | | | | | | | | | | | | | | | | | | | | | | | | | | | | | | | | | | | |
| 9/30/19 | | $ | 10.66 | | | $ | 0.37 | | | $ | 0.66 | | | $ | 1.03 | | | $ | (0.36 | ) | | $ | - | | | $ | (0.36 | ) | | $ | 11.33 | | | | 9.98% | | | $ | 847,736 | | | | 0.43% | | | | 3.42% | |
| 9/30/18 | | | 11.04 | | | | 0.34 | | | | (0.39 | ) | | | (0.05 | ) | | | (0.33 | ) | | | - | | | | (0.33 | ) | | | 10.66 | | | | (0.46% | ) | | | 695,501 | | | | 0.42% | | | | 3.19% | |
| 9/30/17 | | | 11.26 | | | | 0.29 | | | | (0.15 | ) | | | 0.14 | | | | (0.36 | ) | | | - | | | | (0.36 | ) | | | 11.04 | | | | 1.41% | | | | 546,975 | | | | 0.42% | | | | 2.70% | |
| 9/30/16 | | | 11.27 | | | | 0.29 | | | | 0.19 | | | | 0.48 | | | | (0.34 | ) | | | (0.15 | ) | | | (0.49 | ) | | | 11.26 | | | | 4.54% | | | | 501,737 | | | | 0.42% | | | | 2.59% | |
| 9/30/15 | | | 11.43 | | | | 0.30 | | | | (0.11 | ) | | | 0.19 | | | | (0.30 | ) | | | (0.05 | ) | | | (0.35 | ) | | | 11.27 | | | | 1.67% | | | | 677,427 | | | | 0.42% | | | | 2.61% | |
Class R5 | | | | | | | | | | | | | | | | | | | | | | | | | | | | | | | | | | | | | | | | | |
| 9/30/19 | | $ | 10.69 | | | $ | 0.36 | | | $ | 0.67 | | | $ | 1.03 | | | $ | (0.35 | ) | | $ | - | | | $ | (0.35 | ) | | $ | 11.37 | | | | 9.92% | | | $ | 317,805 | | | | 0.53% | | | | 3.32% | |
| 9/30/18 | | | 11.07 | | | | 0.33 | | | | (0.39 | ) | | | (0.06 | ) | | | (0.32 | ) | | | - | | | | (0.32 | ) | | | 10.69 | | | | (0.57% | ) | | | 294,370 | | | | 0.52% | | | | 3.07% | |
| 9/30/17 | | | 11.29 | | | | 0.28 | | | | (0.15 | ) | | | 0.13 | | | | (0.35 | ) | | | - | | | | (0.35 | ) | | | 11.07 | | | | 1.30% | | | | 358,319 | | | | 0.52% | | | | 2.58% | |
| 9/30/16 | | | 11.30 | | | | 0.28 | | | | 0.19 | | | | 0.47 | | | | (0.33 | ) | | | (0.15 | ) | | | (0.48 | ) | | | 11.29 | | | | 4.40% | | | | 408,472 | | | | 0.52% | | | | 2.49% | |
| 9/30/15 | | | 11.45 | | | | 0.29 | | | | (0.11 | ) | | | 0.18 | | | | (0.28 | ) | | | (0.05 | ) | | | (0.33 | ) | | | 11.30 | | | | 1.63% | | | | 489,222 | | | | 0.52% | | | | 2.51% | |
Service Class | | | | | | | | | | | | | | | | | | | | | | | | | | | | | | | | | | | | | | | | | |
| 9/30/19 | | $ | 10.63 | | | $ | 0.35 | | | $ | 0.64 | | | $ | 0.99 | | | $ | (0.33 | ) | | $ | - | | | $ | (0.33 | ) | | $ | 11.29 | | | | 9.67% | | | $ | 86,988 | | | | 0.63% | | | | 3.22% | |
| 9/30/18 | | | 11.01 | | | | 0.32 | | | | (0.39 | ) | | | (0.07 | ) | | | (0.31 | ) | | | - | | | | (0.31 | ) | | | 10.63 | | | | (0.66% | ) | | | 101,502 | | | | 0.62% | | | | 2.98% | |
| 9/30/17 | | | 11.22 | | | | 0.27 | | | | (0.15 | ) | | | 0.12 | | | | (0.33 | ) | | | - | | | | (0.33 | ) | | | 11.01 | | | | 1.24% | | | | 100,903 | | | | 0.62% | | | | 2.51% | |
| 9/30/16 | | | 11.23 | | | | 0.26 | | | | 0.20 | | | | 0.46 | | | | (0.32 | ) | | | (0.15 | ) | | | (0.47 | ) | | | 11.22 | | | | 4.34% | | | | 91,885 | | | | 0.62% | | | | 2.40% | |
| 9/30/15 | | | 11.38 | | | | 0.27 | | | | (0.10 | ) | | | 0.17 | | | | (0.27 | ) | | | (0.05 | ) | | | (0.32 | ) | | | 11.23 | | | | 1.49% | | | | 130,923 | | | | 0.62% | | | | 2.40% | |
| | | | | | | | | | | | | | | | | | | | |
| | | Year ended September 30 | |
| | | 2019 | | | 2018 | | | 2017 | | | 2016 | | | 2015 | |
Portfolio turnover rate | | | 261 | % | | | 140 | % | | | 213 | % | | | 330 | % | | | 361 | % |
| c | Per share amount calculated on the average shares method. |
| l | Employee retirement benefit plans that invest plan assets in the Separate Investment Accounts (SIAs) may be subject to certain charges as set forth in their respective Plan Documents. Total return figures would be lower for the periods presented if they reflected these charges. |
| m | Total return excludes sales charges, if any, and would be lower for the period presented if it reflected these charges. |
The accompanying notes are an integral part of the financial statements.
196
| | | | | | | | | | | | | | | | | | | | | | | | | | | | | | | | | | | | | | | | | | | | | | | | |
| | | | | |
| Income (loss) from
investment operations |
| |
| Less distributions to
shareholders |
| | | | | | | | | |
|
Ratios / Supplemental Data |
|
| | | Net
asset
value,
beginning
of the
period | | | Net
investment
income
(loss)c | | | Net
realized
and
unrealized
gain (loss)
on
investments | | | Total
income
(loss) from
investment
operations | | | From net
investment
income | | | From net
realized
gains | | | Total
distributions | | | Net
asset
value,
end of
the
period | | | Total
returnl,m | | | Net
assets,
end of
the
period
(000’s) | | | Ratio of
expenses
to average
daily net
assets | | | Net
investment
income
(loss) to
average
daily net
assets | |
Administrative Class | | | | | | | | | | | | | | | | | | | | | | | | | | | | | | | | | | | | | | | | | |
| 9/30/19 | | $ | 10.55 | | | $ | 0.33 | | | $ | 0.66 | | | $ | 0.99 | | | $ | (0.33 | ) | | $ | - | | | $ | (0.33 | ) | | $ | 11.21 | | | | 9.65% | | | $ | 67,239 | | | | 0.73% | | | | 3.13% | |
| 9/30/18 | | | 10.92 | | | | 0.31 | | | | (0.38 | ) | | | (0.07 | ) | | | (0.30 | ) | | | - | | | | (0.30 | ) | | | 10.55 | | | | (0.70% | ) | | | 69,478 | | | | 0.72% | | | | 2.88% | |
| 9/30/17 | | | 11.14 | | | | 0.26 | | | | (0.15 | ) | | | 0.11 | | | | (0.33 | ) | | | - | | | | (0.33 | ) | | | 10.92 | | | | 1.11% | | | | 71,425 | | | | 0.72% | | | | 2.38% | |
| 9/30/16 | | | 11.16 | | | | 0.25 | | | | 0.19 | | | | 0.44 | | | | (0.31 | ) | | | (0.15 | ) | | | (0.46 | ) | | | 11.14 | | | | 4.19% | | | | 85,249 | | | | 0.72% | | | | 2.29% | |
| 9/30/15 | | | 11.32 | | | | 0.26 | | | | (0.10 | ) | | | 0.16 | | | | (0.27 | ) | | | (0.05 | ) | | | (0.32 | ) | | | 11.16 | | | | 1.38% | | | | 84,709 | | | | 0.72% | | | | 2.31% | |
Class A | | | | | | | | | | | | | | | | | | | | | | | | | | | | | | | | | | | | | | | | | |
| 9/30/19 | | $ | 10.45 | | | $ | 0.30 | | | $ | 0.65 | | | $ | 0.95 | | | $ | (0.30 | ) | | $ | - | | | $ | (0.30 | ) | | $ | 11.10 | | | | 9.32% | | | $ | 97,070 | | | | 0.98% | | | | 2.87% | |
| 9/30/18 | | | 10.82 | | | | 0.28 | | | | (0.38 | ) | | | (0.10 | ) | | | (0.27 | ) | | | - | | | | (0.27 | ) | | | 10.45 | | | | (1.00% | ) | | | 106,562 | | | | 0.97% | | | | 2.63% | |
| 9/30/17 | | | 11.03 | | | | 0.23 | | | | (0.15 | ) | | | 0.08 | | | | (0.29 | ) | | | - | | | | (0.29 | ) | | | 10.82 | | | | 0.87% | | | | 114,317 | | | | 0.97% | | | | 2.13% | |
| 9/30/16 | | | 11.04 | | | | 0.22 | | | | 0.20 | | | | 0.42 | | | | (0.28 | ) | | | (0.15 | ) | | | (0.43 | ) | | | 11.03 | | | | 4.01% | | | | 150,014 | | | | 0.97% | | | | 2.04% | |
| 9/30/15 | | | 11.20 | | | | 0.23 | | | | (0.10 | ) | | | 0.13 | | | | (0.24 | ) | | | (0.05 | ) | | | (0.29 | ) | | | 11.04 | | | | 1.12% | | | | 166,649 | | | | 0.97% | | | | 2.06% | |
Class R4 | | | | | | | | | | | | | | | | | | | | | | | | | | | | | | | | | | | | | | | | | | | | | | | | |
| 9/30/19 | | $ | 10.39 | | | $ | 0.31 | | | $ | 0.64 | | | $ | 0.95 | | | $ | (0.30 | ) | | $ | - | | | $ | (0.30 | ) | | $ | 11.04 | | | | 9.47% | | | $ | 14,011 | | | | 0.88% | | | | 2.98% | |
| 9/30/18 | | | 10.78 | | | | 0.29 | | | | (0.39 | ) | | | (0.10 | ) | | | (0.29 | ) | | | - | | | | (0.29 | ) | | | 10.39 | | | | (0.97% | ) | | | 10,624 | | | | 0.87% | | | | 2.72% | |
| 9/30/17 | | | 11.00 | | | | 0.24 | | | | (0.14 | ) | | | 0.10 | | | | (0.32 | ) | | | - | | | | (0.32 | ) | | | 10.78 | | | | 1.03% | | | | 14,811 | | | | 0.87% | | | | 2.23% | |
| 9/30/16 | | | 11.03 | | | | 0.23 | | | | 0.19 | | | | 0.42 | | | | (0.30 | ) | | | (0.15 | ) | | | (0.45 | ) | | | 11.00 | | | | 4.09% | | | | 14,906 | | | | 0.87% | | | | 2.14% | |
| 9/30/15 | | | 11.20 | | | | 0.25 | | | | (0.11 | ) | | | 0.14 | | | | (0.26 | ) | | | (0.05 | ) | | | (0.31 | ) | | | 11.03 | | | | 1.28% | | | | 8,960 | | | | 0.87% | | | | 2.21% | |
Class R3 | | | | | | | | | | | | | | | | | | | | | | | | | | | | | | | | | | | | | | | | | |
| 9/30/19 | | $ | 10.67 | | | $ | 0.29 | | | $ | 0.67 | | | $ | 0.96 | | | $ | (0.29 | ) | | $ | - | | | $ | (0.29 | ) | | $ | 11.34 | | | | 9.24% | | | $ | 1,225 | | | | 1.13% | | | | 2.72% | |
| 9/30/18 | | | 11.02 | | | | 0.27 | | | | (0.39 | ) | | | (0.12 | ) | | | (0.23 | ) | | | - | | | | (0.23 | ) | | | 10.67 | | | | (1.13% | ) | | | 803 | | | | 1.12% | | | | 2.49% | |
| 9/30/17 | | | 11.25 | | | | 0.22 | | | | (0.16 | ) | | | 0.06 | | | | (0.29 | ) | | | - | | | | (0.29 | ) | | | 11.02 | | | | 0.64% | | | | 828 | | | | 1.12% | | | | 1.99% | |
| 9/30/16 | | | 11.25 | | | | 0.21 | | | | 0.20 | | | | 0.41 | | | | (0.26 | ) | | | (0.15 | ) | | | (0.41 | ) | | | 11.25 | | | | 3.89% | | | | 783 | | | | 1.12% | | | | 1.89% | |
| 9/30/15 | | | 11.40 | | | | 0.22 | | | | (0.10 | ) | | | 0.12 | | | | (0.22 | ) | | | (0.05 | ) | | | (0.27 | ) | | | 11.25 | | | | 1.02% | | | | 625 | | | | 1.12% | | | | 1.90% | |
197
MassMutual Premier Diversified Bond Fund – Financial Statements(Continued)
Financial Highlights(For a share outstanding throughout each period)
| | | | | | | | | | | | | | | | | | | | | | | | | | | | | | | | | | | | | | | | | | | | | | | | | | | | |
| | | | | | Income (loss) from investment
operations | | | Less distributions to shareholders | | | | | | | | |
Ratios / Supplemental Data | |
| | | Net
asset
value,
beginning
of the
period | | | Net
investment
income
(loss)c,j | | | Net
realized
and
unrealized
gain (loss)
on
investments | | | Total
income
(loss) from
investment
operations | | | From net
investment
income | | | From net
realized
gains | | | Total
distributions | | | Net
asset
value,
end of
the
period | | | Total
returnl,m | | | Net
assets,
end of
the
period
(000’s) | | | Ratio of
expenses
to average
daily net
assets
before
expense
waivers | | | Ratio of
expenses
to average
daily net
assets
after
expense
waiversj | | | Net
investment
income
(loss) to
average
daily net
assets | |
Class I | | | | | | | | | | | | | | | | | | | | | | | | | | | | | | | | | | | | | | | | | | | | | |
9/30/19 | | $ | 10.59 | | | $ | 0.38 | | | $ | 0.64 | | | $ | 1.02 | | | $ | (0.33 | ) | | $ | - | | | $ | (0.33 | ) | | $ | 11.28 | | | | 9.98% | | | $ | 60,965 | | | | 0.55% | | | | 0.55% | n | | | 3.54% | |
| 9/30/18 | | | 10.97 | | | | 0.35 | | | | (0.41 | ) | | | (0.06 | ) | | | (0.32 | ) | | | - | | | | (0.32 | ) | | | 10.59 | | | | (0.55% | ) | | | 21,746 | | | | 0.50% | | | | 0.50% | n | | | 3.33% | |
| 9/30/17 | | | 11.01 | | | | 0.31 | | | | (0.09 | ) | | | 0.22 | | | | (0.26 | ) | | | - | | | | (0.26 | ) | | | 10.97 | | | | 2.16% | | | | 27,548 | | | | 0.51% | | | | 0.51% | n | | | 2.87% | |
| 9/30/16 | | | 10.73 | | | | 0.28 | | | | 0.31 | | | | 0.59 | | | | (0.26 | ) | | | (0.05 | ) | | | (0.31 | ) | | | 11.01 | | | | 5.71% | | | | 20,147 | | | | 0.53% | | | | 0.52% | | | | 2.60% | |
| 9/30/15 | | | 10.88 | | | | 0.28 | | | | (0.19 | ) | | | 0.09 | | | | (0.23 | ) | | | (0.01 | ) | | | (0.24 | ) | | | 10.73 | | | | 0.81% | | | | 15,756 | | | | 0.56% | | | | 0.52% | | | | 2.54% | |
Class R5 | | | | | | | | | | | | | | | | | | | | | | | | | | | | | | | | | | | | | | | | | | | | | |
9/30/19 | | $ | 9.78 | | | $ | 0.34 | | | $ | 0.60 | | | $ | 0.94 | | | $ | (0.32 | ) | | $ | - | | | $ | (0.32 | ) | | $ | 10.40 | | | | 9.99% | | | $ | 109,659 | | | | 0.65% | | | | 0.65% | n | | | 3.46% | |
| 9/30/18 | | | 10.16 | | | | 0.32 | | | | (0.39 | ) | | | (0.07 | ) | | | (0.31 | ) | | | - | | | | (0.31 | ) | | | 9.78 | | | | (0.69% | ) | | | 98,402 | | | | 0.60% | | | | 0.60% | n | | | 3.24% | |
| 9/30/17 | | | 10.22 | | | | 0.28 | | | | (0.09 | ) | | | 0.19 | | | | (0.25 | ) | | | - | | | | (0.25 | ) | | | 10.16 | | | | 2.02% | | | | 88,740 | | | | 0.61% | | | | 0.61% | n | | | 2.76% | |
| 9/30/16 | | | 9.98 | | | | 0.25 | | | | 0.29 | | | | 0.54 | | | | (0.25 | ) | | | (0.05 | ) | | | (0.30 | ) | | | 10.22 | | | | 5.63% | | | | 77,693 | | | | 0.63% | | | | 0.62% | | | | 2.50% | |
| 9/30/15 | | | 10.14 | | | | 0.24 | | | | (0.17 | ) | | | 0.07 | | | | (0.22 | ) | | | (0.01 | ) | | | (0.23 | ) | | | 9.98 | | | | 0.66% | | | | 65,209 | | | | 0.66% | | | | 0.62% | | | | 2.41% | |
Service Class | | | | | | | | | | | | | | | | | | | | | | | | | | | | | | | | | | | | | | | | | | | | | |
9/30/19 | | $ | 9.91 | | | $ | 0.33 | | | $ | 0.61 | | | $ | 0.94 | | | $ | (0.31 | ) | | $ | - | | | $ | (0.31 | ) | | $ | 10.54 | | | | 9.80% | | | $ | 12,976 | | | | 0.75% | | | | 0.75% | n | | | 3.35% | |
| 9/30/18 | | | 10.28 | | | | 0.31 | | | | (0.38 | ) | | | (0.07 | ) | | | (0.30 | ) | | | - | | | | (0.30 | ) | | | 9.91 | | | | (0.69% | ) | | | 18,946 | | | | 0.70% | | | | 0.70% | n | | | 3.14% | |
| 9/30/17 | | | 10.34 | | | | 0.27 | | | | (0.09 | ) | | | 0.18 | | | | (0.24 | ) | | | - | | | | (0.24 | ) | | | 10.28 | | | | 1.89% | | | | 16,047 | | | | 0.71% | | | | 0.71% | n | | | 2.65% | |
| 9/30/16 | | | 10.09 | | | | 0.24 | | | | 0.30 | | | | 0.54 | | | | (0.24 | ) | | | (0.05 | ) | | | (0.29 | ) | | | 10.34 | | | | 5.53% | | | | 16,990 | | | | 0.73% | | | | 0.72% | | | | 2.39% | |
| 9/30/15 | | | 10.24 | | | | 0.24 | | | | (0.17 | ) | | | 0.07 | | | | (0.21 | ) | | | (0.01 | ) | | | (0.22 | ) | | | 10.09 | | | | 0.59% | | | | 20,226 | | | | 0.76% | | | | 0.72% | | | | 2.32% | |
| | | | | | | | | | | | | | | | | | | | |
| | | Year ended September 30 | |
| | | 2019 | | | 2018 | | | 2017 | | | 2016 | | | 2015 | |
Portfolio turnover rate | | | 236 | % | | | 142 | % | | | 207 | % | | | 314 | % | | | 362 | % |
| c | Per share amount calculated on the average shares method. |
| j | Computed after giving effect to an agreement by MML Advisers and/or MassMutual to waive certain fees and expenses of the Fund. |
| l | Employee retirement benefit plans that invest plan assets in the Separate Investment Accounts (SIAs) may be subject to certain charges as set forth in their respective Plan Documents. Total return figures would be lower for the periods presented if they reflected these charges. |
| m | Total return excludes sales charges, if any, and would be lower for the period presented if it reflected these charges. |
| n | Expenses incurred during the period fell under the expense cap. |
The accompanying notes are an integral part of the financial statements.
198
| | | | | | | | | | | | | | | | | | | | | | | | | | | | | | | | | | | | | | | | | | | | | | | | | | | | |
| | | | | | Income (loss) from investment
operations | | | Less distributions to shareholders | | | | | | | | |
Ratios / Supplemental Data | |
| | | Net
asset
value,
beginning
of the
period | | | Net
investment
income
(loss)c,j | | | Net
realized
and
unrealized
gain (loss)
on
investments | | | Total
income
(loss) from
investment
operations | | | From net
investment
income | | | From net
realized
gains | | | Total
distributions | | | Net
asset
value,
end of
the
period | | | Total
returnl,m | | | Net
assets,
end of
the
period
(000’s) | | | Ratio of
expenses
to average
daily net
assets
before
expense
waivers | | | Ratio of
expenses
to average
daily net
assets
after
expense
waiversj | | | Net
investment
income
(loss) to
average
daily net
assets | |
Administrative Class | | | | | | | | | | | | | | | | | | | | | | | | | | | | | | | | | | | | | | | | | | | | | |
9/30/19 | | $ | 9.88 | | | $ | 0.32 | | | $ | 0.62 | | | $ | 0.94 | | | $ | (0.30 | ) | | $ | - | | | $ | (0.30 | ) | | $ | 10.52 | | | | 9.79% | | | $ | 21,870 | | | | 0.85% | | | | 0.85% | n | | | 3.25% | |
| 9/30/18 | | | 10.25 | | | | 0.30 | | | | (0.38 | ) | | | (0.08 | ) | | | (0.29 | ) | | | - | | | | (0.29 | ) | | | 9.88 | | | | (0.83% | ) | | | 27,039 | | | | 0.80% | | | | 0.80% | n | | | 3.03% | |
| 9/30/17 | | | 10.31 | | | | 0.26 | | | | (0.09 | ) | | | 0.17 | | | | (0.23 | ) | | | - | | | | (0.23 | ) | | | 10.25 | | | | 1.78% | | | | 26,601 | | | | 0.81% | | | | 0.81% | n | | | 2.54% | |
| 9/30/16 | | | 10.07 | | | | 0.23 | | | | 0.29 | | | | 0.52 | | | | (0.23 | ) | | | (0.05 | ) | | | (0.28 | ) | | | 10.31 | | | | 5.38% | | | | 34,731 | | | | 0.83% | | | | 0.82% | | | | 2.29% | |
| 9/30/15 | | | 10.22 | | | | 0.23 | | | | (0.17 | ) | | | 0.06 | | | | (0.20 | ) | | | (0.01 | ) | | | (0.21 | ) | | | 10.07 | | | | 0.54% | | | | 35,581 | | | | 0.86% | | | | 0.82% | | | | 2.22% | |
Class A | | | | | | | | | | | | | | | | | | | | | | | | | | | | | | | | | | | | | | | | | | | | | |
9/30/19 | | $ | 9.85 | | | $ | 0.30 | | | $ | 0.60 | | | $ | 0.90 | | | $ | (0.27 | ) | | $ | - | | | $ | (0.27 | ) | | $ | 10.48 | | | | 9.45% | | | $ | 28,973 | | | | 1.10% | | | | 1.10% | n | | | 3.01% | |
| 9/30/18 | | | 10.23 | | | | 0.28 | | | | (0.40 | ) | | | (0.12 | ) | | | (0.26 | ) | | | - | | | | (0.26 | ) | | | 9.85 | | | | (1.17% | ) | | | 32,456 | | | | 1.05% | | | | 1.05% | n | | | 2.78% | |
| 9/30/17 | | | 10.28 | | | | 0.23 | | | | (0.07 | ) | | | 0.16 | | | | (0.21 | ) | | | - | | | | (0.21 | ) | | | 10.23 | | | | 1.63% | | | | 34,137 | | | | 1.06% | | | | 1.06% | n | | | 2.30% | |
| 9/30/16 | | | 10.04 | | | | 0.20 | | | | 0.29 | | | | 0.49 | | | | (0.20 | ) | | | (0.05 | ) | | | (0.25 | ) | | | 10.28 | | | | 5.06% | | | | 37,243 | | | | 1.08% | | | | 1.07% | | | | 2.04% | |
| 9/30/15 | | | 10.17 | | | | 0.20 | | | | (0.16 | ) | | | 0.04 | | | | (0.16 | ) | | | (0.01 | ) | | | (0.17 | ) | | | 10.04 | | | | 0.21% | | | | 36,941 | | | | 1.11% | | | | 1.07% | | | | 1.96% | |
Class R4 | | | | | | | | | | | | | | | | | | | | | | | | | | | | | | | | | | | | | | | | | | | | | | | | | | | | |
9/30/19 | | $ | 9.78 | | | $ | 0.31 | | | $ | 0.59 | | | $ | 0.90 | | | $ | (0.30 | ) | | $ | - | | | $ | (0.30 | ) | | $ | 10.38 | | | | 9.49% | | | $ | 6,925 | | | | 1.00% | | | | 1.00% | n | | | 3.12% | |
| 9/30/18 | | | 10.16 | | | | 0.28 | | | | (0.38 | ) | | | (0.10 | ) | | | (0.28 | ) | | | - | | | | (0.28 | ) | | | 9.78 | | | | (1.01% | ) | | | 4,730 | | | | 0.95% | | | | 0.95% | n | | | 2.87% | |
| 9/30/17 | | | 10.22 | | | | 0.24 | | | | (0.07 | ) | | | 0.17 | | | | (0.23 | ) | | | - | | | | (0.23 | ) | | | 10.16 | | | | 1.77% | | | | 5,032 | | | | 0.96% | | | | 0.96% | n | | | 2.41% | |
| 9/30/16 | | | 10.01 | | | | 0.21 | | | | 0.29 | | | | 0.50 | | | | (0.24 | ) | | | (0.05 | ) | | | (0.29 | ) | | | 10.22 | | | | 5.18% | | | | 3,765 | | | | 0.98% | | | | 0.97% | | | | 2.15% | |
| 9/30/15 | | | 10.18 | | | | 0.22 | | | | (0.18 | ) | | | 0.04 | | | | (0.20 | ) | | | (0.01 | ) | | | (0.21 | ) | | | 10.01 | | | | 0.34% | | | | 2,959 | | | | 1.01% | | | | 0.97% | | | | 2.17% | |
Class R3 | | | | | | | | | | | | | | | | | | | | | | | | | | | | | | | | | | | | | | | | | | | | | | | | | | | | |
9/30/19 | | $ | 9.72 | | | $ | 0.28 | | | $ | 0.60 | | | $ | 0.88 | | | $ | (0.26 | ) | | $ | - | | | $ | (0.26 | ) | | $ | 10.34 | | | | 9.35% | | | $ | 3,553 | | | | 1.25% | | | | 1.25% | n | | | 2.85% | |
| 9/30/18 | | | 10.10 | | | | 0.26 | | | | (0.38 | ) | | | (0.12 | ) | | | (0.26 | ) | | | - | | | | (0.26 | ) | | | 9.72 | | | | (1.24% | ) | | | 4,530 | | | | 1.20% | | | | 1.20% | n | | | 2.64% | |
| 9/30/17 | | | 10.19 | | | | 0.22 | | | | (0.09 | ) | | | 0.13 | | | | (0.22 | ) | | | - | | | | (0.22 | ) | | | 10.10 | | | | 1.41% | | | | 3,869 | | | | 1.21% | | | | 1.21% | n | | | 2.18% | |
| 9/30/16 | | | 9.99 | | | | 0.19 | | | | 0.29 | | | | 0.48 | | | | (0.23 | ) | | | (0.05 | ) | | | (0.28 | ) | | | 10.19 | | | | 4.94% | | | | 2,592 | | | | 1.23% | | | | 1.22% | | | | 1.95% | |
| 9/30/15 | | | 10.16 | | | | 0.19 | | | | (0.17 | ) | | | 0.02 | | | | (0.18 | ) | | | (0.01 | ) | | | (0.19 | ) | | | 9.99 | | | | 0.15% | | | | 412 | | | | 1.26% | | | | 1.22% | | | | 1.84% | |
199
MassMutual Premier High Yield Fund – Financial Statements(Continued)
Financial Highlights(For a share outstanding throughout each period)
| | | | | | | | | | | | | | | | | | | | | | | | | | | | | | | | | | | | | | | | | | | | | | | | | | | | |
| | | | | | Income (loss) from investment
operations | | | Less distributions to shareholders | | | | | | | | |
Ratios / Supplemental Data | |
| | | Net
asset
value,
beginning
of the
period | | | Net
investment
income
(loss)c,j | | | Net
realized
and
unrealized
gain (loss)
on
investments | | | Total
income
(loss) from
investment
operations | | | From net
investment
income | | | From net
realized
gains | | | Total
distributions | | | Net
asset
value,
end
of the
period | | | Total
returnl,m | | | Net
assets,
end of
the
period
(000’s) | | | Ratio of
expenses
to average
daily net
assets
before
expense
waivers | | | Ratio of
expenses
to average
daily net
assets
after
expense
waiversj | | | Net
investment
income
(loss) to
average
daily net
assets | |
Class I | | | | | | | | | | | | | | | | | | | | | | | | | | | | | | | | | | | | | | | | | | | | | |
9/30/19 | | $ | 9.27 | | | $ | 0.56 | | | $ | (0.10 | ) | | $ | 0.46 | | | $ | (0.52 | ) | | $ | - | | | $ | (0.52 | ) | | $ | 9.21 | | | | 5.45% | | | $ | 326,836 | | | | 0.54% | | | | 0.54% | n | | | 6.31% | |
| 9/30/18 | | | 9.62 | | | | 0.58 | | | | (0.33 | ) | | | 0.25 | | | | (0.60 | ) | | | - | | | | (0.60 | ) | | | 9.27 | | | | 2.78% | | | | 382,927 | | | | 0.54% | | | | 0.54% | n | | | 6.32% | |
| 9/30/17 | | | 9.29 | | | | 0.62 | | | | 0.28 | | | | 0.90 | | | | (0.57 | ) | | | - | | | | (0.57 | ) | | | 9.62 | | | | 10.22% | | | | 242,645 | | | | 0.54% | | | | 0.54% | n | | | 6.63% | |
| 9/30/16 | | | 8.98 | | | | 0.62 | | | | 0.28 | | | | 0.90 | | | | (0.59 | ) | | | - | | | | (0.59 | ) | | | 9.29 | | | | 10.86% | | | | 220,759 | | | | 0.57% | | | | 0.55% | | | | 7.05% | |
| 9/30/15 | | | 10.16 | | | | 0.61 | | | | (0.86 | ) | | | (0.25 | ) | | | (0.69 | ) | | | (0.24 | ) | | | (0.93 | ) | | | 8.98 | | | | (2.27% | ) | | | 106,575 | | | | 0.58% | | | | 0.55% | | | | 6.47% | |
Class R5 | | | | | | | | | | | | | | | | | | | | | | | | | | | | | | | | | | | | | | | | | | | | | |
9/30/19 | | $ | 9.31 | | | $ | 0.56 | | | $ | (0.11 | ) | | $ | 0.45 | | | $ | (0.51 | ) | | $ | - | | | $ | (0.51 | ) | | $ | 9.25 | | | | 5.29% | | | $ | 41,369 | | | | 0.64% | | | | 0.64% | n | | | 6.23% | |
| 9/30/18 | | | 9.66 | | | | 0.57 | | | | (0.33 | ) | | | 0.24 | | | | (0.59 | ) | | | - | | | | (0.59 | ) | | | 9.31 | | | | 2.65% | | | | 43,613 | | | | 0.64% | | | | 0.64% | n | | | 6.20% | |
| 9/30/17 | | | 9.33 | | | | 0.61 | | | | 0.28 | | | | 0.89 | | | | (0.56 | ) | | | - | | | | (0.56 | ) | | | 9.66 | | | | 10.08% | | | | 55,628 | | | | 0.64% | | | | 0.64% | n | | | 6.54% | |
| 9/30/16 | | | 9.02 | | | | 0.61 | | | | 0.28 | | | | 0.89 | | | | (0.58 | ) | | | - | | | | (0.58 | ) | | | 9.33 | | | | 10.68% | | | | 45,867 | | | | 0.67% | | | | 0.65% | | | | 6.93% | |
| 9/30/15 | | | 10.19 | | | | 0.60 | | | | (0.85 | ) | | | (0.25 | ) | | | (0.68 | ) | | | (0.24 | ) | | | (0.92 | ) | | | 9.02 | | | | (2.28% | ) | | | 41,616 | | | | 0.68% | | | | 0.65% | | | | 6.38% | |
Service Class | | | | | | | | | | | | | | | | | | | | | | | | | | | | | | | | | | | | | | | | | | | | | |
9/30/19 | | $ | 9.31 | | | $ | 0.55 | | | $ | (0.11 | ) | | $ | 0.44 | | | $ | (0.50 | ) | | $ | - | | | $ | (0.50 | ) | | $ | 9.25 | | | | 5.20% | | | $ | 49,174 | | | | 0.74% | | | | 0.74% | n | | | 6.13% | |
| 9/30/18 | | | 9.66 | | | | 0.56 | | | | (0.33 | ) | | | 0.23 | | | | (0.58 | ) | | | - | | | | (0.58 | ) | | | 9.31 | | | | 2.55% | | | | 45,296 | | | | 0.74% | | | | 0.74% | n | | | 6.11% | |
| 9/30/17 | | | 9.33 | | | | 0.60 | | | | 0.28 | | | | 0.88 | | | | (0.55 | ) | | | - | | | | (0.55 | ) | | | 9.66 | | | | 9.93% | | | | 49,581 | | | | 0.74% | | | | 0.74% | n | | | 6.45% | |
| 9/30/16 | | | 9.01 | | | | 0.60 | | | | 0.29 | | | | 0.89 | | | | (0.57 | ) | | | - | | | | (0.57 | ) | | | 9.33 | | | | 10.70% | | | | 59,787 | | | | 0.77% | | | | 0.75% | | | | 6.83% | |
| 9/30/15 | | | 10.18 | | | | 0.59 | | | | (0.86 | ) | | | (0.27 | ) | | | (0.66 | ) | | | (0.24 | ) | | | (0.90 | ) | | | 9.01 | | | | (2.40% | ) | | | 62,734 | | | | 0.78% | | | | 0.75% | | | | 6.27% | |
| | | | | | | | | | | | | | | | | | | | |
| | | Year ended September 30 | |
| | | 2019 | | | 2018 | | | 2017 | | | 2016 | | | 2015 | |
Portfolio turnover rate | | | 54 | % | | | 38 | % | | | 70 | % | | | 50 | % | | | 76 | % |
| c | Per share amount calculated on the average shares method. |
| j | Computed after giving effect to an agreement by MML Advisers and/or MassMutual to waive certain fees and expenses of the Fund. |
| l | Employee retirement benefit plans that invest plan assets in the Separate Investment Accounts (SIAs) may be subject to certain charges as set forth in their respective Plan Documents. Total return figures would be lower for the periods presented if they reflected these charges. |
| m | Total return excludes sales charges, if any, and would be lower for the period presented if it reflected these charges. |
| n | Expenses incurred during the period fell under the expense cap. |
The accompanying notes are an integral part of the financial statements.
200
| | | | | | | | | | | | | | | | | | | | | | | | | | | | | | | | | | | | | | | | | | | | | | | | | | | | |
| | | | | | Income (loss) from investment
operations | | | Less distributions to shareholders | | | | | | | | |
Ratios / Supplemental Data | |
| | | Net
asset
value,
beginning
of the
period | | | Net
investment
income
(loss)c,j | | | Net
realized
and
unrealized
gain (loss)
on
investments | | | Total
income
(loss) from
investment
operations | | | From net
investment
income | | | From net
realized
gains | | | Total
distributions | | | Net
asset
value,
end
of the
period | | | Total
returnl,m | | | Net
assets,
end of
the
period
(000’s) | | | Ratio of
expenses
to average
daily net
assets
before
expense
waivers | | | Ratio of
expenses
to average
daily net
assets
after
expense
waiversj | | | Net
investment
income
(loss) to
average
daily net
assets | |
Administrative Class | | | | | | | | | | | | | | | | | | | | | | | | | | | | | | | | | | | | | | | | | | | | | |
9/30/19 | | $ | 9.16 | | | $ | 0.53 | | | $ | (0.10 | ) | | $ | 0.43 | | | $ | (0.49 | ) | | $ | - | | | $ | (0.49 | ) | | $ | 9.10 | | | | 5.13% | | | $ | 25,980 | | | | 0.84% | | | | 0.84% | n | | | 6.03% | |
| 9/30/18 | | | 9.51 | | | | 0.55 | | | | (0.33 | ) | | | 0.22 | | | | (0.57 | ) | | | - | | | | (0.57 | ) | | | 9.16 | | | | 2.49% | | | | 31,250 | | | | 0.84% | | | | 0.84% | n | | | 6.01% | |
| 9/30/17 | | | 9.20 | | | | 0.58 | | | | 0.28 | | | | 0.86 | | | | (0.55 | ) | | | - | | | | (0.55 | ) | | | 9.51 | | | | 9.79% | | | | 32,889 | | | | 0.84% | | | | 0.84% | n | | | 6.34% | |
| 9/30/16 | | | 8.89 | | | | 0.58 | | | | 0.29 | | | | 0.87 | | | | (0.56 | ) | | | - | | | | (0.56 | ) | | | 9.20 | | | | 10.63% | | | | 28,948 | | | | 0.87% | | | | 0.85% | | | | 6.74% | |
| 9/30/15 | | | 10.07 | | | | 0.57 | | | | (0.85 | ) | | | (0.28 | ) | | | (0.66 | ) | | | (0.24 | ) | | | (0.90 | ) | | | 8.89 | | | | (2.58% | ) | | | 24,221 | | | | 0.88% | | | | 0.85% | | | | 6.18% | |
Class A | | | | | | | | | | | | | | | | | | | | | | | | | | | | | | | | | | | | | | | | | | | | | |
9/30/19 | | $ | 9.13 | | | $ | 0.51 | | | $ | (0.10 | ) | | $ | 0.41 | | | $ | (0.47 | ) | | $ | - | | | $ | (0.47 | ) | | $ | 9.07 | | | | 4.89% | | | $ | 31,392 | | | | 1.09% | | | | 1.09% | n | | | 5.77% | |
| 9/30/18 | | | 9.49 | | | | 0.52 | | | | (0.33 | ) | | | 0.19 | | | | (0.55 | ) | | | - | | | | (0.55 | ) | | | 9.13 | | | | 2.10% | | | | 27,393 | | | | 1.09% | | | | 1.09% | n | | | 5.76% | |
| 9/30/17 | | | 9.17 | | | | 0.56 | | | | 0.28 | | | | 0.84 | | | | (0.52 | ) | | | - | | | | (0.52 | ) | | | 9.49 | | | | 9.63% | | | | 29,357 | | | | 1.09% | | | | 1.09% | n | | | 6.09% | |
| 9/30/16 | | | 8.86 | | | | 0.56 | | | | 0.29 | | | | 0.85 | | | | (0.54 | ) | | | - | | | | (0.54 | ) | | | 9.17 | | | | 10.31% | | | | 29,055 | | | | 1.12% | | | | 1.10% | | | | 6.49% | |
| 9/30/15 | | | 10.02 | | | | 0.55 | | | | (0.85 | ) | | | (0.30 | ) | | | (0.62 | ) | | | (0.24 | ) | | | (0.86 | ) | | | 8.86 | | | | (2.78% | ) | | | 28,572 | | | | 1.13% | | | | 1.10% | | | | 5.93% | |
Class R4 | | | | | | | | | | | | | | | | | | | | | | | | | | | | | | | | | | | | | | | | | | | | | | | | | | | | |
9/30/19 | | $ | 9.04 | | | $ | 0.51 | | | $ | (0.10 | ) | | $ | 0.41 | | | $ | (0.48 | ) | | $ | - | | | $ | (0.48 | ) | | $ | 8.97 | | | | 4.97% | | | $ | 47,055 | | | | 0.99% | | | | 0.99% | n | | | 5.88% | |
| 9/30/18 | | | 9.40 | | | | 0.53 | | | | (0.33 | ) | | | 0.20 | | | | (0.56 | ) | | | - | | | | (0.56 | ) | | | 9.04 | | | | 2.30% | | | | 35,011 | | | | 0.99% | | | | 0.99% | n | | | 5.87% | |
| 9/30/17 | | | 9.11 | | | | 0.56 | | | | 0.28 | | | | 0.84 | | | | (0.55 | ) | | | - | | | | (0.55 | ) | | | 9.40 | | | | 9.66% | | | | 30,611 | | | | 0.99% | | | | 0.99% | n | | | 6.18% | |
| 9/30/16 | | | 8.84 | | | | 0.57 | | | | 0.28 | | | | 0.85 | | | | (0.58 | ) | | | - | | | | (0.58 | ) | | | 9.11 | | | | 10.44% | | | | 18,428 | | | | 1.02% | | | | 1.00% | | | | 6.66% | |
| 9/30/15 | | | 10.02 | | | | 0.54 | | | | (0.83 | ) | | | (0.29 | ) | | | (0.65 | ) | | | (0.24 | ) | | | (0.89 | ) | | | 8.84 | | | | (2.67% | ) | | | 2,672 | | | | 1.03% | | | | 1.00% | | | | 5.97% | |
Class R3 | | | | | | | | | | | | | | | | | | | | | | | | | | | | | | | | | | | | | | | | | | | | | |
9/30/19 | | $ | 9.23 | | | $ | 0.50 | | | $ | (0.10 | ) | | $ | 0.40 | | | $ | (0.46 | ) | | $ | - | | | $ | (0.46 | ) | | $ | 9.17 | | | | 4.71% | | | $ | 42,509 | | | | 1.24% | | | | 1.24% | n | | | 5.63% | |
| 9/30/18 | | | 9.60 | | | | 0.51 | | | | (0.33 | ) | | | 0.18 | | | | (0.55 | ) | | | - | | | | (0.55 | ) | | | 9.23 | | | | 2.04% | | | | 44,944 | | | | 1.24% | | | | 1.24% | n | | | 5.62% | |
| 9/30/17 | | | 9.29 | | | | 0.55 | | | | 0.29 | | | | 0.84 | | | | (0.53 | ) | | | - | | | | (0.53 | ) | | | 9.60 | | | | 9.43% | | | | 36,626 | | | | 1.24% | | | | 1.24% | n | | | 5.93% | |
| 9/30/16 | | | 9.01 | | | | 0.56 | | | | 0.28 | | | | 0.84 | | | | (0.56 | ) | | | - | | | | (0.56 | ) | | | 9.29 | | | | 10.12% | | | | 13,928 | | | | 1.27% | | | | 1.25% | | | | 6.38% | |
| 9/30/15 | | | 10.17 | | | | 0.54 | | | | (0.85 | ) | | | (0.31 | ) | | | (0.61 | ) | | | (0.24 | ) | | | (0.85 | ) | | | 9.01 | | | | (2.91% | ) | | | 3,423 | | | | 1.28% | | | | 1.25% | | | | 5.74% | |
201
MassMutual Premier Balanced Fund – Financial Statements(Continued)
Financial Highlights(For a share outstanding throughout each period)
| | | | | | | | | | | | | | | | | | | | | | | | | | | | | | | | | | | | | | | | | | | | | | | | | | | | |
| | | | | |
| Income (loss) from investment
operations |
| | | Less distributions to shareholders | | | | | | | | | | |
|
Ratios / Supplemental Data |
|
| | | Net
asset
value,
beginning
of the
period | | | Net
investment
income
(loss)c,j | | | Net
realized
and
unrealized
gain (loss)
on
investments | | | Total
income
(loss) from
investment
operations | | | From net
investment
income | | | From net
realized
gains | | | Total
distributions | | | Net
asset
value,
end of
the
period | | | Total
returnl,m | | | Net
assets,
end of
the
period
(000’s) | | | Ratio of
expenses
to average
daily net
assets
before
expense
waivers | | | Ratio of
expenses
to average
daily net
assets
after
expense
waiversj | | | Net
investment
income
(loss) to
average
daily net
assets | |
Class I | | | | | | | | | | | | | | | | | | | | | | | | | | | | | | | | | | | | | | | | | | | | | | | | | | | | |
| 9/30/19 | | $ | 12.86 | | | $ | 0.24 | | | $ | (0.09 | )aa | | $ | 0.15 | | | $ | (0.22 | ) | | $ | (0.72 | ) | | $ | (0.94 | ) | | $ | 12.07 | | | | 1.91% | | | $ | 31,567 | | | | 0.76% | | | | 0.74% | | | | 2.06% | |
| 9/30/18 | | | 12.53 | | | | 0.22 | | | | 1.02 | | | | 1.24 | | | | (0.24 | ) | | | (0.67 | ) | | | (0.91 | ) | | | 12.86 | | | | 10.21% | | | | 11,637 | | | | 0.70% | | | | 0.60% | | | | 1.79% | |
| 9/30/17 | | | 11.32 | | | | 0.21 | | | | 1.28 | | | | 1.49 | | | | (0.22 | ) | | | (0.06 | ) | | | (0.28 | ) | | | 12.53 | | | | 13.39% | | | | 8,270 | | | | 0.68% | | | | 0.60% | | | | 1.76% | |
| 9/30/16 | | | 11.48 | | | | 0.22 | | | | 0.84 | | | | 1.06 | | | | (0.29 | ) | | | (0.93 | ) | | | (1.22 | ) | | | 11.32 | | | | 9.96% | | | | 967 | | | | 0.68% | | | | 0.60% | | | | 1.98% | |
| 9/30/15 | | | 13.01 | | | | 0.22 | | | | (0.44 | ) | | | (0.22 | ) | | | (0.24 | ) | | | (1.07 | ) | | | (1.31 | ) | | | 11.48 | | | | (1.96% | ) | | | 376 | | | | 0.65% | | | | 0.60% | | | | 1.77% | |
Class R5 | | | | | | | | | | | | | | | | | | | | | | | | | | | | | | | | | | | | | | | | | | | | | |
| 9/30/19 | | $ | 12.85 | | | $ | 0.23 | | | $ | (0.09 | )aa | | $ | 0.14 | | | $ | (0.20 | ) | | $ | (0.72 | ) | | $ | (0.92 | ) | | $ | 12.07 | | | | 1.88% | | | $ | 45,321 | | | | 0.86% | | | | 0.83% | | | | 1.94% | |
| 9/30/18 | | | 12.53 | | | | 0.21 | | | | 1.01 | | | | 1.22 | | | | (0.23 | ) | | | (0.67 | ) | | | (0.90 | ) | | | 12.85 | | | | 10.01% | | | | 45,211 | | | | 0.80% | | | | 0.70% | | | | 1.67% | |
| 9/30/17 | | | 11.32 | | | | 0.20 | | | | 1.28 | | | | 1.48 | | | | (0.21 | ) | | | (0.06 | ) | | | (0.27 | ) | | | 12.53 | | | | 13.27% | | | | 49,381 | | | | 0.78% | | | | 0.70% | | | | 1.66% | |
| 9/30/16 | | | 11.48 | | | | 0.21 | | | | 0.84 | | | | 1.05 | | | | (0.28 | ) | | | (0.93 | ) | | | (1.21 | ) | | | 11.32 | | | | 9.82% | | | | 53,727 | | | | 0.78% | | | | 0.70% | | | | 1.87% | |
| 9/30/15 | | | 13.00 | | | | 0.21 | | | | (0.44 | ) | | | (0.23 | ) | | | (0.22 | ) | | | (1.07 | ) | | | (1.29 | ) | | | 11.48 | | | | (2.03% | ) | | | 62,971 | | | | 0.75% | | | | 0.70% | | | | 1.70% | |
Service Class | | | | | | | | | | | | | | | | | | | | | | | | | | | | | | | | | | | | | | | | | | | | | |
| 9/30/19 | | $ | 13.50 | | | $ | 0.23 | | | $ | (0.09 | )aa | | $ | 0.14 | | | $ | (0.19 | ) | | $ | (0.72 | ) | | $ | (0.91 | ) | | $ | 12.73 | | | | 1.73% | | | $ | 6,045 | | | | 0.96% | | | | 0.92% | | | | 1.84% | |
| 9/30/18 | | | 13.11 | | | | 0.21 | | | | 1.06 | | | | 1.27 | | | | (0.21 | ) | | | (0.67 | ) | | | (0.88 | ) | | | 13.50 | | | | 9.94% | | | | 7,243 | | | | 0.90% | | | | 0.80% | | | | 1.58% | |
| 9/30/17 | | | 11.83 | | | | 0.19 | | | | 1.34 | | | | 1.53 | | | | (0.19 | ) | | | (0.06 | ) | | | (0.25 | ) | | | 13.11 | | | | 13.11% | | | | 6,978 | | | | 0.88% | | | | 0.80% | | | | 1.54% | |
| 9/30/16 | | | 11.94 | | | | 0.20 | | | | 0.89 | | | | 1.09 | | | | (0.27 | ) | | | (0.93 | ) | | | (1.20 | ) | | | 11.83 | | | | 9.76% | | | | 14,130 | | | | 0.88% | | | | 0.80% | | | | 1.87% | |
| 9/30/15 | | | 13.48 | | | | 0.20 | | | | (0.46 | ) | | | (0.26 | ) | | | (0.21 | ) | | | (1.07 | ) | | | (1.28 | ) | | | 11.94 | | | | (2.18% | ) | | | 12,545 | | | | 0.85% | | | | 0.80% | | | | 1.60% | |
| | | | | | | | | | | | | | | | | | | | |
| | | Year ended September 30 | |
| | | 2019 | | | 2018 | | | 2017 | | | 2016 | | | 2015 | |
Portfolio turnover rate | | | 161 | % | | | 77 | % | | | 108 | % | | | 176 | % | | | 204 | % |
| c | Per share amount calculated on the average shares method. |
| j | Computed after giving effect to an agreement by MML Advisers and/or MassMutual to waive certain fees and expenses of the Fund. |
| l | Employee retirement benefit plans that invest plan assets in the Separate Investment Accounts (SIAs) may be subject to certain charges as set forth in their respective Plan Documents. Total return figures would be lower for the periods presented if they reflected these charges. |
| m | Total return excludes sales charges, if any, and would be lower for the period presented if it reflected these charges. |
| aa | The amount shown for a share outstanding does not correspond with the aggregate net realized and unrealized gain (loss) for the period due to the timing of purchases and redemptions of Fund shares in relation to the fluctuating market values of the Fund. |
The accompanying notes are an integral part of the financial statements.
202
| | | | | | | | | | | | | | | | | | | | | | | | | | | | | | | | | | | | | | | | | | | | | | | | | | | | |
| | | | | |
| Income (loss) from investment
operations |
| | | Less distributions to shareholders | | | | | | | | | | |
|
Ratios / Supplemental Data |
|
| | | Net
asset
value,
beginning
of the
period | | | Net
investment
income
(loss)c,j | | | Net
realized
and
unrealized
gain (loss)
on
investments | | | Total
income
(loss) from
investment
operations | | | From net
investment
income | | | From net
realized
gains | | | Total
distributions | | | Net
asset
value,
end of
the
period | | | Total
returnl,m | | | Net
assets,
end of
the
period
(000’s) | | | Ratio of
expenses
to average
daily net
assets
before
expense
waivers | | | Ratio of
expenses
to average
daily net
assets
after
expense
waiversj | | | Net
investment
income
(loss) to
average
daily net
assets | |
Administrative Class | | | | | | | | | | | | | | | | | | | | | | | | | | | | | | | | | | | | | | | | | | | | | |
| 9/30/19 | | $ | 12.89 | | | $ | 0.20 | | | $ | (0.09 | )aa | | $ | 0.11 | | | $ | (0.17 | ) | | $ | (0.72 | ) | | $ | (0.89 | ) | | $ | 12.11 | | | | 1.62% | | | $ | 6,981 | | | | 1.06% | | | | 1.02% | | | | 1.73% | |
| 9/30/18 | | | 12.55 | | | | 0.18 | | | | 1.02 | | | | 1.20 | | | | (0.19 | ) | | | (0.67 | ) | | | (0.86 | ) | | | 12.89 | | | | 9.88% | | | | 8,129 | | | | 1.00% | | | | 0.90% | | | | 1.47% | |
| 9/30/17 | | | 11.35 | | | | 0.17 | | | | 1.28 | | | | 1.45 | | | | (0.19 | ) | | | (0.06 | ) | | | (0.25 | ) | | | 12.55 | | | | 13.01% | | | | 9,413 | | | | 0.98% | | | | 0.90% | | | | 1.46% | |
| 9/30/16 | | | 11.51 | | | | 0.19 | | | | 0.84 | | | | 1.03 | | | | (0.26 | ) | | | (0.93 | ) | | | (1.19 | ) | | | 11.35 | | | | 9.59% | | | | 9,751 | | | | 0.98% | | | | 0.90% | | | | 1.68% | |
| 9/30/15 | | | 13.04 | | | | 0.19 | | | | (0.44 | ) | | | (0.25 | ) | | | (0.21 | ) | | | (1.07 | ) | | | (1.28 | ) | | | 11.51 | | | | (2.23% | ) | | | 8,691 | | | | 0.95% | | | | 0.90% | | | | 1.51% | |
Class A | | | | | | | | | | | | | | | | | | | | | | | | | | | | | | | | | | | | | | | | | | | | | |
| 9/30/19 | | $ | 12.51 | | | $ | 0.17 | | | $ | (0.08 | )aa | | $ | 0.09 | | | $ | (0.14 | ) | | $ | (0.72 | ) | | $ | (0.86 | ) | | $ | 11.74 | | | | 1.44% | | | $ | 26,981 | | | | 1.31% | | | | 1.27% | | | | 1.49% | |
| 9/30/18 | | | 12.22 | | | | 0.15 | | | | 0.98 | | | | 1.13 | | | | (0.17 | ) | | | (0.67 | ) | | | (0.84 | ) | | | 12.51 | | | | 9.48% | | | | 30,517 | | | | 1.25% | | | | 1.15% | | | | 1.22% | |
| 9/30/17 | | | 11.05 | | | | 0.14 | | | | 1.25 | | | | 1.39 | | | | (0.16 | ) | | | (0.06 | ) | | | (0.22 | ) | | | 12.22 | | | | 12.78% | | | | 32,637 | | | | 1.23% | | | | 1.15% | | | | 1.21% | |
| 9/30/16 | | | 11.22 | | | | 0.15 | | | | 0.83 | | | | 0.98 | | | | (0.22 | ) | | | (0.93 | ) | | | (1.15 | ) | | | 11.05 | | | | 9.38% | | | | 30,781 | | | | 1.23% | | | | 1.15% | | | | 1.42% | |
| 9/30/15 | | | 12.73 | | | | 0.15 | | | | (0.43 | ) | | | (0.28 | ) | | | (0.16 | ) | | | (1.07 | ) | | | (1.23 | ) | | | 11.22 | | | | (2.49% | ) | | | 31,375 | | | | 1.20% | | | | 1.15% | | | | 1.26% | |
Class R4 | | | | | | | | | | | | | | | | | | | | | | | | | | | | | | | | | | | | | | | | | | | | | | | | | | | | |
| 9/30/19 | | $ | 12.42 | | | $ | 0.18 | | | $ | (0.08 | )aa | | $ | 0.10 | | | $ | (0.16 | ) | | $ | (0.72 | ) | | $ | (0.88 | ) | | $ | 11.64 | | | | 1.52% | | | $ | 2,853 | | | | 1.21% | | | | 1.17% | | | | 1.59% | |
| 9/30/18 | | | 12.15 | | | | 0.16 | | | | 0.97 | | | | 1.13 | | | | (0.19 | ) | | | (0.67 | ) | | | (0.86 | ) | | | 12.42 | | | | 9.58% | | | | 3,499 | | | | 1.15% | | | | 1.05% | | | | 1.34% | |
| 9/30/17 | | | 10.99 | | | | 0.15 | | | | 1.24 | | | | 1.39 | | | | (0.17 | ) | | | (0.06 | ) | | | (0.23 | ) | | | 12.15 | | | | 12.88% | | | | 2,822 | | | | 1.13% | | | | 1.05% | | | | 1.32% | |
| 9/30/16 | | | 11.20 | | | | 0.16 | | | | 0.83 | | | | 0.99 | | | | (0.27 | ) | | | (0.93 | ) | | | (1.20 | ) | | | 10.99 | | | | 9.51% | | | | 2,373 | | | | 1.13% | | | | 1.05% | | | | 1.54% | |
| 9/30/15 | | | 12.74 | | | | 0.17 | | | | (0.44 | ) | | | (0.27 | ) | | | (0.20 | ) | | | (1.07 | ) | | | (1.27 | ) | | | 11.20 | | | | (2.46% | ) | | | 2,010 | | | | 1.10% | | | | 1.05% | | | | 1.49% | |
Class R3 | | | | | | | | | | | | | | | | | | | | | | | | | | | | | | | | | | | | | | | | | | | | | | | | | | | | |
| 9/30/19 | | $ | 12.36 | | | $ | 0.15 | | | $ | (0.08 | )aa | | $ | 0.07 | | | $ | (0.14 | ) | | $ | (0.72 | ) | | $ | (0.86 | ) | | $ | 11.57 | | | | 1.27% | | | $ | 7,236 | | | | 1.46% | | | | 1.42% | | | | 1.35% | |
| 9/30/18 | | | 12.09 | | | | 0.13 | | | | 0.97 | | | | 1.10 | | | | (0.16 | ) | | | (0.67 | ) | | | (0.83 | ) | | | 12.36 | | | | 9.32% | | | | 8,002 | | | | 1.40% | | | | 1.30% | | | | 1.08% | |
| 9/30/17 | | | 10.95 | | | | 0.12 | | | | 1.24 | | | | 1.36 | | | | (0.16 | ) | | | (0.06 | ) | | | (0.22 | ) | | | 12.09 | | | | 12.58% | | | | 7,251 | | | | 1.38% | | | | 1.30% | | | | 1.08% | |
| 9/30/16 | | | 11.18 | | | | 0.14 | | | | 0.82 | | | | 0.96 | | | | (0.26 | ) | | | (0.93 | ) | | | (1.19 | ) | | | 10.95 | | | | 9.29% | | | | 5,002 | | | | 1.38% | | | | 1.30% | | | | 1.31% | |
| 9/30/15 | | | 12.72 | | | | 0.14 | | | | (0.44 | ) | | | (0.30 | ) | | | (0.17 | ) | | | (1.07 | ) | | | (1.24 | ) | | | 11.18 | | | | (2.66% | ) | | | 1,734 | | | | 1.35% | | | | 1.30% | | | | 1.16% | |
203
MassMutual Premier Disciplined Value Fund – Financial Statements(Continued)
Financial Highlights(For a share outstanding throughout each period)
| | | | | | | | | | | | | | | | | | | | | | | | | | | | | | | | | | | | | | | | | | | | | | | | |
| | | | | |
| Income (loss) from investment
operations |
| |
| Less distributions
to shareholders |
| | | | | | | | | | | Ratios / Supplemental Data | |
| | | Net
asset
value,
beginning
of the
period | | | Net
investment
income
(loss)c | | | Net
realized
and
unrealized
gain (loss)
on
investments | | | Total
income
(loss) from
investment
operations | | | From net
investment
income | | | From net
realized
gains | | | Total
distributions | | | Net
asset
value,
end of
the
period | | | Total
returnl,m | | | Net
assets,
end of
the
period
(000’s) | | | Ratio of
expenses
to average
daily net
assets | | | Net
investment
income
(loss) to
average
daily net
assets | |
Class I | | | | | | | | | | | | | | | | | | | | | | | | | | | | | | | | | | | | | | | | | | | | | | | | |
| 9/30/19 | | $ | 17.06 | | | $ | 0.28 | | | $ | (0.76 | ) | | $ | (0.48 | ) | | $ | (0.40 | ) | | $ | (2.20 | ) | | $ | (2.60 | ) | | $ | 13.98 | | | | (1.20% | ) | | $ | 16,781 | | | | 0.64% | | | | 2.03% | |
| 9/30/18 | | | 17.67 | | | | 0.29 | | | | 1.28 | | | | 1.57 | | | | (0.36 | ) | | | (1.82 | ) | | | (2.18 | ) | | | 17.06 | | | | 9.34% | | | | 19,546 | | | | 0.57% | | | | 1.74% | |
| 9/30/17 | | | 16.05 | | | | 0.31 | | | | 2.40 | | | | 2.71 | | | | (0.53 | ) | | | (0.56 | ) | | | (1.09 | ) | | | 17.67 | | | | 17.36% | | | | 79,531 | | | | 0.57% | | | | 1.87% | |
| 9/30/16 | | | 14.75 | | | | 0.35 | | | | 1.56 | | | | 1.91 | | | | (0.32 | ) | | | (0.29 | ) | | | (0.61 | ) | | | 16.05 | | | | 13.26% | | | | 73,202 | | | | 0.53% | | | | 2.29% | |
| 9/30/15 | | | 15.75 | | | | 0.29 | | | | (1.00 | ) | | | (0.71 | ) | | | (0.29 | ) | | | - | | | | (0.29 | ) | | | 14.75 | | | | (4.64% | ) | | | 163,640 | | | | 0.53% | | | | 1.84% | |
Class R5 | | | | | | | | | | | | | | | | | | | | | | | | | | | | | | | | | | | | | | | | | |
| 9/30/19 | | $ | 17.09 | | | $ | 0.27 | | | $ | (0.76 | ) | | $ | (0.49 | ) | | $ | (0.39 | ) | | $ | (2.20 | ) | | $ | (2.59 | ) | | $ | 14.01 | | | | (1.32% | ) | | $ | 53,709 | | | | 0.74% | | | | 1.92% | |
| 9/30/18 | | | 17.69 | | | | 0.28 | | | | 1.28 | | | | 1.56 | | | | (0.34 | ) | | | (1.82 | ) | | | (2.16 | ) | | | 17.09 | | | | 9.27% | | | | 59,987 | | | | 0.67% | | | | 1.65% | |
| 9/30/17 | | | 16.06 | | | | 0.30 | | | | 2.40 | | | | 2.70 | | | | (0.51 | ) | | | (0.56 | ) | | | (1.07 | ) | | | 17.69 | | | | 17.31% | | | | 46,583 | | | | 0.67% | | | | 1.78% | |
| 9/30/16 | | | 14.76 | | | | 0.34 | | | | 1.55 | | | | 1.89 | | | | (0.30 | ) | | | (0.29 | ) | | | (0.59 | ) | | | 16.06 | | | | 13.11% | | | | 46,644 | | | | 0.63% | | | | 2.22% | |
| 9/30/15 | | | 15.76 | | | | 0.28 | | | | (1.01 | ) | | | (0.73 | ) | | | (0.27 | ) | | | - | | | | (0.27 | ) | | | 14.76 | | | | (4.74% | ) | | | 46,754 | | | | 0.63% | | | | 1.73% | |
Service Class | | | | | | | | | | | | | | | | | | | | | | | | | | | | | | | | | | | | | | | | | |
| 9/30/19 | | $ | 16.95 | | | $ | 0.25 | | | $ | (0.76 | ) | | $ | (0.51 | ) | | $ | (0.36 | ) | | $ | (2.20 | ) | | $ | (2.56 | ) | | $ | 13.88 | | | | (1.43% | ) | | $ | 20,401 | | | | 0.84% | | | | 1.82% | |
| 9/30/18 | | | 17.57 | | | | 0.26 | | | | 1.26 | | | | 1.52 | | | | (0.32 | ) | | | (1.82 | ) | | | (2.14 | ) | | | 16.95 | | | | 9.10% | | | | 50,102 | | | | 0.77% | | | | 1.55% | |
| 9/30/17 | | | 15.95 | | | | 0.28 | | | | 2.39 | | | | 2.67 | | | | (0.49 | ) | | | (0.56 | ) | | | (1.05 | ) | | | 17.57 | | | | 17.19% | | | | 49,413 | | | | 0.77% | | | | 1.65% | |
| 9/30/16 | | | 14.66 | | | | 0.32 | | | | 1.55 | | | | 1.87 | | | | (0.29 | ) | | | (0.29 | ) | | | (0.58 | ) | | | 15.95 | | | | 13.03% | | | | 64,634 | | | | 0.73% | | | | 2.12% | |
| 9/30/15 | | | 15.66 | | | | 0.26 | | | | (1.00 | ) | | | (0.74 | ) | | | (0.26 | ) | | | - | | | | (0.26 | ) | | | 14.66 | | | | (4.84% | ) | | | 65,799 | | | | 0.73% | | | | 1.65% | |
| | | | | | | | | | | | | | | | | | | | |
| | | Year ended September 30 | |
| | | 2019 | | | 2018 | | | 2017 | | | 2016 | | | 2015 | |
Portfolio turnover rate | | | 53 | % | | | 80 | % | | | 102 | % | | | 109 | % | | | 113 | % |
| c | Per share amount calculated on the average shares method. |
| l | Employee retirement benefit plans that invest plan assets in the Separate Investment Accounts (SIAs) may be subject to certain charges as set forth in their respective Plan Documents. Total return figures would be lower for the periods presented if they reflected these charges. |
| m | Total return excludes sales charges, if any, and would be lower for the period presented if it reflected these charges. |
The accompanying notes are an integral part of the financial statements.
204
| | | | | | | | | | | | | | | | | | | | | | | | | | | | | | | | | | | | | | | | | | | | | | | | |
| | | | | |
| Income (loss) from investment
operations |
| |
| Less distributions
to shareholders |
| | | | | | | | | | | Ratios / Supplemental Data | |
| | | Net
asset
value,
beginning
of the
period | | | Net
investment
income
(loss)c | | | Net
realized
and
unrealized
gain (loss)
on
investments | | | Total
income
(loss) from
investment
operations | | | From net
investment
income | | | From net
realized
gains | | | Total
distributions | | | Net
asset
value,
end of
the
period | | | Total
returnl,m | | | Net
assets,
end of
the
period
(000’s) | | | Ratio of
expenses
to average
daily net
assets | | | Net
investment
income
(loss) to
average
daily net
assets | |
Administrative Class | | | | | | | | | | | | | | | | | | | | | | | | | | | | | | | | | | | | | | | | | |
| 9/30/19 | | $ | 17.27 | | | $ | 0.25 | | | $ | (0.76 | ) | | $ | (0.51 | ) | | $ | (0.36 | ) | | $ | (2.20 | ) | | $ | (2.56 | ) | | $ | 14.20 | | | | (1.46% | ) | | $ | 5,731 | | | | 0.94% | | | | 1.72% | |
| 9/30/18 | | | 17.86 | | | | 0.25 | | | | 1.29 | | | | 1.54 | | | | (0.31 | ) | | | (1.82 | ) | | | (2.13 | ) | | | 17.27 | | | | 9.02% | | | | 9,147 | | | | 0.87% | | | | 1.46% | |
| 9/30/17 | | | 16.21 | | | | 0.27 | | | | 2.41 | | | | 2.68 | | | | (0.47 | ) | | | (0.56 | ) | | | (1.03 | ) | | | 17.86 | | | | 17.01% | | | | 5,970 | | | | 0.87% | | | | 1.57% | |
| 9/30/16 | | | 14.88 | | | | 0.31 | | | | 1.58 | | | | 1.89 | | | | (0.27 | ) | | | (0.29 | ) | | | (0.56 | ) | | | 16.21 | | | | 12.97% | | | | 5,801 | | | | 0.83% | | | | 2.00% | |
| 9/30/15 | | | 15.90 | | | | 0.25 | | | | (1.02 | ) | | | (0.77 | ) | | | (0.25 | ) | | | - | | | | (0.25 | ) | | | 14.88 | | | | (4.97% | ) | | | 7,460 | | | | 0.83% | | | | 1.55% | |
Class A | | | | | | | | | | | | | | | | | | | | | | | | | | | | | | | | | | | | | | | | | |
| 9/30/19 | | $ | 16.78 | | | $ | 0.20 | | | $ | (0.74 | ) | | $ | (0.54 | ) | | $ | (0.31 | ) | | $ | (2.20 | ) | | $ | (2.51 | ) | | $ | 13.73 | | | | (1.75% | ) | | $ | 6,012 | | | | 1.19% | | | | 1.48% | |
| 9/30/18 | | | 17.39 | | | | 0.20 | | | | 1.25 | | | | 1.45 | | | | (0.24 | ) | | | (1.82 | ) | | | (2.06 | ) | | | 16.78 | | | | 8.74% | | | | 8,886 | | | | 1.12% | | | | 1.20% | |
| 9/30/17 | | | 15.82 | | | | 0.22 | | | | 2.36 | | | | 2.58 | | | | (0.45 | ) | | | (0.56 | ) | | | (1.01 | ) | | | 17.39 | | | | 16.74% | | | | 9,120 | | | | 1.12% | | | | 1.32% | |
| 9/30/16 | | | 14.53 | | | | 0.27 | | | | 1.53 | | | | 1.80 | | | | (0.22 | ) | | | (0.29 | ) | | | (0.51 | ) | | | 15.82 | | | | 12.65% | | | | 10,415 | | | | 1.08% | | | | 1.78% | |
| 9/30/15 | | | 15.51 | | | | 0.20 | | | | (0.98 | ) | | | (0.78 | ) | | | (0.20 | ) | | | - | | | | (0.20 | ) | | | 14.53 | | | | (5.13% | ) | | | 8,081 | | | | 1.08% | | | | 1.30% | |
Class R4 | | | | | | | | | | �� | | | | | | | | | | | | | | | | | | | | | | | | | | | | | | | | | | | |
| 9/30/19 | | $ | 16.67 | | | $ | 0.22 | | | $ | (0.75 | ) | | $ | (0.53 | ) | | $ | (0.31 | ) | | $ | (2.20 | ) | | $ | (2.51 | ) | | $ | 13.63 | | | | (1.65% | ) | | $ | 4,039 | | | | 1.09% | | | | 1.58% | |
| 9/30/18 | | | 17.32 | | | | 0.22 | | | | 1.24 | | | | 1.46 | | | | (0.29 | ) | | | (1.82 | ) | | | (2.11 | ) | | | 16.67 | | | | 8.84% | | | | 6,428 | | | | 1.02% | | | | 1.30% | |
| 9/30/17 | | | 15.77 | | | | 0.24 | | | | 2.36 | | | | 2.60 | | | | (0.49 | ) | | | (0.56 | ) | | | (1.05 | ) | | | 17.32 | | | | 16.94% | | | | 10,139 | | | | 1.02% | | | | 1.43% | |
| 9/30/16 | | | 14.51 | | | | 0.28 | | | | 1.53 | | | | 1.81 | | | | (0.26 | ) | | | (0.29 | ) | | | (0.55 | ) | | | 15.77 | | | | 12.75% | | | | 4,127 | | | | 0.98% | | | | 1.90% | |
| 9/30/15 | | | 15.52 | | | | 0.21 | | | | (0.98 | ) | | | (0.77 | ) | | | (0.24 | ) | | | - | | | | (0.24 | ) | | | 14.51 | | | | (5.10% | ) | | | 2,524 | | | | 0.98% | | | | 1.34% | |
Class R3 | | | | | | | | | | | | | | | | | | | | | | | | | | | | | | | | | | | | | | | | | |
| 9/30/19 | | $ | 16.90 | | | $ | 0.18 | | | $ | (0.74 | ) | | $ | (0.56 | ) | | $ | (0.29 | ) | | $ | (2.20 | ) | | $ | (2.49 | ) | | $ | 13.85 | | | | (1.85% | ) | | $ | 4,346 | | | | 1.34% | | | | 1.33% | |
| 9/30/18 | | | 17.56 | | | | 0.18 | | | | 1.25 | | | | 1.43 | | | | (0.27 | ) | | | (1.82 | ) | | | (2.09 | ) | | | 16.90 | | | | 8.53% | | | | 4,196 | | | | 1.27% | | | | 1.05% | |
| 9/30/17 | | | 15.92 | | | | 0.20 | | | | 2.38 | | | | 2.58 | | | | (0.38 | ) | | | (0.56 | ) | | | (0.94 | ) | | | 17.56 | | | | 16.62% | | | | 3,820 | | | | 1.27% | | | | 1.18% | |
| 9/30/16 | | | 14.62 | | | | 0.25 | | | | 1.54 | | | | 1.79 | | | | (0.20 | ) | | | (0.29 | ) | | | (0.49 | ) | | | 15.92 | | | | 12.49% | | | | 648 | | | | 1.23% | | | | 1.66% | |
| 9/30/15 | | | 15.61 | | | | 0.19 | | | | (1.00 | ) | | | (0.81 | ) | | | (0.18 | ) | | | - | | | | (0.18 | ) | | | 14.62 | | | | (5.29% | ) | | | 185 | | | | 1.23% | | | | 1.19% | |
205
MassMutual Premier Main Street Fund – Financial Statements(Continued)
Financial Highlights(For a share outstanding throughout each period)
| | | | | | | | | | | | | | | | | | | | | | | | | | | | | | | | | | | | | | | | | | | | | | | | |
| | | | | |
| Income (loss) from investment
operations |
| | | Less distributions to shareholders | | | | | | | | | | | | Ratios / Supplemental Data | |
| | | Net
asset
value,
beginning
of the
period | | | Net
investment
income
(loss)c | | | Net
realized
and
unrealized
gain (loss)
on
investments | | | Total
income
(loss) from
investment
operations | | | From net
investment
income | | | From net
realized
gains | | | Total
distributions | | | Net
asset
value,
end of
the
period | | | Total
returnl,m | | | Net
assets,
end of
the
period
(000’s) | | | Ratio of
expenses
to average
daily net
assets | | | Net
investment
income
(loss) to
average
daily net
assets | |
Class I | | | | | | | | | | | | | | | | | | | | | | | | | | | | | | | | | | | | | | | | | | | | | | | | |
| 9/30/19 | | $ | 12.04 | | | $ | 0.14 | | | $ | 0.30 | | | $ | 0.44 | | | $ | (0.13 | ) | | $ | (1.28 | ) | | $ | (1.41 | ) | | $ | 11.07 | | | | 5.60% | | | $ | 24,639 | | | | 0.73% | | | | 1.29% | |
| 9/30/18 | | | 11.94 | | | | 0.14 | | | | 0.89 | | | | 1.03 | | | | (0.14 | ) | | | (0.79 | ) | | | (0.93 | ) | | | 12.04 | | | | 9.11% | | | | 24,123 | | | | 0.71% | | | | 1.17% | |
| 9/30/17 | | | 10.42 | | | | 0.16 | | | | 1.81 | | | | 1.97 | | | | (0.15 | ) | | | (0.30 | ) | | | (0.45 | ) | | | 11.94 | | | | 19.50% | | | | 8,516 | | | | 0.71% | | | | 1.40% | |
| 9/30/16 | | | 13.75 | | | | 0.18 | | | | 1.43 | | | | 1.61 | | | | (0.22 | ) | | | (4.72 | ) | | | (4.94 | ) | | | 10.42 | | | | 14.34% | | | | 739 | | | | 0.72% | | | | 1.68% | |
| 9/30/15 | | | 14.23 | | | | 0.14 | | | | (0.19 | ) | | | (0.05 | ) | | | (0.13 | ) | | | (0.30 | ) | | | (0.43 | ) | | | 13.75 | | | | (0.36% | ) | | | 37 | | | | 0.65% | | | | 0.99% | |
Class R5 | | | | | | | | | | | | | | | | | | | | | | | | | | | | | | | | | | | | | | | | | |
| 9/30/19 | | $ | 12.03 | | | $ | 0.13 | | | $ | 0.29 | | | $ | 0.42 | | | $ | (0.11 | ) | | $ | (1.28 | ) | | $ | (1.39 | ) | | $ | 11.06 | | | | 5.47% | | | $ | 48,226 | | | | 0.83% | | | | 1.19% | |
| 9/30/18 | | | 11.93 | | | | 0.12 | | | | 0.90 | | | | 1.02 | | | | (0.13 | ) | | | (0.79 | ) | | | (0.92 | ) | | | 12.03 | | | | 9.00% | | | | 67,695 | | | | 0.81% | | | | 1.04% | |
| 9/30/17 | | | 10.41 | | | | 0.15 | | | | 1.81 | | | | 1.96 | | | | (0.14 | ) | | | (0.30 | ) | | | (0.44 | ) | | | 11.93 | | | | 19.40% | | | | 78,580 | | | | 0.81% | | | | 1.36% | |
| 9/30/16 | | | 13.73 | | | | 0.13 | | | | 1.48 | | | | 1.61 | | | | (0.21 | ) | | | (4.72 | ) | | | (4.93 | ) | | | 10.41 | | | | 14.28% | | | | 73,380 | | | | 0.82% | | | | 1.27% | |
| 9/30/15 | | | 14.22 | | | | 0.14 | | | | (0.21 | ) | | | (0.07 | ) | | | (0.12 | ) | | | (0.30 | ) | | | (0.42 | ) | | | 13.73 | | | | (0.50% | ) | | | 69,529 | | | | 0.76% | | | | 0.95% | |
Service Class | | | | | | | | | | | | | | | | | | | | | | | | | | | | | | | | | | | | | | | | | |
| 9/30/19 | | $ | 12.44 | | | $ | 0.12 | | | $ | 0.32 | | | $ | 0.44 | | | $ | (0.10 | ) | | $ | (1.28 | ) | | $ | (1.38 | ) | | $ | 11.50 | | | | 5.38% | | | $ | 652 | | | | 0.93% | | | | 1.08% | |
| 9/30/18 | | | 12.30 | | | | 0.11 | | | | 0.93 | | | | 1.04 | | | | (0.11 | ) | | | (0.79 | ) | | | (0.90 | ) | | | 12.44 | | | | 8.94% | | | | 738 | | | | 0.91% | | | | 0.95% | |
| 9/30/17 | | | 10.71 | | | | 0.15 | | | | 1.85 | | | | 2.00 | | | | (0.11 | ) | | | (0.30 | ) | | | (0.41 | ) | | | 12.30 | | | | 19.21% | | | | 1,133 | | | | 0.91% | | | | 1.28% | |
| 9/30/16 | | | 13.91 | | | | 0.12 | | | | 1.51 | | | | 1.63 | | | | (0.11 | ) | | | (4.72 | ) | | | (4.83 | ) | | | 10.71 | | | | 14.21% | | | | 1,979 | | | | 0.92% | | | | 0.98% | |
| 9/30/15 | | | 14.40 | | | | 0.13 | | | | (0.21 | ) | | | (0.08 | ) | | | (0.11 | ) | | | (0.30 | ) | | | (0.41 | ) | | | 13.91 | | | | (0.57% | ) | | | 6,517 | | | | 0.86% | | | | 0.88% | |
| | | | | | | | | | | | | | | | | | | | |
| | | Year ended September 30 | |
| | | 2019 | | | 2018 | | | 2017 | | | 2016 | | | 2015 | |
Portfolio turnover rate | | | 55 | % | | | 64 | % | | | 35 | % | | | 38 | % | | | 54 | % |
| c | Per share amount calculated on the average shares method. |
| l | Employee retirement benefit plans that invest plan assets in the Separate Investment Accounts (SIAs) may be subject to certain charges as set forth in their respective Plan Documents. Total return figures would be lower for the periods presented if they reflected these charges. |
| m | Total return excludes sales charges, if any, and would be lower for the period presented if it reflected these charges. |
The accompanying notes are an integral part of the financial statements.
206
| | | | | | | | | | | | | | | | | | | | | | | | | | | | | | | | | | | | | | | | | | | | | | | | |
| | | | | |
| Income (loss) from investment
operations |
| | | Less distributions to shareholders | | | | | | | | | | | | Ratios / Supplemental Data | |
| | | Net
asset
value,
beginning
of the
period | | | Net
investment
income
(loss)c | | | Net
realized
and
unrealized
gain (loss)
on
investments | | | Total
income
(loss) from
investment
operations | | | From net
investment
income | | | From net
realized
gains | | | Total
distributions | | | Net
asset
value,
end of
the
period | | | Total
returnl,m | | | Net
assets,
end of
the
period
(000’s) | | | Ratio of
expenses
to average
daily net
assets | | | Net
investment
income
(loss) to
average
daily net
assets | |
Administrative Class | | | | | | | | | | | | | | | | | | | | | | | | | | | | | | | | | | | | | | | | | |
| 9/30/19 | | $ | 12.01 | | | $ | 0.10 | | | $ | 0.31 | | | $ | 0.41 | | | $ | (0.09 | ) | | $ | (1.28 | ) | | $ | (1.37 | ) | | $ | 11.05 | | | | 5.30% | | | $ | 24,458 | | | | 1.03% | | | | 0.98% | |
| 9/30/18 | | | 11.91 | | | | 0.10 | | | | 0.89 | | | | 0.99 | | | | (0.10 | ) | | | (0.79 | ) | | | (0.89 | ) | | | 12.01 | | | | 8.79% | | | | 28,295 | | | | 1.01% | | | | 0.84% | |
| 9/30/17 | | | 10.40 | | | | 0.13 | | | | 1.80 | | | | 1.93 | | | | (0.12 | ) | | | (0.30 | ) | | | (0.42 | ) | | | 11.91 | | | | 19.07% | | | | 30,996 | | | | 1.01% | | | | 1.17% | |
| 9/30/16 | | | 13.71 | | | | 0.11 | | | | 1.48 | | | | 1.59 | | | | (0.18 | ) | | | (4.72 | ) | | | (4.90 | ) | | | 10.40 | | | | 14.11% | | | | 29,371 | | | | 1.02% | | | | 1.05% | |
| 9/30/15 | | | 14.19 | | | | 0.11 | | | | (0.20 | ) | | | (0.09 | ) | | | (0.09 | ) | | | (0.30 | ) | | | (0.39 | ) | | | 13.71 | | | | (0.63% | ) | | | 31,644 | | | | 0.96% | | | | 0.77% | |
Class A | | | | | | | | | | | | | | | | | | | | | | | | | | | | | | | | | | | | | | | | | |
| 9/30/19 | | $ | 11.83 | | | $ | 0.08 | | | $ | 0.29 | | | $ | 0.37 | | | $ | (0.06 | ) | | $ | (1.28 | ) | | $ | (1.34 | ) | | $ | 10.86 | | | | 5.01% | | | $ | 12,843 | | | | 1.28% | | | | 0.74% | |
| 9/30/18 | | | 11.75 | | | | 0.07 | | | | 0.88 | | | | 0.95 | | | | (0.08 | ) | | | (0.79 | ) | | | (0.87 | ) | | | 11.83 | | | | 8.49% | | | | 14,495 | | | | 1.26% | | | | 0.60% | |
| 9/30/17 | | | 10.26 | | | | 0.10 | | | | 1.79 | | | | 1.89 | | | | (0.10 | ) | | | (0.30 | ) | | | (0.40 | ) | | | 11.75 | | | | 18.88% | | | | 13,096 | | | | 1.26% | | | | 0.90% | |
| 9/30/16 | | | 13.58 | | | | 0.09 | | | | 1.45 | | | | 1.54 | | | | (0.14 | ) | | | (4.72 | ) | | | (4.86 | ) | | | 10.26 | | | | 13.78% | | | | 11,877 | | | | 1.27% | | | | 0.82% | |
| 9/30/15 | | | 14.07 | | | | 0.07 | | | | (0.20 | ) | | | (0.13 | ) | | | (0.06 | ) | | | (0.30 | ) | | | (0.36 | ) | | | 13.58 | | | | (0.96% | ) | | | 12,906 | | | | 1.21% | | | | 0.52% | |
Class R4 | | | | | | | | | | | | | | | | | | | | | | | | | | | | | | | | | | | | | | | | | | | | | | | | |
| 9/30/19 | | $ | 11.75 | | | $ | 0.09 | | | $ | 0.29 | | | $ | 0.38 | | | $ | (0.08 | ) | | $ | (1.28 | ) | | $ | (1.36 | ) | | $ | 10.77 | | | | 5.08% | | | $ | 6,379 | | | | 1.18% | | | | 0.83% | |
| 9/30/18 | | | 11.67 | | | | 0.08 | | | | 0.87 | | | | 0.95 | | | | (0.08 | ) | | | (0.79 | ) | | | (0.87 | ) | | | 11.75 | | | | 8.63% | | | | 6,394 | | | | 1.16% | | | | 0.70% | |
| 9/30/17 | | | 10.22 | | | | 0.11 | | | | 1.78 | | | | 1.89 | | | | (0.14 | ) | | | (0.30 | ) | | | (0.44 | ) | | | 11.67 | | | | 19.02% | | | | 5,268 | | | | 1.16% | | | | 0.99% | |
| 9/30/16 | | | 13.57 | | | | 0.15 | | | | 1.40 | | | | 1.55 | | | | (0.18 | ) | | | (4.72 | ) | | | (4.90 | ) | | | 10.22 | | | | 13.88% | | | | 3,421 | | | | 1.17% | | | | 1.45% | |
| 9/30/15 | | | 14.07 | | | | 0.09 | | | | (0.21 | ) | | | (0.12 | ) | | | (0.08 | ) | | | (0.30 | ) | | | (0.38 | ) | | | 13.57 | | | | (0.85% | ) | | | 105 | | | | 1.11% | | | | 0.63% | |
Class R3 | | | | | | | | | | | | | | | | | | | | | | | | | | | | | | | | | | | | | | | | | |
| 9/30/19 | | $ | 11.85 | | | $ | 0.06 | | | $ | 0.30 | | | $ | 0.36 | | | $ | (0.05 | ) | | $ | (1.28 | ) | | $ | (1.33 | ) | | $ | 10.88 | | | | 4.87% | | | $ | 1,239 | | | | 1.43% | | | | 0.61% | |
| 9/30/18 | | | 11.76 | | | | 0.05 | | | | 0.88 | | | | 0.93 | | | | (0.05 | ) | | | (0.79 | ) | | | (0.84 | ) | | | 11.85 | | | | 8.34% | | | | 1,813 | | | | 1.41% | | | | 0.45% | |
| 9/30/17 | | | 10.30 | | | | 0.08 | | | | 1.79 | | | | 1.87 | | | | (0.11 | ) | | | (0.30 | ) | | | (0.41 | ) | | | 11.76 | | | | 18.69% | | | | 1,144 | | | | 1.41% | | | | 0.74% | |
| 9/30/16 | | | 13.66 | | | | 0.07 | | | | 1.46 | | | | 1.53 | | | | (0.17 | ) | | | (4.72 | ) | | | (4.89 | ) | | | 10.30 | | | | 13.60% | | | | 802 | | | | 1.42% | | | | 0.70% | |
| 9/30/15 | | | 14.15 | | | | 0.05 | | | | (0.20 | ) | | | (0.15 | ) | | | (0.04 | ) | | | (0.30 | ) | | | (0.34 | ) | | | 13.66 | | | | (1.07% | ) | | | 140 | | | | 1.36% | | | | 0.38% | |
207
MassMutual Premier Disciplined Growth Fund – Financial Statements(Continued)
Financial Highlights(For a share outstanding throughout each period)
| | | | | | | | | | | | | | | | | | | | | | | | | | | | | | | | | | | | | | | | | | | | | | | | |
| | | | | | Income (loss) from
investment operations | | | Less distributions to shareholders | | | | | | | | | Ratios / Supplemental Data | |
| | | Net
asset
value,
beginning
of the
period | | | Net
investment
income
(loss)c | | | Net
realized
and
unrealized
gain (loss)
on
investments | | | Total
income
(loss) from
investment
operations | | | From net
investment
income | | | From net
realized
gains | | | Total
distributions | | | Net
asset
value,
end of
the
period | | | Total
returnl,m | | | Net
assets,
end of
the
period
(000’s) | | | Ratio of
expenses
to average
daily net
assets | | | Net
investment
income
(loss) to
average
daily net
assets | |
Class I | | | | | | | | | | | | | | | | | | | | | | | | | | | | | | | | | | | | | | | | | | | | | | | | |
9/30/19 | | $ | 14.37 | | | $ | 0.10 | | | $ | (0.47 | ) | | $ | (0.37 | ) | | $ | (0.15 | ) | | $ | (2.85 | ) | | $ | (3.00 | ) | | $ | 11.00 | | | | 0.99% | | | $ | 28,367 | | | | 0.55% | | | | 0.89% | |
| 9/30/18 | | | 13.13 | | | | 0.10 | | | | 2.81 | | | | 2.91 | | | | (0.12 | ) | | | (1.55 | ) | | | (1.67 | ) | | | 14.37 | | | | 23.95% | | | | 30,279 | | | | 0.52% | | | | 0.78% | |
| 9/30/17 | | | 11.69 | | | | 0.13 | | | | 2.30 | | | | 2.43 | | | | (0.17 | ) | | | (0.82 | ) | | | (0.99 | ) | | | 13.13 | | | | 22.32% | | | | 113,313 | | | | 0.53% | | | | 1.09% | |
| 9/30/16 | | | 11.37 | | | | 0.14 | | | | 1.17 | | | | 1.31 | | | | (0.14 | ) | | | (0.85 | ) | | | (0.99 | ) | | | 11.69 | | | | 11.94% | | | | 107,336 | | | | 0.51% | | | | 1.22% | |
| 9/30/15 | | | 12.87 | | | | 0.15 | | | | 0.04 | | | | 0.19 | | | | (0.14 | ) | | | (1.55 | ) | | | (1.69 | ) | | | 11.37 | | | | 1.30% | | | | 184,981 | | | | 0.50% | | | | 1.21% | |
Class R5 | | | | | | | | | | | | | | | | | | | | | | | | | | | | | | | | | | | | | | | | | |
9/30/19 | | $ | 14.37 | | | $ | 0.09 | | | $ | (0.48 | ) | | $ | (0.39 | ) | | $ | (0.13 | ) | | $ | (2.85 | ) | | $ | (2.98 | ) | | $ | 11.00 | | | | 0.85% | | | $ | 100,651 | | | | 0.65% | | | | 0.79% | |
| 9/30/18 | | | 13.14 | | | | 0.09 | | | | 2.80 | | | | 2.89 | | | | (0.11 | ) | | | (1.55 | ) | | | (1.66 | ) | | | 14.37 | | | | 23.72% | | | | 112,178 | | | | 0.62% | | | | 0.69% | |
| 9/30/17 | | | 11.69 | | | | 0.12 | | | | 2.31 | | | | 2.43 | | | | (0.16 | ) | | | (0.82 | ) | | | (0.98 | ) | | | 13.14 | | | | 22.27% | | | | 87,103 | | | | 0.63% | | | | 1.00% | |
| 9/30/16 | | | 11.38 | | | | 0.13 | | | | 1.16 | | | | 1.29 | | | | (0.13 | ) | | | (0.85 | ) | | | (0.98 | ) | | | 11.69 | | | | 11.70% | | | | 76,893 | | | | 0.61% | | | | 1.12% | |
| 9/30/15 | | | 12.88 | | | | 0.14 | | | | 0.04 | | | | 0.18 | | | | (0.13 | ) | | | (1.55 | ) | | | (1.68 | ) | | | 11.38 | | | | 1.29% | | | | 85,630 | | | | 0.60% | | | | 1.12% | |
Service Class | | | | | | | | | | | | | | | | | | | | | | | | | | | | | | | | | | | | | | | | | |
9/30/19 | | $ | 14.40 | | | $ | 0.08 | | | $ | (0.47 | ) | | $ | (0.39 | ) | | $ | (0.12 | ) | | $ | (2.85 | ) | | $ | (2.97 | ) | | $ | 11.04 | | | | 0.79% | | | $ | 31,895 | | | | 0.75% | | | | 0.71% | |
| 9/30/18 | | | 13.17 | | | | 0.08 | | | | 2.80 | | | | 2.88 | | | | (0.10 | ) | | | (1.55 | ) | | | (1.65 | ) | | | 14.40 | | | | 23.54% | | | | 74,294 | | | | 0.72% | | | | 0.59% | |
| 9/30/17 | | | 11.71 | | | | 0.11 | | | | 2.31 | | | | 2.42 | | | | (0.14 | ) | | | (0.82 | ) | | | (0.96 | ) | | | 13.17 | | | | 22.15% | | | | 73,755 | | | | 0.73% | | | | 0.89% | |
| 9/30/16 | | | 11.40 | | | | 0.12 | | | | 1.16 | | | | 1.28 | | | | (0.12 | ) | | | (0.85 | ) | | | (0.97 | ) | | | 11.71 | | | | 11.58% | | | | 80,551 | | | | 0.71% | | | | 1.02% | |
| 9/30/15 | | | 12.90 | | | | 0.12 | | | | 0.05 | | | | 0.17 | | | | (0.12 | ) | | | (1.55 | ) | | | (1.67 | ) | | | 11.40 | | | | 1.19% | | | | 87,882 | | | | 0.70% | | | | 1.02% | |
| | | | | | | | | | | | | | | | | | | | |
| | | Year ended September 30 | |
| | | 2019 | | | 2018 | | | 2017 | | | 2016 | | | 2015 | |
Portfolio turnover rate | | | 49 | % | | | 73 | % | | | 105 | % | | | 124 | % | | | 138 | % |
| c | Per share amount calculated on the average shares method. |
| l | Employee retirement benefit plans that invest plan assets in the Separate Investment Accounts (SIAs) may be subject to certain charges as set forth in their respective Plan Documents. Total return figures would be lower for the periods presented if they reflected these charges. |
| m | Total return excludes sales charges, if any, and would be lower for the period presented if it reflected these charges. |
The accompanying notes are an integral part of the financial statements.
208
| | | | | | | | | | | | | | | | | | | | | | | | | | | | | | | | | | | | | | | | | | | | | | | | |
| | | | | | Income (loss) from
investment operations | | | Less distributions to shareholders | | | | | | | | | Ratios / Supplemental Data | |
| | | Net
asset
value,
beginning
of the
period | | | Net
investment
income
(loss)c,j | | | Net
realized
and
unrealized
gain (loss)
on
investments | | | Total
income
(loss) from
investment
operations | | | From net
investment
income | | | From net
realized
gains | | | Total
distributions | | | Net
asset
value,
end of
the
period | | | Total
returnl,m | | | Net
assets,
end of
the
period
(000’s) | | | Ratio of
expenses
to average
daily net
assets | | | Net
investment
income
(loss) to
average
daily net
assets | |
Administrative Class | | | | | | | | | | | | | | | | | | | | | | | | | | | | | | | | | | | | | | | | | |
9/30/19 | | $ | 14.55 | | | $ | 0.07 | | | $ | (0.47 | ) | | $ | (0.40 | ) | | $ | (0.11 | ) | | $ | (2.85 | ) | | $ | (2.96 | ) | | $ | 11.19 | | | | 0.66% | | | $ | 37,316 | | | | 0.85% | | | | 0.60% | |
| 9/30/18 | | | 13.28 | | | | 0.07 | | | | 2.83 | | | | 2.90 | | | | (0.08 | ) | | | (1.55 | ) | | | (1.63 | ) | | | 14.55 | | | | 23.51% | | | | 42,622 | | | | 0.82% | | | | 0.49% | |
| 9/30/17 | | | 11.81 | | | | 0.09 | | | | 2.34 | | | | 2.43 | | | | (0.14 | ) | | | (0.82 | ) | | | (0.96 | ) | | | 13.28 | | | | 21.95% | | | | 41,678 | | | | 0.83% | | | | 0.78% | |
| 9/30/16 | | | 11.48 | | | | 0.10 | | | | 1.19 | | | | 1.29 | | | | (0.11 | ) | | | (0.85 | ) | | | (0.96 | ) | | | 11.81 | | | | 11.57% | | | | 38,399 | | | | 0.81% | | | | 0.91% | |
| 9/30/15 | | | 12.98 | | | | 0.11 | | | | 0.04 | | | | 0.15 | | | | (0.10 | ) | | | (1.55 | ) | | | (1.65 | ) | | | 11.48 | | | | 1.08% | | | | 33,634 | | | | 0.80% | | | | 0.91% | |
Class A | | | | | | | | | | | | | | | | | | | | | | | | | | | | | | | | | | | | | |
9/30/19 | | $ | 14.15 | | | $ | 0.04 | | | $ | (0.47 | ) | | $ | (0.43 | ) | | $ | (0.07 | ) | | $ | (2.85 | ) | | $ | (2.92 | ) | | $ | 10.80 | | | | 0.42% | | | $ | 29,210 | | | | 1.10% | | | | 0.35% | |
| 9/30/18 | | | 12.95 | | | | 0.03 | | | | 2.77 | | | | 2.80 | | | | (0.05 | ) | | | (1.55 | ) | | | (1.60 | ) | | | 14.15 | | | | 23.22% | | | | 39,399 | | | | 1.07% | | | | 0.24% | |
| 9/30/17 | | | 11.53 | | | | 0.07 | | | | 2.28 | | | | 2.35 | | | | (0.11 | ) | | | (0.82 | ) | | | (0.93 | ) | | | 12.95 | | | | 21.73% | | | | 36,625 | | | | 1.08% | | | | 0.55% | |
| 9/30/16 | | | 11.23 | | | | 0.07 | | | | 1.15 | | | | 1.22 | | | | (0.07 | ) | | | (0.85 | ) | | | (0.92 | ) | | | 11.53 | | | | 11.23% | | | | 38,743 | | | | 1.06% | | | | 0.67% | |
| 9/30/15 | | | 12.74 | | | | 0.08 | | | | 0.04 | | | | 0.12 | | | | (0.08 | ) | | | (1.55 | ) | | | (1.63 | ) | | | 11.23 | | | | 0.78% | | | | 38,035 | | | | 1.05% | | | | 0.66% | |
Class R4 | | | | | | | | | | | | | | | | | | | | | | | | | | | | | | | | | | | | | | | | | | | | | | | | |
9/30/19 | | $ | 14.05 | | | $ | 0.05 | | | $ | (0.46 | ) | | $ | (0.41 | ) | | $ | (0.09 | ) | | $ | (2.85 | ) | | $ | (2.94 | ) | | $ | 10.70 | | | | 0.59% | | | $ | 24,049 | | | | 1.00% | | | | 0.45% | |
| 9/30/18 | | | 12.89 | | | | 0.04 | | | | 2.74 | | | | 2.78 | | | | (0.07 | ) | | | (1.55 | ) | | | (1.62 | ) | | | 14.05 | | | | 23.26% | | | | 31,265 | | | | 0.97% | | | | 0.34% | |
| 9/30/17 | | | 11.50 | | | | 0.07 | | | | 2.27 | | | | 2.34 | | | | (0.13 | ) | | | (0.82 | ) | | | (0.95 | ) | | | 12.89 | | | | 21.80% | | | | 26,809 | | | | 0.98% | | | | 0.61% | |
| 9/30/16 | | | 11.23 | | | | 0.08 | | | | 1.16 | | | | 1.24 | | | | (0.12 | ) | | | (0.85 | ) | | | (0.97 | ) | | | 11.50 | | | | 11.38% | | | | 14,016 | | | | 0.96% | | | | 0.75% | |
| 9/30/15 | | | 12.74 | | | | 0.09 | | | | 0.05 | | | | 0.14 | | | | (0.10 | ) | | | (1.55 | ) | | | (1.65 | ) | | | 11.23 | | | | 0.94% | | | | 6,003 | | | | 0.95% | | | | 0.78% | |
Class R3 | | | | | | | | | | | | | | | | | | | | | | | | | | | | | | | | | | | | | | | | | | | | | | | | |
9/30/19 | | $ | 14.02 | | | $ | 0.02 | | | $ | (0.47 | ) | | $ | (0.45 | ) | | $ | (0.06 | ) | | $ | (2.85 | ) | | $ | (2.91 | ) | | $ | 10.66 | | | | 0.23% | | | $ | 6,015 | | | | 1.25% | | | | 0.20% | |
| 9/30/18 | | | 12.86 | | | | 0.01 | | | | 2.74 | | | | 2.75 | | | | (0.04 | ) | | | (1.55 | ) | | | (1.59 | ) | | | 14.02 | | | | 23.01% | | | | 7,119 | | | | 1.22% | | | | 0.10% | |
| 9/30/17 | | | 11.45 | | | | 0.04 | | | | 2.27 | | | | 2.31 | | | | (0.08 | ) | | | (0.82 | ) | | | (0.90 | ) | | | 12.86 | | | | 21.52% | | | | 4,310 | | | | 1.23% | | | | 0.38% | |
| 9/30/16 | | | 11.21 | | | | 0.06 | | | | 1.14 | | | | 1.20 | | | | (0.11 | ) | | | (0.85 | ) | | | (0.96 | ) | | | 11.45 | | | | 11.01% | | | | 3,159 | | | | 1.21% | | | | 0.55% | |
| 9/30/15 | | | 12.73 | | | | 0.06 | | | | 0.04 | | | | 0.10 | | | | (0.07 | ) | | | (1.55 | ) | | | (1.62 | ) | | | 11.21 | | | | 0.66% | | | | 3,637 | | | | 1.20% | | | | 0.51% | |
209
MassMutual Premier Small Cap Opportunities Fund – Financial Statements(Continued)
Financial Highlights(For a share outstanding throughout each period)
| | | | | | | | | | | | | | | | | | | | | | | | | | | | | | | | | | | | | | | | | | | | | | | | |
| | | | | | Income (loss) from investment
operations | | | Less distributions to shareholders | | | | | | | | |
Ratios / Supplemental Data | |
| | | Net asset
value,
beginning
of the
period | | | Net
investment
income
(loss)c | | | Net
realized
and
unrealized
gain
(loss) on
investments | | | Total
income
(loss) from
investment
operations | | | From net
investment
income | | | From net
realized
gains | | | Total
distributions | | | Net
asset
value,
end of
the
period | | | Total
returnl,m | | | Net
assets,
end of
the
period
(000’s) | | | Ratio of
expenses
to average
daily net
assets | | | Net
investment
income
(loss) to
average
daily net
assets | |
Class I | | | | | | | | | | | | | | | | | | | | | | | | | | | | | | | | | | | | | | | | | | | | | | | | |
9/30/19 | | $ | 16.47 | | | $ | 0.11 | | | $ | (1.43 | ) | | $ | (1.32 | ) | | $ | (0.07 | ) | | $ | (1.36 | ) | | $ | (1.43 | ) | | $ | 13.72 | | | | (7.01% | ) | | $ | 35,326 | | | | 0.70% | | | | 0.82% | |
| 9/30/18 | | | 16.41 | | | | 0.11 | | | | 1.96 | | | | 2.07 | | | | (0.07 | ) | | | (1.94 | ) | | | (2.01 | ) | | | 16.47 | | | | 13.93% | | | | 40,439 | | | | 0.69% | | | | 0.73% | |
| 9/30/17 | | | 13.81 | | | | 0.11 | | | | 3.01 | | | | 3.12 | | | | (0.18 | ) | | | (0.34 | ) | | | (0.52 | ) | | | 16.41 | | | | 23.05% | | | | 15,105 | | | | 0.70% | | | | 0.75% | |
| 9/30/16 | | | 13.84 | | | | 0.17 | | | | 1.31 | | | | 1.48 | | | | (0.12 | ) | | | (1.39 | ) | | | (1.51 | ) | | | 13.81 | | | | 11.60% | | | | 3,642 | | | | 0.71% | | | | 1.33% | |
| 9/30/15 | | | 15.78 | | | | 0.13 | | | | 0.44 | | | | 0.57 | | | | (0.17 | ) | | | (2.34 | ) | | | (2.51 | ) | | | 13.84 | | | | 2.63% | | | | 0 | f | | | 0.68% | | | | 0.84% | |
| Class R5 | | | | | | | | | | | | | | | | | | | | | | | | | | | | | | | | | | | | | | | | | |
9/30/19 | | $ | 16.44 | | | $ | 0.10 | | | $ | (1.43 | ) | | $ | (1.33 | ) | | $ | (0.06 | ) | | $ | (1.36 | ) | | $ | (1.42 | ) | | $ | 13.69 | | | | (7.14% | ) | | $ | 61,826 | | | | 0.80% | | | | 0.71% | |
| 9/30/18 | | | 16.38 | | | | 0.10 | | | | 1.96 | | | | 2.06 | | | | (0.06 | ) | | | (1.94 | ) | | | (2.00 | ) | | | 16.44 | | | | 13.82% | | | | 77,025 | | | | 0.79% | | | | 0.62% | |
| 9/30/17 | | | 13.78 | | | | 0.10 | | | | 3.00 | | | | 3.10 | | | | (0.16 | ) | | | (0.34 | ) | | | (0.50 | ) | | | 16.38 | | | | 22.99% | | | | 64,889 | | | | 0.80% | | | | 0.63% | |
| 9/30/16 | | | 13.82 | | | | 0.15 | | | | 1.30 | | | | 1.45 | | | | (0.10 | ) | | | (1.39 | ) | | | (1.49 | ) | | | 13.78 | | | | 11.40% | | | | 61,310 | | | | 0.81% | | | | 1.16% | |
| 9/30/15 | | | 15.77 | | | | 0.13 | | | | 0.41 | | | | 0.54 | | | | (0.15 | ) | | | (2.34 | ) | | | (2.49 | ) | | | 13.82 | | | | 2.44% | | | | 58,840 | | | | 0.79% | | | | 0.82% | |
| Service Class | | | | | | | | | | | | | | | | | | | | | | | | | | | | | | | | | | | | | | | | | |
9/30/19 | | $ | 16.39 | | | $ | 0.08 | | | $ | (1.41 | ) | | $ | (1.33 | ) | | $ | (0.04 | ) | | $ | (1.36 | ) | | $ | (1.40 | ) | | $ | 13.66 | | | | (7.16% | ) | | $ | 17,073 | | | | 0.90% | | | | 0.61% | |
| 9/30/18 | | | 16.34 | | | | 0.08 | | | | 1.95 | | | | 2.03 | | | | (0.04 | ) | | | (1.94 | ) | | | (1.98 | ) | | | 16.39 | | | | 13.68% | | | | 18,192 | | | | 0.89% | | | | 0.52% | |
| 9/30/17 | | | 13.75 | | | | 0.08 | | | | 3.00 | | | | 3.08 | | | | (0.15 | ) | | | (0.34 | ) | | | (0.49 | ) | | | 16.34 | | | | 22.87% | | | | 14,726 | | | | 0.90% | | | | 0.54% | |
| 9/30/16 | | | 13.81 | | | | 0.14 | | | | 1.29 | | | | 1.43 | | | | (0.10 | ) | | | (1.39 | ) | | | (1.49 | ) | | | 13.75 | | | | 11.23% | | | | 13,313 | | | | 0.91% | | | | 1.08% | |
| 9/30/15 | | | 15.76 | | | | 0.11 | | | | 0.43 | | | | 0.54 | | | | (0.15 | ) | | | (2.34 | ) | | | (2.49 | ) | | | 13.81 | | | | 2.41% | | | | 6,927 | | | | 0.89% | | | | 0.73% | |
| | | | | | | | | | | | | | | | | | | | |
| | | Year ended September 30 | |
| | | 2019 | | | 2108 | | | 2017 | | | 2016 | | | 2015 | |
Portfolio turnover rate | | | 34 | % | | | 57 | % | | | 62 | % | | | 57 | % | | | 52 | % |
| c | Per share amount calculated on the average shares method. |
| d | Amount is less than $0.005 per share. |
| f | Amount is less than $500. |
| l | Employee retirement benefit plans that invest plan assets in the Separate Investment Accounts (SIAs) may be subject to certain charges as set forth in their respective Plan Documents. Total return figures would be lower for the periods presented if they reflected these charges. |
| m | Total return excludes sales charges, if any, and would be lower for the period presented if it reflected these charges. |
The accompanying notes are an integral part of the financial statements.
210
| | | | | | | | | | | | | | | | | | | | | | | | | | | | | | | | | | | | | | | | | | | | | | | | |
| | | | | | Income (loss) from investment
operations | | | Less distributions to shareholders | | | | | | | | |
Ratios / Supplemental Data | |
| | | Net asset
value,
beginning
of the
period | | | Net
investment
income
(loss)c | | | Net
realized
and
unrealized
gain
(loss) on
investments | | | Total
income
(loss) from
investment
operations | | | From net
investment
income | | | From net
realized
gains | | | Total
distributions | | | Net
asset
value,
end of
the
period | | | Total
returnl,m | | | Net
assets,
end of
the
period
(000’s) | | | Ratio of
expenses
to average
daily net
assets | | | Net
investment
income
(loss) to
average
daily net
assets | |
| Administrative Class | | | | | | | | | | | | | | | | | | | | | | | | | | | | | | | | | | | | | | | | | |
9/30/19 | | $ | 16.29 | | | $ | 0.07 | | | $ | (1.41 | ) | | $ | (1.34 | ) | | $ | (0.02 | ) | | $ | (1.36 | ) | | $ | (1.38 | ) | | $ | 13.57 | | | | (7.28% | ) | | $ | 20,377 | | | | 1.00% | | | | 0.51% | |
| 9/30/18 | | | 16.25 | | | | 0.07 | | | | 1.94 | | | | 2.01 | | | | (0.03 | ) | | | (1.94 | ) | | | (1.97 | ) | | | 16.29 | | | | 13.59% | | | | 26,503 | | | | 0.99% | | | | 0.42% | |
| 9/30/17 | | | 13.68 | | | | 0.07 | | | | 2.98 | | | | 3.05 | | | | (0.14 | ) | | | (0.34 | ) | | | (0.48 | ) | | | 16.25 | | | | 22.75% | | | | 23,967 | | | | 1.00% | | | | 0.44% | |
| 9/30/16 | | | 13.72 | | | | 0.12 | | | | 1.29 | | | | 1.41 | | | | (0.06 | ) | | | (1.39 | ) | | | (1.45 | ) | | | 13.68 | | | | 11.17% | | | | 17,641 | | | | 1.01% | | | | 0.94% | |
| 9/30/15 | | | 15.68 | | | | 0.10 | | | | 0.41 | | | | 0.51 | | | | (0.13 | ) | | | (2.34 | ) | | | (2.47 | ) | | | 13.72 | | | | 2.25% | | | | 18,171 | | | | 0.99% | | | | 0.64% | |
Class A | | | | | | | | | | | | | | | | | | | | | | | | | | | | | | | | | | | | | | | | | |
9/30/19 | | $ | 15.92 | | | $ | 0.03 | | | $ | (1.38 | ) | | $ | (1.35 | ) | | $ | - | | | $ | (1.36 | ) | | $ | (1.36 | ) | | $ | 13.21 | | | | (7.54% | ) | | $ | 50,524 | | | | 1.25% | | | | 0.26% | |
| 9/30/18 | | | 15.93 | | | | 0.03 | | | | 1.90 | | | | 1.93 | | | | - | | | | (1.94 | ) | | | (1.94 | ) | | | 15.92 | | | | 13.34% | | | | 69,157 | | | | 1.24% | | | | 0.17% | |
| 9/30/17 | | | 13.42 | | | | 0.03 | | | | 2.92 | | | | 2.95 | | | | (0.10 | ) | | | (0.34 | ) | | | (0.44 | ) | | | 15.93 | | | | 22.42% | | | | 73,462 | | | | 1.25% | | | | 0.19% | |
| 9/30/16 | | | 13.49 | | | | 0.09 | | | | 1.26 | | | | 1.35 | | | | (0.03 | ) | | | (1.39 | ) | | | (1.42 | ) | | | 13.42 | | | | 10.88% | | | | 69,495 | | | | 1.26% | | | | 0.70% | |
| 9/30/15 | | | 15.43 | | | | 0.06 | | | | 0.42 | | | | 0.48 | | | | (0.08 | ) | | | (2.34 | ) | | | (2.42 | ) | | | 13.49 | | | | 2.04% | | | | 66,359 | | | | 1.24% | | | | 0.38% | |
Class R4 | | | | | | | | | | | | | | | | | | | | | | | | | | | | | | | | | | | | | | | | | | | | | | | | |
9/30/19 | | $ | 15.81 | | | $ | 0.05 | | | $ | (1.38 | ) | | $ | (1.33 | ) | | $ | (0.00 | )d | | $ | (1.36 | ) | | $ | (1.36 | ) | | $ | 13.12 | | | | (7.43% | ) | | $ | 10,591 | | | | 1.15% | | | | 0.36% | |
| 9/30/18 | | | 15.83 | | | | 0.04 | | | | 1.89 | | | | 1.93 | | | | (0.01 | ) | | | (1.94 | ) | | | (1.95 | ) | | | 15.81 | | | | 13.42% | | | | 11,773 | | | | 1.14% | | | | 0.26% | |
| 9/30/17 | | | 13.36 | | | | 0.04 | | | | 2.91 | | | | 2.95 | | | | (0.14 | ) | | | (0.34 | ) | | | (0.48 | ) | | | 15.83 | | | | 22.50% | | | | 9,717 | | | | 1.15% | | | | 0.29% | |
| 9/30/16 | | | 13.48 | | | | 0.10 | | | | 1.27 | | | | 1.37 | | | | (0.10 | ) | | | (1.39 | ) | | | (1.49 | ) | | | 13.36 | | | | 11.06% | | | | 4,467 | | | | 1.16% | | | | 0.75% | |
| 9/30/15 | | | 15.44 | | | | 0.12 | | | | 0.38 | | | | 0.50 | | | | (0.12 | ) | | | (2.34 | ) | | | (2.46 | ) | | | 13.48 | | | | 2.17% | | | | 571 | | | | 1.14% | | | | 0.84% | |
Class R3 | | | | | | | | | | | | | | | | | | | | | | | | | | | | | | | | | | | | | | | | | | | | | | | | |
9/30/19 | | $ | 15.71 | | | $ | 0.01 | | | $ | (1.36 | ) | | $ | (1.35 | ) | | $ | - | | | $ | (1.36 | ) | | $ | (1.36 | ) | | $ | 13.00 | | | | (7.66% | ) | | $ | 8,551 | | | | 1.40% | | | | 0.11% | |
| 9/30/18 | | | 15.77 | | | | 0.00 | d | | | 1.88 | | | | 1.88 | | | | - | | | | (1.94 | ) | | | (1.94 | ) | | | 15.71 | | | | 13.14% | | | | 10,564 | | | | 1.39% | | | | 0.02% | |
| 9/30/17 | | | 13.32 | | | | 0.01 | | | | 2.89 | | | | 2.90 | | | | (0.11 | ) | | | (0.34 | ) | | | (0.45 | ) | | | 15.77 | | | | 22.19% | | | | 9,008 | | | | 1.40% | | | | 0.04% | |
| 9/30/16 | | | 13.46 | | | | 0.07 | | | | 1.25 | | | | 1.32 | | | | (0.07 | ) | | | (1.39 | ) | | | (1.46 | ) | | | 13.32 | | | | 10.72% | | | | 5,524 | | | | 1.41% | | | | 0.51% | |
| 9/30/15 | | | 15.42 | | | | 0.07 | | | | 0.40 | | | | 0.47 | | | | (0.09 | ) | | | (2.34 | ) | | | (2.43 | ) | | | 13.46 | | | | 1.97% | | | | 1,245 | | | | 1.39% | | | | 0.45% | |
211
MassMutual Premier Global Fund – Financial Statements (Continued)
Financial Highlights (For a share outstanding throughout each period)
| | | | | | | | | | | | | | | | | | | | | | | | | | | | | | | | | | | | | | | | | | | | | | | | |
| | | | | |
| Income (loss) from investment
operations |
| |
| Less distributions to
shareholders |
| | | | | | | | | | | Ratios / Supplemental Data | |
| | | Net
asset
value,
beginning
of the
period | | | Net
investment
income
(loss)c | | | Net
realized
and
unrealized
gain (loss)
on
investments | | | Total
income
(loss) from
investment
operations | | | From net
investment
income | | | From net
realized
gains | | | Total
distributions | | | Net
asset
value,
end of
the
period | | | Total
returnl,m | | | Net
assets,
end of
the
period
(000’s) | | | Ratio of
expenses
to average
daily net
assets | | | Net
investment
income
(loss) to
average
daily net
assets | |
Class I | | | | | | | | | | | | | | | | | | | | | | | | | | | | | | | | | | | | | | | | | | | | | | | | |
| 9/30/19 | | $ | 16.08 | | | $ | 0.10 | | | $ | (0.83 | ) | | $ | (0.73 | ) | | $ | (0.11 | ) | | $ | (2.89 | ) | | $ | (3.00 | ) | | $ | 12.35 | | | | (1.93% | ) | | $ | 70,159 | | | | 0.84% | | | | 0.79% | |
| 9/30/18 | | | 16.46 | | | | 0.13 | | | | 1.52 | | | | 1.65 | | | | (0.16 | ) | | | (1.87 | ) | | | (2.03 | ) | | | 16.08 | | | | 10.39% | | | | 50,503 | | | | 0.86% | | | | 0.79% | |
| 9/30/17 | | | 13.47 | | | | 0.12 | | | | 3.43 | | | | 3.55 | | | | (0.18 | ) | | | (0.38 | ) | | | (0.56 | ) | | | 16.46 | | | | 27.53% | | | | 34,308 | | | | 0.86% | | | | 0.78% | |
| 9/30/16 | | | 13.94 | | | | 0.11 | | | | 0.66 | | | | 0.77 | | | | (0.14 | ) | | | (1.10 | ) | | | (1.24 | ) | | | 13.47 | | | | 5.50% | | | | 16,576 | | | | 0.85% | | | | 0.85% | |
| 9/30/15 | | | 15.11 | | | | 0.18 | | | | (0.46 | ) | | | (0.28 | ) | | | (0.19 | ) | | | (0.70 | ) | | | (0.89 | ) | | | 13.94 | | | | (1.92% | ) | | | 1,044 | | | | 0.84% | | | | 1.16% | |
Class R5 | | | | | | | | | | | | | | | | | | | | | | | | | | | | | | | | | | | | | | | | | |
| 9/30/19 | | $ | 16.09 | | | $ | 0.08 | | | $ | (0.83 | ) | | $ | (0.75 | ) | | $ | (0.09 | ) | | $ | (2.89 | ) | | $ | (2.98 | ) | | $ | 12.36 | | | | (2.07% | ) | | $ | 98,379 | | | | 0.94% | | | | 0.66% | |
| 9/30/18 | | | 16.47 | | | | 0.11 | | | | 1.53 | | | | 1.64 | | | | (0.15 | ) | | | (1.87 | ) | | | (2.02 | ) | | | 16.09 | | | | 10.28% | | | | 101,536 | | | | 0.96% | | | | 0.65% | |
| 9/30/17 | | | 13.46 | | | | 0.08 | | | | 3.48 | | | | 3.56 | | | | (0.17 | ) | | | (0.38 | ) | | | (0.55 | ) | | | 16.47 | | | | 27.55% | | | | 120,521 | | | | 0.96% | | | | 0.54% | |
| 9/30/16 | | | 13.93 | | | | 0.12 | | | | 0.63 | | | | 0.75 | | | | (0.12 | ) | | | (1.10 | ) | | | (1.22 | ) | | | 13.46 | | | | 5.37% | | | | 125,171 | | | | 0.95% | | | | 0.89% | |
| 9/30/15 | | | 15.11 | | | | 0.15 | | | | (0.46 | ) | | | (0.31 | ) | | | (0.17 | ) | | | (0.70 | ) | | | (0.87 | ) | | | 13.93 | | | | (2.07% | ) | | | 166,316 | | | | 0.94% | | | | 0.99% | |
Service Class | | | | | | | | | | | | | | | | | | | | | | | | | | | | | | | | | | | | | | | | | |
| 9/30/19 | | $ | 15.94 | | | $ | 0.06 | | | $ | (0.82 | ) | | $ | (0.76 | ) | | $ | (0.06 | ) | | $ | (2.89 | ) | | $ | (2.95 | ) | | $ | 12.23 | | | | (2.23% | ) | | $ | 6,361 | | | | 1.04% | | | | 0.43% | |
| 9/30/18 | | | 16.33 | | | | 0.10 | | | | 1.51 | | | | 1.61 | | | | (0.13 | ) | | | (1.87 | ) | | | (2.00 | ) | | | 15.94 | | | | 10.17% | | | | 16,104 | | | | 1.06% | | | | 0.60% | |
| 9/30/17 | | | 13.35 | | | | 0.07 | | | | 3.44 | | | | 3.51 | | | | (0.15 | ) | | | (0.38 | ) | | | (0.53 | ) | | | 16.33 | | | | 27.37% | | | | 19,086 | | | | 1.06% | | | | 0.46% | |
| 9/30/16 | | | 13.83 | | | | 0.11 | | | | 0.62 | | | | 0.73 | | | | (0.11 | ) | | | (1.10 | ) | | | (1.21 | ) | | | 13.35 | | | | 5.28% | | | | 28,699 | | | | 1.05% | | | | 0.87% | |
| 9/30/15 | | | 15.01 | | | | 0.14 | | | | (0.46 | ) | | | (0.32 | ) | | | (0.16 | ) | | | (0.70 | ) | | | (0.86 | ) | | | 13.83 | | | | (2.15% | ) | | | 30,582 | | | | 1.04% | | | | 0.95% | |
| | | | | | | | | | | | | | | | | | | | |
| | | Year ended September 30 | |
| | | 2019 | | | 2018 | | | 2017 | | | 2016 | | | 2015 | |
Portfolio turnover rate | | | 32 | % | | | 42 | % | | | 30 | % | | | 25 | % | | | 32 | % |
| c | Per share amount calculated on the average shares method. |
| d | Amount is less than $0.005 per share. |
| l | Employee retirement benefit plans that invest plan assets in the Separate Investment Accounts (SIAs) may be subject to certain charges as set forth in their respective Plan Documents. Total return figures would be lower for the periods presented if they reflected these charges. |
| m | Total return excludes sales charges, if any, and would be lower for the period presented if it reflected these charges. |
The accompanying notes are an integral part of the financial statements.
212
| | | | | | | | | | | | | | | | | | | | | | | | | | | | | | | | | | | | | | | | | | | | | | | | |
| | | | | |
| Income (loss) from investment
operations |
| |
| Less distributions to
shareholders |
| | | | | | | | | | | Ratios / Supplemental Data | |
| | | Net
asset
value,
beginning
of the
period | | | Net
investment
income
(loss)c | | | Net
realized
and
unrealized
gain (loss)
on
investments | | | Total
income
(loss) from
investment
operations | | | From net
investment
income | | | From net
realized
gains | | | Total
distributions | | | Net
asset
value,
end of
the
period | | | Total
returnl,m | | | Net
assets,
end of
the
period
(000’s) | | | Ratio of
expenses
to average
daily net
assets | | | Net
investment
income
(loss) to
average
daily net
assets | |
Administrative Class | | | | | | | | | | | | | | | | | | | | | | | | | | | | | | | | | | | | | | | | | |
| 9/30/19 | | $ | 16.06 | | | $ | 0.06 | | | $ | (0.83 | ) | | $ | (0.77 | ) | | $ | (0.06 | ) | | $ | (2.89 | ) | | $ | (2.95 | ) | | $ | 12.34 | | | | (2.30% | ) | | $ | 77,097 | | | | 1.14% | | | | 0.45% | |
| 9/30/18 | | | 16.44 | | | | 0.07 | | | | 1.53 | | | | 1.60 | | | | (0.11 | ) | | | (1.87 | ) | | | (1.98 | ) | | | 16.06 | | | | 10.07% | | | | 90,239 | | | | 1.16% | | | | 0.46% | |
| 9/30/17 | | | 13.44 | | | | 0.05 | | | | 3.47 | | | | 3.52 | | | | (0.14 | ) | | | (0.38 | ) | | | (0.52 | ) | | | 16.44 | | | | 27.24% | | | | 103,200 | | | | 1.16% | | | | 0.36% | |
| 9/30/16 | | | 13.91 | | | | 0.09 | | | | 0.63 | | | | 0.72 | | | | (0.09 | ) | | | (1.10 | ) | | | (1.19 | ) | | | 13.44 | | | | 5.15% | | | | 99,085 | | �� | | 1.15% | | | | 0.68% | |
| 9/30/15 | | | 15.08 | | | | 0.12 | | | | (0.45 | ) | | | (0.33 | ) | | | (0.14 | ) | | | (0.70 | ) | | | (0.84 | ) | | | 13.91 | | | | (2.23% | ) | | | 120,753 | | | | 1.14% | | | | 0.79% | |
Class A | | | | | | | | | | | | | | | | | | | | | | | | | | | | | | | | | | | | | | | | | |
| 9/30/19 | | $ | 15.87 | | | $ | 0.03 | | | $ | (0.82 | ) | | $ | (0.79 | ) | | $ | (0.02 | ) | | $ | (2.89 | ) | | $ | (2.91 | ) | | $ | 12.17 | | | | (2.48% | ) | | $ | 24,676 | | | | 1.39% | | | | 0.20% | |
| 9/30/18 | | | 16.27 | | | | 0.03 | | | | 1.51 | | | | 1.54 | | | | (0.07 | ) | | | (1.87 | ) | | | (1.94 | ) | | | 15.87 | | | | 9.74% | | | | 31,725 | | | | 1.41% | | | | 0.21% | |
| 9/30/17 | | | 13.29 | | | | 0.02 | | | | 3.44 | | | | 3.46 | | | | (0.10 | ) | | | (0.38 | ) | | | (0.48 | ) | | | 16.27 | | | | 26.99% | | | | 30,769 | | | | 1.41% | | | | 0.12% | |
| 9/30/16 | | | 13.77 | | | | 0.06 | | | | 0.61 | | | | 0.67 | | | | (0.05 | ) | | | (1.10 | ) | | | (1.15 | ) | | | 13.29 | | | | 4.85% | | | | 32,200 | | | | 1.40% | | | | 0.44% | |
| 9/30/15 | | | 14.92 | | | | 0.08 | | | | (0.44 | ) | | | (0.36 | ) | | | (0.09 | ) | | | (0.70 | ) | | | (0.79 | ) | | | 13.77 | | | | (2.44% | ) | | | 40,690 | | | | 1.39% | | | | 0.54% | |
Class R4 | | | | | | | | | | | | | | | | | | | | | | | | | | | | | | | | | | | | | | | | | | | | | | | | |
| 9/30/19 | | $ | 15.71 | | | $ | 0.04 | | | $ | (0.82 | ) | | $ | (0.78 | ) | | $ | (0.06 | ) | | $ | (2.89 | ) | | $ | (2.95 | ) | | $ | 11.98 | | | | (2.45% | ) | | $ | 7,531 | | | | 1.29% | | | | 0.32% | |
| 9/30/18 | | | 16.13 | | | | 0.04 | | | | 1.51 | | | | 1.55 | | | | (0.10 | ) | | | (1.87 | ) | | | (1.97 | ) | | | 15.71 | | | | 9.90% | | | | 7,790 | | | | 1.31% | | | | 0.27% | |
| 9/30/17 | | | 13.21 | | | | 0.03 | | | | 3.41 | | | | 3.44 | | | | (0.14 | ) | | | (0.38 | ) | | | (0.52 | ) | | | 16.13 | | | | 27.05% | | | | 5,560 | | | | 1.31% | | | | 0.20% | |
| 9/30/16 | | | 13.74 | | | | 0.09 | | | | 0.61 | | | | 0.70 | | | | (0.13 | ) | | | (1.10 | ) | | | (1.23 | ) | | | 13.21 | | | | 5.05% | | | | 4,322 | | | | 1.30% | | | | 0.73% | |
| 9/30/15 | | | 14.93 | | | | 0.12 | | | | (0.48 | ) | | | (0.36 | ) | | | (0.13 | ) | | | (0.70 | ) | | | (0.83 | ) | | | 13.74 | | | | (2.44% | ) | | | 729 | | | | 1.29% | | | | 0.79% | |
Class R3 | | | | | | | | | | | | | | | | | | | | | | | | | | | | | | | | | | | | | | | | | |
| 9/30/19 | | $ | 15.80 | | | $ | 0.01 | | | $ | (0.82 | ) | | $ | (0.81 | ) | | $ | - | | | $ | (2.89 | ) | | $ | (2.89 | ) | | $ | 12.10 | | | | (2.69% | ) | | $ | 10,226 | | | | 1.54% | | | | 0.06% | |
| 9/30/18 | | | 16.21 | | | | 0.01 | | | | 1.51 | | | | 1.52 | | | | (0.06 | ) | | | (1.87 | ) | | | (1.93 | ) | | | 15.80 | | | | 9.64% | | | | 11,029 | | | | 1.56% | | | | 0.06% | |
| 9/30/17 | | | 13.27 | | | | (0.00 | )d | | | 3.42 | | | | 3.42 | | | | (0.10 | ) | | | (0.38 | ) | | | (0.48 | ) | | | 16.21 | | | | 26.73% | | | | 10,696 | | | | 1.56% | | | | (0.03% | ) |
| 9/30/16 | | | 13.79 | | | | 0.05 | | | | 0.61 | | | | 0.66 | | | | (0.08 | ) | | | (1.10 | ) | | | (1.18 | ) | | | 13.27 | | | | 4.78% | | | | 8,702 | | | | 1.55% | | | | 0.42% | |
| 9/30/15 | | | 14.97 | | | | 0.05 | | | | (0.43 | ) | | | (0.38 | ) | | | (0.10 | ) | | | (0.70 | ) | | | (0.80 | ) | | | 13.79 | | | | (2.63% | ) | | | 2,905 | | | | 1.54% | | | | 0.36% | |
213
MassMutual Premier International Equity Fund – Financial Statements(Continued)
Financial Highlights(For a share outstanding throughout each period)
| | | | | | | | | | | | | | | | | | | | | | | | | | | | | | | | | | | | | | | | | | | | | | | | | | | | |
| | | | | |
| Income (loss) from investment
operations |
| |
| Less distributions to
shareholders |
| | | | | | | | | | | Ratios /Supplemental Data | |
| | | Net
asset
value,
beginning
of the
period | | | Net
investment
income
(loss)c,j | | | Net
realized
and
unrealized
gain (loss)
on
investments | | | Total
income
(loss) from
investment
operations | | | From net
investment
income | | | From net
realized
gains | | | Total
distributions | | | Net
asset
value,
end of
the
period | | | Total
returnl,m | | | Net
assets,
end of
the
period
(000’s) | | | Ratio of
expenses
to average
daily net
assets
before
expense
waiver | | | Ratio of
expenses
to average
daily net
assets
after
expense
waiversj | | | Net
investment
income
(loss) to
average
daily net
assets | |
Class I | | | | | | | | | | | | | | | | | | | | | | | | | | | | | | | | | | | | | | | | | | | | | | | | | | | | |
| 9/30/19 | | $ | 12.99 | | | $ | 0.09 | | | $ | (0.49 | ) | | $ | (0.40 | ) | | $ | (0.12 | ) | | $ | (0.46 | ) | | $ | (0.58 | ) | | $ | 12.01 | | | | (2.49% | ) | | $ | 149,979 | | | | 0.93% | | | | 0.92% | | | | 0.81% | |
| 9/30/18 | | | 13.44 | | | | 0.14 | | | | (0.42 | ) | | | (0.28 | ) | | | (0.17 | ) | | | - | | | | (0.17 | ) | | | 12.99 | | | | (2.14% | ) | | | 293,575 | | | | 0.96% | | | | 0.94% | | | | 1.01% | |
| 9/30/17 | | | 11.97 | | | | 0.18 | | | | 1.61 | | | | 1.79 | | | | (0.15 | ) | | | (0.17 | ) | | | (0.32 | ) | | | 13.44 | | | | 15.60% | | | | 246,510 | | | | 0.96% | | | | 0.94% | | | | 1.46% | |
| 9/30/16 | | | 11.55 | | | | 0.15 | | | | 0.85 | | | | 1.00 | | | | (0.14 | ) | | | (0.44 | ) | | | (0.58 | ) | | | 11.97 | | | | 8.86% | | | | 195,019 | | | | 0.95% | | | | 0.94% | | | | 1.30% | |
| 9/30/15 | | | 14.39 | | | | 0.18 | | | | (0.60 | ) | | | (0.42 | ) | | | (0.18 | ) | | | (2.24 | ) | | | (2.42 | ) | | | 11.55 | | | | (3.02% | ) | | | 169,842 | | | | 0.96% | | | | N/A | | | | 1.42% | |
Class R5 | | | | | | | | | | | | | | | | | | | | | | | | | | | | | | | | | | | | | | | | | | | | | |
| 9/30/19 | | $ | 12.98 | | | $ | 0.10 | | | $ | (0.51 | ) | | $ | (0.41 | ) | | $ | (0.11 | ) | | $ | (0.46 | ) | | $ | (0.57 | ) | | $ | 12.00 | | | | (2.63% | ) | | $ | 94,827 | | | | 1.03% | | | | 1.02% | | | | 0.89% | |
| 9/30/18 | | | 13.44 | | | | 0.12 | | | | (0.42 | ) | | | (0.30 | ) | | | (0.16 | ) | | | - | | | | (0.16 | ) | | | 12.98 | | | | (2.32% | ) | | | 147,654 | | | | 1.06% | | | | 1.04% | | | | 0.85% | |
| 9/30/17 | | | 11.97 | | | | 0.17 | | | | 1.61 | | | | 1.78 | | | | (0.14 | ) | | | (0.17 | ) | | | (0.31 | ) | | | 13.44 | | | | 15.47% | | | | 195,316 | | | | 1.06% | | | | 1.04% | | | | 1.38% | |
| 9/30/16 | | | 11.54 | | | | 0.14 | | | | 0.85 | | | | 0.99 | | | | (0.12 | ) | | | (0.44 | ) | | | (0.56 | ) | | | 11.97 | | | | 8.83% | | | | 221,320 | | | | 1.05% | | | | 1.04% | | | | 1.18% | |
| 9/30/15 | | | 14.38 | | | | 0.13 | | | | (0.57 | ) | | | (0.44 | ) | | | (0.16 | ) | | | (2.24 | ) | | | (2.40 | ) | | | 11.54 | | | | (3.17% | ) | | | 251,687 | | | | 1.06% | | | | N/A | | | | 1.05% | |
Service Class | | | | | | | | | | | | | | | | | | | | | | | | | | | | | | | | | | | | | | | | | | | | | |
| 9/30/19 | | $ | 12.94 | | | $ | 0.07 | | | $ | (0.49 | ) | | $ | (0.42 | ) | | $ | (0.09 | ) | | $ | (0.46 | ) | | $ | (0.55 | ) | | $ | 11.97 | | | | (2.74% | ) | | $ | 9,393 | | | | 1.13% | | | | 1.12% | | | | 0.60% | |
| 9/30/18 | | | 13.39 | | | | 0.11 | | | | (0.41 | ) | | | (0.30 | ) | | | (0.15 | ) | | | - | | | | (0.15 | ) | | | 12.94 | | | | (2.33% | ) | | | 23,069 | | | | 1.16% | | | | 1.14% | | | | 0.79% | |
| 9/30/17 | | | 11.93 | | | | 0.15 | | | | 1.61 | | | | 1.76 | | | | (0.13 | ) | | | (0.17 | ) | | | (0.30 | ) | | | 13.39 | | | | 15.33% | | | | 21,422 | | | | 1.16% | | | | 1.14% | | | | 1.25% | |
| 9/30/16 | | | 11.51 | | | | 0.13 | | | | 0.84 | | | | 0.97 | | | | (0.11 | ) | | | (0.44 | ) | | | (0.55 | ) | | | 11.93 | | | | 8.66% | | | | 22,510 | | | | 1.15% | | | | 1.14% | | | | 1.09% | |
| 9/30/15 | | | 14.34 | | | | 0.13 | | | | (0.57 | ) | | | (0.44 | ) | | | (0.15 | ) | | | (2.24 | ) | | | (2.39 | ) | | | 11.51 | | | | (3.20% | ) | | | 21,741 | | | | 1.16% | | | | N/A | | | | 1.03% | |
| | | | | | | | | | | | | | | | | | | | |
| | | Year ended September 30 | |
| | | 2019 | | | 2018 | | | 2017 | | | 2016 | | | 2015 | |
Portfolio turnover rate | | | 52 | % | | | 70 | % | | | 44 | % | | | 36 | % | | | 45 | % |
| c | Per share amount calculated on the average shares method. |
| j | Computed after giving effect to an agreement by MML Advisers and/or MassMutual to waive certain fees and expenses of the Fund. |
| l | Employee retirement benefit plans that invest plan assets in the Separate Investment Accounts (SIAs) may be subject to certain charges as set forth in their respective Plan Documents. Total return figures would be lower for the periods presented if they reflected these charges. |
| m | Total return excludes sales charges, if any, and would be lower for the period presented if it reflected these charges. |
The accompanying notes are an integral part of the financial statements.
214
| | | | | | | | | | | | | | | | | | | | | | | | | | | | | | | | | | | | | | | | | | | | | | | | | | | | |
| | | | | | Income (loss) from investment
operations | | | Less distributions to shareholders | | | | | | | | | | | | Ratios /Supplemental Data | |
| | | Net
asset
value,
beginning
of the
period | | | Net
investment
income
(loss)c,j | | | Net
realized
and
unrealized
gain (loss)
on
investments | | | Total
income
(loss) from
investment
operations | | | From net
investment
income | | | From net
realized
gains | | | Total
distributions | | | Net
asset
value,
end of
the
period | | | Total
returnl,m | | | Net
assets,
end of
the
period
(000’s) | | | Ratio of
expenses
to average
daily net
assets
before
expense
waivers | | | Ratio of
expenses
to average
daily net
assets
after
expense
waiversj | | | Net
investment
income
(loss) to
average
daily net
assets | |
Administrative Class | | | | | | | | | | | | | | | | | | | | | | | | | | | | | | | | | | | | | | | | | | | | | |
| 9/30/19 | | $ | 12.87 | | | $ | 0.08 | | | $ | (0.51 | ) | | $ | (0.43 | ) | | $ | (0.07 | ) | | $ | (0.46 | ) | | $ | (0.53 | ) | | $ | 11.91 | | | | (2.77% | ) | | $ | 5,465 | | | | 1.23% | | | | 1.22% | | | | 0.65% | |
| 9/30/18 | | | 13.32 | | | | 0.08 | | | | (0.40 | ) | | | (0.32 | ) | | | (0.13 | ) | | | - | | | | (0.13 | ) | | | 12.87 | | | | (2.49% | ) | | | 11,908 | | | | 1.26% | | | | 1.24% | | | | 0.58% | |
| 9/30/17 | | | 11.87 | | | | 0.15 | | | | 1.58 | | | | 1.73 | | | | (0.11 | ) | | | (0.17 | ) | | | (0.28 | ) | | | 13.32 | | | | 15.19% | | | | 17,968 | | | | 1.26% | | | | 1.24% | | | | 1.22% | |
| 9/30/16 | | | 11.45 | | | | 0.11 | | | | 0.85 | | | | 0.96 | | | | (0.10 | ) | | | (0.44 | ) | | | (0.54 | ) | | | 11.87 | | | | 8.59% | | | | 18,407 | | | | 1.25% | | | | 1.24% | | | | 0.97% | |
| 9/30/15 | | | 14.27 | | | | 0.12 | | | | (0.56 | ) | | | (0.44 | ) | | | (0.14 | ) | | | (2.24 | ) | | | (2.38 | ) | | | 11.45 | | | | (3.28% | ) | | | 19,307 | | | | 1.26% | | | | N/A | | | | 0.96% | |
Class A | | | | | | | | | | | | | | | | | | | | | | | | | | | | | | | | | | | | | | | | | | | | | |
| 9/30/19 | | $ | 12.49 | | | $ | 0.05 | | | $ | (0.50 | ) | | $ | (0.45 | ) | | $ | (0.04 | ) | | $ | (0.46 | ) | | $ | (0.50 | ) | | $ | 11.54 | | | | (3.09% | ) | | $ | 22,004 | | | | 1.48% | | | | 1.47% | | | | 0.46% | |
| 9/30/18 | | | 12.93 | | | | 0.05 | | | | (0.39 | ) | | | (0.34 | ) | | | (0.10 | ) | | | - | | | | (0.10 | ) | | | 12.49 | | | | (2.70% | ) | | | 30,719 | | | | 1.51% | | | | 1.49% | | | | 0.41% | |
| 9/30/17 | | | 11.52 | | | | 0.10 | | | | 1.56 | | | | 1.66 | | | | (0.08 | ) | | | (0.17 | ) | | | (0.25 | ) | | | 12.93 | | | | 14.95% | | | | 39,746 | | | | 1.51% | | | | 1.49% | | | | 0.90% | |
| 9/30/16 | | | 11.12 | | | | 0.08 | | | | 0.83 | | | | 0.91 | | | | (0.07 | ) | | | (0.44 | ) | | | (0.51 | ) | | | 11.52 | | | | 8.34% | | | | 42,907 | | | | 1.50% | | | | 1.49% | | | | 0.72% | |
| 9/30/15 | | | 13.94 | | | | 0.08 | | | | (0.56 | ) | | | (0.48 | ) | | | (0.10 | ) | | | (2.24 | ) | | | (2.34 | ) | | | 11.12 | | | | (3.54% | ) | | | 47,166 | | | | 1.51% | | | | N/A | | | | 0.65% | |
Class R4 | | | | | | | | | | | | | | | | | | | | | | | | | | | | | | | | | | | | | | | | | | | | | | | | | | | | |
| 9/30/19 | | $ | 12.38 | | | $ | 0.05 | | | $ | (0.48 | ) | | $ | (0.43 | ) | | $ | (0.06 | ) | | $ | (0.46 | ) | | $ | (0.52 | ) | | $ | 11.43 | | | | (2.95% | ) | | $ | 4,895 | | | | 1.38% | | | | 1.37% | | | | 0.48% | |
| 9/30/18 | | | 12.84 | | | | 0.07 | | | | (0.40 | ) | | | (0.33 | ) | | | (0.13 | ) | | | - | | | | (0.13 | ) | | | 12.38 | | | | (2.63% | ) | | | 10,673 | | | | 1.41% | | | | 1.39% | | | | 0.54% | |
| 9/30/17 | | | 11.47 | | | | 0.13 | | | | 1.53 | | | | 1.66 | | | | (0.12 | ) | | | (0.17 | ) | | | (0.29 | ) | | | 12.84 | | | | 15.10% | | | | 10,932 | | | | 1.41% | | | | 1.39% | | | | 1.10% | |
| 9/30/16 | | | 11.11 | | | | 0.14 | | | | 0.77 | | | | 0.91 | | | | (0.11 | ) | | | (0.44 | ) | | | (0.55 | ) | | | 11.47 | | | | 8.42% | | | | 3,648 | | | | 1.40% | | | | 1.39% | | | | 1.28% | |
| 9/30/15 | | | 13.94 | | | | 0.09 | | | | (0.55 | ) | | | (0.46 | ) | | | (0.13 | ) | | | (2.24 | ) | | | (2.37 | ) | | | 11.11 | | | | (3.46% | ) | | | 349 | | | | 1.41% | | | | N/A | | | | 0.73% | |
Class R3 | | | | | | | | | | | | | | | | | | | | | | | | | | | | | | | | | | | | | | | | | | | | | | | | | | | | |
| 9/30/19 | | $ | 12.34 | | | $ | 0.02 | | | $ | (0.48 | ) | | $ | (0.46 | ) | | $ | (0.04 | ) | | $ | (0.46 | ) | | $ | (0.50 | ) | | $ | 11.38 | | | | (3.24% | ) | | $ | 5,415 | | | | 1.63% | | | | 1.62% | | | | 0.21% | |
| 9/30/18 | | | 12.79 | | | | 0.03 | | | | (0.39 | ) | | | (0.36 | ) | | | (0.09 | ) | | | - | | | | (0.09 | ) | | | 12.34 | | | | (2.88% | ) | | | 9,024 | | | | 1.66% | | | | 1.64% | | | | 0.25% | |
| 9/30/17 | | | 11.43 | | | | 0.09 | | | | 1.54 | | | | 1.63 | | | | (0.10 | ) | | | (0.17 | ) | | | (0.27 | ) | | | 12.79 | | | | 14.77% | | | | 9,045 | | | | 1.66% | | | | 1.64% | | | | 0.77% | |
| 9/30/16 | | | 11.09 | | | | 0.09 | | | | 0.80 | | | | 0.89 | | | | (0.11 | ) | | | (0.44 | ) | | | (0.55 | ) | | | 11.43 | | | | 8.24% | | | | 3,618 | | | | 1.65% | | | | 1.64% | | | | 0.82% | |
| 9/30/15 | | | 13.93 | | | | 0.05 | | | | (0.54 | ) | | | (0.49 | ) | | | (0.11 | ) | | | (2.24 | ) | | | (2.35 | ) | | | 11.09 | | | | (3.76% | ) | | | 524 | | | | 1.66% | | | | N/A | | | | 0.41% | |
215
MassMutual Premier Strategic Emerging Markets Fund – Financial Statements(Continued)
Financial Highlights(For a share outstanding throughout each period)
| | | | | | | | | | | | | | | | | | | | | | | | | | | | | | | | | | | | | | | | | | | | | | | | |
| | | | | | Income (loss) from investment
operations | | | Less distributions to shareholders | | | | | | Ratios / Supplemental Data | |
| | | Net
asset
value,
beginning
of the
period | | | Net
investment
income
(loss)c,j | | | Net
realized
and
unrealized
gain (loss)
on
investments | | | Total
income
(loss) from
investment
operations | | | From net
investment
income | | | Total
distributions | | | Net
asset
value,
end of
the
period | | | Total
returnl,m | | | Net
assets,
end of
the
period
(000’s) | | | Ratio of
expenses
to average
daily net
assets
before
expense
waivers | | | Ratio of
expenses
to average
daily net
assets
after
expense
waiversj | | | Net
investment
income
(loss) to
average
daily net
assets | |
Class I | | | | | | | | | | | | | | | | | | | | | | | | | | | | | | | | | | | | | | | | | |
9/30/19 | | $ | 12.75 | | | $ | 0.07 | | | $ | 0.28 | | | $ | 0.35 | | | $ | (0.08 | ) | | $ | (0.08 | ) | | $ | 13.02 | | | | 2.85% | | | $ | 141,988 | | | | 1.21% | | | | 1.10% | | | | 0.55% | |
| 9/30/18 | | | 12.88 | | | | 0.08 | | | | (0.04 | ) | | | 0.04 | | | | (0.17 | ) | | | (0.17 | ) | | | 12.75 | | | | 0.31% | | | | 216,085 | | | | 1.27% | | | | 1.05% | | | | 0.62% | |
| 9/30/17 | | | 10.79 | | | | 0.07 | | | | 2.14 | | | | 2.21 | | | | (0.12 | ) | | | (0.12 | ) | | | 12.88 | | | | 20.85% | | | | 236,991 | | | | 1.28% | | | | 1.05% | | | | 0.65% | |
| 9/30/16 | | | 9.19 | | | | 0.07 | | | | 1.61 | | | | 1.68 | | | | (0.08 | ) | | | (0.08 | ) | | | 10.79 | | | | 18.36% | | | | 204,626 | | | | 1.31% | | | | 1.05% | | | | 0.69% | |
| 9/30/15 | | | 12.11 | | | | 0.09 | | | | (2.87 | ) | | | (2.78 | ) | | | (0.14 | ) | | | (0.14 | ) | | | 9.19 | | | | (23.13% | ) | | | 127,823 | | | | 1.37% | | | | 1.05% | | | | 0.77% | |
Class R5 | | | | | | | | | | | | | | | | | | | | | | | | | | | | | | | | | | | | | | | | | |
9/30/19 | | $ | 12.92 | | | $ | 0.06 | | | $ | 0.29 | | | $ | 0.35 | | | $ | (0.07 | ) | | $ | (0.07 | ) | | $ | 13.20 | | | | 2.78% | | | $ | 4,295 | | | | 1.31% | | | | 1.22% | | | | 0.45% | |
| 9/30/18 | | | 13.05 | | | | 0.07 | | | | (0.04 | ) | | | 0.03 | | | | (0.16 | ) | | | (0.16 | ) | | | 12.92 | | | | 0.21% | | | | 4,047 | | | | 1.37% | | | | 1.15% | | | | 0.53% | |
| 9/30/17 | | | 10.94 | | | | 0.06 | | | | 2.16 | | | | 2.22 | | | | (0.11 | ) | | | (0.11 | ) | | | 13.05 | | | | 20.59% | | | | 3,887 | | | | 1.38% | | | | 1.15% | | | | 0.54% | |
| 9/30/16 | | | 9.30 | | | | 0.04 | | | | 1.65 | | | | 1.69 | | | | (0.05 | ) | | | (0.05 | ) | | | 10.94 | | | | 18.22% | | | | 3,148 | | | | 1.41% | | | | 1.15% | | | | 0.38% | |
| 9/30/15 | | | 12.24 | | | | 0.08 | | | | (2.89 | ) | | | (2.81 | ) | | | (0.13 | ) | | | (0.13 | ) | | | 9.30 | | | | (23.20% | ) | | | 7,389 | | | | 1.47% | | | | 1.15% | | | | 0.67% | |
Service Class | | | | | | | | | | | | | | | | | | | | | | | | | | | | | | | | | | | | | | | | | |
9/30/19 | | $ | 12.73 | | | $ | 0.05 | | | $ | 0.29 | | | $ | 0.34 | | | $ | (0.02 | ) | | $ | (0.02 | ) | | $ | 13.05 | | | | 2.71% | | | $ | 419 | | | | 1.41% | | | | 1.31% | | | | 0.42% | |
| 9/30/18 | | | 12.85 | | | | 0.05 | | | | (0.03 | ) | | | 0.02 | | | | (0.14 | ) | | | (0.14 | ) | | | 12.73 | | | | 0.10% | | | | 230 | | | | 1.47% | | | | 1.25% | | | | 0.41% | |
| 9/30/17 | | | 10.78 | | | | (0.02 | ) | | | 2.19 | | | | 2.17 | | | | (0.10 | ) | | | (0.10 | ) | | | 12.85 | | | | 20.41% | | | | 434 | | | | 1.48% | | | | 1.25% | | | | (0.20% | ) |
| 9/30/16 | | | 9.17 | | | | 0.04 | | | | 1.63 | | | | 1.67 | | | | (0.06 | ) | | | (0.06 | ) | | | 10.78 | | | | 18.27% | | | | 8,238 | | | | 1.51% | | | | 1.25% | | | | 0.43% | |
| 9/30/15 | | | 12.09 | | | | 0.07 | | | | (2.87 | ) | | | (2.80 | ) | | | (0.12 | ) | | | (0.12 | ) | | | 9.17 | | | | (23.23% | ) | | | 7,015 | | | | 1.57% | | | | 1.25% | | | | 0.63% | |
| | | | | | | | | | | | | | | | | | | | |
| | | Year ended September 30 | |
| | | 2019 | | | 2018 | | | 2017 | | | 2016 | | | 2015 | |
Portfolio turnover rate | | | 32 | % | | | 38 | % | | | 51 | % | | | 33 | % | | | 40 | % |
| c | Per share amount calculated on the average shares method. |
| d | Amount is less than $0.005 per share. |
| j | Computed after giving effect to an agreement by MML Advisers and/or MassMutual to waive certain fees and expenses of the Fund. |
| l | Employee retirement benefit plans that invest plan assets in the Separate Investment Accounts (SIAs) may be subject to certain charges as set forth in their respective Plan Documents. Total return figures would be lower for the periods presented if they reflected these charges. |
| m | Total return excludes sales charges, if any, and would be lower for the period presented if it reflected these charges. |
The accompanying notes are an integral part of the financial statements.
216
| | | | | | | | | | | | | | | | | | | | | | | | | | | | | | | | | | | | | | | | | | | | | | | | |
| | | | | | Income (loss) from investment
operations | | | Less distributions to shareholders | | | | | | Ratios / Supplemental Data | |
| | | Net
asset
value,
beginning
of the
period | | | Net
investment
income
(loss)c,j | | | Net
realized
and
unrealized
gain (loss)
on
investments | | | Total
income
(loss) from
investment
operations | | | From net
investment
income | | | Total
distributions | | | Net
asset
value,
end of
the
period | | | Total
returnl,m | | | Net
assets,
end of
the
period
(000’s) | | | Ratio of
expenses
to average
daily net
assets
before
expense
waivers | | | Ratio of
expenses
to average
daily net
assets
after
expense
waiversj | | | Net
investment
income
(loss) to
average
daily net
assets | |
Administrative Class | | | | | | | | | | | | | | | | | | | | | | | | | | | | | | | | | | | | | | | | | |
9/30/19 | | $ | 12.78 | | | $ | 0.03 | | | $ | 0.30 | | | $ | 0.33 | | | $ | (0.03 | ) | | $ | (0.03 | ) | | $ | 13.08 | | | | 2.61% | | | $ | 927 | | | | 1.51% | | | | 1.41% | | | | 0.24% | |
| 9/30/18 | | | 12.91 | | | | 0.04 | | | | (0.03 | ) | | | 0.01 | | | | (0.14 | ) | | | (0.14 | ) | | | 12.78 | | | | 0.02% | | | | 879 | | | | 1.57% | | | | 1.35% | | | | 0.33% | |
| 9/30/17 | | | 10.84 | | | | 0.05 | | | | 2.13 | | | | 2.18 | | | | (0.11 | ) | | | (0.11 | ) | | | 12.91 | | | | 20.35% | | | | 1,565 | | | | 1.58% | | | | 1.35% | | | | 0.41% | |
| 9/30/16 | | | 9.23 | | | | 0.04 | | | | 1.62 | | | | 1.66 | | | | (0.05 | ) | | | (0.05 | ) | | | 10.84 | | | | 18.02% | | | | 677 | | | | 1.61% | | | | 1.35% | | | | 0.42% | |
| 9/30/15 | | | 12.15 | | | | 0.06 | | | | (2.88 | ) | | | (2.82 | ) | | | (0.10 | ) | | | (0.10 | ) | | | 9.23 | | | | (23.32% | ) | | | 431 | | | | 1.67% | | | | 1.35% | | | | 0.54% | |
Class A | | | | | | | | | | | | | | | | | | | | | | | | | | | | | | | | | | | | | | | | | |
9/30/19 | | $ | 12.73 | | | $ | 0.01 | | | $ | 0.28 | | | $ | 0.29 | | | $ | (0.04 | ) | | $ | (0.04 | ) | | $ | 12.98 | | | | 2.32% | | | $ | 885 | | | | 1.76% | | | | 1.68% | | | | 0.09% | |
| 9/30/18 | | | 12.88 | | | | 0.04 | | | | (0.07 | ) | | | (0.03 | ) | | | (0.12 | ) | | | (0.12 | ) | | | 12.73 | | | | (0.23% | ) | | | 386 | | | | 1.82% | | | | 1.60% | | | | 0.30% | |
| 9/30/17 | | | 10.74 | | | | 0.02 | | | | 2.14 | | | | 2.16 | | | | (0.02 | ) | | | (0.02 | ) | | | 12.88 | | | | 20.18% | | | | 118 | | | | 1.83% | | | | 1.60% | | | | 0.14% | |
| 9/30/16 | | | 9.13 | | | | 0.01 | | | | 1.60 | | | | 1.61 | | | | (0.00 | )d | | | (0.00 | )d | | | 10.74 | | | | 17.68% | | | | 95 | | | | 1.86% | | | | 1.60% | | | | 0.11% | |
| 9/30/15 | | | 12.04 | | | | 0.00 | d | | | (2.81 | ) | | | (2.81 | ) | | | (0.10 | ) | | | (0.10 | ) | | | 9.13 | | | | (23.47% | ) | | | 190 | | | | 1.92% | | | | 1.60% | | | | 0.02% | |
Class R4 | | | | | | | | | | | | | | | | | | | | | | | | | | | | | | | | | | | | | | | | | | | | | | | | |
9/30/19 | | $ | 12.63 | | | $ | 0.01 | | | $ | 0.29 | | | $ | 0.30 | | | $ | (0.03 | ) | | $ | (0.03 | ) | | $ | 12.90 | | | | 2.38% | | | $ | 1,337 | | | | 1.66% | | | | 1.57% | | | | 0.05% | |
| 9/30/18 | | | 12.76 | | | | 0.03 | | | | (0.04 | ) | | | (0.01 | ) | | | (0.12 | ) | | | (0.12 | ) | | | 12.63 | | | | (0.10% | ) | | | 1,295 | | | | 1.72% | | | | 1.50% | | | | 0.22% | |
| 9/30/17 | | | 10.72 | | | | 0.03 | | | | 2.11 | | | | 2.14 | | | | (0.10 | ) | | | (0.10 | ) | | | 12.76 | | | | 20.23% | | | | 1,019 | | | | 1.73% | | | | 1.50% | | | | 0.24% | |
| 9/30/16 | | | 9.14 | | | | 0.02 | | | | 1.61 | | | | 1.63 | | | | (0.05 | ) | | | (0.05 | ) | | | 10.72 | | | | 17.87% | | | | 599 | | | | 1.76% | | | | 1.50% | | | | 0.23% | |
| 9/30/15 | | | 12.05 | | | | 0.03 | | | | (2.84 | ) | | | (2.81 | ) | | | (0.10 | ) | | | (0.10 | ) | | | 9.14 | | | | (23.45% | ) | | | 112 | | | | 1.82% | | | | 1.50% | | | | 0.27% | |
Class R3 | | | | | | | | | | | | | | | | | | | | | | | | | | | | | | | | | | | | | | | | | | | | | | | | |
9/30/19 | | $ | 12.60 | | | $ | (0.02 | ) | | $ | 0.29 | | | $ | 0.27 | | | $ | - | | | $ | - | | | $ | 12.87 | | | | 2.14% | | | $ | 750 | | | | 1.91% | | | | 1.81% | | | | (0.15% | ) |
| 9/30/18 | | | 12.73 | | | | (0.01 | ) | | | (0.04 | ) | | | (0.05 | ) | | | (0.08 | ) | | | (0.08 | ) | | | 12.60 | | | | (0.39% | ) | | | 761 | | | | 1.97% | | | | 1.75% | | | | (0.09% | ) |
| 9/30/17 | | | 10.70 | | | | (0.01 | ) | | | 2.12 | | | | 2.11 | | | | (0.08 | ) | | | (0.08 | ) | | | 12.73 | | | | 19.88% | | | | 821 | | | | 1.98% | | | | 1.75% | | | | (0.07% | ) |
| 9/30/16 | | | 9.12 | | | | 0.00 | d | | | 1.61 | | | | 1.61 | | | | (0.03 | ) | | | (0.03 | ) | | | 10.70 | | | | 17.66% | | | | 642 | | | | 2.01% | | | | 1.75% | | | | 0.04% | |
| 9/30/15 | | | 12.03 | | | | 0.03 | | | | (2.86 | ) | | | (2.83 | ) | | | (0.08 | ) | | | (0.08 | ) | | | 9.12 | | | | (23.57% | ) | | | 184 | | | | 2.07% | | | | 1.75% | | | | 0.24% | |
217
Notes to Financial Statements
MassMutual Premier Funds (the “Trust”) is registered under the Investment Company Act of 1940, as amended (the “1940 Act”), as anopen-end management investment company. The Trust is organized under the laws of the Commonwealth of Massachusetts as a Massachusetts business trust pursuant to an Agreement and Declaration of Trust dated August 1, 1994, as amended and restated as of November 21, 2011, as it may be further amended from time to time. The following are 14 series of the Trust (each individually referred to as a “Fund” or collectively as the “Funds”):
MassMutual Premier U.S. Government Money Market Fund (“U.S. Government Money Market Fund”)
MassMutual Premier Short-Duration Bond Fund (“Short-Duration Bond Fund”)
MassMutual Premier Inflation-Protected and Income Fund (“Inflation-Protected and Income Fund”)
MassMutual Premier Core Bond Fund (“Core Bond Fund”)
MassMutual Premier Diversified Bond Fund (“Diversified Bond Fund”)
MassMutual Premier High Yield Fund (“High Yield Fund”)
MassMutual Premier Balanced Fund (“Balanced Fund”)
MassMutual Premier Disciplined Value Fund (“Disciplined Value Fund”)
MassMutual Premier Main Street Fund (“Main Street Fund”)
MassMutual Premier Disciplined Growth Fund (“Disciplined Growth Fund”)
MassMutual Premier Small Cap Opportunities Fund (“Small Cap Opportunities Fund”)
MassMutual Premier Global Fund (“Global Fund”)
MassMutual Premier International Equity Fund (“International Equity Fund”)
MassMutual Premier Strategic Emerging Markets Fund (“Strategic Emerging Markets Fund”)
Each share class of a Fund represents an interest in the same portfolio of assets. The principal difference among the classes is the level of service and administration fees, and shareholder and distribution service expenses borne by the classes. Because each class will have different fees and expenses, performance and share prices will vary between the classes. The classes of shares are offered to different types of investors, as outlined in the Funds’ Prospectus.
| 2. | | Significant Accounting Policies |
The following is a summary of significant accounting policies followed consistently by each Fund in the preparation of the financial statements in conformity with accounting principles generally accepted in the United States of America (“generally accepted accounting principles”). The preparation of the financial statements in accordance with generally accepted accounting principles requires management to make estimates and assumptions that affect the reported amounts and disclosures in the financial statements. Actual results could differ from those estimates.
Each Fund is an investment company and accordingly follows the investment company accounting and reporting guidance of the Financial Accounting Standards Board (“FASB”) Accounting Standards Codification Topic 946, Financial Services – Investment Companies.
New Disclosure Requirements
Pursuant to amendments to certain disclosure requirements in RegulationS-X adopted by the Securities and Exchange Commission (“SEC”), the presentation of certain disclosures within the Statements of Assets and Liabilities and the Statements of Changes in Net Assets have been conformed to meet these new requirements. There is no longer a requirement to present the components of distributable earnings on the Statements of Assets and Liabilities. Adjustments to the Statements of Changes in Net Assets include updates to prior year distributions to shareholders, distributions in excess of net investment income, and undistributed net investment income.
218
Notes to Financial Statements(Continued)
The following is a summary of the previously disclosed amounts, as reported at September 30, 2018:
| | | | | | | | | | | | | | | | | | | | | | | | | | | | |
| | | U.S.
Government
Money Market
Fund | | | Short-
Duration
Bond Fund | | | Inflation-
Protected and
Income Fund | | | Core Bond
Fund | | | Diversified
Bond Fund | | | High Yield
Fund | | | Balanced
Fund | |
Distributions to shareholders | | | | | | | | | | | | | | | | | | | | | | | | | | | | |
From net investment income: | | | | | | | | | | | | | | | | | | | | | | | | | | | | |
Class I | | $ | - | | | $ | (7,691,067 | ) | | $ | (2,927,040 | ) | | $ | (16,298,876 | ) | | $ | (843,981 | ) | | $ | (15,260,676 | ) | | $ | (150,517 | ) |
Class R5 | | | (4,036,266 | ) | | | (3,581,314 | ) | | | (1,630,948 | ) | | | (10,042,498 | ) | | | (2,762,770 | ) | | | (3,402,827 | ) | | | (825,274 | ) |
Service Class | | | - | | | | (1,800,199 | ) | | | (1,365,911 | ) | | | (2,847,221 | ) | | | (455,302 | ) | | | (2,834,872 | ) | | | (112,228 | ) |
Administrative Class | | | - | | | | (675,313 | ) | | | (362,670 | ) | | | (1,969,162 | ) | | | (738,553 | ) | | | (1,983,745 | ) | | | (142,305 | ) |
Class A | | | - | | | | (1,139,950 | ) | | | (495,760 | ) | | | (2,716,702 | ) | | | (874,975 | ) | | | (1,668,415 | ) | | | (418,692 | ) |
Class R4 | | | - | | | | (295,883 | ) | | | (157,975 | ) | | | (452,049 | ) | | | (142,412 | ) | | | (1,876,196 | ) | | | (46,983 | ) |
Class R3 | | | - | | | | (127,705 | ) | | | (112,214 | ) | | | (12,415 | ) | | | (101,773 | ) | | | (2,304,959 | ) | | | (95,231 | ) |
| | | | | | | | | | | | | | | | | | | | | | | | | | | | |
Total distributions from net investment income | | | (4,036,266 | ) | | | (15,311,431 | ) | | | (7,052,518 | ) | | | (34,338,923 | ) | | | (5,919,766 | ) | | | (29,331,690 | ) | | | (1,791,230 | ) |
| | | | | | | | | | | | | | | | | | | | | | | | | | | | |
From net realized gains: | | | | | | | | | | | | | | | | | | | | | | | | | | | | |
Class I | | | - | | | | - | | | | - | | | | - | | | | - | | | | - | | | | (419,886 | ) |
Class R5 | | | (15,250 | ) | | | - | | | | - | | | | - | | | | - | | | | - | | | | (2,441,906 | ) |
Service Class | | | - | | | | - | | | | - | | | | - | | | | - | | | | - | | | | (363,420 | ) |
Administrative Class | | | - | | | | - | | | | - | | | | - | | | | - | | | | - | | | | (489,679 | ) |
Class A | | | - | | | | - | | | | - | | | | - | | | | - | | | | - | | | | (1,685,763 | ) |
Class R4 | | | - | | | | - | | | | - | | | | - | | | | - | | | | - | | | | (165,644 | ) |
Class R3 | | | - | | | | - | | | | - | | | | - | | | | - | | | | - | | | | (408,357 | ) |
| | | | | | | | | | | | | | | | | | | | | | | | | | | | |
Total distributions from net realized gains | | | (15,250 | ) | | | - | | | | - | | | | - | | | | - | | | | - | | | | (5,974,655 | ) |
| | | | | | | | | | | | | | | | | | | | | | | | | | | | |
Accumulated undistributed (distributions in excess of) net investment income at end of year | | $ | (104,879 | ) | | $ | 13,817,391 | | | $ | 7,520,348 | | | $ | 30,094,743 | | | $ | 5,283,381 | | | $ | 21,882,233 | | | $ | 1,419,307 | |
| | | | | | | | | | | | | | | | | | | | | | | | | | | | |
| | | | | | | |
| | | Disciplined
Value Fund | | | Main Street
Fund | | | Disciplined
Growth
Fund | | | Small Cap
Opportunities
Fund | | | Global
Fund | | | International
Equity Fund | | | Strategic
Emerging
Markets
Fund | |
Distributions to shareholders | | | | | | | | | | | | | | | | | | | | | | | | | | | | |
From net investment income: | | | | | | | | | | | | | | | | | | | | | | | | | | | | |
Class I | | $ | (1,604,136 | ) | | $ | (121,371 | ) | | $ | (1,067,533 | ) | | $ | (80,448 | ) | | $ | (371,046 | ) | | $ | (3,222,891 | ) | | $ | (3,266,714 | ) |
Class R5 | | | (858,883 | ) | | | (792,770 | ) | | | (749,015 | ) | | | (217,215 | ) | | | (973,977 | ) | | | (2,165,164 | ) | | | (48,833 | ) |
Service Class | | | (884,855 | ) | | | (10,364 | ) | | | (553,563 | ) | | | (37,295 | ) | | | (148,279 | ) | | | (228,348 | ) | | | (4,633 | ) |
Administrative Class | | | (104,018 | ) | | | (274,091 | ) | | | (250,708 | ) | | | (36,981 | ) | | | (697,807 | ) | | | (161,875 | ) | | | (15,720 | ) |
Class A | | | (119,815 | ) | | | (86,861 | ) | | | (132,436 | ) | | | - | | | | (127,246 | ) | | | (277,389 | ) | | | (1,765 | ) |
Class R4 | | | (157,778 | ) | | | (36,158 | ) | | | (154,197 | ) | | | (4,317 | ) | | | (34,562 | ) | | | (124,071 | ) | | | (9,767 | ) |
Class R3 | | | (58,916 | ) | | | (4,833 | ) | | | (15,204 | ) | | | - | | | | (38,175 | ) | | | (57,228 | ) | | | (5,088 | ) |
| | | | | | | | | | | | | | | | | | | | | | | | | | | | |
Total distributions from net investment income | | | (3,788,401 | ) | | | (1,326,448 | ) | | | (2,922,656 | ) | | | (376,256 | ) | | | (2,391,092 | ) | | | (6,236,966 | ) | | | (3,352,520 | ) |
| | | | | | | | | | | | | | | | | | | | | | | | | | | | |
From net realized gains: | | | | | | | | | | | | | | | | | | | | | | | | | | | | |
Class I | | | (8,075,905 | ) | | | (698,041 | ) | | | (12,964,775 | ) | | | (2,130,989 | ) | | | (4,234,464 | ) | | | - | | | | - | |
Class R5 | | | (4,566,582 | ) | | | (5,009,325 | ) | | | (10,132,474 | ) | | | (7,472,114 | ) | | | (12,439,902 | ) | | | - | | | | - | |
Service Class | | | (4,962,387 | ) | | | (72,606 | ) | | | (8,469,423 | ) | | | (1,770,371 | ) | | | (2,169,952 | ) | | | - | | | | - | |
Administrative Class | | | (612,898 | ) | | | (2,130,007 | ) | | | (4,565,652 | ) | | | (2,825,371 | ) | | | (11,456,262 | ) | | | - | | | | - | |
Class A | | | (891,635 | ) | | | (909,629 | ) | | | (4,168,816 | ) | | | (8,525,904 | ) | | | (3,406,608 | ) | | | - | | | | - | |
Class R4 | | | (982,879 | ) | | | (339,371 | ) | | | (3,156,438 | ) | | | (1,168,317 | ) | | | (660,525 | ) | | | - | | | | - | |
Class R3 | | | (391,570 | ) | | | (74,044 | ) | | | (526,943 | ) | | | (1,100,523 | ) | | | (1,219,812 | ) | | | - | | | | - | |
| | | | | | | | | | | | | | | | | | | | | | | | | | | | |
Total distributions from net realized gains | | | (20,483,856 | ) | | | (9,233,023 | ) | | | (43,984,521 | ) | | | (24,993,589 | ) | | | (35,587,525 | ) | | | - | | | | - | |
| | | | | | | | | | | | | | | | | | | | | | | | | | | | |
Accumulated undistributed (distributions in excess of) net investment income at end of year | | $ | 2,503,043 | | | $ | 764,017 | | | $ | 2,130,813 | | | $ | 112,405 | | | $ | 170,090 | | | $ | 4,117,064 | | | $ | (471,716 | ) |
| | | | | | | | | | | | | | | | | | | | | | | | | | | | |
219
Notes to Financial Statements(Continued)
Investment Valuation
The net asset value of each Fund’s shares is determined once daily as of the close of regular trading on the New York Stock Exchange (“NYSE”), on each day the NYSE is open for trading (a “business day”). The NYSE normally closes at 4:00 p.m. Eastern Time but may close earlier on some days. If the NYSE is scheduled to close early, the business day will be considered to end as of the time of the NYSE’s scheduled close. A Fund will not treat an intraday disruption in NYSE trading or other event that causes an unscheduled closing of the NYSE as a close of business of the NYSE for these purposes and will instead fair value securities in accordance with procedures approved annually by the Board of Trustees (“Trustees”), and under the general oversight of the Trustees. On holidays and other days when the NYSE is closed, each Fund’s net asset value generally is not calculated and the Funds do not anticipate accepting buy or sell orders. However, the value of each Fund’s assets may still be affected on such days to the extent that a Fund holds foreign securities that trade on days that foreign securities markets are open.
Equity securities and derivative contracts that are actively traded on a national securities exchange or contract market are valued on the basis of information furnished by a pricing service, which provides the last reported sale price, or, in the case of futures contracts, the settlement price, for securities or derivatives listed on the exchange or contract market or the official closing price on the NASDAQ National Market System (“NASDAQ System”), or in the case ofover-the-counter (“OTC”) securities for which an official closing price is unavailable or not reported on the NASDAQ System, the last reported bid price. Portfolio securities traded on more than one national securities exchange are valued at the last price at the close of the exchange representing the principal market for such securities. Debt securities (with the exception of debt securities held by the U.S. Government Money Market Fund) are valued on the basis of valuations furnished by a pricing service, which generally determines valuations taking into account factors such asinstitutional-size trading in similar securities, yield, quality, coupon rate, maturity, type of issue, trading characteristics, and other market data. Shares of otheropen-end mutual funds are valued at their closing net asset values as reported on each business day. The U.S. Government Money Market Fund’s debt securities are typically valued at amortized cost, but may be valued using a vendor quote if the Fund’s investment adviser determines it more closely approximates current market value, in accordance with Rule2a-7 under the 1940 Act pursuant to which the U.S. Government Money Market Fund must adhere to certain conditions. It is the intention of the U.S. Government Money Market Fund to maintain a stable net asset value per share of $1.00, although this cannot be assured.
Investments for which market quotations are readily available are marked to market daily based on those quotations. Market quotations may be provided by third-party vendors or market makers, and may be determined on the basis of a variety of factors, such as broker quotations, financial modeling, and other market data, such as market indexes and yield curves, counterparty information, and foreign exchange rates. U.S. Government and agency securities may be valued on the basis of market quotations or using a model that may incorporate market observable data such as reported sales of similar securities, broker quotes, yields, bids, offers, quoted market prices, and reference data. The fair values of OTC derivative contracts, including forward, swap, and option contracts related to interest rates, foreign currencies, credit standing of reference entities, equity prices, or commodity prices, may be based on market quotations or may be modeled using a series of techniques, including simulation models, depending on the contract and the terms of the transaction. The fair values of asset-backed securities and mortgage-backed securities are estimated based on models that consider the estimated cash flows of each debt tranche of the issuer, established benchmark yield, and estimated tranche-specific spread to the benchmark yield based on the unique attributes of the tranche, including, but not limited to, prepayment speed assumptions and attributes of the collateral. Restricted securities are generally valued at a discount to similar publicly traded securities.
Investments for which market quotations are not available or for which a pricing service or vendor does not provide a value, or for which such market quotations or values are considered by the investment adviser or subadviser to be unreliable (including, for example, certain foreign securities, thinly-traded securities, certain restricted securities, certain initial public offerings, or securities whose values may have been affected by a significant event) are stated at fair valuations determined in good faith by the Funds’ Valuation Committee1 in accordance with procedures approved annually by the Trustees, and under the general oversight of the Trustees. The Funds’ Valuation Committee employs various methods to determine fair valuations including a regular review of significant inputs and assumptions and review of any related market activity. The Funds’ Valuation Committee reports to the
| 1 | The voting members of the Valuation Committee consist of the President, Treasurer, Assistant Treasurers, Vice Presidents (except for the CCO, Secretary, and Assistant Secretaries) of the Trust, as well as such other members as the Trustees may from time to time designate. Thenon-voting members of the Valuation Committee consist of the CCO, Secretary, and Assistant Secretaries. The Valuation Committee reviews and determines the fair valuation of portfolio securities and the Funds’ pricing procedures in general. |
220
Notes to Financial Statements(Continued)
Trustees at its regularly scheduled meetings. It is possible that fair value prices will be used by the Funds to a significant extent. The value determined for an investment using the Funds’ fair value procedures may differ from recent market prices for the investment and may be significantly different from the value realized upon the sale of such investment.
The Funds may invest in securities that are traded principally in foreign markets and that trade on weekends and other days when the Funds do not price their shares. As a result, the values of the Funds’ portfolio securities may change on days when the prices of the Funds’ shares are not calculated. The prices of the Funds’ shares will reflect any such changes when the prices of the Funds’ shares are next calculated, which is the next business day. The Funds may use fair value pricing more frequently for securities primarily traded in foreign markets because, among other things, most foreign markets close well before the Funds value their securities. The earlier close of these foreign markets gives rise to the possibility that significant events, including broad market moves, may have occurred in the interim. The Funds’ investments may be priced based on fair values provided by a third-party vendor, based on certain factors and methodologies applied by such vendor, in the event that there is movement in the U.S. market, between the close of the foreign market and the time the Funds calculate their net asset values. All assets and liabilities expressed in foreign currencies are converted into U.S. dollars at the mean between the buying and selling rates of such currencies against the U.S. dollar at the end of each business day.
For investments in equity or debt issued by privately held companies or funds (“Private Company” or collectively, the “Private Companies”) and any other investments fair valued using significant unobservable inputs, as described below, the fair valuation approaches used by third party service providers and/or the Funds’ subadvisers utilize one or a combination of, but not limited to, the following inputs:
Market approach: (i) recent market transactions, including subsequent rounds of financing, in the underlying investment or comparable issuers; (ii) recapitalizations and other transactions across the capital structure; and (iii) market multiples of comparable issuers.
Income approach: (i) future cash flows discounted to present value and adjusted as appropriate for liquidity, credit, and/or market risks; (ii) quoted prices for similar investments or assets in active markets; and (iii) other risk factors, such as interest rates, yield curves, volatilities, prepayment speeds, loss severities, credit risks, recovery rates, liquidation amounts, and/or default rates.
Cost approach: (i) audited or unaudited financial statements, investor communications, and financial or operational metrics issued by the Private Company; (ii) changes in the valuation of relevant indices or publicly traded companies comparable to the Private Company; (iii) relevant news and other public sources; and (iv) known secondary market transactions in the Private Company’s interests and merger or acquisition activity in companies comparable to the Private Company.
Investments in series of preferred stock issued by Private Companies are typically valued utilizing Market approach in determining the enterprise value of the company. Such investments often contain rights and preferences that differ from other series of preferred and common stock of the same issuer. Valuation techniques such as the current value method (“CVM”), an option pricing model (“OPM”), a probability weighted expected return model (“PWERM”), or a hybrid of those techniques are used in allocating enterprise value of the company, as deemed appropriate under the circumstances. The CVM allocates value among the various parts of a company’s capital structure assuming that the value of convertible preferred stock is represented by the most favorable claim the preferred stockholders have on the enterprise value as of the valuation date. The use of OPM and PWERM techniques involve a determination of the exit scenarios of the investment in order to appropriately allocate the enterprise value of the company among the various parts of its capital structure.
The Private Companies are not subject to the public company disclosure, timing, and reporting standards as other investments held by a Fund. Typically, the most recently available information for a Private Company is as of a date that is earlier than the date a Fund is calculating its net asset value. This factor may result in a difference between the value of the investment and the price a Fund could receive upon the sale of the investment.
Fair value is defined as the price that would be received to sell an asset or paid to transfer a liability in an orderly transaction between market participants at the measurement date. A three-tier hierarchy is utilized to maximize the use of observable market data inputs and minimize the use of unobservable inputs and to establish classification of fair value measurements for disclosure purposes. Inputs refer broadly to the assumptions that market participants would use in pricing the asset or liability, including
221
Notes to Financial Statements(Continued)
assumptions about risk, for example, the risk inherent in a particular valuation technique used to measure fair value (such as a pricing model) and/or the risk inherent in the inputs to the valuation technique. Inputs may be observable or unobservable. Observable inputs are inputs that reflect the assumptions market participants would use in pricing the asset or liability and are developed based on market data obtained from sources independent of the reporting entity. Unobservable inputs are inputs that reflect the reporting entity’s own assumptions about the assumptions market participants would use in pricing the asset or liability and are developed based on the best information available in the circumstances. The three-tier hierarchy of inputs is summarized in the three broad Levels listed below. The inputs or methodology used for valuing investments are not necessarily an indication of the risk associated with investing in those investments and the determination of the significance of a particular input to the fair value measurement in its entirety requires judgment and consideration of factors specific to each security.
Level 1 – quoted prices (unadjusted) in active markets for identical investments that the Funds can access at the measurement date
Level 2 – other significant observable inputs (including quoted prices for similar investments, interest rates, prepayment speeds, credit risk, etc.)
Level 3 – significant unobservable inputs, to the extent observable inputs are not available (including the Funds’ own assumptions in determining the fair value of investments)
The availability of observable inputs can vary from security to security and is affected by a wide variety of factors, including, for example, the type of security, whether the security is new and not yet established in the marketplace, the liquidity of markets, and other characteristics particular to the security. To the extent that valuation is based on models or inputs that are less observable or unobservable in the market, the determination of fair value requires more judgment. Accordingly, the degree of judgment exercised in determining fair value is greatest for instruments categorized in Level 3.
Changes in valuation techniques may result in transfers in or out of an investment’s assigned Level within the hierarchy. In addition, in periods of market dislocation, the observability of prices and inputs may be reduced for many instruments. This condition, as well as changes related to liquidity of investments, could cause a security to be reclassified between Levels.
In certain cases, the inputs used to measure fair value may fall into different Levels of the fair value hierarchy. In such cases, for disclosure purposes, the Level in the fair value hierarchy within which the fair value measurement falls is determined based on the lowest Level input that is significant to the overall fair value measurement.
The U.S. Government Money Market Fund characterized all investments at Level 2, as of September 30, 2019. The Disciplined Value Fund, Disciplined Growth Fund, and Small Cap Opportunities Fund characterized all long-term investments at Level 1, and all short-term investments at Level 2, as of September 30, 2019. For each Fund noted in the preceding sentences, the level classification by major category of investments is the same as the category presentation in the Portfolio of Investments.
The following is the aggregate value by input level, as of September 30, 2019, for the remaining Funds’ investments:
| | | | | | | | | | | | | | | | |
| | | Level 1 | | | Level 2 | | | Level 3 | | | Total | |
| Short-Duration Bond Fund | | | | | | | | | | | | |
| Asset Investments | | | | | | | | | | | | |
Corporate Debt | | $ | - | | | $ | 207,200,466 | | | $ | - | | | $ | 207,200,466 | |
Municipal Obligations | | | - | | | | 906,904 | | | | - | | | | 906,904 | |
Non-U.S. Government Agency Obligations | | | - | | | | 282,494,323 | | | | - | | | | 282,494,323 | |
U.S. Government Agency Obligations and Instrumentalities | | | - | | | | 6,126,615 | | | | - | | | | 6,126,615 | |
U.S. Treasury Obligations | | | - | | | | 1,944,675 | | | | - | | | | 1,944,675 | |
Purchased Options | | | - | | | | 4,189,081 | | | | - | | | | 4,189,081 | |
Short-Term Investments | | | - | | | | 25,377,309 | | | | - | | | | 25,377,309 | |
| | | | | | | | | | | | | | | | |
| Total Investments | | $ | - | | | $ | 528,239,373 | | | $ | - | | | $ | 528,239,373 | |
| | | | | | | | | | | | | | | | |
222
Notes to Financial Statements(Continued)
| | | | | | | | | | | | | | | | |
| | | Level 1 | | | Level 2 | | | Level 3 | | | Total | |
| Short-Duration Bond Fund (Continued) | | | | | | | | | | | | |
| Asset Derivatives | | | | | | | | | | | | |
Futures Contracts | | $ | 1,350,748 | | | $ | - | | | $ | - | | | $ | 1,350,748 | |
| | | | | | | | | | | | | | | | |
| Liability Derivatives | | | | | | | | | | | | |
Futures Contracts | | $ | (647,969 | ) | | $ | - | | | $ | - | | | $ | (647,969 | ) |
| | | | | | | | | | | | | | | | |
| | | | |
| Inflation-Protected and Income Fund | | | | | | | | | | | | |
| Asset Investments | | | | | | | | | | | | |
Corporate Debt | | $ | - | | | $ | 1,020,341 | | | $ | - | | | $ | 1,020,341 | |
Non-U.S. Government Agency Obligations | | | - | | | | 95,667,401 | | | | - | | | | 95,667,401 | |
U.S. Government Agency Obligations and Instrumentalities | | | - | | | | 586,511 | | | | - | | | | 586,511 | |
U.S. Treasury Obligations | | | - | | | | 168,758,602 | | | | - | | | | 168,758,602 | |
Purchased Options | | | - | | | | 1,291,226 | | | | - | | | | 1,291,226 | |
Short-Term Investments | | | - | | | | 57,618,325 | | | | - | | | | 57,618,325 | |
| | | | | | | | | | | | | | | | |
| Total Investments | | $ | - | | | $ | 324,942,406 | | | $ | - | | | $ | 324,942,406 | |
| | | | | | | | | | | | | | | | |
| Asset Derivatives | | | | | | | | | | | | |
Futures Contracts | | $ | 73,459 | | | $ | - | | | $ | - | | | $ | 73,459 | |
Swap Agreements | | | - | | | | 564,715 | | | | - | | | | 564,715 | |
| | | | | | | | | | | | | | | | |
| Total | | $ | 73,459 | | | $ | 564,715 | | | $ | - | | | $ | 638,174 | |
| | | | | | | | | | | | | | | | |
| Liability Derivatives | | | | | | | | | | | | |
Futures Contracts | | $ | (170,084 | ) | | $ | - | | | $ | - | | | $ | (170,084 | ) |
Swap Agreements | | | - | | | | (354,712 | ) | | | - | | | | (354,712 | ) |
| | | | | | | | | | | | | | | | |
| Total | | $ | (170,084 | ) | | $ | (354,712 | ) | | $ | - | | | $ | (524,796 | ) |
| | | | | | | | | | | | | | | | |
| | | | |
| Core Bond Fund | | | | | | | | | | | | |
| Asset Investments | | | | | | | | | | | | |
Preferred Stock | | $ | 3,451,500 | | | $ | - | | | $ | - | | | $ | 3,451,500 | |
Corporate Debt | | | - | | | | 495,785,425 | | | | - | | | | 495,785,425 | |
Municipal Obligations | | | - | | | | 8,097,559 | | | | - | | | | 8,097,559 | |
Non-U.S. Government Agency Obligations | | | - | | | | 459,573,880 | | | | - | | | | 459,573,880 | |
Sovereign Debt Obligations | | | - | | | | 9,844,290 | | | | - | | | | 9,844,290 | |
U.S. Government Agency Obligations and Instrumentalities | | | - | | | | 370,542,343 | | | | - | | | | 370,542,343 | |
U.S. Treasury Obligations | | | - | | | | 74,143,615 | | | | - | | | | 74,143,615 | |
Purchased Options | | | - | | | | 7,777,030 | | | | - | | | | 7,777,030 | |
Mutual Funds | | | 4,658,310 | | | | - | | | | - | | | | 4,658,310 | |
Short-Term Investments | | | - | | | | 171,172,853 | | | | - | | | | 171,172,853 | |
| | | | | | | | | | | | | | | | |
| Total Investments | | $ | 8,109,810 | | | $ | 1,596,936,995 | | | $ | - | | | $ | 1,605,046,805 | |
| | | | | | | | | | | | | | | | |
| Asset Derivatives | | | | | | | | | | | | |
Futures Contracts | | $ | 233,595 | | | $ | - | | | $ | - | | | $ | 233,595 | |
| | | | | | | | | | | | | | | | |
| Liability Derivatives | | | | | | | | | | | | |
Futures Contracts | | $ | (2,956,071 | ) | | $ | - | | | $ | - | | | $ | (2,956,071 | ) |
| | | | | | | | | | | | | | | | |
| | | | |
| Diversified Bond Fund | | | | | | | | | | | | |
| Asset Investments | | | | | | | | | | | | |
Common Stock | | $ | 27,991 | | | $ | - | | | $ | 807 | ** | | $ | 28,798 | |
Preferred Stock | | | 265,500 | | | | - | | | | - | | | | 265,500 | |
Corporate Debt | | | - | | | | 101,159,769 | | | | - | | | | 101,159,769 | |
Municipal Obligations | | | - | | | | 708,736 | | | | - | | | | 708,736 | |
223
Notes to Financial Statements(Continued)
| | | | | | | | | | | | | | | | |
| | | Level 1 | | | Level 2 | | | Level 3 | | | Total | |
| | | | |
| Diversified Bond Fund (Continued) | | | | | | | | | | | | |
| Asset Investments (Continued) | | | | | | | | | | | | |
Non-U.S. Government Agency Obligations | | $ | - | | | $ | 74,023,960 | | | $ | - | | | $ | 74,023,960 | |
Sovereign Debt Obligations | | | - | | | | 1,677,184 | | | | - | | | | 1,677,184 | |
U.S. Government Agency Obligations and Instrumentalities | | | - | | | | 51,263,670 | | | | - | | | | 51,263,670 | |
U.S. Treasury Obligations | | | - | | | | 7,049,370 | | | | - | | | | 7,049,370 | |
Purchased Options | | | - | | | | 2,018,057 | | | | - | | | | 2,018,057 | |
Warrants | | | - | | | | - | | | | 3,812 | ** | | | 3,812 | |
Mutual Funds | | | 2,921,048 | | | | - | | | | - | | | | 2,921,048 | |
Short-Term Investments | | | - | | | | 27,416,416 | | | | - | | | | 27,416,416 | |
| | | | | | | | | | | | | | | | |
| Total Investments | | $ | 3,214,539 | | | $ | 265,317,162 | | | $ | 4,619 | | | $ | 268,536,320 | |
| | | | | | | | | | | | | | | | |
| Asset Derivatives | | | | | | | | | | | | |
Forward Contracts | | $ | - | | | $ | 77,422 | | | $ | - | | | $ | 77,422 | |
Futures Contracts | | | 50,078 | | | | - | | | | - | | | | 50,078 | |
| | | | | | | | | | | | | | | | |
| Total | | $ | 50,078 | | | $ | 77,422 | | | $ | - | | | $ | 127,500 | |
| | | | | | | | | | | | | | | | |
| Liability Derivatives | | | | | | | | | | | | |
Forward Contracts | | $ | - | | | $ | (146,154 | ) | | $ | - | | | $ | (146,154 | ) |
Futures Contracts | | | (498,239 | ) | | | - | | | | - | | | | (498,239 | ) |
| | | | | | | | | | | | | | | | |
| Total | | $ | (498,239 | ) | | $ | (146,154 | ) | | $ | - | | | $ | (644,393 | ) |
| | | | | | | | | | | | | | | | |
| | | | |
| High Yield Fund | | | | | | | | | | | | |
| Asset Investments | | | | | | | | | | | | |
Common Stock | | $ | 915,359 | | | $ | 1,376,793 | | | $ | 9,899 | ** | | $ | 2,302,051 | |
Preferred Stock | | | - | | | | 93,120 | | | | - | | | | 93,120 | |
Bank Loans | | | - | | | | 29,538,863 | | | | - | | | | 29,538,863 | |
Corporate Debt | | | - | | | | 523,335,795 | | | | - | | | | 523,335,795 | |
Warrants | | | - | | | | - | | | | 3,314 | ** | | | 3,314 | |
Mutual Funds | | | 21,256,820 | | | | - | | | | - | | | | 21,256,820 | |
Short-Term Investments | | | - | | | | 3,986,020 | | | | - | | | | 3,986,020 | |
| | | | | | | | | | | | | | | | |
| Total Investments | | $ | 22,172,179 | | | $ | 558,330,591 | | | $ | 13,213 | | | $ | 580,515,983 | |
| | | | | | | | | | | | | | | | |
| | | | |
| Balanced Fund | | | | | | | | | | | | |
| Asset Investments | | | | | | | | | | | | |
Common Stock | | $ | 61,459,767 | | | $ | - | | | $ | - | | | $ | 61,459,767 | |
Preferred Stock | | | 132,750 | | | | - | | | | - | | | | 132,750 | |
Corporate Debt | | | - | | | | 16,350,664 | | | | - | | | | 16,350,664 | |
Municipal Obligations | | | - | | | | 396,191 | | | | - | | | | 396,191 | |
Non-U.S. Government Agency Obligations | | | - | | | | 14,697,431 | | | | - | | | | 14,697,431 | |
Sovereign Debt Obligations | | | - | | | | 306,699 | | | | - | | | | 306,699 | |
U.S. Government Agency Obligations and Instrumentalities | | | - | | | | 12,422,706 | | | | - | | | | 12,422,706 | |
U.S. Treasury Obligations | | | - | | | | 1,612,401 | | | | - | | | | 1,612,401 | |
Purchased Options | | | - | | | | 197,841 | | | | - | | | | 197,841 | |
Mutual Funds | | | 11,629,837 | | | | - | | | | - | | | | 11,629,837 | |
Short-Term Investments | | | - | | | | 6,772,846 | | | | - | | | | 6,772,846 | |
| | | | | | | | | | | | | | | | |
| Total Investments | | $ | 73,222,354 | | | $ | 52,756,779 | | | $ | - | | | $ | 125,979,133 | |
| | | | | | | | | | | | | | | | |
| Asset Derivatives | | | | | | | | | | | | |
Futures Contracts | | $ | 7,203 | | | $ | - | | | $ | - | | | $ | 7,203 | |
| | | | | | | | | | | | | | | | |
224
Notes to Financial Statements(Continued)
| | | | | | | | | | | | | | | | |
| | | Level 1 | | | Level 2 | | | Level 3 | | | Total | |
| Balanced Fund (Continued) | | | | | | | | | | | | |
| Liability Derivatives | | | | | | | | | | | | |
Futures Contracts | | $ | (127,329 | ) | | $ | - | | | $ | - | | | $ | (127,329 | ) |
| | | | | | | | | | | | | | | | |
| | | | |
| Main Street Fund | | | | | | | | | | | | |
| Asset Investments | | | | | | | | | | | | |
Common Stock | | $ | 115,597,791 | | | $ | 1,926,297 | * | | $ | - | | | $ | 117,524,088 | |
| | | | | | | | | | | | | | | | |
| | | | |
| Global Fund | | | | | | | | | | | | |
| Asset Investments | | | | | | | | | | | | |
Common Stock* | | | | | | | | | | | | | | | | |
Cayman Islands | | $ | 6,736,581 | | | $ | - | | | $ | - | | | $ | 6,736,581 | |
France | | | - | | | | 20,441,580 | | | | - | | | | 20,441,580 | |
Germany | | | - | | | | 16,850,107 | | | | - | | | | 16,850,107 | |
India | | | 5,037,161 | | | | 5,596,553 | | | | - | | | | 10,633,714 | |
Italy | | | - | | | | 677,501 | | | | - | | | | 677,501 | |
Japan | | | - | | | | 40,347,793 | | | | - | | | | 40,347,793 | |
Netherlands | | | 1,149,351 | | | | 11,544,529 | | | | - | | | | 12,693,880 | |
Spain | | | - | | | | 4,837,593 | | | | - | | | | 4,837,593 | |
Sweden | | | - | | | | 6,705,471 | | | | - | | | | 6,705,471 | |
Switzerland | | | - | | | | 5,127,144 | | | | - | | | | 5,127,144 | |
United Kingdom | | | 1,359,641 | | | | 12,008,871 | | | | - | | | | 13,368,512 | |
United States | | | 149,796,717 | | | | - | | | | - | | | | 149,796,717 | |
Preferred Stock* | | | | | | | | | | | | | | | | |
Germany | | | - | | | | 1,720,463 | | | | - | | | | 1,720,463 | |
India | | | 42,452 | | | | - | | | | - | | | | 42,452 | |
Mutual Funds | | | 2,433,703 | | | | - | | | | - | | | | 2,433,703 | |
Short-Term Investments | | | - | | | | 2,958,022 | | | | - | | | | 2,958,022 | |
| | | | | | | | | | | | | | | | |
| Total Investments | | $ | 166,555,606 | | | $ | 128,815,627 | | | $ | - | | | $ | 295,371,233 | |
| | | | | | | | | | | | | | | | |
| | | | |
| International Equity Fund | | | | | | | | | | | | |
| Asset Investments | | | | | | | | | | | | |
Common Stock* | | | | | | | | | | | | | | | | |
Australia | | $ | - | | | $ | 4,982,344 | | | $ | - | | | $ | 4,982,344 | |
Belgium | | | - | | | | 1,389,561 | | | | - | | | | 1,389,561 | |
Canada | | | 17,219,984 | | | | - | | | | - | | | | 17,219,984 | |
Cayman Islands | | | 3,696,118 | | | | 2,313,886 | | | | - | | | | 6,010,004 | |
Denmark | | | 801,382 | | | | 5,884,431 | | | | - | | | | 6,685,813 | |
Finland | | | - | | | | 6,597,918 | | | | - | | | | 6,597,918 | |
France | | | - | | | | 43,059,899 | | | | - | | | | 43,059,899 | |
Germany | | | - | | | | 21,460,274 | | | | - | | | | 21,460,274 | |
India | | | 6,036,871 | | | | - | | | | - | | | | 6,036,871 | |
Ireland | | | 3,032,670 | | | | 4,244,123 | | | | - | | | | 7,276,793 | |
Japan | | | - | | | | 36,091,423 | | | | - | | | | 36,091,423 | |
Netherlands | | | - | | | | 25,957,458 | | | | - | | | | 25,957,458 | |
New Zealand | | | - | | | | 4,941,768 | | | | - | | | | 4,941,768 | |
Panama | | | 1,959,344 | | | | - | | | | - | | | | 1,959,344 | |
Spain | | | - | | | | 13,443,869 | | | | - | | | | 13,443,869 | |
Sweden | | | - | | | | 10,628,937 | | | | - | | | | 10,628,937 | |
Switzerland | | | - | | | | 33,881,417 | | | | - | | | | 33,881,417 | |
225
Notes to Financial Statements(Continued)
| | | | | | | | | | | | | | | | |
| | | Level 1 | | | Level 2 | | | Level 3 | | | Total | |
| | | | |
| International Equity Fund (Continued) | | | | | | | | | | | | |
| Asset Investments (Continued) | | | | | | | | | | | | |
Common Stock* (Continued) | | | | | | | | | | | | | | | | |
Taiwan | | $ | - | | | $ | 3,312,348 | | | $ | - | | | $ | 3,312,348 | |
Thailand | | | 2,983,639 | | | | - | | | | - | | | | 2,983,639 | |
United Kingdom | | | 2,445,522 | | | | 24,995,790 | | | | - | | | | 27,441,312 | |
United States | | | 7,680,230 | | | | - | | | | - | | | | 7,680,230 | |
Preferred Stock | | | | | | | | | | | | | | | | |
India | | | 48,400 | | | | - | | | | - | | | | 48,400 | |
Mutual Funds | | | 1,621,105 | | | | - | | | | - | | | | 1,621,105 | |
Short-Term Investments | | | - | | | | 2,181,720 | | | | - | | | | 2,181,720 | |
| | | | | | | | | | | | | | | | |
| Total Investments | | $ | 47,525,265 | | | $ | 245,367,166 | | | $ | - | | | $ | 292,892,431 | |
| | | | | | | | | | | | | | | | |
| | | | |
| Strategic Emerging Markets Fund | | | | | | | | | | | | |
| Asset Investments | | | | | | | | | | | | |
Common Stock* | | | | | | | | | | | | | | | | |
Bermuda | | $ | 2,968,185 | | | $ | 1,543,914 | | | $ | - | | | $ | 4,512,099 | |
Brazil | | | 5,917,908 | | | | - | | | | - | | | | 5,917,908 | |
Cayman Islands | | | 21,229,999 | | | | 9,602,063 | | | | - | | | | 30,832,062 | |
Chile | | | 1,593,970 | | | | - | | | | - | | | | 1,593,970 | |
China | | | - | | | | 7,955,967 | | | | - | | | | 7,955,967 | |
Colombia | | | 773,751 | | | | - | | | | - | | | | 773,751 | |
Egypt | | | - | | | | 840,999 | | | | - | | | | 840,999 | |
France | | | - | | | | 7,901,234 | | | | - | | | | 7,901,234 | |
Hong Kong | | | - | | | | 6,852,955 | | | | - | | | | 6,852,955 | |
India | | | - | | | | 14,941,074 | | | | - | | | | 14,941,074 | |
Indonesia | | | - | | | | 1,554,562 | | | | - | | | | 1,554,562 | |
Italy | | | - | | | | 2,127,514 | | | | - | | | | 2,127,514 | |
Mexico | | | 10,269,738 | | | | - | | | | - | | | | 10,269,738 | |
Netherlands | | | 1,541,770 | | | | 29,321 | | | | - | | | | 1,571,091 | |
Philippines | | | - | | | | 3,758,414 | | | | - | | | | 3,758,414 | |
Republic of Korea | | | - | | | | 4,270,073 | | | | - | | | | 4,270,073 | |
Russia | | | 243,563 | | | | 11,206,397 | | | | - | | | | 11,449,960 | |
South Africa | | | - | | | | 3,848,939 | | | | - | | | | 3,848,939 | |
Spain | | | 626,083 | | | | - | | | | - | | | | 626,083 | |
Taiwan | | | - | | | | 6,774,456 | | | | - | | | | 6,774,456 | |
Thailand | | | 639,673 | | | | - | | | | - | | | | 639,673 | |
Turkey | | | - | | | | 2,315,028 | | | | - | | | | 2,315,028 | |
United Arab Emirates | | | - | | | | 607,201 | | | | - | | | | 607,201 | |
United Kingdom | | | - | | | | 3,930,576 | | | | - | | | | 3,930,576 | |
United States | | | 4,501,306 | | | | - | | | | - | | | | 4,501,306 | |
Preferred Stock | | | | | | | | | | | | | | | | |
Brazil | | | 1,998,522 | | | | - | | | | - | | | | 1,998,522 | |
India | | | 55,035 | | | | - | | | | - | | | | 55,035 | |
Singapore | | | - | | | | - | | | | 2,438,401 | | | | 2,438,401 | |
Mutual Funds | | | 3,245,885 | | | | - | | | | - | | | | 3,245,885 | |
Short-Term Investments | | | - | | | | 5,989,895 | | | | - | | | | 5,989,895 | |
| | | | | | | | | | | | | | | | |
| Total Investments | | $ | 55,605,388 | | | $ | 96,050,582 | | | $ | 2,438,401 | | | $ | 154,094,371 | |
| | | | | | | | | | | | | | | | |
226
Notes to Financial Statements(Continued)
| * | Includes foreign equity securities whose values were adjusted to reflect market trading of comparable securities or other correlated instruments after the close of trading in their applicable foreign markets, as applicable. |
| ** | None of the unobservable inputs for Level 3 assets, individually or collectively, had a material impact on the Fund(s). Level 3 investments at the end of the period in relation to net assets were not significant and accordingly, a reconciliation of Level 3 assets for the year ended September 30, 2019 is not presented. |
The following tables show Fund(s) with certain assets and liabilities, which approximate fair value and would be categorized at Level 2 as of September 30, 2019.
| | | | | | | | | | | | |
| | | | | | | |
Statements of Assets and Liabilities location: | | Short-
Duration
Bond
Fund | | Inflation-
Protected
and Income
Fund | | Core
Bond
Fund | | Diversified
Bond
Fund | | High
Yield
Fund | | Balanced
Fund |
| | | | | | | |
Receivables from: | | | | | | | | | | | | |
Collateral pledged for open swap agreements | | | | X | | | | | | | | |
| | | | | | | |
Payables for: | | | | | | | | | | | | |
Investments purchased on a when-issued basis | | | | | | X | | X | | X | | X |
Collateral held for open purchased options | | X | | X | | X | | X | | | | X |
Collateral held for when-issued securities | | | | | | X | | | | | | |
Due to custodian | | | | X | | | | | | | | |
Securities on loan | | | | | | X | | X | | X | | X |
| | | | | | | | | | | | |
| | | | | | | |
Statements of Assets and Liabilities location: | | Disciplined
Value
Fund | | Disciplined
Growth
Fund | | Small Cap
Opportunities
Fund | | Global
Fund | | International
Equity Fund | | Strategic
Emerging
Markets
Fund |
| | | | | | | |
Receivables from: | | | | | | | | | | | | |
Collateral pledged for closed futures contracts | | X | | | | | | | | | | |
| | | | | | | |
Payables for: | | | | | | | | | | | | |
Due to custodian | | X | | | | | | | | | | |
Securities on loan | | X | | X | | X | | X | | X | | X |
The Funds, with the exception of the Short-Duration Bond Fund, Inflation-Protected and Income Fund, Core Bond Fund, Diversified Bond Fund, and Balanced Fund, had no Level 3 transfers during the year ended September 30, 2019. The Inflation-Protected and Income Fund and Balanced Fund had Level 3 transfers during the year ended September 30, 2019; however, none of the transfers individually or collectively had a material impact on the Inflation-Protected and Income Fund or the Balanced Fund.
The following table shows Level 3 transfers:
| | | | | | | | | | | | | | | | |
| | | Transfers In * | | | Transfers Out * | |
| | | Level 2-
Other
Significant
Observable
Inputs | | | Level 3-
Significant
Unobservable
Inputs | | | Level 2-
Other
Significant
Observable
Inputs | | | Level 3-
Significant
Unobservable
Inputs | |
| Short-Duration Bond Fund | | $ | 7,417,534 | | | $ | - | | | $ | - | | | $ | (7,417,534 | ) |
| Core Bond Fund | | | 14,736,805 | | | | - | | | | - | | | | (14,736,805 | ) |
| Diversified Bond Fund | | | 2,600,992 | | | | - | | | | - | | | | (2,600,992 | ) |
| * | Transfers occurred as inputs were more observable. |
227
Notes to Financial Statements(Continued)
Following is a reconciliation of investments for which significant unobservable inputs (Level 3) were used in determining value:
Asset Valuation Inputs
| | | | | | | | | | | | | | | | | | | | | | | | | | | | | | | | | | | | | | | | |
| | | Investments in Securities | |
| | | Balance
as of
9/30/18 | | | Accrued
Discounts
(Premiums) | | | Realized
Gain
(Loss) | | | Change in
Unrealized
Appreciation
(Depreciation) | | | Purchases | | | (Sales) | | | Transfers
into
Level 3 | | | Transfers
(out) of
Level 3 | | | Balance
as of
9/30/19 | | | Net Change in
Unrealized
Appreciation
(Depreciation)
from
Investments
Still held
as of
9/30/19 | |
| Strategic Emerging Markets Fund | | | | | | | | | | | | | | | | | | | | | | | | | | | | |
Preferred Stock | | $ | - | | | $ | - | | | $ | - | | | $ | - | | | $ | 2,438,401 | | | $ | - | | | $ | - | | | $ | - | | | $ | 2,438,401 | | | $ | - | |
| | | | | | | | | | | | | | | | | | | | | | | | | | | | | | | | | | | | | | | | |
The Strategic Emerging Markets Fund fair values certain of its Level 3 investments using acquisition cost, although the transaction may not have occurred during the current reporting period. These investments are generally privately held investments, but may include defaulted securities and new debt issuances. There may not be a secondary market for such investments, and/or there are a limited number of investors. The determination to fair value such investments at cost is based upon factors consistent with the principles of fair value measurement that are reasonably available to the Valuation Committee. Valuations are reviewed by members of the Valuation Committee utilizing available market information to determine if the carrying value of these investments should be adjusted. Such market data may include, but is not limited to, observations of the trading multiples of public companies considered comparable to the private companies being valued, financial or operational information released by the company, and/or news or corporate events that affect the investment, also referred to as enterprise value (EV) to earnings before interest, taxes, depreciation, and amortization (EBITDA) ratios. Valuations may be adjusted to account for company-specific issues, the lack of liquidity inherent in a nonpublic investment and the fact that comparable public companies are not identical to the investments being fair valued by the Strategic Emerging Markets Fund. All market variables are assessed on a regular frequency and calibrated as necessary.
| | | | | | | | | | | | |
| Strategic Emerging Markets Fund | | Fair Value
Amount | | | Valuation
Technique | | Unobservable Input Description | | Value/
Weighted
Average
Range | |
| Preferred Stock — $2,438,401 | | | | | | | | | | |
Grab Holdings, Inc. | | $ | 2,438,401 | | | Market Approach | | Market Transaction | | $ | 6.16 | |
| | | | | | | | | | | | |
| Total | | $ | 2,438,401 | | | | | | | | | |
| | | | | | | | | | | | |
Derivative Instruments
Derivatives are financial instruments whose values are based on the values of one or more indicators, such as a security, asset, currency, interest rate, or index. Derivative transactions can create investment leverage and may be highly volatile. Losses from derivatives can be substantially greater than the derivatives’ original cost and can sometimes be unlimited. A Fund may not be able to close out a derivative transaction at a favorable time or price.
228
Notes to Financial Statements(Continued)
At September 30, 2019, and during the year then ended, the Fund(s) had the following derivatives and transactions in derivatives, grouped into the indicated risk categories:
| | | | | | | | | | | | | | | | | | | | |
| | | Credit
Risk | | | Equity
Risk | | | Foreign
Exchange
Risk | | | Interest
Rate
Risk | | | Total | |
| Short-Duration Bond Fund | | | | | | | | | | | | | | | |
| Asset Derivatives | | | | | | | | | | | | | | | |
Purchased Options* | | $ | - | | | $ | - | | | $ | - | | | $ | 4,189,081 | | | $ | 4,189,081 | |
Futures Contracts^^ | | | - | | | | - | | | | - | | | | 1,350,748 | | | | 1,350,748 | |
| | | | | | | | | | | | | | | | | | | | |
Total Value | | $ | - | | | $ | - | | | $ | - | | | $ | 5,539,829 | | | $ | 5,539,829 | |
| | | | | | | | | | | | | | | | | | | | |
| Liability Derivatives | | | | | | | | | | | | | | | |
Futures Contracts^^ | | $ | - | | | $ | - | | | $ | - | | | $ | (647,969 | ) | | $ | (647,969 | ) |
| | | | | | | | | | | | | | | | | | | | |
| Realized Gain (Loss)# | | | | | | | | | | | | | | | |
Purchased Options | | $ | - | | | $ | - | | | $ | - | | | $ | 640,233 | | | $ | 640,233 | |
Futures Contracts | | | - | | | | - | | | | - | | | | (7,582,266 | ) | | | (7,582,266 | ) |
Swap Agreements | | | (91,924 | ) | | | - | | | | - | | | | 58,563 | | | | (33,361 | ) |
| | | | | | | | | | | | | | | | | | | | |
Total Realized Gain (Loss) | | $ | (91,924 | ) | | $ | - | | | $ | - | | | $ | (6,883,470 | ) | | $ | (6,975,394 | ) |
| | | | | | | | | | | | | | | | | | | | |
| Change in Appreciation (Depreciation)## | | | | | | | | | | | | | | | |
Purchased Options | | $ | - | | | $ | - | | | $ | - | | | $ | (159,497 | ) | | $ | (159,497 | ) |
Futures Contracts | | | - | | | | - | | | | - | | | | 116,415 | | | | 116,415 | |
Swap Agreements | | | 228,036 | | | | - | | | | - | | | | - | | | | 228,036 | |
| | | | | | | | | | | | | | | | | | | | |
Total Change in Appreciation (Depreciation) | | $ | 228,036 | | | $ | - | | | $ | - | | | $ | (43,082 | ) | | $ | 184,954 | |
| | | | | | | | | | | | | | | | | | | | |
| | | | | |
| Inflation-Protected and Income Fund | | | | | | | | | | | | | | | |
| Asset Derivatives | | | | | | | | | | | | | | | |
Purchased Options* | | $ | - | | | $ | - | | | $ | - | | | $ | 1,291,226 | | | $ | 1,291,226 | |
Futures Contracts^^ | | | - | | | | - | | | | - | | | | 73,459 | | | | 73,459 | |
Swap Agreements* | | | - | | | | 485,665 | | | | - | | | | - | | | | 485,665 | |
Swap Agreements^^, ^^^ | | | - | | | | - | | | | - | | | | 79,050 | | | | 79,050 | |
| | | | | | | | | | | | | | | | | | | | |
Total Value | | $ | - | | | $ | 485,665 | | | $ | - | | | $ | 1,443,735 | | | $ | 1,929,400 | |
| | | | | | | | | | | | | | | | | | | | |
| Liability Derivatives | | | | | | | | | | | | | | | |
Futures Contracts^^ | | $ | - | | | $ | - | | | $ | - | | | $ | (170,084 | ) | | $ | (170,084 | ) |
Swap Agreements^ | | | - | | | | (150,930 | ) | | | - | | | | (203,782 | ) | | | (354,712 | ) |
| | | | | | | | | | | | | | | | | | | | |
Total Value | | $ | - | | | $ | (150,930 | ) | | $ | - | | | $ | (373,866 | ) | | $ | (524,796 | ) |
| | | | | | | | | | | | | | | | | | | | |
| Realized Gain (Loss)# | | | | | | | | | | | | | | | |
Purchased Options | | $ | - | | | $ | - | | | $ | - | | | $ | 187,647 | | | $ | 187,647 | |
Futures Contracts | | | - | | | | - | | | | - | | | | 534,020 | | | | 534,020 | |
Swap Agreements | | | (25,906 | ) | | | (4,495 | ) | | | - | | | | (744,874 | ) | | | (775,275 | ) |
| | | | | | | | | | | | | | | | | | | | |
Total Realized Gain (Loss) | | $ | (25,906 | ) | | $ | (4,495 | ) | | $ | - | | | $ | (23,207 | ) | | $ | (53,608 | ) |
| | | | | | | | | | | | | | | | | | | | |
| Change in Appreciation (Depreciation)## | | | | | | | | | | | | | | | |
Purchased Options | | $ | - | | | $ | - | | | $ | - | | | $ | (58,128 | ) | | $ | (58,128 | ) |
Futures Contracts | | | - | | | | - | | | | - | | | | (140,861 | ) | | | (140,861 | ) |
Swap Agreements | | | 94,668 | | | | 334,422 | | | | - | | | | (312,882 | ) | | | 116,208 | |
| | | | | | | | | | | | | | | | | | | | |
Total Change in Appreciation (Depreciation) | | $ | 94,668 | | | $ | 334,422 | | | $ | - | | | $ | (511,871 | ) | | $ | (82,781 | ) |
| | | | | | | | | | | | | | | | | | | | |
229
Notes to Financial Statements(Continued)
| | | | | | | | | | | | | | | | | | | | |
| | | Credit
Risk | | | Equity
Risk | | | Foreign
Exchange
Risk | | | Interest
Rate
Risk | | | Total | |
| Core Bond Fund | | | | | | | | | | | | | | | |
| Asset Derivatives | | | | | | | | | | | | | | | |
Purchased Options* | | $ | - | | | $ | - | | | $ | - | | | $ | 7,777,030 | | | $ | 7,777,030 | |
Futures Contracts^^ | | | - | | | | - | | | | - | | | | 233,595 | | | | 233,595 | |
| | | | | | | | | | | | | | | | | | | | |
Total Value | | $ | - | | | $ | - | | | $ | - | | | $ | 8,010,625 | | | $ | 8,010,625 | |
| | | | | | | | | | | | | | | | | | | | |
| Liability Derivatives | | | | | | | | | | | | | | | |
Futures Contracts^^ | | $ | - | | | $ | - | | | $ | - | | | $ | (2,956,071 | ) | | $ | (2,956,071 | ) |
| | | | | | | | | | | | | | | | | | | | |
| Realized Gain (Loss)# | | | | | | | | | | | | | | | |
Purchased Options | | $ | - | | | $ | - | | | $ | - | | | $ | 1,184,428 | | | $ | 1,184,428 | |
Futures Contracts | | | - | | | | - | | | | - | | | | 18,343,788 | | | | 18,343,788 | |
Swap Agreements | | | (176,844 | ) | | | - | | | | - | | | | 109,539 | | | | (67,305 | ) |
| | | | | | | | | | | | | | | | | | | | |
Total Realized Gain (Loss) | | $ | (176,844 | ) | | $ | - | | | $ | - | | | $ | 19,637,755 | | | $ | 19,460,911 | |
| | | | | | | | | | | | | | | | | | | | |
| Change in Appreciation (Depreciation)## | | | | | | | | | | | | | | | |
Purchased Options | | $ | - | | | $ | - | | | $ | - | | | $ | (299,925 | ) | | $ | (299,925 | ) |
Futures Contracts | | | - | | | | - | | | | - | | | | (278,544 | ) | | | (278,544 | ) |
Swap Agreements | | | 475,660 | | | | - | | | | - | | | | - | | | | 475,660 | |
| | | | | | | | | | | | | | | | | | | | |
Total Change in Appreciation (Depreciation) | | $ | 475,660 | | | $ | - | | | $ | - | | | $ | (578,469 | ) | | $ | (102,809 | ) |
| | | | | | | | | | | | | | | | | | | | |
| | | | | |
| Diversified Bond Fund | | | | | | | | | | | | | | | |
| Asset Derivatives | | | | | | | | | | | | | | | |
Purchased Options* | | $ | - | | | $ | - | | | $ | - | | | $ | 2,018,057 | | | $ | 2,018,057 | |
Forward Contracts* | | | - | | | | - | | | | 77,422 | | | | - | | | | 77,422 | |
Futures Contracts^^ | | | - | | | | - | | | | - | | | | 50,078 | | | | 50,078 | |
| | | | | | | | | | | | | | | | | | | | |
Total Value | | $ | - | | | $ | - | | | $ | 77,422 | | | $ | 2,068,135 | | | $ | 2,145,557 | |
| | | | | | | | | | | | | | | | | | | | |
| Liability Derivatives | | | | | | | | | | | | | | | |
Forward Contracts^ | | $ | - | | | $ | - | | | $ | (146,154 | ) | | $ | - | | | $ | (146,154 | ) |
Futures Contracts^^ | | | - | | | | - | | | | - | | | | (498,239 | ) | | | (498,239 | ) |
| | | | | | | | | | | | | | | | | | | | |
Total Value | | $ | - | | | $ | - | | | $ | (146,154 | ) | | $ | (498,239 | ) | | $ | (644,393 | ) |
| | | | | | | | | | | | | | | | | | | | |
| Realized Gain (Loss)# | | | | | | | | | | | | | | | |
Purchased Options | | $ | - | | | $ | - | | | $ | (123 | ) | | $ | 308,091 | | | $ | 307,968 | |
Forward Contracts | | | - | | | | - | | | | (33,655 | ) | | | - | | | | (33,655 | ) |
Futures Contracts | | | - | | | | - | | | | - | | | | 2,806,937 | | | | 2,806,937 | |
Swap Agreements | | | (48,329 | ) | | | - | | | | - | | | | 49,022 | | | | 693 | |
| | | | | | | | | | | | | | | | | | | | |
Total Realized Gain (Loss) | | $ | (48,329 | ) | | $ | - | | | $ | (33,778 | ) | | $ | 3,164,050 | | | $ | 3,081,943 | |
| | | | | | | | | | | | | | | | | | | | |
| Change in Appreciation (Depreciation)## | | | | | | | | | | | | | | | |
Purchased Options | | $ | - | | | $ | - | | | $ | - | | | $ | (77,395 | ) | | $ | (77,395 | ) |
Forward Contracts | | | - | | | | - | | | | (4,899 | ) | | | - | | | | (4,899 | ) |
Futures Contracts | | | - | | | | - | | | | - | | | | 9,541 | | | | 9,541 | |
Swap Agreements | | | 70,546 | | | | - | | | | - | | | | - | | | | 70,546 | |
| | | | | | | | | | | | | | | | | | | | |
Total Change in Appreciation (Depreciation) | | $ | 70,546 | | | $ | - | | | $ | (4,899 | ) | | $ | (67,854 | ) | | $ | (2,207 | ) |
| | | | | | | | | | | | | | | | | | | | |
230
Notes to Financial Statements(Continued)
| | | | | | | | | | | | | | | | | | | | |
| | | Credit
Risk | | | Equity
Risk | | | Foreign
Exchange
Risk | | | Interest
Rate
Risk | | | Total | |
| Balanced Fund | | | | | | | | | | | | | | | |
| Asset Derivatives | | | | | | | | | | | | | | | |
Purchased Options* | | $ | - | | | $ | - | | | $ | - | | | $ | 197,841 | | | $ | 197,841 | |
Futures Contracts^^ | | | - | | | | - | | | | - | | | | 7,203 | | | | 7,203 | |
| | | | | | | | | | | | | | | | | | | | |
Total Value | | $ | - | | | $ | - | | | $ | - | | | $ | 205,044 | | | $ | 205,044 | |
| | | | | | | | | | | | | | | | | | | | |
| Liability Derivatives | | | | | | | | | | | | | | | |
Futures Contracts^^ | | $ | - | | | $ | (55,202 | ) | | $ | - | | | $ | (72,127 | ) | | $ | (127,329 | ) |
| | | | | | | | | | | | | | | | | | | | |
| Realized Gain (Loss)# | | | | | | | | | | | | | | | |
Purchased Options | | $ | - | | | $ | - | | | $ | - | | | $ | 30,115 | | | $ | 30,115 | |
Futures Contracts | | | - | | | | (106,742 | ) | | | - | | | | 557,239 | | | | 450,497 | |
Swap Agreements | | | (10,142 | ) | | | - | | | | - | | | | 1,506 | | | | (8,636 | ) |
| | | | | | | | | | | | | | | | | | | | |
Total Realized Gain (Loss) | | $ | (10,142 | ) | | $ | (106,742 | ) | | $ | - | | | $ | 588,860 | | | $ | 471,976 | |
| | | | | | | | | | | | | | | | | | | | |
| Change in Appreciation (Depreciation)## | | | | | | | | | | | | | | | |
Purchased Options | | $ | - | | | $ | - | | | $ | - | | | $ | (7,899 | ) | | $ | (7,899 | ) |
Futures Contracts | | | - | | | | (79,572 | ) | | | - | | | | 11,297 | | | | (68,275 | ) |
Swap Agreements | | | 17,353 | | | | - | | | | - | | | | - | | | | 17,353 | |
| | | | | | | | | | | | | | | | | | | | |
Total Change in Appreciation (Depreciation) | | $ | 17,353 | | | $ | (79,572 | ) | | $ | - | | | $ | 3,398 | | | $ | (58,821 | ) |
| | | | | | | | | | | | | | | | | | | | |
| | | | | |
| Disciplined Value Fund | | | | | | | | | | | | | | | |
| Realized Gain (Loss)# | | | | | | | | | | | | | | | |
Futures Contracts | | $ | - | | | $ | 107,452 | | | $ | - | | | $ | - | | | $ | 107,452 | |
| | | | | | | | | | | | | | | | | | | | |
| | | | | |
| Disciplined Growth Fund | | | | | | | | | | | | | | | |
| Realized Gain (Loss)# | | | | | | | | | | | | | | | |
Futures Contracts | | $ | - | | | $ | 230,909 | | | $ | - | | | $ | - | | | $ | 230,909 | |
| | | | | | | | | | | | | | | | | | | | |
| * | Statements of Assets and Liabilities location: Investments, at value, or Receivables from: open forward contracts or open swap agreements, at value, as applicable. |
| ^ | Statements of Assets and Liabilities location: Payables for: open forward contracts or open swap agreements, at value, as applicable. |
| ^^ | Cumulative appreciation (depreciation) on futures contracts and centrally cleared swaps is reported in “Futures Contracts” and “Swap Agreements” in each applicable Fund’s Portfolio of Investments. Only current day’s variation margin, if any, is reported within the Statements of Assets and Liabilities. |
| ^^^ | Represents centrally cleared swaps which are not subject to a master netting agreement. |
| # | Statements of Operations location: Amounts are included in net realized gain (loss) on: investment transactions, forward contracts, futures contracts, or swap agreements, as applicable. |
| ## | Statements of Operations location: Amounts are included in net change in unrealized appreciation (depreciation) on: investment transactions, forward contracts, futures contracts, or swap agreements, as applicable. |
For the year ended September 30, 2019, the number of contracts, notional amounts, or shares/units for each derivative type was as follows:
| | | | | | | | | | | | | | | | | | | | |
| | | Number of Contracts, Notional Amounts, or Shares/Units† | |
Fund Name | | Futures
Contracts | | | Forward
Contracts | | | Swap
Agreements | | | Purchased
Options | | | Purchased
Swaptions | |
Short-Duration Bond Fund | | | 2,531 | | | $ | - | | | $ | 4,093,000 | | | | - | | | $ | 101,852,500 | |
Inflation-Protected and Income Fund | | | 529 | | | | - | | | | 86,038,694 | | | | - | | | | 31,778,333 | |
Core Bond Fund | | | 2,068 | | | | - | | | | 8,532,000 | | | | - | | | | 189,060,000 | |
231
Notes to Financial Statements(Continued)
| | | | | | | | | | | | | | | | | | | | |
| | | Number of Contracts, Notional Amounts, or Shares/Units† | |
Fund Name | | Futures
Contracts | | | Forward
Contracts | | | Swap
Agreements | | | Purchased
Options | | | Purchased
Swaptions | |
Diversified Bond Fund | | | 328 | | | $ | 6,704,277 | | | $ | 1,538,000 | | | | 525,333 | | | $ | 49,067,500 | |
Balanced Fund | | | 88 | | | | - | | | | 194,000 | | | | - | | | | 4,812,500 | |
Disciplined Value Fund | | | 91 | | | | - | | | | - | | | | - | | | | - | |
Disciplined Growth Fund | | | 198 | | | | - | | | | - | | | | - | | | | - | |
| † | Amount(s) disclosed represent average number of contracts for futures contracts, notional amounts for forward contracts, swap agreements, and purchased swaptions, or shares/units outstanding for purchased options based on absolute values, which is indicative of volume of this derivative type, for the months that the Fund held such derivatives during the year ended September 30, 2019. |
The Portfolio of Investments included in a Fund’s financial statements shows the assets or liabilities of a Fund associated with individual derivatives transactions. The terms of many of those transactions contemplate that derivatives receivables and payables between the same two parties may be netted and that the parties will collateralize certain obligations. The following tables provide an illustration of the possible effect of netting provisions and of collateral (delivered or received) on a Fund’s derivatives exposure as of September 30, 2019. Netting arrangements vary among different counterparties, and the actual disposition of derivatives receivables and payables, and of collateral, in a bankruptcy or insolvency can be complicated and difficult to predict.
The following table presents derivative assets by counterparty net of amounts available for offset under a master netting agreement (“MNA”), or similar agreement, and net of the related collateral received by the Fund(s) as of September 30, 2019.
| | | | | | | | | | | | | | | | |
Counterparty | | Derivative Assets
Subject to an
MNA by
Counterparty† | | | Financial
Instruments
Available for Offset | | | Collateral
Received*** | | | Net Amount* | |
| Short-Duration Bond Fund | | | | | | | | | | | | |
Barclays Bank PLC | | $ | 2,007,493 | | | $ | - | | | $ | (1,889,000 | ) | | $ | 118,493 | |
Credit Suisse International | | | 2,181,588 | | | | - | | | | (2,100,000 | ) | | | 81,588 | |
| | | | | | | | | | | | | | | | |
| | $ | 4,189,081 | | | $ | - | | | $ | (3,989,000 | ) | | $ | 200,081 | |
| | | | | | | | | | | | | | | | |
| Inflation-Protected and Income Fund | | | | | | | | | | |
Barclays Bank PLC | | $ | 932,805 | | | $ | - | | | $ | (932,805 | ) | | $ | - | |
BNP Paribas SA | | | 299,719 | | | | (118,481 | ) | | | (140,000 | ) | | | 41,238 | |
Credit Suisse International | | | 451,394 | | | | - | | | | (451,394 | ) | | | - | |
Goldman Sachs International | | | 92,973 | | | | - | | | | - | | | | 92,973 | |
| | | | | | | | | | | | | | | | |
| | $ | 1,776,891 | | | $ | (118,481 | ) | | $ | (1,524,199 | ) | | $ | 134,211 | |
| | | | | | | | | | | | | | | | |
| Core Bond Fund | | | | | | | | | | | | |
Barclays Bank PLC | | $ | 3,822,103 | | | $ | - | | | $ | (3,659,000 | ) | | $ | 163,103 | |
Credit Suisse International | | | 3,954,927 | | | | - | | | | (3,750,000 | ) | | | 204,927 | |
| | | | | | | | | | | | | | | | |
| | $ | 7,777,030 | | | $ | - | | | $ | (7,409,000 | ) | | $ | 368,030 | |
| | | | | | | | | | | | | | | | |
| Diversified Bond Fund | | | | | | | | | | | | |
Bank of America N.A. | | $ | 15,353 | | | $ | (15,353 | ) | | $ | - | | | $ | - | |
Barclays Bank PLC | | | 986,494 | | | | (37,659 | ) | | | (900,000 | ) | | | 48,835 | |
BNP Paribas SA | | | 6,562 | | | | (6,562 | ) | | | - | | | | - | |
Citibank N.A. | | | 26,870 | | | | (26,870 | ) | | | - | | | | - | |
Credit Suisse International | | | 1,045,300 | | | | - | | | | (1,045,300 | ) | | | - | |
Goldman Sachs International | | | 1,685 | | | | (1,000 | ) | | | - | | | | 685 | |
JP Morgan Chase Bank N.A. | | | 13,215 | | | | (12,051 | ) | | | - | | | | 1,164 | |
| | | | | | | | | | | | | | | | |
| | $ | 2,095,479 | | | $ | (99,495 | ) | | $ | (1,945,300 | ) | | $ | 50,684 | |
| | | | | | | | | | | | | | | | |
232
Notes to Financial Statements(Continued)
| | | | | | | | | | | | | | | | |
Counterparty | | Derivative Assets
Subject to an
MNA by
Counterparty† | | | Financial
Instruments
Available for Offset | | | Collateral
Received*** | | | Net Amount* | |
| Balanced Fund | | | | | | | | | | | | |
Barclays Bank PLC | | $ | 95,613 | | | $ | - | | | $ | (95,613 | ) | | $ | - | |
Credit Suisse International | | | 102,228 | | | | - | | | | (102,228 | ) | | | - | |
| | | | | | | | | | | | | | | | |
| | $ | 197,841 | | | $ | - | | | $ | (197,841 | ) | | $ | - | |
| | | | | | | | | | | | | | | | |
The following table presents derivative liabilities by counterparty net of amounts available for offset under an MNA, or similar agreement, and net of the related collateral pledged by the Fund(s) as of September 30, 2019.
| | | | | | | | | | | | | | | | |
Counterparty | | Derivative Liabilities
Subject to an
MNA by
Counterparty† | | | Financial
Instruments
Available for Offset | | | Collateral
Pledged*** | | | Net Amount** | |
| Inflation-Protected and Income Fund | | | | | | | | | | |
Bank of America N.A. | | $ | (131,533 | ) | | $ | - | | | $ | 131,533 | | | $ | - | |
BNP Paribas SA | | | (118,481 | ) | | | 118,481 | | | | - | | | | - | |
Morgan Stanley & Co. LLC | | | (104,698 | ) | | | - | | | | - | | | | (104,698 | ) |
| | | | | | | | | | | | | | | | |
| | $ | (354,712 | ) | | $ | 118,481 | | | $ | 131,533 | | | $ | (104,698 | ) |
| | | | | | | | | | | | | | | | |
| Diversified Bond Fund | | | | | | | | �� | | | | |
Bank of America N.A. | | $ | (25,851 | ) | | $ | 15,353 | | | $ | - | | | $ | (10,498 | ) |
Barclays Bank PLC | | | (37,659 | ) | | | 37,659 | | | | - | | | | - | |
BNP Paribas SA | | | (28,830 | ) | | | 6,562 | | | | - | | | | (22,268 | ) |
Citibank N.A. | | | (40,763 | ) | | | 26,870 | | | | - | | | | (13,893 | ) |
Goldman Sachs International | | | (1,000 | ) | | | 1,000 | | | | - | | | | - | |
JP Morgan Chase Bank N.A. | | | (12,051 | ) | | | 12,051 | | | | - | | | | - | |
| | | | | | | | | | | | | | | | |
| | $ | (146,154 | ) | | $ | 99,495 | | | $ | - | | | $ | (46,659 | ) |
| | | | | | | | | | | | | | | | |
| * | Represents the net amount receivable from the counterparty in the event of default. |
| ** | Represents the net amount payable to the counterparty in the event of default. |
| *** | The amount presented here may be less than the total amount of collateral received/pledged as the net amount of derivative assets and liabilities for a counterparty cannot be less than $0. |
| † | The amount presented here may be less than the total amount shown in the Statements of Assets and Liabilities as some derivatives held by the counterparty are not covered within the master netting agreements. |
Such agreements typically permit a single net payment in the event of default, including the bankruptcy or insolvency of the counterparty. Typically, the Fund(s) and counterparties are not permitted to sell,re-pledge, or use the collateral they receive.
Further details regarding the derivatives and other investments held by the Fund(s) during the year ended September 30, 2019, are discussed below.
Foreign Currency Exchange Transactions
A Fund may engage in foreign currency exchange transactions for hedging purposes in order to protect against uncertainty in the level of future foreign currency exchange rates, or for other,non-hedging purposes.
A Fund may enter into foreign currency exchange transactions, including foreign currency forward contracts. These contracts call for the Fund to deliver in the future an amount of one currency in return for an amount of another currency, at an exchange rate determined at the time the contract is entered into. Forward contracts are private contractual arrangements and a Fund is subject to
233
Notes to Financial Statements(Continued)
the risk that its counterparty will not, or will not be able to, perform its obligations. This type of arrangement may require the Fund to post margin. A Fund may enter into foreign currency exchange transactions in order to hedge against changes in the values of the assets or liabilities denominated in one or more foreign currencies, or otherwise to increase or reduce a Fund’s exposure to various foreign currencies. The use of foreign currency exchange transactions may create investment leverage.
Whenever a Fund enters into a foreign currency exchange transaction, it is subject to the risk that the value of the transaction will move in a direction unfavorable to it. When the Fund uses the transactions for hedging purposes, it is likely that the Fund will have an asset or liability that will offset any loss (or gain) on the transactions, at least in part. If a Fund enters into foreign currency exchange transactions other than for hedging purposes (for example, seeking to profit from an anticipated change in the values of currencies by creating directional exposures in the portfolio with respect to one or more currencies), it will generally be subject to the same risks, but is less likely to have assets or liabilities that will offset any losses on the transactions. There can be no assurance that a Fund will be able to terminate any foreign currency exchange transaction prior to its maturity in order to limit its loss on the transaction.
Forward foreign currency contracts are marked to market daily and the change in their value is recorded by the Funds as an unrealized gain or loss. Forward foreign currency contracts are valued at the settlement price established through dealers or other market sources on the day which they are traded. When a forward foreign currency contract is extinguished, through delivery or offset by entering into another forward foreign currency contract, the Funds record a realized gain or loss equal to the difference between the value of the contract at the time it was opened and the value of the contract at the time it was extinguished or offset. The notional or contractual amounts of these instruments do not necessarily represent the amounts potentially subject to risk. The measurement of the risk associated with these instruments is meaningful only when all related and offsetting transactions and counterparty risks are considered.
A Fund’s current exposure to a counterparty is the unrealized appreciation on the contract.
Futures Contracts
A Fund may seek to manage a variety of different risks, such as interest rate risk, equity price risk, and currency risk, through the use of futures contracts. A Fund may use interest rate futures contracts to adjust the interest rate sensitivity (duration) of its portfolio or the credit exposure of the portfolio. Interest rate futures contracts obligate the long or short holder to take or make delivery of a specified quantity of a financial instrument, such as a specific fixed income security, during a specified future period at a specified price. A Fund may use index futures contracts to hedge against broad market risks to its portfolio or to gain broad market exposure when it holds uninvested cash or as an inexpensive substitute for cash investments directly in securities or other assets, including commodities and precious metals. Securities index futures contracts are contracts to buy or sell units of a securities index at a specified future date at a price agreed upon when the contract is made and are settled in cash. Positions in futures contracts may be closed out only on an exchange or board of trade which provides a secondary market for such futures. Because futures contracts are exchange-traded, they typically have minimal exposure to counterparty risk.
Parties to a futures contract are not required to post the entire notional amount of the contract, but rather a small percentage of that amount (by way of margin), both at the time they enter into futures transactions, and then on a daily basis if their positions decline in value; as a result, futures contracts are highly leveraged. Such payments are known as variation margin and are recorded by the Funds as unrealized gains or losses. Because futures markets are highly leveraged, they can be extremely volatile, and there can be no assurance that the pricing of a futures contract will correlate precisely with the pricing of the asset or index underlying it or the asset or liability of the Fund that is the subject of the hedge. It may not always be possible for a Fund to enter into a closing transaction with respect to a futures contract it has entered into, at a favorable time or price. When a Fund enters into a futures transaction, it is subject to the risk that the value of the futures contract will move in a direction unfavorable to it. When a Fund uses futures contracts for hedging purposes, it is likely that the Fund will have an asset or liability that will offset any loss (or gain) on the transactions, at least in part.
When a futures contract is closed, the Fund records a realized gain or loss equal to the difference between the value of the contract at the time it was opened and the value at the time it was closed. Futures contracts are valued at the settlement price established each day by the board of trade or exchange on which they are traded.
234
Notes to Financial Statements(Continued)
Swap Agreements
Swap agreements are typicallytwo-party contracts entered into primarily by institutional investors. In a standard “swap” transaction, two parties agree to exchange the returns (or differentials in rates of return) earned or realized on particular predetermined investments or instruments or rates, which may be adjusted for an interest factor. The gross returns to be exchanged or “swapped” between the parties are generally calculated with respect to a “notional amount,” (i.e., the return on or increase in value of a particular dollar amount invested at a particular interest rate or in a “basket” of securities representing a particular index).
Interest Rate Swaps.When a Fund enters into an interest rate swap, it typically agrees to make payments to its counterparty based on a specified long- or short-term interest rate, and will receive payments from its counterparty based on another interest rate. Other forms of interest rate swap agreements include, among others, interest rate caps, under which, in return for a specified payment stream, one party agrees to make payments to the other to the extent that interest rates exceed a specified rate, or “cap”; interest rate floors, under which, in return for a specified payment stream, one party agrees to make payments to the other to the extent that interest rates fall below a specified rate, or “floor”; and interest rate collars, under which a party sells a cap and purchases a floor or vice versa in an attempt to protect itself against interest rate movements exceeding given minimum or maximum levels. A Fund may enter into an interest rate swap in order, for example, to hedge against the effect of interest rate changes on the value of specific securities in its portfolio, or to adjust the interest rate sensitivity (duration) or the credit exposure of its portfolio overall, or otherwise as a substitute for a direct investment in debt securities.
Total Return Swaps. A Fund also may enter into total return swaps. In a total return swap, one party typically agrees to pay to the other a short-term interest rate in return for a payment at one or more times in the future based on the increase in the value of an underlying security or other asset, or index of securities or assets; if the underlying security, asset, or index declines in value, the party that pays the short-term interest rate must also pay to its counterparty a payment based on the amount of the decline. A Fund may take either side of such a swap, and so may take a long or short position in the underlying security, asset, or index. A Fund may enter into a total return swap to hedge against an exposure in its portfolio — such as interest rate risk (including to adjust the duration or credit quality of a Fund’s bond portfolio), equity risk, or credit risk — or generally to put cash to work efficiently in the markets in anticipation of, or as a replacement for, cash investments. A Fund may also enter into a total return swap to gain exposure to securities or markets in which it might not be able to invest directly (in so-called market access transactions).
Credit Default Swaps.A Fund also may enter into credit default swap transactions, as a “buyer” or “seller” of credit protection. In a credit default swap, one party provides what is in effect insurance against a default or other adverse credit event affecting an issuer of debt securities (typically referred to as a “reference entity”). In general, the buyer of credit protection is obligated to pay the protection seller an upfront amount or a periodic stream of payments over the term of the swap. If a “credit event” occurs, the buyer has the right to deliver to the seller bonds or other obligations of the reference entity (with a value up to the full notional value of the swap), and to receive a payment equal to the par value of the bonds or other obligations. Credit events that would trigger a request that the seller make payment are specific to each credit default swap agreement, but generally include bankruptcy, failure to pay, restructuring, acceleration, default, or repudiation/moratorium. When a Fund buys protection, it may or may not own securities of the reference entity. If it does own securities of the reference entity, the swap serves as a hedge against a decline in the value of the securities due to the occurrence of a credit event involving the issuer of the securities. If the Fund does not own securities of the reference entity, the credit default swap may be seen to create a short position in the reference entity. If a Fund is a buyer and no credit event occurs, the Fund will typically recover nothing under the swap, but will have had to pay the required upfront payment and stream of continuing payments under the swap. When a Fund sells protection under a credit default swap, the position may have the effect of creating leverage in the Fund’s portfolio through the Fund’s indirect long exposure to the issuer or securities on which the swap is written. When a Fund sells protection, it may do so either to earn additional income or to create a “synthetic” long position.
Whenever a Fund enters into a swap agreement, it takes on counterparty risk — the risk that its counterparty will be unable or unwilling to meet its obligations under the swap agreement. The Fund also takes the risk that the market will move against its position in the swap agreement. In the case of an interest rate swap, the value of the swap may increase or decrease depending on changes in interest rates. In the case of a total return swap, the swap will change in value depending on the change in value of the asset or index on which the swap is written. In the case of a credit default swap, the swap will become more or less valuable depending on the credit of the issuer of the underlying security, and, if a credit event occurs under a swap where the Fund is the
235
Notes to Financial Statements(Continued)
seller of credit protection, the Fund could be required to purchase the security at par value, resulting in a significant loss to the Fund. When the Fund enters into any type of swap for hedging purposes, it is likely that the Fund will have an asset or liability that will offset any loss (or gain) on the swap, at least in part. Swap agreements may benon-transferable or otherwise highly illiquid, and a Fund may not be able to terminate or transfer a swap agreement at any particular time or at an acceptable price.
Swaptions.A Fund may also enter into options on swap agreements (“swaptions”). A swaption is a contract that gives a counterparty the right (but not the obligation) to enter into a new swap agreement or to shorten, extend, cancel, or otherwise modify an existing swap agreement, at some designated future time on specified terms. A Fund may write (sell) and purchase put and call swaptions. Depending on the terms of the particular option agreement, a Fund will generally incur a greater degree of risk when it writes a swaption than it will incur when it purchases a swaption. When a Fund purchases a swaption, it risks losing only the amount of the premium it has paid should it decide to let the option expire unexercised. However, when a Fund writes a swaption, upon exercise of the option the Fund will become obligated according to the terms of the underlying agreement. A Fund may enter into swaptions for the same purposes as swaps. For information regarding the accounting treatment of options, see “Options, Rights, and Warrants” below.
Centrally Cleared Swaps.Certain clearinghouses currently offer clearing for limited types of derivatives transactions, principally certain interest rate swaps, certain index swaps, and credit derivatives. In a cleared derivative transaction, a Fund typically enters into the transaction with a financial institution counterparty, and performance of the transaction is effectively guaranteed by a central clearinghouse, thereby reducing or eliminating the Fund’s exposure to the credit risk of its original counterparty. The Fund will be required to post amounts (“initial margin”) with the clearinghouse or at the instruction of the clearinghouse. The initial margin required by a clearinghouse may be greater than the initial margin the Fund would be required to post in an uncleared transaction. If cash is deposited as the initial margin, it is shown as collateral on a Fund’s Statement of Assets and Liabilities. Swap agreements aremarked-to-market daily and subsequent payments (“variation margin”) are made or received by a Fund depending on whether unrealized gains or losses are incurred. These amounts are reflected as receivables or payables on a Fund’s Statement of Assets and Liabilities (“Variation margin on open derivative instruments”) and as a component of net change in unrealized appreciation (depreciation) on a Fund’s Statement of Operations. Only a limited number of transaction types are currently eligible for clearing.
During the term of a swap transaction, changes in the value of the swap are recognized as unrealized gains or losses by marking to market to reflect the market value of the swap. When the swap is terminated, a Fund will record a realized gain or loss equal to the difference, if any, between the proceeds from (or cost of) the closing transaction and a Fund’s basis in the agreement. Upfront swap premium payments paid or received by a Fund, if any, are recorded within the value of the open swap agreement on the Fund’s Statement of Assets and Liabilities and represent payments paid or received upon entering into the swap agreement to compensate for differences between stated terms of the swap agreement and prevailing market conditions (credit spreads, currency exchange rates, and other relevant factors). These upfront payments are recorded as realized gain or loss on the Fund’s Statement of Operations upon termination or maturity of the swap agreement.
During the term of a swap transaction, the periodic net payments can be made for a set period of time or may be triggered by a predetermined credit event. The net periodic payments may be based on a fixed or variable interest rate, the change in market value of a specified security, basket of securities or index, or the return generated by a security. These periodic payments received or made by the Funds are recorded in the accompanying Statements of Operations as realized gains and losses, respectively.
A Fund’s current exposure to a counterparty is the fair value of the transaction.
Options, Rights, and Warrants
A Fund may purchase and sell put and call options on securities or an index of securities to enhance investment performance or to protect against changes in market prices. A Fund that invests in debt securities may also purchase and sell put and call options to adjust the interest rate sensitivity of its portfolio or the credit exposure of the portfolio.
Call Options.A call option gives the holder the right to purchase, and obligates the writer to sell, a security at the strike price at any time before the expiration date.
236
Notes to Financial Statements(Continued)
Put Options.A put option gives the holder the right to sell, and obligates the writer to buy, a security at the exercise price at any time before the expiration date.
Writing putandcall options. A Fund may write call options on a security it owns, in a “directional” strategy hoping to realize a greater current return through the receipt of premiums. In return for the option premium, the Fund takes the risk that it will have to forego any increase in the value of the security over the strike price. When a Fund has written a call option on a security it does not own, its exposure on such an option is theoretically unlimited. A Fund may enter into closing purchase transactions in order to realize a profit or limit a loss on a previously written call option or, in the case of a call option on a security it owns, to free itself to sell the underlying security or to write another call on the security, or protect a security from being called in an unexpected market rise. Any profits from a closing purchase transaction in the case of a call option on a security a Fund owns may be offset by a decline in the value of the underlying security. Conversely, because increases in the market price of a call option will generally reflect increases in the market price of the underlying security, any loss resulting from a closing purchase transaction relating to a call option on a security a Fund owns is likely to be offset in whole or in part by unrealized appreciation of the underlying security owned by the Fund. A Fund may not be able to close out a call option that it has previously written. A Fund may write put options in order to enhance its current return by taking a long directional position as to a security or index of securities. By writing a put option, the Fund assumes the risk that it may be required to purchase the underlying security for an exercise price higher than its then current market value, resulting in a potential capital loss unless the security later appreciates in value. A Fund may terminate a put option that it has written before it expires by entering into a closing purchase transaction. Any loss from this transaction may be partially or entirely offset by the premium received on the terminated option. A Fund may not be able to close out a put option that it has previously written.
When a Fund writes a call or put option, an amount equal to the premium received is recorded as a liability. Premiums received from writing options which expire are treated as realized gains. Premiums received from writing options which are exercised or closed are added to the proceeds or offset against the amount paid on the underlying investment to determine the realized gain or loss.
Purchasingputandcall options. A Fund may purchase put options to protect portfolio holdings against a decline in market value of a security or securities held by it. A Fund may also purchase a put option hoping to profit from an anticipated decline in the value of the underlying security. If the Fund holds the security underlying the option, the option premium and any transaction costs will reduce any profit the Fund might have realized had it sold the underlying security instead of buying the put option. A Fund may purchase call options to hedge against an increase in the price of securities that the Fund wants ultimately to buy. A Fund may also purchase a call option as a long directional investment hoping to profit from an anticipated increase in the value of the underlying security. In order for a call option to be profitable, the market price of the underlying security must rise sufficiently above the exercise price to cover the premium and transaction costs. These costs will reduce any profit the Fund might have realized had it bought the underlying security at the time it purchased the call option.
When a Fund purchases an option, it runs the risk that it will lose its entire investment in the option in a relatively short period of time, unless the Fund exercises the option or enters into a closing sale transaction before the option’s expiration. If the price of the underlying security does not rise (in the case of a call) or fall (in the case of a put) to an extent sufficient to cover the option premium and transaction costs, the Fund will lose part or all of its investment in the option. This contrasts with an investment by a Fund in the underlying security, since the Fund will not realize a loss if the security’s price does not change. Premiums paid for purchasing options that expire are treated as realized losses.
OTC Options.OTC options purchased or sold by a Fund are not traded on securities or options exchanges or backed by clearinghouses. Rather, they are entered into directly between a Fund and the counterparty to the option. In the case of an OTC option purchased by the Fund, the value of the option to the Fund will depend on the willingness and ability of the option writer to perform its obligations to the Fund. In addition, OTC options may not be transferable and there may be little or no secondary market for them, so they may be considered illiquid. It may not be possible to enter into closing transactions with respect to OTC options or otherwise to terminate such options, and as a result a Fund may be required to remain obligated on an unfavorable OTC option until its expiration. OTC options are valued using prices supplied by a primary pricing source, selected pursuant to procedures approved by the Trustees.
237
Notes to Financial Statements(Continued)
Rights and Warrants.A Fund may purchase or hold warrants or rights in order to gain exposure to the underlying security without owning the security, including, for example, cases where the Fund hopes to lock in the price today of a security it may wish to purchase in the future. Warrants generally give the holder the right, but not the obligation, to buy a security at a stated price. In order for a warrant to be profitable, the market price of the underlying security must rise sufficiently above the exercise price to cover any premium and transaction costs. Rights may similarly confer on the holder the right to purchase or acquire securities, including through participation in aso-called rights offering. Bonds may be issued with warrants or other rights attached to purchase or acquire equity or other debt securities, typically of the bond issuer. The market prices of bonds with warrants or rights attached to purchase equity securities or bonds may, to some degree, reflect changes in the values of the underlying securities.
When a Fund purchases or otherwise acquires warrants or other rights, it runs the risk that it will lose its entire investment in the warrants or rights, unless the Fund exercises the warrant or right, acquires the underlying securities, or enters into a closing transaction before expiration. If the price of the underlying security does not rise to an extent sufficient to cover any premium and transaction costs, the Fund will lose part or all of its investment. Any premiums or purchase price paid for warrants or other rights that expire are treated as realized losses. Warrants and similar rights differ from options in that they are typically written by the issuer of the security underlying the warrant or right. Although some warrants and rights may benon-transferable, others may be tradedover-the-counter or on an exchange.
Inflation-Linked Securities
Inflation-linked securities are typically fixed income securities whose principal values are periodically adjusted according to a measure of inflation. If the index measuring inflation falls, the principal value of an inflation-linked security will be adjusted downward, and consequently the interest payable on the security (calculated with respect to a smaller principal amount) will be reduced. Repayment of the original principal of the security upon maturity (as adjusted for inflation) is guaranteed in the case of U.S. Treasury inflation-linked securities. For securities that do not provide a similar guarantee, the adjusted principal value of the security repaid at maturity may be less than the original principal.
Alternatively, the interest rates payable on certain inflation-linked securities may be adjusted according to a measure of inflation. As a result, the principal values of such securities do not adjust according to the rate of inflation, although the interest payable on such securities may decline during times of falling inflation.
The values of inflation-linked securities are expected to change in response to changes in real interest rates. Real interest rates are tied to the relationship between nominal interest rates and the rate of inflation. If nominal interest rates increase at a faster rate than inflation, real interest rates may rise, leading to a decrease in value of inflation-linked securities. Inflation-linked securities may cause a potential cash flow mismatch to investors, because an increase in the principal amount of an inflation-linked security will be treated as interest income currently subject to tax at ordinary income rates even though investors will not receive repayment of principal until maturity. If a Fund invests in such securities, it will be required to distribute such interest income in order to qualify for treatment as a regulated investment company and eliminate the Fund-level tax, without a corresponding receipt of cash, and therefore may be required to dispose of portfolio securities at a time when it may not be advantageous to do so in order to make such distributions.
Bank Loans
A Fund may invest in bank loans including, for example, corporate loans, loan participations, direct debt, bank debt, and bridge debt. A Fund may invest in a loan by lending money to a borrower directly as part of a syndicate of lenders. In a syndicated loan, the agent that originated and structured the loan typically administers and enforces the loan on behalf of the syndicate. Failure by the agent to fulfill its obligations may delay or adversely affect receipt of payment by a Fund. A Fund may also invest in loans through novations, assignments, and participation interests. In a novation, a Fund typically assumes all of the rights of a lending institution in a loan, including the right to receive payments of principal and interest and other amounts directly from the borrower and to enforce its rights as a lender directly against the borrower. When a Fund takes an assignment of a loan, the Fund acquires some or all of the interest of another lender (or assignee) in the loan. In such cases, the Fund may be required generally to rely upon the assignor to demand payment and enforce rights under the loan. If a Fund acquires a participation in the loan, the Fund purchases an indirect interest in a loan held by a third party and the Fund typically will have a contractual relationship only with
238
Notes to Financial Statements(Continued)
the third party loan investor, not with the borrower. As a result, a Fund may have the right to receive payments of principal, interest, and any fees to which it is entitled only from the loan investor selling the participation and only upon receipt by such loan investor of such payments from the borrower. In such cases, a Fund assumes the credit risk of both the borrower and the loan investor selling the participation, and the Fund may be unable to realize some or all of the value of its interest in the loan in the event of the insolvency of the third party.
Changes in the financial condition of the borrower or economic conditions or other circumstances may reduce the capacity of the borrower to make principal and interest payments on such instruments and may lead to defaults. The value of any collateral securing a bank loan may decline after the Fund invests, and there is a risk that the value of the collateral may not be sufficient to cover the amount owed to the Fund.
At September 30, 2019, the Funds had no unfunded loan commitments.
Repurchase Agreements
Each Fund may enter into repurchase agreements with certain banks and broker-dealers whereby a Fund acquires a security for cash and obtains a simultaneous commitment from the seller to repurchase the security at an agreed upon price and date. A Fund, through its custodian, takes possession of the securities collateralizing the repurchase agreement in a segregated account. Repurchase agreements must be fully collateralized at all times, but involve some risk to a Fund if the other party should default on its obligation and the Fund is delayed or prevented from recovering the collateral, or if the Fund is required to return collateral to a borrower at a time when it may realize a loss on the investment of that collateral. Collateral for certaintri-party repurchase agreements is held at the Fund’s custodian orsub-custodian in a segregated account for the benefit of the Fund and the counterparty.
Reverse Repurchase Agreements
Each Fund may enter into reverse repurchase agreements with banks and broker-dealers to enhance return. Reverse repurchase agreements involve sales by a Fund of portfolio securities concurrently with an agreement by the Fund to repurchase the same securities at a later date at a fixed price (typically equal to the original sale price plus interest). During the reverse repurchase agreement period, the Fund continues to receive principal and interest payments on the securities and also has the opportunity to earn a return on the purchase price received by it from the counterparty.
Certain agreements have no stated maturity and can be terminated by either party at any time. Interest on the value of the reverse repurchase agreements issued and outstanding is based upon competitive market rates determined at the time of issuance. A Fund may utilize reverse repurchase agreements when it is anticipated that the interest income to be earned from the investment of the proceeds of the transaction is greater than the interest expense of the transaction. Reverse repurchase agreements generally create investment leverage and involve the risk that the market value of the security that a Fund is obligated to repurchase under the agreement may decline below the repurchase price. For financial reporting purposes, cash received in exchange for securities delivered plus accrued interest payments to be made to the counterparty is recorded as a liability in the Statements of Assets and Liabilities at face value including accrued interest. Due to the short term nature of reverse repurchase agreements, face value approximates fair value. Interest payments made by a Fund to the counterparties are recorded as a component of interest expense in the Statements of Operations. In periods of increased demand for a security, a Fund may receive a fee for use of the security by the counterparty, which may result in interest income to the Fund.
Reverse repurchase transactions are entered into by a Fund under a Master Repurchase Agreement (“MRA”), which permits the Fund, under certain circumstances, including an event of default (such as bankruptcy or insolvency), to offset payables and/or receivables under the MRA with collateral held and/or posted to the counterparty and creates one single net payment due to or from the Fund. With reverse repurchase transactions, typically a Fund and the counterparties are permitted to sell,re-pledge, or use the collateral associated with the transaction. However, bankruptcy or insolvency laws of a particular jurisdiction may impose restrictions on or prohibitions against such a right of offset in the event of an MRA counterparty’s bankruptcy or insolvency. Pursuant to the terms of the MRA, a Fund receives or posts securities as collateral with a market value in excess of the repurchase price to be paid or received by the Fund upon the maturity of the transaction. Upon a bankruptcy or insolvency of the MRA counterparty, the Fund is considered an unsecured creditor with respect to excess collateral and, as such, the return of excess collateral may be delayed.
239
Notes to Financial Statements(Continued)
In the event the buyer of securities under an MRA files for bankruptcy or becomes insolvent, a Fund’s use of the proceeds from the sale of its securities may be restricted or forfeited, and the counterparty may fail to return/resell the securities in question to the Fund.
During the year ended September 30, 2019, the average balance outstanding for open reverse repurchase agreements for the Inflation-Protected and Income Fund was $3,737,531. The maximum balance outstanding for the Inflation-Protected and Income Fund was $72,497,500 during the year ended September 30, 2019. The weighted average maturity was 19 days, at a weighted average interest rate of 2.305%.
Average balance outstanding was calculated based on daily balances outstanding during the period that the Inflation-Protected and Income Fund had entered into reverse repurchase transactions.
When-Issued, Delayed-Delivery, Forward Commitment, andTo-Be-Announced Transactions
A Fund may enter into when-issued, delayed-delivery, forward commitment, orto-be-announced (“TBA”) transactions (collectively, the “Forward Transactions”) in order to lock in the purchase price of the underlying security, or in order to adjust the interest rate exposure of the Fund’s existing portfolio. In Forward Transactions, a Fund commits to purchase or sell particular securities, with payment and delivery to take place at a future date. In the case of TBA purchase commitments, the unit price and the estimated principal amount are established when the Fund enters into a commitment, with the actual principal amount being within a specified range of the estimate. Although a Fund does not typically pay for the securities in these types of transactions until they are delivered, it immediately assumes the risks of ownership, including the risk of price fluctuation. As a result, each of these types of transactions may create investment leverage in a Fund’s portfolio and increase the volatility of the Fund. If a Fund’s counterparty fails to deliver a security purchased in a Forward Transaction, there may be a loss, and the Fund may have missed an opportunity to make an alternative investment.
These securities are valued on the basis of valuations furnished by a pricing service, selected pursuant to procedures approved by the Trustees, which determines valuations taking into account appropriate factors such asinstitutional-size trading in similar groups of securities, yield, quality, coupon rate, maturity, type of issue, trading characteristics, and other market data. Securities for which no market quotation is available are valued at fair value in accordance with procedures approved by the Trustees. The Funds record on a daily basis the unrealized appreciation (depreciation) based upon changes in the values of these securities. When a Forward Transaction is closed, the Funds record a realized gain or loss equal to the difference between the value of the transaction at the time it was opened and the value of the transaction at the time it was closed.
Dollar Roll Transactions
A Fund may enter into dollar roll transactions, in which the Fund sells mortgage-backed securities for delivery in the current month and simultaneously contracts to purchase substantially similar securities on a specified future date from the same party. A Fund may invest in dollar rolls in order to benefit from anticipated changes in pricing for the mortgage-backed securities during the term of the transaction, or for the purpose of creating investment leverage. In a dollar roll, the securities that are to be purchased will be of the same type as the securities sold, but will be supported by different pools of mortgages.
Dollar rolls involve the risk that the Fund’s counterparty will be unable to deliver the mortgage-backed securities underlying the dollar roll at the fixed time. If the counterparty files for bankruptcy or becomes insolvent, a Fund’s use of the transaction proceeds may be restricted pending a determination by the counterparty or its representative, whether to enforce the Fund’s obligation to repurchase the securities. A Fund can incur a loss on a dollar roll transaction (either because its counterparty fails to perform or because the value of the mortgages subject to the transaction declines) and on the investments made by the Fund with the proceeds of the dollar roll transaction.
A Fund accounts for a dollar roll transaction as a purchase and sale whereby the difference in the sales price and purchase price of the security sold is recorded as a realized gain (loss). If certain criteria are met, these dollar roll transactions may be considered financing transactions, whereby the difference in the sales price and the future purchase price is recorded as an adjustment to interest income. Dollar roll transactions generally have the effect of creating leverage in a Fund’s portfolio.
240
Notes to Financial Statements(Continued)
Securities Lending
Each Fund, other than the U.S. Government Money Market Fund, may lend its securities; however, lending cannot exceed 33% of the total assets of the Fund taken at current value. The Funds’ securities lending activities are governed by a Securities Lending Agency Agreement (“Lending Agreement”) between each Fund and the lending agent (“Agent”). The Lending Agreement authorizes the Agent to lend portfolio securities held by a Fund to approved borrowers (each, a “Borrower”).
Each Fund expects that in connection with any securities on loan, the loan will be secured continuously by collateral consisting of cash (U.S. currency) adjusted daily to have value at least equal to the current market value of the securities loaned. The market value of the loaned securities is determined at the close of business of a Fund and any additional collateral is delivered to the Fund the next business day. The Funds bear the risk of loss with respect to the investment of cash collateral. As with other extensions of credit, the Funds may bear the risk of delay in recovery of the loaned securities or even loss of rights in the collateral should the Borrower of the securities fail financially. Pursuant to the Lending Agreement, the Agent has provided indemnification to the Funds in the event of default by a Borrower with respect to a loan. The Funds receive compensation for lending their securities in the form of a securities loan fee paid by the Borrower, as well as a share of the income earned on investment of the cash collateral received for the loaned securities. At September 30, 2019, the Funds’ collateral was equal to or greater than 100% of the market value of securities on loan.
Subject to the terms of the Lending Agreement and the agreement between the Agent and the applicable Borrower (“Borrowing Agreement”), security loans can be terminated by the Agent, the Fund, or the Borrower and the related securities must be returned within the earlier of the customary settlement period for such securities or the period of time specified in the Borrowing Agreement.
The Funds employ the Agent to implement their securities lending program and the Agent receives a fee from the Funds for its services. In addition, the Funds may be required to pay a rebate to the Borrower. Accordingly, a Fund’s compensation for lending its securities is reduced by any such fees or rebate paid to the Agent or Borrower, respectively. Income received by the Funds in securities lending transactions during the year ended September 30, 2019, is reflected as securities lending income on the Statement of Operations.
Accounting for Investment Transactions
Investment transactions are accounted for on the trade date. Realized gains and losses on sales of investments and unrealized appreciation and depreciation of investments are computed by the specific identification cost method. Proceeds received from litigation, if any, are included in realized gains on investment transactions for any investments that are no longer held in the portfolio and as a reduction in cost for investments that continue to be held in the portfolio. Interest income, adjusted for amortization of discounts and premiums on debt securities, is earned from the settlement date and is recorded on the accrual basis. Dividend income and realized capital gain distributions are recorded on theex-dividend date.Non-cash dividends received in the form of stock are recorded as dividend income at market value. Withholding taxes on foreign interest, dividends, and capital gains have been provided for in accordance with the applicable country’s tax rules and rates. Foreign dividend income is recorded on theex-dividend date or as soon as practicable after the Fund determines the existence of a dividend declaration after exercising reasonable due diligence. Distributions received on securities that represent a return of capital or capital gains are recorded as a reduction of cost of investments and/or as a realized gain. The Funds determine the classification of distributions received as return of capital distributions or capital gain distributions.
Foreign Currency Translation
The books and records of the Funds are maintained in U.S. dollars. The market values of foreign currencies, foreign securities, and other assets and liabilities denominated in foreign currencies are translated into U.S. dollars at the mean of the buying and selling rates of such currencies against the U.S. dollar at the end of each business day. Purchases and sales of foreign securities and income and expense items are translated at the rates of exchange prevailing on the respective dates of such transactions. The Funds do not isolate that portion of the results of operations arising from changes in the exchange rates from that portion arising from changes in the market prices of securities. Net realized foreign currency gains and losses resulting from changes in exchange rates
241
Notes to Financial Statements(Continued)
include foreign currency gains and losses between trade date and settlement date on investment securities transactions, foreign currency transactions, and the difference between the amounts of dividends or interest recorded on the books of the Funds and the amount actually received.
Allocation of Operating Activity
In maintaining the records for the Funds, the income and expense accounts are allocated daily to each class of shares. Investment income and loss, and unrealized and realized gains or losses are prorated among the classes of shares based on the relative net assets of each. Expenses are allocated to each class of shares depending on the nature of the expenditures. Administration and service fees, if any, which are directly attributable to a class of shares, are charged to that class’s operations. Expenses of a Fund not directly attributable to the operations of any specific class of shares of the Fund are prorated among the classes to which the expense relates based on relative net assets or another alternative method.
Foreign Securities
The Global Fund invests a significant amount of its assets in foreign securities and each of the International Equity Fund and Strategic Emerging Markets Fund invests substantially all of its assets in foreign securities. The other Funds may also invest in foreign securities. Foreign securities, including American Depositary Receipts, are subject to additional risks compared to securities of U.S. issuers, including international trade, currency, political, regulatory, and diplomatic risks. In addition, fluctuations in currency exchange rates may adversely affect the values of foreign securities and the price of a Fund’s shares. Emerging markets securities are subject to greater risks than securities issued in developed foreign markets, including less liquidity, greater price volatility, higher relative rates of inflation, greater political, economic, and social instability, greater custody and operational risks, and greater volatility in currency exchange rates.
Federal Income Tax
It is each Fund’s intent to continue to comply with the provisions of Subchapter M of the Internal Revenue Code of 1986, as amended, applicable to a regulated investment company. Under such provisions, the Funds would not be subject to federal income taxes on their ordinary income and net realized capital gains to the extent they are distributed or deemed to have been distributed to their shareholders. Therefore, the Funds have not made any provision for federal income tax.
Dividends and Distributions to Shareholders
Dividends from net investment income of each Fund, other than the U.S. Government Money Market Fund, are declared and paid annually and at other times as may be required to satisfy tax or regulatory requirements. Dividends from net investment income are declared daily and paid monthly for the U.S. Government Money Market Fund. Distributions of any net realized capital gains of each Fund are declared and paid annually and at other times as may be required to satisfy tax or regulatory requirements.
Distributions to shareholders are recorded on theex-dividend date. Income and capital gain distributions are determined in accordance with income tax regulations, which may differ from generally accepted accounting principles. As a result, net investment income and net realized capital gains on investment transactions for a reporting period may differ significantly from distributions during such period.
3. Advisory Fees and Other Transactions
Investment Advisory Fees and Investment Subadvisers
MML Investment Advisers, LLC (“MML Advisers”), a wholly-owned subsidiary of Massachusetts Mutual Life Insurance Company (“MassMutual”), serves as investment adviser to each Fund. Under the investment advisory agreements between MML
242
Notes to Financial Statements(Continued)
Advisers and the Trust on behalf of each Fund, MML Advisers is responsible for providing investment management services for each Fund. In return for these services, MML Advisers receives advisory fees, based upon each Fund’s average daily net assets, computed and accrued daily and payable monthly, at the following annual rates:
| | |
Fund | | Investment Advisory Fee |
U.S. Government Money Market Fund | | 0.35% on the first $1 billion; and |
| | 0.33% on any excess over $1 billion |
Short-Duration Bond Fund | | 0.35% on the first $500 million; and |
| | 0.30% on any excess over $500 million |
Inflation-Protected and Income Fund | | 0.38% on the first $350 million; and |
| | 0.33% on any excess over $350 million |
Core Bond Fund | | 0.38% on the first $1.5 billion; |
| | 0.33% on the next $500 million; and |
| | 0.28% on any excess over $2 billion |
Diversified Bond Fund | | 0.40% on the first $150 million; and |
| | 0.30% on any excess over $150 million |
High Yield Fund | | 0.48% on the first $250 million; and |
| | 0.455% on any excess over $250 million |
Balanced Fund | | 0.48% on the first $300 million; and |
| | 0.43% on any excess over $300 million |
Disciplined Value Fund | | 0.45% on the first $400 million; and |
| | 0.40% on any excess over $400 million |
Main Street Fund | | 0.55% on the first $300 million; and |
| | 0.50% on any excess over $300 million |
Disciplined Growth Fund | | 0.45% on the first $400 million; and |
| | 0.40% on any excess over $400 million |
Small Cap Opportunities Fund | | 0.58% on the first $300 million; and |
| | 0.53% on any excess over $300 million |
Global Fund | | 0.75% on the first $400 million; and |
| | 0.70% on any excess over $400 million |
International Equity Fund | | 0.85% on the first $500 million; |
| | 0.80% on the next $500 million; and |
| | 0.75% on any excess over $1 billion |
Strategic Emerging Markets Fund | | 1.00% on the first $350 million; and |
| | 0.95% on any excess over $350 million |
MML Advisers has entered into investment subadvisory agreements with Barings LLC (“Barings”), a wholly-owned subsidiary of MM Asset Management Holding LLC, itself a wholly-owned subsidiary of MassMutual Holding LLC, a controlled subsidiary of MassMutual, on behalf of certain Funds. These agreements provide that Barings manage the investment and reinvestment of assets of these Funds. Barings receives a subadvisory fee from MML Advisers, based upon each Fund’s average daily net assets, at the following annual rates:
| | |
U.S. Government Money Market Fund | | 0.05% |
Short-Duration Bond Fund | | 0.08% |
Inflation-Protected and Income Fund | | 0.08% |
Core Bond Fund | | 0.10% |
Diversified Bond Fund | | 0.10% |
High Yield Fund | | 0.20% |
Balanced Fund: fixed income portion | | 0.09% |
Balanced Fund: equity portion* | | 0.22% of the first $50 million; |
| | 0.21% of the next $50 million; and |
243
Notes to Financial Statements(Continued)
| | |
| | 0.20% of any excess over $100 million |
Disciplined Value Fund* | | 0.25% of the first $50 million; |
| | 0.21% of the next $50 million; |
| | 0.17% of the next $650 million; and |
| | 0.14% of any excess over $750 million |
Disciplined Growth Fund* | | 0.25% of the first $50 million; |
| | 0.21% of the next $50 million; |
| | 0.17% of the next $650 million; and |
| | 0.14% of any excess over $750 million |
| * | Subadvisory fee based on Aggregate Assets. For purposes of these subadvisory agreements, “Aggregate Assets” means the aggregate of (i) the average daily net assets of the Fund determined at the close of the NYSE on each day that the NYSE is open for trading, and (ii) the average daily net assets of certain other funds or accounts of MML Advisers or its affiliates, including other funds registered under the 1940 Act, for which Barings provides investment advisory services, as agreed upon from time to time by MML Advisers and Barings, determined at the close of the NYSE on each day that the NYSE is open for trading. |
Effective at the close of business on May 24, 2019, Invesco Advisers, Inc. (“Invesco”), replaced OppenheimerFunds, Inc. (“OFI”), a wholly-owned subsidiary of Oppenheimer Acquisition Corp., itself an indirect majority-owned subsidiary of MassMutual Holding LLC, as subadviser to the Global Fund. MML Advisers has entered into an investment subadvisory agreement with Invesco, pursuant to which Invesco serves as the subadviser to the Fund. This agreement provides that Invesco manage the investment and reinvestment of the assets of the Fund. Invesco receives a subadvisory fee from MML Advisers, based upon the Fund’s average daily net assets.
Prior to the close of business on May 24, 2019, MML Advisers had entered into an investment subadvisory agreement with OFI, on behalf of the Global Fund. This agreement provided that OFI manage the investment and reinvestment of the assets of the Fund. OFI received a subadvisory fee from MML Advisers, based upon the Fund’s average daily net assets, at the following annual rates:
| | |
Global Fund | | 0.40% of the first $100 million; |
| | 0.35% of the next $250 million; and |
| | 0.30% of any excess over $350 million |
Effective at the close of business on May 24, 2019, Invesco Advisers, Inc. (“Invesco”), replaced OFI Global Institutional, Inc. (“OFI Global Institutional”), a wholly-owned subsidiary of OFI, on behalf of certain Funds. MML Advisers has entered into investment subadvisory agreements with Invesco, pursuant to which Invesco serves as the subadviser to the Main Street Fund, Small Cap Opportunities Fund, International Equity Fund, and Strategic Emerging Markets Fund. These agreements provide that Invesco manage the investment and reinvestment of the assets of each Fund. Invesco receives a subadvisory fee from MML Advisers, based upon the average daily net assets of each Fund.
Prior to the close of business on May 24, 2019, MML Advisers had entered into investment subadvisory agreements with OFI Global Institutional, on behalf of certain Funds. These agreements provided that OFI Global Institutional manage the investment and reinvestment of the assets of these Funds. OFI Global Institutional received a subadvisory fee from MML Advisers, based upon each Fund’s average daily net assets, at the following annual rates:
| | |
Main Street Fund | | 0.30% |
Small Cap Opportunities Fund | | 0.40% of the first $1 billion; and |
| | 0.30% of any excess over $1 billion |
International Equity Fund | | 0.50% of the first $50 million; |
| | 0.45% of the next $150 million; |
| | 0.40% of the next $250 million; and |
| | 0.35% of any excess over $450 million |
Strategic Emerging Markets Fund | | 0.70% |
244
Notes to Financial Statements(Continued)
The Funds’ subadvisory fees are paid monthly by MML Advisers out of the advisory fees previously disclosed above.
Administration Fees
Under an Administrative and Shareholder Services Agreement between the Trust and MML Advisers, on behalf of each Fund, MML Advisers is obligated to provide certain administrative and shareholder services. In return for these services, MML Advisers receives an administrative services fee, based upon the average daily net assets of the applicable class of shares of the Funds, at the following annual rates:
| | | | | | | | | | | | | | | | | | | | | | | | | | | | |
| | | Class I | | | Class R5 | | | Service
Class | | | Administrative
Class | | | Class A | | | Class R4 | | | Class R3 | |
U.S. Government Money Market Fund | | | N/A | | | | 0.10% | | | | N/A | | | | N/A | | | | N/A | | | | N/A | | | | N/A | |
Short-Duration Bond Fund | | | None | | | | 0.10% | | | | 0.15% | | | | 0.15% | | | | 0.15% | | | | 0.20% | | | | 0.20% | |
Inflation-Protected and Income Fund | | | None | | | | 0.10% | | | | 0.15% | | | | 0.15% | | | | 0.15% | | | | 0.20% | | | | 0.20% | |
Core Bond Fund | | | None | | | | 0.10% | | | | 0.15% | | | | 0.15% | | | | 0.15% | | | | 0.20% | | | | 0.20% | |
Diversified Bond Fund | | | None | | | | 0.10% | | | | 0.15% | | | | 0.15% | | | | 0.15% | | | | 0.20% | | | | 0.20% | |
High Yield Fund | | | None | | | | 0.10% | | | | 0.15% | | | | 0.15% | | | | 0.15% | | | | 0.20% | | | | 0.20% | |
Balanced Fund | | | None | | | | 0.10% | | | | 0.15% | | | | 0.15% | | | | 0.15% | | | | 0.20% | | | | 0.20% | |
Disciplined Value Fund | | | None | | | | 0.10% | | | | 0.15% | | | | 0.15% | | | | 0.15% | | | | 0.20% | | | | 0.20% | |
Main Street Fund | | | None | | | | 0.10% | | | | 0.15% | | | | 0.15% | | | | 0.15% | | | | 0.20% | | | | 0.20% | |
Disciplined Growth Fund | | | None | | | | 0.10% | | | | 0.15% | | | | 0.15% | | | | 0.15% | | | | 0.20% | | | | 0.20% | |
Small Cap Opportunities Fund | | | None | | | | 0.10% | | | | 0.15% | | | | 0.15% | | | | 0.15% | | | | 0.20% | | | | 0.20% | |
Global Fund | | | None | | | | 0.10% | | | | 0.15% | | | | 0.15% | | | | 0.15% | | | | 0.20% | | | | 0.20% | |
International Equity Fund | | | None | | | | 0.10% | | | | 0.15% | | | | 0.15% | | | | 0.15% | | | | 0.20% | | | | 0.20% | |
Strategic Emerging Markets Fund | | | None | | | | 0.10% | | | | 0.15% | | | | 0.15% | | | | 0.15% | | | | 0.20% | | | | 0.20% | |
Distribution and Service Fees
MML Distributors, LLC (the “Distributor”) acts as distributor to each Fund. Pursuant to a 12b-1 Plan adopted by the Trust, Class A shares and Class R4 shares of each Fund pay an annual fee of 0.25% of the average daily net assets of the class; and Class R3 shares of each Fund pay an annual fee of 0.50% of the average daily net assets of the class, to the Distributor. Such payments compensate the Distributor for services provided and expenses incurred by it for purposes of promoting the sale of the relevant class of shares, reducing redemptions of shares, or maintaining or improving services provided to each Fund’s shareholders. The Distributor is a wholly-owned subsidiary of MassMutual.
Effective April 1, 2014, the Trust entered into a separate Supplemental Shareholder Services Agreement with MassMutual, on behalf of Service Class shares, Administrative Class shares, and Class A shares of each Fund. Fees payable under the Supplemental Shareholder Services Agreement are intended to compensate MassMutual for its provision of shareholder services to the Funds’ investors and are calculated and paid based on the average daily net assets attributable to the relevant share classes of the Funds separately, at the following annual rates: 0.05% for Service Class shares, and 0.15% for Administrative Class shares and Class A shares. MassMutual may pay these fees to other intermediaries for providing shareholder services to the Funds’ investors.
Expense Caps and Waivers
Effective February 1, 2019, MML Advisers has agreed to cap the fees and expenses of the Fund noted below (other than extraordinary litigation and legal expenses, Acquired Fund Fees and Expenses#, interest expense, short sale dividend and loan
245
Notes to Financial Statements(Continued)
expense, or other non-recurring or unusual expenses such as organizational expenses and shareholder meeting expenses, as applicable), based upon the average daily net assets of the applicable class of shares of the Fund, as follows:
| | | | | | | | | | | | | | | | | | | | | | | | | | | | |
| | | Class I | | | Class R5 | | | Service
Class | | | Administrative
Class | | | Class A | | | Class R4 | | | Class R3 | |
Strategic Emerging Markets Fund* | | | 1.15% | | | | 1.25% | | | | 1.35% | | | | 1.45% | | | | 1.70% | | | | 1.60% | | | | 1.85% | |
| # | Acquired Fund Fees and Expenses are borne indirectly by a Fund through investments in other pooled investment vehicles. |
| * | Expense caps in effect through January 31, 2020. |
Prior to February 1, 2019, MML Advisers agreed to cap the fees and expenses of the Funds noted below (other than extraordinary litigation and legal expenses, Acquired Fund Fees and Expenses#, interest expense, short sale dividend and loan expense, or other non-recurring or unusual expenses such as organizational expenses and shareholder meeting expenses, as applicable), based upon the average daily net assets of the applicable class of shares for the Funds, as follows:
| | | | | | | | | | | | | | | | | | | | | | | | | | | | |
| | | Class I | | | Class R5 | | | Service
Class | | | Administrative
Class | | | Class A | | | Class R4 | | | Class R3 | |
Diversified Bond Fund | | | 0.52% | | | | 0.62% | | | | 0.72% | | | | 0.82% | | | | 1.07% | | | | 0.97% | | | | 1.22% | |
High Yield Fund | | | 0.55% | | | | 0.65% | | | | 0.75% | | | | 0.85% | | | | 1.10% | | | | 1.00% | | | | 1.25% | |
Balanced Fund | | | 0.60% | | | | 0.70% | | | | 0.80% | | | | 0.90% | | | | 1.15% | | | | 1.05% | | | | 1.30% | |
Strategic Emerging Markets Fund | | | 1.05% | | | | 1.15% | | | | 1.25% | | | | 1.35% | | | | 1.60% | | | | 1.50% | | | | 1.75% | |
| # | Acquired Fund Fees and Expenses are expenses borne indirectly by a Fund through investments in other pooled investment vehicles. |
Effective November 1, 2018, MML Advisers has agreed to cap the fees and expenses of the Fund noted below (other than extraordinary litigation and legal expenses, Acquired Fund Fees and Expenses#, short sale dividend and loan expense, or other non-recurring or unusual expenses such as organizational expenses and shareholder meeting expenses, as applicable), based upon the average daily net assets of the applicable class of shares of the Fund, as follows:
| | | | | | | | | | | | | | | | | | | | | | | | | | | | |
| | | Class I | | | Class R5 | | | Service
Class | | | Administrative
Class | | | Class A | | | Class R4 | | | Class R3 | |
Inflation-Protected and Income Fund** | | | 0.48% | | | | 0.58% | | | | 0.68% | | | | 0.78% | | | | 1.03% | | | | 0.93% | | | | 1.18% | |
| # | Acquired Fund Fees and Expenses are borne indirectly by a Fund through investments in other pooled investment vehicles. |
| ** | Expense caps in effect through January 31, 2020. |
MML Advisers voluntarily waived 0.03% of the advisory fee of the Inflation-Protected and Income Fund through January 31, 2019.
MML Advisers voluntarily waived 0.02% of the advisory fees through January 31, 2019 and, effective July 1, 2019, has agreed to waive 0.02% of the advisory fees through January 31, 2021 of the International Equity Fund.
Expense caps and waiver amounts are reflected as a reduction of expenses on the Statements of Operations.
Deferred Compensation
Trustees of the Funds who are not officers or employees of MassMutual may elect to defer receipt of their annual fees in accordance with terms of aNon-Qualified Deferred Compensation Plan. Amounts deferred shall accrue interest or earnings and shall be recorded on the Funds’ books as other liabilities. Deferred compensation is included within Trustees’ fees and expenses in the Statements of Assets and Liabilities.
246
Notes to Financial Statements(Continued)
Other
Certain officers and trustees of the Funds may also be employees of MassMutual. The compensation of a trustee who is not an employee of MassMutual is borne by the Funds.
The following table shows beneficial ownership of Funds’ shares by affiliated parties at September 30, 2019:
| | | | |
| | | Total % Ownership
by Related Party | |
U.S. Government Money Market Fund | | | 48.0% | |
Short-Duration Bond Fund | | | 82.6% | |
Inflation-Protected and Income Fund | | | 75.3% | |
Core Bond Fund | | | 79.5% | |
Diversified Bond Fund | | | 51.7% | |
High Yield Fund | | | 71.0% | |
Balanced Fund | | | 73.3% | |
Disciplined Value Fund | | | 88.4% | |
Main Street Fund | | | 79.5% | |
Disciplined Growth Fund | | | 76.3% | |
Small Cap Opportunities Fund | | | 64.8% | |
Global Fund | | | 76.4% | |
International Equity Fund | | | 87.3% | |
Strategic Emerging Markets Fund | | | 99.2% | |
| 4. | | Purchases and Sales of Investments |
Cost of purchases and proceeds from sales of investment securities (excluding short-term investments) for the year ended September 30, 2019, were as follows:
| | | | | | | | | | | | | | | | |
| | | Purchases | | | Sales | |
| | | Long-Term U.S.
Government
Securities | | | Other
Long-Term
Securities | | | Long-Term U.S.
Government
Securities | | | Other
Long-Term
Securities | |
Short-Duration Bond Fund | | $ | 51,127,671 | | | $ | 243,731,752 | | | $ | 58,652,299 | | | $ | 209,595,183 | |
Inflation-Protected and Income Fund | | | 53,368,425 | | | | 69,956,798 | | | | 139,710,783 | | | | 83,542,647 | |
Core Bond Fund | | | 3,080,541,342 | | | | 452,462,546 | | | | 3,083,394,511 | | | | 355,063,188 | |
Diversified Bond Fund | | | 430,877,980 | | | | 88,796,131 | | | | 424,661,858 | | | | 66,275,949 | |
High Yield Fund | | | - | | | | 295,064,650 | | | | - | | | | 284,100,918 | |
Balanced Fund | | | 132,218,327 | | | | 55,018,647 | | | | 128,515,983 | | | | 54,695,331 | |
Disciplined Value Fund | | | - | | | | 70,365,648 | | | | - | | | | 112,578,806 | |
Main Street Fund | | | - | | | | 68,387,088 | | | | - | | | | 95,614,181 | |
Disciplined Growth Fund | | | - | | | | 143,342,017 | | | | - | | | | 218,066,059 | |
Small Cap Opportunities Fund | | | - | | | | 71,364,893 | | | | - | | | | 98,831,986 | |
Global Fund | | | - | | | | 96,143,010 | | | | - | | | | 106,588,776 | |
International Equity Fund | | | - | | | | 200,137,675 | | | | - | | | | 412,157,174 | |
Strategic Emerging Markets Fund | | | - | | | | 58,571,561 | | | | - | | | | 132,364,947 | |
247
Notes to Financial Statements(Continued)
The Funds may purchase from, or sell securities to, other affiliated Funds under procedures adopted by the Trustees. These procedures have been designed to ensure that cross trades conducted by the Funds comply with Rule17a-7 under the 1940 Act. The cross trades disclosed in the table below are included within the respective purchases and sales amounts shown in the table above, as applicable.
| | | | | | | | |
Fund | | Purchases | | | Sales | |
Main Street Fund | | $ | 1,042 | | | $ | 539,186 | |
Small Cap Opportunities Fund | | | 403,366 | | | | - | |
Global Fund | | | 15,375 | | | | 249,870 | |
International Equity Fund | | | 61,106 | | | | 88,357,943 | |
Strategic Emerging Markets Fund | | | 25,174 | | | | - | |
| 5. | | Capital Share Transactions |
Changes in shares outstanding for each Fund were as follows:
| | | | | | | | | | | | | | | | |
| | | Year Ended September 30, 2019 | | | Year Ended September 30, 2018 | |
| | | Shares | | | Amount | | | Shares | | | Amount | |
| | | | | | | | | | | | | |
| U.S. Government Money Market Fund Class R5 | |
Sold | | | 1,331,672,991 | | | $ | 1,331,672,991 | | | | 1,634,442,005 | | | $ | 1,634,442,005 | |
Issued as reinvestment of dividends | | | 6,237,689 | | | | 6,237,689 | | | | 4,051,053 | | | | 4,051,053 | |
Redeemed | | | (1,343,903,475 | ) | | | (1,343,903,475 | ) | | | (1,651,239,818 | ) | | | (1,651,239,818 | ) |
| | | | | | | | | | | | | | | | |
Net increase (decrease) | | | (5,992,795 | ) | | $ | (5,992,795 | ) | | | (12,746,760 | ) | | $ | (12,746,760 | ) |
| | | | | | | | | | | | | | | | |
| Short-Duration Bond Fund Class I | |
Sold | | | 11,237,045 | | | $ | 114,624,486 | | | | 10,106,165 | | | $ | 103,558,175 | |
Issued as reinvestment of dividends | | | 722,304 | | | | 7,172,482 | | | | 743,720 | | | | 7,548,756 | |
Redeemed | | | (8,009,695 | ) | | | (81,335,446 | ) | | | (23,810,795 | ) | | | (244,511,740 | ) |
| | | | | | | | | | | | | | | | |
Net increase (decrease) | | | 3,949,654 | | | $ | 40,461,522 | | | | (12,960,910 | ) | | $ | (133,404,809 | ) |
| | | | | | | | | | | | | | | | |
| Short-Duration Bond Fund Class R5 | |
Sold | | | 5,675,044 | | | $ | 57,906,445 | | | | 4,974,732 | | | $ | 51,046,998 | |
Issued as reinvestment of dividends | | | 471,038 | | | | 4,696,245 | | | | 351,454 | | | | 3,581,314 | |
Redeemed | | | (3,886,993 | ) | | | (39,752,303 | ) | | | (7,101,253 | ) | | | (73,093,674 | ) |
| | | | | | | | | | | | | | | | |
Net increase (decrease) | | | 2,259,089 | | | $ | 22,850,387 | | | | (1,775,067 | ) | | $ | (18,465,362 | ) |
| | | | | | | | | | | | | | | | |
| Short-Duration Bond Fund Service Class | |
Sold | | | 1,403,928 | | | $ | 14,169,640 | | | | 2,762,265 | | | $ | 28,231,157 | |
Issued as reinvestment of dividends | | | 219,466 | | | | 2,172,717 | | | | 177,885 | | | | 1,800,199 | |
Redeemed | | | (3,697,465 | ) | | | (37,741,167 | ) | | | (3,172,568 | ) | | | (32,429,634 | ) |
| | | | | | | | | | | | | | | | |
Net increase (decrease) | | | (2,074,071 | ) | | $ | (21,398,810 | ) | | | (232,418 | ) | | $ | (2,398,278 | ) |
| | | | | | | | | | | | | | | | |
| Short-Duration Bond Fund Administrative Class | |
Sold | | | 603,747 | | | $ | 6,077,886 | | | | 1,202,823 | | | $ | 12,242,262 | |
Issued as reinvestment of dividends | | | 112,687 | | | | 1,112,224 | | | | 66,929 | | | | 675,313 | |
Redeemed | | | (1,018,975 | ) | | | (10,315,813 | ) | | | (697,315 | ) | | | (7,091,000 | ) |
| | | | | | | | | | | | | | | | |
Net increase (decrease) | | | (302,541 | ) | | $ | (3,125,703 | ) | | | 572,437 | | | $ | 5,826,575 | |
| | | | | | | | | | | | | | | | |
| Short-Duration Bond Fund Class A | |
Sold | | | 1,517,014 | | | $ | 15,272,722 | | | | 2,381,969 | | | $ | 24,087,817 | |
Issued as reinvestment of dividends | | | 196,382 | | | | 1,926,511 | | | | 113,653 | | | | 1,139,950 | |
Redeemed | | | (1,504,303 | ) | | | (15,041,585 | ) | | | (2,220,862 | ) | | | (22,414,094 | ) |
| | | | | | | | | | | | | | | | |
Net increase (decrease) | | | 209,093 | | | $ | 2,157,648 | | | | 274,760 | | | $ | 2,813,673 | |
| | | | | | | | | | | | | | | | |
248
Notes to Financial Statements(Continued)
| | | | | | | | | | | | | | | | |
| | | Year Ended September 30, 2019 | | | Year Ended September 30, 2018 | |
| | | Shares | | | Amount | | | Shares | | | Amount | |
| | | | | | | | | | | | | |
| Short-Duration Bond Fund Class R4 | |
Sold | | | 338,663 | | | $ | 3,420,688 | | | | 359,847 | | | $ | 3,672,330 | |
Issued as reinvestment of dividends | | | 44,583 | | | | 442,706 | | | | 29,151 | | | | 295,883 | |
Redeemed | | | (500,995 | ) | | | (5,065,219 | ) | | | (376,372 | ) | | | (3,841,630 | ) |
| | | | | | | | | | | | | | | | |
Net increase (decrease) | | | (117,749 | ) | | $ | (1,201,825 | ) | | | 12,626 | | | $ | 126,583 | |
| | | | | | | | | | | | | | | | |
| Short-Duration Bond Fund Class R3 | |
Sold | | | 346,491 | | | $ | 3,499,365 | | | | 290,039 | | | $ | 2,940,092 | |
Issued as reinvestment of dividends | | | 25,912 | | | | 256,012 | | | | 12,632 | | | | 127,705 | |
Redeemed | | | (464,621 | ) | | | (4,677,821 | ) | | | (169,578 | ) | | | (1,721,203 | ) |
| | | | | | | | | | | | | | | | |
Net increase (decrease) | | | (92,218 | ) | | $ | (922,444 | ) | | | 133,093 | | | $ | 1,346,594 | |
| | | | | | | | | | | | | | | | |
| Inflation-Protected and Income Fund Class I | |
Sold | | | 4,769,855 | | | $ | 48,558,437 | | | | 7,869,782 | | | $ | 80,850,575 | |
Issued as reinvestment of dividends | | | 430,466 | | | | 4,218,564 | | | | 285,844 | | | | 2,927,040 | |
Redeemed | | | (3,634,908 | ) | | | (36,914,487 | ) | | | (4,536,837 | ) | | | (46,557,972 | ) |
| | | | | | | | | | | | | | | | |
Net increase (decrease) | | | 1,565,413 | | | $ | 15,862,514 | | | | 3,618,789 | | | $ | 37,219,643 | |
| | | | | | | | | | | | | | | | |
| Inflation-Protected and Income Fund Class R5 | |
Sold | | | 2,002,638 | | | $ | 20,550,947 | | | | 2,066,590 | | | $ | 21,140,242 | |
Issued as reinvestment of dividends | | | 191,642 | | | | 1,880,006 | | | | 158,962 | | | | 1,630,948 | |
Redeemed | | | (1,137,534 | ) | | | (11,677,300 | ) | | | (2,104,030 | ) | | | (21,707,186 | ) |
| | | | | | | | | | | | | | | | |
Net increase (decrease) | | | 1,056,746 | | | $ | 10,753,653 | | | | 121,522 | | | $ | 1,064,004 | |
| | | | | | | | | | | | | | | | |
| Inflation-Protected and Income Fund Service Class | |
Sold | | | 738,699 | | | $ | 7,545,447 | | | | 825,796 | | | $ | 8,452,422 | |
Issued as reinvestment of dividends | | | 148,067 | | | | 1,448,100 | | | | 133,520 | | | | 1,365,911 | |
Redeemed | | | (1,009,421 | ) | | | (10,234,536 | ) | | | (1,552,037 | ) | | | (16,039,171 | ) |
| | | | | | | | | | | | | | | | |
Net increase (decrease) | | | (122,655 | ) | | $ | (1,240,989 | ) | | | (592,721 | ) | | $ | (6,220,838 | ) |
| | | | | | | | | | | | | | | | |
| Inflation-Protected and Income Fund Administrative Class | |
Sold | | | 481,364 | | | $ | 4,895,076 | | | | 369,129 | | | $ | 3,816,046 | |
Issued as reinvestment of dividends | | | 42,796 | | | | 423,256 | | | | 35,074 | | | | 362,670 | |
Redeemed | | | (438,145 | ) | | | (4,458,680 | ) | | | (352,788 | ) | | | (3,648,937 | ) |
| | | | | | | | | | | | | | | | |
Net increase (decrease) | | | 86,015 | | | $ | 859,652 | | | | 51,415 | | | $ | 529,779 | |
| | | | | | | | | | | | | | | | |
| Inflation-Protected and Income Fund Class A | |
Sold | | | 473,235 | | | $ | 4,758,574 | | | | 400,937 | | | $ | 4,049,416 | |
Issued as reinvestment of dividends | | | 51,135 | | | | 493,963 | | | | 49,070 | | | | 495,608 | |
Redeemed | | | (1,019,829 | ) | | | (10,188,262 | ) | | | (561,452 | ) | | | (5,685,283 | ) |
| | | | | | | | | | | | | | | | |
Net increase (decrease) | | | (495,459 | ) | | $ | (4,935,725 | ) | | | (111,445 | ) | | $ | (1,140,259 | ) |
| | | | | | | | | | | | | | | | |
| Inflation-Protected and Income Fund Class R4 | |
Sold | | | 233,527 | | | $ | 2,326,856 | | | | 285,772 | | | $ | 2,886,526 | |
Issued as reinvestment of dividends | | | 18,033 | | | | 173,122 | | | | 15,735 | | | | 157,975 | |
Redeemed | | | (263,174 | ) | | | (2,606,018 | ) | | | (226,782 | ) | | | (2,289,323 | ) |
| | | | | | | | | | | | | | | | |
Net increase (decrease) | | | (11,614 | ) | | $ | (106,040 | ) | | | 74,725 | | | $ | 755,178 | |
| | | | | | | | | | | | | | | | |
| Inflation-Protected and Income Fund Class R3 | |
Sold | | | 141,891 | | | $ | 1,412,120 | | | | 203,780 | | | $ | 2,042,245 | |
Issued as reinvestment of dividends | | | 11,444 | | | | 110,088 | | | | 11,166 | | | | 112,214 | |
Redeemed | | | (194,688 | ) | | | (1,923,350 | ) | | | (216,085 | ) | | | (2,167,066 | ) |
| | | | | | | | | | | | | | | | |
Net increase (decrease) | | | (41,353 | ) | | $ | (401,142 | ) | | | (1,139 | ) | | $ | (12,607 | ) |
| | | | | | | | | | | | | | | | |
249
Notes to Financial Statements(Continued)
| | | | | | | | | | | | | | | | |
| | | Year Ended September 30, 2019 | | | Year Ended September 30, 2018 | |
| | | Shares | | | Amount | | | Shares | | | Amount | |
| | | | | | | | | | | | | |
| Core Bond Fund Class I | |
Sold | | | 24,647,274 | | | $ | 264,896,073 | | | | 22,783,365 | | | $ | 243,037,250 | |
Issued as reinvestment of dividends | | | 2,312,656 | | | | 23,843,483 | | | | 1,514,765 | | | | 16,298,876 | |
Redeemed | | | (17,383,135 | ) | | | (186,973,836 | ) | | | (8,603,406 | ) | | | (92,352,193 | ) |
| | | | | | | | | | | | | | | | |
Net increase (decrease) | | | 9,576,795 | | | $ | 101,765,720 | | | | 15,694,724 | | | $ | 166,983,933 | |
| | | | | | | | | | | | | | | | |
| Core Bond Fund Class R5 | |
Sold | | | 4,982,113 | | | $ | 54,433,354 | | | | 2,778,298 | | | $ | 29,909,932 | |
Issued as reinvestment of dividends | | | 847,450 | | | | 8,771,104 | | | | 929,861 | | | | 10,042,498 | |
Redeemed | | | (5,402,116 | ) | | | (57,734,793 | ) | | | (8,540,433 | ) | | | (92,141,095 | ) |
| | | | | | | | | | | | | | | | |
Net increase (decrease) | | | 427,447 | | | $ | 5,469,665 | | | | (4,832,274 | ) | | $ | (52,188,665 | ) |
| | | | | | | | | | | | | | | | |
| Core Bond Fund Service Class | |
Sold | | | 1,125,854 | | | $ | 12,212,574 | | | | 1,696,831 | | | $ | 18,067,651 | |
Issued as reinvestment of dividends | | | 274,078 | | | | 2,820,260 | | | | 265,104 | | | | 2,847,221 | |
Redeemed | | | (3,250,559 | ) | | | (35,348,490 | ) | | | (1,577,235 | ) | | | (16,858,554 | ) |
| | | | | | | | | | | | | | | | |
Net increase (decrease) | | | (1,850,627 | ) | | $ | (20,315,656 | ) | | | 384,700 | | | $ | 4,056,318 | |
| | | | | | | | | | | | | | | | |
| Core Bond Fund Administrative Class | |
Sold | | | 932,538 | | | $ | 10,063,209 | | | | 1,642,019 | | | $ | 17,332,769 | |
Issued as reinvestment of dividends | | | 204,168 | | | | 2,086,599 | | | | 184,551 | | | | 1,969,162 | |
Redeemed | | | (1,723,811 | ) | | | (18,338,331 | ) | | | (1,778,250 | ) | | | (18,868,378 | ) |
| | | | | | | | | | | | | | | | |
Net increase (decrease) | | | (587,105 | ) | | $ | (6,188,523 | ) | | | 48,320 | | | $ | 433,553 | |
| | | | | | | | | | | | | | | | |
| Core Bond Fund Class A | |
Sold | | | 1,004,600 | | | $ | 10,668,442 | | | | 1,491,298 | | | $ | 15,702,424 | |
Issued as reinvestment of dividends | | | 277,919 | | | | 2,820,882 | | | | 256,523 | | | | 2,716,576 | |
Redeemed | | | (2,739,046 | ) | | | (28,934,737 | ) | | | (2,115,044 | ) | | | (22,349,113 | ) |
| | | | | | | | | | | | | | | | |
Net increase (decrease) | | | (1,456,527 | ) | | $ | (15,445,413 | ) | | | (367,223 | ) | | $ | (3,930,113 | ) |
| | | | | | | | | | | | | | | | |
| Core Bond Fund Class R4 | |
Sold | | | 493,233 | | | $ | 5,135,939 | | | | 599,474 | | | $ | 6,346,602 | |
Issued as reinvestment of dividends | | | 34,573 | | | | 348,493 | | | | 42,930 | | | | 452,049 | |
Redeemed | | | (281,474 | ) | | | (2,958,999 | ) | | | (994,402 | ) | | | (10,285,227 | ) |
| | | | | | | | | | | | | | | | |
Net increase (decrease) | | | 246,332 | | | $ | 2,525,433 | | | | (351,998 | ) | | $ | (3,486,576 | ) |
| | | | | | | | | | | | | | | | |
| Core Bond Fund Class R3 | |
Sold | | | 77,905 | | | $ | 868,497 | | | | 32,471 | | | $ | 347,294 | |
Issued as reinvestment of dividends | | | 2,087 | | | | 21,641 | | | | 1,146 | | | | 12,415 | |
Redeemed | | | (47,161 | ) | | | (516,604 | ) | | | (33,483 | ) | | | (365,432 | ) |
| | | | | | | | | | | | | | | | |
Net increase (decrease) | | | 32,831 | | | $ | 373,534 | | | | 134 | | | $ | (5,723 | ) |
| | | | | | | | | | | | | | | | |
| Diversified Bond Fund Class I | |
Sold | | | 4,432,486 | | | $ | 48,173,645 | | | | 1,324,721 | | | $ | 14,093,601 | |
Issued as reinvestment of dividends | | | 78,600 | | | | 803,296 | | | | 78,951 | | | | 843,981 | |
Redeemed | | | (1,159,866 | ) | | | (12,271,054 | ) | | | (1,861,259 | ) | | | (19,736,385 | ) |
| | | | | | | | | | | | | | | | |
Net increase (decrease) | | | 3,351,220 | | | $ | 36,705,887 | | | | (457,587 | ) | | $ | (4,798,803 | ) |
| | | | | | | | | | | | | | | | |
| Diversified Bond Fund Class R5 | |
Sold | | | 2,119,174 | | | $ | 20,940,783 | | | | 1,987,736 | | | $ | 19,520,566 | |
Issued as reinvestment of dividends | | | 366,569 | | | | 3,456,741 | | | | 279,350 | | | | 2,762,770 | |
Redeemed | | | (1,997,969 | ) | | | (19,459,573 | ) | | | (945,032 | ) | | | (9,313,768 | ) |
| | | | | | | | | | | | | | | | |
Net increase (decrease) | | | 487,774 | | | $ | 4,937,951 | | | | 1,322,054 | | | $ | 12,969,568 | |
| | | | | | | | | | | | | | | | |
250
Notes to Financial Statements(Continued)
| | | | | | | | | | | | | | | | |
| | | Year Ended September 30, 2019 | | | Year Ended September 30, 2018 | |
| | | Shares | | | Amount | | | Shares | | | Amount | |
| | | | | | | | | | | | | |
| Diversified Bond Fund Service Class | |
Sold | | | 168,384 | | | $ | 1,696,825 | | | | 804,805 | | | $ | 7,956,675 | |
Issued as reinvestment of dividends | | | 49,353 | | | | 472,306 | | | | 45,439 | | | | 455,302 | |
Redeemed | | | (898,867 | ) | | | (8,857,395 | ) | | | (498,529 | ) | | | (5,004,950 | ) |
| | | | | | | | | | | | | | | | |
Net increase (decrease) | | | (681,130 | ) | | $ | (6,688,264 | ) | | | 351,715 | | | $ | 3,407,027 | |
| | | | | | | | | | | | | | | | |
| Diversified Bond Fund Administrative Class | |
Sold | | | 414,721 | | | $ | 4,131,180 | | | | 629,189 | | | $ | 6,241,735 | |
Issued as reinvestment of dividends | | | 69,720 | | | | 665,828 | | | | 73,855 | | | | 738,553 | |
Redeemed | | | (1,140,810 | ) | | | (11,396,359 | ) | | | (561,494 | ) | | | (5,577,202 | ) |
| | | | | | | | | | | | | | | | |
Net increase (decrease) | | | (656,369 | ) | | $ | (6,599,351 | ) | | | 141,550 | | | $ | 1,403,086 | |
| | | | | | | | | | | | | | | | |
| Diversified Bond Fund Class A | |
Sold | | | 388,197 | | | $ | 3,877,401 | | | | 787,151 | | | $ | 7,791,616 | |
Issued as reinvestment of dividends | | | 89,996 | | | | 858,563 | | | | 87,585 | | | | 874,975 | |
Redeemed | | | (1,008,253 | ) | | | (10,157,105 | ) | | | (919,681 | ) | | | (9,094,361 | ) |
| | | | | | | | | | | | | | | | |
Net increase (decrease) | | | (530,060 | ) | | $ | (5,421,141 | ) | | | (44,945 | ) | | $ | (427,770 | ) |
| | | | | | | | | | | | | | | | |
| Diversified Bond Fund Class R4 | |
Sold | | | 363,034 | | | $ | 3,570,002 | | | | 96,755 | | | $ | 951,473 | |
Issued as reinvestment of dividends | | | 20,459 | | | | 193,130 | | | | 14,371 | | | | 142,412 | |
Redeemed | | | (200,398 | ) | | | (1,992,151 | ) | | | (122,877 | ) | | | (1,207,967 | ) |
| | | | | | | | | | | | | | | | |
Net increase (decrease) | | | 183,095 | | | $ | 1,770,981 | | | | (11,751 | ) | | $ | (114,082 | ) |
| | | | | | | | | | | | | | | | |
| Diversified Bond Fund Class R3 | |
Sold | | | 85,656 | | | $ | 843,759 | | | | 130,676 | | | $ | 1,279,675 | |
Issued as reinvestment of dividends | | | 12,103 | | | | 114,013 | | | | 10,311 | | | | 101,773 | |
Redeemed | | | (219,953 | ) | | | (2,174,820 | ) | | | (58,055 | ) | | | (569,674 | ) |
| | | | | | | | | | | | | | | | |
Net increase (decrease) | | | (122,194 | ) | | $ | (1,217,048 | ) | | | 82,932 | | | $ | 811,774 | |
| | | | | | | | | | | | | | | | |
| High Yield Fund Class I | |
Sold | | | 13,454,925 | | | $ | 119,780,618 | | | | 21,534,203 | | | $ | 198,712,130 | |
Issued as reinvestment of dividends | | | 2,286,979 | | | | 19,347,843 | | | | 1,686,568 | | | | 15,212,849 | |
Redeemed | | | (21,562,709 | ) | | | (191,402,484 | ) | | | (7,118,844 | ) | | | (65,255,094 | ) |
| | | | | | | | | | | | | | | | |
Net increase (decrease) | | | (5,820,805 | ) | | $ | (52,274,023 | ) | | | 16,101,927 | | | $ | 148,669,885 | |
| | | | | | | | | | | | | | | | |
| High Yield Fund Class R5 | |
Sold | | | 999,091 | | | $ | 8,984,134 | | | | 1,210,212 | | | $ | 11,122,712 | |
Issued as reinvestment of dividends | | | 267,401 | | | | 2,275,582 | | | | 375,174 | | | | 3,402,827 | |
Redeemed | | | (1,480,564 | ) | | | (13,166,309 | ) | | | (2,657,925 | ) | | | (24,198,393 | ) |
| | | | | | | | | | | | | | | | |
Net increase (decrease) | | | (214,072 | ) | | $ | (1,906,593 | ) | | | (1,072,539 | ) | | $ | (9,672,854 | ) |
| | | | | | | | | | | | | | | | |
| High Yield Fund Service Class | |
Sold | | | 823,525 | | | $ | 7,456,934 | | | | 514,400 | | | $ | 4,727,461 | |
Issued as reinvestment of dividends | | | 288,420 | | | | 2,454,456 | | | | 312,555 | | | | 2,834,872 | |
Redeemed | | | (662,544 | ) | | | (5,887,077 | ) | | | (1,092,778 | ) | | | (10,131,684 | ) |
| | | | | | | | | | | | | | | | |
Net increase (decrease) | | | 449,401 | | | $ | 4,024,313 | | | | (265,823 | ) | | $ | (2,569,351 | ) |
| | | | | | | | | | | | | | | | |
| High Yield Fund Administrative Class | |
Sold | | | 539,634 | | | $ | 4,801,988 | | | | 577,696 | | | $ | 5,236,660 | |
Issued as reinvestment of dividends | | | 175,196 | | | | 1,468,139 | | | | 222,144 | | | | 1,983,745 | |
Redeemed | | | (1,271,243 | ) | | | (11,177,491 | ) | | | (843,838 | ) | | | (7,592,294 | ) |
| | | | | | | | | | | | | | | | |
Net increase (decrease) | | | (556,413 | ) | | $ | (4,907,364 | ) | | | (43,998 | ) | | $ | (371,889 | ) |
| | | | | | | | | | | | | | | | |
251
Notes to Financial Statements(Continued)
| | | | | | | | | | | | | | | | |
| | | Year Ended September 30, 2019 | | | Year Ended September 30, 2018 | |
| | | Shares | | | Amount | | | Shares | | | Amount | |
| | | | | | | | | | | | | |
| High Yield Fund Class A | |
Sold | | | 1,265,970 | | | $ | 11,204,745 | | | | 670,122 | | | $ | 6,076,237 | |
Issued as reinvestment of dividends | | | 162,228 | | | | 1,357,846 | | | | 186,531 | | | | 1,665,727 | |
Redeemed | | | (966,562 | ) | | | (8,519,965 | ) | | | (951,520 | ) | | | (8,620,549 | ) |
| | | | | | | | | | | | | | | | |
Net increase (decrease) | | | 461,636 | | | $ | 4,042,626 | | | | (94,867 | ) | | $ | (878,585 | ) |
| | | | | | | | | | | | | | | | |
| High Yield Fund Class R4 | |
Sold | | | 2,578,632 | | | $ | 22,111,480 | | | | 1,456,931 | | | $ | 13,030,381 | |
Issued as reinvestment of dividends | | | 216,148 | | | | 1,787,546 | | | | 212,480 | | | | 1,876,196 | |
Redeemed | | | (1,421,349 | ) | | | (12,310,460 | ) | | | (1,051,678 | ) | | | (9,421,862 | ) |
| | | | | | | | | | | | | | | | |
Net increase (decrease) | | | 1,373,431 | | | $ | 11,588,566 | | | | 617,733 | | | $ | 5,484,715 | |
| | | | | | | | | | | | | | | | |
| High Yield Fund Class R3 | |
Sold | | | 745,706 | | | $ | 6,655,229 | | | | 1,632,126 | | | $ | 15,020,841 | |
Issued as reinvestment of dividends | | | 263,316 | | | | 2,230,290 | | | | 255,256 | | | | 2,304,959 | |
Redeemed | | | (1,242,387 | ) | | | (10,964,684 | ) | | | (831,635 | ) | | | (7,585,009 | ) |
| | | | | | | | | | | | | | | | |
Net increase (decrease) | | | (233,365 | ) | | $ | (2,079,165 | ) | | | 1,055,747 | | | $ | 9,740,791 | |
| | | | | | | | | | | | | | | | |
| Balanced Fund Class I | |
Sold | | | 2,015,264 | | | $ | 23,672,797 | | | | 474,665 | | | $ | 5,849,630 | |
Issued as reinvestment of dividends | | | 103,704 | | | | 1,128,296 | | | | 46,487 | | | | 570,403 | |
Redeemed | | | (409,628 | ) | | | (4,762,291 | ) | | | (275,684 | ) | | | (3,455,840 | ) |
| | | | | | | | | | | | | | | | |
Net increase (decrease) | | | 1,709,340 | | | $ | 20,038,802 | | | | 245,468 | | | $ | 2,964,193 | |
| | | | | | | | | | | | | | | | |
| Balanced Fund Class R5 | |
Sold | | | 533,987 | | | $ | 6,498,013 | | | | 291,984 | | | $ | 3,681,896 | |
Issued as reinvestment of dividends | | | 322,811 | | | | 3,512,186 | | | | 266,274 | | | | 3,267,180 | |
Redeemed | | | (619,845 | ) | | | (7,255,273 | ) | | | (980,947 | ) | | | (12,344,633 | ) |
| | | | | | | | | | | | | | | | |
Net increase (decrease) | | | 236,953 | | | $ | 2,754,926 | | | | (422,689 | ) | | $ | (5,395,557 | ) |
| | | | | | | | | | | | | | | | |
| Balanced Fund Service Class | |
Sold | | | 56,864 | | | $ | 704,414 | | | | 40,015 | | | $ | 528,265 | |
Issued as reinvestment of dividends | | | 40,978 | | | | 470,839 | | | | 36,872 | | | | 475,648 | |
Redeemed | | | (159,632 | ) | | | (2,010,098 | ) | | | (72,452 | ) | | | (949,210 | ) |
| | | | | | | | | | | | | | | | |
Net increase (decrease) | | | (61,790 | ) | | $ | (834,845 | ) | | | 4,435 | | | $ | 54,703 | |
| | | | | | | | | | | | | | | | |
| Balanced Fund Administrative Class | |
Sold | | | 87,979 | | | $ | 1,039,911 | | | | 140,237 | | | $ | 1,751,607 | |
Issued as reinvestment of dividends | | | 48,914 | | | | 535,122 | | | | 51,256 | | | | 631,984 | |
Redeemed | | | (191,364 | ) | | | (2,228,416 | ) | | | (310,393 | ) | | | (3,861,192 | ) |
| | | | | | | | | | | | | | | | |
Net increase (decrease) | | | (54,471 | ) | | $ | (653,383 | ) | | | (118,900 | ) | | $ | (1,477,601 | ) |
| | | | | | | | | | | | | | | | |
| Balanced Fund Class A | |
Sold | | | 160,969 | | | $ | 1,848,162 | | | | 162,501 | | | $ | 1,985,151 | |
Issued as reinvestment of dividends | | | 182,222 | | | | 1,935,198 | | | | 175,481 | | | | 2,104,021 | |
Redeemed | | | (483,832 | ) | | | (5,667,735 | ) | | | (570,242 | ) | | | (6,985,600 | ) |
| | | | | | | | | | | | | | | | |
Net increase (decrease) | | | (140,641 | ) | | $ | (1,884,375 | ) | | | (232,260 | ) | | $ | (2,896,428 | ) |
| | | | | | | | | | | | | | | | |
| Balanced Fund Class R4 | |
Sold | | | 67,879 | | | $ | 775,293 | | | | 54,087 | | | $ | 660,514 | |
Issued as reinvestment of dividends | | | 21,965 | | | | 231,293 | | | | 17,868 | | | | 212,627 | |
Redeemed | | | (126,383 | ) | | | (1,416,944 | ) | | | (22,635 | ) | | | (279,005 | ) |
| | | | | | | | | | | | | | | | |
Net increase (decrease) | | | (36,539 | ) | | $ | (410,358 | ) | | | 49,320 | | | $ | 594,136 | |
| | | | | | | | | | | | | | | | |
252
Notes to Financial Statements(Continued)
| | | | | | | | | | | | | | | | |
| | | Year Ended September 30, 2019 | | | Year Ended September 30, 2018 | |
| | | Shares | | | Amount | | | Shares | | | Amount | |
| | | | | | | | | | | | | |
| Balanced Fund Class R3 | |
Sold | | | 168,771 | | | $ | 1,930,659 | | | | 91,437 | | | $ | 1,097,904 | |
Issued as reinvestment of dividends | | | 61,641 | | | | 645,997 | | | | 42,461 | | | | 503,588 | |
Redeemed | | | (252,274 | ) | | | (2,810,057 | ) | | | (86,465 | ) | | | (1,037,397 | ) |
| | | | | | | | | | | | | | | | |
Net increase (decrease) | | | (21,862 | ) | | $ | (233,401 | ) | | | 47,433 | | | $ | 564,095 | |
| | | | | | | | | | | | | | | | |
| Disciplined Value Fund Class I | |
Sold | | | 160,261 | | | $ | 2,202,983 | | | | 732,864 | | | $ | 12,390,961 | |
Issued as reinvestment of dividends | | | 233,069 | | | | 2,950,659 | | | | 587,738 | | | | 9,680,040 | |
Redeemed | | | (338,730 | ) | | | (4,714,167 | ) | | | (4,674,834 | ) | | | (80,329,894 | ) |
| | | | | | | | | | | | | | | | |
Net increase (decrease) | | | 54,600 | | | $ | 439,475 | | | | (3,354,232 | ) | | $ | (58,258,893 | ) |
| | | | | | | | | | | | | | | | |
| Disciplined Value Fund Class R5 | |
Sold | | | 123,108 | | | $ | 1,736,363 | | | | 1,002,794 | | | $ | 15,968,735 | |
Issued as reinvestment of dividends | | | 693,290 | | | | 8,804,772 | | | | 328,617 | | | | 5,425,465 | |
Redeemed | | | (493,934 | ) | | | (7,042,796 | ) | | | (453,908 | ) | | | (7,767,239 | ) |
| | | | | | | | | | | | | | | | |
Net increase (decrease) | | | 322,464 | | | $ | 3,498,339 | | | | 877,503 | | | $ | 13,626,961 | |
| | | | | | | | | | | | | | | | |
| Disciplined Value Fund Service Class | |
Sold | | | 326,225 | | | $ | 4,391,304 | | | | 301,299 | | | $ | 4,960,574 | |
Issued as reinvestment of dividends | | | 512,421 | | | | 6,451,380 | | | | 356,756 | | | | 5,847,242 | |
Redeemed | | | (2,324,597 | ) | | | (33,134,768 | ) | | | (515,208 | ) | | | (8,683,545 | ) |
| | | | | | | | | | | | | | | | |
Net increase (decrease) | | | (1,485,951 | ) | | $ | (22,292,084 | ) | | | 142,847 | | | $ | 2,124,271 | |
| | | | | | | | | | | | | | | | |
| Disciplined Value Fund Administrative Class | |
Sold | | | 35,597 | | | $ | 497,307 | | | | 208,182 | | | $ | 3,430,161 | |
Issued as reinvestment of dividends | | | 103,832 | | | | 1,338,400 | | | | 42,903 | | | | 716,916 | |
Redeemed | | | (265,367 | ) | | | (3,622,759 | ) | | | (55,714 | ) | | | (944,166 | ) |
| | | | | | | | | | | | | | | | |
Net increase (decrease) | | | (125,938 | ) | | $ | (1,787,052 | ) | | | 195,371 | | | $ | 3,202,911 | |
| | | | | | | | | | | | | | | | |
| Disciplined Value Fund Class A | |
Sold | | | 76,285 | | | $ | 1,015,797 | | | | 84,628 | | | $ | 1,363,885 | |
Issued as reinvestment of dividends | | | 102,118 | | | | 1,275,458 | | | | 62,167 | | | | 1,011,450 | |
Redeemed | | | (270,115 | ) | | | (3,700,038 | ) | | | (141,706 | ) | | | (2,388,469 | ) |
| | | | | | | | | | | | | | | | |
Net increase (decrease) | | | (91,712 | ) | | $ | (1,408,783 | ) | | | 5,089 | | | $ | (13,134 | ) |
| | | | | | | | | | | | | | | | |
| Disciplined Value Fund Class R4 | |
Sold | | | 30,449 | | | $ | 407,194 | | | | 95,743 | | | $ | 1,606,499 | |
Issued as reinvestment of dividends | | | 76,557 | | | | 948,544 | | | | 70,629 | | | | 1,140,657 | |
Redeemed | | | (196,329 | ) | | | (2,640,631 | ) | | | (366,195 | ) | | | (5,987,621 | ) |
| | | | | | | | | | | | | | | | |
Net increase (decrease) | | | (89,323 | ) | | $ | (1,284,893 | ) | | | (199,823 | ) | | $ | (3,240,465 | ) |
| | | | | | | | | | | | | | | | |
| Disciplined Value Fund Class R3 | |
Sold | | | 62,163 | | | $ | 861,475 | | | | 38,819 | | | $ | 645,381 | |
Issued as reinvestment of dividends | | | 50,347 | | | | 634,881 | | | | 27,451 | | | | 450,486 | |
Redeemed | | | (46,924 | ) | | | (636,881 | ) | | | (35,644 | ) | | | (593,089 | ) |
| | | | | | | | | | | | | | | | |
Net increase (decrease) | | | 65,586 | | | $ | 859,475 | | | | 30,626 | | | $ | 502,778 | |
| | | | | | | | | | | | | | | | |
| Main Street Fund Class I | |
Sold | | | 707,690 | | | $ | 7,459,768 | | | | 1,455,961 | | | $ | 17,025,915 | |
Issued as reinvestment of dividends | | | 311,387 | | | | 2,939,489 | | | | 72,068 | | | | 819,412 | |
Redeemed | | | (795,786 | ) | | | (8,188,803 | ) | | | (238,679 | ) | | | (2,760,638 | ) |
| | | | | | | | | | | | | | | | |
Net increase (decrease) | | | 223,291 | | | $ | 2,210,454 | | | | 1,289,350 | | | $ | 15,084,689 | |
| | | | | | | | | | | | | | | | |
253
Notes to Financial Statements(Continued)
| | | | | | | | | | | | | | | | |
| | | Year Ended September 30, 2019 | | | Year Ended September 30, 2018 | |
| | | Shares | | | Amount | | | Shares | | | Amount | |
| | | | | | | | | | | | | |
| Main Street Fund Class R5 | |
Sold | | | 320,187 | | | $ | 3,429,258 | | | | 308,862 | | | $ | 3,546,126 | |
Issued as reinvestment of dividends | | | 810,689 | | | | 7,652,907 | | | | 510,299 | | | | 5,802,095 | |
Redeemed | | | (2,396,090 | ) | | | (25,267,861 | ) | | | (1,781,903 | ) | | | (20,584,719 | ) |
| | | | | | | | | | | | | | | | |
Net increase (decrease) | | | (1,265,214 | ) | | $ | (14,185,696 | ) | | | (962,742 | ) | | $ | (11,236,498 | ) |
| | | | | | | | | | | | | | | | |
| Main Street Fund Service Class | |
Sold | | | 7,141 | | | $ | 83,854 | | | | 18,878 | | | $ | 218,315 | |
Issued as reinvestment of dividends | | | 7,635 | | | | 74,980 | | | | 7,049 | | | | 82,970 | |
Redeemed | | | (17,365 | ) | | | (202,749 | ) | | | (58,708 | ) | | | (661,875 | ) |
| | | | | | | | | | | | | | | | |
Net increase (decrease) | | | (2,589 | ) | | $ | (43,915 | ) | | | (32,781 | ) | | $ | (360,590 | ) |
| | | | | | | | | | | | | | | | |
| Main Street Fund Administrative Class | |
Sold | | | 169,186 | | | $ | 1,816,324 | | | | 272,926 | | | $ | 3,205,249 | |
Issued as reinvestment of dividends | | | 331,904 | | | | 3,133,171 | | | | 211,442 | | | | 2,404,098 | |
Redeemed | | | (642,203 | ) | | | (6,810,668 | ) | | | (731,927 | ) | | | (8,408,960 | ) |
| | | | | | | | | | | | | | | | |
Net increase (decrease) | | | (141,113 | ) | | $ | (1,861,173 | ) | | | (247,559 | ) | | $ | (2,799,613 | ) |
| | | | | | | | | | | | | | | | |
| Main Street Fund Class A | |
Sold | | | 89,198 | | | $ | 909,751 | | | | 209,870 | | | $ | 2,365,366 | |
Issued as reinvestment of dividends | | | 171,815 | | | | 1,597,879 | | | | 88,812 | | | | 996,464 | |
Redeemed | | | (303,230 | ) | | | (3,103,946 | ) | | | (188,836 | ) | | | (2,130,271 | ) |
| | | | | | | | | | | | | | | | |
Net increase (decrease) | | | (42,217 | ) | | $ | (596,316 | ) | | | 109,846 | | | $ | 1,231,559 | |
| | | | | | | | | | | | | | | | |
| Main Street Fund Class R4 | |
Sold | | | 41,075 | | | $ | 431,892 | | | | 134,127 | | | $ | 1,479,906 | |
Issued as reinvestment of dividends | | | 78,074 | | | | 719,840 | | | | 33,710 | | | | 375,529 | |
Redeemed | | | (71,044 | ) | | | (736,685 | ) | | | (75,265 | ) | | | (854,370 | ) |
| | | | | | | | | | | | | | | | |
Net increase (decrease) | | | 48,105 | | | $ | 415,047 | | | | 92,572 | | | $ | 1,001,065 | |
| | | | | | | | | | | | | | | | |
| Main Street Fund Class R3 | |
Sold | | | 8,724 | | | $ | 91,217 | | | | 75,280 | | | $ | 857,949 | |
Issued as reinvestment of dividends | | | 22,025 | | | | 205,497 | | | | 7,011 | | | | 78,877 | |
Redeemed | | | (69,865 | ) | | | (647,708 | ) | | | (26,603 | ) | | | (302,284 | ) |
| | | | | | | | | | | | | | | | |
Net increase (decrease) | | | (39,116 | ) | | $ | (350,994 | ) | | | 55,688 | | | $ | 634,542 | |
| | | | | | | | | | | | | | | | |
| Disciplined Growth Fund Class I | |
Sold | | | 679,048 | | | $ | 7,752,566 | | | | 1,248,695 | | | $ | 16,549,619 | |
Issued as reinvestment of dividends | | | 693,240 | | | | 6,509,520 | | | | 1,111,030 | | | | 14,032,308 | |
Redeemed | | | (900,524 | ) | | | (9,857,631 | ) | | | (8,880,927 | ) | | | (123,933,918 | ) |
| | | | | | | | | | | | | | | | |
Net increase (decrease) | | | 471,764 | | | $ | 4,404,455 | | | | (6,521,202 | ) | | $ | (93,351,991 | ) |
| | | | | | | | | | | | | | | | |
| Disciplined Growth Fund Class R5 | |
Sold | | | 911,451 | | | $ | 10,250,074 | | | | 1,802,066 | | | $ | 23,637,837 | |
Issued as reinvestment of dividends | | | 2,380,302 | | | | 22,374,835 | | | | 860,197 | | | | 10,881,489 | |
Redeemed | | | (1,951,550 | ) | | | (21,737,682 | ) | | | (1,484,931 | ) | | | (19,754,357 | ) |
| | | | | | | | | | | | | | | | |
Net increase (decrease) | | | 1,340,203 | | | $ | 10,887,227 | | | | 1,177,332 | | | $ | 14,764,969 | |
| | | | | | | | | | | | | | | | |
| Disciplined Growth Fund Service Class | |
Sold | | | 772,192 | | | $ | 8,172,909 | | | | 358,311 | | | $ | 4,838,194 | |
Issued as reinvestment of dividends | | | 1,601,401 | | | | 15,117,227 | | | | 711,031 | | | | 9,022,986 | |
Redeemed | | | (4,642,422 | ) | | | (51,282,818 | ) | | | (1,513,105 | ) | | | (19,801,006 | ) |
| | | | | | | | | | | | | | | | |
Net increase (decrease) | | | (2,268,829 | ) | | $ | (27,992,682 | ) | | | (443,763 | ) | | $ | (5,939,826 | ) |
| | | | | | | | | | | | | | | | |
254
Notes to Financial Statements(Continued)
| | | | | | | | | | | | | | | | |
| | | Year Ended September 30, 2019 | | | Year Ended September 30, 2018 | |
| | | Shares | | | Amount | | | Shares | | | Amount | |
| | | | | | | | | | | | | |
| Disciplined Growth Fund Administrative Class | |
Sold | | | 265,275 | | | $ | 3,046,171 | | | | 318,113 | | | $ | 4,338,774 | |
Issued as reinvestment of dividends | | | 892,271 | | | | 8,539,033 | | | | 375,691 | | | | 4,816,360 | |
Redeemed | | | (752,716 | ) | | | (8,456,239 | ) | | | (902,194 | ) | | | (12,069,585 | ) |
| | | | | | | | | | | | | | | | |
Net increase (decrease) | | | 404,830 | | | $ | 3,128,965 | | | | (208,390 | ) | | $ | (2,914,451 | ) |
| | | | | | | | | | | | | | | | |
| Disciplined Growth Fund Class A | |
Sold | | | 231,268 | | | $ | 2,609,037 | | | | 381,606 | | | $ | 5,117,644 | |
Issued as reinvestment of dividends | | | 862,355 | | | | 7,985,405 | | | | 344,100 | | | | 4,301,251 | |
Redeemed | | | (1,173,716 | ) | | | (12,206,478 | ) | | | (768,585 | ) | | | (10,082,034 | ) |
| | | | | | | | | | | | | | | | |
Net increase (decrease) | | | (80,093 | ) | | $ | (1,612,036 | ) | | | (42,879 | ) | | $ | (663,139 | ) |
| | | | | | | | | | | | | | | | |
| Disciplined Growth Fund Class R4 | |
Sold | | | 218,067 | | | $ | 2,411,721 | | | | 258,063 | | | $ | 3,395,895 | |
Issued as reinvestment of dividends | | | 706,552 | | | | 6,472,019 | | | | 266,987 | | | | 3,310,635 | |
Redeemed | | | (901,113 | ) | | | (9,430,716 | ) | | | (380,251 | ) | | | (4,953,210 | ) |
| | | | | | | | | | | | | | | | |
Net increase (decrease) | | | 23,506 | | | $ | (546,976 | ) | | | 144,799 | | | $ | 1,753,320 | |
| | | | | | | | | | | | | | | | |
| Disciplined Growth Fund Class R3 | |
Sold | | | 91,777 | | | $ | 1,001,124 | | | | 185,821 | | | $ | 2,379,315 | |
Issued as reinvestment of dividends | | | 164,124 | | | | 1,501,736 | | | | 43,722 | | | | 542,147 | |
Redeemed | | | (199,714 | ) | | | (2,079,642 | ) | | | (56,844 | ) | | | (744,233 | ) |
| | | | | | | | | | | | | | | | |
Net increase (decrease) | | | 56,187 | | | $ | 423,218 | | | | 172,699 | | | $ | 2,177,229 | |
| | | | | | | | | | | | | | | | |
| Small Cap Opportunities Fund Class I | |
Sold | | | 1,065,052 | | | $ | 14,069,847 | | | | 1,720,561 | | | $ | 26,928,334 | |
Issued as reinvestment of dividends | | | 296,313 | | | | 3,656,500 | | | | 148,718 | | | | 2,211,437 | |
Redeemed | | | (1,242,218 | ) | | | (16,867,073 | ) | | | (334,416 | ) | | | (5,142,675 | ) |
| | | | | | | | | | | | | | | | |
Net increase (decrease) | | | 119,147 | | | $ | 859,274 | | | | 1,534,863 | | | $ | 23,997,096 | |
| | | | | | | | | | | | | | | | |
| Small Cap Opportunities Fund Class R5 | |
Sold | | | 717,156 | | | $ | 10,241,766 | | | | 1,329,365 | | | $ | 20,333,335 | |
Issued as reinvestment of dividends | | | 527,091 | | | | 6,499,034 | | | | 517,451 | | | | 7,689,329 | |
Redeemed | | | (1,415,334 | ) | | | (19,422,056 | ) | | | (1,122,352 | ) | | | (17,453,240 | ) |
| | | | | | | | | | | | | | | | |
Net increase (decrease) | | | (171,087 | ) | | $ | (2,681,256 | ) | | | 724,464 | | | $ | 10,569,424 | |
| | | | | | | | | | | | | | | | |
| Small Cap Opportunities Fund Service Class | |
Sold | | | 286,283 | | | $ | 3,814,895 | | | | 396,002 | | | $ | 6,062,374 | |
Issued as reinvestment of dividends | | | 121,291 | | | | 1,491,884 | | | | 121,893 | | | | 1,807,666 | |
Redeemed | | | (267,221 | ) | | | (3,606,025 | ) | | | (309,361 | ) | | | (4,880,046 | ) |
| | | | | | | | | | | | | | | | |
Net increase (decrease) | | | 140,353 | | | $ | 1,700,754 | | | | 208,534 | | | $ | 2,989,994 | |
| | | | | | | | | | | | | | | | |
| Small Cap Opportunities Fund Administrative Class | |
Sold | | | 262,124 | | | $ | 3,520,679 | | | | 230,055 | | | $ | 3,664,711 | |
Issued as reinvestment of dividends | | | 162,217 | | | | 1,983,912 | | | | 194,189 | | | | 2,862,351 | |
Redeemed | | | (549,601 | ) | | | (7,433,114 | ) | | | (272,031 | ) | | | (4,230,604 | ) |
| | | | | | | | | | | | | | | | |
Net increase (decrease) | | | (125,260 | ) | | $ | (1,928,523 | ) | | | 152,213 | | | $ | 2,296,458 | |
| | | | | | | | | | | | | | | | |
| Small Cap Opportunities Fund Class A | |
Sold | | | 543,203 | | | $ | 7,122,888 | | | | 379,961 | | | $ | 5,797,136 | |
Issued as reinvestment of dividends | | | 475,538 | | | | 5,673,168 | | | | 590,410 | | | | 8,525,518 | |
Redeemed | | | (1,539,107 | ) | | | (19,719,299 | ) | | | (1,236,254 | ) | | | (18,696,446 | ) |
| | | | | | | | | | | | | | | | |
Net increase (decrease) | | | (520,366 | ) | | $ | (6,923,243 | ) | | | (265,883 | ) | | $ | (4,373,792 | ) |
| | | | | | | | | | | | | | | | |
255
Notes to Financial Statements(Continued)
| | | | | | | | | | | | | | | | |
| | | Year Ended September 30, 2019 | | | Year Ended September 30, 2018 | |
| | | Shares | | | Amount | | | Shares | | | Amount | |
| | | | | | | | | | | | | |
| Small Cap Opportunities Fund Class R4 | |
Sold | | | 121,027 | | | $ | 1,577,885 | | | | 267,011 | | | $ | 3,882,617 | |
Issued as reinvestment of dividends | | | 86,045 | | | | 1,018,771 | | | | 81,831 | | | | 1,172,634 | |
Redeemed | | | (144,511 | ) | | | (1,868,406 | ) | | | (217,946 | ) | | | (3,313,174 | ) |
| | | | | | | | | | | | | | | | |
Net increase (decrease) | | | 62,561 | | | $ | 728,250 | | | | 130,896 | | | $ | 1,742,077 | |
| | | | | | | | | | | | | | | | |
| Small Cap Opportunities Fund Class R3 | |
Sold | | | 125,331 | | | $ | 1,561,072 | | | | 226,966 | | | $ | 3,461,865 | |
Issued as reinvestment of dividends | | | 75,413 | | | | 886,852 | | | | 77,121 | | | | 1,100,523 | |
Redeemed | | | (215,349 | ) | | | (2,742,881 | ) | | | (202,840 | ) | | | (3,098,444 | ) |
| | | | | | | | | | | | | | | | |
Net increase (decrease) | | | (14,605 | ) | | $ | (294,957 | ) | | | 101,247 | | | $ | 1,463,944 | |
| | | | | | | | | | | | | | | | |
| Global Fund Class I | |
Sold | | | 2,716,764 | | | $ | 33,263,336 | | | | 2,179,660 | | | $ | 34,819,222 | |
Issued as reinvestment of dividends | | | 934,821 | | | | 10,142,807 | | | | 293,906 | | | | 4,605,510 | |
Redeemed | | | (1,108,583 | ) | | | (13,912,435 | ) | | | (1,417,505 | ) | | | (22,513,383 | ) |
| | | | | | | | | | | | | | | | |
Net increase (decrease) | | | 2,543,002 | | | $ | 29,493,708 | | | | 1,056,061 | | | $ | 16,911,349 | |
| | | | | | | | | | | | | | | | |
| Global Fund Class R5 | |
Sold | | | 1,193,730 | | | $ | 14,732,552 | | | | 394,219 | | | $ | 6,447,523 | |
Issued as reinvestment of dividends | | | 1,737,067 | | | | 18,881,920 | | | | 855,477 | | | | 13,413,879 | |
Redeemed | | | (1,279,751 | ) | | | (16,243,402 | ) | | | (2,257,649 | ) | | | (37,104,891 | ) |
| | | | | | | | | | | | | | | | |
Net increase (decrease) | | | 1,651,046 | | | $ | 17,371,070 | | | | (1,007,953 | ) | | $ | (17,243,489 | ) |
| | | | | | | | | | | | | | | | |
| Global Fund Service Class | |
Sold | | | 137,582 | | | $ | 1,743,409 | | | | 198,777 | | | $ | 3,228,615 | |
Issued as reinvestment of dividends | | | 206,208 | | | | 2,220,861 | | | | 149,082 | | | | 2,318,231 | |
Redeemed | | | (834,039 | ) | | | (10,776,346 | ) | | | (506,365 | ) | | | (8,196,460 | ) |
| | | | | | | | | | | | | | | | |
Net increase (decrease) | | | (490,249 | ) | | $ | (6,812,076 | ) | | | (158,506 | ) | | $ | (2,649,614 | ) |
| | | | | | | | | | | | | | | | |
| Global Fund Administrative Class | |
Sold | | | 531,169 | | | $ | 6,831,201 | | | | 439,272 | | | $ | 7,156,796 | |
Issued as reinvestment of dividends | | | 1,501,760 | | | | 16,324,130 | | | | 775,132 | | | | 12,154,069 | |
Redeemed | | | (1,404,831 | ) | | | (17,557,465 | ) | | | (1,872,560 | ) | | | (30,339,919 | ) |
| | | | | | | | | | | | | | | | |
Net increase (decrease) | | | 628,098 | | | $ | 5,597,866 | | | | (658,156 | ) | | $ | (11,029,054 | ) |
| | | | | | | | | | | | | | | | |
| Global Fund Class A | |
Sold | | | 316,115 | | | $ | 3,994,179 | | | | 308,652 | | | $ | 4,960,489 | |
Issued as reinvestment of dividends | | | 540,734 | | | | 5,807,488 | | | | 227,491 | | | | 3,532,931 | |
Redeemed | | | (827,277 | ) | | | (10,216,642 | ) | | | (429,102 | ) | | | (6,981,420 | ) |
| | | | | | | | | | | | | | | | |
Net increase (decrease) | | | 29,572 | | | $ | (414,975 | ) | | | 107,041 | | | $ | 1,512,000 | |
| | | | | | | | | | | | | | | | |
| Global Fund Class R4 | |
Sold | | | 197,998 | | | $ | 2,453,024 | | | | 252,719 | | | $ | 4,011,669 | |
Issued as reinvestment of dividends | | | 151,487 | | | | 1,601,209 | | | | 45,283 | | | | 695,087 | |
Redeemed | | | (216,855 | ) | | | (2,616,744 | ) | | | (146,839 | ) | | | (2,316,829 | ) |
| | | | | | | | | | | | | | | | |
Net increase (decrease) | | | 132,630 | | | $ | 1,437,489 | | | | 151,163 | | | $ | 2,389,927 | |
| | | | | | | | | | | | | | | | |
| Global Fund Class R3 | |
Sold | | | 261,788 | | | $ | 3,012,181 | | | | 184,058 | | | $ | 2,936,668 | |
Issued as reinvestment of dividends | | | 188,126 | | | | 2,011,068 | | | | 81,318 | | | | 1,257,987 | |
Redeemed | | | (302,818 | ) | | | (3,580,543 | ) | | | (227,096 | ) | | | (3,572,602 | ) |
| | | | | | | | | | | | | | | | |
Net increase (decrease) | | | 147,096 | | | $ | 1,442,706 | | | | 38,280 | | | $ | 622,053 | |
| | | | | | | | | | | | | | | | |
256
Notes to Financial Statements(Continued)
| | | | | | | | | | | | | | | | |
| | | Year Ended September 30, 2019 | | | Year Ended September 30, 2018 | |
| | | Shares | | | Amount | | | Shares | | | Amount | |
| | | | | | | | | | | | | |
| International Equity Fund Class I | |
Sold | | | 3,634,930 | | | $ | 42,635,723 | | | | 8,323,476 | | | $ | 111,155,945 | |
Issued as reinvestment of dividends | | | 1,237,647 | | | | 13,156,184 | | | | 235,936 | | | | 3,222,891 | |
Redeemed | | | (14,992,578 | ) | | | (175,347,987 | ) | | | (4,293,607 | ) | | | (58,566,694 | ) |
| | | | | | | | | | | | | | | | |
Net increase (decrease) | | | (10,120,001 | ) | | $ | (119,556,080 | ) | | | 4,265,805 | | | $ | 55,812,142 | |
| | | | | | | | | | | | | | | | |
| International Equity Fund Class R5 | |
Sold | | | 342,264 | | | $ | 3,957,527 | | | | 489,688 | | | $ | 6,750,033 | |
Issued as reinvestment of dividends | | | 585,665 | | | | 6,231,478 | | | | 158,503 | | | | 2,165,164 | |
Redeemed | | | (4,400,311 | ) | | | (51,578,933 | ) | | | (3,809,968 | ) | | | (52,081,072 | ) |
| | | | | | | | | | | | | | | | |
Net increase (decrease) | | | (3,472,382 | ) | | $ | (41,389,928 | ) | | | (3,161,777 | ) | | $ | (43,165,875 | ) |
| | | | | | | | | | | | | | | | |
| International Equity Fund Service Class | |
Sold | | | 104,243 | | | $ | 1,209,070 | | | | 580,432 | | | $ | 8,077,239 | |
Issued as reinvestment of dividends | | | 67,635 | | | | 718,289 | | | | 16,753 | | | | 228,348 | |
Redeemed | | | (1,170,201 | ) | | | (13,597,428 | ) | | | (413,441 | ) | | | (5,774,816 | ) |
| | | | | | | | | | | | | | | | |
Net increase (decrease) | | | (998,323 | ) | | $ | (11,670,069 | ) | | | 183,744 | | | $ | 2,530,771 | |
| | | | | | | | | | | | | | | | |
| International Equity Fund Administrative Class | |
Sold | | | 91,345 | | | $ | 1,054,123 | | | | 245,948 | | | $ | 3,294,013 | |
Issued as reinvestment of dividends | | | 43,583 | | | | 460,669 | | | | 11,930 | | | | 161,875 | |
Redeemed | | | (600,981 | ) | | | (6,827,189 | ) | | | (681,611 | ) | | | (9,357,279 | ) |
| | | | | | | | | | | | | | | | |
Net increase (decrease) | | | (466,053 | ) | | $ | (5,312,397 | ) | | | (423,733 | ) | | $ | (5,901,391 | ) |
| | | | | | | | | | | | | | | | |
| International Equity Fund Class A | |
Sold | | | 205,857 | | | $ | 2,323,334 | | | | 266,005 | | | $ | 3,541,329 | |
Issued as reinvestment of dividends | | | 118,131 | | | | 1,213,203 | | | | 21,028 | | | | 277,357 | |
Redeemed | | | (876,926 | ) | | | (9,588,312 | ) | | | (900,925 | ) | | | (11,824,149 | ) |
| | | | | | | | | | | | | | | | |
Net increase (decrease) | | | (552,938 | ) | | $ | (6,051,775 | ) | | | (613,892 | ) | | $ | (8,005,463 | ) |
| | | | | | | | | | | | | | | | |
| International Equity Fund Class R4 | |
Sold | | | 91,803 | | | $ | 1,012,410 | | | | 235,686 | | | $ | 3,093,177 | |
Issued as reinvestment of dividends | | | 44,423 | | | | 451,336 | | | | 9,500 | | | | 124,071 | |
Redeemed | | | (570,047 | ) | | | (6,392,679 | ) | | | (234,483 | ) | | | (3,040,348 | ) |
| | | | | | | | | | | | | | | | |
Net increase (decrease) | | | (433,821 | )�� | | $ | (4,928,933 | ) | | | 10,703 | | | $ | 176,900 | |
| | | | | | | | | | | | | | | | |
| International Equity Fund Class R3 | |
Sold | | | 88,507 | | | $ | 974,430 | | | | 162,404 | | | $ | 2,114,450 | |
Issued as reinvestment of dividends | | | 37,193 | | | | 377,140 | | | | 4,385 | | | | 57,228 | |
Redeemed | | | (381,182 | ) | | | (3,946,437 | ) | | | (142,843 | ) | | | (1,864,023 | ) |
| | | | | | | | | | | | | | | | |
Net increase (decrease) | | | (255,482 | ) | | $ | (2,594,867 | ) | | | 23,946 | | | $ | 307,655 | |
| | | | | | | | | | | | | | | | |
| Strategic Emerging Markets Fund Class I | |
Sold | | | 2,656,702 | | | $ | 34,135,959 | | | | 2,864,792 | | | $ | 38,498,964 | |
Issued as reinvestment of dividends | | | 114,592 | | | | 1,339,579 | | | | 250,132 | | | | 3,266,714 | |
Redeemed | | | (8,819,308 | ) | | | (111,427,031 | ) | | | (4,566,502 | ) | | | (60,014,070 | ) |
| | | | | | | | | | | | | | | | |
Net increase (decrease) | | | (6,048,014 | ) | | $ | (75,951,493 | ) | | | (1,451,578 | ) | | $ | (18,248,392 | ) |
| | | | | | | | | | | | | | | | |
| Strategic Emerging Markets Fund Class R5 | |
Sold | | | 11,142 | | | $ | 145,745 | | | | 14,639 | | | $ | 201,300 | |
Issued as reinvestment of dividends | | | 1,883 | | | | 22,332 | | | | 3,685 | | | | 48,833 | |
Redeemed | | | (933 | ) | | | (11,005 | ) | | | (2,930 | ) | | | (40,483 | ) |
| | | | | | | | | | | | | | | | |
Net increase (decrease) | | | 12,092 | | | $ | 157,072 | | | | 15,394 | | | $ | 209,650 | |
| | | | | | | | | | | | | | | | |
257
Notes to Financial Statements(Continued)
| | | | | | | | | | | | | | | | |
| | | Year Ended September 30, 2019 | | | Year Ended September 30, 2018 | |
| | | Shares | | | Amount | | | Shares | | | Amount | |
| | | | | | | | | | | | | |
| Strategic Emerging Markets Fund Service Class | |
Sold | | | 24,803 | | | $ | 315,789 | | | | 7,875 | | | $ | 106,427 | |
Issued as reinvestment of dividends | | | 21 | | | | 247 | | | | 355 | | | | 4,633 | |
Redeemed | | | (10,805 | ) | | | (130,619 | ) | | | (23,879 | ) | | | (320,311 | ) |
| | | | | | | | | | | | | | | | |
Net increase (decrease) | | | 14,019 | | | $ | 185,417 | | | | (15,649 | ) | | $ | (209,251 | ) |
| | | | | | | | | | | | | | | | |
| Strategic Emerging Markets Fund Administrative Class | |
Sold | | | 11,605 | | | $ | 144,773 | | | | 21,635 | | | $ | 293,035 | |
Issued as reinvestment of dividends | | | 185 | | | | 2,174 | | | | 1,197 | | | | 15,720 | |
Redeemed | | | (9,726 | ) | | | (123,132 | ) | | | (75,265 | ) | | | (988,042 | ) |
| | | | | | | | | | | | | | | | |
Net increase (decrease) | | | 2,064 | | | $ | 23,815 | | | | (52,433 | ) | | $ | (679,287 | ) |
| | | | | | | | | | | | | | | | |
| Strategic Emerging Markets Fund Class A | |
Sold | | | 51,270 | | | $ | 639,433 | | | | 41,318 | | | $ | 554,398 | |
Issued as reinvestment of dividends | | | 155 | | | | 1,818 | | | | 135 | | | | 1,765 | |
Redeemed | | | (13,550 | ) | | | (179,393 | ) | | | (20,323 | ) | | | (270,060 | ) |
| | | | | | | | | | | | | | | | |
Net increase (decrease) | | | 37,875 | | | $ | 461,858 | | | | 21,130 | | | $ | 286,103 | |
| | | | | | | | | | | | | | | | |
| Strategic Emerging Markets Fund Class R4 | |
Sold | | | 50,999 | | | $ | 614,004 | | | | 32,580 | | | $ | 441,272 | |
Issued as reinvestment of dividends | | | 250 | | | | 2,905 | | | | 752 | | | | 9,767 | |
Redeemed | | | (50,142 | ) | | | (641,795 | ) | | | (10,626 | ) | | | (140,187 | ) |
| | | | | | | | | | | | | | | | |
Net increase (decrease) | | | 1,107 | | | $ | (24,886 | ) | | | 22,706 | | | $ | 310,852 | |
| | | | | | | | | | | | | | | | |
| Strategic Emerging Markets Fund Class R3 | |
Sold | | | 18,121 | | | $ | 228,206 | | | | 14,865 | | | $ | 196,350 | |
Issued as reinvestment of dividends | | | - | | | | - | | | | 392 | | | | 5,088 | |
Redeemed | | | (20,308 | ) | | | (252,485 | ) | | | (19,366 | ) | | | (255,182 | ) |
| | | | | | | | | | | | | | | | |
Net increase (decrease) | | | (2,187 | ) | | $ | (24,279 | ) | | | (4,109 | ) | | $ | (53,744 | ) |
| | | | | | | | | | | | | | | | |
Purchases of Class A shares are subject to afront-end sales charge of up to 5.50% of the amount purchased. A portion of thefront-end sales charge may be retained by the Distributor. The Distributor retained the following amounts during the year ended September 30, 2019:
| | | | |
| | | Front-End Sales Charges
Retained by Distributor | |
Inflation-Protected and Income Fund | | $ | 35 | |
Core Bond Fund | | | 1,755 | |
Diversified Bond Fund | | | 35 | |
High Yield Fund | | | 23 | |
Main Street Fund | | | 68 | |
Redemptions of Class A shares made within eighteen months of purchase from initial investments of $1 million or more are subject to a contingent deferred sales charge of 1% of the amount redeemed. The Distributor receives all contingent deferred sales charges. Any contingent deferred sales charges imposed during the year ended September 30, 2019, were waived for any redemptions subject to such a charge.
258
Notes to Financial Statements(Continued)
| 6. | | Federal Income Tax Information |
At September 30, 2019, the aggregate cost of investments and the unrealized appreciation (depreciation) in the value of all investments owned by the Fund(s), as computed on a federal income tax basis, were as follows:
| | | | | | | | | | | | | | | | |
| | | Federal Income
Tax Cost | | | Tax Basis
Unrealized
Appreciation | | | Tax Basis
Unrealized
(Depreciation) | | | Net Unrealized
Appreciation
(Depreciation) | |
U.S. Government Money Market Fund | | $ | 357,384,786 | | | $ | - | | | $ | - | | | $ | - | |
Short-Duration Bond Fund | | | 524,189,512 | | | | 9,106,666 | | | | (4,354,027 | ) | | | 4,752,639 | |
Inflation-Protected and Income Fund | | | 319,253,066 | | | | 6,825,809 | | | | (1,136,469 | ) | | | 5,689,340 | |
Core Bond Fund | | | 1,564,685,458 | | | | 46,095,338 | | | | (8,456,467 | ) | | | 37,638,871 | |
Diversified Bond Fund | | | 262,330,105 | | | | 8,113,256 | | | | (1,907,041 | ) | | | 6,206,215 | |
High Yield Fund | | | 584,071,699 | | | | 19,528,035 | | | | (23,083,751 | ) | | | (3,555,716 | ) |
Balanced Fund | | | 118,274,216 | | | | 10,343,595 | | | | (2,758,804 | ) | | | 7,584,791 | |
Disciplined Value Fund | | | 109,155,919 | | | | 8,591,310 | | | | (6,170,792 | ) | | | 2,420,518 | |
Main Street Fund | | | 102,683,810 | | | | 16,316,162 | | | | (1,475,884 | ) | | | 14,840,278 | |
Disciplined Growth Fund | | | 222,364,704 | | | | 42,390,161 | | | | (6,874,146 | ) | | | 35,516,015 | |
Small Cap Opportunities Fund | | | 195,924,384 | | | | 29,027,176 | | | | (14,294,939 | ) | | | 14,732,237 | |
Global Fund | | | 189,906,061 | | | | 114,245,678 | | | | (8,780,506 | ) | | | 105,465,172 | |
International Equity Fund | | | 255,438,187 | | | | 51,579,052 | | | | (14,124,808 | ) | | | 37,454,244 | |
Strategic Emerging Markets Fund | | | 146,090,992 | | | | 18,652,593 | | | | (10,649,214 | ) | | | 8,003,379 | |
Note: The aggregate cost for investments for the U.S. Government Money Market Fund at September 30, 2019, is the same for financial reporting and federal income tax purposes.
Net capital loss carryforwards may be applied against any net realized taxable gains in succeeding years, subject to the carryforward period limitations, where applicable. On December 22, 2010, the Regulated Investment Company Modernization Act of 2010 (the “Modernization Act”) was signed by the President. The Modernization Act changed the capital loss carryforward rules as they relate to regulated investment companies. Capital losses generated in tax years beginning after the date of enactment may now be carried forward indefinitely, and retain the character of the original loss. Underpre-enactment law, capital losses could be carried forward for up to eight tax years as short-term capital losses. The provisions affecting the utilization of capital loss carryforwards under the Modernization Act also require the utilization of post-enactment losses prior to the utilization ofpre-enactment losses.
At September 30, 2019, for federal income tax purposes, there were no unused capital losses.
At September 30, 2019, the following Fund(s) had post-enactment accumulated capital loss carryforwards:
| | | | | | | | |
| | | Short Term
Capital Loss
Carryforward | | | Long term
Capital Loss
Carryforward | |
Short-Duration Bond Fund | | $ | 3,074,646 | | | $ | 19,144,330 | |
Inflation-Protected and Income Fund | | | 1,602,347 | | | | 5,704,207 | |
Core Bond Fund | | | - | | | | 15,012,224 | |
Diversified Bond Fund | | | - | | | | 278,677 | |
High Yield Fund | | | 3,743,060 | | | | 12,679,386 | |
Net capital loss carryforwards for the Fund(s) shown in the above table are from post-enactment years and are, therefore, not subject to the eight-year carryforward period and possible expiration.
259
Notes to Financial Statements(Continued)
The following Fund(s) elected to defer to the fiscal year beginning October 1, 2019, post-October capital losses:
| | | | | | | | |
| | | Post-October
Loss | | | Post October
Currency
Loss | |
Disciplined Growth Fund | | $ | 98,417 | | | $ | - | |
Generally accepted accounting principles in the United States of America require that only distributions in excess of tax basis earnings and profits be reported in the financial statements as a return of capital.
The tax character of distributions (including capital gain dividends, if any, designated pursuant to Section 852 of the Code) paid during the year ended September 30, 2019, was as follows:
| | | | | | | | |
| | | Ordinary
Income | | | Long Term
Capital Gain | |
U.S. Government Money Market Fund | | $ | 6,235,386 | | | $ | - | |
Short-Duration Bond Fund | | | 17,809,014 | | | | - | |
Inflation-Protected and Income Fund | | | 8,747,260 | | | | - | |
Core Bond Fund | | | 40,712,602 | | | | - | |
Diversified Bond Fund | | | 6,563,877 | | | | - | |
High Yield Fund | | | 30,929,893 | | | | - | |
Balanced Fund | | | 2,960,247 | | | | 5,499,132 | |
Disciplined Value Fund | | | 8,020,020 | | | | 14,384,074 | |
Main Street Fund | | | 2,485,726 | | | | 13,838,038 | |
Disciplined Growth Fund | | | 22,346,107 | | | | 46,153,668 | |
Small Cap Opportunities Fund | | | 3,770,587 | | | | 17,439,806 | |
Global Fund | | | 1,949,949 | | | | 55,040,887 | |
International Equity Fund | | | 4,243,842 | | | | 18,364,608 | |
Strategic Emerging Markets Fund | | | 1,369,055 | | | | - | |
The tax character of distributions (including capital gain dividends, if any, designated pursuant to Section 852 of the Code) paid during the year ended September 30, 2018, was as follows:
| | | | | | | | | | | | |
| | | Ordinary
Income | | | Long Term
Capital Gain | | | Return of
Capital | |
U.S. Government Money Market Fund | | $ | 4,051,516 | | | $ | - | | | $ | - | |
Short-Duration Bond Fund | | | 15,311,431 | | | | - | | | | - | |
Inflation-Protected and Income Fund | | | 7,052,518 | | | | - | | | | - | |
Core Bond Fund | | | 34,338,923 | | | | - | | | | - | |
Diversified Bond Fund | | | 5,919,766 | | | | - | | | | - | |
High Yield Fund | | | 29,331,690 | | | | - | | | | - | |
Balanced Fund | | | 2,873,428 | | | | 4,892,457 | | | | - | |
Disciplined Value Fund | | | 11,270,704 | | | | 13,001,553 | | | | - | |
Main Street Fund | | | 2,132,665 | | | | 8,426,806 | | | | - | |
Disciplined Growth Fund | | | 23,976,151 | | | | 22,931,026 | | | | - | |
Small Cap Opportunities Fund | | | 5,166,910 | | | | 20,202,935 | | | | - | |
Global Fund | | | 3,313,284 | | | | 34,665,333 | | | | - | |
International Equity Fund | | | 6,236,966 | | | | - | | | | - | |
Strategic Emerging Markets Fund | | | 3,352,520 | | | | - | | | | - | |
260
Notes to Financial Statements(Continued)
The following Fund(s) have elected to pass through the foreign tax credit for the year ended September 30, 2019:
| | | | |
| | | Amount | |
International Equity Fund | | $ | 497,028 | |
Strategic Emerging Markets Fund | | | 267,497 | |
Capital accounts within the financial statements are periodically adjusted for permanent differences between book and tax accounting. These adjustments have no impact on net assets or the results of operations. Temporary book and tax accounting differences will reverse in subsequent periods. At September 30, 2019, temporary book and tax accounting differences were primarily attributable to the deferral of wash sale losses, deferred Trustee compensation, and other temporary basis adjustments.
At September 30, 2019, the components of distributable earnings on a tax basis were as follows:
| | | | | | | | | | | | | | | | |
| | | Undistributed
Ordinary
Income | | | Undistributed
Long Term
Capital Gain
(Capital Loss
Carryover) | | | Other
Temporary
Differences | | | Unrealized
Appreciation
(Depreciation) | |
U.S. Government Money Market Fund | | $ | - | | | $ | - | | | $ | (65,403 | ) | | $ | - | |
Short-Duration Bond Fund | | | 11,557,532 | | | | (22,218,976 | ) | | | (69,118 | ) | | | 4,752,639 | |
Inflation-Protected and Income Fund | | | 5,994,405 | | | | (7,306,554 | ) | | | (36,568 | ) | | | 5,564,608 | |
Core Bond Fund | | | 34,483,925 | | | | (15,012,224 | ) | | | (187,019 | ) | | | 37,638,871 | |
Diversified Bond Fund | | | 6,107,149 | | | | (278,677 | ) | | | (23,806 | ) | | | 6,135,232 | |
High Yield Fund | | | 24,968,273 | | | | (16,422,446 | ) | | | (36,841 | ) | | | (3,555,716 | ) |
Balanced Fund | | | 2,077,644 | | | | 4,916,385 | | | | (20,432 | ) | | | 7,584,791 | |
Disciplined Value Fund | | | 1,622,718 | | | | 5,534,198 | | | | (32,800 | ) | | | 2,420,518 | |
Main Street Fund | | | 829,158 | | | | 8,877,143 | | | | (19,791 | ) | | | 14,840,278 | |
Disciplined Growth Fund | | | 1,388,529 | | | | 21,737,925 | | | | (137,615 | ) | | | 35,516,015 | |
Small Cap Opportunities Fund | | | 576,036 | | | | 1,182,756 | | | | (29,453 | ) | | | 14,732,237 | |
Global Fund | | | 1,587,972 | | | | 739,537 | | | | (44,706 | ) | | | 105,446,804 | |
International Equity Fund | | | 2,633,421 | | | | 8,442,845 | | | | (77,149 | ) | | | 37,235,591 | |
Strategic Emerging Markets Fund | | | 954,257 | | | | 13,050,144 | | | | (19,088 | ) | | | 7,728,898 | |
During the year ended September 30, 2019, the following amounts were reclassified due to permanent differences between book and tax accounting:
| | | | | | | | | | | | |
| | | Paid-in
Capital | | | Accumulated
Net Realized
Gain (Loss) on
Investments | | | Undistributed
Net Investment
Income (Loss) | |
U.S. Government Money Market Fund | | $ | (22,228 | ) | | $ | (19,866 | ) | | $ | 42,094 | |
Short-Duration Bond Fund | | | 184 | | | | (595,175 | ) | | | 594,991 | |
Inflation-Protected and Income Fund | | | 91 | | | | (45,875 | ) | | | 45,784 | |
Core Bond Fund | | | 493 | | | | (1,598,358 | ) | | | 1,597,865 | |
Diversified Bond Fund | | | 62 | | | | (184,979 | ) | | | 184,917 | |
High Yield Fund | | | 333 | | | | (14,271 | ) | | | 13,938 | |
Balanced Fund | | | 56 | | | | (70,595 | ) | | | 70,539 | |
Disciplined Value Fund | | | 89 | | | | 131,765 | | | | (131,854 | ) |
Main Street Fund | | | (705 | ) | | | 121,462 | | | | (120,757 | ) |
Disciplined Growth Fund | | | 104 | | | | 64,107 | | | | (64,211 | ) |
Small Cap Opportunities Fund | | | (11,240 | ) | | | 221,226 | | | | (209,986 | ) |
Global Fund | | | 119 | | | | (25,985 | ) | | | 25,866 | |
261
Notes to Financial Statements(Continued)
| | | | | | | | | | | | |
| | | Paid-in
Capital | | | Accumulated
Net Realized
Gain (Loss) on
Investments | | | Undistributed
Net Investment
Income (Loss) | |
International Equity Fund | | $ | 207 | | | $ | 434,984 | | | $ | (435,191 | ) |
Strategic Emerging Markets Fund | | | 50 | | | | (929,920 | ) | | | 929,870 | |
The Funds did not have any unrecognized tax benefits at September 30, 2019, nor were there any increases or decreases in unrecognized tax benefits for the year then ended. The Funds recognize interest and penalties, if any, related to unrecognized tax benefits as an income tax expense in the Statements of Operations. During the year ended September 30, 2019, the Funds did not incur any such interest or penalties. The Funds are subject to examination by U.S. federal and state tax authorities for returns filed for the prior three fiscal years. Foreign taxes are provided for based on the Funds’ understanding of the tax rules and rates that exist in the foreign markets in which they invest.
| 7. | | Investment in Affiliated Issuers |
A summary of the Funds’ transactions in the securities of affiliated issuers during the year ended September 30, 2019, was as follows:
| | | | | | | | | | | | | | | | | | | | | | | | | | | | | | | | | | | | |
| | | Beginning
Value as of
9/30/18 | | | Purchases | | | Sales | | | Change in
Unrealized
Appreciation/
Depreciation | | | Net
Realized
Gain (Loss) | | | Value as of
9/30/19 | | | Number of
Shares Held
as of
9/30/19 | | | Dividend
Income | | | Realized
Gains
Distributions | |
| Global Fund | |
| | | | | | | | | |
Invesco Oppenheimer Institutional Government Money Market Fund, Class
Institutional | | $ | 4,096,417 | | | $ | 53,264,936 | | | $ | (57,361,353 | ) | | $ | - | | | $ | - | | | $ | - | # | | $ | - | | | $ | 113,609 | | | $ | - | |
| | | | | | | | | | | | | | | | | | | | | | | | | | | | | | | | | | | | |
| International Equity Fund | |
| | | | | | | | | |
Invesco Oppenheimer Institutional Government Money Market Fund, Class Institutional | | $ | 17,496,757 | | | $ | 125,830,360 | | | $ | (143,327,117 | ) | | $ | - | | | $ | - | | | $ | - | # | | | - | | | $ | 354,956 | | | $ | - | |
| | | | | | | | | | | | | | | | | | | | | | | | | | | | | | | | | | | | |
| # | Effective May 24, 2019, the fund is no longer advised by OFI Global Asset Management and, therefore, the fund is no longer affiliated. |
Under the Funds’ organizational documents, current and former Trustees and Officers are provided with specified rights to indemnification against liabilities arising in connection with the performance of their duties to the Funds, and shareholders are indemnified against personal liability for obligations of the Funds. In the normal course of business, the Funds may also enter into contracts that provide general indemnifications. The Funds’ maximum exposure under these arrangements is unknown as this would be dependent on future claims that may be made against the Funds. The risk of material loss from such claims is considered remote.
| 9. | | New Accounting Pronouncements |
In March 2017, FASB issued Accounting Standards Update2017-08, Receivables — Nonrefundable Fees and Other Costs (Subtopic310-20): Premium Amortization on Purchased Callable Debt Securities (“ASU2017-08”). For entities that hold callable debt securities at a premium, ASU2017-08 requires that the premium be amortized to the earliest call date. ASU2017-08 would first be effective for fiscal years beginning after December 15, 2018, and interim periods within those fiscal years. Management is currently evaluating the implication, if any, of these changes and its impact on the Funds’ financial statements.
262
Notes to Financial Statements(Continued)
In August 2018, FASB issued Accounting Standards Update2018-13 — Fair Value Measurement (Topic 820) Disclosure Framework — Changes to the Disclosure Requirements for Fair Value Measurement (“ASU2018-13”). ASU2018-13 eliminates the requirement to disclose the amount of and reasons for transfers between Level 1 and Level 2 of the fair value hierarchy, the timing of transfers between levels of the fair value hierarchy, and the valuation processes for Level 3 fair value measurements. ASU2018-13 requires that information is provided about the measurement uncertainty of Level 3 fair value measurements as of the reporting date. The amendment is effective for fiscal years, and interim periods within those fiscal years, beginning after December 15, 2019. Management has evaluated the impact of ASU2018-13 and has early adopted the disclosure requirements and the impact, if any, is reflected within the Funds’ financial statements.
On December 7, 2010, the Trust was named as a defendant and putative member of the proposed defendant class of shareholders named in an adversary proceeding brought by The Official Committee of Unsecured Creditors of Tribune Company (the “Official Committee”) in the U.S. Bankruptcy Court for the District of Delaware, in connection with Tribune Company’s Chapter 11 bankruptcy proceeding (In re Tribune Company). The proceeding relates to a leveraged buyout (“LBO”) transaction by which Tribune Company converted to a privately-held company in 2007, and the putative defendant class is comprised of beneficial owners of shares of Tribune Company who received proceeds (the “Proceeds”) of the LBO. The Official Committee seeks to recover payments of those Proceeds. On April 5, 2012, the adversary proceeding was transferred to the Southern District of New York for consolidated pretrial proceedings. The action is now being prosecuted by the litigation trustee (“Trustee”) for the Tribune Litigation Trust.
The potential amounts sought to be recovered from the Balanced Fund, Disciplined Value Fund, and Small Cap Opportunities Fund, are approximately $44,200, $299,880, and $414,800, respectively, plus interest and the Official Committee’s court costs.
In addition, on June 2, 2011, the Disciplined Value Fund and Small Cap Opportunities Fund were named as defendants in a closely related, parallel adversary proceeding brought in connection with the Tribune Company’s LBO by Deutsche Bank Trust Company Americas, in its capacity as successor indenture trustee for a certain series of Senior Notes, Law Debenture Trust Company of New York, in its capacity as successor indenture trustee for a certain series of Senior Notes, and Wilmington Trust Company, in its capacity as successor indenture trustee for the PHONES Notes (together, the “Plaintiffs”), in the United States District Court for the District of Massachusetts. The Plaintiffs also seek to recover payments of the Proceeds. On December 20, 2011, this action was transferred to the Southern District of New York for consolidated pretrial proceedings.
The Funds cannot predict the outcome of these proceedings. Accordingly, the Funds have not accrued any amounts related to these proceedings. If the proceedings were to be decided in a manner adverse to the Funds, or if the Funds were to enter into a settlement agreement with the Trustee or the Plaintiffs, as applicable, the payment of such judgment or settlement could potentially have a material adverse effect on the Funds’ net asset values depending on the net assets of each applicable Fund at the time of such judgment or settlement.
263
Report of Independent Registered Public Accounting Firm
To the Board of Trustees of MassMutual Premier Funds and Shareholders of MassMutual Premier U.S. Government Money Market Fund, MassMutual Premier Short-Duration Bond Fund, MassMutual Premier Inflation-Protected and Income Fund, MassMutual Premier Core Bond Fund, MassMutual Premier Diversified Bond Fund, MassMutual Premier High Yield Fund, MassMutual Premier Balanced Fund, MassMutual Premier Disciplined Value Fund, MassMutual Premier Main Street Fund, MassMutual Premier Disciplined Growth Fund, MassMutual Premier Small Cap Opportunities Fund, MassMutual Premier Global Fund, MassMutual Premier International Equity Fund, and MassMutual Premier Strategic Emerging Markets Fund (collectively, the “Funds”):
Opinion on the Financial Statements and Financial Highlights
We have audited the accompanying statements of assets and liabilities of the Funds, including the portfolios of investments, as of September 30, 2019, the related statements of operations for the year then ended, the statements of changes in net assets for each of the two years in the period then ended, and the financial highlights for each of the five years in the period then ended, and the related notes. In our opinion, the financial statements and financial highlights present fairly, in all material respects, the financial position of each of the Funds as of September 30, 2019, and the results of their operations for the year then ended, the changes in their net assets for each of the two years in the period then ended, and the financial highlights for each of the five years in the period then ended, in conformity with accounting principles generally accepted in the United States of America.
Basis for Opinion
These financial statements and financial highlights are the responsibility of the Funds’ management. Our responsibility is to express an opinion on the Funds’ financial statements and financial highlights based on our audits. We are a public accounting firm registered with the Public Company Accounting Oversight Board (United States) (PCAOB) and are required to be independent with respect to the Funds in accordance with the U.S. federal securities laws and the applicable rules and regulations of the Securities and Exchange Commission and the PCAOB.
We conducted our audits in accordance with the standards of the PCAOB. Those standards require that we plan and perform the audit to obtain reasonable assurance about whether the financial statements and financial highlights are free of material misstatement, whether due to error or fraud. The Funds are not required to have, nor were we engaged to perform, an audit of their internal control over financial reporting. As part of our audits we are required to obtain an understanding of internal control over financial reporting but not for the purpose of expressing an opinion on the effectiveness of the Funds’ internal control over financial reporting. Accordingly, we express no such opinion.
Our audits included performing procedures to assess the risks of material misstatement of the financial statements and financial highlights, whether due to error or fraud, and performing procedures that respond to those risks. Such procedures included examining, on a test basis, evidence regarding the amounts and disclosures in the financial statements and financial highlights. Our audits also included evaluating the accounting principles used and significant estimates made by management, as well as evaluating the overall presentation of the financial statements and financial highlights. Our procedures included confirmation of securities owned as of September 30, 2019, by correspondence with the custodian and brokers; when replies were not received from brokers, we performed other auditing procedures. We believe that our audits provide a reasonable basis for our opinion.
/s/ Deloitte & Touche LLP
Boston, Massachusetts
November 26, 2019
We have served as the auditor of one or more MassMutual investment companies since 1995.
264
Trustees and Officers (Unaudited)
The following table lists the Trust’s Trustees and Officers; their address and age; their position with the Trust; the length of time holding that position with the Trust; their principal occupation(s) during the past five years; the number of portfolios in the fund complex they oversee; and other directorships they hold in companies subject to registration or reporting requirements of the Securities Exchange Act of 1934 (generally called “public companies”) or in registered investment companies. The Trust’s Statement of Additional Information includes additional information about the Trust’s Trustees and is available, without charge, upon request by calling 1-888-309-3539 or by writing MassMutual Premier Funds, c/o Massachusetts Mutual Life Insurance Company, 100 Bright Meadow Blvd., Enfield, Connecticut 06082-1981, Attention: MassMutual U.S. Product and Marketing.
Independent Trustees
| | | | | | | | | | |
Name, Address*, and Age | | Position(s)
Held with
Trust | | Term of
Office** and
Length of
Time Served | | Principal Occupation(s)
During Past 5 Years | | Number of
Portfolios in
Fund Complex
Overseen by Trustee | | Other Directorships Held by Trustee |
Allan W. Blair Age: 71 | | Trustee | | Since
2012 | | Retired; President and Chief Executive Officer (1996-2014), Economic Development Council of Western Massachusetts (non-profit development company); President and Chief Executive Officer (1984-2014), Westover Metropolitan Development Corporation (quasi-public development company). | | 109 | | Trustee (since 2003), MassMutual Select Funds (open-end investment company); Trustee (since 2003), MML Series Investment Fund (open-end investment company); Trustee (since 2012), MML Series Investment Fund II (open-end investment company). |
| | | | | |
Nabil N.El-Hage Age: 61 | | Trustee Chairman | | Since
2003 2006- 2012 | | Founder and CEO (since 2018), AEE International LLC (a Puerto Rico LLC); Founder and sole member (2016-2018), PR Academy of Executive Education LLC (a Puerto Rico LLC); Chairman (2011-2016), Academy of Executive Education, LLC (a Massachusetts LLC). | | 109 | | Director (2011-2015), Argo Group International Holdings, Ltd. (underwriter of specialty insurance and reinsurance products); Trustee (since 2012), MassMutual Select Funds (open-end investment company); Trustee (since 2012), MML Series Investment Fund (open-end investment company); Trustee (since 2005), Chairman (2006-2012), MML Series Investment Fund II (open-end investment company). |
| | | | | |
Maria D. Furman Age: 65 | | Trustee | | Since
2004 | | Retired. | | 109 | | Trustee (since 2011), GMO Series Trust (open-end investment company); Trustee (since 2012), MassMutual Select Funds (open-end investment company); Trustee (since 2012), MML Series Investment Fund (open-end investment company); Trustee (since 2005), MML Series Investment Fund II (open-end investment company). |
| | | | | |
R. Alan Hunter, Jr. Age: 72 | | Chairperson Trustee | | Since 2016 Since 2012 | | Retired. | | 109 | | Director (2007-2018), Actuant Corporation (diversified industrial company); Chairperson (since 2016), Trustee (since 2003), MassMutual Select Funds (open-end investment company); Chairperson (since 2016), Trustee (since 2003), MML Series Investment Fund (open-end investment company); Chairperson (since 2016), Trustee (since 2012), MML Series Investment Fund II (open-end investment company). |
265
Trustees and Officers (Unaudited)(Continued)
| | | | | | | | | | |
Name, Address*, and Age | | Position(s)
Held with
Trust | | Term of
Office** and
Length of
Time Served | | Principal Occupation(s)
During Past 5 Years | | Number of
Portfolios in
Fund Complex
Overseen by Trustee | | Other Directorships Held by Trustee |
C. Ann Merrifield Age: 68 | | Trustee | | Since
2004 | | Retired; President and Chief Executive Officer (2012-2014), PathoGenetix (genomics company). | | 109 | | Director (2015-2018), Juniper Pharmaceuticals Inc. (specialty pharmaceutical company); Director (since 2014), Flexion Therapeutics (specialty pharmaceutical company); Chairperson (2017-2018) and Director (since 2014), InVivo Therapeutics (research and clinical-stage biomaterials and biotechnology company); Trustee (since 2012), MassMutual Select Funds (open-end investment company); Trustee (since 2012), MML Series Investment Fund (open-end investment company); Trustee (since 2005), MML Series Investment Fund II (open-end investment company). |
| | | | | |
Susan B. Sweeney Age: 67 | | Trustee | | Since
2012 | | Retired; Senior Vice President and Chief Investment Officer (2010-2014), Selective Insurance Group (property and casualty company). | | 111^ | | Trustee (since 2012), Barings Corporate Investors (closed-end investment company); Trustee (since 2012), Barings Participation Investors (closed-end investment company); Trustee (since 2009), MassMutual Select Funds (open-end investment company); Trustee (since 2009), MML Series Investment Fund (open-end investment company); Trustee (since 2012), MML Series Investment Fund II (open-end investment company). |
Interested Trustees
| | | | | | | | | | |
Name, Address*, and Age | | Position(s)
Held with
Trust | | Term of
Office** and
Length of
Time Served | | Principal Occupation(s)
During Past 5 Years | | Number of
Portfolios in
Fund Complex
Overseen by Trustee | | Other Directorships Held by Trustee |
Teresa Hassara^^ Age: 57 | | Trustee | | Since
2017 | | Director (since 2017), MML Advisers; Head of Workplace Solutions (since 2017), MassMutual; President of Institutional Retirement (2009-2016),TIAA-CREF. | | 109 | | Trustee (since 2017), MassMutual Select Funds (open-end investment company); Trustee (since 2017), MML Series Investment Fund (open-end investment company); Trustee (since 2017), MML Series Investment Fund II (open-end investment company). |
266
Trustees and Officers (Unaudited)(Continued)
| | | | | | | | | | |
Name, Address*, and Age | | Position(s)
Held with
Trust | | Term of
Office** and
Length of
Time Served | | Principal Occupation(s)
During Past 5 Years | | Number of
Portfolios in
Fund Complex
Overseen by Trustee | | Other Directorships Held by Trustee |
Robert E. Joyal^^^ Age: 74 | | Trustee | | Since
2012 | | Retired. | | 111^ | | Director (since 2018), Jefferies Financial Group Inc. (holding company); Director (2013-2018), Leucadia National Corporation (holding company); Director (2012-2017), Ormat Technologies, Inc. (provider of alternative energy technology); Director (2006-2014), Jefferies Group LLC (investment bank); Trustee (since 2003), Barings Corporate Investors (closed-end investment company); Trustee (since 2003), Barings Participation Investors (closed-end investment company); Trustee (since 2003), MassMutual Select Funds (open-end investment company); Trustee (since 2003), MML Series Investment Fund (open-end investment company); Trustee (since 2012), MML Series Investment Fund II (open-end investment company). |
Principal Officers who are not Trustees
| | | | | | | | |
Name, Address*, and Age | | Position(s) Held
with Trust | | Term of
Office# and
Length of
Time Served | | Principal Occupation(s) During Past 5 Years | | Number of
Portfolios in
Fund Complex
Overseen by Officer |
Joseph Fallon Age: 44 | | Vice President Assistant Vice President | | Since
2017 2015-
2017 | | Investment Director (since 2014), MML Advisers; Head of Investment Consulting (since 2018), Head of Investment Consulting & Strategy (2017-2018), Investment Director (2006-2017), MassMutual; Vice President (since 2017), Assistant Vice President (2015-2017), MassMutual Select Funds (open-end investment company); Vice President (since 2017), Assistant Vice President (2015-2017), MML Series Investment Fund (open-end investment company); Vice President (since 2017), Assistant Vice President (2015-2017), MML Series Investment Fund II (open-end investment company). | | 109 |
| | | | |
Andrew M. Goldberg Age: 53 | | Vice President, Secretary (formerly known as “Clerk”), and Chief Legal Officer Assistant Clerk | | Since
2008 2004-
2008 | | Lead Counsel, Investment Adviser & Mutual Funds (since 2018), Assistant Vice President and Counsel (2004-2018), MassMutual; Secretary (since 2015), Assistant Secretary (2013-2015), MML Advisers; Vice President, Secretary, and Chief Legal Officer (since 2008), Assistant Secretary (2001-2008), MassMutual Select Funds (open-end investment company); Vice President, Secretary, and Chief Legal Officer (since 2008), Assistant Secretary (2001-2008), MML Series Investment Fund (open-end investment company); Vice President, Secretary (formerly known as “Clerk”), and Chief Legal Officer (since 2008), Assistant Clerk (2005-2008), MML Series Investment Fund II (open-end investment company). | | 109 |
| | | | |
Renee Hitchcock Age: 48 | | Chief Financial Officer and Treasurer Assistant Treasurer | | Since
2016 2007-
2016 | | Head of Mutual Fund Administration (since 2018), Assistant Vice President (2015-2018), Director (2007-2015), MassMutual; Chief Financial Officer and Treasurer (since 2016), Assistant Treasurer (2007-2016), MML Series Investment Fund (open-end investment company); Chief Financial Officer and Treasurer (since 2016), Assistant Treasurer (2007-2016), MassMutual Select Funds (open-end investment company); Chief Financial Officer and Treasurer (since 2016), Assistant Treasurer (2007-2016), MML Series Investment Fund II (open-end investment company). | | 109 |
| | | | |
Jill Nareau Robert Age: 47 | | Vice President and Assistant Secretary Assistant Secretary (formerly known as “Assistant Clerk”) | | Since
2017 2008-
2017 | | Lead Counsel, Investment Adviser & Mutual Funds (since 2018), Assistant Vice President and Counsel (2009-2018), MassMutual; Assistant Secretary (since 2015), MML Advisers; Vice President and Assistant Secretary (since 2017), Assistant Secretary (2008-2017), MassMutual Select Funds (open-end investment company); Vice President and Assistant Secretary (since 2017), Assistant Secretary (2008-2017), MML Series Investment Fund (open-end investment company); Vice President and Assistant Secretary (since 2017), Assistant Secretary (formerly known as “Assistant Clerk”) (2008-2017), MML Series Investment Fund II (open-end investment company). | | 109 |
267
Trustees and Officers (Unaudited)(Continued)
| | | | | | | | |
Name, Address*, and Age | | Position(s) Held
with Trust | | Term of
Office# and
Length of
Time Served | | Principal Occupation(s) During Past 5 Years | | Number of
Portfolios in
Fund Complex
Overseen by Officer |
Douglas Steele Age: 44 | | Vice President | | Since
2016 | | Vice President and Head of Investment Management (since 2017), Head of Investment Due Diligence (2016-2017), MML Advisers; Head of Investment Management (since 2017), Assistant Vice President(2013-2017), MassMutual; Vice President (since 2016), MassMutual Select Funds (open-end investment company); Vice President (since 2016), MML Series Investment Fund (open-end investment company); Vice President (since 2016), MML Series Investment Fund II (open-end investment company). | | 109 |
| | | | |
Philip S. Wellman Age: 55 | | Vice President and Chief Compliance Officer | | Since
2007 | | Vice President and Chief Compliance Officer (since 2013), MML Advisers; Head of Mutual Funds & RIA Compliance (since 2018), Vice President, Associate General Counsel, and Chief Compliance Officer (Mutual Funds) (2014-2018), Vice President, Associate General Counsel, and Chief Compliance Officer (Mutual Funds and Investment Advisory) (2008-2014), MassMutual; Vice President and Chief Compliance Officer (since 2007), MassMutual Select Funds (open-end investment company); Vice President and Chief Compliance Officer (since 2007), MML Series Investment Fund (open-end investment company); Vice President and Chief Compliance Officer (since 2007), MML Series Investment Fund II (open-end investment company). | | 109 |
| | | | |
Eric H. Wietsma Age: 53 | | President
Vice President | | Since
2008 2006-
2008 | | President (2013-2018, since 2019), Vice President (2018-2019), Director (since 2013), MML Advisers; Head of Workplace Operations (since 2018), Senior Vice President (2010-2018), MassMutual; President (since 2008), Vice President (2006-2008), MassMutual Select Funds (open-end investment company); President (since 2019), Vice President (2006-2019), MML Series Investment Fund(open-end investment company); President (since 2019), Vice President (2006-2019), MML Series Investment Fund II (open-end investment company). | | 109 |
| * | The address of each Trustee and Principal Officer is the same as that for the Trust; 100 Bright Meadow Blvd., Enfield, Connecticut 06082-1981. |
| ** | Each Trustee of the Trust serves until the next meeting of shareholders called for the purpose of electing Trustees and until the election and qualification of his or her successor or until he or she dies, resigns, or is removed. Notwithstanding the foregoing, unless the Trustees determine that it is desirable and in the best interest of the Trust that an exception to the retirement policy of the Trust be made, a Trustee shall retire and cease to serve as a Trustee upon the conclusion of the calendar year in which such Trustee attains the age ofseventy-five years, however, with the exception of Mr. Robert E. Joyal, an interested Trustee of the Trust shall no longer serve as a Trustee if or when they are no longer an employee of MassMutual or an affiliate. |
| | The Chairperson is elected to hold such office for a term of three years or until their successor is elected and qualified to carry out the duties and responsibilities of their office, or until he or she retires, dies, resigns, is removed, or becomes disqualified. The Chairperson shall hold office at the pleasure of the Trustees. |
| ^ | Barings Participation Investors and Barings Corporate Investors are deemed to be a part of the Fund Complex, because they are managed by Barings LLC, an affiliate of MML Advisers. |
| ^^ | Ms. Hassara is an “Interested Person,” as that term is defined in the 1940 Act, as an employee of MassMutual. |
| ^^^ | Mr. Joyal is an Interested Person through his position as a director of Jefferies Financial Group Inc., which controls Jefferies Group LLC, a broker-dealer that may execute portfolio transactions and/or engage in principal transactions with the Funds, other investment companies advised by MML Advisers or holding themselves out to investors as related companies for purposes of investment or investor services, or any other advisory accounts over which MML Advisers has brokerage placement discretion. |
| # | The President, Treasurer, and Secretary and such other officers as the Trustees may in their discretion from time to time elect are elected to hold such office until their successor is elected and qualified to carry out the duties and responsibilities of their office, or until he or she dies, resigns, is removed, or becomes disqualified. Each officer shall hold office at the pleasure of the Trustees. |
268
Federal Tax Information (Unaudited)
For corporate shareholders, a portion of the ordinary dividends paid during the Fund(s)’ year ended September 30, 2019, qualified for the dividends received deduction, as follows:
| | | | |
| |
| | | Dividends Received
Deductions | |
Short-Duration Bond Fund | | | 0.01% | |
Core Bond Fund | | | 0.11% | |
Diversified Bond Fund | | | 0.20% | |
Balanced Fund | | | 39.23% | |
Disciplined Value Fund | | | 52.72% | |
Main Street Fund | | | 92.16% | |
Disciplined Growth Fund | | | 21.34% | |
Small Cap Opportunities Fund | | | 53.32% | |
Global Fund | | | 64.97% | |
International Equity Fund | | | 0.10% | |
Strategic Emerging Markets Fund | | | 0.68% | |
For the year ended September 30, 2019, the following Fund(s) earned the following foreign sources of income:
| | | | |
| |
| | | Amount | |
International Equity Fund | | $ | 5,926,755 | |
Strategic Emerging Markets Fund | | | 2,971,798 | |
Under Section 854(b)(2) of the Code, the Fund(s) hereby designate the following maximum amounts as qualified dividends for purposes of the maximum rate under Section 1(h)(11) of the Code for the year ended September 30, 2019:
| | | | |
| |
| | | Qualified Dividend
Income | |
Short-Duration Bond Fund | | $ | 9,929 | |
Core Bond Fund | | | 192,332 | |
Diversified Bond Fund | | | 16,741 | |
Balanced Fund | | | 1,247,784 | |
Disciplined Value Fund | | | 3,255,145 | |
Main Street Fund | | | 2,296,875 | |
Disciplined Growth Fund | | | 3,986,389 | |
Small Cap Opportunities Fund | | | 1,893,181 | |
Global Fund | | | 4,411,740 | |
International Equity Fund | | | 5,710,861 | |
Strategic Emerging Markets Fund | | | 2,228,480 | |
269
Other Information (Unaudited)
Proxy Voting
A description of the policies and procedures that each Fund’s investment adviser and subadvisers use to vote proxies relating to the Fund’s portfolio securities is available, without charge, upon request, by calling1-888-309-3539, and on the SEC’s EDGAR database on its website at http://www.sec.gov.
Information regarding how the Funds voted proxies relating to portfolio securities during the most recent12-month period ended June 30 is available, without charge, upon request, on the MassMutual website at http://www.massmutual.com/funds and on the SEC’s EDGAR database on its website at http://www.sec.gov.
Quarterly Reporting
For periods ending on or after March 31, 2019, the Funds, except for the U.S. Government Money Market Fund, filed their complete schedule of portfolio holdings with the SEC for the first and third quarters of each fiscal year as an exhibit to their reports on FormN-PORT. The Funds’ FormsN-PORT will be available on the SEC’s EDGAR database on its website at http://www.sec.gov. For periods ending prior to March 31, 2019, this information was filed on FormN-Q. The Funds’ FormsN-Q are available on the SEC’s EDGAR database on its website at http://www.sec.gov.
Submission of Matter to a Vote of Security Holders
Pursuant to a written consent dated February 15, 2019, MassMutual and each of the MassMutual RetireSMARTSM Funds and MassMutual RetireSMARTSM by JPMorgan Funds, together in their capacity as the owner of a majority of the issued and outstanding shares of the MassMutual Premier High Yield Fund (the “Fund”), approved the ability for MML Advisers to appoint subadvisers for the Fund without shareholder approval, as described in the Information Statement dated January 22, 2019.
Trustees’ Approval of Investment Advisory Contracts
At their meetings in May and June 2019, the Contract Committee (the “Committee”) and the Trustees, including the Trustees who are not “interested persons” (as such term is defined in the 1940 Act) of the Trust, MML Advisers, or the subadvisers (the “Independent Trustees”), re-approved the existing advisory and subadvisory agreements (collectively, the “Contracts”) for each of the U.S. Government Money Market Fund, Short-Duration Bond Fund, Inflation-Protected and Income Fund, Core Bond Fund, Diversified Bond Fund, High Yield Fund, Balanced Fund, Disciplined Value Fund, Main Street Fund, Disciplined Growth Fund, Small Cap Opportunities Fund, Global Fund, International Equity Fund, and Strategic Emerging Markets Fund. In preparation for the meetings, the Trustees requested, and MML Advisers and the subadvisers provided in advance, certain materials relevant to the consideration of the Contracts (the “Meeting Materials”). In all of their deliberations, the Trustees were advised by independent counsel.
The Committee received in advance of the meetings (i) a memorandum from MML Advisers discussing the nature and quality of the services it provides as investment adviser to the Funds; (ii) a profitability analysis prepared by MML Advisers; and (iii) a fee and performance study report (the “Third-Party Report”) with respect to each Fund prepared by an independent third-party vendor (the “Third-Party”). The Third-Party Report provided detailed comparative advisory fee, total expense, and performance information for each Fund to assist the Committee in its evaluation of the Contracts. The Committee also considered information presented to it throughout the year regarding MML Advisers and each of the subadvisers.
The Committee considered the nature, scope, and quality of services MML Advisers provides to the Funds, including: (i) the financial condition, stability, and business strategy of MML Advisers; (ii) the capabilities of MML Advisers with respect to regulatory compliance and its ability to monitor compliance with the investment policies of the Funds; (iii) MML Advisers’ ability to provide investment oversight and provide for administrative and shareholder services to the Funds; and (iv) the experience and qualifications of the personnel of MML Advisers that perform, or oversee the performance of, the services provided to the Funds, and the needs of the Funds for administrative and shareholder services.
270
Other Information (Unaudited)(Continued)
The Committee then reviewed and considered, for each Fund separately, the detailed information presented in the Third-Party Report regarding: (i) Fund expenses, including, among other things, both the Fund’s net advisory fee and total net expense ratio against peer funds; and (ii) the Fund’s relative performance (over various time periods against funds in its “category” and a benchmark index). In connection with the Committee’s review, MML Advisers provided commentary and analysis regarding each Fund’s expenses and performance and a recommendation as to the action to be taken by the Committee. The Committee noted that it had received in the Meeting Materials or during the course of the past year: (i) detailed information regarding MML Advisers’ ability to provide investment oversight and provide for administrative and shareholder services to the Funds; and (ii) a wide range of information about the subadvisers and their personnel with responsibility for providing services to the Funds and the fees payable to each subadviser by MML Advisers. MML Advisers reviewed with the Committee in detail the work MML Advisers does in its oversight roles, the expertise it brings to these roles, the size of its teams, and the financial commitment it has made to provide those services. Throughout the discussion, MML Advisers responded to Committee members’ questions and provided additional information concerning each Fund.
The Committee reviewed the expense and performance information for each Fund. (References to any one- or three-year period below are to periods ended December 31, 2018. In all cases, the comparative expense information is that of a Fund’s “peer group” and the comparative performance information is that of a Fund’s “performance category.”)
The Committee considered that the total net expense ratios for all of the Funds other than the International Equity Fund and U.S. Government Money Market Fund were within the top sixty percent of their peer groups, and in most cases in the top thirty percent. Of those Funds, all had net advisory fees at or below the medians of their peers, or in the top sixty percent of their peer groups, except the Diversified Bond Fund, Inflation-Protected and Income Fund, Strategic Emerging Markets Fund, and Core Bond Fund, the levels of whose net advisory fees the Committee did not consider to be inconsistent with the advisory agreements’ continuation, in light of the Funds’ generally acceptable total net expense ratios and long-term relative performance records.
With respect to the International Equity Fund, the Committee considered that MML Advisers was proposing to implement a contractual two basis point advisory fee waiver in order to reduce the Fund’s net advisory fee and total net expense ratio, both of which are above the peer medians.
With respect to the U.S. Government Money Market Fund, the Committee considered MML Advisers’ statements that, although the Fund’s total net expense ratio and net advisory fee are both above their medians, peer group pricing continues to be influenced by expense waivers in light of historically low interest rates and MML Advisers is waiting to see how the marketplace adjusts to currently higher rates before proposing changes, if any, to the Fund’s pricing.
The Committee considered that a number of the Funds achieved one- and three-year investment performance at or above the medians of their performance categories, or in the top sixty percent of their performance categories. These Funds included the Inflation-Protected and Income Fund, Strategic Emerging Markets Fund, Core Bond Fund, Balanced Fund, Small Cap Opportunities Fund, High Yield Fund, and Short-Duration Bond Fund.
The Committee considered that each of the Global Fund, Disciplined Growth Fund, and Diversified Bond Fund had achieved favorable three-year relative performance, but had experienced less favorable one-year performance. The Committee took into account factors cited by MML Advisers as to the recent underperformance and MML Advisers’ continued confidence in the longer-term performance of the subadvisers in question.
As to the Main Street Fund and Disciplined Value Fund, the Committee considered MML Advisers’ statements that, although the Funds had underperformed in the most recent one- and three-year periods, each had experienced favorable long-term performance, and that MML Advisers remains confident in the Funds’ subadvisers.
With respect to the International Equity Fund, the Committee considered MML Advisers’ statements that, although the Fund’s subadviser has achieved favorable performance over the long term, its most recent performance has been disappointing, and that the subadviser is on “watch” status in light of that recent performance.
As to the U.S. Government Money Market Fund, the Committee considered MML Advisers’ statements that the Fund’s performance is generally in line with that of its peers.
271
Other Information (Unaudited)(Continued)
The Committee also reviewed and considered information included in the Meeting Materials, or discussed at the meeting and during the course of the year, concerning economies of scale and the profitability of MML Advisers’ advisory relationship with the various Funds, including: (i) a description of MML Advisers’ revenues from the Funds (including advisory fees and administrative and shareholder services fees, as applicable) and the expense allocation methodology employed by MML Advisers; and (ii) profitability information for each individual Fund. The discussions included consideration of the intangible benefits derived by MML Advisers and its affiliates resulting from their relationships with the Funds and any so-called “fallout benefits” to MML Advisers (which were not considered to be substantial in any event), such as any reputational value derived from serving as investment adviser to the Funds, and benefits accruing to subadvisers due to so-called “soft-dollar arrangements.”
Prior to the votes being taken to approve the Contracts, the Committee met separately in executive session to discuss the appropriateness of such contracts. The Committee weighed the foregoing matters in light of the advice given to them by their independent legal counsel as to the law applicable to the review of investment advisory contracts. In arriving at a decision, the Committee did not identify any single matter as all-important or controlling. The foregoing summary does not detail all of the matters considered.
As to each of the Funds, the Committee concluded that: (i) overall, it was satisfied with the nature, extent, and quality of services provided, and expected to be provided in the future, under the Contracts, including the level of MML Advisers’ oversight of each Fund and the subadvisory process; (ii) MML Advisers’ levels of profitability from its relationship with the various Funds are not excessive and the advisory fees payable under the advisory agreements and each Fund’s total net expenses are fair and reasonable; (iii) the investment processes, research capabilities, and philosophies of the subadvisers generally appear well suited to the Funds, given their investment objectives and policies; (iv) either the relative or absolute performance of a Fund (in each case, taking into account the applicable investment strategy and risk profile of the Fund), or the steps MML Advisers has proposed in respect of the underperformance of a Fund, are sufficient to warrant continuation of the Contracts for each of the Funds; and (v) the terms of the Contracts are fair and reasonable with respect to each Fund and are in the best interests of each Fund’s shareholders.
272
Other Information (Unaudited)(Continued)
Fund ExpensesSeptember 30, 2019
Expense Examples:
The following information is in regards to expenses for the six months ended September 30, 2019:
As a shareholder of the Funds, you may incur two types of costs: (1) transaction costs, including sales charges (loads) on purchase payments or redemptions; and (2) ongoing costs, including advisory fees, distribution and/or service(12b-1) fees, and other Fund expenses. These examples are intended to help you understand your ongoing costs (in dollars) of investing in the Funds and to compare these costs with the ongoing costs of investing in other mutual funds. These examples are based on an investment of $1,000 invested for the six months ended September 30, 2019.
Actual Expenses:
The first four columns of the table below provide information about actual account values and actual expenses. You may use this information, together with the amount you invested, to estimate the expenses that you paid over the period. Simply divide your account value by $1,000 (for example, an $8,600 account value divided by $1,000 = 8.6), then multiply the result by the number under the heading entitled “Operating Expenses Incurred” to estimate the expenses you paid on your account during this period.
Hypothetical Example for Comparison Purposes:
The last two columns of the table below provide information about hypothetical account values and hypothetical expenses based on the Fund’s actual expense ratio and an assumed rate of return of 5% per year before expenses, which is not the Fund’s actual return. The hypothetical account values and expenses may not be used to estimate the actual ending account balance or expenses you paid for the period. You may use this information to compare the ongoing costs of investing in the Fund and other funds. To do so, compare this 5% hypothetical example with the 5% hypothetical examples that appear in the shareholder reports of the other funds.
Please note that the expenses shown in the table are meant to highlight your ongoing costs only and do not reflect any transactional costs. Therefore, the last two columns of the table are useful in comparing ongoing costs only, and will not help you determine the relative total costs of owning different funds. In addition, if these transactional costs were included, your costs would have been higher.
| | | | | | | | | | | | | | | | | | | | | | | | |
| | | Beginning
Value | | | Annualized
Expense
Ratio | | | Ending
Value (Based
on Actual
Returns and
Expenses) | | | Operating
Expenses
Incurred* | | | Ending
Value (Based
on
Hypothetical
Returns and
Expenses) | | | Operating
Expenses
Incurred* | |
| U.S. Government Money Market Fund | | | | | | | | | | | | | | | | | | | | | | | | |
Class R5 | | $ | 1,000 | | | | 0.52 | % | | $ | 1,009.30 | | | $ | 2.65 | | | $ | 1,022.70 | | | $ | 2.67 | |
| Short-Duration Bond Fund | | | | | | | | | | | | | | | | | | | | | | | | |
Class I | | | 1,000 | | | | 0.43 | % | | | 1,020.80 | | | | 2.20 | | | | 1,023.20 | | | | 2.20 | |
Class R5 | | | 1,000 | | | | 0.53 | % | | | 1,019.70 | | | | 2.71 | | | | 1,022.70 | | | | 2.72 | |
Service Class | | | 1,000 | | | | 0.63 | % | | | 1,018.90 | | | | 3.22 | | | | 1,022.10 | | | | 3.23 | |
Administrative Class | | | 1,000 | | | | 0.73 | % | | | 1,018.90 | | | | 3.73 | | | | 1,021.60 | | | | 3.74 | |
Class A | | | 1,000 | | | | 0.98 | % | | | 1,018.10 | | | | 5.01 | | | | 1,020.40 | | | | 5.02 | |
Class R4 | | | 1,000 | | | | 0.88 | % | | | 1,017.80 | | | | 4.50 | | | | 1,020.90 | | | | 4.51 | |
Class R3 | | | 1,000 | | | | 1.13 | % | | | 1,016.90 | | | | 5.78 | | | | 1,019.60 | | | | 5.78 | |
273
Other Information (Unaudited)(Continued)
| | | | | | | | | | | | | | | | | | | | | | | | |
| | | Beginning
Value | | | Annualized
Expense
Ratio | | | Ending
Value (Based
on Actual
Returns and
Expenses) | | | Operating
Expenses
Incurred* | | | Ending
Value (Based
on
Hypothetical
Returns and
Expenses) | | | Operating
Expenses
Incurred* | |
| Inflation-Protected and Income Fund | | | | | | | | | | | | | | | | | | | | | | | | |
Class I | | $ | 1,000 | | | | 0.47 | % | | $ | 1,043.30 | | | $ | 2.43 | | | $ | 1,023.00 | | | $ | 2.41 | |
Class R5 | | | 1,000 | | | | 0.57 | % | | | 1,042.30 | | | | 2.95 | | | | 1,022.50 | | | | 2.92 | |
Service Class | | | 1,000 | | | | 0.67 | % | | | 1,041.50 | | | | 3.47 | | | | 1,021.90 | | | | 3.43 | |
Administrative Class | | | 1,000 | | | | 0.77 | % | | | 1,041.00 | | | | 3.98 | | | | 1,021.40 | | | | 3.94 | |
Class A | | | 1,000 | | | | 1.02 | % | | | 1,040.00 | | | | 5.27 | | | | 1,020.20 | | | | 5.22 | |
Class R4 | | | 1,000 | | | | 0.92 | % | | | 1,040.30 | | | | 4.76 | | | | 1,020.70 | | | | 4.71 | |
Class R3 | | | 1,000 | | | | 1.17 | % | | | 1,039.20 | | | | 6.05 | | | | 1,019.40 | | | | 5.99 | |
| Core Bond Fund | | | | | | | | | | | | | | | | | | | | | | | | |
Class I | | | 1,000 | | | | 0.43 | % | | | 1,054.90 | | | | 2.24 | | | | 1,023.20 | | | | 2.20 | |
Class R5 | | | 1,000 | | | | 0.54 | % | | | 1,054.70 | | | | 2.81 | | | | 1,022.60 | | | | 2.77 | |
Service Class | | | 1,000 | | | | 0.64 | % | | | 1,054.20 | | | | 3.33 | | | | 1,022.10 | | | | 3.28 | |
Administrative Class | | | 1,000 | | | | 0.74 | % | | | 1,053.60 | | | | 3.85 | | | | 1,021.60 | | | | 3.79 | |
Class A | | | 1,000 | | | | 0.99 | % | | | 1,052.10 | | | | 5.15 | | | | 1,020.30 | | | | 5.07 | |
Class R4 | | | 1,000 | | | | 0.89 | % | | | 1,052.40 | | | | 4.63 | | | | 1,020.80 | | | | 4.56 | |
Class R3 | | | 1,000 | | | | 1.14 | % | | | 1,051.90 | | | | 5.93 | | | | 1,019.60 | | | | 5.83 | |
| Diversified Bond Fund | | | | | | | | | | | | | | | | | | | | | | | | |
Class I | | | 1,000 | | | | 0.56 | % | | | 1,057.20 | | | | 2.92 | | | | 1,022.50 | | | | 2.87 | |
Class R5 | | | 1,000 | | | | 0.68 | % | | | 1,056.90 | | | | 3.54 | | | | 1,021.90 | | | | 3.48 | |
Service Class | | | 1,000 | | | | 0.79 | % | | | 1,056.10 | | | | 4.12 | | | | 1,021.30 | | | | 4.05 | |
Administrative Class | | | 1,000 | | | | 0.89 | % | | | 1,056.20 | | | | 4.64 | | | | 1,020.80 | | | | 4.56 | |
Class A | | | 1,000 | | | | 1.13 | % | | | 1,054.30 | | | | 5.88 | | | | 1,019.60 | | | | 5.78 | |
Class R4 | | | 1,000 | | | | 1.03 | % | | | 1,054.90 | | | | 5.36 | | | | 1,020.10 | | | | 5.27 | |
Class R3 | | | 1,000 | | | | 1.29 | % | | | 1,054.00 | | | | 6.71 | | | | 1,018.80 | | | | 6.60 | |
| High Yield Fund | | | | | | | | | | | | | | | | | | | | | | | | |
Class I | | | 1,000 | | | | 0.55 | % | | | 1,040.70 | | | | 2.84 | | | | 1,022.60 | | | | 2.82 | |
Class R5 | | | 1,000 | | | | 0.65 | % | | | 1,039.30 | | | | 3.36 | | | | 1,022.00 | | | | 3.33 | |
Service Class | | | 1,000 | | | | 0.75 | % | | | 1,039.30 | | | | 3.88 | | | | 1,021.50 | | | | 3.84 | |
Administrative Class | | | 1,000 | | | | 0.85 | % | | | 1,040.00 | | | | 4.39 | | | | 1,021.00 | | | | 4.35 | |
Class A | | | 1,000 | | | | 1.09 | % | | | 1,037.80 | | | | 5.63 | | | | 1,019.80 | | | | 5.58 | |
Class R4 | | | 1,000 | | | | 0.99 | % | | | 1,038.20 | | | | 5.11 | | | | 1,020.30 | | | | 5.07 | |
Class R3 | | | 1,000 | | | | 1.25 | % | | | 1,037.30 | | | | 6.45 | | | | 1,019.00 | | | | 6.40 | |
| Balanced Fund | | | | | | | | | | | | | | | | | | | | | | | | |
Class I | | | 1,000 | | | | 0.79 | % | | | 1,042.30 | | | | 4.09 | | | | 1,021.30 | | | | 4.05 | |
Class R5 | | | 1,000 | | | | 0.91 | % | | | 1,042.30 | | | | 4.71 | | | | 1,020.70 | | | | 4.66 | |
Service Class | | | 1,000 | | | | 1.02 | % | | | 1,041.70 | | | | 5.28 | | | | 1,020.20 | | | | 5.22 | |
Administrative Class | | | 1,000 | | | | 1.11 | % | | | 1,041.30 | | | | 5.74 | | | | 1,019.70 | | | | 5.68 | |
Class A | | | 1,000 | | | | 1.36 | % | | | 1,039.90 | | | | 7.03 | | | | 1,018.40 | | | | 6.96 | |
Class R4 | | | 1,000 | | | | 1.27 | % | | | 1,040.20 | | | | 6.57 | | | | 1,018.90 | | | | 6.50 | |
Class R3 | | | 1,000 | | | | 1.52 | % | | | 1,039.50 | | | | 7.86 | | | | 1,017.60 | | | | 7.77 | |
| Disciplined Value Fund | | | | | | | | | | | | | | | | | | | | | | | | |
Class I | | | 1,000 | | | | 0.66 | % | | | 1,031.70 | | | | 3.40 | | | | 1,022.00 | | | | 3.38 | |
Class R5 | | | 1,000 | | | | 0.76 | % | | | 1,031.70 | | | | 3.91 | | | | 1,021.50 | | | | 3.89 | |
Service Class | | | 1,000 | | | | 0.87 | % | | | 1,030.40 | | | | 4.48 | | | | 1,020.90 | | | | 4.46 | |
Administrative Class | | | 1,000 | | | | 0.97 | % | | | 1,030.50 | | | | 4.99 | | | | 1,020.40 | | | | 4.97 | |
Class A | | | 1,000 | | | | 1.22 | % | | | 1,029.20 | | | | 6.27 | | | | 1,019.20 | | | | 6.24 | |
Class R4 | | | 1,000 | | | | 1.12 | % | | | 1,029.50 | | | | 5.76 | | | | 1,019.70 | | | | 5.73 | |
Class R3 | | | 1,000 | | | | 1.36 | % | | | 1,029.00 | | | | 6.99 | | | | 1,018.40 | | | | 6.96 | |
274
Other Information (Unaudited)(Continued)
| | | | | | | | | | | | | | | | | | | | | | | | |
| | | Beginning
Value | | | Annualized
Expense
Ratio | | | Ending
Value (Based
on Actual
Returns and
Expenses) | | | Operating
Expenses
Incurred* | | | Ending
Value (Based
on
Hypothetical
Returns and
Expenses) | | | Operating
Expenses
Incurred* | |
| Main Street Fund | | | | | | | | | | | | | | | | | | | | | | | | |
Class I | | $ | 1,000 | | | | 0.74 | % | | $ | 1,068.50 | | | $ | 3.88 | | | $ | 1,021.60 | | | $ | 3.79 | |
Class R5 | | | 1,000 | | | | 0.84 | % | | | 1,067.60 | | | | 4.40 | | | | 1,021.10 | | | | 4.30 | |
Service Class | | | 1,000 | | | | 0.94 | % | | | 1,067.80 | | | | 4.93 | | | | 1,020.60 | | | | 4.81 | |
Administrative Class | | | 1,000 | | | | 1.04 | % | | | 1,066.60 | | | | 5.45 | | | | 1,020.10 | | | | 5.32 | |
Class A | | | 1,000 | | | | 1.29 | % | | | 1,064.70 | | | | 6.75 | | | | 1,018.80 | | | | 6.60 | |
Class R4 | | | 1,000 | | | | 1.19 | % | | | 1,065.30 | | | | 6.23 | | | | 1,019.30 | | | | 6.09 | |
Class R3 | | | 1,000 | | | | 1.44 | % | | | 1,064.60 | | | | 7.53 | | | | 1,018.00 | | | | 7.36 | |
| Disciplined Growth Fund | | | | | | | | | | | | | | | | | | | | | | | | |
Class I | | | 1,000 | | | | 0.55 | % | | | 1,052.60 | | | | 2.86 | | | | 1,022.60 | | | | 2.82 | |
Class R5 | | | 1,000 | | | | 0.65 | % | | | 1,051.60 | | | | 3.38 | | | | 1,022.00 | | | | 3.33 | |
Service Class | | | 1,000 | | | | 0.75 | % | | | 1,051.40 | | | | 3.90 | | | | 1,021.50 | | | | 3.84 | |
Administrative Class | | | 1,000 | | | | 0.85 | % | | | 1,050.70 | | | | 4.42 | | | | 1,021.00 | | | | 4.35 | |
Class A | | | 1,000 | | | | 1.10 | % | | | 1,049.60 | | | | 5.71 | | | | 1,019.80 | | | | 5.63 | |
Class R4 | | | 1,000 | | | | 1.00 | % | | | 1,050.00 | | | | 5.20 | | | | 1,020.30 | | | | 5.12 | |
Class R3 | | | 1,000 | | | | 1.25 | % | | | 1,048.20 | | | | 6.49 | | | | 1,019.00 | | | | 6.40 | |
| Small Cap Opportunities Fund | | | | | | | | | | | | | | | | | | | | | | | | |
Class I | | | 1,000 | | | | 0.70 | % | | | 1,037.80 | | | | 3.62 | | | | 1,021.80 | | | | 3.59 | |
Class R5 | | | 1,000 | | | | 0.80 | % | | | 1,037.10 | | | | 4.13 | | | | 1,021.30 | | | | 4.10 | |
Service Class | | | 1,000 | | | | 0.90 | % | | | 1,037.20 | | | | 4.65 | | | | 1,020.80 | | | | 4.61 | |
Administrative Class | | | 1,000 | | | | 1.00 | % | | | 1,036.70 | | | | 5.16 | | | | 1,020.30 | | | | 5.12 | |
Class A | | | 1,000 | | | | 1.25 | % | | | 1,035.30 | | | | 6.45 | | | | 1,019.00 | | | | 6.40 | |
Class R4 | | | 1,000 | | | | 1.15 | % | | | 1,035.50 | | | | 5.93 | | | | 1,019.50 | | | | 5.89 | |
Class R3 | | | 1,000 | | | | 1.40 | % | | | 1,034.20 | | | | 7.22 | | | | 1,018.20 | | | | 7.16 | |
| Global Fund | | | | | | | | | | | | | | | | | | | | | | | | |
Class I | | | 1,000 | | | | 0.80 | % | | | 996.80 | | | | 4.05 | | | | 1,021.30 | | | | 4.10 | |
Class R5 | | | 1,000 | | | | 0.90 | % | | | 996.80 | | | | 4.55 | | | | 1,020.80 | | | | 4.61 | |
Service Class | | | 1,000 | | | | 0.99 | % | | | 995.10 | | | | 5.01 | | | | 1,020.30 | | | | 5.07 | |
Administrative Class | | | 1,000 | | | | 1.10 | % | | | 995.20 | | | | 5.56 | | | | 1,019.80 | | | | 5.63 | |
Class A | | | 1,000 | | | | 1.35 | % | | | 994.30 | | | | 6.82 | | | | 1,018.50 | | | | 6.91 | |
Class R4 | | | 1,000 | | | | 1.25 | % | | | 994.20 | | | | 6.32 | | | | 1,019.00 | | | | 6.40 | |
Class R3 | | | 1,000 | | | | 1.50 | % | | | 993.40 | | | | 7.58 | | | | 1,017.70 | | | | 7.67 | |
| International Equity Fund | | | | | | | | | | | | | | | | | | | | | | | | |
Class I | | | 1,000 | | | | 0.84 | % | | | 1,029.10 | | | | 4.32 | | | | 1,021.10 | | | | 4.30 | |
Class R5 | | | 1,000 | | | | 0.95 | % | | | 1,028.30 | | | | 4.88 | | | | 1,020.50 | | | | 4.86 | |
Service Class | | | 1,000 | | | | 1.04 | % | | | 1,028.40 | | | | 5.35 | | | | 1,020.10 | | | | 5.32 | |
Administrative Class | | | 1,000 | | | | 1.15 | % | | | 1,027.60 | | | | 5.91 | | | | 1,019.50 | | | | 5.89 | |
Class A | | | 1,000 | | | | 1.41 | % | | | 1,025.80 | | | | 7.24 | | | | 1,018.20 | | | | 7.21 | |
Class R4 | | | 1,000 | | | | 1.30 | % | | | 1,027.00 | | | | 6.68 | | | | 1,018.80 | | | | 6.65 | |
Class R3 | | | 1,000 | | | | 1.56 | % | | | 1,025.20 | | | | 8.01 | | | | 1,017.40 | | | | 7.98 | |
| Strategic Emerging Markets Fund | | | | | | | | | | | | | | | | | | | | | | | | |
Class I | | | 1,000 | | | | 1.13 | % | | | 993.90 | | | | 5.71 | | | | 1,019.60 | | | | 5.78 | |
Class R5 | | | 1,000 | | | | 1.25 | % | | | 994.00 | | | | 6.32 | | | | 1,019.00 | | | | 6.40 | |
Service Class | | | 1,000 | | | | 1.33 | % | | | 993.90 | | | | 6.72 | | | | 1,018.60 | | | | 6.80 | |
Administrative Class | | | 1,000 | | | | 1.44 | % | | | 993.20 | | | | 7.27 | | | | 1,018.00 | | | | 7.36 | |
Class A | | | 1,000 | | | | 1.70 | % | | | 991.60 | | | | 8.58 | | | | 1,016.70 | | | | 8.69 | |
Class R4 | | | 1,000 | | | | 1.60 | % | | | 991.60 | | | | 8.08 | | | | 1,017.20 | | | | 8.18 | |
Class R3 | | | 1,000 | | | | 1.84 | % | | | 990.80 | | | | 9.28 | | | | 1,016.00 | | | | 9.40 | |
| * | Expenses are calculated using the annualized expense ratio for the six months ended September 30, 2019, multiplied by the average account value over the period, multiplied by 185 days in the period, divided by 365 days in the year, unless stated otherwise. |
275
| | |
Underwriter: MML Distributors, LLC 100 Bright Meadow Blvd. Enfield, Connecticut 06082-1981 | | |

| | |
© 2019 Massachusetts Mutual Life Insurance Company (MassMutual), Springfield, MA 01111-0001. All rights reserved. www.massmutual.com. Investment Adviser: MML Investment Advisers, LLC | | RS-45700-01 |
Item 2. Code of Ethics.
As of September 30, 2019, the Registrant adopted a Code of Ethics that applies to the Principal Executive Officer and Principal Financial Officer pursuant to the Sarbanes-Oxley Act of 2002. For the year ended September 30, 2019, there were no reportable amendments to a provision of the Code of Ethics. A copy of its Code of Ethics is filed with this FormN-CSR under Item 13(a)(1).
Item 3. Audit Committee Financial Expert.
The Registrant’s Board of Trustees has determined that Susan B. Sweeney and Nabil N. El-Hage, both members of the Audit Committee, are audit committee financial experts as defined by the Securities and Exchange Commission (the “SEC”). Ms. Sweeney and Mr. El-Hage are both “independent” as defined by the SEC for purposes of audit committee financial expert determinations.
Item 4. Principal Accountant Fees and Services.
References below to Deloitte & Touche LLP include its affiliates where applicable.
| | (a) | AUDIT FEES: The aggregate fees billed to the Registrant for professional services rendered by its independent auditors, Deloitte & Touche LLP, for the audit of the Registrant’s annual financial statements for the fiscal years ended 2019 and 2018 were $462,692 and $481,929, respectively. |
| | (b) | AUDIT RELATED FEES: No such fees were billed to the Registrant by Deloitte & Touche LLP for the fiscal years ended 2019 and 2018. No such fees were billed to the Registrant’s adviser and any entity controlling, controlled by, or under common control with the adviser that provides ongoing services to the Registrant by Deloitte & Touche LLP* for the fiscal years ended 2019 and 2018. |
| | (c) | TAX FEES: The aggregate fees billed to the Registrant for professional services rendered by Deloitte & Touche LLP for the review of Form1120-RIC, Form 8613, excise distribution projections, distribution calculation and reasonable out of pocket expenses for the fiscal years ended 2019 and 2018 were $109,954 and $107,502, respectively. No such fees were billed to the Registrant’s adviser and any entity controlling, controlled by, or under common control with the adviser that provides ongoing services to the Registrant by Deloitte & Touche LLP* for the fiscal years ended 2019 and 2018. |
| | (d) | ALL OTHER FEES: No such fees were billed to the Registrant by Deloitte & Touche LLP for the fiscal years ended 2019 and 2018. No such fees were billed to the Registrant’s adviser and any entity controlling, controlled by, or under common control with the adviser that provides ongoing services to the Registrant by Deloitte & Touche LLP* for the fiscal years ended 2019 and 2018. |
| | (e) | (1) AUDIT COMMITTEEPRE-APPOVAL POLICY: All services to be performed for the Registrant by Deloitte & Touche LLP must bepre-approved by the audit committee. All services performed during the fiscal years ended 2019 and 2018 werepre-approved by the committee. |
(2) Not applicable.
| | (g) | The aggregatenon-audit fees billed by Deloitte & Touche LLP for services rendered to the Registrant, the Registrant’s adviser and any entity controlling, controlled by, or under common control with the adviser that provides ongoing services to the Registrant, for the fiscal years ended 2019 and 2018 were $1,352,377 and $15,542,262, respectively. |
| | (h) | The audit committee considers whether the provision ofnon-audit services by Deloitte & Touche LLP to the Registrant’s adviser and any entity controlling, controlled by, or under common control with the adviser that provides ongoing services to the Registrant that were notpre-approved pursuant to paragraph (c)(7)(ii) of Rule2-01 of RegulationS-X is compatible with maintaining Deloitte & Touche LLP’s independence. |
| | * | Refers to fees that were required to be approved by the audit committee for services that relate directly to the operations and financial reporting of the Registrant. |
Item 5. Audit Committee of Listed Registrants.
Not applicable to this filing.
Item 6. Investments.
Please see portfolio of investments contained in the Reports to Stockholders included under Item 1 of this formN-CSR.
Item 7. Disclosure of Proxy Voting Policies and Procedures forClosed-End Management Investment Companies.
Not applicable to this filing.
Item 8. Portfolio Managers ofClosed-End Management Investment Companies.
Not applicable to this filing.
Item 9. Purchases of Equity Securities byClosed-End Management Investment Company and Affiliated Purchasers.
Not applicable to this filing.
Item 10. Submission of Matters to a Vote of Security Holders.
Not applicable to this filing.
Item 11. Controls and Procedures.
(a) The Registrant’s Principal Executive Officer and Principal Financial Officer have concluded that the Registrant’s disclosure controls and procedures (as defined inRule 30a-3(c) under the Investment Company Act of 1940, as amended (the “1940 Act”) (17 CFR270.30a-3(c))) are effective, as of a date within 90 days of the filing date of thisForm N-CSR, to provide reasonable assurance that the information required to be disclosed by the Registrant onForm N-CSR is recorded, processed, summarized, and reported within the time periods specified in the SEC’s rules and forms, based on their evaluation of these disclosure controls and procedures required byRule 30a-3(b) under the 1940 Act (17 CFR270.30a-3(b)) andRules 13a-15(b) or15d-15(b) under the Securities Exchange Act of 1934 (17 CFR240.13a-15(b) or240.15d-15(b)).
(b) There were no changes in the Registrant’s internal control over financial reporting (as defined inRule 30a-3(d) under the 1940 Act (17 CFR270.30a-3(d))) that occurred during the period covered by this report that has materially affected, or is reasonably likely to materially affect, the Registrant’s internal control over financial reporting.
Item 12. Disclosure of Securities Lending Activities forClosed-End Management Investment Companies
Not applicable to this filing.
Item 13. Exhibits.
(a)(1) Code of Ethics (Item 2) is attached.
(a)(2) Certifications of the Principal Executive Officer and Principal Financial Officer of the Registrant as required byRule 30a-2(a) under the 1940 Act (17 CFR270.30a-2(a)) are attached hereto as Exhibit 99CERT.
(a)(3) Not applicable to this filing.
(a)(4) Not applicable to this filing.
(b) Certifications pursuant to Section 906 of the Sarbanes-Oxley Act of 2002 as required by Rule30a-2(b), under the 1940 Act (17 CFR270.30a-2(b)), Rule15d-14(b) under the Securities Exchange Act of 1934 (17 CFR240.15d-14(b)) and Section 1350 of Chapter 63 of Title 18 of the United States Code (18 U.S.C. 1350) are attached hereto as Exhibit 99.906CERT.
SIGNATURES
Pursuant to the requirements of the Securities Exchange Act of 1934 and the Investment Company Act of 1940, the registrant has duly caused this report to be signed on its behalf by the undersigned, thereunto duly authorized.
| | | | |
(Registrant) | | MassMutual Premier Funds |
| | | | |
| | |
By (Signature and Title) | | /s/ Eric Wietsma | | |
| | Eric Wietsma, President and Principal Executive Officer |
|
Date 11/26/2019 |
Pursuant to the requirements of the Securities Exchange Act of 1934 and the Investment Company Act of 1940, this report has been signed below by the following persons on behalf of the registrant and in the capacities and on the dates indicated.
| | | | |
By (Signature and Title) | | /s/ Eric Wietsma | | |
| | Eric Wietsma, President and Principal Executive Officer |
| |
Date 11/26/2019 | | |
| | |
By (Signature and Title) | | /s/ Renee Hitchcock | | |
| | Renee Hitchcock, Treasurer and Principal Financial Officer |
| |
Date 11/26/2019 | | |