UNITED STATES
SECURITIES AND EXCHANGE COMMISSION
Washington, D.C. 20549
FORM N-CSR
CERTIFIED SHAREHOLDER REPORT OF REGISTERED
MANAGEMENT INVESTMENT COMPANIES
| | | | |
| Investment Company Act file number | | 811-08690 |
|
MassMutual Premier Funds |
| (Exact name of registrant as specified in charter) | | |
|
100 Bright Meadow Blvd., Enfield, CT 06082 |
| (Address of principal executive offices) | | (Zip code) |
| | |
| Eric Wietsma | | | | |
100 Bright Meadow Blvd., Enfield, CT 06082 |
| | (Name and address of agent for service) | | |
Registrant’s telephone number, including area code: (860) 562-1000
Date of fiscal year end: 9/30/2016
Date of reporting period: 9/30/2016
Item 1. Reports to Stockholders.

Table of Contents
This material must be preceded or accompanied by a current prospectus (or summary prospectus, if available) for the MassMutual Premier Funds. Investors should consider a Fund’s investment objective, risks, and charges and expenses carefully before investing. This and other information about the investment company is available in the prospectus (or summary prospectus, if available). Read it carefully before investing.
MassMutual Premier Funds – President’s Letter to Shareholders (Unaudited)
To Our Shareholders

Eric Wietsma
“MassMutual believes that the ongoing uncertainties in markets today highlight the importance of taking a long-term perspective and not reacting to current events or short-term market changes.”
September 30, 2016
Continued strength in U.S. markets in a challenging market environment
I am pleased to present you with the MassMutual Premier Funds Annual Report, covering the period ended September 30, 2016 (the “fiscal year”). Domestic stocks outperformed most international equities during the fiscal year, as a generally strong market environment in the U.S. contrasted with weakness in many of the world’s other large economies, including Europe and Japan. The economic difficulties elsewhere – punctuated, for example, by a challenging interest rate environment in Japan and uncertainty in Europe following the surprising Brexit vote that ratified the United Kingdom’s eventual exit from the European Union – had virtually no impact on major U.S. stock indexes during the fiscal year. Nevertheless, during the reporting period, market volatility emerged from time to time, serving as a general reminder for investors that market conditions are cyclical and can change anytime.
In MassMutual’s view, the ongoing uncertainties in markets today highlight the importance of taking a long-term perspective and not reacting to current events or short-term market changes. We also believe retirement investors who follow certain investment guidelines, such as the ones below, may increase their chances of reaching their retirement income goals.
Suggestions for retirement investors under any market conditions
Contribute as much as you can
While it is impossible to control your investments’ performance, you can control how often and how much you save. Contributing to your retirement account on a regular basis and increasing your contribution level as often as you are able, may be one way to help you realize your long-term investment objectives.*
Continue to invest
Some of the most sophisticated investors believe that individuals who can withstand a market downturn have the potential to be rewarded by accumulating larger positions at more favorable prices (relative to those who do not continue investing during a down market). That’s why most financial professionals believe it’s important to stay in the market, regardless of short-term results.
Time may be your ally
For most people, investing for retirement occurs over many decades. While retirement investors often know that the financial markets will be volatile from time to time, seasoned investors tend to understand the wisdom of taking a long-term approach. They know that this can help them navigate the market’s downturns, leverage its upturns, and successfully grow their account balances.
Monitor your asset allocation and diversify
Stocks, bonds, and short-term/money market investments are investment types that typically behave differently depending upon the economic and market environment. Each of these categories contains an even greater array of sub-categories, such as small-cap stocks, international stocks, and high-yield bonds. Many financial professionals believe that investors can take advantage of different opportunities in the market and reduce the risk of over-exposure to one or two poorly performing investment types by maintaining a portfolio that includes a mix of investment types and sub-categories.
| * | Systematic investing and asset allocation do not ensure a profit or protect against loss in a declining market. Systematic investing involves continuous investment in securities regardless of fluctuating price levels. Investors should consider their ability to continue investing through periods of low price levels. |
1
MassMutual Premier Funds – President’s Letter to Shareholders (Unaudited) (Continued)
Make informed choices and seek professional guidance
Many financial advisors will suggest that retirement investors select an appropriate combination of investments that aligns with their retirement income goals. Doing so can help you weather the inevitable ups and downs of the markets.
For retirement investors who work with a financial professional
If you work with a financial professional, this may be an excellent time to contact him or her for assistance in assessing whether or not you:
| • | | are saving enough for retirement based on your long-term needs; |
| • | | are invested properly, based on your goals and objectives and where you are in your retirement planning journey; and |
| • | | feel you are taking the right steps to help reduce your longevity risk, which is the risk you could “outlive” your retirement savings. |
Protect who matters most
MassMutual believes that nothing matters more than the safety and well-being of your loved ones. That’s why we have always been committed to helping our customers put themselves on the path to a more secure financial future. And it’s why we have always encouraged retirement investors to maintain perspective over the long term, and avoid reacting to short-term changes in the markets. In our view, challenging market conditions have the potential to reward patient investors. Thank you for your continued confidence in MassMutual.
Sincerely,

Eric Wietsma
President
The information provided is the opinion of MassMutual Funds Investment Management Group as of 10/1/16 and is subject to change without notice. It is not to be construed as tax, legal or investment advice. Of course, past performance does not guarantee future results.
2
MassMutual Premier Funds – Economic and Market Overview (Unaudited)
September 30, 2016
Economic and Market Commentary
February 2016 marked an inflection point in fiscal year 2016. From the start of the fiscal year until mid-February, markets showed a decidedly bearish tendency. Over the second half of the fiscal year, markets rebounded and even advanced.
Federal Reserve Board (Fed) chair Janet Yellen’s testimony before the U.S. Senate Committee on Banking, Housing, and Urban Affairs on February 11, 2016 marked the turning point, when she confirmed a “slower for longer” plan for rate hikes going forward. This marked a dramatic shift from the Fed’s December meeting, where they raised policy rates and signaled as many as four more hikes to come. Following Yellen’s remarks, markets responded as if a weight had been lifted. In addition, the sluggish domestic economy started to return more positive reports and modest gross domestic product (GDP) estimates were revised upward, although slightly. (GDP reflects the total value of goods and services produced in the United States.) Investors responded favorably and markets delivered broad positive returns for the fiscal year.
During the one-year period ended September 30, 2016, the technology-focused NASDAQ Composite® Index rose 14.97%, the S&P 500® Index (S&P 500) of large-capitalization U.S. stocks gained 15.43%, the Dow Jones Industrial AverageSM (Dow) grew 15.46%, and the Russell 2000® Index of small-capitalization stocks added 15.47%. In foreign markets, the MSCI EAFE® Index, a barometer for foreign stocks in developed markets, returned 6.52%, and the MSCI Emerging Markets Index, a measure of the performance of emerging stock markets throughout the world, rose 16.78%.*
Bonds also rewarded investors during the fiscal period, with the Bloomberg Barclays U.S. Aggregate Bond Index, a broad measure of the U.S. investment-grade bond markets, rising 5.19%. The performance of shorter-term debt investments continued to reflect the unrelenting low interest rate environment. Yields on the 2-year U.S. Treasury bond closed the period at 0.7%, while 10-year Treasury bonds yielded 1.6%. A “risk-on” environment developed as the fiscal year unfolded and high-yield bonds gained momentum, which helped the Bloomberg Barclays U.S. Corporate High-Yield Index, which measures the performance of fixed-rate, below-investment-grade debt securities from corporate sectors, deliver a return of 12.73%.*
These returns were not without market volatility and surprises, however. Before rebounding, major indexes lagged significantly in January and February. After climbing sharply in October 2015, major indexes plateaued and bounced through November and December. They fell sharply through January and into February – until the Fed announcement triggered a more sustained period of growth. Markets stuttered over concerns that Apple would not be able to sustain its growth in the smartphone market. Early concerns over China were replaced by negative interest rates in Japan and the surprising Brexit vote (in which voters approved the United Kingdom’s departure from the European Union) in June. It is worth noting that domestic market volatility and global economic turbulence proved unable to disrupt momentum in U.S. markets.
Q4 2015 – Markets recover to end 2015 flat
The fourth quarter of 2015 produced meaningful returns across most major indexes. The bulk of the quarter’s recovery occurred in October, as fears about China’s economy and plunging oil prices eased. However, the returns followed a poor third quarter 2015 and managed to bring calendar year-end 2015 results back up to where the year started. For example, the Dow returned 7.70% for the quarter and ended the year up 0.21%. The S&P 500 returned 7.04% for the quarter and ended the year up 1.38%.
November and December offered stiff headwinds to the October rally, as crude oil prices broke to new lows for the year – ending 2015 down 31%. At their mid-December meeting, the Fed finally acted to raise the target range for federal funds rate by 0.25%, in its first upward move since 2006. (The federal funds rate is the interest rate that banks and financial institutions charge each other for borrowing funds overnight.) These factors led to choppy market action over the last two months of 2015. U.S. GDP for the quarter increased at a tepid 1.4% annual rate, following rates of 3.9% and 2.0%, respectively, for the second and third quarters of 2015.
| * | Indexes are unmanaged, do not incur fees or expenses and cannot be purchased directly for investment. |
3
MassMutual Premier Funds – Economic and Market Overview (Unaudited) (Continued)
Q1 2016 – The inflection point
Headwinds continued into January and early February of 2016. China’s slowing economy and falling crude oil prices, along with a weak January employment report, stoked fears that a U.S. recession could be on the near-term horizon. By February 11, the S&P 500 had dropped to 1,810. At this point, Fed Chair Janet Yellen signaled that the central bank would be patient in beginning to normalize policy and that it was unlikely that economic conditions would warrant an increase in the target range for the federal funds rate for at least the next few Open Market Committee meetings.
Headwinds immediately shifted to tailwinds. The S&P 500 gained nearly 250 points by the end of the first quarter, initiating a rally that would more or less continue through the second and third quarters of 2016. The employment picture improved, as February’s non-farm payrolls came in stronger than the previous two months, and December 2015 and January 2016 payroll numbers were revised upward. Once again, the quarter recovered what it had lost and ended essentially where it started the year. Despite this, the climate had changed.
Q2 2016 – Upward domestic momentum rides over negative interest rates and Brexit
While Britain’s historic Brexit vote dominated news at the end of the second quarter, the unusual arrival of negative interest rates for Japan’s sovereign debt proved puzzling for many investors early in the quarter. Both seemed to feed a “flight to quality” reaction that resulted in a stronger U.S. dollar. Neither, however, served to derail the strengthening U.S. economy. By the end of the second quarter, concerns about China’s economy and falling oil prices moderated. U.S. GDP firmed up and the Fed softened its interest rate hike strategy, taking a more cautious approach. May’s disappointing jobs report created investor concerns that the Fed could seriously consider suspending any move to raise rates for at least a year. The quarter ended with broad-based gains across a variety of asset classes, improved consumer spending, low unemployment rates, and better-than-expected corporate earnings reports.
On June 23, global economic focus shifted to the United Kingdom. The Brexit vote pushed European stocks more deeply into negative territory on concerns that the immediate impact might slow growth in the U.K. and the larger European region. Investors also worried that the British vote might encourage other countries to follow suit. Interestingly, emerging market and Pacific country stocks delivered positive returns for the quarter and year-to-date.
Q3 2016 – Ending the fiscal year on the upswing
By the end of July, it seemed markets had shrugged off Brexit fears. The U.S. economy was gathering steam. The U.S. labor market continued to show strength as job openings rose in June and hiring increased. U.S. consumer confidence hit a 12-month high in August, according to the Conference Board’s consumer confidence index, which reflected improved consumer assessment of economic conditions and the six-month economic outlook. Corporate earnings came in better than expected for the second consecutive quarter, even though it was the fifth consecutive declining quarter. In mid-September, the U.S. Census Bureau announced that real median household income had jumped 5%, the biggest annual increase since they first started gathering this data in 1968. The two major candidates for president of the U.S. accepted their party’s nominations in July. As September came to a close, it became more evident that this year’s election will be hotly contested.
The fiscal year ended on an optimistic note, but investors endured a steady stream of uncertainty, surprises and volatility throughout. Long-term investors with a view to saving for retirement income pay attention to such things, but maintain a thoughtful and disciplined response, since they tend not to react to short-term turbulence. Many retirement investors wisely subscribe to the wisdom of a well-diversified portfolio using an appropriate mix of available strategies, whether active or passive. They know that markets go down and that markets go up, which requires retirement investors to be consistent and focused.
The information provided is the opinion of MassMutual Funds Investment Management Group as of 10/1/16 and is subject to change without notice. It is not to be construed as tax, legal or investment advice. Of course, past performance does not guarantee future results.
4
MassMutual Premier U.S. Government Money Market Fund – Portfolio Manager Report (Unaudited)
What is the investment approach of MassMutual Premier U.S. Government Money Market Fund (formerly known as MassMutual Premier Money Market Fund), and who is the Fund’s subadviser?
Please note that prior to May 1, 2016, the Fund was known as the MassMutual Premier Money Market Fund. The Fund’s investment objective and investment strategy also changed on May 1, 2016.
The Fund seeks current income consistent with preservation of capital and liquidity. Under normal circumstances, the Fund invests at least 99.5% of its total assets in cash, U.S. Government securities, and/or repurchase agreements fully collateralized by cash or U.S. Government securities. Under normal circumstances, the Fund invests at least 80% of its net assets in U.S. Government securities and repurchase agreements that are fully collateralized by U.S. Government securities. The Fund’s subadviser is Barings LLC (Barings). Effective September 12, 2016, Babson Capital Management LLC, subadviser to the Fund, changed its name to “Barings LLC.” The investment objectives of the Fund remain the same. The Fund seeks to maintain, but does not guarantee, a stable $1.00 share price. You could lose money by investing in the Fund. Although the Fund seeks to preserve the value of your investment at $1.00 per share, it cannot guarantee it will do so. An investment in the Fund is not insured or guaranteed by the Federal Deposit Insurance Corporation or any other government agency. The Fund’s sponsor has no legal obligation to provide financial support to the Fund, and you should not expect that the sponsor will provide financial support to the Fund at any time.
How did the Fund perform during the 12 months ended September 30, 2016?
The Fund’s Class R5 shares returned 0.00%, trailing the 0.20% return of the Citigroup 3-Month Treasury Bill Index (the “benchmark”), an unmanaged index representing the performance of 3-month U.S. Treasury bills that reflects reinvestment of all distributions and changes in market prices. During the period, the Fund waived certain fees to allow it to achieve the 0.00% return. The Fund’s Class R5 Shares would have had a negative return if the waiver had not been in effect.
For a discussion on the economic and market environment during the 12-month period ended September 30, 2016, please see the Economic and Market Overview, beginning on page 3.
Subadviser discussion of factors that contributed to the Fund’s performance
Short-term interest rates continued to be pegged down by Federal Reserve (the “Fed”) monetary policy, which drove low nominal yields for the Fund for the year ended September 30, 2016.
On May 1, 2016, the Fund converted to a government fund from a prime fund. This change allows the Fund to continue to seek to maintain, but not guarantee, a stable $1.00 Net Asset Value (NAV), without subjecting investors to potential liquidity fees and redemption gates should they wish to exit the Fund during times of potential market volatility (unless the Fund Trustees were to deem them necessary). The Fund now consists primarily of U.S. government securities, including securities from U.S. government agencies and repurchase agreements with such securities as collateral.
The Fund bought a large amount of floating agency paper after the conversion in order to maximize yield, while keeping the weighted average maturity at a manageable level. (Agency paper is debt issued by the federal government for financing purposes.) The weighted average maturity of the Fund was 46 days, as of September 30, 2016. These floating rate notes allow the Fund to earn more yield than a traditional one-month agency discount note, but they also provide the added benefit of helping to shield the Fund from some interest rate risk. If the Fed raises interest rates, then these notes may provide the Fund with some protection in terms of yield competitiveness. The Fed is currently in a tightening cycle, albeit a gradual one, so the Fund has been buying a large volume of these instruments. As of September 30, 2016, floating agency paper comprised about 35% of the Fund.
Subadviser outlook
At the beginning of 2016, the Fed’s narrative called for as many as four potential rate hikes in the coming year. Nine months later, we still haven’t seen a single one. Various Fed presidents continue to pay lip service to the need to raise rates, but our view is that every time they talk about an impending rate hike and fail to follow through, they lose a bit of credibility with market participants. One rate hike before the end of the calendar year looks like a distinct possibility, with three of the nine Fed voting members casting their ballot for a rate hike at the last meeting. We are positioning the Fund with enough floating rate securities so that a Fed hike does not cause too much pain, while still buying some longer-dated securities that may help to enhance the Fund’s yield in case they decide not to raise rates in the next several months.
5
MassMutual Premier U.S. Government Money Market Fund – Portfolio Manager Report (Unaudited) (Continued)
| | | | |
MassMutual Premier
U.S. Government Money Market Fund
Portfolio Characteristics
(% of Net Assets) on 9/30/16 | |
| | |
Short-Term Investments and Other Assets and Liabilities | | | 100.0 | % |
| | | | | |
Net Assets | | | 100.0 | % |
| | | | | |
6
MassMutual Premier U.S. Government Money Market Fund – Portfolio Manager Report (Unaudited) (Continued)
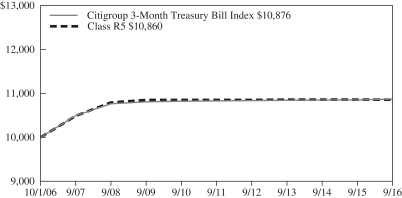
Growth of a $10,000 Investment
Hypothetical Investments in MassMutual Premier U.S. Government Money Market Fund Class R5 and the Citigroup 3-Month Treasury Bill Index.
| | | | | | | | | | | | |
| | | | |
| TOTAL RETURN | | One Year
10/1/15 -
9/30/16 | | | Five Year
Average
Annual
10/1/11 -
9/30/16 | | | Ten Year
Average
Annual
10/1/06 -
9/30/16 | |
| Class R5 | | | 0.00% | | | | 0.01% | | | | 0.83% | |
| Citigroup 3-Month Treasury Bill Index | | | 0.20% | | | | 0.08% | | | | 0.84% | |
GROWTH OF $10,000 INVESTMENT FOR THE PAST 10 YEARS
Performance data quoted represents past performance; past performance is not predictive of future results. The investment return and principal value of shares of the Fund will fluctuate with market conditions so that shares of the Fund, when redeemed, may be worth more or less than their original cost. Current performance of the Fund may be lower or higher than the performance quoted. Performance data current to the most recent month-end may be obtained by calling 1-888-309-3539.
Investors should note that the Fund is a professionally managed mutual fund, while the Citigroup 3-Month Treasury Bill Index is unmanaged, does not incur expenses, and cannot be purchased directly by investors. Treasury bills are backed by the U.S. government and offer a fixed rate of return, while the Fund's shares are not guaranteed. Investors should read the Fund's prospectus with regard to the Fund's investment objective, risks, and charges and expenses in conjunction with these financial statements. Employee retirement benefit plans that invest plan assets in the Separate Investment Accounts (SIAs) may be subject to certain charges as set forth in their respective Plan Documents. Total return figures would be lower for the periods presented if they reflected these charges. The performance tables and charts do not reflect the deduction of taxes that a shareholder would pay on the Fund distributions or the redemption of the Fund shares.
You could lose money by investing in the MassMutual Premier U.S. Government Money Market Fund. Although the Fund seeks to preserve the value of your investment at $1.00 per share, it cannot guarantee it will do so. An investment in the Fund is not insured or guaranteed by the Federal Deposit Insurance Corporation or any other government agency. The Fund’s sponsor has no legal obligation to provide financial support to the Fund, and you should not expect that the sponsor will provide financial support to the Fund at any time.
7
MassMutual Premier Short-Duration Bond Fund – Portfolio Manager Report (Unaudited)
What is the investment approach of MassMutual Premier Short-Duration Bond Fund, and who is the Fund’s subadviser?
The Fund seeks to achieve a high total rate of return primarily from current income while minimizing fluctuations in capital values by investing primarily in a diversified portfolio of short-term investment grade fixed income securities. Under normal circumstances, the Fund invests at least 80% of its net assets (plus the amount of any borrowings for investment purposes) in investment grade fixed income securities (rated Baa3 or higher by Moody’s, BBB- or higher by Standard & Poor’s or the equivalent by any NRSRO, or, if unrated, determined to be of comparable quality by the subadviser). The Fund’s subadviser is Barings LLC (Barings). Effective September 12, 2016, Babson Capital Management LLC, subadviser to the Fund, changed its name to “Barings LLC.” The investment objectives of the Fund remain the same.
How did the Fund perform during the 12 months ended September 30, 2016?
The Fund’s Class R5 shares returned 1.88%, outpacing the 0.89% return of the Bloomberg Barclays U.S. 1-3 Year Government Bond Index (the “benchmark”), an unmanaged index of U.S. government bonds with one to three years remaining to the scheduled payment of principal.
For a discussion on the economic and market environment during the 12-month period ended September 30, 2016, please see the Economic and Market Overview, beginning on page 3.
Subadviser discussion of factors that contributed to the Fund’s performance
For the year ended September 30, 2016, bond duration and maturity positioning benefited the Fund. As the shape of the yield curve declined and flattened, the duration of the Fund’s portfolio decreased from 2.9 years to 1.7 years. (The yield curve is a graph showing the term structure of interest rates by plotting the yields of all bonds of comparable quality with maturities ranging from the shortest – typically one month – to the longest – typically 30 years – available. The resulting curve shows whether short-term interest rates are higher or lower than long-term rates.) The decline and flattening of the yield from a longer-duration posture to a shorter position helped performance. (Duration is a measure of a bond fund’s sensitivity to interest rates. The longer the duration, the greater the price impact on the bond or portfolio when interest rates rise or fall.) Treasury positioning also contributed to the Fund’s performance.
An allocation to the corporate bond sector was the primary positive contributor to Fund performance. Investment-grade securities and bonds rated BB in the high-yield sector contributed. Fund holdings in the banking and leasing sub-sectors were the best performers. Conversely, Fund holdings in metals & mining and energy were the worst-performing sub-sectors. Convertible securities were the primary detractors from performance of the Fund over the period, driven largely by the sell-off in metals & mining and oil & gas producers during the first quarter. The Fund exited its convertible position during the first and second quarters.
Asset-backed securities (ABS) were the primary contributors to performance within the securitized sector. (Bond issuers create “securitized” bonds by pooling various types of contractual debt, such as mortgages, auto loans, or credit card debt.) Allocations to government-guaranteed student loans and commercial ABS collateral were the largest contributing sub-sectors. An allocation to credit card receivables underperformed during the period. Automotive loan collateral represents the largest allocation, followed by student loans. Additional collateral consists of timeshares and franchise receivables. The Fund’s allocations to Agency collateralized mortgage obligations (CMO) securities and commercial mortgage-backed securities (CMBS) also benefited performance. (“Agency” refers to government-sponsored entities that issue bonds backed by mortgage loans, including Ginnie Mae, Fannie Mae, Freddie Mac, and the Federal Home Loan Banks.) Finally, AAA-rated, short-weighted average life Collateral Loan Obligations (CLOs) were a modest contributor to performance.
The Fund uses derivative instruments on occasion for yield curve, duration, and downside risk management. Performance from derivatives contributed to performance over the last year. Derivatives are securities that derive their value from the performance of one or more other investments and take the form of a contract between two or more parties. Most derivatives are used for hedging, speculation, or both.
8
MassMutual Premier Short-Duration Bond Fund – Portfolio Manager Report (Unaudited) (Continued)
Subadviser outlook
After a brief downdraft following the Brexit vote (which ratified the United Kingdom’s eventual departure from the European Union), fixed-income investments seem to have recovered nicely. Our view is that global central banks stepped up in effective and coordinated ways to help calm market fears. Still, we believe there is a growing nervousness over reliance on monetary policy to promote growth and asset prices. Importantly, global growth expectations are falling once again, as big economic engines such as the U.S. and China are struggling to instill consumer confidence. Consequently, we believe that an environment of less buoyant market conditions is possible.
With a softening in corporate fundamentals, the Fund is focusing on yield opportunities, often post-merger and acquisition events, where Fund management believes credit spreads to Treasury bonds provide attractive opportunities. (Credit spreads are the differences in yields between comparable bonds, with widening spreads often indicating increasing yields and decreasing prices for bonds.) As of September 30, 2016, the Fund maintained an active allocation to sectors such as corporates and securitized, relative to governments and Agencies, and seeks to add return in excess to the benchmark by investing in under-covered sectors where we have competitive advantages, such as consumer and commercial ABS, CLOs, and emerging markets.
9
MassMutual Premier Short-Duration Bond Fund – Portfolio Manager Report (Unaudited) (Continued)
| | | | |
MassMutual Premier
Short-Duration Bond Fund
Portfolio Characteristics
(% of Net Assets) on 9/30/16 | |
| | |
Corporate Debt | | | 46.2 | % |
Non-U.S. Government Agency Obligations | | | 42.7 | % |
U.S. Government Agency Obligations and Instrumentalities | | | 7.0 | % |
U.S. Treasury Obligations | | | 3.9 | % |
Municipal Obligations | | | 0.1 | % |
| | | | | |
Total Long-Term Investments | | | 99.9 | % |
Short-Term Investments and Other Assets and Liabilities | | | 0.1 | % |
| | | | | |
Net Assets | | | 100.0 | % |
| | | | | |
10
MassMutual Premier Short-Duration Bond Fund – Portfolio Manager Report (Unaudited) (Continued)
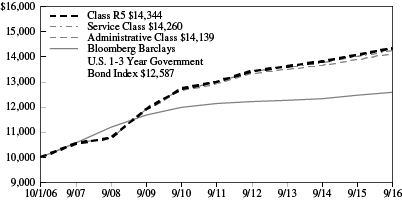
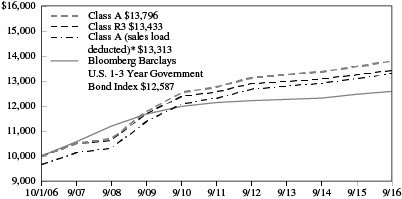
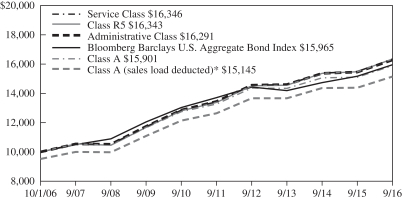
Growth of a $10,000 Investment
Hypothetical Investments in MassMutual Premier Short-Duration Bond Fund Class R5, Service Class, Administrative Class, Class A, Class A (sales load deducted), Class R3, and the Bloomberg Barclays U.S. 1-3 Year Government Bond Index.
| | | | | | | | | | | | |
| | | | |
| TOTAL RETURN | | One Year
10/1/15 -
9/30/16 | | | Five Year
Average
Annual
10/1/11 -
9/30/16 | | | Ten Year
Average
Annual
10/1/06 -
9/30/16 | |
| Class R5 | | | 1.88% | | | | 1.98% | | | | 3.67% | |
| Service Class | | | 1.78% | | | | 1.89% | | | | 3.61% | |
| Administrative Class | | | 1.78% | | | | 1.82% | | | | 3.52% | |
| Class A | | | 1.59% | | | | 1.57% | | | | 3.27% | |
| Class A (sales load deducted)* | | | -1.97% | | | | 0.85% | | | | 2.90% | |
| Class R3 | | | 1.37% | | | | 1.31% | | | | 2.99% | |
| Bloomberg Barclays U.S. 1-3 Year Government Bond Index | | | 0.89% | | | | 0.72% | | | | 2.33% | |
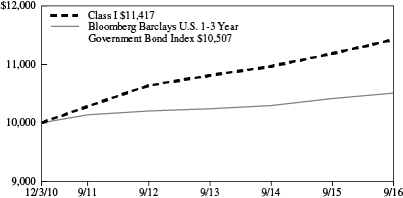
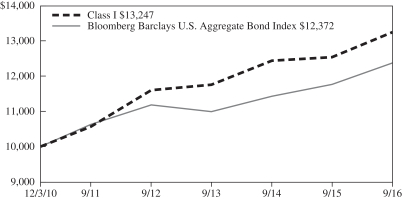
Hypothetical Investments in MassMutual Premier Short-Duration Bond Fund Class I and the Bloomberg Barclays U.S. 1-3 Year Government Bond Index.
| | | | | | | | | | | | |
| | | | |
| TOTAL RETURN | | One Year
10/1/15 -
9/30/16 | | | Five Year
Average
Annual
10/1/11 -
9/30/16 | | | Since
Inception
Average
Annual
12/3/10 -
9/30/16 | |
| Class I | | | 2.08% | | | | 2.13% | | | | 2.30% | |
| Bloomberg Barclays U.S. 1-3 Year Government Bond Index | | | 0.89% | | | | 0.72% | | | | 0.85% | |
GROWTH OF $10,000 INVESTMENT FOR THE PAST 10 YEARS
GROWTH OF $10,000 INVESTMENT SINCE INCEPTION
* Class A (sales load deducted) returns include the 3.50% maximum sales charge.
Performance data quoted represents past performance; past performance is not predictive of future results. The investment return and principal value of shares of the Fund will fluctuate with market conditions so that shares of the Fund, when redeemed, may be worth more or less than their original cost. Current performance of the Fund may be lower or higher than the performance quoted. Performance data current to the most recent month-end may be obtained by calling 1-888-309-3539.
Investors should note that the Fund is a professionally managed mutual fund, while the Bloomberg Barclays U.S. 1-3 Year Government Bond Index is unmanaged, does not incur expenses, and cannot be purchased directly by investors. Investors should read the Fund's prospectus with regard to the Fund's investment objective, risks, and charges and expenses in conjunction with these financial statements. Employee retirement benefit plans that invest plan assets in the Separate Investment Accounts (SIAs) may be subject to certain charges as set forth in their respective Plan Documents. Total return figures would be lower for the periods presented if they reflected these charges. The performance tables and charts do not reflect the deduction of taxes that a shareholder would pay on the Fund distributions or the redemption of the Fund shares.
11
MassMutual Premier Short-Duration Bond Fund – Portfolio Manager Report (Unaudited) (Continued)
Growth of a $10,000 Investment
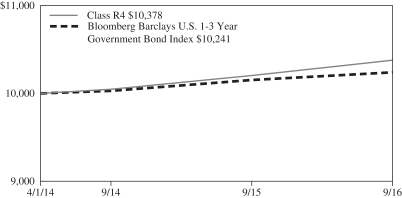
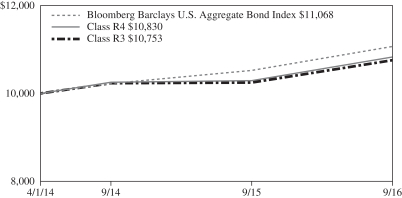
Hypothetical Investments in MassMutual Premier Short-Duration Bond Fund Class R4 and the Bloomberg Barclays U.S. 1-3 Year Government Bond Index.
| | | | | | | | |
| | | |
| TOTAL RETURN | | One Year
10/1/15 -
9/30/16 | | | Since
Inception
Average
Annual
4/1/14 -
9/30/16 | |
| Class R4 | | | 1.69% | | | | 1.49% | |
| Bloomberg Barclays U.S. 1-3 Year Government Bond Index | | | 0.89% | | | | 0.95% | |
GROWTH OF $10,000 INVESTMENT SINCE INCEPTION
Performance data quoted represents past performance; past performance is not predictive of future results. The investment return and principal value of shares of the Fund will fluctuate with market conditions so that shares of the Fund, when redeemed, may be worth more or less than their original cost. Current performance of the Fund may be lower or higher than the performance quoted. Performance data current to the most recent month-end may be obtained by calling 1-888-309-3539.
Investors should note that the Fund is a professionally managed mutual fund, while the Bloomberg Barclays U.S. 1-3 Year Government Bond Index is unmanaged, does not incur expenses, and cannot be purchased directly by investors. Investors should read the Fund's prospectus with regard to the Fund's investment objective, risks, and charges and expenses in conjunction with these financial statements. Employee retirement benefit plans that invest plan assets in the Separate Investment Accounts (SIAs) may be subject to certain charges as set forth in their respective Plan Documents. Total return figures would be lower for the periods presented if they reflected these charges. The performance tables and charts do not reflect the deduction of taxes that a shareholder would pay on the Fund distributions or the redemption of the Fund shares.
12
MassMutual Premier Inflation-Protected and Income Fund – Portfolio Manager Report (Unaudited)
What is the investment approach of MassMutual Premier Inflation-Protected and Income Fund, and who is the Fund’s subadviser?
The Fund seeks to achieve as high a total rate of real return on an annual basis as is considered consistent with prudent investment risk and the preservation of capital by investing, under normal circumstances, at least 80% of its net assets (plus the amount of any borrowings for investment purposes) in inflation-indexed bonds and other income-producing securities. The Fund’s subadviser is Barings LLC (Barings). Effective September 12, 2016, Babson Capital Management LLC, subadviser to the Fund, changed its name to “Barings LLC.” The investment objectives of the Fund remain the same.
How did the Fund perform during the 12 months ended September 30, 2016?
The Fund’s Class R5 shares returned 7.14%, outpacing the 6.58% return of the Bloomberg Barclays U.S. Treasury Inflation Protected Securities (TIPS) Index (Series-L) (the “benchmark”), an unmanaged index that measures the broad performance of U.S. Treasury inflation-indexed bonds.
How do inflation-indexed bonds protect against inflation?
Like many other fixed-income securities, inflation-indexed bonds pay income twice a year, based on a stated coupon rate. However, both the principal and the interest payment are adjusted for the level of inflation. The inflation rate – as measured by the Consumer Price Index for All Urban Consumers (“CPI-U”) – results in an adjustment to the principal amount of an inflation-protected security. The coupon rate is then applied to the adjusted principal amount to determine the interest payment. For example, assuming an inflation rate of 3%, a security with a par value of $1,000 and an annual coupon rate of 1.75%, the adjusted principal amount after one year would be $1,030 ($1,000 increased by 3%). The semi-annual interest payment would be calculated by multiplying $1,030 by 1.75% and dividing by 2 instead of using the original $1,000 par value to calculate the amount of interest.
For a discussion on the economic and market environment during the 12-month period ended September 30, 2016, please see the Economic and Market Overview, beginning on page 3.
Subadviser discussion of factors that contributed to the Fund’s performance
Consumer prices, as measured by the U.S. Bureau of Labor Statistics, were up relative to last year, as unadjusted Headline CPI came in at 1.1%, up from 0.0%. (CPI measures changes in the price of a market basket of consumer goods and services; Core CPI does not include food and energy prices. Headline CPI includes food and energy.) While shelter costs continue to be a major driver of core inflation, the headline year-over-year change remains impaired due to energy prices. Core CPI increased to 2.3%, up from 1.9%.
TIPS positioning, in aggregate, helped to drive Fund performance during the period. Underweight positioning in shorter-maturity inflation bonds contributed.
In addition to TIPS, the Fund also invested in high-quality, income-producing securities, including asset-backed and money market securities. The income earned by these investments contributed positively to the Fund’s full-year performance. Asset-backed securities (ABS) were the main drivers of performance. Security selections in auto loans and timeshares within the ABS sector were the primary contributors. An allocation to high-quality commercial paper also helped performance. (Commercial paper is the commonly used name for short-term unsecured promissory notes sold by banks and corporations to meet short-term debt obligations.)
The Fund may use derivative instruments for yield curve and duration management – and for replicating cash bonds and gaining market exposure in order to implement Fund management views. Derivatives are securities that derive their value from the performance of one or more other investments and take the form of a contract between two or more parties. Most derivatives are used for hedging, speculation, or both. Derivatives, in aggregate, contributed to the Fund’s performance.
13
MassMutual Premier Inflation-Protected and Income Fund – Portfolio Manager Report (Unaudited) (Continued)
Subadviser outlook
Global inflation developments remain subdued despite regional disparities. Deflationary pressures in the U.S. continue to fade.
In the September Federal Open Market Committee (FOMC) statement, the Committee “indicated that the labor market had continued to strengthen and growth of economic activity had picked up from the modest pace seen in the first half of this year. Members continued to expect inflation to remain low in the near term, but most anticipated that, with gradual adjustments in the stance of monetary policy, it would rise gradually to the Committee’s 2 percent objective over the medium term.” With inflation below 2 percent, the Committee maintained the target range for the federal funds rate at 1/4 to 1/2 percent. (The federal funds rate is the interest rate that banks and financial institutions charge each other for borrowing funds overnight.)
Given the recent global developments and the upcoming U.S. presidential and congressional elections, we continue to proceed with caution. Nonetheless, we remain optimistic and opportunistic on the TIPS market given volatility and relative value opportunities.
14
MassMutual Premier Inflation-Protected and Income Fund – Portfolio Manager Report (Unaudited) (Continued)
| | | | |
MassMutual Premier
Inflation-Protected and Income Fund
Portfolio Characteristics
(% of Net Assets) on 9/30/16 | |
| | |
U.S. Treasury Obligations | | | 93.1 | % |
Non-U.S. Government Agency Obligations | | | 54.0 | % |
Corporate Debt | | | 4.1 | % |
Municipal Obligations | | | 0.1 | % |
U.S. Government Agency Obligations and Instrumentalities | | | 0.1 | % |
| | | | | |
Total Long-Term Investments | | | 151.4 | % |
Short-Term Investments and Other Assets and Liabilities | | | (51.4 | )% |
| | | | | |
Net Assets | | | 100.0 | % |
| | | | | |
15
MassMutual Premier Inflation-Protected and Income Fund – Portfolio Manager Report (Unaudited) (Continued)
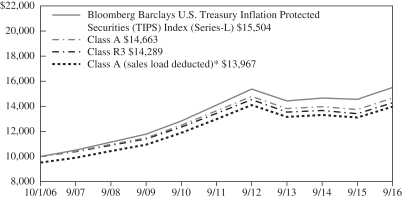
Growth of a $10,000 Investment
Hypothetical Investments in MassMutual Premier Inflation-Protected and Income Fund Class R5, Service Class, Administrative Class, Class A, Class A (sales load deducted), Class R3, and the Bloomberg Barclays U.S. Treasury Inflation Protected Securities (TIPS) Index (Series-L).
| | | | | | | | | | | | |
| | | | |
| TOTAL RETURN | | One Year
10/1/15 -
9/30/16 | | | Five Year
Average
Annual
10/1/11 -
9/30/16 | | | Ten Year
Average
Annual
10/1/06 -
9/30/16 | |
| Class R5 | | | 7.14% | | | | 1.90% | | | | 4.34% | |
| Service Class | | | 6.96% | | | | 1.80% | | | | 4.24% | |
| Administrative Class | | | 6.90% | | | | 1.69% | | | | 4.09% | |
| Class A | | | 6.65% | | | | 1.47% | | | | 3.90% | |
| Class A (sales load deducted)* | | | 1.58% | | | | 0.49% | | | | 3.40% | |
| Class R3 | | | 6.47% | | | | 1.23% | | | | 3.63% | |
| Bloomberg Barclays U.S. Treasury Inflation Protected Securities (TIPS) Index (Series-L) | | | 6.58% | | | | 1.93% | | | | 4.48% | |
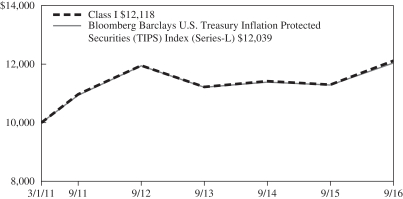
Hypothetical Investments in MassMutual Premier Inflation-Protected and Income Fund Class I and the Bloomberg Barclays U.S. Treasury Inflation Protected Securities (TIPS) Index (Series-L).
| | | | | | | | | | | | |
| | | | |
| TOTAL RETURN | | One Year
10/1/15 -
9/30/16 | | | Five Year
Average
Annual
10/1/11 -
9/30/16 | | | Since
Inception
Average
Annual
3/1/11 -
9/30/16 | |
| Class I | | | 7.26% | | | | 2.00% | | | | 3.50% | |
| Bloomberg Barclays U.S. Treasury Inflation Protected Securities (TIPS) Index (Series-L) | | | 6.58% | | | | 1.93% | | | | 3.38% | |
GROWTH OF $10,000 INVESTMENT FOR THE PAST 10 YEARS
GROWTH OF $10,000 INVESTMENT SINCE INCEPTION
* Class A (sales load deducted) returns include the 4.75% maximum sales charge.
Performance data quoted represents past performance; past performance is not predictive of future results. The investment return and principal value of shares of the Fund will fluctuate with market conditions so that shares of the Fund, when redeemed, may be worth more or less than their original cost. Current performance of the Fund may be lower or higher than the performance quoted. Performance data current to the most recent month-end may be obtained by calling 1-888-309-3539.
Investors should note that the Fund is a professionally managed mutual fund, while the Bloomberg Barclays U.S. Treasury Inflation Protected Securities (TIPS) Index (Series-L) is unmanaged, does not incur expenses, and cannot be purchased directly by investors. Investors should read the Fund’s prospectus with regard to the Fund’s investment objective, risks, and charges and expenses in conjunction with these financial statements. Employee retirement benefit plans that invest plan assets in the Separate Investment Accounts (SIAs) may be subject to certain charges as set forth in their respective Plan Documents. Total return figures would be lower for the periods presented if they reflected these charges. The performance tables and charts do not reflect the deduction of taxes that a shareholder would pay on the Fund distributions or the redemption of the Fund shares.
16
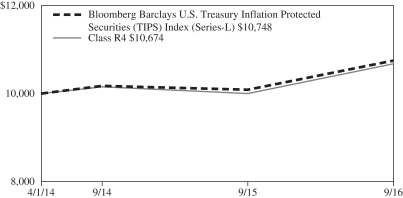
MassMutual Premier Inflation-Protected and Income Fund – Portfolio Manager Report (Unaudited) (Continued)
Growth of a $10,000 Investment
Hypothetical Investments in MassMutual Premier Inflation-Protected and Income Fund Class R4 and the Bloomberg Barclays U.S. Treasury Inflation Protected Securities (TIPS) Index (Series-L).
| | | | | | | | |
| | | |
| TOTAL RETURN | | One Year
10/1/15 -
9/30/16 | | | Since
Inception
Average
Annual
4/1/14 -
9/30/16 | |
| Class R4 | | | 6.77% | | | | 2.64% | |
| Bloomberg Barclays U.S. Treasury Inflation Protected Securities (TIPS) Index (Series-L) | | | 6.58% | | | | 2.92% | |
GROWTH OF $10,000 INVESTMENT SINCE INCEPTION
Performance data quoted represents past performance; past performance is not predictive of future results. The investment return and principal value of shares of the Fund will fluctuate with market conditions so that shares of the Fund, when redeemed, may be worth more or less than their original cost. Current performance of the Fund may be lower or higher than the performance quoted. Performance data current to the most recent month-end may be obtained by calling 1-888-309-3539.
Investors should note that the Fund is a professionally managed mutual fund, while the Bloomberg Barclays U.S. Treasury Inflation Protected Securities (TIPS) Index (Series-L) is unmanaged, does not incur expenses, and cannot be purchased directly by investors. Investors should read the Fund’s prospectus with regard to the Fund’s investment objective, risks, and charges and expenses in conjunction with these financial statements. Employee retirement benefit plans that invest plan assets in the Separate Investment Accounts (SIAs) may be subject to certain charges as set forth in their respective Plan Documents. Total return figures would be lower for the periods presented if they reflected these charges. The performance tables and charts do not reflect the deduction of taxes that a shareholder would pay on the Fund distributions or the redemption of the Fund shares.
17
MassMutual Premier Core Bond Fund – Portfolio Manager Report (Unaudited)
What is the investment approach of MassMutual Premier Core Bond Fund, and who is the Fund’s subadviser?
The Fund seeks to achieve a high total rate of return consistent with prudent investment risk and the preservation of capital by investing primarily in a diversified portfolio of investment grade fixed income securities. Under normal circumstances, the Fund invests at least 80% of its net assets (plus the amount of any borrowings for investment purposes) in investment grade fixed income securities (rated Baa3 or higher by Moody’s, BBB- or higher by Standard & Poor’s or the equivalent by any NRSRO, or, if unrated, determined to be of comparable quality by the subadviser). The Fund’s subadviser is Barings LLC (Barings). Effective September 12, 2016, Babson Capital Management LLC, subadviser to the Fund, changed its name to “Barings LLC.” The investment objectives of the Fund remain the same.
How did the Fund perform during the 12 months ended September 30, 2016?
The Fund’s Class R5 shares returned 4.50%, underperforming the 5.19% return of the Bloomberg Barclays U.S. Aggregate Bond Index (the “benchmark”), an unmanaged index of fixed-rate investment-grade securities with at least one year to maturity, combining the Bloomberg Barclays U.S. Treasury Bond Index, the Bloomberg Barclays U.S. Government-Related Bond Index, the Bloomberg Barclays U.S. Corporate Bond Index, and the Bloomberg Barclays U.S. Securitized Bond Index.
For a discussion on the economic and market environment during the 12-month period ended September 30, 2016, please see the Economic and Market Overview, beginning on page 3.
Subadviser discussion of factors that contributed to the Fund’s performance
During the year ended September 30, 2016, an overweight to investment-grade bonds and an out-of-benchmark allocation to high-yield corporate bonds rated BB were the primary detractors from full-year returns, and exposure to the energy industry was the main driver of this underperformance. An overweight, relative to the benchmark, to asset-backed securities (ABS) was the primary detractor in the securitized sector, largely due to holdings in government-guaranteed student loans, which underperformed. (Bond issuers create securitized bonds by pooling various types of contractual debt, such as mortgages, auto loans, or credit card debt.) A modest overweight to commercial mortgage-backed securities (CMBS) also detracted from Fund performance. Short-weighted average life collateral loan obligations (CLOs) rated AAA detracted from performance, but only modestly.
Turning to the positive, the Fund’s investments in Agency mortgage-backed securities (MBS) were the primary contributors to the Fund’s performance. (“Agency” refers to government-sponsored entities that issue bonds backed by mortgage loans, including Ginnie Mae, Fannie Mae, Freddie Mac, and the Federal Home Loan Banks.) The Fund’s positioning in lower-coupon securities benefited performance, as did a modest allocation to Agency collateralized mortgage obligation (CMO) securities. The Fund has used CMOs as a proxy for higher-coupon (and more expensive) Agency MBS. Finally, the Fund was able to successfully navigate between 30- and 15-year mortgages during the year, based on relative value pricing, which helped to drive positive impact to return.
The Fund uses derivatives on occasion for yield curve, duration, and downside hedging. Derivatives are securities that derive their value from the performance of one or more other investments and take the form of a contract between two or more parties. In aggregate, these positions contributed to performance over the year.
Subadviser outlook
After a brief downdraft following the Brexit vote (which ratified the United Kingdom’s eventual departure from the European Union), fixed-income investments seem to have recovered nicely. Our view is that global central banks stepped up in effective and coordinated ways to help calm market fears. Still, we believe there is a growing nervousness over reliance on monetary policy to promote growth and asset prices. Importantly, global growth expectations are falling once again, as big economic engines such as the U.S. and China are struggling to instill consumer confidence. Consequently, we believe that an environment of less buoyant market conditions is possible.
18
MassMutual Premier Core Bond Fund – Portfolio Manager Report (Unaudited) (Continued)
With a softening in corporate fundamentals, the Fund is focusing on yield opportunities, often post-merger and acquisition events, where Fund management believes credit spreads to Treasury bonds provide attractive opportunities. (Credit spreads are the differences in yields between comparable bonds, with widening spreads often indicating increasing yields and decreasing prices for bonds.)
As of September 30, 2016, the Fund remained overweight in sectors such as corporates and securitized relative to liquid products, such as governments and Agencies and seeks to add return in excess to the benchmark by investing in under-covered sectors where we have competitive advantages, such as consumer and commercial ABS, CLOs, and emerging markets.
19
MassMutual Premier Core Bond Fund – Portfolio Manager Report (Unaudited) (Continued)
| | | | |
MassMutual Premier
Core Bond Fund
Portfolio Characteristics
(% of Net Assets) on 9/30/16 | |
| | |
Corporate Debt | | | 39.8 | % |
Non-U.S. Government Agency Obligations | | | 29.3 | % |
U.S. Government Agency Obligations and Instrumentalities | | | 26.3 | % |
U.S. Treasury Obligations | | | 1.4 | % |
Municipal Obligations | | | 1.1 | % |
Sovereign Debt Obligations | | | 1.0 | % |
Preferred Stock | | | 0.3 | % |
| | | | | |
Total Long-Term Investments | | | 99.2 | % |
Short-Term Investments and Other Assets and Liabilities | | | 0.8 | % |
| | | | | |
Net Assets | | | 100.0 | % |
| | | | | |
20
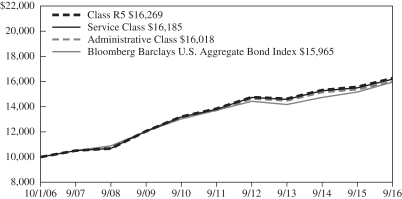
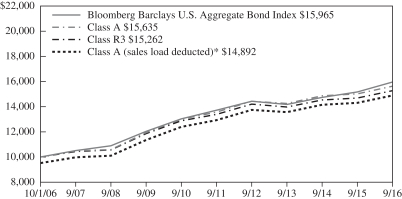
MassMutual Premier Core Bond Fund – Portfolio Manager Report (Unaudited) (Continued)
Growth of a $10,000 Investment
Hypothetical Investments in MassMutual Premier Core Bond Fund Class R5, Service Class, Administrative Class, Class A, Class A (sales load deducted), Class R3, and the Bloomberg Barclays U.S. Aggregate Bond Index.
| | | | | | | | | | | | |
| | | | |
| TOTAL RETURN | | One Year
10/1/15 -
9/30/16 | | | Five Year
Average
Annual
10/1/11 -
9/30/16 | | | Ten Year
Average
Annual
10/1/06 -
9/30/16 | |
| Class R5 | | | 4.50% | | | | 3.30% | | | | 4.99% | |
| Service Class | | | 4.43% | | | | 3.23% | | | | 4.93% | |
| Administrative Class | | | 4.28% | | | | 3.14% | | | | 4.82% | |
| Class A | | | 4.10% | | | | 2.88% | | | | 4.57% | |
| Class A (sales load deducted)* | | | -0.84% | | | | 1.88% | | | | 4.06% | |
| Class R3 | | | 3.89% | | | | 2.64% | | | | 4.32% | |
| Bloomberg Barclays U.S. Aggregate Bond Index | | | 5.19% | | | | 3.08% | | | | 4.79% | |
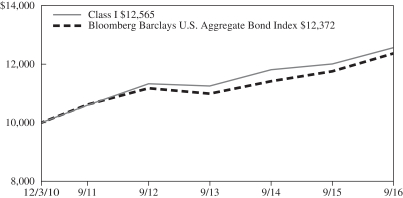
Hypothetical Investments in MassMutual Premier Core Bond Fund Class I and the Bloomberg Barclays U.S. Aggregate Bond Index.
| | | | | | | | | | | | |
| | | | |
| TOTAL RETURN | | One Year
10/1/15 -
9/30/16 | | | Five Year
Average
Annual
10/1/11 -
9/30/16 | | | Since
Inception
Average
Annual
12/3/10 -
9/30/16 | |
| Class I | | | 4.63% | | | | 3.45% | | | | 4.00% | |
| Bloomberg Barclays U.S. Aggregate Bond Index | | | 5.19% | | | | 3.08% | | | | 3.72% | |
GROWTH OF $10,000 INVESTMENT FOR THE PAST 10 YEARS
GROWTH OF $10,000 INVESTMENT SINCE INCEPTION
* Class A (sales load deducted) returns include the 4.75% maximum sales charge.
Performance data quoted represents past performance; past performance is not predictive of future results. The investment return and principal value of shares of the Fund will fluctuate with market conditions so that shares of the Fund, when redeemed, may be worth more or less than their original cost. Current performance of the Fund may be lower or higher than the performance quoted. Performance data current to the most recent month-end may be obtained by calling 1-888-309-3539.
Investors should note that the Fund is a professionally managed mutual fund, while the Bloomberg Barclays U.S. Aggregate Bond Index is unmanaged, does not incur expenses, and cannot be purchased directly by investors. Investors should read the Fund’s prospectus with regard to the Fund’s investment objective, risks, and charges and expenses in conjunction with these financial statements. Employee retirement benefit plans that invest plan assets in the Separate Investment Accounts (SIAs) may be subject to certain charges as set forth in their respective Plan Documents. Total return figures would be lower for the periods presented if they reflected these charges. The performance tables and charts do not reflect the deduction of taxes that a shareholder would pay on the Fund distributions or the redemption of the Fund shares.
21
MassMutual Premier Core Bond Fund – Portfolio Manager Report (Unaudited) (Continued)
Growth of a $10,000 Investment
Hypothetical Investments in MassMutual Premier Core Bond Fund Class R4 and the Bloomberg Barclays U.S. Aggregate Bond Index.
| | | | | | | | |
| | | |
| TOTAL RETURN | | One Year
10/1/15 -
9/30/16 | | | Since
Inception
Average
Annual
4/1/14 -
9/30/16 | |
| Class R4 | | | 4.19% | | | | 3.10% | |
| Bloomberg Barclays U.S. Aggregate Bond Index | | | 5.19% | | | | 4.14% | |
GROWTH OF $10,000 INVESTMENT SINCE INCEPTION

Performance data quoted represents past performance; past performance is not predictive of future results. The investment return and principal value of shares of the Fund will fluctuate with market conditions so that shares of the Fund, when redeemed, may be worth more or less than their original cost. Current performance of the Fund may be lower or higher than the performance quoted. Performance data current to the most recent month-end may be obtained by calling 1-888-309-3539.
Investors should note that the Fund is a professionally managed mutual fund, while the Bloomberg Barclays U.S. Aggregate Bond Index is unmanaged, does not incur expenses, and cannot be purchased directly by investors. Investors should read the Fund’s prospectus with regard to the Fund’s investment objective, risks, and charges and expenses in conjunction with these financial statements. Employee retirement benefit plans that invest plan assets in the Separate Investment Accounts (SIAs) may be subject to certain charges as set forth in their respective Plan Documents. Total return figures would be lower for the periods presented if they reflected these charges. The performance tables and charts do not reflect the deduction of taxes that a shareholder would pay on the Fund distributions or the redemption of the Fund shares.
22
MassMutual Premier Diversified Bond Fund – Portfolio Manager Report (Unaudited)
What is the investment approach of MassMutual Premier Diversified Bond Fund, and who is the Fund’s subadviser?
The Fund seeks a superior total rate of return by investing in fixed income instruments. Under normal circumstances, the Fund invests at least 80% of its net assets (plus the amount of any borrowings for investment purposes) in fixed income securities. The Fund’s subadviser is Barings LLC (Barings). Effective September 12, 2016, Babson Capital Management LLC, subadviser to the Fund, changed its name to “Barings LLC.” The investment objectives of the Fund remain the same.
How did the Fund perform during the 12 months ended September 30, 2016?
The Fund’s Class R5 shares returned 5.63%, outpacing the 5.19% return of the Bloomberg Barclays U.S. Aggregate Bond Index (the “benchmark”), an unmanaged index of fixed-rate investment-grade securities with at least one year to maturity, combining the Bloomberg Barclays U.S. Treasury Bond Index, the Bloomberg Barclays U.S. Government-Related Bond Index, the Bloomberg Barclays U.S. Corporate Bond Index, and the Bloomberg Barclays U.S. Securitized Bond Index.
For a discussion on the economic and market environment during the 12-month period ended September 30, 2016, please see the Economic and Market Overview, beginning on page 3.
Subadviser discussion of factors that contributed to the Fund’s performance
An overweight allocation to investment-grade corporate bonds, relative to the benchmark – followed by high-yield – were the best-performing sectors, and had the strongest positive impacts from a sector view, during the year. Within corporate bonds, the satellite and banking industries were the primary contributors to performance.
Outside of corporate bonds, the Fund’s investments in Agency mortgage-backed securities (MBS) contributed to performance within the securitized area. (“Agency” refers to government-sponsored entities that issue bonds backed by mortgage loans, including Ginnie Mae, Fannie Mae, Freddie Mac, and the Federal Home Loan Banks.) The Fund’s positioning in lower-coupon securities benefited full-year returns, as did a modest allocation to Agency collateralized mortgage obligation (CMO) securities. Additionally, the Fund was able to successfully navigate between 30- and 15-year mortgages during the year, based on relative value pricing, which helped to drive returns.
Exposure to the energy industry, within the corporate sector, was the main source of detraction during the period. An out-of-benchmark allocation to convertible bonds also detracted. As corporate fundamentals slowed with mixed global economic data, and spreads to Treasury bonds continued to tighten, the Fund reduced its overweight exposure in the 10- to 30-year part of the maturity curve to become more neutral relative to the benchmark. An overweight to asset-backed securities (ABS) was the primary detractor in the securitized sector, largely due to holdings in government-guaranteed Federal Family Education Loan (FFEL) Program student loans, which underperformed during the period. A modest overweight to commercial mortgage- backed Securities (CMBS) also detracted over the year, as the Fund’s positions have a shorter-weighted average life than the benchmark. Finally, short-weighted average life collateral loan obligations (CLOs) rated AAA were a modest detractor from performance. Prices have recovered somewhat and we believe they offer an attractive income pickup.
The Fund uses derivative instruments for yield curve, duration, and downside hedging. Derivatives are securities that derive their value from the performance of one or more other investments and take the form of a contract between two or more parties. In aggregate, these positions contributed to performance over the year.
Subadviser outlook
After a brief downdraft following the Brexit vote (which ratified the United Kingdom’s eventual departure from the European Union), fixed-income investments seem to have recovered nicely. Our view is that global central banks stepped up in effective and coordinated ways to help calm market fears. Still, we believe there is a growing nervousness over reliance on monetary policy to promote growth and asset prices. Importantly, global growth expectations are falling once again, as big economic engines such as the U.S. and China are struggling to instill consumer confidence. Consequently, we believe that an environment of less buoyant market conditions is possible.
23
MassMutual Premier Diversified Bond Fund – Portfolio Manager Report (Unaudited) (Continued)
With a softening in corporate fundamentals, the Fund is focusing on yield opportunities, often post-merger and acquisition events, where Fund management believes credit spreads to Treasury bonds provide attractive opportunities. (Credit spreads are the differences in yields between comparable bonds, with widening spreads often indicating increasing yields and decreasing prices for bonds.)
As of September 30, 2016, the Fund remained overweight in sectors such as corporates and securitized relative to liquid products, such as governments and Agencies and seeks to add return in excess to the benchmark by investing in under-covered sectors where we have competitive advantages, such as consumer and commercial ABS, CLOs, and emerging markets.
24
MassMutual Premier Diversified Bond Fund – Portfolio Manager Report (Unaudited) (Continued)
| | | | |
MassMutual Premier
Diversified Bond Fund
Portfolio Characteristics
(% of Net Assets) on 9/30/16 | |
| | |
Corporate Debt | | | 43.0 | % |
Non-U.S. Government Agency Obligations | | | 25.4 | % |
U.S. Government Agency Obligations and Instrumentalities | | | 22.8 | % |
U.S. Treasury Obligations | | | 4.1 | % |
Sovereign Debt Obligations | | | 0.6 | % |
Municipal Obligations | | | 0.2 | % |
Preferred Stock | | | 0.1 | % |
Common Stock | | | 0.0 | % |
| | | | | |
Total Long-Term Investments | | | 96.2 | % |
Short-Term Investments and Other Assets and Liabilities | | | 3.8 | % |
| | | | | |
Net Assets | | | 100.0 | % |
| | | | | |
25
MassMutual Premier Diversified Bond Fund – Portfolio Manager Report (Unaudited) (Continued)
Growth of a $10,000 Investment
Hypothetical Investments in MassMutual Premier Diversified Bond Fund Class R5, Service Class, Administrative Class, Class A, Class A (sales load deducted), and the Bloomberg Barclays U.S. Aggregate Bond Index.
| | | | | | | | | | | | |
| | | | |
| TOTAL RETURN | | One Year
10/1/15 -
9/30/16 | | | Five Year
Average
Annual
10/1/11 -
9/30/16 | | | Ten Year
Average
Annual
10/1/06 -
9/30/16 | |
| Class R5 | | | 5.63% | | | | 4.09% | | | | 5.03% | |
| Service Class | | | 5.53% | | | | 4.00% | | | | 5.04% | |
| Administrative Class | | | 5.38% | | | | 3.92% | | | | 5.00% | |
| Class A | | | 5.16% | | | | 3.68% | | | | 4.75% | |
| Class A (sales load deducted)* | | | 0.26% | | | | 2.67% | | | | 4.24% | |
| Bloomberg Barclays U.S. Aggregate Bond Index | | | 5.19% | | | | 3.08% | | | | 4.79% | |
Hypothetical Investments in MassMutual Premier Diversified Bond Fund Class I and the Bloomberg Barclays U.S. Aggregate Bond Index.
| | | | | | | | | | | | |
| | | | |
| TOTAL RETURN | | One Year
10/1/15 -
9/30/16 | | | Five Year
Average
Annual
10/1/11 -
9/30/16 | | | Since
Inception
Average
Annual
12/3/10 -
9/30/16 | |
| Class I | | | 5.71% | | | | 4.64% | | | | 4.94% | |
| Bloomberg Barclays U.S. Aggregate Bond Index | | | 5.19% | | | | 3.08% | | | | 3.72% | |
Hypothetical Investments in MassMutual Premier Diversified Bond Fund Class R4, Class R3, and the Bloomberg Barclays U.S. Aggregate Bond Index.
| | | | | | | | |
| | | |
| TOTAL RETURN | | One Year
10/1/15 -
9/30/16 | | | Since
Inception
Average
Annual
4/1/14 -
9/30/16 | |
| Class R4 | | | 5.28% | | | | 3.24% | |
| Class R3 | | | 4.94% | | | | 2.94% | |
| Bloomberg Barclays U.S. Aggregate Bond Index | | | 5.19% | | | | 4.14% | |
GROWTH OF $10,000 INVESTMENT FOR THE PAST 10 YEARS
GROWTH OF $10,000 INVESTMENT SINCE INCEPTION
* Class A (sales load deducted) returns include the 4.75% maximum sales charge.
Performance data quoted represents past performance; past performance is not predictive of future results. The investment return and principal value of shares of the Fund will fluctuate with market conditions so that shares of the Fund, when redeemed, may be worth more or less than their original cost. Current performance of the Fund may be lower or higher than the performance quoted. Performance data current to the most recent month-end may be obtained by calling 1-888-309-3539.
Investors should note that the Fund is a professionally managed mutual fund, while the Bloomberg Barclays U.S. Aggregate Bond Index is unmanaged, does not incur expenses, and cannot be purchased directly by investors. Investors should read the Fund’s prospectus with regard to the Fund’s investment objective, risks, and charges and expenses in conjunction with these financial statements. Employee retirement benefit plans that invest plan assets in the Separate Investment Accounts (SIAs) may be subject to certain charges as set forth in their respective Plan Documents. Total return figures would be lower for the periods presented if they reflected these charges. The performance tables and charts do not reflect the deduction of taxes that a shareholder would pay on the Fund distributions or the redemption of the Fund shares.
26
MassMutual Premier High Yield Fund – Portfolio Manager Report (Unaudited)
What is the investment approach of MassMutual Premier High Yield Fund, and who is the Fund’s subadviser?
The Fund seeks to achieve a high level of total return, with an emphasis on current income, by investing primarily in high yield debt and related securities. Under normal circumstances, the Fund invests at least 80% of its net assets (plus the amount of any borrowings for investment purposes) in lower rated fixed income securities (rated below Baa3 by Moody’s, below BBB- by Standard & Poor’s or the equivalent by any NRSRO (using the lower rating) or, if unrated, determined to be of below investment grade quality by the Fund’s subadviser). The Fund’s subadviser is Barings LLC (Barings). Effective September 12, 2016, Babson Capital Management LLC, subadviser to the Fund, changed its name to “Barings LLC.” The investment objectives of the Fund remain the same.
How did the Fund perform during the 12 months ended September 30, 2016?
The Fund’s Class R5 shares returned 10.68%, underperforming the 12.73% return of the Bloomberg Barclays U.S. Corporate High-Yield Bond Index (the “benchmark”), which covers the universe of fixed rate, non-investment-grade debt from corporate sectors.
For a discussion on the economic and market environment during the 12-month period ended September 30, 2016, please see the Economic and Market Overview, beginning on page 3.
Subadviser discussion of factors that contributed to the Fund’s performance
Although the Fund posted historically strong absolute results for the year ended September 30, 2016, it nevertheless underperformed the benchmark, as the market began its historic rally in February after trading down significantly, in tandem with oil and commodity prices, over the final quarter of 2015. Over the year, the high-yield market, particularly in the U.S., was driven by sentiment around commodity prices, with energy and metals & mining bonds experiencing significant volatility. The relentless rally in high-yield issues was further exacerbated as record low interest rates around the world helped spark a move towards yield. This prompted lower-quality bonds to produce outsized gains for the benchmark as they recovered, largely indiscriminately, from the punitive environment that persisted throughout the second half of 2015 and early 2016.
As it relates to the Fund, the basic industry sector – and specifically, its metals & mining subset – was the primary driver of the Fund’s underperformance. At the beginning of the fiscal year, the Fund was approximately 1% underweight in metals & mining, relative to the benchmark, but has since moved to a slight overweight. Due to the Fund’s preference for higher-quality issues within the sector, however, the benchmark benefited from massive capital appreciation in lower-quality issuers and was able to outperform the Fund.
Outside of commodity-centric sectors, the Fund’s key overweight positions were in the capital goods, other industrial, and transportation sectors – and its key underweight allocations were in the communications, consumer non-cyclical, and financials sectors. In terms of industry weightings, the Fund’s weightings largely remained unchanged. Compared to last year, the Fund’s exposure to the communications sector increased, whereas its allocation to consumer non-cyclicals decreased. The Fund’s allocation to basic industry increased as well, although much of the increase was due to organic growth through price appreciation as the year progressed and the sector rallied.
The Fund’s top three holdings for the year were Fieldwood Energy, an energy exploration and production company focused in the Gulf of Mexico; Altice, a multinational cable and telecommunications operator; and Coveris, which designs, manufactures, and supplies paper and packaging products.
Subadviser outlook
In our view, the U.S. market remains technically sound; however, central bank policy and November’s elections will, we expect, likely dominate investor sentiment in the fourth quarter. With a new U.S. president in office for the first time in eight years, we believe that markets will pay close attention to the changing political environment in 2017, regardless of November’s outcome. As has been the case since February 2016, we expect commodity prices to continue to be a key inflection point, as new issue supply should trail off after September’s uptick. After September’s robust new issue volume, the high-yield bond pipeline has slowed, adding to the strong technical environment in the U.S. market.
27
MassMutual Premier High Yield Fund – Portfolio Manager Report (Unaudited) (Continued)
| | | | |
MassMutual Premier
High Yield Fund
Portfolio Characteristics
(% of Net Assets) on 9/30/16 | |
| | |
Corporate Debt | | | 93.6 | % |
Bank Loans | | | 2.7 | % |
Common Stock | | | 0.0 | % |
| | | | | |
Total Long-Term Investments | | | 96.3 | % |
Short-Term Investments and Other Assets and Liabilities | | | 3.7 | % |
| | | | | |
Net Assets | | | 100.0 | % |
| | | | | |
28
MassMutual Premier High Yield Fund – Portfolio Manager Report (Unaudited) (Continued)
Growth of a $10,000 Investment
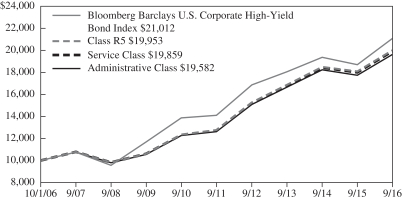
Hypothetical Investments in MassMutual Premier High Yield Fund Class R5, Service Class, Administrative Class, Class A, Class A (sales load deducted), Class R3, and the Bloomberg Barclays U.S. Corporate High-Yield Bond Index.
| | | | | | | | | | | | |
| | | | |
| TOTAL RETURN | | One Year
10/1/15 -
9/30/16 | | | Five Year
Average
Annual
10/1/11 -
9/30/16 | | | Ten Year
Average
Annual
10/1/06 -
9/30/16 | |
| Class R5 | | | 10.68% | | | | 9.40% | | | | 7.15% | |
| Service Class | | | 10.70% | | | | 9.35% | | | | 7.10% | |
| Administrative Class | | | 10.63% | | | | 9.21% | | | | 6.95% | |
| Class A | | | 10.31% | | | | 8.93% | | | | 6.69% | |
| Class A (sales load deducted)* | | | 3.97% | | | | 7.65% | | | | 6.06% | |
| Class R3 | | | 10.12% | | | | 8.69% | | | | 6.41% | |
| Bloomberg Barclays U.S. Corporate High-Yield Bond Index | | | 12.73% | | | | 8.34% | | | | 7.71% | |
GROWTH OF $10,000 INVESTMENT FOR THE PAST 10 YEARS
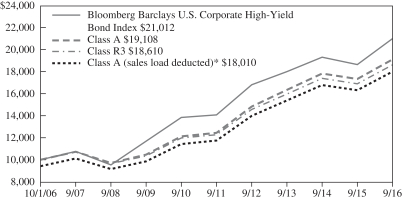
* Class A (sales load deducted) returns include the 5.75% maximum sales charge.
Performance data quoted represents past performance; past performance is not predictive of future results. The investment return and principal value of shares of the Fund will fluctuate with market conditions so that shares of the Fund, when redeemed, may be worth more or less than their original cost. Current performance of the Fund may be lower or higher than the performance quoted. Performance data current to the most recent month-end may be obtained by calling 1-888-309-3539.
Investors should note that the Fund is a professionally managed mutual fund, while the Bloomberg Barclays U.S. Corporate High-Yield Bond Index is unmanaged, does not incur expenses, and cannot be purchased directly by investors. Investors should read the Fund's prospectus with regard to the Fund's investment objective, risks, and charges and expenses in conjunction with these financial statements. Employee retirement benefit plans that invest plan assets in the Separate Investment Accounts (SIAs) may be subject to certain charges as set forth in their respective Plan Documents. Total return figures would be lower for the periods presented if they reflected these charges. The performance tables and charts do not reflect the deduction of taxes that a shareholder would pay on the Fund distributions or the redemption of the Fund shares.
29
MassMutual Premier High Yield Fund – Portfolio Manager Report (Unaudited) (Continued)
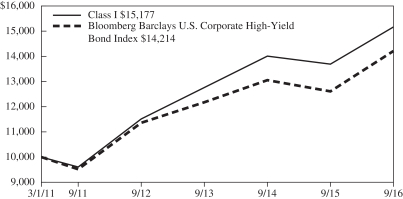
Growth of a $10,000 Investment
Hypothetical Investments in MassMutual Premier High Yield Fund Class I and the Bloomberg Barclays U.S. Corporate High-Yield Bond Index.
| | | | | | | | | | | | |
| | | | |
| TOTAL RETURN | | One Year
10/1/15 -
9/30/16 | | | Five Year
Average
Annual
10/1/11 -
9/30/16 | | | Since
Inception
Average
Annual
3/1/11 -
9/30/16 | |
| Class I | | | 10.86% | | | | 9.59% | | | | 7.75% | |
| Bloomberg Barclays U.S. Corporate High-Yield Bond Index | | | 12.73% | | | | 8.34% | | | | 6.49% | |
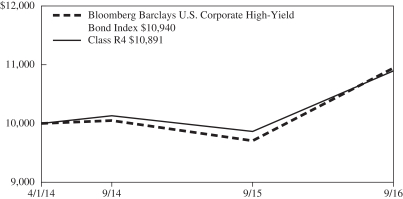
Hypothetical Investments in MassMutual Premier High Yield Fund Class R4 and the Bloomberg Barclays U.S. Corporate High-Yield Bond Index.
| | | | | | | | |
| | | |
| TOTAL RETURN | | One Year
10/1/15 -
9/30/16 | | | Since
Inception
Average
Annual
4/1/14 -
9/30/16 | |
| Class R4 | | | 10.44% | | | | 3.47% | |
| Bloomberg Barclays U.S. Corporate High-Yield Bond Index | | | 12.73% | | | | 3.66% | |
GROWTH OF $10,000 INVESTMENT SINCE INCEPTION
Performance data quoted represents past performance; past performance is not predictive of future results. The investment return and principal value of shares of the Fund will fluctuate with market conditions so that shares of the Fund, when redeemed, may be worth more or less than their original cost. Current performance of the Fund may be lower or higher than the performance quoted. Performance data current to the most recent month-end may be obtained by calling 1-888-309-3539.
Investors should note that the Fund is a professionally managed mutual fund, while the Bloomberg Barclays U.S. Corporate High-Yield Bond Index is unmanaged, does not incur expenses, and cannot be purchased directly by investors. Investors should read the Fund's prospectus with regard to the Fund's investment objective, risks, and charges and expenses in conjunction with these financial statements. Employee retirement benefit plans that invest plan assets in the Separate Investment Accounts (SIAs) may be subject to certain charges as set forth in their respective Plan Documents. Total return figures would be lower for the periods presented if they reflected these charges. The performance tables and charts do not reflect the deduction of taxes that a shareholder would pay on the Fund distributions or the redemption of the Fund shares.
30
MassMutual Premier Balanced Fund – Portfolio Manager Report (Unaudited)
What is the investment approach of MassMutual Premier Balanced Fund, and who is the Fund’s subadviser?
The Fund seeks to achieve a high total rate of return over an extended period of time consistent with the preservation of capital by investing in a diversified portfolio of equity securities, fixed income securities, and money market instruments. The Fund invests across different asset classes (U.S. equity securities, international equity securities, fixed income securities, including bank loans and Rule 144A securities, and money market instruments), each represented by a different segment of the Fund’s portfolio. The subadviser typically adjusts the allocation among the four segments, based on its judgment about each segment’s potential for returns in comparison with those of other segments and corresponding risk. The Fund’s subadviser is Barings LLC (Barings). Effective September 12, 2016, Babson Capital Management LLC, subadviser to the Fund, changed its name to “Barings LLC.” The investment objectives of the Fund remain the same.
How did the Fund perform during the 12 months ended September 30, 2016?
The Fund’s Class R5 shares returned 9.91%, significantly trailing the 15.43% return of the S&P 500® Index (“the stock component’s benchmark”), a widely recognized, unmanaged index representative of common stocks of larger capitalized U.S. companies – but outperforming the 6.52% return of the MSCI EAFE Index (“the international component’s benchmark”), a widely recognized, unmanaged index representative of equity securities in developed markets, excluding the U.S. and Canada, and the 5.19% return of the Bloomberg Barclays U.S. Aggregate Bond Index (“the bond component’s benchmark”), an unmanaged index of fixed-rate investment-grade securities with at least one year to maturity, combining the Bloomberg Barclays U.S. Treasury Bond Index, the Bloomberg Barclays U.S. Government-Related Bond Index, the Bloomberg Barclays U.S. Corporate Bond Index, and the Bloomberg Barclays U.S. Securitized Bond Index. Additionally, the Fund’s Class R5 shares modestly outperformed the 9.64% return of the Lipper Balanced Fund Index, an unmanaged, equally weighted index of the 30 largest mutual funds within the Lipper Balanced Category; but trailed the 10.44% return of the Custom Balanced Index, which comprises the stock component’s benchmark, the bond component’s benchmark, and the international component’s benchmark. The weightings of each index in the Custom Balanced Index are 50%, 40% and 10%, respectively.
For a discussion on the economic and market environment during the 12-month period ended September 30, 2016, please see the Economic and Market Overview, beginning on page 3.
Subadviser discussion of factors that contributed to the Fund’s stock component performance
Throughout the year ended September 30, 2016, the Fund’s emphasis on U.S. equities – at the expense of its allocations to bonds and foreign equities – helped performance. The Fund’s equity investments lost ground early in the year, as value stocks in the cyclical and energy sectors were down relative to the market. The Fund made up ground with respect to its equity investments later in the year as these sectors rebounded. Sectors that Fund management believed would be able to maintain growth in a slowing world economy – such as health care, retail and consumer discretionary – were the best performers early in the year, but then became the laggards. Examples of Fund holdings that followed this pattern included Anthem, a company that manages health benefits; retailer Ross Stores; and Clorox, the consumer goods manufacturer. Conversely, Fund holdings that outperformed for the year included steel producer Nucor and ConocoPhilips, an oil and gas company.
Subadviser discussion of factors that contributed to the Fund’s bond component performance
During the year ended September 30, 2016, an overweight, relative to the bond component’s benchmark, to asset-backed securities (ABS) was the primary detractor in the securitized sector, largely due to holdings in government-guaranteed student loans, which underperformed. (Bond issuers create securitized bonds by pooling various types of contractual debt, such as mortgages, auto loans, or credit card debt.) A modest overweight to commercial mortgage-backed securities (CMBS) also detracted from Fund performance. An overweight to investment-grade bonds and an out-of-benchmark allocation to high-yield corporate bonds rated BB were the primary detractors from the bond component’s performance, and exposure to the energy industry was the main driver of its underperformance. Conversely, the Fund’s investments in Agency mortgage-backed securities (MBS) were the primary contributors to the Fund’s fixed-income performance. (“Agency” refers to government-sponsored entities that issue bonds backed by mortgage loans, including Ginnie Mae, Fannie Mae, Freddie Mac, and the Federal Home Loan Banks.) The Fund’s positioning in lower-coupon securities benefited performance, as did a modest allocation to Agency collateralized mortgage obligation (CMO) securities.
31
MassMutual Premier Balanced Fund – Portfolio Manager Report (Unaudited) (Continued)
The Fund uses derivatives on occasion for yield curve, duration, and downside hedging. In aggregate, these positions detracted modestly from Fund performance over the year. Derivatives are securities that derive their value from the performance of one or more other investments and take the form of a contract between two or more parties.
Subadviser outlook
In our view, the market priced in a recession when there was none. Instead, we believe that a more “classic” economic recovery seems to be getting underway. Following the Great Recession, housing, employment and bank balance sheets were so low that it took about six years to get back to normal levels. Recently, normalcy has been achieved and the economy is acting in a more familiar pattern, as incomes gains have generated more spending and more growth. Since the normal imbalances that bring an end to a recovery are only starting to be built, we think this may be a longer-than-normal economic cycle. We believe that the equity market has the potential to do well in that type of environment.
32
MassMutual Premier Balanced Fund – Portfolio Manager Report (Unaudited) (Continued)
| | | | |
MassMutual Premier
Balanced Fund
Portfolio Characteristics
(% of Net Assets) on 9/30/16 | |
| | |
Common Stock | | | 59.0 | % |
Corporate Debt | | | 12.4 | % |
Mutual Funds | | | 9.0 | % |
Non-U.S. Government Agency Obligations | | | 8.5 | % |
U.S. Government Agency Obligations and Instrumentalities | | | 8.5 | % |
U.S. Treasury Obligations | | | 1.3 | % |
Municipal Obligations | | | 0.4 | % |
Sovereign Debt Obligations | | | 0.4 | % |
Preferred Stock | | | 0.1 | % |
Rights | | | 0.0 | % |
| | | | | |
Total Long-Term Investments | | | 99.6 | % |
Short-Term Investments and Other Assets and Liabilities | | | 0.4 | % |
| | | | | |
Net Assets | | | 100.0 | % |
| | | | | |
33
MassMutual Premier Balanced Fund – Portfolio Manager Report (Unaudited) (Continued)
Growth of a $10,000 Investment
Hypothetical Investments in MassMutual Premier Balanced Fund Class R5, Service Class, Administrative Class, Class A, Class A (sales load deducted), the S&P 500 Index, the MSCI EAFE Index, the Bloomberg Barclays U.S. Aggregate Bond Index, the Lipper Balanced Fund Index, and the Custom Balanced Index.
| | | | | | | | | | | | |
| | | | |
| TOTAL RETURN | | One Year
10/1/15 -
9/30/16 | | | Five Year
Average
Annual
10/1/11 -
9/30/16 | | | Ten Year
Average
Annual
10/1/06 -
9/30/16 | |
| Class R5 | | | 9.91% | | | | 10.00% | | | | 5.88% | |
| Service Class | | | 9.76% | | | | 9.84% | | | | 5.71% | |
| Administrative Class | | | 9.69% | | | | 9.71% | | | | 5.57% | |
| Class A | | | 9.38% | | | | 9.43% | | | | 5.32% | |
| Class A (sales load deducted)* | | | 3.09% | | | | 8.14% | | | | 4.69% | |
| S&P 500 Index# | | | 15.43% | | | | 16.37% | | | | 7.24% | |
| MSCI EAFE Index | | | 6.52% | | | | 7.39% | | | | 1.82% | |
| Bloomberg Barclays U.S. Aggregate Bond Index | | | 5.19% | | | | 3.08% | | | | 4.79% | |
| Lipper Balanced Fund Index | | | 9.64% | | | | 9.56% | | | | 5.47% | |
| Custom Balanced Index | | | 10.44% | | | | 10.18% | | | | 6.15% | |
Hypothetical Investments in MassMutual Premier Balanced Fund Class I, Class R4, Class R3, the S&P 500 Index, the MSCI EAFE Index, the Bloomberg Barclays U.S. Aggregate Bond Index, the Lipper Balanced Fund Index, and the Custom Balanced Index.
| | | | | | | | |
| | | |
| TOTAL RETURN | | One Year
10/1/15 -
9/30/16 | | | Since
Inception
Average
Annual
4/1/14 -
9/30/16 | |
| Class I | | | 9.96% | | | | 4.67% | |
| Class R4 | | | 9.51% | | | | 4.19% | |
| Class R3 | | | 9.29% | | | | 3.96% | |
| S&P 500 Index# | | | 15.43% | | | | 8.30% | |
| MSCI EAFE Index | | | 6.52% | | | | -1.90% | |
| Bloomberg Barclays U.S. Aggregate Bond Index | | | 5.19% | | | | 4.14% | |
| Lipper Balanced Fund Index | | | 9.64% | | | | 4.51% | |
| Custom Balanced Index | | | 10.44% | | | | 5.68% | |
GROWTH OF $10,000 INVESTMENT FOR THE PAST 10 YEARS
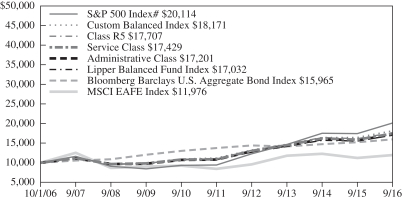
GROWTH OF $10,000 INVESTMENT SINCE INCEPTION
* Class A (sales load deducted) returns include the 5.75% maximum sales charge.
# Benchmark.
Performance data quoted represents past performance; past performance is not predictive of future results. The investment return and principal value of shares of the Fund will fluctuate with market conditions so that shares of the Fund, when redeemed, may be worth more or less than their original cost. Current performance of the Fund may be lower or higher than the performance quoted. Performance data current to the most recent month-end may be obtained by calling 1-888-309-3539.
Investors should note that the Fund is a professionally managed mutual fund, while the S&P 500 Index, the MSCI EAFE Index, the Bloomberg Barclays U.S. Aggregate Bond Index, the Lipper Balanced Fund Index, and the Custom Balanced Index are unmanaged, do not incur expenses and cannot be purchased directly by investors. Investors should read the Fund’s prospectus with regard to the Fund’s investment objective, risks, and charges and expenses in conjunction with these financial statements. Employee retirement benefit plans that invest plan assets in the Separate Investment Accounts (SIAs) may be subject to certain charges as set forth in their respective Plan Documents. Total return figures would be lower for the periods presented if they reflected these charges. The performance tables and charts do not reflect the deduction of taxes that a shareholder would pay on the Fund distributions or the redemption of the Fund shares.
34
MassMutual Premier Value Fund – Portfolio Manager Report (Unaudited)
What is the investment approach of MassMutual Premier Value Fund, and who is the Fund’s subadviser?
The Fund seeks to achieve long-term capital appreciation primarily through investment in a portfolio of common stocks of established companies with varying market capitalizations that the Fund’s subadviser believes are undervalued in the marketplace. While the Fund does not limit its investments to issuers in a particular capitalization range, the subadviser currently focuses on securities of larger size companies. The Fund’s subadviser is OFI Global Institutional, Inc. (OFI Global).
How did the Fund perform during the 12 months ended September 30, 2016?
The Fund’s Class R5 shares returned 10.74%, underperforming, by a wide margin, the 16.20% return of the Russell 1000® Value Index (the “benchmark”), an unmanaged index consisting of those Russell 1000 securities (representing the 1,000 largest U.S. companies, based on market capitalization) with greater than average value orientation that tend to exhibit lower price-to-book ratios and lower forecasted growth rates than securities in the growth universe. Similarly, the Fund’s Class R5 shares’ 10.74% return trailed the 15.43% return of the S&P 500® Index, a widely recognized, unmanaged index representative of common stocks of larger capitalized U.S. companies.
For a discussion on the economic and market environment during the 12-month period ended September 30, 2016, please see the Economic and Market Overview, beginning on page 3.
Subadviser discussion of factors that contributed to the Fund’s performance
For the year ended September 30, 2016, the Fund underperformed the benchmark due primarily to stock selection in the health care, financials, and materials sectors, and an overweight position, relative to the benchmark, in the consumer discretionary sector. The Fund narrowly outperformed the benchmark in the telecommunication services sector due to an underweight position, and in the utilities sector due to stock selection.
Fund holdings that were detractors from performance during the period included Citigroup, Inc. (financials); Teva Pharmaceutical Industries Ltd. (health care); and Genworth Financial, Inc. (financials). Over the volatile opening months of 2016, financial companies experienced declines. After the Bank of Japan followed the European Central Bank in pursuing a negative interest rate policy, bank stocks fell sharply. In this environment, financial stocks such as Citigroup detracted from performance. This weakness led to opportunities, however, as the Fund was able to add to positions in financial stocks at favorable prices. Teva Pharmaceutical Industries is a global provider of generic and specialty pharmaceuticals. The timing of its acquisition of Allergan was delayed, which weighed on shares. The acquisition was completed in August 2016. Later in the reporting period, a U.S. agency invalidated patents protecting its multiple sclerosis drug Copaxone. Genworth Financial reported a fourth-quarter 2015 loss and suspended sales of traditional life insurance and fixed annuity products. The Fund exited its position in Genworth during the period.
Turning to the positive, Fund holdings that were top contributors to full-year performance included Apache Corp. (energy); Broadcom Ltd. (information technology); and UnitedHealth Group, Inc. (health care). Weakness in energy stocks during the second half of 2015 allowed the Fund to add to positions in a number of exploration and production companies, such as Apache. Energy companies have been aggressively cutting capital expenditure plans, which should lead to higher returns on invested capital as oil prices stabilize. Broadcom is a manufacturer of semiconductors with applications in broadband and wireless communications. Broadcom’s merger with Avago Technologies was completed during the reporting period. UnitedHealth is a diversified health care company whose shares performed well in 2016. The company’s health-services unit, Optum, continued to perform strongly, with strong revenue growth.
Subadviser outlook
While many investors focus on a short-term view when considering potential investments, the Fund utilizes in-depth fundamental research to identify companies that Fund management believes are poised for an unanticipated acceleration in return on invested capital over a multi-year time horizon. We believe this longer-term approach provides a more comprehensive outlook of potential investments by focusing on all three financial statements – income statement, balance sheet, and statement of cash flows – and helps Fund management uncover companies whose generation and use of free cash flow may not be fully reflected in the current stock price.
35
MassMutual Premier Value Fund – Portfolio Manager Report (Unaudited) (Continued)
| | | | |
MassMutual Premier
Value Fund
Largest Holdings
(% of Net Assets) on 9/30/16 | |
| | |
Bank of America Corp. | | | 4.3 | % |
JP Morgan Chase & Co. | | | 4.0 | % |
Ally Financial, Inc. | | | 3.5 | % |
American International Group, Inc. | | | 3.2 | % |
Edison International | | | 2.8 | % |
Wal-Mart Stores, Inc. | | | 2.8 | % |
Pfizer, Inc. | | | 2.6 | % |
UnitedHealth Group, Inc. | | | 2.6 | % |
The Procter & Gamble Co. | | | 2.3 | % |
Broadcom Ltd. | | | 2.3 | % |
| | | | | |
| | | | 30.4 | % |
| | | | | |
| | | | |
MassMutual Premier
Value Fund
Sector Table
(% of Net Assets) on 9/30/16 | |
| | |
Financial | | | 22.4 | % |
Consumer, Non-cyclical | | | 18.3 | % |
Industrial | | | 14.2 | % |
Technology | | | 11.6 | % |
Energy | | | 11.3 | % |
Consumer, Cyclical | | | 7.2 | % |
Communications | | | 7.1 | % |
Utilities | | | 3.2 | % |
Basic Materials | | | 2.4 | % |
Mutual Funds | | | 1.1 | % |
| | | | | |
Total Long-Term Investments | | | 98.8 | % |
Short-Term Investments and Other Assets and Liabilities | | | 1.2 | % |
| | | | | |
Net Assets | | | 100.0 | % |
| | | | | |
36
MassMutual Premier Value Fund – Portfolio Manager Report (Unaudited) (Continued)
Growth of a $10,000 Investment
Hypothetical Investments in MassMutual Premier Value Fund Class R5, Service Class, Administrative Class, Class A, Class A (sales load deducted), Class R3, the Russell 1000 Value Index, and the S&P 500 Index.
| | | | | | | | | | | | |
| | | | |
| TOTAL RETURN | | One Year
10/1/15 -
9/30/16 | | | Five Year
Average
Annual
10/1/11 -
9/30/16 | | | Ten Year
Average
Annual
10/1/06 -
9/30/16 | |
| Class R5 | | | 10.74% | | | | 13.47% | | | | 5.27% | |
| Service Class | | | 10.66% | | | | 13.36% | | | | 5.16% | |
| Administrative Class | | | 10.53% | | | | 13.24% | | | | 5.04% | |
| Class A | | | 10.23% | | | | 12.93% | | | | 4.75% | |
| Class A (sales load deducted)* | | | 3.89% | | | | 11.60% | | | | 4.13% | |
| Class R3 | | | 10.12% | | | | 12.67% | | | | 4.46% | |
| Russell 1000 Value Index# | | | 16.20% | | | | 16.15% | | | | 5.85% | |
| S&P 500 Index | | | 15.43% | | | | 16.37% | | | | 7.24% | |
GROWTH OF $10,000 INVESTMENT FOR THE PAST 10 YEARS
* Class A (sales load deducted) returns include the 5.75% maximum sales charge.
# Benchmark.
Performance data quoted represents past performance; past performance is not predictive of future results. The investment return and principal value of shares of the Fund will fluctuate with market conditions so that shares of the Fund, when redeemed, may be worth more or less than their original cost. Current performance of the Fund may be lower or higher than the performance quoted. Performance data current to the most recent month-end may be obtained by calling 1-888-309-3539.
Investors should note that the Fund is a professionally managed mutual fund, while the Russell 1000 Value Index and the S&P 500 Index are unmanaged, do not incur expenses, and cannot be purchased directly by investors. Investors should read the Fund's prospectus with regard to the Fund's investment objective, risks, and charges and expenses in conjunction with these financial statements. Employee retirement benefit plans that invest plan assets in the Separate Investment Accounts (SIAs) may be subject to certain charges as set forth in their respective Plan Documents. Total return figures would be lower for the periods presented if they reflected these charges. The performance tables and charts do not reflect the deduction of taxes that a shareholder would pay on the Fund distributions or the redemption of the Fund shares.
37
MassMutual Premier Value Fund – Portfolio Manager Report (Unaudited) (Continued)
Growth of a $10,000 Investment
Hypothetical Investments in MassMutual Premier Value Fund Class I, Class R4, the Russell 1000 Value Index, and the S&P 500 Index.
| | | | | | | | |
| | | |
| TOTAL RETURN | | One Year
10/1/15 -
9/30/16 | | | Since
Inception
Average
Annual
4/1/14 -
9/30/16 | |
| Class I | | | 10.92% | | | | 4.73% | |
| Class R4 | | | 10.41% | | | | 4.25% | |
| Russell 1000 Value Index# | | | 16.20% | | | | 6.29% | |
| S&P 500 Index | | | 15.43% | | | | 8.30% | |
GROWTH OF $10,000 INVESTMENT SINCE INCEPTION
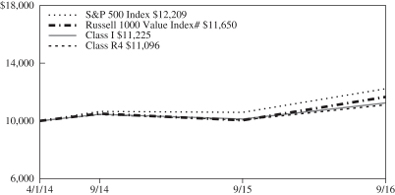
# Benchmark.
Performance data quoted represents past performance; past performance is not predictive of future results. The investment return and principal value of shares of the Fund will fluctuate with market conditions so that shares of the Fund, when redeemed, may be worth more or less than their original cost. Current performance of the Fund may be lower or higher than the performance quoted. Performance data current to the most recent month-end may be obtained by calling 1-888-309-3539.
Investors should note that the Fund is a professionally managed mutual fund, while the Russell 1000 Value Index and the S&P 500 Index are unmanaged, do not incur expenses, and cannot be purchased directly by investors. Investors should read the Fund's prospectus with regard to the Fund's investment objective, risks, and charges and expenses in conjunction with these financial statements. Employee retirement benefit plans that invest plan assets in the Separate Investment Accounts (SIAs) may be subject to certain charges as set forth in their respective Plan Documents. Total return figures would be lower for the periods presented if they reflected these charges. The performance tables and charts do not reflect the deduction of taxes that a shareholder would pay on the Fund distributions or the redemption of the Fund shares.
38
MassMutual Premier Disciplined Value Fund – Portfolio Manager Report (Unaudited)
What is the investment approach of MassMutual Premier Disciplined Value Fund, and who is the Fund’s subadviser?
The Fund seeks to create a diversified portfolio of equity securities in order to outperform the total return performance of its benchmark, the Russell 1000® Value Index*. Under normal circumstances, the Fund invests mainly in common stocks of companies that the Fund’s subadviser considers to be undervalued. The Fund will normally invest in common stocks of companies with market capitalizations of at least $200 million at the time of purchase. The Fund’s subadviser is Barings LLC (Barings). Effective September 12, 2016, Babson Capital Management LLC, subadviser to the Fund, changed its name to “Barings LLC.” The investment objectives of the Fund remain the same.
How did the Fund perform during the 12 months ended September 30, 2016?
The Fund’s Class R5 shares returned 13.11%, behind the 16.20% return of the Russell 1000 Value Index (the “benchmark”), an unmanaged index consisting of those Russell 1000 securities (representing the 1,000 largest U.S. companies, based on market capitalization) with greater than average value orientation that tend to exhibit lower price-to-book ratios and lower forecasted growth rates than securities in the growth universe.
For a discussion on the economic and market environment during the 12-month period ended September 30, 2016, please see the Economic and Market Overview, beginning on page 3.
Subadviser discussion of factors that contributed to the Fund’s performance
For the first five months of our fiscal year (the year ended September 30, 2016), the stocks in the value benchmark that did the best were those that could grow, even when the economy was faltering, like Kimberly-Clark, the maker of Kleenex tissues and drug manufacturer Mylan. Then, following the sea change that occurred in the markets in March, the “safety stocks” underperformed – often dramatically. Stocks that were most exposed to rising basic material prices and the economic cycle, like the gold miner Newmont Mining and the mining equipment maker Joy Global, outperformed.
The Fund is always searching for mispriced stocks, but this past year, the search was particularly difficult, as value was destroyed and replaced with changes in commodity prices. Historically, the Fund has generally dealt with gyrations in commodity-related stocks by buying affected companies when their prices were depressed – and market participants felt that the asset (and the company) was less attractive – and waiting for the prices to rebound. During the past year, that strategy worked well for some of our commodity holdings, but the Fund’s financial holdings, which were sold during the period due to their perceived exposure to energy companies, have yet to recover fully.
The Fund underperformed by looking for value in the energy industry. The Fund held an overweight position, relative to the benchmark, in CVR Energy, an independent refiner that had a good balance sheet and was able to produce free cash flow in the market downturn. The Fund was underweight, on the other hand, in Chevron, the integrated energy company, since it produced negative free cash flow and was trading at high multiples to its earnings. With these two Fund holdings, allocation mattered, as CVR declined 55% for the year, and Chevron advanced 36%. Investors were attracted to the integrated oil companies based on the view that they would benefit from rising oil prices, but did not want the refiners that would not.
During the year, it paid for the Fund to emphasize value in the technology sector. The Fund advanced on a relative basis by having an overweight allocation in old technology companies like Micron Technology, the memory chip manufacturer, and Cisco, the networking company. These two Fund holdings were cheap, due to investors’ uncertainty over the prospects that they could continue to grow as the technology landscape changes. Based on Fund management’s appreciation for the value proposition of these two companies, the Fund held overweight stakes in both, and this helped its full-year performance.
| * | The Fund is not promoted, sponsored, or endorsed by, nor in any way affiliated with Russell Investment Group (“Russell”). Russell is not responsible for and has not reviewed the Fund nor any associated literature or publications and Russell makes no representation or warranty, express or implied, as to their accuracy, or completeness, or otherwise. The Russell 1000® Value Index and Russell® are trademarks of the Frank Russell Company. |
39
MassMutual Premier Disciplined Value Fund – Portfolio Manager Report (Unaudited) (Continued)
Subadviser outlook
In our view, the market priced in a recession when there was none. We believe instead that a more “classic” economic recovery seems to be getting underway. Following the Great Recession, housing, employment and bank balance sheets were so low that it took about six years to get back to normal levels. Recently, normalcy has been achieved since the consumer’s balance sheet recovered from the housing debacle and incomes have begun to rise. Since the normal imbalances that bring an end to a recovery are only starting to be built, we think this may be a longer-than-normal economic cycle. We believe that the equity market has the potential to do well in that type of environment.
40
MassMutual Premier Disciplined Value Fund – Portfolio Manager Report (Unaudited) (Continued)
| | | | |
MassMutual Premier
Disciplined Value Fund
Largest Holdings
(% of Net Assets) on 9/30/16 | |
| | |
Exxon Mobil Corp. | | | 3.7 | % |
Johnson & Johnson | | | 2.7 | % |
General Electric Co. | | | 2.5 | % |
JP Morgan Chase & Co. | | | 2.3 | % |
Merck & Co., Inc. | | | 1.8 | % |
Pfizer, Inc. | | | 1.7 | % |
AT&T, Inc. | | | 1.6 | % |
Bank of America Corp. | | | 1.6 | % |
Wells Fargo & Co. | | | 1.6 | % |
Berkshire Hathaway, Inc. Class B | | | 1.6 | % |
| | | | | |
| | | | 21.1 | % |
| | | | | |
| | | | |
MassMutual Premier
Disciplined Value Fund
Sector Table
(% of Net Assets) on 9/30/16 | |
| | |
Financial | | | 28.0 | % |
Consumer, Non-cyclical | | | 16.5 | % |
Industrial | | | 10.9 | % |
Energy | | | 10.9 | % |
Technology | | | 9.2 | % |
Consumer, Cyclical | | | 8.9 | % |
Communications | | | 7.1 | % |
Utilities | | | 5.2 | % |
Basic Materials | | | 3.0 | % |
| | | | | |
Total Long-Term Investments | | | 99.7 | % |
Short-Term Investments and Other Assets and Liabilities | | | 0.3 | % |
| | | | | |
Net Assets | | | 100.0 | % |
| | | | | |
41
MassMutual Premier Disciplined Value Fund – Portfolio Manager Report (Unaudited) (Continued)
Growth of a $10,000 Investment
Hypothetical Investments in MassMutual Premier Disciplined Value Fund Class R5, Service Class, Administrative Class, Class A, Class A (sales load deducted), Class R3, and the Russell 1000 Value Index.
| | | | | | | | | | | | |
| | | | |
| TOTAL RETURN | | One Year
10/1/15 -
9/30/16 | | | Five Year
Average
Annual
10/1/11 -
9/30/16 | | | Ten Year
Average
Annual
10/1/06 -
9/30/16 | |
| Class R5 | | | 13.11% | | | | 15.14% | | | | 5.14% | |
| Service Class | | | 13.03% | | | | 15.02% | | | | 4.99% | |
| Administrative Class | | | 12.97% | | | | 14.90% | | | | 4.86% | |
| Class A | | | 12.65% | | | | 14.60% | | | | 4.59% | |
| Class A (sales load deducted)* | | | 6.18% | | | | 13.25% | | | | 3.97% | |
| Class R3 | | | 12.49% | | | | 14.35% | | | | 4.31% | |
| Russell 1000 Value Index | | | 16.20% | | | | 16.15% | | | | 5.85% | |
GROWTH OF $10,000 INVESTMENT FOR THE PAST 10 YEARS
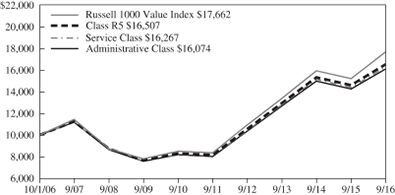
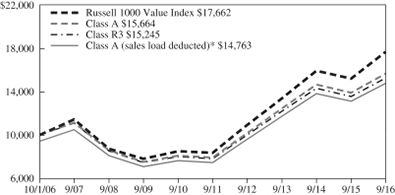
* Class A (sales load deducted) returns include the 5.75% maximum sales charge.
Performance data quoted represents past performance; past performance is not predictive of future results. The investment return and principal value of shares of the Fund will fluctuate with market conditions so that shares of the Fund, when redeemed, may be worth more or less than their original cost. Current performance of the Fund may be lower or higher than the performance quoted. Performance data current to the most recent month-end may be obtained by calling 1-888-309-3539.
Investors should note that the Fund is a professionally managed mutual fund, while the Russell 1000 Value Index is unmanaged, does not incur expenses, and cannot be purchased directly by investors. Investors should read the Fund's prospectus with regard to the Fund's investment objective, risks, and charges and expenses in conjunction with these financial statements. Employee retirement benefit plans that invest plan assets in the Separate Investment Accounts (SIAs) may be subject to certain charges as set forth in their respective Plan Documents. Total return figures would be lower for the periods presented if they reflected these charges. The performance tables and charts do not reflect the deduction of taxes that a shareholder would pay on the Fund distributions or the redemption of the Fund shares.
42
MassMutual Premier Disciplined Value Fund – Portfolio Manager Report (Unaudited) (Continued)
Growth of a $10,000 Investment
Hypothetical Investments in MassMutual Premier Disciplined Value Fund Class I, Class R4, and the Russell 1000 Value Index.
| | | | | | | | |
| | | |
| TOTAL RETURN | | One Year
10/1/15 -
9/30/16 | | | Since
Inception
Average
Annual
4/1/14 -
9/30/16 | |
| Class I | | | 13.26% | | | | 4.74% | |
| Class R4 | | | 12.75% | | | | 4.27% | |
| Russell 1000 Value Index | | | 16.20% | | | | 6.29% | |
GROWTH OF $10,000 INVESTMENT SINCE INCEPTION
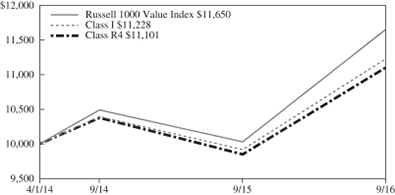
Performance data quoted represents past performance; past performance is not predictive of future results. The investment return and principal value of shares of the Fund will fluctuate with market conditions so that shares of the Fund, when redeemed, may be worth more or less than their original cost. Current performance of the Fund may be lower or higher than the performance quoted. Performance data current to the most recent month-end may be obtained by calling 1-888-309-3539.
Investors should note that the Fund is a professionally managed mutual fund, while the Russell 1000 Value Index is unmanaged, does not incur expenses, and cannot be purchased directly by investors. Investors should read the Fund's prospectus with regard to the Fund's investment objective, risks, and charges and expenses in conjunction with these financial statements. Employee retirement benefit plans that invest plan assets in the Separate Investment Accounts (SIAs) may be subject to certain charges as set forth in their respective Plan Documents. Total return figures would be lower for the periods presented if they reflected these charges. The performance tables and charts do not reflect the deduction of taxes that a shareholder would pay on the Fund distributions or the redemption of the Fund shares.
43
MassMutual Premier Main Street Fund – Portfolio Manager Report (Unaudited)
What is the investment approach of MassMutual Premier Main Street Fund, and who is the Fund’s subadviser?
The Fund seeks a high total return by investing primarily in common stocks of U.S. companies of different capitalization ranges. The Fund’s subadviser currently focuses on “large capitalization” issuers, which are considered to be companies with market capitalizations at the time of purchase within the market capitalization range of companies included within the Russell 1000® Index, although it may purchase stocks of companies with any market capitalization. The Fund’s subadviser is OFI Global Institutional, Inc. (OFI Global).
How did the Fund perform during the 12 months ended September 30, 2016?
The Fund’s Class R5 shares returned 14.28%, trailing the 15.43% return of the S&P 500® Index (the “benchmark”), a widely recognized, unmanaged index representative of common stocks of larger capitalized U.S. companies.
For a discussion on the economic and market environment during the 12-month period ended September 30, 2016, please see the Economic and Market Overview, beginning on page 3.
Subadviser discussion of factors that contributed to the Fund’s performance
For the year ended September 30, 2016, the Fund underperformed the benchmark primarily within the information technology sector, due to stock selection and an underweight position, relative to the benchmark. The Fund also underperformed in the energy and telecommunication services sectors as a result of stock selection and underweight positions. Outperforming sectors for the Fund included consumer discretionary, financials, and consumer staples. Stock selection drove the outperformance of these three sectors.
Fund holdings that were detractors from performance included Citigroup, Inc. (financials); HollyFrontier Corporation (energy); and Express Scripts Holding Company (health care). Starting with Citigroup, over the first half of the reporting period, the stock, along with other large banking companies, underperformed, largely as a result of inaction by the Federal Reserve. HollyFrontier is a U.S. refiner of petroleum. Rising gasoline supply and falling supplies of cheap U.S. oil caused operating margins to decline and the short-term outlook for profitability to diminish for the company. The CEO of pharmaceutical manufacturer Mylan called out the supply chain, including pharmacy benefit managers (PBMs) such as Express Scripts for the reason why the price of its EpiPen has skyrocketed over the last few years. Consequently, investor concern regarding scrutiny over manufacturer rebates and transparency of the PBM business model put pressure on the stock.
Fund holdings that were top individual contributors during the fiscal year included Alphabet, Inc. (information technology); Philip Morris (consumer staples); and Chevron Corporation (energy). During the reporting period, Alphabet – the parent company of Google – announced plans to enhance financial disclosures to investors, thereby providing greater transparency into the drivers of value creation. With the arrival of a new CFO, investors gained conviction in greater cost controls and more effective capital allocation, both of which could lead to rising profitability. In addition, the company announced a stock buyback over the fourth quarter of 2015 and posted strong earnings for the second quarter of 2016. Philip Morris, the world’s second-largest tobacco company, sells tobacco-related products internationally (outside the U.S.). The stock benefited as management continued to execute well, which led to share gains in many markets worldwide. Additionally, as the U.S. dollar flattened (relative to other currencies), the stock was boosted further, as investors appeared to expect the pressure on the company’s earnings – from a strengthening dollar – to subside. Finally, Chevron benefited from the sharp rebound of oil prices following the first quarter of 2016. Furthermore, Chevron’s attractive yield and more focused capital spending plans were rewarded by the market.
Subadviser outlook
We expect heightened uncertainty to potentially return to the equity markets. Traditionally, during periods of economic uncertainty and heightened market volatility, investors have often favored stocks of higher-quality companies, with greater consistency and stability of revenue and earnings. This has often led to relatively better stock performance of those companies. We think focusing on companies with economic moats and skilled management teams could position the Fund well, should this environment materialize. During times of economic volatility, in our view, such companies have the potential to widen their lead over weaker competitors. The Fund seeks to invest in companies characterized by these qualities at compelling valuations, and we believe this disciplined approach may help to generate positive long-term performance.
44
MassMutual Premier Main Street Fund – Portfolio Manager Report (Unaudited) (Continued)
| | | | |
MassMutual Premier
Main Street Fund
Largest Holdings
(% of Net Assets) on 9/30/16 | |
| | |
Apple, Inc. | | | 5.6 | % |
Alphabet, Inc. Class C | | | 4.8 | % |
General Electric Co. | | | 4.0 | % |
Comcast Corp. Class A | | | 3.4 | % |
Mondelez International, Inc. Class A | | | 2.9 | % |
PepsiCo, Inc. | | | 2.8 | % |
Citigroup, Inc. | | | 2.7 | % |
Berkshire Hathaway, Inc. Class B | | | 2.7 | % |
Philip Morris International, Inc. | | | 2.6 | % |
Chevron Corp. | | | 2.5 | % |
| | | | | |
| | | | 34.0 | % |
| | | | | |
| | | | |
MassMutual Premier Main Street Fund
Sector Table
(% of Net Assets) on 9/30/16 | |
| | |
Consumer, Non-cyclical | | | 26.3 | % |
Financial | | | 17.9 | % |
Communications | | | 15.1 | % |
Industrial | | | 11.5 | % |
Technology | | | 10.5 | % |
Energy | | | 6.4 | % |
Consumer, Cyclical | | | 6.0 | % |
Utilities | | | 2.8 | % |
Mutual Funds | | | 2.4 | % |
Basic Materials | | | 2.2 | % |
| | | | | |
Total Long-Term Investments | | | 101.1 | % |
Short-Term Investments and Other Assets and Liabilities | | | (1.1 | )% |
| | | | | |
Net Assets | | | 100.0 | % |
| | | | | |
45
MassMutual Premier Main Street Fund – Portfolio Manager Report (Unaudited) (Continued)
Growth of a $10,000 Investment
Hypothetical Investments in MassMutual Premier Main Street Fund Class R5, Service Class, Administrative Class, Class A, Class A (sales load deducted), Class R3, and the S&P 500 Index.
| | | | | | | | | | | | |
| | | | |
| TOTAL RETURN | | One Year
10/1/15 -
9/30/16 | | | Five Year
Average
Annual
10/1/11 -
9/30/16 | | | Ten Year
Average
Annual
10/1/06 -
9/30/16 | |
| Class R5 | | | 14.28% | | | | 15.92% | | | | 6.70% | |
| Service Class | | | 14.21% | | | | 15.85% | | | | 6.62% | |
| Administrative Class | | | 14.11% | | | | 15.68% | | | | 6.49% | |
| Class A | | | 13.78% | | | | 15.40% | | | | 6.22% | |
| Class A (sales load deducted)* | | | 7.23% | | | | 14.04% | | | | 5.59% | |
| Class R3 | | | 13.60% | | | | 15.13% | | | | 5.94% | |
| S&P 500 Index | | | 15.43% | | | | 16.37% | | | | 7.24% | |
Hypothetical Investments in MassMutual Premier Main Street Fund Class I, Class R4, and the S&P 500 Index.
| | | | | | | | |
| | | |
| TOTAL RETURN | | One Year
10/1/15 -
9/30/16 | | | Since
Inception
Average
Annual
4/1/14 -
9/30/16 | |
| Class I | | | 14.34% | | | | 7.88% | |
| Class R4 | | | 13.88% | | | | 7.40% | |
| S&P 500 Index | | | 15.43% | | | | 8.30% | |
GROWTH OF $10,000 INVESTMENT FOR PAST 10 YEARS
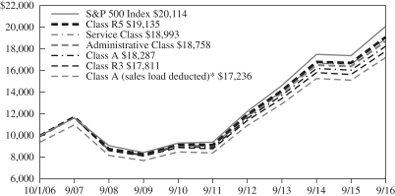
GROWTH OF $10,000 INVESTMENT SINCE INCEPTION
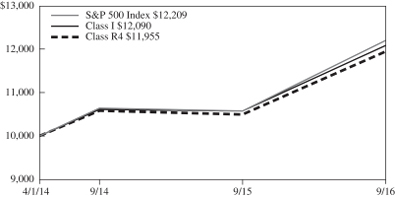
* Class A (sales load deducted) returns include the 5.75% maximum sales charge.
Performance data quoted represents past performance; past performance is not predictive of future results. The investment return and principal value of shares of the Fund will fluctuate with market conditions so that shares of the Fund, when redeemed, may be worth more or less than their original cost. Current performance of the Fund may be lower or higher than the performance quoted. Performance data current to the most recent month-end may be obtained by calling 1-888-309-3539.
Investors should note that the Fund is a professionally managed mutual fund, while the S&P 500 Index is unmanaged, does not incur expenses, and cannot be purchased directly by investors. Investors should read the Fund's prospectus with regard to the Fund's investment objective, risks, and charges and expenses in conjunction with these financial statements. Employee retirement benefit plans that invest plan assets in the Separate Investment Accounts (SIAs) may be subject to certain charges as set forth in their respective Plan Documents. Total return figures would be lower for the periods presented if they reflected these charges. The performance tables and charts do not reflect the deduction of taxes that a shareholder would pay on the Fund distributions or the redemption of the Fund shares.
46
MassMutual Premier Disciplined Growth Fund – Portfolio Manager Report (Unaudited)
What is the investment approach of MassMutual Premier Disciplined Growth Fund, and who is the Fund’s subadviser?
The Fund seeks to create a diversified portfolio of equity securities in order to outperform the total return performance of its benchmark, the Russell 1000® Growth Index*. Under normal circumstances, the Fund invests mainly in common stocks of companies that the Fund’s subadviser believes offer the potential for long-term growth. The Fund will normally invest in common stocks of companies with market capitalizations of at least $200 million at the time of purchase. The Fund’s subadviser is Barings LLC (Barings). Effective September 12, 2016, Babson Capital Management LLC, subadviser to the Fund, changed its name to “Barings LLC.” The investment objectives of the Fund remain the same.
How did the Fund perform during the 12 months ended September 30, 2016?
The Fund’s Class R5 shares returned 11.70%, underperforming the 13.76% return of the Russell 1000 Growth Index (the “benchmark”), an unmanaged index consisting of those Russell 1000 securities (representing the 1,000 largest U.S. companies based on market capitalization) with greater than average growth orientation that tend to exhibit higher price-to-book ratios and higher forecasted growth rates than securities in the value universe.
For a discussion on the economic and market environment during the 12-month period ended September 30, 2016, please see the Economic and Market Overview, beginning on page 3.
Subadviser discussion of factors that contributed to the Fund’s performance
For the year ended September 30, 2016, the securities that were up the most at the start of the fiscal year eventually were down sharply relative to the market, and the stocks that eventually outperformed had started the fiscal year down sharply. The pariah industries up until February were mining, energy, chemicals, and semiconductors. These were some of the best-performing industries after February.
The Fund seeks stocks that have multiple favorable characteristics, such as companies that are growing and offer value. This approach hurt Fund performance throughout much of the year, as investors chased the extremes. Initially, they pursued companies that could withstand a recession – and they were willing to pay high earnings multiples for these stable growth stocks. After February, however, investors preferred companies with high operating leverage, despite the fact that their earnings were declining and often negative. For example, Fund holding Royal Gold, a gold miner, had a drop in earnings down to $1 per share, from $1.63 in 2012. Yet it went up 115% year to date in 2016, after declining 21% in the fourth quarter of 2015, and 41% for all of 2015. Conversely, Nike, a shoe manufacturer, was a Fund holding that was down 15% year to date in 2016, but had been up 31% in 2015. Its earnings have doubled since 2012.
At the sector level, the Fund lost relative performance by looking for value in the retail industry. The Fund held an underweight stake, relative to the benchmark, in online retailing giant Amazon, and it had an overweight allocation to GNC, the health- and nutrition-related product retailer. Conversely, the Fund gained relative performance by holding an underweight allocation to Celgene, the biotechnology company, which declined over the period. Finally, the Fund’s overweight stake in Waters Corp, the maker of equipment used in the pharmaceutical industry, helped to drive full-year performance.
Subadviser outlook
In our view, the market priced in a recession when there was none. We believe instead that a more “classic” economic recovery seems to be getting underway. Following the Great Recession, housing, employment and bank balance sheets were so low that it took about six years to get back to normal levels. Recently, normalcy has been achieved since the consumer’s balance sheet recovered from the housing debacle and incomes have begun to rise. Since the normal imbalances that bring an end to a recovery are only starting to be built, we think this may be a longer-than-normal economic cycle. We believe that the equity market has the potential to do well in that type of environment.
| * | The Fund is not promoted, sponsored, or endorsed by, nor in any way affiliated with Russell Investment Group (“Russell”). Russell is not responsible for and has not reviewed the Fund nor any associated literature or publications and Russell makes no representation or warranty, express or implied, as to their accuracy, or completeness, or otherwise. The Russell 1000® Growth Index and Russell® are trademarks of the Frank Russell Company. |
47
MassMutual Premier Disciplined Growth Fund – Portfolio Manager Report (Unaudited) (Continued)
| | | | |
MassMutual Premier
Disciplined Growth Fund
Largest Holdings
(% of Net Assets) on 9/30/16 | |
| | |
Apple, Inc. | | | 5.2 | % |
Microsoft Corp. | | | 4.8 | % |
Alphabet, Inc. Class A | | | 2.3 | % |
Alphabet, Inc. Class C | | | 2.0 | % |
Amazon.com, Inc. | | | 2.0 | % |
Facebook, Inc. Class A | | | 1.9 | % |
AbbVie, Inc. | | | 1.7 | % |
Amgen, Inc. | | | 1.6 | % |
Gilead Sciences, Inc. | | | 1.4 | % |
PepsiCo, Inc. | | | 1.4 | % |
| | | | | |
| | | | 24.3 | % |
| | | | | |
| | | | |
MassMutual Premier
Disciplined Growth Fund
Sector Table
(% of Net Assets) on 9/30/16 | |
| | |
Consumer, Non-cyclical | | | 25.2 | % |
Technology | | | 21.0 | % |
Communications | | | 17.2 | % |
Consumer, Cyclical | | | 14.4 | % |
Industrial | | | 11.5 | % |
Financial | | | 6.6 | % |
Basic Materials | | | 2.5 | % |
Energy | | | 0.6 | % |
Utilities | | | 0.1 | % |
| | | | | |
Total Long-Term Investments | | | 99.1 | % |
Short-Term Investments and Other Assets and Liabilities | | | 0.9 | % |
| | | | | |
Net Assets | | | 100.0 | % |
| | | | | |
48
MassMutual Premier Disciplined Growth Fund – Portfolio Manager Report (Unaudited) (Continued)
Growth of a $10,000 Investment
Hypothetical Investments in MassMutual Premier Disciplined Growth Fund Class R5, Service Class, Administrative Class, Class A, Class A (sales load deducted), and the Russell 1000 Growth Index.
| | | | | | | | | | | | |
| | | | |
| TOTAL RETURN | | One Year
10/1/15 -
9/30/16 | | | Five Year
Average
Annual
10/1/11 -
9/30/16 | | | Ten Year
Average
Annual
10/1/06 -
9/30/16 | |
| Class R5 | | | 11.70% | | | | 16.35% | | | | 8.41% | |
| Service Class | | | 11.58% | | | | 16.22% | | | | 8.36% | |
| Administrative Class | | | 11.57% | | | | 16.10% | | | | 8.21% | |
| Class A | | | 11.23% | | | | 15.80% | | | | 7.94% | |
| Class A (sales load deducted)* | | | 4.83% | | | | 14.43% | | | | 7.30% | |
| Russell 1000 Growth Index | | | 13.76% | | | | 16.60% | | | | 8.85% | |
Hypothetical Investments in MassMutual Premier Disciplined Growth Fund Class I, Class R4, Class R3, and the Russell 1000 Growth Index.
| | | | | | | | |
| | | |
| TOTAL RETURN | | One Year
10/1/15 -
9/30/16 | | | Since
Inception
Average
Annual
4/1/14 -
9/30/16 | |
| Class I | | | 11.94% | | | | 7.71% | |
| Class R4 | | | 11.38% | | | | 7.23% | |
| Class R3 | | | 11.01% | | | | 6.93% | |
| Russell 1000 Growth Index | | | 13.76% | | | | 9.41% | |
GROWTH OF $10,000 INVESTMENT FOR THE PAST 10 YEARS
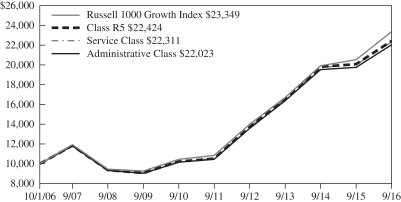
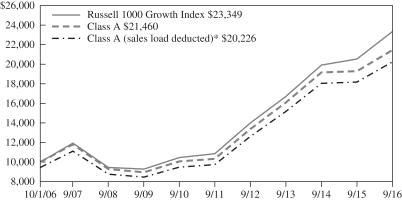
GROWTH OF $10,000 INVESTMENT SINCE INCEPTION

* Class A (sales load deducted) returns include the 5.75% maximum sales charge.
Performance data quoted represents past performance; past performance is not predictive of future results. The investment return and principal value of shares of the Fund will fluctuate with market conditions so that shares of the Fund, when redeemed, may be worth more or less than their original cost. Current performance of the Fund may be lower or higher than the performance quoted. Performance data current to the most recent month-end may be obtained by calling 1-888-309-3539.
Investors should note that the Fund is a professionally managed mutual fund, while the Russell 1000 Growth Index is unmanaged, does not incur expenses, and cannot be purchased directly by investors. Investors should read the Fund's prospectus with regard to the Fund's investment objective, risks, and charges and expenses in conjunction with these financial statements. Employee retirement benefit plans that invest plan assets in the Separate Investment Accounts (SIAs) may be subject to certain charges as set forth in their respective Plan Documents. Total return figures would be lower for the periods presented if they reflected these charges. The performance tables and charts do not reflect the deduction of taxes that a shareholder would pay on the Fund distributions or the redemption of the Fund shares.
49
MassMutual Premier Small Cap Opportunities Fund – Portfolio Manager Report (Unaudited)
What is the investment approach of MassMutual Premier Small Cap Opportunities Fund, and who is the Fund’s subadviser?
The Fund seeks capital appreciation by investing primarily in common stocks of small-capitalization U.S. companies that the Fund’s subadviser believes have favorable business trends or prospects based on fundamental analysis. Under normal circumstances, the Fund will invest at least 80% of its net assets (plus the amount of any borrowings for investment purposes) in securities of small-cap companies. The Fund’s subadviser is OFI Global Institutional, Inc. (OFI Global).
How did the Fund perform during the 12 months ended September 30, 2016?
The Fund’s Class R5 shares returned 11.40%, lagging the 15.47% return of the Russell 2000® Index (the “benchmark”), a widely recognized, unmanaged index representative of common stocks of smaller capitalized U.S. companies.
For a discussion on the economic and market environment during the 12-month period ended September 30, 2016, please see the Economic and Market Overview, beginning on page 3.
Subadviser discussion of factors that contributed to the Fund’s performance
For the year ended September 30, 2016, the Fund’s underperformance versus the benchmark stemmed largely from stock selection in the industrials, materials, and information technology sectors. Conversely, the Fund outperformed in consumer discretionary due to an underweight position, and in financials and energy, where stock selection drove results.
Fund holdings that detracted the most from performance included Korn/Ferry International (industrials); Party City Holdco, Inc. (consumer discretionary); and Western Refining, Inc. (energy). Executive recruiter and talent management firm Korn/Ferry’s stock fell sharply in the first half of 2016, after several years of solid price appreciation. Fiscal third-quarter earnings results came in as expected, but forward revenue guidance was lower than anticipated largely due to currency fluctuations. Party City, a designer, manufacturer, and retailer of party goods such as tableware, balloons, costumes and novelties, went public in April 2015. After two consecutive disappointing sales results, we recognized that management needs to build investor confidence that they can deliver on guidance as a public company. The Fund exited the Party City position during the period. The stock of crude oil refiner Western Refining, located primarily in the southwestern U.S., was an outperformer during much of 2015 – driven by an oversupply of crude oil at favorable prices, which the company then refined and sold at higher output prices. During the fourth quarter of 2015, this input/output price spread began to narrow, as domestic energy supplies responded to lower production resulting from the severe decline in energy prices. As a result, the Fund also eliminated the Western Refining position from its portfolio during the period.
Fund holdings that contributed the most to performance during the year included Burlington Stores, Inc. (consumer discretionary); WellCare Health Plans, Inc. (health care); and MKS Instruments, Inc. (information technology). Burlington Stores owns and operates branded apparel retail stores throughout the U.S. During the fourth quarter of 2015, both weather and secular issues negatively impacted apparel retailers and department stores – pushing earnings down by 10%-15% for many. In contrast, Burlington grew earnings despite being in the early stages of a transition to an off-price retail model. Management’s success in a challenging environment led to rising investor confidence, which boosted the stock price. WellCare is a managed care company for government-sponsored health care coverage with a focus on Medicare and Medicaid programs. Investors reacted favorably when the company updated its longer-term growth goals of doubling its revenue within five years and attaining an after-tax margin of at least 2%. Additionally, the Centers for Medicare and Medicaid (CMS) announced its preliminary 2017 rates, which could bode well for the company’s Medicare Advantage business. MKS Instruments is a provider of instruments, subsystems, and process control solutions that enable its customers to measure, control, power, monitor and analyze the critical parameters of the advanced processes that they manage. The company reported strong earnings for the second quarter of 2016, due in part to benefits from its recent acquisition of Newport Corporation.
Subadviser outlook
In our view, the U.S. economy continues its “slow and steady” growth, driven by favorable employment and inflation data. However, we believe that rhetoric around Brexit (the United Kingdom’s June 2016 vote to leave the European Union) and U.S. elections have the potential to cause global contagion by slowing global trade. We expect that U.S. corporate revenues, earnings, and free cash flow may have topped out for the near term. We remain skeptical, but very open, to change our view, based on fundamental evidence. Our view is that the energy, financials, and industrial sectors have shown signs of bottoming. Consequently, we believe that, from a valuation perspective, U.S. equities look favorable, based on current interest rate levels.
50
MassMutual Premier Small Cap Opportunities Fund – Portfolio Manager Report (Unaudited) (Continued)
| | | | |
MassMutual Premier
Small Cap Opportunities Fund
Largest Holdings
(% of Net Assets) on 9/30/16 | |
| | |
Prestige Brands Holdings, Inc. | | | 2.2 | % |
MB Financial, Inc. | | | 2.0 | % |
Pinnacle Foods, Inc. | | | 2.0 | % |
WellCare Health Plans, Inc. | | | 1.9 | % |
CACI International, Inc. Class A | | | 1.9 | % |
Webster Financial Corp. | | | 1.9 | % |
MKS Instruments, Inc. | | | 1.8 | % |
Portland General Electric Co. | | | 1.6 | % |
Allete, Inc. | | | 1.6 | % |
KAR Auction Services, Inc. | | | 1.6 | % |
| | | | | |
| | | | 18.5 | % |
| | | | | |
| | | | |
MassMutual Premier
Small Cap Opportunities Fund
Sector Table
(% of Net Assets) on 9/30/16 | |
| | |
Consumer, Non-cyclical | | | 30.0 | % |
Financial | | | 18.0 | % |
Technology | | | 14.5 | % |
Consumer, Cyclical | | | 11.2 | % |
Industrial | | | 10.1 | % |
Mutual Funds | | | 8.5 | % |
Energy | | | 4.3 | % |
Basic Materials | | | 4.3 | % |
Utilities | | | 3.2 | % |
Communications | | | 1.7 | % |
Diversified | | | 0.6 | % |
| | | | | |
Total Long-Term Investments | | | 106.4 | % |
Short-Term Investments and Other Assets and Liabilities | | | (6.4 | )% |
| | | | | |
Net Assets | | | 100.0 | % |
| | | | | |
51
MassMutual Premier Small Cap Opportunities Fund – Portfolio Manager Report (Unaudited) (Continued)
Growth of a $10,000 Investment
Hypothetical Investments in MassMutual Premier Small Cap Opportunities Fund Class R5, Service Class, Administrative Class, Class A, Class A (sales load deducted), and the Russell 2000 Index.
| | | | | | | | | | | | |
| | | | |
| TOTAL RETURN | | One Year
10/1/15 -
9/30/16 | | | Five Year
Average
Annual
10/1/11 -
9/30/16 | | | Ten Year Average
Annual
10/1/06 -
9/30/16 | |
| Class R5 | | | 11.40% | | | | 17.07% | | | | 7.79% | |
| Service Class | | | 11.23% | | | | 16.96% | | | | 7.69% | |
| Administrative Class | | | 11.17% | | | | 16.84% | | | | 7.60% | |
| Class A | | | 10.88% | | | | 16.55% | | | | 7.31% | |
| Class A (sales load deducted)* | | | 4.50% | | | | 15.18% | | | | 6.68% | |
| Russell 2000 Index | | | 15.47% | | | | 15.82% | | | | 7.07% | |
Hypothetical Investments in MassMutual Premier Small Cap Opportunities Fund Class I, Class R4, Class R3, and the Russell 2000 Index.
| | | | | | | | |
| | | |
| TOTAL RETURN | | One Year
10/1/15 -
9/30/16 | | | Since
Inception
Average
Annual
4/1/14 -
9/30/16 | |
| Class I | | | 11.60% | | | | 3.83% | |
| Class R4 | | | 11.06% | | | | 3.33% | |
| Class R3 | | | 10.72% | | | | 3.07% | |
| Russell 2000 Index | | | 15.47% | | | | 4.08% | |
GROWTH OF $10,000 INVESTMENT FOR THE PAST 10 YEARS
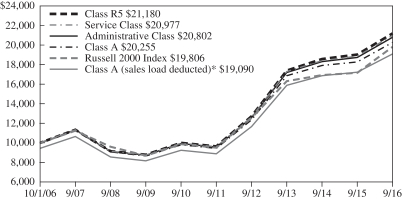
GROWTH OF $10,000 INVESTMENT SINCE INCEPTION
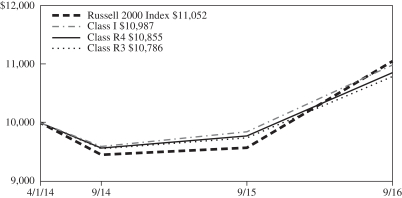
* Class A (sales load deducted) returns include the 5.75% maximum sales charge.
Performance data quoted represents past performance; past performance is not predictive of future results. The investment return and principal value of shares of the Fund will fluctuate with market conditions so that shares of the Fund, when redeemed, may be worth more or less than their original cost. Current performance of the Fund may be lower or higher than the performance quoted. Performance data current to the most recent month-end may be obtained by calling 1-888-309-3539.
Investors should note that the Fund is a professionally managed mutual fund, while the Russell 2000 Index is unmanaged, does not incur expenses, and cannot be purchased directly by investors. Investors should read the Fund’s prospectus with regard to the Fund’s investment objective, risks, and charges and expenses in conjunction with these financial statements. Employee retirement benefit plans that invest plan assets in the Separate Investment Accounts (SIAs) may be subject to certain charges as set forth in their respective Plan Documents. Total return figures would be lower for the periods presented if they reflected these charges. The performance tables and charts do not reflect the deduction of taxes that a shareholder would pay on the Fund distributions or the redemption of the Fund shares.
52
MassMutual Premier Global Fund – Portfolio Manager Report (Unaudited)
What is the investment approach of MassMutual Premier Global Fund, and who is the Fund’s subadviser?
The Fund seeks long-term capital appreciation by investing primarily in common stocks of companies in the U.S. and foreign countries. The Fund can invest without limit in foreign securities, including American Depositary Receipts, and can invest in any country, including developing or emerging market countries. However, the Fund currently emphasizes investments in developed markets such as the United States, Western European countries, and Japan. The Fund normally will invest in at least three countries (one of which may be the United States) and typically invests in a number of different countries. The Fund’s subadviser is OppenheimerFunds, Inc. (OFI).
How did the Fund perform during the 12 months ended September 30, 2016?
The Fund’s Class R5 shares returned 5.37%, trailing, by a wide margin, the 11.96% return of the MSCI All Country World Index (ACWI) (the “benchmark”), an unmanaged index representative of stocks domiciled in global developed and emerging markets, including the United States.
For a discussion on the economic and market environment during the 12-month period ended September 30, 2016, please see the Economic and Market Overview, beginning on page 3.
Subadviser discussion of factors that contributed to the Fund’s performance
For the year ended September 30, 2016, the Fund underperformed primarily due to stock selection in the financials, health care, and materials sectors. The Fund outperformed the benchmark within telecommunication services and consumer discretionary as a result of stronger relative stock selection, and in information technology, due to an overweight position, relative to the benchmark. On a country basis, stock selection in the United States and Switzerland were the largest underperformers versus the benchmark. Germany also underperformed for the Fund, due largely to stock selection. The Fund outperformed the benchmark in Japan, primarily as a result of stock selection. The Fund outperformed, to a lesser degree, in Mexico and Denmark.
Fund holdings that were detractors from performance included SunEdison, Inc. (information technology; United States), Circassia Pharmaceuticals (health care; United Kingdom), and Credit Suisse Group AG (financials; Switzerland). The Fund purchased SunEdison, one of the world’s largest and most geographically diverse low-cost renewable energy developers, after the stock price had fallen significantly – presenting what Fund management considered an attractive risk/reward. The reversal of low debt costs in the energy market that resulted from widening high-yield spreads challenged SunEdison’s growth rate. Ultimately, the company filed for bankruptcy. The Fund exited its position during the period. Circassia Pharmaceuticals’ share price declined sharply following the release of phase III clinical trial data related to an immunotherapy treatment for cat allergies. The trials did not show the treatment to be effective. Credit Suisse, a global investment bank and wealth manager, is a high-quality banking system whose stock price fell after a large fourth-quarter net loss. Declining interest rates around most of the world compounded the bank’s underperformance.
Turning to the positive, Fund holdings that were top individual contributors during the year included S&P Global, Inc., an American financial information and analytics corporation in the financials sector; Internet software and services provider Alphabet (the parent company of Google; information technology); and Keyence Corporation (a Japanese developer and manufacturer of factory automation solutions such as automation sensors, vision systems and barcode readers; information technology). S&P Global’s second-quarter 2016 results exceeded most expectations, largely driven by the performance of its ratings group. Shares of Alphabet rebounded in the third quarter of 2016 after falling in the second quarter. The company also posted strong second-quarter results. Keyence reported strong operating results at the close of April for their fiscal third quarter.
Subadviser outlook
Our thematic, long-term, investment style leads us towards quality businesses with sustainability of both enterprise and advantaged position. The Fund seeks to buy these at prices that do not fully reflect what Fund management estimates to be their future value. We are committed to having a portfolio that is diversified across a range of businesses across industries and geographies that are the source of opportunity and stability. We seek to invested in businesses that connect the world – physically and virtually; businesses that connect savers with investors and lenders; businesses that cure intractable diseases and make it more affordable and rational; and businesses that allow people to spend their hard-earned money on things that give them pleasure and on daily necessities. Our perspective is that this should be a fund for all seasons.
53
MassMutual Premier Global Fund – Portfolio Manager Report (Unaudited) (Continued)
| | | | |
MassMutual Premier
Global Fund
Largest Holdings (% of Net Assets) on 9/30/16 | |
| | |
S&P Global, Inc. | | | 3.7 | % |
Aetna, Inc. | | | 2.9 | % |
Colgate-Palmolive Co. | | | 2.6 | % |
Alphabet, Inc. Class C | | | 2.6 | % |
Alphabet, Inc. Class A | | | 2.6 | % |
Murata Manufacturing Co. Ltd. | | | 2.5 | % |
SAP SE | | | 2.5 | % |
Facebook, Inc. Class A | | | 2.4 | % |
Airbus Group SE | | | 2.4 | % |
Citigroup, Inc. | | | 2.3 | % |
| | | | | |
| | | | 26.5 | % |
| | | | | |
| | | | |
MassMutual Premier
Global Fund
Sector Table
(% of Net Assets) on 9/30/16 | |
| | |
Consumer, Non-cyclical | | | 25.4 | % |
Industrial | | | 18.3 | % |
Financial | | | 16.7 | % |
Communications | | | 15.6 | % |
Consumer, Cyclical | | | 9.6 | % |
Technology | | | 8.6 | % |
Mutual Funds | | | 5.2 | % |
Diversified | | | 2.1 | % |
Energy | | | 1.6 | % |
Basic Materials | | | 1.0 | % |
| | | | | |
Total Long-Term Investments | | | 104.1 | % |
Short-Term Investments and Other Assets and Liabilities | | | (4.1 | )% |
| | | | | |
Net Assets | | | 100.0 | % |
| | | | | |
54
MassMutual Premier Global Fund – Portfolio Manager Report (Unaudited) (Continued)
Growth of a $10,000 Investment
Hypothetical Investments in MassMutual Premier Global Fund Class R5, Service Class, Administrative Class, Class A, Class A (sales load deducted), Class R3, and the MSCI ACWI.
| | | | | | | | | | | | |
| | | | |
| TOTAL RETURN | | One Year
10/1/15 -
9/30/16 | | | Five Year
Average Annual
10/1/11 -
9/30/16 | | | Ten Year
Average
Annual
10/1/06 -
9/30/16 | |
| Class R5 | | | 5.37% | | | | 11.57% | | | | 5.05% | |
| Service Class | | | 5.28% | | | | 11.46% | | | | 4.92% | |
| Administrative Class | | | 5.15% | | | | 11.32% | | | | 4.80% | |
| Class A | | | 4.85% | | | | 11.02% | | | | 4.51% | |
| Class A (sales load deducted)* | | | -1.18% | | | | 9.71% | | | | 3.89% | |
| Class R3 | | | 4.78% | | | | 10.91% | | | | 4.40% | |
| MSCI ACWI | | | 11.96% | | | | 10.63% | | | | 4.34% | |
Hypothetical Investments in MassMutual Premier Global Fund Class I, Class R4, and the MSCI ACWI.
| | | | | | | | |
| | | |
| TOTAL RETURN | | One Year
10/1/15 -
9/30/16 | | | Since
Inception
Average
Annual
4/1/14 -
9/30/16 | |
| Class I | | | 5.50% | | | | 2.08% | |
| Class R4 | | | 5.05% | | | | 1.62% | |
| MSCI ACWI | | | 11.96% | | | | 2.83% | |
GROWTH OF $10,000 INVESTMENT FOR THE PAST 10 YEARS
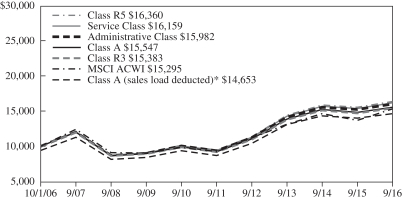
GROWTH OF $10,000 INVESTMENT SINCE INCEPTION

* Class A (sales load deducted) returns include the 5.75% maximum sales charge.
Performance data quoted represents past performance; past performance is not predictive of future results. The investment return and principal value of shares of the Fund will fluctuate with market conditions so that shares of the Fund, when redeemed, may be worth more or less than their original cost. Current performance of the Fund may be lower or higher than the performance quoted. Performance data current to the most recent month-end may be obtained by calling 1-888-309-3539.
Investors should note that the Fund is a professionally managed mutual fund, while the MSCI ACWI is unmanaged, does not incur expenses, and cannot be purchased directly by investors. Investors should read the Fund’s prospectus with regard to the Fund’s investment objective, risks, and charges and expenses in conjunction with these financial statements. Employee retirement benefit plans that invest plan assets in the Separate Investment Accounts (SIAs) may be subject to certain charges as set forth in their respective Plan Documents. Total return figures would be lower for the periods presented if they reflected these charges. The performance tables and charts do not reflect the deduction of taxes that a shareholder would pay on the Fund distributions or the redemption of the Fund shares.
55
MassMutual Premier International Equity Fund – Portfolio Manager Report (Unaudited)
What is the investment approach of MassMutual Premier International Equity Fund, and who is the Fund’s subadviser?
The Fund seeks to achieve long-term capital appreciation by investing primarily in common stock of foreign companies. Under normal circumstances, the Fund invests at least 80% of its net assets (plus the amount of any borrowings for investment purposes) in securities of foreign companies. The Fund’s subadviser is OFI Global Institutional, Inc. (OFI Global).
How did the Fund perform during the 12 months ended September 30, 2016?
The Fund’s Class R5 shares returned 8.83%, trailing the 9.26% return of the MSCI All Country World Index (ACWI) ex USA (the “benchmark”), an unmanaged index representative of stocks domiciled in global developed and emerging markets, excluding the United States.
For a discussion on the economic and market environment during the 12-month period ended September 30, 2016, please see the Economic and Market Overview, beginning on page 3.
Subadviser discussion of factors that contributed to the Fund’s performance
For the year ended September 30, 2016, the Fund underperformed the benchmark within the consumer discretionary and materials sectors – largely due to stock selection – and in the energy sector as the result of an underweight position, relative to the benchmark. Conversely, the Fund benefited primarily from an underweight position in the financials sector, and stock selection within the health care and consumer staples sectors. On a country basis, the largest underperformer for the Fund was the United Kingdom (U.K.), where stock selection and an overweight position detracted from performance. The Fund also underperformed on a relative basis in Brazil and China, due to underweight positions and stock selection. On the other hand, stock selection in France, Switzerland, and Japan proved positive for the Fund’s relative performance for the year.
Fund holdings that were the top individual detractors from full-year performance included U.K.-based stocks Essentra (materials), Travis Perkins (industrials), and Inmarsat (telecommunication services). Essentra – an international supplier of specialty plastic packaging for health and personal care products, fiber filters, and protective components for industrial equipment – guided revenue and earnings expectations lower after losing a large filter customer. Travis Perkins is a leader in the builders’ merchant and home improvement markets, and one of the U.K.’s largest product suppliers to the construction market. The stock sold off in the wake of the Brexit vote, which authorized the U.K.’s departure from the European Union. Inmarsat, a provider of global mobile satellite communications services, saw its share price fall in May 2016 after reporting a decrease in profit and revenue guidance, which it attributed to ongoing volatility in oil prices and weak conditions in the commercial shipping market.
On the positive side, Fund holdings that helped to drive performance included information technology stocks Infineon Technologies AG (Germany) and Keyence Corporation (Japan) – and consumer staples stock Saputo, Inc. (Canada). Infineon Technologies is a leading producer of automobile-related semiconductor chips, transistors and radio devices. During the reporting period, the company made an acquisition that was viewed favorably by investors. Keyence, the world’s leading supplier of sensors and vison equipment for factory automation, announced earnings results that drove up the stock price. Saputo, a dairy processor that is one of the world’s largest producers of mozzarella cheese, announced better-than-expected fourth-quarter 2015 results in early February 2016, despite a generally weak environment for the prices of milk and cheese.
Subadviser outlook
This fiscal year has been relatively volatile for stock prices and equity market indexes so far. As we enter the fourth quarter of 2016, which tends to be, from a historical perspective, more choppy than smooth, we expect more volatility. However, as long-term investors, we will continue to seek companies that are operating in secular growth areas of the global economy – including those that have strong and sustainable pricing power and financial strength – should periods of market volatility give the Fund the opportunity to acquire shares in those companies at attractive prices.
56
MassMutual Premier International Equity Fund – Portfolio Manager Report (Unaudited) (Continued)
| | | | |
MassMutual Premier
International Equity Fund
Largest Holdings
(% of Net Assets) on 9/30/16 | |
| | |
Infineon Technologies AG | | | 2.1 | % |
Dollarama, Inc. | | | 2.0 | % |
Nippon Telegraph & Telephone Corp. | | | 1.7 | % |
Valeo SA | | | 1.7 | % |
Continental AG | | | 1.6 | % |
Nidec Corp. | | | 1.5 | % |
Amadeus IT Group SA | | | 1.4 | % |
SEB SA | | | 1.4 | % |
Keyence Corp. | | | 1.4 | % |
Hero Honda Motors Ltd. | | | 1.3 | % |
| | | | | |
| | | | 16.1 | % |
| | | | | |
| | | | |
MassMutual Premier
International Equity Fund
Sector Table
(% of Net Assets) on 9/30/16 | |
| | |
Consumer, Non-cyclical | | | 28.6 | % |
Consumer, Cyclical | | | 22.3 | % |
Industrial | | | 18.1 | % |
Communications | | | 11.9 | % |
Technology | | | 9.4 | % |
Mutual Funds | | | 4.0 | % |
Basic Materials | | | 3.4 | % |
Financial | | | 3.1 | % |
Diversified | | | 0.9 | % |
Energy | | | 0.7 | % |
| | | | | |
Total Long-Term Investments | | | 102.4 | % |
Short-Term Investments and Other Assets and Liabilities | | | (2.4 | )% |
| | | | | |
Net Assets | | | 100.0 | % |
| | | | | |
57
MassMutual Premier International Equity Fund – Portfolio Manager Report (Unaudited) (Continued)
Growth of a $10,000 Investment
Hypothetical Investments in MassMutual Premier International Equity Fund Class R5, Service Class, Administrative Class, Class A, Class A (sales load deducted), and the MSCI ACWI ex USA.
| | | | | | | | | | | | |
| | | | |
| TOTAL RETURN | | One Year
10/1/15 -
9/30/16 | | | Five Year
Average
Annual
10/1/11 -
9/30/16 | | | Ten Year
Average
Annual
10/1/06 -
9/30/16 | |
| Class R5 | | | 8.83% | | | | 9.60% | | | | 5.02% | |
| Service Class | | | 8.66% | | | | 9.53% | | | | 4.97% | |
| Administrative Class | | | 8.59% | | | | 9.40% | | | | 4.83% | |
| Class A | | | 8.25% | | | | 9.12% | | | | 4.57% | |
| Class A (sales load deducted)* | | | 2.02% | | | | 7.84% | | | | 3.95% | |
| MSCI ACWI ex USA | | | 9.26% | | | | 6.04% | | | | 2.16% | |
Hypothetical Investments in MassMutual Premier International Equity Fund Class I, Class R4, Class R3, and the MSCI ACWI ex USA.
| | | | | | | | |
| | | |
| TOTAL RETURN | | One Year
10/1/15 -
9/30/16 | | | Since
Inception
Average
Annual
4/1/14 -
9/30/16 | |
| Class I | | | 8.86% | | | | -0.72% | |
| Class R4 | | | 8.42% | | | | -1.18% | |
| Class R3 | | | 8.24% | | | | -1.40% | |
| MSCI ACWI ex USA | | | 9.26% | | | | -1.83% | |
GROWTH OF $10,000 INVESTMENT FOR THE PAST 10 YEARS
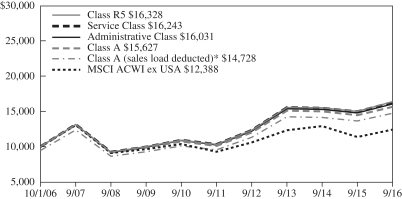
GROWTH OF $10,000 INVESTMENT SINCE INCEPTION
* Class A (sales load deducted) returns include the 5.75% maximum sales charge.
Performance data quoted represents past performance; past performance is not predictive of future results. The investment return and principal value of shares of the Fund will fluctuate with market conditions so that shares of the Fund, when redeemed, may be worth more or less than their original cost. Current performance of the Fund may be lower or higher than the performance quoted. Performance data current to the most recent month-end may be obtained by calling 1-888-309-3539.
Investors should note that the Fund is a professionally managed mutual fund, while the MSCI ACWI ex USA is unmanaged, does not incur expenses, and cannot be purchased directly by investors. Investors should read the Fund's prospectus with regard to the Fund's investment objective, risks, and charges and expenses in conjunction with these financial statements. Employee retirement benefit plans that invest plan assets in the Separate Investment Accounts (SIAs) may be subject to certain charges as set forth in their respective Plan Documents. Total return figures would be lower for the periods presented if they reflected these charges. The performance tables and charts do not reflect the deduction of taxes that a shareholder would pay on the Fund distributions or the redemption of the Fund shares.
58
MassMutual Premier Strategic Emerging Markets Fund – Portfolio Manager Report (Unaudited)
What is the investment approach of MassMutual Premier Strategic Emerging Markets Fund, and who is the Fund’s subadviser?
The Fund seeks long-term capital growth by investing mainly in common stocks of issuers in developing and emerging markets throughout the world and at times, up to 100% of its total assets in foreign securities. Under normal market conditions, the Fund will invest at least 80% of its net assets (plus the amount of any borrowings for investment purposes) in equity securities of issuers whose principal activities are in a developing (or emerging) market, i.e., are in a developing market or are economically tied to a developing market country. The Fund will invest in at least three developing markets. In general, countries may be considered developing or emerging markets if they are included in any one of the Morgan Stanley Capital Index (“MSCI”) emerging markets indices, classified as a developing or emerging market, or classified under a similar or corresponding classification, by organizations such as the World Bank and the International Monetary Fund, or have economies, industries, and stock markets with similar characteristics. The Fund’s subadviser is OFI Global Institutional, Inc. (OFI Global).
How did the Fund perform during the 12 months ended September 30, 2016?
The Fund’s Class R5 shares returned 18.22%, outperforming the 16.78% return of the MSCI Emerging Markets Index (the “benchmark”), an unmanaged market capitalization-weighted index of equity securities of companies domiciled in various countries. The Index is designed to represent the performance of emerging stock markets throughout the world and excludes certain market segments unavailable to U.S.-based investors.
For a discussion on the economic and market environment during the 12-month period ended September 30, 2016, please see the Economic and Market Overview, beginning on page 3.
Subadviser discussion of factors that contributed to the Fund’s performance
Stock selection in the consumer discretionary sector largely drove the Fund’s outperformance versus the benchmark for the year ended September 30, 2016. Also contributing positively to performance were stock selection in the information technology and materials sectors, along with an underweight position, relative to the benchmark, in telecommunication services. The Fund underperformed the benchmark within consumer staples due to weaker relative stock selection. Stock selection, and an overweight position in health care, also detracted from relative performance, as did an underweight position in energy. On a country basis, the largest outperformer versus the benchmark was stock selection in China. An overweight position in the United States and an underweight position in Poland also contributed positively to relative performance. The Fund underperformed the benchmark in India, due to stock selection and an overweight position there.
Fund holdings that contributed positively to full-year performance included information technology stocks Tencent Holdings Ltd. (China); Alibaba Group Holding Ltd. (China); and Taiwan Semiconductor Manufacturing Co., Ltd. (Taiwan). Tencent Holdings is one of China’s leading internet companies. The stock’s performance was in part driven by better-than-expected results. Alibaba, the largest e-commerce operator in China, saw its shares rally after reporting strong quarterly earnings in August 2016. The company enjoys formidable competitive advantages in its marketplace. Taiwan Semiconductor Manufacturing is the largest semiconductor foundry, with a 50% share of global revenues. The stock rallied on investor optimism surrounding stronger-than-expected inventory restocking.
Fund holdings that were detractors from performance included JD.com, Inc. (consumer discretionary; China); Embraer (industrials; Brazil); and Dr. Reddy’s Laboratories (health care; India). JD.com is the second-largest e-commerce operator in China. The stock was weak during the year, as investor concerns centered on slowing growth and the company’s ability to compete effectively against Alibaba. Our extensive research led Fund management to doubt JD.com’s potential to disrupt Alibaba’s dominance, and the Fund exited its position during the period. Embraer, the Brazilian aircraft manufacturer, struggled primarily on the back of weaker demand in both its commercial and corporate jet businesses. Finally, Dr. Reddy’s Laboratories is an Indian pharmaceutical company with exposure to a host of therapies, including cardiovascular, oncology, and pain. Revenues declined due to the lack of meaningful drug approvals and price erosion.
59
MassMutual Premier Strategic Emerging Markets Fund – Portfolio Manager Report (Unaudited) (Continued)
Subadviser outlook
In our view, emerging markets have the potential to outperform developed markets in the near term. We believe that the interest rate environment, the recovery in commodity prices, the broad stabilization in developing economies and corporate earnings all appear supportive. Our belief is that emerging markets should not be viewed as a tactical trading opportunity: rather, they have evolved from peripheral to essential investments. Emerging markets now represent a meaningful portion of global gross domestic product (GDP) and are the largest contributors to global growth. (GDP reflects the total value of goods and services produced.) Additionally, emerging markets have grown from 10% of world market capitalization in 2005 to 25% at the end of 2015.
The Fund’s approach to investing and the positioning of the Fund remain unchanged. The Fund has exposure to sectors and industries where Fund management believes there is dynamic change and real value is being extracted, including e-commerce, cloud computing, internet services, health care, travel and education.
60
MassMutual Premier Strategic Emerging Markets Fund – Portfolio Manager Report (Unaudited) (Continued)
| | | | |
MassMutual Premier
Strategic Emerging Markets Fund
Largest Holdings
(% of Net Assets) on 9/30/16 | |
| | |
Tencent Holdings Ltd. | | | 5.4 | % |
Alibaba Group Holding Ltd. Sponsored ADR (Cayman Islands) | | | 5.0 | % |
Housing Development Finance Corp. | | | 4.9 | % |
Taiwan Semiconductor Manufacturing Co. Ltd. | | | 4.0 | % |
Baidu, Inc. Sponsored ADR (Cayman Islands) | | | 3.8 | % |
Magnit OJSC | | | 3.2 | % |
NovaTek OAO Sponsored GDR (Russia) | | | 2.6 | % |
AIA Group Ltd. | | | 2.5 | % |
Lojas Americanas SA 0.670% | | | 2.5 | % |
Infosys Technologies Ltd. | | | 2.3 | % |
| | | | | |
| | | | 36.2 | % |
| | | | | |
| | | | |
MassMutual Premier
Strategic Emerging Markets Fund
Sector Table
(% of Net Assets) on 9/30/16 | |
| | |
Financial | | | 23.0 | % |
Communications | | | 19.5 | % |
Consumer, Non-cyclical | | | 17.1 | % |
Consumer, Cyclical | | | 14.8 | % |
Technology | | | 7.9 | % |
Industrial | | | 4.0 | % |
Diversified | | | 2.9 | % |
Energy | | | 2.6 | % |
Basic Materials | | | 1.9 | % |
Mutual Funds | | | 0.9 | % |
| | | | | |
Total Long-Term Investments | | | 94.6 | % |
Short-Term Investments and Other Assets and Liabilities | | | 5.4 | % |
| | | | | |
Net Assets | | | 100.0 | % |
| | | | | |
61
MassMutual Premier Strategic Emerging Markets Fund – Portfolio Manager Report (Unaudited) (Continued)
Growth of a $10,000 Investment
Hypothetical Investments in MassMutual Premier Strategic Emerging Markets Fund Class R5, Service Class, Administrative Class, Class A, Class A (sales load deducted), and the MSCI Emerging Markets Index.
| | | | | | | | | | | | |
| | | | |
| TOTAL RETURN | | One Year
10/1/15 -
9/30/16 | | | Five Year
Average
Annual
10/1/11 -
9/30/16 | | | Since
Inception
Average
Annual
11/3/08 -
9/30/16 | |
| Class R5 | | | 18.22% | | | | 1.02% | | | | 6.73% | |
| Service Class | | | 18.14% | | | | 0.94% | | | | 6.64% | |
| Administrative Class | | | 18.02% | | | | 0.80% | | | | 6.50% | |
| Class A | | | 17.68% | | | | 0.55% | | | | 6.22% | |
| Class A (sales load deducted)* | | | 10.91% | | | | -0.63% | | | | 5.43% | |
| MSCI Emerging Markets Index | | | 16.78% | | | | 3.03% | | | | 8.59% | |
Hypothetical Investments in MassMutual Premier Strategic Emerging Markets Fund Class I and the MSCI Emerging Markets Index.
| | | | | | | | | | | | |
| | | | |
| TOTAL RETURN | | One Year
10/1/15 -
9/30/16 | | | Five Year
Average
Annual
10/1/11 -
9/30/16 | | | Since
Inception
Average
Annual
3/1/11 -
9/30/16 | |
| Class I | | | 18.47% | | | | 1.19% | | | | -2.98% | |
| MSCI Emerging Markets Index | | | 16.78% | | | | 3.03% | | | | -1.08% | |
GROWTH OF $10,000 INVESTMENT SINCE INCEPTION
* Class A (sales load deducted) returns include the 5.75% maximum sales charge.
Performance data quoted represents past performance; past performance is not predictive of future results. The investment return and principal value of shares of the Fund will fluctuate with market conditions so that shares of the Fund, when redeemed, may be worth more or less than their original cost. Current performance of the Fund may be lower or higher than the performance quoted. Performance data current to the most recent month-end may be obtained by calling 1-888-309-3539.
Investors should note that the Fund is a professionally managed mutual fund, while the MSCI Emerging Markets Index is unmanaged, does not incur expenses, and cannot be purchased directly by investors. Investors should read the Fund's prospectus with regard to the Fund's investment objective, risks, and charges and expenses in conjunction with these financial statements. Employee retirement benefit plans that invest plan assets in the Separate Investment Accounts (SIAs) may be subject to certain charges as set forth in their respective Plan Documents. Total return figures would be lower for the periods presented if they reflected these charges. The performance tables and charts do not reflect the deduction of taxes that a shareholder would pay on the Fund distributions or the redemption of the Fund shares.
62
MassMutual Premier Strategic Emerging Markets Fund – Portfolio Manager Report (Unaudited) (Continued)
Growth of a $10,000 Investment
Hypothetical Investments in MassMutual Premier Strategic Emerging Markets Fund Class R4, Class R3, and the MSCI Emerging Markets Index.
| | | | | | | | |
| | | |
| TOTAL RETURN | | One Year
10/1/15 -
9/30/16 | | | Since
Inception
Average
Annual
4/1/14 -
9/30/16 | |
| Class R4 | | | 17.87% | | | | -2.69% | |
| Class R3 | | | 17.53% | | | | -2.93% | |
| MSCI Emerging Markets Index | | | 16.78% | | | | -1.22% | |
GROWTH OF $10,000 INVESTMENT SINCE INCEPTION
Performance data quoted represents past performance; past performance is not predictive of future results. The investment return and principal value of shares of the Fund will fluctuate with market conditions so that shares of the Fund, when redeemed, may be worth more or less than their original cost. Current performance of the Fund may be lower or higher than the performance quoted. Performance data current to the most recent month-end may be obtained by calling 1-888-309-3539.
Investors should note that the Fund is a professionally managed mutual fund, while the MSCI Emerging Markets Index is unmanaged, does not incur expenses, and cannot be purchased directly by investors. Investors should read the Fund's prospectus with regard to the Fund's investment objective, risks, and charges and expenses in conjunction with these financial statements. Employee retirement benefit plans that invest plan assets in the Separate Investment Accounts (SIAs) may be subject to certain charges as set forth in their respective Plan Documents. Total return figures would be lower for the periods presented if they reflected these charges. The performance tables and charts do not reflect the deduction of taxes that a shareholder would pay on the Fund distributions or the redemption of the Fund shares.
63
MassMutual Premier U.S. Government Money Market Fund – Portfolio of Investments
September 30, 2016
| | | | | | | | |
| | | Principal
Amount | | | Value | |
| SHORT-TERM INVESTMENTS — 102.4% | |
| Discount Notes — 88.8% | |
Federal Farm Credit Bank
0.557% 6/29/17 | | $ | 13,000,000 | | | $ | 12,999,973 | |
Federal Farm Credit Banks
0.553% 6/05/17 | | | 2,500,000 | | | | 2,500,008 | |
Federal Farm Credit Banks
0.581% 4/17/17 | | | 1,217,000 | | | | 1,217,200 | |
Federal Home Loan Bank
0.510% 11/16/16 | | | 10,000,000 | | | | 10,001,674 | |
Federal Home Loan Bank
0.518% 10/05/16 | | | 5,000,000 | | | | 5,000,086 | |
Federal Home Loan Bank
0.531% 3/17/17 | | | 2,250,000 | | | | 2,249,744 | |
Federal Home Loan Bank
0.538% 3/10/17 | | | 25,000,000 | | | | 25,000,235 | |
Federal Home Loan Bank
0.563% 9/05/17 | | | 10,000,000 | | | | 10,005,664 | |
Federal Home Loan Bank
0.574% 6/28/17 | | | 21,400,000 | | | | 21,404,910 | |
Federal Home Loan Bank
0.575% 10/26/16 | | | 10,000,000 | | | | 10,001,132 | |
Federal Home Loan Bank
0.602% 9/01/17 | | | 12,000,000 | | | | 12,007,605 | |
Federal Home Loan Bank
0.652% 2/23/17 | | | 22,450,000 | | | | 22,461,925 | |
Federal Home Loan Bank
0.672% 2/10/17 | | | 1,000,000 | | | | 1,000,332 | |
Federal Home Loan Bank
0.728% 2/08/17 | | | 3,050,000 | | | | 3,051,546 | |
Federal Home Loan Bank
0.803% 3/23/17 | | | 2,500,000 | | | | 2,501,838 | |
Federal Home Loan Bank
0.806% 3/22/17 | | | 3,000,000 | | | | 3,002,231 | |
Federal Home Loan Bank Discount Notes
0.203% 10/12/16 | | | 1,400,000 | | | | 1,399,914 | |
Federal Home Loan Bank Discount Notes
0.244% 10/05/16 | | | 1,500,000 | | | | 1,499,960 | |
Federal Home Loan Bank Discount Notes
0.264% 10/28/16 | | | 1,500,000 | | | | 1,499,707 | |
Federal Home Loan Bank Discount Notes
0.284% 10/28/16 | | | 6,500,000 | | | | 6,498,635 | |
Federal Home Loan Bank Discount Notes
0.289% 10/06/16 | | | 2,600,000 | | | | 2,599,897 | |
Federal Home Loan Bank Discount Notes
0.294% 10/12/16 | | | 2,700,000 | | | | 2,699,761 | |
| | | | | | | | |
| | | Principal
Amount | | | Value | |
Federal Home Loan Bank Discount Notes
0.294% 10/13/16 | | $ | 2,400,000 | | | $ | 2,399,768 | |
Federal Home Loan Bank Discount Notes
0.294% 10/14/16 | | | 2,800,000 | | | | 2,799,707 | |
Federal Home Loan Bank Discount Notes
0.294% 10/25/16 | | | 7,500,000 | | | | 7,498,550 | |
Federal Home Loan Bank Discount Notes
0.299% 10/26/16 | | | 1,750,000 | | | | 1,749,641 | |
Federal Home Loan Bank Discount Notes
0.304% 10/13/16 | | | 1,300,000 | | | | 1,299,870 | |
Federal Home Loan Bank Discount Notes
0.345% 11/25/16 | | | 2,925,000 | | | | 2,923,481 | |
Federal Home Loan Bank Discount Notes
0.365% 10/05/16 | | | 1,000,000 | | | | 999,960 | |
Federal Home Loan Bank Discount Notes
0.410% 10/19/16 | | | 4,000,000 | | | | 3,999,180 | |
Federal Home Loan Bank Discount Notes
0.416% 1/23/17 | | | 1,500,000 | | | | 1,498,052 | |
Federal Home Loan Bank Discount Notes
0.420% 11/02/16 | | | 10,000,000 | | | | 9,996,178 | |
Federal Home Loan Bank Discount Notes
0.420% 12/16/16 | | | 2,500,000 | | | | 2,497,783 | |
Federal Home Loan Bank Discount Notes
0.420% 12/23/16 | | | 1,839,000 | | | | 1,837,219 | |
Federal Home Loan Bank Discount Notes
0.420% 12/28/16 | | | 6,000,000 | | | | 5,993,840 | |
Federal Home Loan Bank Discount Notes
0.430% 10/04/16 | | | 700,000 | | | | 699,975 | |
Federal Home Loan Bank Discount Notes
0.430% 12/28/16 | | | 4,154,000 | | | | 4,149,634 | |
Federal Home Loan Bank Discount Notes
0.442% 1/06/17 | | | 4,000,000 | | | | 3,995,312 | |
Federal Home Loan Bank Discount Notes
0.450% 10/05/16 | | | 2,800,000 | | | | 2,799,860 | |
The accompanying notes are an integral part of the financial statements.
64
MassMutual Premier U.S. Government Money Market Fund – Portfolio of Investments (Continued)
| | | | | | | | |
| | | Principal
Amount | | | Value | |
Federal Home Loan Bank Discount Notes
0.457% 2/03/17 | | $ | 10,000,000 | | | $ | 9,984,375 | |
Federal Home Loan Bank Discount Notes
0.460% 10/03/16 | | | 1,800,000 | | | | 1,799,954 | |
Federal Home Loan Bank Discount Notes
0.460% 10/07/16 | | | 5,000,000 | | | | 4,999,617 | |
Federal Home Loan Bank Discount Notes
0.462% 2/03/17 | | | 1,400,000 | | | | 1,397,788 | |
Federal Home Loan Bank Discount Notes
0.468% 2/03/17 | | | 15,000,000 | | | | 14,976,042 | |
Federal Home Loan Bank Discount Notes
0.493% 3/08/17 | | | 10,000,000 | | | | 9,978,714 | |
Federal Home Loan Bank Discount Notes
0.500% 3/30/17 | | | 1,390,000 | | | | 1,386,525 | |
Federal Home Loan Bank Discount Notes
0.570% 11/02/16 | | | 2,000,000 | | | | 1,998,987 | |
Federal Home Loan Bank Discount Notes
0.580% 2/21/17 | | | 5,000,000 | | | | 4,988,481 | |
Federal Home Loan Mortgage Corp.
0.400% 10/17/16 | | | 3,100,000 | | | | 3,099,449 | |
Federal Home Loan Mortgage Corp.
0.408% 10/17/16 | | | 3,400,000 | | | | 3,399,383 | |
Federal Home Loan Mortgage Corp.
0.437% 3/27/17 | | | 5,000,000 | | | | 4,989,429 | |
Federal Home Loan Mortgage Corp.
0.560% 1/03/17 | | | 300,000 | | | | 299,561 | |
Federal National Mortgage Association
0.445% 1/03/17 | | | 5,000,000 | | | | 4,994,190 | |
Federal National Mortgage Association
0.450% 11/14/16 | | | 10,000,000 | | | | 9,994,500 | |
Federal National Mortgage Association
0.560% 11/23/16 | | | 1,400,000 | | | | 1,398,846 | |
| | | | | | | | |
| | | | | | | 297,427,828 | |
| | | | | | | | |
| Repurchase Agreement — 12.4% | |
HSBC Securities (USA) Inc. Tri-Party Repurchase Agreement, dated 9/30/16, 0.450%, due 10/03/16 (a) | | | 41,500,000 | | | | 41,500,000 | |
| | | | | | | | |
| | | | | | | | |
| | | Principal
Amount | | | Value | |
| Time Deposit — 0.0% | |
Euro Time Deposit
0.010% 10/03/16 | | $ | 76,745 | | | $ | 76,745 | |
| | | | | | | | |
| U.S. Government Obligation — 1.2% | |
U.S. Treasury Note,
0.875%, due 11/30/16 | | | 3,900,000 | | | | 3,901,572 | |
| | | | | | | | |
| | |
TOTAL SHORT-TERM INVESTMENTS
(Cost $342,906,145) | | | | | | | 342,906,145 | |
| | | | | | | | |
| | |
| TOTAL INVESTMENTS — 102.4% (Cost $342,906,145) (b) | | | | | | | 342,906,145 | |
| | |
| Other Assets/(Liabilities) — (2.4)% | | | | | | | (8,185,901 | ) |
| | | | | | | | |
| | |
| NET ASSETS — 100.0% | | | | | | $ | 334,720,244 | |
| | | | | | | | |
Notes to Portfolio of Investments
Percentages are stated as a percent of net assets.
| (a) | Maturity value of $41,501,556. Collateralized by U.S. Government Agency obligations with a rate of 1.250%, maturity date of 7/15/20, and an aggregate market value, including accrued interest, of $42,334,863. |
| (b) | See Note 6 for aggregate cost for federal tax purposes. |
The accompanying notes are an integral part of the financial statements.
65
MassMutual Premier Short-Duration Bond Fund – Portfolio of Investments
September 30, 2016
| | | | | | | | |
| | | Principal
Amount | | | Value | |
| BONDS & NOTES — 99.9% | |
|
| CORPORATE DEBT — 46.2% | |
| Aerospace & Defense — 1.0% | |
Harris Corp.
1.999% 4/27/18 | | $ | 2,800,000 | | | $ | 2,815,921 | |
L-3 Communications Corp.
5.200% 10/15/19 | | | 2,510,000 | | | | 2,748,422 | |
| | | | | | | | |
| | | | | | | 5,564,343 | |
| | | | | | | | |
| Agriculture — 1.4% | |
Bunge Ltd. Finance Corp.
3.200% 6/15/17 | | | 4,895,000 | | | | 4,958,234 | |
Imperial Brands Finance PLC (a)
2.950% 7/21/20 | | | 2,878,000 | | | | 2,971,440 | |
| | | | | | | | |
| | | | | | | 7,929,674 | |
| | | | | | | | |
| Airlines — 0.4% | |
American Airlines Pass-Through Trust, Series 2014-1, Class B
4.375% 4/01/24 | | | 99,427 | | | | 101,037 | |
WestJet Airlines Ltd. (a)
3.500% 6/16/21 | | | 1,885,000 | | | | 1,931,722 | |
| | | | | | | | |
| | | | | | | 2,032,759 | |
| | | | | | | | |
| Auto Manufacturers — 1.8% | |
Ford Motor Credit Co. LLC
2.240% 6/15/18 | | | 2,780,000 | | | | 2,802,198 | |
General Motors Co.
3.500% 10/02/18 | | | 395,000 | | | | 407,186 | |
General Motors Financial Co., Inc.
2.400% 5/09/19 | | | 760,000 | | | | 764,285 | |
General Motors Financial Co., Inc.
3.100% 1/15/19 | | | 905,000 | | | | 922,492 | |
General Motors Financial Co., Inc.
3.200% 7/13/20 | | | 705,000 | | | | 721,883 | |
Hyundai Capital America (a)
2.400% 10/30/18 | | | 2,350,000 | | | | 2,382,642 | |
Hyundai Capital America (a)
2.550% 2/06/19 | | | 485,000 | | | | 493,423 | |
Nissan Motor Acceptance Corp. (a)
1.900% 9/14/21 | | | 1,415,000 | | | | 1,411,171 | |
| | | | | | | | |
| | | | | | | 9,905,280 | |
| | | | | | | | |
| Automotive & Parts — 1.0% | |
The Goodyear Tire & Rubber Co.
5.125% 11/15/23 | | | 2,660,000 | | | | 2,773,050 | |
Lear Corp.
4.750% 1/15/23 | | | 2,700,000 | | | | 2,804,625 | |
| | | | | | | | |
| | | | | | | 5,577,675 | |
| | | | | | | | |
| Banks — 4.2% | |
ANZ New Zealand Int’l Ltd. (a)
2.250% 2/01/19 | | | 2,765,000 | | | | 2,799,297 | |
| | | | | | | | |
| | | Principal
Amount | | | Value | |
Bancolombia SA
5.950% 6/03/21 | | $ | 1,215,000 | | | $ | 1,340,692 | |
CIT Group, Inc.
4.250% 8/15/17 | | | 2,760,000 | | | | 2,811,750 | |
Citigroup, Inc.
2.350% 8/02/21 | | | 2,600,000 | | | | 2,610,117 | |
First Horizon National Corp.
3.500% 12/15/20 | | | 3,120,000 | | | | 3,184,437 | |
The Goldman Sachs Group, Inc.
2.750% 9/15/20 | | | 2,750,000 | | | | 2,816,897 | |
Itau Unibanco Holding SA (a)
2.850% 5/26/18 | | | 840,000 | | | | 842,100 | |
Macquarie Bank Ltd. (a)
2.850% 1/15/21 | | | 380,000 | | | | 391,412 | |
Mitsubishi UFJ Trust & Banking Corp. (a)
2.650% 10/19/20 | | | 2,830,000 | | | | 2,898,016 | |
Regions Financial Corp.
3.200% 2/08/21 | | | 530,000 | | | | 550,966 | |
Regions Financial Corp.
7.500% 5/15/18 | | | 340,000 | | | | 369,986 | |
Sumitomo Mitsui Financial Group, Inc.
2.058% 7/14/21 | | | 1,440,000 | | | | 1,428,261 | |
SVB Financial Group
5.375% 9/15/20 | | | 225,000 | | | | 250,079 | |
Turkiye Garanti Bankasi AS (a)
4.750% 10/17/19 | | | 1,290,000 | | | | 1,299,778 | |
| | | | | | | | |
| | | | | | | 23,593,788 | |
| | | | | | | | |
| Beverages — 0.9% | |
Anheuser-Busch InBev Finance, Inc.
2.650% 2/01/21 | | | 1,735,000 | | | | 1,790,340 | |
Coca-Cola Femsa SAB de CV
2.375% 11/26/18 | | | 2,272,000 | | | | 2,311,119 | |
Molson Coors Brewing Co.
2.100% 7/15/21 | | | 660,000 | | | | 666,074 | |
| | | | | | | | |
| | | | | | | 4,767,533 | |
| | | | | | | | |
| Biotechnology — 0.5% | |
Celgene Corp.
2.250% 5/15/19 | | | 270,000 | | | | 274,585 | |
Celgene Corp.
2.875% 8/15/20 | | | 2,650,000 | | | | 2,741,380 | |
| | | | | | | | |
| | | | | | | 3,015,965 | |
| | | | | | | | |
| Building Materials — 1.1% | |
Holcim US Finance Sarl & Cie SCS (a)
6.000% 12/30/19 | | | 2,399,000 | | | | 2,680,580 | |
Martin Marietta Material, Inc. 3 mo. USD LIBOR + 1.100%, FRN
1.938% 6/30/17 | | | 585,000 | | | | 586,417 | |
Masco Corp.
3.500% 4/01/21 | | | 830,000 | | | | 859,050 | |
The accompanying notes are an integral part of the financial statements.
66
MassMutual Premier Short-Duration Bond Fund – Portfolio of Investments (Continued)
| | | | | | | | |
| | | Principal
Amount | | | Value | |
Masco Corp.
7.125% 3/15/20 | | $ | 1,750,000 | | | $ | 2,012,500 | |
| | | | | | | | |
| | | | | | | 6,138,547 | |
| | | | | | | | |
| Chemicals — 2.1% | |
Airgas, Inc.
3.050% 8/01/20 | | | 2,705,000 | | | | 2,807,179 | |
CF Industries, Inc.
6.875% 5/01/18 | | | 2,820,000 | | | | 3,033,474 | |
Ecolab, Inc.
2.000% 1/14/19 | | | 1,425,000 | | | | 1,441,543 | |
LyondellBasell Industries NV
5.000% 4/15/19 | | | 2,567,000 | | | | 2,755,117 | |
RPM International, Inc.
6.125% 10/15/19 | | | 952,000 | | | | 1,061,566 | |
RPM International, Inc.
6.500% 2/15/18 | | | 395,000 | | | | 418,956 | |
| | | | | | | | |
| | | | | | | 11,517,835 | |
| | | | | | | | |
| Commercial Services — 1.4% | |
Leidos Holdings, Inc.
4.450% 12/01/20 | | | 2,301,000 | | | | 2,392,350 | |
S&P Global, Inc.
3.300% 8/14/20 | | | 2,050,000 | | | | 2,151,946 | |
The Western Union Co.
5.930% 10/01/16 | | | 3,050,000 | | | | 3,050,000 | |
| | | | | | | | |
| | | | | | | 7,594,296 | |
| | | | | | | | |
| Computers — 0.4% | |
Diamond 1 Finance Corp./Diamond 2 Finance Corp. (a)
3.480% 6/01/19 | | | 1,305,000 | | | | 1,342,153 | |
Diamond 1 Finance Corp./Diamond 2 Finance Corp. (a)
4.420% 6/15/21 | | | 720,000 | | | | 752,487 | |
| | | | | | | | |
| | | | | | | 2,094,640 | |
| | | | | | | | |
| Diversified Financial — 5.3% | |
AerCap Ireland Capital Ltd./AerCap Global Aviation Trust
3.950% 2/01/22 | | | 1,520,000 | | | | 1,558,000 | |
AerCap Ireland Capital Ltd./AerCap Global Aviation Trust
4.500% 5/15/21 | | | 2,050,000 | | | | 2,144,812 | |
Air Lease Corp.
2.125% 1/15/18 | | | 2,200,000 | | | | 2,211,000 | |
Air Lease Corp.
3.375% 1/15/19 | | | 1,075,000 | | | | 1,104,154 | |
Air Lease Corp.
5.625% 4/01/17 | | | 190,000 | | | | 193,240 | |
Ally Financial, Inc.
3.600% 5/21/18 | | | 1,285,000 | | | | 1,304,275 | |
Ally Financial, Inc.
4.750% 9/10/18 | | | 2,020,000 | | | | 2,090,700 | |
| | | | | | | | |
| | | Principal
Amount | | | Value | |
BGC Partners, Inc. (a)
5.125% 5/27/21 | | $ | 1,865,000 | | | $ | 1,952,933 | |
The Goldman Sachs Group, Inc.
2.875% 2/25/21 | | | 2,720,000 | | | | 2,789,749 | |
Icahn Enterprises LP/Icahn Enterprises Finance Corp.
3.500% 3/15/17 | | | 2,730,000 | | | | 2,733,276 | |
International Lease Finance Corp.
3.875% 4/15/18 | | | 1,745,000 | | | | 1,786,444 | |
Lazard Group LLC
4.250% 11/14/20 | | | 1,510,000 | | | | 1,619,008 | |
Lazard Group LLC
6.850% 6/15/17 | | | 104,000 | | | | 107,303 | |
Merrill Lynch & Co., Inc.
5.700% 5/02/17 | | | 3,100,000 | | | | 3,172,648 | |
Morgan Stanley
4.750% 3/22/17 | | | 4,500,000 | | | | 4,574,106 | |
| | | | | | | | |
| | | | | | | 29,341,648 | |
| | | | | | | | |
| Electric — 2.1% | |
Ameren Corp.
2.700% 11/15/20 | | | 1,165,000 | | | | 1,201,140 | |
EDP Finance BV (a)
4.125% 1/15/20 | | | 2,460,000 | | | | 2,549,790 | |
EDP Finance BV (a)
4.900% 10/01/19 | | | 343,000 | | | | 364,544 | |
Entergy Texas, Inc.
2.550% 6/01/21 | | | 325,000 | | | | 334,261 | |
Entergy Texas, Inc.
7.125% 2/01/19 | | | 1,780,000 | | | | 1,996,783 | |
IPALCO Enterprises, Inc.
5.000% 5/01/18 | | | 900,000 | | | | 938,250 | |
Israel Electric Corp. Ltd. (a)
7.250% 1/15/19 | | | 1,185,000 | | | | 1,315,350 | |
Majapahit Holding BV (a)
7.750% 1/20/20 | | | 1,160,000 | | | | 1,334,000 | |
The Southern Co.
1.850% 7/01/19 | | | 465,000 | | | | 468,657 | |
The Southern Co.
2.350% 7/01/21 | | | 1,040,000 | | | | 1,059,863 | |
Tri-State Generation & Transmission Association, Series 2003, Class A (a)
6.040% 1/31/18 | | | 104,496 | | | | 105,628 | |
| | | | | | | | |
| | | | | | | 11,668,266 | |
| | | | | | | | |
| Electronics — 0.2% | |
FLIR Systems, Inc.
3.125% 6/15/21 | | | 650,000 | | | | 670,885 | |
Jabil Circuit, Inc.
8.250% 3/15/18 | | | 255,000 | | | | 277,619 | |
| | | | | | | | |
| | | | | | | 948,504 | |
| | | | | | | | |
| Engineering & Construction — 0.1% | |
SBA Tower Trust (a)
3.598% 4/15/43 | | | 440,000 | | | | 441,475 | |
| | | | | | | | |
The accompanying notes are an integral part of the financial statements.
67
MassMutual Premier Short-Duration Bond Fund – Portfolio of Investments (Continued)
| | | | | | | | |
| | | Principal
Amount | | | Value | |
| Environmental Controls — 0.3% | |
Clean Harbors, Inc.
5.250% 8/01/20 | | $ | 1,400,000 | | | $ | 1,438,500 | |
| | | | | | | | |
| Foods — 0.1% | |
JBS Investments GmbH (a)
7.750% 10/28/20 | | | 634,000 | | | | 664,115 | |
Tyson Foods, Inc.
2.650% 8/15/19 | | | 180,000 | | | | 184,571 | |
| | | | | | | | |
| | | | | | | 848,686 | |
| | | | | | | | |
| Forest Products & Paper — 0.5% | |
Sappi Papier Holding GmbH (a)
7.750% 7/15/17 | | | 2,750,000 | | | | 2,811,875 | |
| | | | | | | | |
| Hand & Machine Tools — 0.3% | |
Stanley Black & Decker, Inc.
2.451% 11/17/18 | | | 1,890,000 | | | | 1,930,985 | |
| | | | | | | | |
| Health Care – Products — 0.4% | |
Boston Scientific Corp.
2.850% 5/15/20 | | | 785,000 | | | | 809,043 | |
Zimmer Biomet Holdings, Inc.
2.000% 4/01/18 | | | 1,213,000 | | | | 1,221,106 | |
| | | | | | | | |
| | | | | | | 2,030,149 | |
| | | | | | | | |
| Health Care – Services — 2.1% | |
Aetna, Inc.
1.900% 6/07/19 | | | 1,720,000 | | | | 1,735,783 | |
Cigna Corp.
4.000% 2/15/22 | | | 971,000 | | | | 1,055,663 | |
Cigna Corp.
4.500% 3/15/21 | | | 1,705,000 | | | | 1,870,073 | |
HCA, Inc.
3.750% 3/15/19 | | | 2,730,000 | | | | 2,822,138 | |
Laboratory Corp. of America Holdings
2.625% 2/01/20 | | | 1,400,000 | | | | 1,426,453 | |
UnitedHealth Group, Inc.
1.700% 2/15/19 | | | 3,000,000 | | | | 3,019,944 | |
| | | | | | | | |
| | | | | | | 11,930,054 | |
| | | | | | | | |
| Home Builders — 0.5% | |
Lennar Corp.
4.500% 11/15/19 | | | 2,653,000 | | | | 2,795,599 | |
| | | | | | | | |
| Housewares — 0.3% | |
Newell Brands, Inc.
2.600% 3/29/19 | | | 1,820,000 | | | | 1,860,841 | |
| | | | | | | | |
| Insurance — 2.3% | |
American International Group, Inc.
3.300% 3/01/21 | | | 1,450,000 | | | | 1,521,339 | |
CNA Financial Corp.
5.750% 8/15/21 | | | 301,000 | | | | 347,008 | |
Lincoln National Corp.
6.250% 2/15/20 | | | 1,290,000 | | | | 1,451,798 | |
Reinsurance Group of America, Inc.
5.625% 3/15/17 | | | 1,365,000 | | | | 1,389,515 | |
| | | | | | | | |
| | | Principal
Amount | | | Value | |
TIAA Asset Management Finance Co. LLC (a)
2.950% 11/01/19 | | $ | 2,700,000 | | | $ | 2,782,053 | |
Trinity Acquisition PLC
3.500% 9/15/21 | | | 1,480,000 | | | | 1,542,564 | |
Unum Group
3.000% 5/15/21 | | | 480,000 | | | | 490,775 | |
Willis North America, Inc.
6.200% 3/28/17 | | | 585,000 | | | | 597,745 | |
Willis Towers Watson PLC
5.750% 3/15/21 | | | 840,000 | | | | 945,991 | |
XLIT Ltd.
5.750% 10/01/21 | | | 1,335,000 | | | | 1,528,124 | |
| | | | | | | | |
| | | | | | | 12,596,912 | |
| | | | | | | | |
| Internet — 0.5% | |
Expedia, Inc.
7.456% 8/15/18 | | | 2,535,000 | | | | 2,791,433 | |
| | | | | | | | |
| Investment Companies — 0.5% | |
Ares Capital Corp.
3.875% 1/15/20 | | | 1,450,000 | | | | 1,499,704 | |
FS Investment Corp.
4.000% 7/15/19 | | | 1,040,000 | | | | 1,057,803 | |
| | | | | | | | |
| | | | | | | 2,557,507 | |
| | | | | | | | |
| Iron & Steel — 0.1% | |
Reliance Steel & Aluminum Co.
6.200% 11/15/16 | | | 499,000 | | | | 501,180 | |
| | | | | | | | |
| Leisure Time — 0.6% | |
Brunswick Corp. (a)
4.625% 5/15/21 | | | 3,069,000 | | | | 3,153,397 | |
| | | | | | | | |
| Lodging — 0.4% | |
Marriott International, Inc.
2.300% 1/15/22 | | | 410,000 | | | | 413,458 | |
Marriott International, Inc.
2.875% 3/01/21 | | | 1,845,000 | | | | 1,913,948 | |
| | | | | | | | |
| | | | | | | 2,327,406 | |
| | | | | | | | |
| Machinery – Diversified — 0.4% | |
CNH Industrial Capital LLC
3.375% 7/15/19 | | | 1,104,000 | | | | 1,123,320 | |
CNH Industrial Capital LLC
3.625% 4/15/18 | | | 265,000 | | | | 268,313 | |
CNH Industrial Capital LLC
4.875% 4/01/21 | | | 590,000 | | | | 626,875 | |
CNH Industrial Capital LLC
6.250% 11/01/16 | | | 510,000 | | | | 511,530 | |
| | | | | | | | |
| | | | | | | 2,530,038 | |
| | | | | | | | |
| Manufacturing — 0.3% | |
Tyco Electronics Group SA
6.550% 10/01/17 | | | 1,461,000 | | | | 1,535,038 | |
| | | | | | | | |
The accompanying notes are an integral part of the financial statements.
68
MassMutual Premier Short-Duration Bond Fund – Portfolio of Investments (Continued)
| | | | | | | | |
| | | Principal
Amount | | | Value | |
| Media — 1.2% | |
Charter Communications Operating LLC/Charter Communications Operating Capital (a)
3.579% 7/23/20 | | $ | 1,845,000 | | | $ | 1,928,391 | |
Sirius XM Radio, Inc. (a)
4.250% 5/15/20 | | | 1,450,000 | | | | 1,479,000 | |
Sirius XM Radio, Inc. (a)
5.750% 8/01/21 | | | 1,400,000 | | | | 1,465,800 | |
Viacom, Inc.
2.250% 2/04/22 | | | 175,000 | | | | 174,181 | |
Viacom, Inc.
6.125% 10/05/17 | | | 1,780,000 | | | | 1,858,391 | |
| | | | | | | | |
| | | | | | | 6,905,763 | |
| | | | | | | | |
| Mining — 0.5% | |
Glencore Canada Corp.
5.500% 6/15/17 | | | 2,271,000 | | | | 2,322,097 | |
Glencore Finance Canada STEP (a)
2.700% 10/25/17 | | | 530,000 | | | | 530,795 | |
| | | | | | | | |
| | | | | | | 2,852,892 | |
| | | | | | | | |
| Office Equipment/Supplies — 0.7% | |
Pitney Bowes, Inc.
3.375% 10/01/21 | | | 3,675,000 | | | | 3,673,232 | |
Pitney Bowes, Inc.
5.750% 9/15/17 | | | 74,000 | | | | 76,788 | |
| | | | | | | | |
| | | | | | | 3,750,020 | |
| | | | | | | | |
| Packaging & Containers — 0.5% | |
Graphic Packaging International, Inc.
4.750% 4/15/21 | | | 2,590,000 | | | | 2,764,825 | |
| | | | | | | | |
| Pharmaceuticals — 2.8% | |
AbbVie, Inc.
1.800% 5/14/18 | | | 2,590,000 | | | | 2,600,580 | |
Actavis Funding SCS Co.
2.350% 3/12/18 | | | 1,580,000 | | | | 1,596,291 | |
Baxalta, Inc.
2.000% 6/22/18 | | | 1,525,000 | | | | 1,528,776 | |
Express Scripts Holding Co.
3.300% 2/25/21 | | | 2,685,000 | | | | 2,821,817 | |
Mylan NV (a)
2.500% 6/07/19 | | | 1,260,000 | | | | 1,271,190 | |
Mylan NV (a)
3.150% 6/15/21 | | | 2,200,000 | | | | 2,241,303 | |
Shire Acquisitions Investments Ireland DAC
2.400% 9/23/21 | | | 735,000 | | | | 735,925 | |
Teva Pharmaceutical Finance Netherlands III BV
2.200% 7/21/21 | | | 2,825,000 | | | | 2,814,347 | |
| | | | | | | | |
| | | | | | | 15,610,229 | |
| | | | | | | | |
| | | | | | | | |
| | | Principal
Amount | | | Value | |
| Pipelines — 0.2% | |
Boardwalk Pipelines LP
5.875% 11/15/16 | | $ | 1,100,000 | | | $ | 1,105,100 | |
| | | | | | | | |
| Real Estate Investment Trusts (REITS) — 2.1% | |
American Tower Corp.
2.250% 1/15/22 | | | 465,000 | | | | 464,051 | |
American Tower Corp.
3.300% 2/15/21 | | | 1,105,000 | | | | 1,155,149 | |
American Tower Corp.
4.500% 1/15/18 | | | 850,000 | | | | 881,590 | |
Crown Castle International Corp.
3.400% 2/15/21 | | | 1,869,000 | | | | 1,955,991 | |
DDR Corp.
7.500% 7/15/18 | | | 2,400,000 | | | | 2,628,982 | |
Digital Realty Trust LP
3.400% 10/01/20 | | | 925,000 | | | | 963,995 | |
Duke Realty LP
8.250% 8/15/19 | | | 550,000 | | | | 643,155 | |
HCP, Inc.
6.000% 1/30/17 | | | 1,450,000 | | | | 1,470,738 | |
Highwoods Realty LP
5.850% 3/15/17 | | | 710,000 | | | | 722,759 | |
Highwoods Realty LP
7.500% 4/15/18 | | | 170,000 | | | | 183,810 | |
Weyerhaeuser Co.
7.375% 10/01/19 | | | 510,000 | | | | 586,320 | |
| | | | | | | | |
| | | | | | | 11,656,540 | |
| | | | | | | | |
| Retail — 1.5% | |
AutoNation, Inc.
3.350% 1/15/21 | | | 735,000 | | | | 756,912 | |
CVS Health Corp.
2.125% 6/01/21 | | | 1,945,000 | | | | 1,964,742 | |
Dollar Tree, Inc.
5.750% 3/01/23 | | | 2,660,000 | | | | 2,862,825 | |
The Home Depot, Inc.
2.000% 4/01/21 | | | 1,555,000 | | | | 1,581,001 | |
QVC, Inc.
3.125% 4/01/19 | | | 1,017,000 | | | | 1,042,760 | |
| | | | | | | | |
| | | | | | | 8,208,240 | |
| | | | | | | | |
| Semiconductors — 0.6% | |
KLA-Tencor Corp.
2.375% 11/01/17 | | | 1,395,000 | | | | 1,404,458 | |
NXP BV/NXP Funding LLC (a)
4.125% 6/01/21 | | | 2,025,000 | | | | 2,169,281 | |
| | | | | | | | |
| | | | | | | 3,573,739 | |
| | | | | | | | |
| Telecommunications — 0.2% | |
Turk Telekomunikasyon AS (a)
3.750% 6/19/19 | | | 230,000 | | | | 231,242 | |
Verizon Communications, Inc.
1.750% 8/15/21 | | | 900,000 | | | | 890,159 | |
| | | | | | | | |
| | | | | | | 1,121,401 | |
| | | | | | | | |
The accompanying notes are an integral part of the financial statements.
69
MassMutual Premier Short-Duration Bond Fund – Portfolio of Investments (Continued)
| | | | | | | | |
| | | Principal
Amount | | | Value | |
| Transportation — 1.0% | |
Asciano Finance Ltd. (a)
5.000% 4/07/18 | | $ | 1,678,000 | | | $ | 1,735,622 | |
Ryder System, Inc.
2.500% 3/01/18 | | | 1,295,000 | | | | 1,311,734 | |
Ryder System, Inc.
2.550% 6/01/19 | | | 295,000 | | | | 300,819 | |
Ryder System, Inc.
2.875% 9/01/20 | | | 1,080,000 | | | | 1,105,932 | |
TTX Co. (a)
2.250% 2/01/19 | | | 925,000 | | | | 937,002 | |
| | | | | | | | |
| | | | | | | 5,391,109 | |
| | | | | | | | |
| Trucking & Leasing — 1.4% | |
Aviation Capital Group Corp. (a)
2.875% 9/17/18 | | | 3,260,000 | | | | 3,300,750 | |
GATX Corp.
2.600% 3/30/20 | | | 1,475,000 | | | | 1,494,553 | |
Penske Truck Leasing Co. LP/PTL Finance Corp. (a)
2.500% 6/15/19 | | | 1,240,000 | | | | 1,258,162 | |
Penske Truck Leasing Co. LP/PTL Finance Corp. (a)
3.050% 1/09/20 | | | 1,650,000 | | | | 1,696,594 | |
| | | | | | | | |
| | | | | | | 7,750,059 | |
| | | | | | | | |
| | |
TOTAL CORPORATE DEBT
(Cost $252,245,932) | | | | | | | 256,461,745 | |
| | | | | | | | |
|
| MUNICIPAL OBLIGATIONS — 0.1% | |
Access to Loans for Learning Student Loan Corp., Series 2004-IV, Class Note FRN
0.915% 4/25/24 | | | 216,659 | | | | 216,611 | |
Louisiana State Public Facilities Authority, Series 2011-A, Class A2 FRN
1.538% 4/26/27 | | | 251,426 | | | | 249,897 | |
| | | | | | | | |
| | | | | | | 466,508 | |
| | | | | | | | |
| | |
TOTAL MUNICIPAL OBLIGATIONS
(Cost $464,293) | | | | | | | 466,508 | |
| | | | | | | | |
|
| NON-U.S. GOVERNMENT AGENCY OBLIGATIONS — 42.7% | |
| Auto Floor Plan ABS — 0.1% | |
NCF Dealer Floorplan Master Trust, Series 2014-1A, Class A, 1 mo. LIBOR + 1.500%, FRN (a)
2.032% 10/20/20 | | | 630,000 | | | | 630,000 | |
| | | | | | | | |
| | | | | | | | |
| | | Principal
Amount | | | Value | |
| Automobile ABS — 8.2% | |
American Credit Acceptance Receivables Trust, Series 2015-2, Class A (a)
1.570% 6/12/19 | | $ | 351,543 | | | $ | 350,878 | |
American Credit Acceptance Receivables Trust, Series 2016-3, Class A (a)
1.700% 11/12/20 | | | 1,018,074 | | | | 1,017,199 | |
American Credit Acceptance Receivables Trust, Series 2015-3, Class A (a)
1.950% 9/12/19 | | | 660,057 | | | | 661,595 | |
American Credit Acceptance Receivables Trust, Series 2016-2, Class A (a)
2.220% 7/13/20 | | | 1,122,276 | | | | 1,123,815 | |
American Credit Acceptance Receivables Trust, Series 2016-1A, Class A (a)
2.370% 5/12/20 | | | 394,886 | | | | 395,005 | |
AmeriCredit Automobile Receivables Trust, Series 2014-1, Class D
2.540% 6/08/20 | | | 710,000 | | | | 719,080 | |
Avis Budget Rental Car Funding AESOP LLC, Series 2012-3A, Class A (a)
2.100% 3/20/19 | | | 600,000 | | | | 600,783 | |
Capital Automotive REIT, Series 2012-1A, Class A (a)
4.700% 7/15/42 | | | 505,465 | | | | 515,269 | |
Carfinance Capital Auto Trust, Series 2013-2A, Class C (a)
4.040% 8/15/19 | | | 760,000 | | | | 762,949 | |
CFC LLC, Series 2014-2A, Class A (a)
1.440% 11/16/20 | | | 219,497 | | | | 218,583 | |
CFC LLC, Series 2015-1A, Class A (a)
1.750% 6/15/21 | | | 405,121 | | | | 403,392 | |
Chesapeake Funding LLC, Series 2015-1A, Class B, 1 mo. LIBOR + .950%, FRN (a)
1.469% 2/07/27 | | | 400,000 | | | | 399,764 | |
CPS Auto Receivables Trust, Series 2016-C, Class B (a)
2.480% 9/15/20 | | | 710,000 | | | | 712,993 | |
CPS Auto Trust, Series 2014-B, Class A (a)
1.110% 11/15/18 | | | 195,162 | | | | 194,493 | |
CPS Auto Trust, Series 2014-C, Class A (a)
1.310% 2/15/19 | | | 261,674 | | | | 261,340 | |
CPS Auto Trust, Series 2014-D, Class A (a)
1.490% 4/15/19 | | | 177,804 | | | | 177,691 | |
CPS Auto Trust, Series 2013-D, Class A (a)
1.540% 7/16/18 | | | 50,284 | | | | 50,256 | |
CPS Auto Trust, Series 2016-C, Class A (a)
1.620% 1/15/20 | | | 659,057 | | | | 658,233 | |
The accompanying notes are an integral part of the financial statements.
70
MassMutual Premier Short-Duration Bond Fund – Portfolio of Investments (Continued)
| | | | | | | | |
| | | Principal
Amount | | | Value | |
CPS Auto Trust, Series 2013-C, Class A (a)
1.640% 4/16/18 | | $ | 15,816 | | | $ | 15,819 | |
CPS Auto Trust, Series 2013-B, Class A (a)
1.820% 9/15/20 | | | 439,723 | | | | 437,182 | |
CPS Auto Trust, Series 2015-C, Class B (a)
2.550% 2/18/20 | | | 750,000 | | | | 753,680 | |
Credit Acceptance Auto Loan Trust, Series 2014-2A, Class A (a)
1.880% 3/15/22 | | | 1,100,000 | | | | 1,100,295 | |
Credit Acceptance Auto Loan Trust, Series 2016-2A, Class A (a)
2.420% 11/15/23 | | | 900,000 | | | | 902,854 | |
Drive Auto Receivables Trust, Series 2016-BA, Class B (a)
2.560% 6/15/20 | | | 520,000 | | | | 524,179 | |
DT Auto Owner Trust, Series 2016-2A, Class A (a)
1.730% 8/15/19 | | | 371,363 | | | | 370,880 | |
DT Auto Owner Trust, Series 2016-3A, Class A (a)
1.750% 11/15/19 | | | 1,033,622 | | | | 1,034,658 | |
DT Auto Owner Trust, Series 2016-1A, Class A (a)
2.000% 9/16/19 | | | 955,573 | | | | 955,401 | |
DT Auto Owner Trust, Series 2016-1A, Class B (a)
2.790% 5/15/20 | | | 1,400,000 | | | | 1,413,026 | |
DT Auto Owner Trust, Series 2016-2A, Class B (a)
2.920% 5/15/20 | | | 730,000 | | | | 729,926 | |
Enterprise Fleet Financing LLC, Series 2016-1, Class A2 (a)
1.830% 9/20/21 | | | 1,500,000 | | | | 1,499,835 | |
Exeter Automobile Receivables Trust, Series 2014-3A, Class A (a)
1.320% 1/15/19 | | | 65,779 | | | | 65,684 | |
Exeter Automobile Receivables Trust, Series 2015-2A, Class A (a)
1.540% 11/15/19 | | | 270,252 | | | | 269,312 | |
Exeter Automobile Receivables Trust, Series 2015-1A, Class A (a)
1.600% 6/17/19 | | | 234,128 | | | | 234,262 | |
Exeter Automobile Receivables Trust, Series 2015-3A, Class A (a)
2.000% 3/16/20 | | | 476,807 | | | | 475,517 | |
Exeter Automobile Receivables Trust, Series 2013-2A, Class B (a)
3.090% 7/16/18 | | | 26,529 | | | | 26,545 | |
First Investors Auto Owner Trust, Series 2013-3A, Class A3 (a)
1.440% 10/15/19 | | | 171,141 | | | | 171,164 | |
| | | | | | | | |
| | | Principal
Amount | | | Value | |
First Investors Auto Owner Trust, Series 2015-2A, Class A1 (a)
1.590% 12/16/19 | | $ | 327,247 | | | $ | 327,342 | |
First Investors Auto Owner Trust, Series 2016-1A, Class A1 (a)
1.920% 5/15/20 | | | 935,932 | | | | 937,455 | |
Flagship Credit Auto Trust,
Series 2014-2, Class A (a)
1.430% 12/16/19 | | | 241,704 | | | | 241,028 | |
Flagship Credit Auto Trust,
Series 2013-2, Class A (a)
1.940% 1/15/19 | | | 51,317 | | | | 51,370 | |
Flagship Credit Auto Trust,
Series 2015-2, Class A (a)
1.980% 10/15/20 | | | 481,799 | | | | 480,161 | |
Flagship Credit Auto Trust,
Series 2015-3, Class A (a)
2.380% 10/15/20 | | | 1,750,231 | | | | 1,757,479 | |
Flagship Credit Auto Trust,
Series 2016-3, Class B (a)
2.430% 6/15/21 | | | 1,150,000 | | | | 1,155,634 | |
Flagship Credit Auto Trust,
Series 2016-1, Class A (a)
2.770% 12/15/20 | | | 1,138,595 | | | | 1,146,339 | |
Flagship Credit Auto Trust,
Series 2013-2, Class B (a)
3.210% 8/15/19 | | | 1,000,000 | | | | 1,006,792 | |
GLS Auto Receivables Trust, Series 2015-1A, Class A (a)
2.250% 12/15/20 | | | 230,125 | | | | 229,814 | |
GO Financial Auto Securitization Trust, Series 2015-1, Class A (a)
1.810% 3/15/18 | | | 35,815 | | | | 35,799 | |
NextGear Floorplan Master Owner Trust, Series 2016-1A, Class A1, 1 mo. LIBOR + 1.700%, FRN (a)
2.224% 4/15/21 | | | 1,250,000 | | | | 1,252,426 | |
NextGear Floorplan Master Owner Trust, Series 2015-2A, Class A (a)
2.380% 10/15/20 | | | 780,000 | | | | 776,289 | |
OneMain Direct Auto Receivables Trust, Series 2016-1A, Class A (a)
2.040% 1/15/21 | | | 585,154 | | | | 586,941 | |
Oscar US Funding Trust II, Series 2015-1A, Class A4 (a)
2.440% 6/15/22 | | | 1,020,000 | | | | 1,007,903 | |
Oscar US Funding Trust IV,
Series 2016-1A, Class A2B, 1 mo. USD LIBOR + 1.700%, FRN (a)
2.224% 7/15/20 | | | 791,841 | | | | 791,621 | |
Oscar US Funding Trust V,
Series 2016-2A, Class A1 (a)
0.900% 9/17/17 | | | 1,020,000 | | | | 1,020,000 | |
The accompanying notes are an integral part of the financial statements.
71
MassMutual Premier Short-Duration Bond Fund – Portfolio of Investments (Continued)
| | | | | | | | |
| | | Principal
Amount | | | Value | |
Oscar US Funding Trust V, Series 2016-2A, Class A2A (a)
2.310% 11/15/19 | | $ | 1,080,000 | | | $ | 1,079,866 | |
Prestige Auto Receivables Trust, Series 2015-1, Class B (a)
2.040% 4/15/21 | | | 1,000,000 | | | | 1,000,575 | |
Santander Drive Auto Receivables Trust, Series 2016-2, Class A1
0.750% 5/15/17 | | | 181,019 | | | | 181,027 | |
Santander Drive Auto Receivables Trust, Series 2016-1, Class A3
1.620% 3/16/20 | | | 600,000 | | | | 598,956 | |
Santander Drive Auto Receivables Trust, Series 2015-S2, Class R1 (a)
1.840% 11/18/19 | | | 14,258 | | | | 14,245 | |
Santander Drive Auto Receivables Trust, Series 2014-1, Class C
2.360% 4/15/20 | | | 840,000 | | | | 845,842 | |
Santander Drive Auto Receivables Trust, Series 2015-2, Class C
2.440% 4/15/21 | | | 1,700,000 | | | | 1,717,014 | |
Santander Drive Auto Receivables Trust, Series 2016-1, Class B
2.470% 12/15/20 | | | 1,100,000 | | | | 1,107,364 | |
Santander Drive Auto Receivables Trust, Series 2014-4, Class D
3.100% 11/16/20 | | | 600,000 | | | | 609,674 | |
Santander Drive Auto Receivables Trust, Series 2016-1, Class D
4.020% 4/15/22 | | | 1,740,000 | | | | 1,816,222 | |
United Auto Credit Securitization Trust, Series 2016-1, Class A (a)
2.000% 10/15/17 | | | 270,604 | | | | 270,540 | |
Westlake Automobile Receivables Trust, Series 2016-2A, Class A2 (a)
1.570% 6/17/19 | | | 1,130,000 | | | | 1,128,801 | |
Westlake Automobile Receivables Trust, Series 2016-1A, Class A2B, 1 mo. USD LIBOR + 1.050%, FRN (a)
1.574% 1/15/19 | | | 2,018,336 | | | | 2,020,997 | |
| | | | | | | | |
| | | | | | | 45,399,053 | |
| | | | | | | | |
| Commercial MBS — 4.0% | |
Banc of America Commercial Mortgage, Inc., Series 2007-3, Class A4, VRN
5.723% 6/10/49 | | | 580,569 | | | | 587,432 | |
Banc of America Commercial Mortgage, Inc., Series 2007-4, Class A4, VRN
5.938% 2/10/51 | | | 542,778 | | | | 554,573 | |
| | | | | | | | |
| | | Principal
Amount | | | Value | |
Banc of America Commercial Mortgage, Inc., Series 2007-4, Class AM, VRN
6.005% 2/10/51 | | $ | 500,000 | | | $ | 513,609 | |
Banc of America Commercial Mortgage, Inc., Series 2008-1, Class A4, VRN
6.436% 2/10/51 | | | 1,158,151 | | | | 1,202,916 | |
Bear Stearns Commercial Mortgage Securities, Series 2006-PW14, Class A4
5.201% 12/11/38 | | | 258,438 | | | | 258,722 | |
Bear Stearns Commercial Mortgage Securities, Series 2006-PW14, Class AM
5.243% 12/11/38 | | | 900,000 | | | | 901,691 | |
Bear Stearns Commercial Mortgage Securities, Series 2007-T26, Class AM, VRN
5.513% 1/12/45 | | | 1,185,000 | | | | 1,194,468 | |
Bear Stearns Commercial Mortgage Securities, Series 2006-T24, Class AM, VRN
5.568% 10/12/41 | | | 663,255 | | | | 662,823 | |
Bear Stearns Commercial Mortgage Securities, Series 2007-PW17, Class A4, VRN
5.694% 6/11/50 | | | 629,865 | | | | 646,796 | |
Bear Stearns Commercial Mortgage Securities, Series 2007-PW18, Class A4
5.700% 6/11/50 | | | 579,706 | | | | 595,162 | |
Bear Stearns Commercial Mortgage Securities, Series 2007-PW17, Class AM, VRN
5.915% 6/11/50 | | | 1,215,000 | | | | 1,242,773 | |
Commercial Mortgage Pass-Through Certificates, Series 2014-BBG, Class A, 1 mo. LIBOR + .800%, FRN (a)
1.325% 3/15/29 | | | 1,085,000 | | | | 1,076,164 | |
Commercial Mortgage Pass-Through Certificates, Series 2014-CR14, Class A2
3.147% 2/10/47 | | | 845,000 | | | | 871,001 | |
Commercial Mortgage Pass-Through Certificates, Series 2007-C9,
Class A4, VRN
6.007% 12/10/49 | | | 956,507 | | | | 977,904 | |
DBRR Trust, Series 2013-EZ3,
Class A, VRN (a)
1.636% 12/18/49 | | | 53,353 | | | | 53,334 | |
DBUBS Mortgage Trust, Series 2011-LC1A, Class A1 (a)
3.742% 11/10/46 | | | 11,685 | | | | 11,776 | |
The accompanying notes are an integral part of the financial statements.
72
MassMutual Premier Short-Duration Bond Fund – Portfolio of Investments (Continued)
| | | | | | | | |
| | | Principal
Amount | | | Value | |
GCCFC Commercial Mortgage Trust, Series 2006-GG7, Class AM, VRN
5.951% 7/10/38 | | $ | 531,134 | | | $ | 531,885 | |
JP Morgan Chase Commercial Mortgage Securities Corp., Series 2006-CB17, Class A4
5.429% 12/12/43 | | | 1,710 | | | | 1,709 | |
JP Morgan Chase Commercial Mortgage Securities Corp., Series 2007-CB20, Class AM, VRN
6.088% 2/12/51 | | | 900,000 | | | | 930,695 | |
Merrill Lynch/Countrywide Commercial Mortgage Trust, Series 2006-4,
Class AM
5.204% 12/12/49 | | | 417,066 | | | | 416,863 | |
Merrill Lynch/Countrywide Commercial Mortgage Trust, Series 2007-9,
Class A4
5.700% 9/12/49 | | | 720,956 | | | | 742,959 | |
ML-CFC Commercial Mortgage Trust, Series 2007-9, Class AM, VRN
5.856% 9/12/49 | | | 680,000 | | | | 699,445 | |
Morgan Stanley Capital I,
Series 2006-IQ12, Class AM
5.370% 12/15/43 | | | 450,000 | | | | 450,675 | |
Morgan Stanley Capital I, Series 2007-HQ11, Class AM, VRN
5.478% 2/12/44 | | | 885,000 | | | | 889,115 | |
Morgan Stanley Capital I, Series 2007-HQ11, Class AJ, VRN
5.508% 2/12/44 | | | 600,000 | | | | 590,052 | |
Morgan Stanley Capital I, Series 2007-IQ14, Class A2
5.610% 4/15/49 | | | 134,905 | | | | 134,593 | |
Morgan Stanley Capital I,
Series 2008-T29, Class A4, VRN
6.477% 1/11/43 | | | 323,784 | | | | 338,923 | |
Morgan Stanley Capital I Trust, Series 2012-C4, Class A2
2.111% 3/15/45 | | | 106,608 | | | | 106,941 | |
STRIPs Ltd., Series 2012-1A, Class A (a)
1.500% 12/25/44 | | | 32,703 | | | | 32,703 | |
TIAA Seasoned Commercial Mortgage Trust, Series 2007-C4, Class AJ, VRN
5.483% 8/15/39 | | | 95,115 | | | | 95,747 | |
Wachovia Bank Commercial Mortgage Trust, Series 2006-C29, Class AM
5.339% 11/15/48 | | | 1,300,000 | | | | 1,303,807 | |
Wachovia Bank Commercial Mortgage Trust, Series 2007-C31, Class A4
5.509% 4/15/47 | | | 1,174,454 | | | | 1,186,166 | |
| | | | | | | | |
| | | Principal
Amount | | | Value | |
Wachovia Bank Commercial Mortgage Trust, Series 2007-C33,
Class AM, VRN
6.158% 2/15/51 | | $ | 240,000 | | | $ | 245,200 | |
Wachovia Bank Commercial Mortgage Trust, Series 2006-C26,
Class AM, VRN
6.285% 6/15/45 | | | 1,200,000 | | | | 1,206,504 | |
WF-RBS Commercial Mortgage Trust, Series 2012-C10, Class A2
1.765% 12/15/45 | | | 880,000 | | | | 878,236 | |
| | | | | | | | |
| | | | | | | 22,133,362 | |
| | | | | | | | |
| Credit Card ABS — 2.6% | |
Chase Issuance Trust, Series 2014-A1, Class A1
1.150% 1/15/19 | | | 14,400,000 | | | | 14,406,218 | |
| | | | | | | | |
| Home Equity ABS — 0.9% | |
ACE Securities Corp., Series 2005-AG1, Class A1B1, 1 mo. USD LIBOR + .270%, FRN
0.795% 8/25/35 | | | 92,022 | | | | 91,950 | |
ACE Securities Corp., Series 2005-HE7, Class A2D, 1 mo. USD LIBOR + .660%, FRN
1.185% 11/25/35 | | | 170,923 | | | | 169,563 | |
ACE Securities Corp., Series 2005-HE5, Class M2, 1 mo. USD LIBOR + .735%, FRN
1.260% 8/25/35 | | | 326,236 | | | | 325,377 | |
Bear Stearns Asset-Backed Securities I Trust, Series 2006-HE3, Class A2, 1 mo. USD LIBOR + .180%, FRN
0.705% 4/25/36 | | | 1,799 | | | | 1,799 | |
Bear Stearns Asset-Backed Securities I Trust, Series 2005-HE12, Class M1, 1 mo. USD LIBOR + .480%, FRN
1.005% 12/25/35 | | | 702,909 | | | | 687,968 | |
Citigroup Mortgage Loan Trust, Series 2005-OPT4, Class M2, 1 mo. USD LIBOR + .430%, FRN
0.955% 7/25/35 | | | 49,205 | | | | 48,961 | |
Countrywide Asset-Backed Certificates, Series 2004-5, Class 3A, 1 mo. USD LIBOR + .460%, FRN
0.985% 9/25/34 | | | 83,223 | | | | 82,280 | |
Credit Suisse Seasoned Loan Trust, Series 2006-1, Class A, 1 mo. USD LIBOR + .240%, FRN (a)
0.765% 10/25/34 | | | 492,996 | | | | 490,419 | |
First Franklin Mortgage Loan Trust, Series 2005-FF6, Class M1, 1 mo. USD LIBOR + .630%, FRN
1.155% 5/25/36 | | | 152,730 | | | | 152,127 | |
The accompanying notes are an integral part of the financial statements.
73
MassMutual Premier Short-Duration Bond Fund – Portfolio of Investments (Continued)
| | | | | | | | |
| | | Principal
Amount | | | Value | |
First Franklin Mortgage Loan Trust, Series 2005-FF4, Class M1, 1 mo. USD LIBOR + .645%, FRN
1.170% 5/25/35 | | $ | 25,391 | | | $ | 25,384 | |
Fremont Home Loan Trust, Series 2005-E, Class 2A3, 1 mo. USD LIBOR + .240%, FRN
0.765% 1/25/36 | | | 82,981 | | | | 82,327 | |
GSAMP Trust, Series 2005-AHL, Class M1, 1 mo. USD LIBOR + .645%, FRN
1.170% 4/25/35 | | | 113,363 | | | | 113,448 | |
Home Equity Asset Trust, Series 2006-4, Class 2A3, 1 mo. USD LIBOR + .170%, FRN
0.695% 8/25/36 | | | 58,921 | | | | 58,923 | |
JP Morgan Mortgage Acquisition Corp., Series 2005-FRE1, Class A2V2, 1 mo. USD LIBOR + .220%, FRN
0.745% 10/25/35 | | | 386,397 | | | | 386,547 | |
Long Beach Mortgage Loan Trust, Series 2005-WL1, Class M2, 1 mo. USD LIBOR + .825%, FRN
1.350% 6/25/35 | | | 472,035 | | | | 467,919 | |
MASTR Asset-Backed Securities Trust, Series 2005-WMC1, Class M3, 1 mo. USD LIBOR + .720%, FRN
1.245% 3/25/35 | | | 676,788 | | | | 674,421 | |
New Century Home Equity Loan Trust, Series 1997-NC5, Class A6, STEP
6.620% 10/25/28 | | | 28 | | | | 28 | |
NovaStar Mortgage Funding Trust, Series 2005-3, Class A2D, 1 mo. LIBOR + .370%, FRN
0.895% 1/25/36 | | | 415,175 | | | | 412,555 | |
Park Place Securities, Inc., Series 2005-WHQ4, Class A1A, 1 mo. USD LIBOR + .260%, FRN
0.785% 9/25/35 | | | 117,315 | | | | 117,369 | |
Park Place Securities, Inc., Series 2005-WCW3, Class A2C, 1 mo. USD LIBOR + .380%, FRN
0.905% 8/25/35 | | | 6,925 | | | | 6,922 | |
Park Place Securities, Inc., Series 2005-WHQ1, Class M2, 1 mo. USD LIBOR + .750%, FRN
1.275% 3/25/35 | | | 25,654 | | | | 25,666 | |
Residential Asset Securities Corp., Series 2005-AHL3, Class A2, 1 mo. USD LIBOR + .240%, FRN
0.765% 11/25/35 | | | 344,573 | | | | 343,258 | |
Residential Asset Securities Corp., Series 2005-EMX4, Class M1, 1 mo. USD LIBOR + .430%, FRN
0.955% 11/25/35 | | | 196,962 | | | | 196,789 | |
| | | | | | | | |
| | | Principal
Amount | | | Value | |
Structured Asset Investment Loan Trust, Series 2005-7, Class A5, 1 mo. USD LIBOR + .720%, FRN
1.245% 8/25/35 | | $ | 3,001 | | | $ | 3,002 | |
| | | | | | | | |
| | | | | | | 4,965,002 | |
| | | | | | | | |
| Other ABS — 18.5% | |
321 Henderson Receivables I LLC, Series 2006-1A, Class A1, 1 mo. USD LIBOR + .200%, FRN (a)
0.724% 3/15/41 | | | 385,296 | | | | 374,528 | |
321 Henderson Receivables I LLC, Series 2006-2A, Class A1, 1 mo. USD LIBOR + .200%, FRN (a)
0.724% 6/15/41 | | | 474,693 | | | | 462,320 | |
321 Henderson Receivables I LLC, Series 2010-3A, Class A (a)
3.820% 12/15/48 | | | 854,162 | | | | 885,928 | |
AIMCO CLO Ltd., Series 2014-AA, Class A, 3 mo. USD LIBOR + 1.540%, FRN (a)
2.236% 7/20/26 | | | 1,000,000 | | | | 1,000,956 | |
ALM VII Ltd., Series 2012-7A, Class A1R, 3 mo. USD LIBOR + 1.480%, FRN (a)
2.314% 10/15/28 | | | 1,290,000 | | | | 1,290,000 | |
ALM VIII Ltd., Series 2013-8A, Class A1A, 3 mo. LIBOR + 1.450%, FRN (a)
2.146% 1/20/26 | | | 730,000 | | | | 729,993 | |
ALM VIII Ltd., Series 2013-8A, Class A1R, 3 mo. LIBOR + 1.490%, FRN (a)
2.343% 10/15/28 | | | 680,000 | | | | 680,000 | |
Alterna Funding I LLC, Series 2014-1A, Class NOTE (a)
1.639% 2/15/21 | | | 1,326,977 | | | | 1,293,803 | |
Apidos CLO XVII, Series 2014-17A, Class A1A, 3 mo. USD LIBOR + 1.500%, FRN (a)
2.179% 4/17/26 | | | 500,000 | | | | 500,012 | |
Arbys Funding LLC, Series 2015-1A, Class A2 (a)
4.969% 10/30/45 | | | 843,625 | | | | 880,534 | |
ARL First LLC, Series 2012-1A, Class A1, 1 mo. USD LIBOR + 1.750%, FRN (a)
2.274% 12/15/42 | | | 1,015,944 | | | | 985,862 | |
AVANT Loans Funding Trust, Series 2016-C, Class A (a)
2.960% 9/16/19 | | | 569,723 | | | | 569,622 | |
AVANT Loans Funding Trust, Series 2016-A, Class A (a)
4.110% 5/15/19 | | | 1,878,953 | | | | 1,886,907 | |
The accompanying notes are an integral part of the financial statements.
74
MassMutual Premier Short-Duration Bond Fund – Portfolio of Investments (Continued)
| | | | | | | | |
| | | Principal
Amount | | | Value | |
BCC Funding VIII LLC, Series 2014-1A, Class A (a)
1.794% 6/20/20 | | $ | 81,462 | | | $ | 81,156 | |
BCC Funding X LLC, Series 2015-1, Class A2 (a)
2.224% 10/20/20 | | | 944,925 | | | | 941,967 | |
BCC Funding XIII LLC, Series 2016-1, Class A1 (a)
1.100% 9/20/17 | | | 1,400,000 | | | | 1,400,013 | |
Birchwood Park CLO Ltd., Series 2014-1A, Class A, 3 mo. USD LIBOR + 1.440%, FRN (a)
2.120% 7/15/26 | | | 1,010,000 | | | | 1,010,083 | |
Blue Hill CLO Ltd., Series 2013-1A, Class A, 3 mo. USD LIBOR + 1.480%, FRN (a)
2.160% 1/15/26 | | | 2,315,000 | | | | 2,315,692 | |
BlueMountain CLO Ltd., Series 2015-2A, Class A1, 3 mo. USD LIBOR + 1.430%, FRN (a)
2.109% 7/18/27 | | | 1,475,000 | | | | 1,477,862 | |
BlueVirgo Trust, Series 2015-1A, Class NOTE (a)
3.000% 12/15/22 | | | 1,900,589 | | | | 1,920,716 | |
CAN Capital Funding LLC, Series 2014-1A, Class A (a)
3.117% 4/15/20 | | | 880,000 | | | | 872,341 | |
Carlyle Global Market Strategies, Series 2014-4A, Class A1, 3 mo. USD LIBOR + 1.500%, FRN (a)
2.180% 10/15/26 | | | 2,050,000 | | | | 2,050,344 | |
Carlyle Global Market Strategies, Series 2014-1A, Class A, 3 mo. USD LIBOR + 1.520%, FRN (a)
2.199% 4/17/25 | | | 1,520,000 | | | | 1,520,040 | |
Cazenovia Creek Funding I LLC, Series 2015-1A, Class A (a)
2.000% 12/10/23 | | | 1,045,411 | | | | 1,038,060 | |
Citi Held For Asset Issuance, Series 2015-PM1, Class A (a)
1.850% 12/15/21 | | | 67,826 | | | | 67,702 | |
Citi Held For Asset Issuance, Series 2015-PM2, Class A (a)
2.350% 3/15/22 | | | 373,112 | | | | 372,853 | |
Citi Held For Asset Issuance, Series 2015-PM3, Class A (a)
2.560% 5/16/22 | | | 176,900 | | | | 176,741 | |
Citigroup Mortgage Loan Trust, Series 2005-OPT3, Class M2, 1 mo. USD LIBOR + .675%, FRN
1.200% 5/25/35 | | | 1,242,175 | | | | 1,237,273 | |
CKE Restaurant Holdings, Inc., Series 2013-1A, Class A2 (a)
4.474% 3/20/43 | | | 1,691,288 | | | | 1,696,835 | |
| | | | | | | | |
| | | Principal
Amount | | | Value | |
Consumer Installment Loan Trust, Series 2016-LD1, Class A (a)
3.960% 7/15/22 | | $ | 653,942 | | | $ | 657,101 | |
Credit-Based Asset Servicing and Securitization LLC, Series 2006-RP2, Class A3, 1 mo. LIBOR + .300%, FRN (a)
0.825% 7/25/36 | | | 425,720 | | | | 424,176 | |
DB Master Finance LLC, Series 2015-1A, Class A2I (a)
3.262% 2/20/45 | | | 1,447,950 | | | | 1,460,667 | |
Diamond Resorts Owner Trust, Series 2013-2, Class A (a)
2.270% 5/20/26 | | | 1,243,608 | | | | 1,236,379 | |
Diamond Resorts Owner Trust, Series 2014-1, Class A (a)
2.540% 5/20/27 | | | 232,250 | | | | 232,439 | |
Diamond Resorts Owner Trust, Series 2015-1, Class A (a)
2.730% 7/20/27 | | | 378,838 | | | | 381,054 | |
Diamond Resorts Owner Trust, Series 2014-1, Class B (a)
2.980% 5/20/27 | | | 383,212 | | | | 385,165 | |
Diamond Resorts Owner Trust, Series 2015-2, Class A (a)
2.990% 5/22/28 | | | 806,153 | | | | 821,165 | |
Diamond Resorts Owner Trust, Series 2015-2, Class B (a)
3.540% 5/22/28 | | | 439,720 | | | | 446,923 | |
Domino’s Pizza Master Issuer LLC, Series 2015-1A, Class A2I (a)
3.484% 10/25/45 | | | 1,310,100 | | | | 1,321,153 | |
Domino’s Pizza Master Issuer LLC, Series 2012-1A, Class A2 (a)
5.216% 1/25/42 | | | 978,724 | | | | 1,005,052 | |
Dong Fang Container Finance II SPV Ltd., Series 2014-1A, Class A1 (a)
1.950% 11/25/39 | | | 541,667 | | | | 531,093 | |
Drug Royalty Corp., Inc., Series 2014-1, Class A1, 3 mo. USD LIBOR + 2.850%, FRN (a)
3.530% 7/15/23 | | | 528,714 | | | | 532,692 | |
Drug Royalty Corp., Inc., Series 2012-1, Class A1, 3 mo. USD LIBOR + 5.250%, FRN (a)
5.930% 7/15/24 | | | 321,769 | | | | 327,427 | |
Eaton Vance CLO, Series 2014-1A, Class A, 3 mo. USD LIBOR + 1.450%, FRN (a)
2.130% 7/15/26 | | | 1,275,000 | | | | 1,274,146 | |
Elara HGV Timeshare Issuer LLC, Series 2016-A, Class A (a)
2.810% 4/25/28 | | | 1,274,386 | | | | 1,273,837 | |
The accompanying notes are an integral part of the financial statements.
75
MassMutual Premier Short-Duration Bond Fund – Portfolio of Investments (Continued)
| | | | | | | | |
| | | Principal
Amount | | | Value | |
Elara HGV Timeshare Issuer LLC, Series 2014-A, Class B (a)
3.020% 2/25/27 | | $ | 507,148 | | | $ | 506,019 | |
Element Rail Leasing I LLC, Series 2014-1A, Class A1 (a)
2.299% 4/19/44 | | | 446,691 | | | | 437,875 | |
Element Rail Leasing II LLC, Series 2015-1A, Class A1 (a)
2.707% 2/19/45 | | | 232,160 | | | | 226,863 | |
Element Rail Leasing II LLC, Series 2016-1A, Class A1 (a)
3.968% 3/19/46 | | | 649,688 | | | | 654,480 | |
Entegry New Orleans Storm Recovery Funding I LLC, Series 2015-1, Class A
2.670% 6/01/27 | | | 291,190 | | | | 302,254 | |
FNA Trust, Series 2014-1A, Class A (a)
1.296% 12/10/22 | | | 515,035 | | | | 509,884 | |
FNA Trust, Series 2015-1, Class A (a)
3.240% 12/10/23 | | | 470,386 | | | | 469,131 | |
FRS I LLC, Series 2013-1A, Class A1 (a)
1.800% 4/15/43 | | | 187,642 | | | | 183,890 | |
Galaxy XX CLO Ltd., Series 2015-20A, Class A, 3 mo. USD LIBOR + 1.450%, FRN (a)
2.146% 7/20/27 | | | 1,475,000 | | | | 1,474,398 | |
Global SC Funding One Ltd., Series 2015-1, Class B1 (a)
2.740% 1/18/30 | | | 162,220 | | | | 159,806 | |
GoldenTree Loan Opportunities VII Ltd., Series 2013-7A, Class A, 3 mo. USD LIBOR + 1.150%, FRN (a)
1.865% 4/25/25 | | | 1,505,000 | | | | 1,497,154 | |
Green Tree Agency Advance Funding Trust I, Series 2015-T2, Class AT2 (a)
3.095% 10/15/48 | | | 1,060,000 | | | | 1,060,332 | |
Hercules Capital Funding Trust, Series 2014-1A, Class A (a)
3.524% 4/16/21 | | | 380,061 | | | | 378,873 | |
Hilton Grand Vacations Trust, Series 2014-AA, Class A (a)
1.770% 11/25/26 | | | 581,677 | | | | 575,638 | |
Hilton Grand Vacations Trust, Series 2013-A, Class A (a)
2.280% 1/25/26 | | | 462,114 | | | | 462,970 | |
Icon Brand Holdings LLC, Series 2012-1A, Class A
(Acquired 11/16/12-7/22/14,
Cost $835,409) (a) (b)
4.229% 1/25/43 | | | 403,088 | | | | 367,177 | |
Icon Brand Holdings LLC, Series 2013-1A, Class A
(Acquired 6/14/13,
Cost $433,917) (a) (b)
4.352% 1/25/43 | | | 433,917 | | | | 403,228 | |
| | | | | | | | |
| | | Principal
Amount | | | Value | |
ING Investment Management CLO Ltd., Series 2013-3A, Class A1, 3 mo. USD LIBOR + 1.450%, FRN (a)
2.129% 1/18/26 | | $ | 790,000 | | | $ | 788,880 | |
ING Investment Management CLO V Ltd., Series 2007-5A, Class A1A, 3 mo. USD LIBOR + .230%, FRN (a)
0.987% 5/01/22 | | | 405,619 | | | | 404,765 | |
LCM Ltd., Series 16A, Class A, 3 mo. USD LIBOR + 1.500%, FRN (a)
2.180% 7/15/26 | | | 1,250,000 | | | | 1,254,658 | |
LCM XI LP, Series 11A, Class A, 3 mo. USD LIBOR + 1.300%, FRN (a)
1.988% 4/19/22 | | | 3,083,775 | | | | 3,083,799 | |
LCM XIV LP, Series 14A, Class A, 3 mo. USD LIBOR + 1.150%, FRN (a)
1.830% 7/15/25 | | | 2,400,000 | | | | 2,397,190 | |
Leaf Receivables Funding LLC, Series 2016-1, Class A1 (a)
1.000% 6/15/17 | | | 1,216,375 | | | | 1,216,381 | |
Madison Park Funding XII Ltd., Series 2014-12A, Class A, 3 mo. USD LIBOR + 1.500%, FRN (a)
2.196% 7/20/26 | | | 2,175,000 | | | | 2,175,063 | |
Madison Park Funding XIV Ltd., Series 2014-14A, Class A2, 3 mo. USD LIBOR + 1.450%, FRN (a)
2.146% 7/20/26 | | | 930,000 | | | | 930,027 | |
Marlette Funding Trust, Series 2016-1A, Class A (a)
3.060% 1/17/23 | | | 1,331,655 | | | | 1,332,090 | |
Miramax LLC, Series 2014-1A,
Class A2 (a)
3.340% 7/20/26 | | | 466,760 | | | | 467,954 | |
Morgan Stanley ABS Capital I, Inc. Trust, Series 2005-WMC6, Class M2, 1 mo. USD LIBOR + .750%, FRN
1.275% 7/25/35 | | | 159,323 | | | | 160,423 | |
Morgan Stanley ABS Capital I, Inc. Trust, Series 2005-WMC4, Class M4, 1 mo. USD LIBOR + .945%, FRN
1.470% 4/25/35 | | | 610,533 | | | | 609,461 | |
MVW Owner Trust, Series 2013-1A, Class A (a)
2.150% 4/22/30 | | | 455,010 | | | | 453,050 | |
MVW Owner Trust, Series 2014-2, Class A (a)
2.250% 9/22/31 | | | 825,492 | | | | 825,859 | |
MVW Owner Trust, Series 2016-1A, Class A (a)
2.250% 12/20/33 | | | 364,608 | | | | 363,902 | |
Nations Equipment Finance Funding II LLC, Series 2014-1A, Class A (a)
1.558% 7/20/18 | | | 141,286 | | | | 141,207 | |
The accompanying notes are an integral part of the financial statements.
76
MassMutual Premier Short-Duration Bond Fund – Portfolio of Investments (Continued)
| | | | | | | | |
| | | Principal
Amount | | | Value | |
Nations Equipment Finance Funding III LLC, Series 2016-1A, Class A (a)
3.610% 2/20/21 | | $ | 996,183 | | | $ | 997,593 | |
Navitas Equipment Receivables LLC, Series 2015-1, Class A2 (a)
2.120% 11/15/18 | | | 1,011,097 | | | | 1,012,366 | |
Oak Hill Credit Partners X Ltd., Series 2014-10A, Class A, 3 mo. USD LIBOR + 1.470%, FRN (a)
2.166% 7/20/26 | | | 450,000 | | | | 450,015 | |
OHA Loan Funding Ltd., Series 2015-1A, Class A, 3 mo. USD LIBOR + 1.500%, FRN (a)
2.317% 2/15/27 | | | 1,350,000 | | | | 1,350,096 | |
OnDeck Asset Securitization Trust II LLC, Series 2016-1A, Class A (a)
4.210% 5/17/20 | | | 420,000 | | | | 419,481 | |
Orange Lake Timeshare Trust, Series 2014-AA, Class A (a)
2.290% 7/09/29 | | | 158,048 | | | | 158,948 | |
Oxford Finance Funding Trust, Series 2014-1A, Class A (a)
3.475% 12/15/22 | | | 320,000 | | | | 316,544 | |
Oxford Finance Funding Trust, Series 2016-1A, Class A (a)
3.968% 6/17/24 | | | 700,000 | | | | 703,516 | |
RAAC, Series 2006-RP2, Class A, 1 mo. USD LIBOR + .250%, FRN (a)
0.774% 2/25/37 | | | 382,669 | | | | 379,075 | |
Race Point VIII CLO Ltd., Series 2012-7A, Class A, 3 mo. USD LIBOR + 1.420%, FRN (a)
2.208% 11/08/24 | | | 550,000 | | | | 549,605 | |
Residential Asset Mortgage Products, Inc., Series 2005-EFC5, Class M1, 1 mo. USD LIBOR + .400%, FRN
0.925% 10/25/35 | | | 287,147 | | | | 286,788 | |
SBA Tower Trust, Series 2014-1A, Class C, STEP (a)
2.898% 10/15/44 | | | 1,390,000 | | | | 1,409,534 | |
Sierra Receivables Funding Co. LLC, Series 2014-2A, Class A (a)
2.050% 6/20/31 | | | 301,571 | | | | 302,147 | |
Sierra Receivables Funding Co. LLC, Series 2013-2A, Class A (a)
2.280% 11/20/25 | | | 274,253 | | | | 274,956 | |
Sierra Receivables Funding Co. LLC, Series 2014-3A, Class A (a)
2.300% 10/20/31 | | | 1,195,956 | | | | 1,196,432 | |
Sierra Receivables Funding Co. LLC, Series 2015-1A, Class A (a)
2.400% 3/22/32 | | | 1,322,688 | | | | 1,328,963 | |
| | | | | | | | |
| | | Principal
Amount | | | Value | |
Sierra Receivables Funding Co. LLC, Series 2015-3A, Class A (a)
2.580% 9/20/32 | | $ | 459,914 | | | $ | 461,711 | |
Sierra Receivables Funding Co. LLC, Series 2012-1A, Class A (a)
2.840% 11/20/28 | | | 83,621 | | | | 83,806 | |
Sierra Receivables Funding Co. LLC, Series 2015-3A, Class B (a)
3.080% 9/20/32 | | | 172,468 | | | | 172,609 | |
Sierra Receivables Funding Co. LLC, Series 2011-3A, Class A (a)
3.370% 7/20/28 | | | 52,397 | | | | 52,507 | |
Sierra Timeshare Receivables Funding LLC, Series 2016-2A, Class B (a)
2.780% 7/20/33 | | | 243,878 | | | | 243,256 | |
SoFi Consumer Loan Program LLC, Series 2016-2A, Class A (a)
3.090% 10/27/25 | | | 2,160,000 | | | | 2,170,461 | |
SoFi Consumer Loan Program LLC, Series 2016-1A, Class A (a)
3.260% 8/25/25 | | | 1,965,119 | | | | 1,974,429 | |
SpringCastle America Funding LLC, Series 2014-AA, Class A (a)
2.700% 5/25/23 | | | 1,651,160 | | | | 1,651,676 | |
SpringCastle America Funding LLC, Series 2016-AA, Class A (a)
3.050% 4/25/29 | | | 2,070,000 | | | | 2,069,921 | |
SPS Servicer Advance Receivables Trust, Series 2015-T3, Class AT3 (a)
2.920% 7/15/47 | | | 550,000 | | | | 551,264 | |
Structured Asset Securities Corp., Series 2007-BC4, Class A3, 1 mo. USD LIBOR + .250%, FRN
0.775% 11/25/37 | | | 23,760 | | | | 23,749 | |
SVO VOI Mortgage LLC, Series 2012-AA, Class A (a)
2.000% 9/20/29 | | | 674,668 | | | | 673,286 | |
Symphony CLO XV Ltd., Series 2014-15A, Class A, 3 mo. USD LIBOR + 1.450%, FRN (a)
2.129% 10/17/26 | | | 1,140,000 | | | | 1,140,018 | |
Taco Bell Funding LLC, Series 2016-1A, Class A2I (a)
3.832% 5/25/46 | | | 1,330,000 | | | | 1,351,523 | |
TAL Advantage LLC, Series 2014-2A, Class A1 (a)
1.700% 5/20/39 | | | 898,655 | | | | 886,569 | |
TCI-Symphony CLO Ltd., Series 2016-1A, Class A, 3 mo. USD LIBOR + 1.480%, FRN (a) (c)
2.399% 10/13/29 | | | 1,060,000 | | | | 1,060,000 | |
The accompanying notes are an integral part of the financial statements.
77
MassMutual Premier Short-Duration Bond Fund – Portfolio of Investments (Continued)
| | | | | | | | |
| | | Principal
Amount | | | Value | |
Trade MAPS 1 Ltd., Series 2013-1A, Class A, 1 mo. LIBOR + .700%, FRN (a)
1.218% 12/10/18 | | $ | 1,275,000 | | | $ | 1,272,918 | |
Trip Rail Master Funding LLC, Series 2011-1A, Class A1B, 1 mo. LIBOR + 2.500%, FRN (a)
3.024% 7/15/41 | | | 485,903 | | | | 479,727 | |
Trip Rail Master Funding LLC, Series 2011-1A, Class A1A (a)
4.370% 7/15/41 | | | 454,888 | | | | 459,057 | |
Voya CLO Ltd., Series 2014-2A, Class A1, 3 mo. USD LIBOR + 1.450%, FRN (a)
2.129% 7/17/26 | | | 1,220,000 | | | | 1,220,007 | |
Welk Resorts LLC, Series 2015-AA, Class A (a)
2.790% 6/16/31 | | | 384,164 | | | | 386,711 | |
Wendys Funding LLC, Series 2015-1A, Class A2I (a)
3.371% 6/15/45 | | | 3,019,500 | | | | 3,033,148 | |
Westgate Resorts LLC, Series 2014-1A, Class A (a)
2.150% 12/20/26 | | | 559,828 | | | | 552,685 | |
Westgate Resorts LLC, Series 2015-2A, Class A (a)
3.200% 7/20/28 | | | 1,047,876 | | | | 1,049,175 | |
| | | | | | | | |
| | | | | | | 102,461,565 | |
| | | | | | | | |
| Student Loans ABS — 7.1% | |
Academic Loan Funding Trust, Series 2013-1A, Class A, 1 mo. USD LIBOR + .800%, FRN (a)
1.325% 12/26/44 | | | 294,431 | | | | 289,708 | |
Access Group, Inc., Series 2004-A, Class A2, 3 mo. USD LIBOR + .260%, FRN
0.975% 4/25/29 | | | 212,865 | | | | 212,045 | |
Access Group, Inc., Series 2015-1, Class A, 1 mo. USD LIBOR + .700%, FRN (a)
1.225% 7/25/56 | | | 1,109,147 | | | | 1,084,706 | |
Access Group, Inc., Series 2003-A, Class A3, 3 mo. Treasury + 1.200%, FRN
1.515% 7/01/38 | | | 592,417 | | | | 538,372 | |
Access Group, Inc., Series 2015-1, Class B, 1 mo. USD LIBOR + 1.500%, FRN (a)
2.025% 7/25/58 | | | 430,000 | | | | 375,715 | |
CIT Education Loan Trust, Series 2005-1, Class A3, 3 mo. USD LIBOR + .120%, FRN
0.970% 3/15/26 | | | 244,392 | | | | 240,841 | |
| | | | | | | | |
| | | Principal
Amount | | | Value | |
College Loan Corp. Trust I, Series 2005-2, Class B, 3 mo. USD LIBOR + .490%, FRN
1.170% 1/15/37 | | $ | 864,547 | | | $ | 743,359 | |
Credit Suisse ABS Repackaging Trust, Series 2013-A, Class B (a)
2.500% 1/25/30 | | | 727,330 | | | | 691,021 | |
DRB Prime Student Loan Trust, Series 2015-D, Class A1, 1 mo. USD LIBOR + 1.700%, FRN (a)
2.225% 1/25/40 | | | 1,163,891 | | | | 1,136,462 | |
DRB Prime Student Loan Trust, Series 2015-A, Class A3
2.320% 4/25/30 | | | 663,106 | | | | 662,574 | |
DRB Prime Student Loan Trust, Series 2016-A, Class A1, 1 mo. USD LIBOR + 2.000%, FRN (a)
2.524% 4/25/40 | | | 788,849 | | | | 786,653 | |
DRB Prime Student Loan Trust, Series 2015-B, Class A3 (a)
2.540% 4/27/26 | | | 503,710 | | | | 500,417 | |
DRB Prime Student Loan Trust, Series 2016-B, Class A2 (a)
2.890% 6/25/40 | | | 1,126,742 | | | | 1,124,880 | |
DRB Prime Student Loan Trust, Series 2015-A, Class A2 (a)
3.060% 7/25/31 | | | 616,148 | | | | 611,368 | |
DRB Prime Student Loan Trust, Series 2015-B, Class A2 (a)
3.170% 7/25/31 | | | 743,874 | | | | 758,645 | |
DRB Prime Student Loan Trust, Series 2015-D, Class A2 (a)
3.200% 1/25/40 | | | 1,949,331 | | | | 1,991,517 | |
Earnest Student Loan Program LLC, Series 2016-B, Class A1, 1 mo. USD LIBOR + 2.050%, FRN (a)
2.575% 2/26/35 | | | 1,695,162 | | | | 1,695,161 | |
Earnest Student Loan Program LLC, Series 2016-C, Class A2 (a)
2.680% 7/25/35 | | | 2,285,232 | | | | 2,269,843 | |
ECMC Group Student Loan Trust, Series 2016-1A, Class A, 1 mo. USD LIBOR + 1.350%, FRN (a)
1.864% 7/26/66 | | | 2,310,000 | | | | 2,309,962 | |
Education Funding Capital Trust I, Series 2004-1, Class A4, 28 day ARS, FRN
1.934% 6/15/43 | | | 1,050,000 | | | | 1,045,313 | |
Education Funding Capital Trust I, Series 2004-1, Class B1, 28 day ARS, FRN
1.943% 6/15/43 | | | 100,000 | | | | 92,502 | |
The accompanying notes are an integral part of the financial statements.
78
MassMutual Premier Short-Duration Bond Fund – Portfolio of Investments (Continued)
| | | | | | | | |
| | | Principal
Amount | | | Value | |
Education Funding Capital Trust I, Series 2004-1, Class A6, 28 day ARS, FRN
1.943% 6/15/43 | | $ | 450,000 | | | $ | 437,307 | |
Kentucky Higher Education Student Loan Corp., Series 2015-1, Class A1, 1 mo. USD LIBOR + .750%, FRN
1.273% 12/01/31 | | | 726,029 | | | | 711,944 | |
KeyCorp Student Loan Trust, Series 2004-A, Class 2A2, 3 mo. USD LIBOR + .300%, FRN
1.034% 10/28/41 | | | 70,582 | | | | 70,313 | |
KeyCorp Student Loan Trust, Series 2006-A, Class 2A4, 3 mo. USD LIBOR + .310%, FRN
1.163% 9/27/35 | | | 505,346 | | | | 499,849 | |
National Collegiate Student Loan Trust, Series 2006-3, Class A3, 1 mo. USD LIBOR + .150%, FRN
0.675% 10/25/27 | | | 133,299 | | | | 133,030 | |
National Collegiate Student Loan Trust, Series 2005-1, Class A4, 1 mo. USD LIBOR + .240%, FRN
0.765% 11/27/28 | | | 338,910 | | | | 335,686 | |
Navient Private Education Loan Trust, Series 2015-BA, Class A1, 1 mo. USD LIBOR + .600%, FRN (a)
1.124% 5/15/23 | | | 155,900 | | | | 155,824 | |
Navient Private Education Loan Trust, Series 2014-AA, Class A2A (a)
2.740% 2/15/29 | | | 930,000 | | | | 946,343 | |
Navient Student Loan Trust, Series 2016-5A, Class A, 1 mo. USD LIBOR + 1.250%, FRN (a)
1.000% 6/25/65 | | | 3,337,796 | | | | 3,337,805 | |
Nelnet Student Loan Trust, Series 2013-5A, Class A, 1 mo. USD LIBOR + .630%, FRN (a)
1.155% 1/25/37 | | | 684,338 | | | | 665,585 | |
Nelnet Student Loan Trust, Series 2015-3A, Class B, 1 mo. USD LIBOR + 1.500%, FRN (a)
2.024% 7/27/50 | | | 395,000 | | | | 340,732 | |
North Carolina State Education Assistance Authority, Series 2011-2, Class A2, 3 mo. USD LIBOR + .800%, FRN
1.515% 7/25/25 | | | 619,238 | | | | 613,371 | |
North Carolina State Education Assistance Authority, Series 2011-1, Class A2, 3 mo. USD LIBOR + .900%, FRN
1.615% 1/26/26 | | | 294,985 | | | | 294,667 | |
| | | | | | | | |
| | | Principal
Amount | | | Value | |
Pennsylvania Higher Education Assistance Agency, Series 2003-1, Class A3, 28 day ARS, FRN
2.013% 7/25/42 | | $ | 250,000 | | | $ | 240,725 | |
SLC Private Student Loan Trust, Series 2006-A, Class A5, 3 mo. USD LIBOR + .170%, FRN
0.850% 7/15/36 | | | 161,726 | | | | 161,160 | |
SLC Private Student Loan Trust, Series 2006-A, Class C, 3 mo. USD LIBOR + .450%, FRN
1.130% 7/15/36 | | | 567,000 | | | | 509,850 | |
SLM Student Loan Trust, Series 2006-10, Class B, 3 mo. USD LIBOR + .220%, FRN
0.535% 3/25/44 | | | 445,559 | | | | 366,894 | |
SLM Student Loan Trust, Series 2007-5, Class A6, 3 mo. USD LIBOR + .110%, FRN
0.825% 1/26/43 | | | 480,000 | | | | 414,027 | |
SLM Student Loan Trust, Series 2003-14, Class A6, 3 mo. USD LIBOR + .300%, FRN
1.015% 7/25/25 | | | 520,000 | | | | 491,176 | |
SLM Student Loan Trust, Series 2005-8, Class B, 3 mo. USD LIBOR + .310%, FRN
1.025% 1/25/40 | | | 717,321 | | | | 612,815 | |
SLM Student Loan Trust, Series 2003-11, Class B, 3 mo. USD LIBOR + .650%, FRN
1.500% 12/15/38 | | | 567,290 | | | | 508,132 | |
SLM Student Loan Trust, Series 2012-A, Class A1, 1 mo. USD LIBOR + 1.400%, FRN (a)
1.924% 8/15/25 | | | 62,788 | | | | 62,904 | |
SLM Student Loan Trust, Series 2003-5, Class A7, 28 day ARS, FRN
3.007% 6/17/30 | | | 100,000 | | | | 100,000 | |
SMB Private Education Loan Trust, Series 2016-A, Class A1, 1 mo. USD LIBOR + .700%, FRN (a)
1.224% 5/15/23 | | | 1,896,767 | | | | 1,896,766 | |
SMB Private Education Loan Trust, Series 2016-B, Class A2B, 1 mo. USD LIBOR + 1.450%, FRN (a)
1.974% 2/17/32 | | | 480,000 | | | | 479,999 | |
SoFi Professional Loan Program LLC, Series 2016-B, Class A2A (a)
1.680% 3/25/31 | | | 1,219,218 | | | | 1,220,410 | |
SoFi Professional Loan Program LLC, Series 2016-B, Class A1, 1 mo. USD LIBOR + 1.200%, FRN (a)
1.725% 6/25/33 | | | 1,321,342 | | | | 1,321,342 | |
The accompanying notes are an integral part of the financial statements.
79
MassMutual Premier Short-Duration Bond Fund – Portfolio of Investments (Continued)
| | | | | | | | |
| | | Principal
Amount | | | Value | |
SoFi Professional Loan Program LLC, Series 2016-A, Class A1, 1 mo. USD LIBOR + 1.750%, FRN (a)
2.275% 8/25/36 | | $ | 1,186,354 | | | $ | 1,207,767 | |
SoFi Professional Loan Program LLC, Series 2016-C, Class A2B (a)
2.360% 12/27/32 | | | 280,000 | | | | 277,634 | |
SoFi Professional Loan Program LLC, Series 2016-A, Class A2 (a)
2.760% 12/26/36 | | | 1,342,504 | | | | 1,363,006 | |
SoFi Professional Loan Program LLC, Series 2014-A, Class A2 (a)
3.020% 10/25/27 | | | 241,399 | | | | 246,047 | |
| | | | | | | | |
| | | | | | | 39,184,174 | |
| | | | | | | | |
| WL Collateral CMO — 1.3% | |
Bank of America Mortgage Securities, Series 2004-G, Class 2A7, FRN
3.301% 8/25/34 | | | 85,909 | | | | 84,119 | |
Connecticut Avenue Securities, Series 2015-C02, Class 1M1, 1 mo. USD LIBOR + 1.150%, FRN
1.675% 5/25/25 | | | 351,280 | | | | 351,724 | |
Connecticut Avenue Securities, Series 2015-C03, Class 1M1, 1 mo. USD LIBOR + 1.500%, FRN
2.025% 7/25/25 | | | 1,352,001 | | | | 1,354,761 | |
Connecticut Avenue Securities, Series 2015-C04, Class 1M1, 1 mo. USD LIBOR + 1.600%, FRN
2.125% 4/25/28 | | | 1,173,909 | | | | 1,176,354 | |
Countrywide Home Loans, Inc., Series 2004-2, Class 1A1, FRN
2.954% 2/25/34 | | | 23,881 | | | | 22,958 | |
Countrywide Home Loans, Inc., Series 2003-42, Class 1A1, FRN
3.294% 9/25/33 | | | 9,384 | | | | 8,845 | |
Federal Home Loan Mortgage Corp. Structured Agency Credit Risk Debt Notes, Series 2016-HQA3, Class M1, 1 mo. USD LIBOR + .800%, FRN
1.324% 3/25/29 | | | 390,000 | | | | 390,128 | |
Federal Home Loan Mortgage Corp. Structured Agency Credit Risk Debt Notes, Series 2016-HQA3, Class M2, 1 mo. USD LIBOR + 1.350%, FRN
1.874% 3/25/29 | | | 350,000 | | | | 350,430 | |
Federal National Mortgage Association Connecticut Avenue Securities, Series 2016-C05, Class 2M1, 1 mo. USD LIBOR + 1.350%, FRN
1.875% 1/25/29 | | | 1,078,037 | | | | 1,082,286 | |
| | | | | | | | |
| | | Principal
Amount | | | Value | |
Federal National Mortgage Association Connecticut Avenue Securities, Series 2016-C04, Class 1M1, 1 mo. USD LIBOR + 1.450%, FRN
1.975% 1/25/29 | | $ | 1,218,494 | | | $ | 1,225,871 | |
GSR Mortgage Loan Trust, Series 2004-9, Class 2A1, VRN
3.285% 8/25/34 | | | 15,017 | | | | 14,721 | |
IndyMac Index Mortgage Loan Trust, Series 2004-AR4, Class 1A, VRN
2.786% 8/25/34 | | | 78,118 | | | | 69,747 | |
Merrill Lynch Mortgage Investors, Inc., Series 2005-A8, Class A3A2,
1 mo. USD LIBOR + .250%, FRN
0.775% 8/25/36 | | | 9,465 | | | | 9,437 | |
Merrill Lynch Mortgage Investors, Inc., Series 2004-A1,
Class IIA2, VRN
2.806% 2/25/34 | | | 180,987 | | | | 183,511 | |
Merrill Lynch Mortgage Investors, Inc., Series 2004-A1,
Class IA, VRN
3.032% 2/25/34 | | | 9,572 | | | | 9,458 | |
Merrill Lynch Mortgage Investors, Inc., Series 2003-A4,
Class IA, VRN
3.065% 7/25/33 | | | 5,375 | | | | 5,296 | |
Morgan Stanley Mortgage Loan Trust, Series 2004-2AR, Class 1A, FRN
2.875% 2/25/34 | | | 304 | | | | 312 | |
Structured Adjustable Rate Mortgage Loan Trust, Series 2004-2, Class 2A, VRN
3.056% 3/25/34 | | | 50,487 | | | | 50,685 | |
Structured Agency Credit Risk Debt Notes, Series 2015-DNA1, Class M1, 1 mo. USD LIBOR + .900%, FRN
1.425% 10/25/27 | | | 428,804 | | | | 429,339 | |
Structured Agency Credit Risk Debt Notes, Series 2016-DNA1, Class M1, 1 mo. USD LIBOR + 1.450%, FRN
1.975% 7/25/28 | | | 584,986 | | | | 587,563 | |
WaMu Mortgage Pass-Through Certificates, Series 2004-AR2, Class A, 12 mo. MTA + 1.400%, FRN
1.907% 4/25/44 | | | 109,639 | | | | 109,502 | |
| | | | | | | | |
| | | | | | | 7,517,047 | |
| | | | | | | | |
| WL Collateral PAC — 0.0% | |
Structured Asset Securities Corp., Series 2002-11A, Class 2A1, FRN
3.157% 6/25/32 | | | 30,617 | | | | 29,904 | |
| | | | | | | | |
| | |
TOTAL NON-U.S. GOVERNMENT AGENCY OBLIGATIONS
(Cost $237,303,836) | | | | | | | 236,726,325 | |
| | | | | | | | |
The accompanying notes are an integral part of the financial statements.
80
MassMutual Premier Short-Duration Bond Fund – Portfolio of Investments (Continued)
| | | | | | | | |
| | | Principal
Amount | | | Value | |
U.S. GOVERNMENT AGENCY OBLIGATIONS
AND INSTRUMENTALITIES — 7.0% | |
| Collateralized Mortgage Obligations — 6.6% | |
Federal Home Loan Mortgage Corp.
Series 4291, Class K
3.000% 5/15/38 | | $ | 2,293,376 | | | $ | 2,362,927 | |
Series 4447, Class PA
3.000% 12/15/44 | | | 595,125 | | | | 625,635 | |
Series 3990, Class VA
3.500% 1/15/25 | | | 1,487,701 | | | | 1,586,292 | |
Series 4213, Class VE
3.500% 6/15/26 | | | 1,423,155 | | | | 1,526,717 | |
Series 4290, Class CA
3.500% 12/15/38 | | | 3,066,981 | | | | 3,190,790 | |
Series 4443, Class BA
3.500% 4/15/41 | | | 788,863 | | | | 819,792 | |
Series 2626, Class A
4.000% 6/15/33 | | | 900,561 | | | | 980,016 | |
Series 4328, Class DA
4.000% 1/15/36 | | | 2,566,208 | | | | 2,698,625 | |
Series 4325, Class MA
4.000% 9/15/39 | | | 3,064,177 | | | | 3,214,313 | |
Series 4336, Class MA
4.000% 1/15/40 | | | 4,755,641 | | | | 4,993,764 | |
Series 4323, Class CA
4.000% 3/15/40 | | | 2,009,214 | | | | 2,144,579 | |
Federal National Mortgage Association Series 2016-74, Class GF
1.000% 10/25/46 1 mo. LIBOR + .500%, FRN | | | 2,350,000 | | | | 2,350,000 | |
Series 2016-62, Class FC
1.025% 9/25/46 1 mo. LIBOR + .500%, FRN | | | 1,993,995 | | | | 1,991,301 | |
Series 2015-58, Class JP
2.500% 3/25/37 | | | 1,075,586 | | | | 1,102,977 | |
Series 2015-20, Class EV
3.500% 7/25/26 | | | 1,597,699 | | | | 1,720,285 | |
Series 2014-14, Class A
3.500% 2/25/37 | | | 1,615,379 | | | | 1,666,920 | |
Series 2015-62, Class VA
4.000% 10/25/26 | | | 480,180 | | | | 527,196 | |
Series 2014-48, Class AB
4.000% 10/25/40 | | | 1,394,575 | | | | 1,465,696 | |
Series 2013-112, Class HQ
4.000% 11/25/43 | | | 587,644 | | | | 635,487 | |
Government National Mortgage Association, Series 2014-131, Class BW, VRN
2.977% 5/20/41 | | | 692,941 | | | | 706,301 | |
| | | | | | | | |
| | | | | | | 36,309,613 | |
| | | | | | | | |
| | | | | | | | |
| | | Principal
Amount | | | Value | |
| Pass-Through Securities — 0.4% | |
Federal Home Loan Mortgage Corp. Pool #1Q0239 1 year CMT + 2.254%, FRN 2.775%
3/01/37 | | $ | 746,123 | | | $ | 790,969 | |
Federal National Mortgage Association
Pool #725692 2.642%
10/01/33 1 year CMT + 2.144%, FRN | | | 121,093 | | | | 127,418 | |
Pool #888586 2.668%
10/01/34 1 year CMT + 2.212%, FRN | | | 228,296 | | | | 240,740 | |
Pool #775539 2.821% 5/01/34 12 mo. USD LIBOR + 1.635%, FRN | | | 77,248 | | | | 80,791 | |
Pool #684154 5.500%
2/01/18 | | | 2,522 | | | | 2,584 | |
Pool #702331 5.500%
5/01/18 | | | 46,056 | | | | 47,476 | |
Pool #725796 5.500%
9/01/19 | | | 351,929 | | | | 368,513 | |
Pool #844564 5.500%
12/01/20 | | | 86,376 | | | | 91,864 | |
Government National Mortgage Association Pool #507545 7.500%
8/15/29 | | | 31,144 | | | | 38,044 | |
Government National Mortgage Association II Pool #82462 2.000%
1/20/40 1 year
CMT + 1.500%, FRN | | | 239,513 | | | | 247,077 | |
Pool #82488 2.000% 3/20/40
1 year CMT + 1.500%, FRN | | | 310,621 | | | | 320,856 | |
| | | | | | | | |
| | | | | | | 2,356,332 | |
| | | | | | | | |
| | |
TOTAL U.S. GOVERNMENT AGENCY OBLIGATIONS AND INSTRUMENTALITIES
(Cost $38,878,121) | | | | | | | 38,665,945 | |
| | | | | | | | |
|
| U.S. TREASURY OBLIGATIONS — 3.9% | |
| U.S. Treasury Bonds & Notes — 3.9% | |
U.S. Treasury Note
0.625% 6/30/18 | | | 8,600,000 | | | | 8,581,524 | |
U.S. Treasury Note
0.750% 2/15/19 | | | 1,700,000 | | | | 1,696,626 | |
U.S. Treasury Note
0.875% 7/31/19 | | | 7,300,000 | | | | 7,301,140 | |
U.S. Treasury Note
1.250% 3/31/21 | | | 1,500,000 | | | | 1,507,922 | |
U.S. Treasury Note (d) (e)
1.750% 10/31/18 | | | 2,300,000 | | | | 2,344,383 | |
| | | | | | | | |
| | | | | | | 21,431,595 | |
| | | | | | | | |
| | |
TOTAL U.S. TREASURY OBLIGATIONS
(Cost $21,458,672) | | | | | | | 21,431,595 | |
| | | | | | | | |
The accompanying notes are an integral part of the financial statements.
81
MassMutual Premier Short-Duration Bond Fund – Portfolio of Investments (Continued)
| | | | | | | | |
| | | Principal
Amount | | | Value | |
TOTAL BONDS & NOTES
(Cost $550,350,854) | | | | | | $ | 553,752,118 | |
| | | | | | | | |
| | |
TOTAL LONG-TERM INVESTMENTS
(Cost $550,350,854) | | | | | | | 553,752,118 | |
| | | | | | | | |
|
| SHORT-TERM INVESTMENTS — 0.9% | |
| Commercial Paper — 0.9% | |
Dollar General Corp. (a)
0.600% 10/03/16 | | $ | 5,250,000 | | | | 5,249,654 | |
| | | | | | | | |
| | | | | | | 5,249,654 | |
| | | | | | | | |
| | |
TOTAL SHORT-TERM INVESTMENTS
(Cost $5,249,825) | | | | | | | 5,249,654 | |
| | | | | | | | |
| | |
TOTAL INVESTMENTS — 100.8%
(Cost $555,600,679) (f) | | | | | | | 559,001,772 | |
| | |
| Other Assets/(Liabilities) — (0.8)% | | | | | | | (4,445,310 | ) |
| | | | | | | | |
| | |
| NET ASSETS — 100.0% | | | | | | $ | 554,556,462 | |
| | | | | | | | |
Notes to Portfolio of Investments
Percentages are stated as a percent of net assets.
| CLO | Collateralized Loan Obligation |
| CMO | Collateralized Mortgage Obligation |
| CMT | Constant Maturity Treasury Index |
| MBS | Mortgage-Backed Security |
| MTA | Monthly Treasury Average Index |
| PAC | Planned Amortization Class |
| (a) | Securities exempt from registration under rule 144A of the Securities Act of 1933. These securities may be resold in transactions exempt from registration, normally to qualified institutional buyers. At September 30, 2016, these securities amounted to a value of $234,254,276 or 42.24% of net assets. |
| (b) | Restricted security. Certain securities are restricted as to resale. At September 30, 2016, these securities amounted to a value of $770,405 or 0.14% of net assets. The Fund generally bears the costs, if any, associated with the disposition of restricted securities. |
| (c) | This security is fair valued in good faith in accordance with procedures approved by the Board of Trustees. At September 30, 2016, these securities amounted to a value of $1,060,000 or 0.19% of net assets. |
| (d) | A portion of this security is held as collateral for open futures contracts. (Note 2). |
| (e) | All or a portion of this security is held as collateral for open swap agreements. (Note 2). |
| (f) | See Note 6 for aggregate cost for federal tax purposes. |
| | | | |
Country weightings, as a percentage of net assets, is as follows: | |
United States | | | 83.4 | % |
Cayman Islands | | | 6.3 | % |
Netherlands | | | 2.8 | % |
Ireland | | | 1.2 | % |
Luxembourg | | | 1.0 | % |
Canada | | | 0.9 | % |
United Kingdom | | | 0.8 | % |
Japan | | | 0.8 | % |
Austria | | | 0.6 | % |
New Zealand | | | 0.5 | % |
Mexico | | | 0.4 | % |
Australia | | | 0.4 | % |
Turkey | | | 0.3 | % |
Colombia | | | 0.2 | % |
Brazil | | | 0.2 | % |
United States Virgin Islands | | | 0.1 | % |
Bermuda | | | 0.0 | % |
| | | | |
Total Long-Term Investments | | | 99.9 | % |
Short-Term Investments and Other Assets and Liabilities | | | 0.1 | % |
| | | | |
Net Assets | | | 100.0 | % |
| | | | |
The accompanying notes are an integral part of the financial statements.
82
MassMutual Premier Inflation-Protected and Income Fund – Portfolio of Investments
September 30, 2016
| | | | | | | | |
| | | Principal
Amount | | | Value | |
| BONDS & NOTES — 151.4% | |
|
| CORPORATE DEBT — 4.1% | |
| Auto Manufacturers — 0.8% | |
General Motors Financial Co., Inc. 3 mo. USD LIBOR + 2.060%, FRN
2.740% 1/15/19 | | $ | 1,280,000 | | | $ | 1,296,756 | |
Nissan Motor Acceptance Corp. 3 mo. USD LIBOR + .550%, FRN (a)
1.385% 3/03/17 | | | 1,100,000 | | | | 1,102,097 | |
| | | | | | | | |
| | | | | | | 2,398,853 | |
| | | | | | | | |
| Banks — 0.2% | |
The Huntington National Bank 3 mo. USD LIBOR + .425%, FRN
1.140% 4/24/17 | | | 765,000 | | | | 764,538 | |
| | | | | | | | |
| Computers — 0.7% | |
Diamond 1 Finance Corp./Diamond 2 Finance Corp. (a)
3.480% 6/01/19 | | | 800,000 | | | | 822,776 | |
Hewlett-Packard Co. 3 mo. USD LIBOR + 1.930%, FRN (a)
2.784% 10/05/18 | | | 1,300,000 | | | | 1,321,861 | |
| | | | | | | | |
| | | | | | | 2,144,637 | |
| | | | | | | | |
| Diversified Financial — 1.7% | |
The Goldman Sachs Group, Inc. 3 mo. USD LIBOR + .625%, FRN
1.460% 6/04/17 | | | 1,625,000 | | | | 1,627,372 | |
The Goldman Sachs Group, Inc. 3 mo. USD LIBOR + .800%, FRN
1.650% 12/15/17 | | | 2,250,000 | | | | 2,256,876 | |
Ally Financial, Inc.
3.600% 5/21/18 | | | 1,295,000 | | | | 1,314,425 | |
| | | | | | | | |
| | | | | | | 5,198,673 | |
| | | | | | | | |
| Holding Company – Diversified — 0.3% | |
MUFG Americas Holdings Corp. 3 mo. USD LIBOR + .570%, FRN
1.362% 2/09/18 | | | 870,000 | | | | 867,017 | |
| | | | | | | | |
| Pharmaceuticals — 0.4% | |
Actavis Funding SCS 3 mo. USD LIBOR + 1.080%, FRN
1.925% 3/12/18 | | | 1,250,000 | | | | 1,259,864 | |
| | | | | | | | |
| | |
TOTAL CORPORATE DEBT
(Cost $13,148,481) | | | | | | | 12,633,582 | |
| | | | | | | | |
|
| MUNICIPAL OBLIGATIONS — 0.1% | |
Access to Loans for Learning Student Loan Corp., Series 2004-IV, Class Note FRN
0.915% 4/25/24 | | | 135,927 | | | | 135,897 | |
| | | | | | | | |
| | | Principal
Amount | | | Value | |
Louisiana State Public Facilities Authority, Series 2011-A,
Class A2 FRN
1.538% 4/26/27 | | $ | 170,969 | | | $ | 169,930 | |
| | | | | | | | |
| | | | | | | 305,827 | |
| | | | | | | | |
| | |
TOTAL MUNICIPAL OBLIGATIONS
(Cost $304,517) | | | | | | | 305,827 | |
| | | | | | | | |
|
| NON-U.S. GOVERNMENT AGENCY OBLIGATIONS —54.0% | |
| Auto Floor Plan ABS — 1.0% | |
Ally Master Owner Trust, Series 2015-2, Class A1, 1 mo. LIBOR + .570%, FRN
1.094% 1/15/21 | | | 900,000 | | | | 900,205 | |
Navistar Financial Dealer Note Master Owner Trust II, Series 2016-1,
Class A, 1 mo. LIBOR + 1.350%, FRN (a)
1.000% 9/27/21 | | | 520,000 | | | | 523,272 | |
Navistar Financial Dealer Note Master Trust, Series 2014-1, Class A, 1 mo. LIBOR + .750%, FRN (a)
1.274% 10/25/19 | | | 1,300,000 | | | | 1,300,325 | |
NCF Dealer Floorplan Master Trust, Series 2014-1A, Class A, 1 mo. LIBOR + 1.500%, FRN (a)
2.032% 10/20/20 | | | 250,000 | | | | 250,000 | |
| | | | | | | | |
| | | | | | | 2,973,802 | |
| | | | | | | | |
| Automobile ABS — 17.3% | |
American Credit Acceptance Receivables Trust, Series 2015-2, Class A (a)
1.570% 6/12/19 | | | 216,334 | | | | 215,925 | |
American Credit Acceptance Receivables Trust, Series 2016-3, Class A (a)
1.700% 11/12/20 | | | 565,597 | | | | 565,111 | |
American Credit Acceptance Receivables Trust, Series 2015-3, Class A (a)
1.950% 9/12/19 | | | 750,963 | | | | 752,713 | |
American Credit Acceptance Receivables Trust, Series 2016-2, Class A (a)
2.220% 7/13/20 | | | 1,780,163 | | | | 1,782,603 | |
American Credit Acceptance Receivables Trust, Series 2016-1A, Class A (a)
2.370% 5/12/20 | | | 235,753 | | | | 235,824 | |
ARI Fleet Lease Trust, Series 2016-A, Class A1 (a)
0.800% 3/15/17 | | | 617,926 | | | | 617,698 | |
Bank of The West Auto Trust, Series 2014-1, Class A4 (a)
1.650% 3/16/20 | | | 420,000 | | | | 422,486 | |
The accompanying notes are an integral part of the financial statements.
83
MassMutual Premier Inflation-Protected and Income Fund – Portfolio of Investments (Continued)
| | | | | | | | |
| | | Principal
Amount | | | Value | |
California Republic Auto Receivables Trust, Series 2013-2, Class A2
1.230% 3/15/19 | | $ | 109,332 | | | $ | 109,303 | |
California Republic Auto Receivables Trust, Series 2013-1, Class A2 (a)
1.410% 9/17/18 | | | 196,055 | | | | 197,284 | |
California Republic Auto Receivables Trust, Series 2015-4, Class A2 (a)
1.600% 9/17/18 | | | 1,653,445 | | | | 1,656,728 | |
CFC LLC, Series 2014-2A, Class A (a)
1.440% 11/16/20 | | | 329,245 | | | | 327,874 | |
CFC LLC, Series 2014-1A, Class A (a)
1.460% 12/17/18 | | | 15,451 | | | | 15,439 | |
CFC LLC, Series 2015-1A, Class A (a)
1.750% 6/15/21 | | | 284,002 | | | | 282,791 | |
Chesapeake Funding II LLC, Series 2016-2A, Class A2, 1 mo. USD LIBOR + 1.000%, FRN (a)
1.448% 6/15/28 | | | 1,540,000 | | | | 1,547,814 | |
Chesapeake Funding LLC, Series 2015-1A, Class B, 1 mo. LIBOR + .950%, FRN (a)
1.469% 2/07/27 | | | 260,000 | | | | 259,847 | |
CPS Auto Trust, Series 2014-B, Class A (a)
1.110% 11/15/18 | | | 130,108 | | | | 129,662 | |
CPS Auto Trust, Series 2014-A, Class A (a)
1.210% 8/15/18 | | | 33,040 | | | | 32,984 | |
CPS Auto Trust, Series 2014-C, Class A (a)
1.310% 2/15/19 | | | 166,520 | | | | 166,308 | |
CPS Auto Trust, Series 2013-A, Class A (a)
1.310% 6/15/20 | | | 194,295 | | | | 193,348 | |
CPS Auto Trust, Series 2012-D, Class A (a)
1.480% 3/16/20 | | | 93,277 | | | | 92,841 | |
CPS Auto Trust, Series 2014-D, Class A (a)
1.490% 4/15/19 | | | 1,170,544 | | | | 1,169,797 | |
CPS Auto Trust, Series 2015-A, Class A (a)
1.530% 7/15/19 | | | 206,180 | | | | 205,854 | |
CPS Auto Trust, Series 2013-D, Class A (a)
1.540% 7/16/18 | | | 48,688 | | | | 48,660 | |
CPS Auto Trust, Series 2016-C, Class A (a)
1.620% 1/15/20 | | | 366,143 | | | | 365,685 | |
CPS Auto Trust, Series 2013-C, Class A (a)
1.640% 4/16/18 | | | 10,198 | | | | 10,200 | |
| | | | | | | | |
| | | Principal
Amount | | | Value | |
CPS Auto Trust, Series 2015-B, Class A (a)
1.650% 11/15/19 | | $ | 411,858 | | | $ | 410,994 | |
CPS Auto Trust, Series 2015-C, Class A (a)
1.770% 6/17/19 | | | 319,614 | | | | 320,409 | |
CPS Auto Trust, Series 2013-B, Class A (a)
1.820% 9/15/20 | | | 238,268 | | | | 236,892 | |
CPS Auto Trust, Series 2016-B, Class A (a)
2.070% 11/15/19 | | | 407,886 | | | | 407,992 | |
CPS Auto Trust, Series 2016-A, Class A (a)
2.250% 10/15/19 | | | 384,426 | | | | 385,249 | |
CPS Auto Trust, Series 2012-C, Class A (a)
2.260% 12/16/19 | | | 91,095 | | | | 90,913 | |
CPS Auto Trust, Series 2015-C, Class B (a)
2.550% 2/18/20 | | | 450,000 | | | | 452,208 | |
Credit Acceptance Auto Loan Trust, Series 2014-2A, Class A (a)
1.880% 3/15/22 | | | 680,000 | | | | 680,182 | |
Drive Auto Receivables Trust, Series 2016-BA, Class A2 (a)
1.380% 8/15/18 | | | 1,590,633 | | | | 1,590,142 | |
Drive Auto Receivables Trust, Series 2016-BA, Class A3 (a)
1.670% 7/15/19 | | | 560,000 | | | | 559,597 | |
Drive Auto Receivables Trust, Series 2016-AA, Class A3 (a)
2.110% 5/15/19 | | | 2,200,000 | | | | 2,202,945 | |
Drive Auto Receivables Trust, Series 2016-BA, Class B (a)
2.560% 6/15/20 | | | 270,000 | | | | 272,170 | |
DT Auto Owner Trust, Series 2015-2A, Class A (a)
1.240% 9/17/18 | | | 308,374 | | | | 308,385 | |
DT Auto Owner Trust, Series 2015-3A, Class A (a)
1.660% 3/15/19 | | | 169,153 | | | | 169,249 | |
DT Auto Owner Trust, Series 2016-2A, Class A (a)
1.730% 8/15/19 | | | 431,046 | | | | 430,486 | |
DT Auto Owner Trust, Series 2016-3A, Class A (a)
1.750% 11/15/19 | | | 397,547 | | | | 397,945 | |
DT Auto Owner Trust, Series 2016-1A, Class A (a)
2.000% 9/16/19 | | | 1,146,688 | | | | 1,146,481 | |
The accompanying notes are an integral part of the financial statements.
84
MassMutual Premier Inflation-Protected and Income Fund – Portfolio of Investments (Continued)
| | | | | | | | |
| | | Principal
Amount | | | Value | |
DT Auto Owner Trust, Series 2016-1A, Class B (a)
2.790% 5/15/20 | | $ | 1,650,000 | | | $ | 1,665,352 | |
Enterprise Fleet Financing LLC, Series 2016-1, Class A1 (a)
0.800% 2/20/17 | | | 482,733 | | | | 482,409 | |
Enterprise Fleet Financing LLC, Series 2016-2, Class A1 (a)
0.850% 7/20/17 | | | 2,848,500 | | | | 2,841,214 | |
Enterprise Fleet Financing LLC, Series 2014-1, Class A2 (a)
0.870% 9/20/19 | | | 91,770 | | | | 91,676 | |
Enterprise Fleet Financing LLC, Series 2016-1, Class A2 (a)
1.830% 9/20/21 | | | 830,000 | | | | 829,908 | |
Exeter Automobile Receivables Trust, Series 2014-3A, Class A (a)
1.320% 1/15/19 | | | 37,588 | | | | 37,534 | |
Exeter Automobile Receivables Trust, Series 2015-2A, Class A (a)
1.540% 11/15/19 | | | 167,299 | | | | 166,717 | |
Exeter Automobile Receivables Trust, Series 2015-1A, Class A (a)
1.600% 6/17/19 | | | 136,220 | | | | 136,298 | |
Exeter Automobile Receivables Trust, Series 2015-3A, Class A (a)
2.000% 3/16/20 | | | 376,678 | | | | 375,658 | |
Exeter Automobile Receivables Trust, Series 2013-2A, Class B (a)
3.090% 7/16/18 | | | 26,529 | | | | 26,545 | |
First Investors Auto Owner Trust, Series 2015-1A, Class A2 (a)
1.210% 4/15/19 | | | 189,573 | | | | 189,525 | |
First Investors Auto Owner Trust, Series 2013-2A, Class A2 (a)
1.230% 3/15/19 | | | 10,055 | | | | 10,055 | |
First Investors Auto Owner Trust, Series 2015-2A, Class A1 (a)
1.590% 12/16/19 | | | 373,996 | | | | 374,105 | |
First Investors Auto Owner Trust, Series 2016-1A, Class A1 (a)
1.920% 5/15/20 | | | 835,654 | | | | 837,013 | |
Flagship Credit Auto Trust, Series 2014-1, Class A (a)
1.210% 4/15/19 | | | 76,526 | | | | 76,386 | |
Flagship Credit Auto Trust, Series 2014-2, Class A (a)
1.430% 12/16/19 | | | 134,280 | | | | 133,905 | |
Flagship Credit Auto Trust, Series 2016-3, Class A1 (a)
1.610% 12/15/19 | | | 1,049,823 | | | | 1,048,979 | |
| | | | | | | | |
| | | Principal
Amount | | | Value | |
Flagship Credit Auto Trust, Series 2015-1, Class A (a)
1.630% 6/15/20 | | $ | 314,143 | | | $ | 312,597 | |
Flagship Credit Auto Trust, Series 2013-2, Class A (a)
1.940% 1/15/19 | | | 44,144 | | | | 44,189 | |
Flagship Credit Auto Trust, Series 2015-2, Class A (a)
1.980% 10/15/20 | | | 672,278 | | | | 669,992 | |
Flagship Credit Auto Trust, Series 2015-3, Class A (a)
2.380% 10/15/20 | | | 1,254,883 | | | | 1,260,079 | |
Flagship Credit Auto Trust, Series 2016-1, Class A (a)
2.770% 12/15/20 | | | 667,976 | | | | 672,519 | |
Flagship Credit Auto Trust, Series 2013-2, Class B (a)
3.210% 8/15/19 | | | 540,000 | | | | 543,668 | |
GLS Auto Receivables Trust, Series 2015-1A, Class A (a)
2.250% 12/15/20 | | | 441,840 | | | | 441,242 | |
GO Financial Auto Securitization Trust, Series 2015-1, Class A (a)
1.810% 3/15/18 | | | 80,583 | | | | 80,547 | |
Hertz Fleet Lease Funding LP, Series 2016-1, Class A1, 1 mo. USD LIBOR + 1.100%, FRN (a)
1.618% 4/10/30 | | | 1,200,000 | | | | 1,202,806 | |
NextGear Floorplan Master Owner Trust, Series 2016-1A, Class A1, 1 mo. LIBOR + 1.700%, FRN (a)
2.224% 4/15/21 | | | 730,000 | | | | 731,417 | |
Oscar US Funding Trust II, Series 2015-1A, Class A4 (a)
2.440% 6/15/22 | | | 620,000 | | | | 612,647 | |
Oscar US Funding Trust IV, Series 2016-1A, Class A2B, 1 mo. USD LIBOR + 1.700%, FRN (a)
2.224% 7/15/20 | | | 453,860 | | | | 453,734 | |
Oscar US Funding Trust V, Series 2016-2A, Class A1 (a)
0.900% 9/17/17 | | | 1,170,000 | | | | 1,170,000 | |
Prestige Auto Receivables Trust, Series 2015-1, Class B (a)
2.040% 4/15/21 | | | 580,000 | | | | 580,333 | |
Santander Drive Auto Receivables Trust, Series 2016-2, Class A1
0.750% 5/15/17 | | | 362,038 | | | | 362,054 | |
Santander Drive Auto Receivables Trust, Series 2015-4, Class A2B, 1 mo. USD LIBOR + .700%, FRN
1.224% 12/17/18 | | | 295,174 | | | | 295,142 | |
The accompanying notes are an integral part of the financial statements.
85
MassMutual Premier Inflation-Protected and Income Fund – Portfolio of Investments (Continued)
| | | | | | | | |
| | | Principal
Amount | | | Value | |
Santander Drive Auto Receivables Trust, Series 2016-1, Class A2B, 1 mo. USD LIBOR + .780%, FRN
1.304% 7/15/19 | | $ | 1,577,506 | | | $ | 1,578,092 | |
Santander Drive Auto Receivables Trust, Series 2015-S2, Class R1 (a)
1.840% 11/18/19 | | | 8,555 | | | | 8,547 | |
Santander Drive Auto Receivables Trust, Series 2014-2, Class C
2.330% 11/15/19 | | | 2,400,000 | | | | 2,413,968 | |
Santander Drive Auto Receivables Trust, Series 2014-1, Class C
2.360% 4/15/20 | | | 500,000 | | | | 503,477 | |
Santander Drive Auto Receivables Trust, Series 2015-2, Class C
2.440% 4/15/21 | | | 900,000 | | | | 909,008 | |
Tidewater Auto Receivables Trust, Series 2016-AA, Class A2 (a)
2.300% 9/15/19 | | | 951,744 | | | | 952,216 | |
United Auto Credit Securitization Trust, Series 2016-1, Class A (a)
2.000% 10/15/17 | | | 156,665 | | | | 156,628 | |
Westlake Automobile Receivables Trust, Series 2016-2A, Class A1 (a)
0.850% 6/15/17 | | | 954,797 | | | | 954,641 | |
Westlake Automobile Receivables Trust, Series 2015-1A, Class A2 (a)
1.170% 3/15/18 | | | 75,183 | | | | 75,170 | |
Westlake Automobile Receivables Trust, Series 2015-2A, Class A2A (a)
1.280% 7/16/18 | | | 192,056 | | | | 191,818 | |
Westlake Automobile Receivables Trust, Series 2016-2A, Class A2 (a)
1.570% 6/17/19 | | | 640,000 | | | | 639,321 | |
Westlake Automobile Receivables Trust, Series 2016-1A, Class A2B, 1 mo. USD LIBOR + 1.050%, FRN (a)
1.574% 1/15/19 | | | 2,441,535 | | | | 2,444,755 | |
Wheels SPV 2 LLC, Series 2016-1A, Class A1 (a)
0.010% 8/20/17 | | | 1,781,147 | | | | 1,781,010 | |
| | | | | | | | |
| | | | | | | 52,831,914 | |
| | | | | | | | |
| Commercial MBS — 0.7% | |
Banc of America Commercial Mortgage, Inc., Series 2007-3, Class A4, VRN
5.723% 6/10/49 | | | 174,171 | | | | 176,230 | |
Commercial Mortgage Pass-Through Certificates, Series 2014-BBG, Class A, 1 mo. LIBOR + .800%, FRN (a)
1.325% 3/15/29 | | | 900,000 | | | | 892,671 | |
| | | | | | | | |
| | | Principal
Amount | | | Value | |
DBRR Trust, Series 2013-EZ3, Class A, VRN (a)
1.636% 12/18/49 | | $ | 28,048 | | | $ | 28,039 | |
DBUBS Mortgage Trust, Series 2011-LC1A, Class A1 (a)
3.742% 11/10/46 | | | 7,995 | | | | 8,057 | |
GCCFC Commercial Mortgage Trust, Series 2006-GG7, Class AM, VRN
5.951% 7/10/38 | | | 323,489 | | | | 323,946 | |
JPMorgan Chase Commercial Mortgage Securities Trust, Series 2006-LDP7, Class AM, VRN
6.116% 4/17/45 | | | 56,973 | | | | 56,973 | |
Morgan Stanley Capital I, Series 2007-HQ11, Class AJ, VRN
5.508% 2/12/44 | | | 350,000 | | | | 344,197 | |
STRIPs Ltd., Series 2012-1A, Class A (a)
1.500% 12/25/44 | | | 162,408 | | | | 162,408 | |
| | | | | | | | |
| | | | | | | 1,992,521 | |
| | | | | | | | |
| Credit Card ABS — 2.7% | |
Chase Issuance Trust, Series 2014-A1,
Class A1
1.150% 1/15/19 | | | 8,200,000 | | | | 8,203,541 | |
| | | | | | | | |
| Home Equity ABS — 0.2% | |
ACE Securities Corp., Series 2005-AG1, Class A1B1, 1 mo. USD LIBOR + .270%, FRN
0.795% 8/25/35 | | | 48,255 | | | | 48,218 | |
ACE Securities Corp., Series 2005-HE5, Class M2, 1 mo. USD LIBOR + .735%, FRN
1.260% 8/25/35 | | | 198,925 | | | | 198,400 | |
Countrywide Asset-Backed Certificates, Series 2004-5, Class 3A, 1 mo. USD LIBOR + .460%, FRN
0.985% 9/25/34 | | | 51,162 | | | | 50,582 | |
First Franklin Mortgage Loan Trust, Series 2005-FF6, Class M1, 1 mo. USD LIBOR + .630%, FRN
1.155% 5/25/36 | | | 103,142 | | | | 102,735 | |
First Franklin Mortgage Loan Trust, Series 2005-FF4, Class M1, 1 mo. USD LIBOR + .645%, FRN
1.170% 5/25/35 | | | 13,979 | | | | 13,976 | |
Long Beach Mortgage Loan Trust, Series 2005-WL1, Class M2, 1 mo. USD LIBOR + .825%, FRN
1.350% 6/25/35 | | | 290,198 | | | | 287,667 | |
Park Place Securities, Inc., Series 2005-WCW3, Class A2C, 1 mo. USD LIBOR + .380%, FRN
0.905% 8/25/35 | | | 3,896 | | | | 3,894 | |
| | | | | | | | |
| | | | | | | 705,472 | |
| | | | | | | | |
The accompanying notes are an integral part of the financial statements.
86
MassMutual Premier Inflation-Protected and Income Fund – Portfolio of Investments (Continued)
| | | | | | | | |
| | | Principal
Amount | | | Value | |
| Other ABS — 17.6% | |
321 Henderson Receivables I LLC, Series 2006-1A, Class A1, 1 mo. USD LIBOR + .200%, FRN (a)
0.724% 3/15/41 | | $ | 526,077 | | | $ | 511,375 | |
321 Henderson Receivables I LLC, Series 2006-2A, Class A1, 1 mo. USD LIBOR + .200%, FRN (a)
0.724% 6/15/41 | | | 1,839,198 | | | | 1,791,257 | |
321 Henderson Receivables I LLC, Series 2006-4A, Class A1, 1 mo. USD LIBOR + .200%, FRN (a)
0.724% 12/15/41 | | | 484,041 | | | | 468,950 | |
321 Henderson Receivables I LLC, Series 2007-1A, Class A1, 1 mo. USD LIBOR + .200%, FRN (a)
0.724% 3/15/42 | | | 691,413 | | | | 659,546 | |
321 Henderson Receivables II LLC, Series 2006-3A, Class A1, 1 mo. USD LIBOR + .200%, FRN (a)
0.642% 9/15/41 | | | 223,929 | | | | 212,208 | |
Alterna Funding I LLC, Series 2014-1A, Class NOTE (a)
1.639% 2/15/21 | | | 1,143,300 | | | | 1,114,717 | |
Apidos CLO XXII, Series 2015-22A, Class X, 3 mo. USD LIBOR + 1.000%, FRN (a)
1.696% 10/20/27 | | | 375,000 | | | | 374,918 | |
ARL First LLC, Series 2012-1A, Class A1, 1 mo. USD LIBOR + 1.750%, FRN (a)
2.274% 12/15/42 | | | 947,219 | | | | 919,171 | |
Ascentium Equipment Receivables LLC, Series 2015-2A, Class A2 (a)
1.570% 12/11/17 | | | 1,137,257 | | | | 1,137,876 | |
AVANT Loans Funding Trust, Series 2016-C, Class A (a)
2.960% 9/16/19 | | | 326,890 | | | | 326,833 | |
AVANT Loans Funding Trust, Series 2016-A, Class A (a)
4.110% 5/15/19 | | | 626,318 | | | | 628,969 | |
BCC Funding VIII LLC, Series 2014-1A, Class A (a)
1.794% 6/20/20 | | | 142,558 | | | | 142,024 | |
BCC Funding X LLC, Series 2015-1, Class A2 (a)
2.224% 10/20/20 | | | 581,493 | | | | 579,672 | |
BCC Funding XIII LLC,
Series 2016-1, Class A1 (a)
1.100% 9/20/17 | | | 3,600,000 | | | | 3,600,034 | |
BlueVirgo Trust,
Series 2015-1A, Class NOTE (a)
3.000% 12/15/22 | | | 1,187,868 | | | | 1,200,448 | |
| | | | | | | | |
| | | Principal
Amount | | | Value | |
Cazenovia Creek Funding I LLC,
Series 2015-1A, Class A (a)
2.000% 12/10/23 | | $ | 1,112,690 | | | $ | 1,104,866 | |
Citi Held For Asset Issuance,
Series 2015-PM1, Class A (a)
1.850% 12/15/21 | | | 43,333 | | | | 43,254 | |
Citi Held For Asset Issuance,
Series 2015-PM2, Class A (a)
2.350% 3/15/22 | | | 223,867 | | | | 223,712 | |
Citi Held For Asset Issuance,
Series 2015-PM3, Class A (a)
2.560% 5/16/22 | | | 109,965 | | | | 109,866 | |
Citigroup Mortgage Loan Trust,
Series 2005-OPT3, Class M2, 1 mo. USD LIBOR + .675%, FRN
1.200% 5/25/35 | | | 737,541 | | | | 734,631 | |
Consumer Credit Origination Loan Trust, Series 2015-1, Class A (a)
2.820% 3/15/21 | | | 40,825 | | | | 41,076 | |
Consumer Installment Loan Trust,
Series 2016-LD1, Class A (a)
3.960% 7/15/22 | | | 355,821 | | | | 357,540 | |
DB Master Finance LLC,
Series 2015-1A, Class A2I (a)
3.262% 2/20/45 | | | 738,750 | | | | 745,238 | |
Dell Equipment Finance Trust,
Series 2015-2, Class A2B, 1 mo. USD LIBOR + .900%, FRN (a)
1.443% 12/22/17 | | | 1,070,595 | | | | 1,071,472 | |
Diamond Resorts Owner Trust,
Series 2013-1, Class A (a)
1.950% 1/20/25 | | | 760,892 | | | | 757,748 | |
Diamond Resorts Owner Trust,
Series 2013-2, Class A (a)
2.270% 5/20/26 | | | 754,549 | | | | 750,163 | |
Diamond Resorts Owner Trust,
Series 2015-1, Class A (a)
2.730% 7/20/27 | | | 129,359 | | | | 130,116 | |
Diamond Resorts Owner Trust,
Series 2015-2, Class B (a)
3.540% 5/22/28 | | | 263,832 | | | | 268,154 | |
Domino’s Pizza Master Issuer LLC,
Series 2012-1A, Class A2 (a)
5.216% 1/25/42 | | | 773,603 | | | | 794,413 | |
Dong Fang Container Finance II SPV Ltd., Series 2014-1A, Class A1 (a)
1.950% 11/25/39 | | | 270,833 | | | | 265,546 | |
Drug Royalty Corp., Inc.,
Series 2014-1, Class A1, 3 mo. USD LIBOR + 2.850%, FRN (a)
3.530% 7/15/23 | | | 451,341 | | | | 454,737 | |
The accompanying notes are an integral part of the financial statements.
87
MassMutual Premier Inflation-Protected and Income Fund – Portfolio of Investments (Continued)
| | | | | | | | |
| | | Principal
Amount | | | Value | |
Elara HGV Timeshare Issuer LLC,
Series 2014-A, Class B (a)
3.020% 2/25/27 | | $ | 285,847 | | | $ | 285,211 | |
Element Rail Leasing II LLC,
Series 2016-1A, Class A1 (a)
3.968% 3/19/46 | | | 380,532 | | | | 383,338 | |
FNA Trust, Series 2014-1A, Class A (a)
1.296% 12/10/22 | | | 315,327 | | | | 312,174 | |
FNA Trust, Series 2015-1, Class A (a)
3.240% 12/10/23 | | | 498,056 | | | | 496,726 | |
Global SC Funding One Ltd.,
Series 2015-1, Class B1 (a)
2.740% 1/18/30 | | | 149,242 | | | | 147,021 | |
GoldenTree Loan Opportunities IV Ltd.,
Series 2007-4A, Class A1B, 3 mo. USD LIBOR + .230%, FRN (a)
1.031% 8/18/22 | | | 733,450 | | | | 731,898 | |
Green Tree Agency Advance Funding Trust I, Series 2015-T1, Class AT1 (a)
2.302% 10/15/46 | | | 700,000 | | | | 699,874 | |
Green Tree Agency Advance Funding Trust I, Series 2015-T2, Class AT2 (a)
3.095% 10/15/48 | | | 620,000 | | | | 620,194 | |
Hilton Grand Vacations Trust,
Series 2014-AA, Class A (a)
1.770% 11/25/26 | | | 357,170 | | | | 353,462 | |
Icon Brand Holdings LLC,
Series 2012-1A, Class A (Acquired 7/22/14,
Cost $591,442) (a) (b)
4.229% 1/25/43 | | | 244,866 | | | | 223,051 | |
ING Investment Management CLO V Ltd., Series 2007-5A, Class A1A,
3 mo. USD LIBOR + .230%, FRN (a)
0.987% 5/01/22 | | | 173,837 | | | | 173,471 | |
LCM XIV LP, Series 14A, Class A,
3 mo. USD LIBOR + 1.150%, FRN (a)
1.830% 7/15/25 | | | 1,150,000 | | | | 1,148,653 | |
Leaf Receivables Funding LLC,
Series 2016-1, Class A1 (a)
1.000% 6/15/17 | | | 1,780,061 | | | | 1,780,070 | |
Marlette Funding Trust, Series 2016-1A, Class A (a)
3.060% 1/17/23 | | | 754,294 | | | | 754,541 | |
Miramax LLC, Series 2014-1A, Class A2 (a)
3.340% 7/20/26 | | | 603,454 | | | | 604,998 | |
Morgan Stanley ABS Capital I, Inc. Trust, Series 2005-WMC4, Class M4, 1 mo. USD LIBOR + .945%, FRN
1.470% 4/25/35 | | | 334,643 | | | | 334,055 | |
Nations Equipment Finance Funding II LLC, Series 2014-1A, Class A (a)
1.558% 7/20/18 | | | 84,771 | | | | 84,724 | |
| | | | | | | | |
| | | Principal
Amount | | | Value | |
Nations Equipment Finance Funding III LLC, Series 2016-1A, Class A (a)
3.610% 2/20/21 | | $ | 562,550 | | | $ | 563,346 | |
Navitas Equipment Receivables LLC,
Series 2015-1, Class A2 (a)
2.120% 11/15/18 | | | 522,981 | | | | 523,638 | |
New Residential Advance Receivables Trust, Series 2016-T1, Class AT1 (a)
2.751% 6/15/49 | | | 400,000 | | | | 399,999 | |
NYCTL Trust, Series 2016-A, Class A (a)
1.470% 11/10/29 | | | 4,400,000 | | | | 4,400,000 | |
OneMain Financial Issuance Trust,
Series 2014-1A, Class A (a)
2.430% 6/18/24 | | | 155,681 | | | | 156,028 | |
Oxford Finance Funding Trust,
Series 2014-1A, Class A (a)
3.475% 12/15/22 | | | 180,000 | | | | 178,056 | |
Oxford Finance Funding Trust,
Series 2016-1A, Class A (a)
3.968% 6/17/24 | | | 400,000 | | | | 402,009 | |
PFS Financing Corp., Series 2014-AA, Class A, 1 mo. LIBOR + .600%, FRN (a)
1.124% 2/15/19 | | | 1,490,000 | | | | 1,488,814 | |
PFS Financing Corp., Series 2014-BA, Class A, 1 mo. LIBOR + .600%, FRN (a)
1.124% 10/15/19 | | | 1,000,000 | | | | 996,089 | |
RAAC, Series 2006-RP2, Class A, 1 mo. USD LIBOR + .250%, FRN (a)
0.774% 2/25/37 | | | 196,118 | | | | 194,276 | |
Sierra Receivables Funding Co. LLC,
Series 2014-2A, Class A (a)
2.050% 6/20/31 | | | 271,414 | | | | 271,933 | |
Sierra Receivables Funding Co. LLC,
Series 2013-2A, Class A (a)
2.280% 11/20/25 | | | 337,810 | | | | 338,675 | |
Sierra Receivables Funding Co. LLC,
Series 2014-3A, Class A (a)
2.300% 10/20/31 | | | 398,652 | | | | 398,811 | |
Sierra Receivables Funding Co. LLC,
Series 2012-1A, Class A (a)
2.840% 11/20/28 | | | 451,551 | | | | 452,550 | |
Sierra Receivables Funding Co. LLC,
Series 2015-3A, Class B (a)
3.080% 9/20/32 | | | 97,732 | | | | 97,812 | |
Sierra Timeshare Receivables Funding LLC, Series 2013-1A, Class A (a)
1.590% 11/20/29 | | | 107,161 | | | | 106,970 | |
Sierra Timeshare Receivables Funding LLC, Series 2015-2A, Class B (a)
3.020% 6/20/32 | | | 172,341 | | | | 172,234 | |
The accompanying notes are an integral part of the financial statements.
88
MassMutual Premier Inflation-Protected and Income Fund – Portfolio of Investments (Continued)
| | | | | | | | |
| | | Principal
Amount | | | Value | |
SoFi Consumer Loan Program LLC,
Series 2016-2A, Class A (a)
3.090% 10/27/25 | | $ | 1,190,000 | | | $ | 1,195,763 | |
SoFi Consumer Loan Program LLC,
Series 2016-1A, Class A (a)
3.260% 8/25/25 | | | 1,122,925 | | | | 1,128,245 | |
SpringCastle America Funding LLC,
Series 2014-AA, Class A (a)
2.700% 5/25/23 | | | 938,973 | | | | 939,266 | |
SpringCastle America Funding LLC,
Series 2016-AA, Class A (a)
3.050% 4/25/29 | | | 1,170,000 | | | | 1,169,955 | |
SPS Servicer Advance Receivables Trust, Series 2015-T2, Class AT2 (a)
2.620% 1/15/47 | | | 1,850,000 | | | | 1,850,798 | |
SPS Servicer Advance Receivables Trust, Series 2015-T3, Class AT3 (a)
2.920% 7/15/47 | | | 340,000 | | | | 340,781 | |
Structured Asset Securities Corp.,
Series 2007-BC4, Class A3, 1 mo. USD LIBOR + .250%, FRN
0.775% 11/25/37 | | | 11,678 | | | | 11,673 | |
SVO VOI Mortgage LLC,
Series 2012-AA, Class A (a)
2.000% 9/20/29 | | | 662,727 | | | | 661,369 | |
Taco Bell Funding LLC,
Series 2016-1A, Class A2I (a)
3.832% 5/25/46 | | | 650,000 | | | | 660,519 | |
TAL Advantage LLC,
Series 2014-2A, Class A1 (a)
1.700% 5/20/39 | | | 404,435 | | | | 398,996 | |
Trade MAPS 1 Ltd., Series 2013-1A, Class A, 1 mo. LIBOR + .700%, FRN (a)
1.218% 12/10/18 | | | 1,620,000 | | | | 1,617,355 | |
Trip Rail Master Funding LLC,
Series 2011-1A, Class A1B, 1 mo. LIBOR + 2.500%, FRN (a)
3.024% 7/15/41 | | | 289,474 | | | | 285,795 | |
Trip Rail Master Funding LLC,
Series 2011-1A, Class A1A (a)
4.370% 7/15/41 | | | 330,827 | | | | 333,860 | |
Westgate Resorts LLC, Series 2014-1A, Class A (a)
2.150% 12/20/26 | | | 305,361 | | | | 301,465 | |
Westgate Resorts LLC, Series 2015-1A, Class A (a)
2.750% 5/20/27 | | | 381,842 | | | | 383,004 | |
Westgate Resorts LLC, Series 2015-2A, Class A (a)
3.200% 7/20/28 | | | 636,210 | | | | 636,999 | |
| | | | | | | | |
| | | | | | | 53,711,074 | |
| | | | | | | | |
| | | | | | | | |
| | | Principal
Amount | | | Value | |
| Student Loans ABS — 13.6% | |
Academic Loan Funding Trust,
Series 2013-1A, Class A, 1 mo. USD LIBOR + .800%, FRN (a)
1.325% 12/26/44 | | $ | 2,110,092 | | | $ | 2,076,240 | |
Access Group, Inc., Series 2006-1, Class A2, 3 mo. USD LIBOR + .110%, FRN
0.935% 8/25/23 | | | 257,567 | | | | 256,642 | |
Access Group, Inc., Series 2004-A, Class A2, 3 mo. USD LIBOR + .260%, FRN
0.975% 4/25/29 | | | 133,899 | | | | 133,383 | |
Access Group, Inc., Series 2005-2, Class A3, 3 mo. USD LIBOR + .180%, FRN
0.991% 11/22/24 | | | 258,258 | | | | 256,141 | |
Access Group, Inc., Series 2003-A, Class A3, 3 mo. Treasury + 1.200%, FRN
1.515% 7/01/38 | | | 169,262 | | | | 153,821 | |
Brazos Higher Education Authority, Inc., Series 2006-2, Class A10 FRN, 3 mo. USD LIBOR + .120%, FRN
0.977% 6/25/26 | | | 350,000 | | | | 329,612 | |
CIT Education Loan Trust, Series 2005-1, Class A3, 3 mo. USD LIBOR + .120%, FRN
0.970% 3/15/26 | | | 919,961 | | | | 906,595 | |
College Loan Corp. Trust I,
Series 2005-1, Class A4, 3 mo. LIBOR + .150%, FRN
0.865% 4/25/27 | | | 2,375,000 | | | | 2,368,273 | |
College Loan Corp. Trust I,
Series 2005-2, Class B, 3 mo. USD LIBOR + .490%, FRN
1.170% 1/15/37 | | | 553,310 | | | | 475,750 | |
Collegiate Funding Services Education Loan Trust, Series 2004-A, Class A3, 3 mo. LIBOR + .210%, FRN
1.063% 9/28/26 | | | 172,905 | | | | 172,473 | |
DRB Prime Student Loan Trust,
Series 2015-D, Class A1, 1 mo. USD LIBOR + 1.700%, FRN (a)
2.225% 1/25/40 | | | 1,014,248 | | | | 990,345 | |
DRB Prime Student Loan Trust,
Series 2015-A, Class A3
2.320% 4/25/30 | | | 188,730 | | | | 188,579 | |
DRB Prime Student Loan Trust,
Series 2016-A, Class A1, 1 mo. USD LIBOR + 2.000%, FRN (a)
2.524% 4/25/40 | | | 306,774 | | | | 305,921 | |
DRB Prime Student Loan Trust,
Series 2015-B, Class A3 (a)
2.540% 4/27/26 | | | 289,633 | | | | 287,740 | |
The accompanying notes are an integral part of the financial statements.
89
MassMutual Premier Inflation-Protected and Income Fund – Portfolio of Investments (Continued)
| | | | | | | | |
| | | Principal
Amount | | | Value | |
DRB Prime Student Loan Trust,
Series 2016-B, Class A2 (a)
2.890% 6/25/40 | | $ | 582,468 | | | $ | 581,506 | |
Earnest Student Loan Program LLC,
Series 2016-C, Class A1, 1 mo. USD LIBOR + 1.850%, FRN (a)
2.326% 10/27/36 | | | 1,333,083 | | | | 1,333,086 | |
Earnest Student Loan Program LLC,
Series 2016-B, Class A1, 1 mo. USD LIBOR + 2.050%, FRN (a)
2.575% 2/26/35 | | | 971,282 | | | | 971,281 | |
ECMC Group Student Loan Trust,
Series 2016-1A, Class A, 1 mo. USD LIBOR + 1.350%, FRN (a)
1.864% 7/26/66 | | | 1,250,000 | | | | 1,249,980 | |
Edsouth Indenture No 9 LLC,
Series 2015-1, Class A, 1 mo. USD LIBOR + .800%, FRN (a)
1.325% 10/25/56 | | | 559,708 | | | | 545,368 | |
Education Funding Capital Trust I,
Series 2004-1, Class A4, 28 day ARS, FRN
1.934% 6/15/43 | | | 1,150,000 | | | | 1,144,867 | |
Education Funding Capital Trust I,
Series 2004-1, Class B1, 28 day ARS, FRN
1.943% 6/15/43 | | | 150,000 | | | | 138,752 | |
Education Funding Capital Trust I,
Series 2004-1, Class A5, 28 day ARS, FRN
1.943% 6/15/43 | | | 650,000 | | | | 635,254 | |
Education Funding Capital Trust I,
Series 2004-1, Class A6, 28 day ARS, FRN
1.943% 6/15/43 | | | 350,000 | | | | 340,128 | |
Education Funding Capital Trust IV,
Series 2004-1, Class A3, 3 mo. LIBOR + .190%, FRN
1.040% 12/16/24 | | | 117,304 | | | | 117,040 | |
Educational Services of America,
Series 2015-2, Class B FRN, 1 mo. USD LIBOR + 1.500%, FRN (a)
2.025% 12/25/58 | | | 750,000 | | | | 689,275 | |
GCO Education Loan Funding Trust,
Series 2007-1A, Class A5L, 3 mo. LIBOR + .070%, FRN (a)
0.895% 5/25/23 | | | 24,859 | | | | 24,795 | |
Goal Capital Funding Trust,
Series 2010-1, Class A, 3 mo. USD LIBOR + .700%, FRN (a)
1.525% 8/25/48 | | | 465,303 | | | | 450,952 | |
Kentucky Higher Education Student Loan Corp., Series 2015-1, Class A1, 1 mo. USD LIBOR + .750%, FRN
1.273% 12/01/31 | | | 436,390 | | | | 427,924 | |
| | | | | | | | |
| | | Principal
Amount | | | Value | |
KeyCorp Student Loan Trust,
Series 2004-A, Class 2A2, 3 mo. USD LIBOR + .300%, FRN
1.034% 10/28/41 | | $ | 358,829 | | | $ | 357,463 | |
KeyCorp Student Loan Trust, Series 2000-A, Class A2, 3 mo. USD LIBOR + .320%, FRN
1.145% 5/25/29 | | | 250,202 | | | | 241,829 | |
KeyCorp Student Loan Trust, Series 2006-A, Class 2A4, 3 mo. USD LIBOR + .310%, FRN
1.163% 9/27/35 | | | 1,106,611 | | | | 1,094,574 | |
National Collegiate Student Loan Trust, Series 2006-3, Class A3, 1 mo. USD LIBOR + .150%, FRN
0.675% 10/25/27 | | | 81,138 | | | | 80,975 | |
National Collegiate Student Loan Trust, Series 2005-1, Class A4, 1 mo. USD LIBOR + .240%, FRN
0.765% 11/27/28 | | | 203,346 | | | | 201,412 | |
Navient Private Education Loan Trust, Series 2014-AA, Class A1, 1 mo. USD LIBOR + .480%, FRN (a)
1.004% 5/16/22 | | | 38,238 | | | | 38,230 | |
Navient Private Education Loan Trust, Series 2015-AA, Class A1, 1 mo. USD LIBOR + .500%, FRN (a)
1.024% 12/15/21 | | | 323,339 | | | | 323,105 | |
Navient Private Education Loan Trust, Series 2015-BA, Class A1, 1 mo. USD LIBOR + .600%, FRN (a)
1.124% 5/15/23 | | | 89,942 | | | | 89,899 | |
Navient Private Education Loan Trust, Series 2015-AA, Class A2B, 1 mo. USD LIBOR + 1.200%, FRN (a)
1.724% 12/15/28 | | | 670,000 | | | | 675,634 | |
Navient Student Loan Trust, Series 2016-5A, Class A, 1 mo. USD LIBOR + 1.250%, FRN (a)
1.000% 6/25/65 | | | 2,449,034 | | | | 2,449,040 | |
Navient Student Loan Trust, Series 2016-3A, Class A2, 1 mo. USD LIBOR + .850%, FRN (a)
1.375% 6/25/65 | | | 600,000 | | | | 600,000 | |
Nelnet Student Loan Trust, Series 2006-2, Class A6, 3 mo. USD LIBOR + .120%, FRN
0.835% 4/25/31 | | | 500,000 | | | | 480,890 | |
Nelnet Student Loan Trust, Series 2006-3, Class B, 3 mo. USD LIBOR + .250%, FRN
1.107% 6/25/41 | | | 431,893 | | | | 352,306 | |
The accompanying notes are an integral part of the financial statements.
90
MassMutual Premier Inflation-Protected and Income Fund – Portfolio of Investments (Continued)
| | | | | | | | |
| | | Principal
Amount | | | Value | |
Nelnet Student Loan Trust, Series 2010-4A, Class A, 1 mo. USD LIBOR + .800%, FRN (a)
1.325% 4/25/46 | | $ | 83,585 | | | $ | 83,315 | |
Nelnet Student Loan Trust, Series 2014-2A, Class B, 1 mo. USD LIBOR + 1.500%, FRN (a)
2.025% 6/25/41 | | | 295,000 | | | | 257,885 | |
Pennsylvania Higher Education Assistance Agency, Series 2004-1, Class A2, 28 day ARS, FRN
0.917% 4/25/44 | | | 450,000 | | | | 441,430 | |
Pennsylvania Higher Education Assistance Agency, Series 2003-1, Class A3, 28 day ARS, FRN
2.013% 7/25/42 | | | 350,000 | | | | 337,015 | |
SLC Private Student Loan Trust, Series 2006-A, Class A5, 3 mo. USD LIBOR + .170%, FRN
0.850% 7/15/36 | | | 2,674,953 | | | | 2,665,585 | |
SLM Private Education Loan Trust, Series 2011-A, Class A3, 1 mo. USD LIBOR + 2.500%, FRN (a)
3.024% 1/15/43 | | | 320,000 | | | | 329,215 | |
SLM Student Loan Trust, Series 2007-5, Class A6, 3 mo. USD LIBOR + .110%, FRN
0.825% 1/26/43 | | | 460,000 | | | | 396,776 | |
SLM Student Loan Trust, Series 2005-5, Class A4, 3 mo. USD LIBOR + .140%, FRN
0.855% 10/25/28 | | | 500,000 | | | | 472,596 | |
SLM Student Loan Trust, Series 2006-5, Class B, 3 mo. USD LIBOR + .210%, FRN
0.925% 10/25/40 | | | 389,562 | | | | 335,046 | |
SLM Student Loan Trust, Series 2006-2, Class B, 3 mo. USD LIBOR + .220%, FRN
0.935% 1/25/41 | | | 427,059 | | | | 351,763 | |
SLM Student Loan Trust, Series 2004-3, Class B, 3 mo. USD LIBOR + .470%, FRN
1.000% 10/25/64 | | | 329,988 | | | | 289,915 | |
SLM Student Loan Trust, Series 2003-14, Class A6, 3 mo. USD LIBOR + .300%, FRN
1.015% 7/25/25 | | | 300,000 | | | | 283,371 | |
SLM Student Loan Trust, Series 2005-8, Class B, 3 mo. USD LIBOR + .310%, FRN
1.025% 1/25/40 | | | 430,392 | | | | 367,689 | |
SLM Student Loan Trust, Series 2014-A, Class A1, 1 mo. USD LIBOR + .600%, FRN (a)
1.124% 7/15/22 | | | 395,296 | | | | 395,041 | |
SLM Student Loan Trust, Series 2003-12, Class A5, 3 mo. USD LIBOR + .280%, FRN (a)
1.130% 9/15/22 | | | 312,198 | | | | 311,366 | |
| | | | | | | | |
| | | Principal
Amount | | | Value | |
SLM Student Loan Trust, Series 2012-E, Class A1, 1 mo. USD LIBOR + .750%, FRN (a)
1.274% 10/16/23 | | $ | 37,714 | | | $ | 37,709 | |
SLM Student Loan Trust, Series 2003-11, Class B, 3 mo. USD LIBOR + .650%, FRN
1.500% 12/15/38 | | | 386,789 | | | | 346,453 | |
SLM Student Loan Trust, Series 2005-6, Class A5B, 3 mo. USD LIBOR + 1.200%, FRN
1.915% 7/27/26 | | | 430,067 | | | | 432,174 | |
SLM Student Loan Trust, Series 2012-A, Class A1, 1 mo. USD LIBOR + 1.400%, FRN (a)
1.924% 8/15/25 | | | 44,849 | | | | 44,932 | |
SLM Student Loan Trust, Series 2003-5, Class A7, 28 day ARS, FRN
3.007% 6/17/30 | | | 500,000 | | | | 500,000 | |
SLM Student Loan Trust, Series 2003-2, Class A7, 28 day ARS, FRN
3.022% 9/15/28 | | | 900,000 | | | | 900,000 | |
SLM Student Loan Trust, Series 2003-5, Class A9, 28 day ARS, FRN
3.024% 6/17/30 | | | 600,000 | | | | 600,000 | |
SLM Student Loan Trust, Series 2002-7, Class A11, 28 day ARS, FRN
3.030% 3/15/28 | | | 400,000 | | | | 400,000 | |
SMB Private Education Loan Trust, Series 2014-A, Class A1, 1 mo. USD LIBOR + .500%, FRN (a)
1.024% 9/15/21 | | | 275,901 | | | | 275,751 | |
SMB Private Education Loan Trust, Series 2016-A, Class A1, 1 mo. USD LIBOR + .700%, FRN (a)
1.224% 5/15/23 | | | 989,617 | | | | 989,617 | |
SoFi Professional Loan Program LLC, Series 2016-C, Class A2A (a)
1.480% 5/26/31 | | | 1,298,420 | | | | 1,296,194 | |
SoFi Professional Loan Program LLC, Series 2016-B, Class A2A (a)
1.680% 3/25/31 | | | 2,003,001 | | | | 2,004,959 | |
SoFi Professional Loan Program LLC, Series 2015-A, Class A1, 1 mo. USD LIBOR + 1.200%, FRN (a)
1.725% 3/25/33 | | | 308,213 | | | | 301,620 | |
SoFi Professional Loan Program LLC, Series 2016-A, Class A1, 1 mo. USD LIBOR + 1.750%, FRN (a)
2.275% 8/25/36 | | | 1,456,773 | | | | 1,483,067 | |
| | | | | | | | |
| | | | | | | 41,467,564 | |
| | | | | | | | |
The accompanying notes are an integral part of the financial statements.
91
MassMutual Premier Inflation-Protected and Income Fund – Portfolio of Investments (Continued)
| | | | | | | | |
| | | Principal
Amount | | | Value | |
| WL Collateral CMO — 0.9% | |
Connecticut Avenue Securities, Series 2015-C02, Class 1M1, 1 mo. USD LIBOR + 1.150%, FRN
1.675% 5/25/25 | | $ | 238,071 | | | $ | 238,372 | |
Connecticut Avenue Securities, Series 2015-C03, Class 1M1, 1 mo. USD LIBOR + 1.500%, FRN
2.025% 7/25/25 | | | 818,859 | | | | 820,531 | |
Credit Suisse First Boston Mortgage Securities Corp., Series 2005-CF1, Class M1, 1 mo. USD LIBOR + .700%, FRN (a)
1.225% 3/25/45 | | | 162,080 | | | | 158,478 | |
Federal National Mortgage Association Connecticut Avenue Securities, Series 2016-C05, Class 2M1, 1 mo. USD LIBOR + 1.350%, FRN
1.875% 1/25/29 | | | 603,305 | | | | 605,683 | |
Federal National Mortgage Association Connecticut Avenue Securities, Series 2016-C04, Class 1M1, 1 mo. USD LIBOR + 1.450%, FRN
1.975% 1/25/29 | | | 673,639 | | | | 677,717 | |
Structured Agency Credit Risk Debt Notes, Series 2015-DNA1, Class M1, 1 mo. USD LIBOR + .900%, FRN
1.425% 10/25/27 | | | 275,660 | | | | 276,004 | |
| | | | | | | | |
| | | | | | | 2,776,785 | |
| | | | | | | | |
| | |
TOTAL NON-U.S. GOVERNMENT AGENCY OBLIGATIONS
(Cost $160,214,662) | | | | | | | 164,662,673 | |
| | | | | | | | |
|
| U.S. GOVERNMENT AGENCY OBLIGATIONS AND INSTRUMENTALITIES — 0.1% | |
| Pass-Through Securities — 0.1% | |
Government National Mortgage Association II Pool #82462 1 year CMT + 1.500%, FRN
2.000% 1/20/40 | | | 159,675 | | | | 164,718 | |
| | | | | | | | |
| | |
TOTAL U.S. GOVERNMENT AGENCY OBLIGATIONS AND INSTRUMENTALITIES
(Cost $169,506) | | | | | | | 164,718 | |
| | | | | | | | |
|
| U.S. TREASURY OBLIGATIONS — 93.1% | |
| U.S. Treasury Bonds & Notes — 93.1% | |
U.S. Treasury Inflation Index (c)
0.125% 4/15/19 | | | 15,611,312 | | | | 15,877,079 | |
U.S. Treasury Inflation Index (c)
0.125% 4/15/20 | | | 15,415,050 | | | | 15,715,767 | |
| | | | | | | | |
| | | Principal
Amount | | | Value | |
U.S. Treasury Inflation Index
0.125% 4/15/21 | | $ | 5,686,296 | | | $ | 5,805,020 | |
U.S. Treasury Inflation Index (c)
0.125% 1/15/22 | | | 12,759,480 | | | | 13,022,759 | |
U.S. Treasury Inflation Index (c)
0.125% 7/15/22 | | | 13,086,733 | | | | 13,398,851 | |
U.S. Treasury Inflation Index (c)
0.125% 1/15/23 | | | 12,021,409 | | | | 12,211,010 | |
U.S. Treasury Inflation Index (c)
0.125% 7/15/24 | | | 12,167,548 | | | | 12,345,182 | |
U.S. Treasury Inflation Index
0.125% 7/15/26 | | | 5,622,400 | | | | 5,683,858 | |
U.S. Treasury Inflation Index (c)
0.250% 1/15/25 | | | 12,243,644 | | | | 12,470,543 | |
U.S. Treasury Inflation Index (c)
0.375% 7/15/23 | | | 12,419,901 | | | | 12,870,769 | |
U.S. Treasury Inflation Index (c)
0.375% 7/15/25 | | | 12,238,850 | | | | 12,639,550 | |
U.S. Treasury Inflation Index (c)
0.625% 7/15/21 | | | 10,789,917 | | | | 11,330,006 | |
U.S. Treasury Inflation Index (c)
0.625% 1/15/24 | | | 12,794,641 | | | | 13,423,088 | |
U.S. Treasury Inflation Index (c)
0.625% 1/15/26 | | | 8,345,719 | | | | 8,777,276 | |
U.S. Treasury Inflation Index (c)
0.625% 2/15/43 | | | 4,710,375 | | | | 4,722,909 | |
U.S. Treasury Inflation Index (c)
0.750% 2/15/42 | | | 5,857,775 | | | | 6,035,435 | |
U.S. Treasury Inflation Index (c)
0.750% 2/15/45 | | | 6,653,155 | | | | 6,857,653 | |
U.S. Treasury Inflation Index
1.000% 2/15/46 | | | 710,976 | | | | 785,935 | |
U.S. Treasury Inflation Index (c) (d) (e)
1.125% 1/15/21 | | | 10,192,890 | | | | 10,847,824 | |
U.S. Treasury Inflation Index (c)
1.250% 7/15/20 | | | 8,850,150 | | | | 9,456,279 | |
U.S. Treasury Inflation Index (c)
1.375% 1/15/20 | | | 6,755,303 | | | | 7,173,004 | |
U.S. Treasury Inflation Index (c)
1.375% 2/15/44 | | | 6,711,965 | | | | 7,961,753 | |
U.S. Treasury Inflation Index (c)
1.750% 1/15/28 | | | 5,169,375 | | | | 6,050,666 | |
U.S. Treasury Inflation Index (c)
1.875% 7/15/19 | | | 5,072,040 | | | | 5,446,935 | |
U.S. Treasury Inflation Index (c)
2.000% 1/15/26 | | | 6,426,409 | | | | 7,548,068 | |
U.S. Treasury Inflation Index (c)
2.125% 2/15/40 | | | 2,226,900 | | | | 2,962,648 | |
U.S. Treasury Inflation Index (c)
2.125% 2/15/41 | | | 3,708,956 | | | | 4,980,353 | |
U.S. Treasury Inflation Index (c)
2.375% 1/15/25 | | | 8,043,399 | | | | 9,584,876 | |
The accompanying notes are an integral part of the financial statements.
92
MassMutual Premier Inflation-Protected and Income Fund – Portfolio of Investments (Continued)
| | | | | | | | |
| | | Principal
Amount | | | Value | |
U.S. Treasury Inflation Index (c)
2.375% 1/15/27 | | $ | 5,370,165 | | | $ | 6,585,842 | |
U.S. Treasury Inflation Index (c)
2.500% 1/15/29 | | | 5,010,468 | | | | 6,360,593 | |
U.S. Treasury Inflation Index (c)
3.375% 4/15/32 | | | 1,694,788 | | | | 2,486,963 | |
U.S. Treasury Inflation Index (c)
3.625% 4/15/28 | | | 3,727,290 | | | | 5,146,496 | |
U.S. Treasury Inflation Index (c)
3.875% 4/15/29 | | | 5,123,755 | | | | 7,382,901 | |
| | | | | | | | |
| | | | | | | 283,947,891 | |
| | | | | | | | |
| | |
TOTAL U.S. TREASURY OBLIGATIONS
(Cost $276,825,469) | | | | | | | 283,947,891 | |
| | | | | | | | |
| | |
TOTAL BONDS & NOTES
(Cost $450,662,635) | | | | | | | 461,714,691 | |
| | | | | | | | |
| | |
TOTAL LONG-TERM INVESTMENTS
(Cost $450,662,635) | | | | | | | 461,714,691 | |
| | | | | | | | |
|
| SHORT-TERM INVESTMENTS — 37.3% | |
| Commercial Paper — 37.3% | |
Agrium, Inc.
1.016% 12/12/16 | | | 5,000,000 | | | | 4,990,307 | |
Amphenol Corp. (a)
0.530% 10/03/16 | | | 1,250,000 | | | | 1,249,925 | |
Anheuser-Busch InBev Worldwide, Inc. (a)
1.019% 1/13/17 | | | 5,000,000 | | | | 4,989,646 | |
The Bank of Nova Scotia (a)
1.230% 2/23/17 | | | 8,000,000 | | | | 7,966,128 | |
Bell Canada (a)
1.017% 1/17/17 | | | 5,000,000 | | | | 4,985,346 | |
CDP Financial, Inc. (a)
1.200% 3/01/17 | | | 8,000,000 | | | | 7,973,113 | |
CenterPoint Energy, Inc. (a)
0.910% 11/17/16 | | | 4,000,000 | | | | 3,995,456 | |
CenterPoint Energy, Inc. (a)
0.910% 11/21/16 | | | 1,000,000 | | | | 998,746 | |
CRH America Finance, Inc. (a)
0.950% 11/01/16 | | | 5,000,000 | | | | 4,996,342 | |
FMC Technologies, Inc. (a)
1.050% 12/12/16 | | | 5,000,000 | | | | 4,990,307 | |
Ford Motor Credit Co. LLC (a)
1.020% 10/25/16 | | | 5,000,000 | | | | 4,997,191 | |
Harley-Davidson Funding Corp. (a)
0.940% 1/05/17 | | | 7,500,000 | | | | 7,478,902 | |
Monsanto Co. (a)
1.050% 11/21/16 | | | 5,075,000 | | | | 5,068,637 | |
NBCUniversal Enterprise, Inc. (a)
1.100% 10/12/16 | | | 5,000,000 | | | | 4,998,725 | |
| | | | | | | | |
| | | Principal
Amount | | | Value | |
ONEOK Partners LP (a)
1.100% 10/17/16 | | $ | 4,500,000 | | | $ | 4,498,328 | |
Schlumberger Holdings (a)
1.050% 12/21/16 | | | 7,500,000 | | | | 7,484,710 | |
Sempra Energy Holdings (a)
1.130% 11/14/16 | | | 5,000,000 | | | | 4,994,750 | |
Spectra Energy Capital (a)
0.960% 10/24/16 | | | 5,000,000 | | | | 4,997,310 | |
Suncor Energy, Inc. (a)
1.050% 10/11/16 | | | 4,000,000 | | | | 3,999,071 | |
Thomson Reuters Corp. (a)
1.100% 10/03/16 | | | 5,000,000 | | | | 4,999,742 | |
TransCanada American (a)
1.016% 11/21/16 | | | 4,685,000 | | | | 4,679,126 | |
Vodafone Group PLC (a)
1.028% 1/23/17 | | | 3,912,000 | | | | 3,898,504 | |
Whirlpool Corp. (a)
1.016% 12/13/16 | | | 4,500,000 | | | | 4,491,111 | |
| | | | | | | | |
| | | | | | | 113,721,423 | |
| | | | | | | | |
| Repurchase Agreement — 0.0% | |
State Street Bank & Trust Co. Repurchase Agreement, dated 9/30/16, 0.010%, due 10/03/16 (f) | | | 97,877 | | | | 97,877 | |
| | | | | | | | |
| | |
TOTAL SHORT-TERM INVESTMENTS
(Cost $113,788,797) | | | | | | | 113,819,300 | |
| | | | | | | | |
| | |
TOTAL INVESTMENTS — 188.7%
(Cost $564,451,432) (g) | | | | | | | 575,533,991 | |
| | |
| Other Assets/(Liabilities) — (88.7)% | | | | | | | (270,590,616 | ) |
| | | | | | | | |
| | |
| NET ASSETS — 100.0% | | | | | | $ | 304,943,375 | |
| | | | | | | | |
Notes to Portfolio of Investments
Percentages are stated as a percent of net assets.
| CLO | Collateralized Loan Obligation |
| CMO | Collateralized Mortgage Obligation |
| CMT | Constant Maturity Treasury Index |
| MBS | Mortgage-Backed Security |
| (a) | Securities exempt from registration under rule 144A of the Securities Act of 1933. These securities may be resold in transactions exempt from registration, normally to qualified institutional buyers. At September 30, 2016, these securities amounted to a value of $236,085,753 or 77.42% of net assets. |
| (b) | Restricted security. Certain securities are restricted as to resale. At September 30, 2016, these securities amounted to a value of $223,051 or 0.07% of net assets. The Fund generally |
The accompanying notes are an integral part of the financial statements.
93
MassMutual Premier Inflation-Protected and Income Fund – Portfolio of Investments (Continued)
Notes to Portfolio of Investments (Continued)
| | bears the costs, if any, associated with the disposition of restricted securities. |
| (c) | All or a portion of this security is held as collateral for open reverse repurchase agreements. (Note 2). |
| (d) | All or a portion of this security is held as collateral for open swap agreements. (Note 2). |
| (e) | A portion of this security is held as collateral for open futures contracts. (Note 2). |
| (f) | Maturity value of $97,877. Collateralized by U.S. Government Agency obligations with a rate of 1.500%, maturity date of 11/30/19, and an aggregate market value, including accrued interest, of $102,375. |
| (g) | See Note 6 for aggregate cost for federal tax purposes. |
The accompanying notes are an integral part of the financial statements.
94
MassMutual Premier Core Bond Fund – Portfolio of Investments
September 30, 2016
| | | | | | | | |
| | | Number of
Shares | | | Value | |
| EQUITIES — 0.3% | |
|
| PREFERRED STOCK — 0.3% | |
| Financial — 0.3% | | | | | | | | |
| Insurance — 0.3% | | | | | | | | |
The Allstate Corp. 5.100% | | | 130,000 | | | $ | 3,550,300 | |
| | | | | | | | |
| | |
TOTAL PREFERRED STOCK
(Cost $3,250,000) | | | | | | | 3,550,300 | |
| | | | | | | | |
| | |
TOTAL EQUITIES
(Cost $3,250,000) | | | | | | | 3,550,300 | |
| | | | | | | | |
| | |
| | | Principal
Amount | | | | |
| BONDS & NOTES — 98.9% | |
|
| CORPORATE DEBT — 39.8% | |
| Advertising — 0.2% | | | | | | | | |
WPP Finance 2010
4.750% 11/21/21 | | $ | 635,000 | | | | 712,284 | |
WPP Finance 2010
5.625% 11/15/43 | | | 1,338,000 | | | | 1,587,493 | |
| | | | | | | | |
| | | | | | | 2,299,777 | |
| | | | | | | | |
| Aerospace & Defense — 0.3% | | | | | | | | |
Exelis, Inc.
4.250% 10/01/16 | | | 2,465,000 | | | | 2,465,000 | |
Spirit AeroSystems, Inc.
3.850% 6/15/26 | | | 1,005,000 | | | | 1,043,745 | |
United Technologies Corp.
6.125% 7/15/38 | | | 465,000 | | | | 632,397 | |
| | | | | | | | |
| | | | | | | 4,141,142 | |
| | | | | | | | |
| Agriculture — 0.7% | | | | | | | | |
Bunge Ltd. Finance Corp.
3.200% 6/15/17 | | | 1,785,000 | | | | 1,808,059 | |
Bunge Ltd. Finance Corp.
3.250% 8/15/26 | | | 1,145,000 | | | | 1,152,090 | |
Bunge Ltd. Finance Corp.
3.500% 11/24/20 | | | 1,145,000 | | | | 1,197,567 | |
Imperial Brands Finance PLC (a)
2.950% 7/21/20 | | | 2,745,000 | | | | 2,834,122 | |
Philip Morris International, Inc.
6.375% 5/16/38 | | | 225,000 | | | | 314,513 | |
Reynolds American, Inc.
3.250% 6/12/20 | | | 980,000 | | | | 1,031,027 | |
| | | | | | | | |
| | | | | | | 8,337,378 | |
| | | | | | | | |
| Airlines — 0.7% | | | | | | | | |
American Airlines Pass-Through Trust,
Series 2014-1, Class A
3.700% 4/01/28 | | | 666,776 | | | | 696,781 | |
American Airlines Pass-Through Trust,
Series 2014-1, Class B
4.375% 4/01/24 | | | 272,342 | | | | 276,754 | |
| | | | | | | | |
| | | Principal
Amount | | | Value | |
Spirit Airlines Pass-Through Trust,
Series 2015-1, Class A
4.100% 10/01/29 | | $ | 2,525,000 | | | $ | 2,575,500 | |
United Airlines Pass-Through Trust,
Series 2014-1, Class A
4.000% 10/11/27 | | | 843,743 | | | | 904,914 | |
WestJet Airlines Ltd. (a)
3.500% 6/16/21 | | | 4,635,000 | | | | 4,749,883 | |
| | | | | | | | |
| | | | | | | 9,203,832 | |
| | | | | | | | |
| Auto Manufacturers — 0.2% | | | | | | | | |
General Motors Financial Co., Inc.
3.200% 7/13/20 | | | 1,110,000 | | | | 1,136,583 | |
Hyundai Capital America (a)
2.550% 2/06/19 | | | 1,150,000 | | | | 1,169,973 | |
| | | | | | | | |
| | | | | | | 2,306,556 | |
| | | | | | | | |
| Automotive & Parts — 0.2% | | | | | | | | |
Lear Corp.
4.750% 1/15/23 | | | 1,440,000 | | | | 1,495,800 | |
Lear Corp.
5.375% 3/15/24 | | | 560,000 | | | | 601,300 | |
| | | | | | | | |
| | | | | | | 2,097,100 | |
| | | | | | | | |
| Banks — 3.1% | | | | | | | | |
Associated Banc-Corp.
4.250% 1/15/25 | | | 3,280,000 | | | | 3,414,237 | |
Bancolombia SA
5.950% 6/03/21 | | | 1,435,000 | | | | 1,583,451 | |
Bank of America Corp.
4.750% 4/21/45 | | | 1,690,000 | | | | 1,804,028 | |
Compass Bank
3.875% 4/10/25 | | | 1,922,000 | | | | 1,880,079 | |
Discover Bank
2.000% 2/21/18 | | | 1,920,000 | | | | 1,926,186 | |
First Horizon National Corp.
3.500% 12/15/20 | | | 4,280,000 | | | | 4,368,395 | |
First Republic Bank
4.375% 8/01/46 | | | 4,790,000 | | | | 4,758,463 | |
ICICI Bank Ltd. (a)
4.700% 2/21/18 | | | 1,800,000 | | | | 1,861,794 | |
ICICI Bank Ltd. (a)
4.750% 11/25/16 | | | 1,300,000 | | | | 1,305,591 | |
JP Morgan Chase & Co.
3.875% 9/10/24 | | | 1,710,000 | | | | 1,800,244 | |
Regions Financial Corp.
7.500% 5/15/18 | | | 895,000 | | | | 973,933 | |
SVB Financial Group
3.500% 1/29/25 | | | 4,285,000 | | | | 4,329,020 | |
SVB Financial Group
5.375% 9/15/20 | | | 515,000 | | | | 572,402 | |
Turkiye Garanti Bankasi AS (a)
4.750% 10/17/19 | | | 1,485,000 | | | | 1,496,256 | |
The accompanying notes are an integral part of the financial statements.
95
MassMutual Premier Core Bond Fund – Portfolio of Investments (Continued)
| | | | | | | | |
| | | Principal
Amount | | | Value | |
Valley National Bancorp
5.125% 9/27/23 | | $ | 1,710,000 | | | $ | 1,831,899 | |
Wells Fargo & Co.
4.300% 7/22/27 | | | 4,325,000 | | | | 4,661,217 | |
| | | | | | | | |
| | | | | | | 38,567,195 | |
| | | | | | | | |
| Beverages — 0.8% | | | | | | | | |
Anheuser-Busch InBev Finance, Inc.
4.900% 2/01/46 | | | 4,875,000 | | | | 5,800,182 | |
Molson Coors Brewing Co.
2.100% 7/15/21 | | | 1,245,000 | | | | 1,256,458 | |
Molson Coors Brewing Co.
3.000% 7/15/26 | | | 2,235,000 | | | | 2,250,480 | |
Molson Coors Brewing Co.
4.200% 7/15/46 | | | 1,190,000 | | | | 1,239,910 | |
| | | | | | | | |
| | | | | | | 10,547,030 | |
| | | | | | | | |
| Biotechnology — 0.1% | | | | | | | | |
Amgen, Inc.
5.150% 11/15/41 | | | 800,000 | | | | 911,749 | |
| | | | | | | | |
| Building Materials — 0.5% | | | | | | | | |
CRH America, Inc.
8.125% 7/15/18 | | | 1,730,000 | | | | 1,913,748 | |
LafargeHolcim Finance US LLC (a)
3.500% 9/22/26 | | | 1,015,000 | | | | 1,039,502 | |
Martin Marietta Material, Inc. 3 mo. USD LIBOR + 1.100%, FRN
1.731% 6/30/17 | | | 1,540,000 | | | | 1,543,730 | |
Owens Corning, Inc.
9.000% 6/15/19 | | | 1,245,000 | | | | 1,454,160 | |
| | | | | | | | |
| | | | | | | 5,951,140 | |
| | | | | | | | |
| Chemicals — 0.4% | | | | | | | | |
Ashland, Inc.
6.875% 5/15/43 | | | 406,000 | | | | 442,540 | |
The Dow Chemical Co.
8.550% 5/15/19 | | | 375,000 | | | | 439,817 | |
Incitec Pivot Finance LLC (a)
6.000% 12/10/19 | | | 880,000 | | | | 953,115 | |
RPM International, Inc.
6.125% 10/15/19 | | | 800,000 | | | | 892,072 | |
RPM International, Inc.
6.500% 2/15/18 | | | 1,375,000 | | | | 1,458,392 | |
Valspar Corp.
7.250% 6/15/19 | | | 650,000 | | | | 737,619 | |
| | | | | | | | |
| | | | | | | 4,923,555 | |
| | | | | | | | |
| Commercial Services — 1.0% | | | | | | | | |
The ADT Corp.
6.250% 10/15/21 | | | 3,100,000 | | | | 3,371,250 | |
ERAC USA Finance LLC (a)
2.800% 11/01/18 | | | 455,000 | | | | 465,330 | |
ERAC USA Finance LLC (a)
6.700% 6/01/34 | | | 355,000 | | | | 470,911 | |
| | | | | | | | |
| | | Principal
Amount | | | Value | |
Leidos Holdings, Inc.
4.450% 12/01/20 | | $ | 6,280,000 | | | $ | 6,529,316 | |
The Western Union Co.
5.930% 10/01/16 | | | 1,405,000 | | | | 1,405,000 | |
| | | | | | | | |
| | | | | | | 12,241,807 | |
| | | | | | | | |
| Computers — 0.2% | | | | | | | | |
Diamond 1 Finance Corp./Diamond 2 Finance Corp. (a)
4.420% 6/15/21 | | | 1,380,000 | | | | 1,442,266 | |
Diamond 1 Finance Corp./Diamond 2 Finance Corp. (a)
6.020% 6/15/26 | | | 535,000 | | | | 586,522 | |
| | | | | | | | |
| | | | | | | 2,028,788 | |
| | | | | | | | |
| Cosmetics & Personal Care — 0.0% | | | | | | | | |
The Procter & Gamble Co.
5.800% 8/15/34 | | | 270,000 | | | | 378,971 | |
| | | | | | | | |
| Distribution & Wholesale — 0.2% | | | | | | | | |
Arrow Electronics, Inc.
4.500% 3/01/23 | | | 135,000 | | | | 142,749 | |
Ingram Micro, Inc.
4.950% 12/15/24 | | | 2,727,000 | | | | 2,759,645 | |
| | | | | | | | |
| | | | | | | 2,902,394 | |
| | | | | | | | |
| Diversified Financial — 4.3% | | | | | | | | |
AerCap Ireland Capital Ltd./AerCap Global Aviation Trust
4.500% 5/15/21 | | | 4,000,000 | | | | 4,185,000 | |
Affiliated Managers Group, Inc.
3.500% 8/01/25 | | | 2,320,000 | | | | 2,306,344 | |
Air Lease Corp.
3.000% 9/15/23 | | | 3,255,000 | | | | 3,217,991 | |
Air Lease Corp.
3.375% 1/15/19 | | | 2,505,000 | | | | 2,572,936 | |
Air Lease Corp.
3.375% 6/01/21 | | | 2,800,000 | | | | 2,904,552 | |
Air Lease Corp.
3.875% 4/01/21 | | | 1,825,000 | | | | 1,929,937 | |
Air Lease Corp.
5.625% 4/01/17 | | | 600,000 | | | | 610,231 | |
Ally Financial, Inc.
3.250% 11/05/18 | | | 610,000 | | | | 613,050 | |
Ally Financial, Inc.
3.600% 5/21/18 | | | 890,000 | | | | 903,350 | |
Ally Financial, Inc.
4.750% 9/10/18 | | | 1,860,000 | | | | 1,925,100 | |
Ares Finance Co. LLC (a)
4.000% 10/08/24 | | | 2,380,000 | | | | 2,305,861 | |
BGC Partners, Inc. (a)
5.125% 5/27/21 | | | 3,790,000 | | | | 3,968,695 | |
Citigroup, Inc.
3.875% 3/26/25 | | | 5,421,000 | | | | 5,594,510 | |
The accompanying notes are an integral part of the financial statements.
96
MassMutual Premier Core Bond Fund – Portfolio of Investments (Continued)
| | | | | | | | |
| | | Principal
Amount | | | Value | |
Citigroup, Inc.
8.125% 7/15/39 | | $ | 225,000 | | | $ | 353,730 | |
Eaton Vance Corp.
6.500% 10/02/17 | | | 91,000 | | | | 95,474 | |
General Electric Capital Corp.
6.875% 1/10/39 | | | 429,000 | | | | 646,191 | |
The Goldman Sachs Group, Inc.
5.375% 3/15/20 | | | 900,000 | | | | 996,604 | |
The Goldman Sachs Group, Inc.
5.750% 1/24/22 | | | 1,600,000 | | | | 1,858,462 | |
The Goldman Sachs Group, Inc.
6.150% 4/01/18 | | | 420,000 | | | | 447,347 | |
The Goldman Sachs Group, Inc.
6.250% 2/01/41 | | | 440,000 | | | | 575,333 | |
The Goldman Sachs Group, Inc.
6.750% 10/01/37 | | | 565,000 | | | | 719,420 | |
Hyundai Capital America (a)
2.875% 8/09/18 | | | 910,000 | | | | 928,721 | |
Icahn Enterprises LP/Icahn Enterprises Finance Corp.
3.500% 3/15/17 | | | 7,240,000 | | | | 7,248,688 | |
International Lease Finance Corp.
3.875% 4/15/18 | | | 2,065,000 | | | | 2,114,044 | |
JP Morgan Chase & Co.
4.500% 1/24/22 | | | 1,500,000 | | | | 1,660,966 | |
Lazard Group LLC
6.850% 6/15/17 | | | 601,000 | | | | 620,085 | |
Legg Mason, Inc.
5.625% 1/15/44 | | | 1,126,000 | | | | 1,168,723 | |
Merrill Lynch & Co., Inc.
7.750% 5/14/38 | | | 555,000 | | | | 804,689 | |
Nasdaq, Inc.
3.850% 6/30/26 | | | 945,000 | | | | 988,822 | |
| | | | | | | | |
| | | | | | | 54,264,856 | |
| | | | | | | | |
| Electric — 2.9% | | | | | | | | |
Duke Energy Corp.
2.650% 9/01/26 | | | 2,595,000 | | | | 2,546,388 | |
Duke Energy Corp.
3.750% 9/01/46 | | | 1,340,000 | | | | 1,299,497 | |
Duke Energy Progress, Inc.
6.125% 9/15/33 | | | 37,000 | | | | 49,510 | |
Entergy Arkansas, Inc.
3.500% 4/01/26 | | | 505,000 | | | | 547,518 | |
Entergy Louisiana LLC
4.950% 1/15/45 | | | 1,095,000 | | | | 1,165,839 | |
Florida Power & Light Co.
4.950% 6/01/35 | | | 950,000 | | | | 1,154,280 | |
IPALCO Enterprises, Inc.
3.450% 7/15/20 | | | 5,935,000 | | | | 6,083,375 | |
Israel Electric Corp. Ltd. (a)
7.250% 1/15/19 | | | 1,370,000 | | | | 1,520,700 | |
Majapahit Holding BV (a)
7.750% 1/20/20 | | | 1,335,000 | | | | 1,535,250 | |
| | | | | | | | |
| | | Principal
Amount | | | Value | |
Metropolitan Edison Co. (a)
4.000% 4/15/25 | | $ | 1,505,000 | | | $ | 1,570,564 | |
National Fuel Gas Co.
3.750% 3/01/23 | | | 985,000 | | | | 996,427 | |
Nevada Power Co. Series N
6.650% 4/01/36 | | | 1,000,000 | | | | 1,395,318 | |
Niagara Mohawk Power Corp. (a)
2.721% 11/28/22 | | | 1,560,000 | | | | 1,589,250 | |
Oncor Electric Delivery Co.
7.500% 9/01/38 | | | 130,000 | | | | 201,977 | |
Pacific Gas & Electric Co.
5.800% 3/01/37 | | | 800,000 | | | | 1,052,320 | |
Pennsylvania Electric Co. (a)
4.150% 4/15/25 | | | 2,090,000 | | | | 2,152,529 | |
PPL Capital Funding, Inc.
1.900% 6/01/18 | | | 400,000 | | | | 401,544 | |
PPL Capital Funding, Inc.
3.100% 5/15/26 | | | 795,000 | | | | 808,118 | |
PPL Capital Funding, Inc.
5.000% 3/15/44 | | | 1,320,000 | | | | 1,487,756 | |
Progress Energy, Inc.
7.000% 10/30/31 | | | 505,000 | | | | 678,020 | |
Puget Energy, Inc.
6.500% 12/15/20 | | | 1,985,000 | | | | 2,303,831 | |
Southern California Edison Co.
5.950% 2/01/38 | | | 820,000 | | | | 1,111,498 | |
Transelec SA (a)
4.625% 7/26/23 | | | 1,250,000 | | | | 1,341,852 | |
Tri-State Generation & Transmission Association, Series 2003, Class A (a)
6.040% 1/31/18 | | | 299,157 | | | | 302,397 | |
Virginia Electric and Power Co.
6.350% 11/30/37 | | | 925,000 | | | | 1,279,768 | |
Wisconsin Public Service Corp.
5.650% 11/01/17 | | | 1,405,000 | | | | 1,466,632 | |
| | | | | | | | |
| | | | | | | 36,042,158 | |
| | | | | | | | |
| Electronics — 0.5% | | | | | | | | |
Amphenol Corp.
2.550% 1/30/19 | | | 1,445,000 | | | | 1,478,719 | |
Arrow Electronics, Inc.
5.125% 3/01/21 | | | 750,000 | | | | 818,626 | |
Avnet, Inc.
4.875% 12/01/22 | | | 944,000 | | | | 1,025,719 | |
FLIR Systems, Inc.
3.125% 6/15/21 | | | 1,360,000 | | | | 1,403,698 | |
Tech Data Corp.
3.750% 9/21/17 | | | 1,345,000 | | | | 1,369,105 | |
| | | | | | | | |
| | | | | | | 6,095,867 | |
| | | | | | | | |
| Engineering & Construction — 0.2% | | | | | | | | |
SBA Tower Trust (a)
2.877% 7/15/21 | | | 1,350,000 | | | | 1,372,883 | |
The accompanying notes are an integral part of the financial statements.
97
MassMutual Premier Core Bond Fund – Portfolio of Investments (Continued)
| | | | | | | | |
| | | Principal
Amount | | | Value | |
SBA Tower Trust (a)
3.156% 10/15/20 | | $ | 1,500,000 | | | $ | 1,514,580 | |
| | | | | | | | |
| | | | | | | 2,887,463 | |
| | | | | | | | |
Environmental Controls — 0.0% | | | | | | | | |
Republic Services, Inc.
5.000% 3/01/20 | | | 40,000 | | | | 44,019 | |
| | | | | | | | |
| Foods — 0.6% | | | | | | | | |
Ingredion, Inc.
3.200% 10/01/26 | | | 1,520,000 | | | | 1,550,338 | |
Kraft Foods, Inc.
6.500% 2/09/40 | | | 381,000 | | | | 519,159 | |
Kraft Heinz Foods Co.
3.000% 6/01/26 | | | 3,635,000 | | | | 3,664,000 | |
The Kroger Co.
2.600% 2/01/21 | | | 1,065,000 | | | | 1,095,202 | |
Tyson Foods, Inc.
4.875% 8/15/34 | | | 745,000 | | | | 824,579 | |
| | | | | | | | |
| | | | | | | 7,653,278 | |
| | | | | | | | |
Forest Products & Paper — 0.1% | | | | | | | | |
Sappi Papier Holding GmbH (a)
7.750% 7/15/17 | | | 1,830,000 | | | | 1,871,175 | |
| | | | | | | | |
| Gas — 0.2% | | | | | | | | |
Spire, Inc.
4.700% 8/15/44 | | | 2,000,000 | | | | 2,187,278 | |
| | | | | | | | |
| Hand & Machine Tools — 0.1% | | | | | | | | |
Kennametal, Inc.
2.650% 11/01/19 | | | 1,200,000 | | | | 1,207,744 | |
| | | | | | | | |
| Health Care – Products — 0.4% | | | | | | | | |
Zimmer Biomet Holdings, Inc.
3.550% 4/01/25 | | | 2,070,000 | | | | 2,133,439 | |
Zimmer Biomet Holdings, Inc.
4.450% 8/15/45 | | | 2,780,000 | | | | 2,846,984 | |
| | | | | | | | |
| | | | | | | 4,980,423 | |
| | | | | | | | |
| Health Care – Services — 0.4% | | | | | | | | |
Aetna, Inc.
3.200% 6/15/26 | | | 2,220,000 | | | | 2,257,130 | |
Aetna, Inc.
4.375% 6/15/46 | | | 545,000 | | | | 570,695 | |
Kaiser Foundation Hospitals
3.500% 4/01/22 | | | 600,000 | | | | 638,981 | |
UnitedHealth Group, Inc.
6.875% 2/15/38 | | | 875,000 | | | | 1,282,355 | |
| | | | | | | | |
| | | | | | | 4,749,161 | |
| | | | | | | | |
| Home Builders — 0.3% | | | | | | | | |
Lennar Corp.
4.500% 11/15/19 | | | 3,767,000 | | | | 3,969,476 | |
| | | | | | | | |
| Housewares — 0.2% | | | | | | | | |
Newell Brands, Inc.
3.850% 4/01/23 | | | 2,325,000 | | | | 2,474,883 | |
| | | | | | | | |
| | | | | | | | |
| | | Principal
Amount | | | Value | |
| Insurance — 3.2% | | | | | | | | |
The Allstate Corp. 3 mo. USD LIBOR + 2.938%, VRN
5.750% 8/15/53 | | $ | 2,270,000 | | | $ | 2,437,412 | |
Arch Capital Group US, Inc.
5.144% 11/01/43 | | | 1,150,000 | | | | 1,261,693 | |
AXIS Specialty Finance PLC
2.650% 4/01/19 | | | 660,000 | | | | 667,053 | |
Brown & Brown, Inc.
4.200% 9/15/24 | | | 474,000 | | | | 493,073 | |
The Chubb Corp. 3 mo. USD LIBOR + 2.250%, VRN
6.375% 4/15/37 | | | 411,000 | | | | 390,491 | |
CNA Financial Corp.
3.950% 5/15/24 | | | 1,250,000 | | | | 1,323,340 | |
CNA Financial Corp.
7.350% 11/15/19 | | | 1,000,000 | | | | 1,152,962 | |
CNO Financial Group, Inc.
4.500% 5/30/20 | | | 1,763,000 | | | | 1,804,871 | |
CNO Financial Group, Inc.
5.250% 5/30/25 | | | 2,104,000 | | | | 2,088,220 | |
Five Corners Funding Trust (a)
4.419% 11/15/23 | | | 1,465,000 | | | | 1,582,029 | |
MetLife Capital Trust IV (a)
7.875% 12/15/67 | | | 2,695,000 | | | | 3,381,142 | |
Principal Financial Group, Inc.
8.875% 5/15/19 | | | 620,000 | | | | 730,512 | |
Prudential Financial, Inc. 3 mo. USD LIBOR + 3.040%, VRN
5.200% 3/15/44 | | | 1,042,000 | | | | 1,074,562 | |
Prudential Financial, Inc. 3 mo. USD LIBOR + 3.920%, VRN
5.625% 6/15/43 | | | 1,845,000 | | | | 1,990,386 | |
QBE Insurance Group Ltd. (a)
2.400% 5/01/18 | | | 900,000 | | | | 904,830 | |
Reinsurance Group of America, Inc.
3.950% 9/15/26 | | | 2,490,000 | | | | 2,605,073 | |
Reinsurance Group of America, Inc.
5.000% 6/01/21 | | | 1,775,000 | | | | 1,940,519 | |
Reinsurance Group of America, Inc.
6.450% 11/15/19 | | | 1,675,000 | | | | 1,897,477 | |
Trinity Acquisition PLC
3.500% 9/15/21 | | | 1,600,000 | | | | 1,667,637 | |
Trinity Acquisition PLC
4.400% 3/15/26 | | | 500,000 | | | | 523,651 | |
Unum Group
3.000% 5/15/21 | | | 1,080,000 | | | | 1,104,243 | |
USF&G Capital I (a)
8.500% 12/15/45 | | | 1,015,000 | | | | 1,391,465 | |
Willis North America, Inc.
7.000% 9/29/19 | | | 706,000 | | | | 791,653 | |
Willis Towers Watson PLC
5.750% 3/15/21 | | | 1,825,000 | | | | 2,055,278 | |
The accompanying notes are an integral part of the financial statements.
98
MassMutual Premier Core Bond Fund – Portfolio of Investments (Continued)
| | | | | | | | |
| | | Principal
Amount | | | Value | |
XLIT Ltd.
4.450% 3/31/25 | | $ | 1,275,000 | | | $ | 1,294,213 | |
XLIT Ltd.
5.750% 10/01/21 | | | 1,140,000 | | | | 1,304,915 | |
XLIT Ltd.
6.375% 11/15/24 | | | 1,990,000 | | | | 2,371,218 | |
| | | | | | | | |
| | | | | | | 40,229,918 | |
| | | | | | | | |
| Internet — 0.8% | | | | | | | | |
Baidu, Inc.
3.250% 8/06/18 | | | 1,965,000 | | | | 2,016,459 | |
Expedia, Inc.
4.500% 8/15/24 | | | 4,188,000 | | | | 4,409,231 | |
Expedia, Inc.
7.456% 8/15/18 | | | 3,420,000 | | | | 3,765,957 | |
| | | | | | | | |
| | | | | | | 10,191,647 | |
| | | | | | | | |
| Investment Companies — 0.8% | | | | | | | | |
Ares Capital Corp.
3.625% 1/19/22 | | | 3,485,000 | | | | 3,507,698 | |
Ares Capital Corp.
3.875% 1/15/20 | | | 3,635,000 | | | | 3,759,604 | |
FS Investment Corp.
4.000% 7/15/19 | | | 2,720,000 | | | | 2,766,561 | |
| | | | | | | | |
| | | | | | | 10,033,863 | |
| | | | | | | | |
| Iron & Steel — 1.1% | | | | | | | | |
ArcelorMittal
5.125% 6/01/20 | | | 2,375,000 | | | | 2,493,750 | |
ArcelorMittal
6.250% 8/05/20 | | | 1,700,000 | | | | 1,848,750 | |
Glencore Funding LLC (a)
2.875% 4/16/20 | | | 3,100,000 | | | | 3,075,200 | |
Glencore Funding LLC (a)
4.625% 4/29/24 | | | 435,000 | | | | 443,265 | |
Reliance Steel & Aluminum Co.
4.500% 4/15/23 | | | 1,125,000 | | | | 1,175,829 | |
Reliance Steel & Aluminum Co.
6.200% 11/15/16 | | | 2,562,000 | | | | 2,573,191 | |
Reliance Steel & Aluminum Co.
6.850% 11/15/36 | | | 1,536,000 | | | | 1,699,525 | |
| | | | | | | | |
| | | | | | | 13,309,510 | |
| | | | | | | | |
| Lodging — 0.3% | | | | | | | | |
Marriott International, Inc.
2.300% 1/15/22 | | | 1,285,000 | | | | 1,295,839 | |
Marriott International, Inc.
3.375% 10/15/20 | | | 1,440,000 | | | | 1,513,417 | |
Starwood Hotels & Resorts Worldwide, Inc.
6.750% 5/15/18 | | | 305,000 | | | | 329,775 | |
| | | | | | | | |
| | | | | | | 3,139,031 | |
| | | | | | | | |
| Machinery – Diversified — 0.4% | | | | | | | | |
CNH Industrial Capital LLC
3.250% 2/01/17 | | | 725,000 | | | | 727,719 | |
| | | | | | | | |
| | | Principal
Amount | | | Value | |
CNH Industrial Capital LLC
3.375% 7/15/19 | | $ | 1,595,000 | | | $ | 1,622,912 | |
CNH Industrial Capital LLC
3.625% 4/15/18 | | | 902,000 | | | | 913,275 | |
CNH Industrial Capital LLC
6.250% 11/01/16 | | | 1,705,000 | | | | 1,710,115 | |
Xylem, Inc.
4.875% 10/01/21 | | | 585,000 | | | | 638,328 | |
| | | | | | | | |
| | | | | | | 5,612,349 | |
| | | | | | | | |
| Media — 0.9% | | | | | | | | |
21st Century Fox America, Co.
6.900% 8/15/39 | | | 525,000 | | | | 704,948 | |
Charter Communications Operating LLC/Charter Communications Operating Capital (a)
3.579% 7/23/20 | | | 2,005,000 | | | | 2,095,622 | |
Charter Communications Operating LLC/Charter Communications Operating Capital (a)
6.484% 10/23/45 | | | 1,655,000 | | | | 2,001,428 | |
Comcast Corp.
3.400% 7/15/46 | | | 2,140,000 | | | | 2,080,298 | |
NBCUniversal Media LLC
6.400% 4/30/40 | | | 100,000 | | | | 139,958 | |
Time Warner Cable, Inc.
6.750% 6/15/39 | | | 655,000 | | | | 796,840 | |
Time Warner Cable, Inc.
8.250% 4/01/19 | | | 235,000 | | | | 270,594 | |
Time Warner Cable, Inc.
8.750% 2/14/19 | | | 365,000 | | | | 420,940 | |
Time Warner, Inc.
4.700% 1/15/21 | | | 900,000 | | | | 1,000,856 | |
Time Warner, Inc.
6.250% 3/29/41 | | | 15,000 | | | | 19,323 | |
Viacom, Inc.
2.250% 2/04/22 | | | 1,120,000 | | | | 1,114,758 | |
Viacom, Inc.
3.450% 10/04/26 | | | 730,000 | | | | 729,598 | |
| | | | | | | | |
| | | | | | | 11,375,163 | |
| | | | | | | | |
| Mining — 0.2% | | | | | | | | |
Glencore Canada Corp.
5.500% 6/15/17 | | | 1,230,000 | | | | 1,257,675 | |
Glencore Finance Canada (a)
5.800% 11/15/16 | | | 1,023,000 | | | | 1,026,581 | |
| | | | | | | | |
| | | | | | | 2,284,256 | |
| | | | | | | | |
| Office Equipment/Supplies — 0.4% | | | | | | | | |
Pitney Bowes, Inc.
3.375% 10/01/21 | | | 3,050,000 | | | | 3,048,533 | |
Pitney Bowes, Inc.
4.625% 3/15/24 | | | 1,875,000 | | | | 1,949,728 | |
Pitney Bowes, Inc.
4.750% 5/15/18 | | | 275,000 | | | | 284,880 | |
The accompanying notes are an integral part of the financial statements.
99
MassMutual Premier Core Bond Fund – Portfolio of Investments (Continued)
| | | | | | | | |
| | | Principal
Amount | | | Value | |
Pitney Bowes, Inc.
5.750% 9/15/17 | | $ | 188,000 | | | $ | 195,082 | |
| | | | | | | | |
| | | | | | | 5,478,223 | |
| | | | | | | | |
| Office Furnishings — 0.0% | | | | | | | | |
Steelcase, Inc.
6.375% 2/15/21 | | | 100,000 | | | | 114,017 | |
| | | | | | | | |
| Oil & Gas — 1.6% | | | | | | | | |
Anadarko Petroleum Corp.
5.550% 3/15/26 | | | 1,180,000 | | | | 1,333,446 | |
ConocoPhillips Co.
2.400% 12/15/22 | | | 1,025,000 | | | | 1,016,415 | |
ConocoPhillips Co.
2.875% 11/15/21 | | | 3,437,000 | | | | 3,531,143 | |
ConocoPhillips Co.
4.200% 3/15/21 | | | 1,350,000 | | | | 1,461,175 | |
Exxon Mobil Corp.
2.222% 3/01/21 | | | 2,088,000 | | | | 2,133,581 | |
Exxon Mobil Corp.
2.397% 3/06/22 | | | 470,000 | | | | 481,811 | |
Helmerich & Payne International Drilling Co.
4.650% 3/15/25 | | | 1,415,000 | | | | 1,493,230 | |
Pemex Project Funding Master Trust
6.625% 6/15/38 | | | 202,000 | | | | 199,980 | |
Petroleos Mexicanos
3.125% 1/23/19 | | | 395,000 | | | | 398,555 | |
Petroleos Mexicanos
5.500% 1/21/21 | | | 1,690,000 | | | | 1,787,175 | |
Petroleos Mexicanos
6.375% 1/23/45 | | | 640,000 | | | | 611,200 | |
Phillips 66
5.875% 5/01/42 | | | 2,245,000 | | | | 2,817,107 | |
Pioneer Natural Resources Co.
4.450% 1/15/26 | | | 2,430,000 | | | | 2,635,366 | |
| | | | | | | | |
| | | | | | | 19,900,184 | |
| | | | | | | | |
| Oil & Gas Services — 0.1% | | | | | | | | |
Weatherford International Ltd.
6.000% 3/15/18 | | | 725,000 | | | | 716,844 | |
| | | | | | | | |
| Packaging & Containers — 1.0% | | | | | | | | |
Amcor Finance USA, Inc. (a)
3.625% 4/28/26 | | | 3,485,000 | | | | 3,598,168 | |
Brambles USA, Inc. (a)
4.125% 10/23/25 | | | 926,000 | | | | 985,659 | |
Brambles USA, Inc., Series A (a)
5.350% 4/01/20 | | | 685,000 | | | | 756,728 | |
CCL Industries, Inc. (a)
3.250% 10/01/26 | | | 3,760,000 | | | | 3,774,006 | |
Crown Americas LLC/Crown Americas Capital Corp. IV
4.500% 1/15/23 | | | 2,311,000 | | | | 2,397,663 | |
| | | | | | | | |
| | | Principal
Amount | | | Value | |
Graphic Packaging International, Inc.
4.875% 11/15/22 | | $ | 440,000 | | | $ | 462,000 | |
| | | | | | | | |
| | | | | | | 11,974,224 | |
| | | | | | | | |
| Pharmaceuticals — 1.9% | | | | | | | | |
AbbVie, Inc.
4.700% 5/14/45 | | | 2,465,000 | | | | 2,654,263 | |
Actavis Funding SCS
3.000% 3/12/20 | | | 2,210,000 | | | | 2,281,858 | |
Actavis Funding SCS
4.750% 3/15/45 | | | 1,395,000 | | | | 1,525,327 | |
Baxalta, Inc.
3.600% 6/23/22 | | | 805,000 | | | | 845,723 | |
Baxalta, Inc.
4.000% 6/23/25 | | | 2,145,000 | | | | 2,289,283 | |
Baxalta, Inc.
5.250% 6/23/45 | | | 1,070,000 | | | | 1,265,880 | |
McKesson Corp.
3.796% 3/15/24 | | | 550,000 | | | | 593,139 | |
McKesson Corp.
4.750% 3/01/21 | | | 850,000 | | | | 944,084 | |
Mylan NV (a)
3.150% 6/15/21 | | | 1,935,000 | | | | 1,971,328 | |
Mylan NV (a)
3.950% 6/15/26 | | | 4,905,000 | | | | 4,941,969 | |
Shire Acquisitions Investments Ireland DAC
2.875% 9/23/23 | | | 405,000 | | | | 406,961 | |
Teva Pharmaceutical Finance Netherlands III BV
2.200% 7/21/21 | | | 1,835,000 | | | | 1,828,080 | |
Teva Pharmaceutical Finance Netherlands III BV
3.150% 10/01/26 | | | 2,325,000 | | | | 2,335,755 | |
Teva Pharmaceutical Finance Netherlands III BV
4.100% 10/01/46 | | | 510,000 | | | | 507,582 | |
| | | | | | | | |
| | | | | | | 24,391,232 | |
| | | | | | | | |
| Pipelines — 1.5% | | | | | | | | |
Alliance Pipeline LP (a)
6.996% 12/31/19 | | | 450,645 | | | | 478,684 | |
Boardwalk Pipelines LLC
5.500% 2/01/17 | | | 914,000 | | | | 922,688 | |
Boardwalk Pipelines LP
5.875% 11/15/16 | | | 2,670,000 | | | | 2,682,378 | |
CenterPoint Energy Resources Corp.
4.500% 1/15/21 | | | 650,000 | | | | 701,923 | |
EnLink Midstream Partners LP
4.850% 7/15/26 | | | 510,000 | | | | 513,200 | |
Enterprise Products Operating Co.
3.700% 2/15/26 | | | 2,530,000 | | | | 2,604,407 | |
Enterprise Products Operating Co.
5.950% 2/01/41 | | | 630,000 | | | | 729,724 | |
The accompanying notes are an integral part of the financial statements.
100
MassMutual Premier Core Bond Fund – Portfolio of Investments (Continued)
| | | | | | | | |
| | | Principal
Amount | | | Value | |
Kinder Morgan Energy Partners LP
6.500% 2/01/37 | | $ | 571,000 | | | $ | 615,754 | |
Kinder Morgan Energy Partners LP
6.950% 1/15/38 | | | 65,000 | | | | 73,792 | |
Kinder Morgan Finance Co. LLC (a)
6.000% 1/15/18 | | | 3,900,000 | | | | 4,089,996 | |
Kinder Morgan, Inc.
4.300% 6/01/25 | | | 1,370,000 | | | | 1,423,858 | |
Magellan Midstream Partners LP
5.000% 3/01/26 | | | 1,660,000 | | | | 1,891,160 | |
Magellan Midstream Partners LP
5.150% 10/15/43 | | | 2,305,000 | | | | 2,544,722 | |
| | | | | | | | |
| | | | | | | 19,272,286 | |
| | | | | | | | |
| Real Estate Investment Trusts (REITS) — 1.7% | |
American Tower Corp.
3.400% 2/15/19 | | | 1,245,000 | | | | 1,293,609 | |
American Tower Corp.
3.450% 9/15/21 | | | 3,025,000 | | | | 3,183,682 | |
American Tower Corp.
4.400% 2/15/26 | | | 1,000,000 | | | | 1,095,277 | |
Brandywine Operating Partners LP
4.950% 4/15/18 | | | 1,100,000 | | | | 1,147,376 | |
DDR Corp.
4.750% 4/15/18 | | | 1,400,000 | | | | 1,453,453 | |
Duke Realty LP
3.250% 6/30/26 | | | 845,000 | | | | 863,805 | |
Duke Realty LP
8.250% 8/15/19 | | | 1,975,000 | | | | 2,309,512 | |
Federal Realty Investment Trust
5.900% 4/01/20 | | | 455,000 | | | | 518,036 | |
Healthcare Trust of America Holdings LP
3.500% 8/01/26 | | | 1,385,000 | | | | 1,403,199 | |
Highwoods Realty LP
5.850% 3/15/17 | | | 2,600,000 | | | | 2,646,725 | |
Host Hotels & Resorts LP
3.750% 10/15/23 | | | 230,000 | | | | 232,936 | |
Host Hotels & Resorts LP
4.000% 6/15/25 | | | 752,000 | | | | 766,206 | |
ProLogis LP
2.750% 2/15/19 | | | 610,000 | | | | 624,162 | |
Tanger Properties LP
3.125% 9/01/26 | | | 2,820,000 | | | | 2,812,268 | |
Weingarten Realty Investors
3.250% 8/15/26 | | | 580,000 | | | | 580,618 | |
| | | | | | | | |
| | | | | | | 20,930,864 | |
| | | | | | | | |
| Retail — 1.6% | | | | | | | | |
AutoNation, Inc.
4.500% 10/01/25 | | | 895,000 | | | | 948,565 | |
Bed Bath & Beyond, Inc.
5.165% 8/01/44 | | | 639,000 | | | | 617,850 | |
| | | | | | | | |
| | | Principal
Amount | | | Value | |
CVS Health Corp.
6.125% 9/15/39 | | $ | 895,000 | | | $ | 1,222,575 | |
CVS Pass-Through Trust (a)
5.926% 1/10/34 | | | 2,114,318 | | | | 2,500,102 | |
Dollar Tree, Inc.
5.750% 3/01/23 | | | 3,240,000 | | | | 3,487,050 | |
El Puerto de Liverpool SAB de CV (a)
3.950% 10/02/24 | | | 2,975,000 | | | | 2,993,594 | |
The Home Depot, Inc.
4.250% 4/01/46 | | | 1,484,000 | | | | 1,713,714 | |
O’Reilly Automotive, Inc.
3.850% 6/15/23 | | | 759,000 | | | | 819,312 | |
QVC, Inc.
3.125% 4/01/19 | | | 1,075,000 | | | | 1,102,229 | |
QVC, Inc.
4.375% 3/15/23 | | | 1,140,000 | | | | 1,143,051 | |
QVC, Inc.
4.450% 2/15/25 | | | 1,225,000 | | | | 1,212,537 | |
QVC, Inc.
5.125% 7/02/22 | | | 750,000 | | | | 794,963 | |
Tiffany & Co.
4.900% 10/01/44 | | | 1,140,000 | | | | 1,155,429 | |
Walgreens Boots Alliance, Inc.
2.700% 11/18/19 | | | 750,000 | | | | 772,862 | |
| | | | | | | | |
| | | | | | | 20,483,833 | |
| | | | | | | | |
| Savings & Loans — 0.1% | | | | | | | | |
Glencore Funding LLC (a)
2.500% 1/15/19 | | | 1,841,000 | | | | 1,836,582 | |
| | | | | | | | |
| Semiconductors — 0.3% | | | | | | | | |
Applied Materials, Inc.
5.850% 6/15/41 | | | 750,000 | | | | 929,362 | |
Lam Research Corp.
3.800% 3/15/25 | | | 2,210,000 | | | | 2,302,205 | |
| | | | | | | | |
| | | | | | | 3,231,567 | |
| | | | | | | | |
| Software — 0.9% | | | | | | | | |
Broadridge Financial Solutions, Inc.
3.400% 6/27/26 | | | 1,160,000 | | | | 1,189,803 | |
Broadridge Financial Solutions, Inc.
3.950% 9/01/20 | | | 745,000 | | | | 791,591 | |
CA, Inc.
2.875% 8/15/18 | | | 835,000 | | | | 850,930 | |
CA, Inc.
5.375% 12/01/19 | | | 1,476,000 | | | | 1,630,012 | |
Microsoft Corp.
4.450% 11/03/45 | | | 2,260,000 | | | | 2,569,405 | |
Oracle Corp.
4.000% 7/15/46 | | | 3,930,000 | | | | 4,060,920 | |
| | | | | | | | |
| | | | | | | 11,092,661 | |
| | | | | | | | |
| Telecommunications — 1.1% | | | | | | | | |
AT&T, Inc.
4.750% 5/15/46 | | | 1,970,000 | | | | 2,061,516 | |
The accompanying notes are an integral part of the financial statements.
101
MassMutual Premier Core Bond Fund – Portfolio of Investments (Continued)
| | | | | | | | |
| | | Principal
Amount | | | Value | |
CenturyLink, Inc.
6.150% 9/15/19 | | $ | 760,000 | | | $ | 820,800 | |
Crown Castle Towers LLC (a)
6.113% 1/15/40 | | | 940,000 | | | | 1,041,755 | |
Deutsche Telekom International Finance BV
8.750% 6/15/30 | | | 290,000 | | | | 450,775 | |
Embarq Corp.
7.995% 6/01/36 | | | 200,000 | | | | 202,396 | |
Rogers Communications, Inc.
7.500% 8/15/38 | | | 160,000 | | | | 219,169 | |
Telefonica Emisiones SAU
5.462% 2/16/21 | | | 650,000 | | | | 738,111 | |
Turk Telekomunikasyon AS (a)
3.750% 6/19/19 | | | 1,510,000 | | | | 1,518,154 | |
Verizon Communications, Inc.
2.625% 2/21/20 | | | 1,866,000 | | | | 1,919,013 | |
Verizon Communications, Inc.
4.862% 8/21/46 | | | 1,366,000 | | | | 1,530,006 | |
Verizon Communications, Inc.
5.012% 8/21/54 | | | 1,222,000 | | | | 1,349,381 | |
Verizon Communications, Inc.
6.550% 9/15/43 | | | 1,218,000 | | | | 1,646,840 | |
| | | | | | | | |
| | | | | | | 13,497,916 | |
| | | | | | | | |
| Transportation — 0.4% | | | | | | | | |
Asciano Finance (a)
4.625% 9/23/20 | | | 845,000 | | | | 888,127 | |
Asciano Finance Ltd. (a)
5.000% 4/07/18 | | | 1,650,000 | | | | 1,706,661 | |
Autoridad del Canal de Panama (a)
4.950% 7/29/35 | | | 1,340,000 | | | | 1,520,900 | |
Burlington Northern Santa Fe LLC
6.750% 3/15/29 | | | 1,053,000 | | | | 1,438,812 | |
| | | | | | | | |
| | | | | | | 5,554,500 | |
| | | | | | | | |
Trucking & Leasing — 0.7% | | | | | | | | |
Aviation Capital Group Corp. (a)
2.875% 9/17/18 | | | 6,665,000 | | | | 6,748,312 | |
GATX Corp.
2.375% 7/30/18 | | | 1,175,000 | | | | 1,186,857 | |
GATX Corp.
4.750% 6/15/22 | | | 1,200,000 | | | | 1,337,736 | |
| | | | | | | | |
| | | | | | | 9,272,905 | |
| | | | | | | | |
| | |
TOTAL CORPORATE DEBT
(Cost $478,385,546) | | | | | | | 499,189,770 | |
| | | | | | | | |
|
| MUNICIPAL OBLIGATIONS — 1.1% | |
JobsOhio Beverage System Series B
4.532% 1/01/35 | | | 3,050,000 | | | | 3,553,555 | |
New York City Municipal Water Finance Authority BAB
5.882% 6/15/44 | | | 390,000 | | | | 560,044 | |
| | | | | | | | |
| | | Principal
Amount | | | Value | |
State of California BAB
7.550% 4/01/39 | | $ | 505,000 | | | $ | 808,712 | |
State of California BAB
7.600% 11/01/40 | | | 3,925,000 | | | | 6,362,935 | |
State of Illinois
5.365% 3/01/17 | | | 2,910,000 | | | | 2,956,764 | |
| | | | | | | | |
| | | | | | | 14,242,010 | |
| | | | | | | | |
| | |
TOTAL MUNICIPAL OBLIGATIONS
(Cost $12,744,208) | | | | | | | 14,242,010 | |
| | | | | | | | |
|
NON-U.S. GOVERNMENT
AGENCY OBLIGATIONS — 29.3% | |
| Auto Floor Plan ABS — 0.1% | | | | | | | | |
NCF Dealer Floorplan Master Trust, Series 2014-1A, Class A, 1 mo. LIBOR + 1.500%, FRN (a)
2.032% 10/20/20 | | | 1,630,000 | | | | 1,629,999 | |
| | | | | | | | |
| Automobile ABS — 1.7% | | | | | | | | |
American Credit Acceptance Receivables Trust, Series 2016-3, Class A (a)
1.700% 11/12/20 | | | 2,309,520 | | | | 2,307,536 | |
Avis Budget Rental Car Funding AESOP LLC, Series 2014-2A, Class A (a)
2.500% 2/20/21 | | | 1,600,000 | | | | 1,615,533 | |
Capital Automotive REIT,
Series 2012-1A, Class A (a)
4.700% 7/15/42 | | | 1,741,047 | | | | 1,774,816 | |
CFC LLC, Series 2014-2A, Class A (a)
1.440% 11/16/20 | | | 639,284 | | | | 636,622 | |
CPS Auto Trust, Series 2014-A, Class A (a)
1.210% 8/15/18 | | | 166,937 | | | | 166,656 | |
CPS Auto Trust, Series 2016-C, Class A (a)
1.620% 1/15/20 | | | 951,972 | | | | 950,781 | |
Credit Acceptance Auto Loan Trust,
Series 2016-2A, Class A (a)
2.420% 11/15/23 | | | 1,300,000 | | | | 1,304,123 | |
Drive Auto Receivables Trust,
Series 2016-BA, Class B (a)
2.560% 6/15/20 | | | 1,170,000 | | | | 1,179,403 | |
GLS Auto Receivables Trust,
Series 2015-1A, Class A (a)
2.250% 12/15/20 | | | 736,400 | | | | 735,404 | |
GO Financial Auto Securitization Trust, Series 2015-1, Class A (a)
1.810% 3/15/18 | | | 107,444 | | | | 107,396 | |
OneMain Direct Auto Receivables Trust, Series 2016-1A, Class A (a)
2.040% 1/15/21 | | | 1,327,616 | | | | 1,331,670 | |
The accompanying notes are an integral part of the financial statements.
102
MassMutual Premier Core Bond Fund – Portfolio of Investments (Continued)
| | | | | | | | |
| | | Principal
Amount | | | Value | |
Oscar US Funding Trust II,
Series 2015-1A, Class A4 (a)
2.440% 6/15/22 | | $ | 2,500,000 | | | $ | 2,470,350 | |
Oscar US Funding Trust IV,
Series 2016-1A, Class A2B, 1 mo.
USD LIBOR + 1.700%, FRN (a)
2.224% 7/15/20 | | | 1,912,007 | | | | 1,911,475 | |
Oscar US Funding Trust V,
Series 2016-2A, Class A4 (a)
2.990% 12/15/23 | | | 4,000,000 | | | | 3,998,927 | |
Santander Drive Auto Receivables Trust, Series 2015-S2, Class R1 (a)
1.840% 11/18/19 | | | 41,062 | | | | 41,025 | |
| | | | | | | | |
| | | | | | | 20,531,717 | |
| | | | | | | | |
| Commercial MBS — 3.8% | | | | | | | | |
Banc of America Commercial Mortgage, Inc., Series 2007-4, Class A4, VRN
5.938% 2/10/51 | | | 1,835,578 | | | | 1,875,464 | |
Banc of America Commercial Mortgage, Inc., Series 2008-1, Class AM, VRN
6.478% 2/10/51 | | | 1,445,000 | | | | 1,504,298 | |
Bear Stearns Commercial Mortgage Securities, Series 2006-PW14, Class A4
5.201% 12/11/38 | | | 961,388 | | | | 962,446 | |
Bear Stearns Commercial Mortgage Securities, Series 2006-PW14, Class AM
5.243% 12/11/38 | | | 1,295,000 | | | | 1,297,433 | |
Bear Stearns Commercial Mortgage Securities, Series 2007-T26, Class A4, VRN
5.471% 1/12/45 | | | 639,733 | | | | 644,626 | |
Bear Stearns Commercial Mortgage Securities, Series 2007-T26,
Class AM, VRN
5.513% 1/12/45 | | | 2,765,000 | | | | 2,787,091 | |
Bear Stearns Commercial Mortgage Securities, Series 2007-PW17,
Class A4, VRN
5.694% 6/11/50 | | | 899,807 | | | | 923,995 | |
Bear Stearns Commercial Mortgage Securities, Series 2007-PW18, Class A4
5.700% 6/11/50 | | | 1,994,189 | | | | 2,047,358 | |
Bear Stearns Commercial Mortgage Securities, Series 2007-T28,
Class AM, VRN
5.835% 9/11/42 | | | 1,170,000 | | | | 1,202,654 | |
| | | | | | | | |
| | | Principal
Amount | | | Value | |
Bear Stearns Commercial Mortgage Securities, Series 2007-PW18,
Class AM, VRN
6.084% 6/11/50 | | $ | 1,660,000 | | | $ | 1,709,291 | |
Commercial Mortgage Pass Through Certificates, Series 2014-UBS2, Class A5
3.961% 3/10/47 | | | 2,176,000 | | | | 2,398,620 | |
Commercial Mortgage Pass Through Certificates, Series 2015-CR23, Class C, VRN
4.398% 5/10/48 | | | 1,050,000 | | | | 980,644 | |
Commercial Mortgage Pass-Through Certificates, Series 2015-CR23, Class B, VRN
4.183% 5/10/48 | | | 1,200,000 | | | | 1,224,016 | |
Commercial Mortgage Pass-Through Certificates, Series 2007-C9, Class AM, VRN
5.650% 12/10/49 | | | 1,320,000 | | | | 1,351,098 | |
Commercial Mortgage Pass-Through Certificates, Series 2007-C9, Class A4, VRN
6.007% 12/10/49 | | | 3,348,229 | | | | 3,423,127 | |
DBCCRE Mortgage Trust,
Series 2014-ARCP, Class A (a)
4.238% 1/10/34 | | | 1,100,000 | | | | 1,173,960 | |
DBRR Trust, Series 2013-EZ3, Class A, VRN (a)
1.635% 12/18/49 | | | 132,620 | | | | 132,574 | |
DBUBS Mortgage Trust,
Series 2011-LC1A, Class A1 (a)
3.742% 11/10/46 | | | 9,225 | | | | 9,297 | |
DBUBS Mortgage Trust,
Series 2011-LC1A, Class B, VRN (a)
5.471% 11/10/46 | | | 860,000 | | | | 968,524 | |
GCCFC Commercial Mortgage Trust, Series 2006-GG7, Class AM, VRN
5.951% 7/10/38 | | | 1,573,730 | | | | 1,575,954 | |
GS Mortgage Securities Corp. II,
Series 2012-GC6, Class AS (a)
4.948% 1/10/45 | | | 800,000 | | | | 897,875 | |
JP Morgan Chase Commercial Mortgage Securities Corp., Series 2006-CB17, Class A4
5.429% 12/12/43 | | | 4,276 | | | | 4,273 | |
Merrill Lynch/Countrywide Commercial Mortgage Trust, Series 2006-4, Class AM
5.204% 12/12/49 | | | 513,666 | | | | 513,416 | |
ML-CFC Commercial Mortgage Trust, Series 2007-9, Class AM, VRN
5.856% 9/12/49 | | | 1,800,000 | | | | 1,851,472 | |
The accompanying notes are an integral part of the financial statements.
103
MassMutual Premier Core Bond Fund – Portfolio of Investments (Continued)
| | | | | | | | |
| | | Principal
Amount | | | Value | |
Morgan Stanley Capital I,
Series 2011-C2, Class B, VRN (a)
5.200% 6/15/44 | | $ | 825,000 | | | $ | 908,815 | |
Morgan Stanley Capital I,
Series 2006-IQ12, Class AM
5.370% 12/15/43 | | | 1,525,000 | | | | 1,527,286 | |
Morgan Stanley Capital I,
Series 2007-IQ14, Class A2
5.610% 4/15/49 | | | 343,843 | | | | 343,049 | |
Morgan Stanley Capital I,
Series 2008-T29, Class A4, VRN
6.477% 1/11/43 | | | 1,113,008 | | | | 1,165,048 | |
STRIPs Ltd., Series 2012-1A, Class A (a)
1.500% 12/25/44 | | | 114,901 | | | | 114,901 | |
TIAA Seasoned Commercial Mortgage Trust, Series 2007-C4, Class AJ, VRN
5.483% 8/15/39 | | | 322,333 | | | | 324,475 | |
VNO Mortgage Trust,
Series 2013-PENN, Class A (a)
3.808% 12/13/29 | | | 1,610,000 | | | | 1,727,867 | |
Wachovia Bank Commercial Mortgage Trust, Series 2007-C31, Class A4
5.509% 4/15/47 | | | 3,665,106 | | | | 3,701,656 | |
Wachovia Bank Commercial Mortgage Trust, Series 2007-C31, Class AM, VRN
5.591% 4/15/47 | | | 1,530,000 | | | | 1,550,359 | |
Wachovia Bank Commercial Mortgage Trust, Series 2007-C33, Class A4, VRN
6.158% 2/15/51 | | | 1,850,575 | | | | 1,876,602 | |
Wachovia Bank Commercial Mortgage Trust, Series 2007-C33, Class AM, VRN
6.158% 2/15/51 | | | 1,775,000 | | | | 1,813,460 | |
Wachovia Bank Commercial Mortgage Trust, Series 2006-C26, Class AM, VRN
6.285% 6/15/45 | | | 1,345,000 | | | | 1,352,290 | |
Wells Fargo Commercial Mortgage Trust, Series 2010-C1, Class A1 (a)
3.349% 11/15/43 | | | 209,922 | | | | 216,853 | |
| | | | | | | | |
| | | | | | | 48,082,167 | |
| | | | | | | | |
| Home Equity ABS — 0.6% | | | | | | | | |
ACE Securities Corp., Series 2005-AG1, Class A1B1, 1 mo. USD LIBOR + .270%, FRN
0.795% 8/25/35 | | | 249,694 | | | | 249,499 | |
| | | | | | | | |
| | | Principal
Amount | | | Value | |
Citigroup Mortgage Loan Trust, Series 2005-OPT4, Class M2, 1 mo. USD LIBOR + ..430%, FRN
0.955% 7/25/35 | | $ | 157,622 | | | $ | 156,840 | |
Countrywide Asset-Backed Certificates, Series 2004-5, Class 3A, 1 mo. USD LIBOR + .460%, FRN
0.985% 9/25/34 | | | 254,614 | | | | 251,728 | |
Countrywide Partnership Trust,
Series 2004-EC1, Class M1, 1 mo. USD LIBOR + .900%, FRN
1.425% 2/25/35 | | | 773,329 | | | | 629,155 | |
First Franklin Mortgage Loan Trust, Series 2005-FF6, Class M1, 1 mo. USD LIBOR + .630%, FRN
1.155% 5/25/36 | | | 504,803 | | | | 502,809 | |
Fremont Home Loan Trust, Series 2005-E, Class 2A3, 1 mo. USD LIBOR + .240%, FRN
0.765% 1/25/36 | | | 214,996 | | | | 213,303 | |
GSAMP Trust, Series 2005-AHL,
Class M1, 1 mo. USD LIBOR +
.645%, FRN
1.170% 4/25/35 | | | 283,408 | | | | 283,620 | |
Home Equity Asset Trust,
Series 2006-4, Class 2A3, 1 mo.
USD LIBOR + .170%, FRN
0.695% 8/25/36 | | | 157,122 | | | | 157,128 | |
Long Beach Mortgage Loan Trust,
Series 2005-WL1, Class M2, 1 mo.
USD LIBOR + .825%, FRN
1.350% 6/25/35 | | | 1,383,073 | | | | 1,371,012 | |
MASTR Asset-Backed Securities Trust, Series 2005-WMC1, Class M3, 1 mo. USD LIBOR + .720%, FRN
1.245% 3/25/35 | | | 1,601,087 | | | | 1,595,488 | |
New Century Home Equity Loan Trust,
Series 1997-NC5, Class A6, STEP
6.620% 10/25/28 | | | 107 | | | | 110 | |
NovaStar Mortgage Funding Trust,
Series 2005-3, Class A2D, 1 mo.
LIBOR + .370%, FRN
0.895% 1/25/36 | | | 1,064,552 | | | | 1,057,833 | |
Park Place Securities, Inc.,
Series 2005-WHQ4, Class A1A, 1 mo. USD LIBOR + .260%, FRN
0.785% 9/25/35 | | | 322,111 | | | | 322,258 | |
Park Place Securities, Inc.,
Series 2005-WCW3, Class A2C, 1 mo. USD LIBOR + .380%, FRN
0.905% 8/25/35 | | | 17,963 | | | | 17,955 | |
The accompanying notes are an integral part of the financial statements.
104
MassMutual Premier Core Bond Fund – Portfolio of Investments (Continued)
| | | | | | | | |
| | | Principal
Amount | | | Value | |
Park Place Securities, Inc.,
Series 2005-WHQ1, Class M2, 1 mo. USD LIBOR + .750%, FRN
1.275% 3/25/35 | | $ | 68,411 | | | $ | 68,443 | |
Structured Asset Investment Loan Trust, Series 2005-7, Class A5, 1 mo. USD LIBOR + .720%, FRN
1.245% 8/25/35 | | | 9,364 | | | | 9,368 | |
| | | | | | | | |
| | | | | | | 6,886,549 | |
| | | | | | | | |
| Other ABS — 14.9% | | | | | | | | |
321 Henderson Receivables I LLC,
Series 2007-1A, Class A1, 1 mo. USD LIBOR + .200%, FRN (a)
0.724% 3/15/42 | | | 757,262 | | | | 722,359 | |
321 Henderson Receivables I LLC,
Series 2015-1A, Class A (a)
3.260% 9/15/72 | | | 608,087 | | | | 609,255 | |
Aames Mortgage Investment Trust,
Series 2004-1, Class M5, 1 mo. USD LIBOR + 1.725%, FRN
2.249% 1/25/35 | | | 1,527,379 | | | | 1,523,086 | |
AIMCO CLO Ltd., Series 2014-AA, Class A, 3 mo. USD LIBOR + 1.540%, FRN (a)
2.236% 7/20/26 | | | 2,500,000 | | | | 2,502,390 | |
ALM VII Ltd., Series 2012-7A,
Class A1R, 3 mo. USD LIBOR + 1.480%, FRN (a)
1.000% 10/15/28 | | | 2,850,000 | | | | 2,850,000 | |
ALM VIII Ltd., Series 2013-8A,
Class A1R, 3 mo. LIBOR + 1.490%, FRN (a)
1.000% 10/15/28 | | | 1,490,000 | | | | 1,490,000 | |
ALM VIII Ltd., Series 2013-8A,
Class A1A, 3 mo. LIBOR + 1.450%, FRN (a)
2.146% 1/20/26 | | | 1,590,000 | | | | 1,589,986 | |
ALM XIV Ltd., Series 2014-14A, Class A1, 3 mo. USD LIBOR + 1.430%, FRN (a)
2.173% 7/28/26 | | | 2,400,000 | | | | 2,399,995 | |
Alterna Funding I LLC,
Series 2014-1A, Class NOTE (a)
1.639% 2/15/21 | | | 824,675 | | | | 804,058 | |
Apidos CLO XV, Series 2013-15A, Class A1, 3 mo. USD LIBOR + 1.350%, FRN (a)
2.046% 10/20/25 | | | 1,000,000 | | | | 1,000,008 | |
Applebee’s/IHOP Funding LLC, Series 2014-1, Class A2 (a)
4.277% 9/05/44 | | | 1,580,000 | | | | 1,605,794 | |
| | | | | | | | |
| | | Principal
Amount | | | Value | |
Arbys Funding LLC, Series 2015-1A, Class A2 (a)
4.969% 10/30/45 | | $ | 2,183,500 | | | $ | 2,279,028 | |
ARL Second LLC, Series 2014-1A, Class A1 (a)
2.920% 6/15/44 | | | 994,665 | | | | 978,645 | |
Atlas Senior Loan Fund V Ltd., Series 2014-1A, Class A, 3 mo. USD LIBOR + 1.550%, FRN (a)
2.229% 7/16/26 | | | 1,000,000 | | | | 1,000,036 | |
Avery Point CLO Ltd.,
Series 2014-5A, Class A, 3 mo. USD LIBOR + 1.460%, FRN (a)
2.139% 7/17/26 | | | 2,500,000 | | | | 2,500,025 | |
Avery Point III CLO Ltd.,
Series 2013-3A, Class A, 3 mo. USD LIBOR + 1.400%, FRN (a)
2.079% 1/18/25 | | | 1,400,000 | | | | 1,400,004 | |
Avery Point VI CLO Ltd.,
Series 2015-6A, Class A, 3 mo. USD LIBOR + 1.450%, FRN (a)
2.228% 8/05/27 | | | 4,225,000 | | | | 4,228,034 | |
BCC Funding VIII LLC,
Series 2014-1A, Class A (a)
1.794% 6/20/20 | | | 209,086 | | | | 208,301 | |
Birchwood Park CLO Ltd.,
Series 2014-1A, Class A, 3 mo. USD LIBOR + 1.440%, FRN (a)
2.120% 7/15/26 | | | 2,415,000 | | | | 2,415,198 | |
Blue Hill CLO Ltd., Series 2013-1A, Class A, 3 mo. USD LIBOR + 1.480%, FRN (a)
2.160% 1/15/26 | | | 1,400,000 | | | | 1,400,419 | |
BlueMountain CLO Ltd.,
Series 2013-2A, Class A, 3 mo. USD LIBOR + 1.200%, FRN (a)
1.902% 1/22/25 | | | 1,100,000 | | | | 1,097,290 | |
BlueMountain CLO Ltd.,
Series 2015-2A, Class A1, 3 mo. USD LIBOR + 1.430%, FRN (a)
2.109% 7/18/27 | | | 2,855,000 | | | | 2,860,539 | |
BlueMountain CLO Ltd.,
Series 2013-3A, Class A, 3 mo. USD LIBOR + 1.400%, FRN (a)
2.152% 10/29/25 | | | 725,000 | | | | 725,032 | |
BlueVirgo Trust, Series 2015-1A, Class NOTE (a)
3.000% 12/15/22 | | | 2,932,337 | | | | 2,963,390 | |
CAN Capital Funding LLC,
Series 2014-1A, Class A (a)
3.117% 4/15/20 | | | 1,700,000 | | | | 1,685,204 | |
The accompanying notes are an integral part of the financial statements.
105
MassMutual Premier Core Bond Fund – Portfolio of Investments (Continued)
| | | | | | | | |
| | | Principal
Amount | | | Value | |
Capital Automotive REIT,
Series 2014-1A, Class A (a)
3.660% 10/15/44 | | $ | 1,100,000 | | | $ | 1,102,698 | |
Carlyle Global Market Strategies, Series 2014-1A, Class A, 3 mo. USD LIBOR + 1.520%, FRN (a)
2.199% 4/17/25 | | | 3,765,000 | | | | 3,765,098 | |
Cazenovia Creek Funding I LLC, Series 2015-1A, Class A (a)
2.000% 12/10/23 | | | 1,035,061 | | | | 1,027,782 | |
Citi Held For Asset Issuance, Series 2015-PM1, Class A (a)
1.850% 12/15/21 | | | 207,247 | | | | 206,867 | |
CKE Restaurant Holdings, Inc., Series 2013-1A, Class A2 (a)
4.474% 3/20/43 | | | 1,264,913 | | | | 1,269,061 | |
CLI Funding V LLC, Series 2014-1A, Class A (a)
3.290% 6/18/29 | | | 1,468,783 | | | | 1,431,155 | |
Consumer Installment Loan Trust, Series 2016-LD1, Class A (a)
3.960% 7/15/22 | | | 1,461,752 | | | | 1,468,814 | |
Consumers Securitization Funding LLC, Series 2014-A, Class A2
2.962% 11/01/25 | | | 1,300,000 | | | | 1,367,991 | |
Cronos Containers Program I Ltd., Series 2014-2A, Class A (a)
3.270% 11/18/29 | | | 875,926 | | | | 851,684 | |
DB Master Finance LLC,
Series 2015-1A, Class A2I (a)
3.262% 2/20/45 | | | 2,561,000 | | | | 2,583,493 | |
Diamond Resorts Owner Trust, Series 2014-1, Class A (a)
2.540% 5/20/27 | | | 503,208 | | | | 503,617 | |
Diamond Resorts Owner Trust, Series 2015-1, Class A (a)
2.730% 7/20/27 | | | 554,397 | | | | 557,640 | |
Diamond Resorts Owner Trust, Series 2015-2, Class A (a)
2.990% 5/22/28 | | | 1,524,362 | | | | 1,552,749 | |
Domino’s Pizza Master Issuer LLC, Series 2015-1A, Class A2I (a)
3.484% 10/25/45 | | | 3,533,300 | | | | 3,563,110 | |
Domino’s Pizza Master Issuer LLC, Series 2015-1A, Class A2II (a)
4.474% 10/25/45 | | | 3,721,875 | | | | 3,772,498 | |
Domino’s Pizza Master Issuer LLC, Series 2012-1A, Class A2 (a)
5.216% 1/25/42 | | | 1,922,285 | | | | 1,973,995 | |
Drug Royalty Corp., Inc.,
Series 2014-1, Class A2 (a)
3.484% 7/15/23 | | | 515,819 | | | | 517,670 | |
| | | | | | | | |
| | | Principal
Amount | | | Value | |
Drug Royalty Corp., Inc.,
Series 2012-1, Class A2 (a)
5.800% 7/15/24 | | $ | 253,077 | | | $ | 256,577 | |
Dryden XXXI Senior Loan Fund, Series 2014-31A, Class A, 3 mo. USD LIBOR + 1.350%, FRN (a)
2.029% 4/18/26 | | | 3,530,000 | | | | 3,529,986 | |
Eaton Vance CLO, Series 2014-1A, Class A, 3 mo. USD LIBOR + 1.450%, FRN (a)
2.130% 7/15/26 | | | 3,300,000 | | | | 3,297,789 | |
Elara HGV Timeshare Issuer LLC, Series 2016-A, Class A (a)
2.810% 4/25/28 | | | 2,898,047 | | | | 2,896,800 | |
Element Rail Leasing II LLC, Series 2015-1A, Class A1 (a)
2.707% 2/19/45 | | | 650,049 | | | | 635,216 | |
Element Rail Leasing II LLC, Series 2016-1A, Class A1 (a)
3.968% 3/19/46 | | | 1,624,220 | | | | 1,636,200 | |
Entegry New Orleans Storm Recovery Funding I LLC, Series 2015-1, Class A
2.670% 6/01/27 | | | 812,515 | | | | 843,386 | |
Fairway Outdoor Funding LLC, Series 2012-1A, Class A2 (a)
4.212% 10/15/42 | | | 3,000,904 | | | | 3,044,294 | |
First Franklin Mortgage Loan Trust, Series 2005-FF7, Class M1, 1 mo. USD LIBOR + .450%, FRN
0.975% 7/25/35 | | | 98,306 | | | | 98,271 | |
First Franklin Mortgage Loan Trust, Series 2005-FF2, Class M3, 1 mo. USD LIBOR + .720%, FRN
1.245% 3/25/35 | | | 639,144 | | | | 636,109 | |
Galaxy XX CLO Ltd.,
Series 2015-20A, Class A, 3 mo. USD LIBOR + 1.450%, FRN (a)
2.146% 7/20/27 | | | 3,170,000 | | | | 3,168,707 | |
Global Container Assets Ltd., Series 2015-1A, Class A2 (a)
3.450% 2/05/30 | | | 1,389,108 | | | | 1,318,123 | |
Global SC Finance II SRL, Series 2014-1A, Class A1 (a)
3.190% 7/17/29 | | | 391,667 | | | | 377,664 | |
Global SC Funding One Ltd., Series 2015-1, Class B1 (a)
2.740% 1/18/30 | | | 291,995 | | | | 287,651 | |
GoldenTree Loan Opportunities VII Ltd., Series 2013-7A, Class A, 3 mo. USD LIBOR + 1.150%, FRN (a)
1.865% 4/25/25 | | | 4,060,000 | | | | 4,038,835 | |
The accompanying notes are an integral part of the financial statements.
106
MassMutual Premier Core Bond Fund – Portfolio of Investments (Continued)
| | | | | | | | |
| | | Principal
Amount | | | Value | |
GoldenTree Loan Opportunities VII Ltd., Series 2014-8A, Class A, 3 mo. USD LIBOR + 1.450%, FRN (a)
2.138% 4/19/26 | | $ | 2,670,000 | | | $ | 2,670,104 | |
GSAMP Trust, Series 2005-HE5, Class M1, 1 mo. USD LIBOR + .420%, FRN
0.945% 11/25/35 | | | 539,626 | | | | 536,344 | |
Hercules Capital Funding Trust, Series 2014-1A, Class A (a)
3.524% 4/16/21 | | | 904,906 | | | | 902,078 | |
HERO Funding Trust, Series 2016-3A, Class A1 (a)
3.080% 9/20/42 | | | 2,280,000 | | | | 2,280,000 | |
Hilton Grand Vacations Trust, Series 2013-A, Class A (a)
2.280% 1/25/26 | | | 507,958 | | | | 508,899 | |
Icon Brand Holdings LLC,
Series 2012-1A, Class A (Acquired 11/16/12-7/29/14, Cost $2,894,295) (a) (b)
4.229% 1/25/43 | | | 1,753,620 | | | | 1,597,390 | |
ING Investment Management CLO Ltd., Series 2013-3A, Class A1, 3 mo. USD LIBOR + 1.450%, FRN (a)
2.129% 1/18/26 | | | 2,025,000 | | | | 2,022,129 | |
J.G. Wentworth XXXV LLC, Series 2015-2A, Class A (a)
3.870% 3/15/58 | | | 789,880 | | | | 816,951 | |
LCM Ltd., Series 16A, Class A, 3 mo. USD LIBOR + 1.500%, FRN (a)
2.180% 7/15/26 | | | 3,200,000 | | | | 3,211,923 | |
LCM XIV LP, Series 14A, Class A, 3 mo. USD LIBOR + 1.150%, FRN (a)
1.830% 7/15/25 | | | 1,200,000 | | | | 1,198,595 | |
Leaf Receivables Funding LLC, Series 2016-1, Class A1 (a)
1.000% 6/15/17 | | | 2,788,763 | | | | 2,788,776 | |
Long Beach Mortgage Loan Trust, Series 2005-1, Class M2, 1 mo. USD LIBOR + .795%, FRN
1.320% 2/25/35 | | | 752,567 | | | | 746,625 | |
Madison Park Funding XII Ltd., Series 2014-12A, Class A, 3 mo. USD LIBOR + 1.500%, FRN (a) 2.196% 7/20/26 | | | 3,200,000 | | | | 3,200,093 | |
Madison Park Funding XIV Ltd., Series 2014-14A, Class A2, 3 mo. USD LIBOR + 1.450%, FRN (a)
2.146% 7/20/26 | | | 2,585,000 | | | | 2,585,075 | |
Marlette Funding Trust, Series 2016-1A, Class A (a)
3.060% 1/17/23 | | | 3,007,863 | | | | 3,008,847 | |
| | | | | | | | |
| | | Principal
Amount | | | Value | |
Marriott Vacation Club Owner Trust, Series 2012-1A, Class A (a)
2.510% 5/20/30 | | $ | 693,596 | | | $ | 691,607 | |
Miramax LLC, Series 2014-1A, Class A2 (a)
3.340% 7/20/26 | | | 1,346,936 | | | | 1,350,381 | |
Morgan Stanley ABS Capital I, Inc. Trust, Series 2005-WMC6, Class M2, 1 mo. USD LIBOR + .750%, FRN
1.275% 7/25/35 | | | 533,782 | | | | 537,469 | |
MVW Owner Trust, Series 2014-2, Class A (a)
2.250% 9/22/31 | | | 1,650,983 | | | | 1,651,717 | |
MVW Owner Trust, Series 2016-1A, Class A (a)
2.250% 12/20/33 | | | 817,903 | | | | 816,321 | |
MVW Owner Trust, Series 2015-1A, Class A (a)
2.520% 12/20/32 | | | 1,441,045 | | | | 1,448,447 | |
Nations Equipment Finance Funding II LLC, Series 2014-1A, Class A (a)
1.558% 7/20/18 | | | 403,674 | | | | 403,450 | |
Nomad CLO Ltd., Series 2013-1A, Class A1, 3 mo. USD LIBOR + 1.200%, FRN (a)
1.880% 1/15/25 | | | 2,575,000 | | | | 2,567,571 | |
Oak Hill Credit Partners VIII Ltd., Series 2013-8A, Class A, 3 mo. USD LIBOR + 1.120%, FRN (a)
1.816% 4/20/25 | | | 2,410,000 | | | | 2,392,474 | |
OHA Loan Funding Ltd., Series 2013-1A, Class A, 3 mo. USD LIBOR + 1.250%, FRN (a)
1.965% 7/23/25 | | | 1,930,000 | | | | 1,927,306 | |
OnDeck Asset Securitization Trust II LLC, Series 2016-1A, Class A (a)
4.210% 5/17/20 | | | 970,000 | | | | 968,801 | |
Orange Lake Timeshare Trust, Series 2014-AA, Class A (a)
2.290% 7/09/29 | | | 419,814 | | | | 422,207 | |
Oxford Finance Funding Trust, Series 2014-1A, Class A (a)
3.475% 12/15/22 | | | 800,000 | | | | 791,361 | |
Oxford Finance Funding Trust, Series 2016-1A, Class A (a)
3.968% 6/17/24 | | | 1,500,000 | | | | 1,507,535 | |
Race Point VIII CLO Ltd.,
Series 2013-8A, Class A, 3 mo.
USD LIBOR + 1.250%, FRN (a)
2.061% 2/20/25 | | | 700,000 | | | | 698,428 | |
Race Point VIII CLO Ltd.,
Series 2012-7A, Class A, 3 mo.
USD LIBOR + 1.420%, FRN (a)
2.208% 11/08/24 | | | 1,300,000 | | | | 1,299,067 | |
The accompanying notes are an integral part of the financial statements.
107
MassMutual Premier Core Bond Fund – Portfolio of Investments (Continued)
| | | | | | | | |
| | | Principal
Amount | | | Value | |
Residential Asset Mortgage Products,
Inc., Series 2005-EFC5, Class M1,
1 mo. USD LIBOR + .400%, FRN
0.925% 10/25/35 | | $ | 706,068 | | | $ | 705,184 | |
Sierra Receivables Funding Co. LLC,
Series 2014-1A, Class A (a)
2.070% 3/20/30 | | | 520,440 | | | | 516,402 | |
Sierra Receivables Funding Co. LLC,
Series 2013-2A, Class A (a)
2.280% 11/20/25 | | | 1,389,548 | | | | 1,393,108 | |
Sierra Receivables Funding Co. LLC,
Series 2016-2A, Class A (a)
2.330% 7/20/33 | | | 1,960,056 | | | | 1,959,009 | |
Sierra Receivables Funding Co. LLC,
Series 2012-1A, Class A (a)
2.840% 11/20/28 | | | 158,879 | | | | 159,230 | |
Sierra Receivables Funding Co. LLC,
Series 2015-3A, Class B (a)
3.080% 9/20/32 | | | 488,658 | | | | 489,060 | |
SoFi Consumer Loan Program LLC,
Series 2016-2A, Class A (a)
3.090% 10/27/25 | | | 4,880,000 | | | | 4,903,634 | |
SoFi Consumer Loan Program LLC,
Series 2016-1A, Class A (a)
3.260% 8/25/25 | | | 4,538,490 | | | | 4,559,992 | |
Spirit Master Funding LLC,
Series 2014-4A, Class A1 (a)
3.501% 1/20/45 | | | 1,100,000 | | | | 1,068,139 | |
SpringCastle America Funding LLC,
Series 2014-AA, Class A (a)
2.700% 5/25/23 | | | 3,449,531 | | | | 3,450,609 | |
SpringCastle America Funding LLC,
Series 2016-AA, Class A (a)
3.050% 4/25/29 | | | 1,800,000 | | | | 1,799,931 | |
SPS Servicer Advance Receivables Trust,
Series 2015-T3, Class AT3 (a)
2.920% 7/15/47 | | | 1,450,000 | | | | 1,453,332 | |
Structured Asset Securities Corp.,
Series 2007-BC4, Class A3, 1 mo.
USD LIBOR + .250%, FRN
0.775% 11/25/37 | | | 62,534 | | | | 62,507 | |
Structured Receivables Finance LLC,
Series 2010-B, Class A (a)
3.730% 8/15/36 | | | 438,094 | | | | 447,902 | |
Symphony CLO XV Ltd.,
Series 2014-15A, Class A, 3 mo.
USD LIBOR + 1.450%, FRN (a)
2.129% 10/17/26 | | | 3,100,000 | | | | 3,100,050 | |
Taco Bell Funding LLC, Series 2016-1A, Class A2I (a)
3.832% 5/25/46 | | | 2,650,000 | | | | 2,692,883 | |
| | | | | | | | |
| | | Principal
Amount | | | Value | �� |
TCI-Symphony CLO Ltd.,
Series 2016-1A, Class A, 3 mo.
USD LIBOR + 1.480%, FRN (a) (c)
2.399% 10/13/29 | | $ | 2,340,000 | | | $ | 2,340,000 | |
Textainer Marine Containers III Ltd.,
Series 2014-1A, Class A (a)
3.270% 10/20/39 | | | 460,750 | | | | 447,707 | |
Trinity Rail Leasing 2012 LLC,
Series 2013-1A, Class A (a)
3.898% 7/15/43 | | | 817,995 | | | | 813,717 | |
Trip Rail Master Funding LLC,
Series 2011-1A, Class A1A (a)
4.370% 7/15/41 | | | 723,685 | | | | 730,319 | |
Wendys Funding LLC,
Series 2015-1A, Class A2I (a)
3.371% 6/15/45 | | | 3,564,000 | | | | 3,580,109 | |
Wendys Funding LLC,
Series 2015-1A, Class A2II (a)
4.080% 6/15/45 | | | 2,311,650 | | | | 2,346,961 | |
Wendys Funding LLC,
Series 2015-1A, Class A23 (a)
4.497% 6/15/45 | | | 3,168,000 | | | | 3,167,317 | |
| | | | | | | | |
| | | | | | | 186,154,679 | |
| | | | | | | | |
| Student Loans ABS — 7.1% | | | | | | | | |
Academic Loan Funding Trust,
Series 2012-1A, Class A2, 1 mo.
USD LIBOR + 1.100%, FRN (a)
1.625% 12/27/44 | | | 1,350,000 | | | | 1,298,114 | |
Access Group, Inc., Series 2005-2,
Class A3, 3 mo. USD LIBOR +
.180%, FRN
0.991% 11/22/24 | | | 600,366 | | | | 595,445 | |
Access Group, Inc., Series 2003-A,
Class A3, 3 mo. Treasury + 1.200%, FRN
1.515% 7/01/38 | | | 655,890 | | | | 596,055 | |
College Loan Corp. Trust I,
Series 2007-1, Class B2, 28 day
ARS, FRN
0.413% 1/25/47 | | | 875,000 | | | | 654,090 | |
College Loan Corp. Trust I,
Series 2002-2, Class A29, 28 day
ARS, FRN (a)
1.566% 3/01/42 | | | 950,000 | | | | 854,648 | |
DRB Prime Student Loan Trust,
Series 2015-B, Class A1, 1 mo.
USD LIBOR + 1.900%, FRN (a)
2.425% 10/27/31 | | | 451,621 | | | | 454,152 | |
DRB Prime Student Loan Trust,
Series 2016-A, Class A1, 1 mo.
USD LIBOR + 2.000%, FRN (a)
2.524% 4/25/40 | | | 1,253,393 | | | | 1,249,905 | |
The accompanying notes are an integral part of the financial statements.
108
MassMutual Premier Core Bond Fund – Portfolio of Investments (Continued)
| | | | | | | | |
| | | Principal
Amount | | | Value | |
DRB Prime Student Loan Trust,
Series 2016-B, Class A2 (a)
2.890% 6/25/40 | | $ | 2,387,165 | | | $ | 2,383,220 | |
DRB Prime Student Loan Trust,
Series 2015-D, Class A2 (a)
3.200% 1/25/40 | | | 2,722,342 | | | | 2,781,257 | |
Earnest Student Loan Program LLC,
Series 2016-C, Class A1, 1 mo.
USD LIBOR + 1.850%, FRN (a)
2.326% 10/27/36 | | | 5,449,957 | | | | 5,449,971 | |
Earnest Student Loan Program LLC,
Series 2016-B, Class A2 (a)
3.020% 5/25/34 | | | 2,190,905 | | | | 2,190,856 | |
ECMC Group Student Loan Trust,
Series 2016-1A, Class A, 1 mo.
USD LIBOR + 1.350%, FRN (a)
1.864% 7/26/66 | | | 5,160,000 | | | | 5,159,916 | |
Education Funding Capital Trust I,
Series 2004-1, Class A4, 28 day ARS,
FRN
1.934% 6/15/43 | | | 2,600,000 | | | | 2,588,394 | |
Education Funding Capital Trust I,
Series 2004-1, Class B1, 28 day ARS,
FRN
1.943% 6/15/43 | | | 700,000 | | | | 647,511 | |
Education Funding Capital Trust I,
Series 2004-1, Class A5, 28 day ARS,
FRN
1.943% 6/15/43 | | | 2,475,000 | | | | 2,418,852 | |
Education Funding Capital Trust I,
Series 2004-1, Class A6, 28 day ARS,
FRN
1.943% 6/15/43 | | | 1,700,000 | | | | 1,652,048 | |
Education Loan Asset-Backed Trust I,
Series 2003-2, Class 2A1, 28 day ARS, FRN (a)
1.933% 8/01/43 | | | 1,950,000 | | | | 1,809,255 | |
Education Loan Asset-Backed Trust I,
Series 2003-1, Class A2, 28 day ARS,
FRN (a)
2.020% 2/01/43 | | | 1,300,000 | | | | 1,217,160 | |
Higher Education Funding I,
Series 2004-1, Class B2, 28 day ARS,
FRN (a)
1.918% 1/01/44 | | | 600,000 | | | | 483,341 | |
Higher Education Funding I,
Series 2004-1, Class B1, 28 day ARS,
FRN (a)
1.932% 1/01/44 | | | 600,000 | | | | 520,232 | |
National Collegiate Student Loan Trust,
Series 2006-3, Class A3, 1 mo.
USD LIBOR + .150%, FRN
0.675% 10/25/27 | | | 347,735 | | | | 347,035 | |
| | | | | | | | |
| | | Principal
Amount | | | Value | |
National Collegiate Student Loan Trust, Series 2005-1, Class A4, 1 mo. USD LIBOR + .240%, FRN
0.765% 11/27/28 | | $ | 580,988 | | | $ | 575,462 | |
Navient Student Loan Trust, Series 2016-5A, Class A, 1 mo. USD LIBOR + 1.250%, FRN (a)
1.000% 6/25/65 | | | 3,703,176 | | | | 3,703,186 | |
Navient Student Loan Trust, Series 2016-1A, Class A, 1 mo. USD LIBOR + .700%, FRN (a)
1.225% 2/25/70 | | | 4,134,546 | | | | 4,021,027 | |
Navient Student Loan Trust, Series 2014-1, Class A4, 1 mo. USD LIBOR + .750%, FRN
1.275% 2/25/39 | | | 3,300,000 | | | | 3,076,599 | |
Navient Student Loan Trust, Series 2015-3, Class B, 1 mo. USD LIBOR + 1.500%, FRN
2.025% 10/25/58 | | | 1,200,000 | | | | 975,830 | |
Nelnet Student Loan Trust, Series 2005-1, Class A5, 3 mo. USD LIBOR + .110%, FRN
0.825% 10/25/33 | | | 1,393,584 | | | | 1,303,560 | |
Nelnet Student Loan Trust, Series 2005-2, Class A5, 3 mo. USD LIBOR + .100%, FRN
0.966% 3/23/37 | | | 1,500,000 | | | | 1,416,793 | |
Nelnet Student Loan Trust, Series 2013-5A, Class A, 1 mo. USD LIBOR + .630%, FRN (a)
1.155% 1/25/37 | | | 2,737,351 | | | | 2,662,342 | |
Nelnet Student Loan Trust, Series 2015-3A, Class B, 1 mo. USD LIBOR + 1.500%, FRN (a)
2.024% 7/27/50 | | | 1,100,000 | | | | 948,875 | |
Nelnet Student Loan Trust, Series 2014-5A, Class B, 1 mo. USD LIBOR + 1.500%, FRN (a)
2.025% 5/25/49 | | | 1,200,000 | | | | 1,051,629 | |
Nelnet Student Loan Trust, Series 2015-2A, Class B, 1 mo. USD LIBOR + 1.500%, FRN (a)
2.025% 5/25/49 | | | 1,130,000 | | | | 971,238 | |
Nelnet Student Loan Trust, Series 2014-3A, Class B, 1 mo. USD LIBOR + 1.500%, FRN (a)
2.025% 10/25/50 | | | 850,000 | | | | 744,998 | |
SLC Private Student Loan Trust, Series 2006-A, Class A5, 3 mo. USD LIBOR + .170%, FRN
0.850% 7/15/36 | | | 517,524 | | | | 515,712 | |
The accompanying notes are an integral part of the financial statements.
109
MassMutual Premier Core Bond Fund – Portfolio of Investments (Continued)
| | | | | | | | |
| | | Principal
Amount | | | Value | |
SLC Private Student Loan Trust,
Series 2006-A, Class C, 3 mo. USD LIBOR + .450%, FRN
1.130% 7/15/36 | | $ | 1,700,000 | | | $ | 1,528,650 | |
SLC Student Loan Trust, Series 2006-A, Class B, 3 mo. USD LIBOR + .300%, FRN
0.980% 7/15/36 | | | 697,000 | | | | 678,183 | |
SLM Student Loan Trust, Series 2005-5, Class A4, 3 mo. USD LIBOR + .140%, FRN
0.855% 10/25/28 | | | 2,300,000 | | | | 2,173,940 | |
SLM Student Loan Trust, Series 2007-3, Class B, 3 mo. USD LIBOR + .150%, FRN
0.865% 1/25/28 | | | 2,600,000 | | | | 1,872,045 | |
SLM Student Loan Trust, Series 2005-8, Class B, 3 mo. USD LIBOR + .310%, FRN
1.025% 1/25/40 | | | 2,086,751 | | | | 1,782,734 | |
SLM Student Loan Trust, Series 2013-2, Class B, 1 mo. USD LIBOR + 1.500%, FRN
2.025% 6/25/43 | | | 1,970,000 | | | | 1,709,885 | |
SLM Student Loan Trust, Series 2003-5, Class A7, 28 day ARS, FRN
3.007% 6/17/30 | | | 450,000 | | | | 450,000 | |
SLM Student Loan Trust,
Series 2003-2, Class A7, 28 day ARS, FRN
3.022% 9/15/28 | | | 600,000 | | | | 600,000 | |
SLM Student Loan Trust,
Series 2002-7, Class A11, 28 day ARS, FRN
3.030% 3/15/28 | | | 1,700,000 | | | | 1,700,000 | |
SMB Private Education Loan Trust, Series 2016-B, Class A2A (a)
2.430% 2/17/32 | | | 1,750,000 | | | | 1,771,640 | |
SMB Private Education Loan Trust, Series 2016-A, Class A2A (a)
2.700% 5/15/31 | | | 3,250,000 | | | | 3,271,974 | |
SoFi Professional Loan Program LLC, Series 2016-B, Class A1, 1 mo. USD LIBOR + 1.200%, FRN (a)
1.725% 6/25/33 | | | 2,991,896 | | | | 2,991,895 | |
SoFi Professional Loan Program LLC, Series 2016-C, Class A2B (a)
2.360% 12/27/32 | | | 630,000 | | | | 624,676 | |
SoFi Professional Loan Program LLC, Series 2016-B, Class A2B (a)
2.740% 10/25/32 | | | 2,200,000 | | | | 2,258,849 | |
| | | | | | | | |
| | | Principal
Amount | | | Value | |
SoFi Professional Loan Program LLC, Series 2016-A, Class A2 (a)
2.760% 12/26/36 | | $ | 3,236,235 | | | $ | 3,285,658 | |
South Carolina Student Loan Corp., Series 2014-1, Class A2, 1 mo. USD LIBOR + 1.000%, FRN
1.523% 1/03/33 | | | 2,030,000 | | | | 1,961,266 | |
South Carolina Student Loan Corp., Series 2014-1, Class B, 1 mo. USD LIBOR + 1.500%, FRN
2.023% 8/01/35 | | | 1,300,000 | | | | 1,115,724 | |
South Texas Higher Education Authority, Inc., Series 2012-1, Class A3, 3 mo. USD LIBOR + ..850%, FRN
1.496% 10/01/46 | | | 2,000,000 | | | | 1,925,636 | |
| | | | | | | | |
| | | | | | | 89,021,463 | |
| | | | | | | | |
| WL Collateral CMO — 1.1% | | | | | | | | |
Bank of America Mortgage Securities, Series 2004-G, Class 2A7, FRN
3.301% 8/25/34 | | | 297,869 | | | | 291,664 | |
Connecticut Avenue Securities, Series 2015-C03, Class 1M1, 1 mo. USD LIBOR + 1.500%, FRN
2.025% 7/25/25 | | | 2,238,607 | | | | 2,243,177 | |
Countrywide Home Loans, Inc., Series 2004-2, Class 1A1, FRN
2.953% 2/25/34 | | | 84,094 | | | | 80,844 | |
Countrywide Home Loans, Inc., Series 2003-42, Class 1A1, FRN
3.294% 9/25/33 | | | 34,022 | | | | 32,068 | |
Federal Home Loan Mortgage Corp. Structured Agency Credit Risk Debt Notes, Series 2016-HQA3, Class M1, 1 mo. USD LIBOR + .800%, FRN
1.324% 3/25/29 | | | 880,000 | | | | 880,288 | |
Federal Home Loan Mortgage Corp. Structured Agency Credit Risk Debt Notes, Series 2016-HQA3, Class M2, 1 mo. USD LIBOR + 1.350%, FRN
1.874% 3/25/29 | | | 790,000 | | | | 790,971 | |
Federal National Mortgage Association Connecticut Avenue Securities, Series 2016-C05, Class 2M1, 1 mo. USD LIBOR + 1.350%, FRN
1.875% 1/25/29 | | | 2,442,891 | | | | 2,452,521 | |
Federal National Mortgage Association Connecticut Avenue Securities, Series 2016-C04, Class 1M1, 1 mo. USD LIBOR + 1.450%, FRN
1.975% 1/25/29 | | | 2,773,808 | | | | 2,790,601 | |
The accompanying notes are an integral part of the financial statements.
110
MassMutual Premier Core Bond Fund – Portfolio of Investments (Continued)
| | | | | | | | |
| | | Principal
Amount | | | Value | |
GSR Mortgage Loan Trust, Series 2004-9, Class 2A1, VRN
3.285% 8/25/34 | | $ | 51,278 | | | $ | 50,268 | |
IndyMac Index Mortgage Loan Trust, Series 2004-AR4, Class 1A, VRN
2.786% 8/25/34 | | | 240,848 | | | | 215,040 | |
Merrill Lynch Mortgage Investors, Inc., Series 2005-A8, Class A3A2, 1 mo. USD LIBOR + .250%, FRN
0.775% 8/25/36 | | | 28,031 | | | | 27,947 | |
Merrill Lynch Mortgage Investors, Inc., Series 2004-A1, Class IA, VRN
3.032% 2/25/34 | | | 36,329 | | | | 35,895 | |
Merrill Lynch Mortgage Investors, Inc., Series 2003-A4, Class IA, VRN
3.065% 7/25/33 | | | 12,584 | | | | 12,397 | |
Morgan Stanley Mortgage Loan Trust, Series 2004-2AR, Class 1A, FRN
2.875% 2/25/34 | | | 1,012 | | | | 1,041 | |
Structured Adjustable Rate Mortgage Loan Trust, Series 2004-2, Class 2A, VRN
3.056% 3/25/34 | | | 181,031 | | | | 181,742 | |
Structured Agency Credit Risk Debt Notes, Series 2015-DNA1, Class M1, 1 mo. USD LIBOR + .900%, FRN
1.425% 10/25/27 | | | 1,301,727 | | | | 1,303,350 | |
Structured Agency Credit Risk Debt Notes, Series 2015-DNA3, Class M1, 1 mo. USD LIBOR + 1.350%, FRN
1.875% 4/25/28 | | | 831,164 | | | | 832,387 | |
Structured Agency Credit Risk Debt Notes, Series 2016-DNA1, Class M1, 1 mo. USD LIBOR + 1.450%, FRN
1.975% 7/25/28 | | | 1,415,288 | | | | 1,421,524 | |
WaMu Mortgage Pass-Through Certificates, Series 2004-AR2, Class A, 12 mo. MTA + 1.400%, FRN
1.907% 4/25/44 | | | 377,157 | | | | 376,688 | |
| | | | | | | | |
| | | | | | | 14,020,413 | |
| | | | | | | | |
| WL Collateral PAC — 0.0% | | | | | | | | |
Structured Asset Securities Corp., Series 2002-11A, Class 2A1, FRN
3.157% 6/25/32 | | | 108,973 | | | | 106,433 | |
| | | | | | | | |
| | |
TOTAL NON-U.S. GOVERNMENT AGENCY OBLIGATIONS
(Cost $367,602,992) | | | | | | | 366,433,420 | |
| | | | | | | | |
| | | | | | | | |
| | | Principal
Amount | | | Value | |
| SOVEREIGN DEBT OBLIGATIONS — 1.0% | |
| Regional (State & Province) — 1.0% | | | | | | | | |
Colombia Government International Bond
6.125% 1/18/41 | | $ | 2,980,000 | | | $ | 3,598,350 | |
Mexico Government International Bond
4.750% 3/08/44 | | | 3,050,000 | | | | 3,160,563 | |
Peruvian Government International Bond
6.550% 3/14/37 | | | 560,000 | | | | 791,000 | |
Poland Government International Bond
6.375% 7/15/19 | | | 1,260,000 | | | | 1,417,500 | |
Province of Quebec Canada
7.500% 9/15/29 | | | 540,000 | | | | 812,862 | |
United Mexican States
5.125% 1/15/20 | | | 1,110,000 | | | | 1,233,765 | |
United Mexican States
6.750% 9/27/34 | | | 950,000 | | | | 1,256,375 | |
| | | | | | | | |
| | | | | | | 12,270,415 | |
| | | | | | | | |
| | |
TOTAL SOVEREIGN DEBT OBLIGATIONS
(Cost $11,057,971) | | | | | | | 12,270,415 | |
| | | | | | | | |
|
| U.S. GOVERNMENT AGENCY OBLIGATIONS AND INSTRUMENTALITIES — 26.3% | |
| Collateralized Mortgage Obligations — 2.0% | | | | | |
Federal Home Loan Mortgage Corp.
Series 4303, Class AP
3.000% 8/15/43 | | | 4,444,111 | | | | 4,586,695 | |
Series 4290, Class CA
3.500% 12/15/38 | | | 2,642,941 | | | | 2,749,632 | |
Series 2617, Class Z
5.500% 5/15/33 | | | 2,173,013 | | | | 2,463,395 | |
Series 2693, Class Z
5.500% 10/15/33 | | | 3,786,373 | | | | 4,238,275 | |
Series 3423, Class PB
5.500% 3/15/38 | | | 771,989 | | | | 872,308 | |
Series 2178, Class PB
7.000% 8/15/29 | | | 305,012 | | | | 349,849 | |
Federal National Mortgage Association Series 2014-7, Class VA
3.500% 5/25/25 | | | 1,717,176 | | | | 1,839,706 | |
Series 2014-48, Class AB
4.000% 10/25/40 | | | 3,686,930 | | | | 3,874,956 | |
Series 2007-32, Class Z
5.500% 4/25/37 | | | 1,154,848 | | | | 1,292,745 | |
Series 2010-60, Class HJ
5.500% 5/25/40 | | | 841,098 | | | | 929,751 | |
Series 1989-20, Class A
6.750% 4/25/18 | | | 2,398 | | | | 2,398 | |
Federal National Mortgage Association REMIC, Series 2007-B2, Class ZA
5.500% 6/25/37 | | | 1,088,949 | | | | 1,209,060 | |
The accompanying notes are an integral part of the financial statements.
111
MassMutual Premier Core Bond Fund – Portfolio of Investments (Continued)
| | | | | | | | |
| | | Principal
Amount | | | Value | |
U.S. Department of Veteran Affairs, Series 1992-1, Class 2Z
7.750% 5/15/22 | | $ | 258,807 | | | $ | 288,017 | |
| | | | | | | | |
| | | | | | | 24,696,787 | |
| | | | | | | | |
| Pass-Through Securities — 24.3% | | | | | | | | |
Federal Home Loan Mortgage Corp.
Pool #Q37467 3.500%
11/01/45 | | | 7,960,233 | | | | 8,476,093 | |
Pool #Q37468 3.500%
11/01/45 | | | 5,913,667 | | | | 6,317,228 | |
Pool #Z40047 4.000%
10/01/41 | | | 412,787 | | | | 445,552 | |
Pool #C03537 4.500%
8/01/40 | | | 1,398,104 | | | | 1,548,619 | |
Pool #G06057 4.500%
10/01/40 | | | 1,613,072 | | | | 1,775,388 | |
Pool #G60485 4.500%
10/01/41 | | | 2,051,916 | | | | 2,259,352 | |
Pool #G60469 4.500%
1/01/42 | | | 1,350,338 | | | | 1,486,638 | |
Pool #G60342 4.500%
5/01/42 | | | 6,688,504 | | | | 7,361,534 | |
Pool #G60172 4.500%
9/01/43 | | | 2,165,650 | | | | 2,400,149 | |
Pool #G11431 6.000%
2/01/18 | | | 739 | | | | 748 | |
Pool #C00836 7.000%
7/01/29 | | | 12,684 | | | | 15,047 | |
Pool #C49314 7.000%
4/01/31 | | | 7,177 | | | | 8,603 | |
Pool #C51422 7.000%
5/01/31 | | | 1,919 | | | | 2,307 | |
Pool #C53034 7.000%
6/01/31 | | | 13,527 | | | | 16,164 | |
Pool #G01311 7.000%
9/01/31 | | | 67,571 | | | | 80,631 | |
Pool #G01317 7.000%
10/01/31 | | | 39,744 | | | | 43,944 | |
Pool #G00143 7.500%
6/01/23 | | | 641 | | | | 725 | |
Pool #C55867 7.500%
2/01/30 | | | 29,955 | | | | 35,125 | |
Pool #C41497 7.500%
9/01/30 | | | 124 | | | | 150 | |
Pool #C44830 7.500%
11/01/30 | | | 25 | | | | 30 | |
Pool #C45235 7.500%
12/01/30 | | | 16,964 | | | | 20,293 | |
Pool #C46038 7.500%
12/01/30 | | | 1,032 | | | | 1,237 | |
Pool #C01116 7.500%
1/01/31 | | | 1,638 | | | | 1,974 | |
| | | | | | | | |
| | | Principal
Amount | | | Value | |
Pool #C46309 7.500%
1/01/31 | | $ | 542 | | | $ | 655 | |
Pool #C46560 7.500%
1/01/31 | | | 584 | | | | 685 | |
Pool #C46810 7.500%
1/01/31 | | | 563 | | | | 682 | |
Pool #C47060 7.500%
1/01/31 | | | 827 | | | | 992 | |
Pool #C47063 7.500%
1/01/31 | | | 3,036 | | | | 3,641 | |
Pool #555481 8.250%
5/01/17 | | | 1,760 | | | | 1,789 | |
Pool #G00653 8.500%
11/01/25 | | | 20,925 | | | | 24,606 | |
Pool #554904 9.000%
3/01/17 | | | 16 | | | | 16 | |
Federal Home Loan Mortgage Corp. TBA | | | | | | | | |
Pool #1J1368 3.000% 10/01/43 (d) | | | 2,525,000 | | | | 2,618,405 | |
Pool #1513 4.000%
7/01/42 (d) | | | 9,050,000 | | | | 9,707,186 | |
Federal National Mortgage Association | | | | | | | | |
Pool #725692 2.642%
10/01/33 1 year CMT + 2.144%, FRN | | | 411,026 | | | | 432,493 | |
Pool #888586 2.668%
10/01/34 1 year CMT + 2.212%, FRN | | | 696,626 | | | | 734,599 | |
Pool #775539 2.821%
5/01/34 12 mo. USD LIBOR + 1.635%, FRN | | | 232,044 | | | | 242,686 | |
Pool #BC6007 3.000%
5/01/31 | | | 5,364,700 | | | | 5,639,851 | |
Pool #AS1304 3.500%
12/01/28 | | | 2,733,331 | | | | 2,895,516 | |
Pool #AV1897 3.500%
12/01/28 | | | 444,274 | | | | 470,636 | |
Pool #AV2325 3.500%
12/01/28 | | | 1,423,152 | | | | 1,507,596 | |
Pool #AS6187 3.500%
11/01/45 | | | 18,274,566 | | | | 19,457,417 | |
Pool #AS6293 3.500%
12/01/45 | | | 9,900,434 | | | | 10,541,255 | |
Pool #AS6306 3.500%
12/01/45 | | | 6,135,468 | | | | 6,548,893 | |
Pool #AS6475 3.500%
1/01/46 | | | 5,053,734 | | | | 5,411,641 | |
Pool #AS6476 3.500%
1/01/46 | | | 5,651,234 | | | | 6,033,796 | |
Pool #AS6477 3.500%
1/01/46 | | | 6,513,580 | | | | 6,937,217 | |
The accompanying notes are an integral part of the financial statements.
112
MassMutual Premier Core Bond Fund – Portfolio of Investments (Continued)
| | | | | | | | |
| | | Principal
Amount | | | Value | |
Pool #AZ7917 4.000%
3/01/41 | | $ | 701,761 | | | $ | 760,314 | |
Pool #AL2441 4.000%
9/01/42 | | | 4,453,910 | | | | 4,856,850 | |
Pool #AL8422 4.000%
1/01/43 | | | 630,024 | | | | 682,591 | |
Pool #BC5984 4.000%
4/01/46 | | | 1,398,588 | | | | 1,503,700 | |
Pool #AB1466 4.500%
9/01/40 | | | 835,632 | | | | 920,957 | |
Pool #AH6787 4.500%
3/01/41 | | | 1,502,299 | | | | 1,666,026 | |
Pool #AL7566 4.500%
10/01/42 | | | 1,620,376 | | | | 1,786,844 | |
Pool #AL6997 4.500%
11/01/42 | | | 3,273,678 | | | | 3,630,458 | |
Pool #675713 5.000%
3/01/18 | | | 2,506 | | | | 2,570 | |
Pool #AD6437 5.000%
6/01/40 | | | 917,131 | | | | 1,029,695 | |
Pool #AD6996 5.000%
7/01/40 | | | 6,405,226 | | | | 7,158,340 | |
Pool #AL8173 5.000%
2/01/44 | | | 2,422,794 | | | | 2,702,361 | |
Pool #545636 6.500%
5/01/17 | | | 2,981 | | | | 3,014 | |
Pool #254379 7.000%
7/01/32 | | | 43,018 | | | | 51,682 | |
Pool #252717 7.500%
9/01/29 | | | 2,658 | | | | 3,209 | |
Pool #535996 7.500%
6/01/31 | | | 10,532 | | | | 12,726 | |
Pool #254009 7.500%
10/01/31 | | | 24,486 | | | | 29,404 | |
Pool #253394 8.000%
7/01/20 | | | 11,714 | | | | 12,692 | |
Pool #323992 8.000%
11/01/29 | | | 2,085 | | | | 2,516 | |
Pool #525725 8.000%
2/01/30 | | | 3,487 | | | | 4,283 | |
Pool #253266 8.000%
5/01/30 | | | 4,851 | | | | 5,926 | |
Pool #537433 8.000%
5/01/30 | | | 2,527 | | | | 3,114 | |
Pool #253347 8.000%
6/01/30 | | | 6,723 | | | | 8,233 | |
Pool #544976 8.000%
7/01/30 | | | 451 | | | | 550 | |
Pool #535428 8.000%
8/01/30 | | | 6,537 | | | | 7,992 | |
Pool #543290 8.000%
9/01/30 | | | 59 | | | | 72 | |
Pool #547786 8.000%
9/01/30 | | | 2,239 | | | | 2,687 | |
| | | | | | | | |
| | | Principal
Amount | | | Value | |
Pool #550767 8.000%
9/01/30 | | $ | 3,971 | | | $ | 4,877 | |
Pool #553061 8.000%
9/01/30 | | | 12,520 | | | | 15,147 | |
Pool #253481 8.000%
10/01/30 | | | 6,531 | | | | 8,004 | |
Pool #535533 8.000%
10/01/30 | | | 5,889 | | | | 7,207 | |
Pool #560741 8.000%
11/01/30 | | | 2,826 | | | | 3,483 | |
Pool #253644 8.000%
2/01/31 | | | 3,168 | | | | 3,861 | |
Pool #581170 8.000%
5/01/31 | | | 1,481 | | | | 1,782 | |
Pool #583916 8.000%
5/01/31 | | | 1,995 | | | | 2,456 | |
Pool #593848 8.000%
7/01/31 | | | 962 | | | | 1,181 | |
Pool #190317 8.000%
8/01/31 | | | 35,674 | | | | 43,585 | |
Pool #545240 8.000%
9/01/31 | | | 3,593 | | | | 4,400 | |
Pool #541202 8.500%
8/01/26 | | | 9,496 | | | | 10,904 | |
Federal National Mortgage Association TBA | | | | | | | | |
Pool #1866 2.500%
11/01/28 (d) | | | 61,700,000 | | | | 63,789,606 | |
Pool #1817 3.000%
12/01/43 (d) | | | 18,006,000 | | | | 18,677,004 | |
Pool #18388 4.000%
11/01/42 (d) | | | 12,650,000 | | | | 13,568,608 | |
Pool #21133 4.500%
7/01/40 (d) | | | 5,250,000 | | | | 5,749,570 | |
Government National Mortgage Association | | | | | | | | |
Pool #783896 3.500%
5/15/44 | | | 6,144,268 | | | | 6,597,648 | |
Pool #404246 6.500%
8/15/28 | | | 229 | | | | 269 | |
Pool #781038 6.500%
5/15/29 | | | 75,738 | | | | 88,566 | |
Pool #781468 6.500%
7/15/32 | | | 4,767 | | | | 5,626 | |
Pool #781496 6.500%
9/15/32 | | | 24,759 | | | | 29,068 | |
Pool #363066 7.000%
8/15/23 | | | 6,012 | | | | 6,824 | |
Pool #352049 7.000%
10/15/23 | | | 2,386 | | | | 2,708 | |
Pool #354674 7.000%
10/15/23 | | | 3,843 | | | | 4,296 | |
Pool #358555 7.000%
10/15/23 | | | 1,199 | | | | 1,355 | |
The accompanying notes are an integral part of the financial statements.
113
MassMutual Premier Core Bond Fund – Portfolio of Investments (Continued)
| | | | | | | | |
| | | Principal
Amount | | | Value | |
Pool #345964 7.000%
11/15/23 | | $ | 1,433 | | | $ | 1,604 | |
Pool #380866 7.000%
3/15/24 | | | 985 | | | | 1,113 | |
Pool #781124 7.000%
12/15/29 | | | 8,873 | | | | 10,527 | |
Pool #781319 7.000%
7/15/31 | | | 172,051 | | | | 205,592 | |
Pool #565982 7.000%
7/15/32 | | | 15,098 | | | | 18,038 | |
Pool #581417 7.000%
7/15/32 | | | 65,303 | | | | 78,481 | |
Pool #588012 7.000%
7/15/32 | | | 19,294 | | | | 23,015 | |
Pool #190766 7.500%
1/15/17 | | | 253 | | | | 254 | |
Pool #187548 7.500%
4/15/17 | | | 851 | | | | 864 | |
Pool #203940 7.500%
4/15/17 | | | 2,042 | | | | 2,063 | |
Pool #201622 7.500%
5/15/17 | | | 2,874 | | | | 2,917 | |
Pool #192796 7.500%
6/15/17 | | | 713 | | | | 726 | |
Pool #357262 7.500%
9/15/23 | | | 1,728 | | | | 1,970 | |
Pool #441009 8.000%
11/15/26 | | | 1,007 | | | | 1,206 | |
Pool #522777 8.000%
12/15/29 | | | 5,834 | | | | 7,120 | |
Pool #434719 8.000%
2/15/30 | | | 96 | | | | 118 | |
Pool #523043 8.000%
3/15/30 | | | 307 | | | | 376 | |
Pool #529134 8.000%
3/15/30 | | | 1,782 | | | | 2,208 | |
Pool #477036 8.000%
4/15/30 | | | 716 | | | | 887 | |
Pool #503157 8.000%
4/15/30 | | | 15,365 | | | | 19,049 | |
Pool #528714 8.000%
4/15/30 | | | 1,880 | | | | 2,332 | |
Pool #544640 8.000%
11/15/30 | | | 17,979 | | | | 22,391 | |
Pool #531298 8.500%
8/15/30 | | | 1,871 | | | | 2,313 | |
Government National Mortgage Association II | | | | | | | | |
Pool #82462 2.000%
1/20/40 1 year CMT + 1.500%, FRN | | | 1,015,080 | | | | 1,047,135 | |
Pool #82488 2.000%
3/20/40 1 year CMT + 1.500%, FRN | | | 1,328,125 | | | | 1,371,884 | |
| | | | | | | | |
| | | Principal
Amount | | | Value | |
Pool #784026 3.500%
12/20/44 | | $ | 3,592,423 | | | $ | 3,856,101 | |
Government National Mortgage Association II TBA | | | | | | | | |
Pool #264 2.500%
7/01/44 (d) | | | 11,800,000 | | | | 12,002,812 | |
Pool #1581 3.000%
8/01/44 (d) | | | 37,425,000 | | | | 39,133,979 | |
| | | | | | | | |
| | | | | | | 304,803,700 | |
| | | | | | | | |
| | |
TOTAL U.S. GOVERNMENT AGENCY OBLIGATIONS AND INSTRUMENTALITIES
(Cost $326,790,337) | | | | | | | 329,500,487 | |
| | | | | | | | |
|
| U.S. TREASURY OBLIGATIONS — 1.4% | |
| U.S. Treasury Bonds & Notes — 1.4% | | | | | |
U.S. Treasury Bond
2.500% 5/15/46 | | | 1,700,000 | | | | 1,764,937 | |
U.S. Treasury Bond (e) (f)
3.500% 2/15/39 | | | 6,600,000 | | | | 8,192,250 | |
U.S. Treasury Note
1.250% 3/31/21 | | | 7,600,000 | | | | 7,640,138 | |
| | | | | | | | |
| | | | | | | 17,597,325 | |
| | | | | | | | |
| | |
TOTAL U.S. TREASURY OBLIGATIONS
(Cost $17,724,879) | | | | | | | 17,597,325 | |
| | | | | | | | |
| | |
TOTAL BONDS & NOTES
(Cost $1,214,305,933) | | | | | | | 1,239,233,427 | |
| | | | | | | | |
| | |
TOTAL LONG-TERM INVESTMENTS
(Cost $1,217,555,933) | | | | | | | 1,242,783,727 | |
| | | | | | | | |
|
| SHORT-TERM INVESTMENTS — 14.9% | |
| Commercial Paper — 14.9% | | | | | | | | |
Agrium, Inc.
0.900% 11/07/16 | | | 10,000,000 | | | | 9,991,229 | |
Agrium, Inc.
0.930% 11/14/16 | | | 4,500,000 | | | | 4,495,275 | |
Agrium, Inc.
1.016% 12/05/16 | | | 7,000,000 | | | | 6,988,116 | |
American Electric Power Co., Inc. (a)
0.900% 10/11/16 | | | 5,000,000 | | | | 4,998,839 | |
The Bank of Nova Scotia (a)
1.230% 2/23/17 | | | 3,500,000 | | | | 3,485,181 | |
Bell Canada (a)
0.900% 12/12/16 | | | 15,000,000 | | | | 14,973,963 | |
Bell Canada (a)
1.017% 1/17/17 | | | 6,750,000 | | | | 6,730,217 | |
The accompanying notes are an integral part of the financial statements.
114
MassMutual Premier Core Bond Fund – Portfolio of Investments (Continued)
| | | | | | | | |
| | | Principal
Amount | | | Value | |
CenterPoint Energy, Inc. (a)
0.910% 11/17/16 | | $ | 11,000,000 | | | $ | 10,987,504 | |
CRH America Finance, Inc. (a)
0.940% 10/27/16 | | | 5,000,000 | | | | 4,996,951 | |
Dollar General Corp. (a)
0.600% 10/03/16 | | | 1,500,000 | | | | 1,499,901 | |
Enterprise Products Operating LLC (a)
0.860% 10/06/16 | | | 3,250,000 | | | | 3,249,602 | |
Enterprise Products Operating LLC (a)
0.880% 10/26/16 | | | 5,000,000 | | | | 4,997,071 | |
Equifax, Inc. (a)
0.900% 10/03/16 | | | 2,500,000 | | | | 2,499,850 | |
FMC Technologies, Inc. (a)
0.944% 10/17/16 | | | 5,000,000 | | | | 4,998,142 | |
FMC Technologies, Inc. (a)
1.050% 12/12/16 | | | 5,750,000 | | | | 5,738,853 | |
Ford Motor Credit Co. (a)
1.016% 10/20/16 | | | 5,000,000 | | | | 4,997,786 | |
Molex Electronic Technologies (a)
0.880% 11/04/16 | | | 13,250,000 | | | | 13,239,347 | |
National Grid USA (a)
0.900% 10/17/16 | | | 5,000,000 | | | | 4,998,142 | |
ONEOK Partners LP (a)
1.116% 10/12/16 | | | 3,000,000 | | | | 2,999,235 | |
Schlumberger Holding Corp. (a)
1.037% 10/17/16 | | | 5,000,000 | | | | 4,998,378 | |
Schlumberger Holdings Corp. (a)
1.067% 10/21/16 | | | 10,000,000 | | | | 9,995,917 | |
Schlumberger Holdings Corp. (a)
1.067% 10/11/16 | | | 5,500,000 | | | | 5,498,891 | |
Sempra Energy Holdings (a)
1.130% 11/14/16 | | | 11,500,000 | | | | 11,487,925 | |
Suncor Energy, Inc. (a)
0.900% 10/25/16 | | | 11,000,000 | | | | 10,993,820 | |
Tate & Lyle International Finance PLC (a)
0.914% 11/08/16 | | | 5,000,000 | | | | 4,995,493 | |
Thomson Reuters Corp. (a)
1.066% 10/24/16 | | | 10,000,000 | | | | 9,995,287 | |
Thomson Reuters Corp. (a)
1.067% 10/17/16 | | | 7,000,000 | | | | 6,997,729 | |
Whirlpool Corp. (a)
1.016% 12/13/16 | | | 5,000,000 | | | | 4,990,123 | |
| | | | | | | | |
| | | | | | | 186,818,767 | |
| | | | | | | | |
| | | | | | | | |
| | | Principal
Amount | | | Value | |
| Time Deposit — 0.0% | | | | | | | | |
Euro Time Deposit
0.010% 10/03/16 | | $ | 277,232 | | | $ | 277,232 | |
| | | | | | | | |
| | |
TOTAL SHORT-TERM INVESTMENTS
(Cost $187,076,455) | | | | | | | 187,095,999 | |
| | | | | | | | |
| | |
TOTAL INVESTMENTS — 114.1%
(Cost $1,404,632,388) (g) | | | | | | | 1,429,879,726 | |
| | |
| Other Assets/(Liabilities) — (14.1)% | | | | | | | (176,833,292 | ) |
| | | | | | | | |
| | |
| NET ASSETS — 100.0% | | | | | | $ | 1,253,046,434 | |
| | | | | | | | |
Notes to Portfolio of Investments
Percentages are stated as a percent of net assets.
| CLO | Collateralized Loan Obligation |
| CMO | Collateralized Mortgage Obligation |
| CMT | Constant Maturity Treasury Index |
| MBS | Mortgage-Backed Security |
| MTA | Monthly Treasury Average Index |
| PAC | Planned Amortization Class |
| (a) | Securities exempt from registration under rule 144A of the Securities Act of 1933. These securities may be resold in transactions exempt from registration, normally to qualified institutional buyers. At September 30, 2016, these securities amounted to a value of $524,516,259 or 41.86% of net assets. |
| (b) | Restricted security. Certain securities are restricted as to resale. At September 30, 2016, these securities amounted to a value of $1,597,390 or 0.13% of net assets. The Fund generally bears the costs, if any, associated with the disposition of restricted securities. |
| (c) | This security is fair valued in good faith in accordance with procedures approved by the Board of Trustees. At September 30, 2016, these securities amounted to a value of $2,340,000 or 0.19% of net assets. |
| (d) | A portion of this security is purchased on a when-issued, delayed-delivery or forward commitment basis. (Note 2). |
| (e) | A portion of this security is held as collateral for open futures contracts. (Note 2). |
| (f) | All or a portion of this security is held as collateral for open swap agreements. (Note 2). |
| (g) | See Note 6 for aggregate cost for federal tax purposes. |
The accompanying notes are an integral part of the financial statements.
115
MassMutual Premier Core Bond Fund – Portfolio of Investments (Continued)
| | | | |
Notes to Portfolio of Investments (Continued) Country weightings, as a percentage of net assets, is as follows: | |
United States | | | 85.4 | % |
Cayman Islands | | | 6.7 | % |
Canada | | | 1.3 | % |
Netherlands | | | 1.1 | % |
Mexico | | | 0.9 | % |
Luxembourg | | | 0.7 | % |
United Kingdom | | | 0.6 | % |
Ireland | | | 0.5 | % |
Colombia | | | 0.4 | % |
Bermuda | | | 0.3 | % |
Australia | | | 0.3 | % |
Turkey | | | 0.2 | % |
Austria | | | 0.1 | % |
India | | | 0.1 | % |
Panama | | | 0.1 | % |
Poland | | | 0.1 | % |
Chile | �� | | 0.1 | % |
United Arab Emirates | | | 0.1 | % |
Peru | | | 0.1 | % |
Spain | | | 0.1 | % |
Barbados | | | 0.0 | % |
| | | | |
Total Long-Term Investments | | | 99.2 | % |
Short-Term Investments and Other Assets and Liabilities | | | 0.8 | % |
| | | | |
Net Assets | | | 100.0 | % |
| | | | |
The accompanying notes are an integral part of the financial statements.
116
MassMutual Premier Diversified Bond Fund – Portfolio of Investments
September 30, 2016
| | | | | | | | |
| | | Number of
Shares | | | Value | |
| EQUITIES — 0.1% | |
|
| COMMON STOCK — 0.0% | |
| Basic Materials — 0.0% | |
| Forest Products & Paper — 0.0% | |
The Newark Group, Inc. (a) (b) | | | 26,904 | | | $ | 807 | |
| | | | | | | | |
| | |
TOTAL COMMON STOCK
(Cost $2,032) | | | | | | | 807 | |
| | | | | | | | |
|
| PREFERRED STOCK — 0.1% | |
| Financial — 0.1% | |
| Insurance — 0.1% | |
The Allstate Corp. 5.100%, 3 mo. LIBOR US + 3.165%, VRN | | | 10,000 | | | | 273,100 | |
| | | | | | | | |
| | |
TOTAL PREFERRED STOCK
(Cost $250,000) | | | | | | | 273,100 | |
| | | | | | | | |
| | |
TOTAL EQUITIES
(Cost $252,032) | | | | | | | 273,907 | |
| | | | | | | | |
| | |
| | | Principal
Amount | | | | |
| BONDS & NOTES — 96.1% | |
|
| CORPORATE DEBT — 43.0% | |
| Advertising — 0.2% | |
Omnicom Group, Inc.
3.625% 5/01/22 | | $ | 150,000 | | | | 160,684 | |
WPP Finance 2010
5.625% 11/15/43 | | | 225,000 | | | | 266,955 | |
| | | | | | | | |
| | | | | | | 427,639 | |
| | | | | | | | |
| Aerospace & Defense — 0.7% | |
Harris Corp.
2.700% 4/27/20 | | | 90,000 | | | | 91,682 | |
Harris Corp.
3.832% 4/27/25 | | | 50,000 | | | | 52,930 | |
Moog, Inc. (c)
5.250% 12/01/22 | | | 600,000 | | | | 620,250 | |
Orbital ATK, Inc.
5.250% 10/01/21 | | | 435,000 | | | | 452,400 | |
Spirit AeroSystems, Inc.
3.850% 6/15/26 | | | 65,000 | | | | 67,506 | |
United Technologies Corp.
6.125% 7/15/38 | | | 105,000 | | | | 142,799 | |
| | | | | | | | |
| | | | | | | 1,427,567 | |
| | | | | | | | |
| Agriculture — 0.7% | |
Altria Group, Inc.
2.850% 8/09/22 | | | 110,000 | | | | 114,855 | |
Altria Group, Inc.
4.250% 8/09/42 | | | 50,000 | | | | 54,097 | |
| | | | | | | | |
| | | Principal
Amount | | | Value | |
Bunge Ltd. Finance Corp.
3.200% 6/15/17 | | $ | 65,000 | | | $ | 65,840 | |
Bunge Ltd. Finance Corp.
3.250% 8/15/26 | | | 185,000 | | | | 186,146 | |
Bunge Ltd. Finance Corp.
3.500% 11/24/20 | | | 50,000 | | | | 52,295 | |
Imperial Brands Finance PLC (c)
3.750% 7/21/22 | | | 510,000 | | | | 541,171 | |
Reynolds American, Inc.
4.450% 6/12/25 | | | 200,000 | | | | 223,145 | |
Reynolds American, Inc.
5.850% 8/15/45 | | | 150,000 | | | | 195,016 | |
| | | | | | | | |
| | | | | | | 1,432,565 | |
| | | | | | | | |
| Airlines — 0.4% | |
American Airlines Pass Through Trust,
Series 2014-1, Class A
3.700% 4/01/28 | | | 59,370 | | | | 62,042 | |
American Airlines Pass-Through Trust,
Series 2014-1, Class B
4.375% 4/01/24 | | | 21,615 | | | | 21,965 | |
United Airlines Pass-Through Trust,
Series 2014-1, Class A
4.000% 10/11/27 | | | 56,564 | | | | 60,665 | |
WestJet Airlines Ltd. (c)
3.500% 6/16/21 | | | 560,000 | | | | 573,880 | |
| | | | | | | | |
| | | | | | | 718,552 | |
| | | | | | | | |
| Auto Manufacturers — 1.6% | |
Ford Motor Co.
6.500% 8/01/18 | | | 100,000 | | | | 108,896 | |
Ford Motor Co.
7.450% 7/16/31 | | | 200,000 | | | | 264,539 | |
Ford Motor Credit Co. LLC
2.551% 10/05/18 | | | 200,000 | | | | 202,933 | |
Ford Motor Credit Co. LLC
2.943% 1/08/19 | | | 265,000 | | | | 271,411 | |
Ford Motor Credit Co. LLC
3.000% 6/12/17 | | | 200,000 | | | | 202,114 | |
General Motors Co.
5.200% 4/01/45 | | | 225,000 | | | | 234,040 | |
General Motors Financial Co., Inc.
3.200% 7/06/21 | | | 945,000 | | | | 956,606 | |
General Motors Financial Co., Inc.
3.700% 5/09/23 | | | 360,000 | | | | 366,141 | |
General Motors Financial Co., Inc.
4.300% 7/13/25 | | | 200,000 | | | | 206,053 | |
Hyundai Capital America (c)
1.450% 2/06/17 | | | 145,000 | | | | 145,128 | |
Hyundai Capital America (c)
2.550% 2/06/19 | | | 80,000 | | | | 81,389 | |
| | | | | | | | |
| | | | | | | 3,039,250 | |
| | | | | | | | |
The accompanying notes are an integral part of the financial statements.
117
MassMutual Premier Diversified Bond Fund – Portfolio of Investments (Continued)
| | | | | | | | |
| | | Principal
Amount | | | Value | |
| Automotive & Parts — 0.3% | |
Cooper Tire & Rubber Co.
8.000% 12/15/19 | | $ | 255,000 | | | $ | 288,150 | |
International Automotive Components Group SA (c)
9.125% 6/01/18 | | | 9,000 | | | | 8,809 | |
Meritor, Inc.
6.750% 6/15/21 | | | 185,000 | | | | 186,387 | |
| | | | | | | | |
| | | | | | | 483,346 | |
| | | | | | | | |
| Banks — 3.9% | |
Associated Banc-Corp.
2.750% 11/15/19 | | | 310,000 | | | | 316,097 | |
Associated Banc-Corp.
4.250% 1/15/25 | | | 495,000 | | | | 515,258 | |
Bank of America Corp.
3.950% 4/21/25 | | | 315,000 | | | | 326,089 | |
Bank of America Corp.
4.000% 4/01/24 | | | 165,000 | | | | 177,806 | |
Bank of America Corp.
4.450% 3/03/26 | | | 190,000 | | | | 203,909 | |
Bank of America Corp.
5.650% 5/01/18 | | | 30,000 | | | | 31,823 | |
Bank of America Corp.
5.875% 2/07/42 | | | 55,000 | | | | 71,704 | |
Bank of America Corp.
7.625% 6/01/19 | | | 850,000 | | | | 975,468 | |
The Bank of Nova Scotia
4.500% 12/16/25 | | | 155,000 | | | | 165,148 | |
Commonwealth Bank of Australia (c)
4.500% 12/09/25 | | | 200,000 | | | | 213,583 | |
Compass Bank
3.875% 4/10/25 | | | 186,000 | | | | 181,943 | |
Discover Bank
3.450% 7/27/26 | | | 285,000 | | | | 286,664 | |
First Republic Bank
4.375% 8/01/46 | | | 560,000 | | | | 556,313 | |
FirstMerit Corp.
4.350% 2/04/23 | | | 35,000 | | | | 36,678 | |
The Goldman Sachs Group, Inc.
5.150% 5/22/45 | | | 290,000 | | | | 316,249 | |
The Goldman Sachs Group, Inc. 3 mo. USD LIBOR + 3.922%, VRN 5.
375% 12/31/49 | | | 240,000 | | | | 241,194 | |
HSBC Holdings PLC
2.950% 5/25/21 | | | 280,000 | | | | 283,994 | |
HSBC Holdings PLC
3.400% 3/08/21 | | | 200,000 | | | | 206,852 | |
HSBC Holdings PLC
6.500% 9/15/37 | | | 125,000 | | | | 160,115 | |
ICICI Bank Ltd. (c)
4.750% 11/25/16 | | | 275,000 | | | | 276,183 | |
| | | | | | | | |
| | | Principal
Amount | | | Value | |
JP Morgan Chase & Co.
3.875% 9/10/24 | | $ | 140,000 | | | $ | 147,388 | |
JP Morgan Chase & Co.
4.950% 6/01/45 | | | 270,000 | | | | 302,437 | |
KeyBank NA
3.400% 5/20/26 | | | 560,000 | | | | 572,316 | |
Morgan Stanley
3.950% 4/23/27 | | | 200,000 | | | | 207,730 | |
SVB Financial Group
3.500% 1/29/25 | | | 295,000 | | | | 298,031 | |
SVB Financial Group
5.375% 9/15/20 | | | 35,000 | | | | 38,901 | |
Valley National Bancorp
5.125% 9/27/23 | | | 110,000 | | | | 117,841 | |
Wells Fargo & Co.
4.300% 7/22/27 | | | 280,000 | | | | 301,767 | |
Wells Fargo & Co.
4.600% 4/01/21 | | | 25,000 | | | | 27,601 | |
| | | | | | | | |
| | | | | | | 7,557,082 | |
| | | | | | | | |
| Beverages — 0.9% | |
Anheuser-Busch InBev Finance, Inc.
3.650% 2/01/26 | | | 365,000 | | | | 392,010 | |
Anheuser-Busch InBev Worldwide, Inc.
8.200% 1/15/39 | | | 250,000 | | | | 403,561 | |
Constellation Brands, Inc.
4.250% 5/01/23 | | | 97,000 | | | | 102,699 | |
Fomento Economico Mexicano SAB de CV
2.875% 5/10/23 | | | 35,000 | | | | 34,870 | |
JB y Cia SA de CV (c)
3.750% 5/13/25 | | | 350,000 | | | | 356,259 | |
Molson Coors Brewing Co.
3.000% 7/15/26 | | | 300,000 | | | | 302,078 | |
Molson Coors Brewing Co.
4.200% 7/15/46 | | | 80,000 | | | | 83,355 | |
| | | | | | | | |
| | | | | | | 1,674,832 | |
| | | | | | | | |
| Biotechnology — 0.4% | |
Amgen, Inc.
5.150% 11/15/41 | | | 175,000 | | | | 199,445 | |
Celgene Corp.
3.550% 8/15/22 | | | 420,000 | | | | 446,243 | |
Gilead Sciences, Inc.
4.750% 3/01/46 | | | 95,000 | | | | 106,167 | |
| | | | | | | | |
| | | | | | | 751,855 | |
| | | | | | | | |
| Building Materials — 0.3% | |
CRH America, Inc. (c)
3.875% 5/18/25 | | | 200,000 | | | | 215,065 | |
CRH America, Inc.
8.125% 7/15/18 | | | 95,000 | | | | 105,090 | |
Griffon Corp.
5.250% 3/01/22 | | | 162,000 | | | | 162,608 | |
The accompanying notes are an integral part of the financial statements.
118
MassMutual Premier Diversified Bond Fund – Portfolio of Investments (Continued)
| | | | | | | | |
| | | Principal
Amount | | | Value | |
Owens Corning, Inc.
4.200% 12/01/24 | | $ | 140,000 | | | $ | 148,526 | |
| | | | | | | | |
| | | | | | | 631,289 | |
| | | | | | | | |
| Chemicals — 0.9% | |
Cytec Industries, Inc.
3.500% 4/01/23 | | | 30,000 | | | | 29,971 | |
Cytec Industries, Inc.
8.950% 7/01/17 | | | 88,000 | | | | 91,949 | |
The Dow Chemical Co.
8.550% 5/15/19 | | | 100,000 | | | | 117,285 | |
Hercules, Inc., Convertible
6.500% 6/30/29 | | | 150,000 | | | | 130,662 | |
Incitec Pivot Finance LLC (c)
6.000% 12/10/19 | | | 50,000 | | | | 54,154 | |
LYB International Finance BV
5.250% 7/15/43 | | | 250,000 | | | | 284,060 | |
Methanex Corp.
5.250% 3/01/22 | | | 40,000 | | | | 41,315 | |
RPM International, Inc.
6.125% 10/15/19 | | | 650,000 | | | | 724,808 | |
RPM International, Inc.
6.500% 2/15/18 | | | 75,000 | | | | 79,549 | |
Valspar Corp.
7.250% 6/15/19 | | | 150,000 | | | | 170,220 | |
| | | | | | | | |
| | | | | | | 1,723,973 | |
| | | | | | | | |
| Commercial Services — 1.0% | |
The ADT Corp.
6.250% 10/15/21 | | | 750,000 | | | | 815,625 | |
ERAC USA Finance LLC (c)
2.800% 11/01/18 | | | 25,000 | | | | 25,568 | |
ERAC USA Finance LLC (c)
3.300% 10/15/22 | | | 75,000 | | | | 78,568 | |
ERAC USA Finance LLC (c)
7.000% 10/15/37 | | | 50,000 | | | | 68,192 | |
Leidos Holdings, Inc.
4.450% 12/01/20 | | | 350,000 | | | | 363,895 | |
S&P Global, Inc.
3.300% 8/14/20 | | | 240,000 | | | | 251,935 | |
S&P Global, Inc.
4.000% 6/15/25 | | | 160,000 | | | | 173,334 | |
Total System Services, Inc.
4.800% 4/01/26 | | | 140,000 | | | | 155,026 | |
The Western Union Co.
5.930% 10/01/16 | | | 80,000 | | | | 80,000 | |
| | | | | | | | |
| | | | | | | 2,012,143 | |
| | | | | | | | |
| Computers — 0.2% | |
Diamond 1 Finance Corp./Diamond 2 Finance Corp. (c)
4.420% 6/15/21 | | | 320,000 | | | | 334,438 | |
| | | | | | | | |
| | | | | | | | |
| | | Principal
Amount | | | Value | |
| Distribution & Wholesale — 0.2% | |
Arrow Electronics, Inc.
3.000% 3/01/18 | | $ | 45,000 | | | $ | 45,752 | |
Arrow Electronics, Inc.
4.500% 3/01/23 | | | 45,000 | | | | 47,583 | |
Ingram Micro, Inc.
4.950% 12/15/24 | | | 335,000 | | | | 339,010 | |
| | | | | | | | |
| | | | | | | 432,345 | |
| | | | | | | | |
| Diversified Financial — 4.3% | |
AerCap Ireland Capital Ltd./AerCap Global Aviation Trust
3.750% 5/15/19 | | | 343,000 | | | | 350,289 | |
AerCap Ireland Capital Ltd./AerCap Global Aviation Trust
4.625% 7/01/22 | | | 400,000 | | | | 420,500 | |
Affiliated Managers Group, Inc.
4.250% 2/15/24 | | | 245,000 | | | | 257,508 | |
Air Lease Corp.
2.625% 9/04/18 | | | 450,000 | | | | 454,089 | |
Air Lease Corp.
3.375% 1/15/19 | | | 175,000 | | | | 179,746 | |
Air Lease Corp.
3.375% 6/01/21 | | | 225,000 | | | | 233,402 | |
Air Lease Corp.
3.875% 4/01/21 | | | 125,000 | | | | 132,188 | |
Air Lease Corp.
5.625% 4/01/17 | | | 40,000 | | | | 40,682 | |
Ally Financial, Inc.
5.125% 9/30/24 | | | 495,000 | | | | 524,700 | |
Ares Finance Co. LLC (c)
4.000% 10/08/24 | | | 225,000 | | | | 217,991 | |
Brookfield Finance, Inc.
4.250% 6/02/26 | | | 430,000 | | | | 444,107 | |
Citigroup, Inc.
3.875% 3/26/25 | | | 440,000 | | | | 454,083 | |
Citigroup, Inc.
4.600% 3/09/26 | | | 345,000 | | | | 368,449 | |
Citigroup, Inc.
5.875% 1/30/42 | | | 75,000 | | | | 96,005 | |
Eaton Vance Corp.
3.625% 6/15/23 | | | 43,000 | | | | 45,482 | |
Eaton Vance Corp.
6.500% 10/02/17 | | | 25,000 | | | | 26,229 | |
GE Capital International Funding Co. Unlimited Co.
4.418% 11/15/35 | | | 254,000 | | | | 285,081 | |
General Electric Capital Corp.
6.875% 1/10/39 | | | 72,000 | | | | 108,452 | |
The Goldman Sachs Group, Inc.
5.950% 1/15/27 | | | 375,000 | | | | 442,097 | |
The Goldman Sachs Group, Inc.
6.250% 2/01/41 | | | 35,000 | | | | 45,765 | |
The accompanying notes are an integral part of the financial statements.
119
MassMutual Premier Diversified Bond Fund – Portfolio of Investments (Continued)
| | | | | | | | |
| | | Principal
Amount | | | Value | |
The Goldman Sachs Group, Inc.
6.750% 10/01/37 | | $ | 40,000 | | | $ | 50,932 | |
Guanay Finance Ltd. (c)
6.000% 12/15/20 | | | 217,632 | | | | 222,257 | |
Hyundai Capital America (c)
2.875% 8/09/18 | | | 60,000 | | | | 61,234 | |
IntercontinentalExchange Group, Inc.
4.000% 10/15/23 | | | 125,000 | | | | 137,036 | |
International Lease Finance Corp.
5.875% 4/01/19 | | | 341,000 | | | | 365,296 | |
JP Morgan Chase & Co.
4.500% 1/24/22 | | | 175,000 | | | | 193,779 | |
Lazard Group LLC
4.250% 11/14/20 | | | 915,000 | | | | 981,055 | |
Lazard Group LLC
6.850% 6/15/17 | | | 24,000 | | | | 24,762 | |
Legg Mason, Inc.
4.750% 3/15/26 | | | 95,000 | | | | 102,647 | |
Legg Mason, Inc.
5.625% 1/15/44 | | | 125,000 | | | | 129,743 | |
Merrill Lynch & Co., Inc.
7.750% 5/14/38 | | | 125,000 | | | | 181,236 | |
Morgan Stanley
4.350% 9/08/26 | | | 80,000 | | | | 85,408 | |
Morgan Stanley
5.750% 1/25/21 | | | 60,000 | | | | 68,396 | |
Morgan Stanley
6.625% 4/01/18 | | | 600,000 | | | | 642,888 | |
| | | | | | | | |
| | | | | | | 8,373,514 | |
| | | | | | | | |
| Electric — 1.6% | |
Appalachian Power Co.
3.400% 6/01/25 | | | 120,000 | | | | 127,855 | |
Berkshire Hathaway Energy
5.950% 5/15/37 | | | 120,000 | | | | 155,432 | |
Duke Energy Corp.
3.750% 9/01/46 | | | 175,000 | | | | 169,710 | |
Elwood Energy LLC
8.159% 7/05/26 | | | 256,408 | | | | 282,369 | |
Entergy Louisiana LLC
4.950% 1/15/45 | | | 110,000 | | | | 117,116 | |
Indianapolis Power & Light Co. (c)
4.050% 5/01/46 | | | 110,000 | | | | 113,327 | |
IPALCO Enterprises, Inc.
3.450% 7/15/20 | | | 290,000 | | | | 297,250 | |
LG&E and KU Energy LLC
4.375% 10/01/21 | | | 250,000 | | | | 275,617 | |
Metropolitan Edison Co. (c)
4.000% 4/15/25 | | | 105,000 | | | | 109,574 | |
National Fuel Gas Co.
3.750% 3/01/23 | | | 55,000 | | | | 55,638 | |
NiSource Finance Corp.
4.800% 2/15/44 | | | 90,000 | | | | 101,692 | |
| | | | | | | | |
| | | Principal
Amount | | | Value | |
Pennsylvania Electric Co. (c)
4.150% 4/15/25 | | $ | 150,000 | | | $ | 154,488 | |
PPL Capital Funding, Inc.
3.100% 5/15/26 | | | 265,000 | | | | 269,373 | |
PPL Capital Funding, Inc.
5.000% 3/15/44 | | | 90,000 | | | | 101,438 | |
Puget Energy, Inc.
3.650% 5/15/25 | | | 100,000 | | | | 104,073 | |
Puget Sound Energy, Inc.
4.300% 5/20/45 | | | 210,000 | | | | 241,674 | |
Southern California Edison Co.
5.950% 2/01/38 | | | 60,000 | | | | 81,329 | |
Tri-State Generation & Transmission Association, Series 2003, Class A (c)
6.040% 1/31/18 | | | 22,392 | | | | 22,635 | |
Tri-State Generation & Transmission Association, Series 2003, Class B (c)
7.144% 7/31/33 | | | 185,000 | | | | 214,648 | |
| | | | | | | | |
| | | | | | | 2,995,238 | |
| | | | | | | | |
| Electrical Components & Equipment — 0.2% | |
Legrand France SA
8.500% 2/15/25 | | | 250,000 | | | | 342,386 | |
| | | | | | | | |
| Electronics — 0.3% | |
Agilent Technologies, Inc.
3.875% 7/15/23 | | | 73,000 | | | | 77,904 | |
Amphenol Corp.
2.550% 1/30/19 | | | 100,000 | | | | 102,333 | |
Avnet, Inc.
4.875% 12/01/22 | | | 67,000 | | | | 72,800 | |
FLIR Systems, Inc.
3.125% 6/15/21 | | | 180,000 | | | | 185,784 | |
Jabil Circuit, Inc.
8.250% 3/15/18 | | | 45,000 | | | | 48,992 | |
PerkinElmer, Inc.
5.000% 11/15/21 | | | 125,000 | | | | 137,764 | |
| | | | | | | | |
| | | | | | | 625,577 | |
| | | | | | | | |
| Engineering & Construction — 0.2% | |
SBA Tower Trust (c)
2.877% 7/15/21 | | | 180,000 | | | | 183,051 | |
SBA Tower Trust (c)
3.156% 10/15/20 | | | 180,000 | | | | 181,750 | |
Zachry Holdings, Inc. (c)
7.500% 2/01/20 | | | 56,000 | | | | 55,720 | |
| | | | | | | | |
| | | | | | | 420,521 | |
| | | | | | | | |
| Entertainment — 0.1% | |
National CineMedia LLC (c)
5.750% 8/15/26 | | | 109,000 | | | | 113,087 | |
| | | | | | | | |
| Foods — 0.5% | |
Kraft Heinz Foods Co.
2.800% 7/02/20 | | | 280,000 | | | | 290,171 | |
The accompanying notes are an integral part of the financial statements.
120
MassMutual Premier Diversified Bond Fund – Portfolio of Investments (Continued)
| | | | | | | | |
| | | Principal
Amount | | | Value | |
Kraft Heinz Foods Co.
3.000% 6/01/26 | | $ | 170,000 | | | $ | 171,356 | |
Tyson Foods, Inc.
2.650% 8/15/19 | | | 45,000 | | | | 46,143 | |
Tyson Foods, Inc.
3.950% 8/15/24 | | | 90,000 | | | | 97,138 | |
Tyson Foods, Inc.
4.500% 6/15/22 | | | 150,000 | | | | 166,548 | |
Tyson Foods, Inc.
4.875% 8/15/34 | | | 65,000 | | | | 71,943 | |
Whole Foods Market, Inc. (c)
5.200% 12/03/25 | | | 155,000 | | | | 168,345 | |
WM Wrigley Jr. Co. (c)
2.400% 10/21/18 | | | 35,000 | | | | 35,569 | |
| | | | | | | | |
| | | | | | | 1,047,213 | |
| | | | | | | | |
| Forest Products & Paper — 0.2% | |
Celulosa Arauco y Constitucion SA
4.750% 1/11/22 | | | 200,000 | | | | 213,828 | |
International Paper Co.
4.750% 2/15/22 | | | 75,000 | | | | 83,534 | |
International Paper Co.
9.375% 5/15/19 | | | 110,000 | | | | 130,772 | |
| | | | | | | | |
| | | | | | | 428,134 | |
| | | | | | | | |
| Health Care – Products — 0.3% | |
St. Jude Medical, Inc.
2.800% 9/15/20 | | | 280,000 | | | | 288,625 | |
Zimmer Biomet Holdings, Inc.
3.550% 4/01/25 | | | 260,000 | | | | 267,968 | |
| | | | | | | | |
| | | | | | | 556,593 | |
| | | | | | | | |
| Health Care – Services — 1.4% | |
Aetna, Inc.
2.400% 6/15/21 | | | 250,000 | | | | 252,895 | |
Aetna, Inc.
3.200% 6/15/26 | | | 300,000 | | | | 305,018 | |
Aetna, Inc.
4.375% 6/15/46 | | | 70,000 | | | | 73,300 | |
HCA, Inc.
4.500% 2/15/27 | | | 493,000 | | | | 496,081 | |
HCA, Inc.
5.250% 4/15/25 | | | 800,000 | | | | 853,000 | |
HCA, Inc.
5.375% 2/01/25 | | | 350,000 | | | | 361,375 | |
Kaiser Foundation Hospitals
3.500% 4/01/22 | | | 65,000 | | | | 69,223 | |
UnitedHealth Group, Inc.
3.950% 10/15/42 | | | 85,000 | | | | 90,311 | |
UnitedHealth Group, Inc.
6.875% 2/15/38 | | | 75,000 | | | | 109,916 | |
| | | | | | | | |
| | | | | | | 2,611,119 | |
| | | | | | | | |
| | | | | | | | |
| | | Principal
Amount | | | Value | |
| Home Furnishing — 0.0% | |
Whirlpool Corp.
3.700% 3/01/23 | | $ | 50,000 | | | $ | 53,265 | |
Whirlpool Corp.
5.150% 3/01/43 | | | 20,000 | | | | 23,418 | |
| | | | | | | | |
| | | | | | | 76,683 | |
| | | | | | | | |
| Household Products — 0.0% | |
Avery Dennison Corp.
3.350% 4/15/23 | | | 30,000 | | | | 30,603 | |
| | | | | | | | |
| Housewares — 0.4% | |
Newell Brands, Inc.
3.850% 4/01/23 | | | 310,000 | | | | 329,984 | |
Newell Brands, Inc.
3.900% 11/01/25 | | | 115,000 | | | | 121,537 | |
Toro Co.
7.800% 6/15/27 | | | 170,000 | | | | 220,218 | |
| | | | | | | | |
| | | | | | | 671,739 | |
| | | | | | | | |
| Insurance — 2.0% | |
The Allstate Corp.
5.550% 5/09/35 | | | 50,000 | | | | 64,197 | |
The Allstate Corp. 3 mo. USD LIBOR + 2.938%, VRN 5.750% 8/15/53 | | | 790,000 | | | | 848,262 | |
American International Group, Inc.
3.300% 3/01/21 | | | 240,000 | | | | 251,808 | |
American International Group, Inc.
3.900% 4/01/26 | | | 135,000 | | | | 142,822 | |
Arch Capital Group US, Inc.
5.144% 11/01/43 | | | 80,000 | | | | 87,770 | |
AXIS Specialty Finance PLC
2.650% 4/01/19 | | | 45,000 | | | | 45,481 | |
Brown & Brown, Inc.
4.200% 9/15/24 | | | 85,000 | | | | 88,420 | |
CNA Financial Corp.
3.950% 5/15/24 | | | 85,000 | | | | 89,987 | |
Five Corners Funding Trust (c)
4.419% 11/15/23 | | | 100,000 | | | | 107,988 | |
Liberty Mutual Group, Inc. (c)
4.250% 6/15/23 | | | 43,000 | | | | 46,518 | |
Marsh & McLennan Cos., Inc.
3.750% 3/14/26 | | | 80,000 | | | | 86,471 | |
Marsh & McLennan Cos., Inc.
5.875% 8/01/33 | | | 150,000 | | | | 190,831 | |
MetLife Capital Trust IV (c)
7.875% 12/15/37 | | | 150,000 | | | | 188,190 | |
Prudential Financial, Inc. 3 mo. USD LIBOR + 3.040%, VRN
5.200% 3/15/44 | | | 59,000 | | | | 60,844 | |
Prudential Financial, Inc. 3 mo. USD LIBOR + 3.920%, VRN
5.625% 6/15/43 | | | 110,000 | | | | 118,668 | |
The accompanying notes are an integral part of the financial statements.
121
MassMutual Premier Diversified Bond Fund – Portfolio of Investments (Continued)
| | | | | | | | |
| | | Principal
Amount | | | Value | |
Prudential Financial, Inc.
6.200% 11/15/40 | | $ | 125,000 | | | $ | 153,848 | |
Reinsurance Group of America, Inc.
3.950% 9/15/26 | | | 315,000 | | | | 329,557 | |
Reinsurance Group of America, Inc.
4.700% 9/15/23 | | | 95,000 | | | | 103,812 | |
Reinsurance Group of America, Inc.
5.000% 6/01/21 | | | 95,000 | | | | 103,859 | |
Trinity Acquisition PLC
4.400% 3/15/26 | | | 65,000 | | | | 68,075 | |
Unum Group
3.000% 5/15/21 | | | 145,000 | | | | 148,255 | |
USF&G Capital I (c)
8.500% 12/15/45 | | | 95,000 | | | | 130,236 | |
Willis North America, Inc.
7.000% 9/29/19 | | | 43,000 | | | | 48,217 | |
XLIT Ltd.
4.450% 3/31/25 | | | 75,000 | | | | 76,130 | |
XLIT Ltd.
5.500% 3/31/45 | | | 200,000 | | | | 195,660 | |
| | | | | | | | |
| | | | | | | 3,775,906 | |
| | | | | | | | |
| Internet — 0.6% | |
Baidu, Inc.
2.250% 11/28/17 | | | 200,000 | | | | 201,601 | |
Expedia, Inc. (c)
5.000% 2/15/26 | | | 280,000 | | | | 294,701 | |
Expedia, Inc.
7.456% 8/15/18 | | | 320,000 | | | | 352,370 | |
Tencent Holdings Ltd. (c)
3.800% 2/11/25 | | | 200,000 | | | | 213,458 | |
| | | | | | | | |
| | | | | | | 1,062,130 | |
| | | | | | | | |
| Investment Companies — 0.4% | |
Ares Capital Corp.
3.625% 1/19/22 | | | 275,000 | | | | 276,791 | |
Ares Capital Corp.
3.875% 1/15/20 | | | 205,000 | | | | 212,027 | |
FS Investment Corp.
4.000% 7/15/19 | | | 200,000 | | | | 203,424 | |
| | | | | | | | |
| | | | | | | 692,242 | |
| | | | | | | | |
| Iron & Steel — 0.3% | |
Glencore Funding LLC (c)
4.000% 4/16/25 | | | 155,000 | | | | 151,542 | |
Reliance Steel & Aluminum Co.
4.500% 4/15/23 | | | 65,000 | | | | 67,937 | |
Reliance Steel & Aluminum Co.
6.200% 11/15/16 | | | 395,000 | | | | 396,725 | |
| | | | | | | | |
| | | | | | | 616,204 | |
| | | | | | | | |
| Leisure Time — 0.0% | |
Carnival Corp.
1.875% 12/15/17 | | | 50,000 | | | | 50,394 | |
| | | | | | | | |
| | | | | | | | |
| | | Principal
Amount | | | Value | |
| Lodging — 1.0% | |
Hyatt Hotels Corp.
3.375% 7/15/23 | | $ | 40,000 | | | $ | 41,135 | |
Marriott International, Inc.
2.300% 1/15/22 | | | 405,000 | | | | 408,416 | |
Marriott International, Inc.
3.375% 10/15/20 | | | 95,000 | | | | 99,844 | |
MGM Resorts International
4.625% 9/01/26 | | | 534,000 | | | | 520,650 | |
Wyndham Worldwide Corp.
2.950% 3/01/17 | | | 60,000 | | | | 60,274 | |
Wyndham Worldwide Corp.
5.625% 3/01/21 | | | 650,000 | | | | 729,157 | |
| | | | | | | | |
| | | | | | | 1,859,476 | |
| | | | | | | | |
| Machinery – Diversified — 0.1% | |
Roper Technologies, Inc.
3.125% 11/15/22 | | | 100,000 | | | | 102,985 | |
Xylem, Inc.
4.875% 10/01/21 | | | 100,000 | | | | 109,116 | |
| | | | | | | | |
| | | | | | | 212,101 | |
| | | | | | | | |
| Manufacturing — 0.2% | |
Carlisle Cos., Inc.
3.750% 11/15/22 | | | 85,000 | | | | 87,359 | |
JB Poindexter & Co., Inc. (c)
9.000% 4/01/22 | | | 200,000 | | | | 211,750 | |
Textron, Inc.
4.300% 3/01/24 | | | 120,000 | | | | 128,964 | |
| | | | | | | | |
| | | | | | | 428,073 | |
| | | | | | | | |
| Media — 3.1% | |
21st Century Fox America, Co.
6.900% 8/15/39 | | | 125,000 | | | | 167,845 | |
CBS Corp.
7.875% 7/30/30 | | | 100,000 | | | | 141,977 | |
CCO Holdings LLC/CCO Holdings Capital Corp.
5.750% 1/15/24 | | | 600,000 | | | | 637,500 | |
Charter Communications Operating LLC/Charter Communications Operating Capital (c)
4.464% 7/23/22 | | | 340,000 | | | | 366,881 | |
Comcast Corp.
3.400% 7/15/46 | | | 160,000 | | | | 155,536 | |
Discovery Communications LLC
4.875% 4/01/43 | | | 200,000 | | | | 190,335 | |
DISH DBS Corp.
5.875% 11/15/24 | | | 1,000,000 | | | | 987,500 | |
SFR Group SA (c)
6.250% 5/15/24 | | | 800,000 | | | | 794,762 | |
Sirius XM Radio, Inc. (c)
5.375% 4/15/25 | | | 1,000,000 | | | | 1,032,500 | |
The accompanying notes are an integral part of the financial statements.
122
MassMutual Premier Diversified Bond Fund – Portfolio of Investments (Continued)
| | | | | | | | |
| | | Principal
Amount | | | Value | |
TEGNA, Inc.
5.125% 7/15/20 | | $ | 500,000 | | | $ | 516,250 | |
Time Warner Cable, Inc.
4.500% 9/15/42 | | | 420,000 | | | | 400,789 | |
Time Warner Cable, Inc.
5.500% 9/01/41 | | | 240,000 | | | | 256,177 | |
Viacom, Inc.
2.250% 2/04/22 | | | 125,000 | | | | 124,415 | |
Viacom, Inc.
3.450% 10/04/26 | | | 270,000 | | | | 269,852 | |
| | | | | | | | |
| | | | | | | 6,042,319 | |
| | | | | | | | |
| Office Equipment/Supplies — 0.4% | |
Pitney Bowes, Inc.
3.375% 10/01/21 | | | 675,000 | | | | 674,675 | |
Pitney Bowes, Inc.
4.625% 3/15/24 | | | 130,000 | | | | 135,181 | |
Pitney Bowes, Inc.
4.750% 5/15/18 | | | 10,000 | | | | 10,359 | |
Pitney Bowes, Inc.
5.750% 9/15/17 | | | 14,000 | | | | 14,528 | |
| | | | | | | | |
| | | | | | | 834,743 | |
| | | | | | | | |
| Oil & Gas — 2.3% | |
Anadarko Petroleum Corp.
5.550% 3/15/26 | | | 150,000 | | | | 169,506 | |
Citgo Holding, Inc. (c)
10.750% 2/15/20 | | | 500,000 | | | | 501,250 | |
Diamond Offshore Drilling, Inc.
5.875% 5/01/19 | | | 175,000 | | | | 181,572 | |
EP Energy LLC/Everest Acquisition Finance, Inc.
9.375% 5/01/20 | | | 150,000 | | | | 106,125 | |
Exxon Mobil Corp.
3.043% 3/01/26 | | | 355,000 | | | | 372,138 | |
Helmerich & Payne International Drilling Co.
4.650% 3/15/25 | | | 35,000 | | | | 36,935 | |
Jupiter Resources, Inc. (c)
8.500% 10/01/22 | | | 225,000 | | | | 189,000 | |
Murphy Oil USA, Inc.
6.000% 8/15/23 | | | 175,000 | | | | 183,969 | |
Newfield Exploration Co.
5.375% 1/01/26 | | | 1,000,000 | | | | 1,002,500 | |
PBF Holding Co. LLC/PBF Finance Corp.
8.250% 2/15/20 | | | 555,000 | | | | 572,482 | |
Pemex Project Funding Master Trust
6.625% 6/15/38 | | | 51,000 | | | | 50,490 | |
Petroleos Mexicanos
3.125% 1/23/19 | | | 25,000 | | | | 25,225 | |
Petroleos Mexicanos
5.500% 1/21/21 | | | 375,000 | | | | 396,563 | |
| | | | | | | | |
| | | Principal
Amount | | | Value | |
Petroleos Mexicanos
6.375% 1/23/45 | | $ | 35,000 | | | $ | 33,425 | |
Phillips 66
4.300% 4/01/22 | | | 75,000 | | | | 82,443 | |
Phillips 66
4.650% 11/15/34 | | | 225,000 | | | | 243,493 | |
Phillips 66
5.875% 5/01/42 | | | 75,000 | | | | 94,113 | |
Pioneer Natural Resources Co.
4.450% 1/15/26 | | | 65,000 | | | | 70,493 | |
Rowan Cos., Inc.
4.875% 6/01/22 | | | 151,000 | | | | 127,595 | |
| | | | | | | | |
| | | | | | | 4,439,317 | |
| | | | | | | | |
| Oil & Gas Services — 0.1% | |
Schlumberger Holdings Corp. (c)
4.000% 12/21/25 | | | 205,000 | | | | 223,035 | |
| | | | | | | | |
| Packaging & Containers — 0.1% | |
Brambles USA, Inc. (c)
4.125% 10/23/25 | | | 90,000 | | | | 95,799 | |
Brambles USA, Inc., Series A (c)
5.350% 4/01/20 | | | 35,000 | | | | 38,665 | |
Sonoco Products Co.
4.375% 11/01/21 | | | 100,000 | | | | 106,844 | |
| | | | | | | | |
| | | | | | | 241,308 | |
| | | | | | | | |
| Pharmaceuticals — 2.4% | |
AbbVie, Inc.
3.200% 5/14/26 | | | 215,000 | | | | 217,656 | |
AbbVie, Inc.
3.600% 5/14/25 | | | 160,000 | | | | 167,242 | |
AbbVie, Inc.
4.400% 11/06/42 | | | 50,000 | | | | 52,027 | |
AbbVie, Inc.
4.500% 5/14/35 | | | 210,000 | | | | 223,800 | |
Actavis Funding SCS
3.450% 3/15/22 | | | 370,000 | | | | 388,440 | |
AstraZeneca PLC
6.450% 9/15/37 | | | 250,000 | | | | 348,616 | |
Baxalta, Inc.
3.600% 6/23/22 | | | 40,000 | | | | 42,023 | |
Baxalta, Inc.
4.000% 6/23/25 | | | 80,000 | | | | 85,381 | |
Express Scripts Holding Co.
3.000% 7/15/23 | | | 435,000 | | | | 441,826 | |
Express Scripts Holding Co.
3.300% 2/25/21 | | | 40,000 | | | | 42,038 | |
Express Scripts Holding Co.
4.800% 7/15/46 | | | 185,000 | | | | 192,173 | |
McKesson Corp.
1.292% 3/10/17 | | | 40,000 | | | | 40,032 | |
McKesson Corp.
2.284% 3/15/19 | | | 45,000 | | | | 45,794 | |
The accompanying notes are an integral part of the financial statements.
123
MassMutual Premier Diversified Bond Fund – Portfolio of Investments (Continued)
| | | | | | | | |
| | | Principal
Amount | | | Value | |
McKesson Corp.
3.796% 3/15/24 | | $ | 75,000 | | | $ | 80,883 | |
McKesson Corp.
4.883% 3/15/44 | | | 70,000 | | | | 82,288 | |
Mylan NV (c)
3.950% 6/15/26 | | | 610,000 | | | | 614,598 | |
Mylan NV (c)
5.250% 6/15/46 | | | 250,000 | | | | 263,302 | |
Shire Acquisitions Investments Ireland DAC
2.875% 9/23/23 | | | 715,000 | | | | 718,463 | |
Teva Pharmaceutical Finance Netherlands III BV
2.800% 7/21/23 | | | 305,000 | | | | 305,783 | |
Teva Pharmaceutical Finance Netherlands III BV
4.100% 10/01/46 | | | 85,000 | | | | 84,597 | |
Valeant Pharmaceuticals International (c)
7.000% 10/01/20 | | | 200,000 | | | | 194,000 | |
Valeant Pharmaceuticals International, Inc. (c)
6.125% 4/15/25 | | | 113,000 | | | | 97,321 | |
| | | | | | | | |
| | | | | | | 4,728,283 | |
| | | | | | | | |
| Pipelines — 1.3% | |
CenterPoint Energy Resources Corp.
4.500% 1/15/21 | | | 175,000 | | | | 188,979 | |
CenterPoint Energy Resources Corp.
5.850% 1/15/41 | | | 150,000 | | | | 180,968 | |
Energy Transfer Equity LP
7.500% 10/15/20 | | | 100,000 | | | | 109,750 | |
Energy Transfer Partners LP
4.150% 10/01/20 | | | 60,000 | | | | 62,756 | |
Energy Transfer Partners LP
4.750% 1/15/26 | | | 200,000 | | | | 206,630 | |
EnLink Midstream Partners LP
4.850% 7/15/26 | | | 70,000 | | | | 70,439 | |
Enterprise Products Operating Co.
5.950% 2/01/41 | | | 135,000 | | | | 156,369 | |
Kinder Morgan Energy Partners LP
6.500% 2/01/37 | | | 85,000 | | | | 91,662 | |
Kinder Morgan Energy Partners LP
6.950% 1/15/38 | | | 15,000 | | | | 17,029 | |
Kinder Morgan, Inc.
3.050% 12/01/19 | | | 250,000 | | | | 255,465 | |
Magellan Midstream Partners LP
5.000% 3/01/26 | | | 470,000 | | | | 535,449 | |
MPLX LP
4.875% 6/01/25 | | | 500,000 | | | | 516,641 | |
Tallgrass Energy Partners LP/Tallgrass Energy Finance Corp. (c)
5.500% 9/15/24 | | | 102,000 | | | | 102,765 | |
| | | | | | | | |
| | | | | | | 2,494,902 | |
| | | | | | | | |
| | | | | | | | |
| | | Principal
Amount | | | Value | |
| Real Estate Investment Trusts (REITS) — 1.3% | |
American Tower Corp.
3.400% 2/15/19 | | $ | 80,000 | | | $ | 83,123 | |
American Tower Corp.
3.450% 9/15/21 | | | 225,000 | | | | 236,803 | |
Brandywine Operating Partners LP
4.950% 4/15/18 | | | 300,000 | | | | 312,921 | |
CubeSmart LP
3.125% 9/01/26 | | | 305,000 | | | | 303,652 | |
DCT Industrial Operating Partnership LP
4.500% 10/15/23 | | | 60,000 | | | | 63,568 | |
DDR Corp.
4.750% 4/15/18 | | | 275,000 | | | | 285,500 | |
Digital Realty Trust LP
3.400% 10/01/20 | | | 140,000 | | | | 145,902 | |
Digital Realty Trust LP
3.950% 7/01/22 | | | 240,000 | | | | 254,376 | |
Duke Realty LP
8.250% 8/15/19 | | | 125,000 | | | | 146,172 | |
Federal Realty Investment Trust
5.900% 4/01/20 | | | 25,000 | | | | 28,463 | |
Highwoods Realty LP
7.500% 4/15/18 | | | 110,000 | | | | 118,936 | |
Host Hotels & Resorts LP
4.000% 6/15/25 | | | 160,000 | | | | 163,022 | |
Liberty Property LP
3.375% 6/15/23 | | | 50,000 | | | | 51,515 | |
ProLogis LP
2.750% 2/15/19 | | | 35,000 | | | | 35,812 | |
ProLogis LP
3.350% 2/01/21 | | | 165,000 | | | | 174,450 | |
Weingarten Realty Investors
3.250% 8/15/26 | | | 75,000 | | | | 75,080 | |
| | | | | | | | |
| | | | | | | 2,479,295 | |
| | | | | | | | |
| Retail — 2.5% | |
Advance Auto Parts, Inc.
4.500% 12/01/23 | | | 455,000 | | | | 492,799 | |
Bed Bath & Beyond, Inc.
3.749% 8/01/24 | | | 30,000 | | | | 31,107 | |
Bed Bath & Beyond, Inc.
5.165% 8/01/44 | | | 75,000 | | | | 72,518 | |
CVS Health Corp.
2.875% 6/01/26 | | | 360,000 | | | | 365,334 | |
CVS Health Corp.
3.500% 7/20/22 | | | 380,000 | | | | 406,748 | |
CVS Health Corp.
6.125% 9/15/39 | | | 25,000 | | | | 34,150 | |
CVS Pass-Through Trust (c)
5.926% 1/10/34 | | | 220,241 | | | | 260,427 | |
CVS Pass-Through Trust (c)
7.507% 1/10/32 | | | 16,874 | | | | 21,549 | |
The accompanying notes are an integral part of the financial statements.
124
MassMutual Premier Diversified Bond Fund – Portfolio of Investments (Continued)
| | | | | | | | |
| | | Principal
Amount | | | Value | |
Dollar Tree, Inc.
5.750% 3/01/23 | | $ | 1,000,000 | | | $ | 1,076,250 | |
El Puerto de Liverpool SAB de CV (c)
3.950% 10/02/24 | | | 280,000 | | | | 281,750 | |
The Home Depot, Inc.
5.950% 4/01/41 | | | 100,000 | | | | 137,517 | |
O’Reilly Automotive, Inc.
3.850% 6/15/23 | | | 46,000 | | | | 49,655 | |
O’Reilly Automotive, Inc.
4.875% 1/14/21 | | | 225,000 | | | | 249,938 | |
O’Reilly Automotive, Inc.
3.550% 3/15/26 | | | 100,000 | | | | 106,009 | |
Signet UK Finance PLC
4.700% 6/15/24 | | | 270,000 | | | | 259,958 | |
Tiffany & Co.
4.900% 10/01/44 | | | 105,000 | | | | 106,421 | |
Wal-Mart Stores, Inc.
5.625% 4/01/40 | | | 205,000 | | | | 276,561 | |
Walgreens Boots Alliance, Inc.
2.700% 11/18/19 | | | 185,000 | | | | 190,639 | |
Walgreens Boots Alliance, Inc.
3.800% 11/18/24 | | | 245,000 | | | | 262,991 | |
Walgreens Boots Alliance, Inc.
4.800% 11/18/44 | | | 95,000 | | | | 104,723 | |
| | | | | | | | |
| | | | | | | 4,787,044 | |
| | | | | | | | |
| Savings & Loans — 0.1% | |
Glencore Funding LLC (c)
2.500% 1/15/19 | | | 114,000 | | | | 113,726 | |
Glencore Funding LLC (c)
3.125% 4/29/19 | | | 65,000 | | | | 65,260 | |
| | | | | | | | |
| | | | | | | 178,986 | |
| | | | | | | | |
| Semiconductors — 0.8% | |
KLA-Tencor Corp.
4.650% 11/01/24 | | | 230,000 | | | | 252,746 | |
Lam Research Corp.
3.800% 3/15/25 | | | 145,000 | | | | 151,050 | |
NXP BV/NXP Funding LLC (c)
3.750% 6/01/18 | | | 110,000 | | | | 113,162 | |
NXP BV/NXP Funding LLC (c)
4.625% 6/01/23 | | | 1,000,000 | | | | 1,093,750 | |
| | | | | | | | |
| | | | | | | 1,610,708 | |
| | | | | | | | |
| Software — 0.3% | |
Broadridge Financial Solutions, Inc.
3.400% 6/27/26 | | | 160,000 | | | | 164,111 | |
Broadridge Financial Solutions, Inc.
3.950% 9/01/20 | | | 45,000 | | | | 47,814 | |
Oracle Corp.
5.375% 7/15/40 | | | 250,000 | | | | 307,302 | |
| | | | | | | | |
| | | | | | | 519,227 | |
| | | | | | | | |
| | | | | | | | |
| | | Principal
Amount | | | Value | |
| Telecommunications — 1.4% | |
AT&T, Inc.
3.400% 5/15/25 | | $ | 270,000 | | | $ | 277,400 | |
AT&T, Inc.
6.550% 2/15/39 | | | 175,000 | | | | 222,865 | |
Embarq Corp.
7.995% 6/01/36 | | | 45,000 | | | | 45,539 | |
Hughes Satellite Systems Corp. (c)
6.625% 8/01/26 | | | 444,000 | | | | 428,460 | |
Motorola Solutions, Inc.
3.500% 3/01/23 | | | 90,000 | | | | 89,548 | |
Telefonaktiebolaget LM Ericsson
4.125% 5/15/22 | | | 225,000 | | | | 242,252 | |
Verizon Communications, Inc.
2.625% 2/21/20 | | | 115,000 | | | | 118,267 | |
Verizon Communications, Inc.
2.625% 8/15/26 | | | 820,000 | | | | 804,805 | |
Verizon Communications, Inc.
3.500% 11/01/24 | | | 240,000 | | | | 256,002 | |
Verizon Communications, Inc.
5.012% 8/21/54 | | | 77,000 | | | | 85,026 | |
Verizon Communications, Inc.
5.150% 9/15/23 | | | 95,000 | | | | 110,668 | |
Verizon Communications, Inc.
6.550% 9/15/43 | | | 79,000 | | | | 106,815 | |
| | | | | | | | |
| | | | | | | 2,787,647 | |
| | | | | | | | |
| Transportation — 0.6% | |
Asciano Finance (c)
4.625% 9/23/20 | | | 45,000 | | | | 47,296 | |
Burlington Northern Santa Fe LLC
6.750% 3/15/29 | | | 160,000 | | | | 218,623 | |
Norfolk Southern Corp.
6.000% 5/23/2111 | | | 125,000 | | | | 153,209 | |
OPE KAG Finance Sub, Inc. (c)
7.875% 7/31/23 | | | 720,000 | | | | 682,200 | |
Ryder System, Inc.
2.550% 6/01/19 | | | 30,000 | | | | 30,592 | |
| | | | | | | | |
| | | | | | | 1,131,920 | |
| | | | | | | | |
| Trucking & Leasing — 0.5% | |
Aviation Capital Group Corp. (c)
2.875% 9/17/18 | | | 280,000 | | | | 283,500 | |
GATX Corp.
4.750% 6/15/22 | | | 125,000 | | | | 139,347 | |
Penske Truck Leasing Co. LP/PTL Finance Corp. (c)
2.500% 6/15/19 | | | 145,000 | | | | 147,124 | |
Penske Truck Leasing Co. LP/PTL Finance Corp. (c)
3.375% 2/01/22 | | | 320,000 | | | | 332,775 | |
| | | | | | | | |
| | | | | | | 902,746 | |
| | | | | | | | |
| | |
TOTAL CORPORATE DEBT
(Cost $79,477,082) | | | | | | | 83,037,289 | |
| | | | | | | | |
The accompanying notes are an integral part of the financial statements.
125
MassMutual Premier Diversified Bond Fund – Portfolio of Investments (Continued)
| | | | | | | | |
| | | Principal
Amount | | | Value | |
| MUNICIPAL OBLIGATIONS — 0.2% | |
State of California BAB
7.550% 4/01/39 | | $ | 125,000 | | | $ | 200,176 | |
State of California BAB
7.600% 11/01/40 | | | 150,000 | | | | 243,170 | |
| | | | | | | | |
| | | | | | | 443,346 | |
| | | | | | | | |
| | |
TOTAL MUNICIPAL OBLIGATIONS
(Cost $353,697) | | | | | | | 443,346 | |
| | | | | | | | |
|
| NON-U.S. GOVERNMENT AGENCY OBLIGATIONS — 25.4% | |
| Auto Floor Plan ABS — 0.2% | |
Capital Automotive REIT, Series 2010-1A, Class A (c)
5.730% 12/15/38 | | | 205,066 | | | | 211,279 | |
NCF Dealer Floorplan Master Trust, Series 2014-1A, Class A, 1 mo. LIBOR + 1.500%, FRN (c)
2.032% 10/20/20 | | | 110,000 | | | | 110,000 | |
| | | | | | | | |
| | | | | | | 321,279 | |
| | | | | | | | |
| Automobile ABS — 1.9% | |
American Credit Acceptance Receivables Trust, Series 2016-1A, Class A (c)
2.370% 5/12/20 | | | 123,770 | | | | 123,808 | |
AmeriCredit Automobile Receivables Trust, Series 2014-2, Class D
2.570% 7/08/20 | | | 300,000 | | | | 303,656 | |
AmeriCredit Automobile Receivables Trust, Series 2016-2, Class C
2.870% 11/08/21 | | | 150,000 | | | | 152,536 | |
Avis Budget Rental Car Funding AESOP LLC, Series 2014-2A, Class A (c)
2.500% 2/20/21 | | | 120,000 | | | | 121,165 | |
CFC LLC, Series 2014-2A, Class A (c)
1.440% 11/16/20 | | | 41,156 | | | | 40,984 | |
CPS Auto Trust, Series 2014-A, Class A (c)
1.210% 8/15/18 | | | 11,303 | | | | 11,284 | |
CPS Auto Trust, Series 2014-C, Class A (c)
1.310% 2/15/19 | | | 61,850 | | | | 61,771 | |
Drive Auto Receivables Trust, Series 2016-BA, Class B (c)
2.560% 6/15/20 | | | 140,000 | | | | 141,125 | |
Drive Auto Receivables Trust, Series 2016-AA, Class B (c)
3.170% 5/15/20 | | | 260,000 | | | | 262,931 | |
Exeter Automobile Receivables Trust, Series 2014-3A, Class A (c)
1.320% 1/15/19 | | | 15,975 | | | | 15,952 | |
Flagship Credit Auto Trust, Series 2016-2, Class A2 (c)
3.050% 8/16/21 | | | 500,000 | | | | 503,060 | |
| | | | | | | | |
| | | Principal
Amount | | | Value | |
GLS Auto Receivables Trust, Series 2015-1A, Class A (c)
2.250% 12/15/20 | | $ | 73,640 | | | $ | 73,540 | |
GO Financial Auto Securitization Trust, Series 2015-1, Class A (c)
1.810% 3/15/18 | | | 11,192 | | | | 11,187 | |
OneMain Direct Auto Receivables Trust, Series 2016-1A, Class A (c)
2.040% 1/15/21 | | | 179,781 | | | | 180,330 | |
Oscar US Funding Trust II, Series 2015-1A, Class A4 (c)
2.440% 6/15/22 | | | 320,000 | | | | 316,205 | |
Oscar US Funding Trust IV, Series 2016-1A, Class A2B, 1 mo. USD LIBOR + 1.700%, FRN (c)
2.224% 7/15/20 | | | 251,072 | | | | 251,002 | |
Oscar US Funding Trust V, Series 2016-2A, Class A4 (c)
2.990% 12/15/23 | | | 600,000 | | | | 599,839 | |
Santander Drive Auto Receivables Trust,
Series 2015-S2, Class R1 (c)
1.840% 11/18/19 | | | 4,277 | | | | 4,274 | |
Santander Drive Auto Receivables Trust, Series 2015-3, Class C
2.740% 1/15/21 | | | 200,000 | | | | 203,082 | |
Santander Drive Auto Receivables Trust, Series 2014-4, Class D
3.100% 11/16/20 | | | 330,000 | | | | 335,321 | |
| | | | | | | | |
| | | | | | | 3,713,052 | |
| | | | | | | | |
| Commercial MBS — 2.9% | |
Banc of America Commercial Mortgage, Inc., Series 2007-3, Class A4, VRN
5.723% 6/10/49 | | | 156,754 | | | | 158,607 | |
Banc of America Commercial Mortgage, Inc., Series 2007-4, Class AM, VRN
6.005% 2/10/51 | | | 95,000 | | | | 97,586 | |
Banc of America Commercial Mortgage, Inc., Series 2008-1, Class A4, VRN
6.435% 2/10/51 | | | 315,533 | | | | 327,730 | |
Banc of America Commercial Mortgage, Inc., Series 2008-1, Class AM, VRN
6.478% 2/10/51 | | | 100,000 | | | | 104,104 | |
Bear Stearns Commercial Mortgage Securities, Series 2007-T26, Class AM, VRN
5.513% 1/12/45 | | | 190,000 | | | | 191,518 | |
Bear Stearns Commercial Mortgage Securities, Series 2007-PW17, Class A4, VRN
5.694% 6/11/50 | | | 571,377 | | | | 586,737 | |
The accompanying notes are an integral part of the financial statements.
126
MassMutual Premier Diversified Bond Fund – Portfolio of Investments (Continued)
| | | | | | | | |
| | | Principal
Amount | | | Value | |
Bear Stearns Commercial Mortgage Securities, Series 2007-PW18, Class A4
5.700% 6/11/50 | | $ | 143,767 | | | $ | 147,600 | |
Bear Stearns Commercial Mortgage Securities, Series 2007-T28, Class AM, VRN
5.835% 9/11/42 | | | 110,000 | | | | 113,070 | |
Bear Stearns Commercial Mortgage Securities, Series 2007-PW17, Class AM, VRN
5.915% 6/11/50 | | | 200,000 | | | | 204,572 | |
Bear Stearns Commercial Mortgage Securities, Series 2007-PW18, Class AM, VRN
6.084% 6/11/50 | | | 115,000 | | | | 118,415 | |
Commercial Mortgage Pass Through Certificates, Series 2014-UBS2, Class A5
3.961% 3/10/47 | | | 152,000 | | | | 167,551 | |
Commercial Mortgage Pass Through Certificates, Series 2014-UBS2, Class AM
4.199% 3/10/47 | | | 100,000 | | | | 109,290 | |
Commercial Mortgage Pass Through Certificates, Series 2014-CR14, Class A4, VRN
4.236% 2/10/47 | | | 110,000 | | | | 123,665 | |
Commercial Mortgage Pass Through Certificates, Series 2015-CR23, Class C, VRN
4.398% 5/10/48 | | | 110,000 | | | | 102,734 | |
DBCCRE Mortgage Trust, Series 2014-ARCP, Class A (c)
4.238% 1/10/34 | | | 100,000 | | | | 106,724 | |
DBRR Trust, Series 2013-EZ3, Class A, VRN (c)
1.635% 12/18/49 | | | 8,841 | | | | 8,838 | |
DBUBS Mortgage Trust, Series 2011-LC1A, Class A1 (c)
3.742% 11/10/46 | | | 3,198 | | | | 3,223 | |
GCCFC Commercial Mortgage Trust, Series 2006-GG7, Class AM, VRN
5.951% 7/10/38 | | | 159,559 | | | | 159,784 | |
JP Morgan Chase Commercial Mortgage Securities Corp., Series 2006-CB17, Class A4
5.429% 12/12/43 | | | 435 | | | | 434 | |
Merrill Lynch/Countrywide Commercial Mortgage Trust, Series 2006-4, Class AM
5.204% 12/12/49 | | | 73,600 | | | | 73,564 | |
ML-CFC Commercial Mortgage Trust,
Series 2007-9, Class AM, VRN 5.856% 9/12/49 | | | 115,000 | | | | 118,288 | |
| | | | | | | | |
| | | Principal
Amount | | | Value | |
Morgan Stanley Capital I, Series 2006-IQ12, Class AM
5.370% 12/15/43 | | $ | 110,000 | | | $ | 110,165 | |
Morgan Stanley Capital I, Series 2007-HQ11, Class AJ, VRN
5.508% 2/12/44 | | | 170,000 | | | | 167,181 | |
Morgan Stanley Capital I, Series 2007-IQ14, Class A2
5.610% 4/15/49 | | | 25,665 | | | | 25,605 | |
STRIPs Ltd., Series 2012-1A, Class A (c)
1.500% 12/25/44 | | | 8,397 | | | | 8,397 | |
TIAA Seasoned Commercial Mortgage Trust, Series 2007-C4, Class AJ, VRN
5.483% 8/15/39 | | | 21,137 | | | | 21,277 | |
VNO Mortgage Trust, Series 2013-PENN, Class A (c)
3.808% 12/13/29 | | | 110,000 | | | | 118,053 | |
Wachovia Bank Commercial Mortgage Trust, Series 2006-C29, Class AM
5.339% 11/15/48 | | | 321,000 | | | | 321,940 | |
Wachovia Bank Commercial Mortgage Trust, Series 2007-C31, Class A4
5.509% 4/15/47 | | | 433,333 | | | | 437,654 | |
Wachovia Bank Commercial Mortgage Trust, Series 2007-C31, Class AM, VRN
5.591% 4/15/47 | | | 110,000 | | | | 111,464 | |
Wachovia Bank Commercial Mortgage Trust, Series 2007-C33, Class A4, VRN
6.158% 2/15/51 | | | 85,280 | | | | 86,479 | |
Wachovia Bank Commercial Mortgage Trust, Series 2007-C33, Class AM, VRN
6.158% 2/15/51 | | | 500,000 | | | | 510,834 | |
Wells Fargo Commercial Mortgage Trust, Series 2015-NXS1, Class C, VRN
3.848% 5/15/48 | | | 140,000 | | | | 140,137 | |
WF-RBS Commercial Mortgage Trust, Series 2012-C8, Class B
4.311% 8/15/45 | | | 110,000 | | | | 118,970 | |
WF-RBS Commercial Mortgage Trust, Series 2012-C8, Class C, VRN
5.031% 8/15/45 | | | 100,000 | | | | 106,974 | |
WF-RBS Commercial Mortgage Trust, Series 2011-C5, Class C, VRN (c)
5.865% 11/15/44 | | | 170,000 | | | | 187,945 | |
WF-RBS Commercial Mortgage Trust, Series 2011-C5, Class D, VRN (c)
5.865% 11/15/44 | | | 115,000 | | | | 124,440 | |
| | | | | | | | |
| | | | | | | 5,621,549 | |
| | | | | | | | |
The accompanying notes are an integral part of the financial statements.
127
MassMutual Premier Diversified Bond Fund – Portfolio of Investments (Continued)
| | | | | | | | |
| | | Principal
Amount | | | Value | |
| Home Equity ABS — 0.8% | |
Accredited Mortgage Loan Trust, Series 2005-3, Class M1, 1 mo. USD LIBOR + .450%, FRN
0.970% 9/25/35 | | $ | 91,067 | | | $ | 90,221 | |
ACE Securities Corp., Series 2005-HE5, Class M2, 1 mo. USD LIBOR + .735%, FRN
1.260% 8/25/35 | | | 159,140 | | | | 158,720 | |
ACE Securities Corp., Series 2005-RM1, Class M2, 1 mo. USD LIBOR + .750%, FRN
1.275% 3/25/35 | | | 17,996 | | | | 18,538 | |
Asset-Backed Securities Corporation Home Equity, Series 2005-HE3, Class M3, 1 mo. USD LIBOR + .705%, FRN
1.230% 4/25/35 | | | 39,285 | | | | 39,560 | |
Bear Stearns Asset-Backed Securities I Trust, Series 2006-HE3, Class A2, 1 mo. USD LIBOR + .180%, FRN
0.705% 4/25/36 | | | 522 | | | | 522 | |
Bear Stearns Asset-Backed Securities I Trust, Series 2005-HE12, Class M1, 1 mo. USD LIBOR + .480%, FRN
1.005% 12/25/35 | | | 281,164 | | | | 275,187 | |
Conseco Finance Corp., Series 2002-A, Class M1, 1 mo. LIBOR + 1.850%, FRN
2.374% 4/15/32 | | | 66,105 | | | | 66,268 | |
Countrywide Asset-Backed Certificates, Series 2004-5, Class 3A, 1 mo. USD LIBOR + .460%, FRN
0.985% 9/25/34 | | | 54,572 | | | | 53,954 | |
Countrywide Partnership Trust, Series 2004-EC1, Class M1, 1 mo. USD LIBOR + .900%, FRN
1.425% 2/25/35 | | | 193,391 | | | | 157,336 | |
Credit Suisse Seasoned Loan Trust, Series 2006-1, Class A, 1 mo. USD LIBOR + .240%, FRN (c)
0.765% 10/25/34 | | | 152,594 | | | | 151,796 | |
Fremont Home Loan Trust, Series 2005-E, Class 2A3, 1 mo. USD LIBOR + .240%, FRN
0.765% 1/25/36 | | | 37,719 | | | | 37,422 | |
JP Morgan Mortgage Acquisition Corp., Series 2005-FRE1, Class A2V2, 1 mo. USD LIBOR + .220%, FRN
0.745% 10/25/35 | | | 74,759 | | | | 74,789 | |
MASTR Asset Backed Securities Trust, Series 2005, Class M1, 1 mo. USD LIBOR + .720%, FRN
1.245% 12/25/34 | | | 99,504 | | | | 88,115 | |
| | | | | | | | |
| | | Principal
Amount | | | Value | |
MASTR Asset-Backed Securities Trust, Series 2005-WMC1, Class M3, 1 mo. USD LIBOR + .720%, FRN
1.245% 3/25/35 | | $ | 92,817 | | | $ | 92,492 | |
New Century Home Equity Loan Trust, Series 1997-NC5, Class A6, STEP
6.620% 10/25/28 | | | 5 | | | | 5 | |
NovaStar Mortgage Funding Trust, Series 2005-3, Class A2D, 1 mo. LIBOR + .370%, FRN
0.895% 1/25/36 | | | 110,004 | | | | 109,310 | |
Option One Mortgage Loan Trust, Series 2005-5, Class A3, 1 mo. USD LIBOR + .210%, FRN
0.735% 12/25/35 | | | 123,329 | | | | 122,847 | |
Option One Mortgage Loan Trust, Series 2005-3, Class M1, 1 mo. USD LIBOR + .470%, FRN
0.995% 8/25/35 | | | 49,584 | | | | 49,408 | |
Park Place Securities, Inc., Series 2005-WHQ4, Class A1A, 1 mo. USD LIBOR + .260%, FRN
0.785% 9/25/35 | | | 19,644 | | | | 19,653 | |
Residential Asset Securities Corp., Series 2005-AHL3, Class A2, 1 mo. USD LIBOR + .240%, FRN
0.765% 11/25/35 | | | 36,507 | | | | 36,368 | |
| | | | | | | | |
| | | | | | | 1,642,511 | |
| | | | | | | | |
| Other ABS — 14.5% | |
321 Henderson Receivables I LLC, Series 2015-1A, Class A (c)
3.260% 9/15/72 | | | 93,552 | | | | 93,731 | |
Aames Mortgage Investment Trust, Series 2004-1, Class M5, 1 mo. USD LIBOR + 1.725%, FRN
2.249% 1/25/35 | | | 97,596 | | | | 97,322 | |
ALM VII Ltd., Series 2012-7A, Class A1R, 3 mo. USD LIBOR + 1.480%, FRN (c)
1.000% 10/15/28 | | | 390,000 | | | | 390,000 | |
ALM VIII Ltd., Series 2013-8A, Class A1R, 3 mo. LIBOR + 1.490%, FRN (c)
1.000% 10/15/28 | | | 670,000 | | | | 670,000 | |
ALM VIII Ltd., Series 2013-8A, Class A1A, 3 mo. LIBOR + 1.450%, FRN (c)
2.146% 1/20/26 | | | 710,000 | | | | 709,994 | |
Alterna Funding I LLC, Series 2014-1A, Class NOTE (c)
1.639% 2/15/21 | | | 56,228 | | | | 54,822 | |
The accompanying notes are an integral part of the financial statements.
128
MassMutual Premier Diversified Bond Fund – Portfolio of Investments (Continued)
| | | | | | | | |
| | | Principal
Amount | | | Value | |
Apidos CLO XVII, Series 2014-17A, Class A1A, 3 mo. USD LIBOR + 1.500%, FRN (c)
2.179% 4/17/26 | | $ | 250,000 | | | $ | 250,006 | |
Applebee’s/IHOP Funding LLC, Series 2014-1, Class A2 (c)
4.277% 9/05/44 | | | 230,000 | | | | 233,755 | |
Arbys Funding LLC, Series 2015-1A, Class A2 (c)
4.969% 10/30/45 | | | 267,975 | | | | 279,699 | |
Argent Securities, Inc. Asset-Backed Pass-Through Certificates, Series 2004-W10, Class M1, 1 mo. USD LIBOR + .900%, FRN
1.424% 10/25/34 | | | 499,837 | | | | 457,462 | |
ARL First LLC, Series 2012-1A, Class A1, 1 mo. USD LIBOR + 1.750%, FRN (c)
2.274% 12/15/42 | | | 119,523 | | | | 115,984 | |
AVANT Loans Funding Trust, Series 2016-B, Class A (c)
3.920% 8/15/19 | | | 97,085 | | | | 97,590 | |
Avery Point CLO Ltd., Series 2014-5A, Class A, 3 mo. USD LIBOR + 1.460%, FRN (c)
2.139% 7/17/26 | | | 250,000 | | | | 250,003 | |
Avery Point III CLO Ltd., Series 2013-3A, Class A, 3 mo. USD LIBOR + 1.400%, FRN (c)
2.079% 1/18/25 | | | 250,000 | | | | 250,001 | |
Avery Point VI CLO Ltd., Series 2015-6A, Class A, 3 mo. USD LIBOR + 1.450%, FRN (c)
2.228% 8/05/27 | | | 445,000 | | | | 445,320 | |
Birchwood Park CLO Ltd., Series 2014-1A, Class A, 3 mo. USD LIBOR + 1.440%, FRN (c)
2.120% 7/15/26 | | | 250,000 | | | | 250,020 | |
Blue Hill CLO Ltd., Series 2013-1A, Class A, 3 mo. USD LIBOR + 1.480%, FRN (c)
2.160% 1/15/26 | | | 250,000 | | | | 250,075 | |
BlueMountain CLO Ltd., Series 2015-2A, Class A1, 3 mo. USD LIBOR + 1.430%, FRN (c)
2.109% 7/18/27 | | | 305,000 | | | | 305,592 | |
BlueVirgo Trust, Series 2015-1A, Class NOTE (c)
3.000% 12/15/22 | | | 346,179 | | | | 349,845 | |
CAN Capital Funding LLC, Series 2014-1A, Class A (c)
3.117% 4/15/20 | | | 160,000 | | | | 158,607 | |
Capital Automotive REIT, Series 2014-1A, Class A (c)
3.660% 10/15/44 | | | 100,000 | | | | 100,245 | |
| | | | | | | | |
| | | Principal
Amount | | | Value | |
Carlyle Global Market Strategies, Series 2014-1A, Class A, 3 mo. USD LIBOR + 1.520%, FRN (c) 2.199% 4/17/25 | | $ | 265,000 | | | $ | 265,007 | |
Carlyle Global Market Strategies CLO Ltd., Series 2013-4A, Class A1, 3 mo. USD LIBOR + 1.470%, FRN (c) 2.150% 10/15/25 | | | 600,000 | | | | 600,015 | |
Citi Held For Asset Issuance, Series 2015-PM1, Class A (c)
1.850% 12/15/21 | | | 24,493 | | | | 24,448 | |
Citigroup Mortgage Loan Trust, Series 2006-SHL1, Class A1, 1 mo. USD LIBOR + .200%, FRN (c) 0.724% 11/25/45 | | | 48,090 | | | | 48,115 | |
Citigroup Mortgage Loan Trust, Inc., Series 2006-WFH2, Class A2A, 1 mo. USD LIBOR + .150%, FRN 0.675% 8/25/36 | | | 118,139 | | | | 116,062 | |
CKE Restaurant Holdings, Inc., Series 2013-1A, Class A2 (c)
4.474% 3/20/43 | | | 421,638 | | | | 423,020 | |
CLI Funding V LLC, Series 2014-2A, Class A (c)
3.380% 10/18/29 | | | 80,749 | | | | 77,262 | |
CLI Funding VI LLC, Series 2016-1A, Class A (c)
4.210% 2/18/41 | | | 561,294 | | | | 543,663 | |
Consumer Credit Origination Loan Trust, Series 2015-1, Class A (c)
2.820% 3/15/21 | | | 40,825 | | | | 41,076 | |
Credit-Based Asset Servicing and Securitization LLC, Series 2006-RP2, Class A3, 1 mo. LIBOR + .300%, FRN (c) 0.825% 7/25/36 | | | 117,073 | | | | 116,648 | |
CWABS Asset-Backed Certificates Trust, Series 2005-4, Class MV5, 1 mo. USD LIBOR + .670%, FRN 1.194% 10/25/35 | | | 440,000 | | | | 390,542 | |
DB Master Finance LLC, Series 2015-1A, Class A2I (c)
3.262% 2/20/45 | | | 512,200 | | | | 516,699 | |
DB Master Finance LLC, Series 2015-1A, Class A2II (c)
3.980% 2/20/45 | | | 394,000 | | | | 401,896 | |
Diamond Resorts Owner Trust, Series 2013-2, Class A (c)
2.270% 5/20/26 | | | 89,428 | | | | 88,908 | |
Diamond Resorts Owner Trust, Series 2015-1, Class A (c)
2.730% 7/20/27 | | | 170,939 | | | | 171,939 | |
Diamond Resorts Owner Trust, Series 2015-2, Class B (c)
3.540% 5/22/28 | | | 134,847 | | | | 137,056 | |
The accompanying notes are an integral part of the financial statements.
129
MassMutual Premier Diversified Bond Fund – Portfolio of Investments (Continued)
| | | | | | | | |
| | | Principal
Amount | | | Value | |
Domino’s Pizza Master Issuer LLC, Series 2015-1A, Class A2I (c)
3.484% 10/25/45 | | $ | 416,850 | | | $ | 420,367 | |
Domino’s Pizza Master Issuer LLC, Series 2015-1A, Class A2II (c)
4.474% 10/25/45 | | | 615,350 | | | | 623,720 | |
Domino’s Pizza Master Issuer LLC, Series 2012-1A, Class A2 (c)
5.216% 1/25/42 | | | 216,843 | | | | 222,676 | |
Dong Fang Container Finance II SPV Ltd., Series 2014-1A, Class A2 (c)
3.550% 11/25/39 | | | 210,132 | | | | 202,164 | |
Drug Royalty Corp., Inc., Series 2012-1, Class A2 (c)
5.800% 7/15/24 | | | 36,154 | | | | 36,654 | |
Dryden XXXI Senior Loan Fund, Series 2014-31A, Class A, 3 mo. USD LIBOR + 1.350%, FRN (c)
2.029% 4/18/26 | | | 370,000 | | | | 369,999 | |
Eaton Vance CLO, Series 2014-1A, Class A, 3 mo. USD LIBOR + 1.450%, FRN (c)
2.130% 7/15/26 | | | 500,000 | | | | 499,665 | |
Elara HGV Timeshare Issuer LLC, Series 2016-A, Class A (c)
2.810% 4/25/28 | | | 387,036 | | | | 386,869 | |
Elara HGV Timeshare Issuer LLC, Series 2016-A, Class B (c)
3.210% 4/25/28 | | | 235,997 | | | | 235,870 | |
Element Rail Leasing II LLC, Series 2015-1A, Class A1 (c)
2.707% 2/19/45 | | | 77,387 | | | | 75,621 | |
Element Rail Leasing II LLC, Series 2015-1A, Class A2 (c)
3.585% 2/19/45 | | | 160,000 | | | | 153,591 | |
Element Rail Leasing II LLC, Series 2016-1A, Class A1 (c)
3.968% 3/19/46 | | | 204,188 | | | | 205,694 | |
Fairway Outdoor Funding LLC, Series 2012-1A, Class A2 (c)
4.212% 10/15/42 | | | 208,952 | | | | 211,973 | |
First Franklin Mortgage Loan Trust, Series 2005-FF7, Class M1, 1 mo. USD LIBOR + .450%, FRN
0.975% 7/25/35 | | | 7,078 | | | | 7,075 | |
Fremont Home Loan Trust, Series 2005-2, Class M2, 1 mo. USD LIBOR + .720%, FRN
1.245% 6/25/35 | | | 119,605 | | | | 118,637 | |
Galaxy XX CLO Ltd., Series 2015-20A, Class A, 3 mo. USD LIBOR + 1.450%, FRN (c)
2.146% 7/20/27 | | | 340,000 | | | | 339,861 | |
| | | | | | | | |
| | | Principal
Amount | | | Value | |
GoldenTree Loan Opportunities VII Ltd., Series 2013-7A, Class A, 3 mo. USD LIBOR + 1.150%, FRN (c)
1.865% 4/25/25 | | $ | 365,000 | | | $ | 363,097 | |
GoldenTree Loan Opportunities VII Ltd., Series 2014-8A, Class A, 3 mo. USD LIBOR + 1.450%, FRN (c)
2.138% 4/19/26 | | | 550,000 | | | | 550,021 | |
Green Tree Agency Advance Funding Trust I, Series 2015-T2, Class AT2 (c)
3.095% 10/15/48 | | | 340,000 | | | | 340,106 | |
Hercules Capital Funding Trust, Series 2014-1A, Class A (c)
3.524% 4/16/21 | | | 226,227 | | | | 225,520 | |
HERO Funding Trust, Series 2016-3A, Class A1 (c)
3.080% 9/20/42 | | | 310,000 | | | | 310,000 | |
Hilton Grand Vacations Trust, Series 2014-AA, Class A (c)
1.770% 11/25/26 | | | 71,434 | | | | 70,692 | |
Hilton Grand Vacations Trust, Series 2013-A, Class A (c)
2.280% 1/25/26 | | | 89,855 | | | | 90,022 | |
Icon Brand Holdings LLC, Series 2012-1A, Class A (Acquired 11/16/12-11/20/12, Cost $77,355) (c) (d)
4.229% 1/25/43 | | | 75,344 | | | | 68,631 | |
Icon Brand Holdings LLC, Series 2013-1A, Class A (Acquired 1/9/14, Cost $78,529) (c) (d)
4.352% 1/25/43 | | | 62,547 | | | | 58,123 | |
ING Investment Management CLO Ltd., Series 2013-3A, Class A1, 3 mo. USD LIBOR + 1.450%, FRN (c)
2.129% 1/18/26 | | | 250,000 | | | | 249,646 | |
J.G. Wentworth XXXV LLC, Series 2015-2A, Class A (c)
3.870% 3/15/58 | | | 88,862 | | | | 91,907 | |
JP Morgan Mortgage Acquisition Trust, Series 2006-CH1, Class A5, 1 mo. USD LIBOR + .230%, FRN
0.755% 7/25/36 | | | 150,000 | | | | 145,537 | |
LCM Ltd., Series 16A, Class A, 3 mo. USD LIBOR + 1.500%, FRN (c)
2.180% 7/15/26 | | | 250,000 | | | | 250,931 | |
Leaf Receivables Funding LLC, Series 2016-1, Class A1 (c)
1.000% 6/15/17 | | | 385,680 | | | | 385,682 | |
Long Beach Mortgage Loan Trust, Series 2005-1, Class M2, 1 mo. USD LIBOR + .795%, FRN
1.320% 2/25/35 | | | 133,592 | | | | 132,537 | |
The accompanying notes are an integral part of the financial statements.
130
MassMutual Premier Diversified Bond Fund – Portfolio of Investments (Continued)
| | | | | | | | |
| | | Principal
Amount | | | Value | |
Madison Park Funding Ltd., Series 2016-22A, Class A, 3 mo. LIBOR + 1.480%, FRN (c)
1.000% 10/25/29 | | $ | 250,000 | | | $ | 250,000 | |
Madison Park Funding XII Ltd., Series 2014-12A, Class A, 3 mo. USD LIBOR + 1.500%, FRN (c)
2.196% 7/20/26 | | | 250,000 | | | | 250,007 | |
Madison Park Funding XIV Ltd., Series 2014-14A, Class A2, 3 mo. USD LIBOR + 1.450%, FRN (c)
2.146% 7/20/26 | | | 280,000 | | | | 280,008 | |
Marlette Funding Trust, Series 2016-1A, Class A (c)
3.060% 1/17/23 | | | 651,859 | | | | 652,072 | |
Merrill Lynch Mortgage Investors, Inc., Series 2005-WMC2, Class M3, 1 mo. USD LIBOR + .705%, FRN
1.230% 4/25/36 | | | 42,413 | | | | 42,284 | |
Miramax LLC, Series 2014-1A, Class A2 (c)
3.340% 7/20/26 | | | 360,072 | | | | 360,993 | |
Morgan Stanley ABS Capital I, Inc. Trust, Series 2005-WMC6, Class M2, 1 mo. USD LIBOR + .750%, FRN
1.275% 7/25/35 | | | 28,414 | | | | 28,611 | |
MVW Owner Trust, Series 2013-1A, Class A (c)
2.150% 4/22/30 | | | 74,592 | | | | 74,271 | |
MVW Owner Trust, Series 2016-1A, Class A (c)
2.250% 12/20/33 | | | 108,397 | | | | 108,187 | |
Nations Equipment Finance Funding II LLC, Series 2014-1A, Class A (c)
1.558% 7/20/18 | | | 50,459 | | | | 50,431 | |
Nations Equipment Finance Funding III LLC, Series 2016-1A, Class A (c)
3.610% 2/20/21 | | | 292,995 | | | | 293,410 | |
Nomad CLO Ltd., Series 2013-1A, Class A1, 3 mo. USD LIBOR + 1.200%, FRN (c)
1.880% 1/15/25 | | | 250,000 | | | | 249,279 | |
Oak Hill Credit Partners VIII Ltd., Series 2013-8A, Class A, 3 mo. USD LIBOR + 1.120%, FRN (c)
1.816% 4/20/25 | | | 225,000 | | | | 223,364 | |
OHA Loan Funding Ltd., Series 2013-1A, Class A, 3 mo. USD LIBOR + 1.250%, FRN (c)
1.965% 7/23/25 | | | 200,000 | | | | 199,721 | |
OnDeck Asset Securitization Trust II LLC, Series 2016-1A, Class A (c)
4.210% 5/17/20 | | | 120,000 | | | | 119,852 | |
| | | | | | | | |
| | | Principal
Amount | | | Value | |
OneMain Financial Issuance Trust, Series 2014-2A, Class A (c)
2.470% 9/18/24 | | $ | 99,268 | | | $ | 99,469 | |
Orange Lake Timeshare Trust, Series 2014-AA, Class A (c)
2.290% 7/09/29 | | | 49,390 | | | | 49,671 | |
Ownit Mortgage Loan Trust, Series 2005-2, Class M4, 1 mo. USD LIBOR + .930%, FRN
1.455% 3/25/36 | | | 62,902 | | | | 62,827 | |
Oxford Finance Funding Trust, Series 2014-1A, Class A (c)
3.475% 12/15/22 | | | 280,000 | | | | 276,976 | |
Park Place Securities Inc, Series 2005-WCW2, Class M1, ABS, 1 mo. USD LIBOR + .500%, FRN
1.025% 7/25/35 | | | 89,116 | | | | 88,349 | |
Park Place Securities, Inc., Series 2005-WCW3, Class M1, 1 mo. USD LIBOR + .480%, FRN
1.005% 8/25/35 | | | 100,000 | | | | 95,497 | |
Popular ABS Mortgage Pass-Through Trust, Series 2006-B, Class A3, 1 mo. USD LIBOR + .280%, FRN
0.805% 5/25/36 | | | 106,650 | | | | 104,670 | |
RAAC, Series 2006-RP2, Class A, 1 mo. USD LIBOR + .250%, FRN (c)
0.774% 2/25/37 | | | 76,534 | | | | 75,815 | |
Race Point VIII CLO Ltd., Series 2013-8A, Class A, 3 mo. USD LIBOR + 1.250%, FRN (c)
2.061% 2/20/25 | | | 250,000 | | | | 249,439 | |
Race Point VIII CLO Ltd., Series 2012-7A, Class A, 3 mo. USD LIBOR + 1.420%, FRN (c)
2.208% 11/08/24 | | | 100,000 | | | | 99,928 | |
Seneca Park CLO Ltd., Series 2014-1A, Class A, 3 mo. USD LIBOR + 1.480%, FRN (c)
2.159% 7/17/26 | | | 250,000 | | | | 250,008 | |
Sierra Receivables Funding Co. LLC, Series 2016-2A, Class A (c)
2.330% 7/20/33 | | | 280,008 | | | | 279,858 | |
Sierra Receivables Funding Co. LLC, Series 2015-3A, Class A (c)
2.580% 9/20/32 | | | 143,723 | | | | 144,285 | |
Sierra Receivables Funding Co. LLC, Series 2012-1A, Class A (c)
2.840% 11/20/28 | | | 11,149 | | | | 11,174 | |
Sierra Receivables Funding Co. LLC, Series 2015-3A, Class B (c)
3.080% 9/20/32 | | | 63,238 | | | | 63,290 | |
The accompanying notes are an integral part of the financial statements.
131
MassMutual Premier Diversified Bond Fund – Portfolio of Investments (Continued)
| | | | | | | | |
| | | Principal
Amount | | | Value | |
Sierra Receivables Funding Co. LLC, Series 2016-1A, Class B (c)
3.670% 3/21/33 | | $ | 182,773 | | | $ | 184,931 | |
Sierra Timeshare Receivables Funding LLC, Series 2015-2A, Class B (c)
3.020% 6/20/32 | | | 86,171 | | | | 86,117 | |
SoFi Consumer Loan Program LLC, Series 2016-1A, Class A (c)
3.260% 8/25/25 | | | 776,690 | | | | 780,370 | |
SoFi Consumer Loan Program LLC, Series 2016-2A, Class B, VRN (c)
4.770% 10/27/25 | | | 350,000 | | | | 349,729 | |
Specialty Underwriting & Residential Finance Trust, Series 2005-AB2, Class M1, 1 mo. USD LIBOR + .450%, FRN
0.975% 6/25/36 | | | 60,000 | | | | 59,394 | |
Spirit Master Funding LLC, Series 2014-4A, Class A1 (c)
3.501% 1/20/45 | | | 110,000 | | | | 106,814 | |
SpringCastle America Funding LLC, Series 2014-AA, Class A (c)
2.700% 5/25/23 | | | 334,211 | | | | 334,315 | |
SpringCastle America Funding LLC, Series 2016-AA, Class A (c)
3.050% 4/25/29 | | | 430,000 | | | | 429,984 | |
SPS Servicer Advance Receivables Trust, Series 2015-T3, Class AT3 (c)
2.920% 7/15/47 | | | 170,000 | | | | 170,391 | |
Store Master Funding LLC, Series 2013-3A, Class A1 (c)
4.240% 11/20/43 | | | 114,745 | | | | 115,109 | |
Structured Asset Securities Corp., Series 2007-BC4, Class A3, 1 mo. USD LIBOR + .250%, FRN
0.775% 11/25/37 | | | 2,085 | | | | 2,084 | |
Symphony CLO XV Ltd., Series 2014-15A, Class A, 3 mo. USD LIBOR + 1.450%, FRN (c)
2.129% 10/17/26 | | | 300,000 | | | | 300,005 | |
Taco Bell Funding LLC, Series 2016-1A, Class A2I (c)
3.832% 5/25/46 | | | 480,000 | | | | 487,768 | |
Taco Bell Funding LLC, Series 2016-1A, Class A23 (c)
4.970% 5/25/46 | | | 440,000 | | | | 454,472 | |
TAL Advantage LLC, Series 2014-2A, Class A1 (c)
1.700% 5/20/39 | | | 109,198 | | | | 107,729 | |
TCI-Symphony CLO Ltd., Series 2016-1A, Class A, 3 mo. USD LIBOR + 1.480%, FRN (b) (c)
2.399% 10/13/29 | | | 320,000 | | | | 320,000 | |
| | | | | | | | |
| | | Principal
Amount | | | Value | |
Trip Rail Master Funding LLC, Series 2011-1A, Class A1A (c)
4.370% 7/15/41 | | $ | 41,353 | | | $ | 41,732 | |
VSE VOI Mortgage LLC, Series 2016-A, Class B (c)
2.740% 7/20/33 | | | 140,000 | | | | 139,986 | |
Wendys Funding LLC, Series 2015-1A, Class A2I (c)
3.371% 6/15/45 | | | 371,250 | | | | 372,928 | |
Wendys Funding LLC, Series 2015-1A, Class A2II (c)
4.080% 6/15/45 | | | 326,700 | | | | 331,690 | |
Wendys Funding LLC, Series 2015-1A, Class A23 (c)
4.497% 6/15/45 | | | 346,500 | | | | 346,425 | |
Westgate Resorts LLC, Series 2014-1A, Class A (c)
2.150% 12/20/26 | | | 137,412 | | | | 135,659 | |
| | | | | | | | |
| | | | | | | 28,006,695 | |
| | | | | | | | |
| Student Loans ABS — 4.6% | |
Academic Loan Funding Trust, Series 2012-1A, Class A2, 1 mo. USD LIBOR + 1.100%, FRN (c)
1.625% 12/27/44 | | | 470,000 | | | | 451,936 | |
Access Group, Inc., Series 2006-1, Class B, 3 mo. USD LIBOR + .450%, FRN
1.275% 8/25/37 | | | 384,296 | | | | 336,901 | |
Access Group, Inc., Series 2003-A, Class A3, 3 mo. Treasury + 1.200%, FRN
1.515% 7/01/38 | | | 42,316 | | | | 38,455 | |
Access Group, Inc., Series 2015-1, Class B, 1 mo. USD LIBOR + 1.500%, FRN (c)
2.025% 7/25/58 | | | 130,000 | | | | 113,588 | |
College Loan Corp. Trust, Series 2002-1, Class A5, 28 day ARS, FRN (c)
1.076% 3/01/42 | | | 150,000 | | | | 134,903 | |
College Loan Corp. Trust I, Series 2002-2, Class A30, 28 day ARS, FRN (c)
1.566% 3/01/42 | | | 100,000 | | | | 90,034 | |
College Loan Corp. Trust I, Series 2003-1, Class A6, 28 day ARS, FRN (c)
1.685% 3/01/42 | | | 200,000 | | | | 180,181 | |
Credit Suisse ABS Repackaging Trust, Series 2013-A, Class B (c)
2.500% 1/25/30 | | | 362,441 | | | | 344,347 | |
The accompanying notes are an integral part of the financial statements.
132
MassMutual Premier Diversified Bond Fund – Portfolio of Investments (Continued)
| | | | | | | | |
| | | Principal
Amount | | | Value | |
DRB Prime Student Loan Trust, Series 2015-B, Class A1, 1 mo. USD LIBOR + 1.900%, FRN (c)
2.425% 10/27/31 | | $ | 173,121 | | | $ | 174,092 | |
DRB Prime Student Loan Trust, Series 2016-B, Class A2 (c)
2.890% 6/25/40 | | | 324,654 | | | | 324,118 | |
DRB Prime Student Loan Trust, Series 2015-A, Class A2 (c)
3.060% 7/25/31 | | | 190,088 | | | | 188,613 | |
Earnest Student Loan Program LLC, Series 2016-B, Class A1, 1 mo. USD LIBOR + 2.050%, FRN (c)
2.575% 2/26/35 | | | 503,967 | | | | 503,967 | |
ECMC Group Student Loan Trust, Series 2016-1A, Class A, 1 mo. USD LIBOR + 1.350%, FRN (c)
1.864% 7/26/66 | | | 690,000 | | | | 689,989 | |
Education Funding Capital Trust I, Series 2004-1, Class A4, 28 day ARS, FRN
1.934% 6/15/43 | | | 100,000 | | | | 99,554 | |
Education Funding Capital Trust I, Series 2004-1, Class B1, 28 day ARS, FRN
1.943% 6/15/43 | | | 200,000 | | | | 185,003 | |
Education Funding Capital Trust I, Series 2004-1, Class A5, 28 day ARS, FRN
1.943% 6/15/43 | | | 350,000 | | | | 342,060 | |
Education Funding Capital Trust I, Series 2004-1, Class A6, 28 day ARS, FRN
1.943% 6/15/43 | | | 200,000 | | | | 194,359 | |
KeyCorp Student Loan Trust, Series 2004-A, Class 2A2, 3 mo. USD LIBOR + .300%, FRN
1.034% 10/28/41 | | | 13,737 | | | | 13,685 | |
KeyCorp Student Loan Trust, Series 2004-A, Class 2B, 3 mo. USD LIBOR + .530%, FRN
1.264% 1/27/42 | | | 100,000 | | | | 99,250 | |
KeyCorp Student Loan Trust, Series 1999-B, Class CTFS, 3 mo. USD LIBOR + .720%, FRN
1.545% 11/25/36 | | | 72,286 | | | | 69,442 | |
Nelnet Student Loan Trust, Series 2006-3, Class B, 3 mo. USD LIBOR + .250%, FRN
1.107% 6/25/41 | | | 205,980 | | | | 168,023 | |
| | | | | | | | |
| | | Principal
Amount | | | Value | |
Nelnet Student Loan Trust, Series 2012-2A, Class B, 1 mo. USD LIBOR + 1.000%, FRN (c)
1.524% 11/25/36 | | $ | 200,000 | | | $ | 172,189 | |
Nelnet Student Loan Trust, Series 2012-1A, Class B, 1 mo. USD LIBOR + 1.000%, FRN (c)
1.525% 6/25/42 | | | 150,000 | | | | 131,358 | |
Nelnet Student Loan Trust, Series 2005-4, Class A4R2, 28 day ARS, FRN
1.526% 3/22/32 | | | 150,000 | | | | 140,279 | |
Nelnet Student Loan Trust, Series 2014-2A, Class B, 1 mo. USD LIBOR + 1.500%, FRN (c)
2.025% 6/25/41 | | | 100,000 | | | | 87,418 | |
Nelnet Student Loan Trust, Series 2014-1A, Class B, 1 mo. USD LIBOR + 1.500%, FRN (c)
2.025% 10/25/47 | | | 240,000 | | | | 212,087 | |
Nelnet Student Loan Trust, Series 2014-5A, Class B, 1 mo. USD LIBOR + 1.500%, FRN (c)
2.025% 5/25/49 | | | 100,000 | | | | 87,636 | |
Pennsylvania Higher Education Assistance Agency, Series 2015-1A, Class B, 1 mo. USD LIBOR + 1.500%, FRN (c)
2.024% 4/25/45 | | | 130,000 | | | | 111,639 | |
SLC Private Student Loan Trust, Series 2006-A, Class C, 3 mo. USD LIBOR + .450%, FRN
1.130% 7/15/36 | | | 190,000 | | | | 170,849 | |
SLM Student Loan Trust, Series 2005-3, Class B, 3 mo. USD LIBOR + .150%, FRN
0.865% 4/25/40 | | | 173,542 | | | | 145,242 | |
SLM Student Loan Trust, Series 2006-5, Class B, 3 mo. USD LIBOR + .210%, FRN
0.925% 10/25/40 | | | 205,032 | | | | 176,340 | |
SLM Student Loan Trust, Series 2004-3, Class B, 3 mo. USD LIBOR + .470%, FRN
1.000% 10/25/64 | | | 170,494 | | | | 149,790 | |
SLM Student Loan Trust, Series 2005-9, Class B, 3 mo. USD LIBOR + .300%, FRN
1.015% 1/25/41 | | | 128,247 | | | | 109,138 | |
SLM Student Loan Trust, Series 2013-2, Class B, 1 mo. USD LIBOR + 1.500%, FRN
2.025% 6/25/43 | | | 110,000 | | | | 95,476 | |
The accompanying notes are an integral part of the financial statements.
133
MassMutual Premier Diversified Bond Fund – Portfolio of Investments (Continued)
| | | | | | | | |
| | | Principal
Amount | | | Value | |
SLM Student Loan Trust, Series 2013-1, Class B, ABS, FRN, 1 mo. USD LIBOR + 1.800%, FRN
2.325% 11/25/43 | | $ | 381,000 | | | $ | 338,954 | |
SLM Student Loan Trust, Series 2003-5, Class A7, 28 day ARS, FRN
3.007% 6/17/30 | | | 50,000 | | | | 50,000 | |
SLM Student Loan Trust, Series 2002-7, Class A11, 28 day ARS, FRN
3.030% 3/15/28 | | | 200,000 | | | | 200,000 | |
SMB Private Education Loan Trust, Series 2016-B, Class A2A (c)
2.430% 2/17/32 | | | 228,000 | | | | 230,819 | |
SoFi Professional Loan Program LLC, Series 2016-A, Class A1, 1 mo. USD LIBOR + 1.750%, FRN (c)
2.275% 8/25/36 | | | 148,294 | | | | 150,971 | |
SoFi Professional Loan Program LLC,
Series 2016-B, Class A2B (c)
2.740% 10/25/32 | | | 300,000 | | | | 308,025 | |
SoFi Professional Loan Program LLC,
Series 2016-A, Class A2 (c)
2.760% 12/26/36 | | | 417,866 | | | | 424,247 | |
SoFi Professional Loan Program LLC,
Series 2014-A, Class A2 (c)
3.020% 10/25/27 | | | 66,190 | | | | 67,465 | |
South Carolina Student Loan Corp.,
Series 2014-1, Class B, 1 mo. USD LIBOR + 1.500%, FRN 2.023% 8/01/35 | | | 400,000 | | | | 343,300 | |
South Carolina Student Loan Corp.,
Series 2015-A, Class A, 1 mo. USD LIBOR + 1.500%, FRN
2.025% 1/25/36 | | | 178,250 | | | | 161,634 | |
| | | | | | | | |
| | | | | | | 8,807,356 | |
| | | | | | | | |
| WL Collateral CMO — 0.5% | |
Bank of America Mortgage Securities,
Series 2004-G, Class 2A7, FRN
3.301% 8/25/34 | | | 47,640 | | | | 46,648 | |
Connecticut Avenue Securities,
Series 2015-C03, Class 1M1, 1 mo. USD LIBOR + 1.500%, FRN
2.025% 7/25/25 | | | 424,157 | | | | 425,023 | |
Countrywide Home Loans, Inc.,
Series 2004-2, Class 1A1, FRN
2.953% 2/25/34 | | | 10,524 | | | | 10,117 | |
Countrywide Home Loans, Inc.,
Series 2003-42, Class 1A1, FRN
3.294% 9/25/33 | | | 4,428 | | | | 4,173 | |
| | | | | | | | |
| | | Principal
Amount | | | Value | |
Federal National Mortgage Association Connecticut Avenue Securities,
Series 2016-C05, Class 2M1, 1 mo. USD LIBOR + 1.350%, FRN
1.875% 1/25/29 | | $ | 326,378 | | | $ | 327,665 | |
GSR Mortgage Loan Trust,
Series 2004-9, Class 2A1, VRN
3.285% 8/25/34 | | | 7,508 | | | | 7,360 | |
IndyMac Index Mortgage Loan Trust,
Series 2004-AR4, Class 1A, VRN
2.786% 8/25/34 | | | 37,594 | | | | 33,566 | |
Merrill Lynch Mortgage Investors, Inc.,
Series 2005-A8, Class A3A2, 1 mo. USD LIBOR + .250%, FRN
0.775% 8/25/36 | | | 8,591 | | | | 8,566 | |
Merrill Lynch Mortgage Investors, Inc.,
Series 2004-A1, Class IA, VRN
3.032% 2/25/34 | | | 4,050 | | | | 4,001 | |
Merrill Lynch Mortgage Investors, Inc.,
Series 2003-A4, Class IA, VRN
3.065% 7/25/33 | | | 2,352 | | | | 2,317 | |
Morgan Stanley Mortgage Loan Trust,
Series 2004-2AR, Class 1A, FRN
2.875% 2/25/34 | | | 125 | | | | 129 | |
Structured Adjustable Rate Mortgage Loan Trust, Series 2004-2, Class 2A, VRN
3.056% 3/25/34 | | | 20,375 | | | | 20,455 | |
WaMu Mortgage Pass-Through Certificates, Series 2004-AR2, Class A, 12 mo. MTA + 1.400%, FRN
1.907% 4/25/44 | | | 48,517 | | | | 48,457 | |
| | | | | | | | |
| | | | | | | 938,477 | |
| | | | | | | | |
| WL Collateral PAC — 0.0% | |
Structured Asset Securities Corp.,
Series 2002-11A, Class 2A1, FRN
3.157% 6/25/32 | | | 13,568 | | | | 13,251 | |
| | | | | | | | |
| | |
TOTAL NON-U.S. GOVERNMENT AGENCY OBLIGATIONS
(Cost $49,109,203) | | | | | | | 49,064,170 | |
| | | | | | | | |
|
| SOVEREIGN DEBT OBLIGATIONS — 0.6% | |
Brazilian Government International Bond
4.875% 1/22/21 | | | 100,000 | | | | 106,750 | |
Brazilian Government International Bond
5.625% 1/07/41 | | | 235,000 | | | | 233,825 | |
Province of Quebec Canada
2.625% 2/13/23 | | | 192,000 | | | | 200,980 | |
The accompanying notes are an integral part of the financial statements.
134
MassMutual Premier Diversified Bond Fund – Portfolio of Investments (Continued)
| | | | | | | | |
| | | Principal
Amount | | | Value | |
Province of Quebec Canada
7.500% 9/15/29 | | $ | 125,000 | | | $ | 188,163 | |
United Mexican States
6.750% 9/27/34 | | | 375,000 | | | | 495,937 | |
| | | | | | | | |
| | |
TOTAL SOVEREIGN DEBT OBLIGATIONS
(Cost $1,181,833) | | | | | | | 1,225,655 | |
| | | | | | | | |
|
| U.S. GOVERNMENT AGENCY OBLIGATIONS AND INSTRUMENTALITIES — 22.8% | |
| Collateralized Mortgage Obligations — 1.0% | |
Federal Home Loan Mortgage Corp.
Series 4303, Class AP
3.000% 8/15/43 | | | 324,432 | | | | 334,841 | |
Series 4290, Class CA
3.500% 12/15/38 | | | 182,776 | | | | 190,154 | |
Series 2617, Class Z
5.500% 5/15/33 | | | 158,189 | | | | 179,328 | |
Series 2693, Class Z
5.500% 10/15/33 | | | 279,705 | | | | 313,087 | |
Series 3423, Class PB
5.500% 3/15/38 | | | 84,217 | | | | 95,161 | |
Series 2178, Class PB
7.000% 8/15/29 | | | 16,577 | | | | 19,014 | |
Federal National Mortgage Association | | | | | | | | |
Series 2014-7, Class VA
3.500% 5/25/25 | | | 123,385 | | | | 132,189 | |
Series 2014-48, Class AB
4.000% 10/25/40 | | | 269,689 | | | | 283,442 | |
Series 2007-32, Class Z
5.500% 4/25/37 | | | 123,058 | | | | 137,752 | |
Series 2010-60, Class HJ
5.500% 5/25/40 | | | 61,845 | | | | 68,364 | |
Federal National Mortgage Association REMIC,
Series 2007-B2, Class ZA
5.500% 6/25/37 | | | 78,909 | | | | 87,613 | |
U.S. Department of Veteran Affairs,
Series 1992-1, Class 2Z
7.750% 5/15/22 | | | 9,396 | | | | 10,456 | |
| | | | | | | | |
| | | | | | | 1,851,401 | |
| | | | | | | | |
| Pass-Through Securities — 21.8% | |
Federal Home Loan Mortgage Corp.
Pool #Q37467 3.500%
11/01/45 | | | 950,476 | | | | 1,012,071 | |
Pool #Q37468 3.500%
11/01/45 | | | 709,640 | | | | 758,067 | |
Pool #C03537 4.500%
8/01/40 | | | 239,145 | | | | 264,891 | |
Pool #G06057 4.500%
10/01/40 | | | 215,076 | | | | 236,718 | |
| | | | | | | | |
| | | Principal
Amount | | | Value | |
Pool #G60485 4.500%
10/01/41 | | $ | 267,641 | | | $ | 294,698 | |
Pool #G60469 4.500%
1/01/42 | | | 180,045 | | | | 198,218 | |
Pool #G60342 4.500%
5/01/42 | | | 876,847 | | | | 965,079 | |
Pool #G60172 4.500%
9/01/43 | | | 277,647 | | | | 307,711 | |
Pool #G11476 5.000%
11/01/18 | | | 15,932 | | | | 16,416 | |
Pool #B16010 5.000%
8/01/19 | | | 380 | | | | 395 | |
Pool #B17058 5.000%
9/01/19 | | | 845 | | | | 887 | |
Pool #B18677 5.000%
1/01/20 | | | 685 | | | | 715 | |
Pool #E89199 6.000%
4/01/17 | | | 318 | | | | 321 | |
Pool #G11431 6.000%
2/01/18 | | | 56 | | | | 56 | |
Pool #G01311 7.000%
9/01/31 | | | 1,425 | | | | 1,701 | |
Pool #C80207 7.500%
9/01/24 | | | 1,820 | | | | 2,085 | |
Pool #C00530 7.500%
7/01/27 | | | 1,237 | | | | 1,468 | |
Pool #C00563 7.500%
11/01/27 | | | 4,128 | | | | 4,917 | |
Pool #C00612 7.500%
4/01/28 | | | 248 | | | | 296 | |
Pool #C55867 7.500%
2/01/30 | | | 4,523 | | | | 5,303 | |
Federal Home Loan Mortgage Corp. TBA
Pool #1J1368 3.000%
10/01/43 (e) | | | 1,200,000 | | | | 1,244,391 | |
Pool #1513 4.000%
7/01/42 (e) | | | 1,250,000 | | | | 1,340,772 | |
Federal National Mortgage Association
Pool #725692 2.642%
10/01/33 1 year CMT + 2.144%, FRN | | | 106,940 | | | | 112,525 | |
Pool #888586 2.668%
10/01/34 1 year CMT + 2.212%, FRN | | | 210,915 | | | | 222,412 | |
Pool #BC6007 3.000%
5/01/31 | | | 707,165 | | | | 743,435 | |
Pool #AR3007 3.000%
2/01/43 | | | 257,958 | | | | 268,800 | |
Pool #AS1304 3.500%
12/01/28 | | | 374,206 | | | | 396,410 | |
Pool #AV1897 3.500%
12/01/28 | | | 55,534 | | | | 58,829 | |
The accompanying notes are an integral part of the financial statements.
135
MassMutual Premier Diversified Bond Fund – Portfolio of Investments (Continued)
| | | | | | | | |
| | | Principal
Amount | | | Value | |
Pool #AV2325 3.500%
12/01/28 | | $ | 196,297 | | | $ | 207,944 | |
Pool #AS6187 3.500%
11/01/45 | | | 2,159,721 | | | | 2,299,513 | |
Pool #AS6293 3.500%
12/01/45 | | | 895,754 | | | | 953,733 | |
Pool #AS6306 3.500%
12/01/45 | | | 738,173 | | | | 787,914 | |
Pool #AS6475 3.500%
1/01/46 | | | 667,474 | | | | 714,745 | |
Pool #AS6476 3.500%
1/01/46 | | | 699,220 | | | | 746,554 | |
Pool #AS6477 3.500%
1/01/46 | | | 804,619 | | | | 856,950 | |
Pool #AX0120 4.000%
9/01/39 | | | 252,155 | | | | 271,067 | |
Pool #AZ7917 4.000%
3/01/41 | | | 116,960 | | | | 126,719 | |
Pool #AL2441 4.000%
9/01/42 | | | 590,825 | | | | 644,276 | |
Pool #AL8422 4.000%
1/01/43 | | | 280,010 | | | | 303,374 | |
Pool #BC5984 4.000%
4/01/46 | | | 168,795 | | | | 181,481 | |
Pool #AB1466 4.500%
9/01/40 | | | 123,797 | | | | 136,438 | |
Pool #AH6787 4.500%
3/01/41 | | | 193,153 | | | | 214,203 | |
Pool #AL7566 4.500%
10/01/42 | | | 207,740 | | | | 229,083 | |
Pool #AL6997 4.500%
11/01/42 | | | 428,696 | | | | 475,417 | |
Pool #735010 5.000%
11/01/19 | | | 76,941 | | | | 80,095 | |
Pool #AD6437 5.000%
6/01/40 | | | 119,373 | | | | 134,024 | |
Pool #AD6996 5.000%
7/01/40 | | | 836,949 | | | | 935,356 | |
Pool #AL8173 5.000%
2/01/44 | | | 320,155 | | | | 357,098 | |
Pool #575579 7.500%
4/01/31 | | | 8,760 | | | | 10,512 | |
Pool #535996 7.500%
6/01/31 | | | 1,457 | | | | 1,761 | |
Federal National Mortgage Association TBA
Pool #1866 2.500%
11/01/28 (e) | | | 9,750,000 | | | | 10,080,205 | |
Pool #1817 3.000%
12/01/43 (e) | | | 1,300,000 | | | | 1,348,445 | |
Pool #18388 4.000%
11/01/42 (e) | | | 1,075,000 | | | | 1,153,064 | |
| | | | | | | | |
| | | Principal
Amount | | | Value | |
Pool #21133 4.500%
7/01/40 (e) | | $ | 975,000 | | | $ | 1,067,777 | |
Government National Mortgage Association
Pool #783896 3.500%
5/15/44 | | | 436,714 | | | | 468,939 | |
Pool #579140 6.500%
1/15/32 | | | 873 | | | | 1,021 | |
Pool #587280 6.500%
9/15/32 | | | 1,257 | | | | 1,461 | |
Pool #550659 6.500%
9/15/35 | | | 113,228 | | | | 131,770 | |
Pool #538689 6.500%
12/15/35 | | | 17,160 | | | | 19,962 | |
Pool #780651 7.000%
10/15/27 | | | 1,719 | | | | 2,014 | |
Pool #462384 7.000%
11/15/27 | | | 921 | | | | 1,078 | |
Pool #482668 7.000%
8/15/28 | | | 1,232 | | | | 1,448 | |
Pool #506804 7.000%
5/15/29 | | | 7,073 | | | | 8,218 | |
Pool #506914 7.000%
5/15/29 | | | 25,823 | | | | 30,164 | |
Pool #581417 7.000%
7/15/32 | | | 3,973 | | | | 4,775 | |
Pool #423836 8.000%
8/15/26 | | | 1,060 | | | | 1,267 | |
Pool #444619 8.000%
3/15/27 | | | 8,610 | | | | 10,251 | |
Government National Mortgage Association II
Pool #82462 2.000%
1/20/40 1 year CMT + 1.500%, FRN | | | 57,027 | | | | 58,828 | |
Pool #82488 2.000%
3/20/40 1 year CMT + 1.500%, FRN | | | 78,381 | | | | 80,964 | |
Pool #784026 3.500%
12/20/44 | | | 483,763 | | | | 519,270 | |
Government National Mortgage Association II TBA
Pool #264 2.500%
7/01/44 (e) | | | 1,750,000 | | | | 1,780,078 | |
Pool #1581 3.000%
8/01/44 (e) | | | 5,975,000 | | | | 6,247,843 | |
| | | | | | | | |
| | | | | | | 42,146,686 | |
| | | | | | | | |
TOTAL U.S. GOVERNMENT AGENCY OBLIGATIONS AND INSTRUMENTALITIES
(Cost $43,633,665) | | | | | | | 43,998,087 | |
| | | | | | | | |
The accompanying notes are an integral part of the financial statements.
136
MassMutual Premier Diversified Bond Fund – Portfolio of Investments (Continued)
| | | | | | | | |
| | | Principal
Amount | | | Value | |
| U.S. TREASURY OBLIGATIONS — 4.1% | |
| U.S. Treasury Bonds & Notes — 4.1% | |
U.S. Treasury Bond
2.500% 5/15/46 | | $ | 900,000 | | | $ | 934,378 | |
U.S. Treasury Bond
2.875% 8/15/45 | | | 1,310,000 | | | | 1,463,507 | |
U.S. Treasury Bond
3.000% 11/15/44 | | | 805,000 | | | | 920,735 | |
U.S. Treasury Bond (f) (g)
3.500% 2/15/39 | | | 1,365,000 | | | | 1,694,306 | |
U.S. Treasury Note
0.875% 7/31/19 | | | 800,000 | | | | 800,125 | |
U.S. Treasury Note
1.250% 3/31/21 | | | 1,820,000 | | | | 1,829,612 | |
U.S. Treasury Note
1.625% 5/15/26 | | | 200,000 | | | | 200,459 | |
| | | | | | | | |
| | | | | | | 7,843,122 | |
| | | | | | | | |
| | |
TOTAL U.S. TREASURY OBLIGATIONS
(Cost $7,628,255) | | | | | | | 7,843,122 | |
| | | | | | | | |
| | |
TOTAL BONDS & NOTES
(Cost $181,383,735) | | | | | | | 185,611,669 | |
| | | | | | | | |
| | |
TOTAL LONG-TERM INVESTMENTS
(Cost $181,635,767) | | | | | | | 185,885,576 | |
| | | | | | | | |
|
| SHORT-TERM INVESTMENTS — 17.9% | |
| Commercial Paper — 17.6% | |
Agrium, Inc.
1.016% 12/05/16 | | | 3,500,000 | | | | 3,494,058 | |
American Electric Power Co., Inc. (c)
0.900% 10/11/16 | | | 3,853,000 | | | | 3,852,105 | |
Bell Canada (c)
0.900% 12/12/16 | | | 3,500,000 | | | | 3,493,925 | |
Dollar General Corp. (c)
0.600% 10/03/16 | | | 4,500,000 | | | | 4,499,704 | |
Enterprise Products Operating LLC (c)
0.860% 10/06/16 | | | 3,500,000 | | | | 3,499,571 | |
Ford Motor Credit Co. (c)
1.016% 11/08/16 | | | 3,750,000 | | | | 3,746,620 | |
Fortive Corp. (c)
0.770% 10/19/16 | | | 2,250,000 | | | | 2,249,058 | |
Molex Electronic Technologies (c)
0.880% 11/04/16 | | | 4,500,000 | | | | 4,496,382 | |
So.carolina El & Gas
0.830% 11/09/16 | | | 1,000,000 | | | | 999,075 | |
Spectra Energy Capital LLC (c)
0.900% 10/03/16 | | | 1,750,000 | | | | 1,749,895 | |
Thomson Reuters Corp. (c)
1.066% 10/24/16 | | | 2,000,000 | | | | 1,999,057 | |
| | | | | | | | |
| | | | | | | 34,079,450 | |
| | | | | | | | |
| | | | | | | | |
| | | Principal
Amount | | | Value | |
| Time Deposit — 0.3% | |
Euro Time Deposit
0.010% 10/03/16 | | $ | 477,376 | | | $ | 477,376 | |
| | | | | | | | |
| | |
TOTAL SHORT-TERM INVESTMENTS
(Cost $34,555,332) | | | | | | | 34,556,826 | |
| | | | | | | | |
| | |
TOTAL INVESTMENTS — 114.1%
(Cost $216,191,099) (h) | | | | | | | 220,442,402 | |
| | |
| Other Assets/(Liabilities) — (14.1)% | | | | | | | (27,280,275 | ) |
| | | | | | | | |
| | |
| NET ASSETS — 100.0% | | | | | | $ | 193,162,127 | |
| | | | | | | | |
Notes to Portfolio of Investments
Percentages are stated as a percent of net assets.
| CLO | Collateralized Loan Obligation |
| CMO | Collateralized Mortgage Obligation |
| CMT | Constant Maturity Treasury Index |
| MBS | Mortgage-Backed Security |
| MTA | Monthly Treasury Average Index |
| PAC | Planned Amortization Class |
| (a) | Non-income producing security. |
| (b) | This security is fair valued in good faith in accordance with procedures approved by the Board of Trustees. At September 30, 2016, these securities amounted to a value of $320,807 or 0.17% of net assets. |
| (c) | Securities exempt from registration under rule 144A of the Securities Act of 1933. These securities may be resold in transactions exempt from registration, normally to qualified institutional buyers. At September 30, 2016, these securities amounted to a value of $79,748,449 or 41.29% of net assets. |
| (d) | Restricted security. Certain securities are restricted as to resale. At September 30, 2016, these securities amounted to a value of $126,754 or 0.07% of net assets. The Fund generally bears the costs, if any, associated with the disposition of restricted securities. |
| (e) | A portion of this security is purchased on a when-issued, delayed-delivery or forward commitment basis. (Note 2). |
| (f) | A portion of this security is held as collateral for open futures contracts. (Note 2). |
| (g) | All or a portion of this security is held as collateral for open swap agreements. (Note 2). |
| (h) | See Note 6 for aggregate cost for federal tax purposes. |
The accompanying notes are an integral part of the financial statements.
137
MassMutual Premier Diversified Bond Fund – Portfolio of Investments (Continued)
Notes to Portfolio of Investments (Continued)
Country weightings, as a percentage of net assets, is as follows:
| | | | |
United States | | | 83.8 | % |
Cayman Islands | | | 5.7 | % |
Netherlands | | | 1.4 | % |
United Kingdom | | | 1.1 | % |
Canada | | | 1.0 | % |
Ireland | | | 0.9 | % |
Mexico | | | 0.8 | % |
France | | | 0.6 | % |
Luxembourg | | | 0.2 | % |
Brazil | | | 0.2 | % |
United Arab Emirates | | | 0.1 | % |
Australia | | | 0.1 | % |
Sweden | | | 0.1 | % |
Chile | | | 0.1 | % |
United States Virgin Islands | | | 0.1 | % |
Panama | | | 0.0 | % |
| | | | |
Total Long-Term Investments | | | 96.2 | % |
Short-Term Investments and Other Assets and Liabilities | | | 3.8 | % |
| | | | |
Net Assets | | | 100.0 | % |
| | | | |
The accompanying notes are an integral part of the financial statements.
138
MassMutual Premier High Yield Fund – Portfolio of Investments
September 30, 2016
| | | | | | | | |
| | | Number of
Shares | | | Value | |
| EQUITIES — 0.0% | |
|
| COMMON STOCK — 0.0% | |
| Basic Materials — 0.0% | |
| Forest Products & Paper — 0.0% | |
The Newark Group, Inc. (a) | | | 329,969 | | | $ | 9,899 | |
| | | | | | | | |
| | |
TOTAL COMMON STOCK
(Cost $37,350) | | | | | | | 9,899 | |
| | | | | | | | |
| | |
TOTAL EQUITIES
(Cost $37,350) | | | | | | | 9,899 | |
| | | | | | | | |
| | |
| | | Principal
Amount | | | | |
| BONDS & NOTES — 96.3% | |
|
| BANK LOANS — 2.7% | |
| Oil & Gas — 2.1% | |
Caelus Energy Alaska O3 LLC, 2nd Lien Term Loan
8.750% 4/15/20 | | $ | 5,254,429 | | | | 3,415,378 | |
Fieldwood Energy LLC, 1st Lien Last Out Term Loan
8.375% 9/30/20 | | | 2,986,561 | | | | 2,075,660 | |
Fieldwood Energy LLC, 2nd Lien Term Loan
8.375% 9/30/20 | | | 3,563,034 | | | | 1,383,633 | |
Fieldwood Energy LLC, New 1st Lien Term Loan
8.000% 8/31/20 | | | 2,255,879 | | | | 1,869,560 | |
| | | | | | | | |
| | | | | | | 8,744,231 | |
| | | | | | | | |
| Pharmaceuticals — 0.6% | |
Synarc-Biocore Holdings LLC, 2nd Lien Term Loan
9.250% 3/10/22 | | | 2,448,101 | | | | 2,423,620 | |
| | | | | | | | |
| | |
TOTAL BANK LOANS
(Cost $12,582,091) | | | | | | | 11,167,851 | |
| | | | | | | | |
|
| CORPORATE DEBT — 93.6% | |
| Aerospace & Defense — 0.2% | |
Moog, Inc. (b)
5.250% 12/01/22 | | | 948,000 | | | | 979,995 | |
| | | | | | | | |
| Agriculture — 0.6% | |
Pinnacle Operating Corp. (b)
9.000% 11/15/20 | | | 3,873,000 | | | | 2,691,735 | |
| | | | | | | | |
| Airlines — 0.8% | |
American Airlines Group, Inc. (b)
5.500% 10/01/19 | | | 3,258,000 | | | | 3,392,392 | |
| | | | | | | | |
| | | | | | | | |
| | | Principal
Amount | | | Value | |
| Apparel — 1.1% | |
Hanesbrands, Inc. (b)
4.625% 5/15/24 | | $ | 1,105,000 | | | $ | 1,134,006 | |
Hanesbrands, Inc. (b)
4.875% 5/15/26 | | | 2,194,000 | | | | 2,243,365 | |
Perry Ellis International, Inc.
7.875% 4/01/19 | | | 1,386,000 | | | | 1,401,593 | |
| | | | | | | | |
| | | | | | | 4,778,964 | |
| | | | | | | | |
| Auto Manufacturers — 0.9% | |
Allied Specialty Vehicles, Inc. (b)
8.500% 11/01/19 | | | 3,600,000 | | | | 3,717,000 | |
| | | | | | | | |
| Automotive & Parts — 3.5% | |
Accuride Corp.
9.500% 8/01/18 | | | 2,790,000 | | | | 2,790,000 | |
Allison Transmission, Inc. (b)
5.000% 10/01/24 | | | 727,000 | | | | 745,175 | |
Deck Chassis Acquisition, Inc. (b)
10.000% 6/15/23 | | | 4,800,000 | | | | 5,040,000 | |
The Goodyear Tire & Rubber Co.
5.000% 5/31/26 | | | 2,637,000 | | | | 2,712,814 | |
International Automotive Components Group SA (b)
9.125% 6/01/18 | | | 3,268,000 | | | | 3,198,555 | |
| | | | | | | | |
| | | | | | | 14,486,544 | |
| | | | | | | | |
| Building Materials — 3.2% | |
BMC East LLC (b)
5.500% 10/01/24 | | | 4,448,000 | | | | 4,448,000 | |
Boise Cascade Co. (b)
5.625% 9/01/24 | | | 623,000 | | | | 632,345 | |
Griffon Corp.
5.250% 3/01/22 | | | 4,000,000 | | | | 4,015,000 | |
James Hardie International Finance Ltd. (b)
5.875% 2/15/23 | | | 1,908,000 | | | | 2,022,480 | |
Louisiana-Pacific Corp. (b)
4.875% 9/15/24 | | | 2,102,000 | | | | 2,102,000 | |
| | | | | | | | |
| | | | | | | 13,219,825 | |
| | | | | | | | |
| Chemicals — 3.6% | |
A Schulman, Inc. (b)
6.875% 6/01/23 | | | 2,648,000 | | | | 2,674,480 | |
Kissner Milling Co. Ltd. (b)
7.250% 6/01/19 | | | 500,000 | | | | 520,000 | |
Omnova Solutions, Inc. STEP
7.875% 11/01/18 | | | 2,011,000 | | | | 2,018,240 | |
Platform Specialty Products Corp. (b)
6.500% 2/01/22 | | | 864,000 | | | | 840,240 | |
Platform Specialty Products Corp. (b)
10.375% 5/01/21 | | | 4,480,000 | | | | 4,827,200 | |
The accompanying notes are an integral part of the financial statements.
139
MassMutual Premier High Yield Fund – Portfolio of Investments (Continued)
| | | | | | | | |
| | | Principal
Amount | | | Value | |
Versum Materials, Inc. (b)
5.500% 9/30/24 | | $ | 3,908,000 | | | $ | 4,015,470 | |
| | | | | | | | |
| | | | | | | 14,895,630 | |
| | | | | | | | |
| Coal — 0.9% | |
SunCoke Energy Partners LP/SunCoke Energy Partners Finance Corp. (b)
7.375% 2/01/20 | | | 1,050,000 | | | | 981,750 | |
SunCoke Energy Partners LP/SunCoke Energy Partners Finance Corp. (b)
7.375% 2/01/20 | | | 928,000 | | | | 867,680 | |
SunCoke Energy Partners LP/SunCoke Energy Partners Finance Corp. (b)
7.375% 2/01/20 | | | 2,000,000 | | | | 1,870,000 | |
SunCoke Energy Partners LP/SunCoke Energy Partners Finance Corp. (b)
7.375% 2/01/20 | | | 81,000 | | | | 75,735 | |
| | | | | | | | |
| | | | | | | 3,795,165 | |
| | | | | | | | |
| Commercial Services — 4.0% | |
AMN Healthcare, Inc. (b) (c)
5.125% 10/01/24 | | | 2,230,000 | | | | 2,252,300 | |
Multi-Color Corp. (b)
6.125% 12/01/22 | | | 491,000 | | | | 515,550 | |
Mustang Merger Corp. (b)
8.500% 8/15/21 | | | 7,420,000 | | | | 7,893,025 | |
Prime Security Services Borrower LLC/Prime Finance, Inc. (b)
9.250% 5/15/23 | | | 2,417,000 | | | | 2,634,530 | |
StoneMor Partners LP/Cornerstone Family Services of West Virginia Subsidiary
7.875% 6/01/21 | | | 3,245,000 | | | | 3,277,450 | |
| | | | | | | | |
| | | | | | | 16,572,855 | |
| | | | | | | | |
| Computers — 1.0% | |
Diamond 1 Finance Corp./Diamond 2 Finance Corp. (b)
7.125% 6/15/24 | | | 1,319,000 | | | | 1,450,700 | |
Western Digital Corp. (b)
10.500% 4/01/24 | | | 2,443,000 | | | | 2,833,880 | |
| | | | | | | | |
| | | | | | | 4,284,580 | |
| | | | | | | | |
| Diversified Financial — 2.3% | |
AerCap Ireland Capital Ltd./AerCap Global Aviation Trust
4.625% 7/01/22 | | | 1,019,000 | | | | 1,071,224 | |
Aircastle Ltd.
5.000% 4/01/23 | | | 269,000 | | | | 281,778 | |
Aircastle Ltd.
5.500% 2/15/22 | | | 269,000 | | | | 289,848 | |
Ally Financial, Inc.
3.250% 11/05/18 | | | 500,000 | | | | 502,500 | |
Ally Financial, Inc.
8.000% 11/01/31 | | | 2,175,000 | | | | 2,680,687 | |
| | | | | | | | |
| | | Principal
Amount | | | Value | |
Double Eagle Acquisition Sub, Inc. (b) (c)
7.500% 10/01/24 | | $ | 1,507,000 | | | $ | 1,533,372 | |
Icahn Enterprises LP/Icahn Enterprises Finance Corp.
5.875% 2/01/22 | | | 2,000,000 | | | | 1,920,000 | |
National Financial Partners Corp. (b)
9.000% 7/15/21 | | | 1,192,000 | | | | 1,224,631 | |
| | | | | | | | |
| | | | | | | 9,504,040 | |
| | | | | | | | |
| Electric — 1.2% | |
NRG Energy, Inc. (b)
6.625% 1/15/27 | | | 1,712,000 | | | | 1,677,760 | |
NRG Energy, Inc. (b)
7.250% 5/15/26 | | | 3,238,000 | | | | 3,294,665 | |
| | | | | | | | |
| | | | | | | 4,972,425 | |
| | | | | | | | |
| Electrical Components & Equipment — 0.4% | |
International Wire Group Holdings, Inc. (b)
8.500% 10/15/17 | | | 1,700,000 | | | | 1,702,380 | |
| | | | | | | | |
| Engineering & Construction — 0.9% | | | | | | | | |
Zachry Holdings, Inc. (b)
7.500% 2/01/20 | | | 3,639,000 | | | | 3,620,805 | |
| | | | | | | | |
| Entertainment — 0.9% | | | | | | | | |
WMG Acquisition Corp. (b)
5.000% 8/01/23 | | | 634,000 | | | | 643,510 | |
WMG Acquisition Corp. (b)
6.750% 4/15/22 | | | 2,750,000 | | | | 2,908,125 | |
| | | | | | | | |
| | | | | | | 3,551,635 | |
| | | | | | | | |
| Foods — 1.2% | |
KeHE Distributors LLC/KeHE Finance Corp. (b)
7.625% 8/15/21 | | | 2,250,000 | | | | 2,233,125 | |
Post Holdings, Inc. (b)
7.750% 3/15/24 | | | 1,392,000 | | | | 1,559,040 | |
Post Holdings, Inc. (b)
8.000% 7/15/25 | | | 911,000 | | | | 1,042,526 | |
| | | | | | | | |
| | | | | | | 4,834,691 | |
| | | | | | | | |
| Forest Products & Paper — 0.6% | |
Appvion, Inc. (b)
9.000% 6/01/20 | | | 3,622,000 | | | | 2,336,190 | |
| | | | | | | | |
| Gas — 0.8% | |
LBC Tank Terminals Holding Netherlands BV (b)
6.875% 5/15/23 | | | 3,188,000 | | | | 3,172,060 | |
| | | | | | | | |
| Hand & Machine Tools — 0.4% | |
Apex Tool Group LLC (b)
7.000% 2/01/21 | | | 1,970,000 | | | | 1,883,813 | |
| | | | | | | | |
| Health Care – Products — 2.9% | |
Alere, Inc. (b)
6.375% 7/01/23 | | | 2,100,000 | | | | 2,142,000 | |
The accompanying notes are an integral part of the financial statements.
140
MassMutual Premier High Yield Fund – Portfolio of Investments (Continued)
| | | | | | | | |
| | | Principal
Amount | | | Value | |
Alere, Inc.
6.500% 6/15/20 | | $ | 2,065,000 | | | $ | 2,065,000 | |
Halyard Health, Inc.
6.250% 10/15/22 | | | 3,824,000 | | | | 3,910,040 | |
Kinetic Concepts, Inc./KCI USA, Inc. (b)
9.625% 10/01/21 | | | 4,000,000 | | | | 4,000,000 | |
| | | | | | | | |
| | | | | | | 12,117,040 | |
| | | | | | | | |
| Health Care – Services — 2.3% | |
HCA, Inc.
4.500% 2/15/27 | | | 1,500,000 | | | | 1,509,375 | |
HCA, Inc.
5.250% 4/15/25 | | | 1,159,000 | | | | 1,235,784 | |
HCA, Inc.
5.375% 2/01/25 | | | 1,150,000 | | | | 1,187,375 | |
HCA, Inc.
5.875% 2/15/26 | | | 2,241,000 | | | | 2,389,466 | |
RegionalCare Hospital Partners Holdings, Inc. (b)
8.250% 5/01/23 | | | 379,000 | | | | 391,317 | |
Tenet Healthcare Corp.
6.750% 6/15/23 | | | 1,042,000 | | | | 969,060 | |
Tenet Healthcare Corp.
8.125% 4/01/22 | | | 2,050,000 | | | | 2,050,000 | |
| | | | | | | | |
| | | | | | | 9,732,377 | |
| | | | | | | | |
| Holding Company – Diversified — 0.4% | |
Carlson Travel Holdings, Inc. (b)
7.500% 8/15/19 | | | 1,755,000 | | | | 1,737,450 | |
| | | | | | | | |
| Home Builders — 2.7% | |
Beazer Homes USA, Inc. (b)
8.750% 3/15/22 | | | 800,000 | | | | 844,000 | |
Brookfield Residential Properties, Inc. (b)
6.375% 5/15/25 | | | 897,000 | | | | 895,879 | |
Brookfield Residential Properties, Inc. (b)
6.500% 12/15/20 | | | 2,230,000 | | | | 2,308,050 | |
Lennar Corp.
4.750% 5/30/25 | | | 1,991,000 | | | | 2,020,865 | |
M/I Homes, Inc.
6.750% 1/15/21 | | | 1,262,000 | | | | 1,321,945 | |
William Lyon Homes, Inc.
7.000% 8/15/22 | | | 1,286,000 | | | | 1,324,580 | |
William Lyon Homes, Inc.
8.500% 11/15/20 | | | 2,238,000 | | | | 2,338,710 | |
| | | | | | | | |
| | | | | | | 11,054,029 | |
| | | | | | | | |
| Insurance — 1.1% | |
CNO Financial Group, Inc.
4.500% 5/30/20 | | | 338,000 | | | | 346,027 | |
CNO Financial Group, Inc.
5.250% 5/30/25 | | | 2,362,000 | | | | 2,344,285 | |
| | | | | | | | |
| | | Principal
Amount | | | Value | |
Onex York Acquisition Corp. (b)
8.500% 10/01/22 | | $ | 2,302,000 | | | $ | 1,789,805 | |
| | | | | | | | |
| | | | | | | 4,480,117 | |
| | | | | | | | |
| Iron & Steel — 0.5% | |
BlueScope Steel Finance Ltd./BlueScope Steel Finance USA LLC (b)
6.500% 5/15/21 | | | 1,989,000 | | | | 2,103,368 | |
| | | | | | | | |
| Leisure Time — 2.1% | |
Brunswick Corp. (b)
4.625% 5/15/21 | | | 910,000 | | | | 935,025 | |
Brunswick Corp.
7.125% 8/01/27 | | | 4,693,000 | | | | 5,526,007 | |
Brunswick Corp.
7.375% 9/01/23 | | | 650,000 | | | | 737,750 | |
Carlson Wagonlit BV (b)
6.875% 6/15/19 | | | 1,646,000 | | | | 1,703,610 | |
| | | | | | | | |
| | | | | | | 8,902,392 | |
| | | | | | | | |
| Lodging — 0.8% | |
Hilton Domestic Operating Co., Inc. (b)
4.250% 9/01/24 | | | 522,000 | | | | 532,440 | |
Interval Acquisition Corp.
5.625% 4/15/23 | | | 2,917,000 | | | | 3,011,802 | |
| | | | | | | | |
| | | | | | | 3,544,242 | |
| | | | | | | | |
| Machinery – Diversified — 0.3% | |
Manitowoc Foodservice, Inc.
9.500% 2/15/24 | | | 1,045,000 | | | | 1,196,525 | |
| | | | | | | | |
| Manufacturing — 3.1% | |
Amsted Industries, Inc. (b)
5.375% 9/15/24 | | | 1,700,000 | | | | 1,691,500 | |
CTP Transportation Products LLC/CTP Finance, Inc. (b)
8.250% 12/15/19 | | | 1,385,000 | | | | 1,083,763 | |
EnPro Industries, Inc.
5.875% 9/15/22 | | | 3,159,000 | | | | 3,253,770 | |
JB Poindexter & Co., Inc. (b)
9.000% 4/01/22 | | | 4,030,000 | | | | 4,266,762 | |
LSB Industries, Inc. STEP
8.500% 8/01/19 | | | 2,613,000 | | | | 2,626,065 | |
| | | | | | | | |
| | | | | | | 12,921,860 | |
| | | | | | | | |
| Media — 6.9% | |
Altice Financing SA (b)
7.500% 5/15/26 | | | 1,597,000 | | | | 1,662,876 | |
CCO Holdings LLC/CCO Holdings Capital Corp (b)
5.875% 4/01/24 | | | 2,700,000 | | | | 2,880,630 | |
CCO Holdings LLC/CCO Holdings Capital Corp.
5.750% 1/15/24 | | | 1,438,000 | | | | 1,527,875 | |
The accompanying notes are an integral part of the financial statements.
141
MassMutual Premier High Yield Fund – Portfolio of Investments (Continued)
| | | | | | | | |
| | | Principal
Amount | | | Value | |
CCO Holdings LLC/CCO Holdings Capital Corp. (b)
5.875% 5/01/27 | | $ | 1,649,000 | | | $ | 1,756,185 | |
DISH DBS Corp. (b)
7.750% 7/01/26 | | | 2,285,000 | | | | 2,427,813 | |
MHGE Parent LLC/MHGE Parent Finance, Inc. (b)
8.500% 8/01/19 | | | 3,000,000 | | | | 3,030,000 | |
Midcontinent Communications & Midcontinent Finance Corp. (b)
6.875% 8/15/23 | | | 1,624,000 | | | | 1,729,560 | |
RCN Telecom Services LLC/RCN Capital Corp. (b)
8.500% 8/15/20 | | | 3,253,000 | | | | 3,468,511 | |
SFR Group SA (b)
6.000% 5/15/22 | | | 770,000 | | | | 785,400 | |
SFR Group SA (b)
6.250% 5/15/24 | | | 385,000 | | | | 382,479 | |
SFR Group SA (b)
7.375% 5/01/26 | | | 1,966,000 | | | | 2,009,626 | |
Sirius XM Radio, Inc. (b)
5.375% 4/15/25 | | | 2,951,000 | | | | 3,046,907 | |
Sirius XM Radio, Inc. (b)
5.375% 7/15/26 | | | 3,300,000 | | | | 3,390,750 | |
Virgin Media Secured Finance PLC (b)
5.500% 8/15/26 | | | 701,000 | | | | 715,020 | |
| | | | | | | | |
| | | | | | | 28,813,632 | |
| | | | | | | | |
| Metal Fabricate & Hardware — 0.3% | |
Novelis Corp. (b)
5.875% 9/30/26 | | | 666,000 | | | | 681,818 | |
Novelis Corp. (b)
6.250% 8/15/24 | | | 372,000 | | | | 394,785 | |
| | | | | | | | |
| | | | | | | 1,076,603 | |
| | | | | | | | |
| Mining — 3.0% | |
Alcoa Nederland Holding BV (b)
6.750% 9/30/24 | | | 2,059,000 | | | | 2,138,786 | |
Alcoa Nederland Holding BV (b)
7.000% 9/30/26 | | | 1,502,000 | | | | 1,552,692 | |
Constellium NV (b)
7.875% 4/01/21 | | | 1,443,000 | | | | 1,540,403 | |
Freeport-McMoRan, Inc.
3.550% 3/01/22 | | | 3,715,000 | | | | 3,380,650 | |
Hecla Mining Co.
6.875% 5/01/21 | | | 2,433,000 | | | | 2,442,124 | |
Teck Resources Ltd. (b)
8.000% 6/01/21 | | | 644,000 | | | | 700,350 | |
Teck Resources Ltd. (b)
8.500% 6/01/24 | | | 804,000 | | | | 920,580 | |
| | | | | | | | |
| | | | | | | 12,675,585 | |
| | | | | | | | |
| | | | | | | | |
| | | Principal
Amount | | | Value | |
| Oil & Gas — 7.2% | |
Calumet Specialty Products Partners LP/Calumet Finance Corp.
7.750% 4/15/23 | | $ | 1,045,000 | | | $ | 836,000 | |
Citgo Holding, Inc. (b)
10.750% 2/15/20 | | | 3,914,000 | | | | 3,923,785 | |
Continental Resources, Inc.
5.000% 9/15/22 | | | 1,201,000 | | | | 1,197,998 | |
EP Energy LLC/Everest Acquisition Finance, Inc.
9.375% 5/01/20 | | | 4,017,000 | | | | 2,842,027 | |
Hilcorp Energy I LP/Hilcorp Finance Co. (b)
5.000% 12/01/24 | | | 1,280,000 | | | | 1,225,600 | |
Jupiter Resources, Inc. (b)
8.500% 10/01/22 | | | 6,357,000 | | | | 5,339,880 | |
Kosmos Energy Ltd. (b)
7.875% 8/01/21 | | | 2,550,000 | | | | 2,473,500 | |
Kosmos Energy Ltd. (b)
7.875% 8/01/21 | | | 1,755,000 | | | | 1,702,350 | |
Newfield Exploration Co.
5.375% 1/01/26 | | | 850,000 | | | | 852,125 | |
PBF Holding Co. LLC/PBF Finance Corp. (b)
7.000% 11/15/23 | | | 936,000 | | | | 882,180 | |
Rowan Cos., Inc.
4.750% 1/15/24 | | | 2,500,000 | | | | 2,037,500 | |
Summit Midstream Holdings LLC/Summit Midstream Finance Corp.
5.500% 8/15/22 | | | 1,171,000 | | | | 1,115,378 | |
Summit Midstream Holdings LLC/Summit Midstream Finance Corp.
7.500% 7/01/21 | | | 1,180,000 | | | | 1,221,300 | |
Sunoco LP/Sunoco Finance Corp. (b)
5.500% 8/01/20 | | | 833,000 | | | | 846,536 | |
Sunoco LP/Sunoco Finance Corp. (b)
6.250% 4/15/21 | | | 1,872,000 | | | | 1,928,160 | |
Tullow Oil PLC (b)
6.250% 4/15/22 | | | 1,660,000 | | | | 1,485,700 | |
| | | | | | | | |
| | | | | | | 29,910,019 | |
| | | | | | | | |
| Oil & Gas Services — 1.0% | |
SESI LLC
7.125% 12/15/21 | | | 1,177,000 | | | | 1,150,518 | |
Welltec A/S (b)
8.000% 2/01/19 | | | 3,250,000 | | | | 3,140,312 | |
| | | | | | | | |
| | | | | | | 4,290,830 | |
| | | | | | | | |
| Packaging & Containers — 1.9% | |
Coveris Holdings SA (b)
7.875% 11/01/19 | | | 5,235,000 | | | | 5,352,787 | |
Sealed Air Corp. (b)
6.875% 7/15/33 | | | 2,334,000 | | | | 2,503,215 | |
| | | | | | | | |
| | | | | | | 7,856,002 | |
| | | | | | | | |
The accompanying notes are an integral part of the financial statements.
142
MassMutual Premier High Yield Fund – Portfolio of Investments (Continued)
| | | | | | | | |
| | | Principal
Amount | | | Value | |
| Pharmaceuticals — 1.8% | |
Capsugel SA (b)
7.000% 5/15/19 | | $ | 1,167,000 | | | $ | 1,169,918 | |
Valeant Pharmaceuticals International, Inc. (b)
6.125% 4/15/25 | | | 7,137,000 | | | | 6,146,741 | |
| | | | | | | | |
| | | | | | | 7,316,659 | |
| | | | | | | | |
| Pipelines — 2.4% | |
Energy Transfer Equity LP
5.500% 6/01/27 | | | 500,000 | | | | 497,500 | |
Energy Transfer Equity LP
5.875% 1/15/24 | | | 2,000,000 | | | | 2,075,000 | |
Genesis Energy LP/Genesis Energy Finance Corp.
6.000% 5/15/23 | | | 2,125,000 | | | | 2,109,062 | |
Genesis Energy LP/Genesis Energy Finance Corp.
6.750% 8/01/22 | | | 1,200,000 | | | | 1,236,456 | |
Sabine Pass Liquefaction LLC (b)
5.000% 3/15/27 | | | 1,015,000 | | | | 1,040,375 | |
Sabine Pass Liquefaction LLC (b)
5.875% 6/30/26 | | | 1,070,000 | | | | 1,162,956 | |
Tesoro Logistics LP/Tesoro Logistics Finance Corp.
6.125% 10/15/21 | | | 613,000 | | | | 640,585 | |
Tesoro Logistics LP/Tesoro Logistics Finance Corp.
6.375% 5/01/24 | | | 1,323,000 | | | | 1,418,918 | |
| | | | | | | | |
| | | | | | | 10,180,852 | |
| | | | | | | | |
| Real Estate Investment Trusts (REITS) — 1.3% | |
Corrections Corp. of America
5.000% 10/15/22 | | | 1,607,000 | | | | 1,454,335 | |
The GEO Group, Inc.
6.000% 4/15/26 | | | 1,887,000 | | | | 1,603,950 | |
MPT Operating Partnership LP/MPT Finance Corp.
5.250% 8/01/26 | | | 892,000 | | | | 925,450 | |
RHP Hotel Properties LP/RHP Finance Corp.
5.000% 4/15/23 | | | 1,426,000 | | | | 1,447,390 | |
| | | | | | | | |
| | | | | | | 5,431,125 | |
| | | | | | | | |
| Retail — 4.4% | |
Brinker International, Inc. (b)
5.000% 10/01/24 | | | 2,093,000 | | | | 2,122,013 | |
Carrols Restaurant Group, Inc.
8.000% 5/01/22 | | | 1,512,000 | | | | 1,634,850 | |
Dollar Tree, Inc.
5.250% 3/01/20 | | | 827,000 | | | | 858,012 | |
Dollar Tree, Inc.
5.750% 3/01/23 | | | 4,733,000 | | | | 5,093,891 | |
| | | | | | | | |
| | | Principal
Amount | | | Value | |
Ferrellgas Partners LP/Ferrellgas Partners Finance Corp.
8.625% 6/15/20 | | $ | 3,484,000 | | | $ | 3,423,030 | |
KFC Holding Co./Pizza Hut Holdings LLC/Taco Bell of America LLC (b)
5.000% 6/01/24 | | | 452,000 | | | | 472,340 | |
KFC Holding Co./Pizza Hut Holdings LLC/Taco Bell of America LLC (b)
5.250% 6/01/26 | | | 771,000 | | | | 815,333 | |
Penske Automotive Group, Inc.
5.500% 5/15/26 | | | 4,000,000 | | | | 3,990,000 | |
| | | | | | | | |
| | | | | | | 18,409,469 | |
| | | | | | | | |
| Savings & Loans — 1.2% | |
Consolidated Energy Finance SA (b)
6.750% 10/15/19 | | | 5,110,000 | | | | 5,046,125 | |
| | | | | | | | |
| Semiconductors — 0.8% | |
NXP BV/NXP Funding LLC (b)
4.125% 6/01/21 | | | 1,282,000 | | | | 1,373,343 | |
NXP BV/NXP Funding LLC (b)
4.625% 6/01/23 | | | 1,794,000 | | | | 1,962,187 | |
| | | | | | | | |
| | | | | | | 3,335,530 | |
| | | | | | | | |
| Software — 2.3% | |
IMS Health, Inc. (b)
5.000% 10/15/26 | | | 3,065,000 | | | | 3,187,600 | |
Infor Software Parent LLC/Infor Software Parent, Inc. (b)
7.125% 5/01/21 | | | 4,096,000 | | | | 3,973,120 | |
JDA Escrow LLC/JDA Bond Finance, Inc. (b) (c)
7.375% 10/15/24 | | | 1,073,000 | | | | 1,102,508 | |
MSCI, Inc. (b)
4.750% 8/01/26 | | | 1,405,000 | | | | 1,422,562 | |
| | | | | | | | |
| | | | | | | 9,685,790 | |
| | | | | | | | |
| Telecommunications — 10.0% | |
Altice Financing SA (b)
6.500% 1/15/22 | | | 1,485,000 | | | | 1,566,675 | |
Altice Finco SA (b)
8.125% 1/15/24 | | | 1,094,000 | | | | 1,132,290 | |
Altice SA (b)
7.750% 5/15/22 | | | 1,955,000 | | | | 2,086,962 | |
Cincinnati Bell, Inc. (b)
7.000% 7/15/24 | | | 2,437,000 | | | | 2,497,925 | |
CPI International, Inc. STEP
8.750% 2/15/18 | | | 5,117,000 | | | | 5,232,132 | |
Digicel Ltd. (b)
6.000% 4/15/21 | | | 2,100,000 | | | | 1,855,140 | |
GCI, Inc.
6.875% 4/15/25 | | | 3,000,000 | | | | 3,075,000 | |
Hughes Satellite Systems Corp. (b)
5.250% 8/01/26 | | | 1,961,000 | | | | 1,936,488 | |
The accompanying notes are an integral part of the financial statements.
143
MassMutual Premier High Yield Fund – Portfolio of Investments (Continued)
| | | | | | | | |
| | | Principal
Amount | | | Value | |
Hughes Satellite Systems Corp. (b)
6.625% 8/01/26 | | $ | 2,666,000 | | | $ | 2,572,690 | |
Level 3 Financing, Inc. (b)
5.250% 3/15/26 | | | 3,132,000 | | | | 3,233,790 | |
Sprint Corp.
7.250% 9/15/21 | | | 1,460,000 | | | | 1,465,475 | |
Sprint Corp.
7.875% 9/15/23 | | | 6,856,000 | | | | 6,898,850 | |
T-Mobile USA, Inc.
6.000% 4/15/24 | | | 951,000 | | | | 1,017,570 | |
T-Mobile USA, Inc.
6.500% 1/15/26 | | | 1,318,000 | | | | 1,458,038 | |
West Corp. (b)
5.375% 7/15/22 | | | 2,175,000 | | | | 2,131,500 | |
Wind Acquisition Finance SA (b)
7.375% 4/23/21 | | | 3,239,000 | | | | 3,384,755 | |
| | | | | | | | |
| | | | | | | 41,545,280 | |
| | | | | | | | |
| Transportation — 4.4% | |
Hornbeck Offshore Services, Inc.
5.000% 3/01/21 | | | 2,750,000 | | | | 1,608,750 | |
OPE KAG Finance Sub, Inc. (b)
7.875% 7/31/23 | | | 6,839,000 | | | | 6,479,952 | |
Topaz Marine SA (b)
8.625% 11/01/18 | | | 2,838,000 | | | | 2,745,084 | |
Watco Cos. LLC/Watco Finance Corp. (b)
6.375% 4/01/23 | | | 2,730,000 | | | | 2,757,300 | |
XPO Logistics, Inc. (b)
6.125% 9/01/23 | | | 1,314,000 | | | | 1,346,850 | |
XPO Logistics, Inc. (b)
6.500% 6/15/22 | | | 3,382,000 | | | | 3,525,735 | |
| | | | | | | | |
| | | | | | | 18,463,671 | |
| | | | | | | | |
| | |
TOTAL CORPORATE DEBT
(Cost $381,433,541) | | | | | | | 390,219,296 | |
| | | | | | | | |
| | |
TOTAL BONDS & NOTES
(Cost $394,015,632) | | | | | | | 401,387,147 | |
| | | | | | | | |
| | |
| TOTAL LONG-TERM INVESTMENTS (Cost $394,052,982) | | | | | | | 401,397,046 | |
| | | | | | | | |
|
| SHORT-TERM INVESTMENTS — 4.4% | |
| Commercial Paper — 2.6% | |
Dollar General Corp. (b)
0.600% 10/03/16 | | | 5,269,000 | | | | 5,268,653 | |
Spectra Energy Capital LLC (b)
0.900% 10/17/16 | | | 5,750,000 | | | | 5,747,863 | |
| | | | | | | | |
| | | Principal
Amount | | | Value | |
| Time Deposit — 1.8% | |
Euro Time Deposit
0.010% 10/03/16 | | $ | 7,301,271 | | | $ | 7,301,271 | |
| | | | | | | | |
| | |
TOTAL SHORT-TERM INVESTMENTS
(Cost $18,317,795) | | | | | | | 18,317,787 | |
| | | | | | | | |
| | |
TOTAL INVESTMENTS — 100.7%
(Cost $412,370,777) (d) | | | | | | | 419,714,833 | |
| | |
| Other Assets/(Liabilities) — (0.7)% | | | | | | | (2,941,906 | ) |
| | | | | | | | |
| | |
| NET ASSETS — 100.0% | | | | | | $ | 416,772,927 | |
| | | | | | | | |
Notes to Portfolio of Investments
Percentages are stated as a percent of net assets.
| (a) | This security is fair valued in good faith in accordance with procedures approved by the Board of Trustees. At September 30, 2016, these securities amounted to a value of $9,899 or 0.00% of net assets. |
| (b) | Securities exempt from registration under rule 144A of the Securities Act of 1933. These securities may be resold in transactions exempt from registration, normally to qualified institutional buyers. At September 30, 2016, these securities amounted to a value of $269,142,508 or 64.58% of net assets. |
| (c) | A portion of this security is purchased on a when-issued, delayed-delivery or forward commitment basis. (Note 2). |
| (d) | See Note 6 for aggregate cost for federal tax purposes. |
Country weightings, as a percentage of net assets, is as follows:
| | | | |
United States | | | 77.6 | % |
Luxembourg | | | 6.6 | % |
Canada | | | 4.0 | % |
Netherlands | | | 3.2 | % |
Bermuda | | | 1.6 | % |
France | | | 0.8 | % |
Denmark | | | 0.8 | % |
Ireland | | | 0.7 | % |
United Kingdom | | | 0.5 | % |
Australia | | | 0.5 | % |
| | | | |
Total Long-Term Investments | | | 96.3 | % |
Short-Term Investments and Other Assets and Liabilities | | | 3.7 | % |
| | | | |
Net Assets | | | 100.0 | % |
| | | | |
The accompanying notes are an integral part of the financial statements.
144
MassMutual Premier Balanced Fund – Portfolio of Investments
September 30, 2016
| | | | | | | | |
| | | Number of
Shares | | | Value | |
| EQUITIES — 59.1% | |
|
| COMMON STOCK — 59.0% | |
| Basic Materials — 1.4% | |
| Chemicals — 1.2% | |
CF Industries Holdings, Inc. | | | 225 | | | $ | 5,479 | |
The Dow Chemical Co. | | | 4,493 | | | | 232,873 | |
E.I. du Pont de Nemours & Co. | | | 2,471 | | | | 165,483 | |
Eastman Chemical Co. | | | 2,194 | | | | 148,490 | |
Ecolab, Inc. | | | 4 | | | | 487 | |
FMC Corp. | | | 4,400 | | | | 212,696 | |
GCP Applied Technologies, Inc. (a) | | | 7,000 | | | | 198,240 | |
Ingevity Corp. (a) | | | 3,100 | | | | 142,910 | |
International Flavors & Fragrances, Inc. | | | 3 | | | | 429 | |
LyondellBasell Industries NV Class A | | | 1,260 | | | | 101,631 | |
Monsanto Co. | | | 969 | | | | 99,032 | |
The Mosaic Co. | | | 300 | | | | 7,338 | |
PPG Industries, Inc. | | | 938 | | | | 96,952 | |
Praxair, Inc. | | | 4 | | | | 483 | |
The Sherwin-Williams Co. | | | 7 | | | | 1,937 | |
| | | | | | | | |
| | | | | | | 1,414,460 | |
| | | | | | | | |
| Forest Products & Paper — 0.0% | |
International Paper Co. | | | 607 | | | | 29,124 | |
| | | | | | | | |
| Iron & Steel — 0.1% | |
Nucor Corp. | | | 2,161 | | | | 106,861 | |
| | | | | | | | |
| Mining — 0.1% | |
Alcoa, Inc. | | | 46 | | | | 466 | |
Freeport-McMoRan, Inc. | | | 48 | | | | 521 | |
Newmont Mining Corp. | | | 1,584 | | | | 62,235 | |
Vulcan Materials Co. | | | 98 | | | | 11,146 | |
| | | | | | | | |
| | | | | | | 74,368 | |
| | | | | | | | |
| | | | | | | 1,624,813 | |
| | | | | | | | |
| Communications — 7.3% | |
| Advertising — 0.1% | |
The Interpublic Group of Companies, Inc. | | | 933 | | | | 20,853 | |
Omnicom Group, Inc. | | | 798 | | | | 67,830 | |
| | | | | | | | |
| | | | | | | 88,683 | |
| | | | | | | | |
| Internet — 3.0% | |
Akamai Technologies, Inc. (a) | | | 10 | | | | 530 | |
Alphabet, Inc. Class A (a) | | | 1,024 | | | | 823,358 | |
Alphabet, Inc. Class C (a) | | | 706 | | | | 548,767 | |
Amazon.com, Inc. (a) | | | 556 | | | | 465,544 | |
eBay, Inc. (a) | | | 9,965 | | | | 327,849 | |
Expedia, Inc. | | | 743 | | | | 86,723 | |
F5 Networks, Inc. (a) | | | 1,210 | | | | 150,814 | |
Facebook, Inc. Class A (a) | | | 4,720 | | | | 605,434 | |
Liberty Ventures Series A (a) | | | 900 | | | | 35,883 | |
Netflix, Inc. (a) | | | 492 | | | | 48,487 | |
| | | | | | | | |
| | | Number of
Shares | | | Value | |
The Priceline Group, Inc. (a) | | | 104 | | | $ | 153,035 | |
Symantec Corp. | | | 9,379 | | | | 235,413 | |
TripAdvisor, Inc. (a) | | | 43 | | | | 2,717 | |
VeriSign, Inc. (a) | | | 189 | | | | 14,787 | |
Yahoo!, Inc. (a) | | | 34 | | | | 1,465 | |
| | | | | | | | |
| | | | | | | 3,500,806 | |
| | | | | | | | |
| Media — 2.1% | |
Cable One, Inc. | | | 158 | | | | 92,272 | |
CBS Corp. Class B | | | 1,570 | | | | 85,942 | |
Charter Communications, Inc. Class A (a) | | | 346 | | | | 93,410 | |
Comcast Corp. Class A | | | 5,681 | | | | 376,877 | |
Discovery Communications, Inc. Series A (a) | | | 8,900 | | | | 239,588 | |
Discovery Communications, Inc. Series C (a) | | | 7,700 | | | | 202,587 | |
Liberty Broadband Corp. Class A (a) | | | 700 | | | | 49,112 | |
Liberty SiriusXM Group Class A (a) | | | 1,500 | | | | 50,970 | |
Liberty SiriusXM Group Class C (a) | | | 1,500 | | | | 50,115 | |
News Corp. Class A | | | 10,630 | | | | 148,607 | |
Scripps Networks Interactive Class A | | | 3,624 | | | | 230,088 | |
Starz Class A (a) | | | 3,650 | | | | 113,843 | |
TEGNA, Inc. | | | 12,107 | | | | 264,659 | |
Time Warner, Inc. | | | 2,488 | | | | 198,070 | |
Tribune Media Co. Class A | | | 600 | | | | 21,912 | |
Twenty-First Century Fox, Inc. Class A | | | 2,921 | | | | 70,747 | |
Viacom, Inc. Class B | | | 2,690 | | | | 102,489 | |
The Walt Disney Co. | | | 382 | | | | 35,472 | |
| | | | | | | | |
| | | | | | | 2,426,760 | |
| | | | | | | | |
| Telecommunications — 2.1% | |
AT&T, Inc. | | | 8,730 | | | | 354,525 | |
CenturyLink, Inc. | | | 8,754 | | | | 240,122 | |
Cisco Systems, Inc. | | | 14,824 | | | | 470,217 | |
Corning, Inc. | | | 9,174 | | | | 216,965 | |
Frontier Communications Corp. | | | 48,670 | | | | 202,467 | |
Juniper Networks, Inc. | | | 3,948 | | | | 94,989 | |
Motorola Solutions, Inc. | | | 3,134 | | | | 239,062 | |
Verizon Communications, Inc. | | | 12,232 | | | | 635,820 | |
Windstream Holdings, Inc. | | | 6,200 | | | | 62,310 | |
| | | | | | | | |
| | | | | | | 2,516,477 | |
| | | | | | | | |
| | | | | | | 8,532,726 | |
| | | | | | | | |
| Consumer, Cyclical — 6.5% | |
| Airlines — 0.7% | |
Alaska Air Group, Inc. | | | 3,900 | | | | 256,854 | |
American Airlines Group, Inc. | | | 6,500 | | | | 237,965 | |
Delta Air Lines, Inc. | | | 5,000 | | | | 196,800 | |
Southwest Airlines Co. | | | 3,966 | | | | 154,238 | |
| | | | | | | | |
| | | | | | | 845,857 | |
| | | | | | | | |
The accompanying notes are an integral part of the financial statements.
145
MassMutual Premier Balanced Fund – Portfolio of Investments (Continued)
| | | | | | | | |
| | | Number of
Shares | | | Value | |
| Apparel — 0.4% | |
Michael Kors Holdings Ltd. (a) | | | 4,200 | | | $ | 196,518 | |
Nike, Inc. Class B | | | 1,384 | | | | 72,867 | |
Ralph Lauren Corp. | | | 1,300 | | | | 131,482 | |
VF Corp. | | | 500 | | | | 28,025 | |
| | | | | | | | |
| | | | | | | 428,892 | |
| | | | | | | | |
| Auto Manufacturers — 0.6% | |
Ford Motor Co. | | | 18,462 | | | | 222,836 | |
General Motors Co. | | | 6,400 | | | | 203,328 | |
Oshkosh Corp. | | | 2,900 | | | | 162,400 | |
PACCAR, Inc. | | | 2,634 | | | | 154,827 | |
| | | | | | | | |
| | | | | | | 743,391 | |
| | | | | | | | |
| Automotive & Parts — 0.2% | |
Allison Transmission Holdings, Inc. | | | 2,000 | | | | 57,360 | |
Delphi Automotive PLC | | | 200 | | | | 14,264 | |
The Goodyear Tire & Rubber Co. | | | 6,361 | | | | 205,460 | |
| | | | | | | | |
| | | | | | | 277,084 | |
| | | | | | | | |
| Distribution & Wholesale — 0.1% | |
Fastenal Co. | | | 70 | | | | 2,925 | |
Genuine Parts Co. | | | 536 | | | | 53,841 | |
W.W. Grainger, Inc. | | | 4 | | | | 899 | |
WESCO International, Inc. (a) | | | 850 | | | | 52,267 | |
| | | | | | | | |
| | | | | | | 109,932 | |
| | | | | | | | |
| Entertainment — 0.2% | |
Gaming and Leisure Properties, Inc. | | | 3,200 | | | | 107,040 | |
The Madison Square Garden Co.
Class A (a) | | | 790 | | | | 133,834 | |
| | | | | | | | |
| | | | | | | 240,874 | |
| | | | | | | | |
| Home Builders — 0.1% | |
D.R. Horton, Inc. | | | 2,659 | | | | 80,302 | |
PulteGroup, Inc. | | | 74 | | | | 1,483 | |
| | | | | | | | |
| | | | | | | 81,785 | |
| | | | | | | | |
| Home Furnishing — 0.1% | |
Harman International Industries, Inc. | | | 124 | | | | 10,472 | |
Whirlpool Corp. | | | 324 | | | | 52,540 | |
| | | | | | | | |
| | | | | | | 63,012 | |
| | | | | | | | |
| Housewares — 0.1% | |
Newell Brands, Inc. | | | 1,083 | | | | 57,031 | |
| | | | | | | | |
| Leisure Time — 0.0% | |
Harley-Davidson, Inc. | | | 8 | | | | 421 | |
Royal Caribbean Cruises Ltd. | | | 100 | | | | 7,495 | |
| | | | | | | | |
| | | | | | | 7,916 | |
| | | | | | | | |
| Lodging — 0.4% | |
Marriott International, Inc. Class A | | | 1,161 | | | | 78,170 | |
Wyndham Worldwide Corp. | | | 3,222 | | | | 216,937 | |
Wynn Resorts Ltd. | | | 1,909 | | | | 185,975 | |
| | | | | | | | |
| | | | | | | 481,082 | |
| | | | | | | | |
| | | | | | | | |
| | | Number of
Shares | | | Value | |
| Retail — 3.5% | |
AutoNation, Inc. (a) | | | 20 | | | $ | 974 | |
AutoZone, Inc. (a) | | | 96 | | | | 73,761 | |
Bed Bath & Beyond, Inc. | | | 373 | | | | 16,080 | |
Best Buy Co., Inc. | | | 8,208 | | | | 313,381 | |
Coach, Inc. | | | 84 | | | | 3,071 | |
Costco Wholesale Corp. | | | 1,078 | | | | 164,406 | |
CVS Health Corp. | | | 2,603 | | | | 231,641 | |
Darden Restaurants, Inc. | | | 473 | | | | 29,004 | |
Dollar General Corp. | | | 600 | | | | 41,994 | |
Dollar Tree, Inc. (a) | | | 71 | | | | 5,604 | |
The Gap, Inc. | | | 7,305 | | | | 162,463 | |
The Home Depot, Inc. | | | 1,990 | | | | 256,073 | |
Kohl’s Corp. | | | 4,261 | | | | 186,419 | |
L Brands, Inc. | | | 600 | | | | 42,462 | |
Lowe’s Cos., Inc. | | | 2,129 | | | | 153,735 | |
Macy’s, Inc. | | | 7,340 | | | | 271,947 | |
McDonald’s Corp. | | | 1,945 | | | | 224,375 | |
Nordstrom, Inc. | | | 3,411 | | | | 176,963 | |
O’Reilly Automotive, Inc. (a) | | | 484 | | | | 135,573 | |
PVH Corp. | | | 1,650 | | | | 182,325 | |
Ross Stores, Inc. | | | 1,392 | | | | 89,506 | |
Staples, Inc. | | | 12,583 | | | | 107,585 | |
Starbucks Corp. | | | 1,290 | | | | 69,841 | |
Target Corp. | | | 2,267 | | | | 155,698 | |
Tiffany & Co. | | | 111 | | | | 8,062 | |
The TJX Cos., Inc. | | | 1,140 | | | | 85,249 | |
Urban Outfitters, Inc. (a) | | | 7,560 | | | | 260,971 | |
Vista Outdoor, Inc. (a) | | | 1,200 | | | | 47,832 | |
Wal-Mart Stores, Inc. | | | 6,953 | | | | 501,450 | |
Walgreens Boots Alliance, Inc. | | | 306 | | | | 24,670 | |
Yum! Brands, Inc. | | | 636 | | | | 57,755 | |
| | | | | | | | |
| | | | | | | 4,080,870 | |
| | | | | | | | |
| Textiles — 0.0% | |
Cintas Corp. | | | 449 | | | | 50,557 | |
| | | | | | | | |
| Toys, Games & Hobbies — 0.1% | |
Hasbro, Inc. | | | 747 | | | | 59,259 | |
Mattel, Inc. | | | 361 | | | | 10,931 | |
| | | | | | | | |
| | | | | | | 70,190 | |
| | | | | | | | |
| | | | | | | 7,538,473 | |
| | | | | | | | |
| Consumer, Non-cyclical — 12.3% | |
| Agriculture — 0.7% | |
Altria Group, Inc. | | | 2,741 | | | | 173,314 | |
Archer-Daniels-Midland Co. | | | 3,926 | | | | 165,559 | |
Philip Morris International, Inc. | | | 3,646 | | | | 354,464 | |
Reynolds American, Inc. | | | 2,282 | | | | 107,596 | |
| | | | | | | | |
| | | | | | | 800,933 | |
| | | | | | | | |
| Beverages — 0.9% | |
Brown-Forman Corp. Class B | | | 2 | | | | 95 | |
The Coca-Cola Co. | | | 3,824 | | | | 161,832 | |
Coca-Cola European Partners PLC | | | 1,485 | | | | 59,251 | |
The accompanying notes are an integral part of the financial statements.
146
MassMutual Premier Balanced Fund – Portfolio of Investments (Continued)
| | | | | | | | |
| | | Number of
Shares | | | Value | |
Constellation Brands, Inc. Class A | | | 42 | | | $ | 6,993 | |
Dr. Pepper Snapple Group, Inc. | | | 1,210 | | | | 110,485 | |
Molson Coors Brewing Co. Class B | | | 436 | | | | 47,873 | |
Monster Beverage Corp. (a) | | | 250 | | | | 36,702 | |
PepsiCo, Inc. | | | 6,082 | | | | 661,539 | |
| | | | | | | | |
| | | | | | | 1,084,770 | |
| | | | | | | | |
| Biotechnology — 1.2% | |
Amgen, Inc. | | | 3,545 | | | | 591,341 | |
Biogen, Inc. (a) | | | 524 | | | | 164,028 | |
Celgene Corp. (a) | | | 1,538 | | | | 160,767 | |
Gilead Sciences, Inc. | | | 5,622 | | | | 444,813 | |
Theravance Biopharma, Inc. (a) | | | 500 | | | | 18,120 | |
| | | | | | | | |
| | | | | | | 1,379,069 | |
| | | | | | | | |
| Commercial Services — 0.8% | |
Automatic Data Processing, Inc. | | | 621 | | | | 54,772 | |
Equifax, Inc. | | | 216 | | | | 29,069 | |
Global Payments, Inc. | | | 400 | | | | 30,704 | |
H&R Block, Inc. | | | 42 | | | | 972 | |
McKesson Corp. | | | 1,091 | | | | 181,924 | |
Moody’s Corp. | | | 325 | | | | 35,191 | |
Paychex, Inc. | | | 813 | | | | 47,049 | |
PayPal Holdings, Inc. (a) | | | 65 | | | | 2,663 | |
Quanta Services, Inc. (a) | | | 2,024 | | | | 56,652 | |
Robert Half International, Inc. | | | 35 | | | | 1,325 | |
S&P Global, Inc. | | | 89 | | | | 11,264 | |
Sotheby’s | | | 2,000 | | | | 76,040 | |
Total System Services, Inc. | | | 421 | | | | 19,850 | |
United Rentals, Inc. (a) | | | 2,000 | | | | 156,980 | |
Visa, Inc. Class A | | | 1,360 | | | | 112,472 | |
The Western Union Co. | | | 8,307 | | | | 172,952 | |
| | | | | | | | |
| | | | | | | 989,879 | |
| | | | | | | | |
| Cosmetics & Personal Care — 0.4% | |
Colgate-Palmolive Co. | | | 2,506 | | | | 185,795 | |
The Estee Lauder Cos., Inc. Class A | | | 796 | | | | 70,494 | |
The Procter & Gamble Co. | | | 2,933 | | | | 263,236 | |
| | | | | | | | |
| | | | | | | 519,525 | |
| | | | | | | | |
| Foods — 1.0% | |
Campbell Soup Co. | | | 1,265 | | | | 69,196 | |
ConAgra Foods, Inc. | | | 3,234 | | | | 152,354 | |
General Mills, Inc. | | | 2,094 | | | | 133,765 | |
The Hershey Co. | | | 419 | | | | 40,056 | |
Hormel Foods Corp. | | | 2,288 | | | | 86,784 | |
The J.M. Smucker Co. | | | 724 | | | | 98,131 | |
Kellogg Co. | | | 135 | | | | 10,459 | |
The Kraft Heinz Co. | | | 1,673 | | | | 149,750 | |
The Kroger Co. | | | 3,568 | | | | 105,898 | |
McCormick & Co., Inc. | | | 73 | | | | 7,294 | |
Mondelez International, Inc. Class A | | | 1,921 | | | | 84,332 | |
Sysco Corp. | | | 1,366 | | | | 66,948 | |
Tyson Foods, Inc. Class A | | | 2,720 | | | | 203,102 | |
Whole Foods Market, Inc. | | | 72 | | | | 2,041 | |
| | | | | | | | |
| | | | | | | 1,210,110 | |
| | | | | | | | |
| | | | | | | | |
| | | Number of
Shares | | | Value | |
| Health Care – Products — 2.1% | |
Baxter International, Inc. | | | 6,922 | | | $ | 329,487 | |
Becton, Dickinson & Co. | | | 221 | | | | 39,720 | |
Boston Scientific Corp. (a) | | | 4,421 | | | | 105,220 | |
C.R. Bard, Inc. | | | 34 | | | | 7,626 | |
Edwards Lifesciences Corp. (a) | | | 540 | | | | 65,102 | |
Hologic, Inc. (a) | | | 1,100 | | | | 42,713 | |
Intuitive Surgical, Inc. (a) | | | 14 | | | | 10,148 | |
Johnson & Johnson | | | 11,469 | | | | 1,354,833 | |
Medtronic PLC | | | 3,416 | | | | 295,142 | |
St. Jude Medical, Inc. | | | 98 | | | | 7,817 | |
Stryker Corp. | | | 49 | | | | 5,704 | |
Varian Medical Systems, Inc. (a) | | | 674 | | | | 67,083 | |
West Pharmaceutical Services, Inc. | | | 900 | | | | 67,050 | |
Zimmer Biomet Holdings, Inc. | | | 364 | | | | 47,327 | |
| | | | | | | | |
| | | | | | | 2,444,972 | |
| | | | | | | | |
| Health Care – Services — 1.2% | |
Aetna, Inc. | | | 902 | | | | 104,136 | |
Anthem, Inc. | | | 1,728 | | | | 216,536 | |
Centene Corp. (a) | | | 1,600 | | | | 107,136 | |
Cigna Corp. | | | 19 | | | | 2,476 | |
DaVita, Inc. (a) | | | 46 | | | | 3,039 | |
DENTSPLY SIRONA, Inc. | | | 1,561 | | | | 92,770 | |
HCA Holdings, Inc. (a) | | | 2,900 | | | | 219,327 | |
Humana, Inc. | | | 225 | | | | 39,800 | |
Laboratory Corporation of America Holdings (a) | | | 1 | | | | 138 | |
Quest Diagnostics, Inc. | | | 635 | | | | 53,740 | |
Thermo Fisher Scientific, Inc. | | | 578 | | | | 91,937 | |
UnitedHealth Group, Inc. | | | 3,271 | | | | 457,940 | |
Universal Health Services, Inc. Class B | | | 110 | | | | 13,554 | |
| | | | | | | | |
| | | | | | | 1,402,529 | |
| | | | | | | | |
| Household Products — 0.3% | |
Avery Dennison Corp. | | | 2,982 | | | | 231,970 | |
The Clorox Co. | | | 547 | | | | 68,473 | |
Kimberly-Clark Corp. | | | 100 | | | | 12,614 | |
| | | | | | | | |
| | | | | | | 313,057 | |
| | | | | | | | |
| Pharmaceuticals — 3.7% | |
Abbott Laboratories | | | 4,304 | | | | 182,016 | |
AbbVie, Inc. | | | 8,404 | | | | 530,040 | |
Allergan PLC (a) | | | 79 | | | | 18,195 | |
AmerisourceBergen Corp. | | | 2,030 | | | | 163,983 | |
Bristol-Myers Squibb Co. | | | 3,512 | | | | 189,367 | |
Cardinal Health, Inc. | | | 1,755 | | | | 136,364 | |
Eli Lilly & Co. | | | 1,007 | | | | 80,822 | |
Endo International PLC (a) | | | 12,100 | | | | 243,815 | |
Express Scripts Holding Co. (a) | | | 4,245 | | | | 299,400 | |
Mallinckrodt PLC (a) | | | 6,020 | | | | 420,076 | |
Mead Johnson Nutrition Co. | | | 1,124 | | | | 88,807 | |
Merck & Co., Inc. | | | 9,529 | | | | 594,705 | |
The accompanying notes are an integral part of the financial statements.
147
MassMutual Premier Balanced Fund – Portfolio of Investments (Continued)
| | | | | | | | |
| | | Number of
Shares | | | Value | |
Mylan NV (a) | | | 7,059 | | | $ | 269,089 | |
Patterson Cos., Inc. | | | 61 | | | | 2,802 | |
Pfizer, Inc. | | | 21,622 | | | | 732,337 | |
Zoetis, Inc. | | | 6,110 | | | | 317,781 | |
| | | | | | | | |
| | | | | | | 4,269,599 | |
| | | | | | | | |
| | | | | | | 14,414,443 | |
| | | | | | | | |
| Diversified — 0.0% | |
| Holding Company – Diversified — 0.0% | |
Leucadia National Corp. | | | 36 | | | | 685 | |
| | | | | | | | |
| Energy — 2.8% | |
| Energy – Alternate Sources — 0.1% | |
First Solar, Inc. (a) | | | 4,300 | | | | 169,807 | |
| | | | | | | | |
| Oil & Gas — 2.4% | |
Anadarko Petroleum Corp. | | | 97 | | | | 6,146 | |
Apache Corp. | | | 2,298 | | | | 146,773 | |
Cabot Oil & Gas Corp. | | | 92 | | | | 2,374 | |
Chesapeake Energy Corp. (a) | | | 98 | | | | 614 | |
Chevron Corp. | | | 5,680 | | | | 584,585 | |
ConocoPhillips | | | 1,910 | | | | 83,028 | |
Devon Energy Corp. | | | 17 | | | | 750 | |
Diamond Offshore Drilling, Inc. | | | 5,685 | | | | 100,113 | |
EOG Resources, Inc. | | | 92 | | | | 8,897 | |
EQT Corp. | | | 29 | | | | 2,106 | |
Exxon Mobil Corp. | | | 10,749 | | | | 938,173 | |
Helmerich & Payne, Inc. | | | 40 | | | | 2,692 | |
Hess Corp. | | | 1,347 | | | | 72,226 | |
Marathon Oil Corp. | | | 14,085 | | | | 222,684 | |
Marathon Petroleum Corp. | | | 2,664 | | | | 108,132 | |
Murphy Oil Corp. | | | 22 | | | | 669 | |
Murphy USA, Inc. (a) | | | 1,426 | | | | 101,759 | |
Noble Energy, Inc. | | | 66 | | | | 2,359 | |
Occidental Petroleum Corp. | | | 30 | | | | 2,188 | |
Phillips 66 | | | 105 | | | | 8,458 | |
Pioneer Natural Resources Co. | | | 3 | | | | 557 | |
Range Resources Corp. | | | 99 | | | | 3,836 | |
Southwestern Energy Co. (a) | | | 900 | | | | 12,456 | |
Tesoro Corp. | | | 2,726 | | | | 216,880 | |
Valero Energy Corp. | | | 3,110 | | | | 164,830 | |
| | | | | | | | |
| | | | | | | 2,793,285 | |
| | | | | | | | |
| Oil & Gas Services — 0.3% | |
Baker Hughes, Inc. | | | 74 | | | | 3,735 | |
FMC Technologies, Inc. (a) | | | 72 | | | | 2,136 | |
Halliburton Co. | | | 71 | | | | 3,186 | |
National Oilwell Varco, Inc. | | | 1,009 | | | | 37,071 | |
Schlumberger Ltd. | | | 787 | | | | 61,890 | |
Transocean Ltd. | | | 19,700 | | | | 210,002 | |
| | | | | | | | |
| | | | | | | 318,020 | |
| | | | | | | | |
| Pipelines — 0.0% | |
Kinder Morgan, Inc. | | | 60 | | | | 1,388 | |
Spectra Energy Corp. | | | 71 | | | | 3,035 | |
| | | | | | | | |
| | | Number of
Shares | | | Value | |
The Williams Cos., Inc. | | | 33 | | | $ | 1,014 | |
| | | | | | | | |
| | | | | | | 5,437 | |
| | | | | | | | |
| | | | | | | 3,286,549 | |
| | | | | | | | |
| Financial — 9.2% | |
| Banks — 1.9% | |
Bank of America Corp. | | | 33,342 | | | | 521,802 | |
The Bank of New York Mellon Corp. | | | 1,195 | | | | 47,657 | |
BB&T Corp. | | | 2,712 | | | | 102,297 | |
Capital One Financial Corp. | | | 2,075 | | | | 149,047 | |
Citizens Financial Group, Inc. | | | 5,000 | | | | 123,550 | |
Comerica, Inc. | | | 124 | | | | 5,868 | |
Fifth Third Bancorp | | | 13,121 | | | | 268,456 | |
Huntington Bancshares, Inc. | | | 1,110 | | | | 10,945 | |
KeyCorp | | | 3,472 | | | | 42,254 | |
M&T Bank Corp. | | | 281 | | | | 32,624 | |
Northern Trust Corp. | | | 1,061 | | | | 72,137 | |
The PNC Financial Services Group, Inc. | | | 645 | | | | 58,108 | |
Regions Financial Corp. | | | 20,543 | | | | 202,759 | |
State Street Corp. | | | 385 | | | | 26,807 | |
SunTrust Banks, Inc. | | | 2,500 | | | | 109,500 | |
U.S. Bancorp | | | 3,029 | | | | 129,914 | |
Wells Fargo & Co. | | | 3,764 | | | | 166,670 | |
Zions Bancorp | | | 3,949 | | | | 122,498 | |
| | | | | | | | |
| | | | | | | 2,192,893 | |
| | | | | | | | |
| Diversified Financial — 3.2% | |
American Express Co. | | | 3,188 | | | | 204,160 | |
Ameriprise Financial, Inc. | | | 205 | | | | 20,453 | |
BlackRock, Inc. | | | 130 | | | | 47,120 | |
The Charles Schwab Corp. | | | 122 | | | | 3,852 | |
Citigroup, Inc. | | | 12,184 | | | | 575,450 | |
CME Group, Inc. | | | 555 | | | | 58,009 | |
Discover Financial Services | | | 2,595 | | | | 146,747 | |
E*TRADE Financial Corp. (a) | | | 7,793 | | | | 226,932 | |
Franklin Resources, Inc. | | | 2,648 | | | | 94,189 | |
The Goldman Sachs Group, Inc. | | | 2,458 | | | | 396,402 | |
Intercontinental Exchange, Inc. | | | 2 | | | | 539 | |
Invesco Ltd. | | | 2,123 | | | | 66,386 | |
JP Morgan Chase & Co. | | | 14,965 | | | | 996,519 | |
Legg Mason, Inc. | | | 47 | | | | 1,574 | |
MasterCard, Inc. Class A | | | 1,450 | | | | 147,566 | |
Morgan Stanley | | | 7,596 | | | | 243,528 | |
Nasdaq, Inc. | | | 422 | | | | 28,502 | |
Navient Corp. | | | 17,518 | | | | 253,485 | |
NorthStar Asset Management Group, Inc. | | | 2,000 | | | | 25,860 | |
Synchrony Financial | | | 4,800 | | | | 134,400 | |
T. Rowe Price Group, Inc. | | | 86 | | | | 5,719 | |
| | | | | | | | |
| | | | | | | 3,677,392 | |
| | | | | | | | |
| Insurance — 2.3% | |
Aflac, Inc. | | | 3,845 | | | | 276,340 | |
The Allstate Corp. | | | 1,786 | | | | 123,555 | |
The accompanying notes are an integral part of the financial statements.
148
MassMutual Premier Balanced Fund – Portfolio of Investments (Continued)
| | | | | | | | |
| | | Number of
Shares | | | Value | |
American International Group, Inc. | | | 3,711 | | | $ | 220,211 | |
Aon PLC | | | 706 | | | | 79,418 | |
Assurant, Inc. | | | 210 | | | | 19,372 | |
Berkshire Hathaway, Inc. Class B (a) | | | 1,623 | | | | 234,475 | |
Chubb Ltd. | | | 2,224 | | | | 279,446 | |
Cincinnati Financial Corp. | | | 724 | | | | 54,604 | |
The Hartford Financial Services Group, Inc. | | | 1,190 | | | | 50,956 | |
Lincoln National Corp. | | | 4,458 | | | | 209,437 | |
Loews Corp. | | | 334 | | | | 13,744 | |
Marsh & McLennan Cos., Inc. | | | 1,230 | | | | 82,717 | |
MetLife, Inc. | | | 3,729 | | | | 165,679 | |
Principal Financial Group, Inc. | | | 3,235 | | | | 166,635 | |
The Progressive Corp. | | | 1,634 | | | | 51,471 | |
Prudential Financial, Inc. | | | 2,235 | | | | 182,488 | |
Torchmark Corp. | | | 380 | | | | 24,278 | |
The Travelers Cos., Inc. | | | 1,243 | | | | 142,386 | |
Unum Group | | | 7,135 | | | | 251,937 | |
XL Group Ltd. | | | 3,297 | | | | 110,878 | |
| | | | | | | | |
| | | | | | | 2,740,027 | |
| | | | | | | | |
| Real Estate — 0.1% | |
CBRE Group, Inc. Class A (a) | | | 1,198 | | | | 33,520 | |
Four Corners Property Trust, Inc. | | | 3,200 | | | | 68,256 | |
| | | | | | | | |
| | | | | | | 101,776 | |
| | | | | | | | |
| Real Estate Investment Trusts (REITS) — 1.6% | |
American Tower Corp. | | | 198 | | | | 22,439 | |
Apartment Investment & Management Co. Class A | | | 3,964 | | | | 181,987 | |
AvalonBay Communities, Inc. | | | 424 | | | | 75,404 | |
Boston Properties, Inc. | | | 7 | | | | 954 | |
Colony Starwood Homes | | | 2,400 | | | | 68,880 | |
Communications Sales & Leasing, Inc. (a) | | | 600 | | | | 18,846 | |
Crown Castle International Corp. | | | 400 | | | | 37,684 | |
Digital Realty Trust, Inc. | | | 810 | | | | 78,667 | |
Equity Residential | | | 3,201 | | | | 205,920 | |
Essex Property Trust, Inc. | | | 300 | | | | 66,810 | |
Extra Space Storage, Inc. | | | 800 | | | | 63,528 | |
Federal Realty Investment Trust | | | 510 | | | | 78,504 | |
General Growth Properties, Inc. | | | 400 | | | | 11,040 | |
HCP, Inc. | | | 976 | | | | 37,039 | |
Host Hotels & Resorts, Inc. | | | 4,130 | | | | 64,304 | |
Iron Mountain, Inc. | | | 73 | | | | 2,740 | |
Kimco Realty Corp. | | | 5,810 | | | | 168,200 | |
The Macerich Co. | | | 3,100 | | | | 250,697 | |
Mack-Cali Realty Corp. | | | 2,050 | | | | 55,801 | |
Prologis, Inc. | | | 4,116 | | | | 220,371 | |
Public Storage | | | 417 | | | | 93,049 | |
Simon Property Group, Inc. | | | 94 | | | | 19,459 | |
SL Green Realty Corp. | | | 100 | | | | 10,810 | |
Ventas, Inc. | | | 36 | | | | 2,543 | |
Vornado Realty Trust | | | 265 | | | | 26,821 | |
| | | | | | | | |
| | | Number of
Shares | | | Value | |
Welltower, Inc. | | | 274 | | | $ | 20,487 | |
Weyerhaeuser Co. | | | 93 | | | | 2,971 | |
| | | | | | | | |
| | | | | | | 1,885,955 | |
| | | | | | | | |
| Savings & Loans — 0.1% | |
Beneficial Bancorp, Inc. | | | 6,800 | | | | 100,028 | |
People’s United Financial, Inc. | | | 3,659 | | | | 57,885 | |
| | | | | | | | |
| | | | | | | 157,913 | �� |
| | | | | | | | |
| | | | | | | 10,755,956 | |
| | | | | | | | |
| Industrial — 7.4% | |
| Aerospace & Defense — 1.3% | |
The Boeing Co. | | | 3,396 | | | | 447,389 | |
General Dynamics Corp. | | | 88 | | | | 13,654 | |
Harris Corp. | | | 1,154 | | | | 105,718 | |
KLX, Inc. (a) | | | 2,900 | | | | 102,080 | |
L-3 Communications Holdings, Inc. | | | 1,334 | | | | 201,074 | |
Lockheed Martin Corp. | | | 421 | | | | 100,922 | |
Northrop Grumman Corp. | | | 653 | | | | 139,709 | |
Raytheon Co. | | | 186 | | | | 25,320 | |
Rockwell Collins, Inc. | | | 57 | | | | 4,808 | |
TransDigm Group, Inc. (a) | | | 50 | | | | 14,456 | |
United Technologies Corp. | | | 3,262 | | | | 331,419 | |
| | | | | | | | |
| | | | | | | 1,486,549 | |
| | | | | | | | |
| Airlines — 0.2% | |
United Continental Holdings, Inc. (a) | | | 4,800 | | | | 251,856 | |
| | | | | | | | |
| Building Materials — 0.3% | |
Armstrong Flooring, Inc. (a) | | | 10,560 | | | | 199,373 | |
Martin Marietta Materials, Inc. | | | 80 | | | | 14,329 | |
Masco Corp. | | | 3,194 | | | | 109,586 | |
| | | | | | | | |
| | | | | | | 323,288 | |
| | | | | | | | |
| Electrical Components & Equipment — 0.2% | |
Emerson Electric Co. | | | 2,343 | | | | 127,717 | |
Energizer Holdings, Inc. | | | 2,100 | | | | 104,916 | |
| | | | | | | | |
| | | | | | | 232,633 | |
| | | | | | | | |
| Electronics — 1.0% | |
Agilent Technologies, Inc. | | | 1,173 | | | | 55,236 | |
Allegion PLC | | | 2,200 | | | | 151,602 | |
Amphenol Corp. Class A | | | 72 | | | | 4,674 | |
FLIR Systems, Inc. | | | 4,135 | | | | 129,922 | |
Fortive Corp. | | | 836 | | | | 42,552 | |
Garmin Ltd. | | | 3,400 | | | | 163,574 | |
Johnson Controls International PLC | | | 1,926 | | | | 89,617 | |
Kimball Electronics, Inc. (a) | | | 7,900 | | | | 109,494 | |
Knowles Corp. (a) | | | 5,500 | | | | 77,275 | |
PerkinElmer, Inc. | | | 1,524 | | | | 85,512 | |
TE Connectivity Ltd. | | | 2,200 | | | | 141,636 | |
Waters Corp. (a) | | | 300 | | | | 47,547 | |
| | | | | | | | |
| | | | | | | 1,098,641 | |
| | | | | | | | |
| Engineering & Construction — 0.2% | |
Fluor Corp. | | | 647 | | | | 33,204 | |
The accompanying notes are an integral part of the financial statements.
149
MassMutual Premier Balanced Fund – Portfolio of Investments (Continued)
| | | | | | | | |
| | | Number of
Shares | | | Value | |
Jacobs Engineering Group, Inc. (a) | | | 4,624 | | | $ | 239,153 | |
| | | | | | | | |
| | | | | | | 272,357 | |
| | | | | | | | |
| Environmental Controls — 0.0% | |
Republic Services, Inc. | | | 87 | | | | 4,389 | |
Stericycle, Inc. (a) | | | 87 | | | | 6,972 | |
Waste Management, Inc. | | | 445 | | | | 28,374 | |
| | | | | | | | |
| | | | | | | 39,735 | |
| | | | | | | | |
| Hand & Machine Tools — 0.1% | |
Snap-on, Inc. | | | 85 | | | | 12,917 | |
Stanley Black & Decker, Inc. | | | 1,032 | | | | 126,915 | |
| | | | | | | | |
| | | | | | | 139,832 | |
| | | | | | | | |
| Machinery – Construction & Mining — 0.2% | |
Caterpillar, Inc. | | | 2,550 | | | | 226,363 | |
| | | | | | | | |
| Machinery – Diversified — 0.6% | |
AGCO Corp. | | | 1,300 | | | | 64,116 | |
Cummins, Inc. | | | 1,803 | | | | 231,055 | |
Deere & Co. | | | 2,381 | | | | 203,218 | |
Flowserve Corp. | | | 91 | | | | 4,390 | |
The Manitowoc Co., Inc. | | | 5,800 | | | | 27,782 | |
Rockwell Automation, Inc. | | | 576 | | | | 70,468 | |
Roper Technologies, Inc. | | | 434 | | | | 79,192 | |
Xylem, Inc. | | | 701 | | | | 36,767 | |
| | | | | | | | |
| | | | | | | 716,988 | |
| | | | | | | | |
| Manufacturing — 2.6% | |
3M Co. | | | 555 | | | | 97,808 | |
Danaher Corp. | | | 2,572 | | | | 201,619 | |
Dover Corp. | | | 603 | | | | 44,405 | |
Eaton Corp. PLC | | | 1,782 | | | | 117,095 | |
General Electric Co. | | | 46,586 | | | | 1,379,877 | |
Honeywell International, Inc. | | | 2,125 | | | | 247,754 | |
Illinois Tool Works, Inc. | | | 1,360 | | | | 162,982 | |
Ingersoll-Rand PLC | | | 800 | | | | 54,352 | |
Leggett & Platt, Inc. | | | 1,595 | | | | 72,700 | |
Parker Hannifin Corp. | | | 1,860 | | | | 233,486 | |
Pentair PLC | | | 1,619 | | | | 104,005 | |
Textron, Inc. | | | 985 | | | | 39,154 | |
Trinseo SA | | | 4,800 | | | | 271,488 | |
| | | | | | | | |
| | | | | | | 3,026,725 | |
| | | | | | | | |
| Packaging & Containers — 0.2% | |
Ball Corp. | | | 2,620 | | | | 214,709 | |
Owens-Illinois, Inc. (a) | | | 422 | | | | 7,761 | |
Sealed Air Corp. | | | 447 | | | | 20,482 | |
WestRock Co. | | | 5 | | | | 242 | |
| | | | | | | | |
| | | | | | | 243,194 | |
| | | | | | | | |
| Transportation — 0.5% | |
C.H. Robinson Worldwide, Inc. | | | 254 | | | | 17,897 | |
CSX Corp. | | | 73 | | | | 2,226 | |
Expeditors International of Washington, Inc. | | | 1,984 | | | | 102,216 | |
FedEx Corp. | | | 946 | | | | 165,247 | |
| | | | | | | | |
| | | Number of
Shares | | | Value | |
Norfolk Southern Corp. | | | 983 | | | $ | 95,410 | |
Ryder System, Inc. | | | 274 | | | | 18,070 | |
Union Pacific Corp. | | | 990 | | | | 96,555 | |
United Parcel Service, Inc. Class B | | | 705 | | | | 77,099 | |
| | | | | | | | |
| | | | | | | 574,720 | |
| | | | | | | | |
| | | | | | | 8,632,881 | |
| | | | | | | | |
| Technology — 10.2% | |
| Computers — 4.1% | |
Accenture PLC Class A | | | 920 | | | | 112,396 | |
Apple, Inc. | | | 14,956 | | | | 1,690,776 | |
Cognizant Technology Solutions Corp. Class A (a) | | | 1,718 | | | | 81,966 | |
CSRA, Inc. | | | 275 | | | | 7,398 | |
Dell Technologies, Inc. Class V (a) | | | 930 | | | | 44,454 | |
Hewlett Packard Enterprise Co. | | | 11,663 | | | | 265,333 | |
HP, Inc. | | | 19,863 | | | | 308,472 | |
International Business Machines Corp. | | | 4,160 | | | | 660,816 | |
Lumentum Holdings, Inc. (a) | | | 1,200 | | | | 50,124 | |
NCR Corp. (a) | | | 7,500 | | | | 241,425 | |
NetApp, Inc. | | | 7,609 | | | | 272,554 | |
Science Applications International Corp. | | | 4,600 | | | | 319,102 | |
Seagate Technology PLC | | | 7,100 | | | | 273,705 | |
Teradata Corp. (a) | | | 7,698 | | | | 238,638 | |
Western Digital Corp. | | | 2,620 | | | | 153,192 | |
| | | | | | | | |
| | | | | | | 4,720,351 | |
| | | | | | | | |
| Office Equipment/Supplies — 0.3% | |
Pitney Bowes, Inc. | | | 5,799 | | | | 105,310 | |
Xerox Corp. | | | 26,773 | | | | 271,210 | |
| | | | | | | | |
| | | | | | | 376,520 | |
| | | | | | | | |
| Semiconductors — 2.4% | |
Analog Devices, Inc. | | | 59 | | | | 3,802 | |
Applied Materials, Inc. | | | 4,867 | | | | 146,740 | |
Broadcom Ltd. | | | 284 | | | | 48,996 | |
Intel Corp. | | | 20,611 | | | | 778,065 | |
KLA-Tencor Corp. | | | 3,598 | | | | 250,817 | |
Lam Research Corp. | | | 1,563 | | | | 148,032 | |
Linear Technology Corp. | | | 681 | | | | 40,376 | |
Microchip Technology, Inc. | | | 1,024 | | | | 63,631 | |
Micron Technology, Inc. (a) | | | 3,433 | | | | 61,039 | |
NVIDIA Corp. | | | 1,185 | | | | 81,196 | |
QUALCOMM, Inc. | | | 8,688 | | | | 595,128 | |
Skyworks Solutions, Inc. | | | 90 | | | | 6,853 | |
Texas Instruments, Inc. | | | 4,645 | | | | 325,986 | |
Xilinx, Inc. | | | 4,861 | | | | 264,147 | |
| | | | | | | | |
| | | | | | | 2,814,808 | |
| | | | | | | | |
| Software — 3.4% | |
Activision Blizzard, Inc. | | | 2,300 | | | | 101,890 | |
Adobe Systems, Inc. (a) | | | 1,405 | | | | 152,499 | |
Autodesk, Inc. (a) | | | 47 | | | | 3,399 | |
CA, Inc. | | | 6,485 | | | | 214,524 | |
The accompanying notes are an integral part of the financial statements.
150
MassMutual Premier Balanced Fund – Portfolio of Investments (Continued)
| | | | | | | | |
| | | Number of
Shares | | | Value | |
CDK Global, Inc. | | | 2,850 | | | $ | 163,476 | |
Citrix Systems, Inc. (a) | | | 2,645 | | | | 225,407 | |
CommerceHub, Inc. Series A (a) | | | 65 | | | | 1,027 | |
CommerceHub, Inc. Series C (a) | | | 130 | | | | 2,068 | |
The Dun & Bradstreet Corp. | | | 1,499 | | | | 204,793 | |
Electronic Arts, Inc. (a) | | | 1,086 | | | | 92,744 | |
Fidelity National Information Services, Inc. | | | 1,660 | | | | 127,870 | |
Fiserv, Inc. (a) | | | 1,194 | | | | 118,767 | |
Intuit, Inc. | | | 959 | | | | 105,500 | |
Microsoft Corp. | | | 31,441 | | | | 1,811,002 | |
Oracle Corp. | | | 14,488 | | | | 569,089 | |
Red Hat, Inc. (a) | | | 624 | | | | 50,438 | |
Salesforce.com, Inc. (a) | | | 880 | | | | 62,770 | |
| | | | | | | | |
| | | | | | | 4,007,263 | |
| | | | | | | | |
| | | | | | | 11,918,942 | |
| | | | | | | | |
| Utilities — 1.9% | |
| Electric — 1.8% | |
The AES Corp. | | | 17,877 | | | | 229,719 | |
Ameren Corp. | | | 1,072 | | | | 52,721 | |
American Electric Power Co., Inc. | | | 1,696 | | | | 108,900 | |
CenterPoint Energy, Inc. | | | 935 | | | | 21,720 | |
CMS Energy Corp. | | | 1,110 | | | | 46,631 | |
Consolidated Edison, Inc. | | | 909 | | | | 68,448 | |
Dominion Resources, Inc. | | | 362 | | | | 26,886 | |
DTE Energy Co. | | | 612 | | | | 57,326 | |
Duke Energy Corp. | | | 1,486 | | | | 118,939 | |
Edison International | | | 1,534 | | | | 110,832 | |
Entergy Corp. | | | 3,411 | | | | 261,726 | |
Eversource Energy | | | 622 | | | | 33,700 | |
Exelon Corp. | | | 5,723 | | | | 190,519 | |
FirstEnergy Corp. | | | 466 | | | | 15,415 | |
NextEra Energy, Inc. | | | 1,496 | | | | 182,991 | |
NRG Energy, Inc. | | | 7,720 | | | | 86,541 | |
PG&E Corp. | | | 323 | | | | 19,758 | |
Pinnacle West Capital Corp. | | | 250 | | | | 18,998 | |
PPL Corp. | | | 3,384 | | | | 116,985 | |
Public Service Enterprise Group, Inc. | | | 1,209 | | | | 50,621 | |
SCANA Corp. | | | 572 | | | | 41,396 | |
The Southern Co. | | | 4,234 | | | | 217,204 | |
WEC Energy Group, Inc. | | | 364 | | | | 21,796 | |
Xcel Energy, Inc. | | | 1,145 | | | | 47,105 | |
| | | | | | | | |
| | | | | | | 2,146,877 | |
| | | | | | | | |
| Gas — 0.1% | |
NiSource, Inc. | | | 172 | | | | 4,147 | |
ONE Gas, Inc. | | | 600 | | | | 37,104 | |
Sempra Energy | | | 102 | | | | 10,933 | |
| | | | | | | | |
| | | | | | | 52,184 | |
| | | | | | | | |
| | | | | | | 2,199,061 | |
| | | | | | | | |
| | |
TOTAL COMMON STOCK
(Cost $65,573,235) | | | | | | | 68,904,529 | |
| | | | | | | | |
| | | | | | | | |
| | | Number of
Shares | | | Value | |
| PREFERRED STOCK — 0.1% | |
| Financial — 0.1% | |
| Insurance — 0.1% | |
The Allstate Corp. 5.100%, 3 mo. LIBOR US + 3.165%, VRN | | | 5,000 | | | $ | 136,550 | |
| | | | | | | | |
| | |
TOTAL PREFERRED STOCK
(Cost $125,000) | | | | | | | 136,550 | |
| | | | | | | | |
| | |
TOTAL EQUITIES
(Cost $65,698,235) | | | | | | | 69,041,079 | |
| | | | | | | | |
| | |
| | | Principal
Amount | | | | |
| BONDS & NOTES — 31.5% | |
|
| CORPORATE DEBT — 12.4% | |
| Advertising — 0.0% | |
WPP Finance 2010
4.750% 11/21/21 | | $ | 20,000 | | | | 22,435 | |
| | | | | | | | |
| Aerospace & Defense — 0.0% | |
Spirit AeroSystems, Inc.
3.850% 6/15/26 | | | 25,000 | | | | 25,964 | |
United Technologies Corp.
6.125% 7/15/38 | | | 15,000 | | | | 20,400 | |
| | | | | | | | |
| | | | | | | 46,364 | |
| | | | | | | | |
| Agriculture — 0.2% | |
Altria Group, Inc.
4.250% 8/09/42 | | | 20,000 | | | | 21,639 | |
Bunge Ltd. Finance Corp.
3.200% 6/15/17 | | | 45,000 | | | | 45,581 | |
Bunge Ltd. Finance Corp.
3.250% 8/15/26 | | | 30,000 | | | | 30,186 | |
Bunge Ltd. Finance Corp.
3.500% 11/24/20 | | | 30,000 | | | | 31,377 | |
Reynolds American, Inc.
3.250% 6/12/20 | | | 30,000 | | | | 31,562 | |
Reynolds American, Inc.
5.850% 8/15/45 | | | 30,000 | | | | 39,003 | |
| | | | | | | | |
| | | | | | | 199,348 | |
| | | | | | | | |
| Airlines — 0.2% | |
American Airlines Pass-Through Trust, Series 2014-1, Class A
3.700% 4/01/28 | | | 22,835 | | | | 23,863 | |
American Airlines Pass-Through Trust, Series 2014-1, Class B
4.375% 4/01/24 | | | 12,969 | | | | 13,179 | |
Spirit Airlines Pass-Through Trust, Series 2015-1, Class A
4.100% 10/01/29 | | | 85,000 | | | | 86,700 | |
United Airlines Pass-Through Trust, Series 2014-1, Class A
4.000% 10/11/27 | | | 28,282 | | | | 30,332 | |
The accompanying notes are an integral part of the financial statements.
151
MassMutual Premier Balanced Fund – Portfolio of Investments (Continued)
| | | | | | | | |
| | | Principal
Amount | | | Value | |
WestJet Airlines Ltd. (b)
3.500% 6/16/21 | | $ | 125,000 | | | $ | 128,098 | |
| | | | | | | | |
| | | | | | | 282,172 | |
| | | | | | | | |
| Auto Manufacturers — 0.1% | |
General Motors Financial Co., Inc.
3.200% 7/13/20 | | | 80,000 | | | | 81,916 | |
Hyundai Capital America (b)
2.550% 2/06/19 | | | 40,000 | | | | 40,695 | |
| | | | | | | | |
| | | | | | | 122,611 | |
| | | | | | | | |
| Automotive & Parts — 0.0% | |
Lear Corp.
4.750% 1/15/23 | | | 28,000 | | | | 29,085 | |
Lear Corp.
5.375% 3/15/24 | | | 20,000 | | | | 21,475 | |
| | | | | | | | |
| | | | | | | 50,560 | |
| | | | | | | | |
| Banks — 0.8% | |
Associated Banc-Corp.
2.750% 11/15/19 | | | 110,000 | | | | 112,163 | |
Bank of America Corp.
4.750% 4/21/45 | | | 40,000 | | | | 42,699 | |
Bank of America Corp.
5.650% 5/01/18 | | | 60,000 | | | | 63,646 | |
Discover Bank
2.000% 2/21/18 | | | 45,000 | | | | 45,145 | |
First Horizon National Corp.
3.500% 12/15/20 | | | 120,000 | | | | 122,478 | |
ICICI Bank Ltd. (b)
4.750% 11/25/16 | | | 59,000 | | | | 59,254 | |
JP Morgan Chase & Co.
3.375% 5/01/23 | | | 10,000 | | | | 10,274 | |
JP Morgan Chase & Co.
3.875% 9/10/24 | | | 50,000 | | | | 52,639 | |
Regions Financial Corp.
7.500% 5/15/18 | | | 30,000 | | | | 32,646 | |
SVB Financial Group
3.500% 1/29/25 | | | 135,000 | | | | 136,387 | |
SVB Financial Group
5.375% 9/15/20 | | | 15,000 | | | | 16,672 | |
Valley National Bancorp
5.125% 9/27/23 | | | 50,000 | | | | 53,564 | |
Wells Fargo & Co.
4.300% 7/22/27 | | | 145,000 | | | | 156,272 | |
| | | | | | | | |
| | | | | | | 903,839 | |
| | | | | | | | |
| Beverages — 0.2% | |
Anheuser-Busch InBev Finance, Inc.
4.900% 2/01/46 | | | 125,000 | | | | 148,723 | |
Molson Coors Brewing Co.
2.100% 7/15/21 | | | 35,000 | | | | 35,322 | |
Molson Coors Brewing Co.
3.000% 7/15/26 | | | 60,000 | | | | 60,415 | |
| | | | | | | | |
| | | Principal
Amount | | | Value | |
Molson Coors Brewing Co.
4.200% 7/15/46 | | $ | 35,000 | | | $ | 36,468 | |
| | | | | | | | |
| | | | | | | 280,928 | |
| | | | | | | | |
| Biotechnology — 0.0% | |
Amgen, Inc.
5.150% 11/15/41 | | | 45,000 | | | | 51,286 | |
| | | | | | | | |
| Building Materials — 0.1% | |
CRH America, Inc.
8.125% 7/15/18 | | | 50,000 | | | | 55,311 | |
Martin Marietta Material, Inc. 3 mo. USD LIBOR + 1.100%, FRN
1.731% 6/30/17 | | | 50,000 | | | | 50,121 | |
Owens Corning, Inc.
9.000% 6/15/19 | | | 10,000 | | | | 11,680 | |
| | | | | | | | |
| | | | | | | 117,112 | |
| | | | | | | | |
| Chemicals — 0.1% | |
Ashland, Inc.
6.875% 5/15/43 | | | 11,000 | | | | 11,990 | |
The Dow Chemical Co.
8.550% 5/15/19 | | | 15,000 | | | | 17,593 | |
Incitec Pivot Finance LLC (b)
6.000% 12/10/19 | | | 25,000 | | | | 27,077 | |
RPM International, Inc.
6.125% 10/15/19 | | | 50,000 | | | | 55,754 | |
RPM International, Inc.
6.500% 2/15/18 | | | 20,000 | | | | 21,213 | |
Valspar Corp.
7.250% 6/15/19 | | | 25,000 | | | | 28,370 | |
| | | | | | | | |
| | | | | | | 161,997 | |
| | | | | | | | |
| Commercial Services — 0.1% | |
The ADT Corp.
6.250% 10/15/21 | | | 85,000 | | | | 92,437 | |
ERAC USA Finance LLC (b)
2.800% 11/01/18 | | | 15,000 | | | | 15,341 | |
| | | | | | | | |
| | | | | | | 107,778 | |
| | | | | | | | |
| Computers — 0.1% | |
Diamond 1 Finance Corp./Diamond 2 Finance Corp. (b)
4.420% 6/15/21 | | | 70,000 | | | | 73,158 | |
Diamond 1 Finance Corp./Diamond 2 Finance Corp. (b)
6.020% 6/15/26 | | | 15,000 | | | | 16,445 | |
| | | | | | | | |
| | | | | | | 89,603 | |
| | | | | | | | |
| Distribution & Wholesale — 0.0% | |
Arrow Electronics, Inc.
4.500% 3/01/23 | | | 10,000 | | | | 10,574 | |
| | | | | | | | |
| Diversified Financial — 1.4% | |
AerCap Ireland Capital Ltd./AerCap Global Aviation Trust
4.500% 5/15/21 | | | 180,000 | | | | 188,325 | |
The accompanying notes are an integral part of the financial statements.
152
MassMutual Premier Balanced Fund – Portfolio of Investments (Continued)
| | | | | | | | |
| | | Principal
Amount | | | Value | |
Affiliated Managers Group, Inc.
3.500% 8/01/25 | | $ | 70,000 | | | $ | 69,588 | |
Air Lease Corp.
3.000% 9/15/23 | | | 90,000 | | | | 88,977 | |
Air Lease Corp.
3.375% 1/15/19 | | | 90,000 | | | | 92,441 | |
Air Lease Corp.
3.375% 6/01/21 | | | 35,000 | | | | 36,307 | |
Air Lease Corp.
3.875% 4/01/21 | | | 60,000 | | | | 63,450 | |
Air Lease Corp.
5.625% 4/01/17 | | | 15,000 | | | | 15,256 | |
Ally Financial, Inc.
3.250% 11/05/18 | | | 15,000 | | | | 15,075 | |
Ally Financial, Inc.
3.600% 5/21/18 | | | 25,000 | | | | 25,375 | |
Ally Financial, Inc.
4.750% 9/10/18 | | | 45,000 | | | | 46,575 | |
Ares Finance Co. LLC (b)
4.000% 10/08/24 | | | 85,000 | | | | 82,352 | |
BGC Partners, Inc. (b)
5.125% 5/27/21 | | | 100,000 | | | | 104,715 | |
Citigroup, Inc.
5.375% 8/09/20 | | | 50,000 | | | | 56,066 | |
Citigroup, Inc.
5.875% 1/30/42 | | | 20,000 | | | | 25,601 | |
Citigroup, Inc.
8.125% 7/15/39 | | | 15,000 | | | | 23,582 | |
Eaton Vance Corp.
6.500% 10/02/17 | | | 4,000 | | | | 4,197 | |
General Electric Capital Corp.
6.875% 1/10/39 | | | 55,000 | | | | 82,845 | |
The Goldman Sachs Group, Inc.
5.375% 3/15/20 | | | 45,000 | | | | 49,830 | |
The Goldman Sachs Group, Inc.
5.750% 1/24/22 | | | 40,000 | | | | 46,462 | |
The Goldman Sachs Group, Inc.
6.150% 4/01/18 | | | 20,000 | | | | 21,302 | |
Hyundai Capital America (b)
2.875% 8/09/18 | | | 30,000 | | | | 30,617 | |
Icahn Enterprises LP/Icahn Enterprises Finance Corp.
3.500% 3/15/17 | | | 235,000 | | | | 235,282 | |
International Lease Finance Corp.
3.875% 4/15/18 | | | 55,000 | | | | 56,306 | |
International Lease Finance Corp.
8.750% 3/15/17 | | | 20,000 | | | | 20,575 | |
JP Morgan Chase & Co.
4.500% 1/24/22 | | | 40,000 | | | | 44,292 | |
JP Morgan Chase & Co.
5.600% 7/15/41 | | | 45,000 | | | | 57,609 | |
Lazard Group LLC
6.850% 6/15/17 | | | 13,000 | | | | 13,413 | |
| | | | | | | | |
| | | Principal
Amount | | | Value | |
Legg Mason, Inc.
5.625% 1/15/44 | | $ | 35,000 | | | $ | 36,328 | |
Merrill Lynch & Co., Inc.
7.750% 5/14/38 | | | 20,000 | | | | 28,998 | |
Nasdaq, Inc.
3.850% 6/30/26 | | | 25,000 | | | | 26,159 | |
| | | | | | | | |
| | | | | | | 1,687,900 | |
| | | | | | | | |
| Electric — 1.1% | |
Appalachian Power Co.
3.400% 6/01/25 | | | 90,000 | | | | 95,891 | |
Duke Energy Corp.
2.650% 9/01/26 | | | 70,000 | | | | 68,689 | |
Duke Energy Corp.
3.750% 9/01/46 | | | 35,000 | | | | 33,942 | |
Entergy Arkansas, Inc.
3.500% 4/01/26 | | | 10,000 | | | | 10,842 | |
Entergy Louisiana LLC
4.950% 1/15/45 | | | 40,000 | | | | 42,588 | |
Florida Power & Light Co.
4.950% 6/01/35 | | | 25,000 | | | | 30,376 | |
IPALCO Enterprises, Inc.
3.450% 7/15/20 | | | 200,000 | | | | 205,000 | |
LG&E and KU Energy LLC
4.375% 10/01/21 | | | 60,000 | | | | 66,148 | |
Metropolitan Edison Co. (b)
4.000% 4/15/25 | | | 50,000 | | | | 52,178 | |
National Fuel Gas Co.
3.750% 3/01/23 | | | 20,000 | | | | 20,232 | |
Nevada Power Co. Series N
6.650% 4/01/36 | | | 20,000 | | | | 27,906 | |
Niagara Mohawk Power Corp. (b)
2.721% 11/28/22 | | | 35,000 | | | | 35,656 | |
NiSource Finance Corp.
5.800% 2/01/42 | | | 40,000 | | | | 49,917 | |
Pacific Gas & Electric Co.
5.800% 3/01/37 | | | 25,000 | | | | 32,885 | |
Pennsylvania Electric Co. (b)
4.150% 4/15/25 | | | 70,000 | | | | 72,094 | |
PPL Capital Funding, Inc.
1.900% 6/01/18 | | | 15,000 | | | | 15,058 | |
PPL Capital Funding, Inc.
5.000% 3/15/44 | | | 45,000 | | | | 50,719 | |
Progress Energy, Inc.
7.000% 10/30/31 | | | 5,000 | | | | 6,713 | |
Puget Energy, Inc.
3.650% 5/15/25 | | | 5,000 | | | | 5,204 | |
Puget Energy, Inc.
6.500% 12/15/20 | | | 59,000 | | | | 68,477 | |
Southern California Edison Co.
5.950% 2/01/38 | | | 20,000 | | | | 27,110 | |
The Southern Co.
1.850% 7/01/19 | | | 40,000 | | | | 40,314 | |
The accompanying notes are an integral part of the financial statements.
153
MassMutual Premier Balanced Fund – Portfolio of Investments (Continued)
| | | | | | | | |
| | | Principal
Amount | | | Value | |
Transelec SA (b)
4.625% 7/26/23 | | $ | 25,000 | | | $ | 26,837 | |
Tri-State Generation & Transmission Association, Series 2003, Class A (b)
6.040% 1/31/18 | | | 17,914 | | | | 18,108 | |
Virginia Electric and Power Co.
6.350% 11/30/37 | | | 30,000 | | | | 41,506 | |
Wisconsin Public Service Corp.
5.650% 11/01/17 | | | 50,000 | | | | 52,193 | |
Xcel Energy, Inc.
3.300% 6/01/25 | | | 45,000 | | | | 47,474 | |
| | | | | | | | |
| | | | | | | 1,244,057 | |
| | | | | | | | |
| Electronics — 0.2% | |
Amphenol Corp.
2.550% 1/30/19 | | | 50,000 | | | | 51,167 | |
Amphenol Corp.
4.000% 2/01/22 | | | 20,000 | | | | 21,375 | |
Arrow Electronics, Inc.
3.500% 4/01/22 | | | 60,000 | | | | 61,623 | |
Avnet, Inc.
4.875% 12/01/22 | | | 23,000 | | | | 24,991 | |
FLIR Systems, Inc.
3.125% 6/15/21 | | | 35,000 | | | | 36,125 | |
| | | | | | | | |
| | | | | | | 195,281 | |
| | | | | | | | |
| Engineering & Construction — 0.0% | |
SBA Tower Trust (b)
2.877% 7/15/21 | | | 40,000 | | | | 40,678 | |
| | | | | | | | |
| Environmental Controls — 0.0% | |
Republic Services, Inc.
3.800% 5/15/18 | | | 30,000 | | | | 31,165 | |
| | | | | | | | |
| Foods — 0.2% | |
Ingredion, Inc.
3.200% 10/01/26 | | | 40,000 | | | | 40,798 | |
Kraft Foods, Inc.
6.500% 2/09/40 | | | 14,000 | | | | 19,077 | |
Kraft Heinz Foods Co.
3.000% 6/01/26 | | | 95,000 | | | | 95,758 | |
The Kroger Co.
2.600% 2/01/21 | | | 25,000 | | | | 25,709 | |
Tyson Foods, Inc.
2.650% 8/15/19 | | | 15,000 | | | | 15,381 | |
Tyson Foods, Inc.
4.875% 8/15/34 | | | 25,000 | | | | 27,670 | |
| | | | | | | | |
| | | | | | | 224,393 | |
| | | | | | | | |
| Forest Products & Paper — 0.2% | |
Sappi Papier Holding GmbH (b)
7.750% 7/15/17 | | | 255,000 | | | | 260,738 | |
| | | | | | | | |
| Hand & Machine Tools — 0.0% | |
Stanley Black & Decker, Inc.
2.451% 11/17/18 | | | 50,000 | | | | 51,084 | |
| | | | | | | | |
| | | | | | | | |
| | | Principal
Amount | | | Value | |
| Health Care – Products — 0.1% | |
Zimmer Biomet Holdings, Inc.
3.550% 4/01/25 | | $ | 115,000 | | | $ | 118,524 | |
| | | | | | | | |
| Health Care – Services — 0.2% | |
Aetna, Inc.
2.400% 6/15/21 | | | 50,000 | | | | 50,579 | |
Aetna, Inc.
3.200% 6/15/26 | | | 60,000 | | | | 61,003 | |
Aetna, Inc.
4.375% 6/15/46 | | | 15,000 | | | | 15,707 | |
Kaiser Foundation Hospitals
3.500% 4/01/22 | | | 15,000 | | | | 15,975 | |
UnitedHealth Group, Inc.
6.875% 2/15/38 | | | 45,000 | | | | 65,950 | |
| | | | | | | | |
| | | | | | | 209,214 | |
| | | | | | | | |
| Home Builders — 0.2% | |
Lennar Corp.
4.750% 12/15/17 | | | 275,000 | | | | 281,875 | |
| | | | | | | | |
| Housewares — 0.1% | |
Newell Brands, Inc.
3.850% 4/01/23 | | | 60,000 | | | | 63,868 | |
Newell Rubbermaid, Inc.
2.050% 12/01/17 | | | 15,000 | | | | 15,105 | |
| | | | | | | | |
| | | | | | | 78,973 | |
| | | | | | | | |
| Insurance — 1.0% | |
The Allstate Corp. 3 mo. USD LIBOR +
2.938%, VRN
5.750% 8/15/53 | | | 70,000 | | | | 75,162 | |
AXIS Specialty Finance PLC
2.650% 4/01/19 | | | 20,000 | | | | 20,214 | |
Brown & Brown, Inc.
4.200% 9/15/24 | | | 16,000 | | | | 16,644 | |
The Chubb Corp. 3 mo. USD LIBOR +
2.250%, VRN
6.375% 3/29/67 | | | 21,000 | | | | 19,952 | |
CNA Financial Corp.
3.950% 5/15/24 | | | 40,000 | | | | 42,347 | |
CNA Financial Corp.
7.350% 11/15/19 | | | 40,000 | | | | 46,118 | |
CNO Financial Group, Inc.
4.500% 5/30/20 | | | 60,000 | | | | 61,425 | |
CNO Financial Group, Inc.
5.250% 5/30/25 | | | 72,000 | | | | 71,460 | |
MetLife Capital Trust IV (b)
7.875% 12/15/67 | | | 70,000 | | | | 87,822 | |
New York Life Global Funding (b)
2.350% 7/14/26 | | | 70,000 | | | | 69,583 | |
Principal Financial Group, Inc.
8.875% 5/15/19 | | | 30,000 | | | | 35,347 | |
Prudential Financial, Inc. 3 mo. USD
LIBOR + 3.040%, VRN
5.200% 3/15/44 | | | 28,000 | | | | 28,875 | |
The accompanying notes are an integral part of the financial statements.
154
MassMutual Premier Balanced Fund – Portfolio of Investments (Continued)
| | | | | | | | |
| | | Principal
Amount | | | Value | |
Prudential Financial, Inc. 3 mo. USD
LIBOR + 3.920%, VRN
5.625% 6/15/43 | | $ | 45,000 | | | $ | 48,546 | |
QBE Insurance Group Ltd. (b)
2.400% 5/01/18 | | | 25,000 | | | | 25,134 | |
Reinsurance Group of America, Inc.
3.950% 9/15/26 | | | 65,000 | | | | 68,004 | |
Reinsurance Group of America, Inc.
4.700% 9/15/23 | | | 55,000 | | | | 60,102 | |
Reinsurance Group of America, Inc.
5.000% 6/01/21 | | | 40,000 | | | | 43,730 | |
Reinsurance Group of America, Inc.
6.450% 11/15/19 | | | 45,000 | | | | 50,977 | |
Trinity Acquisition PLC
3.500% 9/15/21 | | | 40,000 | | | | 41,691 | |
Trinity Acquisition PLC
4.400% 3/15/26 | | | 10,000 | | | | 10,473 | |
Unum Group
3.000% 5/15/21 | | | 25,000 | | | | 25,561 | |
USF&G Capital I (b)
8.500% 12/15/45 | | | 35,000 | | | | 47,982 | |
Willis North America, Inc.
7.000% 9/29/19 | | | 21,000 | | | | 23,548 | |
Willis Towers Watson PLC
5.750% 3/15/21 | | | 55,000 | | | | 61,940 | |
XLIT Ltd.
4.450% 3/31/25 | | | 40,000 | | | | 40,603 | |
XLIT Ltd.
5.750% 10/01/21 | | | 25,000 | | | | 28,617 | |
XLIT Ltd.
6.375% 11/15/24 | | | 55,000 | | | | 65,536 | |
| | | | | | | | |
| | | | | | | 1,217,393 | |
| | | | | | | | |
| Internet — 0.1% | |
Expedia, Inc.
7.456% 8/15/18 | | | 90,000 | | | | 99,104 | |
Tencent Holdings Ltd. (b)
2.875% 2/11/20 | | | 55,000 | | | | 56,468 | |
| | | | | | | | |
| | | | | | | 155,572 | |
| | | | | | | | |
| Investment Companies — 0.3% | |
Ares Capital Corp.
3.625% 1/19/22 | | | 80,000 | | | | 80,521 | |
Ares Capital Corp.
3.875% 1/15/20 | | | 130,000 | | | | 134,456 | |
FS Investment Corp.
4.000% 7/15/19 | | | 90,000 | | | | 91,541 | |
| | | | | | | | |
| | | | | | | 306,518 | |
| | | | | | | | |
| Iron & Steel — 0.4% | |
ArcelorMittal
5.125% 6/01/20 | | | 80,000 | | | | 84,000 | |
ArcelorMittal
6.250% 8/05/20 | | | 60,000 | | | | 65,250 | |
| | | | | | | | |
| | | Principal
Amount | | | Value | |
Glencore Funding LLC (b)
2.875% 4/16/20 | | $ | 150,000 | | | $ | 148,800 | |
Glencore Funding LLC (b)
4.625% 4/29/24 | | | 5,000 | | | | 5,095 | |
Reliance Steel & Aluminum Co.
4.500% 4/15/23 | | | 30,000 | | | | 31,356 | |
Reliance Steel & Aluminum Co.
6.200% 11/15/16 | | | 55,000 | | | | 55,240 | |
Reliance Steel & Aluminum Co.
6.850% 11/15/36 | | | 55,000 | | | | 60,855 | |
| | | | | | | | |
| | | | | | | 450,596 | |
| | | | | | | | |
| Lodging — 0.1% | |
Marriott International, Inc.
2.300% 1/15/22 | | | 25,000 | | | | 25,211 | |
Marriott International, Inc.
3.375% 10/15/20 | | | 50,000 | | | | 52,549 | |
Starwood Hotels & Resorts Worldwide, Inc.
6.750% 5/15/18 | | | 5,000 | | | | 5,406 | |
| | | | | | | | |
| | | | | | | 83,166 | |
| | | | | | | | |
| Machinery – Diversified — 0.1% | |
CNH Industrial Capital LLC
3.250% 2/01/17 | | | 25,000 | | | | 25,094 | |
CNH Industrial Capital LLC
3.375% 7/15/19 | | | 50,000 | | | | 50,875 | |
CNH Industrial Capital LLC
3.625% 4/15/18 | | | 25,000 | | | | 25,312 | |
CNH Industrial Capital LLC
6.250% 11/01/16 | | | 45,000 | | | | 45,135 | |
Xylem, Inc.
4.875% 10/01/21 | | | 20,000 | | | | 21,823 | |
| | | | | | | | |
| | | | | | | 168,239 | |
| | | | | | | | |
| Manufacturing — 0.1% | |
General Electric Co.
4.125% 10/09/42 | | | 50,000 | | | | 54,719 | |
Ingersoll-Rand Global Holding Co. Ltd.
6.875% 8/15/18 | | | 40,000 | | | | 43,972 | |
| | | | | | | | |
| | | | | | | 98,691 | |
| | | | | | | | |
| Media — 0.3% | |
21st Century Fox America, Co.
6.900% 8/15/39 | | | 25,000 | | | | 33,569 | |
Charter Communications Operating LLC/Charter Communications Operating Capital (b)
3.579% 7/23/20 | | | 65,000 | | | | 67,938 | |
Comcast Corp.
3.400% 7/15/46 | | | 55,000 | | | | 53,466 | |
NBCUniversal Media LLC
6.400% 4/30/40 | | | 5,000 | | | | 6,998 | |
Time Warner Cable, Inc.
8.250% 4/01/19 | | | 10,000 | | | | 11,515 | |
The accompanying notes are an integral part of the financial statements.
155
MassMutual Premier Balanced Fund – Portfolio of Investments (Continued)
| | | | | | | | |
| | | Principal
Amount | | | Value | |
Time Warner Cable, Inc.
8.750% 2/14/19 | | $ | 10,000 | | | $ | 11,532 | |
Time Warner, Inc.
4.700% 1/15/21 | | | 35,000 | | | | 38,922 | |
Time Warner, Inc.
6.100% 7/15/40 | | | 25,000 | | | | 31,416 | |
Time Warner, Inc.
6.250% 3/29/41 | | | 5,000 | | | | 6,441 | |
Viacom, Inc.
2.250% 2/04/22 | | | 35,000 | | | | 34,836 | |
Viacom, Inc.
3.450% 10/04/26 | | | 20,000 | | | | 19,989 | |
| | | | | | | | |
| | | | | | | 316,622 | |
| | | | | | | | |
| Mining — 0.0% | |
Glencore Finance Canada (b)
5.800% 11/15/16 | | | 45,000 | | | | 45,158 | |
| | | | | | | | |
| Office Equipment/Supplies — 0.1% | |
Pitney Bowes, Inc.
3.375% 10/01/21 | | | 80,000 | | | | 79,961 | |
Pitney Bowes, Inc.
4.625% 3/15/24 | | | 65,000 | | | | 67,591 | |
Pitney Bowes, Inc.
4.750% 5/15/18 | | | 5,000 | | | | 5,180 | |
Pitney Bowes, Inc.
5.750% 9/15/17 | | | 6,000 | | | | 6,226 | |
| | | | | | | | |
| | | | | | | 158,958 | |
| | | | | | | | |
| Office Furnishings — 0.1% | |
Steelcase, Inc.
6.375% 2/15/21 | | | 50,000 | | | | 57,008 | |
| | | | | | | | |
| Oil & Gas — 0.5% | |
Anadarko Petroleum Corp.
5.550% 3/15/26 | | | 30,000 | | | | 33,901 | |
ConocoPhillips Co.
2.400% 12/15/22 | | | 25,000 | | | | 24,791 | |
ConocoPhillips Co.
2.875% 11/15/21 | | | 93,000 | | | | 95,547 | |
ConocoPhillips Co.
4.200% 3/15/21 | | | 35,000 | | | | 37,882 | |
Exxon Mobil Corp.
2.222% 3/01/21 | | | 107,000 | | | | 109,336 | |
Exxon Mobil Corp.
2.397% 3/06/22 | | | 10,000 | | | | 10,251 | |
Helmerich & Payne International Drilling Co.
4.650% 3/15/25 | | | 45,000 | | | | 47,488 | |
Pemex Project Funding Master Trust
6.625% 6/15/38 | | | 5,000 | | | | 4,950 | |
Petroleos Mexicanos
3.125% 1/23/19 | | | 10,000 | | | | 10,090 | |
Petroleos Mexicanos
5.500% 1/21/21 | | | 60,000 | | | | 63,450 | |
| | | | | | | | |
| | | Principal
Amount | | | Value | |
Petroleos Mexicanos
6.375% 1/23/45 | | $ | 15,000 | | | $ | 14,325 | |
Phillips 66
5.875% 5/01/42 | | | 75,000 | | | | 94,113 | |
Pioneer Natural Resources Co.
4.450% 1/15/26 | | | 60,000 | | | | 65,071 | |
| | | | | | | | |
| | | | | | | 611,195 | |
| | | | | | | | |
| Packaging & Containers — 0.3% | |
Amcor Finance USA, Inc. (b)
3.625% 4/28/26 | | | 95,000 | | | | 98,085 | |
Brambles USA, Inc. (b)
4.125% 10/23/25 | | | 24,000 | | | | 25,546 | |
Brambles USA, Inc., Series A (b)
5.350% 4/01/20 | | | 15,000 | | | | 16,571 | |
CCL Industries, Inc. (b)
3.250% 10/01/26 | | | 105,000 | | | | 105,391 | |
Crown Americas LLC/Crown Americas Capital Corp. IV
4.500% 1/15/23 | | | 63,000 | | | | 65,363 | |
Graphic Packaging International, Inc.
4.875% 11/15/22 | | | 10,000 | | | | 10,500 | |
| | | | | | | | |
| | | | | | | 321,456 | |
| | | | | | | | |
| Pharmaceuticals — 0.8% | |
Actavis Funding SCS
3.000% 3/12/20 | | | 75,000 | | | | 77,439 | |
Actavis Funding SCS
3.800% 3/15/25 | | | 105,000 | | | | 111,127 | |
Actavis Funding SCS
4.750% 3/15/45 | | | 45,000 | | | | 49,204 | |
Baxalta, Inc.
3.600% 6/23/22 | | | 25,000 | | | | 26,265 | |
Baxalta, Inc.
4.000% 6/23/25 | | | 70,000 | | | | 74,709 | |
Baxalta, Inc.
5.250% 6/23/45 | | | 35,000 | | | | 41,407 | |
McKesson Corp.
2.284% 3/15/19 | | | 20,000 | | | | 20,353 | |
McKesson Corp.
3.796% 3/15/24 | | | 15,000 | | | | 16,177 | |
McKesson Corp.
4.750% 3/01/21 | | | 30,000 | | | | 33,321 | |
McKesson Corp.
4.883% 3/15/44 | | | 10,000 | | | | 11,755 | |
McKesson Corp.
6.000% 3/01/41 | | | 30,000 | | | | 38,615 | |
Merck Sharp & Dohme Corp.
5.850% 6/30/39 | | | 10,000 | | | | 13,349 | |
Mylan NV (b)
3.150% 6/15/21 | | | 50,000 | | | | 50,939 | |
Mylan NV (b)
3.950% 6/15/26 | | | 135,000 | | | | 136,017 | |
The accompanying notes are an integral part of the financial statements.
156
MassMutual Premier Balanced Fund – Portfolio of Investments (Continued)
| | | | | | | | |
| | | Principal
Amount | | | Value | |
Pfizer, Inc.
7.200% 3/15/39 | | $ | 35,000 | | | $ | 53,613 | |
Teva Pharmaceutical Finance Netherlands III BV
2.200% 7/21/21 | | | 50,000 | | | | 49,811 | |
Teva Pharmaceutical Finance Netherlands III BV
3.150% 10/01/26 | | | 65,000 | | | | 65,301 | |
Teva Pharmaceutical Finance Netherlands III BV
4.100% 10/01/46 | | | 15,000 | | | | 14,929 | |
| | | | | | | | |
| | | | | | | 884,331 | |
| | | | | | | | |
| Pipelines — 0.5% | |
Boardwalk Pipelines LLC
5.500% 2/01/17 | | | 40,000 | | | | 40,380 | |
Boardwalk Pipelines LP
5.875% 11/15/16 | | | 95,000 | | | | 95,440 | |
CenterPoint Energy Resources Corp.
4.500% 1/15/21 | | | 25,000 | | | | 26,997 | |
EnLink Midstream Partners LP
4.850% 7/15/26 | | | 15,000 | | | | 15,094 | |
Enterprise Products Operating Co.
3.700% 2/15/26 | | | 75,000 | | | | 77,206 | |
Kinder Morgan Energy Partners LP
6.000% 2/01/17 | | | 25,000 | | | | 25,361 | |
Kinder Morgan Energy Partners LP
6.500% 2/01/37 | | | 25,000 | | | | 26,960 | |
Kinder Morgan Energy Partners LP
6.950% 1/15/38 | | | 5,000 | | | | 5,676 | |
Kinder Morgan Finance Co. LLC (b)
6.000% 1/15/18 | | | 35,000 | | | | 36,705 | |
Magellan Midstream Partners LP
5.000% 3/01/26 | | | 30,000 | | | | 34,178 | |
Magellan Midstream Partners LP
5.150% 10/15/43 | | | 110,000 | | | | 121,440 | |
Southern Natural Gas Co. LLC (b)
5.900% 4/01/17 | | | 55,000 | | | | 56,171 | |
| | | | | | | | |
| | | | | | | 561,608 | |
| | | | | | | | |
| Real Estate Investment Trusts (REITS) — 0.5% | |
American Tower Corp.
3.400% 2/15/19 | | | 40,000 | | | | 41,562 | |
American Tower Corp.
3.450% 9/15/21 | | | 100,000 | | | | 105,246 | |
American Tower Corp.
4.400% 2/15/26 | | | 25,000 | | | | 27,382 | |
American Tower Corp.
4.500% 1/15/18 | | | 60,000 | | | | 62,230 | |
Boston Properties LP
3.700% 11/15/18 | | | 20,000 | | | | 20,837 | |
Brandywine Operating Partners LP
4.950% 4/15/18 | | | 40,000 | | | | 41,723 | |
| | | | | | | | |
| | | Principal
Amount | | | Value | |
DDR Corp.
4.750% 4/15/18 | | $ | 15,000 | | | $ | 15,573 | |
Duke Realty LP
3.250% 6/30/26 | | | 20,000 | | | | 20,445 | |
Duke Realty LP
8.250% 8/15/19 | | | 50,000 | | | | 58,469 | |
Federal Realty Investment Trust
5.900% 4/01/20 | | | 10,000 | | | | 11,385 | |
Healthcare Trust of America Holdings LP
3.500% 8/01/26 | | | 40,000 | | | | 40,525 | |
Host Hotels & Resorts LP
4.000% 6/15/25 | | | 25,000 | | | | 25,472 | |
ProLogis LP
2.750% 2/15/19 | | | 15,000 | | | | 15,348 | |
Tanger Properties LP
3.125% 9/01/26 | | | 75,000 | | | | 74,794 | |
Weingarten Realty Investors
3.250% 8/15/26 | | | 15,000 | | | | 15,016 | |
| | | | | | | | |
| | | | | | | 576,007 | |
| | | | | | | | |
| Retail — 0.5% | |
Bed Bath & Beyond, Inc.
5.165% 8/01/44 | | | 25,000 | | | | 24,173 | |
CVS Health Corp.
6.125% 9/15/39 | | | 10,000 | | | | 13,660 | |
CVS Pass-Through Trust (b)
5.926% 1/10/34 | | | 52,858 | | | | 62,503 | |
Dollar Tree, Inc.
5.750% 3/01/23 | | | 90,000 | | | | 96,862 | |
The Home Depot, Inc.
5.950% 4/01/41 | | | 30,000 | | | | 41,255 | |
O’Reilly Automotive, Inc.
3.850% 6/15/23 | | | 23,000 | | | | 24,828 | |
QVC, Inc.
3.125% 4/01/19 | | | 35,000 | | | | 35,887 | |
QVC, Inc.
4.375% 3/15/23 | | | 25,000 | | | | 25,067 | |
QVC, Inc.
4.450% 2/15/25 | | | 45,000 | | | | 44,542 | |
QVC, Inc.
5.125% 7/02/22 | | | 10,000 | | | | 10,599 | |
Tiffany & Co.
4.900% 10/01/44 | | | 40,000 | | | | 40,541 | |
Wal-Mart Stores, Inc.
5.625% 4/15/41 | | | 40,000 | | | | 54,359 | |
Walgreens Boots Alliance, Inc.
2.700% 11/18/19 | | | 25,000 | | | | 25,762 | |
Walgreens Boots Alliance, Inc.
3.800% 11/18/24 | | | 45,000 | | | | 48,304 | |
| | | | | | | | |
| | | | | | | 548,342 | |
| | | | | | | | |
| Savings & Loans — 0.1% | |
Glencore Funding LLC (b)
2.500% 1/15/19 | | | 55,000 | | | | 54,868 | |
The accompanying notes are an integral part of the financial statements.
157
MassMutual Premier Balanced Fund – Portfolio of Investments (Continued)
| | | | | | | | |
| | | Principal
Amount | | | Value | |
Glencore Funding LLC (b)
3.125% 4/29/19 | | $ | 30,000 | | | $ | 30,120 | |
| | | | | | | | |
| | | | | | | 84,988 | |
| | | | | | | | |
| Semiconductors — 0.1% | |
Lam Research Corp.
3.800% 3/15/25 | | | 75,000 | | | | 78,129 | |
QUALCOMM, Inc.
3.450% 5/20/25 | | | 42,000 | | | | 44,729 | |
| | | | | | | | |
| | | | | | | 122,858 | |
| | | | | | | | |
| Software — 0.3% | |
Broadridge Financial Solutions, Inc.
3.400% 6/27/26 | | | 30,000 | | | | 30,771 | |
Broadridge Financial Solutions, Inc.
3.950% 9/01/20 | | | 25,000 | | | | 26,563 | |
CA, Inc.
2.875% 8/15/18 | | | 25,000 | | | | 25,477 | |
CA, Inc.
5.375% 12/01/19 | | | 28,000 | | | | 30,922 | |
Microsoft Corp.
4.450% 11/03/45 | | | 64,000 | | | | 72,762 | |
Oracle Corp.
4.000% 7/15/46 | | | 110,000 | | | | 113,664 | |
| | | | | | | | |
| | | | | | | 300,159 | |
| | | | | | | | |
| Telecommunications — 0.4% | |
America Movil SAB de CV
5.000% 3/30/20 | | | 25,000 | | | | 27,474 | |
AT&T, Inc.
4.750% 5/15/46 | | | 65,000 | | | | 68,020 | |
British Telecom PLC
9.375% 12/15/30 | | | 15,000 | | | | 24,283 | |
CenturyLink, Inc.
6.150% 9/15/19 | | | 30,000 | | | | 32,400 | |
Cisco Systems, Inc.
5.500% 1/15/40 | | | 10,000 | | | | 12,953 | |
Deutsche Telekom International Finance BV
8.750% 6/15/30 | | | 15,000 | | | | 23,316 | |
Telefonica Emisiones SAU
5.462% 2/16/21 | | | 30,000 | | | | 34,067 | |
Verizon Communications, Inc.
2.625% 2/21/20 | | | 57,000 | | | | 58,619 | |
Verizon Communications, Inc.
4.862% 8/21/46 | | | 55,000 | | | | 61,603 | |
Verizon Communications, Inc.
5.012% 8/21/54 | | | 41,000 | | | | 45,274 | |
Verizon Communications, Inc.
6.550% 9/15/43 | | | 42,000 | | | | 56,787 | |
| | | | | | | | |
| | | | | | | 444,796 | |
| | | | | | | | |
| Transportation — 0.1% | |
Asciano Finance (b)
4.625% 9/23/20 | | | 20,000 | | | | 21,021 | |
| | | | | | | | |
| | | Principal
Amount | | | Value | |
Asciano Finance Ltd. (b)
5.000% 4/07/18 | | $ | 55,000 | | | $ | 56,888 | |
| | | | | | | | |
| | | | | | | 77,909 | |
| | | | | | | | |
| Trucking & Leasing — 0.1% | |
GATX Corp.
2.375% 7/30/18 | | | 30,000 | | | | 30,303 | |
GATX Corp.
4.750% 6/15/22 | | | 30,000 | | | | 33,443 | |
| | | | | | | | |
| | | | | | | 63,746 | |
| | | | | | | | |
| | |
TOTAL CORPORATE DEBT
(Cost $13,854,865) | | | | | | | 14,525,805 | |
| | | | | | | | |
|
| MUNICIPAL OBLIGATIONS — 0.4% | |
JobsOhio Beverage System Series B
4.532% 1/01/35 | | | 150,000 | | | | 174,765 | |
State of California BAB
7.550% 4/01/39 | | | 25,000 | | | | 40,035 | |
State of California BAB
7.600% 11/01/40 | | | 85,000 | | | | 137,796 | |
State of Illinois
5.365% 3/01/17 | | | 100,000 | | | | 101,607 | |
| | | | | | | | |
| | | | | | | 454,203 | |
| | | | | | | | |
| | |
TOTAL MUNICIPAL OBLIGATIONS
(Cost $413,663) | | | | | | | 454,203 | |
| | | | | | | | |
| | |
| NON-U.S. GOVERNMENT AGENCY OBLIGATIONS — 8.5% | | | | | | | | |
| Auto Floor Plan ABS — 0.0% | |
NCF Dealer Floorplan Master Trust,
Series 2014-1A, Class A, 1 mo. LIBOR + 1.500%, FRN (b)
2.032% 10/20/20 | | | 50,000 | | | | 50,000 | |
| | | | | | | | |
| Automobile ABS — 0.5% | |
American Credit Acceptance Receivables Trust, Series 2016-3, Class A (b)
1.700% 11/12/20 | | | 65,986 | | | | 65,930 | |
Capital Automotive REIT,
Series 2011-1A, Class A (b)
5.610% 11/15/39 | | | 93,594 | | | | 97,721 | |
CPS Auto Trust, Series 2012-D, Class A (b)
1.480% 3/16/20 | | | 12,955 | | | | 12,895 | |
Drive Auto Receivables Trust,
Series 2016-BA, Class B (b)
2.560% 6/15/20 | | | 30,000 | | | | 30,241 | |
First Investors Auto Owner Trust,
Series 2016-2A, Class B (b)
2.210% 7/15/22 | | | 80,000 | | | | 80,114 | |
The accompanying notes are an integral part of the financial statements.
158
MassMutual Premier Balanced Fund – Portfolio of Investments (Continued)
| | | | | | | | |
| | | Principal
Amount | | | Value | |
Flagship Credit Auto Trust,
Series 2013-2, Class A (b)
1.940% 1/15/19 | | $ | 4,138 | | | $ | 4,143 | |
GLS Auto Receivables Trust,
Series 2015-1A, Class A (b)
2.250% 12/15/20 | | | 23,012 | | | | 22,981 | |
GO Financial Auto Securitization Trust,
Series 2015-1, Class A (b)
1.810% 3/15/18 | | | 3,581 | | | | 3,580 | |
Oscar US Funding Trust IV,
Series 2016-1A, Class A2B, 1 mo. USD LIBOR + 1.700%, FRN (b)
2.224% 7/15/20 | | | 48,283 | | | | 48,270 | |
Oscar US Funding Trust V, Series 2016-2A, Class A4 (b)
2.990% 12/15/23 | | | 110,000 | | | | 109,970 | |
Santander Drive Auto Receivables Trust, Series 2015-3, Class C
2.740% 1/15/21 | | | 50,000 | | | | 50,771 | |
Santander Drive Auto Receivables Trust, Series 2015-4, Class C
2.970% 3/15/21 | | | 50,000 | | | | 50,940 | |
| | | | | | | | |
| | | | | | | 577,556 | |
| | | | | | | | |
| Commercial MBS — 1.5% | |
Banc of America Commercial Mortgage, Inc., Series 2007-4, Class A4, VRN
5.938% 2/10/51 | | | 49,344 | | | | 50,416 | |
Banc of America Commercial Mortgage, Inc., Series 2007-4, Class AM, VRN
6.005% 2/10/51 | | | 45,000 | | | | 46,225 | |
Banc of America Commercial Mortgage, Inc., Series 2008-1, Class A4, VRN
6.436% 2/10/51 | | | 53,784 | | | | 55,863 | |
Banc of America Commercial Mortgage, Inc., Series 2008-1, Class AM, VRN
6.478% 2/10/51 | | | 50,000 | | | | 52,052 | |
Bear Stearns Commercial Mortgage Securities, Series 2006-PW14, Class A4
5.201% 12/11/38 | | | 25,844 | | | | 25,872 | |
Bear Stearns Commercial Mortgage Securities, Series 2006-PW14, Class AM
5.243% 12/11/38 | | | 50,000 | | | | 50,094 | |
Bear Stearns Commercial Mortgage Securities, Series 2007-T26, Class AM, VRN
5.513% 1/12/45 | | | 105,000 | | | | 105,839 | |
Bear Stearns Commercial Mortgage Securities, Series 2007-PW17, Class A4, VRN
5.694% 6/11/50 | | | 35,992 | | | | 36,960 | |
Bear Stearns Commercial Mortgage Securities, Series 2007-PW17, Class AM, VRN
5.915% 6/11/50 | | | 120,000 | | | | 122,743 | |
| | | | | | | | |
| | | Principal
Amount | | | Value | |
Commercial Mortgage Pass Through Certificates, Series 2013-GAM, Class A1 (b)
1.705% 2/10/28 | | $ | 82,876 | | | $ | 81,642 | |
Commercial Mortgage Pass Through Certificates, Series 2012-CR4, Class B (b)
3.703% 10/15/45 | | | 35,000 | | | | 36,728 | |
Commercial Mortgage Pass Through Certificates, Series 2015-CR23, Class C, VRN
4.398% 5/10/48 | | | 35,000 | | | | 32,688 | |
Commercial Mortgage Pass-Through Certificates, Series 2007-C9, Class AM, VRN
5.650% 12/10/49 | | | 50,000 | | | | 51,178 | |
DBCCRE Mortgage Trust, Series 2014-ARCP, Class A (b)
4.238% 1/10/34 | | | 100,000 | | | | 106,724 | |
DBRR Trust, Series 2013-EZ3, Class A, VRN (b)
1.635% 12/18/49 | | | 6,097 | | | | 6,095 | |
GCCFC Commercial Mortgage Trust, Series 2006-GG7, Class AM, VRN
5.951% 7/10/38 | | | 43,715 | | | | 43,776 | |
JP Morgan Chase Commercial Mortgage Securities Corp., Series 2006-CB17, Class A4
5.429% 12/12/43 | | | 143 | | | | 142 | |
JP Morgan Chase Commercial Mortgage Securities Corp., Series 2007-CB18, Class AM, VRN
5.466% 6/12/47 | | | 65,000 | | | | 65,476 | |
ML-CFC Commercial Mortgage Trust, Series 2007-9, Class AM, VRN
5.856% 9/12/49 | | | 60,000 | | | | 61,716 | |
Morgan Stanley Capital I, Series 2011-C2, Class B, VRN (b)
5.200% 6/15/44 | | | 100,000 | | | | 110,159 | |
Morgan Stanley Capital I, Series 2006-IQ12, Class AM
5.370% 12/15/43 | | | 40,000 | | | | 40,060 | |
Morgan Stanley Capital I, Series 2007-HQ11, Class AM, VRN
5.478% 2/12/44 | | | 60,000 | | | | 60,279 | |
Morgan Stanley Capital I, Series 2007-IQ14, Class A2
5.610% 4/15/49 | | | 13,820 | | | | 13,788 | |
Morgan Stanley Capital I, Series 2008-T29, Class A4, VRN
6.477% 1/11/43 | | | 28,331 | | | | 29,656 | |
STRIPs Ltd., Series 2012-1A, Class A (b)
1.500% 12/25/44 | | | 4,419 | | | | 4,419 | |
The accompanying notes are an integral part of the financial statements.
159
MassMutual Premier Balanced Fund – Portfolio of Investments (Continued)
| | | | | | | | |
| | | Principal
Amount | | | Value | |
TIAA Seasoned Commercial Mortgage Trust, Series 2007-C4, Class AJ, VRN
5.483% 8/15/39 | | $ | 10,568 | | | $ | 10,638 | |
Wachovia Bank Commercial Mortgage Trust, Series 2006-C29, Class AM
5.339% 11/15/48 | | | 70,000 | | | | 70,205 | |
Wachovia Bank Commercial Mortgage Trust, Series 2007-C31, Class A4
5.509% 4/15/47 | | | 121,495 | | | | 122,707 | |
Wachovia Bank Commercial Mortgage Trust, Series 2007-C33, Class A4, VRN
6.158% 2/15/51 | | | 29,848 | | | | 30,268 | |
Wachovia Bank Commercial Mortgage Trust, Series 2007-C33, Class AM, VRN
6.158% 2/15/51 | | | 50,000 | | | | 51,083 | |
Wells Fargo Commercial Mortgage Trust, Series 2010-C1, Class A1 (b)
3.349% 11/15/43 | | | 32,296 | | | | 33,362 | |
WF-RBS Commercial Mortgage Trust, Series 2012-C8, Class B
4.311% 8/15/45 | | | 40,000 | | | | 43,262 | |
WF-RBS Commercial Mortgage Trust, Series 2011-C3, Class B (b)
4.740% 3/15/44 | | | 50,000 | | | | 54,300 | |
| | | | | | | | |
| | | | | | | 1,706,415 | |
| | | | | | | | |
| Home Equity ABS — 0.2% | |
ACE Securities Corp., Series 2005-AG1, Class A1B1, 1 mo. USD LIBOR + .270%, FRN
0.795% 8/25/35 | | | 19,078 | | | | 19,063 | |
ACE Securities Corp., Series 2005-HE7, Class A2D, 1 mo. USD LIBOR + .660%, FRN
1.185% 11/25/35 | | | 16,639 | | | | 16,506 | |
Citigroup Mortgage Loan Trust, Series 2005-OPT4, Class M2, 1 mo. USD LIBOR + .430%, FRN
0.955% 7/25/35 | | | 5,004 | | | | 4,979 | |
Countrywide Asset-Backed Certificates, Series 2004-5, Class 3A, 1 mo. USD LIBOR + .460%, FRN
0.985% 9/25/34 | | | 8,868 | | | | 8,768 | |
First Franklin Mortgage Loan Trust, Series 2005-FF6, Class M1, 1 mo. USD LIBOR + .630%, FRN
1.155% 5/25/36 | | | 13,885 | | | | 13,830 | |
First Franklin Mortgage Loan Trust, Series 2005-FF4, Class M1, 1 mo. USD LIBOR + .645%, FRN
1.170% 5/25/35 | | | 1,683 | | | | 1,682 | |
| | | | | | | | |
| | | Principal
Amount | | | Value | |
Fremont Home Loan Trust, Series 2005-E, Class 2A3, 1 mo. USD LIBOR + .240%, FRN
0.765% 1/25/36 | | $ | 7,544 | | | $ | 7,484 | |
GSAMP Trust, Series 2005-AHL, Class M1, 1 mo. USD LIBOR + .645%, FRN
1.170% 4/25/35 | | | 11,336 | | | | 11,344 | |
Home Equity Asset Trust, Series 2006-4, Class 2A3, 1 mo. USD LIBOR + .170%, FRN
0.695% 8/25/36 | | | 6,547 | | | | 6,547 | |
Long Beach Mortgage Loan Trust, Series 2005-WL1, Class M2, 1 mo.
USD LIBOR + .825%, FRN
1.350% 6/25/35 | | | 43,221 | | | | 42,844 | |
MASTR Asset-Backed Securities Trust, Series 2005-WMC1, Class M3, 1 mo.
USD LIBOR + .720%, FRN
1.245% 3/25/35 | | | 58,010 | | | | 57,808 | |
NovaStar Mortgage Funding Trust, Series 2005-3, Class A2D, 1 mo.
LIBOR + .370%, FRN
0.895% 1/25/36 | | | 35,485 | | | | 35,261 | |
Park Place Securities, Inc., Series 2005-WHQ4, Class A1A, 1 mo
. USD LIBOR + .260%, FRN
0.785% 9/25/35 | | | 9,822 | | | | 9,827 | |
Park Place Securities, Inc., Series 2005-WCW3, Class A2C, 1 mo
. USD LIBOR + .380%, FRN
0.905% 8/25/35 | | | 649 | | | | 649 | |
Park Place Securities, Inc., Series 2005-WHQ1, Class M2, 1 mo
. USD LIBOR + .750%, FRN
1.275% 3/25/35 | | | 2,443 | | | | 2,444 | |
Structured Asset Investment Loan Trust, Series 2005-7, Class A5, 1 mo.
USD LIBOR + .720%, FRN
1.245% 8/25/35 | | | 235 | | | | 235 | |
| | | | | | | | |
| | | | | | | 239,271 | |
| | | | | | | | |
| Other ABS — 3.9% | |
321 Henderson Receivables I LLC, Series 2015-1A, Class A (b)
3.260% 9/15/72 | | | 46,776 | | | | 46,866 | |
ALM XIV Ltd., Series 2014-14A, Class A1, 3 mo. USD LIBOR + 1.430%, FRN (b)
2.173% 7/28/26 | | | 250,000 | | | | 250,000 | |
Alterna Funding I LLC, Series 2014-1A, Class NOTE (b)
1.639% 2/15/21 | | | 37,485 | | | | 36,548 | |
Applebee’s/IHOP Funding LLC, Series 2014-1, Class A2 (b)
4.277% 9/05/44 | | | 90,000 | | | | 91,469 | |
The accompanying notes are an integral part of the financial statements.
160
MassMutual Premier Balanced Fund – Portfolio of Investments (Continued)
| | | | | | | | |
| | | Principal
Amount | | | Value | |
Arbys Funding LLC, Series 2015-1A, Class A2 (b)
4.969% 10/30/45 | | $ | 69,475 | | | $ | 72,515 | |
Avery Point VI CLO Ltd., Series 2015-6A, Class A, 3 mo. USD LIBOR + 1.450%, FRN (b)
2.228% 8/05/27 | | | 250,000 | | | | 250,179 | |
BCC Funding VIII LLC, Series 2014-1A, Class A (b)
1.794% 6/20/20 | | | 13,577 | | | | 13,526 | |
BlueVirgo Trust, Series 2015-1A, Class NOTE (b)
3.000% 12/15/22 | | | 81,454 | | | | 82,316 | |
Cazenovia Creek Funding I LLC, Series 2015-1A, Class A (b)
2.000% 12/10/23 | | | 51,753 | | | | 51,389 | |
Citi Held For Asset Issuance, Series 2015-PM1, Class A (b)
1.850% 12/15/21 | | | 18,841 | | | | 18,806 | |
Citigroup Mortgage Loan Trust, Series 2006-SHL1, Class A1, 1 mo.
USD LIBOR + .200%, FRN (b)
0.724% 11/25/45 | | | 25,969 | | | | 25,982 | |
CKE Restaurant Holdings, Inc., Series 2013-1A, Class A2 (b)
4.474% 3/20/43 | | | 47,375 | | | | 47,530 | |
CLI Funding V LLC, Series 2014-1A, Class A (b)
3.290% 6/18/29 | | | 76,300 | | | | 74,346 | |
DB Master Finance LLC, Series 2015-1A, Class A2I (b)
3.262% 2/20/45 | | | 59,100 | | | | 59,619 | |
Diamond Resorts Owner Trust, Series 2014-1, Class A (b)
2.540% 5/20/27 | | | 38,708 | | | | 38,740 | |
Diamond Resorts Owner Trust, Series 2015-1, Class A (b)
2.730% 7/20/27 | | | 46,200 | | | | 46,470 | |
Domino’s Pizza Master Issuer LLC, Series 2015-1A, Class A2I (b)
3.484% 10/25/45 | | | 99,250 | | | | 100,087 | |
Domino’s Pizza Master Issuer LLC, Series 2015-1A, Class A2II (b)
4.474% 10/25/45 | | | 109,175 | | | | 110,660 | |
Domino’s Pizza Master Issuer LLC, Series 2012-1A, Class A2 (b)
5.216% 1/25/42 | | | 58,606 | | | | 60,183 | |
Dryden XXXI Senior Loan Fund, Series 2014-31A, Class A, 3 mo. USD LIBOR + 1.350%, FRN (b)
2.029% 4/18/26 | | | 250,000 | | | | 249,999 | |
Eaton Vance CLO, Series 2014-1A, Class A, 3 mo. USD LIBOR + 1.450%, FRN (b)
2.130% 7/15/26 | | | 250,000 | | | | 249,833 | |
| | | | | | | | |
| | | Principal
Amount | | | Value | |
Elara HGV Timeshare Issuer LLC, Series 2016-A, Class A (b)
2.810% 4/25/28 | | $ | 94,399 | | | $ | 94,358 | |
Element Rail Leasing II LLC, Series 2015-1A, Class A1 (b)
2.707% 2/19/45 | | | 77,387 | | | | 75,621 | |
Fairway Outdoor Funding LLC, Series 2012-1A, Class A2 (b)
4.212% 10/15/42 | | | 88,916 | | | | 90,201 | |
First Franklin Mortgage Loan Trust, Series 2005-FF7, Class M1, 1 mo. USD LIBOR + .450%, FRN
0.975% 7/25/35 | | | 3,264 | | | | 3,263 | |
GoldenTree Loan Opportunities VII Ltd., Series 2013-7A, Class A, 3 mo. USD LIBOR + 1.150%, FRN (b)
1.865% 4/25/25 | | | 250,000 | | | | 248,697 | |
Hilton Grand Vacations Trust, Series 2013-A, Class A (b)
2.280% 1/25/26 | | | 36,676 | | | | 36,744 | |
Icon Brand Holdings LLC, Series 2012-1A, Class A (Acquired 11/16/12,
Cost $50,000) (b) (c)
4.229% 1/25/43 | | | 37,672 | | | | 34,316 | |
Icon Brand Holdings LLC, Series 2013-1A, Class A (Acquired 1/9/14, Cost $49,081) (b) (c)
4.352% 1/25/43 | | | 39,092 | | | | 36,327 | |
LCM Ltd., Series 16A, Class A, 3 mo. USD LIBOR + 1.500%, FRN (b)
2.180% 7/15/26 | | | 250,000 | | | | 250,931 | |
Leaf Receivables Funding LLC, Series 2016-1, Class A1 (b)
1.000% 6/15/17 | | | 71,202 | | | | 71,203 | |
Long Beach Mortgage Loan Trust, Series 2005-1, Class M2, 1 mo. USD LIBOR + .795%, FRN
1.320% 2/25/35 | | | 26,718 | | | | 26,507 | |
Madison Park Funding XII Ltd., Series 2014-12A, Class A, 3 mo. USD LIBOR + 1.500%, FRN (b)
2.196% 7/20/26 | | | 250,000 | | | | 250,007 | |
Miramax LLC, Series 2014-1A, Class A2 (b)
3.340% 7/20/26 | | | 66,680 | | | | 66,851 | |
Morgan Stanley ABS Capital I, Inc. Trust, Series 2005-WMC6, Class M2, 1 mo. USD LIBOR + ..750%, FRN
1.275% 7/25/35 | | | 11,163 | | | | 11,240 | |
Morgan Stanley ABS Capital I, Inc. Trust, Series 2005-WMC4, Class M4, 1 mo. USD LIBOR + ..945%, FRN
1.470% 4/25/35 | | | 49,969 | | | | 49,881 | |
The accompanying notes are an integral part of the financial statements.
161
MassMutual Premier Balanced Fund – Portfolio of Investments (Continued)
| | | | | | | | |
| | | Principal
Amount | | | Value | |
Nations Equipment Finance Funding II LLC, Series 2014-1A, Class A (b)
1.558% 7/20/18 | | $ | 20,184 | | | $ | 20,172 | |
Oak Hill Credit Partners VIII Ltd., Series 2013-8A, Class A, 3 mo. USD LIBOR + 1.120%, FRN (b)
1.816% 4/20/25 | | | 200,000 | | | | 198,546 | |
Oxford Finance Funding Trust, Series 2016-1A, Class A (b)
3.968% 6/17/24 | | | 50,000 | | | | 50,251 | |
SBA Tower Trust, Series 2014-1A, Class C, STEP (b)
2.898% 10/15/44 | | | 100,000 | | | | 101,405 | |
Sierra Receivables Funding Co. LLC,
Series 2012-1A, Class A (b)
2.840% 11/20/28 | | | 11,149 | | | | 11,174 | |
Sierra Receivables Funding Co. LLC,
Series 2015-3A, Class B (b)
3.080% 9/20/32 | | | 57,489 | | | | 57,536 | |
SoFi Consumer Loan Program LLC,
Series 2016-2A, Class A (b)
3.090% 10/27/25 | | | 130,000 | | | | 130,630 | |
SoFi Consumer Loan Program LLC,
Series 2016-1A, Class A (b)
3.260% 8/25/25 | | | 121,650 | | | | 122,227 | |
Specialty Underwriting & Residential Finance Trust, Series 2005-AB2, Class M1, 1 mo. USD LIBOR + .450%, FRN
0.975% 6/25/36 | | | 40,000 | | | | 39,596 | |
SpringCastle America Funding LLC,
Series 2014-AA, Class A (b)
2.700% 5/25/23 | | | 79,574 | | | | 79,599 | |
Structured Asset Securities Corp.,
Series 2007-BC4, Class A3, 1 mo. USD LIBOR + .250%, FRN
0.775% 11/25/37 | | | 2,085 | | | | 2,084 | |
Taco Bell Funding LLC, Series 2016-1A, Class A2I (b)
3.832% 5/25/46 | | | 80,000 | | | | 81,295 | |
Trip Rail Master Funding LLC,
Series 2011-1A, Class A1A (b)
4.370% 7/15/41 | | | 41,353 | | | | 41,732 | |
Welk Resorts LLC, Series 2015-AA, Class A (b)
2.790% 6/16/31 | | | 35,571 | | | | 35,807 | |
Wendys Funding LLC, Series 2015-1A, Class A2I (b)
3.371% 6/15/45 | | | 118,800 | | | | 119,337 | |
Wendys Funding LLC, Series 2015-1A, Class A2II (b)
4.080% 6/15/45 | | | 49,500 | | | | 50,256 | |
| | | | | | | | |
| | | Principal
Amount | | | Value | |
Wendys Funding LLC, Series 2015-1A, Class A23 (b)
4.497% 6/15/45 | | $ | 74,250 | | | $ | 74,234 | |
| | | | | | | | |
| | | | | | | 4,539,091 | |
| | | | | | | | |
| Student Loans ABS — 2.1% | |
Access Group, Inc., Series 2003-A, Class A3, 3 mo. Treasury + 1.200%, FRN
1.515% 7/01/38 | | | 21,158 | | | | 19,227 | |
Access Group, Inc., Series 2015-1, Class B, 1 mo. USD LIBOR + 1.500%, FRN (b)
2.025% 7/25/58 | | | 100,000 | | | | 87,376 | |
College Loan Corp. Trust, Series 2002-1, Class A5, 28 day ARS, FRN (b)
1.076% 3/01/42 | | | 50,000 | | | | 44,968 | |
College Loan Corp. Trust I, Series 2007-1, Class B2, 28 day ARS, FRN
0.413% 1/25/47 | | | 35,000 | | | | 26,164 | |
College Loan Corp. Trust I, Series 2002-2, Class A29, 28 day ARS, FRN (b)
1.566% 3/01/42 | | | 50,000 | | | | 44,981 | |
College Loan Corp. Trust I, Series 2003-1, Class A6, 28 day ARS, FRN (b)
1.685% 3/01/42 | | | 100,000 | | | | 90,090 | |
DRB Prime Student Loan Trust,
Series 2016-A, Class A1, 1 mo.
USD LIBOR + 2.000%, FRN (b)
2.524% 4/25/40 | | | 87,650 | | | | 87,406 | |
Earnest Student Loan Program LLC,
Series 2016-C, Class A1, 1 mo. USD LIBOR + 1.850%, FRN (b)
2.326% 10/27/36 | | | 156,833 | | | | 156,834 | |
Earnest Student Loan Program LLC,
Series 2016-B, Class A1, 1 mo. USD LIBOR + 2.050%, FRN (b)
2.575% 2/26/35 | | | 100,793 | | | | 100,793 | |
ECMC Group Student Loan Trust, Series 2016-1A, Class A, 1 mo. USD LIBOR + 1.350%, FRN (b)
1.864% 7/26/66 | | | 140,000 | | | | 139,998 | |
EdLinc Student Loan Funding Trust, Series 2012-1, Class B, 1 mo. USD LIBOR + 4.240%, FRN (b)
4.765% 11/26/40 | | | 65,000 | | | | 75,360 | |
Education Funding Capital Trust I, Series 2004-1, Class B1, 28 day ARS, FRN
6/15/43 | | | 50,000 | | | | 46,251 | |
Education Funding Capital Trust I,
Series 2004-1, Class A6, 28 day ARS, FRN
1.687% 6/15/43 | | | 50,000 | | | | 48,590 | |
The accompanying notes are an integral part of the financial statements.
162
MassMutual Premier Balanced Fund – Portfolio of Investments (Continued)
| | | | | | | | |
| | | Principal
Amount | | | Value | |
Education Funding Capital Trust I,
Series 2004-1, Class A4, 28 day ARS, FRN
1.934% 6/15/43 | | $ | 50,000 | | | $ | 49,777 | |
Education Loan Asset-Backed Trust I, Series 2003-2, Class 2A1, 28 day ARS, FRN (b)
1.933% 8/01/43 | | | 50,000 | | | | 46,391 | |
Kentucky Higher Education Student Loan Corp., Series 2015-1, Class A1, 1 mo. USD LIBOR + ..750%, FRN
1.273% 12/01/31 | | | 77,237 | | | | 75,739 | |
KeyCorp Student Loan Trust, Series 2004-A, Class 2A2, 3 mo. USD LIBOR + .300%, FRN
1.034% 10/28/41 | | | 13,974 | | | | 13,921 | |
KnowledgeWorks Foundation, Series 2010-1, Class A, 3 mo. USD LIBOR + .950%, FRN
1.775% 2/25/42 | | | 44,225 | | | | 43,598 | |
National Collegiate Student Loan Trust, Series 2006-3, Class A3, 1 mo. USD LIBOR + ..150%, FRN
0.675% 10/25/27 | | | 12,750 | | | | 12,725 | |
National Collegiate Student Loan Trust, Series 2005-1, Class A4, 1 mo.
USD LIBOR + .240%, FRN
0.765% 11/27/28 | | | 19,366 | | | | 19,182 | |
Navient Student Loan Trust, Series 2016-5A, Class A, 1 mo. USD LIBOR + 1.250%, FRN (b)
1.000% 6/25/65 | | | 108,627 | | | | 108,627 | |
Navient Student Loan Trust, Series 2016-1A, Class A, 1 mo. USD LIBOR + .700%, FRN (b)
1.225% 2/25/70 | | | 91,879 | | | | 89,356 | |
Navient Student Loan Trust, Series 2014-1, Class A4, 1 mo. USD LIBOR + .750%, FRN
1.275% 2/25/39 | | | 100,000 | | | | 93,230 | |
Navient Student Loan Trust, Series 2015-3, Class B, 1 mo. USD LIBOR + 1.500%, FRN
2.025% 10/25/58 | | | 40,000 | | | | 32,528 | |
Nelnet Student Loan Trust, Series 2005-2, Class A5, 3 mo. USD LIBOR + .100%, FRN
0.966% 3/23/37 | | | 100,000 | | | | 94,453 | |
Nelnet Student Loan Trust, Series 2013-5A, Class A, 1 mo. USD LIBOR + .630%, FRN (b)
1.155% 1/25/37 | | | 57,028 | | | | 55,465 | |
| | | | | | | | |
| | | Principal
Amount | | | Value | |
Securitized Asset Backed Receivables LLC, Series 2005-HE1, Class A3C, ABS, FRN, 1 mo. USD LIBOR + ..660%, FRN
1.185% 10/25/35 | | $ | 12,889 | | | $ | 12,898 | |
SLC Private Student Loan Trust, Series 2006-A, Class C, 3 mo. USD LIBOR + .450%, FRN
1.130% 7/15/36 | | | 100,000 | | | | 89,920 | |
SLM Student Loan Trust, Series 2006-10, Class B, 3 mo. USD LIBOR + .220%, FRN
0.535% 3/25/44 | | | 73,646 | | | | 60,643 | |
SLM Student Loan Trust, Series 2013-6, Class A3, 1 mo. USD LIBOR + .650%, FRN
1.175% 6/25/55 | | | 100,000 | | | | 99,081 | |
SLM Student Loan Trust, Series 2003-5, Class A7, 28 day ARS, FRN
3.007% 6/17/30 | | | 50,000 | | | | 50,000 | |
SLM Student Loan Trust, Series 2003-5, Class A9, 28 day ARS, FRN
3.024% 6/17/30 | | | 50,000 | | | | 50,000 | |
SMB Private Education Loan Trust, Series 2016-A, Class A2A (b)
2.700% 5/15/31 | | | 100,000 | | | | 100,676 | |
SMB Private Education Loan Trust, Series 2015-C, Class A2A (b)
2.750% 7/15/27 | | | 100,000 | | | | 102,849 | |
SoFi Professional Loan Program LLC, Series 2016-B, Class A1, 1 mo. USD LIBOR + 1.200%, FRN (b)
1.725% 6/25/33 | | | 94,382 | | | | 94,381 | |
South Carolina Student Loan Corp., Series 2010-1, Class A3, 3 mo. USD LIBOR + 1.050%, FRN
1.765% 10/27/36 | | | 100,000 | | | | 99,163 | |
| | | | | | | | |
| | | | | | | 2,462,641 | |
| | | | | | | | |
| WL Collateral CMO — 0.3% | |
Connecticut Avenue Securities, Series 2015-C03, Class 1M1, 1 mo. USD LIBOR + 1.500%, FRN
2.025% 7/25/25 | | | 76,584 | | | | 76,740 | |
Countrywide Home Loans, Inc., Series 2004-2, Class 1A1, FRN
2.953% 2/25/34 | | | 5,262 | | | | 5,059 | |
Countrywide Home Loans, Inc., Series 2003-42, Class 1A1, FRN
3.294% 9/25/33 | | | 2,053 | | | | 1,935 | |
Federal National Mortgage Association Connecticut Avenue Securities, Series 2016-C05, Class 2M1, 1 mo. USD LIBOR + 1.350%, FRN
1.875% 1/25/29 | | | 69,232 | | | | 69,505 | |
The accompanying notes are an integral part of the financial statements.
163
MassMutual Premier Balanced Fund – Portfolio of Investments (Continued)
| | | | | | | | |
| | | Principal
Amount | | | Value | |
Federal National Mortgage Association Connecticut Avenue Securities, Series 2016-C04, Class 1M1, 1 mo. USD LIBOR + 1.450%, FRN
1.975% 1/25/29 | | $ | 79,252 | | | $ | 79,731 | |
GSR Mortgage Loan Trust, Series 2004-9, Class 2A1, VRN
3.285% 8/25/34 | | | 3,182 | | | | 3,119 | |
IndyMac Index Mortgage Loan Trust, Series 2004-AR4, Class 1A, VRN
2.786% 8/25/34 | | | 17,088 | | | | 15,257 | |
Merrill Lynch Mortgage Investors, Inc., Series 2005-A8, Class A3A2, 1 mo. USD LIBOR + .250%, FRN
0.775% 8/25/36 | | | 1,019 | | | | 1,016 | |
Merrill Lynch Mortgage Investors, Inc., Series 2004-A1, Class IA, VRN
3.032% 2/25/34 | | | 2,209 | | | | 2,183 | |
Merrill Lynch Mortgage Investors, Inc., Series 2003-A4, Class IA, VRN
3.065% 7/25/33 | | | 1,344 | | | | 1,324 | |
Morgan Stanley Mortgage Loan Trust, Series 2004-2AR, Class 1A, FRN
2.875% 2/25/34 | | | 71 | | | | 73 | |
Structured Adjustable Rate Mortgage Loan Trust, Series 2004-2, Class 2A, VRN
3.056% 3/25/34 | | | 11,269 | | | | 11,314 | |
WaMu Mortgage Pass-Through Certificates, Series 2004-AR2, Class A, 12 mo. MTA + 1.400%, FRN
1.907% 4/25/44 | | | 23,309 | | | | 23,280 | |
| | | | | | | | |
| | | | | | | 290,536 | |
| | | | | | | | |
| WL Collateral PAC — 0.0% | |
Structured Asset Securities Corp., Series 2002-11A, Class 2A1, FRN
3.157% 6/25/32 | | | 6,604 | | | | 6,450 | |
| | | | | | | | |
| | |
TOTAL NON-U.S. GOVERNMENT AGENCY OBLIGATIONS
(Cost $9,924,414) | | | | | | | 9,871,960 | |
| | | | | | | | |
|
| SOVEREIGN DEBT OBLIGATIONS — 0.4% | |
Colombia Government International Bond
6.125% 1/18/41 | | | 100,000 | | | | 120,750 | |
Colombia Government International Bond
7.375% 3/18/19 | | | 40,000 | | | | 45,160 | |
Export-Import Bank of Korea
1.750% 2/27/18 | | | 10,000 | | | | 10,040 | |
Mexico Government International Bond
4.750% 3/08/44 | | | 91,000 | | | | 94,299 | |
Poland Government International Bond
6.375% 7/15/19 | | | 50,000 | | | | 56,250 | |
| | | | | | | | |
| | | Principal
Amount | | | Value | |
United Mexican States
5.125% 1/15/20 | | $ | 35,000 | | | $ | 38,903 | |
United Mexican States
6.750% 9/27/34 | | | 35,000 | | | | 46,287 | |
| | | | | | | | |
| | | | | | | 411,689 | |
| | | | | | | | |
| | |
TOTAL SOVEREIGN DEBT OBLIGATIONS
(Cost $383,893) | | | | | | | 411,689 | |
| | | | | | | | |
|
| U.S. GOVERNMENT AGENCY OBLIGATIONS AND INSTRUMENTALITIES — 8.5% | |
| Collateralized Mortgage Obligations — 0.8% | |
Federal Home Loan Mortgage Corp. | | | | | | | | |
Series 4303, Class AP
3.000% 8/15/43 | | | 149,973 | | | | 154,785 | |
Series 4290, Class CA
3.500% 12/15/38 | | | 91,388 | | | | 95,077 | |
Series 2617, Class Z
5.500% 5/15/33 | | | 72,156 | | | | 81,799 | |
Series 2693, Class Z
5.500% 10/15/33 | | | 129,493 | | | | 144,948 | |
Series 3423, Class PB
5.500% 3/15/38 | | | 28,072 | | | | 31,720 | |
Federal National Mortgage Association | | | | | | | | |
Series 2014-7, Class VA
3.500% 5/25/25 | | | 55,722 | | | | 59,698 | |
Series 2014-48, Class AB
4.000% 10/25/40 | | | 124,199 | | | | 130,533 | |
Series 2007-32, Class Z
5.500% 4/25/37 | | | 42,597 | | | | 47,683 | |
Series 2010-60, Class HJ
5.500% 5/25/40 | | | 24,738 | | | | 27,346 | |
Federal National Mortgage Association REMIC Series 2007-B2, Class ZA
5.500% 6/25/37 | | | 36,824 | | | | 40,886 | |
U.S. Department of Veteran Affairs Series 1992-1, Class 2Z
7.750% 5/15/22 | | | 29,895 | | | | 33,269 | |
| | | | | | | | |
| | | | | | | 847,744 | |
| | | | | | | | |
| Pass-Through Securities — 7.7% | |
Federal Home Loan Mortgage Corp. | | | | | | | | |
Pool #Q37467 3.500%
11/01/45 | | | 237,619 | | | | 253,018 | |
Pool #Q37468 3.500%
11/01/45 | | | 165,583 | | | | 176,882 | |
Pool #C03537 4.500%
8/01/40 | | | 53,961 | | | | 59,770 | |
Pool #G06057 4.500%
10/01/40 | | | 39,431 | | | | 43,398 | |
Pool #G60485 4.500%
10/01/41 | | | 53,528 | | | | 58,940 | |
The accompanying notes are an integral part of the financial statements.
164
MassMutual Premier Balanced Fund – Portfolio of Investments (Continued)
| | | | | | | | |
| | | Principal
Amount | | | Value | |
Pool #G60469 4.500%
1/01/42 | | $ | 36,009 | | | $ | 39,644 | |
Pool #G60342 4.500%
5/01/42 | | | 183,526 | | | | 201,993 | |
Pool #G60172 4.500%
9/01/43 | | | 51,563 | | | | 57,146 | |
Pool #G05253 5.000%
2/01/39 | | | 12,050 | | | | 13,485 | |
Pool #G11431 6.000%
2/01/18 | | | 200 | | | | 202 | |
Pool #G00729 8.000%
6/01/27 | | | 14,745 | | | | 17,729 | |
Pool #554904 9.000%
3/01/17 | | | 11 | | | | 11 | |
Federal Home Loan Mortgage Corp. TBA
Pool #1513 4.000%
10/13/46 (d) | | | 250,000 | | | | 268,154 | |
Federal National Mortgage Association | | | | | | | | |
Pool #725692 2.642%
10/01/33 1 year CMT + 2.144%, FRN | | | 15,726 | | | | 16,548 | |
Pool #888586 2.668%
10/01/34 1 year CMT + 2.212%, FRN | | | 25,666 | | | | 27,066 | |
Pool #BC6007 3.000%
5/01/31 | | | 146,310 | | | | 153,814 | |
Pool #AS1304 3.500%
12/01/28 | | | 65,079 | | | | 68,941 | |
Pool #AV2325 3.500%
12/01/28 | | | 32,716 | | | | 34,657 | |
Pool #AS6187 3.500%
11/01/45 | | | 522,130 | | | | 555,926 | |
Pool #AS6293 3.500%
12/01/45 | | | 160,293 | | | | 170,668 | |
Pool #AS6306 3.500%
12/01/45 | | | 172,560 | | | | 184,188 | |
Pool #AS6475 3.500%
1/01/46 | | | 133,495 | | | | 142,949 | |
Pool #AS6476 3.500%
1/01/46 | | | 143,675 | | | | 153,402 | |
Pool #AS6477 3.500%
1/01/46 | | | 162,839 | | | | 173,430 | |
Pool #AZ7917 4.000%
3/01/41 | | | 19,493 | | | | 21,120 | |
Pool #AL2441 4.000%
9/01/42 | | | 121,195 | | | | 132,159 | |
Pool #AL8422 4.000%
1/01/43 | | | 23,334 | | | | 25,281 | |
Pool #BC5984 4.000%
4/01/46 | | | 24,114 | | | | 25,926 | |
Pool #AB1466 4.500%
9/01/40 | | | 24,759 | | | | 27,288 | |
Pool #AH6787 4.500%
3/01/41 | | | 42,923 | | | | 47,601 | |
| | | | | | | | |
| | | Principal
Amount | | | Value | |
Pool #AL7566 4.500%
10/01/42 | | $ | 41,548 | | | $ | 45,817 | |
Pool #AL6997 4.500%
11/01/42 | | | 85,739 | | | | 95,083 | |
Pool #AD6437 5.000%
6/01/40 | | | 23,292 | | | | 26,151 | |
Pool #AD6996 5.000%
7/01/40 | | | 170,806 | | | | 190,889 | |
Pool #AL8173 5.000%
2/01/44 | | | 60,570 | | | | 67,559 | |
Pool #564594 7.000%
1/01/31 | | | 7,498 | | | | 8,848 | |
Pool #253795 7.000%
5/01/31 | | | 6,082 | | | | 7,260 | |
Pool #507061 7.500%
10/01/29 | | | 739 | | | | 890 | |
Pool #531196 7.500%
2/01/30 | | | 909 | | | | 1,101 | |
Pool #527761 7.500%
2/01/30 | | | 1,525 | | | | 1,738 | |
Pool #534420 7.500%
3/01/30 | | | 637 | | | | 771 | |
Pool #253183 7.500%
4/01/30 | | | 2,441 | | | | 2,938 | |
Pool #253265 7.500%
5/01/30 | | | 1,510 | | | | 1,793 | |
Pool #535248 8.000%
4/01/30 | | | 153 | | | | 186 | |
Pool #539460 8.000%
5/01/30 | | | 1,184 | | | | 1,459 | |
Pool #190317 8.000%
8/01/31 | | | 1,808 | | | | 2,209 | |
Federal National Mortgage Association TBA
Pool #1866 2.500%
11/17/31 (d) | | | 2,100,000 | | | | 2,171,121 | |
Pool #1817 3.000%
11/14/46 (d) | | | 534,000 | | | | 553,900 | |
Pool #18388 4.000%
11/14/46 (d) | | | 425,000 | | | | 455,862 | |
Pool #21133 4.500%
10/13/46 (d) | | | 175,000 | | | | 191,652 | |
Government National Mortgage Association
Pool #783896 3.500%
5/15/44 | | | 211,871 | | | | 227,505 | |
Pool #351528 7.000%
8/15/23 | | | 2,256 | | | | 2,370 | |
Pool #352049 7.000%
10/15/23 | | | 799 | | | | 907 | |
Pool #588012 7.000%
7/15/32 | | | 3,262 | | | | 3,892 | |
Pool #189371 7.500%
6/15/17 | | | 46 | | | | 46 | |
The accompanying notes are an integral part of the financial statements.
165
MassMutual Premier Balanced Fund – Portfolio of Investments (Continued)
| | | | | | | | |
| | | Principal
Amount | | | Value | |
Government National Mortgage Association II | | | | | | | | |
Pool #82462 2.000%
1/20/40 1 year CMT + 1.500%, FRN | | $ | 22,811 | | | $ | 23,531 | |
Pool #82488 2.000%
3/20/40 1 year CMT + 1.500%, FRN | | | 26,127 | | | | 26,988 | |
Pool #784026 3.500%
12/20/44 | | | 58,052 | | | | 62,312 | |
Government National Mortgage Association II TBA | | | | | | | | |
Pool #264 2.500%
10/20/46 (d) | | | 375,000 | | | | 381,445 | |
Pool #1581 3.000%
11/21/46 (d) | | | 1,250,000 | | | | 1,307,080 | |
| | | | | | | | |
| | | | | | | 9,014,639 | |
| | | | | | | | |
| | |
TOTAL U.S. GOVERNMENT AGENCY OBLIGATIONS AND INSTRUMENTALITIES
(Cost $9,783,024) | | | | | | | 9,862,383 | |
| | | | | | | | |
|
| U.S. TREASURY OBLIGATIONS — 1.3% | |
| U.S. Treasury Bonds & Notes — 1.3% | |
U.S. Treasury Bond
2.500% 5/15/46 | | | 615,000 | | | | 638,492 | |
U.S. Treasury Bond (e) (f)
3.500% 2/15/39 | | | 625,000 | | | | 775,781 | |
U.S. Treasury Note
1.625% 5/15/26 | | | 130,000 | | | | 130,298 | |
| | | | | | | | |
| | | | | | | 1,544,571 | |
| | | | | | | | |
| | |
TOTAL U.S. TREASURY OBLIGATIONS
(Cost $1,536,137) | | | | | | | 1,544,571 | |
| | | | | | | | |
| | |
TOTAL BONDS & NOTES
(Cost $35,895,996) | | | | | | | 36,670,611 | |
| | | | | | | | |
| | |
| | | Number of
Shares | | | | |
|
| MUTUAL FUNDS — 9.0% | |
| Diversified Financial — 9.0% | |
iShares China Large-Cap ETF | | | 2,800 | | | | 106,428 | |
iShares MSCI Australia Index Fund | | | 7,000 | | | | 146,300 | |
iShares MSCI EAFE Index Fund | | | 58,430 | | | | 3,454,966 | |
iShares MSCI France Index Fund | | | 8,500 | | | | 205,360 | |
iShares MSCI Germany Index Fund | | | 7,200 | | | | 189,144 | |
iShares MSCI Italy Capped Index Fund | | | 5,800 | | | | 63,916 | |
iShares MSCI Japan Index Fund | | | 41,200 | | | | 516,648 | |
| | | | | | | | |
| | | Number of
Shares | | | Value | |
iShares MSCI Singapore ETF | | | 2,300 | | | $ | 24,978 | |
iShares MSCI South Korea Capped Index Fund | | | 1,800 | | | | 104,634 | |
iShares MSCI Spain Index Fund | | | 3,400 | | | | 91,188 | |
iShares MSCI Sweden Index Fund | | | 2,100 | | | | 61,047 | |
iShares MSCI Switzerland Capped Index Fund | | | 6,400 | | | | 195,520 | |
iShares MSCI Turkey Investable Market Index Fund | | | 1,700 | | | | 64,362 | |
iShares MSCI United Kingdom ETF | | | 21,000 | | | | 332,640 | |
Vanguard FTSE Developed Markets ETF | | | 74,840 | | | | 2,799,764 | |
Vanguard MSCI Emerging Markets ETF | | | 55,800 | | | | 2,099,754 | |
| | | | | | | | |
| | | | | | | 10,456,649 | |
| | | | | | | | |
| | |
TOTAL MUTUAL FUNDS
(Cost $10,650,274) | | | | | | | 10,456,649 | |
| | | | | | | | |
|
| RIGHTS — 0.0% | |
| Consumer, Cyclical — 0.0% | |
| Auto Manufacturers — 0.0% | |
Safeway Casa Ley Contingent Value (a) (g) | | | 3,821 | | | | 3,859 | |
Safeway PDC LLC Contingent Value (a) (g) | | | 3,821 | | | | 191 | |
| | | | | | | | |
| | | | | | | 4,050 | |
| | | | | | | | |
| | |
TOTAL RIGHTS
(Cost $4,050) | | | | | | | 4,050 | |
| | | | | | | | |
| | |
TOTAL LONG-TERM INVESTMENTS
(Cost $112,248,555) | | | | | | | 116,172,389 | |
| | | | | | | | |
| | |
| | | Principal
Amount | | | | |
|
| SHORT-TERM INVESTMENTS — 4.7% | |
| Commercial Paper — 4.7% | |
American Electric Power Co., Inc. (b)
0.900% 10/11/16 | | $ | 647,000 | | | | 646,849 | |
Dollar General Corp. (b)
0.600% 10/03/16 | | | 541,000 | | | | 540,964 | |
DTE Capital Corp. (b)
0.650% 10/03/16 | | | 365,000 | | | | 364,978 | |
Fortive Corp. (b)
0.770% 10/19/16 | | | 705,000 | | | | 704,705 | |
Monsanto Co. (d)
1.050% 11/21/16 | | | 425,000 | | | | 424,467 | |
ONEOK Partners LP (b)
1.100% 10/17/16 | | | 692,000 | | | | 691,743 | |
Sempra Energy Holdings (b)
0.700% 10/06/16 | | | 377,000 | | | | 376,954 | |
The accompanying notes are an integral part of the financial statements.
166
MassMutual Premier Balanced Fund – Portfolio of Investments (Continued)
| | | | | | | | |
| | | Principal
Amount | | | Value | |
Sempra Energy Holdings (b)
0.900% 10/04/16 | | $ | 500,000 | | | $ | 499,960 | |
Thomson Reuters Corp. (b)
1.050% 10/17/16 | | | 486,000 | | | | 485,842 | |
TransCanada American (b)
1.016% 11/21/16 | | | 280,000 | | | | 279,649 | |
Volvo Group Treasury NA (b)
0.820% 10/12/16 | | | 500,000 | | | | 499,873 | |
| | | | | | | | |
| | | | | | | 5,515,984 | |
| | | | | | | | |
| Repurchase Agreement — 0.0% | |
State Street Bank & Trust Co. Repurchase Agreement, dated 9/30/16, 0.010%, due 10/03/16 (h) | | | 4,470 | | | | 4,470 | |
| | | | | | | | |
| Time Deposit — 0.0% | |
Euro Time Deposit
0.010% 10/03/16 | | | 2,457 | | | | 2,457 | |
| | | | | | | | |
| | |
TOTAL SHORT-TERM INVESTMENTS
(Cost $5,522,669) | | | | | | | 5,522,911 | |
| | | | | | | | |
| | |
TOTAL INVESTMENTS — 104.3%
(Cost $117,771,224) (i) | | | | | | | 121,695,300 | |
| | |
| Other Assets/(Liabilities) — (4.3)% | | | | | | | (4,965,108 | ) |
| | | | | | | | |
| | |
| NET ASSETS — 100.0% | | | | | | $ | 116,730,192 | |
| | | | | | | | |
Notes to Portfolio of Investments
Percentages are stated as a percent of net assets.
| CLO | Collateralized Loan Obligation |
| CMO | Collateralized Mortgage Obligation |
| CMT | Constant Maturity Treasury Index |
| MBS | Mortgage-Backed Security |
| MTA | Monthly Treasury Average Index |
| PAC | Planned Amortization Class |
| (a) | Non-income producing security. |
| (b) | Securities exempt from registration under rule 144A of the Securities Act of 1933. These securities may be resold in transactions exempt from registration, normally to qualified institutional buyers. At September 30, 2016, these securities amounted to a value of $14,271,708 or 12.23% of net assets. |
| (c) | Restricted security. Certain securities are restricted as to resale. At September 30, 2016, these securities amounted to a value of $70,643 or 0.06% of net assets. The Fund generally |
| | bears the costs, if any, associated with the disposition of restricted securities. |
| (d) | A portion of this security is purchased on a when-issued, delayed-delivery or forward commitment basis. (Note 2). |
| (e) | A portion of this security is held as collateral for open futures contracts. (Note 2). |
| (f) | All or a portion of this security is held as collateral for open swap agreements. (Note 2). |
| (g) | This security is fair valued in good faith in accordance with procedures approved by the Board of Trustees. At September 30, 2016, these securities amounted to a value of $4,050 or 0.00% of net assets. |
| (h) | Maturity value of $4,470. Collateralized by U.S. Government Agency obligations with a rate of 3.125%, maturity date of 5/15/19, and an aggregate market value, including accrued interest, of $5,358. |
| (i) | See Note 6 for aggregate cost for federal tax purposes. |
The accompanying notes are an integral part of the financial statements.
167
MassMutual Premier Value Fund – Portfolio of Investments
September 30, 2016
| | | | | | | | |
| | | Number of
Shares | | | Value | |
| EQUITIES — 97.7% | |
| | |
| COMMON STOCK — 97.7% | | | | | | | | |
| Basic Materials — 2.4% | | | | | | | | |
| Chemicals — 1.4% | | | | | | | | |
Eastman Chemical Co. | | | 13,170 | | | $ | 891,347 | |
| | | | | | | | |
| Mining — 1.0% | | | | | | | | |
Goldcorp, Inc. | | | 38,900 | | | | 642,628 | |
| | | | | | | | |
| | | | | | | 1,533,975 | |
| | | | | | | | |
| Communications — 7.1% | | | | | | | | |
| Advertising — 1.2% | | | | | | | | |
Nielsen Holdings PLC | | | 14,790 | | | | 792,300 | |
| | | | | | | | |
| Internet — 1.1% | | | | | | | | |
Alphabet, Inc. Class A (a) | | | 880 | | | | 707,573 | |
| | | | | | | | |
| Media — 3.3% | | | | | | | | |
CBS Corp. Class B | | | 6,110 | | | | 334,461 | |
Comcast Corp. Class A | | | 16,510 | | | | 1,095,274 | |
DISH Network Corp. Class A (a) | | | 7,950 | | | | 435,501 | |
The Walt Disney Co. | | | 3,170 | | | | 294,366 | |
| | | | | | | | |
| | | | | | | 2,159,602 | |
| | | | | | | | |
| Telecommunications — 1.5% | | | | | | | | |
T-Mobile US, Inc. (a) | | | 20,400 | | | | 953,088 | |
| | | | | | | | |
| | | | | | | 4,612,563 | |
| | | | | | | | |
| Consumer, Cyclical — 7.2% | | | | | | | | |
| Airlines — 0.8% | | | | | | | | |
Delta Air Lines, Inc. | | | 13,769 | | | | 541,948 | |
| | | | | | | | |
| Home Builders — 0.2% | | | | | | | | |
Lennar Corp. Class A | | | 2,270 | | | | 96,112 | |
| | | | | | | | |
| Home Furnishing — 1.0% | | | | | | | | |
Whirlpool Corp. | | | 4,000 | | | | 648,640 | |
| | | | | | | | |
| Leisure Time — 0.6% | | | | | | | | |
Carnival Corp. | | | 8,330 | | | | 406,670 | |
| | | | | | | | |
| Retail — 4.6% | | | | | | | | |
Wal-Mart Stores, Inc. | | | 24,870 | | | | 1,793,625 | |
Walgreens Boots Alliance, Inc. | | | 14,970 | | | | 1,206,881 | |
| | | | | | | | |
| | | | | | | 3,000,506 | |
| | | | | | | | |
| | | | | | | 4,693,876 | |
| | | | | | | | |
| Consumer, Non-cyclical — 18.3% | |
| Beverages — 0.9% | |
The Coca-Cola Co. | | | 14,070 | | | | 595,442 | |
| | | | | | | | |
| Biotechnology — 2.3% | |
Amgen, Inc. | | | 5,344 | | | | 891,433 | |
Gilead Sciences, Inc. | | | 7,120 | | | | 563,334 | |
| | | | | | | | |
| | | | | | | 1,454,767 | |
| | | | | | | | |
| Cosmetics & Personal Care — 2.3% | |
The Procter & Gamble Co. | | | 16,930 | | | | 1,519,468 | |
| | | | | | | | |
| | | | | | | | |
| | | Number of
Shares | | | Value | |
| Health Care – Products — 2.0% | |
Zimmer Biomet Holdings, Inc. | | | 10,140 | | | $ | 1,318,403 | |
| | | | | | | | |
| Health Care – Services — 3.8% | |
Thermo Fisher Scientific, Inc. | | | 4,920 | | | | 782,575 | |
UnitedHealth Group, Inc. | | | 12,050 | | | | 1,687,000 | |
| | | | | | | | |
| | | | | | | 2,469,575 | |
| | | | | | | | |
| Pharmaceuticals — 7.0% | |
Cardinal Health, Inc. | | | 9,200 | | | | 714,840 | |
Eli Lilly & Co. | | | 10,790 | | | | 866,006 | |
Pfizer, Inc. | | | 50,390 | | | | 1,706,709 | |
Teva Pharmaceutical Industries Ltd. Sponsored ADR (Israel) | | | 27,120 | | | | 1,247,791 | |
| | | | | | | | |
| | | | | | | 4,535,346 | |
| | | | | | | | |
| | | | | | | 11,893,001 | |
| | | | | | | | |
| Energy — 11.3% | |
| Oil & Gas — 9.0% | |
Apache Corp. | | | 13,173 | | | | 841,359 | |
Chevron Corp. | | | 7,116 | | | | 732,379 | |
Concho Resources, Inc. (a) | | | 5,489 | | | | 753,914 | |
ConocoPhillips | | | 12,191 | | | | 529,943 | |
Hess Corp. | | | 12,900 | | | | 691,698 | |
Newfield Exploration Co. (a) | | | 8,472 | | | | 368,193 | |
Phillips 66 | | | 5,900 | | | | 475,245 | |
Suncor Energy, Inc. | | | 52,360 | | | | 1,454,561 | |
| | | | | | | | |
| | | | | | | 5,847,292 | |
| | | | | | | | |
| Oil & Gas Services — 1.0% | |
Schlumberger Ltd. | | | 8,211 | | | | 645,713 | |
| | | | | | | | |
| Pipelines — 1.3% | |
Enbridge, Inc. | | | 18,976 | | | | 839,308 | |
| | | | | | | | |
| | | | | | | 7,332,313 | |
| | | | | | | | |
| Financial — 22.4% | |
| Banks — 4.3% | |
Bank of America Corp. | | | 177,660 | | | | 2,780,379 | |
| | | | | | | | |
| Diversified Financial — 10.5% | |
Ally Financial, Inc. | | | 115,900 | | | | 2,256,573 | |
Citigroup, Inc. | | | 8,270 | | | | 390,592 | |
JP Morgan Chase & Co. | | | 39,190 | | | | 2,609,662 | |
Nasdaq, Inc. | | | 10,050 | | | | 678,777 | |
Synchrony Financial | | | 31,600 | | | | 884,800 | |
| | | | | | | | |
| | | | | | | 6,820,404 | |
| | | | | | | | |
| Insurance — 5.7% | |
American International Group, Inc. | | | 35,220 | | | | 2,089,955 | |
Aon PLC | | | 8,568 | | | | 963,814 | |
MetLife, Inc. | | | 14,570 | | | | 647,345 | |
| | | | | | | | |
| | | | | | | 3,701,114 | |
| | | | | | | | |
| Real Estate Investment Trusts (REITS) — 1.9% | |
Crown Castle International Corp. | | | 3,290 | | | | 309,951 | |
Digital Realty Trust, Inc. | | | 3,320 | | | | 322,439 | |
The accompanying notes are an integral part of the financial statements.
168
MassMutual Premier Value Fund – Portfolio of Investments (Continued)
| | | | | | | | |
| | | Number of
Shares | | | Value | |
HCP, Inc. | | | 16,940 | | | $ | 642,873 | |
| | | | | | | | |
| | | | | | | 1,275,263 | |
| | | | | | | | |
| | | | | | | 14,577,160 | |
| | | | | | | | |
| Industrial — 14.2% | |
| Aerospace & Defense — 1.2% | |
Lockheed Martin Corp. | | | 3,364 | | | | 806,418 | |
| | | | | | | | |
| Electronics — 3.3% | |
Johnson Controls International PLC | | | 29,363 | | | | 1,366,260 | |
TE Connectivity Ltd. | | | 12,533 | | | | 806,875 | |
| | | | | | | | |
| | | | | | | 2,173,135 | |
| | | | | | | | |
| Environmental Controls — 0.6% | |
Waste Management, Inc. | | | 5,653 | | | | 360,435 | |
| | | | | | | | |
| Machinery – Construction & Mining — 0.8% | |
Caterpillar, Inc. | | | 5,504 | | | | 488,590 | |
| | | | | | | | |
| Manufacturing — 5.9% | |
Danaher Corp. | | | 10,315 | | | | 808,593 | |
Eaton Corp. PLC | | | 22,640 | | | | 1,487,675 | |
Parker Hannifin Corp. | | | 6,704 | | | | 841,553 | |
Pentair PLC | | | 10,710 | | | | 688,010 | |
| | | | | | | | |
| | | | | | | 3,825,831 | |
| | | | | | | | |
| Packaging & Containers — 0.6% | |
WestRock Co. | | | 8,680 | | | | 420,806 | |
| | | | | | | | |
| Transportation — 1.8% | |
FedEx Corp. | | | 2,740 | | | | 478,623 | |
XPO Logistics, Inc. (a) (b) | | | 18,510 | | | | 678,762 | |
| | | | | | | | |
| | | | | | | 1,157,385 | |
| | | | | | | | |
| | | | | | | 9,232,600 | |
| | | | | | | | |
| Technology — 11.6% | |
| Computers — 4.2% | |
Apple, Inc. | | | 9,974 | | | | 1,127,561 | |
Synopsys, Inc. (a) | | | 14,869 | | | | 882,475 | |
Western Digital Corp. | | | 12,784 | | | | 747,481 | |
| | | | | | | | |
| | | | | | | 2,757,517 | |
| | | | | | | | |
| Semiconductors — 4.7% | |
Broadcom Ltd. | | | 8,776 | | | | 1,514,035 | |
Micron Technology, Inc. (a) | | | 10,975 | | | | 195,135 | |
NXP Semiconductor NV (a) | | | 6,170 | | | | 629,402 | |
Texas Instruments, Inc. | | | 10,470 | | | | 734,785 | |
| | | | | | | | |
| | | | | | | 3,073,357 | |
| | | | | | | | |
| Software — 2.7% | |
First Data Corp. Class A (a) | | | 50,160 | | | | 660,105 | |
Leidos Holdings, Inc. | | | 2,421 | | | | 104,781 | |
Microsoft Corp. | | | 16,778 | | | | 966,413 | |
| | | | | | | | |
| | | | | | | 1,731,299 | |
| | | | | | | | |
| | | | | | | 7,562,173 | |
| | | | | | | | |
| | | | | | | | |
| | | Number of
Shares | | | Value | |
| Utilities — 3.2% | |
| Electric — 3.2% | |
Edison International | | | 25,573 | | | $ | 1,847,649 | |
NextEra Energy, Inc. | | | 1,597 | | | | 195,345 | |
| | | | | | | | |
| | | | | | | 2,042,994 | |
| | | | | | | | |
| | |
TOTAL COMMON STOCK
(Cost $57,015,217) | | | | | | | 63,480,655 | |
| | | | | | | | |
| | |
TOTAL EQUITIES
(Cost $57,015,217) | | | | | | | 63,480,655 | |
| | | | | | | | |
|
| MUTUAL FUNDS — 1.1% | |
| Diversified Financial — 1.1% | | | | | | | | |
State Street Navigator Securities Lending Prime Portfolio (c) | | | 687,150 | | | | 687,150 | |
| | | | | | | | |
| | |
TOTAL MUTUAL FUNDS
(Cost $687,150) | | | | | | | 687,150 | |
| | | | | | | | |
| | |
TOTAL LONG-TERM INVESTMENTS
(Cost $57,702,367) | | | | | | | 64,167,805 | |
| | | | | | | | |
| | |
| | | Principal
Amount | | | | |
|
| SHORT-TERM INVESTMENTS — 2.3% | |
| Repurchase Agreement — 2.3% | | | | | | | | |
State Street Bank & Trust Co. Repurchase Agreement, dated 9/30/16, 0.010%, due 10/03/16 (d) | | $ | 1,474,363 | | | | 1,474,363 | |
| | | | | | | | |
| | |
TOTAL SHORT-TERM INVESTMENTS
(Cost $1,474,363) | | | | | | | 1,474,363 | |
| | | | | | | | |
| | |
TOTAL INVESTMENTS — 101.1%
(Cost $59,176,730) (e) | | | | | | | 65,642,168 | |
| | |
| Other Assets/(Liabilities) — (1.1)% | | | | | | | (689,046 | ) |
| | | | | | | | |
| | |
| NET ASSETS — 100.0% | | | | | | $ | 64,953,122 | |
| | | | | | | | |
Notes to Portfolio of Investments
Percentages are stated as a percent of net assets.
| ADR | American Depositary Receipt |
| (a) | Non-income producing security. |
| (b) | Denotes all or a portion of security on loan. The total value of securities on loan as of September 30, 2016, was $671,941 or 1.03% of net assets. Total securities on loan may not correspond with the amounts identified in the Portfolio of Investments because pending sales may be in the process of recall from the brokers. (Note 2). |
| (c) | Represents investment of security lending collateral. (Note 2). |
The accompanying notes are an integral part of the financial statements.
169
MassMutual Premier Value Fund – Portfolio of Investments (Continued)
Notes to Portfolio of Investments (Continued)
| (d) | Maturity value of $1,474,364. Collateralized by U.S. Government Agency obligations with a rate of 3.125%, maturity date of 5/15/21, and an aggregate market value, including accrued interest, of $1,504,487. |
| (e) | See Note 6 for aggregate cost for federal tax purposes. |
Country weightings, as a percentage of net assets, is as follows:
| | | | |
United States | | | 78.1 | % |
Ireland | | | 5.5 | % |
Canada | | | 4.5 | % |
United Kingdom | | | 2.7 | % |
Singapore | | | 2.3 | % |
Netherlands | | | 2.0 | % |
Israel | | | 1.9 | % |
Switzerland | | | 1.2 | % |
Panama | | | 0.6 | % |
| | | | |
Total Long-Term Investments | | | 98.8 | % |
Short-Term Investments and Other Assets and Liabilities | | | 1.2 | % |
| | | | |
Net Assets | | | 100.0 | % |
| | | | |
The accompanying notes are an integral part of the financial statements.
170
MassMutual Premier Disciplined Value Fund – Portfolio of Investments
September 30, 2016
| | | | | | | | |
| | | Number of
Shares | | | Value | |
| EQUITIES — 99.7% | |
|
| COMMON STOCK — 99.7% | |
| Basic Materials — 3.0% | |
| Chemicals — 1.8% | |
Cabot Corp. | | | 10,500 | | | $ | 550,305 | |
Celanese Corp. Series A | | | 5,300 | | | | 352,768 | |
The Dow Chemical Co. | | | 22,910 | | | | 1,187,425 | |
Eastman Chemical Co. | | | 2,800 | | | | 189,504 | |
FMC Corp. | | | 3,600 | | | | 174,024 | |
Huntsman Corp. | | | 14,600 | | | | 237,542 | |
LyondellBasell Industries NV Class A | | | 5,700 | | | | 459,762 | |
The Mosaic Co. | | | 11,600 | | | | 283,736 | |
Westlake Chemical Corp. | | | 4,460 | | | | 238,610 | |
| | | | | | | | |
| | | | | | | 3,673,676 | |
| | | | | | | | |
| Forest Products & Paper — 0.4% | |
Domtar Corp. | | | 8,700 | | | | 323,031 | |
International Paper Co. | | | 8,900 | | | | 427,022 | |
| | | | | | | | |
| | | | | | | 750,053 | |
| | | | | | | | |
| Iron & Steel — 0.7% | |
Nucor Corp. | | | 5,600 | | | | 276,920 | |
Reliance Steel & Aluminum Co. | | | 4,500 | | | | 324,135 | |
Steel Dynamics, Inc. | | | 19,100 | | | | 477,309 | |
United States Steel Corp. | | | 14,590 | | | | 275,167 | |
| | | | | | | | |
| | | | | | | 1,353,531 | |
| | | | | | | | |
| Mining — 0.1% | |
Freeport-McMoRan, Inc. | | | 31 | | | | 337 | |
Newmont Mining Corp. | | | 6,500 | | | | 255,385 | |
| | | | | | | | |
| | | | | | | 255,722 | |
| | | | | | | | |
| | | | | | | 6,032,982 | |
| | | | | | | | |
| Communications — 7.1% | |
| Internet — 0.2% | |
FireEye, Inc. (a) | | | 1,400 | | | | 20,622 | |
Symantec Corp. | | | 19,900 | | | | 499,490 | |
| | | | | | | | |
| | | | | | | 520,112 | |
| | | | | | | | |
| Media — 0.9% | |
Comcast Corp. Class A | | | 900 | | | | 59,706 | |
Discovery Communications, Inc. Series A (a) | | | 12,400 | | | | 333,808 | |
Discovery Communications, Inc. Series C (a) | | | 10,900 | | | | 286,779 | |
DISH Network Corp. Class A (a) | | | 2,700 | | | | 147,906 | |
Graham Holdings Co. Class B | | | 6 | | | | 2,888 | |
John Wiley & Sons, Inc. Class A | | | 1,400 | | | | 72,254 | |
News Corp. Class A | | | 2,300 | | | | 32,154 | |
TEGNA, Inc. | | | 11,255 | | | | 246,034 | |
Time Warner, Inc. | | | 2,190 | | | | 174,346 | |
Twenty-First Century Fox, Inc. Class A | | | 6,500 | | | | 157,430 | |
| | | | | | | | |
| | | Number of
Shares | | | Value | |
Viacom, Inc. Class B | | | 7,800 | | | $ | 297,180 | |
| | | | | | | | |
| | | | | | | 1,810,485 | |
| | | | | | | | |
| Telecommunications — 6.0% | |
ARRIS International PLC (a) | | | 12,400 | | | | 351,292 | |
AT&T, Inc. | | | 81,014 | | | | 3,289,979 | |
CenturyLink, Inc. | | | 14,107 | | | | 386,955 | |
Cisco Systems, Inc. | | | 98,200 | | | | 3,114,904 | |
Corning, Inc. | | | 25,300 | | | | 598,345 | |
EchoStar Corp. Class A (a) | | | 8,500 | | | | 372,555 | |
Frontier Communications Corp. | | | 108,089 | | | | 449,650 | |
Juniper Networks, Inc. | | | 1,400 | | | | 33,684 | |
Level 3 Communications, Inc. (a) | | | 3,300 | | | | 153,054 | |
Motorola Solutions, Inc. | | | 5,800 | | | | 442,424 | |
Sprint Corp. (a) | | | 51,000 | | | | 338,130 | |
T-Mobile US, Inc. (a) | | | 1,650 | | | | 77,088 | |
Telephone & Data Systems, Inc. | | | 22,918 | | | | 622,911 | |
United States Cellular Corp. (a) | | | 11,900 | | | | 432,446 | |
Verizon Communications, Inc. | | | 31,200 | | | | 1,621,776 | |
| | | | | | | | |
| | | | | | | 12,285,193 | |
| | | | | | | | |
| | | | | | | 14,615,790 | |
| | | | | | | | |
| Consumer, Cyclical — 8.9% | |
| Airlines — 1.5% | |
Alaska Air Group, Inc. | | | 4,600 | | | | 302,956 | |
American Airlines Group, Inc. | | | 17,100 | | | | 626,031 | |
Copa Holdings SA Class A | | | 9,000 | | | | 791,370 | |
Delta Air Lines, Inc. | | | 5,800 | | | | 228,288 | |
JetBlue Airways Corp. (a) | | | 32,600 | | | | 562,024 | |
Spirit Airlines, Inc. (a) | | | 13,100 | | | | 557,143 | |
| | | | | | | | |
| | | | | | | 3,067,812 | |
| | | | | | | | |
| Auto Manufacturers — 1.3% | |
Ford Motor Co. | | | 97,200 | | | | 1,173,204 | |
General Motors Co. | | | 38,000 | | | | 1,207,260 | |
PACCAR, Inc. | | | 6,400 | | | | 376,192 | |
| | | | | | | | |
| | | | | | | 2,756,656 | |
| | | | | | | | |
| Automotive & Parts — 0.7% | |
Allison Transmission Holdings, Inc. | | | 6,500 | | | | 186,420 | |
The Goodyear Tire & Rubber Co. | | | 11,900 | | | | 384,370 | |
Lear Corp. | | | 7,270 | | | | 881,269 | |
| | | | | | | | |
| | | | | | | 1,452,059 | |
| | | | | | | | |
| Distribution & Wholesale — 0.3% | |
Genuine Parts Co. | | | 200 | | | | 20,090 | |
Ingram Micro, Inc. Class A | | | 12,800 | | | | 456,448 | |
WESCO International, Inc. (a) | | | 1,200 | | | | 73,788 | |
| | | | | | | | |
| | | | | | | 550,326 | |
| | | | | | | | |
| Entertainment — 0.2% | |
International Game Technology PLC | | | 17,100 | | | | 416,898 | |
Regal Entertainment Group Class A | | | 1,200 | | | | 26,100 | |
| | | | | | | | |
| | | | | | | 442,998 | |
| | | | | | | | |
The accompanying notes are an integral part of the financial statements.
171
MassMutual Premier Disciplined Value Fund – Portfolio of Investments (Continued)
| | | | | | | | |
| | | Number of
Shares | | | Value | |
| Home Builders — 0.0% | |
D.R. Horton, Inc. | | | 600 | | | $ | 18,120 | |
Lennar Corp. | | | 100 | | | | 3,357 | |
| | | | | | | | |
| | | | | | | 21,477 | |
| | | | | | | | |
| Home Furnishing — 0.2% | |
Whirlpool Corp. | | | 2,850 | | | | 462,156 | |
| | | | | | | | |
| Leisure Time — 0.0% | |
Brunswick Corp. | | | 500 | | | | 24,390 | |
| | | | | | | | |
| Lodging — 0.1% | |
Hyatt Hotels Corp. Class A (a) | | | 100 | | | | 4,922 | |
Marriott International, Inc. Class A | | | 3,360 | | | | 226,229 | |
| | | | | | | | |
| | | | | | | 231,151 | |
| | | | | | | | |
| Retail — 4.6% | |
Best Buy Co., Inc. | | | 19,100 | | | | 729,238 | |
Burlington Stores, Inc. (a) | | | 1,300 | | | | 105,326 | |
CVS Health Corp. | | | 2,580 | | | | 229,594 | |
Darden Restaurants, Inc. | | | 1,100 | | | | 67,452 | |
Dillard’s, Inc. Class A | | | 8,120 | | | | 511,641 | |
Foot Locker, Inc. | | | 3,400 | | | | 230,248 | |
GameStop Corp. Class A | | | 5,500 | | | | 151,745 | |
The Gap, Inc. | | | 31,000 | | | | 689,440 | |
The Home Depot, Inc. | | | 3,380 | | | | 434,939 | |
JC Penney Co., Inc. (a) | | | 52,900 | | | | 487,738 | |
Kohl’s Corp. | | | 13,500 | | | | 590,625 | |
Macy’s, Inc. | | | 7,744 | | | | 286,915 | |
Nu Skin Enterprises, Inc. Class A | | | 12,200 | | | | 790,316 | |
PVH Corp. | | | 4,800 | | | | 530,400 | |
Staples, Inc. | | | 28,400 | | | | 242,820 | |
Target Corp. | | | 7,200 | | | | 494,496 | |
Urban Outfitters, Inc. (a) | | | 9,100 | | | | 314,132 | |
Wal-Mart Stores, Inc. | | | 29,500 | | | | 2,127,540 | |
Walgreens Boots Alliance, Inc. | | | 1,900 | | | | 153,178 | |
The Wendy’s Co. | | | 1,300 | | | | 14,040 | |
World Fuel Services Corp. | | | 3,500 | | | | 161,910 | |
| | | | | | | | |
| | | | | | | 9,343,733 | |
| | | | | | | | |
| | | | | | | 18,352,758 | |
| | | | | | | | |
| Consumer, Non-cyclical — 16.5% | |
| Agriculture — 0.6% | |
Archer-Daniels-Midland Co. | | | 10,400 | | | | 438,568 | |
Bunge Ltd. | | | 600 | | | | 35,538 | |
Philip Morris International, Inc. | | | 7,120 | | | | 692,206 | |
Reynolds American, Inc. | | | 1,500 | | | | 70,725 | |
| | | | | | | | |
| | | | | | | 1,237,037 | |
| | | | | | | | |
| Beverages — 0.3% | |
The Coca-Cola Co. | | | 7,900 | | | | 334,328 | |
Molson Coors Brewing Co. Class B | | | 260 | | | | 28,548 | |
PepsiCo, Inc. | | | 2,910 | | | | 316,521 | |
| | | | | | | | |
| | | | | | | 679,397 | |
| | | | | | | | |
| | | | | | | | |
| | | Number of
Shares | | | Value | |
| Commercial Services — 0.8% | |
Hertz Global Holdings, Inc. (a) | | | 9,800 | | | $ | 393,568 | |
Manpower, Inc. | | | 6,700 | | | | 484,142 | |
Paychex, Inc. | | | 300 | | | | 17,361 | |
Quanta Services, Inc. (a) | | | 2,100 | | | | 58,779 | |
RR Donnelley & Sons Co. | | | 9,400 | | | | 147,768 | |
United Rentals, Inc. (a) | | | 6,200 | | | | 486,638 | |
| | | | | | | | |
| | | | | | | 1,588,256 | |
| | | | | | | | |
| Cosmetics & Personal Care — 1.6% | |
Colgate-Palmolive Co. | | | 4,100 | | | | 303,974 | |
Edgewell Personal Care Co. (a) | | | 6,280 | | | | 499,386 | |
The Procter & Gamble Co. | | | 28,510 | | | | 2,558,772 | |
| | | | | | | | |
| | | | | | | 3,362,132 | |
| | | | | | | | |
| Foods — 1.9% | |
ConAgra Foods, Inc. | | | 1,300 | | | | 61,243 | |
Ingredion, Inc. | | | 2,970 | | | | 395,188 | |
The J.M. Smucker Co. | | | 2,630 | | | | 356,470 | |
The Kraft Heinz Co. | | | 8,100 | | | | 725,031 | |
Mondelez International, Inc. Class A | | | 20,450 | | | | 897,755 | |
Pilgrim’s Pride Corp. | | | 200 | | | | 4,224 | |
Pinnacle Foods, Inc. | | | 1,900 | | | | 95,323 | |
Post Holdings, Inc. (a) | | | 9,800 | | | | 756,266 | |
Tyson Foods, Inc. Class A | | | 6,600 | | | | 492,822 | |
| | | | | | | | |
| | | | | | | 3,784,322 | |
| | | | | | | | |
| Health Care – Products — 4.2% | |
Alere, Inc. (a) | | | 1,300 | | | | 56,212 | |
Baxter International, Inc. | | | 18,000 | | | | 856,800 | |
Johnson & Johnson | | | 47,160 | | | | 5,571,011 | |
Medtronic PLC | | | 21,669 | | | | 1,872,202 | |
Teleflex, Inc. | | | 1,740 | | | | 292,407 | |
Zimmer Biomet Holdings, Inc. | | | 120 | | | | 15,602 | |
| | | | | | | | |
| | | | | | | 8,664,234 | |
| | | | | | | | |
| Health Care – Services — 1.2% | |
Aetna, Inc. | | | 4,631 | | | | 534,649 | |
Anthem, Inc. | | | 4,230 | | | | 530,061 | |
Cigna Corp. | | | 80 | | | | 10,426 | |
DaVita, Inc. (a) | | | 2,500 | | | | 165,175 | |
DENTSPLY SIRONA, Inc. | | | 2,200 | | | | 130,746 | |
HCA Holdings, Inc. (a) | | | 5,900 | | | | 446,217 | |
LifePoint Health, Inc. (a) | | | 300 | | | | 17,769 | |
Quest Diagnostics, Inc. | | | 700 | | | | 59,241 | |
Thermo Fisher Scientific, Inc. | | | 1,620 | | | | 257,677 | |
UnitedHealth Group, Inc. | | | 2,370 | | | | 331,800 | |
WellCare Health Plans, Inc. (a) | | | 390 | | | | 45,665 | |
| | | | | | | | |
| | | | | | | 2,529,426 | |
| | | | | | | | |
| Household Products — 0.2% | |
Avery Dennison Corp. | | | 2,300 | | | | 178,917 | |
The Clorox Co. | | | 960 | | | | 120,173 | |
Kimberly-Clark Corp. | | | 270 | | | | 34,058 | |
| | | | | | | | |
| | | | | | | 333,148 | |
| | | | | | | | |
The accompanying notes are an integral part of the financial statements.
172
MassMutual Premier Disciplined Value Fund – Portfolio of Investments (Continued)
| | | | | | | | |
| | | Number of
Shares | | | Value | |
| Pharmaceuticals — 5.7% | |
Abbott Laboratories | | | 15,700 | | | $ | 663,953 | |
Allergan PLC (a) | | | 830 | | | | 191,157 | |
Cardinal Health, Inc. | | | 2,700 | | | | 209,790 | |
Endo International PLC (a) | | | 38,400 | | | | 773,760 | |
Express Scripts Holding Co. (a) | | | 10,800 | | | | 761,724 | |
Mallinckrodt PLC (a) | | | 9,060 | | | | 632,207 | |
Mead Johnson Nutrition Co. | | | 2,900 | | | | 229,129 | |
Merck & Co., Inc. | | | 59,428 | | | | 3,708,902 | |
Mylan NV (a) | | | 23,200 | | | | 884,384 | |
Pfizer, Inc. | | | 100,313 | | | | 3,397,601 | |
Quintiles Transnational Holdings, Inc. (a) | | | 2,500 | | | | 202,650 | |
United Therapeutics Corp. (a) | | | 550 | | | | 64,944 | |
VWR Corp. (a) | | | 1,800 | | | | 51,048 | |
| | | | | | | | |
| | | | | | | 11,771,249 | |
| | | | | | | | |
| | | | | | | 33,949,201 | |
| | | | | | | | |
| Energy — 10.9% | |
| Energy – Alternate Sources — 0.1% | |
First Solar, Inc. (a) | | | 5,400 | | | | 213,246 | |
| | | | | | | | |
| Oil & Gas — 8.8% | |
Apache Corp. | | | 1,328 | | | | 84,819 | |
Chevron Corp. | | | 29,175 | | | | 3,002,691 | |
ConocoPhillips | | | 2,848 | | | | 123,803 | |
Devon Energy Corp. | | | 6,450 | | | | 284,509 | |
Diamond Offshore Drilling, Inc. | | | 5,800 | | | | 102,138 | |
Ensco PLC Class A | | | 53,600 | | | | 455,600 | |
EQT Corp. | | | 500 | | | | 36,310 | |
Exxon Mobil Corp. | | | 86,190 | | | | 7,522,663 | |
Helmerich & Payne, Inc. | | | 7,700 | | | | 518,210 | |
Hess Corp. | | | 6,800 | | | | 364,616 | |
Marathon Oil Corp. | | | 22,800 | | | | 360,468 | |
Marathon Petroleum Corp. | | | 18,240 | | | | 740,362 | |
Murphy Oil Corp. | | | 6,100 | | | | 185,440 | |
Murphy USA, Inc. (a) | | | 8,200 | | | | 585,152 | |
Nabors Industries Ltd. | | | 23,400 | | | | 284,544 | |
Noble Corp. PLC | | | 8,500 | | | | 53,890 | |
Noble Energy, Inc. | | | 80 | | | | 2,859 | |
Occidental Petroleum Corp. | | | 6,230 | | | | 454,292 | |
PBF Energy, Inc. Class A | | | 26,800 | | | | 606,752 | |
QEP Resources, Inc. | | | 27,700 | | | | 540,981 | |
Rowan Cos. PLC Class A | | | 29,200 | | | | 442,672 | |
Tesoro Corp. | | | 2,650 | | | | 210,834 | |
Valero Energy Corp. | | | 16,064 | | | | 851,392 | |
Whiting Petroleum Corp. (a) | | | 33,700 | | | | 294,538 | |
WPX Energy, Inc. (a) | | | 66 | | | | 871 | |
| | | | | | | | |
| | | | | | | 18,110,406 | |
| | | | | | | | |
| Oil & Gas Services — 1.9% | |
Baker Hughes, Inc. | | | 2,603 | | | | 131,373 | |
Frank’s International NV | | | 21,400 | | | | 278,200 | |
Halliburton Co. | | | 10,100 | | | | 453,288 | |
| | | | | | | | |
| | | Number of
Shares | | | Value | |
HollyFrontier Corp. | | | 23,400 | | | $ | 573,300 | |
National Oilwell Varco, Inc. | | | 7,400 | | | | 271,876 | |
Oceaneering International, Inc. | | | 10,000 | | | | 275,100 | |
Schlumberger Ltd. | | | 6,740 | | | | 530,034 | |
Superior Energy Services, Inc. | | | 27,300 | | | | 488,670 | |
Targa Resources Corp. | | | 900 | | | | 44,199 | |
Transocean Ltd. | | | 69,100 | | | | 736,606 | |
| | | | | | | | |
| | | | | | | 3,782,646 | |
| | | | | | | | |
| Pipelines — 0.1% | |
National Fuel Gas Co. | | | 1,150 | | | | 62,180 | |
Spectra Energy Corp. | | | 3,000 | | | | 128,250 | |
| | | | | | | | |
| | | | | | | 190,430 | |
| | | | | | | | |
| | | | | | | 22,296,728 | |
| | | | | | | | |
| Financial — 28.0% | |
| Banks — 8.0% | |
Associated Banc-Corp. | | | 7,350 | | | | 143,986 | |
Bank of America Corp. | | | 208,373 | | | | 3,261,037 | |
Bank of Hawaii Corp. | | | 820 | | | | 59,548 | |
The Bank of New York Mellon Corp. | | | 8,350 | | | | 332,998 | |
BB&T Corp. | | | 16,119 | | | | 608,009 | |
Capital One Financial Corp. | | | 9,350 | | | | 671,610 | |
Citizens Financial Group, Inc. | | | 23,700 | | | | 585,627 | |
Commerce Bancshares, Inc. | | | 4,111 | | | | 202,508 | |
East West Bancorp, Inc. | | | 1,500 | | | | 55,065 | |
Fifth Third Bancorp | | | 25,760 | | | | 527,050 | |
First Horizon National Corp. | | | 6,616 | | | | 100,762 | |
First Republic Bank | | | 2,600 | | | | 200,486 | |
Huntington Bancshares, Inc. | | | 7,871 | | | | 77,608 | |
KeyCorp | | | 34,596 | | | | 421,033 | |
M&T Bank Corp. | | | 5 | | | | 581 | |
PacWest Bancorp | | | 3,800 | | | | 163,058 | |
The PNC Financial Services Group, Inc. | | | 11,636 | | | | 1,048,287 | |
Popular, Inc. | | | 15,100 | | | | 577,122 | |
Regions Financial Corp. | | | 56,860 | | | | 561,208 | |
State Street Corp. | | | 9,800 | | | | 682,374 | |
SunTrust Banks, Inc. | | | 13,300 | | | | 582,540 | |
SVB Financial Group (a) | | | 70 | | | | 7,738 | |
Synovus Financial Corp. | | | 6,571 | | | | 213,755 | |
TCF Financial Corp. | | | 37,600 | | | | 545,576 | |
U.S. Bancorp | | | 25,990 | | | | 1,114,711 | |
Wells Fargo & Co. | | | 72,510 | | | | 3,210,743 | |
Zions Bancorp | | | 13,050 | | | | 404,811 | |
| | | | | | | | |
| | | | | | | 16,359,831 | |
| | | | | | | | |
| Commercial Services — 0.1% | |
CoreLogic, Inc. (a) | | | 5,600 | | | | 219,632 | |
| | | | | | | | |
| Diversified Financial — 7.8% | |
Air Lease Corp. | | | 8,600 | | | | 245,788 | |
Ally Financial, Inc. | | | 14,300 | | | | 278,421 | |
American Express Co. | | | 17,400 | | | | 1,114,296 | |
Ameriprise Financial, Inc. | | | 60 | | | | 5,986 | |
The accompanying notes are an integral part of the financial statements.
173
MassMutual Premier Disciplined Value Fund – Portfolio of Investments (Continued)
| | | | | | | | |
| | | Number of
Shares | | | Value | |
CIT Group, Inc. | | | 1,900 | | | $ | 68,970 | |
Citigroup, Inc. | | | 65,371 | | | | 3,087,472 | |
CME Group, Inc. | | | 2,660 | | | | 278,023 | |
Discover Financial Services | | | 5,500 | | | | 311,025 | |
E*TRADE Financial Corp. (a) | | | 10,500 | | | | 305,760 | |
FNF Group | | | 2,557 | | | | 94,379 | |
Franklin Resources, Inc. | | | 9,800 | | | | 348,586 | |
The Goldman Sachs Group, Inc. | | | 9,780 | | | | 1,577,221 | |
Intercontinental Exchange, Inc. | | | 7 | | | | 1,886 | |
JP Morgan Chase & Co. | | | 71,727 | | | | 4,776,301 | |
MasterCard, Inc. Class A | | | 3,600 | | | | 366,372 | |
Morgan Stanley | | | 37,100 | | | | 1,189,426 | |
Nasdaq, Inc. | | | 3,000 | | | | 202,620 | |
Navient Corp. | | | 71,700 | | | | 1,037,499 | |
Raymond James Financial, Inc. | | | 1,900 | | | | 110,599 | |
Santander Consumer USA Holdings, Inc. (a) | | | 36,000 | | | | 437,760 | |
SLM Corp. (a) | | | 8,000 | | | | 59,760 | |
Synchrony Financial | | | 7,200 | | | | 201,600 | |
| | | | | | | | |
| | | | | | | 16,099,750 | |
| | | | | | | | |
| Diversified Financial Services — 0.1% | |
Voya Financial, Inc. | | | 4,200 | | | | 121,044 | |
| | | | | | | | |
| Insurance — 6.8% | |
Aflac, Inc. | | | 9,200 | | | | 661,204 | |
Alleghany Corp. (a) | | | 85 | | | | 44,627 | |
Allied World Assurance Co Holdings AG | | | 11,960 | | | | 483,423 | |
The Allstate Corp. | | | 5,000 | | | | 345,900 | |
American Financial Group, Inc. | | | 1,300 | | | | 97,500 | |
American International Group, Inc. | | | 21,702 | | | | 1,287,797 | |
American National Insurance Co. | | | 390 | | | | 47,564 | |
AmTrust Financial Services, Inc. | | | 18,000 | | | | 482,940 | |
Arch Capital Group Ltd. (a) | | | 4,100 | | | | 324,966 | |
Aspen Insurance Holdings Ltd. | | | 600 | | | | 27,954 | |
Assurant, Inc. | | | 190 | | | | 17,528 | |
Assured Guaranty Ltd. | | | 31,400 | | | | 871,350 | |
Axis Capital Holdings Ltd. | | | 2,600 | | | | 141,258 | |
Berkshire Hathaway, Inc. Class B (a) | | | 22,150 | | | | 3,200,010 | |
Chubb Ltd. | | | 3,481 | | | | 437,388 | |
Cincinnati Financial Corp. | | | 2,820 | | | | 212,684 | |
Endurance Specialty Holdings Ltd. | | | 1,600 | | | | 104,720 | |
Everest Re Group Ltd. | | | 1,560 | | | | 296,353 | |
First American Financial Corp. | | | 3,400 | | | | 133,552 | |
The Hanover Insurance Group, Inc. | | | 300 | | | | 22,626 | |
The Hartford Financial Services Group, Inc. | | | 90 | | | | 3,854 | |
Lincoln National Corp. | | | 6,298 | | | | 295,880 | |
Loews Corp. | | | 2,820 | | | | 116,043 | |
Markel Corp. (a) | | | 5 | | | | 4,644 | |
Marsh & McLennan Cos., Inc. | | | 300 | | | | 20,175 | |
Mercury General Corp. | | | 90 | | | | 4,937 | |
MetLife, Inc. | | | 11,940 | | | | 530,494 | |
| | | | | | | | |
| | | Number of
Shares | | | Value | |
Old Republic International Corp. | | | 11,700 | | | $ | 206,154 | |
Principal Financial Group, Inc. | | | 7,000 | | | | 360,570 | |
ProAssurance Corp. | | | 1,900 | | | | 99,712 | |
The Progressive Corp. | | | 800 | | | | 25,200 | |
Prudential Financial, Inc. | | | 7,500 | | | | 612,375 | |
Reinsurance Group of America, Inc. | | | 4,590 | | | | 495,445 | |
RenaissanceRe Holdings Ltd. | | | 440 | | | | 52,870 | |
Torchmark Corp. | | | 890 | | | | 56,862 | |
The Travelers Cos., Inc. | | | 5,799 | | | | 664,275 | |
Unum Group | | | 18,900 | | | | 667,359 | |
Validus Holdings Ltd. | | | 1,300 | | | | 64,766 | |
W.R. Berkley Corp. | | | 900 | | | | 51,984 | |
White Mountains Insurance Group Ltd. | | | 33 | | | | 27,390 | |
XL Group Ltd. | | | 9,550 | | | | 321,167 | |
| | | | | | | | |
| | | | | | | 13,923,500 | |
| | | | | | | | |
| Real Estate — 0.0% | |
WP Carey, Inc. | | | 100 | | | | 6,453 | |
| | | | | | | | |
| Real Estate Investment Trusts (REITS) — 5.2% | |
Alexandria Real Estate Equities, Inc. | | | 1,600 | | | | 174,032 | |
American Campus Communities, Inc. | | | 100 | | | | 5,087 | |
American Capital Agency Corp. | | | 25,300 | | | | 494,362 | |
Annaly Capital Management, Inc. | | | 26,460 | | | | 277,830 | |
Apartment Investment & Management Co. Class A | | | 5,700 | | | | 261,687 | |
Apple Hospitality REIT, Inc. | | | 2,600 | | | | 48,126 | |
AvalonBay Communities, Inc. | | | 1,464 | | | | 260,358 | |
Boston Properties, Inc. | | | 1,050 | | | | 143,104 | |
Brandywine Realty Trust | | | 2,000 | | | | 31,240 | |
Camden Property Trust | | | 7,800 | | | | 653,172 | |
Care Capital Properties, Inc. | | | 1,200 | | | | 34,200 | |
Chimera Investment Corp. | | | 32,420 | | | | 517,099 | |
Communications Sales & Leasing, Inc. (a) | | | 72 | | | | 2,262 | |
Corporate Office Properties Trust | | | 2,700 | | | | 76,545 | |
Corrections Corporation of America | | | 32,205 | | | | 446,683 | |
DCT Industrial Trust, Inc. | | | 1,300 | | | | 63,115 | |
Duke Realty Corp. | | | 9,600 | | | | 262,368 | |
EPR Properties | | | 3,400 | | | | 267,716 | |
Equity Commonwealth (a) | | | 2,167 | | | | 65,487 | |
Equity Residential | | | 7,600 | | | | 488,908 | |
Essex Property Trust, Inc. | | | 523 | | | | 116,472 | |
HCP, Inc. | | | 7,800 | | | | 296,010 | |
Highwoods Properties, Inc. | | | 3,400 | | | | 177,208 | |
Hospitality Properties Trust | | | 4,540 | | | | 134,929 | |
Host Hotels & Resorts, Inc. | | | 13,503 | | | | 210,242 | |
Kilroy Realty Corp. | | | 3,100 | | | | 214,985 | |
Kimco Realty Corp. | | | 6,100 | | | | 176,595 | |
Liberty Property Trust | | | 1,770 | | | | 71,419 | |
The Macerich Co. | | | 3,982 | | | | 322,024 | |
MFA Financial, Inc. | | | 101,300 | | | | 757,724 | |
Mid-America Apartment Communities, Inc. | | | 100 | | | | 9,399 | |
The accompanying notes are an integral part of the financial statements.
174
MassMutual Premier Disciplined Value Fund – Portfolio of Investments (Continued)
| | | | | | | | |
| | | Number of
Shares | | | Value | |
National Retail Properties, Inc. | | | 300 | | | $ | 15,255 | |
Omega Healthcare Investors, Inc. | | | 4,700 | | | | 166,615 | |
Piedmont Office Realty Trust, Inc. Class A | | | 22,100 | | | | 481,117 | |
Post Properties, Inc. | | | 300 | | | | 19,839 | |
Prologis, Inc. | | | 8,985 | | | | 481,057 | |
Rayonier, Inc. | | | 5,400 | | | | 143,316 | |
Realty Income Corp. | | | 2,700 | | | | 180,711 | |
Retail Properties of America, Inc. Class A | | | 4,200 | | | | 70,560 | |
Senior Housing Properties Trust | | | 400 | | | | 9,084 | |
Spirit Realty Capital, Inc. | | | 16,100 | | | | 214,613 | |
Starwood Property Trust, Inc. | | | 6,400 | | | | 144,128 | |
Tanger Factory Outlet Centers, Inc. | | | 6,500 | | | | 253,240 | |
Two Harbors Investment Corp. | | | 66,300 | | | | 565,539 | |
Ventas, Inc. | | | 3,300 | | | | 233,079 | |
Vornado Realty Trust | | | 138 | | | | 13,967 | |
Weingarten Realty Investors | | | 4,400 | | | | 171,512 | |
Welltower, Inc. | | | 7,100 | | | | 530,867 | |
| | | | | | | | |
| | | | | | | 10,754,887 | |
| | | | | | | | |
| Savings & Loans — 0.0% | |
New York Community Bancorp, Inc. | | | 90 | | | | 1,281 | |
People’s United Financial, Inc. | | | 4,200 | | | | 66,444 | |
| | | | | | | | |
| | | | | | | 67,725 | |
| | | | | | | | |
| | | | | | | 57,552,822 | |
| | | | | | | | |
| Industrial — 10.9% | |
| Aerospace & Defense — 1.5% | |
General Dynamics Corp. | | | 1,170 | | | | 181,537 | |
Harris Corp. | | | 2,638 | | | | 241,667 | |
L-3 Communications Holdings, Inc. | | | 2,150 | | | | 324,069 | |
Northrop Grumman Corp. | | | 810 | | | | 173,300 | |
Raytheon Co. | | | 1,400 | | | | 190,582 | |
Spirit AeroSystems Holdings, Inc. Class A (a) | | | 11,700 | | | | 521,118 | |
United Technologies Corp. | | | 13,470 | | | | 1,368,552 | |
| | | | | | | | |
| | | | | | | 3,000,825 | |
| | | | | | | | |
| Airlines — 0.3% | |
United Continental Holdings, Inc. (a) | | | 13,900 | | | | 729,333 | |
| | | | | | | | |
| Building Materials — 0.6% | |
Lennox International, Inc. | | | 600 | | | | 94,218 | |
Martin Marietta Materials, Inc. | | | 30 | | | | 5,373 | |
Masco Corp. | | | 10,500 | | | | 360,255 | |
Owens Corning, Inc. | | | 9,800 | | | | 523,222 | |
USG Corp. (a) | | | 6,500 | | | | 168,025 | |
| | | | | | | | |
| | | | | | | 1,151,093 | |
| | | | | | | | |
| Electrical Components & Equipment — 0.5% | |
Emerson Electric Co. | | | 4,400 | | | | 239,844 | |
Energizer Holdings, Inc. | | | 16,400 | | | | 819,344 | |
| | | | | | | | |
| | | | | | | 1,059,188 | |
| | | | | | | | |
| | | | | | | | |
| | | Number of
Shares | | | Value | |
| Electronics — 0.8% | |
Agilent Technologies, Inc. | | | 5,000 | | | $ | 235,450 | |
Arrow Electronics, Inc. (a) | | | 3,800 | | | | 243,086 | |
Avnet, Inc. | | | 3,600 | | | | 147,816 | |
Dolby Laboratories, Inc. Class A | | | 6,200 | | | | 336,598 | |
Fortive Corp. | | | 1,400 | | | | 71,260 | |
Garmin Ltd. | | | 6,900 | | | | 331,959 | |
Gentex Corp. | | | 3,100 | | | | 54,436 | |
Jabil Circuit, Inc. | | | 2,400 | | | | 52,368 | |
Johnson Controls International PLC | | | 3,629 | | | | 168,857 | |
PerkinElmer, Inc. | | | 510 | | | | 28,616 | |
Trimble Navigation Ltd. (a) | | | 500 | | | | 14,280 | |
| | | | | | | | |
| | | | | | | 1,684,726 | |
| | | | | | | | |
| Engineering & Construction — 0.9% | |
AECOM (a) | | | 16,511 | | | | 490,872 | |
Chicago Bridge & Iron Co. NV | | | 5,800 | | | | 162,574 | |
Fluor Corp. | | | 6,200 | | | | 318,184 | |
Jacobs Engineering Group, Inc. (a) | | | 11,800 | | | | 610,296 | |
KBR, Inc. | | | 15,400 | | | | 233,002 | |
| | | | | | | | |
| | | | | | | 1,814,928 | |
| | | | | | | | |
| Environmental Controls — 0.1% | |
Republic Services, Inc. | | | 3,290 | | | | 165,981 | |
Waste Management, Inc. | | | 2,340 | | | | 149,198 | |
| | | | | | | | |
| | | | | | | 315,179 | |
| | | | | | | | |
| Hand & Machine Tools — 0.1% | |
Lincoln Electric Holdings, Inc. | | | 600 | | | | 37,572 | |
Stanley Black & Decker, Inc. | | | 1,635 | | | | 201,072 | |
| | | | | | | | |
| | | | | | | 238,644 | |
| | | | | | | | |
| Machinery – Construction & Mining — 0.7% | |
Caterpillar, Inc. | | | 10,800 | | | | 958,716 | |
Ingersoll-Rand PLC | | | 700 | | | | 47,558 | |
Terex Corp. | | | 13,800 | | | | 350,658 | |
| | | | | | | | |
| | | | | | | 1,356,932 | |
| | | | | | | | |
| Machinery – Diversified — 0.9% | |
AGCO Corp. | | | 9,270 | | | | 457,196 | |
Cummins, Inc. | | | 5,850 | | | | 749,678 | |
Deere & Co. | | | 6,100 | | | | 520,635 | |
IDEX Corp. | | | 100 | | | | 9,357 | |
Roper Technologies, Inc. | | | 160 | | | | 29,195 | |
Xylem, Inc. | | | 1,700 | | | | 89,165 | |
| | | | | | | | |
| | | | | | | 1,855,226 | |
| | | | | | | | |
| Manufacturing — 3.5% | |
Carlisle Cos., Inc. | | | 1,000 | | | | 102,570 | |
Colfax Corp. (a) | | | 400 | | | | 12,572 | |
Crane Co. | | | 20 | | | | 1,260 | |
Danaher Corp. | | | 2,400 | | | | 188,136 | |
Dover Corp. | | | 1,000 | | | | 73,640 | |
Eaton Corp. PLC | | | 9,972 | | | | 655,260 | |
General Electric Co. | | | 175,590 | | | | 5,200,976 | |
Parker Hannifin Corp. | | | 3,430 | | | | 430,568 | |
The accompanying notes are an integral part of the financial statements.
175
MassMutual Premier Disciplined Value Fund – Portfolio of Investments (Continued)
| | | | | | | | |
| | | Number of
Shares | | | Value | |
Pentair PLC | | | 319 | | | $ | 20,493 | |
Trinity Industries, Inc. | | | 20,400 | | | | 493,272 | |
| | | | | | | | |
| | | | | | | 7,178,747 | |
| | | | | | | | |
| Metal Fabricate & Hardware — 0.3% | |
The Timken Co. | | | 14,900 | | | | 523,586 | |
Valmont Industries, Inc. | | | 780 | | | | 104,965 | |
| | | | | | | | |
| | | | | | | 628,551 | |
| | | | | | | | |
| Packaging & Containers — 0.1% | |
Bemis Co., Inc. | | | 2,160 | | | | 110,182 | |
Graphic Packaging Holding Co. | | | 1,400 | | | | 19,586 | |
WestRock Co. | | | 40 | | | | 1,939 | |
| | | | | | | | |
| | | | | | | 131,707 | |
| | | | | | | | |
| Shipbuilding — 0.2% | |
Huntington Ingalls Industries, Inc. | | | 2,980 | | | | 457,192 | |
| | | | | | | | |
| Transportation — 0.4% | |
CSX Corp. | | | 4,900 | | | | 149,450 | |
Expeditors International of Washington, Inc. | | | 3,400 | | | | 175,168 | |
FedEx Corp. | | | 220 | | | | 38,430 | |
Ryder System, Inc. | | | 390 | | | | 25,720 | |
Union Pacific Corp. | | | 4,600 | | | | 448,638 | |
| | | | | | | | |
| | | | | | | 837,406 | |
| | | | | | | | |
| | | | | | | 22,439,677 | |
| | | | | | | | |
| Technology — 9.2% | |
| Computers — 2.8% | |
Amdocs Ltd. | | | 3,000 | | | | 173,550 | |
Apple, Inc. | | | 7,460 | | | | 843,353 | |
Brocade Communications Systems, Inc. | | | 61,800 | | | | 570,414 | |
Computer Sciences Corp. | | | 70 | | | | 3,655 | |
Hewlett Packard Enterprise Co. | | | 43,100 | | | | 980,525 | |
HP, Inc. | | | 43,900 | | | | 681,767 | |
International Business Machines Corp. | | | 4,950 | | | | 786,307 | |
Lexmark International, Inc. Class A | | | 14,400 | | | | 575,424 | |
NetApp, Inc. | | | 17,200 | | | | 616,104 | |
Synopsys, Inc. (a) | | | 6,500 | | | | 385,775 | |
Western Digital Corp. | | | 3,636 | | | | 212,597 | |
| | | | | | | | |
| | | | | | | 5,829,471 | |
| | | | | | | | |
| Office Equipment/Supplies — 0.3% | |
Xerox Corp. | | | 54,156 | | | | 548,600 | |
| | | | | | | | |
| Semiconductors — 3.8% | |
Analog Devices, Inc. | | | 4,600 | | | | 296,470 | |
Applied Materials, Inc. | | | 14,300 | | | | 431,145 | |
Broadcom Ltd. | | | 327 | | | | 56,414 | |
Cree, Inc. (a) | | | 7,900 | | | | 203,188 | |
Intel Corp. | | | 76,000 | | | | 2,869,000 | |
Lam Research Corp. | | | 7,452 | | | | 705,779 | |
Linear Technology Corp. | | | 2,200 | | | | 130,438 | |
Micron Technology, Inc. (a) | | | 16,600 | | | | 295,148 | |
| | | | | | | | |
| | | Number of
Shares | | | Value | |
NVIDIA Corp. | | | 600 | | | $ | 41,112 | |
QUALCOMM, Inc. | | | 30,400 | | | | 2,082,400 | |
Teradyne, Inc. | | | 6,400 | | | | 138,112 | |
Xilinx, Inc. | | | 9,000 | | | | 489,060 | |
| | | | | | | | |
| | | | | | | 7,738,266 | |
| | | | | | | | |
| Software — 2.3% | |
Allscripts Healthcare Solutions, Inc. (a) | | | 21,300 | | | | 280,521 | |
ANSYS, Inc. (a) | | | 1,400 | | | | 129,654 | |
CA, Inc. | | | 19,090 | | | | 631,498 | |
The Dun & Bradstreet Corp. | | | 2,610 | | | | 356,578 | |
Fidelity National Information Services, Inc. | | | 1,400 | | | | 107,842 | |
Leidos Holdings, Inc. | | | 12,950 | | | | 560,476 | |
Nuance Communications, Inc. (a) | | | 19,500 | | | | 282,750 | |
Oracle Corp. | | | 49,700 | | | | 1,952,216 | |
VMware, Inc. Class A (a) | | | 4,900 | | | | 359,415 | |
| | | | | | | | |
| | | | | | | 4,660,950 | |
| | | | | | | | |
| | | | | | | 18,777,287 | |
| | | | | | | | |
| Utilities — 5.2% | |
| Electric — 4.8% | |
The AES Corp. | | | 17,700 | | | | 227,445 | |
Alliant Energy Corp. | | | 2,600 | | | | 99,606 | |
Ameren Corp. | | | 1,160 | | | | 57,049 | |
American Electric Power Co., Inc. | | | 7,830 | | | | 502,764 | |
Calpine Corp. (a) | | | 4,400 | | | | 55,616 | |
CenterPoint Energy, Inc. | | | 2,200 | | | | 51,106 | |
CMS Energy Corp. | | | 10,500 | | | | 441,105 | |
Consolidated Edison, Inc. | | | 4,160 | | | | 313,248 | |
Dominion Resources, Inc. | | | 1,300 | | | | 96,551 | |
DTE Energy Co. | | | 4,210 | | | | 394,351 | |
Duke Energy Corp. | | | 11,314 | | | | 905,572 | |
Edison International | | | 4,880 | | | | 352,580 | |
Entergy Corp. | | | 9,200 | | | | 705,916 | |
Eversource Energy | | | 2,381 | | | | 129,003 | |
Exelon Corp. | | | 30,875 | | | | 1,027,829 | |
FirstEnergy Corp. | | | 3,527 | | | | 116,673 | |
Great Plains Energy, Inc. | | | 12,537 | | | | 342,135 | |
Hawaiian Electric Industries, Inc. | | | 2,800 | | | | 83,580 | |
NextEra Energy, Inc. | | | 6,370 | | | | 779,178 | |
NRG Energy, Inc. | | | 42,800 | | | | 479,788 | |
PG&E Corp. | | | 2,130 | | | | 130,292 | |
Pinnacle West Capital Corp. | | | 960 | | | | 72,950 | |
PPL Corp. | | | 18,000 | | | | 622,260 | |
Public Service Enterprise Group, Inc. | | | 7,600 | | | | 318,212 | |
SCANA Corp. | | | 2,520 | | | | 182,372 | |
The Southern Co. | | | 15,550 | | | | 797,715 | |
WEC Energy Group, Inc. | | | 3,720 | | | | 222,754 | |
Westar Energy, Inc. | | | 200 | | | | 11,350 | |
Xcel Energy, Inc. | | | 9,720 | | | | 399,881 | |
| | | | | | | | |
| | | | | | | 9,918,881 | |
| | | | | | | | |
The accompanying notes are an integral part of the financial statements.
176
MassMutual Premier Disciplined Value Fund – Portfolio of Investments (Continued)
| | | | | | | | |
| | | Number of
Shares | | | Value | |
| Gas — 0.4% | |
Atmos Energy Corp. | | | 1,350 | | | $ | 100,535 | |
NiSource, Inc. | | | 3,290 | | | | 79,322 | |
Sempra Energy | | | 2,320 | | | | 248,681 | |
UGI Corp. | | | 8,035 | | | | 363,503 | |
Vectren Corp. | | | 150 | | | | 7,530 | |
| | | | | | | | |
| | | | | | | 799,571 | |
| | | | | | | | |
| Water — 0.0% | |
Aqua America, Inc. | | | 25 | | | | 762 | |
| | | | | | | | |
| | | | | | $ | 10,719,214 | |
| | | | | | | | |
| | |
TOTAL COMMON STOCK
(Cost $194,752,097) | | | | | | | 204,736,459 | |
| | | | | | | | |
| | |
TOTAL EQUITIES
(Cost $194,752,097) | | | | | | | 204,736,459 | |
| | | | | | | | |
|
| RIGHTS — 0.0% | |
| Consumer, Cyclical — 0.0% | |
| Retail — 0.0% | |
Safeway Casa Ley Contingent Value (a) (b) | | | 9,300 | | | | 9,393 | |
Safeway PDC, LLC Contingent Value (a) (b) | | | 9,300 | | | | 465 | |
| | | | | | | | |
| | | | | | | 9,858 | |
| | | | | | | | |
| | |
TOTAL RIGHTS
(Cost $9,858) | | | | | | | 9,858 | |
| | | | | | | | |
| | |
TOTAL LONG-TERM INVESTMENTS
(Cost $194,761,955) | | | | | | | 204,746,317 | |
| | | | | | | | |
| | |
| | | Principal
Amount | | | | |
| SHORT-TERM INVESTMENTS — 0.1% | |
| Repurchase Agreement — 0.1% | |
State Street Bank & Trust Co. Repurchase Agreement, dated 9/30/16, 0.010%, due 10/03/16 (c) | | $ | 256,130 | | | | 256,130 | |
| | | | | | | | |
| Time Deposit — 0.0% | |
Euro Time Deposit
0.010% 10/03/16 | | | 3,009 | | | | 3,009 | |
| | | | | | | | |
| | |
TOTAL SHORT-TERM INVESTMENTS
(Cost $259,139) | | | | | | | 259,139 | |
| | | | | | | | |
| | |
TOTAL INVESTMENTS — 99.8%
(Cost $195,021,094) (d) | | | | | | | 205,005,456 | |
| | |
| Other Assets/(Liabilities) — 0.2% | | | | | | | 465,119 | |
| | | | | | | | |
| | |
| NET ASSETS — 100.0% | | | | | | $ | 205,470,575 | |
| | | | | | | | |
Notes to Portfolio of Investments
Percentages are stated as a percent of net assets.
| (a) | Non-income producing security. |
| (b) | This security is fair valued in good faith in accordance with procedures approved by the Board of Trustees. At September 30, 2016, these securities amounted to a value of $9,858 or 0.00% of net assets. |
| (c) | Maturity value of $256,130. Collateralized by U.S. Government Agency obligations with a rate of 1.500%, maturity date of 11/30/19, and an aggregate market value, including accrued interest, of $266,175. |
| (d) | See Note 6 for aggregate cost for federal tax purposes. |
The accompanying notes are an integral part of the financial statements.
177
MassMutual Premier Main Street Fund – Portfolio of Investments
September 30, 2016
| | | | | | | | |
| | | Number of
Shares | | | Value | |
| EQUITIES — 98.7% | |
|
| COMMON STOCK — 98.7% | |
| Basic Materials — 2.2% | |
| Chemicals — 1.5% | |
E.I. du Pont de Nemours & Co. | | | 12,460 | | | $ | 834,446 | |
PPG Industries, Inc. | | | 9,944 | | | | 1,027,812 | |
| | | | | | | | |
| | | | | | | 1,862,258 | |
| | | | | | | | |
| Mining — 0.7% | |
Vulcan Materials Co. | | | 7,225 | | | | 821,699 | |
| | | | | | | | |
| | | | | | | 2,683,957 | |
| | | | | | | | |
| Communications — 15.1% | |
| Advertising — 1.2% | |
Nielsen Holdings PLC | | | 27,300 | | | | 1,462,461 | |
| | | | | | | | |
| Internet — 7.7% | |
Alphabet, Inc. Class C (a) | | | 7,465 | | | | 5,802,470 | |
Amazon.com, Inc. (a) | | | 1,459 | | | | 1,221,635 | |
Facebook, Inc. Class A (a) | | | 18,166 | | | | 2,330,153 | |
| | | | | | | | |
| | | | | | | 9,354,258 | |
| | | | | | | | |
| Media — 3.4% | |
Comcast Corp. Class A | | | 61,751 | | | | 4,096,561 | |
| | | | | | | | |
| Telecommunications — 2.8% | |
Cisco Systems, Inc. | | | 29,450 | | | | 934,154 | |
Verizon Communications, Inc. | | | 48,350 | | | | 2,513,233 | |
| | | | | | | | |
| | | | | | | 3,447,387 | |
| | | | | | | | |
| | | | | | | 18,360,667 | |
| | | | | | | | |
| Consumer, Cyclical — 6.0% | |
| Automotive & Parts — 0.6% | |
Delphi Automotive PLC | | | 10,534 | | | | 751,285 | |
| | | | | | | | |
| Retail — 5.4% | |
AutoZone, Inc. (a) | | | 1,775 | | | | 1,363,803 | |
CarMax, Inc. (a) | | | 7,611 | | | | 406,047 | |
The Home Depot, Inc. | | | 19,741 | | | | 2,540,272 | |
McDonald’s Corp. | | | 19,457 | | | | 2,244,560 | |
| | | | | | | | |
| | | | | | | 6,554,682 | |
| | | | | | | | |
| | | | | | | 7,305,967 | |
| | | | | | | | |
| Consumer, Non-cyclical — 26.3% | |
| Agriculture — 2.6% | |
Philip Morris International, Inc. | | | 32,811 | | | | 3,189,885 | |
| | | | | | | | |
| Beverages — 2.8% | |
PepsiCo, Inc. | | | 30,797 | | | | 3,349,790 | |
| | | | | | | | |
| Biotechnology — 1.0% | |
Celgene Corp. (a) | | | 11,122 | | | | 1,162,583 | |
| | | | | | | | |
| Commercial Services — 3.4% | |
McKesson Corp. | | | 7,473 | | | | 1,246,123 | |
PayPal Holdings, Inc. (a) | | | 40,767 | | | | 1,670,224 | |
S&P Global, Inc. | | | 9,670 | | | | 1,223,835 | |
| | | | | | | | |
| | | | | | | 4,140,182 | |
| | | | | | | | |
| | | | | | | | |
| | | Number of
Shares | | | Value | |
| Foods — 5.1% | |
The Kraft Heinz Co. | | | 30,680 | | | $ | 2,746,167 | |
Mondelez International, Inc. Class A | | | 79,501 | | | | 3,490,094 | |
| | | | | | | | |
| | | | | | | 6,236,261 | |
| | | | | | | | |
| Health Care – Products — 3.8% | |
Boston Scientific Corp. (a) | | | 61,483 | | | | 1,463,295 | |
Johnson & Johnson | | | 19,450 | | | | 2,297,629 | |
Stryker Corp. | | | 7,480 | | | | 870,747 | |
| | | | | | | | |
| | | | | | | 4,631,671 | |
| | | | | | | | |
| Health Care – Services — 2.6% | |
Humana, Inc. | | | 5,442 | | | | 962,635 | |
UnitedHealth Group, Inc. | | | 15,959 | | | | 2,234,260 | |
| | | | | | | | |
| | | | | | | 3,196,895 | |
| | | | | | | | |
| Pharmaceuticals — 5.0% | |
Express Scripts Holding Co. (a) | | | 34,979 | | | | 2,467,069 | |
Merck & Co., Inc. | | | 36,761 | | | | 2,294,254 | |
Mylan NV (a) | | | 21,938 | | | | 836,276 | |
Valeant Pharmaceuticals International, Inc. (a) (b) | | | 16,416 | | | | 403,013 | |
| | | | | | | | |
| | | | | | | 6,000,612 | |
| | | | | | | | |
| | | | | | | 31,907,879 | |
| | | | | | | | |
| Energy — 6.4% | |
| Oil & Gas — 4.7% | |
Chevron Corp. | | | 29,923 | | | | 3,079,675 | |
Noble Energy, Inc. | | | 29,401 | | | | 1,050,792 | |
Suncor Energy, Inc. | | | 58,668 | | | | 1,629,797 | |
| | | | | | | | |
| | | | | | | 5,760,264 | |
| | | | | | | | |
| Oil & Gas Services — 0.5% | |
HollyFrontier Corp. | | | 23,262 | | | | 569,919 | |
| | | | | | | | |
| Pipelines — 1.2% | |
Magellan Midstream Partners LP | | | 21,019 | | | | 1,486,884 | |
| | | | | | | | |
| | | | | | | 7,817,067 | |
| | | | | | | | |
| Financial — 17.9% | |
| Banks — 3.7% | |
The Bank of New York Mellon Corp. | | | 42,017 | | | | 1,675,638 | |
SunTrust Banks, Inc. | | | 32,918 | | | | 1,441,808 | |
U.S. Bancorp | | | 32,216 | | | | 1,381,744 | |
| | | | | | | | |
| | | | | | | 4,499,190 | |
| | | | | | | | |
| Diversified Financial — 7.3% | |
American Express Co. | | | 14,802 | | | | 947,920 | |
Citigroup, Inc. | | | 69,855 | | | | 3,299,252 | |
CME Group, Inc. | | | 28,065 | | | | 2,933,354 | |
Discover Financial Services | | | 29,268 | | | | 1,655,105 | |
| | | | | | | | |
| | | | | | | 8,835,631 | |
| | | | | | | | |
| Insurance — 5.3% | |
Berkshire Hathaway, Inc. Class B (a) | | | 22,660 | | | | 3,273,690 | |
Marsh & McLennan Cos., Inc. | | | 12,553 | | | | 844,189 | |
The accompanying notes are an integral part of the financial statements.
178
MassMutual Premier Main Street Fund – Portfolio of Investments (Continued)
| | | | | | | | |
| | | Number of
Shares | | | Value | |
MetLife, Inc. | | | 20,580 | | | $ | 914,370 | |
The Progressive Corp. | | | 44,820 | | | | 1,411,830 | |
| | | | | | | | |
| | | | | | | 6,444,079 | |
| | | | | | | | |
| Real Estate Investment Trusts (REITS) — 1.6% | |
Mid-America Apartment Communities, Inc. | | | 9,726 | | | | 914,147 | |
Simon Property Group, Inc. | | | 4,900 | | | | 1,014,349 | |
| | | | | | | | |
| | | | | | | 1,928,496 | |
| | | | | | | | |
| | | | | | | 21,707,396 | |
| | | | | | | | |
| Industrial — 11.5% | |
| Aerospace & Defense — 1.8% | |
Lockheed Martin Corp. | | | 4,923 | | | | 1,180,142 | |
United Technologies Corp. | | | 10,459 | | | | 1,062,634 | |
| | | | | | | | |
| | | | | | | 2,242,776 | |
| | | | | | | | |
| Electronics — 1.7% | |
Agilent Technologies, Inc. | | | 12,844 | | | | 604,824 | |
Johnson Controls International PLC | | | 31,084 | | | | 1,446,339 | |
| | | | | | | | |
| | | | | | | 2,051,163 | |
| | | | | | | | |
| Environmental Controls — 1.0% | |
Republic Services, Inc. | | | 10,114 | | | | 510,251 | |
Waste Connections, Inc. | | | 9,837 | | | | 734,824 | |
| | | | | | | | |
| | | | | | | 1,245,075 | |
| | | | | | | | |
| Machinery – Diversified — 1.1% | |
Deere & Co. (b) | | | 16,116 | | | | 1,375,501 | |
| | | | | | | | |
| Manufacturing — 4.0% | |
General Electric Co. | | | 163,216 | | | | 4,834,458 | |
| | | | | | | | |
| Transportation — 1.9% | |
Canadian National Railway Co. (b) | | | 16,230 | | | | 1,061,442 | |
Canadian Pacific Railway Ltd. | | | 7,989 | | | | 1,219,920 | |
| | | | | | | | |
| | | | | | | 2,281,362 | |
| | | | | | | | |
| | | | | | | 14,030,335 | |
| | | | | | | | |
| Technology — 10.5% | |
| Computers — 8.2% | |
Amdocs Ltd. | | | 35,019 | | | | 2,025,849 | |
Apple, Inc. | | | 60,542 | | | | 6,844,273 | |
Western Digital Corp. | | | 18,128 | | | | 1,059,944 | |
| | | | | | | | |
| | | | | | | 9,930,066 | |
| | | | | | | | |
| Office Equipment/Supplies — 0.7% | |
Xerox Corp. | | | 89,130 | | | | 902,887 | |
| | | | | | | | |
| Semiconductors — 0.9% | |
Applied Materials, Inc. | | | 35,553 | | | | 1,071,923 | |
| | | | | | | | |
| Software — 0.7% | |
Cerner Corp. (a) | | | 14,785 | | | | 912,974 | |
| | | | | | | | |
| | | | | | | 12,817,850 | |
| | | | | | | | |
| Utilities — 2.8% | |
| Electric — 2.2% | |
PG&E Corp. | | | 43,570 | | | | 2,665,177 | |
| | | | | | | | |
| | | | | | | | |
| | | Number of
Shares | | | Value | |
| Gas — 0.6% | |
AmeriGas Partners LP | | | 16,405 | | | $ | 749,052 | |
| | | | | | | | |
| | | | | | | 3,414,229 | |
| | | | | | | | |
| | |
TOTAL COMMON STOCK
(Cost $108,408,164) | | | | | | | 120,045,347 | |
| | | | | | | | |
| | |
TOTAL EQUITIES
(Cost $108,408,164) | | | | | | | 120,045,347 | |
| | | | | | | | |
|
| MUTUAL FUNDS — 2.4% | |
| Diversified Financial — 2.4% | |
State Street Navigator Securities Lending Prime Portfolio (c) | | | 2,854,304 | | | | 2,854,304 | |
| | | | | | | | |
| | |
TOTAL MUTUAL FUNDS
(Cost $2,854,304) | | | | | | | 2,854,304 | |
| | | | | | | | |
| | |
TOTAL LONG-TERM INVESTMENTS
(Cost $111,262,468) | | | | | | | 122,899,651 | |
| | | | | | | | |
| | |
| | | Principal
Amount | | | | |
| SHORT-TERM INVESTMENTS — 1.6% | |
| Repurchase Agreement — 1.6% | |
State Street Bank & Trust Co. Repurchase Agreement, dated 9/30/16, 0.010%, due 10/03/16 (d) | | $ | 1,981,632 | | | | 1,981,632 | |
| | | | | | | | |
| | |
TOTAL SHORT-TERM INVESTMENTS
(Cost $1,981,632) | | | | | | | 1,981,632 | |
| | | | | | | | |
| | |
TOTAL INVESTMENTS — 102.7%
(Cost $113,244,100) (e) | | | | | | | 124,881,283 | |
| | |
| Other Assets/(Liabilities) — (2.7)% | | | | | | | (3,312,509 | ) |
| | | | | | | | |
| | |
| NET ASSETS — 100.0% | | | | | | $ | 121,568,774 | |
| | | | | | | | |
Notes to Portfolio of Investments
Percentages are stated as a percent of net assets.
| (a) | Non-income producing security. |
| (b) | Denotes all or a portion of security on loan. The total value of securities on loan as of September 30, 2016, was $2,791,340 or 2.30% of net assets. Total securities on loan may not correspond with the amounts identified in the Portfolio of Investments because pending sales may be in the process of recall from the brokers. (Note 2). |
| (c) | Represents investment of security lending collateral. (Note 2). |
| (d) | Maturity value of $1,981,634. Collateralized by U.S. Government Agency obligations with a rate of 2.125%, maturity date of 9/30/21, and an aggregate market value, including accrued interest, of $2,021,677. |
| (e) | See Note 6 for aggregate cost for federal tax purposes. |
The accompanying notes are an integral part of the financial statements.
179
MassMutual Premier Disciplined Growth Fund – Portfolio of Investments
September 30, 2016
| | | | | | | | |
| | | Number of
Shares | | | Value | |
| EQUITIES — 99.1% | |
|
| COMMON STOCK — 99.1% | |
| Basic Materials — 2.5% | |
| Chemicals — 2.3% | |
Air Products & Chemicals, Inc. | | | 5,840 | | | $ | 877,986 | |
Celanese Corp. Series A | | | 20,790 | | | | 1,383,782 | |
The Dow Chemical Co. | | | 400 | | | | 20,732 | |
E.I. du Pont de Nemours & Co. | | | 34,600 | | | | 2,317,162 | |
Eastman Chemical Co. | | | 2,196 | | | | 148,625 | |
Ecolab, Inc. | | | 7,698 | | | | 937,001 | |
FMC Corp. | | | 5,300 | | | | 256,202 | |
LyondellBasell Industries NV Class A | | | 10,670 | | | | 860,642 | |
Monsanto Co. | | | 10,830 | | | | 1,106,826 | |
PPG Industries, Inc. | | | 2,540 | | | | 262,534 | |
| | | | | | | | |
| | | | | | | 8,171,492 | |
| | | | | | | | |
| Iron & Steel — 0.2% | |
Steel Dynamics, Inc. | | | 36,200 | | | | 904,638 | |
| | | | | | | | |
| Mining — 0.0% | |
Southern Copper Corp. | | | 2 | | | | 53 | |
| | | | | | | | |
| | | | | | | 9,076,183 | |
| | | | | | | | |
| Communications — 17.2% | |
| Advertising — 0.7% | |
Clear Channel Outdoor Holdings, Inc. Class A | | | 87,000 | | | | 508,080 | |
The Interpublic Group of Companies, Inc. | | | 11,400 | | | | 254,790 | |
Nielsen Holdings PLC | | | 12,000 | | | | 642,840 | |
Omnicom Group, Inc. | | | 12,000 | | | | 1,020,000 | |
| | | | | | | | |
| | | | | | | 2,425,710 | |
| | | | | | | | |
| Internet — 10.4% | |
Alphabet, Inc. Class A (a) | | | 10,089 | | | | 8,112,161 | |
Alphabet, Inc. Class C (a) | | | 9,359 | | | | 7,274,657 | |
Amazon.com, Inc. (a) | | | 8,661 | | | | 7,251,942 | |
CDW Corp. | | | 3,400 | | | | 155,482 | |
eBay, Inc. (a) | | | 62,030 | | | | 2,040,787 | |
Equinix, Inc. | | | 7 | | | | 2,522 | |
Expedia, Inc. | | | 3,322 | | | | 387,744 | |
F5 Networks, Inc. (a) | | | 8,710 | | | | 1,085,614 | |
Facebook, Inc. Class A (a) | | | 53,110 | | | | 6,812,420 | |
FireEye, Inc. (a) | | | 700 | | | | 10,311 | |
GoDaddy, Inc. Class A (a) | | | 1,600 | | | | 55,248 | |
Groupon, Inc. (a) | | | 45,400 | | | | 233,810 | |
IAC/InterActiveCorp | | | 1,400 | | | | 87,458 | |
Liberty Interactive Corp. QVC Group (a) | | | 22,100 | | | | 442,221 | |
Liberty Ventures Series A (a) | | | 70 | | | | 2,791 | |
Netflix, Inc. (a) | | | 17 | | | | 1,675 | |
The Priceline Group, Inc. (a) | | | 1,235 | | | | 1,817,290 | |
Rackspace Hosting, Inc. (a) | | | 3,200 | | | | 101,408 | |
| | | | | | | | |
| | | Number of
Shares | | | Value | |
Symantec Corp. | | | 48,300 | | | $ | 1,212,330 | |
VeriSign, Inc. (a) | | | 1,140 | | | | 89,194 | |
| | | | | | | | |
| | | | | | | 37,177,065 | |
| | | | | | | | |
| Media — 4.2% | |
AMC Networks, Inc. Class A (a) | | | 9,700 | | | | 503,042 | |
CBS Corp. Class B | | | 13,800 | | | | 755,412 | |
Charter Communications, Inc. Class A (a) | | | 1,170 | | | | 315,865 | |
Comcast Corp. Class A | | | 68,300 | | | | 4,531,022 | |
Discovery Communications, Inc. Series A (a) | | | 37,300 | | | | 1,004,116 | |
Discovery Communications, Inc. Series C (a) | | | 36,700 | | | | 965,577 | |
DISH Network Corp. Class A (a) | | | 17,700 | | | | 969,606 | |
Scripps Networks Interactive Class A | | | 15,500 | | | | 984,095 | |
Sirius XM Holdings, Inc. (a) | | | 162,300 | | | | 676,791 | |
Starz Class A (a) | | | 19,200 | | | | 598,848 | |
Time Warner, Inc. | | | 11,700 | | | | 931,437 | |
Tribune Media Co. Class A | | | 24,000 | | | | 876,480 | |
Twenty-First Century Fox, Inc. Class A | | | 11,900 | | | | 288,218 | |
Viacom, Inc. Class B | | | 9,500 | | | | 361,950 | |
The Walt Disney Co. | | | 15,840 | | | | 1,470,902 | |
| | | | | | | | |
| | | | | | | 15,233,361 | |
| | | | | | | | |
| Telecommunications — 1.9% | |
Arista Networks, Inc. (a) | | | 1,200 | | | | 102,096 | |
ARRIS International PLC (a) | | | 23,200 | | | | 657,256 | |
CommScope Holding Co., Inc. (a) | | | 1,000 | | | | 30,110 | |
Motorola Solutions, Inc. | | | 19,800 | | | | 1,510,344 | |
T-Mobile US, Inc. (a) | | | 10,000 | | | | 467,200 | |
Verizon Communications, Inc. | | | 76,200 | | | | 3,960,876 | |
| | | | | | | | |
| | | | | | | 6,727,882 | |
| | | | | | | | |
| | | | | | | 61,564,018 | |
| | | | | | | | |
| Consumer, Cyclical — 14.4% | |
| Airlines — 1.1% | |
Alaska Air Group, Inc. | | | 16,600 | | | | 1,093,276 | |
Delta Air Lines, Inc. | | | 23,400 | | | | 921,024 | |
JetBlue Airways Corp. (a) | | | 61,600 | | | | 1,061,984 | |
Southwest Airlines Co. | | | 21,800 | | | | 847,802 | |
| | | | | | | | |
| | | | | | | 3,924,086 | |
| | | | | | | | |
| Apparel — 1.1% | |
Carter’s, Inc. | | | 100 | | | | 8,671 | |
Michael Kors Holdings Ltd. (a) | | | 30,900 | | | | 1,445,811 | |
Nike, Inc. Class B | | | 16,180 | | | | 851,877 | |
Ralph Lauren Corp. | | | 15,210 | | | | 1,538,339 | |
Skechers U.S.A., Inc. Class A (a) | | | 10 | | | | 229 | |
VF Corp. | | | 400 | | | | 22,420 | |
| | | | | | | | |
| | | | | | | 3,867,347 | |
| | | | | | | | |
The accompanying notes are an integral part of the financial statements.
180
MassMutual Premier Disciplined Growth Fund – Portfolio of Investments (Continued)
| | | | | | | | |
| | | Number of
Shares | | | Value | |
| Auto Manufacturers — 0.2% | |
PACCAR, Inc. | | | 11,900 | | | $ | 699,482 | |
| | | | | | | | |
| Automotive & Parts — 0.7% | |
BorgWarner, Inc. | | | 80 | | | | 2,814 | |
Delphi Automotive PLC | | | 3,800 | | | | 271,016 | |
Lear Corp. | | | 8,400 | | | | 1,018,248 | |
Visteon Corp. | | | 15,550 | | | | 1,114,313 | |
| | | | | | | | |
| | | | | | | 2,406,391 | |
| | | | | | | | |
| Distribution & Wholesale — 0.1% | |
Genuine Parts Co. | | | 2,600 | | | | 261,170 | |
HD Supply Holdings, Inc. (a) | | | 4,100 | | | | 131,118 | |
| | | | | | | | |
| | | | | | | 392,288 | |
| | | | | | | | |
| Entertainment — 0.2% | |
Cinemark Holdings, Inc. | | | 8,700 | | | | 333,036 | |
The Madison Square Garden Co. Class A (a) | | | 3 | | | | 508 | |
Regal Entertainment Group Class A | | | 20,500 | | | | 445,875 | |
Six Flags Entertainment Corp. | | | 1,000 | | | | 53,610 | |
| | | | | | | | |
| | | | | | | 833,029 | |
| | | | | | | | |
| Home Builders — 0.1% | |
D.R. Horton, Inc. | | | 6,900 | | | | 208,380 | |
Lennar Corp. | | | 200 | | | | 6,714 | |
Thor Industries, Inc. | | | 1,600 | | | | 135,520 | |
| | | | | | | | |
| | | | | | | 350,614 | |
| | | | | | | | |
| Home Furnishing — 0.5% | |
Harman International Industries, Inc. | | | 1,590 | | | | 134,276 | |
Tempur Sealy International, Inc. (a) | | | 5,600 | | | | 317,744 | |
Whirlpool Corp. | | | 8,090 | | | | 1,311,874 | |
| | | | | | | | |
| | | | | | | 1,763,894 | |
| | | | | | | | |
| Household Products — 0.3% | |
Tupperware Brands Corp. | | | 14,800 | | | | 967,476 | |
| | | | | | | | |
| Housewares — 0.1% | |
Newell Brands, Inc. | | | 64 | | | | 3,370 | |
The Toro Co. | | | 6,360 | | | | 297,903 | |
| | | | | | | | |
| | | | | | | 301,273 | |
| | | | | | | | |
| Leisure Time — 0.5% | |
Brunswick Corp. | | | 21,400 | | | | 1,043,892 | |
Harley-Davidson, Inc. | | | 5,500 | | | | 289,245 | |
Polaris Industries, Inc. | | | 8,700 | | | | 673,728 | |
| | | | | | | | |
| | | | | | | 2,006,865 | |
| | | | | | | | |
| Lodging — 1.6% | |
Choice Hotels International, Inc. | | | 29,700 | | | | 1,338,876 | |
Hyatt Hotels Corp. Class A (a) | | | 22,100 | | | | 1,087,762 | |
Marriott International, Inc. Class A | | | 15,207 | | | | 1,023,887 | |
MGM Resorts International (a) | | | 1,000 | | | | 26,030 | |
Wyndham Worldwide Corp. | | | 26,300 | | | | 1,770,779 | |
Wynn Resorts Ltd. | | | 4,420 | | | | 430,597 | |
| | | | | | | | |
| | | | | | | 5,677,931 | |
| | | | | | | | |
| | | | | | | | |
| | | Number of
Shares | | | Value | |
| Retail — 7.7% | |
AutoNation, Inc. (a) | | | 2,500 | | | $ | 121,775 | |
AutoZone, Inc. (a) | | | 468 | | | | 359,583 | |
Brinker International, Inc. | | | 2,200 | | | | 110,946 | |
Burlington Stores, Inc. (a) | | | 1,500 | | | | 121,530 | |
Cabela’s, Inc. (a) | | | 100 | | | | 5,493 | |
Casey’s General Stores, Inc. | | | 40 | | | | 4,806 | |
Chipotle Mexican Grill, Inc. (a) | | | 3 | | | | 1,271 | |
Coach, Inc. | | | 37,009 | | | | 1,353,049 | |
Costco Wholesale Corp. | | | 9,510 | | | | 1,450,370 | |
CVS Health Corp. | | | 32,050 | | | | 2,852,129 | |
Darden Restaurants, Inc. | | | 8,300 | | | | 508,956 | |
Dollar General Corp. | | | 1,500 | | | | 104,985 | |
Dollar Tree, Inc. (a) | | | 27 | | | | 2,131 | |
Domino’s Pizza, Inc. | | | 2,890 | | | | 438,847 | |
Dunkin’ Brands Group, Inc. | | | 3,800 | | | | 197,904 | |
Foot Locker, Inc. | | | 5,700 | | | | 386,004 | |
The Gap, Inc. | | | 53,900 | | | | 1,198,736 | |
The Home Depot, Inc. | | | 36,810 | | | | 4,736,711 | |
L Brands, Inc. | | | 3,500 | | | | 247,695 | |
Lowe’s Cos., Inc. | | | 31,800 | | | | 2,296,278 | |
Macy’s, Inc. | | | 2,100 | | | | 77,805 | |
McDonald’s Corp. | | | 20,480 | | | | 2,362,573 | |
The Michaels Cos., Inc. (a) | | | 7,800 | | | | 188,526 | |
Nordstrom, Inc. | | | 26,300 | | | | 1,364,444 | |
Nu Skin Enterprises, Inc. Class A | | | 18,530 | | | | 1,200,373 | |
O’Reilly Automotive, Inc. (a) | | | 1,150 | | | | 322,127 | |
Panera Bread Co. Class A (a) | | | 970 | | | | 188,878 | |
Ross Stores, Inc. | | | 5,560 | | | | 357,508 | |
Starbucks Corp. | | | 11,800 | | | | 638,852 | |
Target Corp. | | | 2,900 | | | | 199,172 | |
The TJX Cos., Inc. | | | 14,120 | | | | 1,055,894 | |
Urban Outfitters, Inc. (a) | | | 45,800 | | | | 1,581,016 | |
Walgreens Boots Alliance, Inc. | | | 3,400 | | | | 274,108 | |
The Wendy’s Co. | | | 3,000 | | | | 32,400 | |
Williams-Sonoma, Inc. | | | 15,900 | | | | 812,172 | |
Yum! Brands, Inc. | | | 7,940 | | | | 721,031 | |
| | | | | | | | |
| | | | | | | 27,876,078 | |
| | | | | | | | |
| Textiles — 0.1% | |
Cintas Corp. | | | 2,600 | | | | 292,760 | |
| | | | | | | | |
| Toys, Games & Hobbies — 0.1% | |
Hasbro, Inc. | | | 4,370 | | | | 346,672 | |
| | | | | | | | |
| | | | | | | 51,706,186 | |
| | | | | | | | |
| Consumer, Non-cyclical — 25.2% | |
| Agriculture — 0.6% | |
Altria Group, Inc. | | | 25,570 | | | | 1,616,791 | |
Philip Morris International, Inc. | | | 5,070 | | | | 492,905 | |
Reynolds American, Inc. | | | 4,880 | | | | 230,092 | |
| | | | | | | | |
| | | | | | | 2,339,788 | |
| | | | | | | | |
| Beverages — 2.4% | |
Brown-Forman Corp. Class B | | | 14 | | | | 664 | |
The accompanying notes are an integral part of the financial statements.
181
MassMutual Premier Disciplined Growth Fund – Portfolio of Investments (Continued)
| | | | | | | | |
| | | Number of
Shares | | | Value | |
The Coca-Cola Co. | | | 51,660 | | | $ | 2,186,251 | |
Coca-Cola European Partners PLC | | | 600 | | | | 23,940 | |
Constellation Brands, Inc. Class A | | | 2,810 | | | | 467,837 | |
Dr. Pepper Snapple Group, Inc. | | | 6,300 | | | | 575,253 | |
Monster Beverage Corp. (a) | | | 1,550 | | | | 227,556 | |
PepsiCo, Inc. | | | 47,053 | | | | 5,117,955 | |
| | | | | | | | |
| | | | | | | 8,599,456 | |
| | | | | | | | |
| Biotechnology — 4.1% | |
Amgen, Inc. | | | 34,430 | | | | 5,743,268 | |
Biogen, Inc. (a) | | | 5,890 | | | | 1,843,747 | |
Celgene Corp. (a) | | | 12,130 | | | | 1,267,949 | |
Charles River Laboratories International, Inc. (a) | | | 8,900 | | | | 741,726 | |
Gilead Sciences, Inc. | | | 64,720 | | | | 5,120,646 | |
| | | | | | | | |
| | | | 14,717,336 | |
| | | | | | | | |
| Commercial Services — 3.5% | |
Automatic Data Processing, Inc. | | | 80 | | | | 7,056 | |
Booz Allen Hamilton Holding Corp. | | | 2,800 | | | | 88,508 | |
Equifax, Inc. | | | 2,390 | | | | 321,646 | |
Euronet Worldwide, Inc. (a) | | | 1,800 | | | | 147,294 | |
FleetCor Technologies, Inc. (a) | | | 750 | | | | 130,298 | |
Gartner, Inc. (a) | | | 3,900 | | | | 344,955 | |
Genpact Ltd. (a) | | | 4,500 | | | | 107,775 | |
Global Payments, Inc. | | | 5,140 | | | | 394,546 | |
IHS Markit Ltd. (a) | | | 10,349 | | | | 388,605 | |
KAR Auction Services, Inc. | | | 4,400 | | | | 189,904 | |
Live Nation Entertainment, Inc. (a) | | | 2,500 | | | | 68,700 | |
McKesson Corp. | | | 10,380 | | | | 1,730,865 | |
Paychex, Inc. | | | 5,200 | | | | 300,924 | |
Quanta Services, Inc. (a) | | | 31,700 | | | | 887,283 | |
RR Donnelley & Sons Co. | | | 70,300 | | | | 1,105,116 | |
S&P Global, Inc. | | | 4,770 | | | | 603,691 | |
Sabre Corp. | | | 3,600 | | | | 101,448 | |
ServiceMaster Global Holdings, Inc. (a) | | | 4,600 | | | | 154,928 | |
Square, Inc. Class A (a) | | | 19,600 | | | | 228,536 | |
Total System Services, Inc. | | | 2,700 | | | | 127,305 | |
United Rentals, Inc. (a) | | | 16,070 | | | | 1,261,334 | |
Vantiv, Inc. Class A (a) | | | 2,300 | | | | 129,421 | |
Verisk Analytics, Inc. (a) | | | 200 | | | | 16,256 | |
Visa, Inc. Class A | | | 22,520 | | | | 1,862,404 | |
The Western Union Co. | | | 79,220 | | | | 1,649,361 | |
WEX, Inc. (a) | | | 3,270 | | | | 353,454 | |
| | | | | | | | |
| | | | 12,701,613 | |
| | | | | | | | |
| Cosmetics & Personal Care — 0.3% | |
Colgate-Palmolive Co. | | | 2,680 | | | | 198,695 | |
The Estee Lauder Cos., Inc. Class A | | | 8,860 | | | | 784,642 | |
| | | | | | | | |
| | | | 983,337 | |
| | | | | | | | |
| Foods — 2.5% | |
Campbell Soup Co. | | | 1,700 | | | | 92,990 | |
ConAgra Foods, Inc. | | | 14,700 | | | | 692,517 | |
| | | | | | | | |
| | | Number of
Shares | | | Value | |
Flowers Foods, Inc. | | | 700 | | | $ | 10,584 | |
General Mills, Inc. | | | 22,660 | | | | 1,447,521 | |
The Hershey Co. | | | 900 | | | | 86,040 | |
Hormel Foods Corp. | | | 10,000 | | | | 379,300 | |
Ingredion, Inc. | | | 6,700 | | | | 891,502 | |
Kellogg Co. | | | 8,740 | | | | 677,088 | |
The Kraft Heinz Co. | | | 2,366 | | | | 211,781 | |
The Kroger Co. | | | 19,220 | | | | 570,449 | |
McCormick & Co., Inc. | | | 2,400 | | | | 239,808 | |
Pilgrim’s Pride Corp. | | | 200 | | | | 4,224 | |
Post Holdings, Inc. (a) | | | 20,100 | | | | 1,551,117 | |
Sysco Corp. | | | 21,600 | | | | 1,058,616 | |
Tyson Foods, Inc. Class A | | | 12,600 | | | | 940,842 | |
The WhiteWave Foods Co. (a) | | | 23 | | | | 1,252 | |
| | | | | | | | |
| | | | | | | 8,855,631 | |
| | | | | | | | |
| Health Care – Products — 3.2% | |
Alere, Inc. (a) | | | 600 | | | | 25,944 | |
Align Technology, Inc. (a) | | | 3,600 | | | | 337,500 | |
Baxter International, Inc. | | | 29,120 | | | | 1,386,112 | |
Becton, Dickinson & Co. | | | 3,310 | | | | 594,906 | |
Boston Scientific Corp. (a) | | | 34,100 | | | | 811,580 | |
Bruker Corp. | | | 3,700 | | | | 83,805 | |
C.R. Bard, Inc. | | | 700 | | | | 156,996 | |
Edwards Lifesciences Corp. (a) | | | 7,200 | | | | 868,032 | |
Henry Schein, Inc. (a) | | | 90 | | | | 14,668 | |
Hill-Rom Holdings, Inc. | | | 2,200 | | | | 136,356 | |
Hologic, Inc. (a) | | | 11,800 | | | | 458,194 | |
IDEXX Laboratories, Inc. (a) | | | 5,600 | | | | 631,288 | |
Intuitive Surgical, Inc. (a) | | | 916 | | | | 663,944 | |
Johnson & Johnson | | | 29,170 | | | | 3,445,852 | |
ResMed, Inc. | | | 5,900 | | | | 382,261 | |
St. Jude Medical, Inc. | | | 1,440 | | | | 114,855 | |
Stryker Corp. | | | 2,970 | | | | 345,738 | |
Teleflex, Inc. | | | 3,400 | | | | 571,370 | |
Varian Medical Systems, Inc. (a) | | | 5,000 | | | | 497,650 | |
| | | | | | | | |
| | | | | | | 11,527,051 | |
| | | | | | | | |
| Health Care – Services — 2.8% | |
Aetna, Inc. | | | 3,330 | | | | 384,449 | |
Amsurg Corp. (a) | | | 8,400 | | | | 563,220 | |
Anthem, Inc. | | | 5,120 | | | | 641,587 | |
Centene Corp. (a) | | | 6,611 | | | | 442,673 | |
Cigna Corp. | | | 70 | | | | 9,122 | |
DaVita, Inc. (a) | | | 11,660 | | | | 770,376 | |
DENTSPLY SIRONA, Inc. | | | 512 | | | | 30,428 | |
HCA Holdings, Inc. (a) | | | 15,200 | | | | 1,149,576 | |
Humana, Inc. | | | 5,070 | | | | 896,832 | |
Laboratory Corporation of America Holdings (a) | | | 1,677 | | | | 230,554 | |
MEDNAX, Inc. (a) | | | 100 | | | | 6,625 | |
Premier, Inc. Class A (a) | | | 29,400 | | | | 950,796 | |
Tenet Healthcare Corp. (a) | | | 22,100 | | | | 500,786 | |
Thermo Fisher Scientific, Inc. | | | 2,890 | | | | 459,683 | |
The accompanying notes are an integral part of the financial statements.
182
MassMutual Premier Disciplined Growth Fund – Portfolio of Investments (Continued)
| | | | | | | | |
| | | Number of
Shares | | | Value | |
UnitedHealth Group, Inc. | | | 15,140 | | | $ | 2,119,600 | |
Universal Health Services, Inc. Class B | | | 530 | | | | 65,307 | |
WellCare Health Plans, Inc. (a) | | | 6,260 | | | | 732,984 | |
| | | | | | | | |
| | | | | | | 9,954,598 | |
| | | | | | | | |
| Household Products — 0.4% | |
Avery Dennison Corp. | | | 5,200 | | | | 404,508 | |
Church & Dwight Co., Inc. | | | 2,820 | | | | 135,134 | |
The Clorox Co. | | | 2,790 | | | | 349,252 | |
Kimberly-Clark Corp. | | | 4,640 | | | | 585,290 | |
| | | | | | | | |
| | | | | | | 1,474,184 | |
| | | | | | | | |
| Pharmaceuticals — 5.4% | |
AbbVie, Inc. | | | 94,683 | | | | 5,971,657 | |
AmerisourceBergen Corp. | | | 10,060 | | | | 812,647 | |
Bristol-Myers Squibb Co. | | | 49,800 | | | | 2,685,216 | |
Cardinal Health, Inc. | | | 9,800 | | | | 761,460 | |
Eli Lilly & Co. | | | 9,000 | | | | 722,340 | |
Express Scripts Holding Co. (a) | | | 27,580 | | | | 1,945,217 | |
Herbalife Ltd. (a) | | | 22,880 | | | | 1,418,331 | |
Mead Johnson Nutrition Co. | | | 10,500 | | | | 829,605 | |
Mylan NV (a) | | | 35,100 | | | | 1,338,012 | |
Pfizer, Inc. | | | 23,000 | | | | 779,010 | |
Quintiles Transnational Holdings, Inc. (a) | | | 2,000 | | | | 162,120 | |
United Therapeutics Corp. (a) | | | 9,120 | | | | 1,076,890 | |
VCA, Inc. (a) | | | 1,100 | | | | 76,978 | |
VWR Corp. (a) | | | 6,200 | | | | 175,832 | |
Zoetis, Inc. | | | 9,800 | | | | 509,698 | |
| | | | | | | | |
| | | | | | | 19,265,013 | |
| | | | | | | | |
| | | | | | | 90,418,007 | |
| | | | | | | | |
| Energy — 0.6% | |
| Oil & Gas — 0.5% | |
Apache Corp. | | | 4,700 | | | | 300,189 | |
Continental Resources, Inc. (a) | | | 40 | | | | 2,078 | |
EOG Resources, Inc. | | | 90 | | | | 8,704 | |
Murphy USA, Inc. (a) | | | 14,300 | | | | 1,020,448 | |
Southwestern Energy Co. (a) | | | 48,700 | | | | 674,008 | |
| | | | | | | | |
| | | | | | | 2,005,427 | |
| | | | | | | | |
| Oil & Gas Services — 0.1% | |
FMC Technologies, Inc. (a) | | | 8,800 | | | | 261,096 | |
Schlumberger Ltd. | | | 70 | | | | 5,505 | |
| | | | | | | | |
| | | | | | | 266,601 | |
| | | | | | | | |
| | | | | | | 2,272,028 | |
| | | | | | | | |
| Financial — 6.6% | |
| Banks — 0.5% | |
Citizens Financial Group, Inc. | | | 38,700 | | | | 956,277 | |
First Republic Bank | | | 7,200 | | | | 555,192 | |
Signature Bank (a) | | | 2,090 | | | | 247,560 | |
SVB Financial Group (a) | | | 40 | | | | 4,422 | |
Western Alliance Bancorp (a) | | | 1,300 | | | | 48,802 | |
| | | | | | | | |
| | | | | | | 1,812,253 | |
| | | | | | | | |
| | | | | | | | |
| | | Number of
Shares | | | Value | |
| Commercial Services — 0.1% | |
CoreLogic, Inc. (a) | | | 10,100 | | | $ | 396,122 | |
| | | | | | | | |
| Diversified Financial — 2.6% | |
Affiliated Managers Group, Inc. (a) | | | 1,400 | | | | 202,580 | |
Air Lease Corp. | | | 27,600 | | | | 788,808 | |
American Express Co. | | | 1,200 | | | | 76,848 | |
Ameriprise Financial, Inc. | | | 1,930 | | | | 192,556 | |
Artisan Partners Asset Management, Inc. Class A | | | 300 | | | | 8,160 | |
The Charles Schwab Corp. | | | 22,700 | | | | 716,639 | |
Credit Acceptance Corp. (a) | | | 3,100 | | | | 623,317 | |
Discover Financial Services | | | 21,100 | | | | 1,193,205 | |
Eaton Vance Corp. | | | 14,700 | | | | 574,035 | |
Federated Investors, Inc. Class B | | | 33,280 | | | | 986,087 | |
Intercontinental Exchange, Inc. | | | 1,090 | | | | 293,602 | |
Invesco Ltd. | | | 31,300 | | | | 978,751 | |
LPL Financial Holdings, Inc. | | | 15,400 | | | | 460,614 | |
MasterCard, Inc. Class A | | | 15,660 | | | | 1,593,718 | |
T. Rowe Price Group, Inc. | | | 4,400 | | | | 292,600 | |
TD Ameritrade Holding Corp. | | | 8,100 | | | | 285,444 | |
| | | | | | | | |
| | | | | | | 9,266,964 | |
| | | | | | | | |
| Insurance — 1.6% | |
AmTrust Financial Services, Inc. | | | 39,800 | | | | 1,067,834 | |
Aon PLC | | | 6,520 | | | | 733,435 | |
Arthur J. Gallagher & Co. | | | 3,200 | | | | 162,784 | |
Brown & Brown, Inc. | | | 15,300 | | | | 576,963 | |
Erie Indemnity Co. Class A | | | 2,290 | | | | 233,740 | |
Lincoln National Corp. | | | 21,300 | | | | 1,000,674 | |
Marsh & McLennan Cos., Inc. | | | 12,800 | | | | 860,800 | |
XL Group Ltd. | | | 36,400 | | | | 1,224,132 | |
| | | | | | | | |
| | | | | | | 5,860,362 | |
| | | | | | | | |
| Real Estate — 0.1% | |
CBRE Group, Inc. Class A (a) | | | 8,100 | | | | 226,638 | |
| | | | | | | | |
| Real Estate Investment Trusts (REITS) — 1.7% | |
American Tower Corp. | | | 7,505 | | | | 850,542 | |
Boston Properties, Inc. | | | 1,890 | | | | 257,588 | |
Care Capital Properties, Inc. | | | 3,500 | | | | 99,750 | |
Crown Castle International Corp. | | | 3,000 | | | | 282,630 | |
CubeSmart | | | 100 | | | | 2,726 | |
Digital Realty Trust, Inc. | | | 600 | | | | 58,272 | |
Equity Lifestyle Properties, Inc. | | | 2,800 | | | | 216,104 | |
Extra Space Storage, Inc. | | | 2,200 | | | | 174,702 | |
Federal Realty Investment Trust | | | 1,140 | | | | 175,480 | |
Healthcare Trust of America, Inc. Class A | | | 500 | | | | 16,310 | |
Iron Mountain, Inc. | | | 43 | | | | 1,614 | |
Lamar Advertising Co.Class A | | | 3,900 | | | | 254,709 | |
Omega Healthcare Investors, Inc. | | | 33,200 | | | | 1,176,940 | |
Public Storage | | | 1,410 | | | | 314,627 | |
Regency Centers Corp. | | | 300 | | | | 23,247 | |
Simon Property Group, Inc. | | | 3,549 | | | | 734,679 | |
The accompanying notes are an integral part of the financial statements.
183
MassMutual Premier Disciplined Growth Fund – Portfolio of Investments (Continued)
| | | | | | | | |
| | | Number of
Shares | | | Value | |
Tanger Factory Outlet Centers, Inc. | | | 20,400 | | | $ | 794,784 | |
Ventas, Inc. | | | 8,000 | | | | 565,040 | |
| | | | | | | | |
| | | | | | | 5,999,744 | |
| | | | | | | | |
| | | | | | | 23,562,083 | |
| | | | | | | | |
| Industrial — 11.5% | |
| Aerospace & Defense — 2.2% | |
The Boeing Co. | | | 29,600 | | | | 3,899,504 | |
General Dynamics Corp. | | | 470 | | | | 72,925 | |
Harris Corp. | | | 3,770 | | | | 345,370 | |
Lockheed Martin Corp. | | | 630 | | | | 151,023 | |
Northrop Grumman Corp. | | | 5,700 | | | | 1,219,515 | |
Raytheon Co. | | | 2,630 | | | | 358,022 | |
Rockwell Collins, Inc. | | | 1,400 | | | | 118,076 | |
Spirit AeroSystems Holdings, Inc. Class A (a) | | | 35,500 | | | | 1,581,170 | |
| | | | | | | | |
| | | | | | | 7,745,605 | |
| | | | | | | | |
| Building Materials — 0.6% | |
Fortune Brands Home & Security, Inc. | | | 15,200 | | | | 883,120 | |
Lennox International, Inc. | | | 2,170 | | | | 340,755 | |
Martin Marietta Materials, Inc. | | | 1,000 | | | | 179,110 | |
Masco Corp. | | | 23,500 | | | | 806,285 | |
| | | | | | | | |
| | | | | | | 2,209,270 | |
| | | | | | | | |
| Electrical Components & Equipment — 0.5% | |
AMETEK, Inc. | | | 275 | | | | 13,140 | |
Emerson Electric Co. | | | 4,210 | | | | 229,487 | |
Energizer Holdings, Inc. | | | 32,900 | | | | 1,643,684 | |
| | | | | | | | |
| | | | | | | 1,886,311 | |
| | | | | | | | |
| Electronics — 0.9% | |
Agilent Technologies, Inc. | | | 5,500 | | | | 258,995 | |
Allegion PLC | | | 11,900 | | | | 820,029 | |
Amphenol Corp. Class A | | | 500 | | | | 32,460 | |
Fortive Corp. | | | 3,760 | | | | 191,384 | |
Gentex Corp. | | | 1,920 | | | | 33,715 | |
Johnson Controls International PLC | | | 10,636 | | | | 494,893 | |
Mettler-Toledo International, Inc. (a) | | | 110 | | | | 46,182 | |
PerkinElmer, Inc. | | | 500 | | | | 28,055 | |
Trimble Navigation Ltd. (a) | | | 20 | | | | 571 | |
Waters Corp. (a) | | | 7,380 | | | | 1,169,656 | |
| | | | | | | | |
| | | | | | | 3,075,940 | |
| | | | | | | | |
| Environmental Controls — 0.2% | |
Clean Harbors, Inc. (a) | | | 200 | | | | 9,596 | |
Stericycle, Inc. (a) | | | 20 | | | | 1,603 | |
Waste Management, Inc. | | | 10,200 | | | | 650,352 | |
| | | | | | | | |
| | | | | | | 661,551 | |
| | | | | | | | |
| Hand & Machine Tools — 0.5% | |
Lincoln Electric Holdings, Inc. | | | 13,500 | | | | 845,370 | |
Snap-on, Inc. | | | 2,270 | | | | 344,949 | |
Stanley Black & Decker, Inc. | | | 5,380 | | | | 661,633 | |
| | | | | | | | |
| | | | | | | 1,851,952 | |
| | | | | | | | |
| | | | | | | | |
| | | Number of
Shares | | | Value | |
| Machinery – Construction & Mining — 0.0% | |
Ingersoll-Rand PLC | | | 1,300 | | | $ | 88,322 | |
| | | | | | | | |
| Machinery – Diversified — 1.1% | |
BWX Technologies, Inc. | | | 21,700 | | | | 832,629 | |
Cognex Corp. | | | 17,600 | | | | 930,336 | |
Cummins, Inc. | | | 370 | | | | 47,415 | |
Deere & Co. | | | 12,700 | | | | 1,083,945 | |
Flowserve Corp. | | | 90 | | | | 4,342 | |
IDEX Corp. | | | 50 | | | | 4,678 | |
Nordson Corp. | | | 2,500 | | | | 249,075 | |
Rockwell Automation, Inc. | | | 4,320 | | | | 528,509 | |
Wabtec Corp. | | | 1,230 | | | | 100,429 | |
Xylem, Inc. | | | 500 | | | | 26,225 | |
Zebra Technologies Corp. Class A (a) | | | 50 | | | | 3,481 | |
| | | | | | | | |
| | | | | | | 3,811,064 | |
| | | | | | | | |
| Manufacturing — 2.6% | |
3M Co. | | | 3,780 | | | | 666,149 | |
Carlisle Cos., Inc. | | | 5,870 | | | | 602,086 | |
Danaher Corp. | | | 7,520 | | | | 589,493 | |
General Electric Co. | | | 104,500 | | | | 3,095,290 | |
Honeywell International, Inc. | | | 23,720 | | | | 2,765,515 | |
Illinois Tool Works, Inc. | | | 10,780 | | | | 1,291,875 | |
Leggett & Platt, Inc. | | | 4,300 | | | | 195,994 | |
Textron, Inc. | | | 2,800 | | | | 111,300 | |
| | | | | | | | |
| | | | | | | 9,317,702 | |
| | | | | | | | |
| Metal Fabricate & Hardware — 0.1% | |
Valmont Industries, Inc. | | | 3,210 | | | | 431,970 | |
| | | | | | | | |
| Miscellaneous – Manufacturing — 0.1% | |
A.O. Smith Corp. | | | 5,100 | | | | 503,829 | |
| | | | | | | | |
| Packaging & Containers — 0.9% | |
Ball Corp. | | | 12,500 | | | | 1,024,375 | |
Bemis Co., Inc. | | | 700 | | | | 35,707 | |
Berry Plastics Group, Inc. (a) | | | 9,900 | | | | 434,115 | |
Crown Holdings, Inc. (a) | | | 12,900 | | | | 736,461 | |
Graphic Packaging Holding Co. | | | 8,600 | | | | 120,314 | |
Owens-Illinois, Inc. (a) | | | 3,700 | | | | 68,043 | |
Packaging Corporation of America | | | 9,200 | | | | 747,592 | |
Sealed Air Corp. | | | 3,000 | | | | 137,460 | |
| | | | | | | | |
| | | | | | | 3,304,067 | |
| | | | | | | | |
| Shipbuilding — 0.5% | |
Huntington Ingalls Industries, Inc. | | | 11,020 | | | | 1,690,688 | |
| | | | | | | | |
| Transportation — 1.3% | |
C.H. Robinson Worldwide, Inc. | | | 2,400 | | | | 169,104 | |
Expeditors International of Washington, Inc. | | | 3,500 | | | | 180,320 | |
FedEx Corp. | | | 8,410 | | | | 1,469,059 | |
Landstar System, Inc. | | | 10,660 | | | | 725,733 | |
Union Pacific Corp. | | | 7,920 | | | | 772,438 | |
United Parcel Service, Inc. Class B | | | 13,140 | | | | 1,436,990 | |
| | | | | | | | |
| | | | | | | 4,753,644 | |
| | | | | | | | |
The accompanying notes are an integral part of the financial statements.
184
MassMutual Premier Disciplined Growth Fund – Portfolio of Investments (Continued)
| | | | | | | | |
| | | Number of
Shares | | | Value | |
| Trucking & Leasing — 0.0% | |
AMERCO | | | 150 | | | $ | 48,634 | |
| | | | | | | | |
| | | | | | | 41,380,549 | |
| | | | | | | | |
| Technology — 21.0% | |
| Computers — 8.4% | |
Accenture PLC Class A | | | 5,020 | | | | 613,293 | |
Apple, Inc. | | | 166,733 | | | | 18,849,166 | |
Cadence Design Systems, Inc. (a) | | | 14,200 | | | | 362,526 | |
Cognizant Technology Solutions Corp. Class A (a) | | | 22,200 | | | | 1,059,162 | |
DST Systems, Inc. | | | 2,690 | | | | 317,205 | |
Fortinet, Inc. (a) | | | 2,500 | | | | 92,325 | |
International Business Machines Corp. | | | 32,110 | | | | 5,100,673 | |
Jack Henry & Associates, Inc. | | | 3,600 | | | | 307,980 | |
Manhattan Associates, Inc. (a) | | | 700 | | | | 40,334 | |
NCR Corp. (a) | | | 36,500 | | | | 1,174,935 | |
Synopsys, Inc. (a) | | | 11,200 | | | | 664,720 | |
Teradata Corp. (a) | | | 52,100 | | | | 1,615,100 | |
| | | | | | | | |
| | | | | | | 30,197,419 | |
| | | | | | | | |
| Office Equipment/Supplies — 0.1% | |
Pitney Bowes, Inc. | | | 17,500 | | | | 317,800 | |
| | | | | | | | |
| Semiconductors — 4.0% | |
Applied Materials, Inc. | | | 35,900 | | | | 1,082,385 | |
Broadcom Ltd. | | | 2,440 | | | | 420,949 | |
Cree, Inc. (a) | | | 400 | | | | 10,288 | |
Intel Corp. | | | 43,600 | | | | 1,645,900 | |
KLA-Tencor Corp. | | | 22,900 | | | | 1,596,359 | |
Lam Research Corp. | | | 10,300 | | | | 975,513 | |
Linear Technology Corp. | | | 5,020 | | | | 297,636 | |
Maxim Integrated Products, Inc. | | | 14,500 | | | | 578,985 | |
Microchip Technology, Inc. | | | 6,100 | | | | 379,054 | |
Micron Technology, Inc. (a) | | | 3,500 | | | | 62,230 | |
NVIDIA Corp. | | | 15,900 | | | | 1,089,468 | |
ON Semiconductor Corp. (a) | | | 9,500 | | | | 117,040 | |
Qorvo, Inc. (a) | | | 11,500 | | | | 641,010 | |
QUALCOMM, Inc. | | | 17,390 | | | | 1,191,215 | |
Skyworks Solutions, Inc. | | | 70 | | | | 5,330 | |
Texas Instruments, Inc. | | | 41,850 | | | | 2,937,033 | |
Xilinx, Inc. | | | 26,210 | | | | 1,424,251 | |
| | | | | | | | |
| | | | | | | 14,454,646 | |
| | | | | | | | |
| Software — 8.5% | |
Activision Blizzard, Inc. | | | 17,800 | | | | 788,540 | |
Adobe Systems, Inc. (a) | | | 8,620 | | | | 935,615 | |
ANSYS, Inc. (a) | | | 2,400 | | | | 222,264 | |
Autodesk, Inc. (a) | | | 50 | | | | 3,616 | |
Black Knight Financial Services, Inc. Class A (a) | | | 3,200 | | | | 130,880 | |
Broadridge Financial Solutions, Inc. | | | 2,560 | | | | 173,542 | |
Citrix Systems, Inc. (a) | | | 9,700 | | | | 826,634 | |
CommerceHub, Inc. Series A (a) | | | 7 | | | | 111 | |
CommerceHub, Inc. Series C (a) | | | 14 | | | | 223 | |
| | | | | | | | |
| | | Number of
Shares | | | Value | |
The Dun & Bradstreet Corp. | | | 9,340 | | | $ | 1,276,031 | |
Electronic Arts, Inc. (a) | | | 6,200 | | | | 529,480 | |
Fidelity National Information Services, Inc. | | | 2,200 | | | | 169,466 | |
First Data Corp. Class A (a) | | | 27,200 | | | | 357,952 | |
Fiserv, Inc. (a) | | | 5,000 | | | | 497,350 | |
IMS Health Holdings, Inc. (a) | | | 6,000 | | | | 188,040 | |
Intuit, Inc. | | | 12,070 | | | | 1,327,821 | |
Leidos Holdings, Inc. | | | 32,000 | | | | 1,384,960 | |
Microsoft Corp. | | | 299,860 | | | | 17,271,936 | |
MSCI, Inc. | | | 2,800 | | | | 235,032 | |
Nuance Communications, Inc. (a) | | | 58,500 | | | | 848,250 | |
Oracle Corp. | | | 14,300 | | | | 561,704 | |
Red Hat, Inc. (a) | | | 2,100 | | | | 169,743 | |
Salesforce.com, Inc. (a) | | | 5,440 | | | | 388,035 | |
SS&C Technologies Holdings, Inc | | | 800 | | | | 25,720 | |
Veeva Systems, Inc. Class A (a) | | | 18,400 | | | | 759,552 | |
VMware, Inc. Class A (a) | | | 18,980 | | | | 1,392,183 | |
| | | | | | | | |
| | | | | | | 30,464,680 | |
| | | | | | | | |
| | | | | | | 75,434,545 | |
| | | | | | | | |
| Utilities — 0.1% | |
| Electric — 0.1% | |
Dominion Resources, Inc. | | | 3,900 | | | | 289,653 | |
| | | | | | | | |
| | |
TOTAL COMMON STOCK
(Cost $336,539,141) | | | | | | | 355,703,252 | |
| | | | | | | | |
| | |
TOTAL EQUITIES
(Cost $336,539,141) | | | | | | | 355,703,252 | |
| | | | | | | | |
| | |
TOTAL LONG-TERM INVESTMENTS
(Cost $336,539,141) | | | | | | | 355,703,252 | |
| | | | | | | | |
| | |
| | | Principal
Amount | | | | |
| SHORT-TERM INVESTMENTS — 1.0% | |
| Repurchase Agreement — 1.0% | |
State Street Bank & Trust Co. Repurchase Agreement, dated 9/30/16, 0.010%, due 10/03/16 (b) | | $ | 3,769,361 | | | | 3,769,361 | |
| | | | | | | | |
| Time Deposit — 0.0% | |
Euro Time Deposit
0.010% 10/03/16 | | | 5,998 | | | | 5,998 | |
| | | | | | | | |
| | |
TOTAL SHORT-TERM INVESTMENTS
(Cost $3,775,359) | | | | | | | 3,775,359 | |
| | | | | | | | |
| | |
TOTAL INVESTMENTS — 100.1%
(Cost $340,314,500) (c) | | | | | | | 359,478,611 | |
| | |
| Other Assets/(Liabilities) — (0.1)% | | | | | | | (381,136 | ) |
| | | | | | | | |
| | |
| NET ASSETS — 100.0% | | | | | | $ | 359,097,475 | |
| | | | | | | | |
The accompanying notes are an integral part of the financial statements.
185
MassMutual Premier Disciplined Growth Fund – Portfolio of Investments (Continued)
Notes to Portfolio of Investments
Percentages are stated as a percent of net assets.
| (a) | Non-income producing security. |
| (b) | Maturity value of $3,769,364. Collateralized by U.S. Government Agency obligations with a rate of 3.125%, maturity date of 5/15/19, and an aggregate market value, including accrued interest, of $3,846,911. |
| (c) | See Note 6 for aggregate cost for federal tax purposes. |
The accompanying notes are an integral part of the financial statements.
186
MassMutual Premier Small Cap Opportunities Fund – Portfolio of Investments
September 30, 2016
| | | | | | | | |
| | | Number of
Shares | | | Value | |
| EQUITIES — 97.9% | |
|
| COMMON STOCK — 97.9% | |
| Basic Materials — 4.3% | |
| Chemicals — 0.7% | |
Ingevity Corp. (a) | | | 23,960 | | | $ | 1,104,556 | |
| | | | | | | | |
| Forest Products & Paper — 2.0% | |
P.H. Glatfelter Co. | | | 116,659 | | | | 2,529,167 | |
Schweitzer-Mauduit International, Inc. | | | 25,880 | | | | 997,933 | |
| | | | | | | | |
| | | | | | | 3,527,100 | |
| | | | | | | | |
| Mining — 1.6% | |
Kaiser Aluminum Corp. | | | 32,500 | | | | 2,810,925 | |
| | | | | | | | |
| | | | | | | 7,442,581 | |
| | | | | | | | |
| Communications — 1.7% | |
| Advertising — 0.4% | |
MDC Partners, Inc. Class A | | | 70,400 | | | | 754,688 | |
| | | | | | | | |
| Internet — 0.9% | |
Zynga, Inc. Class A (a) | | | 535,800 | | | | 1,559,178 | |
| | | | | | | | |
| Telecommunications — 0.4% | |
RigNet, Inc. (a) | | | 48,450 | | | | 732,564 | |
| | | | | | | | |
| | | | | | | 3,046,430 | |
| | | | | | | | |
| Consumer, Cyclical — 11.2% | |
| Airlines — 1.1% | |
Spirit Airlines, Inc. (a) | | | 45,300 | | | | 1,926,609 | |
| | | | | | | | |
| Automotive & Parts — 1.0% | |
Visteon Corp. | | | 23,840 | | | | 1,708,374 | |
| | | | | | | | |
| Entertainment — 1.5% | |
International Speedway Corp. Class A | | | 40,810 | | | | 1,363,870 | |
The Madison Square Garden Co. Class A (a) | | | 7,740 | | | | 1,311,234 | |
| | | | | | | | |
| | | | | | | 2,675,104 | |
| | | | | | | | |
| Retail — 7.0% | |
Burlington Stores, Inc. (a) | | | 26,930 | | | | 2,181,869 | |
Group 1 Automotive, Inc. | | | 31,420 | | | | 2,007,110 | |
Popeyes Louisiana Kitchen, Inc. (a) | | | 33,630 | | | | 1,787,098 | |
Sally Beauty Holdings, Inc. (a) (b) | | | 61,380 | | | | 1,576,238 | |
Sonic Corp. | | | 102,420 | | | | 2,681,355 | |
Texas Roadhouse, Inc. | | | 50,870 | | | | 1,985,456 | |
| | | | | | | | |
| | | | | | | 12,219,126 | |
| | | | | | | | |
| Storage & Warehousing — 0.6% | |
Wesco Aircraft Holdings, Inc. (a) | | | 86,120 | | | | 1,156,592 | |
| | | | | | | | |
| | | | | | | 19,685,805 | |
| | | | | | | | |
| Consumer, Non-cyclical — 30.0% | |
| Agriculture — 1.6% | |
Universal Corp. | | | 48,240 | | | | 2,808,533 | |
| | | | | | | | |
| | | | | | | | |
| | | Number of
Shares | | | Value | |
| Beverages — 0.5% | |
The Boston Beer Co., Inc. Class A (a) (b) | | | 5,060 | | | $ | 785,616 | |
| | | | | | | | |
| Biotechnology — 0.9% | |
Sage Therapeutics, Inc. (a) (b) | | | 13,850 | | | | 637,793 | |
Ultragenyx Pharmaceutical, Inc. (a) (b) | | | 13,380 | | | | 949,177 | |
| | | | | | | | |
| | | | | | | 1,586,970 | |
| | | | | | | | |
| Commercial Services — 10.8% | |
Aaron’s, Inc. | | | 46,170 | | | | 1,173,641 | |
ABM Industries, Inc. | | | 63,750 | | | | 2,530,875 | |
Booz Allen Hamilton Holding Corp. | | | 79,800 | | | | 2,522,478 | |
James River Group Holdings Ltd. | | | 53,870 | | | | 1,950,094 | |
KAR Auction Services, Inc. | | | 65,550 | | | | 2,829,138 | |
Korn/Ferry International | | | 134,253 | | | | 2,819,313 | |
On Assignment, Inc. (a) | | | 74,420 | | | | 2,700,702 | |
Paylocity Holding Corp. (a) (b) | | | 54,560 | | | | 2,425,738 | |
| | | | | | | | |
| | | | | | | 18,951,979 | |
| | | | | | | | |
| Foods — 2.0% | |
Pinnacle Foods, Inc. | | | 70,440 | | | | 3,533,975 | |
| | | | | | | | |
| Health Care – Products — 3.0% | |
Intersect ENT, Inc. (a) | | | 49,430 | | | | 782,971 | |
NuVasive, Inc. (a) | | | 18,720 | | | | 1,247,875 | |
NxStage Medical, Inc. (a) | | | 72,600 | | | | 1,814,274 | |
The Spectranetics Corp. (a) | | | 55,000 | | | | 1,379,950 | |
| | | | | | | | |
| | | | | | | 5,225,070 | |
| | | | | | | | |
| Health Care – Services — 5.1% | |
Acadia Healthcare Co., Inc. (a) | | | 22,670 | | | | 1,123,299 | |
Addus HomeCare Corp. (a) | | | 18,290 | | | | 478,466 | |
Amedisys, Inc. (a) | | | 31,910 | | | | 1,513,810 | |
HealthSouth Corp. | | | 62,633 | | | | 2,541,021 | |
WellCare Health Plans, Inc. (a) | | | 28,776 | | | | 3,369,382 | |
| | | | | | | | |
| | | | | | | 9,025,978 | |
| | | | | | | | |
| Household Products — 3.2% | |
Acco Brands Corp. (a) | | | 191,440 | | | | 1,845,481 | |
Prestige Brands Holdings, Inc. (a) | | | 78,506 | | | | 3,789,485 | |
| | | | | | | | |
| | | | | | | 5,634,966 | |
| | | | | | | | |
| Pharmaceuticals — 2.9% | |
Acadia Pharmaceuticals, Inc. (a) (b) | | | 26,290 | | | | 836,285 | |
Akorn, Inc. (a) | | | 24,280 | | | | 661,873 | |
Axovant Sciences Ltd. (a) (b) | | | 25,770 | | | | 360,780 | |
Diplomat Pharmacy, Inc. (a) (b) | | | 29,550 | | | | 827,695 | |
Impax Laboratories, Inc. (a) | | | 22,080 | | | | 523,296 | |
TherapeuticsMD, Inc. (a) (b) | | | 79,500 | | | | 541,395 | |
VWR Corp. (a) | | | 47,720 | | | | 1,353,339 | |
| | | | | | | | |
| | | | | | | 5,104,663 | |
| | | | | | | | |
| | | | | | | 52,657,750 | |
| | | | | | | | |
The accompanying notes are an integral part of the financial statements.
187
MassMutual Premier Small Cap Opportunities Fund – Portfolio of Investments (Continued)
| | | | | | | | |
| | | Number of
Shares | | | Value | |
| Diversified — 0.6% | |
| Holding Company – Diversified — 0.6% | |
FCB Financial Holdings, Inc. Class A (a) | | | 25,000 | | | $ | 960,750 | |
| | | | | | | | |
| Energy — 4.3% | |
| Energy – Alternate Sources — 0.9% | |
Renewable Energy Group, Inc. (a) (b) | | | 177,769 | | | | 1,505,703 | |
| | | | | | | | |
| Oil & Gas — 1.4% | |
Suburban Propane Partners LP | | | 71,605 | | | | 2,384,446 | |
| | | | | | | | |
| Oil & Gas Services — 0.7% | |
HollyFrontier Corp. | | | 53,117 | | | | 1,301,367 | |
| | | | | | | | |
| Pipelines — 1.3% | |
Cone Midstream Partners LP | | | 94,370 | | | | 1,708,097 | |
Noble Midstream Partners LP (a) | | | 19,570 | | | | 546,003 | |
| | | | | | | | |
| | | | | | | 2,254,100 | |
| | | | | | | | |
| | | | | | | 7,445,616 | |
| | | | | | | | |
| Financial — 18.0% | |
| Banks — 4.7% | |
Chemical Financial Corp. | | | 30,033 | | | | 1,325,356 | |
MB Financial, Inc. | | | 93,910 | | | | 3,572,337 | |
Webster Financial Corp. | | | 86,320 | | | | 3,281,023 | |
| | | | | | | | |
| | | | | | | 8,178,716 | |
| | | | | | | | |
| Diversified Financial — 0.8% | |
Stifel Financial Corp. (a) | | | 34,750 | | | | 1,336,137 | |
| | | | | | | | |
| Insurance — 2.0% | |
Endurance Specialty Holdings Ltd. | | | 32,690 | | | | 2,139,561 | |
Old Republic International Corp. | | | 81,620 | | | | 1,438,144 | |
| | | | | | | | |
| | | | | | | 3,577,705 | |
| | | | | | | | |
| Real Estate — 1.3% | |
Four Corners Property Trust, Inc. | | | 110,200 | | | | 2,350,566 | |
| | | | | | | | |
| Real Estate Investment Trusts (REITS) — 5.9% | |
Brandywine Realty Trust | | | 157,420 | | | | 2,458,901 | |
Chatham Lodging Trust | | | 80,745 | | | | 1,554,341 | |
DiamondRock Hospitality Co. | | | 195,520 | | | | 1,779,232 | |
DuPont Fabros Technology, Inc. | | | 43,310 | | | | 1,786,538 | |
National Storage Affiliates Trust | | | 94,630 | | | | 1,981,552 | |
Seritage Growth Properties Class A (b) | | | 17,190 | | | | 871,189 | |
| | | | | | | | |
| | | | | | | 10,431,753 | |
| | | | | | | | |
| Savings & Loans — 3.3% | |
BankUnited, Inc. | | | 72,698 | | | | 2,195,480 | |
Beneficial Bancorp, Inc. | | | 63,110 | | | | 928,348 | |
Berkshire Hills Bancorp, Inc. | | | 33,490 | | | | 928,008 | |
Oritani Financial Corp. | | | 108,748 | | | | 1,709,518 | |
| | | | | | | | |
| | | | | | | 5,761,354 | |
| | | | | | | | |
| | | | | | | 31,636,231 | |
| | | | | | | | |
| | | | | | | | |
| | | Number of
Shares | | | Value | |
| Industrial — 10.1% | |
| Aerospace & Defense — 1.8% | |
AAR Corp. | | | 43,139 | | | $ | 1,351,114 | |
Curtiss-Wright Corp. | | | 18,920 | | | | 1,723,801 | |
| | | | | | | | |
| | | | | | | 3,074,915 | |
| | | | | | | | |
| Building Materials — 2.6% | |
Boise Cascade Co. (a) | | | 63,040 | | | | 1,601,216 | |
Masonite International Corp. (a) | | | 32,370 | | | | 2,012,443 | |
Summit Materials, Inc. Class A (a) | | | 53,861 | | | | 999,121 | |
| | | | | | | | |
| | | | | | | 4,612,780 | |
| | | | | | | | |
| Electrical Components & Equipment — 0.9% | |
Generac Holdings, Inc. (a) (b) | | | 45,210 | | | | 1,641,123 | |
| | | | | | | | |
| Engineering & Construction — 1.9% | |
AECOM (a) | | | 36,496 | | | | 1,085,026 | |
Dycom Industries, Inc. (a) | | | 11,970 | | | | 978,907 | |
KBR, Inc. | | | 88,370 | | | | 1,337,038 | |
| | | | | | | | |
| | | | | | | 3,400,971 | |
| | | | | | | | |
| Manufacturing — 1.1% | |
Matthews International Corp. Class A | | | 31,010 | | | | 1,884,168 | |
| | | | | | | | |
| Miscellaneous – Manufacturing — 0.5% | |
Hexcel Corp. | | | 21,600 | | | | 956,880 | |
| | | | | | | | |
| Transportation — 1.3% | |
Genesee & Wyoming, Inc. Class A (a) | | | 31,980 | | | | 2,205,021 | |
| | | | | | | | |
| | | | | | | 17,775,858 | |
| | | | | | | | |
| Technology — 14.5% | |
| Computers — 4.3% | |
CACI International, Inc. Class A (a) | | | 32,880 | | | | 3,317,592 | |
Fortinet, Inc. (a) | | | 42,787 | | | | 1,580,124 | |
j2 Global, Inc. | | | 40,286 | | | | 2,683,450 | |
| | | | | | | | |
| | | | | | | 7,581,166 | |
| | | | | | | | |
| Office Equipment/Supplies — 0.9% | |
Pitney Bowes, Inc. | | | 83,180 | | | | 1,510,549 | |
| | | | | | | | |
| Semiconductors — 3.5% | |
Cavium, Inc. (a) (b) | | | 29,690 | | | | 1,727,958 | |
Cypress Semiconductor Corp. | | | 90,131 | | | | 1,095,993 | |
MKS Instruments, Inc. | | | 64,840 | | | | 3,224,493 | |
| | | | | | | | |
| | | | | | | 6,048,444 | |
| | | | | | | | |
| Software — 5.8% | |
Black Knight Financial Services, Inc. Class A (a) (b) | | | 58,280 | | | | 2,383,652 | |
Guidewire Software, Inc. (a) | | | 28,660 | | | | 1,719,027 | |
Imperva, Inc. (a) | | | 19,610 | | | | 1,053,253 | |
Proofpoint, Inc. (a) (b) | | | 32,830 | | | | 2,457,326 | |
SYNNEX Corp. | | | 23,120 | | | | 2,638,223 | |
| | | | | | | | |
| | | | | | | 10,251,481 | |
| | | | | | | | |
| | | | | | | 25,391,640 | |
| | | | | | | | |
The accompanying notes are an integral part of the financial statements.
188
MassMutual Premier Small Cap Opportunities Fund – Portfolio of Investments (Continued)
| | | | | | | | |
| | | Number of
Shares | | | Value | |
| Utilities — 3.2% | |
| Electric — 3.2% | |
Allete, Inc. | | | 47,660 | | | $ | 2,841,489 | |
Portland General Electric Co. | | | 66,800 | | | | 2,845,012 | |
| | | | | | | | |
| | | | | | | 5,686,501 | |
| | | | | | | | |
| | |
TOTAL COMMON STOCK
(Cost $155,017,117) | | | | | | | 171,729,162 | |
| | | | | | | | |
| | |
TOTAL EQUITIES
(Cost $155,017,117) | | | | | | | 171,729,162 | |
| | | | | | | | |
|
| MUTUAL FUNDS — 8.5% | |
| Diversified Financial — 8.5% | |
State Street Navigator Securities Lending Prime Portfolio (c) | | | 14,957,330 | | | | 14,957,330 | |
| | | | | | | | |
| | |
TOTAL MUTUAL FUNDS
(Cost $14,957,330) | | | | | | | 14,957,330 | |
| | | | | | | | |
| | |
TOTAL LONG-TERM INVESTMENTS
(Cost $169,974,447) | | | | | | | 186,686,492 | |
| | | | | | | | |
| | |
| | | Principal
Amount | | | | |
| SHORT-TERM INVESTMENTS — 2.0% | |
| Repurchase Agreement — 2.0% | |
State Street Bank & Trust Co. Repurchase Agreement, dated 9/30/16, 0.010%, due 10/03/16 (d) | | $ | 3,521,460 | | | | 3,521,460 | |
| | | | | | | | |
| | |
TOTAL SHORT-TERM INVESTMENTS
(Cost $3,521,460) | | | | | | | 3,521,460 | |
| | | | | | | | |
| | |
TOTAL INVESTMENTS — 108.4%
(Cost $173,495,907) (e) | | | | | | | 190,207,952 | |
| | |
| Other Assets/(Liabilities) — (8.4)% | | | | | | | (14,815,069 | ) |
| | | | | | | | |
| | |
| NET ASSETS — 100.0% | | | | | | $ | 175,392,883 | |
| | | | | | | | |
Notes to Portfolio of Investments
Percentages are stated as a percent of net assets.
| (a) | Non-income producing security. |
| (b) | Denotes all or a portion of security on loan. The total value of securities on loan as of September 30, 2016, was $14,616,927 or 8.33% of net assets. Total securities on loan may not correspond with the amounts identified in the Portfolio of Investments because pending sales may be in the process of recall from the brokers. (Note 2). |
| (c) | Represents investment of security lending collateral. (Note 2). |
| (d) | Maturity value of $3,521,463. Collateralized by U.S. Government Agency obligations with a rate of 3.125%, maturity date of 5/15/21, and an aggregate market value, including accrued interest, of $3,593,133. |
| (e) | See Note 6 for aggregate cost for federal tax purposes. |
The accompanying notes are an integral part of the financial statements.
189
MassMutual Premier Global Fund – Portfolio of Investments
September 30, 2016
| | | | | | | | |
| | | Number of
Shares | | | Value | |
| EQUITIES — 98.9% | |
|
| COMMON STOCK — 97.1% | |
| Brazil — 0.2% | |
Embraer SA Sponsored ADR (Brazil) | | | 39,190 | | | $ | 676,419 | |
| | | | | | | | |
| Cayman Islands — 1.3% | |
JD.com, Inc. ADR (Cayman Islands) (a) (b) | | | 149,921 | | | | 3,911,439 | |
| | | | | | | | |
| Denmark — 0.3% | |
FLSmidth & Co. A/S (b) | | | 27,405 | | | | 1,030,822 | |
| | | | | | | | |
| France — 5.7% | |
Kering | | | 24,320 | | | | 4,900,718 | |
LVMH Moet Hennessy Louis Vuitton SE | | | 39,770 | | | | 6,779,899 | |
Societe Generale SA | | | 93,530 | | | | 3,227,775 | |
Technip SA | | | 49,135 | | | | 3,017,553 | |
| | | | | | | | |
| | | | | | | 17,925,945 | |
| | | | | | | | |
| Germany — 7.0% | |
Allianz SE | | | 34,413 | | | | 5,108,016 | |
Bayer AG | | | 40,170 | | | | 4,034,830 | |
Linde AG | | | 18,843 | | | | 3,202,275 | |
SAP SE | | | 85,546 | | | | 7,783,657 | |
Siemens AG | | | 17,330 | | | | 2,028,701 | |
| | | | | | | | |
| | | | | | | 22,157,479 | |
| | | | | | | | |
| India — 3.8% | |
DLF Ltd. | | | 2,350,502 | | | | 5,194,678 | |
ICICI Bank Ltd. Sponsored ADR (India) | | | 525,240 | | | | 3,923,543 | |
Zee Entertainment Enterprises Ltd. | | | 344,878 | | | | 2,830,912 | |
| | | | | | | | |
| | | | | | | 11,949,133 | |
| | | | | | | | |
| Italy — 1.2% | |
Banca Monte dei Paschi di Siena SpA (a) | | | 854,286 | | | | 178,811 | |
Brunello Cucinelli SpA (b) | | | 58,049 | | | | 1,128,336 | |
Prysmian SpA | | | 66,606 | | | | 1,745,312 | |
Tod’s SpA (b) | | | 15,514 | | | | 819,095 | |
| | | | | | | | |
| | | | | | | 3,871,554 | |
| | | | | | | | |
| Japan — 14.4% | |
The Dai-ichi Life Insurance Co. Ltd. | | | 268,400 | | | | 3,683,869 | |
Fanuc Corp. | | | 13,700 | | | | 2,318,682 | |
KDDI Corp. | | | 185,000 | | | | 5,692,924 | |
Keyence Corp. | | | 9,820 | | | | 7,147,165 | |
Kyocera Corp. (b) | | | 82,000 | | | | 3,933,929 | |
Murata Manufacturing Co. Ltd. | | | 59,710 | | | | 7,788,215 | |
Nidec Corp. | | | 71,500 | | | | 6,578,079 | |
Nintendo Co. Ltd. | | | 7,100 | | | | 1,878,704 | |
Rakuten, Inc. | | | 118,000 | | | | 1,534,957 | |
Sumitomo Mitsui Financial Group, Inc. | | | 66,400 | | | | 2,237,875 | |
| | | | | | | | |
| | | Number of
Shares | | | Value | |
Suzuki Motor Corp. | | | 71,400 | | | $ | 2,390,244 | |
| | | | | | | | |
| | | | | | | 45,184,643 | |
| | | | | | | | |
| Netherlands — 2.4% | |
Airbus Group SE | | | 122,340 | | | | 7,400,194 | |
| | | | | | | | |
| Spain — 3.6% | |
Banco Bilbao Vizcaya Argentaria SA | | | 388,454 | | | | 2,348,541 | |
Industria de Diseno Textil SA | | | 190,822 | | | | 7,073,873 | |
Repsol YPF SA | | | 143,363 | | | | 1,945,648 | |
| | | | | | | | |
| | | | | | | 11,368,062 | |
| | | | | | | | |
| Sweden — 1.6% | |
Assa Abloy AB Class B | | | 238,350 | | | | 4,839,632 | |
Telefonaktiebolaget LM Ericsson Class B | | | 33,595 | | | | 242,455 | |
| | | | | | | | |
| | | | | | | 5,082,087 | |
| | | | | | | | |
| Switzerland — 4.0% | |
Credit Suisse Group | | | 83,955 | | | | 1,098,372 | |
Nestle SA | | | 36,593 | | | | 2,883,295 | |
Roche Holding AG | | | 11,906 | | | | 2,949,546 | |
UBS Group AG | | | 418,833 | | | | 5,687,192 | |
| | | | | | | | |
| | | | | | | 12,618,405 | |
| | | | | | | | |
| United Kingdom — 5.4% | |
Circassia Pharmaceuticals PLC (a) | | | 647,107 | | | | 792,616 | |
Earthport PLC (a) | | | 1,745,622 | | | | 328,401 | |
International Game Technology PLC | | | 103,732 | | | | 2,528,986 | |
Prudential PLC | | | 293,852 | | | | 5,215,425 | |
Shire Ltd. | | | 32,090 | | | | 2,074,131 | |
Unilever PLC | | | 127,342 | | | | 6,036,902 | |
| | | | | | | | |
| | | | | | | 16,976,461 | |
| | | | | | | | |
| United States — 46.2% | |
3M Co. | | | 29,140 | | | | 5,135,342 | |
Acadia Pharmaceuticals, Inc. (a) (b) | | | 78,880 | | | | 2,509,173 | |
Adobe Systems, Inc. (a) | | | 49,740 | | | | 5,398,780 | |
Aetna, Inc. | | | 77,820 | | | | 8,984,319 | |
Alphabet, Inc. Class A (a) | | | 9,990 | | | | 8,032,559 | |
Alphabet, Inc. Class C (a) | | | 10,358 | | | | 8,051,170 | |
Anthem, Inc. | | | 41,900 | | | | 5,250,489 | |
Biogen, Inc. (a) | | | 12,030 | | | | 3,765,751 | |
BioMarin Pharmaceutical, Inc. (a) | | | 26,770 | | | | 2,476,760 | |
Bluebird Bio, Inc. (a) (b) | | | 14,160 | | | | 959,765 | |
Citigroup, Inc. | | | 155,160 | | | | 7,328,207 | |
Colgate-Palmolive Co. | | | 111,060 | | | | 8,233,988 | |
eBay, Inc. (a) | | | 65,850 | | | | 2,166,465 | |
Emerson Electric Co. | | | 48,270 | | | | 2,631,198 | |
Facebook, Inc. Class A (a) | | | 58,130 | | | | 7,456,335 | |
FNF Group | | | 75,850 | | | | 2,799,624 | |
Gilead Sciences, Inc. | | | 43,670 | | | | 3,455,170 | |
The Goldman Sachs Group, Inc. | | | 25,140 | | | | 4,054,328 | |
Intuit, Inc. | | | 65,840 | | | | 7,243,058 | |
Ionis Pharmaceuticals, Inc. (a) (b) | | | 39,430 | | | | 1,444,715 | |
The accompanying notes are an integral part of the financial statements.
190
MassMutual Premier Global Fund – Portfolio of Investments (Continued)
| | | | | | | | |
| | | Number of
Shares | | | Value | |
MacroGenics, Inc. (a) | | | 53,830 | | | $ | 1,610,055 | |
Maxim Integrated Products, Inc. | | | 167,760 | | | | 6,698,657 | |
PayPal Holdings, Inc. (a) | | | 92,640 | | | | 3,795,461 | |
S&P Global, Inc. | | | 91,350 | | | | 11,561,256 | |
Sage Therapeutics, Inc. (a) (b) | | | 31,730 | | | | 1,461,167 | |
Tiffany & Co. (b) | | | 52,000 | | | | 3,776,760 | |
Twitter, Inc. (a) | | | 125,690 | | | | 2,897,154 | |
United Parcel Service, Inc. Class B | | | 45,600 | | | | 4,986,816 | |
Vertex Pharmaceuticals, Inc. (a) | | | 9,500 | | | | 828,495 | |
The Walt Disney Co. | | | 61,900 | | | | 5,748,034 | |
Zimmer Biomet Holdings, Inc. | | | 35,960 | | | | 4,675,519 | |
| | | | | | | | |
| | | | | | | 145,416,570 | |
| | | | | | | | |
| | |
TOTAL COMMON STOCK
(Cost $200,598,441) | | | | | | | 305,569,213 | |
| | | | | | | | |
|
| PREFERRED STOCK — 1.8% | |
| Germany — 1.7% | |
Bayerische Motoren Werke AG 4.940% | | | 75,507 | | | | 5,566,054 | |
| | | | | | | | |
| India — 0.1% | |
Zee Entertainment Enterprises Ltd., 6.000% | | | 1,120,452 | | | | 159,199 | |
| | | | | | | | |
| | |
TOTAL PREFERRED STOCK
(Cost $3,353,884) | | | | | | | 5,725,253 | |
| | | | | | | | |
| | |
TOTAL EQUITIES
(Cost $203,952,325) | | | | | | | 311,294,466 | |
| | | | | | | | |
|
| MUTUAL FUNDS — 5.2% | |
| United States — 5.2% | |
Oppenheimer Institutional Money Market Fund Class E (c) | | | 3,661,292 | | | | 3,661,292 | |
State Street Navigator Securities Lending Prime Portfolio (d) | | | 12,607,626 | | | | 12,607,626 | |
| | | | | | | | |
| | | | | | | 16,268,918 | |
| | | | | | | | |
| | |
TOTAL MUTUAL FUNDS
(Cost $16,268,918) | | | | | | | 16,268,918 | |
| | | | | | | | |
| | |
TOTAL LONG-TERM INVESTMENTS
(Cost $220,221,243) | | | | | | | 327,563,384 | |
| | | | | | | | |
| | |
TOTAL INVESTMENTS — 104.1%
(Cost $220,221,243) (e) | | | | | | | 327,563,384 | |
| | |
| Other Assets/(Liabilities) — (4.1)% | | | | | | | (12,807,933 | ) |
| | | | | | | | |
| | |
| NET ASSETS — 100.0% | | | | | | $ | 314,755,451 | |
| | | | | | | | |
Notes to Portfolio of Investments
Percentages are stated as a percent of net assets.
| ADR | American Depositary Receipt |
| (a) | Non-income producing security. |
| (b) | Denotes all or a portion of security on loan. The total value of securities on loan as of September 30, 2016, was $12,249,775 or 3.89% of net assets. Total securities on loan may not correspond with the amounts identified in the Portfolio of Investments because pending sales may be in the process of recall from the brokers. (Note 2). |
| (c) | Affiliated issuer. See Note 7 for a summary of transactions in the investments of affiliated issuers. |
| (d) | Represents investment of security lending collateral. (Note 2). |
| (e) | See Note 6 for aggregate cost for federal tax purposes. |
The accompanying notes are an integral part of the financial statements.
191
MassMutual Premier International Equity Fund – Portfolio of Investments
September 30, 2016
| | | | | | | | |
| | | Number of
Shares | | | Value | |
| EQUITIES — 98.4% | |
|
| COMMON STOCK — 98.4% | |
| Australia — 3.2% | |
CIMIC Group Ltd. | | | 135,442 | | | $ | 2,994,877 | |
CSL Ltd. | | | 72,500 | | | | 5,954,075 | |
Sonic Healthcare Ltd. | | | 218,911 | | | | 3,697,762 | |
Telstra Corp. Ltd. | | | 912,966 | | | | 3,625,980 | |
| | | | | | | | |
| | | | | | | 16,272,694 | |
| | | | | | | | |
| Belgium — 0.7% | |
Anheuser-Busch InBev SA/NV | | | 27,508 | | | | 3,611,077 | |
| | | | | | | | |
| Brazil — 0.3% | |
Empresa Brasileira de Aeronautica SA | | | 321,819 | | | | 1,386,370 | |
| | | | | | | | |
| Canada — 6.2% | |
Alimentation Couche-Tard, Inc. Class B | | | 106,564 | | | | 5,164,327 | |
CCL Industries, Inc. Class B | | | 27,454 | | | | 5,286,143 | |
Dollarama, Inc. (a) | | | 129,530 | | | | 10,113,006 | |
Hudson’s Bay Co. (a) | | | 319,301 | | | | 4,103,369 | |
Saputo, Inc. | | | 187,921 | | | | 6,530,217 | |
| | | | | | | | |
| | | | | | | 31,197,062 | |
| | | | | | | | |
| Denmark — 3.9% | |
Coloplast A/S Class B | | | 61,934 | | | | 4,802,782 | |
Novo Nordisk A/S Class B | | | 112,282 | | | | 4,678,283 | |
Novozymes A/S | | | 114,194 | | | | 5,022,081 | |
Pandora A/S | | | 12,587 | | | | 1,526,233 | |
William Demant Holding A/S (b) | | | 189,451 | | | | 3,867,246 | |
| | | | | | | | |
| | | | | | | 19,896,625 | |
| | | | | | | | |
| Finland — 1.1% | |
Nokia OYJ | | | 938,999 | | | | 5,442,532 | |
| | | | | | | | |
| France — 13.7% | |
Cie Generale d’Optique Essilor International SA | | | 37,888 | | | | 4,886,183 | |
Danone SA | | | 48,837 | | | | 3,622,356 | |
Dassault Systemes SA | | | 65,676 | | | | 5,697,805 | |
Edenred | | | 221,034 | | | | 5,168,331 | |
Hermes International | | | 12,666 | | | | 5,153,233 | |
Iliad SA | | | 20,080 | | | | 4,213,621 | |
Legrand SA | | | 76,530 | | | | 4,512,257 | |
LVMH Moet Hennessy Louis Vuitton SE | | | 27,390 | | | | 4,669,384 | |
Pernod-Ricard SA | | | 28,805 | | | | 3,408,116 | |
Schneider Electric SE | | | 64,980 | | | | 4,530,923 | |
SEB SA | | | 49,997 | | | | 7,054,211 | |
Technicolor SA Registered | | | 649,260 | | | | 4,431,505 | |
Technip SA | | | 60,772 | | | | 3,732,222 | |
Valeo SA | | | 144,244 | | | | 8,411,706 | |
| | | | | | | | |
| | | | | | | 69,491,853 | |
| | | | | | | | |
| | | | | | | | |
| | | Number of
Shares | | | Value | |
| Germany — 8.3% | |
Bayerische Motoren Werke AG | | | 35,619 | | | $ | 2,993,356 | |
Brenntag AG | | | 110,230 | | | | 6,015,147 | |
Continental AG | | | 37,664 | | | | 7,918,681 | |
Infineon Technologies AG | | | 591,341 | | | | 10,551,423 | |
ProSiebenSat.1 Media SE | | | 105,268 | | | | 4,508,187 | |
SAP SE | | | 72,065 | | | | 6,557,048 | |
United Internet AG | | | 78,687 | | | | 3,481,375 | |
| | | | | | | | |
| | | | | | | 42,025,217 | |
| | | | | | | | |
| India — 1.8% | |
Hero Honda Motors Ltd. | | | 129,989 | | | | 6,702,499 | |
ICICI Bank Ltd. Sponsored ADR (India) | | | 340,325 | | | | 2,542,228 | |
| | | | | | | | |
| | | | | | | 9,244,727 | |
| | | | | | | | |
| Ireland — 2.3% | |
Experian PLC | | | 262,980 | | | | 5,269,015 | |
James Hardie Industries NV | | | 415,700 | | | | 6,520,527 | |
| | | | | | | | |
| | | | | | | 11,789,542 | |
| | | | | | | | |
| Japan — 6.3% | |
Hoya Corp. | | | 129,200 | | | | 5,188,568 | |
Keyence Corp. | | | 9,509 | | | | 6,920,814 | |
Nidec Corp. | | | 80,800 | | | | 7,433,689 | |
Nippon Telegraph & Telephone Corp. | | | 186,500 | | | | 8,517,527 | |
Yahoo! Japan Corp. (a) | | | 1,005,600 | | | | 4,003,867 | |
| | | | | | | | |
| | | | | | | 32,064,465 | |
| | | | | | | | |
| Luxembourg — 0.9% | |
SES SA | | | 189,320 | | | | 4,643,704 | |
| | | | | | | | |
Mexico — 0.6% | |
Grupo Televisa SAB Sponsored ADR (Mexico) | | | 127,160 | | | | 3,266,740 | |
| | | | | | | | |
| Netherlands — 7.2% | |
Aalberts Industries NV | | | 190,001 | | | | 6,478,573 | |
Airbus Group SE | | | 93,870 | | | | 5,678,079 | |
ASML Holding NV | | | 46,738 | | | | 5,125,248 | |
Boskalis Westminster | | | 92,093 | | | | 3,277,427 | |
Gemalto NV | | | 43,268 | | | | 2,774,378 | |
Gemalto NV | | | 22,371 | | | | 1,434,446 | |
Heineken NV | | | 74,558 | | | | 6,557,603 | |
Koninklijke Vopak NV | | | 96,450 | | | | 5,062,470 | |
| | | | | | | | |
| | | | | | | 36,388,224 | |
| | | | | | | | |
| Panama — 1.3% | |
Carnival Corp. | | | 137,200 | | | | 6,698,104 | |
| | | | | | | | |
| South Africa — 0.9% | |
The SPAR Group Ltd. | | | 313,696 | | | | 4,396,829 | |
| | | | | | | | |
| Spain — 4.7% | |
Amadeus IT Group SA | | | 144,953 | | | | 7,241,844 | |
Grifols SA | | | 258,638 | | | | 5,572,573 | |
The accompanying notes are an integral part of the financial statements.
192
MassMutual Premier International Equity Fund – Portfolio of Investments (Continued)
| | | | | | | | |
| | | Number of
Shares | | | Value | |
Industria de Diseno Textil SA | | | 120,822 | | | $ | 4,478,936 | |
Prosegur Cia de Seguridad SA | | | 924,964 | | | | 6,462,939 | |
| | | | | | | | |
| | | | | | | 23,756,292 | |
| | | | | | | | |
| Sweden — 2.3% | |
Atlas Copco AB | | | 195,436 | | | | 5,880,143 | |
Swedish Match AB | | | 88,010 | | | | 3,228,086 | |
Telefonaktiebolaget LM Ericsson Class B | | | 346,700 | | | | 2,502,139 | |
| | | | | | | | |
| | | | | | | 11,610,368 | |
| | | | | | | | |
| Switzerland — 11.2% | |
ABB Ltd. | | | 99,632 | | | | 2,237,087 | |
Aryzta AG | | | 101,292 | | | | 4,494,800 | |
Barry Callebaut AG | | | 3,867 | | | | 5,138,125 | |
Cie Financiere Richemont SA | | | 65,871 | | | | 4,010,734 | |
Galenica AG Registered | | | 3,491 | | | | 3,701,614 | |
Lonza Group AG Registered | | | 28,832 | | | | 5,501,747 | |
Roche Holding AG | | | 22,890 | | | | 5,670,679 | |
SGS SA | | | 1,563 | | | | 3,499,131 | |
Sika AG | | | 1,135 | | | | 5,516,339 | |
Sonova Holding AG | | | 31,974 | | | | 4,525,399 | |
Syngenta AG (b) | | | 6,894 | | | | 3,012,994 | |
Temenos Group AG | | | 105,032 | | | | 6,616,530 | |
UBS Group AG | | | 203,285 | | | | 2,760,339 | |
| | | | | | | | |
| | | | | | | 56,685,518 | |
| | | | | | | | |
| Thailand — 1.3% | |
CP ALL PCL | | | 3,747,300 | | | | 6,651,052 | |
| | | | | | | | |
| United Kingdom — 20.2% | |
Aggreko PLC | | | 166,768 | | | | 2,061,278 | |
Aveva Group PLC | | | 66,327 | | | | 1,717,779 | |
BT Group PLC | | | 889,813 | | | | 4,486,507 | |
Bunzl PLC | | | 224,863 | | | | 6,653,405 | |
Burberry Group PLC | | | 256,862 | | | | 4,596,883 | |
Diageo PLC | | | 90,869 | | | | 2,605,493 | |
Dignity PLC | | | 102,407 | | | | 3,719,480 | |
Domino’s Pizza Group PLC | | | 1,061,510 | | | | 5,135,791 | |
Essentra PLC | | | 449,334 | | | | 2,829,915 | |
ICAP PLC | | | 833,278 | | | | 5,034,126 | |
Inmarsat PLC | | | 238,740 | | | | 2,184,595 | |
Intertek Group PLC | | | 124,380 | | | | 5,631,324 | |
Prudential PLC | | | 239,718 | | | | 4,254,628 | |
Reckitt Benckiser Group PLC | | | 59,056 | | | | 5,565,300 | |
Rolls-Royce Holdings PLC | | | 410,120 | | | | 3,827,835 | |
Royal Mail PLC | | | 717,307 | | | | 4,543,986 | |
Sky PLC | | | 306,227 | | | | 3,548,429 | |
Spectris PLC | | | 96,429 | | | | 2,459,732 | |
Travis Perkins PLC | | | 244,226 | | | | 4,880,644 | |
Tullett Prebon PLC | | | 261,739 | | | | 1,131,747 | |
Unilever PLC | | | 105,827 | | | | 5,016,941 | |
Vodafone Group PLC | | | 2,095,642 | | | | 6,008,992 | |
The Weir Group PLC | | | 85,794 | | | | 1,886,161 | |
Whitbread PLC | | | 74,769 | | | | 3,794,079 | |
| | | | | | | | |
| | | Number of
Shares | | | Value | |
William Hill PLC | | | 1,055,188 | | | $ | 4,160,486 | |
Wolseley PLC | | | 88,751 | | | | 5,002,661 | |
| | | | | | | | |
| | | | | | | 102,738,197 | |
| | | | | | | | |
| | |
TOTAL COMMON STOCK
(Cost $459,887,679) | | | | | | | 499,257,192 | |
| | | | | | | | |
|
| PREFERRED STOCK — 0.0% | |
| India — 0.0% | |
Zee Entertainment Enterprises Ltd., 6.000% | | | 653,347 | | | | 92,831 | |
| | | | | | | | |
| | |
TOTAL PREFERRED STOCK
(Cost $19,494) | | | | | | | 92,831 | |
| | | | | | | | |
| | |
TOTAL EQUITIES
(Cost $459,907,173) | | | | | | | 499,350,023 | |
| | | | | | | | |
|
| MUTUAL FUNDS — 4.0% | |
| United States — 4.0% | |
Oppenheimer Institutional Money Market Fund Class E (c) | | | 6,403,734 | | | | 6,403,734 | |
State Street Navigator Securities Lending Prime Portfolio (d) | | | 13,876,296 | | | | 13,876,296 | |
| | | | | | | | |
| | | | | | | 20,280,030 | |
| | | | | | | | |
| | |
TOTAL MUTUAL FUNDS
(Cost $20,280,030) | | | | | | | 20,280,030 | |
| | | | | | | | |
|
| WARRANTS — 0.0% | |
| UNITED STATES — 0.0% | |
Mei Pharma, Inc., Expires 5/10/17, Strike 7.14 (b) (e) | | | 301,298 | | | | - | |
| | | | | | | | |
| | |
TOTAL WARRANTS
(Cost $0) | | | | | | | - | |
| | | | | | | | |
| | |
TOTAL LONG-TERM INVESTMENTS
(Cost $480,187,203) | | | | | | | 519,630,053 | |
| | | | | | | | |
| | |
TOTAL INVESTMENTS — 102.4%
(Cost $480,187,203) (f) | | | | | | | 519,630,053 | |
| | |
| Other Assets/(Liabilities) — (2.4)% | | | | | | | (12,202,188 | ) |
| | | | | | | | |
| | |
| NET ASSETS — 100.0% | | | | | | $ | 507,427,865 | |
| | | | | | | | |
Notes to Portfolio of Investments
Percentages are stated as a percent of net assets.
| ADR | American Depositary Receipt |
| (a) | Denotes all or a portion of security on loan. The total value of securities on loan as of September 30, 2016, was $13,176,018 or 2.60% of net assets. Total securities on loan may not correspond with the amounts identified in the Portfolio of |
The accompanying notes are an integral part of the financial statements.
193
MassMutual Premier International Equity Fund – Portfolio of Investments (Continued)
Notes to Portfolio of Investments (Continued)
| | Investments because pending sales may be in the process of recall from the brokers. (Note 2). |
| (b) | Non-income producing security. |
| (c) | Affiliated issuer. See Note 7 for a summary of transactions in the investments of affiliated issuers. |
| (d) | Represents investment of security lending collateral. (Note 2). |
| (e) | This security is fair valued in good faith in accordance with procedures approved by the Board of Trustees. At September 30, 2016, these securities amounted to a value of $0 or 0.00% of net assets. |
| (f) | See Note 6 for aggregate cost for federal tax purposes. |
The accompanying notes are an integral part of the financial statements.
194
MassMutual Premier Strategic Emerging Markets Fund – Portfolio of Investments
September 30, 2016
| | | | | | | | |
| | | Number of
Shares | | | Value | |
| EQUITIES — 93.3% | |
|
| COMMON STOCK — 90.8% | |
| Bermuda — 1.4% | |
Jardine Strategic Holdings Ltd. | | | 90,014 | | | $ | 2,945,203 | |
| | | | | | | | |
| Brazil — 4.8% | |
Ambev SA ADR (Brazil) | | | 290,790 | | | | 1,770,911 | |
BM&F BOVESPA SA | | | 569,100 | | | | 2,941,614 | |
Cielo SA | | | 21,100 | | | | 210,925 | |
Embraer SA Sponsored ADR (Brazil) | | | 84,650 | | | | 1,461,059 | |
Estacio Participacoes SA | | | 319,100 | | | | 1,747,512 | |
Kroton Educacional SA | | | 301,441 | | | | 1,370,882 | |
Sul America SA | | | 192,800 | | | | 962,177 | |
| | | | | | | | |
| | | | | | | 10,465,080 | |
| | | | | | | | |
| Cayman Islands — 21.0% | |
3SBio, Inc. (a) (b) | | | 125,000 | | | | 142,259 | |
Alibaba Group Holding Ltd. Sponsored ADR (Cayman Islands) (a) | | | 103,980 | | | | 11,000,044 | |
Baidu, Inc. Sponsored ADR (Cayman Islands) (a) | | | 45,970 | | | | 8,369,758 | |
China Lodging Group Ltd. Sponsored ADR (Cayman Islands) | | | 34,597 | | | | 1,559,979 | |
Ctrip.com International Ltd. ADR (Cayman Islands) (a) | | | 98,490 | | | | 4,586,679 | |
Melco Crown Entertainment Ltd. ADR (Cayman Islands) | | | 125,540 | | | | 2,022,449 | |
New Oriental Education & Technology Group, Inc. Sponsored ADR (Cayman Islands) (a) | | | 62,590 | | | | 2,901,673 | |
SOHO China Ltd. | | | 1,427,000 | | | | 773,533 | |
Tencent Holdings Ltd. | | | 427,493 | | | | 11,845,053 | |
Tingyi Cayman Islands Holding Corp. | | | 1,096,000 | | | | 1,277,922 | |
Want Want China Holdings Ltd. | | | 2,267,000 | | | | 1,411,112 | |
| | | | | | | | |
| | | | | | | 45,890,461 | |
| | | | | | | | |
| China — 2.3% | |
China Pacific Insurance Group Co. Ltd. Class H | | | 540,800 | | | | 2,009,789 | |
Sinopharm Group Co. Ltd. Class H | | | 630,800 | | | | 3,059,472 | |
| | | | | | | | |
| | | | | | | 5,069,261 | |
| | | | | | | | |
| Colombia — 1.8% | |
Almacenes Exito SA (b) | | | 32,800 | | | | 167,418 | |
Grupo Aval Acciones y Valores SA (c) | | | 236,190 | | | | 2,085,558 | |
Grupo de Inversiones Suramericana SA | | | 128,765 | | | | 1,680,038 | |
| | | | | | | | |
| | | | | | | 3,933,014 | |
| | | | | | | | |
| Egypt — 0.6% | |
Commercial International Bank | | | 254,596 | | | | 1,369,036 | |
| | | | | | | | |
| | | | | | | | |
| | | Number of
Shares | | | Value | |
| France — 2.6% | |
Kering | | | 12,393 | | | $ | 2,497,311 | |
LVMH Moet Hennessy Louis Vuitton SE | | | 19,148 | | | | 3,264,307 | |
| | | | | | | | |
| | | | | | | 5,761,618 | |
| | | | | | | | |
| Hong Kong — 3.8% | |
AIA Group Ltd. | | | 826,400 | | | | 5,536,971 | |
Hang Lung Properties Ltd. | | | 290,000 | | | | 1,106,342 | |
Hong Kong Exchanges and Clearing Ltd. | | | 58,230 | | | | 1,536,075 | |
| | | | | | | | |
| | | | | | | 8,179,388 | |
| | | | | | | | |
| India — 14.8% | |
Apollo Hospitals Enterprise Ltd. | | | 84,606 | | | | 1,675,123 | |
Asian Paints Ltd. | | | 31,928 | | | | 558,376 | |
Dr Reddy’s Laboratories Ltd. | | | 48,987 | | | | 2,283,966 | |
Glenmark Pharmaceuticals Ltd. | | | 63,430 | | | | 881,819 | |
Housing Development Finance Corp. | | | 509,142 | | | | 10,702,089 | |
Infosys Technologies Ltd. | | | 321,866 | | | | 5,011,402 | |
Kotak Mahindra Bank Ltd. | | | 190,900 | | | | 2,243,248 | |
Sun Pharmaceutical Industries Ltd. | | | 77,247 | | | | 864,126 | |
Tata Consultancy Services Ltd. | | | 61,179 | | | | 2,241,181 | |
UltraTech Cement Ltd. | | | 28,579 | | | | 1,658,741 | |
Zee Entertainment Enterprises Ltd. | | | 492,935 | | | | 4,046,230 | |
| | | | | | | | |
| | | | | | | 32,166,301 | |
| | | | | | | | |
| Indonesia — 2.1% | |
Astra International Tbk PT | | | 2,728,000 | | | | 1,733,312 | |
Bank Mandiri Persero Tbk PT | | | 1,674,500 | | | | 1,443,280 | |
Indocement Tunggal Prakarsa Tbk PT | | | 805,500 | | | | 1,072,957 | |
Semen Indonesia Persero Tbk PT | | | 487,000 | | | | 378,384 | |
| | | | | | | | |
| | | | | | | 4,627,933 | |
| | | | | | | | |
| Italy — 1.4% | |
Prada SpA | | | 932,700 | | | | 2,997,055 | |
| | | | | | | | |
| Japan — 2.1% | |
Fast Retailing Co., Ltd. (c) | | | 6,000 | | | | 1,932,005 | |
Murata Manufacturing Co. Ltd. | | | 19,500 | | | | 2,543,463 | |
| | | | | | | | |
| | | | | | | 4,475,468 | |
| | | | | | | | |
| Malaysia — 1.9% | |
Genting Bhd | | | 1,573,500 | | | | 3,022,860 | |
Genting Malaysia Bhd | | | 964,500 | | | | 1,062,596 | |
| | | | | | | | |
| | | | | | | 4,085,456 | |
| | | | | | | | |
| Mexico — 4.0% | |
Fomento Economico Mexicano SAB de CV | | | 211,751 | | | | 1,949,030 | |
Fomento Economico Mexicano SAB de CV, Series B Sponsored ADR (Mexico) | | | 8,590 | | | | 790,623 | |
Grupo Aeroportuario del Sureste SAB de CV Class B | | | 62,810 | | | | 918,774 | |
The accompanying notes are an integral part of the financial statements.
195
MassMutual Premier Strategic Emerging Markets Fund – Portfolio of Investments (Continued)
| | | | | | | | |
| | | Number of
Shares | | | Value | |
Grupo Financiero Banorte SAB de CV Class O | | | 448,252 | | | $ | 2,353,180 | |
Grupo Financiero Inbursa SAB de CV Class O | | | 1,259,424 | | | | 1,987,564 | |
Kimberly-Clark de Mexico SAB de CV Class A (Mexico) | | | 38,431 | | | | 86,932 | |
Wal-Mart de Mexico SAB de CV | | | 326,653 | | | | 715,142 | |
| | | | | | | | |
| | | | | | | 8,801,245 | |
| | | | | | | | |
| Nigeria — 0.4% | |
Nigerian Breweries PLC | | | 1,252,771 | | | | 597,783 | |
Zenith Bank PLC | | | 6,667,001 | | | | 317,909 | |
| | | | | | | | |
| | | | | | | 915,692 | |
| | | | | | | | |
| Philippines — 3.0% | |
Ayala Land, Inc. | | | 380,700 | | | | 308,661 | |
Jollibee Foods Corp. | | | 305,160 | | | | 1,552,984 | |
SM Investments Corp. | | | 188,235 | | | | 2,624,613 | |
SM Prime Holdings, Inc. | | | 3,508,600 | | | | 2,046,335 | |
| | | | | | | | |
| | | | | | | 6,532,593 | |
| | | | | | | | |
| Poland — 0.8% | |
Bank Pekao SA | | | 56,657 | | | | 1,840,750 | |
| | | | | | | | |
| Republic of Korea — 1.3% | |
LG Household & Health Care Ltd. | | | 293 | | | | 254,178 | |
NAVER Corp. | | | 3,302 | | | | 2,650,684 | |
| | | | | | | | |
| | | | | | | 2,904,862 | |
| | | | | | | | |
| Russia — 8.0% | |
Alrosa AO (a) | | | 1,447,598 | | | | 1,994,217 | |
Magnit OJSC (a) | | | 42,002 | | | | 6,990,386 | |
NovaTek OAO Sponsored GDR (Russia) (d) | | | 51,832 | | | | 5,706,212 | |
Sberbank of Russia PJSC Sponsored ADR (Russia) | | | 287,680 | | | | 2,692,977 | |
| | | | | | | | |
| | | | | | | 17,383,792 | |
| | | | | | | | |
| Singapore — 0.5% | |
Global Logistic Properties Ltd. | | | 769,000 | | | | 1,059,895 | |
| | | | | | | | |
| Taiwan — 4.0% | |
Taiwan Semiconductor Manufacturing Co. Ltd. | | | 1,481,000 | | | | 8,685,704 | |
| | | | | | | | |
| Thailand — 0.7% | |
Airports of Thailand PCL | | | 35,700 | | | | 411,091 | |
CP ALL PCL | | | 573,200 | | | | 1,017,368 | |
| | | | | | | | |
| | | | | | | 1,428,459 | |
| | | | | | | | |
| Turkey — 1.0% | |
Anadolu Efes Biracilik Ve Malt Sanayii AS | | | 165,208 | | | | 999,178 | |
BIM Birlesik Magazalar AS | | | 69,904 | | | | 1,166,174 | |
| | | | | | | | |
| | | | | | | 2,165,352 | |
| | | | | | | | |
| United Arab Emirates — 1.3% | |
DP World Ltd. | | | 153,065 | | | | 2,899,636 | |
| | | | | | | | |
| | | | | | | | |
| | | Number of
Shares | | | Value | |
| United Kingdom — 2.7% | |
Glencore PLC (a) | | | 543,925 | | | $ | 1,491,166 | |
Old Mutual PLC | | | 918,497 | | | | 2,418,091 | |
SABMiller PLC | | | 34,106 | | | | 1,987,453 | |
| | | | | | | | |
| | | | | | | 5,896,710 | |
| | | | | | | | |
| United States — 2.5% | |
Cognizant Technology Solutions Corp. Class A (a) | | | 24,590 | | | | 1,173,189 | |
Las Vegas Sands Corp. | | | 46,590 | | | | 2,680,788 | |
MercadoLibre, Inc. | | | 1,480 | | | | 273,756 | |
Tiffany & Co. (c) | | | 17,530 | | | | 1,273,204 | |
| | | | | | | | |
| | | | | | | 5,400,937 | |
| | | | | | | | |
| | |
TOTAL COMMON STOCK
(Cost $185,268,538) | | | | | | | 197,880,901 | |
| | | | | | | | |
|
| PREFERRED STOCK — 2.5% | |
| Brazil — 2.5% | |
Lojas Americanas SA 0.670% | | | 861,320 | | | | 5,347,247 | |
| | | | | | | | |
| India — 0.0% | |
Zee Entertainment Enterprises Ltd., 6.000% | | | 612,906 | | | | 87,085 | |
| | | | | | | | |
| | |
TOTAL PREFERRED STOCK
(Cost $4,105,301) | | | | | | | 5,434,332 | |
| | | | | | | | |
| | |
TOTAL EQUITIES
(Cost $189,373,839) | | | | | | | 203,315,233 | |
| | | | | | | | |
|
| MUTUAL FUNDS — 0.9% | |
| United States — 0.9% | |
State Street Navigator Securities Lending Prime Portfolio (e) | | | 1,880,846 | | | | 1,880,846 | |
| | | | | | | | |
| | |
TOTAL MUTUAL FUNDS
(Cost $1,880,846) | | | | | | | 1,880,846 | |
| | | | | | | | |
|
| RIGHTS — 0.4% | |
| Russia — 0.4% | |
Moscow Exchange OAO (a) | | | 466,280 | | | | 942,628 | |
| | | | | | | | |
| | |
TOTAL RIGHTS
(Cost $824,434) | | | | | | | 942,628 | |
| | | | | | | | |
|
| WARRANTS — 0.0% | |
| Malaysia — 0.0% | |
Genting BHD, Expires 12/18/18, Strike Price 7.96 (a) | | | 121,100 | | | | 40,996 | |
| | | | | | | | |
| | |
TOTAL WARRANTS
(Cost $57,060) | | | | | | | 40,996 | |
| | | | | | | | |
| | |
TOTAL LONG-TERM INVESTMENTS
(Cost $192,136,179) | | | | | | | 206,179,703 | |
| | | | | | | | |
The accompanying notes are an integral part of the financial statements.
196
MassMutual Premier Strategic Emerging Markets Fund – Portfolio of Investments (Continued)
| | | | | | | | |
| | | Principal
Amount | | | Value | |
| SHORT-TERM INVESTMENTS — 5.7% | |
| Repurchase Agreement — 5.7% | |
State Street Bank & Trust Co. Repurchase Agreement, dated 9/30/16, 0.010%, due 10/03/16 (f) | | $ | 12,559,882 | | | $ | 12,559,882 | |
| | | | | | | | |
| Time Deposit — 0.0% | |
Euro Time Deposit
0.010% 10/03/16 | | | 714 | | | | 714 | |
| | | | | | | | |
| | |
TOTAL SHORT-TERM INVESTMENTS
(Cost $12,560,596) | | | | | | | 12,560,596 | |
| | | | | | | | |
| | |
TOTAL INVESTMENTS — 100.3%
(Cost $204,696,775) (g) | | | | | | | 218,740,299 | |
| | |
| Other Assets/(Liabilities) — (0.3)% | | | | | | | (716,191 | ) |
| | | | | | | | |
| | |
| NET ASSETS — 100.0% | | | | | | $ | 218,024,108 | |
| | | | | | | | |
Notes to Portfolio of Investments
Percentages are stated as a percent of net assets.
| ADR | American Depositary Receipt |
| GDR | Global Depositary Receipt |
| (a) | Non-income producing security. |
| (b) | Securities exempt from registration under rule 144A of the Securities Act of 1933. These securities may be resold in transactions exempt from registration, normally to qualified institutional buyers. At September 30, 2016, these securities amounted to a value of $309,677 or 0.14% of net assets. |
| (c) | Denotes all or a portion of security on loan. The total value of securities on loan as of September 30, 2016, was $1,805,199 or 0.83% of net assets. Total securities on loan may not correspond with the amounts identified in the Portfolio of Investments because pending sales may be in the process of recall from the brokers. (Note 2). |
| (d) | Security exempt from registration under Regulation S of the Securities Act of 1933, which exempts from registration securities offered and sold outside the United States. Security may not be offered or sold in the United States except pursuant to an exemption from, or in a transaction not subject to, the registration requirements of the Securities Act of 1933. At September 30, 2016, these securities amounted to a value of $5,706,212 or 2.62% of net assets. |
| (e) | Represents investment of security lending collateral. (Note 2). |
| (f) | Maturity value of $12,559,893. Collateralized by U.S. Government Agency obligations with a rate of 1.000%, maturity date of 5/15/18, and an aggregate market value, including accrued interest, of $12,815,252. |
| (g) | See Note 6 for aggregate cost for federal tax purposes. |
The accompanying notes are an integral part of the financial statements.
197
MassMutual Premier Funds – Financial Statements
Statements of Assets and Liabilities
September 30, 2016
| | | | | | | | |
| | | MassMutual
Premier U.S.
Government
Money Market
Fund | | | MassMutual
Premier Short-
Duration Bond
Fund | |
| Assets: | | | | | | | | |
Investments, at value (Note 2) (a) | | $ | - | | | $ | 553,752,118 | |
Repurchase agreement, at value (Note 2) (b) | | | 41,500,000 | | | | - | |
Other short-term investments, at value (Note 2) (c) | | | 301,406,145 | | | | 5,249,654 | |
| | | | | | | | |
Total investments | | | 342,906,145 | | | | 559,001,772 | |
| | | | | | | | |
Foreign currency, at value (d) | | | - | | | | - | |
Receivables from: | | | | | | | | |
Investments sold | | | - | | | | - | |
Investments sold on a when-issued basis (Note 2) | | | - | | | | 7,152,107 | |
Collateral pledged for reverse repurchase agreements (Note 2) | | | - | | | | - | |
Open forward foreign currency contracts (Note 2) | | | - | | | | 151,174 | |
Investment adviser (Note 3) | | | 22,784 | | | | - | |
Fund shares sold | | | 42,623 | | | | 321,262 | |
Variation margin on open derivative instruments (Note 2) | | | - | | | | 126,861 | |
Interest and dividends | | | 59,149 | | | | 3,108,931 | |
Open swap agreements, at value (Note 2) | | | - | | | | - | |
Prepaid expenses | | | 9,978 | | | | 31,354 | |
| | | | | | | | |
Total assets | | | 343,040,679 | | | | 569,893,461 | |
| | | | | | | | |
| Liabilities: | | | | | | | | |
Payables for: | | | | | | | | |
Investments purchased | | | - | | | $ | 3,707,779 | |
Reverse repurchase agreements (Note 2) | | | - | | | | - | |
Interest for reverse repurchase agreements (Note 2) | | | - | | | | - | |
Open forward foreign currency contracts (Note 2) | | | - | | | | 106,867 | |
Investments purchased on a when-issued basis (Note 2) | | | - | | | | 4,214,382 | |
Fund shares repurchased | | | 8,042,940 | | | | 6,301,709 | |
Open swap agreements, at value (Note 2) | | | - | | | | 271,168 | |
Trustees’ fees and expenses (Note 3) | | | 100,568 | | | | 92,790 | |
Variation margin on open derivative instruments (Note 2) | | | - | | | | 9,695 | |
Collateral held for open derivative instruments (Note 2) | | | - | | | | - | |
Collateral held for when-issued securities (Note 2) | | | - | | | | - | |
Affiliates (Note 3): | | | | | | | | |
Investment advisory fees | | | 101,020 | | | | 168,748 | |
Administration fees | | | 40,128 | | | | 50,124 | |
Service fees | | | - | | | | 62,928 | |
Shareholder service fees | | | - | | | | 17,142 | |
Distribution fees | | | - | | | | 2,095 | |
Due to custodian | | | - | | | | 282,637 | |
Accrued expense and other liabilities | | | 35,779 | | | | 48,935 | |
| | | | | | | | |
Total liabilities | | | 8,320,435 | | | | 15,336,999 | |
| | | | | | | | |
Net assets | | $ | 334,720,244 | | | $ | 554,556,462 | |
| | | | | | | | |
| Net assets consist of: | | | | | | | | |
Paid-in capital | | $ | 334,817,515 | | | $ | 556,326,564 | |
Undistributed (accumulated) net investment income (loss) | | | (97,271 | ) | | | 9,580,122 | |
Accumulated net realized gain (loss) on investments and foreign currency transactions | | | - | | | | (14,443,129 | ) |
Net unrealized appreciation (depreciation) on investments and foreign currency translations | | | - | | | | 3,092,905 | |
| | | | | | | | |
Net assets | | $ | 334,720,244 | | | $ | 554,556,462 | |
| | | | | | | | |
| | | | | | | | |
(a) Cost of investments: | | $ | - | | | $ | 550,350,854 | |
(b) Cost of repurchase agreements: | | $ | 41,500,000 | | | $ | - | |
(c) Cost of other short-term investments: | | $ | 301,406,145 | | | $ | 5,249,825 | |
(d) Cost of foreign currency: | | $ | - | | | $ | - | |
The accompanying notes are an integral part of the financial statements.
198
| | | | | | | | | | | | | | |
MassMutual
Premier
Inflation-
Protected and
Income Fund | | | MassMutual
Premier
Core Bond
Fund | | | MassMutual
Premier
Diversified
Bond Fund | | | MassMutual
Premier
High Yield
Fund | |
| | | | | | | | | | | | | | |
| $ | 461,714,691 | | | $ | 1,242,783,727 | | | $ | 185,885,576 | | | $ | 401,397,046 | |
| | 97,877 | | | | - | | | | - | | | | - | |
| | 113,721,423 | | | | 187,095,999 | | | | 34,556,826 | | | | 18,317,787 | |
| | | | | | | | | | | | | | |
| | 575,533,991 | | | | 1,429,879,726 | | | | 220,442,402 | | | | 419,714,833 | |
| | | | | | | | | | | | | | |
| | - | | | | - | | | | 3,112 | | | | - | |
| | | | | | | | | | | | | | |
| | 687,207 | | | | 1,878,302 | | | | 323,841 | | | | 214,151 | |
| | - | | | | 213,069,577 | | | | 24,022,750 | | | | - | |
| | 48,823 | | | | - | | | | - | | | | - | |
| | - | | | | 365,472 | | | | 137,911 | | | | - | |
| | 1 | | | | - | | | | - | | | | 2,822 | |
| | 401,025 | | | | 681,598 | | | | 161,407 | | | | 331,372 | |
| | - | | | | - | | | | - | | | | - | |
| | 777,159 | | | | 6,961,540 | | | | 1,177,042 | | | | 7,694,102 | |
| | 226,813 | | | | - | | | | - | | | | - | |
| | 30,332 | | | | 38,416 | | | | 32,270 | | | | 37,732 | |
| | | | | | | | | | | | | | |
| | 577,705,351 | | | | 1,652,874,631 | | | | 246,300,735 | | | | 427,995,012 | |
| | | | | | | | | | | | | | |
| | | | | | | | | | | | | | |
| | | | | | | | | | | | | | |
| | 4,735,048 | | | | 9,426,449 | | | | 2,635,259 | | | | 5,764,352 | |
| | 264,809,962 | | | | - | | | | - | | | | - | |
| | 266,580 | | | | - | | | | - | | | | - | |
| | - | | | | 258,358 | | | | 103,898 | | | | - | |
| | 1,689,955 | | | | 385,828,377 | | | | 49,949,217 | | | | 4,810,000 | |
| | 507,559 | | | | 1,178,019 | | | | 18,128 | | | | 332,160 | |
| | 245,129 | | | | 694,082 | | | | 87,097 | | | | - | |
| | 50,805 | | | | 276,075 | | | | 31,534 | | | | 36,204 | |
| | 11,372 | | | | 887,464 | | | | 88,286 | | | | - | |
| | - | | | | - | | | | 63,000 | | | | - | |
| | - | | | | 556,314 | | | | - | | | | - | |
| | | | | | | | | | | | | | |
| | 102,193 | | | | 415,538 | | | | 61,687 | | | | 153,184 | |
| | 27,699 | | | | 92,346 | | | | 25,141 | | | | 31,232 | |
| | 19,385 | | | | 104,823 | | | | 26,508 | | | | 36,536 | |
| | 7,432 | | | | 32,635 | | | | 9,541 | | | | 9,569 | |
| | 1,554 | | | | 500 | | | | 903 | | | | 7,998 | |
| | 251,611 | | | | - | | | | - | | | | - | |
| | 35,692 | | | | 77,217 | | | | 38,409 | | | | 40,850 | |
| | | | | | | | | | | | | | |
| | 272,761,976 | | | | 399,828,197 | | | | 53,138,608 | | | | 11,222,085 | |
| | | | | | | | | | | | | | |
| $ | 304,943,375 | | | $ | 1,253,046,434 | | | $ | 193,162,127 | | | $ | 416,772,927 | |
| | | | | | | | | | | | | | |
| | | | | | | | | | | | | | |
| $ | 296,289,415 | | | $ | 1,220,042,470 | | | $ | 186,829,305 | | | $ | 408,729,052 | |
| | 5,913,818 | | | | 28,012,559 | | | | 3,221,808 | | | | 16,712,123 | |
| | (8,392,698 | ) | | | (20,342,448 | ) | | | (1,105,806 | ) | | | (16,012,304 | ) |
| | 11,132,840 | | | | 25,333,853 | | | | 4,216,820 | | | | 7,344,056 | |
| | | | | | | | | | | | | | |
| $ | 304,943,375 | | | $ | 1,253,046,434 | | | $ | 193,162,127 | | | $ | 416,772,927 | |
| | | | | | | | | | | | | | |
| | | | | | | | | | | | | | |
| $ | 450,662,635 | | | $ | 1,217,555,933 | | | $ | 181,635,767 | | | $ | 394,052,982 | |
| $ | 97,877 | | | $ | - | | | $ | - | | | $ | - | |
| $ | 113,690,920 | | | $ | 187,076,455 | | | $ | 34,555,332 | | | $ | 18,317,795 | |
| $ | - | | | $ | - | | | $ | 3,386 | | | $ | - | |
199
MassMutual Premier Funds – Financial Statements (Continued)
Statements of Assets and Liabilities
September 30, 2016
| | | | | | | | |
| | | MassMutual
Premier
U.S. Government
Money Market
Fund | | | MassMutual
Premier
Short-Duration
Bond Fund | |
| Class I shares: | | | | | | | | |
Net assets | | $ | - | | | $ | 166,281,443 | |
| | | | | | | | |
Shares outstanding (a) | | | - | | | | 15,999,198 | |
| | | | | | | | |
Net asset value, offering price and redemption price per share | | $ | - | | | $ | 10.39 | |
| | | | | | | | |
| Class R5 shares: | | | | | | | | |
Net assets | | $ | 334,720,244 | | | $ | 199,354,197 | |
| | | | | | | | |
Shares outstanding (a) | | | 334,958,526 | | | | 19,134,029 | |
| | | | | | | | |
Net asset value, offering price and redemption price per share | | $ | 1.00 | | | $ | 10.42 | |
| | | | | | | | |
| Service Class shares: | | | | | | | | |
Net assets | | $ | - | | | $ | 55,309,367 | |
| | | | | | | | |
Shares outstanding (a) | | | - | | | | 5,344,713 | |
| | | | | | | | |
Net asset value, offering price and redemption price per share | | $ | - | | | $ | 10.35 | |
| | | | | | | | |
| Administrative Class shares: | | | | | | | | |
Net assets | | $ | - | | | $ | 32,905,606 | |
| | | | | | | | |
Shares outstanding (a) | | | - | | | | 3,193,271 | |
| | | | | | | | |
Net asset value, offering price and redemption price per share | | $ | - | | | $ | 10.30 | |
| | | | | | | | |
| Class A shares: | | | | | | | | |
Net assets | | $ | - | | | $ | 87,598,127 | |
| | | | | | | | |
Shares outstanding (a) | | | - | | | | 8,561,389 | |
| | | | | | | | |
Net asset value and redemption price per share | | $ | - | | | $ | 10.23 | |
| | | | | | | | |
Offering price per share | | | | | | | | |
(100/[100-maximum sales charge] of net asset value) | | $ | - | | | $ | 10.60 | |
| | | | | | | | |
| Class R4 shares: | | | | | | | | |
Net assets | | $ | - | | | $ | 9,446,268 | |
| | | | | | | | |
Shares outstanding (a) | | | - | | | | 911,762 | |
| | | | | | | | |
Net asset value, offering price and redemption price per share | | $ | - | | | $ | 10.36 | |
| | | | | | | | |
| Class R3 shares: | | | | | | | | |
Net assets | | $ | - | | | $ | 3,661,454 | |
| | | | | | | | |
Shares outstanding (a) | | | - | | | | 355,062 | |
| | | | | | | | |
Net asset value, offering price and redemption price per share | | $ | - | | | $ | 10.31 | |
| | | | | | | | |
| (a) | Authorized unlimited number of shares with no par value. |
The accompanying notes are an integral part of the financial statements.
200
| | | | | | | | | | | | | | |
MassMutual
Premier
Inflation-
Protected and
Income Fund | | | MassMutual
Premier
Core Bond
Fund | | | MassMutual
Premier
Diversified
Bond Fund | | | MassMutual
Premier
High Yield
Fund | |
| | | | | | | | | | | | | | |
| $ | 122,514,828 | | | $ | 501,736,814 | | | $ | 20,147,396 | | | $ | 220,759,227 | |
| | | | | | | | | | | | | | |
| | 11,349,781 | | | | 44,545,349 | | | | 1,830,152 | | | | 23,760,599 | |
| | | | | | | | | | | | | | |
| $ | 10.79 | | | $ | 11.26 | | | $ | 11.01 | | | $ | 9.29 | |
| | | | | | | | | | | | | | |
| | | | | | | | | | | | | | |
| $ | 65,361,193 | | | $ | 408,472,172 | | | $ | 77,692,573 | | | $ | 45,866,864 | |
| | | | | | | | | | | | | | |
| | 6,054,411 | | | | 36,178,377 | | | | 7,603,352 | | | | 4,915,589 | |
| | | | | | | | | | | | | | |
| $ | 10.80 | | | $ | 11.29 | | | $ | 10.22 | | | $ | 9.33 | |
| | | | | | | | | | | | | | |
| | | | | | | | | | | | | | |
| $ | 71,039,881 | | | $ | 91,885,402 | | | $ | 16,990,281 | | | $ | 59,787,262 | |
| | | | | | | | | | | | | | |
| | 6,604,465 | | | | 8,189,903 | | | | 1,643,423 | | | | 6,410,845 | |
| | | | | | | | | | | | | | |
| $ | 10.76 | | | $ | 11.22 | | | $ | 10.34 | | | $ | 9.33 | |
| | | | | | | | | | | | | | |
| | | | | | | | | | | | | | |
| $ | 14,408,027 | | | $ | 85,249,089 | | | $ | 34,731,390 | | | $ | 28,948,401 | |
| | | | | | | | | | | | | | |
| | 1,326,264 | | | | 7,650,167 | | | | 3,369,269 | | | | 3,147,981 | |
| | | | | | | | | | | | | | |
| $ | 10.86 | | | $ | 11.14 | | | $ | 10.31 | | | $ | 9.20 | |
| | | | | | | | | | | | | | |
| | | | | | | | | | | | | | |
| $ | 23,476,105 | | | $ | 150,013,926 | | | $ | 37,243,208 | | | $ | 29,055,313 | |
| | | | | | | | | | | | | | |
| | 2,215,510 | | | | 13,599,037 | | | | 3,622,520 | | | | 3,168,956 | |
| | | | | | | | | | | | | | |
| $ | 10.60 | | | $ | 11.03 | | | $ | 10.28 | | | $ | 9.17 | |
| | | | | | | | | | | | | | |
| | | | | | | | | | | | | | |
| $ | 11.13 | | | $ | 11.58 | | | $ | 10.79 | | | $ | 9.73 | |
| | | | | | | | | | | | | | |
| | | | | | | | | | | | | | |
| $ | 5,351,555 | | | $ | 14,905,905 | | | $ | 3,765,068 | | | $ | 18,428,349 | |
| | | | | | | | | | | | | | |
| | 506,531 | | | | 1,354,740 | | | | 368,252 | | | | 2,023,634 | |
| | | | | | | | | | | | | | |
| $ | 10.57 | | | $ | 11.00 | | | $ | 10.22 | | | $ | 9.11 | |
| | | | | | | | | | | | | | |
| | | | | | | | | | | | | | |
| $ | 2,791,786 | | | $ | 783,126 | | | $ | 2,592,211 | | | $ | 13,927,511 | |
| | | | | | | | | | | | | | |
| | 264,011 | | | | 69,631 | | | | 254,399 | | | | 1,499,404 | |
| | | | | | | | | | | | | | |
| $ | 10.57 | | | $ | 11.25 | | | $ | 10.19 | | | $ | 9.29 | |
| | | | | | | | | | | | | | |
201
MassMutual Premier Funds – Financial Statements (Continued)
Statements of Assets and Liabilities
September 30, 2016
| | | | | | | | |
| | |
MassMutual
Premier
Balanced
Fund | | | MassMutual
Premier
Value
Fund | |
| Assets: | | | | | | | | |
Investments, at value (Note 2) (a) | | $ | 116,172,389 | | | $ | 64,167,805 | |
Repurchase agreement, at value (Note 2) (b) | | | 4,470 | | | | 1,474,363 | |
Other short-term investments, at value (Note 2) (c) | | | 5,518,441 | | | | - | |
| | | | | | | | |
Total investments (d) | | | 121,695,300 | | | | 65,642,168 | |
| | | | | | | | |
Receivables from: | | | | | | | | |
Investments sold | | | 571,773 | | | | 32,141 | |
Investments sold on a when-issued basis (Note 2) | | | 5,520,325 | | | | - | |
Open forward foreign currency contracts (Note 2) | | | 9,649 | | | | - | |
Investment adviser (Note 3) | | | 1,957 | | | | 7,786 | |
Fund shares sold | | | 66,624 | | | | 10,544 | |
Collateral pledged for open derivative instruments (Note 2) | | | 71,397 | | | | - | |
Interest and dividends | | | 304,660 | | | | 44,491 | |
Foreign taxes withheld | | | - | | | | 3,128 | |
Prepaid expenses | | | 30,792 | | | | 30,512 | |
| | | | | | | | |
Total assets | | | 128,272,477 | | | | 65,770,770 | |
| | | | | | | | |
| Liabilities: | | | | | | | | |
Payables for: | | | | | | | | |
Investments purchased | | | 474,315 | | | | - | |
Open forward foreign currency contracts (Note 2) | | | 6,821 | | | | - | |
Investments purchased on a when-issued basis (Note 2) | | | 10,833,369 | | | | - | |
Fund shares repurchased | | | 40,346 | | | | 1,294 | |
Securities on loan (Note 2) | | | - | | | | 687,150 | |
Open swap agreements, at value (Note 2) | | | 18,857 | | | | - | |
Trustees’ fees and expenses (Note 3) | | | 31,101 | | | | 53,118 | |
Variation margin on open derivative instruments (Note 2) | | | 2,409 | | | | - | |
Affiliates (Note 3): | | | | | | | | |
Investment advisory fees | | | 45,891 | | | | 26,433 | |
Administration fees | | | 20,097 | | | | 14,171 | |
Service fees | | | 24,258 | | | | 3,846 | |
Shareholder service fees | | | 5,594 | | | | 2,167 | |
Distribution fees | | | 3,110 | | | | 66 | |
Accrued expense and other liabilities | | | 36,117 | | | | 29,403 | |
| | | | | | | | |
Total liabilities | | | 11,542,285 | | | | 817,648 | |
| | | | | | | | |
Net assets | | $ | 116,730,192 | | | $ | 64,953,122 | |
| | | | | | | | |
| Net assets consist of: | | | | | | | | |
Paid-in capital | | $ | 111,253,218 | | | $ | 91,314,469 | |
Undistributed (accumulated) net investment income (loss) | | | 1,442,249 | | | | 534,123 | |
Accumulated net realized gain (loss) on investments and foreign currency transactions | | | 143,462 | | | | (33,360,908 | ) |
Net unrealized appreciation (depreciation) on investments and foreign currency translations | | | 3,891,263 | | | | 6,465,438 | |
| | | | | | | | |
Net assets | | $ | 116,730,192 | | | $ | 64,953,122 | |
| | | | | | | | |
| | | | | | | | |
(a) Cost of investments: | | $ | 112,248,555 | | | $ | 57,702,367 | |
(b) Cost of repurchase agreements: | | $ | 4,470 | | | $ | 1,474,363 | |
(c) Cost of other short-term investments: | | $ | 5,518,199 | | | $ | - | |
(d) Securities on loan with market value of: | | $ | - | | | $ | 671,941 | |
The accompanying notes are an integral part of the financial statements.
202
| | | | | | | | | | | | | | |
MassMutual
Premier
Disciplined
Value Fund | | | MassMutual
Premier
Main Street
Fund | | | MassMutual
Premier
Disciplined
Growth
Fund | | | MassMutual
Premier
Small Cap
Opportunities
Fund | |
| | | | | | | | | | | | | | |
| $ | 204,746,317 | | | $ | 122,899,651 | | | $ | 355,703,252 | | | $ | 186,686,492 | |
| | 256,130 | | | | 1,981,632 | | | | 3,769,361 | | | | 3,521,460 | |
| | 3,009 | | | | - | | | | 5,998 | | | | - | |
| | | | | | | | | | | | | | |
| | 205,005,456 | | | | 124,881,283 | | | | 359,478,611 | | | | 190,207,952 | |
| | | | | | | | | | | | | | |
| | | | | | | | | | | | | | |
| | - | | | | - | | | | 4,890 | | | | 298,053 | |
| | - | | | | - | | | | - | | | | - | |
| | - | | | | - | | | | - | | | | - | |
| | - | | | | - | | | | - | | | | - | |
| | 372,187 | | | | 19,167 | | | | 349,851 | | | | 176,533 | |
| | - | | | | - | | | | - | | | | - | |
| | 464,765 | | | | 200,193 | | | | 215,645 | | | | 188,141 | |
| | - | | | | - | | | | - | | | | - | |
| | 34,468 | | | | 25,064 | | | | 34,035 | | | | 35,325 | |
| | | | | | | | | | | | | | |
| | 205,876,876 | | | | 125,125,707 | | | | 360,083,032 | | | | 190,906,004 | |
| | | | | | | | | | | | | | |
| | | | | | | | | | | | | | |
| | | | | | | | | | | | | | |
| | - | | | | 482,212 | | | | - | | | | - | |
| | - | | | | - | | | | - | | | | - | |
| | - | | | | - | | | | - | | | | - | |
| | 143,240 | | | | 73,531 | | | | 618,577 | | | | 307,292 | |
| | - | | | | 2,854,304 | | | | - | | | | 14,957,330 | |
| | - | | | | - | | | | - | | | | - | |
| | 50,754 | | | | 28,733 | | | | 51,151 | | | | 41,753 | |
| | - | | | | - | | | | - | | | | - | |
| | | | | | | | | | | | | | |
| | 112,547 | | | | 53,766 | | | | 159,941 | | | | 83,362 | |
| | 22,195 | | | | 19,194 | | | | 37,506 | | | | 26,072 | |
| | 8,511 | | | | 8,355 | | | | 35,240 | | | | 49,821 | |
| | 4,671 | | | | 5,143 | | | | 12,803 | | | | 11,248 | |
| | 911 | | | | 488 | | | | 1,727 | | | | 3,223 | |
| | 63,472 | | | | 31,207 | | | | 68,612 | | | | 33,020 | |
| | | | | | | | | | | | | | |
| | 406,301 | | | | 3,556,933 | | | | 985,557 | | | | 15,513,121 | |
| | | | | | | | | | | | | | |
| $ | 205,470,575 | | | $ | 121,568,774 | | | $ | 359,097,475 | | | $ | 175,392,883 | |
| | | | | | | | | | | | | | |
| | | | | | | | | | | | | | |
| $ | 185,871,083 | | | $ | 106,076,084 | | | $ | 314,378,042 | | | $ | 155,365,698 | |
| | 5,187,556 | | | | 929,368 | | | | 3,372,682 | | | | 1,276,727 | |
| | 4,427,574 | | | | 2,926,182 | | | | 22,182,640 | | | | 2,038,413 | |
| | 9,984,362 | | | | 11,637,140 | | | | 19,164,111 | | | | 16,712,045 | |
| | | | | | | | | | | | | | |
| $ | 205,470,575 | | | $ | 121,568,774 | | | $ | 359,097,475 | | | $ | 175,392,883 | |
| | | | | | | | | | | | | | |
| | | | | | | | | | | | | | |
| $ | 194,761,955 | | | $ | 111,262,468 | | | $ | 336,539,141 | | | $ | 169,974,447 | |
| $ | 256,130 | | | $ | 1,981,632 | | | $ | 3,769,361 | | | $ | 3,521,460 | |
| $ | 3,009 | | | $ | - | | | $ | 5,998 | | | $ | - | |
| $ | - | | | $ | 2,791,340 | | | $ | - | | | $ | 14,616,927 | |
203
MassMutual Premier Funds – Financial Statements (Continued)
Statements of Assets and Liabilities
September 30, 2016
| | | | | | | | |
| | | MassMutual
Premier
Balanced
Fund | | | MassMutual
Premier
Value
Fund | |
| Class I shares: | | | | | | | | |
Net assets | | $ | 967,110 | | | $ | 110,376 | |
| | | | | | | | |
Shares outstanding (a) | | | 85,430 | | | | 5,083 | |
| | | | | | | | |
Net asset value, offering price and redemption price per share | | $ | 11.32 | | | $ | 21.71 | |
| | | | | | | | |
| Class R5 shares: | | | | | | | | |
Net assets | | $ | 53,726,719 | | | $ | 46,856,175 | |
| | | | | | | | |
Shares outstanding (a) | | | 4,744,402 | | | | 2,158,799 | |
| | | | | | | | |
Net asset value, offering price and redemption price per share | | $ | 11.32 | | | $ | 21.70 | |
| | | | | | | | |
| Service Class shares: | | | | | | | | |
Net assets | | $ | 14,129,545 | | | $ | 144,323 | |
| | | | | | | | |
Shares outstanding (a) | | | 1,194,055 | | | | 6,628 | |
| | | | | | | | |
Net asset value, offering price and redemption price per share | | $ | 11.83 | | | $ | 21.77 | |
| | | | | | | | |
| Administrative Class shares: | | | | | | | | |
Net assets | | $ | 9,751,191 | | | $ | 11,707,865 | |
| | | | | | | | |
Shares outstanding (a) | | | 858,812 | | | | 538,212 | |
| | | | | | | | |
Net asset value, offering price and redemption price per share | | $ | 11.35 | | | $ | 21.75 | |
| | | | | | | | |
| Class A shares: | | | | | | | | |
Net assets | | $ | 30,781,403 | | | $ | 5,918,175 | |
| | | | | | | | |
Shares outstanding (a) | | | 2,784,929 | | | | 272,423 | |
| | | | | | | | |
Net asset value and redemption price per share | | $ | 11.05 | | | $ | 21.72 | |
| | | | | | | | |
Offering price per share | | | | | | | | |
(100/[100-maximum sales charge] of net asset value) | | $ | 11.72 | | | $ | 23.05 | |
| | | | | | | | |
| Class R4 shares: | | | | | | | | |
Net assets | | $ | 2,372,641 | | | $ | 109,654 | |
| | | | | | | | |
Shares outstanding (a) | | | 215,877 | | | | 5,053 | |
| | | | | | | | |
Net asset value, offering price and redemption price per share | | $ | 10.99 | | | $ | 21.70 | |
| | | | | | | | |
| Class R3 shares: | | | | | | | | |
Net assets | | $ | 5,001,583 | | | $ | 106,554 | |
| | | | | | | | |
Shares outstanding (a) | | | 456,851 | | | | 4,935 | |
| | | | | | | | |
Net asset value, offering price and redemption price per share | | $ | 10.95 | | | $ | 21.59 | |
| | | | | | | | |
| (a) | Authorized unlimited number of shares with no par value. |
The accompanying notes are an integral part of the financial statements.
204
| | | | | | | | | | | | | | |
MassMutual
Premier
Disciplined
Value Fund | | | MassMutual
Premier
Main Street
Fund | | | MassMutual
Premier
Disciplined
Growth Fund | | | MassMutual
Premier
Small Cap
Opportunities
Fund | |
| | | | | | | | | | | | | | |
| $ | 73,201,857 | | | $ | 739,317 | | | $ | 107,336,307 | | | $ | 3,642,137 | |
| | | | | | | | | | | | | | |
| | 4,561,940 | | | | 70,943 | | | | 9,184,214 | | | | 263,752 | |
| | | | | | | | | | | | | | |
| $ | 16.05 | | | $ | 10.42 | | | $ | 11.69 | | | $ | 13.81 | |
| | | | | | | | | | | | | | |
| | | | | | | | | | | | | | |
| $ | 46,643,725 | | | $ | 73,380,261 | | | $ | 76,893,189 | | | $ | 61,310,270 | |
| | | | | | | | | | | | | | |
| | 2,903,701 | | | | 7,046,758 | | | | 6,577,464 | | | | 4,448,141 | |
| | | | | | | | | | | | | | |
| $ | 16.06 | | | $ | 10.41 | | | $ | 11.69 | | | $ | 13.78 | |
| | | | | | | | | | | | | | |
| | | | | | | | | | | | | | |
| $ | 64,634,473 | | | $ | 1,979,263 | | | $ | 80,550,804 | | | $ | 13,313,186 | |
| | | | | | | | | | | | | | |
| | 4,052,766 | | | | 184,838 | | | | 6,879,083 | | | | 967,883 | |
| | | | | | | | | | | | | | |
| $ | 15.95 | | | $ | 10.71 | | | $ | 11.71 | | | $ | 13.75 | |
| | | | | | | | | | | | | | |
| | | | | | | | | | | | | | |
| $ | 5,800,726 | | | $ | 29,370,503 | | | $ | 38,399,159 | | | $ | 17,641,421 | |
| | | | | | | | | | | | | | |
| | 357,918 | | | | 2,825,441 | | | | 3,252,623 | | | | 1,289,381 | |
| | | | | | | | | | | | | | |
| $ | 16.21 | | | $ | 10.40 | | | $ | 11.81 | | | $ | 13.68 | |
| | | | | | | | | | | | | | |
| | | | | | | | | | | | | | |
| $ | 10,414,601 | | | $ | 11,876,921 | | | $ | 38,742,647 | | | $ | 69,494,773 | |
| | | | | | | | | | | | | | |
| | 658,479 | | | | 1,157,324 | | | | 3,358,920 | | | | 5,177,209 | |
| | | | | | | | | | | | | | |
| $ | 15.82 | | | $ | 10.26 | | | $ | 11.53 | | | $ | 13.42 | |
| | | | | | | | | | | | | | |
| | | | | | | | | | | | | | |
| $ | 16.79 | | | $ | 10.89 | | | $ | 12.23 | | | $ | 14.24 | |
| | | | | | | | | | | | | | |
| | | | | | | | | | | | | | |
| $ | 4,126,712 | | | $ | 3,420,515 | | | $ | 14,016,074 | | | $ | 4,467,157 | |
| | | | | | | | | | | | | | |
| | 261,634 | | | | 334,539 | | | | 1,219,059 | | | | 334,490 | |
| | | | | | | | | | | | | | |
| $ | 15.77 | | | $ | 10.22 | | | $ | 11.50 | | | $ | 13.36 | |
| | | | | | | | | | | | | | |
| | | | | | | | | | | | | | |
| $ | 648,481 | | | $ | 801,994 | | | $ | 3,159,295 | | | $ | 5,523,939 | |
| | | | | | | | | | | | | | |
| | 40,741 | | | | 77,853 | | | | 275,887 | | | | 414,773 | |
| | | | | | | | | | | | | | |
| $ | 15.92 | | | $ | 10.30 | | | $ | 11.45 | | | $ | 13.32 | |
| | | | | | | | | | | | | | |
205
MassMutual Premier Funds – Financial Statements (Continued)
Statements of Assets and Liabilities
September 30, 2016
| | | | | | | | | | | | |
| | | MassMutual
Premier
Global Fund | | | MassMutual
Premier
International
Equity Fund | | | MassMutual
Premier
Strategic
Emerging
Markets Fund | |
| Assets: | | | | | | | | | | | | |
Investments, at value — unaffiliated issuers (Note 2) (a) | | $ | 323,902,092 | | | $ | 513,226,319 | | | $ | 206,179,703 | |
Investments, at value — affiliated issuers (Note 2 & 7) (b) | | | 3,661,292 | | | | 6,403,734 | | | | - | |
Repurchase agreement, at value (Note 2) (c) | | | - | | | | - | | | | 12,559,882 | |
Other short-term investments, at value (Note 2) (d) | | | - | | | | - | | | | 714 | |
| | | | | | | | | | | | |
Total investments (e) | | | 327,563,384 | | | | 519,630,053 | | | | 218,740,299 | |
| | | | | | | | | | | | |
Cash | | | 1 | | | | - | | | | - | |
Foreign currency, at value (f) | | | - | | | | 110,847 | | | | 814,815 | |
Receivables from: | | | | | | | | | | | | |
Investments sold | | | - | | | | 937,535 | | | | 1,220,883 | |
Investment adviser (Note 3) | | | - | | | | - | | | | 34,548 | |
Fund shares sold | | | 100,348 | | | | 643,888 | | | | 232,470 | |
Interest and dividends | | | 306,132 | | | | 605,965 | | | | 282,015 | |
Foreign taxes withheld | | | 282,502 | | | | 701,503 | | | | 31,395 | |
Prepaid expenses | | | 25,390 | | | | 31,732 | | | | 40,736 | |
| | | | | | | | | | | | |
Total assets | | | 328,277,757 | | | | 522,661,523 | | | | 221,397,161 | |
| | | | | | | | | | | | |
| Liabilities: | | | | | | | | | | | | |
Payables for: | | | | | | | | | | | | |
Investments purchased | | | 159,335 | | | | 175,098 | | | | 913,223 | |
Fund shares repurchased | | | 336,798 | | | | 176,052 | | | | 89,563 | |
Securities on loan (Note 2) | | | 12,607,626 | | | | 13,876,296 | | | | 1,880,846 | |
Trustees’ fees and expenses (Note 3) | | | 64,473 | | | | 114,714 | | | | 21,005 | |
Affiliates (Note 3): | | | | | | | | | | | | |
Investment advisory fees | | | 193,935 | | | | 361,682 | | | | 176,855 | |
Administration fees | | | 42,468 | | | | 40,212 | | | | 9,791 | |
Service fees | | | 29,097 | | | | 31,345 | | | | 762 | |
Shareholder service fees | | | 17,366 | | | | 8,465 | | | | 430 | |
Distribution fees | | | 5,416 | | | | 2,019 | | | | 293 | |
Accrued expense and other liabilities | | | 65,792 | | | | 447,775 | | | | 280,285 | |
| | | | | | | | | | | | |
Total liabilities | | | 13,522,306 | | | | 15,233,658 | | | | 3,373,053 | |
| | | | | | | | | | | | |
Net assets | | $ | 314,755,451 | | | $ | 507,427,865 | | | $ | 218,024,108 | |
| | | | | | | | | | | | |
| Net assets consist of: | | | | | | | | | | | | |
Paid-in capital | | $ | 201,862,054 | | | $ | 460,839,821 | | | $ | 232,415,182 | |
Undistributed (accumulated) net investment income (loss) | | | 1,433,844 | | | | 5,407,457 | | | | - | |
Distributions in excess of net investment income | | | - | | | | - | | | | (261,325 | ) |
Accumulated net realized gain (loss) on investments and foreign currency transactions | | | 4,144,703 | | | | 2,144,639 | | | | (27,942,445 | ) |
Net unrealized appreciation (depreciation) on investments and foreign currency translations | | | 107,314,850 | | | | 39,035,948 | | | | 13,812,696 | |
| | | | | | | | | | | | |
Net assets | | $ | 314,755,451 | | | $ | 507,427,865 | | | $ | 218,024,108 | |
| | | | | | | | | | | | |
| | | | | | | | | | | | |
(a) Cost of investments — unaffiliated issuers: | | $ | 216,559,951 | | | $ | 473,783,469 | | | $ | 192,136,179 | |
(b) Cost of investments — affiliated issuers: | | $ | 3,661,292 | | | $ | 6,403,734 | | | $ | - | |
(c) Cost of repurchase agreements: | | $ | - | | | $ | - | | | $ | 12,559,882 | |
(d) Cost of other short-term investments: | | $ | - | | | $ | - | | | $ | 714 | |
(e) Securities on loan with market value of: | | $ | 12,249,775 | | | $ | 13,176,018 | | | $ | 1,805,199 | |
(f) Cost of foreign currency: | | $ | - | | | $ | 110,850 | | | $ | 821,165 | |
The accompanying notes are an integral part of the financial statements.
206
| | | | | | | | | | | | |
| | | MassMutual
Premier
Global Fund | | | MassMutual
Premier
International
Equity Fund | | | MassMutual
Premier
Strategic
Emerging
Markets Fund | |
| Class I shares: | | | | | | | | | | | | |
Net assets | | $ | 16,575,894 | | | $ | 195,018,514 | | | $ | 204,625,787 | |
| | | | | | | | | | | | |
Shares outstanding (a) | | | 1,230,918 | | | | 16,287,078 | | | | 18,956,021 | |
| | | | | | | | | | | | |
Net asset value, offering price and redemption price per share | | $ | 13.47 | | | $ | 11.97 | | | $ | 10.79 | |
| | | | | | | | | | | | |
| Class R5 shares: | | | | | | | | | | | | |
Net assets | | $ | 125,170,944 | | | $ | 221,319,577 | | | $ | 3,148,169 | |
| | | | | | | | | | | | |
Shares outstanding (a) | | | 9,298,346 | | | | 18,488,703 | | | | 287,867 | |
| | | | | | | | | | | | |
Net asset value, offering price and redemption price per share | | $ | 13.46 | | | $ | 11.97 | | | $ | 10.94 | |
| | | | | | | | | | | | |
| Service Class shares: | | | | | | | | | | | | |
Net assets | | $ | 28,699,318 | | | $ | 22,509,947 | | | $ | 8,237,814 | |
| | | | | | | | | | | | |
Shares outstanding (a) | | | 2,150,073 | | | | 1,886,340 | | | | 764,503 | |
| | | | | | | | | | | | |
Net asset value, offering price and redemption price per share | | $ | 13.35 | | | $ | 11.93 | | | $ | 10.78 | |
| | | | | | | | | | | | |
| Administrative Class shares: | | | | | | | | | | | | |
Net assets | | $ | 99,084,577 | | | $ | 18,406,894 | | | $ | 676,557 | |
| | | | | | | | | | | | |
Shares outstanding (a) | | | 7,371,590 | | | | 1,550,886 | | | | 62,422 | |
| | | | | | | | | | | | |
Net asset value, offering price and redemption price per share | | $ | 13.44 | | | $ | 11.87 | | | $ | 10.84 | |
| | | | | | | | | | | | |
| Class A shares: | | | | | | | | | | | | |
Net assets | | $ | 32,200,332 | | | $ | 42,907,089 | | | $ | 94,596 | |
| | | | | | | | | | | | |
Shares outstanding (a) | | | 2,422,043 | | | | 3,723,459 | | | | 8,805 | |
| | | | | | | | | | | | |
Net asset value and redemption price per share | | $ | 13.29 | | | $ | 11.52 | | | $ | 10.74 | |
| | | | | | | | | | | | |
Offering price per share | | | | | | | | | | | | |
(100/[100-maximum sales charge] of net asset value) | | $ | 14.10 | | | $ | 12.22 | | | $ | 11.40 | |
| | | | | | | | | | | | |
| Class R4 shares: | | | | | | | | | | | | |
Net assets | | $ | 4,321,999 | | | $ | 3,648,075 | | | $ | 599,443 | |
| | | | | | | | | | | | |
Shares outstanding (a) | | | 327,236 | | | | 317,966 | | | | 55,917 | |
| | | | | | | | | | | | |
Net asset value, offering price and redemption price per share | | $ | 13.21 | | | $ | 11.47 | | | $ | 10.72 | |
| | | | | | | | | | | | |
| Class R3 shares: | | | | | | | | | | | | |
Net assets | | $ | 8,702,387 | | | $ | 3,617,769 | | | $ | 641,742 | |
| | | | | | | | | | | | |
Shares outstanding (a) | | | 655,926 | | | | 316,591 | | | | 60,002 | |
| | | | | | | | | | | | |
Net asset value, offering price and redemption price per share | | $ | 13.27 | | | $ | 11.43 | | | $ | 10.70 | |
| | | | | | | | | | | | |
| (a) | Authorized unlimited number of shares with no par value. |
207
MassMutual Premier Funds – Financial Statements (Continued)
Statements of Operations
For the Year Ended September 30, 2016
| | | | | | | | |
| | | MassMutual
Premier U.S.
Government
Money Market
Fund | | | MassMutual
Premier
Short-
Duration
Bond Fund | |
| Investment income (Note 2): | | | | | | | | |
Dividends | | $ | - | | | $ | 20,156 | |
Interest (a) | | | 1,340,038 | | | | 13,746,963 | |
| | | | | | | | |
Total investment income | | | 1,340,038 | | | | 13,767,119 | |
| | | | | | | | |
| Expenses (Note 3): | | | | | | | | |
Investment advisory fees | | | 1,316,730 | | | | 1,996,913 | |
Custody fees | | | 40,822 | | | | 71,543 | |
Interest expense | | | - | | | | - | |
Audit fees | | | 31,661 | | | | 37,351 | |
Legal fees | | | 7,890 | | | | 6,611 | |
Accounting & Administration fees | | | 71,311 | | | | 60,168 | |
Proxy fees | | | 985 | | | | 985 | |
Shareholder reporting fees | | | 24,368 | | | | 30,550 | |
Trustees’ fees | | | 17,986 | | | | 26,960 | |
Registration and filing fees | | | 21,144 | | | | 86,608 | |
Transfer agent fees | | | 3,000 | | | | 3,000 | |
| | | | | | | | |
| | | 1,535,897 | | | | 2,320,689 | |
Administration fees: | | | | | | | | |
Class R5 | | | 376,208 | | | | 189,868 | |
Service Class | | | - | | | | 98,494 | |
Administrative Class | | | - | | | | 53,779 | |
Class A | | | - | | | | 133,414 | |
Class R4 | | | - | | | | 15,724 | |
Class R3 | | | - | | | | 5,221 | |
Distribution fees: | | | | | | | | |
Class R3 | | | - | | | | 6,527 | |
Service fees: | | | | | | | | |
Class A | | | - | | | | 222,356 | |
Class R4 | | | - | | | | 19,655 | |
Class R3 | | | - | | | | 6,527 | |
Shareholder service fees: | | | | | | | | |
Service Class | | | - | | | | 32,832 | |
Administrative Class | | | - | | | | 53,779 | |
Class A | | | - | | | | 133,414 | |
| | | | | | | | |
Total expenses | | | 1,912,105 | | | | 3,292,279 | |
Expenses waived: | | | | | | | | |
Class I fees reimbursed by adviser | | | - | | | | - | |
Class R5 fees reimbursed by adviser | | | (572,139 | ) | | | - | |
Service Class fees reimbursed by adviser | | | - | | | | - | |
Administrative Class fees reimbursed by adviser | | | - | | | | - | |
Class A fees reimbursed by adviser | | | - | | | | - | |
Class R4 fees reimbursed by adviser | | | - | | | | - | |
Class R3 fees reimbursed by adviser | | | - | | | | - | |
Class I advisory fees waived | | | - | | | | - | |
Class R5 advisory fees waived | | | - | | | | - | |
Service Class advisory fees waived | | | - | | | | - | |
Administrative Class advisory fees waived | | | - | | | | - | |
Class A advisory fees waived | | | - | | | | - | |
Class R4 advisory fees waived | | | - | | | | - | |
Class R3 advisory fees waived | | | - | | | | - | |
| | | | | | | | |
Net expenses | | | 1,339,966 | | | | 3,292,279 | |
| | | | | | | | |
Net investment income (loss) | | | 72 | | | | 10,474,840 | |
| | | | | | | | |
The accompanying notes are an integral part of the financial statements.
208
| | | | | | | | | | | | | | |
MassMutual
Premier
Inflation-
Protected and
Income Fund | | | MassMutual
Premier
Core Bond
Fund | | | MassMutual
Premier
Diversified
Bond Fund | | | MassMutual
Premier
High Yield
Fund | |
| | | | | | | | | | | | | | |
| $ | - | | | $ | 225,984 | | | $ | 20,563 | | | $ | - | |
| | 7,219,834 | | | | 41,921,208 | | | | 5,618,228 | | | | 23,596,593 | |
| | | | | | | | | | | | | | |
| | 7,219,834 | | | | 42,147,192 | | | | 5,638,791 | | | | 23,596,593 | |
| | | | | | | | | | | | | | |
| | | | | | | | | | | | | | |
| | 1,279,207 | | | | 5,324,982 | | | | 702,535 | | | | 1,476,411 | |
| | 82,292 | | | | 147,617 | | | | 57,359 | | | | 74,458 | |
| | 1,486,420 | | | | - | | | | - | | | | - | |
| | 37,393 | | | | 38,916 | | | | 38,130 | | | | 36,237 | |
| | 3,773 | | | | 16,822 | | | | 2,066 | | | | 3,203 | |
| | 49,031 | | | | 98,223 | | | | 43,510 | | | | 46,064 | |
| | 985 | | | | 985 | | | | 985 | | | | 985 | |
| | 19,981 | | | | 67,833 | | | | 12,678 | | | | 25,028 | |
| | 15,844 | | | | 66,544 | | | | 8,445 | | | | 13,679 | |
| | 85,966 | | | | 89,043 | | | | 81,611 | | | | 84,564 | |
| | 3,000 | | | | 3,000 | | | | 3,000 | | | | 3,000 | |
| | | | | | | | | | | | | | |
| | 3,063,892 | | | | 5,853,965 | | | | 950,319 | | | | 1,763,629 | |
| | | | | | | | | | | | | | |
| | 59,471 | | | | 435,760 | | | | 70,401 | | | | 39,097 | |
| | 108,175 | | | | 168,700 | | | | 26,618 | | | | 89,641 | |
| | 18,377 | | | | 130,527 | | | | 52,238 | | | | 39,210 | |
| | 34,391 | | | | 239,353 | | | | 53,990 | | | | 41,227 | |
| | 5,845 | | | | 25,442 | | | | 6,848 | | | | 20,478 | |
| | 2,855 | | | | 1,409 | | | | 2,012 | | | | 17,001 | |
| | | | | | | | | | | | | | |
| | 3,569 | | | | 1,761 | | | | 2,515 | | | | 21,250 | |
| | | | | | | | | | | | | | |
| | 57,319 | | | | 398,921 | | | | 89,983 | | | | 68,711 | |
| | 7,306 | | | | 31,802 | | | | 8,560 | | | | 25,598 | |
| | 3,569 | | | | 1,761 | | | | 2,515 | | | | 21,250 | |
| | | | | | | | | | | | | | |
| | 36,058 | | | | 56,233 | | | | 8,873 | | | | 29,880 | |
| | 18,377 | | | | 130,527 | | | | 52,238 | | | | 39,210 | |
| | 34,391 | | | | 239,353 | | | | 53,990 | | | | 41,227 | |
| | | | | | | | | | | | | | |
| | 3,453,595 | | | | 7,715,514 | | | | 1,381,100 | | | | 2,257,409 | |
| | | | | | | | | | | | | | |
| | - | | | | - | | | | (882 | ) | | | (23,604 | ) |
| | - | | | | - | | | | (3,523 | ) | | | (7,027 | ) |
| | - | | | | - | | | | (887 | ) | | | (11,098 | ) |
| | - | | | | - | | | | (1,742 | ) | | | (4,754 | ) |
| | - | | | | - | | | | (1,800 | ) | | | (5,035 | ) |
| | - | | | | - | | | | (171 | ) | | | (1,614 | ) |
| | - | | | | - | | | | (51 | ) | | | (1,372 | ) |
| | (16,479 | ) | | | - | | | | - | | | | - | |
| | (5,921 | ) | | | - | | | | - | | | | - | |
| | (7,180 | ) | | | - | | | | - | | | | - | |
| | (1,220 | ) | | | - | | | | - | | | | - | |
| | (2,283 | ) | | | - | | | | - | | | | - | |
| | (291 | ) | | | - | | | | - | | | | - | |
| | (142 | ) | | | - | | | | - | | | | - | |
| | | | | | | | | | | | | | |
| | 3,420,079 | | | | 7,715,514 | | | | 1,372,044 | | | | 2,202,905 | |
| | | | | | | | | | | | | | |
| | 3,799,755 | | | | 34,431,678 | | | | 4,266,747 | | | | 21,393,688 | |
| | | | | | | | | | | | | | |
209
MassMutual Premier Funds – Financial Statements (Continued)
Statements of Operations (Continued)
For the Year Ended September 30, 2016
| | | | | | | | |
| | | MassMutual
Premier
U.S. Government
Money Market
Fund | | | MassMutual
Premier
Short-Duration
Bond Fund | |
| Realized and unrealized gain (loss): | | | | | | | | |
Net realized gain (loss) on: | | | | | | | | |
Investment transactions | | $ | 24,972 | | | $ | (5,379,365 | ) |
Futures contracts | | | - | | | | 368,686 | |
Swap agreements | | | - | | | | 58,656 | |
Foreign currency transactions | | | - | | | | - | |
| | | | | | | | |
Net realized gain (loss) | | | 24,972 | | | | (4,952,023 | ) |
| | | | | | | | |
Net change in unrealized appreciation (depreciation) on: | | | | | | | | |
Investment transactions | | | - | | | | 5,789,108 | |
Futures contracts | | | - | | | | (407,776 | ) |
Swap agreements | | | - | | | | (146,958 | ) |
Translation of assets and liabilities in foreign currencies | | | - | | | | 44,307 | |
| | | | | | | | |
Net change in unrealized appreciation (depreciation) | | | - | | | | 5,278,681 | |
| | | | | | | | |
Net realized gain (loss) and change in unrealized appreciation (depreciation) | | | 24,972 | | | | 326,658 | |
| | | | | | | | |
Net increase (decrease) in net assets resulting from operations | | $ | 25,044 | | | $ | 10,801,498 | |
| | | | | | | | |
| | | | | | | | |
(a) Net of foreign withholding tax of: | | $ | - | | | $ | 235 | |
The accompanying notes are an integral part of the financial statements.
210
| | | | | | | | | | | | | | |
MassMutual
Premier
Inflation-
Protected and
Income Fund | | | MassMutual
Premier
Core Bond
Fund | | | MassMutual
Premier
Diversified
Bond Fund | | | MassMutual
Premier
High Yield
Fund | |
| | | | | | | | | | | | | | |
| | | | | | | | | | | | | | |
| $ | 2,857,046 | | | $ | (10,310,499 | ) | | $ | (712,516 | ) | | $ | (8,408,542 | ) |
| | (93,972 | ) | | | 7,127,802 | | | | 453,395 | | | | - | |
| | 72,755 | | | | 146,651 | | | | 15,079 | | | | - | |
| | - | | | | - | | | | (95,787 | ) | | | - | |
| | | | | | | | | | | | | | |
| | 2,835,829 | | | | (3,036,046 | ) | | | (339,829 | ) | | | (8,408,542 | ) |
| | | | | | | | | | | | | | |
| | | | | | | | | | | | | | |
| | 15,358,946 | | | | 27,271,448 | | | | 5,894,364 | | | | 22,383,759 | |
| | 34,910 | | | | 314,858 | | | | (29,914 | ) | | | - | |
| | 108,070 | | | | (404,547 | ) | | | (54,458 | ) | | | - | |
| | - | | | | 107,113 | | | | 48,966 | | | | - | |
| | | | | | | | | | | | | | |
| | 15,501,926 | | | | 27,288,872 | | | | 5,858,958 | | | | 22,383,759 | |
| | | | | | | | | | | | | | |
| | 18,337,755 | | | | 24,252,826 | | | | 5,519,129 | | | | 13,975,217 | |
| | | | | | | | | | | | | | |
| $ | 22,137,510 | | | $ | 58,684,504 | | | $ | 9,785,876 | | | $ | 35,368,905 | |
| | | | | | | | | | | | | | |
| | | | | | | | | | | | | | |
| $ | - | | | $ | - | | | $ | - | | | $ | - | |
211
MassMutual Premier Funds – Financial Statements (Continued)
Statements of Operations
For the Year Ended September 30, 2016
| | | | | | | | |
| | | MassMutual
Premier
Balanced
Fund | | | MassMutual
Premier
Value
Fund | |
| Investment income (Note 2): | | | | | | | | |
Dividends (a) | | $ | 1,798,338 | | | $ | 1,365,737 | |
Interest | | | 1,190,144 | | | | 5,854 | |
Securities lending net income | | | - | | | | 30,964 | |
| | | | | | | | |
Total investment income | | | 2,988,482 | | | | 1,402,555 | |
| | | | | | | | |
| Expenses (Note 3): | | | | | | | | |
Investment advisory fees | | | 557,302 | | | | 319,876 | |
Custody fees | | | 46,857 | | | | 19,878 | |
Audit fees | | | 38,067 | | | | 35,742 | |
Legal fees | | | 1,585 | | | | 788 | |
Accounting & Administration fees | | | 48,302 | | | | 49,682 | |
Proxy fees | | | 985 | | | | 985 | |
Shareholder reporting fees | | | 11,031 | | | | 7,975 | |
Trustees’ fees | | | 5,381 | | | | 2,945 | |
Registration and filing fees | | | 80,633 | | | | 86,205 | |
Transfer agent fees | | | 3,000 | | | | 3,000 | |
| | | | | | | | |
| | | 793,143 | | | | 527,076 | |
Administration fees: | | | | | | | | |
Class R5 | | | 55,564 | | | | 45,804 | |
Service Class | | | 20,344 | | | | 197 | |
Administrative Class | | | 13,701 | | | | 17,644 | |
Class A | | | 46,025 | | | | 8,954 | |
Class R4 | | | 4,460 | | | | 208 | |
Class R3 | | | 8,504 | | | | 199 | |
Distribution fees: | | | | | | | | |
Class R3 | | | 10,630 | | | | 249 | |
Service fees: | | | | | | | | |
Class A | | | 76,709 | | | | 14,923 | |
Class R4 | | | 5,575 | | | | 259 | |
Class R3 | | | 10,630 | | | | 249 | |
Shareholder service fees: | | | | | | | | |
Service Class | | | 6,781 | | | | 65 | |
Administrative Class | | | 13,701 | | | | 17,644 | |
Class A | | | 46,025 | | | | 8,954 | |
| | | | | | | | |
Total expenses | | | 1,111,792 | | | | 642,425 | |
Expenses waived: | | | | | | | | |
Class I fees reimbursed by adviser | | | (525 | ) | | | (233 | ) |
Class R5 fees reimbursed by adviser | | | (46,470 | ) | | | (102,529 | ) |
Service Class fees reimbursed by adviser | | | (11,224 | ) | | | (293 | ) |
Administrative Class fees reimbursed by adviser | | | (7,550 | ) | | | (26,343 | ) |
Class A fees reimbursed by adviser | | | (25,441 | ) | | | (13,374 | ) |
Class R4 fees reimbursed by adviser | | | (1,849 | ) | | | (231 | ) |
Class R3 fees reimbursed by adviser | | | (3,458 | ) | | | (224 | ) |
| | | | | | | | |
Net expenses | | | 1,015,275 | | | | 499,198 | |
| | | | | | | | |
Net investment income (loss) | | | 1,973,207 | | | | 903,357 | |
| | | | | | | | |
The accompanying notes are an integral part of the financial statements.
212
| | | | | | | | | | | | | | |
MassMutual
Premier
Disciplined
Value Fund | | | MassMutual
Premier
Main Street
Fund | | | MassMutual
Premier
Disciplined
Growth
Fund | | | MassMutual
Premier
Small Cap
Opportunities
Fund | |
| | | | | | | | | | | | | | |
| $ | 8,775,516 | | | $ | 2,540,557 | | | $ | 8,071,345 | | | $ | 3,104,656 | |
| | 8,949 | | | | 7,325 | | | | 10,315 | | | | 7,283 | |
| | - | | | | 10,523 | | | | - | | | | 62,008 | |
| | | | | | | | | | | | | | |
| | 8,784,465 | | | | 2,558,405 | | | | 8,081,660 | | | | 3,173,947 | |
| | | | | | | | | | | | | | |
| | | | | | | | | | | | | | |
| | 1,394,256 | | | | 676,106 | | | | 2,073,048 | | | | 937,061 | |
| | 28,919 | | | | 21,154 | | | | 41,780 | | | | 25,846 | |
| | 36,844 | | | | 34,198 | | | | 36,964 | | | | 35,178 | |
| | 3,480 | | | | 1,722 | | | | 5,242 | | | | 1,834 | |
| | 46,090 | | | | 45,762 | | | | 53,449 | | | | 43,215 | |
| | 986 | | | | 985 | | | | 985 | | | | 985 | |
| | 42,920 | | | | 11,737 | | | | 49,329 | | | | 12,135 | |
| | 14,442 | | | | 5,611 | | | | 21,982 | | | | 7,373 | |
| | 85,008 | | | | 86,725 | | | | 80,188 | | | | 81,588 | |
| | 3,000 | | | | 3,000 | | | | 3,000 | | | | 3,000 | |
| | | | | | | | | | | | | | |
| | 1,655,945 | | | | 887,000 | | | | 2,365,967 | | | | 1,148,215 | |
| | | | | | | | | | | | | | |
| | 46,349 | | | | 75,154 | | | | 88,336 | | | | 58,508 | |
| | 100,027 | | | | 4,446 | | | | 128,486 | | | | 16,210 | |
| | 10,106 | | | | 47,973 | | | | 55,207 | | | | 25,568 | |
| | 12,647 | | | | 18,038 | | | | 59,000 | | | | 100,416 | |
| | 5,287 | | | | 545 | | | | 20,782 | | | | 5,955 | |
| | 2,129 | | | | 833 | | | | 7,768 | | | | 6,168 | |
| | | | | | | | | | | | | | |
| | 2,661 | | | | 1,042 | | | | 9,709 | | | | 7,710 | |
| | | | | | | | | | | | | | |
| | 21,078 | | | | 30,063 | | | | 98,334 | | | | 167,360 | |
| | 6,609 | | | | 681 | | | | 25,978 | | | | 7,444 | |
| | 2,661 | | | | 1,042 | | | | 9,709 | | | | 7,710 | |
| | | | | | | | | | | | | | |
| | 33,342 | | | | 1,482 | | | | 42,829 | | | | 5,403 | |
| | 10,106 | | | | 47,973 | | | | 55,207 | | | | 25,568 | |
| | 12,647 | | | | 18,038 | | | | 59,000 | | | | 100,416 | |
| | | | | | | | | | | | | | |
| | 1,921,594 | | | | 1,134,310 | | | | 3,026,312 | | | | 1,682,651 | |
| | | | | | | | | | | | | | |
| | - | | | | - | | | | - | | | | - | |
| | - | | | | - | | | | - | | | | - | |
| | - | | | | - | | | | - | | | | - | |
| | - | | | | - | | | | - | | | | - | |
| | - | | | | - | | | | - | | | | - | |
| | - | | | | - | | | | - | | | | - | |
| | - | | | | - | | | | - | | | | - | |
| | | | | | | | | | | | | | |
| | 1,921,594 | | | | 1,134,310 | | | | 3,026,312 | | | | 1,682,651 | |
| | | | | | | | | | | | | | |
| | 6,862,871 | | | | 1,424,095 | | | | 5,055,348 | | | | 1,491,296 | |
| | | | | | | | | | | | | | |
213
MassMutual Premier Funds – Financial Statements (Continued)
Statements of Operations (Continued)
For the Year Ended September 30, 2016
| | | | | | | | |
| | |
MassMutual
Premier
Balanced
Fund | | | MassMutual
Premier
Value
Fund | |
| Realized and unrealized gain (loss): | | | | | | | | |
Net realized gain (loss) on: | | | | | | | | |
Investment transactions | | $ | 497,262 | | | $ | (673,740 | ) |
Futures contracts | | | 317,670 | | | | - | |
Swap agreements | | | 4,024 | | | | - | |
Foreign currency transactions | | | - | | | | (179 | ) |
| | | | | | | | |
Net realized gain (loss) | | | 818,956 | | | | (673,919 | ) |
| | | | | | | | |
Net change in unrealized appreciation (depreciation) on: | | | | | | | | |
Investment transactions | | | 7,918,577 | | | | 6,242,120 | |
Futures contracts | | | (22,690 | ) | | | - | |
Swap agreements | | | (13,217 | ) | | | - | |
Translation of assets and liabilities in foreign currencies | | | 2,828 | | | | - | |
| | | | | | | | |
Net change in unrealized appreciation (depreciation) | | | 7,885,498 | | | | 6,242,120 | |
| | | | | | | | |
Net realized gain (loss) and change in unrealized appreciation (depreciation) | | | 8,704,454 | | | | 5,568,201 | |
| | | | | | | | |
Net increase (decrease) in net assets resulting from operations | | $ | 10,677,661 | | | $ | 6,471,558 | |
| | | | | | | | |
| | | | | | | | |
(a) Net of foreign withholding tax of: | | $ | - | | | $ | 17,504 | |
The accompanying notes are an integral part of the financial statements.
214
| | | | | | | | | | | | | | |
MassMutual
Premier
Disciplined
Value Fund | | | MassMutual
Premier
Main Street
Fund | | | MassMutual
Premier
Disciplined
Growth Fund | | | MassMutual
Premier
Small Cap
Opportunities
Fund | |
| | | | | | | | | | | | | | |
| | | | | | | | | | | | | | |
| $ | 7,375,476 | | | $ | 3,985,583 | | | $ | 22,562,050 | | | $ | 2,294,136 | |
| | - | | | | - | | | | - | | | | - | |
| | - | | | | - | | | | - | | | | - | |
| | - | | | | (4,100 | ) | | | - | | | | (15,898 | ) |
| | | | | | | | | | | | | | |
| | 7,375,476 | | | | 3,981,483 | | | | 22,562,050 | | | | 2,278,238 | |
| | | | | | | | | | | | | | |
| | | | | | | | | | | | | | |
| | 23,824,174 | | | | 11,068,665 | | | | 22,627,437 | | | | 13,568,676 | |
| | - | | | | - | | | | - | | | | - | |
| | - | | | | - | | | | - | | | | - | |
| | - | | | | 472 | | | | - | | | | (2 | ) |
| | | | | | | | | | | | | | |
| | 23,824,174 | | | | 11,069,137 | | | | 22,627,437 | | | | 13,568,674 | |
| | | | | | | | | | | | | | |
| | 31,199,650 | | | | 15,050,620 | | | | 45,189,487 | | | | 15,846,912 | |
| | | | | | | | | | | | | | |
| $ | 38,062,521 | | | $ | 16,474,715 | | | $ | 50,244,835 | | | $ | 17,338,208 | |
| | | | | | | | | | | | | | |
| | | | | | | | | | | | | | |
| $ | 4,369 | | | $ | 12,209 | | | $ | - | | | $ | 3,181 | |
215
MassMutual Premier Funds – Financial Statements (Continued)
Statements of Operations
For the Year Ended September 30, 2016
| | | | | | | | | | | | |
| | | MassMutual
Premier
Global Fund | | | MassMutual
Premier
International
Equity Fund | | | MassMutual
Premier
Strategic
Emerging
Markets Fund | |
| Investment income (Note 2): | | | | | | | | | | | | |
Dividends — unaffiliated issuers (a) | | $ | 6,077,875 | | | $ | 11,243,652 | | | $ | 3,051,323 | |
Dividends — affiliated issuers (Note 7) | | | 14,748 | | | | 31,259 | | | | - | |
Interest | | | 9,345 | | | | 10,316 | | | | 7,794 | |
Securities lending net income | | | 221,215 | | | | 189,281 | | | | 27,511 | |
| | | | | | | | | | | | |
Total investment income | | | 6,323,183 | | | | 11,474,508 | | | | 3,086,628 | |
| | | | | | | | | | | | |
| Expenses (Note 3): | | | | | | | | | | | | |
Investment advisory fees | | | 2,572,047 | | | | 4,367,967 | | | | 1,780,453 | |
Custody fees | | | 100,634 | | | | 254,478 | | | | 325,632 | |
Audit fees | | | 43,550 | | | | 44,415 | | | | 63,324 | |
Legal fees | | | 4,158 | | | | 5,738 | | | | 1,862 | |
Accounting & Administration fees | | | 57,614 | | | | 64,339 | | | | 51,144 | |
Proxy fees | | | 986 | | | | 985 | | | | 985 | |
Shareholder reporting fees | | | 18,366 | | | | 24,566 | | | | 10,818 | |
Trustees’ fees | | | 16,493 | | | | 24,180 | | | | 7,899 | |
Registration and filing fees | | | 87,534 | | | | 83,569 | | | | 80,205 | |
Transfer agent fees | | | 3,000 | | | | 3,000 | | | | 3,000 | |
| | | | | | | | | | | | |
| | | 2,904,382 | | | | 4,873,237 | | | | 2,325,322 | |
Administration fees: | | | | | | | | | | | | |
Class R5 | | | 148,084 | | | | 236,052 | | | | 3,896 | |
Service Class | | | 48,183 | | | | 32,751 | | | | 11,384 | |
Administrative Class | | | 163,005 | | | | 28,407 | | | | 760 | |
Class A | | | 56,531 | | | | 67,645 | | | | 297 | |
Class R4 | | | 6,487 | | | | 3,626 | | | | 608 | |
Class R3 | | | 12,879 | | | | 4,017 | | | | 635 | |
Distribution fees: | | | | | | | | | | | | |
Class R3 | | | 16,099 | | | | 5,021 | | | | 794 | |
Service fees: | | | | | | | | | | | | |
Class A | | | 94,219 | | | | 112,741 | | | | 495 | |
Class R4 | | | 8,108 | | | | 4,532 | | | | 760 | |
Class R3 | | | 16,099 | | | | 5,021 | | | | 794 | |
Shareholder service fees: | | | | | | | | | | | | |
Service Class | | | 16,061 | | | | 10,917 | | | | 3,795 | |
Administrative Class | | | 163,005 | | | | 28,407 | | | | 760 | |
Class A | | | 56,531 | | | | 67,645 | | | | 297 | |
| | | | | | | | | | | | |
Total expenses | | | 3,709,673 | | | | 5,480,019 | | | | 2,350,597 | |
Expenses waived: | | | | | | | | | | | | |
Class I fees reimbursed by adviser | | | - | | | | - | | | | (423,080 | ) |
Class R5 fees reimbursed by adviser | | | - | | | | - | | | | (9,949 | ) |
Service Class fees reimbursed by adviser | | | - | | | | - | | | | (19,415 | ) |
Administrative Class fees reimbursed by adviser | | | - | | | | - | | | | (1,298 | ) |
Class A fees reimbursed by adviser | | | - | | | | - | | | | (504 | ) |
Class R4 fees reimbursed by adviser | | | - | | | | - | | | | (782 | ) |
Class R3 fees reimbursed by adviser | | | - | | | | - | | | | (818 | ) |
Class I advisory fees waived | | | - | | | | (12,841 | ) | | | - | |
Class R5 advisory fees waived | | | - | | | | (15,452 | ) | | | - | |
Service Class advisory fees waived | | | - | | | | (1,459 | ) | | | - | |
Administrative Class advisory fees waived | | | - | | | | (1,251 | ) | | | - | |
Class A advisory fees waived | | | - | | | | (2,964 | ) | | | - | |
Class R4 advisory fees waived | | | - | | | | (145 | ) | | | - | |
Class R3 advisory fees waived | | | - | | | | (156 | ) | | | - | |
| | | | | | | | | | | | |
Net expenses | | | 3,709,673 | | | | 5,445,751 | | | | 1,894,751 | |
| | | | | | | | | | | | |
Net investment income (loss) | | | 2,613,510 | | | | 6,028,757 | | | | 1,191,877 | |
| | | | | | | | | | | | |
The accompanying notes are an integral part of the financial statements.
216
| | | | | | | | | | | | |
| | | MassMutual
Premier
Global Fund | | | MassMutual
Premier
International
Equity Fund | | | MassMutual
Premier
Strategic
Emerging
Markets Fund | |
| Realized and unrealized gain (loss): | | | | | | | | | | | | |
Net realized gain (loss) on: | | | | | | | | | | | | |
Investment transactions | | $ | 9,169,625 | | | $ | 8,949,056 | | | $ | (11,773,317 | ) |
Foreign currency transactions | | | (24,318 | ) | | | (379,712 | ) | | | (169,438 | ) |
| | | | | | | | | | | | |
Net realized gain (loss) | | | 9,145,307 | | | | 8,569,344 | | | | (11,942,755 | ) |
| | | | | | | | | | | | |
Net change in unrealized appreciation (depreciation) on: | | | | | | | | | | | | |
Investment transactions | | | 3,237,405 | * | | | 29,119,510 | * | | | 40,859,458 | * |
Translation of assets and liabilities in foreign currencies | | | 97,019 | | | | 9,560 | | | | 543,835 | |
| | | | | | | | | | | | |
Net change in unrealized appreciation (depreciation) | | | 3,334,424 | | | | 29,129,070 | | | | 41,403,293 | |
| | | | | | | | | | | | |
Net realized gain (loss) and change in unrealized appreciation (depreciation) | | | 12,479,731 | | | | 37,698,414 | | | | 29,460,538 | |
| | | | | | | | | | | | |
Net increase (decrease) in net assets resulting from operations | | $ | 15,093,241 | | | $ | 43,727,171 | | | $ | 30,652,415 | |
| | | | | | | | | | | | |
| | | | | | | | | | | | |
(a) Net of foreign withholding tax of: | | $ | 466,435 | | | $ | 951,595 | | | $ | 231,806 | |
* Net Increase (decrease) in accrued foreign capital gains tax of: | | $ | (15,224 | ) | | $ | (235,598 | ) | | $ | (206,943 | ) |
217
MassMutual Premier Funds – Financial Statements (Continued)
Statements of Changes in Net Assets
| | | | | | | | |
| | | MassMutual
Premier U.S. Government Money Market Fund | |
| | | Year
Ended
September 30, 2016 | | | Year
Ended
September 30, 2015 | |
| Increase (Decrease) in Net Assets: | | | | | | | | |
| Operations: | | | | | | | | |
Net investment income (loss) | | $ | 72 | | | $ | 2 | |
Net realized gain (loss) on investment transactions | | | 24,972 | | | | 9,187 | |
Net change in unrealized appreciation (depreciation) on investments | | | - | | | | - | |
| | | | | | | | |
Net increase (decrease) in net assets resulting from operations | | | 25,044 | | | | 9,189 | |
| | | | | | | | |
| Distributions to shareholders (Note 2): | | | | | | | | |
From net investment income: | | | | | | | | |
Class I | | | - | | | | - | |
Class R5 | | | (11,965 | ) | | | (21,751 | ) |
Service Class | | | - | | | | - | |
Administrative Class | | | - | | | | - | |
Class A | | | - | | | | - | |
Class R4 | | | - | | | | - | |
Class R3 | | | - | | | | - | |
| | | | | | | | |
Total distributions from net investment income | | | (11,965 | ) | | | (21,751 | ) |
| | | | | | | | |
From net realized gains: | | | | | | | | |
Class I | | | - | | | | - | |
Class R5 | | | - | | | | - | |
Service Class | | | - | | | | - | |
Administrative Class | | | - | | | | - | |
Class A | | | - | | | | - | |
Class R4 | | | - | | | | - | |
Class R3 | | | - | | | | - | |
| | | | | | | | |
Total distributions from net realized gains | | | - | | | | - | |
| | | | | | | | |
| Net fund share transactions (Note 5): | | | | | | | | |
Class I | | | - | | | | - | |
Class R5 | | | (65,310,212 | ) | | | (74,490,267 | ) |
Service Class | | | - | | | | - | |
Administrative Class | | | - | | | | - | |
Class A | | | - | | | | - | |
Class R4 | | | - | | | | - | |
Class R3 | | | - | | | | - | |
| | | | | | | | |
Increase (decrease) in net assets from fund share transactions | | | (65,310,212 | ) | | | (74,490,267 | ) |
| | | | | | | | |
Total increase (decrease) in net assets | | | (65,297,133 | ) | | | (74,502,829 | ) |
| Net assets | | | | | | | | |
Beginning of year | | | 400,017,377 | | | | 474,520,206 | |
| | | | | | | | |
End of year | | $ | 334,720,244 | | | $ | 400,017,377 | |
| | | | | | | | |
Undistributed (accumulated) net investment income (loss) included in net assets at end of year | | $ | (97,271 | ) | | $ | - | |
| | | | | | | | |
Distributions in excess of net investment income included in net assets at end of year | | $ | - | | | $ | (85,599 | ) |
| | | | | | | | |
The accompanying notes are an integral part of the financial statements.
218
| | | | | | | | | | | | | | |
MassMutual
Premier Short-Duration Bond Fund | | | MassMutual
Premier Inflation-Protected and Income Fund | |
Year
Ended
September 30, 2016 | | | Year
Ended
September 30, 2015 | | | Year
Ended
September 30, 2016 | | | Year
Ended
September 30, 2015 | |
| | | | | | | | | | | | | | |
| | | | | | | | | | | | | | |
| $ | 10,474,840 | | | $ | 9,778,461 | | | $ | 3,799,755 | | | $ | 1,568,601 | |
| | (4,952,023 | ) | | | 4,831,207 | | | | 2,835,829 | | | | 56,664 | |
| | 5,278,681 | | | | (3,521,904 | ) | | | 15,501,926 | | | | (5,677,634 | ) |
| | | | | | | | | | | | | | |
| | 10,801,498 | | | | 11,087,764 | | | | 22,137,510 | | | | (4,052,369 | ) |
| | | | | | | | | | | | | | |
| | | | | | | | | | | | | | |
| | | | | | | | | | | | | | |
| | (4,222,083 | ) | | | (5,420,085 | ) | | | (2,070,502 | ) | | | (4,160,845 | ) |
| | (4,590,598 | ) | | | (3,732,581 | ) | | | (582,044 | ) | | | (1,358,727 | ) |
| | (1,958,806 | ) | | | (1,578,728 | ) | | | (756,409 | ) | | | (1,728,889 | ) |
| | (879,709 | ) | | | (909,686 | ) | | | (105,506 | ) | | | (229,733 | ) |
| | (1,838,838 | ) | | | (1,377,822 | ) | | | (134,206 | ) | | | (517,740 | ) |
| | (175,113 | ) | | | (2,011 | ) | | | (14,543 | ) | | | (2,162 | ) |
| | (45,671 | ) | | | (10,081 | ) | | | (3,444 | ) | | | (28,215 | ) |
| | | | | | | | | | | | | | |
| | (13,710,818 | ) | | | (13,030,994 | ) | | | (3,666,654 | ) | | | (8,026,311 | ) |
| | | | | | | | | | | | | | |
| | | | | | | | | | | | | | |
| | - | | | | (31,639 | ) | | | - | | | | - | |
| | - | | | | (23,140 | ) | | | - | | | | - | |
| | - | | | | (10,181 | ) | | | - | | | | - | |
| | - | | | | (6,113 | ) | | | - | | | | - | |
| | - | | | | (10,578 | ) | | | - | | | | - | |
| | - | | | | (14 | ) | | | - | | | | - | |
| | - | | | | (85 | ) | | | - | | | | - | |
| | | | | | | | | | | | | | |
| | - | | | | (81,750 | ) | | | - | | | | - | |
| | | | | | | | | | | | | | |
| | | | | | | | | | | | | | |
| | 12,058,459 | | | | (37,900,272 | ) | | | (39,685,040 | ) | | | (995,545 | ) |
| | 40,882,540 | | | | (19,307,586 | ) | | | 1,731,671 | | | | 4,450,406 | |
| | (29,715,905 | ) | | | 10,755,918 | | | | (10,071,596 | ) | | | 2,699,074 | |
| | (3,556,410 | ) | | | (6,050,203 | ) | | | 1,797,747 | | | | 1,680,909 | |
| | 12,649,341 | | | | (1,471,102 | ) | | | (147,850 | ) | | | (2,841,746 | ) |
| | 3,603,350 | | | | 5,778,574 | | | | 4,132,071 | | | | 904,670 | |
| | 2,100,060 | | | | 951,559 | | | | 2,300,600 | | | | (1,161,906 | ) |
| | | | | | | | | | | | | | |
| | 38,021,435 | | | | (47,243,112 | ) | | | (39,942,397 | ) | | | 4,735,862 | |
| | | | | | | | | | | | | | |
| | 35,112,115 | | | | (49,268,092 | ) | | | (21,471,541 | ) | | | (7,342,818 | ) |
| | | | | | | | | | | | | | |
| | 519,444,347 | | | | 568,712,439 | | | | 326,414,916 | | | | 333,757,734 | |
| | | | | | | | | | | | | | |
| $ | 554,556,462 | | | $ | 519,444,347 | | | $ | 304,943,375 | | | $ | 326,414,916 | |
| | | | | | | | | | | | | | |
$ | 9,580,122 | | | $ | 9,836,894 | | | $ | 5,913,818 | | | $ | 3,667,508 | |
| | | | | | | | | | | | | | |
$ | - | | | $ | - | | | $ | - | | | $ | - | |
| | | | | | | | | | | | | | |
219
MassMutual Premier Funds – Financial Statements (Continued)
Statements of Changes in Net Assets
| | | | | | | | |
| | | MassMutual
Premier Core Bond Fund | |
| | | Year
Ended
September 30, 2016 | | | Year
Ended
September 30, 2015 | |
| Increase (Decrease) in Net Assets: | | | | | | | | |
| Operations: | | | | | | | | |
Net investment income (loss) | | $ | 34,431,678 | | | $ | 39,296,685 | |
Net realized gain (loss) on investment transactions | | | (3,036,046 | ) | | | 21,283,898 | |
Net change in unrealized appreciation (depreciation) on investments | | | 27,288,872 | | | | (37,563,240 | ) |
| | | | | | | | |
Net increase (decrease) in net assets resulting from operations | | | 58,684,504 | | | | 23,017,343 | |
| | | | | | | | |
| Distributions to shareholders (Note 2): | | | | | | | | |
From net investment income: | | | | | | | | |
Class I | | | (18,392,842 | ) | | | (16,526,951 | ) |
Class R5 | | | (13,227,798 | ) | | | (12,500,333 | ) |
Service Class | | | (3,755,333 | ) | | | (3,035,623 | ) |
Administrative Class | | | (2,491,012 | ) | | | (1,757,067 | ) |
Class A | | | (4,190,328 | ) | | | (3,657,324 | ) |
Class R4 | | | (267,681 | ) | | | (2,400 | ) |
Class R3 | | | (14,877 | ) | | | (24,295 | ) |
| | | | | | | | |
Total distributions from net investment income | | | (42,339,871 | ) | | | (37,503,993 | ) |
| | | | | | | | |
From net realized gains: | | | | | | | | |
Class I | | | (8,265,546 | ) | | | (2,792,420 | ) |
Class R5 | | | (6,172,224 | ) | | | (2,220,261 | ) |
Service Class | | | (1,803,649 | ) | | | (570,786 | ) |
Administrative Class | | | (1,231,876 | ) | | | (334,199 | ) |
Class A | | | (2,311,413 | ) | | | (784,888 | ) |
Class R4 | | | (134,733 | ) | | | (461 | ) |
Class R3 | | | (8,654 | ) | | | (5,687 | ) |
| | | | | | | | |
Total distributions from net realized gains | | | (19,928,095 | ) | | | (6,708,702 | ) |
| | | | | | | | |
| Net fund share transactions (Note 5): | | | | | | | | |
Class I | | | (174,674,936 | ) | | | 66,420,673 | |
Class R5 | | | (79,824,947 | ) | | | (14,972,782 | ) |
Service Class | | | (37,745,897 | ) | | | (33,975,362 | ) |
Administrative Class | | | 627,367 | | | | 14,913,957 | |
Class A | | | (16,166,644 | ) | | | (5,483,609 | ) |
Class R4 | | | 5,745,974 | | | | 8,927,907 | |
Class R3 | | | 153,907 | | | | (590,696 | ) |
| | | | | | | | |
Increase (decrease) in net assets from fund share transactions | | | (301,885,176 | ) | | | 35,240,088 | |
| | | | | | | | |
Total increase (decrease) in net assets | | | (305,468,638 | ) | | | 14,044,736 | |
| Net assets | | | | | | | | |
Beginning of year | | | 1,558,515,072 | | | | 1,544,470,336 | |
| | | | | | | | |
End of year | | $ | 1,253,046,434 | | | $ | 1,558,515,072 | |
| | | | | | | | |
Undistributed (accumulated) net investment income (loss) included in net assets at end of year | | $ | 28,012,559 | | | $ | 29,872,748 | |
| | | | | | | | |
The accompanying notes are an integral part of the financial statements.
220
| | | | | | | | | | | | | | |
MassMutual
Premier Diversified Bond Fund | | | MassMutual
Premier High Yield Fund | |
Year
Ended
September 30, 2016 | | | Year
Ended
September 30, 2015 | | | Year
Ended
September 30, 2016 | | | Year
Ended
September 30, 2015 | |
| | | | | | | �� | | | | | | | |
| | | | | | | | | | | | | | |
| $ | 4,266,747 | | | $ | 3,789,400 | | | $ | 21,393,688 | | | $ | 16,574,927 | |
| | (339,829 | ) | | | 1,415,659 | | | | (8,408,542 | ) | | | (7,044,423 | ) |
| | 5,858,958 | | | | (4,741,775 | ) | | | 22,383,759 | | | | (16,253,367 | ) |
| | | | | | | | | | | | | | |
| | 9,785,876 | | | | 463,284 | | | | 35,368,905 | | | | (6,722,863 | ) |
| | | | | | | | | | | | | | |
| | | | | | | | | | | | | | |
| | | | | | | | | | | | | | |
| | (386,359 | ) | | | (126,324 | ) | | | (6,934,044 | ) | | | (6,818,597 | ) |
| | (1,753,470 | ) | | | (1,478,875 | ) | | | (2,287,408 | ) | | | (2,615,584 | ) |
| | (398,210 | ) | | | (314,167 | ) | | | (3,971,242 | ) | | | (3,958,291 | ) |
| | (817,856 | ) | | | (509,626 | ) | | | (1,621,145 | ) | | | (1,580,452 | ) |
| | (695,744 | ) | | | (623,741 | ) | | | (1,679,547 | ) | | | (1,969,985 | ) |
| | (80,375 | ) | | | (2,017 | ) | | | (478,602 | ) | | | (6,622 | ) |
| | (12,501 | ) | | | (1,821 | ) | | | (346,635 | ) | | | (47,733 | ) |
| | | | | | | | | | | | | | |
| | (4,144,515 | ) | | | (3,056,571 | ) | | | (17,318,623 | ) | | | (16,997,264 | ) |
| | | | | | | | | | | | | | |
| | | | | | | | | | | | | | |
| | (75,901 | ) | | | (2,792 | ) | | | - | | | | (2,371,954 | ) |
| | (358,118 | ) | | | (34,169 | ) | | | - | | | | (925,575 | ) |
| | (85,619 | ) | | | (7,825 | ) | | | - | | | | (1,423,138 | ) |
| | (180,295 | ) | | | (13,049 | ) | | | - | | | | (572,351 | ) |
| | (177,335 | ) | | | (20,396 | ) | | | - | | | | (754,539 | ) |
| | (17,224 | ) | | | (52 | ) | | | - | | | | (2,420 | ) |
| | (2,843 | ) | | | (52 | ) | | | - | | | | (18,782 | ) |
| | | | | | | | | | | | | | |
| | (897,335 | ) | | | (78,335 | ) | | | - | | | | (6,068,759 | ) |
| | | | | | | | | | | | | | |
| | | | | | | | | | | | | | |
| | 3,835,480 | | | | 10,258,037 | | | | 103,407,200 | | | | 12,960,747 | |
| | 10,574,682 | | | | (1,947,196 | ) | | | 2,622,746 | | | | 6,413,130 | |
| | (3,636,750 | ) | | | 4,867,979 | | | | (4,834,727 | ) | | | 8,446,472 | |
| | (1,669,108 | ) | | | 14,020,447 | | | | 3,660,580 | | | | 4,167,071 | |
| | (639,376 | ) | | | 2,799,634 | | | | (506,306 | ) | | | (1,491,826 | ) |
| | 729,170 | | | | 2,872,655 | | | | 14,811,423 | | | | 2,658,808 | |
| | 2,138,551 | | | | 312,227 | | | | 9,748,074 | | | | 2,875,355 | |
| | | | | | | | | | | | | | |
| | 11,332,649 | | | | 33,183,783 | | | | 128,908,990 | | | | 36,029,757 | |
| | | | | | | | | | | | | | |
| | 16,076,675 | | | | 30,512,161 | | | | 146,959,272 | | | | 6,240,871 | |
| | | | | | | | | | | | | | |
| | 177,085,452 | | | | 146,573,291 | | | | 269,813,655 | | | | 263,572,784 | |
| | | | | | | | | | | | | | |
| $ | 193,162,127 | | | $ | 177,085,452 | | | $ | 416,772,927 | | | $ | 269,813,655 | |
| | | | | | | | | | | | | | |
| | | | | | | | | | | | | | |
| $ | 3,221,808 | | | $ | 2,826,250 | | | $ | 16,712,123 | | | $ | 12,658,491 | |
| | | | | | | | | | | | | | |
221
MassMutual Premier Funds – Financial Statements (Continued)
Statements of Changes in Net Assets
| | | | | | | | |
| | | MassMutual
Premier Balanced Fund | |
| | | Year
Ended
September 30, 2016 | | | Year
Ended
September 30, 2015 | |
| Increase (Decrease) in Net Assets: | | | | | | | | |
| Operations: | | | | | | | | |
Net investment income (loss) | | $ | 1,973,207 | | | $ | 2,605,942 | |
Net realized gain (loss) on investment transactions | | | 818,956 | | | | 10,376,426 | |
Net change in unrealized appreciation (depreciation) on investments | | | 7,885,498 | | | | (14,014,766 | ) |
| | | | | | | | |
Net increase (decrease) in net assets resulting from operations | | | 10,677,661 | | | | (1,032,398 | ) |
| | | | | | | | |
| Distributions to shareholders (Note 2): | | | | | | | | |
From net investment income: | | | | | | | | |
Class I | | | (9,467 | ) | | | (683,991 | ) |
Class R5 | | | (1,332,335 | ) | | | (1,236,920 | ) |
Service Class | | | (296,398 | ) | | | (190,039 | ) |
Administrative Class | | | (196,174 | ) | | | (131,261 | ) |
Class A | | | (576,849 | ) | | | (434,419 | ) |
Class R4 | | | (51,793 | ) | | | (1,600 | ) |
Class R3 | | | (91,642 | ) | | | (1,404 | ) |
| | | | | | | | |
Total distributions from net investment income | | | (2,554,658 | ) | | | (2,679,634 | ) |
| | | | | | | | |
From net realized gains: | | | | | | | | |
Class I | | | (30,621 | ) | | | (3,061,965 | ) |
Class R5 | | | (4,510,492 | ) | | | (5,968,539 | ) |
Service Class | | | (1,042,848 | ) | | | (958,600 | ) |
Administrative Class | | | (716,470 | ) | | | (683,201 | ) |
Class A | | | (2,460,146 | ) | | | (2,879,874 | ) |
Class R4 | | | (181,309 | ) | �� | | (8,757 | ) |
Class R3 | | | (324,797 | ) | | | (8,749 | ) |
| | | | | | | | |
Total distributions from net realized gains | | | (9,266,683 | ) | | | (13,569,685 | ) |
| | | | | | | | |
| Net fund share transactions (Note 5): | | | | | | | | |
Class I | | | 554,717 | | | | (33,680,201 | ) |
Class R5 | | | (8,586,844 | ) | | | (3,086,541 | ) |
Service Class | | | 1,703,110 | | | | 2,092,772 | |
Administrative Class | | | 1,144,383 | | | | 2,640,463 | |
Class A | | | (391,427 | ) | | | 1,219,005 | |
Class R4 | | | 393,794 | | | | 2,044,531 | |
Class R3 | | | 3,353,909 | | | | 1,710,445 | |
| | | | | | | | |
Increase (decrease) in net assets from fund share transactions | | | (1,828,358 | ) | | | (27,059,526 | ) |
| | | | | | | | |
Total increase (decrease) in net assets | | | (2,972,038 | ) | | | (44,341,243 | ) |
| Net assets | | | | | | | | |
Beginning of year | | | 119,702,230 | | | | 164,043,473 | |
| | | | | | | | |
End of year | | $ | 116,730,192 | | | $ | 119,702,230 | |
| | | | | | | | |
Undistributed (accumulated) net investment income (loss) included in net assets at end of year | | $ | 1,442,249 | | | $ | 1,831,968 | |
| | | | | | | | |
The accompanying notes are an integral part of the financial statements.
222
| | | | | | | | | | | | | | |
MassMutual
Premier Value Fund | | | MassMutual
Premier Disciplined Value Fund | |
Year
Ended
September 30, 2016 | | | Year
Ended
September 30, 2015 | | | Year
Ended
September 30, 2016 | | | Year
Ended
September 30, 2015 | |
| | | | | | | | | | | | | | |
| | | | | | | | | | | | | | |
| $ | 903,357 | | | $ | 1,060,198 | | | $ | 6,862,871 | | | $ | 6,060,577 | |
| | (673,919 | ) | | | 10,215,221 | | | | 7,375,476 | | | | 25,680,515 | |
| | 6,242,120 | | | | (12,525,891 | ) | | | 23,824,174 | | | | (45,119,771 | ) |
| | | | | | | | | | | | | | |
| | 6,471,558 | | | | (1,250,472 | ) | | | 38,062,521 | | | | (13,378,679 | ) |
| | | | | | | | | | | | | | |
| | | | | | | | | | | | | | |
| | | | | | | | | | | | | | |
| | (1,729 | ) | | | (2,038 | ) | | | (3,673,296 | ) | | | (3,260,008 | ) |
| | (721,893 | ) | | | (1,167,383 | ) | | | (938,314 | ) | | | (1,184,635 | ) |
| | (1,852 | ) | | | (2,270 | ) | | | (1,307,815 | ) | | | (1,139,617 | ) |
| | (158,282 | ) | | | (229,145 | ) | | | (133,031 | ) | | | (115,418 | ) |
| | (67,859 | ) | | | (103,865 | ) | | | (120,839 | ) | | | (139,242 | ) |
| | (1,234 | ) | | | (1,679 | ) | | | (45,578 | ) | | | (1,573 | ) |
| | (927 | ) | | | (1,243 | ) | | | (2,452 | ) | | | (1,953 | ) |
| | | | | | | | | | | | | | |
| | (953,776 | ) | | | (1,507,623 | ) | | | (6,221,325 | ) | | | (5,842,446 | ) |
| | | | | | | | | | | | | | |
| | | | | | | | | | | | | | |
| | - | | | | - | | | | (3,272,325 | ) | | | - | |
| | - | | | | - | | | | (887,232 | ) | | | - | |
| | - | | | | - | | | | (1,291,029 | ) | | | - | |
| | - | | | | - | | | | (140,597 | ) | | | - | |
| | - | | | | - | | | | (154,323 | ) | | | - | |
| | - | | | | - | | | | (49,544 | ) | | | - | |
| | - | | | | - | | | | (3,446 | ) | | | - | |
| | | | | | | | | | | | | | |
| | - | | | | - | | | | (5,798,496 | ) | | | - | |
| | | | | | | | | | | | | | |
| | | | | | | | | | | | | | |
| | (105 | ) | | | 2,038 | | | | (105,330,995 | ) | | | (8,358,014 | ) |
| | (3,540,323 | ) | | | (16,610,303 | ) | | | (3,963,835 | ) | | | (22,465,744 | ) |
| | 24,174 | | | | (17,825 | ) | | | (6,743,282 | ) | | | 2,166,675 | |
| | (1,293,998 | ) | | | (1,495,530 | ) | | | (2,220,786 | ) | | | 984,939 | |
| | (1,220,248 | ) | | | (584,377 | ) | | | 1,609,747 | | | | (2,091,109 | ) |
| | (197 | ) | | | 1,879 | | | | 1,357,808 | | | | 2,601,007 | |
| | 1,761 | | | | 287 | | | | 277,321 | | | | 24,926 | |
| | | | | | | | | | | | | | |
| | (6,028,936 | ) | | | (18,703,831 | ) | | | (115,014,022 | ) | | | (27,137,320 | ) |
| | | | | | | | | | | | | | |
| | (511,154 | ) | | | (21,461,926 | ) | | | (88,971,322 | ) | | | (46,358,445 | ) |
| | | | | | | | | | | | | | |
| | 65,464,276 | | | | 86,926,202 | | | | 294,441,897 | | | | 340,800,342 | |
| | | | | | | | | | | | | | |
| $ | 64,953,122 | | | $ | 65,464,276 | | | $ | 205,470,575 | | | $ | 294,441,897 | |
| | | | | | | | | | | | | | |
$ | 534,123 | | | $ | 688,111 | | | $ | 5,187,556 | | | $ | 4,396,342 | |
| | | | | | | | | | | | | | |
223
MassMutual Premier Funds – Financial Statements (Continued)
Statements of Changes in Net Assets
| | | | | | | | |
| | | MassMutual
Premier Main Street Fund | |
| | | Year
Ended
September 30, 2016 | | | Year
Ended
September 30, 2015 | |
| Increase (Decrease) in Net Assets: | | | | | | | | |
| Operations: | | | | | | | | |
Net investment income (loss) | | $ | 1,424,095 | | | $ | 1,705,347 | |
Net realized gain (loss) on investment transactions | | | 3,981,483 | | | | 42,937,276 | |
Net change in unrealized appreciation (depreciation) on investments | | | 11,069,137 | | | | (39,140,775 | ) |
| | | | | | | | |
Net increase (decrease) in net assets resulting from operations | | | 16,474,715 | | | | 5,501,848 | |
| | | | | | | | |
| Distributions to shareholders (Note 2): | | | | | | | | |
From net investment income: | | | | | | | | |
Class I | | | (419 | ) | | | (445,293 | ) |
Class R5 | | | (1,121,638 | ) | | | (854,427 | ) |
Service Class | | | (13,942 | ) | | | (53,727 | ) |
Administrative Class | | | (406,873 | ) | | | (215,423 | ) |
Class A | | | (127,765 | ) | | | (57,341 | ) |
Class R4 | | | (2,224 | ) | | | (638 | ) |
Class R3 | | | (3,796 | ) | | | (359 | ) |
| | | | | | | | |
Total distributions from net investment income | | | (1,676,657 | ) | | | (1,627,208 | ) |
| | | | | | | | |
From net realized gains: | | | | | | | | |
Class I | | | (8,799 | ) | | | (1,023,142 | ) |
Class R5 | | | (25,323,663 | ) | | | (2,113,464 | ) |
Service Class | | | (583,837 | ) | | | (146,016 | ) |
Administrative Class | | | (10,656,650 | ) | | | (699,444 | ) |
Class A | | | (4,277,912 | ) | | | (295,968 | ) |
Class R4 | | | (58,326 | ) | | | (2,283 | ) |
Class R3 | | | (103,854 | ) | | | (2,553 | ) |
| | | | | | | | |
Total distributions from net realized gains | | | (41,013,041 | ) | | | (4,282,870 | ) |
| | | | | | | | |
| Net fund share transactions (Note 5): | | | | | | | | |
Class I | | | 708,043 | | | | (50,324,825 | ) |
Class R5 | | | 20,325,095 | | | | (26,331,864 | ) |
Service Class | | | (4,511,613 | ) | | | (11,956 | ) |
Administrative Class | | | 4,469,765 | | | | (2,542,180 | ) |
Class A | | | 1,857,708 | | | | (270,690 | ) |
Class R4 | | | 3,326,066 | | | | 3,121 | |
Class R3 | | | 730,284 | | | | 24,879 | |
| | | | | | | | |
Increase (decrease) in net assets from fund share transactions | | | 26,905,348 | | | | (79,453,515 | ) |
| | | | | | | | |
Total increase (decrease) in net assets | | | 690,365 | | | | (79,861,745 | ) |
| Net assets | | | | | | | | |
Beginning of year | | | 120,878,409 | | | | 200,740,154 | |
| | | | | | | | |
End of year | | $ | 121,568,774 | | | $ | 120,878,409 | |
| | | | | | | | |
Undistributed (accumulated) net investment income (loss) included in net assets at end of year | | $ | 929,368 | | | $ | 1,225,944 | |
| | | | | | | | |
The accompanying notes are an integral part of the financial statements.
224
| | | | | | | | | | | | | | |
MassMutual
Premier Disciplined Growth Fund | | | MassMutual
Premier Small Cap Opportunities Fund | |
Year
Ended
September 30, 2016 | | | Year
Ended
September 30, 2015 | | | Year
Ended
September 30, 2016 | | | Year
Ended
September 30, 2015 | |
| | | | | | | | | | | | | | |
| | | | | | | | | | | | | | |
| $ | 5,055,348 | | | $ | 5,166,663 | | | $ | 1,491,296 | | | $ | 1,145,559 | |
| | 22,562,050 | | | | 38,051,105 | | | | 2,278,238 | | | | 15,510,850 | |
| | 22,627,437 | | | | (36,320,687 | ) | | | 13,568,674 | | | | (11,140,128 | ) |
| | | | | | | | | | | | | | |
| | 50,244,835 | | | | 6,897,081 | | | | 17,338,208 | | | | 5,516,281 | |
| | | | | | | | | | | | | | |
| | | | | | | | | | | | | | |
| | | | | | | | | | | | | | |
| | (2,336,591 | ) | | | (1,940,078 | ) | | | (16,478 | ) | | | (50,971 | ) |
| | (955,316 | ) | | | (1,159,490 | ) | | | (402,813 | ) | | | (691,849 | ) |
| | (905,689 | ) | | | (763,710 | ) | | | (74,292 | ) | | | (65,843 | ) |
| | (318,099 | ) | | | (207,877 | ) | | | (66,134 | ) | | | (149,435 | ) |
| | (234,446 | ) | | | (212,683 | ) | | | (145,188 | ) | | | (343,507 | ) |
| | (83,598 | ) | | | (807 | ) | | | (8,881 | ) | | | (723 | ) |
| | (36,279 | ) | | | (608 | ) | | | (11,123 | ) | | | (535 | ) |
| | | | | | | | | | | | | | |
| | (4,870,018 | ) | | | (4,285,253 | ) | | | (724,909 | ) | | | (1,302,863 | ) |
| | | | | | | | | | | | | | |
| | | | | | | | | | | | | | |
| | (14,078,291 | ) | | | (21,502,191 | ) | | | (199,275 | ) | | | (697,224 | ) |
| | (6,415,840 | ) | | | (13,925,527 | ) | | | (5,761,090 | ) | | | (10,582,387 | ) |
| | (6,571,097 | ) | | | (10,069,315 | ) | | | (1,084,737 | ) | | | (1,036,035 | ) |
| | (2,545,498 | ) | | | (3,075,438 | ) | | | (1,523,756 | ) | | | (2,618,610 | ) |
| | (2,763,442 | ) | | | (4,261,079 | ) | | | (6,655,266 | ) | | | (10,627,106 | ) |
| | (609,627 | ) | | | (12,902 | ) | | | (128,067 | ) | | | (14,502 | ) |
| | (292,275 | ) | | | (12,890 | ) | | | (210,981 | ) | | | (14,488 | ) |
| | | | | | | | | | | | | | |
| | (33,276,070 | ) | | | (52,859,342 | ) | | | (15,563,172 | ) | | | (25,590,352 | ) |
| | | | | | | | | | | | | | |
| | | | | | | | | | | | | | |
| | (82,494,554 | ) | | | 21,589,852 | | | | 3,682,738 | | | | (4,421,503 | ) |
| | (11,108,613 | ) | | | (12,388,040 | ) | | | 2,275,492 | | | | (6,192,961 | ) |
| | (9,579,854 | ) | | | 11,101,949 | | | | 6,367,336 | | | | 994,631 | |
| | 3,777,490 | | | | 12,848,190 | | | | (754,240 | ) | | | 3,023,166 | |
| | (597,334 | ) | | | 7,107,732 | | | | 2,901,383 | | | | 5,264,138 | |
| | 7,725,117 | | | | 6,430,980 | | | | 3,575,259 | | | | 508,727 | |
| | (524,477 | ) | | | 3,684,829 | | | | 4,182,258 | | | | 1,292,881 | |
| | | | | | | | | | | | | | |
| | (92,802,225 | ) | | | 50,375,492 | | | | 22,230,226 | | | | 469,079 | |
| | | | | | | | | | | | | | |
| | (80,703,478 | ) | | | 127,978 | | | | 23,280,353 | | | | (20,907,855 | ) |
| | | | | | | | | | | | | | |
| | 439,800,953 | | | | 439,672,975 | | | | 152,112,530 | | | | 173,020,385 | |
| | | | | | | | | | | | | | |
| $ | 359,097,475 | | | $ | 439,800,953 | | | $ | 175,392,883 | | | $ | 152,112,530 | |
| | | | | | | | | | | | | | |
$ | 3,372,682 | | | $ | 3,694,487 | | | $ | 1,276,727 | | | $ | 684,412 | |
| | | | | | | | | | | | | | |
225
MassMutual Premier Funds – Financial Statements (Continued)
Statements of Changes in Net Assets
| | | | | | | | |
| | | MassMutual
Premier Global Fund | |
| | | Year
Ended
September 30, 2016 | | | Year
Ended
September 30, 2015 | |
| Increase (Decrease) in Net Assets: | | | | | | | | |
| Operations: | | | | | | | | |
Net investment income (loss) | | $ | 2,613,510 | | | $ | 3,613,845 | |
Net realized gain (loss) on investment transactions | | | 9,145,307 | | | | 28,485,709 | |
Net change in unrealized appreciation (depreciation) on investments | | | 3,334,424 | | | | (41,258,420 | ) |
| | | | | | | | |
Net increase (decrease) in net assets resulting from operations | | | 15,093,241 | | | | (9,158,866 | ) |
| | | | | | | | |
| Distributions to shareholders (Note 2): | | | | | | | | |
From net investment income: | | | | | | | | |
Class I | | | (30,113 | ) | | | (1,251 | ) |
Class R5 | | | (1,390,770 | ) | | | (2,308,576 | ) |
Service Class | | | (278,289 | ) | | | (201,567 | ) |
Administrative Class | | | (724,998 | ) | | | (1,242,589 | ) |
Class A | | | (152,532 | ) | | | (273,008 | ) |
Class R4 | | | (31,513 | ) | | | (919 | ) |
Class R3 | | | (27,852 | ) | | | (11,076 | ) |
| | | | | | | | |
Total distributions from net investment income | | | (2,636,067 | ) | | | (4,038,986 | ) |
| | | | | | | | |
From net realized gains: | | | | | | | | |
Class I | | | (244,605 | ) | | | (4,724 | ) |
Class R5 | | | (12,918,214 | ) | | | (9,357,304 | ) |
Service Class | | | (2,753,401 | ) | | | (865,462 | ) |
Administrative Class | | | (9,121,946 | ) | | | (6,191,912 | ) |
Class A | | | (3,237,261 | ) | | | (2,043,203 | ) |
Class R4 | | | (273,902 | ) | | | (4,772 | ) |
Class R3 | | | (362,854 | ) | | | (81,198 | ) |
| | | | | | | | |
Total distributions from net realized gains | | | (28,912,183 | ) | | | (18,548,575 | ) |
| | | | | | | | |
| Net fund share transactions (Note 5): | | | | | | | | |
Class I | | | 14,821,632 | | | | 1,046,052 | |
Class R5 | | | (32,776,913 | ) | | | (24,642,293 | ) |
Service Class | | | 4,152 | | | | 19,275,412 | |
Administrative Class | | | (16,995,190 | ) | | | (5,233,190 | ) |
Class A | | | (6,557,294 | ) | | | (2,493,648 | ) |
Class R4 | | | 3,828,117 | | | | 663,340 | |
Class R3 | | | 5,865,901 | | | | 1,640,341 | |
| | | | | | | | |
Increase (decrease) in net assets from fund share transactions | | | (31,809,595 | ) | | | (9,743,986 | ) |
| | | | | | | | |
Total increase (decrease) in net assets | | | (48,264,604 | ) | | | (41,490,413 | ) |
| Net assets | | | | | | | | |
Beginning of year | | | 363,020,055 | | | | 404,510,468 | |
| | | | | | | | |
End of year | | $ | 314,755,451 | | | $ | 363,020,055 | |
| | | | | | | | |
Undistributed (accumulated) net investment income (loss) included in net assets at end of year | | $ | 1,433,844 | | | $ | 1,346,379 | |
| | | | | | | | |
Distributions in excess of net investment income included in net assets at end of year | | $ | - | | | $ | - | |
| | | | | | | | |
The accompanying notes are an integral part of the financial statements.
226
| | | | | | | | | | | | | | |
MassMutual
Premier International Equity Fund | | | MassMutual
Premier Strategic Emerging Markets Fund | |
Year
Ended
September 30, 2016 | | | Year
Ended
September 30, 2015 | | | Year
Ended
September 30, 2016 | | | Year
Ended
September 30, 2015 | |
| | | | | | | | | | | | | | |
| | | | | | | | | | | | | | |
| $ | 6,028,757 | | | $ | 5,847,272 | | | $ | 1,191,877 | | | $ | 1,220,505 | |
| | 8,569,344 | | | | 19,055,754 | | | | (11,942,755 | ) | | | (11,348,107 | ) |
| | 29,129,070 | | | | (43,072,684 | ) | | | 41,403,293 | | | | (30,861,635 | ) |
| | | | | | | | | | | | | | |
| | 43,727,171 | | | | (18,169,658 | ) | | | 30,652,415 | | | | (40,989,237 | ) |
| | | | | | | | | | | | | | |
| | | | | | | | | | | | | | |
| | | | | | | | | | | | | | |
| | (2,095,715 | ) | | | (1,052,391 | ) | | | (1,204,528 | ) | | | (1,724,701 | ) |
| | (2,525,746 | ) | | | (3,791,949 | ) | | | (13,627 | ) | | | (93,369 | ) |
| | (212,860 | ) | | | (243,009 | ) | | | (44,993 | ) | | | (2,863 | ) |
| | (166,318 | ) | | | (175,534 | ) | | | (2,191 | ) | | | (3,624 | ) |
| | (272,171 | ) | | | (413,993 | ) | | | (82 | ) | | | (4,729 | ) |
| | (5,437 | ) | | | (898 | ) | | | (742 | ) | | | (850 | ) |
| | (10,452 | ) | | | (715 | ) | | | (649 | ) | | | (652 | ) |
| | | | | | | | | | | | | | |
| | (5,288,699 | ) | | | (5,678,489 | ) | | | (1,266,812 | ) | | | (1,830,788 | ) |
| | | | | | | | | | | | | | |
| | | | | | | | | | | | | | |
| | (6,711,005 | ) | | | (12,802,456 | ) | | | - | | | | - | |
| | (9,017,251 | ) | | | (51,616,098 | ) | | | - | | | | - | |
| | (829,544 | ) | | | (3,526,132 | ) | | | - | | | | - | |
| | (730,576 | ) | | | (2,863,471 | ) | | | - | | | | - | |
| | (1,787,455 | ) | | | (8,963,627 | ) | | | - | | | | - | |
| | (21,263 | ) | | | (14,917 | ) | | | - | | | | - | |
| | (41,357 | ) | | | (14,901 | ) | | | - | | | | - | |
| | | | | | | | | | | | | | |
| | (19,138,451 | ) | | | (79,801,602 | ) | | | - | | | | - | |
| | | | | | | | | | | | | | |
| | | | | | | | | | | | | | |
| | 17,828,478 | | | | 128,329,404 | | | | 49,518,495 | | | | 26,035,772 | |
| | (38,880,404 | ) | | | (38,369,156 | ) | | | (4,842,404 | ) | | | 819,180 | |
| | (69,542 | ) | | | 2,785,375 | | | | (25,957 | ) | | | 8,198,398 | |
| | (1,562,712 | ) | | | 4,694,603 | | | | 160,783 | | | | 147,520 | |
| | (5,899,158 | ) | | | 4,870,336 | | | | (129,809 | ) | | | (203,196 | ) |
| | 3,112,106 | | | | 292,417 | | | | 417,128 | | | | 39,879 | |
| | 2,981,376 | | | | 485,280 | | | | 396,277 | | | | 131,784 | |
| | | | | | | | | | | | | | |
| | (22,489,856 | ) | | | 103,088,259 | | | | 45,494,513 | | | | 35,169,337 | |
| | | | | | | | | | | | | | |
| | (3,189,835 | ) | | | (561,490 | ) | | | 74,880,116 | | | | (7,650,688 | ) |
| | | | | | | | | | | | | | |
| | 510,617,700 | | | | 511,179,190 | | | | 143,143,992 | | | | 150,794,680 | |
| | | | | | | | | | | | | | |
| $ | 507,427,865 | | | $ | 510,617,700 | | | $ | 218,024,108 | | | $ | 143,143,992 | |
| | | | | | | | | | | | | | |
$ | 5,407,457 | | | $ | 5,077,285 | | | $ | - | | | $ | 31,050 | |
| | | | | | | | | | | | | | |
| $ | - | | | $ | - | | | $ | (261,325 | ) | | $ | - | |
| | | | | | | | | | | | | | |
227
MassMutual Premier Funds – Financial Statements (Continued)
Statement of Cash Flows
For the Year Ended September 30, 2016
| | | | |
| | | MassMutual
Premier
Inflation-
Protected and
Income Fund | |
| Cash flows from operating activities: | | | | |
Net increase (decrease) in net assets resulting from operations | | $ | 22,137,510 | |
Adjustments to reconcile net increase in net assets resulting from operations to net cash provided by (used in) operating activities: | | | | |
Investments purchased | | | (221,648,727 | ) |
Investments sold | | | 268,687,033 | |
(Increase) Decrease to the principal amount of inflation-indexed bonds | | | (2,271,028 | ) |
(Purchase) Sale of short-term investments, net | | | (10,236,639 | ) |
Amortization (Accretion) of discount and premium, net | | | 1,769,561 | |
(Increase) Decrease in receivable from interest and dividends | | | 89,313 | |
(Increase) Decrease in prepaid expenses | | | 3,239 | |
(Increase) Decrease in receivable for open swap agreements | | | (27,522 | ) |
Increase (Decrease) in payable for Trustees’ fees and expenses | | | 2,045 | |
Increase (Decrease) in payable for investment advisory fees | | | (210 | ) |
Increase (Decrease) in payable for administration fees | | | 2,811 | |
Increase (Decrease) in payable for service fees | | | 3,689 | |
Increase (Decrease) in payable for distribution fees | | | 1,310 | |
Increase (Decrease) in payable for shareholder service fees | | | 39 | |
Increase (Decrease) in variation margin payable on open derivative instruments | | | 36,352 | |
Increase (Decrease) in payable for accrued expenses and other liabilities | | | 2,744 | |
Net change in unrealized (appreciation) depreciation on investments | | | (15,358,946 | ) |
Net realized (gain) loss from investments | | | (2,857,046 | ) |
| | | | |
Net cash from (used in) operating activities | | | 40,335,528 | |
| | | | |
| Cash flows from (used in) financing activities: | | | | |
Increase (Decrease) in due to custodian | | | 251,598 | |
Proceeds from shares sold | | | 111,281,191 | |
Payment on shares redeemed | | | (155,101,187 | ) |
Cash distributions paid | | | (1,029 | ) |
Net increase in reverse repurchase agreements | | | 217,813 | |
Increase (Decrease) in collateral pledged for reverse repurchase agreements | | | 2,892,589 | |
Increase (Decrease) in payable for interest for reverse repurchase agreements | | | 123,497 | |
| | | | |
Net cash from (used in) financing activities | | | (40,335,528 | ) |
| | | | |
| |
Net increase (decrease) in cash | | | - | |
Cash at beginning of year | | | - | |
| | | | |
Cash at end of year | | $ | - | |
| | | | |
| |
Non cash financing activities not included herein consist of: | | | | |
Reinvestment of all distributions | | $ | 3,665,625 | |
Cash paid out for interest on reverse repurchase agreements | | $ | 1,362,923 | |
The accompanying notes are an integral part of the financial statements.
228
MassMutual Premier U.S. Government Money Market Fund – Financial Statements (Continued)
Financial Highlights (For a share outstanding throughout each period)
| | | | | | | | | | | | | | | | | | | | | | | | | | | | | | | | | | | | | | | | | | | | | | | | |
| | | | | | Income (loss) from investment
operations | | | Less distributions to shareholders | | | | | | | | |
Ratios / Supplemental Data | |
| | | Net
asset
value,
beginning
of the
period | | | Net
investment
income
(loss)c,j | | | Net
realized
and
unrealized
gain (loss)
on
investments | | | Total
income
(loss) from
investment
operations | | | From net
investment
income | | | Total
distributions | | | Net
asset
value,
end of
the
period | | | Total
returnl | | | Net
assets,
end of
the
period
(000’s) | | | Ratio of
expenses
to average
daily net
assets
before
expense
waivers | | | Ratio of
expenses
to average
daily net
assets
after
expense
waiversj | | | Net
investment
income
(loss) to
average
daily net
assets | |
| Class R5 | | | | | | | | | | | | | | | | | | | | | | | | | | | | | | | | | | | | | | | | | |
| 9/30/16 | | $ | 1.00 | | | $ | 0.00 | d | | $ | 0.00 | d | | $ | 0.00 | d | | $ | (0.00 | )d | | $ | (0.00 | )d | | $ | 1.00 | | | | 0.00% | e | | $ | 334,720 | | | | 0.51% | | | | 0.36% | | | | 0.00% | e |
| 9/30/15 | | | 1.00 | | | | 0.00 | d | | | 0.00 | d | | | 0.00 | d | | | (0.00 | )d | | | (0.00 | )d | | | 1.00 | | | | 0.01% | | | | 400,017 | | | | 0.50% | | | | 0.14% | | | | 0.00% | e |
| 9/30/14 | | | 1.00 | | | | 0.00 | d | | | 0.00 | d | | | 0.00 | d | | | (0.00 | )d | | | (0.00 | )d | | | 1.00 | | | | 0.00% | e | | | 474,520 | | | | 0.48% | | | | 0.12% | | | | 0.00% | e |
| 9/30/13 | | | 1.00 | | | | 0.00 | d | | | (0.00 | )d | | | 0.00 | d | | | (0.00 | )d | | | (0.00 | )d | | | 1.00 | | | | 0.01% | | | | 152,076 | | | | 0.45% | | | | 0.15% | | | | 0.01% | |
| 9/30/12i | | | 1.00 | | | | 0.00 | d | | | 0.00 | d | | | 0.00 | d | | | (0.00 | )d | | | (0.00 | )d | | | 1.00 | | | | 0.00% | b,e | | | 162,906 | | | | 0.46% | a | | | 0.16% | a | | | 0.00% | a,e |
| 10/31/11 | | | 1.00 | | | | 0.00 | d | | | 0.00 | d | | | 0.00 | d | | | (0.00 | )d | | | (0.00 | )d | | | 1.00 | | | | 0.00% | e | | | 189,764 | | | | 0.46% | | | | 0.20% | | | | 0.00% | e |
| b | Percentage represents the results for the period and is not annualized. |
| c | Per share amount calculated on the average shares method. |
| d | Amount is less than $0.005 per share. |
| e | Amount is less than 0.005%. |
| i | For the period November 1, 2011 through September 30, 2012. |
| j | Computed after giving effect to an agreement by MML Advisers and/or MassMutual to waive certain fees and expenses of the Fund. |
| l | Employee retirement benefit plans that invest plan assets in the Separate Investment Accounts (SIAs) may be subject to certain charges as set forth in their respective Plan Documents. Total return figures would be lower for the periods presented if they reflected these charges. |
The accompanying notes are an integral part of the financial statements.
229
MassMutual Premier Short-Duration Bond Fund – Financial Statements (Continued)
Financial Highlights (For a share outstanding throughout each period)
| | | | | | | | | | | | | | | | | | | | | | | | | | | | | | | | | | | | | | | | | | | | | | | | | | | | |
| | | | | | Income (loss) from investment
operations | | | Less distributions to shareholders | | | | | | | | |
Ratios / Supplemental Data | |
| | | Net
asset
value,
beginning
of the
period | | | Net
investment
income
(loss)c,j | | | Net
realized
and
unrealized
gain (loss)
on
investments | | | Total
income
(loss) from
investment
operations | | | From net
investment
income | | | From net
realized
gains | | | Total
distributions | | | Net
asset
value,
end of
the
period | | | Total
returnl,m | | | Net
assets,
end of
the
period
(000’s) | | | Ratio of
expenses
to average
daily net
assets
before
expense
waivers | | | Ratio of
expenses
to average
daily net
assets
after
expense
waiversj | | | Net
investment
income
(loss) to
average
daily net
assets | |
Class I | | | | | | | | | | | | | | | | | | | | | | | | | | | | | | | | | | | | | | | | | | | | | |
| 9/30/16 | | $ | 10.46 | | | $ | 0.20 | | | $ | 0.00 | d | | $ | 0.20 | | | $ | (0.27 | ) | | $ | - | | | $ | (0.27 | ) | | $ | 10.39 | | | | 1.98% | * | | $ | 166,281 | | | | 0.40% | | | | N/A | | | | 1.97% | |
| 9/30/15 | | | 10.50 | | | | 0.19 | | | | 0.01 | | | | 0.20 | | | | (0.24 | ) | | | (0.00 | )d | | | (0.24 | ) | | | 10.46 | | | | 2.00% | | | | 154,219 | | | | 0.40% | | | | N/A | | | | 1.83% | |
| 9/30/14 | | | 10.57 | | | | 0.17 | | | | (0.01 | ) | | | 0.16 | | | | (0.23 | ) | | | - | | | | (0.23 | ) | | | 10.50 | | | | 1.46% | | | | 193,155 | | | | 0.44% | | | | 0.37% | | | | 1.62% | |
| 9/30/13 | | | 10.77 | | | | 0.18 | | | | (0.02 | ) | | | 0.16 | | | | (0.23 | ) | | | (0.13 | ) | | | (0.36 | ) | | | 10.57 | | | | 1.62% | | | | 188,114 | | | | 0.50% | | | | 0.36% | | | | 1.68% | |
| 9/30/12i | | | 10.87 | | | | 0.18 | | | | 0.16 | | | | 0.34 | | | | (0.22 | ) | | | (0.22 | ) | | | (0.44 | ) | | | 10.77 | | | | 3.20% | b | | | 134,803 | | | | 0.51% | a | | | 0.37% | a | | | 1.83% | a |
| 10/31/11g | | | 10.86 | | | | 0.20 | | | | 0.13 | | | | 0.33 | | | | (0.25 | ) | | | (0.07 | ) | | | (0.32 | ) | | | 10.87 | | | | 3.05% | b | | | 137,464 | | | | 0.52% | a | | | 0.37% | a | | | 2.07% | a |
Class R5 | | | | | | | | | | | | | | | | | | | | | | | | | | | | | | | | | | | | | | | | | | | | | |
| 9/30/16 | | $ | 10.49 | | | $ | 0.19 | | | $ | 0.00 | d | | $ | 0.19 | | | $ | (0.26 | ) | | $ | - | | | $ | (0.26 | ) | | $ | 10.42 | | | | 1.88% | | | $ | 199,354 | | | | 0.50% | | | | N/A | | | | 1.87% | |
| 9/30/15 | | | 10.52 | | | | 0.18 | | | | 0.02 | | | | 0.20 | | | | (0.23 | ) | | | (0.00 | )d | | | (0.23 | ) | | | 10.49 | | | | 1.95% | | | | 159,429 | | | | 0.50% | | | | N/A | | | | 1.73% | |
| 9/30/14 | | | 10.59 | | | | 0.15 | | | | (0.01 | ) | | | 0.14 | | | | (0.21 | ) | | | - | | | | (0.21 | ) | | | 10.52 | | | | 1.36% | | | | 179,221 | | | | 0.59% | | | | 0.52% | | | | 1.47% | |
| 9/30/13 | | | 10.79 | | | | 0.16 | | | | (0.02 | ) | | | 0.14 | | | | (0.21 | ) | | | (0.13 | ) | | | (0.34 | ) | | | 10.59 | | | | 1.43% | | | | 196,790 | | | | 0.69% | | | | 0.55% | | | | 1.48% | |
| 9/30/12i | | | 10.88 | | | | 0.16 | | | | 0.16 | | | | 0.32 | | | | (0.19 | ) | | | (0.22 | ) | | | (0.41 | ) | | | 10.79 | | | | 2.91% | b | | | 158,361 | | | | 0.70% | a | | | 0.56% | a | | | 1.64% | a |
| 10/31/11 | | | 10.93 | | | | 0.20 | | | | 0.05 | | | | 0.25 | | | | (0.23 | ) | | | (0.07 | ) | | | (0.30 | ) | | | 10.88 | | | | 2.38% | | | | 155,719 | | | | 0.67% | | | | 0.55% | | | | 1.86% | |
Service Class | | | | | | | | | | | | | | | | | | | | | | | | | | | | | | | | | | | | | | | | | | | | | |
| 9/30/16 | | $ | 10.42 | | | $ | 0.18 | | | $ | 0.00 | d | | $ | 0.18 | | | $ | (0.25 | ) | | $ | - | | | $ | (0.25 | ) | | $ | 10.35 | | | | 1.78% | | | $ | 55,309 | | | | 0.60% | | | | N/A | | | | 1.75% | |
| 9/30/15 | | | 10.45 | | | | 0.17 | | | | 0.02 | | | | 0.19 | | | | (0.22 | ) | | | (0.00 | )d | | | (0.22 | ) | | | 10.42 | | | | 1.87% | | | | 86,058 | | | | 0.60% | | | | N/A | | | | 1.64% | |
| 9/30/14 | | | 10.53 | | | | 0.15 | | | | (0.02 | ) | | | 0.13 | | | | (0.21 | ) | | | - | | | | (0.21 | ) | | | 10.45 | | | | 1.25% | | | | 75,423 | | | | 0.66% | | | | 0.59% | | | | 1.40% | |
| 9/30/13 | | | 10.72 | | | | 0.15 | | | | (0.01 | ) | | | 0.14 | | | | (0.20 | ) | | | (0.13 | ) | | | (0.33 | ) | | | 10.53 | | | | 1.33% | | | | 75,944 | | | | 0.74% | | | | 0.60% | | | | 1.43% | |
| 9/30/12i | | | 10.82 | | | | 0.15 | | | | 0.16 | | | | 0.31 | | | | (0.19 | ) | | | (0.22 | ) | | | (0.41 | ) | | | 10.72 | | | | 2.93% | b | | | 79,985 | | | | 0.75% | a | | | 0.61% | a | | | 1.59% | a |
| 10/31/11 | | | 10.87 | | | | 0.19 | | | | 0.05 | | | | 0.24 | | | | (0.22 | ) | | | (0.07 | ) | | | (0.29 | ) | | | 10.82 | | | | 2.30% | | | | 75,045 | | | | 0.73% | | | | 0.60% | | | | 1.80% | |
| | | | | | | | | | | | | | | | | | | | | | | | |
| | | Year ended September 30 | | | Period ended
September 30, 2012b,i | | | Year ended
October 31 | |
| | | 2016 | | | 2015 | | | 2014 | | | 2013 | | | | | | 2011 | |
Portfolio turnover rate | | | 87 | % | | | 59 | % | | | 90 | % | | | 146 | % | | | 349 | % | | | 384 | % |
| b | Percentage represents the results for the period and is not annualized. |
| c | Per share amount calculated on the average shares method. |
| d | Amount is less than $0.005 per share. |
| g | For the period December 3, 2010 (commencement of operations) through October 31, 2011. |
| i | For the period November 1, 2011 through September 30, 2012. |
| j | Computed after giving effect to an agreement by MML Advisers and/or MassMutual to waive certain fees and expenses of the Fund. |
| l | Employee retirement benefit plans that invest plan assets in the Separate Investment Accounts (SIAs) may be subject to certain charges as set forth in their respective Plan Documents. Total return figures would be lower for the periods presented if they reflected these charges. |
| m | Total return excludes sales charges, if any, and would be lower for the period presented if it reflected these charges. |
| gg | For the period April 1, 2014 (commencement of operations) through September 30, 2014. |
| * | Generally accepted accounting principles may require adjustment to be made to the net assets of the Fund at period end for financial reporting purposes, and as such, the net asset values for shareholder transactions and the returns based on those net asset values may differ from the returns reported in the portfolio manager commentary section of this report. |
The accompanying notes are an integral part of the financial statements.
230
| | | | | | | | | | | | | | | | | | | | | | | | | | | | | | | | | | | | | | | | | | | | | | | | | | | | |
| | | | | | Income (loss) from investment
operations | | | Less distributions to shareholders | | | | | | | | |
Ratios / Supplemental Data | |
| | | Net
asset
value,
beginning
of the
period | | | Net
investment
income
(loss)c,j | | | Net
realized
and
unrealized
gain (loss)
on
investments | | | Total
income
(loss) from
investment
operations | | | From net
investment
income | | | From net
realized
gains | | | Total
distributions | | | Net
asset
value,
end of
the
period | | | Total
returnl,m | | | Net
assets,
end of
the
period
(000’s) | | | Ratio of
expenses
to average
daily net
assets
before
expense
waivers | | | Ratio of
expenses
to average
daily net
assets
after
expense
waiversj | | | Net
investment
income
(loss) to
average
daily net
assets | |
Administrative Class | | | | | | | | | | | | | | | | | | | | | | | | | | | | | | | | | | | | | | | | | | | | | |
| 9/30/16 | | $ | 10.37 | | | $ | 0.17 | | | $ | 0.00 | d | | $ | 0.17 | | | $ | (0.24 | ) | | $ | - | | | $ | (0.24 | ) | | $ | 10.30 | | | | 1.69% | * | | $ | 32,906 | | | | 0.70% | | | | N/A | | | | 1.66% | |
| 9/30/15 | | | 10.41 | | | | 0.16 | | | | 0.01 | | | | 0.17 | | | | (0.21 | ) | | | (0.00 | )d | | | (0.21 | ) | | | 10.37 | | | | 1.69% | | | | 36,789 | | | | 0.70% | | | | N/A | | | | 1.53% | |
| 9/30/14 | | | 10.49 | | | | 0.14 | | | | (0.02 | ) | | | 0.12 | | | | (0.20 | ) | | | - | | | | (0.20 | ) | | | 10.41 | | | | 1.19% | | | | 42,999 | | | | 0.75% | | | | 0.68% | | | | 1.31% | |
| 9/30/13 | | | 10.69 | | | | 0.14 | | | | (0.01 | ) | | | 0.13 | | | | (0.20 | ) | | | (0.13 | ) | | | (0.33 | ) | | | 10.49 | | | | 1.27% | | | | 48,954 | | | | 0.82% | | | | 0.68% | | | | 1.36% | |
| 9/30/12i | | | 10.74 | | | | 0.15 | | | | 0.16 | | | | 0.31 | | | | (0.14 | ) | | | (0.22 | ) | | | (0.36 | ) | | | 10.69 | | | | 2.87% | b | | | 37,298 | | | | 0.83% | a | | | 0.69% | a | | | 1.51% | a |
| 10/31/11 | | | 10.80 | | | | 0.18 | | | | 0.05 | | | | 0.23 | | | | (0.22 | ) | | | (0.07 | ) | | | (0.29 | ) | | | 10.74 | | | | 2.18% | | | | 44,760 | | | | 0.80% | | | | 0.68% | | | | 1.72% | |
Class A | | | | | | | | | | | | | | | | | | | | | | | | | | | | | | | | | | | | | | | | | | | | | |
| 9/30/16 | | $ | 10.30 | | | $ | 0.14 | | | $ | 0.00 | d | | $ | 0.14 | | | $ | (0.21 | ) | | $ | - | | | $ | (0.21 | ) | | $ | 10.23 | | | | 1.49% | * | | $ | 87,598 | | | | 0.95% | | | | N/A | | | | 1.42% | |
| 9/30/15 | | | 10.34 | | | | 0.13 | | | | 0.02 | | | | 0.15 | | | | (0.19 | ) | | | (0.00 | )d | | | (0.19 | ) | | | 10.30 | | | | 1.44% | | | | 75,507 | | | | 0.95% | | | | N/A | | | | 1.28% | |
| 9/30/14 | | | 10.41 | | | | 0.11 | | | | (0.01 | ) | | | 0.10 | | | | (0.17 | ) | | | - | | | | (0.17 | ) | | | 10.34 | | | | 0.88% | | | | 77,196 | | | | 1.00% | | | | 0.93% | | | | 1.06% | |
| 9/30/13 | | | 10.62 | | | | 0.12 | | | | (0.02 | ) | | | 0.10 | | | | (0.18 | ) | | | (0.13 | ) | | | (0.31 | ) | | | 10.41 | | | | 0.99% | | | | 74,711 | | | | 1.07% | | | | 0.93% | | | | 1.11% | |
| 9/30/12i | | | 10.71 | | | | 0.12 | | | | 0.16 | | | | 0.28 | | | | (0.15 | ) | | | (0.22 | ) | | | (0.37 | ) | | | 10.62 | | | | 2.66% | b | | | 71,031 | | | | 1.08% | a | | | 0.94% | a | | | 1.26% | a |
| 10/31/11 | | | 10.76 | | | | 0.16 | | | | 0.05 | | | | 0.21 | | | | (0.19 | ) | | | (0.07 | ) | | | (0.26 | ) | | | 10.71 | | | | 2.02% | | | | 69,635 | | | | 1.06% | | | | 0.93% | | | | 1.48% | |
Class R4 | | | | | | | | | | | | | | | | | | | | | | | | | | | | | | | | | | | | | | | | | | | | | | | | | | | | |
| 9/30/16 | | $ | 10.45 | | | $ | 0.16 | | | $ | 0.00 | d | | $ | 0.16 | | | $ | (0.25 | ) | | $ | - | | | $ | (0.25 | ) | | $ | 10.36 | | | | 1.59% | * | | $ | 9,446 | | | | 0.85% | | | | N/A | | | | 1.53% | |
| 09/30/15 | | | 10.50 | | | | 0.14 | | | | 0.02 | | | | 0.16 | | | | (0.21 | ) | | | (0.00 | )d | | | (0.21 | ) | | | 10.45 | | | | 1.57% | | | | 5,881 | | | | 0.85% | | | | N/A | | | | 1.39% | |
| 09/30/14gg | | | 10.45 | | | | 0.06 | | | | (0.01 | ) | | | 0.05 | | | | - | | | | - | | | | - | | | | 10.50 | | | | 0.48% | b | | | 100 | | | | 0.84% | a | | | N/A | | | | 1.22% | a |
Class R3 | | | | | | | | | | | | | | | | | | | | | | | | | | | | | | | | | | | | | | | | | | | | | |
| 9/30/16 | | $ | 10.42 | | | $ | 0.13 | | | $ | 0.00 | d | | $ | 0.13 | | | $ | (0.24 | ) | | $ | - | | | $ | (0.24 | ) | | $ | 10.31 | | | | 1.27% | * | | $ | 3,661 | | | | 1.10% | | | | N/A | | | | 1.29% | |
| 9/30/15 | | | 10.46 | | | | 0.12 | | | | 0.01 | | | | 0.13 | | | | (0.17 | ) | | | (0.00 | )d | | | (0.17 | ) | | | 10.42 | | | | 1.27% | | | | 1,561 | | | | 1.10% | | | | N/A | | | | 1.15% | |
| 9/30/14 | | | 10.44 | | | | 0.09 | | | | (0.02 | ) | | | 0.07 | | | | (0.05 | ) | | | - | | | | (0.05 | ) | | | 10.46 | | | | 0.72% | | | | 618 | | | | 1.23% | | | | 1.16% | | | | 0.82% | |
| 9/30/13 | | | 10.49 | | | | 0.08 | | | | - | | | | 0.08 | | | | - | | | | (0.13 | ) | | | (0.13 | ) | | | 10.44 | | | | 0.74% | | | | 1,251 | | | | 1.37% | | | | 1.23% | | | | 0.81% | |
| 9/30/12i | | | 10.60 | | | | 0.09 | | | | 0.15 | | | | 0.24 | | | | (0.13 | ) | | | (0.22 | ) | | | (0.35 | ) | | | 10.49 | | | | 2.29% | b | | | 944 | | | | 1.38% | a | | | 1.24% | a | | | 0.93% | a |
| 10/31/11 | | | 10.66 | | | | 0.12 | | | | 0.06 | | | | 0.18 | | | | (0.17 | ) | | | (0.07 | ) | | | (0.24 | ) | | | 10.60 | | | | 1.67% | | | | 8,835 | | | | 1.36% | | | | 1.23% | | | | 1.18% | |
231
MassMutual Premier Inflation-Protected and Income Fund – Financial Statements (Continued)
Financial Highlights (For a share outstanding throughout each period)
| | | | | | | | | | | | | | | | | | | | | | | | | | | | | | | | | | | | | | | | | | | | | | | | | | | | | | | | | | | | |
| | | | | | Income (loss) from investment
operations | | | Less distributions
to shareholders | | | | | | | | | Ratios / Supplemental Data | |
| | | Net
asset
value,
beginning
of the
period | | | Net
investment
income
(loss)c,j | | | Net
realized
and
unrealized
gain (loss)
on
investments | | | Total
income
(loss) from
investment
operations | | | From net
investment
income | | | From
net
realized
gains | | | Total
distributions | | | Net
asset
value,
end of
the
period | | | Total
returnl,m | | | Net
assets,
end of
the
period
(000’s) | | | Ratio of
expenses
to
average
daily net
assets
before
expense
waiversn | | | Ratio of
expenses
to
average
daily net
assets
after
expense
waiversj,n | | | | | | Interest
expense
to
average
daily
net
assets p | | | Net
investment
income
(loss) to
average
daily net
assets | |
Class I | | | | | | | | | | | | | | | | | | | | | | | | | | | | | | | | | | | | | | | | | | | | | | | | | |
| 9/30/16 | | $ | 10.19 | | | $ | 0.13 | | | $ | 0.59 | | | $ | 0.72 | | | $ | (0.12 | ) | | $ | - | | | $ | (0.12 | ) | | $ | 10.79 | | | | 7.16% | * | | $ | 122,515 | | | | 0.91% | | | | 0.90% | | | | | | | | 0.44% | | | | 1.23% | |
| 9/30/15 | | | 10.56 | | | | 0.06 | | | | (0.17 | ) | | | (0.11 | ) | | | (0.26 | ) | | | - | | | | (0.26 | ) | | | 10.19 | | | | (1.12% | ) | | | 153,421 | | | | 0.67% | | | | N/A | | | | | | | | 0.20% | | | | 0.56% | |
| 9/30/14 | | | 11.00 | | | | 0.26 | | | | (0.08 | ) | | | 0.18 | | | | (0.26 | ) | | | (0.36 | ) | | | (0.62 | ) | | | 10.56 | | | | 1.79% | | | | 160,396 | | | | 0.64% | | | | 0.58% | | | | | | | | 0.13% | | | | 2.42% | |
| 9/30/13 | | | 12.22 | | | | 0.28 | | | | (0.99 | ) | | | (0.71 | ) | | | (0.40 | ) | | | (0.11 | ) | | | (0.51 | ) | | | 11.00 | | | | (6.12% | ) | | | 115,192 | | | | 0.77% | | | | 0.64% | | | | | | | | 0.20% | | | | 2.43% | |
| 9/30/12i | | | 11.91 | | | | 0.23 | | | | 0.59 | | | | 0.82 | | | | (0.51 | ) | | | - | | | | (0.51 | ) | | | 12.22 | | | | 7.12% | b | | | 124,528 | | | | 0.79% | a | | | 0.66% | a | | | | | | | 0.21% | a | | | 2.10% | a |
| 10/31/11h | | | 10.67 | | | | 0.30 | | | | 0.94 | | | | 1.24 | | | | - | | | | - | | | | - | | | | 11.91 | | | | 11.62% | b | | | 101,708 | | | | 0.74% | a | | | 0.60% | a | | | | | | | 0.15% | a | | | 3.88% | a |
Class R5 | | | | | | | | | | | | | | | | | | | | | | | | | | | | | | | | | | | | | | | | | | | | | | | | | | | | | | | | | |
| 9/30/16 | | $ | 10.19 | | | $ | 0.13 | | | $ | 0.59 | | | $ | 0.72 | | | $ | (0.11 | ) | | $ | - | | | $ | (0.11 | ) | | $ | 10.80 | | | | 7.14% | | | $ | 65,361 | | | | 1.01% | | | | 1.00% | | | | | | | | 0.44% | | | | 1.22% | |
| 9/30/15 | | | 10.56 | | | | 0.05 | | | | (0.18 | ) | | | (0.13 | ) | | | (0.24 | ) | | | - | | | | (0.24 | ) | | | 10.19 | | | | (1.22% | ) | | | 60,285 | | | | 0.77% | | | | N/A | | | | | | | | 0.20% | | | | 0.48% | |
| 9/30/14 | | | 10.99 | | | | 0.24 | | | | (0.07 | ) | | | 0.17 | | | | (0.24 | ) | | | (0.36 | ) | | | (0.60 | ) | | | 10.56 | | | | 1.62% | | | | 57,910 | | | | 0.75% | | | | 0.69% | | | | | | | | 0.13% | | | | 2.30% | |
| 9/30/13 | | | 12.22 | | | | 0.27 | | | | (1.00 | ) | | | (0.73 | ) | | | (0.39 | ) | | | (0.11 | ) | | | (0.50 | ) | | | 10.99 | | | | (6.22% | ) | | | 56,344 | | | | 0.88% | | | | 0.75% | | | | | | | | 0.20% | | | | 2.29% | |
| 9/30/12i | | | 11.90 | | | | 0.21 | | | | 0.60 | | | | 0.81 | | | | (0.49 | ) | | | - | | | | (0.49 | ) | | | 12.22 | | | | 7.02% | b | | | 75,714 | | | | 0.90% | a | | | 0.77% | a | | | | | | | 0.21% | a | | | 1.96% | a |
| 10/31/11 | | | 11.30 | | | | 0.53 | | | | 0.43 | | | | 0.96 | | | | (0.36 | ) | | | - | | | | (0.36 | ) | | | 11.90 | | | | 8.99% | | | | 89,413 | | | | 0.83% | | | | 0.73% | | | | | | | | 0.17% | | | | 4.79% | |
Service Class | | | | | | | | | | | | | | | | | | | | | | | | | | | | | | | | | | | | | | | | | | | | | | | | | | | | | |
| 9/30/16 | | $ | 10.16 | | | $ | 0.10 | | | $ | 0.60 | | | $ | 0.70 | | | $ | (0.10 | ) | | $ | - | | | $ | (0.10 | ) | | $ | 10.76 | | | | 6.96% | | | $ | 71,040 | | | | 1.11% | | | | 1.10% | | | | | | | | 0.44% | | | | 0.95% | |
| 9/30/15 | | | 10.52 | | | | 0.04 | | | | (0.17 | ) | | | (0.13 | ) | | | (0.23 | ) | | | - | | | | (0.23 | ) | | | 10.16 | | | | (1.23% | ) | | | 77,147 | | | | 0.87% | | | | N/A | | | | | | | | 0.20% | | | | 0.37% | |
| 9/30/14 | | | 10.96 | | | | 0.23 | | | | (0.08 | ) | | | 0.15 | | | | (0.23 | ) | | | (0.36 | ) | | | (0.59 | ) | | | 10.52 | | | | 1.54% | | | | 77,120 | | | | 0.85% | | | | 0.79% | | | | | | | | 0.13% | | | | 2.16% | |
| 9/30/13 | | | 12.18 | | | | 0.26 | | | | (1.00 | ) | | | (0.74 | ) | | | (0.37 | ) | | | (0.11 | ) | | | (0.48 | ) | | | 10.96 | | | | (6.35% | ) | | | 82,273 | | | | 0.98% | | | | 0.85% | | | | | | | | 0.20% | | | | 2.20% | |
| 9/30/12i | | | 11.87 | | | | 0.21 | | | | 0.58 | | | | 0.79 | | | | (0.48 | ) | | | - | | | | (0.48 | ) | | | 12.18 | | | | 6.90% | b | | | 95,417 | | | | 1.00% | a | | | 0.87% | a | | | | | | | 0.21% | a | | | 1.94% | a |
| 10/31/11 | | | 11.27 | | | | 0.48 | | | | 0.47 | | | | 0.95 | | | | (0.35 | ) | | | - | | | | (0.35 | ) | | | 11.87 | | | | 8.80% | | | | 80,118 | | | | 0.92% | | | | 0.84% | | | | | | | | 0.18% | | | | 4.36% | |
| | | | | | | | | | | | | | | | | | | | | | | | |
| | | Year ended September 30 | | | Period ended
September 30, 2012b,i | | | Year ended
October 31 | |
| | | 2016 | | | 2015 | | | 2014 | | | 2013 | | | | | | 2011 | |
Portfolio turnover rate | | | 46 | % | | | 59 | % | | | 65 | % | | | 56 | % | | | 29 | % | | | 46 | % |
| b | Percentage represents the results for the period and is not annualized. |
| c | Per share amount calculated on the average shares method. |
| d | Amount is less than $0.005 per share. |
| h | For the period March 1, 2011 (commencement of operations) through October 31, 2011. |
| i | For the period November 1, 2011 through September 30, 2012. |
| j | Computed after giving effect to an agreement by MML Advisers and/or MassMutual to waive certain fees and expenses of the Fund. |
| l | Employee retirement benefit plans that invest plan assets in the Separate Investment Accounts (SIAs) may be subject to certain charges as set forth in their respective Plan Documents. Total return figures would be lower for the periods presented if they reflected these charges. |
| m | Total return excludes sales charges, if any, and would be lower for the period presented if it reflected these charges. |
| n | Includes interest expense. |
| p | Interest expense incurred as a result of entering into reverse repurchase agreements is included in the Fund’s net expenses in the Statements of Operations. Income earned on investing proceeds from reverse repurchase agreements is included in interest income in the Statements of Operations. |
| gg | For the period April 1, 2014 (commencement of operations) through September 30, 2014. |
| * | Generally accepted accounting principles may require adjustment to be made to the net assets of the Fund at period end for financial reporting purposes, and as such, the net asset values for shareholder transactions and the returns based on those net asset values may differ from the returns reported in the portfolio manager commentary section of this report. |
The accompanying notes are an integral part of the financial statements.
232
| | | | | | | | | | | | | | | | | | | | | | | | | | | | | | | | | | | | | | | | | | | | | | | | | | | | | | | | | | | | |
| | | | | | Income (loss) from investment
operations | | | Less distributions
to shareholders | | | | | | | | | Ratios / Supplemental Data | |
| | | Net
asset
value,
beginning
of the
period | | | Net
investment
income
(loss)c,j | | | Net
realized
and
unrealized
gain (loss)
on
investments | | | Total
income
(loss) from
investment
operations | | | From net
investment
income | | | From
net
realized
gains | | | Total
distributions | | | Net
asset
value,
end of
the
period | | | Total
returnl,m | | | Net
assets,
end of
the
period
(000’s) | | | Ratio of
expenses
to
average
daily net
assets
before
expense
waiversn | | | Ratio of
expenses
to
average
daily net
assets
after
expense
waiversj,n | | | | | | Interest
expense
to
average
daily
net
assets p | | | Net
investment
income
(loss) to
average
daily net
assets | |
Administrative Class | | | | | | | | | | | | | | | | | | | | | | | | | | | | | | | | | | | | | | | | | | | | | | | | | | | | | |
| 9/30/16 | | $ | 10.26 | | | $ | 0.10 | | | $ | 0.59 | | | $ | 0.69 | | | $ | (0.09 | ) | | $ | - | | | $ | (0.09 | ) | | $ | 10.86 | | | | 6.80% | * | | $ | 14,408 | | | | 1.21% | | | | 1.20% | | | | | | | | 0.44% | | | | 0.96% | |
| 9/30/15 | | | 10.62 | | | | 0.04 | | | | (0.17 | ) | | | (0.13 | ) | | | (0.23 | ) | | | - | | | | (0.23 | ) | | | 10.26 | | | | (1.30% | ) | | | 11,859 | | | | 0.97% | | | | N/A | | | | | | | | 0.20% | | | | 0.36% | |
| 9/30/14 | | | 11.06 | | | | 0.23 | | | | (0.09 | ) | | | 0.14 | | | | (0.22 | ) | | | (0.36 | ) | | | (0.58 | ) | | | 10.62 | | | | 1.42% | | | | 10,584 | | | | 0.92% | | | | 0.86% | | | | | | | | 0.13% | | | | 2.15% | |
| 9/30/13 | | | 12.28 | | | | 0.24 | | | | (0.99 | ) | | | (0.75 | ) | | | (0.36 | ) | | | (0.11 | ) | | | (0.47 | ) | | | 11.06 | | | | (6.46% | ) | | | 10,183 | | | | 1.10% | | | | 0.97% | | | | | | | | 0.20% | | | | 2.08% | |
| 9/30/12i | | | 11.84 | | | | 0.19 | | | | 0.59 | | | | 0.78 | | | | (0.34 | ) | | | - | | | | (0.34 | ) | | | 12.28 | | | | 6.78% | b | | | 9,466 | | | | 1.15% | a | | | 1.02% | a | | | | | | | 0.21% | a | | | 1.78% | a |
| 10/31/11 | | | 11.24 | | | | 0.56 | | | | 0.37 | | | | 0.93 | | | | (0.33 | ) | | | - | | | | (0.33 | ) | | | 11.84 | | | | 8.64% | | | | 6,301 | | | | 1.07% | | | | 0.99% | | | | | | | | 0.18% | | | | 5.15% | |
Class A | | | | | | | | | | | | | | | | | | | | | | | | | | | | | | | | | | | | | | | | | | | | | | | | | | | | | |
| 9/30/16 | | $ | 10.00 | | | $ | 0.08 | | | $ | 0.58 | | | $ | 0.66 | | | $ | (0.06 | ) | | $ | - | | | $ | (0.06 | ) | | $ | 10.60 | | | | 6.65% | | | $ | 23,476 | | | | 1.46% | | | | 1.45% | | | | | | | | 0.44% | | | | 0.76% | |
| 9/30/15 | | | 10.36 | | | | (0.00 | )d | | | (0.16 | ) | | | (0.16 | ) | | | (0.20 | ) | | | - | | | | (0.20 | ) | | | 10.00 | | | | (1.58% | ) | | | 22,320 | | | | 1.22% | | | | N/A | | | | | | | | 0.20% | | | | (0.02% | ) |
| 9/30/14 | | | 10.80 | | | | 0.19 | | | | (0.08 | ) | | | 0.11 | | | | (0.19 | ) | | | (0.36 | ) | | | (0.55 | ) | | | 10.36 | | | | 1.16% | | | | 26,054 | | | | 1.18% | | | | 1.11% | | | | | | | | 0.13% | | | | 1.79% | |
| 9/30/13 | | | 12.00 | | | | 0.22 | | | | (0.98 | ) | | | (0.76 | ) | | | (0.33 | ) | | | (0.11 | ) | | | (0.44 | ) | | | 10.80 | | | | (6.62% | ) | | | 28,778 | | | | 1.28% | | | | 1.15% | | | | | | | | 0.20% | | | | 1.93% | |
| 9/30/12i | | | 11.70 | | | | 0.17 | | | | 0.58 | | | | 0.75 | | | | (0.45 | ) | | | - | | | | (0.45 | ) | | | 12.00 | | | | 6.65% | b | | | 38,957 | | | | 1.30% | a | | | 1.17% | a | | | | | | | 0.21% | a | | | 1.62% | a |
| 10/31/11 | | | 11.11 | | | | 0.45 | | | | 0.45 | | | | 0.90 | | | | (0.31 | ) | | | - | | | | (0.31 | ) | | | 11.70 | | | | 8.50% | | | | 37,528 | | | | 1.26% | | | | 1.14% | | | | | | | | 0.18% | | | | 4.10% | |
Class R4 | | | | | | | | | | | | | | | | | | | | | | | | | | | | | | | | | | | | | | | | | | | | | | | | | | | | | | | | | | | | |
| 9/30/16 | | $ | 10.00 | | | $ | 0.12 | | | $ | 0.55 | | | $ | 0.67 | | | $ | (0.10 | ) | | $ | - | | | $ | (0.10 | ) | | $ | 10.57 | | | | 6.77% | | | $ | 5,352 | | | | 1.36% | | | | 1.35% | | | | | | | | 0.44% | | | | 1.21% | |
| 9/30/15 | | | 10.37 | | | | 0.14 | | | | (0.29 | ) | | | (0.15 | ) | | | (0.22 | ) | | | - | | | | (0.22 | ) | | | 10.00 | | | | (1.47% | ) | | | 996 | | | | 1.12% | | | | N/A | | | | | | | | 0.20% | | | | 1.42% | |
| 9/30/14gg | | | 10.22 | | | | 0.16 | | | | (0.01 | ) | | | 0.15 | | | | - | | | | - | | | | - | | | | 10.37 | | | | 1.47% | b | | | 101 | | | | 1.03% | a | | | N/A | | | | | | | | 0.13% | a | | | 3.03% | a |
Class R3 | | | | | | | | | | | | | | | | | | | | | | | | | | | | | | | | | | | | | | | | | | | | | | | | | | | | | |
| 9/30/16 | | $ | 10.01 | | | $ | 0.15 | | | $ | 0.48 | | | $ | 0.63 | | | $ | (0.07 | ) | | $ | - | | | $ | (0.07 | ) | | $ | 10.57 | | | | 6.37% | * | | $ | 2,792 | | | | 1.61% | | | | 1.60% | | | | | | | | 0.44% | | | | 1.46% | |
| 9/30/15 | | | 10.37 | | | | (0.03 | ) | | | (0.15 | ) | | | (0.18 | ) | | | (0.18 | ) | | | - | | | | (0.18 | ) | | | 10.01 | | | | (1.76% | ) | | | 386 | | | | 1.37% | | | | N/A | | | | | | | | 0.20% | | | | (0.30% | ) |
| 9/30/14 | | | 10.82 | | | | 0.17 | | | | (0.09 | ) | | | 0.08 | | | | (0.17 | ) | | | (0.36 | ) | | | (0.53 | ) | | | 10.37 | | | | 0.93% | | | | 1,593 | | | | 1.40% | | | | 1.33% | | | | | | | | 0.13% | | | | 1.66% | |
| 9/30/13 | | | 12.04 | | | | 0.18 | | | | (0.97 | ) | | | (0.79 | ) | | | (0.32 | ) | | | (0.11 | ) | | | (0.43 | ) | | | 10.82 | | | | (6.84% | ) | | | 1,404 | | | | 1.59% | | | | 1.46% | | | | | | | | 0.20% | | | | 1.59% | |
| 9/30/12i | | | 11.76 | | | | 0.14 | | | | 0.58 | | | | 0.72 | | | | (0.44 | ) | | | - | | | | (0.44 | ) | | | 12.04 | | | | 6.27% | b | | | 1,155 | | | | 1.60% | a | | | 1.47% | a | | | | | | | 0.21% | a | | | 1.27% | a |
| 10/31/11 | | | 11.18 | | | | 0.43 | | | | 0.45 | | | | 0.88 | | | | (0.30 | ) | | | - | | | | (0.30 | ) | | | 11.76 | | | | 8.16% | | | | 664 | | | | 1.56% | | | | 1.43% | | | | | | | | 0.17% | | | | 3.85% | |
233
MassMutual Premier Core Bond Fund – Financial Statements (Continued)
Financial Highlights (For a share outstanding throughout each period)
| | | | | | | | | | | | | | | | | | | | | | | | | | | | | | | | | | | | | | | | | | | | | | | | | | | | |
| | | | | | Income (loss) from investment
operations | | | Less distributions to shareholders | | | | | | | | |
Ratios / Supplemental Data | |
| | | Net
asset
value,
beginning
of the
period | | | Net
investment
income
(loss)c,j | | | Net
realized
and
unrealized
gain
(loss) on
investments | | | Total
income
(loss) from
investment
operations | | | From net
investment
income | | | From net
realized
gains | | | Total
distributions | | | Net
asset
value,
end of
the
period | | | Total
returnl,m | | | Net
assets,
end of
the
period
(000’s) | | | Ratio of
expenses
to average
daily net
assets
before
expense
waivers | | | Ratio of
expenses
to average
daily net
assets
after
expense
waiversj | | | Net
investment
income
(loss) to
average
daily net
assets | |
Class I | | | | | | | | | | | | | | | | | | | | | | | | | | | | | | | | | | | | | | | | | | | | | |
| 9/30/16 | | $ | 11.27 | | | $ | 0.29 | | | $ | 0.19 | | | $ | 0.48 | | | $ | (0.34 | ) | | $ | (0.15 | ) | | $ | (0.49 | ) | | $ | 11.26 | | | | 4.54% | * | | $ | 501,737 | | | | 0.42% | | | | N/A | | | | 2.59% | |
| 9/30/15 | | | 11.43 | | | | 0.30 | | | | (0.11 | ) | | | 0.19 | | | | (0.30 | ) | | | (0.05 | ) | | | (0.35 | ) | | | 11.27 | | | | 1.67% | | | | 677,427 | | | | 0.42% | | | | N/A | | | | 2.61% | |
| 9/30/14 | | | 11.27 | | | | 0.29 | | | | 0.25 | | | | 0.54 | | | | (0.38 | ) | | | - | | | | (0.38 | ) | | | 11.43 | | | | 4.92% | | | | 620,248 | | | | 0.49% | | | | 0.40% | | | | 2.59% | |
| 9/30/13 | | | 11.88 | | | | 0.28 | | | | (0.36 | ) | | | (0.08 | ) | | | (0.29 | ) | | | (0.24 | ) | | | (0.53 | ) | | | 11.27 | | | | (0.70% | ) | | | 485,302 | | | | 0.56% | | | | 0.38% | | | | 2.48% | |
| 9/30/12i | | | 11.66 | | | | 0.25 | | | | 0.49 | | | | 0.74 | | | | (0.27 | ) | | | (0.25 | ) | | | (0.52 | ) | | | 11.88 | | | | 6.63% | b | | | 518,536 | | | | 0.56% | a | | | 0.38% | a | | | 2.39% | a |
| 10/31/11g | | | 11.67 | | | | 0.28 | | | | 0.41 | | | | 0.69 | | | | (0.34 | ) | | | (0.36 | ) | | | (0.70 | ) | | | 11.66 | | | | 6.32% | b | | | 316,018 | | | | 0.58% | a | | | 0.40% | a | | | 2.65% | a |
Class R5 | | | | | | | | | | | | | | | | | | | | | | | | | | | | | | | | | | | | | | | | | | | | | |
| 9/30/16 | | $ | 11.30 | | | $ | 0.28 | | | $ | 0.19 | | | $ | 0.47 | | | $ | (0.33 | ) | | $ | (0.15 | ) | | $ | (0.48 | ) | | $ | 11.29 | | | | 4.40% | * | | $ | 408,472 | | | | 0.52% | | | | N/A | | | | 2.49% | |
| 9/30/15 | | | 11.45 | | | | 0.29 | | | | (0.11 | ) | | | 0.18 | | | | (0.28 | ) | | | (0.05 | ) | | | (0.33 | ) | | | 11.30 | | | | 1.63% | | | | 489,222 | | | | 0.52% | | | | N/A | | | | 2.51% | |
| 9/30/14 | | | 11.27 | | | | 0.27 | | | | 0.26 | | | | 0.53 | | | | (0.35 | ) | | | - | | | | (0.35 | ) | | | 11.45 | | | | 4.72% | | | | 511,202 | | | | 0.64% | | | | 0.55% | | | | 2.43% | |
| 9/30/13 | | | 11.89 | | | | 0.26 | | | | (0.37 | ) | | | (0.11 | ) | | | (0.27 | ) | | | (0.24 | ) | | | (0.51 | ) | | | 11.27 | | | | (0.81% | ) | | | 516,103 | | | | 0.77% | | | | 0.59% | | | | 2.25% | |
| 9/30/12i | | | 11.66 | | | | 0.23 | | | | 0.49 | | | | 0.72 | | | | (0.24 | ) | | | (0.25 | ) | | | (0.49 | ) | | | 11.89 | | | | 6.35% | b | | | 728,293 | | | | 0.77% | a | | | 0.59% | a | | | 2.19% | a |
| 10/31/11 | | | 11.83 | | | | 0.28 | | | | 0.24 | | | | 0.52 | | | | (0.33 | ) | | | (0.36 | ) | | | (0.69 | ) | | | 11.66 | | | | 4.79% | | | | 799,669 | | | | 0.74% | | | | 0.59% | | | | 2.47% | |
Service Class | | | | | | | | | | | | | | | | | | | | | | | | | | | | | | | | | | | | | | | | | | | | | |
| 9/30/16 | | $ | 11.23 | | | $ | 0.26 | | | $ | 0.20 | | | $ | 0.46 | | | $ | (0.32 | ) | | $ | (0.15 | ) | | $ | (0.47 | ) | | $ | 11.22 | | | | 4.34% | * | | $ | 91,885 | | | | 0.62% | | | | N/A | | | | 2.40% | |
| 9/30/15 | | | 11.38 | | | | 0.27 | | | | (0.10 | ) | | | 0.17 | | | | (0.27 | ) | | | (0.05 | ) | | | (0.32 | ) | | | 11.23 | | | | 1.49% | | | | 130,923 | | | | 0.62% | | | | N/A | | | | 2.40% | |
| 9/30/14 | | | 11.22 | | | | 0.27 | | | | 0.24 | | | | 0.51 | | | | (0.35 | ) | | | - | | | | (0.35 | ) | | | 11.38 | | | | 4.65% | | | | 166,094 | | | | 0.71% | | | | 0.63% | | | | 2.36% | |
| 9/30/13 | | | 11.83 | | | | 0.25 | | | | (0.36 | ) | | | (0.11 | ) | | | (0.26 | ) | | | (0.24 | ) | | | (0.50 | ) | | | 11.22 | | | | (0.94% | ) | | | 143,460 | | | | 0.82% | | | | 0.64% | | | | 2.21% | |
| 9/30/12i | | | 11.61 | | | | 0.23 | | | | 0.48 | | | | 0.71 | | | | (0.24 | ) | | | (0.25 | ) | | | (0.49 | ) | | | 11.83 | | | | 6.34% | b | | | 162,692 | | | | 0.82% | a | | | 0.64% | a | | | 2.14% | a |
| 10/31/11 | | | 11.78 | | | | 0.27 | | | | 0.25 | | | | 0.52 | | | | (0.33 | ) | | | (0.36 | ) | | | (0.69 | ) | | | 11.61 | | | | 4.75% | | | | 153,857 | | | | 0.79% | | | | 0.64% | | | | 2.42% | |
| | | | | | | | | | | | | | | | | | | | | | | | |
| | | Year ended September 30 | | | Period ended
September 30, 2012b,i | | | Year ended
October 31 | |
| | | 2016 | | | 2015 | | | 2014 | | | 2013 | | | | | | 2011 | |
Portfolio turnover rate | | | 330 | % | | | 361 | % | | | 361 | % | | | 452 | % | | | 447 | % | | | 539 | % |
| b | Percentage represents the results for the period and is not annualized. |
| c | Per share amount calculated on the average shares method. |
| g | For the period December 3, 2010 (commencement of operations) through October 31,2011. |
| i | For the period November 1, 2011 through September 30, 2012. |
| j | Computed after giving effect to an agreement by MML Advisers and/or MassMutual to waive certain fees and expenses of the Fund. |
| l | Employee retirement benefit plans that invest plan assets in the Separate Investment Accounts (SIAs) may be subject to certain charges as set forth in their respective Plan Documents. Total return figures would be lower for the periods presented if they reflected these charges. |
| m | Total return excludes sales charges, if any, and would be lower for the period presented if it reflected these charges. |
| gg | For the period April 1, 2014 (commencement of operations) through September 30, 2014. |
| * | Generally accepted accounting principles may require adjustment to be made to the net assets of the Fund at period end for financial reporting purposes, and as such, the net asset values for shareholder transactions and the returns based on those net asset values may differ from the returns reported in the portfolio manager commentary section of this report. |
The accompanying notes are an integral part of the financial statements.
234
| | | | | | | | | | | | | | | | | | | | | | | | | | | | | | | | | | | | | | | | | | | | | | | | | | | | |
| | | | | | Income (loss) from investment
operations | | | Less distributions to shareholders | | | | | | | | |
Ratios / Supplemental Data | |
| | | Net
asset
value,
beginning
of the
period | | | Net
investment
income
(loss)c,j | | | Net
realized
and
unrealized
gain
(loss) on
investments | | | Total
income
(loss) from
investment
operations | | | From net
investment
income | | | From net
realized
gains | | | Total
distributions | | | Net
asset
value,
end of
the
period | | | Total
returnl,m | | | Net
assets,
end of
the
period
(000’s) | | | Ratio of
expenses
to average
daily net
assets
before
expense
waivers | | | Ratio of
expenses
to average
daily net
assets
after
expense
waiversj | | | Net
investment
income
(loss) to
average
daily net
assets | |
Administrative Class | | | | | | | | | | | | | | | | | | | | | | | | | | | | | | | | | | | | | | | | | | | | | |
| 9/30/16 | | $ | 11.16 | | | $ | 0.25 | | | $ | 0.19 | | | $ | 0.44 | | | $ | (0.31 | ) | | $ | (0.15 | ) | | $ | (0.46 | ) | | $ | 11.14 | | | | 4.19% | * | | $ | 85,249 | | | | 0.72% | | | | N/A | | | | 2.29% | |
| 9/30/15 | | | 11.32 | | | | 0.26 | | | | (0.10 | ) | | | 0.16 | | | | (0.27 | ) | | | (0.05 | ) | | | (0.32 | ) | | | 11.16 | | | | 1.38% | | | | 84,709 | | | | 0.72% | | | | N/A | | | | 2.31% | |
| 9/30/14 | | | 11.16 | | | | 0.25 | | | | 0.25 | | | | 0.50 | | | | (0.34 | ) | | | - | | | | (0.34 | ) | | | 11.32 | | | | 4.60% | | | | 70,975 | | | | 0.81% | | | | 0.71% | | | | 2.27% | |
| 9/30/13 | | | 11.77 | | | | 0.24 | | | | (0.36 | ) | | | (0.12 | ) | | | (0.25 | ) | | | (0.24 | ) | | | (0.49 | ) | | | 11.16 | | | | (1.03% | ) | | | 80,694 | | | | 0.89% | | | | 0.71% | | | | 2.15% | |
| 9/30/12i | | | 11.53 | | | | 0.22 | | | | 0.48 | | | | 0.70 | | | | (0.21 | ) | | | (0.25 | ) | | | (0.46 | ) | | | 11.77 | | | | 6.28% | b | | | 91,405 | | | | 0.89% | a | | | 0.71% | a | | | 2.07% | a |
| 10/31/11 | | | 11.70 | | | | 0.26 | | | | 0.25 | | | | 0.51 | | | | (0.32 | ) | | | (0.36 | ) | | | (0.68 | ) | | | 11.53 | | | | 4.70% | | | | 91,457 | | | | 0.86% | | | | 0.71% | | | | 2.35% | |
Class A | | | | | | | | | | | | | | | | | | | | | | | | | | | | | | | | | | | | | | | | | | | | | |
| 9/30/16 | | $ | 11.04 | | | $ | 0.22 | | | $ | 0.20 | | | $ | 0.42 | | | $ | (0.28 | ) | | $ | (0.15 | ) | | $ | (0.43 | ) | | $ | 11.03 | | | | 4.01% | * | | $ | 150,014 | | | | 0.97% | | | | N/A | | | | 2.04% | |
| 9/30/15 | | | 11.20 | | | | 0.23 | | | | (0.10 | ) | | | 0.13 | | | | (0.24 | ) | | | (0.05 | ) | | | (0.29 | ) | | | 11.04 | | | | 1.12% | | | | 166,649 | | | | 0.97% | | | | N/A | | | | 2.06% | |
| 9/30/14 | | | 11.04 | | | | 0.22 | | | | 0.25 | | | | 0.47 | | | | (0.31 | ) | | | - | | | | (0.31 | ) | | | 11.20 | | | | 4.25% | | | | 174,618 | | | | 1.05% | | | | 0.96% | | | | 2.02% | |
| 9/30/13 | | | 11.65 | | | | 0.21 | | | | (0.36 | ) | | | (0.15 | ) | | | (0.22 | ) | | | (0.24 | ) | | | (0.46 | ) | | | 11.04 | | | | (1.20% | ) | | | 180,654 | | | | 1.14% | | | | 0.96% | | | | 1.90% | |
| 9/30/12i | | | 11.44 | | | | 0.19 | | | | 0.48 | | | | 0.67 | | | | (0.21 | ) | | | (0.25 | ) | | | (0.46 | ) | | | 11.65 | | | | 6.01% | b | | | 192,598 | | | | 1.14% | a | | | 0.96% | a | | | 1.82% | a |
| 10/31/11 | | | 11.62 | | | | 0.23 | | | | 0.24 | | | | 0.47 | | | | (0.29 | ) | | | (0.36 | ) | | | (0.65 | ) | | | 11.44 | | | | 4.39% | | | | 201,638 | | | | 1.12% | | | | 0.96% | | | | 2.10% | |
Class R4 | | | | | | | | | | | | | | | | | | | | | | | | | | | | | | | | | | | | | | | | | | | | | | | | | | | | |
| 9/30/16 | | $ | 11.03 | | | $ | 0.23 | | | $ | 0.19 | | | $ | 0.42 | | | $ | (0.30 | ) | | $ | (0.15 | ) | | $ | (0.45 | ) | | $ | 11.00 | | | | 4.09% | | | $ | 14,906 | | | | 0.87% | | | | N/A | | | | 2.14% | |
| 9/30/15 | | | 11.20 | | | | 0.25 | | | | (0.11 | ) | | | 0.14 | | | | (0.26 | ) | | | (0.05 | ) | | | (0.31 | ) | | | 11.03 | | | | 1.28% | | | | 8,960 | | | | 0.87% | | | | N/A | | | | 2.21% | |
| 9/30/14gg | | | 10.95 | | | | 0.12 | | | | 0.13 | | | | 0.25 | | | | - | | | | - | | | | - | | | | 11.20 | | | | 2.28% | b | | | 102 | | | | 0.86% | a | | | N/A | | | | 2.08% | a |
Class R3 | | | | | | | | | | | | | | | | | | | | | | | | | | | | | | | | | | | | | | | | | | | | | |
| 9/30/16 | | $ | 11.25 | | | $ | 0.21 | | | $ | 0.20 | | | $ | 0.41 | | | $ | (0.26 | ) | | $ | (0.15 | ) | | $ | (0.41 | ) | | $ | 11.25 | | | | 3.89% | | | $ | 783 | | | | 1.12% | | | | N/A | | | | 1.89% | |
| 9/30/15 | | | 11.40 | | | | 0.22 | | | | (0.10 | ) | | | 0.12 | | | | (0.22 | ) | | | (0.05 | ) | | | (0.27 | ) | | | 11.25 | | | | 1.02% | b | | | 625 | | | | 1.12% | | | | N/A | | | | 1.90% | |
| 9/30/14 | | | 11.20 | | | | 0.20 | | | | 0.24 | | | | 0.44 | | | | (0.24 | ) | | | - | | | | (0.24 | ) | | | 11.40 | | | | 4.02% | | | | 1,231 | | | | 1.29% | | | | 1.20% | | | | 1.78% | |
| 9/30/13 | | | 11.83 | | | | 0.18 | | | | (0.36 | ) | | | (0.18 | ) | | | (0.21 | ) | | | (0.24 | ) | | | (0.45 | ) | | | 11.20 | | | | (1.53% | ) | | | 1,742 | | | | 1.46% | | | | 1.28% | | | | 1.59% | |
| 9/30/12i | | | 11.61 | | | | 0.16 | | | | 0.48 | | | | 0.64 | | | | (0.17 | ) | | | (0.25 | ) | | | (0.42 | ) | | | 11.83 | | | | 5.72% | b | | | 1,555 | | | | 1.46% | a | | | 1.28% | a | | | 1.49% | a |
| 10/31/11 | | | 11.78 | | | | 0.20 | | | | 0.25 | | | | 0.45 | | | | (0.26 | ) | | | (0.36 | ) | | | (0.62 | ) | | | 11.61 | | | | 4.12% | | | | 1,014 | | | | 1.44% | | | | 1.28% | | | | 1.78% | |
235
MassMutual Premier Diversified Bond Fund – Financial Statements (Continued)
Financial Highlights (For a share outstanding throughout each period)
| | | | | | | | | | | | | | | | | | | | | | | | | | | | | | | | | | | | | | | | | | | | | | | | | | | | |
| | | | | | Income (loss) from investment
operations | | | Less distributions to shareholders | | | | | | | | |
Ratios / Supplemental Data | |
| | | Net asset
value,
beginning
of the
period | | | Net
investment
income
(loss)c,j | | | Net
realized
and
unrealized
gain (loss)
on
investments | | | Total
income
(loss) from
investment
operations | | | From net
investment
income | | | From net
realized
gains | | | Total
distributions | | | Net
asset
value,
end of
the
period | | | Total
returnl,m | | | Net
assets,
end of
the
period
(000’s) | | | Ratio of
expenses
to average
daily net
assets
before
expense
waivers | | | Ratio of
expenses
to average
daily net
assets
after
expense
waiversj | | | Net
investment
income
(loss) to
average
daily net
assets | |
Class I | | | | | | | | | | | | | | | | | | | | | | | | | | | | | | | | | | | | | | | | | | | | | |
| 9/30/16 | | $ | 10.73 | | | $ | 0.28 | | | $ | 0.31 | | | $ | 0.59 | | | $ | (0.26 | ) | | $ | (0.05 | ) | | $ | (0.31 | ) | | $ | 11.01 | | | | 5.71% | | | $ | 20,147 | | | | 0.53% | | | | 0.52% | | | | 2.60% | |
| 9/30/15 | | | 10.88 | | | | 0.28 | | | | (0.19 | ) | | | 0.09 | | | | (0.23 | ) | | | (0.01 | ) | | | (0.24 | ) | | | 10.73 | | | | 0.81% | | | | 15,756 | | | | 0.56% | | | | 0.52% | | | | 2.54% | |
| 9/30/14 | | | 10.61 | | | | 0.29 | | | | 0.30 | | | | 0.59 | | | | (0.31 | ) | | | (0.01 | ) | | | (0.32 | ) | | | 10.88 | | | | 5.75% | | | | 5,659 | | | | 0.59% | | | | 0.51% | | | | 2.68% | |
| 9/30/13 | | | 11.24 | | | | 0.37 | | | | (0.22 | ) | | | 0.15 | | | | (0.48 | ) | | | (0.30 | ) | | | (0.78 | ) | | | 10.61 | | | | 1.36% | | | | 0 | f | | | 0.66% | | | | 0.48% | | | | 3.44% | |
| 9/30/12i | | | 11.08 | | | | 0.29 | | | | 0.63 | | | | 0.92 | | | | - | | | | (0.76 | ) | | | (0.76 | ) | | | 11.24 | | | | 8.84% | b | | | 0 | f | | | 0.67% | a | | | 0.50% | a | | | 2.90% | a |
| 10/31/11g | | | 10.96 | | | | 0.32 | | | | 0.36 | | | | 0.68 | | | | (0.47 | ) | | | (0.09 | ) | | | (0.56 | ) | | | 11.08 | | | | 6.56% | b | | | 0 | f | | | 0.64% | a | | | 0.47% | a | | | 3.22% | a |
Class R5 | | | | | | | | | | | | | | | | | | | | | | | | | | | | | | | | | | | | | | | | | | | | | |
| 9/30/16 | | $ | 9.98 | | | $ | 0.25 | | | $ | 0.29 | | | $ | 0.54 | | | $ | (0.25 | ) | | $ | (0.05 | ) | | $ | (0.30 | ) | | $ | 10.22 | | | | 5.63% | | | $ | 77,693 | | | | 0.63% | | | | 0.62% | | | | 2.50% | |
| 9/30/15 | | | 10.14 | | | | 0.24 | | | | (0.17 | ) | | | 0.07 | | | | (0.22 | ) | | | (0.01 | ) | | | (0.23 | ) | | | 9.98 | | | | 0.66% | | | | 65,209 | | | | 0.66% | | | | 0.62% | | | | 2.41% | |
| 9/30/14 | | | 9.90 | | | | 0.26 | | | | 0.28 | | | | 0.54 | | | | (0.29 | ) | | | (0.01 | ) | | | (0.30 | ) | | | 10.14 | | | | 5.49% | | | | 68,204 | | | | 0.69% | | | | 0.59% | | | | 2.59% | |
| 9/30/13 | | | 10.57 | | | | 0.29 | | | | (0.25 | ) | | | 0.04 | | | | (0.41 | ) | | | (0.30 | ) | | | (0.71 | ) | | | 9.90 | | | | 0.40% | | | | 37,501 | | | | 0.86% | | | | 0.69% | | | | 2.83% | |
| 9/30/12i | | | 11.07 | | | | 0.28 | | | | 0.48 | | | | 0.76 | | | | (0.50 | ) | | | (0.76 | ) | | | (1.26 | ) | | | 10.57 | | | | 7.61% | b | | | 38,986 | | | | 0.93% | a | | | 0.76% | a | | | 3.00% | a |
| 10/31/11 | | | 11.10 | | | | 0.35 | | | | 0.15 | | | | 0.50 | | | | (0.44 | ) | | | (0.09 | ) | | | (0.53 | ) | | | 11.07 | | | | 4.85% | | | | 31,390 | | | | 0.85% | | | | 0.72% | | | | 3.25% | |
Service Class | | | | | | | | | | | | | | | | | | | | | | | | | | | | | | | | | | | | | | | | | | | | | |
| 9/30/16 | | $ | 10.09 | | | $ | 0.24 | | | $ | 0.30 | | | $ | 0.54 | | | $ | (0.24 | ) | | $ | (0.05 | ) | | $ | (0.29 | ) | | $ | 10.34 | | | | 5.53% | | | $ | 16,990 | | | | 0.73% | | | | 0.72% | | | | 2.39% | |
| 9/30/15 | | | 10.24 | | | | 0.24 | | | | (0.17 | ) | | | 0.07 | | | | (0.21 | ) | | | (0.01 | ) | | | (0.22 | ) | | | 10.09 | | | | 0.59% | | | | 20,226 | | | | 0.76% | | | | 0.72% | | | | 2.32% | |
| 9/30/14 | | | 10.00 | | | | 0.25 | | | | 0.28 | | | | 0.53 | | | | (0.28 | ) | | | (0.01 | ) | | | (0.29 | ) | | | 10.24 | | | | 5.37% | | | | 15,644 | | | | 0.79% | | | | 0.69% | | | | 2.51% | |
| 9/30/13 | | | 10.58 | | | | 0.28 | | | | (0.25 | ) | | | 0.03 | | | | (0.31 | ) | | | (0.30 | ) | | | (0.61 | ) | | | 10.00 | | | | 0.34% | | | | 10,226 | | | | 0.94% | | | | 0.77% | | | | 2.71% | |
| 9/30/12i | | | 11.08 | | | | 0.28 | | | | 0.48 | | | | 0.76 | | | | (0.50 | ) | | | (0.76 | ) | | | (1.26 | ) | | | 10.58 | | | | 7.62% | b | | | 34,732 | | | | 0.98% | a | | | 0.81% | a | | | 2.96% | a |
| 10/31/11 | | | 11.12 | | | | 0.35 | | | | 0.14 | | | | 0.49 | | | | (0.44 | ) | | | (0.09 | ) | | | (0.53 | ) | | | 11.08 | | | | 4.77% | | | | 35,701 | | | | 0.92% | | | | 0.77% | | | | 3.21% | |
| | | | | | | | | | | | | | | | | | | | | | | | |
| | | Year ended September 30 | | | Period ended
September 30, 2012b,i | | | Year ended
October 31 | |
| | | 2016 | | | 2015 | | | 2014 | | | 2013 | | | | | | 2011 | |
Portfolio turnover rate | | | 314 | % | | | 362 | % | | | 382 | % | | | 438 | % | | | 463 | % | | | 566 | % |
| b | Percentage represents the results for the period and is not annualized. |
| c | Per share amount calculated on the average shares method. |
| f | Amount is less than $500. |
| g | For the period December 3, 2010 (commencement of operations) through October 31,2011. |
| i | For the period November 1, 2011 through September 30, 2012. |
| j | Computed after giving effect to an agreement by MML Advisers and/or MassMutual to waive certain fees and expenses of the Fund. |
| l | Employee retirement benefit plans that invest plan assets in the Separate Investment Accounts (SIAs) may be subject to certain charges as set forth in their respective Plan Documents. Total return figures would be lower for the periods presented if they reflected these charges. |
| m | Total return excludes sales charges, if any, and would be lower for the period presented if it reflected these charges. |
| gg | For the period April 1, 2014 (commencement of operations) through September 30, 2014. |
| * | Generally accepted accounting principles may require adjustment to be made to the net assets of the Fund at period end for financial reporting purposes, and as such, the net asset values for shareholder transactions and the returns based on those net asset values may differ from the returns reported in the portfolio manager commentary section of this report. |
The accompanying notes are an integral part of the financial statements.
236
| | | | | | | | | | | | | | | | | | | | | | | | | | | | | | | | | | | | | | | | | | | | | | | | | | | | |
| | | | | | Income (loss) from investment
operations | | | Less distributions to shareholders | | | | | | | | |
Ratios / Supplemental Data | |
| | | Net asset
value,
beginning
of the
period | | | Net
investment
income
(loss)c,j | | | Net
realized
and
unrealized
gain (loss)
on
investments | | | Total
income
(loss) from
investment
operations | | | From net
investment
income | | | From net
realized
gains | | | Total
distributions | | | Net
asset
value,
end of
the
period | | | Total
returnl,m | | | Net
assets,
end of
the
period
(000’s) | | | Ratio of
expenses
to average
daily net
assets
before
expense
waivers | | | Ratio of
expenses
to average
daily net
assets
after
expense
waiversj | | | Net
investment
income
(loss) to
average
daily net
assets | |
Administrative Class | | | | | | | | | | | | | | | | | | | | | | | | | | | | | | | | | | | | | | | | | | | | | |
| 9/30/16 | | $ | 10.07 | | | $ | 0.23 | | | $ | 0.29 | | | $ | 0.52 | | | $ | (0.23 | ) | | $ | (0.05 | ) | | $ | (0.28 | ) | | $ | 10.31 | | | | 5.38% | | | $ | 34,731 | | | | 0.83% | | | | 0.82% | | | | 2.29% | |
| 9/30/15 | | | 10.22 | | | | 0.23 | | | | (0.17 | ) | | | 0.06 | | | | (0.20 | ) | | | (0.01 | ) | | | (0.21 | ) | | | 10.07 | | | | 0.54% | | | | 35,581 | | | | 0.86% | | | | 0.82% | | | | 2.22% | |
| 9/30/14 | | | 9.99 | | | | 0.24 | | | | 0.28 | | | | 0.52 | | | | (0.28 | ) | | | (0.01 | ) | | | (0.29 | ) | | | 10.22 | | | | 5.26% | | | | 22,159 | | | | 0.89% | | | | 0.79% | | | | 2.41% | |
| 9/30/13 | | | 10.67 | | | | 0.28 | | | | (0.25 | ) | | | 0.03 | | | | (0.41 | ) | | | (0.30 | ) | | | (0.71 | ) | | | 9.99 | | | | 0.26% | | | | 13,271 | | | | 0.97% | | | | 0.80% | | | | 2.73% | |
| 9/30/12i | | | 11.03 | | | | 0.28 | | | | 0.48 | | | | 0.76 | | | | (0.36 | ) | | | (0.76 | ) | | | (1.12 | ) | | | 10.67 | | | | 7.61% | b | | | 10,174 | | | | 0.99% | a | | | 0.82% | a | | | 2.95% | a |
| 10/31/11 | | | 11.07 | | | | 0.34 | | | | 0.15 | | | | 0.49 | | | | (0.44 | ) | | | (0.09 | ) | | | (0.53 | ) | | | 11.03 | | | | 4.74% | | | | 11,093 | | | | 0.92% | | | | 0.78% | | | | 3.19% | |
Class A | | | | | | | | | | | | | | | | | | | | | | | | | | | | | | | | | | | | | | | | | | | | | |
| 9/30/16 | | $ | 10.04 | | | $ | 0.20 | | | $ | 0.29 | | | $ | 0.49 | | | $ | (0.20 | ) | | $ | (0.05 | ) | | $ | (0.25 | ) | | $ | 10.28 | | | | 5.06% | * | | $ | 37,243 | | | | 1.08% | | | | 1.07% | | | | 2.04% | |
| 9/30/15 | | | 10.17 | | | | 0.20 | | | | (0.16 | ) | | | 0.04 | | | | (0.16 | ) | | | (0.01 | ) | | | (0.17 | ) | | | 10.04 | | | | 0.21% | | | | 36,941 | | | | 1.11% | | | | 1.07% | | | | 1.96% | |
| 9/30/14 | | | 9.94 | | | | 0.22 | | | | 0.27 | | | | 0.49 | | | | (0.25 | ) | | | (0.01 | ) | | | (0.26 | ) | | | 10.17 | | | | 5.04% | | | | 34,703 | | | | 1.16% | | | | 1.06% | | | | 2.15% | |
| 9/30/13 | | | 10.61 | | | | 0.25 | | | | (0.25 | ) | | | - | | | | (0.37 | ) | | | (0.30 | ) | | | (0.67 | ) | | | 9.94 | | | | (0.05% | ) | | | 32,005 | | | | 1.22% | | | | 1.05% | | | | 2.47% | |
| 9/30/12i | | | 11.09 | | | | 0.26 | | | | 0.48 | | | | 0.74 | | | | (0.46 | ) | | | (0.76 | ) | | | (1.22 | ) | | | 10.61 | | | | 7.39% | b | | | 37,826 | | | | 1.23% | a | | | 1.06% | a | | | 2.71% | a |
| 10/31/11 | | | 11.13 | | | | 0.32 | | | | 0.15 | | | | 0.47 | | | | (0.42 | ) | | | (0.09 | ) | | | (0.51 | ) | | | 11.09 | | | | 4.49% | | | | 37,674 | | | | 1.18% | | | | 1.02% | | | | 2.96% | |
Class R4 | | | | | | | | | | | | | | | | | | | | | | | | | | | | | | | | | | | | | | | | | | | | | | | | | | | | |
| 9/30/16 | | $ | 10.01 | | | $ | 0.21 | | | $ | 0.29 | | | $ | 0.50 | | | $ | (0.24 | ) | | $ | (0.05 | ) | | $ | (0.29 | ) | | $ | 10.22 | | | | 5.18% | * | | $ | 3,765 | | | | 0.98% | | | | 0.97% | | | | 2.15% | |
| 9/30/15 | | | 10.18 | | | | 0.22 | | | | (0.18 | ) | | | 0.04 | | | | (0.20 | ) | | | (0.01 | ) | | | (0.21 | ) | | | 10.01 | | | | 0.34% | | | | 2,959 | | | | 1.01% | | | | 0.97% | | | | 2.17% | |
| 9/30/14gg | | | 9.93 | | | | 0.11 | | | | 0.14 | | | | 0.25 | | | | - | | | | - | | | | - | | | | 10.18 | | | | 2.52% | b | | | 102 | | | | 1.00% | a | | | 0.97% | a | | | 2.12% | a |
Class R3 | | | | | | | | | | | | | | | | | | | | | | | | | | | | | | | | | | | | | | | | | | | | | | | | | | | | |
| 9/30/16 | | $ | 9.99 | | | $ | 0.19 | | | $ | 0.29 | | | $ | 0.48 | | | $ | (0.23 | ) | | $ | (0.05 | ) | | $ | (0.28 | ) | | $ | 10.19 | | | | 4.94% | | | $ | 2,592 | | | | 1.23% | a | | | 1.22% | | | | 1.95% | |
| 9/30/15 | | | 10.16 | | | | 0.19 | | | | (0.17 | ) | | | 0.02 | | | | (0.18 | ) | | | (0.01 | ) | | | (0.19 | ) | | | 9.99 | | | | 0.15% | | | | 412 | | | | 1.26% | | | | 1.22% | | | | 1.84% | |
| 9/30/14gg | | | 9.93 | | | | 0.09 | | | | 0.14 | | | | 0.23 | | | | - | | | | - | | | | - | | | | 10.16 | | | | 2.32% | b | | | 102 | | | | 1.25% | a | | | 1.22% | a | | | 1.87% | a |
237
MassMutual Premier High Yield Fund – Financial Statements (Continued)
Financial Highlights (For a share outstanding throughout each period)
| | | | | | | | | | | | | | | | | | | | | | | | | | | | | | | | | | | | | | | | | | | | | | | | | | | | |
| | | | | | Income (loss) from investment
operations | | | Less distributions to shareholders | | | | | | | | |
Ratios / Supplemental Data | |
| | | Net asset
value,
beginning
of the
period | | | Net
investment
income
(loss)c,j | | | Net
realized
and
unrealized
gain
(loss) on
investments | | | Total
income
(loss) from
investment
operations | | | From net
investment
income | | | From net
realized
gains | | | Total
distributions | | | Net
asset
value,
end
of the
period | | | Total
returnl,m | | | Net
assets,
end of
the
period
(000’s) | | | Ratio of
expenses
to average
daily net
assets
before
expense
waivers | | | Ratio of
expenses
to average
daily net
assets
after
expense
waiversj | | | Net
investment
income
(loss) to
average
daily net
assets | |
Class I | | | | | | | | | | | | | | | | | | | | | | | | | | | | | | | | | | | | | | | | | | | | | |
| 9/30/16 | | $ | 8.98 | | | $ | 0.62 | | | $ | 0.28 | | | $ | 0.90 | | | $ | (0.59 | ) | | $ | - | | | $ | (0.59 | ) | | $ | 9.29 | | | | 10.86% | | | $ | 220,759 | | | | 0.57% | | | | 0.55% | | | | 7.05% | |
| 9/30/15 | | | 10.16 | | | | 0.61 | | | | (0.86 | ) | | | (0.25 | ) | | | (0.69 | ) | | | (0.24 | ) | | | (0.93 | ) | | | 8.98 | | | | (2.27% | ) | | | 106,575 | | | | 0.58% | | | | 0.55% | | | | 6.47% | |
| 9/30/14 | | | 10.07 | | | | 0.68 | | | | 0.25 | | | | 0.93 | | | | (0.67 | ) | | | (0.17 | ) | | | (0.84 | ) | | | 10.16 | | | | 9.79% | | | | 105,460 | | | | 0.57% | | | | 0.52% | | | | 6.68% | |
| 9/30/13 | | | 9.78 | | | | 0.70 | | | | 0.30 | | | | 1.00 | | | | (0.71 | ) | | | - | | | | (0.71 | ) | | | 10.07 | | | | 10.75% | | | | 99,457 | | | | 0.60% | | | | 0.50% | | | | 7.09% | |
| 9/30/12i | | | 9.19 | | | | 0.64 | | | | 0.53 | | | | 1.17 | | | | (0.58 | ) | | | - | | | | (0.58 | ) | | | 9.78 | | | | 13.58% | b | | | 101,547 | | | | 0.59% | a | | | 0.49% | a | | | 7.59% | a |
| 10/31/11h | | | 9.06 | | | | 0.45 | | | | (0.32 | ) | | | 0.13 | | | | - | | | | - | | | | - | | | | 9.19 | | | | 1.43% | b | | | 77,527 | | | | 0.61% | a | | | 0.50% | a | | | 7.42% | a |
Class R5 | | | | | | | | | | | | | | | | | | | | | | | | | | | | | | | | | | | | | | | | | | | | | |
| 9/30/16 | | $ | 9.02 | | | $ | 0.61 | | | $ | 0.28 | | | $ | 0.89 | | | $ | (0.58 | ) | | $ | - | | | $ | (0.58 | ) | | $ | 9.33 | | | | 10.68% | | | $ | 45,867 | | | | 0.67% | | | | 0.65% | | | | 6.93% | |
| 9/30/15 | | | 10.19 | | | | 0.60 | | | | (0.85 | ) | | | (0.25 | ) | | | (0.68 | ) | | | (0.24 | ) | | | (0.92 | ) | | | 9.02 | | | | (2.28% | ) | | | 41,616 | | | | 0.68% | | | | 0.65% | | | | 6.38% | |
| 9/30/14 | | | 10.09 | | | | 0.66 | | | | 0.26 | | | | 0.92 | | | | (0.65 | ) | | | (0.17 | ) | | | (0.82 | ) | | | 10.19 | | | | 9.63% | | | | 39,737 | | | | 0.72% | | | | 0.67% | | | | 6.52% | |
| 9/30/13 | | | 9.80 | | | | 0.68 | | | | 0.30 | | | | 0.98 | | | | (0.69 | ) | | | - | | | | (0.69 | ) | | | 10.09 | | | | 10.51% | | | | 31,341 | | | | 0.80% | | | | 0.70% | | | | 6.86% | |
| 9/30/12i | | | 9.17 | | | | 0.62 | | | | 0.52 | | | | 1.14 | | | | (0.51 | ) | | | - | | | | (0.51 | ) | | | 9.80 | | | | 13.22% | b | | | 22,723 | | | | 0.80% | a | | | 0.70% | a | | | 7.37% | a |
| 10/31/11 | | | 9.52 | | | | 0.67 | | | | (0.15 | ) | | | 0.52 | | | | (0.87 | ) | | | - | | | | (0.87 | ) | | | 9.17 | | | | 6.10% | | | | 37,865 | | | | 0.77% | | | | 0.71% | | | | 7.34% | |
Service Class | | | | | | | | | | | | | | | | | | | | | | | | | | | | | | | | | | | | | | | | | | | | | |
| 9/30/16 | | $ | 9.01 | | | $ | 0.60 | | | $ | 0.29 | | | $ | 0.89 | | | $ | (0.57 | ) | | $ | - | | | $ | (0.57 | ) | | $ | 9.33 | | | | 10.70% | | | $ | 59,787 | | | | 0.77% | | | | 0.75% | | | | 6.83% | |
| 9/30/15 | | | 10.18 | | | | 0.59 | | | | (0.86 | ) | | | (0.27 | ) | | | (0.66 | ) | | | (0.24 | ) | | | (0.90 | ) | | | 9.01 | | | | (2.40% | ) | | | 62,734 | | | | 0.78% | | | | 0.75% | | | | 6.27% | |
| 9/30/14 | | | 10.09 | | | | 0.65 | | | | 0.26 | | | | 0.91 | | | | (0.65 | ) | | | (0.17 | ) | | | (0.82 | ) | | | 10.18 | | | | 9.46% | | | | 61,150 | | | | 0.80% | | | | 0.75% | | | | 6.45% | |
| 9/30/13 | | | 9.80 | | | | 0.67 | | | | 0.31 | | | | 0.98 | | | | (0.69 | ) | | | - | | | | (0.69 | ) | | | 10.09 | | | | 10.56% | | | | 58,569 | | | | 0.85% | | | | 0.75% | | | | 6.82% | |
| 9/30/12i | | | 9.20 | | | | 0.62 | | | | 0.53 | | | | 1.15 | | | | (0.55 | ) | | | - | | | | (0.55 | ) | | | 9.80 | | | | 13.23% | b | | | 57,111 | | | | 0.85% | a | | | 0.75% | a | | | 7.33% | a |
| 10/31/11 | | | 9.55 | | | | 0.66 | | | | (0.14 | ) | | | 0.52 | | | | (0.87 | ) | | | - | | | | (0.87 | ) | | | 9.20 | | | | 5.95% | | | | 55,184 | | | | 0.82% | | | | 0.76% | | | | 7.29% | |
| | | | | | | | | | | | | | | | | | | | | | | | |
| | | Year ended September 30 | | | Period ended
September 30, 2012b,i | | | Year ended
October 31 | |
| | | 2016 | | | 2015 | | | 2014 | | | 2013 | | | | | | 2011 | |
Portfolio turnover rate | | | 50 | % | | | 76 | % | | | 80 | % | | | 106 | % | | | 86 | % | | | 72 | % |
| b | Percentage represents the results for the period and is not annualized. |
| c | Per share amount calculated on the average shares method. |
| h | For the period March 1, 2011 (commencement of operations) through October 31, 2011. |
| i | For the period November 1, 2011 through September 30, 2012. |
| j | Computed after giving effect to an agreement by MML Advisers and/or MassMutual to waive certain fees and expenses of the Fund. |
| l | Employee retirement benefit plans that invest plan assets in the Separate Investment Accounts (SIAs) may be subject to certain charges as set forth in their respective Plan Documents. Total return figures would be lower for the periods presented if they reflected these charges. |
| m | Total return excludes sales charges, if any, and would be lower for the period presented if it reflected these charges. |
| gg | For the period April 1, 2014 (commencement of operations) through September 30, 2014. |
The accompanying notes are an integral part of the financial statements.
238
| | | | | | | | | | | | | | | | | | | | | | | | | | | | | | | | | | | | | | | | | | | | | | | | | | | | |
| | | | | | Income (loss) from investment
operations | | | Less distributions to shareholders | | | | | | | | |
Ratios / Supplemental Data | |
| | | Net asset
value,
beginning
of the
period | | | Net
investment
income
(loss)c,j | | | Net
realized
and
unrealized
gain
(loss) on
investments | | | Total
income
(loss) from
investment
operations | | | From net
investment
income | | | From net
realized
gains | | | Total
distributions | | | Net
asset
value,
end
of the
period | | | Total
returnl,m | | | Net
assets,
end of
the
period
(000’s) | | | Ratio of
expenses
to average
daily net
assets
before
expense
waivers | | | Ratio of
expenses
to average
daily net
assets
after
expense
waiversj | | | Net
investment
income
(loss) to
average
daily net
assets | |
Administrative Class | | | | | | | | | | | | | | | | | | | | | | | | | | | | | | | | | | | | | | | | | | | | | |
| 9/30/16 | | $ | 8.89 | | | $ | 0.58 | | | $ | 0.29 | | | $ | 0.87 | | | $ | (0.56 | ) | | $ | - | | | $ | (0.56 | ) | | $ | 9.20 | | | | 10.63% | | | $ | 28,948 | | | | 0.87% | | | | 0.85% | | | | 6.74% | |
| 9/30/15 | | | 10.07 | | | | 0.57 | | | | (0.85 | ) | | | (0.28 | ) | | | (0.66 | ) | | | (0.24 | ) | | | (0.90 | ) | | | 8.89 | | | | (2.58% | ) | | | 24,221 | | | | 0.88% | | | | 0.85% | | | | 6.18% | |
| 9/30/14 | | | 9.99 | | | | 0.64 | | | | 0.25 | | | | 0.89 | | | | (0.64 | ) | | | (0.17 | ) | | | (0.81 | ) | | | 10.07 | | | | 9.37% | | | | 22,802 | | | | 0.92% | | | | 0.87% | | | | 6.33% | |
| 9/30/13 | | | 9.72 | | | | 0.65 | | | | 0.31 | | | | 0.96 | | | | (0.69 | ) | | | - | | | | (0.69 | ) | | | 9.99 | | | | 10.40% | | | | 14,288 | | | | 1.00% | | | | 0.90% | | | | 6.66% | |
| 9/30/12i | | | 9.13 | | | | 0.60 | | | | 0.53 | | | | 1.13 | | | | (0.54 | ) | | | - | | | | (0.54 | ) | | | 9.72 | | | | 12.98% | b | | | 8,886 | | | | 1.00% | a | | | 0.90% | a | | | 7.17% | a |
| 10/31/11 | | | 9.48 | | | | 0.64 | | | | (0.14 | ) | | | 0.50 | | | | (0.85 | ) | | | - | | | | (0.85 | ) | | | 9.13 | | | | 5.84% | | | | 4,980 | | | | 0.98% | | | | 0.91% | | | | 7.04% | |
Class A | | | | | | | | | | | | | | | | | | | | | | | | | | | | | | | | | | | | | | | | | | | | | |
| 9/30/16 | | $ | 8.86 | | | $ | 0.56 | | | $ | 0.29 | | | $ | 0.85 | | | $ | (0.54 | ) | | $ | - | | | $ | (0.54 | ) | | $ | 9.17 | | | | 10.31% | | | $ | 29,055 | | | | 1.12% | | | | 1.10% | | | | 6.49% | |
| 9/30/15 | | | 10.02 | | | | 0.55 | | | | (0.85 | ) | | | (0.30 | ) | | | (0.62 | ) | | | (0.24 | ) | | | (0.86 | ) | | | 8.86 | | | | (2.78% | ) | | | 28,572 | | | | 1.13% | | | | 1.10% | | | | 5.93% | |
| 9/30/14 | | | 9.94 | | | | 0.61 | | | | 0.25 | | | | 0.86 | | | | (0.61 | ) | | | (0.17 | ) | | | (0.78 | ) | | | 10.02 | | | | 9.10% | | | | 33,597 | | | | 1.17% | | | | 1.12% | | | | 6.08% | |
| 9/30/13 | | | 9.66 | | | | 0.63 | | | | 0.29 | | | | 0.92 | | | | (0.64 | ) | | | - | | | | (0.64 | ) | | | 9.94 | | | | 10.09% | | | | 31,490 | | | | 1.25% | | | | 1.15% | | | | 6.43% | |
| 9/30/12i | | | 9.07 | | | | 0.58 | | | | 0.52 | | | | 1.10 | | | | (0.51 | ) | | | - | | | | (0.51 | ) | | | 9.66 | | | | 12.78% | b | | | 41,525 | | | | 1.25% | a | | | 1.15% | a | | | 6.95% | a |
| 10/31/11 | | | 9.42 | | | | 0.62 | | | | (0.14 | ) | | | 0.48 | | | | (0.83 | ) | | | - | | | | (0.83 | ) | | | 9.07 | | | | 5.60% | | | | 31,330 | | | | 1.22% | | | | 1.16% | | | | 6.91% | |
Class R4 | | | | | | | | | | | | | | | | | | | | | | | | | | | | | | | | | | | | | | | | | | | | | | | | | | | | |
| 9/30/16 | | $ | 8.84 | | | $ | 0.57 | | | $ | 0.28 | | | $ | 0.85 | | | $ | (0.58 | ) | | $ | - | | | $ | (0.58 | ) | | $ | 9.11 | | | | 10.44% | | | $ | 18,428 | | | | 1.02% | | | | 1.00% | | | | 6.66% | |
| 9/30/15 | | | 10.02 | | | | 0.54 | | | | (0.83 | ) | | | (0.29 | ) | | | (0.65 | ) | | | (0.24 | ) | | | (0.89 | ) | | | 8.84 | | | | (2.67% | ) | | | 2,672 | | | | 1.03% | | | | 1.00% | | | | 5.97% | |
| 9/30/14gg | | | 9.89 | | | | 0.31 | | | | (0.18 | ) | | | 0.13 | | | | - | | | | - | | | | - | | | | 10.02 | | | | 1.31% | b | | | 101 | | | | 1.01% | a | | | 1.00% | a | | | 6.05% | a |
Class R3 | | | | | | | | | | | | | | | | | | | | | | | | | | | | | | | | | | | | | | | | | | | | | |
| 9/30/16 | | $ | 9.01 | | | $ | 0.56 | | | $ | 0.28 | | | $ | 0.84 | | | $ | (0.56 | ) | | $ | - | | | $ | (0.56 | ) | | $ | 9.29 | | | | 10.12% | | | $ | 13,928 | | | | 1.27% | | | | 1.25% | | | | 6.38% | |
| 9/30/15 | | | 10.17 | | | | 0.54 | | | | (0.85 | ) | | | (0.31 | ) | | | (0.61 | ) | | | (0.24 | ) | | | (0.85 | ) | | | 9.01 | | | | (2.91% | ) | | | 3,423 | | | | 1.28% | | | | 1.25% | | | | 5.74% | |
| 9/30/14 | | | 10.07 | | | | 0.59 | | | | 0.27 | | | | 0.86 | | | | (0.59 | ) | | | (0.17 | ) | | | (0.76 | ) | | | 10.17 | | | | 8.92% | | | | 726 | | | | 1.39% | | | | 1.34% | | | | 5.84% | |
| 9/30/13 | | | 9.78 | | | | 0.60 | | | | 0.31 | | | | 0.91 | | | | (0.62 | ) | | | - | | | | (0.62 | ) | | | 10.07 | | | | 9.69% | | | | 727 | | | | 1.55% | | | | 1.45% | | | | 6.10% | |
| 9/30/12i | | | 9.17 | | | | 0.56 | | | | 0.53 | | | | 1.09 | | | | (0.48 | ) | | | - | | | | (0.48 | ) | | | 9.78 | | | | 12.55% | b | | | 526 | | | | 1.55% | a | | | 1.45% | a | | | 6.64% | a |
| 10/31/11 | | | 9.51 | | | | 0.61 | | | | (0.16 | ) | | | 0.45 | | | | (0.79 | ) | | | - | | | | (0.79 | ) | | | 9.17 | | | | 5.19% | | | | 336 | | | | 1.51% | | | | 1.46% | | | | 6.68% | |
239
MassMutual Premier Balanced Fund – Financial Statements (Continued)
Financial Highlights (For a share outstanding throughout each period)
| | | | | | | | | | | | | | | | | | | | | | | | | | | | | | | | | | | | | | | | | | | | | | | | | | | | |
| | | | | | Income (loss) from investment
operations | | | Less distributions to shareholders | | | | | | | | |
Ratios / Supplemental Data | |
| | | Net
asset
value,
beginning
of the
period | | | Net
investment
income
(loss)c,j | | | Net
realized
and
unrealized
gain (loss)
on
investments | | | Total
income
(loss) from
investment
operations | | | From net
investment
income | | | From net
realized
gains | | | Total
distributions | | | Net
asset
value,
end of
the
period | | | Total
returnl,m | | | Net
assets,
end of
the
period
(000’s) | | | Ratio of
expenses
to average
daily net
assets
before
expense
waivers | | | Ratio of
expenses
to average
daily net
assets
after
expense
waiversj | | | Net
investment
income
(loss) to
average
daily net
assets | |
Class I | | | | | | | | | | | | | | | | | | | | | | | | | | | | | | | | | | | | | | | | | | | | | | | | | | | | |
| 9/30/16 | | $ | 11.48 | | | $ | 0.22 | | | $ | 0.84 | | | $ | 1.06 | | | $ | (0.29 | ) | | $ | (0.93 | ) | | $ | (1.22 | ) | | $ | 11.32 | | | | 9.96% | | | $ | 967 | | | | 0.68% | | | | 0.60% | | | | 1.98% | |
| 9/30/15 | | | 13.01 | | | | 0.22 | | | | (0.44 | ) | | | (0.22 | ) | | | (0.24 | ) | | | (1.07 | ) | | | (1.31 | ) | | | 11.48 | | | | (1.96% | ) | | | 376 | | | | 0.65% | | | | 0.60% | | | | 1.77% | |
| 9/30/14gg | | | 12.51 | | | | 0.12 | | | | 0.38 | | | | 0.50 | | | | - | | | | - | | | | - | | | | 13.01 | | | | 4.00% | b | | | 36,306 | | | | 0.61% | a | | | 0.60% | a | | | 1.82% | a |
Class R5 | | | | | | | | | | | | | | | | | | | | | | | | | | | | | | | | | | | | | | | | | | | | | |
| 9/30/16 | | $ | 11.48 | | | $ | 0.21 | | | $ | 0.84 | | | $ | 1.05 | | | $ | (0.28 | ) | | $ | (0.93 | ) | | $ | (1.21 | ) | | $ | 11.32 | | | | 9.82% | * | | $ | 53,727 | | | | 0.78% | | | | 0.70% | | | | 1.87% | |
| 9/30/15 | | | 13.00 | | | | 0.21 | | | | (0.44 | ) | | | (0.23 | ) | | | (0.22 | ) | | | (1.07 | ) | | | (1.29 | ) | | | 11.48 | | | | (2.03% | ) | | | 62,971 | | | | 0.75% | | | | 0.70% | | | | 1.70% | |
| 9/30/14 | | | 12.38 | | | | 0.21 | | | | 1.25 | | | | 1.46 | | | | (0.21 | ) | | | (0.63 | ) | | | (0.84 | ) | | | 13.00 | | | | 12.33% | | | | 74,267 | | | | 0.67% | | | | 0.67%k | | | | 1.69% | |
| 9/30/13 | | | 11.34 | | | | 0.21 | | | | 1.04 | | | | 1.25 | | | | (0.21 | ) | | | - | | | | (0.21 | ) | | | 12.38 | | | | 11.17% | | | | 106,661 | | | | 0.64% | | | | 0.63% | | | | 1.78% | |
| 9/30/12i | | | 10.34 | | | | 0.20 | | | | 1.02 | | | | 1.22 | | | | (0.22 | ) | | | - | | | | (0.22 | ) | | | 11.34 | | | | 12.12% | b | | | 100,521 | | | | 0.65% | a | | | 0.63% | a | | | 1.99% | a |
| 10/31/11 | | | 9.95 | | | | 0.19 | | | | 0.39 | | | | 0.58 | | | | (0.19 | ) | | | - | | | | (0.19 | ) | | | 10.34 | | | | 5.88% | | | | 97,350 | | | | 0.67% | | | | 0.65% | | | | 1.85% | |
Service Class | | | | | | | | | | | | | | | | | | | | | | | | | | | | | | | | | | | | | | | | | | | | | |
| 9/30/16 | | $ | 11.94 | | | $ | 0.20 | | | $ | 0.89 | | | $ | 1.09 | | | $ | (0.27 | ) | | $ | (0.93 | ) | | $ | (1.20 | ) | | $ | 11.83 | | | | 9.76% | | | $ | 14,130 | | | | 0.88% | | | | 0.80% | | | | 1.87% | |
| 9/30/15 | | | 13.48 | | | | 0.20 | | | | (0.46 | ) | | | (0.26 | ) | | | (0.21 | ) | | | (1.07 | ) | | | (1.28 | ) | | | 11.94 | | | | (2.18% | ) | | | 12,545 | | | | 0.85% | | | | 0.80% | | | | 1.60% | |
| 9/30/14 | | | 12.80 | | | | 0.21 | | | | 1.29 | | | | 1.50 | | | | (0.19 | ) | | | (0.63 | ) | | | (0.82 | ) | | | 13.48 | | | | 12.23% | | | | 11,914 | | | | 0.80% | | | | 0.80%k | | | | 1.57% | |
| 9/30/13 | | | 11.73 | | | | 0.20 | | | | 1.06 | | | | 1.26 | | | | (0.19 | ) | | | - | | | | (0.19 | ) | | | 12.80 | | | | 10.92% | | | | 9,370 | | | | 0.80% | | | | 0.79% | | | | 1.63% | |
| 9/30/12i | | | 10.68 | | | | 0.19 | | | | 1.06 | | | | 1.25 | | | | (0.20 | ) | | | - | | | | (0.20 | ) | | | 11.73 | | | | 12.02% | b | | | 6,294 | | | | 0.81% | a | | | 0.79% | a | | | 1.82% | a |
| 10/31/11 | | | 10.28 | | | | 0.18 | | | | 0.40 | | | | 0.58 | | | | (0.18 | ) | | | - | | | | (0.18 | ) | | | 10.68 | | | | 5.65% | | | | 4,638 | | | | 0.83% | | | | 0.81% | | | | 1.69% | |
| | | | | | | | | | | | | | | | | | | | | | | | |
| | | Year ended September 30 | | | Period ended
September 30, 2012b,i | | | Year ended
October 31 | |
| | | 2016 | | | 2015 | | | 2014 | | | 2013 | | | | | | 2011 | |
Portfolio turnover rate | | | 176 | % | | | 204 | % | | | 192 | % | | | 242 | % | | | 228 | % | | | 272 | % |
| b | Percentage represents the results for the period and is not annualized. |
| c | Per share amount calculated on the average shares method. |
| i | For the period November 1, 2011 through September 30, 2012. |
| j | Computed after giving effect to an agreement by MML Advisers and/or MassMutual to waive certain fees and expenses of the Fund. |
| k | Amount waived had no impact on the ratio of expenses to average daily net assets. |
| l | Employee retirement benefit plans that invest plan assets in the Separate Investment Accounts (SIAs) may be subject to certain charges as set forth in their respective Plan Documents. Total return figures would be lower for the periods presented if they reflected these charges. |
| m | Total return excludes sales charges, if any, and would be lower for the period presented if it reflected these charges. |
| gg | For the period April 1, 2014 (commencement of operations) through September 30, 2014. |
| * | Generally accepted accounting principles may require adjustment to be made to the net assets of the Fund at period end for financial reporting purposes, and as such, the net asset values for shareholder transactions and the returns based on those net asset values may differ from the returns reported in the portfolio manager commentary section of this report. |
The accompanying notes are an integral part of the financial statements.
240
| | | | | | | | | | | | | | | | | | | | | | | | | | | | | | | | | | | | | | | | | | | | | | | | | | | | |
| | | | | | Income (loss) from investment
operations | | | Less distributions to shareholders | | | | | | | | |
Ratios / Supplemental Data | |
| | | Net
asset
value,
beginning
of the
period | | | Net
investment
income
(loss)c,j | | | Net
realized
and
unrealized
gain (loss)
on
investments | | | Total
income
(loss) from
investment
operations | | | From net
investment
income | | | From net
realized
gains | | | Total
distributions | | | Net
asset
value,
end of
the
period | | | Total
returnl,m | | | Net
assets,
end of
the
period
(000’s) | | | Ratio of
expenses
to average
daily net
assets
before
expense
waivers | | | Ratio of
expenses
to average
daily net
assets
after
expense
waiversj | | | Net
investment
income
(loss) to
average
daily net
assets | |
Administrative Class | | | | | | | | | | | | | | | | | | | | | | | | | | | | | | | | | | | | | | | | | | | | | |
| 9/30/16 | | $ | 11.51 | | | $ | 0.19 | | | $ | 0.84 | | | $ | 1.03 | | | $ | (0.26 | ) | | $ | (0.93 | ) | | $ | (1.19 | ) | | $ | 11.35 | | | | 9.59% | * | | $ | 9,751 | | | | 0.98% | | | | 0.90% | | | | 1.68% | |
| 9/30/15 | | | 13.04 | | | | 0.19 | | | | (0.44 | ) | | | (0.25 | ) | | | (0.21 | ) | | | (1.07 | ) | | | (1.28 | ) | | | 11.51 | | | | (2.23% | ) | | | 8,691 | | | | 0.95% | | | | 0.90% | | | | 1.51% | |
| 9/30/14 | | | 12.41 | | | | 0.19 | | | | 1.25 | | | | 1.44 | | | | (0.18 | ) | | | (0.63 | ) | | | (0.81 | ) | | | 13.04 | | | | 12.09% | | | | 7,089 | | | | 0.92% | | | | 0.92%k | | | | 1.46% | |
| 9/30/13 | | | 11.38 | | | | 0.17 | | | | 1.04 | | | | 1.21 | | | | (0.18 | ) | | | - | | | | (0.18 | ) | | | 12.41 | | | | 10.69% | | | | 3,603 | | | | 0.95% | | | | 0.94% | | | | 1.47% | |
| 9/30/12i | | | 10.29 | | | | 0.16 | | | | 1.03 | | | | 1.19 | | | | (0.10 | ) | | | - | | | | (0.10 | ) | | | 11.38 | | | | 11.80% | b | | | 3,234 | | | | 0.96% | a | | | 0.94% | a | | | 1.65% | a |
| 10/31/11 | | | 9.91 | | | | 0.16 | | | | 0.39 | | | | 0.55 | | | | (0.17 | ) | | | - | | | | (0.17 | ) | | | 10.29 | | | | 5.61% | | | | 818 | | | | 0.96% | | | | 0.94% | | | | 1.56% | |
Class A | | | | | | | | | | | | | | | | | | | | | | | | | | | | | | | | | | | | | | | | | | | | | |
| 9/30/16 | | $ | 11.22 | | | $ | 0.15 | | | $ | 0.83 | | | $ | 0.98 | | | $ | (0.22 | ) | | $ | (0.93 | ) | | $ | (1.15 | ) | | $ | 11.05 | | | | 9.38% | | | $ | 30,781 | | | | 1.23% | | | | 1.15% | | | | 1.42% | |
| 9/30/15 | | | 12.73 | | | | 0.15 | | | | (0.43 | ) | | | (0.28 | ) | | | (0.16 | ) | | | (1.07 | ) | | | (1.23 | ) | | | 11.22 | | | | (2.49% | ) | | | 31,375 | | | | 1.20% | | | | 1.15% | | | | 1.26% | |
| 9/30/14 | | | 12.14 | | | | 0.15 | | | | 1.22 | | | | 1.37 | | | | (0.15 | ) | | | (0.63 | ) | | | (0.78 | ) | | | 12.73 | | | | 11.80% | | | | 34,260 | | | | 1.18% | | | | 1.17% | | | | 1.18% | |
| 9/30/13 | | | 11.15 | | | | 0.14 | | | | 1.01 | | | | 1.15 | | | | (0.16 | ) | | | - | | | | (0.16 | ) | | | 12.14 | | | | 10.50% | | | | 38,017 | | | | 1.20% | | | | 1.19% | | | | 1.23% | |
| 9/30/12i | | | 10.17 | | | | 0.14 | | | | 1.01 | | | | 1.15 | | | | (0.17 | ) | | | - | | | | (0.17 | ) | | | 11.15 | | | | 11.50% | b | | | 17,759 | | | | 1.21% | a | | | 1.19% | a | | | 1.42% | a |
| 10/31/11 | | | 9.79 | | | | 0.13 | | | | 0.39 | | | | 0.52 | | | | (0.14 | ) | | | - | | | | (0.14 | ) | | | 10.17 | | | | 5.38% | | | | 12,622 | | | | 1.23% | | | | 1.21% | | | | 1.29% | |
Class R4 | | | | | | | | | | | | | | | | | | | | | | | | | | | | | | | | | | | | | | | | | | | | | | | | | | | | |
| 9/30/16 | | $ | 11.20 | | | $ | 0.16 | | | $ | 0.83 | | | $ | 0.99 | | | $ | (0.27 | ) | | $ | (0.93 | ) | | $ | (1.20 | ) | | $ | 10.99 | | | | 9.51% | | | $ | 2,373 | | | | 1.13% | | | | 1.05% | | | | 1.54% | |
| 9/30/15 | | | 12.74 | | | | 0.17 | | | | (0.44 | ) | | | (0.27 | ) | | | (0.20 | ) | | | (1.07 | ) | | | (1.27 | ) | | | 11.20 | | | | (2.46% | ) | | | 2,010 | | | | 1.10% | | | | 1.05% | | | | 1.49% | |
| 9/30/14gg | | | 12.28 | | | | 0.09 | | | | 0.37 | | | | 0.46 | | | | - | | | | - | | | | - | | | | 12.74 | | | | 3.75% | b | | | 104 | | | | 1.06% | a | | | 1.05% | a | | | 1.38% | a |
Class R3 | | | | | | | | | | | | | | | | | | | | | | | | | | | | | | | | | | | | | | | | | | | | | | | | | | | | |
| 9/30/16 | | $ | 11.18 | | | $ | 0.14 | | | $ | 0.82 | | | $ | 0.96 | | | $ | (0.26 | ) | | $ | (0.93 | ) | | $ | (1.19 | ) | | $ | 10.95 | | | | 9.29% | | | $ | 5,002 | | | | 1.38% | | | | 1.30% | | | | 1.31% | |
| 9/30/15 | | | 12.72 | | | | 0.14 | | | | (0.44 | ) | | | (0.30 | ) | | | (0.17 | ) | | | (1.07 | ) | | | (1.24 | ) | | | 11.18 | | | | (2.66% | ) | | | 1,734 | | | | 1.35% | | | | 1.30% | | | | 1.16% | |
| 9/30/14gg | | | 12.28 | | | | 0.07 | | | | 0.37 | | | | 0.44 | | | | - | | | | - | | | | - | | | | 12.72 | | | | 3.58% | b | | | 104 | | | | 1.31% | a | | | 1.30% | a | | | 1.13% | a |
241
MassMutual Premier Value Fund – Financial Statements (Continued)
Financial Highlights (For a share outstanding throughout each period)
| | | | | | | | | | | | | | | | | | | | | | | | | | | | | | | | | | | | | | | | | | | | | | | | |
| | | | | | Income (loss) from investment
operations | | | Less distributions to shareholders | | | | | | | | |
Ratios / Supplemental Data | |
| | | Net
asset
value,
beginning
of the
period | | | Net
investment
income
(loss)c,j | | | Net
realized
and
unrealized
gain (loss)
on
investments | | | Total
income
(loss) from
investment
operations | | | From net
investment
income | | | Total
distributions | | | Net
asset
value,
end of
the
period | | | Total
returnl,m | | | Net
assets,
end of
the
period
(000’s) | | | Ratio of
expenses
to average
daily net
assets
before
expense
waivers | | | Ratio of
expenses
to average
daily net
assets
after
expense
waiversj | | | Net
investment
income
(loss) to
average
daily net
assets | |
Class I | | | | | | | | | | | | | | | | | | | | | | | | | | | | | | | | | | | | | | | | | | | | | | | | |
| 9/30/16 | | $ | 19.91 | | | $ | 0.33 | | | $ | 1.81 | | | $ | 2.14 | | | $ | (0.34 | ) | | $ | (0.34 | ) | | $ | 21.71 | | | | 10.87% | * | | $ | 110 | | | | 0.82% | | | | 0.60% | | | | 1.60% | |
| 9/30/15 | | | 20.95 | | | | 0.32 | | | | (0.95 | ) | | | (0.63 | ) | | | (0.41 | ) | | | (0.41 | ) | | | 19.91 | | | | (3.10% | ) | | | 101 | | | | 0.73% | | | | 0.60% | | | | 1.50% | |
| 9/30/14gg | | | 20.06 | | | | 0.16 | | | | 0.73 | | | | 0.89 | | | | - | | | | - | | | | 20.95 | | | | 4.44% | b | | | 105 | | | | 0.63% | a | | | 0.60% | a | | | 1.50% | a |
| Class R5 | | | | | | | | | | | | | | | | | | | | | | | | | | | | | | | | | | | | | | | | | |
| 9/30/16 | | $ | 19.90 | | | $ | 0.31 | | | $ | 1.81 | | | $ | 2.12 | | | $ | (0.32 | ) | | $ | (0.32 | ) | | $ | 21.70 | | �� | | 10.74% | | | $ | 46,856 | | | | 0.92% | | | | 0.70% | | | | 1.49% | |
| 9/30/15 | | | 20.93 | | | | 0.29 | | | | (0.93 | ) | | | (0.64 | ) | | | (0.39 | ) | | | (0.39 | ) | | | 19.90 | | | | (3.16% | ) | | | 46,467 | | | | 0.83% | | | | 0.70% | | | | 1.38% | |
| 9/30/14 | | | 18.37 | | | | 0.32 | | | | 2.56 | | | | 2.88 | | | | (0.32 | ) | | | (0.32 | ) | | | 20.93 | | | | 15.85% | | | | 64,896 | | | | 0.67% | | | | 0.66% | | | | 1.64% | |
| 9/30/13 | | | 15.23 | | | | 0.28 | | | | 3.12 | | | | 3.40 | | | | (0.26 | ) | | | (0.26 | ) | | | 18.37 | | | | 22.56% | | | | 99,626 | | | | 0.62% | | | | N/A | | | | 1.69% | |
| 9/30/12i | | | 13.96 | | | | 0.26 | | | | 1.24 | | | | 1.50 | | | | (0.23 | ) | | | (0.23 | ) | | | 15.23 | | | | 11.14% | b | | | 128,342 | | | | 0.62% | a | | | N/A | | | | 1.96% | a |
| 10/31/11 | | | 13.67 | | | | 0.19 | | | | 0.30 | | | | 0.49 | | | | (0.20 | ) | | | (0.20 | ) | | | 13.96 | | | | 3.55% | | | | 140,828 | | | | 0.61% | | | | N/A | | | | 1.28% | |
| Service Class | | | | | | | | | | | | | | | | | | | | | | | | | | | | | | | | | | | | | | | | | |
| 9/30/16 | | $ | 19.97 | | | $ | 0.29 | | | $ | 1.81 | | | $ | 2.10 | | | $ | (0.30 | ) | | $ | (0.30 | ) | | $ | 21.77 | | | | 10.61% | * | | $ | 144 | | | | 1.02% | | | | 0.80% | | | | 1.41% | |
| 9/30/15 | | | 21.01 | | | | 0.28 | | | | (0.95 | ) | | | (0.67 | ) | | | (0.37 | ) | | | (0.37 | ) | | | 19.97 | | | | (3.28% | ) | | | 109 | | | | 0.93% | | | | 0.80% | | | | 1.30% | |
| 9/30/14 | | | 18.43 | | | | 0.31 | | | | 2.57 | | | | 2.88 | | | | (0.30 | ) | | | (0.30 | ) | | | 21.01 | | | | 15.81% | | | | 132 | | | | 0.78% | | | | 0.76% | | | | 1.52% | |
| 9/30/13 | | | 15.29 | | | | 0.26 | | | | 3.12 | | | | 3.38 | | | | (0.24 | ) | | | (0.24 | ) | | | 18.43 | | | | 22.42% | | | | 110 | | | | 0.72% | | | | N/A | | | | 1.59% | |
| 9/30/12i | | | 14.00 | | | | 0.24 | | | | 1.27 | | | | 1.51 | | | | (0.22 | ) | | | (0.22 | ) | | | 15.29 | | | | 11.04% | b | | | 127 | | | | 0.72% | a | | | N/A | | | | 1.86% | a |
| 10/31/11 | | | 13.66 | | | | 0.17 | | | | 0.30 | | | | 0.47 | | | | (0.13 | ) | | | (0.13 | ) | | | 14.00 | | | | 3.44% | | | | 143 | | | | 0.71% | | | | N/A | | | | 1.19% | |
| | | | | | | | | | | | | | | | | | | | | | | | |
| | | Year ended September 30 | | | Period ended
September 30, 2012b,i | | | Year ended
October 31 | |
| | | 2016 | | | 2015 | | | 2014 | | | 2013 | | | | | | 2011 | |
Portfolio turnover rate | | | 62 | % | | | 54 | % | | | 43 | % | | | 150 | % | | | 72 | % | | | 93 | % |
| b | Percentage represents the results for the period and is not annualized. |
| c | Per share amount calculated on the average shares method. |
| i | For the period November 1, 2011 through September 30, 2012. |
| j | Computed after giving effect to an agreement by MML Advisers and/or MassMutual to waive certain fees and expenses of the Fund. |
| l | Employee retirement benefit plans that invest plan assets in the Separate Investment Accounts (SIAs) may be subject to certain charges as set forth in their respective Plan Documents. Total return figures would be lower for the periods presented if they reflected these charges. |
| m | Total return excludes sales charges, if any, and would be lower for the period presented if it reflected these charges. |
| gg | For the period April 1, 2014 (commencement of operations) through September 30, 2014. |
| * | Generally accepted accounting principles may require adjustment to be made to the net assets of the Fund at period end for financial reporting purposes, and as such, the net asset values for shareholder transactions and the returns based on those net asset values may differ from the returns reported in the portfolio manager commentary section of this report. |
The accompanying notes are an integral part of the financial statements.
242
| | | | | | | | | | | | | | | | | | | | | | | | | | | | | | | | | | | | | | | | | | | | | | | | |
| | | | | | Income (loss) from investment
operations | | | Less distributions to shareholders | | | | | | | | |
Ratios / Supplemental Data | |
| | | Net
asset
value,
beginning
of the
period | | | Net
investment
income
(loss)c,j | | | Net
realized
and
unrealized
gain (loss)
on
investments | | | Total
income
(loss) from
investment
operations | | | From net
investment
income | | | Total
distributions | | | Net
asset
value,
end of
the
period | | | Total
returnl,m | | | Net
assets,
end of
the
period
(000’s) | | | Ratio of
expenses
to average
daily net
assets
before
expense
waivers | | | Ratio of
expenses
to average
daily net
assets
after
expense
waiversj | | | Net
investment
income
(loss) to
average
daily net
assets | |
| Administrative Class | | | | | | | | | | | | | | | | | | | | | | | | | | | | | | | | | | | | | | | | | |
| 9/30/16 | | $ | 19.94 | | | $ | 0.27 | | | $ | 1.81 | | | $ | 2.08 | | | $ | (0.27 | ) | | $ | (0.27 | ) | | $ | 21.75 | | | | 10.53% | | | $ | 11,708 | | | | 1.12% | | | | 0.90% | | | | 1.29% | |
| 9/30/15 | | | 20.98 | | | | 0.26 | | | | (0.96 | ) | | | (0.70 | ) | | | (0.34 | ) | | | (0.34 | ) | | | 19.94 | | | | (3.40% | ) | | | 11,984 | | | | 1.03% | | | | 0.90% | | | | 1.20% | |
| 9/30/14 | | | 18.40 | | | | 0.28 | | | | 2.58 | | | | 2.86 | | | | (0.28 | ) | | | (0.28 | ) | | | 20.98 | | | | 15.65% | | | | 14,077 | | | | 0.88% | | | | 0.87% | | | | 1.40% | |
| 9/30/13 | | | 15.25 | | | | 0.25 | | | | 3.12 | | | | 3.37 | | | | (0.22 | ) | | | (0.22 | ) | | | 18.40 | | | | 22.32% | | | | 15,628 | | | | 0.83% | | | | N/A | | | | 1.48% | |
| 9/30/12i | | | 13.97 | | | | 0.23 | | | | 1.25 | | | | 1.48 | | | | (0.20 | ) | | | (0.20 | ) | | | 15.25 | | | | 10.91% | b | | | 18,705 | | | | 0.83% | a | | | N/A | | | | 1.74% | a |
| 10/31/11 | | | 13.68 | | | | 0.16 | | | | 0.30 | | | | 0.46 | | | | (0.17 | ) | | | (0.17 | ) | | | 13.97 | | | | 3.32% | | | | 19,579 | | | | 0.82% | | | | N/A | | | | 1.08% | |
| Class A | | | | | | | | | | | | | | | | | | | | | | | | | | | | | | | | | | | | | | | | | |
| 9/30/16 | | $ | 19.91 | | | $ | 0.21 | | | $ | 1.81 | | | $ | 2.02 | | | $ | (0.21 | ) | | $ | (0.21 | ) | | $ | 21.72 | | | | 10.23% | | | $ | 5,918 | | | | 1.37% | | | | 1.15% | | | | 1.04% | |
| 9/30/15 | | | 20.94 | | | | 0.20 | | | | (0.94 | ) | | | (0.74 | ) | | | (0.29 | ) | | | (0.29 | ) | | | 19.91 | | | | (3.59% | ) | | | 6,605 | | | | 1.28% | | | | 1.15% | | | | 0.95% | |
| 9/30/14 | | | 18.35 | | | | 0.23 | | | | 2.57 | | | | 2.80 | | | | (0.21 | ) | | | (0.21 | ) | | | 20.94 | | | | 15.35% | | | | 7,513 | | | | 1.15% | | | | 1.14% | | | | 1.13% | |
| 9/30/13 | | | 15.22 | | | | 0.20 | | | | 3.11 | | | | 3.31 | | | | (0.18 | ) | | | (0.18 | ) | | | 18.35 | | | | 21.94% | | | | 8,304 | | | | 1.12% | | | | N/A | | | | 1.19% | |
| 9/30/12i | | | 13.91 | | | | 0.19 | | | | 1.26 | | | | 1.45 | | | | (0.14 | ) | | | (0.14 | ) | | | 15.22 | | | | 10.59% | b | | | 9,649 | | | | 1.12% | a | | | ��N/A | | | | 1.45% | a |
| 10/31/11 | | | 13.62 | | | | 0.11 | | | | 0.31 | | | | 0.42 | | | | (0.13 | ) | | | (0.13 | ) | | | 13.91 | | | | 3.04% | | | | 9,800 | | | | 1.11% | | | | N/A | | | | 0.78% | |
Class R4 | | | | | | | | | | | | | | | | | | | | | | | | | | | | | | | | | | | | | | | | | | | | | | | | |
| 9/30/16 | | $ | 19.89 | | | $ | 0.23 | | | $ | 1.82 | | | $ | 2.05 | | | $ | (0.24 | ) | | $ | (0.24 | ) | | $ | 21.70 | | | | 10.41% | | | $ | 110 | | | | 1.27% | | | | 1.05% | | | | 1.15% | |
| 9/30/15 | | | 20.95 | | | | 0.23 | | | | (0.95 | ) | | | (0.72 | ) | | | (0.34 | ) | | | (0.34 | ) | | | 19.89 | | | | (3.57% | ) | | | 101 | | | | 1.18% | | | | 1.05% | | | | 1.06% | |
| 9/30/14gg | | | 20.11 | | | | 0.11 | | | | 0.73 | | | | 0.84 | | | | - | | | | - | | | | 20.95 | | | | 4.23% | b | | | 104 | | | | 1.08% | a | | | 1.05% | a | | | 1.05% | a |
| Class R3 | | | | | | | | | | | | | | | | | | | | | | | | | | | | | | | | | | | | | | | | | |
| 9/30/16 | | $ | 19.79 | | | $ | 0.18 | | | $ | 1.81 | | | $ | 1.99 | | | $ | (0.19 | ) | | $ | (0.19 | ) | | $ | 21.59 | | | | 10.12% | | | $ | 107 | | | | 1.53% | | | | 1.30% | | | | 0.90% | |
| 9/30/15 | | | 20.82 | | | | 0.17 | | | | (0.94 | ) | | | (0.77 | ) | | | (0.26 | ) | | | (0.26 | ) | | | 19.79 | | | | (3.77% | ) | | | 96 | | | | 1.43% | | | | 1.30% | | | | 0.81% | |
| 9/30/14 | | | 18.26 | | | | 0.18 | | | | 2.56 | | | | 2.74 | | | | (0.18 | ) | | | (0.18 | ) | | | 20.82 | | | | 15.09% | | | | 101 | | | | 1.38% | | | | 1.37% | | | | 0.91% | |
| 9/30/13 | | | 15.15 | | | | 0.15 | | | | 3.10 | | | | 3.25 | | | | (0.14 | ) | | | (0.14 | ) | | | 18.26 | | | | 21.54% | | | | 88 | | | | 1.43% | | | | N/A | | | | 0.87% | |
| 9/30/12i | | | 13.87 | | | | 0.17 | | | | 1.23 | | | | 1.40 | | | | (0.12 | ) | | | (0.12 | ) | | | 15.15 | | | | 10.28% | b | | | 74 | | | | 1.43% | a | | | N/A | | | | 1.28% | a |
| 10/31/11 | | | 13.59 | | | | 0.07 | | | | 0.31 | | | | 0.38 | | | | (0.10 | ) | | | (0.10 | ) | | | 13.87 | | | | 2.74% | | | | 117 | | | | 1.42% | | | | N/A | | | | 0.46% | |
243
MassMutual Premier Disciplined Value Fund – Financial Statements (Continued)
Financial Highlights (For a share outstanding throughout each period)
| | | | | | | | | | | | | | | | | | | | | | | | | | | | | | | | | | | | | | | | | | | | | | | | | | | | |
| | | | | | Income (loss) from investment
operations | | | Less distributions to shareholders | | | | | | | | | Ratios / Supplemental Data | |
| | | Net
asset
value,
beginning
of the
period | | | Net
investment
income
(loss)c,j | | | Net
realized
and
unrealized
gain (loss)
on
investments | | | Total
income
(loss) from
investment
operations | | | From net
investment
income | | | From net
realized
gains | | | Total
distributions | | | Net
asset
value,
end of
the
period | | | Total
returnl,m | | | Net
assets,
end of
the
period
(000’s) | | | Ratio of
expenses
to average
daily net
assets
before
expense
waivers | | | Ratio of
expenses
to average
daily net
assets
after
expense
waiversj | | | Net
investment
income
(loss) to
average
daily net
assets | |
Class I | | | | | | | | | | | | | | | | | | | | | | | | | | | | | | | | | | | | | | | | | | | | | | | | | | | | |
| 9/30/16 | | $ | 14.75 | | | $ | 0.35 | | | $ | 1.56 | | | $ | 1.91 | | | $ | (0.32 | ) | | $ | (0.29 | ) | | $ | (0.61 | ) | | $ | 16.05 | | | | 13.26% | | | $ | 73,202 | | | | 0.53% | | | | N/A | | | | 2.29% | |
| 9/30/15 | | | 15.75 | | | | 0.29 | | | | (1.00 | ) | | | (0.71 | ) | | | (0.29 | ) | | | - | | | | (0.29 | ) | | | 14.75 | | | | (4.64% | ) | | | 163,640 | | | | 0.53% | | | | N/A | | | | 1.84% | |
| 9/30/14gg | | | 15.15 | | | | 0.14 | | | | 0.46 | | | | 0.60 | | | | - | | | | - | | | | - | | | | 15.75 | | | | 3.96% | b | | | 182,826 | | | | 0.50% | a | | | N/A | | | | 1.73% | a |
Class R5 | | | | | | | | | | | | | | | | | | | | | | | | | | | | | | | | | | | | | | | | | | | | | |
| 9/30/16 | | $ | 14.76 | | | $ | 0.34 | | | $ | 1.55 | | | $ | 1.89 | | | $ | (0.30 | ) | | $ | (0.29 | ) | | $ | (0.59 | ) | | $ | 16.06 | | | | 13.11% | | | $ | 46,644 | | | | 0.63% | | | | N/A | | | | 2.22% | |
| 9/30/15 | | | 15.76 | | | | 0.28 | | | | (1.01 | ) | | | (0.73 | ) | | | (0.27 | ) | | | - | | | | (0.27 | ) | | | 14.76 | | | | (4.74% | ) | | | 46,754 | | | | 0.63% | | | | N/A | | | | 1.73% | |
| 9/30/14 | | | 13.55 | | | | 0.27 | | | | 2.20 | | | | 2.47 | | | | (0.26 | ) | | | - | | | | (0.26 | ) | | | 15.76 | | | | 18.30% | | | | 71,929 | | | | 0.57% | | | | N/A | | | | 1.81% | |
| 9/30/13 | | | 11.29 | | | | 0.26 | | | | 2.26 | | | | 2.52 | | | | (0.26 | ) | | | - | | | | (0.26 | ) | | | 13.55 | | | | 22.88% | | | | 236,830 | | | | 0.56% | | | | 0.53% | | | | 2.08% | |
| 9/30/12i | | | 9.94 | | | | 0.22 | | | | 1.32 | | | | 1.54 | | | | (0.19 | ) | | | - | | | | (0.19 | ) | | | 11.29 | | | | 15.93% | b | | | 212,647 | | | | 0.57% | a | | | 0.52% | a | | | 2.28% | a |
| 10/31/11 | | | 9.50 | | | | 0.18 | | | | 0.44 | | | | 0.62 | | | | (0.18 | ) | | | - | | | | (0.18 | ) | | | 9.94 | | | | 6.55% | | | | 201,137 | | | | 0.59% | | | | 0.57% | | | | 1.82% | |
Service Class | | | | | | | | | | | | | | | | | | | | | | | | | | | | | | | | | | | | | | | | | | | | | |
| 9/30/16 | | $ | 14.66 | | | $ | 0.32 | | | $ | 1.55 | | | $ | 1.87 | | | $ | (0.29 | ) | | $ | (0.29 | ) | | $ | (0.58 | ) | | $ | 15.95 | | | | 13.03% | | | $ | 64,634 | | | | 0.73% | | | | N/A | | | | 2.12% | |
| 9/30/15 | | | 15.66 | | | | 0.26 | | | | (1.00 | ) | | | (0.74 | ) | | | (0.26 | ) | | | - | | | | (0.26 | ) | | | 14.66 | | | | (4.84% | ) | | | 65,799 | | | | 0.73% | | | | N/A | | | | 1.65% | |
| 9/30/14 | | | 13.48 | | | | 0.25 | | | | 2.17 | | | | 2.42 | | | | (0.24 | ) | | | - | | | | (0.24 | ) | | | 15.66 | | | | 18.15% | | | | 68,003 | | | | 0.68% | | | | N/A | | | | 1.66% | |
| 9/30/13 | | | 11.22 | | | | 0.25 | | | | 2.26 | | | | 2.51 | | | | (0.25 | ) | | | - | | | | (0.25 | ) | | | 13.48 | | | | 22.82% | | | | 69,162 | | | | 0.65% | | | | 0.62% | | | | 2.01% | |
| 9/30/12i | | | 9.88 | | | | 0.21 | | | | 1.31 | | | | 1.52 | | | | (0.18 | ) | | | - | | | | (0.18 | ) | | | 11.22 | | | | 15.78% | b | | | 66,311 | | | | 0.66% | a | | | 0.61% | a | | | 2.18% | a |
| 10/31/11 | | | 9.45 | | | | 0.17 | | | | 0.43 | | | | 0.60 | | | | (0.17 | ) | | | - | | | | (0.17 | ) | | | 9.88 | | | | 6.38% | | | | 53,589 | | | | 0.69% | | | | 0.68% | | | | 1.71% | |
| | | | | | | | | | | | | | | | | | | | | | | | |
| | | Year ended September 30 | | | Period ended
September 30, 2012b,i | | | Year ended
October 31 | |
| | | 2016 | | | 2015 | | | 2014 | | | 2013 | | | | | | 2011 | |
Portfolio turnover rate | | | 109 | % | | | 113 | % | | | 92 | % | | | 145 | % | | | 127 | % | | | 124 | % |
| b | Percentage represents the results for the period and is not annualized. |
| c | Per share amount calculated on the average shares method. |
| i | For the period November 1, 2011 through September 30, 2012. |
| j | Computed after giving effect to an agreement by MML Advisers and/or MassMutual to waive certain fees and expenses of the Fund. |
| k | Amount waived had no impact on the ratio of expenses to average daily net assets. |
| l | Employee retirement benefit plans that invest plan assets in the Separate Investment Accounts (SIAs) may be subject to certain charges as set forth in their respective Plan Documents. Total return figures would be lower for the periods presented if they reflected these charges. |
| m | Total return excludes sales charges, if any, and would be lower for the period presented if it reflected these charges. |
| gg | For the period April 1, 2014 (commencement of operations) through September 30, 2014. |
The accompanying notes are an integral part of the financial statements.
244
| | | | | | | | | | | | | | | | | | | | | | | | | | | | | | | | | | | | | | | | | | | | | | | | | | | | |
| | | | | | Income (loss) from investment
operations | | | Less distributions to shareholders | | | | | | | | | Ratios / Supplemental Data | |
| | | Net
asset
value,
beginning
of the
period | | | Net
investment
income
(loss)c,j | | | Net
realized
and
unrealized
gain (loss)
on
investments | | | Total
income
(loss) from
investment
operations | | | From net
investment
income | | | From net
realized
gains | | | Total
distributions | | | Net
asset
value,
end of
the
period | | | Total
returnl,m | | | Net
assets,
end of
the
period
(000’s) | | | Ratio of
expenses
to average
daily net
assets
before
expense
waivers | | | Ratio of
expenses
to average
daily net
assets
after
expense
waiversj | | | Net
investment
income
(loss) to
average
daily net
assets | |
Administrative Class | | | | | | | | | | | | | | | | | | | | | | | | | | | | | | | | | | | | | | | | | | | | | |
| 9/30/16 | | $ | 14.88 | | | $ | 0.31 | | | $ | 1.58 | | | $ | 1.89 | | | $ | (0.27 | ) | | $ | (0.29 | ) | | $ | (0.56 | ) | | $ | 16.21 | | | | 12.97% | | | $ | 5,801 | | | | 0.83% | | | | N/A | | | | 2.00% | |
| 9/30/15 | | | 15.90 | | | | 0.25 | | | | (1.02 | ) | | | (0.77 | ) | | | (0.25 | ) | | | - | | | | (0.25 | ) | | | 14.88 | | | | (4.97% | ) | | | 7,460 | | | | 0.83% | | | | N/A | | | | 1.55% | |
| 9/30/14 | | | 13.68 | | | | 0.23 | | | | 2.23 | | | | 2.46 | | | | (0.24 | ) | | | - | | | | (0.24 | ) | | | 15.90 | | | | 18.02% | | | | 7,047 | | | | 0.80% | | | | N/A | | | | 1.54% | |
| 9/30/13 | | | 11.40 | | | | 0.23 | | | | 2.29 | | | | 2.52 | | | | (0.24 | ) | | | - | | | | (0.24 | ) | | | 13.68 | | | | 22.60% | | | | 4,459 | | | | 0.79% | | | | 0.76% | | | | 1.82% | |
| 9/30/12i | | | 9.85 | | | | 0.20 | | | | 1.35 | | | | 1.55 | | | | - | | | | - | | | | - | | | | 11.40 | | | | 15.74% | b | | | 2,717 | | | | 0.80% | a | | | 0.75% | a | | | 2.04% | a |
| 10/31/11 | | | 9.41 | | | | 0.16 | | | | 0.44 | | | | 0.60 | | | | (0.16 | ) | | | - | | | | (0.16 | ) | | | 9.85 | | | | 6.36% | | | | 1,948 | | | | 0.84% | | | | 0.84% | k | | | 1.53% | |
Class A | | | | | | | | | | | | | | | | | | | | | | | | | | | | | | | | | | | | | | | | | | | | | |
| 9/30/16 | | $ | 14.53 | | | $ | 0.27 | | | $ | 1.53 | | | $ | 1.80 | | | $ | (0.22 | ) | | $ | (0.29 | ) | | $ | (0.51 | ) | | $ | 15.82 | | | | 12.65% | | | $ | 10,415 | | | | 1.08% | | | | N/A | | | | 1.78% | |
| 9/30/15 | | | 15.51 | | | | 0.20 | | | | (0.98 | ) | | | (0.78 | ) | | | (0.20 | ) | | | - | | | | (0.20 | ) | | | 14.53 | | | | (5.13% | ) | | | 8,081 | | | | 1.08% | | | | N/A | | | | 1.30% | |
| 9/30/14 | | | 13.36 | | | | 0.19 | | | | 2.15 | | | | 2.34 | | | | (0.19 | ) | | | - | | | | (0.19 | ) | | | 15.51 | | | | 17.67% | | | | 10,718 | | | | 1.05% | | | | N/A | | | | 1.29% | |
| 9/30/13 | | | 11.13 | | | | 0.20 | | | | 2.24 | | | | 2.44 | | | | (0.21 | ) | | | - | | | | (0.21 | ) | | | 13.36 | | | | 22.26% | | | | 11,844 | | | | 1.04% | | | | 1.01% | | | | 1.60% | |
| 9/30/12i | | | 9.79 | | | | 0.17 | | | | 1.31 | | | | 1.48 | | | | (0.14 | ) | | | - | | | | (0.14 | ) | | | 11.13 | | | | 15.41% | b | | | 9,501 | | | | 1.05% | a | | | 1.00% | a | | | 1.80% | a |
| 10/31/11 | | | 9.36 | | | | 0.13 | | | | 0.43 | | | | 0.56 | | | | (0.13 | ) | | | - | | | | (0.13 | ) | | | 9.79 | | | | 5.99% | | | | 9,129 | | | | 1.09% | | | | 1.07% | | | | 1.31% | |
Class R4 | | | | | | | | | | | | | | | | | | | | | | | | | | | | | | | | | | | | | | | | | | | | | | | | | |
| 9/30/16 | | $ | 14.51 | | | $ | 0.28 | | | $ | 1.53 | | | $ | 1.81 | | | $ | (0.26 | ) | | $ | (0.29 | ) | | $ | (0.55 | ) | | $ | 15.77 | | | | 12.75% | | | $ | 4,127 | | | | 0.98% | | | | N/A | | | | 1.90% | |
| 9/30/15 | | | 15.52 | | | | 0.21 | | | | (0.98 | ) | | | (0.77 | ) | | | (0.24 | ) | | | - | | | | (0.24 | ) | | | 14.51 | | | | (5.10% | ) | | | 2,524 | | | | 0.98% | | | | N/A | | | | 1.34% | |
| 9/30/14gg | | | 14.96 | | | | 0.10 | | | | 0.46 | | | | 0.56 | | | | - | | | | - | | | | - | | | | 15.52 | | | | 3.74% | b | | | 104 | | | | 0.95% | a | | | N/A | | | | 1.32% | a |
Class R3 | | | | | | | | | | | | | | | | | | | | | | | | | | | | | | | | | | | | | | | | | | | | | |
| 9/30/16 | | $ | 14.62 | | | $ | 0.25 | | | $ | 1.54 | | | $ | 1.79 | | | $ | (0.20 | ) | | $ | (0.29 | ) | | $ | (0.49 | ) | | $ | 15.92 | | | | 12.49% | | | $ | 648 | | | | 1.23% | | | | N/A | | | | 1.66% | |
| 9/30/15 | | | 15.61 | | | | 0.19 | | | | (1.00 | ) | | | (0.81 | ) | | | (0.18 | ) | | | - | | | | (0.18 | ) | | | 14.62 | | | | (5.29% | ) | | | 185 | | | | 1.23% | | | | N/A | | | | 1.19% | |
| 9/30/14 | | | 13.43 | | | | 0.16 | | | | 2.17 | | | | 2.33 | | | | (0.15 | ) | | | - | | | | (0.15 | ) | | | 15.61 | | | | 17.48% | | | | 174 | | | | 1.27% | | | | N/A | | | | 1.06% | |
| 9/30/13 | | | 11.19 | | | | 0.16 | | | | 2.26 | | | | 2.42 | | | | (0.18 | ) | | | - | | | | (0.18 | ) | | | 13.43 | | | | 21.92% | | | | 153 | | | | 1.34% | | | | 1.31% | | | | 1.30% | |
| 9/30/12i | | | 9.83 | | | | 0.14 | | | | 1.32 | | | | 1.46 | | | | (0.10 | ) | | | - | | | | (0.10 | ) | | | 11.19 | | | | 15.08% | b | | | 126 | | | | 1.35% | a | | | 1.30% | a | | | 1.50% | a |
| 10/31/11 | | | 9.40 | | | | 0.10 | | | | 0.43 | | | | 0.53 | | | | (0.10 | ) | | | - | | | | (0.10 | ) | | | 9.83 | | | | 5.64% | | | | 129 | | | | 1.40% | | | | 1.38% | | | | 1.01% | |
245
MassMutual Premier Main Street Fund – Financial Statements (Continued)
Financial Highlights (For a share outstanding throughout each period)
| | | | | | | | | | | | | | | | | | | | | | | | | | | | | | | | | | | | | | | | | | | | | | | | | | | | |
| | | | | | Income (loss) from investment
operations | | | Less distributions to shareholders | | | | | | | | | Ratios / Supplemental Data | |
| | | Net
asset
value,
beginning
of the
period | | | Net
investment
income
(loss)c,j | | | Net
realized
and
unrealized
gain (loss)
on
investments | | | Total
income
(loss) from
investment
operations | | | From net
investment
income | | | From net
realized
gains | | | Total
distributions | | | Net
asset
value,
end of
the
period | | | Total
returnl,m | | | Net
assets,
end of
the
period
(000’s) | | | Ratio of
expenses
to average
daily net
assets
before
expense
waivers | | | Ratio of
expenses
to average
daily net
assets
after
expense
waiversj | | | Net
investment
income
(loss) to
average
daily net
assets | |
Class I | | | | | | | | | | | | | | | | | | | | | | | | | | | | | | | | | | | | | | | | | | | | | | | | | | | | |
| 9/30/16 | | $ | 13.75 | | | $ | 0.18 | | | $ | 1.43 | | | $ | 1.61 | | | $ | (0.22 | ) | | $ | (4.72 | ) | | $ | (4.94 | ) | | $ | 10.42 | | | | 14.34% | | | $ | 739 | | | | 0.72% | | | | N/A | | | | 1.68% | |
| 9/30/15 | | | 14.23 | | | | 0.14 | | | | (0.19 | ) | | | (0.05 | ) | | | (0.13 | ) | | | (0.30 | ) | | | (0.43 | ) | | | 13.75 | | | | (0.36% | ) | | | 37 | | | | 0.65% | | | | N/A | | | | 0.99% | |
| 9/30/14gg | | | 13.41 | | | | 0.08 | | | | 0.74 | | | | 0.82 | | | | - | | | | - | | | | - | | | | 14.23 | | | | 6.11% | b | | | 47,537 | | | | 0.62% | a | | | N/A | | | | 1.07% | a |
Class R5 | | | | | | | | | | | | | | | | | | | | | | | | | | | | | | | | | | | | | | | | | | | | | |
| 9/30/16 | | $ | 13.73 | | | $ | 0.13 | | | $ | 1.48 | | | $ | 1.61 | | | $ | (0.21 | ) | | $ | (4.72 | ) | | $ | (4.93 | ) | | $ | 10.41 | | | | 14.28% | | | $ | 73,380 | | | | 0.82% | | | | N/A | | | | 1.27% | |
| 9/30/15 | | | 14.22 | | | | 0.14 | | | | (0.21 | ) | | | (0.07 | ) | | | (0.12 | ) | | | (0.30 | ) | | | (0.42 | ) | | | 13.73 | | | | (0.50% | ) | | | 69,529 | | | | 0.76% | | | | N/A | | | | 0.95% | |
| 9/30/14 | | | 12.10 | | | | 0.12 | | | | 2.11 | | | | 2.23 | | | | (0.11 | ) | | | - | | | | (0.11 | ) | | | 14.22 | | | | 18.54% | | | | 97,358 | | | | 0.76% | | | | 0.72% | | | | 0.89% | |
| 9/30/13 | | | 10.32 | | | | 0.13 | | | | 1.78 | | | | 1.91 | | | | (0.13 | ) | | | - | | | | (0.13 | ) | | | 12.10 | | | | 18.65% | | | | 131,115 | | | | 0.80% | | | | 0.71% | | | | 1.16% | |
| 9/30/12i | | | 8.77 | | | | 0.08 | | | | 1.54 | | | | 1.62 | | | | (0.07 | ) | | | - | | | | (0.07 | ) | | | 10.32 | | | | 18.79% | b | | | 121,085 | | | | 0.81% | a | | | 0.71% | a | | | 0.97% | a |
| 10/31/11 | | | 8.50 | | | | 0.08 | | | | 0.27 | | | | 0.35 | | | | (0.08 | ) | | | - | | | | (0.08 | ) | | | 8.77 | | | | 4.08% | | | | 111,826 | | | | 0.81% | | | | 0.71% | | | | 0.91% | |
Service Class | | | | | | | | | | | | | | | | | | | | | | | | | | | | | | | | | | | | | | | | | | | | | |
| 9/30/16 | | $ | 13.91 | | | $ | 0.12 | | | $ | 1.51 | | | $ | 1.63 | | | $ | (0.11 | ) | | $ | (4.72 | ) | | $ | (4.83 | ) | | $ | 10.71 | | | | 14.21% | | | $ | 1,979 | | | | 0.92% | | | | N/A | | | | 0.98% | |
| 9/30/15 | | | 14.40 | | | | 0.13 | | | | (0.21 | ) | | | (0.08 | ) | | | (0.11 | ) | | | (0.30 | ) | | | (0.41 | ) | | | 13.91 | | | | (0.57% | ) | | | 6,517 | | | | 0.86% | | | | N/A | | | | 0.88% | |
| 9/30/14 | | | 12.26 | | | | 0.11 | | | | 2.14 | | | | 2.25 | | | | (0.11 | ) | | | - | | | | (0.11 | ) | | | 14.40 | | | | 18.40% | | | | 6,742 | | | | 0.84% | | | | 0.79% | | | | 0.82% | |
| 9/30/13 | | | 10.46 | | | | 0.12 | | | | 1.81 | | | | 1.93 | | | | (0.13 | ) | | | - | | | | (0.13 | ) | | | 12.26 | | | | 18.71% | | | | 5,267 | | | | 0.85% | | | | 0.76% | | | | 1.11% | |
| 9/30/12i | | | 8.81 | | | | 0.08 | | | | 1.57 | | | | 1.65 | | | | - | | | | - | | | | - | | | | 10.46 | | | | 18.73% | b | | | 4,905 | | | | 0.86% | a | | | 0.76% | a | | | 0.86% | a |
| 10/31/11 | | | 8.55 | | | | 0.08 | | | | 0.26 | | | | 0.34 | | | | (0.08 | ) | | | - | | | | (0.08 | ) | | | 8.81 | | | | 4.00% | | | | 0 | f | | | 0.86% | | | | 0.76% | | | | 0.90% | |
| | | | | | | | | | | | | | | | | | | | | | | | |
| | | Year ended September 30 | | | Period ended
September 30, 2012b,i | | | Year ended
October 31 | |
| | | 2016 | | | 2015 | | | 2014 | | | 2013 | | | | | | 2011 | |
Portfolio turnover rate | | | 38 | % | | | 54 | % | | | 53 | % | | | 43 | % | | | 37 | % | | | 37 | % |
| b | Percentage represents the results for the period and is not annualized. |
| c | Per share amount calculated on the average shares method. |
| f | Amount is less than $500. |
| i | For the period November 1, 2011 through September 30, 2012. |
| j | Computed after giving effect to an agreement by MML Advisers and/or MassMutual to waive certain fees and expenses of the Fund. |
| l | Employee retirement benefit plans that invest plan assets in the Separate Investment Accounts (SIAs) may be subject to certain charges as set forth in their respective Plan Documents. Total return figures would be lower for the periods presented if they reflected these charges. |
| m | Total return excludes sales charges, if any, and would be lower for the period presented if it reflected these charges. |
| gg | For the period April 1, 2014 (commencement of operations) through September 30, 2014. |
The accompanying notes are an integral part of the financial statements.
246
| | | | | | | | | | | | | | | | | | | | | | | | | | | | | | | | | | | | | | | | | | | | | | | | | | | | |
| | | | | | Income (loss) from investment
operations | | | Less distributions to shareholders | | | | | | | | | Ratios / Supplemental Data | |
| | | Net
asset
value,
beginning
of the
period | | | Net
investment
income
(loss)c,j | | | Net
realized
and
unrealized
gain (loss)
on
investments | | | Total
income
(loss) from
investment
operations | | | From net
investment
income | | | From net
realized
gains | | | Total
distributions | | | Net
asset
value,
end of
the
period | | | Total
returnl,m | | | Net
assets,
end of
the
period
(000’s) | | | Ratio of
expenses
to average
daily net
assets
before
expense
waivers | | | Ratio of
expenses
to average
daily net
assets
after
expense
waiversj | | | Net
investment
income
(loss) to
average
daily net
assets | |
Administrative Class | | | | | | | | | | | | | | | | | | | | | | | | | | | | | | | | | | | | | | | | | | | | | |
| 9/30/16 | | $ | 13.71 | | | $ | 0.11 | | | $ | 1.48 | | | $ | 1.59 | | | $ | (0.18 | ) | | $ | (4.72 | ) | | $ | (4.90 | ) | | $ | 10.40 | | | | 14.11% | | | $ | 29,371 | | | | 1.02% | | | | N/A | | | | 1.05% | |
| 9/30/15 | | | 14.19 | | | | 0.11 | | | | (0.20 | ) | | | (0.09 | ) | | | (0.09 | ) | | | (0.30 | ) | | | (0.39 | ) | | | 13.71 | | | | (0.63% | ) | | | 31,644 | | | | 0.96% | | | | N/A | | | | 0.77% | |
| 9/30/14 | | | 12.08 | | | | 0.09 | | | | 2.11 | | | | 2.20 | | | | (0.09 | ) | | | - | | | | (0.09 | ) | | | 14.19 | | | | 18.26% | | | | 35,299 | | | | 0.96% | | | | 0.92% | | | | 0.69% | |
| 9/30/13 | | | 10.30 | | | | 0.11 | | | | 1.78 | | | | 1.89 | | | | (0.11 | ) | | | - | | | | (0.11 | ) | | | 12.08 | | | | 18.52% | | | | 33,164 | | | | 1.00% | | | | 0.91% | | | | 0.97% | |
| 9/30/12i | | | 8.75 | | | | 0.07 | | | | 1.53 | | | | 1.60 | | | | (0.05 | ) | | | - | | | | (0.05 | ) | | | 10.30 | | | | 18.44% | b | | | 32,593 | | | | 1.01% | a | | | 0.91% | a | | | 0.77% | a |
| 10/31/11 | | | 8.48 | | | | 0.06 | | | | 0.27 | | | | 0.33 | | | | (0.06 | ) | | | - | | | | (0.06 | ) | | | 8.75 | | | | 3.89% | | | | 39,959 | | | | 1.01% | | | | 0.91% | | | | 0.71% | |
Class A | | | | | | | | | | | | | | | | | | | | | | | | | | | | | | | | | | | | | | | | | | | | | |
| 9/30/16 | | $ | 13.58 | | | $ | 0.09 | | | $ | 1.45 | | | $ | 1.54 | | | $ | (0.14 | ) | | $ | (4.72 | ) | | $ | (4.86 | ) | | $ | 10.26 | | | | 13.78% | | | $ | 11,877 | | | | 1.27% | | | | N/A | | | | 0.82% | |
| 9/30/15 | | | 14.07 | | | | 0.07 | | | | (0.20 | ) | | | (0.13 | ) | | | (0.06 | ) | | | (0.30 | ) | | | (0.36 | ) | | | 13.58 | | | | (0.96% | ) | | | 12,906 | | | | 1.21% | | | | N/A | | | | 0.52% | |
| 9/30/14 | | | 11.98 | | | | 0.06 | | | | 2.09 | | | | 2.15 | | | | (0.06 | ) | | | - | | | | (0.06 | ) | | | 14.07 | | | | 17.99% | | | | 13,580 | | | | 1.21% | | | | 1.17% | | | | 0.44% | |
| 9/30/13 | | | 10.23 | | | | 0.08 | | | | 1.76 | | | | 1.84 | | | | (0.09 | ) | | | - | | | | (0.09 | ) | | | 11.98 | | | | 18.18% | | | | 13,493 | | | | 1.25% | | | | 1.16% | | | | 0.71% | |
| 9/30/12i | | | 8.68 | | | | 0.04 | | | | 1.54 | | | | 1.58 | | | | (0.03 | ) | | | - | | | | (0.03 | ) | | | 10.23 | | | | 18.23% | b | | | 11,976 | | | | 1.26% | a | | | 1.16% | a | | | 0.51% | a |
| 10/31/11 | | | 8.41 | | | | 0.04 | | | | 0.27 | | | | 0.31 | | | | (0.04 | ) | | | - | | | | (0.04 | ) | | | 8.68 | | | | 3.66% | | | | 8,120 | | | | 1.26% | | | | 1.16% | | | | 0.46% | |
Class R4 | | | | | | | | | | | | | | | | | | | | | | | | | | | | | | | | | | | | | | | | | | | | | | | | | | | | |
| 9/30/16 | | $ | 13.57 | | | $ | 0.15 | | | $ | 1.40 | | | $ | 1.55 | | | $ | (0.18 | ) | | $ | (4.72 | ) | | $ | (4.90 | ) | | $ | 10.22 | | | | 13.88% | | | $ | 3,421 | | | | 1.17% | | | | N/A | | | | 1.45% | |
| 9/30/15 | | | 14.07 | | | | 0.09 | | | | (0.21 | ) | | | (0.12 | ) | | | (0.08 | ) | | | (0.30 | ) | | | (0.38 | ) | | | 13.57 | | | | (0.85% | ) | | | 105 | | | | 1.11% | | | | N/A | | | | 0.63% | |
| 9/30/14gg | | | 13.29 | | | | 0.04 | | | | 0.74 | | | | 0.78 | | | | - | | | | - | | | | - | | | | 14.07 | | | | 5.87% | b | | | 106 | | | | 1.07% | a | | | N/A | | | | 0.60% | a |
Class R3 | | | | | | | | | | | | | | | | | | | | | | | | | | | | | | | | | | | | | | | | | | | | | |
| 9/30/16 | | $ | 13.66 | | | $ | 0.07 | | | $ | 1.46 | | | $ | 1.53 | | | $ | (0.17 | ) | | $ | (4.72 | ) | | $ | (4.89 | ) | | $ | 10.30 | | | | 13.60% | | | $ | 802 | | | | 1.42% | | | | N/A | | | | 0.70% | |
| 9/30/15 | | | 14.15 | | | | 0.05 | | | | (0.20 | ) | | | (0.15 | ) | | | (0.04 | ) | | | (0.30 | ) | | | (0.34 | ) | | | 13.66 | | | | (1.07% | ) | | | 140 | | | | 1.36% | | | | N/A | | | | 0.38% | |
| 9/30/14 | | | 12.03 | | | | 0.03 | | | | 2.11 | | | | 2.14 | | | | (0.02 | ) | | | - | | | | (0.02 | ) | | | 14.15 | | | | 17.78% | | | | 119 | | | | 1.41% | | | | 1.38% | | | | 0.24% | |
| 9/30/13 | | | 10.24 | | | | 0.05 | | | | 1.77 | | | | 1.82 | | | | (0.03 | ) | | | - | | | | (0.03 | ) | | | 12.03 | | | | 17.82% | | | | 70 | | | | 1.55% | | | | 1.46% | | | | 0.45% | |
| 9/30/12i | | | 8.70 | | | | 0.02 | | | | 1.54 | | | | 1.56 | | | | (0.02 | ) | | | - | | | | (0.02 | ) | | | 10.24 | | | | 17.92% | b | | | 94 | | | | 1.56% | a | | | 1.46% | a | | | 0.25% | a |
| 10/31/11 | | | 8.44 | | | | 0.01 | | | | 0.26 | | | | 0.27 | | | | (0.01 | ) | | | - | | | | (0.01 | ) | | | 8.70 | | | | 3.25% | | | | 329 | | | | 1.56% | | | | 1.46% | | | | 0.17% | |
247
MassMutual Premier Disciplined Growth Fund – Financial Statements (Continued)
Financial Highlights (For a share outstanding throughout each period)
| | | | | | | | | | | | | | | | | | | | | | | | | | | | | | | | | | | | | | | | | | | | | | | | | | | | |
| | | | | | Income (loss) from
investment operations | | | Less distributions to shareholders | | | | | | | | | Ratios / Supplemental Data | |
| | | Net
asset
value,
beginning
of the
period | | | Net
investment
income
(loss)c,j | | | Net
realized
and
unrealized
gain (loss)
on
investments | | | Total
income
(loss) from
investment
operations | | | From net
investment
income | | | From net
realized
gains | | | Total
distributions | | | Net
asset
value,
end of
the
period | | | Total
returnl,m | | | Net
assets,
end of
the
period
(000’s) | | | Ratio of
expenses
to average
daily net
assets
before
expense
waivers | | | Ratio of
expenses
to average
daily net
assets
after
expense
waiversj | | | Net
investment
income
(loss) to
average
daily net
assets | |
Class I | | | | | | | | | | | | | | | | | | | | | | | | | | | | | | | | | | | | | | | | | | | | | | | | | | | | |
| 9/30/16 | | $ | 11.37 | | | $ | 0.14 | | | $ | 1.17 | | | $ | 1.31 | | | $ | (0.14 | ) | | $ | (0.85 | ) | | $ | (0.99 | ) | | $ | 11.69 | | | | 11.94% | | | $ | 107,336 | | | | 0.51% | | | | N/A | | | | 1.22% | |
| 9/30/15 | | | 12.87 | | | | 0.15 | | | | 0.04 | | | | 0.19 | | | | (0.14 | ) | | | (1.55 | ) | | | (1.69 | ) | | | 11.37 | | | | 1.30% | | | | 184,981 | | | | 0.50% | | | | N/A | | | | 1.21% | |
| 9/30/14gg | | | 12.13 | | | | 0.07 | | | | 0.67 | | | | 0.74 | | | | - | | | | - | | | | - | | | | 12.87 | | | | 6.18% | b | | | 182,512 | | | | 0.50% | a | | | N/A | | | | 1.14% | a |
Class R5 | | | | | | | | | | | | | | | | | | | | | | | | | | | | | | | | | | | | | | | | | | | | | |
| 9/30/16 | | $ | 11.38 | | | $ | 0.13 | | | $ | 1.16 | | | $ | 1.29 | | | $ | (0.13 | ) | | $ | (0.85 | ) | | $ | (0.98 | ) | | $ | 11.69 | | | | 11.70% | | | $ | 76,893 | | | | 0.61% | | | | N/A | | | | 1.12% | |
| 9/30/15 | | | 12.88 | | | | 0.14 | | | | 0.04 | | | | 0.18 | | | | (0.13 | ) | | | (1.55 | ) | | | (1.68 | ) | | | 11.38 | | | | 1.29% | | | | 85,630 | | | | 0.60% | | | | N/A | | | | 1.12% | |
| 9/30/14 | | | 13.26 | | | | 0.15 | | | | 2.17 | | | | 2.32 | | | | (0.16 | ) | | | (2.54 | ) | | | (2.70 | ) | | | 12.88 | | | | 19.60% | | | | 110,762 | | | | 0.57% | | | | N/A | | | | 1.16% | |
| 9/30/13 | | | 11.17 | | | | 0.18 | | | | 2.11 | | | | 2.29 | | | | (0.17 | ) | | | (0.03 | ) | | | (0.20 | ) | | | 13.26 | | | | 20.83% | | | | 209,795 | | | | 0.56% | | | | 0.53% | | | | 1.50% | |
| 9/30/12i | | | 9.67 | | | | 0.14 | | | | 1.46 | | | | 1.60 | | | | (0.10 | ) | | | - | | | | (0.10 | ) | | | 11.17 | | | | 16.92% | b | | | 211,276 | | | | 0.57% | a | | | 0.52% | a | | | 1.50% | a |
| 10/31/11 | | | 8.90 | | | | 0.10 | | | | 0.77 | | | | 0.87 | | | | (0.10 | ) | | | - | | | | (0.10 | ) | | | 9.67 | | | | 9.81% | | | | 176,486 | | | | 0.57% | | | | 0.55% | | | | 1.03% | |
Service Class | | | | | | | | | | | | | | | | | | | | | | | | | | | | | | | | | | | | | | | | | | | | | |
| 9/30/16 | | $ | 11.40 | | | $ | 0.12 | | | $ | 1.16 | | | $ | 1.28 | | | $ | (0.12 | ) | | $ | (0.85 | ) | | $ | (0.97 | ) | | $ | 11.71 | | | | 11.58% | | | $ | 80,551 | | | | 0.71% | | | | N/A | | | | 1.02% | |
| 9/30/15 | | | 12.90 | | | | 0.12 | | | | 0.05 | | | | 0.17 | | | | (0.12 | ) | | | (1.55 | ) | | | (1.67 | ) | | | 11.40 | | | | 1.19% | | | | 87,882 | | | | 0.70% | | | | N/A | | | | 1.02% | |
| 9/30/14 | | | 13.28 | | | | 0.13 | | | | 2.18 | | | | 2.31 | | | | (0.15 | ) | | | (2.54 | ) | | | (2.69 | ) | | | 12.90 | | | | 19.45% | | | | 86,743 | | | | 0.67% | | | | N/A | | | | 1.02% | |
| 9/30/13 | | | 11.19 | | | | 0.17 | | | | 2.11 | | | | 2.28 | | | | (0.16 | ) | | | (0.03 | ) | | | (0.19 | ) | | | 13.28 | | | | 20.79% | | | | 64,469 | | | | 0.65% | | | | 0.62% | | | | 1.42% | |
| 9/30/12i | | | 9.68 | | | | 0.13 | | | | 1.48 | | | | 1.61 | | | | (0.10 | ) | | | - | | | | (0.10 | ) | | | 11.19 | | | | 16.81% | b | | | 57,792 | | | | 0.66% | a | | | 0.61% | a | | | 1.40% | a |
| 10/31/11 | | | 8.91 | | | | 0.10 | | | | 0.77 | | | | 0.87 | | | | (0.10 | ) | | | - | | | | (0.10 | ) | | | 9.68 | | | | 9.62% | | | | 49,364 | | | | 0.63% | | | | 0.61% | | | | 1.01% | |
| | | | | | | | | | | | | | | | | | | | | | | | |
| | | Year ended September 30 | | | Period ended
September 30, 2012b,i | | | Year ended
October 31 | |
| | | 2016 | | | 2015 | | | 2014 | | | 2013 | | | | | | 2011 | |
Portfolio turnover rate | | | 124 | % | | | 138 | % | | | 142 | % | | | 153 | % | | | 142 | % | | | 134 | % |
| b | Percentage represents the results for the period and is not annualized. |
| c | Per share amount calculated on the average shares method. |
| i | For the period November 1, 2011 through September 30, 2012. |
| j | Computed after giving effect to an agreement by MML Advisers and/or MassMutual to waive certain fees and expenses of the Fund. |
| k | Amount waived had no impact on the ratio of expenses to average daily net assets. |
| l | Employee retirement benefit plans that invest plan assets in the Separate Investment Accounts (SIAs) may be subject to certain charges as set forth in their respective Plan Documents. Total return figures would be lower for the periods presented if they reflected these charges. |
| m | Total return excludes sales charges, if any, and would be lower for the period presented if it reflected these charges. |
| gg | For the period April 1, 2014 (commencement of operations) through September 30, 2014. |
The accompanying notes are an integral part of the financial statements.
248
| | | | | | | | | | | | | | | | | | | | | | | | | | | | | | | | | | | | | | | | | | | | | | | | | | | | |
| | | | | | Income (loss) from
investment operations | | | Less distributions to shareholders | | | | | | | | | Ratios / Supplemental Data | |
| | | Net
asset
value,
beginning
of the
period | | | Net
investment
income
(loss)c,j | | | Net
realized
and
unrealized
gain (loss)
on
investments | | | Total
income
(loss) from
investment
operations | | | From net
investment
income | | | From net
realized
gains | | | Total
distributions | | | Net
asset
value,
end of
the
period | | | Total
returnl,m | | | Net
assets,
end of
the
period
(000’s) | | | Ratio of
expenses
to average
daily net
assets
before
expense
waivers | | | Ratio of
expenses
to average
daily net
assets
after
expense
waiversj | | | Net
investment
income
(loss) to
average
daily net
assets | |
Administrative Class | | | | | | | | | | | | | | | | | | | | | | | | | | | | | | | | | | | | | | | | | | | | | |
| 9/30/16 | | $ | 11.48 | | | $ | 0.10 | | | $ | 1.19 | | | $ | 1.29 | | | $ | (0.11 | ) | | $ | (0.85 | ) | | $ | (0.96 | ) | | $ | 11.81 | | | | 11.57% | | | $ | 38,399 | | | | 0.81% | | | | N/A | | | | 0.91% | |
| 9/30/15 | | | 12.98 | | | | 0.11 | | | | 0.04 | | | | 0.15 | | | | (0.10 | ) | | | (1.55 | ) | | | (1.65 | ) | | | 11.48 | | | | 1.08% | | | | 33,634 | | | | 0.80% | | | | N/A | | | | 0.91% | |
| 9/30/14 | | | 13.35 | | | | 0.12 | | | | 2.19 | | | | 2.31 | | | | (0.14 | ) | | | (2.54 | ) | | | (2.68 | ) | | | 12.98 | | | | 19.33% | | | | 24,252 | | | | 0.79% | | | | N/A | | | | 0.92% | |
| 9/30/13 | | | 11.26 | | | | 0.15 | | | | 2.12 | | | | 2.27 | | | | (0.15 | ) | | | (0.03 | ) | | | (0.18 | ) | | | 13.35 | | | | 20.58% | | | | 20,092 | | | | 0.78% | | | | 0.75% | | | | 1.23% | |
| 9/30/12i | | | 9.65 | | | | 0.12 | | | | 1.49 | | | | 1.61 | | | | - | | | | - | | | | - | | | | 11.26 | | | | 16.68% | b | | | 8,593 | | | | 0.80% | a | | | 0.75% | a | | | 1.22% | a |
| 10/31/11 | | | 8.88 | | | | 0.09 | | | | 0.76 | | | | 0.85 | | | | (0.08 | ) | | | - | | | | (0.08 | ) | | | 9.65 | | | | 9.50% | | | �� | 512 | | | | 0.76% | | | | 0.76%k | | | | 0.97% | |
Class A | | | | | | | | | | | | | | | | | | | | | | | | | | | | | | | | | | | | | | | | | |
| 9/30/16 | | $ | 11.23 | | | $ | 0.07 | | | $ | 1.15 | | | $ | 1.22 | | | $ | (0.07 | ) | | $ | (0.85 | ) | | $ | (0.92 | ) | | $ | 11.53 | | | | 11.23% | | | $ | 38,743 | | | | 1.06% | | | | N/A | | | | 0.67% | |
| 9/30/15 | | | 12.74 | | | | 0.08 | | | | 0.04 | | | | 0.12 | | | | (0.08 | ) | | | (1.55 | ) | | | (1.63 | ) | | | 11.23 | | | | 0.78% | | | | 38,035 | | | | 1.05% | | | | N/A | | | | 0.66% | |
| 9/30/14 | | | 13.15 | | | | 0.08 | | | | 2.16 | | | | 2.24 | | | | (0.11 | ) | | | (2.54 | ) | | | (2.65 | ) | | | 12.74 | | | | 19.02% | | | | 35,193 | | | | 1.04% | | | | N/A | | | | 0.66% | |
| 9/30/13 | | | 11.10 | | | | 0.12 | | | | 2.09 | | | | 2.21 | | | | (0.13 | ) | | | (0.03 | ) | | | (0.16 | ) | | | 13.15 | | | | 20.27% | | | | 19,445 | | | | 1.04% | | | | 1.01% | | | | 1.03% | |
| 9/30/12i | | | 9.60 | | | | 0.10 | | | | 1.46 | | | | 1.56 | | | | (0.06 | ) | | | - | | | | (0.06 | ) | | | 11.10 | | | | 16.37% | b | | | 14,686 | | | | 1.05% | a | | | 1.00% | a | | | 1.00% | a |
| 10/31/11 | | | 8.84 | | | | 0.06 | | | | 0.76 | | | | 0.82 | | | | (0.06 | ) | | | - | | | | (0.06 | ) | | | 9.60 | | | | 9.33% | | | | 6,587 | | | | 1.03% | | | | 1.01% | | | | 0.61% | |
Class R4 | | | | | | | | | | | | | | | | | | | | | | | | | | | | | | | | | | | | | | | | | | | | | | | | | | | | |
| 9/30/16 | | $ | 11.23 | | | $ | 0.08 | | | $ | 1.16 | | | $ | 1.24 | | | $ | (0.12 | ) | | $ | (0.85 | ) | | $ | (0.97 | ) | | $ | 11.50 | | | | 11.38% | | | $ | 14,016 | | | | 0.96% | | | | N/A | | | | 0.75% | |
| 9/30/15 | | | 12.74 | | | | 0.09 | | | | 0.05 | | | | 0.14 | | | | (0.10 | ) | | | (1.55 | ) | | | (1.65 | ) | | | 11.23 | | | | 0.94% | | | | 6,003 | | | | 0.95% | | | | N/A | | | | 0.78% | |
| 9/30/14gg | | | 12.03 | | | | 0.04 | | | | 0.67 | | | | 0.71 | | | | - | | | | - | | | | - | | | | 12.74 | | | | 5.90% | b | | | 106 | | | | 0.95% | a | | | N/A | | | | 0.68% | a |
Class R3 | | | | | | | | | | | | | | | | | | | | | | | | | | | | | | | | | | | | | | | | | | | | | | | | | | | | |
| 9/30/16 | | $ | 11.21 | | | $ | 0.06 | | | $ | 1.14 | | | $ | 1.20 | | | $ | (0.11 | ) | | $ | (0.85 | ) | | $ | (0.96 | ) | | $ | 11.45 | | | | 11.01% | | | $ | 3,159 | | | | 1.21% | | | | N/A | | | | 0.55% | |
| 9/30/15 | | | 12.73 | | | | 0.06 | | | | 0.04 | | | | 0.10 | | | | (0.07 | ) | | | (1.55 | ) | | | (1.62 | ) | | | 11.21 | | | | 0.66% | | | | 3,637 | | | | 1.20% | | | | N/A | | | | 0.51% | |
| 9/30/14gg | | | 12.03 | | | | 0.03 | | | | 0.67 | | | | 0.70 | | | | - | | | | - | | | | - | | | | 12.73 | | | | 5.82% | b | | | 106 | | | | 1.20% | a | | | N/A | | | | 0.43% | a |
249
MassMutual Premier Small Cap Opportunities Fund – Financial Statements (Continued)
Financial Highlights (For a share outstanding throughout each period)
| | | | | | | | | | | | | | | | | | | | | | | | | | | | | | | | | | | | | | | | | | | | | | | | | | | | |
| | | | | | Income (loss) from investment
operations | | | Less distributions to shareholders | | | | | | | | |
Ratios / Supplemental Data | |
| | | Net asset
value,
beginning
of the
period | | | Net
investment
income
(loss)c,j | | | Net
realized
and
unrealized
gain
(loss) on
investments | | | Total
income
(loss) from
investment
operations | | | From net
investment
income | | | From net
realized
gains | | | Total
distributions | | | Net
asset
value,
end of
the
period | | | Total
returnl,m | | | Net
assets,
end of
the
period
(000’s) | | | Ratio of
expenses
to average
daily net
assets
before
expense
waivers | | | Ratio of
expenses
to average
daily net
assets
after
expense
waiversj | | | Net
investment
income
(loss) to
average
daily net
assets | |
Class I | | | | | | | | | | | | | | | | | | | | | | | | | | | | | | | | | | | | | | | | | | | | | | | | | | | | |
| 9/30/16 | | $ | 13.84 | | | $ | 0.17 | | | $ | 1.31 | | | $ | 1.48 | | | $ | (0.12 | ) | | $ | (1.39 | ) | | $ | (1.51 | ) | | $ | 13.81 | | | | 11.60% | | | $ | 3,642 | | | | 0.71% | | | | N/A | | | | 1.33% | |
| 9/30/15 | | | 15.78 | | | | 0.13 | | | | 0.44 | | | | 0.57 | | | | (0.17 | ) | | | (2.34 | ) | | | (2.51 | ) | | | 13.84 | | | | 2.63% | | | | 0 | f | | | 0.68% | | | | N/A | | | | 0.84% | |
| 9/30/14gg | | | 16.45 | | | | 0.39 | | | | (1.06 | ) | | | (0.67 | ) | | | - | | | | - | | | | - | | | | 15.78 | | | | (4.07% | )b | | | 4,801 | | | | 0.66% | a | | | N/A | | | | 4.79% | a |
| Class R5 | | | | | | | | | | | | | | | | | | | | | | | | | | | | | | | | | | | | | | | | | | | | | |
| 9/30/16 | | $ | 13.82 | | | $ | 0.15 | | | $ | 1.30 | | | $ | 1.45 | | | $ | (0.10 | ) | | $ | (1.39 | ) | | $ | (1.49 | ) | | $ | 13.78 | | | | 11.40% | | | $ | 61,310 | | | | 0.81% | | | | N/A | | | | 1.16% | |
| 9/30/15 | | | 15.77 | | | | 0.13 | | | | 0.41 | | | | 0.54 | | | | (0.15 | ) | | | (2.34 | ) | | | (2.49 | ) | | | 13.82 | | | | 2.44% | | | | 58,840 | | | | 0.79% | | | | N/A | | | | 0.82% | |
| 9/30/14 | | | 14.92 | | | | 0.17 | | | | 0.83 | | | | 1.00 | | | | (0.15 | ) | | | - | | | | (0.15 | ) | | | 15.77 | | | | 6.75% | | | | 73,288 | | | | 0.74% | | | | N/A | | | | 1.04% | |
| 9/30/13 | | | 11.03 | | | | 0.16 | | | | 3.86 | | | | 4.02 | | | | (0.13 | ) | | | - | | | | (0.13 | ) | | | 14.92 | | | | 36.88% | | | | 83,213 | | | | 0.73% | | | | 0.70% | | | | 1.23% | |
| 9/30/12i | | | 9.77 | | | | 0.09 | | | | 1.24 | | | | 1.33 | | | | (0.07 | ) | | | - | | | | (0.07 | ) | | | 11.03 | | | | 13.78% | b | | | 68,091 | | | | 0.78% | a | | | 0.69%a | | | | 1.00% | a |
| 10/31/11 | | | 9.15 | | | | 0.07 | | | | 0.62 | | | | 0.69 | | | | (0.07 | ) | | | - | | | | (0.07 | ) | | | 9.77 | | | | 7.53% | | | | 118,553 | | | | 0.76% | | | | 0.69% | | | | 0.74% | |
| Service Class | | | | | | | | | | | | | | | | | | | | | | | | | | | | | | | | | | | | | | | | | | | | | |
| 9/30/16 | | $ | 13.81 | | | $ | 0.14 | | | $ | 1.29 | | | $ | 1.43 | | | $ | (0.10 | ) | | $ | (1.39 | ) | | $ | (1.49 | ) | | $ | 13.75 | | | | 11.23% | | | $ | 13,313 | | | | 0.91% | | | | N/A | | | | 1.08% | |
| 9/30/15 | | | 15.76 | | | | 0.11 | | | | 0.43 | | | | 0.54 | | | | (0.15 | ) | | | (2.34 | ) | | | (2.49 | ) | | | 13.81 | | | | 2.41% | | | | 6,927 | | | | 0.89% | | | | N/A | | | | 0.73% | |
| 9/30/14 | | | 14.92 | | | | 0.16 | | | | 0.82 | | | | 0.98 | | | | (0.14 | ) | | | - | | | | (0.14 | ) | | | 15.76 | | | | 6.60% | | | | 6,865 | | | | 0.84% | | | | N/A | | | | 0.98% | |
| 9/30/13 | | | 11.03 | | | | 0.14 | | | | 3.88 | | | | 4.02 | | | | (0.13 | ) | | | - | | | | (0.13 | ) | | | 14.92 | | | | 36.79% | | | | 2,627 | | | | 0.83% | | | | 0.80% | | | | 1.15% | |
| 9/30/12i | | | 9.76 | | | | 0.09 | | | | 1.23 | | | | 1.32 | | | | (0.05 | ) | | | - | | | | (0.05 | ) | | | 11.03 | | | | 13.65% | b | | | 3,299 | | | | 0.88% | a | | | 0.79%a | | | | 0.94% | a |
| 10/31/11 | | | 9.14 | | | | 0.06 | | | | 0.62 | | | | 0.68 | | | | (0.06 | ) | | | - | | | | (0.06 | ) | | | 9.76 | | | | 7.45% | | | | 1,972 | | | | 0.86% | | | | 0.79% | | | | 0.63% | |
| | | | | | | | | | | | | | | | | | | | | | | | |
| | | Year ended September 30 | | | Period ended
September 30, 2012b,i | | | Year ended
October 31 | |
| | | 2016 | | | 2015 | | | 2014 | | | 2013 | | | | | | 2011 | |
Portfolio turnover rate | | | 57 | % | | | 52 | % | | | 66 | % | | | 91 | % | | | 79 | %q | | | 96 | % |
| b | Percentage represents the results for the period and is not annualized. |
| c | Per share amount calculated on the average shares method. |
| f | Amount is less than $500. |
| i | For the period November 1, 2011 through September 30, 2012. |
| j | Computed after giving effect to an agreement by MML Advisers and/or MassMutual to waive certain fees and expenses of the Fund. |
| l | Employee retirement benefit plans that invest plan assets in the Separate Investment Accounts (SIAs) may be subject to certain charges as set forth in their respective Plan Documents. Total return figures would be lower for the periods presented if they reflected these charges. |
| m | Total return excludes sales charges, if any, and would be lower for the period presented if it reflected these charges. |
| q | Portfolio turnover rate excludes securities sold from redemptions in-kind. Securities sold from redemptions in-kind had no impact on portfolio turnover rate. |
| gg | For the period April 1, 2014 (commencement of operations) through September 30, 2014. |
The accompanying notes are an integral part of the financial statements.
250
| | | | | | | | | | | | | | | | | | | | | | | | | | | | | | | | | | | | | | | | | | | | | | | | | | | | |
| | | | | | Income (loss) from investment
operations | | | Less distributions to shareholders | | | | | | | | |
Ratios / Supplemental Data | |
| | | Net asset
value,
beginning
of the
period | | | Net
investment
income
(loss)c,j | | | Net
realized
and
unrealized
gain
(loss) on
investments | | | Total
income
(loss) from
investment
operations | | | From net
investment
income | | | From net
realized
gains | | | Total
distributions | | | Net
asset
value,
end of
the
period | | | Total
returnl,m | | | Net
assets,
end of
the
period
(000’s) | | | Ratio of
expenses
to average
daily net
assets
before
expense
waivers | | | Ratio of
expenses
to average
daily net
assets
after
expense
waiversj | | | Net
investment
income
(loss) to
average
daily net
assets | |
| Administrative Class | | | | | | | | | | | | | | | | | | | | | | | | | | | | | | | | | | | | | | | | | | | | | |
| 9/30/16 | | $ | 13.72 | | | $ | 0.12 | | | $ | 1.29 | | | $ | 1.41 | | | $ | (0.06 | ) | | $ | (1.39 | ) | | $ | (1.45 | ) | | $ | 13.68 | | | | 11.17% | | | $ | 17,641 | | | | 1.01% | | | | N/A | | | | 0.94% | |
| 9/30/15 | | | 15.68 | | | | 0.10 | | | | 0.41 | | | | 0.51 | | | | (0.13 | ) | | | (2.34 | ) | | | (2.47 | ) | | | 13.72 | | | | 2.25% | | | | 18,171 | | | | 0.99% | | | | N/A | | | | 0.64% | |
| 9/30/14 | | | 14.84 | | | | 0.14 | | | | 0.83 | | | | 0.97 | | | | (0.13 | ) | | | - | | | | (0.13 | ) | | | 15.68 | | | | 6.55% | | | | 17,595 | | | | 0.95% | | | | N/A | | | | 0.86% | |
| 9/30/13 | | | 10.98 | | | | 0.13 | | | | 3.85 | | | | 3.98 | | | | (0.12 | ) | | | - | | | | (0.12 | ) | | | 14.84 | | | | 36.60% | | | | 9,661 | | | | 0.93% | | | | 0.90% | | | | 1.02% | |
| 9/30/12i | | | 9.72 | | | | 0.08 | | | | 1.23 | | | | 1.31 | | | | (0.05 | ) | | | - | | | | (0.05 | ) | | | 10.98 | | | | 13.60% | b | | | 5,928 | | | | 0.98% | a | | | 0.89%a | | | | 0.83% | a |
| 10/31/11 | | | 9.08 | | | | 0.05 | | | | 0.62 | | | | 0.67 | | | | (0.03 | ) | | | - | | | | (0.03 | ) | | | 9.72 | | | | 7.37% | | | | 2,534 | | | | 0.96% | | | | 0.89% | | | | 0.54% | |
| Class A | | | | | | | | | | | | | | | | | | | | | | | | | | | | | | | | | | | | | | | | | | | | | |
| 9/30/16 | | $ | 13.49 | | | $ | 0.09 | | | $ | 1.26 | | | $ | 1.35 | | | $ | (0.03 | ) | | $ | (1.39 | ) | | $ | (1.42 | ) | | $ | 13.42 | | | | 10.88% | | | $ | 69,495 | | | | 1.26% | | | | N/A | | | | 0.70% | |
| 9/30/15 | | | 15.43 | | | | 0.06 | | | | 0.42 | | | | 0.48 | | | | (0.08 | ) | | | (2.34 | ) | | | (2.42 | ) | | | 13.49 | | | | 2.04% | | | | 66,359 | | | | 1.24% | | | | N/A | | | | 0.38% | |
| 9/30/14 | | | 14.62 | | | | 0.09 | | | | 0.81 | | | | 0.90 | | | | (0.09 | ) | | | - | | | | (0.09 | ) | | | 15.43 | | | | 6.19% | | | | 70,281 | | | | 1.19% | | | | N/A | | | | 0.60% | |
| 9/30/13 | | | 10.80 | | | | 0.10 | | | | 3.80 | | | | 3.90 | | | | (0.08 | ) | | | - | | | | (0.08 | ) | | | 14.62 | | | | 36.40% | | | | 77,201 | | | | 1.18% | | | | 1.15% | | | | 0.77% | |
| 9/30/12i | | | 9.56 | | | | 0.05 | | | | 1.21 | | | | 1.26 | | | | (0.02 | ) | | | - | | | | (0.02 | ) | | | 10.80 | | | | 13.25% | b | | | 58,551 | | | | 1.23% | a | | | 1.14%a | | | | 0.50% | a |
| 10/31/11 | | | 8.95 | | | | 0.03 | | | | 0.61 | | | | 0.64 | | | | (0.03 | ) | | | - | | | | (0.03 | ) | | | 9.56 | | | | 7.13% | | | | 58,004 | | | | 1.21% | | | | 1.14% | | | | 0.30% | |
Class R4 | | | | | | | | | | | | | | | | | | | | | | | | | | | | | | | | | | | | | | | | | | | | | | | | | | | | |
| 9/30/16 | | $ | 13.48 | | | $ | 0.10 | | | $ | 1.27 | | | $ | 1.37 | | | $ | (0.10 | ) | | $ | (1.39 | ) | | $ | (1.49 | ) | | $ | 13.36 | | | | 11.06% | | | $ | 4,467 | | | | 1.16% | | | | N/A | | | | 0.75% | |
| 9/30/15 | | | 15.44 | | | | 0.12 | | | | 0.38 | | | | 0.50 | | | | (0.12 | ) | | | (2.34 | ) | | | (2.46 | ) | | | 13.48 | | | | 2.17% | | | | 571 | | | | 1.14% | | | | N/A | | | | 0.84% | |
| 9/30/14gg | | | 16.14 | | | | 0.04 | | | | (0.74 | ) | | | (0.70 | ) | | | - | | | | - | | | | - | | | | 15.44 | | | | (4.34% | )b | | | 96 | | | | 1.11% | a | | | N/A | | | | 0.46% | a |
Class R3 | | | | | | | | | | | | | | | | | | | | | | | | | | | | | | | | | | | | | | | | | | | | | | | | | | | | |
| 9/30/16 | | $ | 13.46 | | | $ | 0.07 | | | $ | 1.25 | | | $ | 1.32 | | | $ | (0.07 | ) | | $ | (1.39 | ) | | $ | (1.46 | ) | | $ | 13.32 | | | | 10.72% | | | $ | 5,524 | | | | 1.41% | | | | N/A | | | | 0.51% | |
| 9/30/15 | | | 15.42 | | | | 0.07 | | | | 0.40 | | | | 0.47 | | | | (0.09 | ) | | | (2.34 | ) | | | (2.43 | ) | | | 13.46 | | | | 1.97% | | | | 1,245 | | | | 1.39% | | | | N/A | | | | 0.45% | |
| 9/30/14gg | | | 16.14 | | | | 0.02 | | | | (0.74 | ) | | | (0.72 | ) | | | - | | | | - | | | | - | | | | 15.42 | | | | (4.46% | )b | | | 96 | | | | 1.36% | a | | | N/A | | | | 0.21% | a |
251
MassMutual Premier Global Fund – Financial Statements (Continued)
Financial Highlights (For a share outstanding throughout each period)
| | | | | | | | | | | | | | | | | | | | | | | | | | | | | | | | | | | | | | | | | | | | | | | | | | | | |
| | | | | | Income (loss) from investment
operations | | | Less distributions to shareholders | | | | | | | | | Ratios / Supplemental Data | |
| | | Net
asset
value,
beginning
of the
period | | | Net
investment
income
(loss)c,j | | | Net
realized
and
unrealized
gain (loss)
on
investments | | | Total
income
(loss) from
investment
operations | | | From net
investment
income | | | From net
realized
gains | | | Total
distributions | | | Net
asset
value,
end of
the
period | | | Total
returnl,m | | | Net
assets,
end of
the
period
(000’s) | | | Ratio of
expenses
to average
daily net
assets
before
expense
waivers | | | Ratio of
expenses
to average
daily net
assets
after
expense
waiversj | | | Net
investment
income
(loss) to
average
daily net
assets | |
Class I | | | | | | | | | | | | | | | | | | | | | | | | | | | | | | | | | | | | | | | | | | | | | | | | | | | | |
| 9/30/16 | | $ | 13.94 | | | $ | 0.11 | | | $ | 0.66 | | | $ | 0.77 | | | $ | (0.14 | ) | | $ | (1.10 | ) | | $ | (1.24 | ) | | $ | 13.47 | | | | 5.50% | | | $ | 16,576 | | | | 0.85% | | | | N/A | | | | 0.85% | |
| 9/30/15 | | | 15.11 | | | | 0.18 | | | | (0.46 | ) | | | (0.28 | ) | | | (0.19 | ) | | | (0.70 | ) | | | (0.89 | ) | | | 13.94 | | | | (1.92% | ) | | | 1,044 | | | | 0.84% | | | | N/A | | | | 1.16% | |
| 9/30/14gg | | | 14.85 | | | | 0.13 | | | | 0.13 | | | | 0.26 | | | | - | | | | - | | | | - | | | | 15.11 | | | | 1.75% | b | | | 102 | | | | 0.84% | a | | | N/A | | | | 1.75% | a |
Class R5 | | | | | | | | | | | | | | | | | | | | | | | | | | | | | | | | | | | | | | | | | | | | | |
| 9/30/16 | | $ | 13.93 | | | $ | 0.12 | | | $ | 0.63 | | | $ | 0.75 | | | $ | (0.12 | ) | | $ | (1.10 | ) | | $ | (1.22 | ) | | $ | 13.46 | | | | 5.37% | | | $ | 125,171 | | | | 0.95% | | | | N/A | | | | 0.89% | |
| 9/30/15 | | | 15.11 | | | | 0.15 | | | | (0.46 | ) | | | (0.31 | ) | | | (0.17 | ) | | | (0.70 | ) | | | (0.87 | ) | | | 13.93 | | | | (2.07% | ) | | | 166,316 | | | | 0.94% | | | | N/A | | | | 0.99% | |
| 9/30/14 | | | 13.99 | | | | 0.15 | | | | 1.25 | | | | 1.40 | | | | (0.16 | ) | | | (0.12 | ) | | | (0.28 | ) | | | 15.11 | | | | 10.18% | | | | 206,074 | | | | 0.99% | | | | 0.91% | | | | 0.99% | |
| 9/30/13 | | | 11.19 | | | | 0.16 | | | | 2.79 | | | | 2.95 | | | | (0.15 | ) | | | - | | | | (0.15 | ) | | | 13.99 | | | | 26.55% | | | | 213,577 | | | | 1.05% | | | | 0.89% | | | | 1.28% | |
| 9/30/12i | | | 10.55 | | | | 0.14 | | | | 0.65 | | | | 0.79 | | | | (0.15 | ) | | | - | | | | (0.15 | ) | | | 11.19 | | | | 7.74% | b | | | 195,534 | | | | 1.05% | a | | | 0.89% | a | | | 1.44% | a |
| 10/31/11 | | | 10.67 | | | | 0.14 | | | | (0.10 | ) | | | 0.04 | | | | (0.16 | ) | | | - | | | | (0.16 | ) | | | 10.55 | | | | 0.37% | | | | 202,981 | | | | 1.04% | | | | 0.89% | | | | 1.27% | |
Service Class | | | | | | | | | | | | | | | | | | | | | | | | | | | | | | | | | | | | | | | | | | | | | |
| 9/30/16 | | $ | 13.83 | | | $ | 0.11 | | | $ | 0.62 | | | $ | 0.73 | | | $ | (0.11 | ) | | $ | (1.10 | ) | | $ | (1.21 | ) | | $ | 13.35 | | | | 5.28% | | | $ | 28,699 | | | | 1.05% | | | | N/A | | | | 0.87% | |
| 9/30/15 | | | 15.01 | | | | 0.14 | | | | (0.46 | ) | | | (0.32 | ) | | | (0.16 | ) | | | (0.70 | ) | | | (0.86 | ) | | | 13.83 | | | | (2.15% | ) | | | 30,582 | | | | 1.04% | | | | N/A | | | | 0.95% | |
| 9/30/14 | | | 13.90 | | | | 0.15 | | | | 1.22 | | | | 1.37 | | | | (0.14 | ) | | | (0.12 | ) | | | (0.26 | ) | | | 15.01 | | | | 9.96% | | | | 14,038 | | | | 1.05% | | | | 1.03% | | | | 0.99% | |
| 9/30/13 | | | 11.12 | | | | 0.14 | | | | 2.78 | | | | 2.92 | | | | (0.14 | ) | | | - | | | | (0.14 | ) | | | 13.90 | | | | 26.47% | | | | 8,558 | | | | 1.08% | | | | 1.03% | | | | 1.13% | |
| 9/30/12i | | | 10.48 | | | | 0.12 | | | | 0.65 | | | | 0.77 | | | | (0.13 | ) | | | - | | | | (0.13 | ) | | | 11.12 | | | | 7.58% | b | | | 7,389 | | | | 1.08% | a | | | 1.03% | a | | | 1.29% | a |
| 10/31/11 | | | 10.61 | | | | 0.13 | | | | (0.10 | ) | | | 0.03 | | | | (0.16 | ) | | | - | | | | (0.16 | ) | | | 10.48 | | | | 0.21% | | | | 7,000 | | | | 1.07% | | | | 1.03% | | | | 1.13% | |
| | | | | | | | | | | | | | | | | | | | | | | | |
| | | Year ended September 30 | | | Period ended
September 30, 2012b,i | | | Year ended
October 31 | |
| | | 2016 | | | 2015 | | | 2014 | | | 2013 | | | | | | 2011 | |
Portfolio turnover rate | | | 25 | % | | | 32 | % | | | 27 | % | | | 28 | % | | | 27 | % | | | 26 | % |
| b | Percentage represents the results for the period and is not annualized. |
| c | Per share amount calculated on the average shares method. |
| i | For the period November 1, 2011 through September 30, 2012. |
| j | Computed after giving effect to an agreement by MML Advisers and/or MassMutual to waive certain fees and expenses of the Fund. |
| l | Employee retirement benefit plans that invest plan assets in the Separate Investment Accounts (SIAs) may be subject to certain charges as set forth in their respective Plan Documents. Total return figures would be lower for the periods presented if they reflected these charges. |
| m | Total return excludes sales charges, if any, and would be lower for the period presented if it reflected these charges. |
| gg | For the period April 1, 2014 (commencement of operations) through September 30, 2014. |
The accompanying notes are an integral part of the financial statements.
252
| | | | | | | | | | | | | | | | | | | | | | | | | | | | | | | | | | | | | | | | | | | | | | | | | | | | |
| | | | | | Income (loss) from investment
operations | | | Less distributions to shareholders | | | | | | | | | Ratios / Supplemental Data | |
| | | Net
asset
value,
beginning
of the
period | | | Net
investment
income
(loss)c,j | | | Net
realized
and
unrealized
gain (loss)
on
investments | | | Total
income
(loss) from
investment
operations | | | From net
investment
income | | | From net
realized
gains | | | Total
distributions | | | Net
asset
value,
end of
the
period | | | Total
returnl,m | | | Net
assets,
end of
the
period
(000’s) | | | Ratio of
expenses
to average
daily net
assets
before
expense
waivers | | | Ratio of
expenses
to average
daily net
assets
after
expense
waiversj | | | Net
investment
income
(loss) to
average
daily net
assets | |
Administrative Class | | | | | | | | | | | | | | | | | | | | | | | | | | | | | | | | | | | | | | | | | | | | | |
| 9/30/16 | | $ | 13.91 | | | $ | 0.09 | | | $ | 0.63 | | | $ | 0.72 | | | $ | (0.09 | ) | | $ | (1.10 | ) | | $ | (1.19 | ) | | $ | 13.44 | | | | 5.15% | | | $ | 99,085 | | | | 1.15% | | | | N/A | | | | 0.68% | |
| 9/30/15 | | | 15.08 | | | | 0.12 | | | | (0.45 | ) | | | (0.33 | ) | | | (0.14 | ) | | | (0.70 | ) | | | (0.84 | ) | | | 13.91 | | | | (2.23% | ) | | | 120,753 | | | | 1.14% | | | | N/A | | | | 0.79% | |
| 9/30/14 | | | 13.96 | | | | 0.11 | | | | 1.25 | | | | 1.36 | | | | (0.12 | ) | | | (0.12 | ) | | | (0.24 | ) | | | 15.08 | | | | 9.87% | | | | 136,272 | | | | 1.18% | | | | 1.14% | | | | 0.77% | |
| 9/30/13 | | | 11.17 | | | | 0.13 | | | | 2.79 | | | | 2.92 | | | | (0.13 | ) | | | - | | | | (0.13 | ) | | | 13.96 | | | | 26.30% | | | | 128,755 | | | | 1.23% | | | | 1.14% | | | | 1.01% | |
| 9/30/12i | | | 10.53 | | | | 0.11 | | | | 0.65 | | | | 0.76 | | | | (0.12 | ) | | | - | | | | (0.12 | ) | | | 11.17 | | | | 7.42% | b | | | 109,534 | | | | 1.23% | a | | | 1.14% | a | | | 1.19% | a |
| 10/31/11 | | | 10.64 | | | | 0.11 | | | | (0.08 | ) | | | 0.03 | | | | (0.14 | ) | | | - | | | | (0.14 | ) | | | 10.53 | | | | 0.11% | | | | 118,025 | | | | 1.22% | | | | 1.14% | | | | 1.03% | |
Class A | | | | | | | | | | | | | | | | | | | | | | | | | | | | | | | | | | | | | | | | | | | | | |
| 9/30/16 | | $ | 13.77 | | | $ | 0.06 | | | $ | 0.61 | | | $ | 0.67 | | | $ | (0.05 | ) | | $ | (1.10 | ) | | $ | (1.15 | ) | | $ | 13.29 | | | | 4.85% | | | $ | 32,200 | | | | 1.40% | | | | N/A | | | | 0.44% | |
| 9/30/15 | | | 14.92 | | | | 0.08 | | | | (0.44 | ) | | | (0.36 | ) | | | (0.09 | ) | | | (0.70 | ) | | | (0.79 | ) | | | 13.77 | | | | (2.44% | ) | | | 40,690 | | | | 1.39% | | | | N/A | | | | 0.54% | |
| 9/30/14 | | | 13.82 | | | | 0.07 | | | | 1.24 | | | | 1.31 | | | | (0.09 | ) | | | (0.12 | ) | | | (0.21 | ) | | | 14.92 | | | | 9.54% | | | | 46,399 | | | | 1.43% | | | | 1.41% | | | | 0.48% | |
| 9/30/13 | | | 11.06 | | | | 0.09 | | | | 2.76 | | | | 2.85 | | | | (0.09 | ) | | | - | | | | (0.09 | ) | | | 13.82 | | | | 25.94% | | | | 48,500 | | | | 1.48% | | | | 1.43% | | | | 0.72% | |
| 9/30/12i | | | 10.42 | | | | 0.09 | | | | 0.64 | | | | 0.73 | | | | (0.09 | ) | | | - | | | | (0.09 | ) | | | 11.06 | | | | 7.11% | b | | | 41,351 | | | | 1.48% | a | | | 1.43% | a | | | 0.92% | a |
| 10/31/11 | | | 10.54 | | | | 0.08 | | | | (0.09 | ) | | | (0.01 | ) | | | (0.11 | ) | | | - | | | | (0.11 | ) | | | 10.42 | | | | (0.11% | ) | | | 37,485 | | | | 1.47% | | | | 1.43% | | | | 0.73% | |
Class R4 | | | | | | | | | | | | | | | | | | | | | | | | | | | | | | | | | | | | | | | | | | | | | | | | | | | | |
| 9/30/16 | | $ | 13.74 | | | $ | 0.09 | | | $ | 0.61 | | | $ | 0.70 | | | $ | (0.13 | ) | | $ | (1.10 | ) | | $ | (1.23 | ) | | $ | 13.21 | | | | 5.05% | | | $ | 4,322 | | | | 1.30% | | | | N/A | | | | 0.73% | |
| 9/30/15 | | | 14.93 | | | | 0.12 | | | | (0.48 | ) | | | (0.36 | ) | | | (0.13 | ) | | | (0.70 | ) | | | (0.83 | ) | | | 13.74 | | | | (2.44% | ) | | | 729 | | | | 1.29% | | | | N/A | | | | 0.79% | |
| 9/30/14gg | | | 14.70 | | | | 0.10 | | | | 0.13 | | | | 0.23 | | | | - | | | | - | | | | - | | | | 14.93 | | | | 1.56% | b | | | 102 | | | | 1.29% | a | | | N/A | | | | 1.30% | a |
Class R3 | | | | | | | | | | | | | | | | | | | | | | | | | | | | | | | | | | | | | | | | | | | | | |
| 9/30/16 | | $ | 13.79 | | | $ | 0.05 | | | $ | 0.61 | | | $ | 0.66 | | | $ | (0.08 | ) | | $ | (1.10 | ) | | $ | (1.18 | ) | | $ | 13.27 | | | | 4.78% | | | $ | 8,702 | | | | 1.55% | | | | N/A | | | | 0.42% | |
| 9/30/15 | | | 14.97 | | | | 0.05 | | | | (0.43 | ) | | | (0.38 | ) | | | (0.10 | ) | | | (0.70 | ) | | | (0.80 | ) | | | 13.79 | | | | (2.63% | ) | | | 2,905 | | | | 1.54% | | | | N/A | | | | 0.36% | |
| 9/30/14 | | | 13.86 | | | | 0.07 | | | | 1.24 | | | | 1.31 | | | | (0.08 | ) | | | (0.12 | ) | | | (0.20 | ) | | | 14.97 | | | | 9.49% | | | | 1,523 | | | | 1.64% | | | | 1.53% | | | | 0.48% | |
| 9/30/13 | | | 11.10 | | | | 0.08 | | | | 2.77 | | | | 2.85 | | | | (0.09 | ) | | | - | | | | (0.09 | ) | | | 13.86 | | | | 25.81% | | | | 1,235 | | | | 1.78% | | | | 1.52% | | | | 0.63% | |
| 9/30/12i | | | 10.46 | | | | 0.08 | | | | 0.64 | | | | 0.72 | | | | (0.08 | ) | | | - | | | | (0.08 | ) | | | 11.10 | | | | 7.07% | b | | | 930 | | | | 1.78% | a | | | 1.52% | a | | | 0.83% | a |
| 10/31/11 | | | 10.58 | | | | 0.07 | | | | (0.09 | ) | | | (0.02 | ) | | | (0.10 | ) | | | - | | | | (0.10 | ) | | | 10.46 | | | | (0.33% | ) | | | 828 | | | | 1.77% | | | | 1.52% | | | | 0.64% | |
253
MassMutual Premier International Equity Fund – Financial Statements (Continued)
Financial Highlights (For a share outstanding throughout each period)
| | | | | | | | | | | | | | | | | | | | | | | | | | | | | | | | | | | | | | | | | | | | | | | | | | | | |
| | | | | | Income (loss) from investment
operations | | | Less distributions to shareholders | | | | | | | | | Ratios /Supplemental Data | |
| | | Net
asset
value,
beginning
of the
period | | | Net
investment
income
(loss)c,j | | | Net
realized
and
unrealized
gain (loss)
on
investments | | | Total
income
(loss) from
investment
operations | | | From net
investment
income | | | From net
realized
gains | | | Total
distributions | | | Net
asset
value,
end of
the
period | | | Total
returnl,m | | | Net
assets,
end of
the
period
(000’s) | | | Ratio of
expenses
to average
daily net
assets
before
expense
waiver | | | Ratio of
expenses
to average
daily net
assets
after
expense
waiversj | | | Net
investment
income
(loss) to
average
daily net
assets | |
Class I | | | | | | | | | | | | | | | | | | | | | | | | | | | | | | | | | | | | | | | | | | | | | | | | | | | | |
| 9/30/16 | | $ | 11.55 | | | $ | 0.15 | | | $ | 0.85 | | | $ | 1.00 | | | $ | (0.14 | ) | | $ | (0.44 | ) | | $ | (0.58 | ) | | $ | 11.97 | | | | 8.86% | | | $ | 195,019 | | | | 0.95% | | | | 0.94% | | | | 1.30% | |
| 9/30/15 | | | 14.39 | | | | 0.18 | | | | (0.60 | ) | | | (0.42 | ) | | | (0.18 | ) | | | (2.24 | ) | | | (2.42 | ) | | | 11.55 | | | | (3.02% | ) | | | 169,842 | | | | 0.96% | | | | N/A | | | | 1.42% | |
| 9/30/14gg | | | 15.47 | | | | 0.14 | | | | (1.22 | ) | | | (1.08 | ) | | | - | | | | - | | | | - | | | | 14.39 | | | | (6.98% | )b | | | 64,208 | | | | 0.96% | a | | | N/A | | | | 1.83% | a |
Class R5 | | | | | | | | | | | | | | | | | | | | | | | | | | | | | | | | | | | | | | | | | | | | | |
| 9/30/16 | | $ | 11.54 | | | $ | 0.14 | | | $ | 0.85 | | | $ | 0.99 | | | $ | (0.12 | ) | | $ | (0.44 | ) | | $ | (0.56 | ) | | $ | 11.97 | | | | 8.83% | | | $ | 221,320 | | | | 1.05% | | | | 1.04% | | | | 1.18% | |
| 9/30/15 | | | 14.38 | | | | 0.13 | | | | (0.57 | ) | | | (0.44 | ) | | | (0.16 | ) | | | (2.24 | ) | | | (2.40 | ) | | | 11.54 | | | | (3.17% | ) | | | 251,687 | | | | 1.06% | | | | N/A | | | | 1.05% | |
| 9/30/14 | | | 15.92 | | | | 0.15 | | | | (0.16 | ) | | | (0.01 | ) | | | (0.19 | ) | | | (1.34 | ) | | | (1.53 | ) | | | 14.38 | | | | (0.32% | ) | | | 351,818 | | | | 1.06% | | | | N/A | | | | 0.97% | |
| 9/30/13 | | | 13.20 | | | | 0.21 | | | | 3.14 | | | | 3.35 | | | | (0.20 | ) | | | (0.43 | ) | | | (0.63 | ) | | | 15.92 | | | | 26.22% | | | | 445,260 | | | | 1.07% | | | | N/A | | | | 1.46% | |
| 9/30/12i | | | 13.95 | | | | 0.18 | | | | 0.71 | | | | 0.89 | | | | (0.23 | ) | | | (1.41 | ) | | | (1.64 | ) | | | 13.20 | | | | 8.60% | b | | | 396,711 | | | | 1.07% | a | | | N/A | | | | 1.52% | a |
| 10/31/11 | | | 13.94 | | | | 0.16 | | | | (0.01 | ) | | | 0.15 | | | | (0.14 | ) | | | - | | | | (0.14 | ) | | | 13.95 | | | | 1.08% | | | | 554,169 | | | | 1.07% | | | | N/A | | | | 1.10% | |
Service Class | | | | | | | | | | | | | | | | | | | | | | | | | | | | | | | | | | | | | | | | | | | | | |
| 9/30/16 | | $ | 11.51 | | | $ | 0.13 | | | $ | 0.84 | | | $ | 0.97 | | | $ | (0.11 | ) | | $ | (0.44 | ) | | $ | (0.55 | ) | | $ | 11.93 | | | | 8.66% | | | $ | 22,510 | | | | 1.15% | | | | 1.14% | | | | 1.09% | |
| 9/30/15 | | | 14.34 | | | | 0.13 | | | | (0.57 | ) | | | (0.44 | ) | | | (0.15 | ) | | | (2.24 | ) | | | (2.39 | ) | | | 11.51 | | | | (3.20% | ) | | | 21,741 | | | | 1.16% | | | | N/A | | | | 1.03% | |
| 9/30/14 | | | 15.90 | | | | 0.14 | | | | (0.17 | ) | | | (0.03 | ) | | | (0.19 | ) | | | (1.34 | ) | | | (1.53 | ) | | | 14.34 | | | | (0.46% | ) | | | 23,473 | | | | 1.12% | | | | N/A | | | | 0.88% | |
| 9/30/13 | | | 13.18 | | | | 0.20 | | | | 3.15 | | | | 3.35 | | | | (0.20 | ) | | | (0.43 | ) | | | (0.63 | ) | | | 15.90 | | | | 26.23% | | | | 25,987 | | | | 1.10% | | | | N/A | | | | 1.42% | |
| 9/30/12i | | | 13.94 | | | | 0.19 | | | | 0.69 | | | | 0.88 | | | | (0.23 | ) | | | (1.41 | ) | | | (1.64 | ) | | | 13.18 | | | | 8.58% | b | | | 21,882 | | | | 1.10% | a | | | N/A | | | | 1.62% | a |
| 10/31/11 | | | 13.92 | | | | 0.16 | | | | (0.02 | ) | | | 0.14 | | | | (0.12 | ) | | | - | | | | (0.12 | ) | | | 13.94 | | | | 1.00% | | | | 19,430 | | | | 1.10% | | | | N/A | | | | 1.10% | |
| | | | | | | | | | | | | | | | | | | | | | | | |
| | | Year ended September 30 | | | Period ended
September 30, 2012b,i | | | Year ended
October 31 | |
| | | 2016 | | | 2015 | | | 2014 | | | 2013 | | | | | | 2011 | |
Portfolio turnover rate | | | 36 | % | | | 45 | % | | | 76 | % | | | 56 | % | | | 36 | % | | | 47 | % |
| b | Percentage represents the results for the period and is not annualized. |
| c | Per share amount calculated on the average shares method. |
| d | Amount is less than $0.005 per share. |
| i | For the period November 1, 2011 through September 30, 2012. |
| j | Computed after giving effect to an agreement by MML Advisers and/or MassMutual to waive certain fees and expenses of the Fund. |
| l | Employee retirement benefit plans that invest plan assets in the Separate Investment Accounts (SIAs) may be subject to certain charges as set forth in their respective Plan Documents. Total return figures would be lower for the periods presented if they reflected these charges. |
| m | Total return excludes sales charges, if any, and would be lower for the period presented if it reflected these charges. |
| gg | For the period April 1, 2014 (commencement of operations) through September 30, 2014. |
| * | Generally accepted accounting principles may require adjustment to be made to the net assets of the Fund at period end for financial reporting purposes, and as such, the net asset values for shareholder transactions and the returns based on those net asset values may differ from the returns reported in the portfolio manager commentary section of this report. |
The accompanying notes are an integral part of the financial statements.
254
| | | | | | | | | | | | | | | | | | | | | | | | | | | | | | | | | | | | | | | | | | | | | | | | | | | | |
| | | | | | Income (loss) from investment
operations | | | Less distributions to shareholders | | | | | | | | | | | | Ratios /Supplemental Data | |
| | | Net
asset
value,
beginning
of the
period | | | Net
investment
income
(loss)c,j | | | Net
realized
and
unrealized
gain (loss)
on
investments | | | Total
income
(loss) from
investment
operations | | | From net
investment
income | | | From net
realized
gains | | | Total
distributions | | | Net
asset
value,
end of
the
period | | | Total
returnl,m | | | Net
assets,
end of
the
period
(000’s) | | | Ratio of
expenses
to average
daily net
assets
before
expense
waivers | | | Ratio of
expenses
to average
daily net
assets
after
expense
waiversj | | | Net
investment
income
(loss) to
average
daily net
assets | |
Administrative Class | | | | | | | | | | | | | | | | | | | | | | | | | | | | | | | | | | | | | | | | | | | | | |
| 9/30/16 | | $ | 11.45 | | | $ | 0.11 | | | $ | 0.85 | | | $ | 0.96 | | | $ | (0.10 | ) | | $ | (0.44 | ) | | $ | (0.54 | ) | | $ | 11.87 | | | | 8.59% | | | $ | 18,407 | | | | 1.25% | | | | 1.24% | | | | 0.97% | |
| 9/30/15 | | | 14.27 | | | | 0.12 | | | | (0.56 | ) | | | (0.44 | ) | | | (0.14 | ) | | | (2.24 | ) | | | (2.38 | ) | | | 11.45 | | | | (3.28% | ) | | | 19,307 | | | | 1.26% | | | | N/A | | | | 0.96% | |
| 9/30/14 | | | 15.82 | | | | 0.13 | | | | (0.18 | ) | | | (0.05 | ) | | | (0.16 | ) | | | (1.34 | ) | | | (1.50 | ) | | | 14.27 | | | | (0.57% | ) | | | 18,339 | | | | 1.25% | | | | N/A | | | | 0.86% | |
| 9/30/13 | | | 13.13 | | | | 0.19 | | | | 3.11 | | | | 3.30 | | | | (0.18 | ) | | | (0.43 | ) | | | (0.61 | ) | | | 15.82 | | | | 25.96% | | | | 18,017 | | | | 1.25% | | | | N/A | | | | 1.31% | |
| 9/30/12i | | | 13.82 | | | | 0.17 | | | | 0.70 | | | | 0.87 | | | | (0.15 | ) | | | (1.41 | ) | | | (1.56 | ) | | | 13.13 | | | | 8.46% | b | | | 15,173 | | | | 1.25% | a | | | N/A | | | | 1.47% | a |
| 10/31/11 | | | 13.81 | | | | 0.14 | | | | (0.01 | ) | | | 0.13 | | | | (0.12 | ) | | | - | | | | (0.12 | ) | | | 13.82 | | | | 0.91% | | | | 12,331 | | | | 1.25% | | | | N/A | | | | 0.94% | |
Class A | | | | | | | | | | | | | | | | | | | | | | | | | | | | | | | | | | | | | | | | | | | | | |
| 9/30/16 | | $ | 11.12 | | | $ | 0.08 | | | $ | 0.83 | | | $ | 0.91 | | | $ | (0.07 | ) | | $ | (0.44 | ) | | $ | (0.51 | ) | | $ | 11.52 | | | | 8.34% | * | | $ | 42,907 | | | | 1.50% | | | | 1.49% | | | | 0.72% | |
| 9/30/15 | | | 13.94 | | | | 0.08 | | | | (0.56 | ) | | | (0.48 | ) | | | (0.10 | ) | | | (2.24 | ) | | | (2.34 | ) | | | 11.12 | | | | (3.54% | ) | | | 47,166 | | | | 1.51% | | | | N/A | | | | 0.65% | |
| 9/30/14 | | | 15.48 | | | | 0.09 | | | | (0.17 | ) | | | (0.08 | ) | | | (0.12 | ) | | | (1.34 | ) | | | (1.46 | ) | | | 13.94 | | | | (0.77% | ) | | | 53,155 | | | | 1.50% | | | | N/A | | | | 0.58% | |
| 9/30/13 | | | 12.85 | | | | 0.14 | | | | 3.06 | | | | 3.20 | | | | (0.14 | ) | | | (0.43 | ) | | | (0.57 | ) | | | 15.48 | | | | 25.70% | | | | 56,137 | | | | 1.50% | | | | N/A | | | | 1.04% | |
| 9/30/12i | | | 13.62 | | | | 0.13 | | | | 0.68 | | | | 0.81 | | | | (0.17 | ) | | | (1.41 | ) | | | (1.58 | ) | | | 12.85 | | | | 8.16% | b | | | 46,292 | | | | 1.50% | a | | | N/A | | | | 1.20% | a |
| 10/31/11 | | | 13.62 | | | | 0.09 | | | | (0.00 | )d | | | 0.09 | | | | (0.09 | ) | | | - | | | | (0.09 | ) | | | 13.62 | | | | 0.63% | | | | 47,318 | | | | 1.50% | | | | N/A | | | | 0.65% | |
Class R4 | | | | | | | | | | | | | | | | | | | | | | | | | | | | | | | | | | | | | | | | | | | | | | | | | | | | |
| 9/30/16 | | $ | 11.11 | | | $ | 0.14 | | | $ | 0.77 | | | $ | 0.91 | | | $ | (0.11 | ) | | $ | (0.44 | ) | | $ | (0.55 | ) | | $ | 11.47 | | | | 8.42% | | | $ | 3,648 | | | | 1.40% | | | | 1.39% | | | | 1.28% | |
| 9/30/15 | | | 13.94 | | | | 0.09 | | | | (0.55 | ) | | | (0.46 | ) | | | (0.13 | ) | | | (2.24 | ) | | | (2.37 | ) | | | 11.11 | | | | (3.46% | ) | | | 349 | | | | 1.41% | | | | N/A | | | | 0.73% | |
| 9/30/14gg | | | 15.03 | | | | 0.11 | | | | (1.20 | ) | | | (1.09 | ) | | | - | | | | - | | | | - | | | | 13.94 | | | | (7.25% | )b | | | 93 | | | | 1.41% | a | | | N/A | | | | 1.47% | a |
Class R3 | | | | | | | | | | | | | | | | | | | | | | | | | | | | | | | | | | | | | | | | | | | | | | | | | | | | |
| 9/30/16 | | $ | 11.09 | | | $ | 0.09 | | | $ | 0.80 | | | $ | 0.89 | | | $ | (0.11 | ) | | $ | (0.44 | ) | | $ | (0.55 | ) | | $ | 11.43 | | | | 8.24% | | | $ | 3,618 | | | | 1.65% | | | | 1.64% | | | | 0.82% | |
| 9/30/15 | | | 13.93 | | | | 0.05 | | | | (0.54 | ) | | | (0.49 | ) | | | (0.11 | ) | | | (2.24 | ) | | | (2.35 | ) | | | 11.09 | | | | (3.76% | ) | | | 524 | | | | 1.66% | | | | N/A | | | | 0.41% | |
| 9/30/14gg | | | 15.03 | | | | 0.09 | | | | (1.19 | ) | | | (1.10 | ) | | | - | | | | - | | | | - | | | | 13.93 | | | | (7.32% | )b | | | 93 | | | | 1.66% | a | | | N/A | | | | 1.22% | a |
255
MassMutual Premier Strategic Emerging Markets Fund – Financial Statements (Continued)
Financial Highlights (For a share outstanding throughout each period)
| | | | | | | | | | | | | | | | | | | | | | | | | | | | | | | | | | | | | | | | | | | | | | | | | | | | |
| | | | | | Income (loss) from investment
operations | | | Less distributions to shareholders | | | | | | | | | Ratios / Supplemental Data | |
| | | Net
asset
value,
beginning
of the
period | | | Net
investment
income
(loss)c,j | | | Net
realized
and
unrealized
gain (loss)
on
investments | | | Total
income
(loss) from
investment
operations | | | From net
investment
income | | | From net
realized
gains | | | Total
distributions | | | Net
asset
value,
end of
the
period | | | Total
returnl,m | | | Net
assets,
end of
the
period
(000’s) | | | Ratio of
expenses
to average
daily net
assets
before
expense
waivers | | | Ratio of
expenses
to average
daily net
assets
after
expense
waiversj | | | Net
investment
income
(loss) to
average
daily net
assets | |
Class I | | | | | | | | | | | | | | | | | | | | | | | | | | | | | | | | | | | | | | | | | | | | | |
| 9/30/16 | | $ | 9.19 | | | $ | 0.07 | | | $ | 1.61 | | | $ | 1.68 | | | $ | (0.08 | ) | | $ | - | | | $ | (0.08 | ) | | $ | 10.79 | | | | 18.36% | * | | $ | 204,626 | | | | 1.31% | | | | 1.05% | | | | 0.69% | |
| 9/30/15 | | | 12.11 | | | | 0.09 | | | | (2.87 | ) | | | (2.78 | ) | | | (0.14 | ) | | | - | | | | (0.14 | ) | | | 9.19 | | | | (23.13% | ) | | | 127,823 | | | | 1.37% | | | | 1.05% | | | | 0.77% | |
| 9/30/14 | | | 11.68 | | | | 0.08 | | | | 0.50 | | | | 0.58 | | | | (0.15 | ) | | | - | | | | (0.15 | ) | | | 12.11 | | | | 5.01% | | | | 140,584 | | | | 1.34% | | | | 1.02% | | | | 0.68% | |
| 9/30/13 | | | 12.03 | | | | 0.16 | | | | (0.41 | ) | | | (0.25 | ) | | | (0.10 | ) | | | - | | | | (0.10 | ) | | | 11.68 | | | | (2.10% | ) | | | 115,463 | | | | 1.23% | | | | 0.99% | | | | 1.30% | |
| 9/30/12i | | | 14.09 | | | | 0.12 | | | | (0.28 | ) | | | (0.16 | ) | | | (0.16 | ) | | | (1.74 | ) | | | (1.90 | ) | | | 12.03 | | | | 0.51% | b | | | 134,793 | | | | 1.24% | a | | | 0.99% | a | | | 1.11% | a |
| 10/31/11h | | | 15.70 | | | | 0.20 | | | | (1.81 | ) | | | (1.61 | ) | | | - | | | | - | | | | - | | | | 14.09 | | | | (10.25% | )b | | | 92,878 | | | | 1.26% | a | | | 0.99% | a | | | 1.98% | a |
Class R5 | | | | | | | | | | | | | | | | | | | | | | | | | | | | | | | | | | | | | | | | | | | | | |
| 9/30/16 | | $ | 9.30 | | | $ | 0.04 | | | $ | 1.65 | | | $ | 1.69 | | | $ | (0.05 | ) | | $ | - | | | $ | (0.05 | ) | | $ | 10.94 | | | | 18.22% | | | $ | 3,148 | | | | 1.41% | | | | 1.15% | | | | 0.38% | |
| 9/30/15 | | | 12.24 | | | | 0.08 | | | | (2.89 | ) | | | (2.81 | ) | | | (0.13 | ) | | | - | | | | (0.13 | ) | | | 9.30 | | | | (23.20% | ) | | | 7,389 | | | | 1.47% | | | | 1.15% | | | | 0.67% | |
| 9/30/14 | | | 11.81 | | | | 0.07 | | | | 0.49 | | | | 0.56 | | | | (0.13 | ) | | | - | | | | (0.13 | ) | | | 12.24 | | | | 4.88% | | | | 8,869 | | | | 1.47% | | | | 1.15% | | | | 0.55% | |
| 9/30/13 | | | 12.17 | | | | 0.15 | | | | (0.42 | ) | | | (0.27 | ) | | | (0.09 | ) | | | - | | | | (0.09 | ) | | | 11.81 | | | | (2.29% | ) | | | 7,008 | | | | 1.39% | | | | 1.15% | | | | 1.22% | |
| 9/30/12i | | | 14.07 | | | | 0.05 | | | | (0.21 | ) | | | (0.16 | ) | | | - | | | | (1.74 | ) | | | (1.74 | ) | | | 12.17 | | | | 0.36% | b | | | 6,110 | | | | 1.40% | a | | | 1.15% | a | | | 0.43% | a |
| 10/31/11 | | | 17.79 | | | | 0.16 | | | | (2.30 | ) | | | (2.14 | ) | | | (0.05 | ) | | | (1.53 | ) | | | (1.58 | ) | | | 14.07 | | | | (13.17% | ) | | | 51,005 | | | | 1.34% | | | | 1.15% | | | | 1.01% | |
Service Class | | | | | | | | | | | | | | | | | | | | | | | | | | | | | | | | | | | | | | | | | | | | | |
| 9/30/16 | | $ | 9.17 | | | $ | 0.04 | | | $ | 1.63 | | | $ | 1.67 | | | $ | (0.06 | ) | | $ | - | | | $ | (0.06 | ) | | $ | 10.78 | | | | 18.27% | * | | $ | 8,238 | | | | 1.51% | | | | 1.25% | | | | 0.43% | |
| 9/30/15 | | | 12.09 | | | | 0.07 | | | | (2.87 | ) | | | (2.80 | ) | | | (0.12 | ) | | | - | | | | (0.12 | ) | | | 9.17 | | | | (23.23% | ) | | | 7,015 | | | | 1.57% | | | | 1.25% | | | | 0.63% | |
| 9/30/14 | | | 11.66 | | | | 0.06 | | | | 0.49 | | | | 0.55 | | | | (0.12 | ) | | | - | | | | (0.12 | ) | | | 12.09 | | | | 4.75% | | | | 256 | | | | 1.57% | | | | 1.25% | | | | 0.46% | |
| 9/30/13 | | | 12.01 | | | | 0.13 | | | | (0.40 | ) | | | (0.27 | ) | | | (0.08 | ) | | | - | | | | (0.08 | ) | | | 11.66 | | | | (2.34% | ) | | | 206 | | | | 1.49% | | | | 1.25% | | | | 1.06% | |
| 9/30/12i | | | 14.06 | | | | 0.09 | | | | (0.28 | ) | | | (0.19 | ) | | | (0.12 | ) | | | (1.74 | ) | | | (1.86 | ) | | | 12.01 | | | | 0.23% | b | | | 203 | | | | 1.50% | a | | | 1.25% | a | | | 0.86% | a |
| 10/31/11 | | | 17.77 | | | | 0.18 | | | | (2.32 | ) | | | (2.14 | ) | | | (0.04 | ) | | | (1.53 | ) | | | (1.57 | ) | | | 14.06 | | | | (13.22% | ) | | | 188 | | | | 1.46% | | | | 1.25% | | | | 1.13% | |
| | | | | | | | | | | | | | | | | | | | | | | | |
| | | Year ended September 30 | | | Period ended
September 30, 2012b,i | | | Year ended
October 31 | |
| | | 2016 | | | 2015 | | | 2014 | | | 2013 | | | | | | 2011 | |
Portfolio turnover rate | | | 33 | % | | | 40 | % | | | 108 | % | | | 75 | % | | | 76 | % | | | 84 | % |
| b | Percentage represents the results for the period and is not annualized. |
| c | Per share amount calculated on the average shares method. |
| d | Amount is less than $0.005 per share. |
| f | Amount is less than $500. |
| h | For the period March 1, 2011 (commencement of operations) through October 31, 2011. |
| i | For the period November 1, 2011 through September 30, 2012. |
| j | Computed after giving effect to an agreement by MML Advisers and/or MassMutual to waive certain fees and expenses of the Fund. |
| l | Employee retirement benefit plans that invest plan assets in the Separate Investment Accounts (SIAs) may be subject to certain charges as set forth in their respective Plan Documents. Total return figures would be lower for the periods presented if they reflected these charges. |
| m | Total return excludes sales charges, if any, and would be lower for the period presented if it reflected these charges. |
| gg | For the period April 1, 2014 (commencement of operations) through September 30, 2014. |
| * | Generally accepted accounting principles may require adjustment to be made to the net assets of the Fund at period end for financial reporting purposes, and as such, the net asset values for shareholder transactions and the returns based on those net asset values may differ from the returns reported in the portfolio manager commentary section of this report. |
The accompanying notes are an integral part of the financial statements.
256
| | | | | | | | | | | | | | | | | | | | | | | | | | | | | | | | | | | | | | | | | | | | | | | | | | | | |
| | | | | | Income (loss) from investment
operations | | | Less distributions to shareholders | | | | | | | | | Ratios / Supplemental Data | |
| | | Net
asset
value,
beginning
of the
period | | | Net
investment
income
(loss)c,j | | | Net
realized
and
unrealized
gain (loss)
on
investments | | | Total
income
(loss) from
investment
operations | | | From net
investment
income | | | From net
realized
gains | | | Total
distributions | | | Net
asset
value,
end of
the
period | | | Total
returnl,m | | | Net
assets,
end of
the
period
(000’s) | | | Ratio of
expenses
to average
daily net
assets
before
expense
waivers | | | Ratio of
expenses
to average
daily net
assets
after
expense
waiversj | | | Net
investment
income
(loss) to
average
daily net
assets | |
Administrative Class | | | | | | | | | | | | | | | | | | | | | | | | | | | | | | | | | | | | | | | | | | | | | |
| 9/30/16 | | $ | 9.23 | | | $ | 0.04 | | | $ | 1.62 | | | $ | 1.66 | | | $ | (0.05 | ) | | $ | - | | | $ | (0.05 | ) | | $ | 10.84 | | | | 18.02% | | | $ | 677 | | | | 1.61% | | | | 1.35% | | | | 0.42% | |
| 9/30/15 | | | 12.15 | | | | 0.06 | | | | (2.88 | ) | | | (2.82 | ) | | | (0.10 | ) | | | - | | | | (0.10 | ) | | | 9.23 | | | | (23.32% | ) | | | 431 | | | | 1.67% | | | | 1.35% | | | | 0.54% | |
| 9/30/14 | | | 11.72 | | | | 0.07 | | | | 0.47 | | | | 0.54 | | | | (0.11 | ) | | | - | | | | (0.11 | ) | | | 12.15 | | | | 4.61% | | | | 409 | | | | 1.68% | | | | 1.37% | | | | 0.59% | |
| 9/30/13 | | | 12.09 | | | | 0.13 | | | | (0.43 | ) | | | (0.30 | ) | | | (0.07 | ) | | | - | | | | (0.07 | ) | | | 11.72 | | | | (2.50% | ) | | | 98 | | | | 1.64% | | | | 1.40% | | | | 1.09% | |
| 9/30/12i | | | 14.02 | | | | 0.15 | | | | (0.34 | ) | | | (0.19 | ) | | | - | | | | (1.74 | ) | | | (1.74 | ) | | | 12.09 | | | | 0.12% | b | | | 63 | | | | 1.65% | a | | | 1.40% | a | | | 1.37% | a |
| 10/31/11 | | | 17.73 | | | | 0.12 | | | | (2.28 | ) | | | (2.16 | ) | | | (0.02 | ) | | | (1.53 | ) | | | (1.55 | ) | | | 14.02 | | | | (13.34% | ) | | | 0 | f | | | 1.57% | | | | 1.39% | | | | 0.71% | |
Class A | | | | | | | | | | | | | | | | | | | | | | | | | | | | | | | | | | | | | | | | | | | | | |
| 9/30/16 | | $ | 9.13 | | | $ | 0.01 | | | $ | 1.60 | | | $ | 1.61 | | | $ | (0.00 | )d | | $ | - | | | $ | (0.00 | )d | | $ | 10.74 | | | | 17.68% | | | $ | 95 | | | | 1.86% | | | | 1.60% | | | | 0.11% | |
| 9/30/15 | | | 12.04 | | | | 0.00 | d | | | (2.81 | ) | | | (2.81 | ) | | | (0.10 | ) | | | - | | | | (0.10 | ) | | | 9.13 | | | | (23.47% | ) | | | 190 | | | | 1.92% | | | | 1.60% | | | | 0.02% | |
| 9/30/14 | | | 11.61 | | | | (0.01 | ) | | | 0.51 | | | | 0.50 | | | | (0.07 | ) | | | - | | | | (0.07 | ) | | | 12.04 | | | | 4.36% | | | | 470 | | | | 1.94% | | | | 1.62% | | | | (0.05% | ) |
| 9/30/13 | | | 11.94 | | | | 0.08 | | | | (0.41 | ) | | | (0.33 | ) | | | - | | | | - | | | | - | | | | 11.61 | | | | (2.76% | ) | | | 336 | | | | 1.89% | | | | 1.65% | | | | 0.63% | |
| 9/30/12i | | | 13.95 | | | | 0.05 | | | | (0.28 | ) | | | (0.23 | ) | | | (0.04 | ) | | | (1.74 | ) | | | (1.78 | ) | | | 11.94 | | | | (0.19% | )b | | | 379 | | | | 1.90% | a | | | 1.65% | a | | | 0.50% | a |
| 10/31/11 | | | 17.68 | | | | 0.10 | | | | (2.30 | ) | | | (2.20 | ) | | | - | | | | (1.53 | ) | | | (1.53 | ) | | | 13.95 | | | | (13.60% | ) | | | 396 | | | | 1.85% | | | | 1.65% | | | | 0.64% | |
Class R4 | | | | | | | | | | | | | | | | | | | | | | | | | | | | | | | | | | | | | | | | | | | | | | | | | | | | |
| 9/30/16 | | $ | 9.14 | | | $ | 0.02 | | | $ | 1.61 | | | $ | 1.63 | | | $ | (0.05 | ) | | $ | - | | | $ | (0.05 | ) | | $ | 10.72 | | | | 17.87% | | | $ | 599 | | | | 1.76% | | | | 1.50% | | | | 0.23% | |
| 9/30/15 | | | 12.05 | | | | 0.03 | | | | (2.84 | ) | | | (2.81 | ) | | | (0.10 | ) | | | - | | | | (0.10 | ) | | | 9.14 | | | | (23.45% | ) | | | 112 | | | | 1.82% | | | | 1.50% | | | | 0.27% | |
| 9/30/14gg | | | 11.64 | | | | 0.05 | | | | 0.36 | | | | 0.41 | | | | - | | | | - | | | | - | | | | 12.05 | | | | 3.52% | b | | | 103 | | | | 1.82% | a | | | 1.50% | a | | | 0.76% | a |
Class R3 | | | | | | | | | | | | | | | | | | | | | | | | | | | | | | | | | | | | | | | | | | | | | | | | | | | | |
| 9/30/16 | | $ | 9.12 | | | $ | 0.00 | d | | $ | 1.61 | | | $ | 1.61 | | | $ | (0.03 | ) | | $ | - | | | $ | (0.03 | ) | | $ | 10.70 | | | | 17.66% | * | | $ | 642 | | | | 2.01% | | | | 1.75% | | | | 0.04% | |
| 9/30/15 | | | 12.03 | | | | 0.03 | | | | (2.86 | ) | | | (2.83 | ) | | | (0.08 | ) | | | - | | | | (0.08 | ) | | | 9.12 | | | | (23.57% | ) | | | 184 | | | | 2.07% | | | | 1.75% | | | | 0.24% | |
| 9/30/14gg | | | 11.64 | | | | 0.03 | | | | 0.36 | | | | 0.39 | | | | - | | | | - | | | | - | | | | 12.03 | | | | 3.35% | b | | | 103 | | | | 2.07% | a | | | 1.75% | a | | | 0.51% | a |
257
Notes to Financial Statements
MassMutual Premier Funds (the “Trust”) is registered under the Investment Company Act of 1940, as amended (the “1940 Act”), as an open-end, management investment company. The Trust is organized under the laws of the Commonwealth of Massachusetts as a Massachusetts business trust pursuant to an Agreement and Declaration of Trust dated August 1, 1994, as amended and restated as of November 21, 2011, as it may be further amended from time to time. The following are 15 series of the Trust (each individually referred to as a “Fund” or collectively as the “Funds”):
MassMutual Premier U.S. Government Money Market Fund (formerly known as Premier Money Market Fund) (“U.S. Government Money Market Fund”)
MassMutual Premier Short-Duration Bond Fund (“Short-Duration Bond Fund”)
MassMutual Premier Inflation-Protected and Income Fund (“Inflation-Protected and Income Fund”)
MassMutual Premier Core Bond Fund (“Core Bond Fund”)
MassMutual Premier Diversified Bond Fund (“Diversified Bond Fund”)
MassMutual Premier High Yield Fund (“High Yield Fund”)
MassMutual Premier Balanced Fund (“Balanced Fund”)
MassMutual Premier Value Fund (“Value Fund”)
MassMutual Premier Disciplined Value Fund (“Disciplined Value Fund”)
MassMutual Premier Main Street Fund (“Main Street Fund”)
MassMutual Premier Disciplined Growth Fund (“Disciplined Growth Fund”)
MassMutual Premier Small Cap Opportunities Fund (“Small Cap Opportunities Fund”)
MassMutual Premier Global Fund (“Global Fund”)
MassMutual Premier International Equity Fund (“International Equity Fund”)
MassMutual Premier Strategic Emerging Markets Fund (“Strategic Emerging Markets Fund”)
Each share class of a Fund represents an interest in the same portfolio of assets. The principal difference among the classes is the level of service and administration fees, and shareholder and distribution service expenses borne by the classes. Because each class will have different fees and expenses, performance and share prices will vary between the classes. The classes of shares are offered to different types of investors, as outlined in the Funds’ Prospectus.
U.S. Government Money Market Fund’s name, investment objective, and investment strategy changed on May 1, 2016 when the Fund changed from a money market fund to a government money market fund.
| 2. | | Significant Accounting Policies |
The following is a summary of significant accounting policies followed consistently by each Fund in the preparation of the financial statements in conformity with accounting principles generally accepted in the United States of America (“generally accepted accounting principles”). The preparation of the financial statements in accordance with generally accepted accounting principles requires management to make estimates and assumptions that affect the reported amounts and disclosures in the financial statements. Actual results could differ from those estimates.
Investment Valuation
The net asset value of each Fund’s shares is determined once daily as of the close of regular trading on the New York Stock Exchange (“NYSE”), on each day the NYSE is open for trading (a “business day”). The NYSE normally closes at 4:00 p.m. Eastern Time, but may close earlier on some days.
Equity securities and derivative contracts that are actively traded on a national securities exchange or contract market are valued on the basis of information furnished by a pricing service, which provides the last reported sale price, or, in the case of futures contracts, the settlement price, for securities or derivatives listed on the exchange or contract market or the official closing price on the NASDAQ National Market System (“NASDAQ System”), or in the case of over-the-counter (“OTC”) securities for which an official closing price is unavailable or not reported on the NASDAQ System, the last reported bid price. Portfolio securities traded on more than one national securities exchange are valued at the last price at the close of the exchange representing the principal
258
Notes to Financial Statements (Continued)
market for such securities. Debt securities (with the exception of debt securities held by the U.S. Government Money Market Fund) are valued on the basis of valuations furnished by a pricing service, which generally determines valuations taking into account factors such as institutional-size trading in similar securities, yield, quality, coupon rate, maturity, type of issue, trading characteristics, and other market data. Shares of other open-end mutual funds are valued at their closing net asset values as reported on each business day. The U.S. Government Money Market Fund’s debt securities are typically valued at amortized cost, but may be valued using a vendor quote if the Fund’s investment adviser determines it more closely approximates current market value, in accordance with Rule 2a-7 under the 1940 Act pursuant to which the U.S. Government Money Market Fund must adhere to certain conditions. It is the intention of the U.S. Government Money Market Fund to maintain a stable net asset value per share of $1.00, although this cannot be assured.
Investments for which market quotations are readily available are marked to market daily based on those quotations. Market quotations may be provided by third-party vendors or market makers, and may be determined on the basis of a variety of factors, such as broker quotations, financial modeling, and other market data, such as market indexes and yield curves, counterparty information, and foreign exchange rates. U.S. Government and agency securities may be valued on the basis of market quotations or using a model that may incorporate market observable data such as reported sales of similar securities, broker quotes, yields, bids, offers, quoted market prices, and reference data. The fair values of OTC derivative contracts, including forward, swap, and option contracts related to interest rates, foreign currencies, credit standing of reference entities, equity prices, or commodity prices, may be based on market quotations or may be modeled using a series of techniques, including simulation models, depending on the contract and the terms of the transaction. The fair values of asset-backed securities and mortgage-backed securities are estimated based on models that consider the estimated cash flows of each debt tranche of the issuer, established benchmark yield, and estimated tranche-specific spread to the benchmark yield based on the unique attributes of the tranche, including, but not limited to, prepayment speed assumptions and attributes of the collateral. Restricted securities are generally valued at a discount to similar publicly traded securities.
Investments for which market quotations are not available or for which a pricing service or vendor does not provide a value, or for which such market quotations or values are considered by the investment adviser or subadviser to be unreliable (including, for example, certain foreign securities, thinly-traded securities, certain restricted securities, certain initial public offerings, or securities whose values may have been affected by a significant event) are stated at fair valuations determined in good faith by the Funds’ Valuation Committee1 in accordance with procedures approved annually by the Board of Trustees (“Trustees”), and under the general oversight of the Trustees. The Funds’ Valuation Committee employs various methods to determine fair valuations including a regular review of significant inputs and assumptions and review of any related market activity. The Funds’ Valuation Committee reports to the Trustees at their regularly scheduled meetings. It is possible that fair value prices will be used by the Funds to a significant extent. The value determined for an investment using the Funds’ fair value procedures may differ from recent market prices for the investment and may be significantly different from the value realized upon the sale of such investment.
The Funds may invest in securities that are traded principally in foreign markets and that trade on weekends and other days when the Funds do not price their shares. As a result, the values of the Funds’ portfolio securities may change on days when the prices of the Funds’ shares are not calculated. The prices of the Funds’ shares will reflect any such changes when the prices of the Funds’ shares are next calculated, which is the next business day. The Funds may use fair value pricing more frequently for securities primarily traded in foreign markets because, among other things, most foreign markets close well before the Funds value their securities. The earlier close of these foreign markets gives rise to the possibility that significant events, including broad market moves, may have occurred in the interim. The Funds’ investments may be priced based on fair values provided by a third-party vendor, based on certain factors and methodologies applied by such vendor, in the event that there is movement in the U.S. market, between the close of the foreign market and the time the Funds calculate their net asset values. All assets and liabilities expressed in foreign currencies are converted into U.S. dollars at the mean between the buying and selling rates of such currencies against the U.S. dollar at the end of each business day.
| 1 | The Valuation Committee consists of the President, Treasurer, Assistant Treasurers, Vice Presidents (except for the CCO), Assistant Vice Presidents, Secretary, and Assistant Secretaries of the Trust, as well as such alternate members as the Trustees may from time to time designate. The Valuation Committee reviews and determines the fair valuation of portfolio securities and the Funds’ pricing procedures in general. |
259
Notes to Financial Statements (Continued)
Fair value is defined as the price that would be received to sell an asset or paid to transfer a liability in an orderly transaction between market participants at the measurement date. A three-tier hierarchy is utilized to maximize the use of observable market data inputs and minimize the use of unobservable inputs and to establish classification of fair value measurements for disclosure purposes. Inputs refer broadly to the assumptions that market participants would use in pricing the asset or liability, including assumptions about risk, for example, the risk inherent in a particular valuation technique used to measure fair value (such as a pricing model) and/or the risk inherent in the inputs to the valuation technique. Inputs may be observable or unobservable. Observable inputs are inputs that reflect the assumptions market participants would use in pricing the asset or liability and are developed based on market data obtained from sources independent of the reporting entity. Unobservable inputs are inputs that reflect the reporting entity’s own assumptions about the assumptions market participants would use in pricing the asset or liability and are developed based on the best information available in the circumstances. The three-tier hierarchy of inputs is summarized in the three broad Levels listed below. The inputs or methodology used for valuing investments are not necessarily an indication of the risk associated with investing in those investments and the determination of the significance of a particular input to the fair value measurement in its entirety requires judgment and consideration of factors specific to each security.
Level 1 – quoted prices (unadjusted) in active markets for identical investments that the Funds can access at the measurement date
The types of assets and liabilities categorized in Level 1 generally include actively traded domestic and certain foreign equity securities, derivatives actively traded on a national securities exchange (such as some warrants, rights, futures, and options), and shares of open-end mutual funds.
Level 2 – other significant observable inputs (including quoted prices for similar investments, interest rates, prepayment speeds, credit risk, etc.)
The types of assets and liabilities categorized in Level 2 generally include debt securities such as U.S. Government and agency securities, mortgage-backed securities, asset-backed securities, municipal obligations, sovereign debt obligations, bank loans, corporate bonds, and those securities valued at amortized cost; OTC derivatives such as swaps, options, swaptions, and forward foreign currency exchange contracts; certain restricted securities; and non-exchange traded equity securities and certain foreign equity securities traded on particular foreign exchanges that close before the Funds determine their net asset values.
Level 3 – significant unobservable inputs (including the Funds’ own assumptions in determining the fair value of investments)
The types of assets and liabilities categorized in Level 3 generally include securities for which prices, spreads, or any of the other aforementioned significant inputs are unobservable. Generally, securities whose trading has been suspended or that have been de-listed from their current primary trading exchange; securities in default or bankruptcy proceedings for which there is no current market quotation; securities and certain derivatives valued by broker quotes which may include brokers’ assumptions; and any illiquid Rule 144A securities or restricted securities issued by non-public entities are categorized in Level 3.
The availability of observable inputs can vary from security to security and is affected by a wide variety of factors, including, for example, the type of security, whether the security is new and not yet established in the marketplace, the liquidity of markets, and other characteristics particular to the security. To the extent that valuation is based on models or inputs that are less observable or unobservable in the market, the determination of fair value requires more judgment. Accordingly, the degree of judgment exercised in determining fair value is greatest for instruments categorized in Level 3.
Changes in valuation techniques may result in transfers in or out of an investment’s assigned Level within the hierarchy. In addition, in periods of market dislocation, the observability of prices and inputs may be reduced for many instruments. This condition, as well as changes related to liquidity of investments, could cause a security to be reclassified between Level 1, Level 2, or Level 3.
In certain cases, the inputs used to measure fair value may fall into different levels of the fair value hierarchy. In such cases, for disclosure purposes the level in the fair value hierarchy within which the fair value measurement falls is determined based on the lowest level input that is significant to the overall fair value measurement.
The U.S. Government Money Market Fund characterized all investments at Level 2, as of September 30, 2016. The Value Fund, Main Street Fund, Disciplined Growth Fund and Small Cap Opportunities Fund characterized all long-term investments at Level 1,
260
Notes to Financial Statements (Continued)
and all short-term investments at Level 2, as of September 30, 2016. For each Fund noted in the preceding sentences, the level classification by major category of investments is the same as the category presentation in the Portfolio of Investments.
The following is the aggregate value by input level, as of September 30, 2016, for the remaining Funds’ investments:
| | | | | | | | | | | | | | | | |
| | | Level 1 | | | Level 2 | | | Level 3 | | | Total | |
Short-Duration Bond Fund | | | | | | | | | | | | | | | | |
Asset Investments | | | | | | | | | | | | | | | | |
Corporate Debt | | $ | - | | | $ | 256,461,745 | | | $ | - | | | $ | 256,461,745 | |
Municipal Obligations | | | - | | | | 466,508 | | | | - | | | | 466,508 | |
Non-U.S. Government Agency Obligations | | | - | | | | 234,895,920 | | | | 1,830,405 | | | | 236,726,325 | |
U.S. Government Agency Obligations and Instrumentalities | | | - | | | | 38,665,945 | | | | - | | | | 38,665,945 | |
U.S. Treasury Obligations | | | - | | | | 21,431,595 | | | | - | | | | 21,431,595 | |
Short-Term Investments | | | - | | | | 5,249,654 | | | | - | | | | 5,249,654 | |
| | | | | | | | | | | | | | | | |
| Total Investments | | $ | - | | | $ | 557,171,367 | | | $ | 1,830,405 | | | $ | 559,001,772 | |
| | | | | | | | | | | | | | | | |
Asset Derivatives | | | | | | | | | | | | | | | | |
Forward Contracts | | $ | - | | | $ | 151,174 | | | $ | - | | | $ | 151,174 | |
Futures Contracts | | | 55,032 | | | | - | | | | - | | | | 55,032 | |
| | | | | | | | | | | | | | | | |
| Total | | $ | 55,032 | | | $ | 151,174 | | | $ | - | | | $ | 206,206 | |
| | | | | | | | | | | | | | | | |
Liability Derivatives | | | | | | | | | | | | | | | | |
Forward Contracts | | $ | - | | | $ | (106,867 | ) | | $ | - | | | $ | (106,867 | ) |
Futures Contracts | | | (220,129 | ) | | | - | | | | - | | | | (220,129 | ) |
Swap Agreements | | | - | | | | (362,725 | ) | | | - | | | | (362,725 | ) |
| | | | | | | | | | | | | | | | |
| Total | | $ | (220,129 | ) | | $ | (469,592 | ) | | $ | - | | | $ | (689,721 | ) |
| | | | | | | | | | | | | | | | |
| | | | |
Inflation-Protected and Income Fund | | | | | | | | | | | | | | | | |
Asset Investments | | | | | | | | | | | | | | | | |
Corporate Debt | | $ | - | | | $ | 12,633,582 | | | $ | - | | | $ | 12,633,582 | |
Municipal Obligations | | | - | | | | 305,827 | | | | - | | | | 305,827 | |
Non-U.S. Government Agency Obligations | | | - | | | | 164,439,622 | | | | 223,051 | | | | 164,662,673 | |
U.S. Government Agency Obligations and Instrumentalities | | | - | | | | 164,718 | | | | - | | | | 164,718 | |
U.S. Treasury Obligations | | | - | | | | 283,947,891 | | | | - | | | | 283,947,891 | |
Short-Term Investments | | | - | | | | 113,819,300 | | | | - | | | | 113,819,300 | |
| | | | | | | | | | | | | | | | |
| Total Investments | | $ | - | | | $ | 575,310,940 | | | $ | 223,051 | | | $ | 575,533,991 | |
| | | | | | | | | | | | | | | | |
Asset Derivatives | | | | | | | | | | | | | | | | |
Futures Contracts | | $ | 7,913 | | | $ | - | | | $ | - | | | $ | 7,913 | |
Swap Agreements | | | - | | | | 226,813 | | | | - | | | | 226,813 | |
| | | | | | | | | | | | | | | | |
| Total | | $ | 7,913 | | | $ | 226,813 | | | $ | - | | | $ | 234,726 | |
| | | | | | | | | | | | | | | | |
Liability Derivatives | | | | | | | | | | | | | | | | |
Futures Contracts | | $ | (18,472 | ) | | $ | - | | | $ | - | | | $ | (18,472 | ) |
Swap Agreements | | | - | | | | (252,357 | ) | | | - | | | | (252,357 | ) |
| | | | | | | | | | | | | | | | |
| Total | | $ | (18,472 | ) | | $ | (252,357 | ) | | $ | - | | | $ | (270,829 | ) |
| | | | | | | | | | | | | | | | |
261
Notes to Financial Statements (Continued)
| | | | | | | | | | | | | | | | |
| | | Level 1 | | | Level 2 | | | Level 3 | | | Total | |
Core Bond Fund | | | | | | | | | | | | | | | | |
Asset Investments | | | | | | | | | | | | | | | | |
Preferred Stock | | $ | 3,550,300 | | | $ | - | | | $ | - | | | $ | 3,550,300 | |
Corporate Debt | | | - | | | | 499,189,770 | | | | - | | | | 499,189,770 | |
Municipal Obligations | | | - | | | | 14,242,010 | | | | - | | | | 14,242,010 | |
Non-U.S. Government Agency Obligations | | | - | | | | 362,496,030 | | | | 3,937,390 | | | | 366,433,420 | |
Sovereign Debt Obligations | | | - | | | | 12,270,415 | | | | - | | | | 12,270,415 | |
U.S. Government Agency Obligations and Instrumentalities | | | - | | | | 329,500,487 | | | | - | | | | 329,500,487 | |
U.S. Treasury Obligations | | | - | | | | 17,597,325 | | | | - | | | | 17,597,325 | |
Short-Term Investments | | | - | | | | 187,095,999 | | | | - | | | | 187,095,999 | |
| | | | | | | | | | | | | | | | |
| Total Investments | | $ | 3,550,300 | | | $ | 1,422,392,036 | | | $ | 3,937,390 | | | $ | 1,429,879,726 | |
| | | | | | | | | | | | | | | | |
Asset Derivatives | | | | | | | | | | | | | | | | |
Forward Contracts | | $ | - | | | $ | 365,472 | | | $ | - | | | $ | 365,472 | |
Futures Contracts | | | 585,204 | | | | - | | | | - | | | | 585,204 | |
| | | | | | | | | | | | | | | | |
| Total | | $ | 585,204 | | | $ | 365,472 | | | $ | - | | | $ | 950,676 | |
| | | | | | | | | | | | | | | | |
Liability Derivatives | | | | | | | | | | | | | | | | |
Forward Contracts | | $ | - | | | $ | (258,358 | ) | | $ | - | | | $ | (258,358 | ) |
Futures Contracts | | | (87,590 | ) | | | - | | | | - | | | | (87,590 | ) |
Swap Agreements | | | - | | | | (961,810 | ) | | | - | | | | (961,810 | ) |
| | | | | | | | | | | | | | | | |
| Total | | $ | (87,590 | ) | | $ | (1,220,168 | ) | | $ | - | | | $ | (1,307,758 | ) |
| | | | | | | | | | | | | | | | |
| | | | |
Diversified Bond Fund | | | | | | | | | | | | | | | | |
Asset Investments | | | | | | | | | | | | | | | | |
Common Stock | | $ | - | | | $ | - | | | $ | 807 | | | $ | 807 | |
Preferred Stock | | | 273,100 | | | | - | | | | - | | | | 273,100 | |
Corporate Debt | | | - | | | | 83,037,289 | | | | - | | | | 83,037,289 | |
Municipal Obligations | | | - | | | | 443,346 | | | | - | | | | 443,346 | |
Non-U.S. Government Agency Obligations | | | - | | | | 48,617,416 | | | | 446,754 | | | | 49,064,170 | |
Sovereign Debt Obligations | | | - | | | | 1,225,655 | | | | - | | | | 1,225,655 | |
U.S. Government Agency Obligations and Instrumentalities | | | - | | | | 43,998,087 | | | | - | | | | 43,998,087 | |
U.S. Treasury Obligations | | | - | | | | 7,843,122 | | | | - | | | | 7,843,122 | |
Short-Term Investments | | | - | | | | 34,556,826 | | | | - | | | | 34,556,826 | |
| | | | | | | | | | | | | | | | |
| Total Investments | | $ | 273,100 | | | $ | 219,721,741 | | | $ | 447,561 | | | $ | 220,442,402 | |
| | | | | | | | | | | | | | | | |
Asset Derivatives | | | | | | | | | | | | | | | | |
Forward Contracts | | $ | - | | | $ | 137,911 | | | $ | - | | | $ | 137,911 | |
Futures Contracts | | | 5,982 | | | | - | | | | - | | | | 5,982 | |
| | | | | | | | | | | | | | | | |
| Total | | $ | 5,982 | | | $ | 137,911 | | | $ | - | | | $ | 143,893 | |
| | | | | | | | | | | | | | | | |
Liability Derivatives | | | | | | | | | | | | | | | | |
Forward Contracts | | $ | - | | | $ | (103,898 | ) | | $ | - | | | $ | (103,898 | ) |
Futures Contracts | | | (6,627 | ) | | | - | | | | - | | | | (6,627 | ) |
Swap Agreements | | | - | | | | (135,285 | ) | | | - | | | | (135,285 | ) |
| | | | | | | | | | | | | | | | |
| Total | | $ | (6,627 | ) | | $ | (239,183 | ) | | $ | - | | | $ | (245,810 | ) |
| | | | | | | | | | | | | | | | |
262
Notes to Financial Statements (Continued)
| | | | | | | | | | | | | | | | |
| | | Level 1 | | | Level 2 | | | Level 3 | | | Total | |
High Yield Fund | | | | | | | | | | | | | | | | |
Asset Investments | | | | | | | | | | | | | | | | |
Common Stock | | $ | - | | | $ | - | | | $ | 9,899 | | | $ | 9,899 | |
Bank Loans | | | - | | | | 11,167,851 | | | | - | | | | 11,167,851 | |
Corporate Debt | | | - | | | | 390,219,296 | | | | - | | | | 390,219,296 | |
Short-Term Investments | | | - | | | | 18,317,787 | | | | - | | | | 18,317,787 | |
| | | | | | | | | | | | | | | | |
| Total Investments | | $ | - | | | $ | 419,704,934 | | | $ | 9,899 | | | $ | 419,714,833 | |
| | | | | | | | | | | | | | | | |
| | | | |
Balanced Fund | | | | | | | | | | | | | | | | |
Asset Investments | | | | | | | | | | | | | | | | |
Common Stock | | $ | 68,904,529 | | | $ | - | | | $ | - | | | $ | 68,904,529 | |
Preferred Stock | | | 136,550 | | | | - | | | | - | | | | 136,550 | |
Corporate Debt | | | - | | | | 14,525,805 | | | | - | | | | 14,525,805 | |
Municipal Obligations | | | - | | | | 454,203 | | | | - | | | | 454,203 | |
Non-U.S. Government Agency Obligations | | | - | | | | 9,801,317 | | | | 70,643 | | | | 9,871,960 | |
Sovereign Debt Obligations | | | - | | | | 411,689 | | | | - | | | | 411,689 | |
U.S. Government Agency Obligations and Instrumentalities | | | - | | | | 9,862,383 | | | | - | | | | 9,862,383 | |
U.S. Treasury Obligations | | | - | | | | 1,544,571 | | | | - | | | | 1,544,571 | |
Mutual Funds | | | 10,456,649 | | | | - | | | | - | | | | 10,456,649 | |
Rights | | | - | | | | - | | | | 4,050 | | | | 4,050 | |
Short-Term Investments | | | - | | | | 5,522,911 | | | | - | | | | 5,522,911 | |
| | | | | | | | | | | | | | | | |
| Total Investments | | $ | 79,497,728 | | | $ | 42,122,879 | | | $ | 74,693 | | | $ | 121,695,300 | |
| | | | | | | | | | | | | | | | |
Asset Derivatives | | | | | | | | | | | | | | | | |
Forward Contracts | | $ | - | | | $ | 9,649 | | | $ | - | | | $ | 9,649 | |
Futures Contracts | | | 916 | | | | - | | | | - | | | | 916 | |
| | | | | | | | | | | | | | | | |
| Total | | $ | 916 | | | $ | 9,649 | | | $ | - | | | $ | 10,565 | |
| | | | | | | | | | | | | | | | |
Liability Derivatives | | | | | | | | | | | | | | | | |
Forward Contracts | | $ | - | | | $ | (6,821 | ) | | $ | - | | | $ | (6,821 | ) |
Futures Contracts | | | (19,566 | ) | | | - | | | | - | | | | (19,566 | ) |
Swap Agreements | | | - | | | | (27,077 | ) | | | - | | | | (27,077 | ) |
| | | | | | | | | | | | | | | | |
| Total | | $ | (19,566 | ) | | $ | (33,898 | ) | | $ | - | | | $ | (53,464 | ) |
| | | | | | | | | | | | | | | | |
| | | | |
Disciplined Value Fund | | | | | | | | | | | | | | | | |
Asset Investments | | | | | | | | | | | | | | | | |
Common Stock | | $ | 204,736,459 | | | $ | - | | | $ | - | | | $ | 204,736,459 | |
Rights | | | - | | | | - | | | | 9,858 | | | | 9,858 | |
Short-Term Investments | | | - | | | | 259,139 | | | | - | | | | 259,139 | |
| | | | | | | | | | | | | | | | |
| Total Investments | | $ | 204,736,459 | | | $ | 259,139 | | | $ | 9,858 | | | $ | 205,005,456 | |
| | | | | | | | | | | | | | | | |
| | | | |
Global Fund | | | | | | | | | | | | | | | | |
Asset Investments | | | | | | | | | | | | | | | | |
Common Stock* | | | | | | | | | | | | | | | | |
Brazil | | $ | 676,419 | | | $ | - | | | $ | - | | | $ | 676,419 | |
Cayman Islands | | | 3,911,439 | | | | - | | | | - | | | | 3,911,439 | |
Denmark | | | - | | | | 1,030,822 | | | | - | | | | 1,030,822 | |
France | | | - | | | | 17,925,945 | | | | - | | | | 17,925,945 | |
Germany | | | - | | | | 22,157,479 | | | | - | | | | 22,157,479 | |
India | | | 3,923,543 | | | | 8,025,590 | | | | - | | | | 11,949,133 | |
Italy | | | - | | | | 3,871,554 | | | | - | | | | 3,871,554 | |
263
Notes to Financial Statements (Continued)
| | | | | | | | | | | | | | | | |
| | | Level 1 | | | Level 2 | | | Level 3 | | | Total | |
Global Fund (Continued) | | | | | | | | | | | | | | | | |
Asset Investments (Continued) | | | | | | | | | | | | | | | | |
Japan | | $ | - | | | $ | 45,184,643 | | | $ | - | | | $ | 45,184,643 | |
Netherlands | | | - | | | | 7,400,194 | | | | - | | | | 7,400,194 | |
Spain | | | - | | | | 11,368,062 | | | | - | | | | 11,368,062 | |
Sweden | | | - | | | | 5,082,087 | | | | - | | | | 5,082,087 | |
Switzerland | | | - | | | | 12,618,405 | | | | - | | | | 12,618,405 | |
United Kingdom | | | 2,528,986 | | | | 14,447,475 | | | | - | | | | 16,976,461 | |
United States | | | 145,416,570 | | | | - | | | | - | | | | 145,416,570 | |
Preferred Stock* | | | | | | | | | | | | | | | | |
Germany | | | - | | | | 5,566,054 | | | | - | | | | 5,566,054 | |
India | | | 159,199 | | | | - | | | | - | | | | 159,199 | |
Mutual Funds | | | 16,268,918 | | | | - | | | | - | | | | 16,268,918 | |
| | | | | | | | | | | | | | | | |
| Total Investments | | $ | 172,885,074 | | | $ | 154,678,310 | | | $ | - | | | $ | 327,563,384 | |
| | | | | | | | | | | | | | | | |
| | | | |
International Equity Fund | | | | | | | | | | | | | | | | |
Asset Investments | | | | | | | | | | | | | | | | |
Common Stock* | | | | | | | | | | | | | | | | |
Australia | | $ | - | | | $ | 16,272,694 | | | $ | - | | | $ | 16,272,694 | |
Belgium | | | - | | | | 3,611,077 | | | | - | | | | 3,611,077 | |
Brazil | | | - | | | | 1,386,370 | | | | - | | | | 1,386,370 | |
Canada | | | 31,197,062 | | | | - | | | | - | | | | 31,197,062 | |
Denmark | | | - | | | | 19,896,625 | | | | - | | | | 19,896,625 | |
Finland | | | - | | | | 5,442,532 | | | | - | | | | 5,442,532 | |
France | | | - | | | | 69,491,853 | | | | - | | | | 69,491,853 | |
Germany | | | - | | | | 42,025,217 | | | | - | | | | 42,025,217 | |
India | | | 2,542,228 | | | | 6,702,499 | | | | - | | | | 9,244,727 | |
Ireland | | | - | | | | 11,789,542 | | | | - | | | | 11,789,542 | |
Japan | | | - | | | | 32,064,465 | | | | - | | | | 32,064,465 | |
Luxembourg | | | - | | | | 4,643,704 | | | | - | | | | 4,643,704 | |
Mexico | | | 3,266,740 | | | | - | | | | - | | | | 3,266,740 | |
Netherlands | | | - | | | | 36,388,224 | | | | - | | | | 36,388,224 | |
Panama | | | 6,698,104 | | | | - | | | | - | | | | 6,698,104 | |
South Africa | | | - | | | | 4,396,829 | | | | - | | | | 4,396,829 | |
Spain | | | - | | | | 23,756,292 | | | | - | | | | 23,756,292 | |
Sweden | | | - | | | | 11,610,368 | | | | - | | | | 11,610,368 | |
Switzerland | | | - | | | | 56,685,518 | | | | - | | | | 56,685,518 | |
Thailand | | | - | | | | 6,651,052 | | | | - | | | | 6,651,052 | |
United Kingdom | | | - | | | | 102,738,197 | | | | - | | | | 102,738,197 | |
Preferred Stock | | | | | | | | | | | | | | | | |
India | | | 92,831 | | | | - | | | | - | | | | 92,831 | |
Mutual Funds | | | 20,280,030 | | | | - | | | | - | | | | 20,280,030 | |
Warrants | | | - | | | | - | | | | - | † | | | - | |
| | | | | | | | | | | | | | | | |
Total Investments | | $ | 64,076,995 | | | $ | 455,553,058 | | | $ | - | | | $ | 519,630,053 | |
| | | | | | | | | | | | | | | | |
| | | | |
Strategic Emerging Markets Fund | | | | | | | | | | | | | | | | |
Asset Investments | | | | | | | | | | | | | | | | |
Common Stock* | | | | | | | | | | | | | | | | |
Bermuda | | $ | - | | | $ | 2,945,203 | | | $ | - | | | $ | 2,945,203 | |
Brazil | | | 3,231,970 | | | | 7,233,110 | | | | - | | | | 10,465,080 | |
Cayman Islands | | | 30,440,582 | | | | 15,449,879 | | | | - | | | | 45,890,461 | |
264
Notes to Financial Statements (Continued)
| | | | | | | | | | | | | | | | |
| | | Level 1 | | | Level 2 | | | Level 3 | | | Total | |
Strategic Emerging Markets Fund (Continued) | | | | | | | | | | | | | | | | |
Asset Investments (Continued) | | | | | | | | | | | | | | | | |
China | | $ | - | | | $ | 5,069,261 | | | $ | - | | | $ | 5,069,261 | |
Colombia | | | 2,252,976 | | | | 1,680,038 | | | | - | | | | 3,933,014 | |
Egypt | | | - | | | | 1,369,036 | | | | - | | | | 1,369,036 | |
France | | | - | | | | 5,761,618 | | | | - | | | | 5,761,618 | |
Hong Kong | | | - | | | | 8,179,388 | | | | - | | | | 8,179,388 | |
India | | | - | | | | 32,166,301 | | | | - | | | | 32,166,301 | |
Indonesia | | | - | | | | 4,627,933 | | | | - | | | | 4,627,933 | |
Italy | | | - | | | | 2,997,055 | | | | - | | | | 2,997,055 | |
Japan | | | - | | | | 4,475,468 | | | | - | | | | 4,475,468 | |
Malaysia | | | - | | | | 4,085,456 | | | | - | | | | 4,085,456 | |
Mexico | | | 8,801,245 | | | | - | | | | - | | | | 8,801,245 | |
Nigeria | | | - | | | | 915,692 | | | | - | | | | 915,692 | |
Philippines | | | - | | | | 6,532,593 | | | | - | | | | 6,532,593 | |
Poland | | | - | | | | 1,840,750 | | | | - | | | | 1,840,750 | |
Republic of Korea | | | - | | | | 2,904,862 | | | | - | | | | 2,904,862 | |
Russia | | | - | | | | 17,383,792 | | | | - | | | | 17,383,792 | |
Singapore | | | - | | | | 1,059,895 | | | | - | | | | 1,059,895 | |
Taiwan | | | - | | | | 8,685,704 | | | | - | | | | 8,685,704 | |
Thailand | | | - | | | | 1,428,459 | | | | - | | | | 1,428,459 | |
Turkey | | | - | | | | 2,165,352 | | | | - | | | | 2,165,352 | |
United Arab Emirates | | | - | | | | 2,899,636 | | | | - | | | | 2,899,636 | |
United Kingdom | | | - | | | | 5,896,710 | | | | - | | | | 5,896,710 | |
United States | | | 5,400,937 | | | | - | | | | - | | | | 5,400,937 | |
Preferred Stock* | | | | | | | | | | | | | | | | |
Brazil | | | - | | | | 5,347,247 | | | | - | | | | 5,347,247 | |
India | | | 87,085 | | | | - | | | | - | | | | 87,085 | |
Mutual Funds | | | 1,880,846 | | | | - | | | | - | | | | 1,880,846 | |
Rights | | | - | | | | 942,628 | | | | - | | | | 942,628 | |
Warrants | | | - | | | | 40,996 | | | | - | | | | 40,996 | |
Short-Term Investments | | | - | | | | 12,560,596 | | | | - | | | | 12,560,596 | |
| | | | | | | | | | | | | | | | |
Total Investments | | $ | 52,095,641 | | | $ | 166,644,658 | | | $ | - | | | $ | 218,740,299 | |
| | | | | | | | | | | | | | | | |
| * | Includes foreign equity securities whose values were adjusted to reflect market trading of comparable securities or other correlated instruments after the close of trading in their applicable foreign markets. |
| † | Represents a security at $0 value as of September 30, 2016. |
The following tables show Funds with certain assets and liabilities, which approximate fair value and would be categorized at Level 2 as of September 30, 2016.
| | | | | | | | | | | | |
Statements of Assets and Liabilities location: | | Short-Duration Bond Fund | | Inflation-
Protected and
Income Fund | | Core
Bond
Fund | | Diversified
Bond | | High
Yield
Fund | | Balanced
Fund |
Receivables from: | | | | | | | | | | | | |
Investments sold on a when-issued basis | | X | | | | X | | X | | | | X |
Collateral pledged for reverse repurchase agreements | | | | X | | | | | | | | |
Collateral pledged for open derivative instruments | | | | | | | | | | | | X |
265
Notes to Financial Statements (Continued)
| | | | | | | | | | | | |
Statements of Assets and Liabilities location: | | Short-Duration Bond Fund | | Inflation-
Protected and
Income Fund | | Core
Bond
Fund | | Diversified
Bond | | High
Yield
Fund | | Balanced
Fund |
Payables from: | | | | | | | | | | | | |
Reverse repurchase agreements | | | | X | | | | | | | | |
Investments purchased on a when-issued basis | | X | | X | | X | | X | | X | | X |
Collateral held for open derivative instruments | | | | | | X | | X | | | | |
Due to custodian | | X | | X | | | | | | | | |
| | | | | | | | | | | | |
Statements of Assets and Liabilities location: | | Value
Fund | | Main
Street
Fund | | Small Cap Opportunities Fund | | Global Fund | | International Equity Fund | | Strategic
Emerging
Markets Fund |
Payables from: | | | | | | | | | | | | |
Securities on loan | | X | | X | | X | | X | | X | | X |
The Funds had no transfers between Level 1 and Level 2 of the fair value hierarchy during the year ended September 30, 2016. The Funds recognize transfers between the Levels as of the beginning of the year.
Following is a reconciliation of investments for which significant unobservable inputs (Level 3) were used in determining value:
Asset Valuation Inputs
| | | | | | | | | | | | | | | | | | | | | | | | | | | | | | | | | | | | | | | | |
| | | Investments in Securities | |
| | | Balance
as of
9/30/15 | | | Accrued
Discounts
(Premiums) | | | Realized
Gain
(Loss) | | | Change in
Unrealized
Appreciation
(Depreciation) | | | Purchases | | | (Sales) | | | Transfers
into
Level 3* | | | Transfers
(out) of
Level 3* | | | Balance
as of
9/30/16 | | | Net Change
in Unrealized
Appreciation
(Depreciation)
from
Investments
Still Held
as of
9/30/16 | |
Short-Duration Bond Fund | | | | | | | | | | | | | | | | | | | | | | | | | | | | | |
Non-U.S. Government Agency Obligations† | | $ | 612,365 | | | $ | - | | | $ | 556 | | | $ | (80,912 | ) | | $ | - | | | $ | (688,922 | ) | | $ | 927,318 | ** | | $ | - | | | $ | 770,405 | | | $ | (80,569 | ) |
Non-U.S. Government Agency Obligations | | | - | | | | - | | | | - | | | | - | | | | 1,060,000 | | | | - | | | | - | | | | - | | | | 1,060,000 | | | | - | |
| | | | | | | | | | | | | | | | | | | | | | | | | | | | | | | | | | | | | | | | |
| | $ | 612,365 | | | $ | - | | | $ | 556 | | | $ | (80,912 | ) | | $ | 1,060,000 | | | $ | (688,922 | ) | | $ | 927,318 | | | $ | - | | | $ | 1,830,405 | | | $ | (80,569 | ) |
| | | | | | | | | | | | | | | | | | | | | | | | | | | | | | | | | | | | | | | | |
| | | | | | | |
Inflation-Protected and Income Fund | | | | | | | | | | | | | | | | | | | | | | | | | | | | | |
Non-U.S. Government Agency Obligations† | | $ | 341,827 | | | $ | - | | | $ | 268 | | | $ | (25,673 | ) | | $ | - | | | $ | (364,777 | ) | | $ | 271,406 | ** | | $ | - | | | $ | 223,051 | | | $ | (25,673 | ) |
| | | | | | | | | | | | | | | | | | | | | | | | | | | | | | | | | | | | | | | | |
| | | | | | | |
Core Bond Fund | | | | | | | | | | | | | | | | | | | | | | | | | | | | | |
Non-U.S. Government Agency Obligations† | | $ | 1,542,794 | | | $ | - | | | $ | 1,016 | | | $ | (183,674 | ) | | $ | - | | | $ | (1,706,432 | ) | | $ | 1,943,686 | ** | | $ | - | | | $ | 1,597,390 | | | $ | (182,807 | ) |
Non-U.S. Government Agency Obligations | | | - | | | | - | | | | - | | | | - | | | | 2,340,000 | | | | - | | | | - | | | | - | | | | 2,340,000 | | | | - | |
| | | | | | | | | | | | | | | | | | | | | | | | | | | | | | | | | | | | | | | | |
| | $ | 1,542,794 | | | $ | - | | | $ | 1,016 | | | $ | (183,674 | ) | | $ | 2,340,000 | | | $ | (1,706,432 | ) | | $ | 1,943,686 | | | $ | - | | | $ | 3,937,390 | | | $ | (182,807 | ) |
| | | | | | | | | | | | | | | | | | | | | | | | | | | | | | | | | | | | | | | | |
| | | | | | | |
Diversified Bond Fund | | | | | | | | | | | | | | | | | | | | | | | | | | | | | |
Common Stock | | $ | 24,752 | | | $ | - | | | $ | - | | | $ | (3,292 | ) | | $ | - | | | $ | (20,653 | ) | | $ | - | | | $ | - | | | $ | 807 | | | $ | (3,292 | ) |
Non-U.S. Government Agency Obligations† | | | 235,350 | | | | - | | | | 275 | | | | (13,574 | ) | | | - | | | | (248,074 | ) | | | 152,777 | ** | | | - | | | | 126,754 | | | | (13,446 | ) |
Non-U.S. Government Agency Obligations | | | - | | | | - | | | | - | | | | - | | | | 320,000 | | | | - | | | | - | | | | - | | | | 320,000 | | | | - | |
| | | | | | | | | | | | | | | | | | | | | | | | | | | | | | | | | | | | | | | | |
| | $ | 260,102 | | | $ | - | | | $ | 275 | | | $ | (16,866 | ) | | $ | 320,000 | | | $ | (268,727 | ) | | $ | 152,777 | | | $ | - | | | $ | 447,561 | | | $ | (16,738 | ) |
| | | | | | | | | | | | | | | | | | | | | | | | | | | | | | | | | | | | | | | | |
266
Notes to Financial Statements (Continued)
| | | | | | | | | | | | | | | | | | | | | | | | | | | | | | | | | | | | | | | | |
| | | Investments in Securities | |
| | | Balance
as of
9/30/15 | | | Accrued
Discounts
(Premiums) | | | Realized
Gain
(Loss) | | | Change in
Unrealized
Appreciation
(Depreciation) | | | Purchases | | | (Sales) | | | Transfers
into
Level 3* | | | Transfers
(out) of
Level 3* | | | Balance
as of
9/30/16 | | | Net Change
in Unrealized
Appreciation
(Depreciation)
from
Investments
Still Held
as of
9/30/16 | |
High Yield Fund | | | | | | | | | | | | | | | | | | | | | | | | | | | | | |
Common Stock | | $ | 303,571 | | | $ | - | | | $ | - | | | $ | (40,379 | ) | | $ | - | | | $ | (253,293 | ) | | $ | - | | | $ | - | | | $ | 9,899 | | | $ | (40,379 | ) |
| | | | | | | | | | | | | | | | | | | | | | | | | | | | | | | | | | | | | | | | |
| | | | | | | |
Balanced Fund | | | | | | | | | | | | | | | | | | | | | | | | | | | | | |
Non-U.S. Government | | | | | | | | | | | | | | | | | | | | | | | | | | | | | | | | | | | | | | | | |
Agency Obligations† | | $ | - | | | $ | - | | | $ | 13 | | | $ | (7,432 | ) | | $ | - | | | $ | (6,985 | ) | | $ | 85,047 | ** | | $ | - | | | $ | 70,643 | | | $ | (7,432 | ) |
Rights | | | 4,050 | | | | - | | | | - | | | | - | | | | - | | | | - | | | | - | | | | - | | | | 4,050 | | | | - | |
| | | | | | | | | | | | | | | | | | | | | | | | | | | | | | | | | | | | | | | | |
| | $ | 4,050 | | | $ | - | | | $ | 13 | | | $ | (7,432 | ) | | $ | - | | | $ | (6,985 | ) | | $ | 85,047 | | | $ | - | | | $ | 74,693 | | | $ | (7,432 | ) |
| | | | | | | | | | | | | | | | | | | | | | | | | | | | | | | | | | | | | | | | |
| | | | | | | |
Disciplined Value Fund | | | | | | | | | | | | | | | | | | | | | | | | | | | | | |
Rights | | $ | 9,858 | | | $ | - | | | $ | - | | | $ | - | | | $ | - | | | $ | - | | | $ | - | | | $ | - | | | $ | 9,858 | | | $ | - | |
| | | | | | | | | | | | | | | | | | | | | | | | | | | | | | | | | | | | | | | | |
| | | | | | | |
International Equity Fund | | | | | | | | | | | | | | | | | | | | | | | | | | | | | |
Warrants | | $ | - | *** | | $ | - | | | $ | - | | | $ | - | | | $ | - | | | $ | - | | | $ | - | | | $ | - | | | $ | - | †† | | $ | - | |
| | | | | | | | | | | | | | | | | | | | | | | | | | | | | | | | | | | | | | | | |
| * | The Fund(s) recognize transfers between the Levels as of the beginning of the year. |
| ** | Transfers occurred between Level 3 and Level 2 as inputs were less observable. |
| *** | Represents a security at $0 value as of September 30, 2015. |
| † | Represents (i) an illiquid 144A security valued by a broker quote or vendor price or (ii) a restricted security issued by a non-public entity valued by a broker quote or vendor price. |
| †† | Represents a security at $0 value as of September 30, 2016. |
None of the unobservable inputs, individually or collectively, had a material impact on the Fund(s).
Derivative Instruments
Derivatives are financial instruments whose values are based on the values of one or more indicators, such as a security, asset, currency, interest rate, or index. Derivative transactions can create investment leverage and may be highly volatile. Gains or losses from derivatives can be substantially greater than their original cost and can sometimes be unlimited. A Fund may not be able to close out a derivative transaction at a favorable time or price. For those Funds that held derivatives during the year ended September 30, 2016, the following tables show how the Fund used these types of derivatives during the year (marked with an “A”), as well as additional uses, if any, it may have for them in the future (marked with an “M”).
| | | | | | | | | | |
Type of Derivative and Objective for Use | | Short-Duration
Bond Fund | | Inflation-
Protected and
Income Fund | | Core
Bond Fund | | Diversified
Bond
Fund | | Balanced
Fund |
Foreign Currency Exchange Transactions* | | | | | | | | | | |
Hedging/Risk Management | | A | | | | A | | A | | A |
Directional Exposures to Currencies | | M | | | | A | | M | | A |
Intention to Create Investment Leverage in Portfolio | | M | | | | M | | M | | M |
| | | | | | |
Futures Contracts** | | | | | | | | | | |
Hedging/Risk Management | | A | | A | | A | | A | | A |
Duration/Credit Quality Management | | A | | A | | A | | A | | A |
Substitution for Direct Investment | | A | | A | | A | | A | | A |
Intention to Create Investment Leverage in Portfolio | | M | | M | | M | | M | | M |
267
Notes to Financial Statements (Continued)
| | | | | | | | | | |
Type of Derivative and Objective for Use | | Short-Duration
Bond Fund | | Inflation-
Protected and
Income Fund | | Core
Bond Fund | | Diversified
Bond
Fund | | Balanced
Fund |
Interest Rate Swaps*** | | | | | | | | | | |
Hedging/Risk Management | | | | A | | A | | A | | |
Duration Management | | | | A | | A | | A | | |
Asset/Liability Management | | | | M | | M | | M | | |
Substitution for Direct Investment | | | | M | | M | | M | | |
Intention to Create Investment Leverage in Portfolio | | | | M | | M | | M | | |
| | | | | | |
Credit Default Swaps (Protection Buyer) | | | | | | | | | | |
Hedging/Risk Management | | A | | A | | A | | A | | A |
Duration/Credit Quality Management | | A | | A | | A | | A | | A |
Income | | A | | A | | A | | A | | A |
Substitution for Direct Investment | | A | | A | | A | | A | | A |
Intention to Create Investment Leverage in Portfolio | | M | | M | | M | | M | | M |
| | | | | | |
Credit Default Swaps (Protection Seller) | | | | | | | | | | |
Hedging/Risk Management | | A | | A | | A | | A | | A |
Duration/Credit Quality Management | | A | | A | | A | | A | | A |
Income | | A | | A | | A | | A | | A |
Substitution for Direct Investment | | A | | A | | A | | A | | A |
Intention to Create Investment Leverage in Portfolio | | M | | M | | M | | M | | M |
| | | | | | |
Purchased Options | | | | | | | | | | |
Hedging/Risk Management | | A | | A | | A | | A | | A |
Duration/Credit Quality Management | | A | | A | | A | | A | | A |
Substitution for Direct Investment | | A | | A | | A | | A | | A |
Directional Investment | | A | | A | | A | | A | | A |
Intention to Create Investment Leverage in Portfolio | | M | | M | | M | | M | | M |
| * | Includes any options purchased or written, futures contracts, forward contracts, and swap agreements, if applicable. |
| ** | Includes any options purchased or written on futures contracts, if applicable. |
| *** | Includes any caps, floors, and collars, and related purchased or written options, if applicable. |
268
Notes to Financial Statements (Continued)
At September 30, 2016, and during the year then ended, the Fund(s) had the following derivatives and transactions in derivatives, grouped into the indicated risk categories:
| | | | | | | | | | | | | | | | | | | | |
| | | Credit
Risk | | | Equity
Risk | | | Foreign
Exchange
Risk | | | Interest
Rate
Risk | | | Total | |
| Short-Duration Bond Fund | | | | | | | | | | | | | | | | | | | | |
| Asset Derivatives | | | | | | | | | | | | | | | | | | | | |
Forward Contracts* | | $ | - | | | $ | - | | | $ | 151,174 | | | $ | - | | | $ | 151,174 | |
Futures Contracts^^ | | | - | | | | - | | | | - | | | | 55,032 | | | | 55,032 | |
| | | | | | | | | | | | | | | | | | | | |
Total Value | | $ | - | | | $ | - | | | $ | 151,174 | | | $ | 55,032 | | | $ | 206,206 | |
| | | | | | | | | | | | | | | | | | | | |
| Liability Derivatives | | | | | | | | | | | | | | | | | | | | |
Forward Contracts^ | | $ | - | | | $ | - | | | $ | (106,867 | ) | | $ | - | | | $ | (106,867 | ) |
Futures Contracts^^ | | | - | | | | - | | | | - | | | | (220,129 | ) | | | (220,129 | ) |
Swap Agreements^ | | | (271,168 | ) | | | - | | | | - | | | | - | | | | (271,168 | ) |
Swap Agreements^^,^^^ | | | (91,557 | ) | | | - | | | | - | | | | - | | | | (91,557 | ) |
| | | | | | | | | | | | | | | | | | | | |
Total Value | | $ | (362,725 | ) | | $ | - | | | $ | (106,867 | ) | | $ | (220,129 | ) | | $ | (689,721 | ) |
| | | | | | | | | | | | | | | | | | | | |
| Realized Gain (Loss)# | | | | | | | | | | | | | | | | | | | | |
Purchased Options | | $ | - | | | $ | - | | | $ | - | | | $ | 164,011 | | | $ | 164,011 | |
Futures Contracts | | | - | | | | - | | | | - | | | | 368,686 | | | | 368,686 | |
Swap Agreements | | | 58,656 | | | | - | | | | - | | | | - | | | | 58,656 | |
| | | | | | | | | | | | | | | | | | | | |
Total Realized Gain (Loss) | | $ | 58,656 | | | $ | - | | | $ | - | | | $ | 532,697 | | | $ | 591,353 | |
| | | | | | | | | | | | | | | | | | | | |
| Change in Appreciation (Depreciation)## | | | | | | | | | | | | | | | | | | | | |
Forward Contracts | | $ | - | | | $ | - | | | $ | 44,307 | | | $ | - | | | $ | 44,307 | |
Futures Contracts | | | - | | | | - | | | | - | | | | (407,776 | ) | | | (407,776 | ) |
Swap Agreements | | | (146,958 | ) | | | - | | | | - | | | | - | | | | (146,958 | ) |
| | | | | | | | | | | | | | | | | | | | |
Total Change in Appreciation (Depreciation) | | $ | (146,958 | ) | | $ | - | | | $ | 44,307 | | | $ | (407,776 | ) | | $ | (510,427 | ) |
| | | | | | | | | | | | | | | | | | | | |
| | | | | |
| Inflation-Protected and Income Fund | | | | | | | | | | | | | | | | | | | | |
| Asset Derivatives | | | | | | | | | | | | | | | | | | | | |
Futures Contracts^^ | | $ | - | | | $ | - | | | $ | - | | | $ | 7,913 | | | $ | 7,913 | |
Swap Agreements* | | | - | | | | - | | | | - | | | | 226,813 | | | | 226,813 | |
| | | | | | | | | | | | | | | | | | | | |
Total Value | | $ | - | | | $ | - | | | $ | - | | | $ | 234,726 | | | $ | 234,726 | |
| | | | | | | | | | | | | | | | | | | | |
| Liability Derivatives | | | | | | | | | | | | | | | | | | | | |
Futures Contracts^^ | | $ | - | | | $ | - | | | $ | - | | | $ | (18,472 | ) | | $ | (18,472 | ) |
Swap Agreements^ | | | (245,129 | ) | | | - | | | | - | | | | - | | | | (245,129 | ) |
Swap Agreements^^,^^^ | | | (7,228 | ) | | | - | | | | - | | | | - | | | | (7,228 | ) |
| | | | | | | | | | | | | | | | | | | | |
Total Value | | $ | (252,357 | ) | | $ | - | | | $ | - | | | $ | (18,472 | ) | | $ | (270,829 | ) |
| | | | | | | | | | | | | | | | | | | | |
| Realized Gain (Loss)# | | | | | | | | | | | | | | | | | | | | |
Purchased Options | | $ | - | | | $ | - | | | $ | 339,543 | | | $ | 57,944 | | | $ | 397,487 | |
Futures Contracts | | | - | | | | - | | | | - | | | | (93,972 | ) | | | (93,972 | ) |
Swap Agreements | | | 72,763 | | | | - | | | | - | | | | (8 | ) | | | 72,755 | |
| | | | | | | | | | | | | | | | | | | | |
Total Realized Gain (Loss) | | $ | 72,763 | | | $ | - | | | $ | 339,543 | | | $ | (36,036 | ) | | $ | 376,270 | |
| | | | | | | | | | | | | | | | | | | | |
| Change in Appreciation (Depreciation)## | | | | | | | | | | | | | | | | | | | | |
Purchased Options | | $ | - | | | $ | - | | | $ | (162,065 | ) | | $ | - | | | $ | (162,065 | ) |
Futures Contracts | | | - | | | | - | | | | - | | | | 34,910 | | | | 34,910 | |
Swap Agreements | | | (118,743 | ) | | | - | | | | - | | | | 226,813 | | | | 108,070 | |
| | | | | | | | | | | | | | | | | | | | |
Total Change in Appreciation (Depreciation) | | $ | (118,743 | ) | | $ | - | | | $ | (162,065 | ) | | $ | 261,723 | | | $ | (19,085 | ) |
| | | | | | | | | | | | | | | | | | | | |
269
Notes to Financial Statements (Continued)
| | | | | | | | | | | | | | | | | | | | |
| | | Credit
Risk | | | Equity
Risk | | | Foreign
Exchange
Risk | | | Interest
Rate
Risk | | | Total | |
| Core Bond Fund | | | | | | | | | | | | | | | | | | | | |
| Asset Derivatives | | | | | | | | | | | | | | | | | | | | |
Forward Contracts* | | $ | - | | | $ | - | | | $ | 365,472 | | | $ | - | | | $ | 365,472 | |
Futures Contracts^^ | | | - | | | | - | | | | - | | | | 585,204 | | | | 585,204 | |
| | | | | | | | | | | | | | | | | | | | |
Total Value | | $ | - | | | $ | - | | | $ | 365,472 | | | $ | 585,204 | | | $ | 950,676 | |
| | | | | | | | | | | | | | | | | | | | |
| | | | | | | | | | | | | | | | | | | | |
| Liability Derivatives | | | | | | | | | | | | | | | | | | | | |
Forward Contracts^ | | $ | - | | | $ | - | | | $ | (258,358 | ) | | $ | - | | | $ | (258,358 | ) |
Futures Contracts^^ | | | - | | | | - | | | | - | | | | (87,590 | ) | | | (87,590 | ) |
Swap Agreements^ | | | (694,082 | ) | | | - | | | | - | | | | - | | | | (694,082 | ) |
Swap Agreements^^,^^^ | | | (267,728 | ) | | | - | | | | - | | | | - | | | | (267,728 | ) |
| | | | | | | | | | | | | | | | | | | | |
Total Value | | $ | (961,810 | ) | | $ | - | | | $ | (258,358 | ) | | $ | (87,590 | ) | | $ | (1,307,758 | ) |
| | | | | | | | | | | | | | | | | | | | |
| Realized Gain (Loss)# | | | | | | | | | | | | | | | | | | | | |
Purchased Options | | $ | - | | | $ | - | | | $ | - | | | $ | 530,521 | | | $ | 530,521 | |
Futures Contracts | | | - | | | | - | | | | - | | | | 7,127,802 | | | | 7,127,802 | |
Swap Agreements | | | 148,655 | | | | - | | | | - | | | | (2,004 | ) | | | 146,651 | |
| | | | | | | | | | | | | | | | | | | | |
Total Realized Gain (Loss) | | $ | 148,655 | | | $ | - | | | $ | - | | | $ | 7,656,319 | | | $ | 7,804,974 | |
| | | | | | | | | | | | | | | | | | | | |
| Change in Appreciation (Depreciation)## | | | | | | | | | | | | | | | | | | | | |
Forward Contracts | | $ | - | | | $ | - | | | $ | 107,114 | | | $ | - | | | $ | 107,114 | |
Futures Contracts | | | - | | | | - | | | | - | | | | 314,858 | | | | 314,858 | |
Swap Agreements | | | (407,677 | ) | | | - | | | | - | | | | 3,130 | | | | (404,547 | ) |
| | | | | | | | | | | | | | | | | | | | |
Total Change in Appreciation (Depreciation) | | $ | (407,677 | ) | | $ | - | | | $ | 107,114 | | | $ | 317,988 | | | $ | 17,425 | |
| | | | | | | | | | | | | | | | | | | | |
| Diversified Bond Fund | | | | | | | | | | | | | | | | | | | | |
| Asset Derivatives | | | | | | | | | | | | | | | | | | | | |
Forward Contracts* | | $ | - | | | $ | - | | | $ | 137,911 | | | $ | - | | | $ | 137,911 | |
Futures Contracts^^ | | | - | | | | - | | | | - | | | | 5,982 | | | | 5,982 | |
| | | | | | | | | | | | | | | | | | | | |
Total Value | | $ | - | | | $ | - | | | $ | 137,911 | | | $ | 5,982 | | | $ | 143,893 | |
| | | | | | | | | | | | | | | | | | | | |
| Liability Derivatives | | | | | | | | | | | | | | | | | | | | |
Forward Contracts^ | | $ | - | | | $ | - | | | $ | (103,898 | ) | | $ | - | | | $ | (103,898 | ) |
Futures Contracts^^ | | | - | | | | - | | | | - | | | | (6,627 | ) | | | (6,627 | ) |
Swap Agreements^ | | | (87,097 | ) | | | - | | | | - | | | | - | | | | (87,097 | ) |
Swap Agreements^^,^^^ | | | (48,188 | ) | | | - | | | | - | | | | - | | | | (48,188 | ) |
| | | | | | | | | | | | | | | | | | | | |
Total Value | | $ | (135,285 | ) | | $ | - | | | $ | (103,898 | ) | | $ | (6,627 | ) | | $ | (245,810 | ) |
| | | | | | | | | | | | | | | | | | | | |
| Realized Gain (Loss)# | | | | | | | | | | | | | | | | | | | | |
Purchased Options | | $ | - | | | $ | - | | | $ | 844,052 | | | $ | 55,364 | | | $ | 899,416 | |
Forward Contracts | | | - | | | | - | | | | (83,532 | ) | | | - | | | | (83,532 | ) |
Futures Contracts | | | - | | | | - | | | | - | | | | 453,395 | | | | 453,395 | |
Swap Agreements | | | 15,079 | | | | - | | | | - | | | | - | | | | 15,079 | |
| | | | | | | | | | | | | | | | | | | | |
Total Realized Gain (Loss) | | $ | 15,079 | | | $ | - | | | $ | 760,520 | | | $ | 508,759 | | | $ | 1,284,358 | |
| | | | | | | | | | | | | | | | | | | | |
| Change in Appreciation (Depreciation)## | | | | | | | | | | | | | | | | | | | | |
Purchased Options | | $ | - | | | $ | - | | | $ | (388,751 | ) | | $ | - | | | $ | (388,751 | ) |
Forward Contracts | | | - | | | | - | | | | 32,361 | | | | - | | | | 32,361 | |
Futures Contracts | | | - | | | | - | | | | - | | | | (29,914 | ) | | | (29,914 | ) |
Swap Agreements | | | (54,458 | ) | | | - | | | | - | | | | - | | | | (54,458 | ) |
| | | | | | | | | | | | | | | | | | | | |
Total Change in Appreciation (Depreciation) | | $ | (54,458 | ) | | $ | - | | | $ | (356,390 | ) | | $ | (29,914 | ) | | $ | (440,762 | ) |
| | | | | | | | | | | | | | | | | | | | |
270
Notes to Financial Statements (Continued)
| | | | | | | | | | | | | | | | | | | | |
| | | Credit
Risk | | | Equity
Risk | | | Foreign
Exchange
Risk | | | Interest
Rate
Risk | | | Total | |
Balanced Fund | | | | | | | | | | | | | | | | | | | | |
| Asset Derivatives | | | | | | | | | | | | | | | | | | | | |
Forward Contracts* | | $ | - | | | $ | - | | | $ | 9,649 | | | $ | - | | | $ | 9,649 | |
Futures Contracts^^ | | | - | | | | - | | | | - | | | | 916 | | | | 916 | |
| | | | | | | | | | | | | | | | | | | | |
Total Value | | $ | - | | | $ | - | | | $ | 9,649 | | | $ | 916 | | | $ | 10,565 | |
| | | | | | | | | | | | | | | | | | | | |
| Liability Derivatives | | | | | | | | | | | | | | | | | | | | |
Forward Contracts^ | | $ | - | | | $ | - | | | $ | (6,821 | ) | | $ | - | | | $ | (6,821 | ) |
Futures Contracts^^ | | | - | | | | (17,060 | ) | | | - | | | | (2,506 | ) | | | (19,566 | ) |
Swap Agreements^ | | | (18,857 | ) | | | - | | | | - | | | | - | | | | (18,857 | ) |
Swap Agreements^^,^^^ | | | (8,220 | ) | | | - | | | | - | | | | - | | | | (8,220 | ) |
| | | | | | | | | | | | | | | | | | | | |
Total Value | | $ | (27,077 | ) | | $ | (17,060 | ) | | $ | (6,821 | ) | | $ | (2,506 | ) | | $ | (53,464 | ) |
| | | | | | | | | | | | | | | | | | | | |
| Realized Gain (Loss)# | | | | | | | | | | | | | | | | | | | | |
Purchased Options | | $ | - | | | $ | - | | | $ | - | | | $ | 16,599 | | | $ | 16,599 | |
Futures Contracts | | | - | | | | 154,010 | | | | - | | | | 163,660 | | | | 317,670 | |
Swap Agreements | | | 4,024 | | | | - | | | | - | | | | - | | | | 4,024 | |
| | | | | | | | | | | | | | | | | | | | |
Total Realized Gain (Loss) | | $ | 4,024 | | | $ | 154,010 | | | $ | - | | | $ | 180,259 | | | $ | 338,293 | |
| | | | | | | | | | | | | | | | | | | | |
| Change in Appreciation (Depreciation)## | | | | | | | | | | | | | | | | | | | | |
Forward Contracts | | $ | - | | | $ | - | | | $ | 2,828 | | | $ | - | | | $ | 2,828 | |
Futures Contracts | | | - | | | | (17,060 | ) | | | - | | | | (5,630 | ) | | | (22,690 | ) |
Swap Agreements | | | (13,217 | ) | | | - | | | | - | | | | - | | | | (13,217 | ) |
| | | | | | | | | | | | | | | | | | | | |
Total Change in Appreciation (Depreciation) | | $ | (13,217 | ) | | $ | (17,060 | ) | | $ | 2,828 | | | $ | (5,630 | ) | | $ | (33,079 | ) |
| | | | | | | | | | | | | | | | | | | | |
| * | Statements of Assets and Liabilities location: Receivables from: open forward foreign currency contracts or open swap agreements at value, as applicable. |
| ^ | Statements of Assets and Liabilities location: Payables for: open forward foreign currency contracts, open swap agreements, at value, as applicable. |
| ^^ | Cumulative appreciation (depreciation) on futures contracts and centrally cleared swaps is reported in “Futures Contracts” and “Swap Agreements” below. Only current day’s variation margin, if any, is reported within the Statements of Assets and Liabilities. |
| ^^^ | Represents centrally cleared swaps which are not subject to a master netting agreement. |
| # | Statements of Operations location: Amounts are included in net realized gain (loss) on: investment transactions, futures contracts, swap agreements, or foreign currency transactions, as applicable. |
| ## | Statements of Operations location: Amounts are included in net change in unrealized appreciation (depreciation) on: investment transactions, futures contracts, swap agreements, or translation of assets and liabilities in foreign currencies, as applicable. |
271
Notes to Financial Statements (Continued)
For the year ended September 30, 2016, the number of contracts, notional amounts, or shares/units for each derivative type was as follows:
| | | | | | | | | | | | | | | | |
| | | Number of Contracts, Notional Amounts or Shares/Units† | |
Fund Name | | Futures
Contracts | | | Forward
Contracts | | | Swap
Agreements | | | Purchased
Options | |
Short-Duration Bond Fund | | | 1,591 | | | $ | 32,209,583 | | | $ | 4,793,333 | | | $ | 127,350,000 | |
Inflation-Protected and Income Fund | | | 165 | | | | - | | | | 26,760,833 | | | | 61,700,000 | |
Core Bond Fund | | | 2,441 | | | | 77,868,380 | | | | 15,452,500 | | | | 411,900,000 | |
Diversified Bond Fund | | | 282 | | | | 16,989,646 | | | | 1,973,334 | | | | 84,000,000 | |
Balanced Fund | | | 81 | | | | 2,055,931 | | | | 385,833 | | | | 12,900,000 | |
| † | Amount(s) disclosed represent average number of contracts for futures contracts, notional amounts for forward contracts, swap agreements, and purchased options, which is indicative of volume of this derivative type, for the months that the Fund held such derivatives during the year ended September 30, 2016. |
The following table presents derivative assets by counterparty net of amounts available for offset under a master netting agreement (“MNA”), or similar agreement, and net of the related collateral received by the Fund(s) as of September 30, 2016.
| | | | | | | | | | | | | | | | |
Counterparty | | Derivative Assets
Subject to an
MNA by
Counterparty† | | | Financial
Instruments
Available for Offset | | | Collateral
Received*** | | | Net Amount* | |
| Short-Duration Bond Fund | | | | | | | | | | | | | | | | |
JP Morgan Chase Bank N.A. | | $ | 151,174 | | | $ | (106,867 | ) | | $ | - | | | $ | 44,307 | |
| | | | | | | | | | | | | | | | |
| Inflation-Protected and Income Fund | | | | | | | | | | | | | | | | |
Bank of America N.A. | | $ | 54,073 | | | $ | - | | | $ | - | | | $ | 54,073 | |
Goldman Sachs International | | | 90,554 | | | | (90,554 | ) | | | - | | | | - | |
JP Morgan Chase Bank N.A. | | | 82,186 | | | | (46,691 | ) | | | - | | | | 35,495 | |
| | | | | | | | | | | | | | | | |
| | $ | 226,813 | | | $ | (137,245 | ) | | $ | - | | | $ | 89,568 | |
| | | | | | | | | | | | | | | | |
| Core Bond Fund | | | | | | | | | | | | | | | | |
JP Morgan Chase Bank N.A. | | $ | 365,472 | | | $ | (258,358 | ) | | $ | - | | | $ | 107,114 | |
| | | | | | | | | | | | | | | | |
| Diversified Bond Fund | | | | | | | | | | | | | | | | |
Bank of America N.A. | | $ | 5,281 | | | $ | (809 | ) | | $ | - | | | $ | 4,472 | |
Barclays Bank PLC | | | 6,519 | | | | - | | | | - | | | | 6,519 | |
Deutsche Bank AG | | | 21,235 | | | | (4,250 | ) | | | - | | | | 16,985 | |
HSBC Bank USA | | | 957 | | | | (957 | ) | | | - | | | | - | |
JP Morgan Chase Bank N.A. | | | 103,919 | | | | (70,433 | ) | | | - | | | | 33,486 | |
| | | | | | | | | | | | | | | | |
| | $ | 137,911 | | | $ | (76,449 | ) | | $ | - | | | $ | 61,462 | |
| | | | | | | | | | | | | | | | |
| Balanced Fund | | | | | | | | | | | | | | | | |
JP Morgan Chase Bank N.A. | | $ | 9,649 | | | $ | (6,821 | ) | | $ | - | | | $ | 2,828 | |
| | | | | | | | | | | | | | | | |
272
Notes to Financial Statements (Continued)
The following table presents derivative liabilities by counterparty net of amounts available for offset under an MNA, or similar agreement, and net of the related collateral pledged by the Fund(s) as of September 30, 2016.
| | | | | | | | | | | | | | | | |
Counterparty | | Derivative Liabilities
Subject to an
MNA by
Counterparty† | | | Financial
Instruments
Available for Offset | | | Collateral
Pledged*** | | | Net Amount** | |
| Short-Duration Bond Fund | | | | | | | | | | | | | | | | |
JP Morgan Chase Bank N.A. | | $ | (106,867 | ) | | $ | 106,867 | | | $ | - | | | $ | - | |
Goldman Sachs International | | | (271,168 | ) | | | - | | | | - | | | | (271,168 | ) |
| | | | | | | | | | | | | | | | |
| | $ | (378,035 | ) | | $ | 106,867 | | | $ | - | | | $ | (271,168 | ) |
| | | | | | | | | | | | | | | | |
| Inflation-Protected and Income Fund | | | | | | | | | | | | | | | | |
Goldman Sachs International | | $ | (198,438 | ) | | $ | 90,554 | | | $ | - | | | $ | (107,884 | ) |
JP Morgan Chase Bank N.A. | | | (46,691 | ) | | | 46,691 | | | | - | | | | - | |
| | | | | | | | | | | | | | | | |
| | $ | (245,129 | ) | | $ | 137,245 | | | $ | - | | | $ | (107,884 | ) |
| | | | | | | | | | | | | | | | |
| Core Bond Fund | | | | | | | | | | | | | | | | |
Goldman Sachs International | | $ | (694,082 | ) | | $ | - | | | $ | 694,082 | | | $ | - | |
JP Morgan Chase Bank N.A. | | | (258,358 | ) | | | 258,358 | | | | - | | | | - | |
| | | | | | | | | | | | | | | | |
| | $ | (952,440 | ) | | $ | 258,358 | | | $ | 694,082 | | | $ | - | |
| | | | | | | | | | | | | | | | |
| Diversified Bond Fund | | | | | | | | | | | | | | | | |
Bank of America N.A. | | $ | (809 | ) | | $ | 809 | | | $ | - | | | $ | - | |
Deutsche Bank AG | | | (4,250 | ) | | | 4,250 | | | | - | | | | - | |
Goldman Sachs International | | | (89,557 | ) | | | - | | | | - | | | | (89,557 | ) |
HSBC Bank USA | | | (25,946 | ) | | | 957 | | | | - | | | | (24,989 | ) |
JP Morgan Chase Bank N.A. | | | (70,433 | ) | | | 70,433 | | | | - | | | | - | |
| | | | | | | | | | | | | | | | |
| | $ | (190,995 | ) | | $ | 76,449 | | | $ | - | | | $ | (114,546 | ) |
| | | | | | | | | | | | | | | | |
| Balanced Fund | | | | | | | | | | | | | | | | |
Goldman Sachs International | | $ | (18,857 | ) | | $ | - | | | $ | - | | | $ | (18,857 | ) |
JP Morgan Chase Bank N.A. | | | (6,821 | ) | | | 6,821 | | | | - | | | | - | |
| | | | | | | | | | | | | | | | |
| | $ | (25,678 | ) | | $ | 6,821 | | | $ | - | | | $ | (18,857 | ) |
| | | | | | | | | | | | | | | | |
| * | Represents the net amount receivable from the counterparty in the event of default. |
| ** | Represents the net amount payable to the counterparty in the event of default. |
| *** | The amount presented here may be less than the total amount of collateral received/pledged as the net amount of derivative assets and liabilities for a counterparty cannot be less than $0. |
| † | The amount presented here may be less than the total amount shown in the Statements of Assets and Liabilities as some derivatives held by the counterparty are not covered within the master netting agreements. |
Such agreements typically permit a single net payment in the event of default, including the bankruptcy or insolvency of the counterparty. Typically, the Fund(s) and counterparties are not permitted to sell, re-pledge, or use the collateral they receive.
Further details regarding the derivatives and other investments held by the Fund(s) during the year ended September 30, 2016, are discussed below.
Foreign Currency Exchange Transactions
A Fund may engage in foreign currency exchange transactions for hedging purposes in order to protect against uncertainty in the level of future foreign currency exchange rates, or for other, non-hedging purposes.
A Fund may enter into foreign currency exchange transactions, including foreign currency forward contracts. These contracts call for the Fund to deliver in the future an amount of one currency in return for an amount of another currency, at an exchange rate
273
Notes to Financial Statements (Continued)
determined at the time the contract is entered into. Forward contracts are private contractual arrangements and a Fund is subject to the risk that its counterparty will not, or will not be able to, perform its obligations. This type of arrangement may require the Fund to post margin. A Fund may also buy and sell options on currencies. When the Fund buys an option, its loss should generally be limited to the amount of the premium paid and any transaction costs. If a Fund sells an option on a currency, it is subject generally to the same risks as if it had entered into a forward contract with respect to that currency. For example, forward contracts are private contractual arrangements and a Fund is subject to the risk that its counterparty will not, or will not be able to, perform its obligations. A Fund may enter into foreign currency exchange transactions in order to hedge against changes in the values of the assets or liabilities denominated in one or more foreign currencies, or otherwise to increase or reduce a Fund’s exposure to various foreign currencies. The use of foreign currency exchange transactions may create investment leverage.
Whenever a Fund enters into a foreign currency exchange transaction, it is subject to the risk that the value of the transaction will move in a direction unfavorable to it. When the Fund uses the transactions for hedging purposes, it is likely that the Fund will have an asset or liability that will offset any loss (or gain) on the transactions, at least in part. If a Fund enters into foreign currency exchange transactions other than for hedging purposes (for example, seeking to profit from an anticipated change in the values of currencies by creating directional exposures in the portfolio with respect to one or more currencies), it will generally be subject to the same risks, but is less likely to have assets or liabilities that will offset any losses on the transactions. There can be no assurance that a Fund will be able to terminate any foreign currency exchange transaction prior to its maturity in order to limit its loss on the transaction.
Forward foreign currency contracts are marked to market daily and the change in their value is recorded by the Funds as an unrealized gain or loss. Forward foreign currency contracts are valued at the settlement price established through dealers or other market sources on the day which they are traded. When a forward foreign currency contract is extinguished, through delivery or offset by entering into another forward foreign currency contract, the Funds record a realized gain or loss equal to the difference between the value of the contract at the time it was opened and the value of the contract at the time it was extinguished or offset. The notional or contractual amounts of these instruments do not necessarily represent the amounts potentially subject to risk. The measurement of the risk associated with these instruments is meaningful only when all related and offsetting transactions and counterparty risks are considered. For information regarding the accounting treatment of options, see “Options, Rights, and Warrants” below.
The Fund(s) listed in the following table had open forward foreign currency contracts at September 30, 2016. A Fund’s current exposure to a counterparty is the unrealized appreciation on the contract.
| | | | | | | | | | | | | | | | | | | | |
| | | | | | Counterparty | | Settlement
Date | | | | | In Exchange
for | | | Unrealized
Appreciation/
(Depreciation) | |
| Short-Duration Bond Fund | | | | | | | | | | | | | | |
| Contract to Buy | | | | | | | | | | | | | | | | | |
| CNH | | | 125,518,200 | | | JP Morgan Chase Bank N.A.* | | 03/15/17 | | | | | | $ | 18,755,693 | | | $ | (106,867 | ) |
| | | | | | | | | | | | | | | | | | | | |
| | | | |
| Contract to Deliver | | | | | | | | | | | | | | |
| CNH | | | 125,518,200 | | | JP Morgan Chase Bank N.A.* | | 03/15/17 | | | | | | $ | 18,800,000 | | | $ | 151,174 | |
| | | | | | | | | | | | | | | | | | | | |
| | | | |
| Core Bond Fund | | | | | | | | | | | | | | |
| Contract to Buy | | | | | | | | | | | | | | | | | |
| CNH | | | 303,446,925 | | | JP Morgan Chase Bank N.A.* | | 03/15/17 | | | | | | $ | 45,342,886 | | | $ | (258,358 | ) |
| | | | | | | | | | | | | | | | | | | | |
| | | | |
| Contract to Deliver | | | | | | | | | | | | | | |
| CNH | | | 303,446,925 | | | JP Morgan Chase Bank N.A.* | | 03/15/17 | | | | | | $ | 45,450,000 | | | $ | 365,472 | |
| | | | | | | | | | | | | | | | | | | | |
274
Notes to Financial Statements (Continued)
| | | | | | | | | | | | | | | | | | | | |
| | | | | | Counterparty | | Settlement
Date | | | | | In Exchange
for | | | Unrealized
Appreciation/
(Depreciation) | |
| Diversified Bond Fund | | | | | | | | | | | | | | |
| Contracts to Buy | | | | | | | | | | | | | | | | | |
| ARS | | | 891,800 | | | Bank of America N.A.* | | 03/01/17 | | | | | | $ | 49,000 | | | $ | 5,093 | |
| MXN | | | 469,754 | | | Bank of America N.A.* | | 10/18/16 | | | | | | | 24,000 | | | | 188 | |
| | | | | | | | | | | | | | | | | | | | |
| | | | | | | | | | | | | | | 73,000 | | | | 5,281 | |
| | | | | | | | | | | | | | | | | | | | |
| | | | | | |
| COP | | | 292,664,140 | | | Barclays Bank PLC* | | 10/18/16 | | | | | | | 98,156 | | | | 3,074 | |
| | | | | | | | | | | | | | | | | | | | |
| | | | | | |
| RUB | | | 16,362,250 | | | Deutsche Bank AG* | | 10/18/16 | | | | | | | 250,000 | | | | 9,732 | |
| THB | | | 8,477,777 | | | Deutsche Bank AG* | | 10/18/16 | | | | | | | 244,699 | | | | (83 | ) |
| ZAR | | | 31,533 | | | Deutsche Bank AG | | 10/18/16 | | | | | | | 2,169 | | | | 123 | |
| | | | | | | | | | | | | | | | | | | | |
| | | | | | | | | | | | | | | 496,868 | | | | 9,772 | |
| | | | | | | | | | | | | | | | | | | | |
| | | | | | |
| MXN | | | 13,888,149 | | | HSBC Bank USA* | | 10/18/16 | | | | | | | 740,965 | | | | (25,868 | ) |
| SEK | | | 2,073,000 | | | HSBC Bank USA* | | 10/18/16 | | | | | | | 241,894 | | | | (78 | ) |
| | | | | | | | | | | | | | | | | | | | |
| | | | | | | | | | | | | | | 982,859 | | | | (25,946 | ) |
| | | | | | | | | | | | | | | | | | | | |
| | | | | | |
| CNH | | | 1,697,475 | | | JP Morgan Chase Bank N.A.* | | 02/22/17 | | | | | | | 251,841 | | | | 619 | |
| CNH | | | 79,116,525 | | | JP Morgan Chase Bank N.A.* | | 03/15/17 | | | | | | | 11,822,072 | | | | (67,361 | ) |
| KZT | | | 81,918,000 | | | JP Morgan Chase Bank N.A.* | | 10/18/16 | | | | | | | 235,397 | | | | 7,321 | |
| MXN | | | 984,967 | | | JP Morgan Chase Bank N.A.* | | 10/18/16 | | | | | | | 52,000 | | | | (1,284 | ) |
| | | | | | | | | | | | | | | | | | | | |
| | | | | | | | | | | | | | | 12,361,310 | | | | (60,705 | ) |
| | | | | | | | | | | | | | | | | | | | |
| | | | | | | | | | | | | | $ | 14,012,193 | | | $ | (68,524 | ) |
| | | | | | | | | | | | | | | | | | | | |
| | | | |
| Contracts to Deliver | | | | | | | | | | | | | | |
| AUD | | | 886 | | | Bank of America N.A.* | | 10/18/16 | | | | | | $ | 660 | | | $ | (18 | ) |
| | | | | | | | | | | | | | | | | | | | |
| | | | | | |
| CHF | | | 94,621 | | | Deutsche Bank AG* | | 10/18/16 | | | | | | | 96,081 | | | | (1,394 | ) |
| ILS | | | 389,927 | | | Deutsche Bank AG* | | 10/18/16 | | | | | | | 101,332 | | | | (2,773 | ) |
| | | | | | | | | | | | | | | | | | | | |
| | | | | | | | | | | | | | | 197,413 | | | | (4,167 | ) |
| | | | | | | | | | | | | | | | | | | | |
| | | | | | |
| CNH | | | 1,697,475 | | | Goldman Sachs International* | | 02/22/17 | | | | | | | 250,000 | | | | (2,460 | ) |
| | | | | | | | | | | | | | | | | | | | |
| | | | | | |
| HKD | | | 1,907,624 | | | HSBC Bank USA* | | 10/18/16 | | | | | | | 246,204 | | | | 228 | |
| SGD | | | 332,754 | | | HSBC Bank USA* | | 10/18/16 | | | | | | | 244,764 | | | | 729 | |
| | | | | | | | | | | | | | | | | | | | |
| | | | | | | | | | | | | | | 490,968 | | | | 957 | |
| | | | | | | | | | | | | | | | | | | | |
| | | | | | |
| CNH | | | 79,116,525 | | | JP Morgan Chase Bank N.A.* | | 03/15/17 | | | | | | | 11,850,000 | | | | 95,289 | |
| ILS | | | 170,201 | | | JP Morgan Chase Bank N.A.* | | 10/18/16 | | | | | | | 45,000 | | | | (441 | ) |
| | | | | | | | | | | | | | | | | | | | |
| | | | | | | | | | | | | | | 11,895,000 | | | | 94,848 | |
| | | | | | | | | | | | | | | | | | | | |
| | | | | | | | | | | | | | $ | 12,834,041 | | | $ | 89,160 | |
| | | | | | | | | | | | | | | | | | | | |
| | | | |
| Cross Currency Forwards | | | | | | | | | | | | | | |
| HRK | | | 1,486,202 | | | Bank of America N.A.* | | 10/18/16 | | | EUR | | | | 198,319 | | | $ | (791 | ) |
| | | | | | | | | | | | | | | | | | | | |
275
Notes to Financial Statements (Continued)
| | | | | | | | | | | | | | | | | | | | |
| | | | | | Counterparty | | Settlement
Date | | | | | In Exchange
for | | | Unrealized
Appreciation/
(Depreciation) | |
| Diversified Bond Fund (Continued) | | | | | | | | | | | | | | |
| Cross Currency Forwards (Continued) | | | | | | | | | | | | | | |
| HUF | | | 40,662,325 | | | Barclays Bank PLC* | | 10/18/16 | | | EUR | | | | 128,866 | | | $ | 3,445 | |
| | | | | | | | | | | | | | | | | | | | |
| | | | | | |
| PLN | | | 1,917,435 | | | Deutsche Bank AG* | | 10/18/16 | | | EUR | | | | 435,811 | | | | 11,380 | |
| | | | | | | | | | | | | | | | | | | | |
| | | | | | |
| EUR | | | 395,846 | | | JP Morgan Chase Bank N.A.* | | 10/18/16 | | | HRK | | | | 2,972,404 | | | | 690 | |
| EUR | | | 130,935 | | | JP Morgan Chase Bank N.A.* | | 10/18/16 | | | HUF | | | | 40,662,325 | | | | (1,120 | ) |
| HRK | | | 1,486,202 | | | JP Morgan Chase Bank N.A.* | | 10/18/16 | | | EUR | | | | 197,817 | | | | (227 | ) |
| | | | | | | | | | | | | | | | | | | | |
| | | | | | | | | | | | | | | | | | | (657 | ) |
| | | | | | | | | | | | | | | | | | | | |
| | | | | | | | | | | | | | | | | | $ | 13,377 | |
| | | | | | | | | | | | | | | | | | | | |
| | | | |
| Balanced Fund | | | | | | | | | | | | | | |
| Contract to Buy | | | | | | | | | | | | | | |
| CNH | | | 8,011,800 | | | JP Morgan Chase Bank N.A.* | | 03/15/17 | | | | | | $ | 1,197,172 | | | $ | (6,821 | ) |
| | | | | | | | | | | | | | | | | | | | |
| | | | |
| Contract to Deliver | | | | | | | | | | | | | | |
| CNH | | | 8,011,800 | | | JP Morgan Chase Bank N.A.* | | 03/15/17 | | | | | | $ | 1,200,000 | | | $ | 9,649 | |
| | | | | | | | | | | | | | | | | | | | |
| * | Contracts are subject to an MNA. |
Futures Contracts
A Fund may seek to manage a variety of different risks, such as interest rate risk, equity price risk, and currency risk, through the use of futures contracts. A Fund may use interest rate futures contracts to adjust the interest rate sensitivity (duration) of its portfolio or the credit exposure of the portfolio. Interest rate futures contracts obligate the long or short holder to take or make delivery of a specified quantity of a financial instrument, such as a specific fixed-income security, during a specified future period at a specified price. A Fund may use index futures to hedge against broad market risks to its portfolio or to gain broad market exposure when it holds uninvested cash or as an inexpensive substitute for cash investments directly in securities or other assets. Securities index futures contracts are contracts to buy or sell units of a securities index at a specified future date at a price agreed upon when the contract is made and are settled in cash. Positions in futures may be closed out only on an exchange or board of trade which provides a secondary market for such futures. Because futures contracts are exchange-traded, they typically have minimal exposure to counterparty risk.
Parties to a futures contract are not required to post the entire notional amount of the contract, but rather a small percentage of that amount (by way of margin), both at the time they enter into futures transactions, and then on a daily basis if their positions decline in value; as a result, futures contracts are highly leveraged. Such payments are known as variation margin and are recorded by the Funds as unrealized gains or losses. Because futures markets are highly leveraged, they can be extremely volatile, and there can be no assurance that the pricing of a futures contract will correlate precisely with the pricing of the asset or index underlying it or the asset or liability of the Fund that is the subject of the hedge. It may not always be possible for a Fund to enter into a closing transaction with respect to a futures contract it has entered into, at a favorable time or price. When a Fund enters into a futures transaction, it is subject to the risk that the value of the futures contract will move in a direction unfavorable to it. When a Fund uses futures contracts for hedging purposes, it is likely that the Fund will have an asset or liability that will offset any loss (or gain) on the transactions, at least in part.
276
Notes to Financial Statements (Continued)
When a futures contract is closed, the Fund records a realized gain or loss equal to the difference between the value of the contract at the time it was opened and the value at the time it was closed. Futures contracts are valued at the settlement price established each day by the board of trade or exchange on which they are traded.
The Fund(s) listed in the following table had open futures contracts at September 30, 2016:
| | | | | | | | | | | | | | | | |
| | | Expiration
Date | | | Number
of
Contracts | | | Notional
Amount | | | Net Unrealized
Appreciation/
(Depreciation) | |
Short-Duration Bond Fund | | | | | | | | | | | | | | | | |
Futures Contracts — Long | | | | | | | | | | | | | | | | |
U.S. Treasury Ultra 10 Year | | | 12/20/16 | | | | 24 | | | $ | 3,459,750 | | | $ | 26,209 | |
U.S. Treasury Note 2 Year | | | 12/30/16 | | | | 793 | | | | 173,245,719 | | | | 28,823 | |
| | | | | | | | | | | | | | | | |
| | | | | | | | | | | | | | $ | 55,032 | |
| | | | | | | | | | | | | | | | |
Futures Contracts — Short | | | | | | | | | | | | | | | | |
U.S. Treasury Note 10 Year | | | 12/20/16 | | | | 375 | | | $ | (49,171,875 | ) | | $ | (139,134 | ) |
U.S. Treasury Note 5 Year | | | 12/30/16 | | | | 320 | | | | (38,885,000 | ) | | | (80,995 | ) |
| | | | | | | | | | | | | | | | |
| | | | | | | | | | | | | | $ | (220,129 | ) |
| | | | | | | | | | | | | | | | |
Inflation-Protected and Income Fund | | | | | | | | | | | | | | | | |
Futures Contracts — Long | | | | | | | | | | | | | | | | |
U.S. Treasury Ultra Long Bond | | | 12/20/16 | | | | 3 | | | $ | 551,625 | | | $ | 6,928 | |
U.S. Treasury Note 2 Year | | | 12/30/16 | | | | 110 | | | | 24,031,563 | | | | (2,982 | ) |
| | | | | | | | | | | | | | | | |
| | | | | | | | | | | | | | $ | 3,946 | |
| | | | | | | | | | | | | | | | |
Futures Contracts — Short | | | | | | | | | | | | | | | | |
U.S. Treasury Long Bond | | | 12/20/16 | | | | 7 | | | $ | (1,177,094 | ) | | $ | (15,490 | ) |
U.S. Treasury Note 10 Year | | | 12/20/16 | | | | 16 | | | | (2,098,000 | ) | | | 985 | |
| | | | | | | | | | | | | | | | |
| | | | | | | | | | | | | | $ | (14,505 | ) |
| | | | | | | | | | | | | | | | |
Core Bond Fund | | | | | | | | | | | | | | | | |
Futures Contracts — Long | | | | | | | | | | | | | | | | |
U.S. Treasury Ultra Long Bond | | | 12/20/16 | | | | 332 | | | $ | 61,046,500 | | | $ | 489,054 | |
U.S. Treasury Note 2 Year | | | 12/30/16 | | | | 227 | | | | 49,592,406 | | | | 1,493 | |
U.S. Treasury Note 5 Year | | | 12/30/16 | | | | 838 | | | | 101,830,094 | | | | 94,657 | |
| | | | | | | | | | | | | | | | |
| | | | | | | | | | | | | | $ | 585,204 | |
| | | | | | | | | | | | | | | | |
Futures Contracts — Short | | | | | | | | | | | | | | | | |
U.S. Treasury Ultra 10 Year | | | 12/20/16 | | | | 7 | | | $ | (1,009,094 | ) | | $ | (7,460 | ) |
U.S. Treasury Ultra Long Bond | | | 12/20/16 | | | | 40 | | | | (6,726,250 | ) | | | (80,130 | ) |
| | | | | | | | | | | | | | | | |
| | | | | | | | | | | | | | $ | (87,590 | ) |
| | | | | | | | | | | | | | | | |
Diversified Bond Fund | | | | | | | | | | | | | | | | |
Futures Contracts — Long | | | | | | | | | | | | | | | | |
U.S. Treasury Ultra Long Bond | | | 12/20/16 | | | | 44 | | | $ | 8,090,500 | | | $ | (6,627 | ) |
U.S. Treasury Note 2 Year | | | 12/30/16 | | | | 94 | | | | 20,536,062 | | | | 87 | |
U.S. Treasury Note 5 Year | | | 12/30/16 | | | | 51 | | | | 6,197,297 | | | | 1,477 | |
| | | | | | | | | | | | | | | | |
| | | | | | | | | | | | | | $ | (5,063 | ) |
| | | | | | | | | | | | | | | | |
Future Contract — Short | | | | | | | | | | | | | | | | |
U.S. Treasury Ultra 10 Year | | | 12/20/16 | | | | 40 | | | $ | (5,766,250 | ) | | $ | 4,418 | |
| | | | | | | | | | | | | | | | |
277
Notes to Financial Statements (Continued)
| | | | | | | | | | | | | | | | |
| | | Expiration
Date | | | Number
of
Contracts | | | Notional
Amount | | | Net Unrealized
Appreciation/
(Depreciation) | |
Balanced Fund | | | | | | | | | | | | | | | | |
Futures Contracts — Long | | | | | | | | | | | | | | | | |
Mini MSCI EAFE | | | 12/16/16 | | | | 17 | | | $ | 1,450,695 | | | $ | (17,060 | ) |
U.S. Treasury Ultra 10 Year | | | 12/20/16 | | | | 1 | | | | 144,156 | | | | (159 | ) |
U.S. Treasury Ultra Long Bond | | | 12/20/16 | | | | 4 | | | | 735,500 | | | | 36 | |
U.S. Treasury Note 2 Year | | | 12/30/16 | | | | 7 | | | | 1,529,281 | | | | 41 | |
U.S. Treasury Note 5 Year | | | 12/30/16 | | | | 31 | | | | 3,766,985 | | | | 839 | |
| | | | | | | | | | | | | | | | |
| | | | | | | | | | | | | | $ | (16,303 | ) |
| | | | | | | | | | | | | | | | |
Future Contract — Short | | | | | | | | | | | | | | | | |
U.S. Treasury Long Bond | | | 12/20/16 | | | | 1 | | | $ | (168,156 | ) | | $ | (2,347 | ) |
| | | | | | | | | | | | | | | | |
Swap Agreements
Swap agreements are typically two-party contracts entered into primarily by institutional investors. In a standard “swap” transaction, two parties agree to exchange the returns (or differentials in rates of return) earned or realized on particular predetermined investments or instruments, which may be adjusted for an interest factor. The gross returns to be exchanged or “swapped” between the parties are generally calculated with respect to a “notional amount,” (i.e., the return on or increase in value of a particular dollar amount invested at a particular interest rate or in a “basket” of securities representing a particular index).
Interest Rate Swaps. When a Fund enters into an interest rate swap, it typically agrees to make payments to its counterparty based on a specified long- or short-term interest rate, and will receive payments from its counterparty based on another interest rate. Other forms of interest rate swap agreements include interest rate caps, under which, in return for a specified payment stream, one party agrees to make payments to the other to the extent that interest rates exceed a specified rate, or “cap”; interest rate floors, under which, in return for a specified payment stream, one party agrees to make payments to the other to the extent that interest rates fall below a specified rate, or “floor”; and interest rate collars, under which a party sells a cap and purchases a floor or vice versa in an attempt to protect itself against interest rate movements exceeding given minimum or maximum levels. A Fund may enter into an interest rate swap in order, for example, to hedge against the effect of interest rate changes on the value of specific securities in its portfolio, or to adjust the interest rate sensitivity (duration) or the credit exposure of its portfolio overall, or otherwise as a substitute for a direct investment in debt securities.
Credit Default Swaps. A Fund also may enter into credit default swap transactions, as a “buyer” or “seller” of credit protection. In a credit default swap, one party provides what is in effect insurance against a default or other adverse credit event affecting an issuer of debt securities (typically referred to as a “reference entity”). In general, the buyer of credit protection is obligated to pay the protection seller an upfront amount or a periodic stream of payments over the term of the swap. If a “credit event” occurs, the buyer has the right to deliver to the seller bonds or other obligations of the reference entity (with a value up to the full notional value of the swap), and to receive a payment equal to the par value of the bonds or other obligations. Credit events that would trigger a request that the seller make payment are specific to each credit default swap agreement, but generally include bankruptcy, failure to pay, restructuring, acceleration, default, or repudiation/moratorium. When a Fund buys protection, it may or may not own securities of the reference entity. If it does own securities of the reference entity, the swap serves as a hedge against a decline in the value of the securities due to the occurrence of a credit event involving the issuer of the securities. If the Fund does not own securities of the reference entity, the credit default swap may be seen to create a short position in the reference entity. If a Fund is a buyer and no credit event occurs, the Fund will typically recover nothing under the swap, but will have had to pay the required upfront payment or stream of continuing payments under the swap. When a Fund sells protection under a credit default swap, the position may have the effect of creating leverage in the Fund’s portfolio through the Fund’s indirect long exposure to the issuer or securities on which the swap is written. When a Fund sells protection, it may do so either to earn additional income or to create a “synthetic” long position.
Whenever a Fund enters into a swap agreement, it takes on counterparty risk — the risk that its counterparty will be unable or unwilling to meet its obligations under the swap agreement. The Fund also takes the risk that the market will move against its position in the swap agreement. In the case of an interest rate swap, the value of the swap may increase or decrease depending on
278
Notes to Financial Statements (Continued)
changes in interest rates. In the case of a credit default swap, the swap will become more or less valuable depending on the credit of the issuer of the underlying security, and, if a credit event occurs under a swap where the Fund is the seller of credit protection, the Fund could be required to purchase the security at par value, resulting in a significant loss to the Fund. When the Fund enters into any type of swap for hedging purposes, it is likely that the Fund will have an asset or liability that will offset any loss (or gain) on the swap, at least in part. Swap agreements may be non-transferable or otherwise highly illiquid, and a Fund may not be able to terminate or transfer a swap agreement at any particular time or at an acceptable price.
Swaptions. A Fund may also enter into options on swap agreements (“swaptions”). A swaption is a contract that gives a counterparty the right (but not the obligation) to enter into a new swap agreement or to shorten, extend, cancel, or otherwise modify an existing swap agreement, at some designated future time on specified terms. A Fund may write (sell) and purchase put and call swaptions. Depending on the terms of the particular option agreement, a Fund will generally incur a greater degree of risk when it writes a swaption than it will incur when it purchases a swaption. When a Fund purchases a swaption, it risks losing only the amount of the premium it has paid should it decide to let the option expire unexercised. However, when a Fund writes a swaption, upon exercise of the option the Fund will become obligated according to the terms of the underlying agreement. A Fund may enter into swaptions for the same purposes as swaps. For information regarding the accounting treatment of options, see “Options, Rights, and Warrants” below.
Centrally Cleared Swaps. Certain clearinghouses currently offer clearing for limited types of derivatives transactions, principally certain interest rate swaps, certain index swaps, and credit derivatives. In a cleared derivative transaction, a Fund typically enters into the transaction with a financial institution counterparty, and performance of the transaction is effectively guaranteed by a central clearinghouse, thereby reducing or eliminating the Fund’s exposure to the credit risk of its original counterparty. The Fund will be required to post amounts (“initial margin”) with the clearinghouse or at the instruction of the clearinghouse. The initial margin required by a clearinghouse may be greater than the initial margin the Fund would be required to post in an uncleared transaction. If cash is deposited as the initial margin, it is shown as collateral on a Fund’s Statement of Assets and Liabilities. Swap agreements are marked-to-market daily and subsequent payments (“variation margin”) are made or received by a Fund depending on whether unrealized gains or losses are incurred. These amounts are reflected as receivables or payables on a Fund’s Statement of Assets and Liabilities (“Variation margin on open derivative instruments”) and as a component of net change in unrealized appreciation (depreciation) on a Fund’s Statement of Operations. Only a limited number of transaction types are currently eligible for clearing.
During the term of a swap transaction, changes in the value of the swap are recognized as unrealized gains or losses by marking to market to reflect the market value of the swap. When the swap is terminated, a Fund will record a realized gain or loss equal to the difference, if any, between the proceeds from (or cost of) the closing transaction and a Fund’s basis in the agreement. Upfront swap premium payments paid or received by a Fund, if any, are recorded within the value of the open swap agreement on the Fund’s Statement of Assets and Liabilities and represent payments paid or received upon entering into the swap agreement to compensate for differences between stated terms of the swap agreement and prevailing market conditions (credit spreads, currency exchange rates, and other relevant factors). These upfront payments are recorded as realized gain or loss on the Fund’s Statement of Operations upon termination or maturity of the swap agreement.
During the term of a swap transaction, the periodic net payments can be made for a set period of time or may be triggered by a predetermined credit event. The net periodic payments may be based on a fixed or variable interest rate, the change in market value of a specified security, basket of securities or index, or the return generated by a security. These periodic payments received or made by the Funds are recorded in the accompanying Statements of Operations as realized gains and losses, respectively.
279
Notes to Financial Statements (Continued)
The Fund(s) listed in the following table had open swap transactions at September 30, 2016. A Fund’s current exposure to a counterparty is the fair value of the transaction.
| | | | | | | | | | | | | | | | | | | | | | | | | | |
Counterparty | | Currency | | Notional
Amount | | | Expiration
Date | | | Receive (Pay)
Fixed Rate | | Deliverable on Default | | Unrealized
Appreciation
(Depreciation) | | | Premium
(Received)
Paid | | | Value | |
Short-Duration Bond Fund* | |
Credit Default Swaps — Buy Protection | |
Centrally Cleared Swaps | |
| | USD | | | 6,460,000 | | | | 6/20/21 | | | (1.000%) | | CDX.NA.IG.26 | | $ | (44,346 | ) | | $ | (47,211 | ) | | $ | (91,557 | ) |
| | | | | | | | | | | | | | | | | | | | | | | | | | |
|
Credit Default Swaps — Sell Protection†† | |
OTC Swaps | |
| Goldman Sachs International | | USD | | | 1,120,000 | | | | 5/11/63 | | | 3.000% | | CMBX.NA.BBB-.6 (Rating: BBB-)† | | $ | (3,574 | ) | | $ | (96,992 | ) | | $ | (100,566 | ) |
| Goldman Sachs International | | USD | | | 1,500,000 | | | | 5/11/63 | | | 3.000% | | CMBX.NA.BBB-.6 (Rating: BBB-)† | | | (135,610 | ) | | | 924 | | | | (134,686 | ) |
| Goldman Sachs International | | USD | | | 400,000 | | | | 5/11/63 | | | 3.000% | | CMBX.NA.BBB-.6 (Rating: BBB-)† | | | (3,868 | ) | | | (32,048 | ) | | | (35,916 | ) |
| | | | | | | | | | | | | | | | | | | | | | | | | | |
| | | (143,052 | ) | | | (128,116 | ) | | | (271,168 | ) |
| | | | | | | | | | | | | | | | | | | | | | | | | | |
|
Inflation-Protected and Income Fund** | |
Credit Default Swaps — Buy Protection | |
Centrally Cleared Swaps | |
| | USD | | | 510,000 | | | | 6/20/21 | | | (1.000%) | | CDX.NA.IG.26 | | $ | (3,501 | ) | | $ | (3,727 | ) | | $ | (7,228 | ) |
| | | | | | | | | | | | | | | | | | | | | | | | | | |
|
Credit Default Swaps — Sell Protection†† | |
OTC Swaps | |
| Goldman Sachs International | | USD | | | 1,220,000 | | | | 5/11/63 | | | 3.000% | | CMBX.NA.BBB-.6 (Rating: BBB-)† | | $ | (110,296 | ) | | $ | 751 | | | $ | (109,545 | ) |
| JP Morgan Chase Bank N.A. | | USD | | | 520,000 | | | | 5/11/63 | | | 3.000% | | CMBX.NA.BBB-.6 (Rating: BBB-)† | | | (47,332 | ) | | | 641 | | | | (46,691 | ) |
| Goldman Sachs International | | USD | | | 730,000 | | | | 5/11/63 | | | 3.000% | | CMBX.NA.BBB-.6 (Rating: BBB-)† | | | (2,329 | ) | | | (63,218 | ) | | | (65,547 | ) |
| Goldman Sachs International | | USD | | | 260,000 | | | | 5/11/63 | | | 3.000% | | CMBX.NA.BBB-.6 (Rating: BBB-)† | | | (2,515 | ) | | | (20,831 | ) | | | (23,346 | ) |
| | | | | | | | | | | | | | | | | | | | | | | | | | |
| | | (162,472 | ) | | | (82,657 | ) | | | (245,129 | ) |
| | | | | | | | | | | | | | | | | | | | | | | | | | |
| | | | | | | | | | | | | | | | | | | | | | | | | | |
Counterparty | | Currency | | Notional
Amount | | | Expiration
Date | | | Payments Made by Fund | | Payments Received by Fund | | Unrealized
Appreciation
(Depreciation) | | | Premium
Received
(Paid) | | | Value | |
Interest Rate Swaps | |
OTC Swaps | |
| Goldman Sachs International | | USD | | | 6,500,000 | | | | 10/13/17 | | | 1.125% | | USA-CPI-U | | $ | 44,316 | | | $ | - | | | $ | 44,316 | |
| Bank of America N.A. | | USD | | | 9,000,000 | | | | 11/06/17 | | | 1.275% | | USA-CPI-U | | | 54,073 | | | | - | | | | 54,073 | |
| Goldman Sachs International | | USD | | | 6,700,000 | | | | 1/13/18 | | | 1.295% | | USA-CPI-U | | | 46,238 | | | | - | | | | 46,238 | |
| JP Morgan Chase Bank N.A. | | USD | | | 6,500,000 | | | | 2/17/18 | | | 1.033% | | USA-CPI-U | | | 82,186 | | | | - | | | | 82,186 | |
| | | | | | | | | | | | | | | | | | | | | | | | | | |
| | | 226,813 | | | | - | | | | 226,813 | |
| | | | | | | | | | | | | | | | | | | | | | | | | | |
280
Notes to Financial Statements (Continued)
| | | | | | | | | | | | | | | | | | | | | | | | | | |
Counterparty | | Currency | | Notional
Amount | | | Expiration
Date | | | Receive (Pay)
Fixed Rate | | Deliverable on Default | | Unrealized
Appreciation
(Depreciation) | | | Premium
(Received)
Paid | | | Value | |
Core Bond Fund*** | |
Credit Default Swaps — Buy Protection | |
Centrally Cleared Swaps | |
| | USD | | | 18,890,000 | | | | 6/20/21 | | | (1.000%) | | CDX.NA.IG.26 | | $ | (129,676 | ) | | $ | (138,052 | ) | | $ | (267,728 | ) |
| | | | | | | | | | | | | | | | | | | | | | | | | | |
|
Credit Default Swaps — Sell Protection†† | |
OTC Swaps | |
| Goldman Sachs International | | USD | | | 4,100,000 | | | | 5/11/63 | | | 3.000% | | CMBX.NA.BBB-.6 (Rating: BBB-)† | | $ | (370,668 | ) | | $ | 2,526 | | | $ | (368,142 | ) |
| Goldman Sachs International | | USD | | | 2,660,000 | | | | 5/11/63 | | | 3.000% | | CMBX.NA.BBB-.6 (Rating: BBB-)† | | | (8,487 | ) | | | (230,356 | ) | | | (238,843 | ) |
| Goldman Sachs International | | USD | | | 970,000 | | | | 5/11/63 | | | 3.000% | | CMBX.NA.BBB-.6 (Rating: BBB-)† | | | (9,381 | ) | | | (77,716 | ) | | | (87,097 | ) |
| | | | | | | | | | | | | | | | | | | | | | | | | | |
| | | (388,536 | ) | | | (305,546 | ) | | | (694,082 | ) |
| | | | | | | | | | | | | | | | | | | | | | | | | | |
|
Diversified Bond Fund**** | |
Credit Default Swaps — Buy Protection | |
Centrally Cleared Swaps | |
| | USD | | | 3,400,000 | | | | 6/20/21 | | | (1.000%) | | CDX.NA.IG.26 | | $ | (23,340 | ) | | $ | (24,848 | ) | | $ | (48,188 | ) |
| | | | | | | | | | | | | | | | | | | | | | | | | | |
|
Credit Default Swaps — Sell Protection†† | |
OTC Swaps | |
| Goldman Sachs International | | USD | | | 450,000 | | | | 5/11/63 | | | 3.000% | | CMBX.NA.BBB-.6 (Rating: BBB-)† | | $ | (40,683 | ) | | $ | 278 | | | $ | (40,405 | ) |
| Goldman Sachs International | | USD | | | 380,000 | | | | 5/11/63 | | | 3.000% | | CMBX.NA.BBB-.6 (Rating: BBB-)† | | | (1,213 | ) | | | (32,908 | ) | | | (34,121 | ) |
| Goldman Sachs International | | USD | | | 140,000 | | | | 5/11/63 | | | 3.000% | | CMBX.NA.BBB-.6 (Rating: BBB-)† | | | (1,354 | ) | | | (11,217 | ) | | | (12,571 | ) |
| | | | | | | | | | | | | | | | | | | | | | | | | | |
| | | (43,250 | ) | | | (43,847 | ) | | | (87,097 | ) |
| | | | | | | | | | | | | | | | | | | | | | | | | | |
|
Balanced Fund***** | |
Credit Default Swaps — Buy Protection | |
Centrally Cleared Swaps | |
| | USD | | | 580,000 | | | | 6/20/21 | | | (1.000%) | | CDX.NA.IG.26 | | $ | (3,981 | ) | | $ | (4,239 | ) | | $ | (8,220 | ) |
| | | | | | | | | | | | | | | | | | | | | | | | | | |
|
Credit Default Swaps — Sell Protection†† | |
OTC Swaps | |
| Goldman Sachs International | | USD | | | 140,000 | | | | 5/11/63 | | | 3.000% | | CMBX.NA.BBB-.6 (Rating: BBB-)† | | $ | (12,657 | ) | | $ | 86 | | | $ | (12,571 | ) |
| Goldman Sachs International | | USD | | | 50,000 | | | | 5/11/63 | | | 3.000% | | CMBX.NA.BBB-.6 (Rating: BBB-)† | | | (160 | ) | | | (4,330 | ) | | | (4,490 | ) |
| Goldman Sachs International | | USD | | | 20,000 | | | | 5/11/63 | | | 3.000% | | CMBX.NA.BBB-.6 (Rating: BBB-)† | | | (193 | ) | | | (1,603 | ) | | | (1,796 | ) |
| | | | | | | | | | | | | | | | | | | | | | | | | | |
| | | (13,010 | ) | | | (5,847 | ) | | | (18,857 | ) |
| | | | | | | | | | | | | | | | | | | | | | | | | | |
| * | Collateral for swap agreements held by Goldman Sachs International amounted to $278,475 in securities, at September 30, 2016. |
| ** | Collateral for swap agreements held by Credit Suisse International amounted to $11,380 in securities, at September 30, 2016. |
| *** | Collateral for swap agreements held by Credit Suisse International and Goldman Sachs International amounted to $214,062 and $829,613 in securities, respectively, at September 30, 2016. |
| **** | Collateral for swap agreements held by Credit Suisse International amounted to $39,433 in securities, at September 30, 2016. |
| ***** | Collateral for swap agreements held by Credit Suisse International amounted to $11,266 in securities, at September 30, 2016. |
| † | Payment is based on a percentage of the index. Reference entities are a number of individual issuers comprising the index. |
| †† | For each credit derivative with sold protection, the credit ratings of the entities referenced, as rated by any rating organization, are included in the equivalent Standard & Poor’s Ratings Group. The reference entity rating represents the |
281
Notes to Financial Statements (Continued)
| | likelihood of a potential payment by the Fund if the referenced entity experiences a credit event as of period end. Notional amounts represent the maximum potential amount of future payments (undiscounted) the Fund could be required to make under the credit derivatives with sold protection. |
Options, Rights, and Warrants
A Fund may purchase and sell put and call options on securities or an index of securities to enhance investment performance or to protect against changes in market prices. A Fund that invests in debt securities may also purchase and sell put and call options to adjust the interest rate sensitivity of its portfolio or the credit exposure of the portfolio.
Call Options. A call option gives the holder the right to purchase, and obligates the writer to sell, a security at the strike price at any time before the expiration date.
Put Options. A put option gives the holder the right to sell, and obligates the writer to buy, a security at the exercise price at any time before the expiration date.
Purchasing put and call options. A Fund may purchase put options to protect portfolio holdings against a decline in market value of a security or securities held by it. A Fund may also purchase a put option hoping to profit from an anticipated decline in the value of the underlying security. If the Fund holds the security underlying the option, the option premium and any transaction costs will reduce any profit the Fund might have realized had it sold the underlying security instead of buying the put option. A Fund may purchase call options to hedge against an increase in the price of securities that the Fund wants ultimately to buy. A Fund may also purchase a call option as a long directional investment hoping to profit from an anticipated increase in the value of the underlying security. In order for a call option to be profitable, the market price of the underlying security must rise sufficiently above the exercise price to cover the premium and transaction costs. These costs will reduce any profit the Fund might have realized had it bought the underlying security at the time it purchased the call option.
When a Fund purchases an option, it runs the risk that it will lose its entire investment in the option in a relatively short period of time, unless the Fund exercises the option or enters into a closing sale transaction before the option’s expiration. If the price of the underlying security does not rise (in the case of a call) or fall (in the case of a put) to an extent sufficient to cover the option premium and transaction costs, the Fund will lose part or all of its investment in the option. This contrasts with an investment by a Fund in the underlying security, since the Fund will not realize a loss if the security’s price does not change. Premiums paid for purchasing options that expire are treated as realized losses.
Writing put and call options. A Fund may write call options on a security it owns, in a “directional” strategy hoping to realize a greater current return through the receipt of premiums. In return for the option premium, the Fund takes the risk that it will have to forego any increase in the value of the security over the strike price. When a Fund has written a call option on a security it does not own, its exposure on such an option is theoretically unlimited. A Fund may enter into closing purchase transactions in order to realize a profit or limit a loss on a previously written call option or, in the case of a call option on a security it owns, to free itself to sell the underlying security or to write another call on the security, or protect a security from being called in an unexpected market rise. Any profits from a closing purchase transaction in the case of a call option on a security a Fund owns may be offset by a decline in the value of the underlying security. Conversely, because increases in the market price of a call option will generally reflect increases in the market price of the underlying security, any loss resulting from a closing purchase transaction relating to a call option on a security a Fund owns is likely to be offset in whole or in part by unrealized appreciation of the underlying security owned by the Fund. A Fund may not be able to close out a call option that it has previously written. A Fund may write put options in order to enhance its current return by taking a long directional position as to a security or index of securities. By writing a put option, the Fund assumes the risk that it may be required to purchase the underlying security for an exercise price higher than its then current market value, resulting in a potential capital loss unless the security later appreciates in value. A Fund may terminate a put option that it has written before it expires by entering into a closing purchase transaction. Any loss from this transaction may be partially or entirely offset by the premium received on the terminated option. A Fund may not be able to close out a put option that it has previously written.
When a Fund writes a call or put option, an amount equal to the premium received is recorded as a liability. Premiums received from writing options which expire are treated as realized gains. Premiums received from writing options which are exercised or closed are added to the proceeds or offset against the amount paid on the underlying investment to determine the realized gain or loss.
282
Notes to Financial Statements (Continued)
OTC Options. OTC options purchased or sold by a Fund are not traded on securities or options exchanges or backed by clearinghouses. Rather, they are entered into directly between a Fund and the counterparty to the option. In the case of an OTC option purchased by the Fund, the value of the option to the Fund will depend on the willingness and ability of the option writer to perform its obligations to the Fund. In addition, OTC options may not be transferable and there may be little or no secondary market for them, so they may be considered illiquid. It may not be possible to enter into closing transactions with respect to OTC options or otherwise to terminate such options, and as a result a Fund may be required to remain obligated on an unfavorable OTC option until its expiration. OTC options are valued using prices supplied by a primary pricing source, selected pursuant to procedures approved by the Trustees.
Rights and Warrants. A Fund may purchase or hold warrants or rights in order to gain exposure to the underlying security without owning the security, including, for example, cases where the Fund hopes to lock in the price today of a security it may wish to purchase in the future. Warrants generally give the holder the right, but not the obligation, to buy a security at a stated price. In order for a warrant to be profitable, the market price of the underlying security must rise sufficiently above the exercise price to cover any premium and transaction costs. Rights may similarly confer on the holder the right to purchase or acquire securities, including through participation in a so-called rights offering. Bonds may be issued with warrants or other rights attached to purchase or acquire equity or other debt securities, typically of the bond issuer. The market prices of bonds with warrants or rights attached to purchase equity securities or bonds may, to some degree, reflect changes in the values of the underlying securities.
When a Fund purchases or otherwise acquires warrants or other rights, it runs the risk that it will lose its entire investment in the warrants or rights, unless the Fund exercises the warrant or right, acquires the underlying securities, or enters into a closing transaction before expiration. If the price of the underlying security does not rise to an extent sufficient to cover any premium and transaction costs, the Fund will lose part or all of its investment. Any premiums or purchase price paid for warrants or other rights that expire are treated as realized losses. Warrants and similar rights differ from options in that they are typically written by the issuer of the security underlying the warrant or right. Although some warrants and rights may be non-transferable, others may be traded over-the-counter or on an exchange.
Inflation-Indexed Bonds
The Funds may invest in inflation-indexed bonds, which are fixed income securities whose principal value or coupon is periodically adjusted according to the rate of inflation, as measured by the Consumer Price Index for All Urban Consumers (“CPI-U”) (for U.S. Treasury inflation-indexed bonds) or, generally, by a comparable inflation index calculated by the foreign government issuing the inflation-indexed bonds.
If the periodic adjustment rate measuring inflation falls, the principal value of inflation-indexed bonds will be adjusted downward, and consequently the interest payable on these securities (calculated with respect to a smaller principal amount) will be reduced. Repayment of the original bond principal upon maturity (as adjusted for inflation) is guaranteed in the case of U.S. Treasury inflation-indexed bonds, even during a period of deflation. However, the current market value of the bonds is not guaranteed, and will fluctuate. The Funds may also invest in other inflation related bonds which may or may not provide a similar guarantee. If a guarantee of principal is not provided, the adjusted principal value of the bond repaid at maturity may be less than the original principal. Any adjustments to the principal amount of an inflation-indexed bond due to inflation will be reflected as increases or decreases to interest income. Such adjustments may have a significant impact on the Fund’s distributions.
The value of inflation-indexed bonds is generally based on changes in real interest rates, which in turn are tied to the relationship between nominal interest rates and the rate of inflation. Therefore, if nominal interest rates increased at a faster rate than inflation, real interest rates might rise, leading to a decrease in value of inflation-indexed bonds. While the values of these securities are expected to be protected from long-term inflationary trends, short-term increases in inflation may lead to a decline in value. There can be no assurance that the CPI-U or any foreign inflation index will accurately measure the real rate of inflation, or that the rate of inflation in a foreign country will correlate to the rate of inflation in the United States. Additionally, if interest rates rise due to reasons other than inflation, investors in these securities may not be protected to the extent that the increase is not reflected in the bond’s inflation measure.
Bank Loans
Certain of the Funds may invest in bank loans including, for example, corporate loans, loan participations, direct debt, bank debt, and bridge debt. A Fund may invest in a loan by lending money to a borrower directly as part of a syndicate of lenders. In a
283
Notes to Financial Statements (Continued)
syndicated loan, the agent that originated and structured the loan typically administers and enforces the loan on behalf of the syndicate. Failure by the agent to fulfill its obligations may delay or adversely affect receipt of payment by a Fund. A Fund may also invest in loans through novations, assignments, and participation interests. In a novation, a Fund typically assumes all of the rights of a lending institution in a loan, including the right to receive payments of principal and interest and other amounts directly from the borrower and to enforce its rights as a lender directly against the borrower. When a Fund takes an assignment of a loan, the Fund acquires some or all of the interest of another lender (or assignee) in the loan. In such cases, the Fund may be required generally to rely upon the assignor to demand payment and enforce rights under the loan. If a Fund acquires a participation in the loan, the Fund purchases an indirect interest in a loan held by a third party and the Fund typically will have a contractual relationship only with the third party loan investor, not with the borrower. As a result, a Fund may have the right to receive payments of principal, interest, and any fees to which it is entitled only from the loan investor selling the participation and only upon receipt by such loan investor of such payments from the borrower. In such cases, a Fund assumes the credit risk of both the borrower and the loan investor selling the participation, and the Fund may be unable to realize some or all of the value of its interest in the loan in the event of the insolvency of the third party.
Changes in the financial condition of the borrower or economic conditions or other circumstances may reduce the capacity of the borrower to make principal and interest payments on such instruments and may lead to defaults. The value of any collateral securing a bank loan may decline after the Fund invests, and there is a risk that the value of the collateral may not be sufficient to cover the amount owed to the Fund.
At September 30, 2016, the Funds had no unfunded loan commitments.
Repurchase Agreements
Each Fund may enter into repurchase agreements with certain banks and broker-dealers whereby a Fund acquires a security for cash and obtains a simultaneous commitment from the seller to repurchase the security at an agreed upon price and date. A Fund, through its custodian, takes possession of the securities collateralizing the repurchase agreement in a segregated account. Repurchase agreements must be fully collateralized at all times, but involve some risk to a Fund if the other party should default on its obligation and the Fund is delayed or prevented from recovering the collateral, or if the Fund is required to return collateral to a borrower at a time when it may realize a loss on the investment of that collateral. Collateral for certain tri-party repurchase agreements is held at the Fund’s custodian or sub-custodian in a segregated account for the benefit of the Fund and the counterparty.
Reverse Repurchase Agreements
Each Fund may enter into reverse repurchase agreements with banks and broker-dealers to enhance return. Reverse repurchase agreements involve sales by a Fund of portfolio securities concurrently with an agreement by the Fund to repurchase the same securities at a later date at a fixed price (typically equal to the original sale price plus interest). During the reverse repurchase agreement period, the Fund continues to receive principal and interest payments on the securities and also has the opportunity to earn a return on the purchase price received by it from the counterparty.
Certain agreements have no stated maturity and can be terminated by either party at any time. Interest on the value of the reverse repurchase agreements issued and outstanding is based upon competitive market rates determined at the time of issuance. A Fund may utilize reverse repurchase agreements when it is anticipated that the interest income to be earned from the investment of the proceeds of the transaction is greater than the interest expense of the transaction. Reverse repurchase agreements generally create investment leverage and involve the risk that the market value of the security that a Fund is obligated to repurchase under the agreement may decline below the repurchase price. For financial reporting purposes, cash received in exchange for securities delivered plus accrued interest payments to be made to the counterparty is recorded as a liability in the Statements of Assets and Liabilities at face value including accrued interest. Due to the short term nature of reverse repurchase agreements, face value approximates fair value. Interest payments made by a Fund to the counterparties are recorded as a component of interest expense in the Statements of Operations. In periods of increased demand for a security, a Fund may receive a fee for use of the security by the counterparty, which may result in interest income to the Fund.
Reverse repurchase transactions are entered into by a Fund under a Master Repurchase Agreement (“MRA”), which permits the Fund, under certain circumstances, including an event of default (such as bankruptcy or insolvency), to offset payables and/or
284
Notes to Financial Statements (Continued)
receivables under the MRA with collateral held and/or posted to the counterparty and creates one single net payment due to or from the Fund. With reverse repurchase transactions, typically a Fund and the counterparties are permitted to sell, re-pledge, or use the collateral associated with the transaction. However, bankruptcy or insolvency laws of a particular jurisdiction may impose restrictions on or prohibitions against such a right of offset in the event of an MRA counterparty’s bankruptcy or insolvency. Pursuant to the terms of the MRA, a Fund receives or posts securities as collateral with a market value in excess of the repurchase price to be paid or received by the Fund upon the maturity of the transaction. Upon a bankruptcy or insolvency of the MRA counterparty, the Fund is considered an unsecured creditor with respect to excess collateral and, as such, the return of excess collateral may be delayed.
In the event the buyer of securities under an MRA files for bankruptcy or becomes insolvent, a Fund’s use of the proceeds from the sale of its securities may be restricted or forfeited, and the counterparty may fail to return/resell the securities in question to the Fund.
The following table is a summary of the Fund(s) open reverse repurchase transactions which are subject to an MRA on a net basis at September 30, 2016:
| | | | | | | | | | | | | | | | |
Counterparty | | Reverse
Repurchase
Agreements | | | Fair Value of
Non-Cash
Collateral* | | | Cash
Collateral
Pledged* | | | Net Amount | |
| Inflation-Protected and Income Fund | | | | | | | | | | | | | | | | |
Banque Paribas | | $ | (41,034,350 | ) | | $ | 41,034,350 | | | $ | - | | | $ | - | |
Daiwa Securities | | | (48,883,375 | ) | | | 48,883,375 | | | | - | | | | - | |
Goldman Sachs & Co. | | | (84,452,112 | ) | | | 84,186,363 | | | | 265,749 | | | | - | |
HSBC Finance Corp. | | | (58,779,500 | ) | | | 58,779,500 | | | | - | | | | - | |
Morgan Stanley | | | (31,660,625 | ) | | | 31,618,183 | | | | 42,442 | | | | - | |
| | | | | | | | | | | | | | | | |
| | $ | (264,809,962 | ) | | $ | 264,501,771 | | | $ | 308,191 | | | $ | - | |
| | | | | | | | | | | | | | | | |
| * | Collateral with a value of $271,092,247 has been pledged in connection with open reverse repurchase transactions. Excess collateral pledged to the individual counterparty is not shown for financial reporting purposes. |
The Fund(s) listed in the following table had open reverse repurchase transactions at September 30, 2016:
| | | | |
Description | | Value | |
| Inflation-Protected and Income Fund | | | | |
Agreement with Banque Paribas, dated 9/02/16, 0.650%, to be repurchased on demand until 10/04/16 at value plus accrued interest. | | $ | 41,034,350 | |
Agreement with Daiwa Securities, dated 8/05/16, 0.650%, to be repurchased on demand until 11/04/16 at value plus accrued interest. | | | 48,883,375 | |
Agreement with Goldman Sachs & Co., dated 7/07/16, 0.630%, to be repurchased on demand until 10/07/16 at value plus accrued interest. | | | 84,452,112 | |
Agreement with HSBC Finance Corp., dated 9/02/16, 0.670%, to be repurchased on demand until 12/02/16 at value plus accrued interest. | | | 58,779,500 | |
Agreement with Morgan Stanley, dated 8/02/16, 0.640%, to be repurchased on demand until 11/02/16 at value plus accrued interest. | | | 31,660,625 | |
| | | | |
| | $ | 264,809,962 | |
| | | | |
Average balance outstanding | | $ | 259,726,971 | |
Maximum balance outstanding | | $ | 268,279,614 | |
Weighted average maturity | | | 62 days | |
Average interest rate | | | 0.57% | |
Average balance outstanding was calculated based on daily balances outstanding during the period that the Fund had entered into reverse repurchase transactions.
285
Notes to Financial Statements (Continued)
The type of underlying collateral and the remaining maturity of open reverse repurchase transactions in relation to the reverse repurchase agreements on the Statements of Assets and Liabilities is as follows:
| | | | | | | | | | | | | | | | | | | | |
| | | Remaining Contractual Maturity of the Agreements | |
| | | Overnight and
Continuous | | | Up to 30 days | | | 31-90 days | | | Greater Than
90 days | | | Total | |
Inflation-Protected and Income Fund | | | | | | | | | | | | | | | | | | | | |
Reverse Repurchase Transactions | | | | | | | | | | | | | | | | | | | | |
U.S. Treasury Obligations | | $ | - | | | $ | 125,486,462 | | | $ | 139,323,500 | | | $ | - | | | $ | 264,809,962 | |
| | | | | | | | | | | | | | | | | | | | |
Total Borrowings | | $ | - | | | $ | 125,486,462 | | | $ | 139,323,500 | | | $ | - | | | $ | 264,809,962 | |
| | | | | | | | | | | | | | | | | | | | |
When-Issued, Delayed-Delivery, Forward Commitment, and To-Be-Announced Transactions
A Fund may enter into when-issued, delayed-delivery, forward commitment, or to-be-announced (“TBA”) transactions (collectively, the “Forward Transactions”) in order to lock in the purchase price of the underlying security, or in order to adjust the interest rate exposure of the Fund’s existing portfolio. In Forward Transactions, a Fund commits to purchase or sell particular securities, with payment and delivery to take place at a future date. In the case of TBA purchase commitments, the unit price and the estimated principal amount are established when the Fund enters into a commitment, with the actual principal amount being within a specified range of the estimate. Although a Fund does not typically pay for the securities in these types of transactions until they are delivered, it immediately assumes the risks of ownership, including the risk of price fluctuation. As a result, each of these types of transactions may create investment leverage in a Fund’s portfolio and increase the volatility of the Fund. If a Fund’s counterparty fails to deliver a security purchased in a Forward Transaction, there may be a loss, and the Fund may have missed an opportunity to make an alternative investment.
These securities are valued on the basis of valuations furnished by a pricing service, selected pursuant to procedures approved by the Trustees, which determines valuations taking into account appropriate factors such as institutional-size trading in similar groups of securities, yield, quality, coupon rate, maturity, type of issue, trading characteristics, and other market data. Securities for which no market quotation is available are valued at fair value in accordance with procedures approved by the Trustees. The Funds record on a daily basis the unrealized appreciation (depreciation) based upon changes in the values of these securities. When a Forward Transaction is closed, the Funds record a realized gain or loss equal to the difference between the value of the transaction at the time it was opened and the value of the transaction at the time it was closed.
Dollar Roll Transactions
A Fund may enter into dollar roll transactions, in which the Fund sells mortgage-backed securities for delivery in the current month and simultaneously contracts to purchase substantially similar securities on a specified future date from the same party. A Fund may invest in dollar rolls in order to benefit from anticipated changes in pricing for the mortgage-backed securities during the term of the transaction, or for the purpose of creating investment leverage. In a dollar roll, the securities that are to be purchased will be of the same type as the securities sold, but will be supported by different pools of mortgages.
Dollar rolls involve the risk that the Fund’s counterparty will be unable to deliver the mortgage-backed securities underlying the dollar roll at the fixed time. If the counterparty files for bankruptcy or becomes insolvent, a Fund’s use of the transaction proceeds may be restricted pending a determination by the counterparty or its representative, whether to enforce the Fund’s obligation to repurchase the securities. A Fund can incur a loss on a dollar roll transaction (either because its counterparty fails to perform or because the value of the mortgages subject to the transaction declines) and on the investments made by the Fund with the proceeds of the dollar roll transaction.
A Fund accounts for a dollar roll transaction as a purchase and sale whereby the difference in the sales price and purchase price of the security sold is recorded as a realized gain (loss). If certain criteria are met, these dollar roll transactions may be considered financing transactions, whereby the difference in the sales price and the future purchase price is recorded as an adjustment to interest income. Dollar roll transactions generally have the effect of creating leverage in a Fund’s portfolio.
Securities Lending
Each Fund may lend its securities; however, lending cannot exceed 33% of the total assets of the Fund taken at current value. The Funds’ securities lending activities are governed by a Securities Lending Agency Agreement (“Lending Agreement”) between each
286
Notes to Financial Statements (Continued)
Fund and the lending agent (“agent”). The Lending Agreement authorizes the agent to lend qualifying U.S. and foreign securities held by a Fund to approved borrowers (each, a “Borrower”).
Each Fund expects that in connection with any securities on loan, the loan will be secured continuously by collateral consisting of cash or securities adjusted daily to have market value at least equal to the current market value of the securities loaned. The market value of the loaned securities is determined at the close of business of a Fund and any additional collateral is delivered to the Fund the next business day. As with other extensions of credit, the Funds may bear the risk of delay in recovery or even loss of rights in the collateral should the Borrower of the securities fail financially. The Funds receive compensation for lending their securities in the form of a securities loan fee paid by the Borrower, as well as a share of the income earned on investment of the cash collateral received for the loaned securities. At September 30, 2016, the Funds’ collateral was equal to or greater than 100% of the market value of securities on loan.
Security loans can be terminated at the discretion of either the lending agent or the Fund and the related securities must be returned within the earlier of the standard trade settlement period for such securities or within three business days. For all Funds, all securities on loan are classified as common stock in the Fund’s Portfolio of Investments at September 30, 2016.
The Funds employ the agent to implement their securities lending program and the agent receives a fee from the Funds for its services. In addition, the Funds may be required to pay a rebate to the Borrower. Accordingly, a Fund’s compensation for lending its securities is reduced by any such fees or rebate paid to the securities lending agent or Borrower, respectively. For the year ended September 30, 2016, the Fund(s) earned securities lending net income as follows:
| | | | | | | | | | | | |
| | | Securities
Lending Gross
Income | | | Securities
Lending Fees
and Expenses | | | Securities
Lending Net
Income | |
Value Fund | | $ | 38,046 | | | $ | 7,082 | | | $ | 30,964 | |
Main Street Fund | | | 13,159 | | | | 2,636 | | | | 10,523 | |
Small Cap Opportunities Fund | | | 77,528 | | | | 15,520 | | | | 62,008 | |
Global Fund | | | 274,071 | | | | 52,856 | | | | 221,215 | |
International Equity Fund | | | 236,021 | | | | 46,740 | | | | 189,281 | |
Strategic Emerging Markets Fund | | | 34,394 | | | | 6,883 | | | | 27,511 | |
Accounting for Investment Transactions
Investment transactions are accounted for on the trade date. Realized gains and losses on sales of investments and unrealized appreciation and depreciation of investments are computed by the specific identification cost method. Proceeds received from litigation, if any, are included in realized gains on investment transactions for any investments that are no longer held in the portfolio and as a reduction in cost for investments that continue to be held in the portfolio. Interest income, adjusted for amortization of discounts and premiums on debt securities, is earned from the settlement date and is recorded on the accrual basis. Dividend income is recorded on the ex-dividend date. Withholding taxes on foreign interest, dividends, and capital gains have been provided for in accordance with the applicable country’s tax rules and rates. Foreign dividend income is recorded on the ex-dividend date or as soon as practicable after the Fund determines the existence of a dividend declaration after exercising reasonable due diligence. Distributions received on securities that represent a return of capital or capital gain are recorded as a reduction of cost of investments and/or as a realized gain. The Funds determine the classification of distributions received as return of capital distributions or capital gain distributions.
Foreign Currency Translation
The books and records of the Funds are maintained in U.S. dollars. The market values of foreign currencies, foreign securities, and other assets and liabilities denominated in foreign currencies are translated into U.S. dollars at the mean of the buying and selling rates of such currencies against the U.S. dollar at the end of each business day. Purchases and sales of foreign securities and income and expense items are translated at the rates of exchange prevailing on the respective dates of such transactions. The Funds do not isolate that portion of the results of operations arising from changes in the exchange rates from that portion arising from changes in the market prices of securities. Net realized foreign currency gains and losses resulting from changes in exchange rates include foreign currency gains and losses between trade date and settlement date on investment securities transactions, foreign
287
Notes to Financial Statements (Continued)
currency transactions, and the difference between the amounts of dividends or interest recorded on the books of the Funds and the amount actually received.
Allocation of Operating Activity
In maintaining the records for the Funds, the income and expense accounts are allocated daily to each class of shares. Investment income and loss, and unrealized and realized gains or losses are prorated among the classes of shares based on the relative net assets of each. Expenses are allocated to each class of shares depending on the nature of the expenditures. Administration and service fees, if any, which are directly attributable to a class of shares, are charged to that class’s operations. Expenses of a Fund not directly attributable to the operations of any specific class of shares of the Fund are prorated among the classes to which the expense relates based on relative net assets.
Foreign Securities
The Global Fund invests a significant amount of its assets and each of the International Equity Fund and Strategic Emerging Markets Fund invests substantially all of its assets in foreign securities. The other Funds may also invest in foreign securities. Foreign securities, including American Depositary Receipts, are subject to additional risks compared to securities of U.S. issuers, including international trade, currency, political, regulatory, and diplomatic risks. In addition, fluctuations in currency exchange rates may adversely affect the values of foreign securities and the price of a Fund’s shares. Emerging markets securities are subject to greater risks than securities issued in developed foreign markets, including less liquidity, greater price volatility, higher relative rates of inflation, greater political, economic, and social instability, greater custody and operational risks, and greater volatility in currency exchange rates.
Federal Income Tax
It is each Fund’s intent to continue to comply with the provisions of subchapter M of the Internal Revenue Code of 1986, as amended (the “Code”), applicable to a regulated investment company. Under such provisions, the Funds would not be subject to federal income taxes on their ordinary income and net realized capital gains to the extent they are distributed or deemed to have been distributed to their shareholders. Therefore, the Funds have not made any provision for federal income tax.
Dividends and Distributions to Shareholders
Dividends from net investment income of each Fund, other than the U.S. Government Money Market Fund, are declared and paid annually and at other times as may be required to satisfy tax or regulatory requirements. Dividends from net investment income are declared daily and paid monthly for the U.S. Government Money Market Fund. Distributions of any net realized capital gains of each Fund are declared and paid annually and at other times as may be required to satisfy tax or regulatory requirements.
Distributions to shareholders are recorded on the ex-dividend date. Income and capital gain distributions are determined in accordance with income tax regulations, which may differ from generally accepted accounting principles. As a result, net investment income and net realized capital gains on investment transactions for a reporting period may differ significantly from distributions during such period.
3. Advisory Fees and Other Transactions
Investment Advisory Fees and Investment Subadvisers
MML Investment Advisers, LLC (“MML Advisers”), a wholly-owned subsidiary of Massachusetts Mutual Life Insurance Company (“MassMutual”), serves as investment adviser to each Fund. Under the investment advisory agreements between MML Advisers and the Trust on behalf of each Fund, MML Advisers is responsible for providing investment management services for each Fund. In return for these services, MML Advisers receives advisory fees, based upon each Fund’s average daily net assets, at the following annual rates:
| | |
Fund | | Investment Advisory Fee |
U.S. Government Money Market Fund | | 0.35% on the first $1 billion; and |
| | 0.33% on any excess over $1 billion |
288
Notes to Financial Statements (Continued)
| | |
Fund | | Investment Advisory Fee |
Short-Duration Bond Fund | | 0.35% on the first $500 million; and |
| | 0.30% on any excess over $500 million |
Inflation-Protected and Income Fund | | 0.38% on the first $350 million; and |
| | 0.33% on any excess over $350 million |
Core Bond Fund | | 0.38% on the first $1.5 billion; |
| | 0.33% on the next $500 million; and |
| | 0.28% on any excess over $2 billion |
Diversified Bond Fund* | | 0.40% on the first $150 million; and |
| | 0.30% on any excess over $150 million |
High Yield Fund | | 0.48% on the first $250 million; and |
| | 0.455% on any excess over $250 million |
Balanced Fund** | | 0.48% on the first $300 million; and |
| | 0.43% on any excess over $300 million |
Value Fund | | 0.50% on the first $250 million; and |
| | 0.47% on any excess over $250 million |
Disciplined Value Fund | | 0.45% on the first $400 million; and |
| | 0.40% on any excess over $400 million |
Main Street Fund | | 0.55% on the first $300 million; and |
| | 0.50% on any excess over $300 million |
Disciplined Growth Fund | | 0.45% on the first $400 million; and |
| | 0.40% on any excess over $400 million |
Small Cap Opportunities Fund** | | 0.58% on the first $300 million; and |
| | 0.53% on any excess over $300 million |
Global Fund | | 0.75% on the first $400 million; and |
| | 0.70% on any excess over $400 million |
International Equity Fund | | 0.85% on the first $500 million; |
| | 0.80% on the next $500 million; and |
| | 0.75% on any excess over $1 billion |
Strategic Emerging Markets Fund | | 1.00% on the first $350 million; and |
| | 0.95% on any excess over $350 million |
| * | Prior to June 1, 2016, the investment advisory fees were as follows: |
| | |
Fund | | Investment Advisory Fee |
Diversified Bond Fund | | 0.40% on the first $150 million; and |
| | 0.35% on any excess over $150 million |
| ** | Prior to January 1, 2016, the investment advisory fees were as follows: |
| | |
Fund | | Investment Advisory Fee |
Balanced Fund | | 0.48% on the first $350 million; and |
| | 0.43% on any excess over $350 million |
Small Cap Opportunities Fund | | 0.58% on the first $400 million; and |
| | 0.53% on any excess over $400 million |
MML Advisers has entered into investment subadvisory agreements with Barings LLC (“Barings”), a wholly-owned subsidiary of MM Asset Management Holding LLC, itself a wholly-owned subsidiary of MassMutual Holding LLC, a controlled subsidiary of
289
Notes to Financial Statements (Continued)
MassMutual, on behalf of certain Funds. These agreements provide that Barings manage the investment and reinvestment of assets of these Funds. Barings receives a subadvisory fee from MML Advisers, based upon each Fund’s average daily net assets, at the following annual rates:
| | |
U.S. Government Money Market Fund | | 0.05% |
Short-Duration Bond Fund | | 0.08% |
Inflation-Protected and Income Fund | | 0.08% |
Core Bond Fund | | 0.10% |
Diversified Bond Fund | | 0.10% |
High Yield Fund | | 0.20% |
Balanced Fund: fixed income portion | | 0.09% |
Balanced Fund: equity portion* | | 0.22% of the first $50 million; |
| | 0.21% of the next $50 million; and |
| | 0.20% of any excess over $100 million |
Disciplined Value Fund* | | 0.25% of the first $50 million; |
| | 0.21% of the next $50 million; |
| | 0.17% of the next $650 million; and |
| | 0.14% of any excess over $750 million |
Disciplined Growth Fund* | | 0.25% of the first $50 million; |
| | 0.21% of the next $50 million; |
| | 0.17% of the next $650 million; and |
| | 0.14% of any excess over $750 million |
| * | Subadvisory fee based on Aggregate Assets. For purposes of these subadvisory agreements, “Aggregate Assets” means the aggregate of (i) the average daily net assets of the Fund determined at the close of the NYSE on each day that the NYSE is open for trading, and (ii) the average daily net assets of certain other funds or accounts of MML Advisers or its affiliates, including other funds registered under the 1940 Act, for which Barings provides investment advisory services, as agreed upon from time to time by MML Advisers and Barings, determined at the close of the NYSE on each day that the NYSE is open for trading. |
In addition, Barings Real Estate Advisers LLC (“Barings Real Estate”) serves as sub-subadviser for the Short-Duration Bond Fund, Inflation-Protected and Income Fund, Core Bond Fund, Diversified Bond Fund, High Yield Fund, and Balanced Fund and is primarily responsible for managing each Fund’s commercial mortgage-backed securities. Barings Real Estate is a wholly-owned subsidiary of Barings. The appointment of Barings Real Estate as a sub-subadviser to each Fund does not relieve Barings of any obligation or liability to any of the Funds that it would otherwise have pursuant to investment subadvisory agreements between MML Advisers and Barings with respect to each Fund, and any and all acts and omissions of Barings Real Estate in respect to any Fund shall be considered the acts and omissions of Barings.
MML Advisers has entered into investment subadvisory agreements with OppenheimerFunds, Inc. (“OFI”), a wholly-owned subsidiary of Oppenheimer Acquisition Corp., itself an indirect majority-owned subsidiary of MassMutual Holding LLC, on behalf of the Global Fund. This agreement provides that OFI manage the investment and reinvestment of the assets of the Global Fund. OFI receives a subadvisory fee from MML Advisers, based upon the Global Fund’s average daily net assets, at the following annual rate:
| | |
Global Fund | | 0.50% of the first $50 million; |
| | 0.40% of the next $200 million; |
| | 0.35% of the next $250 million; |
| | 0.30% of the next $250 million; |
| | 0.28% of the next $50 million; and |
| | 0.25% of any excess over $800 million |
290
Notes to Financial Statements (Continued)
MML Advisers has entered into investment subadvisory agreements with OFI Global Institutional, Inc. (“OFI Global Institutional”), a wholly-owned subsidiary of OFI, on behalf of certain Funds. These agreements provide that OFI Global Institutional manage the investment and reinvestment of the assets of these Funds. OFI Global Institutional receives a subadvisory fee from MML Advisers, based upon each Fund’s average daily net assets, at the following annual rates:
| | |
Value Fund | | 0.23% |
Main Street Fund | | 0.33% of the first $1 billion; and |
| | 0.30% of any excess over $1 billion |
Small Cap Opportunities Fund | | 0.40% of the first $1 billion; and |
| | 0.30% of any excess over $1 billion |
International Equity Fund | | 0.50% of the first $50 million; |
| | 0.45% of the next $150 million; |
| | 0.40% of the next $250 million; and |
| | 0.35% of any excess over $450 million |
Strategic Emerging Markets Fund | | 0.70% |
The Funds’ subadvisory fees are paid by MML Advisers out of the advisory fees previously disclosed above.
Administration Fees
Under an Administrative and Shareholder Services Agreement between the Trust and MML Advisers, on behalf of each Fund, MML Advisers is obligated to provide certain administrative and shareholder services. In return for these services, MML Advisers receives an administrative services fee, based upon the average daily net assets of the applicable class of shares of the Funds, at the following annual rates:
| | | | | | | | | | | | | | | | | | | | | | | | | | | | |
| | | Class I | | | Class R5 | | | Service
Class | | | Administrative
Class | | | Class A | | | Class R4 | | | Class R3 | |
U.S. Government Money Market Fund | | | N/A | | | | 0.10% | | | | N/A | | | | N/A | | | | N/A | | | | N/A | | | | N/A | |
Short-Duration Bond Fund | | | None | | | | 0.10% | | | | 0.15% | | | | 0.15% | | | | 0.15% | | | | 0.20% | | | | 0.20% | |
Inflation-Protected and Income Fund | | | None | | | | 0.10% | | | | 0.15% | | | | 0.15% | | | | 0.15% | | | | 0.20% | | | | 0.20% | |
Core Bond Fund | | | None | | | | 0.10% | | | | 0.15% | | | | 0.15% | | | | 0.15% | | | | 0.20% | | | | 0.20% | |
Diversified Bond Fund | | | None | | | | 0.10% | | | | 0.15% | | | | 0.15% | | | | 0.15% | | | | 0.20% | | | | 0.20% | |
High Yield Fund | | | None | | | | 0.10% | | | | 0.15% | | | | 0.15% | | | | 0.15% | | | | 0.20% | | | | 0.20% | |
Balanced Fund | | | None | | | | 0.10% | | | | 0.15% | | | | 0.15% | | | | 0.15% | | | | 0.20% | | | | 0.20% | |
Value Fund | | | None | | | | 0.10% | | | | 0.15% | | | | 0.15% | | | | 0.15% | | | | 0.20% | | | | 0.20% | |
Disciplined Value Fund | | | None | | | | 0.10% | | | | 0.15% | | | | 0.15% | | | | 0.15% | | | | 0.20% | | | | 0.20% | |
Main Street Fund | | | None | | | | 0.10% | | | | 0.15% | | | | 0.15% | | | | 0.15% | | | | 0.20% | | | | 0.20% | |
Disciplined Growth Fund | | | None | | | | 0.10% | | | | 0.15% | | | | 0.15% | | | | 0.15% | | | | 0.20% | | | | 0.20% | |
Small Cap Opportunities Fund | | | None | | | | 0.10% | | | | 0.15% | | | | 0.15% | | | | 0.15% | | | | 0.20% | | | | 0.20% | |
Global Fund | | | None | | | | 0.10% | | | | 0.15% | | | | 0.15% | | | | 0.15% | | | | 0.20% | | | | 0.20% | |
International Equity Fund | | | None | | | | 0.10% | | | | 0.15% | | | | 0.15% | | | | 0.15% | | | | 0.20% | | | | 0.20% | |
Strategic Emerging Markets Fund | | | None | | | | 0.10% | | | | 0.15% | | | | 0.15% | | | | 0.15% | | | | 0.20% | | | | 0.20% | |
Distribution and Service Fees
MML Distributors, LLC (the “Distributor”) acts as distributor to each Fund. Pursuant to a 12b-1 Plan adopted by the Trust, Class A shares and Class R4 shares of each Fund pay an annual fee of 0.25% of the average daily net assets of the class; and Class R3 shares of each Fund pay an annual fee of 0.50% of the average daily net assets of the class, to the Distributor. Such payments compensate the Distributor for services provided and expenses incurred by it for purposes of promoting the sale of the relevant class of shares, reducing redemptions of shares, or maintaining or improving services provided to each Fund’s shareholders. The Distributor is a wholly-owned subsidiary of MassMutual.
291
Notes to Financial Statements (Continued)
Effective April 1, 2014, the Trust entered into a separate Supplemental Shareholder Services Agreement with MassMutual, on behalf of Service Class shares, Administrative Class shares, and Class A shares of each Fund. Fees payable under the Supplemental Shareholder Services Agreement are intended to compensate MassMutual for its provision of shareholder services to the Funds’ investors and are calculated and paid based on the average daily net assets attributable to the relevant share classes of the Funds separately, at the following annual rates: 0.05% for Service Class shares, and 0.15% for Administrative Class shares and Class A shares. MassMutual may pay these fees to other intermediaries for providing shareholder services to the Funds’ investors.
Expense Caps and Waivers
MML Advisers contractually agreed to cap the fees and expenses of the Funds noted below (other than extraordinary litigation and legal expenses, Acquired Fund Fees and Expenses#, interest expense, short sale dividend and loan expense, or other non-recurring or unusual expenses such as organizational expenses and shareholder meeting expenses) through January 31, 2017 based upon the average daily net assets of the applicable class of shares for the Funds, as follows:
| | | | | | | | | | | | | | | | | | | | | | | | | | | | |
| | | Class I | | | Class R5 | | | Service
Class | | | Administrative
Class | | | Class A | | | Class R4 | | | Class R3 | |
Diversified Bond Fund | | | 0.52% | | | | 0.62% | | | | 0.72% | | | | 0.82% | | | | 1.07% | | | | 0.97% | | | | 1.22% | |
High Yield Fund | | | 0.55% | | | | 0.65% | | | | 0.75% | | | | 0.85% | | | | 1.10% | | | | 1.00% | | | | 1.25% | |
Balanced Fund | | | 0.60% | | | | 0.70% | | | | 0.80% | | | | 0.90% | | | | 1.15% | | | | 1.05% | | | | 1.30% | |
Value Fund | | | 0.60% | | | | 0.70% | | | | 0.80% | | | | 0.90% | | | | 1.15% | | | | 1.05% | | | | 1.30% | |
Strategic Emerging Markets Fund | | | 1.05% | | | | 1.15% | | | | 1.25% | | | | 1.35% | | | | 1.60% | | | | 1.50% | | | | 1.75% | |
| # | Acquired Fund Fees and Expenses are expenses borne indirectly by a Fund through investments in other pooled investment vehicles. |
For the U.S. Government Money Market Fund, MML Advisers has agreed to voluntarily waive some or all of its fees in an attempt to allow the Fund to avoid a negative yield. There is no guarantee that the Fund will be able to avoid a negative yield. Payments made to intermediaries will be unaffected. MML Advisers may amend or discontinue this waiver at any time without advance notice.
For the Inflation-Protected and Income Fund, effective June 1, 2016, MML Advisers has agreed to voluntarily waive .03% of its management fees through January 31, 2017. MML Advisers may amend or discontinue this waiver at any time without advance notice.
For the International Equity Fund, effective June 1, 2016, MML Advisers has agreed to voluntarily waive .02% of its management fees through January 31, 2017. MML Advisers may amend or discontinue this waiver at any time without advance notice.
Expense caps and waiver amounts are reflected as a reduction of expenses on the Statements of Operations.
Deferred Compensation
Trustees of the Funds who are not officers or employees of MassMutual may elect to defer receipt of their annual fees in accordance with terms of a Non-Qualified Deferred Compensation Plan. Amounts deferred shall accrue interest or earnings and shall be recorded on the Funds’ books as other liabilities. Deferred compensation is included within Trustees’ fees and expenses in the Statements of Assets and Liabilities.
Other
Certain officers and trustees of the Funds are also employees of MassMutual. The compensation of each trustee who is not an employee of MassMutual is borne by the Funds.
292
Notes to Financial Statements (Continued)
The following table shows beneficial ownership of Funds’ shares by affiliated parties at September 30, 2016:
| | | | |
| | | Total % of Ownership
by Related Party | |
U.S. Government Money Market Fund | | | 49.0% | |
Short-Duration Bond Fund | | | 86.0% | |
Inflation-Protected and Income Fund | | | 87.8% | |
Core Bond Fund | | | 84.9% | |
Diversified Bond Fund | | | 55.2% | |
High Yield Fund | | | 84.2% | |
Balanced Fund | | | 72.8% | |
Value Fund | | | 95.8% | |
Disciplined Value Fund | | | 78.3% | |
Main Street Fund | | | 93.0% | |
Disciplined Growth Fund | | | 74.8% | |
Small Cap Opportunities Fund | | | 83.1% | |
Global Fund | | | 89.3% | |
International Equity Fund | | | 92.0% | |
Strategic Emerging Markets Fund | | | 99.2% | |
4. Purchases and Sales of Investments
Cost of purchases and proceeds from sales of investment securities (excluding short-term investments) for the year ended September 30, 2016, were as follows:
| | | | | | | | | | | | | | | | |
| | | Purchases | | | Sales | |
| | | Long-Term U.S.
Government
Securities | | | Other
Long-Term
Securities | | | Long-Term U.S.
Government
Securities | | | Other
Long-Term
Securities | |
Short-Duration Bond Fund | | $ | 177,595,609 | | | $ | 363,233,917 | | | $ | 255,075,681 | | | $ | 241,026,342 | |
Inflation-Protected and Income Fund | | | 72,706,984 | | | | 151,416,874 | | | | 123,331,408 | | | | 142,798,410 | |
Core Bond Fund | | | 4,141,661,817 | | | | 447,561,234 | | | | 4,219,326,325 | | | | 708,767,469 | |
Diversified Bond Fund | | | 509,115,152 | | | | 51,586,467 | | | | 511,944,125 | | | | 37,176,826 | |
High Yield Fund | | | - | | | | 296,710,608 | | | | - | | | | 149,060,582 | |
Balanced Fund | | | 115,370,838 | | | | 87,323,966 | | | | 115,196,095 | | | | 92,944,273 | |
Value Fund | | | - | | | | 39,042,765 | | | | - | | | | 45,552,571 | |
Disciplined Value Fund | | | - | | | | 328,886,284 | | | | - | | | | 443,318,934 | |
Main Street Fund | | | - | | | | 46,268,077 | | | | - | | | | 57,981,601 | |
Disciplined Growth Fund | | | - | | | | 572,079,578 | | | | - | | | | 694,498,813 | |
Small Cap Opportunities Fund | | | - | | | | 96,177,396 | | | | - | | | | 90,173,547 | |
Global Fund | | | - | | | | 85,424,372 | | | | - | | | | 146,112,515 | |
International Equity Fund | | | - | | | | 184,637,023 | | | | - | | | | 221,619,572 | |
Strategic Emerging Markets Fund | | | - | | | | 95,096,436 | | | | - | | | | 55,434,825 | |
293
Notes to Financial Statements (Continued)
| 5. | | Capital Share Transactions |
Changes in shares outstanding for each Fund were as follows:
| | | | | | | | | | | | | | | | |
| | | Year Ended September 30, 2016 | | | Year Ended September 30, 2015 | |
| | | | |
| | | Shares | | | Amount | | | Shares | | | Amount | |
| | | | | | | | | | | | | | | | |
U.S. Government Money Market Fund Class R5 | | | | | | | | | | | | | | | | |
Sold | | | 1,663,936,209 | | | $ | 1,663,936,205 | | | | 2,098,061,759 | | | $ | 2,098,061,759 | |
Issued as reinvestment of dividends | | | 11,965 | | | | 11,965 | | | | 21,747 | | | | 21,747 | |
Redeemed | | | (1,729,258,382 | ) | | | (1,729,258,382 | ) | | | (2,172,573,773 | ) | | | (2,172,573,773 | ) |
| | | | | | | | | | | | | | | | |
Net increase (decrease) | | | (65,310,208 | ) | | $ | (65,310,212 | ) | | | (74,490,267 | ) | | $ | (74,490,267 | ) |
| | | | | | | | | | | | | | | | |
Short-Duration Bond Fund Class I | | | | | | | | | | | | | | | | |
Sold | | | 13,052,465 | | | $ | 134,134,974 | | | | 14,244,985 | | | $ | 149,501,532 | |
Issued as reinvestment of dividends | | | 406,694 | | | | 4,111,675 | | | | 518,611 | | | | 5,331,332 | |
Redeemed | | | (12,199,325 | ) | | | (126,188,190 | ) | | | (18,426,909 | ) | | | (192,733,136 | ) |
| | | | | | | | | | | | | | | | |
Net increase (decrease) | | | 1,259,834 | | | $ | 12,058,459 | | | | (3,663,313 | ) | | $ | (37,900,272 | ) |
| | | | | | | | | | | | | | | | |
Short-Duration Bond Fund Class R5 | | | | | | | | | | | | | | | | |
Sold | | | 8,767,054 | | | $ | 90,738,499 | | | | 4,337,919 | | | $ | 45,463,713 | |
Issued as reinvestment of dividends | | | 452,722 | | | | 4,590,598 | | | | 364,279 | | | | 3,755,721 | |
Redeemed | | | (5,289,514 | ) | | | (54,446,557 | ) | | | (6,540,196 | ) | | | (68,527,020 | ) |
| | | | | | | | | | | | | | | | |
Net increase (decrease) | | | 3,930,262 | | | $ | 40,882,540 | | | | (1,837,998 | ) | | $ | (19,307,586 | ) |
| | | | | | | | | | | | | | | | |
Short-Duration Bond Fund Service Class | | | | | | | | | | | | | | | | |
Sold | | | 1,622,718 | | | $ | 16,673,754 | | | | 3,793,475 | | | $ | 39,361,080 | |
Issued as reinvestment of dividends | | | 194,326 | | | | 1,958,806 | | | | 155,016 | | | | 1,588,909 | |
Redeemed | | | (4,734,274 | ) | | | (48,348,465 | ) | | | (2,905,164 | ) | | | (30,194,071 | ) |
| | | | | | | | | | | | | | | | |
Net increase (decrease) | | | (2,917,230 | ) | | $ | (29,715,905 | ) | | | 1,043,327 | | | $ | 10,755,918 | |
| | | | | | | | | | | | | | | | |
Short-Duration Bond Fund Administrative Class | | | | | | | | | | | | | | | | |
Sold | | | 1,644,279 | | | $ | 16,838,267 | | | | 1,707,520 | | | $ | 17,649,505 | |
Issued as reinvestment of dividends | | | 87,620 | | | | 879,709 | | | | 89,609 | | | | 915,799 | |
Redeemed | | | (2,085,242 | ) | | | (21,274,386 | ) | | | (2,381,475 | ) | | | (24,615,507 | ) |
| | | | | | | | | | | | | | | | |
Net increase (decrease) | | | (353,343 | ) | | $ | (3,556,410 | ) | | | (584,346 | ) | | $ | (6,050,203 | ) |
| | | | | | | | | | | | | | | | |
Short-Duration Bond Fund Class A | | | | | | | | | | | | | | | | |
Sold | | | 3,068,293 | | | $ | 31,304,881 | | | | 1,524,289 | | | $ | 15,676,710 | |
Issued as reinvestment of dividends | | | 184,068 | | | | 1,838,837 | | | | 136,519 | | | | 1,388,400 | |
Redeemed | | | (2,018,225 | ) | | | (20,494,377 | ) | | | (1,799,785 | ) | | | (18,536,212 | ) |
| | | | | | | | | | | | | | | | |
Net increase (decrease) | | | 1,234,136 | | | $ | 12,649,341 | | | | (138,977 | ) | | $ | (1,471,102 | ) |
| | | | | | | | | | | | | | | | |
Short-Duration Bond Fund Class R4 | | | | | | | | | | | | | | | | |
Sold | | | 513,116 | | | $ | 5,284,172 | | | | 692,767 | | | $ | 7,239,359 | |
Issued as reinvestment of dividends | | | 17,079 | | | | 172,671 | | | | 197 | | | | 2,025 | |
Redeemed | | | (180,971 | ) | | | (1,853,493 | ) | | | (139,995 | ) | | | (1,462,810 | ) |
| | | | | | | | | | | | | | | | |
Net increase (decrease) | | | 349,224 | | | $ | 3,603,350 | | | | 552,969 | | | $ | 5,778,574 | |
| | | | | | | | | | | | | | | | |
Short-Duration Bond Fund Class R3 | | | | | | | | | | | | | | | | |
Sold | | | 277,492 | | | $ | 2,843,660 | | | | 182,546 | | | $ | 1,902,907 | |
Issued as reinvestment of dividends | | | 4,531 | | | | 45,671 | | | | 988 | | | | 10,166 | |
Redeemed | | | (76,783 | ) | | | (789,271 | ) | | | (92,800 | ) | | | (961,514 | ) |
| | | | | | | | | | | | | | | | |
Net increase (decrease) | | | 205,240 | | | $ | 2,100,060 | | | | 90,734 | | | $ | 951,559 | |
| | | | | | | | | | | | | | | | |
294
Notes to Financial Statements (Continued)
| | | | | | | | | | | | | | | | |
| | | Year Ended September 30, 2016 | | | Year Ended September 30, 2015 | |
| | | | |
| | | Shares | | | Amount | | | Shares | | | Amount | |
| | | | | | | | | | | | | | | | |
Inflation-Protected and Income Fund Class I | |
Sold | | | 5,757,789 | | | $ | 59,582,229 | | | | 6,924,795 | | | $ | 72,523,398 | |
Issued as reinvestment of dividends | | | 207,258 | | | | 2,070,502 | | | | 402,404 | | | | 4,160,845 | |
Redeemed | | | (9,664,230 | ) | | | (101,337,771 | ) | | | (7,472,551 | ) | | | (77,679,788 | ) |
| | | | | | | | | | | | | | | | |
Net increase (decrease) | | | (3,699,183 | ) | | $ | (39,685,040 | ) | | | (145,352 | ) | | $ | (995,545 | ) |
| | | | | | | | | | | | | | | | |
Inflation-Protected and Income Fund Class R5 | |
Sold | | | 1,688,822 | | | $ | 17,618,935 | | | | 1,465,538 | | | $ | 15,243,339 | |
Issued as reinvestment of dividends | | | 58,204 | | | | 582,044 | | | | 131,405 | | | | 1,358,727 | |
Redeemed | | | (1,606,436 | ) | | | (16,469,308 | ) | | | (1,169,219 | ) | | | (12,151,660 | ) |
| | | | | | | | | | | | | | | | |
Net increase (decrease) | | | 140,590 | | | $ | 1,731,671 | | | | 427,724 | | | $ | 4,450,406 | |
| | | | | | | | | | | | | | | | |
Inflation-Protected and Income Fund Service Class | |
Sold | | | 1,262,096 | | | $ | 13,159,948 | | | | 1,301,135 | | | $ | 13,512,111 | |
Issued as reinvestment of dividends | | | 75,869 | | | | 756,409 | | | | 167,528 | | | | 1,728,889 | |
Redeemed | | | (2,327,798 | ) | | | (23,987,953 | ) | | | (1,205,467 | ) | | | (12,541,926 | ) |
| | | | | | | | | | | | | | | | |
Net increase (decrease) | | | (989,833 | ) | | $ | (10,071,596 | ) | | | 263,196 | | | $ | 2,699,074 | |
| | | | | | | | | | | | | | | | |
Inflation-Protected and Income Fund Administrative Class | |
Sold | | | 646,044 | | | $ | 6,834,582 | | | | 343,388 | | | $ | 3,606,158 | |
Issued as reinvestment of dividends | | | 10,477 | | | | 105,506 | | | | 22,047 | | | | 229,733 | |
Redeemed | | | (486,329 | ) | | | (5,142,341 | ) | | | (205,763 | ) | | | (2,154,982 | ) |
| | | | | | | | | | | | | | | | |
Net increase (decrease) | | | 170,192 | | | $ | 1,797,747 | | | | 159,672 | | | $ | 1,680,909 | |
| | | | | | | | | | | | | | | | |
Inflation-Protected and Income Fund Class A | |
Sold | | | 566,784 | | | $ | 5,819,526 | | | | 576,018 | | | $ | 5,916,452 | |
Issued as reinvestment of dividends | | | 13,621 | | | | 134,169 | | | | 50,796 | | | | 517,616 | |
Redeemed | | | (596,303 | ) | | | (6,101,545 | ) | | | (909,162 | ) | | | (9,275,814 | ) |
| | | | | | | | | | | | | | | | |
Net increase (decrease) | | | (15,898 | ) | | $ | (147,850 | ) | | | (282,348 | ) | | $ | (2,841,746 | ) |
| | | | | | | | | | | | | | | | |
Inflation-Protected and Income Fund Class R4 | |
Sold | | | 560,700 | | | $ | 5,700,016 | | | | 98,463 | | | $ | 991,534 | |
Issued as reinvestment of dividends | | | 1,381 | | | | 13,551 | | | | 213 | | | | 2,162 | |
Redeemed | | | (155,187 | ) | | | (1,581,496 | ) | | | (8,824 | ) | | | (89,026 | ) |
| | | | | | | | | | | | | | | | |
Net increase (decrease) | | | 406,894 | | | $ | 4,132,071 | | | | 89,852 | | | $ | 904,670 | |
| | | | | | | | | | | | | | | | |
Inflation-Protected and Income Fund Class R3 | |
Sold | | | 277,546 | | | $ | 2,838,252 | | | | 40,136 | | | $ | 414,679 | |
Issued as reinvestment of dividends | | | 350 | | | | 3,444 | | | | 2,763 | | | | 28,215 | |
Redeemed | | | (52,446 | ) | | | (541,096 | ) | | | (157,938 | ) | | | (1,604,800 | ) |
| | | | | | | | | | | | | | | | |
Net increase (decrease) | | | 225,450 | | | $ | 2,300,600 | | | | (115,039 | ) | | $ | (1,161,906 | ) |
| | | | | | | | | | | | | | | | |
Core Bond Fund Class I | | | | | | | | | | | | | | | | |
Sold | | | 14,060,151 | | | $ | 156,373,556 | | | | 19,030,672 | | | $ | 216,572,086 | |
Issued as reinvestment of dividends | | | 2,498,443 | | | | 26,658,389 | | | | 1,721,869 | | | | 19,319,371 | |
Redeemed | | | (32,114,427 | ) | | | (357,706,881 | ) | | | (14,921,035 | ) | | | (169,470,784 | ) |
| | | | | | | | | | | | | | | | |
Net increase (decrease) | | | (15,555,833 | ) | | $ | (174,674,936 | ) | | | 5,831,506 | | | $ | 66,420,673 | |
| | | | | | | | | | | | | | | | |
Core Bond Fund Class R5 | | | | | | | | | | | | | | | | |
Sold | | | 2,690,313 | | | $ | 29,746,398 | | | | 5,819,269 | | | $ | 66,822,566 | |
Issued as reinvestment of dividends | | | 1,811,393 | | | | 19,400,021 | | | | 1,307,335 | | | | 14,720,593 | |
Redeemed | | | (11,634,707 | ) | | | (128,971,366 | ) | | | (8,464,814 | ) | | | (96,515,941 | ) |
| | | | | | | | | | | | | | | | |
Net increase (decrease) | | | (7,133,001 | ) | | $ | (79,824,947 | ) | | | (1,338,210 | ) | | $ | (14,972,782 | ) |
| | | | | | | | | | | | | | | | |
295
Notes to Financial Statements (Continued)
| | | | | | | | | | | | | | | | |
| | | Year Ended September 30, 2016 | | | Year Ended September 30, 2015 | |
| | | | |
| | | Shares | | | Amount | | | Shares | | | Amount | |
| | | | | | | | | | | | | | | | |
Core Bond Fund Service Class | | | | | | | | | | | | | | | | |
Sold | | | 1,284,205 | | | $ | 14,139,544 | | | | 2,927,966 | | | $ | 33,182,559 | |
Issued as reinvestment of dividends | | | 521,970 | | | | 5,558,982 | | | | 322,001 | | | | 3,606,409 | |
Redeemed | | | (5,275,810 | ) | | | (57,444,423 | ) | | | (6,186,908 | ) | | | (70,764,330 | ) |
| | | | | | | | | | | | | | | | |
Net increase (decrease) | | | (3,469,635 | ) | | $ | (37,745,897 | ) | | | (2,936,941 | ) | | $ | (33,975,362 | ) |
| | | | | | | | | | | | | | | | |
Core Bond Fund Administrative Class | | | | | | | | | | | | | | | | |
Sold | | | 2,300,519 | | | $ | 25,056,753 | | | | 2,427,404 | | | $ | 27,401,585 | |
Issued as reinvestment of dividends | | | 351,880 | | | | 3,722,888 | | | | 187,726 | | | | 2,091,266 | |
Redeemed | | | (2,594,694 | ) | | | (28,152,274 | ) | | | (1,294,519 | ) | | | (14,578,894 | ) |
| | | | | | | | | | | | | | | | |
Net increase (decrease) | | | 57,705 | | | $ | 627,367 | | | | 1,320,611 | | | $ | 14,913,957 | |
| | | | | | | | | | | | | | | | |
Core Bond Fund Class A | | | | | | | | | | | | | | | | |
Sold | | | 1,636,651 | | | $ | 17,700,256 | | | | 2,233,314 | | | $ | 24,978,948 | |
Issued as reinvestment of dividends | | | 619,171 | | | | 6,501,293 | | | | 401,983 | | | | 4,441,914 | |
Redeemed | | | (3,746,735 | ) | | | (40,368,193 | ) | | | (3,133,482 | ) | | | (34,904,471 | ) |
| | | | | | | | | | | | | | | | |
Net increase (decrease) | | | (1,490,913 | ) | | $ | (16,166,644 | ) | | | (498,185 | ) | | $ | (5,483,609 | ) |
| | | | | | | | | | | | | | | | |
Core Bond Fund Class R4 | | | | | | | | | | | | | | | | |
Sold | | | 682,691 | | | $ | 7,268,738 | | | | 829,056 | | | $ | 9,218,618 | |
Issued as reinvestment of dividends | | | 38,061 | | | | 398,115 | | | | 260 | | | | 2,861 | |
Redeemed | | | (178,039 | ) | | | (1,920,879 | ) | | | (26,422 | ) | | | (293,572 | ) |
| | | | | | | | | | | | | | | | |
Net increase (decrease) | | | 542,713 | | | $ | 5,745,974 | | | | 802,894 | | | $ | 8,927,907 | |
| | | | | | | | | | | | | | | | |
Core Bond Fund Class R3 | | | | | | | | | | | | | | | | |
Sold | | | 19,547 | | | $ | 215,262 | | | | 13,313 | | | $ | 152,593 | |
Issued as reinvestment of dividends | | | 2,195 | | | | 23,531 | | | | 2,663 | | | | 29,982 | |
Redeemed | | | (7,626 | ) | | | (84,886 | ) | | | (68,446 | ) | | | (773,271 | ) |
| | | | | | | | | | | | | | | | |
Net increase (decrease) | | | 14,116 | | | $ | 153,907 | | | | (52,470 | ) | | $ | (590,696 | ) |
| | | | | | | | | | | | | | | | |
Diversified Bond Fund Class I | | | | | | | | | | | | | | | | |
Sold | | | 576,858 | | | $ | 6,148,415 | | | | 1,083,993 | | | $ | 11,734,255 | |
Issued as reinvestment of dividends | | | 44,663 | | | | 462,260 | | | | 12,044 | | | | 129,116 | |
Redeemed | | | (259,806 | ) | | | (2,775,195 | ) | | | (147,907 | ) | | | (1,605,334 | ) |
| | | | | | | | | | | | | | | | |
Net increase (decrease) | | | 361,715 | | | $ | 3,835,480 | | | | 948,130 | | | $ | 10,258,037 | |
| | | | | | | | | | | | | | | | |
Diversified Bond Fund Class R5 | | | | | | | | | | | | | | | | |
Sold | | | 2,095,040 | | | $ | 20,821,771 | | | | 953,544 | | | $ | 9,622,221 | |
Issued as reinvestment of dividends | | | 219,500 | | | | 2,111,588 | | | | 151,456 | | | | 1,513,044 | |
Redeemed | | | (1,243,836 | ) | | | (12,358,677 | ) | | | (1,298,692 | ) | | | (13,082,461 | ) |
| | | | | | | | | | | | | | | | |
Net increase (decrease) | | | 1,070,704 | | | $ | 10,574,682 | | | | (193,692 | ) | | $ | (1,947,196 | ) |
| | | | | | | | | | | | | | | | |
Diversified Bond Fund Service Class | | | | | | | | | | | | | | | | |
Sold | | | 237,627 | | | $ | 2,399,222 | | | | 795,621 | | | $ | 8,126,652 | |
Issued as reinvestment of dividends | | | 49,674 | | | | 483,829 | | | | 31,849 | | | | 321,992 | |
Redeemed | | | (647,922 | ) | | | (6,519,801 | ) | | | (350,564 | ) | | | (3,580,665 | ) |
| | | | | | | | | | | | | | | | |
Net increase (decrease) | | | (360,621 | ) | | $ | (3,636,750 | ) | | | 476,906 | | | $ | 4,867,979 | |
| | | | | | | | | | | | | | | | |
Diversified Bond Fund Administrative Class | | | | | | | | | | | | | | | | |
Sold | | | 560,811 | | | $ | 5,656,308 | | | | 2,302,595 | | | $ | 23,544,622 | |
Issued as reinvestment of dividends | | | 102,691 | | | | 998,151 | | | | 51,801 | | | | 522,675 | |
Redeemed | | | (828,200 | ) | | | (8,323,567 | ) | | | (987,830 | ) | | | (10,046,850 | ) |
| | | | | | | | | | | | | | | | |
Net increase (decrease) | | | (164,698 | ) | | $ | (1,669,108 | ) | | | 1,366,566 | | | $ | 14,020,447 | |
| | | | | | | | | | | | | | | | |
296
Notes to Financial Statements (Continued)
| | | | | | | | | | | | | | | | |
| | | Year Ended September 30, 2016 | | | Year Ended September 30, 2015 | |
| | | | |
| | | Shares | | | Amount | | | Shares | | | Amount | |
| | | | | | | | | | | | | | | | |
Diversified Bond Fund Class A | | | | | | | | | | | | | | | | |
Sold | | | 761,793 | | | $ | 7,589,872 | | | | 1,565,859 | | | $ | 15,977,500 | |
Issued as reinvestment of dividends | | | 89,915 | | | | 873,079 | | | | 63,902 | | | | 644,137 | |
Redeemed | | | (910,427 | ) | | | (9,102,327 | ) | | | (1,359,858 | ) | | | (13,822,003 | ) |
| | | | | | | | | | | | | | | | |
Net increase (decrease) | | | (58,719 | ) | | $ | (639,376 | ) | | | 269,903 | | | $ | 2,799,634 | |
| | | | | | | | | | | | | | | | |
Diversified Bond Fund Class R4 | | | | | | | | | | | | | | | | |
Sold | | | 141,806 | | | $ | 1,415,357 | | | | 340,478 | | | $ | 3,425,319 | |
Issued as reinvestment of dividends | | | 9,804 | | | | 94,609 | | | | 206 | | | | 2,069 | |
Redeemed | | | (79,015 | ) | | | (780,796 | ) | | | (55,098 | ) | | | (554,733 | ) |
| | | | | | | | | | | | | | | | |
Net increase (decrease) | | | 72,595 | | | $ | 729,170 | | | | 285,586 | | | $ | 2,872,655 | |
| | | | | | | | | | | | | | | | |
Diversified Bond Fund Class R3 | | | | | | | | | | | | | | | | |
Sold | | | 238,535 | | | $ | 2,392,274 | | | | 32,540 | | | $ | 326,014 | |
Issued as reinvestment of dividends | | | 1,298 | | | | 12,502 | | | | 187 | | | | 1,872 | |
Redeemed | | | (26,671 | ) | | | (266,225 | ) | | | (1,560 | ) | | | (15,659 | ) |
| | | | | | | | | | | | | | | | |
Net increase (decrease) | | | 213,162 | | | $ | 2,138,551 | | | | 31,167 | | | $ | 312,227 | |
| | | | | | | | | | | | | | | | |
High Yield Fund Class I | | | | | | | | | | | | | | | | |
Sold | | | 16,053,242 | | | $ | 140,164,355 | | | | 5,408,758 | | | $ | 50,326,663 | |
Issued as reinvestment of dividends | | | 840,340 | | | | 6,932,809 | | | | 1,048,990 | | | | 9,189,152 | |
Redeemed | | | (4,999,532 | ) | | | (43,689,964 | ) | | | (4,973,672 | ) | | | (46,555,068 | ) |
| | | | | | | | | | | | | | | | |
Net increase (decrease) | | | 11,894,050 | | | $ | 103,407,200 | | | | 1,484,076 | | | $ | 12,960,747 | |
| | | | | | | | | | | | | | | | |
High Yield Fund Class R5 | | | | | | | | | | | | | | | | |
Sold | | | 1,507,512 | | | $ | 13,358,792 | | | | 1,030,909 | | | $ | 9,641,134 | |
Issued as reinvestment of dividends | | | 275,924 | | | | 2,287,408 | | | | 402,404 | | | | 3,541,159 | |
Redeemed | | | (1,483,805 | ) | | | (13,023,454 | ) | | | (717,100 | ) | | | (6,769,163 | ) |
| | | | | | | | | | | | | | | | |
Net increase (decrease) | | | 299,631 | | | $ | 2,622,746 | | | | 716,213 | | | $ | 6,413,130 | |
| | | | | | | | | | | | | | | | |
High Yield Fund Service Class | | | | | | | | | | | | | | | | |
Sold | | | 938,792 | | | $ | 8,283,984 | | | | 1,902,023 | | | $ | 17,475,973 | |
Issued as reinvestment of dividends | | | 479,040 | | | | 3,971,242 | | | | 611,526 | | | | 5,381,429 | |
Redeemed | | | (1,968,879 | ) | | | (17,089,953 | ) | | | (1,556,234 | ) | | | (14,410,930 | ) |
| | | | | | | | | | | | | | | | |
Net increase (decrease) | | | (551,047 | ) | | $ | (4,834,727 | ) | | | 957,315 | | | $ | 8,446,472 | |
| | | | | | | | | | | | | | | | |
High Yield Fund Administrative Class | | | | | | | | | | | | | | | | |
Sold | | | 961,794 | | | $ | 8,362,359 | | | | 909,942 | | | $ | 8,417,600 | |
Issued as reinvestment of dividends | | | 198,184 | | | | 1,621,145 | | | | 247,733 | | | | 2,152,803 | |
Redeemed | | | (735,160 | ) | | | (6,322,924 | ) | | | (699,091 | ) | | | (6,403,332 | ) |
| | | | | | | | | | | | | | | | |
Net increase (decrease) | | | 424,818 | | | $ | 3,660,580 | | | | 458,584 | | | $ | 4,167,071 | |
| | | | | | | | | | | | | | | | |
High Yield Fund Class A | | | | | | | | | | | | | | | | |
Sold | | | 620,626 | | | $ | 5,388,621 | | | | 864,568 | | | $ | 7,884,156 | |
Issued as reinvestment of dividends | | | 205,252 | | | | 1,676,905 | | | | 313,397 | | | | 2,720,285 | |
Redeemed | | | (880,422 | ) | | | (7,571,832 | ) | | | (1,306,801 | ) | | | (12,096,267 | ) |
| | | | | | | | | | | | | | | | |
Net increase (decrease) | | | (54,544 | ) | | $ | (506,306 | ) | | | (128,836 | ) | | $ | (1,491,826 | ) |
| | | | | | | | | | | | | | | | |
High Yield Fund Class R4 | | | | | | | | | | | | | | | | |
Sold | | | 1,994,886 | | | $ | 17,145,053 | | | | 316,737 | | | $ | 2,881,451 | |
Issued as reinvestment of dividends | | | 58,215 | | | | 472,120 | | | | 1,045 | | | | 9,041 | |
Redeemed | | | (331,663 | ) | | | (2,805,750 | ) | | | (25,697 | ) | | | (231,684 | ) |
| | | | | | | | | | | | | | | | |
Net increase (decrease) | | | 1,721,438 | | | $ | 14,811,423 | | | | 292,085 | | | $ | 2,658,808 | |
| | | | | | | | | | | | | | | | |
297
Notes to Financial Statements (Continued)
| | | | | | | | | | | | | | | | |
| | | Year Ended September 30, 2016 | | | Year Ended September 30, 2015 | |
| | | | |
| | | Shares | | | Amount | | | Shares | | | Amount | |
| | | | | | | | | | | | | | | | |
High Yield Fund Class R3 | | | | | | | | | | | | | | | | |
Sold | | | 1,256,552 | | | $ | 10,962,917 | | | | 404,122 | | | $ | 3,756,007 | |
Issued as reinvestment of dividends | | | 41,813 | | | | 346,635 | | | | 7,533 | | | | 66,515 | |
Redeemed | | | (178,837 | ) | | | (1,561,478 | ) | | | (103,147 | ) | | | (947,167 | ) |
| | | | | | | | | | | | | | | | |
Net increase (decrease) | | | 1,119,528 | | | $ | 9,748,074 | | | | 308,508 | | | $ | 2,875,355 | |
| | | | | | | | | | | | | | | | |
Balanced Fund Class I | | | | | | | | | | | | | | | | |
Sold | | | 49,821 | | | $ | 525,193 | | | | 276,732 | | | $ | 3,478,414 | |
Issued as reinvestment of dividends | | | 3,775 | | | | 40,088 | | | | 316,381 | | | | 3,745,956 | |
Redeemed | | | (959 | ) | | | (10,564 | ) | | | (3,351,869 | ) | | | (40,904,571 | ) |
| | | | | | | | | | | | | | | | |
Net increase (decrease) | | | 52,637 | | | $ | 554,717 | | | | (2,758,756 | ) | | $ | (33,680,201 | ) |
| | | | | | | | | | | | | | | | |
Balanced Fund Class R5 | | | | | | | | | | | | | | | | |
Sold | | | 183,962 | | | $ | 2,040,064 | | | | 315,592 | | | $ | 3,905,546 | |
Issued as reinvestment of dividends | | | 549,138 | | | | 5,842,827 | | | | 608,056 | | | | 7,205,459 | |
Redeemed | | | (1,474,757 | ) | | | (16,469,735 | ) | | | (1,149,428 | ) | | | (14,197,546 | ) |
| | | | | | | | | | | | | | | | |
Net increase (decrease) | | | (741,657 | ) | | $ | (8,586,844 | ) | | | (225,780 | ) | | $ | (3,086,541 | ) |
| | | | | | | | | | | | | | | | |
Balanced Fund Service Class | | | | | | | | | | | | | | | | |
Sold | | | 229,288 | | | $ | 2,747,680 | | | | 310,522 | | | $ | 3,938,966 | |
Issued as reinvestment of dividends | | | 120,436 | | | | 1,339,246 | | | | 93,083 | | | | 1,148,639 | |
Redeemed | | | (206,050 | ) | | | (2,383,816 | ) | | | (237,041 | ) | | | (2,994,833 | ) |
| | | | | | | | | | | | | | | | |
Net increase (decrease) | | | 143,674 | | | $ | 1,703,110 | | | | 166,564 | | | $ | 2,092,772 | |
| | | | | | | | | | | | | | | | |
Balanced Fund Administrative Class | | | | | | | | | | | | | | | | |
Sold | | | 125,540 | | | $ | 1,383,702 | | | | 239,806 | | | $ | 3,034,390 | |
Issued as reinvestment of dividends | | | 85,454 | | | | 912,644 | | | | 68,442 | | | | 814,462 | |
Redeemed | | | (107,412 | ) | | | (1,151,963 | ) | | | (96,665 | ) | | | (1,208,389 | ) |
| | | | | | | | | | | | | | | | |
Net increase (decrease) | | | 103,582 | | | $ | 1,144,383 | | | | 211,583 | | | $ | 2,640,463 | |
| | | | | | | | | | | | | | | | |
Balanced Fund Class A | | | | | | | | | | | | | | | | |
Sold | | | 219,229 | | | $ | 2,362,104 | | | | 661,784 | | | $ | 7,995,462 | |
Issued as reinvestment of dividends | | | 291,391 | | | | 3,036,297 | | | | 284,914 | | | | 3,313,545 | |
Redeemed | | | (521,475 | ) | | | (5,789,828 | ) | | | (841,443 | ) | | | (10,090,002 | ) |
| | | | | | | | | | | | | | | | |
Net increase (decrease) | | | (10,855 | ) | | $ | (391,427 | ) | | | 105,255 | | | $ | 1,219,005 | |
| | | | | | | | | | | | | | | | |
Balanced Fund Class R4 | | | | | | | | | | | | | | | | |
Sold | | | 56,412 | | | $ | 600,705 | | | | 191,323 | | | $ | 2,282,482 | |
Issued as reinvestment of dividends | | | 21,474 | | | | 222,254 | | | | 893 | | | | 10,357 | |
Redeemed | | | (41,431 | ) | | | (429,165 | ) | | | (20,937 | ) | | | (248,308 | ) |
| | | | | | | | | | | | | | | | |
Net increase (decrease) | | | 36,455 | | | $ | 393,794 | | | | 171,279 | | | $ | 2,044,531 | |
| | | | | | | | | | | | | | | | |
Balanced Fund Class R3 | | | | | | | | | | | | | | | | |
Sold | | | 330,972 | | | $ | 3,677,203 | | | | 175,459 | | | $ | 2,051,256 | |
Issued as reinvestment of dividends | | | 39,268 | | | | 405,641 | | | | 875 | | | | 10,153 | |
Redeemed | | | (68,421 | ) | | | (728,935 | ) | | | (29,445 | ) | | | (350,964 | ) |
| | | | | | | | | | | | | | | | |
Net increase (decrease) | | | 301,819 | | | $ | 3,353,909 | | | | 146,889 | | | $ | 1,710,445 | |
| | | | | | | | | | | | | | | | |
Value Fund Class I | | | | | | | | | | | | | | | | |
Sold | | | - | | | $ | - | | | | - | | | $ | - | |
Issued as reinvestment of dividends | | | - | + | | | 2 | | | | 98 | | | | 2,038 | |
Redeemed | | | (5 | ) | | | (107 | ) | | | - | | | | - | |
| | | | | | | | | | | | | | | | |
Net increase (decrease) | | | (5 | ) | | $ | (105 | ) | | | 98 | | | $ | 2,038 | |
| | | | | | | | | | | | | | | | |
298
Notes to Financial Statements (Continued)
| | | | | | | | | | | | | | | | |
| | | Year Ended September 30, 2016 | | | Year Ended September 30, 2015 | |
| | | | |
| | | Shares | | | Amount | | | Shares | | | Amount | |
| | | | | | | | | | | | | | | | |
Value Fund Class R5 | | | | | | | | | | | | | | | | |
Sold | | | 29,655 | | | $ | 606,091 | | | | 116,263 | | | $ | 2,530,054 | |
Issued as reinvestment of dividends | | | 35,561 | | | | 721,893 | | | | 56,070 | | | | 1,167,383 | |
Redeemed | | | (241,660 | ) | | | (4,868,307 | ) | | | (937,056 | ) | | | (20,307,740 | ) |
| | | | | | | | | | | | | | | | |
Net increase (decrease) | | | (176,444 | ) | | $ | (3,540,323 | ) | | | (764,723 | ) | | $ | (16,610,303 | ) |
| | | | | | | | | | | | | | | | |
Value Fund Service Class | | | | | | | | | | | | | | | | |
Sold | | | 1,345 | | | $ | 28,228 | | | | 294 | | | $ | 6,296 | |
Issued as reinvestment of dividends | | | 91 | | | | 1,852 | | | | 109 | | | | 2,270 | |
Redeemed | | | (282 | ) | | | (5,906 | ) | | | (1,216 | ) | | | (26,391 | ) |
| | | | | | | | | | | | | | | | |
Net increase (decrease) | | | 1,154 | | | $ | 24,174 | | | | (813 | ) | | $ | (17,825 | ) |
| | | | | | | | | | | | | | | | |
Value Fund Administrative Class | | | | | | | | | | | | | | | | |
Sold | | | 31,011 | | | $ | 629,277 | | | | 36,267 | | | $ | 768,553 | |
Issued as reinvestment of dividends | | | 7,770 | | | | 158,282 | | | | 10,969 | | | | 229,145 | |
Redeemed | | | (101,645 | ) | | | (2,081,557 | ) | | | (117,259 | ) | | | (2,493,228 | ) |
| | | | | | | | | | | | | | | | |
Net increase (decrease) | | | (62,864 | ) | | $ | (1,293,998 | ) | | | (70,023 | ) | | $ | (1,495,530 | ) |
| | | | | | | | | | | | | | | | |
Value Fund Class A | | | | | | | | | | | | | | | | |
Sold | | | 12,631 | | | $ | 258,606 | | | | 16,773 | | | $ | 358,299 | |
Issued as reinvestment of dividends | | | 3,328 | | | | 67,859 | | | | 4,970 | | | | 103,865 | |
Redeemed | | | (75,363 | ) | | | (1,546,713 | ) | | | (48,625 | ) | | | (1,046,541 | ) |
| | | | | | | | | | | | | | | | |
Net increase (decrease) | | | (59,404 | ) | | $ | (1,220,248 | ) | | | (26,882 | ) | | $ | (584,377 | ) |
| | | | | | | | | | | | | | | | |
Value Fund Class R4 | | | | | | | | | | | | | | | | |
Sold | | | - | | | $ | - | | | | 9 | | | $ | 200 | |
Issued as reinvestment of dividends | | | - | + | | | 2 | | | | 81 | | | | 1,679 | |
Redeemed | | | (10 | ) | | | (199 | ) | | | - | | | | - | |
| | | | | | | | | | | | | | | | |
Net increase (decrease) | | | (10 | ) | | $ | (197 | ) | | | 90 | | | $ | 1,879 | |
| | | | | | | | | | | | | | | | |
Value Fund Class R3 | | | | | | | | | | | | | | | | |
Sold | | | 91 | | | $ | 1,850 | | | | 10 | | | $ | 219 | |
Issued as reinvestment of dividends | | | 3 | | | | 53 | | | | 3 | | | | 68 | |
Redeemed | | | (7 | ) | | | (142 | ) | | | - | | | | - | |
| | | | | | | | | | | | | | | | |
Net increase (decrease) | | | 87 | | | $ | 1,761 | | | | 13 | | | $ | 287 | |
| | | | | | | | | | | | | | | | |
Disciplined Value Fund Class I | | | | | | | | | | | | | | | | |
Sold | | | 3,431,726 | | | $ | 52,221,364 | | | | 3,444,558 | | | $ | 55,155,749 | |
Issued as reinvestment of dividends | | | 465,524 | | | | 6,945,621 | | | | 206,591 | | | | 3,260,008 | |
Redeemed | | | (10,428,754 | ) | | | (164,497,980 | ) | | | (4,163,649 | ) | | | (66,773,771 | ) |
| | | | | | | | | | | | | | | | |
Net increase (decrease) | | | (6,531,504 | ) | | $ | (105,330,995 | ) | | | (512,500 | ) | | $ | (8,358,014 | ) |
| | | | | | | | | | | | | | | | |
Disciplined Value Fund Class R5 | | | | | | | | | | | | | | | | |
Sold | | | 271,272 | | | $ | 4,116,817 | | | | 260,622 | | | $ | 4,154,850 | |
Issued as reinvestment of dividends | | | 122,191 | | | | 1,825,546 | | | | 74,977 | | | | 1,184,635 | |
Redeemed | | | (658,335 | ) | | | (9,906,198 | ) | | | (1,732,100 | ) | | | (27,805,229 | ) |
| | | | | | | | | | | | | | | | |
Net increase (decrease) | | | (264,872 | ) | | $ | (3,963,835 | ) | | | (1,396,501 | ) | | $ | (22,465,744 | ) |
| | | | | | | | | | | | | | | | |
Disciplined Value Fund Service Class | | | | | | | | | | | | | | | | |
Sold | | | 402,248 | | | $ | 6,069,204 | | | | 799,029 | | | $ | 12,659,134 | |
Issued as reinvestment of dividends | | | 175,006 | | | | 2,598,844 | | | | 72,587 | | | | 1,139,617 | |
Redeemed | | | (1,014,180 | ) | | | (15,411,330 | ) | | | (725,496 | ) | | | (11,632,076 | ) |
| | | | | | | | | | | | | | | | |
Net increase (decrease) | | | (436,926 | ) | | $ | (6,743,282 | ) | | | 146,120 | | | $ | 2,166,675 | |
| | | | | | | | | | | | | | | | |
299
Notes to Financial Statements (Continued)
| | | | | | | | | | | | | | | | |
| | | Year Ended September 30, 2016 | | | Year Ended September 30, 2015 | |
| | | | |
| | | Shares | | | Amount | | | Shares | | | Amount | |
| | | | | | | | | | | | | | | | |
Disciplined Value Fund Administrative Class | | | | | | | | | | | | | | | | |
Sold | | | 69,348 | | | $ | 1,072,405 | | | | 303,684 | | | $ | 4,933,854 | |
Issued as reinvestment of dividends | | | 18,121 | | | | 273,628 | | | | 7,232 | | | | 115,418 | |
Redeemed | | | (230,829 | ) | | | (3,566,819 | ) | | | (252,915 | ) | | | (4,064,333 | ) |
| | | | | | | | | | | | | | | | |
Net increase (decrease) | | | (143,360 | ) | | $ | (2,220,786 | ) | | | 58,001 | | | $ | 984,939 | |
| | | | | | | | | | | | | | | | |
Disciplined Value Fund Class A | | | | | | | | | | | | | | | | |
Sold | | | 176,047 | | | $ | 2,725,708 | | | | 152,326 | | | $ | 2,392,590 | |
Issued as reinvestment of dividends | | | 18,643 | | | | 275,162 | | | | 8,920 | | | | 139,242 | |
Redeemed | | | (92,501 | ) | | | (1,391,123 | ) | | | (295,844 | ) | | | (4,622,941 | ) |
| | | | | | | | | | | | | | | | |
Net increase (decrease) | | | 102,189 | | | $ | 1,609,747 | | | | (134,598 | ) | | $ | (2,091,109 | ) |
| | | | | | | | | | | | | | | | |
Disciplined Value Fund Class R4 | | | | | | | | | | | | | | | | |
Sold | | | 97,797 | | | $ | 1,511,747 | | | | 171,659 | | | $ | 2,669,767 | |
Issued as reinvestment of dividends | | | 6,213 | | | | 91,383 | | | | 101 | | | | 1,573 | |
Redeemed | | | (16,301 | ) | | | (245,322 | ) | | | (4,520 | ) | | | (70,333 | ) |
| | | | | | | | | | | | | | | | |
Net increase (decrease) | | | 87,709 | | | $ | 1,357,808 | | | | 167,240 | | | $ | 2,601,007 | |
| | | | | | | | | | | | | | | | |
Disciplined Value Fund Class R3 | | | | | | | | | | | | | | | | |
Sold | | | 133,800 | | | $ | 1,945,948 | | | | 8,388 | | | $ | 134,747 | |
Issued as reinvestment of dividends | | | 97 | | | | 1,443 | | | | 23 | | | | 358 | |
Redeemed | | | (105,790 | ) | | | (1,670,070 | ) | | | (6,905 | ) | | | (110,179 | ) |
| | | | | | | | | | | | | | | | |
Net increase (decrease) | | | 28,107 | | | $ | 277,321 | | | | 1,506 | | | $ | 24,926 | |
| | | | | | | | | | | | | | | | |
Main Street Fund Class I | | | | | | | | | | | | | | | | |
Sold | | | 74,242 | | | $ | 775,688 | | | | 449,703 | | | $ | 6,510,261 | |
Issued as reinvestment of dividends | | | 950 | | | | 9,218 | | | | 105,340 | | | | 1,468,435 | |
Redeemed | | | (6,958 | ) | | | (76,863 | ) | | | (3,893,561 | ) | | | (58,303,521 | ) |
| | | | | | | | | | | | | | | | |
Net increase (decrease) | | | 68,234 | | | $ | 708,043 | | | | (3,338,518 | ) | | $ | (50,324,825 | ) |
| | | | | | | | | | | | | | | | |
Main Street Fund Class R5 | | | | | | | | | | | | | | | | |
Sold | | | 814,150 | | | $ | 10,206,587 | | | | 492,152 | | | $ | 7,061,192 | |
Issued as reinvestment of dividends | | | 2,723,512 | | | | 26,445,301 | | | | 212,905 | | | | 2,967,891 | |
Redeemed | | | (1,554,370 | ) | | | (16,326,793 | ) | | | (2,489,207 | ) | | | (36,360,947 | ) |
| | | | | | | | | | | | | | | | |
Net increase (decrease) | | | 1,983,292 | | | $ | 20,325,095 | | | | (1,784,150 | ) | | $ | (26,331,864 | ) |
| | | | | | | | | | | | | | | | |
Main Street Fund Service Class | | | | | | | | | | | | | | | | |
Sold | | | 53,859 | | | $ | 561,634 | | | | 67,506 | | | $ | 981,109 | |
Issued as reinvestment of dividends | | | 59,838 | | | | 597,779 | | | | 14,136 | | | | 199,743 | |
Redeemed | | | (397,401 | ) | | | (5,671,026 | ) | | | (81,284 | ) | | | (1,192,808 | ) |
| | | | | | | | | | | | | | | | |
Net increase (decrease) | | | (283,704 | ) | | $ | (4,511,613 | ) | | | 358 | | | $ | (11,956 | ) |
| | | | | | | | | | | | | | | | |
Main Street Fund Administrative Class | | | | | | | | | | | | | | | | |
Sold | | | 202,028 | | | $ | 2,196,323 | | | | 156,130 | | | $ | 2,241,800 | |
Issued as reinvestment of dividends | | | 1,139,395 | | | | 11,063,523 | | | | 65,629 | | | | 914,867 | |
Redeemed | | | (824,549 | ) | | | (8,790,081 | ) | | | (400,539 | ) | | | (5,698,847 | ) |
| | | | | | | | | | | | | | | | |
Net increase (decrease) | | | 516,874 | | | $ | 4,469,765 | | | | (178,780 | ) | | $ | (2,542,180 | ) |
| | | | | | | | | | | | | | | | |
Main Street Fund Class A | | | | | | | | | | | | | | | | |
Sold | | | 254,961 | | | $ | 2,648,319 | | | | 182,251 | | | $ | 2,560,020 | |
Issued as reinvestment of dividends | | | 458,924 | | | | 4,405,674 | | | | 25,528 | | | | 353,308 | |
Redeemed | | | (506,735 | ) | | | (5,196,285 | ) | | | (223,014 | ) | | | (3,184,018 | ) |
| | | | | | | | | | | | | | | | |
Net increase (decrease) | | | 207,150 | | | $ | 1,857,708 | | | | (15,235 | ) | | $ | (270,690 | ) |
| | | | | | | | | | | | | | | | |
300
Notes to Financial Statements (Continued)
| | | | | | | | | | | | | | | | |
| | | Year Ended September 30, 2016 | | | Year Ended September 30, 2015 | |
| | | | |
| | | Shares | | | Amount | | | Shares | | | Amount | |
| | | | | | | | | | | | | | | | |
Main Street Fund Class R4 | | | | | | | | | | | | | | | | |
Sold | | | 339,113 | | | $ | 3,454,121 | | | | 15 | | | $ | 200 | |
Issued as reinvestment of dividends | | | 2,372 | | | | 22,677 | | | | 211 | | | | 2,921 | |
Redeemed | | | (14,696 | ) | | | (150,732 | ) | | | - | | | | - | |
| | | | | | | | | | | | | | | | |
Net increase (decrease) | | | 326,789 | | | $ | 3,326,066 | | | | 226 | | | $ | 3,121 | |
| | | | | | | | | | | | | | | | |
Main Street Fund Class R3 | | | | | | | | | | | | | | | | |
Sold | | | 64,073 | | | $ | 699,287 | | | | 4,760 | | | $ | 68,609 | |
Issued as reinvestment of dividends | | | 10,020 | | | | 96,689 | | | | 153 | | | | 2,137 | |
Redeemed | | | (6,464 | ) | | | (65,692 | ) | | | (3,131 | ) | | | (45,867 | ) |
| | | | | | | | | | | | | | | | |
Net increase (decrease) | | | 67,629 | | | $ | 730,284 | | | | 1,782 | | | $ | 24,879 | |
| | | | | | | | | | | | | | | | |
Disciplined Growth Fund Class I | | | | | | | | | | | | | | | | |
Sold | | | 5,952,867 | | | $ | 67,693,803 | | | | 6,228,963 | | | $ | 74,775,662 | |
Issued as reinvestment of dividends | | | 1,469,551 | | | | 16,414,882 | | | | 2,045,573 | | | | 23,442,269 | |
Redeemed | | | (14,501,026 | ) | | | (166,603,239 | ) | | | (6,187,567 | ) | | | (76,628,079 | ) |
| | | | | | | | | | | | | | | | |
Net increase (decrease) | | | (7,078,608 | ) | | $ | (82,494,554 | ) | | | 2,086,969 | | | $ | 21,589,852 | |
| | | | | | | | | | | | | | | | |
Disciplined Growth Fund Class R5 | | | | | | | | | | | | | | | | |
Sold | | | 842,095 | | | $ | 9,475,004 | | | | 1,197,799 | | | $ | 15,046,095 | |
Issued as reinvestment of dividends | | | 659,316 | | | | 7,371,156 | | | | 1,315,171 | | | | 15,085,017 | |
Redeemed | | | (2,450,267 | ) | | | (27,954,773 | ) | | | (3,586,718 | ) | | | (42,519,152 | ) |
| | | | | | | | | | | | | | | | |
Net increase (decrease) | | | (948,856 | ) | | $ | (11,108,613 | ) | | | (1,073,748 | ) | | $ | (12,388,040 | ) |
| | | | | | | | | | | | | | | | |
Disciplined Growth Fund Service Class | | | | | | | | | | | | | | | | |
Sold | | | 523,863 | | | $ | 5,931,125 | | | | 1,043,006 | | | $ | 12,712,032 | |
Issued as reinvestment of dividends | | | 666,975 | | | | 7,476,786 | | | | 942,002 | | | | 10,833,025 | |
Redeemed | | | (2,023,734 | ) | | | (22,987,765 | ) | | | (998,702 | ) | | | (12,443,108 | ) |
| | | | | | | | | | | | | | | | |
Net increase (decrease) | | | (832,896 | ) | | $ | (9,579,854 | ) | | | 986,306 | | | $ | 11,101,949 | |
| | | | | | | | | | | | | | | | |
Disciplined Growth Fund Administrative Class | | | | | | | | | | | | | | | | |
Sold | | | 598,748 | | | $ | 6,921,739 | | | | 1,435,438 | | | $ | 17,695,945 | |
Issued as reinvestment of dividends | | | 253,191 | | | | 2,863,597 | | | | 283,289 | | | | 3,283,315 | |
Redeemed | | | (528,609 | ) | | | (6,007,846 | ) | | | (658,059 | ) | | | (8,131,070 | ) |
| | | | | | | | | | | | | | | | |
Net increase (decrease) | | | 323,330 | | | $ | 3,777,490 | | | | 1,060,668 | | | $ | 12,848,190 | |
| | | | | | | | | | | | | | | | |
Disciplined Growth Fund Class A | | | | | | | | | | | | | | | | |
Sold | | | 667,957 | | | $ | 7,302,947 | | | | 805,051 | | | $ | 9,585,803 | |
Issued as reinvestment of dividends | | | 270,812 | | | | 2,997,888 | | | | 393,817 | | | | 4,473,761 | |
Redeemed | | | (965,793 | ) | | | (10,898,169 | ) | | | (575,621 | ) | | | (6,951,832 | ) |
| | | | | | | | | | | | | | | | |
Net increase (decrease) | | | (27,024 | ) | | $ | (597,334 | ) | | | 623,247 | | | $ | 7,107,732 | |
| | | | | | | | | | | | | | | | |
Disciplined Growth Fund Class R4 | | | | | | | | | | | | | | | | |
Sold | | | 887,025 | | | $ | 10,016,241 | | | | 558,251 | | | $ | 6,809,227 | |
Issued as reinvestment of dividends | | | 62,015 | | | | 684,022 | | | | 1,208 | | | | 13,709 | |
Redeemed | | | (264,491 | ) | | | (2,975,146 | ) | | | (33,262 | ) | | | (391,956 | ) |
| | | | | | | | | | | | | | | | |
Net increase (decrease) | | | 684,549 | | | $ | 7,725,117 | | | | 526,197 | | | $ | 6,430,980 | |
| | | | | | | | | | | | | | | | |
Disciplined Growth Fund Class R3 | | | | | | | | | | | | | | | | |
Sold | | | 231,824 | | | $ | 2,570,463 | | | | 335,111 | | | $ | 3,909,294 | |
Issued as reinvestment of dividends | | | 29,017 | | | | 319,473 | | | | 1,189 | | | | 13,498 | |
Redeemed | | | (309,402 | ) | | | (3,414,413 | ) | | | (20,165 | ) | | | (237,963 | ) |
| | | | | | | | | | | | | | | | |
Net increase (decrease) | | | (48,561 | ) | | $ | (524,477 | ) | | | 316,135 | | | $ | 3,684,829 | |
| | | | | | | | | | | | | | | | |
301
Notes to Financial Statements (Continued)
| | | | | | | | | | | | | | | | |
| | | Year Ended September 30, 2016 | | | Year Ended September 30, 2015 | |
| | | | |
| | | Shares | | | Amount | | | Shares | | | Amount | |
| | | | | | | | | | | | | | | | |
Small Cap Opportunities Fund Class I | | | | | | | | | | | | | | | | |
Sold | | | 286,501 | | | $ | 3,976,110 | | | | 9,025 | | | $ | 140,466 | |
Issued as reinvestment of dividends | | | 16,948 | | | | 215,753 | | | | 50,725 | | | | 748,194 | |
Redeemed | | | (39,704 | ) | | | (509,125 | ) | | | (363,990 | ) | | | (5,310,163 | ) |
| | | | | | | | | | | | | | | | |
Net increase (decrease) | | | 263,745 | | | $ | 3,682,738 | | | | (304,240 | ) | | $ | (4,421,503 | ) |
| | | | | | | | | | | | | | | | |
Small Cap Opportunities Fund Class R5 | | | | | �� | | | | | | | | | | | |
Sold | | | 362,600 | | | $ | 4,763,279 | | | | 331,504 | | | $ | 5,068,786 | |
Issued as reinvestment of dividends | | | 484,965 | | | | 6,163,903 | | | | 764,355 | | | | 11,274,236 | |
Redeemed | | | (655,837 | ) | | | (8,651,690 | ) | | | (1,487,625 | ) | | | (22,535,983 | ) |
| | | | | | | | | | | | | | | | |
Net increase (decrease) | | | 191,728 | | | $ | 2,275,492 | | | | (391,766 | ) | | $ | (6,192,961 | ) |
| | | | | | | | | | | | | | | | |
Small Cap Opportunities Fund Service Class | | | | | | | | | | | | | | | | |
Sold | | | 476,495 | | | $ | 6,517,316 | | | | 129,813 | | | $ | 2,054,493 | |
Issued as reinvestment of dividends | | | 91,262 | | | | 1,159,029 | | | | 74,754 | | | | 1,101,878 | |
Redeemed | | | (101,465 | ) | | | (1,309,009 | ) | | | (138,482 | ) | | | (2,161,740 | ) |
| | | | | | | | | | | | | | | | |
Net increase (decrease) | | | 466,292 | | | $ | 6,367,336 | | | | 66,085 | | | $ | 994,631 | |
| | | | | | | | | | | | | | | | |
Small Cap Opportunities Fund Administrative Class | | | | | | | | | | | | | | | | |
Sold | | | 361,220 | | | $ | 4,769,152 | | | | 208,536 | | | $ | 3,228,916 | |
Issued as reinvestment of dividends | | | 125,782 | | | | 1,589,890 | | | | 188,816 | | | | 2,768,045 | |
Redeemed | | | (521,928 | ) | | | (7,113,282 | ) | | | (195,386 | ) | | | (2,973,795 | ) |
| | | | | | | | | | | | | | | | |
Net increase (decrease) | | | (34,926 | ) | | $ | (754,240 | ) | | | 201,966 | | | $ | 3,023,166 | |
| | | | | | | | | | | | | | | | |
Small Cap Opportunities Fund Class A | | | | | | | | | | | | | | | | |
Sold | | | 816,162 | | | $ | 10,490,835 | | | | 709,534 | | | $ | 10,812,296 | |
Issued as reinvestment of dividends | | | 547,510 | | | | 6,800,076 | | | | 759,694 | | | | 10,969,973 | |
Redeemed | | | (1,105,166 | ) | | | (14,389,528 | ) | | | (1,104,358 | ) | | | (16,518,131 | ) |
| | | | | | | | | | | | | | | | |
Net increase (decrease) | | | 258,506 | | | $ | 2,901,383 | | | | 364,870 | | | $ | 5,264,138 | |
| | | | | | | | | | | | | | | | |
Small Cap Opportunities Fund Class R4 | | | | | | | | | | | | | | | | |
Sold | | | 367,076 | | | $ | 4,539,252 | | | | 35,165 | | | $ | 494,685 | |
Issued as reinvestment of dividends | | | 10,215 | | | | 126,151 | | | | 1,056 | | | | 15,225 | |
Redeemed | | | (85,139 | ) | | | (1,090,144 | ) | | | (79 | ) | | | (1,183 | ) |
| | | | | | | | | | | | | | | | |
Net increase (decrease) | | | 292,152 | | | $ | 3,575,259 | | | | 36,142 | | | $ | 508,727 | |
| | | | | | | | | | | | | | | | |
Small Cap Opportunities Fund Class R3 | | | | | | | | | | | | | | | | |
Sold | | | 356,665 | | | $ | 4,627,657 | | | | 88,552 | | | $ | 1,326,500 | |
Issued as reinvestment of dividends | | | 17,139 | | | | 211,494 | | | | 1,042 | | | | 15,023 | |
Redeemed | | | (51,552 | ) | | | (656,893 | ) | | | (3,269 | ) | | | (48,642 | ) |
| | | | | | | | | | | | | | | | |
Net increase (decrease) | | | 322,252 | | | $ | 4,182,258 | | | | 86,325 | | | $ | 1,292,881 | |
| | | | | | | | | | | | | | | | |
Global Fund Class I | | | | | | | | | | | | | | | | |
Sold | | | 1,240,605 | | | $ | 15,937,011 | | | | 70,509 | | | $ | 1,080,807 | |
Issued as reinvestment of dividends | | | 19,723 | | | | 265,859 | | | | 426 | | | | 5,975 | |
Redeemed | | | (104,352 | ) | | | (1,381,238 | ) | | | (2,727 | ) | | | (40,730 | ) |
| | | | | | | | | | | | | | | | |
Net increase (decrease) | | | 1,155,976 | | | $ | 14,821,632 | | | | 68,208 | | | $ | 1,046,052 | |
| | | | | | | | | | | | | | | | |
Global Fund Class R5 | | | | | | | | | | | | | | | | |
Sold | | | 266,787 | | | $ | 3,628,888 | | | | 1,212,379 | | | $ | 18,616,115 | |
Issued as reinvestment of dividends | | | 1,061,497 | | | | 14,308,984 | | | | 830,903 | | | | 11,665,880 | |
Redeemed | | | (3,970,723 | ) | | | (50,714,785 | ) | | | (3,744,503 | ) | | | (54,924,288 | ) |
| | | | | | | | | | | | | | | | |
Net increase (decrease) | | | (2,642,439 | ) | | $ | (32,776,913 | ) | | | (1,701,221 | ) | | $ | (24,642,293 | ) |
| | | | | | | | | | | | | | | | |
302
Notes to Financial Statements (Continued)
| | | | | | | | | | | | | | | | |
| | | Year Ended September 30, 2016 | | | Year Ended September 30, 2015 | |
| | | | |
| | | Shares | | | Amount | | | Shares | | | Amount | |
| | | | | | | | | | | | | | | | |
Global Fund Service Class | | | | | | | | | | | | | | | | |
Sold | | | 536,351 | | | $ | 7,546,075 | | | | 1,485,357 | | | $ | 22,453,517 | |
Issued as reinvestment of dividends | | | 226,584 | | | | 3,031,690 | | | | 76,490 | | | | 1,067,029 | |
Redeemed | | | (824,489 | ) | | | (10,573,613 | ) | | | (285,755 | ) | | | (4,245,134 | ) |
| | | | | | | | | | | | | | | | |
Net increase (decrease) | | | (61,554 | ) | | $ | 4,152 | | | | 1,276,092 | | | $ | 19,275,412 | |
| | | | | | | | | | | | | | | | |
Global Fund Administrative Class | | | | | | | | | | | | | | | | |
Sold | | | 503,850 | | | $ | 6,652,106 | | | | 1,074,659 | | | $ | 16,481,382 | |
Issued as reinvestment of dividends | | | 730,485 | | | | 9,846,944 | | | | 529,523 | | | | 7,434,501 | |
Redeemed | | | (2,546,020 | ) | | | (33,494,240 | ) | | | (1,958,305 | ) | | | (29,149,073 | ) |
| | | | | | | | | | | | | | | | |
Net increase (decrease) | | | (1,311,685 | ) | | $ | (16,995,190 | ) | | | (354,123 | ) | | $ | (5,233,190 | ) |
| | | | | | | | | | | | | | | | |
Global Fund Class A | | | | | | | | | | | | | | | | |
Sold | | | 213,653 | | | $ | 2,833,054 | | | | 364,718 | | | $ | 5,487,180 | |
Issued as reinvestment of dividends | | | 253,681 | | | | 3,389,184 | | | | 166,245 | | | | 2,315,792 | |
Redeemed | | | (1,001,274 | ) | | | (12,779,532 | ) | | | (684,280 | ) | | | (10,296,620 | ) |
| | | | | | | | | | | | | | | | |
Net increase (decrease) | | | (533,940 | ) | | $ | (6,557,294 | ) | | | (153,317 | ) | | $ | (2,493,648 | ) |
| | | | | | | | | | | | | | | | |
Global Fund Class R4 | | | | | | | | | | | | | | | | |
Sold | | | 352,039 | | | $ | 4,760,090 | | | | 47,809 | | | $ | 688,190 | |
Issued as reinvestment of dividends | | | 22,365 | | | | 296,555 | | | | 409 | | | | 5,691 | |
Redeemed | | | (100,236 | ) | | | (1,228,528 | ) | | | (1,953 | ) | | | (30,541 | ) |
| | | | | | | | | | | | | | | | |
Net increase (decrease) | | | 274,168 | | | $ | 3,828,117 | | | | 46,265 | | | $ | 663,340 | |
| | | | | | | | | | | | | | | | |
Global Fund Class R3 | | | | | | | | | | | | | | | | |
Sold | | | 580,735 | | | $ | 7,557,485 | | | | 139,548 | | | $ | 2,086,186 | |
Issued as reinvestment of dividends | | | 29,266 | | | | 390,706 | | | | 6,605 | | | | 92,274 | |
Redeemed | | | (164,736 | ) | | | (2,082,290 | ) | | | (37,265 | ) | | | (538,119 | ) |
| | | | | | | | | | | | | | | | |
Net increase (decrease) | | | 445,265 | | | $ | 5,865,901 | | | | 108,888 | | | $ | 1,640,341 | |
| | | | | | | | | | | | | | | | |
International Equity Fund Class I | | | | | | | | | | | | | | | | |
Sold | | | 5,126,763 | | | $ | 59,500,946 | | | | 11,522,250 | | | $ | 145,522,491 | |
Issued as reinvestment of dividends | | | 767,136 | | | | 8,806,720 | | | | 1,190,279 | | | | 13,854,847 | |
Redeemed | | | (4,314,817 | ) | | | (50,479,188 | ) | | | (2,467,354 | ) | | | (31,047,934 | ) |
| | | | | | | | | | | | | | | | |
Net increase (decrease) | | | 1,579,082 | | | $ | 17,828,478 | | | | 10,245,175 | | | $ | 128,329,404 | |
| | | | | | | | | | | | | | | | |
International Equity Fund Class R5 | | | | | | | | | | | | | | | | |
Sold | | | 832,489 | | | $ | 9,732,787 | | | | 1,912,873 | | | $ | 24,018,377 | |
Issued as reinvestment of dividends | | | 1,004,612 | | | | 11,542,997 | | | | 4,760,142 | | | | 55,408,047 | |
Redeemed | | | (5,155,511 | ) | | | (60,156,188 | ) | | | (9,339,471 | ) | | | (117,795,580 | ) |
| | | | | | | | | | | | | | | | |
Net increase (decrease) | | | (3,318,410 | ) | | $ | (38,880,404 | ) | | | (2,666,456 | ) | | $ | (38,369,156 | ) |
| | | | | | | | | | | | | | | | |
International Equity Fund Service Class | | | | | | | | | | | | | | | | |
Sold | | | 415,401 | | | $ | 4,758,303 | | | | 459,996 | | | $ | 5,832,457 | |
Issued as reinvestment of dividends | | | 90,960 | | | | 1,042,403 | | | | 324,367 | | | | 3,769,141 | |
Redeemed | | | (509,062 | ) | | | (5,870,248 | ) | | | (531,882 | ) | | | (6,816,223 | ) |
| | | | | | | | | | | | | | | | |
Net increase (decrease) | | | (2,701 | ) | | $ | (69,542 | ) | | | 252,481 | | | $ | 2,785,375 | |
| | | | | | | | | | | | | | | | |
International Equity Fund Administrative Class | | | | | | | | | | | | | | | | |
Sold | | | 284,044 | | | $ | 3,244,782 | | | | 585,599 | | | $ | 7,200,902 | |
Issued as reinvestment of dividends | | | 78,606 | | | | 896,894 | | | | 262,663 | | | | 3,039,005 | |
Redeemed | | | (498,193 | ) | | | (5,704,388 | ) | | | (446,641 | ) | | | (5,545,304 | ) |
| | | | | | | | | | | | | | | | |
Net increase (decrease) | | | (135,543 | ) | | $ | (1,562,712 | ) | | | 401,621 | | | $ | 4,694,603 | |
| | | | | | | | | | | | | | | | |
303
Notes to Financial Statements (Continued)
| | | | | | | | | | | | | | | | |
| | | Year Ended September 30, 2016 | | | Year Ended September 30, 2015 | |
| | | | |
| | | Shares | | | Amount | | | Shares | | | Amount | |
| | | | | | | | | | | | | | | | |
International Equity Fund Class A | | | | | | | | | | | | | | | | |
Sold | | | 477,964 | | | $ | 5,257,944 | | | | 764,735 | | | $ | 9,617,896 | |
Issued as reinvestment of dividends | | | 185,538 | | | | 2,059,474 | | | | 832,764 | | | | 9,376,918 | |
Redeemed | | | (1,179,715 | ) | | | (13,216,576 | ) | | | (1,171,938 | ) | | | (14,124,478 | ) |
| | | | | | | | | | | | | | | | |
Net increase (decrease) | | | (516,213 | ) | | $ | (5,899,158 | ) | | | 425,561 | | | $ | 4,870,336 | |
| | | | | | | | | | | | | | | | |
International Equity Fund Class R4 | | | | | | | | | | | | | | | | |
Sold | | | 357,253 | | | $ | 3,900,990 | | | | 23,736 | | | $ | 280,919 | |
Issued as reinvestment of dividends | | | 2,014 | | | | 22,234 | | | | 1,407 | | | | 15,815 | |
Redeemed | | | (72,739 | ) | | | (811,118 | ) | | | (358 | ) | | | (4,317 | ) |
| | | | | | | | | | | | | | | | |
Net increase (decrease) | | | 286,528 | | | $ | 3,112,106 | | | | 24,785 | | | $ | 292,417 | |
| | | | | | | | | | | | | | | | |
International Equity Fund Class R3 | | | | | | | | | | | | | | | | |
Sold | | | 353,737 | | | $ | 3,922,066 | | | | 41,257 | | | $ | 494,060 | |
Issued as reinvestment of dividends | | | 4,298 | | | | 47,362 | | | | 1,389 | | | | 15,616 | |
Redeemed | | | (88,685 | ) | | | (988,052 | ) | | | (2,058 | ) | | | (24,396 | ) |
| | | | | | | | | | | | | | | | |
Net increase (decrease) | | | 269,350 | | | $ | 2,981,376 | | | | 40,588 | | | $ | 485,280 | |
| | | | | | | | | | | | | | | | |
Strategic Emerging Markets Fund Class I | | | | | | | | | | | | | | | | |
Sold | | | 7,117,369 | | | $ | 69,627,630 | | | | 4,409,170 | | | $ | 48,926,480 | |
Issued as reinvestment of dividends | | | 125,734 | | | | 1,204,528 | | | | 159,991 | | | | 1,724,701 | |
Redeemed | | | (2,194,935 | ) | | | (21,313,663 | ) | | | (2,274,672 | ) | | | (24,615,409 | ) |
| | | | | | | | | | | | | | | | |
Net increase (decrease) | | | 5,048,168 | | | $ | 49,518,495 | | | | 2,294,489 | | | $ | 26,035,772 | |
| | | | | | | | | | | | | | | | |
Strategic Emerging Markets Fund Class R5 | | | | | | | | | | | | | | | | |
Sold | | | 7,941 | | | $ | 78,778 | | | | 149,435 | | | $ | 1,721,513 | |
Issued as reinvestment of dividends | | | 1,403 | | | | 13,627 | | | | 8,550 | | | | 93,369 | |
Redeemed | | | (515,991 | ) | | | (4,934,809 | ) | | | (87,773 | ) | | | (995,702 | ) |
| | | | | | | | | | | | | | | | |
Net increase (decrease) | | | (506,647 | ) | | $ | (4,842,404 | ) | | | 70,212 | | | $ | 819,180 | |
| | | | | | | | | | | | | | | | |
Strategic Emerging Markets Fund Service Class | | | | | | | | | | | | | | | | |
Sold | | | 57,885 | | | $ | 545,681 | | | | 763,288 | | | $ | 8,428,013 | |
Issued as reinvestment of dividends | | | 4,604 | | | | 44,104 | | | | 265 | | | | 2,863 | |
Redeemed | | | (62,560 | ) | | | (615,742 | ) | | | (20,159 | ) | | | (232,478 | ) |
| | | | | | | | | | | | | | | | |
Net increase (decrease) | | | (71 | ) | | $ | (25,957 | ) | | | 743,394 | | | $ | 8,198,398 | |
| | | | | | | | | | | | | | | | |
Strategic Emerging Markets Fund Administrative Class | | | | | | | | | | | | | | | | |
Sold | | | 37,722 | | | $ | 356,889 | | | | 22,565 | | | $ | 251,973 | |
Issued as reinvestment of dividends | | | 227 | | | | 2,191 | | | | 334 | | | | 3,624 | |
Redeemed | | | (22,210 | ) | | | (198,297 | ) | | | (9,874 | ) | | | (108,077 | ) |
| | | | | | | | | | | | | | | | |
Net increase (decrease) | | | 15,739 | | | $ | 160,783 | | | | 13,025 | | | $ | 147,520 | |
| | | | | | | | | | | | | | | | |
Strategic Emerging Markets Fund Class A | | | | | | | | | | | | | | | | |
Sold | | | 6,619 | | | $ | 61,796 | | | | 14,164 | | | $ | 159,503 | |
Issued as reinvestment of dividends | | | 9 | | | | 82 | | | | 440 | | | | 4,729 | |
Redeemed | | | (18,692 | ) | | | (191,687 | ) | | | (32,744 | ) | | | (367,428 | ) |
| | | | | | | | | | | | | | | | |
Net increase (decrease) | | | (12,064 | ) | | $ | (129,809 | ) | | | (18,140 | ) | | $ | (203,196 | ) |
| | | | | | | | | | | | | | | | |
Strategic Emerging Markets Fund Class R4 | | | | | | | | | | | | | | | | |
Sold | | | 45,526 | | | $ | 435,805 | | | | 3,613 | | | $ | 39,541 | |
Issued as reinvestment of dividends | | | 35 | | | | 333 | | | | 79 | | | | 850 | |
Redeemed | | | (1,878 | ) | | | (19,010 | ) | | | (49 | ) | | | (512 | ) |
| | | | | | | | | | | | | | | | |
Net increase (decrease) | | | 43,683 | | | $ | 417,128 | | | | 3,643 | | | $ | 39,879 | |
| | | | | | | | | | | | | | | | |
304
Notes to Financial Statements (Continued)
| | | | | | | | | | | | | | | | |
| | | Year Ended September 30, 2016 | | | Year Ended September 30, 2015 | |
| | | | |
| | | Shares | | | Amount | | | Shares | | | Amount | |
| | | | | | | | | | | | | | | | |
Strategic Emerging Markets Fund Class R3 | | | | | | | | | | | | | | | | |
Sold | | | 41,899 | | | $ | 416,440 | | | | 14,221 | | | $ | 160,366 | |
Issued as reinvestment of dividends | | | 43 | | | | 411 | | | | 61 | | | | 652 | |
Redeemed | | | (2,110 | ) | | | (20,574 | ) | | | (2,703 | ) | | | (29,234 | ) |
| | | | | | | | | | | | | | | | |
Net increase (decrease) | | | 39,832 | | | $ | 396,277 | | | | 11,579 | | | $ | 131,784 | |
| | | | | | | | | | | | | | | | |
| + | Amount rounds to less than 0.5 share. |
Purchases of Class A shares are subject to a front-end sales charge of up to 5.75% of the amount purchased. A portion of the front-end sales charge may be retained by the Distributor. For the year ended September 30, 2016, no material amounts have been retained by the Distributor.
Redemptions or exchanges of Class A shares made within eighteen months of purchase from initial investments of $1 million or more are subject to a contingent deferred sales charge of 1% of the amount redeemed. Prior to April 1, 2014, redemptions or exchanges of Class R3 shares made within eighteen months of purchase were subject to a contingent deferred sales charge of 1% of the amount redeemed. The Distributor receives all contingent deferred sales charges. Any contingent deferred sales charges imposed during the year ended September 30, 2016, were waived for any redemptions or exchanges subject to such a charge.
| 6. | | Federal Income Tax Information |
At September 30, 2016, the cost of securities and the unrealized appreciation (depreciation) in the value of investments owned by the Fund(s), as computed on a federal income tax basis, were as follows:
| | | | | | | | | | | | | | | | |
| | | Federal Income
Tax Cost | | | Tax Basis
Unrealized
Appreciation | | | Tax Basis
Unrealized
(Depreciation) | | | Net Unrealized
Appreciation
(Depreciation) | |
Short-Duration Bond Fund | | $ | 559,318,088 | | | $ | 9,644,262 | | | $ | (9,960,578 | ) | | $ | (316,316 | ) |
Inflation-Protected and Income Fund | | | 570,108,349 | | | | 7,825,507 | | | | (2,399,865 | ) | | | 5,425,642 | |
Core Bond Fund | | | 1,408,833,172 | | | | 29,648,443 | | | | (8,601,889 | ) | | | 21,046,554 | |
Diversified Bond Fund | | | 216,666,161 | | | | 4,928,002 | | | | (1,151,761 | ) | | | 3,776,241 | |
High Yield Fund | | | 412,333,256 | | | | 15,539,037 | | | | (8,157,460 | ) | | | 7,381,577 | |
Balanced Fund | | | 118,289,294 | | | | 6,288,075 | | | | (2,882,069 | ) | | | 3,406,006 | |
Value Fund | | | 59,442,155 | | | | 7,233,163 | | | | (1,033,150 | ) | | | 6,200,013 | |
Disciplined Value Fund | | | 197,201,612 | | | | 13,011,722 | | | | (5,207,878 | ) | | | 7,803,844 | |
Main Street Fund | | | 113,485,738 | | | | 14,093,440 | | | | (2,697,895 | ) | | | 11,395,545 | |
Disciplined Growth Fund | | | 342,158,036 | | | | 26,368,070 | | | | (9,047,495 | ) | | | 17,320,575 | |
Small Cap Opportunities Fund | | | 173,698,901 | | | | 22,849,065 | | | | (6,340,014 | ) | | | 16,509,051 | |
Global Fund | | | 224,091,981 | | | | 112,711,121 | | | | (9,239,718 | ) | | | 103,471,403 | |
International Equity Fund | | | 485,226,000 | | | | 75,905,024 | | | | (41,500,971 | ) | | | 34,404,053 | |
Strategic Emerging Markets Fund | | | 209,552,817 | | | | 23,563,149 | | | | (14,375,667 | ) | | | 9,187,482 | |
Note: The aggregate cost for investments for the U.S. Government Money Market Fund at September 30, 2016, is the same for financial reporting and federal income tax purposes.
Net capital loss carryforwards may be applied against any net realized taxable gains in succeeding years, subject to the carryforward period limitations, where applicable. On December 22, 2010, the Regulated Investment Company Modernization Act of 2010 (the “Modernization Act”) was signed by the President. The Modernization Act changed the capital loss carryforward rules as they relate to regulated investment companies. Capital losses generated in tax years beginning after the date of enactment may now be carried forward indefinitely, and retain the character of the original loss. Under pre-enactment law, capital losses could be carried forward for up to eight tax years as short-term capital losses. The provisions affecting the utilization of capital loss
305
Notes to Financial Statements (Continued)
carryforwards under the Modernization Act also require the utilization of post-enactment losses prior to the utilization of pre-enactment losses.
At September 30, 2016, the following Fund(s) had available, for federal income tax purposes, pre-enactment unused capital losses:
| | | | | | | | |
| | | Expiring
2016 | | | Expiring
2017 | |
Value Fund | | $ | - | | | $ | 32,385,573 | |
Net capital loss carryforwards for the Fund(s) shown in the above table are from pre-enactment years and are, therefore subject to the eight-year carryforward period and possible expiration.
At September 30, 2016, the following Fund(s) had post-enactment accumulated capital loss carryforwards:
| | | | | | | | |
| | | Short Term
Capital Loss
Carryforward | | | Long Term
Capital Loss
Carryforward | |
Short-Duration Bond Fund | | $ | 1,421,271 | | | $ | 9,469,545 | |
Inflation-Protected and Income Fund | | | - | | | | 2,752,784 | |
Diversified Bond Fund | | | - | | | | 466,614 | |
High Yield Fund | | | 2,914,543 | | | | 7,712,338 | |
Strategic Emerging Markets Fund | | | 10,431,237 | | | | 15,066,925 | |
Net capital loss carryforwards for the Fund(s) shown in the above table are from post-enactment years and are, therefore, not subject to the eight-year carryforward period and possible expiration.
The following Fund(s) elected to defer to the fiscal year beginning October 1, 2016, post-October capital losses:
| | | | |
| | | Post-October
Loss | |
Core Bond Fund | | $ | 15,644,050 | |
Diversified Bond Fund | | | 164,775 | |
High Yield Fund | | | 5,422,943 | |
Value Fund | | | 709,908 | |
Generally accepted accounting principles in the United States of America require that only distributions in excess of tax basis earnings and profits be reported in the financial statements as a return of capital.
The tax character of distributions (including capital gain dividends, if any, designated pursuant to Section 852 of the Code) paid during the year ended September 30, 2016, was as follows:
| | | | | | | | | | | | |
| | | Ordinary
Income | | | Long Term
Capital Gain | | | Return of
Capital | |
U.S. Government Money Market Fund | | $ | 11,965 | | | $ | - | | | $ | - | |
Short-Duration Bond Fund | | | 13,710,818 | | | | - | | | | - | |
Inflation-Protected and Income Fund | | | 3,666,654 | | | | - | | | | - | |
Core Bond Fund | | | 52,085,840 | | | | 10,182,126 | | | | - | |
Diversified Bond Fund | | | 5,041,850 | | | | - | | | | - | |
High Yield Fund | | | 17,318,623 | | | | - | | | | - | |
Balanced Fund | | | 3,566,564 | | | | 8,254,777 | | | | - | |
Value Fund | | | 953,776 | | | | - | | | | - | |
Disciplined Value Fund | | | 6,224,660 | | | | 5,795,161 | | | | - | |
306
Notes to Financial Statements (Continued)
| | | | | | | | | | | | |
| | | Ordinary
Income | | | Long Term
Capital Gain | | | Return of
Capital | |
Main Street Fund | | $ | 4,106,333 | | | $ | 38,583,365 | | | $ | - | |
Disciplined Growth Fund | | | 9,124,718 | | | | 29,021,370 | | | | - | |
Small Cap Opportunities Fund | | | 724,909 | | | | 15,563,172 | | | | - | |
Global Fund | | | 2,636,067 | | | | 28,912,183 | | | | - | |
International Equity Fund | | | 5,340,091 | | | | 19,087,059 | | | | - | |
Strategic Emerging Markets Fund | | | 1,266,812 | | | | - | | | | - | |
The tax character of distributions (including capital gain dividends, if any, designated pursuant to Section 852 of the Code) paid during the year ended September 30, 2015, was as follows:
| | | | | | | | | | | | |
| | | Ordinary
Income | | | Long Term
Capital Gain | | | Return of
Capital | |
U.S. Government Money Market Fund | | $ | 21,751 | | | $ | - | | | $ | - | |
Short-Duration Bond Fund | | | 13,112,744 | | | | - | | | | - | |
Inflation-Protected and Income Fund | | | 8,026,311 | | | | - | | | | - | |
Core Bond Fund | | | 43,089,362 | | | | 1,123,333 | | | | - | |
Diversified Bond Fund | | | 3,134,906 | | | | - | | | | - | |
High Yield Fund | | | 19,489,380 | | | | 3,576,643 | | | | - | |
Balanced Fund | | | 9,477,666 | | | | 6,771,653 | | | | - | |
Value Fund | | | 1,507,623 | | | | - | | | | - | |
Disciplined Value Fund | | | 5,842,446 | | | | - | | | | - | |
Main Street Fund | | | 1,627,208 | | | | 4,282,870 | | | | - | |
Disciplined Growth Fund | | | 31,936,491 | | | | 25,208,104 | | | | - | |
Small Cap Opportunities Fund | | | 4,414,401 | | | | 22,478,814 | | | | - | |
Global Fund | | | 4,038,986 | | | | 18,548,575 | | | | - | |
International Equity Fund | | | 6,038,494 | | | | 79,441,597 | | | | - | |
Strategic Emerging Markets Fund | | | 1,830,788 | | | | - | | | | - | |
The following Fund(s) have elected to pass through the foreign tax credit for the year ended September 30, 2016:
| | | | |
| | | Amount | |
Global Fund | | $ | 319,732 | |
International Equity Fund | | | 572,297 | |
Strategic Emerging Markets Fund | | | 219,563 | |
Capital accounts within the financial statements are periodically adjusted for permanent differences between book and tax accounting. These adjustments have no impact on net assets or the results of operations. Temporary book and tax accounting differences will reverse in subsequent periods. At September 30, 2016, temporary book and tax accounting differences were primarily attributable to investments in forward contracts, futures contracts, options contracts, swap agreements, premium amortization accruals, passive foreign investment companies, non-taxable dividends basis adjustments, the deferral of wash sale losses, and deferred Trustee compensation.
At September 30, 2016, the components of distributable earnings on a tax basis were as follows:
| | | | | | | | | | | | | | | | |
| | | Undistributed
Ordinary
Income | | | Undistributed
Long Term
Capital Gain
(Capital Loss
Carryover) | | | Other
Temporary
Differences | | | Unrealized
Appreciation
(Depreciation) | |
U.S. Government Money Market Fund | | $ | 1,235 | | | $ | - | | | $ | (98,506 | ) | | $ | - | |
Short-Duration Bond Fund | | | 9,532,341 | | | | (10,890,816 | ) | | | (95,311 | ) | | | (316,316 | ) |
Inflation-Protected and Income Fund | | | 5,804,238 | | | | (2,752,784 | ) | | | (49,947 | ) | | | 5,652,453 | |
307
Notes to Financial Statements (Continued)
| | | | | | | | | | | | | | | | |
| | | Undistributed
Ordinary
Income | | | Undistributed
Long Term
Capital Gain
(Capital Loss
Carryover) | | | Other
Temporary
Differences | | | Unrealized
Appreciation
(Depreciation) | |
Core Bond Fund | | $ | 27,885,858 | | | $ | - | | | $ | (15,928,446 | ) | | $ | 21,046,552 | |
Diversified Bond Fund | | | 3,209,621 | | | | (466,614 | ) | | | (198,126 | ) | | | 3,787,941 | |
High Yield Fund | | | 16,746,451 | | | | (10,626,881 | ) | | | (5,457,271 | ) | | | 7,381,576 | |
Balanced Fund | | | 1,975,790 | | | | 126,106 | | | | (30,928 | ) | | | 3,406,006 | |
Value Fund | | | 586,888 | | | | (32,385,573 | ) | | | (762,675 | ) | | | 6,200,013 | |
Disciplined Value Fund | | | 5,236,584 | | | | 6,608,093 | | | | (49,029 | ) | | | 7,803,844 | |
Main Street Fund | | | 1,088,844 | | | | 3,036,396 | | | | (28,052 | ) | | | 11,395,502 | |
Disciplined Growth Fund | | | 8,763,013 | | | | 18,684,374 | | | | (48,529 | ) | | | 17,320,575 | |
Small Cap Opportunities Fund | | | 1,317,596 | | | | 2,241,410 | | | | (40,872 | ) | | | 16,509,051 | |
Global Fund | | | 3,263,756 | | | | 6,248,056 | | | | (62,527 | ) | | | 103,444,112 | |
International Equity Fund | | | 5,755,122 | | | | 6,949,677 | | | | (111,860 | ) | | | 33,995,105 | |
Strategic Emerging Markets Fund | | | 2,170,490 | | | | (25,498,162 | ) | | | (20,056 | ) | | | 8,956,654 | |
During the year ended September 30, 2016, the following amounts were reclassified due to permanent differences between book and tax accounting:
| | | | | | | | | | | | |
| | | Paid-in
Capital | | | Accumulated
Net Realized
Gain (Loss) on
Investments | | | Undistributed
Net Investment
Income (Loss) | |
U.S. Government Money Market Fund | | $ | (790,417 | ) | | $ | 790,196 | | | $ | 221 | |
Short-Duration Bond Fund | | | 20 | | | | (2,979,226 | ) | | | 2,979,206 | |
Inflation-Protected and Income Fund | | | 12 | | | | (2,113,221 | ) | | | 2,113,209 | |
Core Bond Fund | | | 57 | | | | (6,048,061 | ) | | | 6,048,004 | |
Diversified Bond Fund | | | 5 | | | | (273,331 | ) | | | 273,326 | |
High Yield Fund | | | 9 | | | | 21,424 | | | | (21,433 | ) |
Balanced Fund | | | 5 | | | | (191,737 | ) | | | 191,732 | |
Value Fund | | | 5 | | | | 103,564 | | | | (103,569 | )�� |
Disciplined Value Fund | | | 241,282 | | | | (390,950 | ) | | | 149,668 | |
Main Street Fund | | | (55 | ) | | | 44,069 | | | | (44,014 | ) |
Disciplined Growth Fund | | | 13 | | | | 507,122 | | | | (507,135 | ) |
Small Cap Opportunities Fund | | | (427 | ) | | | 174,499 | | | | (174,072 | ) |
Global Fund | | | 14 | | | | (110,036 | ) | | | 110,022 | |
International Equity Fund | | | 19 | | | | 409,867 | | | | (409,886 | ) |
Strategic Emerging Markets Fund | | | (2,215 | ) | | | 219,655 | | | | (217,440 | ) |
The Funds did not have any unrecognized tax benefits at September 30, 2016, nor were there any increases or decreases in unrecognized tax benefits for the year then ended. The Funds recognize interest and penalties, if any, related to unrecognized tax benefits as an income tax expense in the Statements of Operations. During the year ended September 30, 2016, the Funds did not incur any such interest or penalties. The Funds are subject to examination by U.S. federal and state tax authorities for returns filed for the prior three fiscal years. Foreign taxes are provided for based on the Funds’ understanding of the tax rules and rates that exist in the foreign markets in which they invest.
308
Notes to Financial Statements (Continued)
| 7. | | Investment in Affiliated Issuers |
A summary of the Funds’ transactions in the securities of affiliated issuers during the year ended September 30, 2016, was as follows:
| | | | | | | | | | | | | | | | | | | | | | | | | | | | |
| | | Number of
Shares Held
as of
9/30/15 | | | Purchases | | | Sales | | | Number of
Shares Held
as of
9/30/16 | | | Value as
of 9/30/16 | | | Dividend
Income | | | Net Realized
Gain (Loss) | |
| | | | | | | | | | | | | | | | | | | | | | | | | | | | |
Global Fund | | | | | | | | | | | | | | | | | | | | | | | | | | | | |
Oppenheimer Institutional Money Market Fund Class E* | | | 5,023,047 | | | | 58,474,044 | | | | 59,835,799 | | | | 3,661,292 | | | $ | 3,661,292 | | | $ | 14,748 | | | $ | - | |
| | | | | | | | | | | | | | | | | | | | | | | | | | | | |
| | | | | | | | | | | | | | | | | | | | | | | | | | | | |
International Equity Fund | | | | | | | | | | | | | | | | | | | | | | | | | | | | |
Oppenheimer Institutional Money Market Fund Class E* | | | 5,956,422 | | | | 105,558,603 | | | | 105,111,291 | | | | 6,403,734 | | | $ | 6,403,734 | | | $ | 31,259 | | | $ | - | |
| | | | | | | | | | | | | | | | | | | | | | | | | | | | |
| * | Fund advised by OFI Global Asset Management, Inc. |
Under the Funds’ organizational documents, current and former Trustees and Officers are provided with specified rights to indemnification against liabilities arising in connection with the performance of their duties to the Funds, and shareholders are indemnified against personal liability for obligations of the Funds. In the normal course of business, the Funds may also enter into contracts that provide general indemnifications. The Funds’ maximum exposure under these arrangements is unknown as this would be dependent on future claims that may be made against the Funds. The risk of material loss from such claims is considered remote.
On December 7, 2010, the Trust was named as a defendant and putative member of the proposed defendant class of shareholders named in an adversary proceeding brought by The Official Committee of Unsecured Creditors of Tribune Company (the “Official Committee”) in the U.S. Bankruptcy Court for the District of Delaware, in connection with Tribune Company’s Chapter 11 bankruptcy proceeding (In re Tribune Company). The proceeding relates to a leveraged buyout (“LBO”) transaction by which Tribune Company converted to a privately-held company in 2007, and the putative defendant class is comprised of beneficial owners of shares of Tribune Company who received proceeds (the “Proceeds”) of the LBO. The Official Committee seeks to recover payments of those Proceeds.
The potential amounts sought to be recovered from the Balanced Fund, Disciplined Value Fund, and Small Cap Opportunities Fund, plus interest and the Official Committee’s court costs, are approximately $44,200, $299,880, and $414,800, respectively.
In addition, on June 2, 2011, the Disciplined Value Fund and Small Cap Opportunities Fund were named as defendants in a closely related, parallel adversary proceeding brought in connection with the Tribune Company’s LBO by Deutsche Bank Trust Company Americas, in its capacity as successor indenture trustee for a certain series of Senior Notes, Law Debenture Trust Company of New York, in its capacity as successor indenture trustee for a certain series of Senior Notes, and Wilmington Trust Company, in its capacity as successor indenture trustee for the PHONES Notes (together, the “Plaintiffs”), in the United States District Court for the District of Massachusetts. The Plaintiffs also seek to recover payments of the Proceeds.
The Funds cannot predict the outcome of these proceedings. Accordingly, the Funds have not accrued any amounts related to these proceedings. If the proceedings were to be decided in a manner adverse to the Funds, or if the Funds were to enter into a settlement agreement with the Official Committee or the Plaintiffs, as applicable, the payment of such judgment or settlement could potentially have a material adverse effect on the Funds’ net asset values depending on the net assets of each applicable Fund at the time of such judgment or settlement.
In preparation of these financial statements, management has evaluated the events and transactions subsequent to September 30, 2016, through the date when the financial statements were issued, and determined that there are no subsequent events or transactions that would require adjustments to or disclosures in the Funds’ financial statements.
309
Report of Independent Registered Public Accounting Firm
To the Board of Trustees of MassMutual Premier Funds and Shareholders of MassMutual Premier U.S. Government Money Market Fund (formerly known as MassMutual Premier Money Market Fund), MassMutual Premier Short-Duration Bond Fund, MassMutual Premier Inflation-Protected and Income Fund, MassMutual Premier Core Bond Fund, MassMutual Premier Diversified Bond Fund, MassMutual Premier High Yield Fund, MassMutual Premier Balanced Fund, MassMutual Premier Value Fund, MassMutual Premier Disciplined Value Fund, MassMutual Premier Main Street Fund, MassMutual Premier Disciplined Growth Fund, MassMutual Premier Small Cap Opportunities Fund, MassMutual Premier Global Fund, MassMutual Premier International Equity Fund, and MassMutual Premier Strategic Emerging Markets Fund (collectively, the “Funds”):
We have audited the accompanying statements of assets and liabilities, including the portfolios of investments, of the Funds as of September 30, 2016, and the related statements of operations for the year then ended, the statement of cash flows for the MassMutual Premier Inflation-Protected and Income Fund for the year then ended, the statements of changes in net assets for each of the two years in the period then ended, and the financial highlights for each of the periods presented. These financial statements and financial highlights are the responsibility of the Funds’ management. Our responsibility is to express an opinion on these financial statements and financial highlights based on our audits.
We conducted our audits in accordance with the standards of the Public Company Accounting Oversight Board (United States). Those standards require that we plan and perform the audit to obtain reasonable assurance about whether the financial statements and financial highlights are free of material misstatement. The Funds are not required to have, nor were we engaged to perform, an audit of their internal control over financial reporting. Our audits included consideration of internal control over financial reporting as a basis for designing audit procedures that are appropriate in the circumstances, but not for the purpose of expressing an opinion on the effectiveness of the Funds’ internal control over financial reporting. Accordingly, we express no such opinion. An audit also includes examining, on a test basis, evidence supporting the amounts and disclosures in the financial statements, assessing the accounting principles used and significant estimates made by management, as well as evaluating the overall financial statement presentation. Our procedures included confirmation of securities owned as of September 30, 2016, by correspondence with the custodian and brokers; where replies were not received from brokers, we performed other auditing procedures. We believe that our audits provide a reasonable basis for our opinion.
In our opinion, the financial statements and financial highlights referred to above present fairly, in all material respects, the financial position of each of the Funds as of September 30, 2016, the results of their operations for the year then ended, the cash flows for the MassMutual Premier Inflation-Protected and Income Fund for the year then ended, the changes in their net assets for each of the two years in the period then ended, and the financial highlights for each of the periods presented, in conformity with accounting principles generally accepted in the United States of America.
Deloitte & Touche LLP
Boston, Massachusetts
November 22, 2016
310
Trustees and Officers (Unaudited)
The following table lists the Trust’s Trustees and Officers; their address and age; their position with the Trust; the length of time holding that position with the Trust; their principal occupation(s) during the past five years; the number of portfolios in the fund complex they oversee; and other directorships they hold in companies subject to registration or reporting requirements of the Securities Exchange Act of 1934 (generally called “public companies”) or in registered investment companies. The Trust’s Statement of Additional Information includes additional information about the Trust’s Trustees and is available, without charge, upon request by calling 1-888-309-3539 or by writing MassMutual Premier Funds, c/o Massachusetts Mutual Life Insurance Company, 100 Bright Meadow Blvd., Enfield, Connecticut 06082-1981, Attention: Retirement Services Marketing.
Disinterested Trustees
| | | | | | | | | | |
Name, Address*, and Age | | Position(s)
Held with
Trust | | Term of
Office** and
Length of
Time Served | | Principal Occupation(s)
During Past 5 Years | | Number of
Portfolios in
Fund Complex
Overseen by Trustee | | Other Directorships Held by Trustee |
Allan W. Blair Age: 68 | | Trustee | | Since
2012 | | Retired; President and Chief Executive Officer (1996-2014), Economic Development Council of Western Massachusetts (non-profit development company); President and Chief Executive Officer (1984-2014), Westover Metropolitan Development Corporation (quasi-public development company). | | 94 | | Trustee (since 2003), MassMutual Select Funds (open-end investment company); Trustee (since 2003), MML Series Investment Fund (open-end investment company); Trustee (since 2012), MML Series Investment Fund II (open-end investment company). |
| | | | | |
Nabil N. El-Hage Age: 58 | | Trustee Chairman | | Since
2003 (2006- 2012) | | Chairman (since 2011), Academy of Executive Education, LLC. | | 94 | | Director (2011-2015), Argo Group International Holdings, Ltd. (underwriter of specialty insurance and reinsurance products); Trustee (since 2012), MassMutual Select Funds (open-end investment company); Trustee (since 2012), MML Series Investment Fund (open-end investment company); Chairman (2006-2012), Trustee (since 2005), MML Series Investment Fund II (open-end investment company). |
| | | | | |
Maria D. Furman Age: 62 | | Trustee | | Since
2004 | | Retired. | | 94 | | Trustee (since 2011), GMO Series Trust (open-end investment company); Trustee (since 2012), MassMutual Select Funds (open-end investment company); Trustee (since 2012), MML Series Investment Fund (open-end investment company); Trustee (since 2005), MML Series Investment Fund II (open-end investment company). |
| | | | | |
R. Alan Hunter, Jr. Age: 69 | | Chairperson Trustee | | Since
2016
Since 2012 | | Retired. | | 94 | | Director (since 2007), Actuant Corporation (diversified industrial company); Chairperson (since 2016), Trustee (since 2003), MassMutual Select Funds (open-end investment company); Chairperson (since 2016), Trustee (since 2003), MML Series Investment Fund (open-end investment company); Chairperson (since 2016), Trustee (since 2012), MML Series Investment Fund II (open-end investment company). |
311
Trustees and Officers (Unaudited) (Continued)
| | | | | | | | | | |
Name, Address*, and Age | | Position(s)
Held with
Trust | | Term of
Office** and
Length of
Time Served | | Principal Occupation(s)
During Past 5 Years | | Number of
Portfolios in
Fund Complex
Overseen by Trustee | | Other Directorships Held by Trustee |
C. Ann Merrifield Age: 65 | | Trustee | | Since
2004 | | Retired; President and Chief Executive Officer (2012-2014), PathoGenetix (genomics company). | | 94 | | Director (since 2015), Juniper Pharmaceuticals Inc. (specialty pharmaceutical company); Director (since 2014), Flexion Therapeutics (specialty pharmaceutical company); Director (since 2014), InVivo Therapeutics (research and clinical-stage biomaterials and biotechnology company); Trustee (since 2012), MassMutual Select Funds (open-end investment company); Trustee (since 2012), MML Series Investment Fund (open-end investment company); Trustee (since 2005), MML Series Investment Fund II (open-end investment company). |
| | | | | |
Susan B. Sweeney Age: 64 | | Trustee | | Since
2012 | | Retired; Senior Vice President and Chief Investment Officer (2010-2014), Selective Insurance Group (property and casualty company). | | 96^ | | Trustee (since 2012), Barings Corporate Investors (closed-end investment company); Trustee (since 2012), Barings Participation Investors (closed-end investment company); Trustee (since 2009), MassMutual Select Funds (open-end investment company); Trustee (since 2009), MML Series Investment Fund (open-end investment company); Trustee (since 2012), MML Series Investment Fund II (open-end investment company). |
Interested Trustees
| | | | | | | | | | |
Name, Address*, and Age | | Position(s)
Held with
Trust | | Term of
Office** and
Length of
Time Served | | Principal Occupation(s)
During Past 5 Years | | Number of
Portfolios in
Fund Complex
Overseen by Trustee | | Other Directorships Held by Trustee |
Robert E. Joyal^^ Age: 71 | | Trustee | | Since
2012 | | Retired. | | 96^ | | Director (since 2013), Leucadia National Corporation (holding company); Director (since 2012), Ormat Technologies, Inc. (provider of alternative and renewable energy technology); Director (2006-2014), Jefferies Group LLC (investment bank); Trustee (since 2003), Barings Corporate Investors (closed-end investment company); Trustee (since 2003), Barings Participation Investors (closed-end investment company); Trustee (since 2003), MassMutual Select Funds (open-end investment company); Trustee (since 2003), MML Series Investment Fund (open-end investment company); Trustee (since 2012), MML Series Investment Fund II (open-end investment company). |
312
Trustees and Officers (Unaudited) (Continued)
| | | | | | | | | | |
Name, Address*, and Age | | Position(s)
Held with
Trust | | Term of
Office** and
Length of
Time Served | | Principal Occupation(s)
During Past 5 Years | | Number of
Portfolios in
Fund Complex
Overseen by Trustee | | Other Directorships Held by Trustee |
Elaine A. Sarsynski^^^ Age: 61 | | Trustee Vice Chairperson | | Since
2011 (2011-2012) | | Executive Vice President (since 2008), MassMutual; Chairman (since 2013), President, Chairman & CEO (2012-2013), Chairman & CEO (2008-2012), MassMutual International, LLC. | | 94 | | Director (since 2012), Horizon Technology Finance Management LLC (specialty finance company); Director (2013-2016), MML Advisers; Trustee (since 2008), MassMutual Select Funds (open-end investment company); Trustee (since 2008), MML Series Investment Fund (open-end investment company); Vice Chairperson (2011-2012), Trustee (since 2011), MML Series Investment Fund II (open-end investment company). |
Principal Officers who are Not Trustees
| | | | | | | | |
Name, Address*, and Age | | Position(s) Held
with Trust | | Term of
Office# and
Length of
Time Served | | Principal Occupation(s) During Past 5 Years | | Number of
Portfolios in
Fund Complex
Overseen by Officer |
Michael C. Eldredge Age: 52 | | Vice President | | Since
2009 | | Head of Asset Allocation Funds (since 2016) and portfolio manager (since 2014), Head of Investments (2014-2016), MML Advisers; Vice President (since 2008), MassMutual; Vice President (since 2009), MassMutual Select Funds (open-end investment company); Vice President (since 2009), MML Series Investment Fund (open-end investment company); Vice President (since 2009), MML Series Investment Fund II (open-end investment company). | | 94 |
| | | | |
Andrew M. Goldberg Age: 50 | | Vice President, Secretary, and Chief Legal Officer Assistant Clerk | | Since
2008 (2004-
2008) | | Assistant Vice President and Counsel (since 2004), MassMutual; Secretary (since 2015), Assistant Secretary (2013-2015), MML Advisers; Vice President, Secretary, and Chief Legal Officer (since 2008), Assistant Secretary (2001-2008), MassMutual Select Funds (open-end investment company); Vice President, Secretary, and Chief Legal Officer (since 2008), Assistant Secretary (2001-2008), MML Series Investment Fund (open-end investment company); Vice President, Secretary (formerly known as “Clerk”), and Chief Legal Officer (since 2008), Assistant Clerk (2005-2008), MML Series Investment Fund II (open-end investment company). | | 94 |
| | | | |
Brian K. Haendiges Age: 56 | | Vice President | | Since
2014 | | Vice President (since 2014) MML Advisers; Senior Vice President (since 2014), Vice President (2010-2014), MassMutual; Vice President (since 2014), MassMutual Select Funds (open-end investment company); President (since 2016), Vice President (2014-2016), MML Series Investment Fund (open-end investment company); President (since 2016), Vice President (2014-2016), MML Series Investment Fund II (open-end investment company). | | 94 |
| | | | |
Renee Hitchcock Age: 45 | | Chief Financial Officer and Treasurer Assistant Treasurer | | Since
2016 (2007-
2016) | | Assistant Vice President (since 2015), Director (2007-2015), MassMutual; Chief Financial Officer and Treasurer (since 2016), Assistant Treasurer (2007-2016), MML Series Investment Fund (open-end investment company); Chief Financial Officer and Treasurer (since 2016), Assistant Treasurer (2007-2016), MassMutual Premier Funds (open-end investment company); Chief Financial Officer and Treasurer (since 2016), Assistant Treasurer (2007-2016), MML Series Investment Fund II (open-end investment company). | | 94 |
| | | | |
Douglas Steele Age: 41 | | Vice President | | Since
2016 | | Head of Investment Due Diligence (since 2016), MML Advisers; Assistant Vice President (since 2013), Investment Director (2005-2013), MassMutual; Vice President (since 2016), MassMutual Select Funds (open-end investment company); Vice President (since 2016), MML Series Investment Fund (open-end investment company); Vice President (since 2016), MML Series Investment Fund II (open-end investment company). | | 94 |
313
Trustees and Officers (Unaudited) (Continued)
| | | | | | | | |
Name, Address*, and Age | | Position(s) Held
with Trust | | Term of
Office# and
Length of
Time Served | | Principal Occupation(s) During Past 5 Years | | Number of
Portfolios in
Fund Complex
Overseen by Officer |
Philip S. Wellman Age: 52 | | Vice President and Chief Compliance Officer | | Since
2007 | | Vice President and Chief Compliance Officer (since 2013), MML Advisers; Vice President, Associate General Counsel, and Chief Compliance Officer (Mutual Funds) (since 2014), Vice President, Associate General Counsel, and Chief Compliance Officer (Mutual Funds and Investment Advisory) (2008-2014), MassMutual; Vice President and Chief Compliance Officer (since 2007), MassMutual Select Funds (open-end investment company); Vice President and Chief Compliance Officer (since 2007), MML Series Investment Fund (open-end investment company); Vice President and Chief Compliance Officer (since 2007), MML Series Investment Fund II (open-end investment company). | | 94 |
| | | | |
Eric H. Wietsma Age: 50 | | President
Vice President | | Since
2008 (2006-
2008) | | Director and President (since 2013), MML Advisers; Senior Vice President (since 2010), MassMutual; President (since 2008), Vice President (2006-2008), MassMutual Select Funds (open-end investment company); Vice President (since 2006), MML Series Investment Fund (open-end investment company); Vice President (since 2006), MML Series Investment Fund II (open-end investment company). | | 94 |
| | | | |
Tina Wilson Age: 45 | | Vice President | | Since
2016 | | Head of Investments (since 2016), MML Advisers; Senior Vice President (since 2014), Vice President (2009-2014), MassMutual; Vice President (since 2016), MassMutual Select Funds (open-end investment company); Vice President (since 2016), MML Series Investment Fund (open-end investment company); Vice President (since 2016), MML Series Investment Fund II (open-end investment company). | | 94 |
| * | The address of each Trustee and Principal Officer is the same as that for the Trust; 100 Bright Meadow Blvd., Enfield, Connecticut 06082-1981. |
| ** | Each Trustee of the Trust serves until the next meeting of shareholders called for the purpose of electing Trustees and until the election and qualification of his or her successor or until he or she dies, resigns, or is removed. Notwithstanding the foregoing, unless the Trustees determine that it is desirable and in the best interest of the Trust that an exception to the retirement policy of the Trust be made, a Trustee shall retire and cease to serve as a Trustee upon the conclusion of the calendar year in which such Trustee attains the age of seventy-two years. |
| | The Chairperson is elected to hold such office for a term of three years or until their successor is elected and qualified to carry out the duties and responsibilities of their office, or until he or she retires, dies, resigns, is removed, or becomes disqualified. The Chairperson shall hold office at the pleasure of the Trustees. |
| ^ | Barings Participation Investors and Barings Corporate Investors are deemed to be a part of the Fund Complex, because they are managed by Barings LLC (formerly known as Babson Capital Management LLC), an affiliate of MML Advisers. |
| ^^ | Mr. Joyal is an “Interested Person,” as that term is defined in the 1940 Act, through his position as a director of Leucadia National Corporation, which controls Jefferies Group LLC, a broker-dealer that may execute portfolio transactions and/or engage in principal transactions with the Funds, other investment companies advised by MML Advisers or holding themselves out to investors as related companies for purposes of investment or investor services, or any other advisory accounts over which MML Advisers has brokerage placement discretion. |
| ^^^ | Ms. Sarsynski is an Interested Person as an employee of MassMutual. |
| # | The President, Treasurer, and Secretary and such other officers as the Trustees may in their discretion from time to time elect are elected to hold such office until their successor is elected and qualified to carry out the duties and responsibilities of their office, or until he or she dies, resigns, is removed, or becomes disqualified. Each officer shall hold office at the pleasure of the Trustees. |
314
Federal Tax Information (Unaudited)
For corporate shareholders, a portion of the ordinary dividends paid during the Fund(s)’ year ended September 30, 2016, qualified for the dividends received deduction, as follows:
| | | | |
| |
| | | Dividends Received
Deductions | |
Short-Duration Bond Fund | | | 0.34% | |
Core Bond Fund | | | 0.59% | |
Diversified Bond Fund | | | 0.60% | |
Balanced Fund | | | 63.49% | |
Value Fund | | | 100.00% | |
Disciplined Value Fund | | | 100.00% | |
Main Street Fund | | | 68.62% | |
Disciplined Growth Fund | | | 74.91% | |
Small Cap Opportunities Fund | | | 100.00% | |
Global Fund | | | 54.22% | |
Strategic Emerging Markets Fund | | | 2.28% | |
For the year ended September 30, 2016, the following Fund(s) earned the following foreign sources of income:
| | | | |
| |
| | | Amount | |
Global Fund | | $ | 3,581,564 | |
International Equity Fund | | | 9,583,260 | |
Strategic Emerging Markets Fund | | | 2,977,441 | |
Under Section 854(b)(2) of the Code, the Fund(s) hereby designate the following maximum amounts as qualified dividends for purposes of the maximum rate under Section 1(h)(11) of the Code for the year ended September 30, 2016:
| | | | |
| |
| | | Qualified Dividend
Income | |
Short-Duration Bond Fund | | | 20,156 | |
Core Bond Fund | | | 225,984 | |
Diversified Bond Fund | | | 20,563 | |
Balanced Fund | | | 1,441,523 | |
Value Fund | | | 1,202,638 | |
Disciplined Value Fund | | | 7,915,600 | |
Main Street Fund | | | 2,302,371 | |
Disciplined Growth Fund | | | 7,672,842 | |
Small Cap Opportunities Fund | | | 2,086,370 | |
Global Fund | | | 5,347,584 | |
International Equity Fund | | | 9,305,856 | |
Strategic Emerging Markets Fund | | | 1,806,409 | |
315
Other Information (Unaudited)
Proxy Voting
A description of the policies and procedures that each Fund’s investment adviser and subadvisers use to vote proxies relating to the Fund’s portfolio securities is available, without charge, upon request, by calling 1-888-309-3539, and on the Securities and Exchange Commission’s (“SEC”) EDGAR database on its website at http://www.sec.gov.
Information regarding how the Funds voted proxies relating to portfolio securities during the most recent 12-month period ended June 30 is available, without charge, upon request, on the MassMutual website at http://www.massmutual.com/funds and on the SEC’s EDGAR database on its website at http://www.sec.gov.
Quarterly Reporting
The Funds file their complete schedule of portfolio holdings with the SEC for the first and third quarters of each fiscal year on Form N-Q. The Funds’ Forms N-Q are available on the SEC’s EDGAR database on its website at http://www.sec.gov and may be reviewed and copied at the SEC’s Public Reference Room in Washington D.C. Information on the operation of the SEC’s Public Reference Room may be obtained by calling 1-800-SEC-0330.
Trustees’ Approval of Investment Advisory Contracts
At their meetings in April and May 2016, the Contract Committee (the “Committee”) and the Trustees, including the Trustees who are not “interested persons” (as such term is defined in the 1940 Act) of the Trust, MML Advisers, or the subadvisers (the “Independent Trustees”), re-approved the existing advisory and subadvisory agreements (collectively, the “Contracts”) for each of the U.S. Government Money Market Fund, Short-Duration Bond Fund, Inflation-Protected and Income Fund, Core Bond Fund, Diversified Bond Fund, High Yield Fund, Balanced Fund, Value Fund, Disciplined Value Fund, Main Street Fund, Disciplined Growth Fund, Small Cap Opportunities Fund, Global Fund, International Equity Fund, and Strategic Emerging Markets Fund. In preparation for the meetings, the Trustees requested, and MML Advisers and the subadvisers provided in advance, certain materials relevant to the consideration of the Contracts (the “Meeting Materials”). In all of their deliberations, the Trustees were advised by independent counsel.
The Committee received in advance of the meetings (i) a memorandum from MML Advisers discussing the nature and quality of the services it provides as investment adviser to the Funds; (ii) a profitability analysis prepared by MML Advisers; and (iii) a fee and performance study report (the “Third-Party Report”) with respect to each Fund prepared by an independent third-party vendor (the “Third-Party”). The Third Party Report provided detailed comparative advisory fee, total expense, and performance information for each Fund to assist the Committee in its evaluation of the Contracts. The Committee also considered information presented to it throughout the year regarding MML Advisers and each of the subadvisers.
The Committee considered the nature, scope, and quality of services MML Advisers provides to the Funds, including: (i) the financial condition, stability, and business strategy of MML Advisers; (ii) the capabilities of MML Advisers with respect to regulatory compliance and its ability to monitor compliance with the investment policies of the Funds; (iii) MML Advisers’ ability to provide investment oversight and provide for administrative and shareholder services to the Funds; and (iv) the experience and qualifications of the personnel of MML Advisers that perform, or oversee the performance of, the services provided to the Funds, and the needs of the Funds for administrative and shareholder services.
The Committee then reviewed and considered, for each Fund separately, the detailed information presented in the Third-Party Report regarding: (i) Fund expenses, including, among other things, both the Fund’s advisory fee and total net expense ratio against peer funds; and (ii) the Fund’s relative performance (over various time periods against peer funds and a benchmark index). In connection with the Committee’s review, MML Advisers provided commentary and analysis regarding each Fund’s performance and expenses. The Committee also noted that it had received in the Meeting Materials or during the course of the past year: (i) detailed information regarding MML Advisers’ ability to provide investment oversight and provide for administrative and shareholder services to the Funds; and (ii) a wide range of information about each subadviser and its personnel with responsibility for providing services to the respective Fund and the fees payable to each subadviser by MML Advisers. MML Advisers reviewed with the Committee in detail the work MML Advisers does in its oversight roles, the expertise it brings to these roles, the size of its teams, and the financial commitment it has made to provide those services. Throughout the discussion, MML Advisers responded to Committee members’ questions and provided additional information concerning each Fund.
316
Other Information (Unaudited) (Continued)
The Committee reviewed the expense and performance information for each Fund. (References to any one- or three-year period below are to periods ended December 31, 2015. In all cases, the comparative expense information is that of a Fund’s “peer group” and the comparative performance information is that of a Fund’s “performance category.”)
The Committee considered that, in the case of three of the Funds, total net expense information showed the Funds to be in the first quartile of their peer groups (favorable), and performance information showed the Funds to have had first or second quartile investment performance in their performance categories for the most recent one- and three-year periods. These Funds included the Global Fund, High Yield Fund, and Main Street Fund, The Committee also considered that the Value Fund had total net expenses in the first quartile, and had performance that improved from the three-year period to the one-year period from the third comparative quartile to the second quartile. The Committee determined that further inquiry was not required in light of the improvement in each Fund’s performance.
The Committee considered information regarding the Funds that had achieved favorable investment performance in recent periods compared to their performance categories, but that had experienced relatively high total net expense ratios:
| • | | Inflation-Protected and Income Fund – The Committee considered that the Fund achieved quite favorable performance for the one- and three-year periods (19th and 27th percentiles, respectively). The Committee considered MML Advisers’ statements that the range of total net expense ratios among the Fund’s peers is quite limited, and that, although the Fund’s total net expense ratio is in the fourth quartile (91st percentile), it exceeded the peer group median by only 9 basis points. The Committee also considered that the Fund’s advisory fee is 2 basis points below the peer group median. In response to the Committee’s request, MML Advisers agreed to voluntarily waive .03% of the Fund’s advisory fee, effective June 1, 2016 through January 31, 2017. |
| • | | International Equity Fund – The Committee noted that the Fund had achieved second quartile performance for the one- and three-year periods (38th and 37th percentiles, respectively). The Committee noted that total net expenses are in the third quartile (63rd percentile) of the peer group. The Committee noted that the Fund’s total net expenses are only 4 basis points above the peer group median, and only 1 basis point above the broader category median, and that the Fund’s advisory fees are at the median of the Fund’s peer group. In response to the Committee’s request, MML Advisers agreed to voluntarily waive .02% of the Fund’s advisory fee, effective June 1, 2016 through January 31, 2017. |
| • | | Short-Duration Bond Fund – The Committee considered that, although the Fund’s total net expenses were in the third comparative quartile (67th percentile), the Fund’s total net expense ratio was only 5 basis points above the peer group median, and its advisory fee was below the peer group median by 8 basis points. The Committee also considered that the performance of the Fund for the one- and three-year periods was in the second and first comparative quartiles (33rd and 23rd percentiles, respectively). |
The Committee considered information regarding the Funds that had underperformed in recent periods compared to their peers. The Committee considered that each of the Funds had relatively favorable total net expenses, first or second quartile, but had achieved unfavorable relative performance.
| • | | Balanced Fund – The Committee considered MML Advisers’ statement that the Fund’s performance has remained generally close to median over the past several years, outperforming in a number of years, although the Fund achieved one- and three-year performance in the third comparative quartile (54th and 61st percentiles, respectively). The Committee considered MML Advisers’ view that international and fixed-income exposures that hurt relative performance in recent periods provide important diversification benefits and may help performance in future periods. The Committee considered MML Advisers’ view that the Fund’s favorable second quartile (34th percentile) total net expense ratio and consistent long-term performance make it an attractive offering. |
| • | | Disciplined Growth Fund – The Committee noted that the Fund’s total net expenses were in the first percentile and that the Fund had achieved performance in the second comparative quartile (40th percentile) for the three-year period. MML Advisers stated that despite the Fund’s recent underperformance, in the third quartile (51st percentile), the Fund has a strong long-term record with performance placing better than median in seven of the last eight years, and MML Advisers has a high degree of confidence in the subadviser. |
| • | | Disciplined Value Fund – The Committee noted that the Fund’s total net expenses were in the first comparative quartile (8th percentile) and that the Fund had achieved performance in the second comparative quartile (35th percentile) for the three-year period. MML Advisers stated that despite the Fund’s recent underperformance, in the third quartile (58th percentile) for the one-year period, the Fund has a strong long-term record with performance placing better than median in five of the last six years, and MML Advisers has a high degree of confidence in the subadviser. |
| • | | Small Cap Opportunities Fund – The Trustees noted that the Fund’s performance over the three-year period has been in the first comparative quartile (8th percentile) and Fund’s total net expenses are in the first percentile. MML Advisers noted that, despite |
317
Other Information (Unaudited) (Continued)
| | its below median performance in the one-year period (third quartile and 62nd percentile), the Fund has a strong long-term record with performance placing better than median in four of the last six years and strong rankings over the 5- and 10-year periods. |
| • | | Strategic Emerging Markets Fund – The Committee considered that the Fund has experienced fourth-quartile performance for the three-year period (82nd percentile), but that performance had improved to the second quartile over the one-year period (47th percentile) and the Fund’s total net expenses are in the second quartile (32nd percentile). The Committee noted that 2014 and 2015 were the first two full calendar years of performance for the Fund’s new subadviser and that the three-year number is negatively affected by the results of the prior subadviser to the Fund. The Committee considered MML Advisers’ statement that, although the Fund is on Under Review status for performance reasons, MML Advisers remains very committed to the subadviser and the strategy. |
The Committee considered information regarding the Funds that had underperformed in recent periods compared to their peers, and that had total net expenses in the third or fourth comparative quartiles.
| • | | Core Bond Fund – The Committee noted that the Fund has total net expenses in the third comparative quartile (57th percentile), but considered that the Fund’s total net expense ratio is only 1 basis point above the peer group median and that its advisory fee is 3 basis points more favorable than the peer group median. The Committee considered that the Fund’s three-year performance was in the third quartile (58th percentile) and that its one-year performance was in the fourth comparative quartile (81st percentile). The Committee considered MML Advisers’ statement that the Fund’s investments in investment grade corporate debt, particularly in energy and commodity industries, hurt the one-year and the three-year comparative performance. |
| • | | Diversified Bond Fund – The Committee noted MML Advisers’ statements that the Fund has experienced quite favorable long-term performance, and that 2015 was the only year of the last 10 when the Fund experienced fourth quartile performance (84th percentile), due to the Fund’s investments in investment grade corporate debt, which underperformed in the period. The Committee considered MML Advisers’ statements that, although the Fund’s total net expenses were in the fourth quartile and 9 basis points above the Fund’s peer group median (90th percentile), the Fund’s advisory fee was 5 basis points more favorable than the peer group median. MML Advisers also noted that there is a 4 basis-point fee waiver in place. MML Advisers noted in its discussion that scale continues to be an issue affecting the Fund’s total net expense ratio. In response to the Committee’s request, MML Advisers agreed to double the current management fee breakpoint amount from .05% to .10%, effective June 1, 2016. |
| • | | U.S. Government Money Market Fund – The Committee considered that the Fund has achieved consistent favorable performance – in the first comparative quartile for the three-year period (25th percentile) – and that MML Advisers has been waiving a portion of its fee in recent years to maintain a positive yield. The Committee considered that the Fund’s gross expense ratio is 9 basis points below the Fund’s peer group median, and that the Fund’s total net expense ratio is only 3 basis points above the peer median. |
The Committee also reviewed and considered information included in the Meeting Materials, or discussed at the meeting, concerning economies of scale and the profitability of MML Advisers’ advisory relationship with the various Funds, including: (i) a description of the revenue (including advisory fees and administrative and shareholder services fees, as applicable) and expense allocation methodology employed by MML Advisers; and (ii) profitability information for each individual Fund. The discussions included consideration of the intangible benefits derived by MML Advisers and its affiliates resulting from their relationships with the Funds and the so-called “fallout benefits” to MML Advisers, such as any reputational value derived from serving as investment adviser to the Funds, and benefits accruing to subadvisers due to so-called “soft-dollar arrangements.”
Prior to the votes being taken to approve the Contracts, the Committee met separately in executive session to discuss the appropriateness of such contracts. The Committee weighed the foregoing matters in light of the advice given to them by their independent legal counsel as to the law applicable to the review of investment advisory contracts. In arriving at a decision, the Committee did not identify any single matter as all-important or controlling. The foregoing summary does not detail all of the matters considered.
As to each of the Funds, the Committee concluded that: (i) overall, it was satisfied with the nature, extent, and quality of services provided, and expected to be provided in the future, under the Contracts, including the level of MML Advisers’ oversight of each Fund and the subadvisory process; (ii) MML Advisers’ levels of profitability from its relationship with the various Funds are not excessive and the advisory fees payable under the Contracts and each Fund’s total net expenses are fair and reasonable; (iii) the investment processes, research capabilities, and philosophies of the subadvisers generally appear well suited to the Funds, given their investment objectives and policies; (iv) either the relative or absolute performance of a Fund (in each case, taking into account the applicable investment strategy and risk profile of the Fund), or the steps MML Advisers has proposed in respect of the underperformance of a Fund, are sufficient to warrant continuation of the Contracts for each of the Funds; and (v) the terms of the Contracts are fair and reasonable with respect to each Fund and are in the best interests of each Fund’s shareholders.
318
Other Information (Unaudited) (Continued)
Fund Expenses September 30, 2016
Expense Examples:
The following information is in regards to expenses for the six months ended September 30, 2016:
As a shareholder of the Funds, you may incur two types of costs: (1) transaction costs, including sales charges (loads) on purchase payments or redemptions; and (2) ongoing costs, including advisory fees, distribution and/or service (12b-1) fees, and other Fund expenses. These examples are intended to help you understand your ongoing costs (in dollars) of investing in the Funds and to compare these costs with the ongoing costs of investing in other mutual funds. These examples are based on an investment of $1,000 invested for the six months ended September 30, 2016.
Actual Expenses:
The first four columns of the table below provide information about actual account values and actual expenses. You may use this information, together with the amount you invested, to estimate the expenses that you paid over the period. Simply divide your account value by $1,000 (for example, an $8,600 account value divided by $1,000 = 8.6), then multiply the result by the number under the heading entitled “Operating Expenses Incurred” to estimate the expenses you paid on your account during this period.
Hypothetical Example for Comparison Purposes:
The last two columns of the table below provide information about hypothetical account values and hypothetical expenses based on the Fund’s actual expense ratio and an assumed rate of return of 5% per year before expenses, which is not the Fund’s actual return. The hypothetical account values and expenses may not be used to estimate the actual ending account balance or expenses you paid for the period. You may use this information to compare the ongoing costs of investing in the Fund and other funds. To do so, compare this 5% hypothetical example with the 5% hypothetical examples that appear in the shareholder reports of the other funds.
Please note that the expenses shown in the table are meant to highlight your ongoing costs only and do not reflect any transactional costs. Therefore, the last two columns of the table are useful in comparing ongoing costs only, and will not help you determine the relative total costs of owning different funds. In addition, if these transactional costs were included, your costs would have been higher.
| | | | | | | | | | | | | | | | | | | | | | | | |
| | | Beginning
Value | | | Annualized
Expense
Ratio | | | Ending
Value (Based
on Actual
Returns and
Expenses) | | | Operating
Expenses
Incurred* | | | Ending
Value (Based
on
Hypothetical
Returns and
Expenses) | | | Operating
Expenses
Incurred* | |
| U.S Government Money Market Fund | | | | | | | | | | | | | | | | | | | | | | | | |
Class R5 | | $ | 1,000 | | | | 0.41 | % | | $ | 1,000.00 | | | $ | 2.05 | | | $ | 1,023.00 | | | $ | 2.07 | |
| Short-Duration Bond Fund | | | | | | | | | | | | | | | | | | | | | | | | |
Class I | | | 1,000 | | | | 0.39 | % | | | 1,016.60 | | | | 1.97 | | | | 1,023.10 | | | | 1.97 | |
Class R5 | | | 1,000 | | | | 0.49 | % | | | 1,015.60 | | | | 2.47 | | | | 1,022.60 | | | | 2.48 | |
Service Class | | | 1,000 | | | | 0.59 | % | | | 1,014.70 | | | | 2.97 | | | | 1,022.10 | | | | 2.98 | |
Administrative Class | | | 1,000 | | | | 0.69 | % | | | 1,014.80 | | | | 3.48 | | | | 1,021.60 | | | | 3.49 | |
Class A | | | 1,000 | | | | 0.94 | % | | | 1,013.90 | | | | 4.73 | | | | 1,020.30 | | | | 4.75 | |
Class R4 | | | 1,000 | | | | 0.84 | % | | | 1,014.70 | | | | 4.23 | | | | 1,020.80 | | | | 4.24 | |
Class R3 | | | 1,000 | | | | 1.09 | % | | | 1,012.80 | | | | 5.48 | | | | 1,019.60 | | | | 5.50 | |
319
Other Information (Unaudited) (Continued)
| | | | | | | | | | | | | | | | | | | | | | | | |
| | | Beginning
Value | | | Annualized
Expense
Ratio | | | Ending
Value (Based
on Actual
Returns and
Expenses) | | | Operating
Expenses
Incurred* | | | Ending
Value (Based
on
Hypothetical
Returns and
Expenses) | | | Operating
Expenses
Incurred* | |
| Inflation-Protected and Income Fund | | | | | | | | | | | | | | | | | | | | | | | | |
Class I | | $ | 1,000 | | | | 0.44 | % | | $ | 1,031.50 | | | $ | 2.23 | | | $ | 1,022.80 | | | $ | 2.23 | |
Class R5 | | | 1,000 | | | | 0.55 | % | | | 1,031.50 | | | | 2.79 | | | | 1,022.30 | | | | 2.78 | |
Service Class | | | 1,000 | | | | 0.64 | % | | | 1,030.70 | | | | 3.25 | | | | 1,021.80 | | | | 3.23 | |
Administrative Class | | | 1,000 | | | | 0.75 | % | | | 1,030.30 | | | | 3.81 | | | | 1,021.30 | | | | 3.79 | |
Class A | | | 1,000 | | | | 1.00 | % | | | 1,029.10 | | | | 5.07 | | | | 1,020.00 | | | | 5.05 | |
Class R4 | | | 1,000 | | | | 0.90 | % | | | 1,030.20 | | | | 4.57 | | | | 1,020.50 | | | | 4.55 | |
Class R3 | | | 1,000 | | | | 1.15 | % | | | 1,029.20 | | | | 5.83 | | | | 1,019.30 | | | | 5.81 | |
| Core Bond Fund | | | | | | | | | | | | | | | | | | | | | | | | |
Class I | | | 1,000 | | | | 0.41 | % | | | 1,034.90 | | | | 2.09 | | | | 1,023.00 | | | | 2.07 | |
Class R5 | | | 1,000 | | | | 0.51 | % | | | 1,034.80 | | | | 2.59 | | | | 1,022.50 | | | | 2.58 | |
Service Class | | | 1,000 | | | | 0.61 | % | | | 1,034.10 | | | | 3.10 | | | | 1,022.00 | | | | 3.08 | |
Administrative Class | | | 1,000 | | | | 0.71 | % | | | 1,033.40 | | | | 3.61 | | | | 1,021.50 | | | | 3.59 | |
Class A | | | 1,000 | | | | 0.96 | % | | | 1,031.80 | | | | 4.88 | | | | 1,020.20 | | | | 4.85 | |
Class R4 | | | 1,000 | | | | 0.86 | % | | | 1,032.80 | | | | 4.37 | | | | 1,020.70 | | | | 4.34 | |
Class R3 | | | 1,000 | | | | 1.11 | % | | | 1,031.20 | | | | 5.64 | | | | 1,019.50 | | | | 5.60 | |
| Diversified Bond Fund | | | | | | | | | | | | | | | | | | | | | | | | |
Class I | | | 1,000 | | | | 0.52 | % | | | 1,037.70 | | | | 2.65 | | | | 1,022.40 | | | | 2.63 | |
Class R5 | | | 1,000 | | | | 0.62 | % | | | 1,037.60 | | | | 3.16 | | | | 1,021.90 | | | | 3.13 | |
Service Class | | | 1,000 | | | | 0.72 | % | | | 1,037.10 | | | | 3.67 | | | | 1,021.40 | | | | 3.64 | |
Administrative Class | | | 1,000 | | | | 0.82 | % | | | 1,036.20 | | | | 4.17 | | | | 1,020.90 | | | | 4.14 | |
Class A | | | 1,000 | | | | 1.07 | % | | | 1,036.30 | | | | 5.45 | | | | 1,019.70 | | | | 5.40 | |
Class R4 | | | 1,000 | | | | 0.97 | % | | | 1,036.50 | | | | 4.94 | | | | 1,020.20 | | | | 4.90 | |
Class R3 | | | 1,000 | | | | 1.22 | % | | | 1,034.50 | | | | 6.21 | | | | 1,018.90 | | | | 6.16 | |
| High Yield Fund | | | | | | | | | | | | | | | | | | | | | | | | |
Class I | | | 1,000 | | | | 0.55 | % | | | 1,106.00 | | | | 2.90 | | | | 1,022.30 | | | | 2.78 | |
Class R5 | | | 1,000 | | | | 0.65 | % | | | 1,105.50 | | | | 3.42 | | | | 1,021.80 | | | | 3.29 | |
Service Class | | | 1,000 | | | | 0.75 | % | | | 1,105.50 | | | | 3.95 | | | | 1,021.30 | | | | 3.79 | |
Administrative Class | | | 1,000 | | | | 0.85 | % | | | 1,104.40 | | | | 4.47 | | | | 1,020.80 | | | | 4.29 | |
Class A | | | 1,000 | | | | 1.10 | % | | | 1,102.20 | | | | 5.78 | | | | 1,019.50 | | | | 5.55 | |
Class R4 | | | 1,000 | | | | 1.00 | % | | | 1,104.20 | | | | 5.26 | | | | 1,020.00 | | | | 5.05 | |
Class R3 | | | 1,000 | | | | 1.25 | % | | | 1,102.00 | | | | 6.57 | | | | 1,018.80 | | | | 6.31 | |
| Balanced Fund | | | | | | | | | | | | | | | | | | | | | | | | |
Class I | | | 1,000 | | | | 0.60 | % | | | 1,050.10 | | | | 3.08 | | | | 1,022.00 | | | | 3.03 | |
Class R5 | | | 1,000 | | | | 0.70 | % | | | 1,050.00 | | | | 3.59 | | | | 1,021.50 | | | | 3.54 | |
Service Class | | | 1,000 | | | | 0.80 | % | | | 1,048.80 | | | | 4.10 | | | | 1,021.00 | | | | 4.04 | |
Administrative Class | | | 1,000 | | | | 0.90 | % | | | 1,048.90 | | | | 4.61 | | | | 1,020.50 | | | | 4.55 | |
Class A | | | 1,000 | | | | 1.15 | % | | | 1,047.40 | | | | 5.89 | | | | 1,019.30 | | | | 5.81 | |
Class R4 | | | 1,000 | | | | 1.05 | % | | | 1,047.70 | | | | 5.38 | | | | 1,019.80 | | | | 5.30 | |
Class R3 | | | 1,000 | | | | 1.30 | % | | | 1,046.80 | | | | 6.65 | | | | 1,018.50 | | | | 6.56 | |
| Value Fund | | | | | | | | | | | | | | | | | | | | | | | | |
Class I | | | 1,000 | | | | 0.60 | % | | | 1,071.50 | | | | 3.11 | | | | 1,022.00 | | | | 3.03 | |
Class R5 | | | 1,000 | | | | 0.70 | % | | | 1,070.50 | | | | 3.62 | | | | 1,021.50 | | | | 3.54 | |
Service Class | | | 1,000 | | | | 0.80 | % | | | 1,070.30 | | | | 4.14 | | | | 1,021.00 | | | | 4.04 | |
Administrative Class | | | 1,000 | | | | 0.90 | % | | | 1,069.30 | | | | 4.66 | | | | 1,020.50 | | | | 4.55 | |
Class A | | | 1,000 | | | | 1.15 | % | | | 1,067.80 | | | | 5.94 | | | | 1,019.30 | | | | 5.81 | |
Class R4 | | | 1,000 | | | | 1.05 | % | | | 1,068.40 | | | | 5.43 | | | | 1,019.80 | | | | 5.30 | |
Class R3 | | | 1,000 | | | | 1.30 | % | | | 1,067.20 | | | | 6.72 | | | | 1,018.50 | | | | 6.56 | |
320
Other Information (Unaudited) (Continued)
| | | | | | | | | | | | | | | | | | | | | | | | |
| | | Beginning
Value | | | Annualized
Expense
Ratio | | | Ending
Value (Based
on Actual
Returns and
Expenses) | | | Operating
Expenses
Incurred* | | | Ending
Value (Based
on
Hypothetical
Returns and
Expenses) | | | Operating
Expenses
Incurred* | |
| Disciplined Value Fund | | | | | | | | | | | | | | | | | | | | | | | | |
Class I | | $ | 1,000 | | | | 0.53 | % | | $ | 1,062.90 | | | $ | 2.73 | | | $ | 1,022.40 | | | $ | 2.68 | |
Class R5 | | | 1,000 | | | | 0.63 | % | | | 1,062.90 | | | | 3.25 | | | | 1,021.90 | | | | 3.18 | |
Service Class | | | 1,000 | | | | 0.73 | % | | | 1,062.60 | | | | 3.76 | | | | 1,021.40 | | | | 3.69 | |
Administrative Class | | | 1,000 | | | | 0.83 | % | | | 1,062.30 | | | | 4.28 | | | | 1,020.90 | | | | 4.19 | |
Class A | | | 1,000 | | | | 1.08 | % | | | 1,061.00 | | | | 5.56 | | | | 1,019.60 | | | | 5.45 | |
Class R4 | | | 1,000 | | | | 0.98 | % | | | 1,060.50 | | | | 5.05 | | | | 1,020.10 | | | | 4.95 | |
Class R3 | | | 1,000 | | | | 1.23 | % | | | 1,059.90 | | | | 6.33 | | | | 1,018.90 | | | | 6.21 | |
| Main Street Fund | | | | | | | | | | | | | | | | | | | | | | | | |
Class I | | | 1,000 | | | | 0.72 | % | | | 1,060.00 | | | | 3.71 | | | | 1,021.40 | | | | 3.64 | |
Class R5 | | | 1,000 | | | | 0.81 | % | | | 1,059.00 | | | | 4.17 | | | | 1,021.00 | | | | 4.09 | |
Service Class | | | 1,000 | | | | 0.90 | % | | | 1,059.30 | | | | 4.63 | | | | 1,020.50 | | | | 4.55 | |
Administrative Class | | | 1,000 | | | | 1.01 | % | | | 1,059.10 | | | | 5.20 | | | | 1,020.00 | | | | 5.10 | |
Class A | | | 1,000 | | | | 1.26 | % | | | 1,056.60 | | | | 6.48 | | | | 1,018.70 | | | | 6.36 | |
Class R4 | | | 1,000 | | | | 1.16 | % | | | 1,058.00 | | | | 5.97 | | | | 1,019.20 | | | | 5.86 | |
Class R3 | | | 1,000 | | | | 1.41 | % | | | 1,056.40 | | | | 7.25 | | | | 1,018.00 | | | | 7.11 | |
| Disciplined Growth Fund | | | | | | | | | | | | | | | | | | | | | | | | |
Class I | | | 1,000 | | | | 0.50 | % | | | 1,036.30 | | | | 2.55 | | | | 1,022.50 | | | | 2.53 | |
Class R5 | | | 1,000 | | | | 0.60 | % | | | 1,035.40 | | | | 3.05 | | | | 1,022.00 | | | | 3.03 | |
Service Class | | | 1,000 | | | | 0.70 | % | | | 1,035.40 | | | | 3.56 | | | | 1,021.50 | | | | 3.54 | |
Administrative Class | | | 1,000 | | | | 0.80 | % | | | 1,035.10 | | | | 4.07 | | | | 1,021.00 | | | | 4.04 | |
Class A | | | 1,000 | | | | 1.05 | % | | | 1,033.20 | | | | 5.34 | | | | 1,019.80 | | | | 5.30 | |
Class R4 | | | 1,000 | | | | 0.95 | % | | | 1,034.20 | | | | 4.83 | | | | 1,020.30 | | | | 4.80 | |
Class R3 | | | 1,000 | | | | 1.20 | % | | | 1,032.50 | | | | 6.10 | | | | 1,019.00 | | | | 6.06 | |
| Small Cap Opportunities Fund | | | | | | | | | | | | | | | | | | | | | | | | |
Class I | | | 1,000 | | | | 0.70 | % | | | 1,079.70 | | | | 3.64 | | | | 1,021.50 | | | | 3.54 | |
Class R5 | | | 1,000 | | | | 0.80 | % | | | 1,079.10 | | | | 4.16 | | | | 1,021.00 | | | | 4.04 | |
Service Class | | | 1,000 | | | | 0.90 | % | | | 1,078.40 | | | | 4.68 | | | | 1,020.50 | | | | 4.55 | |
Administrative Class | | | 1,000 | | | | 1.00 | % | | | 1,078.00 | | | | 5.20 | | | | 1,020.00 | | | | 5.05 | |
Class A | | | 1,000 | | | | 1.25 | % | | | 1,077.00 | | | | 6.49 | | | | 1,018.80 | | | | 6.31 | |
Class R4 | | | 1,000 | | | | 1.15 | % | | | 1,077.40 | | | | 5.97 | | | | 1,019.30 | | | | 5.81 | |
Class R3 | | | 1,000 | | | | 1.40 | % | | | 1,075.90 | | | | 7.27 | | | | 1,018.00 | | | | 7.06 | |
| Global Fund | | | | | | | | | | | | | | | | | | | | | | | | |
Class I | | | 1,000 | | | | 0.84 | % | | | 1,069.00 | | | | 4.34 | | | | 1,020.80 | | | | 4.24 | |
Class R5 | | | 1,000 | | | | 0.92 | % | | | 1,068.30 | | | | 4.76 | | | | 1,020.40 | | | | 4.65 | |
Service Class | | | 1,000 | | | | 1.03 | % | | | 1,068.00 | | | | 5.33 | | | | 1,019.90 | | | | 5.20 | |
Administrative Class | | | 1,000 | | | | 1.13 | % | | | 1,067.50 | | | | 5.84 | | | | 1,019.40 | | | | 5.70 | |
Class A | | | 1,000 | | | | 1.38 | % | | | 1,065.80 | | | | 7.13 | | | | 1,018.10 | | | | 6.96 | |
Class R4 | | | 1,000 | | | | 1.28 | % | | | 1,067.00 | | | | 6.61 | | | | 1,018.60 | | | | 6.46 | |
Class R3 | | | 1,000 | | | | 1.53 | % | | | 1,065.90 | | | | 7.90 | | | | 1,017.40 | | | | 7.72 | |
| International Equity Fund | | | | | | | | | | | | | | | | | | | | | | | | |
Class I | | | 1,000 | | | | 0.91 | % | | | 1,023.10 | | | | 4.60 | | | | 1,020.50 | | | | 4.60 | |
Class R5 | | | 1,000 | | | | 1.01 | % | | | 1,023.10 | | | | 5.11 | | | | 1,020.00 | | | | 5.10 | |
Service Class | | | 1,000 | | | | 1.11 | % | | | 1,022.30 | | | | 5.61 | | | | 1,019.50 | | | | 5.60 | |
Administrative Class | | | 1,000 | | | | 1.21 | % | | | 1,021.50 | | | | 6.12 | | | | 1,019.00 | | | | 6.11 | |
Class A | | | 1,000 | | | | 1.46 | % | | | 1,020.40 | | | | 7.37 | | | | 1,017.70 | | | | 7.36 | |
Class R4 | | | 1,000 | | | | 1.38 | % | | | 1,020.50 | | | | 6.97 | | | | 1,018.10 | | | | 6.96 | |
Class R3 | | | 1,000 | | | | 1.63 | % | | | 1,019.60 | | | | 8.23 | | | | 1,016.90 | | | | 8.22 | |
321
Other Information (Unaudited) (Continued)
| | | | | | | | | | | | | | | | | | | | | | | | |
| | | Beginning
Value | | | Annualized
Expense
Ratio | | | Ending
Value (Based
on Actual
Returns and
Expenses) | | | Operating
Expenses
Incurred* | | | Ending
Value (Based
on
Hypothetical
Returns and
Expenses) | | | Operating
Expenses
Incurred* | |
| Strategic Emerging Markets Fund | | | | | | | | | | | | | | | | | | | | | | | | |
Class I | | $ | 1,000 | | | | 1.05 | % | | $ | 1,098.70 | | | $ | 5.51 | | | $ | 1,019.80 | | | $ | 5.30 | |
Class R5 | | | 1,000 | | | | 1.15 | % | | | 1,098.40 | | | | 6.03 | | | | 1,019.30 | | | | 5.81 | |
Service Class | | | 1,000 | | | | 1.25 | % | | | 1,097.80 | | | | 6.56 | | | | 1,018.80 | | | | 6.31 | |
Administrative Class | | | 1,000 | | | | 1.35 | % | | | 1,097.20 | | | | 7.08 | | | | 1,018.30 | | | | 6.81 | |
Class A | | | 1,000 | | | | 1.60 | % | | | 1,094.80 | | | | 8.38 | | | | 1,017.00 | | | | 8.07 | |
Class R4 | | | 1,000 | | | | 1.50 | % | | | 1,096.10 | | | | 7.86 | | | | 1,017.50 | | | | 7.57 | |
Class R3 | | | 1,000 | | | | 1.75 | % | | | 1,095.20 | | | | 9.17 | | | | 1,016.30 | | | | 8.82 | |
| * | Expenses are calculated using the annualized expense ratio for the six months ended September 30, 2016, multiplied by the average account value over the period, multiplied by 183 days in the period, divided by 366 days in the year, unless stated otherwise. |
322
| | |
Underwriter: MML Distributors, LLC 100 Bright Meadow Blvd. Enfield, CT 06082-1981 | |  |

| | |
©2016 Massachusetts Mutual Life Insurance Company, Springfield, MA. All rights reserved. www.massmutual.com. MassMutual
Financial Group is a marketing name for Massachusetts Mutual Life Insurance Company (MassMutual) and its affiliated companies and sales representatives. Investment Adviser: MML Investment Advisers, LLC | | RS-41031-00 |
Item 2. Code of Ethics.
As of September 30, 2016, the Registrant adopted a Code of Ethics that applies to the Principal Executive Officer and Principal Financial Officer pursuant to the Sarbanes-Oxley Act of 2002. For the year ended September 30, 2016, there were no reportable amendments to a provision of the Code of Ethics. A copy of its Code of Ethics is filed with this Form N-CSR under Item 12(a)(1).
Item 3. Audit Committee Financial Expert.
The Registrant’s Board of Trustees has determined that Susan B. Sweeney and Nabil N. El-Hage, both members of the Audit Committee, are audit committee financial experts as defined by the Securities and Exchange Commission (the “SEC”). Ms. Sweeney and Mr. El-Hage are both “independent” as defined by the SEC for purposes of audit committee financial expert determinations.
Item 4. Principal Accountant Fees and Services.
References below to Deloitte & Touche LLP include its affiliates where applicable.
| | (a) | AUDIT FEES: The aggregate fees billed to the Registrant for professional services rendered by its independent auditors, Deloitte & Touche LLP, for the audit of the Registrant’s annual financial statements for the fiscal years ended 2016 and 2015 were $491,121.35 and $585,135, respectively. |
| | (b) | AUDIT RELATED FEES: No such fees were billed to the Registrant by Deloitte & Touche LLP for the fiscal years ended 2016 and 2015. No such fees were billed to the Registrant’s adviser and any entity controlling, controlled by, or under common control with the adviser that provides ongoing services to the Registrant by Deloitte & Touche LLP* for the fiscal years ended 2016 and 2015. |
| | (c) | TAX FEES: The aggregate fees billed to the Registrant for professional services rendered by Deloitte & Touche LLP for the review of Form 1120-RIC, Form 8613, excise distribution projections, distribution calculation and reasonable out of pocket expenses for the fiscal years ended 2016 and 2015 were $113,040 and $123,781, respectively. No such fees were billed to the Registrant’s adviser and any entity controlling, controlled by, or under common control with the adviser that provides ongoing services to the Registrant by Deloitte & Touche LLP* for the fiscal years ended 2016 and 2015. |
| | (d) | ALL OTHER FEES: No such fees were billed to the Registrant by Deloitte & Touche LLP for the fiscal years ended 2016 and 2015. No such fees were billed to the Registrant’s adviser and any entity controlling, controlled by, or under common control with the adviser that provides ongoing services to the Registrant by Deloitte & Touche LLP* for the fiscal years ended 2016 and 2015. |
| | (e) | (1) AUDIT COMMITTEE PRE-APPOVAL POLICY: All services to be performed for the Registrant by Deloitte & Touche LLP must be pre-approved by the audit committee. All services performed during the fiscal years ended 2016 and 2015 were pre-approved by the committee. |
(2) Not applicable.
| | (g) | The aggregate non-audit fees billed by Deloitte & Touche LLP for services rendered to the Registrant, the Registrant’s adviser and any entity controlling, controlled by, or under common control with the adviser that provides ongoing services to the Registrant, for the fiscal years ended 2016 and 2015 were $3,715,481 and $1,338,894, respectively. |
| | (h) | The audit committee considers whether the provision of non-audit services by Deloitte & Touche LLP to the Registrant’s adviser and any entity controlling, controlled by, or under common control with the adviser that provides ongoing services to the Registrant that were not pre-approved pursuant to paragraph (c)(7)(ii) of Rule 2-01 of Regulation S-X is compatible with maintaining Deloitte & Touche LLP’s independence. |
| | * | Refers to fees that were required to be approved by the audit committee for services that relate directly to the operations and financial reporting of the Registrant. |
Item 5. Audit Committee of Listed Registrants.
Not applicable to this filing.
Item 6. Investments.
Please see portfolio of investments contained in the Reports to Stockholders included under Item 1 of this form N-CSR.
Item 7. Disclosure of Proxy Voting Policies and Procedures for Closed-End Management Investment Companies.
Not applicable to this filing.
Item 8. Portfolio Managers of Closed-End Management Investment Companies.
Not applicable to this filing.
Item 9. Purchases of Equity Securities by Closed-End Management Investment Company and Affiliated Purchasers.
Not applicable to this filing.
Item 10. Submission of Matters to a Vote of Security Holders.
Not applicable to this filing.
Item 11. Controls and Procedures.
(a) The Registrant’s Principal Executive Officer and Principal Financial Officer have concluded that the Registrant’s disclosure controls and procedures (as defined in Rule 30a-3(c) under the Investment Company Act of 1940, as amended (the “1940 Act”) (17 CFR 270.30a-3(c))) are effective, as of a date within 90 days of the filing date of this Form N-CSR, to provide reasonable assurance that the information required to be disclosed by the Registrant on Form N-CSR is recorded, processed, summarized, and reported within the time periods specified in the SEC’s rules and forms, based on their evaluation of these disclosure controls and procedures required by Rule 30a-3(b) under the 1940 Act (17 CFR 270.30a-3(b)) and Rules 13a-15(b) or 15d-15(b) under the Securities Exchange Act of 1934 (17 CFR 240.13a-15(b) or 240.15d-15(b)).
(b) There were no changes in the Registrant’s internal control over financial reporting (as defined in Rule 30a-3(d) under the 1940 Act (17 CFR 270.30a-3(d))) that occurred during the Registrant’s most recent fiscal quarter that has materially affected, or is reasonably likely to materially affect, the Registrant’s internal control over financial reporting.
Item 12. Exhibits.
(a)(1) Code of Ethics (Item 2) is attached.
(a)(2) Certifications of the Principal Executive Officer and Principal Financial Officer of the Registrant as required by Rule 30a-2(a) under the 1940 Act (17 CFR 270.30a-2(a)) are attached hereto as Exhibit 99CERT.
(a)(3) Not applicable to this filing.
(b) Certifications pursuant to Section 906 of the Sarbanes-Oxley Act of 2002 as required by Rule 30a-2(b), under the 1940 Act (17 CFR 270.30a-2(b)), Rule 15d-14(b) under the Securities Exchange Act of 1934 (17 CFR 240.15d-14(b)) and Section 1350 of Chapter 63 of Title 18 of the United States Code (18 U.S.C. 1350) are attached hereto as Exhibit 99.906CERT.
SIGNATURES
Pursuant to the requirements of the Securities Exchange Act of 1934 and the Investment Company Act of 1940, the registrant has duly caused this report to be signed on its behalf by the undersigned, thereunto duly authorized.
| | |
(Registrant) | | MassMutual Premier Funds |
| | | | |
By (Signature and Title) | | /s/ Eric Wietsma |
| | Eric Wietsma, President and Principal Executive Officer |
Pursuant to the requirements of the Securities Exchange Act of 1934 and the Investment Company Act of 1940, this report has been signed below by the following persons on behalf of the registrant and in the capacities and on the dates indicated.
| | |
By (Signature and Title) | | /s/ Eric Wietsma |
| | Eric Wietsma, President and Principal Executive Officer |
| | |
By (Signature and Title) | | /s/ Renee Hitchcock |
| | Renee Hitchcock, Treasurer and Principal Financial Officer |