UNITED STATES
SECURITIES AND EXCHANGE COMMISSION
Washington, D.C. 20549
FORM N-CSR
CERTIFIED SHAREHOLDER REPORT OF REGISTERED
MANAGEMENT INVESTMENT COMPANIES
| Investment Company Act file number | 811-08690 | |
| MassMutual Premier Funds |
| (Exact name of registrant as specified in charter) |
| 100 Bright Meadow Blvd., Enfield, CT | 06082 |
| (Address of principal executive offices) | (Zip code) |
| Eric Wietsma |
| 100 Bright Meadow Blvd., Enfield, CT 06082 |
| (Name and address of agent for service) |
| Registrant's telephone number, including area code: | (860) 562-1000 | |
| Date of fiscal year end: | 9/30/2020 | |
| | | |
| Date of reporting period: | 9/30/2020 | |
Item 1. Reports to Stockholders.

This material must be preceded or accompanied by a current prospectus (or summary prospectus, if available) for the MassMutual Premier Funds. Investors should consider a Fund’s investment objective, risks, and charges and expenses carefully before investing. This and other information about the investment company is available in the prospectus (or summary prospectus, if available). Read it carefully before investing.
Important Notice: Beginning on January 1, 2021, as permitted by regulations adopted by the Securities and Exchange Commission, paper copies of the Fund’s annual and semi-annual reports will no longer be sent by mail, unless you specifically request paper copies of the reports from the Fund (or from your financial intermediary, such as a broker-dealer, bank, or retirement plan recordkeeper). Instead, the reports will be made available on the Fund’s website (http://www.massmutual.com/funds), and you will be notified by mail each time a report is posted and provided with a website link to access the report. If you already elected to receive shareholder reports electronically, you will not be affected by this change and you need not take any action. If you would like to receive shareholder reports and other communications electronically from the Fund and are either a direct investor in the Fund or MassMutual serves as your retirement plan recordkeeper, please call (800) 767-1000 extension 43012 or send your request to enroll to RSProspectusFulfillment@massmutual.com. If you have invested in the Fund through another financial intermediary (such as a broker-dealer, bank, or retirement plan recordkeeper), you can request electronic delivery by contacting that financial intermediary. Beginning on January 1, 2019, you may elect to receive all future reports in paper free of charge. If you invest directly with the MassMutual Funds or MassMutual serves as your retirement plan recordkeeper, you can call (800) 767-1000 extension 43012 or send an email request to RSProspectusFulfillment@massmutual.com to inform the Funds or MassMutual that you wish to continue receiving paper copies of your shareholder reports. If you invest through a financial intermediary other than MassMutual, you can contact that financial intermediary to request that you continue to receive paper copies of your shareholder reports. Your election to receive reports in paper will apply to all funds held in your account if you invest through your financial intermediary or all funds held within the fund complex if you invest directly with a Fund. |
[THIS PAGE INTENTIONALLY LEFT BLANK]
MassMutual Premier Funds – President’s Letter to Shareholders (Unaudited) |
To Our Shareholders

Eric Wietsma
“We encourage you to maintain perspective when it comes to retirement investing, despite short-term changes in the markets or day-to-day events that may seem unsettling. MassMutual’s view is that changing market conditions have the potential to reward patient investors.”
September 30, 2020
The return of market volatility challenges retirement investors
I am pleased to present you with the MassMutual Premier Funds Annual Report, covering the year ended September 30, 2020 (the “fiscal year”). U.S. stocks and international stocks both experienced gains in the fiscal year despite the global economic recession brought on by the COVID-19 crisis. A swift response to the pandemic by the Federal Reserve Board and Congress delivered unprecedented monetary and fiscal stimulus to support the U.S. economy and financial markets. The global response was similar in speed and magnitude. U.S. bond investors enjoyed positive returns in a falling yield environment, fueled by lower economic growth expectations, interest rate decreases, and supportive central bank policy.
The return of volatility and the reality of market sell-offs can test an investor’s mettle, but also serve to remind investors that market conditions are cyclical and subject to change anytime. In MassMutual’s view, the market environment that ensued from the pandemic (with stocks largely selling off and then, for the most part, recovering) underscores the importance of maintaining a long-term perspective and avoiding reacting to current events. That’s why we continue to believe that retirement investors should create and maintain a plan that focuses on their goals, how long they have to invest, and how comfortable they are with market volatility.
Suggestions for retirement investors under any market conditions
● | You are likely in it for the long run. Investing for retirement doesn’t happen overnight. Most people save and invest for retirement throughout their working years. Although the financial markets will go up and down over time, taking a long-term approach to investing gives you more time to ride out the downturns as you work toward your retirement income goals. |
● | Keep contributing. While it’s impossible to control how your investments perform, you can control how often and how much you save. Saving as much as possible and increasing your contributions regularly is one way smart retirement investors can help boost their retirement savings, regardless of the investment environment.* |
● | Invest continually. Financial professionals often advise their clients to stay in the market, regardless of short-term results. Here’s why: Individuals who can invest in all market conditions have the potential to be rewarded even during market downturns, when more favorable prices may enable them to accumulate larger positions. This has the potential to put them at an advantage when the markets turn around. |
● | Monitor your asset allocation and diversify. Stocks, bonds, and short-term/money market investments are asset classes that tend to behave differently, depending upon the economic and market environment. Those broad asset classes contain an even greater array of asset sub-categories (such as small-cap stocks, international stocks, and high-yield bonds). Most financial professionals agree that investors can take advantage of different opportunities in the market and reduce the risk of over-exposure to one or two poorly performing asset types by selecting a number of investments that represent a mix of asset classes and sub-categories.* |
*Systematic investing and asset allocation do not ensure a profit or protect against loss in a declining market. Systematic investing involves continuous investment in securities regardless of fluctuating price levels. Investors should consider their ability to continue investing through periods of low price levels.
(Continued)
1
MassMutual Premier Funds – President’s Letter to Shareholders (Unaudited) (Continued) |
If you work with a financial professional, you may wish to consider checking in with him or her to help you determine if:
● | you are saving enough for retirement; |
● | your retirement account is invested properly for all market conditions, based on your goals and objectives, as well as your investment time horizon; and |
● | you are taking the right steps to help reduce your longevity risk, which is the chance that you could “run out” of retirement savings during your lifetime. |
We live mutual, every day
MassMutual believes that humanity brings out the best in one another. That’s why, for nearly 170 years, through ups and downs and good times and bad, we have continually believed that we are stronger when we rely on one another. That’s also why we encourage you to maintain perspective when it comes to retirement investing, despite short-term changes in the markets or day-to-day events that may seem unsettling. MassMutual’s view is that changing market conditions have the potential to reward patient investors. Thank you for your continued confidence and trust in MassMutual.
Sincerely,

Eric Wietsma
President
© 2020 Massachusetts Mutual Life Insurance Company (MassMutual®), Springfield, MA 01111-0001. All rights reserved. www.MassMutual.com Underwriter: MML Distributors, LLC. (MMLD) Member FINRA and SIPC (www.FINRA.org and www.SIPC.org), 100 Bright Meadow Blvd., Enfield, CT 06082. MMLD is a wholly-owned subsidiary of MassMutual. Investment advisory services provided to the Funds by MML Investment Advisers, LLC (MML Advisers), a wholly-owned subsidiary of MassMutual. The information provided is the opinion of MML Advisers as of 10/1/20 and is subject to change without notice. It is not to be construed as tax, legal, or investment advice. Of course, past performance does not guarantee future results.
2
MassMutual Premier Funds Annual Report – Economic and Market Overview (Unaudited) |
September 30, 2020
Market Highlights
● | For the reporting period from October 1, 2019 through September 30, 2020, U.S. stocks were up over 15%, despite the global economic recession brought on by the COVID-19 crisis. |
● | The first quarter of 2020 was one of the most difficult quarters on record for the markets. COVID-19 fears turned to reality as “social distancing,” shuttered businesses, and the associated lost economic activity became the new norm. |
● | A swift response to the pandemic by the Federal Reserve Board and Congress delivered unprecedented monetary and fiscal stimulus to support the U.S. economy and financial markets. The global response was similar in speed and magnitude. |
● | Foreign stocks in developed markets and emerging markets also experienced gains in the fiscal year, aided by increasing economic activity in the second half of the year and the weakening of the U.S. dollar. |
● | U.S. bond investors enjoyed positive returns in a falling yield environment, fueled by lower economic growth expectations, interest rate decreases, and supportive central bank policy. |
Market Environment
Global stock investors experienced significant levels of volatility for the fiscal year beginning October 1, 2019. U.S. stocks rose steadily until mid-February 2020, when the severity of the COVID-19 crisis was becoming apparent with rising case counts, hospitalizations, and deaths. Investor sentiment quickly turned negative, with March 2020 marking the end of the 11-year bull market. The S&P 500® Index* fell 34% from its February high to its March low, as the reality that the COVID-19 crisis had stalled the global economy and the imminence of a recession became evident.
Investors started the second quarter of 2020 facing increasing COVID-19 deaths, record unemployment levels, and expectations for an unprecedented decline in economic activity. Despite this, global markets ultimately recorded one of their best quarters ever. Investors responded positively to the massive amounts of monetary and fiscal stimulus. In addition, progress in combating COVID-19 and increasing economic activity, with the transition back to work for many, fueled the market turnaround. Central banks supported bond market liquidity and kept interest rates low through government and corporate bond purchases. Better-than-expected second quarter corporate earnings, a strong rebound in housing demand, and progress on COVID-19 therapeutics and vaccine research helped to tamp down investor concerns and drove many stocks, especially in the information technology sector, to new highs in the third quarter of 2020.
Global political tensions lessened significantly in the fiscal year, reducing market volatility up until the COVID-19 crisis emerged. In December 2019, a phase one trade agreement was reached between the U.S. and China. In the agreement, the U.S. agreed to roll back tariffs and China agreed to increase intellectual property protections, increase agricultural purchases, and open its markets to more U.S. firms. Similarly, the U.S., Mexico, and Canada reached a new trade agreement that opened up Mexico and Canada to more exports and strengthened intellectual property protection. In Europe, a Brexit agreement was reached in December 2019 that resulted in Britain’s departure from the European Union on January 31, 2020, and allowed investors to set aside concerns regarding European Union stability for the time being.
The broad market S&P 500 delivered a strong 15.15% return for the fiscal year. The Dow Jones Industrial AverageSM was also up a respectable 5.70%. The technology-heavy NASDAQ Composite Index was one of the biggest winners, up 40.96% for the fiscal year. Small- and mid-cap stocks underperformed their larger peers, as small caps barely broke even – while growth stocks outperformed their value counterparts by over 40% during the period.
Seven of 11 sectors delivered positive returns for the fiscal year, led by information technology, consumer discretionary, health care, and communication services, which all enjoyed double-digit growth and beat the S&P 500. The energy sector was the worst performer for the fiscal year, down over 45%. The financial, real estate, and utilities sectors also ended in negative territory.
* Indexes referenced, other than the MSCI Indexes, are unmanaged, do not incur fees, expenses, or taxes, and cannot be purchased directly for investment. The MSCI Indexes are unmanaged, do not incur fees or expenses, and cannot be purchased directly for investment.
3
MassMutual Premier Funds Annual Report – Economic and Market Overview (Unaudited) (Continued) |
Developed international markets, as measured by the MSCI EAFE® Index, significantly trailed their domestic peers, ending the fiscal year barely in positive territory, up 0.49%. Emerging-market stocks, as measured by the MSCI Emerging Markets Index, fared significantly better, ending up 10.54% for the period. Developed international and emerging-market stocks benefited from increasing economic activity in the second half of the fiscal year and the weakening U.S. dollar.
Bond yields fell sharply during the fiscal year, with the 10-year U.S. Treasury bond yield falling from a high of 1.94% in October 2019 to a low of 0.69% at the close of the period. Falling yields generally produce rising bond prices; consequently, bond index returns benefited. The Bloomberg Barclays U.S. Aggregate Bond Index ended the period up 6.98%. Investment-grade corporate bonds also advanced. The Bloomberg Barclays U.S. Corporate Bond Index, which tracks investment-grade corporate bonds, ended the period with a 7.90% gain. The Bloomberg Barclays U.S. Corporate High Yield Bond Index also ended in positive territory, advancing 3.25%, despite rising corporate bankruptcies.
Review and maintain your strategy
MassMutual is committed to helping people secure their long-term future and protect the ones they love. While the return of volatility and the reality of market sell-offs can test an investor’s mettle, we’d like to remind you as a retirement investor that it’s important to maintain perspective and have realistic expectations about the future performance of your investment accounts. As described in this report, financial markets can reverse suddenly with little or no notice. Our multi-managed and sub-advised mutual funds tap into the deep expertise of seasoned asset managers who are committed to helping long-term investors prepare for retirement – in all market conditions. As always, we recommend that you work with a personal financial professional, who can help you define an investment strategy that aligns with your comfort level with respect to market volatility, how long you have to save and invest, and your specific financial goals. Thank you for your confidence in MassMutual.
© 2020 Massachusetts Mutual Life Insurance Company (MassMutual®), Springfield, MA 01111-0001. All rights reserved. www.MassMutual.com Underwriter: MML Distributors, LLC. (MMLD) Member FINRA and SIPC (www.FINRA.org and www.SIPC.org), 100 Bright Meadow Blvd., Enfield, CT 06082. MMLD is a wholly-owned subsidiary of MassMutual. Investment advisory services provided to the Funds by MML Investment Advisers, LLC (MML Advisers), a wholly-owned subsidiary of MassMutual. The information provided is the opinion of MML Advisers as of 10/1/20 and is subject to change without notice. It is not to be construed as tax, legal, or investment advice. Of course, past performance does not guarantee future results.
4
MassMutual Premier U.S. Government Money Market Fund – Portfolio Manager Report (Unaudited) |
What is the investment approach of MassMutual Premier U.S. Government Money Market Fund, and who is the Fund’s subadviser?
The Fund seeks current income consistent with preservation of capital and liquidity. The Fund normally invests at least 99.5% of its total assets in cash, U.S. Government securities, and/or repurchase agreements fully collateralized by cash or U.S. Government securities. Under normal circumstances, the Fund invests at least 80% of its net assets in U.S. Government securities and repurchase agreements that are fully collateralized by U.S. Government securities. The Fund’s subadviser is Barings LLC (Barings). The Fund seeks to maintain, but does not guarantee, a stable $1.00 share price. You could lose money by investing in the Fund. Although the Fund seeks to preserve the value of your investment at $1.00 per share, it cannot guarantee it will do so. An investment in the Fund is not insured or guaranteed by the Federal Deposit Insurance Corporation or any other government agency. The Fund’s sponsor has no legal obligation to provide financial support to the Fund, and you should not expect that the sponsor will provide financial support to the Fund at any time.
How did the Fund perform during the 12 months ended September 30, 2020?
The Fund’s Class R5 shares returned 0.56%, underperforming the 1.02% return of the FTSE 3-Month Treasury Bill Index (the “benchmark”), which measures daily performance of 3 month US Treasury bills.
For a discussion on the economic and market environment during the 12-month period ended September 30, 2020, please see the Economic and Market Overview, beginning on page 3.
Subadviser discussion of factors that contributed to the Fund’s performance
The U.S. Federal Reserve (the Fed) decreased the federal funds target rate several times during the year ended September 30, 2020, from a range of 1.50% to 1.75%, to 0.00% to 0.25% – largely as a result of the market volatility brought on by the global pandemic. Prolonged lockdowns were cited as having an adverse effect on the economy and, as a result, the Fed took a more accommodative stance as the economy moved into recessionary territory. Normally, interest rates are ratcheted up or down in 0.25% increments, based upon the Fed’s view of the underlying economy; however, the unforeseen global pandemic caused the Fed to act quickly and sharply in early 2020.
LIBOR (London Interbank Offered Rate, which is an interest rate used in the short-term international interbank market) rates decreased, with 1-month LIBOR down 1.87% to 0.15% over the year – and 3-month LIBOR down 1.85% to 0.23% over the 12-month period. The sharp unexpected decrease in LIBOR had a negative effect on Fund performance due to the number of adjustable rate issues in the Fund that were tied to LIBOR.
At period-end, the curve out to one year is extremely flat, with no expected rate hike on the horizon. Consequently, there is little impetus to extend the duration of the Fund at this time until the yield curve steepens.
Subadviser outlook
Market trends finished the period showing modest signs of improvement. Security valuations have moved modestly higher and spreads have moved tighter since the volatility experienced in March. Due to what Barings believes is still a positive technical backdrop of strong market demand for risk assets, many segments have proved resilient in battling the headwinds of the resurgence in new issue volume and growing macro concerns. In Fund management’s view, all eyes are now on the U.S. Congress as the economy awaits an additional round of fiscal stimulus. Without a meaningful agreement reached in Congress, however, Barings believes that the continuation and path of this recovery seem somewhat in question heading toward the end of 2020. Facing a still uncertain environment leading into the fourth quarter, the Fund is maintaining a defensive stance and Fund management is remaining diligent to its fundamental bottom-up process of capital preservation.
5
MassMutual Premier U.S. Government Money Market Fund – Portfolio Manager Report (Unaudited) (Continued) |
MassMutual Premier
U.S. Government Money Market Fund
Portfolio Characteristics
(% of Net Assets) on 9/30/20 |
Discount Notes | 67.7% |
Repurchase Agreement | 12.6% |
U.S. Treasury Bonds & Notes | 19.8% |
Total Short-Term Investments | 100.1% |
Other Assets & Liabilities | (0.1)% |
Net Assets | 100.0% |
| | |
6
MassMutual Premier U.S. Government Money Market Fund – Portfolio Manager Report (Unaudited) (Continued) |
GROWTH OF $10,000 INVESTMENT

The graph above illustrates the Fund’s historical performance for the past 10 fiscal years or since inception (for Funds lacking 10-year records) in comparison to its benchmark index, as well as one or more additional indexes, if applicable.
Average Annual Total Returns (for the periods ended 09/30/2020) | | |
| Inception Date
of Class | 1 Year | 5 Years | 10 Years |
Class R5 | 10/03/1994 | 0.56% | 0.74% | 0.37% |
FTSE 3-Month Treasury Bill Index | | 1.02% | 1.16% | 0.61% |
Generally accepted accounting principles require adjustments to be made to the net assets of the Fund at period end for financial reporting purposes only, and as such, the total return based on the unadjusted net asset value per share may differ from the total return reported in the financial highlights.
Performance results in the graph and table are shown both with and without the imposition of the maximum applicable sales charge (if applicable) and reflect the percentage change in net asset value, including reinvestment of dividends and capital gains distributions. Investors should note that the Fund is a professionally managed mutual fund, while the index or indexes shown above are unmanaged, cannot be purchased directly, and, with the exception of any peer group index, do not incur expenses.
Performance data quoted in the graph and table represents past performance; past performance is not predictive of future results. The investment return and principal value of shares of the Fund fluctuate, so your shares, when sold, may be worth more or less than their original cost. Current performance of the Fund may be lower or higher than the performance quoted. The performance shown does not reflect the deduction of taxes, if any, that a shareholder would pay on Fund distributions or the redemption of Fund shares. Performance data current to the most recent month end may be obtained by calling 1-888-309-3539.
Investors should read the Fund’s prospectus with regard to the Fund’s investment objectives, risks, and charges and expenses in conjunction with these financial statements. Employee retirement benefit plans that invest plan assets in the Separate Investment Accounts (SIAs) may be subject to certain charges as set forth in their respective Plan Documents. Total return figures would be lower for the periods presented if they reflected these charges.
7
MassMutual Premier Short-Duration Bond Fund – Portfolio Manager Report (Unaudited) |
What is the investment approach of MassMutual Premier Short-Duration Bond Fund, and who is the Fund’s subadviser?
The Fund seeks to achieve a high total rate of return primarily from current income while minimizing fluctuations in capital values by investing primarily in a diversified portfolio of short-term investment grade fixed income securities. Under normal circumstances, the Fund invests at least 80% of its net assets (plus the amount of any borrowings for investment purposes) in investment grade fixed income securities (rated Baa3 or higher by Moody’s, BBB- or higher by Standard & Poor’s or the equivalent by any NRSRO, or, if unrated, determined to be of comparable quality by the subadviser). The Fund’s subadviser is Barings LLC (Barings).
How did the Fund perform during the 12 months ended September 30, 2020?
The Fund’s Class R5 shares returned 1.15%, underperforming the 3.62% return of the Bloomberg Barclays U.S. 1-3 Year Government Bond Index (the “benchmark”), which measures the performance of the U.S. Treasury and U.S. Agency Indexes with maturities of 1-3 years, including Treasuries and U.S. agency debentures. It is a component of the U.S. Government/Credit Index and the U.S. Aggregate Index.
For a discussion on the economic and market environment during the 12-month period ended September 30, 2020, please see the Economic and Market Overview, beginning on page 3.
Subadviser discussion of factors that contributed to the Fund’s performance
Over the course of the 12-month period, the U.S. Treasury curve between 3 months and 3 years remained flat and, as a result, the Fund held a shorter duration positioning, relative to the benchmark. (Duration is a measure of a bond fund’s sensitivity to interest rates. The longer the duration, the greater the price impact on the fund when interest rates rise or fall.) Bond duration and maturity positioning detracted from the Fund’s performance for the period; at period-end, the duration of the Fund stood at 0.46 years. An underweight to U.S. Treasuries also detracted from Fund performance.
Asset-backed securities (ABS) was a top detractor from the Fund’s performance for the year ended September 30, 2020. During the period, the Fund held an overweight allocation to the sector, relative to the benchmark. The asset class underwent significant spread widening over the period as a result of the market volatility experienced in March 2020. (Credit spreads are the differences in yields between comparable bonds, with widening spreads often indicating increasing yields and decreasing prices for bonds.) As of period-end, spreads in most COVID-impacted securitized sectors had not fully recovered to pre-pandemic levels. Similarly, the secondary oil & gas producers and gas pipeline industries detracted from performance over the period. Finally, CMBS and residential mortgage-backed securities (RMBS) also hindered the Fund’s returns.
Turning to the positive, the Fund’s allocation to corporate credit was a top positive contributor, as investment-grade and high-yield bonds rated BB helped to drive the Fund’s performance for the period. Fund holdings in the banking, insurance, and metals/mining sectors were the best performers. On the other hand, real estate investment trusts (REITs), leasing, and secondary oil & gas producers were among the top detractors.
The Fund uses derivative instruments for yield curve, duration, downside hedging, and to gain exposures. Derivatives are securities that derive their value from the performance of one or more other investments and take the form of a contract between two or more parties. Most derivatives are used for hedging, speculation, or both. They may also be used as a substitute for a direct investment. In aggregate, these positions positively contributed to performance over the period.
Subadviser outlook
Market trends finished the period showing modest signs of improvement. Security valuations have moved modestly higher and spreads have moved tighter since the volatility experienced in March. Due to what Barings believes is still a positive technical backdrop of strong market demand for risk assets, many segments have proved resilient in battling the headwinds of the resurgence in new issue volume and growing macro concerns. In Fund management’s view, all eyes are now on the U.S. Congress as the economy awaits an additional round of fiscal stimulus. Without a meaningful agreement reached in Congress,
8
MassMutual Premier Short-Duration Bond Fund – Portfolio Manager Report (Unaudited) (Continued) |
however, Barings believes that the continuation and path of this recovery seems somewhat in question heading toward the end of 2020. Facing a still uncertain environment leading into the fourth quarter, the Fund is maintaining a defensive stance and Fund management is remaining diligent to its fundamental bottom-up process of capital preservation.
MassMutual Premier
Short-Duration Bond Fund
Portfolio Characteristics
(% of Net Assets) on 9/30/20 |
Non-U.S. Government Agency Obligations | 52.3% |
Corporate Debt | 41.0% |
U.S. Government Agency Obligations and Instrumentalities | 1.0% |
U.S. Treasury Obligations | 0.4% |
Municipal Obligations | 0.2% |
Purchased Options | 0.1% |
Total Long-Term Investments | 95.0% |
Short-Term Investments and Other Assets and Liabilities | 5.0% |
Net Assets | 100.0% |
| | |
9
MassMutual Premier Short-Duration Bond Fund – Portfolio Manager Report (Unaudited) (Continued) |
GROWTH OF $10,000 INVESTMENT

The graph above illustrates a representative class of the Fund’s historical performance for the past 10 fiscal years or since inception (for Funds lacking 10-year records) in comparison to its benchmark index, as well as one or more additional indexes, if applicable. The performance of other share classes will be greater than or less than the class depicted above.
Average Annual Total Returns (for the periods ended 09/30/2020) | | | | |
| Inception Date
of Class | 1 Year | 5 Years | 10 Years | Since Inception
12/03/2010 | Since Inception
04/01/2014 |
Class I | 12/03/2010 | 1.26% | 2.30% | | 2.32% | |
Class R5 | 10/03/1994 | 1.15% | 2.18% | 2.11% | | |
Service Class | 01/01/1998 | 1.00% | 2.06% | 2.02% | | |
Administrative Class | 05/03/1999 | 0.94% | 1.99% | 1.93% | | |
Class R4 | 04/01/2014 | 0.79% | 1.84% | | | 1.73% |
Class A | 01/01/1998 | 0.71% | 1.74% | 1.68% | | |
Class A (sales load deducted)* | 01/01/1998 | -1.81% | 1.23% | 1.42% | | |
Class R3 | 12/31/2002 | 0.53% | 1.57% | 1.46% | | |
Bloomberg Barclays U.S. 1-3 Year Government Bond Index | 3.62% | 1.82% | 1.30% | 1.34% | 1.63% |
* | Class A (sales load deducted) returns include the 2.50% maximum sales charge. |
Generally accepted accounting principles require adjustments to be made to the net assets of the Fund at period end for financial reporting purposes only, and as such, the total return based on the unadjusted net asset value per share may differ from the total return reported in the financial highlights.
Performance results in the graph and table are shown both with and without the imposition of the maximum applicable sales charge (if applicable) and reflect the percentage change in net asset value, including reinvestment of dividends and capital gains distributions. Investors should note that the Fund is a professionally managed mutual fund, while the index or indexes shown above are unmanaged, cannot be purchased directly, and, with the exception of any peer group index, do not incur expenses.
Performance data quoted in the graph and table represents past performance; past performance is not predictive of future results. The investment return and principal value of shares of the Fund fluctuate, so your shares, when sold, may be worth more or less than their original cost. Current performance of the Fund may be lower or higher than the performance quoted. The performance shown does not reflect the deduction of taxes, if any, that a shareholder would pay on Fund distributions or the redemption of Fund shares. Performance data current to the most recent month end may be obtained by calling 1-888-309-3539.
Investors should read the Fund’s prospectus with regard to the Fund’s investment objectives, risks, and charges and expenses in conjunction with these financial statements. Employee retirement benefit plans that invest plan assets in the Separate Investment Accounts (SIAs) may be subject to certain charges as set forth in their respective Plan Documents. Total return figures would be lower for the periods presented if they reflected these charges.
10
MassMutual Premier Inflation-Protected and Income Fund– Portfolio Manager Report (Unaudited) |
What is the investment approach of MassMutual Premier Inflation-Protected and Income Fund, and who is the Fund’s subadviser?
The Fund seeks to achieve as high a total rate of real return on an annual basis as is considered consistent with prudent investment risk and the preservation of capital by investing, under normal circumstances, at least 80% of its net assets (plus the amount of any borrowings for investment purposes) in inflation-indexed bonds and other income-producing securities. The Fund’s subadviser is Barings LLC (Barings).
How did the Fund perform during the 12 months ended September 30, 2020?
The Fund’s Class R5 shares returned 9.92%, underperforming the 10.08% return of the Bloomberg Barclays U.S. Treasury Inflation Protected Securities (TIPS) Index (Series-L) (the “benchmark”), which measures the performance of rules-based, market value-weighted inflation-protected securities issued by the U.S. Treasury. It is a subset of the Global Inflation-Linked Index (Series-L).
How do inflation-indexed bonds protect against inflation?
Like many other fixed-income securities, inflation-indexed bonds pay income twice a year, based on a stated coupon rate. However, both the principal and the interest payment are adjusted for the level of inflation. The inflation rate – as measured by the Consumer Price Index for All Urban Consumers (“CPI-U”) – results in an adjustment to the principal amount of an inflation-protected security. The coupon rate is then applied to the adjusted principal amount to determine the interest payment. For example, assuming an inflation rate of 3%, a security with a par value of $1,000 and an annual coupon rate of 1.75%, the adjusted principal amount after one year would be $1,030 ($1,000 increased by 3%). The semi-annual interest payment would be calculated by multiplying $1,030 by 1.75% and dividing by 2 instead of using the original $1,000 par value to calculate the amount of interest.
For a discussion on the economic and market environment during the 12-month period ended September 30, 2020, please see the Economic and Market Overview, beginning on page 3.
Subadviser discussion of factors that contributed to the Fund’s performance
Consumer prices, as measured by the U.S. Bureau of Labor Statistics, were down for the year-to-date 2020, as unadjusted Headline CPI came in at 1.3% for the month of August, down from 2.3% at year-end 2019. (The Consumer Price Index [CPI] measures changes in the price of a market basket of consumer goods and services; Core CPI does not include food and energy prices. Headline CPI includes food and energy.) Core CPI decreased to 1.7% for the month of August, down from 2.3% at year-end 2019. Core CPI is running slightly below the 2% inflation objective of the Federal Open Market Committee (FOMC).
TIPS positioning in aggregate detracted from Fund performance during the period.
In addition to TIPS, the Fund also invested in high-quality, income-producing securities, including asset-backed and money market securities. The income earned by these asset classes contributed positively over the reporting period. Allocations to asset-backed securities (ABS) and high-quality commercial paper were the main drivers of performance. (Bond issuers create securitized bonds by pooling various types of contractual debt – such as mortgages, auto loans, and credit card debt. Commercial paper is the commonly used name for short-term unsecured promissory notes sold by banks and corporations to meet short-term debt obligations.) Security selections in auto loans and student loans within the ABS sector were contributors to the Fund’s performance during the period.
The Fund may use derivative instruments for yield curve and duration management, as well as for replicating cash bonds and gaining market exposure in order to implement Fund manager views. (Derivatives are securities that derive their value from the performance of one or more other investments and take the form of a contract between two or more parties. Most derivatives are used for hedging, speculation, or both.) During the period, Fund management used total rate of return index inflation swaps, Treasury futures, CPI swaps, credit default swaps to hedge whole business ABS exposure, CMBX as a proxy for commercial
11
MassMutual Premier Inflation-Protected and Income Fund– Portfolio Manager Report (Unaudited) (Continued) |
mortgage-backed securities, and interest rate swaptions. (An interest rate swaption is an over-the-counter option that grants its owner the right but not the obligation to enter an underlying interest rate swap.) The Fund’s use of derivatives marginally contributed to its performance over the reporting period.
Subadviser outlook
Uncertainty looms regarding reopening the economy, as President Trump tested positive for COVID-19 mere weeks before Election Day. The Bureau of Labor Statistics reported the addition of 661,000 jobs in September, signaling decelerating job growth despite the fact that, as of this writing, about half of the jobs lost from the spring shutdown of the economy have been regained. Fundamentals have shown mixed sentiments, with positive data for home sales, durable goods orders, and capital goods orders – while factory orders and ISM manufacturing data have disappointed. Fund management anticipates that jobs could continue to materialize as employees are called back to work and the economy’s gross domestic product (GDP) stabilizes, albeit possibly at a slower rate than in recent months.
MassMutual Premier
Inflation-Protected and Income Fund
Portfolio Characteristics
(% of Net Assets) on 9/30/20 |
Non-U.S. Government Agency Obligations | 60.5% |
U.S. Treasury Obligations | 21.9% |
U.S. Government Agency Obligations and Instrumentalities | 4.5% |
Purchased Options | 0.2% |
Municipal Obligations | 0.0% |
Total Long-Term Investments | 87.1% |
Short-Term Investments and Other Assets and Liabilities | 12.9% |
Net Assets | 100.0% |
| | |
12
MassMutual Premier Inflation-Protected and Income Fund– Portfolio Manager Report (Unaudited) (Continued) |
GROWTH OF $10,000 INVESTMENT

The graph above illustrates a representative class of the Fund’s historical performance for the past 10 fiscal years or since inception (for Funds lacking 10-year records) in comparison to its benchmark index, as well as one or more additional indexes, if applicable. The performance of other share classes will be greater than or less than the class depicted above.
Average Annual Total Returns (for the periods ended 09/30/2020) | | | | |
| Inception Date
of Class | 1 Year | 5 Years | 10 Years | Since Inception
03/01/2011 | Since Inception
04/01/2014 |
Class I | 03/01/2011 | 9.93% | 4.79% | | 3.78% | |
Class R5 | 12/31/2003 | 9.92% | 4.70% | 3.53% | | |
Service Class | 12/31/2003 | 9.82% | 4.57% | 3.42% | | |
Administrative Class | 12/31/2003 | 9.70% | 4.48% | 3.30% | | |
Class R4 | 04/01/2014 | 9.51% | 4.33% | | | 3.31% |
Class A | 12/31/2003 | 9.42% | 4.22% | 3.08% | | |
Class A (sales load deducted)* | 12/31/2003 | 4.77% | 3.32% | 2.63% | | |
Class R3 | 12/31/2003 | 9.20% | 4.05% | 2.86% | | |
Bloomberg Barclays U.S. Treasury Inflation Protected Securities (TIPS) Index (Series-L) | | 10.08% | 4.61% | 3.57% | 3.69% | 3.66% |
* | Class A (sales load deducted) returns include the 4.25% maximum sales charge. |
Generally accepted accounting principles require adjustments to be made to the net assets of the Fund at period end for financial reporting purposes only, and as such, the total return based on the unadjusted net asset value per share may differ from the total return reported in the financial highlights.
Performance results in the graph and table are shown both with and without the imposition of the maximum applicable sales charge (if applicable) and reflect the percentage change in net asset value, including reinvestment of dividends and capital gains distributions. Investors should note that the Fund is a professionally managed mutual fund, while the index or indexes shown above are unmanaged, cannot be purchased directly, and, with the exception of any peer group index, do not incur expenses.
Performance data quoted in the graph and table represents past performance; past performance is not predictive of future results. The investment return and principal value of shares of the Fund fluctuate, so your shares, when sold, may be worth more or less than their original cost. Current performance of the Fund may be lower or higher than the performance quoted. The performance shown does not reflect the deduction of taxes, if any, that a shareholder would pay on Fund distributions or the redemption of Fund shares. Performance data current to the most recent month end may be obtained by calling 1-888-309-3539.
Investors should read the Fund’s prospectus with regard to the Fund’s investment objectives, risks, and charges and expenses in conjunction with these financial statements. Employee retirement benefit plans that invest plan assets in the Separate Investment Accounts (SIAs) may be subject to certain charges as set forth in their respective Plan Documents. Total return figures would be lower for the periods presented if they reflected these charges.
13
MassMutual Premier Core Bond Fund – Portfolio Manager Report (Unaudited) |
What is the investment approach of MassMutual Premier Core Bond Fund, and who is the Fund’s subadviser?
The Fund seeks to achieve a high total rate of return consistent with prudent investment risk and the preservation of capital by investing primarily in a diversified portfolio of investment grade fixed income securities. Under normal circumstances, the Fund invests at least 80% of its net assets (plus the amount of any borrowings for investment purposes) in investment grade fixed income securities (rated Baa3 or higher by Moody’s, BBB- or higher by Standard & Poor’s or the equivalent by any NRSRO, or, if unrated, determined to be of comparable quality by the subadviser). The Fund’s subadviser is Barings LLC (Barings).
How did the Fund perform during the 12 months ended September 30, 2020?
The Fund’s Class R5 shares returned 6.16%, underperforming the 6.98% return of the Bloomberg Barclays U.S. Aggregate Bond Index (the “benchmark”), which measures the performance of the investment grade, U.S. dollar-denominated, fixed-rate taxable bond market, including Treasuries, government-related and corporate securities, agency mortgage-backed securities (MBS) (agency fixed-rate and hybrid ARM pass-throughs), asset-backed securities (ABS), and commercial mortgage-backed securities (CMBS). (“Agency” refers to debt issued by U.S. federal government agencies or government-sponsored entities for financing purposes.)
For a discussion on the economic and market environment during the 12-month period ended September 30, 2020, please see the Economic and Market Overview, beginning on page 3.
Subadviser discussion of factors that contributed to the Fund’s performance
For the year ended September 30, 2020, ABS was a top detractor from the Fund’s performance. During the period, the Fund held an overweight allocation to the sector, relative to the benchmark. The asset class underwent significant spread widening over the period as a result of the market volatility experienced in March 2020. (Credit spreads are the differences in yields between comparable bonds, with widening spreads often indicating increasing yields and decreasing prices for bonds.) As of period-end, spreads in most COVID-impacted securitized sectors had not fully recovered to pre-pandemic levels. Similarly, the secondary oil & gas producers and gas pipeline industries detracted from performance over the period. Finally, CMBS and residential mortgage-backed securities (RMBS) also hindered the Fund’s returns.
On the positive side, the Fund’s overweight to investment-grade corporate bonds contributed to performance for the period, as did investments in the insurance, integrated oil, and financial industries. Within securitized sectors, agency MBS helped to drive the Fund’s full-period results, although the Fund held an underweight stake in the sector. An allocation to high-quality, short-weighted average life collateralized loan obligations (CLOs) contributed positively to performance. The Fund had approximately a 4% to 5% allocation to the out-of-index sector.
The Fund uses derivative instruments for yield curve, duration, downside hedging, and to gain exposures. (Derivatives are securities that derive their value from the performance of one or more other investments and take the form of a contract between two or more parties.) Most derivatives are used for hedging, speculation, or both. They may also be used as a substitute for a direct investment. In aggregate, these positions positively contributed to performance over the period.
Subadviser outlook
Market trends finished the period showing modest signs of improvement. Security valuations have moved modestly higher and spreads have moved tighter since the volatility experienced in March. Due to what Barings believes is still a positive technical backdrop of strong market demand for risk assets, many segments have proved resilient in battling the headwinds of the resurgence in new issue volume and growing macro concerns. In Fund management’s view, all eyes are now on the U.S. Congress as the economy awaits an additional round of fiscal stimulus. Without a meaningful agreement reached in Congress, however, Barings believes that the continuation and path of this recovery seems somewhat in question heading toward the end of 2020. Facing a still uncertain environment leading into the fourth quarter, the Fund is maintaining a defensive stance and Fund management is remaining diligent to its fundamental bottom-up process of capital preservation.
At period-end, the Fund remained overweight in the corporate and securitized sectors, relative to liquid products, such as governments and agencies.
14
MassMutual Premier Core Bond Fund – Portfolio Manager Report (Unaudited) (Continued) |
MassMutual Premier
Core Bond Fund
Portfolio Characteristics
(% of Net Assets) on 9/30/20 |
Corporate Debt | 39.7% |
Non-U.S. Government Agency Obligations | 32.4% |
U.S. Government Agency Obligations and Instrumentalities | 23.0% |
U.S. Treasury Obligations | 3.0% |
Sovereign Debt Obligations | 0.7% |
Municipal Obligations | 0.3% |
Preferred Stock | 0.2% |
Purchased Options | 0.2% |
Total Long-Term Investments | 99.5% |
Short-Term Investments and Other Assets and Liabilities | 0.5% |
Net Assets | 100.0% |
| | |
15
MassMutual Premier Core Bond Fund – Portfolio Manager Report (Unaudited) (Continued) |
GROWTH OF $10,000 INVESTMENT

The graph above illustrates a representative class of the Fund’s historical performance for the past 10 fiscal years or since inception (for Funds lacking 10-year records) in comparison to its benchmark index, as well as one or more additional indexes, if applicable. The performance of other share classes will be greater than or less than the class depicted above.
Average Annual Total Returns (for the periods ended 09/30/2020) | | | | |
| Inception Date
of Class | 1 Year | 5 Years | 10 Years | Since Inception
12/03/2010 | Since Inception
04/01/2014 |
Class I | 12/03/2010 | 6.28% | 4.29% | | 4.08% | |
Class R5 | 10/03/1994 | 6.16% | 4.18% | 3.76% | | |
Service Class | 01/01/1998 | 6.06% | 4.07% | 3.67% | | |
Administrative Class | 05/03/1999 | 5.94% | 3.97% | 3.58% | | |
Class R4 | 04/01/2014 | 5.80% | 3.82% | | | 3.48% |
Class A | 01/01/1998 | 5.70% | 3.72% | 3.32% | | |
Class A (sales load deducted)* | 01/01/1998 | 1.21% | 2.82% | 2.87% | | |
Class R3 | 12/31/2002 | 5.54% | 3.57% | 3.11% | | |
Bloomberg Barclays U.S. Aggregate Bond Index | | 6.98% | 4.18% | 3.64% | 3.80% | 4.01% |
* | Class A (sales load deducted) returns include the 4.25% maximum sales charge. |
Generally accepted accounting principles require adjustments to be made to the net assets of the Fund at period end for financial reporting purposes only, and as such, the total return based on the unadjusted net asset value per share may differ from the total return reported in the financial highlights.
Performance results in the graph and table are shown both with and without the imposition of the maximum applicable sales charge (if applicable) and reflect the percentage change in net asset value, including reinvestment of dividends and capital gains distributions. Investors should note that the Fund is a professionally managed mutual fund, while the index or indexes shown above are unmanaged, cannot be purchased directly, and, with the exception of any peer group index, do not incur expenses.
Performance data quoted in the graph and table represents past performance; past performance is not predictive of future results. The investment return and principal value of shares of the Fund fluctuate, so your shares, when sold, may be worth more or less than their original cost. Current performance of the Fund may be lower or higher than the performance quoted. The performance shown does not reflect the deduction of taxes, if any, that a shareholder would pay on Fund distributions or the redemption of Fund shares. Performance data current to the most recent month end may be obtained by calling 1-888-309-3539.
Investors should read the Fund’s prospectus with regard to the Fund’s investment objectives, risks, and charges and expenses in conjunction with these financial statements. Employee retirement benefit plans that invest plan assets in the Separate Investment Accounts (SIAs) may be subject to certain charges as set forth in their respective Plan Documents. Total return figures would be lower for the periods presented if they reflected these charges.
16
MassMutual Premier Diversified Bond Fund – Portfolio Manager Report (Unaudited) |
What is the investment approach of MassMutual Premier Diversified Bond Fund, and who is the Fund’s subadviser?
The Fund seeks a superior total rate of return by investing in fixed income instruments. Under normal circumstances, the Fund invests at least 80% of its net assets (plus the amount of any borrowings for investment purposes) in fixed income securities. The Fund’s subadviser is Barings LLC (Barings).
How did the Fund perform during the 12 months ended September 30, 2020?
The Fund’s Class R5 shares returned 5.30%, underperforming the 6.98% return of the Bloomberg Barclays U.S. Aggregate Bond Index (the “benchmark”), which measures the performance of the investment grade, U.S. dollar-denominated, fixed-rate taxable bond market, including Treasuries, government-related and corporate securities, agency mortgage-backed securities (MBS) (agency fixed-rate and hybrid ARM pass-throughs), asset-backed securities (ABS), and commercial mortgage-backed securities (CMBS). (“Agency” refers to debt issued by U.S. federal government agencies or government-sponsored entities for financing purposes.)
For a discussion on the economic and market environment during the 12-month period ended September 30, 2020, please see the Economic and Market Overview, beginning on page 3.
Subadviser discussion of factors that contributed to the Fund’s performance
For the year ended September 30, 2020, ABS was a top detractor from the Fund’s performance. During the period, the Fund held an overweight allocation to the sector, relative to the benchmark. The asset class underwent significant spread widening over the period as a result of the market volatility experienced in March 2020. (Credit spreads are the differences in yields between comparable bonds, with widening spreads often indicating increasing yields and decreasing prices for bonds.) As of period-end, spreads in most COVID-impacted securitized sectors had not fully recovered to pre-pandemic levels. Similarly, the secondary oil & gas producers and gas pipeline industries detracted from performance over the period. Finally, CMBS and residential mortgage-backed securities (RMBS) also hindered the Fund’s returns.
On the positive side, the Fund’s overweight to investment-grade corporate bonds contributed to performance for the period. Corporate assets rebounded on the back of swift monetary implementation from the U.S. Federal Reserve, which was positive for the sector. The corporate market has seen a significant recovery since peak spread levels in March 2020. Outperformance for the sector was a result of the Fund’s overweight allocation.
Within securitized sectors, agency MBS helped to drive the Fund’s full-period results, although the Fund held an underweight stake in the sector. An allocation to high-quality, short-weighted average life collateralized loan obligations (CLOs) contributed positively to performance. The Fund had approximately a 4% to 5% allocation to the out-of-index sector.
The Fund uses derivative instruments for yield curve, duration, downside hedging, and to gain exposures. (Derivatives are securities that derive their value from the performance of one or more other investments and take the form of a contract between two or more parties.) Most derivatives are used for hedging, speculation, or both. They may also be used as a substitute for a direct investment. In aggregate, these positions positively contributed to performance over the period.
Subadviser outlook
Market trends finished the period showing modest signs of improvement. Security valuations have moved modestly higher and spreads have moved tighter since the volatility experienced in March. Due to what Barings believes is still a positive technical backdrop of strong market demand for risk assets, many segments have proved resilient in battling the headwinds of the resurgence in new issue volume and growing macro concerns. In Fund management’s view, all eyes are now on the U.S. Congress as the economy awaits an additional round of fiscal stimulus. Without a meaningful agreement reached in Congress, however, Barings believes that the continuation and path of this recovery seems somewhat in question heading toward the end of 2020. Facing a still uncertain environment leading into the fourth quarter, the Fund is maintaining a defensive stance and Fund management is remaining diligent to its fundamental bottom-up process of capital preservation.
17
MassMutual Premier Diversified Bond Fund – Portfolio Manager Report (Unaudited) (Continued) |
At period-end, the Fund remained overweight in the corporate and securitized sectors, relative to liquid products, such as governments and agencies.
MassMutual Premier
Diversified Bond Fund
Portfolio Characteristics
(% of Net Assets) on 9/30/20 |
Corporate Debt | 47.0% |
Non-U.S. Government Agency Obligations | 29.7% |
U.S. Government Agency Obligations and Instrumentalities | 16.6% |
U.S. Treasury Obligations | 2.7% |
Sovereign Debt Obligations | 0.8% |
Purchased Options | 0.2% |
Preferred Stock | 0.1% |
Common Stock | 0.0% |
Warrants | 0.0% |
Total Long-Term Investments | 97.1% |
Short-Term Investments and Other Assets and Liabilities | 2.9% |
Net Assets | 100.0% |
| | |
18
MassMutual Premier Diversified Bond Fund – Portfolio Manager Report (Unaudited) (Continued) |
GROWTH OF $10,000 INVESTMENT

The graph above illustrates a representative class of the Fund’s historical performance for the past 10 fiscal years or since inception (for Funds lacking 10-year records) in comparison to its benchmark index, as well as one or more additional indexes, if applicable. The performance of other share classes will be greater than or less than the class depicted above.
Average Annual Total Returns (for the periods ended 09/30/2020) | | | | |
| Inception Date
of Class | 1 Year | 5 Years | 10 Years | Since Inception
12/03/2010 | Since Inception
04/01/2014 |
Class I | 12/03/2010 | 5.43% | 4.49% | | 4.63% | |
Class R5 | 05/03/1999 | 5.30% | 4.39% | 4.11% | | |
Service Class | 05/03/1999 | 5.20% | 4.28% | 4.03% | | |
Administrative Class | 05/03/1999 | 5.10% | 4.18% | 3.96% | | |
Class R4 | 04/01/2014 | 5.05% | 4.03% | | | 3.54% |
Class A | 05/03/1999 | 4.96% | 3.95% | 3.70% | | |
Class A (sales load deducted)* | 05/03/1999 | 0.50% | 3.05% | 3.25% | | |
Class R3 | 04/01/2014 | 4.61% | 3.75% | | | 3.26% |
Bloomberg Barclays U.S. Aggregate Bond Index | | 6.98% | 4.18% | 3.64% | 3.80% | 4.01% |
* | Class A (sales load deducted) returns include the 4.25% maximum sales charge. |
Generally accepted accounting principles require adjustments to be made to the net assets of the Fund at period end for financial reporting purposes only, and as such, the total return based on the unadjusted net asset value per share may differ from the total return reported in the financial highlights.
Performance results in the graph and table are shown both with and without the imposition of the maximum applicable sales charge (if applicable) and reflect the percentage change in net asset value, including reinvestment of dividends and capital gains distributions. Investors should note that the Fund is a professionally managed mutual fund, while the index or indexes shown above are unmanaged, cannot be purchased directly, and, with the exception of any peer group index, do not incur expenses.
Performance data quoted in the graph and table represents past performance; past performance is not predictive of future results. The investment return and principal value of shares of the Fund fluctuate, so your shares, when sold, may be worth more or less than their original cost. Current performance of the Fund may be lower or higher than the performance quoted. The performance shown does not reflect the deduction of taxes, if any, that a shareholder would pay on Fund distributions or the redemption of Fund shares. Performance data current to the most recent month end may be obtained by calling 1-888-309-3539.
Investors should read the Fund’s prospectus with regard to the Fund’s investment objectives, risks, and charges and expenses in conjunction with these financial statements. Employee retirement benefit plans that invest plan assets in the Separate Investment Accounts (SIAs) may be subject to certain charges as set forth in their respective Plan Documents. Total return figures would be lower for the periods presented if they reflected these charges.
19
MassMutual Premier High Yield Fund – Portfolio Manager Report (Unaudited) |
What is the investment approach of MassMutual Premier High Yield Fund, and who is the Fund’s subadviser?
The Fund seeks to achieve a high level of total return, with an emphasis on current income, by investing primarily in high yield debt and related securities. Under normal circumstances, the Fund invests at least 80% of its net assets (plus the amount of any borrowings for investment purposes) in lower rated fixed income securities (rated below Baa3 by Moody’s, below BBB- by Standard & Poor’s or the equivalent by any NRSRO (using the lower rating) or, if unrated, determined to be of below investment grade quality by the Fund’s subadviser). The Fund’s subadviser is Barings LLC (Barings).
How did the Fund perform during the 12 months ended September 30, 2020?
The Fund’s Service Class shares returned -0.48%, underperforming the 3.25% return of the Bloomberg Barclays U.S. Corporate High-Yield Bond Index (the “benchmark”), which measures the performance of U.S. dollar-denominated, non-investment grade, fixed-rate, taxable corporate bonds, including corporate bonds, fixed-rate bullet, puttable, and callable bonds, SEC Rule 144A securities, original issue zeros, pay-in-kind bonds, fixed-rate and fixed-to-floating capital securities.
For a discussion on the economic and market environment during the 12-month period ended September 30, 2020, please see the Economic and Market Overview, beginning on page 3.
Subadviser discussion of factors that contributed to the Fund’s performance
For the one year period ended September 30, 2020, the U.S. high-yield bond market finished the fiscal year with largely positive performance, despite the historic sell-off in March due to the COVID-19 pandemic and the resulting global economic shutdown.
Returns were mostly positive across industries, after the broad bounce-back from the steep declines of March 2020. Exceptions to this included the real estate investment trust (REIT) and services sectors, which were down modestly, although the energy and transportation sectors were the most substantial detractors. The top contributors for the period were the consumer cyclical and consumer noncyclical sectors. Higher-quality bonds significantly outperformed their lower-quality counterparts, with credits rated CCC and below ending in negative territory, while single-Bs were modestly positive, and double-Bs exhibited notable strength given the risk-off sentiment for much of the period.
As it relates to the Fund, benchmark-relative performance was primarily driven by the underperformance of Fund holdings in April of 2020. As crude oil prices sharply rebounded following the sell-off in March, the Fund’s positioning within the energy sector and its underweight allocation to that market segment resulted in the Fund not realizing the extent of the recovery from the March downturn that the benchmark did. For the reporting period, an underweight position and individual credit performance across energy names was the largest detractor from the Fund’s relative performance. Positive contributors included the communications and technology sectors, due to strong credit selection in each. Across ratings, the Fund was hindered by idiosyncratic credit events and a bias toward lower quality.
With respect to Fund holdings, the largest detractors during the reporting period were American Airlines, the world’s largest passenger airline; Fieldwood Energy, a private exploration and production company with operations focused in the Gulf of Mexico; and Tullow Oil, a U.K.-based, independent public exploration and production company that focuses primarily in offshore regions of Africa. The Fund’s top-performing holdings were Ford Motor Company, one of the world’s largest automobile manufacturers; Sprint, a U.S.-based wireless operator; and JBS USA, an American protein producer that mainly processes beef and pork.
Subadviser outlook
While Barings expects earnings to generally be supportive over the coming months, it believes that the lack of a fiscal package could lead to higher volatility in the market until the post-election period in the U.S. Barings is concerned that a contested U.S. presidential election could be a substantial negative for the market in the near term. Going into 2021, Barings likes the setup for risk assets. The prospect of additional stimulus and the increased likelihood that one or more vaccines have the potential to help the economy begin to turn the corner, in Barings’ view. And while Treasury rates could move higher in the interim, Barings believes that inflation will remain in check, providing room for spread levels to tighten from current levels. Further, Barings is
20
MassMutual Premier High Yield Fund – Portfolio Manager Report (Unaudited) (Continued) |
beginning to see the emergence of increased M&A activity, which will initially be supportive for spreads. (Credit spreads are the differences in yields between comparable bonds, with widening spreads often indicating increasing yields and decreasing prices for bonds.)
MassMutual Premier
High Yield Fund
Portfolio Characteristics
(% of Net Assets) on 9/30/20 |
Corporate Debt | 92.6% |
Bank Loans | 3.3% |
Common Stock | 0.1% |
Warrants | 0.0% |
Total Long-Term Investments | 96.0% |
Short-Term Investments and Other Assets and Liabilities | 4.0% |
Net Assets | 100.0% |
| | |
21
MassMutual Premier High Yield Fund – Portfolio Manager Report (Unaudited) (Continued) |
GROWTH OF $10,000 INVESTMENT
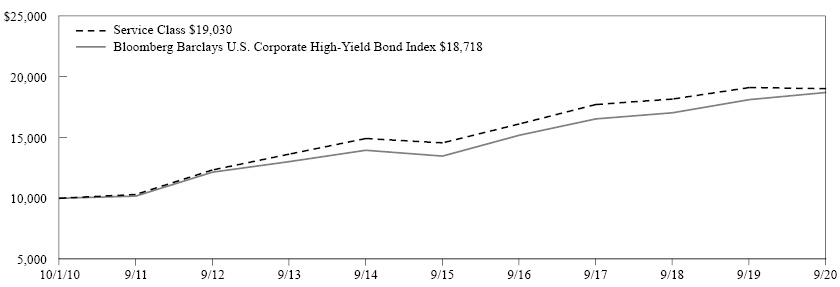
The graph above illustrates a representative class of the Fund’s historical performance for the past 10 fiscal years or since inception (for Funds lacking 10-year records) in comparison to its benchmark index, as well as one or more additional indexes, if applicable. The performance of other share classes will be greater than or less than the class depicted above.
Average Annual Total Returns (for the periods ended 09/30/2020) | | | | |
| Inception Date
of Class | 1 Year | 5 Years | 10 Years | Since Inception
03/01/2011 | Since Inception
04/01/2014 |
Class I | 03/01/2011 | -0.28% | 5.72% | | 6.37% | |
Class R5 | 11/01/2004 | -0.28% | 5.60% | 6.74% | | |
Service Class | 09/05/2000 | -0.48% | 5.49% | 6.65% | | |
Administrative Class | 11/01/2004 | -0.55% | 5.41% | 6.53% | | |
Class R4 | 04/01/2014 | -0.75% | 5.24% | | | 3.78% |
Class A | 11/01/2004 | -0.81% | 5.14% | 6.26% | | |
Class A (sales load deducted)* | 11/01/2004 | -6.27% | 3.95% | 5.66% | | |
Class R3 | 11/01/2004 | -0.96% | 4.98% | 6.06% | | |
Bloomberg Barclays U.S. Corporate High-Yield Bond Index | 3.25% | 6.79% | 6.47% | 6.02% | 4.70% |
* | Class A (sales load deducted) returns include the 5.50% maximum sales charge. |
Generally accepted accounting principles require adjustments to be made to the net assets of the Fund at period end for financial reporting purposes only, and as such, the total return based on the unadjusted net asset value per share may differ from the total return reported in the financial highlights.
Performance results in the graph and table are shown both with and without the imposition of the maximum applicable sales charge (if applicable) and reflect the percentage change in net asset value, including reinvestment of dividends and capital gains distributions. Investors should note that the Fund is a professionally managed mutual fund, while the index or indexes shown above are unmanaged, cannot be purchased directly, and, with the exception of any peer group index, do not incur expenses.
Performance data quoted in the graph and table represents past performance; past performance is not predictive of future results. The investment return and principal value of shares of the Fund fluctuate, so your shares, when sold, may be worth more or less than their original cost. Current performance of the Fund may be lower or higher than the performance quoted. The performance shown does not reflect the deduction of taxes, if any, that a shareholder would pay on Fund distributions or the redemption of Fund shares. Performance data current to the most recent month end may be obtained by calling 1-888-309-3539.
Investors should read the Fund’s prospectus with regard to the Fund’s investment objectives, risks, and charges and expenses in conjunction with these financial statements. Employee retirement benefit plans that invest plan assets in the Separate Investment Accounts (SIAs) may be subject to certain charges as set forth in their respective Plan Documents. Total return figures would be lower for the periods presented if they reflected these charges.
22
MassMutual Premier Balanced Fund – Portfolio Manager Report (Unaudited) |
What is the investment approach of MassMutual Premier Balanced Fund, and who is the Fund’s subadviser?
The Fund seeks to achieve a high total rate of return over an extended period of time consistent with the preservation of capital by investing in a diversified portfolio of equity securities, fixed income securities, and money market instruments. The Fund invests across different asset classes (U.S. equity securities, international equity securities, fixed income securities, including bank loans and Rule 144A securities, and money market instruments), each represented by a different segment of the Fund’s portfolio. The subadviser typically adjusts the allocation among the four segments, based on its judgment about each segment’s potential for returns in comparison with those of other segments and corresponding risk. The Fund’s subadviser is Barings LLC (Barings).
How did the Fund perform during the 12 months ended September 30, 2020?
The Fund’s Class R5 shares returned 9.29%, underperforming the 15.15% return of the S&P 500® Index (the “stock component’s benchmark”), which measures the performance of 500 widely held stocks in the U.S. equity market, and outperforming, by a wide margin, the 0.49% return of the MSCI EAFE Index (the “international component’s benchmark”), which measures the performance of equity securities in the large- and mid-cap segments of developed markets, excluding the U.S. and Canada. The international component’s benchmark is free float-adjusted market-capitalization weighted. The Fund’s Class R5 shares outperformed the 6.98% return of the Bloomberg Barclays U.S. Aggregate Bond Index (the “bond component’s benchmark”), which measures the performance of the investment grade, U.S. dollar-denominated, fixed-rate taxable bond market, including Treasuries, government-related and corporate securities, mortgage-backed securities (MBS) (agency fixed-rate and hybrid ARM pass-throughs), asset-backed securities (ABS), and commercial mortgage-backed securities (CMBS). Additionally, the Fund’s Class R5 shares outperformed the 8.99% return of the Lipper Balanced Fund Index, an unmanaged, equally weighted index of the 30 largest mutual funds within the Lipper Balanced Category; and underperformed the 11.67% return of the Custom Balanced Index, which comprises the stock component’s benchmark, the bond component’s benchmark, and the international component’s benchmark. The weightings of each index in the Custom Balanced Index are 50%, 40% and 10%, respectively.
For a discussion on the economic and market environment during the 12-month period ended September 30, 2020, please see the Economic and Market Overview, beginning on page 3.
Subadviser discussion of factors that contributed to the Fund’s stock component performance
U.S. stocks outperformed both the international component’s benchmark and the bond component’s benchmark for the year ended September 30, 2020. The Fund held an overweight allocation to U.S. equities relative to bonds, which helped to drive performance during the reporting period. U.S. stocks have been the best-performing asset class because the companies that have been leading the business transformation to cloud computing and artificial intelligence are mainly U.S. large-cap firms. These companies have done particularly well relative to others during the pandemic, as when the world went virtual, they had the platforms in place, ready to go.
With respect to the Fund’s specific stock holdings, the oil refining company Phillips 66 was trading at 10 times earnings before the pandemic – a 50% discount to the rest of the market. However, the pandemic slowed the economy, particularly transportation. Consequently, Phillips’ earnings expectations for 2020 declined 60%. The Fund held an overweight stake in Phillips during the reporting period, and the stock was down 47%, which hurt performance. The Fund’s underweight position in Boeing, the aircraft manufacturer, helped performance. Boeing had been struggling prior to the pandemic due to the shutdown of their 737 Max airplanes over safety concerns. The onset of the pandemic cut air travel to a fraction of its peak levels and airlines subsequently cut their aircraft orders. Boeing currently has no earnings and negative cash flow. It fell 55% during the period, and the Fund’s underweight stake proved beneficial.
The Fund occasionally uses derivatives. The equity portion of the Fund had a slight gain from derivative use during the reporting period. (Derivatives are securities that derive their value from the performance of one or more other investments and take the form of a contract between two or more parties.) Most derivatives are used for hedging, speculation, or both. The Fund uses derivative instruments for yield curve, duration, downside hedging, and to gain exposures in the fixed income component.
23
MassMutual Premier Balanced Fund – Portfolio Manager Report (Unaudited) (Continued) |
Subadviser discussion of factors that contributed to the Fund’s bond component performance
In the fixed income component, the Fund’s overweight to investment-grade corporate bonds, relative to the bond component’s benchmark, was a positive contributor to performance. Within securitized sectors, agency MBS contributed positively to returns, while CMBS and residential mortgage-backed securities (RMBS) detracted. (“Agency” refers to debt issued by U.S. federal government agencies or government-sponsored entities for financing purposes. Bond issuers create securitized bonds by pooling various types of contractual debt – such as mortgages, auto loans, or credit card debt.)
With respect to the Fund’s use of derivative instruments in the fixed income component, in the aggregate, those positions positively contributed to performance over the period.
Subadviser outlook
With rates so low, it is natural to ponder if the bond portion of the Fund can continue to provide the stability and return enhancement it has over the past 10 years. Barings realizes that the expected return of a bond portfolio may be only a few percentage points, given the low starting yields, but Barings believes the fixed income component of the Fund allows the Fund to continue to be overweight in stocks, since the bond positioning smooths out the bumps when stocks fall out of favor. Given the attractiveness of stocks and the buffer bonds provide, Barings continues to believe in this strategy.
MassMutual Premier
Balanced Fund
Portfolio Characteristics
(% of Net Assets) on 9/30/20 |
Common Stock | 55.2% |
Corporate Debt | 12.7% |
Non-U.S. Government Agency Obligations | 10.0% |
U.S. Government Agency Obligations and Instrumentalities | 7.9% |
Mutual Funds | 7.7% |
U.S. Treasury Obligations | 3.1% |
Sovereign Debt Obligations | 0.2% |
Municipal Obligations | 0.1% |
Preferred Stock | 0.1% |
Purchased Options | 0.1% |
Rights | 0.0% |
Warrants | 0.0% |
Total Long-Term Investments | 97.1% |
Short-Term Investments and Other Assets and Liabilities | 2.9% |
Net Assets | 100.0% |
| | |
24
MassMutual Premier Balanced Fund – Portfolio Manager Report (Unaudited) (Continued) |
GROWTH OF $10,000 INVESTMENT

The graph above illustrates a representative class of the Fund’s historical performance for the past 10 fiscal years or since inception (for Funds lacking 10-year records) in comparison to its benchmark index, as well as one or more additional indexes, if applicable. The performance of other share classes will be greater than or less than the class depicted above.
Average Annual Total Returns (for the periods ended 09/30/2020) | | | |
| Inception Date
of Class | 1 Year | 5 Years | 10 Years | Since Inception
04/01/2014 |
Class I | 04/01/2014 | 9.49% | 8.92% | | 7.11% |
Class R5 | 10/03/1994 | 9.29% | 8.79% | 8.51% | |
Service Class | 01/01/1998 | 9.22% | 8.69% | 8.38% | |
Administrative Class | 05/03/1999 | 9.13% | 8.58% | 8.24% | |
Class R4 | 04/01/2014 | 8.94% | 8.42% | | 6.61% |
Class A | 01/01/1998 | 8.80% | 8.31% | 7.98% | |
Class A (sales load deducted)* | 01/01/1998 | 2.81% | 7.09% | 7.38% | |
Class R3 | 04/01/2014 | 8.66% | 8.16% | | 6.35% |
S&P 500 Index# | | 15.15% | 14.15% | 13.74% | 11.67% |
MSCI EAFE Index | | 0.49% | 5.26% | 4.62% | 2.26% |
Bloomberg Barclays U.S. Aggregate Bond Index | | 6.98% | 4.18% | 3.64% | 4.01% |
Lipper Balanced Fund Index+ | | 8.99% | 8.26% | 7.93% | 6.59% |
Custom Balanced Index | | 11.67% | 9.60% | 9.06% | 7.95% |
* | Class A (sales load deducted) returns include the 5.50% maximum sales charge. |
Generally accepted accounting principles require adjustments to be made to the net assets of the Fund at period end for financial reporting purposes only, and as such, the total return based on the unadjusted net asset value per share may differ from the total return reported in the financial highlights.
Performance results in the graph and table are shown both with and without the imposition of the maximum applicable sales charge (if applicable) and reflect the percentage change in net asset value, including reinvestment of dividends and capital gains distributions. Investors should note that the Fund is a professionally managed mutual fund, while the index or indexes shown above are unmanaged, cannot be purchased directly, and, with the exception of any peer group index, do not incur expenses.
Performance data quoted in the graph and table represents past performance; past performance is not predictive of future results. The investment return and principal value of shares of the Fund fluctuate, so your shares, when sold, may be worth more or less than their original cost. Current performance of the Fund may be lower or higher than the performance quoted. The performance shown does not reflect the deduction of taxes, if any, that a shareholder would pay on Fund distributions or the redemption of Fund shares. Performance data current to the most recent month end may be obtained by calling 1-888-309-3539.
Investors should read the Fund’s prospectus with regard to the Fund’s investment objectives, risks, and charges and expenses in conjunction with these financial statements. Employee retirement benefit plans that invest plan assets in the Separate Investment Accounts (SIAs) may be subject to certain charges as set forth in their respective Plan Documents. Total return figures would be lower for the periods presented if they reflected these charges.
25
MassMutual Premier Disciplined Value Fund – Portfolio Manager Report (Unaudited) |
What is the investment approach of MassMutual Premier Disciplined Value Fund, and who is the Fund’s subadviser?
The Fund seeks to create a diversified portfolio of equity securities in order to outperform the total return performance of its benchmark, the Russell 1000® Value Index*. Under normal circumstances, the Fund invests mainly in common stocks of companies that the Fund’s subadviser considers to be undervalued. The Fund will normally invest in common stocks of companies with market capitalizations of at least $200 million at the time of purchase. The Fund’s subadviser is Barings LLC (Barings).
* | The Fund is sponsored solely by MassMutual. The Fund is not in any way connected to or sponsored, endorsed, sold or promoted by the London Stock Exchange Group plc and its group undertakings (collectively, the “LSE Group”). FTSE Russell is a trading name of certain of the LSE Group companies. |
| All rights in the Russell 1000® Value Index (the “Index”) vest in the relevant LSE Group company which owns the Index. “Russell 1000® Value” and “Russell®” are trade marks of the relevant LSE Group company and are used by any other LSE Group company under license. |
| The Index is calculated by or on behalf of FTSE International Limited or its affiliate, agent or partner. The LSE Group does not accept any liability whatsoever to any person arising out of (a) the use of, reliance on or any error in the Index or (b) investment in or operation of the Fund. The LSE Group makes no claim, prediction, warranty or representation either as to the results to be obtained from the Fund or the suitability of the Index for the purpose to which it is being put by the Fund. |
How did the Fund perform during the 12 months ended September 30, 2020?
The Fund’s Service Class shares returned -7.54%, underperforming the -5.03% return of the Russell 1000 Value Index (the “benchmark”), which measures the performance of the large-cap value segment of U.S. equity securities. It includes the Russell 1000 Index companies with lower price-to-book ratios and lower expected growth values. It is market-capitalization weighted.
For a discussion on the economic and market environment during the 12-month period ended September 30, 2020, please see the Economic and Market Overview, beginning on page 3.
Subadviser discussion of factors that contributed to the Fund’s performance
Companies that are cyclical in nature tend to be in the value universe because the market will pay less for earnings that go up and down with the cycle. The pandemic hit these industries’ earnings the hardest because economic growth fell so dramatically. During the reporting period, large-cap value stocks declined by 5%, while their growth counterparts rose by 3%. The pandemic is just the latest in a series of woes that have befallen cyclical stocks. Before the pandemic, they were hit by the trade war, and before that, the slow growth following the Great Financial Crisis. This series of setbacks, in tandem with the rise of growth stocks, has driven cyclicals down to some of their lowest relative valuation levels in 50 years.
With respect to the Fund’s specific stock holdings, the oil refining company Phillips 66 was trading at 10 times earnings before the pandemic – a 50% discount to the rest of the market. However, the pandemic slowed the economy, particularly transportation. Consequently, Phillips’ earnings expectations for 2020 declined 60%. The Fund held an overweight stake, relative to the benchmark, in Phillips during the reporting period, and the stock was down 47%, which hurt performance.
With respect to semiconductor stocks, their earnings tend to follow the economic cycle, so they often are in the value universe. Fund holding Micron Technologies’ stock price traded at seven times its annual earnings at the beginning of the reporting period. This made it one of the cheapest stocks in the large-cap universe. During the pandemic, expectations for the company’s 2020 earnings actually rose, as did the stock’s price, and this helped performance due to the Fund’s overweight allocation to Micron Technologies.
Subadviser outlook
The value universe is made up of stocks that have earnings, cash flows, or book value that are valued less by the market, so investors get those earnings cheaper. The companies that make up this universe tend to be in unglamorous sectors or those that are experiencing problems. Lately, banks, energy, and travel and leisure companies have made up a disproportionate share of the value universe. Over the past 50 years, it has paid to buy stocks cheap and wait for their prospects to improve and be noticed by the market. However, since the Great Financial Crisis, world growth has been slower than in the past and the hoped-for turn in profitability has not been strong enough to get investors to notice. Investors have been far more interested in owning digital companies that are growing rapidly and have tremendous room to continue growing in the future.
26
MassMutual Premier Disciplined Value Fund – Portfolio Manager Report (Unaudited) (Continued) |
Barings believes that, as with most investment insights, there is a tendency of taking a good idea too far. Barings believes that, for the past 10 years, investors have underpriced the advantage of compounding high-profit margins. The same holds true for the capital-heavy cyclicals that are so out of favor; these industries are important and although their growth has been muted, in Barings’ view, the introduction of robotics may boost margins in the years to come, giving them margins closer to today’s growth stock darlings.
MassMutual Premier
Disciplined Value Fund
Largest Holdings
(% of Net Assets) on 9/30/20 |
Johnson & Johnson | 2.7% |
JPMorgan Chase & Co. | 2.2% |
Verizon Communications, Inc. | 2.0% |
Berkshire Hathaway, Inc. Class B | 2.0% |
Pfizer, Inc. | 2.0% |
Intel Corp. | 1.9% |
Cisco Systems, Inc. | 1.6% |
Comcast Corp. Class A | 1.5% |
Walmart, Inc. | 1.4% |
Bank of America Corp. | 1.4% |
| | 18.7% |
| | |
MassMutual Premier
Disciplined Value Fund
Sector Table
(% of Net Assets) on 9/30/20 |
Consumer, Non-cyclical | 23.3% |
Financial | 21.6% |
Industrial | 13.0% |
Communications | 11.1% |
Consumer, Cyclical | 10.8% |
Technology | 8.7% |
Utilities | 4.9% |
Energy | 3.4% |
Basic Materials | 3.0% |
Mutual Funds | 0.1% |
Total Long-Term Investments | 99.9% |
Short-Term Investments and Other Assets and Liabilities | 0.1% |
Net Assets | 100.0% |
| | |
27
MassMutual Premier Disciplined Value Fund – Portfolio Manager Report (Unaudited) (Continued) |
GROWTH OF $10,000 INVESTMENT

The graph above illustrates a representative class of the Fund’s historical performance for the past 10 fiscal years or since inception (for Funds lacking 10-year records) in comparison to its benchmark index, as well as one or more additional indexes, if applicable. The performance of other share classes will be greater than or less than the class depicted above.
Average Annual Total Returns (for the periods ended 09/30/2020) | | | |
| Inception Date
of Class | 1 Year | 5 Years | 10 Years | Since Inception
04/01/2014 |
Class I | 04/01/2014 | -7.26% | 5.90% | | 4.37% |
Class R5 | 11/01/2004 | -7.34% | 5.80% | 8.83% | |
Service Class | 12/19/2000 | -7.54% | 5.66% | 8.70% | |
Administrative Class | 11/01/2004 | -7.62% | 5.58% | 8.59% | |
Class R4 | 04/01/2014 | -7.70% | 5.43% | | 3.90% |
Class A | 11/01/2004 | -7.77% | 5.32% | 8.32% | |
Class A (sales load deducted)* | 11/01/2004 | -12.84% | 4.14% | 7.71% | |
Class R3 | 11/01/2004 | -7.98% | 5.16% | 8.10% | |
Russell 1000 Value Index | | -5.03% | 7.66% | 9.95% | 5.88% |
* | Class A (sales load deducted) returns include the 5.50% maximum sales charge. |
Generally accepted accounting principles require adjustments to be made to the net assets of the Fund at period end for financial reporting purposes only, and as such, the total return based on the unadjusted net asset value per share may differ from the total return reported in the financial highlights.
Performance results in the graph and table are shown both with and without the imposition of the maximum applicable sales charge (if applicable) and reflect the percentage change in net asset value, including reinvestment of dividends and capital gains distributions. Investors should note that the Fund is a professionally managed mutual fund, while the index or indexes shown above are unmanaged, cannot be purchased directly, and, with the exception of any peer group index, do not incur expenses.
Performance data quoted in the graph and table represents past performance; past performance is not predictive of future results. The investment return and principal value of shares of the Fund fluctuate, so your shares, when sold, may be worth more or less than their original cost. Current performance of the Fund may be lower or higher than the performance quoted. The performance shown does not reflect the deduction of taxes, if any, that a shareholder would pay on Fund distributions or the redemption of Fund shares. Performance data current to the most recent month end may be obtained by calling 1-888-309-3539.
Investors should read the Fund’s prospectus with regard to the Fund’s investment objectives, risks, and charges and expenses in conjunction with these financial statements. Employee retirement benefit plans that invest plan assets in the Separate Investment Accounts (SIAs) may be subject to certain charges as set forth in their respective Plan Documents. Total return figures would be lower for the periods presented if they reflected these charges.
28
MassMutual Premier Main Street Fund – Portfolio Manager Report (Unaudited) |
What is the investment approach of MassMutual Premier Main Street Fund, and who is the Fund’s subadviser?
The Fund seeks a high total return by investing primarily in common stocks of U.S. companies of different capitalization ranges. The Fund’s subadviser currently focuses on “large capitalization” issuers, which are considered to be companies with market capitalizations at the time of purchase within the market capitalization range of companies included within the Russell 1000® Index, although it may purchase stocks of companies with any market capitalization. The Fund’s subadviser is Invesco Advisers, Inc. (Invesco).
How did the Fund perform during the 12 months ended September 30, 2020?
The Fund’s Class R5 shares returned 12.10%, underperforming the 15.15% return of the S&P 500® Index (the “benchmark”), which measures the performance of 500 widely held stocks in the U.S. equity market.
For a discussion on the economic and market environment during the 12-month period ended September 30, 2020, please see the Economic and Market Overview, beginning on page 3.
Subadviser discussion of factors that contributed to the Fund’s performance
A moderate underweight exposure to the information technology sector, relative to the benchmark, as well as stock selection within that sector, were the primary drivers of the Fund’s underperformance during the reporting period. A moderate overweight to the financials sector was also a detractor, although this was offset by strong stock selection in that sector. Stock selection in the energy sector was a secondary detractor. In addition to the strong stock selection in financials, strong stock selection in the consumer discretionary, real estate, and industrials sectors also contributed to the Fund’s performance.
Stocks that were the key individual detractors from the Fund’s relative performance included Apple (not owning it), Suncor, Magellan, and Capital One Financial. Apple is the largest weight in the benchmark and has been one of the top performers. The Fund eliminated Apple from its portfolio prior to the reporting period on concerns over flattening growth rates – and Invesco’s view that the addressable market for the iPhone had peaked. Suncor, an integrated energy company, and Magellan, which is primarily a refined products pipeline company, significantly underperformed the broad market, in tandem with the rest of the energy sector. The energy sector experienced significantly negative returns despite the benchmark gaining over 15% during the period. The Fund eliminated its position in Suncor during the period. Capital One Financial underperformed after the unemployment picture quickly deteriorated in March 2020 due to COVID-19-related concerns about consumers’ ability to make payments on their credit cards and other loans. Of the larger U.S. banks, Capital One is considered to have the most exposure to the health of the consumer.
The Fund holdings that were top individual contributors to the Fund’s relative returns during the reporting period included Microsoft, Amazon, and UnitedHealth. Microsoft and Amazon were already benefiting from strong execution and various tailwinds that accelerated due to pandemic – including the increased need and importance of technology, including cloud services, to work from home. Microsoft experienced continued momentum for its commercial cloud offerings, while continuing to report strong revenue growth and operating margin expansion. Amazon continued to benefit from retail disruption in its e-commerce business, which was driving market share gains, in addition to the acceleration of digital transformation benefiting its AWS cloud services. Finally, UnitedHealth saw strong gains, as concerns around the potential for a Medicare For All plan waned and the company continued to report strong results. Furthermore, the U.S. government gave managed care a gift by repealing the health insurance fee, starting in 2021.
Subadviser outlook
Invesco believes that the worst of the recession is behind us, but the speed at which the economy will continue to recover remains uncertain. A vaccine will not help the economy for the remainder of 2020, in Invesco’s view, as the development and distribution timeline is too long. That said, Invesco’s base case is that at least one of the vaccines in development could receive FDA approval in the fourth quarter of 2020, with the bulk of the distribution in early 2021.
29
MassMutual Premier Main Street Fund – Portfolio Manager Report (Unaudited) (Continued) |
Invesco opines that the further rebound in the economy fueled by the vaccine, when it comes, has the potential to be substantial. This is not a recession caused by excesses that need to be burned off with time (as seen in previous recessions), and there is significant pent-up demand for entertainment and travel-related services. On the other hand, Fund management does not think a simple resumption of the previous economic trend is inevitable. Even with government assistance programs, there are businesses and jobs being permanently lost, and the reallocation of people and resources in the economy could take time. Moreover, Invesco believes this traumatic experience for many consumers is likely to change future behaviors, increasing the savings rate and reducing the velocity of money. Interest rates are low now in the flight to safety and liquidity we have witnessed, but Invesco believes that long-term rates bear watching. Equities represent ownership interests in productive assets, which over the long term, Invesco believes, are still the best place to invest.
MassMutual Premier
Main Street Fund
Largest Holdings
(% of Net Assets) on 9/30/20 |
Microsoft Corp. | 8.8% |
Amazon.com, Inc. | 7.0% |
UnitedHealth Group, Inc. | 4.2% |
The Procter & Gamble Co. | 3.8% |
Facebook, Inc. Class A | 3.5% |
QUALCOMM, Inc. | 3.1% |
Lockheed Martin Corp. | 2.9% |
Prologis, Inc. | 2.8% |
Berkshire Hathaway, Inc. Class B | 2.5% |
JP Morgan Chase & Co. | 2.5% |
| | 41.1% |
| | |
MassMutual Premier
Main Street Fund
Sector Table
(% of Net Assets) on 9/30/20 |
Consumer, Non-cyclical | 24.1% |
Technology | 20.3% |
Communications | 17.9% |
Financial | 17.8% |
Industrial | 9.2% |
Consumer, Cyclical | 6.3% |
Energy | 1.9% |
Utilities | 1.2% |
Basic Materials | 0.5% |
Mutual Funds | 0.1% |
Total Long-Term Investments | 99.3% |
Short-Term Investments and Other Assets and Liabilities | 0.7% |
Net Assets | 100.0% |
| | |
30
MassMutual Premier Main Street Fund – Portfolio Manager Report (Unaudited) (Continued) |
GROWTH OF $10,000 INVESTMENT

The graph above illustrates a representative class of the Fund’s historical performance for the past 10 fiscal years or since inception (for Funds lacking 10-year records) in comparison to its benchmark index, as well as one or more additional indexes, if applicable. The performance of other share classes will be greater than or less than the class depicted above.
Average Annual Total Returns (for the periods ended 09/30/2020) | | | |
| Inception Date
of Class | 1 Year | 5 Years | 10 Years | Since Inception
04/01/2014 |
Class I | 04/01/2014 | 12.22% | 12.06% | | 10.09% |
Class R5 | 12/31/2004 | 12.10% | 11.95% | 12.32% | |
Service Class | 12/31/2004 | 11.88% | 11.83% | 12.24% | |
Administrative Class | 12/31/2004 | 11.79% | 11.71% | 12.10% | |
Class R4 | 04/01/2014 | 11.68% | 11.56% | | 9.59% |
Class A | 12/31/2004 | 11.53% | 11.44% | 11.81% | |
Class A (sales load deducted)* | 12/31/2004 | 5.40% | 10.19% | 11.18% | |
Class R3 | 12/31/2004 | 11.41% | 11.28% | 11.59% | |
S&P 500 Index | | 15.15% | 14.15% | 13.74% | 11.67% |
* | Class A (sales load deducted) returns include the 5.50% maximum sales charge. |
Generally accepted accounting principles require adjustments to be made to the net assets of the Fund at period end for financial reporting purposes only, and as such, the total return based on the unadjusted net asset value per share may differ from the total return reported in the financial highlights.
Performance results in the graph and table are shown both with and without the imposition of the maximum applicable sales charge (if applicable) and reflect the percentage change in net asset value, including reinvestment of dividends and capital gains distributions. Investors should note that the Fund is a professionally managed mutual fund, while the index or indexes shown above are unmanaged, cannot be purchased directly, and, with the exception of any peer group index, do not incur expenses.
Performance data quoted in the graph and table represents past performance; past performance is not predictive of future results. The investment return and principal value of shares of the Fund fluctuate, so your shares, when sold, may be worth more or less than their original cost. Current performance of the Fund may be lower or higher than the performance quoted. The performance shown does not reflect the deduction of taxes, if any, that a shareholder would pay on Fund distributions or the redemption of Fund shares. Performance data current to the most recent month end may be obtained by calling 1-888-309-3539.
Investors should read the Fund’s prospectus with regard to the Fund’s investment objectives, risks, and charges and expenses in conjunction with these financial statements. Employee retirement benefit plans that invest plan assets in the Separate Investment Accounts (SIAs) may be subject to certain charges as set forth in their respective Plan Documents. Total return figures would be lower for the periods presented if they reflected these charges.
31
MassMutual Premier Disciplined Growth Fund – Portfolio Manager Report (Unaudited) |
What is the investment approach of MassMutual Premier Disciplined Growth Fund, and who is the Fund’s subadviser?
The Fund seeks to create a diversified portfolio of equity securities in order to outperform the total return performance of its benchmark, the Russell 1000® Growth Index*. Under normal circumstances, the Fund invests mainly in common stocks of companies that the Fund’s subadviser believes offer the potential for long-term growth. The Fund will normally invest in common stocks of companies with market capitalizations of at least $200 million at the time of purchase. The Fund’s subadviser is Barings LLC (Barings).
* | The Fund is sponsored solely by MassMutual. The Fund is not in any way connected to or sponsored, endorsed, sold or promoted by the London Stock Exchange Group plc and its group undertakings (collectively, the “LSE Group”). FTSE Russell is a trading name of certain of the LSE Group companies. |
| All rights in the Russell 1000® Growth Index (the “Index”) vest in the relevant LSE Group company which owns the Index. “Russell 1000® Growth” and “Russell®” are trade marks of the relevant LSE Group company and are used by any other LSE Group company under license. |
| The Index is calculated by or on behalf of FTSE International Limited or its affiliate, agent or partner. The LSE Group does not accept any liability whatsoever to any person arising out of (a) the use of, reliance on or any error in the Index or (b) investment in or operation of the Fund. The LSE Group makes no claim, prediction, warranty or representation either as to the results to be obtained from the Fund or the suitability of the Index for the purpose to which it is being put by the Fund. |
How did the Fund perform during the 12 months ended September 30, 2020?
The Fund’s Service Class shares returned 32.33%, significantly underperforming the 37.53% return of the Russell 1000 Growth Index (the “benchmark”), which measures the performance of the large-cap growth segment of U.S. equity securities. It includes the Russell 1000 Index companies with higher price-to-book ratios and higher forecasted growth values. It is market-capitalization weighted.
For a discussion on the economic and market environment during the 12-month period ended September 30, 2020, please see the Economic and Market Overview, beginning on page 3.
Subadviser discussion of factors that contributed to the Fund’s performance
As the U.S. shut down due to the pandemic, large-cap growth stocks fell 32% from mid-February to mid-March. Since that time, they have recovered all the lost ground and were up a stunning 37% for the reporting period.
Digital businesses were generally the beneficiaries of the shutdown, and digital companies dominate the large-cap growth benchmark. In fact, the top five names in the benchmark make up over 32% of the index. These companies – Apple, Amazon, Facebook, Google, and Microsoft – rose an incredible 52%, on average, during the reporting period.
For the year ended September 30, 2020, the Fund lost the most relative performance due to its underweight allocation, relative to the benchmark, to electric vehicle manufacturer Tesla, which trades at 900 times trailing earnings and 200 times next year’s earnings. Tesla has twice as much debt as they have equity, and they only recently produced positive cash flow. The Fund’s framework includes a value component, so the framework deemed Tesla too expensive. Ultimately, Tesla was up 790% during the reporting period, so the Fund’s underweight allocation to Tesla hurt its relative performance considerably.
Turning to the positive, the Fund’s underweight stake in aircraft manufacturer Boeing helped relative performance. Boeing was struggling prior to the pandemic due to the shutdown of their 737 Max airplanes because of safety issues. The pandemic cut air travel to a fraction of peak levels and airlines have cut the aircraft orders. Boeing currently has no earnings and negative cash flow, so the Fund held an underweight stake. Boeing fell 55% during the reporting period, and this helped the Fund’s performance.
Subadviser outlook
Prior to the pandemic, market expectations were for the largest growth stocks in the U.S. to grow their earnings 2.5 times faster than the rest of the market. Now that lead has increased to over three times. This advantage is unusual, but even more unusual is that these companies also have free cash flow margins double the market. The largest growth companies tend to be light on assets, own a disproportionate share of patents, and have very high margins. The raw material for many is data, and some even obtain the data free of charge. This is a tremendous advantage, and it has allowed them to accrue a disproportionate share of profits. Investors have noticed, and these companies trade at a significant premium to the rest of the market. In Barings’ view, the advantage of the largest
32
MassMutual Premier Disciplined Growth Fund – Portfolio Manager Report (Unaudited) (Continued) |
growth companies was compounded by the lack of growth in the rest of the large-cap universe, particularly during the pandemic. Barings opines that, as the world emerges from lockdown, the non-digital companies will do better. The digital growth companies’ earnings may not suffer much, although they may have to compete for investors’ interest. Large-cap growth stocks have such strong fundamentals that Barings believes there is no reason to abandon them as others begin to catch up.
MassMutual Premier
Disciplined Growth Fund
Largest Holdings
(% of Net Assets) on 9/30/20 |
Apple, Inc. | 11.9% |
Microsoft Corp. | 9.9% |
Amazon.com, Inc. | 7.8% |
Facebook, Inc. Class A | 4.5% |
Alphabet, Inc. Class C | 2.5% |
Mastercard, Inc. Class A | 2.4% |
Visa, Inc. Class A | 2.1% |
Alphabet, Inc. Class A | 2.1% |
NVIDIA Corp. | 1.9% |
Adobe, Inc. | 1.7% |
| | 46.8% |
| | |
MassMutual Premier
Disciplined Growth Fund
Sector Table
(% of Net Assets) on 9/30/20 |
Technology | 38.6% |
Consumer, Non-cyclical | 21.2% |
Communications | 20.3% |
Consumer, Cyclical | 8.4% |
Financial | 7.2% |
Industrial | 4.5% |
Basic Materials | 0.5% |
Energy | 0.2% |
Mutual Funds | 0.0% |
Utilities | 0.0% |
Total Long-Term Investments | 100.9% |
Short-Term Investments and Other Assets and Liabilities | (0.9)% |
Net Assets | 100.0% |
| | |
33
MassMutual Premier Disciplined Growth Fund – Portfolio Manager Report (Unaudited) (Continued) |
GROWTH OF $10,000 INVESTMENT

The graph above illustrates a representative class of the Fund’s historical performance for the past 10 fiscal years or since inception (for Funds lacking 10-year records) in comparison to its benchmark index, as well as one or more additional indexes, if applicable. The performance of other share classes will be greater than or less than the class depicted above.
Average Annual Total Returns (for the periods ended 09/30/2020) | | | |
| Inception Date
of Class | 1 Year | 5 Years | 10 Years | Since Inception
04/01/2014 |
Class I | 04/01/2014 | 32.63% | 17.85% | | 14.74% |
Class R5 | 11/01/2004 | 32.48% | 17.69% | 16.07% | |
Service Class | 12/19/2000 | 32.33% | 17.56% | 15.95% | |
Administrative Class | 11/01/2004 | 32.19% | 17.46% | 15.83% | |
Class R4 | 04/01/2014 | 31.97% | 17.29% | | 14.21% |
Class A | 11/01/2004 | 31.87% | 17.18% | 15.53% | |
Class A (sales load deducted)* | 11/01/2004 | 24.62% | 15.86% | 14.88% | |
Class R3 | 04/01/2014 | 31.78% | 16.99% | | 13.93% |
Russell 1000 Growth Index | | 37.53% | 20.10% | 17.25% | 16.84% |
* | Class A (sales load deducted) returns include the 5.50% maximum sales charge. |
Generally accepted accounting principles require adjustments to be made to the net assets of the Fund at period end for financial reporting purposes only, and as such, the total return based on the unadjusted net asset value per share may differ from the total return reported in the financial highlights.
Performance results in the graph and table are shown both with and without the imposition of the maximum applicable sales charge (if applicable) and reflect the percentage change in net asset value, including reinvestment of dividends and capital gains distributions. Investors should note that the Fund is a professionally managed mutual fund, while the index or indexes shown above are unmanaged, cannot be purchased directly, and, with the exception of any peer group index, do not incur expenses.
Performance data quoted in the graph and table represents past performance; past performance is not predictive of future results. The investment return and principal value of shares of the Fund fluctuate, so your shares, when sold, may be worth more or less than their original cost. Current performance of the Fund may be lower or higher than the performance quoted. The performance shown does not reflect the deduction of taxes, if any, that a shareholder would pay on Fund distributions or the redemption of Fund shares. Performance data current to the most recent month end may be obtained by calling 1-888-309-3539.
Investors should read the Fund’s prospectus with regard to the Fund’s investment objectives, risks, and charges and expenses in conjunction with these financial statements. Employee retirement benefit plans that invest plan assets in the Separate Investment Accounts (SIAs) may be subject to certain charges as set forth in their respective Plan Documents. Total return figures would be lower for the periods presented if they reflected these charges.
34
MassMutual Premier Small Cap Opportunities Fund – Portfolio Manager Report (Unaudited) |
What is the investment approach of MassMutual Premier Small Cap Opportunities Fund, and who is the Fund’s subadviser?
The Fund seeks capital appreciation by investing primarily in common stocks of small-capitalization U.S. companies that the Fund’s subadviser believes have favorable business trends or prospects based on fundamental analysis. Under normal circumstances, the Fund invests at least 80% of its net assets (plus the amount of any borrowings for investment purposes) in securities of small-cap companies. The Fund’s subadviser is Invesco Advisers, Inc. (Invesco).
How did the Fund perform during the 12 months ended September 30, 2020?
The Fund’s Class A shares returned 2.07%, outperforming the 0.39% return of the Russell 2000® Index (the “benchmark”), which measures the performance of the small-cap segment of the U.S. equity universe. It is a subset of the Russell 3000 Index and includes approximately 2000 of the smallest securities based on a combination of their market cap and current index membership.
For a discussion on the economic and market environment during the 12-month period ended September 30, 2020, please see the Economic and Market Overview, beginning on page 3.
Subadviser discussion of factors that contributed to the Fund’s performance
Strong stock selection within the health care, communication services, and energy sectors drove the Fund’s outperformance during the period, although this was partially offset by less-than-favorable stock selection within the consumer discretionary, materials, and financials sectors.
The top-performing Fund holdings during the reporting period included Quidel, Renewable Energy, and Zynga. Quidel specializes in rapid diagnostic testing and has been a major beneficiary of the COVID-19 pandemic. In addition to already strong demand for its point-of-care testing for the flu, the company received FDA Emergency Use Authorization (EUA) to market its rapid point-of-care COVID-19 antigen test to detect current infection on its Sofia platform. Renewable Energy Group, a pure play in renewable fuels, has benefited from a growing interest within the sector, as the demand outlook has improved from more U.S. states looking to adopt low carbon fuel standard (LCFS) programs. This has spurred several refiners and integrated oil companies to announce renewable diesel projects. Zynga, a mobile gaming company, experienced strong top-line growth and improved profitability, and the company has a robust pipeline of new game titles in development. Furthermore, Zynga has benefited from an increase in gaming driven by COVID-19-related social distancing mandates.
Fund holdings that were key individual detractors from the Fund’s relative performance included Matador Resources, WSFS Financial, and ProAssurance. Matador Resources, an oil and gas exploration & production (E&P) company, has been negatively affected by low oil prices and decreased demand that was exacerbated by the pandemic – as well as an increase in supply driven by the Russia-Saudi Arabia price war earlier in 2020. Additionally, Matador has a relatively high debt load, which puts the company in a less advantageous position. The Fund eliminated Matador from the portfolio during the period. WSFS, a regional bank, underperformed along with the financials sector, which was the second-worst-performing market segment in the benchmark, directly behind energy. Banks have been particularly challenged during the pandemic, and have been hampered by persistently low interest rates. Finally, ProAssurance, a property and casualty insurer, underperformed after disclosing some material adverse possibilities related to its medical malpractice claims as well as disability claims related to COVID-19 outbreak. This was coupled with a poorly timed acquisition that spooked investors. ProAssurance has also been eliminated from the Fund’s portfolio.
Subadviser outlook
Invesco believes that the worst of the recession is behind us, but the speed at which the economy will continue to recover remains uncertain. A vaccine will not help the economy for the remainder of 2020, in Invesco’s view, as the development and distribution timeline is too long. That said, Invesco’s base case is that at least one of the vaccines in development could receive FDA approval in the fourth quarter of 2020, with the bulk of the distribution in early 2021.
35
MassMutual Premier Small Cap Opportunities Fund – Portfolio Manager Report (Unaudited) (Continued) |
Invesco opines that the further rebound in the economy fueled by the vaccine, when it comes, has the potential to be substantial. This is not a recession caused by excesses that need to be burned off with time (as seen in previous recessions), and there is significant pent-up demand for entertainment and travel-related services. On the other hand, Fund management does not think a simple resumption of the previous economic trend is inevitable. Even with government assistance programs, there are businesses and jobs being permanently lost, and the reallocation of people and resources in the economy could take time. Moreover, Invesco believes this traumatic experience for many consumers is likely to change future behaviors, increasing the savings rate and reducing the velocity of money. Interest rates are low now in the flight to safety and liquidity we have witnessed, but Invesco believes that long-term rates bear watching. Equities represent ownership interests in productive assets, which over the long term, Invesco believes, are still the best place to invest.
MassMutual Premier
Small Cap Opportunities Fund
Largest Holdings
(% of Net Assets) on 9/30/20 |
Renewable Energy Group, Inc. | 2.6% |
LHC Group, Inc. | 2.6% |
BJ’s Wholesale Club Holdings, Inc. | 2.4% |
AutoNation, Inc. | 2.1% |
Tandem Diabetes Care, Inc. | 2.0% |
ASGN, Inc. | 2.0% |
Emergent BioSolutions, Inc. | 1.9% |
Rexnord Corp. | 1.8% |
Four Corners Property Trust, Inc. | 1.8% |
Semtech Corp. | 1.7% |
| | 20.9% |
| | |
MassMutual Premier
Small Cap Opportunities Fund
Sector Table
(% of Net Assets) on 9/30/20 |
Consumer, Non-cyclical | 26.8% |
Financial | 18.5% |
Industrial | 16.1% |
Consumer, Cyclical | 14.7% |
Technology | 12.3% |
Utilities | 3.0% |
Energy | 3.0% |
Basic Materials | 2.6% |
Communications | 1.5% |
Total Long-Term Investments | 98.5% |
Short-Term Investments and Other Assets and Liabilities | 1.5% |
Net Assets | 100.0% |
| | |
36
MassMutual Premier Small Cap Opportunities Fund – Portfolio Manager Report (Unaudited) (Continued) |
GROWTH OF $10,000 INVESTMENT

The graph above illustrates a representative class of the Fund’s historical performance for the past 10 fiscal years or since inception (for Funds lacking 10-year records) in comparison to its benchmark index, as well as one or more additional indexes, if applicable. The performance of other share classes will be greater than or less than the class depicted above.
Average Annual Total Returns (for the periods ended 09/30/2020) | | | |
| Inception Date
of Class | 1 Year | 5 Years | 10 Years | Since Inception
04/01/2014 |
Class I | 04/01/2014 | 2.62% | 8.35% | | 6.10% |
Class R5 | 11/01/2004 | 2.56% | 8.23% | 10.97% | |
Service Class | 11/01/2004 | 2.37% | 8.11% | 10.85% | |
Administrative Class | 11/01/2004 | 2.27% | 8.01% | 10.75% | |
Class R4 | 04/01/2014 | 2.16% | 7.85% | | 5.61% |
Class A | 07/20/1998 | 2.07% | 7.74% | 10.47% | |
Class A (sales load deducted)* | 07/20/1998 | -3.55% | 6.53% | 9.85% | |
Class R3 | 04/01/2014 | 1.87% | 7.56% | | 5.34% |
Russell 2000 Index | | 0.39% | 8.00% | 9.85% | 5.39% |
* | Class A (sales load deducted) returns include the 5.50% maximum sales charge. |
Generally accepted accounting principles require adjustments to be made to the net assets of the Fund at period end for financial reporting purposes only, and as such, the total return based on the unadjusted net asset value per share may differ from the total return reported in the financial highlights.
Performance results in the graph and table are shown both with and without the imposition of the maximum applicable sales charge (if applicable) and reflect the percentage change in net asset value, including reinvestment of dividends and capital gains distributions. Investors should note that the Fund is a professionally managed mutual fund, while the index or indexes shown above are unmanaged, cannot be purchased directly, and, with the exception of any peer group index, do not incur expenses.
Performance data quoted in the graph and table represents past performance; past performance is not predictive of future results. The investment return and principal value of shares of the Fund fluctuate, so your shares, when sold, may be worth more or less than their original cost. Current performance of the Fund may be lower or higher than the performance quoted. The performance shown does not reflect the deduction of taxes, if any, that a shareholder would pay on Fund distributions or the redemption of Fund shares. Performance data current to the most recent month end may be obtained by calling 1-888-309-3539.
Investors should read the Fund’s prospectus with regard to the Fund’s investment objectives, risks, and charges and expenses in conjunction with these financial statements. Employee retirement benefit plans that invest plan assets in the Separate Investment Accounts (SIAs) may be subject to certain charges as set forth in their respective Plan Documents. Total return figures would be lower for the periods presented if they reflected these charges.
37
MassMutual Premier Global Fund – Portfolio Manager Report (Unaudited) |
What is the investment approach of MassMutual Premier Global Fund, and who is the Fund’s subadviser?
The Fund seeks long-term capital appreciation by investing primarily in common stocks of companies in the U.S. and foreign countries. The Fund can invest without limit in foreign securities, including American Depositary Receipts (ADRs), and can invest in any country, including developing or emerging market countries. However, the Fund currently emphasizes investments in developed markets such as the United States, Western European countries, and Japan. As a fundamental policy, the Fund normally will invest in at least three countries (one of which may be the United States). Typically, the Fund invests in a number of different countries. The Fund’s subadviser is Invesco Advisers, Inc. (Invesco).
How did the Fund perform during the 12 months ended September 30, 2020?
The Fund’s Class R5 shares returned 22.77%, outperforming, by a wide margin, the 10.44% return of the MSCI All Country World Index (ACWI) (the “benchmark”), which measures the performance of the large- and mid-cap segments of all country markets. It is free float-adjusted market-capitalization weighted.
For a discussion on the economic and market environment during the 12-month period ended September 30, 2020, please see the Economic and Market Overview, beginning on page 3.
Subadviser discussion of factors that contributed to the Fund’s performance
For the year ended September 30, 2020, the Fund held, on average, overweight allocations, relative to the benchmark, to the consumer discretionary and communication services sectors, and an underweight stake in the financials sector. The Fund outperformed the benchmark in the information technology, energy, utilities, real estate, and consumer staples sectors. For the period, the Fund’s performance was driven by sector allocations.
The three Fund holdings that were major positive contributors to performance for the period were, JD.com, Inc.; Adobe Incorporated; and S&P Global Inc. JD.com, Inc. is the number-two player in e-commerce in China. It has demonstrated through the pandemic the strength and relevance of its end-to-end service model, which marries its e-commerce platform to its wholly owned distribution network. As the pandemic swept across parts of China, JD.com was able to operate in a highly effective manner. Adobe Incorporated, a longtime Fund holding, was among the first software companies to move to a cloud-based subscription model. This has led to a consistent growth trajectory and expanding margins. Adobe is far and away the leader in the creative suite, and in campaign management, which is very relevant to digital advertising. S&P Global Inc. has a very good business model, in Invesco’s view. Its ratings business is oligopolistic and benefits when debt is either being issued or refinanced. Also, it earns a royalty stream off its suite of index offerings, such as the S&P 500® Index. Furthermore, passive investment trends have been very good for S&P Global.
On the downside, the three Fund holdings that were major detractors from performance for the reporting period were Airbus SE, Citigroup Inc. (Citi), and ICICI Bank Limited. Airbus SE, the wide-body aircraft maker, has appealing traits. Among them are limited competition and structurally growing demand for travel. COVID-19, however, has dropped an exogenous shock to the system that will take time to heal. Citi also has been a victim of COVID-19. The aftermath of the pandemic has ushered in a period of low interest rates that central bankers have indicated may last for years. That means that net interest margins could be compressed for an extended period. Consequently, the Fund eliminated Citi from its portfolio earlier in the year. Indian multinational bank ICICI Bank Limited had been on a steady path to improvement in its non-performing loan book. In addition, the loan book has seen growth at a mid-teens rate and its net interest margin has been steady. India remains a structurally “underbanked” nation with attractive demographics, which creates a favorable backdrop for the bank’s future growth potential.
Subadviser outlook
The past 12 months were good for global equities, based merely on the numbers. COVID-19 and its economic shutdowns, however, have sown a recession that, in Invesco’s view, far exceeds that of the global financial crisis – and may even have weighed heavily on the emerging social tension evident in our society today. The reaction, however, from central banks worldwide and from fiscal authorities has been massive. In Invesco’s view, this has spurred financial markets to price a recovery coming, potentially next year, though a full resumption of normal economic activity may not emerge until the second half of 2021.
38
MassMutual Premier Global Fund – Portfolio Manager Report (Unaudited) (Continued) |
Invesco believes that there is some reason for optimism. It appears that there may be several viable vaccine therapies available, to at a minimum vaccinate the more vulnerable in our society. In addition, although some aspects of the way we lived and worked prior to the pandemic may be forever altered, that may be a good thing. Generally speaking, our society is figuring out a way to live forward, not backward, and some of these new ways of doing things may ultimately be viewed as better in the long term.
MassMutual Premier
Global Fund
Largest Holdings
(% of Net Assets) on 9/30/20 |
Alphabet, Inc. Class A | 8.0% |
Adobe, Inc. | 5.2% |
S&P Global, Inc. | 4.9% |
Facebook, Inc. Class A | 4.8% |
LVMH Moet Hennessy Louis Vuitton SE | 4.3% |
JD.com, Inc. ADR | 4.3% |
Intuit, Inc. | 4.0% |
SAP SE | 3.3% |
PayPal Holdings, Inc. | 3.3% |
Nidec Corp. | 3.2% |
| | 45.3% |
| | |
MassMutual Premier
Global Fund
Sector Table
(% of Net Assets) on 9/30/20 |
Industrial | 21.3% |
Technology | 21.3% |
Communications | 20.9% |
Consumer, Non-cyclical | 20.8% |
Consumer, Cyclical | 9.2% |
Financial | 4.7% |
Total Long-Term Investments | 98.2% |
Short-Term Investments and Other Assets and Liabilities | 1.8% |
Net Assets | 100.0% |
| | |
39
MassMutual Premier Global Fund – Portfolio Manager Report (Unaudited) (Continued) |
GROWTH OF $10,000 INVESTMENT

The graph above illustrates a representative class of the Fund’s historical performance for the past 10 fiscal years or since inception (for Funds lacking 10-year records) in comparison to its benchmark index, as well as one or more additional indexes, if applicable. The performance of other share classes will be greater than or less than the class depicted above.
Average Annual Total Returns (for the periods ended 09/30/2020) | | | |
| Inception Date
of Class | 1 Year | 5 Years | 10 Years | Since Inception
04/01/2014 |
Class I | 04/01/2014 | 22.90% | 12.35% | | 9.34% |
Class R5 | 12/31/2004 | 22.77% | 12.25% | 10.59% | |
Service Class | 12/31/2004 | 22.75% | 12.14% | 10.47% | |
Administrative Class | 12/31/2004 | 22.56% | 12.01% | 10.34% | |
Class R4 | 04/01/2014 | 22.36% | 11.85% | | 8.84% |
Class A | 12/31/2004 | 22.22% | 11.73% | 10.06% | |
Class A (sales load deducted)* | 12/31/2004 | 15.50% | 10.48% | 9.43% | |
Class R3 | 12/31/2004 | 21.99% | 11.57% | 9.92% | |
MSCI ACWI Index | | 10.44% | 10.30% | 8.55% | 7.12% |
* | Class A (sales load deducted) returns include the 5.50% maximum sales charge. |
Generally accepted accounting principles require adjustments to be made to the net assets of the Fund at period end for financial reporting purposes only, and as such, the total return based on the unadjusted net asset value per share may differ from the total return reported in the financial highlights.
Performance results in the graph and table are shown both with and without the imposition of the maximum applicable sales charge (if applicable) and reflect the percentage change in net asset value, including reinvestment of dividends and capital gains distributions. Investors should note that the Fund is a professionally managed mutual fund, while the index or indexes shown above are unmanaged, cannot be purchased directly, and, with the exception of any peer group index, do not incur expenses.
Performance data quoted in the graph and table represents past performance; past performance is not predictive of future results. The investment return and principal value of shares of the Fund fluctuate, so your shares, when sold, may be worth more or less than their original cost. Current performance of the Fund may be lower or higher than the performance quoted. The performance shown does not reflect the deduction of taxes, if any, that a shareholder would pay on Fund distributions or the redemption of Fund shares. Performance data current to the most recent month end may be obtained by calling 1-888-309-3539.
Investors should read the Fund’s prospectus with regard to the Fund’s investment objectives, risks, and charges and expenses in conjunction with these financial statements. Employee retirement benefit plans that invest plan assets in the Separate Investment Accounts (SIAs) may be subject to certain charges as set forth in their respective Plan Documents. Total return figures would be lower for the periods presented if they reflected these charges.
40
MassMutual Premier International Equity Fund – Portfolio Manager Report (Unaudited) |
What is the investment approach of MassMutual Premier International Equity Fund, and are is the Fund’s subadvisers?
The Fund seeks to achieve long-term capital appreciation by investing primarily in common stock of foreign companies. Under normal circumstances, the Fund invests at least 80% of its net assets (plus the amount of any borrowings for investment purposes) in securities of foreign companies. The Fund may invest up to 100% of its total assets in such securities. The Fund may invest in emerging markets as well as in developed markets throughout the world. From time to time, the Fund may place greater emphasis on investing in one or more particular regions (such as Asia, Europe, or Latin America). The Fund’s subadvisers are Wellington Management Company LLP (Wellington Management), which managed approximately 74% of the Fund’s portfolio; and Thompson, Siegel & Walmsley LLC (TSW), which was responsible for approximately 26% of the Fund’s portfolio, as of September 30, 2020. Effective August 4, 2020, Wellington Management and TSW replaced Invesco Advisers, Inc. (Invesco) as co-subadvisers of the Fund.
How did the Fund perform during the 12 months ended September 30, 2020?
The Fund’s Class R5 shares returned 13.14%, outperforming, by a wide margin, the 3.00% return of the MSCI All Country World Index (ACWI) ex USA (the “benchmark”), which measures the performance of the large- and mid-cap segments of the particular regions, excluding U.S. equity securities, including developed and emerging markets. It is free float-adjusted market-capitalization weighted.
For a discussion on the economic and market environment during the 12-month period ended September 30, 2020, please see the Economic and Market Overview, beginning on page 3.
Subadviser discussion of factors that contributed to the Fund’s performance
During the portion of the period that Invesco served as a subadviser of the Fund (October 1, 2019–August 3, 2020), the Fund outperformed in all sectors relative to the benchmark, although outperformance was greatest in the information technology sector due to the Fund’s overweight position; in the financials sector, because of an underweight stake; in health care, due to an overweight allocation; and in energy, due to an underweight position. The companies that contributed the most to performance during the fiscal year were ASML Holding NV, Taiwan Semiconductor Manufacturing Company (TSMC), and EPAM Systems, Inc. ASML Holding NV, a Dutch company, makes the equipment needed for producing semiconductors. It is the only supplier of the extreme ultraviolet lithography equipment that is required to produce the next generation of semiconductor chips. TSMC has become the dominant player in the semiconductor foundry industry. The need for semiconductors continues to proliferate as the “internet of things” becomes a reality and individuals digitize more of their business and personal activities. The complexity and capital intensity of high-end semiconductor production has highly concentrated the industry such that it is now, in effect, an oligopoly, and TSMC holds the lion’s share. EPAM Systems, Inc. is an Eastern European information technology services company that focuses on helping businesses digitize their operations.
On the downside, the companies that detracted the most from Invesco’s performance during the reporting period were Airbus SE, TechnipFMC plc, and Melrose Industries PLC. Airbus SE dominates the wide-body, long-haul jet market, with its U.S. competitor Boeing. TechnipFMC plc, a Franco-U.S. company, is a leading provider of oil services around the world. Melrose Industries PLC is a U.K. company that acquires underperforming industrial businesses, primarily in the manufacturing sector, and improves their return structure. Melrose Industries has a significant investment in the aerospace industry, so its shares declined in conjunction with all things air travel-related in the coronavirus market sell-off.
TSW became a co-subadviser of the Fund on August 4, 2020. For the period from August 4–September 30, 2020, the United Kingdom contributed the most to the TSW Fund component’s relative returns. Sports betting and gaming group GVC was one Fund component holding that performed well after one of its competitors, William Hill Plc, announced it was in takeover discussions with Caesars Entertainment and Apollo Management. On the downside, Japan is the region that detracted the most from the Fund component’s relative performance. Within Japan, Toshiba was the Fund component holding that was the largest detractor; it declined after reporting results heavily impacted by COVID-19, despite maintaining its full-year guidance. From a sector perspective, communication services and materials contributed the most to relative returns. In the communication services sector, Japanese video game and electronics company Nintendo advanced, as consumer behavior during COVID-19 continued to boost sales of Switch consoles and games. In the materials sector, Irish packaging company Smurfit Kappa benefited from an improving pricing environment. On the downside, the industrials sector detracted the most from relative results, with Toshiba being the primary laggard.
41
MassMutual Premier International Equity Fund – Portfolio Manager Report (Unaudited) (Continued) |
Wellington Management became a subadviser of the Fund on August 4, 2020. For the period from August 4–September 30, 2020, favorable security selection within the financials and health care sectors primarily drove the Fund component’s performance, although this was somewhat offset by security selection within the industrials and communication services sectors. Sector allocation, a residual of Wellington Management’s bottom-up stock selection process, aided performance, driven by underweights to energy and financials, but was somewhat offset by an underweight to consumer discretionary. Fund component holdings that were top contributors to relative performance during the period included Sysmex and Canadian National Railway. Shares of Japanese health care company Sysmex rose following positive clinical study results. Despite the company reporting disappointing second-quarter results, shares of freight railway Canadian National Railway rose during the period, aided by shipments of higher volumes of grain and the company’s buyout of TransX. Fund component holding KDDI was a top detractor from relative returns during the period, and a lack of exposure to benchmark holding Alibaba also hurt relative performance. Shares of KDDI, a Japanese telecommunications operator, declined over the period on concerns that Yoshihide Suga, Japan’s new prime minister, is considering charging carriers for the use of public radio waves. Shares of Alibaba, a Chinese technology company, rose during the period after the company reported fiscal first-quarter results that beat both revenue and earnings estimates, with revenue growth returning to levels not seen since the pandemic.
Subadviser outlook
TSW notes that global equities continued to rebound from COVID-19 lows in the third quarter of 2020. In its view, consecutive periods of strong equity performance demonstrate the potential for a global economic recovery and continued risk appetite. The recovery has favored IT, cyclicals, and companies with pricing power while the energy, real estate, and financials sectors have been notable laggards. TSW believes there has been no shortage of stocks offering favorable risk/reward profiles, as company-specific valuations are foregone in favor of sector allocations.
Wellington Management continues to see the risk of a strong “second wave” of the coronavirus this fall. Already, there has been a dramatic resurgence of cases in Europe, and early signs of reacceleration in the U.S. Wellington Management believes that the risk of more economic pain from this pandemic is not yet behind us. In addition, Wellington Management views that the political climate in the U.S. has become increasingly worrisome. Policy uncertainty is very high, and the risk of a disjointed and disrupted election only adds to the risk in markets.
MassMutual Premier
International Equity Fund
Largest Holdings
(% of Net Assets) on 9/30/20 |
Nestle SA Registered | 3.1% |
Novartis AG Registered | 3.0% |
Linde PLC | 3.0% |
Roche Holding AG | 3.0% |
Reckitt Benckiser Group PLC | 2.9% |
AIA Group Ltd. | 2.8% |
Canadian National Railway Co. | 2.6% |
Koninklijke Philips NV | 2.4% |
Schneider Electric SE | 2.4% |
Astellas Pharma, Inc. | 2.4% |
| | 27.6% |
| | |
MassMutual Premier
International Equity Fund
Sector Table
(% of Net Assets) on 9/30/20 |
Consumer, Non-cyclical | 40.9% |
Industrial | 13.2% |
Financial | 13.0% |
Consumer, Cyclical | 8.1% |
Technology | 5.6% |
Utilities | 5.1% |
Basic Materials | 4.4% |
Communications | 3.0% |
Energy | 2.1% |
Mutual Funds | 1.1% |
Diversified | 0.3% |
Total Long-Term Investments | 96.8% |
Short-Term Investments and Other Assets and Liabilities | 3.2% |
Net Assets | 100.0% |
| | |
42
MassMutual Premier International Equity Fund – Portfolio Manager Report (Unaudited) (Continued) |
GROWTH OF $10,000 INVESTMENT
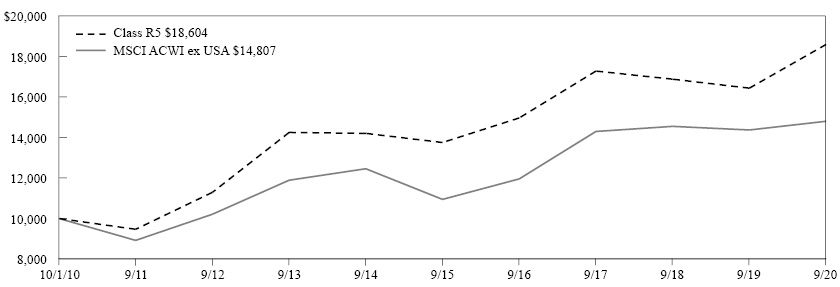
The graph above illustrates a representative class of the Fund’s historical performance for the past 10 fiscal years or since inception (for Funds lacking 10-year records) in comparison to its benchmark index, as well as one or more additional indexes, if applicable. The performance of other share classes will be greater than or less than the class depicted above.
Average Annual Total Returns (for the periods ended 09/30/2020) | | | |
| Inception Date
of Class | 1 Year | 5 Years | 10 Years | Since Inception
04/01/2014 |
Class I | 04/01/2014 | 13.17% | 6.33% | | 3.18% |
Class R5 | 10/03/1994 | 13.14% | 6.22% | 6.40% | |
Service Class | 01/01/1998 | 12.94% | 6.10% | 6.32% | |
Administrative Class | 05/03/1999 | 12.81% | 5.99% | 6.19% | |
Class R4 | 04/01/2014 | 12.70% | 5.86% | | 2.71% |
Class A | 01/01/1998 | 12.61% | 5.73% | 5.94% | |
Class A (sales load deducted)* | 01/01/1998 | 6.42% | 4.54% | 5.34% | |
Class R3 | 04/01/2014 | 12.42% | 5.59% | | 2.45% |
MSCI ACWI ex USA | | 3.00% | 6.23% | 4.00% | 2.61% |
* | Class A (sales load deducted) returns include the 5.50% maximum sales charge. |
Generally accepted accounting principles require adjustments to be made to the net assets of the Fund at period end for financial reporting purposes only, and as such, the total return based on the unadjusted net asset value per share may differ from the total return reported in the financial highlights.
Performance results in the graph and table are shown both with and without the imposition of the maximum applicable sales charge (if applicable) and reflect the percentage change in net asset value, including reinvestment of dividends and capital gains distributions. Investors should note that the Fund is a professionally managed mutual fund, while the index or indexes shown above are unmanaged, cannot be purchased directly, and, with the exception of any peer group index, do not incur expenses.
Performance data quoted in the graph and table represents past performance; past performance is not predictive of future results. The investment return and principal value of shares of the Fund fluctuate, so your shares, when sold, may be worth more or less than their original cost. Current performance of the Fund may be lower or higher than the performance quoted. The performance shown does not reflect the deduction of taxes, if any, that a shareholder would pay on Fund distributions or the redemption of Fund shares. Performance data current to the most recent month end may be obtained by calling 1-888-309-3539.
Investors should read the Fund’s prospectus with regard to the Fund’s investment objectives, risks, and charges and expenses in conjunction with these financial statements. Employee retirement benefit plans that invest plan assets in the Separate Investment Accounts (SIAs) may be subject to certain charges as set forth in their respective Plan Documents. Total return figures would be lower for the periods presented if they reflected these charges.
43
MassMutual Premier Strategic Emerging Markets Fund – Portfolio Manager Report (Unaudited) |
What is the investment approach of MassMutual Premier Strategic Emerging Markets Fund, and who is the Fund’s subadviser?
The Fund seeks long-term capital growth by investing mainly in common stocks of issuers in developing and emerging markets throughout the world and at times may invest up to 100% of its total assets in foreign securities. Under normal market conditions, the Fund will invest at least 80% of its net assets (plus the amount of any borrowings for investment purposes) in equity securities of issuers whose principal activities are in a developing (or emerging) market, i.e., are in a developing market or are economically tied to a developing market country. The Fund will invest in at least three developing markets. In general, countries may be considered developing or emerging markets if they are included in any one of the MSCI emerging markets indices, classified as a developing or emerging market, or classified under a similar or corresponding classification, by organizations such as the World Bank and the International Monetary Fund, or have economies, industries, and stock markets with similar characteristics. The Fund’s subadviser is Invesco Advisers, Inc. (Invesco).
How did the Fund perform during the 12 months ended September 30, 2020?
The Fund’s Class R5 shares returned 10.15%, underperforming the 10.54% return of the MSCI Emerging Markets (EM) Index (the “benchmark”), which measures the performance of the large- and mid-cap segments of emerging market equity securities. It is free float-adjusted market-capitalization weighted.
For a discussion on the economic and market environment during the 12-month period ended September 30, 2020, please see the Economic and Market Overview, beginning on page 3.
Subadviser discussion of factors that contributed to the Fund’s performance
For the year ended September 30, 2020, stock selection and an underweight allocation to consumer staples, relative to the benchmark, detracted from the Fund’s performance, as did an overweight to, and stock selection within, the financials sector. An underweight in the information technology sector also hampered the Fund’s performance. On the positive side, stock selection in the communication services sector and an overweight stake in the consumer discretionary sector contributed to relative performance. With regard to country exposure, stock selection in India, as well as overweights to and stock selection within Mexico and Peru detracted from performance. On the other hand, stock selection in China and Brazil, along with an overweight to France, were the main contributors to the Fund’s relative returns.
Fund holdings that were detractors from absolute performance included Fomento Economico Mexicano (FEMSA), FirstRand Limited, and Housing Development Finance Corporation. FEMSA has transformed itself over the past several years from one of the largest beverage companies in Latin America to a leading retail operator. While the company has strong expansion and long-term growth opportunities, the Mexican economy has created a challenging backdrop in the near term and this weighed on the stock during the reporting period. FirstRand Limited, one of the largest banks in South Africa, underperformed due to the unfavorable economic conditions in South Africa, which generated severe macroeconomic headwinds that impacted the stock. The Fund trimmed its position in FirstRand Limited in the third quarter of 2020. Housing Development Finance Corporation (HDFC), a long-term holding of the Fund, provides financial services to consumers and corporations in India. HDFC declined due to several macroeconomic headwinds. These included a weak real estate market, development stagnation, and expectations for weak economic growth in India, all of which pre-dated the global pandemic.
Turning to the positive, Fund holdings that contributed to absolute performance during the reporting period included Alibaba, Taiwan Semiconductor Manufacturing (TSMC), and Tencent. Alibaba, one of China’s most dominant internet companies, reported a strong recovery in core commerce in concert with profitability improvement, which resulted from stringent cost control measures implemented in the wake of the pandemic. TSMC is the world’s preeminent semiconductor foundry. For the past 30 years, the company has made in-house design and innovation a priority, while placing a large emphasis on client service and trust, allowing them to capture a majority of the overall market share. Tencent is a Chinese internet company that has created a broad ecosystem built on gaming, messaging, fintech, cloud, and content. During the reporting period, mobile game growth accelerated with high Daily Average Users (DAU), which many largely attribute to the COVID-19 lockdown.
44
MassMutual Premier Strategic Emerging Markets Fund – Portfolio Manager Report (Unaudited) (Continued) |
Subadviser outlook
During this period of crisis and uncertainty, Invesco remains focused on understanding the macroeconomic pressures that are idiosyncratic to emerging markets, while maintaining its unwavering approach of bottom-up investing that focuses on the long term and avoids tactical decisions. Invesco plans to continue seeking high-quality companies that have durable long-term growth potential, supported by strong competitive positions, balance sheets, and cash flows that will potentially enable them to thrive in the post-coronavirus world. At period-end, the Fund had exposure to sectors and industries where Fund management views dynamic change and real value potentially being extracted – including ecommerce, cloud computing, internet services, health care, travel, and education.
MassMutual Premier
Strategic Emerging Markets Fund
Largest Holdings
(% of Net Assets) on 9/30/20 |
Taiwan Semiconductor Manufacturing Co. Ltd. | 8.1% |
Tencent Holdings Ltd. | 7.2% |
Alibaba Group Holding Ltd. Sponsored ADR | 6.4% |
Kering SA | 5.2% |
Yum China Holdings, Inc. | 4.0% |
AIA Group Ltd. | 3.9% |
Housing Development Finance Corp. Ltd. | 3.9% |
Yandex NV Class A | 3.5% |
Huazhu Group Ltd. ADR | 3.4% |
Kotak Mahindra Bank Ltd. | 2.8% |
| | 48.4% |
| | |
MassMutual Premier
Strategic Emerging Markets Fund
Sector Table
(% of Net Assets) on 9/30/20 |
Financial | 23.6% |
Consumer, Cyclical | 18.9% |
Communications | 18.5% |
Technology | 12.3% |
Consumer, Non-cyclical | 11.3% |
Industrial | 4.8% |
Energy | 3.4% |
Basic Materials | 3.0% |
Mutual Funds | 0.4% |
Total Long-Term Investments | 96.2% |
Short-Term Investments and Other Assets and Liabilities | 3.8% |
Net Assets | 100.0% |
| | |
45
MassMutual Premier Strategic Emerging Markets Fund – Portfolio Manager Report (Unaudited) (Continued) |
GROWTH OF $10,000 INVESTMENT
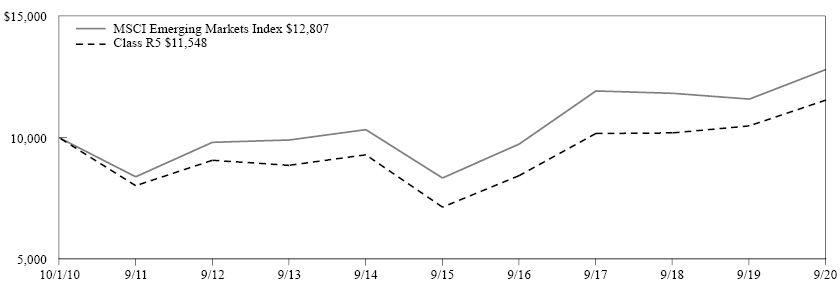
The graph above illustrates a representative class of the Fund’s historical performance for the past 10 fiscal years or since inception (for Funds lacking 10-year records) in comparison to its benchmark index, as well as one or more additional indexes, if applicable. The performance of other share classes will be greater than or less than the class depicted above.
Average Annual Total Returns (for the periods ended 09/30/2020) | | | | |
| Inception Date
of Class | 1 Year | 5 Years | 10 Years | Since Inception
03/01/2011 | Since Inception
04/01/2014 |
Class I | 03/01/2011 | 10.24% | 10.24% | | 1.57% | |
Class R5 | 11/03/2008 | 10.15% | 10.11% | 1.45% | | |
Service Class | 11/03/2008 | 10.03% | 10.00% | 1.36% | | |
Administrative Class | 11/03/2008 | 9.88% | 9.90% | 1.25% | | |
Class R4 | 04/01/2014 | 9.76% | 9.75% | | | 3.64% |
Class A | 11/03/2008 | 9.67% | 9.64% | 1.00% | | |
Class A (sales load deducted)* | 11/03/2008 | 3.63% | 8.41% | 0.43% | | |
Class R3 | 04/01/2014 | 9.49% | 9.45% | | | 3.37% |
MSCI Emerging Markets Index | | 10.54% | 8.97% | 2.50% | 2.25% | 3.82% |
* | Class A (sales load deducted) returns include the 5.50% maximum sales charge. |
Generally accepted accounting principles require adjustments to be made to the net assets of the Fund at period end for financial reporting purposes only, and as such, the total return based on the unadjusted net asset value per share may differ from the total return reported in the financial highlights.
Performance results in the graph and table are shown both with and without the imposition of the maximum applicable sales charge (if applicable) and reflect the percentage change in net asset value, including reinvestment of dividends and capital gains distributions. Investors should note that the Fund is a professionally managed mutual fund, while the index or indexes shown above are unmanaged, cannot be purchased directly, and, with the exception of any peer group index, do not incur expenses.
Performance data quoted in the graph and table represents past performance; past performance is not predictive of future results. The investment return and principal value of shares of the Fund fluctuate, so your shares, when sold, may be worth more or less than their original cost. Current performance of the Fund may be lower or higher than the performance quoted. The performance shown does not reflect the deduction of taxes, if any, that a shareholder would pay on Fund distributions or the redemption of Fund shares. Performance data current to the most recent month end may be obtained by calling 1-888-309-3539.
Investors should read the Fund’s prospectus with regard to the Fund’s investment objectives, risks, and charges and expenses in conjunction with these financial statements. Employee retirement benefit plans that invest plan assets in the Separate Investment Accounts (SIAs) may be subject to certain charges as set forth in their respective Plan Documents. Total return figures would be lower for the periods presented if they reflected these charges.
46
MassMutual Premier U.S. Government Money Market Fund – Portfolio of Investments |
September 30, 2020 |
| | | Principal
Amount | | | Value | |
SHORT-TERM INVESTMENTS — 100.1% |
Discount Notes — 67.7% |
Federal Farm Credit Bank | | | | | | | | |
0.142% , 10/02/20, 10/02/20 (a) | | $ | 900,000 | | | $ | 899,997 | |
SOFR + .080% 0.150% FRN , 10/01/20, 1/14/21 (a) | | | 3,000,000 | | | | 3,000,000 | |
0.152% , 10/02/20, 10/02/20 (a) | | | 2,400,000 | | | | 2,399,990 | |
1 mo. USD LIBOR + .090% 0.246% FRN , 10/21/20, 4/21/21 (a) | | | 5,000,000 | | | | 5,002,363 | |
1.613% , 11/10/20, 11/10/20 (a) | | | 4,200,000 | | | | 4,192,673 | |
Federal Home Loan Bank | | | | | | | | |
0.051% , 10/01/20, 10/01/20 (a) | | | 5,340,000 | | | | 5,340,000 | |
0.051% 10/14/20, 10/14/20 (a) | | | 700,000 | | | | 699,987 | |
3 mo. USD LIBOR - .205% 0.070% FRN , 10/15/20, 10/15/20 (a) | | | 18,000,000 | | | | 18,000,000 | |
0.076% , 10/22/20, 10/22/20 (a) | | | 2,500,000 | | | | 2,499,891 | |
SOFR + .030% 0.100% FRN , 10/01/20, 1/28/21 (a) | | | 21,000,000 | | | | 21,000,000 | |
0.101% 10/28/20, 10/28/20 (a) | | | 8,800,000 | | | | 8,799,340 | |
0.107% , 10/21/20, 10/21/20 (a) | | | 10,000,000 | | | | 9,999,417 | |
0.117% , 12/09/20, 12/09/20 (a) | | | 7,900,000 | | | | 7,898,259 | |
0.117% , 12/21/20, 12/21/20 (a) | | | 6,000,000 | | | | 5,998,447 | |
SOFR + .050% 0.120% FRN , 10/01/20, 1/28/21 (a) | | | 4,600,000 | | | | 4,600,000 | |
SOFR + .060% 0.130% FRN , 10/01/20, 2/11/22 (a) | | | 13,000,000 | | | | 13,000,000 | |
3 mo. USD LIBOR - .170% 0.134% FRN , 10/06/20, 1/06/21 (a) | | | 4,700,000 | | | | 4,700,257 | |
SOFR + .065% 0.135% FRN , 10/01/20, 2/26/21 (a) | | | 13,000,000 | | | �� | 13,000,000 | |
0.142% , 10/13/20, 10/13/20 (a) | | | 1,850,000 | | | | 1,849,914 | |
SOFR + .080% 0.150% FRN , 10/02/20, 10/02/20 (a) | | | 5,000,000 | | | | 5,000,001 | |
SOFR + .090% 0.160% FRN , 10/01/20, 11/20/20 (a) | | | 5,000,000 | | | | 5,000,000 | |
SOFR + .090% 0.160% FRN , 10/01/20, 11/30/20 (a) | | | 7,000,000 | | | | 7,000,000 | |
SOFR + .100% 0.170% FRN , 10/01/20, 12/23/20 (a) | | | 7,000,000 | | | | 7,000,000 | |
SOFR + .110% 0.180% FRN , 10/01/20, 12/10/20 (a) | | | 12,000,000 | | | | 12,000,000 | |
0.223% , 11/24/20, 11/24/20 (a) | | | 1,000,000 | | | | 999,670 | |
0.376% 1/20/21, 1/20/21 (a) | | | 5,000,000 | | | | 4,994,296 | |
Federal Home Loan Mortgage Corp. SOFR + .030% 0.100% FRN, 10/01/20, 1/12/21(a) | | | 12,000,000 | | | | 12,000,000 | |
Federal National Mortgage Association | | | | | | | | |
0.076% , 10/07/20, 10/07/20 (a) | | | 264,000 | | | | 263,997 | |
| | | Principal
Amount | | | Value | |
SOFR + .075% 0.145% FRN , 10/01/20, 10/30/20 (a) | | $ | 1,000,000 | | | $ | 1,000,031 | |
| | | | | | | | 188,138,530 | |
Repurchase Agreement — 12.6% |
HSBC Securities (USA) Inc., Tri-Party Repurchase Agreement, dated 9/30/20, 0.050%, due 10/01/20 (b) | | | 35,000,000 | | | | 35,000,000 | |
U.S. Treasury Bonds & Notes — 19.8% |
U.S. Treasury Bill | | | | | | | | |
0.000% 10/06/20 | | | 1,700,000 | | | | 1,699,989 | |
0.000% 10/06/20 | | | 600,000 | | | | 599,993 | |
0.000% 10/13/20 | | | 11,400,000 | | | | 11,399,724 | |
0.000% 10/20/20 | | | 7,600,000 | | | | 7,599,711 | |
0.000% 10/20/20 | | | 7,000,000 | | | | 6,999,673 | |
0.000% 10/27/20 | | | 16,600,000 | | | | 16,598,851 | |
0.000% 11/17/20 | | | 5,100,000 | | | | 5,099,434 | |
U.S. Treasury Note | | | | | | | | |
2.875% 10/31/20 | | | 5,000,000 | | | | 5,005,323 | |
| | | | | | | | 55,002,698 | |
| | | | | | | | | |
TOTAL SHORT-TERM INVESTMENTS (Cost $278,141,228) | | | | | | | 278,141,228 | |
| | | | | | | | | |
TOTAL INVESTMENTS — 100.1% (Cost $278,141,228) (c) | | | | | | | 278,141,228 | |
| | | | | | | | | |
Other Assets/(Liabilities) — (0.1)% | | | | | | | (149,978 | ) |
| | | | | | | | | |
NET ASSETS — 100.0% | | | | | | $ | 277,991,250 | |
Abbreviation Legend
Notes to Portfolio of Investments
Percentages are stated as a percent of net assets.
(a) | The stated maturity dates reflect reset date and final maturity date, respectively. |
(b) | Maturity value of $35,000,049. Collateralized by U.S. Government Agency obligations with a rate of 4.375%, maturity date of 11/15/39, and an aggregate market value, including accrued interest, of $35,700,099. |
(c) | See Note 6 for aggregate cost for federal tax purposes. |
The accompanying notes are an integral part of the financial statements.
47
MassMutual Premier Short-Duration Bond Fund – Portfolio of Investments |
September 30, 2020 |
| | | Principal
Amount | | | Value | |
BONDS & NOTES — 94.9% |
CORPORATE DEBT — 41.0% |
Agriculture — 1.5% |
BAT Capital Corp. | | | | | | | | |
3.222% 8/15/24 | | $ | 1,100,000 | | | $ | 1,176,909 | |
Bunge Ltd. Finance Corp. | | | | | | | | |
1.630% 8/17/25 | | | 320,000 | | | | 321,400 | |
3.500% 11/24/20 | | | 1,690,000 | | | | 1,697,397 | |
Imperial Brands Finance PLC | | | | | | | | |
3.125% 7/26/24 (a) | | | 1,043,000 | | | | 1,102,944 | |
3.500% 2/11/23 (a) | | | 979,000 | | | | 1,024,133 | |
Reynolds American, Inc. | | | | | | | | |
4.450% 6/12/25 | | | 985,000 | | | | 1,108,458 | |
| | | | | | | | 6,431,241 | |
Airlines — 0.1% |
American Airlines Pass-Through Trust, Series 2014-1, Class B, | | | | | | | | |
4.375% 4/01/24 | | | 58,601 | | | | 41,502 | |
Delta Air Lines, Inc. / SkyMiles IP Ltd. | | | | | | | | |
4.500% 10/20/25 (a) | | | 408,000 | | | | 418,956 | |
| | | | | | | | 460,458 | |
Auto Manufacturers — 2.0% |
Ford Motor Credit Co. LLC | | | | | | | | |
3 mo. USD LIBOR + .810% 1.114% FRN 4/05/21 | | | 660,000 | | | | 650,351 | |
3 mo. USD LIBOR + 1.235% 1.515% FRN 2/15/23 | | | 1,130,000 | | | | 1,039,814 | |
3.087% 1/09/23 | | | 625,000 | | | | 612,431 | |
3.350% 11/01/22 | | | 935,000 | | | | 920,975 | |
General Motors Financial Co., Inc. | | | | | | | | |
3.250% 1/05/23 | | | 2,465,000 | | | | 2,547,546 | |
Hyundai Capital America | | | | | | | | |
2.375% 2/10/23 (a) | | | 1,510,000 | | | | 1,550,228 | |
2.850% 11/01/22 (a) | | | 810,000 | | | | 837,637 | |
Nissan Motor Acceptance Corp. | | | | | | | | |
1.900% 9/14/21 (a) | | | 485,000 | | | | 486,968 | |
| | | | | | | | 8,645,950 | |
Banks — 8.6% |
ABN AMRO Bank NV | | | | | | | | |
4.750% 7/28/25 (a) | | | 985,000 | | | | 1,109,208 | |
Banco Santander SA | | | | | | | | |
2.746% 5/28/25 | | | 1,200,000 | | | | 1,258,744 | |
3.500% 4/11/22 | | | 1,030,000 | | | | 1,068,395 | |
Bank of America Corp. 3 mo. USD LIBOR + .930% | | | | | | | | |
2.816% VRN 7/21/23 | | | 3,230,000 | | | | 3,354,756 | |
The Bank of Nova Scotia | | | | | | | | |
4.500% 12/16/25 | | | 1,020,000 | | | | 1,181,551 | |
| | | Principal
Amount | | | Value | |
Barclays Bank PLC | | | | | | | | |
10.179% 6/12/21 (a) | | $ | 1,522,000 | | | $ | 1,601,310 | |
Barclays PLC 3 mo. USD LIBOR + 1.380% | | | | | | | | |
1.660% FRN 5/16/24 | | | 595,000 | | | | 596,621 | |
BPCE SA | | | | | | | | |
5.700% 10/22/23 (a) | | | 1,895,000 | | | | 2,125,231 | |
Citigroup, Inc. | | | | | | | | |
4.400% 6/10/25 | | | 1,965,000 | | | | 2,217,125 | |
Credit Suisse AG | | | | | | | | |
6.500% 8/08/23 (a) | | | 2,400,000 | | | | 2,718,000 | |
Danske Bank A/S | | | | | | | | |
5.000% 1/12/22 (a) | | | 1,080,000 | | | | 1,134,592 | |
Deutsche Bank AG SOFR + 2.159% | | | | | | | | |
2.222% VRN 9/18/24 | | | 1,525,000 | | | | 1,535,599 | |
Discover Bank | | | | | | | | |
4.200% 8/08/23 | | | 1,000,000 | | | | 1,094,880 | |
First Horizon National Corp. | | | | | | | | |
3.500% 12/15/20 | | | 1,290,000 | | | | 1,294,384 | |
The Goldman Sachs Group, Inc. | | | | | | | | |
4.250% 10/21/25 | | | 4,195,000 | | | | 4,772,656 | |
HSBC Holdings PLC | | | | | | | | |
4.250% 3/14/24 | | | 2,025,000 | | | | 2,171,537 | |
Mitsubishi UFJ Financial Group, Inc. | | | | | | | | |
2.665% 7/25/22 | | | 1,350,000 | | | | 1,399,544 | |
Morgan Stanley | | | | | | | | |
SOFR + 1.990% 2.188% VRN 4/28/26 | | | 1,030,000 | | | | 1,078,703 | |
4.100% 5/22/23 | | | 984,000 | | | | 1,065,840 | |
Sumitomo Mitsui Financial Group, Inc. | | | | | | | | |
1.474% 7/08/25 | | | 780,000 | | | | 794,344 | |
2.448% 9/27/24 | | | 855,000 | | | | 903,269 | |
3.748% 7/19/23 | | | 364,000 | | | | 394,423 | |
Synchrony Bank | | | | | | | | |
3.000% 6/15/22 | | | 750,000 | | | | 773,988 | |
UBS Group AG | | | | | | | | |
4.125% 9/24/25 (a) | | | 840,000 | | | | 956,829 | |
| | | | | | | | 36,601,529 | |
Beverages — 1.0% |
Bacardi Ltd. | | | | | | | | |
4.450% 5/15/25 (a) | | | 1,756,000 | | | | 1,961,367 | |
Molson Coors Beverage Co. | | | | | | | | |
3.000% 7/15/26 | | | 1,380,000 | | | | 1,471,246 | |
3.500% 5/01/22 | | | 720,000 | | | | 748,579 | |
| | | | | | | | 4,181,192 | |
Chemicals — 1.6% |
DuPont de Nemours, Inc. | | | | | | | | |
4.493% 11/15/25 | | | 1,660,000 | | | | 1,913,416 | |
The accompanying notes are an integral part of the financial statements.
48
MassMutual Premier Short-Duration Bond Fund – Portfolio of Investments (Continued) |
| | | Principal
Amount | | | Value | |
Huntsman International LLC | | | | | | | | |
5.125% 11/15/22 | | $ | 1,798,000 | | | $ | 1,933,386 | |
Nutrition & Biosciences, Inc. | | | | | | | | |
1.230% 10/01/25 (a) | | | 800,000 | | | | 797,996 | |
RPM International, Inc. | | | | | | | | |
3.450% 11/15/22 | | | 43,000 | | | | 44,561 | |
Syngenta Finance NV | | | | | | | | |
4.441% 4/24/23 (a) | | | 1,460,000 | | | | 1,541,966 | |
4.892% 4/24/25 (a) | | | 565,000 | | | | 612,575 | |
| | | | | | | | 6,843,900 | |
Computers — 1.3% |
Dell International LLC / EMC Corp. | | | | | | | | |
4.000% 7/15/24 (a) | | | 1,113,000 | | | | 1,201,794 | |
5.850% 7/15/25 (a) | | | 836,000 | | | | 974,100 | |
Genpact Luxembourg Sarl | | | | | | | | |
3.375% 12/01/24 | | | 905,000 | | | | 947,706 | |
3.700% STEP 4/01/22 | | | 1,480,000 | | | | 1,515,140 | |
Leidos, Inc. | | | | | | | | |
2.950% 5/15/23 (a) | | | 910,000 | | | | 951,933 | |
| | | | | | | | 5,590,673 | |
Diversified Financial Services — 4.0% |
AerCap Ireland Capital DAC / AerCap Global Aviation Trust | | | | | | | | |
2.875% 8/14/24 | | | 2,190,000 | | | | 2,109,279 | |
AerCap Ireland Capital DAC/AerCap Global Aviation Trust | | | | | | | | |
4.500% 9/15/23 | | | 590,000 | | | | 608,025 | |
Aircastle Ltd. | | | | | | | | |
5.000% 4/01/23 | | | 2,390,000 | | | | 2,395,385 | |
Antares Holdings LP | | | | | | | | |
6.000% 8/15/23 (a) | | | 1,172,000 | | | | 1,185,194 | |
Avolon Holdings Funding Ltd. | | | | | | | | |
2.875% 2/15/25 (a) | | | 815,000 | | | | 747,030 | |
BGC Partners, Inc. | | | | | | | | |
4.375% 12/15/25 (a) | | | 785,000 | | | | 800,868 | |
Brookfield Finance, Inc. | | | | | | | | |
4.000% 4/01/24 | | | 1,520,000 | | | | 1,673,244 | |
Lazard Group LLC | | | | | | | | |
3.750% 2/13/25 | | | 1,840,000 | | | | 1,994,495 | |
LeasePlan Corp. NV | | | | | | | | |
2.875% 10/24/24 (a) | | | 715,000 | | | | 737,892 | |
Park Aerospace Holdings Ltd. | | | | | | | | |
5.250% 8/15/22 (a) | | | 3,310,000 | | | | 3,323,390 | |
Synchrony Financial | | | | | | | | |
2.850% 7/25/22 | | | 1,540,000 | | | | 1,584,888 | |
| | | | | | | | 17,159,690 | |
| | | Principal
Amount | | | Value | |
Electric — 0.9% |
Enel Finance International NV | | | | | | | | |
2.875% 5/25/22 (a) | | $ | 755,000 | | | $ | 779,062 | |
Entergy Texas, Inc. | | | | | | | | |
2.550% 6/01/21 | | | 605,000 | | | | 613,006 | |
Pacific Gas and Electric Co. | | | | | | | | |
1.750% 6/16/22 | | | 1,465,000 | | | | 1,466,760 | |
Puget Energy, Inc. | | | | | | | | |
6.000% 9/01/21 | | | 740,000 | | | | 775,471 | |
| | | | | | | | 3,634,299 | |
Gas — 0.4% |
NiSource, Inc. | | | | | | | | |
0.950% 8/15/25 | | | 1,505,000 | | | | 1,503,422 | |
Housewares — 0.5% |
Newell Brands, Inc. | | | | | | | | |
4.350% STEP 4/01/23 | | | 2,015,000 | | | | 2,106,239 | |
Insurance — 3.2% |
AmTrust Financial Services, Inc. | | | | | | | | |
6.125% 8/15/23 | | | 1,565,000 | | | | 1,451,066 | |
Athene Global Funding | | | | | | | | |
2.750% 6/25/24 (a) | | | 2,650,000 | | | | 2,763,141 | |
CNO Financial Group, Inc. | | | | | | | | |
5.250% 5/30/25 | | | 1,515,000 | | | | 1,737,650 | |
Enstar Group Ltd. | | | | | | | | |
4.500% 3/10/22 | | | 1,800,000 | | | | 1,875,330 | |
Equitable Holdings, Inc. | | | | | | | | |
3.900% 4/20/23 | | | 211,000 | | | | 226,851 | |
Jackson National Life Global Funding | | | | | | | | |
2.500% 6/27/22 (a) | | | 1,040,000 | | | | 1,074,342 | |
Lincoln National Corp. | | | | | | | | |
4.000% 9/01/23 | | | 310,000 | | | | 338,428 | |
Trinity Acquisition PLC | | | | | | | | |
3.500% 9/15/21 | | | 1,215,000 | | | | 1,244,945 | |
Unum Group | | | | | | | | |
3.875% 11/05/25 | | | 1,395,000 | | | | 1,516,116 | |
4.500% 3/15/25 | | | 620,000 | | | | 688,684 | |
Willis Towers Watson PLC | | | | | | | | |
5.750% 3/15/21 | | | 840,000 | | | | 858,767 | |
| | | | | | | | 13,775,320 | |
Investment Companies — 1.6% |
Ares Capital Corp. | | | | | | | | |
4.200% 6/10/24 | | | 2,499,000 | | | | 2,603,203 | |
BlackRock TCP Capital Corp. | | | | | | | | |
3.900% 8/23/24 | | | 835,000 | | | | 848,377 | |
4.125% 8/11/22 | | | 1,805,000 | | | | 1,830,688 | |
Sixth Street Specialty Lending, Inc. | | | | | | | | |
3.875% 11/01/24 | | | 1,665,000 | | | | 1,686,730 | |
| | | | | | | | 6,968,998 | |
The accompanying notes are an integral part of the financial statements.
49
MassMutual Premier Short-Duration Bond Fund – Portfolio of Investments (Continued) |
| | | Principal
Amount | | | Value | |
Iron & Steel — 0.4% |
Reliance Steel & Aluminum Co. | | | | | | | | |
1.300% 8/15/25 | | $ | 810,000 | | | $ | 808,997 | |
Steel Dynamics, Inc. | | | | | | | | |
2.400% 6/15/25 | | | 375,000 | | | | 391,265 | |
2.800% 12/15/24 | | | 610,000 | | | | 643,506 | |
| | | | | | | | 1,843,768 | |
Lodging — 0.6% |
Las Vegas Sands Corp. | | | | | | | | |
3.200% 8/08/24 | | | 2,165,000 | | | | 2,188,532 | |
Marriott International, Inc. /MD | | | | | | | | |
5.750% 5/01/25 | | | 389,000 | | | | 434,132 | |
| | | | | | | | 2,622,664 | |
Machinery – Diversified — 0.5% |
CNH Industrial Capital LLC | | | | | | | | |
1.950% 7/02/23 | | | 275,000 | | | | 280,156 | |
3.875% 10/15/21 | | | 1,015,000 | | | | 1,042,620 | |
4.875% 4/01/21 | | | 590,000 | | | | 601,389 | |
| | | | | | | | 1,924,165 | |
Media — 1.0% |
Sirius XM Radio, Inc. | | | | | | | | |
3.875% 8/01/22 (a) | | | 2,200,000 | | | | 2,223,375 | |
ViacomCBS, Inc. | | | | | | | | |
4.750% 5/15/25 | | | 1,890,000 | | | | 2,171,408 | |
| | | | | | | | 4,394,783 | |
Mining — 1.0% |
Glencore Funding LLC | | | | | | | | |
4.125% 5/30/23 (a) | | | 1,480,000 | | | | 1,586,693 | |
Kinross Gold Corp. | | | | | | | | |
5.125% 9/01/21 | | | 550,000 | | | | 565,932 | |
5.950% 3/15/24 | | | 1,950,000 | | | | 2,223,952 | |
| | | | | | | | 4,376,577 | |
Oil & Gas — 1.4% |
Continental Resources, Inc. | | | | | | | | |
5.000% 9/15/22 | | | 1,017,000 | | | | 1,009,454 | |
EQT Corp. | | | | | | | | |
3.000% 10/01/22 | | | 1,610,000 | | | | 1,571,762 | |
7.875% STEP 2/01/25 | | | 790,000 | | | | 875,676 | |
Newfield Exploration Co. | | | | | | | | |
5.625% 7/01/24 | | | 1,220,000 | | | | 1,183,462 | |
Petroleos Mexicanos | | | | | | | | |
4.625% 9/21/23 | | | 1,115,000 | | | | 1,105,361 | |
Valero Energy Corp. | | | | | | | | |
2.700% 4/15/23 | | | 428,000 | | | | 443,442 | |
| | | | | | | | 6,189,157 | |
| | | Principal
Amount | | | Value | |
Packaging & Containers — 0.4% |
Graphic Packaging International LLC | | | | | | | | |
4.750% 4/15/21 | | $ | 1,510,000 | | | $ | 1,521,325 | |
Pharmaceuticals — 1.1% |
AbbVie, Inc. | | | | | | | | |
3.800% 3/15/25 (a) | | | 745,000 | | | | 826,087 | |
Cardinal Health, Inc. 3 mo. USD LIBOR + .770% | | | | | | | | |
1.020% FRN 6/15/22 | | | 1,345,000 | | | | 1,353,137 | |
Mylan, Inc. | | | | | | | | |
3.125% 1/15/23 (a) | | | 1,375,000 | | | | 1,446,414 | |
Teva Pharmaceutical Finance Netherlands III BV | | | | | | | | |
2.200% 7/21/21 | | | 654,000 | | | | 647,787 | |
Upjohn, Inc. | | | | | | | | |
1.650% 6/22/25 (a) | | | 355,000 | | | | 363,393 | |
| | | | | | | | 4,636,818 | |
Pipelines — 1.8% |
Energy Transfer Operating LP | | | | | | | | |
4.200% 9/15/23 | | | 2,020,000 | | | | 2,132,012 | |
EnLink Midstream Partners LP | | | | | | | | |
4.400% 4/01/24 | | | 1,340,000 | | | | 1,206,000 | |
EQM Midstream Partners LP | | | | | | | | |
4.750% 7/15/23 | | | 1,305,000 | | | | 1,302,455 | |
MPLX LP 3 mo. USD LIBOR + 1.100% | | | | | | | | |
1.342% FRN 9/09/22 | | | 2,155,000 | | | | 2,155,087 | |
Plains All American Pipeline LP/PAA Finance Corp. | | | | | | | | |
3.850% 10/15/23 | | | 952,000 | | | | 996,373 | |
| | | | | | | | 7,791,927 | |
Private Equity — 0.4% |
Hercules Capital, Inc. | | | | | | | | |
4.625% 10/23/22 | | | 1,495,000 | | | | 1,513,380 | |
Real Estate Investment Trusts (REITS) — 2.7% |
CubeSmart LP | | | | | | | | |
4.375% 12/15/23 | | | 764,000 | | | | 839,508 | |
Essex Portfolio LP | | | | | | | | |
3.500% 4/01/25 | | | 330,000 | | | | 362,465 | |
3.875% 5/01/24 | | | 424,000 | | | | 463,583 | |
Host Hotels & Resorts LP | | | | | | | | |
3.750% 10/15/23 | | | 2,140,000 | | | | 2,207,790 | |
SBA Tower Trust | | | | | | | | |
2.836% 1/15/50 (a) | | | 3,350,000 | | | | 3,585,281 | |
Service Properties Trust | | | | | | | | |
4.350% 10/01/24 | | | 1,215,000 | | | | 1,099,575 | |
Tanger Properties LP | | | | | | | | |
3.875% 12/01/23 | | | 1,325,000 | | | | 1,332,569 | |
The accompanying notes are an integral part of the financial statements.
50
MassMutual Premier Short-Duration Bond Fund – Portfolio of Investments (Continued) |
| | | Principal
Amount | | | Value | |
VEREIT Operating Partnership LP | | | | | | | | |
4.600% 2/06/24 | | $ | 1,410,000 | | | $ | 1,512,648 | |
| | | | | | | | 11,403,419 | |
Retail — 1.0% |
O’Reilly Automotive, Inc. | | | | | | | | |
3.800% 9/01/22 | | | 191,000 | | | | 201,266 | |
3.850% 6/15/23 | | | 2,206,000 | | | | 2,368,791 | |
QVC, Inc. | | | | | | | | |
4.375% 3/15/23 | | | 1,850,000 | | | | 1,918,219 | |
| | | | | | | | 4,488,276 | |
Semiconductors — 0.2% |
Microchip Technology, Inc. | | | | | | | | |
3.922% 6/01/21 | | | 905,000 | | | | 925,030 | |
Telecommunications — 1.1% |
Qwest Corp | | | | | | | | |
6.750% 12/01/21 | | | 1,255,000 | | | | 1,325,343 | |
Sprint Communications, Inc. | | | | | | | | |
9.250% 4/15/22 | | | 800,000 | | | | 887,576 | |
T-Mobile USA, Inc. | | | | | | | | |
1.500% 2/15/26 (a) | | | 980,000 | | | | 987,565 | |
Telefonaktiebolaget LM Ericsson | | | | | | | | |
4.125% 5/15/22 | | | 1,406,000 | | | | 1,465,537 | |
| | | | | | | | 4,666,021 | |
Transportation — 0.4% |
Ryder System, Inc. | | | | | | | | |
2.500% 9/01/22 | | | 40,000 | | | | 41,293 | |
3.400% 3/01/23 | | | 485,000 | | | | 514,483 | |
3.750% 6/09/23 | | | 920,000 | | | | 988,916 | |
| | | | | | | | 1,544,692 | |
Trucking & Leasing — 0.3% |
Penske Truck Leasing Co. LP/PTL Finance Corp. | | | | | | | | |
4.875% 7/11/22 (a) | | | 1,367,000 | | | | 1,469,079 | |
| | | | | | | | | |
TOTAL CORPORATE DEBT (Cost $171,370,136) | | | | | | | 175,213,992 | |
| | | | | | | | | |
MUNICIPAL OBLIGATIONS — 0.2% |
Louisiana State Public Facilities Authority, Revenue Bonds, Series 2011-A, Class A2, 3 mo. USD LIBOR | | | | | | | | |
1.168% FRN 4/26/27 | | | 27,546 | | | | 27,568 | |
| | | Principal
Amount | | | Value | |
Pennsylvania Higher Education Assistance Agency, Revenue Bonds, Series 2006-2, Class B, 28 day ARS | | | | | | | | |
1.655% FRN 10/25/42 | | $ | 650,000 | | | $ | 645,138 | |
| | | | | | | | | |
TOTAL MUNICIPAL OBLIGATIONS (Cost $668,608) | | | | | | | 672,706 | |
| | | | | | | | | |
NON-U.S. GOVERNMENT AGENCY OBLIGATIONS — 52.3% |
Auto Floor Plan Asset-Backed Securities — 0.4% |
Navistar Financial Dealer Note Master Owner Trust II | | | | | | | | |
Series 2019-1, Class C, 1 mo. USD LIBOR + .950% 1.098% FRN 5/25/24 (a) | | | 856,000 | | | | 851,543 | |
Series 2019-1, Class D, 1 mo. USD LIBOR + 1.450% 1.598% FRN 5/25/24 (a) | | | 768,000 | | | | 763,713 | |
| | | | | | | | 1,615,256 | |
Automobile Asset-Backed Securities — 7.6% |
AmeriCredit Automobile Receivables Trust | | | | | | | | |
Series 2020-1, Class D, 1.800% 12/18/25 | | | 2,419,000 | | | | 2,437,437 | |
Series 2019-3, Class D, 2.580% 9/18/25 | | | 1,425,000 | | | | 1,461,158 | |
Avis Budget Rental Car Funding AESOP LLC | | | | | | | | |
Series 2020-1A, Class C, 3.020% 8/20/26 (a) | | | 5,143,000 | | | | 5,011,148 | |
Series 2019-3A, Class C, 3.150% 3/20/26 (a) | | | 2,764,000 | | | | 2,715,032 | |
Series 2019-1A, Class C, 4.530% 3/20/23 (a) | | | 633,000 | | | | 640,995 | |
Series 2018-1A, Class C, 4.730% 9/20/24 (a) | | | 1,270,000 | | | | 1,313,676 | |
Carmax Auto Owner Trust, Series 2019-4, Class D | | | | | | | | |
2.800% 4/15/26 | | | 1,399,000 | | | | 1,411,600 | |
Carvana Auto Receivables Trust, Series 2019-4A, Class D | | | | | | | | |
3.070% 7/15/25 (a) | | | 1,734,000 | | | | 1,783,909 | |
Drive Auto Receivables Trust, Series 2019-4, Class D | | | | | | | | |
2.700% 2/16/27 | | | 1,333,000 | | | | 1,364,684 | |
Exeter Automobile Receivables Trust, Series 2019-3A, Class D | | | | | | | | |
3.110% 8/15/25 (a) | | | 985,000 | | | | 1,016,294 | |
The accompanying notes are an integral part of the financial statements.
51
MassMutual Premier Short-Duration Bond Fund – Portfolio of Investments (Continued) |
| | | Principal
Amount | | | Value | |
Ford Credit Auto Owner Trust, Series 2020-1, Class C | | | | | | | | |
2.540% 8/15/31 (a) | | $ | 2,408,000 | | | $ | 2,437,902 | |
Hertz Fleet Lease Funding LP, Series 2019-1, Class D | | | | | | | | |
3.440% 1/10/33 (a) | | | 1,976,000 | | | | 1,888,853 | |
Hertz Vehicle Financing II LP | | | | | | | | |
Series 2017-1A, Class B, 3.560% 10/25/21 (a) | | | 1,430,000 | | | | 1,418,032 | |
Series 2018-1A, Class B, 3.600% 2/25/24 (a) | | | 1,420,000 | | | | 1,407,839 | |
Hertz Vehicle Financing LLC, Series 2018-3A, Class B | | | | | | | | |
4.370% 7/25/24 (a) | | | 950,000 | | | | 940,538 | |
Hertz Vehicle Financing LP, Series 2019-3A, Class B | | | | | | | | |
3.030% 12/26/25 (a) | | | 1,036,000 | | | | 1,031,339 | |
OneMain Direct Auto Receivables Trust, Series 2017-2A, Class C | | | | | | | | |
2.820% 7/15/24 (a) | | | 673,339 | | | | 673,823 | |
Santander Revolving Auto Loan Trust | | | | | | | | |
Series 2019-A, Class B, 2.800% 1/26/32 (a) | | | 399,000 | | | | 419,818 | |
Series 2019-A, Class C, 3.000% 1/26/32 (a) | | | 258,000 | | | | 261,217 | |
Series 2019-A, Class D, 3.450% 1/26/32 (a) | | | 1,720,000 | | | | 1,713,792 | |
Westlake Automobile Receivables Trust, Series 2019-3A, Class E | | | | | | | | |
3.590% 3/17/25 (a) | | | 1,395,000 | | | | 1,383,695 | |
| | | | | | | | 32,732,781 | |
Commercial Mortgage-Backed Securities — 4.8% |
BAMLL Commercial Mortgage Securities Trust | | | | | | | | |
Series 2018-DSNY, Class C, 1 mo. USD LIBOR + 1.350% 1.502% FRN 9/15/34 (a) | | | 300,000 | | | | 280,507 | |
Series 2019-BPR, Class CMP, 4.024% VRN 11/05/32 (a) (b) | | | 800,000 | | | | 720,966 | |
Series 2019-BPR, Class DMP, 4.024% VRN 11/05/32 (a) (b) | | | 1,110,000 | | | | 897,572 | |
Bear Stearns Commercial Mortgage Securities, Series 2007-T26, Class AM, | | | | | | | | |
5.513% VRN 1/12/45 (b) | | | 168,914 | | | | 167,187 | |
BHMS Mortgage Trust | | | | | | | | |
Series 2018-ATLS, Class A, 1 mo. USD LIBOR + 1.250% 1.402% FRN 7/15/35 (a) | | | 1,880,000 | | | | 1,797,780 | |
Series 2018-ATLS, Class B, 1 mo. USD LIBOR + 1.500% 1.652% FRN 7/15/35 (a) | | | 2,600,000 | | | | 2,411,567 | |
| | | Principal
Amount | | | Value | |
BX Commercial Mortgage Trust | | | | | | | | |
Series 2020-BXLP, Class E, 1 mo. USD LIBOR + 1.600% 1.752% FRN 12/15/36 (a) | | $ | 1,881,278 | | | $ | 1,859,063 | |
Series 2018-IND, Class E, 1 mo. USD LIBOR + 1.700% 1.852% FRN 11/15/35 (a) | | | 1,855,000 | | | | 1,840,056 | |
Series 2019-XL, Class E, 1 mo. USD LIBOR + 1.800% 1.952% FRN 10/15/36 (a) | | | 742,351 | | | | 735,443 | |
Series 2019-XL, Class F, 1 mo. USD LIBOR + 2.000% 2.152% FRN 10/15/36 (a) | | | 2,892,510 | | | | 2,858,361 | |
CAMB Commercial Mortgage Trust, Series 2019-LIFE, Class E, 1 mo. USD LIBOR + 2.150% | | | | | | | | |
2.302% FRN 12/15/37 (a) | | | 1,335,725 | | | | 1,319,113 | |
Commercial Mortgage Trust, Series 2015-DC1, Class B, | | | | | | | | |
4.035% VRN 2/10/48 (b) | | | 797,000 | | | | 823,005 | |
Credit Suisse Mortgage Capital Certificates, Series 2019-ICE4, Class D, 1 mo. USD LIBOR + 1.600% | | | | | | | | |
1.752% FRN 5/15/36 (a) | | | 820,000 | | | | 811,802 | |
GS Mortgage Securities Trust, Series 2015-GC34, Class C, | | | | | | | | |
4.805% VRN 10/10/48 (b) | | | 1,100,000 | | | | 982,303 | |
KNDL Mortgage Trust, Series 2019-KNSQ, Class E, 1 mo. USD LIBOR + 1.800% | | | | | | | | |
1.952% FRN 5/15/36 (a) | | | 739,000 | | | | 730,921 | |
Morgan Stanley Bank of America Merrill Lynch Trust, Series 2013-C7, Class B | | | | | | | | |
3.769% 2/15/46 | | | 1,000,000 | | | | 995,585 | |
Morgan Stanley Capital I Trust, Series 2012-STAR, Class D | | | | | | | | |
4.057% 8/05/34 (a) | | | 1,000,000 | | | | 968,795 | |
MSCG Trust, Series 2018-SELF, Class C, 1 mo. USD LIBOR + 1.180% | | | | | | | | |
1.332% FRN 10/15/37 (a) | | | 185,000 | | | | 182,786 | |
| | | | | | | | 20,382,812 | |
Home Equity Asset-Backed Securities — 0.0% |
Credit Suisse Seasoned Loan Trust, Series 2006-1, Class A, 1 mo. USD LIBOR + .240% | | | | | | | | |
0.388% FRN 10/25/34 (a) | | | 170,356 | | | | 168,945 | |
The accompanying notes are an integral part of the financial statements.
52
MassMutual Premier Short-Duration Bond Fund – Portfolio of Investments (Continued) |
| | | Principal
Amount | | | Value | |
Other Asset-Backed Securities — 23.1% |
321 Henderson Receivables I LLC, Series 2006-1A, Class A1, 1 mo. USD LIBOR + .200% | | | | | | | | |
0.352% FRN 3/15/41 (a) | | $ | 86,462 | | | $ | 85,062 | |
321 Henderson Receivables LLC, Series 2006-2A, Class A1, 1 mo. USD LIBOR + .200% | | | | | | | | |
0.352% FRN 6/15/41 (a) | | | 196,894 | | | | 190,405 | |
AASET Trust | | | | | | | | |
Series 2017-1A, Class A, 3.967% 5/16/42 (a) | | | 217,885 | | | | 196,983 | |
Series 2020-1A, Class B, 4.335% 1/16/40 (a) | | | 489,753 | | | | 341,806 | |
Series 2018-2A, Class A, 4.454% 11/18/38 (a) | | | 1,513,007 | | | | 1,407,199 | |
Adams Outdoor Advertising LP, Series 2018-1, Class A | | | | | | | | |
4.810% 11/15/48 (a) | | | 791,167 | | | | 823,193 | |
Affirm Asset Securitization Trust | | | | | | | | |
Series 2020-A, Class A, 2.100% 2/18/25 (a) | | | 2,777,000 | | | | 2,782,223 | |
Series 2020-Z1, Class A, 3.460% 10/15/24 (a) | | | 982,622 | | | | 989,087 | |
Arbor Realty Commercial Real Estate Notes, Series 2018-FL1, Class A, 1 mo. USD LIBOR + 1.150% | | | | | | | | |
1.302% FRN 6/15/28 (a) | | | 880,000 | | | | 869,027 | |
Ascentium Equipment Receivables Trust, Series 2019-2A, Class E | | | | | | | | |
3.780% 5/10/27 (a) | | | 1,722,000 | | | | 1,725,556 | |
Avant Loans Funding Trust, Series 2019-A, Class A | | | | | | | | |
3.480% 7/15/22 (a) | | | 66,654 | | | | 66,676 | |
Bain Capital Credit CLO Ltd. | | | | | | | | |
Series 2016-2A, Class BR, 3 mo. USD LIBOR + 1.800% 2.075% FRN 1/15/29 (a) | | | 500,000 | | | | 497,386 | |
Series 2020-2A, Class A, 3 mo. USD LIBOR + 1.850% 2.211% FRN 7/21/31 (a) | | | 1,000,000 | | | | 1,002,162 | |
Benefit Street Partners CLO X Ltd., Series 2016-10A, Class A2R, 3 mo. USD LIBOR + 1.750% | | | | | | | | |
2.025% FRN 1/15/29 (a) | | | 1,500,000 | | | | 1,480,710 | |
BlueMountain CLO Ltd., Series 2013-1A, Class A1R2, 3 mo. USD LIBOR + 1.230% | | | | | | | | |
1.502% FRN 1/20/29 (a) | | | 985,040 | | | | 982,106 | |
| | | Principal
Amount | | | Value | |
BRE Grand Islander Timeshare Issuer LLC | | | | | | | | |
Series 2017-1A, Class A, 2.940% 5/25/29 (a) | | $ | 233,340 | | | $ | 234,393 | |
Series 2019-A, Class B, 3.780% 9/26/33 (a) | | | 661,188 | | | | 653,964 | |
CAL Funding II Ltd., Series 2018-2A, Class A | | | | | | | | |
4.340% 9/25/43 (a) | | | 632,000 | | | | 626,707 | |
Capital Automotive REIT, Series 2017-1A, Class A1 | | | | | | | | |
3.870% 4/15/47 (a) | | | 581,937 | | | | 583,002 | |
CARS-DB4 LP, Series 2020-1A, Class B1 | | | | | | | | |
4.170% 2/15/50 (a) | | | 1,100,000 | | | | 1,135,076 | |
Castlelake Aircraft Securitization Trust, Series 2019-1A, Class A | | | | | | | | |
3.967% 4/15/39 (a) | | | 389,863 | | | | 360,802 | |
Castlelake Aircraft Structured Trust, Series 2018-1, Class A | | | | | | | | |
4.125% 6/15/43 (a) | | | 691,313 | | | | 645,389 | |
Cbam CLO Management Cbam, Series 2018-6A, Class A1R, 3 mo. USD LIBOR + 1.270% | | | | | | | | |
1.545% FRN 1/15/31 (a) | | | 1,500,000 | | | | 1,491,640 | |
CF Hippolyta LLC, Series 2020-1, Class B1 | | | | | | | | |
2.280% 7/15/60 (a) | | | 223,000 | | | | 226,895 | |
CIFC Funding IV Ltd., Series 2015-4A, Class A2R, | | | | | | | | |
2.122% FRN 10/20/27 (a) (b) | | | 300,000 | | | | 299,522 | |
CLI Funding LLC, Series 2019-1A, Class A | | | | | | | | |
3.710% 5/18/44 (a) | | | 707,077 | | | | 719,794 | |
CLI Funding V LLC, Series 2014-1A, Class A | | | | | | | | |
3.290% 6/18/29 (a) | | | 732,759 | | | | 732,759 | |
CNH Equipment Trust, Series 2020-A, Class B | | | | | | | | |
2.300% 10/15/27 | | | 545,000 | | | | 569,719 | |
DB Master Finance LLC | | | | | | | | |
Series 2019-1A, Class A2I, 3.787% 5/20/49 (a) | | | 625,680 | | | | 642,418 | |
Series 2019-1A, Class A2II, 4.021% 5/20/49 (a) | | | 738,540 | | | | 781,115 | |
Diamond Resorts Owner Trust, Series 2019-1A, Class A | | | | | | | | |
2.890% 2/20/32 (a) | | | 1,044,817 | | | | 1,062,453 | |
Domino’s Pizza Master Issuer LLC | | | | | | | | |
Series 2017-1A, Class A2II, 3.082% 7/25/47 (a) | | | 2,771,625 | | | | 2,774,605 | |
The accompanying notes are an integral part of the financial statements.
53
MassMutual Premier Short-Duration Bond Fund – Portfolio of Investments (Continued) |
| | | Principal
Amount | | | Value | |
Series 2018-1A, Class A2I, 4.116% 7/25/48 (a) | | $ | 950,600 | | | $ | 1,004,541 | |
Elara HGV Timeshare Issuer LLC | | | | | | | | |
Series 2017-A, Class A, 2.690% 3/25/30 (a) | | | 264,400 | | | | 263,517 | |
Series 2014-A, Class B, 3.020% VRN 2/25/27 (a) (b) | | | 80,923 | | | | 80,806 | |
Series 2019-A, Class C, 3.450% 1/25/34 (a) | | | 1,611,856 | | | | 1,583,272 | |
Elmwood CLO II Ltd., Series 2019-2A, Class A, 3 mo. USD LIBOR + 1.450% | | | | | | | | |
1.722% FRN 4/20/31 (a) | | | 1,250,000 | | | | 1,250,484 | |
FCI Funding LLC, Series 2019-1A, Class A | | | | | | | | |
3.630% 2/18/31 (a) | | | 256,328 | | | | 260,806 | |
GoldentTree Loan Management US CLO 1 Ltd., Series 2017-1A, Class B1R, 3 mo. USD LIBOR + 1.450% | | | | | | | | |
1.722% FRN 4/20/29 (a) | | | 500,000 | | | | 494,893 | |
Goodgreen Trust | | | | | | | | |
Series 2019-2A, Class A, 2.760% 10/15/54 (a) | | | 1,423,764 | | | | 1,442,930 | |
Series 2016-1A, Class A, 3.230% 10/15/52 (a) | | | 729,370 | | | | 758,157 | |
Series 2019-1A, Class A, 3.860% 10/15/54 (a) | | | 623,751 | | | | 660,531 | |
Series 2018-1A, Class A, 3.930% VRN 10/15/53 (a) (b) | | | 1,243,110 | | | | 1,321,117 | |
Hero Funding Trust | | | | | | | | |
Series 2017-3A, Class A1, 3.190% 9/20/48 (a) | | | 735,965 | | | | 758,475 | |
Series 2017-2A, Class A1, 3.280% 9/20/48 (a) | | | 170,742 | | | | 176,653 | |
Series 2016-4A, Class A1, 3.570% 9/20/47 (a) | | | 423,681 | | | | 440,875 | |
Series 2017-2A, Class A2, 4.070% 9/20/48 (a) | | | 140,611 | | | | 148,525 | |
Series 2018-1A, Class A2, 4.670% 9/20/48 (a) | | | 833,915 | | | | 894,846 | |
Hilton Grand Vacations Trust | | | | | | | | |
Series 2019-AA, Class C, 2.840% 7/25/33 (a) | | | 1,526,108 | | | | 1,530,696 | |
Series 2017-AA, Class B, 2.960% 12/26/28 (a) | | | 305,165 | | | | 307,860 | |
Horizon Aircraft Finance I Ltd., Series 2018-1, Class A | | | | | | | | |
4.458% 12/15/38 (a) | | | 461,570 | | | | 436,039 | |
Horizon Aircraft Finance III Ltd, Series 2019-2, Class B | | | | | | | | |
4.458% 11/15/39 (a) | | | 1,757,143 | | | | 1,324,746 | |
| | | Principal
Amount | | | Value | |
KDAC Aviation Finance Ltd., Series 2017-1A, Class A | | | | | | | | |
4.212% 12/15/42 (a) | | $ | 380,897 | | | $ | 334,570 | |
KREF Ltd., Series 2018-FL1, Class AS, 1 mo. USD LIBOR + 1.350% | | | | | | | | |
1.501% FRN 6/15/36 (a) | | | 2,600,000 | | | | 2,575,867 | |
Lendmark Funding Trust, Series 2018-1A, Class A | | | | | | | | |
3.810% 12/21/26 (a) | | | 930,000 | | | | 947,445 | |
Lunar Aircraft Ltd., Series 2020-1A, Class A | | | | | | | | |
3.376% 2/15/45 (a) | | | 445,354 | | | | 412,561 | |
MACH 1 Cayman Ltd., Series 2019-1, Class A | | | | | | | | |
3.474% 10/15/39 (a) | | | 938,598 | | | | 853,717 | |
Marlette Funding Trust, Series 2019-2A, Class B | | | | | | | | |
3.530% 7/16/29 (a) | | | 540,000 | | | | 550,585 | |
Milos CLO Ltd., Series 2017-1A, Class AR, 3 mo. USD LIBOR + 1.070% | | | | | | | | |
1.342% FRN 10/20/30 (a) | | | 1,150,000 | | | | 1,131,279 | |
Mosaic Solar Loans LLC | | | | | | | | |
Series 2018-2GS, Class A, 4.200% 2/22/44 (a) | | | 637,398 | | | | 678,098 | |
Series 2017-1A, Class A, 4.450% 6/20/42 (a) | | | 146,369 | | | | 157,114 | |
Neuberger Berman CLO Ltd., Series 2015-20A, Class BR, 3 mo. USD LIBOR + 1.250% | | | | | | | | |
1.525% FRN 1/15/28 (a) | | | 1,500,000 | | | | 1,478,605 | |
New Residential Advance Receivables Trust Advance Receivables Backed, Series 2019-T4, Class DT4 | | | | | | | | |
2.804% 10/15/51 (a) | | | 1,921,000 | | | | 1,920,986 | |
NP SPE II LLC | | | | | | | | |
Series 2019-1A, Class A1, 2.574% 9/20/49 (a) | | | 487,641 | | | | 484,250 | |
Series 2017-1A, Class A1, 3.372% 10/21/47 (a) | | | 391,518 | | | | 399,847 | |
OCP CLO Ltd., Series 2015-8A, Class A2AR, 3 mo. USD LIBOR + 1.450% | | | | | | | | |
1.723% FRN 4/17/27 (a) | | | 2,150,000 | | | | 2,142,357 | |
OneMain Financial Issuance Trust, Series 2019-2A, Class C | | | | | | | | |
3.660% 10/14/36 (a) | | | 1,550,000 | | | | 1,619,854 | |
Orange Lake Timeshare Trust | | | | | | | | |
Series 2016-A, Class B, 2.910% 3/08/29 (a) | | | 398,484 | | | | 376,605 | |
The accompanying notes are an integral part of the financial statements.
54
MassMutual Premier Short-Duration Bond Fund – Portfolio of Investments (Continued) |
| | | Principal
Amount | | | Value | |
Series 2019-A, Class D, 4.930% 4/09/38 (a) | | $ | 1,338,770 | | | $ | 1,233,140 | |
Oxford Finance Funding Trust | | | | | | | | |
Series 2020-1A, Class A2, 3.101% 2/15/28 (a) | | | 698,000 | | | | 707,978 | |
Series 2016-1A, Class A, 3.968% 6/17/24 (a) | | | 85,525 | | | | 85,558 | |
Palmer Square CLO Ltd., Series 2015-1A, Class A2R2, 3 mo. USD LIBOR + 1.650% | | | | | | | | |
1.897% FRN 5/21/29 (a) | | | 1,250,000 | | | | 1,244,669 | |
Pioneer Aircraft Finance Ltd., Series 2019-1, Class A | | | | | | | | |
3.967% 6/15/44 (a) | | | 689,739 | | | | 638,346 | |
PNMAC GMSR Issuer Trust, Series 2018-GT1, Class A, 1 mo. USD LIBOR + 2.850% | | | | | | | | |
2.998% FRN 2/25/23 (a) | | | 670,000 | | | | 653,929 | |
Recette CLO Ltd., Series 2015-1A, Class CR, 3 mo. USD LIBOR + 1.700% | | | | | | | | |
1.972% FRN 10/20/27 (a) | | | 700,000 | | | | 695,480 | |
Rockford Tower CLO Ltd. | | | | | | | | |
Series 2017-1A, Class BR, 3 mo. USD LIBOR + 1.450% 1.725% FRN 4/15/29 (a) | | | 550,000 | | | | 539,255 | |
Series 2017-2A, Class BR, 3 mo. USD LIBOR + 1.500% 1.775% FRN 10/15/29 (a) | | | 1,000,000 | | | | 981,148 | |
RR 3 Ltd., Series 2018-3A, Class A1R2, 3 mo. USD LIBOR + 1.090% | | | | | | | | |
1.365% FRN 1/15/30 (a) | | | 1,250,000 | | | | 1,236,907 | |
SBA Tower Trust, Series 2014-2A, Class C, | | | | | | | | |
3.869% STEP 10/15/49 (a) | | | 1,030,000 | | | | 1,084,486 | |
Sierra Receivables Funding LLC | | | | | | | | |
Series 2016-3A, Class B, 2.630% 10/20/33 (a) | | | 456,554 | | | | 449,212 | |
Series 2016-2A, Class B, 2.780% 7/20/33 (a) | | | 704,656 | | | | 702,512 | |
Series 2019-3A, Class C, 3.000% 8/20/36 (a) | | | 1,146,755 | | | | 1,130,310 | |
Series 2015-3A, Class B, 3.080% 9/20/32 (a) | | | 30,446 | | | | 30,418 | |
Series 2020-2A, Class C, 3.510% 7/20/37 (a) | | | 264,314 | | | | 266,839 | |
Series 2019-3A, Class D, 4.180% 8/20/36 (a) | | | 841,591 | | | | 791,701 | |
Series 2018-1A, Class B, 4.236% 4/20/35 | | | 1,077,586 | | | | 1,055,164 | |
Series 2019-2A, Class D, 4.540% 5/20/36 (a) | | | 643,400 | | | | 621,049 | |
| | | Principal
Amount | | | Value | |
Series 2019-1A, Class D, 4.750% 1/20/36 (a) | | $ | 621,807 | | | $ | 600,317 | |
SoFi Consumer Loan Program Trust, Series 2019-3, Class D | | | | | | | | |
3.890% 5/25/28 (a) | | | 2,981,000 | | | | 2,986,776 | |
SpringCastle America Funding LLC, Series 2020-AA, Class A | | | | | | | | |
1.970% 9/25/37 (a) | | | 2,000,000 | | | | 2,021,490 | |
Stack Infrastructure Issuer LLC, Series 2020-1A, Class A2 | | | | | | | | |
1.893% 8/25/45 (a) | | | 367,000 | | | | 369,447 | |
Store Master Funding I-VII, Series 2018-1A, Class A3 | | | | | | | | |
4.400% 10/20/48 (a) | | | 1,238,021 | | | | 1,264,863 | |
Taco Bell Funding LLC, Series 2018-1A, Class A2I | | | | | | | | |
4.318% 11/25/48 (a) | | | 2,279,400 | | | | 2,327,835 | |
TAL Advantage VII LLC, Series 2020-1A, Class B | | | | | | | | |
3.290% 9/20/45 (a) | | | 800,000 | | | | 799,158 | |
Tif Funding II LLC, Series 2020-1A, Class A | | | | | | | | |
2.090% 8/20/45 (a) | | | 271,294 | | | | 270,848 | |
TLF National Tax Lien Trust, Series 2017-1A, Class A | | | | | | | | |
3.090% 12/15/29 (a) | | | 825,891 | | | | 831,338 | |
Trafigura Securitisation Finance PLC | | | | | | | | |
Series 2018-1A, Class A1, 1 mo. USD LIBOR + .730% 0.882% FRN 3/15/22 (a) | | | 1,340,000 | | | | 1,317,387 | |
Series 2018-1A, Class B, 4.290% 3/15/22 (a) | | | 1,870,000 | | | | 1,864,854 | |
Treman Park CLO Ltd., Series 2015-1A, Class ARR, 3 mo. USD LIBOR + 1.070% | | | | | | | | |
1.342% FRN 10/20/28 (a) | | | 1,100,000 | | | | 1,092,837 | |
Trinity Rail Leasing LP | | | | | | | | |
Series 2018-1A, Class A1, 3.820% 6/17/48 (a) | | | 1,161,430 | | | | 1,163,992 | |
Series 2019-1A, Class A, 3.820% 4/17/49 (a) | | | 1,555,540 | | | | 1,620,439 | |
Trip Rail Master Funding LLC | | | | | | | | |
Series 2017-1A, Class A1, 2.709% 8/15/47 (a) | | | 127,118 | | | | 127,232 | |
Series 2011-1A, Class A2, 6.024% 7/15/41 (a) | | | 2,246,612 | | | | 2,336,352 | |
Triton Container Finance VIII LLC, Series 2020-1A, Class A | | | | | | | | |
2.110% 9/20/45 (a) | | | 1,300,000 | | | | 1,301,672 | |
Vantage Data Centers LLC, Series 2020-1A, Class A2 | | | | | | | | |
1.645% 9/15/45 (a) (c) | | | 1,425,000 | | | | 1,425,000 | |
The accompanying notes are an integral part of the financial statements.
55
MassMutual Premier Short-Duration Bond Fund – Portfolio of Investments (Continued) |
| | | Principal
Amount | | | Value | |
VSE VOI Mortgage LLC | | | | | | | | |
Series 2016-A, Class B, 2.740% 7/20/33 (a) | | $ | 374,573 | | | $ | 369,541 | |
Series 2018-A, Class C, 4.020% 2/20/36 (a) | | | 422,040 | | | | 394,788 | |
Welk Resorts LLC | | | | | | | | |
Series 2015-AA, Class A, 2.790% 6/16/31 (a) | | | 91,887 | | | | 91,508 | |
Series 2017-AA, Class B, 3.410% 6/15/33 (a) | | | 647,827 | | | | 639,382 | |
Westgate Resorts LLC, Series 2020-1A, Class A | | | | | | | | |
2.713% 3/20/34 (a) | | | 782,722 | | | | 800,194 | |
Willis Engine Structured Trust IV, Series 2018-A, Class A, | | | | | | | | |
4.750% STEP 9/15/43 (a) | | | 616,333 | | | | 519,841 | |
| | | | | | | | 98,868,535 | |
Student Loans Asset-Backed Securities — 9.2% |
Access Group, Inc., Series 2015-1, Class B, 1 mo. USD LIBOR + 1.500% | | | | | | | | |
1.648% FRN 7/25/58 (a) | | | 530,000 | | | | 468,016 | |
College Avenue Student Loans LLC | | | | | | | | |
Series 2018-A, Class A1, 1 mo. USD LIBOR + 1.200% 1.348% FRN 12/26/47 (a) | | | 1,190,547 | | | | 1,178,684 | |
Series 2019-A, Class B, 3.810% 12/28/48 (a) | | | 1,038,000 | | | | 1,027,898 | |
College Loan Corp. Trust I, Series 2005-2, Class B, 3 mo. USD LIBOR + .490% | | | | | | | | |
0.765% FRN 1/15/37 | | | 497,128 | | | | 446,528 | |
Commonbond Student Loan Trust | | | | | | | | |
Series 2019-AGS, Class B, 3.040% 1/25/47 (a) | | | 1,216,700 | | | | 1,176,786 | |
Series 2018-AGS, Class C, 3.820% 2/25/44 (a) | | | 167,997 | | | | 165,551 | |
Series 2018-BGS, Class C, 4.120% 9/25/45 (a) | | | 123,387 | | | | 123,405 | |
Series 2018-CGS, Class C, 4.350% 2/25/46 (a) | | | 57,386 | | | | 57,770 | |
Series 2017-AGS, Class C, 5.280% 5/25/41 (a) | | | 211,392 | | | | 218,270 | |
Credit Suisse ABS Repackaging Trust, Series 2013-A, Class B | | | | | | | | |
2.500% 1/25/30 (a) | | | 175,235 | | | | 174,831 | |
Earnest Student Loan Program LLC, Series 2016-B, Class A1, 1 mo. USD LIBOR + 2.050% | | | | | | | | |
2.198% FRN 2/26/35 (a) | | | 183,620 | | | | 173,215 | |
| | | Principal
Amount | | | Value | |
EdLinc Student Loan Funding, Series 2017-A, Class A, PRIME - 1.150% | | | | | | | | |
3.600% FRN 12/01/47 (a) | | $ | 1,239,725 | | | $ | 1,225,079 | |
ELFI Graduate Loan Program LLC, Series 2018-A, Class B | | | | | | | | |
4.000% 8/25/42 (a) | | | 489,428 | | | | 486,165 | |
Laurel Road Prime Student Loan Trust | | | | | | | | |
Series 2017-C, Class B, 2.950% 11/25/42 (a) | | | 418,373 | | | | 415,038 | |
Series 2019-A, Class BFX, 3.000% 10/25/48 (a) | | | 522,946 | | | | 531,523 | |
Series 2017-B, Class CFX, 3.610% 8/25/42 (a) | | | 452,896 | | | | 432,360 | |
Series 2018-B, Class BFX, 3.720% 5/26/43 (a) | | | 546,147 | | | | 558,603 | |
Navient Private Education Refi Loan Trust, Series 2020-BA, Class B | | | | | | | | |
2.770% 1/15/69 (a) | | | 1,800,000 | | | | 1,815,737 | |
Navient Student Loan Trust | | | | | | | | |
Series 2018-2A, Class A3, 1 mo. USD LIBOR + .750% 0.898% FRN 3/25/67 (a) | | | 1,830,000 | | | | 1,777,271 | |
Series 2018-3A, Class A3, 1 mo. USD LIBOR + .800% 0.948% FRN 3/25/67 (a) | | | 2,500,000 | | | | 2,475,294 | |
Series 2019-2A, Class A2, 1 mo. USD LIBOR + 1.000% 1.148% FRN 2/27/68 (a) | | | 919,000 | | | | 919,902 | |
Series 2016-7A, Class A, 1 mo. USD LIBOR + 1.150% 1.298% FRN 3/25/66 (a) | | | 1,402,839 | | | | 1,402,839 | |
Nelnet Private Education Loan Trust | | | | | | | | |
Series 2016-A, Class A1A, 1 mo. USD LIBOR + 1.750% 1.898% FRN 12/26/40 (a) | | | 149,502 | | | | 142,803 | |
Series 2016-A, Class A1B, 3.600% 12/26/40 (a) | | | 179,029 | | | | 179,949 | |
Nelnet Student Loan Trust | | | | | | | | |
Series 2018-3A, Class A3, 1 mo. USD LIBOR + .750% 0.898% FRN 9/27/66 (a) | | | 1,950,000 | | | | 1,912,895 | |
Series 2007-2A, Class A4A2, 28 day ARS 1.497% FRN 6/25/35 (a) | | | 2,800,000 | | | | 2,683,343 | |
Series 2018-5A, Class B, 1 mo. USD LIBOR + 1.450% 1.598% FRN 2/25/67 (a) | | | 1,000,000 | | | | 938,942 | |
Series 2015-3A, Class B, 1 mo. USD LIBOR + 1.500% 1.648% FRN 6/25/54 (a) | | | 395,000 | | | | 382,300 | |
The accompanying notes are an integral part of the financial statements.
56
MassMutual Premier Short-Duration Bond Fund – Portfolio of Investments (Continued) |
| | | Principal
Amount | | | Value | |
SLC Student Loan Trust, Series 2005-3, Class B, 3 mo. USD LIBOR + .250% | | | | | | | | |
0.500% FRN 6/15/55 | | $ | 1,235,209 | | | $ | 1,081,117 | |
SLM Student Loan Trust | | | | | | | | |
Series 2006-2, Class R, 0.000% 1/25/41 | | | 3,391 | | | | 2,042,452 | |
Series 2005-6, Class B, 3 mo. USD LIBOR + .290% 0.535% FRN 1/25/44 | | | 1,261,808 | | | | 1,124,264 | |
Series 2005-9, Class B, 3 mo. USD LIBOR + .300% 0.545% FRN 1/25/41 | | | 934,299 | | | | 837,821 | |
Series 2005-8, Class B, 3 mo. USD LIBOR + .310% 0.555% FRN 1/25/55 | | | 453,546 | | | | 403,217 | |
Series 2003-11, Class B, 3 mo. USD LIBOR + .650% 0.900% FRN 12/15/38 | | | 358,008 | | | | 328,852 | |
Series 2006-7, Class B, 3 mo. USD LIBOR + .200% 1.191% FRN 1/27/42 | | | 2,917,524 | | | | 2,581,787 | |
SMB Private Education Loan Trust | | | | | | | | |
Series 2016-B, Class A2B, 1 mo. USD LIBOR + 1.450% 1.602% FRN 2/17/32 (a) | | | 245,263 | | | | 246,369 | |
Series 2015-C, Class A3, 1 mo. USD LIBOR + 1.950% 2.102% FRN 8/16/32 (a) | | | 1,350,000 | | | | 1,315,472 | |
SoFi Alternative Trust, Series 2019-C, Class PT, | | | | | | | | |
4.861% VRN 1/25/45 (a) (b) | | | 2,314,969 | | | | 2,488,591 | |
SoFi Professional Loan Program LLC | | | | | | | | |
Series 2018-A, Class R1, 0.000%2/25/42 (a) | | | 1,928,100 | | | | 797,157 | |
Series 2017-D, Class R1, 0.000% 9/25/40 (a) | | | 2,333,800 | | | | 805,208 | |
Series 2018-B, Class R1, 0.000% 8/26/47 (a) | | | 1,727,800 | | | | 638,077 | |
Series 2018-D, Class R1, 0.000% 2/25/48 (a) | | | 2,069,700 | | | | 457,611 | |
Series 2019-A, Class R1, 0.000% 6/15/48 (a) | | | 3,162,200 | | | | 749,125 | |
| | | | | | | | 39,388,117 | |
Whole Loan Collateral Collateralized Mortgage Obligations — 7.2% |
Angel Oak Mortgage Trust | | | | | | | | |
Series 2020-5, Class A2, 1.579% VRN 5/25/65 (a) (b) | | | 961,946 | | | | 960,657 | |
Series 2020-5, Class A3, 2.041% VRN 5/25/65 (a) (b) | | | 875,284 | | | | 874,130 | |
Series 2018-3, Class A3, 3.238% VRN 5/25/59 (a) (b) | | | 1,672,092 | | | | 1,689,319 | |
| | | Principal
Amount | | | Value | |
Series 2019-6, Class M1, 3.389% VRN 11/25/59 (a) (b) | | $ | 1,900,000 | | | $ | 1,921,316 | |
Series 2017-3, Class M1, 3.900% VRN 11/25/47 (a) (b) | | | 650,000 | | | | 664,316 | |
Bank of America Mortgage Securities, Series 2004-G, Class 2A7, | | | | | | | | |
3.091% VRN 8/25/34 (b) | | | 23,845 | | | | 23,317 | |
Citigroup Mortgage Loan Trust | | | | | | | | |
Series 2019-IMC1, Class A3, 3.030% VRN 7/25/49 (a) (b) | | | 955,974 | | | | 952,993 | |
Series 2019-IMC1, Class M1, 3.170% VRN 7/25/49 (a) (b) | | | 1,798,000 | | | | 1,752,598 | |
Countrywide Home Loans, Inc. | | | | | | | | |
Series 2004-2, Class 1A1, 3.666% VRN 2/25/34 (b) | | | 18,744 | | | | 18,096 | |
Series 2003-42, Class 1A1, 3.991% VRN 9/25/33 (b) | | | 4,746 | | | | 4,553 | |
Deephaven Residential Mortgage Trust | | | | | | | | |
Series 2018-1A, Class A2, 3.027% VRN 12/25/57 (a) (b) | | | 384,608 | | | | 387,207 | |
Series 2019-4A, Class M1, 3.484% VRN 10/25/59 (a) (b) | | | 1,300,000 | | | | 1,311,857 | |
Series 2018-2A, Class A3, 3.684% VRN 4/25/58 (a) (b) | | | 955,325 | | | | 962,357 | |
Series 2018-3A, Class A3, 3.963% VRN 8/25/58 (a) (b) | | | 227,629 | | | | 230,257 | |
Series 2018-4A, Class A3, 4.285% VRN 10/25/58 (a) (b) | | | 879,785 | | | | 888,617 | |
GSR Mortgage Loan Trust, Series 2004-9, Class 2A1, | | | | | | | | |
3.490% VRN 8/25/34 (b) | | | 7,162 | | | | 7,231 | |
IndyMac Index Mortgage Loan Trust, Series 2004-AR4, Class 1A, | | | | | | | | |
3.165% VRN 8/25/34 (b) | | | 45,410 | | | | 45,277 | |
JP Morgan Mortgage Trust | | | | | | | | |
Series 2018-1, Class A5, 3.500% VRN 6/25/48 (a) (b) | | | 356,883 | | | | 357,590 | |
Series 2018-4, Class A15, 3.500% VRN 10/25/48 (a) (b) | | | 252,394 | | | | 252,937 | |
Series 2017-6, Class A5, 3.500% VRN 12/25/48 (a) (b) | | | 465,746 | | | | 471,250 | |
Merrill Lynch Mortgage Investors, Inc. | | | | | | | | |
Series 2003-A4, Class IA, 3.032% VRN 7/25/33 (b) | | | 2,388 | | | | 2,276 | |
Series 2004-A1, Class IA, 3.250% VRN 2/25/34 (b) | | | 2,430 | | | | 2,400 | |
Series 2004-A1, Class IIA2, 3.418% VRN 2/25/34 (b) | | | 68,303 | | | | 66,383 | |
MFA Trust | | | | | | | | |
Series 2020-NQM1, Class A2, 1.787% VRN 8/25/49 (a) (b) | | | 1,575,150 | | | | 1,573,681 | |
The accompanying notes are an integral part of the financial statements.
57
MassMutual Premier Short-Duration Bond Fund – Portfolio of Investments (Continued) |
| | | Principal
Amount | | | Value | |
Series 2020-NQM1, Class A3, 2.300% VRN 8/25/49 (a) (b) | | $ | 1,835,737 | | | $ | 1,833,543 | |
New Residential Mortgage Loan Trust | | | | | | | | |
Series 2019-NQM2, Class A3, 3.752% VRN 4/25/49 (a) (b) | | | 669,601 | | | | 679,946 | |
Series 2019-NQM1, Class A3, 3.928% VRN 1/25/49 (a) (b) | | | 1,071,234 | | | | 1,089,729 | |
Onslow Bay Financial LLC, Series 2020-INV1, Class A21, | | | | | | | | |
3.500% VRN 12/25/49 (a) (b) | | | 1,464,930 | | | | 1,493,446 | |
PSMC Trust | | | | | | | | |
Series 2018-1, Class A3, 3.500% VRN 2/25/48 (a) (b) | | | 524,210 | | | | 529,837 | |
Series 2018-2, Class A3, 3.500% VRN 6/25/48 (a) (b) | | | 414,420 | | | | 416,830 | |
Sequoia Mortgage Trust | | | | | | | | |
Series 2018-5, Class A4, 3.500% VRN 5/25/48 (a) (b) | | | 377,476 | | | | 379,902 | |
Series 2018-7, Class A4, 4.000% VRN 9/25/48 (a) (b) | | | 59,054 | | | | 58,975 | |
Series 2019-1, Class A4, 4.000% VRN 2/25/49 (a) (b) | | | 16,949 | | | | 16,915 | |
Starwood Mortgage Residential Trust, Series 2019-INV1, Class A3, | | | | | | | | |
2.916% VRN 9/27/49 (a) (b) | | | 1,372,537 | | | | 1,390,989 | |
Structured Adjustable Rate Mortgage Loan Trust, Series 2004-2, Class 2A, | | | | | | | | |
2.970% VRN 3/25/34 (b) | | | 19,457 | | | | 19,312 | |
TIAA Bank Mortgage Loan Trust, Series 2018-2, Class A4, | | | | | | | | |
3.500% VRN 7/25/48 (a) (b) | | | 222,148 | | | | 222,453 | |
Verus Securitization Trust | | | | | | | | |
Series 2020-1, Class M1, 3.021% VRN 1/25/60 (a) (b) | | | 2,551,000 | | | | 2,539,297 | |
Series 2019-4, Class M1, 3.207% VRN 11/25/59 (a) (b) | | | 1,100,000 | | | | 1,083,882 | |
Series 2019-INV2, Class A3, 3.219% VRN 7/25/59 (a) (b) | | | 1,505,169 | | | | 1,537,459 | |
Series 2019-INV3, Class M1, 3.279% VRN 11/25/59 (a) (b) | | | 667,000 | | | | 668,832 | |
Series 2020-4, Class M1, 3.291% VRN 5/25/65 (a) (b) | | | 1,254,000 | | | | 1,250,910 | |
| | | Principal
Amount | | | Value | |
Washington Mutual Mortgage Pass-Through Certificates, Series 2004-AR2, Class A, 12 mo. MTA + 1.400% | | | | | | | | |
2.419% FRN 4/25/44 | | $ | 57,553 | | | $ | 55,044 | |
| | | | | | | | 30,687,916 | |
| | | | | | | | | |
TOTAL NON-U.S. GOVERNMENT AGENCY OBLIGATIONS (Cost $227,435,245) | | | | | | | 223,844,362 | |
| | | | | | | | | |
U.S. GOVERNMENT AGENCY OBLIGATIONS AND INSTRUMENTALITIES — 1.0% |
Collateralized Mortgage Obligations — 0.1% |
Government National Mortgage Association Series 2014-131, Class BW 2.868% FRN 5/20/41(b) | | | 232,566 | | | | 240,006 | |
Pass-Through Securities — 0.1% |
Federal Home Loan Mortgage Corp. Pool #1Q0239, 1 year CMT + 2.211% 3.823% 3/01/37 | | | 118,668 | | | | 125,050 | |
Federal National Mortgage Association | | | | | | | | |
Pool #775539 12 mo. USD LIBOR + 1.641% 2.516% FRN 5/01/34 | | | 16,513 | | | | 17,191 | |
Pool #725692 1 year CMT + 2.137% 3.138% FRN 10/01/33 | | | 36,069 | | | | 37,781 | |
Pool #888586 1 year CMT + 2.196% 3.326% FRN 10/01/34 | | | 92,897 | | | | 97,893 | |
Pool #844564 5.500% 12/01/20 | | | 783 | | | | 784 | |
Government National Mortgage Association Pool #507545 7.500% 8/15/29 | | | 24,198 | | | | 28,034 | |
| | | | | | | | 306,733 | |
Whole Loans — 0.8% |
Federal Home Loan Mortgage Corp. Structured Agency Credit Risk Debt Notes, Series 2020-DNA3, Class M2, 1 mo. USD LIBOR + 3.000% | | | | | | | | |
3.148% FRN 6/25/50 (a) | | | 3,218,000 | | | | 3,226,986 | |
Federal National Mortgage Association Connecticut Avenue Securities Trust | | | | | | | | |
Series 2019-R03, Class 1M2, 1 mo. USD LIBOR + 2.150% 2.298% FRN 9/25/31 (a) | | | 83,790 | | | | 83,569 | |
The accompanying notes are an integral part of the financial statements.
58
MassMutual Premier Short-Duration Bond Fund – Portfolio of Investments (Continued) |
| | | Principal
Amount | | | Value | |
Series 2019-R02, Class 1M2, 1 mo. USD LIBOR + 2.300% 2.448% FRN 8/25/31 (a) | | $ | 540,787 | | | $ | 537,416 | |
| | | | | | | | 3,847,971 | |
| | | | | | | | | |
TOTAL U.S. GOVERNMENT AGENCY OBLIGATIONS AND INSTRUMENTALITIES (Cost $4,370,588) | | | | | | | 4,394,710 | |
| | | | | | | | | |
U.S. TREASURY OBLIGATIONS — 0.4% |
U.S. Treasury Bonds & Notes — 0.4% |
U.S. Treasury Note | | | | | | | | |
8.000% 11/15/21 (d) | | | 1,720,000 | | | | 1,871,469 | |
| | | | | | | | | |
TOTAL U.S. TREASURY OBLIGATIONS (Cost $1,962,681) | | | | | | | 1,871,469 | |
| | | | | | | | | |
TOTAL BONDS & NOTES (Cost $405,807,258) | | | | | | | 405,997,239 | |
| | | | | | | | | |
TOTAL PURCHASED OPTIONS (#) — 0.1% (Cost $609,046) | | | | | | | 395,550 | |
| | | | | | | | | |
TOTAL LONG-TERM INVESTMENTS (Cost $406,416,304) | | | | | | | 406,392,789 | |
| | | | | | | | | |
SHORT-TERM INVESTMENTS — 5.3% |
Commercial Paper — 3.7% |
American Honda Finance Corp. | | | | | | | | |
0.315% 11/19/20 | | | 3,000,000 | | | | 2,998,929 | |
Avangrid, Inc. | | | | | | | | |
0.254% 10/20/20 (a) | | | 3,000,000 | | | | 2,999,695 | |
Bemis Co., Inc. | | | | | | | | |
0.183% 10/21/20 (a) | | | 5,000,000 | | | | 4,999,463 | |
Intercontinental Exchange, Inc. | | | | | | | | |
0.376% 11/13/20 (a) (e) | | | 1,000,000 | | | | 999,557 | |
LyondellBasell Industries NV | | | | | | | | |
0.162% 11/03/20 (a) | | | 1,000,000 | | | | 999,818 | |
| | | Principal
Amount | | | Value | |
Nutrien Ltd. | | | | | | | | |
0.213% 12/22/20 (a) | | $ | 2,000,000 | | | $ | 1,998,963 | |
Societe Generale | | | | | | | | |
0.081% 10/06/20 (a) | | | 1,000,000 | | | | 999,983 | |
| | | | | | | | 15,996,408 | |
U.S. Treasury Bill — 1.6% |
U.S. Treasury Bill | | | | | | | | |
0.000% 10/06/20 | | | 7,000,000 | | | | 6,999,936 | |
| | | | | | | | | |
TOTAL SHORT-TERM INVESTMENTS (Cost $22,996,233) | | | | | | | 22,996,344 | |
| | | | | | | | | |
TOTAL INVESTMENTS — 100.3% (Cost $429,412,537) (f) | | | | | | | 429,389,133 | |
| | | | | | | | | |
Other Assets/(Liabilities) — (0.3)% | | | | | | | (1,409,508 | ) |
| | | | | | | | | |
NET ASSETS — 100.0% | | | | | | $ | 427,979,625 | |
Abbreviation Legend
CLO | Collateralized Loan Obligation |
Notes to Portfolio of Investments
Percentages are stated as a percent of net assets.
(a) | Security is exempt from registration under Regulation S or Rule 144A of the Securities Act of 1933. These securities are considered restricted and may be resold in transactions exempt from registration. At September 30, 2020, the aggregate market value of these securities amounted to $267,338,616 or 62.47% of net assets. |
(b) | Certain variable rate securities are not based on a published reference rate and spread but are determined by the issuer or agent and are based on current market conditions. These securities do not indicate a reference rate and spread in their description above. The rates shown are the current interest rates at September 30, 2020. |
(c) | A portion of this security is purchased on a when-issued, delayed-delivery or forward commitment basis. (Note 2). |
(d) | A portion of this security is pledged/held as collateral for open derivatives. (Note 2). |
(e) | This security is fair valued in good faith in accordance with procedures approved by the Board of Trustees. At September 30, 2020, these securities amounted to a value of $999,557 or 0.23% of net assets. |
(f) | See Note 6 for aggregate cost for federal tax purposes. |
The accompanying notes are an integral part of the financial statements.
59
MassMutual Premier Short-Duration Bond Fund – Portfolio of Investments (Continued) |
(#) Interest Rate Swaptions Purchased
| | | | | | | Paid by Fund | | | Received by Fund | | | | | | | | | | | | | | | |
| Description | | Counterparty | | Expiration
Date | | Rate | | | Frequency | | | Rate | | | Frequency | | | Notional
Amount | | Value | | | Premium
Paid
(Received) | | | Unrealized
Appreciation/
(Depreciation) | |
| Call | | | | | | | | | | | | | | | | | | | | | | | | | | | | | | |
| 10-Year Interest Rate Swap, 12/15/42 | | Barclays Bank PLC* | | 12/13/32 | | | 3-Month USD LIBOR BBA | | | | Quarterly | | | | 2.44 | % | | | Semi-Annually | | | USD | | | 800,000 | | | $ | 101,520 | | | $ | 39,994 | | | $ | 61,526 | |
| | | | | | | | | | | | | | | | | | | | | | | | | | | | | | | | | | | | | | | |
| Put | | | | | | | | | | | | | | | | | | | | | | | | | | | | | | | | | | | | | | |
| 10-Year Interest Rate Swap, 2/02/43 | | Credit Suisse International* | | 1/31/33 | | | 3.11 | % | | | Semi-Annually | | | | 3-Month USD LIBOR BBA | | | | Quarterly | | | USD | | | 11,880,000 | | | $ | 294,030 | | | $ | 569,052 | | | $ | (275,022 | ) |
| | | | | | | | | | | | | | | | | | | | | | | | | | | | | $ | 395,550 | | | $ | 609,046 | | | $ | (213,496 | ) |
Futures contracts
| | Expiration
Date | | | Number of
Contracts | | | Notional
Amount | | | Value/ Net
Unrealized
Appreciation/
(Depreciation) | |
Long | | | | | | | | | | | | | | | | |
U.S. Treasury Note 10 Year | | | 12/21/20 | | | | 337 | | | $ | 46,973,089 | | | $ | 48,942 | |
| | | | | | | | | | | | | | | | | |
Short | | | | | | | | | | | | | | | | |
90 Day Eurodollar | | | 12/14/20 | | | | 5 | | | $ | (1,218,921 | ) | | $ | (28,017 | ) |
U.S. Treasury Ultra 10 Year | | | 12/21/20 | | | | 125 | | | | (19,939,285 | ) | | | (50,949 | ) |
U.S. Treasury Note 2 Year | | | 12/31/20 | | | | 300 | | | | (66,258,166 | ) | | | (30,115 | ) |
U.S. Treasury Note 5 Year | | | 12/31/20 | | | | 1,234 | | | | (155,376,180 | ) | | | (146,383 | ) |
90 Day Eurodollar | | | 3/15/21 | | | | 4 | | | | (975,487 | ) | | | (22,563 | ) |
90 Day Eurodollar | | | 9/13/21 | | | | 8 | | | | (1,951,273 | ) | | | (44,927 | ) |
90 Day Eurodollar | | | 3/14/22 | | | | 7 | | | | (1,706,839 | ) | | | (39,311 | ) |
90 Day Eurodollar | | | 9/19/22 | | | | 6 | | | | (1,462,405 | ) | | | (33,995 | ) |
90 Day Eurodollar | | | 3/13/23 | | | | 5 | | | | (1,217,921 | ) | | | (28,579 | ) |
90 Day Eurodollar | | | 12/18/23 | | | | 7 | | | | (1,703,514 | ) | | | (39,661 | ) |
90 Day Eurodollar | | | 12/16/24 | | | | 19 | | | | (4,618,126 | ) | | | (104,087 | ) |
| | | | | | | | | | | | | | $ | (568,587 | ) |
The accompanying notes are an integral part of the financial statements.
60
MassMutual Premier Short-Duration Bond Fund – Portfolio of Investments (Continued) |
Centrally Cleared Credit Default Swaps - Buy Protection
Reference
Obligation/Index | | Rate Paid
by Fund | | | Payment
Frequency | | | Termination
Date | | | Notional
Amount | | | Value | | | Upfront
Premium
Paid/
(Received) | | | Unrealized
Appreciation
(Depreciation) | |
CDX.NA.IG Series 35† | | | 1.00% | | | | Quarterly | | | | 12/20/2025 | | | | USD | | | | 2,000,000 | | | $ | (41,682 | ) | | $ | (49,003 | ) | | $ | 7,321 | |
CDX.NA.IG Series 35† | | | 1.00% | | | | Quarterly | | | | 12/20/2025 | | | | USD | | | | 2,200,000 | | | | (45,851 | ) | | | (52,572 | ) | | | 6,721 | |
| | | | | | | | | | | | | | | | | | | | | | | $ | (87,533 | ) | | $ | (101,575 | ) | | $ | 14,042 | |
* | Contracts are subject to a Master Netting Agreement. |
† | Payment is based on a percentage of the index. Reference entities are a number of individual issuers comprising the index. |
Currency Legend
Country weightings, as a percentage of net assets, is as follows:
United States | | | 75.9 | % |
Cayman Islands | | | 7.3 | % |
United Kingdom | | | 1.8 | % |
Bermuda | | | 1.6 | % |
Ireland | | | 1.6 | % |
Netherlands | | | 1.3 | % |
Canada | | | 0.9 | % |
Switzerland | | | 0.9 | % |
Japan | | | 0.8 | % |
Luxembourg | | | 0.6 | % |
Spain | | | 0.5 | % |
France | | | 0.5 | % |
Germany | | | 0.4 | % |
Sweden | | | 0.3 | % |
Denmark | | | 0.3 | % |
Mexico | | | 0.3 | % |
Total Long-Term Investments | | | 95.0 | % |
Short-Term Investments and Other Assets and Liabilities | | | 5.0 | % |
Net Assets | | | 100.0 | % |
The accompanying notes are an integral part of the financial statements.
61
MassMutual Premier Inflation-Protected and Income Fund — Portfolio of Investments |
September 30, 2020 |
| | | Principal
Amount | | | Value | |
BONDS & NOTES — 86.9% |
MUNICIPAL OBLIGATIONS — 0.0% |
AccessLex Institute, Revenue Bonds, Series 2004-A, Class A3, | | | | | | | | |
1.699% 7/01/39 | | $ | 50,000 | | | $ | 49,952 | |
| | | | | | | | | |
TOTAL MUNICIPAL OBLIGATIONS (Cost $49,327) | | | | | | | 49,952 | |
| | | | | | | | | |
NON-U.S. GOVERNMENT AGENCY OBLIGATIONS — 60.5% |
Auto Floor Plan Asset-Backed Securities — 3.0% |
Navistar Financial Dealer Note Master Owner Trust II | | | | | | | | |
Series 2019-1, Class A, 1 mo. USD LIBOR + .640% 0.788% FRN 5/25/24 (a) | | | 2,800,000 | | | | 2,797,014 | |
Series 2019-1, Class B, 1 mo. USD LIBOR + .750% 0.898% FRN 5/25/24 (a) | | | 3,159,000 | | | | 3,151,662 | |
Series 2019-1, Class C, 1 mo. USD LIBOR + .950% 1.098% FRN 5/25/24 (a) | | | 1,611,000 | | | | 1,602,612 | |
NextGear Floorplan Master Owner Trust, Series 2017-2A, Class A1, 1 mo. USD LIBOR + .680% | | | | | | | | |
0.832% FRN 10/17/22 (a) | | | 3,300,000 | | | | 3,300,330 | |
| | | | | | | | 10,851,618 | |
Automobile Asset-Backed Securities — 15.0% |
American Credit Acceptance Receivables Trust | | | | | | | | |
Series 2018-3, Class C, 3.750% 10/15/24 (a) | | | 2,853,256 | | | | 2,876,816 | |
Series 2016-4, Class E, 5.840% 2/12/24 (a) | | | 4,250,000 | | | | 4,250,425 | |
AmeriCredit Automobile Receivables Trust, Series 2020-2, Class A2A, | | | | | | | | |
0.600% 12/18/23 | | | 3,556,000 | | | | 3,562,398 | |
Avis Budget Rental Car Funding AESOP LLC | | | | | | | | |
Series 2019-1A, Class C, 4.530% 3/20/23 (a) | | | 322,000 | | | | 326,067 | |
Series 2016-1A, Class C, 4.940% 6/20/22 (a) | | | 1,150,000 | | | | 1,160,070 | |
CarMax Auto Owner Trust | | | | | | | | |
Series 2016-4, Class B, 1.920% 7/15/22 | | | 310,000 | | | | 310,850 | |
Series 2017-1, Class C, 2.840% 10/17/22 | | | 320,000 | | | | 322,580 | |
Series 2017-2, Class D, 3.390% 10/16/23 | | | 2,650,000 | | | | 2,698,028 | |
| | | Principal
Amount | | | Value | |
Exeter Automobile Receivables Trust | | | | | | | | |
Series 2020-2A, Class A, 1.130% 8/15/23 (a) | | $ | 680,155 | | | $ | 682,114 | |
Series 2019-3A, Class A, 2.590% 9/15/22 (a) | | | 109,457 | | | | 109,591 | |
Hertz Vehicle Financing II LP | | | | | | | | |
Series 2016-4A, Class B, 3.290% 7/25/22 (a) | | | 2,000,000 | | | | 1,997,522 | |
Series 2017-1A, Class B, 3.560% 10/25/21 (a) | | | 2,430,000 | | | | 2,409,663 | |
Series 2019-1A, Class B, 4.100% 3/25/23 (a) | | | 2,000,000 | | | | 1,992,393 | |
Series 2017-2A, Class C, 5.310% 10/25/23 (a) | | | 1,750,000 | | | | 1,695,642 | |
OneMain Direct Auto Receivables Trust | | | | | | | | |
Series 2017-2A, Class C, 2.820% 7/15/24 (a) | | | 6,314,931 | | | | 6,319,470 | |
Series 2017-2A, Class E, 4.740% 11/14/25 (a) | | | 900,000 | | | | 900,086 | |
OneMain Direct Auto Receivables Trust 2018-1, Series 2018-1A, Class A, | | | | | | | | |
3.430% 12/16/24 (a) | | | 690,714 | | | | 699,815 | |
OSCAR US Funding Trust IX LLC, Series 2018-2A, Class A3, | | | | | | | | |
3.390% 9/12/22 (a) | | | 3,003,026 | | | | 3,037,430 | |
OSCAR US Funding X LLC, Series 2019-1A, Class A2, | | | | | | | | |
3.100% 4/11/22 (a) | | | 1,959,650 | | | | 1,970,180 | |
OSCAR US Funding XI LLC, Series 2019-2A, Class A2, | | | | | | | | |
2.490% 8/10/22 (a) | | | 3,006,943 | | | | 3,027,265 | |
Santander Drive Auto Receivables Trust, Series 2020-2, Class A2A, | | | | | | | | |
0.620% 5/15/23 | | | 4,826,000 | | | | 4,832,040 | |
Tesla Auto Lease Trust, Series 2018-B, Class A, | | | | | | | | |
3.710% 8/20/21 (a) | | | 4,685,330 | | | | 4,729,151 | |
World Omni Auto Receivables Trust, Series 2019-C, Class A2B, 1 mo. USD LIBOR + .230% | | | | | | | | |
0.382% FRN 2/15/23 | | | 4,403,494 | | | | 4,406,131 | |
| | | | | | | | 54,315,727 | |
Commercial Mortgage-Backed Securities — 2.2% |
BHMS Mortgage Trust, Series 2018-ATLS, Class B, 1 mo. USD LIBOR + 1.500% | | | | | | | | |
1.652% FRN 7/15/35 (a) | | | 1,150,000 | | | | 1,066,655 | |
The accompanying notes are an integral part of the financial statements.
62
MassMutual Premier Inflation-Protected and Income Fund — Portfolio of Investments (Continued) |
| | | Principal
Amount | | | Value | |
BX Commercial Mortgage Trust | | | | | | | | |
Series 2020-BXLP, Class E, 1 mo. USD LIBOR + 1.600% 1.752% FRN 12/15/36 (a) | | $ | 1,198,903 | | | $ | 1,184,745 | |
Series 2018-IND, Class E, 1 mo. USD LIBOR + 1.700% 1.852% FRN 11/15/35 (a) | | | 1,449,000 | | | | 1,437,326 | |
Series 2019-XL, Class F, 1 mo. USD LIBOR + 2.000% 2.152% FRN 10/15/36 (a) | | | 2,325,780 | | | | 2,298,321 | |
CAMB Commercial Mortgage Trust, Series 2019-LIFE, Class D, 1 mo. USD LIBOR + 1.750% | | | | | | | | |
1.902% FRN 12/15/37 (a) | | | 250,836 | | | | 245,272 | |
DBJPM 17-C6 Mortgage Trust, Series 2017-C6, Class A1, | | | | | | | | |
1.907% 6/10/50 | | | 513,650 | | | | 517,745 | |
JP Morgan Chase Commercial Mortgage Securities Corp., Series 2018-LAQ, Class A, 1 mo. USD LIBOR + 1.000% | | | | | | | | |
1.152% FRN 6/15/32 (a) | | | 796,172 | | | | 760,359 | |
KNDL Mortgage Trust, Series 2019-KNSQ, Class E, 1 mo. USD LIBOR + 1.800% | | | | | | | | |
1.952% FRN 5/15/36 (a) | | | 389,000 | | | | 384,748 | |
| | | | | | | | 7,895,171 | |
Home Equity Asset-Backed Securities — 1.0% |
Option One Mortgage Loan Trust Asset-Backed Certificates, Series 2005-5, Class M1, 1 mo. USD LIBOR + 0.390% | | | | | | | | |
0.538% FRN 12/25/35 | | | 3,778,234 | | | | 3,731,482 | |
| | | | | | | | 3,731,482 | |
Other Asset-Backed Securities — 19.4% |
321 Henderson Receivables LLC | | | | | | | | |
Series 2006-2A, Class A1, 1 mo. USD LIBOR + .200% 0.352% FRN 6/15/41 (a) | | | 762,865 | | | | 737,725 | |
Series 2006-3A, Class A1, 1 mo. USD LIBOR + .200% 0.352% FRN 9/15/41 (a) | | | 95,055 | | | | 93,255 | |
Series 2007-1A, Class A1, 1 mo. USD LIBOR + .200% 0.352% FRN 3/15/42 (a) | | | 421,707 | | | | 407,223 | |
AASET Trust | | | | | | | | |
Series 2017-1A, Class A, 3.967% 5/16/42 (a) | | | 129,893 | | | | 117,432 | |
Series 2018-2A, Class A, 4.454% 11/18/38 (a) | | | 1,286,925 | | | | 1,196,928 | |
Affirm Asset Securitization Trust, Series 2020-Z1, Class A, | | | | | | | | |
3.460% 10/15/24 (a) | | | 2,920,821 | | | | 2,940,040 | |
| | | Principal
Amount | | | Value | |
AIMCO CLO, Series 2015-AA, Class AR, 3 mo. USD LIBOR + .850% | | | | | | | | |
1.125% FRN 1/15/28 (a) | | $ | 1,378,174 | | | $ | 1,369,513 | |
Arbor Realty Commercial Real Estate Notes, Series 2018-FL1, Class A, 1 mo. USD LIBOR + 1.150% | | | | | | | | |
1.302% FRN 6/15/28 (a) | | | 920,000 | | | | 908,528 | |
Avant Loans Funding Trust, Series 2019-B, Class A, | | | | | | | | |
2.720% 10/15/26 (a) | | | 742,408 | | | | 745,202 | |
Avery Point IV CLO Ltd., Series 2014-1A, Class AR, 3 mo. USD LIBOR + 1.100% | | | | | | | | |
1.345% FRN 4/25/26 (a) | | | 284,760 | | | | 284,538 | |
Carlyle Global Market Strategies CLO Ltd., Series 2013-2A, Class AR, 3 mo. USD LIBOR + .890% | | | | | | | | |
1.162% FRN 1/18/29 (a) | | | 1,877,537 | | | | 1,854,606 | |
Citigroup Mortgage Loan Trust, Inc., Series 2006-WFH3, Class M1, 1 mo. USD LIBOR + 0.290% | | | | | | | | |
0.438% FRN 10/25/36 | | | 443,342 | | | | 442,375 | |
CLI Funding V LLC, Series 2013-1A, Class Note, | | | | | | | | |
2.830% 3/18/28 (a) | | | 879,676 | | | | 879,676 | |
KREF Ltd. | | | | | | | | |
Series 2018-FL1, Class A, 1 mo. USD LIBOR + 1.100% 1.251% FRN 6/15/36 (a) | | | 4,300,000 | | | | 4,269,639 | |
Series 2018-FL1, Class AS, 1 mo. USD LIBOR + 1.350% 1.501% FRN 6/15/36 (a) | | | 1,520,000 | | | | 1,505,892 | |
Series 2018-FL1, Class D, 1 mo. USD LIBOR + 2.550% 2.701% FRN 6/15/36 (a) | | | 2,110,000 | | | | 2,027,079 | |
LCM Ltd., Series 19A, Class AR, 3 mo. USD LIBOR + 1.240% | | | | | | | | |
1.515% FRN 7/15/27 (a) | | | 1,200,000 | | | | 1,196,467 | |
Lendmark Funding Trust, Series 2018-1A, Class A, | | | | | | | | |
3.810% 12/21/26 (a) | | | 410,000 | | | | 417,691 | |
Magnetite XVIII Ltd., Series 2016-18A, Class AR, 3 mo. USD LIBOR + 1.080% | | | | | | | | |
1.360% FRN 11/15/28 (a) | | | 3,000,000 | | | | 2,983,197 | |
Marlette Funding Trust | | | | | | | | |
Series 2019-4A, Class A, 2.390% 12/17/29 (a) | | | 4,063,918 | | | | 4,101,735 | |
Series 2019-3A, Class A, 2.690% 9/17/29 (a) | | | 2,886,180 | | | | 2,911,392 | |
The accompanying notes are an integral part of the financial statements.
63
MassMutual Premier Inflation-Protected and Income Fund — Portfolio of Investments (Continued) |
| | | Principal
Amount | | | Value | |
Series 2019-2A, Class A, 3.130% 7/16/29 (a) | | $ | 3,465,287 | | | $ | 3,502,310 | |
Series 2019-1A, Class A, 3.440% 4/16/29 (a) | | | 5,185,325 | | | | 5,237,842 | |
Series 2018-3A, Class B, 3.860% 9/15/28 (a) | | | 3,480,995 | | | | 3,503,579 | |
Neuberger Berman CLO XX Ltd., Series 2015-20A, Class AR, 3 mo. USD LIBOR + .800% | | | | | | | | |
1.075% FRN 1/15/28 (a) | | | 1,420,887 | | | | 1,410,304 | |
NP SPE II LLC, Series 2019-1A, Class A1, | | | | | | | | |
2.574% 9/20/49 (a) | | | 310,163 | | | | 308,007 | |
OCP CLO Ltd., Series 2015-10A, Class A1R, 3 mo. USD LIBOR + .820% | | | | | | | | |
1.065% FRN 10/26/27 (a) | | | 982,680 | | | | 976,305 | |
Onemain Financial Issuance Trust, Series 2018-1A, Class A, | | | | | | | | |
3.300% 3/14/29 (a) | | | 3,779,000 | | | | 3,844,880 | |
Orange Lake Timeshare Trust, Series 2016-A, Class A, | | | | | | | | |
2.610% 3/08/29 (a) | | | 696,120 | | | | 697,553 | |
Oxford Finance Funding Trust, Series 2016-1A, Class A, | | | | | | | | |
3.968% 6/17/24 (a) | | | 48,871 | | | | 48,890 | |
PFS Financing Corp. | | | | | | | | |
Series 2019-B, Class A, 1 mo. USD LIBOR + .550% 0.702% FRN 9/15/23 (a) | | | 600,000 | | | | 600,384 | |
Series 2019-B, Class B, 1 mo. USD LIBOR + .800% 0.952% FRN 9/15/23 (a) | | | 1,100,000 | | | | 1,095,906 | |
Planet Fitness Master Issuer LLC, Series 2018-1A, Class A2I, | | | | | | | | |
4.262% 9/05/48 (a) | | | 2,548,000 | | | | 2,546,971 | |
PNMAC GMSR Issuer Trust, Series 2018-GT1, Class A, 1 mo. USD LIBOR + 2.850% | | | | | | | | |
2.998% FRN 2/25/23 (a) | | | 270,000 | | | | 263,524 | |
SCF Equipment Leasing LLC, Series 2020-1A, Class A2, | | | | | | | | |
0.680% 10/20/25 (a) | | | 1,671,000 | | | | 1,674,083 | |
Sierra Receivables Funding LLC | | | | | | | | |
Series 2019-3A, Class C, 3.000% 8/20/36 (a) | | | 2,054,603 | | | | 2,025,139 | |
Series 2019-1A, Class C, 3.770% 1/20/36 (a) | | | 565,279 | | | | 567,569 | |
Series 2019-3A, Class D, 4.180% 8/20/36 (a) | | | 515,403 | | | | 484,849 | |
Series 2018-1A, Class B, 4.236% 4/20/35 | | | 586,333 | | | | 574,133 | |
| | | Principal
Amount | | | Value | |
Series 2019-1A, Class D, 4.750% 1/20/36 (a) | | $ | 362,721 | | | $ | 350,185 | |
SoFi Consumer Loan Program Trust | | | | | | | | |
Series 2017-4, Class A, 2.500% 5/26/26 (a) | | | 240,815 | | | | 242,469 | |
Series 2017-6, Class A2, 2.820% 11/25/26 (a) | | | 1,596,108 | | | | 1,608,221 | |
Series 2018-1, Class A2, 3.140% 2/25/27 (a) | | | 1,513,937 | | | | 1,524,128 | |
Series 2016-1A, Class A, 3.260% 8/25/25 (a) | | | 1,686,569 | | | | 1,699,747 | |
Series 2017-2, Class A, 3.280% 2/25/26 (a) | | | 262,615 | | | | 262,491 | |
SoFi Consumer Loan Program LLC, Series 2016-2A, Class B, | | | | | | | | |
4.770% VRN 10/27/25 (a) (b) | | | 2,089,646 | | | | 2,102,035 | |
Trafigura Securitisation Finance PLC, Series 2018-1A, Class A2, | | | | | | | | |
3.730% 3/15/22 (a) | | | 1,000,000 | | | | 1,010,945 | |
Verizon Owner Trust., Series 2018-1A, Class A1A, | | | | | | | | |
2.820% 9/20/22 (a) | | | 806,897 | | | | 812,760 | |
| | | | | | | | 70,365,342 | |
Student Loans Asset-Backed Securities — 11.7% |
Brazos Higher Education Authority, Inc., Revenue Bonds, Series 2006-2, Class B2, | | | | | | | | |
1.656% 6/25/42 | | | 1,050,000 | | | | 1,000,797 | |
Chase Education Loan Trust, Series 2007-A, Class A4, 3 mo. USD LIBOR + .100% | | | | | | | | |
0.333% FRN 6/28/39 | | | 2,908,851 | | | | 2,765,455 | |
College Loan Corp. Trust I, Series 2005-2, Class B, 3 mo. USD LIBOR + .490% | | | | | | | | |
0.765% FRN 1/15/37 | | | 318,162 | | | | 285,778 | |
Commonbond Student Loan Trust, Series 2018-CGS, Class C, | | | | | | | | |
4.350% 2/25/46 (a) | | | 28,693 | | | | 28,885 | |
DRB Prime Student Loan Trust | | | | | | | | |
Series 2016-R, Class A1, 1 mo. USD LIBOR + 1.900% 2.048% FRN 10/25/44 (a) | | | 811,878 | | | | 813,854 | |
Series 2016-A, Class A1, 1 mo. USD LIBOR + 2.000% 2.148% FRN 4/25/40 (a) | | | 254,373 | | | | 251,666 | |
ECMC Group Student Loan Trust | | | | | | | | |
Series 2017-1A, Class A, 1 mo. USD LIBOR + 1.200% 1.348% FRN 12/27/66 (a) | | | 1,291,975 | | | | 1,284,822 | |
The accompanying notes are an integral part of the financial statements.
64
MassMutual Premier Inflation-Protected and Income Fund — Portfolio of Investments (Continued) |
| | | Principal
Amount | | | Value | |
Series 2016-1A, Class A, 1 mo. USD LIBOR + 1.350% 1.498% FRN 7/26/66 (a) | | $ | 1,369,737 | | | $ | 1,383,174 | |
EdLinc Student Loan Funding Trust, Series 2017-A, Class A, PRIME - 1.150% | | | | | | | | |
3.600% FRN 12/01/47 (a) | | | 387,414 | | | | 382,837 | |
Edsouth Indenture, No.10 LLC, Series 2015-2, Class B, 1 mo. USD LIBOR + 1.500% | | | | | | | | |
1.648% FRN 12/25/58 (a) | | | 750,000 | | | | 737,941 | |
Education Loan Asset-Backed Trust I, Series 2013-1, Class A1, 1 mo. USD LIBOR + 0.800% | | | | | | | | |
0.948% FRN 6/25/26 (a) | | | 118,765 | | | | 118,625 | |
ELFI Graduate Loan Program LLC, Series 2018-A, Class A1, 1 mo. USD LIBOR + .750% | | | | | | | | |
0.898% FRN 8/25/42 (a) | | | 1,310,778 | | | | 1,301,088 | |
Goal Capital Funding Trust, Series 2010-1, Class A, 3 mo. USD LIBOR + .700% | | | | | | | | |
0.950% FRN 8/25/48 (a) | | | 197,911 | | | | 194,223 | |
JP Morgan Student Loan Trust, Series 2007-A, Class B, 3 mo. USD LIBOR + .350% | | | | | | | | |
0.597% FRN 6/28/39 (a) | | | 290,214 | | | | 260,199 | |
KeyCorp Student Loan Trust, Series 2005-A, Class 2B, 3 mo. USD LIBOR + .730% | | | | | | | | |
0.963% FRN 9/27/38 | | | 1,654,312 | | | | 1,631,587 | |
Laurel Road Prime Student Loan Trust | | | | | | | | |
Series 2017-C, Class A1, 0.698% FRN 11/25/42 (a) (b) | | | 95,621 | | | | 92,267 | |
Series 2019-A, Class A1FX, 2.340% 10/25/48 (a) | | | 538,106 | | | | 527,074 | |
Series 2018-B, Class A2FX, 3.540% 5/26/43 (a) | | | 3,298,131 | | | | 3,389,303 | |
Navient Student Loan Trust | | | | | | | | |
Series 2019-2A, Class A2, 1 mo. USD LIBOR + 1.000% 1.148% FRN 2/27/68 (a) | | | 2,758,000 | | | | 2,760,707 | |
Series 2016-7A, Class A, 1 mo. USD LIBOR + 1.150% 1.298% FRN 3/25/66 (a) | | | 1,466,605 | | | | 1,466,605 | |
Series 2016-5A, Class A, 1 mo. USD LIBOR + 1.250% 1.398% FRN 6/25/65 (a) | | | 1,552,247 | | | | 1,552,246 | |
Series 2019-3A, Class B, 1 mo. USD LIBOR + 1.550% 1.698% FRN 7/25/68 (a) | | | 2,550,000 | | | | 2,246,068 | |
| | | Principal
Amount | | | Value | |
Nelnet Private Education Loan Trust, Series 2016-A, Class A1A, 1 mo. USD LIBOR + 1.750% | | | | | | | | |
1.898% FRN 12/26/40 (a) | | $ | 131,798 | | | $ | 125,892 | |
Nelnet Student Loan Trust | | | | | | | | |
Series 2005-2, Class B, 3 mo. USD LIBOR + .170% 0.395% FRN 3/23/37 | | | 523,365 | | | | 446,331 | |
Series 2006-2, Class B, 3 mo. USD LIBOR + .200% 0.445% FRN 1/25/38 | | | 397,390 | | | | 339,256 | |
Series 2006-3, Class B, 3 mo. USD LIBOR + .250% 0.475% FRN 6/25/41 | | | 253,054 | | | | 218,926 | |
Series 2004-3, Class B, 3 mo. USD LIBOR + .350% 0.595% FRN 10/25/40 | | | 644,799 | | | | 606,874 | |
Series 2014-2A, Class B, 1 mo. USD LIBOR + 1.500% 1.648% FRN 6/25/41 (a) | | | 295,000 | | | | 279,306 | |
SLC Student Loan Trust | | | | | | | | |
Series 2006-2, Class B, 3 mo. USD LIBOR + .230% 0.480% FRN 12/15/39 | | | 319,428 | | | | 277,385 | |
Series 2005-2, Class B, 3 mo. USD LIBOR + .280% 0.530% FRN 3/15/40 | | | 1,065,069 | | | | 931,382 | |
SLM Private Credit Student Loan Trust, Series 2004-B, Class B, 3 mo. USD LIBOR + .470% | | | | | | | | |
0.720% FRN 9/15/33 | | | 498,847 | | | | 497,770 | |
SLM Student Loan Trust | | | | | | | | |
Series 2006-5, Class A5, 3 mo. USD LIBOR + 0.110% 0.355% FRN 1/25/27 | | | 738,405 | | | | 737,308 | |
Series 2006-4, Class B, 3 mo. USD LIBOR + .200% 0.445% FRN 1/25/70 | | | 208,751 | | | | 186,282 | |
Series 2006-5, Class B, 3 mo. USD LIBOR + .210% 0.455% FRN 10/25/40 | | | 256,667 | | | | 229,470 | |
Series 2006-2, Class B, 3 mo. USD LIBOR + .220% 0.465% FRN 1/25/41 | | | 303,930 | | | | 271,778 | |
Series 2005-8, Class B, 3 mo. USD LIBOR + .310% 0.555% FRN 1/25/55 | | | 272,127 | | | | 241,930 | |
Series 2004-3, Class B, 3 mo. USD LIBOR + .470% 0.715% FRN 10/25/64 | | | 211,688 | | | | 188,008 | |
Series 2003-11, Class B, 3 mo. USD LIBOR + .650% 0.900% FRN 12/15/38 | | | 244,096 | | | | 224,217 | |
The accompanying notes are an integral part of the financial statements.
65
MassMutual Premier Inflation-Protected and Income Fund — Portfolio of Investments (Continued) |
| | | Principal
Amount | | | Value | |
SMB Private Education Loan Trust | | | | | | | | |
Series 2019-A, Class A1, 1 mo. USD LIBOR + .350% 0.502% FRN 2/16/26 (a) | | $ | 488,756 | | | $ | 483,291 | |
Series 2019-A, Class A2B, 1 mo. USD LIBOR + .870% 1.022% FRN 7/15/36 (a) | | | 1,740,000 | | | | 1,718,047 | |
Series 2014-A, Class A2B, 1 mo. USD LIBOR + 1.150% 1.302% FRN 5/15/26 (a) | | | 699,116 | | | | 700,661 | |
SoFi Alternative Trust, Series 2019-C, Class PT, | | | | | | | | |
4.861% VRN 1/25/45 (a) (b) | | | 1,342,011 | | | | 1,442,662 | |
SoFi Professional Loan Program LLC | | | | | | | | |
Series 2019-C, Class A1FX, 2.130% 11/16/48 (a) | | | 979,857 | | | | 986,590 | |
Series 2016-B, Class A2B, 2.740% 10/25/32 (a) | | | 4,069,594 | | | | 4,135,038 | |
Series 2018-D, Class A2FX, 3.600% 2/25/48 (a) | | | 2,540,000 | | | | 2,649,215 | |
| | | | | | | | 42,392,820 | |
Whole Loan Collateral Collateralized Mortgage Obligations — 8.2% |
Angel Oak Mortgage Trust, Series 2018-3, Class A3, | | | | | | | | |
3.238% VRN 5/25/59 (a) (b) | | | 719,000 | | | | 726,407 | |
BRAVO Residential Funding Trust, Series 2019-NQM1, Class A1, | | | | | | | | |
2.666% VRN 7/25/59 (a) (b) | | | 6,443,725 | | | | 6,541,776 | |
CIM Trust, Series 2019-INV3, Class A11, 1 mo. USD LIBOR + 1.000% | | | | | | | | |
1.125% FRN 8/25/49 (a) | | | 2,848,224 | | | | 2,848,112 | |
Citigroup Mortgage Loan Trust, Series 2019-IMC1, Class A3, | | | | | | | | |
3.030% VRN 7/25/49 (a) (b) | | | 852,747 | | | | 850,088 | |
Deephaven Residential Mortgage Trust | | | | | | | | |
Series 2019-4A, Class A3, 3.047% VRN 10/25/59 (a) (b) | | | 3,203,085 | | | | 3,200,401 | |
Series 2019-2A, Class A1, 3.558% VRN 4/25/59 (a) (b) | | | 657,449 | | | | 672,169 | |
Series 2018-4A, Class A3, 4.285% VRN 10/25/58 (a) (b) | | | 943,193 | | | | 952,661 | |
JP Morgan Mortgage Trust | | | | | | | | |
Series 2018-1, Class A5, 3.500% VRN 6/25/48 (a) (b) | | | 162,219 | | | | 162,541 | |
Series 2018-3, Class A5, 3.500% VRN 9/25/48 (a) (b) | | | 293,136 | | | | 295,162 | |
Series 2017-6, Class A5, 3.500% VRN 12/25/48 (a) (b) | | | 196,833 | | | | 199,159 | |
New Residential Mortgage Loan Trust | | | | | | | | |
Series 2019-NQM2, Class A3, 3.752% VRN 4/25/49 (a) (b) | | | 373,064 | | | | 378,827 | |
| | | Principal
Amount | | | Value | |
Series 2019-NQM1, Class A3, 3.928% VRN 1/25/49 (a) (b) | | $ | 683,766 | | | $ | 695,572 | |
Onslow Bay Financial LLC, Series 2020-EXP1, Class 2A2, 1 mo. USD LIBOR + .950% | | | | | | | | |
1.098% FRN 2/25/60 (a) | | | 1,529,279 | | | | 1,531,706 | |
PSMC Trust, Series 2018-1, Class A3, | | | | | | | | |
3.500% VRN 2/25/48 (a) (b) | | | 199,699 | | | | 201,843 | |
Sequoia Mortgage Trust, Series 2018-3, Class A4, | | | | | | | | |
3.500% VRN 3/25/48 (a) (b) | | | 214,817 | | | | 215,455 | |
Starwood Mortgage Residential Trust, Series 2019-INV1, Class A3, | | | | | | | | |
2.916% VRN 9/27/49 (a) (b) | | | 1,043,657 | | | | 1,057,688 | |
Verus Securitization Trust | | | | | | | | |
Series 2019-INV2, Class A3, 3.219% VRN 7/25/59 (a) (b) | | | 1,220,407 | | | | 1,246,588 | |
Series 2019-2, Class A3, 3.448% VRN 5/25/59 (a) (b) | | | 2,200,373 | | | | 2,221,045 | |
Series 2019-1, Class A1, 3.836% VRN 2/25/59 (a) (b) | | | 1,765,872 | | | | 1,786,105 | |
Series 2019-1, Class A3, 4.040% VRN 2/25/59 (a) (b) | | | 3,858,175 | | | | 3,912,033 | |
| | | | | | | | 29,695,338 | |
| | | | | | | | | |
TOTAL NON-U.S. GOVERNMENT AGENCY OBLIGATIONS (Cost $219,086,200) | | | | | | | 219,247,498 | |
| | | | | | | | | |
U.S. GOVERNMENT AGENCY OBLIGATIONS AND INSTRUMENTALITIES — 4.5% |
Whole Loans — 4.5% |
Federal Home Loan Mortgage Corp. Structured Agency Credit Risk Debt Notes | | | | | | | | |
Series 2020-DNA3, Class M1, 1 mo. USD LIBOR + 1.500% 1.648% FRN 6/25/50 (a) | | | 10,160,000 | | | | 10,177,093 | |
Series 2020-DNA4, Class M1, 1 mo. USD LIBOR + 1.500% 1.648% FRN 8/25/50 (a) | | | 5,553,000 | | | | 5,569,844 | |
Federal National Mortgage Association Connecticut Avenue Securities Trust, Series 2019-R03, Class 1M2, 1 mo. USD LIBOR + 2.150% | | | | | | | | |
2.298% FRN 9/25/31 (a) | | | 673,833 | | | | 672,060 | |
| | | | | | | | 16,418,997 | |
| | | | | | | | | |
TOTAL U.S. GOVERNMENT AGENCY OBLIGATIONS AND INSTRUMENTALITIES (Cost $16,391,297) | | | | | | | 16,418,997 | |
The accompanying notes are an integral part of the financial statements.
66
MassMutual Premier Inflation-Protected and Income Fund — Portfolio of Investments (Continued) |
| | | Principal
Amount | | | Value | |
U.S. TREASURY OBLIGATIONS — 21.9% |
U.S. Treasury Bonds & Notes — 21.9% |
U.S. Treasury Inflation Index | | | | | | | | |
0.125% 10/15/24 | | $ | 7,067,970 | | | $ | 7,502,678 | |
0.125% 4/15/25 | | | 1,002,930 | | | | 1,067,428 | |
0.125% 7/15/26 | | | 2,669,453 | | | | 2,895,835 | |
0.125% 1/15/30 | | | 5,336,517 | | | | 5,899,353 | |
0.125% 7/15/30 | | | 3,839,520 | | | | 4,271,066 | |
0.250% 1/15/25 | | | 4,374,960 | | | | 4,668,390 | |
0.250% 7/15/29 | | | 5,089,119 | | | | 5,694,181 | |
0.250% 2/15/50 | | | 2,015,260 | | | | 2,381,995 | |
0.375% 7/15/25 (c) | | | 3,113,450 | | | | 3,380,525 | |
0.500% 4/15/24 | | | 3,543,702 | | | | 3,762,645 | |
0.500% 1/15/28 | | | 2,310,528 | | | | 2,593,658 | |
0.625% 4/15/23 | | | 3,097,532 | | | | 3,241,035 | |
0.625% 1/15/24 | | | 1,498,851 | | | | 1,592,880 | |
0.625% 1/15/26 | | | 3,161,754 | | | | 3,485,772 | |
0.625% 2/15/43 | | | 450,708 | | | | 556,131 | |
0.750% 7/15/28 | | | 2,394,310 | | | | 2,759,130 | |
0.750% 2/15/42 | | | 1,261,117 | | | | 1,588,564 | |
0.750% 2/15/45 | | | 1,529,167 | | | | 1,949,449 | |
0.875% 1/15/29 | | | 3,693,456 | | | | 4,303,598 | |
0.875% 2/15/47 | | | 1,341,475 | | | | 1,787,218 | |
1.000% 2/15/49 | | | 1,652,348 | | | | 2,309,177 | |
1.375% 2/15/44 | | | 2,334,255 | | | | 3,325,250 | |
2.000% 1/15/26 | | | 1,827,308 | | | | 2,152,619 | |
2.125% 2/15/40 | | | 838,999 | | | | 1,286,979 | |
2.125% 2/15/41 | | | 958,198 | | | | 1,490,072 | |
3.875% 4/15/29 | | | 2,442,643 | | | | 3,512,730 | |
| | | | | | | | 79,458,358 | |
| | | | | | | | | |
TOTAL U.S. TREASURY OBLIGATIONS (Cost $73,953,081) | | | | | | | 79,458,358 | |
| | | | | | | | | |
TOTAL BONDS & NOTES (Cost $309,479,905) | | | | | | | 315,174,805 | |
| | | | | | | | | |
TOTAL PURCHASED OPTIONS (#) — 0.2% (Cost $1,137,772) | | | | | | | 736,405 | |
| | | | | | | | | |
TOTAL LONG-TERM INVESTMENTS (Cost $310,617,677) | | | | | | | 315,911,210 | |
| | | Principal
Amount | | | Value | |
SHORT-TERM INVESTMENTS — 13.9% |
Commercial Paper — 13.6% |
AstraZeneca PLC | | | | | | | | |
2.059% 11/02/20 (a) | | $ | 4,000,000 | | | $ | 3,998,676 | |
BAT International Financial PLC | | | | | | | | |
0.406% 10/13/20 (a) | | | 5,000,000 | | | | 4,999,175 | |
Boeing Co. | | | | | | | | |
2.109% 11/10/20 (a) | | | 4,000,000 | | | | 3,994,971 | |
Dominion Resources, Inc. | | | | | | | | |
0.304% 11/16/20 | | | 4,000,000 | | | | 3,998,950 | |
Ei Dupont | | | | | | | | |
0.835% 12/02/20 (a) | | | 2,000,000 | | | | 1,999,321 | |
0.866% 12/09/20 (a) | | | 2,000,000 | | | | 1,999,211 | |
Enbridge (US), Inc. | | | | | | | | |
0.203% 10/15/20 (a) | | | 4,000,000 | | | | 3,999,700 | |
FMC Technologies, Inc. | | | | | | | | |
0.355% 12/08/20 (a) | | | 1,000,000 | | | | 999,586 | |
Intercontinental Exchange, Inc. | | | | | | | | |
0.376% 12/15/20 (a) (d) | | | 3,000,000 | | | | 2,997,600 | |
0.376% 12/22/20 (a) (d) | | | 2,000,000 | | | | 1,998,236 | |
Rogers Communications | | | | | | | | |
0.458% 8/25/21 (a) | | | 4,000,000 | | | | 3,983,331 | |
Suncor Energy, Inc. | | | | | | | | |
0.284% 12/14/20 (a) | | | 2,500,000 | | | | 2,498,854 | |
0.305% 1/29/21 (a) | | | 1,000,000 | | | | 999,089 | |
Walt Disney Co. | | | | | | | | |
0.356% 7/16/21 (a) | | | 2,000,000 | | | | 1,994,316 | |
Waste Management, Inc. | | | | | | | | |
0.458% 9/15/21 (a) | | | 5,000,000 | | | | 4,982,597 | |
Xylem, Inc. | | | | | | | | |
2.102% 11/18/20 (a) | | | 4,000,000 | | | | 3,998,895 | |
| | | | | | | | 49,442,508 | |
Repurchase Agreement — 0.3% |
Fixed Income Clearing Corp., Repurchase Agreement, dated 9/30/20, 0.000%, due 10/01/20 (e) | | | 1,010,124 | | | | 1,010,124 | |
| | | | | | | | | |
TOTAL SHORT-TERM INVESTMENTS (Cost $50,423,429) | | | | | | | 50,452,632 | |
| | | | | | | | | |
TOTAL INVESTMENTS — 101.0% (Cost $361,041,106) (f) | | | | | | | 366,363,842 | |
| | | | | | | | | |
Other Assets/(Liabilities) — (1.0)% | | | | | | | (3,536,490 | ) |
| | | | | | | | | |
NET ASSETS — 100.0% | | | | | | $ | 362,827,352 | |
The accompanying notes are an integral part of the financial statements.
67
MassMutual Premier Inflation-Protected and Income Fund — Portfolio of Investments (Continued) |
Abbreviation Legend
CLO | Collateralized Loan Obligation |
Notes to Portfolio of Investments
Percentages are stated as a percent of net assets.
(a) | Security is exempt from registration under Regulation S or Rule 144A of the Securities Act of 1933. These securities are considered restricted and may be resold in transactions exempt from registration. At September 30, 2020, the aggregate market value of these securities amounted to $248,631,757 or 68.53% of net assets. |
(b) | Certain variable rate securities are not based on a published reference rate and spread but are determined by the issuer or agent and are based on current market conditions. These securities do not indicate a reference rate and spread in their description above. The rates shown are the current interest rates at September 30, 2020. |
(c) | A portion of this security is pledged/held as collateral for open derivatives. (Note 2). |
(d) | This security is fair valued in good faith in accordance with procedures approved by the Board of Trustees. At September 30, 2020, these securities amounted to a value of $4,995,836 or 1.38% of net assets. |
(e) | Maturity value of $1,010,124. Collateralized by U.S. Government Agency obligations with a rate of 2.375%, maturity date of 3/15/22, and an aggregate market value, including accrued interest, of $1,030,371. |
(f) | See Note 6 for aggregate cost for federal tax purposes. |
(#) Interest Rate Swaptions Purchased
| | | | | | | Paid by Fund | | | Received by Fund | | | | | | | | | | | | | | |
| Description | | Counterparty | | Expiration
Date | | Rate | | | Frequency | | | Rate | | Frequency | | | Notional
Amount | | Value | | | Premium
Paid
(Received) | | | Unrealized
Appreciation/
(Depreciation) | |
| Call | | | | | | | | | | | | | | | | | | | | | | | | | | | | | |
| 10-Year Interest Rate Swap, 12/15/42 | | Barclays Bank PLC* | | 12/13/32 | | | 3-Month USD LIBOR BBA | | | | Quarterly | | | 2.44% | | | Semi-Annually | | | USD | | | 1,219,750 | | | $ | 154,786 | | | $ | 60,978 | | | $ | 93,808 | |
| | | | | | | | | | | | | | | | | | | | | | | | | | | | | | | | | | | | | |
| Put | | | | | | | | | | | | | | | | | | | | | | | | | | | | | | | | | | | | |
| 10-Year Interest Rate Swap, 12/15/42 | | Barclays Bank PLC* | | 12/13/32 | | | 2.94 | % | | | Semi-Annually | | | 3-Month USD LIBOR BBA | | | Quarterly | | | USD | | | 14,190,000 | | | $ | 391,786 | | | $ | 709,401 | | | $ | (317,615 | ) |
| 10-Year Interest Rate Swap, 2/02/43 | | Credit Suisse International* | | 1/31/33 | | | 3.11 | % | | | Semi-Annually | | | 3-Month USD LIBOR BBA | | | Quarterly | | | USD | | | 7,670,000 | | | | 189,833 | | | | 367,393 | | | | (177,560 | ) |
| | | | | | | | | | | | | | | | | | | | | | | | | | | | 581,619 | | | | 1,076,794 | | | | (495,175 | ) |
| | | | | | | | | | | | | | | | | | | | | | | | | | | $ | 736,405 | | | $ | 1,137,772 | | | $ | (401,367 | ) |
Futures contracts
| | Expiration
Date | | | Number of
Contracts | | | Notional
Amount | | | Value/ Net
Unrealized
Appreciation/
(Depreciation) | |
Long | | | | | | | | | | | | | | | | |
U.S. Treasury Long Bond | | | 12/21/20 | | | | 22 | | | $ | 3,883,019 | | | $ | (4,831 | ) |
U.S. Treasury Note 2 Year | | | 12/31/20 | | | | 22 | | | | 4,860,867 | | | | 274 | |
U.S. Treasury Note 5 Year | | | 12/31/20 | | | | 39 | | | | 4,914,004 | | | | 1,215 | |
| | | | | | | | | | | | | | $ | (3,342 | ) |
Short | | | | | | | | | | | | | | | | |
The accompanying notes are an integral part of the financial statements.
68
MassMutual Premier Inflation-Protected and Income Fund — Portfolio of Investments (Continued) |
| | Expiration
Date | | | Number of
Contracts | | | Notional
Amount | | | Value/ Net
Unrealized
Appreciation/
(Depreciation) | |
U.S. Treasury Ultra 10 Year | | | 12/21/20 | | | | 38 | | | $ | (6,062,428 | ) | | $ | (14,603 | ) |
U.S. Treasury Ultra Bond | | | 12/21/20 | | | | 13 | | | | (2,909,598 | ) | | | 26,035 | |
| | | | | | | | | | | | | | $ | 11,432 | |
Centrally Cleared Credit Default Swaps - Buy Protection
Reference
Obligation/Index | | Rate Paid
by Fund | | | Payment
Frequency | | Termination
Date | | Notional
Amount | | Value | | | Upfront
Premium
Paid/
(Received) | | | Unrealized
Appreciation
(Depreciation) | |
| CDX.NA.IG Series 35† | | | 1.000 | % | | Quarterly | | 12/20/2025 | | USD | | | 1,600,000 | | | $ | (33,346 | ) | | $ | (38,234 | ) | | $ | 4,888 | |
OTC Interest Rate Swaps
| Paid by the Fund | | | Received by the Fund | | | | | | | | | | | | | | | | | | |
Rate/
Reference | | | Frequency | | | Rate/
Reference | | Frequency | | | Counterparty | | Termination
Date | | Notional
Amount | | Value | | | Upfront
Premium
Paid/
(Received) | | | Unrealized
Appreciation
(Depreciation) | |
| | 1.790 | % | | | Maturity | | | U.S. Consumer Price Index | | | Maturity | | | BNP Paribas SA* | | 1/22/22 | | USD | | | 3,400,000 | | | $ | (42,685 | ) | | $ | — | | | $ | (42,685 | ) |
| | 1.823 | % | | | Maturity | | | U.S. Consumer Price Index | | | Maturity | | | BNP Paribas SA* | | 2/04/22 | | USD | | | 5,500,000 | | | | (74,751 | ) | | | — | | | | (74,751 | ) |
| | 1.505 | % | | | Maturity | | | U.S. Consumer Price Index | | | Maturity | | | BNP Paribas SA* | | 2/14/22 | | USD | | | 6,000,000 | | | | (45,223 | ) | | | — | | | | (45,223 | ) |
| | 1.833 | % | | | Maturity | | | U.S. Consumer Price Index | | | Maturity | | | Goldman Sachs & Co.* | | 8/28/23 | | USD | | | 3,500,000 | | | | (4,083 | ) | | | — | | | | (4,083 | ) |
| | 1.880 | % | | | Maturity | | | U.S. Consumer Price Index | | | Maturity | | | Goldman Sachs & Co.* | | 8/28/25 | | USD | | | 2,000,000 | | | | (3,660 | ) | | | — | | | | (3,660 | ) |
| | 1.180 | % | | | Maturity | | | U.S. Consumer Price Index | | | Maturity | | | Goldman Sachs International* | | 6/22/22 | | USD | | | 1,000,000 | | | | 11,445 | | | | — | | | | 11,445 | |
| | 1.669 | % | | | Maturity | | | U.S. Consumer Price Index | | | Maturity | | | Goldman Sachs International* | | 11/08/22 | | USD | | | 2,500,000 | | | | (19,792 | ) | | | — | | | | (19,792 | ) |
| | | | | | | | | | | | | | | | | | | | | | | | | $ | (178,749 | ) | | $ | — | | | $ | (178,749 | ) |
The accompanying notes are an integral part of the financial statements.
69
MassMutual Premier Inflation-Protected and Income Fund — Portfolio of Investments (Continued) |
OTC Total Return Swaps
| Paid by the Fund | | | Received by the Fund | | | | | | | | | | | | | | | | |
Rate/
Reference | | | No. of
Contracts/
Notional | | Frequency | | | Rate/
Reference | | No. of
Contracts/
Notional | | | Frequency | | | Counterparty | | Termination
Date | | Value | | | Upfront
Premium
Received
(Paid)/
Received | | | Unrealized
Appreciation
(Depreciation) | |
| | 1.00 | % | | USD | | | 56,910,635 | | | | Maturity | | | Bloomberg Barclays US Treasury Inflation Notes TR Index | | | 59,469,342 | | | | Maturity | | | Barclays Bank PLC* | | 10/30/20 | | $ | 2,558,707 | | | $ | — | | | $ | 2,558,707 | |
| | 0.30 | % | | USD | | | 47,783,148 | | | | Maturity | | | Bloomberg Barclays US Treasury Inflation Notes TR Index | | | 49,232,340 | | | | Maturity | | | BNP Paribas SA* | | 11/30/20 | | | 1,449,192 | | | | — | | | | 1,449,192 | |
| | 0.29 | % | | USD | | | 27,374,764 | | | | Maturity | | | Bloomberg Barclays US Treasury Inflation Notes TR Index | | | 27,571,480 | | | | Maturity | | | BNP Paribas SA* | | 1/29/21 | | | 196,715 | | | | — | | | | 196,715 | |
| | 0.30 | % | | USD | | | 20,000,000 | | | | Maturity | | | Bloomberg Barclays US Treasury Inflation Notes TR Index | | | 20,032,101 | | | | Maturity | | | BNP Paribas SA* | | 2/26/21 | | | 32,101 | | | | — | | | | 32,101 | |
| | 0.31 | % | | USD | | | 47,000,000 | | | | Maturity | | | Bloomberg Barclays US Treasury Inflation Notes TR Index | | | 48,966,000 | | | | Maturity | | | Goldman Sachs International* | | 11/30/20 | | | 1,966,000 | | | | — | | | | 1,966,000 | |
| | 0.29 | % | | USD | | | 27,374,764 | | | | Maturity | | | Bloomberg Barclays US Treasury Inflation Notes TR Index | | | 27,571,480 | | | | Maturity | | | Goldman Sachs International* | | 1/29/21 | | | 196,716 | | | | — | | | | 196,716 | |
| | 0.30 | % | | USD | | | 41,145,535 | | | | Maturity | | | Bloomberg Barclays US Treasury Inflation Notes TR Index | | | 40,993,374 | | | | Maturity | | | Goldman Sachs International* | | 2/26/21 | | | (152,161 | ) | | | — | | | | (152,161 | ) |
| | | | | | | | | | | | | | | | | | | | | | | | | | | | | $ | 6,247,270 | | | $ | — | | | $ | 6,247,270 | |
* | Contracts are subject to a Master Netting Agreement. |
† | Payment is based on a percentage of the index. Reference entities are a number of individual issuers comprising the index. |
Currency Legend
The accompanying notes are an integral part of the financial statements.
70
MassMutual Premier Inflation-Protected and Income Fund — Portfolio of Investments (Continued) |
Country weightings, as a percentage of net assets, is as follows:
United States | | | 79.4 | % |
Cayman Islands | | | 5.2 | % |
Japan | | | 2.2 | % |
Ireland | | | 0.3 | % |
Total Long-Term Investments | | | 87.1 | % |
Short-Term Investments and Other Assets and Liabilities | | | 12.9 | % |
Net Assets | | | 100.0 | % |
The accompanying notes are an integral part of the financial statements.
71
MassMutual Premier Core Bond Fund — Portfolio of Investments |
September 30, 2020 |
| | | Number of
Shares | | | Value | |
EQUITIES — 0.2% |
PREFERRED STOCK — 0.2% |
Financial — 0.2% |
Insurance — 0.2% |
The Allstate Corp., 3 mo. USD LIBOR + 3.165% | | | | | | | | |
5.100% VRN 1/15/53 | | | 130,000 | | | $ | 3,376,100 | |
| | | | | | | | | |
TOTAL PREFERRED STOCK (Cost $3,250,000) | | | | | | | 3,376,100 | |
| | | | | | | | | |
TOTAL EQUITIES (Cost $3,250,000) | | | | | | | 3,376,100 | |
| | | Principal
Amount | | | | | |
BONDS & NOTES — 99.1% |
CORPORATE DEBT — 39.7% |
Aerospace & Defense — 0.2% |
BAE Systems PLC | | | | | | | | |
1.900% 2/15/31 (a) | | $ | 775,000 | | | | 771,450 | |
Raytheon Technologies Corp. | | | | | | | | |
4.500% 6/01/42 | | | 1,375,000 | | | | 1,735,973 | |
| | | | | | | | 2,507,423 | |
Agriculture — 0.9% |
BAT Capital Corp. | | | | | | | | |
2.259% 3/25/28 | | | 930,000 | | | | 934,614 | |
4.700% 4/02/27 | | | 1,175,000 | | | | 1,347,995 | |
4.758% 9/06/49 | | | 805,000 | | | | 874,273 | |
Bunge Ltd. Finance Corp. | | | | | | | | |
1.630% 8/17/25 | | | 505,000 | | | | 507,209 | |
3.250% 8/15/26 | | | 1,383,000 | | | | 1,491,358 | |
4.350% 3/15/24 | | | 2,120,000 | | | | 2,336,030 | |
Imperial Brands Finance PLC | | | | | | | | |
3.500% 7/26/26 (a) | | | 1,675,000 | | | | 1,812,086 | |
3.875% 7/26/29 (a) | | | 1,842,000 | | | | 1,995,225 | |
Reynolds American, Inc. | | | | | | | | |
5.850% 8/15/45 | | | 1,025,000 | | | | 1,245,523 | |
| | | | | | | | 12,544,313 | |
Airlines — 0.2% |
American Airlines Pass-Through Trust, Series 2014-1, Class B, | | | | | | | | |
4.375% 4/01/24 | | | 160,514 | | | | 113,681 | |
Delta Air Lines, Inc. / SkyMiles IP Ltd. | | | | | | | | |
4.500% 10/20/25 (a) | | | 1,258,000 | | | | 1,291,780 | |
Spirit Airlines Pass-Through Trust, Series 2015-1, Class A, | | | | | | | | |
4.100% 10/01/29 | | | 1,263,103 | | | | 1,133,713 | |
| | | Principal
Amount | | | Value | |
United Airlines Pass-Through Trust, Series 2018-1, Class B, | | | | | | | | |
4.600% 9/01/27 | | $ | 448,794 | | | $ | 348,006 | |
| | | | | | | | 2,887,180 | |
Auto Manufacturers — 1.8% |
Ford Motor Credit Co. LLC | | | | | | | | |
3.087% 1/09/23 | | | 1,790,000 | | | | 1,754,003 | |
4.140% 2/15/23 | | | 2,355,000 | | | | 2,369,648 | |
5.085% 1/07/21 | | | 1,163,000 | | | | 1,164,454 | |
General Motors Co. | | | | | | | | |
4.200% 10/01/27 | | | 1,290,000 | | | | 1,382,514 | |
5.150% 4/01/38 | | | 785,000 | | | | 833,644 | |
General Motors Financial Co., Inc. | | | | | | | | |
3.500% 11/07/24 | | | 2,990,000 | | | | 3,141,137 | |
4.150% 6/19/23 | | | 3,064,000 | | | | 3,252,497 | |
4.200% 11/06/21 | | | 1,466,000 | | | | 1,513,124 | |
Hyundai Capital America | | | | | | | | |
2.850% 11/01/22 (a) | | | 2,185,000 | | | | 2,259,552 | |
3.000% 2/10/27 (a) | | | 5,775,000 | | | | 5,967,140 | |
| | | | | | | | 23,637,713 | |
Banks — 5.6% |
ABN AMRO Bank NV | | | | | | | | |
4.750% 7/28/25 (a) | | | 412,000 | | | | 463,953 | |
Associated Banc-Corp. | | | | | | | | |
4.250% 1/15/25 | | | 2,580,000 | | | | 2,748,896 | |
Bank of America Corp. | | | | | | | | |
SOFR + 2.150% 2.592% VRN 4/29/31 | | | 1,730,000 | | | | 1,840,583 | |
4.183% 11/25/27 | | | 1,380,000 | | | | 1,581,091 | |
3 mo. USD LIBOR + 1.814% 4.244% VRN 4/24/38 | | | 1,125,000 | | | | 1,370,939 | |
3 mo. USD LIBOR + 1.310% 4.271% VRN 7/23/29 | | | 615,000 | | | | 721,433 | |
6.110% 1/29/37 | | | 1,275,000 | | | | 1,799,858 | |
7.750% 5/14/38 | | | 1,055,000 | | | | 1,747,277 | |
The Bank of Nova Scotia | | | | | | | | |
4.500% 12/16/25 | | | 1,885,000 | | | | 2,183,553 | |
3 mo. USD LIBOR + 2.648% 4.650% VRN (b) | | | 3,550,000 | | | | 3,441,299 | |
Barclays Bank PLC | | | | | | | | |
10.179% 6/12/21 (a) | | | 5,444,000 | | | | 5,727,680 | |
Barclays PLC | | | | | | | | |
3 mo. USD LIBOR + 1.380% 1.660% FRN 5/16/24 | | | 2,290,000 | | | | 2,296,238 | |
4.337% 1/10/28 | | | 1,600,000 | | | | 1,781,696 | |
BPCE SA | | | | | | | | |
1.652% 10/06/26 (a) (c) | | | 2,860,000 | | | | 2,864,598 | |
4.625% 7/11/24 | | | 1,600,000 | | | | 1,756,281 | |
The accompanying notes are an integral part of the financial statements.
72
MassMutual Premier Core Bond Fund — Portfolio of Investments (Continued) |
| | | Principal
Amount | | | Value | |
Citigroup, Inc. | | | | | | | | |
3.875% 3/26/25 | | $ | 1,846,000 | | | $ | 2,033,796 | |
4.450% 9/29/27 | | | 1,075,000 | | | | 1,246,563 | |
6.000% 10/31/33 | | | 510,000 | | | | 687,028 | |
6.625% 6/15/32 | | | 500,000 | | | | 698,565 | |
8.125% 7/15/39 | | | 225,000 | | | | 391,632 | |
Credit Suisse AG | | | | | | | | |
6.500% 8/08/23 (a) | | | 3,806,000 | | | | 4,310,295 | |
Deutsche Bank AG | | | | | | | | |
3.150% 1/22/21 | | | 2,505,000 | | | | 2,520,155 | |
Discover Bank 5 year USD Swap + 1.730% | | | | | | | | |
4.682% VRN 8/09/28 | | | 3,275,000 | | | | 3,433,314 | |
First Republic Bank | | | | | | | | |
4.375% 8/01/46 | | | 4,530,000 | | | | 5,487,220 | |
Fulton Financial Corp. | | | | | | | | |
3.600% 3/16/22 | | | 1,485,000 | | | | 1,517,749 | |
The Goldman Sachs Group, Inc. | | | | | | | | |
4.250% 10/21/25 | | | 375,000 | | | | 426,638 | |
5.950% 1/15/27 | | | 1,333,000 | | | | 1,640,252 | |
6.250% 2/01/41 | | | 440,000 | | | | 657,316 | |
6.750% 10/01/37 | | | 1,065,000 | | | | 1,547,369 | |
HSBC Holdings PLC | | | | | | | | |
4.250% 3/14/24 | | | 2,041,000 | | | | 2,188,695 | |
4.250% 8/18/25 | | | 1,739,000 | | | | 1,889,896 | |
JP Morgan Chase & Co. | | | | | | | | |
SOFR + 2.515% 2.956% VRN 5/13/31 | | | 1,350,000 | | | | 1,448,421 | |
5.600% 7/15/41 | | | 1,225,000 | | | | 1,796,454 | |
Morgan Stanley | | | | | | | | |
4.350% 9/08/26 | | | 3,925,000 | | | | 4,543,191 | |
Valley National Bancorp | | | | | | | | |
5.125% 9/27/23 | | | 1,710,000 | | | | 1,832,258 | |
Wells Fargo & Co. | | | | | | | | |
5.375% 11/02/43 | | | 851,000 | | | | 1,126,512 | |
5.606% 1/15/44 | | | 620,000 | | | | 846,217 | |
| | | | | | | | 74,594,911 | |
Beverages — 0.6% |
Anheuser-Busch Cos. LLC/Anheuser-Busch InBev Worldwide, Inc. | | | | | | | | |
4.900% 2/01/46 | | | 4,975,000 | | | | 6,134,321 | |
Molson Coors Beverage Co. | | | | | | | | |
4.200% 7/15/46 | | | 1,689,000 | | | | 1,781,626 | |
5.000% 5/01/42 | | | 350,000 | | | | 396,394 | |
| | | | | | | | 8,312,341 | |
Chemicals — 1.0% |
CF Industries, Inc. | | | | | | | | |
3.400% 12/01/21 (a) | | | 650,000 | | | | 666,738 | |
| | | Principal
Amount | | | Value | |
DuPont de Nemours, Inc. | | | | | | | | |
5.319% 11/15/38 | | $ | 2,075,000 | | | $ | 2,633,087 | |
Huntsman International LLC | | | | | | | | |
5.125% 11/15/22 | | | 1,137,000 | | | | 1,222,614 | |
Nutrition & Biosciences, Inc. | | | | | | �� | | |
1.832% 10/15/27 (a) | | | 980,000 | | | | 984,443 | |
Syngenta Finance NV | | | | | | | | |
4.441% 4/24/23 (a) | | | 2,400,000 | | | | 2,534,738 | |
Yara International ASA | | | | | | | | |
3.148% 6/04/30 (a) | | | 500,000 | | | | 535,044 | |
4.750% 6/01/28 (a) | | | 3,932,000 | | | | 4,607,590 | |
| | | | | | | | 13,184,254 | |
Commercial Services — 0.1% |
ERAC USA Finance LLC | | | | | | | | |
6.700% 6/01/34 (a) | | | 355,000 | | | | 490,322 | |
PayPal Holdings, Inc. | | | | | | | | |
3.250% 6/01/50 | | | 950,000 | | | | 1,050,902 | |
| | | | | | | | 1,541,224 | |
Computers — 0.9% |
Apple, Inc. | | | | | | | | |
2.650% 5/11/50 | | | 955,000 | | | | 1,000,728 | |
Dell International LLC/EMC Corp. | | | | | | | | |
6.020% 6/15/26 (a) | | | 3,164,000 | | | | 3,715,104 | |
Genpact Luxembourg Sarl | | | | | | | | |
3.375% 12/01/24 | | | 4,235,000 | | | | 4,434,845 | |
3.700% STEP 4/01/22 | | | 2,295,000 | | | | 2,349,490 | |
Leidos, Inc. | | | | | | | | |
4.375% 5/15/30 (a) | | | 785,000 | | | | 919,981 | |
| | | | | | | | 12,420,148 | |
Diversified Financial Services — 3.3% |
AerCap Ireland Capital DAC/AerCap Global Aviation Trust | | | | | | | | |
4.500% 9/15/23 | | | 1,840,000 | | | | 1,896,213 | |
6.500% 7/15/25 | | | 885,000 | | | | 955,416 | |
Aircastle Ltd. | | | | | | | | |
4.400% 9/25/23 | | | 3,835,000 | | | | 3,793,774 | |
5.000% 4/01/23 | | | 1,950,000 | | | | 1,954,394 | |
Antares Holdings LP | | | | | | | | |
6.000% 8/15/23 (a) | | | 3,935,000 | | | | 3,979,297 | |
8.500% 5/18/25 (a) | | | 1,185,000 | | | | 1,249,721 | |
Ares Finance Co. LLC | | | | | | | | |
4.000% 10/08/24 (a) | | | 2,380,000 | | | | 2,544,175 | |
Avolon Holdings Funding Ltd. | | | | | | | | |
3.250% 2/15/27 (a) | | | 1,740,000 | | | | 1,552,308 | |
Brookfield Finance, Inc. | | | | | | | | |
4.350% 4/15/30 | | | 4,185,000 | | | | 4,885,732 | |
4.850% 3/29/29 | | | 2,168,000 | | | | 2,586,692 | |
The accompanying notes are an integral part of the financial statements.
73
MassMutual Premier Core Bond Fund — Portfolio of Investments (Continued) |
| | | Principal
Amount | | | Value | |
GE Capital International Funding Co. Unlimited Co. | | | | | | | | |
4.418% 11/15/35 | | $ | 790,000 | | | $ | 833,891 | |
Global Aircraft Leasing Co. Ltd. | | | | | | | | |
6.500% 9/15/24 (a) | | | 1,787,531 | | | | 996,549 | |
Lazard Group LLC | | | | | | | | |
3.625% 3/01/27 | | | 1,209,000 | | | | 1,305,822 | |
3.750% 2/13/25 | | | 210,000 | | | | 227,632 | |
4.500% 9/19/28 | | | 2,055,000 | | | | 2,377,229 | |
LeasePlan Corp. NV | | | | | | | | |
2.875% 10/24/24 (a) | | | 1,930,000 | | | | 1,991,793 | |
Legg Mason, Inc. | | | | | | | | |
5.625% 1/15/44 | | | 1,346,000 | | | | 1,863,675 | |
Park Aerospace Holdings Ltd. | | | | | | | | |
4.500% 3/15/23 (a) | | | 2,225,000 | | | | 2,204,862 | |
5.250% 8/15/22 (a) | | | 6,015,000 | | | | 6,039,333 | |
5.500% 2/15/24 (a) | | | 685,000 | | | | 690,223 | |
| | | | | | | | 43,928,731 | |
Electric — 1.0% |
Appalachian Power Co. | | | | | | | | |
4.500% 3/01/49 | | | 1,500,000 | | | | 1,875,215 | |
The Cleveland Electric Illuminating Co. | | | | | | | | |
5.950% 12/15/36 | | | 589,000 | | | | 767,028 | |
CMS Energy Corp. | | | | | | | | |
4.700% 3/31/43 | | | 655,000 | | | | 818,232 | |
4.875% 3/01/44 | | | 700,000 | | | | 916,481 | |
Duke Energy Progress, Inc. | | | | | | | | |
6.125% 9/15/33 | | | 37,000 | | | | 50,670 | |
Entergy Arkansas LLC | | | | | | | | |
2.650% 6/15/51 | | | 2,290,000 | | | | 2,311,070 | |
Infraestructura Energetica Nova SAB de CV | | | | | | | | |
3.750% 1/14/28 (a) | | | 1,505,000 | | | | 1,489,950 | |
ITC Holdings Corp. | | | | | | | | |
2.950% 5/14/30 (a) | | | 1,220,000 | | | | 1,311,913 | |
Nevada Power Co. | | | | | | | | |
6.650% 4/01/36 | | | 1,000,000 | | | | 1,477,293 | |
Oncor Electric Delivery Co. | | | | | | | | |
7.500% 9/01/38 | | | 130,000 | | | | 214,243 | |
Pacific Gas and Electric Co. | | | | | | | | |
2.500% 2/01/31 | | | 1,035,000 | | | | 984,771 | |
PPL Capital Funding, Inc. | | | | | | | | |
4.000% 9/15/47 | | | 1,050,000 | | | | 1,202,009 | |
| | | | | | | | 13,418,875 | |
Electronics — 0.1% |
Arrow Electronics, Inc. | | | | | | | | |
5.125% 3/01/21 | | | 750,000 | | | | 762,492 | |
| | | Principal
Amount | | | Value | |
Foods — 0.3% |
JBS USA LUX SA/JBS USA Food Co./JBS USA Finance, Inc. | | | | | | | | |
5.500% 1/15/30 (a) | | $ | 928,000 | | | $ | 1,010,100 | |
Kraft Heinz Foods Co. | | | | | | | | |
3.950% 7/15/25 | | | 791,000 | | | | 858,273 | |
Mars, Inc. | | | | | | | | |
3.950% 4/01/49 (a) | | | 1,135,000 | | | | 1,374,009 | |
Smithfield Foods, Inc. | | | | | | | | |
3.000% 10/15/30 (a) | | | 1,208,000 | | | | 1,210,610 | |
| | | | | | | | 4,452,992 | |
Forest Products & Paper — 0.1% |
Fibria Overseas Finance Ltd. | | | | | | | | |
4.000% 1/14/25 | | | 1,225,000 | | | | 1,298,500 | |
Gas — 0.3% |
CenterPoint Energy Resources Corp. | | | | | | | | |
6.625% 11/01/37 | | | 1,500,000 | | | | 2,151,622 | |
NiSource, Inc. | | | | | | | | |
4.800% 2/15/44 | | | 1,350,000 | | | | 1,687,183 | |
| | | | | | | | 3,838,805 | |
Health Care – Services — 0.4% |
Advocate Health & Hospitals Corp. | | | | | | | | |
3.829% 8/15/28 | | | 960,000 | | | | 1,111,608 | |
City of Hope | | | | | | | | |
4.378% 8/15/48 | | | 1,275,000 | | | | 1,551,213 | |
Humana, Inc. | | | | | | | | |
4.800% 3/15/47 | | | 780,000 | | | | 1,021,108 | |
UnitedHealth Group, Inc. | | | | | | | | |
3.125% 5/15/60 | | | 1,150,000 | | | | 1,234,218 | |
| | | | | | | | 4,918,147 | |
Insurance — 5.7% |
Allstate Corp. 3 mo. USD LIBOR + 2.938% | | | | | | | | |
5.750% VRN 8/15/53 | | | 4,970,000 | | | | 5,175,132 | |
American International Group, Inc. | | | | | | | | |
3.400% 6/30/30 | | | 840,000 | | | | 930,186 | |
4.200% 4/01/28 | | | 1,300,000 | | | | 1,507,612 | |
4.500% 7/16/44 | | | 1,200,000 | | | | 1,399,867 | |
4.750% 4/01/48 | | | 450,000 | | | | 551,321 | |
3 mo. USD LIBOR + 2.868% 5.750% VRN 4/01/48 | | | 3,920,000 | | | | 4,281,780 | |
AmTrust Financial Services, Inc. | | | | | | | | |
6.125% 8/15/23 | | | 4,330,000 | | | | 4,014,770 | |
Arch Capital Group US, Inc. | | | | | | | | |
5.144% 11/01/43 | | | 500,000 | | | | 636,144 | |
Athene Global Funding | | | | | | | | |
2.500% 1/14/25 (a) | | | 3,535,000 | | | | 3,643,751 | |
The accompanying notes are an integral part of the financial statements.
74
MassMutual Premier Core Bond Fund — Portfolio of Investments (Continued) |
| | | Principal
Amount | | | Value | |
Athene Holding Ltd. | | | | | | | | |
4.125% 1/12/28 | | $ | 7,507,000 | | | $ | 8,151,920 | |
6.150% 4/03/30 | | | 590,000 | | | | 700,639 | |
AXIS Specialty Finance LLC | | | | | | | | |
3.900% 7/15/29 | | | 1,505,000 | | | | 1,644,900 | |
5 year CMT + 3.186% 4.900% VRN 1/15/40 | | | 1,670,000 | | | | 1,668,416 | |
AXIS Specialty Finance PLC | | | | | | | | |
4.000% 12/06/27 | | | 2,760,000 | | | | 3,021,128 | |
Brighthouse Financial, Inc. | | | | | | | | |
3.700% 6/22/27 | | | 1,600,000 | | | | 1,659,781 | |
4.700% 6/22/47 | | | 1,525,000 | | | | 1,467,656 | |
5.625% 5/15/30 | | | 1,190,000 | | | | 1,385,833 | |
Brown & Brown, Inc. | | | | | | | | |
2.375% 3/15/31 | | | 770,000 | | | | 774,735 | |
4.200% 9/15/24 | | | 1,278,000 | | | | 1,410,285 | |
CNO Financial Group, Inc. | | | | | | | | |
5.250% 5/30/25 | | | 3,264,000 | | | | 3,743,690 | |
Enstar Group Ltd. | | | | | | | | |
4.500% 3/10/22 | | | 1,815,000 | | | | 1,890,957 | |
4.950% 6/01/29 | | | 2,050,000 | | | | 2,297,142 | |
Equitable Holdings, Inc. | | | | | | | | |
5.000% 4/20/48 | | | 1,250,000 | | | | 1,477,537 | |
Markel Corp. | | | | | | | | |
3.350% 9/17/29 | | | 715,000 | | | | 789,442 | |
New York Life Insurance Co. | | | | | | | | |
3.750% 5/15/50 (a) | | | 695,000 | | | | 783,558 | |
The Progressive Corp. 3 mo. USD LIBOR + 2.539% | | | | | | | | |
5.375% VRN (b) | | | 1,950,000 | | | | 1,950,000 | |
Prudential Financial, Inc. | | | | | | | | |
5 year CMT + 3.035% 3.700% VRN 10/01/50 | | | 480,000 | | | | 489,744 | |
3 mo. USD LIBOR + 3.920% 5.625% VRN 6/15/43 | | | 1,300,000 | | | | 1,380,829 | |
3 mo. USD LIBOR + 2.665% 5.700% VRN 9/15/48 | | | 3,380,000 | | | | 3,821,261 | |
3 mo. USD LIBOR + 4.175% 5.875% VRN 9/15/42 | | | 650,000 | | | | 684,586 | |
Reinsurance Group of America, Inc. | | | | | | | | |
3.150% 6/15/30 | | | 1,590,000 | | | | 1,731,092 | |
Teachers Insurance & Annuity Association of America | | | | | | | | |
4.270% 5/15/47 (a) | | | 1,025,000 | | | | 1,200,090 | |
USF&G Capital I | | | | | | | | |
8.500% 12/15/45 (a) | | | 1,015,000 | | | | 1,595,101 | |
Voya Financial, Inc. 3 mo. USD LIBOR + 2.084% | | | | | | | | |
4.700% VRN 1/23/48 | | | 1,010,000 | | | | 1,010,947 | |
| | | Principal
Amount | | | Value | |
Willis North America, Inc. | | | | | | | | |
2.950% 9/15/29 | | $ | 1,200,000 | | | $ | 1,293,094 | |
4.500% 9/15/28 | | | 2,135,000 | | | | 2,538,538 | |
XLIT Ltd. | | | | | | | | |
4.450% 3/31/25 | | | 2,564,000 | | | | 2,899,775 | |
| | | | | | | | 75,603,239 | |
Internet — 0.2% |
Alphabet, Inc. | | | | | | | | |
2.250% 8/15/60 | | | 1,080,000 | | | | 1,021,224 | |
Amazon.com, Inc. | | | | | | | | |
4.050% 8/22/47 | | | 1,055,000 | | | | 1,370,664 | |
| | | | | | | | 2,391,888 | |
Investment Companies — 1.3% |
Ares Capital Corp. | | | | | | | | |
3.500% 2/10/23 | | | 3,465,000 | | | | 3,559,151 | |
4.200% 6/10/24 | | | 2,100,000 | | | | 2,187,566 | |
BlackRock TCP Capital Corp. | | | | | | | | |
3.900% 8/23/24 | | | 4,215,000 | | | | 4,282,525 | |
4.125% 8/11/22 | | | 2,810,000 | | | | 2,849,992 | |
Sixth Street Specialty Lending, Inc. | | | | | | | | |
3.875% 11/01/24 | | | 4,505,000 | | | | 4,563,794 | |
| | | | | | | | 17,443,028 | |
Iron & Steel — 0.2% |
Vale Overseas Ltd. | | | | | | | | |
6.250% 8/10/26 | | | 1,550,000 | | | | 1,832,875 | |
6.875% 11/21/36 | | | 825,000 | | | | 1,073,894 | |
| | | | | | | | 2,906,769 | |
Machinery – Diversified — 0.3% |
CNH Industrial Capital LLC | | | | | | | | |
1.950% 7/02/23 | | | 755,000 | | | | 769,155 | |
3.875% 10/15/21 | | | 2,870,000 | | | | 2,948,097 | |
| | | | | | | | 3,717,252 | |
Media — 1.5% |
Charter Communications Operating LLC/Charter Communications Operating Capital | | | | | | | | |
6.484% 10/23/45 | | | 1,905,000 | | | | 2,555,087 | |
Comcast Corp. | | | | | | | | |
3.400% 7/15/46 | | | 1,450,000 | | | | 1,613,401 | |
3.450% 2/01/50 | | | 1,675,000 | | | | 1,892,179 | |
3.969% 11/01/47 | | | 660,000 | | | | 788,956 | |
4.750% 3/01/44 | | | 925,000 | | | | 1,218,716 | |
Discovery Communications LLC | | | | | | | | |
3.950% 3/20/28 | | | 1,907,000 | | | | 2,169,402 | |
4.000% 9/15/55 (a) | | | 1,186,000 | | | | 1,204,152 | |
4.650% 5/15/50 | | | 705,000 | | | | 808,151 | |
Grupo Televisa SAB | | | | | | | | |
6.625% 3/18/25 | | | 2,637,000 | | | | 3,175,937 | |
The accompanying notes are an integral part of the financial statements.
75
MassMutual Premier Core Bond Fund — Portfolio of Investments (Continued) |
| | | Principal
Amount | | | Value | |
Time Warner Cable, Inc. | | | | | | | | |
6.750% 6/15/39 | | $ | 655,000 | | | $ | 885,766 | |
ViacomCBS, Inc. | | | | | | | | |
4.200% 5/19/32 | | | 1,600,000 | | | | 1,830,969 | |
The Walt Disney Co. | | | | | | | | |
3.600% 1/13/51 | | | 1,990,000 | | | | 2,242,545 | |
| | | | | | | | 20,385,261 | |
Mining — 0.8% |
Glencore Finance Canada Ltd. | | | | | | | | |
5.550% STEP 10/25/42 (a) | | | 857,000 | | | | 1,004,610 | |
Glencore Funding LLC | | | | | | | | |
3.875% 10/27/27 (a) | | | 950,000 | | | | 1,035,861 | |
4.000% 4/16/25 (a) | | | 2,150,000 | | | | 2,359,818 | |
4.625% 4/29/24 (a) | | | 4,085,000 | | | | 4,500,247 | |
Kinross Gold Corp. | | | | | | | | |
4.500% 7/15/27 | | | 996,000 | | | | 1,129,654 | |
Teck Resources Ltd. | | | | | | | | |
6.000% 8/15/40 | | | 1,075,000 | | | | 1,217,302 | |
| | | | | | | | 11,247,492 | |
Miscellaneous - Manufacturing — 0.2% |
Carlisle Cos., Inc. | | | | | | | | |
2.750% 3/01/30 | | | 1,793,000 | | | | 1,905,891 | |
General Electric Co. | | | | | | | | |
6.875% 1/10/39 | | | 429,000 | | | | 551,091 | |
| | | | | | | | 2,456,982 | |
Oil & Gas — 2.4% |
BP Capital Markets PLC 5 year CMT + 4.036% | | | | | | | | |
4.375% VRN (b) | | | 1,925,000 | | | | 2,006,813 | |
Cenovus Energy, Inc. | | | | | | | | |
4.250% 4/15/27 | | | 1,475,000 | | | | 1,333,519 | |
6.750% 11/15/39 | | | 1,176,000 | | | | 1,182,290 | |
Devon Energy Corp. | | | | | | | | |
5.850% 12/15/25 | | | 2,055,000 | | | | 2,303,032 | |
Diamondback Energy, Inc. | | | | | | | | |
3.250% 12/01/26 | | | 1,420,000 | | | | 1,424,677 | |
EQT Corp. | | | | | | | | |
3.900% 10/01/27 | | | 5,620,000 | | | | 5,173,912 | |
7.875% STEP 2/01/25 | | | 2,200,000 | | | | 2,438,590 | |
Marathon Petroleum Corp. | | | | | | | | |
4.500% 4/01/48 | | | 495,000 | | | | 501,659 | |
4.750% 9/15/44 | | | 625,000 | | | | 651,574 | |
6.500% 3/01/41 | | | 1,060,000 | | | | 1,292,264 | |
Newfield Exploration Co. | | | | | | | | |
5.375% 1/01/26 | | | 1,875,000 | | | | 1,760,869 | |
5.625% 7/01/24 | | | 1,200,000 | | | | 1,164,061 | |
5.750% 1/30/22 | | | 2,110,000 | | | | 2,109,088 | |
| | | Principal
Amount | | | Value | |
Occidental Petroleum Corp. | | | | | | | | |
6.600% 3/15/46 | | $ | 1,228,000 | | | $ | 1,057,615 | |
Ovintiv, Inc. | | | | | | | | |
6.500% 2/01/38 | | | 530,000 | | | | 481,311 | |
Patterson-UTI Energy, Inc. | | | | | | | | |
3.950% 2/01/28 | | | 2,060,000 | | | | 1,592,159 | |
Petroleos Mexicanos | | | | | | | | |
5.350% 2/12/28 | | | 1,925,000 | | | | 1,665,125 | |
6.375% 1/23/45 | | | 640,000 | | | | 490,560 | |
6.500% 3/13/27 | | | 295,000 | | | | 276,424 | |
6.625% 6/15/38 | | | 202,000 | | | | 159,277 | |
Saudi Arabian Oil Co. | | | | | | | | |
4.250% 4/16/39 (a) | | | 2,580,000 | | | | 2,965,674 | |
| | | | | | | | 32,030,493 | |
Oil & Gas Services — 0.3% |
National Oilwell Varco, Inc. | | | | | | | | |
3.600% 12/01/29 | | | 2,155,000 | | | | 2,093,088 | |
3.950% 12/01/42 | | | 1,778,000 | | | | 1,598,826 | |
| | | | | | | | 3,691,914 | |
Packaging & Containers — 0.3% |
Amcor Finance USA, Inc. | | | | | | | | |
3.625% 4/28/26 | | | 2,985,000 | | | | 3,325,200 | |
WRKCo, Inc. | | | | | | | | |
3.000% 6/15/33 | | | 890,000 | | | | 968,137 | |
| | | | | | | | 4,293,337 | |
Pharmaceuticals — 1.7% |
AbbVie, Inc. | | | | | | | | |
4.050% 11/21/39 (a) | | | 1,345,000 | | | | 1,546,694 | |
4.700% 5/14/45 | | | 1,465,000 | | | | 1,803,856 | |
Bristol-Myers Squibb Co. | | | | | | | | |
4.350% 11/15/47 | | | 1,150,000 | | | | 1,518,820 | |
Cigna Corp. | | | | | | | | |
4.800% 7/15/46 (a) | | | 1,105,000 | | | | 1,384,635 | |
CVS Health Corp. | | | | | | | | |
4.300% 3/25/28 | | | 1,325,000 | | | | 1,550,875 | |
5.050% 3/25/48 | | | 370,000 | | | | 472,271 | |
6.125% 9/15/39 | | | 895,000 | | | | 1,243,597 | |
CVS Pass-Through Trust | | | | | | | | |
5.926% 1/10/34 (a) | | | 1,798,220 | | | | 2,081,073 | |
Dentsply Sirona, Inc. | | | | | | | | |
3.250% 6/01/30 | | | 820,000 | | | | 891,489 | |
McKesson Corp. | | | | | | | | |
4.883% 3/15/44 | | | 800,000 | | | | 979,896 | |
Mylan NV | | | | | | | | |
3.950% 6/15/26 | | | 2,765,000 | | | | 3,110,708 | |
5.250% 6/15/46 | | | 1,750,000 | | | | 2,171,932 | |
Takeda Pharmaceutical Co. Ltd. | | | | | | | | |
3.375% 7/09/60 | | | 1,300,000 | | | | 1,369,472 | |
The accompanying notes are an integral part of the financial statements.
76
MassMutual Premier Core Bond Fund — Portfolio of Investments (Continued) |
| | | Principal
Amount | | | Value | |
Teva Pharmaceutical Finance Netherlands III BV | | | | | | | | |
2.200% 7/21/21 | | $ | 1,352,000 | | | $ | 1,339,156 | |
Upjohn, Inc. | | | | | | | | |
2.700% 6/22/30 (a) | | | 1,650,000 | | | | 1,708,346 | |
| | | | | | | | 23,172,820 | |
Pipelines — 2.1% |
Energy Transfer Operating LP | | | | | | | | |
4.200% 4/15/27 | | | 2,425,000 | | | | 2,509,024 | |
5.875% 1/15/24 | | | 1,125,000 | | | | 1,238,611 | |
6.125% 12/15/45 | | | 1,385,000 | | | | 1,390,251 | |
3 mo. USD LIBOR + 4.028% 6.250% VRN (b) | | | 2,635,000 | | | | 1,719,337 | |
EnLink Midstream Partners LP | | | | | | | | |
4.150% 6/01/25 | | | 2,972,000 | | | | 2,558,981 | |
4.850% 7/15/26 | | | 996,000 | | | | 861,650 | |
Enterprise Products Operating LLC | | | | | | | | |
3 mo. USD LIBOR + 3.033% 5.250% VRN 8/16/77 | | | 2,550,000 | | | | 2,428,237 | |
3 mo. USD LIBOR + 2.570% 5.375% VRN 2/15/78 | | | 1,120,000 | | | | 996,800 | |
EQM Midstream Partners LP | | | | | | | | |
4.750% 7/15/23 | | | 2,870,000 | | | | 2,864,403 | |
MPLX LP | | | | | | | | |
4.500% 4/15/38 | | | 1,115,000 | | | | 1,141,478 | |
6.250% 10/15/22 | | | 624,000 | | | | 624,678 | |
3 mo. USD LIBOR + 4.652% 6.875% VRN (b) | | | 3,550,000 | | | | 2,907,042 | |
Plains All American Pipeline LP 3 mo. USD LIBOR + 4.110% | | | | | | | | |
6.125% VRN (b) | | | 2,590,000 | | | | 1,643,096 | |
Plains All American Pipeline LP/PAA Finance Corp. | | | | | | | | |
3.800% 9/15/30 | | | 1,570,000 | | | | 1,522,401 | |
4.500% 12/15/26 | | | 589,000 | | | | 626,251 | |
4.700% 6/15/44 | | | 1,525,000 | | | | 1,352,137 | |
6.650% 1/15/37 | | | 475,000 | | | | 519,761 | |
Sunoco Logistics Partners Operations LP | | | | | | | | |
5.300% 4/01/44 | | | 500,000 | | | | 465,845 | |
| | | | | | | | 27,369,983 | |
Private Equity — 0.6% |
Apollo Management Holdings LP 5 year CMT + 3.266% | | | | | | | | |
4.950% VRN 1/14/50 (a) | | | 1,045,000 | | | | 1,044,605 | |
Carlyle Finance Subsidiary LLC | | | | | | | | |
3.500% 9/19/29 (a) | | | 1,345,000 | | | | 1,455,470 | |
Hercules Capital, Inc. | | | | | | | | |
4.625% 10/23/22 | | | 3,220,000 | | | | 3,259,588 | |
| | | Principal
Amount | | | Value | |
KKR Group Finance Co. VI LLC | | | | | | | | |
3.750% 7/01/29 (a) | | $ | 1,480,000 | | | $ | 1,702,662 | |
KKR Group Finance Co. VIII LLC | | | | | | | | |
3.500% 8/25/50 (a) | | | 920,000 | | | | 937,514 | |
| | | | | | | | 8,399,839 | |
Real Estate Investment Trusts (REITS) — 2.3% |
Agree LP | | | | | | | | |
2.900% 10/01/30 | | | 615,000 | | | | 637,888 | |
American Tower Trust #1 | | | | | | | | |
3.652% 3/15/48 (a) | | | 1,810,000 | | | | 1,963,626 | |
Crown Castle International Corp. | | | | | | | | |
5.200% 2/15/49 | | | 356,000 | | | | 468,481 | |
Healthcare Trust of America Holdings LP | | | | | | | | |
3.500% 8/01/26 | | | 2,375,000 | | | | 2,643,735 | |
Highwoods Realty LP | | | | | | | | |
4.125% 3/15/28 | | | 625,000 | | | | 689,543 | |
Host Hotels & Resorts LP | | | | | | | | |
3.500% 9/15/30 | | | 2,756,000 | | | | 2,638,072 | |
SBA Tower Trust | | | | | | | | |
1.884% 7/15/50 (a) | | | 1,936,000 | | | | 1,979,000 | |
Service Properties Trust | | | | | | | | |
4.500% 6/15/23 | | | 953,000 | | | | 934,588 | |
4.950% 10/01/29 | | | 1,445,000 | | | | 1,239,087 | |
Spirit Realty LP | | | | | | | | |
3.200% 1/15/27 | | | 2,455,000 | | | | 2,486,495 | |
3.400% 1/15/30 | | | 490,000 | | | | 487,181 | |
4.000% 7/15/29 | | | 2,405,000 | | | | 2,501,665 | |
4.450% 9/15/26 | | | 298,000 | | | | 319,762 | |
Store Capital Corp. | | | | | | | | |
4.625% 3/15/29 | | | 1,733,000 | | | | 1,858,299 | |
Tanger Properties LP | | | | | | | | |
3.875% 12/01/23 | | | 1,777,000 | | | | 1,787,151 | |
VEREIT Operating Partnership LP | | | | | | | | |
3.100% 12/15/29 | | | 3,615,000 | | | | 3,621,321 | |
3.400% 1/15/28 | | | 710,000 | | | | 741,306 | |
4.625% 11/01/25 | | | 2,525,000 | | | | 2,789,886 | |
WP Carey, Inc. | | | | | | | | |
4.250% 10/01/26 | | | 1,036,000 | | | | 1,169,635 | |
| | | | | | | | 30,956,721 | |
Retail — 0.7% |
Advance Auto Parts, Inc. | | | | | | | | |
1.750% 10/01/27 | | | 405,000 | | | | 403,798 | |
AutoZone, Inc. | | | | | | | | |
1.650% 1/15/31 | | | 1,285,000 | | | | 1,258,019 | |
El Puerto de Liverpool SAB de CV | | | | | | | | |
3.950% 10/02/24 (a) | | | 3,375,000 | | | | 3,514,253 | |
The accompanying notes are an integral part of the financial statements.
77
MassMutual Premier Core Bond Fund — Portfolio of Investments (Continued) |
| | | Principal
Amount | | | Value | |
O’Reilly Automotive, Inc. | | | | | | | | |
4.200% 4/01/30 | | $ | 1,205,000 | | | $ | 1,445,072 | |
Starbucks Corp. | | | | | | | | |
2.550% 11/15/30 | | | 2,205,000 | | | | 2,341,168 | |
| | | | | | | | 8,962,310 | |
Semiconductors — 0.2% |
KLA Corp. | | | | | | | | |
3.300% 3/01/50 | | | 2,240,000 | | | | 2,366,608 | |
Software — 0.5% |
Broadridge Financial Solutions, Inc. | | | | | | | | |
2.900% 12/01/29 | | | 1,600,000 | | | | 1,733,325 | |
Microsoft Corp. | | | | | | | | |
4.450% 11/03/45 | | | 2,560,000 | | | | 3,617,239 | |
Oracle Corp. | | | | | | | | |
3.600% 4/01/50 | | | 1,215,000 | | | | 1,369,510 | |
| | | | | | | | 6,720,074 | |
Telecommunications — 1.2% |
AT&T, Inc. | | | | | | | | |
1.650% 2/01/28 | | | 895,000 | | | | 896,692 | |
3.500% 9/15/53 (a) | | | 2,083,000 | | | | 2,013,894 | |
3.550% 9/15/55 (a) | | | 6,775,000 | | | | 6,566,145 | |
Crown Castle Towers LLC | | | | | | | | |
4.241% 7/15/48 (a) | | | 1,750,000 | | | | 1,994,254 | |
Qwest Corp | | | | | | | | |
6.750% 12/01/21 | | | 908,000 | | | | 958,893 | |
Telefonica Emisiones SAU | | | | | | | | |
4.665% 3/06/38 | | | 1,040,000 | | | | 1,198,637 | |
Verizon Communications, Inc. | | | | | | | | |
6.550% 9/15/43 | | | 996,000 | | | | 1,621,270 | |
| | | | | | | | 15,249,785 | |
Transportation — 0.4% |
Autoridad del Canal de Panama | | | | | | | | |
4.950% 7/29/35 (a) | | | 1,340,000 | | | | 1,666,638 | |
CSX Corp. | | | | | | | | |
4.750% 11/15/48 | | | 820,000 | | | | 1,088,621 | |
Kansas City Southern | | | | | | | | |
2.875% 11/15/29 | | | 840,000 | | | | 890,420 | |
Norfolk Southern Corp. | | | | | | | | |
4.050% 8/15/52 | | | 1,180,000 | | | | 1,446,031 | |
| | | | | | | | 5,091,710 | |
| | | | | | | | | |
TOTAL CORPORATE DEBT (Cost $499,458,196) | | | | | | | 528,705,554 | |
| | | Principal
Amount | | | Value | |
MUNICIPAL OBLIGATIONS — 0.3% |
JobsOhio Beverage System Series B, Revenue Bonds | | | | | | | | |
4.532% 1/01/35 | | $ | 3,050,000 | | | $ | 3,915,865 | |
| | | | | | | | | |
TOTAL MUNICIPAL OBLIGATIONS (Cost $3,248,766) | | | | | | | 3,915,865 | |
| | | | | | | | | |
NON-U.S. GOVERNMENT AGENCY OBLIGATIONS — 32.4% |
Automobile Asset-Backed Securities — 1.2% |
Avis Budget Rental Car Funding AESOP LLC, Series 2019-1A, Class C | | | | | | | | |
4.530% 3/20/23 (a) | | | 1,577,000 | | | | 1,596,919 | |
Carvana Auto Receivables Trust, Series 2019-4A, Class D | | | | | | | | |
3.070% 7/15/25 (a) | | | 2,109,000 | | | | 2,169,702 | |
Hertz Vehicle Financing LP | | | | | | | | |
Series 2019-3A, Class B, 3.030% 12/26/25 (a) | | | 2,938,000 | | | | 2,924,782 | |
Series 2019-3A, Class C, 3.430% 12/26/25 (a) | | | 2,971,400 | | | | 2,903,335 | |
OneMain Direct Auto Receivables Trust, Series 2019-1A, Class B | | | | | | | | |
3.950% 11/14/28 (a) | | | 2,383,000 | | | | 2,504,596 | |
Santander Revolving Auto Loan Trust | | | | | | | | |
Series 2019-A, Class B, 2.800% 1/26/32 (a) | | | 1,111,000 | | | | 1,168,966 | |
Series 2019-A, Class C, 3.000% 1/26/32 (a) | | | 717,000 | | | | 725,940 | |
Series 2019-A, Class D, 3.450% 1/26/32 (a) | | | 1,408,000 | | | | 1,402,918 | |
| | | | | | | | 15,397,158 | |
Commercial Mortgage-Backed Securities — 5.3% |
Aventura Mall Trust, Series 2018-AVM, Class C, | | | | | | | | |
4.249% VRN 7/05/40 (a) (d) | | | 4,140,000 | | | | 3,886,992 | |
BAMLL Commercial Mortgage Securities Trust, Series 2018-DSNY, Class C, 1 mo. USD LIBOR + 1.350% | | | | | | | | |
1.502% FRN 9/15/34 (a) | | | 760,000 | | | | 710,617 | |
BANK | | | | | | | | |
Series 2019-BN17, Class B, 4.128% VRN 4/15/52 (d) | | | 917,000 | | | | 1,061,496 | |
Series 2019-BN16, Class AS, 4.267% 2/15/52 | | | 822,500 | | | | 979,082 | |
Series 2019-BN16, Class B, 4.438% VRN 2/15/52 (d) | | | 684,276 | | | | 765,102 | |
The accompanying notes are an integral part of the financial statements.
78
MassMutual Premier Core Bond Fund — Portfolio of Investments (Continued) |
| | | Principal
Amount | | | Value | |
BBCMS Mortgage Trust | | | | | | | | |
Series 2020-C7, Class AS, 2.444% 4/15/53 | | $ | 1,784,000 | | | $ | 1,873,972 | |
Series 2018-CHRS, Class B, 4.409% VRN 8/05/38 (a) (d) | | | 2,200,000 | | | | 1,956,149 | |
Series 2018-CHRS, Class C, 4.409% VRN 8/05/38 (a) (d) | | | 1,590,000 | | | | 1,305,089 | |
Series 2018-CHRS, Class D, 4.409% VRN 8/05/38 (a) (d) | | | 1,220,000 | | | | 917,787 | |
Benchmark Mortgage Trust, Series 2019-B14, Class AS | | | | | | | | |
3.352% 12/15/62 | | | 3,650,000 | | | | 4,064,855 | |
BHMS Mortgage Trust | | | | | | | | |
Series 2018-ATLS, Class A, 1 mo. USD LIBOR + 1.250% 1.402% FRN 7/15/35 (a) | | | 5,180,000 | | | | 4,953,459 | |
Series 2018-ATLS, Class B, 1 mo. USD LIBOR + 1.500% 1.652% FRN 7/15/35 (a) | | | 4,800,000 | | | | 4,452,123 | |
BX Commercial Mortgage Trust | | | | | | | | |
Series 2018-IND, Class B, 1 mo. USD LIBOR + .900% 1.052% FRN 11/15/35 (a) | | | 770,000 | | | | 767,175 | |
Series 2018-IND, Class E, 1 mo. USD LIBOR + 1.700% 1.852% FRN 11/15/35 (a) | | | 2,142,000 | | | | 2,124,743 | |
Series 2019-XL, Class E, 1 mo. USD LIBOR + 1.800% 1.952% FRN 10/15/36 (a) | | | 2,040,990 | | | | 2,021,998 | |
Series 2019-XL, Class F, 1 mo. USD LIBOR + 2.000% 2.152% FRN 10/15/36 (a) | | | 2,481,464 | | | | 2,452,168 | |
CAMB Commercial Mortgage Trust, Series 2019-LIFE, Class D, 1 mo. USD LIBOR + 1.750% | | | | | | | | |
1.902% FRN 12/15/37 (a) | | | 1,104,426 | | | | 1,079,928 | |
Century Plaza Towers | | | | | | | | |
Series 2019-CPT, Class D, 3.097% VRN 11/13/39 (a) (d) | | | 1,256,000 | | | | 1,252,397 | |
Series 2019-CPT, Class E, 3.097% VRN 11/13/39 (a) (d) | | | 1,961,000 | | | | 1,851,135 | |
Citigroup Commercial Mortgage Trust, Series 2019-GC41, Class C | | | | | | | | |
3.502% 8/10/56 | | | 1,259,000 | | | | 1,245,130 | |
Commercial Mortgage Pass-Through Certificates | | | | | | | | |
Series 2015-CR23, Class B, 4.183% VRN 5/10/48 (d) | | | 1,200,000 | | | | 1,298,255 | |
Series 2015-CR23, Class C, 4.435% VRN 5/10/48 (d) | | | 1,050,000 | | | | 1,057,084 | |
DBUBS Mortgage Trust, Series 2011-LC1A, Class B, | | | | | | | | |
5.471% VRN 11/10/46 (a) (d) | | | 860,000 | | | | 861,884 | |
| | | Principal
Amount | | | Value | |
GS Mortgage Securities Trust | | | | | | | | |
Series 2019-GC39, Class C, 4.005% VRN 5/10/52 (d) | | $ | 1,357,000 | | | $ | 1,331,227 | |
Series 2012-GC6, Class AS, 4.948% 1/10/45 (a) | | | 800,000 | | | | 822,387 | |
Jackson Park Trust, Series 2019-LIC, Class C, | | | | | | | | |
3.131% VRN 10/14/39 (a) (d) | | | 2,900,000 | | | | 2,994,009 | |
JPMBB Commercial Mortgage Securities Trust, Series 2015-C27, Class B | | | | | | | | |
3.898% 2/15/48 | | | 2,800,000 | | | | 2,963,633 | |
JPMDB Commercial Mortgage Securities Trust, Series 2017-C7, Class C, | | | | | | | | |
4.323% VRN 10/15/50 (d) | | | 2,900,000 | | | | 2,655,099 | |
KNDL Mortgage Trust, Series 2019-KNSQ, Class E, 1 mo. USD LIBOR + 1.800% | | | | | | | | |
1.952% FRN 5/15/36 (a) | | | 1,730,000 | | | | 1,711,088 | |
Manhattan West, Series 2020-1MW, Class B, | | | | | | | | |
2.413% VRN 9/10/39 (a) (d) | | | 2,799,000 | | | | 2,867,916 | |
MFT Trust | | | | | | | | |
Series 2020-ABC, Class A, 3.358% 2/10/42 (a) | | | 1,185,000 | | | | 1,225,626 | |
Series 2020-ABC, Class B, 3.477% VRN 2/10/42 (a) (d) | | | 1,278,000 | | | | 1,298,044 | |
MKT Mortgage Trust | | | | | | | | |
Series 2020-525M, Class D, 2.941% VRN 2/12/40 (a) (d) | | | 595,000 | | | | 581,803 | |
Series 2020-525M, Class E, 2.941% VRN 2/12/40 (a) (d) | | | 1,220,000 | | | | 1,138,768 | |
Morgan Stanley Capital I Trust | | | | | | | | |
Series 2019-L2, Class AS, 4.272% 3/15/52 | | | 2,450,000 | | | | 2,878,782 | |
Series 2018-H3, Class B, 4.620% VRN 7/15/51 (d) | | | 740,000 | | | | 855,846 | |
Series 2011-C2, Class B, 5.200% VRN 6/15/44 (a) (d) | | | 825,000 | | | | 828,164 | |
Wells Fargo Commercial Mortgage Trust | | | | | | | | |
Series 2019-C49, Class AS, 4.244% 3/15/52 | | | 1,492,000 | | | | 1,749,894 | |
Series 2018-C45, Class AS, 4.405% VRN 6/15/51 (d) | | | 1,400,000 | | | | 1,642,833 | |
Series 2018-C45, Class B, 4.556% 6/15/51 | | | 390,000 | | | | 428,694 | |
| | | | | | | | 70,912,433 | |
The accompanying notes are an integral part of the financial statements.
79
MassMutual Premier Core Bond Fund — Portfolio of Investments (Continued) |
| | | Principal
Amount | | | Value | |
Other Asset-Backed Securities — 15.7% |
321 Henderson Receivables LLC, Series 2015-1A, Class A | | | | | | | | |
3.260% 9/15/72 (a) | | $ | 2,805,852 | | | $ | 2,919,019 | |
522 Funding CLO I Ltd., Series 2018-2A, Class C, 3 mo. USD LIBOR + 2.250% | | | | | | | | |
2.522% FRN 10/20/31 (a) | | | 1,400,000 | | | | 1,363,320 | |
AASET Trust | | | | | | | | |
Series 2020-1A, Class A, 3.351% 1/16/40 (a) | | | 1,934,608 | | | | 1,782,578 | |
Series 2019-1, Class A, 3.844% 5/15/39 (a) | | | 2,424,978 | | | | 2,259,718 | |
Series 2018-2A, Class A, 4.454% 11/18/38 (a) | | | 1,756,479 | | | | 1,633,645 | |
Adams Outdoor Advertising LP, Series 2018-1, Class A | | | | | | | | |
4.810% 11/15/48 (a) | | | 2,315,610 | | | | 2,409,344 | |
AGL CLO 7 Ltd., Series 2020-7A, Class A1, 3 mo. USD LIBOR + 1.800% | | | | | | | | |
2.050% FRN 7/15/31 (a) | | | 500,000 | | | | 501,146 | |
Anchorage Capital CLO 9 Ltd., Series 2016-9A, Class CR, 3 mo. USD LIBOR + 2.850% | | | | | | | | |
3.125% FRN 7/15/32 (a) | | | 1,000,000 | | | | 1,000,385 | |
Apidos CLO XXV, Series 2016-25A, Class A2R, 3 mo. USD LIBOR + 1.700% | | | | | | | | |
1.972% FRN 10/20/31 (a) | | | 2,610,000 | | | | 2,587,418 | |
Atlas Senior Loan Fund VII Ltd., Series 2016-7A, Class A1R, 3 mo. USD LIBOR + 1.280% | | | | | | | | |
1.531% FRN 11/27/31 (a) | | | 2,384,880 | | | | 2,344,480 | |
Avery Point VII CLO Ltd., Series 2015-7A, Class DR, 3 mo. USD LIBOR + 3.600% | | | | | | | | |
3.875% FRN 1/15/28 (a) | | | 1,000,000 | | | | 954,041 | |
Ballyrock CLO Ltd., Series 2019-2A, Class C, 3 mo. USD LIBOR + 4.100% | | | | | | | | |
4.353% FRN 11/20/30 (a) | | | 800,000 | | | | 799,808 | |
Benefit Street Partners CLO V-B Ltd., Series 2018-5BA, Class A1A, 3 mo. USD LIBOR + 1.090% | | | | | | | | |
1.362% FRN 4/20/31 (a) | | | 1,920,000 | | | | 1,888,508 | |
Benefit Street Partners CLO X Ltd., Series 2016-10A, Class CR, 3 mo. USD LIBOR + 3.500% | | | | | | | | |
3.775% FRN 1/15/29 (a) | | | 700,000 | | | | 658,686 | |
| | | Principal
Amount | | | Value | |
Benefit Street Partners CLO XVIII Ltd., Series 2019-18A, Class B, 3 mo. USD LIBOR + 1.950% | | | | | | | | |
2.225% FRN 10/15/32 (a) | | $ | 750,000 | | | $ | 750,465 | |
BlueMountain CLO XXV Ltd., Series 2019-25A, Class B, 3 mo. USD LIBOR + 1.800% | | | | | | | | |
2.075% FRN 7/15/32 (a) | | | 2,750,000 | | | | 2,746,362 | |
BRE Grand Islander Timeshare Issuer LLC, Series 2017-1A, Class A | | | | | | | | |
2.940% 5/25/29 (a) | | | 484,909 | | | | 487,099 | |
CAL Funding II Ltd., Series 2018-2A, Class A | | | | | | | | |
4.340% 9/25/43 (a) | | | 1,184,000 | | | | 1,174,084 | |
Canyon Capital CLO Ltd., Series 2019-2A, Class C, 3 mo. USD LIBOR + 2.750% | | | | | | | | |
3.025% FRN 10/15/32 (a) | | | 400,000 | | | | 395,634 | |
Capital Automotive REIT | | | | | | | | |
Series 2014-1A, Class A, 3.660% 10/15/44 (a) | | | 1,039,253 | | | | 1,037,477 | |
Series 2017-1A, Class A2, 4.180% 4/15/47 (a) | | | 901,064 | | | | 903,889 | |
Carlyle Global Market Strategies CLO Ltd. | | | | | | | | |
Series 2018-4A, Class A2, 3 mo. USD LIBOR + 1.800% 2.072% FRN 1/20/31 (a) | | | 1,080,000 | | | | 1,069,133 | |
Series 2015-3A, Class CR, 3 mo. USD LIBOR + 2.850% 3.097% FRN 7/28/28 (a) | | | 310,000 | | | | 289,591 | |
CARS-DB4 LP | | | | | | | | |
Series 2020-1A, Class A3, 3.250% 2/15/50 (a) | | | 605,531 | | | | 621,134 | |
Series 2020-1A, Class A6, 3.810% 2/15/50 (a) | | | 493,000 | | | | 510,942 | |
Castlelake Aircraft Securitization Trust, Series 2019-1A, Class A | | | | | | | | |
3.967% 4/15/39 (a) | | | 2,842,925 | | | | 2,631,007 | |
Castlelake Aircraft Structured Trust, Series 2018-1, Class A | | | | | | | | |
4.125% 6/15/43 (a) | | | 2,985,217 | | | | 2,786,907 | |
CBAM Ltd., Series 2018-6A, Class B1R, 3 mo. USD LIBOR + 2.100% | | | | | | | | |
2.375% FRN 1/15/31 (a) | | | 1,200,000 | | | | 1,200,632 | |
CF Hippolyta LLC | | | | | | | | |
Series 2020-1, Class A1, 1.690% 7/15/60 (a) | | | 1,580,000 | | | | 1,597,855 | |
Series 2020-1, Class B1, 2.280% 7/15/60 (a) | | | 703,000 | | | | 715,279 | |
The accompanying notes are an integral part of the financial statements.
80
MassMutual Premier Core Bond Fund — Portfolio of Investments (Continued) |
| | | Principal
Amount | | | Value | |
CIFC Funding Ltd. | | | | | | | | |
Series 2017-5A, Class A1, 3 mo. USD LIBOR + 1.180% 1.453% FRN 11/16/30 (a) | | $ | 2,100,000 | | | $ | 2,081,566 | |
Series 2020-1A, Class A1, 3 mo. USD LIBOR + 1.700% 1.942% FRN 7/15/32 (a) | | | 800,000 | | | | 802,410 | |
Clear Creek CLO Ltd., Series 2015-1A, Class AR, 3 mo. USD LIBOR + 1.200% | | | | | | | | |
1.472% FRN 10/20/30 (a) | | | 2,120,000 | | | | 2,093,595 | |
CLI Funding V LLC, Series 2014-1A, Class A | | | | | | | | |
3.290% 6/18/29 (a) | | | 671,696 | | | | 671,696 | |
Crestline Denali CLO XIV Ltd., Series 2016-1A, Class A1R, 3 mo. USD LIBOR + 1.280% | | | | | | | | |
1.536% FRN 10/23/31 (a) | | | 1,299,146 | | | | 1,274,703 | |
Cronos Containers Program Ltd., Series 2014-2A, Class A | | | | | | | | |
3.270% 11/18/29 (a) | | | 387,037 | | | | 387,649 | |
DB Master Finance LLC, Series 2019-1A, Class A23 | | | | | | | | |
4.352% 5/20/49 (a) | | | 1,917,630 | | | | 2,096,254 | |
Domino’s Pizza Master Issuer LLC | | | | | | | | |
Series 2019-1A, Class A2, 3.668% 10/25/49 (a) | | | 1,379,575 | | | | 1,464,550 | |
Series 2018-1A, Class A2I, 4.116% 7/25/48 (a) | | | 1,479,800 | | | | 1,563,771 | |
Series 2017-1A, Class A23, 4.118% 7/25/47 (a) | | | 651,575 | | | | 695,681 | |
Series 2015-1A, Class A2II, 4.474% 10/25/45 (a) | | | 3,600,000 | | | | 3,828,052 | |
Dryden 72 CLO Ltd., Series 2019-72A, Class B, 3 mo. USD LIBOR + 1.900% | | | | | | | | |
2.180% FRN 5/15/32 (a) | | | 1,700,000 | | | | 1,700,522 | |
Eaton Vance CLO 2020-1 Ltd., Series 2020-1A, Class C, 3 mo. USD LIBOR + 2.800% | | | | | | | | |
0.000% FRN 10/15/30 (a) | | | 400,000 | | | | 400,196 | |
Eaton Vance CLO Ltd., Series 2018-1A, Class B, 3 mo. USD LIBOR + 1.750% | | | | | | | | |
2.025% FRN 10/15/30 (a) | | | 1,700,000 | | | | 1,691,638 | |
Elmwood CLO II Ltd., Series 2019-2A, Class A, 3 mo. USD LIBOR + 1.450% | | | | | | | | |
1.722% FRN 4/20/31 (a) | | | 3,500,000 | | | | 3,501,355 | |
Elmwood CLO III Ltd., Series 2019-3A, Class B, 3 mo. USD LIBOR + 1.950% | | | | | | | | |
2.225% FRN 10/15/32 (a) | | | 1,300,000 | | | | 1,302,839 | |
| | | Principal
Amount | | | Value | |
Elmwood CLO IV Ltd., Series 2020-1A, Class A, 3 mo. USD LIBOR + 1.240% | | | | | | | | |
2.422% FRN 4/15/33 (a) | | $ | 1,000,000 | | | $ | 992,048 | |
FCI Funding LLC, Series 2019-1A, Class A | | | | | | | | |
3.630% 2/18/31 (a) | | | 352,688 | | | | 358,850 | |
Flatiron CLO Ltd. | | | | | | | | |
Series 2019-1A, Class B, 3 mo. USD LIBOR + 1.900% 2.180% FRN 11/16/32 (a) | | | 1,300,000 | | | | 1,300,283 | |
Series 2019-1A, Class C, 3 mo. USD LIBOR + 2.700% 2.980% FRN 11/16/32 (a) | | | 250,000 | | | | 246,273 | |
Global Container Assets Ltd., Series 2015-1A, Class A2 | | | | | | | | |
3.450% 2/05/30 (a) | | | 662,192 | | | | 661,458 | |
Global SC Finance SRL, Series 2014-1A, Class A1 | | | | | | | | |
3.190% 7/17/29 (a) | | | 191,667 | | | | 190,663 | |
Goldentree Loan Management US CLO Ltd., Series 2019-5A, Class C, 3 mo. USD LIBOR + 2.700% | | | | | | | | |
2.972% FRN 10/20/32 (a) | | | 500,000 | | | | 496,366 | |
Goodgreen Trust | | | | | | | | |
Series 2019-2A, Class A, 2.760% 10/15/54 (a) | | | 3,786,104 | | | | 3,837,069 | |
Series 2016-1A, Class A, 3.230% 10/15/52 (a) | | | 1,556,332 | | | | 1,617,758 | |
Series 2017-1A, Class A, 3.740% 10/15/52 (a) | | | 743,123 | | | | 783,763 | |
Series 2019-1A, Class A, 3.860% 10/15/54 (a) | | | 1,586,134 | | | | 1,679,661 | |
Series 2018-1A, Class A, 3.930% VRN 10/15/53 (a) (d) | | | 1,946,021 | | | | 2,068,137 | |
Helios Issuer LLC, Series 2017-1A, Class A | | | | | | | | |
4.940% 9/20/49 (a) | | | 1,436,407 | | | | 1,529,066 | |
Hero Funding Trust | | | | | | | | |
Series 2016-3A, Class A1, 3.080% 9/20/42 (a) | | | 812,454 | | | | 823,832 | |
Series 2017-3A, Class A1, 3.190% 9/20/48 (a) | | | 840,318 | | | | 866,021 | |
Series 2017-2A, Class A1, 3.280% 9/20/48 (a) | | | 256,114 | | | | 264,979 | |
Series 2016-4A, Class A1, 3.570% 9/20/47 (a) | | | 822,682 | | | | 856,069 | |
Series 2017-2A, Class A2, 4.070% 9/20/48 (a) | | | 205,895 | | | | 217,483 | |
Series 2018-1A, Class A2, 4.670% 9/20/48 (a) | | | 1,501,047 | | | | 1,610,722 | |
The accompanying notes are an integral part of the financial statements.
81
MassMutual Premier Core Bond Fund — Portfolio of Investments (Continued) |
| | | Principal
Amount | | | Value | |
Highbridge Loan Management Ltd. | | | | | | | | |
Series 12A-18, Class B, 3 mo. USD LIBOR + 1.850% 2.122% FRN 7/18/31 (a) | | $ | 1,700,000 | | | $ | 1,649,041 | |
Series 13A-18, Class C, 3 mo. USD LIBOR + 2.150% 2.425% FRN 10/15/30 (a) | | | 1,000,000 | | | | 968,662 | |
Horizon Aircraft Finance I Ltd. | | | | | | | | |
Series 2019-1, Class A, 3.721% 7/15/39 (a) | | | 1,540,719 | | | | 1,438,557 | |
Series 2018-1, Class A, 4.458% 12/15/38 (a) | | | 1,118,419 | | | | 1,056,555 | |
Horizon Aircraft Finance III Ltd., Series 2019-2, Class A | | | | | | | | |
3.425% 11/15/39 (a) | | | 2,963,582 | | | | 2,717,117 | |
ICG US CLO Ltd., Series 2019-1A, Class A1A, 3 mo. USD LIBOR + 1.380% | | | | | | | | |
1.625% FRN 10/26/32 (a) | | | 900,000 | | | | 893,427 | |
J.G. Wentworth LLC, Series 2018-2A, Class A | | | | | | | | |
3.960% 10/15/75 (a) | | | 1,559,909 | | | | 1,595,897 | |
J.G. Wentworth XXXV LLC, Series 2015-2A, Class A | | | | | | | | |
3.870% 3/15/58 (a) | | | 640,437 | | | | 670,107 | |
KKR Financial CLO Ltd. | | | | | | | | |
Series 24, Class A1, 3 mo. USD LIBOR + 1.360% 1.632% FRN 4/20/32 (a) | | | 1,800,000 | | | | 1,782,299 | |
Series 25, Class B1, 3 mo. USD LIBOR + 2.000% 2.275% FRN 4/15/32 (a) | | | 1,500,000 | | | | 1,497,747 | |
Labrador Aviation Finance Ltd., Series 2016-1A, Class A1 | | | | | | | | |
4.300% 1/15/42 (a) | | | 2,096,667 | | | | 1,853,608 | |
Lunar Aircraft Ltd., Series 2020-1A, Class A | | | | | | | | |
3.376% 2/15/45 (a) | | | 1,200,428 | | | | 1,112,037 | |
MACH 1 Cayman Ltd., Series 2019-1, Class A | | | | | | | | |
3.474% 10/15/39 (a) | | | 2,575,341 | | | | 2,342,444 | |
Madison Park Funding Ltd. | | | | | | | | |
Series 2018-28A, Class B, 3 mo. USD LIBOR + 1.600% 1.875% FRN 7/15/30 (a) | | | 2,090,000 | | | | 2,053,343 | |
Series 2018-29A, Class C, 3 mo. USD LIBOR + 2.200% 2.472% FRN 10/18/30 (a) | | | 680,000 | | | | 662,056 | |
Magnetite XV Ltd., Series 2015-15A, Class CR, 3 mo. USD LIBOR + 1.800% | | | | | | | | |
2.045% FRN 7/25/31 (a) | | | 2,830,000 | | | | 2,748,629 | |
| | | Principal
Amount | | | Value | |
Mariner Finance Issuance Trust, Series 2018-AA, Class A | | | | | | | | |
4.200% 11/20/30 (a) | | $ | 2,235,000 | | | $ | 2,246,544 | |
Mosaic Solar Loans LLC | | | | | | | | |
Series 2017-2A, Class A, 3.820% 6/22/43 (a) | | | 602,783 | | | | 635,198 | |
Series 2018-1A, Class A, 4.010% 6/22/43 (a) | | | 265,127 | | | | 280,013 | |
Series 2017-1A, Class A, 4.450% 6/20/42 (a) | | | 284,826 | | | | 305,736 | |
MP CLO III Ltd., Series 2013-1A, Class AR, 3 mo. USD LIBOR + 1.250% | | | | | | | | |
1.522% FRN 10/20/30 (a) | | | 1,850,000 | | | | 1,827,349 | |
MVW Owner Trust, Series 2017-1A, Class A | | | | | | | | |
2.420% 12/20/34 (a) | | | 201,092 | | | | 205,019 | |
New Residential Advance Receivables Trust Advance Receivables Backed 2020-T1, Series 2020-T1, Class ET1 | | | | | | | | |
5.467% 8/15/53 (a) | | | 2,495,000 | | | | 2,499,339 | |
NP SPE LLC, Series 2017-1A, Class A2 | | | | | | | | |
4.219% 10/21/47 (a) | | | 2,190,000 | | | | 2,250,867 | |
Octagon Investment Partners 39 Ltd., Series 2018-3A, Class C, 3 mo. USD LIBOR + 2.200% | | | | | | | | |
2.472% FRN 10/20/30 (a) | | | 1,180,000 | | | | 1,160,047 | |
OHA Credit Funding Ltd. | | | | | | | | |
Series 2019-4A, Class A1, 3 mo. USD LIBOR + 1.330% 1.588% FRN 10/22/32 (a) | | | 1,250,000 | | | | 1,242,775 | |
Series 2019-4A, Class C, 3 mo. USD LIBOR + 2.650% 2.908% FRN 10/22/32 (a) | | | 1,000,000 | | | | 997,770 | |
OneMain Financial Issuance Trust, Series 2019-2A, Class A | | | | | | | | |
3.140% 10/14/36 (a) | | | 10,200,000 | | | | 10,870,106 | |
OneMain Financial Issuance Trust 2020-2, Series 2020-2A, Class B | | | | | | | | |
2.210% 9/14/35 (a) | | | 496,000 | | | | 494,644 | |
Oxford Finance Funding Trust | | | | | | | | |
Series 2020-1A, Class A2, 3.101% 2/15/28 (a) | | | 1,894,000 | | | | 1,921,075 | |
Series 2016-1A, Class A, 3.968% 6/17/24 (a) | | | 183,267 | | | | 183,338 | |
Pioneer Aircraft Finance Ltd., Series 2019-1, Class A | | | | | | | | |
3.967% 6/15/44 (a) | | | 1,809,043 | | | | 1,674,250 | |
Planet Fitness Master Issuer LLC, Series 2019-1A, Class A2 | | | | | | | | |
3.858% 12/05/49 (a) | | | 2,962,613 | | | | 2,786,429 | |
The accompanying notes are an integral part of the financial statements.
82
MassMutual Premier Core Bond Fund — Portfolio of Investments (Continued) |
| | | Principal
Amount | | | Value | |
PNMAC GMSR Issuer Trust, Series 2018-GT1, Class A, 1 mo. USD LIBOR + 2.850% | | | | | | | | |
2.998% FRN 2/25/23 (a) | | $ | 1,180,000 | | | $ | 1,151,696 | |
Regatta XIV Funding Ltd., Series 2018-3A, Class B, 3 mo. USD LIBOR + 1.850% | | | | | | | | |
2.095% FRN 10/25/31 (a) | | | 1,030,000 | | | | 1,025,593 | |
Sierra Receivables Funding LLC | | | | | | | | |
Series 2015-3A, Class B, 3.080% 9/20/32 (a) | | | 86,265 | | | | 86,184 | |
Series 2019-1A, Class D, 4.750% 1/20/36 (a) | | | 1,705,259 | | | | 1,646,325 | |
Series 2018-3A, Class D, 5.200% 9/20/35 (a) | | | 985,181 | | | | 951,478 | |
Sierra Timeshare 2020-2 Receivables Funding LLC, Series 2020-2A, Class B | | | | | | | | |
2.320% 7/20/37 (a) | | | 1,284,489 | | | | 1,283,421 | |
Stack Infrastructure Issuer LLC, Series 2020-1A, Class A2 | | | | | | | | |
1.893% 8/25/45 (a) | | | 1,135,000 | | | | 1,142,568 | |
Steele Creek CLO Ltd., Series 2018-2A, Class C, 3 mo. USD LIBOR + 2.300% | | | | | | | | |
2.570% FRN 8/18/31 (a) | | | 1,660,000 | | | | 1,550,425 | |
Store Master Funding I-VII | | | | | | | | |
Series 2019-1, Class A2, 3.650% 11/20/49 (a) | | | 3,604,102 | | | | 3,656,325 | |
Series 2018-1A, Class A2, 4.290% 10/20/48 (a) | | | 1,459,807 | | | | 1,545,898 | |
Structured Asset Securities Corp. Mortgage Loan Trust, Series 2006-GEL1, Class M2, 1 mo. USD LIBOR + .800% | | | | | | | | |
0.948% FRN 11/25/35 (a) | | | 1,306,291 | | | | 1,244,345 | |
Structured Receivables Finance LLC, Series 2010-B, Class A | | | | | | | | |
3.730% 8/15/36 (a) | | | 206,260 | | | | 216,326 | |
Sunnova Helios II Issuer LLC, Series 2018-1A, Class A | | | | | | | | |
4.870% 7/20/48 (a) | | | 622,434 | | | | 669,733 | |
SuttonPark Structured Settlements LLC, Series 2017-1A, Class A | | | | | | | | |
4.190% 1/15/71 (a) | | | 1,849,587 | | | | 2,139,982 | |
Taco Bell Funding LLC, Series 2018-1A, Class A2II | | | | | | | | |
4.940% 11/25/48 (a) | | | 1,414,800 | | | | 1,510,450 | |
TAL Advantage VII LLC, Series 2020-1A, Class A | | | | | | | | |
2.050% 9/20/45 (a) | | | 5,500,000 | | | | 5,509,828 | |
| | | Principal
Amount | | | Value | |
Textainer Marine Containers VII Ltd., Series 2019-1A, Class A | | | | | | | | |
3.960% 4/20/44 (a) | | $ | 478,800 | | | $ | 478,800 | |
THL Credit Wind River CLO Ltd., Series 2018-3A, Class B, 3 mo. USD LIBOR + 1.700% | | | | | | | | |
1.972% FRN 1/20/31 (a) | | | 2,440,000 | | | | 2,411,208 | |
TICP CLO XIV Ltd., Series 2019-14A, Class A2, 3 mo. USD LIBOR + 1.900% | | | | | | | | |
2.172% FRN 10/20/32 (a) | | | 250,000 | | | | 250,131 | |
Tif Funding II LLC, Series 2020-1A, Class A | | | | | | | | |
2.090% 8/20/45 (a) | | | 836,738 | | | | 835,363 | |
Trinity Rail Leasing LP | | | | | | | | |
Series 2019-2A, Class A2, 3.100% 10/18/49 (a) | | | 4,127,000 | | | | 4,025,173 | |
Series 2019-1A, Class A, 3.820% 4/17/49 (a) | | | 4,283,371 | | | | 4,462,078 | |
Series 2018-1A, Class A2, 4.620% 6/17/48 (a) | | | 2,370,000 | | | | 2,408,953 | |
Trip Rail Master Funding LLC, Series 2017-1A, Class A1 | | | | | | | | |
2.709% 8/15/47 (a) | | | 171,333 | | | | 171,486 | |
Triton Container Finance VIII LLC, Series 2020-1A, Class A | | | | | | | | |
2.110% 9/20/45 (a) | | | 4,050,000 | | | | 4,055,210 | |
Vantage Data Centers LLC, Series 2020-2A, Class A2 | | | | | | | | |
1.992% 9/15/45 (a) (c) | | | 1,702,000 | | | | 1,702,780 | |
Vivint Solar Financing V LLC, Series 2018-1A, Class B | | | | | | | | |
7.370% 4/30/48 (a) | | | 2,546,243 | | | | 2,584,248 | |
Voya CLO Ltd. | | | | | | | | |
Series 2015-3A, Class A3R, 3 mo. USD LIBOR + 1.700% 1.972% FRN 10/20/31 (a) | | | 1,500,000 | | | | 1,469,157 | |
Series 2019-3A, Class B1, 3 mo. USD LIBOR + 1.850% 2.123% FRN 10/17/32 (a) | | | 1,500,000 | | | | 1,494,812 | |
WAVE LLC | | | | | | | | |
Series 2019-1A, Class A, 3.597% 9/15/44 (a) | | | 4,845,508 | | | | 4,494,548 | |
Series 2017-1A, Class C, 6.656% 11/15/42 (a) | | | 1,776,594 | | | | 742,713 | |
WAVE Trust, Series 2017-1A, Class A | | | | | | | | |
3.844% 11/15/42 (a) | | | 3,034,576 | | | | 2,745,829 | |
Wendy’s Funding LLC, Series 2015-1A, Class A23 | | | | | | | | |
4.497% 6/15/45 (a) | | | 3,040,000 | | | | 3,035,863 | |
The accompanying notes are an integral part of the financial statements.
83
MassMutual Premier Core Bond Fund — Portfolio of Investments (Continued) |
| | | Principal
Amount | | | Value | |
Westgate Resorts LLC, Series 2017-1A, Class A | | | | | | | | |
3.050% 12/20/30 (a) | | $ | 451,359 | | | $ | 449,987 | |
Willis Engine Structured Trust IV, Series 2018-A, Class A, | | | | | | | | |
4.750% STEP 9/15/43 (a) | | | 1,171,900 | | | | 988,429 | |
| | | | | | | | 208,735,934 | |
Student Loans Asset-Backed Securities — 9.5% |
College Avenue Student Loans LLC | | | | | | | | |
Series 2019-A, Class B, 3.810% 12/28/48 (a) | | | 2,630,000 | | | | 2,604,404 | |
Series 2019-A, Class C, 4.460% 12/28/48 (a) | | | 1,505,000 | | | | 1,489,670 | |
College Loan Corp. Trust I, Series 2007-1, Class B2, 28 day ARS | | | | | | | | |
1.667% FRN 1/25/47 | | | 875,000 | | | | 696,596 | |
ECMC Group Student Loan Trust | | | | | | | | |
Series 2018-2A, Class A, 1 mo. USD LIBOR + .800% 0.948% FRN 9/25/68 (a) | | | 4,650,815 | | | | 4,563,335 | |
Series 2017-1A, Class A, 1 mo. USD LIBOR + 1.200% 1.348% FRN 12/27/66 (a) | | | 2,016,741 | | | | 2,005,576 | |
Series 2016-1A, Class A, 1 mo. USD LIBOR + 1.350% 1.498% FRN 7/26/66 (a) | | | 2,838,490 | | | | 2,866,336 | |
EdLinc Student Loan Funding, Series 2017-A, Class A, PRIME - 1.150% | | | | | | | | |
3.600% FRN 12/01/47 (a) | | | 1,767,577 | | | | 1,746,694 | |
Education Loan Asset-Backed Trust I | | | | | | | | |
Series 2003-1, Class A2, 28 day ARS 0.000%FRN 2/01/43 (a) | | | 1,300,000 | | | | 1,198,856 | |
Series 2003-2, Class 2A1, 28 day ARS 0.000%FRN 8/01/43 (a) | | | 1,950,000 | | | | 1,799,072 | |
Series 2013-1, Class B1, 1 mo. USD LIBOR + 1.000% 1.148% FRN 11/25/33 (a) | | | 1,102,698 | | | | 1,014,074 | |
Higher Education Funding I | | | | | | | | |
Series 2004-1, Class B2, 28 day ARS 0.000%FRN 1/01/44 (a) | | | 600,000 | | | | 524,132 | |
Series 2004-1, Class B1, 28 day ARS 1.796% FRN 1/01/44 (a) | | | 600,000 | | | | 532,442 | |
Laurel Road Prime Student Loan Trust | | | | | | | | |
Series 2017-B, Class BFX, 3.020% 8/25/42 (a) | | | 538,731 | | | | 544,429 | |
Series 2018-B, Class BFX, 3.720% 5/26/43 (a) | | | 436,918 | | | | 446,883 | |
Navient Private Education Loan Trust, Series 2018-BA, Class A2B, 1 mo. USD LIBOR + .720% | | | | | | | | |
0.872% FRN 12/15/59 (a) | | | 779,496 | | | | 746,327 | |
| | | Principal
Amount | | | Value | |
Navient Private Education Refi Loan Trust | | | | | | | | |
Series 2019-CA, Class B, 3.670% 2/15/68 (a) | | $ | 1,512,000 | | | $ | 1,553,204 | |
Series 2019-A, Class B, 3.900% 1/15/43 (a) | | | 1,500,000 | | | | 1,530,100 | |
Series 2018-CA, Class B, 4.220% 6/16/42 (a) | | | 1,480,000 | | | | 1,496,800 | |
Navient Student Loan Trust | | | | | | | | |
Series 2016-1A, Class A, 1 mo. USD LIBOR + .700% 0.848% FRN 2/25/70 (a) | | | 2,630,200 | | | | 2,564,553 | |
Series 2018-2A, Class A3, 1 mo. USD LIBOR + .750% 0.898% FRN 3/25/67 (a) | | | 3,320,000 | | | | 3,224,338 | |
Series 2018-3A, Class A3, 1 mo. USD LIBOR + .800% 0.948% FRN 3/25/67 (a) | | | 4,650,000 | | | | 4,604,046 | |
Series 2019-1A, Class A2, 1 mo. USD LIBOR + .900% 1.048% FRN 12/27/67 (a) | | | 3,100,000 | | | | 3,091,779 | |
Series 2019-2A, Class A2, 1 mo. USD LIBOR + 1.000% 1.148% FRN 2/27/68 (a) | | | 1,548,000 | | | | 1,549,519 | |
Series 2016-7A, Class A, 1 mo. USD LIBOR + 1.150% 1.298% FRN 3/25/66 (a) | | | 3,188,271 | | | | 3,188,271 | |
Series 2016-5A, Class A, 1 mo. USD LIBOR + 1.250% 1.398% FRN 6/25/65 (a) | | | 2,347,147 | | | | 2,347,146 | |
Series 2016-6A, Class A3, 1 mo. USD LIBOR + 1.300% 1.448% FRN 3/25/66 (a) | | | 6,800,000 | | | | 6,859,454 | |
Series 2014-8, Class B, 1 mo. USD LIBOR + 1.500% 1.648% FRN 7/26/49 | | | 2,500,000 | | | | 2,320,872 | |
Series 2015-3, Class B, 1 mo. USD LIBOR + 1.500% 1.648% FRN 10/25/58 | | | 1,200,000 | | | | 1,081,498 | |
Series 2019-BA, Class B, 4.040% 12/15/59 (a) | | | 3,700,000 | | | | 3,860,064 | |
Series 2018-EA, Class B, 4.440% 12/15/59 (a) | | | 730,000 | | | | 759,071 | |
Nelnet Private Education Loan Trust, Series 2016-A, Class A1B | | | | | | | | |
3.600% 12/26/40 (a) | | | 342,320 | | | | 344,078 | |
Nelnet Student Loan Trust | | | | | | | | |
Series 2018-3A, Class A3, 1 mo. USD LIBOR + .750% 0.898% FRN 9/27/66 (a) | | | 4,500,000 | | | | 4,414,374 | |
Series 2014-3A, Class B, 1 mo. USD LIBOR + 1.500% 1.648% FRN 10/25/50 (a) | | | 975,000 | | | | 913,711 | |
The accompanying notes are an integral part of the financial statements.
84
MassMutual Premier Core Bond Fund — Portfolio of Investments (Continued) |
| | | Principal
Amount | | | Value | |
Series 2014-5A, Class B, 1 mo. USD LIBOR + 1.500% 1.648% FRN 5/26/54 (a) | | $ | 1,300,000 | | | $ | 1,233,799 | |
Series 2015-2A, Class B, 1 mo. USD LIBOR + 1.500% 1.648% FRN 5/26/54 (a) | | | 1,130,000 | | | | 1,060,844 | |
Series 2015-3A, Class B, 1 mo. USD LIBOR + 1.500% 1.648% FRN 6/25/54 (a) | | | 1,100,000 | | | | 1,064,632 | |
Series 2019-4A, Class B, 1 mo. USD LIBOR + 1.650% 1.798% FRN 9/26/67 (a) | | | 3,800,000 | | | | 3,616,222 | |
Series 2019-5, Class B, 3.450% 10/25/67 (a) | | | 2,850,000 | | | | 2,713,814 | |
SLC Student Loan Trust | | | | | | | | |
Series 2007-1, Class A5, 3 mo. USD LIBOR + .090% 0.370% FRN 2/15/68 | | | 8,400,000 | | | | 7,440,091 | |
Series 2005-1, Class B, 3 mo. USD LIBOR + .200% 0.480% FRN 2/15/45 | | | 1,532,076 | | | | 1,379,065 | |
SLM Student Loan Trust | | | | | | | | |
Series 2006-2, Class R, 0.000% 1/25/41 | | | 9,078 | | | | 5,467,820 | |
Series 2006-5, Class B, 3 mo. USD LIBOR + .210% 0.455% FRN 10/25/40 | | | 1,801,169 | | | | 1,610,319 | |
Series 2005-8, Class B, 3 mo. USD LIBOR + .310% 0.555% FRN 1/25/55 | | | 1,319,405 | | | | 1,172,995 | |
Series 2003-14, Class A7, 3 mo. USD LIBOR + .600% 0.845% FRN 10/25/65 (a) | | | 9,670,000 | | | | 9,446,428 | |
SMB Private Education Loan Trust, Series 2017-A, Class B | | | | | | | | |
3.500% 6/17/41 (a) | | | 1,800,000 | | | | 1,793,014 | |
SMB Private Education Loan Trust 2020-B, Series 2020-BA, Class B | | | | | | | | |
2.760% 7/15/53 (a) | | | 3,431,000 | | | | 3,335,901 | |
SoFi Alternative Trust, Series 2019-C, Class PT, | | | | | | | | |
4.861% VRN 1/25/45 (a) (d) | | | 6,233,666 | | | | 6,701,191 | |
SoFi Professional Loan Program LLC | | | | | | | | |
Series 2017-D, Class R1, 0.010% 9/25/40 (a) | | | 4,647,800 | | | | 1,603,584 | |
Series 2018-A, Class R1, 0.010% 2/25/42 (a) | | | 3,470,600 | | | | 1,434,892 | |
Series 2018-B, Class R1, 0.010% 8/26/47 (a) | | | 3,139,900 | | | | 1,159,565 | |
Series 2018-D, Class R1, 0.010% 2/25/48 (a) | | | 5,678,800 | | | | 1,255,583 | |
Series 2019-A, Class R1, 0.010% 6/15/48 (a) | | | 8,126,500 | | | | 1,925,168 | |
| | | Principal
Amount | | | Value | |
South Carolina Student Loan Corp., Series 2014-1, Class B, 1 mo. USD LIBOR + 1.500% | | | | | | | | |
1.655% FRN 8/01/35 | | $ | 3,025,000 | | | $ | 2,903,226 | |
| | | | | | | | 126,799,857 | |
Whole Loan Collateral Collateralized Mortgage Obligations — 0.7% |
Bank of America Mortgage Securities, Series 2004-G, Class 2A7, | | | | | | | | |
3.091% VRN 8/25/34 (d) | | | 82,677 | | | | 80,848 | |
Citigroup Mortgage Loan Trust, Series 2019-IMC1, Class M1, | | | | | | | | |
3.170% VRN 7/25/49 (a) (d) | | | 1,188,500 | | | | 1,158,489 | |
Countrywide Home Loans, Inc. | | | | | | | | |
Series 2004-2, Class 1A1, 3.666% VRN 2/25/34 (d) | | | 66,004 | | | | 63,721 | |
Series 2003-42, Class 1A1, 3.991% VRN 9/25/33 (d) | | | 17,207 | | | | 16,506 | |
Deephaven Residential Mortgage Trust | | | | | | | | |
Series 2018-1A, Class A3, 3.202% VRN 12/25/57 (a) (d) | | | 254,989 | | | | 255,106 | |
Series 2019-1A, Class A3, 3.948% VRN 1/25/59 (a) (d) | | | 705,618 | | | | 713,367 | |
GSR Mortgage Loan Trust, Series 2004-9, Class 2A1, | | | | | | | | |
3.490% VRN 8/25/34 (d) | | | 24,455 | | | | 24,691 | |
IndyMac Index Mortgage Loan Trust, Series 2004-AR4, Class 1A, | | | | | | | | |
3.165% VRN 8/25/34 (d) | | | 140,005 | | | | 139,596 | |
JP Morgan Mortgage Trust, Series 2017-1, Class A11, | | | | | | | | |
3.500% VRN 1/25/47 (a) (d) | | | 1,865,672 | | | | 1,901,865 | |
Merrill Lynch Mortgage Investors, Inc. | | | | | | | | |
Series 2003-A4, Class IA, 3.032% VRN 7/25/33 (d) | | | 5,955 | | | | 5,675 | |
Series 2004-A1, Class IA, 3.250% VRN 2/25/34 (d) | | | 9,224 | | | | 9,108 | |
PSMC Trust, Series 2018-2, Class A1, | | | | | | | | |
3.500% VRN 6/25/48 (a) (d) | | | 1,621,979 | | | | 1,650,854 | |
Sequoia Mortgage Trust | | | | | | | | |
Series 2018-CH2, Class A3, 4.000% VRN 6/25/48 (a) (d) | | | 1,560,952 | | | | 1,604,511 | |
Series 2018-CH4, Class A2, 4.000% VRN 10/25/48 (a) (d) | | | 684,925 | | | | 698,911 | |
Series 2019-1, Class A1, 4.000% VRN 2/25/49 (a) (d) | | | 180,784 | | | | 184,262 | |
Structured Adjustable Rate Mortgage Loan Trust, Series 2004-2, Class 2A, | | | | | | | | |
2.970% VRN 3/25/34 (d) | | | 69,767 | | | | 69,248 | |
The accompanying notes are an integral part of the financial statements.
85
MassMutual Premier Core Bond Fund — Portfolio of Investments (Continued) |
| | | Principal
Amount | | | Value | |
Washington Mutual Mortgage Pass-Through Certificates, Series 2004-AR2, Class A, 12 mo. MTA + 1.400% | | | | | | | | |
2.419% FRN 4/25/44 | | $ | 197,983 | | | $ | 189,351 | |
Wells Fargo Mortgage Backed Securities Trust, Series 2019-1, Class A1, | | | | | | | | |
4.000% VRN 11/25/48 (a) (d) | | | 768,143 | | | | 784,308 | |
| | | | | | | | 9,550,417 | |
| | | | | | | | | |
TOTAL NON-U.S. GOVERNMENT AGENCY OBLIGATIONS (Cost $436,327,730) | | | | | | | 431,395,799 | |
| | | | | | | | | |
SOVEREIGN DEBT OBLIGATIONS — 0.7% |
Colombia Government International Bond | | | | | | | | |
6.125% 1/18/41 | | | 2,980,000 | | | | 3,821,850 | |
Mexico Government International Bond | | | | | | | | |
4.750% 3/08/44 | | | 4,328,000 | | | | 4,719,684 | |
6.750% 9/27/34 | | | 950,000 | | | | 1,273,950 | |
| | | | | | | | 9,815,484 | |
| | | | | | | | | |
TOTAL SOVEREIGN DEBT OBLIGATIONS (Cost $8,551,708) | | | | | | | 9,815,484 | |
| | | | | | | | | |
U.S. GOVERNMENT AGENCY OBLIGATIONS AND INSTRUMENTALITIES — 23.0% |
Collateralized Mortgage Obligations — 0.2% |
Federal Home Loan Mortgage Corp. | | | | | | | | |
Series 2617, Class Z, 5.500% 5/15/33 | | | 953,799 | | | | 1,103,061 | |
Series 2693, Class Z, 5.500% 10/15/33 | | | 1,722,380 | | | | 1,955,678 | |
Series 2178, Class PB, 7.000% 8/15/29 | | | 132,019 | | | | 149,843 | |
| | | | | | | | 3,208,582 | |
Pass-Through Securities — 22.2% |
Federal Home Loan Mortgage Corp. | | | | | | | | |
Pool #RA2483 3.500% 6/01/50 | | | 13,946,964 | | | | 14,854,575 | |
Pool #Z40047 4.000% 10/01/41 | | | 176,670 | | | | 195,514 | |
Pool #C00836 7.000% 7/01/29 | | | 6,122 | | | | 7,067 | |
Pool #C49314 7.000% 4/01/31 | | | 4,168 | | | | 4,946 | |
Pool #C51422 7.000% 5/01/31 | | | 1,581 | | | | 1,879 | |
Pool #C53034 7.000% 6/01/31 | | | 10,795 | | | | 12,675 | |
Pool #G01311 7.000% 9/01/31 | | | 31,555 | | | | 37,035 | |
Pool #G01317 7.000% 10/01/31 | | | 18,472 | | | | 21,683 | |
Pool #G00143 7.500% 6/01/23 | | | 121 | | | | 128 | |
| | | Principal
Amount | | | Value | |
Pool #C55867 7.500% 2/01/30 | | $ | 12,742 | | | $ | 14,363 | |
Pool #C41497 7.500% 9/01/30 | | | 62 | | | | 73 | |
Pool #C44830 7.500% 11/01/30 | | | 19 | | | | 22 | |
Pool #C45235 7.500% 12/01/30 | | | 13,076 | | | | 15,172 | |
Pool #C46038 7.500% 12/01/30 | | | 509 | | | | 592 | |
Pool #C01116 7.500% 1/01/31 | | | 670 | | | | 789 | |
Pool #C46309 7.500% 1/01/31 | | | 417 | | | | 489 | |
Pool #C46810 7.500% 1/01/31 | | | 106 | | | | 125 | |
Pool #C47063 7.500% 1/01/31 | | | 2,272 | | | | 2,653 | |
Pool #C47060 7.500% 1/01/31 | | | 573 | | | | 674 | |
Pool #G00653 8.500% 11/01/25 | | | 8,514 | | | | 9,319 | |
Federal National Mortgage Association | | | | | | | | |
Pool #775539 12 mo. USD LIBOR + 1.641% 2.516% FRN 5/01/34 | | | 49,603 | | | | 51,640 | |
Pool #MA3029 3.000% 6/01/32 | | | 3,573,665 | | | | 3,766,870 | |
Pool #MA3090 3.000% 8/01/32 | | | 1,534,235 | | | | 1,617,182 | |
Pool #725692 1 year CMT + 2.137% 3.138% FRN 10/01/33 | | | 122,430 | | | | 128,241 | |
Pool #888586 1 year CMT + 2.196% 3.326% FRN 10/01/34 | | | 283,468 | | | | 298,713 | |
Pool #AS1304 3.500% 12/01/28 | | | 1,056,893 | | | | 1,136,461 | |
Pool #AV1897 3.500% 12/01/28 | | | 205,862 | | | | 221,360 | |
Pool #AV2325 3.500% 12/01/28 | | | 547,634 | | | | 588,863 | |
Pool #MA1356 3.500% 2/01/43 | | | 7,459,706 | | | | 8,096,678 | |
Pool #CA6096 3.500% 6/01/50 | | | 12,709,046 | | | | 13,659,218 | |
Pool #FM4017 3.500% 8/01/50 | | | 1,173,261 | | | | 1,242,645 | |
Pool #CA1909 4.500% 6/01/48 | | | 6,304,613 | | | | 6,826,483 | |
Pool #AD6437 5.000% 6/01/40 | | | 405,643 | | | | 464,937 | |
Pool #AD6996 5.000% 7/01/40 | | | 2,619,903 | | | | 3,002,859 | |
Pool #AL8173 5.000% 2/01/44 | | | 1,038,282 | | | | 1,181,289 | |
Pool #254379 7.000% 7/01/32 | | | 21,562 | | | | 25,577 | |
Pool #252717 7.500% 9/01/29 | | | 1,181 | | | | 1,370 | |
Pool #535996 7.500% 6/01/31 | | | 4,073 | | | | 4,773 | |
Pool #254009 7.500% 10/01/31 | | | 12,210 | | | | 14,234 | |
Pool #323992 8.000% 11/01/29 | | | 810 | | | | 932 | |
Pool #525725 8.000% 2/01/30 | | | 2,795 | | | | 3,282 | |
Pool #253266 8.000% 5/01/30 | | | 2,953 | | | | 3,452 | |
Pool #537433 8.000% 5/01/30 | | | 1,138 | | | | 1,343 | |
Pool #253347 8.000% 6/01/30 | | | 2,925 | | | | 3,423 | |
Pool #544976 8.000% 7/01/30 | | | 338 | | | | 393 | |
Pool #535428 8.000% 8/01/30 | | | 3,076 | | | | 3,597 | |
Pool #543290 8.000% 9/01/30 | | | 48 | | | | 56 | |
Pool #547786 8.000% 9/01/30 | | | 1,231 | | | | 1,438 | |
Pool #550767 8.000% 9/01/30 | | | 1,709 | | | | 2,022 | |
Pool #553061 8.000% 9/01/30 | | | 1,459 | | | | 1,640 | |
Pool #253481 8.000% 10/01/30 | | | 2,779 | | | | 3,258 | |
Pool #535533 8.000% 10/01/30 | | | 2,875 | | | | 3,368 | |
Pool #253644 8.000% 2/01/31 | | | 1,109 | | | | 1,303 | |
The accompanying notes are an integral part of the financial statements.
86
MassMutual Premier Core Bond Fund — Portfolio of Investments (Continued) |
| | | Principal
Amount | | | Value | |
Pool #581170 8.000% 5/01/31 | | $ | 1,101 | | | $ | 1,263 | |
Pool #593848 8.000% 7/01/31 | | | 789 | | | | 930 | |
Pool #190317 8.000% 8/01/31 | | | 17,277 | | | | 20,220 | |
Pool #545240 8.000% 9/01/31 | | | 1,649 | | | | 1,933 | |
Pool #541202 8.500% 8/01/26 | | | 3,299 | | | | 3,459 | |
Government National Mortgage Association I | | | | | | | | |
Pool #404246 6.500% 8/15/28 | | | 169 | | | | 190 | |
Pool #781038 6.500% 5/15/29 | | | 35,012 | | | | 39,357 | |
Pool #781468 6.500% 7/15/32 | | | 2,402 | | | | 2,768 | |
Pool #781496 6.500% 9/15/32 | | | 11,693 | | | | 13,399 | |
Pool #363066 7.000% 8/15/23 | | | 1,256 | | | | 1,321 | |
Pool #352049 7.000% 10/15/23 | | | 755 | | | | 796 | |
Pool #354674 7.000% 10/15/23 | | | 995 | | | | 1,049 | |
Pool #345964 7.000% 11/15/23 | | | 498 | | | | 528 | |
Pool #380866 7.000% 3/15/24 | | | 411 | | | | 438 | |
Pool #781124 7.000% 12/15/29 | | | 4,475 | | | | 5,103 | |
Pool #781319 7.000% 7/15/31 | | | 83,050 | | | | 96,250 | |
Pool #581417 7.000% 7/15/32 | | | 11,111 | | | | 12,661 | |
Pool #565982 7.000% 7/15/32 | | | 12,776 | | | | 14,981 | |
Pool #357262 7.500% 9/15/23 | | | 604 | | | | 641 | |
Pool #441009 8.000% 11/15/26 | | | 626 | | | | 703 | |
Pool #522777 8.000% 12/15/29 | | | 4,301 | | | | 4,925 | |
Pool #523043 8.000% 3/15/30 | | | 231 | | | | 266 | |
Pool #529134 8.000% 3/15/30 | | | 1,438 | | | | 1,685 | |
Pool #477036 8.000% 4/15/30 | | | 577 | | | | 676 | |
Pool #503157 8.000% 4/15/30 | | | 12,442 | | | | 14,581 | |
Pool #528714 8.000% 4/15/30 | | | 1,526 | | | | 1,789 | |
Pool #544640 8.000% 11/15/30 | | | 9,676 | | | | 11,328 | |
Pool #531298 8.500% 8/15/30 | | | 835 | | | | 964 | |
Government National Mortgage Association II | | | | | | | | |
Pool# MA6656 3.000% 5/20/50 | | | 13,267,828 | | | | 13,923,617 | |
Pool# MA6710 3.000% 6/20/50 | | | 13,375,016 | | | | 14,065,361 | |
Pool #MA4321 3.500% 3/20/47 | | | 8,947,684 | | | | 9,571,513 | |
Government National Mortgage Association II TBA | | | | | | | | |
Pool #548 3.000% 8/01/49 (c) | | | 3,100,000 | | | | 3,245,555 | |
Pool #1635 3.500% 6/01/49 (c) | | | 76,055,000 | | | | 80,095,422 | |
Uniform Mortgage Backed Securities TBA | | | | | | | | |
Pool #505 2.000% 5/01/35 (c) | | | 49,350,000 | | | | 51,300,865 | |
Pool #1082 2.000% 4/01/50 (c) | | | 23,050,000 | | | | 23,835,141 | |
Pool #17115 3.500% 4/01/49 (c) | | | 34,725,000 | | | | 36,607,748 | |
Pool #18388 4.000% 2/01/48 (c) | | | 4,900,000 | | | | 5,225,390 | |
| | | | | | | | 295,663,489 | |
| | | Principal
Amount | | | Value | |
Whole Loans — 0.6% |
Federal Home Loan Mortgage Corp. Structured Agency Credit Risk Debt Notes | | | | | | | | |
Series 2016-HQA3, Class M2, 1 mo. USD LIBOR + 1.350% 1.498% FRN 3/25/29 | | $ | 64,131 | | | $ | 64,029 | |
Series 2020-DNA3, Class M1, 1 mo. USD LIBOR + 1.500% 1.648% FRN 6/25/50 (a) | | | 3,590,000 | | | | 3,596,040 | |
Series 2020-DNA3, Class M2, 1 mo. USD LIBOR + 3.000% 3.148% FRN 6/25/50 (a) | | | 4,680,000 | | | | 4,693,069 | |
| | | | | | | | 8,353,138 | |
| | | | | | | | | |
TOTAL U.S. GOVERNMENT AGENCY OBLIGATIONS AND INSTRUMENTALITIES (Cost $306,043,726) | | | | | | | 307,225,209 | |
| | | | | | | | | |
U.S. TREASURY OBLIGATIONS — 3.0% |
U.S. Treasury Bonds & Notes — 3.0% |
U.S. Treasury Bond | | | | | | | | |
2.250% 8/15/49 (e) | | | 7,900,000 | | | | 9,418,265 | |
3.500% 2/15/39 (e) | | | 13,400,000 | | | | 18,825,940 | |
U.S. Treasury Note | | | | | | | | |
0.375% 4/30/25 | | | 12,000,000 | | | | 12,071,420 | |
| | | | | | | | 40,315,625 | |
| | | | | | | | | |
TOTAL U.S. TREASURY OBLIGATIONS (Cost $40,498,445) | | | | | | | 40,315,625 | |
| | | | | | | | | |
TOTAL BONDS & NOTES (Cost $1,294,128,571) | | | | | | | 1,321,373,536 | |
| | | | | | | | | |
TOTAL PURCHASED OPTIONS (#) — 0.2% (Cost $3,506,056) | | | | | | | 2,487,476 | |
| | | | | | | | | |
TOTAL LONG-TERM INVESTMENTS (Cost $1,300,884,627) | | | | | | | 1,327,237,112 | |
The accompanying notes are an integral part of the financial statements.
87
MassMutual Premier Core Bond Fund — Portfolio of Investments (Continued) |
| | | Principal
Amount | | | Value | |
SHORT-TERM INVESTMENTS — 16.2% |
Commercial Paper — 16.2% |
American Honda Finance Corp. | | | | | | | | |
0.406% 11/04/20 | | $ | 3,000,000 | | | $ | 2,999,364 | |
0.538% 10/28/20 | | | 5,000,000 | | | | 4,999,253 | |
0.793% 10/21/20 | | | 5,000,000 | | | | 4,999,522 | |
AstraZeneca PLC | | | | | | | | |
2.053% 12/11/20 (a) | | | 5,000,000 | | | | 4,996,100 | |
2.113% 11/10/20 (a) | | | 5,000,000 | | | | 4,997,927 | |
2.155% 11/10/20 (a) | | | 5,000,000 | | | | 4,997,927 | |
Avangrid, Inc. | | | | | | | | |
0.274% 12/10/20 (a) | | | 5,000,000 | | | | 4,997,860 | |
BAT International Financial PLC | | | | | | | | |
0.355% 10/14/20 (a) | | | 5,000,000 | | | | 4,999,137 | |
0.355% 11/04/20 (a) | | | 4,000,000 | | | | 3,999,249 | |
0.406% 10/13/20 (a) | | | 7,000,000 | | | | 6,998,845 | |
Bemis Co., Inc. | | | | | | | | |
0.142% 10/05/20 (a) | | | 600,000 | | | | 599,988 | |
Boeing Co. | | | | | | | | |
2.109% 11/10/20 (a) | | | 4,000,000 | | | | 3,994,971 | |
2.109% 11/12/20 (a) | | | 5,000,000 | | | | 4,993,407 | |
Canadian Natural Resources Ltd. | | | | | | | | |
0.183% 10/05/20 (a) | | | 5,000,000 | | | | 4,999,889 | |
0.223% 10/14/20 (a) | | | 6,000,000 | | | | 5,999,585 | |
Daimler Fin NA | | | | | | | | |
0.691% 10/08/20 (a) | | | 3,000,000 | | | | 2,999,892 | |
Ei Dupont | | | | | | | | |
0.835% 12/02/20 (a) | | | 5,000,000 | | | | 4,998,303 | |
0.866% 12/09/20 (a) | | | 5,000,000 | | | | 4,998,026 | |
1.586% 12/09/20 (a) | | | 5,000,000 | | | | 4,998,026 | |
Enbridge (US), Inc. | | | | | | | | |
0.243% 11/20/20 (a) | | | 5,000,000 | | | | 4,998,555 | |
0.599% 10/01/20 (a) | | | 5,000,000 | | | | 4,999,978 | |
Entergy Corp. | | | | | | | | |
0.355% 10/26/20 (a) | | | 5,000,000 | | | | 4,998,971 | |
Harley-Davidson Funding Corp. | | | | | | | | |
0.457% 11/05/20 (a) | | | 6,400,000 | | | | 6,398,758 | |
Intercontinental Exchange, Inc. | | | | | | | | |
0.304% 11/04/20 (a)(f) | | | 3,000,000 | | | | 2,998,956 | |
0.345% 10/28/20 (a)(f) | | | 7,000,000 | | | | 6,998,068 | |
0.345% 11/19/20 (a)(f) | | | 2,000,000 | | | | 1,998,984 | |
0.376% 12/11/20 (a)(f) | | | 5,000,000 | | | | 4,996,230 | |
Nutrien Ltd. | | | | | | | | |
0.203% 11/16/20 (a) | | | 8,000,000 | | | | 7,997,901 | |
0.213% 12/23/20 (a) | | | 5,000,000 | | | | 4,997,363 | |
0.213% 12/30/20 | | | 4,000,000 | | | | 3,997,900 | |
Rogers Communications | | | | | | | | |
0.458% 8/25/21 (a) | | | 10,000,000 | | | | 9,958,327 | |
| | | Principal
Amount | | | Value | |
Suncor Energy, Inc. | | | | | | | | |
0.284% 12/14/20 (a) | | $ | 4,500,000 | | | $ | 4,497,938 | |
0.305% 1/26/21 (a) | | | 4,000,000 | | | | 3,996,499 | |
0.406% 11/13/20 (a) | | | 7,000,000 | | | | 6,998,297 | |
Transcanada Pipelines Ltd. | | | | | | | | |
0.193% 10/02/20 | | | 2,000,000 | | | | 1,999,982 | |
0.284% 12/08/20 (a) | | | 8,000,000 | | | | 7,996,688 | |
0.294% 12/15/20 (a) | | | 5,000,000 | | | | 4,997,667 | |
VW Credit, Inc. | | | | | | | | |
0.223% 12/02/20 (a) | | | 7,000,000 | | | | 6,997,403 | |
Waste Management, Inc. | | | | | | | | |
0.458% 9/15/21 (a) | | | 15,000,000 | | | | 14,947,792 | |
Xylem, Inc. | | | | | | | | |
2.102% 11/18/20 (a) | | | 10,000,000 | | | | 9,997,237 | |
| | | | | | | | 215,336,765 | |
| | | | | | | | | |
TOTAL SHORT-TERM INVESTMENTS (Cost $215,221,277) | | | | | | | 215,336,765 | |
| | | | | | | | | |
TOTAL INVESTMENTS — 115.7% (Cost $1,516,105,904) (g) | | | | | | | 1,542,573,877 | |
| | | | | | | | | |
Other Assets/(Liabilities) — (15.7)% | | | | | | | (209,498,054 | ) |
| | | | | | | | | |
NET ASSETS — 100.0% | | | | | | $ | 1,333,075,823 | |
Abbreviation Legend
CLO | Collateralized Loan Obligation |
Notes to Portfolio of Investments
Percentages are stated as a percent of net assets.
(a) | Security is exempt from registration under Regulation S or Rule 144A of the Securities Act of 1933. These securities are considered restricted and may be resold in transactions exempt from registration. At September 30, 2020, the aggregate market value of these securities amounted to $705,917,675 or 52.95% of net assets. |
(b) | Security is perpetual and has no stated maturity date. |
(c) | A portion of this security is purchased on a when-issued, delayed-delivery statements or forward commitment basis. (Note 2). |
(d) | Certain variable rate securities are not based on a published reference rate and spread but are determined by the issuer or agent and are based on current market conditions. These securities do not indicate a reference rate and spread in their description above. The rates shown are the current interest rates at September 30, 2020. |
The accompanying notes are an integral part of the financial statements.
88
MassMutual Premier Core Bond Fund — Portfolio of Investments (Continued) |
Notes to Portfolio of Investments (Continued)
(e) | All or a portion of this security is pledged/held as collateral for open derivatives. (Note 2). |
(f) | This security is fair valued in good faith in accordance with procedures approved by the Board of Trustees. At September 30, 2020, these securities amounted to a value of $16,992,238 or 1.27% of net assets. |
(g) | See Note 6 for aggregate cost for federal tax purposes. |
(#) Interest Rate Swaptions Purchased
| | | | | | | Paid by Fund | | | Received by Fund | | | | | | | | | | | | | | | |
| Description | | Counterparty | | Expiration
Date | | Rate | | | Frequency | | | Rate | | | Frequency | | | Notional
Amount | | Value | | | Premium
Paid
(Received) | | | Unrealized
Appreciation/
(Depreciation) | |
| Call | | | | | | | | | | | | | | | | | | | | | | | | | | | | | | |
| 10 -Year Interest Rate Swap, 12/15/42 | | Barclays Bank PLC* | | 12/13/32 | | | 3-Month USD LIBOR BBA | | | | Quarterly | | | | 2.44 | % | | | Semi-Annually | | | USD | | | 5,551,000 | | | $ | 704,422 | | | $ | 277,507 | | | $ | 426,915 | |
| | | | | | | | | | | | | | | | | | | | | | | | | | | | | | | | | | | | | | | |
| Put | | | | | | | | | | | | | | | | | | | | | | | | | | | | | | | | | | | | | | |
| 10 -Year Interest Rate Swap, 12/15/42 | | Barclays Bank PLC* | | 12/13/32 | | | 2.94 | % | | | Semi-Annually | | | | 3-Month USD LIBOR BBA | | | | Quarterly | | | USD | | | 64,580,000 | | | $ | 1,783,054 | | | $ | 3,228,549 | | | $ | (1,445,495 | ) |
| | | | | | | | | | | | | | | | | | | | | | | | | | | | | $ | 2,487,476 | | | $ | 3,506,056 | | | $ | (1,018,580 | ) |
Futures contracts
| | Expiration
Date | | | Number of
Contracts | | | Notional
Amount | | | Value/ Net
Unrealized
Appreciation/
(Depreciation) | |
Long | | | | | | | | | | | | | | | | |
U.S. Treasury Long Bond | | | 12/21/20 | | | | 91 | | | $ | 15,959,423 | | | $ | 82,171 | |
U.S. Treasury Ultra Bond | | | 12/21/20 | | | | 348 | | | | 78,292,921 | | | | (1,102,171 | ) |
U.S. Treasury Note 2 Year | | | 12/31/20 | | | | 949 | | | | 209,611,595 | | | | 80,335 | |
U.S. Treasury Note 5 Year | | | 12/31/20 | | | | 357 | | | | 44,972,754 | | | | 20,402 | |
| | | | | | | | | | | | | | $ | (919,263 | ) |
Short | | | | | | | | | | | | | | | | |
90 Day Eurodollar | | | 12/14/20 | | | | 12 | | | $ | (2,925,411 | ) | | $ | (67,239 | ) |
U.S. Treasury Ultra 10 Year | | | 12/21/20 | | | | 86 | | | | (13,720,678 | ) | | | (32,603 | ) |
90 Day Eurodollar | | | 3/15/21 | | | | 12 | | | | (2,926,460 | ) | | | (67,690 | ) |
90 Day Eurodollar | | | 9/13/21 | | | | 21 | | | | (5,122,093 | ) | | | (117,932 | ) |
90 Day Eurodollar | | | 3/14/22 | | | | 19 | | | | (4,632,849 | ) | | | (106,701 | ) |
90 Day Eurodollar | | | 9/19/22 | | | | 17 | | | | (4,143,481 | ) | | | (96,319 | ) |
90 Day Eurodollar | | | 3/13/23 | | | | 14 | | | | (3,410,179 | ) | | | (80,021 | ) |
90 Day Eurodollar | | | 12/18/23 | | | | 19 | | | | (4,623,824 | ) | | | (107,651 | ) |
90 Day Eurodollar | | | 12/16/24 | | | | 50 | | | | (12,152,959 | ) | | | (273,916 | ) |
| | | | | | | | | | | | | | $ | (950,072 | ) |
The accompanying notes are an integral part of the financial statements.
89
MassMutual Premier Core Bond Fund — Portfolio of Investments (Continued) |
Centrally Cleared Credit Default Swaps - Buy Protection
Reference
Obligation/Index | | Rate Paid
by Fund | | | Payment
Frequency | | Termination
Date | | Notional Amount | | Value | | | Upfront
Premium
Paid/
(Received) | | | Unrealized
Appreciation
(Depreciation) | |
| CDX.NA.IG.35† | | | 1.000 | % | | Quarterly | | 12/20/2025 | | USD | | | 5,400,000 | | | $ | (112,541 | ) | | $ | (132,308 | ) | | $ | 19,767 | |
| CDX.NA.IG.35† | | | 1.000 | % | | Quarterly | | 12/20/2025 | | USD | | | 6,200,000 | | | | (129,215 | ) | | | (148,157 | ) | | | 18,942 | |
| | | | | | | | | | | | | | | | | $ | (241,756 | ) | | $ | (280,465 | ) | | $ | 38,709 | |
* | Contracts are subject to a Master Netting Agreement. |
† | Payment is based on a percentage of the index. Reference entities are a number of individual issuers comprising the index. |
Currency Legend
Country weightings, as a percentage of net assets, is as follows:
United States | | | 82.6 | % |
Cayman Islands | | | 7.1 | % |
United Kingdom | | | 1.8 | % |
Bermuda | | | 1.6 | % |
Canada | | | 1.5 | % |
Mexico | | | 1.2 | % |
Netherlands | | | 0.9 | % |
Luxembourg | | | 0.5 | % |
Norway | | | 0.4 | % |
France | | | 0.3 | % |
Switzerland | | | 0.3 | % |
Colombia | | | 0.3 | % |
Ireland | | | 0.3 | % |
Saudi Arabia | | | 0.2 | % |
Germany | | | 0.2 | % |
Panama | | | 0.1 | % |
Japan | | | 0.1 | % |
Spain | | | 0.1 | % |
Barbados | | | 0.0 | % |
Total Long-Term Investments | | | 99.5 | % |
Short-Term Investments and Other Assets and Liabilities | | | 0.5 | % |
Net Assets | | | 100.0 | % |
The accompanying notes are an integral part of the financial statements.
90
MassMutual Premier Diversified Bond Fund — Portfolio of Investments |
September 30, 2020 |
| | | Number of
Shares | | | Value | |
EQUITIES — 0.1% |
COMMON STOCK — 0.0% |
Basic Materials — 0.0% |
Forest Products & Paper — 0.0% |
The Newark Group, Inc. (a) (b) | | | 26,904 | | | $ | 807 | |
Energy — 0.0% |
Oil & Gas — 0.0% |
Jupiter Resources, Inc. (b) | | | 18,661 | | | | 13,996 | |
| | | | | | | | | |
TOTAL COMMON STOCK (Cost $92,228) | | | | | | | 14,803 | |
| | | | | | | | | |
PREFERRED STOCK — 0.1% |
Financial — 0.1% |
Insurance — 0.1% |
The Allstate Corp., 3 mo. USD LIBOR + 3.165% | | | | | | | | |
5.100% VRN | | | 10,000 | | | | 259,700 | |
| | | | | | | | | |
TOTAL PREFERRED STOCK (Cost $250,000) | | | | | | | 259,700 | |
| | | | | | | | | |
TOTAL EQUITIES (Cost $342,228) | | | | | | | 274,503 | |
| | | Principal
Amount | | | | | |
BONDS & NOTES — 96.8% |
CORPORATE DEBT — 47.0% |
Aerospace & Defense — 0.5% |
BAE Systems PLC | | | | | | | | |
3.000% 9/15/50 (c) | | $ | 230,000 | | | | 232,518 | |
TransDigm, Inc. | | | | | | | | |
5.500% 11/15/27 | | | 250,000 | | | | 240,263 | |
6.250% 3/15/26 (c) | | | 500,000 | | | | 522,148 | |
6.375% 6/15/26 | | | 225,000 | | | | 225,884 | |
| | | | | | | | 1,220,813 | |
Agriculture — 1.1% |
BAT Capital Corp. | | | | | | | | |
2.259% 3/25/28 | | | 320,000 | | | | 321,587 | |
4.700% 4/02/27 | | | 200,000 | | | | 229,446 | |
4.758% 9/06/49 | | | 165,000 | | | | 179,199 | |
Bunge Ltd. Finance Corp. | | | | | | | | |
1.630% 8/17/25 | | | 90,000 | | | | 90,394 | |
3.250% 8/15/26 | | | 220,000 | | | | 237,237 | |
4.350% 3/15/24 | | | 360,000 | | | | 396,684 | |
Imperial Brands Finance PLC | | | | | | | | |
3.500% 7/26/26 (c) | | | 300,000 | | | | 324,553 | |
3.875% 7/26/29 (c) | | | 320,000 | | | | 346,619 | |
| | | Principal
Amount | | | Value | |
Imperial Tobacco Finance PLC | | | | | | | | |
4.250% 7/21/25 (c) | | $ | 300,000 | | | $ | 331,998 | |
Reynolds American, Inc. | | | | | | | | |
5.850% 8/15/45 | | | 150,000 | | | | 182,272 | |
| | | | | | | | 2,639,989 | |
Airlines — 0.0% |
American Airlines Pass-Through Trust, Series 2014-1, Class B, | | | | | | | | |
4.375% 4/01/24 | | | 12,739 | | | | 9,022 | |
United Airlines Pass-Through Trust, Series 2018-1, Class B, | | | | | | | | |
4.600% 9/01/27 | | | 82,348 | | | | 63,855 | |
| | | | | | | | 72,877 | |
Auto Manufacturers — 1.5% |
Ford Motor Co. | | | | | | | | |
7.450% 7/16/31 | | | 270,000 | | | | 311,513 | |
Ford Motor Credit Co. LLC | | | | | | | | |
3.087% 1/09/23 | | | 310,000 | | | | 303,766 | |
3.336% 3/18/21 | | | 825,000 | | | | 825,206 | |
4.140% 2/15/23 | | | 285,000 | | | | 286,773 | |
5.085% 1/07/21 | | | 200,000 | | | | 200,250 | |
General Motors Co. | | | | | | | | |
4.200% 10/01/27 | | | 215,000 | | | | 230,419 | |
5.150% 4/01/38 | | | 230,000 | | | | 244,252 | |
5.200% 4/01/45 | | | 225,000 | | | | 242,362 | |
General Motors Financial Co., Inc. | | | | | | | | |
3.500% 11/07/24 | | | 315,000 | | | | 330,922 | |
4.150% 6/19/23 | | | 255,000 | | | | 270,688 | |
4.200% 11/06/21 | | | 245,000 | | | | 252,875 | |
| | | | | | | | 3,499,026 | |
Banks — 5.1% |
Associated Banc-Corp. | | | | | | | | |
4.250% 1/15/25 | | | 413,000 | | | | 440,036 | |
Banco General SA | | | | | | | | |
4.125% 8/07/27 (c) | | | 260,000 | | | | 286,653 | |
Bank of America Corp. | | | | | | | | |
SOFR + 2.150% 2.592% VRN 4/29/31 | | | 300,000 | | | | 319,176 | |
3 mo. USD LIBOR + 1.814% 4.244% VRN 4/24/38 | | | 210,000 | | | | 255,909 | |
3 mo. USD LIBOR + 1.310% 4.271% VRN 7/23/29 | | | 200,000 | | | | 234,612 | |
6.110% 1/29/37 | | | 190,000 | | | | 268,214 | |
7.750% 5/14/38 | | | 125,000 | | | | 207,023 | |
The Bank of Nova Scotia 3 mo. USD LIBOR + 2.648% | | | | | | | | |
4.650% VRN (d) | | | 550,000 | | | | 533,159 | |
Barclays Bank PLC | | | | | | | | |
10.179% 6/12/21 (c) | | | 800,000 | | | | 841,687 | |
The accompanying notes are an integral part of the financial statements.
91
MassMutual Premier Diversified Bond Fund — Portfolio of Investments (Continued) |
| | | Principal
Amount | | | Value | |
Barclays PLC | | | | | | | | |
3 mo. USD LIBOR + 1.380% 1.660% FRN 5/16/24 | | $ | 365,000 | | | $ | 365,994 | |
4.375% 9/11/24 | | | 200,000 | | | | 214,471 | |
Citigroup, Inc. | | | | | | | | |
4.600% 3/09/26 | | | 495,000 | | | | 567,442 | |
5.250% 3/07/25 | | | 500,000 | | | | 529,000 | |
5.875% 1/30/42 | | | 100,000 | | | | 146,510 | |
6.000% 10/31/33 | | | 85,000 | | | | 114,505 | |
Credit Suisse AG | | | | | | | | |
6.500% 8/08/23 (c) | | | 575,000 | | | | 651,187 | |
Deutsche Bank AG | | | | | | | | |
3.150% 1/22/21 | | | 395,000 | | | | 397,390 | |
First Republic Bank | | | | | | | | |
4.375% 8/01/46 | | | 510,000 | | | | 617,766 | |
Fulton Financial Corp. | | | | | | | | |
3.600% 3/16/22 | | | 240,000 | | | | 245,293 | |
The Goldman Sachs Group, Inc. | | | | | | | | |
5.150% 5/22/45 | | | 290,000 | | | | 382,197 | |
5.950% 1/15/27 | | | 170,000 | | | | 209,184 | |
6.250% 2/01/41 | | | 35,000 | | | | 52,287 | |
6.750% 10/01/37 | | | 165,000 | | | | 239,733 | |
HSBC Holdings PLC | | | | | | | | |
4.250% 3/14/24 | | | 200,000 | | | | 214,473 | |
4.250% 8/18/25 | | | 127,000 | | | | 138,020 | |
6.500% 9/15/37 | | | 125,000 | | | | 169,626 | |
Huntington Bancshares, Inc. 3 mo. USD LIBOR + 2.880% | | | | | | | | |
5.700% VRN (d) | | | 510,000 | | | | 477,044 | |
JP Morgan Chase & Co. | | | | | | | | |
SOFR + 2.515% 2.956% VRN 5/13/31 | | | 235,000 | | | | 252,133 | |
4.950% 6/01/45 | | | 170,000 | | | | 230,380 | |
Morgan Stanley | | | | | | | | |
4.350% 9/08/26 | | | 450,000 | | | | 520,875 | |
5.000% 11/24/25 | | | 175,000 | | | | 205,595 | |
NBK Tier 1 Financing 2 Ltd. 6 year USD Swap + 2.832% | | | | | | | | |
4.500% VRN (c) (d) | | | 685,000 | | | | 675,499 | |
Nordea Bank Abp 5 year CMT + 4.110% | | | | | | | | |
6.625% VRN (c) (d) | | | 405,000 | | | | 456,974 | |
Valley National Bancorp | | | | | | | | |
5.125% 9/27/23 | | | 110,000 | | | | 117,865 | |
Wells Fargo & Co. | | | | | | | | |
5.606% 1/15/44 | | | 105,000 | | | | 143,311 | |
| | | | | | | | 11,721,223 | |
| | | Principal
Amount | | | Value | |
Beverages — 0.7% |
Anheuser-Busch InBev Worldwide, Inc. | | | | | | | | |
4.600% 4/15/48 | | $ | 255,000 | | | $ | 304,074 | |
8.200% 1/15/39 | | | 250,000 | | | | 406,425 | |
Bacardi Ltd. | | | | | | | | |
5.150% 5/15/38 (c) | | | 200,000 | | | | 243,900 | |
Becle SAB de CV | | | | | | | | |
3.750% 5/13/25 (c) | | | 350,000 | | | | 372,213 | |
Molson Coors Beverage Co. | | | | | | | | |
4.200% 7/15/46 | | | 191,000 | | | | 201,474 | |
5.000% 5/01/42 | | | 135,000 | | | | 152,895 | |
| | | | | | | | 1,680,981 | |
Building Materials — 0.4% |
Standard Industries, Inc. | | | | | | | | |
4.750% 1/15/28 (c) | | | 151,000 | | | | 156,662 | |
5.000% 2/15/27 (c) | | | 490,000 | | | | 509,600 | |
Standard Industries, Inc. /NJ | | | | | | | | |
4.375% 7/15/30 (c) | | | 200,000 | | | | 205,053 | |
| | | | | | | | 871,315 | |
Chemicals — 1.1% |
CF Industries, Inc. | | | | | | | | |
4.950% 6/01/43 | | | 200,000 | | | | 232,565 | |
5.375% 3/15/44 | | | 128,000 | | | | 154,033 | |
DuPont de Nemours, Inc. | | | | | | | | |
5.319% 11/15/38 | | | 345,000 | | | | 437,790 | |
Methanex Corp. | | | | | | | | |
5.250% 3/01/22 | | | 40,000 | | | | 42,370 | |
Syngenta Finance NV | | | | | | | | |
3.933% 4/23/21 (c) | | | 325,000 | | | | 329,194 | |
4.892% 4/24/25 (c) | | | 500,000 | | | | 542,102 | |
Yara International ASA | | | | | | | | |
3.148% 6/04/30 (c) | | | 85,000 | | | | 90,957 | |
4.750% 6/01/28 (c) | | | 690,000 | | | | 808,555 | |
| | | | | | | | 2,637,566 | |
Commercial Services — 0.1% |
ERAC USA Finance LLC | | | | | | | | |
7.000% 10/15/37 (c) | | | 50,000 | | | | 72,265 | |
PayPal Holdings, Inc. | | | | | | | | |
3.250% 6/01/50 | | | 165,000 | | | | 182,525 | |
| | | | | | | | 254,790 | |
Computers — 1.0% |
Dell International LLC/EMC Corp. | | | | | | | | |
6.020% 6/15/26 (c) | | | 375,000 | | | | 440,317 | |
8.350% 7/15/46 (c) | | | 275,000 | | | | 363,334 | |
Genpact Luxembourg Sarl | | | | | | | | |
3.375% 12/01/24 | | | 660,000 | | | | 691,145 | |
3.700% STEP 4/01/22 | | | 435,000 | | | | 445,328 | |
The accompanying notes are an integral part of the financial statements.
92
MassMutual Premier Diversified Bond Fund — Portfolio of Investments (Continued) |
| | | Principal
Amount | | | Value | |
Leidos, Inc. | | | | | | | | |
4.375% 5/15/30 (c) | | $ | 135,000 | | | $ | 158,213 | |
5.500% 7/01/33 | | | 226,000 | | | | 261,595 | |
| | | | | | | | 2,359,932 | |
Diversified Financial Services — 4.3% |
AerCap Ireland Capital DAC/AerCap Global Aviation Trust | | | | | | | | |
4.500% 9/15/23 | | | 315,000 | | | | 324,623 | |
6.500% 7/15/25 | | | 285,000 | | | | 307,676 | |
Air Lease Corp. | | | | | | | | |
2.875% 1/15/26 | | | 950,000 | | | | 933,572 | |
Aircastle Ltd. | | | | | | | | |
4.125% 5/01/24 | | | 200,000 | | | | 197,121 | |
4.400% 9/25/23 | | | 275,000 | | | | 272,044 | |
Alliance Data Systems Corp. | | | | | | | | |
7.000% 1/15/26 (c) | | | 200,000 | | | | 199,020 | |
Ally Financial, Inc. | | | | | | | | |
5.125% 9/30/24 | | | 317,000 | | | | 353,295 | |
8.000% 11/01/31 | | | 651,000 | | | | 891,300 | |
Antares Holdings LP | | | | | | | | |
6.000% 8/15/23 (c) | | | 790,000 | | | | 798,893 | |
8.500% 5/18/25 (c) | | | 330,000 | | | | 348,023 | |
Ares Finance Co. LLC | | | | | | | | |
4.000% 10/08/24 (c) | | | 375,000 | | | | 400,868 | |
Avolon Holdings Funding Ltd. | | | | | | | | |
4.375% 5/01/26 (c) | | | 205,000 | | | | 194,826 | |
5.125% 10/01/23 (c) | | | 325,000 | | | | 324,214 | |
BGC Partners, Inc. | | | | | | | | |
4.375% 12/15/25 (c) | | | 435,000 | | | | 443,793 | |
Brookfield Finance, Inc. | | | | | | | | |
4.250% 6/02/26 | | | 280,000 | | | | 320,928 | |
4.350% 4/15/30 | | | 405,000 | | | | 472,813 | |
4.850% 3/29/29 | | | 408,000 | | | | 486,794 | |
GE Capital International Funding Co. Unlimited Co. | | | | | | | | |
4.418% 11/15/35 | | | 230,000 | | | | 242,779 | |
Global Aircraft Leasing Co. Ltd. | | | | | | | | |
6.500% 9/15/24 (c) | | | 616,568 | | | | 343,737 | |
Lazard Group LLC | | | | | | | | |
3.625% 3/01/27 | | | 196,000 | | | | 211,697 | |
3.750% 2/13/25 | | | 125,000 | | | | 135,496 | |
4.500% 9/19/28 | | | 275,000 | | | | 318,121 | |
LeasePlan Corp. NV | | | | | | | | |
2.875% 10/24/24 (c) | | | 330,000 | | | | 340,566 | |
Legg Mason, Inc. | | | | | | | | |
5.625% 1/15/44 | | | 235,000 | | | | 325,382 | |
Park Aerospace Holdings Ltd. | | | | | | | | |
4.500% 3/15/23 (c) | | | 250,000 | | | | 247,737 | |
| | | Principal
Amount | | | Value | |
5.250% 8/15/22 (c) | | $ | 415,000 | | | $ | 416,679 | |
| | | | | | | | 9,851,997 | |
Electric — 1.1% |
Berkshire Hathaway Energy Co. | | | | | | | | |
5.950% 5/15/37 | | | 120,000 | | | | 170,611 | |
The Cleveland Electric Illuminating Co. | | | | | | | | |
5.950% 12/15/36 | | | 175,000 | | | | 227,894 | |
CMS Energy Corp. | | | | | | | | |
4.700% 3/31/43 | | | 115,000 | | | | 143,659 | |
4.875% 3/01/44 | | | 180,000 | | | | 235,666 | |
Elwood Energy LLC | | | | | | | | |
8.159% 7/05/26 | | | 171,251 | | | | 179,814 | |
Enel Finance International NV | | | | | | | | |
6.000% 10/07/39 (c) | | | 175,000 | | | | 237,904 | |
Entergy Louisiana LLC | | | | | | | | |
4.950% 1/15/45 | | | 110,000 | | | | 121,055 | |
Indianapolis Power & Light Co. | | | | | | | | |
4.050% 5/01/46 (c) | | | 110,000 | | | | 135,454 | |
Infraestructura Energetica Nova SAB de CV | | | | | | | | |
3.750% 1/14/28 (c) | | | 200,000 | | | | 198,000 | |
ITC Holdings Corp. | | | | | | | | |
2.950% 5/14/30 (c) | | | 210,000 | | | | 225,821 | |
Virginia Electric & Power Co. | | | | | | | | |
6.000% 1/15/36 | | | 100,000 | | | | 141,022 | |
Xcel Energy, Inc. | | | | | | | | |
6.500% 7/01/36 | | | 270,000 | | | | 395,847 | |
| | | | | | | | 2,412,747 | |
Electronics — 0.2% |
Ingram Micro, Inc. | | | | | | | | |
5.450% STEP 12/15/24 | | | 335,000 | | | | 358,319 | |
Entertainment — 0.2% |
Live Nation Entertainment, Inc. | | | | | | | | |
5.625% 3/15/26 (c) | | | 77,000 | | | | 74,305 | |
Wynn Resorts Finance LLC / Wynn Resorts Capital Corp. | | | | | | | | |
5.125% 10/01/29 (c) | | | 382,000 | | | | 363,855 | |
| | | | | | | | 438,160 | |
Foods — 0.8% |
Albertsons Cos., Inc. / Safeway, Inc. / New Albertsons LP / Albertson’s LLC | | | | | | | | |
4.625% 1/15/27 (c) | | | 521,000 | | | | 533,082 | |
JBS USA LUX SA/JBS USA Food Co./JBS USA Finance, Inc. | | | | | | | | |
5.500% 1/15/30 (c) | | | 700,000 | | | | 761,929 | |
Mars, Inc. | | | | | | | | |
3.950% 4/01/49 (c) | | | 330,000 | | | | 399,492 | |
The accompanying notes are an integral part of the financial statements.
93
MassMutual Premier Diversified Bond Fund — Portfolio of Investments (Continued) |
| | | Principal
Amount | | | Value | |
Smithfield Foods, Inc. | | | | | | | | |
3.000% 10/15/30 (c) | | $ | 206,000 | | | $ | 206,445 | |
| | | | | | | | 1,900,948 | |
Forest Products & Paper — 0.1% |
Fibria Overseas Finance Ltd. | | | | | | | | |
4.000% 1/14/25 | | | 225,000 | | | | 238,500 | |
Gas — 0.3% |
NiSource, Inc. | | | | | | | | |
4.800% 2/15/44 | | | 545,000 | | | | 681,122 | |
Health Care – Products — 0.1% |
Dentsply Sirona, Inc. | | | | | | | | |
3.250% 6/01/30 | | | 140,000 | | | | 152,205 | |
Health Care – Services — 1.0% |
Centene Corp. | | | | | | | | |
4.625% 12/15/29 | | | 153,000 | | | | 165,035 | |
5.250% 4/01/25 (c) | | | 140,000 | | | | 145,495 | |
HCA, Inc. | | | | | | | | |
3.500% 9/01/30 | | | 1,064,000 | | | | 1,084,088 | |
5.375% 2/01/25 | | | 350,000 | | | | 383,250 | |
Humana, Inc. | | | | | | | | |
4.800% 3/15/47 | | | 130,000 | | | | 170,185 | |
IHC Health Services, Inc. | | | | | | | | |
4.131% 5/15/48 | | | 275,000 | | | | 353,394 | |
| | | | | | | | 2,301,447 | |
Home Builders — 0.9% |
Lennar Corp. | | | | | | | | |
4.750% 11/29/27 | | | 592,000 | | | | 675,916 | |
Mattamy Group Corp. | | | | | | | | |
5.250% 12/15/27 (c) | | | 227,000 | | | | 233,242 | |
PulteGroup, Inc. | | | | | | | | |
5.000% 1/15/27 | | | 198,000 | | | | 223,988 | |
5.500% 3/01/26 | | | 441,000 | | | | 502,740 | |
Taylor Morrison Communities, Inc. | | | | | | | | |
5.750% 1/15/28 (c) | | | 500,000 | | | | 543,750 | |
| | | | | | | | 2,179,636 | |
Housewares — 0.1% |
The Toro Co. | | | | | | | | |
7.800% 6/15/27 | | | 170,000 | | | | 216,857 | |
Insurance — 6.5% |
Allstate Corp. 3 mo. USD LIBOR + 2.938% | | | | | | | | |
5.750% VRN 8/15/53 | | | 844,000 | | | | 878,835 | |
American International Group, Inc. | | | | | | | | |
3.400% 6/30/30 | | | 220,000 | | | | 243,620 | |
4.750% 4/01/48 | | | 95,000 | | | | 116,390 | |
3 mo. USD LIBOR + 2.868% 5.750% VRN 4/01/48 | | | 755,000 | | | | 824,680 | |
| | | Principal
Amount | | | Value | |
AmTrust Financial Services, Inc. | | | | | | | | |
6.125% 8/15/23 | | $ | 765,000 | | | $ | 709,307 | |
Arch Capital Group Ltd. | | | | | | | | |
3.635% 6/30/50 | | | 375,000 | | | | 403,160 | |
Arch Capital Group US, Inc. | | | | | | | | |
5.144% 11/01/43 | | | 80,000 | | | | 101,783 | |
Athene Global Funding | | | | | | | | |
2.500% 1/14/25 (c) | | | 615,000 | | | | 633,920 | |
Athene Holding Ltd. | | | | | | | | |
4.125% 1/12/28 | | | 679,000 | | | | 737,332 | |
6.150% 4/03/30 | | | 595,000 | | | | 706,577 | |
AXIS Specialty Finance LLC | | | | | | | | |
3.900% 7/15/29 | | | 375,000 | | | | 409,859 | |
5 year CMT + 3.186% 4.900% VRN 1/15/40 | | | 490,000 | | | | 489,535 | |
AXIS Specialty Finance PLC | | | | | | | | |
4.000% 12/06/27 | | | 420,000 | | | | 459,737 | |
Brighthouse Financial, Inc. | | | | | | | | |
4.700% 6/22/47 | | | 500,000 | | | | 481,199 | |
5.625% 5/15/30 | | | 260,000 | | | | 302,787 | |
Brown & Brown, Inc. | | | | | | | | |
2.375% 3/15/31 | | | 135,000 | | | | 135,830 | |
CNO Financial Group, Inc. | | | | | | | | |
5.250% 5/30/25 | | | 535,000 | | | | 613,626 | |
5.250% 5/30/29 | | | 200,000 | | | | 230,930 | |
Enstar Finance LLC 5 year CMT + 5.468% | | | | | | | | |
5.750% VRN 9/01/40 | | | 825,000 | | | | 840,535 | |
Enstar Group Ltd. | | | | | | | | |
4.500% 3/10/22 | | | 495,000 | | | | 515,716 | |
4.950% 6/01/29 | | | 575,000 | | | | 644,320 | |
Equitable Holdings, Inc. | | | | | | | | |
5 year CMT + 4.736% 4.950% VRN (d) | | | 280,000 | | | | 285,600 | |
5.000% 4/20/48 | | | 225,000 | | | | 265,957 | |
Markel Corp. | | | | | | | | |
3.350% 9/17/29 | | | 125,000 | | | | 138,014 | |
5 year CMT + 5.662% 6.000% VRN (d) | | | 699,000 | | | | 739,192 | |
MetLife Capital Trust IV | | | | | | | | |
7.875% 12/15/67 (c) | | | 225,000 | | | | 310,524 | |
The Progressive Corp. 3 mo. USD LIBOR + 2.539% | | | | | | | | |
5.375% VRN (d) | | | 573,000 | | | | 573,000 | |
Prudential Financial, Inc. | | | | | | | | |
5 year CMT + 3.035% 3.700% VRN 10/01/50 | | | 220,000 | | | | 224,466 | |
3 mo. USD LIBOR + 3.920% 5.625% VRN 6/15/43 | | | 200,000 | | | | 212,435 | |
The accompanying notes are an integral part of the financial statements.
94
MassMutual Premier Diversified Bond Fund — Portfolio of Investments (Continued) |
| | | Principal
Amount | | | Value | |
3 mo. USD LIBOR + 2.665% 5.700% VRN 9/15/48 | | $ | 350,000 | | | $ | 395,693 | |
6.200% 11/15/40 | | | 125,000 | | | | 175,564 | |
Teachers Insurance & Annuity Association of America | | | | | | | | |
4.270% 5/15/47 (c) | | | 175,000 | | | | 204,893 | |
Unum Group | | | | | | | | |
4.000% 6/15/29 | | | 155,000 | | | | 169,796 | |
4.500% 3/15/25 | | | 330,000 | | | | 366,558 | |
USF&G Capital I | | | | | | | | |
8.500% 12/15/45 (c) | | | 95,000 | | | | 149,295 | |
XLIT Ltd. | | | | | | | | |
5.500% 3/31/45 | | | 200,000 | | | | 263,508 | |
| | | | | | | | 14,954,173 | |
Internet — 0.4% |
Alphabet, Inc. | | | | | | | | |
2.250% 8/15/60 | | | 185,000 | | | | 174,932 | |
Amazon.com, Inc. | | | | | | | | |
4.050% 8/22/47 | | | 260,000 | | | | 337,794 | |
Netflix, Inc. | | | | | | | | |
4.875% 6/15/30 (c) | | | 166,000 | | | | 189,240 | |
Prosus NV | | | | | | | | |
3.680% 1/21/30 (c) | | | 220,000 | | | | 237,347 | |
| | | | | | | | 939,313 | |
Investment Companies — 1.6% |
Ares Capital Corp. | | | | | | | | |
3.500% 2/10/23 | | | 610,000 | | | | 626,575 | |
4.200% 6/10/24 | | | 525,000 | | | | 546,892 | |
BlackRock TCP Capital Corp. | | | | | | | | |
3.900% 8/23/24 | | | 170,000 | | | | 172,723 | |
4.125% 8/11/22 | | | 845,000 | | | | 857,026 | |
Icahn Enterprises LP/ Icahn Enterprises Finance Corp. | | | | | | | | |
4.750% 9/15/24 | | | 500,000 | | | | 506,250 | |
6.750% 2/01/24 | | | 200,000 | | | | 205,155 | |
Sixth Street Specialty Lending, Inc. | | | | | | | | |
3.875% 11/01/24 | | | 770,000 | | | | 780,049 | |
| | | | | | | | 3,694,670 | |
Iron & Steel — 0.2% |
Vale Overseas Ltd. | | | | | | | | |
6.250% 8/10/26 | | | 275,000 | | | | 325,187 | |
6.875% 11/21/36 | | | 150,000 | | | | 195,254 | |
| | | | | | | | 520,441 | |
Machinery – Diversified — 0.1% |
CNH Industrial Capital LLC | | | | | | | | |
1.950% 7/02/23 | | | 130,000 | | | | 132,437 | |
| | | Principal
Amount | | | Value | |
Media — 2.5% |
CCO Holdings LLC/CCO Holdings Capital Corp. | | | | | | | | |
5.000% 2/01/28 (c) | | $ | 250,000 | | | $ | 262,500 | |
Comcast Corp. | | | | | | | | |
3.450% 2/01/50 | | | 145,000 | | | | 163,801 | |
4.600% 8/15/45 | | | 400,000 | | | | 515,999 | |
CSC Holdings LLC | | | | | | | | |
4.625% 12/01/30 (c) | | | 250,000 | | | | 251,875 | |
5.750% 1/15/30 (c) | | | 200,000 | | | | 212,500 | |
Discovery Communications LLC | | | | | | | | |
3.950% 3/20/28 | | | 130,000 | | | | 147,888 | |
4.000% 9/15/55 (c) | | | 435,000 | | | | 441,658 | |
4.125% 5/15/29 | | | 150,000 | | | | 172,559 | |
4.650% 5/15/50 | | | 55,000 | | | | 63,047 | |
DISH DBS Corp. | | | | | | | | |
7.375% 7/01/28 | | | 500,000 | | | | 515,000 | |
Grupo Televisa SAB | | | | | | | | |
6.625% 3/18/25 | | | 275,000 | | | | 331,203 | |
Time Warner Cable, Inc. | | | | | | | | |
4.500% 9/15/42 | | | 250,000 | | | | 271,566 | |
6.750% 6/15/39 | | | 275,000 | | | | 371,886 | |
ViacomCBS, Inc. | | | | | | | | |
4.200% 5/19/32 | | | 300,000 | | | | 343,307 | |
VTR Finance NV | | | | | | | | |
6.375% 7/15/28 (c) | | | 900,000 | | | | 948,375 | |
The Walt Disney Co. | | | | | | | | |
3.600% 1/13/51 | | | 345,000 | | | | 388,783 | |
6.650% 11/15/37 | | | 200,000 | | | | 302,056 | |
| | | | | | | | 5,704,003 | |
Mining — 1.4% |
First Quantum Minerals Ltd. | | | | | | | | |
6.875% 3/01/26 (c) | | | 1,000,000 | | | | 963,750 | |
Glencore Finance Canada Ltd. | | | | | | | | |
5.550% STEP 10/25/42 (c) | | | 149,000 | | | | 174,664 | |
Glencore Funding LLC | | | | | | | | |
3.875% 10/27/27 (c) | | | 260,000 | | | | 283,499 | |
4.000% 4/16/25 (c) | | | 180,000 | | | | 197,566 | |
4.625% 4/29/24 (c) | | | 200,000 | | | | 220,330 | |
Kinross Gold Corp. | | | | | | | | |
4.500% 7/15/27 | | | 225,000 | | | | 255,193 | |
5.950% 3/15/24 | | | 200,000 | | | | 228,098 | |
Perenti Finance Pty Ltd. | | | | | | | | |
6.500% 10/07/25 (c) (e) | | | 325,000 | | | | 326,826 | |
Teck Resources Ltd. | | | | | | | | |
3.900% 7/15/30 (c) | | | 220,000 | | | | 230,192 | |
5.200% 3/01/42 | | | 97,000 | | | | 100,973 | |
The accompanying notes are an integral part of the financial statements.
95
MassMutual Premier Diversified Bond Fund — Portfolio of Investments (Continued) |
| | | Principal
Amount | | | Value | |
6.250% 7/15/41 | | $ | 143,000 | | | $ | 165,311 | |
| | | | | | | | 3,146,402 | |
Miscellaneous - Manufacturing — 0.2% |
Carlisle Cos., Inc. | | | | | | | | |
2.750% 3/01/30 | | | 314,000 | | | | 333,770 | |
General Electric Co. | | | | | | | | |
4.125% 10/09/42 | | | 12,000 | | | | 12,141 | |
6.875% 1/10/39 | | | 72,000 | | | | 92,491 | |
| | | | | | | | 438,402 | |
Office Equipment/Supplies — 0.1% |
CDW LLC / CDW Finance Corp. | | | | | | | | |
4.250% 4/01/28 | | | 206,000 | | | | 213,210 | |
Oil & Gas — 2.8% |
BP Capital Markets PLC 5 year CMT + 4.036% | | | | | | | | |
4.375% VRN (d) | | | 905,000 | | | | 943,462 | |
Cenovus Energy, Inc. | | | | | | | | |
4.250% 4/15/27 | | | 350,000 | | | | 316,428 | |
6.750% 11/15/39 | | | 175,000 | | | | 175,936 | |
Continental Resources, Inc. | | | | | | | | |
5.000% 9/15/22 | | | 137,000 | | | | 135,983 | |
Devon Energy Corp. | | | | | | | | |
5.000% 6/15/45 | | | 289,000 | | | | 274,312 | |
EQT Corp. | | | | | | | | |
3.900% 10/01/27 | | | 860,000 | | | | 791,737 | |
7.875% STEP 2/01/25 | | | 380,000 | | | | 421,211 | |
Jupiter Resources, Inc | | | | | | | | |
10.000% 1/31/24 (a) (f) | | | 22,586 | | | | 21,941 | |
Laredo Petroleum, Inc. | | | | | | | | |
9.500% 1/15/25 | | | 138,000 | | | | 82,237 | |
10.125% 1/15/28 | | | 170,000 | | | | 100,300 | |
Marathon Petroleum Corp. | | | | | | | | |
4.500% 4/01/48 | | | 85,000 | | | | 86,144 | |
6.500% 3/01/41 | | | 175,000 | | | | 213,345 | |
Newfield Exploration Co. | | | | | | | | |
5.750% 1/30/22 | | | 93,000 | | | | 92,960 | |
Occidental Petroleum Corp. | | | | | | | | |
2.900% 8/15/24 | | | 187,000 | | | | 158,656 | |
5.875% 9/01/25 | | | 300,000 | | | | 274,938 | |
6.375% 9/01/28 | | | 300,000 | | | | 277,710 | |
6.600% 3/15/46 | | | 235,000 | | | | 202,394 | |
6.950% 7/01/24 | | | 177,000 | | | | 171,301 | |
Ovintiv, Inc. | | | | | | | | |
6.500% 2/01/38 | | | 160,000 | | | | 145,301 | |
Patterson-UTI Energy, Inc. | | | | | | | | |
3.950% 2/01/28 | | | 350,000 | | | | 270,513 | |
5.150% 11/15/29 | | | 615,000 | | | | 477,323 | |
| | | Principal
Amount | | | Value | |
Petroleos Mexicanos | | | | | | | | |
5.350% 2/12/28 | | $ | 190,000 | | | $ | 164,350 | |
6.375% 1/23/45 | | | 35,000 | | | | 26,828 | |
6.500% 3/13/27 | | | 65,000 | | | | 60,907 | |
6.625% 6/15/38 | | | 51,000 | | | | 40,214 | |
Saudi Arabian Oil Co. | | | | | | | | |
4.250% 4/16/39 (c) | | | 385,000 | | | | 442,552 | |
| | | | | | | | 6,368,983 | |
Oil & Gas Services — 0.2% |
National Oilwell Varco, Inc. | | | | | | | | |
3.600% 12/01/29 | | | 275,000 | | | | 267,100 | |
3.950% 12/01/42 | | | 314,000 | | | | 282,357 | |
| | | | | | | | 549,457 | |
Packaging & Containers — 0.1% |
Mauser Packaging Solutions Holding Co. | | | | | | | | |
5.500% 4/15/24 (c) | | | 49,000 | | | | 49,174 | |
WRKCo, Inc. | | | | | | | | |
3.000% 6/15/33 | | | 155,000 | | | | 168,608 | |
| | | | | | | | 217,782 | |
Pharmaceuticals — 1.7% |
AbbVie, Inc. | | | | | | | | |
4.700% 5/14/45 | | | 350,000 | | | | 430,955 | |
Bausch Health Americas, Inc. | | | | | | | | |
9.250% 4/01/26 (c) | | | 400,000 | | | | 440,000 | |
Bausch Health Cos., Inc. | | | | | | | | |
5.250% 1/30/30 (c) | | | 250,000 | | | | 246,250 | |
6.125% 4/15/25 (c) | | | 113,000 | | | | 115,684 | |
7.000% 3/15/24 (c) | | | 115,000 | | | | 119,025 | |
Bristol-Myers Squibb Co. | | | | | | | | |
4.350% 11/15/47 | | | 205,000 | | | | 270,746 | |
Cigna Corp. | | | | | | | | |
4.800% 7/15/46 (c) | | | 185,000 | | | | 231,817 | |
CVS Health Corp. | | | | | | | | |
5.050% 3/25/48 | | | 115,000 | | | | 146,787 | |
6.125% 9/15/39 | | | 25,000 | | | | 34,737 | |
CVS Pass-Through Trust | | | | | | | | |
5.926% 1/10/34 (c) | | | 187,315 | | | | 216,779 | |
7.507% 1/10/32 (c) | | | 13,846 | | | | 17,290 | |
McKesson Corp. | | | | | | | | |
4.883% 3/15/44 | | | 70,000 | | | | 85,741 | |
Mylan NV | | | | | | | | |
5.250% 6/15/46 | | | 350,000 | | | | 434,387 | |
Par Pharmaceutical, Inc. | | | | | | | | |
7.500% 4/01/27 (c) | | | 488,000 | | | | 511,268 | |
Takeda Pharmaceutical Co. Ltd. | | | | | | | | |
3.375% 7/09/60 | | | 235,000 | | | | 247,558 | |
The accompanying notes are an integral part of the financial statements.
96
MassMutual Premier Diversified Bond Fund — Portfolio of Investments (Continued) |
| | | Principal
Amount | | | Value | |
Upjohn, Inc. | | | | | | | | |
2.700% 6/22/30 (c) | | $ | 280,000 | | | $ | 289,901 | |
| | | | | | | | 3,838,925 | |
Pipelines — 2.0% |
Energy Transfer Operating LP | | | | | | | | |
4.200% 4/15/27 | | | 320,000 | | | | 331,088 | |
4.750% 1/15/26 | | | 200,000 | | | | 212,990 | |
6.125% 12/15/45 | | | 280,000 | | | | 281,061 | |
3 mo. USD LIBOR + 4.028% 6.250% VRN (d) | | | 740,000 | | | | 482,850 | |
5 year CMT + 5.134% 6.750% VRN (d) | | | 270,000 | | | | 207,900 | |
EnLink Midstream Partners LP | | | | | | | | |
4.150% 6/01/25 | | | 339,000 | | | | 291,889 | |
4.850% 7/15/26 | | | 154,000 | | | | 133,227 | |
3 mo. USD LIBOR + 4.110% 6.000% VRN (d) | | | 375,000 | | | | 150,000 | |
Enterprise Products Operating LLC 3 mo. USD LIBOR + 2.570% | | | | | | | | |
5.375% VRN 2/15/78 | | | 200,000 | | | | 178,000 | |
EQM Midstream Partners LP | | | | | | | | |
4.750% 7/15/23 | | | 375,000 | | | | 374,269 | |
MPLX LP | | | | | | | | |
4.500% 4/15/38 | | | 195,000 | | | | 199,631 | |
3 mo. USD LIBOR + 4.652% 6.875% VRN (d) | | | 850,000 | | | | 696,052 | |
Plains All American Pipeline LP/PAA Finance Corp. | | | | | | | | |
3.800% 9/15/30 | | | 265,000 | | | | 256,966 | |
4.500% 12/15/26 | | | 232,000 | | | | 246,673 | |
4.700% 6/15/44 | | | 260,000 | | | | 230,528 | |
6.650% 1/15/37 | | | 175,000 | | | | 191,491 | |
Sunoco Logistics Partners Operations LP | | | | | | | | |
5.300% 4/01/44 | | | 175,000 | | | | 163,046 | |
| | | | | | | | 4,627,661 | |
Private Equity — 0.7% |
Apollo Management Holdings LP 5 year CMT + 3.266% | | | | | | | | |
4.950% VRN 1/14/50 (c) | | | 175,000 | | | | 174,934 | |
Hercules Capital, Inc. | | | | | | | | |
4.625% 10/23/22 | | | 945,000 | | | | 956,618 | |
KKR Group Finance Co. VI LLC | | | | | | | | |
3.750% 7/01/29 (c) | | | 280,000 | | | | 322,125 | |
KKR Group Finance Co. VIII LLC | | | | | | | | |
3.500% 8/25/50 (c) | | | 160,000 | | | | 163,046 | |
| | | | | | | | 1,616,723 | |
| | | Principal
Amount | | | Value | |
Real Estate Investment Trusts (REITS) — 2.3% |
Agree LP | | | | | | | | |
2.900% 10/01/30 | | $ | 110,000 | | | $ | 114,094 | |
Crown Castle International Corp. | | | | | | | | |
4.750% 5/15/47 | | | 70,000 | | | | 86,520 | |
5.200% 2/15/49 | | | 58,000 | | | | 76,326 | |
ESH Hospitality, Inc. | | | | | | | | |
4.625% 10/01/27 (c) | | | 363,000 | | | | 356,201 | |
Healthcare Trust of America Holdings LP | | | | | | | | |
3.500% 8/01/26 | | | 175,000 | | | | 194,802 | |
3.750% 7/01/27 | | | 240,000 | | | | 266,977 | |
Host Hotels & Resorts LP | | | | | | | | |
3.500% 9/15/30 | | | 476,000 | | | | 455,632 | |
Iron Mountain, Inc. | | | | | | | | |
5.250% 7/15/30 (c) | | | 250,000 | | | | 260,625 | |
Service Properties Trust | | | | | | | | |
4.950% 10/01/29 | | | 590,000 | | | | 505,925 | |
Spirit Realty LP | | | | | | | | |
3.200% 1/15/27 | | | 220,000 | | | | 222,822 | |
3.400% 1/15/30 | | | 325,000 | | | | 323,130 | |
4.000% 7/15/29 | | | 385,000 | | | | 400,474 | |
4.450% 9/15/26 | | | 59,000 | | | | 63,309 | |
Store Capital Corp. | | | | | | | | |
4.625% 3/15/29 | | | 250,000 | | | | 268,075 | |
Tanger Properties LP | | | | | | | | |
3.750% 12/01/24 | | | 430,000 | | | | 426,745 | |
VEREIT Operating Partnership LP | | | | | | | | |
3.100% 12/15/29 | | | 610,000 | | | | 611,067 | |
3.400% 1/15/28 | | | 105,000 | | | | 109,630 | |
4.625% 11/01/25 | | | 495,000 | | | | 546,928 | |
| | | | | | | | 5,289,282 | |
Retail — 0.6% |
Advance Auto Parts, Inc. | | | | | | | | |
1.750% 10/01/27 | | | 70,000 | | | | 69,792 | |
AutoZone, Inc. | | | | | | | | |
1.650% 1/15/31 | | | 225,000 | | | | 220,276 | |
El Puerto de Liverpool SAB de CV | | | | | | | | |
3.950% 10/02/24 (c) | | | 280,000 | | | | 291,553 | |
O’Reilly Automotive, Inc. | | | | | | | | |
4.200% 4/01/30 | | | 210,000 | | | | 251,838 | |
Penske Automotive Group, Inc. | | | | | | | | |
5.500% 5/15/26 | | | 500,000 | | | | 515,790 | |
| | | | | | | | 1,349,249 | |
Semiconductors — 0.1% |
KLA Corp. | | | | | | | | |
3.300% 3/01/50 | | | 190,000 | | | | 200,739 | |
The accompanying notes are an integral part of the financial statements.
97
MassMutual Premier Diversified Bond Fund — Portfolio of Investments (Continued) |
| | | Principal
Amount | | | Value | |
Software — 0.4% |
CDK Global, Inc. | | | | | | | | |
5.250% 5/15/29 (c) | | $ | 256,000 | | | $ | 272,640 | |
Genesys Telecommunications Laboratories, Inc./Greeneden Lux 3 Sarl/Greeneden US Ho | | | | | | | | |
10.000% 11/30/24 (c) | | | 50,000 | | | | 52,950 | |
Oracle Corp. | | | | | | | | |
3.600% 4/01/50 | | | 210,000 | | | | 236,705 | |
Solera LLC/ Solera Finance, Inc. | | | | | | | | |
10.500% 3/01/24 (c) | | | 237,000 | | | | 247,665 | |
| | | | | | | | 809,960 | |
Telecommunications — 2.0% |
AT&T, Inc. | | | | | | | | |
3.500% 9/15/53 (c) | | | 617,000 | | | | 596,530 | |
3.550% 9/15/55 (c) | | | 814,000 | | | | 788,907 | |
CommScope, Inc. | | | | | | | | |
8.250% 3/01/27 (c) | | | 850,000 | | | | 884,000 | |
Empresa Nacional de Telecomunicaciones SA | | | | | | | | |
4.875% 10/30/24 (c) | | | 200,000 | | | | 213,780 | |
Hughes Satellite Systems Corp. | | | | | | | | |
6.625% 8/01/26 | | | 444,000 | | | | 480,497 | |
Qwest Corp | | | | | | | | |
6.750% 12/01/21 | | | 156,000 | | | | 164,744 | |
Sprint Capital Corp. | | | | | | | | |
6.875% 11/15/28 | | | 500,000 | | | | 625,000 | |
T-Mobile USA, Inc. | | | | | | | | |
5.375% 4/15/27 | | | 165,000 | | | | 176,121 | |
Telefonica Emisiones SAU | | | | | | | | |
4.665% 3/06/38 | | | 335,000 | | | | 386,099 | |
Verizon Communications, Inc. | | | | | | | | |
6.550% 9/15/43 | | | 157,000 | | | | 255,562 | |
| | | | | | | | 4,571,240 | |
Transportation — 0.5% |
CSX Corp. | | | | | | | | |
4.750% 11/15/48 | | | 145,000 | | | | 192,500 | |
Kansas City Southern | | | | | | | | |
2.875% 11/15/29 | | | 146,000 | | | | 154,764 | |
Kenan Advantage Group, Inc. | | | | | | | | |
7.875% 7/31/23 (c) | | | 720,000 | | | | 698,400 | |
| | | | | | | | 1,045,664 | |
| | | | | | | | | |
TOTAL CORPORATE DEBT (Cost $103,189,257) | | | | | | | 107,919,166 | |
| | | Principal
Amount | | | Value | |
NON-U.S. GOVERNMENT AGENCY OBLIGATIONS — 29.7% |
Automobile Asset-Backed Securities — 1.9% |
Avis Budget Rental Car Funding AESOP LLC, Series 2019-1A, Class C | | | | | | | | |
4.530% 3/20/23 (c) | | $ | 222,000 | | | $ | 224,804 | |
Hertz Vehicle Financing II LP | | | | | | | | |
Series 2018-1A, Class B, 3.600% 2/25/24 (c) | | | 650,000 | | | | 644,433 | |
Series 2019-2A, Class C, 4.260% 5/25/25 (c) | | | 730,000 | | | | 706,014 | |
Series 2017-2A, Class C, 5.310% 10/25/23 (c) | | | 100,000 | | | | 96,894 | |
OneMain Direct Auto Receivables Trust | | | | | | | | |
Series 2019-1A, Class C, 4.190% 11/14/28 (c) | | | 888,000 | | | | 933,318 | |
Series 2019-1A, Class D, 4.680% 4/14/31 (c) | | | 422,000 | | | | 438,262 | |
Santander Revolving Auto Loan Trust | | | | | | | | |
Series 2019-A, Class B, 2.800% 1/26/32 (c) | | | 195,000 | | | | 205,174 | |
Series 2019-A, Class C, 3.000% 1/26/32 (c) | | | 121,000 | | | | 122,509 | |
Series 2019-A, Class D, 3.450% 1/26/32 (c) | | | 957,000 | | | | 953,546 | |
| | | | | | | | 4,324,954 | |
Commercial Mortgage-Backed Securities — 6.4% |
Aventura Mall Trust, Series 2018-AVM, Class D, | | | | | | | | |
4.249% VRN 7/05/40 (c) (g) | | | 530,000 | | | | 420,393 | |
BAMLL Commercial Mortgage Securities Trust | | | | | | | | |
Series 2018-DSNY, Class C, 1 mo. USD LIBOR + 1.350% 1.502% FRN 9/15/34 (c) | | | 150,000 | | | | 140,253 | |
Series 2019-BPR, Class CMP, 4.024% VRN 11/05/32 (c) (g) | | | 440,000 | | | | 396,531 | |
Series 2019-BPR, Class DMP, 4.024% VRN 11/05/32 (c) (g) | | | 540,000 | | | | 436,657 | |
BANK, Series 2019-BN17, Class C, | | | | | | | | |
4.670% VRN 4/15/52 (g) | | | 331,000 | | | | 355,163 | |
BBCMS Mortgage Trust | | | | | | | | |
Series 2018-CHRS, Class B, 4.409% VRN 8/05/38 (c) (g) | | | 400,000 | | | | 355,663 | |
Series 2018-CHRS, Class C, 4.409% VRN 8/05/38 (c) (g) | | | 280,000 | | | | 229,827 | |
Series 2018-CHRS, Class D, 4.409% VRN 8/05/38 (c) (g) | | | 270,000 | | | | 203,117 | |
The accompanying notes are an integral part of the financial statements.
98
MassMutual Premier Diversified Bond Fund — Portfolio of Investments (Continued) |
| | | Principal
Amount | | | Value | |
BHMS Mortgage Trust, Series 2018-ATLS, Class B, 1 mo. USD LIBOR + 1.500% | | | | | | | | |
1.652% FRN 7/15/35 (c) | | $ | 900,000 | | | $ | 834,773 | |
BX Commercial Mortgage Trust | | | | | | | | |
Series 2018-IND, Class E, 1 mo. USD LIBOR + 1.700% 1.852% FRN 11/15/35 (c) | | | 504,000 | | | | 499,940 | |
Series 2019-XL, Class E, 1 mo. USD LIBOR + 1.800% 1.952% FRN 10/15/36 (c) | | | 356,936 | | | | 353,614 | |
Series 2019-XL, Class F, 1 mo. USD LIBOR + 2.000% 2.152% FRN 10/15/36 (c) | | | 654,066 | | | | 646,344 | |
CAMB Commercial Mortgage Trust, Series 2019-LIFE, Class E, 1 mo. USD LIBOR + 2.150% | | | | | | | | |
2.302% FRN 12/15/37 (c) | | | 572,453 | | | | 565,334 | |
Century Plaza Towers | | | | | | | | |
Series 2019-CPT, Class D, 3.097% VRN 11/13/39 (c) (g) | | | 225,000 | | | | 224,355 | |
Series 2019-CPT, Class E, 3.097% VRN 11/13/39 (c) (g) | | | 316,000 | | | | 298,296 | |
Citigroup Commercial Mortgage Trust | | | | | | | | |
Series 2019-GC41, Class C, 3.502% 8/10/56 | | | 222,000 | | | | 219,554 | |
Series 2019-SMRT, Class C, 4.682% 1/10/36 (c) | | | 315,000 | | | | 331,259 | |
Commercial Mortgage Pass-Through Certificates | | | | | | | | |
Series 2014-UBS2, Class AM, 4.199% 3/10/47 | | | 100,000 | | | | 107,433 | |
Series 2015-CR23, Class C, 4.435% VRN 5/10/48 (g) | | | 110,000 | | | | 110,742 | |
Credit Suisse Mortgage Capital Certificates, Series 2019-ICE4, Class D, 1 mo. USD LIBOR + 1.600% | | | | | | | | |
1.752% FRN 5/15/36 (c) | | | 560,000 | | | | 554,401 | |
DC Office Trust | | | | | | | | |
Series 2019-MTC, Class D, 3.174% VRN 9/15/45 (c) (g) | | | 357,000 | | | | 353,511 | |
Series 2019-MTC, Class E, 3.174% VRN 9/15/45 (c) (g) | | | 622,000 | | | | 521,183 | |
GB Trust | | | | | | | | |
Series 2020-FLIX, Class C, 1 mo. USD LIBOR + 1.600% 1.752% FRN 8/15/37 (c) | | | 242,000 | | | | 242,000 | |
Series 2020-FLIX, Class D, 1 mo. USD LIBOR + 2.350% 2.502% FRN 8/15/37 (c) | | | 394,000 | | | | 394,000 | |
| | | Principal
Amount | | | Value | |
GS Mortgage Securities Corp. II, Series 2018-GS10, Class D | | | | | | | | |
3.000% 7/10/51 (c) | | $ | 599,000 | | | $ | 422,809 | |
Hudson Yards Mortgage Trust, Series 2019-30HY, Class E, | | | | | | | | |
3.558% VRN 7/10/39 (c) (g) | | | 630,000 | | | | 616,045 | |
Jackson Park Trust, Series 2019-LIC, Class D, | | | | | | | | |
3.242% VRN 10/14/39 (c) (g) | | | 686,000 | | | | 681,810 | |
JP Morgan Chase Commercial Mortgage Securities Trust, Series 2019-OSB, Class E, | | | | | | | | |
3.909% VRN 6/05/39 (c) (g) | | | 553,000 | | | | 505,874 | |
JPMBB Commercial Mortgage Securities Trust | | | | | | | | |
Series 2015-C27, Class C, 4.445% VRN 2/15/48 (g) | | | 1,065,400 | | | | 1,065,197 | |
Series 2014-C21, Class C, 4.813% VRN 8/15/47 (g) | | | 300,000 | | | | 289,254 | |
KNDL Mortgage Trust, Series 2019-KNSQ, Class E, 1 mo. USD LIBOR + 1.800% | | | | | | | | |
1.952% FRN 5/15/36 (c) | | | 263,000 | | | | 260,125 | |
Manhattan West | | | | | | | | |
Series 2020-1MW, Class C, 2.413% VRN 9/10/39 (c) (g) | | | 601,000 | | | | 599,591 | |
Series 2020-1MW, Class D, 2.413% VRN 9/10/39 (c) (g) | | | 440,000 | | | | 427,996 | |
MFT Trust | | | | | | | | |
Series 2020-ABC, Class A, 3.358% 2/10/42 (c) | | | 205,000 | | | | 212,028 | |
Series 2020-ABC, Class B, 3.477% VRN 2/10/42 (c) (g) | | | 215,000 | | | | 218,372 | |
MKT Mortgage Trust, Series 2020-525M, Class E, | | | | | | | | |
2.941% VRN 2/12/40 (c) (g) | | | 213,000 | | | | 198,818 | |
Wells Fargo Commercial Mortgage Trust, Series 2015-NXS1, Class C, | | | | | | | | |
3.848% VRN 5/15/48 (g) | | | 140,000 | | | | 137,139 | |
WF-RBS Commercial Mortgage Trust | | | | | | | | |
Series 2012-C8, Class C, 5.048% VRN 8/15/45 (g) | | | 100,000 | | | | 96,335 | |
Series 2011-C5, Class C, 5.844% VRN 11/15/44 (c) (g) | | | 170,000 | | | | 171,279 | |
Series 2011-C5, Class D, 5.844% VRN 11/15/44 (c) (g) | | | 115,000 | | | | 111,392 | |
| | | | | | | | 14,808,407 | |
Home Equity Asset-Backed Securities — 0.1% |
Credit Suisse Seasoned Loan Trust, Series 2006-1, Class A, 1 mo. USD LIBOR + .240% | | | | | | | | |
0.388% FRN 10/25/34 (c) | | | 52,729 | | | | 52,293 | |
The accompanying notes are an integral part of the financial statements.
99
MassMutual Premier Diversified Bond Fund — Portfolio of Investments (Continued) |
| | | Principal
Amount | | | Value | |
Mastr Asset-Backed Securities Trust, Series 2005, Class NC1 M1, 1 mo. USD LIBOR + .720% | | | | | | | | |
0.868% FRN 12/25/34 | | $ | 92,326 | | | $ | 82,786 | |
| | | | | | | | 135,079 | |
Other Asset-Backed Securities — 14.5% |
321 Henderson Receivables LLC, Series 2015-1A, Class A | | | | | | | | |
3.260% 9/15/72 (c) | | | 69,280 | | | | 72,075 | |
AASET Trust | | | | | | | | |
Series 2019-1, Class A, 3.844% 5/15/39 (c) | | | 368,980 | | | | 343,834 | |
Series 2018-2A, Class A, 4.454% 11/18/38 (c) | | | 617,376 | | | | 574,202 | |
Series 2019-2, Class C, 6.413% 10/16/39 (c) | | | 1,133,714 | | | | 539,334 | |
AGL CLO 7 Ltd., Series 2020-7A, Class A1, 3 mo. USD LIBOR + 1.800% | | | | | | | | |
2.050% FRN 7/15/31 (c) | | | 300,000 | | | | 300,688 | |
AIMCO CLO Series Ltd., Series 2018-AA, Class B, 3 mo. USD LIBOR + 1.400% | | | | | | | | |
1.673% FRN 4/17/31 (c) | | | 250,000 | | | | 245,284 | |
Anchorage Capital CLO Ltd. | | | | | | | | |
Series 2019-11A, Class A, 3 mo. USD LIBOR + 1.390% 1.648% FRN 7/22/32 (c) | | | 500,000 | | | | 500,079 | |
Series 2020-15A, Class A, 3 mo. USD LIBOR + 1.850% 2.089% FRN 7/20/31 (c) | | | 250,000 | | | | 250,903 | |
Series 2019-11A, Class C, 3 mo. USD LIBOR + 3.000% 3.258% FRN 7/22/32 (c) | | | 250,000 | | | | 250,542 | |
Argent Securities, Inc. Asset-Backed Pass-Through Certificates, Series 2004-W10, Class M1, 1 mo. USD LIBOR + .900% | | | | | | | | |
1.048% FRN 10/25/34 | | | 251,197 | | | | 230,494 | |
Ascentium Equipment Receivables Trust, Series 2019-2A, Class E | | | | | | | | |
3.780% 5/10/27 (c) | | | 787,000 | | | | 788,625 | |
Atrium XV, Series 15A, Class B, 3 mo. USD LIBOR + 1.750% | | | | | | | | |
2.006% FRN 1/23/31 (c) | | | 250,000 | | | | 246,860 | |
Avery Point VII CLO Ltd., Series 2015-7A, Class DR, 3 mo. USD LIBOR + 3.600% | | | | | | | | |
3.875% FRN 1/15/28 (c) | | | 250,000 | | | | 238,510 | |
Benefit Street Partners CLO X Ltd., Series 2016-10A, Class CR, 3 mo. USD LIBOR + 3.500% | | | | | | | | |
3.775% FRN 1/15/29 (c) | | | 250,000 | | | | 235,245 | |
| | | Principal
Amount | | | Value | |
Benefit Street Partners CLO XVIII Ltd., Series 2019-18A, Class B, 3 mo. USD LIBOR + 1.950% | | | | | | | | |
2.225% FRN 10/15/32 (c) | | $ | 250,000 | | | $ | 250,155 | |
Blackbird Capital Aircraft Lease Securitization Ltd., Series 2016-1A, Class A, | | | | | | | | |
4.213% STEP 12/16/41 (c) | | | 385,417 | | | | 342,990 | |
BRE Grand Islander Timeshare Issuer LLC | | | | | | | | |
Series 2017-1A, Class A, 2.940% 5/25/29 (c) | | | 83,856 | | | | 84,235 | |
Series 2017-1A, Class B, 3.240% 5/25/29 (c) | | | 69,273 | | | | 68,031 | |
Canyon Capital CLO Ltd., Series 2019-2A, Class C, 3 mo. USD LIBOR + 2.750% | | | | | | | | |
3.025% FRN 10/15/32 (c) | | | 250,000 | | | | 247,272 | |
Capital Automotive REIT | | | | | | | | |
Series 2014-1A, Class A, 3.660% 10/15/44 (c) | | | 94,478 | | | | 94,316 | |
Series 2017-1A, Class A2, 4.180% 4/15/47 (c) | | | 150,177 | | | | 150,648 | |
CARS-DB4 LP | | | | | | | | |
Series 2020-1A, Class B1, 4.170% 2/15/50 (c) | | | 242,000 | | | | 249,717 | |
Series 2020-1A, Class B3, 4.950% 2/15/50 (c) | | | 671,000 | | | | 679,900 | |
Castlelake Aircraft Securitization Trust, Series 2019-1A, Class A | | | | | | | | |
3.967% 4/15/39 (c) | | | 207,816 | | | | 192,325 | |
CF Hippolyta LLC, Series 2020-1, Class B1 | | | | | | | | |
2.280% 7/15/60 (c) | | | 128,000 | | | | 130,236 | |
CIFC Funding Ltd., Series 2017-5A, Class A1, 3 mo. USD LIBOR + 1.180% | | | | | | | | |
1.453% FRN 11/16/30 (c) | | | 250,000 | | | | 247,806 | |
CLI Funding LLC, Series 2014-2A, Class A | | | | | | | | |
3.380% 10/18/29 (c) | | | 37,619 | | | | 37,622 | |
CLI Funding VI LLC, Series 2019-1A, Class B | | | | | | | | |
4.640% 5/18/44 (c) | | | 111,052 | | | | 109,509 | |
Crestline Denali CLO XIV Ltd. | | | | | | | | |
Series 2016-1A, Class A1R, 3 mo. USD LIBOR + 1.280% 1.536% FRN 10/23/31 (c) | | | 349,770 | | | | 343,189 | |
Series 2016-1A, Class BR, 3 mo. USD LIBOR + 1.800% 2.056% FRN 10/23/31 (c) | | | 250,000 | | | | 243,138 | |
The accompanying notes are an integral part of the financial statements.
100
MassMutual Premier Diversified Bond Fund — Portfolio of Investments (Continued) |
| | | Principal
Amount | | | Value | |
CWABS Asset-Backed Certificates Trust, Series 2005-4, Class MV5, 1 mo. USD LIBOR + 1.005% | | | | | | | | |
1.153% FRN 10/25/35 | | $ | 440,000 | | | $ | 423,010 | |
DB Master Finance LLC | | | | | | | | |
Series 2019-1A, Class A2II, 4.021% 5/20/49 (c) | | | 322,740 | | | | 341,345 | |
Series 2019-1A, Class A23, 4.352% 5/20/49 (c) | | | 292,050 | | | | 319,254 | |
Domino’s Pizza Master Issuer LLC | | | | | | | | |
Series 2019-1A, Class A2, 3.668% 10/25/49 (c) | | | 248,125 | | | | 263,408 | |
Series 2018-1A, Class A2I, 4.116% 7/25/48 (c) | | | 264,600 | | | | 279,615 | |
Series 2017-1A, Class A23, 4.118% 7/25/47 (c) | | | 165,325 | | | | 176,516 | |
Series 2015-1A, Class A2II, 4.474% 10/25/45 (c) | | | 595,200 | | | | 632,905 | |
Eaton Vance CLO Ltd., Series 2013-1A, Class BRR, 3 mo. USD LIBOR + 2.800% | | | | | | | | |
3.075% FRN 1/15/28 (c) | | | 250,000 | | | | 250,004 | |
Elara HGV Timeshare Issuer LLC | | | | | | | | |
Series 2016-A, Class A, 2.730% 4/25/28 (c) | | | 106,489 | | | | 106,034 | |
Series 2016-A, Class B, 3.220% 4/25/28 (c) | | | 64,932 | | | | 63,556 | |
Elmwood CLO II Ltd., Series 2019-2A, Class A, 3 mo. USD LIBOR + 1.450% | | | | | | | | |
1.722% FRN 4/20/31 (c) | | | 450,000 | | | | 450,174 | |
Elmwood CLO III Ltd., Series 2019-3A, Class A1, 3 mo. USD LIBOR + 1.370% | | | | | | | | |
1.645% FRN 10/15/32 (c) | | | 250,000 | | | | 249,347 | |
Falcon Aerospace Ltd., Series 2019-1, Class C | | | | | | | | |
6.656% 9/15/39 (c) | | | 318,930 | | | | 127,674 | |
FCI Funding LLC, Series 2019-1A, Class A | | | | | | | | |
3.630% 2/18/31 (c) | | | 51,418 | | | | 52,316 | |
Goldentree Loan Management US CLO Ltd., Series 2019-5A, Class C, 3 mo. USD LIBOR + 2.700% | | | | | | | | |
2.972% FRN 10/20/32 (c) | | | 250,000 | | | | 248,183 | |
Goodgreen Trust | | | | | | | | |
Series 2016-1A, Class A, 3.230% 10/15/52 (c) | | | 251,684 | | | | 261,618 | |
Series 2017-1A, Class A, 3.740% 10/15/52 (c) | | | 137,192 | | | | 144,695 | |
Series 2019-2A, Class B, 3.860% 10/15/54 (c) | | | 155,813 | | | | 158,618 | |
| | | Principal
Amount | | | Value | |
Harbor Park CLO Ltd., Series 2018-1A, Class B1, 3 mo. USD LIBOR + 1.700% | | | | | | | | |
1.972% FRN 1/20/31 (c) | | $ | 280,000 | | | $ | 279,119 | |
Helios Issuer LLC, Series 2017-1A, Class A | | | | | | | | |
4.940% 9/20/49 (c) | | | 253,484 | | | | 269,835 | |
Hero Funding Trust | | | | | | | | |
Series 2016-3A, Class A1, 3.080% 9/20/42 (c) | | | 110,465 | | | | 112,012 | |
Series 2017-3A, Class A1, 3.190% 9/20/48 (c) | | | 142,799 | | | | 147,167 | |
Series 2017-2A, Class A1, 3.280% 9/20/48 (c) | | | 55,240 | | | | 57,152 | |
Series 2016-4A, Class A2, 4.290% 9/20/47 (c) | | | 111,062 | | | | 116,690 | |
Horizon Aircraft Finance I Ltd., Series 2018-1, Class B | | | | | | | | |
5.270% 12/15/38 (c) | | | 225,200 | | | | 172,026 | |
Horizon Aircraft Finance II Ltd., Series 2019-1, Class B | | | | | | | | |
4.703% 7/15/39 (c) | | | 273,167 | | | | 204,113 | |
Horizon Aircraft Finance III Ltd., Series 2019-2, Class A | | | | | | | | |
3.425% 11/15/39 (c) | | | 506,992 | | | | 464,828 | |
HPS Loan Management Ltd., Series 15A-19, Class C, 3 mo. USD LIBOR + 2.700% | | | | | | | | |
2.958% FRN 7/22/32 (c) | | | 250,000 | | | | 247,169 | |
ICG US CLO Ltd., Series 2019-1A, Class A1A, 3 mo. USD LIBOR + 1.380% | | | | | | | | |
1.625% FRN 10/26/32 (c) | | | 250,000 | | | | 248,174 | |
J.G. Wentworth XLIII LLC, Series 2019-1A, Class B | | | | | | | | |
4.510% 8/15/73 (c) | | | 138,000 | | | | 144,678 | |
Kayne CLO 4 Ltd., Series 2019-4A, Class B1, 3 mo. USD LIBOR + 2.100% | | | | | | | | |
2.345% FRN 4/25/32 (c) | | | 250,000 | | | | 251,368 | |
KDAC Aviation Finance Ltd., Series 2017-1A, Class A | | | | | | | | |
4.212% 12/15/42 (c) | | | 335,189 | | | | 294,422 | |
Kestrel Aircraft Fundig Limited, Series 2018-1A, Class A | | | | | | | | |
4.250% 12/15/38 (c) | | | 382,121 | | | | 331,709 | |
KKR Financial CLO Ltd., Series 26, Class B1, 3 mo. USD LIBOR + 2.050% | | | | | | | | |
2.325% FRN 7/15/32 (c) | | | 250,000 | | | | 250,216 | |
The accompanying notes are an integral part of the financial statements.
101
MassMutual Premier Diversified Bond Fund — Portfolio of Investments (Continued) |
| | | Principal
Amount | | | Value | |
KREF Ltd., Series 2018-FL1, Class D, 1 mo. USD LIBOR + 2.550% | | | | | | | | |
2.701% FRN 6/15/36 (c) | | $ | 450,000 | | | $ | 432,315 | |
Labrador Aviation Finance Ltd., Series 2016-1A, Class A1 | | | | | | | | |
4.300% 1/15/42 (c) | | | 362,292 | | | | 320,293 | |
Lunar Aircraft Ltd. | | | | | | | | |
Series 2020-1A, Class A, 3.376% 2/15/45 (c) | | | 215,661 | | | | 199,781 | |
Series 2020-1A, Class B, 4.335% 2/15/45 (c) | | | 137,424 | | | | 89,741 | |
Series 2020-1A, Class C, 6.413% 2/15/45 (c) | | | 203,989 | | | | 83,271 | |
MACH 1 Cayman Ltd., Series 2019-1, Class B | | | | | | | | |
4.335% 10/15/39 (c) | | | 341,850 | | | | 257,661 | |
Madison Park Funding Ltd., Series 2018-28A, Class B, 3 mo. USD LIBOR + 1.600% | | | | | | | | |
1.875% FRN 7/15/30 (c) | | | 950,000 | | | | 933,338 | |
Magnetite XV Ltd., Series 2015-15A, Class CR, 3 mo. USD LIBOR + 1.800% | | | | | | | | |
2.045% FRN 7/25/31 (c) | | | 490,000 | | | | 475,911 | |
Mosaic Solar Loans LLC, Series 2017-1A, Class A | | | | | | | | |
4.450% 6/20/42 (c) | | | 47,471 | | | | 50,956 | |
MP CLO III Ltd., Series 2013-1A, Class AR, 3 mo. USD LIBOR + 1.250% | | | | | | | | |
1.522% FRN 10/20/30 (c) | | | 250,000 | | | | 246,939 | |
NP SPE LLC, Series 2017-1A, Class A2 | | | | | | | | |
4.219% 10/21/47 (c) | | | 380,000 | | | | 390,561 | |
OHA Credit Funding Ltd. | | | | | | | | |
Series 2019-4A, Class A1, 3 mo. USD LIBOR + 1.330% 1.588% FRN 10/22/32 (c) | | | 250,000 | | | | 248,555 | |
Series 2015-11A, Class CR, 3 mo. USD LIBOR + 2.150% 2.422% FRN 1/20/32 (c) | | | 300,000 | | | | 291,896 | |
OneMain Financial Issuance Trust | | | | | | | | |
Series 2019-2A, Class A, 3.140% 10/14/36 (c) | | | 1,700,000 | | | | 1,811,684 | |
Series 2020-2A, Class D, 3.450% 9/14/35 (c) | | | 280,000 | | | | 279,188 | |
Series 2019-2A, Class C, 3.660% 10/14/36 (c) | | | 400,000 | | | | 418,027 | |
Orange Lake Timeshare Trust, Series 2019-A, Class D | | | | | | | | |
4.930% 4/09/38 (c) | | | 550,171 | | | | 506,762 | |
| | | Principal
Amount | | | Value | |
Oxford Finance Funding Trust, Series 2020-1A, Class A2 | | | | | | | | |
3.101% 2/15/28 (c) | | $ | 344,000 | | | $ | 348,917 | |
Park Place Securities, Inc., Series 2005-WCW3, Class M1, 1 mo. USD LIBOR + .480% | | | | | | | | |
0.628% FRN 8/25/35 | | | 37,937 | | | | 37,527 | |
Pioneer Aircraft Finance Ltd., Series 2019-1, Class B | | | | | | | | |
4.948% 6/15/44 (c) | | | 341,661 | | | | 239,199 | |
Planet Fitness Master Issuer LLC, Series 2019-1A, Class A2 | | | | | | | | |
3.858% 12/05/49 (c) | | | 505,183 | | | | 475,140 | |
PNMAC GMSR Issuer Trust, Series 2018-GT1, Class A, 1 mo. USD LIBOR + 2.850% | | | | | | | | |
2.998% FRN 2/25/23 (c) | | | 210,000 | | | | 204,963 | |
Popular ABS Mortgage Pass-Through Trust, Series 2006-B, Class A3, 1 mo. USD LIBOR + .280% | | | | | | | | |
0.428% FRN 5/25/36 | | | 5,846 | | | | 5,821 | |
Rockford Tower CLO Ltd., Series 2018-1A, Class B, 3 mo. USD LIBOR + 1.720% | | | | | | | | |
1.973% FRN 5/20/31 (c) | | | 250,000 | | | | 246,485 | |
RR 3 Ltd., Series 2018-3A, Class A1R2, 3 mo. USD LIBOR + 1.090% | | | | | | | | |
1.365% FRN 1/15/30 (c) | | | 500,000 | | | | 494,763 | |
Sierra Receivables Funding LLC | | | | | | | | |
Series 2015-3A, Class B, 3.080% 9/20/32 (c) | | | 11,164 | | | | 11,153 | |
Series 2020-2A, Class C, 3.510% 7/20/37 (c) | | | 143,566 | | | | 144,938 | |
Series 2016-1A, Class B, 3.670% 3/21/33 (c) | | | 25,530 | | | | 25,446 | |
Series 2019-1A, Class D, 4.750% 1/20/36 (c) | | | 376,853 | | | | 363,829 | |
Steele Creek CLO Ltd., Series 2018-2A, Class C, 3 mo. USD LIBOR + 2.300% | | | | | | | | |
2.570% FRN 8/18/31 (c) | | | 490,000 | | | | 457,656 | |
Store Master Funding I-VII and XIV | | | | | | | | |
Series 2019-1, Class A4, 4.490% 11/20/49 (c) | | | 766,792 | | | | 748,326 | |
Series 2018-1A, Class A4, 4.740% 10/20/48 (c) | | | 237,700 | | | | 248,890 | |
Sunnova Helios II Issuer LLC, Series 2018-1A, Class A | | | | | | | | |
4.870% 7/20/48 (c) | | | 114,438 | | | | 123,135 | |
The accompanying notes are an integral part of the financial statements.
102
MassMutual Premier Diversified Bond Fund — Portfolio of Investments (Continued) |
| | | Principal
Amount | | | Value | |
SuttonPark Structured Settlements LLC, Series 2017-1A, Class A | | | | | | | | |
4.190% 1/15/71 (c) | | $ | 292,537 | | | $ | 338,467 | |
Taco Bell Funding LLC | | | | | | | | |
Series 2018-1A, Class A2II, 4.940% 11/25/48 (c) | | | 304,575 | | | | 325,166 | |
Series 2016-1A, Class A23, 4.970% 5/25/46 (c) | | | 425,700 | | | | 457,183 | |
Textainer Marine Containers VII Ltd., Series 2019-1A, Class B | | | | | | | | |
5.280% 4/20/44 (c) | | | 189,747 | | | | 189,747 | |
THL Credit Wind River CLO Ltd., Series 2018-3A, Class B, 3 mo. USD LIBOR + 1.700% | | | | | | | | |
1.972% FRN 1/20/31 (c) | | | 490,000 | | | | 484,218 | |
TICP CLO VI Ltd, Series 2016-6A, Class DR, 3 mo. USD LIBOR + 3.300% | | | | | | | | |
3.575% FRN 1/15/29 (c) | | | 350,000 | | | | 342,437 | |
TICP CLO XIV Ltd., Series 2019-14A, Class A2, 3 mo. USD LIBOR + 1.900% | | | | | | | | |
2.172% FRN 10/20/32 (c) | | | 250,000 | | | | 250,131 | |
Tif Funding II LLC, Series 2020-1A, Class A | | | | | | | | |
2.090% 8/20/45 (c) | | | 145,088 | | | | 144,849 | |
Trinity Rail Leasing LP | | | | | | | | |
Series 2019-2A, Class A2, 3.100% 10/18/49 (c) | | | 700,000 | | | | 682,729 | |
Series 2018-1A, Class A2, 4.620% 6/17/48 (c) | | | 430,000 | | | | 437,067 | |
Triton Container Finance VIII LLC, Series 2020-1A, Class A | | | | | | | | |
2.110% 9/20/45 (c) | | | 700,000 | | | | 700,900 | |
Vantage Data Centers LLC, Series 2020-2A, Class A2 | | | | | | | | |
1.992% 9/15/45 (c) (e) (g) | | | 300,000 | | | | 300,137 | |
VSE VOI Mortgage LLC, Series 2016-A, Class B | | | | | | | | |
2.740% 7/20/33 (c) | | | 32,775 | | | | 32,335 | |
Wave USA | | | | | | | | |
4.581% 9/15/44 (c) | | | 608,521 | | | | 428,231 | |
Westgate Resorts LLC, Series 2017-1A, Class A | | | | | | | | |
3.050% 12/20/30 (c) | | | 72,111 | | | | 71,891 | |
Willis Engine Structured Trust III, Series 2017-A, Class A, | | | | | | | | |
4.690% STEP 8/15/42 (c) | | | 361,272 | | | | 306,097 | |
Willis Engine Structured Trust IV, Series 2018-A, Class A, | | | | | | | | |
4.750% STEP 9/15/43 (c) | | | 225,699 | | | | 190,364 | |
| | | | | | | | 33,321,730 | |
| | | Principal
Amount | | | Value | |
Student Loans Asset-Backed Securities — 5.8% |
Access Group, Inc., Series 2015-1, Class B, 1 mo. USD LIBOR + 1.500% | | | | | | | | |
1.648% FRN 7/25/58 (c) | | $ | 130,000 | | | $ | 114,796 | |
Brazos Higher Education Authority, Inc., | | | | | | | | |
1.652% 6/25/42 | | | 450,000 | | | | 430,543 | |
College Avenue Student Loans LLC | | | | | | | | |
Series 2019-A, Class C, 4.460% 12/28/48 (c) | | | 225,000 | | | | 222,708 | |
Series 2019-A, Class D, 5.500% 12/28/48 (c) | | | 174,000 | | | | 166,545 | |
Commonbond Student Loan Trust, Series 2017-AGS, Class C | | | | | | | | |
5.280% 5/25/41 (c) | | | 72,066 | | | | 74,410 | |
Credit Suisse ABS Repackaging Trust, Series 2013-A, Class B | | | | | | | | |
2.500% 1/25/30 (c) | | | 87,323 | | | | 87,121 | |
EdLinc Student Loan Funding Trust, Series 2017-A, Class A, PRIME - 1.150% | | | | | | | | |
3.600% FRN 12/01/47 (c) | | | 290,561 | | | | 287,128 | |
Goal Capital Funding Trust, Series 2006-1, Class B, 3 mo. USD LIBOR + .450% | | | | | | | | |
0.700% FRN 8/25/42 | | | 505,934 | | | | 439,788 | |
KeyCorp Student Loan Trust, Series 1999-B, Class CTFS, 3 mo. USD LIBOR + .900% | | | | | | | | |
1.150% FRN 11/25/36 | | | 7,525 | | | | 7,511 | |
Navient Private Education Refi Loan Trust | | | | | | | | |
Series 2020-DA, Class B, 3.330% 5/15/69 (c) | | | 1,003,000 | | | | 988,260 | |
Series 2018-CA, Class B, 4.220% 6/16/42 (c) | | | 530,000 | | | | 536,016 | |
Navient Student Loan Trust | | | | | | | | |
Series 2019-BA, Class A2B, 1 mo. USD LIBOR + .980% 1.132% FRN 12/15/59 (c) | | | 1,000,000 | | | | 998,020 | |
Series 2018-1A, Class B, 1 mo. USD LIBOR + 1.200% 1.348% FRN 3/25/67 (c) | | | 250,000 | | | | 236,127 | |
Series 2018-EA, Class B, 4.440% 12/15/59 (c) | | | 140,000 | | | | 145,575 | |
Nelnet Private Education Loan Trust | | | | | | | | |
Series 2016-A, Class A1A, 1 mo. USD LIBOR + 1.750% 1.898% FRN 12/26/40 (c) | | | 49,178 | | | | 46,975 | |
Series 2016-A, Class A1B, 3.600% 12/26/40 (c) | | | 55,086 | | | | 55,369 | |
The accompanying notes are an integral part of the financial statements.
103
MassMutual Premier Diversified Bond Fund — Portfolio of Investments (Continued) |
| | | Principal
Amount | | | Value | |
Nelnet Student Loan Trust | | | | | | | | |
Series 2006-3, Class B, 3 mo. USD LIBOR + .250% 0.475% FRN 6/25/41 | | $ | 120,687 | | | $ | 104,411 | |
Series 2012-2A, Class B, 1 mo. USD LIBOR + 1.000% 1.148% FRN 11/25/36 (c) | | | 200,000 | | | | 188,189 | |
Series 2012-1A, Class B, 1 mo. USD LIBOR + 1.000% 1.148% FRN 6/25/42 (c) | | | 150,000 | | | | 135,556 | |
Series 2012-4A, Class B, 1 mo. USD LIBOR + 1.000% 1.148% FRN 7/26/49 (c) | | | 350,000 | | | | 317,734 | |
Series 2005-4, Class A4R2, 28 day ARS 1.191% FRN 3/22/32 | | | 145,411 | | | | 139,588 | |
Series 2018-5A, Class B, 1 mo. USD LIBOR + 1.450% 1.598% FRN 2/25/67 (c) | | | 800,000 | | | | 751,154 | |
Series 2014-1A, Class B, 1 mo. USD LIBOR + 1.500% 1.648% FRN 10/25/47 (c) | | | 440,000 | | | | 413,249 | |
Series 2014-5A, Class B, 1 mo. USD LIBOR + 1.500% 1.648% FRN 5/26/54 (c) | | | 100,000 | | | | 94,908 | |
Series 2014-2A, Class B, 1 mo. USD LIBOR + 1.500% 1.675% FRN 6/25/41 (c) | | | 100,000 | | | | 94,680 | |
SLM Student Loan Trust | | | | | | | | |
Series 2006-2, Class R, 0.000% 1/25/41 | | | 1,363 | | | | 820,956 | |
Series 2006-4, Class B, 3 mo. USD LIBOR + .200% 0.445% FRN 1/25/70 | | | 162,362 | | | | 144,886 | |
Series 2006-5, Class B, 3 mo. USD LIBOR + .210% 0.455% FRN 10/25/40 | | | 135,088 | | | | 120,774 | |
Series 2005-6, Class B, 3 mo. USD LIBOR + .290% 0.535% FRN 1/25/44 | | | 325,628 | | | | 290,133 | |
Series 2005-9, Class B, 3 mo. USD LIBOR + .300% 0.545% FRN 1/25/41 | | | 405,280 | | | | 363,429 | |
Series 2004-3, Class B, 3 mo. USD LIBOR + .470% 0.715% FRN 10/25/64 | | | 109,372 | | | | 97,137 | |
Series 2003-14, Class A7, 3 mo. USD LIBOR + .600% 0.845% FRN 10/25/65 (c) | | | 910,000 | | | | 888,961 | |
Series 2006-7, Class B, 3 mo. USD LIBOR + .200% 1.191% FRN 1/27/42 | | | 303,457 | | | | 268,537 | |
SMB Private Education Loan Trust | | | | | | | | |
Series 2019-A, Class B, 4.000% 11/17/42 (c) | | | 185,000 | | | | 190,637 | |
| | | Principal
Amount | | | Value | |
Series 2015-C, Class C, 4.500% 9/17/46 (c) | | $ | 350,000 | | | $ | 377,131 | |
SoFi Professional Loan Program LLC | | | | | | | | |
Series 2018-A, Class R1, 0.000%2/25/42 (c) | | | 1,000,000 | | | | 413,442 | |
Series 2019-A, Class R1, 0.000%6/15/48 (c) | | | 1,361,200 | | | | 322,468 | |
Series 2017-D, Class R1, 0.000% 9/25/40 (c) | | | 1,000,000 | | | | 345,020 | |
Series 2018-D, Class R1, 0.000% 2/25/48 (c) | | | 911,500 | | | | 201,533 | |
Series 2017-D, Class BFX, 3.610% 9/25/40 (c) | | | 500,000 | | | | 496,336 | |
Series 2017-C, Class C, 4.210% VRN 7/25/40 (c) (g) | | | 180,000 | | | | 182,522 | |
Series 2017-A, Class C, 4.430% VRN 3/26/40 (c) (g) | | | 170,000 | | | | 156,760 | |
South Carolina Student Loan Corp. | | | | | | | | |
Series 2015-A, Class A, 1 mo. USD LIBOR + 1.500% 1.648% FRN 1/25/36 | | | 86,938 | | | | 84,423 | |
Series 2014-1, Class B, 1 mo. USD LIBOR + 1.500% 1.655% FRN 8/01/35 | | | 550,000 | | | | 527,859 | |
| | | | | | | | 13,369,305 | |
Whole Loan Collateral Collateralized Mortgage Obligations — 1.0% |
Angel Oak Mortgage Trust I LLC | | | | | | | | |
Series 2019-4, Class M1, 3.459% VRN 7/26/49 (c) (g) | | | 492,000 | | | | 497,257 | |
Series 2019-2, Class M1, 4.065% VRN 3/25/49 (c) (g) | | | 260,000 | | | | 264,928 | |
Bank of America Mortgage Securities, Series 2004-G, Class 2A7, | | | | | | | | |
3.091% VRN 8/25/34 (g) | | | 13,223 | | | | 12,931 | |
Countrywide Home Loans, Inc. | | | | | | | | |
Series 2004-2, Class 1A1, 3.666% VRN 2/25/34 (g) | | | 8,260 | | | | 7,974 | |
Series 2003-42, Class 1A1, 3.991% VRN 9/25/33 (g) | | | 2,240 | | | | 2,148 | |
Deephaven Residential Mortgage Trust | | | | | | | | |
Series 2019-3A, Class M1, 3.405% VRN 7/25/59 (c) (g) | | | 800,000 | | | | 804,828 | |
Series 2019-1A, Class M1, 4.402% VRN 1/25/59 (c) (g) | | | 250,000 | | | | 252,817 | |
GSR Mortgage Loan Trust, Series 2004-9, Class 2A1, | | | | | | | | |
3.490% VRN 8/25/34 (g) | | | 3,581 | | | | 3,615 | |
IndyMac Index Mortgage Loan Trust, Series 2004-AR4, Class 1A, | | | | | | | | |
3.165% VRN 8/25/34 (g) | | | 21,854 | | | | 21,790 | |
The accompanying notes are an integral part of the financial statements.
104
MassMutual Premier Diversified Bond Fund — Portfolio of Investments (Continued) |
| | | Principal
Amount | | | Value | |
JP Morgan Mortgage Trust, Series 2017-1, Class A11, | | | | | | | | |
3.500% VRN 1/25/47 (c) (g) | | $ | 297,426 | | | $ | 303,196 | |
Merrill Lynch Mortgage Investors, Inc. | | | | | | | | |
Series 2003-A4, Class IA, 3.032% VRN 7/25/33 (g) | | | 1,045 | | | | 996 | |
Series 2004-A1, Class IA, 3.250% VRN 2/25/34 (g) | | | 1,028 | | | | 1,015 | |
Structured Adjustable Rate Mortgage Loan Trust, Series 2004-2, Class 2A, | | | | | | | | |
2.970% VRN 3/25/34 (g) | | | 7,852 | | | | 7,794 | |
Washington Mutual Mortgage Pass-Through Certificates, Series 2004-AR2, Class A, 12 mo. MTA + 1.400% | | | | | | | | |
2.419% FRN 4/25/44 | | | 25,468 | | | | 24,358 | |
| | | | | | | | 2,205,647 | |
| | | | | | | | | |
TOTAL NON-U.S. GOVERNMENT AGENCY OBLIGATIONS (Cost $71,006,135) | | | | | | | 68,165,122 | |
| | | | | | | | | |
SOVEREIGN DEBT OBLIGATIONS — 0.8% |
Colombia Government International Bond | | | | | | | | |
6.125% 1/18/41 | | | 440,000 | | | | 564,300 | |
Mexico Government International Bond | | | | | | | | |
4.750% 3/08/44 | | | 614,000 | | | | 669,567 | |
6.750% 9/27/34 | | | 375,000 | | | | 502,875 | |
| | | | | | | | 1,736,742 | |
| | | | | | | | | |
TOTAL SOVEREIGN DEBT OBLIGATIONS (Cost $1,635,346) | | | | | | | 1,736,742 | |
| | | | | | | | | |
U.S. GOVERNMENT AGENCY OBLIGATIONS AND INSTRUMENTALITIES — 16.6% |
Collateralized Mortgage Obligations — 0.1% |
Federal Home Loan Mortgage Corp. | | | | | | | | |
Series 2617, Class Z, 5.500% 5/15/33 | | | 69,434 | | | | 80,299 | |
Series 2693, Class Z, 5.500% 10/15/33 | | | 127,235 | | | | 144,469 | |
Series 2178, Class PB, 7.000% 8/15/29 | | | 7,175 | | | | 8,144 | |
| | | | | | | | 232,912 | |
Pass-Through Securities — 16.1% |
Federal Home Loan Mortgage Corp. | | | | | | | | |
Pool #G01311 7.000% 9/01/31 | | | 666 | | | | 781 | |
| | | Principal
Amount | | | Value | |
Pool #C80207 7.500% 9/01/24 | | $ | 434 | | | $ | 475 | |
Pool #C00530 7.500% 7/01/27 | | | 461 | | | | 521 | |
Pool #C00563 7.500% 11/01/27 | | | 1,671 | | | | 1,900 | |
Pool #C00612 7.500% 4/01/28 | | | 55 | | | | 63 | |
Pool #C55867 7.500% 2/01/30 | | | 1,924 | | | | 2,169 | |
Federal National Mortgage Association | | | | | | | | |
Pool #MA3029 3.000% 6/01/32 | | | 612,271 | | | | 645,373 | |
Pool #MA3090 3.000% 8/01/32 | | | 260,040 | | | | 274,099 | |
Pool #AR3007 3.000% 2/01/43 | | | 160,877 | | | | 171,336 | |
Pool #725692 1 year CMT + 2.137% 3.138% FRN 10/01/33 | | | 31,854 | | | | 33,365 | |
Pool #888586 1 year CMT + 2.196% 3.326% FRN 10/01/34 | | | 85,825 | | | | 90,440 | |
Pool #AS1304 3.500% 12/01/28 | | | 144,694 | | | | 155,587 | |
Pool #AV1897 3.500% 12/01/28 | | | 25,733 | | | | 27,670 | |
Pool #AV2325 3.500% 12/01/28 | | | 75,536 | | | | 81,222 | |
Pool #MA1356 3.500% 2/01/43 | | | 988,112 | | | | 1,072,486 | |
Pool #CA6096 3.500% 6/01/50 | | | 2,183,601 | | | | 2,346,854 | |
Pool #FM4017 3.500% 8/01/50 | | | 199,704 | | | | 211,514 | |
Pool #CA1909 4.500% 6/01/48 | | | 1,025,750 | | | | 1,110,658 | |
Pool #AD6437 5.000% 6/01/40 | | | 52,798 | | | | 60,516 | |
Pool #AD6996 5.000% 7/01/40 | | | 342,334 | | | | 392,374 | |
Pool #AL8173 5.000% 2/01/44 | | | 137,202 | | | | 156,099 | |
Pool #575579 7.500% 4/01/31 | | | 3,350 | | | | 3,928 | |
Pool #535996 7.500% 6/01/31 | | | 563 | | | | 660 | |
Government National Mortgage Association I | | | | | | | | |
Pool #579140 6.500% 1/15/32 | | | 579 | | | | 662 | |
Pool #587280 6.500% 9/15/32 | | | 887 | | | | 1,001 | |
Pool #550659 6.500% 9/15/35 | | | 64,563 | | | | 75,601 | |
Pool #538689 6.500% 12/15/35 | | | 12,818 | | | | 15,141 | |
Pool #780651 7.000% 10/15/27 | | | 692 | | | | 771 | |
Pool #462384 7.000% 11/15/27 | | | 386 | | | | 432 | |
Pool #482668 7.000% 8/15/28 | | | 767 | | | | 868 | |
Pool #581417 7.000% 7/15/32 | | | 676 | | | | 770 | |
Pool #423836 8.000% 8/15/26 | | | 490 | | | | 545 | |
Pool #444619 8.000% 3/15/27 | | | 4,564 | | | | 5,072 | |
Government National Mortgage Association II | | | | | | | | |
Pool# MA6656 3.000% 5/20/50 | | | 2,289,254 | | | | 2,402,405 | |
Pool# MA6710 3.000% 6/20/50 | | | 2,303,475 | | | | 2,422,368 | |
Pool #MA4321 3.500% 3/20/47 | | | 1,584,486 | | | | 1,694,955 | |
Government National Mortgage Association II TBA | | | | | | | | |
Pool #548 3.000% 10/21/50 (e) | | | 1,850,000 | | | | 1,936,863 | |
Pool #1635 3.500% 10/21/50 (e) | | | 7,330,000 | | | | 7,719,406 | |
Uniform Mortgage Backed Securities TBA | | | | | | | | |
Pool #505 2.000% 10/19/35 (e) | | | 7,250,000 | | | | 7,536,601 | |
Pool #1082 2.000% 10/14/50 (e) | | | 3,775,000 | | | | 3,903,586 | |
The accompanying notes are an integral part of the financial statements.
105
MassMutual Premier Diversified Bond Fund — Portfolio of Investments (Continued) |
| | | Principal
Amount | | | Value | |
Pool #17115 3.500% 10/14/50 (e) | | $ | 2,300,000 | | | $ | 2,424,703 | |
| | | | | | | | 36,981,840 | |
Whole Loans — 0.4% |
Federal Home Loan Mortgage Corp. Structured Agency Credit Risk Debt Notes, Series 2019-DNA3, Class M2, 1 mo. USD LIBOR + 2.050% | | | | | | | | |
2.198% FRN 7/25/49 (c) | | | 285,628 | | | | 279,811 | |
Federal National Mortgage Association Connecticut Avenue Securities Trust | | | | | | | | |
Series 2019-R04, Class 2M2, 1 mo. USD LIBOR + 2.100% 2.248% FRN 6/25/39 (c) | | | 143,385 | | | | 142,412 | |
Series 2019-R03, Class 1M2, 1 mo. USD LIBOR + 2.150% 2.298% FRN 9/25/31 (c) | | | 87,891 | | | | 87,660 | |
Series 2019-R02, Class 1M2, 1 mo. USD LIBOR + 2.300% 2.448% FRN 8/25/31 (c) | | | 287,158 | | | | 285,368 | |
| | | | | | | | 795,251 | |
| | | | | | | | | |
TOTAL U.S. GOVERNMENT AGENCY OBLIGATIONS AND INSTRUMENTALITIES (Cost $37,824,341) | | | | | | | 38,010,003 | |
| | | | | | | | | |
U.S. TREASURY OBLIGATIONS — 2.7% |
U.S. Treasury Bonds & Notes — 2.7% |
U.S. Treasury Bond | | | | | | | | |
2.250% 8/15/49 (h) | | | 2,470,000 | | | | 2,944,698 | |
3.500% 2/15/39 | | | 1,200,000 | | | | 1,685,905 | |
U.S. Treasury Note | | | | | | | | |
0.375% 4/30/25 | | | 1,500,000 | | | | 1,508,928 | |
| | | | | | | | 6,139,531 | |
| | | | | | | | | |
TOTAL U.S. TREASURY OBLIGATIONS (Cost $6,199,712) | | | | | | | 6,139,531 | |
| | | | | | | | | |
TOTAL BONDS & NOTES (Cost $219,854,791) | | | | | | | 221,970,564 | |
| | | | | | | | | |
TOTAL PURCHASED OPTIONS (#) — 0.2% (Cost $710,400) | | | | | | | 471,770 | |
| | | Number of
Shares | | | Value | |
WARRANTS — 0.0% |
Consumer, Non-cyclical — 0.0% |
Chemicals — 0.0% | | | | | | | | |
Hercules LLC, Expires 3/31/29, Strike 0.09 (a) (b) (f) | | | 150 | | | $ | 3,780 | |
| | | | | | | | | |
TOTAL WARRANTS (Cost $0) | | | | | | | 3,780 | |
| | | | | | | | | |
TOTAL LONG-TERM INVESTMENTS (Cost $220,907,419) | | | | | | | 222,720,617 | |
| | | Principal
Amount | | | | | |
SHORT-TERM INVESTMENTS — 12.6% |
Commercial Paper — 12.2% |
American Honda Finance Corp. | | | | | | | | |
0.315% 11/19/20 | | $ | 3,000,000 | | | | 2,998,929 | |
AT&T, Inc. | | | | | | | | |
0.213% 12/10/20 (c) | | | 1,000,000 | | | | 999,375 | |
Avangrid, Inc. | | | | | | | | |
0.223% 12/07/20 (c) | | | 1,000,000 | | | | 999,594 | |
0.233% 12/07/20 (c) | | | 2,000,000 | | | | 1,999,188 | |
Bemis Co., Inc. | | | | | | | | |
0.183% 10/21/20 (c) | | | 3,000,000 | | | | 2,999,677 | |
Carnival Corp. | | | | | | | | |
1.902% 11/25/20 (c) | | | 2,000,000 | | | | 1,987,845 | |
Dominion Resources | | | | | | | | |
0.203% 10/13/20 | | | 3,000,000 | | | | 2,999,810 | |
Harley-Davidson, Inc. | | | | | | | | |
0.254% 10/08/20 (c) | | | 1,000,000 | | | | 999,962 | |
Intercontinental Exchange, Inc. | | | | | | | | |
0.376% 12/02/20 (a)(c) | | | 3,000,000 | | | | 2,998,044 | |
LyondellBasell Industries NV | | | | | | | | |
0.162% 10/28/20 (c) | | | 1,000,000 | | | | 999,853 | |
Nrw. Bank | | | | | | | | |
0.162% 11/03/20 (c) | | | 3,000,000 | | | | 2,999,660 | |
Nutrien Ltd. | | | | | | | | |
0.223% 12/17/20 (c) | | | 3,000,000 | | | | 2,998,557 | |
Spire, Inc. | | | | | | | | |
0.152% 11/02/20 (c) | | | 1,000,000 | | | | 999,824 | |
Suncor Energy, Inc. | | | | | | | | |
0.223% 11/23/20 (c) | | | 1,000,000 | | | | 999,691 | |
| | | | | | | | 27,980,009 | |
The accompanying notes are an integral part of the financial statements.
106
MassMutual Premier Diversified Bond Fund — Portfolio of Investments (Continued) |
| | | Principal
Amount | | | Value | |
U.S. Treasury Bill — 0.4% |
U.S. Treasury Bill | | | | | | | | |
0.000% 10/06/20 | | $ | 1,000,000 | | | $ | 999,991 | |
| | | | | | | | | |
TOTAL SHORT-TERM INVESTMENTS (Cost $28,986,511) | | | | | | | 28,980,000 | |
| | | | | | | | | |
TOTAL INVESTMENTS — 109.7% (Cost $249,893,930) (i) | | | | | | | 251,700,617 | |
| | | | | | | | | |
Other Assets/(Liabilities) — (9.7)% | | | | | | | (22,183,880 | ) |
| | | | | | | | | |
NET ASSETS — 100.0% | | | | | | $ | 229,516,737 | |
Abbreviation Legend
CLO | Collateralized Loan Obligation |
Notes to Portfolio of Investments
Percentages are stated as a percent of net assets.
(a) | This security is fair valued in good faith in accordance with procedures approved by the Board of Trustees. At September 30, 2020, these securities amounted to a value of $3,024,572 or 1.32% of net assets. |
(b) | Non-income producing security. |
(c) | Security is exempt from registration under Regulation S or Rule 144A of the Securities Act of 1933. These securities are considered restricted and may be resold in transactions exempt from registration. At September 30, 2020, the aggregate market value of these securities amounted to $115,179,973 or 50.18% of net assets. |
(d) | Security is perpetual and has no stated maturity date. |
(e) | A portion of this security is purchased on a when-issued, delayed-delivery or forward commitment basis. (Note 2). |
(f) | Investment was valued using significant unobservable inputs. |
(g) | Certain variable rate securities are not based on a published reference rate and spread but are determined by the issuer or agent and are based on current market conditions. These securities do not indicate a reference rate and spread in their description above. The rates shown are the current interest rates at September 30, 2020. |
(h) | A portion of this security is pledged/held as collateral for open derivatives. (Note 2). |
(i) | See Note 6 for aggregate cost for federal tax purposes. |
(#) Interest Rate Swaptions Purchased
| | | | | | | Paid by Fund | | | Received by Fund | | | | | | | | | | | | | | | |
| Description | | Counterparty | | Expiration
Date | | Rate | | | Frequency | | | Rate | | | Frequency | | | Notional
Amount | | Value | | | Premium
Paid
(Received) | | | Unrealized
Appreciation/
(Depreciation) | |
| Call | | | | | | | | | | | | | | | | | | | | | | | | | | | | | | |
| 10-Year Interest Rate Swap, 12/15/42 | | Barclays Bank PLC* | | 12/13/32 | | | 3-Month USD LIBOR BBA | | | | Quarterly | | | | 2.44 | % | | | Semi-Annually | | | USD | | | 800,000 | | | $ | 101,520 | | | $ | 39,994 | | | $ | 61,526 | |
| | | | | | | | | | | | | | | | | | | | | | | | | | | | | | | | | | | | | | | |
| Put | | | | | | | | | | | | | | | | | | | | | | | | | | | | | | | | | | | | | | |
| 10-Year Interest Rate Swap, 12/15/42 | | Barclays Bank PLC* | | 12/13/32 | | | 2.94 | % | | | Semi-Annually | | | | 3-Month USD LIBOR BBA | | | | Quarterly | | | USD | | | 13,410,000 | | | $ | 370,250 | | | $ | 670,406 | | | $ | (300,156 | ) |
| | | | | | | | | | | | | | | | | | | | | | | | | | | | | $ | 471,770 | | | $ | 710,400 | | | $ | (238,630 | ) |
The accompanying notes are an integral part of the financial statements.
107
MassMutual Premier Diversified Bond Fund — Portfolio of Investments (Continued) |
Forward contracts
Counterparty | | Settlement
Date | | | Currency Purchased | | | Currency Sold | | | Unrealized
Appreciation
(Depreciation) | |
Bank of America N.A.* | | | 10/13/20 | | | | USD | | | | 106,443 | | | | CHF | | | | 99,609 | | | $ | (1,738 | ) |
Bank of America N.A.* | | | 10/13/20 | | | | RUB | | | | 7,228,532 | | | | USD | | | | 100,341 | | | | (7,420 | ) |
Bank of America N.A.* | | | 11/10/20 | | | | MXN | | | | 1,916,957 | | | | USD | | | | 87,000 | | | | (693 | ) |
Bank of America N.A.* | | | 11/17/20 | | | | USD | | | | 382,000 | | | | EUR | | | | 322,275 | | | | 3,789 | |
Bank of America N.A.* | | | 10/13/20 | | | | PLN | | | | 2,561,137 | | | | USD | | | | 649,144 | | | | 13,450 | |
Bank of America N.A.* | | | 10/13/20 | | | | USD | | | | 195,000 | | | | RUB | | | | 15,272,498 | | | | (1,324 | ) |
Barclays Bank PLC* | | | 11/17/20 | | | | USD | | | | 253,560 | | | | ILS | | | | 862,230 | | | | 1,729 | |
Citibank N.A.* | | | 10/13/20 | | | | TRY | | | | 1,740,173 | | | | USD | | | | 230,401 | | | | (5,567 | ) |
Citibank N.A.* | | | 11/10/20 | | | | BRL | | | | 2,266,776 | | | | USD | | | | 438,058 | | | | (34,837 | ) |
Citibank N.A.* | | | 11/16/20 | | | | PKR | | | | 6,689,150 | | | | USD | | | | 41,000 | | | | (991 | ) |
Citibank N.A.* | | | 11/17/20 | | | | USD | | | | 152,116 | | | | CHF | | | | 137,732 | | | | 2,387 | |
Goldman Sachs International* | | | 10/06/20 | | | | USD | | | | 357,549 | | | | MXN | | | | 8,034,975 | | | | (5,662 | ) |
Goldman Sachs International* | | | 10/06/20 | | | | MXN | | | | 8,034,975 | | | | USD | | | | 343,044 | | | | 20,167 | |
Goldman Sachs International* | | | 10/13/20 | | | | USD | | | | 155,000 | | | | PLN | | | | 582,880 | | | | 4,202 | |
Goldman Sachs International* | | | 11/10/20 | | | | MXN | | | | 1,215,217 | | | | USD | | | | 54,536 | | | | 176 | |
Goldman Sachs International* | | | 1/12/21 | | | | MXN | | | | 8,034,975 | | | | USD | | | | 353,637 | | | | 5,609 | |
JP Morgan Chase Bank N.A.* | | | 10/06/20 | | | | USD | | | | 157,505 | | | | BRL | | | | 892,344 | | | | (1,368 | ) |
JP Morgan Chase Bank N.A.* | | | 10/06/20 | | | | BRL | | | | 892,344 | | | | USD | | | | 161,847 | | | | (2,974 | ) |
JP Morgan Chase Bank N.A.* | | | 10/13/20 | | | | USD | | | | 242,956 | | | | TRY | | | | 1,740,173 | | | | 18,122 | |
JP Morgan Chase Bank N.A.* | | | 11/10/20 | | | | BRL | | | | 214,624 | | | | USD | | | | 38,000 | | | | 178 | |
JP Morgan Chase Bank N.A.* | | | 11/16/20 | | | | PKR | | | | 5,521,717 | | | | USD | | | | 34,131 | | | | (1,105 | ) |
JP Morgan Chase Bank N.A.* | | | 11/17/20 | | | | USD | | | | 130,000 | | | | EUR | | | | 111,761 | | | | (1,158 | ) |
JP Morgan Chase Bank N.A.* | | | 11/24/20 | | | | INR | | | | 7,542,390 | | | | USD | | | | 102,000 | | | | (289 | ) |
JP Morgan Chase Bank N.A.* | | | 11/24/20 | | | | USD | | | | 260,537 | | | | SGD | | | | 357,261 | | | | (1,199 | ) |
JP Morgan Chase Bank N.A.* | | | 1/12/21 | | | | BRL | | | | 892,344 | | | | USD | | | | 157,089 | | | | 1,356 | |
Morgan Stanley & Co. LLC* | | | 10/13/20 | | | | ZAR | | | | 4,292,379 | | | | USD | | | | 249,902 | | | | 6,013 | |
Morgan Stanley & Co. LLC* | | | 10/20/20 | | | | AUD | | | | 205,527 | | | | USD | | | | 144,544 | | | | 2,670 | |
Morgan Stanley & Co. LLC* | | | 11/24/20 | | | | AUD | | | | 233,701 | | | | USD | | | | 167,654 | | | | (242 | ) |
| | | | | | | | | | | | | | | | | | | | | | | $ | 13,281 | |
Futures contracts
| | Expiration
Date | | | Number of
Contracts | | | Notional
Amount | | | Value/ Net
Unrealized
Appreciation/
(Depreciation) | |
Long | | | | | | | | | | | | | | | | |
U.S. Treasury Long Bond | | | 12/21/20 | | | | 31 | | | $ | 5,471,527 | | | $ | (6,808 | ) |
U.S. Treasury Ultra Bond | | | 12/21/20 | | | | 58 | | | | 13,041,695 | | | | (176,570 | ) |
U.S. Treasury Note 2 Year | | | 12/31/20 | | | | 164 | | | | 36,221,472 | | | | 16,122 | |
| | | | | | | | | | | | | | | $ | (167,256 | ) |
The accompanying notes are an integral part of the financial statements.
108
MassMutual Premier Diversified Bond Fund — Portfolio of Investments (Continued) |
| | Expiration
Date | | | Number of
Contracts | | | Notional
Amount | | | Value/ Net
Unrealized
Appreciation/
(Depreciation) | |
Short | | | | | | | | | | | | | | | | |
90 Day Eurodollar | | | 12/14/20 | | | | 2 | | | $ | (487,568 | ) | | $ | (11,207 | ) |
U.S. Treasury Ultra 10 Year | | | 12/21/20 | | | | 45 | | | | (7,180,828 | ) | | | (15,656 | ) |
U.S. Treasury Note 5 Year | | | 12/31/20 | | | | 8 | | | | (1,007,944 | ) | | | (306 | ) |
90 Day Eurodollar | | | 3/15/21 | | | | 2 | | | | (487,743 | ) | | | (11,282 | ) |
90 Day Eurodollar | | | 9/13/21 | | | | 3 | | | | (731,728 | ) | | | (16,847 | ) |
90 Day Eurodollar | | | 3/14/22 | | | | 3 | | | | (731,503 | ) | | | (16,847 | ) |
90 Day Eurodollar | | | 9/19/22 | | | | 3 | | | | (731,203 | ) | | | (16,997 | ) |
90 Day Eurodollar | | | 3/13/23 | | | | 2 | | | | (487,168 | ) | | | (11,432 | ) |
90 Day Eurodollar | | | 12/18/23 | | | | 3 | | | | (730,078 | ) | | | (16,997 | ) |
90 Day Eurodollar | | | 12/16/24 | | | | 6 | | | | (1,458,353 | ) | | | (32,872 | ) |
| | | | | | | | | | | | | | | $ | (150,443 | ) |
Centrally Cleared Credit Default Swaps - Buy Protection
Reference
Obligation/Index | | Rate Paid
by Fund | | | Payment
Frequency | | Termination
Date | | Notional Amount | | Value | | | Upfront
Premium
Paid/
(Received) | | | Unrealized
Appreciation
(Depreciation) | |
| CDX.NA.IG Series 35† | | | 1.00 | % | | Quarterly | | 12/20/2025 | | USD | | | 900,000 | | | $ | (18,757 | ) | | $ | (22,051 | ) | | $ | 3,294 | |
| CDX.NA.IG Series 35† | | | 1.00 | % | | Quarterly | | 12/20/2025 | | USD | | | 1,100,000 | | | | (22,925 | ) | | | (26,286 | ) | | | 3,361 | |
| | | | | | | | | | | | | | | | | $ | (41,682 | ) | | $ | (48,337 | ) | | $ | 6,655 | |
* | Contracts are subject to a Master Netting Agreement. |
† | Payment is based on a percentage of the index. Reference entities are a number of individual issuers comprising the index. |
Currency Legend
The accompanying notes are an integral part of the financial statements.
109
MassMutual Premier Diversified Bond Fund — Portfolio of Investments (Continued) |
Country weightings, as a percentage of net assets, is as follows:
United States | | | 78.9 | % |
Cayman Islands | | | 6.5 | % |
Canada | | | 2.3 | % |
United Kingdom | | | 2.0 | % |
Bermuda | | | 1.7 | % |
Netherlands | | | 1.3 | % |
Mexico | | | 1.1 | % |
Luxembourg | | | 0.5 | % |
Norway | | | 0.4 | % |
Ireland | | | 0.4 | % |
United Arab Emirates | | | 0.3 | % |
Switzerland | | | 0.3 | % |
Colombia | | | 0.2 | % |
Finland | | | 0.2 | % |
Saudi Arabia | | | 0.2 | % |
Germany | | | 0.2 | % |
Spain | | | 0.2 | % |
Australia | | | 0.1 | % |
Panama | | | 0.1 | % |
Japan | | | 0.1 | % |
Chile | | | 0.1 | % |
Total Long-Term Investments | | | 97.1 | % |
Short-Term Investments and Other Assets and Liabilities | | | 2.9 | % |
Net Assets | | | 100.0 | % |
The accompanying notes are an integral part of the financial statements.
110
MassMutual Premier High Yield Fund — Portfolio of Investments |
September 30, 2020 |
| | | Number of
Shares | | | Value | |
EQUITIES — 0.1% |
COMMON STOCK — 0.1% |
Basic Materials — 0.0% |
Forest Products & Paper — 0.0% |
The Newark Group, Inc. (a) (b) | | | 329,969 | | | $ | 9,899 | |
Consumer, Non-cyclical — 0.0% |
Agriculture — 0.0% |
Pinnacle Operating Corp. (a) (b) | | | 313,098 | | | | — | |
Energy — 0.1% |
Oil & Gas — 0.1% |
Fieldwood Energy LLC (a) | | | 10,961 | | | | 110 | |
Fieldwood Energy LLC (a) | | | 44,668 | | | | 447 | |
Jupiter Resources, Inc. (a) | | | 610,239 | | | | 457,679 | |
| | | | | | | | 458,236 | |
| | | | | | | | | |
TOTAL COMMON STOCK (Cost $4,333,621) | | | | | | | 468,135 | |
| | | | | | | | | |
TOTAL EQUITIES (Cost $4,333,621) | | | | | | | 468,135 | |
| | | Principal
Amount | | | | | |
BONDS & NOTES — 95.9% |
BANK LOANS — 3.3% |
Oil & Gas — 0.0% |
Fieldwood Energy LLC, Exit 2nd Lien Term Loan, | | | | | | | | |
0.000% 4/11/23 (c) | | $ | 3,084,695 | | | | 710 | |
Packaging & Containers — 1.3% |
BWAY Holding Co., 2017 Term Loan B, 3 mo. LIBOR + 3.250% | | | | | | | | |
3.523% VRN 4/03/24 | | | 4,561,635 | | | | 4,273,704 | |
Consolidated Energy Finance, SA, Term Loan B, 1 mo. LIBOR + 2.500% | | | | | | | | |
2.656% VRN 5/07/25 | | | 3,134,577 | | | | 2,848,547 | |
Trident TPI Holdings, Inc., 2017 USD Term Loan B1, 3 mo. LIBOR + 3.000% | | | | | | | | |
4.000% VRN 10/17/24 | | | 673,839 | | | | 656,151 | |
| | | | | | | | 7,778,402 | |
Software — 2.0% |
Banff Merger Sub, Inc., 2018 USD Term Loan B, 1 mo. LIBOR + 4.250% | | | | | | | | |
4.397% VRN 10/02/25 | | | 2,868,814 | | | | 2,778,189 | |
| | | Principal
Amount | | | Value | |
Finastra USA, Inc. | | | | | | | | |
USD 1st Lien Term Loan, 3 mo. LIBOR + 3.500%, 6 mo. LIBOR + 3.500% | | | | | | | | |
4.500% VRN 6/13/24 | | $ | 3,538,792 | | | $ | 3,300,808 | |
USD 2nd Lien Term Loan, 6 mo. LIBOR + 7.250% | | | | | | | | |
8.250% VRN 6/13/25 | | | 6,000,000 | | | | 5,619,000 | |
| | | | | | | | 11,697,997 | |
| | | | | | | | | |
TOTAL BANK LOANS (Cost $22,512,086) | | | | | | | 19,477,109 | |
| | | | | | | | | |
CORPORATE DEBT — 92.6% |
Advertising — 0.7% |
Clear Channel International BV | | | | | | | | |
6.625% 8/01/25 (d) | | | 1,570,000 | | | | 1,605,794 | |
Terrier Media Buyer, Inc. | | | | | | | | |
8.875% 12/15/27 (d) | | | 2,561,000 | | | | 2,580,207 | |
| | | | | | | | 4,186,001 | |
Aerospace & Defense — 3.2% |
Signature Aviation US Holdings, Inc. | | | | | | | | |
4.000% 3/01/28 (d) | | | 2,864,000 | | | | 2,663,520 | |
TransDigm, Inc. | | | | | | | | |
5.500% 11/15/27 | | | 4,192,000 | | | | 4,028,721 | |
6.250% 3/15/26 (d) | | | 1,250,000 | | | | 1,305,369 | |
6.375% 6/15/26 | | | 1,510,000 | | | | 1,515,934 | |
8.000% 12/15/25 (d) | | | 1,076,000 | | | | 1,170,150 | |
Triumph Group, Inc. | | | | | | | | |
5.250% 6/01/22 | | | 1,825,000 | | | | 1,496,500 | |
6.250% 9/15/24 (d) | | | 1,347,000 | | | | 1,146,351 | |
7.750% 8/15/25 | | | 4,319,000 | | | | 2,769,559 | |
8.875% 6/01/24 (d) | | | 2,147,000 | | | | 2,286,555 | |
| | | | | | | | 18,382,659 | |
Agriculture — 0.3% |
JBS Investments II GmbH | | | | | | | | |
7.000% 1/15/26 (d) | | | 1,574,000 | | | | 1,680,245 | |
Airlines — 0.9% |
American Airlines Group, Inc. | | | | | | | | |
3.750% 3/01/25 (d) | | | 1,440,000 | | | | 730,123 | |
Delta Air Lines, Inc. / SkyMiles IP Ltd. | | | | | | | | |
4.500% 10/20/25 (d) | | | 1,085,000 | | | | 1,114,135 | |
4.750% 10/20/28 (d) | | | 1,998,000 | | | | 2,074,482 | |
Mileage Plus Holdings LLC / Mileage Plus Intellectual Property Assets Ltd. | | | | | | | | |
6.500% 6/20/27 (d) | | | 1,137,000 | | | | 1,183,901 | |
| | | | | | | | 5,102,641 | |
The accompanying notes are an integral part of the financial statements.
111
MassMutual Premier High Yield Fund — Portfolio of Investments (Continued) |
| | | Principal
Amount | | | Value | |
Auto Manufacturers — 3.8% |
Allison Transmission, Inc. | | | | | | | | |
4.750% 10/01/27 (d) | | $ | 2,473,000 | | | $ | 2,544,099 | |
Ford Motor Co. | | | | | | | | |
7.450% 7/16/31 | | | 3,209,000 | | | | 3,702,384 | |
8.500% 4/21/23 | | | 1,325,000 | | | | 1,444,250 | |
9.000% 4/22/25 | | | 1,029,000 | | | | 1,179,759 | |
9.625% 4/22/30 | | | 3,100,000 | | | | 4,002,875 | |
Ford Motor Credit Co. LLC | | | | | | | | |
3.087% 1/09/23 | | | 650,000 | | | | 636,929 | |
3.664% 9/08/24 | | | 646,000 | | | | 632,127 | |
4.125% 8/17/27 | | | 1,335,000 | | | | 1,298,287 | |
4.134% 8/04/25 | | | 771,000 | | | | 763,610 | |
4.140% 2/15/23 | | | 342,000 | | | | 344,127 | |
4.389% 1/08/26 | | | 712,000 | | | | 703,876 | |
4.687% 6/09/25 | | | 1,000,000 | | | | 1,012,400 | |
5.113% 5/03/29 | | | 322,000 | | | | 330,050 | |
5.125% 6/16/25 | | | 1,236,000 | | | | 1,274,625 | |
5.596% 1/07/22 | | | 396,000 | | | | 404,910 | |
5.875% 8/02/21 | | | 1,796,000 | | | | 1,829,675 | |
| | | | | | | | 22,103,983 | |
Auto Parts & Equipment — 0.6% |
Adient Global Holdings Ltd. | | | | | | | | |
4.875% 8/15/26 (d) | | | 762,000 | | | | 725,805 | |
Adient US LLC | | | | | | | | |
9.000% 4/15/25 (d) | | | 466,000 | | | | 513,765 | |
Clarios Global LP | | | | | | | | |
6.750% 5/15/25 (d) | | | 452,000 | | | | 475,730 | |
Clarios Global LP/Clarios US Finance Co. | | | | | | | | |
8.500% 5/15/27 (d) | | | 1,946,000 | | | | 2,009,245 | |
| | | | | | | | 3,724,545 | |
Building Materials — 2.3% |
Cemex SAB de CV | | | | | | | | |
5.200% 9/17/30 (d) | | | 1,289,000 | | | | 1,295,316 | |
7.375% 6/05/27 (d) | | | 1,499,000 | | | | 1,619,684 | |
Cornerstone Building Brands, Inc. | | | | | | | | |
6.125% 1/15/29 (d) | | | 1,575,000 | | | | 1,595,302 | |
Forterra Finance LLC / FRTA Finance Corp. | | | | | | | | |
6.500% 7/15/25 (d) | | | 640,000 | | | | 676,192 | |
Griffon Corp. | | | | | | | | |
5.750% 3/01/28 | | | 1,258,000 | | | | 1,313,138 | |
James Hardie International Finance DAC | | | | | | | | |
4.750% 1/15/25 (d) | | | 1,027,000 | | | | 1,048,824 | |
5.000% 1/15/28 (d) | | | 1,102,000 | | | | 1,148,835 | |
PGT Innovations, Inc. | | | | | | | | |
6.750% 8/01/26 (d) | | | 1,279,000 | | | | 1,362,135 | |
| | | Principal
Amount | | | Value | |
Standard Industries, Inc. | | | | | | | | |
4.750% 1/15/28 (d) | | $ | 2,619,000 | | | $ | 2,717,213 | |
Summit Materials LLC / Summit Materials Finance Corp. | | | | | | | | |
5.250% 1/15/29 (d) | | | 836,000 | | | | 870,485 | |
| | | | | | | | 13,647,124 | |
Chemicals — 1.6% |
CF Industries, Inc. | | | | | | | | |
4.950% 6/01/43 | | | 266,000 | | | | 309,311 | |
5.375% 3/15/44 | | | 1,040,000 | | | | 1,251,515 | |
Consolidated Energy Finance SA | | | | | | | | |
6.875% 6/15/25 (d) | | | 4,286,000 | | | | 3,900,260 | |
CVR Partners LP/CVR Nitrogen Finance Corp. | | | | | | | | |
9.250% 6/15/23 (d) | | | 1,732,000 | | | | 1,602,100 | |
Nouryon Holding BV | | | | | | | | |
8.000% 10/01/26 (d) | | | 604,000 | | | | 639,322 | |
Valvoline, Inc. | | | | | | | | |
4.250% 2/15/30 (d) | | | 940,000 | | | | 958,800 | |
4.375% 8/15/25 | | | 653,000 | | | | 671,774 | |
| | | | | | | | 9,333,082 | |
Coal — 1.6% |
Peabody Energy Corp. | | | | | | | | |
6.000% 3/31/22 (d) | | | 8,054,000 | | | | 4,671,320 | |
SunCoke Energy Partners LP/SunCoke Energy Partners Finance Corp. | | | | | | | | |
7.500% 6/15/25 (d) | | | 1,841,000 | | | | 1,660,619 | |
Warrior Met Coal, Inc. | | | | | | | | |
8.000% 11/01/24 (d) | | | 2,960,000 | | | | 3,014,582 | |
| | | | | | | | 9,346,521 | |
Commercial Services — 0.9% |
Prime Security Services Borrower LLC / Prime Finance, Inc. | | | | | | | | |
6.250% 1/15/28 (d) | | | 3,925,000 | | | | 3,974,062 | |
Sabre GLBL, Inc. | | | | | | | | |
9.250% 4/15/25 (d) | | | 306,000 | | | | 336,774 | |
TMS International Holding Corp. | | | | | | | | |
7.250% 8/15/25 (d) | | | 1,046,000 | | | | 976,703 | |
| | | | | | | | 5,287,539 | |
Computers — 1.9% |
Banff Merger Sub, Inc. | | | | | | | | |
9.750% 9/01/26 (d) | | | 2,792,000 | | | | 2,951,423 | |
Dell International LLC/EMC Corp. | | | | | | | | |
7.125% 6/15/24 (d) | | | 3,673,000 | | | | 3,820,618 | |
Diebold Nixdorf, Inc. | | | | | | | | |
9.375% 7/15/25 (d) | | | 3,050,000 | | | | 3,217,750 | |
The accompanying notes are an integral part of the financial statements.
112
MassMutual Premier High Yield Fund — Portfolio of Investments (Continued) |
| | | Principal
Amount | | | Value | |
Presidio Holdings, Inc. | | | | | | | | |
8.250% 2/01/28 (d) | | $ | 442,000 | | | $ | 462,995 | |
Science Applications International Corp. | | | | | | | | |
4.875% 4/01/28 (d) | | | 861,000 | | | | 874,165 | |
| | | | | | | | 11,326,951 | |
Distribution & Wholesale — 1.5% |
Core & Main Holdings LP | | | | | | | | |
8.625% 9/15/24 (d) | | | 657,000 | | | | 661,928 | |
Core & Main LP | | | | | | | | |
6.125% 8/15/25 (d) | | | 1,330,000 | | | | 1,347,190 | |
KAR Auction Services, Inc. | | | | | | | | |
5.125% 6/01/25 (d) | | | 2,548,000 | | | | 2,547,949 | |
Resideo Funding, Inc. | | | | | | | | |
6.125% 11/01/26 (d) | | | 4,000,000 | | | | 3,940,000 | |
| | | | | | | | 8,497,067 | |
Diversified Financial Services — 2.6% |
Alliance Data Systems Corp. | | | | | | | | |
4.750% 12/15/24 (d) | | | 3,554,000 | | | | 3,331,164 | |
Global Aircraft Leasing Co. Ltd. | | | | | | | | |
6.500% 9/15/24 (d) | | | 6,217,500 | | | | 3,466,256 | |
LPL Holdings, Inc. | | | | | | | | |
4.625% 11/15/27 (d) | | | 1,425,000 | | | | 1,439,250 | |
5.750% 9/15/25 (d) | | | 4,383,000 | | | | 4,541,599 | |
OneMain Finance Corp. | | | | | | | | |
5.375% 11/15/29 | | | 2,393,000 | | | | 2,488,720 | |
| | | | | | | | 15,266,989 | |
Electric — 1.9% |
NRG Energy, Inc. | | | | | | | | |
5.250% 6/15/29 (d) | | | 1,660,000 | | | | 1,805,250 | |
PG&E Corp. | | | | | | | | |
5.000% 7/01/28 | | | 3,549,000 | | | | 3,442,530 | |
5.250% 7/01/30 | | | 501,000 | | | | 484,717 | |
Pike Corp. | | | | | | | | |
5.500% 9/01/28 (d) | | | 2,046,000 | | | | 2,058,665 | |
Vistra Operations Co. LLC | | | | | | | | |
4.300% 7/15/29 (d) | | | 2,779,000 | | | | 3,033,340 | |
| | | | | | | | 10,824,502 | |
Electrical Components & Equipment — 0.4% |
WESCO Distribution, Inc. Co. | | | | | | | | |
7.125% 6/15/25 (d) | | | 1,013,000 | | | | 1,103,461 | |
7.250% 6/15/28 (d) | | | 1,046,000 | | | | 1,146,076 | |
| | | | | | | | 2,249,537 | |
Engineering & Construction — 0.7% |
MasTec, Inc. | | | | | | | | |
4.500% 8/15/28 (d) | | | 1,762,000 | | | | 1,779,620 | |
| | | Principal
Amount | | | Value | |
New Enterprise Stone & Lime Co., Inc. | | | | | | | | |
9.750% 7/15/28 (d) | | $ | 1,374,000 | | | $ | 1,483,920 | |
Weekley Homes LLC / Weekley Finance Corp. | | | | | | | | |
4.875% 9/15/28 (d) | | | 697,000 | | | | 703,970 | |
| | | | | | | | 3,967,510 | |
Entertainment — 2.2% |
Banijay Entertainment SASU | | | | | | | | |
5.375% 3/01/25 (d) | | | 1,083,000 | | | | 1,089,769 | |
Boyne USA, Inc. | | | | | | | | |
7.250% 5/01/25 (d) | | | 632,000 | | | | 663,600 | |
Caesars Entertainment, Inc. | | | | | | | | |
6.250% 7/01/25 (d) | | | 1,847,000 | | | | 1,930,568 | |
8.125% 7/01/27 (d) | | | 1,888,000 | | | | 2,001,280 | |
Caesars Resort Collection LLC / CRC Finco, Inc. | | | | | | | | |
5.250% 10/15/25 (d) | | | 1,123,000 | | | | 1,086,502 | |
5.750% 7/01/25 (d) | | | 1,035,000 | | | | 1,067,344 | |
Live Nation Entertainment, Inc. | | | | | | | | |
4.750% 10/15/27 (d) | | | 2,788,000 | | | | 2,611,129 | |
Scientific Games International, Inc. | | | | | | | | |
5.000% 10/15/25 (d) | | | 873,000 | | | | 877,365 | |
7.250% 11/15/29 (d) | | | 800,000 | | | | 812,000 | |
8.250% 3/15/26 (d) | | | 160,000 | | | | 167,054 | |
8.625% 7/01/25 (d) | | | 627,000 | | | | 654,259 | |
| | | | | | | | 12,960,870 | |
Foods — 3.6% |
JBS USA LUX SA/JBS USA Finance, Inc. | | | | | | | | |
5.750% 6/15/25 (d) | | | 1,329,000 | | | | 1,369,933 | |
6.500% 4/15/29 (d) | | | 4,969,000 | | | | 5,515,441 | |
6.750% 2/15/28 (d) | | | 2,816,000 | | | | 3,062,175 | |
JBS USA LUX SA/JBS USA Food Co./JBS USA Finance, Inc. | | | | | | | | |
5.500% 1/15/30 (d) | | | 3,745,000 | | | | 4,076,320 | |
Kraft Heinz Foods Co. | | | | | | | | |
4.625% 1/30/29 | | | 2,213,000 | | | | 2,463,809 | |
5.200% 7/15/45 | | | 830,000 | | | | 907,383 | |
6.500% 2/09/40 | | | 2,000,000 | | | | 2,541,836 | |
6.875% 1/26/39 | | | 434,000 | | | | 581,325 | |
Simmons Foods, Inc. | | | | | | | | |
7.750% 1/15/24 (d) | | | 555,000 | | | | 581,363 | |
| | | | | | | | 21,099,585 | |
Forest Products & Paper — 0.2% |
Clearwater Paper Corp. | | | | | | | | |
4.750% 8/15/28 (d) | | | 1,055,000 | | | | 1,057,637 | |
The accompanying notes are an integral part of the financial statements.
113
MassMutual Premier High Yield Fund — Portfolio of Investments (Continued) |
| | | Principal
Amount | | | Value | |
Hand & Machine Tools — 0.5% |
Apex Tool Group LLC/BC Mountain Finance, Inc. | | | | | | | | |
9.000% 2/15/23 (d) | | $ | 3,171,000 | | | $ | 2,933,175 | |
Health Care – Products — 0.7% |
Avanos Medical, Inc. | | | | | | | | |
6.250% 10/15/22 | | | 3,824,000 | | | | 3,825,530 | |
Health Care – Services — 3.8% |
Centene Corp. | | | | | | | | |
4.250% 12/15/27 | | | 985,000 | | | | 1,030,734 | |
4.625% 12/15/29 | | | 3,765,000 | | | | 4,061,155 | |
5.250% 4/01/25 (d) | | | 656,000 | | | | 681,748 | |
5.375% 6/01/26 (d) | | | 226,000 | | | | 238,148 | |
Encompass Health Corp. Co. | | | | | | | | |
4.625% 4/01/31 (e) | | | 948,000 | | | | 948,000 | |
HCA, Inc. | | | | | | | | |
3.500% 9/01/30 | | | 6,313,000 | | | | 6,432,189 | |
Molina Healthcare, Inc. | | | | | | | | |
4.375% 6/15/28 (d) | | | 860,000 | | | | 877,630 | |
Radiology Partners, Inc. | | | | | | | | |
9.250% 2/01/28 (d) | | | 1,333,000 | | | | 1,386,320 | |
Tenet Healthcare Corp. | | | | | | | | |
4.625% 9/01/24 (d) | | | 806,000 | | | | 812,545 | |
4.875% 1/01/26 (d) | | | 2,600,000 | | | | 2,647,216 | |
5.125% 11/01/27 (d) | | | 392,000 | | | | 402,662 | |
6.125% 10/01/28 (d) | | | 1,400,000 | | | | 1,361,500 | |
8.125% 4/01/22 | | | 968,000 | | | | 1,076,319 | |
| | | | | | | | 21,956,166 | |
Home Builders — 2.1% |
Brookfield Residential Properties, Inc. | | | | | | | | |
6.375% 5/15/25 (d) | | | 827,000 | | | | 827,000 | |
Brookfield Residential Properties, Inc. / Brookfield Residential US Corp. | | | | | | | | |
4.875% 2/15/30 (d) | | | 1,165,000 | | | | 1,090,452 | |
M/I Homes, Inc. | | | | | | | | |
4.950% 2/01/28 | | | 1,544,000 | | | | 1,590,320 | |
5.625% 8/01/25 | | | 1,629,000 | | | | 1,686,015 | |
Mattamy Group Corp. | | | | | | | | |
4.625% 3/01/30 (d) | | | 4,214,000 | | | | 4,267,096 | |
STL Holding Co. LLC | | | | | | | | |
7.500% 2/15/26 (d) | | | 2,000,000 | | | | 2,007,500 | |
TRI Pointe Group, Inc. | | | | | | | | |
5.700% 6/15/28 | | | 649,000 | | | | 710,655 | |
| | | | | | | | 12,179,038 | |
Housewares — 0.4% |
Newell Brands, Inc. | | | | | | | | |
4.700% STEP 4/01/26 | | | 1,351,000 | | | | 1,438,815 | |
| | | Principal
Amount | | | Value | |
5.875% STEP 4/01/36 | | $ | 596,000 | | | $ | 682,635 | |
| | | | | | | | 2,121,450 | |
Insurance — 0.8% |
Acrisure LLC/Acrisure Finance, Inc. | | | | | | | | |
7.000% 11/15/25 (d) | | | 3,199,000 | | | | 3,142,618 | |
8.125% 2/15/24 (d) | | | 448,000 | | | | 469,280 | |
Amwins Group, Inc. | | | | | | | | |
7.750% 7/01/26 (d) | | | 1,145,000 | | | | 1,225,150 | |
| | | | | | | | 4,837,048 | |
Internet — 1.5% |
Netflix, Inc. | | | | | | | | |
4.875% 6/15/30 (d) | | | 1,353,000 | | | | 1,542,420 | |
5.375% 11/15/29 (d) | | | 2,115,000 | | | | 2,492,845 | |
5.875% 11/15/28 | | | 1,961,000 | | | | 2,339,875 | |
Northwest Fiber LLC / Northwest Fiber Finance Sub, Inc. | | | | | | | | |
10.750% 6/01/28 (d) | | | 549,000 | | | | 598,410 | |
Uber Technologies, Inc. | | | | | | | | |
6.250% 1/15/28 (d) | | | 1,640,000 | | | | 1,684,608 | |
| | | | | | | | 8,658,158 | |
Investment Companies — 2.0% |
Icahn Enterprises LP/ Icahn Enterprises Finance Corp. | | | | | | | | |
4.750% 9/15/24 | | | 1,388,000 | | | | 1,405,350 | |
Icahn Enterprises LP/Icahn Enterprises Finance Corp. | | | | | | | | |
5.250% 5/15/27 | | | 4,518,000 | | | | 4,706,852 | |
6.250% 5/15/26 | | | 1,000,000 | | | | 1,042,500 | |
6.375% 12/15/25 | | | 4,385,000 | | | | 4,507,627 | |
| | | | | | | | 11,662,329 | |
Iron & Steel — 0.7% |
Big River Steel LLC / BRS Finance Corp. | | | | | | | | |
6.625% 1/31/29 (d) | | | 1,180,000 | | | | 1,193,157 | |
Cleveland-Cliffs, Inc. | | | | | | | | |
6.750% 3/15/26 (d) | | | 3,026,000 | | | | 3,078,955 | |
| | | | | | | | 4,272,112 | |
Leisure Time — 1.1% |
Brunswick Corp. | | | | | | | | |
7.375% 9/01/23 | | | 650,000 | | | | 751,320 | |
7.125% 8/01/27 | | | 2,494,000 | | | | 3,076,851 | |
Carlson Travel, Inc. | | | | | | | | |
6.750% 12/15/25 (d) | | | 1,198,000 | | | | 904,490 | |
11.500% 12/15/26 (d) | | | 3,108,000 | | | | 1,872,290 | |
| | | | | | | | 6,604,951 | |
Lodging — 1.4% |
Wyndham Destinations, Inc. | | | | | | | | |
6.625% 7/31/26 (d) | | | 1,980,000 | | | | 2,074,268 | |
The accompanying notes are an integral part of the financial statements.
114
MassMutual Premier High Yield Fund — Portfolio of Investments (Continued) |
| | | Principal
Amount | | | Value | |
Wyndham Hotels & Resorts, Inc. | | | | | | | | |
4.375% 8/15/28 (d) | | $ | 854,000 | | | $ | 828,380 | |
Wynn Las Vegas LLC/Wynn Las Vegas Capital Corp. | | | | | | | | |
5.250% 5/15/27 (d) | | | 1,195,000 | | | | 1,111,350 | |
5.500% 3/01/25 (d) | | | 3,361,000 | | | | 3,171,944 | |
Wynn Macau Ltd. | | | | | | | | |
5.125% 12/15/29 (d) | | | 1,114,000 | | | | 1,068,855 | |
| | | | | | | | 8,254,797 | |
Machinery – Diversified — 0.3% |
Clark Equipment Co. | | | | | | | | |
5.875% 6/01/25 (d) | | | 1,260,000 | | | | 1,305,675 | |
Vertical US Newco, Inc. | | | | | | | | |
5.250% 7/15/27 (d) | | | 357,000 | | | | 371,018 | |
| | | | | | | | 1,676,693 | |
Media — 9.8% |
Altice Financing SA | | | | | | | | |
5.000% 1/15/28 (d) | | | 1,325,000 | | | | 1,286,906 | |
7.500% 5/15/26 (d) | | | 3,289,000 | | | | 3,481,505 | |
Block Communications, Inc. | | | | | | | | |
4.875% 3/01/28 (d) | | | 1,516,000 | | | | 1,546,320 | |
CCO Holdings LLC/CCO Holdings Capital Corp. | | | | | | | | |
4.500% 8/15/30 (d) | | | 3,525,000 | | | | 3,701,409 | |
4.500% 5/01/32 (d) | | | 223,000 | | | | 232,756 | |
4.750% 3/01/30 (d) | | | 486,000 | | | | 514,553 | |
5.125% 5/01/27 (d) | | | 872,000 | | | | 917,536 | |
5.375% 6/01/29 (d) | | | 2,500,000 | | | | 2,709,375 | |
Clear Channel Worldwide Holdings, Inc. | | | | | | | | |
5.125% 8/15/27 (d) | | | 1,398,000 | | | | 1,342,429 | |
9.250% 2/15/24 | | | 853,000 | | | | 826,898 | |
CSC Holdings LLC | | | | | | | | |
3.375% 2/15/31 (d) | | | 2,827,000 | | | | 2,737,243 | |
4.625% 12/01/30 (d) | | | 2,279,000 | | | | 2,296,092 | |
7.500% 4/01/28 (d) | | | 2,001,000 | | | | 2,208,204 | |
DISH DBS Corp. | | | | | | | | |
5.000% 3/15/23 | | | 902,000 | | | | 920,040 | |
DISH Network Corp. | | | | | | | | |
3.375% 8/15/26 | | | 2,964,000 | | | | 2,720,942 | |
GCI LLC | | | | | | | | |
6.625% 6/15/24 (d) | | | 1,137,000 | | | | 1,219,546 | |
iHeartCommunications, Inc. | | | | | | | | |
8.375% 5/01/27 | | | 2,033,000 | | | | 2,002,505 | |
LCPR Senior Secured Financing DAC | | | | | | | | |
6.750% 10/15/27 (d) | | | 1,343,000 | | | | 1,403,435 | |
Midcontinent Communications / Midcontinent Finance Corp. | | | | | | | | |
5.375% 8/15/27 (d) | | | 930,000 | | | | 955,575 | |
| | | Principal
Amount | | | Value | |
Radiate Holdco LLC / Radiate Finance, Inc. | | | | | | | | |
4.500% 9/15/26 (d) | | $ | 3,691,000 | | | $ | 3,690,225 | |
6.500% 9/15/28 (d) | | | 4,200,000 | | | | 4,304,002 | |
Sirius XM Radio, Inc. | | | | | | | | |
5.375% 7/15/26 (d) | | | 2,668,000 | | | | 2,776,588 | |
TEGNA, Inc. | | | | | | | | |
4.625% 3/15/28 (d) | | | 1,877,000 | | | | 1,835,331 | |
Townsquare Media, Inc. | | | | | | | | |
6.500% 4/01/23 (d) | | | 562,000 | | | | 514,933 | |
Videotron Ltd. | | | | | | | | |
5.125% 4/15/27 (d) | | | 89,000 | | | | 93,628 | |
Virgin Media Finance PLC | | | | | | | | |
5.000% 7/15/30 (d) | | | 626,000 | | | | 622,870 | |
Virgin Media Secured Finance PLC | | | | | | | | |
5.500% 5/15/29 (d) | | | 7,354,000 | | | | 7,894,151 | |
Ziggo BV | | | | | | | | |
4.875% 1/15/30 (d) | | | 656,000 | | | | 678,960 | |
5.500% 1/15/27 (d) | | | 1,449,000 | | | | 1,517,827 | |
| | | | | | | | 56,951,784 | |
Mining — 3.8% |
Arconic Corp. | | | | | | | | |
6.125% 2/15/28 (d) | | | 455,000 | | | | 467,228 | |
Compass Minerals International, Inc. | | | | | | | | |
4.875% 7/15/24 (d) | | | 1,040,000 | | | | 1,061,018 | |
6.750% 12/01/27 (d) | | | 1,855,000 | | | | 2,003,400 | |
First Quantum Minerals Ltd. | | | | | | | | |
6.500% 3/01/24 (d) | | | 2,110,000 | | | | 2,022,962 | |
6.875% 3/01/26 (d) | | | 1,191,000 | | | | 1,147,826 | |
6.875% 10/15/27 (d) (e) | | | 4,000,000 | | | | 3,855,000 | |
7.500% 4/01/25 (d) | | | 2,796,000 | | | | 2,765,552 | |
Freeport-McMoRan, Inc. | | | | | | | | |
4.125% 3/01/28 | | | 326,000 | | | | 330,075 | |
4.375% 8/01/28 | | | 1,544,000 | | | | 1,596,427 | |
4.625% 8/01/30 | | | 2,600,000 | | | | 2,733,770 | |
Hudbay Minerals, Inc. | | | | | | | | |
6.125% 4/01/29 (d) | | | 678,000 | | | | 671,220 | |
Kinross Gold Corp. | | | | | | | | |
6.875% 9/01/41 | | | 1,177,000 | | | | 1,541,111 | |
New Gold, Inc. | | | | | | | | |
6.375% 5/15/25 (d) | | | 1,608,000 | | | | 1,660,260 | |
Northwest Acquisitions ULC/Dominion Finco, Inc. | | | | | | | | |
7.125% 11/01/22 (c) (d) | | | 3,748,000 | | | | 59,968 | |
Novelis Corp. | | | | | | | | |
4.750% 1/30/30 (d) | | | 338,000 | | | | 331,990 | |
| | | | | | | | 22,247,807 | |
The accompanying notes are an integral part of the financial statements.
115
MassMutual Premier High Yield Fund — Portfolio of Investments (Continued) |
| | | Principal
Amount | | | Value | |
Miscellaneous - Manufacturing — 1.0% |
Amsted Industries, Inc. | | | | | | | | |
5.625% 7/01/27 (d) | | $ | 2,783,000 | | | $ | 2,960,611 | |
Gates Global LLC / Gates Corp. | | | | | | | | |
6.250% 1/15/26 (d) | | | 2,800,000 | | | | 2,886,212 | |
| | | | | | | | 5,846,823 | |
Oil & Gas — 7.2% |
Antero Resources Corp. | | | | | | | | |
5.375% 11/01/21 | | | 1,684,000 | | | | 1,599,800 | |
Apache Corp. | | | | | | | | |
4.375% 10/15/28 | | | 557,000 | | | | 509,655 | |
4.750% 4/15/43 | | | 278,000 | | | | 247,246 | |
5.100% 9/01/40 | | | 556,000 | | | | 497,967 | |
5.350% 7/01/49 | | | 832,000 | | | | 734,240 | |
Cenovus Energy, Inc. | | | | | | | | |
4.250% 4/15/27 | | | 394,000 | | | | 356,208 | |
5.250% 6/15/37 | | | 1,000,000 | | | | 862,558 | |
5.400% 6/15/47 | | | 581,000 | | | | 490,857 | |
6.750% 11/15/39 | | | 656,000 | | | | 659,509 | |
Continental Resources, Inc. | | | | | | | | |
3.800% 6/01/24 | | | 638,000 | | | | 588,555 | |
4.375% 1/15/28 | | | 719,000 | | | | 622,834 | |
CVR Energy, Inc. | | | | | | | | |
5.250% 2/15/25 (d) | | | 1,500,000 | | | | 1,305,000 | |
5.750% 2/15/28 (d) | | | 6,102,000 | | | | 5,186,700 | |
Endeavor Energy Resources LP / EER Finance, Inc. | | | | | | | | |
6.625% 7/15/25 (d) | | | 1,277,000 | | | | 1,312,117 | |
Hilcorp Energy I LP / Hilcorp Finance Co. | | | | | | | | |
5.000% 12/01/24 (d) | | | 338,000 | | | | 306,735 | |
5.750% 10/01/25 (d) | | | 186,000 | | | | 168,330 | |
6.250% 11/01/28 (d) | | | 1,910,000 | | | | 1,738,100 | |
Jonah Energy LLC/Jonah Energy Finance Corp. | | | | | | | | |
7.250% 10/15/25 (d) | | | 2,599,000 | | | | 289,139 | |
Jupiter Resources, Inc | | | | | | | | |
10.000% 1/31/24 (b) (f) | | | 738,589 | | | | 717,488 | |
Laredo Petroleum, Inc. | | | | | | | | |
9.500% 1/15/25 | | | 1,117,000 | | | | 665,643 | |
10.125% 1/15/28 | | | 1,373,000 | | | | 810,070 | |
MEG Energy Corp. | | | | | | | | |
7.125% 2/01/27 (d) | | | 2,722,000 | | | | 2,441,171 | |
Nabors Industries Ltd. | | | | | | | | |
7.250% 1/15/26 (d) | | | 769,000 | | | | 378,732 | |
7.500% 1/15/28 (d) | | | 465,000 | | | | 223,781 | |
Neptune Energy Bondco PLC | | | | | | | | |
6.625% 5/15/25 (d) | | | 2,750,000 | | | | 2,452,780 | |
| | | Principal
Amount | | | Value | |
Occidental Petroleum Corp. | | | | | | | | |
2.700% 8/15/22 | | $ | 683,000 | | | $ | 638,175 | |
2.700% 2/15/23 | | | 270,000 | | | | 247,050 | |
2.900% 8/15/24 | | | 391,000 | | | | 331,736 | |
3.500% 6/15/25 | | | 804,000 | | | | 667,320 | |
4.200% 3/15/48 | | | 133,000 | | | | 91,438 | |
4.400% 4/15/46 | | | 838,000 | | | | 595,156 | |
4.400% 8/15/49 | | | 328,000 | | | | 229,634 | |
4.500% 7/15/44 | | | 340,000 | | | | 243,312 | |
5.875% 9/01/25 | | | 822,000 | | | | 753,330 | |
6.200% 3/15/40 | | | 2,447,000 | | | | 2,027,584 | |
6.375% 9/01/28 | | | 839,000 | | | | 776,662 | |
6.450% 9/15/36 | | | 954,000 | | | | 813,285 | |
6.600% 3/15/46 | | | 1,500,000 | | | | 1,291,875 | |
6.950% 7/01/24 | | | 369,000 | | | | 357,118 | |
Ovintiv, Inc. | | | | | | | | |
6.500% 8/15/34 | | | 458,000 | | | | 426,498 | |
6.500% 2/01/38 | | | 214,000 | | | | 194,341 | |
6.625% 8/15/37 | | | 97,000 | | | | 88,715 | |
7.200% 11/01/31 | | | 129,000 | | | | 127,789 | |
7.375% 11/01/31 | | | 79,000 | | | | 78,871 | |
Parkland Corp. | | | | | | | | |
5.875% 7/15/27 (d) | | | 1,149,000 | | | | 1,207,886 | |
PBF Holding Co. LLC / PBF Finance Corp. | | | | | | | | |
6.000% 2/15/28 (d) | | | 5,518,000 | | | | 3,702,854 | |
7.250% 6/15/25 | | | 2,184,000 | | | | 1,648,920 | |
9.250% 5/15/25 (d) | | | 352,000 | | | | 360,807 | |
| | | | | | | | 42,065,571 | |
Oil & Gas Services — 0.4% |
Welltec A/S | | | | | | | | |
9.500% 12/01/22 (d) | | | 2,492,000 | | | | 2,192,960 | |
Packaging & Containers — 1.5% |
Graphic Packaging International LLC | | | | | | | | |
3.500% 3/15/28 (d) | | | 905,000 | | | | 902,737 | |
Mauser Packaging Solutions Holding Co. | | | | | | | | |
7.250% 4/15/25 (d) | | | 3,211,000 | | | | 3,022,354 | |
Plastipak Holdings, Inc. | | | | | | | | |
6.250% 10/15/25 (d) | | | 2,970,000 | | | | 2,970,000 | |
Trident TPI Holdings, Inc. | | | | | | | | |
9.250% 8/01/24 (d) | | | 1,614,000 | | | | 1,713,342 | |
| | | | | | | | 8,608,433 | |
Pharmaceuticals — 2.0% |
Bausch Health Americas, Inc. | | | | | | | | |
9.250% 4/01/26 (d) | | | 4,611,000 | | | | 5,072,100 | |
Bausch Health Cos., Inc. | | | | | | | | |
5.000% 1/30/28 (d) | | | 1,953,000 | | | | 1,896,851 | |
The accompanying notes are an integral part of the financial statements.
116
MassMutual Premier High Yield Fund — Portfolio of Investments (Continued) |
| | | Principal
Amount | | | Value | |
5.250% 1/30/30 (d) | | $ | 916,000 | | | $ | 902,260 | |
6.125% 4/15/25 (d) | | | 250,000 | | | | 255,938 | |
9.000% 12/15/25 (d) | | | 870,000 | | | | 946,386 | |
Par Pharmaceutical, Inc. | | | | | | | | |
7.500% 4/01/27 (d) | | | 2,647,000 | | | | 2,773,209 | |
| | | | | | | | 11,846,744 | |
Pipelines — 3.0% |
Buckeye Partners LP | | | | | | | | |
5.850% 11/15/43 | | | 277,000 | | | | 256,598 | |
Cheniere Energy Partners LP | | | | | | | | |
5.625% 10/01/26 | | | 2,397,000 | | | | 2,492,880 | |
DCP Midstream Operating LP | | | | | | | | |
5.625% 7/15/27 | | | 924,000 | | | | 945,252 | |
6.450% 11/03/36 (d) | | | 43,000 | | | | 41,206 | |
EnLink Midstream LLC | | | | | | | | |
5.375% 6/01/29 | | | 786,000 | | | | 636,660 | |
EnLink Midstream Partners LP | | | | | | | | |
4.850% 7/15/26 | | | 254,000 | | | | 219,738 | |
EQM Midstream Partners LP | | | | | | | | |
6.000% 7/01/25 (d) | | | 777,000 | | | | 801,281 | |
6.500% 7/01/27 (d) | | | 644,000 | | | | 682,653 | |
Genesis Energy LP/Genesis Energy Finance Corp. | | | | | | | | |
5.625% 6/15/24 | | | 610,000 | | | | 519,921 | |
6.000% 5/15/23 | | | 635,000 | | | | 576,263 | |
6.250% 5/15/26 | | | 290,000 | | | | 241,486 | |
6.500% 10/01/25 | | | 3,466,000 | | | | 2,998,090 | |
Harvest Midstream I LP | | | | | | | | |
7.500% 9/01/28 (d) | | | 1,049,000 | | | | 1,043,755 | |
Tallgrass Energy Partners LP/Tallgrass Energy Finance Corp. | | | | | | | | |
7.500% 10/01/25 (d) | | | 1,400,000 | | | | 1,405,670 | |
Targa Resources Partners LP/Targa Resources Partners Finance Corp. | | | | | | | | |
4.875% 2/01/31 (d) | | | 1,354,000 | | | | 1,311,247 | |
5.000% 1/15/28 | | | 139,000 | | | | 135,525 | |
5.500% 3/01/30 (d) | | | 122,000 | | | | 122,128 | |
6.875% 1/15/29 | | | 259,000 | | | | 277,052 | |
Western Midstream Operating LP | | | | | | | | |
5.050% STEP 2/01/30 | | | 618,000 | | | | 601,478 | |
5.300% 3/01/48 | | | 1,707,000 | | | | 1,374,135 | |
5.450% 4/01/44 | | | 850,000 | | | | 726,750 | |
| | | | | | | | 17,409,768 | |
Real Estate — 0.1% |
Realogy Group LLC/Realogy Co-Issuer Corp. | | | | | | | | |
9.375% 4/01/27 (d) | | | 742,000 | | | | 768,118 | |
| | | Principal
Amount | | | Value | |
Real Estate Investment Trusts (REITS) — 2.1% |
ESH Hospitality, Inc. | | | | | | | | |
4.625% 10/01/27 (d) | | $ | 1,689,000 | | | $ | 1,657,365 | |
Iron Mountain, Inc. | | | | | | | | |
5.250% 7/15/30 (d) | | | 1,273,000 | | | | 1,327,102 | |
MPT Operating Partnership LP/MPT Finance Corp. | | | | | | | | |
5.000% 10/15/27 | | | 1,778,000 | | | | 1,853,921 | |
Park Intermediate Holdings LLC / PK Domestic Property LLC / PK Finance Co-Issuer | | | | | | | | |
5.875% 10/01/28 (d) | | | 1,082,000 | | | | 1,079,295 | |
RHP Hotel Properties LP/RHP Finance Corp. | | | | | | | | |
4.750% 10/15/27 | | | 1,850,000 | | | | 1,705,552 | |
5.000% 4/15/23 | | | 1,315,000 | | | | 1,287,740 | |
Service Properties Trust | | | | | | | | |
3.950% 1/15/28 | | | 330,000 | | | | 273,900 | |
4.375% 2/15/30 | | | 521,000 | | | | 432,430 | |
4.950% 2/15/27 | | | 261,000 | | | | 232,290 | |
7.500% 9/15/25 | | | 2,061,000 | | | | 2,190,225 | |
| | | | | | | | 12,039,820 | |
Retail — 2.3% |
Asbury Automotive Group, Inc. | | | | | | | | |
4.500% 3/01/28 (d) | | | 940,000 | | | | 945,875 | |
4.750% 3/01/30 (d) | | | 277,000 | | | | 279,077 | |
Beacon Roofing Supply, Inc. | | | | | | | | |
4.875% 11/01/25 (d) | | | 1,917,000 | | | | 1,878,660 | |
Group 1 Automotive, Inc. | | | | | | | | |
4.000% 8/15/28 (d) | | | 398,000 | | | | 391,035 | |
Penske Automotive Group, Inc. | | | | | | | | |
3.500% 9/01/25 | | | 3,809,000 | | | | 3,793,478 | |
5.500% 5/15/26 | | | 3,689,000 | | | | 3,805,499 | |
Specialty Building Products Holdings LLC / SBP Finance Corp. | | | | | | | | |
6.375% 9/30/26 (d) | | | 2,016,000 | | | | 2,051,280 | |
| | | | | | | | 13,144,904 | |
Software — 4.5% |
BY Crown Parent LLC | | | | | | | | |
7.375% 10/15/24 (d) | | | 1,007,000 | | | | 1,022,105 | |
BY Crown Parent LLC / BY Bond Finance, Inc. | | | | | | | | |
4.250% 1/31/26 (d) | | | 4,709,000 | | | | 4,794,351 | |
CDK Global, Inc. | | | | | | | | |
5.250% 5/15/29 (d) | | | 278,000 | | | | 296,070 | |
Open Text Corp. | | | | | | | | |
3.875% 2/15/28 (d) | | | 1,384,000 | | | | 1,399,999 | |
Open Text Holdings, Inc. | | | | | | | | |
4.125% 2/15/30 (d) | | | 601,000 | | | | 618,092 | |
The accompanying notes are an integral part of the financial statements.
117
MassMutual Premier High Yield Fund — Portfolio of Investments (Continued) |
| | | Principal
Amount | | | Value | |
Solera LLC/ Solera Finance, Inc. | | | | | | | | |
10.500% 3/01/24 (d) | | $ | 3,995,000 | | | $ | 4,174,775 | |
SS&C Technologies, Inc. | | | | | | | | |
5.500% 9/30/27 (d) | | | 2,853,000 | | | | 3,031,940 | |
Veritas US, Inc./Veritas Bermuda Ltd. | | | | | | | | |
7.500% 9/01/25 (d) | | | 2,800,000 | | | | 2,887,500 | |
10.500% 2/01/24 (d) | | | 8,735,000 | | | | 8,214,394 | |
| | | | | | | | 26,439,226 | |
Storage & Warehousing — 0.5% |
LBC Tank Terminals Holding Netherlands BV | | | | | | | | |
6.875% 5/15/23 (d) | | | 3,188,000 | | | | 3,164,090 | |
Telecommunications — 5.9% |
Avaya, Inc. | | | | | | | | |
6.125% 9/15/28 (d) | | | 1,400,000 | | | | 1,427,440 | |
CenturyLink, Inc. | | | | | | | | |
5.125% 12/15/26 (d) | | | 2,211,000 | | | | 2,271,559 | |
6.750% 12/01/23 | | | 1,215,000 | | | | 1,331,944 | |
CommScope Technologies Finance LLC | | | | | | | | |
6.000% 6/15/25 (d) | | | 928,000 | | | | 940,574 | |
CommScope Technologies LLC | | | | | | | | |
5.000% 3/15/27 (d) | | | 1,015,000 | | | | 974,400 | |
CommScope, Inc. | | | | | | | | |
7.125% 7/01/28 (d) | | | 500,000 | | | | 513,750 | |
8.250% 3/01/27 (d) | | | 1,459,000 | | | | 1,517,360 | |
Consolidated Communications, Inc. | | | | | | | | |
6.500% 10/01/28 (d) (e) | | | 2,049,000 | | | | 2,089,980 | |
Hughes Satellite Systems Corp. | | | | | | | | |
6.625% 8/01/26 | | | 3,035,000 | | | | 3,284,477 | |
Sprint Capital Corp. | | | | | | | | |
8.750% 3/15/32 | | | 2,219,000 | | | | 3,248,194 | |
Sprint Corp. | | | | | | | | |
7.625% 3/01/26 | | | 3,526,000 | | | | 4,260,766 | |
7.875% 9/15/23 | | | 3,858,000 | | | | 4,431,877 | |
T-Mobile USA, Inc. | | | | | | | | |
4.500% 2/01/26 | | | 488,000 | | | | 502,835 | |
Telecom Italia Capital | | | | | | | | |
6.000% 9/30/34 | | | 704,000 | | | | 816,640 | |
Telecom Italia SpA | | | | | | | | |
5.303% 5/30/24 (d) | | | 2,027,000 | | | | 2,194,228 | |
ViaSat, Inc. | | | | | | | | |
5.625% 9/15/25 (d) | | | 1,272,000 | | | | 1,246,560 | |
5.625% 4/15/27 (d) | | | 796,000 | | | | 818,885 | |
6.500% 7/15/28 (d) | | | 1,654,000 | | | | 1,656,398 | |
Windstream Escrow LLC / Windstream Escrow Finance Corp. | | | | | | | | |
7.750% 8/15/28 (d) | | | 527,000 | | | | 517,778 | |
| | | | | | | | 34,045,645 | |
| | | Principal
Amount | | | Value | |
Toys, Games & Hobbies — 0.3% |
Mattel, Inc. | | | | | | | | |
6.750% 12/31/25 (d) | | $ | 1,534,000 | | | $ | 1,618,370 | |
Transportation — 2.0% |
Kenan Advantage Group, Inc. | | | | | | | | |
7.875% 7/31/23 (d) | | | 6,737,000 | | | | 6,534,890 | |
XPO Logistics, Inc. | | | | | | | | |
6.250% 5/01/25 (d) | | | 500,000 | | | | 534,307 | |
6.750% 8/15/24 (d) | | | 4,277,000 | | | | 4,530,199 | |
| | | | | | | | 11,599,396 | |
| | | | | | | | | |
TOTAL CORPORATE DEBT (Cost $545,896,995) | | | | | | | 539,015,894 | |
| | | | | | | | | |
TOTAL BONDS & NOTES (Cost $568,409,081) | | | | | | | 558,493,003 | |
| | | Number of
Shares | | | | | |
WARRANTS — 0.0% |
Basic Materials — 0.0% |
Forest Products & Paper — 0.0% |
Appvion Holding Corp. Tranche A, Expires 6/13/23, Strike price 31.25 (a) (b) (f) | | | 5,301 | | | | — | |
Appvion Holding Corp. Tranche B, Expires 6/13/23, Strike price 31.25 (a) (b) (f) | | | 5,301 | | | | — | |
| | | | | | | | — | |
| | | | | | | | | |
TOTAL WARRANTS (Cost $0) | | | | | | | — | |
| | | | | | | | | |
TOTAL LONG-TERM INVESTMENTS (Cost $572,742,702) | | | | | | | 558,961,138 | |
| | | Principal
Amount | | | | | |
SHORT-TERM INVESTMENTS — 2.9% |
Commercial Paper — 2.9% |
BAT International Finance PLC | | | | | | | | |
0.355% 10/15/20 (d) | | $ | 2,000,000 | | | | 1,999,642 | |
Bemis Co., Inc. | | | | | | | | |
0.183% 10/22/20 (d) | | | 5,000,000 | | | | 4,999,435 | |
Canadian Natural Resources Ltd. | | | | | | | | |
0.223% 10/14/20 (d) | | | 1,500,000 | | | | 1,499,896 | |
CenterPoint Energy, Inc. | | | | | | | | |
0.152% 10/01/20 (d) | | | 4,000,000 | | | | 3,999,988 | |
Duke Energy Corp. | | | | | | | | |
0.223% 1/04/21 (d) | | | 3,500,000 | | | | 3,497,778 | |
The accompanying notes are an integral part of the financial statements.
118
MassMutual Premier High Yield Fund — Portfolio of Investments (Continued) |
| | | Principal
Amount | | | Value | |
Harley-Davidson Funding Corp. | | | | | | | | |
0.203% 10/29/20 (d) | | $ | 1,000,000 | | | $ | 999,848 | |
| | | | | | | | 16,996,587 | |
| | | | | | | | | |
TOTAL SHORT-TERM INVESTMENTS (Cost $16,996,896) | | | | | | | 16,996,587 | |
| | | | | | | | | |
TOTAL INVESTMENTS — 98.9% (Cost $589,739,598) (g) | | | | | | | 575,957,725 | |
| | | | | | | | | |
Other Assets/(Liabilities) — 1.1% | | | | | | | 6,174,786 | |
| | | | | | | | | |
NET ASSETS — 100.0% | | | | | | $ | 582,132,511 | |
Abbreviation Legend
Notes to Portfolio of Investments
Percentages are stated as a percent of net assets.
(a) | Non-income producing security. |
(b) | This security is fair valued in good faith in accordance with procedures approved by the Board of Trustees. At September 30, 2020, these securities amounted to a value of $727,387 or 0.12% of net assets. |
(c) | Security is currently in default due to bankruptcy or failure to make payment of principal or interest of the issuer. Income is not being accrued. At September 30, 2020, these securities amounted to a value of $60,678 or 0.01% of net assets. |
(d) | Security is exempt from registration under Regulation S or Rule 144A of the Securities Act of 1933. These securities are considered restricted and may be resold in transactions exempt from registration. At September 30, 2020, the aggregate market value of these securities amounted to $389,756,280 or 66.95% of net assets. |
(e) | A portion of this security is purchased on a when-issued, delayed-delivery or forward commitment basis. (Note 2). |
(f) | Investment was valued using significant unobservable inputs. |
(g) | See Note 6 for aggregate cost for federal tax purposes. |
Country weightings, as a percentage of net assets, is as follows:
United States | | | 82.1 | % |
Canada | | | 5.7 | % |
United Kingdom | | | 2.0 | % |
Luxembourg | | | 1.6 | % |
Netherlands | | | 1.3 | % |
Cayman Islands | | | 0.8 | % |
Ireland | | | 0.6 | % |
Mexico | | | 0.5 | % |
Italy | | | 0.4 | % |
Denmark | | | 0.4 | % |
Austria | | | 0.3 | % |
France | | | 0.2 | % |
Bermuda | | | 0.1 | % |
Total Long-Term Investments | | | 96.0 | % |
Short-Term Investments and Other Assets and Liabilities | | | 4.0 | % |
Net Assets | | | 100.0 | % |
The accompanying notes are an integral part of the financial statements.
119
MassMutual Premier Balanced Fund — Portfolio of Investments |
September 30, 2020 |
| | | Number of
Shares | | | Value | |
EQUITIES — 55.3% |
COMMON STOCK — 55.2% |
Basic Materials — 1.1% |
Chemicals — 0.8% |
Air Products & Chemicals, Inc. | | | 60 | | | $ | 17,872 | |
Celanese Corp. | | | 920 | | | | 98,854 | |
CF Industries Holdings, Inc. | | | 2,325 | | | | 71,401 | |
Dow, Inc. | | | 820 | | | | 38,581 | |
DuPont de Nemours, Inc. | | | 620 | | | | 34,398 | |
Eastman Chemical Co. | | | 894 | | | | 69,839 | |
Ecolab, Inc. | | | 4 | | | | 799 | |
FMC Corp. | | | 500 | | | | 52,955 | |
International Flavors & Fragrances, Inc. | | | 23 | | | | 2,816 | |
Linde PLC | | | 134 | | | | 31,910 | |
LyondellBasell Industries NV Class A | | | 2,180 | | | | 153,668 | |
The Mosaic Co. | | | 200 | | | | 3,654 | |
PPG Industries, Inc. | | | 1,388 | | | | 169,447 | |
The Sherwin-Williams Co. | | | 437 | | | | 304,475 | |
| | | | | | | | 1,050,669 | |
Forest Products & Paper — 0.1% |
International Paper Co. | | | 3,607 | | | | 146,228 | |
Iron & Steel — 0.0% |
Nucor Corp. | | | 561 | | | | 25,166 | |
Mining — 0.2% |
Freeport-McMoRan, Inc. | | | 548 | | | | 8,571 | |
Newmont Corp. | | | 3,784 | | | | 240,095 | |
| | | | | | | | 248,666 | |
| | | | | | | | 1,470,729 | |
Communications — 9.5% |
Advertising — 0.1% |
The Interpublic Group of Cos., Inc. | | | 3,133 | | | | 52,227 | |
Omnicom Group, Inc. | | | 1,198 | | | | 59,301 | |
| | | | | | | | 111,528 | |
Internet — 6.9% |
Alphabet, Inc. Class A (a) | | | 934 | | | | 1,368,870 | |
Alphabet, Inc. Class C (a) | | | 796 | | | | 1,169,802 | |
Amazon.com, Inc. (a) | | | 1,096 | | | | 3,451,008 | |
Booking Holdings, Inc. (a) | | | 234 | | | | 400,299 | |
CDW Corp. | | | 610 | | | | 72,913 | |
E*TRADE Financial Corp. | | | 893 | | | | 44,695 | |
eBay, Inc. | | | 4,765 | | | | 248,257 | |
Expedia Group, Inc. | | | 103 | | | | 9,444 | |
F5 Networks, Inc. (a) | | | 200 | | | | 24,554 | |
Facebook, Inc. Class A (a) | | | 8,440 | | | | 2,210,436 | |
Netflix, Inc. (a) | | | 432 | | | | 216,013 | |
NortonLifeLock, Inc. | | | 2,679 | | | | 55,830 | |
| | | Number of
Shares | | | Value | |
Twitter, Inc. (a) | | | 200 | | | $ | 8,900 | |
VeriSign, Inc. (a) | | | 529 | | | | 108,366 | |
| | | | | | | | 9,389,387 | |
Media — 0.8% |
Charter Communications, Inc. Class A (a) | | | 306 | | | | 191,048 | |
Comcast Corp. Class A | | | 12,162 | | | | 562,614 | |
Discovery, Inc. Class A (a) (b) | | | 1,200 | | | | 26,124 | |
Discovery, Inc. Class C (a) | | | 3,095 | | | | 60,662 | |
DISH Network Corp. Class A (a) | | | 1,000 | | | | 29,030 | |
Fox Corp. Class A | | | 2,173 | | | | 60,475 | |
Fox Corp. Class B | | | 433 | | | | 12,111 | |
News Corp. Class A | | | 130 | | | | 1,823 | |
ViacomCBS, Inc. Class B (b) | | | 752 | | | | 21,063 | |
The Walt Disney Co. | | | 787 | | | | 97,651 | |
| | | | | | | | 1,062,601 | |
Telecommunications — 1.7% |
Arista Networks, Inc. (a) | | | 230 | | | | 47,594 | |
AT&T, Inc. | | | 9,835 | | | | 280,396 | |
CenturyLink, Inc. | | | 4,254 | | | | 42,923 | |
Cisco Systems, Inc. | | | 20,524 | | | | 808,440 | |
Corning, Inc. | | | 1,174 | | | | 38,049 | |
Juniper Networks, Inc. | | | 1,048 | | | | 22,532 | |
Motorola Solutions, Inc. | | | 394 | | | | 61,783 | |
T-Mobile US, Inc. (a) | | | 500 | | | | 57,180 | |
Verizon Communications, Inc. | | | 17,332 | | | | 1,031,081 | |
| | | | | | | | 2,389,978 | |
| | | | | | | | 12,953,494 | |
Consumer, Cyclical — 4.8% |
Airlines — 0.1% |
Alaska Air Group, Inc. | | | 100 | | | | 3,663 | |
American Airlines Group, Inc. (b) | | | 400 | | | | 4,916 | |
Delta Air Lines, Inc. | | | 1,100 | | | | 33,638 | |
Southwest Airlines Co. | | | 666 | | | | 24,975 | |
United Airlines Holdings, Inc. (a) | | | 300 | | | | 10,425 | |
| | | | | | | | 77,617 | |
Apparel — 0.4% |
Hanesbrands, Inc. | | | 4,000 | | | | 63,000 | |
NIKE, Inc. Class B | | | 3,204 | | | | 402,230 | |
PVH Corp. | | | 240 | | | | 14,314 | |
Ralph Lauren Corp. | | | 400 | | | | 27,188 | |
Tapestry, Inc. | | | 84 | | | | 1,313 | |
Under Armour, Inc. Class C (a) | | | 100 | | | | 984 | |
VF Corp. | | | 400 | | | | 28,100 | |
| | | | | | | | 537,129 | |
Auto Manufacturers — 0.3% |
Cummins, Inc. | | | 1,013 | | | | 213,905 | |
The accompanying notes are an integral part of the financial statements.
120
MassMutual Premier Balanced Fund — Portfolio of Investments (Continued) |
| | | Number of
Shares | | | Value | |
Ford Motor Co. | | | 4,662 | | | $ | 31,049 | |
General Motors Co. | | | 4,100 | | | | 121,319 | |
PACCAR, Inc. | | | 734 | | | | 62,595 | |
| | | | | | | | 428,868 | |
Auto Parts & Equipment — 0.0% |
BorgWarner, Inc. | | | 700 | | | | 27,118 | |
Distribution & Wholesale — 0.1% |
Copart, Inc. (a) | | | 600 | | | | 63,096 | |
Fastenal Co. | | | 1,340 | | | | 60,421 | |
W.W. Grainger, Inc. | | | 164 | | | | 58,510 | |
| | | | | | | | 182,027 | |
Home Builders — 0.2% |
D.R. Horton, Inc. | | | 759 | | | | 57,403 | |
Lennar Corp. Class A | | | 1,400 | | | | 114,352 | |
NVR, Inc. (a) | | | 20 | | | | 81,662 | |
PulteGroup, Inc. | | | 974 | | | | 45,087 | |
| | | | | | | | 298,504 | |
Home Furnishing — 0.1% |
Leggett & Platt, Inc. | | | 95 | | | | 3,911 | |
Whirlpool Corp. | | | 444 | | | | 81,647 | |
| | | | | | | | 85,558 | |
Housewares — 0.0% |
Newell Brands, Inc. | | | 683 | | | | 11,720 | |
Leisure Time — 0.0% |
Harley-Davidson, Inc. | | | 508 | | | | 12,466 | |
Norwegian Cruise Line Holdings Ltd. (a) (b) | | | 200 | | | | 3,422 | |
Royal Caribbean Cruises Ltd. | | | 100 | | | | 6,473 | |
| | | | | | | | 22,361 | |
Lodging — 0.3% |
Hilton Worldwide Holdings, Inc. | | | 2,200 | | | | 187,704 | |
Las Vegas Sands Corp. | | | 1,300 | | | | 60,658 | |
Marriott International, Inc. Class A | | | 1,211 | | | | 112,115 | |
Wynn Resorts Ltd. | | | 9 | | | | 646 | |
| | | | | | | | 361,123 | |
Retail — 3.3% |
Advance Auto Parts, Inc. | | | 140 | | | | 21,490 | |
AutoZone, Inc. (a) | | | 76 | | | | 89,501 | |
Best Buy Co., Inc. | | | 1,008 | | | | 112,180 | |
Chipotle Mexican Grill, Inc. (a) | | | 30 | | | | 37,311 | |
Costco Wholesale Corp. | | | 308 | | | | 109,340 | |
Darden Restaurants, Inc. | | | 373 | | | | 37,576 | |
Dollar General Corp. | | | 1,040 | | | | 218,005 | |
Dollar Tree, Inc. (a) | | | 371 | | | | 33,887 | |
Domino’s Pizza, Inc. | | | 340 | | | | 144,595 | |
The Gap, Inc. | | | 105 | | | | 1,788 | |
Genuine Parts Co. | | | 446 | | | | 42,446 | |
| | | Number of
Shares | | | Value | |
The Home Depot, Inc. | | | 4,620 | | | $ | 1,283,020 | |
Kohl’s Corp. | | | 1,261 | | | | 23,366 | |
L Brands, Inc. | | | 600 | | | | 19,086 | |
Lowe’s Cos., Inc. | | | 5,039 | | | | 835,769 | |
McDonald’s Corp. | | | 205 | | | | 44,996 | |
Nordstrom, Inc. (b) | | | 1,511 | | | | 18,011 | |
O’Reilly Automotive, Inc. (a) | | | 404 | | | | 186,276 | |
Ross Stores, Inc. | | | 212 | | | | 19,784 | |
Starbucks Corp. | | | 1,290 | | | | 110,837 | |
Target Corp. | | | 1,557 | | | | 245,103 | |
Tiffany & Co. | | | 111 | | | | 12,859 | |
The TJX Cos., Inc. | | | 780 | | | | 43,407 | |
Tractor Supply Co. | | | 510 | | | | 73,103 | |
Walgreens Boots Alliance, Inc. | | | 1,606 | | | | 57,688 | |
Walmart, Inc. | | | 3,763 | | | | 526,481 | |
Yum! Brands, Inc. | | | 1,506 | | | | 137,498 | |
| | | | | | | | 4,485,403 | |
Toys, Games & Hobbies — 0.0% |
Hasbro, Inc. | | | 387 | | | | 32,013 | |
| | | | | | | | 6,549,441 | |
Consumer, Non-cyclical — 11.9% |
Agriculture — 0.8% |
Altria Group, Inc. | | | 11,841 | | | | 457,536 | |
Archer-Daniels-Midland Co. | | | 126 | | | | 5,858 | |
Philip Morris International, Inc. | | | 8,846 | | | | 663,361 | |
| | | | | | | | 1,126,755 | |
Beverages — 0.8% |
Brown-Forman Corp. Class B | | | 2 | | | | 151 | |
The Coca-Cola Co. | | | 9,324 | | | | 460,326 | |
Constellation Brands, Inc. Class A | | | 82 | | | | 15,540 | |
Molson Coors Beverage Co. Class B | | | 236 | | | | 7,920 | |
Monster Beverage Corp. (a) | | | 1,250 | | | | 100,250 | |
PepsiCo, Inc. | | | 3,802 | | | | 526,957 | |
| | | | | | | | 1,111,144 | |
Biotechnology — 1.6% |
Alexion Pharmaceuticals, Inc. (a) | | | 1,160 | | | | 132,739 | |
Amgen, Inc. | | | 3,085 | | | | 784,083 | |
Biogen, Inc. (a) | | | 1,194 | | | | 338,714 | |
Corteva, Inc. | | | 420 | | | | 12,100 | |
Gilead Sciences, Inc. | | | 6,652 | | | | 420,340 | |
Illumina, Inc. (a) | | | 30 | | | | 9,272 | |
Incyte Corp. (a) | | | 40 | | | | 3,590 | |
Regeneron Pharmaceuticals, Inc. (a) | | | 420 | | | | 235,108 | |
Vertex Pharmaceuticals, Inc. (a) | | | 1,110 | | | | 302,053 | |
| | | | | | | | 2,237,999 | |
Commercial Services — 0.9% |
Automatic Data Processing, Inc. | | | 1,111 | | | | 154,973 | |
The accompanying notes are an integral part of the financial statements.
121
MassMutual Premier Balanced Fund — Portfolio of Investments (Continued) |
| | | Number of
Shares | | | Value | |
Cintas Corp. | | | 349 | | | $ | 116,158 | |
Equifax, Inc. | | | 26 | | | | 4,079 | |
FleetCor Technologies, Inc. (a) | | | 200 | | | | 47,620 | |
Gartner, Inc. (a) | | | 20 | | | | 2,499 | |
Global Payments, Inc. | | | 170 | | | | 30,189 | |
H&R Block, Inc. | | | 2,542 | | | | 41,409 | |
IHS Markit Ltd. | | | 1,000 | | | | 78,510 | |
MarketAxess Holdings, Inc. | | | 60 | | | | 28,895 | |
Moody’s Corp. | | | 415 | | | | 120,288 | |
Nielsen Holdings PLC | | | 600 | | | | 8,508 | |
PayPal Holdings, Inc. (a) | | | 345 | | | | 67,975 | |
Quanta Services, Inc. | | | 324 | | | | 17,127 | |
Robert Half International, Inc. | | | 1,635 | | | | 86,557 | |
S&P Global, Inc. | | | 889 | | | | 320,573 | |
United Rentals, Inc. (a) | | | 500 | | | | 87,250 | |
Verisk Analytics, Inc. | | | 380 | | | | 70,418 | |
| | | | | | | | 1,283,028 | |
Cosmetics & Personal Care — 0.9% |
Colgate-Palmolive Co. | | | 4,906 | | | | 378,498 | |
Coty, Inc. Class A | | | 200 | | | | 540 | |
The Estee Lauder Cos., Inc. Class A | | | 166 | | | | 36,230 | |
The Procter & Gamble Co. | | | 5,383 | | | | 748,183 | |
| | | | | | | | 1,163,451 | |
Foods — 0.6% |
Campbell Soup Co. | | | 1,265 | | | | 61,188 | |
Conagra Brands, Inc. | | | 1,184 | | | | 42,281 | |
General Mills, Inc. | | | 2,594 | | | | 159,998 | |
The Hershey Co. | | | 569 | | | | 81,560 | |
Hormel Foods Corp. | | | 488 | | | | 23,858 | |
The J.M. Smucker Co. | | | 274 | | | | 31,653 | |
Kellogg Co. | | | 635 | | | | 41,015 | |
The Kraft Heinz Co. | | | 173 | | | | 5,181 | |
The Kroger Co. | | | 4,268 | | | | 144,728 | |
Lamb Weston Holdings, Inc. | | | 700 | | | | 46,389 | |
McCormick & Co., Inc. | | | 213 | | | | 41,343 | |
Mondelez International, Inc. Class A | | | 321 | | | | 18,441 | |
Sysco Corp. | | | 1,066 | | | | 66,327 | |
Tyson Foods, Inc. Class A | | | 120 | | | | 7,138 | |
| | | | | | | | 771,100 | |
Health Care – Products — 0.8% |
Abbott Laboratories | | | 889 | | | | 96,750 | |
Align Technology, Inc. (a) | | | 60 | | | | 19,642 | |
Baxter International, Inc. | | | 622 | | | | 50,021 | |
Boston Scientific Corp. (a) | | | 21 | | | | 802 | |
The Cooper Cos., Inc. | | | 20 | | | | 6,742 | |
Danaher Corp. | | | 152 | | | | 32,730 | |
Dentsply Sirona, Inc. | | | 61 | | | | 2,668 | |
Edwards Lifesciences Corp. (a) | | | 1,620 | | | | 129,308 | |
| | | Number of
Shares | | | Value | |
Henry Schein, Inc. (a) | | | 100 | | | $ | 5,878 | |
IDEXX Laboratories, Inc. (a) | | | 250 | | | | 98,278 | |
Intuitive Surgical, Inc. (a) | | | 62 | | | | 43,992 | |
Medtronic PLC | | | 436 | | | | 45,309 | |
ResMed, Inc. | | | 300 | | | | 51,429 | |
Stryker Corp. | | | 639 | | | | 133,148 | |
Teleflex, Inc. | | | 10 | | | | 3,404 | |
Thermo Fisher Scientific, Inc. | | | 588 | | | | 259,614 | |
Varian Medical Systems, Inc. (a) | | | 4 | | | | 688 | |
West Pharmaceutical Services, Inc. | | | 150 | | | | 41,235 | |
Zimmer Biomet Holdings, Inc. | | | 4 | | | | 545 | |
| | | | | | | | 1,022,183 | |
Health Care – Services — 1.0% |
Anthem, Inc. | | | 708 | | | | 190,162 | |
Centene Corp. (a) | | | 180 | | | | 10,499 | |
DaVita, Inc. (a) | | | 846 | | | | 72,460 | |
HCA Healthcare, Inc. | | | 860 | | | | 107,225 | |
Humana, Inc. | | | 475 | | | | 196,598 | |
Laboratory Corp. of America Holdings (a) | | | 1 | | | | 188 | |
Quest Diagnostics, Inc. | | | 95 | | | | 10,877 | |
UnitedHealth Group, Inc. | | | 2,561 | | | | 798,443 | |
Universal Health Services, Inc. Class B | | | 10 | | | | 1,070 | |
| | | | | | | | 1,387,522 | |
Household Products & Wares — 0.4% |
Avery Dennison Corp. | | | 382 | | | | 48,835 | |
Church & Dwight Co., Inc. | | | 400 | | | | 37,484 | |
The Clorox Co. | | | 707 | | | | 148,590 | |
Kimberly-Clark Corp. | | | 1,890 | | | | 279,077 | |
| | | | | | | | 513,986 | |
Pharmaceuticals — 4.1% |
AbbVie, Inc. | | | 9,273 | | | | 812,222 | |
AmerisourceBergen Corp. | | | 630 | | | | 61,060 | |
Becton Dickinson and Co. | | | 238 | | | | 55,378 | |
Bristol-Myers Squibb Co. | | | 11,010 | | | | 663,793 | |
Cardinal Health, Inc. | | | 955 | | | | 44,837 | |
Cigna Corp. | | | 854 | | | | 144,676 | |
CVS Health Corp. | | | 4,246 | | | | 247,966 | |
Eli Lilly and Co. | | | 4,077 | | | | 603,477 | |
Johnson & Johnson | | | 7,519 | | | | 1,119,429 | |
McKesson Corp. | | | 631 | | | | 93,975 | |
Merck & Co., Inc. | | | 7,129 | | | | 591,351 | |
Mylan NV (a) | | | 2,659 | | | | 39,433 | |
Pfizer, Inc. | | | 23,422 | | | | 859,587 | |
Zoetis, Inc. | | | 1,340 | | | | 221,596 | |
| | | | | | | | 5,558,780 | |
| | | | | | | | 16,175,948 | |
The accompanying notes are an integral part of the financial statements.
122
MassMutual Premier Balanced Fund — Portfolio of Investments (Continued) |
| | | Number of
Shares | | | Value | |
Energy — 0.9% |
Oil & Gas — 0.7% |
Apache Corp. | | | 198 | | | $ | 1,875 | |
Cabot Oil & Gas Corp. | | | 4,692 | | | | 81,453 | |
Chevron Corp. | | | 4,100 | | | | 295,200 | |
Concho Resources, Inc. | | | 100 | | | | 4,412 | |
ConocoPhillips | | | 5,210 | | | | 171,096 | |
Devon Energy Corp. | | | 917 | | | | 8,675 | |
Diamondback Energy, Inc. | | | 340 | | | | 10,241 | |
EOG Resources, Inc. | | | 2,702 | | | | 97,110 | |
Exxon Mobil Corp. | | | 4,149 | | | | 142,435 | |
Hess Corp. | | | 447 | | | | 18,296 | |
HollyFrontier Corp. | | | 1,400 | | | | 27,594 | |
Marathon Oil Corp. | | | 1,085 | | | | 4,438 | |
Marathon Petroleum Corp. | | | 775 | | | | 22,738 | |
Noble Energy, Inc. | | | 266 | | | | 2,274 | |
Occidental Petroleum Corp. | | | 558 | | | | 5,585 | |
Phillips 66 | | | 2,345 | | | | 121,565 | |
Pioneer Natural Resources Co. | | | 3 | | | | 258 | |
Valero Energy Corp. | | | 630 | | | | 27,292 | |
| | | | | | | | 1,042,537 | |
Oil & Gas Services — 0.1% |
Baker Hughes Co. | | | 74 | | | | 983 | |
Halliburton Co. | | | 2,271 | | | | 27,366 | |
National Oilwell Varco, Inc. | | | 1,009 | | | | 9,142 | |
Schlumberger NV | | | 2,687 | | | | 41,810 | |
TechnipFMC PLC | | | 72 | | | | 454 | |
| | | | | | | | 79,755 | |
Pipelines — 0.1% |
Kinder Morgan, Inc. | | | 2,260 | | | | 27,866 | |
The Williams Cos., Inc. | | | 6,433 | | | | 126,408 | |
| | | | | | | | 154,274 | |
| | | | | | | | 1,276,566 | |
Financial — 7.5% |
Banks — 2.2% |
Bank of America Corp. | | | 22,742 | | | | 547,855 | |
The Bank of New York Mellon Corp. | | | 3,495 | | | | 120,018 | |
Citigroup, Inc. | | | 5,184 | | | | 223,482 | |
Citizens Financial Group, Inc. | | | 900 | | | | 22,752 | |
Comerica, Inc. | | | 924 | | | | 35,343 | |
Fifth Third Bancorp | | | 1,621 | | | | 34,560 | |
The Goldman Sachs Group, Inc. | | | 758 | | | | 152,335 | |
Huntington Bancshares, Inc. | | | 1,110 | | | | 10,179 | |
JP Morgan Chase & Co. | | | 9,675 | | | | 931,412 | |
KeyCorp | | | 2,272 | | | | 27,105 | |
M&T Bank Corp. | | | 361 | | | | 33,244 | |
Morgan Stanley | | | 2,596 | | | | 125,516 | |
Northern Trust Corp. | | | 511 | | | | 39,843 | |
| | | Number of
Shares | | | Value | |
The PNC Financial Services Group, Inc. | | | 1,755 | | | $ | 192,892 | |
Regions Financial Corp. | | | 3,743 | | | | 43,157 | |
State Street Corp. | | | 1,385 | | | | 82,172 | |
SVB Financial Group (a) | | | 100 | | | | 24,062 | |
Truist Financial Corp. | | | 1,066 | | | | 40,561 | |
US Bancorp | | | 3,729 | | | | 133,685 | |
Wells Fargo & Co. | | | 5,364 | | | | 126,108 | |
Zions Bancorp NA | | | 349 | | | | 10,198 | |
| | | | | | | | 2,956,479 | |
Diversified Financial Services — 2.6% |
Alliance Data Systems Corp. | | | 930 | | | | 39,041 | |
American Express Co. | | | 1,708 | | | | 171,227 | |
Ameriprise Financial, Inc. | | | 805 | | | | 124,059 | |
BlackRock, Inc. | | | 290 | | | | 163,429 | |
Capital One Financial Corp. | | | 575 | | | | 41,320 | |
Cboe Global Markets, Inc. | | | 300 | | | | 26,322 | |
The Charles Schwab Corp. | | | 2,922 | | | | 105,864 | |
CME Group, Inc. | | | 275 | | | | 46,010 | |
Discover Financial Services | | | 1,495 | | | | 86,381 | |
Franklin Resources, Inc. | | | 848 | | | | 17,257 | |
Intercontinental Exchange, Inc. | | | 1,310 | | | | 131,066 | |
Invesco Ltd. | | | 5,923 | | | | 67,581 | |
Jefferies Financial Group, Inc. | | | 36 | | | | 648 | |
Mastercard, Inc. Class A | | | 3,850 | | | | 1,301,954 | |
Nasdaq, Inc. | | | 22 | | | | 2,700 | |
Raymond James Financial, Inc. | | | 100 | | | | 7,276 | |
Synchrony Financial | | | 4,000 | | | | 104,680 | |
T. Rowe Price Group, Inc. | | | 686 | | | | 87,959 | |
Visa, Inc. Class A | | | 4,700 | | | | 939,859 | |
The Western Union Co. | | | 3,107 | | | | 66,583 | |
| | | | | | | | 3,531,216 | |
Insurance — 1.5% |
Aflac, Inc. | | | 1,990 | | | | 72,337 | |
The Allstate Corp. | | | 1,686 | | | | 158,720 | |
American International Group, Inc. | | | 1,811 | | | | 49,857 | |
Aon PLC Class A | | | 276 | | | | 56,939 | |
Assurant, Inc. | | | 30 | | | | 3,639 | |
Berkshire Hathaway, Inc. Class B (a) | | | 3,933 | | | | 837,493 | |
Chubb Ltd. | | | 174 | | | | 20,205 | |
Cincinnati Financial Corp. | | | 334 | | | | 26,042 | |
Everest Re Group Ltd. | | | 10 | | | | 1,975 | |
Globe Life, Inc. | | | 480 | | | | 38,352 | |
The Hartford Financial Services Group, Inc. | | | 790 | | | | 29,119 | |
Lincoln National Corp. | | | 1,058 | | | | 33,147 | |
Loews Corp. | | | 134 | | | | 4,657 | |
Marsh & McLennan Cos., Inc. | | | 230 | | | | 26,381 | |
The accompanying notes are an integral part of the financial statements.
123
MassMutual Premier Balanced Fund — Portfolio of Investments (Continued) |
| | | Number of
Shares | | | Value | |
MetLife, Inc. | | | 4,429 | | | $ | 164,626 | |
Principal Financial Group, Inc. | | | 1,235 | | | | 49,734 | |
The Progressive Corp. | | | 2,934 | | | | 277,762 | |
Prudential Financial, Inc. | | | 1,195 | | | | 75,906 | |
The Travelers Cos., Inc. | | | 797 | | | | 86,227 | |
Unum Group | | | 1,435 | | | | 24,151 | |
| | | | | | | | 2,037,269 | |
Real Estate — 0.0% |
CBRE Group, Inc. Class A (a) | | | 1,098 | | | | 51,573 | |
Real Estate Investment Trusts (REITS) — 1.2% |
Alexandria Real Estate Equities, Inc. | | | 30 | | | | 4,800 | |
American Tower Corp. | | | 1,658 | | | | 400,788 | |
Apartment Investment and Management Co. Class A | | | 63 | | | | 2,124 | |
AvalonBay Communities, Inc. | | | 314 | | | | 46,893 | |
Boston Properties, Inc. | | | 527 | | | | 42,318 | |
Crown Castle International Corp. | | | 260 | | | | 43,290 | |
Digital Realty Trust, Inc. | | | 50 | | | | 7,338 | |
Duke Realty Corp. | | | 1,400 | | | | 51,660 | |
Equinix, Inc. | | | 90 | | | | 68,412 | |
Equity Residential | | | 1,201 | | | | 61,647 | |
Essex Property Trust, Inc. | | | 240 | | | | 48,190 | |
Extra Space Storage, Inc. | | | 400 | | | | 42,796 | |
Federal Realty Investment Trust | | | 10 | | | | 734 | |
Healthpeak Properties, Inc. | | | 676 | | | | 18,353 | |
Host Hotels & Resorts, Inc. | | | 1,730 | | | | 18,667 | |
Iron Mountain, Inc. (b) | | | 1,473 | | | | 39,462 | |
Kimco Realty Corp. | | | 2,110 | | | | 23,759 | |
Mid-America Apartment Communities, Inc. | | | 300 | | | | 34,785 | |
Prologis, Inc. | | | 1,916 | | | | 192,788 | |
Public Storage | | | 427 | | | | 95,101 | |
Realty Income Corp. | | | 300 | | | | 18,225 | |
Regency Centers Corp. | | | 500 | | | | 19,010 | |
Simon Property Group, Inc. | | | 2,094 | | | | 135,440 | |
SL Green Realty Corp. (b) | | | 610 | | | | 28,286 | |
Ventas, Inc. | | | 1,136 | | | | 47,667 | |
Vornado Realty Trust | | | 1,065 | | | | 35,901 | |
Welltower, Inc. | | | 1,074 | | | | 59,167 | |
Weyerhaeuser Co. | | | 93 | | | | 2,652 | |
| | | | | | | | 1,590,253 | |
Savings & Loans — 0.0% |
People’s United Financial, Inc. | | | 1,159 | | | | 11,949 | |
| | | | | | | | 10,178,739 | |
Industrial — 4.2% |
Aerospace & Defense — 0.8% |
The Boeing Co. | | | 316 | | | | 52,222 | |
General Dynamics Corp. | | | 458 | | | | 63,401 | |
| | | Number of
Shares | | | Value | |
Howmet Aerospace, Inc. | | | 815 | | | $ | 13,627 | |
L3 Harris Technologies, Inc. | | | 176 | | | | 29,892 | |
Lockheed Martin Corp. | | | 1,621 | | | | 621,297 | |
Northrop Grumman Corp. | | | 413 | | | | 130,297 | |
Raytheon Technologies Corp. | | | 2,209 | | | | 127,106 | |
TransDigm Group, Inc. | | | 160 | | | | 76,019 | |
| | | | | | | | 1,113,861 | |
Building Materials — 0.2% |
Carrier Global Corp. | | | 4,374 | | | | 133,582 | |
Johnson Controls International PLC | | | 426 | | | | 17,402 | |
Masco Corp. | | | 1,594 | | | | 87,877 | |
Vulcan Materials Co. | | | 8 | | | | 1,085 | |
| | | | | | | | 239,946 | |
Electrical Components & Equipment — 0.2% |
AMETEK, Inc. | | | 400 | | | | 39,760 | |
Emerson Electric Co. | | | 2,843 | | | | 186,416 | |
| | | | | | | | 226,176 | |
Electronics — 0.6% |
Agilent Technologies, Inc. | | | 373 | | | | 37,651 | |
Allegion PLC | | | 300 | | | | 29,673 | |
Amphenol Corp. Class A | | | 132 | | | | 14,292 | |
FLIR Systems, Inc. | | | 435 | | | | 15,595 | |
Fortive Corp. | | | 136 | | | | 10,364 | |
Garmin Ltd. | | | 400 | | | | 37,944 | |
Honeywell International, Inc. | | | 2,015 | | | | 331,689 | |
Keysight Technologies, Inc. (a) | | | 600 | | | | 59,268 | |
Mettler-Toledo International, Inc. (a) | | | 100 | | | | 96,575 | |
PerkinElmer, Inc. | | | 24 | | | | 3,012 | |
Roper Technologies, Inc. | | | 24 | | | | 9,483 | |
TE Connectivity Ltd. | | | 400 | | | | 39,096 | |
Waters Corp. (a) | | | 300 | | | | 58,704 | |
| | | | | | | | 743,346 | |
Engineering & Construction — 0.0% |
Jacobs Engineering Group, Inc. | | | 124 | | | | 11,503 | |
Environmental Controls — 0.1% |
Pentair PLC | | | 400 | | | | 18,308 | |
Republic Services, Inc. | | | 87 | | | | 8,121 | |
Waste Management, Inc. | | | 1,065 | | | | 120,526 | |
| | | | | | | | 146,955 | |
Hand & Machine Tools — 0.0% |
Snap-on, Inc. | | | 165 | | | | 24,277 | |
Stanley Black & Decker, Inc. | | | 2 | | | | 324 | |
| | | | | | | | 24,601 | |
Machinery – Construction & Mining — 0.2% |
Caterpillar, Inc. | | | 1,560 | | | | 232,674 | |
Machinery – Diversified — 0.2% |
Deere & Co. | | | 1 | | | | 222 | |
The accompanying notes are an integral part of the financial statements.
124
MassMutual Premier Balanced Fund — Portfolio of Investments (Continued) |
| | | Number of
Shares | | | Value | |
Dover Corp. | | | 203 | | | $ | 21,993 | |
Flowserve Corp. | | | 291 | | | | 7,941 | |
Ingersoll Rand, Inc. (a) | | | 52 | | | | 1,851 | |
Otis Worldwide Corp. | | | 2,087 | | | | 130,271 | |
Rockwell Automation, Inc. | | | 766 | | | | 169,041 | |
Xylem, Inc. | | | 1 | | | | 84 | |
| | | | | | | | 331,403 | |
Miscellaneous - Manufacturing — 0.7% |
3M Co. | | | 2,375 | | | | 380,427 | |
Eaton Corp. PLC | | | 1,082 | | | | 110,396 | |
General Electric Co. | | | 3,186 | | | | 19,849 | |
Illinois Tool Works, Inc. | | | 1,600 | | | | 309,136 | |
Parker-Hannifin Corp. | | | 320 | | | | 64,749 | |
Textron, Inc. | | | 485 | | | | 17,504 | |
Trane Technologies PLC | | | 560 | | | | 67,900 | |
| | | | | | | | 969,961 | |
Packaging & Containers — 0.1% |
Amcor PLC | | | 4,300 | | | | 47,515 | |
Ball Corp. | | | 140 | | | | 11,637 | |
Packaging Corp. of America | | | 610 | | | | 66,520 | |
Sealed Air Corp. | | | 47 | | | | 1,824 | |
WestRock Co. | | | 1,105 | | | | 38,388 | |
| | | | | | | | 165,884 | |
Shipbuilding — 0.0% |
Huntington Ingalls Industries, Inc. | | | 170 | | | | 23,927 | |
Transportation — 1.1% |
C.H. Robinson Worldwide, Inc. | | | 254 | | | | 25,956 | |
CSX Corp. | | | 3,073 | | | | 238,680 | |
Expeditors International of Washington, Inc. | | | 684 | | | | 61,916 | |
FedEx Corp. | | | 6 | | | | 1,509 | |
Kansas City Southern | | | 260 | | | | 47,016 | |
Norfolk Southern Corp. | | | 553 | | | | 118,336 | |
Old Dominion Freight Line, Inc. | | | 280 | | | | 50,658 | |
Union Pacific Corp. | | | 2,320 | | | | 456,738 | |
United Parcel Service, Inc. Class B | | | 3,005 | | | | 500,723 | |
| | | | | | | | 1,501,532 | |
| | | | | | | | 5,731,769 | |
Technology — 14.0% |
Computers — 4.6% |
Accenture PLC Class A | | | 1,770 | | | | 400,002 | |
Apple, Inc. | | | 44,024 | | | | 5,098,420 | |
Cognizant Technology Solutions Corp. Class A | | | 1,418 | | | | 98,438 | |
DXC Technology Co. | | | 1,145 | | | | 20,438 | |
Fortinet, Inc. (a) | | | 890 | | | | 104,851 | |
Hewlett Packard Enterprise Co. | | | 1,563 | | | | 14,645 | |
HP, Inc. | | | 6,163 | | | | 117,035 | |
| | | Number of
Shares | | | Value | |
International Business Machines Corp. | | | 2,590 | | | $ | 315,125 | |
Leidos Holdings, Inc. | | | 100 | | | | 8,915 | |
NetApp, Inc. | | | 1,409 | | | | 61,771 | |
Seagate Technology PLC | | | 1,300 | | | | 64,051 | |
Western Digital Corp. | | | 120 | | | | 4,386 | |
| | | | | | | | 6,308,077 | |
Office & Business Equipment — 0.0% |
Xerox Holdings Corp. | | | 943 | | | | 17,700 | |
Zebra Technologies Corp. Class A (a) | | | 170 | | | | 42,918 | |
| | | | | | | | 60,618 | |
Semiconductors — 3.7% |
Advanced Micro Devices, Inc. (a) | | | 1,600 | | | | 131,184 | |
Analog Devices, Inc. | | | 217 | | | | 25,333 | |
Applied Materials, Inc. | | | 3,867 | | | | 229,893 | |
Broadcom, Inc. | | | 834 | | | | 303,843 | |
Intel Corp. | | | 18,111 | | | | 937,788 | |
KLA Corp. | | | 818 | | | | 158,479 | |
Lam Research Corp. | | | 943 | | | | 312,840 | |
Maxim Integrated Products, Inc. | | | 900 | | | | 60,849 | |
Microchip Technology, Inc. | | | 344 | | | | 35,349 | |
Micron Technology, Inc. (a) | | | 2,333 | | | | 109,558 | |
NVIDIA Corp. | | | 1,915 | | | | 1,036,436 | |
QUALCOMM, Inc. | | | 6,788 | | | | 798,812 | |
Skyworks Solutions, Inc. | | | 490 | | | | 71,295 | |
Texas Instruments, Inc. | | | 5,135 | | | | 733,227 | |
Xilinx, Inc. | | | 561 | | | | 58,479 | |
| | | | | | | | 5,003,365 | |
Software — 5.7% |
Activision Blizzard, Inc. | | | 2,200 | | | | 178,090 | |
Adobe, Inc. (a) | | | 1,725 | | | | 845,992 | |
Akamai Technologies, Inc. (a) | | | 310 | | | | 34,267 | |
Autodesk, Inc. (a) | | | 357 | | | | 82,471 | |
Broadridge Financial Solutions, Inc. | | | 100 | | | | 13,200 | |
Cadence Design Systems, Inc. (a) | | | 1,400 | | | | 149,282 | |
Cerner Corp. | | | 700 | | | | 50,603 | |
Citrix Systems, Inc. | | | 495 | | | | 68,167 | |
Electronic Arts, Inc. (a) | | | 1,666 | | | | 217,263 | |
Fidelity National Information Services, Inc. | | | 130 | | | | 19,137 | |
Fiserv, Inc. (a) | | | 78 | | | | 8,038 | |
Intuit, Inc. | | | 859 | | | | 280,214 | |
Jack Henry & Associates, Inc. | | | 290 | | | | 47,151 | |
Microsoft Corp. | | | 21,961 | | | | 4,619,057 | |
MSCI, Inc. | | | 230 | | | | 82,059 | |
Oracle Corp. | | | 11,088 | | | | 661,954 | |
Paychex, Inc. | | | 813 | | | | 64,853 | |
salesforce.com, Inc. (a) | | | 200 | | | | 50,264 | |
ServiceNow, Inc. (a) | | | 250 | | | | 121,250 | |
The accompanying notes are an integral part of the financial statements.
125
MassMutual Premier Balanced Fund — Portfolio of Investments (Continued) |
| | | Number of
Shares | | | Value | |
Synopsys, Inc. (a) | | | 360 | | | $ | 77,033 | |
Take-Two Interactive Software, Inc. (a) | | | 210 | | | | 34,696 | |
| | | | | | | | 7,705,041 | |
| | | | | | | | 19,077,101 | |
Utilities — 1.3% |
Electric — 1.3% |
AES Corp. | | | 2,077 | | | | 37,614 | |
Alliant Energy Corp. | | | 700 | | | | 36,155 | |
Ameren Corp. | | | 172 | | | | 13,602 | |
American Electric Power Co., Inc. | | | 196 | | | | 16,019 | |
CenterPoint Energy, Inc. | | | 635 | | | | 12,287 | |
CMS Energy Corp. | | | 110 | | | | 6,755 | |
Consolidated Edison, Inc. | | | 509 | | | | 39,600 | |
Dominion Energy, Inc. | | | 210 | | | | 16,575 | |
DTE Energy Co. | | | 92 | | | | 10,584 | |
Duke Energy Corp. | | | 1,586 | | | | 140,456 | |
Edison International | | | 134 | | | | 6,813 | |
Entergy Corp. | | | 201 | | | | 19,805 | |
Evergy, Inc. | | | 2,400 | | | | 121,968 | |
Eversource Energy | | | 122 | | | | 10,193 | |
Exelon Corp. | | | 2,923 | | | | 104,526 | |
FirstEnergy Corp. | | | 1,766 | | | | 50,702 | |
NextEra Energy, Inc. | | | 116 | | | | 32,197 | |
NRG Energy, Inc. | | | 5,920 | | | | 181,981 | |
Pinnacle West Capital Corp. | | | 250 | | | | 18,638 | |
PPL Corp. | | | 6,884 | | | | 187,314 | |
Public Service Enterprise Group, Inc. | | | 2,009 | | | | 110,314 | |
Sempra Energy | | | 1,752 | | | | 207,367 | |
The Southern Co. | | | 6,934 | | | | 375,961 | |
WEC Energy Group, Inc. | | | 364 | | | | 35,272 | |
Xcel Energy, Inc. | | | 145 | | | | 10,006 | |
| | | | | | | | 1,802,704 | |
Gas — 0.0% |
NiSource, Inc. | | | 172 | | | | 3,784 | |
Water — 0.0% |
American Water Works Co., Inc. | | | 50 | | | | 7,244 | |
| | | | | | | | 1,813,732 | |
| | | | | | | | | |
TOTAL COMMON STOCK (Cost $62,570,175) | | | | | | | 75,227,519 | |
| | | Number of
Shares | | | Value | |
PREFERRED STOCK — 0.1% |
Financial — 0.1% |
Insurance — 0.1% |
The Allstate Corp., 3 mo. USD LIBOR + 3.165% | | | | | | | | |
5.100% VRN | | | 5,000 | | | $ | 129,850 | |
| | | | | | | | | |
TOTAL PREFERRED STOCK (Cost $125,000) | | | | | | | 129,850 | |
| | | | | | | | | |
TOTAL EQUITIES (Cost $62,695,175) | | | | | | | 75,357,369 | |
| | | Principal
Amount | | | | | |
BONDS & NOTES — 34.0% |
CORPORATE DEBT — 12.7% |
Aerospace & Defense — 0.0% |
Raytheon Technologies Corp. | | | | | | | | |
4.500% 6/01/42 | | $ | 30,000 | | | | 37,876 | |
6.125% 7/15/38 | | | 15,000 | | | | 21,538 | |
| | | | | | | | 59,414 | |
Agriculture — 0.2% |
BAT Capital Corp. | | | | | | | | |
2.259% 3/25/28 | | | 35,000 | | | | 35,174 | |
4.700% 4/02/27 | | | 45,000 | | | | 51,625 | |
4.758% 9/06/49 | | | 25,000 | | | | 27,151 | |
Bunge Ltd. Finance Corp. | | | | | | | | |
1.630% 8/17/25 | | | 15,000 | | | | 15,066 | |
3.250% 8/15/26 | | | 51,000 | | | | 54,996 | |
4.350% 3/15/24 | | | 85,000 | | | | 93,661 | |
Reynolds American, Inc. | | | | | | | | |
5.850% 8/15/45 | | | 35,000 | | | | 42,530 | |
| | | | | | | | 320,203 | |
Airlines — 0.1% |
American Airlines Pass-Through Trust, Series 2014-1, Class B, | | | | | | | | |
4.375% 4/01/24 | | | 7,644 | | | | 5,413 | |
Delta Air Lines, Inc. / SkyMiles IP Ltd. | | | | | | | | |
4.500% 10/20/25 (c) | | | 92,000 | | | | 94,471 | |
Spirit Airlines Pass-Through Trust, Series 2015-1, Class A, | | | | | | | | |
4.100% 10/01/29 | | | 62,240 | | | | 55,864 | |
United Airlines Pass-Through Trust, Series 2018-1, Class B, | | | | | | | | |
4.600% 9/01/27 | | | 12,352 | | | | 9,578 | |
| | | | | | | | 165,326 | |
The accompanying notes are an integral part of the financial statements.
126
MassMutual Premier Balanced Fund — Portfolio of Investments (Continued) |
| | | Principal
Amount | | | Value | |
Auto Manufacturers — 0.4% |
Ford Motor Co. | | | | | | | | |
4.346% 12/08/26 | | $ | 50,000 | | | $ | 49,353 | |
Ford Motor Credit Co. LLC | | | | | | | | |
3.810% 1/09/24 | | | 200,000 | | | | 198,000 | |
General Motors Co. | | | | | | | | |
4.200% 10/01/27 | | | 30,000 | | | | 32,151 | |
5.150% 4/01/38 | | | 20,000 | | | | 21,239 | |
General Motors Financial Co., Inc. | | | | | | | | |
3.500% 11/07/24 | | | 100,000 | | | | 105,055 | |
4.150% 6/19/23 | | | 78,000 | | | | 82,799 | |
4.200% 11/06/21 | | | 52,000 | | | | 53,672 | |
| | | | | | | | 542,269 | |
Banks — 1.6% |
Bank of America Corp. | | | | | | | | |
SOFR + 2.150% 2.592% VRN 4/29/31 | | | 55,000 | | | | 58,516 | |
4.183% 11/25/27 | | | 45,000 | | | | 51,557 | |
3 mo. USD LIBOR + 1.814% 4.244% VRN 4/24/38 | | | 25,000 | | | | 30,465 | |
3 mo. USD LIBOR + 1.310% 4.271% VRN 7/23/29 | | | 20,000 | | | | 23,461 | |
4.750% 4/21/45 | | | 70,000 | | | | 91,571 | |
7.750% 5/14/38 | | | 20,000 | | | | 33,124 | |
The Bank of Nova Scotia | | | | | | | | |
4.500% 12/16/25 | | | 40,000 | | | | 46,335 | |
3 mo. USD LIBOR + 2.648% 4.650% VRN (d) | | | 125,000 | | | | 121,172 | |
Barclays Bank PLC | | | | | | | | |
10.179% 6/12/21 (c) | | | 160,000 | | | | 168,337 | |
Citigroup, Inc. | | | | | | | | |
4.450% 9/29/27 | | | 30,000 | | | | 34,788 | |
5.500% 9/13/25 | | | 60,000 | | | | 71,121 | |
5.875% 1/30/42 | | | 20,000 | | | | 29,302 | |
6.000% 10/31/33 | | | 17,000 | | | | 22,901 | |
6.625% 6/15/32 | | | 15,000 | | | | 20,957 | |
8.125% 7/15/39 | | | 15,000 | | | | 26,109 | |
First Republic Bank | | | | | | | | |
4.375% 8/01/46 | | | 250,000 | | | | 302,827 | |
Fulton Financial Corp. | | | | | | | | |
3.600% 3/16/22 | | | 45,000 | | | | 45,992 | |
The Goldman Sachs Group, Inc. | | | | | | | | |
4.250% 10/21/25 | | | 35,000 | | | | 39,820 | |
5.950% 1/15/27 | | | 80,000 | | | | 98,440 | |
6.750% 10/01/37 | | | 35,000 | | | | 50,852 | |
HSBC Holdings PLC | | | | | | | | |
4.250% 8/18/25 | | | 200,000 | | | | 217,354 | |
| | | Principal
Amount | | | Value | |
JP Morgan Chase & Co. | | | | | | | | |
SOFR + 2.515% 2.956% VRN 5/13/31 | | $ | 45,000 | | | $ | 48,281 | |
5.600% 7/15/41 | | | 45,000 | | | | 65,992 | |
Morgan Stanley | | | | | | | | |
4.350% 9/08/26 | | | 135,000 | | | | 156,263 | |
5.000% 11/24/25 | | | 40,000 | | | | 46,993 | |
SVB Financial Group | | | | | | | | |
3.125% 6/05/30 | | | 20,000 | | | | 22,269 | |
3.500% 1/29/25 | | | 85,000 | | | | 91,475 | |
The Toronto-Dominion Bank 5 year USD Swap + 2.205% | | | | | | | | |
3.625% VRN 9/15/31 | | | 50,000 | | | | 56,196 | |
Valley National Bancorp | | | | | | | | |
5.125% 9/27/23 | | | 50,000 | | | | 53,575 | |
Wells Fargo & Co. | | | | | | | | |
5.375% 11/02/43 | | | 14,000 | | | | 18,533 | |
5.606% 1/15/44 | | | 15,000 | | | | 20,473 | |
| | | | | | | | 2,165,051 | |
Beverages — 0.2% |
Anheuser-Busch Cos. LLC/Anheuser-Busch InBev Worldwide, Inc. | | | | | | | | |
4.900% 2/01/46 | | | 170,000 | | | | 209,615 | |
Molson Coors Beverage Co. | | | | | | | | |
4.200% 7/15/46 | | | 39,000 | | | | 41,139 | |
5.000% 5/01/42 | | | 5,000 | | | | 5,663 | |
| | | | | | | | 256,417 | |
Building Materials — 0.1% |
Standard Industries, Inc. | | | | | | | | |
5.000% 2/15/27 (c) | | | 156,000 | | | | 162,240 | |
Chemicals — 0.3% |
CF Industries, Inc. | | | | | | | | |
4.500% 12/01/26 (c) | | | 60,000 | | | | 69,624 | |
DuPont de Nemours, Inc. | | | | | | | | |
5.319% 11/15/38 | | | 55,000 | | | | 69,793 | |
Huntsman International LLC | | | | | | | | |
5.125% 11/15/22 | | | 30,000 | | | | 32,259 | |
Nutrition & Biosciences, Inc. | | | | | | | | |
1.832% 10/15/27 (c) | | | 35,000 | | | | 35,159 | |
Yara International ASA | | | | | | | | |
3.148% 6/04/30 (c) | | | 15,000 | | | | 16,051 | |
4.750% 6/01/28 (c) | | | 132,000 | | | | 154,680 | |
| | | | | | | | 377,566 | |
Commercial Services — 0.0% |
PayPal Holdings, Inc. | | | | | | | | |
3.250% 6/01/50 | | | 30,000 | | | | 33,186 | |
The accompanying notes are an integral part of the financial statements.
127
MassMutual Premier Balanced Fund — Portfolio of Investments (Continued) |
| | | Principal
Amount | | | Value | |
Computers — 0.3% |
Apple, Inc. | | | | | | | | |
1.650% 5/11/30 | | $ | 50,000 | | | $ | 51,793 | |
2.650% 5/11/50 | | | 30,000 | | | | 31,437 | |
Dell International LLC/EMC Corp. | | | | | | | | |
6.020% 6/15/26 (c) | | | 113,000 | | | | 132,682 | |
Genpact Luxembourg Sarl | | | | | | | | |
3.375% 12/01/24 | | | 140,000 | | | | 146,606 | |
3.700% STEP 4/01/22 | | | 65,000 | | | | 66,543 | |
Leidos, Inc. | | | | | | | | |
4.375% 5/15/30 (c) | | | 25,000 | | | | 29,299 | |
| | | | | | | | 458,360 | |
Cosmetics & Personal Care — 0.0% |
The Estee Lauder Cos., Inc. | | | | | | | | |
2.375% 12/01/29 | | | 45,000 | | | | 48,404 | |
Diversified Financial Services — 1.1% |
AerCap Ireland Capital DAC / AerCap Global Aviation Trust | | | | | | | | |
4.500% 5/15/21 | | | 105,000 | | | | 107,001 | |
Aircastle Ltd. | | | | | | | | |
4.400% 9/25/23 | | | 50,000 | | | | 49,463 | |
5.000% 4/01/23 | | | 100,000 | | | | 100,225 | |
Ally Financial, Inc. | | | | | | | | |
4.125% 2/13/22 | | | 65,000 | | | | 67,360 | |
Antares Holdings LP | | | | | | | | |
6.000% 8/15/23 (c) | | | 250,000 | | | | 252,814 | |
Ares Finance Co. LLC | | | | | | | | |
4.000% 10/08/24 (c) | | | 85,000 | | | | 90,863 | |
Avolon Holdings Funding Ltd. | | | | | | | | |
3.250% 2/15/27 (c) | | | 55,000 | | | | 49,067 | |
Brookfield Finance, Inc. | | | | | | | | |
4.350% 4/15/30 | | | 135,000 | | | | 157,604 | |
4.850% 3/29/29 | | | 75,000 | | | | 89,484 | |
Global Aircraft Leasing Co. Ltd. | | | | | | | | |
6.500% 9/15/24 (c) | | | 62,175 | | | | 34,663 | |
Lazard Group LLC | | | | | | | | |
3.625% 3/01/27 | | | 34,000 | | | | 36,723 | |
3.750% 2/13/25 | | | 20,000 | | | | 21,679 | |
4.500% 9/19/28 | | | 95,000 | | | | 109,896 | |
Legg Mason, Inc. | | | | | | | | |
5.625% 1/15/44 | | | 45,000 | | | | 62,307 | |
Park Aerospace Holdings Ltd. | | | | | | | | |
4.500% 3/15/23 (c) | | | 50,000 | | | | 49,548 | |
5.250% 8/15/22 (c) | | | 260,000 | | | | 261,052 | |
| | | | | | | | 1,539,749 | |
Electric — 0.6% |
Avangrid, Inc. | | | | | | | | |
3.800% 6/01/29 | | | 64,000 | | | | 74,057 | |
| | | Principal
Amount | | | Value | |
The Cleveland Electric Illuminating Co. | | | | | | | | |
3.500% 4/01/28 (c) | | $ | 25,000 | | | $ | 27,014 | |
CMS Energy Corp. | | | | | | | | |
4.700% 3/31/43 | | | 25,000 | | | | 31,230 | |
4.875% 3/01/44 | | | 130,000 | | | | 170,204 | |
Entergy Arkansas LLC | | | | | | | | |
2.650% 6/15/51 | | | 80,000 | | | | 80,736 | |
Entergy Louisiana LLC | | | | | | | | |
4.950% 1/15/45 | | | 40,000 | | | | 44,020 | |
ITC Holdings Corp. | | | | | | | | |
2.950% 5/14/30 (c) | | | 40,000 | | | | 43,014 | |
Metropolitan Edison Co. | | | | | | | | |
4.300% 1/15/29 (c) | | | 56,000 | | | | 65,789 | |
Nevada Power Co. | | | | | | | | |
6.650% 4/01/36 | | | 20,000 | | | | 29,546 | |
Pacific Gas and Electric Co. | | | | | | | | |
2.500% 2/01/31 | | | 35,000 | | | | 33,301 | |
Pennsylvania Electric Co. | | | | | | | | |
4.150% 4/15/25 (c) | | | 70,000 | | | | 76,762 | |
Puget Energy, Inc. | | | | | | | | |
3.650% 5/15/25 | | | 5,000 | | | | 5,351 | |
Xcel Energy, Inc. | | | | | | | | |
6.500% 7/01/36 | | | 110,000 | | | | 161,271 | |
| | | | | | | | 842,295 | |
Foods — 0.3% |
Ingredion, Inc. | | | | | | | | |
3.200% 10/01/26 | | | 27,000 | | | | 29,832 | |
JBS USA LUX SA/JBS USA Finance, Inc. | | | | | | | | |
6.500% 4/15/29 (c) | | | 25,000 | | | | 27,749 | |
JBS USA LUX SA/JBS USA Food Co./JBS USA Finance, Inc. | | | | | | | | |
5.500% 1/15/30 (c) | | | 92,000 | | | | 100,139 | |
Kraft Heinz Foods Co. | | | | | | | | |
3.950% 7/15/25 | | | 63,000 | | | | 68,358 | |
Mars, Inc. | | | | | | | | |
3.950% 4/01/49 (c) | | | 75,000 | | | | 90,794 | |
Smithfield Foods, Inc. | | | | | | | | |
3.000% 10/15/30 (c) | | | 43,000 | | | | 43,093 | |
| | | | | | | | 359,965 | |
Forest Products & Paper — 0.0% |
Fibria Overseas Finance Ltd. | | | | | | | | |
4.000% 1/14/25 | | | 35,000 | | | | 37,100 | |
Gas — 0.0% |
CenterPoint Energy Resources Corp. | | | | | | | | |
6.250% 2/01/37 | | | 35,000 | | | | 46,518 | |
The accompanying notes are an integral part of the financial statements.
128
MassMutual Premier Balanced Fund — Portfolio of Investments (Continued) |
| | | Principal
Amount | | | Value | |
Health Care – Services — 0.1% |
Advocate Health & Hospitals Corp. | | | | | | | | |
3.829% 8/15/28 | | $ | 25,000 | | | $ | 28,948 | |
Humana, Inc. | | | | | | | | |
4.800% 3/15/47 | | | 25,000 | | | | 32,728 | |
UnitedHealth Group, Inc. | | | | | | | | |
3.125% 5/15/60 | | | 40,000 | | | | 42,929 | |
| | | | | | | | 104,605 | |
Home Builders — 0.0% |
Lennar Corp. | | | | | | | | |
4.750% 5/30/25 | | | 30,000 | | | | 32,741 | |
Insurance — 2.0% |
Allstate Corp. 3 mo. USD LIBOR + 2.938% | | | | | | | | |
5.750% VRN 8/15/53 | | | 175,000 | | | | 182,223 | |
American International Group, Inc. | | | | | | | | |
4.200% 4/01/28 | | | 40,000 | | | | 46,388 | |
4.500% 7/16/44 | | | 25,000 | | | | 29,164 | |
4.750% 4/01/48 | | | 15,000 | | | | 18,377 | |
3 mo. USD LIBOR + 2.868% 5.750% VRN 4/01/48 | | | 115,000 | | | | 125,613 | |
AmTrust Financial Services, Inc. | | | | | | | | |
6.125% 8/15/23 | | | 145,000 | | | | 134,444 | |
Arch Capital Finance LLC | | | | | | | | |
5.031% 12/15/46 | | | 30,000 | | | | 37,814 | |
Arch Capital Group Ltd. | | | | | | | | |
3.635% 6/30/50 | | | 55,000 | | | | 59,130 | |
Athene Global Funding | | | | | | | | |
2.500% 1/14/25 (c) | | | 115,000 | | | | 118,538 | |
Athene Holding Ltd. | | | | | | | | |
4.125% 1/12/28 | | | 240,000 | | | | 260,618 | |
AXIS Specialty Finance LLC | | | | | | | | |
3.900% 7/15/29 | | | 95,000 | | | | 103,831 | |
5 year CMT + 3.186% 4.900% VRN 1/15/40 | | | 55,000 | | | | 54,948 | |
AXIS Specialty Finance PLC | | | | | | | | |
4.000% 12/06/27 | | | 60,000 | | | | 65,677 | |
Brighthouse Financial, Inc. | | | | | | | | |
3.700% 6/22/27 | | | 55,000 | | | | 57,055 | |
4.700% 6/22/47 | | | 50,000 | | | | 48,120 | |
5.625% 5/15/30 | | | 45,000 | | | | 52,405 | |
Brown & Brown, Inc. | | | | | | | | |
2.375% 3/15/31 | | | 25,000 | | | | 25,154 | |
4.200% 9/15/24 | | | 42,000 | | | | 46,347 | |
CNO Financial Group, Inc. | | | | | | | | |
5.250% 5/30/25 | | | 107,000 | | | | 122,725 | |
Enstar Group Ltd. | | | | | | | | |
4.500% 3/10/22 | | | 70,000 | | | | 72,929 | |
4.950% 6/01/29 | | | 65,000 | | | | 72,836 | |
| | | Principal
Amount | | | Value | |
Equitable Financial Life Global Funding | | | | | | | | |
1.400% 7/07/25 (c) | | $ | 50,000 | | | $ | 51,045 | |
Equitable Holdings, Inc. | | | | | | | | |
5.000% 4/20/48 | | | 40,000 | | | | 47,281 | |
Markel Corp. | | | | | | | | |
3.350% 9/17/29 | | | 25,000 | | | | 27,603 | |
New York Life Insurance Co. | | | | | | | | |
3.750% 5/15/50 (c) | | | 25,000 | | | | 28,186 | |
The Progressive Corp. 3 mo. USD LIBOR + 2.539% | | | | | | | | |
5.375% VRN (d) | | | 70,000 | | | | 70,000 | |
Prudential Financial, Inc. | | | | | | | | |
5 year CMT + 3.035% 3.700% VRN 10/01/50 | | | 20,000 | | | | 20,406 | |
3 mo. USD LIBOR + 3.920% 5.625% VRN 6/15/43 | | | 45,000 | | | | 47,798 | |
3 mo. USD LIBOR + 2.665% 5.700% VRN 9/15/48 | | | 110,000 | | | | 124,361 | |
3 mo. USD LIBOR + 4.175% 5.875% VRN 9/15/42 | | | 50,000 | | | | 52,660 | |
Reinsurance Group of America, Inc. | | | | | | | | |
3.150% 6/15/30 | | | 55,000 | | | | 59,881 | |
3.900% 5/15/29 | | | 60,000 | | | | 68,495 | |
Teachers Insurance & Annuity Association of America | | | | | | | | |
4.270% 5/15/47 (c) | | | 35,000 | | | | 40,979 | |
USF&G Capital I | | | | | | | | |
8.500% 12/15/45 (c) | | | 35,000 | | | | 55,004 | |
Voya Financial, Inc. 3 mo. USD LIBOR + 2.084% | | | | | | | | |
4.700% VRN 1/23/48 | | | 25,000 | | | | 25,023 | |
Willis North America, Inc. | | | | | | | | |
2.950% 9/15/29 | | | 45,000 | | | | 48,491 | |
4.500% 9/15/28 | | | 65,000 | | | | 77,286 | |
XLIT Ltd. | | | | | | | | |
4.450% 3/31/25 | | | 89,000 | | | | 100,655 | |
| | | | | | | | 2,679,490 | |
Internet — 0.1% |
Alphabet, Inc. | | | | | | | | |
2.250% 8/15/60 | | | 35,000 | | | | 33,095 | |
Amazon.com, Inc. | | | | | | | | |
4.050% 8/22/47 | | | 45,000 | | | | 58,465 | |
| | | | | | | | 91,560 | |
Investment Companies — 0.5% |
Ares Capital Corp. | | | | | | | | |
3.500% 2/10/23 | | | 125,000 | | | | 128,397 | |
BlackRock TCP Capital Corp. | | | | | | | | |
3.900% 8/23/24 | | | 180,000 | | | | 182,884 | |
The accompanying notes are an integral part of the financial statements.
129
MassMutual Premier Balanced Fund — Portfolio of Investments (Continued) |
| | | Principal
Amount | | | Value | |
4.125% 8/11/22 | | $ | 70,000 | | | $ | 70,996 | |
Icahn Enterprises LP/Icahn Enterprises Finance Corp. | | | | | | | | |
6.250% 2/01/22 | | | 105,000 | | | | 106,110 | |
Sixth Street Specialty Lending, Inc. | | | | | | | | |
3.875% 11/01/24 | | | 145,000 | | | | 146,892 | |
| | | | | | | | 635,279 | |
Iron & Steel — 0.1% |
Vale Overseas Ltd. | | | | | | | | |
6.250% 8/10/26 | | | 50,000 | | | | 59,125 | |
6.875% 11/21/36 | | | 35,000 | | | | 45,559 | |
| | | | | | | | 104,684 | |
Machinery – Diversified — 0.1% |
CNH Industrial Capital LLC | | | | | | | | |
1.950% 7/02/23 | | | 25,000 | | | | 25,469 | |
3.875% 10/15/21 | | | 95,000 | | | | 97,585 | |
| | | | | | | | 123,054 | |
Media — 0.5% |
CCO Holdings LLC/CCO Holdings Capital Corp. | | | | | | | | |
5.125% 5/01/27 (c) | | | 30,000 | | | | 31,567 | |
Charter Communications Operating LLC/Charter Communications Operating Capital | | | | | | | | |
6.484% 10/23/45 | | | 35,000 | | | | 46,944 | |
Comcast Corp. | | | | | | | | |
3.400% 7/15/46 | | | 45,000 | | | | 50,071 | |
3.450% 2/01/50 | | | 55,000 | | | | 62,131 | |
3.969% 11/01/47 | | | 25,000 | | | | 29,885 | |
4.750% 3/01/44 | | | 35,000 | | | | 46,114 | |
Discovery Communications LLC | | | | | | | | |
3.950% 3/20/28 | | | 62,000 | | | | 70,531 | |
4.000% 9/15/55 (c) | | | 30,000 | | | | 30,459 | |
4.650% 5/15/50 | | | 30,000 | | | | 34,389 | |
Grupo Televisa SAB | | | | | | | | |
6.625% 3/18/25 | | | 100,000 | | | | 120,438 | |
Time Warner Cable, Inc. | | | | | | | | |
6.750% 6/15/39 | | | 30,000 | | | | 40,569 | |
ViacomCBS, Inc. | | | | | | | | |
4.200% 5/19/32 | | | 40,000 | | | | 45,774 | |
The Walt Disney Co. | | | | | | | | |
3.600% 1/13/51 | | | 65,000 | | | | 73,249 | |
| | | | | | | | 682,121 | |
Mining — 0.2% |
Glencore Finance Canada Ltd. | | | | | | | | |
5.550% STEP 10/25/42 (c) | | | 23,000 | | | | 26,962 | |
Glencore Funding LLC | | | | | | | | |
3.875% 10/27/27 (c) | | | 25,000 | | | | 27,259 | |
| | | Principal
Amount | | | Value | |
4.625% 4/29/24 (c) | | $ | 85,000 | | | $ | 93,640 | |
Kinross Gold Corp. | | | | | | | | |
4.500% 7/15/27 | | | 31,000 | | | | 35,160 | |
5.125% 9/01/21 | | | 31,000 | | | | 31,898 | |
Teck Resources Ltd. | | | | | | | | |
6.000% 8/15/40 | | | 35,000 | | | | 39,633 | |
| | | | | | | | 254,552 | |
Miscellaneous - Manufacturing — 0.0% |
Carlisle Cos., Inc. | | | | | | | | |
2.750% 3/01/30 | | | 59,000 | | | | 62,715 | |
General Electric Co. | | | | | | | | |
4.125% 10/09/42 | | | 5,000 | | | | 5,059 | |
| | | | | | | | 67,774 | |
Oil & Gas — 0.7% |
BP Capital Markets PLC 5 year CMT + 4.036% | | | | | | | | |
4.375% VRN (d) | | | 65,000 | | | | 67,763 | |
Cenovus Energy, Inc. | | | | | | | | |
4.250% 4/15/27 | | | 50,000 | | | | 45,204 | |
6.750% 11/15/39 | | | 29,000 | | | | 29,155 | |
Diamondback Energy, Inc. | | | | | | | | |
3.250% 12/01/26 | | | 45,000 | | | | 45,148 | |
EQT Corp. | | | | | | | | |
3.000% 10/01/22 | | | 65,000 | | | | 63,456 | |
3.900% 10/01/27 | | | 195,000 | | | | 179,522 | |
7.875% STEP 2/01/25 | | | 70,000 | | | | 77,591 | |
Marathon Petroleum Corp. | | | | | | | | |
4.500% 4/01/48 | | | 10,000 | | | | 10,135 | |
6.500% 3/01/41 | | | 35,000 | | | | 42,669 | |
Newfield Exploration Co. | | | | | | | | |
5.375% 1/01/26 | | | 60,000 | | | | 56,348 | |
5.625% 7/01/24 | | | 40,000 | | | | 38,802 | |
5.750% 1/30/22 | | | 66,000 | | | | 65,971 | |
Occidental Petroleum Corp. | | | | | | | | |
6.600% 3/15/46 | | | 81,000 | | | | 69,761 | |
Ovintiv, Inc. | | | | | | | | |
6.500% 2/01/38 | | | 15,000 | | | | 13,622 | |
Patterson-UTI Energy, Inc. | | | | | | | | |
3.950% 2/01/28 | | | 72,000 | | | | 55,648 | |
Petroleos Mexicanos | | | | | | | | |
5.350% 2/12/28 | | | 30,000 | | | | 25,950 | |
6.375% 1/23/45 | | | 15,000 | | | | 11,498 | |
6.500% 3/13/27 | | | 10,000 | | | | 9,370 | |
6.625% 6/15/38 | | | 5,000 | | | | 3,943 | |
| | | | | | | | 911,556 | |
Oil & Gas Services — 0.1% |
National Oilwell Varco, Inc. | | | | | | | | |
3.600% 12/01/29 | | | 70,000 | | | | 67,989 | |
The accompanying notes are an integral part of the financial statements.
130
MassMutual Premier Balanced Fund — Portfolio of Investments (Continued) |
| | | Principal
Amount | | | Value | |
3.950% 12/01/42 | | $ | 60,000 | | | $ | 53,954 | |
| | | | | | | | 121,943 | |
Packaging & Containers — 0.1% |
Amcor Finance USA, Inc. | | | | | | | | |
3.625% 4/28/26 | | | 95,000 | | | | 105,827 | |
WRKCo, Inc. | | | | | | | | |
3.000% 6/15/33 | | | 30,000 | | | | 32,634 | |
| | | | | | | | 138,461 | |
Pharmaceuticals — 0.6% |
AbbVie, Inc. | | | | | | | | |
4.050% 11/21/39 (c) | | | 40,000 | | | | 45,998 | |
4.700% 5/14/45 | | | 75,000 | | | | 92,348 | |
Becton Dickinson and Co. | | | | | | | | |
4.685% 12/15/44 | | | 25,000 | | | | 30,911 | |
Bristol-Myers Squibb Co. | | | | | | | | |
4.350% 11/15/47 | | | 30,000 | | | | 39,621 | |
Cigna Corp. | | | | | | | | |
4.800% 7/15/46 (c) | | | 30,000 | | | | 37,592 | |
CVS Health Corp. | | | | | | | | |
4.300% 3/25/28 | | | 45,000 | | | | 52,671 | |
5.050% 3/25/48 | | | 20,000 | | | | 25,528 | |
6.125% 9/15/39 | | | 10,000 | | | | 13,895 | |
CVS Pass-Through Trust | | | | | | | | |
5.926% 1/10/34 (c) | | | 44,955 | | | | 52,027 | |
Dentsply Sirona, Inc. | | | | | | | | |
3.250% 6/01/30 | | | 25,000 | | | | 27,180 | |
McKesson Corp. | | | | | | | | |
4.883% 3/15/44 | | | 10,000 | | | | 12,249 | |
6.000% 3/01/41 | | | 30,000 | | | | 40,874 | |
Mylan NV | | | | | | | | |
3.950% 6/15/26 | | | 90,000 | | | | 101,253 | |
5.250% 6/15/46 | | | 60,000 | | | | 74,466 | |
Teva Pharmaceutical Finance Netherlands III BV | | | | | | | | |
2.200% 7/21/21 | | | 59,000 | | | | 58,439 | |
Upjohn, Inc. | | | | | | | | |
2.700% 6/22/30 (c) | | | 55,000 | | | | 56,945 | |
| | | | | | | | 761,997 | |
Pipelines — 0.6% |
Energy Transfer Operating LP | | | | | | | | |
4.200% 4/15/27 | | | 30,000 | | | | 31,039 | |
5.875% 1/15/24 | | | 30,000 | | | | 33,030 | |
6.125% 12/15/45 | | | 40,000 | | | | 40,152 | |
3 mo. USD LIBOR + 4.028% 6.250% VRN (d) | | | 95,000 | | | | 61,988 | |
5 year CMT + 5.134% 6.750% VRN (d) | | | 45,000 | | | | 34,650 | |
| | | Principal
Amount | | | Value | |
EnLink Midstream Partners LP | | | | | | | | |
4.150% 6/01/25 | | $ | 125,000 | | | $ | 107,629 | |
4.850% 7/15/26 | | | 24,000 | | | | 20,763 | |
Enterprise Products Operating LLC | | | | | | | | |
3 mo. USD LIBOR + 3.033% 5.250% VRN 8/16/77 | | | 45,000 | | | | 42,851 | |
3 mo. USD LIBOR + 2.570% 5.375% VRN 2/15/78 | | | 30,000 | | | | 26,700 | |
EQM Midstream Partners LP | | | | | | | | |
4.750% 7/15/23 | | | 70,000 | | | | 69,863 | |
MPLX LP | | | | | | | | |
4.500% 4/15/38 | | | 30,000 | | | | 30,712 | |
6.250% 10/15/22 | | | 19,000 | | | | 19,021 | |
3 mo. USD LIBOR + 4.652% 6.875% VRN (d) | | | 90,000 | | | | 73,700 | |
Plains All American Pipeline LP 3 mo. USD LIBOR + 4.110% | | | | | | | | |
6.125% VRN (d) | | | 105,000 | | | | 66,612 | |
Plains All American Pipeline LP/PAA Finance Corp. | | | | | | | | |
3.800% 9/15/30 | | | 50,000 | | | | 48,484 | |
4.500% 12/15/26 | | | 67,000 | | | | 71,237 | |
4.700% 6/15/44 | | | 50,000 | | | | 44,332 | |
Sunoco Logistics Partners Operations LP | | | | | | | | |
5.300% 4/01/44 | | | 25,000 | | | | 23,292 | |
| | | | | | | | 846,055 | |
Private Equity — 0.2% |
Apollo Management Holdings LP 5 year CMT + 3.266% | | | | | | | | |
4.950% VRN 1/14/50 (c) | | | 35,000 | | | | 34,987 | |
Carlyle Finance Subsidiary LLC | | | | | | | | |
3.500% 9/19/29 (c) | | | 65,000 | | | | 70,339 | |
Hercules Capital, Inc. | | | | | | | | |
4.625% 10/23/22 | | | 70,000 | | | | 70,861 | |
KKR Group Finance Co. VI LLC | | | | | | | | |
3.750% 7/01/29 (c) | | | 50,000 | | | | 57,522 | |
KKR Group Finance Co. VIII LLC | | | | | | | | |
3.500% 8/25/50 (c) | | | 30,000 | | | | 30,571 | |
| | | | | | | | 264,280 | |
Real Estate Investment Trusts (REITS) — 0.7% |
Agree LP | | | | | | | | |
2.900% 10/01/30 | | | 20,000 | | | | 20,744 | |
American Tower Trust #1 | | | | | | | | |
3.652% 3/15/48 (c) | | | 50,000 | | | | 54,244 | |
Crown Castle International Corp. | | | | | | | | |
5.200% 2/15/49 | | | 13,000 | | | | 17,108 | |
Healthcare Trust of America Holdings LP | | | | | | | | |
3.500% 8/01/26 | | | 75,000 | | | | 83,486 | |
The accompanying notes are an integral part of the financial statements.
131
MassMutual Premier Balanced Fund — Portfolio of Investments (Continued) |
| | | Principal
Amount | | | Value | |
Highwoods Realty LP | | | | | | | | |
4.125% 3/15/28 | | $ | 20,000 | | | $ | 22,065 | |
Host Hotels & Resorts LP | | | | | | | | |
3.500% 9/15/30 | | | 93,000 | | | | 89,021 | |
Service Properties Trust | | | | | | | | |
4.500% 6/15/23 | | | 30,000 | | | | 29,420 | |
4.950% 10/01/29 | | | 45,000 | | | | 38,588 | |
Spirit Realty LP | | | | | | | | |
3.200% 1/15/27 | | | 100,000 | | | | 101,283 | |
3.400% 1/15/30 | | | 25,000 | | | | 24,856 | |
4.000% 7/15/29 | | | 55,000 | | | | 57,211 | |
4.450% 9/15/26 | | | 11,000 | | | | 11,803 | |
Store Capital Corp. | | | | | | | | |
4.625% 3/15/29 | | | 62,000 | | | | 66,483 | |
Tanger Properties LP | | | | | | | | |
3.875% 12/01/23 | | | 58,000 | | | | 58,331 | |
VEREIT Operating Partnership LP | | | | | | | | |
3.100% 12/15/29 | | | 115,000 | | | | 115,201 | |
3.400% 1/15/28 | | | 25,000 | | | | 26,102 | |
4.625% 11/01/25 | | | 85,000 | | | | 93,917 | |
WP Carey, Inc. | | | | | | | | |
4.250% 10/01/26 | | | 32,000 | | | | 36,128 | |
| | | | | | | | 945,991 | |
Retail — 0.1% |
Advance Auto Parts, Inc. | | | | | | | | |
1.750% 10/01/27 | | | 15,000 | | | | 14,955 | |
AutoZone, Inc. | | | | | | | | |
1.650% 1/15/31 | | | 45,000 | | | | 44,055 | |
Starbucks Corp. | | | | | | | | |
2.550% 11/15/30 | | | 70,000 | | | | 74,323 | |
| | | | | | | | 133,333 | |
Semiconductors — 0.1% |
KLA Corp. | | | | | | | | |
3.300% 3/01/50 | | | 75,000 | | | | 79,239 | |
Microchip Technology, Inc. | | | | | | | | |
3.922% 6/01/21 | | | 25,000 | | | | 25,553 | |
| | | | | | | | 104,792 | |
Software — 0.2% |
Broadridge Financial Solutions, Inc. | | | | | | | | |
2.900% 12/01/29 | | | 79,000 | | | | 85,583 | |
Microsoft Corp. | | | | | | | | |
4.450% 11/03/45 | | | 89,000 | | | | 125,756 | |
| | | | | | | | 211,339 | |
Telecommunications — 0.4% |
AT&T, Inc. | | | | | | | | |
1.650% 2/01/28 | | | 30,000 | | | | 30,057 | |
3.500% 9/15/53 (c) | | | 133,000 | | | | 128,588 | |
3.550% 9/15/55 (c) | | | 188,000 | | | | 182,204 | |
| | | Principal
Amount | | | Value | |
Crown Castle Towers LLC | | | | | | | | |
4.241% 7/15/48 (c) | | $ | 40,000 | | | $ | 45,583 | |
Qwest Corp | | | | | | | | |
6.750% 12/01/21 | | | 29,000 | | | | 30,625 | |
Sprint Communications, Inc. | | | | | | | | |
9.250% 4/15/22 | | | 65,000 | | | | 72,115 | |
Telefonaktiebolaget LM Ericsson | | | | | | | | |
4.125% 5/15/22 | | | 63,000 | | | | 65,668 | |
Verizon Communications, Inc. | | | | | | | | |
6.550% 9/15/43 | | | 34,000 | | | | 55,345 | |
| | | | | | | | 610,185 | |
Transportation — 0.1% |
CSX Corp. | | | | | | | | |
4.750% 11/15/48 | | | 20,000 | | | | 26,551 | |
Norfolk Southern Corp. | | | | | | | | |
4.050% 8/15/52 | | | 35,000 | | | | 42,891 | |
| | | | | | | | 69,442 | |
| | | | | | | | | |
TOTAL CORPORATE DEBT (Cost $16,275,757) | | | | | | | 17,309,297 | |
| | | | | | | | | |
MUNICIPAL OBLIGATIONS — 0.1% |
JobsOhio Beverage System Series B, Revenue Bonds, | | | | | | | | |
4.532% 1/01/35 | | | 150,000 | | | | 192,584 | |
State of California BAB, General Obligation | | | | | | | | |
7.600% 11/01/40 | | | 10,000 | | | | 18,013 | |
| | | | | | | | 210,597 | |
| | | | | | | | | |
TOTAL MUNICIPAL OBLIGATIONS (Cost $174,830) | | | | | | | 210,597 | |
| | | | | | | | | |
NON-U.S. GOVERNMENT AGENCY OBLIGATIONS — 10.0% |
Automobile Asset-Backed Securities — 0.3% |
Avis Budget Rental Car Funding AESOP LLC, Series 2019-1A, Class C | | | | | | | | |
4.530% 3/20/23 (c) | | | 100,000 | | | | 101,263 | |
Hertz Vehicle Financing LLC, Series 2018-3A, Class A | | | | | | | | |
4.030% 7/25/24 (c) | | | 97,620 | | | | 97,372 | |
Santander Revolving Auto Loan Trust | | | | | | | | |
Series 2019-A, Class B, 2.800% 1/26/32 (c) | | | 34,000 | | | | 35,774 | |
Series 2019-A, Class C, 3.000% 1/26/32 (c) | | | 20,000 | | | | 20,249 | |
The accompanying notes are an integral part of the financial statements.
132
MassMutual Premier Balanced Fund — Portfolio of Investments (Continued) |
| | | Principal
Amount | | | Value | |
Series 2019-A, Class D, 3.450% 1/26/32 (c) | | $ | 147,000 | | | $ | 146,470 | |
| | | | | | | | 401,128 | |
Commercial Mortgage-Backed Securities — 1.8% |
Aventura Mall Trust, Series 2018-AVM, Class C, | | | | | | | | |
4.249% VRN 7/05/40 (c) (e) | | | 190,000 | | | | 178,389 | |
BANK | | | | | | | | |
Series 2019-BN17, Class B, 4.128% VRN 4/15/52 (e) | | | 29,000 | | | | 33,570 | |
Series 2019-BN16, Class AS, 4.267% 2/15/52 | | | 31,333 | | | | 37,298 | |
Series 2019-BN16, Class B, 4.438% VRN 2/15/52 (e) | | | 24,330 | | | | 27,204 | |
BBCMS Mortgage Trust | | | | | | | | |
Series 2020-C7, Class AS, 2.444% 4/15/53 | | | 57,000 | | | | 59,875 | |
Series 2018-CHRS, Class B, 4.409% VRN 8/05/38 (c) (e) | | | 100,000 | | | | 88,916 | |
Series 2018-CHRS, Class C, 4.409% VRN 8/05/38 (c) (e) | | | 100,000 | | | | 82,081 | |
Benchmark Mortgage Trust, Series 2019-B14, Class AS | | | | | | | | |
3.352% 12/15/62 | | | 150,000 | | | | 167,049 | |
BHMS Mortgage Trust | | | | | | | | |
Series 2018-ATLS, Class A, 1 mo. USD LIBOR + 1.250% 1.402% FRN 7/15/35 (c) | | | 150,000 | | | | 143,440 | |
Series 2018-ATLS, Class B, 1 mo. USD LIBOR + 1.500% 1.652% FRN 7/15/35 (c) | | | 100,000 | | | | 92,753 | |
BX Commercial Mortgage Trust | | | | | | | | |
Series 2018-IND, Class B, 1 mo. USD LIBOR + .900% 1.052% FRN 11/15/35 (c) | | | 70,000 | | | | 69,743 | |
Series 2019-XL, Class E, 1 mo. USD LIBOR + 1.800% 1.952% FRN 10/15/36 (c) | | | 142,395 | | | | 141,070 | |
CD Commercial Mortgage Trust | | | | | | | | |
Series 2019-CD8, Class B, 3.366% 8/15/57 | | | 78,000 | | | | 80,999 | |
Series 2019-CD8, Class C, 3.719% 8/15/57 | | | 94,000 | | | | 87,726 | |
Citigroup Commercial Mortgage Trust, Series 2017-C4, Class C, | | | | | | | | |
4.339% VRN 10/12/50 (e) | | | 70,000 | | | | 63,970 | |
Commercial Mortgage Pass-Through Certificates | | | | | | | | |
Series 2013-GAM, Class A1, 1.705% 2/10/28 (c) | | | 8,319 | | | | 8,301 | |
Series 2012-CR4, Class B, 3.703% 10/15/45 (c) | | | 35,000 | | | | 22,853 | |
| | | Principal
Amount | | | Value | |
Series 2015-CR23, Class C, 4.435% VRN 5/10/48 (e) | | $ | 35,000 | | | $ | 35,236 | |
Series 2014-UBS5, Class B, 4.514% VRN 9/10/47 (e) | | | 50,000 | | | | 51,018 | |
Series 2014-LC17, Class C, 4.705% VRN 10/10/47 (e) | | | 100,000 | | | | 101,227 | |
GS Mortgage Securities Trust, Series 2017-GS6, Class B | | | | | | | | |
3.869% 5/10/50 | | | 79,000 | | | | 87,552 | |
Jackson Park Trust, Series 2019-LIC, Class C, | | | | | | | | |
3.131% VRN 10/14/39 (c) (e) | | | 100,000 | | | | 103,242 | |
JP Morgan Chase Commercial Mortgage Securities Trust, Series 2016-JP2, Class AS | | | | | | | | |
3.056% 8/15/49 | | | 140,000 | | | | 148,990 | |
JPMDB Commercial Mortgage Securities Trust, Series 2017-C7, Class C, | | | | | | | | |
4.323% VRN 10/15/50 (e) | | | 100,000 | | | | 91,555 | |
Morgan Stanley Capital I Trust | | | | | | | | |
Series 2019-L2, Class AS, 4.272% 3/15/52 | | | 100,000 | | | | 117,501 | |
Series 2018-H3, Class B, 4.620% VRN 7/15/51 (e) | | | 20,000 | | | | 23,131 | |
Series 2011-C2, Class B, 5.200% VRN 6/15/44 (c) (e) | | | 100,000 | | | | 100,383 | |
Wells Fargo Commercial Mortgage Trust | | | | | | | | |
Series 2018-C45, Class AS, 4.405% VRN 6/15/51 (e) | | | 30,000 | | | | 35,204 | |
Series 2018-C45, Class B, 4.556% 6/15/51 | | | 10,000 | | | | 10,992 | |
WF-RBS Commercial Mortgage Trust | | | | | | | | |
Series 2012-C8, Class B, 4.311% 8/15/45 | | | 40,000 | | | | 40,766 | |
Series 2011-C3, Class B, 4.740% 3/15/44 (c) | | | 50,000 | | | | 50,327 | |
| | | | | | | | 2,382,361 | |
Other Asset-Backed Securities — 4.9% |
321 Henderson Receivables LLC, Series 2015-1A, Class A | | | | | | | | |
3.260% 9/15/72 (c) | | | 103,920 | | | | 108,112 | |
AASET Trust, Series 2018-2A, Class A | | | | | | | | |
4.454% 11/18/38 (c) | | | 217,386 | | | | 202,184 | |
Adams Outdoor Advertising LP, Series 2018-1, Class A | | | | | | | | |
4.810% 11/15/48 (c) | | | 96,484 | | | | 100,389 | |
American Tower Trust #1, Series 13, Class 2A | | | | | | | | |
3.070% 3/15/48 (c) | | | 50,000 | | | | 51,105 | |
The accompanying notes are an integral part of the financial statements.
133
MassMutual Premier Balanced Fund — Portfolio of Investments (Continued) |
| | | Principal
Amount | | | Value | |
Anchorage Capital CLO Ltd., Series 2019-11A, Class A, 3 mo. USD LIBOR + 1.390% | | | | | | | | |
1.648% FRN 7/22/32 (c) | | $ | 250,000 | | | $ | 250,040 | |
Ascentium Equipment Receivables Trust, Series 2019-2A, Class E | | | | | | | | |
3.780% 5/10/27 (c) | | | 177,000 | | | | 177,366 | |
BlueMountain CLO XXV Ltd., Series 2019-25A, Class B, 3 mo. USD LIBOR + 1.800% | | | | | | | | |
2.075% FRN 7/15/32 (c) | | | 250,000 | | | | 249,669 | |
Castlelake Aircraft Securitization Trust, Series 2019-1A, Class A | | | | | | | | |
3.967% 4/15/39 (c) | | | 207,816 | | | | 192,325 | |
CF Hippolyta LLC, Series 2020-1, Class A1 | | | | | | | | |
1.690% 7/15/60 (c) | | | 100,000 | | | | 101,130 | |
CLI Funding V LLC, Series 2014-1A, Class A | | | | | | | | |
3.290% 6/18/29 (c) | | | 34,893 | | | | 34,893 | |
DB Master Finance LLC | | | | | | | | |
Series 2019-1A, Class A2II, 4.021% 5/20/49 (c) | | | 74,250 | | | | 78,530 | |
Series 2019-1A, Class A23, 4.352% 5/20/49 (c) | | | 66,330 | | | | 72,509 | |
Domino’s Pizza Master Issuer LLC | | | | | | | | |
Series 2019-1A, Class A2, 3.668% 10/25/49 (c) | | | 49,625 | | | | 52,682 | |
Series 2015-1A, Class A2II, 4.474% 10/25/45 (c) | | | 105,600 | | | | 112,290 | |
Eaton Vance CLO Ltd., Series 2018-1A, Class B, 3 mo. USD LIBOR + 1.750% | | | | | | | | |
2.025% FRN 10/15/30 (c) | | | 250,000 | | | | 248,770 | |
Elara HGV Timeshare Issuer LLC, Series 2016-A, Class A | | | | | | | | |
2.730% 4/25/28 (c) | | | 25,973 | | | | 25,862 | |
Elmwood CLO II Ltd., Series 2019-2A, Class A, 3 mo. USD LIBOR + 1.450% | | | | | | | | |
1.722% FRN 4/20/31 (c) | | | 250,000 | | | | 250,097 | |
First Franklin Mortgage Loan Trust, Series 2004-FFH4, Class M6, 1 mo. USD LIBOR + 1.725% | | | | | | | | |
1.873% FRN 1/25/35 | | | 80,000 | | | | 74,792 | |
Goodgreen Trust | | | | | | | | |
Series 2019-2A, Class A, 2.760% 10/15/54 (c) | | | 120,843 | | | | 122,469 | |
Series 2016-1A, Class A, 3.230% 10/15/52 (c) | | | 51,364 | | | | 53,391 | |
Series 2017-1A, Class A, 3.740% 10/15/52 (c) | | | 85,745 | | | | 90,434 | |
| | | Principal
Amount | | | Value | |
Series 2019-1A, Class A, 3.860% 10/15/54 (c) | | $ | 125,419 | | | $ | 132,815 | |
Helios Issuer LLC, Series 2017-1A, Class A | | | | | | | | |
4.940% 9/20/49 (c) | | | 84,495 | | | | 89,945 | |
Hero Funding Trust | | | | | | | | |
Series 2016-4A, Class A1, 3.570% 9/20/47 (c) | | | 53,474 | | | | 55,644 | |
Series 2018-1A, Class A2, 4.670% 9/20/48 (c) | | | 65,522 | | | | 70,309 | |
Highbridge Loan Management Ltd., Series 13A-18, Class C, 3 mo. USD LIBOR + 2.150% | | | | | | | | |
2.425% FRN 10/15/30 (c) | | | 250,000 | | | | 242,166 | |
Horizon Aircraft Finance III Ltd., Series 2019-2, Class A | | | | | | | | |
3.425% 11/15/39 (c) | | | 338,640 | | | | 310,477 | |
J.G. Wentworth LLC, Series 2017-1A, Class B | | | | | | | | |
5.430% 8/15/62 (c) | | | 200,000 | | | | 221,902 | |
KKR Financial CLO Ltd., Series 24, Class A1, 3 mo. USD LIBOR + 1.360% | | | | | | | | |
1.632% FRN 4/20/32 (c) | | | 250,000 | | | | 247,542 | |
MP CLO III Ltd., Series 2013-1A, Class AR, 3 mo. USD LIBOR + 1.250% | | | | | | | | |
1.522% FRN 10/20/30 (c) | | | 250,000 | | | | 246,939 | |
OneMain Financial Issuance Trust, Series 2019-2A, Class A | | | | | | | | |
3.140% 10/14/36 (c) | | | 330,000 | | | | 351,680 | |
Orange Lake Timeshare Trust, Series 2016-A, Class B | | | | | | | | |
2.910% 3/08/29 (c) | | | 12,299 | | | | 11,624 | |
Oxford Finance Funding Trust | | | | | | | | |
Series 2020-1A, Class A2, 3.101% 2/15/28 (c) | | | 68,000 | | | | 68,972 | |
Series 2016-1A, Class A, 3.968% 6/17/24 (c) | | | 6,109 | | | | 6,111 | |
Planet Fitness Master Issuer LLC, Series 2019-1A, Class A2 | | | | | | | | |
3.858% 12/05/49 (c) | | | 92,303 | | | | 86,813 | |
Rockford Tower CLO Ltd., Series 2019-1A, Class B1, 3 mo. USD LIBOR + 2.050% | | | | | | | | |
2.322% FRN 4/20/32 (c) | | | 300,000 | | | | 300,015 | |
SBA Tower Trust, Series 2014-2A, Class C, | | | | | | | | |
3.869% STEP 10/15/49 (c) | | | 100,000 | | | | 105,290 | |
Sierra Receivables Funding LLC | | | | | | | | |
Series 2015-3A, Class B, 3.080% 9/20/32 (c) | | | 10,149 | | | | 10,139 | |
The accompanying notes are an integral part of the financial statements.
134
MassMutual Premier Balanced Fund — Portfolio of Investments (Continued) |
| | | Principal
Amount | | | Value | |
Series 2018-3A, Class C, 4.170% 9/20/35 (c) | | $ | 102,702 | | | $ | 105,073 | |
Store Master Funding I-VII, Series 2019-1, Class A2 | | | | | | | | |
3.650% 11/20/49 (c) | | | 114,993 | | | | 116,659 | |
Taco Bell Funding LLC | | | | | | | | |
Series 2018-1A, Class A2II, 4.940% 11/25/48 (c) | | | 39,300 | | | | 41,957 | |
Series 2016-1A, Class A23, 4.970% 5/25/46 (c) | | | 217,688 | | | | 233,787 | |
TAL Advantage VII LLC, Series 2020-1A, Class A | | | | | | | | |
2.050% 9/20/45 (c) | | | 200,000 | | | | 200,357 | |
Trinity Rail Leasing LP | | | | | | | | |
Series 2019-2A, Class A2, 3.100% 10/18/49 (c) | | | 122,000 | | | | 118,990 | |
Series 2018-1A, Class A2, 4.620% 6/17/48 (c) | | | 230,000 | | | | 233,780 | |
Triton Container Finance VIII LLC, Series 2020-1A, Class A | | | | | | | | |
2.110% 9/20/45 (c) | | | 150,000 | | | | 150,193 | |
WAVE Trust, Series 2017-1A, Class B | | | | | | | | |
5.682% 11/15/42 (c) | | | 202,760 | | | | 145,646 | |
Welk Resorts LLC, Series 2015-AA, Class A | | | | | | | | |
2.790% 6/16/31 (c) | | | 8,508 | | | | 8,473 | |
Willis Engine Structured Trust III, Series 2017-A, Class A, | | | | | | | | |
4.690% STEP 8/15/42 (c) | | | 200,707 | | | | 170,054 | |
| | | | | | | | 6,732,391 | |
Student Loans Asset-Backed Securities — 2.9% |
Access Group, Inc., Series 2015-1, Class B, 1 mo. USD LIBOR + 1.500% | | | | | | | | |
1.648% FRN 7/25/58 (c) | | | 100,000 | | | | 88,305 | |
College Loan Corp. Trust I, Series 2007-1, Class B2, 28 day ARS | | | | | | | | |
FRN 1/25/47 | | | 35,000 | | | | 27,864 | |
Commonbond Student Loan Trust, Series 2017-AGS, Class B | | | | | | | | |
3.470% 5/25/41 (c) | | | 67,075 | | | | 64,463 | |
Earnest Student Loan Program LLC, Series 2016-B, Class A1, 1 mo. USD LIBOR + 2.050% | | | | | | | | |
2.198% FRN 2/26/35 (c) | | | 10,918 | | | | 10,299 | |
ECMC Group Student Loan Trust | | | | | | | | |
Series 2018-2A, Class A, 1 mo. USD LIBOR + .800% 0.948% FRN 9/25/68 (c) | | | 72,669 | | | | 71,302 | |
Series 2017-1A, Class A, 1 mo. USD LIBOR + 1.200% 1.348% FRN 12/27/66 (c) | | | 63,023 | | | | 62,674 | |
| | | Principal
Amount | | | Value | |
Series 2016-1A, Class A, 1 mo. USD LIBOR + 1.350% 1.498% FRN 7/26/66 (c) | | $ | 77,013 | | | $ | 77,769 | |
EdLinc Student Loan Funding Trust | | | | | | | | |
Series 2017-A, Class A, PRIME - 1.150% 3.600% FRN 12/01/47 (c) | | | 48,427 | | | | 47,855 | |
Series 2012-1, Class B, 1 mo. USD LIBOR + 4.240% 4.388% FRN 11/26/40 (c) | | | 65,000 | | | | 69,040 | |
Education Loan Asset-Backed Trust I, Series 2003-2, Class 2A1, 28 day ARS | | | | | | | | |
FRN 8/01/43 (c) | | | 50,000 | | | | 46,130 | |
ELFI Graduate Loan Program LLC, Series 2019-A, Class B, | | | | | | | | |
2.940% VRN 3/25/44 (c) (e) | | | 151,000 | | | | 146,382 | |
KnowledgeWorks Foundation, Series 2010-1, Class A, 3 mo. USD LIBOR + .950% | | | | | | | | |
1.200% FRN 2/25/42 | | | 19,679 | | | | 19,348 | |
Navient Private Education Refi Loan Trust | | | | | | | | |
Series 2019-EA, Class A2B, 1 mo. USD LIBOR + .920% 1.072% FRN 5/15/68 (c) | | | 100,000 | | | | 99,821 | |
Series 2019-EA, Class B, 3.390% 5/15/68 (c) | | | 156,000 | | | | 155,630 | |
Navient Student Loan Trust | | | | | | | | |
Series 2016-1A, Class A, 1 mo. USD LIBOR + .700% 0.848% FRN 2/25/70 (c) | | | 58,449 | | | | 56,990 | |
Series 2018-3A, Class A3, 1 mo. USD LIBOR + .800% 0.948% FRN 3/25/67 (c) | | | 100,000 | | | | 99,012 | |
Series 2016-7A, Class A, 1 mo. USD LIBOR + 1.150% 1.298% FRN 3/25/66 (c) | | | 127,531 | | | | 127,531 | |
Series 2016-5A, Class A, 1 mo. USD LIBOR + 1.250% 1.398% FRN 6/25/65 (c) | | | 68,850 | | | | 68,850 | |
Series 2016-6A, Class A3, 1 mo. USD LIBOR + 1.300% 1.448% FRN 3/25/66 (c) | | | 210,000 | | | | 211,836 | |
Series 2018-4A, Class B, 1 mo. USD LIBOR + 1.300% 1.448% FRN 6/27/67 (c) | | | 100,000 | | | | 93,808 | |
Series 2015-3, Class B, 1 mo. USD LIBOR + 1.500% 1.648% FRN 10/25/58 | | | 40,000 | | | | 36,050 | |
Series 2019-BA, Class B, 4.040% 12/15/59 (c) | | | 150,000 | | | | 156,489 | |
The accompanying notes are an integral part of the financial statements.
135
MassMutual Premier Balanced Fund — Portfolio of Investments (Continued) |
| | | Principal
Amount | | | Value | |
Nelnet Private Education Loan Trust | | | | | | | | |
Series 2016-A, Class A1A, 1 mo. USD LIBOR + 1.750% 1.898% FRN 12/26/40 (c) | | $ | 19,671 | | | $ | 18,790 | |
Series 2016-A, Class A1B, 3.600% 12/26/40 (c) | | | 19,674 | | | | 19,775 | |
Nelnet Student Loan Trust | | | | | | | | |
Series 2018-3A, Class A3, 1 mo. USD LIBOR + .750% 0.898% FRN 9/27/66 (c) | | | 100,000 | | | | 98,097 | |
Series 2018-5A, Class B, 1 mo. USD LIBOR + 1.450% 1.598% FRN 2/25/67 (c) | | | 200,000 | | | | 187,788 | |
Series 2019-5, Class A, 2.530% 10/25/67 (c) | | | 279,754 | | | | 290,587 | |
SLC Student Loan Trust, Series 2005-1, Class B, 3 mo. USD LIBOR + .200% | | | | | | | | |
0.480% FRN 2/15/45 | | | 37,368 | | | | 33,636 | |
SLM Student Loan Trust | | | | | | | | |
Series 2005-4, Class B, 3 mo. USD LIBOR + .180% 0.425% FRN 7/25/55 | | | 215,475 | | | | 191,752 | |
Series 2006-5, Class B, 3 mo. USD LIBOR + .210% 0.455% FRN 10/25/40 | | | 125,632 | | | | 112,320 | |
Series 2006-2, Class B, 3 mo. USD LIBOR + .220% 0.465% FRN 1/25/41 | | | 53,923 | | | | 48,219 | |
Series 2005-6, Class B, 3 mo. USD LIBOR + .290% 0.535% FRN 1/25/44 | | | 73,266 | | | | 65,280 | |
Series 2005-8, Class B, 3 mo. USD LIBOR + .310% 0.555% FRN 1/25/55 | | | 41,231 | | | | 36,656 | |
Series 2004-1 Class B, 3 mo. USD LIBOR + .500% 0.745% FRN 7/25/39 | | | 38,554 | | | | 35,603 | |
Series 2003-11, Class B, 3 mo. USD LIBOR + .650% 0.900% FRN 12/15/38 | | | 81,365 | | | | 74,739 | |
Series 2014-2, Class B, 1 mo. USD LIBOR + 1.500% 1.648% FRN 1/25/72 | | | 300,000 | | | | 264,398 | |
SMB Private Education Loan Trust | | | | | | | | |
Series 2019-B, Class A2B, 1 mo. USD LIBOR + 1.000% 1.152% FRN 6/15/37 (c) | | | 250,000 | | | | 249,585 | |
Series 2017-A, Class B, 3.500% 6/17/41 (c) | | | 100,000 | | | | 99,612 | |
SoFi Professional Loan Program LLC | | | | | | | | |
Series 2016-B, Class A1, 1 mo. USD LIBOR + 1.200% 1.348% FRN 6/25/33 (c) | | | 12,455 | | | | 12,495 | |
| | | Principal
Amount | | | Value | |
Series 2019-C, Class BFX, 3.050% 11/16/48 (c) | | $ | 123,000 | | | $ | 126,351 | |
South Carolina Student Loan Corp., Series 2010-1, Class A3, 3 mo. USD LIBOR + 1.050% | | | | | | | | |
1.295% FRN 10/27/36 | | | 99,980 | | | | 99,349 | |
| | | | | | | | 3,902,480 | |
Whole Loan Collateral Collateralized Mortgage Obligations — 0.1% |
Countrywide Home Loans, Inc. | | | | | | | | |
Series 2004-2, Class 1A1, 3.666% VRN 2/25/34 (e) | | | 4,130 | | | | 3,987 | |
Series 2003-42, Class 1A1, 3.991% VRN 9/25/33 (e) | | | 1,038 | | | | 996 | |
Deephaven Residential Mortgage Trust, Series 2018-1A, Class A1, | | | | | | | | |
2.976% VRN 12/25/57 (c) (e) | | | 25,499 | | | | 25,658 | |
GSR Mortgage Loan Trust, Series 2004-9, Class 2A1, | | | | | | | | |
3.490% VRN 8/25/34 (e) | | | 1,518 | | | | 1,532 | |
IndyMac Index Mortgage Loan Trust, Series 2004-AR4, Class 1A, | | | | | | | | |
3.165% VRN 8/25/34 (e) | | | 9,933 | | | | 9,904 | |
JP Morgan Mortgage Trust, Series 2017-1, Class A11, | | | | | | | | |
3.500% VRN 1/25/47 (c) (e) | | | 54,077 | | | | 55,127 | |
Merrill Lynch Mortgage Investors, Inc. | | | | | | | | |
Series 2003-A4, Class IA, 3.032% VRN 7/25/33 (e) | | | 597 | | | | 569 | |
Series 2004-A1, Class IA, 3.250% VRN 2/25/34 (e) | | | 561 | | | | 554 | |
PSMC Trust, Series 2018-2, Class A1, | | | | | | | | |
3.500% VRN 6/25/48 (c) (e) | | | 43,837 | | | | 44,618 | |
Structured Adjustable Rate Mortgage Loan Trust, Series 2004-2, Class 2A, | | | | | | | | |
2.970% VRN 3/25/34 (e) | | | 4,343 | | | | 4,311 | |
Washington Mutual Mortgage Pass-Through Certificates, Series 2004-AR2, Class A, 12 mo. MTA + 1.400% | | | | | | | | |
2.419% FRN 4/25/44 | | | 12,236 | | | | 11,702 | |
Wells Fargo Mortgage Backed Securities Trust, Series 2019-1, Class A1, | | | | | | | | |
4.000% VRN 11/25/48 (c) (e) | | | 35,728 | | | | 36,479 | |
| | | | | | | | 195,437 | |
| | | | | | | | | |
TOTAL NON-U.S. GOVERNMENT AGENCY OBLIGATIONS (Cost $13,764,597) | | | | | | | 13,613,797 | |
The accompanying notes are an integral part of the financial statements.
136
MassMutual Premier Balanced Fund — Portfolio of Investments (Continued) |
| | | Principal
Amount | | | Value | |
SOVEREIGN DEBT OBLIGATIONS — 0.2% |
Colombia Government International Bond | | | | | | | | |
6.125% 1/18/41 | | $ | 100,000 | | | $ | 128,250 | |
Mexico Government International Bond | | | | | | | | |
4.750% 3/08/44 | | | 179,000 | | | | 195,199 | |
| | | | | | | | 323,449 | |
| | | | | | | | | |
TOTAL SOVEREIGN DEBT OBLIGATIONS (Cost $281,064) | | | | | | | 323,449 | |
| | | | | | | | | |
U.S. GOVERNMENT AGENCY OBLIGATIONS AND INSTRUMENTALITIES — 7.9% |
Collateralized Mortgage Obligations — 0.1% |
Federal Home Loan Mortgage Corp. | | | | | | | | |
Series 2617, Class Z, 5.500% 5/15/33 | | | 31,671 | | | | 36,628 | |
Series 2693, Class Z, 5.500% 10/15/33 | | | 58,905 | | | | 66,883 | |
| | | | | | | | 103,511 | |
Pass-Through Securities — 7.5% |
Federal Home Loan Mortgage Corp. | | | | | | | | |
Pool #RA2483 3.500% 6/01/50 | | | 464,899 | | | | 495,152 | |
Pool #G05253 5.000% 2/01/39 | | | 5,000 | | | | 5,759 | |
Pool #G00729 8.000% 6/01/27 | | | 7,204 | | | | 8,179 | |
Federal National Mortgage Association | | | | | | | | |
Pool #MA3029 3.000% 6/01/32 | | | 112,458 | | | | 118,538 | |
Pool #MA3090 3.000% 8/01/32 | | | 52,008 | | | | 54,820 | |
Pool #725692 1 year CMT + 2.137% 3.138% FRN 10/01/33 | | | 4,684 | | | | 4,907 | |
Pool #888586 1 year CMT + 2.196% 3.326% FRN 10/01/34 | | | 10,444 | | | | 11,006 | |
Pool #AS1304 3.500% 12/01/28 | | | 25,164 | | | | 27,059 | |
Pool #AV2325 3.500% 12/01/28 | | | 12,589 | | | | 13,537 | |
Pool #MA1356 3.500% 2/01/43 | | | 217,168 | | | | 235,711 | |
Pool #CA6096 3.500% 6/01/50 | | | 417,092 | | | | 448,275 | |
Pool #FM4017 3.500% 8/01/50 | | | 49,926 | | | | 52,878 | |
Pool #CA1909 4.500% 6/01/48 | | | 150,110 | | | | 162,535 | |
Pool #AD6437 5.000% 6/01/40 | | | 10,302 | | | | 11,808 | |
Pool #AD6996 5.000% 7/01/40 | | | 69,864 | | | | 80,076 | |
Pool #AL8173 5.000% 2/01/44 | | | 25,957 | | | | 29,532 | |
Pool #564594 7.000% 1/01/31 | | | 5,578 | | | | 6,410 | |
Pool #253795 7.000% 5/01/31 | | | 2,478 | | | | 2,890 | |
Pool #507061 7.500% 10/01/29 | | | 455 | | | | 524 | |
Pool #527761 7.500% 2/01/30 | | | 458 | | | | 478 | |
Pool #253183 7.500% 4/01/30 | | | 1,112 | | | | 1,293 | |
Pool #253265 7.500% 5/01/30 | | | 617 | | | | 717 | |
Pool #535248 8.000% 4/01/30 | | | 54 | | | | 63 | |
| | | Principal
Amount | | | Value | |
Pool #539460 8.000% 5/01/30 | | $ | 956 | | | $ | 1,125 | |
Pool #190317 8.000% 8/01/31 | | | 876 | | | | 1,025 | |
Government National Mortgage Association I Pool #352049 7.000% 10/15/23 | | | 253 | | | | 267 | |
Government National Mortgage Association II | | | | | | | | |
Pool# MA6656 3.000% 5/20/50 | | | 443,081 | | | | 464,982 | |
Pool# MA6710 3.000% 6/20/50 | | | 396,297 | | | | 416,751 | |
Pool #MA4321 3.500% 3/20/47 | | | 302,916 | | | | 324,036 | |
Government National Mortgage Association II TBA Pool #1635 3.500% 10/21/50 (f) | | | 2,950,000 | | | | 3,106,719 | |
Uniform Mortgage Backed Securities TBA | | | | | | | | |
Pool #505 2.000% 10/19/35 (f) | | | 1,450,000 | | | | 1,507,320 | |
Pool #1082 2.000% 10/14/50 (f) | | | 700,000 | | | | 723,844 | |
Pool #17115 3.500% 10/14/50 (f) | | | 1,625,000 | | | | 1,713,106 | |
Pool #21133 4.500% 10/14/50 (f) | | | 225,000 | | | | 243,369 | |
| | | | | | | | 10,274,691 | |
Whole Loans — 0.3% |
Federal Home Loan Mortgage Corp. Structured Agency Credit Risk Debt Notes | | | | | | | | |
Series 2020-DNA3, Class M1, 1 mo. USD LIBOR + 1.500% 1.648% FRN 6/25/50 (c) | | | 120,000 | | | | 120,202 | |
Series 2019-DNA3, Class M2, 1 mo. USD LIBOR + 2.050% 2.198% FRN 7/25/49 (c) | | | 91,089 | | | | 89,234 | |
Federal National Mortgage Association Connecticut Avenue Securities Trust, Series 2019-R01, Class 2M2, 1 mo. USD LIBOR + 2.450% | | | | | | | | |
2.598% FRN 7/25/31 (c) | | | 119,122 | | | | 118,196 | |
| | | | | | | | 327,632 | |
| | | | | | | | | |
TOTAL U.S. GOVERNMENT AGENCY OBLIGATIONS AND INSTRUMENTALITIES (Cost $10,677,201) | | | | | | | 10,705,834 | |
| | | | | | | | | |
U.S. TREASURY OBLIGATIONS — 3.1% |
U.S. Treasury Bonds & Notes — 3.1% |
U.S. Treasury Bond | | | | | | | | |
2.250% 8/15/49 (g) | | | 710,000 | | | | 846,452 | |
3.500% 2/15/39 | | | 980,000 | | | | 1,376,822 | |
U.S. Treasury Note | | | | | | | | |
0.125% 5/15/23 | | | 700,000 | | | | 699,603 | |
0.375% 4/30/25 | | | 900,000 | | | | 905,357 | |
The accompanying notes are an integral part of the financial statements.
137
MassMutual Premier Balanced Fund — Portfolio of Investments (Continued) |
| | | Principal
Amount | | | Value | |
1.625% 8/15/29 | | $ | 350,000 | | | $ | 381,185 | |
| | | | | | | | 4,209,419 | |
| | | | | | | | | |
TOTAL U.S. TREASURY OBLIGATIONS (Cost $4,227,155) | | | | | | | 4,209,419 | |
| | | | | | | | | |
TOTAL BONDS & NOTES (Cost $45,400,604) | | | | | | | 46,372,393 | |
| | | | | | | | | |
TOTAL PURCHASED OPTIONS (#) — 0.1% (Cost $130,531) | | | | | | | 84,300 | |
| | | Number of
Shares | | | | | |
RIGHTS — 0.0% |
Consumer, Non-cyclical — 0.0% |
Pharmaceuticals — 0.0% |
Bristol-Myers Squibb Co., Expires 3/31/21 (a) | | | 3,598 | | | | 8,096 | |
| | | | | | | | | |
TOTAL RIGHTS (Cost $7,664) | | | | | | | 8,096 | |
| | | | | | | | | |
WARRANTS — 0.0% |
Energy — 0.0% |
Oil & Gas — 0.0% |
Occidental Petroleum Corp., Expires 8/3/27 (a) | | | 69 | | | | 207 | |
| | | | | | | | | |
TOTAL WARRANTS (Cost $342) | | | | | | | 207 | |
| | | | | | | | | |
MUTUAL FUNDS — 7.7% |
Diversified Financial Services — 7.7% |
iShares China Large-Cap ETF (b) | | | 2,800 | | | | 117,600 | |
iShares MSCI Australia ETF (b) | | | 7,000 | | | | 138,040 | |
iShares MSCI EAFE ETF | | | 43,430 | | | | 2,764,319 | |
iShares MSCI France ETF | | | 8,500 | | | | 237,490 | |
iShares MSCI Germany ETF | | | 7,200 | | | | 209,736 | |
iShares MSCI India ETF (b) | | | 13,000 | | | | 440,180 | |
iShares MSCI Italy ETF (b) | | | 2,900 | | | | 70,702 | |
iShares MSCI Japan ETF (b) | | | 10,300 | | | | 608,421 | |
iShares MSCI Singapore ETF | | | 1,150 | | | | 21,528 | |
iShares MSCI South Korea ETF (b) | | | 1,800 | | | | 117,612 | |
iShares MSCI Spain ETF | | | 3,400 | | | | 73,984 | |
iShares MSCI Sweden ETF | | | 2,100 | | | | 74,151 | |
iShares MSCI Switzerland Capped ETF | | | 6,400 | | | | 262,848 | |
| | | Number of
Shares | | | Value | |
iShares MSCI Turkey Investable Market ETF (b) | | | 1,700 | | | $ | 33,592 | |
iShares MSCI United Kingdom ETF (b) | | | 10,500 | | | | 267,645 | |
State Street Navigator Securities Lending Prime Portfolio (h) | | | 516,386 | | | | 516,386 | |
Vanguard FTSE Developed Markets ETF | | | 74,840 | | | | 3,060,956 | |
Vanguard FTSE Emerging Markets ETF | | | 35,200 | | | | 1,522,047 | |
| | | | | | | | | |
TOTAL MUTUAL FUNDS (Cost $9,791,610) | | | | | | | 10,537,237 | |
| | | | | | | | | |
TOTAL LONG-TERM INVESTMENTS (Cost $118,025,926) | | | | | | | 132,359,602 | |
| | | Principal
Amount | | | | | |
SHORT-TERM INVESTMENTS — 5.7% |
Commercial Paper — 4.4% |
Carnival Corp. | | | | | | | | |
1.746% 11/25/20 (c) | | $ | 1,000,000 | | | | 993,922 | |
Duke Energy Corp. | | | | | | | | |
0.223% 10/02/20 (c) | | | 1,000,000 | | | | 999,995 | |
Harley-Davidson Funding Corp. | | | | | | | | |
0.304% 10/19/20 (c) | | | 1,000,000 | | | | 999,890 | |
Intercontinental Exchange, Inc. | | | | | | | | |
0.376% 12/03/20 (c) (i) | | | 1,000,000 | | | | 999,337 | |
Keurig Dr Pepper | | | | | | | | |
0.193% 10/13/20 (c) | | | 1,000,000 | | | | 999,937 | |
Societe Generale | | | | | | | | |
0.081% 10/06/20 (c) | | | 1,000,000 | | | | 999,984 | |
| | | | | | | | 5,993,065 | |
Repurchase Agreement — 1.3% |
Fixed Income Clearing Corp., Repurchase Agreement, dated 9/30/20, 0.000%, due 10/01/20 (j) | | | 1,737,564 | | | | 1,737,564 | |
| | | | | | | | | |
TOTAL SHORT-TERM INVESTMENTS (Cost $7,734,089) | | | | | | | 7,730,629 | |
| | | | | | | | | |
TOTAL INVESTMENTS — 102.8% (Cost $125,760,015) (k) | | | | | | | 140,090,231 | |
| | | | | | | | | |
Other Assets/(Liabilities) — (2.8)% | | | | | | | (3,826,930 | ) |
| | | | | | | | | |
NET ASSETS — 100.0% | | | | | | $ | 136,263,301 | |
The accompanying notes are an integral part of the financial statements.
138
MassMutual Premier Balanced Fund — Portfolio of Investments (Continued) |
Abbreviation Legend
CLO | Collateralized Loan Obligation |
Notes to Portfolio of Investments
Percentages are stated as a percent of net assets.
(a) | Non-income producing security. |
(b) | Denotes all or a portion of security on loan. The total value of securities on loan as of September 30, 2020, was $1,914,722 or 1.41% of net assets. Total securities on loan may be less than the amounts identified in the Portfolio of Investments. The Fund received $1,453,100 of non-cash collateral (U.S. Treasury and/or Agency obligations) related to securities lending activity. This amount is not reflected on either the Portfolio of Investments or the Statement of Assets and Liabilities. (Note 2). |
(c) | Security is exempt from registration under Regulation S or Rule 144A of the Securities Act of 1933. These securities are considered restricted and may be resold in transactions exempt from registration. At September 30, 2020, the aggregate market value of these securities amounted to $20,855,213 or 15.31% of net assets. |
(d) | Security is perpetual and has no stated maturity date. |
(e) | Certain variable rate securities are not based on a published reference rate and spread but are determined by the issuer or agent and are based on current market conditions. These securities do not indicate a reference rate and spread in their description above. The rates shown are the current interest rates at September 30, 2020. |
(f) | A portion of this security is purchased on a when-issued, delayed-delivery or forward commitment basis. (Note 2). |
(g) | A portion of this security is pledged/held as collateral for open derivatives. (Note 2). |
(h) | Represents investment of security lending cash collateral. (Note 2). |
(i) | This security is fair valued in good faith in accordance with procedures approved by the Board of Trustees. At September 30, 2020, these securities amounted to a value of $999,337 or 0.73% of net assets. |
(j) | Maturity value of $1,737,564. Collateralized by U.S. Government Agency obligations with a rate of 2.375%, maturity date of 3/15/22, and an aggregate market value, including accrued interest, of $1,772,346. |
(k) | See Note 6 for aggregate cost for federal tax purposes. |
(#) Interest Rate Swaptions Purchased
| | | | | | | Paid by Fund | | | Received by Fund | | | | | | | | | | | | | | |
| Description | | Counterparty | | Expiration
Date | | Rate | | | Frequency | | | Rate | | Frequency | | | Notional
Amount | | Value | | | Premium
Paid
(Received) | | | Unrealized
Appreciation/
(Depreciation) | |
| Call | | | | | | | | | | | | | | | | | | | | | | | | | | | | | |
| 10-Year Interest Rate Swap, 12/15/42 | | Barclays Bank PLC* | | 12/13/32 | | | 3-Month USD LIBOR BBA | | | | Quarterly | | | 2.44% | | | Semi-Annually | | | USD | | | 138,250 | | | $ | 17,544 | | | $ | 6,912 | | | $ | 10,632 | |
| | | | | | | | | | | | | | | | | | | | | | | | | | | | | | | | | | | | | |
| Put | | | | | | | | | | | | | | | | | | | | | | | | | | | | | | | | | | | | |
| 10-Year Interest Rate Swap, 12/15/42 | | Barclays Bank PLC* | | 12/13/32 | | | 2.94 | % | | | Semi-Annually | | | 3-Month USD LIBOR BBA | | | Quarterly | | | USD | | | 1,620,000 | | | $ | 44,728 | | | $ | 80,988 | | | $ | (36,260 | ) |
| 10-Year Interest Rate Swap, 2/02/43 | | Credit Suisse International* | | 1/31/33 | | | 3.11 | % | | | Semi-Annually | | | 3-Month USD LIBOR BBA | | | Quarterly | | | USD | | | 890,000 | | | | 22,028 | | | | 42,631 | | | | (20,603 | ) |
| | | | | | | | | | | | | | | | | | | | | | | | | | | | 66,756 | | | | 123,619 | | | | (56,863 | ) |
| | | | | | | | | | | | | | | | | | | | | | | | | | | $ | 84,300 | | | $ | 130,531 | | | $ | (46,231 | ) |
The accompanying notes are an integral part of the financial statements.
139
MassMutual Premier Balanced Fund — Portfolio of Investments (Continued) |
Futures contracts
| | Expiration
Date | | | Number of
Contracts | | | Notional
Amount | | | Value/ Net
Unrealized
Appreciation/
(Depreciation) | |
Long | | | | | | | | | | | | | | | | |
E-MINI MSCI EAFE INDEX | | | 12/18/20 | | | | 3 | | | $ | 281,394 | | | $ | (3,414 | ) |
Mini MSCI Emerging Market Index | | | 12/18/20 | | | | 25 | | | | 1,349,203 | | | | 11,423 | |
U.S. Treasury Long Bond | | | 12/21/20 | | | | 2 | | | | 353,002 | | | | (439 | ) |
U.S. Treasury Ultra Bond | | | 12/21/20 | | | | 9 | | | | 2,027,000 | | | | (30,687 | ) |
U.S. Treasury Note 2 Year | | | 12/31/20 | | | | 36 | | | | 7,951,541 | | | | 3,053 | |
U.S. Treasury Note 5 Year | | | 12/31/20 | | | | 9 | | | | 1,133,601 | | | | 680 | |
| | | | | | | | | | | | | | $ | (19,384 | ) |
Short | | | | | | | | | | | | | | | | |
U.S. Treasury Ultra 10 Year | | | 12/21/20 | | | | 2 | | | $ | (319,029 | ) | | $ | (815 | ) |
Centrally Cleared Credit Default Swaps - Buy Protection
Reference
Obligation/Index | | Rate Paid
by Fund | | | Payment
Frequency | | Termination
Date | | Notional Amount | | Value | | | Upfront
Premium
Paid/
(Received) | | | Unrealized
Appreciation
(Depreciation) | |
| CDX.NA.IG Series 35† | | | 1.000 | % | | Quarterly | | 12/20/2025 | | USD | | | 200,000 | | | $ | (4,168 | ) | | $ | (4,779 | ) | | $ | 611 | |
| CDX.NA.IG Series 35† | | | 1.000 | % | | Quarterly | | 12/20/2025 | | USD | | | 200,000 | | | | (4,168 | ) | | | (4,900 | ) | | | 732 | |
| | | | | | | | | | | | | | | | | $ | (8,336 | ) | | $ | (9,679 | ) | | $ | 1,343 | |
* | Contracts are subject to a Master Netting Agreement. |
† | Payment is based on a percentage of the index. Reference entities are a number of individual issuers comprising the index. |
Currency Legend
The accompanying notes are an integral part of the financial statements.
140
MassMutual Premier Disciplined Value Fund — Portfolio of Investments |
September 30, 2020 |
| | | Number of
Shares | | | Value | |
EQUITIES — 99.8% |
COMMON STOCK — 99.8% |
Basic Materials — 3.0% |
Chemicals — 1.9% |
Air Products & Chemicals, Inc. | | | 100 | | | $ | 29,786 | |
Albemarle Corp. | | | 10 | | | | 893 | |
Cabot Corp. | | | 200 | | | | 7,206 | |
Celanese Corp. | | | 1,810 | | | | 194,485 | |
CF Industries Holdings, Inc. | | | 1,700 | | | | 52,207 | |
The Chemours Co. | | | 1,300 | | | | 27,183 | |
Dow, Inc. | | | 2,603 | | | | 122,471 | |
DuPont de Nemours, Inc. | | | 903 | | | | 50,099 | |
Eastman Chemical Co. | | | 1,360 | | | | 106,243 | |
Ecolab, Inc. | | | 100 | | | | 19,984 | |
Element Solutions, Inc. (a) | | | 1,800 | | | | 18,918 | |
FMC Corp. | | | 500 | | | | 52,955 | |
Huntsman Corp. | | | 2,900 | | | | 64,409 | |
Linde PLC | | | 340 | | | | 80,964 | |
LyondellBasell Industries NV Class A | | | 4,300 | | | | 303,107 | |
The Mosaic Co. | | | 400 | | | | 7,308 | |
NewMarket Corp. | | | 250 | | | | 85,580 | |
Olin Corp. | | | 3,000 | | | | 37,140 | |
PPG Industries, Inc. | | | 1,590 | | | | 194,107 | |
RPM International, Inc. | | | 100 | | | | 8,284 | |
Valvoline, Inc. | | | 2,100 | | | | 39,984 | |
Westlake Chemical Corp. | | | 260 | | | | 16,437 | |
| | | | | | | | 1,519,750 | |
Forest Products & Paper — 0.3% |
International Paper Co. | | | 6,100 | | | | 247,294 | |
Iron & Steel — 0.3% |
Nucor Corp. | | | 800 | | | | 35,888 | |
Reliance Steel & Aluminum Co. | | | 810 | | | | 82,652 | |
Steel Dynamics, Inc. | | | 3,100 | | | | 88,753 | |
| | | | | | | | 207,293 | |
Mining — 0.5% |
Freeport-McMoRan, Inc. | | | 931 | | | | 14,561 | |
Newmont Corp. | | | 6,100 | | | | 387,045 | |
Southern Copper Corp. | | | 800 | | | | 36,216 | |
| | | | | | | | 437,822 | |
| | | | | | | | 2,412,159 | |
Communications — 11.1% |
Advertising — 0.3% |
The Interpublic Group of Cos., Inc. | | | 5,200 | | | | 86,684 | |
Omnicom Group, Inc. | | | 2,400 | | | | 118,800 | |
| | | | | | | | 205,484 | |
Internet — 2.1% |
Alphabet, Inc. Class A (a) | | | 560 | | | | 820,736 | |
| | | Number of
Shares | | | Value | |
Alphabet, Inc. Class C (a) | | | 370 | | | $ | 543,752 | |
E*TRADE Financial Corp. | | | 1,100 | | | | 55,055 | |
eBay, Inc. | | | 1,400 | | | | 72,940 | |
F5 Networks, Inc. (a) | | | 210 | | | | 25,782 | |
Lyft, Inc. Class A (a) | | | 100 | | | | 2,755 | |
TD Ameritrade Holding Corp. | | | 1,500 | | | | 58,725 | |
TripAdvisor, Inc. | | | 900 | | | | 17,631 | |
Twitter, Inc. (a) | | | 400 | | | | 17,800 | |
Uber Technologies, Inc. (a) | | | 300 | | | | 10,944 | |
VeriSign, Inc. (a) | | | 400 | | | | 81,940 | |
| | | | | | | | 1,708,060 | |
Media — 2.9% |
Charter Communications, Inc. Class A (a) | | | 90 | | | | 56,191 | |
Comcast Corp. Class A | | | 25,800 | | | | 1,193,508 | |
Discovery, Inc. Class A (a) (b) | | | 1,800 | | | | 39,186 | |
Discovery, Inc. Class C (a) | | | 4,928 | | | | 96,589 | |
DISH Network Corp. Class A (a) | | | 241 | | | | 6,996 | |
Fox Corp. Class A | | | 4,133 | | | | 115,021 | |
Fox Corp. Class B (a) | | | 1,433 | | | | 40,081 | |
John Wiley & Sons, Inc. Class A | | | 700 | | | | 22,197 | |
Liberty Broadband Corp. Class C (a) | | | 60 | | | | 8,572 | |
Liberty Media Corp-Liberty SiriusXM Class A (a) | | | 1,300 | | | | 43,121 | |
Liberty Media Corp-Liberty SiriusXM Class C (a) | | | 1,221 | | | | 40,391 | |
Madison Square Garden Entertainment Corp. (a) | | | 10 | | | | 685 | |
The New York Times Co. Class A (b) | | | 100 | | | | 4,279 | |
Nexstar Media Group, Inc. Class A | | | 430 | | | | 38,670 | |
ViacomCBS, Inc. Class A | | | 293 | | | | 8,875 | |
ViacomCBS, Inc. Class B (b) | | | 2,460 | | | | 68,904 | |
The Walt Disney Co. | | | 4,678 | | | | 580,446 | |
| | | | | | | | 2,363,712 | |
Telecommunications — 5.8% |
Arista Networks, Inc. (a) | | | 190 | | | | 39,317 | |
AT&T, Inc. | | | 35,736 | | | | 1,018,833 | |
CenturyLink, Inc. | | | 16,107 | | | | 162,520 | |
Ciena Corp. (a) | | | 1,400 | | | | 55,566 | |
Cisco Systems, Inc. | | | 33,200 | | | | 1,307,748 | |
EchoStar Corp. Class A (a) | | | 600 | | | | 14,934 | |
Juniper Networks, Inc. | | | 1,200 | | | | 25,800 | |
Motorola Solutions, Inc. | | | 660 | | | | 103,494 | |
T-Mobile US, Inc. (a) | | | 2,141 | | | | 244,845 | |
Telephone & Data Systems, Inc. | | | 1,918 | | | | 35,368 | |
Ubiquiti, Inc. | | | 350 | | | | 58,331 | |
The accompanying notes are an integral part of the financial statements.
141
MassMutual Premier Disciplined Value Fund — Portfolio of Investments (Continued) |
| | | Number of
Shares | | | Value | |
Verizon Communications, Inc. | | | 27,900 | | | $ | 1,659,771 | |
| | | | | | | | 4,726,527 | |
| | | | | | | | 9,003,783 | |
Consumer, Cyclical — 10.8% |
Airlines — 0.4% |
Alaska Air Group, Inc. | | | 500 | | | | 18,315 | |
American Airlines Group, Inc. (b) | | | 400 | | | | 4,916 | |
Copa Holdings SA Class A | | | 80 | | | | 4,027 | |
Delta Air Lines, Inc. | | | 5,600 | | | | 171,248 | |
JetBlue Airways Corp. (a) | | | 1,900 | | | | 21,527 | |
Southwest Airlines Co. | | | 1,800 | | | | 67,500 | |
United Airlines Holdings, Inc. (a) | | | 1,800 | | | | 62,550 | |
| | | | | | | | 350,083 | |
Apparel — 0.3% |
Capri Holdings Ltd. (a) | | | 2,500 | | | | 45,000 | |
Columbia Sportswear Co. | | | 100 | | | | 8,698 | |
Hanesbrands, Inc. | | | 7,000 | | | | 110,250 | |
PVH Corp. | | | 400 | | | | 23,856 | |
Ralph Lauren Corp. | | | 80 | | | | 5,438 | |
Skechers U.S.A., Inc. Class A (a) | | | 100 | | | | 3,022 | |
Tapestry, Inc. | | | 600 | | | | 9,378 | |
VF Corp. | | | 700 | | | | 49,175 | |
| | | | | | | | 254,817 | |
Auto Manufacturers — 1.0% |
Cummins, Inc. | | | 1,850 | | | | 390,646 | |
Ford Motor Co. | | | 8,100 | | | | 53,946 | |
General Motors Co. | | | 6,300 | | | | 186,417 | |
PACCAR, Inc. | | | 2,000 | | | | 170,560 | |
| | | | | | | | 801,569 | |
Auto Parts & Equipment — 0.5% |
Allison Transmission Holdings, Inc. | | | 2,100 | | | | 73,794 | |
Aptiv PLC | | | 1,400 | | | | 128,352 | |
BorgWarner, Inc. | | | 1,600 | | | | 61,984 | |
Gentex Corp. | | | 3,200 | | | | 82,400 | |
Lear Corp. | | | 480 | | | | 52,344 | |
| | | | | | | | 398,874 | |
Distribution & Wholesale — 0.2% |
Fastenal Co. | | | 1,400 | | | | 63,126 | |
HD Supply Holdings, Inc. (a) | | | 1,900 | | | | 78,356 | |
IAA, Inc. (a) | | | 200 | | | | 10,414 | |
LKQ Corp. (a) | | | 1,400 | | | | 38,822 | |
| | | | | | | | 190,718 | |
Entertainment — 0.0% |
Madison Square Garden Sports Corp. (a) | | | 10 | | | | 1,505 | |
Food Services — 0.0% |
Aramark | | | 1,400 | | | | 37,030 | |
| | | Number of
Shares | | | Value | |
Home Builders — 1.0% |
D.R. Horton, Inc. | | | 2,600 | | | $ | 196,638 | |
Lennar Corp. Class A | | | 3,370 | | | | 275,262 | |
Lennar Corp. Class B | | | 1,449 | | | | 95,141 | |
NVR, Inc. (a) | | | 20 | | | | 81,662 | |
PulteGroup, Inc. | | | 1,600 | | | | 74,064 | |
Toll Brothers, Inc. | | | 1,200 | | | | 58,392 | |
| | | | | | | | 781,159 | |
Home Furnishing — 0.3% |
Dolby Laboratories, Inc. Class A | | | 300 | | | | 19,884 | |
Tempur Sealy International, Inc. (a) | | | 1,000 | | | | 89,190 | |
Whirlpool Corp. | | | 550 | | | | 101,139 | |
| | | | | | | | 210,213 | |
Housewares — 0.1% |
Newell Brands, Inc. | | | 1,700 | | | | 29,172 | |
The Scotts Miracle-Gro Co. | | | 90 | | | | 13,762 | |
| | | | | | | | 42,934 | |
Leisure Time — 0.1% |
Carnival Corp. (b) | | | 100 | | | | 1,518 | |
Harley-Davidson, Inc. | | | 1,200 | | | | 29,448 | |
Norwegian Cruise Line Holdings Ltd. (a) (b) | | | 400 | | | | 6,844 | |
Polaris, Inc. | | | 620 | | | | 58,491 | |
Royal Caribbean Cruises Ltd. | | | 360 | | | | 23,303 | |
| | | | | | | | 119,604 | |
Lodging — 0.8% |
Extended Stay America, Inc. | | | 300 | | | | 3,585 | |
Hilton Worldwide Holdings, Inc. | | | 2,700 | | | | 230,364 | |
Las Vegas Sands Corp. | | | 1,800 | | | | 83,988 | |
Marriott International, Inc. Class A | | | 2,500 | | | | 231,450 | |
MGM Resorts International | | | 100 | | | | 2,175 | |
Wyndham Destinations, Inc. | | | 2,000 | | | | 61,520 | |
| | | | | | | | 613,082 | |
Retail — 6.1% |
Advance Auto Parts, Inc. | | | 40 | | | | 6,140 | |
AutoNation, Inc. (a) | | | 1,400 | | | | 74,102 | |
AutoZone, Inc. (a) | | | 60 | | | | 70,658 | |
Best Buy Co., Inc. | | | 1,990 | | | | 221,467 | |
Casey’s General Stores, Inc. | | | 50 | | | | 8,883 | |
Costco Wholesale Corp. | | | 250 | | | | 88,750 | |
Darden Restaurants, Inc. | | | 1,300 | | | | 130,962 | |
Dick’s Sporting Goods, Inc. | | | 200 | | | | 11,576 | |
Foot Locker, Inc. | | | 400 | | | | 13,212 | |
The Gap, Inc. | | | 200 | | | | 3,406 | |
Genuine Parts Co. | | | 170 | | | | 16,179 | |
The Home Depot, Inc. | | | 3,880 | | | | 1,077,515 | |
Kohl’s Corp. | | | 1,900 | | | | 35,207 | |
McDonald’s Corp. | | | 2,670 | | | | 586,038 | |
The accompanying notes are an integral part of the financial statements.
142
MassMutual Premier Disciplined Value Fund — Portfolio of Investments (Continued) |
| | | Number of
Shares | | | Value | |
MSC Industrial Direct Co., Inc. Class A | | | 600 | | | $ | 37,968 | |
Nu Skin Enterprises, Inc. Class A | | | 1,100 | | | | 55,099 | |
Penske Automotive Group, Inc. | | | 200 | | | | 9,532 | |
Qurate Retail, Inc. | | | 2,400 | | | | 17,232 | |
Starbucks Corp. | | | 2,200 | | | | 189,024 | |
Target Corp. | | | 4,160 | | | | 654,867 | |
Tiffany & Co. | | | 100 | | | | 11,585 | |
Walgreens Boots Alliance, Inc. | | | 4,739 | | | | 170,225 | |
Walmart, Inc. | | | 8,240 | | | | 1,152,858 | |
Williams-Sonoma, Inc. | | | 300 | | | | 27,132 | |
Yum China Holdings, Inc. | | | 2,800 | | | | 148,260 | |
Yum! Brands, Inc. | | | 1,890 | | | | 172,557 | |
| | | | | | | | 4,990,434 | |
| | | | | | | | 8,792,022 | |
Consumer, Non-cyclical — 23.3% |
Agriculture — 1.8% |
Altria Group, Inc. | | | 13,500 | | | | 521,640 | |
Bunge Ltd. | | | 100 | | | | 4,570 | |
Philip Morris International, Inc. | | | 12,760 | | | | 956,872 | |
| | | | | | | | 1,483,082 | |
Beverages — 1.1% |
Brown-Forman Corp. Class A | | | 300 | | | | 20,604 | |
Brown-Forman Corp. Class B | | | 100 | | | | 7,532 | |
The Coca-Cola Co. | | | 9,700 | | | | 478,889 | |
Constellation Brands, Inc. Class A | | | 210 | | | | 39,797 | |
Keurig Dr Pepper, Inc. | | | 100 | | | | 2,760 | |
Molson Coors Beverage Co. Class B | | | 360 | | | | 12,082 | |
PepsiCo, Inc. | | | 2,650 | | | | 367,290 | |
| | | | | | | | 928,954 | |
Biotechnology — 1.9% |
Alexion Pharmaceuticals, Inc. (a) | | | 1,870 | | | | 213,984 | |
Biogen, Inc. (a) | | | 1,410 | | | | 399,989 | |
Corteva, Inc. | | | 3 | | | | 86 | |
Exelixis, Inc. (a) | | | 2,100 | | | | 51,345 | |
Gilead Sciences, Inc. | | | 12,400 | | | | 783,556 | |
United Therapeutics Corp. (a) | | | 630 | | | | 63,630 | |
| | | | | | | | 1,512,590 | |
Commercial Services — 1.3% |
ADT, Inc. | | | 13,300 | | | | 108,661 | |
AMERCO | | | 70 | | | | 24,919 | |
Automatic Data Processing, Inc. | | | 550 | | | | 76,719 | |
CoreLogic, Inc. | | | 400 | | | | 27,068 | |
Equifax, Inc. | | | 10 | | | | 1,569 | |
Global Payments, Inc. | | | 330 | | | | 58,601 | |
Graham Holdings Co. Class B | | | 6 | | | | 2,425 | |
H&R Block, Inc. | | | 1,500 | | | | 24,435 | |
IHS Markit Ltd. | | | 900 | | | | 70,659 | |
| | | Number of
Shares | | | Value | |
ManpowerGroup, Inc. | | | 1,230 | | | $ | 90,196 | |
Nielsen Holdings PLC | | | 600 | | | | 8,508 | |
Quanta Services, Inc. | | | 600 | | | | 31,716 | |
Robert Half International, Inc. | | | 1,500 | | | | 79,410 | |
S&P Global, Inc. | | | 800 | | | | 288,480 | |
Sabre Corp. | | | 2,000 | | | | 13,020 | |
United Rentals, Inc. (a) | | | 700 | | | | 122,150 | |
| | | | | | | | 1,028,536 | |
Cosmetics & Personal Care — 2.0% |
Colgate-Palmolive Co. | | | 7,400 | | | | 570,910 | |
Coty, Inc. Class A | | | 200 | | | | 540 | |
The Procter & Gamble Co. | | | 7,410 | | | | 1,029,916 | |
| | | | | | | | 1,601,366 | |
Foods — 1.9% |
Campbell Soup Co. | | | 1,200 | | | | 58,044 | |
Conagra Brands, Inc. | | | 2,764 | | | | 98,702 | |
Flowers Foods, Inc. | | | 1,900 | | | | 46,227 | |
General Mills, Inc. | | | 5,900 | | | | 363,912 | |
The Hershey Co. | | | 390 | | | | 55,903 | |
Hormel Foods Corp. | | | 900 | | | | 44,001 | |
Ingredion, Inc. | | | 160 | | | | 12,109 | |
The J.M. Smucker Co. | | | 290 | | | | 33,501 | |
Kellogg Co. | | | 1,000 | | | | 64,590 | |
The Kraft Heinz Co. | | | 3,100 | | | | 92,845 | |
The Kroger Co. | | | 8,400 | | | | 284,844 | |
Lamb Weston Holdings, Inc. | | | 1,133 | | | | 75,084 | |
McCormick & Co., Inc. | | | 60 | | | | 11,646 | |
Mondelez International, Inc. Class A | | | 2,150 | | | | 123,517 | |
Pilgrim’s Pride Corp. (a) | | | 1,500 | | | | 22,448 | |
Post Holdings, Inc. (a) | | | 260 | | | | 22,360 | |
Sprouts Farmers Market, Inc. (a) | | | 2,600 | | | | 54,418 | |
Sysco Corp. | | | 1,000 | | | | 62,220 | |
Tyson Foods, Inc. Class A | | | 800 | | | | 47,584 | |
US Foods Holding Corp. (a) | | | 400 | | | | 8,888 | |
| | | | | | | | 1,582,843 | |
Health Care – Products — 2.5% |
Abbott Laboratories | | | 3,000 | | | | 326,490 | |
Baxter International, Inc. | | | 1,500 | | | | 120,630 | |
Boston Scientific Corp. (a) | | | 700 | | | | 26,747 | |
The Cooper Cos., Inc. | | | 30 | | | | 10,114 | |
Danaher Corp. | | | 1,360 | | | | 292,849 | |
Henry Schein, Inc. (a) | | | 300 | | | | 17,634 | |
Hill-Rom Holdings, Inc. | | | 560 | | | | 46,766 | |
Medtronic PLC | | | 4,819 | | | | 500,790 | |
QIAGEN NV (a) | | | 800 | | | | 41,808 | |
Steris PLC | | | 90 | | | | 15,857 | |
Stryker Corp. | | | 950 | | | | 197,951 | |
Thermo Fisher Scientific, Inc. | | | 750 | | | | 331,140 | |
The accompanying notes are an integral part of the financial statements.
143
MassMutual Premier Disciplined Value Fund — Portfolio of Investments (Continued) |
| | | Number of
Shares | | | Value | |
Zimmer Biomet Holdings, Inc. | | | 780 | | | $ | 106,189 | |
| | | | | | | | 2,034,965 | |
Health Care – Services — 1.8% |
Anthem, Inc. | | | 1,310 | | | | 351,853 | |
Centene Corp. (a) | | | 1,256 | | | | 73,262 | |
DaVita, Inc. (a) | | | 800 | | | | 68,520 | |
Encompass Health Corp. | | | 100 | | | | 6,498 | |
HCA Healthcare, Inc. | | | 770 | | | | 96,004 | |
Humana, Inc. | | | 720 | | | | 298,001 | |
IQVIA Holdings, Inc. (a) | | | 120 | | | | 18,916 | |
Laboratory Corp. of America Holdings (a) | | | 320 | | | | 60,246 | |
Molina Healthcare, Inc. (a) | | | 330 | | | | 60,403 | |
PPD, Inc. (a) | | | 800 | | | | 29,592 | |
Quest Diagnostics, Inc. | | | 590 | | | | 67,549 | |
UnitedHealth Group, Inc. | | | 760 | | | | 236,945 | |
Universal Health Services, Inc. Class B | | | 690 | | | | 73,844 | |
| | | | | | | | 1,441,633 | |
Household Products & Wares — 0.9% |
Avery Dennison Corp. | | | 470 | | | | 60,085 | |
The Clorox Co. | | | 350 | | | | 73,560 | |
Kimberly-Clark Corp. | | | 3,640 | | | | 537,482 | |
Reynolds Consumer Products, Inc. | | | 1,200 | | | | 36,744 | |
Spectrum Brands Holdings, Inc. | | | 100 | | | | 5,716 | |
| | | | | | | | 713,587 | |
Pharmaceuticals — 8.1% |
AbbVie, Inc. | | | 1,313 | | | | 115,006 | |
AmerisourceBergen Corp. | | | 550 | | | | 53,306 | |
Becton Dickinson and Co. | | | 1,150 | | | | 267,582 | |
Bristol-Myers Squibb Co. | | | 14,300 | | | | 862,147 | |
Cigna Corp. | | | 1,863 | | | | 315,611 | |
CVS Health Corp. | | | 10,789 | | | | 630,077 | |
Herbalife Nutrition Ltd. (a) | | | 500 | | | | 23,325 | |
Horizon Therapeutics PLC (a) | | | 100 | | | | 7,768 | |
Jazz Pharmaceuticals PLC (a) | | | 400 | | | | 57,036 | |
Johnson & Johnson | | | 14,500 | | | | 2,158,760 | |
McKesson Corp. | | | 430 | | | | 64,040 | |
Merck & Co., Inc. | | | 2,428 | | | | 201,403 | |
Mylan NV (a) | | | 5,500 | | | | 81,565 | |
Perrigo Co. PLC | | | 800 | | | | 36,728 | |
Pfizer, Inc. | | | 44,115 | | | | 1,619,020 | |
Zoetis, Inc. | | | 420 | | | | 69,455 | |
| | | | | | | | 6,562,829 | |
| | | | | | | | 18,890,385 | |
Energy — 3.4% |
Oil & Gas — 3.0% |
Apache Corp. | | | 128 | | | | 1,212 | |
| | | Number of
Shares | | | Value | |
Cabot Oil & Gas Corp. | | | 4,500 | | | $ | 78,120 | |
Chevron Corp. | | | 10,895 | | | | 784,440 | |
Cimarex Energy Co. | | | 500 | | | | 12,165 | |
Concho Resources, Inc. | | | 200 | | | | 8,824 | |
ConocoPhillips | | | 9,148 | | | | 300,420 | |
Devon Energy Corp. | | | 50 | | | | 473 | |
Diamondback Energy, Inc. | | | 670 | | | | 20,180 | |
EOG Resources, Inc. | | | 3,690 | | | | 132,619 | |
EQT Corp. | | | 400 | | | | 5,172 | |
Exxon Mobil Corp. | | | 18,390 | | | | 631,329 | |
Hess Corp. | | | 200 | | | | 8,186 | |
HollyFrontier Corp. | | | 2,800 | | | | 55,188 | |
Marathon Oil Corp. | | | 2,900 | | | | 11,861 | |
Marathon Petroleum Corp. | | | 1,277 | | | | 37,467 | |
Murphy Oil Corp. | | | 1,700 | | | | 15,164 | |
Noble Energy, Inc. | | | 480 | | | | 4,104 | |
Occidental Petroleum Corp. | | | 1,288 | | | | 12,893 | |
Parsley Energy, Inc. Class A | | | 400 | | | | 3,744 | |
Phillips 66 | | | 3,260 | | | | 168,999 | |
Pioneer Natural Resources Co. | | | 400 | | | | 34,396 | |
Valero Energy Corp. | | | 1,134 | | | | 49,125 | |
WPX Energy, Inc. (a) | | | 66 | | | | 323 | |
| | | | | | | | 2,376,404 | |
Oil & Gas Services — 0.1% |
Baker Hughes Co. | | | 3 | | | | 40 | |
Halliburton Co. | | | 3,100 | | | | 37,355 | |
Schlumberger NV | | | 3,840 | | | | 59,750 | |
| | | | | | | | 97,145 | |
Pipelines — 0.3% |
Kinder Morgan, Inc. | | | 4,400 | | | | 54,252 | |
ONEOK, Inc. | | | 800 | | | | 20,784 | |
Targa Resources Corp. | | | 100 | | | | 1,403 | |
The Williams Cos., Inc. | | | 8,700 | | | | 170,955 | |
| | | | | | | | 247,394 | |
| | | | | | | | 2,720,943 | |
Financial — 21.6% |
Banks — 8.3% |
Associated Banc-Corp. | | | 1,350 | | | | 17,037 | |
Bank of America Corp. | | | 46,473 | | | | 1,119,535 | |
Bank of Hawaii Corp. | | | 820 | | | | 41,426 | |
The Bank of New York Mellon Corp. | | | 10,150 | | | | 348,551 | |
Bank OZK | | | 300 | | | | 6,396 | |
BOK Financial Corp. | | | 100 | | | | 5,151 | |
Citigroup, Inc. | | | 11,671 | | | | 503,137 | |
Citizens Financial Group, Inc. | | | 1,900 | | | | 48,032 | |
Comerica, Inc. | | | 700 | | | | 26,775 | |
Commerce Bancshares, Inc. | | | 334 | | | | 18,801 | |
Cullen/Frost Bankers, Inc. | | | 70 | | | | 4,477 | |
The accompanying notes are an integral part of the financial statements.
144
MassMutual Premier Disciplined Value Fund — Portfolio of Investments (Continued) |
| | | Number of
Shares | | | Value | |
East West Bancorp, Inc. | | | 1,600 | | | $ | 52,384 | |
F.N.B. Corp. | | | 2,900 | | | | 19,662 | |
Fifth Third Bancorp | | | 2,560 | | | | 54,579 | |
First Horizon National Corp. | | | 3,016 | | | | 28,441 | |
The Goldman Sachs Group, Inc. | | | 2,390 | | | | 480,318 | |
Huntington Bancshares, Inc. | | | 1,771 | | | | 16,240 | |
JPMorgan Chase & Co. | | | 18,127 | | | | 1,745,086 | |
KeyCorp | | | 5,896 | | | | 70,339 | |
M&T Bank Corp. | | | 855 | | | | 78,737 | |
Morgan Stanley | | | 7,800 | | | | 377,130 | |
Northern Trust Corp. | | | 1,030 | | | | 80,309 | |
PacWest Bancorp | | | 2,400 | | | | 40,992 | |
The PNC Financial Services Group, Inc. | | | 3,096 | | | | 340,281 | |
Popular, Inc. | | | 900 | | | | 32,643 | |
Prosperity Bancshares, Inc. | | | 100 | | | | 5,183 | |
Regions Financial Corp. | | | 4,160 | | | | 47,965 | |
State Street Corp. | | | 4,800 | | | | 284,784 | |
SVB Financial Group (a) | | | 40 | | | | 9,625 | |
Synovus Financial Corp. | | | 1,271 | | | | 26,907 | |
TCF Financial Corp. | | | 9 | | | | 210 | |
Truist Financial Corp. | | | 1,900 | | | | 72,295 | |
Umpqua Holdings Corp. | | | 3,300 | | | | 35,046 | |
US Bancorp | | | 7,890 | | | | 282,857 | |
Webster Financial Corp. | | | 600 | | | | 15,846 | |
Wells Fargo & Co. | | | 14,153 | | | | 332,737 | |
Western Alliance Bancorp | | | 1,000 | | | | 31,620 | |
Zions Bancorp NA | | | 350 | | | | 10,227 | |
| | | | | | | | 6,711,761 | |
Diversified Financial Services — 3.7% |
Alliance Data Systems Corp. | | | 1,880 | | | | 78,922 | |
Ally Financial, Inc. | | | 2,600 | | | | 65,182 | |
American Express Co. | | | 1,790 | | | | 179,448 | |
Ameriprise Financial, Inc. | | | 1,880 | | | | 289,727 | |
BlackRock, Inc. | | | 830 | | | | 467,747 | |
Capital One Financial Corp. | | | 950 | | | | 68,267 | |
Cboe Global Markets, Inc. | | | 400 | | | | 35,096 | |
The Charles Schwab Corp. | | | 6,800 | | | | 246,364 | |
CME Group, Inc. | | | 1,340 | | | | 224,195 | |
Credit Acceptance Corp. (a) (b) | | | 10 | | | | 3,386 | |
Discover Financial Services | | | 2,400 | | | | 138,672 | |
Eaton Vance Corp. | | | 1,400 | | | | 53,410 | |
Evercore, Inc. Class A | | | 200 | | | | 13,092 | |
Franklin Resources, Inc. | | | 2,600 | | | | 52,910 | |
Intercontinental Exchange, Inc. | | | 1,935 | | | | 193,597 | |
Invesco Ltd. | | | 7,700 | | | | 87,857 | |
Lazard Ltd. Class A | | | 2,000 | | | | 66,100 | |
LPL Financial Holdings, Inc. | | | 500 | | | | 38,335 | |
Nasdaq, Inc. | | | 540 | | | | 66,263 | |
| | | Number of
Shares | | | Value | |
OneMain Holdings, Inc. | | | 1,000 | | | $ | 31,250 | |
Raymond James Financial, Inc. | | | 200 | | | | 14,552 | |
Santander Consumer USA Holdings, Inc. | | | 1,800 | | | | 32,742 | |
SEI Investments Co. | | | 500 | | | | 25,360 | |
SLM Corp. | | | 10,200 | | | | 82,518 | |
Synchrony Financial | | | 5,600 | | | | 146,552 | |
T. Rowe Price Group, Inc. | | | 1,180 | | | | 151,300 | |
Virtu Financial, Inc. Class A | | | 2,100 | | | | 48,321 | |
The Western Union Co. | | | 3,700 | | | | 79,291 | |
| | | | | | | | 2,980,456 | |
Insurance — 5.6% |
Aflac, Inc. | | | 5,600 | | | | 203,560 | |
Alleghany Corp. | | | 5 | | | | 2,602 | |
The Allstate Corp. | | | 4,280 | | | | 402,919 | |
American Financial Group, Inc. | | | 250 | | | | 16,745 | |
American International Group, Inc. | | | 3,102 | | | | 85,398 | |
American National Group, Inc. | | | 450 | | | | 30,389 | |
Arch Capital Group Ltd. (a) | | | 1,700 | | | | 49,725 | |
Arthur J Gallagher & Co. | | | 400 | | | | 42,232 | |
Assurant, Inc. | | | 50 | | | | 6,066 | |
Assured Guaranty Ltd. | | | 1,600 | | | | 34,368 | |
Athene Holding Ltd. Class A (a) | | | 300 | | | | 10,224 | |
Axis Capital Holdings Ltd. | | | 400 | | | | 17,616 | |
Berkshire Hathaway, Inc. Class B (a) | | | 7,760 | | | | 1,652,414 | |
Brighthouse Financial, Inc. (a) | | | 230 | | | | 6,189 | |
Chubb Ltd. | | | 1,321 | | | | 153,395 | |
Cincinnati Financial Corp. | | | 110 | | | | 8,577 | |
CNA Financial Corp. | | | 400 | | | | 11,996 | |
Equitable Holdings, Inc. | | | 5,400 | | | | 98,496 | |
Erie Indemnity Co. Class A | | | 20 | | | | 4,206 | |
Everest Re Group Ltd. | | | 10 | | | | 1,975 | |
Fidelity National Financial, Inc. | | | 557 | | | | 17,440 | |
First American Financial Corp. | | | 600 | | | | 30,546 | |
Globe Life, Inc. | | | 600 | | | | 47,940 | |
The Hanover Insurance Group, Inc. | | | 430 | | | | 40,067 | |
The Hartford Financial Services Group, Inc. | | | 2,690 | | | | 99,153 | |
Kemper Corp. | | | 400 | | | | 26,732 | |
Lincoln National Corp. | | | 1,698 | | | | 53,198 | |
Loews Corp. | | | 20 | | | | 695 | |
Markel Corp. (a) | | | 5 | | | | 4,869 | |
Marsh & McLennan Cos., Inc. | | | 180 | | | | 20,646 | |
Mercury General Corp. | | | 90 | | | | 3,723 | |
MetLife, Inc. | | | 7,840 | | | | 291,413 | |
MGIC Investment Corp. | | | 5,600 | | | | 49,616 | |
Old Republic International Corp. | | | 3,100 | | | | 45,694 | |
Primerica, Inc. | | | 100 | | | | 11,314 | |
Principal Financial Group, Inc. | | | 1,900 | | | | 76,513 | |
The accompanying notes are an integral part of the financial statements.
145
MassMutual Premier Disciplined Value Fund — Portfolio of Investments (Continued) |
| | | Number of
Shares | | | Value | |
The Progressive Corp. | | | 4,300 | | | $ | 407,081 | |
Prudential Financial, Inc. | | | 2,860 | | | | 181,667 | |
Reinsurance Group of America, Inc. | | | 300 | | | | 28,557 | |
RenaissanceRe Holdings Ltd. | | | 10 | | | | 1,697 | |
The Travelers Cos., Inc. | | | 1,569 | | | | 169,750 | |
Unum Group | | | 2,600 | | | | 43,758 | |
Voya Financial, Inc. | | | 400 | | | | 19,172 | |
W.R. Berkley Corp. | | | 450 | | | | 27,518 | |
White Mountains Insurance Group Ltd. | | | 3 | | | | 2,337 | |
Willis Towers Watson PLC | | | 150 | | | | 31,323 | |
| | | | | | | | 4,571,511 | |
Real Estate — 0.2% |
CBRE Group, Inc. Class A (a) | | | 1,900 | | | | 89,243 | |
Jones Lang LaSalle, Inc. | | | 670 | | | | 64,092 | |
| | | | | | | | 153,335 | |
Real Estate Investment Trusts (REITS) — 3.8% |
AGNC Investment Corp. | | | 600 | | | | 8,346 | |
Alexandria Real Estate Equities, Inc. | | | 60 | | | | 9,600 | |
American Campus Communities, Inc. | | | 100 | | | | 3,492 | |
Americold Realty Trust | | | 2,200 | | | | 78,650 | |
Annaly Capital Management, Inc. | | | 14,960 | | | | 106,515 | |
Apartment Investment and Management Co. Class A | | | 899 | | | | 30,314 | |
Apple Hospitality REIT, Inc. | | | 1,900 | | | | 18,259 | |
AvalonBay Communities, Inc. | | | 324 | | | | 48,386 | |
Boston Properties, Inc. | | | 940 | | | | 75,482 | |
Brixmor Property Group, Inc. | | | 3,300 | | | | 38,577 | |
Brookfield Property REIT, Inc. Class A (b) | | | 3,200 | | | | 39,168 | |
Camden Property Trust | | | 100 | | | | 8,898 | |
CoreSite Realty Corp. | | | 380 | | | | 45,174 | |
CubeSmart | | | 200 | | | | 6,462 | |
Digital Realty Trust, Inc. | | | 130 | | | | 19,079 | |
Douglas Emmett, Inc. | | | 1,200 | | | | 30,120 | |
Duke Realty Corp. | | | 1,100 | | | | 40,590 | |
EPR Properties | | | 500 | | | | 13,750 | |
Equity Commonwealth | | | 2,267 | | | | 60,370 | |
Equity LifeStyle Properties, Inc. | | | 800 | | | | 49,040 | |
Equity Residential | | | 3,100 | | | | 159,123 | |
Essex Property Trust, Inc. | | | 503 | | | | 100,997 | |
Extra Space Storage, Inc. | | | 370 | | | | 39,586 | |
Federal Realty Investment Trust | | | 90 | | | | 6,610 | |
First Industrial Realty Trust, Inc. | | | 1,000 | | | | 39,800 | |
Gaming and Leisure Properties, Inc. | | | 2,179 | | | | 80,471 | |
Healthpeak Properties, Inc. | | | 400 | | | | 10,860 | |
Highwoods Properties, Inc. | | | 1,800 | | | | 60,426 | |
Host Hotels & Resorts, Inc. | | | 5,003 | | | | 53,982 | |
Hudson Pacific Properties, Inc. | | | 300 | | | | 6,579 | |
| | | Number of
Shares | | | Value | |
Invitation Homes, Inc. | | | 1,300 | | | $ | 36,387 | |
Iron Mountain, Inc. (b) | | | 1,500 | | | | 40,185 | |
JBG SMITH Properties | | | 19 | | | | 508 | |
Kilroy Realty Corp. | | | 100 | | | | 5,196 | |
Kimco Realty Corp. | | | 4,900 | | | | 55,174 | |
Lamar Advertising Co. Class A | | | 800 | | | | 52,936 | |
Life Storage, Inc. | | | 400 | | | | 42,108 | |
Medical Properties Trust, Inc. | | | 300 | | | | 5,289 | |
Mid-America Apartment Communities, Inc. | | | 443 | | | | 51,366 | |
National Retail Properties, Inc. | | | 300 | | | | 10,353 | |
New Residential Investment Corp. | | | 5,800 | | | | 46,110 | |
Omega Healthcare Investors, Inc. | | | 2,000 | | | | 59,880 | |
Outfront Media, Inc. | | | 500 | | | | 7,275 | |
Paramount Group, Inc. | | | 2,600 | | | | 18,408 | |
Park Hotels & Resorts, Inc. | | | 2,900 | | | | 28,971 | |
Prologis, Inc. | | | 4,207 | | | | 423,308 | |
Public Storage | | | 330 | | | | 73,498 | |
Realty Income Corp. | | | 900 | | | | 54,675 | |
SBA Communications Corp. | | | 190 | | | | 60,511 | |
Simon Property Group, Inc. | | | 1,430 | | | | 92,493 | |
SL Green Realty Corp. (b) | | | 1,280 | | | | 59,354 | |
Spirit Realty Capital, Inc. | | | 240 | | | | 8,100 | |
Starwood Property Trust, Inc. | | | 2,700 | | | | 40,743 | |
STORE Capital Corp. | | | 500 | | | | 13,715 | |
Sun Communities, Inc. | | | 100 | | | | 14,061 | |
UDR, Inc. | | | 300 | | | | 9,783 | |
Ventas, Inc. | | | 2,600 | | | | 109,096 | |
VEREIT, Inc. | | | 900 | | | | 5,850 | |
VICI Properties, Inc. | | | 2,300 | | | | 53,751 | |
Vornado Realty Trust | | | 2,538 | | | | 85,556 | |
Weingarten Realty Investors | | | 3,100 | | | | 52,576 | |
Welltower, Inc. | | | 900 | | | | 49,581 | |
Weyerhaeuser Co. | | | 3,200 | | | | 91,264 | |
WP Carey, Inc. | | | 800 | | | | 52,128 | |
| | | | | | | | 3,098,895 | |
Savings & Loans — 0.0% |
New York Community Bancorp, Inc. | | | 1,590 | | | | 13,150 | |
People’s United Financial, Inc. | | | 600 | | | | 6,186 | |
Sterling Bancorp | | | 1,700 | | | | 17,884 | |
| | | | | | | | 37,220 | |
| | | | | | | | 17,553,178 | |
Industrial — 13.0% |
Aerospace & Defense — 1.1% |
The Boeing Co. | | | 280 | | | | 46,273 | |
General Dynamics Corp. | | | 1,440 | | | | 199,339 | |
Hexcel Corp. | | | 400 | | | | 13,420 | |
Howmet Aerospace, Inc. | | | 300 | | | | 5,016 | |
The accompanying notes are an integral part of the financial statements.
146
MassMutual Premier Disciplined Value Fund — Portfolio of Investments (Continued) |
| | | Number of
Shares | | | Value | |
L3 Harris Technologies, Inc. | | | 257 | | | $ | 43,649 | |
Northrop Grumman Corp. | | | 130 | | | | 41,014 | |
Raytheon Technologies Corp. | | | 6,168 | | | | 354,907 | |
Spirit AeroSystems Holdings, Inc. Class A | | | 500 | | | | 9,455 | |
TransDigm Group, Inc. | | | 330 | | | | 156,789 | |
| | | | | | | | 869,862 | |
Building Materials — 0.6% |
Carrier Global Corp. | | | 4,990 | | | | 152,395 | |
Eagle Materials, Inc. | | | 300 | | | | 25,896 | |
Fortune Brands Home & Security, Inc. | | | 200 | | | | 17,304 | |
Johnson Controls International PLC | | | 929 | | | | 37,950 | |
Lennox International, Inc. | | | 30 | | | | 8,178 | |
Masco Corp. | | | 3,500 | | | | 192,955 | |
MDU Resources Group, Inc. | | | 700 | | | | 15,750 | |
Owens Corning | | | 200 | | | | 13,762 | |
| | | | | | | | 464,190 | |
Electrical Components & Equipment — 0.6% |
Acuity Brands, Inc. | | | 250 | | | | 25,587 | |
AMETEK, Inc. | | | 300 | | | | 29,820 | |
Emerson Electric Co. | | | 6,700 | | | | 439,319 | |
| | | | | | | | 494,726 | |
Electronics — 2.1% |
Agilent Technologies, Inc. | | | 1,500 | | | | 151,410 | |
Allegion PLC | | | 390 | | | | 38,575 | |
Amphenol Corp. Class A | | | 600 | | | | 64,962 | |
Arrow Electronics, Inc. (a) | | | 500 | | | | 39,330 | |
Avnet, Inc. | | | 1,700 | | | | 43,928 | |
Coherent, Inc. (a) | | | 10 | | | | 1,109 | |
FLIR Systems, Inc. | | | 500 | | | | 17,925 | |
Fortive Corp. | | | 300 | | | | 22,863 | |
Garmin Ltd. | | | 500 | | | | 47,430 | |
Honeywell International, Inc. | | | 5,200 | | | | 855,972 | |
Hubbell, Inc. | | | 260 | | | | 35,578 | |
Jabil, Inc. | | | 2,100 | | | | 71,946 | |
Keysight Technologies, Inc. (a) | | | 630 | | | | 62,231 | |
Mettler-Toledo International, Inc. (a) | | | 20 | | | | 19,315 | |
National Instruments Corp. | | | 1,500 | | | | 53,550 | |
nVent Electric PLC | | | 1,519 | | | | 26,871 | |
PerkinElmer, Inc. | | | 10 | | | | 1,255 | |
Roper Technologies, Inc. | | | 50 | | | | 19,756 | |
Trimble, Inc. (a) | | | 200 | | | | 9,740 | |
Waters Corp. (a) | | | 620 | | | | 121,322 | |
| | | | | | | | 1,705,068 | |
| | | Number of
Shares | | | Value | |
Engineering & Construction — 0.1% |
AECOM (a) | | | 111 | | | $ | 4,644 | |
frontdoor, Inc. (a) | | | 800 | | | | 31,128 | |
Jacobs Engineering Group, Inc. | | | 100 | | | | 9,277 | |
| | | | | | | | 45,049 | |
Environmental Controls — 0.5% |
Clean Harbors, Inc. (a) | | | 600 | | | | 33,618 | |
Pentair PLC | | | 1,019 | | | | 46,640 | |
Republic Services, Inc. | | | 690 | | | | 64,412 | |
Waste Management, Inc. | | | 2,620 | | | | 296,505 | |
| | | | | | | | 441,175 | |
Hand & Machine Tools — 0.2% |
Lincoln Electric Holdings, Inc. | | | 800 | | | | 73,632 | |
Regal Beloit Corp. | | | 200 | | | | 18,774 | |
Snap-on, Inc. | | | 360 | | | | 52,967 | |
Stanley Black & Decker, Inc. | | | 5 | | | | 811 | |
| | | | | | | | 146,184 | |
Machinery – Construction & Mining — 0.9% |
BWX Technologies, Inc. | | | 900 | | | | 50,679 | |
Caterpillar, Inc. | | | 4,690 | | | | 699,513 | |
Oshkosh Corp. | | | 300 | | | | 22,050 | |
| | | | | | | | 772,242 | |
Machinery – Diversified — 1.1% |
AGCO Corp. | | | 566 | | | | 42,037 | |
Crane Co. | | | 120 | | | | 6,016 | |
Curtiss-Wright Corp. | | | 220 | | | | 20,517 | |
Deere & Co. | | | 1,040 | | | | 230,495 | |
Dover Corp. | | | 560 | | | | 60,670 | |
Flowserve Corp. | | | 600 | | | | 16,374 | |
GrafTech International Ltd. | | | 8,900 | | | | 60,876 | |
IDEX Corp. | | | 200 | | | | 36,482 | |
Ingersoll Rand, Inc. (a) | | | 111 | | | | 3,952 | |
Otis Worldwide Corp. | | | 4,195 | | | | 261,852 | |
Rockwell Automation, Inc. | | | 820 | | | | 180,957 | |
| | | | | | | | 920,228 | |
Metal Fabricate & Hardware — 0.1% |
The Timken Co. | | | 500 | | | | 27,110 | |
Valmont Industries, Inc. | | | 350 | | | | 43,463 | |
| | | | | | | | 70,573 | |
Miscellaneous - Manufacturing — 2.0% |
3M Co. | | | 2,600 | | | | 416,468 | |
A.O. Smith Corp. | | | 1,200 | | | | 63,360 | |
AptarGroup, Inc. | | | 20 | | | | 2,264 | |
Carlisle Cos., Inc. | | | 360 | | | | 44,053 | |
Eaton Corp. PLC | | | 1,982 | | | | 202,224 | |
General Electric Co. | | | 4,990 | | | | 31,088 | |
Illinois Tool Works, Inc. | | | 2,310 | | | | 446,315 | |
The accompanying notes are an integral part of the financial statements.
147
MassMutual Premier Disciplined Value Fund — Portfolio of Investments (Continued) |
| | | Number of
Shares | | | Value | |
ITT, Inc. | | | 400 | | | $ | 23,620 | |
Parker-Hannifin Corp. | | | 980 | | | | 198,293 | |
Textron, Inc. | | | 200 | | | | 7,218 | |
Trane Technologies PLC | | | 1,240 | | | | 150,350 | |
Trinity Industries, Inc. | | | 800 | | | | 15,600 | |
| | | | | | | | 1,600,853 | |
Packaging & Containers — 0.8% |
Amcor PLC | | | 7,500 | | | | 82,875 | |
Ardagh Group SA | | | 2,400 | | | | 33,720 | |
Berry Global Group, Inc. (a) | | | 1,900 | | | | 91,808 | |
Crown Holdings, Inc. (a) | | | 1,200 | | | | 92,232 | |
Graphic Packaging Holding Co. | | | 4,300 | | | | 60,587 | |
Packaging Corp. of America | | | 1,300 | | | | 141,765 | |
Silgan Holdings, Inc. | | | 2,600 | | | | 95,602 | |
Sonoco Products Co. | | | 800 | | | | 40,856 | |
WestRock Co. | | | 1,440 | | | | 50,026 | |
| | | | | | | | 689,471 | |
Shipbuilding — 0.0% |
Huntington Ingalls Industries, Inc. | | | 260 | | | | 36,595 | |
Transportation — 2.9% |
C.H. Robinson Worldwide, Inc. | | | 700 | | | | 71,533 | |
CSX Corp. | | | 7,500 | | | | 582,525 | |
Expeditors International of Washington, Inc. | | | 600 | | | | 54,312 | |
FedEx Corp. | | | 310 | | | | 77,971 | |
J.B. Hunt Transport Services, Inc. | | | 520 | | | | 65,718 | |
Kansas City Southern | | | 560 | | | | 101,265 | |
Landstar System, Inc. | | | 580 | | | | 72,784 | |
Norfolk Southern Corp. | | | 830 | | | | 177,612 | |
Old Dominion Freight Line, Inc. | | | 70 | | | | 12,664 | |
Ryder System, Inc. | | | 790 | | | | 33,370 | |
Union Pacific Corp. | | | 3,030 | | | | 596,516 | |
United Parcel Service, Inc. Class B | | | 2,400 | | | | 399,912 | |
XPO Logistics, Inc. (a) | | | 1,000 | | | | 84,660 | |
| | | | | | | | 2,330,842 | |
| | | | | | | | 10,587,058 | |
Technology — 8.7% |
Computers — 2.7% |
Amdocs Ltd. | | | 1,000 | | | | 57,410 | |
CACI International, Inc. Class A (a) | | | 210 | | | | 44,764 | |
Cognizant Technology Solutions Corp. Class A | | | 4,600 | | | | 319,332 | |
Dell Technologies C (a) | | | 793 | | | | 53,678 | |
DXC Technology Co. | | | 900 | | | | 16,065 | |
Hewlett Packard Enterprise Co. | | | 4,400 | | | | 41,228 | |
HP, Inc. | | | 15,700 | | | | 298,143 | |
International Business Machines Corp. | | | 8,900 | | | | 1,082,863 | |
Leidos Holdings, Inc. | | | 850 | | | | 75,777 | |
| | | Number of
Shares | | | Value | |
NCR Corp. (a) | | | 2,200 | | | $ | 48,708 | |
NetApp, Inc. | | | 1,700 | | | | 74,528 | |
Science Applications International Corp. | | | 600 | | | | 47,052 | |
Western Digital Corp. | | | 36 | | | | 1,316 | |
| | | | | | | | 2,160,864 | |
Office & Business Equipment — 0.1% |
Xerox Holdings Corp. | | | 3,014 | | | | 56,573 | |
Zebra Technologies Corp. Class A (a) | | | 130 | | | | 32,820 | |
| | | | | | | | 89,393 | |
Semiconductors — 4.2% |
Analog Devices, Inc. | | | 1,320 | | | | 154,097 | |
Broadcom, Inc. | | | 130 | | | | 47,362 | |
Entegris, Inc. | | | 100 | | | | 7,434 | |
Intel Corp. | | | 30,300 | | | | 1,568,934 | |
Maxim Integrated Products, Inc. | | | 2,300 | | | | 155,503 | |
Microchip Technology, Inc. | | | 280 | | | | 28,773 | |
Micron Technology, Inc. (a) | | | 6,700 | | | | 314,632 | |
ON Semiconductor Corp. (a) | | | 300 | | | | 6,507 | |
Qorvo, Inc. (a) | | | 650 | | | | 83,856 | |
Skyworks Solutions, Inc. | | | 1,580 | | | | 229,890 | |
Texas Instruments, Inc. | | | 5,550 | | | | 792,484 | |
| | | | | | | | 3,389,472 | |
Software — 1.7% |
Activision Blizzard, Inc. | | | 3,400 | | | | 275,230 | |
Akamai Technologies, Inc. (a) | | | 100 | | | | 11,054 | |
Aspen Technology, Inc. (a) | | | 260 | | | | 32,914 | |
Autodesk, Inc. (a) | | | 330 | | | | 76,233 | |
Citrix Systems, Inc. | | | 1,230 | | | | 169,383 | |
Electronic Arts, Inc. (a) | | | 3,180 | | | | 414,704 | |
Fidelity National Information Services, Inc. | | | 290 | | | | 42,691 | |
Fiserv, Inc. (a) | | | 200 | | | | 20,610 | |
Jack Henry & Associates, Inc. | | | 270 | | | | 43,899 | |
Manhattan Associates, Inc. (a) | | | 600 | | | | 57,294 | |
Nuance Communications, Inc. (a) | | | 600 | | | | 19,914 | |
Oracle Corp. | | | 3,200 | | | | 191,040 | |
SS&C Technologies Holdings, Inc | | | 100 | | | | 6,052 | |
Take-Two Interactive Software, Inc. (a) | | | 50 | | | | 8,261 | |
Teradata Corp. (a) | | | 1,500 | | | | 34,050 | |
Zynga, Inc. Class A (a) | | | 2,700 | | | | 24,624 | |
| | | | | | | | 1,427,953 | |
| | | | | | | | 7,067,682 | |
Utilities — 4.9% |
Electric — 4.8% |
AES Corp. | | | 500 | | | | 9,055 | |
Alliant Energy Corp. | | | 200 | | | | 10,330 | |
The accompanying notes are an integral part of the financial statements.
148
MassMutual Premier Disciplined Value Fund — Portfolio of Investments (Continued) |
| | | Number of
Shares | | | Value | |
Ameren Corp. | | | 660 | | | $ | 52,193 | |
American Electric Power Co., Inc. | | | 1,030 | | | | 84,182 | |
Avangrid, Inc. | | | 100 | | | | 5,046 | |
CenterPoint Energy, Inc. | | | 2,000 | | | | 38,700 | |
CMS Energy Corp. | | | 500 | | | | 30,705 | |
Consolidated Edison, Inc. | | | 360 | | | | 28,008 | |
Dominion Energy, Inc. | | | 1,085 | | | | 85,639 | |
DTE Energy Co. | | | 120 | | | | 13,805 | |
Duke Energy Corp. | | | 6,414 | | | | 568,024 | |
Edison International | | | 780 | | | | 39,655 | |
Entergy Corp. | | | 210 | | | | 20,691 | |
Evergy, Inc. | | | 4,660 | | | | 236,821 | |
Eversource Energy | | | 181 | | | | 15,123 | |
Exelon Corp. | | | 4,675 | | | | 167,178 | |
FirstEnergy Corp. | | | 6,127 | | | | 175,906 | |
Hawaiian Electric Industries, Inc. | | | 600 | | | | 19,944 | |
IDACORP, Inc. | | | 400 | | | | 31,960 | |
NextEra Energy, Inc. | | | 1,272 | | | | 353,056 | |
NRG Energy, Inc. | | | 6,700 | | | | 205,958 | |
OGE Energy Corp. | | | 600 | | | | 17,994 | |
Pinnacle West Capital Corp. | | | 560 | | | | 41,748 | |
PPL Corp. | | | 7,400 | | | | 201,354 | |
Public Service Enterprise Group, Inc. | | | 2,400 | | | | 131,784 | |
Sempra Energy | | | 2,540 | | | | 300,635 | |
The Southern Co. | | | 10,750 | | | | 582,865 | |
Vistra Corp. | | | 13,500 | | | | 254,610 | |
WEC Energy Group, Inc. | | | 1,520 | | | | 147,288 | |
Xcel Energy, Inc. | | | 320 | | | | 22,083 | |
| | | | | | | | 3,892,340 | |
Gas — 0.1% |
Atmos Energy Corp. | | | 250 | | | | 23,898 | |
National Fuel Gas Co. | | | 1,350 | | | | 54,796 | |
NiSource, Inc. | | | 490 | | | | 10,780 | |
UGI Corp. | | | 435 | | | | 14,346 | |
| | | | | | | | 103,820 | |
Water — 0.0% |
American Water Works Co., Inc. | | | 100 | | | | 14,488 | |
Essential Utilities, Inc. | | | 125 | | | | 5,031 | |
| | | | | | | | 19,519 | |
| | | | | | | | 4,015,679 | |
| | | | | | | | | |
TOTAL COMMON STOCK (Cost $84,692,529) | | | | | | | 81,042,889 | |
| | | | | | | | | |
TOTAL EQUITIES (Cost $84,692,529) | | | | | | | 81,042,889 | |
| | | Number of
Shares | | | Value | |
WARRANTS — 0.0% |
Energy — 0.0% |
Oil & Gas — 0.0% |
Occidental Petroleum Corp., Expires 8/3/27 (a) | | | 161 | | | $ | 483 | |
| | | | | | | | | |
TOTAL WARRANTS (Cost $797) | | | | | | | 483 | |
| | | | | | | | | |
MUTUAL FUNDS — 0.1% |
Diversified Financial Services — 0.1% |
State Street Navigator Securities Lending Prime Portfolio (c) | | | 53,163 | | | | 53,163 | |
| | | | | | | | | |
TOTAL MUTUAL FUNDS (Cost $53,163) | | | | | | | 53,163 | |
| | | | | | | | | |
TOTAL LONG-TERM INVESTMENTS (Cost $84,746,489) | | | | | | | 81,096,535 | |
| | | Principal
Amount | | | | | |
SHORT-TERM INVESTMENTS — 0.3% |
Repurchase Agreement — 0.3% |
Fixed Income Clearing Corp., Repurchase Agreement, dated 9/30/20, 0.000%, due 10/01/20 (d) | | $ | 218,836 | | | | 218,836 | |
| | | | | | | | | |
TOTAL SHORT-TERM INVESTMENTS (Cost $218,836) | | | | | | | 218,836 | |
| | | | | | | | | |
TOTAL INVESTMENTS — 100.2% (Cost $84,965,325) (e) | | | | | | | 81,315,371 | |
| | | | | | | | | |
Other Assets/(Liabilities) — (0.2)% | | | | | | | (152,515 | ) |
| | | | | | | | | |
NET ASSETS — 100.0% | | | | | | $ | 81,162,856 | |
The accompanying notes are an integral part of the financial statements.
149
MassMutual Premier Disciplined Value Fund — Portfolio of Investments (Continued) |
Notes to Portfolio of Investments
Percentages are stated as a percent of net assets.
(a) | Non-income producing security. |
(b) | Denotes all or a portion of security on loan. The total value of securities on loan as of September 30, 2020, was $264,738 or 0.33% of net assets. Total securities on loan may be less than the amounts identified in the Portfolio of Investments. The Fund received $218,107 of non-cash collateral (U.S. Treasury and/or Agency obligations) related to securities lending activity. This amount is not reflected on either the Portfolio of Investments or the Statement of Assets and Liabilities. (Note 2). |
(c) | Represents investment of security lending cash collateral. (Note 2). |
(d) | Maturity value of $218,836. Collateralized by U.S. Government Agency obligations with a rate of 2.375%, maturity date of 3/15/22, and an aggregate market value, including accrued interest, of $223,275. |
(e) | See Note 6 for aggregate cost for federal tax purposes. |
The accompanying notes are an integral part of the financial statements.
150
MassMutual Premier Main Street Fund — Portfolio of Investments |
September 30, 2020 |
| | | Number of
Shares | | | Value | |
EQUITIES — 99.2% |
COMMON STOCK — 99.2% |
Basic Materials — 0.5% |
Chemicals — 0.5% |
Valvoline, Inc. | | | 29,334 | | | $ | 558,519 | |
Communications — 17.9% |
Internet — 14.2% |
Alphabet, Inc. Class A (a) | | | 806 | | | | 1,181,274 | |
Amazon.com, Inc. (a) | | | 2,591 | | | | 8,158,360 | |
Booking Holdings, Inc. (a) | | | 1,027 | | | | 1,756,868 | |
Facebook, Inc. Class A (a) | | | 15,551 | | | | 4,072,807 | |
Tencent Holdings Ltd. ADR | | | 21,642 | | | | 1,464,081 | |
| | | | | | | | 16,633,390 | |
Telecommunications — 3.7% |
Motorola Solutions, Inc. | | | 9,572 | | | | 1,500,985 | |
Verizon Communications, Inc. | | | 47,526 | | | | 2,827,322 | |
| | | | | | | | 4,328,307 | |
| | | | | | | | 20,961,697 | |
Consumer, Cyclical — 6.3% |
Auto Manufacturers — 0.5% |
General Motors Co. | | | 18,532 | | | | 548,362 | |
Entertainment — 0.5% |
Live Nation Entertainment, Inc. (a) | | | 4,435 | | | | 238,958 | |
Warner Music Group Corp. Class A | | | 13,170 | | | | 378,505 | |
| | | | | | | | 617,463 | |
Home Builders — 0.9% |
D.R. Horton, Inc. | | | 13,860 | | | | 1,048,232 | |
Retail — 4.4% |
The Home Depot, Inc. | | | 9,615 | | | | 2,670,182 | |
O’Reilly Automotive, Inc. (a) | | | 1,718 | | | | 792,135 | |
Target Corp. | | | 10,610 | | | | 1,670,226 | |
| | | | | | | | 5,132,543 | |
| | | | | | | | 7,346,600 | |
Consumer, Non-cyclical — 24.1% |
Beverages — 1.0% |
Constellation Brands, Inc. Class A | | | 6,280 | | | | 1,190,123 | |
Biotechnology — 1.6% |
Amgen, Inc. | | | 7,497 | | | | 1,905,438 | |
Cosmetics & Personal Care — 3.8% |
The Procter & Gamble Co. | | | 31,671 | | | | 4,401,952 | |
Foods — 1.6% |
a2 Milk Co. Ltd. (a) (b) | | | 18,265 | | | | 185,101 | |
Mondelez International, Inc. Class A | | | 16,318 | | | | 937,469 | |
Sysco Corp. | | | 11,080 | | | | 689,398 | |
| | | | | | | | 1,811,968 | |
| | | Number of
Shares | | | Value | |
Health Care – Products — 3.8% |
Alcon, Inc. (a) | | | 9,628 | | | $ | 548,314 | |
Avantor, Inc. (a) | | | 20,020 | | | | 450,250 | |
Quidel Corp. (a) | | | 1,250 | | | | 274,225 | |
Thermo Fisher Scientific, Inc. | | | 5,592 | | | | 2,468,980 | |
Zimmer Biomet Holdings, Inc. | | | 5,341 | | | | 727,124 | |
| | | | | | | | 4,468,893 | |
Health Care – Services — 6.4% |
HCA Healthcare, Inc. | | | 17,912 | | | | 2,233,268 | |
Laboratory Corp. of America Holdings (a) | | | 2,044 | | | | 384,824 | |
UnitedHealth Group, Inc. | | | 15,685 | | | | 4,890,112 | |
| | | | | | | | 7,508,204 | |
Household Products & Wares — 0.9% |
Church & Dwight Co., Inc. | | | 6,912 | | | | 647,723 | |
Reckitt Benckiser Group PLC | | | 4,568 | | | | 445,349 | |
| | | | | | | | 1,093,072 | |
Pharmaceuticals — 5.0% |
AstraZeneca PLC Sponsored ADR | | | 48,205 | | | | 2,641,634 | |
Merck & Co., Inc. | | | 32,844 | | | | 2,724,410 | |
Neurocrine Biosciences, Inc. (a) | | | 4,678 | | | | 449,836 | |
| | | | | | | | 5,815,880 | |
| | | | | | | | 28,195,530 | |
Energy — 1.9% |
Oil & Gas — 0.9% |
Cabot Oil & Gas Corp. | | | 33,401 | | | | 579,841 | |
Valero Energy Corp. | | | 11,356 | | | | 491,942 | |
| | | | | | | | 1,071,783 | |
Pipelines — 1.0% |
Magellan Midstream Partners LP (c) | | | 31,827 | | | | 1,088,484 | |
| | | | | | | | 2,160,267 | |
Financial — 17.8% |
Banks — 2.5% |
JP Morgan Chase & Co. | | | 30,630 | | | | 2,948,750 | |
Diversified Financial Services — 6.7% |
Capital One Financial Corp. | | | 22,541 | | | | 1,619,796 | |
Intercontinental Exchange, Inc. | | | 23,040 | | | | 2,305,152 | |
Mastercard, Inc. Class A | | | 7,563 | | | | 2,557,580 | |
Rocket Cos., Inc. (a) (b) | | | 64,592 | | | | 1,287,319 | |
| | | | | | | | 7,769,847 | |
Insurance — 5.8% |
Berkshire Hathaway, Inc. Class B (a) | | | 13,901 | | | | 2,960,079 | |
Equitable Holdings, Inc. | | | 93,674 | | | | 1,708,614 | |
The Progressive Corp. | | | 22,807 | | | | 2,159,138 | |
| | | | | | | | 6,827,831 | |
The accompanying notes are an integral part of the financial statements.
151
MassMutual Premier Main Street Fund — Portfolio of Investments (Continued) |
| | | Number of
Shares | | | Value | |
Real Estate Investment Trusts (REITS) — 2.8% |
Prologis, Inc. | | | 32,094 | | | $ | 3,229,298 | |
| | | | | | | | 20,775,726 | |
Industrial — 9.2% |
Aerospace & Defense — 2.9% |
Lockheed Martin Corp. | | | 8,880 | | | | 3,403,526 | |
Building Materials — 0.2% |
Vulcan Materials Co. | | | 1,770 | | | | 239,906 | |
Electronics — 1.1% |
Honeywell International, Inc. | | | 7,727 | | | | 1,271,942 | |
Environmental Controls — 1.3% |
Waste Connections, Inc. | | | 15,019 | | | | 1,558,972 | |
Transportation — 3.7% |
C.H. Robinson Worldwide, Inc. | | | 7,486 | | | | 764,994 | |
Union Pacific Corp. | | | 9,697 | | | | 1,909,049 | |
United Parcel Service, Inc. Class B | | | 9,578 | | | | 1,595,982 | |
| | | | | | | | 4,270,025 | |
| | | | | | | | 10,744,371 | |
Technology — 20.3% |
Computers — 2.1% |
Accenture PLC Class A | | | 7,782 | | | | 1,758,654 | |
Amdocs Ltd. | | | 11,757 | | | | 674,970 | |
| | | | | | | | 2,433,624 | |
Semiconductors — 7.1% |
Applied Materials, Inc. | | | 42,544 | | | | 2,529,241 | |
QUALCOMM, Inc. | | | 31,086 | | | | 3,658,200 | |
Texas Instruments, Inc. | | | 14,876 | | | | 2,124,144 | |
| | | | | | | | 8,311,585 | |
Software — 11.1% |
Adobe, Inc. (a) | | | 2,162 | | | | 1,060,310 | |
Fiserv, Inc. (a) | | | 8,125 | | | | 837,281 | |
Microsoft Corp. | | | 49,017 | | | | 10,309,745 | |
Snowflake, Inc. Class A (a) (b) | | | 700 | | | | 175,700 | |
Workday, Inc. Class A (a) | | | 2,729 | | | | 587,090 | |
| | | | | | | | 12,970,126 | |
| | | | | | | | 23,715,335 | |
Utilities — 1.2% |
Electric — 1.2% |
Duke Energy Corp. | | | 15,996 | | | | 1,416,606 | |
| | | | | | | | | |
TOTAL COMMON STOCK (Cost $92,112,874) | | | | | | | 115,874,651 | |
| | | | | | | | | |
TOTAL EQUITIES (Cost $92,112,874) | | | | | | | 115,874,651 | |
| | | Number of
Shares | | | Value | |
MUTUAL FUNDS — 0.1% |
Diversified Financial Services — 0.1% |
State Street Navigator Securities Lending Prime Portfolio (d) | | | 177,581 | | | $ | 177,581 | |
| | | | | | | | | |
TOTAL MUTUAL FUNDS (Cost $177,581) | | | | | | | 177,581 | |
| | | | | | | | | |
TOTAL LONG-TERM INVESTMENTS (Cost $92,290,455) | | | | | | | 116,052,232 | |
| | | Principal
Amount | | | | | |
SHORT-TERM INVESTMENTS — 1.1% |
Repurchase Agreement — 1.1% |
Fixed Income Clearing Corp., Repurchase Agreement, dated 9/30/20, 0.000%, due 10/01/20 (e) | | $ | 1,238,164 | | | | 1,238,164 | |
| | | | | | | | | |
TOTAL SHORT-TERM INVESTMENTS (Cost $1,238,164) | | | | | | | 1,238,164 | |
| | | | | | | | | |
TOTAL INVESTMENTS — 100.4% (Cost $93,528,619) (f) | | | | | | | 117,290,396 | |
| | | | | | | | | |
Other Assets/(Liabilities) — (0.4)% | | | | | | | (490,016 | ) |
| | | | | | | | | |
NET ASSETS — 100.0% | | | | | | $ | 116,800,380 | |
Abbreviation Legend
ADR | American Depositary Receipt |
Notes to Portfolio of Investments
Percentages are stated as a percent of net assets.
(a) | Non-income producing security. |
(b) | Denotes all or a portion of security on loan. The total value of securities on loan as of September 30, 2020, was $1,628,520 or 1.39% of net assets. Total securities on loan may be less than the amounts identified in the Portfolio of Investments. The Fund received $1,498,132 of non-cash collateral (U.S. Treasury and/or Agency obligations) related to securities lending activity. This amount is not reflected on either the Portfolio of Investments or the Statement of Assets and Liabilities. (Note 2). |
(c) | Security is a Master Limited Partnership. |
(d) | Represents investment of security lending cash collateral. (Note 2). |
(e) | Maturity value of $1,238,164. Collateralized by U.S. Government Agency obligations with a rate of 2.375%, maturity date of 3/15/22, and an aggregate market value, including accrued interest, of $1,262,949. |
(f) | See Note 6 for aggregate cost for federal tax purposes. |
The accompanying notes are an integral part of the financial statements.
152
MassMutual Premier Disciplined Growth Fund — Portfolio of Investments |
September 30, 2020 |
| | | Number of
Shares | | | Value | |
EQUITIES — 100.9% |
COMMON STOCK — 100.9% |
Basic Materials — 0.5% |
Chemicals — 0.5% |
Air Products & Chemicals, Inc. | | | 20 | | | $ | 5,957 | |
Ecolab, Inc. | | | 40 | | | | 7,994 | |
FMC Corp. | | | 215 | | | | 22,771 | |
NewMarket Corp. | | | 508 | | | | 173,898 | |
RPM International, Inc. | | | 301 | | | | 24,935 | |
The Sherwin-Williams Co. | | | 1,456 | | | | 1,014,453 | |
W.R. Grace & Co. | | | 102 | | | | 4,110 | |
| | | | | | | | 1,254,118 | |
Mining — 0.0% |
Royal Gold, Inc. | | | 193 | | | | 23,193 | |
| | | | | | | | 1,277,311 | |
Communications — 20.3% |
Advertising — 0.0% |
The Trade Desk, Inc. Class A (a) | | | 52 | | | | 26,976 | |
Internet — 19.5% |
Alphabet, Inc. Class A (a) | | | 3,679 | | | | 5,391,942 | |
Alphabet, Inc. Class C (a) | | | 4,549 | | | | 6,685,210 | |
Amazon.com, Inc. (a) | | | 6,461 | | | | 20,343,945 | |
Anaplan, Inc. (a) | | | 118 | | | | 7,384 | |
Booking Holdings, Inc. (a) | | | 875 | | | | 1,496,845 | |
CDW Corp. | | | 3,429 | | | | 409,868 | |
eBay, Inc. | | | 20,132 | | | | 1,048,877 | |
Etsy, Inc. (a) | | | 1,118 | | | | 135,982 | |
Expedia Group, Inc. | | | 10 | | | | 917 | |
Facebook, Inc. Class A (a) | | | 45,018 | | | | 11,790,214 | |
FireEye, Inc. (a) | | | 108 | | | | 1,333 | |
GoDaddy, Inc. Class A (a) | | | 5,156 | | | | 391,701 | |
GrubHub, Inc. (a) | | | 17 | | | | 1,230 | |
IAC/InterActiveCorp (a) | | | 82 | | | | 9,822 | |
Match Group, Inc. (a) | | | 2,189 | | | | 242,213 | |
Netflix, Inc. (a) | | | 3,749 | | | | 1,874,613 | |
NortonLifeLock, Inc. | | | 19,831 | | | | 413,278 | |
Okta, Inc. (a) | | | 76 | | | | 16,253 | |
Palo Alto Networks, Inc. (a) | | | 1,547 | | | | 378,628 | |
Pinterest, Inc. (a) | | | 287 | | | | 11,913 | |
Proofpoint, Inc. (a) | | | 676 | | | | 71,352 | |
Roku, Inc. (a) | | | 82 | | | | 15,482 | |
Spotify Technology SA (a) | | | 77 | | | | 18,678 | |
Uber Technologies, Inc. (a) | | | 1,789 | | | | 65,263 | |
VeriSign, Inc. (a) | | | 1,882 | | | | 385,528 | |
Wayfair, Inc. Class A (a) | | | 102 | | | | 29,683 | |
Zendesk, Inc. (a) | | | 81 | | | | 8,337 | |
Zillow Group, Inc. Class A (a) | | | 14 | | | | 1,422 | |
| | | Number of
Shares | | | Value | |
Zillow Group, Inc. Class C (a) (b) | | | 31 | | | $ | 3,149 | |
| | | | | | | | 51,251,062 | |
Media — 0.6% |
Altice USA, Inc. Class A (a) | | | 6,667 | | | | 173,342 | |
Cable One, Inc. | | | 96 | | | | 181,001 | |
Charter Communications, Inc. Class A (a) | | | 1,478 | | | | 922,774 | |
FactSet Research Systems, Inc. | | | 135 | | | | 45,209 | |
Liberty Media Corp-Liberty SiriusXM Class A (a) | | | 2,133 | | | | 70,752 | |
Liberty Media Corp-Liberty SiriusXM Class C (a) | | | 2,251 | | | | 74,463 | |
Nexstar Media Group, Inc. Class A | | | 522 | | | | 46,943 | |
Sirius XM Holdings, Inc. (b) | | | 17,138 | | | | 91,860 | |
World Wrestling Entertainment, Inc. Class A | | | 753 | | | | 30,474 | |
| | | | | | | | 1,636,818 | |
Telecommunications — 0.2% |
Arista Networks, Inc. (a) | | | 959 | | | | 198,446 | |
CommScope Holding Co., Inc. (a) | | | 44 | | | | 396 | |
Motorola Solutions, Inc. | | | 265 | | | | 41,555 | |
Switch, Inc. Class A | | | 59 | | | | 921 | |
Ubiquiti, Inc. | | | 1,258 | | | | 209,658 | |
| | | | | | | | 450,976 | |
| | | | | | | | 53,365,832 | |
Consumer, Cyclical — 8.4% |
Apparel — 0.7% |
NIKE, Inc. Class B | | | 14,793 | | | | 1,857,113 | |
VF Corp. | | | 62 | | | | 4,356 | |
| | | | | | | | 1,861,469 | |
Auto Manufacturers — 1.2% |
Tesla, Inc. (a) | | | 7,665 | | | | 3,288,362 | |
Auto Parts & Equipment — 0.1% |
Allison Transmission Holdings, Inc. | | | 6,513 | | | | 228,867 | |
Distribution & Wholesale — 0.4% |
Copart, Inc. (a) | | | 2,074 | | | | 218,102 | |
Fastenal Co. | | | 7,715 | | | | 347,869 | |
IAA, Inc. (a) | | | 100 | | | | 5,207 | |
Pool Corp. | | | 1,071 | | | | 358,292 | |
W.W. Grainger, Inc. | | | 558 | | | | 199,078 | |
| | | | | | | | 1,128,548 | |
Entertainment — 0.0% |
Live Nation Entertainment, Inc. (a) | | | 137 | | | | 7,381 | |
Vail Resorts, Inc. | | | 10 | | | | 2,140 | |
| | | | | | | | 9,521 | |
Home Builders — 0.0% |
NVR, Inc. (a) | | | 10 | | | | 40,831 | |
The accompanying notes are an integral part of the financial statements.
153
MassMutual Premier Disciplined Growth Fund — Portfolio of Investments (Continued) |
| | | Number of
Shares | | | Value | |
Home Furnishing — 0.2% |
Dolby Laboratories, Inc. Class A | | | 29 | | | $ | 1,922 | |
Tempur Sealy International, Inc. (a) | | | 4,738 | | | | 422,582 | |
| | | | | | | | 424,504 | |
Housewares — 0.1% |
The Scotts Miracle-Gro Co. | | | 807 | | | | 123,399 | |
The Toro Co. | | | 100 | | | | 8,395 | |
| | | | | | | | 131,794 | |
Leisure Time — 0.0% |
Peloton Interactive, Inc. Class A (a) | | | 14 | | | | 1,389 | |
Planet Fitness, Inc. Class A (a) | | | 221 | | | | 13,618 | |
Polaris, Inc. | | | 168 | | | | 15,849 | |
Virgin Galactic Holdings, Inc. (a) (b) | | | 34 | | | | 654 | |
| | | | | | | | 31,510 | |
Lodging — 0.1% |
Las Vegas Sands Corp. | | | 3,674 | | | | 171,429 | |
Wynn Resorts Ltd. | | | 20 | | | | 1,436 | |
| | | | | | | | 172,865 | |
Retail — 5.6% |
AutoZone, Inc. (a) | | | 287 | | | | 337,983 | |
Best Buy Co., Inc. | | | 2,849 | | | | 317,065 | |
Burlington Stores, Inc. (a) | | | 284 | | | | 58,530 | |
CarMax, Inc. (a) | | | 29 | | | | 2,665 | |
Carvana Co. (a) | | | 71 | | | | 15,837 | |
Chipotle Mexican Grill, Inc. (a) | | | 257 | | | | 319,634 | |
Costco Wholesale Corp. | | | 2,565 | | | | 910,575 | |
Dollar General Corp. | | | 6,616 | | | | 1,386,846 | |
Dollar Tree, Inc. (a) | | | 882 | | | | 80,562 | |
Domino’s Pizza, Inc. | | | 1,803 | | | | 766,780 | |
Dunkin’ Brands Group, Inc. | | | 1,635 | | | | 133,923 | |
Five Below, Inc. (a) | | | 53 | | | | 6,731 | |
Floor & Decor Holdings, Inc. Class A (a) | | | 70 | | | | 5,236 | |
The Home Depot, Inc. | | | 14,195 | | | | 3,942,093 | |
Lowe’s Cos., Inc. | | | 21,363 | | | | 3,543,267 | |
Lululemon Athletica, Inc. (a) | | | 563 | | | | 185,435 | |
McDonald’s Corp. | | | 1,800 | | | | 395,082 | |
O’Reilly Automotive, Inc. (a) | | | 1,861 | | | | 858,070 | |
Ollie’s Bargain Outlet Holdings, Inc. (a) | | | 127 | | | | 11,093 | |
Ross Stores, Inc. | | | 532 | | | | 49,646 | |
Starbucks Corp. | | | 3,534 | | | | 303,641 | |
The TJX Cos., Inc. | | | 2,029 | | | | 112,914 | |
Tractor Supply Co. | | | 2,975 | | | | 426,437 | |
Ulta Beauty, Inc. (a) | | | 355 | | | | 79,513 | |
The Wendy’s Co. | | | 4,565 | | | | 101,777 | |
Williams-Sonoma, Inc. | | | 1,701 | | | | 153,838 | |
Yum China Holdings, Inc. | | | 1,483 | | | | 78,525 | |
| | | Number of
Shares | | | Value | |
Yum! Brands, Inc. | | | 576 | | | $ | 52,589 | |
| | | | | | | | 14,636,287 | |
Toys, Games & Hobbies — 0.0% |
Mattel, Inc. (a) | | | 3,074 | | | | 35,966 | |
| | | | | | | | 21,990,524 | |
Consumer, Non-cyclical — 21.2% |
Agriculture — 0.4% |
Altria Group, Inc. | | | 28,490 | | | | 1,100,854 | |
Beverages — 1.7% |
The Boston Beer Co., Inc. Class A (a) | | | 6 | | | | 5,300 | |
Brown-Forman Corp. Class A | | | 469 | | | | 32,211 | |
Brown-Forman Corp. Class B | | | 424 | | | | 31,936 | |
The Coca-Cola Co. | | | 30,927 | | | | 1,526,866 | |
Monster Beverage Corp. (a) | | | 6,441 | | | | 516,568 | |
PepsiCo, Inc. | | | 17,547 | | | | 2,432,014 | |
| | | | | | | | 4,544,895 | |
Biotechnology — 3.3% |
ACADIA Pharmaceuticals, Inc. (a) | | | 77 | | | | 3,176 | |
Acceleron Pharma, Inc. (a) | | | 29 | | | | 3,263 | |
Alexion Pharmaceuticals, Inc. (a) | | | 1,606 | | | | 183,775 | |
Alnylam Pharmaceuticals, Inc. (a) | | | 75 | | | | 10,920 | |
Amgen, Inc. | | | 16,880 | | | | 4,290,221 | |
Biogen, Inc. (a) | | | 1,763 | | | | 500,128 | |
BioMarin Pharmaceutical, Inc. (a) | | | 111 | | | | 8,445 | |
Bluebird Bio, Inc. (a) | | | 54 | | | | 2,913 | |
Exact Sciences Corp. (a) | | | 116 | | | | 11,826 | |
Exelixis, Inc. (a) | | | 7,999 | | | | 195,576 | |
Guardant Health, Inc. (a) | | | 48 | | | | 5,365 | |
Illumina, Inc. (a) | | | 112 | | | | 34,617 | |
Immunomedics, Inc. (a) | | | 243 | | | | 20,662 | |
Incyte Corp. (a) | | | 124 | | | | 11,128 | |
Ionis Pharmaceuticals, Inc. (a) | | | 280 | | | | 13,286 | |
Iovance Biotherapeutics, Inc. (a) | | | 99 | | | | 3,259 | |
Livongo Health, Inc. (a) | | | 36 | | | | 5,042 | |
Moderna, Inc. (a) | | | 195 | | | | 13,796 | |
Regeneron Pharmaceuticals, Inc. (a) | | | 2,438 | | | | 1,364,744 | |
Sage Therapeutics, Inc. (a) | | | 8 | | | | 489 | |
Seattle Genetics, Inc. (a) | | | 317 | | | | 62,034 | |
Vertex Pharmaceuticals, Inc. (a) | | | 6,802 | | | | 1,850,960 | |
| | | | | | | | 8,595,625 | |
Commercial Services — 3.1% |
2U, Inc. (a) | | | 39 | | | | 1,321 | |
Automatic Data Processing, Inc. | | | 4,370 | | | | 609,571 | |
Avalara, Inc. (a) | | | 47 | | | | 5,985 | |
Booz Allen Hamilton Holding Corp. | | | 4,423 | | | | 367,020 | |
Bright Horizons Family Solutions, Inc. (a) | | | 35 | | | | 5,321 | |
Chegg, Inc. (a) | | | 96 | | | | 6,858 | |
The accompanying notes are an integral part of the financial statements.
154
MassMutual Premier Disciplined Growth Fund — Portfolio of Investments (Continued) |
| | | Number of
Shares | | | Value | |
Cintas Corp. | | | 1,540 | | | $ | 512,558 | |
CoreLogic, Inc. | | | 2,962 | | | | 200,438 | |
CoStar Group, Inc. (a) | | | 29 | | | | 24,607 | |
Equifax, Inc. | | | 82 | | | | 12,866 | |
FleetCor Technologies, Inc. (a) | | | 1,487 | | | | 354,055 | |
Gartner, Inc. (a) | | | 1,359 | | | | 169,807 | |
H&R Block, Inc. | | | 2,654 | | | | 43,234 | |
IHS Markit Ltd. | | | 6,256 | | | | 491,159 | |
MarketAxess Holdings, Inc. | | | 244 | | | | 117,508 | |
Moody’s Corp. | | | 2,056 | | | | 595,932 | |
Morningstar, Inc. | | | 101 | | | | 16,222 | |
Paylocity Holding Corp. (a) | | | 29 | | | | 4,681 | |
PayPal Holdings, Inc. (a) | | | 12,562 | | | | 2,475,091 | |
Quanta Services, Inc. | | | 970 | | | | 51,274 | |
Rollins, Inc. | | | 585 | | | | 31,701 | |
S&P Global, Inc. | | | 2,839 | | | | 1,023,743 | |
Square, Inc. Class A (a) | | | 922 | | | | 149,871 | |
StoneCo Ltd. Class A (a) | | | 847 | | | | 44,798 | |
TransUnion | | | 2,009 | | | | 169,017 | |
Verisk Analytics, Inc. | | | 3,212 | | | | 595,216 | |
WEX, Inc. (a) | | | 37 | | | | 5,142 | |
| | | | | | | | 8,084,996 | |
Cosmetics & Personal Care — 0.7% |
The Estee Lauder Cos., Inc. Class A | | | 539 | | | | 117,637 | |
The Procter & Gamble Co. | | | 13,048 | | | | 1,813,541 | |
| | | | | | | | 1,931,178 | |
Foods — 0.5% |
Beyond Meat, Inc. (a) (b) | | | 41 | | | | 6,808 | |
Campbell Soup Co. | | | 3,390 | | | | 163,974 | |
Grocery Outlet Holding Corp. (a) | | | 341 | | | | 13,408 | |
The Hershey Co. | | | 2,176 | | | | 311,908 | |
Kellogg Co. | | | 1,566 | | | | 101,148 | |
Lamb Weston Holdings, Inc. | | | 1,414 | | | | 93,706 | |
McCormick & Co., Inc. | | | 502 | | | | 97,438 | |
Pilgrim’s Pride Corp. (a) | | | 126 | | | | 1,886 | |
Sprouts Farmers Market, Inc. (a) | | | 9,537 | | | | 199,609 | |
Sysco Corp. | | | 5,021 | | | | 312,407 | |
| | | | | | | | 1,302,292 | |
Health Care – Products — 2.3% |
10X Genomics, Inc. Class A (a) | | | 37 | | | | 4,613 | |
Abbott Laboratories | | | 7,383 | | | | 803,492 | |
ABIOMED, Inc. (a) | | | 40 | | | | 11,082 | |
Adaptive Biotechnologies Corp. (a) | | | 179 | | | | 8,705 | |
Align Technology, Inc. (a) | | | 248 | | | | 81,185 | |
Avantor, Inc. (a) | | | 1,973 | | | | 44,373 | |
Baxter International, Inc. | | | 2,858 | | | | 229,840 | |
Bio-Techne Corp. | | | 25 | | | | 6,193 | |
Bruker Corp. | | | 214 | | | | 8,507 | |
| | | Number of
Shares | | | Value | |
The Cooper Cos., Inc. | | | 12 | | | $ | 4,045 | |
Edwards Lifesciences Corp. (a) | | | 10,729 | | | | 856,389 | |
Haemonetics Corp. (a) | | | 760 | | | | 66,310 | |
Hill-Rom Holdings, Inc. | | | 913 | | | | 76,245 | |
Hologic, Inc. (a) | | | 1,187 | | | | 78,900 | |
ICU Medical, Inc. (a) | | | 52 | | | | 9,504 | |
IDEXX Laboratories, Inc. (a) | | | 1,510 | | | | 593,596 | |
Insulet Corp. (a) | | | 51 | | | | 12,066 | |
Intuitive Surgical, Inc. (a) | | | 233 | | | | 165,323 | |
Masimo Corp. (a) | | | 602 | | | | 142,108 | |
Novocure Ltd. (a) | | | 84 | | | | 9,350 | |
Penumbra, Inc. (a) | | | 24 | | | | 4,665 | |
Quidel Corp. (a) | | | 763 | | | | 167,387 | |
Repligen Corp. (a) | | | 473 | | | | 69,786 | |
ResMed, Inc. | | | 2,231 | | | | 382,460 | |
Steris PLC | | | 56 | | | | 9,867 | |
Stryker Corp. | | | 1,628 | | | | 339,226 | |
Tandem Diabetes Care, Inc. (a) | | | 44 | | | | 4,994 | |
Teleflex, Inc. | | | 370 | | | | 125,955 | |
Thermo Fisher Scientific, Inc. | | | 3,147 | | | | 1,389,464 | |
Varian Medical Systems, Inc. (a) | | | 159 | | | | 27,348 | |
West Pharmaceutical Services, Inc. | | | 1,101 | | | | 302,665 | |
| | | | | | | | 6,035,643 | |
Health Care – Services — 2.4% |
Amedisys, Inc. (a) | | | 145 | | | | 34,282 | |
Anthem, Inc. | | | 1,421 | | | | 381,667 | |
Centene Corp. (a) | | | 2,301 | | | | 134,217 | |
Charles River Laboratories International, Inc. (a) | | | 596 | | | | 134,964 | |
Chemed Corp. | | | 264 | | | | 126,813 | |
DaVita, Inc. (a) | | | 3,068 | | | | 262,774 | |
Encompass Health Corp. | | | 100 | | | | 6,498 | |
HCA Healthcare, Inc. | | | 2,339 | | | | 291,627 | |
Humana, Inc. | | | 1,153 | | | | 477,215 | |
IQVIA Holdings, Inc. (a) | | | 63 | | | | 9,931 | |
Laboratory Corp. of America Holdings (a) | | | 92 | | | | 17,321 | |
Molina Healthcare, Inc. (a) | | | 1,083 | | | | 198,232 | |
PPD, Inc. (a) | | | 814 | | | | 30,110 | |
Syneos Health, Inc. (a) | | | 113 | | | | 6,007 | |
Teladoc Health, Inc. (a) (b) | | | 46 | | | | 10,085 | |
UnitedHealth Group, Inc. | | | 12,987 | | | | 4,048,957 | |
| | | | | | | | 6,170,700 | |
Household Products & Wares — 0.5% |
Avery Dennison Corp. | | | 574 | | | | 73,380 | |
Church & Dwight Co., Inc. | | | 4,577 | | | | 428,911 | |
The Clorox Co. | | | 3,002 | | | | 630,930 | |
The accompanying notes are an integral part of the financial statements.
155
MassMutual Premier Disciplined Growth Fund — Portfolio of Investments (Continued) |
| | | Number of
Shares | | | Value | |
Reynolds Consumer Products, Inc. | | | 1,505 | | | $ | 46,083 | |
| | | | | | | | 1,179,304 | |
Pharmaceuticals — 6.3% |
AbbVie, Inc. | | | 45,387 | | | | 3,975,447 | |
Agios Pharmaceuticals, Inc. (a) | | | 4 | | | | 140 | |
AmerisourceBergen Corp. | | | 1,493 | | | | 144,702 | |
Bristol-Myers Squibb Co. | | | 23,196 | | | | 1,398,487 | |
Cardinal Health, Inc. | | | 5,899 | | | | 276,958 | |
Cigna Corp. | | | 1,834 | | | | 310,698 | |
DexCom, Inc. (a) | | | 1,033 | | | | 425,834 | |
Eli Lilly and Co. | | | 23,123 | | | | 3,422,666 | |
Global Blood Therapeutics, Inc. (a) | | | 41 | | | | 2,261 | |
Herbalife Nutrition Ltd. (a) | | | 1,797 | | | | 83,830 | |
Horizon Therapeutics PLC (a) | | | 103 | | | | 8,001 | |
Johnson & Johnson | | | 7,189 | | | | 1,070,298 | |
McKesson Corp. | | | 3,043 | | | | 453,194 | |
Merck & Co., Inc. | | | 42,539 | | | | 3,528,610 | |
Neurocrine Biosciences, Inc. (a) | | | 1,553 | | | | 149,336 | |
PRA Health Sciences, Inc. (a) | | | 856 | | | | 86,833 | |
Reata Pharmaceuticals, Inc. Class A (a) (b) | | | 15 | | | | 1,461 | |
Sarepta Therapeutics, Inc. (a) | | | 63 | | | | 8,847 | |
Zoetis, Inc. | | | 7,423 | | | | 1,227,542 | |
| | | | | | | | 16,575,145 | |
| | | | | | | | 55,520,632 | |
Energy — 0.2% |
Energy – Alternate Sources — 0.1% |
Enphase Energy, Inc. (a) | | | 1,431 | | | | 118,186 | |
SolarEdge Technologies, Inc. (a) | | | 667 | | | | 158,980 | |
| | | | | | | | 277,166 | |
Pipelines — 0.1% |
Cheniere Energy, Inc. (a) | | | 806 | | | | 37,294 | |
Equitrans Midstream Corp. | | | 13,803 | | | | 116,773 | |
| | | | | | | | 154,067 | |
| | | | | | | | 431,233 | |
Financial — 7.2% |
Diversified Financial Services — 5.0% |
Ares Management Corp. Class A | | | 1,369 | | | | 55,335 | |
Cboe Global Markets, Inc. | | | 803 | | | | 70,455 | |
Credit Acceptance Corp. (a) (b) | | | 7 | | | | 2,370 | |
Intercontinental Exchange, Inc. | | | 4,630 | | | | 463,232 | |
LendingTree, Inc. (a) (b) | | | 5 | | | | 1,534 | |
LPL Financial Holdings, Inc. | | | 406 | | | | 31,128 | |
Mastercard, Inc. Class A | | | 18,515 | | | | 6,261,218 | |
SLM Corp. | | | 7,545 | | | | 61,039 | |
T. Rowe Price Group, Inc. | | | 1,188 | | | | 152,325 | |
Tradeweb Markets, Inc. Class A | | | 403 | | | | 23,374 | |
Virtu Financial, Inc. Class A | | | 8,582 | | | | 197,472 | |
| | | Number of
Shares | | | Value | |
Visa, Inc. Class A | | | 28,208 | | | $ | 5,640,754 | |
The Western Union Co. | | | 5,042 | | | | 108,050 | |
| | | | | | | | 13,068,286 | |
Insurance — 0.6% |
Alleghany Corp. | | | 6 | | | | 3,123 | |
Aon PLC Class A | | | 1,802 | | | | 371,753 | |
Axis Capital Holdings Ltd. | | | 20 | | | | 881 | |
Brown & Brown, Inc. | | | 218 | | | | 9,869 | |
Erie Indemnity Co. Class A | | | 10 | | | | 2,103 | |
Lincoln National Corp. | | | 842 | | | | 26,380 | |
Marsh & McLennan Cos., Inc. | | | 1,087 | | | | 124,679 | |
Primerica, Inc. | | | 989 | | | | 111,895 | |
The Progressive Corp. | | | 10,311 | | | | 976,142 | |
RenaissanceRe Holdings Ltd. | | | 69 | | | | 11,712 | |
| | | | | | | | 1,638,537 | |
Private Equity — 0.0% |
Apollo Global Management, Inc. | | | 106 | | | | 4,744 | |
The Carlyle Group, Inc. (b) | | | 8 | | | | 197 | |
| | | | | | | | 4,941 | |
Real Estate Investment Trusts (REITS) — 1.6% |
American Tower Corp. | | | 3,732 | | | | 902,136 | |
Americold Realty Trust | | | 992 | | | | 35,464 | |
Brookfield Property REIT, Inc. Class A (b) | | | 3,145 | | | | 38,495 | |
CoreSite Realty Corp. | | | 1,528 | | | | 181,649 | |
Crown Castle International Corp. | | | 1,100 | | | | 183,150 | |
Equinix, Inc. | | | 794 | | | | 603,543 | |
Equity LifeStyle Properties, Inc. | | | 3,937 | | | | 241,338 | |
Extra Space Storage, Inc. | | | 679 | | | | 72,646 | |
Iron Mountain, Inc. (b) | | | 10,001 | | | | 267,927 | |
Public Storage | | | 3,680 | | | | 819,610 | |
SBA Communications Corp. | | | 11 | | | | 3,503 | |
Simon Property Group, Inc. | | | 13,680 | | | | 884,822 | |
| | | | | | | | 4,234,283 | |
| | | | | | | | 18,946,047 | |
Industrial — 4.5% |
Aerospace & Defense — 1.5% |
HEICO Corp. | | | 28 | | | | 2,930 | |
HEICO Corp. Class A | | | 54 | | | | 4,788 | |
Lockheed Martin Corp. | | | 7,869 | | | | 3,016,030 | |
Mercury Systems, Inc. (a) | | | 81 | | | | 6,274 | |
Northrop Grumman Corp. | | | 2,379 | | | | 750,551 | |
Spirit AeroSystems Holdings, Inc. Class A | | | 2,102 | | | | 39,749 | |
TransDigm Group, Inc. | | | 116 | | | | 55,114 | |
| | | | | | | | 3,875,436 | |
Building Materials — 0.1% |
Armstrong World Industries, Inc. | | | 289 | | | | 19,886 | |
The accompanying notes are an integral part of the financial statements.
156
MassMutual Premier Disciplined Growth Fund — Portfolio of Investments (Continued) |
| | | Number of
Shares | | | Value | |
Carrier Global Corp. | | | 6,546 | | | $ | 199,915 | |
Trex Co., Inc. (a) | | | 1,818 | | | | 130,169 | |
| | | | | | | | 349,970 | |
Electrical Components & Equipment — 0.1% |
Energizer Holdings, Inc. | | | 737 | | | | 28,846 | |
Generac Holdings, Inc. (a) | | | 407 | | | | 78,812 | |
Universal Display Corp. | | | 38 | | | | 6,868 | |
| | | | | | | | 114,526 | |
Electronics — 0.4% |
Agilent Technologies, Inc. | | | 419 | | | | 42,294 | |
Allegion PLC | | | 1,034 | | | | 102,273 | |
Amphenol Corp. Class A | | | 2,269 | | | | 245,665 | |
Coherent, Inc. (a) | | | 37 | | | | 4,104 | |
Jabil, Inc. | | | 1,113 | | | | 38,131 | |
Keysight Technologies, Inc. (a) | | | 1,031 | | | | 101,842 | |
Mettler-Toledo International, Inc. (a) | | | 491 | | | | 474,183 | |
PerkinElmer, Inc. | | | 295 | | | | 37,026 | |
Roper Technologies, Inc. | | | 25 | | | | 9,878 | |
Waters Corp. (a) | | | 312 | | | | 61,052 | |
| | | | | | | | 1,116,448 | |
Engineering & Construction — 0.0% |
frontdoor, Inc. (a) | | | 347 | | | | 13,502 | |
Environmental Controls — 0.1% |
Waste Management, Inc. | | | 971 | | | | 109,888 | |
Hand & Machine Tools — 0.0% |
Lincoln Electric Holdings, Inc. | | | 620 | | | | 57,065 | |
MSA Safety, Inc. | | | 98 | | | | 13,148 | |
| | | | | | | | 70,213 | |
Machinery – Construction & Mining — 0.0% |
BWX Technologies, Inc. | | | 1,340 | | | | 75,455 | |
Vertiv Holdings Co. (a) | | | 174 | | | | 3,014 | |
| | | | | | | | 78,469 | |
Machinery – Diversified — 0.2% |
Cognex Corp. | | | 899 | | | | 58,525 | |
Graco, Inc. | | | 502 | | | | 30,798 | |
Nordson Corp. | | | 666 | | | | 127,752 | |
Rockwell Automation, Inc. | | | 1,734 | | | | 382,659 | |
| | | | | | | | 599,734 | |
Miscellaneous - Manufacturing — 0.7% |
3M Co. | | | 6,413 | | | | 1,027,234 | |
Axon Enterprise, Inc. (a) | | | 41 | | | | 3,719 | |
Donaldson Co., Inc. | | | 58 | | | | 2,692 | |
Illinois Tool Works, Inc. | | | 3,411 | | | | 659,039 | |
| | | | | | | | 1,692,684 | |
Packaging & Containers — 0.1% |
Amcor PLC | | | 3,941 | | | | 43,548 | |
| | | Number of
Shares | | | Value | |
Ball Corp. | | | 215 | | | $ | 17,871 | |
Berry Global Group, Inc. (a) | | | 4,479 | | | | 216,425 | |
Crown Holdings, Inc. (a) | | | 313 | | | | 24,057 | |
Graphic Packaging Holding Co. | | | 4,549 | | | | 64,096 | |
| | | | | | | | 365,997 | |
Shipbuilding — 0.0% |
Huntington Ingalls Industries, Inc. | | | 69 | | | | 9,712 | |
Transportation — 1.3% |
C.H. Robinson Worldwide, Inc. | | | 589 | | | | 60,190 | |
Expeditors International of Washington, Inc. | | | 2,244 | | | | 203,127 | |
J.B. Hunt Transport Services, Inc. | | | 346 | | | | 43,727 | |
Landstar System, Inc. | | | 2,118 | | | | 265,788 | |
Old Dominion Freight Line, Inc. | | | 1,004 | | | | 181,644 | |
Union Pacific Corp. | | | 5,922 | | | | 1,165,864 | |
United Parcel Service, Inc. Class B | | | 8,776 | | | | 1,462,345 | |
XPO Logistics, Inc. (a) | | | 990 | | | | 83,813 | |
| | | | | | | | 3,466,498 | |
| | | | | | | | 11,863,077 | |
Technology — 38.6% |
Computers — 13.6% |
Accenture PLC Class A | | | 13,612 | | | | 3,076,176 | |
Apple, Inc. | | | 270,012 | | | | 31,270,090 | |
CACI International, Inc. Class A (a) | | | 78 | | | | 16,627 | |
Cognizant Technology Solutions Corp. Class A | | | 1,427 | | | | 99,062 | |
Crowdstrike Holdings, Inc. Class A (a) | | | 55 | | | | 7,553 | |
Dell Technologies C (a) | | | 983 | | | | 66,539 | |
EPAM Systems, Inc. (a) | | | 722 | | | | 233,408 | |
Fortinet, Inc. (a) | | | 4,443 | | | | 523,430 | |
Genpact Ltd. | | | 561 | | | | 21,851 | |
Globant SA (a) | | | 29 | | | | 5,197 | |
Leidos Holdings, Inc. | | | 245 | | | | 21,842 | |
Lumentum Holdings, Inc. (a) | | | 406 | | | | 30,503 | |
NetApp, Inc. | | | 4,585 | | | | 201,006 | |
Pure Storage, Inc. Class A (a) | | | 370 | | | | 5,694 | |
Science Applications International Corp. | | | 1,309 | | | | 102,652 | |
Zscaler, Inc. (a) | | | 47 | | | | 6,612 | |
| | | | | | | | 35,688,242 | |
Office & Business Equipment — 0.1% |
Zebra Technologies Corp. Class A (a) | | | 1,008 | | | | 254,480 | |
Semiconductors — 7.1% |
Advanced Micro Devices, Inc. (a) | | | 7,360 | | | | 603,446 | |
Analog Devices, Inc. | | | 218 | | | | 25,449 | |
Applied Materials, Inc. | | | 20,528 | | | | 1,220,390 | |
Broadcom, Inc. | | | 5,642 | | | | 2,055,493 | |
Entegris, Inc. | | | 2,117 | | | | 157,378 | |
The accompanying notes are an integral part of the financial statements.
157
MassMutual Premier Disciplined Growth Fund — Portfolio of Investments (Continued) |
| | | Number of
Shares | | | Value | |
Inphi Corp. (a) | | | 275 | | | $ | 30,869 | |
IPG Photonics Corp. (a) | | | 15 | | | | 2,549 | |
KLA Corp. | | | 4,710 | | | | 912,515 | |
Lam Research Corp. | | | 4,541 | | | | 1,506,477 | |
Maxim Integrated Products, Inc. | | | 2,365 | | | | 159,898 | |
Microchip Technology, Inc. | | | 1,085 | | | | 111,495 | |
MKS Instruments, Inc. | | | 349 | | | | 38,121 | |
Monolithic Power Systems, Inc. | | | 116 | | | | 32,435 | |
NVIDIA Corp. | | | 9,142 | | | | 4,947,833 | |
QUALCOMM, Inc. | | | 34,093 | | | | 4,012,064 | |
Teradyne, Inc. | | | 4,519 | | | | 359,080 | |
Texas Instruments, Inc. | | | 14,155 | | | | 2,021,192 | |
Xilinx, Inc. | | | 2,961 | | | | 308,655 | |
| | | | | | | | 18,505,339 | |
Software — 17.8% |
Activision Blizzard, Inc. | | | 6,924 | | | | 560,498 | |
Adobe, Inc. (a) | | | 9,106 | | | | 4,465,856 | |
Akamai Technologies, Inc. (a) | | | 2,774 | | | | 306,638 | |
Alteryx, Inc. Class A (a) (b) | | | 41 | | | | 4,656 | |
ANSYS, Inc. (a) | | | 926 | | | | 303,015 | |
Aspen Technology, Inc. (a) | | | 1,176 | | | | 148,870 | |
Atlassian Corp. PLC Class A (a) | | | 1,831 | | | | 332,857 | |
Autodesk, Inc. (a) | | | 1,927 | | | | 445,156 | |
Bill.com Holdings, Inc. (a) | | | 141 | | | | 14,144 | |
Black Knight, Inc. (a) | | | 99 | | | | 8,618 | |
Broadridge Financial Solutions, Inc. | | | 1,910 | | | | 252,120 | |
Cadence Design Systems, Inc. (a) | | | 7,958 | | | | 848,562 | |
CDK Global, Inc. | | | 802 | | | | 34,959 | |
Ceridian HCM Holding, Inc. (a) | | | 57 | | | | 4,711 | |
Cerner Corp. | | | 6,124 | | | | 442,704 | |
Change Healthcare, Inc. (a) | | | 337 | | | | 4,890 | |
Citrix Systems, Inc. | | | 1,665 | | | | 229,287 | |
Cloudflare, Inc. Class A (a) | | | 74 | | | | 3,038 | |
Coupa Software, Inc. (a) | | | 163 | | | | 44,701 | |
Datadog, Inc. Class A (a) | | | 1,991 | | | | 203,401 | |
DocuSign, Inc. (a) | | | 116 | | | | 24,968 | |
Dropbox, Inc. Class A (a) | | | 4,792 | | | | 92,294 | |
Dynatrace, Inc. (a) | | | 105 | | | | 4,307 | |
Elastic NV (a) | | | 37 | | | | 3,992 | |
Electronic Arts, Inc. (a) | | | 1,625 | | | | 211,916 | |
Everbridge, Inc. (a) | | | 22 | | | | 2,766 | |
Fair Isaac Corp. (a) | | | 846 | | | | 359,871 | |
Fastly, Inc. Class A (a) | | | 38 | | | | 3,560 | |
Fiserv, Inc. (a) | | | 259 | | | | 26,690 | |
Five9, Inc. (a) | | | 341 | | | | 44,221 | |
Guidewire Software, Inc. (a) | | | 11 | | | | 1,147 | |
HubSpot, Inc. (a) | | | 35 | | | | 10,228 | |
Intuit, Inc. | | | 4,214 | | | | 1,374,649 | |
| | | Number of
Shares | | | Value | |
Jack Henry & Associates, Inc. | | | 1,745 | | | $ | 283,720 | |
Manhattan Associates, Inc. (a) | | | 1,225 | | | | 116,975 | |
Medallia, Inc. (a) (b) | | | 55 | | | | 1,508 | |
Microsoft Corp. | | | 124,020 | | | | 26,085,127 | |
MongoDB, Inc. (a) | | | 26 | | | | 6,019 | |
MSCI, Inc. | | | 1,109 | | | | 395,669 | |
New Relic, Inc. (a) | | | 35 | | | | 1,973 | |
Nutanix, Inc. Class A (a) | | | 132 | | | | 2,928 | |
Oracle Corp. | | | 54,736 | | | | 3,267,739 | |
PagerDuty, Inc. (a) (b) | | | 49 | | | | 1,328 | |
Paychex, Inc. | | | 4,325 | | | | 345,005 | |
Paycom Software, Inc. (a) | | | 291 | | | | 90,588 | |
Pegasystems, Inc. | | | 24 | | | | 2,905 | |
Pluralsight, Inc. Class A (a) | | | 65 | | | | 1,113 | |
PTC, Inc. (a) | | | 89 | | | | 7,362 | |
RealPage, Inc. (a) | | | 60 | | | | 3,458 | |
RingCentral, Inc. Class A (a) | | | 51 | | | | 14,005 | |
salesforce.com, Inc. (a) | | | 4,109 | | | | 1,032,674 | |
ServiceNow, Inc. (a) | | | 2,584 | | | | 1,253,240 | |
Slack Technologies, Inc. Class A (a) (b) | | | 254 | | | | 6,822 | |
Smartsheet, Inc. Class A (a) | | | 69 | | | | 3,410 | |
Splunk, Inc. (a) | | | 181 | | | | 34,052 | |
SS&C Technologies Holdings, Inc | | | 353 | | | | 21,364 | |
Synopsys, Inc. (a) | | | 3,109 | | | | 665,264 | |
Take-Two Interactive Software, Inc. (a) | | | 1,367 | | | | 225,856 | |
Teradata Corp. (a) | | | 1,776 | | | | 40,315 | |
Twilio, Inc. Class A (a) | | | 107 | | | | 26,439 | |
Tyler Technologies, Inc. (a) | | | 174 | | | | 60,649 | |
Veeva Systems, Inc. Class A (a) | | | 2,152 | | | | 605,121 | |
VMware, Inc. Class A (a) (b) | | | 1,510 | | | | 216,942 | |
Workday, Inc. Class A (a) | | | 811 | | | | 174,470 | |
Zoom Video Communications, Inc. Class A (a) | | | 2,127 | | | | 999,924 | |
Zynga, Inc. Class A (a) | | | 1,826 | | | | 16,653 | |
| | | | | | | | 46,829,907 | |
| | | | | | | | 101,277,968 | |
Utilities — 0.0% |
Electric — 0.0% |
NRG Energy, Inc. | | | 1,172 | | | | 36,027 | |
| | | | | | | | | |
TOTAL COMMON STOCK (Cost $179,308,978) | | | | | | | 264,708,651 | |
| | | | | | | | | |
TOTAL EQUITIES (Cost $179,308,978) | | | | | | | 264,708,651 | |
The accompanying notes are an integral part of the financial statements.
158
MassMutual Premier Disciplined Growth Fund — Portfolio of Investments (Continued) |
| | | Number of
Shares | | | Value | |
RIGHTS — 0.0% |
Consumer, Non-cyclical — 0.0% |
Pharmaceuticals — 0.0% |
Bristol-Myers Squibb Co., Expires 3/31/21 (a) | | | 29,980 | | | $ | 67,455 | |
| | | | | | | | | |
TOTAL RIGHTS (Cost $63,857) | | | | | | | 67,455 | |
| | | | | | | | | |
MUTUAL FUNDS — 0.0% |
Diversified Financial Services — 0.0% |
State Street Navigator Securities Lending Prime Portfolio (c) | | | 57,014 | | | | 57,014 | |
| | | | | | | | | |
TOTAL MUTUAL FUNDS (Cost $57,014) | | | | | | | 57,014 | |
| | | | | | | | | |
TOTAL LONG-TERM INVESTMENTS (Cost $179,429,849) | | | | | | | 264,833,120 | |
| | | | | | | | | |
TOTAL INVESTMENTS — 100.9% (Cost $179,429,849) (d) | | | | | | | 264,833,120 | |
| | | | | | | | | |
Other Assets/(Liabilities) — (0.9)% | | | | | | | (2,344,439 | ) |
| | | | | | | | | |
NET ASSETS — 100.0% | | | | | | $ | 262,488,681 | |
Notes to Portfolio of Investments
Percentages are stated as a percent of net assets.
(a) | Non-income producing security. |
(b) | Denotes all or a portion of security on loan. The total value of securities on loan as of September 30, 2020, was $569,226 or 0.22% of net assets. Total securities on loan may be less than the amounts identified in the Portfolio of Investments. The Fund received $524,701 of non-cash collateral (U.S. Treasury and/or Agency obligations) related to securities lending activity. This amount is not reflected on either the Portfolio of Investments or the Statement of Assets and Liabilities. (Note 2). |
(c) | Represents investment of security lending cash collateral. (Note 2). |
(d) | See Note 6 for aggregate cost for federal tax purposes. |
The accompanying notes are an integral part of the financial statements.
159
MassMutual Premier Small Cap Opportunities Fund — Portfolio of Investments |
September 30, 2020 |
| | | Number of
Shares | | | Value | |
EQUITIES — 98.5% |
COMMON STOCK — 98.5% |
Basic Materials — 2.6% |
Forest Products & Paper — 0.6% |
Schweitzer-Mauduit International, Inc. | | | 41,848 | | | $ | 1,271,761 | |
Mining — 2.0% |
Compass Minerals International, Inc. | | | 49,160 | | | | 2,917,645 | |
Kaiser Aluminum Corp. | | | 30,957 | | | | 1,658,986 | |
| | | | | | | | 4,576,631 | |
| | | | | | | | 5,848,392 | |
Communications — 1.5% |
Internet — 1.5% |
Q2 Holdings, Inc. (a) (b) | | | 36,587 | | | | 3,338,930 | |
Consumer, Cyclical — 14.7% |
Auto Parts & Equipment — 3.0% |
Dorman Products, Inc. (a) | | | 35,698 | | | | 3,226,385 | |
Visteon Corp. (a) | | | 51,441 | | | | 3,560,746 | |
| | | | | | | | 6,787,131 | |
Entertainment — 0.3% |
Cedar Fair LP (c) | | | 24,847 | | | | 697,455 | |
Retail — 11.4% |
AutoNation, Inc. (a) | | | 87,511 | | | | 4,631,957 | |
Big Lots, Inc. | | | 29,106 | | | | 1,298,128 | |
BJ’s Wholesale Club Holdings, Inc. (a) | | | 128,461 | | | | 5,337,555 | |
Foot Locker, Inc. | | | 32,528 | | | | 1,074,400 | |
Jack in the Box, Inc. | | | 39,708 | | | | 3,149,242 | |
Ollie’s Bargain Outlet Holdings, Inc. (a) | | | 11,391 | | | | 995,004 | |
Suburban Propane Partners LP (c) | | | 202,955 | | | | 3,304,107 | |
Texas Roadhouse, Inc. | | | 55,346 | | | | 3,364,483 | |
The Wendy’s Co. | | | 118,045 | | | | 2,631,813 | |
| | | | | | | | 25,786,689 | |
| | | | | | | | 33,271,275 | |
Consumer, Non-cyclical — 26.8% |
Biotechnology — 4.5% |
ADC Therapeutics SA (a) | | | 18,800 | | | | 620,212 | |
Emergent BioSolutions, Inc. (a) | | | 41,647 | | | | 4,303,384 | |
NeoGenomics, Inc. (a) | | | 55,567 | | | | 2,049,867 | |
Twist Bioscience Corp. (a) | | | 30,141 | | | | 2,289,812 | |
Zai Lab Ltd. ADR (a) | | | 9,999 | | | | 831,617 | |
| | | | | | | | 10,094,892 | |
Commercial Services — 5.1% |
ASGN, Inc. (a) | | | 70,403 | | | | 4,474,815 | |
Korn Ferry | | | 114,111 | | | | 3,309,219 | |
| | | Number of
Shares | | | Value | |
Monro, Inc. | | | 55,688 | | | $ | 2,259,262 | |
Paylocity Holding Corp. (a) | | | 9,377 | | | | 1,513,635 | |
| | | | | | | | 11,556,931 | |
Foods — 1.9% |
BellRing Brands, Inc. Class A (a) | | | 100,257 | | | | 2,079,330 | |
The Simply Good Foods Co. (a) | | | 103,574 | | | | 2,283,807 | |
| | | | | | | | 4,363,137 | |
Health Care – Products — 7.5% |
Adaptive Biotechnologies Corp. (a) | | | 31,730 | | | | 1,543,030 | |
AtriCure, Inc. (a) | | | 49,865 | | | | 1,989,613 | |
Inspire Medical Systems, Inc. (a) | | | 20,756 | | | | 2,678,562 | |
Intersect ENT, Inc. (a) | | | 49,783 | | | | 811,961 | |
iRhythm Technologies, Inc. (a) | | | 9,449 | | | | 2,249,901 | |
OraSure Technologies, Inc. (a) | | | 66,683 | | | | 811,532 | |
Repligen Corp. (a) | | | 15,427 | | | | 2,276,100 | |
Tandem Diabetes Care, Inc. (a) | | | 40,205 | | | | 4,563,267 | |
| | | | | | | | 16,923,966 | |
Health Care – Services — 5.1% |
Addus HomeCare Corp. (a) | | | 35,936 | | | | 3,396,311 | |
American Well Corp. (a) | | | 20,537 | | | | 608,717 | |
LHC Group, Inc. (a) | | | 27,353 | | | | 5,814,154 | |
Tenet Healthcare Corp. (a) | | | 65,394 | | | | 1,602,807 | |
| | | | | | | | 11,421,989 | |
Household Products & Wares — 1.2% |
Acco Brands Corp. | | | 477,889 | | | | 2,771,756 | |
Pharmaceuticals — 1.5% |
Axsome Therapeutics, Inc. (a) (b) | | | 11,325 | | | | 806,906 | |
Collegium Pharmaceutical, Inc. (a) | | | 65,364 | | | | 1,360,879 | |
G1 Therapeutics, Inc. (a) (b) | | | 29,748 | | | | 343,589 | |
uniQure NV (a) | | | 23,531 | | | | 866,647 | |
| | | | | | | | 3,378,021 | |
| | | | | | | | 60,510,692 | |
Energy — 3.0% |
Energy – Alternate Sources — 2.6% |
Renewable Energy Group, Inc. (a) | | | 108,842 | | | | 5,814,340 | |
Pipelines — 0.4% |
Noble Midstream Partners LP (c) | | | 124,998 | | | | 914,985 | |
| | | | | | | | 6,729,325 | |
Financial — 18.5% |
Banks — 5.2% |
The Bank of NT Butterfield & Son Ltd. | | | 93,755 | | | | 2,088,861 | |
BankUnited, Inc. | | | 96,645 | | | | 2,117,492 | |
Cathay General Bancorp | | | 58,015 | | | | 1,257,765 | |
CIT Group, Inc. | | | 69,062 | | | | 1,223,088 | |
The accompanying notes are an integral part of the financial statements.
160
MassMutual Premier Small Cap Opportunities Fund — Portfolio of Investments (Continued) |
| | | Number of
Shares | | | Value | |
First Horizon National Corp. | | | 227,962 | | | $ | 2,149,682 | |
Heritage Financial Corp. | | | 110,759 | | | | 2,036,858 | |
Signature Bank | | | 10,395 | | | | 862,681 | |
| | | | | | | | 11,736,427 | |
Diversified Financial Services — 2.5% |
Federated Hermes, Inc. | | | 48,236 | | | | 1,037,556 | |
Focus Financial Partners, Inc. Class A (a) | | | 63,027 | | | | 2,066,655 | |
Stifel Financial Corp. | | | 52,128 | | | | 2,635,592 | |
| | | | | | | | 5,739,803 | |
Insurance — 0.7% |
ProSight Global, Inc. (a) | | | 56,884 | | | | 645,065 | |
Selectquote, Inc. (a) | | | 40,125 | | | | 812,531 | |
| | | | | | | | 1,457,596 | |
Real Estate Investment Trusts (REITS) — 5.9% |
Brandywine Realty Trust (b) | | | 247,052 | | | | 2,554,518 | |
DiamondRock Hospitality Co. | | | 424,623 | | | | 2,152,839 | |
EPR Properties | | | 79,977 | | | | 2,199,367 | |
Four Corners Property Trust, Inc. | | | 157,253 | | | | 4,024,104 | |
National Storage Affiliates Trust | | | 73,104 | | | | 2,391,232 | |
| | | | | | | | 13,322,060 | |
Savings & Loans — 4.2% |
Berkshire Hills Bancorp, Inc. | | | 86,625 | | | | 875,779 | |
OceanFirst Financial Corp. | | | 101,038 | | | | 1,383,210 | |
Pacific Premier Bancorp, Inc. | | | 102,908 | | | | 2,072,567 | |
Sterling Bancorp | | | 132,698 | | | | 1,395,983 | |
WSFS Financial Corp. | | | 140,819 | | | | 3,797,889 | |
| | | | | | | | 9,525,428 | |
| | | | | | | | 41,781,314 | |
Industrial — 16.1% |
Building Materials — 2.3% |
Masonite International Corp. (a) | | | 31,961 | | | | 3,144,963 | |
Summit Materials, Inc. Class A (a) | | | 116,721 | | | | 1,930,565 | |
| | | | | | | | 5,075,528 | |
Electrical Components & Equipment — 1.9% |
Energizer Holdings, Inc. | | | 60,352 | | | | 2,362,177 | |
EnerSys | | | 30,219 | | | | 2,028,299 | |
| | | | | | | | 4,390,476 | |
Electronics — 0.7% |
Atkore International Group, Inc. (a) | | | 73,019 | | | | 1,659,722 | |
Engineering & Construction — 3.7% |
Comfort Systems USA, Inc. | | | 25,452 | | | | 1,311,032 | |
KBR, Inc. | | | 153,303 | | | | 3,427,855 | |
| | | Number of
Shares | | | Value | |
TopBuild Corp. (a) | | | 21,213 | | | $ | 3,620,847 | |
| | | | | | | | 8,359,734 | |
Environmental Controls — 1.5% |
Evoqua Water Technologies Corp. (a) | | | 111,997 | | | | 2,376,576 | |
US Ecology, Inc. | | | 30,950 | | | | 1,011,137 | |
| | | | | | | | 3,387,713 | |
Machinery – Diversified — 1.0% |
Chart Industries, Inc. (a) | | | 32,807 | | | | 2,305,348 | |
Metal Fabricate & Hardware — 2.3% |
Rexnord Corp. | | | 135,277 | | | | 4,036,666 | |
Valmont Industries, Inc. | | | 9,745 | | | | 1,210,134 | |
| | | | | | | | 5,246,800 | |
Miscellaneous - Manufacturing — 0.9% |
EnPro Industries, Inc. | | | 37,378 | | | | 2,108,493 | |
Transportation — 1.8% |
CryoPort, Inc. (a) (b) | | | 54,456 | | | | 2,581,214 | |
Hub Group, Inc. Class A (a) | | | 28,346 | | | | 1,422,828 | |
| | | | | | | | 4,004,042 | |
| | | | | | | | 36,537,856 | |
Technology — 12.3% |
Computers — 2.4% |
CACI International, Inc. Class A (a) | | | 14,187 | | | | 3,024,101 | |
Perspecta, Inc. | | | 128,712 | | | | 2,503,448 | |
| | | | | | | | 5,527,549 | |
Semiconductors — 4.7% |
Brooks Automation, Inc. | | | 63,557 | | | | 2,940,147 | |
MKS Instruments, Inc. | | | 35,072 | | | | 3,830,915 | |
Semtech Corp. (a) | | | 72,887 | | | | 3,860,095 | |
| | | | | | | | 10,631,157 | |
Software — 5.2% |
1Life Healthcare, Inc. (a) | | | 31,641 | | | | 897,339 | |
Bottomline Technologies de, Inc. (a) | | | 77,200 | | | | 3,254,752 | |
Envestnet, Inc. (a) | | | 23,881 | | | | 1,842,658 | |
j2 Global, Inc. (a) | | | 52,497 | | | | 3,633,842 | |
Zynga, Inc. Class A (a) | | | 222,775 | | | | 2,031,708 | |
| | | | | | | | 11,660,299 | |
| | | | | | | | 27,819,005 | |
Utilities — 3.0% |
Electric — 0.9% |
Avista Corp. | | | 61,329 | | | | 2,092,545 | |
Gas — 2.1% |
National Fuel Gas Co. | | | 42,484 | | | | 1,724,426 | |
The accompanying notes are an integral part of the financial statements.
161
MassMutual Premier Small Cap Opportunities Fund — Portfolio of Investments (Continued) |
| | | Number of
Shares | | | Value | |
South Jersey Industries, Inc. | | | 156,085 | | | $ | 3,007,758 | |
| | | | | | | | 4,732,184 | |
| | | | | | | | 6,824,729 | |
| | | | | | | | | |
TOTAL COMMON STOCK (Cost $222,300,995) | | | | | | | 222,661,518 | |
| | | | | | | | | |
TOTAL EQUITIES (Cost $222,300,995) | | | | | | | 222,661,518 | |
| | | | | | | | | |
TOTAL LONG-TERM INVESTMENTS (Cost $222,300,995) | | | | | | | 222,661,518 | |
| | | Principal
Amount | | | | | |
SHORT-TERM INVESTMENTS — 1.2% |
Repurchase Agreement — 1.2% |
Fixed Income Clearing Corp., Repurchase Agreement, dated 9/30/20, 0.000%, due 10/01/20 (d) | | $ | 2,698,637 | | | | 2,698,637 | |
| | | | | | | | | |
TOTAL SHORT-TERM INVESTMENTS (Cost $2,698,637) | | | | | | | 2,698,637 | |
| | | | | | | | | |
TOTAL INVESTMENTS — 99.7% (Cost $224,999,632) (e) | | | | | | | 225,360,155 | |
| | | | | | | | | |
Other Assets/(Liabilities) — 0.3% | | | | | | | 588,825 | |
| | | | | | | | | |
NET ASSETS — 100.0% | | | | | | $ | 225,948,980 | |
Abbreviation Legend
ADR | American Depositary Receipt |
Notes to Portfolio of Investments
Percentages are stated as a percent of net assets.
(a) | Non-income producing security. |
(b) | Denotes all or a portion of security on loan. The total value of securities on loan as of September 30, 2020, was $7,061,075 or 3.13% of net assets. Total securities on loan may be less than the amounts identified in the Portfolio of Investments. The Fund received $7,231,346 of non-cash collateral (U.S. Treasury and/or Agency obligations) related to securities lending activity. This amount is not reflected on either the Portfolio of Investments or the Statement of Assets and Liabilities. (Note 2). |
(c) | Security is a Master Limited Partnership. |
(d) | Maturity value of $2,698,637. Collateralized by U.S. Government Agency obligations with a rate of 2.375%, maturity date of 3/15/22, and an aggregate market value, including accrued interest, of $2,752,688. |
(e) | See Note 6 for aggregate cost for federal tax purposes. |
The accompanying notes are an integral part of the financial statements.
162
MassMutual Premier Global Fund — Portfolio of Investments |
September 30, 2020 |
| | | Number of
Shares | | | Value | |
EQUITIES — 98.2% |
COMMON STOCK — 98.2% |
Cayman Islands — 5.8% |
Farfetch Ltd. Class A (a) (b) | | | 87,774 | | | $ | 2,208,394 | |
JD.com, Inc. ADR (b) | | | 172,958 | | | | 13,423,270 | |
StoneCo Ltd. Class A (b) | | | 48,087 | | | | 2,543,322 | |
| | | | | | | | 18,174,986 | |
Denmark — 0.1% |
Ascendis Pharma A/S ADR (b) | | | 1,471 | | | | 227,005 | |
France — 7.3% |
Dassault Systemes SE | | | 5,006 | | | | 933,793 | |
Kering SA | | | 12,873 | | | | 8,552,629 | |
LVMH Moet Hennessy Louis Vuitton SE | | | 29,197 | | | | 13,649,476 | |
| | | | | | | | 23,135,898 | |
Germany — 3.3% |
SAP SE | | | 67,507 | | | | 10,512,419 | |
India — 2.5% |
DLF Ltd. | | | 2,220,913 | | | | 4,600,986 | |
ICICI Bank Ltd. Sponsored ADR (b) | | | 334,170 | | | | 3,284,891 | |
| | | | | | | | 7,885,877 | |
Italy — 0.2% |
Brunello Cucinelli SpA (a) (b) | | | 21,702 | | | | 661,906 | |
Japan — 15.1% |
Capcom Co. Ltd. | | | 80,200 | | | | 4,485,172 | |
FANUC Corp. | | | 16,800 | | | | 3,222,865 | |
Keyence Corp. | | | 18,500 | | | | 8,621,788 | |
MinebeaMitsumi, Inc. | | | 51,600 | | | | 973,554 | |
Murata Manufacturing Co. Ltd. | | | 121,530 | | | | 7,841,343 | |
Nidec Corp. | | | 107,200 | | | | 9,969,710 | |
Omron Corp. | | | 63,000 | | | | 4,907,279 | |
Takeda Pharmaceutical Co. Ltd. | | | 73,608 | | | | 2,622,063 | |
TDK Corp. | | | 45,300 | | | | 4,953,728 | |
| | | | | | | | 47,597,502 | |
Netherlands — 2.8% |
Airbus SE (b) | | | 87,836 | | | | 6,375,554 | |
ASML Holding NV | | | 3,567 | | | | 1,315,276 | |
uniQure NV (b) | | | 28,966 | | | | 1,066,818 | |
| | | | | | | | 8,757,648 | |
Spain — 1.2% |
Industria de Diseno Textil SA | | | 136,342 | | | | 3,790,676 | |
Sweden — 3.0% |
Assa Abloy AB Class B | | | 179,698 | | | | 4,194,341 | |
Atlas Copco AB Class A | | | 112,254 | | | | 5,342,526 | |
| | | | | | | | 9,536,867 | |
| | | Number of
Shares | | | Value | |
Switzerland — 0.4% |
Zur Rose Group AG (b) | | | 4,886 | | | $ | 1,163,276 | |
United Kingdom — 1.4% |
International Game Technology PLC (a) | | | 95,525 | | | | 1,063,193 | |
Prudential PLC | | | 239,892 | | | | 3,424,877 | |
| | | | | | | | 4,488,070 | |
United States — 55.1% |
Adobe, Inc. (b) | | | 33,743 | | | | 16,548,579 | |
Agilent Technologies, Inc. | | | 52,118 | | | | 5,260,791 | |
Alphabet, Inc. Class A (b) | | | 17,264 | | | | 25,302,118 | |
Amazon.com, Inc. (b) | | | 1,496 | | | | 4,710,500 | |
Analog Devices, Inc. | | | 4,886 | | | | 570,392 | |
Anthem, Inc. | | | 9,807 | | | | 2,634,062 | |
Avantor, Inc. (b) | | | 164,896 | | | | 3,708,511 | |
Blueprint Medicines Corp. (b) | | | 18,696 | | | | 1,733,119 | |
Boston Scientific Corp. (b) | | | 47,958 | | | | 1,832,475 | |
Centene Corp. (b) | | | 47,611 | | | | 2,777,150 | |
Colgate-Palmolive Co. | | | 20,730 | | | | 1,599,320 | |
Dun & Bradstreet Holdings, Inc. (b) | | | 19,982 | | | | 512,738 | |
Electronic Arts, Inc. (b) | | | 22,161 | | | | 2,890,016 | |
Equifax, Inc. | | | 29,415 | | | | 4,615,214 | |
Facebook, Inc. Class A (b) | | | 57,554 | | | | 15,073,393 | |
Fidelity National Information Services, Inc. | | | 28,957 | | | | 4,262,760 | |
Illumina, Inc. (b) | | | 6,403 | | | | 1,979,039 | |
Incyte Corp. (b) | | | 7,475 | | | | 670,807 | |
Intuit, Inc. | | | 38,876 | | | | 12,681,740 | |
Ionis Pharmaceuticals, Inc. (b) | | | 34,820 | | | | 1,652,209 | |
IQVIA Holdings, Inc. (b) | | | 6,208 | | | | 978,567 | |
MacroGenics, Inc. (b) | | | 67,421 | | | | 1,698,335 | |
Maxim Integrated Products, Inc. | | | 110,019 | | | | 7,438,385 | |
Microsoft Corp. | | | 16,055 | | | | 3,376,848 | |
PayPal Holdings, Inc. (b) | | | 52,401 | | | | 10,324,569 | |
Pegasystems, Inc. | | | 16,706 | | | | 2,022,094 | |
Phathom Pharmaceuticals, Inc. (a) (b) | | | 31,535 | | | | 1,156,388 | |
S&P Global, Inc. | | | 42,658 | | | | 15,382,475 | |
Sage Therapeutics, Inc. (b) | | | 12,654 | | | | 773,412 | |
Sarepta Therapeutics, Inc. (b) | | | 14,695 | | | | 2,063,619 | |
Twist Bioscience Corp. (b) | | | 1,633 | | | | 124,059 | |
United Parcel Service, Inc. Class B | | | 35,458 | | | | 5,908,367 | |
Veracyte, Inc. (b) | | | 42,078 | | | | 1,367,114 | |
Visa, Inc. Class A | | | 17,269 | | | | 3,453,282 | |
The Walt Disney Co. | | | 40,631 | | | | 5,041,494 | |
Zimmer Biomet Holdings, Inc. | | | 11,695 | | | | 1,592,157 | |
| | | | | | | | 173,716,098 | |
| | | | | | | | | |
TOTAL COMMON STOCK (Cost $157,817,029) | | | | | | | 309,648,228 | |
The accompanying notes are an integral part of the financial statements.
163
MassMutual Premier Global Fund — Portfolio of Investments (Continued) |
| | | Number of
Shares | | | Value | |
PREFERRED STOCK — 0.0% |
India — 0.0% |
Zee Entertainment Enterprises Ltd. | | | | | | | | |
6.000% | | | 573,050 | | | $ | 27,961 | |
| | | | | | | | | |
TOTAL PREFERRED STOCK (Cost $22,479) | | | | | | | 27,961 | |
| | | | | | | | | |
TOTAL EQUITIES (Cost $157,839,508) | | | | | | | 309,676,189 | |
| | | | | | | | | |
TOTAL LONG-TERM INVESTMENTS (Cost $157,839,508) | | | | | | | 309,676,189 | |
| | | Principal
Amount | | | | | |
SHORT-TERM INVESTMENTS — 2.3% |
Repurchase Agreement — 2.3% |
Fixed Income Clearing Corp., Repurchase Agreement, dated 9/30/20, 0.000%, due 10/01/20 (c) | | $ | 7,071,875 | | | | 7,071,875 | |
| | | | | | | | | |
TOTAL SHORT-TERM INVESTMENTS (Cost $7,071,875) | | | | | | | 7,071,875 | |
| | | | | | | | | |
TOTAL INVESTMENTS — 100.5% (Cost $164,911,383) (d) | | | | | | | 316,748,064 | |
| | | | | | | | | |
Other Assets/(Liabilities) — (0.5)% | | | | | | | (1,471,620 | ) |
| | | | | | | | | |
NET ASSETS — 100.0% | | | | | | $ | 315,276,444 | |
Abbreviation Legend
ADR | American Depositary Receipt |
Notes to Portfolio of Investments
Percentages are stated as a percent of net assets.
(a) | Denotes all or a portion of security on loan. The total value of securities on loan as of September 30, 2020, was $5,032,702 or 1.60% of net assets. Total securities on loan may be less than the amounts identified in the Portfolio of Investments. The Fund received $5,120,706 of non-cash collateral (U.S. Treasury and/or Agency obligations) related to securities lending activity. This amount is not reflected on either the Portfolio of Investments or the Statement of Assets and Liabilities. (Note 2). |
(b) | Non-income producing security. |
(c) | Maturity value of $7,071,875. Collateralized by U.S. Government Agency obligations with a rate of 2.375%, maturity date of 3/15/22, and an aggregate market value, including accrued interest, of $7,213,323. |
(d) | See Note 6 for aggregate cost for federal tax purposes. |
Sector weightings, as a percentage of net assets, is as follows:
Industrial | | | 21.3 | % |
Technology | | | 21.3 | % |
Communications | | | 20.9 | % |
Consumer, Non-cyclical | | | 20.8 | % |
Consumer, Cyclical | | | 9.2 | % |
Financial | | | 4.7 | % |
Total Long-Term Investments | | | 98.2 | % |
Short-Term Investments and Other Assets and Liabilities | | | 1.8 | % |
Net Assets | | | 100.0 | % |
The accompanying notes are an integral part of the financial statements.
164
MassMutual Premier International Equity Fund — Portfolio of Investments |
September 30, 2020 |
| | | Number of
Shares | | | Value | |
EQUITIES — 95.7% |
COMMON STOCK — 95.7% |
Australia — 0.6% |
Challenger Ltd. | | | 72,100 | | | $ | 198,511 | |
Lendlease Corp Ltd. | | | 36,100 | | | | 285,938 | |
Macquarie Group Ltd. | | | 6,100 | | | | 523,974 | |
Santos Ltd. | | | 47,900 | | | | 168,098 | |
| | | | | | | | 1,176,521 | |
Belgium — 0.5% |
Groupe Bruxelles Lambert SA | | | 4,700 | | | | 423,616 | |
KBC Group NV | | | 8,500 | | | | 425,621 | |
| | | | | | | | 849,237 | |
Canada — 6.2% |
The Bank of Nova Scotia | | | 71,623 | | | | 2,975,618 | |
Canadian National Railway Co. | | | 46,610 | | | | 4,963,962 | |
Intact Financial Corp. | | | 34,863 | | | | 3,733,068 | |
| | | | | | | | 11,672,648 | |
Cayman Islands — 0.5% |
Baidu, Inc. Sponsored ADR (a) | | | 1,040 | | | | 131,654 | |
CK Asset Holdings Ltd. | | | 71,500 | | | | 348,854 | |
CK Hutchison Holdings Ltd. | | | 91,000 | | | | 551,722 | |
| | | | | | | | 1,032,230 | |
Denmark — 0.4% |
AP Moller - Maersk A/S Class B | | | 390 | | | | 618,310 | |
The Drilling Co. of 1972 A/S (a) (b) | | | 2,800 | | | | 60,776 | |
| | | | | | | | 679,086 | |
France — 13.0% |
Arkema SA | | | 4,500 | | | | 477,399 | |
AXA SA | | | 114,728 | | | | 2,117,917 | |
Capgemini SE | | | 34,252 | | | | 4,386,849 | |
Dassault Aviation SA (a) | | | 160 | | | | 135,811 | |
Engie SA (a) | | | 59,000 | | | | 788,563 | |
LVMH Moet Hennessy Louis Vuitton SE | | | 7,374 | | | | 3,447,314 | |
Rexel SA (a) | | | 19,500 | | | | 244,624 | |
Sanofi | | | 9,000 | | | | 902,421 | |
Schneider Electric SE | | | 36,056 | | | | 4,475,090 | |
TOTAL SE (b) | | | 67,968 | | | | 2,333,548 | |
Ubisoft Entertainment SA (a) | | | 4,300 | | | | 388,588 | |
Veolia Environnement SA | | | 29,900 | | | | 644,821 | |
Vinci SA | | | 45,945 | | | | 3,832,312 | |
Vivendi SA | | | 17,000 | | | | 473,827 | |
| | | | | | | | 24,649,084 | |
Germany — 5.0% |
Allianz SE Registered | | | 2,660 | | | | 510,238 | |
Bayer AG Registered | | | 6,800 | | | | 425,005 | |
Deutsche Boerse AG | | | 2,780 | | | | 488,221 | |
| | | Number of
Shares | | | Value | |
Deutsche Post AG Registered | | | 8,200 | | | $ | 373,929 | |
Fresenius SE & Co. KGaA | | | 17,400 | | | | 792,041 | |
HeidelbergCement AG | | | 11,800 | | | | 723,829 | |
Infineon Technologies AG | | | 25,700 | | | | 726,969 | |
Merck KGaA | | | 21,548 | | | | 3,146,499 | |
SAP SE | | | 6,800 | | | | 1,058,919 | |
Siemens AG Registered | | | 7,360 | | | | 930,640 | |
Siemens Energy AG (a) (c) | | | 3,680 | | | | 99,236 | |
Talanx AG (a) | | | 5,100 | | | | 164,564 | |
| | | | | | | | 9,440,090 | |
Hong Kong — 3.0% |
AIA Group Ltd. | | | 542,848 | | | | 5,347,693 | |
China Mobile Ltd. | | | 57,500 | | | | 369,647 | |
| | | | | | | | 5,717,340 | |
Ireland — 4.0% |
AIB Group PLC (a) | | | 116,900 | | | | 119,916 | |
DCC PLC | | | 7,700 | | | | 593,400 | |
Linde PLC (a) | | | 23,994 | | | | 5,678,962 | |
Linde PLC | | | 1,470 | | | | 350,051 | |
Ryanair Holdings PLC Sponsored ADR (a) | | | 2,000 | | | | 163,520 | |
Smurfit Kappa Group PLC | | | 17,900 | | | | 702,384 | |
| | | | | | | | 7,608,233 | |
Israel — 0.2% |
Check Point Software Technologies Ltd. (a) | | | 2,790 | | | | 335,749 | |
Italy — 0.6% |
Mediobanca Banca di Credito Finanziario SpA | | | 38,300 | | | | 300,343 | |
Prysmian SpA | | | 13,000 | | | | 378,004 | |
UniCredit SpA (a) | | | 44,700 | | | | 368,627 | |
| | | | | | | | 1,046,974 | |
Japan — 17.8% |
Astellas Pharma, Inc. | | | 300,250 | | | | 4,469,683 | |
Chugai Pharmaceutical Co. Ltd. | | | 44,190 | | | | 1,982,987 | |
Daiwa Securities Group, Inc. (b) | | | 95,700 | | | | 401,673 | |
Denka Co. Ltd. | | | 12,000 | | | | 365,227 | |
ENEOS Holdings, Inc. | | | 45,800 | | | | 163,549 | |
FANUC Corp. | | | 3,200 | | | | 613,879 | |
Fujitsu Ltd. | | | 4,100 | | | | 561,415 | |
Hitachi Ltd. | | | 22,600 | | | | 763,647 | |
Japan Airlines Co. Ltd. (a) | | | 18,400 | | | | 345,413 | |
Kao Corp. | | | 28,500 | | | | 2,138,644 | |
KDDI Corp. | | | 132,380 | | | | 3,348,678 | |
Kirin Holdings Co. Ltd. | | | 144,630 | | | | 2,716,443 | |
Kyocera Corp. | | | 8,400 | | | | 479,959 | |
Matsumotokiyoshi Holdings Co. Ltd. | | | 5,800 | | | | 211,593 | |
Nintendo Co. Ltd. | | | 1,500 | | | | 852,721 | |
The accompanying notes are an integral part of the financial statements.
165
MassMutual Premier International Equity Fund — Portfolio of Investments (Continued) |
| | | Number of
Shares | | | Value | |
Olympus Corp. | | | 34,600 | | | $ | 718,199 | |
ORIX Corp. | | | 51,700 | | | | 643,635 | |
Rakuten, Inc. | | | 70,100 | | | | 757,259 | |
Sega Sammy Holdings, Inc. | | | 38,100 | | | | 463,414 | |
Seven & i Holdings Co. Ltd. | | | 26,200 | | | | 809,921 | |
Shiseido Co. Ltd. | | | 69,070 | | | | 3,963,270 | |
Sony Corp. | | | 17,900 | | | | 1,369,080 | |
Square Enix Holdings Co. Ltd. | | | 8,200 | | | | 545,187 | |
Sumitomo Mitsui Financial Group, Inc. | | | 25,200 | | | | 701,219 | |
Sysmex Corp. | | | 29,280 | | | | 2,794,310 | |
Toshiba Corp. | | | 22,300 | | | | 567,628 | |
Toyota Industries Corp. | | | 13,900 | | | | 878,931 | |
| | | | | | | | 33,627,564 | |
Luxembourg — 0.2% |
ArcelorMittal SA (a) | | | 29,800 | | | | 397,412 | |
Netherlands — 7.7% |
Airbus SE (a) | | | 1,100 | | | | 79,843 | |
ASML Holding NV | | | 1,490 | | | | 549,415 | |
EXOR NV | | | 2,900 | | | | 157,810 | |
Heineken Holding NV | | | 8,200 | | | | 638,163 | |
Heineken NV | | | 48,442 | | | | 4,304,865 | |
Koninklijke Philips NV (a) | | | 96,163 | | | | 4,530,261 | |
NXP Semiconductor NV | | | 3,300 | | | | 411,873 | |
Unilever NV | | | 64,871 | | | | 3,916,278 | |
| | | | | | | | 14,588,508 | |
Norway — 0.2% |
Mowi ASA | | | 24,500 | | | | 434,611 | |
Singapore — 0.3% |
DBS Group Holdings, Ltd. | | | 36,200 | | | | 532,441 | |
Spain — 4.1% |
Iberdrola SA | | | 323,833 | | | | 3,985,682 | |
Industria de Diseno Textil SA | | | 118,830 | | | | 3,303,796 | |
Siemens Gamesa Renewable Energy SA | | | 17,500 | | | | 471,690 | |
| | | | | | | | 7,761,168 | |
Sweden — 2.0% |
Assa Abloy AB Class B | | | 126,697 | | | | 2,957,242 | |
Investor AB Class B | | | 7,200 | | | | 469,497 | |
Volvo AB Class B (a) | | | 18,100 | | | | 347,639 | |
| | | | | | | | 3,774,378 | |
Switzerland — 11.0% |
ABB Ltd. Registered | | | 27,800 | | | | 704,591 | |
Alcon, Inc. (a) | | | 8,500 | | | | 482,579 | |
Nestle SA Registered | | | 49,295 | | | | 5,848,314 | |
Novartis AG Registered | | | 65,896 | | | | 5,726,446 | |
Roche Holding AG | | | 16,474 | | | | 5,636,204 | |
Temenos Group AG Registered | | | 11,527 | | | | 1,552,300 | |
| | | Number of
Shares | | | Value | |
UBS Group AG Registered | | | 69,500 | | | $ | 775,875 | |
| | | | | | | | 20,726,309 | |
United Kingdom — 18.4% |
Ashtead Group PLC | | | 12,600 | | | | 451,446 | |
AstraZeneca PLC | | | 31,954 | | | | 3,477,902 | |
Aviva PLC | | | 153,900 | | | | 565,918 | |
BAE Systems PLC | | | 361,987 | | | | 2,239,070 | |
Barratt Developments PLC | | | 17,000 | | | | 103,944 | |
BHP Group PLC ADR | | | 3,600 | | | | 153,576 | |
The British Land Co. PLC | | | 83,200 | | | | 361,722 | |
Bunzl PLC | | | 9,300 | | | | 300,050 | |
Compass Group PLC | | | 141,016 | | | | 2,116,813 | |
Diageo PLC | | | 72,502 | | | | 2,483,788 | |
Experian PLC | | | 65,919 | | | | 2,466,743 | |
Glencore PLC (a) | | | 63,000 | | | | 130,518 | |
GVC Holdings PLC (a) | | | 35,700 | | | | 449,341 | |
Imperial Brands PLC | | | 21,300 | | | | 375,452 | |
Inchcape PLC (a) | | | 56,800 | | | | 321,549 | |
Informa PLC (a) | | | 31,300 | | | | 151,759 | |
Liberty Global PLC Class C (a) | | | 20,000 | | | | 410,700 | |
National Grid PLC | | | 361,639 | | | | 4,163,084 | |
Persimmon PLC | | | 13,200 | | | | 419,251 | |
Prudential PLC | | | 134,645 | | | | 1,922,292 | |
Reckitt Benckiser Group PLC | | | 56,446 | | | | 5,503,098 | |
Smith & Nephew PLC | | | 218,698 | | | | 4,261,630 | |
Tesco PLC | | | 269,300 | | | | 738,309 | |
Unilever PLC | | | 19,800 | | | | 1,220,034 | |
| | | | | | | | 34,787,989 | |
| | | | | | | | | |
TOTAL COMMON STOCK (Cost $181,090,852) | | | | | | | 180,837,572 | |
| | | | | | | | | |
TOTAL EQUITIES (Cost $181,090,852) | | | | | | | 180,837,572 | |
| | | | | | | | | |
MUTUAL FUNDS — 1.1% |
United States — 1.1% |
State Street Navigator Securities Lending Prime Portfolio (d) | | | 2,066,194 | | | | 2,066,194 | |
| | | | | | | | | |
TOTAL MUTUAL FUNDS (Cost $2,066,194) | | | | | | | 2,066,194 | |
| | | | | | | | | |
TOTAL LONG-TERM INVESTMENTS (Cost $183,157,046) | | | | | | | 182,903,766 | |
The accompanying notes are an integral part of the financial statements.
166
MassMutual Premier International Equity Fund — Portfolio of Investments (Continued) |
| | | Principal
Amount | | | Value | |
SHORT-TERM INVESTMENTS — 0.2% |
Repurchase Agreement — 0.2% |
Fixed Income Clearing Corp., Repurchase Agreement, dated 9/30/20, 0.000%, due 10/01/20 (e) | | $ | 361,315 | | | $ | 361,315 | |
| | | | | | | | | |
TOTAL SHORT-TERM INVESTMENTS (Cost $361,315) | | | | | | | 361,315 | |
| | | | | | | | | |
TOTAL INVESTMENTS — 97.0% (Cost $183,518,361) (f) | | | | | | | 183,265,081 | |
| | | | | | | | | |
Other Assets/(Liabilities) — 3.0% | | | | | | | 5,624,912 | |
| | | | | | | | | |
NET ASSETS — 100.0% | | | | | | $ | 188,889,993 | |
Abbreviation Legend
ADR | American Depositary Receipt |
Notes to Portfolio of Investments
Percentages are stated as a percent of net assets.
(a) | Non-income producing security. |
(b) | Denotes all or a portion of security on loan. The total value of securities on loan as of September 30, 2020, was $2,355,366 or 1.25% of net assets. Total securities on loan may be less than the amounts identified in the Portfolio of Investments. The Fund received $408,560 of non-cash collateral (U.S. Treasury and/or Agency obligations) related to securities lending activity. This amount is not reflected on either the Portfolio of Investments or the Statement of Assets and Liabilities. (Note 2). |
(c) | A portion of this security is purchased on a when-issued, delayed-delivery or forward commitment basis. (Note 2). |
(d) | Represents investment of security lending cash collateral. (Note 2). |
(e) | Maturity value of $361,315. Collateralized by U.S. Government Agency obligations with a rate of 2.375%, maturity date of 3/15/22, and an aggregate market value, including accrued interest, of $368,610. |
(f) | See Note 6 for aggregate cost for federal tax purposes. |
Sector weightings, as a percentage of net assets, is as follows:
Consumer, Non-cyclical | | | 40.9 | % |
Industrial | | | 13.2 | % |
Financial | | | 13.0 | % |
Consumer, Cyclical | | | 8.1 | % |
Technology | | | 5.6 | % |
Utilities | | | 5.1 | % |
Basic Materials | | | 4.4 | % |
Communications | | | 3.0 | % |
Energy | | | 2.1 | % |
Mutual Funds | | | 1.1 | % |
Diversified | | | 0.3 | % |
Total Long-Term Investments | | | 96.8 | % |
Short-Term Investments and Other Assets and Liabilities | | | 3.2 | % |
Net Assets | | | 100.0 | % |
The accompanying notes are an integral part of the financial statements.
167
MassMutual Premier Strategic Emerging Markets Fund — Portfolio of Investments |
September 30, 2020 |
| | | Number of
Shares | | | Value | |
EQUITIES — 95.8% |
COMMON STOCK — 92.9% |
Belgium — 1.0% |
Anheuser-Busch InBev SA | | | 32,262 | | | $ | 1,741,425 | |
Bermuda — 1.8% |
Credicorp Ltd. | | | 15,744 | | | | 1,952,099 | |
Jardine Strategic Holdings Ltd. | | | 62,471 | | | | 1,237,644 | |
| | | | | | | | 3,189,743 | |
Brazil — 2.3% |
Ambev SA | | | 369,539 | | | | 825,160 | |
B3 SA - Brasil Bolsa Balcao | | | 159,426 | | | | 1,561,642 | |
Vale SA Sponsored ADR (a) | | | 162,174 | | | | 1,715,801 | |
| | | | | | | | 4,102,603 | |
Cayman Islands — 25.0% |
Alibaba Group Holding Ltd. Sponsored ADR (b) | | | 39,444 | | | | 11,595,747 | |
Budweiser Brewing Co. APAC Ltd. (c) | | | 596,700 | | | | 1,743,081 | |
Hansoh Pharmaceutical Group Co. Ltd. (b) (c) | | | 146,000 | | | | 715,005 | |
Huazhu Group Ltd. ADR | | | 142,757 | | | | 6,172,813 | |
Innovent Biologics, Inc. (b) (c) | | | 123,500 | | | | 919,724 | |
Meituan Dianping Class B (b) | | | 44,700 | | | | 1,405,782 | |
New Oriental Education & Technology Group, Inc. Sponsored ADR (b) | | | 3,229 | | | | 482,735 | |
OneConnect Financial Technology Co. Ltd. (b) | | | 85,840 | | | | 1,828,392 | |
Pagseguro Digital Ltd. Class A (a) (b) | | | 43,529 | | | | 1,641,479 | |
Tencent Holdings Ltd. | | | 194,990 | | | | 12,985,042 | |
Wuxi Biologics Cayman, Inc. (b) (c) | | | 30,500 | | | | 748,484 | |
ZTO Express Cayman, Inc. (b) | | | 9,870 | | | | 285,528 | |
ZTO Express Cayman, Inc. ADR | | | 151,577 | | | | 4,535,184 | |
| | | | | | | | 45,058,996 | |
Chile — 0.7% |
Falabella SA | | | 432,441 | | | | 1,266,920 | |
China — 4.9% |
Jiangsu Hengrui Medicine Co. Ltd. Class A | | | 283,338 | | | | 3,750,649 | |
Ping An Insurance Group Co. of China Ltd. Class A | | | 455,271 | | | | 5,103,080 | |
| | | | | | | | 8,853,729 | |
Colombia — 0.3% |
Grupo Aval Acciones y Valores SA | | | 125,667 | | | | 579,325 | |
Egypt — 0.8% |
Commercial International Bank Egypt SAE | | | 357,343 | | | | 1,507,421 | |
| | | Number of
Shares | | | Value | |
France — 5.9% |
Kering SA | | | 14,218 | | | $ | 9,446,228 | |
LVMH Moet Hennessy Louis Vuitton SE | | | 148 | | | | 69,189 | |
Pernod Ricard SA | | | 6,542 | | | | 1,044,038 | |
| | | | | | | | 10,559,455 | |
Hong Kong — 3.9% |
AIA Group Ltd. | | | 715,400 | | | | 7,047,533 | |
India — 11.6% |
HDFC Bank Ltd. (b) | | | 125,995 | | | | 1,855,512 | |
Housing Development Finance Corp. Ltd. | | | 297,434 | | | | 7,030,556 | |
Infosys Ltd. | | | 56,300 | | | | 776,073 | |
Kotak Mahindra Bank Ltd. (b) | | | 297,214 | | | | 5,109,609 | |
Oberoi Realty Ltd. (b) | | | 119,776 | | | | 643,861 | |
Tata Consultancy Services Ltd. | | | 132,207 | | | | 4,467,248 | |
Zee Entertainment Enterprises Ltd. | | | 353,109 | | | | 1,012,540 | |
| | | | | | | | 20,895,399 | |
Indonesia — 1.1% |
Bank Central Asia Tbk PT | | | 696,600 | | | | 1,271,277 | |
Indocement Tunggal Prakarsa Tbk PT | | | 464,835 | | | | 325,483 | |
Semen Indonesia Persero Tbk PT | | | 534,700 | | | | 330,724 | |
| | | | | | | | 1,927,484 | |
Italy — 1.9% |
Moncler SpA (b) | | | 29,217 | | | | 1,196,679 | |
PRADA SpA (b) | | | 547,100 | | | | 2,135,544 | |
| | | | | | | | 3,332,223 | |
Mexico — 4.6% |
Alsea SAB de CV (b) | | | 334,428 | | | | 318,373 | |
Fomento Economico Mexicano SAB de CV | | | 606,330 | | | | 3,405,748 | |
Fomento Economico Mexicano SAB de CV Sponsored ADR | | | 14,347 | | | | 806,158 | |
Grupo Aeroportuario del Sureste SAB de CV Class B (b) | | | 55,788 | | | | 647,410 | |
Grupo Financiero Inbursa SAB de CV Class O (b) | | | 716,748 | | | | 553,975 | |
Grupo Mexico SAB de CV Series B | | | 981,858 | | | | 2,499,105 | |
| | | | | | | | 8,230,769 | |
Netherlands — 3.5% |
Yandex NV Class A (b) | | | 97,927 | | | | 6,389,737 | |
Philippines — 2.4% |
Ayala Land, Inc. | | | 2,161,700 | | | | 1,324,443 | |
SM Investments Corp. | | | 127,000 | | | | 2,305,384 | |
SM Prime Holdings, Inc. | | | 1,166,857 | | | | 709,623 | |
| | | | | | | | 4,339,450 | |
Republic of Korea — 1.6% |
Amorepacific Corp. | | | 1,244 | | | | 173,196 | |
The accompanying notes are an integral part of the financial statements.
168
MassMutual Premier Strategic Emerging Markets Fund — Portfolio of Investments (Continued) |
| | | Number of
Shares | | | Value | |
AMOREPACIFIC Group | | | 6,975 | | | $ | 289,435 | |
Samsung Biologics Co. Ltd. (b) (c) | | | 4,113 | | | | 2,424,753 | |
| | | | | | | | 2,887,384 | |
Russia — 5.8% |
Novatek PJSC Sponsored GDR Registered (c) | | | 8,802 | | | | 1,205,874 | |
Novatek PJSC Sponsored GDR Registered (c) | | | 35,732 | | | | 4,889,199 | |
Polyus PJSC (b) | | | 2,824 | | | | 593,109 | |
Polyus PJSC GDR (c) (d) | | | 850 | | | | 89,590 | |
Polyus PJSC GDR (c) (d) | | | 5,075 | | | | 534,905 | |
Sberbank of Russia PJSC (b) | | | 1,067,867 | | | | 3,137,109 | |
| | | | | | | | 10,449,786 | |
South Africa — 0.6% |
FirstRand Ltd. | | | 443,738 | | | | 1,090,381 | |
Switzerland — 0.6% |
Cie Financiere Richemont SA Registered | | | 16,975 | | | | 1,136,999 | |
Taiwan — 8.3% |
MediaTek, Inc. | | | 22,000 | | | | 463,912 | |
Taiwan Semiconductor Manufacturing Co. Ltd. | | | 971,000 | | | | 14,583,037 | |
| | | | | | | | 15,046,949 | |
Turkey — 0.3% |
Akbank T.A.S. (b) | | | 863,010 | | | | 575,003 | |
United States — 4.0% |
Yum China Holdings, Inc. | | | 136,729 | | | | 7,239,801 | |
| | | | | | | | | |
TOTAL COMMON STOCK (Cost $151,738,456) | | | | | | | 167,448,515 | |
| | | | | | | | | |
PREFERRED STOCK — 2.9% |
Brazil — 1.6% |
Lojas Americanas SA 0.640% | | | 565,998 | | | | 2,861,284 | |
India — 0.0% |
Zee Entertainment Enterprises Ltd. 6.000% | | | 742,906 | | | | 36,249 | |
Singapore — 1.3% |
Grab Holdings, Inc. (Acquired 6/18/19, Cost $2,438,401) (b) (d) (e) (f) | | | 395,658 | | | | 2,438,401 | |
| | | | | | | | | |
TOTAL PREFERRED STOCK (Cost $5,691,601) | | | | | | | 5,335,934 | |
| | | | | | | | | |
TOTAL EQUITIES (Cost $157,430,057) | | | | | | | 172,784,449 | |
| | | Number of
Shares | | | Value | |
MUTUAL FUNDS — 0.4% |
United States — 0.4% |
State Street Navigator Securities Lending Prime Portfolio (g) | | | 674,091 | | | $ | 674,091 | |
| | | | | | | | | |
TOTAL MUTUAL FUNDS (Cost $674,091) | | | | | | | 674,091 | |
| | | | | | | | | |
TOTAL LONG-TERM INVESTMENTS (Cost $158,104,148) | | | | | | | 173,458,540 | |
| | | Principal
Amount | | | | | |
SHORT-TERM INVESTMENTS — 3.6% |
Repurchase Agreement — 3.6% |
Fixed Income Clearing Corp., Repurchase Agreement, dated 9/30/20, 0.000%, due 10/01/20 (h) | | $ | 6,489,955 | | | | 6,489,955 | |
| | | | | | | | | |
TOTAL SHORT-TERM INVESTMENTS (Cost $6,489,955) | | | | | | | 6,489,955 | |
| | | | | | | | | |
TOTAL INVESTMENTS — 99.8% (Cost $164,594,103) (i) | | | | | | | 179,948,495 | |
| | | | | | | | | |
Other Assets/(Liabilities) — 0.2% | | | | | | | 302,492 | |
| | | | | | | | | |
NET ASSETS — 100.0% | | | | | | $ | 180,250,987 | |
Abbreviation Legend
ADR | American Depositary Receipt |
GDR | Global Depositary Receipt |
The accompanying notes are an integral part of the financial statements.
169
MassMutual Premier Strategic Emerging Markets Fund — Portfolio of Investments (Continued) |
Notes to Portfolio of Investments
Percentages are stated as a percent of net assets.
(a) | Denotes all or a portion of security on loan. The total value of securities on loan as of September 30, 2020, was $2,752,442 or 1.53% of net assets. Total securities on loan may be less than the amounts identified in the Portfolio of Investments. The Fund received $2,142,131 of non-cash collateral (U.S. Treasury and/or Agency obligations) related to securities lending activity. This amount is not reflected on either the Portfolio of Investments or the Statement of Assets and Liabilities. (Note 2). |
(b) | Non-income producing security. |
(c) | Security is exempt from registration under Regulation S or Rule 144A of the Securities Act of 1933. These securities are considered restricted and may be resold in transactions exempt from registration. At September 30, 2020, the aggregate market value of these securities amounted to $13,270,615 or 7.36% of net assets. |
(d) | This security is fair valued in good faith in accordance with procedures approved by the Board of Trustees. At September 30, 2020, these securities amounted to a value of $3,062,896 or 1.70% of net assets. |
(e) | Investment was valued using significant unobservable inputs. |
(f) | Restricted security. Certain securities are restricted as to resale. At September 30, 2020, these securities amounted to a value of $2,438,401 or 1.35% of net assets. The Fund generally bears the costs, if any, associated with the disposition of restricted securities. |
(g) | Represents investment of security lending cash collateral. (Note 2). |
(h) | Maturity value of $6,489,955. Collateralized by U.S. Government Agency obligations with a rate of 2.375%, maturity date of 3/15/22, and an aggregate market value, including accrued interest, of $6,619,784. |
(i) | See Note 6 for aggregate cost for federal tax purposes. |
Sector weightings, as a percentage of net assets, is as follows:
Financial | | | 23.6 | % |
Consumer, Cyclical | | | 18.9 | % |
Communications | | | 18.5 | % |
Technology | | | 12.3 | % |
Consumer, Non-cyclical | | | 11.3 | % |
Industrial | | | 4.8 | % |
Energy | | | 3.4 | % |
Basic Materials | | | 3.0 | % |
Mutual Funds | | | 0.4 | % |
Total Long-Term Investments | | | 96.2 | % |
Short-Term Investments and Other Assets and Liabilities | | | 3.8 | % |
Net Assets | | | 100.0 | % |
The accompanying notes are an integral part of the financial statements.
170
[THIS PAGE INTENTIONALLY LEFT BLANK]
MassMutual Premier Funds – Financial Statements |
Statements of Assets and Liabilities
September 30, 2020 |
| | | MassMutual
Premier
U.S. Government
Money Market
Fund | | | MassMutual
Premier
Short-Duration
Bond Fund | |
Assets: | | | | | | | | |
Investments, at value (Note 2) (a) | | $ | — | | | $ | 406,392,789 | |
Repurchase agreements, at value (Note 2) (b) | | | 35,000,000 | | | | — | |
Other short-term investments, at value (Note 2) (c) | | | 243,141,228 | | | | 22,996,344 | |
Total investments (d) | | | 278,141,228 | | | | 429,389,133 | |
Cash | | | 57,920 | | | | 3,359,964 | |
Foreign currency, at value (e) | | | — | | | | — | |
Receivables from: | | | | | | | | |
Investments sold | | | | | | | | |
Regular delivery | | | — | | | | — | |
Delayed delivery | | | — | | | | — | |
Open forward contracts (Note 2) | | | — | | | | — | |
Fund shares sold | | | 9,224,816 | | | | 286,375 | |
Collateral pledged for open futures contracts (Note 2) | | | — | | | | 100,000 | |
Collateral pledged for open swap agreements (Note 2) | | | — | | | | 50,000 | |
Investment adviser (Note 3) | | | 81,208 | | | | — | |
Variation margin on open derivative instruments (Note 2) | | | — | | | | 102,199 | |
Interest and dividends | | | 83,949 | | | | 2,184,728 | |
Interest tax reclaim receivable | | | — | | | | 4,000 | |
Open swap agreements, at value (Note 2) | | | — | | | | — | |
Prepaid expenses | | | 11,218 | | | | 40,423 | |
Total assets | | | 287,600,339 | | | | 435,516,822 | |
Liabilities: | | | | | | | | |
Payables for: | | | | | | | | |
Investments purchased | | | | | | | | |
Regular delivery | | | — | | | | — | |
Delayed delivery | | | — | | | | 1,425,000 | |
Collateral held for open swap agreements (Note 2) | | | — | | | | — | |
Collateral held for open purchased options (Note 2) | | | — | | | | 389,000 | |
Open forward contracts (Note 2) | | | — | | | | — | |
Interest and dividends | | | — | | | | — | |
Fund shares repurchased | | | 9,400,666 | | | | 5,392,687 | |
Collateral held for securities on loan (Note 2) (f) | | | — | | | | — | |
Open swap agreements, at value (Note 2) | | | — | | | | — | |
Trustees’ fees and expenses (Note 3) | | | 51,708 | | | | 56,501 | |
Variation margin on open derivative instruments (Note 2) | | | — | | | | 1,215 | |
Affiliates (Note 3): | | | | | | | | |
Investment advisory fees | | | 81,884 | | | | 124,487 | |
Administration fees | | | 35,378 | | | | 38,800 | |
Service fees | | | — | | | | 39,371 | |
Shareholder service fees | | | — | | | | 10,199 | |
Distribution fees | | | — | | | | 4,651 | |
Commitment and Contingent Liabilities (Note 9) | | | — | | | | — | |
Accrued expense and other liabilities | | | 39,453 | | | | 55,286 | |
Total liabilities | | | 9,609,089 | | | | 7,537,197 | |
Net assets | | $ | 277,991,250 | | | $ | 427,979,625 | |
Net assets consist of: | | | | | | | | |
Paid-in capital | | $ | 278,035,190 | | | $ | 447,900,960 | |
Accumulated Gain (Loss) | | | (43,940 | ) | | | (19,921,335 | ) |
Net assets | | $ | 277,991,250 | | | $ | 427,979,625 | |
(a) | Cost of investments: | | $ | — | | | $ | 406,416,304 | |
(b) | Cost of repurchase agreements: | | $ | 35,000,000 | | | $ | — | |
(c) | Cost of other short-term investments: | | $ | 243,141,228 | | | $ | 22,996,233 | |
(d) | Securities on loan with market value of: | | $ | — | | | $ | — | |
(e) | Cost of foreign currency: | | $ | — | | | $ | — | |
(f) | Non-cash collateral is not included. | | | | | | | | |
The accompanying notes are an integral part of the financial statements.
172
| | MassMutual
Premier
Inflation-
Protected and
Income Fund | | | MassMutual
Premier
Core Bond
Fund | | | MassMutual
Premier
Diversified Bond
Fund | | | MassMutual
Premier
High Yield
Fund | | | MassMutual
Premier
Balanced
Fund | |
| | | | | | | | | | | | | | | | | | | | |
| | $ | 315,911,210 | | | $ | 1,327,237,112 | | | $ | 222,720,617 | | | $ | 558,961,138 | | | $ | 132,359,602 | |
| | | 1,010,124 | | | | — | | | | — | | | | — | | | | 1,737,564 | |
| | | 49,442,508 | | | | 215,336,765 | | | | 28,980,000 | | | | 16,996,587 | | | | 5,993,065 | |
| | | 366,363,842 | | | | 1,542,573,877 | | | | 251,700,617 | | | | 575,957,725 | | | | 140,090,231 | |
| | | 819,984 | | | | 9,583,645 | | | | 1,759,716 | | | | 6,301,710 | | | | 3,790,944 | |
| | | — | | | | — | | | | 3,098 | | | | — | | | | — | |
| | | | | | | | | | | | | | | | | | | | |
| | | | | | | | | | | | | | | | | | | | |
| | | — | | | | 4,030,659 | | | | 509,219 | | | | 867,142 | | | | — | |
| | | — | | | | 8,441,250 | | | | — | | | | — | | | | — | |
| | | — | | | | — | | | | 79,848 | | | | — | | | | — | |
| | | 685,909 | | | | 1,368,694 | | | | 81,970 | | | | 1,144,152 | | | | 12,659 | |
| | | — | | | | — | | | | — | | | | — | | | | 361,350 | |
| | | 10,000 | | | | — | | | | — | | | | — | | | | — | |
| | | — | | | | — | | | | — | | | | — | | | | 3 | |
| | | 20,078 | | | | — | | | | — | | | | — | | | | 20,150 | |
| | | 379,728 | | | | 6,717,551 | | | | 1,437,243 | | | | 7,876,961 | | | | 288,690 | |
| | | — | | | | — | | | | 1,015 | | | | — | | | | — | |
| | | 6,410,876 | | | | — | | | | — | | | | — | | | | — | |
| | | 43,051 | | | | 48,897 | | | | 44,980 | | | | 50,226 | | | | 39,160 | |
| | | 374,733,468 | | | | 1,572,764,573 | | | | 255,617,706 | | | | 592,197,916 | | | | 144,603,187 | |
| | | | | | | | | | | | | | | | | | | | |
| | | | | | | | | | | | | | | | | | | | |
| | | | | | | | | | | | | | | | | | | | |
| | | 1,337,585 | | | | 18,185,915 | | | | 889,323 | | | | 1,561,644 | | | | 59,763 | |
| | | — | | | | 213,355,143 | | | | 24,145,119 | | | | 6,997,000 | | | | 7,297,050 | |
| | | 3,630,000 | | | | — | | | | — | | | | — | | | | — | |
| | | 3,380,000 | | | | 2,599,000 | | | | 400,000 | | | | — | | | | 170,000 | |
| | | — | | | | — | | | | 66,567 | | | | — | | | | — | |
| | | 372,084 | | | | — | | | | — | | | | — | | | | — | |
| | | 2,597,513 | | | | 3,977,572 | | | | 282,202 | | | | 1,068,760 | | | | 108,775 | |
| | | — | | | | — | | | | — | | | | — | | | | 516,386 | |
| | | 342,355 | | | | — | | | | — | | | | — | | | | — | |
| | | 30,630 | | | | 153,434 | | | | 20,303 | | | | 33,466 | | | | 16,425 | |
| | | — | | | | 771,190 | | | | 121,950 | | | | — | | | | 19,768 | |
| | | | | | | | | | | | | | | | | | | | |
| | | 112,175 | | | | 417,867 | | | | 68,745 | | | | 218,894 | | | | 53,172 | |
| | | 28,276 | | | | 76,422 | | | | 28,074 | | | | 36,666 | | | | 21,804 | |
| | | 17,672 | | | | 46,301 | | | | 18,853 | | | | 63,641 | | | | 23,430 | |
| | | 6,722 | | | | 20,091 | | | | 4,383 | | | | 7,514 | | | | 4,313 | |
| | | 2,009 | | | | 622 | | | | 2,388 | | | | 22,316 | | | | 4,752 | |
| | | — | | | | — | | | | — | | | | — | | | | — | |
| | | 49,095 | | | | 85,193 | | | | 53,062 | | | | 55,504 | | | | 44,248 | |
| | | 11,906,116 | | | | 239,688,750 | | | | 26,100,969 | | | | 10,065,405 | | | | 8,339,886 | |
| | $ | 362,827,352 | | | $ | 1,333,075,823 | | | $ | 229,516,737 | | | $ | 582,132,511 | | | $ | 136,263,301 | |
| | | | | | | | | | | | | | | | | | | | |
| | $ | 333,633,680 | | | $ | 1,243,263,479 | | | $ | 213,869,402 | | | $ | 618,492,468 | | | $ | 118,441,114 | |
| | | 29,193,672 | | | | 89,812,344 | | | | 15,647,335 | | | | (36,359,957 | ) | | | 17,822,187 | |
| | $ | 362,827,352 | | | $ | 1,333,075,823 | | | $ | 229,516,737 | | | $ | 582,132,511 | | | $ | 136,263,301 | |
| | $ | 310,617,677 | | | $ | 1,300,884,627 | | | $ | 220,907,419 | | | $ | 572,742,702 | | | $ | 118,025,926 | |
| | $ | 1,010,124 | | | $ | — | | | $ | — | | | $ | — | | | $ | 1,737,564 | |
| | $ | 49,413,305 | | | $ | 215,221,277 | | | $ | 28,986,511 | | | $ | 16,996,896 | | | $ | 5,996,525 | |
| | $ | — | | | $ | — | | | $ | — | | | $ | — | | | $ | 1,914,722 | |
| | $ | — | | | $ | — | | | $ | 2,978 | | | $ | — | | | $ | — | |
| | | | | | | | | | | | | | | | | | | | |
The accompanying notes are an integral part of the financial statements.
173
MassMutual Premier Funds – Financial Statements (Continued) |
Statements of Assets and Liabilities
September 30, 2020 |
| | | MassMutual
Premier
U.S. Government
Money Market
Fund | | | MassMutual
Premier
Short-Duration
Bond Fund | |
Class I shares: | | | | | | | | |
Net assets | | $ | — | | | $ | 189,804,835 | |
Shares outstanding (a) | | | — | | | | 18,818,157 | |
Net asset value, offering price and redemption price per share | | $ | — | | | $ | 10.09 | |
Class R5 shares: | | | | | | | | |
Net assets | | $ | 277,991,250 | | | $ | 110,812,837 | |
Shares outstanding (a) | | | 278,197,303 | | | | 10,953,428 | |
Net asset value, offering price and redemption price per share | | $ | 1.00 | | | $ | 10.12 | |
Service Class shares: | | | | | | | | |
Net assets | | $ | — | | | $ | 38,558,654 | |
Shares outstanding (a) | | | — | | | | 3,839,211 | |
Net asset value, offering price and redemption price per share | | $ | — | | | $ | 10.04 | |
Administrative Class shares: | | | | | | | | |
Net assets | | $ | — | | | $ | 27,628,245 | |
Shares outstanding (a) | | | — | | | | 2,763,237 | |
Net asset value, offering price and redemption price per share | | $ | — | | | $ | 10.00 | |
Class A shares: | | | | | | | | |
Net assets | | $ | — | | | $ | 41,913,026 | |
Shares outstanding (a) | | | — | | | | 4,226,747 | |
Net asset value, and redemption price per share | | $ | — | | | $ | 9.92 | |
Offering price per share (100/[100-maximum sales charge] of net asset value) | | $ | — | | | $ | 10.17 | |
Class R4 shares: | | | | | | | | |
Net assets | | $ | — | | | $ | 11,524,928 | |
Shares outstanding (a) | | | — | | | | 1,146,672 | |
Net asset value, offering price and redemption price per share | | $ | — | | | $ | 10.05 | |
Class R3 shares: | | | | | | | | |
Net assets | | $ | — | | | $ | 7,737,100 | |
Shares outstanding (a) | | | — | | | | 775,382 | |
Net asset value, offering price and redemption price per share | | $ | — | | | $ | 9.98 | |
(a) | Authorized unlimited number of shares with no par value. |
The accompanying notes are an integral part of the financial statements.
174
| | MassMutual
Premier
Inflation-
Protected and
Income Fund | | | MassMutual
Premier
Core Bond
Fund | | | MassMutual
Premier
Diversified Bond
Fund | | | MassMutual
Premier
High Yield
Fund | | | MassMutual
Premier
Balanced
Fund | |
| | | | | | | | | | | | | | | | | | | | |
| | $ | 176,809,112 | | | $ | 786,360,459 | | | $ | 97,182,635 | | | $ | 375,807,149 | | | $ | 42,455,083 | |
| | | 15,503,692 | | | | 67,552,048 | | | | 8,444,555 | | | | 43,554,713 | | | | 3,424,388 | |
| | $ | 11.40 | | | $ | 11.64 | | | $ | 11.51 | | | $ | 8.63 | | | $ | 12.40 | |
| | | | | | | | | | | | | | | | | | | | |
| | $ | 86,368,806 | | | $ | 316,359,447 | | | $ | 78,289,042 | | | $ | 49,115,923 | | | $ | 42,198,814 | |
| | | 7,571,346 | | | | 27,094,012 | | | | 7,398,392 | | | | 5,659,483 | | | | 3,404,824 | |
| | $ | 11.41 | | | $ | 11.68 | | | $ | 10.58 | | | $ | 8.68 | | | $ | 12.39 | |
| | | | | | | | | | | | | | | | | | | | |
| | $ | 54,729,099 | | | $ | 83,875,758 | | | $ | 12,067,190 | | | $ | 33,897,162 | | | $ | 8,636,594 | |
| | | 4,814,966 | | | | 7,228,454 | | | | 1,124,351 | | | | 3,908,179 | | | | 658,238 | |
| | $ | 11.37 | | | $ | 11.60 | | | $ | 10.73 | | | $ | 8.67 | | | $ | 13.12 | |
| | | | | | | | | | | | | | | | | | | | |
| | $ | 15,287,675 | | | $ | 76,596,563 | | | $ | 17,107,500 | | | $ | 23,549,348 | | | $ | 5,849,045 | |
| | | 1,330,989 | | | | 6,657,054 | | | | 1,597,551 | | | | 2,761,856 | | | | 470,174 | |
| | $ | 11.49 | | | $ | 11.51 | | | $ | 10.71 | | | $ | 8.53 | | | $ | 12.44 | |
| | | | | | | | | | | | | | | | | | | | |
| | $ | 22,018,087 | | | $ | 58,572,364 | | | $ | 14,756,439 | | | $ | 24,556,211 | | | $ | 26,626,329 | |
| | | 1,967,996 | | | | 5,137,223 | | | | 1,380,937 | | | | 2,892,277 | | | | 2,212,608 | |
| | $ | 11.19 | | | $ | 11.40 | | | $ | 10.69 | | | $ | 8.49 | | | $ | 12.03 | |
| | $ | 11.69 | | | $ | 11.91 | | | $ | 11.16 | | | $ | 8.98 | | | $ | 12.73 | |
| | | | | | | | | | | | | | | | | | | | |
| | $ | 4,358,272 | | | $ | 10,444,174 | | | $ | 6,232,972 | | | $ | 40,159,972 | | | $ | 2,994,392 | |
| | | 391,830 | | | | 921,631 | | | | 589,910 | | | | 4,790,991 | | | | 251,165 | |
| | $ | 11.12 | | | $ | 11.33 | | | $ | 10.57 | | | $ | 8.38 | | | $ | 11.92 | |
| | | | | | | | | | | | | | | | | | | | |
| | $ | 3,256,301 | | | $ | 867,058 | | | $ | 3,880,959 | | | $ | 35,046,746 | | | $ | 7,503,044 | |
| | | 292,723 | | | | 74,569 | | | | 368,433 | | | | 4,076,636 | | | | 633,136 | |
| | $ | 11.12 | | | $ | 11.63 | | | $ | 10.53 | | | $ | 8.60 | | | $ | 11.85 | |
The accompanying notes are an integral part of the financial statements.
175
MassMutual Premier Funds – Financial Statements (Continued) |
Statements of Assets and Liabilities
September 30, 2020 |
| | | MassMutual
Premier
Disciplined
Value Fund | | | MassMutual
Premier
Main Street
Fund | |
Assets: | | | | | | | | |
Investments, at value (Note 2) (a) | | $ | 81,096,535 | | | $ | 116,052,232 | |
Repurchase agreements, at value (Note 2) (b) | | | 218,836 | | | | 1,238,164 | |
Total investments (c) | | | 81,315,371 | | | | 117,290,396 | |
Cash | | | 1,848 | | | | 8,185 | |
Foreign currency, at value (d) | | | — | | | | — | |
Receivables from: | | | | | | | | |
Investments sold | | | | | | | | |
Regular delivery | | | 438,693 | | | | 40,588 | |
Fund shares sold | | | 18,722 | | | | 37,077 | |
Investment adviser (Note 3) | | | — | | | | — | |
Interest and dividends | | | 111,349 | | | | 38,729 | |
Foreign taxes withheld | | | — | | | | 1,768 | |
Prepaid expenses | | | 36,681 | | | | 34,053 | |
Total assets | | | 81,922,664 | | | | 117,450,796 | |
Liabilities: | | | | | | | | |
Payables for: | | | | | | | | |
Investments purchased | | | | | | | | |
Regular delivery | | | — | | | | 289,834 | |
Delayed delivery | | | — | | | | — | |
Fund shares repurchased | | | 588,410 | | | | 40,636 | |
Collateral held for securities on loan (Note 2) (e) | | | 53,163 | | | | 177,581 | |
Trustees’ fees and expenses (Note 3) | | | 25,168 | | | | 15,843 | |
Affiliates (Note 3): | | | | | | | | |
Investment advisory fees | | | 30,662 | | | | 52,691 | |
Administration fees | | | 11,948 | | | | 14,331 | |
Service fees | | | 7,627 | | | | 12,544 | |
Shareholder service fees | | | 1,694 | | | | 4,113 | |
Distribution fees | | | 2,424 | | | | 765 | |
Due to custodian | | | — | | | | — | |
Commitment and Contingent Liabilities (Note 9) | | | — | | | | — | |
Accrued expense and other liabilities | | | 38,712 | | | | 42,078 | |
Total liabilities | | | 759,808 | | | | 650,416 | |
Net assets | | $ | 81,162,856 | | | $ | 116,800,380 | |
Net assets consist of: | | | | | | | | |
Paid-in capital | | $ | 85,501,685 | | | $ | 90,484,774 | |
Accumulated Gain (Loss) | | | (4,338,829 | ) | | | 26,315,606 | |
Net assets | | $ | 81,162,856 | | | $ | 116,800,380 | |
(a) | Cost of investments: | | $ | 84,746,489 | | | $ | 92,290,455 | |
(b) | Cost of repurchase agreements: | | $ | 218,836 | | | $ | 1,238,164 | |
(c) | Securities on loan with market value of: | | $ | 264,738 | | | $ | 1,628,520 | |
(d) | Cost of foreign currency: | | $ | — | | | $ | — | |
(e) | Non-cash collateral is not included. | | | | | | | | |
The accompanying notes are an integral part of the financial statements.
176
| | MassMutual
Premier
Disciplined
Growth Fund | | | MassMutual
Premier
Small Cap
Opportunities
Fund | | | MassMutual
Premier
Global Fund | | | MassMutual
Premier
International
Equity Fund | | | MassMutual
Premier
Strategic
Emerging
Markets Fund | |
| | | | | | | | | | | | | | | | | | | | |
| | $ | 264,833,120 | | | $ | 222,661,518 | | | $ | 309,676,189 | | | $ | 182,903,766 | | | $ | 173,458,540 | |
| | | — | | | | 2,698,637 | | | | 7,071,875 | | | | 361,315 | | | | 6,489,955 | |
| | | 264,833,120 | | | | 225,360,155 | | | | 316,748,064 | | | | 183,265,081 | | | | 179,948,495 | |
| | | — | | | | — | | | | — | | | | 6,862,358 | | | | 8,513 | |
| | | — | | | | — | | | | 35,995 | | | | 42,164 | | | | 50,714 | |
| | | | | | | | | | | | | | | | | | | | |
| | | | | | | | | | | | | | | | | | | | |
| | | 350,532 | | | | — | | | | — | | | | — | | | | 311,657 | |
| | | 133,500 | | | | 1,641,786 | | | | 102,510 | | | | 427,939 | | | | 847,283 | |
| | | — | | | | — | | | | — | | | | — | | | | 13,677 | |
| | | 110,975 | | | | 190,347 | | | | 233,926 | | | | 444,934 | | | | 220,519 | |
| | | — | | | | — | | | | 375,679 | | | | 911,949 | | | | 3,930 | |
| | | 44,737 | | | | 43,652 | | | | 34,199 | | | | 40,199 | | | | 49,039 | |
| | | 265,472,864 | | | | 227,235,940 | | | | 317,530,373 | | | | 191,994,624 | | | | 181,453,827 | |
| | | | | | | | | | | | | | | | | | | | |
| | | | | | | | | | | | | | | | | | | | |
| | | | | | | | | | | | | | | | | | | | |
| | | — | | | | 887,876 | | | | — | | | | 1,092 | | | | 112 | |
| | | — | | | | — | | | | — | | | | 94,171 | | | | — | |
| | | 2,424,806 | | | | 150,296 | | | | 1,887,379 | | | | 632,683 | | | | 253,695 | |
| | | 57,014 | | | | — | | | | — | | | | 2,066,194 | | | | 674,091 | |
| | | 31,558 | | | | 24,143 | | | | 36,237 | | | | 59,519 | | | | 15,916 | |
| | | | | | | | | | | | | | | | | | | | |
| | | 99,046 | | | | 107,131 | | | | 195,025 | | | | 131,188 | | | | 147,455 | |
| | | 31,077 | | | | 24,820 | | | | 32,297 | | | | 17,159 | | | | 7,669 | |
| | | 39,976 | | | | 37,393 | | | | 25,110 | | | | 14,792 | | | | 2,399 | |
| | | 9,607 | | | | 8,212 | | | | 12,991 | | | | 2,983 | | | | 456 | |
| | | 4,071 | | | | 4,014 | | | | 5,730 | | | | 1,722 | | | | 593 | |
| | | 244,998 | | | | — | | | | — | | | | — | | | | — | |
| | | — | | | | — | | | | — | | | | — | | | | — | |
| | | 42,030 | | | | 43,075 | | | | 59,160 | | | | 83,128 | | | | 100,454 | |
| | | 2,984,183 | | | | 1,286,960 | | | | 2,253,929 | | | | 3,104,631 | | | | 1,202,840 | |
| | $ | 262,488,681 | | | $ | 225,948,980 | | | $ | 315,276,444 | | | $ | 188,889,993 | | | $ | 180,250,987 | |
| | | | | | | | | | | | | | | | | | | | |
| | $ | 166,910,407 | | | $ | 207,935,621 | | | $ | 148,717,283 | | | $ | 119,826,419 | | | $ | 167,189,536 | |
| | | 95,578,274 | | | | 18,013,359 | | | | 166,559,161 | | | | 69,063,574 | | | | 13,061,451 | |
| | $ | 262,488,681 | | | $ | 225,948,980 | | | $ | 315,276,444 | | | $ | 188,889,993 | | | $ | 180,250,987 | |
| | $ | 179,429,849 | | | $ | 222,300,995 | | | $ | 157,839,508 | | | $ | 183,157,046 | | | $ | 158,104,148 | |
| | $ | — | | | $ | 2,698,637 | | | $ | 7,071,875 | | | $ | 361,315 | | | $ | 6,489,955 | |
| | $ | 569,226 | | | $ | 7,061,075 | | | $ | 5,032,702 | | | $ | 2,355,366 | | | $ | 2,752,442 | |
| | $ | — | | | $ | — | | | $ | 36,125 | | | $ | 41,931 | | | $ | 50,785 | |
| | | | | | | | | | | | | | | | | | | | |
The accompanying notes are an integral part of the financial statements.
177
MassMutual Premier Funds – Financial Statements (Continued) |
Statements of Assets and Liabilities
September 30, 2020 |
| | | MassMutual
Premier
Disciplined
Value Fund | | | MassMutual
Premier
Main Street
Fund | |
Class I shares: | | | | | | | | |
Net assets | | $ | 20,649,767 | | | $ | 30,273,476 | |
Shares outstanding (a) | | | 1,709,641 | | | | 2,683,820 | |
Net asset value, offering price and redemption price per share | | $ | 12.08 | | | $ | 11.28 | |
Class R5 shares: | | | | | | | | |
Net assets | | $ | 32,417,557 | | | $ | 45,358,379 | |
Shares outstanding (a) | | | 2,677,900 | | | | 4,025,026 | |
Net asset value, offering price and redemption price per share | | $ | 12.11 | | | $ | 11.27 | |
Service Class shares: | | | | | | | | |
Net assets | | $ | 11,617,523 | | | $ | 181,756 | |
Shares outstanding (a) | | | 968,529 | | | | 15,465 | |
Net asset value, offering price and redemption price per share | | $ | 12.00 | | | $ | 11.75 | |
Administrative Class shares: | | | | | | | | |
Net assets | | $ | 4,214,085 | | | $ | 21,263,583 | |
Shares outstanding (a) | | | 343,059 | | | | 1,889,595 | |
Net asset value, offering price and redemption price per share | | $ | 12.28 | | | $ | 11.25 | |
Class A shares: | | | | | | | | |
Net assets | | $ | 5,569,117 | | | $ | 12,085,564 | |
Shares outstanding (a) | | | 470,105 | | | | 1,094,262 | |
Net asset value, and redemption price per share | | $ | 11.85 | | | $ | 11.04 | |
Offering price per share (100/[100-maximum sales charge] of net asset value) | | $ | 12.54 | | | $ | 11.68 | |
Class R4 shares: | | | | | | | | |
Net assets | | $ | 2,706,793 | | | $ | 6,418,276 | |
Shares outstanding (a) | | | 230,253 | | | | 586,478 | |
Net asset value, offering price and redemption price per share | | $ | 11.76 | | | $ | 10.94 | |
Class R3 shares: | | | | | | | | |
Net assets | | $ | 3,988,014 | | | $ | 1,219,346 | |
Shares outstanding (a) | | | 333,650 | | | | 110,158 | |
Net asset value, offering price and redemption price per share | | $ | 11.95 | | | $ | 11.07 | |
(a) | Authorized unlimited number of shares with no par value. |
The accompanying notes are an integral part of the financial statements.
178
| | MassMutual
Premier
Disciplined
Growth Fund | | | MassMutual
Premier
Small Cap
Opportunities
Fund | | | MassMutual
Premier
Global Fund | | | MassMutual
Premier
International
Equity Fund | | | MassMutual
Premier
Strategic
Emerging
Markets Fund | |
| | | | | | | | | | | | | | | | | | | | |
| | $ | 35,702,129 | | | $ | 39,988,400 | | | $ | 75,892,808 | | | $ | 96,308,485 | | | $ | 169,365,820 | |
| | | 2,779,263 | | | | 2,864,495 | | | | 5,046,822 | | | | 7,361,126 | | | | 12,799,468 | |
| | $ | 12.85 | | | $ | 13.96 | | | $ | 15.04 | | | $ | 13.08 | | | $ | 13.23 | |
| | | | | | | | | | | | | | | | | | | | |
| | $ | 101,466,245 | | | $ | 92,440,404 | | | $ | 111,037,859 | | | $ | 61,444,113 | | | $ | 3,165,178 | |
| | | 7,895,173 | | | | 6,637,803 | | | | 7,378,612 | | | | 4,699,302 | | | | 235,668 | |
| | $ | 12.85 | | | $ | 13.93 | | | $ | 15.05 | | | $ | 13.08 | | | $ | 13.43 | |
| | | | | | | | | | | | | | | | | | | | |
| | $ | 25,667,672 | | | $ | 17,145,822 | | | $ | 6,165,870 | | | $ | 4,523,629 | | | $ | 2,472,730 | |
| | | 1,987,307 | | | | 1,234,267 | | | | 413,671 | | | | 346,860 | | | | 186,561 | |
| | $ | 12.92 | | | $ | 13.89 | | | $ | 14.91 | | | $ | 13.04 | | | $ | 13.25 | |
| | | | | | | | | | | | | | | | | | | | |
| | $ | 36,956,711 | | | $ | 18,422,071 | | | $ | 80,606,742 | | | $ | 3,565,167 | | | $ | 989,038 | |
| | | 2,821,093 | | | | 1,334,969 | | | | 5,362,071 | | | | 274,890 | | | | 74,402 | |
| | $ | 13.10 | | | $ | 13.80 | | | $ | 15.03 | | | $ | 12.97 | | | $ | 13.29 | |
| | | | | | | | | | | | | | | | | | | | |
| | $ | 27,988,479 | | | $ | 42,490,985 | | | $ | 22,903,301 | | | $ | 18,670,406 | | | $ | 2,028,769 | |
| | | 2,223,521 | | | | 3,167,132 | | | | 1,545,292 | | | | 1,486,906 | | | | 154,096 | |
| | $ | 12.59 | | | $ | 13.42 | | | $ | 14.82 | | | $ | 12.56 | | | $ | 13.17 | |
| | $ | 13.32 | | | $ | 14.20 | | | $ | 15.68 | | | $ | 13.29 | | | $ | 13.94 | |
| | | | | | | | | | | | | | | | | | | | |
| | $ | 28,832,428 | | | $ | 9,413,117 | | | $ | 8,877,586 | | | $ | 1,950,797 | | | $ | 1,237,147 | |
| | | 2,316,134 | | | | 705,801 | | | | 608,368 | | | | 156,743 | | | | 94,444 | |
| | $ | 12.45 | | | $ | 13.34 | | | $ | 14.59 | | | $ | 12.45 | | | $ | 13.10 | |
| | | | | | | | | | | | | | | | | | | | |
| | $ | 5,875,017 | | | $ | 6,048,181 | | | $ | 9,792,278 | | | $ | 2,427,396 | | | $ | 992,305 | |
| | | 472,808 | | | | 458,804 | | | | 665,032 | | | | 196,100 | | | | 76,048 | |
| | $ | 12.43 | | | $ | 13.18 | | | $ | 14.72 | | | $ | 12.38 | | | $ | 13.05 | |
The accompanying notes are an integral part of the financial statements.
179
MassMutual Premier Funds – Financial Statements (Continued) |
Statements of Operations
For the Year Ended September 30, 2020 |
| | | MassMutual
Premier
U.S. Government
Money Market
Fund | | | MassMutual
Premier
Short-Duration
Bond Fund | |
Investment income (Note 2): | | | | | | | | |
Dividends (a) | | $ | — | | | $ | 470,989 | |
Interest (b) | | | 3,120,556 | | | | 17,580,989 | |
Securities lending net income | | | — | | | | 2,680 | |
Total investment income | | | 3,120,556 | | | | 18,054,658 | |
Expenses (Note 3): | | | | | | | | |
Investment advisory fees | | | 1,094,806 | | | | 1,644,782 | |
Custody fees | | | 16,443 | | | | 44,380 | |
Audit fees | | | 34,296 | | | | 40,279 | |
Legal fees | | | 7,680 | | | | 15,867 | |
Proxy fees | | | 1,221 | | | | 1,221 | |
Accounting & Administration fees | | | 74,221 | | | | 82,798 | |
Shareholder reporting fees | | | 10,702 | | | | 33,569 | |
Trustees’ fees | | | 15,069 | | | | 23,590 | |
Registration and filing fees | | | 26,432 | | | | 100,374 | |
Transfer agent fees | | | 2,983 | | | | 2,983 | |
| | | | 1,283,853 | | | | 1,989,843 | |
Administration fees: | | | | | | | | |
Class R5 | | | 312,802 | | | | 136,829 | |
Service Class | | | — | | | | 63,877 | |
Administrative Class | | | — | | | | 42,904 | |
Class A | | | — | | | | 76,695 | |
Class R4 | | | — | | | | 23,807 | |
Class R3 | | | — | | | | 13,976 | |
Distribution and Service fees: | | | | | | | | |
Class A | | | — | | | | 127,825 | |
Class R4 | | | — | | | | 29,759 | |
Class R3 | | | — | | | | 34,940 | |
Shareholder service fees: | | | | | | | | |
Service Class | | | — | | | | 21,292 | |
Administrative Class | | | — | | | | 42,904 | |
Class A | | | — | | | | 76,695 | |
Total expenses | | | 1,596,655 | | | | 2,681,346 | |
Expenses waived (Note 3): | | | | | | | | |
Class R5 fees reimbursed by adviser | | | (333,254 | ) | | | — | |
Net expenses: | | | 1,263,401 | | | | 2,681,346 | |
Net investment income (loss) | | | 1,857,155 | | | | 15,373,312 | |
The accompanying notes are an integral part of the financial statements.
180
| | MassMutual
Premier
Inflation-
Protected and
Income Fund | | | MassMutual
Premier
Core Bond
Fund | | | MassMutual
Premier
Diversified Bond
Fund | | | MassMutual
Premier
High Yield
Fund | | | MassMutual
Premier
Balanced
Fund | |
| | | | | | | | | | | | | | | | | | | | |
| | $ | — | | | $ | 1,426,629 | | | $ | 202,044 | | | $ | — | | | $ | 1,696,051 | |
| | | 7,777,995 | | | | 49,370,471 | | | | 9,494,095 | | | | 33,742,626 | | | | 1,443,281 | |
| | | 4,671 | | | | 29,415 | | | | 13,181 | | | | 163,252 | | | | 11,527 | |
| | | 7,782,666 | | | | 50,826,515 | | | | 9,709,320 | | | | 33,905,878 | | | | 3,150,859 | |
| | | | | | | | | | | | | | | | | | | | |
| | | 1,270,248 | | | | 5,231,660 | | | | 867,844 | | | | 2,503,820 | | | | 613,765 | |
| | | 49,600 | | | | 103,840 | | | | 52,120 | | | | 72,857 | | | | 36,589 | |
| | | 40,641 | | | | 40,912 | | | | 41,610 | | | | 39,215 | | | | 41,675 | |
| | | 11,837 | | | | 44,634 | | | | 16,742 | | | | 13,498 | | | | 4,612 | |
| | | 1,221 | | | | 1,221 | | | | 1,221 | | | | 1,221 | | | | 1,221 | |
| | | 55,294 | | | | 136,789 | | | | 91,736 | | | | 67,512 | | | | 74,638 | |
| | | 27,146 | | | | 58,657 | | | | 24,488 | | | | 35,444 | | | | 22,124 | |
| | | 15,368 | | | | 65,037 | | | | 11,337 | | | | 25,849 | | | | 5,909 | |
| | | 98,957 | | | | 100,347 | | | | 98,340 | | | | 101,135 | | | | 99,177 | |
| | | 2,983 | | | | 2,983 | | | | 2,983 | | | | 2,983 | | | | 2,983 | |
| | | 1,573,295 | | | | 5,786,080 | | | | 1,208,421 | | | | 2,863,534 | | | | 902,693 | |
| | | | | | | | | | | | | | | | | | | | |
| | | 79,600 | | | | 317,543 | | | | 104,544 | | | | 43,525 | | | | 42,643 | |
| | | 73,686 | | | | 126,227 | | | | 18,414 | | | | 59,913 | | | | 9,423 | |
| | | 22,477 | | | | 102,342 | | | | 28,694 | | | | 36,999 | | | | 8,441 | |
| | | 27,967 | | | | 116,181 | | | | 35,106 | | | | 41,395 | | | | 39,346 | |
| | | 10,314 | | | | 23,543 | | | | 12,472 | | | | 85,171 | | | | 5,833 | |
| | | 6,929 | | | | 2,522 | | | | 6,781 | | | | 74,656 | | | | 14,453 | |
| | | | | | | | | | | | | | | | | | | | |
| | | 46,612 | | | | 193,634 | | | | 58,510 | | | | 68,992 | | | | 65,577 | |
| | | 12,893 | | | | 29,429 | | | | 15,590 | | | | 106,465 | | | | 7,292 | |
| | | 17,324 | | | | 6,304 | | | | 16,952 | | | | 186,640 | | | | 36,134 | |
| | | | | | | | | | | | | | | | | | | | |
| | | 24,562 | | | | 42,076 | | | | 6,138 | | | | 19,971 | | | | 3,141 | |
| | | 22,477 | | | | 102,342 | | | | 28,694 | | | | 36,999 | | | | 8,440 | |
| | | 27,967 | | | | 116,180 | | | | 35,106 | | | | 41,395 | | | | 39,346 | |
| | | 1,946,103 | | | | 6,964,403 | | | | 1,575,422 | | | | 3,665,655 | | | | 1,182,762 | |
| | | | | | | | | | | | | | | | | | | | |
| | | — | | | | — | | | | — | | | | — | | | | — | |
| | | 1,946,103 | | | | 6,964,403 | | | | 1,575,422 | | | | 3,665,655 | | | | 1,182,762 | |
| | | 5,836,563 | | | | 43,862,112 | | | | 8,133,898 | | | | 30,240,223 | | | | 1,968,097 | |
The accompanying notes are an integral part of the financial statements.
181
MassMutual Premier Funds – Financial Statements (Continued) |
Statements of Operations
For the Year Ended September 30, 2020 |
| | | MassMutual
Premier
U.S. Government
Money Market
Fund | | | MassMutual
Premier
Short-Duration
Bond Fund | |
Realized and unrealized gain (loss): | | | | | | | | |
Net realized gain (loss) on: | | | | | | | | |
Investment transactions | | $ | 21,481 | | | $ | 1,830,017 | |
Futures contracts | | | — | | | | (8,778,213 | ) |
Swap agreements | | | — | | | | 478,671 | |
Foreign currency transactions | | | — | | | | — | |
Forward contracts | | | — | | | | — | |
Net realized gain (loss) | | | 21,481 | | | | (6,469,525 | ) |
Net change in unrealized appreciation (depreciation) on: | | | | | | | | |
Investment transactions | | | — | | | | (5,462,549 | ) |
Futures contracts | | | — | | | | (1,222,424 | ) |
Swap agreements | | | — | | | | 14,042 | |
Translation of assets and liabilities in foreign currencies | | | — | | | | — | |
Forward contracts | | | — | | | | — | |
Net change in unrealized appreciation (depreciation) | | | — | | | | (6,670,931 | ) |
Net realized gain (loss) and change in unrealized appreciation (depreciation) | | | 21,481 | | | | (13,140,456 | ) |
Net increase (decrease) in net assets resulting from operations | | $ | 1,878,636 | | | $ | 2,232,856 | |
(a) | Net of foreign withholding tax of: | | $ | — | | | $ | — | |
(b) | Net of foreign withholding tax of: | | $ | — | | | $ | 3,343 | |
The accompanying notes are an integral part of the financial statements.
182
| | MassMutual
Premier
Inflation-
Protected and
Income Fund | | | MassMutual
Premier
Core Bond
Fund | | | MassMutual
Premier
Diversified Bond
Fund | | | MassMutual
Premier
High Yield
Fund | | | MassMutual
Premier
Balanced
Fund | |
| | | | | | | | | | | | | | | | | | | | |
| | | | | | | | | | | | | | | | | | | | |
| | $ | 7,369,440 | | | $ | 27,887,997 | | | $ | 4,879,131 | | | $ | (28,586,034 | ) | | $ | 1,585,219 | |
| | | 289,682 | | | | 17,110,287 | | | | 2,731,073 | | | | — | | | | 782,207 | |
| | | 13,343,574 | | | | 1,345,964 | | | | 234,052 | | | | — | | | | 44,467 | |
| | | (33 | ) | | | — | | | | (28 | ) | | | — | | | | — | |
| | | — | | | | — | | | | 32,767 | | | | — | | | | — | |
| | | 21,002,663 | | | | 46,344,248 | | | | 7,876,995 | | | | (28,586,034 | ) | | | 2,411,893 | |
| | | | | | | | | | | | | | | | | | | | |
| | | (1,502,175 | ) | | | (11,370,162 | ) | | | (4,622,045 | ) | | | (10,167,934 | ) | | | 6,611,772 | |
| | | 104,715 | | | | 853,141 | | | | 130,462 | | | | — | | | | 99,927 | |
| | | 5,863,719 | | | | 38,709 | | | | 6,655 | | | | — | | | | 1,343 | |
| | | — | | | | — | | | | 6,954 | | | | — | | | | — | |
| | | — | | | | — | | | | 82,013 | | | | — | | | | — | |
| | | 4,466,259 | | | | (10,478,312 | ) | | | (4,395,961 | ) | | | (10,167,934 | ) | | | 6,713,042 | |
| | | 25,468,922 | | | | 35,865,936 | | | | 3,481,034 | | | | (38,753,968 | ) | | | 9,124,935 | |
| | $ | 31,305,485 | | | $ | 79,728,048 | | | $ | 11,614,932 | | | $ | (8,513,745 | ) | | $ | 11,093,032 | |
| | $ | — | | | $ | — | | | $ | 19 | | | $ | — | | | $ | — | |
| | $ | — | | | $ | — | | | $ | 3,785 | | | $ | 128 | | | $ | — | |
The accompanying notes are an integral part of the financial statements.
183
MassMutual Premier Funds – Financial Statements (Continued) |
Statements of Operations
For the Year Ended September 30, 2020 |
| | | MassMutual
Premier
Disciplined
Value Fund | | | MassMutual
Premier
Main Street
Fund | |
Investment income (Note 2): | | | | | | | | |
Dividends (a) | | $ | 2,711,707 | | | $ | 2,035,363 | |
Interest | | | 863 | | | | 5,028 | |
Securities lending net income | | | 6,720 | | | | 3,221 | |
Total investment income | | | 2,719,290 | | | | 2,043,612 | |
Expenses (Note 3): | | | | | | | | |
Investment advisory fees | | | 420,224 | | | | 632,456 | |
Custody fees | | | 19,622 | | | | 21,943 | |
Audit fees | | | 40,172 | | | | 37,310 | |
Legal fees | | | 2,507 | | | | 6,672 | |
Proxy fees | | | 1,221 | | | | 1,217 | |
Accounting & Administration fees | | | 35,326 | | | | 33,349 | |
Shareholder reporting fees | | | 44,502 | | | | 16,690 | |
Trustees’ fees | | | 4,966 | | | | 5,446 | |
Registration and filing fees | | | 96,651 | | | | 98,605 | |
Transfer agent fees | | | 2,983 | | | | 2,975 | |
| | | | 668,174 | | | | 856,663 | |
Administration fees: | | | | | | | | |
Class R5 | | | 47,012 | | | | 45,671 | |
Service Class | | | 21,545 | | | | 478 | |
Administrative Class | | | 6,929 | | | | 33,166 | |
Class A | | | 8,888 | | | | 18,476 | |
Class R4 | | | 6,144 | | | | 12,538 | |
Class R3 | | | 7,824 | | | | 2,339 | |
Distribution and Service fees: | | | | | | | | |
Class A | | | 14,814 | | | | 30,794 | |
Class R4 | | | 7,680 | | | | 15,673 | |
Class R3 | | | 19,560 | | | | 5,846 | |
Shareholder service fees: | | | | | | | | |
Service Class | | | 7,181 | | | | 159 | |
Administrative Class | | | 6,929 | | | | 33,166 | |
Class A | | | 8,889 | | | | 18,476 | |
Total expenses | | | 831,569 | | | | 1,073,445 | |
Expenses waived (Note 3): | | | | | | | | |
Class I fees reimbursed by adviser | | | — | | | | — | |
Class R5 fees reimbursed by adviser | | | — | | | | — | |
Service Class fees reimbursed by adviser | | | — | | | | — | |
Administrative Class fees reimbursed by adviser | | | — | | | | — | |
Class A fees reimbursed by adviser | | | — | | | | — | |
Class R4 fees reimbursed by adviser | | | — | | | | — | |
Class R3 fees reimbursed by adviser | | | — | | | | — | |
Class I advisory fees waived | | | — | | | | — | |
Class R5 advisory fees waived | | | — | | | | — | |
Service Class advisory fees waived | | | — | | | | — | |
Administrative Class advisory fees waived | | | — | | | | — | |
Class A advisory fees waived | | | — | | | | — | |
Class R4 advisory fees waived | | | — | | | | — | |
Class R3 advisory fees waived | | | — | | | | — | |
Net expenses: | | | 831,569 | | | | 1,073,445 | |
Net investment income (loss) | | | 1,887,721 | | | | 970,167 | |
The accompanying notes are an integral part of the financial statements.
184
| | MassMutual
Premier
Disciplined
Growth Fund | | | MassMutual
Premier
Small Cap
Opportunities
Fund | | | MassMutual
Premier
Global Fund | | | MassMutual
Premier
International
Equity Fund | | | MassMutual
Premier
Strategic
Emerging
Markets Fund | |
| | | | | | | | | | | | | | | | | | | | |
| | $ | 3,240,821 | | | $ | 3,171,915 | | | $ | 2,527,899 | | | $ | 2,872,784 | | | $ | 2,021,016 | |
| | | 4,462 | | | | 12,101 | | | | 17,715 | | | | 19,400 | | | | 31,722 | |
| | | 16,531 | | | | 45,898 | | | | 10,905 | | | | 25,623 | | | | 31,791 | |
| | | 3,261,814 | | | | 3,229,914 | | | | 2,556,519 | | | | 2,917,807 | | | | 2,084,529 | |
| | | | | | | | | | | | | | | | | | | | |
| | | 1,107,759 | | | | 1,278,272 | | | | 2,241,937 | | | | 1,940,224 | | | | 1,640,854 | |
| | | 22,483 | | | | 19,784 | | | | 53,513 | | | | 149,355 | | | | 194,525 | |
| | | 40,066 | | | | 38,403 | | | | 43,785 | | | | 47,508 | | | | 65,059 | |
| | | 5,015 | | | | 10,832 | | | | 14,783 | | | | 11,901 | | | | 8,610 | |
| | | 1,221 | | | | 1,221 | | | | 1,217 | | | | 1,222 | | | | 1,221 | |
| | | 34,824 | | | | 31,965 | | | | 43,881 | | | | 42,566 | | | | 39,644 | |
| | | 48,387 | | | | 24,220 | | | | 26,907 | | | | 28,565 | | | | 20,163 | |
| | | 12,261 | | | | 10,526 | | | | 14,245 | | | | 11,713 | | | | 7,627 | |
| | | 96,900 | | | | 99,141 | | | | 98,838 | | | | 102,459 | | | | 98,841 | |
| | | 2,983 | | | | 2,983 | | | | 2,975 | | | | 2,984 | | | | 2,983 | |
| | | 1,371,899 | | | | 1,517,347 | | | | 2,542,081 | | | | 2,338,497 | | | | 2,079,527 | |
| | | | | | | | | | | | | | | | | | | | |
| | | 91,500 | | | | 86,552 | | | | 103,731 | | | | 79,687 | | | | 4,295 | |
| | | 36,554 | | | | 25,092 | | | | 9,783 | | | | 10,207 | | | | 2,211 | |
| | | 58,049 | | | | 28,509 | | | | 117,167 | | | | 7,102 | | | | 1,438 | |
| | | 42,108 | | | | 68,282 | | | | 34,365 | | | | 29,108 | | | | 1,943 | |
| | | 51,141 | | | | 19,195 | | | | 15,471 | | | | 6,380 | | | | 2,568 | |
| | | 11,457 | | | | 14,185 | | | | 19,628 | | | | 7,514 | | | | 1,509 | |
| | | | | | | | | | | | | | | | | | | | |
| | | 70,180 | | | | 113,803 | | | | 57,276 | | | | 48,513 | | | | 3,238 | |
| | | 63,927 | | | | 23,994 | | | | 19,339 | | | | 7,976 | | | | 3,210 | |
| | | 28,644 | | | | 35,462 | | | | 49,070 | | | | 18,784 | | | | 3,772 | |
| | | | | | | | | | | | | | | | | | | | |
| | | 12,184 | | | | 8,364 | | | | 3,261 | | | | 3,402 | | | | 737 | |
| | | 58,049 | | | | 28,509 | | | | 117,167 | | | | 7,102 | | | | 1,438 | |
| | | 42,108 | | | | 68,282 | | | | 34,365 | | | | 29,108 | | | | 1,943 | |
| | | 1,937,800 | | | | 2,037,576 | | | | 3,122,704 | | | | 2,593,380 | | | | 2,107,829 | |
| | | | | | | | | | | | | | | | | | | | |
| | | — | | | | — | | | | — | | | | — | | | | (180,397 | ) |
| | | — | | | | — | | | | — | | | | — | | | | (5,194 | ) |
| | | — | | | | — | | | | — | | | | — | | | | (1,776 | ) |
| | | — | | | | — | | | | — | | | | — | | | | (1,156 | ) |
| | | — | | | | — | | | | — | | | | — | | | | (1,543 | ) |
| | | — | | | | — | | | | — | | | | — | | | | (1,557 | ) |
| | | — | | | | — | | | | — | | | | — | | | | (922 | ) |
| | | — | | | | — | | | | — | | | | (22,373 | ) | | | — | |
| | | — | | | | — | | | | — | | | | (15,933 | ) | | | — | |
| | | — | | | | — | | | | — | | | | (1,361 | ) | | | — | |
| | | — | | | | — | | | | — | | | | (947 | ) | | | — | |
| | | — | | | | — | | | | — | | | | (3,885 | ) | | | — | |
| | | — | | | | — | | | | — | | | | (637 | ) | | | — | |
| | | — | | | | — | | | | — | | | | (750 | ) | | | — | |
| | | 1,937,800 | | | | 2,037,576 | | | | 3,122,704 | | | | 2,547,494 | | | | 1,915,284 | |
| | | 1,324,014 | | | | 1,192,338 | | | | (566,185 | ) | | | 370,313 | | | | 169,245 | |
The accompanying notes are an integral part of the financial statements.
185
MassMutual Premier Funds – Financial Statements (Continued) |
Statements of Operations
For the Year Ended September 30, 2020 |
| | | MassMutual
Premier
Disciplined
Value Fund | | | MassMutual
Premier
Main Street
Fund | |
Realized and unrealized gain (loss): | | | | | | | | |
Net realized gain (loss) on: | | | | | | | | |
Investment transactions | | $ | (1,590,538 | ) | | $ | 2,856,353 | |
Futures contracts | | | 2,399 | | | | — | |
Foreign currency transactions | | | — | | | | (2,623 | ) |
Forward contracts | | | — | | | | — | |
Net realized gain (loss) | | | (1,588,139 | ) | | | 2,853,730 | |
Net change in unrealized appreciation (depreciation) on: | | | | | | | | |
Investment transactions | | | (6,436,717 | ) | | | 8,973,648 | |
Translation of assets and liabilities in foreign currencies | | | — | | | | 98 | |
Net change in unrealized appreciation (depreciation) | | | (6,436,717 | ) | | | 8,973,746 | |
Net realized gain (loss) and change in unrealized appreciation (depreciation) | | | (8,024,856 | ) | | | 11,827,476 | |
Net increase (decrease) in net assets resulting from operations | | $ | (6,137,135 | ) | | $ | 12,797,643 | |
(a) | Net of foreign withholding tax of: | | $ | 392 | | | $ | 14,897 | |
* | Net of net increase (decrease) in accrued foreign capital gains tax of: | | $ | — | | | $ | — | |
The accompanying notes are an integral part of the financial statements.
186
| | MassMutual
Premier
Disciplined
Growth Fund | | | MassMutual
Premier
Small Cap
Opportunities
Fund | | | MassMutual
Premier
Global Fund | | | MassMutual
Premier
International
Equity Fund | | | MassMutual
Premier
Strategic
Emerging
Markets Fund | |
| | | | | | | | | | | | | | | | | | | | |
| | | | | | | | | | | | | | | | | | | | |
| | $ | 15,780,801 | | | $ | 16,322,661 | | | $ | 17,569,349 | | | $ | 72,236,834 | | | $ | 627,544 | |
| | | 6,286 | | | | — | | | | — | | | | — | | | | — | |
| | | — | | | | — | | | | (3,658 | ) | | | (73,412 | ) | | | (151,154 | ) |
| | | — | | | | — | | | | — | | | | — | | | | — | |
| | | 15,787,087 | | | | 16,322,661 | | | | 17,565,691 | | | | 72,163,422 | | | | 476,390 | |
| | | | | | | | | | | | | | | | | | | | |
| | | 49,887,218 | | | | (14,216,827 | ) | | | 43,893,489 | | | | (40,700,557 | )* | | | 5,115,039 | * |
| | | — | | | | — | | | | 31,671 | | | | 71,954 | | | | (1,842 | ) |
| | | 49,887,218 | | | | (14,216,827 | ) | | | 43,925,160 | | | | (40,628,603 | ) | | | 5,113,197 | |
| | | 65,674,305 | | | | 2,105,834 | | | | 61,490,851 | | | | 31,534,819 | | | | 5,589,587 | |
| | $ | 66,998,319 | | | $ | 3,298,172 | | | $ | 60,924,666 | | | $ | 31,905,132 | | | $ | 5,758,832 | |
| | $ | — | | | $ | — | | | $ | 184,743 | | | $ | 317,663 | | | $ | 213,409 | |
| | $ | — | | | $ | — | | | $ | — | | | $ | 187,114 | | | $ | 254,329 | |
The accompanying notes are an integral part of the financial statements.
187
MassMutual Premier Funds – Financial Statements (Continued) |
Statements of Changes in Net Assets |
| | | MassMutual
Premier
U.S. Government
Money Market
Fund | |
| | | Year
Ended
September 30, 2020 | | | Year
Ended
September 30, 2019 | |
Increase (Decrease) in Net Assets: | | | | | | | | |
Operations: | | | | | | | | |
Net investment income (loss) | | $ | 1,857,155 | | | $ | 6,230,984 | |
Net realized gain (loss) | | | 21,481 | | | | 19,866 | |
Net change in unrealized appreciation (depreciation) | | | — | | | | — | |
Net increase (decrease) in net assets resulting from operations | | | 1,878,636 | | | | 6,250,850 | |
Distributions to shareholders (Note 2): | | | | | | | | |
Class I | | �� | — | | | | — | |
Class R5 | | | (1,857,173 | ) | | | (6,235,386 | ) |
Service Class | | | — | | | | — | |
Administrative Class | | | — | | | | — | |
Class A | | | — | | | | — | |
Class R4 | | | — | | | | — | |
Class R3 | | | — | | | | — | |
Total distributions | | | (1,857,173 | ) | | | (6,235,386 | ) |
Net fund share transactions (Note 5): | | | | | | | | |
Class I | | | — | | | | — | |
Class R5 | | | (55,603,850 | ) | | | (5,992,795 | ) |
Service Class | | | — | | | | — | |
Administrative Class | | | — | | | | — | |
Class A | | | — | | | | — | |
Class R4 | | | — | | | | — | |
Class R3 | | | — | | | | — | |
Increase (decrease) in net assets from fund share transactions | | | (55,603,850 | ) | | | (5,992,795 | ) |
Total increase (decrease) in net assets | | | (55,582,387 | ) | | | (5,977,331 | ) |
Net assets | | | | | | | | |
Beginning of year | | | 333,573,637 | | | | 339,550,968 | |
End of year | | $ | 277,991,250 | | | $ | 333,573,637 | |
The accompanying notes are an integral part of the financial statements.
188
| | MassMutual
Premier
Short-Duration
Bond Fund | | | MassMutual
Premier
Inflation-Protected
and Income Fund | |
| | Year
Ended
September 30, 2020 | | | Year
Ended
September 30, 2019 | | | Year
Ended
September 30, 2020 | | | Year
Ended
September 30, 2019 | |
| | | | | | | | | | | | | | | | |
| | | | | | | | | | | | | | | | |
| | $ | 15,373,312 | | | $ | 14,885,046 | | | $ | 5,836,563 | | | $ | 6,804,543 | |
| | | (6,469,525 | ) | | | (6,421,931 | ) | | | 21,002,663 | | | | 2,393,072 | |
| | | (6,670,931 | ) | | | 10,537,281 | | | | 4,466,259 | | | | 10,347,105 | |
| | | 2,232,856 | | | | 19,000,396 | | | | 31,305,485 | | | | 19,544,720 | |
| | | | | | | | | | | | | | | | |
| | | (6,439,923 | ) | | | (7,202,599 | ) | | | (3,271,533 | ) | | | (4,218,564 | ) |
| | | (5,030,849 | ) | | | (4,696,245 | ) | | | (1,477,050 | ) | | | (1,880,006 | ) |
| | | (1,504,685 | ) | | | (2,172,717 | ) | | | (871,286 | ) | | | (1,448,100 | ) |
| | | (942,181 | ) | | | (1,112,224 | ) | | | (263,596 | ) | | | (423,256 | ) |
| | | (1,619,767 | ) | | | (1,926,511 | ) | | | (266,814 | ) | | | (494,124 | ) |
| | | (362,441 | ) | | | (442,706 | ) | | | (119,159 | ) | | | (173,122 | ) |
| | | (188,593 | ) | | | (256,012 | ) | | | (58,266 | ) | | | (110,088 | ) |
| | | (16,088,439 | ) | | | (17,809,014 | ) | | | (6,327,704 | ) | | | (8,747,260 | ) |
| | | | | | | | | | | | | | | | |
| | | (9,507,555 | ) | | | 40,461,522 | | | | 10,466,269 | | | | 15,862,514 | |
| | | (43,468,770 | ) | | | 22,850,387 | | | | 6,927,049 | | | | 10,753,653 | |
| | | (11,656,238 | ) | | | (21,398,810 | ) | | | 151,557 | | | | (1,240,989 | ) |
| | | (2,599,555 | ) | | | (3,125,703 | ) | | | (1,966,880 | ) | | | 859,652 | |
| | | (11,610,572 | ) | | | 2,157,648 | | | | 4,411,119 | | | | (4,935,725 | ) |
| | | (653,230 | ) | | | (1,201,825 | ) | | | (2,929,193 | ) | | | (106,040 | ) |
| | | 834,163 | | | | (922,444 | ) | | | (1,258,092 | ) | | | (401,142 | ) |
| | | (78,661,757 | ) | | | 38,820,775 | | | | 15,801,829 | | | | 20,791,923 | |
| | | (92,517,340 | ) | | | 40,012,157 | | | | 40,779,610 | | | | 31,589,383 | |
| | | | | | | | | | | | | | | | |
| | | 520,496,965 | | | | 480,484,808 | | | | 322,047,742 | | | | 290,458,359 | |
| | $ | 427,979,625 | | | $ | 520,496,965 | | | $ | 362,827,352 | | | $ | 322,047,742 | |
The accompanying notes are an integral part of the financial statements.
189
MassMutual Premier Funds – Financial Statements (Continued) |
Statements of Changes in Net Assets |
| | | MassMutual
Premier Core Bond
Fund | |
| | | Year
Ended
September 30, 2020 | | | Year
Ended
September 30, 2019 | |
Increase (Decrease) in Net Assets: | | | | | | | | |
Operations: | | | | | | | | |
Net investment income (loss) | | $ | 43,862,112 | | | $ | 43,994,608 | |
Net realized gain (loss) | | | 46,344,248 | | | | 27,040,977 | |
Net change in unrealized appreciation (depreciation) | | | (10,478,312 | ) | | | 54,727,210 | |
Net increase (decrease) in net assets resulting from operations | | | 79,728,048 | | | | 125,762,795 | |
Distributions to shareholders (Note 2): | | | | | | | | |
Class I | | | (28,739,602 | ) | | | (23,843,483 | ) |
Class R5 | | | (10,399,843 | ) | | | (8,771,104 | ) |
Service Class | | | (2,527,437 | ) | | | (2,820,260 | ) |
Administrative Class | | | (2,078,397 | ) | | | (2,086,599 | ) |
Class A | | | (2,633,014 | ) | | | (2,821,022 | ) |
Class R4 | | | (424,542 | ) | | | (348,493 | ) |
Class R3 | | | (36,423 | ) | | | (21,641 | ) |
Total distributions | | | (46,839,258 | ) | | | (40,712,602 | ) |
Net fund share transactions (Note 5): | | | | | | | | |
Class I | | | (80,854,947 | ) | | | 101,765,720 | |
Class R5 | | | (9,818,466 | ) | | | 5,469,665 | |
Service Class | | | (4,972,926 | ) | | | (20,315,656 | ) |
Administrative Class | | | 7,845,267 | | | | (6,188,523 | ) |
Class A | | | (39,811,644 | ) | | | (15,445,413 | ) |
Class R4 | | | (3,869,904 | ) | | | 2,525,433 | |
Class R3 | | | (405,143 | ) | | | 373,534 | |
Increase (decrease) in net assets from fund share transactions | | | (131,887,763 | ) | | | 68,184,760 | |
Total increase (decrease) in net assets | | | (98,998,973 | ) | | | 153,234,953 | |
Net assets | | | | | | | | |
Beginning of year | | | 1,432,074,796 | | | | 1,278,839,843 | |
End of year | | $ | 1,333,075,823 | | | $ | 1,432,074,796 | |
The accompanying notes are an integral part of the financial statements.
190
| | MassMutual
Premier Diversified
Bond Fund | | | MassMutual
Premier High Yield
Fund | |
| | Year
Ended
September 30, 2020 | | | Year
Ended
September 30, 2019 | | | Year
Ended
September 30, 2020 | | | Year
Ended
September 30, 2019 | |
| | | | | | | | | | | | | | | | |
| | | | | | | | | | | | | | | | |
| | $ | 8,133,898 | | | $ | 7,189,341 | | | $ | 30,240,223 | | | $ | 33,965,154 | |
| | | 7,876,995 | | | | 3,561,731 | | | | (28,586,034 | ) | | | (11,040,111 | ) |
| | | (4,395,961 | ) | | | 9,393,591 | | | | (10,167,934 | ) | | | 3,399,787 | |
| | | 11,614,932 | | | | 20,144,663 | | | | (8,513,745 | ) | | | 26,324,830 | |
| | | | | | | | | | | | | | | | |
| | | (2,101,217 | ) | | | (803,296 | ) | | | (19,290,018 | ) | | | (19,353,739 | ) |
| | | (3,753,102 | ) | | | (3,456,741 | ) | | | (2,645,773 | ) | | | (2,275,582 | ) |
| | | (378,278 | ) | | | (472,306 | ) | | | (2,839,443 | ) | | | (2,454,456 | ) |
| | | (659,827 | ) | | | (665,828 | ) | | | (1,494,189 | ) | | | (1,468,139 | ) |
| | | (716,898 | ) | | | (858,563 | ) | | | (1,705,017 | ) | | | (1,360,141 | ) |
| | | (215,413 | ) | | | (193,130 | ) | | | (2,695,196 | ) | | | (1,787,546 | ) |
| | | (82,760 | ) | | | (114,013 | ) | | | (2,129,846 | ) | | | (2,230,290 | ) |
| | | (7,907,495 | ) | | | (6,563,877 | ) | | | (32,799,482 | ) | | | (30,929,893 | ) |
| | | | | | | | | | | | | | | | |
| | | 34,615,594 | | | | 36,705,887 | | | | 74,242,644 | | | | (52,274,023 | ) |
| | | (32,548,751 | ) | | | 4,937,951 | | | | 10,728,146 | | | | (1,906,593 | ) |
| | | (1,130,942 | ) | | | (6,688,264 | ) | | | (12,136,187 | ) | | | 4,024,313 | |
| | | (5,019,779 | ) | | | (6,599,351 | ) | | | (756,700 | ) | | | (4,907,364 | ) |
| | | (14,533,794 | ) | | | (5,421,141 | ) | | | (4,678,180 | ) | | | 4,042,626 | |
| | | (750,863 | ) | | | 1,770,981 | | | | (3,613,189 | ) | | | 11,588,566 | |
| | | 257,082 | | | | (1,217,048 | ) | | | (4,657,373 | ) | | | (2,079,165 | ) |
| | | (19,111,453 | ) | | | 23,489,015 | | | | 59,129,161 | | | | (41,511,640 | ) |
| | | (15,404,016 | ) | | | 37,069,801 | | | | 17,815,934 | | | | (46,116,703 | ) |
| | | | | | | | | | | | | | | | |
| | | 244,920,753 | | | | 207,850,952 | | | | 564,316,577 | | | | 610,433,280 | |
| | $ | 229,516,737 | | | $ | 244,920,753 | | | $ | 582,132,511 | | | $ | 564,316,577 | |
The accompanying notes are an integral part of the financial statements.
191
MassMutual Premier Funds – Financial Statements (Continued) |
Statements of Changes in Net Assets |
| | | MassMutual
Premier Balanced
Fund | |
| | | Year
Ended
September 30, 2020 | | | Year
Ended
September 30, 2019 | |
Increase (Decrease) in Net Assets: | | | | | | | | |
Operations: | | | | | | | | |
Net investment income (loss) | | $ | 1,968,097 | | | $ | 2,110,305 | |
Net realized gain (loss) | | | 2,411,893 | | | | 5,301,636 | |
Net change in unrealized appreciation (depreciation) | | | 6,713,042 | | | | (4,984,154 | ) |
Net increase (decrease) in net assets resulting from operations | | | 11,093,032 | | | | 2,427,787 | |
Distributions to shareholders (Note 2): | | | | | | | | |
Class I | | | (2,058,041 | ) | | | (1,128,296 | ) |
Class R5 | | | (2,810,372 | ) | | | (3,512,186 | ) |
Service Class | | | (333,607 | ) | | | (470,839 | ) |
Administrative Class | | | (416,607 | ) | | | (535,122 | ) |
Class A | | | (1,592,728 | ) | | | (1,935,646 | ) |
Class R4 | | | (186,064 | ) | | | (231,293 | ) |
Class R3 | | | (431,814 | ) | | | (645,997 | ) |
Total distributions | | | (7,829,233 | ) | | | (8,459,379 | ) |
Net fund share transactions (Note 5): | | | | | | | | |
Class I | | | 9,819,379 | | | | 20,038,802 | |
Class R5 | | | (4,017,631 | ) | | | 2,754,926 | |
Service Class | | | 2,376,960 | | | | (834,845 | ) |
Administrative Class | | | (1,278,102 | ) | | | (653,383 | ) |
Class A | | | (1,098,652 | ) | | | (1,884,375 | ) |
Class R4 | | | 79,759 | | | | (410,358 | ) |
Class R3 | | | 133,779 | | | | (233,401 | ) |
Increase (decrease) in net assets from fund share transactions | | | 6,015,492 | | | | 18,777,366 | |
Total increase (decrease) in net assets | | | 9,279,291 | | | | 12,745,774 | |
Net assets | | | | | | | | |
Beginning of year | | | 126,984,010 | | | | 114,238,236 | |
End of year | | $ | 136,263,301 | | | $ | 126,984,010 | |
The accompanying notes are an integral part of the financial statements.
192
| | MassMutual
Premier
Disciplined Value
Fund | | | MassMutual
Premier Main
Street Fund | |
| | Year
Ended
September 30, 2020 | | | Year
Ended
September 30, 2019 | | | Year
Ended
September 30, 2020 | | | Year
Ended
September 30, 2019 | |
| | | | | | | | | | | | | | | | |
| | | | | | | | | | | | | | | | |
| | $ | 1,887,721 | | | $ | 2,438,165 | | | $ | 970,167 | | | $ | 1,386,706 | |
| | | (1,588,139 | ) | | | 6,496,723 | | | | 2,853,730 | | | | 10,434,330 | |
| | | (6,436,717 | ) | | | (11,828,423 | ) | | | 8,973,746 | | | | (6,202,846 | ) |
| | | (6,137,135 | ) | | | (2,893,535 | ) | | | 12,797,643 | | | | 5,618,190 | |
| | | | | | | | | | | | | | | | |
| | | (1,207,781 | ) | | | (2,950,659 | ) | | | (2,335,592 | ) | | | (2,939,489 | ) |
| | | (3,793,792 | ) | | | (8,804,772 | ) | | | (4,468,709 | ) | | | (7,652,907 | ) |
| | | (1,356,284 | ) | | | (6,451,380 | ) | | | (60,335 | ) | | | (74,980 | ) |
| | | (384,917 | ) | | | (1,338,400 | ) | | | (2,255,886 | ) | | | (3,133,171 | ) |
| | | (462,189 | ) | | | (1,275,458 | ) | | | (1,188,476 | ) | | | (1,597,880 | ) |
| | | (270,247 | ) | | | (948,544 | ) | | | (593,581 | ) | | | (719,840 | ) |
| | | (271,118 | ) | | | (634,881 | ) | | | (106,551 | ) | | | (205,497 | ) |
| | | (7,746,328 | ) | | | (22,404,094 | ) | | | (11,009,130 | ) | | | (16,323,764 | ) |
| | | | | | | | | | | | | | | | |
| | | 5,690,091 | | | | 439,475 | | | | 4,720,668 | | | | 2,210,454 | |
| | | (13,564,584 | ) | | | 3,498,339 | | | | (3,314,019 | ) | | | (14,185,696 | ) |
| | | (7,037,326 | ) | | | (22,292,084 | ) | | | (480,381 | ) | | | (43,915 | ) |
| | | (923,700 | ) | | | (1,787,052 | ) | | | (3,288,186 | ) | | | (1,861,173 | ) |
| | | 590,977 | | | | (1,408,783 | ) | | | (940,432 | ) | | | (596,316 | ) |
| | | (902,025 | ) | | | (1,284,893 | ) | | | (75,478 | ) | | | 415,047 | |
| | | 173,619 | | | | 859,475 | | | | (45,007 | ) | | | (350,994 | ) |
| | | (15,972,948 | ) | | | (21,975,523 | ) | | | (3,422,835 | ) | | | (14,412,593 | ) |
| | | (29,856,411 | ) | | | (47,273,152 | ) | | | (1,634,322 | ) | | | (25,118,167 | ) |
| | | | | | | | | | | | | | | | |
| | | 111,019,267 | | | | 158,292,419 | | | | 118,434,702 | | | | 143,552,869 | |
| | $ | 81,162,856 | | | $ | 111,019,267 | | | $ | 116,800,380 | | | $ | 118,434,702 | |
The accompanying notes are an integral part of the financial statements.
193
MassMutual Premier Funds – Financial Statements (Continued) |
Statements of Changes in Net Assets |
| | | MassMutual
Premier
Disciplined Growth
Fund | |
| | | Year
Ended
September 30, 2020 | | | Year
Ended
September 30, 2019 | |
Increase (Decrease) in Net Assets: | | | | | | | | |
Operations: | | | | | | | | |
Net investment income (loss) | | $ | 1,324,014 | | | $ | 1,944,500 | |
Net realized gain (loss) | | | 15,787,087 | | | | 23,547,277 | |
Net change in unrealized appreciation (depreciation) | | | 49,887,218 | | | | (25,336,115 | ) |
Net increase (decrease) in net assets resulting from operations | | | 66,998,319 | | | | 155,662 | |
Distributions to shareholders (Note 2): | | | | | | | | |
Class I | | | (4,066,618 | ) | | | (6,509,520 | ) |
Class R5 | | | (10,651,101 | ) | | | (22,374,835 | ) |
Service Class | | | (3,510,848 | ) | | | (15,117,227 | ) |
Administrative Class | | | (4,502,486 | ) | | | (8,539,033 | ) |
Class A | | | (3,558,796 | ) | | | (7,985,405 | ) |
Class R4 | | | (3,012,939 | ) | | | (6,472,019 | ) |
Class R3 | | | (622,111 | ) | | | (1,501,736 | ) |
Total distributions | | | (29,924,899 | ) | | | (68,499,775 | ) |
Net fund share transactions (Note 5): | | | | | | | | |
Class I | | | 2,527,124 | | | | 4,404,455 | |
Class R5 | | | (12,423,986 | ) | | | 10,887,227 | |
Service Class | | | (10,042,051 | ) | | | (27,992,682 | ) |
Administrative Class | | | (6,249,077 | ) | | | 3,128,965 | |
Class A | | | (5,224,452 | ) | | | (1,612,036 | ) |
Class R4 | | | 554,847 | | | | (546,976 | ) |
Class R3 | | | (1,231,292 | ) | | | 423,218 | |
Increase (decrease) in net assets from fund share transactions | | | (32,088,887 | ) | | | (11,307,829 | ) |
Total increase (decrease) in net assets | | | 4,984,533 | | | | (79,651,942 | ) |
Net assets | | | | | | | | |
Beginning of year | | | 257,504,148 | | | | 337,156,090 | |
End of year | | $ | 262,488,681 | | | $ | 257,504,148 | |
The accompanying notes are an integral part of the financial statements.
194
| | MassMutual
Premier Small
Cap Opportunities
Fund | | | MassMutual
Premier Global
Fund | |
| | Year
Ended
September 30, 2020 | | | Year
Ended
September 30, 2019 | | | Year
Ended
September 30, 2020 | | | Year
Ended
September 30, 2019 | |
| | | | | | | | | | | | | | | | |
| | | | | | | | | | | | | | | | |
| | $ | 1,192,338 | | | $ | 1,153,352 | | | $ | (566,185 | ) | | $ | 1,627,212 | |
| | | 16,322,661 | | | | 4,354,988 | | | | 17,565,691 | | | | 3,878,613 | |
| | | (14,216,827 | ) | | | (25,144,927 | ) | | | 43,925,160 | | | | (11,127,382 | ) |
| | | 3,298,172 | | | | (19,636,587 | ) | | | 60,924,666 | | | | (5,621,557 | ) |
| | | | | | | | | | | | | | | | |
| | | (319,615 | ) | | | (3,656,500 | ) | | | (704,508 | ) | | | (10,142,807 | ) |
| | | (868,871 | ) | | | (6,499,034 | ) | | | (889,589 | ) | | | (18,881,920 | ) |
| | | (121,119 | ) | | | (1,491,884 | ) | | | (46,110 | ) | | | (2,220,861 | ) |
| | | (120,787 | ) | | | (1,983,912 | ) | | | (520,255 | ) | | | (16,324,130 | ) |
| | | (240,626 | ) | | | (5,673,440 | ) | | | (96,678 | ) | | | (5,808,841 | ) |
| | | (53,838 | ) | | | (1,018,771 | ) | | | (37,330 | ) | | | (1,601,209 | ) |
| | | (41,924 | ) | | | (886,852 | ) | | | (33,038 | ) | | | (2,011,068 | ) |
| | | (1,766,780 | ) | | | (21,210,393 | ) | | | (2,327,508 | ) | | | (56,990,836 | ) |
| | | | | | | | | | | | | | | | |
| | | 3,750,962 | | | | 859,274 | | | | (8,188,470 | ) | | | 29,493,708 | |
| | | 31,631,154 | | | | (2,681,256 | ) | | | (7,862,395 | ) | | | 17,371,070 | |
| | | (277,871 | ) | | | 1,700,754 | | | | (1,349,526 | ) | | | (6,812,076 | ) |
| | | (2,309,215 | ) | | | (1,928,523 | ) | | | (11,808,341 | ) | | | 5,597,866 | |
| | | (8,630,606 | ) | | | (6,923,243 | ) | | | (6,273,139 | ) | | | (414,975 | ) |
| | | (1,391,345 | ) | | | 728,250 | | | | (242,789 | ) | | | 1,437,489 | |
| | | (2,622,730 | ) | | | (294,957 | ) | | | (2,025,307 | ) | | | 1,442,706 | |
| | | 20,150,349 | | | | (8,539,701 | ) | | | (37,749,967 | ) | | | 48,115,788 | |
| | | 21,681,741 | | | | (49,386,681 | ) | | | 20,847,191 | | | | (14,496,605 | ) |
| | | | | | | | | | | | | | | | |
| | | 204,267,239 | | | | 253,653,920 | | | | 294,429,253 | | | | 308,925,858 | |
| | $ | 225,948,980 | | | $ | 204,267,239 | | | $ | 315,276,444 | | | $ | 294,429,253 | |
The accompanying notes are an integral part of the financial statements.
195
MassMutual Premier Funds – Financial Statements (Continued) |
Statements of Changes in Net Assets |
| | | MassMutual
Premier
International
Equity Fund | |
| | | Year
Ended
September 30, 2020 | | | Year
Ended
September 30, 2019 | |
Increase (Decrease) in Net Assets: | | | | | | | | |
Operations: | | | | | | | | |
Net investment income (loss) | | $ | 370,313 | | | $ | 2,997,156 | |
Net realized gain (loss) | | | 72,163,422 | | | | 13,863,056 | |
Net change in unrealized appreciation (depreciation) | | | (40,628,603 | ) | | | (37,392,335 | ) |
Net increase (decrease) in net assets resulting from operations | | | 31,905,132 | | | | (20,532,123 | ) |
Distributions to shareholders (Note 2): | | | | | | | | |
Class I | | | (5,748,906 | ) | | | (13,156,184 | ) |
Class R5 | | | (3,666,648 | ) | | | (6,231,478 | ) |
Service Class | | | (339,316 | ) | | | (718,289 | ) |
Administrative Class | | | (208,684 | ) | | | (460,669 | ) |
Class A | | | (760,247 | ) | | | (1,213,354 | ) |
Class R4 | | | (173,825 | ) | | | (451,336 | ) |
Class R3 | | | (178,640 | ) | | | (377,140 | ) |
Total distributions | | | (11,076,266 | ) | | | (22,608,450 | ) |
Net fund share transactions (Note 5): | | | | | | | | |
Class I | | | (64,531,410 | ) | | | (119,556,080 | ) |
Class R5 | | | (39,999,853 | ) | | | (41,389,928 | ) |
Service Class | | | (5,596,696 | ) | | | (11,670,069 | ) |
Administrative Class | | | (2,311,502 | ) | | | (5,312,397 | ) |
Class A | | | (4,918,009 | ) | | | (6,051,775 | ) |
Class R4 | | | (3,192,959 | ) | | | (4,928,933 | ) |
Class R3 | | | (3,367,017 | ) | | | (2,594,867 | ) |
Increase (decrease) in net assets from fund share transactions | | | (123,917,446 | ) | | | (191,504,049 | ) |
Total increase (decrease) in net assets | | | (103,088,580 | ) | | | (234,644,622 | ) |
Net assets | | | �� | | | | | |
Beginning of year | | | 291,978,573 | | | | 526,623,195 | |
End of year | | $ | 188,889,993 | | | $ | 291,978,573 | |
The accompanying notes are an integral part of the financial statements.
196
| | MassMutual
Premier Strategic
Emerging Markets
Fund | |
| | Year
Ended
September 30, 2020 | | | Year
Ended
September 30, 2019 | |
| | | | | | | | |
| | | | | | | | |
| | $ | 169,245 | | | $ | 1,012,926 | |
| | | 476,390 | | | | 20,636,717 | |
| | | 5,113,197 | | | | (18,190,614 | ) |
| | | 5,758,832 | | | | 3,459,029 | |
| | | | | | | | |
| | | (13,661,324 | ) | | | (1,339,579 | ) |
| | | (365,359 | ) | | | (22,332 | ) |
| | | (41,689 | ) | | | (247 | ) |
| | | (79,749 | ) | | | (2,174 | ) |
| | | (90,537 | ) | | | (1,818 | ) |
| | | (112,016 | ) | | | (2,905 | ) |
| | | (60,918 | ) | | | — | |
| | | (14,411,592 | ) | | | (1,369,055 | ) |
| | | | | | | | |
| | | 36,043,075 | | | | (75,951,493 | ) |
| | | (1,169,915 | ) | | | 157,072 | |
| | | 2,095,511 | | | | 185,417 | |
| | | 49,690 | | | | 23,815 | |
| | | 1,149,943 | | | | 461,858 | |
| | | (88,054 | ) | | | (24,886 | ) |
| | | 222,204 | | | | (24,279 | ) |
| | | 38,302,454 | | | | (75,172,496 | ) |
| | | 29,649,694 | | | | (73,082,522 | ) |
| | | | | | | | |
| | | 150,601,293 | | | | 223,683,815 | |
| | $ | 180,250,987 | | | $ | 150,601,293 | |
The accompanying notes are an integral part of the financial statements.
197
[THIS PAGE INTENTIONALLY LEFT BLANK]
MassMutual Premier U.S. Government Money Market Fund – Financial Statements (Continued) |
Financial Highlights (For a share outstanding throughout each period) |
| | | Income (loss) from investment
operations | Less distributions to shareholders | | | Ratios / Supplemental Data |
| | Net
asset
value,
beginning
of the
period | Net
investment
income
(loss)c,j | Net
realized
and
unrealized
gain (loss)
on
investments | Total
income
(loss) from
investment
operations | From net
investment
income | From net
realized
gains | Total
distributions | Net
asset
value,
end of
the
period | Total
returnl | Net
assets,
end of
the
period
(000’s) | Ratio of
expenses
to average
daily net
assets
before
expense
waivers | Ratio of
expenses
to average
daily net
assets
after
expense
waiversj | Net
investment
income
(loss) to
average
daily net
assets |
Class R5 | | | | | | | | | | | | | |
9/30/20 | $ 1.00 | $ 0.01 | $ 0.00d | $ 0.01 | $ (0.01) | $ — | $ (0.01) | $ 1.00 | 0.56% | $ 277,991 | 0.51% | 0.40% | 0.59% |
9/30/19 | 1.00 | 0.02 | 0.00d | 0.02 | (0.02) | (0.00)d | (0.02) | 1.00 | 1.85% | 333,574 | 0.52% | N/A | 1.83% |
9/30/18 | 1.00 | 0.01 | 0.00d | 0.01 | (0.01) | (0.00)d | (0.01) | 1.00 | 1.08% | 339,551 | 0.50% | N/A | 1.04% |
9/30/17 | 1.00 | 0.00d | 0.00d | 0.00d | (0.00)d | — | (0.00)d | 1.00 | 0.23% | 352,317 | 0.52% | 0.51% | 0.22% |
9/30/16 | 1.00 | 0.00d | 0.00d | 0.00d | (0.00)d | — | (0.00)d | 1.00 | 0.00%e | 334,720 | 0.51% | 0.36% | 0.00%e |
c | Per share amount calculated on the average shares method. |
d | Amount is less than $0.005 per share. |
e | Amount is less than 0.005%. |
j | Computed after giving effect to an agreement by MML Advisers to waive certain fees and expenses of the Fund. |
l | Employee retirement benefit plans that invest plan assets in the Separate Investment Accounts (SIAs) may be subject to certain charges as set forth in their respective Plan Documents. Total return figures would be lower for the periods presented if they reflected these charges. |
The accompanying notes are an integral part of the financial statements.
199
MassMutual Premier Short-Duration Bond Fund – Financial Statements (Continued) |
Financial Highlights (For a share outstanding throughout each period) |
| | | Income (loss) from investment
operations | Less distributions to shareholders | | | Ratios / Supplemental Data |
| | Net
asset
value,
beginning
of the
period | Net
investment
income
(loss)c | Net
realized
and
unrealized
gain (loss)
on
investments | Total
income
(loss) from
investment
operations | From net
investment
income | From net
realized
gains | Total
distributions | Net
asset
value,
end of
the
period | Total
returnl,m | Net
assets,
end of
the
period
(000’s) | Ratio of
expenses
to average
daily net
assets | Net
investment
income
(loss) to
average
daily net
assets |
Class I | | | | | | | | | | | | |
9/30/20 | $ 10.31 | $ 0.34 | $ (0.21) | $ 0.13 | $ (0.35) | $ — | $ (0.35) | $ 10.09 | 1.26% | $ 189,805 | 0.42% | 3.41% |
9/30/19 | 10.30 | 0.32 | 0.08 | 0.40 | (0.39) | — | (0.39) | 10.31 | 4.05% | 204,282 | 0.43% | 3.13% |
9/30/18 | 10.40 | 0.27 | (0.10) | 0.17 | (0.27) | — | (0.27) | 10.30 | 1.65% | 163,465 | 0.39% | 2.64% |
9/30/17 | 10.39 | 0.23 | 0.03 | 0.26 | (0.25) | — | (0.25) | 10.40 | 2.57% | 299,768 | 0.40% | 2.20% |
9/30/16 | 10.46 | 0.20 | 0.00d | 0.20 | (0.27) | — | (0.27) | 10.39 | 1.98% | 166,281 | 0.40% | 1.97% |
Class R5 | | | | | | | | | | | |
9/30/20 | $ 10.34 | $ 0.33 | $ (0.21) | $ 0.12 | $ (0.34) | $ — | $ (0.34) | $ 10.12 | 1.15% | $ 110,813 | 0.52% | 3.31% |
9/30/19 | 10.33 | 0.31 | 0.08 | 0.39 | (0.38) | — | (0.38) | 10.34 | 3.92% | 158,895 | 0.53% | 3.03% |
9/30/18 | 10.42 | 0.26 | (0.09) | 0.17 | (0.26) | — | (0.26) | 10.33 | 1.63% | 135,411 | 0.49% | 2.55% |
9/30/17 | 10.42 | 0.22 | 0.02 | 0.24 | (0.24) | — | (0.24) | 10.42 | 2.36% | 155,172 | 0.50% | 2.09% |
9/30/16 | 10.49 | 0.19 | 0.00d | 0.19 | (0.26) | — | (0.26) | 10.42 | 1.88% | 199,354 | 0.50% | 1.87% |
Service Class | | | | | | | | | | | |
9/30/20 | $ 10.26 | $ 0.32 | $ (0.22) | $ 0.10 | $ (0.32) | $ — | $ (0.32) | $ 10.04 | 1.00% | $ 38,559 | 0.62% | 3.19% |
9/30/19 | 10.25 | 0.30 | 0.08 | 0.38 | (0.37) | — | (0.37) | 10.26 | 3.82% | 51,201 | 0.63% | 2.92% |
9/30/18 | 10.35 | 0.25 | (0.10) | 0.15 | (0.25) | — | (0.25) | 10.25 | 1.50% | 72,408 | 0.59% | 2.45% |
9/30/17 | 10.35 | 0.21 | 0.02 | 0.23 | (0.23) | — | (0.23) | 10.35 | 2.24% | 75,544 | 0.60% | 2.00% |
9/30/16 | 10.42 | 0.18 | 0.00d | 0.18 | (0.25) | — | (0.25) | 10.35 | 1.78% | 55,309 | 0.60% | 1.75% |
| | Year ended September 30 |
| | 2020 | 2019 | 2018 | 2017 | 2016 |
Portfolio turnover rate | 37% | 55% | 68% | 72% | 87% |
c | Per share amount calculated on the average shares method. |
d | Amount is less than $0.005 per share. |
l | Employee retirement benefit plans that invest plan assets in the Separate Investment Accounts (SIAs) may be subject to certain charges as set forth in their respective Plan Documents. Total return figures would be lower for the periods presented if they reflected these charges. |
m | Total return excludes sales charges, if any, and would be lower for the period presented if it reflected these charges. |
The accompanying notes are an integral part of the financial statements.
200
| | | | | | | |
| | | | | | | |
| | | Income (loss) from investment
operations | Less distributions to shareholders | | | Ratios / Supplemental Data |
| | Net
asset
value,
beginning
of the
period | Net
investment
income
(loss)c | Net
realized
and
unrealized
gain (loss)
on
investments | Total
income
(loss) from
investment
operations | From net
investment
income | From net
realized
gains | Total
distributions | Net
asset
value,
end of
the
period | Total
returnl,m | Net
assets,
end of
the
period
(000’s) | Ratio of
expenses
to average
daily net
assets | Net
investment
income
(loss) to
average
daily net
assets |
Administrative Class | | | | | | | | | | |
9/30/20 | $ 10.22 | $ 0.31 | $ (0.21) | $ 0.10 | $ (0.32) | $ — | $ (0.32) | $ 10.00 | 0.94% | $ 27,628 | 0.72% | 3.12% |
9/30/19 | 10.21 | 0.29 | 0.08 | 0.37 | (0.36) | — | (0.36) | 10.22 | 3.76% | 31,270 | 0.73% | 2.83% |
9/30/18 | 10.31 | 0.24 | (0.10) | 0.14 | (0.24) | — | (0.24) | 10.21 | 1.35% | 34,342 | 0.69% | 2.37% |
9/30/17 | 10.30 | 0.19 | 0.04 | 0.23 | (0.22) | — | (0.22) | 10.31 | 2.24% | 28,771 | 0.70% | 1.89% |
9/30/16 | 10.37 | 0.17 | 0.00d | 0.17 | (0.24) | — | (0.24) | 10.30 | 1.69% | 32,906 | 0.70% | 1.66% |
Class A | | | | | | | | | | | |
9/30/20 | $ 10.14 | $ 0.28 | $ (0.21) | $ 0.07 | $ (0.29) | $ — | $ (0.29) | $ 9.92 | 0.71% | $ 41,913 | 0.97% | 2.87% |
9/30/19 | 10.14 | 0.26 | 0.08 | 0.34 | (0.34) | — | (0.34) | 10.14 | 3.44% | 55,315 | 0.98% | 2.58% |
9/30/18 | 10.24 | 0.21 | (0.10) | 0.11 | (0.21) | — | (0.21) | 10.14 | 1.10% | 53,188 | 0.94% | 2.11% |
9/30/17 | 10.23 | 0.16 | 0.04 | 0.20 | (0.19) | — | (0.19) | 10.24 | 2.00% | 50,893 | 0.95% | 1.62% |
9/30/16 | 10.30 | 0.14 | 0.00d | 0.14 | (0.21) | — | (0.21) | 10.23 | 1.49% | 87,598 | 0.95% | 1.42% |
Class R4 | | | | | | | | | | | |
9/30/20 | $ 10.27 | $ 0.29 | $ (0.21) | $ 0.08 | $ (0.30) | $ — | $ (0.30) | $ 10.05 | 0.79% | $ 11,525 | 0.87% | 2.96% |
9/30/19 | 10.26 | 0.27 | 0.08 | 0.35 | (0.34) | — | (0.34) | 10.27 | 3.57% | 12,494 | 0.88% | 2.67% |
9/30/18 | 10.36 | 0.23 | (0.11) | 0.12 | (0.22) | — | (0.22) | 10.26 | 1.21% | 13,691 | 0.84% | 2.21% |
9/30/17 | 10.36 | 0.18 | 0.03 | 0.21 | (0.21) | — | (0.21) | 10.36 | 2.05% | 13,693 | 0.85% | 1.75% |
9/30/16 | 10.45 | 0.16 | 0.00d | 0.16 | (0.25) | — | (0.25) | 10.36 | 1.59% | 9,446 | 0.85% | 1.53% |
Class R3 | | | | | | | | | | | |
9/30/20 | $ 10.20 | $ 0.27 | $ (0.22) | $ 0.05 | $ (0.27) | $ — | $ (0.27) | $ 9.98 | 0.53% | $ 7,737 | 1.12% | 2.72% |
9/30/19 | 10.20 | 0.24 | 0.09 | 0.33 | (0.33) | — | (0.33) | 10.20 | 3.29% | 7,040 | 1.13% | 2.43% |
9/30/18 | 10.30 | 0.20 | (0.10) | 0.10 | (0.20) | — | (0.20) | 10.20 | 0.97% | 7,980 | 1.09% | 1.97% |
9/30/17 | 10.31 | 0.15 | 0.03 | 0.18 | (0.19) | — | (0.19) | 10.30 | 1.79% | 6,689 | 1.10% | 1.50% |
9/30/16 | 10.42 | 0.13 | 0.00d | 0.13 | (0.24) | — | (0.24) | 10.31 | 1.27% | 3,661 | 1.10% | 1.29% |
The accompanying notes are an integral part of the financial statements.
201
MassMutual Premier Inflation-Protected and Income Fund – Financial Statements (Continued) |
Financial Highlights (For a share outstanding throughout each period) |
| | | Income (loss) from investment
operations | Less distributions to shareholders | | | Ratios / Supplemental Data |
| | Net
asset
value,
beginning
of the
period | Net
investment
income
(loss)c,j | Net
realized
and
unrealized
gain (loss)
on
investments | Total
income
(loss) from
investment
operations | From net
investment
income | From net
realized
gains | Total
distributions | Net
asset
value,
end of
the
period | Total
returnl,m | Net
assets,
end of
the
period
(000’s) | Ratio of
expenses
to average
daily net
assets
before
expense
waivers
(including
interest
expense)p | Ratio of
expenses
to average
daily net
assets
after
expense
waivers
(including
interest
expense)j,p | Ratio of
expenses
to average
daily net
assets
after
expense
waivers
(excluding
interest
expense)j | Net
investment
income
(loss) to
average
daily net
assets
(including
interest
expense)p |
Class I | | | | | | | | | | | | | | |
9/30/20 | $ 10.59 | $ 0.20 | $ 0.83 | $ 1.03 | $ (0.22) | $ — | $ (0.22) | $11.40 | 9.93% | $176,809 | 0.47% | 0.47%n | 0.47%n | 1.86% |
9/30/19 | 10.24 | 0.25 | 0.42 | 0.67 | (0.32) | — | (0.32) | 10.59 | 6.80% | 154,260 | 0.50% | 0.49% | 0.46% | 2.40% |
9/30/18 | 10.46 | 0.34 | (0.26) | 0.08 | (0.30) | — | (0.30) | 10.24 | 0.74% | 133,153 | 1.74% | 1.71% | 0.45% | 3.33% |
9/30/17 | 10.79 | 0.23 | (0.27) | (0.04) | (0.29) | — | (0.29) | 10.46 | (0.32%) | 98,194 | 1.26% | 1.23% | 0.45% | 2.24% |
9/30/16 | 10.19 | 0.13 | 0.59 | 0.72 | (0.12) | — | (0.12) | 10.79 | 7.16% | 122,515 | 0.91% | 0.90% | 0.46% | 1.23% |
Class R5 | | | | | | | | | | | | | |
9/30/20 | $ 10.59 | $ 0.19 | $ 0.84 | $ 1.03 | $ (0.21) | $ — | $ (0.21) | $11.41 | 9.92% | $ 86,369 | 0.57% | 0.57%n | 0.57%n | 1.75% |
9/30/19 | 10.24 | 0.24 | 0.42 | 0.66 | (0.31) | — | (0.31) | 10.59 | 6.68% | 73,365 | 0.60% | 0.59% | 0.56% | 2.30% |
9/30/18 | 10.46 | 0.34 | (0.27) | 0.07 | (0.29) | — | (0.29) | 10.24 | 0.63% | 60,121 | 1.84% | 1.81% | 0.55% | 3.29% |
9/30/17 | 10.80 | 0.22 | (0.28) | (0.06) | (0.28) | — | (0.28) | 10.46 | (0.51%) | 60,155 | 1.36% | 1.33% | 0.55% | 2.07% |
9/30/16 | 10.19 | 0.13 | 0.59 | 0.72 | (0.11) | — | (0.11) | 10.80 | 7.14% | 65,361 | 1.01% | 1.00% | 0.56% | 1.22% |
Service Class | | | | | | | | | | | | | |
9/30/20 | $ 10.55 | $ 0.18 | $ 0.84 | $ 1.02 | $ (0.20) | $ — | $ (0.20) | $11.37 | 9.82% | $ 54,729 | 0.67% | 0.67%n | 0.67%n | 1.66% |
9/30/19 | 10.20 | 0.22 | 0.43 | 0.65 | (0.30) | — | (0.30) | 10.55 | 6.60% | 50,873 | 0.71% | 0.70% | 0.67% | 2.17% |
9/30/18 | 10.42 | 0.32 | (0.27) | 0.05 | (0.27) | — | (0.27) | 10.20 | 0.51% | 50,449 | 1.94% | 1.91% | 0.65% | 3.16% |
9/30/17 | 10.76 | 0.21 | (0.29) | (0.08) | (0.26) | — | (0.26) | 10.42 | (0.63%) | 57,719 | 1.46% | 1.43% | 0.65% | 2.00% |
9/30/16 | 10.16 | 0.10 | 0.60 | 0.70 | (0.10) | — | (0.10) | 10.76 | 6.96% | 71,040 | 1.11% | 1.10% | 0.66% | 0.95% |
| | Year ended September 30 |
| | 2020 | 2019 | 2018 | 2017 | 2016 |
Portfolio turnover rate | 110% | 42% | 62% | 25% | 46% |
c | Per share amount calculated on the average shares method. |
d | Amount is less than $0.005 per share. |
j | Computed after giving effect to an agreement by MML Advisers to waive certain fees and expenses of the Fund. |
l | Employee retirement benefit plans that invest plan assets in the Separate Investment Accounts (SIAs) may be subject to certain charges as set forth in their respective Plan Documents. Total return figures would be lower for the periods presented if they reflected these charges. |
m | Total return excludes sales charges, if any, and would be lower for the period presented if it reflected these charges. |
n | Expenses incurred during the period fell under the expense cap. |
p | Interest expense incurred as a result of entering into reverse repurchase agreements and Treasury roll transactions is included in the Fund’s net expenses in the Statements of Operations. Income earned on investing proceeds from reverse repurchase agreements and Treasury roll transactions is included in interest income in the Statements of Operations. |
The accompanying notes are an integral part of the financial statements.
202
| | | | | | | |
| | | | | | | |
| | | Income (loss) from investment
operations | Less distributions to shareholders | | | Ratios / Supplemental Data |
| | Net
asset
value,
beginning
of the
period | Net
investment
income
(loss)c,j | Net
realized
and
unrealized
gain (loss)
on
investments | Total
income
(loss) from
investment
operations | From net
investment
income | From net
realized
gains | Total
distributions | Net
asset
value,
end of
the
period | Total
returnl,m | Net
assets,
end of
the
period
(000’s) | Ratio of
expenses
to average
daily net
assets
before
expense
waivers
(including
interest
expense)p | Ratio of
expenses
to average
daily net
assets
after
expense
waivers
(including
interest
expense)j,p | Ratio of
expenses
to average
daily net
assets
after
expense
waivers
(excluding
interest
expense)j | Net
investment
income
(loss) to
average
daily net
assets
(including
interest
expense)p |
Administrative Class | | | | | | | | | | | | |
9/30/20 | $ 10.66 | $ 0.17 | $ 0.85 | $ 1.02 | $ (0.19) | $ — | $ (0.19) | $11.49 | 9.70% | $15,288 | 0.77% | 0.77%n | 0.77%n | 1.56% |
9/30/19 | 10.30 | 0.21 | 0.44 | 0.65 | (0.29) | — | (0.29) | 10.66 | 6.53% | 16,168 | 0.80% | 0.79% | 0.76% | 2.03% |
9/30/18 | 10.53 | 0.31 | (0.28) | 0.03 | (0.26) | — | (0.26) | 10.30 | 0.31% | 14,744 | 2.04% | 2.01% | 0.75% | 3.02% |
9/30/17 | 10.86 | 0.20 | (0.27) | (0.07) | (0.26) | — | (0.26) | 10.53 | (0.58%) | 14,519 | 1.56% | 1.53% | 0.75% | 1.94% |
9/30/16 | 10.26 | 0.10 | 0.59 | 0.69 | (0.09) | — | (0.09) | 10.86 | 6.80% | 14,408 | 1.21% | 1.20% | 0.76% | 0.96% |
Class A | | | | | | | | | | | | | |
9/30/20 | $ 10.39 | $ 0.14 | $ 0.82 | $ 0.96 | $ (0.16) | $ — | $ (0.16) | $11.19 | 9.42% | $22,018 | 1.02% | 1.02%n | 1.02%n | 1.30% |
9/30/19 | 10.05 | 0.18 | 0.42 | 0.60 | (0.26) | — | (0.26) | 10.39 | 6.16% | 16,136 | 1.06% | 1.05% | 1.02% | 1.78% |
9/30/18 | 10.27 | 0.28 | (0.26) | 0.02 | (0.24) | — | (0.24) | 10.05 | 0.16% | 20,582 | 2.29% | 2.26% | 1.00% | 2.80% |
9/30/17 | 10.60 | 0.17 | (0.27) | (0.10) | (0.23) | — | (0.23) | 10.27 | (0.92%) | 22,180 | 1.81% | 1.78% | 1.00% | 1.67% |
9/30/16 | 10.00 | 0.08 | 0.58 | 0.66 | (0.06) | — | (0.06) | 10.60 | 6.65% | 23,476 | 1.46% | 1.45% | 1.01% | 0.76% |
Class R4 | | | | | | | | | | | | | |
9/30/20 | $ 10.33 | $ 0.15 | $ 0.82 | $ 0.97 | $ (0.18) | $ — | $ (0.18) | $11.12 | 9.51% | $ 4,358 | 0.92% | 0.92%n | 0.92%n | 1.40% |
9/30/19 | 10.00 | 0.19 | 0.42 | 0.61 | (0.28) | — | (0.28) | 10.33 | 6.27% | 6,949 | 0.96% | 0.95% | 0.92% | 1.95% |
9/30/18 | 10.22 | 0.29 | (0.26) | 0.03 | (0.25) | — | (0.25) | 10.00 | 0.31% | 6,840 | 2.19% | 2.16% | 0.90% | 2.87% |
9/30/17 | 10.57 | 0.18 | (0.28) | (0.10) | (0.25) | — | (0.25) | 10.22 | (0.84%) | 6,231 | 1.71% | 1.68% | 0.90% | 1.78% |
9/30/16 | 10.00 | 0.12 | 0.55 | 0.67 | (0.10) | — | (0.10) | 10.57 | 6.77% | 5,352 | 1.36% | 1.35% | 0.91% | 1.21% |
Class R3 | | | | | | | | | | | | | |
9/30/20 | $ 10.33 | $ 0.12 | $ 0.82 | $ 0.94 | $ (0.15) | $ — | $ (0.15) | $11.12 | 9.20% | $ 3,256 | 1.17% | 1.17%n | 1.17%n | 1.16% |
9/30/19 | 9.99 | 0.17 | 0.41 | 0.58 | (0.24) | — | (0.24) | 10.33 | 6.03% | 4,297 | 1.21% | 1.20% | 1.17% | 1.68% |
9/30/18 | 10.22 | 0.27 | (0.27) | 0.00d | (0.23) | — | (0.23) | 9.99 | 0.03% | 4,569 | 2.44% | 2.41% | 1.15% | 2.69% |
9/30/17 | 10.57 | 0.16 | (0.27) | (0.11) | (0.24) | — | (0.24) | 10.22 | (1.00%) | 4,686 | 1.97% | 1.94% | 1.16% | 1.54% |
9/30/16 | 10.01 | 0.15 | 0.48 | 0.63 | (0.07) | — | (0.07) | 10.57 | 6.37% | 2,792 | 1.61% | 1.60% | 1.16% | 1.46% |
The accompanying notes are an integral part of the financial statements.
203
MassMutual Premier Core Bond Fund – Financial Statements (Continued) |
Financial Highlights (For a share outstanding throughout each period) |
| | | Income (loss) from investment
operations | Less distributions to shareholders | | | Ratios / Supplemental Data |
| | Net
asset
value,
beginning
of the
period | Net
investment
income
(loss)c | Net
realized
and
unrealized
gain (loss)
on
investments | Total
income
(loss) from
investment
operations | From net
investment
income | From net
realized
gains | Total
distributions | Net
asset
value,
end of
the
period | Total
returnl,m | Net
assets,
end of
the
period
(000’s) | Ratio of
expenses
to average
daily net
assets | Net
investment
income
(loss) to
average
daily net
assets |
Class I | | | | | | | | | | | | |
9/30/20 | $ 11.33 | $ 0.37 | $ 0.32 | $ 0.69 | $ (0.38) | $ — | $ (0.38) | $11.64 | 6.28% | $ 786,360 | 0.42% | 3.27% |
9/30/19 | 10.66 | 0.37 | 0.66 | 1.03 | (0.36) | — | (0.36) | 11.33 | 9.98% | 847,736 | 0.43% | 3.42% |
9/30/18 | 11.04 | 0.34 | (0.39) | (0.05) | (0.33) | — | (0.33) | 10.66 | (0.46%) | 695,501 | 0.42% | 3.19% |
9/30/17 | 11.26 | 0.29 | (0.15) | 0.14 | (0.36) | — | (0.36) | 11.04 | 1.41% | 546,975 | 0.42% | 2.70% |
9/30/16 | 11.27 | 0.29 | 0.19 | 0.48 | (0.34) | (0.15) | (0.49) | 11.26 | 4.54% | 501,737 | 0.42% | 2.59% |
Class R5 | | | | | | | | | | | |
9/30/20 | $ 11.37 | $ 0.36 | $ 0.32 | $ 0.68 | $ (0.37) | $ — | $ (0.37) | $11.68 | 6.16% | $ 316,359 | 0.52% | 3.17% |
9/30/19 | 10.69 | 0.36 | 0.67 | 1.03 | (0.35) | — | (0.35) | 11.37 | 9.92% | 317,805 | 0.53% | 3.32% |
9/30/18 | 11.07 | 0.33 | (0.39) | (0.06) | (0.32) | — | (0.32) | 10.69 | (0.57%) | 294,370 | 0.52% | 3.07% |
9/30/17 | 11.29 | 0.28 | (0.15) | 0.13 | (0.35) | — | (0.35) | 11.07 | 1.30% | 358,319 | 0.52% | 2.58% |
9/30/16 | 11.30 | 0.28 | 0.19 | 0.47 | (0.33) | (0.15) | (0.48) | 11.29 | 4.40% | 408,472 | 0.52% | 2.49% |
Service Class | | | | | | | | | | | |
9/30/20 | $ 11.29 | $ 0.35 | $ 0.31 | $ 0.66 | $ (0.35) | $ — | $ (0.35) | $11.60 | 6.06% | $ 83,876 | 0.62% | 3.08% |
9/30/19 | 10.63 | 0.35 | 0.64 | 0.99 | (0.33) | — | (0.33) | 11.29 | 9.67% | 86,988 | 0.63% | 3.22% |
9/30/18 | 11.01 | 0.32 | (0.39) | (0.07) | (0.31) | — | (0.31) | 10.63 | (0.66%) | 101,502 | 0.62% | 2.98% |
9/30/17 | 11.22 | 0.27 | (0.15) | 0.12 | (0.33) | — | (0.33) | 11.01 | 1.24% | 100,903 | 0.62% | 2.51% |
9/30/16 | 11.23 | 0.26 | 0.20 | 0.46 | (0.32) | (0.15) | (0.47) | 11.22 | 4.34% | 91,885 | 0.62% | 2.40% |
| | Year ended September 30 |
| | 2020 | 2019 | 2018 | 2017 | 2016 |
Portfolio turnover rate | 231% | 261% | 140% | 213% | 330% |
c | Per share amount calculated on the average shares method. |
l | Employee retirement benefit plans that invest plan assets in the Separate Investment Accounts (SIAs) may be subject to certain charges as set forth in their respective Plan Documents. Total return figures would be lower for the periods presented if they reflected these charges. |
m | Total return excludes sales charges, if any, and would be lower for the period presented if it reflected these charges. |
The accompanying notes are an integral part of the financial statements.
204
| | | | | | | |
| | | | | | | |
| | | Income (loss) from investment
operations | Less distributions to shareholders | | | Ratios / Supplemental Data |
| | Net
asset
value,
beginning
of the
period | Net
investment
income
(loss)c | Net
realized
and
unrealized
gain (loss)
on
investments | Total
income
(loss) from
investment
operations | From net
investment
income | From net
realized
gains | Total
distributions | Net
asset
value,
end of
the
period | Total
returnl,m | Net
assets,
end of
the
period
(000’s) | Ratio of
expenses
to average
daily net
assets | Net
investment
income
(loss) to
average
daily net
assets |
Administrative Class | | | | | | | | | | |
9/30/20 | $ 11.21 | $ 0.33 | $ 0.32 | $ 0.65 | $ (0.35) | $ — | $ (0.35) | $ 11.51 | 5.94% | $ 76,597 | 0.72% | 2.97% |
9/30/19 | 10.55 | 0.33 | 0.66 | 0.99 | (0.33) | — | (0.33) | 11.21 | 9.65% | 67,239 | 0.73% | 3.13% |
9/30/18 | 10.92 | 0.31 | (0.38) | (0.07) | (0.30) | — | (0.30) | 10.55 | (0.70%) | 69,478 | 0.72% | 2.88% |
9/30/17 | 11.14 | 0.26 | (0.15) | 0.11 | (0.33) | — | (0.33) | 10.92 | 1.11% | 71,425 | 0.72% | 2.38% |
9/30/16 | 11.16 | 0.25 | 0.19 | 0.44 | (0.31) | (0.15) | (0.46) | 11.14 | 4.19% | 85,249 | 0.72% | 2.29% |
Class A | | | | | | | | | | | |
9/30/20 | $ 11.10 | $ 0.30 | $ 0.32 | $ 0.62 | $ (0.32) | $ — | $ (0.32) | $ 11.40 | 5.70% | $ 58,572 | 0.97% | 2.72% |
9/30/19 | 10.45 | 0.30 | 0.65 | 0.95 | (0.30) | — | (0.30) | 11.10 | 9.32% | 97,070 | 0.98% | 2.87% |
9/30/18 | 10.82 | 0.28 | (0.38) | (0.10) | (0.27) | — | (0.27) | 10.45 | (1.00%) | 106,562 | 0.97% | 2.63% |
9/30/17 | 11.03 | 0.23 | (0.15) | 0.08 | (0.29) | — | (0.29) | 10.82 | 0.87% | 114,317 | 0.97% | 2.13% |
9/30/16 | 11.04 | 0.22 | 0.20 | 0.42 | (0.28) | (0.15) | (0.43) | 11.03 | 4.01% | 150,014 | 0.97% | 2.04% |
Class R4 | | | | | | | | | | | |
9/30/20 | $ 11.04 | $ 0.31 | $ 0.31 | $ 0.62 | $ (0.33) | $ — | $ (0.33) | $ 11.33 | 5.80% | $ 10,444 | 0.87% | 2.80% |
9/30/19 | 10.39 | 0.31 | 0.64 | 0.95 | (0.30) | — | (0.30) | 11.04 | 9.47% | 14,011 | 0.88% | 2.98% |
9/30/18 | 10.78 | 0.29 | (0.39) | (0.10) | (0.29) | — | (0.29) | 10.39 | (0.97%) | 10,624 | 0.87% | 2.72% |
9/30/17 | 11.00 | 0.24 | (0.14) | 0.10 | (0.32) | — | (0.32) | 10.78 | 1.03% | 14,811 | 0.87% | 2.23% |
9/30/16 | 11.03 | 0.23 | 0.19 | 0.42 | (0.30) | (0.15) | (0.45) | 11.00 | 4.09% | 14,906 | 0.87% | 2.14% |
Class R3 | | | | | | | | | | | |
9/30/20 | $ 11.34 | $ 0.29 | $ 0.32 | $ 0.61 | $ (0.32) | $ — | $ (0.32) | $ 11.63 | 5.54% | $ 867 | 1.12% | 2.57% |
9/30/19 | 10.67 | 0.29 | 0.67 | 0.96 | (0.29) | — | (0.29) | 11.34 | 9.24% | 1,225 | 1.13% | 2.72% |
9/30/18 | 11.02 | 0.27 | (0.39) | (0.12) | (0.23) | — | (0.23) | 10.67 | (1.13%) | 803 | 1.12% | 2.49% |
9/30/17 | 11.25 | 0.22 | (0.16) | 0.06 | (0.29) | — | (0.29) | 11.02 | 0.64% | 828 | 1.12% | 1.99% |
9/30/16 | 11.25 | 0.21 | 0.20 | 0.41 | (0.26) | (0.15) | (0.41) | 11.25 | 3.89% | 783 | 1.12% | 1.89% |
The accompanying notes are an integral part of the financial statements.
205
MassMutual Premier Diversified Bond Fund – Financial Statements (Continued) |
Financial Highlights (For a share outstanding throughout each period) |
| | | Income (loss) from investment
operations | Less distributions to shareholders | | | Ratios / Supplemental Data |
| | Net
asset
value,
beginning
of the
period | Net
investment
income
(loss)c,j | Net
realized
and
unrealized
gain (loss)
on
investments | Total
income
(loss) from
investment
operations | From net
investment
income | From net
realized
gains | Total
distributions | Net
asset
value,
end of
the
period | Total
returnl,m | Net
assets,
end
of the
period
(000’s) | Ratio of
expenses
to average
daily net
assets
before
expense
waivers | Ratio of
expenses
to average
daily net
assets
after
expense
waiversj | Net
investment
income
(loss) to
average
daily net
assets |
Class I | | | | | | | | | | | | | |
9/30/20 | $ 11.28 | $ 0.39 | $ 0.20 | $ 0.59 | $ (0.36) | $ (0.00)d | $ (0.36) | $ 11.51 | 5.43% | $ 97,183 | 0.51% | N/A | 3.54% |
9/30/19 | 10.59 | 0.38 | 0.64 | 1.02 | (0.33) | — | (0.33) | 11.28 | 9.98% | 60,965 | 0.55% | 0.55%n | 3.54% |
9/30/18 | 10.97 | 0.35 | (0.41) | (0.06) | (0.32) | — | (0.32) | 10.59 | (0.55%) | 21,746 | 0.50% | 0.50%n | 3.33% |
9/30/17 | 11.01 | 0.31 | (0.09) | 0.22 | (0.26) | — | (0.26) | 10.97 | 2.16% | 27,548 | 0.51% | 0.51%n | 2.87% |
9/30/16 | 10.73 | 0.28 | 0.31 | 0.59 | (0.26) | (0.05) | (0.31) | 11.01 | 5.71% | 20,147 | 0.53% | 0.52% | 2.60% |
Class R5 | | | | | | | | | | | | |
9/30/20 | $ 10.40 | $ 0.35 | $ 0.18 | $ 0.53 | $ (0.35) | $ (0.00)d | $ (0.35) | $ 10.58 | 5.30% | $ 78,289 | 0.61% | N/A | 3.46% |
9/30/19 | 9.78 | 0.34 | 0.60 | 0.94 | (0.32) | — | (0.32) | 10.40 | 9.99% | 109,659 | 0.65% | 0.65%n | 3.46% |
9/30/18 | 10.16 | 0.32 | (0.39) | (0.07) | (0.31) | — | (0.31) | 9.78 | (0.69%) | 98,402 | 0.60% | 0.60%n | 3.24% |
9/30/17 | 10.22 | 0.28 | (0.09) | 0.19 | (0.25) | — | (0.25) | 10.16 | 2.02% | 88,740 | 0.61% | 0.61%n | 2.76% |
9/30/16 | 9.98 | 0.25 | 0.29 | 0.54 | (0.25) | (0.05) | (0.30) | 10.22 | 5.63% | 77,693 | 0.63% | 0.62% | 2.50% |
Service Class | | | | | | | | | | | | |
9/30/20 | $ 10.54 | $ 0.35 | $ 0.18 | $ 0.53 | $ (0.34) | $ (0.00)d | $ (0.34) | $ 10.73 | 5.20% | $ 12,067 | 0.71% | N/A | 3.36% |
9/30/19 | 9.91 | 0.33 | 0.61 | 0.94 | (0.31) | — | (0.31) | 10.54 | 9.80% | 12,976 | 0.75% | 0.75%n | 3.35% |
9/30/18 | 10.28 | 0.31 | (0.38) | (0.07) | (0.30) | — | (0.30) | 9.91 | (0.69%) | 18,946 | 0.70% | 0.70%n | 3.14% |
9/30/17 | 10.34 | 0.27 | (0.09) | 0.18 | (0.24) | — | (0.24) | 10.28 | 1.89% | 16,047 | 0.71% | 0.71%n | 2.65% |
9/30/16 | 10.09 | 0.24 | 0.30 | 0.54 | (0.24) | (0.05) | (0.29) | 10.34 | 5.53% | 16,990 | 0.73% | 0.72% | 2.39% |
| | Year ended September 30 |
| | 2020 | 2019 | 2018 | 2017 | 2016 |
Portfolio turnover rate | 186% | 236% | 142% | 207% | 314% |
c | Per share amount calculated on the average shares method. |
d | Amount is less than $0.005 per share. |
j | Computed after giving effect to an agreement by MML Advisers to waive certain fees and expenses of the Fund. |
l | Employee retirement benefit plans that invest plan assets in the Separate Investment Accounts (SIAs) may be subject to certain charges as set forth in their respective Plan Documents. Total return figures would be lower for the periods presented if they reflected these charges. |
m | Total return excludes sales charges, if any, and would be lower for the period presented if it reflected these charges. |
n | Expenses incurred during the period fell under the expense cap. |
The accompanying notes are an integral part of the financial statements.
206
| | | | | | | |
| | | | | | | |
| | | Income (loss) from investment
operations | Less distributions to shareholders | | | Ratios / Supplemental Data |
| | Net
asset
value,
beginning
of the
period | Net
investment
income
(loss)c,j | Net
realized
and
unrealized
gain (loss)
on
investments | Total
income
(loss) from
investment
operations | From net
investment
income | From net
realized
gains | Total
distributions | Net
asset
value,
end of
the
period | Total
returnl,m | Net
assets,
end
of the
period
(000’s) | Ratio of
expenses
to average
daily net
assets
before
expense
waivers | Ratio of
expenses
to average
daily net
assets
after
expense
waiversj | Net
investment
income
(loss) to
average
daily net
assets |
Administrative Class | | | | | | | | | | | |
9/30/20 | $ 10.52 | $ 0.34 | $ 0.18 | $ 0.52 | $ (0.33) | $ (0.00)d | $ (0.33) | $ 10.71 | 5.10% | $ 17,108 | 0.81% | N/A | 3.25% |
9/30/19 | 9.88 | 0.32 | 0.62 | 0.94 | (0.30) | — | (0.30) | 10.52 | 9.79% | 21,870 | 0.85% | 0.85%n | 3.25% |
9/30/18 | 10.25 | 0.30 | (0.38) | (0.08) | (0.29) | — | (0.29) | 9.88 | (0.83%) | 27,039 | 0.80% | 0.80%n | 3.03% |
9/30/17 | 10.31 | 0.26 | (0.09) | 0.17 | (0.23) | — | (0.23) | 10.25 | 1.78% | 26,601 | 0.81% | 0.81%n | 2.54% |
9/30/16 | 10.07 | 0.23 | 0.29 | 0.52 | (0.23) | (0.05) | (0.28) | 10.31 | 5.38% | 34,731 | 0.83% | 0.82% | 2.29% |
Class A | | | | | | | | | | | | |
9/30/20 | $ 10.48 | $ 0.31 | $ 0.20 | $ 0.51 | $ (0.30) | $ (0.00)d | $ (0.30) | $ 10.69 | 4.96% | $ 14,756 | 1.06% | N/A | 2.99% |
9/30/19 | 9.85 | 0.30 | 0.60 | 0.90 | (0.27) | — | (0.27) | 10.48 | 9.45% | 28,973 | 1.10% | 1.10%n | 3.01% |
9/30/18 | 10.23 | 0.28 | (0.40) | (0.12) | (0.26) | — | (0.26) | 9.85 | (1.17%) | 32,456 | 1.05% | 1.05%n | 2.78% |
9/30/17 | 10.28 | 0.23 | (0.07) | 0.16 | (0.21) | — | (0.21) | 10.23 | 1.63% | 34,137 | 1.06% | 1.06%n | 2.30% |
9/30/16 | 10.04 | 0.20 | 0.29 | 0.49 | (0.20) | (0.05) | (0.25) | 10.28 | 5.06% | 37,243 | 1.08% | 1.07% | 2.04% |
Class R4 | | | | | | | | | | | | |
9/30/20 | $ 10.38 | $ 0.32 | $ 0.19 | $ 0.51 | $ (0.32) | $ (0.00)d | $ (0.32) | $ 10.57 | 5.05% | $ 6,233 | 0.96% | N/A | 3.10% |
9/30/19 | 9.78 | 0.31 | 0.59 | 0.90 | (0.30) | — | (0.30) | 10.38 | 9.49% | 6,925 | 1.00% | 1.00%n | 3.12% |
9/30/18 | 10.16 | 0.28 | (0.38) | (0.10) | (0.28) | — | (0.28) | 9.78 | (1.01%) | 4,730 | 0.95% | 0.95%n | 2.87% |
9/30/17 | 10.22 | 0.24 | (0.07) | 0.17 | (0.23) | — | (0.23) | 10.16 | 1.77% | 5,032 | 0.96% | 0.96%n | 2.41% |
9/30/16 | 10.01 | 0.21 | 0.29 | 0.50 | (0.24) | (0.05) | (0.29) | 10.22 | 5.18% | 3,765 | 0.98% | 0.97% | 2.15% |
Class R3 | | | | | | | | | | | | |
9/30/20 | $ 10.34 | $ 0.29 | $ 0.17 | $ 0.46 | $ (0.27) | $ (0.00)d | $ (0.27) | $ 10.53 | 4.61% | $ 3,881 | 1.21% | N/A | 2.85% |
9/30/19 | 9.72 | 0.28 | 0.60 | 0.88 | (0.26) | — | (0.26) | 10.34 | 9.35% | 3,553 | 1.25% | 1.25%n | 2.85% |
9/30/18 | 10.10 | 0.26 | (0.38) | (0.12) | (0.26) | — | (0.26) | 9.72 | (1.24%) | 4,530 | 1.20% | 1.20%n | 2.64% |
9/30/17 | 10.19 | 0.22 | (0.09) | 0.13 | (0.22) | — | (0.22) | 10.10 | 1.41% | 3,869 | 1.21% | 1.21%n | 2.18% |
9/30/16 | 9.99 | 0.19 | 0.29 | 0.48 | (0.23) | (0.05) | (0.28) | 10.19 | 4.94% | 2,592 | 1.23% | 1.22% | 1.95% |
The accompanying notes are an integral part of the financial statements.
207
MassMutual Premier High Yield Fund – Financial Statements (Continued) |
Financial Highlights (For a share outstanding throughout each period) |
| | | Income (loss) from investment
operations | Less distributions to shareholders | | | Ratios / Supplemental Data |
| | Net
asset
value,
beginning
of the
period | Net
investment
income
(loss)c,j | Net
realized
and
unrealized
gain (loss)
on
investments | Total
income
(loss) from
investment
operations | From net
investment
income | From net
realized
gains | Total
distributions | Net
asset
value,
end of
the
period | Total
returnl,m | Net
assets,
end
of the
period
(000’s) | Ratio of
expenses
to average
daily net
assets
before
expense
waivers | Ratio of
expenses
to average
daily net
assets
after
expense
waiversj | Net
investment
income
(loss) to
average
daily net
assets |
Class I | | | | | | | | | | | | | |
9/30/20 | $ 9.21 | $ 0.50 | $ (0.52) | $ (0.02) | $ (0.56) | $ — | $ (0.56) | $ 8.63 | (0.28%) | $ 375,807 | 0.53% | N/A | 5.79% |
9/30/19 | 9.27 | 0.56 | (0.10) | 0.46 | (0.52) | — | (0.52) | 9.21 | 5.45% | 326,836 | 0.54% | 0.54%n | 6.31% |
9/30/18 | 9.62 | 0.58 | (0.33) | 0.25 | (0.60) | — | (0.60) | 9.27 | 2.78% | 382,927 | 0.54% | 0.54%n | 6.32% |
9/30/17 | 9.29 | 0.62 | 0.28 | 0.90 | (0.57) | — | (0.57) | 9.62 | 10.22% | 242,645 | 0.54% | 0.54%n | 6.63% |
9/30/16 | 8.98 | 0.62 | 0.28 | 0.90 | (0.59) | — | (0.59) | 9.29 | 10.86% | 220,759 | 0.57% | 0.55% | 7.05% |
Class R5 | | | | | | | | | | | | |
9/30/20 | $ 9.25 | $ 0.49 | $ (0.51) | $ (0.02) | $ (0.55) | $ — | $ (0.55) | $ 8.68 | (0.28%) | $ 49,116 | 0.63% | N/A | 5.69% |
9/30/19 | 9.31 | 0.56 | (0.11) | 0.45 | (0.51) | — | (0.51) | 9.25 | 5.29% | 41,369 | 0.64% | 0.64%n | 6.23% |
9/30/18 | 9.66 | 0.57 | (0.33) | 0.24 | (0.59) | — | (0.59) | 9.31 | 2.65% | 43,613 | 0.64% | 0.64%n | 6.20% |
9/30/17 | 9.33 | 0.61 | 0.28 | 0.89 | (0.56) | — | (0.56) | 9.66 | 10.08% | 55,628 | 0.64% | 0.64%n | 6.54% |
9/30/16 | 9.02 | 0.61 | 0.28 | 0.89 | (0.58) | — | (0.58) | 9.33 | 10.68% | 45,867 | 0.67% | 0.65% | 6.93% |
Service Class | | | | | | | | | | | | |
9/30/20 | $ 9.25 | $ 0.48 | $ (0.52) | $ (0.04) | $ (0.54) | $ — | $ (0.54) | $ 8.67 | (0.48%) | $ 33,897 | 0.73% | N/A | 5.58% |
9/30/19 | 9.31 | 0.55 | (0.11) | 0.44 | (0.50) | — | (0.50) | 9.25 | 5.20% | 49,174 | 0.74% | 0.74%n | 6.13% |
9/30/18 | 9.66 | 0.56 | (0.33) | 0.23 | (0.58) | — | (0.58) | 9.31 | 2.55% | 45,296 | 0.74% | 0.74%n | 6.11% |
9/30/17 | 9.33 | 0.60 | 0.28 | 0.88 | (0.55) | — | (0.55) | 9.66 | 9.93% | 49,581 | 0.74% | 0.74%n | 6.45% |
9/30/16 | 9.01 | 0.60 | 0.29 | 0.89 | (0.57) | — | (0.57) | 9.33 | 10.70% | 59,787 | 0.77% | 0.75% | 6.83% |
| | Year ended September 30 |
| | 2020 | 2019 | 2018 | 2017 | 2016 |
Portfolio turnover rate | 79% | 54% | 38% | 70% | 50% |
c | Per share amount calculated on the average shares method. |
j | Computed after giving effect to an agreement by MML Advisers to waive certain fees and expenses of the Fund. |
l | Employee retirement benefit plans that invest plan assets in the Separate Investment Accounts (SIAs) may be subject to certain charges as set forth in their respective Plan Documents. Total return figures would be lower for the periods presented if they reflected these charges. |
m | Total return excludes sales charges, if any, and would be lower for the period presented if it reflected these charges. |
n | Expenses incurred during the period fell under the expense cap. |
The accompanying notes are an integral part of the financial statements.
208
| | | | | | | |
| | | | | | | |
| | | Income (loss) from investment
operations | Less distributions to shareholders | | | Ratios / Supplemental Data |
| | Net
asset
value,
beginning
of the
period | Net
investment
income
(loss)c,j | Net
realized
and
unrealized
gain (loss)
on
investments | Total
income
(loss) from
investment
operations | From net
investment
income | From net
realized
gains | Total
distributions | Net
asset
value,
end of
the
period | Total
returnl,m | Net
assets,
end
of the
period
(000’s) | Ratio of
expenses
to average
daily net
assets
before
expense
waivers | Ratio of
expenses
to average
daily net
assets
after
expense
waiversj | Net
investment
income
(loss) to
average
daily net
assets |
Administrative Class | | | | | | | | | | | |
9/30/20 | $ 9.10 | $ 0.47 | $ (0.51) | $ (0.04) | $ (0.53) | $ — | $ (0.53) | $ 8.53 | (0.55%) | $ 23,549 | 0.83% | N/A | 5.49% |
9/30/19 | 9.16 | 0.53 | (0.10) | 0.43 | (0.49) | — | (0.49) | 9.10 | 5.13% | 25,980 | 0.84% | 0.84%n | 6.03% |
9/30/18 | 9.51 | 0.55 | (0.33) | 0.22 | (0.57) | — | (0.57) | 9.16 | 2.49% | 31,250 | 0.84% | 0.84%n | 6.01% |
9/30/17 | 9.20 | 0.58 | 0.28 | 0.86 | (0.55) | — | (0.55) | 9.51 | 9.79% | 32,889 | 0.84% | 0.84%n | 6.34% |
9/30/16 | 8.89 | 0.58 | 0.29 | 0.87 | (0.56) | — | (0.56) | 9.20 | 10.63% | 28,948 | 0.87% | 0.85% | 6.74% |
Class A | | | | | | | | | | | | |
9/30/20 | $ 9.07 | $ 0.44 | $ (0.50) | $ (0.06) | $ (0.52) | $ — | $ (0.52) | $ 8.49 | (0.81%) | $ 24,556 | 1.08% | N/A | 5.24% |
9/30/19 | 9.13 | 0.51 | (0.10) | 0.41 | (0.47) | — | (0.47) | 9.07 | 4.89% | 31,392 | 1.09% | 1.09%n | 5.77% |
9/30/18 | 9.49 | 0.52 | (0.33) | 0.19 | (0.55) | — | (0.55) | 9.13 | 2.10% | 27,393 | 1.09% | 1.09%n | 5.76% |
9/30/17 | 9.17 | 0.56 | 0.28 | 0.84 | (0.52) | — | (0.52) | 9.49 | 9.63% | 29,357 | 1.09% | 1.09%n | 6.09% |
9/30/16 | 8.86 | 0.56 | 0.29 | 0.85 | (0.54) | — | (0.54) | 9.17 | 10.31% | 29,055 | 1.12% | 1.10% | 6.49% |
Class R4 | | | | | | | | | | | | |
9/30/20 | $ 8.97 | $ 0.45 | $ (0.51) | $ (0.06) | $ (0.53) | $ — | $ (0.53) | $ 8.38 | (0.75%) | $ 40,160 | 0.98% | N/A | 5.34% |
9/30/19 | 9.04 | 0.51 | (0.10) | 0.41 | (0.48) | — | (0.48) | 8.97 | 4.97% | 47,055 | 0.99% | 0.99%n | 5.88% |
9/30/18 | 9.40 | 0.53 | (0.33) | 0.20 | (0.56) | — | (0.56) | 9.04 | 2.30% | 35,011 | 0.99% | 0.99%n | 5.87% |
9/30/17 | 9.11 | 0.56 | 0.28 | 0.84 | (0.55) | — | (0.55) | 9.40 | 9.66% | 30,611 | 0.99% | 0.99%n | 6.18% |
9/30/16 | 8.84 | 0.57 | 0.28 | 0.85 | (0.58) | — | (0.58) | 9.11 | 10.44% | 18,428 | 1.02% | 1.00% | 6.66% |
Class R3 | | | | | | | | | | | | |
9/30/20 | $ 9.17 | $ 0.44 | $ (0.52) | $ (0.08) | $ (0.49) | $ — | $ (0.49) | $ 8.60 | (0.96%) | $ 35,047 | 1.23% | N/A | 5.09% |
9/30/19 | 9.23 | 0.50 | (0.10) | 0.40 | (0.46) | — | (0.46) | 9.17 | 4.71% | 42,509 | 1.24% | 1.24%n | 5.63% |
9/30/18 | 9.60 | 0.51 | (0.33) | 0.18 | (0.55) | — | (0.55) | 9.23 | 2.04% | 44,944 | 1.24% | 1.24%n | 5.62% |
9/30/17 | 9.29 | 0.55 | 0.29 | 0.84 | (0.53) | — | (0.53) | 9.60 | 9.43% | 36,626 | 1.24% | 1.24%n | 5.93% |
9/30/16 | 9.01 | 0.56 | 0.28 | 0.84 | (0.56) | — | (0.56) | 9.29 | 10.12% | 13,928 | 1.27% | 1.25% | 6.38% |
The accompanying notes are an integral part of the financial statements.
209
MassMutual Premier Balanced Fund – Financial Statements (Continued) |
Financial Highlights (For a share outstanding throughout each period) |
| | | Income (loss) from investment
operations | Less distributions to shareholders | | | Ratios / Supplemental Data |
| | Net
asset
value,
beginning
of the
period | Net
investment
income
(loss)c,j | Net
realized
and
unrealized
gain (loss)
on
investments | Total
income
(loss) from
investment
operations | From net
investment
income | From net
realized
gains | Total
distributions | Net
asset
value,
end of
the
period | Total
returnl,m | Net
assets,
end
of the
period
(000’s) | Ratio of
expenses
to average
daily net
assets
before
expense
waivers | Ratio of
expenses
to average
daily net
assets
after
expense
waiversj | Net
investment
income
(loss) to
average
daily net
assets |
Class I | | | | | | | | | | | | | |
9/30/20 | $ 12.07 | $ 0.21 | $ 0.90 | $ 1.11 | $ (0.27) | $ (0.51) | $ (0.78) | $ 12.40 | 9.49% | $ 42,455 | 0.71% | N/A | 1.75% |
9/30/19 | 12.86 | 0.24 | (0.09)aa | 0.15 | (0.22) | (0.72) | (0.94) | 12.07 | 1.91% | 31,567 | 0.76% | 0.74% | 2.06% |
9/30/18 | 12.53 | 0.22 | 1.02 | 1.24 | (0.24) | (0.67) | (0.91) | 12.86 | 10.21% | 11,637 | 0.70% | 0.60% | 1.79% |
9/30/17 | 11.32 | 0.21 | 1.28 | 1.49 | (0.22) | (0.06) | (0.28) | 12.53 | 13.39% | 8,270 | 0.68% | 0.60% | 1.76% |
9/30/16 | 11.48 | 0.22 | 0.84 | 1.06 | (0.29) | (0.93) | (1.22) | 11.32 | 9.96% | 967 | 0.68% | 0.60% | 1.98% |
Class R5 | | | | | | | | | | | | |
9/30/20 | $ 12.07 | $ 0.20 | $ 0.89 | $ 1.09 | $ (0.26) | $ (0.51) | $ (0.77) | $ 12.39 | 9.29% | $ 42,199 | 0.81% | N/A | 1.66% |
9/30/19 | 12.85 | 0.23 | (0.09)aa | 0.14 | (0.20) | (0.72) | (0.92) | 12.07 | 1.88% | 45,321 | 0.86% | 0.83% | 1.94% |
9/30/18 | 12.53 | 0.21 | 1.01 | 1.22 | (0.23) | (0.67) | (0.90) | 12.85 | 10.01% | 45,211 | 0.80% | 0.70% | 1.67% |
9/30/17 | 11.32 | 0.20 | 1.28 | 1.48 | (0.21) | (0.06) | (0.27) | 12.53 | 13.27% | 49,381 | 0.78% | 0.70% | 1.66% |
9/30/16 | 11.48 | 0.21 | 0.84 | 1.05 | (0.28) | (0.93) | (1.21) | 11.32 | 9.82% | 53,727 | 0.78% | 0.70% | 1.87% |
Service Class | | | | | | | | | | | | |
9/30/20 | $ 12.73 | $ 0.19 | $ 0.95 | $ 1.14 | $ (0.24) | $ (0.51) | $ (0.75) | $ 13.12 | 9.22% | $ 8,637 | 0.91% | N/A | 1.56% |
9/30/19 | 13.50 | 0.23 | (0.09)aa | 0.14 | (0.19) | (0.72) | (0.91) | 12.73 | 1.73% | 6,045 | 0.96% | 0.92% | 1.84% |
9/30/18 | 13.11 | 0.21 | 1.06 | 1.27 | (0.21) | (0.67) | (0.88) | 13.50 | 9.94% | 7,243 | 0.90% | 0.80% | 1.58% |
9/30/17 | 11.83 | 0.19 | 1.34 | 1.53 | (0.19) | (0.06) | (0.25) | 13.11 | 13.11% | 6,978 | 0.88% | 0.80% | 1.54% |
9/30/16 | 11.94 | 0.20 | 0.89 | 1.09 | (0.27) | (0.93) | (1.20) | 11.83 | 9.76% | 14,130 | 0.88% | 0.80% | 1.87% |
| | Year ended September 30 |
| | 2020 | 2019 | 2018 | 2017 | 2016 |
Portfolio turnover rate | 113% | 161% | 77% | 108% | 176% |
c | Per share amount calculated on the average shares method. |
j | Computed after giving effect to an agreement by MML Advisers to waive certain fees and expenses of the Fund. |
l | Employee retirement benefit plans that invest plan assets in the Separate Investment Accounts (SIAs) may be subject to certain charges as set forth in their respective Plan Documents. Total return figures would be lower for the periods presented if they reflected these charges. |
m | Total return excludes sales charges, if any, and would be lower for the period presented if it reflected these charges. |
aa | The amount shown for a share outstanding does not correspond with the aggregate net realized and unrealized gain (loss) for the period due to the timing of purchases and redemptions of Fund shares in relation to the fluctuating market values of the Fund. |
The accompanying notes are an integral part of the financial statements.
210
| | | | | | | |
| | | | | | | |
| | | Income (loss) from investment
operations | Less distributions to shareholders | | | Ratios / Supplemental Data |
| | Net
asset
value,
beginning
of the
period | Net
investment
income
(loss)c,j | Net
realized
and
unrealized
gain (loss)
on
investments | Total
income
(loss) from
investment
operations | From net
investment
income | From net
realized
gains | Total
distributions | Net
asset
value,
end of
the
period | Total
returnl,m | Net
assets,
end
of the
period
(000’s) | Ratio of
expenses
to average
daily net
assets
before
expense
waivers | Ratio of
expenses
to average
daily net
assets
after
expense
waiversj | Net
investment
income
(loss) to
average
daily net
assets |
Administrative Class | | | | | | | | | | | |
9/30/20 | $ 12.11 | $ 0.17 | $ 0.90 | $ 1.07 | $ (0.23) | $ (0.51) | $ (0.74) | $ 12.44 | 9.13% | $ 5,849 | 1.01% | N/A | 1.44% |
9/30/19 | 12.89 | 0.20 | (0.09)aa | 0.11 | (0.17) | (0.72) | (0.89) | 12.11 | 1.62% | 6,981 | 1.06% | 1.02% | 1.73% |
9/30/18 | 12.55 | 0.18 | 1.02 | 1.20 | (0.19) | (0.67) | (0.86) | 12.89 | 9.88% | 8,129 | 1.00% | 0.90% | 1.47% |
9/30/17 | 11.35 | 0.17 | 1.28 | 1.45 | (0.19) | (0.06) | (0.25) | 12.55 | 13.01% | 9,413 | 0.98% | 0.90% | 1.46% |
9/30/16 | 11.51 | 0.19 | 0.84 | 1.03 | (0.26) | (0.93) | (1.19) | 11.35 | 9.59% | 9,751 | 0.98% | 0.90% | 1.68% |
Class A | | | | | | | | | | | | |
9/30/20 | $ 11.74 | $ 0.14 | $ 0.86 | $ 1.00 | $ (0.20) | $ (0.51) | $ (0.71) | $ 12.03 | 8.80% | $ 26,626 | 1.26% | N/A | 1.21% |
9/30/19 | 12.51 | 0.17 | (0.08)aa | 0.09 | (0.14) | (0.72) | (0.86) | 11.74 | 1.44% | 26,981 | 1.31% | 1.27% | 1.49% |
9/30/18 | 12.22 | 0.15 | 0.98 | 1.13 | (0.17) | (0.67) | (0.84) | 12.51 | 9.48% | 30,517 | 1.25% | 1.15% | 1.22% |
9/30/17 | 11.05 | 0.14 | 1.25 | 1.39 | (0.16) | (0.06) | (0.22) | 12.22 | 12.78% | 32,637 | 1.23% | 1.15% | 1.21% |
9/30/16 | 11.22 | 0.15 | 0.83 | 0.98 | (0.22) | (0.93) | (1.15) | 11.05 | 9.38% | 30,781 | 1.23% | 1.15% | 1.42% |
Class R4 | | | | | | | | | | | | |
9/30/20 | $ 11.64 | $ 0.15 | $ 0.86 | $ 1.01 | $ (0.22) | $ (0.51) | $ (0.73) | $ 11.92 | 8.94% | $ 2,994 | 1.16% | N/A | 1.31% |
9/30/19 | 12.42 | 0.18 | (0.08)aa | 0.10 | (0.16) | (0.72) | (0.88) | 11.64 | 1.52% | 2,853 | 1.21% | 1.17% | 1.59% |
9/30/18 | 12.15 | 0.16 | 0.97 | 1.13 | (0.19) | (0.67) | (0.86) | 12.42 | 9.58% | 3,499 | 1.15% | 1.05% | 1.34% |
9/30/17 | 10.99 | 0.15 | 1.24 | 1.39 | (0.17) | (0.06) | (0.23) | 12.15 | 12.88% | 2,822 | 1.13% | 1.05% | 1.32% |
9/30/16 | 11.20 | 0.16 | 0.83 | 0.99 | (0.27) | (0.93) | (1.20) | 10.99 | 9.51% | 2,373 | 1.13% | 1.05% | 1.54% |
Class R3 | | | | | | | | | | | | |
9/30/20 | $ 11.57 | $ 0.12 | $ 0.85 | $ 0.97 | $ (0.18) | $ (0.51) | $ (0.69) | $ 11.85 | 8.66% | $ 7,503 | 1.41% | N/A | 1.06% |
9/30/19 | 12.36 | 0.15 | (0.08)aa | 0.07 | (0.14) | (0.72) | (0.86) | 11.57 | 1.27% | 7,236 | 1.46% | 1.42% | 1.35% |
9/30/18 | 12.09 | 0.13 | 0.97 | 1.10 | (0.16) | (0.67) | (0.83) | 12.36 | 9.32% | 8,002 | 1.40% | 1.30% | 1.08% |
9/30/17 | 10.95 | 0.12 | 1.24 | 1.36 | (0.16) | (0.06) | (0.22) | 12.09 | 12.58% | 7,251 | 1.38% | 1.30% | 1.08% |
9/30/16 | 11.18 | 0.14 | 0.82 | 0.96 | (0.26) | (0.93) | (1.19) | 10.95 | 9.29% | 5,002 | 1.38% | 1.30% | 1.31% |
The accompanying notes are an integral part of the financial statements.
211
MassMutual Premier Disciplined Value Fund – Financial Statements (Continued) |
Financial Highlights (For a share outstanding throughout each period) |
| | | Income (loss) from investment
operations | Less distributions to shareholders | | | Ratios / Supplemental Data |
| | Net
asset
value,
beginning
of the
period | Net
investment
income
(loss)c | Net
realized
and
unrealized
gain (loss)
on
investments | Total
income
(loss) from
investment
operations | From net
investment
income | From net
realized
gains | Total
distributions | Net
asset
value,
end of
the
period | Total
returnl,m | Net
assets,
end of
the
period
(000’s) | Ratio of
expenses
to average
daily net
assets | Net
investment
income
(loss) to
average
daily net
assets |
Class I | | | | | | | | | | | | |
9/30/20 | $ 13.98 | $ 0.28 | $ (1.16) | $ (0.88) | $ (0.31) | $ (0.71) | $ (1.02) | $ 12.08 | (7.26%) | $ 20,650 | 0.72% | 2.20% |
9/30/19 | 17.06 | 0.28 | (0.76) | (0.48) | (0.40) | (2.20) | (2.60) | 13.98 | (1.20%) | 16,781 | 0.64% | 2.03% |
9/30/18 | 17.67 | 0.29 | 1.28 | 1.57 | (0.36) | (1.82) | (2.18) | 17.06 | 9.34% | 19,546 | 0.57% | 1.74% |
9/30/17 | 16.05 | 0.31 | 2.40 | 2.71 | (0.53) | (0.56) | (1.09) | 17.67 | 17.36% | 79,531 | 0.57% | 1.87% |
9/30/16 | 14.75 | 0.35 | 1.56 | 1.91 | (0.32) | (0.29) | (0.61) | 16.05 | 13.26% | 73,202 | 0.53% | 2.29% |
Class R5 | | | | | | | | | | | |
9/30/20 | $ 14.01 | $ 0.27 | $ (1.17) | $ (0.90) | $ (0.29) | $ (0.71) | $ (1.00) | $ 12.11 | (7.34%) | $ 32,418 | 0.82% | 2.10% |
9/30/19 | 17.09 | 0.27 | (0.76) | (0.49) | (0.39) | (2.20) | (2.59) | 14.01 | (1.32%) | 53,709 | 0.74% | 1.92% |
9/30/18 | 17.69 | 0.28 | 1.28 | 1.56 | (0.34) | (1.82) | (2.16) | 17.09 | 9.27% | 59,987 | 0.67% | 1.65% |
9/30/17 | 16.06 | 0.30 | 2.40 | 2.70 | (0.51) | (0.56) | (1.07) | 17.69 | 17.31% | 46,583 | 0.67% | 1.78% |
9/30/16 | 14.76 | 0.34 | 1.55 | 1.89 | (0.30) | (0.29) | (0.59) | 16.06 | 13.11% | 46,644 | 0.63% | 2.22% |
Service Class | | | | | | | | | | | |
9/30/20 | $ 13.88 | $ 0.25 | $ (1.16) | $ (0.91) | $ (0.26) | $ (0.71) | $ (0.97) | $ 12.00 | (7.46%) | $ 11,618 | 0.92% | 1.98% |
9/30/19 | 16.95 | 0.25 | (0.76) | (0.51) | (0.36) | (2.20) | (2.56) | 13.88 | (1.43%) | 20,401 | 0.84% | 1.82% |
9/30/18 | 17.57 | 0.26 | 1.26 | 1.52 | (0.32) | (1.82) | (2.14) | 16.95 | 9.10% | 50,102 | 0.77% | 1.55% |
9/30/17 | 15.95 | 0.28 | 2.39 | 2.67 | (0.49) | (0.56) | (1.05) | 17.57 | 17.19% | 49,413 | 0.77% | 1.65% |
9/30/16 | 14.66 | 0.32 | 1.55 | 1.87 | (0.29) | (0.29) | (0.58) | 15.95 | 13.03% | 64,634 | 0.73% | 2.12% |
| | Year ended September 30 |
| | 2020 | 2019 | 2018 | 2017 | 2016 |
Portfolio turnover rate | 57% | 53% | 80% | 102% | 109% |
c | Per share amount calculated on the average shares method. |
l | Employee retirement benefit plans that invest plan assets in the Separate Investment Accounts (SIAs) may be subject to certain charges as set forth in their respective Plan Documents. Total return figures would be lower for the periods presented if they reflected these charges. |
m | Total return excludes sales charges, if any, and would be lower for the period presented if it reflected these charges. |
The accompanying notes are an integral part of the financial statements.
212
| | | | | | | |
| | | | | | | |
| | | Income (loss) from investment
operations | Less distributions to shareholders | | | Ratios / Supplemental Data |
| | Net
asset
value,
beginning
of the
period | Net
investment
income
(loss)c | Net
realized
and
unrealized
gain (loss)
on
investments | Total
income
(loss) from
investment
operations | From net
investment
income | From net
realized
gains | Total
distributions | Net
asset
value,
end of
the
period | Total
returnl,m | Net
assets,
end of
the
period
(000’s) | Ratio of
expenses
to average
daily net
assets | Net
investment
income
(loss) to
average
daily net
assets |
Administrative Class | | | | | | | | | | |
9/30/20 | $ 14.20 | $ 0.24 | $ (1.20) | $ (0.96) | $ (0.25) | $ (0.71) | $ (0.96) | $ 12.28 | (7.62%) | $ 4,214 | 1.02% | 1.88% |
9/30/19 | 17.27 | 0.25 | (0.76) | (0.51) | (0.36) | (2.20) | (2.56) | 14.20 | (1.46%) | 5,731 | 0.94% | 1.72% |
9/30/18 | 17.86 | 0.25 | 1.29 | 1.54 | (0.31) | (1.82) | (2.13) | 17.27 | 9.02% | 9,147 | 0.87% | 1.46% |
9/30/17 | 16.21 | 0.27 | 2.41 | 2.68 | (0.47) | (0.56) | (1.03) | 17.86 | 17.01% | 5,970 | 0.87% | 1.57% |
9/30/16 | 14.88 | 0.31 | 1.58 | 1.89 | (0.27) | (0.29) | (0.56) | 16.21 | 12.97% | 5,801 | 0.83% | 2.00% |
Class A | | | | | | | | | | | |
9/30/20 | $ 13.73 | $ 0.21 | $ (1.15) | $ (0.94) | $ (0.23) | $ (0.71) | $ (0.94) | $ 11.85 | (7.77%) | $ 5,569 | 1.27% | 1.66% |
9/30/19 | 16.78 | 0.20 | (0.74) | (0.54) | (0.31) | (2.20) | (2.51) | 13.73 | (1.75%) | 6,012 | 1.19% | 1.48% |
9/30/18 | 17.39 | 0.20 | 1.25 | 1.45 | (0.24) | (1.82) | (2.06) | 16.78 | 8.74% | 8,886 | 1.12% | 1.20% |
9/30/17 | 15.82 | 0.22 | 2.36 | 2.58 | (0.45) | (0.56) | (1.01) | 17.39 | 16.74% | 9,120 | 1.12% | 1.32% |
9/30/16 | 14.53 | 0.27 | 1.53 | 1.80 | (0.22) | (0.29) | (0.51) | 15.82 | 12.65% | 10,415 | 1.08% | 1.78% |
Class R4 | | | | | | | | | | | |
9/30/20 | $ 13.63 | $ 0.21 | $ (1.13) | $ (0.92) | $ (0.24) | $ (0.71) | $ (0.95) | $ 11.76 | (7.70%) | $ 2,707 | 1.17% | 1.73% |
9/30/19 | 16.67 | 0.22 | (0.75) | (0.53) | (0.31) | (2.20) | (2.51) | 13.63 | (1.65%) | 4,039 | 1.09% | 1.58% |
9/30/18 | 17.32 | 0.22 | 1.24 | 1.46 | (0.29) | (1.82) | (2.11) | 16.67 | 8.84% | 6,428 | 1.02% | 1.30% |
9/30/17 | 15.77 | 0.24 | 2.36 | 2.60 | (0.49) | (0.56) | (1.05) | 17.32 | 16.94% | 10,139 | 1.02% | 1.43% |
9/30/16 | 14.51 | 0.28 | 1.53 | 1.81 | (0.26) | (0.29) | (0.55) | 15.77 | 12.75% | 4,127 | 0.98% | 1.90% |
Class R3 | | | | | | | | | | | |
9/30/20 | $ 13.85 | $ 0.19 | $ (1.17) | $ (0.98) | $ (0.21) | $ (0.71) | $ (0.92) | $ 11.95 | (7.98%) | $ 3,988 | 1.42% | 1.50% |
9/30/19 | 16.90 | 0.18 | (0.74) | (0.56) | (0.29) | (2.20) | (2.49) | 13.85 | (1.85%) | 4,346 | 1.34% | 1.33% |
9/30/18 | 17.56 | 0.18 | 1.25 | 1.43 | (0.27) | (1.82) | (2.09) | 16.90 | 8.53% | 4,196 | 1.27% | 1.05% |
9/30/17 | 15.92 | 0.20 | 2.38 | 2.58 | (0.38) | (0.56) | (0.94) | 17.56 | 16.62% | 3,820 | 1.27% | 1.18% |
9/30/16 | 14.62 | 0.25 | 1.54 | 1.79 | (0.20) | (0.29) | (0.49) | 15.92 | 12.49% | 648 | 1.23% | 1.66% |
The accompanying notes are an integral part of the financial statements.
213
MassMutual Premier Main Street Fund – Financial Statements (Continued) |
Financial Highlights (For a share outstanding throughout each period) |
| | | Income (loss) from investment
operations | Less distributions to shareholders | | | Ratios / Supplemental Data |
| | Net
asset
value,
beginning
of the
period | Net
investment
income
(loss)c | Net
realized
and
unrealized
gain (loss)
on
investments | Total
income
(loss) from
investment
operations | From net
investment
income | From net
realized
gains | Total
distributions | Net
asset
value,
end of
the
period | Total
returnl,m | Net
assets,
end of
the
period
(000’s) | Ratio of
expenses
to average
daily net
assets | Net
investment
income
(loss) to
average
daily net
assets |
Class I | | | | | | | | | | | | |
9/30/20 | $ 11.07 | $ 0.11 | $ 1.19 | $ 1.30 | $ (0.13) | $ (0.96) | $ (1.09) | $ 11.28 | 12.22% | $ 30,273 | 0.74% | 1.03% |
9/30/19 | 12.04 | 0.14 | 0.30 | 0.44 | (0.13) | (1.28) | (1.41) | 11.07 | 5.60% | 24,639 | 0.73% | 1.29% |
9/30/18 | 11.94 | 0.14 | 0.89 | 1.03 | (0.14) | (0.79) | (0.93) | 12.04 | 9.11% | 24,123 | 0.71% | 1.17% |
9/30/17 | 10.42 | 0.16 | 1.81 | 1.97 | (0.15) | (0.30) | (0.45) | 11.94 | 19.50% | 8,516 | 0.71% | 1.40% |
9/30/16 | 13.75 | 0.18 | 1.43 | 1.61 | (0.22) | (4.72) | (4.94) | 10.42 | 14.34% | 739 | 0.72% | 1.68% |
Class R5 | | | | | | | | | | | |
9/30/20 | $ 11.06 | $ 0.10 | $ 1.18 | $ 1.28 | $ (0.11) | $ (0.96) | $ (1.07) | $ 11.27 | 12.10% | $ 45,358 | 0.84% | 0.93% |
9/30/19 | 12.03 | 0.13 | 0.29 | 0.42 | (0.11) | (1.28) | (1.39) | 11.06 | 5.47% | 48,226 | 0.83% | 1.19% |
9/30/18 | 11.93 | 0.12 | 0.90 | 1.02 | (0.13) | (0.79) | (0.92) | 12.03 | 9.00% | 67,695 | 0.81% | 1.04% |
9/30/17 | 10.41 | 0.15 | 1.81 | 1.96 | (0.14) | (0.30) | (0.44) | 11.93 | 19.40% | 78,580 | 0.81% | 1.36% |
9/30/16 | 13.73 | 0.13 | 1.48 | 1.61 | (0.21) | (4.72) | (4.93) | 10.41 | 14.28% | 73,380 | 0.82% | 1.27% |
Service Class | | | | | | | | | | | |
9/30/20 | $ 11.50 | $ 0.09 | $ 1.22 | $ 1.31 | $ (0.10) | $ (0.96) | $ (1.06) | $ 11.75 | 11.88% | $ 182 | 0.94% | 0.82% |
9/30/19 | 12.44 | 0.12 | 0.32 | 0.44 | (0.10) | (1.28) | (1.38) | 11.50 | 5.38% | 652 | 0.93% | 1.08% |
9/30/18 | 12.30 | 0.11 | 0.93 | 1.04 | (0.11) | (0.79) | (0.90) | 12.44 | 8.94% | 738 | 0.91% | 0.95% |
9/30/17 | 10.71 | 0.15 | 1.85 | 2.00 | (0.11) | (0.30) | (0.41) | 12.30 | 19.21% | 1,133 | 0.91% | 1.28% |
9/30/16 | 13.91 | 0.12 | 1.51 | 1.63 | (0.11) | (4.72) | (4.83) | 10.71 | 14.21% | 1,979 | 0.92% | 0.98% |
| | Year ended September 30 |
| | 2020 | 2019 | 2018 | 2017 | 2016 |
Portfolio turnover rate | 38% | 55% | 64% | 35% | 38% |
c | Per share amount calculated on the average shares method. |
l | Employee retirement benefit plans that invest plan assets in the Separate Investment Accounts (SIAs) may be subject to certain charges as set forth in their respective Plan Documents. Total return figures would be lower for the periods presented if they reflected these charges. |
m | Total return excludes sales charges, if any, and would be lower for the period presented if it reflected these charges. |
The accompanying notes are an integral part of the financial statements.
214
| | | | | | | |
| | | | | | | |
| | | Income (loss) from investment
operations | Less distributions to shareholders | | | Ratios / Supplemental Data |
| | Net
asset
value,
beginning
of the
period | Net
investment
income
(loss)c | Net
realized
and
unrealized
gain (loss)
on
investments | Total
income
(loss) from
investment
operations | From net
investment
income | From net
realized
gains | Total
distributions | Net
asset
value,
end of
the
period | Total
returnl,m | Net
assets,
end of
the
period
(000’s) | Ratio of
expenses
to average
daily net
assets | Net
investment
income
(loss) to
average
daily net
assets |
Administrative Class | | | | | | | | | | |
9/30/20 | $ 11.05 | $ 0.08 | $ 1.17 | $ 1.25 | $ (0.09) | $ (0.96) | $ (1.05) | $ 11.25 | 11.79% | $ 21,264 | 1.04% | 0.73% |
9/30/19 | 12.01 | 0.10 | 0.31 | 0.41 | (0.09) | (1.28) | (1.37) | 11.05 | 5.30% | 24,458 | 1.03% | 0.98% |
9/30/18 | 11.91 | 0.10 | 0.89 | 0.99 | (0.10) | (0.79) | (0.89) | 12.01 | 8.79% | 28,295 | 1.01% | 0.84% |
9/30/17 | 10.40 | 0.13 | 1.80 | 1.93 | (0.12) | (0.30) | (0.42) | 11.91 | 19.07% | 30,996 | 1.01% | 1.17% |
9/30/16 | 13.71 | 0.11 | 1.48 | 1.59 | (0.18) | (4.72) | (4.90) | 10.40 | 14.11% | 29,371 | 1.02% | 1.05% |
Class A | | | | | | | | | | | |
9/30/20 | $ 10.86 | $ 0.05 | $ 1.15 | $ 1.20 | $ (0.06) | $ (0.96) | $ (1.02) | $ 11.04 | 11.53% | $ 12,086 | 1.29% | 0.48% |
9/30/19 | 11.83 | 0.08 | 0.29 | 0.37 | (0.06) | (1.28) | (1.34) | 10.86 | 5.01% | 12,843 | 1.28% | 0.74% |
9/30/18 | 11.75 | 0.07 | 0.88 | 0.95 | (0.08) | (0.79) | (0.87) | 11.83 | 8.49% | 14,495 | 1.26% | 0.60% |
9/30/17 | 10.26 | 0.10 | 1.79 | 1.89 | (0.10) | (0.30) | (0.40) | 11.75 | 18.88% | 13,096 | 1.26% | 0.90% |
9/30/16 | 13.58 | 0.09 | 1.45 | 1.54 | (0.14) | (4.72) | (4.86) | 10.26 | 13.78% | 11,877 | 1.27% | 0.82% |
Class R4 | | | | | | | | | | | |
9/30/20 | $ 10.77 | $ 0.06 | $ 1.15 | $ 1.21 | $ (0.08) | $ (0.96) | $ (1.04) | $ 10.94 | 11.68% | $ 6,418 | 1.19% | 0.58% |
9/30/19 | 11.75 | 0.09 | 0.29 | 0.38 | (0.08) | (1.28) | (1.36) | 10.77 | 5.08% | 6,379 | 1.18% | 0.83% |
9/30/18 | 11.67 | 0.08 | 0.87 | 0.95 | (0.08) | (0.79) | (0.87) | 11.75 | 8.63% | 6,394 | 1.16% | 0.70% |
9/30/17 | 10.22 | 0.11 | 1.78 | 1.89 | (0.14) | (0.30) | (0.44) | 11.67 | 19.02% | 5,268 | 1.16% | 0.99% |
9/30/16 | 13.57 | 0.15 | 1.40 | 1.55 | (0.18) | (4.72) | (4.90) | 10.22 | 13.88% | 3,421 | 1.17% | 1.45% |
Class R3 | | | | | | | | | | | |
9/30/20 | $ 10.88 | $ 0.03 | $ 1.16 | $ 1.19 | $ (0.04) | $ (0.96) | $ (1.00) | $ 11.07 | 11.41% | $ 1,219 | 1.44% | 0.33% |
9/30/19 | 11.85 | 0.06 | 0.30 | 0.36 | (0.05) | (1.28) | (1.33) | 10.88 | 4.87% | 1,239 | 1.43% | 0.61% |
9/30/18 | 11.76 | 0.05 | 0.88 | 0.93 | (0.05) | (0.79) | (0.84) | 11.85 | 8.34% | 1,813 | 1.41% | 0.45% |
9/30/17 | 10.30 | 0.08 | 1.79 | 1.87 | (0.11) | (0.30) | (0.41) | 11.76 | 18.69% | 1,144 | 1.41% | 0.74% |
9/30/16 | 13.66 | 0.07 | 1.46 | 1.53 | (0.17) | (4.72) | (4.89) | 10.30 | 13.60% | 802 | 1.42% | 0.70% |
The accompanying notes are an integral part of the financial statements.
215
MassMutual Premier Disciplined Growth Fund – Financial Statements (Continued) |
Financial Highlights (For a share outstanding throughout each period) |
| | | Income (loss) from investment
operations | Less distributions to shareholders | | | Ratios / Supplemental Data |
| | Net
asset
value,
beginning
of the
period | Net
investment
income
(loss)c | Net
realized
and
unrealized
gain (loss)
on
investments | Total
income
(loss) from
investment
operations | From net
investment
income | From net
realized
gains | Total
distributions | Net
asset
value,
end of
the
period | Total
returnl,m | Net
assets,
end of
the
period
(000’s) | Ratio of
expenses
to average
daily net
assets | Net
investment
income
(loss) to
average
daily net
assets |
Class I | | | | | | | | | | | | |
9/30/20 | $ 11.00 | $ 0.09 | $ 3.18 | $ 3.27 | $ (0.11) | $ (1.31) | $ (1.42) | $ 12.85 | 32.63% | $ 35,702 | 0.56% | 0.77% |
9/30/19 | 14.37 | 0.10 | (0.47) | (0.37) | (0.15) | (2.85) | (3.00) | 11.00 | 0.99% | 28,367 | 0.55% | 0.89% |
9/30/18 | 13.13 | 0.10 | 2.81 | 2.91 | (0.12) | (1.55) | (1.67) | 14.37 | 23.95% | 30,279 | 0.52% | 0.78% |
9/30/17 | 11.69 | 0.13 | 2.30 | 2.43 | (0.17) | (0.82) | (0.99) | 13.13 | 22.32% | 113,313 | 0.53% | 1.09% |
9/30/16 | 11.37 | 0.14 | 1.17 | 1.31 | (0.14) | (0.85) | (0.99) | 11.69 | 11.94% | 107,336 | 0.51% | 1.22% |
Class R5 | | | | | | | | | | | |
9/30/20 | $ 11.00 | $ 0.07 | $ 3.19 | $ 3.26 | $ (0.10) | $ (1.31) | $ (1.41) | $ 12.85 | 32.48% | $ 101,466 | 0.66% | 0.67% |
9/30/19 | 14.37 | 0.09 | (0.48) | (0.39) | (0.13) | (2.85) | (2.98) | 11.00 | 0.85% | 100,651 | 0.65% | 0.79% |
9/30/18 | 13.14 | 0.09 | 2.80 | 2.89 | (0.11) | (1.55) | (1.66) | 14.37 | 23.72% | 112,178 | 0.62% | 0.69% |
9/30/17 | 11.69 | 0.12 | 2.31 | 2.43 | (0.16) | (0.82) | (0.98) | 13.14 | 22.27% | 87,103 | 0.63% | 1.00% |
9/30/16 | 11.38 | 0.13 | 1.16 | 1.29 | (0.13) | (0.85) | (0.98) | 11.69 | 11.70% | 76,893 | 0.61% | 1.12% |
Service Class | | | | | | | | | | | |
9/30/20 | $ 11.04 | $ 0.06 | $ 3.20 | $ 3.26 | $ (0.07) | $ (1.31) | $ (1.38) | $ 12.92 | 32.33% | $ 25,668 | 0.76% | 0.57% |
9/30/19 | 14.40 | 0.08 | (0.47) | (0.39) | (0.12) | (2.85) | (2.97) | 11.04 | 0.79% | 31,895 | 0.75% | 0.71% |
9/30/18 | 13.17 | 0.08 | 2.80 | 2.88 | (0.10) | (1.55) | (1.65) | 14.40 | 23.54% | 74,294 | 0.72% | 0.59% |
9/30/17 | 11.71 | 0.11 | 2.31 | 2.42 | (0.14) | (0.82) | (0.96) | 13.17 | 22.15% | 73,755 | 0.73% | 0.89% |
9/30/16 | 11.40 | 0.12 | 1.16 | 1.28 | (0.12) | (0.85) | (0.97) | 11.71 | 11.58% | 80,551 | 0.71% | 1.02% |
| | Year ended September 30 |
| | 2020 | 2019 | 2018 | 2017 | 2016 |
Portfolio turnover rate | 50% | 49% | 73% | 105% | 124% |
c | Per share amount calculated on the average shares method. |
l | Employee retirement benefit plans that invest plan assets in the Separate Investment Accounts (SIAs) may be subject to certain charges as set forth in their respective Plan Documents. Total return figures would be lower for the periods presented if they reflected these charges. |
m | Total return excludes sales charges, if any, and would be lower for the period presented if it reflected these charges. |
The accompanying notes are an integral part of the financial statements.
216
| | | | | | | |
| | | | | | | |
| | | Income (loss) from investment
operations | Less distributions to shareholders | | | Ratios / Supplemental Data |
| | Net
asset
value,
beginning
of the
period | Net
investment
income
(loss)c | Net
realized
and
unrealized
gain (loss)
on
investments | Total
income
(loss) from
investment
operations | From net
investment
income | From net
realized
gains | Total
distributions | Net
asset
value,
end of
the
period | Total
returnl,m | Net
assets,
end of
the
period
(000’s) | Ratio of
expenses
to average
daily net
assets | Net
investment
income
(loss) to
average
daily net
assets |
Administrative Class | | | | | | | | | | |
9/30/20 | $ 11.19 | $ 0.05 | $ 3.25 | $ 3.30 | $ (0.08) | $ (1.31) | $ (1.39) | $ 13.10 | 32.19% | $ 36,957 | 0.86% | 0.47% |
9/30/19 | 14.55 | 0.07 | (0.47) | (0.40) | (0.11) | (2.85) | (2.96) | 11.19 | 0.66% | 37,316 | 0.85% | 0.60% |
9/30/18 | 13.28 | 0.07 | 2.83 | 2.90 | (0.08) | (1.55) | (1.63) | 14.55 | 23.51% | 42,622 | 0.82% | 0.49% |
9/30/17 | 11.81 | 0.09 | 2.34 | 2.43 | (0.14) | (0.82) | (0.96) | 13.28 | 21.95% | 41,678 | 0.83% | 0.78% |
9/30/16 | 11.48 | 0.10 | 1.19 | 1.29 | (0.11) | (0.85) | (0.96) | 11.81 | 11.57% | 38,399 | 0.81% | 0.91% |
Class A | | | | | | | | | | | |
9/30/20 | $ 10.80 | $ 0.02 | $ 3.13 | $ 3.15 | $ (0.05) | $ (1.31) | $ (1.36) | $ 12.59 | 31.87% | $ 27,988 | 1.11% | 0.22% |
9/30/19 | 14.15 | 0.04 | (0.47) | (0.43) | (0.07) | (2.85) | (2.92) | 10.80 | 0.42% | 29,210 | 1.10% | 0.35% |
9/30/18 | 12.95 | 0.03 | 2.77 | 2.80 | (0.05) | (1.55) | (1.60) | 14.15 | 23.22% | 39,399 | 1.07% | 0.24% |
9/30/17 | 11.53 | 0.07 | 2.28 | 2.35 | (0.11) | (0.82) | (0.93) | 12.95 | 21.73% | 36,625 | 1.08% | 0.55% |
9/30/16 | 11.23 | 0.07 | 1.15 | 1.22 | (0.07) | (0.85) | (0.92) | 11.53 | 11.23% | 38,743 | 1.06% | 0.67% |
Class R4 | | | | | | | | | | | |
9/30/20 | $ 10.70 | $ 0.03 | $ 3.09 | $ 3.12 | $ (0.06) | $ (1.31) | $ (1.37) | $ 12.45 | 31.97% | $ 28,832 | 1.01% | 0.31% |
9/30/19 | 14.05 | 0.05 | (0.46) | (0.41) | (0.09) | (2.85) | (2.94) | 10.70 | 0.59% | 24,049 | 1.00% | 0.45% |
9/30/18 | 12.89 | 0.04 | 2.74 | 2.78 | (0.07) | (1.55) | (1.62) | 14.05 | 23.26% | 31,265 | 0.97% | 0.34% |
9/30/17 | 11.50 | 0.07 | 2.27 | 2.34 | (0.13) | (0.82) | (0.95) | 12.89 | 21.80% | 26,809 | 0.98% | 0.61% |
9/30/16 | 11.23 | 0.08 | 1.16 | 1.24 | (0.12) | (0.85) | (0.97) | 11.50 | 11.38% | 14,016 | 0.96% | 0.75% |
Class R3 | | | | | | | | | | | |
9/30/20 | $ 10.66 | $ 0.01 | $ 3.09 | $ 3.10 | $ (0.02) | $ (1.31) | $ (1.33) | $ 12.43 | 31.78% | $ 5,875 | 1.26% | 0.05% |
9/30/19 | 14.02 | 0.02 | (0.47) | (0.45) | (0.06) | (2.85) | (2.91) | 10.66 | 0.23% | 6,015 | 1.25% | 0.20% |
9/30/18 | 12.86 | 0.01 | 2.74 | 2.75 | (0.04) | (1.55) | (1.59) | 14.02 | 23.01% | 7,119 | 1.22% | 0.10% |
9/30/17 | 11.45 | 0.04 | 2.27 | 2.31 | (0.08) | (0.82) | (0.90) | 12.86 | 21.52% | 4,310 | 1.23% | 0.38% |
9/30/16 | 11.21 | 0.06 | 1.14 | 1.20 | (0.11) | (0.85) | (0.96) | 11.45 | 11.01% | 3,159 | 1.21% | 0.55% |
The accompanying notes are an integral part of the financial statements.
217
MassMutual Premier Small Cap Opportunities Fund – Financial Statements (Continued) |
Financial Highlights (For a share outstanding throughout each period) |
| | | Income (loss) from investment
operations | Less distributions to shareholders | | | Ratios / Supplemental Data |
| | Net
asset
value,
beginning
of the
period | Net
investment
income
(loss)c | Net
realized
and
unrealized
gain (loss)
on
investments | Total
income
(loss) from
investment
operations | From net
investment
income | From net
realized
gains | Total
distributions | Net
asset
value,
end of
the
period | Total
returnl,m | Net
assets,
end of
the
period
(000’s) | Ratio of
expenses
to average
daily net
assets | Net
investment
income
(loss) to
average
daily net
assets |
Class I | | | | | | | | | | | | |
9/30/20 | $ 13.72 | $ 0.10 | $ 0.27 | $ 0.37 | $ (0.06) | $ (0.07) | $ (0.13) | $ 13.96 | 2.62% | $ 39,988 | 0.69% | 0.77% |
9/30/19 | 16.47 | 0.11 | (1.43) | (1.32) | (0.07) | (1.36) | (1.43) | 13.72 | (7.01%) | 35,326 | 0.70% | 0.82% |
9/30/18 | 16.41 | 0.11 | 1.96 | 2.07 | (0.07) | (1.94) | (2.01) | 16.47 | 13.93% | 40,439 | 0.69% | 0.73% |
9/30/17 | 13.81 | 0.11 | 3.01 | 3.12 | (0.18) | (0.34) | (0.52) | 16.41 | 23.05% | 15,105 | 0.70% | 0.75% |
9/30/16 | 13.84 | 0.17 | 1.31 | 1.48 | (0.12) | (1.39) | (1.51) | 13.81 | 11.60% | 3,642 | 0.71% | 1.33% |
Class R5 | | | | | | | | | | | |
9/30/20 | $ 13.69 | $ 0.09 | $ 0.27 | $ 0.36 | $ (0.05) | $ (0.07) | $ (0.12) | $ 13.93 | 2.56% | $ 92,440 | 0.79% | 0.68% |
9/30/19 | 16.44 | 0.10 | (1.43) | (1.33) | (0.06) | (1.36) | (1.42) | 13.69 | (7.14%) | 61,826 | 0.80% | 0.71% |
9/30/18 | 16.38 | 0.10 | 1.96 | 2.06 | (0.06) | (1.94) | (2.00) | 16.44 | 13.82% | 77,025 | 0.79% | 0.62% |
9/30/17 | 13.78 | 0.10 | 3.00 | 3.10 | (0.16) | (0.34) | (0.50) | 16.38 | 22.99% | 64,889 | 0.80% | 0.63% |
9/30/16 | 13.82 | 0.15 | 1.30 | 1.45 | (0.10) | (1.39) | (1.49) | 13.78 | 11.40% | 61,310 | 0.81% | 1.16% |
Service Class | | | | | | | | | | | |
9/30/20 | $ 13.66 | $ 0.08 | $ 0.25 | $ 0.33 | $ (0.03) | $ (0.07) | $ (0.10) | $ 13.89 | 2.37% | $ 17,146 | 0.89% | 0.58% |
9/30/19 | 16.39 | 0.08 | (1.41) | (1.33) | (0.04) | (1.36) | (1.40) | 13.66 | (7.16%) | 17,073 | 0.90% | 0.61% |
9/30/18 | 16.34 | 0.08 | 1.95 | 2.03 | (0.04) | (1.94) | (1.98) | 16.39 | 13.68% | 18,192 | 0.89% | 0.52% |
9/30/17 | 13.75 | 0.08 | 3.00 | 3.08 | (0.15) | (0.34) | (0.49) | 16.34 | 22.87% | 14,726 | 0.90% | 0.54% |
9/30/16 | 13.81 | 0.14 | 1.29 | 1.43 | (0.10) | (1.39) | (1.49) | 13.75 | 11.23% | 13,313 | 0.91% | 1.08% |
| | Year ended September 30 |
| | 2020 | 2019 | 2018 | 2017 | 2016 |
Portfolio turnover rate | 47% | 34% | 57% | 62% | 57% |
c | Per share amount calculated on the average shares method. |
d | Amount is less than $0.005 per share. |
l | Employee retirement benefit plans that invest plan assets in the Separate Investment Accounts (SIAs) may be subject to certain charges as set forth in their respective Plan Documents. Total return figures would be lower for the periods presented if they reflected these charges. |
m | Total return excludes sales charges, if any, and would be lower for the period presented if it reflected these charges. |
The accompanying notes are an integral part of the financial statements.
218
| | | | | | | |
| | | | | | | |
| | | Income (loss) from investment
operations | Less distributions to shareholders | | | Ratios / Supplemental Data |
| | Net
asset
value,
beginning
of the
period | Net
investment
income
(loss)c | Net
realized
and
unrealized
gain (loss)
on
investments | Total
income
(loss) from
investment
operations | From net
investment
income | From net
realized
gains | Total
distributions | Net
asset
value,
end of
the
period | Total
returnl,m | Net
assets,
end of
the
period
(000’s) | Ratio of
expenses
to average
daily net
assets | Net
investment
income
(loss) to
average
daily net
assets |
Administrative Class | | | | | | | | | | |
9/30/20 | $ 13.57 | $ 0.06 | $ 0.26 | $ 0.32 | $ (0.02) | $ (0.07) | $ (0.09) | $ 13.80 | 2.27% | $ 18,422 | 0.99% | 0.48% |
9/30/19 | 16.29 | 0.07 | (1.41) | (1.34) | (0.02) | (1.36) | (1.38) | 13.57 | (7.28%) | 20,377 | 1.00% | 0.51% |
9/30/18 | 16.25 | 0.07 | 1.94 | 2.01 | (0.03) | (1.94) | (1.97) | 16.29 | 13.59% | 26,503 | 0.99% | 0.42% |
9/30/17 | 13.68 | 0.07 | 2.98 | 3.05 | (0.14) | (0.34) | (0.48) | 16.25 | 22.75% | 23,967 | 1.00% | 0.44% |
9/30/16 | 13.72 | 0.12 | 1.29 | 1.41 | (0.06) | (1.39) | (1.45) | 13.68 | 11.17% | 17,641 | 1.01% | 0.94% |
Class A | | | | | | | | | | | |
9/30/20 | $ 13.21 | $ 0.03 | $ 0.25 | $ 0.28 | $ — | $ (0.07) | $ (0.07) | $ 13.42 | 2.07% | $ 42,491 | 1.24% | 0.22% |
9/30/19 | 15.92 | 0.03 | (1.38) | (1.35) | — | (1.36) | (1.36) | 13.21 | (7.54%) | 50,524 | 1.25% | 0.26% |
9/30/18 | 15.93 | 0.03 | 1.90 | 1.93 | — | (1.94) | (1.94) | 15.92 | 13.34% | 69,157 | 1.24% | 0.17% |
9/30/17 | 13.42 | 0.03 | 2.92 | 2.95 | (0.10) | (0.34) | (0.44) | 15.93 | 22.42% | 73,462 | 1.25% | 0.19% |
9/30/16 | 13.49 | 0.09 | 1.26 | 1.35 | (0.03) | (1.39) | (1.42) | 13.42 | 10.88% | 69,495 | 1.26% | 0.70% |
Class R4 | | | | | | | | | | | |
9/30/20 | $ 13.12 | $ 0.04 | $ 0.25 | $ 0.29 | $ — | $ (0.07) | $ (0.07) | $ 13.34 | 2.16% | $ 9,413 | 1.14% | 0.32% |
9/30/19 | 15.81 | 0.05 | (1.38) | (1.33) | (0.00)d | (1.36) | (1.36) | 13.12 | (7.43%) | 10,591 | 1.15% | 0.36% |
9/30/18 | 15.83 | 0.04 | 1.89 | 1.93 | (0.01) | (1.94) | (1.95) | 15.81 | 13.42% | 11,773 | 1.14% | 0.26% |
9/30/17 | 13.36 | 0.04 | 2.91 | 2.95 | (0.14) | (0.34) | (0.48) | 15.83 | 22.50% | 9,717 | 1.15% | 0.29% |
9/30/16 | 13.48 | 0.10 | 1.27 | 1.37 | (0.10) | (1.39) | (1.49) | 13.36 | 11.06% | 4,467 | 1.16% | 0.75% |
Class R3 | | | | | | | | | | | |
9/30/20 | $ 13.00 | $ 0.01 | $ 0.24 | $ 0.25 | $ — | $ (0.07) | $ (0.07) | $ 13.18 | 1.87% | $ 6,048 | 1.39% | 0.07% |
9/30/19 | 15.71 | 0.01 | (1.36) | (1.35) | — | (1.36) | (1.36) | 13.00 | (7.66%) | 8,551 | 1.40% | 0.11% |
9/30/18 | 15.77 | 0.00d | 1.88 | 1.88 | — | (1.94) | (1.94) | 15.71 | 13.14% | 10,564 | 1.39% | 0.02% |
9/30/17 | 13.32 | 0.01 | 2.89 | 2.90 | (0.11) | (0.34) | (0.45) | 15.77 | 22.19% | 9,008 | 1.40% | 0.04% |
9/30/16 | 13.46 | 0.07 | 1.25 | 1.32 | (0.07) | (1.39) | (1.46) | 13.32 | 10.72% | 5,524 | 1.41% | 0.51% |
The accompanying notes are an integral part of the financial statements.
219
MassMutual Premier Global Fund – Financial Statements (Continued) |
Financial Highlights (For a share outstanding throughout each period) |
| | | Income (loss) from investment
operations | Less distributions to shareholders | | | Ratios / Supplemental Data |
| | Net
asset
value,
beginning
of the
period | Net
investment
income
(loss)c | Net
realized
and
unrealized
gain (loss)
on
investments | Total
income
(loss) from
investment
operations | From net
investment
income | From net
realized
gains | Total
distributions | Net
asset
value,
end of
the
period | Total
returnl,m | Net
assets,
end of
the
period
(000’s) | Ratio of
expenses
to average
daily net
assets | Net
investment
income
(loss) to
average
daily net
assets |
Class I | | | | | | | | | | | | |
9/30/20 | $ 12.35 | $ 0.00d | $ 2.81 | $ 2.81 | $ (0.09) | $ (0.03) | $ (0.12) | $ 15.04 | 22.90% | $ 75,893 | 0.85% | 0.00%e |
9/30/19 | 16.08 | 0.10 | (0.83) | (0.73) | (0.11) | (2.89) | (3.00) | 12.35 | (1.93%) | 70,159 | 0.84% | 0.79% |
9/30/18 | 16.46 | 0.13 | 1.52 | 1.65 | (0.16) | (1.87) | (2.03) | 16.08 | 10.39% | 50,503 | 0.86% | 0.79% |
9/30/17 | 13.47 | 0.12 | 3.43 | 3.55 | (0.18) | (0.38) | (0.56) | 16.46 | 27.53% | 34,308 | 0.86% | 0.78% |
9/30/16 | 13.94 | 0.11 | 0.66 | 0.77 | (0.14) | (1.10) | (1.24) | 13.47 | 5.50% | 16,576 | 0.85% | 0.85% |
Class R5 | | | | | | | | | | | |
9/30/20 | $ 12.36 | $ (0.01) | $ 2.81 | $ 2.80 | $ (0.08) | $ (0.03) | $ (0.11) | $ 15.05 | 22.77% | $ 111,038 | 0.95% | (0.09%) |
9/30/19 | 16.09 | 0.08 | (0.83) | (0.75) | (0.09) | (2.89) | (2.98) | 12.36 | (2.07%) | 98,379 | 0.94% | 0.66% |
9/30/18 | 16.47 | 0.11 | 1.53 | 1.64 | (0.15) | (1.87) | (2.02) | 16.09 | 10.28% | 101,536 | 0.96% | 0.65% |
9/30/17 | 13.46 | 0.08 | 3.48 | 3.56 | (0.17) | (0.38) | (0.55) | 16.47 | 27.55% | 120,521 | 0.96% | 0.54% |
9/30/16 | 13.93 | 0.12 | 0.63 | 0.75 | (0.12) | (1.10) | (1.22) | 13.46 | 5.37% | 125,171 | 0.95% | 0.89% |
Service Class | | | | | | | | | | | |
9/30/20 | $ 12.23 | $ (0.03) | $ 2.80 | $ 2.77 | $ (0.06) | $ (0.03) | $ (0.09) | $ 14.91 | 22.75% | $ 6,166 | 1.05% | (0.19%) |
9/30/19 | 15.94 | 0.06 | (0.82) | (0.76) | (0.06) | (2.89) | (2.95) | 12.23 | (2.23%) | 6,361 | 1.04% | 0.43% |
9/30/18 | 16.33 | 0.10 | 1.51 | 1.61 | (0.13) | (1.87) | (2.00) | 15.94 | 10.17% | 16,104 | 1.06% | 0.60% |
9/30/17 | 13.35 | 0.07 | 3.44 | 3.51 | (0.15) | (0.38) | (0.53) | 16.33 | 27.37% | 19,086 | 1.06% | 0.46% |
9/30/16 | 13.83 | 0.11 | 0.62 | 0.73 | (0.11) | (1.10) | (1.21) | 13.35 | 5.28% | 28,699 | 1.05% | 0.87% |
| | Year ended September 30 |
| | 2020 | 2019 | 2018 | 2017 | 2016 |
Portfolio turnover rate | 12% | 32% | 42% | 30% | 25% |
c | Per share amount calculated on the average shares method. |
d | Amount is less than $0.005 per share. |
e | Amount is less than 0.005%. |
l | Employee retirement benefit plans that invest plan assets in the Separate Investment Accounts (SIAs) may be subject to certain charges as set forth in their respective Plan Documents. Total return figures would be lower for the periods presented if they reflected these charges. |
m | Total return excludes sales charges, if any, and would be lower for the period presented if it reflected these charges. |
The accompanying notes are an integral part of the financial statements.
220
| | | | | | | |
| | | | | | | |
| | | Income (loss) from investment
operations | Less distributions to shareholders | | | Ratios / Supplemental Data |
| | Net
asset
value,
beginning
of the
period | Net
investment
income
(loss)c | Net
realized
and
unrealized
gain (loss)
on
investments | Total
income
(loss) from
investment
operations | From net
investment
income | From net
realized
gains | Total
distributions | Net
asset
value,
end of
the
period | Total
returnl,m | Net
assets,
end of
the
period
(000’s) | Ratio of
expenses
to average
daily net
assets | Net
investment
income
(loss) to
average
daily net
assets |
Administrative Class | | | | | | | | | | |
9/30/20 | $ 12.34 | $ (0.04) | $ 2.81 | $ 2.77 | $ (0.05) | $ (0.03) | $ (0.08) | $ 15.03 | 22.56% | $ 80,607 | 1.15% | (0.29%) |
9/30/19 | 16.06 | 0.06 | (0.83) | (0.77) | (0.06) | (2.89) | (2.95) | 12.34 | (2.30%) | 77,097 | 1.14% | 0.45% |
9/30/18 | 16.44 | 0.07 | 1.53 | 1.60 | (0.11) | (1.87) | (1.98) | 16.06 | 10.07% | 90,239 | 1.16% | 0.46% |
9/30/17 | 13.44 | 0.05 | 3.47 | 3.52 | (0.14) | (0.38) | (0.52) | 16.44 | 27.24% | 103,200 | 1.16% | 0.36% |
9/30/16 | 13.91 | 0.09 | 0.63 | 0.72 | (0.09) | (1.10) | (1.19) | 13.44 | 5.15% | 99,085 | 1.15% | 0.68% |
Class A | | | | | | | | | | | |
9/30/20 | $ 12.17 | $ (0.07) | $ 2.77 | $ 2.70 | $ (0.02) | $ (0.03) | $ (0.05) | $ 14.82 | 22.22% | $ 22,903 | 1.40% | (0.55%) |
9/30/19 | 15.87 | 0.03 | (0.82) | (0.79) | (0.02) | (2.89) | (2.91) | 12.17 | (2.48%) | 24,676 | 1.39% | 0.20% |
9/30/18 | 16.27 | 0.03 | 1.51 | 1.54 | (0.07) | (1.87) | (1.94) | 15.87 | 9.74% | 31,725 | 1.41% | 0.21% |
9/30/17 | 13.29 | 0.02 | 3.44 | 3.46 | (0.10) | (0.38) | (0.48) | 16.27 | 26.99% | 30,769 | 1.41% | 0.12% |
9/30/16 | 13.77 | 0.06 | 0.61 | 0.67 | (0.05) | (1.10) | (1.15) | 13.29 | 4.85% | 32,200 | 1.40% | 0.44% |
Class R4 | | | | | | | | | | | |
9/30/20 | $ 11.98 | $ (0.06) | $ 2.73 | $ 2.67 | $ (0.03) | $ (0.03) | $ (0.06) | $ 14.59 | 22.36% | $ 8,878 | 1.30% | (0.45%) |
9/30/19 | 15.71 | 0.04 | (0.82) | (0.78) | (0.06) | (2.89) | (2.95) | 11.98 | (2.45%) | 7,531 | 1.29% | 0.32% |
9/30/18 | 16.13 | 0.04 | 1.51 | 1.55 | (0.10) | (1.87) | (1.97) | 15.71 | 9.90% | 7,790 | 1.31% | 0.27% |
9/30/17 | 13.21 | 0.03 | 3.41 | 3.44 | (0.14) | (0.38) | (0.52) | 16.13 | 27.05% | 5,560 | 1.31% | 0.20% |
9/30/16 | 13.74 | 0.09 | 0.61 | 0.70 | (0.13) | (1.10) | (1.23) | 13.21 | 5.05% | 4,322 | 1.30% | 0.73% |
Class R3 | | | | | | | | | | | |
9/30/20 | $ 12.10 | $ (0.09) | $ 2.75 | $ 2.66 | $ (0.01) | $ (0.03) | $ (0.04) | $ 14.72 | 21.99% | $ 9,792 | 1.55% | (0.69%) |
9/30/19 | 15.80 | 0.01 | (0.82) | (0.81) | — | (2.89) | (2.89) | 12.10 | (2.69%) | 10,226 | 1.54% | 0.06% |
9/30/18 | 16.21 | 0.01 | 1.51 | 1.52 | (0.06) | (1.87) | (1.93) | 15.80 | 9.64% | 11,029 | 1.56% | 0.06% |
9/30/17 | 13.27 | (0.00)d | 3.42 | 3.42 | (0.10) | (0.38) | (0.48) | 16.21 | 26.73% | 10,696 | 1.56% | (0.03%) |
9/30/16 | 13.79 | 0.05 | 0.61 | 0.66 | (0.08) | (1.10) | (1.18) | 13.27 | 4.78% | 8,702 | 1.55% | 0.42% |
The accompanying notes are an integral part of the financial statements.
221
MassMutual Premier International Equity Fund – Financial Statements (Continued) |
Financial Highlights (For a share outstanding throughout each period) |
| | | Income (loss) from investment
operations | Less distributions to shareholders | | | Ratios / Supplemental Data |
| | Net
asset
value,
beginning
of the
period | Net
investment
income
(loss)c,j | Net
realized
and
unrealized
gain (loss)
on
investments | Total
income
(loss) from
investment
operations | From net
investment
income | From net
realized
gains | Total
distributions | Net
asset
value,
end of
the
period | Total
returnl,m | Net
assets,
end of
the
period
(000’s) | Ratio of
expenses
to average
daily net
assets
before
expense
waiver | Ratio of
expenses
to average
daily net
assets
after
expense
waiversj | Net
investment
income
(loss) to
average
daily net
assets |
Class I | | | | | | | | | | | | | |
9/30/20 | $ 12.01 | $ 0.03 | $ 1.54 | $ 1.57 | $ (0.13) | $ (0.37) | $ (0.50) | $ 13.08 | 13.17% | $ 96,308 | 1.02% | 1.00% | 0.26% |
9/30/19 | 12.99 | 0.09 | (0.49) | (0.40) | (0.12) | (0.46) | (0.58) | 12.01 | (2.49%) | 149,979 | 0.93% | 0.92% | 0.81% |
9/30/18 | 13.44 | 0.14 | (0.42) | (0.28) | (0.17) | — | (0.17) | 12.99 | (2.14%) | 293,575 | 0.96% | 0.94% | 1.01% |
9/30/17 | 11.97 | 0.18 | 1.61 | 1.79 | (0.15) | (0.17) | (0.32) | 13.44 | 15.60% | 246,510 | 0.96% | 0.94% | 1.46% |
9/30/16 | 11.55 | 0.15 | 0.85 | 1.00 | (0.14) | (0.44) | (0.58) | 11.97 | 8.86% | 195,019 | 0.95% | 0.94% | 1.30% |
Class R5 | | | | | | | | | | | | |
9/30/20 | $ 12.00 | $ 0.02 | $ 1.55 | $ 1.57 | $ (0.12) | $ (0.37) | $ (0.49) | $ 13.08 | 13.14% | $ 61,444 | 1.12% | 1.10% | 0.20% |
9/30/19 | 12.98 | 0.10 | (0.51) | (0.41) | (0.11) | (0.46) | (0.57) | 12.00 | (2.63%) | 94,827 | 1.03% | 1.02% | 0.89% |
9/30/18 | 13.44 | 0.12 | (0.42) | (0.30) | (0.16) | — | (0.16) | 12.98 | (2.32%) | 147,654 | 1.06% | 1.04% | 0.85% |
9/30/17 | 11.97 | 0.17 | 1.61 | 1.78 | (0.14) | (0.17) | (0.31) | 13.44 | 15.47% | 195,316 | 1.06% | 1.04% | 1.38% |
9/30/16 | 11.54 | 0.14 | 0.85 | 0.99 | (0.12) | (0.44) | (0.56) | 11.97 | 8.83% | 221,320 | 1.05% | 1.04% | 1.18% |
Service Class | | | | | | | | | | | | |
9/30/20 | $ 11.97 | $ 0.00d | $ 1.54 | $ 1.54 | $ (0.10) | $ (0.37) | $ (0.47) | $ 13.04 | 12.94% | $ 4,524 | 1.22% | 1.20% | 0.00%e |
9/30/19 | 12.94 | 0.07 | (0.49) | (0.42) | (0.09) | (0.46) | (0.55) | 11.97 | (2.74%) | 9,393 | 1.13% | 1.12% | 0.60% |
9/30/18 | 13.39 | 0.11 | (0.41) | (0.30) | (0.15) | — | (0.15) | 12.94 | (2.33%) | 23,069 | 1.16% | 1.14% | 0.79% |
9/30/17 | 11.93 | 0.15 | 1.61 | 1.76 | (0.13) | (0.17) | (0.30) | 13.39 | 15.33% | 21,422 | 1.16% | 1.14% | 1.25% |
9/30/16 | 11.51 | 0.13 | 0.84 | 0.97 | (0.11) | (0.44) | (0.55) | 11.93 | 8.66% | 22,510 | 1.15% | 1.14% | 1.09% |
| | Year ended September 30 |
| | 2020 | 2019 | 2018 | 2017 | 2016 |
Portfolio turnover rate | 106% | 52% | 70% | 44% | 36% |
c | Per share amount calculated on the average shares method. |
d | Amount is less than $0.005 per share. |
e | Amount is less than 0.005%. |
j | Computed after giving effect to an agreement by MML Advisers to waive certain fees and expenses of the Fund. |
l | Employee retirement benefit plans that invest plan assets in the Separate Investment Accounts (SIAs) may be subject to certain charges as set forth in their respective Plan Documents. Total return figures would be lower for the periods presented if they reflected these charges. |
m | Total return excludes sales charges, if any, and would be lower for the period presented if it reflected these charges. |
The accompanying notes are an integral part of the financial statements.
222
| | | | | | | |
| | | | | | | |
| | | Income (loss) from investment
operations | Less distributions to shareholders | | | Ratios / Supplemental Data |
| | Net
asset
value,
beginning
of the
period | Net
investment
income
(loss)c,j | Net
realized
and
unrealized
gain (loss)
on
investments | Total
income
(loss) from
investment
operations | From net
investment
income | From net
realized
gains | Total
distributions | Net
asset
value,
end of
the
period | Total
returnl,m | Net
assets,
end of
the
period
(000’s) | Ratio of
expenses
to average
daily net
assets
before
expense
waivers | Ratio of
expenses
to average
daily net
assets
after
expense
waiversj | Net
investment
income
(loss) to
average
daily net
assets |
Administrative Class | | | | | | | | | | | |
9/30/20 | $ 11.91 | $ (0.00)d | $ 1.52 | $ 1.52 | $ (0.09) | $ (0.37) | $ (0.46) | $ 12.97 | 12.81% | $ 3,565 | 1.32% | 1.30% | (0.02%) |
9/30/19 | 12.87 | 0.08 | (0.51) | (0.43) | (0.07) | (0.46) | (0.53) | 11.91 | (2.77%) | 5,465 | 1.23% | 1.22% | 0.65% |
9/30/18 | 13.32 | 0.08 | (0.40) | (0.32) | (0.13) | — | (0.13) | 12.87 | (2.49%) | 11,908 | 1.26% | 1.24% | 0.58% |
9/30/17 | 11.87 | 0.15 | 1.58 | 1.73 | (0.11) | (0.17) | (0.28) | 13.32 | 15.19% | 17,968 | 1.26% | 1.24% | 1.22% |
9/30/16 | 11.45 | 0.11 | 0.85 | 0.96 | (0.10) | (0.44) | (0.54) | 11.87 | 8.59% | 18,407 | 1.25% | 1.24% | 0.97% |
Class A | | | | | | | | | | | | |
9/30/20 | $ 11.54 | $ (0.03) | $ 1.48 | $ 1.45 | $ (0.06) | $ (0.37) | $ (0.43) | $ 12.56 | 12.61% | $ 18,670 | 1.57% | 1.55% | (0.22%) |
9/30/19 | 12.49 | 0.05 | (0.50) | (0.45) | (0.04) | (0.46) | (0.50) | 11.54 | (3.09%) | 22,004 | 1.48% | 1.47% | 0.46% |
9/30/18 | 12.93 | 0.05 | (0.39) | (0.34) | (0.10) | — | (0.10) | 12.49 | (2.70%) | 30,719 | 1.51% | 1.49% | 0.41% |
9/30/17 | 11.52 | 0.10 | 1.56 | 1.66 | (0.08) | (0.17) | (0.25) | 12.93 | 14.95% | 39,746 | 1.51% | 1.49% | 0.90% |
9/30/16 | 11.12 | 0.08 | 0.83 | 0.91 | (0.07) | (0.44) | (0.51) | 11.52 | 8.34% | 42,907 | 1.50% | 1.49% | 0.72% |
Class R4 | | | | | | | | | | | | |
9/30/20 | $ 11.43 | $ (0.04) | $ 1.48 | $ 1.44 | $ (0.05) | $ (0.37) | $ (0.42) | $ 12.45 | 12.70% | $ 1,951 | 1.47% | 1.45% | (0.31%) |
9/30/19 | 12.38 | 0.05 | (0.48) | (0.43) | (0.06) | (0.46) | (0.52) | 11.43 | (2.95%) | 4,895 | 1.38% | 1.37% | 0.48% |
9/30/18 | 12.84 | 0.07 | (0.40) | (0.33) | (0.13) | — | (0.13) | 12.38 | (2.63%) | 10,673 | 1.41% | 1.39% | 0.54% |
9/30/17 | 11.47 | 0.13 | 1.53 | 1.66 | (0.12) | (0.17) | (0.29) | 12.84 | 15.10% | 10,932 | 1.41% | 1.39% | 1.10% |
9/30/16 | 11.11 | 0.14 | 0.77 | 0.91 | (0.11) | (0.44) | (0.55) | 11.47 | 8.42% | 3,648 | 1.40% | 1.39% | 1.28% |
Class R3 | | | | | | | | | | | | |
9/30/20 | $ 11.38 | $ (0.06) | $ 1.47 | $ 1.41 | $ (0.04) | $ (0.37) | $ (0.41) | $ 12.38 | 12.42% | $ 2,427 | 1.72% | 1.70% | (0.49%) |
9/30/19 | 12.34 | 0.02 | (0.48) | (0.46) | (0.04) | (0.46) | (0.50) | 11.38 | (3.24%) | 5,415 | 1.63% | 1.62% | 0.21% |
9/30/18 | 12.79 | 0.03 | (0.39) | (0.36) | (0.09) | — | (0.09) | 12.34 | (2.88%) | 9,024 | 1.66% | 1.64% | 0.25% |
9/30/17 | 11.43 | 0.09 | 1.54 | 1.63 | (0.10) | (0.17) | (0.27) | 12.79 | 14.77% | 9,045 | 1.66% | 1.64% | 0.77% |
9/30/16 | 11.09 | 0.09 | 0.80 | 0.89 | (0.11) | (0.44) | (0.55) | 11.43 | 8.24% | 3,618 | 1.65% | 1.64% | 0.82% |
The accompanying notes are an integral part of the financial statements.
223
MassMutual Premier Strategic Emerging Markets Fund – Financial Statements (Continued) |
Financial Highlights (For a share outstanding throughout each period) |
| | | Income (loss) from investment
operations | Less distributions to shareholders | | | Ratios / Supplemental Data |
| | Net
asset
value,
beginning
of the
period | Net
investment
income
(loss)c,j | Net
realized
and
unrealized
gain (loss)
on
investments | Total
income
(loss) from
investment
operations | From net
investment
income | From net
realized
gains | Total
distributions | Net
asset
value,
end of
the
period | Total
returnl,m | Net
assets,
end of
the
period
(000’s) | Ratio of
expenses
to average
daily net
assets
before
expense
waivers | Ratio of
expenses
to average
daily net
assets
after
expense
waiversj | Net
investment
income
(loss) to
average
daily net
assets |
Class I | | | | | | | | | | | | | |
9/30/20 | $ 13.02 | $ 0.02 | $ 1.33 | $ 1.35 | $ (0.08) | $ (1.06) | $ (1.14) | $ 13.23 | 10.33% | $ 169,366 | 1.27% | 1.15% | 0.12% |
9/30/19 | 12.75 | 0.07 | 0.28 | 0.35 | (0.08) | — | (0.08) | 13.02 | 2.85% | 141,988 | 1.21% | 1.10% | 0.55% |
9/30/18 | 12.88 | 0.08 | (0.04) | 0.04 | (0.17) | — | (0.17) | 12.75 | 0.31% | 216,085 | 1.27% | 1.05% | 0.62% |
9/30/17 | 10.79 | 0.07 | 2.14 | 2.21 | (0.12) | — | (0.12) | 12.88 | 20.85% | 236,991 | 1.28% | 1.05% | 0.65% |
9/30/16 | 9.19 | 0.07 | 1.61 | 1.68 | (0.08) | — | (0.08) | 10.79 | 18.36% | 204,626 | 1.31% | 1.05% | 0.69% |
Class R5 | | | | | | | | | | | | |
9/30/20 | $ 13.20 | $ 0.00d | $ 1.35 | $ 1.35 | $ (0.06) | $ (1.06) | $ (1.12) | $ 13.43 | 10.23% | $ 3,165 | 1.37% | 1.25% | 0.02% |
9/30/19 | 12.92 | 0.06 | 0.29 | 0.35 | (0.07) | — | (0.07) | 13.20 | 2.78% | 4,295 | 1.31% | 1.22% | 0.45% |
9/30/18 | 13.05 | 0.07 | (0.04) | 0.03 | (0.16) | — | (0.16) | 12.92 | 0.21% | 4,047 | 1.37% | 1.15% | 0.53% |
9/30/17 | 10.94 | 0.06 | 2.16 | 2.22 | (0.11) | — | (0.11) | 13.05 | 20.59% | 3,887 | 1.38% | 1.15% | 0.54% |
9/30/16 | 9.30 | 0.04 | 1.65 | 1.69 | (0.05) | — | (0.05) | 10.94 | 18.22% | 3,148 | 1.41% | 1.15% | 0.38% |
Service Class | | | | | | | | | | | | |
9/30/20 | $ 13.05 | $ (0.01) | $ 1.33 | $ 1.32 | $ (0.06) | $ (1.06) | $ (1.12) | $ 13.25 | 10.12% | $ 2,473 | 1.47% | 1.35% | (0.05%) |
9/30/19 | 12.73 | 0.05 | 0.29 | 0.34 | (0.02) | — | (0.02) | 13.05 | 2.71% | 419 | 1.41% | 1.31% | 0.42% |
9/30/18 | 12.85 | 0.05 | (0.03) | 0.02 | (0.14) | — | (0.14) | 12.73 | 0.10% | 230 | 1.47% | 1.25% | 0.41% |
9/30/17 | 10.78 | (0.02) | 2.19 | 2.17 | (0.10) | — | (0.10) | 12.85 | 20.41% | 434 | 1.48% | 1.25% | (0.20%) |
9/30/16 | 9.17 | 0.04 | 1.63 | 1.67 | (0.06) | — | (0.06) | 10.78 | 18.27% | 8,238 | 1.51% | 1.25% | 0.43% |
| | Year ended September 30 |
| | 2020 | 2019 | 2018 | 2017 | 2016 |
Portfolio turnover rate | 71% | 32% | 38% | 51% | 33% |
c | Per share amount calculated on the average shares method. |
d | Amount is less than $0.005 per share. |
j | Computed after giving effect to an agreement by MML Advisers to waive certain fees and expenses of the Fund. |
l | Employee retirement benefit plans that invest plan assets in the Separate Investment Accounts (SIAs) may be subject to certain charges as set forth in their respective Plan Documents. Total return figures would be lower for the periods presented if they reflected these charges. |
m | Total return excludes sales charges, if any, and would be lower for the period presented if it reflected these charges. |
The accompanying notes are an integral part of the financial statements.
224
| | | | | | | |
| | | | | | | |
| | | Income (loss) from investment
operations | Less distributions to shareholders | | | Ratios / Supplemental Data |
| | Net
asset
value,
beginning
of the
period | Net
investment
income
(loss)c,j | Net
realized
and
unrealized
gain (loss)
on
investments | Total
income
(loss) from
investment
operations | From net
investment
income | From net
realized
gains | Total
distributions | Net
asset
value,
end of
the
period | Total
returnl,m | Net
assets,
end of
the
period
(000’s) | Ratio of
expenses
to average
daily net
assets
before
expense
waivers | Ratio of
expenses
to average
daily net
assets
after
expense
waiversj | Net
investment
income
(loss) to
average
daily net
assets |
Administrative Class | | | | | | | | | | | |
9/30/20 | $ 13.08 | $ (0.02) | $ 1.33 | $ 1.31 | $ (0.04) | $ (1.06) | (1.10) | $ 13.29 | 9.96% | $ 989 | 1.57% | 1.45% | (0.16%) |
9/30/19 | 12.78 | 0.03 | 0.30 | 0.33 | (0.03) | — | (0.03) | 13.08 | 2.61% | 927 | 1.51% | 1.41% | 0.24% |
9/30/18 | 12.91 | 0.04 | (0.03) | 0.01 | (0.14) | — | (0.14) | 12.78 | 0.02% | 879 | 1.57% | 1.35% | 0.33% |
9/30/17 | 10.84 | 0.05 | 2.13 | 2.18 | (0.11) | — | (0.11) | 12.91 | 20.35% | 1,565 | 1.58% | 1.35% | 0.41% |
9/30/16 | 9.23 | 0.04 | 1.62 | 1.66 | (0.05) | — | (0.05) | 10.84 | 18.02% | 677 | 1.61% | 1.35% | 0.42% |
Class A | | | | | | | | | | | | |
9/30/20 | $ 12.98 | $ (0.05) | $ 1.32 | $ 1.27 | $ (0.02) | $ (1.06) | $ (1.08) | $ 13.17 | 9.75% | $ 2,029 | 1.82% | 1.70% | (0.42%) |
9/30/19 | 12.73 | 0.01 | 0.28 | 0.29 | (0.04) | — | (0.04) | 12.98 | 2.32% | 885 | 1.76% | 1.68% | 0.09% |
9/30/18 | 12.88 | 0.04 | (0.07) | (0.03) | (0.12) | — | (0.12) | 12.73 | (0.23%) | 386 | 1.82% | 1.60% | 0.30% |
9/30/17 | 10.74 | 0.02 | 2.14 | 2.16 | (0.02) | — | (0.02) | 12.88 | 20.18% | 118 | 1.83% | 1.60% | 0.14% |
9/30/16 | 9.13 | 0.01 | 1.60 | 1.61 | (0.00)d | — | (0.00)d | 10.74 | 17.68% | 95 | 1.86% | 1.60% | 0.11% |
Class R4 | | | | | | | | | | | | |
9/30/20 | $ 12.90 | $ (0.04) | $ 1.32 | $ 1.28 | $ (0.02) | $ (1.06) | (1.08) | $ 13.10 | 9.84% | $ 1,237 | 1.72% | 1.60% | (0.30%) |
9/30/19 | 12.63 | 0.01 | 0.29 | 0.30 | (0.03) | — | (0.03) | 12.90 | 2.38% | 1,337 | 1.66% | 1.57% | 0.05% |
9/30/18 | 12.76 | 0.03 | (0.04) | (0.01) | (0.12) | — | (0.12) | 12.63 | (0.10%) | 1,295 | 1.72% | 1.50% | 0.22% |
9/30/17 | 10.72 | 0.03 | 2.11 | 2.14 | (0.10) | — | (0.10) | 12.76 | 20.23% | 1,019 | 1.73% | 1.50% | 0.24% |
9/30/16 | 9.14 | 0.02 | 1.61 | 1.63 | (0.05) | — | (0.05) | 10.72 | 17.87% | 599 | 1.76% | 1.50% | 0.23% |
Class R3 | | | | | | | | | | | | |
9/30/20 | $ 12.87 | $ (0.07) | $ 1.31 | $ 1.24 | $ (0.00)d | $ (1.06) | $ (1.06) | $ 13.05 | 9.57% | $ 992 | 1.97% | 1.85% | (0.58%) |
9/30/19 | 12.60 | (0.02) | 0.29 | 0.27 | — | — | — | 12.87 | 2.14% | 750 | 1.91% | 1.81% | (0.15%) |
9/30/18 | 12.73 | (0.01) | (0.04) | (0.05) | (0.08) | — | (0.08) | 12.60 | (0.39%) | 761 | 1.97% | 1.75% | (0.09%) |
9/30/17 | 10.70 | (0.01) | 2.12 | 2.11 | (0.08) | — | (0.08) | 12.73 | 19.88% | 821 | 1.98% | 1.75% | (0.07%) |
9/30/16 | 9.12 | 0.00d | 1.61 | 1.61 | (0.03) | — | (0.03) | 10.70 | 17.66% | 642 | 2.01% | 1.75% | 0.04% |
The accompanying notes are an integral part of the financial statements.
225
Notes to Financial Statements |
MassMutual Premier Funds (the “Trust”) is registered under the Investment Company Act of 1940, as amended (the “1940 Act”), as an open-end management investment company. The Trust is organized under the laws of the Commonwealth of Massachusetts as a Massachusetts business trust pursuant to an Agreement and Declaration of Trust dated August 1, 1994, as amended and restated as of November 21, 2011, as it may be further amended from time to time. The following are 14 series of the Trust (each individually referred to as a “Fund” or collectively as the “Funds”):
MassMutual Premier U.S. Government Money Market Fund (“U.S. Government Money Market Fund”)
MassMutual Premier Short-Duration Bond Fund (“Short-Duration Bond Fund”)
MassMutual Premier Inflation-Protected and Income Fund (“Inflation-Protected and Income Fund”)
MassMutual Premier Core Bond Fund (“Core Bond Fund”)
MassMutual Premier Diversified Bond Fund (“Diversified Bond Fund”)
MassMutual Premier High Yield Fund (“High Yield Fund”)
MassMutual Premier Balanced Fund (“Balanced Fund”)
MassMutual Premier Disciplined Value Fund (“Disciplined Value Fund”)
MassMutual Premier Main Street Fund (“Main Street Fund”)
MassMutual Premier Disciplined Growth Fund (“Disciplined Growth Fund”)
MassMutual Premier Small Cap Opportunities Fund (“Small Cap Opportunities Fund”)
MassMutual Premier Global Fund (“Global Fund”)
MassMutual Premier International Equity Fund (“International Equity Fund”)
MassMutual Premier Strategic Emerging Markets Fund (“Strategic Emerging Markets Fund”)
Each share class of a Fund represents an interest in the same portfolio of assets. The principal difference among the classes is the level of service and administration fees, and shareholder and distribution service expenses borne by the classes. Because each class will have different fees and expenses, performance and share prices will vary between the classes. The classes of shares are offered to different types of investors, as outlined in the Funds’ Prospectus.
2. | Significant Accounting Policies |
The following is a summary of significant accounting policies followed consistently by each Fund in the preparation of the financial statements in conformity with accounting principles generally accepted in the United States of America (“generally accepted accounting principles”). The preparation of the financial statements in accordance with generally accepted accounting principles requires management to make estimates and assumptions that affect the reported amounts and disclosures in the financial statements. Actual results could differ from those estimates.
Each Fund is an investment company and accordingly follows the investment company accounting and reporting guidance of the Financial Accounting Standards Board (“FASB”) Accounting Standards Codification Topic 946, Financial Services – Investment Companies.
Investment Valuation
The net asset value of each Fund’s shares is determined once daily as of the close of regular trading on the New York Stock Exchange (“NYSE”), on each day the NYSE is open for trading (a “business day”). The NYSE normally closes at 4:00 p.m. Eastern Time, but may close earlier on some days. If the NYSE is scheduled to close early, the business day will be considered to end as of the time of the NYSE’s scheduled close. A Fund will not treat an intraday disruption in NYSE trading or other event that causes an unscheduled closing of the NYSE as a close of business of the NYSE for these purposes and will instead fair value securities in accordance with procedures approved annually by the Board of Trustees (“Trustees”), and under the general oversight of the Trustees. On holidays and other days when the NYSE is closed, each Fund’s net asset value generally is not calculated and the Funds do not anticipate accepting buy or sell orders. However, the value of each Fund’s assets may still be affected on such days to the extent that a Fund holds foreign securities that trade on days that foreign securities markets are open.
226
Notes to Financial Statements (Continued) |
Equity securities and derivative contracts that are actively traded on a national securities exchange or contract market are valued on the basis of information furnished by a pricing service, which provides the last reported sale price, or, in the case of futures contracts, the settlement price, for securities or derivatives listed on the exchange or contract market or the official closing price on the NASDAQ National Market System (“NASDAQ System”), or in the case of over-the-counter (“OTC”) securities for which an official closing price is unavailable or not reported on the NASDAQ System, the last reported bid price. Portfolio securities traded on more than one national securities exchange are valued at the last price at the close of the exchange representing the principal market for such securities. Debt securities (with the exception of debt securities held by the U.S. Government Money Market Fund) are valued on the basis of valuations furnished by a pricing service, which generally determines valuations taking into account factors such as institutional-size trading in similar securities, yield, quality, coupon rate, maturity, type of issue, trading characteristics, and other market data. Shares of other open-end mutual funds are valued at their closing net asset values as reported on each business day. The U.S. Government Money Market Fund’s debt securities are typically valued at amortized cost, but may be valued using a vendor quote if the Fund’s investment adviser determines it more closely approximates current market value, in accordance with Rule 2a-7 under the 1940 Act pursuant to which the U.S. Government Money Market Fund must adhere to certain conditions. It is the intention of the U.S. Government Money Market Fund to maintain a stable net asset value per share of $1.00, although this cannot be assured.
Investments for which market quotations are readily available are marked to market daily based on those quotations. Market quotations may be provided by third-party vendors or market makers, and may be determined on the basis of a variety of factors, such as broker quotations, financial modeling, and other market data, such as market indexes and yield curves, counterparty information, and foreign exchange rates. U.S. Government and agency securities may be valued on the basis of market quotations or using a model that may incorporate market observable data such as reported sales of similar securities, broker quotes, yields, bids, offers, quoted market prices, and reference data. The fair values of OTC derivative contracts, including forward, swap, and option contracts related to interest rates, foreign currencies, credit standing of reference entities, equity prices, or commodity prices, may be based on market quotations or may be modeled using a series of techniques, including simulation models, depending on the contract and the terms of the transaction. The fair values of asset-backed securities and mortgage-backed securities are estimated based on models that consider the estimated cash flows of each debt tranche of the issuer, established benchmark yield, and estimated tranche-specific spread to the benchmark yield based on the unique attributes of the tranche, including, but not limited to, prepayment speed assumptions and attributes of the collateral. Restricted securities are generally valued at a discount to similar publicly traded securities.
Investments for which market quotations are not available or for which a pricing service or vendor does not provide a value, or for which such market quotations or values are considered by the investment adviser or subadviser to be unreliable (including, for example, certain foreign securities, thinly-traded securities, certain restricted securities, certain initial public offerings, or securities whose values may have been affected by a significant event) are stated at fair valuations determined in good faith by the Funds’ Valuation Committee1 in accordance with procedures approved annually by the Trustees, and under the general oversight of the Trustees. The Funds’ Valuation Committee employs various methods to determine fair valuations including a regular review of significant inputs and assumptions and review of any related market activity. The Funds’ Valuation Committee reports to the Trustees at its regularly scheduled meetings. It is possible that fair value prices will be used by the Funds to a significant extent. The value determined for an investment using the Funds’ fair value procedures may differ from recent market prices for the investment and may be significantly different from the value realized upon the sale of such investment.
The Funds may invest in securities that are traded principally in foreign markets and that trade on weekends and other days when the Funds do not price their shares. As a result, the values of the Funds’ portfolio securities may change on days when the prices of the Funds’ shares are not calculated. The prices of the Funds’ shares will reflect any such changes when the prices of the Funds’ shares are next calculated, which is the next business day. The Funds may use fair value pricing more frequently for securities primarily traded in foreign markets because, among other things, most foreign markets close well before the Funds value their securities. The earlier close of these foreign markets gives rise to the possibility that significant events, including
1 | The voting members of the Valuation Committee consist of the President, Treasurer, Assistant Treasurers, Vice Presidents (except for the CCO, Secretary, and Assistant Secretaries) of the Trust, as well as such other members as the Trustees may from time to time designate. The non-voting members of the Valuation Committee consist of the CCO, Secretary, and Assistant Secretaries. The Valuation Committee reviews and determines the fair valuation of portfolio securities and the Funds’ pricing procedures in general. |
227
Notes to Financial Statements (Continued) |
broad market moves, may have occurred in the interim. The Funds’ investments may be priced based on fair values provided by a third-party vendor, based on certain factors and methodologies applied by such vendor, in the event that there is movement in the U.S. market, between the close of the foreign market and the time the Funds calculate their net asset values. All assets and liabilities expressed in foreign currencies are converted into U.S. dollars at the mean between the buying and selling rates of such currencies against the U.S. dollar at the end of each business day.
For investments in equity or debt issued by privately held companies or funds (“Private Company” or collectively, the “Private Companies”) and any other investments fair valued using significant unobservable inputs, as described below, the fair valuation approaches used by third party service providers and/or the Funds’ subadvisers utilize one or a combination of, but not limited to, the following inputs:
Market approach: (i) recent market transactions, including subsequent rounds of financing, in the underlying investment or comparable issuers; (ii) recapitalizations and other transactions across the capital structure; and (iii) market multiples of comparable issuers.
Income approach: (i) future cash flows discounted to present value and adjusted as appropriate for liquidity, credit, and/or market risks; (ii) quoted prices for similar investments or assets in active markets; and (iii) other risk factors, such as interest rates, yield curves, volatilities, prepayment speeds, loss severities, credit risks, recovery rates, liquidation amounts, and/or default rates.
Cost approach: (i) audited or unaudited financial statements, investor communications, and financial or operational metrics issued by the Private Company; (ii) changes in the valuation of relevant indices or publicly traded companies comparable to the Private Company; (iii) relevant news and other public sources; and (iv) known secondary market transactions in the Private Company’s interests and merger or acquisition activity in companies comparable to the Private Company.
Investments in series of preferred stock issued by Private Companies are typically valued utilizing Market approach in determining the enterprise value of the company. Such investments often contain rights and preferences that differ from other series of preferred and common stock of the same issuer. Valuation techniques such as the current value method (“CVM”), an option pricing model (“OPM”), a probability weighted expected return model (“PWERM”), or a hybrid of those techniques are used in allocating enterprise value of the company, as deemed appropriate under the circumstances. The CVM allocates value among the various parts of a company’s capital structure assuming that the value of convertible preferred stock is represented by the most favorable claim the preferred stockholders have on the enterprise value as of the valuation date. The use of OPM and PWERM techniques involve a determination of the exit scenarios of the investment in order to appropriately allocate the enterprise value of the company among the various parts of its capital structure.
The Private Companies are not subject to the public company disclosure, timing, and reporting standards as other investments held by a Fund. Typically, the most recently available information for a Private Company is as of a date that is earlier than the date a Fund is calculating its net asset value. This factor may result in a difference between the value of the investment and the price a Fund could receive upon the sale of the investment.
Fair value is defined as the price that would be received to sell an asset or paid to transfer a liability in an orderly transaction between market participants at the measurement date. A three-tier hierarchy is utilized to maximize the use of observable market data inputs and minimize the use of unobservable inputs and to establish classification of fair value measurements for disclosure purposes. Inputs refer broadly to the assumptions that market participants would use in pricing the asset or liability, including assumptions about risk, for example, the risk inherent in a particular valuation technique used to measure fair value (such as a pricing model) and/or the risk inherent in the inputs to the valuation technique. Inputs may be observable or unobservable. Observable inputs are inputs that reflect the assumptions market participants would use in pricing the asset or liability and are developed based on market data obtained from sources independent of the reporting entity. Unobservable inputs are inputs that reflect the reporting entity’s own assumptions about the assumptions market participants would use in pricing the asset or liability and are developed based on the best information available in the circumstances. The three-tier hierarchy of inputs is summarized
228
Notes to Financial Statements (Continued) |
in the three broad Levels listed below. The inputs or methodology used for valuing investments are not necessarily an indication of the risk associated with investing in those investments and the determination of the significance of a particular input to the fair value measurement in its entirety requires judgment and consideration of factors specific to each security.
Level 1 – quoted prices (unadjusted) in active markets for identical investments that the Funds can access at the measurement date
Level 2 – other significant observable inputs (including quoted prices for similar investments, interest rates, prepayment speeds, credit risk, etc.)
Level 3 – significant unobservable inputs, to the extent observable inputs are not available (including the Funds’ own assumptions in determining the fair value of investments)
The availability of observable inputs can vary from security to security and is affected by a wide variety of factors, including, for example, the type of security, whether the security is new and not yet established in the marketplace, the liquidity of markets, and other characteristics particular to the security. To the extent that valuation is based on models or inputs that are less observable or unobservable in the market, the determination of fair value requires more judgment. Accordingly, the degree of judgment exercised in determining fair value is greatest for instruments categorized in Level 3.
Changes in valuation techniques may result in transfers in or out of an investment’s assigned Level within the hierarchy. In addition, in periods of market dislocation, the observability of prices and inputs may be reduced for many instruments. This condition, as well as changes related to liquidity of investments, could cause a security to be reclassified between Levels.
In certain cases, the inputs used to measure fair value may fall into different Levels of the fair value hierarchy. In such cases, for disclosure purposes, the Level in the fair value hierarchy within which the fair value measurement falls is determined based on the lowest Level input that is significant to the overall fair value measurement.
The U.S.Government Money Market Fund characterized all investments at Level 2, as of September 30, 2020. The Disciplined Value Fund, Disciplined Growth Fund, and Small Cap Opportunities Fund characterized all long-term investments at Level 1, and all short-term investments at Level 2, as of September 30, 2020. For each Fund noted in the preceding sentences, the level classification by major category of investments is the same as the category presentation in the Portfolio of Investments.
The following is the aggregate value by input level, as of September 30, 2020, for the remaining Funds’ investments:
| | | Level 1 | | | Level 2 | | | Level 3 | | | Total | |
Short-Duration Bond Fund | | | | | | | | | | | | | | | | |
Asset Investments | | | | | | | | | | | | | | | | |
Corporate Debt | | $ | — | | | $ | 175,213,992 | | | $ | — | | | $ | 175,213,992 | |
Municipal Obligations | | | — | | | | 672,706 | | | | — | | | | 672,706 | |
Non-U.S. Government Agency Obligations | | | — | | | | 223,844,362 | | | | — | | | | 223,844,362 | |
U.S. Government Agency Obligations and Instrumentalities | | | — | | | | 4,394,710 | | | | — | | | | 4,394,710 | |
U.S. Treasury Obligations | | | — | | | | 1,871,469 | | | | — | | | | 1,871,469 | |
Purchased Options | | | — | | | | 395,550 | | | | — | | | | 395,550 | |
Short-Term Investments | | | — | | | | 22,996,344 | | | | — | | | | 22,996,344 | |
Total Investments | | $ | — | | | $ | 429,389,133 | | | $ | — | | | $ | 429,389,133 | |
Asset Derivatives | | | | | | | | | | | | | | | | |
Futures Contracts | | $ | 48,942 | | | $ | — | | | $ | — | | | $ | 48,942 | |
Liability Derivatives | | | | | | | | | | | | | | | | |
Futures Contracts | | $ | (568,587 | ) | | $ | — | | | $ | — | | | $ | (568,587 | ) |
Swap Agreements | | | — | | | | (87,533 | ) | | | — | | | | (87,533 | ) |
Total | | $ | (568,587 | ) | | $ | (87,533 | ) | | $ | — | | | $ | (656,120 | ) |
229
Notes to Financial Statements (Continued) |
| | | Level 1 | | | Level 2 | | | Level 3 | | | Total | |
Inflation-Protected and Income Fund | | | | | | | | | | | | | | | | |
Asset Investments | | | | | | | | | | | | | | | | |
Municipal Obligations | | $ | — | | | $ | 49,952 | | | $ | — | | | $ | 49,952 | |
Non-U.S. Government Agency Obligations | | | — | | | | 219,247,498 | | | | — | | | | 219,247,498 | |
U.S. Government Agency Obligations and Instrumentalities | | | — | | | | 16,418,997 | | | | — | | | | 16,418,997 | |
U.S. Treasury Obligations | | | — | | | | 79,458,358 | | | | — | | | | 79,458,358 | |
Purchased Options | | | — | | | | 736,405 | | | | — | | | | 736,405 | |
Short-Term Investments | | | — | | | | 50,452,632 | | | | — | | | | 50,452,632 | |
Total Investments | | $ | — | | | $ | 366,363,842 | | | $ | — | | | $ | 366,363,842 | |
Asset Derivatives | | | | | | | | | | | | | | | | |
Futures Contracts | | $ | 27,524 | | | $ | — | | | $ | — | | | $ | 27,524 | |
Swap Agreements | | | — | | | | 6,410,876 | | | | — | | | | 6,410,876 | |
Total | | $ | 27,524 | | | $ | 6,410,876 | | | $ | — | | | $ | 6,438,400 | |
Liability Derivatives | | | | | | | | | | | | | | | | |
Futures Contracts | | $ | (19,434 | ) | | $ | — | | | $ | — | | | $ | (19,434 | ) |
Swap Agreements | | | — | | | | (375,701 | ) | | | — | | | | (375,701 | ) |
Total | | $ | (19,434 | ) | | $ | (375,701 | ) | | $ | — | | | $ | (395,135 | ) |
| | | | | | | | | | | | | | | | | |
Core Bond Fund | | | | | | | | | | | | | | | | |
Asset Investments | | | | | | | | | | | | | | | | |
Preferred Stock | | $ | 3,376,100 | | | $ | — | | | $ | — | | | $ | 3,376,100 | |
Corporate Debt | | | — | | | | 528,705,554 | | | | — | | | | 528,705,554 | |
Municipal Obligations | | | — | | | | 3,915,865 | | | | — | | | | 3,915,865 | |
Non-U.S. Government Agency Obligations | | | — | | | | 431,395,799 | | | | — | | | | 431,395,799 | |
Sovereign Debt Obligations | | | — | | | | 9,815,484 | | | | — | | | | 9,815,484 | |
U.S. Government Agency Obligations and Instrumentalities | | | — | | | | 307,225,209 | | | | — | | | | 307,225,209 | |
U.S. Treasury Obligations | | | — | | | | 40,315,625 | | | | — | | | | 40,315,625 | |
Purchased Options | | | — | | | | 2,487,476 | | | | — | | | | 2,487,476 | |
Short-Term Investments | | | — | | | | 215,336,765 | | | | — | | | | 215,336,765 | |
Total Investments | | $ | 3,376,100 | | | $ | 1,539,197,777 | | | $ | — | | | $ | 1,542,573,877 | |
Asset Derivatives | | | | | | | | | | | | | | | | |
Futures Contracts | | $ | 182,908 | | | $ | — | | | $ | — | | | $ | 182,908 | |
Liability Derivatives | | | | | | | | | | | | | | | | |
Futures Contracts | | $ | (2,052,243 | ) | | $ | — | | | $ | — | | | $ | (2,052,243 | ) |
Swap Agreements | | | — | | | | (241,756 | ) | | | — | | | | (241,756 | ) |
Total | | $ | (2,052,243 | ) | | $ | (241,756 | ) | | $ | — | | | $ | (2,293,999 | ) |
| | | | | | | | | | | | | | | | | |
Diversified Bond Fund | | | | | | | | | | | | | | | | |
Asset Investments | | | | | | | | | | | | | | | | |
Common Stock | | $ | 13,996 | | | $ | 807 | | | $ | — | | | $ | 14,803 | |
Preferred Stock | | | 259,700 | | | | — | | | | — | | | | 259,700 | |
Corporate Debt | | | — | | | | 107,897,225 | | | | 21,941 | ** | | | 107,919,166 | |
Non-U.S. Government Agency Obligations | | | — | | | | 68,165,122 | | | | — | | | | 68,165,122 | |
Sovereign Debt Obligations | | | — | | | | 1,736,742 | | | | — | | | | 1,736,742 | |
U.S. Government Agency Obligations and Instrumentalities | | | — | | | | 38,010,003 | | | | — | | | | 38,010,003 | |
U.S. Treasury Obligations | | | — | | | | 6,139,531 | | | | — | | | | 6,139,531 | |
Purchased Options | | | — | | | | 471,770 | | | | — | | | | 471,770 | |
Warrants | | | — | | | | — | | | | 3,780 | ** | | | 3,780 | |
Short-Term Investments | | | — | | | | 28,980,000 | | | | — | | | | 28,980,000 | |
Total Investments | | $ | 273,696 | | | $ | 251,401,200 | | | $ | 25,721 | | | $ | 251,700,617 | |
230
Notes to Financial Statements (Continued) |
| | | Level 1 | | | Level 2 | | | Level 3 | | | Total | |
Diversified Bond Fund (Continued) | | | | | | | | | | | | | | | | |
Asset Derivatives | | | | | | | | | | | | | | | | |
Forwards Contracts | | $ | — | | | $ | 79,848 | | | $ | — | | | $ | 79,848 | |
Futures Contracts | | | 16,122 | | | | — | | | | — | | | | 16,122 | |
Total | | $ | 16,122 | | | $ | 79,848 | | | $ | — | | | $ | 95,970 | |
Liability Derivatives | | | | | | | | | | | | | | | | |
Forwards Contracts | | $ | — | | | $ | (66,567 | ) | | $ | — | | | $ | (66,567 | ) |
Futures Contracts | | | (333,821 | ) | | | — | | | | — | | | | (333,821 | ) |
Swap Agreements | | | — | | | | (41,682 | ) | | | — | | | | (41,682 | ) |
Total | | $ | (333,821 | ) | | $ | (108,249 | ) | | $ | — | | | $ | (442,070 | ) |
| | | | | | | | | | | | | | | | | |
High Yield Fund | | | | | | | | | | | | | | | | |
Asset Investments | | | | | | | | | | | | | | | | |
Common Stock | | $ | 457,679 | | | $ | 10,456 | | | $ | — | | | $ | 468,135 | |
Bank Loans | | | — | | | | 19,477,109 | | | | — | | | | 19,477,109 | |
Corporate Debt | | | — | | | | 538,298,406 | | | | 717,488 | ** | | | 539,015,894 | |
Warrants | | | — | | | | — | | | | — | +** | | | — | |
Short-Term Investments | | | — | | | | 16,996,587 | | | | — | | | | 16,996,587 | |
Total Investments | | $ | 457,679 | | | $ | 574,782,558 | | | $ | 717,488 | | | $ | 575,957,725 | |
| | | | | | | | | | | | | | | | | |
Balanced Fund | | | | | | | | | | | | | | | | |
Asset Investments | | | | | | | | | | | | | | | | |
Common Stock | | $ | 75,227,519 | | | $ | — | | | $ | — | | | $ | 75,227,519 | |
Preferred Stock | | | 129,850 | | | | — | | | | — | | | | 129,850 | |
Corporate Debt | | | — | | | | 17,309,297 | | | | — | | | | 17,309,297 | |
Municipal Obligations | | | — | | | | 210,597 | | | | — | | | | 210,597 | |
Non-U.S. Government Agency Obligations | | | — | | | | 13,613,797 | | | | — | | | | 13,613,797 | |
Sovereign Debt Obligations | | | — | | | | 323,449 | | | | — | | | | 323,449 | |
U.S. Government Agency Obligations and Instrumentalities | | | — | | | | 10,705,834 | | | | — | | | | 10,705,834 | |
U.S. Treasury Obligations | | | — | | | | 4,209,419 | | | | — | | | | 4,209,419 | |
Purchased Options | | | — | | | | 84,300 | | | | — | | | | 84,300 | |
Rights | | | 8,096 | | | | — | | | | — | | | | 8,096 | |
Warrants | | | 207 | | | | — | | | | — | | | | 207 | |
Mutual Funds | | | 10,537,237 | | | | — | | | | — | | | | 10,537,237 | |
Short-Term Investments | | | — | | | | 7,730,629 | | | | — | | | | 7,730,629 | |
Total Investments | | $ | 85,902,909 | | | $ | 54,187,322 | | | $ | — | | | $ | 140,090,231 | |
Asset Derivatives | | | | | | | | | | | | | | | | |
Futures Contracts | | $ | 15,156 | | | $ | — | | | $ | — | | | $ | 15,156 | |
Liability Derivatives | | | | | | | | | | | | | | | | |
Futures Contracts | | $ | (35,355 | ) | | $ | — | | | $ | — | | | $ | (35,355 | ) |
Swap Agreements | | | — | | | | (8,336 | ) | | | — | | | | (8,336 | ) |
Total | | $ | (35,355 | ) | | $ | (8,336 | ) | | $ | — | | | $ | (43,691 | ) |
| | | | | | | | | | | | | | | | | |
Main Street Fund | | | | | | | | | | | | | | | | |
Asset Investments | | | | | | | | | | | | | | | | |
Common Stock | | $ | 113,780,120 | | | $ | 2,094,531 | * | | $ | — | | | $ | 115,874,651 | |
Mutual Funds | | | 177,581 | | | | — | | | | — | | | | 177,581 | |
Short-Term Investments | | | — | | | | 1,238,164 | | | | — | | | | 1,238,164 | |
Total Investments | | $ | 113,957,701 | | | $ | 3,332,695 | | | $ | — | | | $ | 117,290,396 | |
| | | | | | | | | | | | | | | | | |
231
Notes to Financial Statements (Continued) |
| | | Level 1 | | | Level 2 | | | Level 3 | | | Total | |
Global Fund | | | | | | | | | | | | | | | | |
Asset Investments | | | | | | | | | | | | | | | | |
Common Stock* | | | | | | | | | | | | | | | | |
Cayman Islands | | $ | 18,174,986 | | | $ | — | | | $ | — | | | $ | 18,174,986 | |
Denmark | | | 227,005 | | | | — | | | | — | | | | 227,005 | |
France | | | — | | | | 23,135,898 | | | | — | | | | 23,135,898 | |
Germany | | | — | | | | 10,512,419 | | | | — | | | | 10,512,419 | |
India | | | 3,284,891 | | | | 4,600,986 | | | | — | | | | 7,885,877 | |
Italy | | | — | | | | 661,906 | | | | — | | | | 661,906 | |
Japan | | | — | | | | 47,597,502 | | | | — | | | | 47,597,502 | |
Netherlands | | | 1,066,818 | | | | 7,690,830 | | | | — | | | | 8,757,648 | |
Spain | | | — | | | | 3,790,676 | | | | — | | | | 3,790,676 | |
Sweden | | | — | | | | 9,536,867 | | | | — | | | | 9,536,867 | |
Switzerland | | | — | | | | 1,163,276 | | | | — | | | | 1,163,276 | |
United Kingdom | | | 1,063,193 | | | | 3,424,877 | | | | — | | | | 4,488,070 | |
United States | | | 173,716,098 | | | | — | | | | — | | | | 173,716,098 | |
Preferred Stock | | | | | | | | | | | | | | | | |
India | | | 27,961 | | | | — | | | | — | | | | 27,961 | |
Short-Term Investments | | | — | | | | 7,071,875 | | | | — | | | | 7,071,875 | |
Total Investments | | $ | 197,560,952 | | | $ | 119,187,112 | | | $ | — | | | $ | 316,748,064 | |
| | | | | | | | | | | | | | | | | |
International Equity Fund | | | | | | | | | | | | | | | | |
Asset Investments | | | | | | | | | | | | | | | | |
Common Stock* | | | | | | | | | | | | | | | | |
Australia | | $ | — | | | $ | 1,176,521 | | | $ | — | | | $ | 1,176,521 | |
Belgium | | | — | | | | 849,237 | | | | — | | | | 849,237 | |
Canada | | | 11,672,648 | | | | — | | | | — | | | | 11,672,648 | |
Cayman Islands | | | 131,654 | | | | 900,576 | | | | — | | | | 1,032,230 | |
Denmark | | | — | | | | 679,086 | | | | — | | | | 679,086 | |
France | | | — | | | | 24,649,084 | | | | — | | | | 24,649,084 | |
Germany | | | 99,236 | | | | 9,340,854 | | | | — | | | | 9,440,090 | |
Hong Kong | | | — | | | | 5,717,340 | | | | — | | | | 5,717,340 | |
Ireland | | | 513,571 | | | | 7,094,662 | | | | — | | | | 7,608,233 | |
Israel | | | 335,749 | | | | — | | | | — | | | | 335,749 | |
Italy | | | — | | | | 1,046,974 | | | | — | | | | 1,046,974 | |
Japan | | | — | | | | 33,627,564 | | | | — | | | | 33,627,564 | |
Luxembourg | | | — | | | | 397,412 | | | | — | | | | 397,412 | |
Netherlands | | | 411,873 | | | | 14,176,635 | | | | — | | | | 14,588,508 | |
Norway | | | — | | | | 434,611 | | | | — | | | | 434,611 | |
Singapore | | | — | | | | 532,441 | | | | — | | | | 532,441 | |
Spain | | | — | | | | 7,761,168 | | | | — | | | | 7,761,168 | |
Sweden | | | — | | | | 3,774,378 | | | | — | | | | 3,774,378 | |
Switzerland | | | — | | | | 20,726,309 | | | | — | | | | 20,726,309 | |
United Kingdom | | | 564,276 | | | | 34,223,713 | | | | — | | | | 34,787,989 | |
Mutual Funds | | | 2,066,194 | | | | — | | | | — | | | | 2,066,194 | |
Short-Term Investments | | | — | | | | 361,315 | | | | — | | | | 361,315 | |
Total Investments | | $ | 15,795,201 | | | $ | 167,469,880 | | | $ | — | | | $ | 183,265,081 | |
232
Notes to Financial Statements (Continued) |
| | | Level 1 | | | Level 2 | | | Level 3 | | | Total | |
Strategic Emerging Markets Fund | | | | | | | | | | | | | | | | |
Asset Investments | | | | | | | | | | | | | | | | |
Common Stock* | | | | | | | | | | | | | | | | |
Belgium | | $ | — | | | $ | 1,741,425 | | | $ | — | | | $ | 1,741,425 | |
Bermuda | | | 1,952,099 | | | | 1,237,644 | | | | — | | | | 3,189,743 | |
Brazil | | | 4,102,603 | | | | — | | | | — | | | | 4,102,603 | |
Cayman Islands | | | 26,541,878 | | | | 18,517,118 | | | | — | | | | 45,058,996 | |
Chile | | | 1,266,920 | | | | — | | | | — | | | | 1,266,920 | |
China | | | — | | | | 8,853,729 | | | | — | | | | 8,853,729 | |
Colombia | | | 579,325 | | | | — | | | | — | | | | 579,325 | |
Egypt | | | — | | | | 1,507,421 | | | | — | | | | 1,507,421 | |
France | | | — | | | | 10,559,455 | | | | — | | | | 10,559,455 | |
Hong Kong | | | — | | | | 7,047,533 | | | | — | | | | 7,047,533 | |
India | | | — | | | | 20,895,399 | | | | — | | | | 20,895,399 | |
Indonesia | | | — | | | | 1,927,484 | | | | — | | | | 1,927,484 | |
Italy | | | — | | | | 3,332,223 | | | | — | | | | 3,332,223 | |
Mexico | | | 8,230,769 | | | | — | | | | — | | | | 8,230,769 | |
Netherlands | | | 6,389,737 | | | | — | | | | — | | | | 6,389,737 | |
Philippines | | | — | | | | 4,339,450 | | | | — | | | | 4,339,450 | |
Republic of Korea | | | — | | | | 2,887,384 | | | | — | | | | 2,887,384 | |
Russia | | | 1,205,874 | | | | 9,243,912 | | | | — | | | | 10,449,786 | |
South Africa | | | — | | | | 1,090,381 | | | | — | | | | 1,090,381 | |
Switzerland | | | — | | | | 1,136,999 | | | | — | | | | 1,136,999 | |
Taiwan | | | — | | | | 15,046,949 | | | | — | | | | 15,046,949 | |
Turkey | | | — | | | | 575,003 | | | | — | | | | 575,003 | |
United States | | | 7,239,801 | | | | — | | | | — | | | | 7,239,801 | |
Preferred Stock | | | | | | | | | | | | | | | | |
Brazil | | | 2,861,284 | | | | — | | | | — | | | | 2,861,284 | |
India | | | 36,249 | | | | — | | | | — | | | | 36,249 | |
Singapore | | | — | | | | — | | | | 2,438,401 | | | | 2,438,401 | |
Mutual Funds | | | 674,091 | | | | — | | | | — | | | | 674,091 | |
Short-Term Investments | | | — | | | | 6,489,955 | | | | — | | | | 6,489,955 | |
Total Investments | | $ | 61,080,630 | | | $ | 116,429,464 | | | $ | 2,438,401 | | | $ | 179,948,495 | |
* | Includes foreign equity securities whose values were adjusted to reflect market trading of comparable securities or other correlated instruments after the close of trading in their respective foreign markets, as applicable. |
** | None of the unobservable inputs for Level 3 assets, individually or collectively, had a material impact on the Fund(s). Level 3 investments at September 30, 2020 in relation to net assets were not significant and accordingly, a reconciliation of Level 3 assets for the year ended September 30, 2020 is not presented. |
+ | Represents a security at $0 value as of September 30, 2020. |
For certain Fund(s) the Statement of Assets and Liabilities shows receivables from investments sold on a delayed delivery basis, collateral pledged for open futures contracts, and collateral pledged for open swap agreements, as well as, any applicable liabilities for investments purchased on a delayed delivery basis, amounts due to custodian, collateral held for open swap agreements, collateral held for open purchased options, and collateral held for securities on loan. These amounts approximate fair value and would be categorized at Level 2 for each applicable Fund as of September 30, 2020.
The Funds, with the exception of the Diversified Bond Fund and High Yield Fund, had no Level 3 transfers during the year ended September 30, 2020. The Diversified Bond Fund and High Yield Fund had Level 3 transfers during the year ended September 30, 2020; however, none of the transfers individually or collectively had a material impact on the Diversified Bond Fund and High Yield Fund.
233
Notes to Financial Statements (Continued) |
Following is a reconciliation of investments for which significant unobservable inputs (Level 3) were used in determining value:
Asset Valuation Inputs
| | | Investments in Securities | |
| | | Balance
as of
9/30/19 | | | Accrued
Discounts
(Premiums) | | | Realized
Gain (Loss) | | | Change in
Unrealized
Appreciation
(Depreciation) | | | Purchases | | | (Sales) | | | Transfers into
Level 3 | | | Transfers
(out) of
Level 3 | | | Balance
as of
9/30/20 | | | Net Change
in Unrealized
Appreciation
(Depreciation)
from
Investments
Still held as of
9/30/20 | |
Strategic Emerging Markets Fund | | | | | | | | | | | | | | | | | | | | | | | | | | | | | | | | |
Preferred Stock | | $ | 2,438,401 | | | $ | — | | | $ | — | | | $ | — | | | $ | — | | | $ | — | | | $ | — | | | $ | — | | | $ | 2,438,401 | | | $ | — | |
The Strategic Emerging Markets Fund fair values certain of its Level 3 investments using acquisition cost, although the transaction may not have occurred during the current reporting period. These investments are generally privately held investments, but may include defaulted securities and new debt issuances. There may not be a secondary market for such investments, and/or there are a limited number of investors. The determination to fair value such investments at cost is based upon factors consistent with the principles of fair value measurement that are reasonably available to the Valuation Committee. Valuations are reviewed by members of the Valuation Committee utilizing available market information to determine if the carrying value of these investments should be adjusted. Such market data may include, but is not limited to, observations of the trading multiples of public companies considered comparable to the private companies being valued, financial or operational information released by the company, and/or news or corporate events that affect the investment, also referred to as enterprise value (EV) to earnings before interest, taxes, depreciation, and amortization (EBITDA) ratios. Valuations may be adjusted to account for company-specific issues, the lack of liquidity inherent in a nonpublic investment and the fact that comparable public companies are not identical to the investments being fair valued by the Strategic Emerging Markets Fund. All market variables are assessed on a regular frequency and calibrated as necessary.
Strategic Emerging Markets Fund | | Fair Value
Amount | | Valuation Technique | Unobservable Input Description | | Value/ Weighted
Average Range | |
Preferred Stock — $2,438,401 | | | | | |
Grab Holdings, Inc. | | $ | 2,438,401 | | Market Approach | Market Transaction | | | $6.16 | |
Total | | $ | 2,438,401 | | | | | | | |
Derivative Instruments
Derivatives are financial instruments whose values are based on the values of one or more indicators, such as a security, asset, currency, interest rate, or index. Derivative transactions can create investment leverage and may be highly volatile. Losses from derivatives can be substantially greater than the derivatives’ original cost and can sometimes be unlimited. A Fund may not be able to close out a derivative transaction at a favorable time or price.
Further details regarding the derivatives and other investments held by the Fund(s) during the year ended September 30, 2020 are discussed below.
234
Notes to Financial Statements (Continued) |
At September 30, 2020, and during the year then ended, the Fund(s) had the following derivatives and transactions in derivatives, grouped into the indicated risk categories:
| | | Credit
Risk | | | Equity
Risk | | | Foreign
Exchange
Risk | | | Interest
Rate Risk | | | Total | |
Short-Duration Bond Fund | | | | | | | | | | | | | | | | | | | | |
Asset Derivatives | | | | | | | | | | | | | | | | | | | | |
Purchased Options* | | $ | — | | | $ | — | | | $ | — | | | $ | 395,550 | | | $ | 395,550 | |
Futures Contracts^^ | | | — | | | | — | | | | — | | | | 48,942 | | | | 48,942 | |
Total Value | | $ | — | | | $ | — | | | $ | — | | | $ | 444,492 | | | $ | 444,492 | |
Liability Derivatives | | | | | | | | | | | | | | | | | | | | |
Futures Contracts^^ | | $ | — | | | $ | — | | | $ | — | | | $ | (568,587 | ) | | $ | (568,587 | ) |
Swap Agreements^^,^^^ | | | (87,533 | ) | | | — | | | | — | | | | — | | | | (87,533 | ) |
Total Value | | $ | (87,533 | ) | | $ | — | | | $ | — | | | $ | (568,587 | ) | | $ | (656,120 | ) |
Realized Gain (Loss)# | | | | | | | | | | | | | | | | | | | | |
Purchased Options | | $ | — | | | $ | — | | | $ | — | | | $ | 302,738 | | | $ | 302,738 | |
Futures Contracts | | | — | | | | — | | | | — | | | | (8,778,213 | ) | | | (8,778,213 | ) |
Swap Agreements | | | 478,671 | | | | — | | | | — | | | | — | | | | 478,671 | |
Total Realized Gain (Loss) | | $ | 478,671 | | | $ | — | | | $ | — | | | $ | (8,475,475 | ) | | $ | (7,996,804 | ) |
Change in Appreciation (Depreciation)## | | | | | | | | | | | | | | | | | | | | |
Purchased Options | | $ | — | | | $ | — | | | $ | — | | | $ | (67,846 | ) | | $ | (67,846 | ) |
Futures Contracts | | | — | | | | | | | | — | | | | (1,222,424 | ) | | | (1,222,424 | ) |
Swap Agreements | | | 14,042 | | | | — | | | | — | | | | — | | | | 14,042 | |
Total Change in Appreciation (Depreciation) | | $ | 14,042 | | | $ | — | | | $ | — | | | $ | (1,290,270 | ) | | $ | (1,276,228 | ) |
| | | | | | | | | | | | | | | | | | | | | |
Inflation-Protected and Income Fund | | | | | | | | | | | | | | | | |
Asset Derivatives | | | | | | | | | | | | | | | | | | | | |
Purchased Options* | | $ | — | | | $ | — | | | $ | — | | | $ | 736,405 | | | $ | 736,405 | |
Futures Contracts^^ | | | — | | | | — | | | | — | | | | 27,524 | | | | 27,524 | |
Swap Agreements* | | | — | | | | 6,399,431 | | | | — | | | | 11,445 | | | | 6,410,876 | |
Total Value | | $ | — | | | $ | 6,399,431 | | | $ | — | | | $ | 775,374 | | | $ | 7,174,805 | |
Liability Derivatives | | | | | | | | | | | | | | | | | | | | |
Futures Contracts^^ | | $ | — | | | $ | — | | | $ | — | | | $ | (19,434 | ) | | $ | (19,434 | ) |
Swap Agreements^ | | | — | | | | (152,161 | ) | | | — | | | | (190,194 | ) | | | (342,355 | ) |
Swap Agreements^^,^^^ | | | (33,346 | ) | | | — | | | | — | | | | — | | | | (33,346 | ) |
Total Value | | $ | (33,346 | ) | | $ | (152,161 | ) | | $ | — | | | $ | (209,628 | ) | | $ | (395,135 | ) |
Realized Gain (Loss)# | | | | | | | | | | | | | | | | | | | | |
Purchased Options | | $ | — | | | $ | — | | | $ | — | | | $ | 436,179 | | | $ | 436,179 | |
Futures Contracts | | | — | | | | — | | | | — | | | | 289,682 | | | | 289,682 | |
Swap Agreements | | | 198,076 | | | | 13,537,242 | | | | — | | | | (391,744 | ) | | | 13,343,574 | |
Total Realized Gain (Loss) | | $ | 198,076 | | | $ | 13,537,242 | | | $ | — | | | $ | 334,117 | | | $ | 14,069,435 | |
Change in Appreciation (Depreciation)## | | | | | | | | | | | | | | | | | | | | |
Purchased Options | | $ | — | | | $ | — | | | $ | — | | | $ | (349,176 | ) | | $ | (349,176 | ) |
Futures Contracts | | | — | | | | — | | | | — | | | | 104,715 | | | | 104,715 | |
Swap Agreements | | | 4,888 | | | | 5,912,848 | | | | — | | | | (54,017 | ) | | | 5,863,719 | |
Total Change in Appreciation (Depreciation) | | $ | 4,888 | | | $ | 5,912,848 | | | $ | — | | | $ | (298,478 | ) | | $ | 5,619,258 | |
| | | | | | | | | | | | | | | | | | | | | |
235
Notes to Financial Statements (Continued) |
| | | Credit
Risk | | | Equity
Risk | | | Foreign
Exchange
Risk | | | Interest
Rate Risk | | | Total | |
Core Bond Fund | | | | | | | | | | | | | | | | | | | | |
Asset Derivatives | | | | | | | | | | | | | | | | | | | | |
Purchased Options* | | $ | — | | | $ | — | | | $ | — | | | $ | 2,487,476 | | | $ | 2,487,476 | |
Futures Contracts^^ | | | — | | | | — | | | | — | | | | 182,908 | | | | 182,908 | |
Total Value | | $ | — | | | $ | — | | | $ | — | | | $ | 2,670,384 | | | $ | 2,670,384 | |
Liability Derivatives | | | | | | | | | | | | | | | | | | | | |
Futures Contracts^^ | | $ | — | | | $ | — | | | $ | — | | | $ | (2,052,243 | ) | | $ | (2,052,243 | ) |
Swap Agreements^^,^^^ | | | (241,756 | ) | | | — | | | | — | | | | — | | | | (241,756 | ) |
Total Value | | $ | (241,756 | ) | | $ | — | | | $ | — | | | $ | (2,052,243 | ) | | $ | (2,293,999 | ) |
Realized Gain (Loss)# | | | | | | | | | | | | | | | | | | | | |
Purchased Options | | $ | — | | | $ | — | | | $ | — | | | $ | 1,833,926 | | | $ | 1,833,926 | |
Futures Contracts | | | — | | | | — | | | | — | | | | 17,110,287 | | | | 17,110,287 | |
Swap Agreements | | | 1,348,843 | | | | — | | | | — | | | | (2,879 | ) | | | 1,345,964 | |
Total Realized Gain (Loss) | | $ | 1,348,843 | | | $ | — | | | $ | — | | | $ | 18,941,334 | | | $ | 20,290,177 | |
Change in Appreciation (Depreciation)## | | | | | | | | | | | | | | | | | | | | |
Purchased Options | | $ | — | | | $ | — | | | $ | — | | | $ | (745,065 | ) | | $ | (745,065 | ) |
Futures Contracts | | | — | | | | | | | | | | | | 853,141 | | | | 853,141 | |
Swap Agreements | | | 38,709 | | | | — | | | | — | | | | — | | | | 38,709 | |
Total Change in Appreciation (Depreciation) | | $ | 38,709 | | | $ | — | | | $ | — | | | $ | 108,076 | | | $ | 146,785 | |
| | | | | | | | | | | | | | | | | | | | | |
Diversified Bond Fund | | | | | | | | | | | | | | | | | | | | |
Asset Derivatives | | | | | | | | | | | | | | | | | | | | |
Purchased Options* | | $ | — | | | $ | — | | | $ | — | | | $ | 471,770 | | | $ | 471,770 | |
Forward Contracts* | | | — | | | | — | | | | 79,848 | | | | — | | | | 79,848 | |
Futures Contracts^^ | | | — | | | | — | | | | — | | | | 16,122 | | | | 16,122 | |
Total Value | | $ | — | | | $ | — | | | $ | 79,848 | | | $ | 487,892 | | | $ | 567,740 | |
Liability Derivatives | | | | | | | | | | | | | | | | | | | | |
Forward Contracts^ | | $ | — | | | $ | — | | | $ | (66,567 | ) | | $ | — | | | $ | (66,567 | ) |
Futures Contracts^^ | | | — | | | | — | | | | — | | | | (333,821 | ) | | | (333,821 | ) |
Swap Agreements^^,^^^ | | | (41,682 | ) | | | — | | | | — | | | | — | | | | (41,682 | ) |
Total Value | | $ | (41,682 | ) | | $ | — | | | $ | (66,567 | ) | | $ | (333,821 | ) | | $ | (442,070 | ) |
Realized Gain (Loss)# | | | | | | | | | | | | | | | | | | | | |
Purchased Options | | $ | — | | | $ | — | | | $ | — | | | $ | 452,543 | | | $ | 452,543 | |
Forward Contracts | | | — | | | | — | | | | 32,767 | | | | — | | | | 32,767 | |
Futures Contracts | | | — | | | | — | | | | — | | | | 2,731,073 | | | | 2,731,073 | |
Swap Agreements | | | 234,052 | | | | — | | | | — | | | | — | | | | 234,052 | |
Total Realized Gain (Loss) | | $ | 234,052 | | | $ | — | | | $ | 32,767 | | | $ | 3,183,616 | | | $ | 3,450,435 | |
Change in Appreciation (Depreciation)## | | | | | | | | | | | | | | | | | | | | |
Purchased Options | | $ | — | | | $ | — | | | $ | — | | | $ | (168,060 | ) | | $ | (168,060 | ) |
Forward Contracts | | | — | | | | — | | | | 82,013 | | | | — | | | | 82,013 | |
Futures Contracts | | | — | | | | — | | | | — | | | | 130,462 | | | | 130,462 | |
Swap Agreements | | | 6,655 | | | | — | | | | — | | | | — | | | | 6,655 | |
Total Change in Appreciation (Depreciation) | | $ | 6,655 | | | $ | — | | | $ | 82,013 | | | $ | (37,598 | ) | | $ | 51,070 | |
| | | | | | | | | | | | | | | | | | | | | |
236
Notes to Financial Statements (Continued) |
| | | Credit
Risk | | | Equity
Risk | | | Foreign
Exchange
Risk | | | Interest
Rate Risk | | | Total | |
Balanced Fund | | | | | | | | | | | | | | | | | | | | |
Asset Derivatives | | | | | | | | | | | | | | | | | | | | |
Purchased Options* | | $ | — | | | $ | — | | | $ | — | | | $ | 84,300 | | | $ | 84,300 | |
Futures Contracts^^ | | | — | | | | 11,423 | | | | — | | | | 3,733 | | | | 15,156 | |
Total Value | | $ | — | | | $ | 11,423 | | | $ | — | | | $ | 88,033 | | | $ | 99,456 | |
Liability Derivatives | | | | | | | | | | | | | | | | | | | | |
Futures Contracts^^ | | $ | — | | | $ | (3,414 | ) | | $ | — | | | $ | (31,941 | ) | | $ | (35,355 | ) |
Swap Agreements^^,^^^ | | | (8,336 | ) | | | — | | | | — | | | | — | | | | (8,336 | ) |
Total Value | | $ | (8,336 | ) | | $ | (3,414 | ) | | $ | — | | | $ | (31,941 | ) | | $ | (43,691 | ) |
Realized Gain (Loss)# | | | | | | | | | | | | | | | | | | | | |
Purchased Options | | $ | — | | | $ | — | | | $ | — | | | $ | 85,198 | | | $ | 85,198 | |
Futures Contracts | | | — | | | | 246,287 | | | | — | | | | 535,920 | | | | 782,207 | |
Swap Agreements | | | 44,883 | | | | — | | | | — | | | | (416 | ) | | | 44,467 | |
Total Realized Gain (Loss) | | $ | 44,883 | | | $ | 246,287 | | | $ | — | | | $ | 620,702 | | | $ | 911,872 | |
Change in Appreciation (Depreciation)## | | | | | | | | | | | | | | | | | | | | |
Purchased Options | | $ | — | | | $ | — | | | $ | — | | | $ | (39,110 | ) | | $ | (39,110 | ) |
Futures Contracts | | | — | | | | 63,210 | | | | — | | | | 36,717 | | | | 99,927 | |
Swap Agreements | | | 1,343 | | | | — | | | | — | | | | — | | | | 1,343 | |
Total Change in Appreciation (Depreciation) | | $ | 1,343 | | | $ | 63,210 | | | $ | — | | | $ | (2,393 | ) | | $ | 62,160 | |
| | | | | | | | | | | | | | | | | | | | | |
Disciplined Value Fund | | | | | | | | | | | | | | | | | | | | |
Realized Gain (Loss)# | | | | | | | | | | | | | | | | | | | | |
Futures Contracts | | $ | — | | | $ | 2,399 | | | $ | — | | | $ | — | | | $ | 2,399 | |
| | | | | | | | | | | | | | | | | | | | | |
Disciplined Growth Fund | | | | | | | | | | | | | | | | | | | | |
Realized Gain (Loss)# | | | | | | | | | | | | | | | | | | | | |
Futures Contracts | | $ | — | | | $ | 6,286 | | | $ | — | | | $ | — | | | $ | 6,286 | |
* | Statements of Assets and Liabilities location: Investments, at value, or Receivables from: open forward contracts or open swap agreements, at value, as applicable. |
^ | Statements of Assets and Liabilities location: Payables for: open forward contracts, or open swap agreements, at value, as applicable. |
^^ | Cumulative appreciation (depreciation) on futures contracts and centrally cleared swaps is reported in “Futures Contracts” and “Swap Agreements” in each applicable Fund’s Portfolio of Investments. Only current day’s variation margin, if any, is reported within the Statements of Assets and Liabilities. |
^^^ | Represents centrally cleared swaps which are not subject to a master netting agreement or similar agreement. |
# | Statements of Operations location: Amounts are included in net realized gain (loss) on: investment transactions, forward contracts, futures contracts, or swap agreements, as applicable. |
## | Statements of Operations location: Amounts are included in net change in unrealized appreciation (depreciation) on: investment transactions, forward contracts, futures contracts, or swap agreements, as applicable. |
For the year ended September 30, 2020, the number of contracts, notional amounts, or shares/units for each derivative type was as follows:
| | | Number of Contracts, Notional Amounts, or Shares/Units† | |
Fund Name | | Futures
Contracts | | | Forward
Contracts | | | Swap
Agreements | | | Purchased
Swaptions | |
Short-Duration Bond Fund | | | 2,259 | | | $ | — | | | $ | 6,900,000 | | | $ | 44,325,833 | |
Inflation-Protected and Income Fund | | | 172 | | | | — | | | | 25,592,155 | | | | 24,825,688 | |
Core Bond Fund | | | 1,997 | | | | — | | | | 19,255,556 | | | | 109,459,750 | |
237
Notes to Financial Statements (Continued) |
| | | Number of Contracts, Notional Amounts, or Shares/Units† | |
Fund Name | | Futures
Contracts | | | Forward
Contracts | | | Swap
Agreements | | | Purchased
Swaptions | |
Diversified Bond Fund | | | 322 | | | $ | 6,291,960 | | | $ | 3,355,556 | | | $ | 26,080,833 | |
Balanced Fund | | | 86 | | | | — | | | | 655,556 | | | | 3,288,396 | |
Disciplined Value Fund | | | 14 | | | | — | | | | — | | | | — | |
Disciplined Growth Fund | | | 23 | | | | — | | | | — | | | | — | |
† | Amount(s) disclosed represent average number of contracts for futures contracts, notional amounts for forward contracts, swap agreements, and purchased swaptions, based on absolute values, which is indicative of volume of this derivative type, for the months that the Fund held such derivatives during the year ended September 30, 2020. |
The Portfolio of Investments included in a Fund’s financial statements shows the assets or liabilities of a Fund associated with individual derivatives transactions. The terms of many of those transactions contemplate that derivatives receivables and payables between the same two parties may be netted and that the parties will collateralize certain obligations. The following tables provide an illustration of the possible effect of netting provisions and of collateral (delivered or received) on a Fund’s derivatives exposure as of September 30, 2020. Netting arrangements vary among different counterparties, and the actual disposition of derivatives receivables and payables, and of collateral, in a bankruptcy or insolvency can be complicated and difficult to predict.
The following table presents derivative assets by counterparty net of amounts available for offset under a master netting agreement (“MNA”) or similar agreement and net of the related collateral received by the Fund(s) as of September 30, 2020.
Counterparty | | Derivative
Assets Subject
to an MNA by
Counterparty† | | | Financial
Instruments
Available for
Offset | | | Collateral
Received*** | | | Net Amount* | |
Short-Duration Bond Fund | | | | | | | | | | | | | | | | |
Barclays Bank PLC | | $ | 101,520 | | | $ | — | | | $ | (101,520 | ) | | $ | — | |
Credit Suisse International | | | 294,030 | | | | — | | | | (250,000 | ) | | | 44,030 | |
| | | $ | 395,550 | | | $ | — | | | $ | (351,520 | ) | | $ | 44,030 | |
Inflation-Protected and Income Fund | | | | | | | | | | | | | | | | |
Barclays Bank PLC | | $ | 3,105,279 | | | $ | — | | | $ | (3,105,279 | ) | | $ | — | |
BNP Paribas SA | | | 1,678,008 | | | | (162,659 | ) | | | (1,460,000 | ) | | | 55,349 | |
Credit Suisse International | | | 189,833 | | | | — | | | | (150,000 | ) | | | 39,833 | |
Goldman Sachs International | | | 2,174,161 | | | | (171,953 | ) | | | (2,002,208 | ) | | | — | |
| | | $ | 7,147,281 | | | $ | (334,612 | ) | | $ | (6,717,487 | ) | | $ | 95,182 | |
Core Bond Fund | | | | | | | | | | | | | | | | |
Barclays Bank PLC | | $ | 2,487,476 | | | $ | — | | | $ | (2,487,476 | ) | | $ | — | |
| | | | | | | | | | | | | | | | | |
Diversified Bond Fund | | | | | | | | | | | | | | | | |
Bank of America N.A. | | $ | 17,239 | | | $ | (11,175 | ) | | $ | — | | | $ | 6,064 | |
Barclays Bank PLC | | | 473,499 | | | | — | | | | (400,000 | ) | | | 73,499 | |
Citibank N.A. | | | 2,387 | | | | (2,387 | ) | | | — | | | | — | |
Goldman Sachs International | | | 30,154 | | | | (5,662 | ) | | | — | | | | 24,492 | |
JP Morgan Chase Bank N.A. | | | 19,656 | | | | (8,093 | ) | | | — | | | | 11,563 | |
Morgan Stanley & Co. LLC | | | 8,683 | | | | (242 | ) | | | — | | | | 8,441 | |
| | | $ | 551,618 | | | $ | (27,559 | ) | | $ | (400,000 | ) | | $ | 124,059 | |
Balanced Fund | | | | | | | | | | | | | | | | |
Barclays Bank PLC | | $ | 62,272 | | | $ | — | | | $ | (62,272 | ) | | $ | — | |
Credit Suisse International | | | 22,028 | | | | — | | | | (22,028 | ) | | | — | |
| | | $ | 84,300 | | | $ | — | | | $ | (84,300 | ) | | $ | — | |
238
Notes to Financial Statements (Continued) |
The following table presents derivative liabilities by counterparty net of amounts available for offset under an MNA or similar agreement and net of the related collateral pledged by the Fund(s) as of September 30, 2020.
Counterparty | | Derivative
Liabilities Subject
to an MNA by
Counterparty† | | | Financial
Instruments
Available for
Offset | | | Collateral
Pledged*** | | | Net
Amount** | |
Inflation-Protected and Income Fund | | | | | | | | | | | | | | | | |
BNP Paribas SA | | $ | (162,659 | ) | | $ | 162,659 | | | $ | — | | | $ | — | |
Goldman Sachs & Co. | | | (7,743 | ) | | | — | | | | — | | | | (7,743 | ) |
Goldman Sachs International | | | (171,953 | ) | | | 171,953 | | | | — | | | | — | |
| | | $ | (342,355 | ) | | $ | 334,612 | | | $ | — | | | $ | (7,743 | ) |
Diversified Bond Fund | | | | | | | | | | | | | | | | |
Bank of America N.A. | | $ | (11,175 | ) | | $ | 11,175 | | | $ | — | | | $ | — | |
Citibank N.A. | | | (41,395 | ) | | | 2,387 | | | | — | | | | (39,008 | ) |
Goldman Sachs International | | | (5,662 | ) | | | 5,662 | | | | — | | | | — | |
JP Morgan Chase Bank N.A. | | | (8,093 | ) | | | 8,093 | | | | — | | | | — | |
Morgan Stanley & Co. LLC | | | (242 | ) | | | 242 | | | | — | | | | — | |
| | | $ | (66,567 | ) | | $ | 27,559 | | | $ | — | | | $ | (39,008 | ) |
* | Represents the net amount receivable from the counterparty in the event of default. |
** | Represents the net amount payable to the counterparty in the event of default. |
*** | The amount presented here may be less than the total amount of collateral received/pledged as the net amount of derivative assets and liabilities for a counterparty cannot be less than $0. |
† | The amount presented here may be less than the total amount shown in the Statements of Assets and Liabilities as some derivatives held by the counterparty are not covered within an MNA or similar agreement. |
Such agreements typically permit a single net payment in the event of default, including the bankruptcy or insolvency of the counterparty. Typically, the Fund(s) and counterparties are not permitted to sell, re-pledge, or use the collateral they receive.
Foreign Currency Exchange Transactions
A Fund may engage in foreign currency exchange transactions for hedging purposes in order to protect against uncertainty in the level of future foreign currency exchange rates, or for other, non-hedging purposes.
A Fund may enter into foreign currency exchange transactions, including foreign currency forward contracts. These contracts call for the Fund to deliver in the future an amount of one currency in return for an amount of another currency, at an exchange rate determined at the time the contract is entered into. Forward contracts are private contractual arrangements and a Fund is subject to the risk that its counterparty will not, or will not be able to, perform its obligations. This type of arrangement may require the Fund to post margin. A Fund may enter into foreign currency exchange transactions in order to hedge against changes in the values of the assets or liabilities denominated in one or more foreign currencies, or otherwise to increase or reduce a Fund’s exposure to various foreign currencies. The use of foreign currency exchange transactions may create investment leverage.
Whenever a Fund enters into a foreign currency exchange transaction, it is subject to the risk that the value of the transaction will move in a direction unfavorable to it. When the Fund uses the transactions for hedging purposes, it is likely that the Fund will have an asset or liability that will offset any loss (or gain) on the transactions, at least in part. If a Fund enters into foreign currency exchange transactions other than for hedging purposes (for example, seeking to profit from an anticipated change in the values of currencies by creating directional exposures in the portfolio with respect to one or more currencies), it will generally be subject to the same risks, but is less likely to have assets or liabilities that will offset any losses on the transactions. There can be no assurance that a Fund will be able to terminate any foreign currency exchange transaction prior to its maturity in order to limit its loss on the transaction.
239
Notes to Financial Statements (Continued) |
Forward foreign currency contracts are marked to market daily and the change in their value is recorded by the Funds as an unrealized gain or loss. Forward foreign currency contracts are valued at the settlement price established through dealers or other market sources on the day which they are traded. When a forward foreign currency contract is extinguished, through delivery or offset by entering into another forward foreign currency contract, the Funds record a realized gain or loss equal to the difference between the value of the contract at the time it was opened and the value of the contract at the time it was extinguished or offset. The notional or contractual amounts of these instruments do not necessarily represent the amounts potentially subject to risk. The measurement of the risk associated with these instruments is meaningful only when all related and offsetting transactions and counterparty risks are considered.
A Fund’s current exposure to a counterparty is the unrealized appreciation on the contract.
Futures Contracts
A Fund may seek to manage a variety of different risks, such as interest rate risk, equity price risk, and currency risk, through the use of futures contracts. A Fund may use interest rate futures contracts to adjust the interest rate sensitivity (duration) of its portfolio or the credit exposure of the portfolio. Interest rate futures contracts obligate the long or short holder to take or make delivery of a specified quantity of a financial instrument, such as a specific fixed income security, during a specified future period at a specified price. A Fund may use index futures contracts to hedge against broad market risks to its portfolio or to gain broad market exposure when it holds uninvested cash or as an inexpensive substitute for cash investments directly in securities or other assets, including commodities and precious metals. Securities index futures contracts are contracts to buy or sell units of a securities index at a specified future date at a price agreed upon when the contract is made and are settled in cash. Positions in futures contracts may be closed out only on an exchange or board of trade which provides a secondary market for such futures. Because futures contracts are exchange-traded, they typically have minimal exposure to counterparty risk.
Parties to a futures contract are not required to post the entire notional amount of the contract, but rather a small percentage of that amount (by way of margin), both at the time they enter into futures transactions, and then on a daily basis if their positions decline in value; as a result, futures contracts are highly leveraged. Such payments are known as variation margin and are recorded by the Funds as unrealized gains or losses. Because futures markets are highly leveraged, they can be extremely volatile, and there can be no assurance that the pricing of a futures contract will correlate precisely with the pricing of the asset or index underlying it or the asset or liability of the Fund that is the subject of the hedge. It may not always be possible for a Fund to enter into a closing transaction with respect to a futures contract it has entered into, at a favorable time or price. When a Fund enters into a futures transaction, it is subject to the risk that the value of the futures contract will move in a direction unfavorable to it. When a Fund uses futures contracts for hedging purposes, it is likely that the Fund will have an asset or liability that will offset any loss (or gain) on the transactions, at least in part.
When a futures contract is closed, the Fund records a realized gain or loss equal to the difference between the value of the contract at the time it was opened and the value at the time it was closed. Futures contracts are valued at the settlement price established each day by the board of trade or exchange on which they are traded.
Swap Agreements
Swap agreements are typically two-party contracts entered into primarily by institutional investors. In a standard “swap” transaction, two parties agree to exchange the returns (or differentials in rates of return) earned or realized on particular predetermined investments or instruments or rates, which may be adjusted for an interest factor. The gross returns to be exchanged or “swapped” between the parties are generally calculated with respect to a “notional amount,” (i.e., the return on or increase in value of a particular dollar amount invested at a particular interest rate or in a “basket” of securities representing a particular index).
Interest Rate Swaps. When a Fund enters into an interest rate swap, it typically agrees to make payments to its counterparty based on a specified long- or short-term interest rate and will receive payments from its counterparty based on another interest rate. Other forms of interest rate swap agreements include, among others, interest rate caps, under which, in return for a specified payment stream, one party agrees to make payments to the other to the extent that interest rates exceed a specified rate, or “cap”; interest rate floors, under which, in return for a specified payment stream, one party agrees to make payments to the other to
240
Notes to Financial Statements (Continued) |
the extent that interest rates fall below a specified rate, or “floor”; and interest rate collars, under which a party sells a cap and purchases a floor or vice versa in an attempt to protect itself against interest rate movements exceeding given minimum or maximum levels. A Fund may enter into an interest rate swap in order, for example, to hedge against the effect of interest rate changes on the value of specific securities in its portfolio, or to adjust the interest rate sensitivity (duration) or the credit exposure of its portfolio overall, or otherwise as a substitute for a direct investment in debt securities.
Total Return Swaps. A Fund also may enter into total return swaps. In a total return swap, one party typically agrees to pay to the other a short-term interest rate in return for a payment at one or more times in the future based on the increase in the value of an underlying security or other asset, or index of securities or assets; if the underlying security, asset, or index declines in value, the party that pays the short-term interest rate must also pay to its counterparty a payment based on the amount of the decline. A Fund may take either side of such a swap, and so may take a long or short position in the underlying security, asset, or index. A Fund may enter into a total return swap to hedge against an exposure in its portfolio — such as interest rate risk (including to adjust the duration or credit quality of a Fund’s bond portfolio), equity risk, or credit risk — or generally to put cash to work efficiently in the markets in anticipation of, or as a replacement for, cash investments. A Fund may also enter into a total return swap to gain exposure to securities or markets in which it might not be able to invest directly (in so-called market access transactions).
Credit Default Swaps. A Fund also may enter into credit default swap transactions, as a “buyer” or “seller” of credit protection. In a credit default swap, one party provides what is in effect insurance against a default or other adverse credit event affecting an issuer of debt securities (typically referred to as a “reference entity”). In general, the buyer of credit protection is obligated to pay the protection seller an upfront amount or a periodic stream of payments over the term of the swap. If a “credit event” occurs, the buyer has the right to deliver to the seller bonds or other obligations of the reference entity (with a value up to the full notional value of the swap), and to receive a payment equal to the par value of the bonds or other obligations. Credit events that would trigger a request that the seller make payment are specific to each credit default swap agreement, but generally include bankruptcy, failure to pay, restructuring, acceleration, default, or repudiation/moratorium. When a Fund buys protection, it may or may not own securities of the reference entity. If it does own securities of the reference entity, the swap serves as a hedge against a decline in the value of the securities due to the occurrence of a credit event involving the issuer of the securities. If the Fund does not own securities of the reference entity, the credit default swap may be seen to create a short position in the reference entity. If a Fund is a buyer and no credit event occurs, the Fund will typically recover nothing under the swap, but will have had to pay the required upfront payment and stream of continuing payments under the swap. When a Fund sells protection under a credit default swap, the position may have the effect of creating leverage in the Fund’s portfolio through the Fund’s indirect long exposure to the issuer or securities on which the swap is written. When a Fund sells protection, it may do so either to earn additional income or to create a “synthetic” long position.
Whenever a Fund enters into a swap agreement, it takes on counterparty risk — the risk that its counterparty will be unable or unwilling to meet its obligations under the swap agreement. The Fund also takes the risk that the market will move against its position in the swap agreement. In the case of an interest rate swap, the value of the swap may increase or decrease depending on changes in interest rates. In the case of a total return swap, the swap will change in value depending on the change in value of the asset or index on which the swap is written. In the case of a credit default swap, the swap will become more or less valuable depending on the credit of the issuer of the underlying security, and, if a credit event occurs under a swap where the Fund is the seller of credit protection, the Fund could be required to purchase the security at par value, resulting in a significant loss to the Fund. When the Fund enters into any type of swap for hedging purposes, it is likely that the Fund will have an asset or liability that will offset any loss (or gain) on the swap, at least in part. Swap agreements may be non-transferable or otherwise highly illiquid, and a Fund may not be able to terminate or transfer a swap agreement at any particular time or at an acceptable price.
Swaptions. A Fund may also enter into options on swap agreements (“swaptions”). A swaption is a contract that gives a counterparty the right (but not the obligation) to enter into a new swap agreement or to shorten, extend, cancel, or otherwise modify an existing swap agreement, at some designated future time on specified terms. A Fund may write (sell) and purchase put and call swaptions. Depending on the terms of the particular option agreement, a Fund will generally incur a greater degree of risk when it writes a swaption than it will incur when it purchases a swaption. When a Fund purchases a swaption, it risks losing only the amount of the premium it has paid should it decide to let the option expire unexercised. However, when a Fund writes
241
Notes to Financial Statements (Continued) |
a swaption, upon exercise of the option the Fund will become obligated according to the terms of the underlying agreement. A Fund may enter into swaptions for the same purposes as swaps. For information regarding the accounting treatment of options, see “Options, Rights, and Warrants” below.
Centrally Cleared Swaps. Certain clearinghouses currently offer clearing for limited types of derivatives transactions, principally certain interest rate swaps, certain index swaps, and credit derivatives. In a cleared derivative transaction, a Fund typically enters into the transaction with a financial institution counterparty, and performance of the transaction is effectively guaranteed by a central clearinghouse, thereby reducing or eliminating the Fund’s exposure to the credit risk of its original counterparty. The Fund will be required to post amounts (“initial margin”) with the clearinghouse or at the instruction of the clearinghouse. The initial margin required by a clearinghouse may be greater than the initial margin the Fund would be required to post in an uncleared transaction. If cash is deposited as the initial margin, it is shown as collateral on a Fund’s Statement of Assets and Liabilities. Swap agreements are marked-to-market daily and subsequent payments (“variation margin”) are made or received by a Fund depending on whether unrealized gains or losses are incurred. These amounts are reflected as receivables or payables on a Fund’s Statement of Assets and Liabilities (“Variation margin on open derivative instruments”) and as a component of net change in unrealized appreciation (depreciation) on a Fund’s Statement of Operations. Only a limited number of transaction types are currently eligible for clearing.
During the term of a swap transaction, changes in the value of the swap are recognized as unrealized gains or losses by marking to market to reflect the market value of the swap. When the swap is terminated, a Fund will record a realized gain or loss equal to the difference, if any, between the proceeds from (or cost of) the closing transaction and a Fund’s basis in the agreement. Upfront swap premium payments paid or received by a Fund, if any, are recorded within the value of the open swap agreement on the Fund’s Statement of Assets and Liabilities and represent payments paid or received upon entering into the swap agreement to compensate for differences between stated terms of the swap agreement and prevailing market conditions (credit spreads, currency exchange rates, and other relevant factors). These upfront payments are recorded as realized gain or loss on the Fund’s Statement of Operations upon termination or maturity of the swap agreement.
During the term of a swap transaction, the periodic net payments can be made for a set period of time or may be triggered by a predetermined credit event. The net periodic payments may be based on a fixed or variable interest rate, the change in market value of a specified security, basket of securities or index, or the return generated by a security. These periodic payments received or made by the Funds are recorded in the accompanying Statements of Operations as realized gains and losses, respectively.
A Fund’s current exposure to a counterparty is the fair value of the transaction.
Options, Rights, and Warrants
A Fund may purchase and sell put and call options on securities or an index of securities to enhance investment performance or to protect against changes in market prices. A Fund that invests in debt securities may also purchase and sell put and call options to adjust the interest rate sensitivity of its portfolio or the credit exposure of the portfolio.
Call Options. A call option gives the holder the right to purchase, and obligates the writer to sell, a security at the strike price at any time before the expiration date.
Put Options. A put option gives the holder the right to sell, and obligates the writer to buy, a security at the exercise price at any time before the expiration date.
Writing put and call options. A Fund may write call options on a security it owns, in a “directional” strategy hoping to realize a greater current return through the receipt of premiums. In return for the option premium, the Fund takes the risk that it will have to forego any increase in the value of the security over the strike price. When a Fund has written a call option on a security it does not own, its exposure on such an option is theoretically unlimited. A Fund may enter into closing purchase transactions in order to realize a profit or limit a loss on a previously written call option or, in the case of a call option on a security it owns, to free itself to sell the underlying security or to write another call on the security, or protect a security from being called in an unexpected market rise. Any profits from a closing purchase transaction in the case of a call option on a security a Fund owns may be offset by a decline in the value of the underlying security. Conversely, because increases in the market price of a call
242
Notes to Financial Statements (Continued) |
option will generally reflect increases in the market price of the underlying security, any loss resulting from a closing purchase transaction relating to a call option on a security a Fund owns is likely to be offset in whole or in part by unrealized appreciation of the underlying security owned by the Fund. A Fund may not be able to close out a call option that it has previously written. A Fund may write put options in order to enhance its current return by taking a long directional position as to a security or index of securities. By writing a put option, the Fund assumes the risk that it may be required to purchase the underlying security for an exercise price higher than its then current market value, resulting in a potential capital loss unless the security later appreciates in value. A Fund may terminate a put option that it has written before it expires by entering into a closing purchase transaction. Any loss from this transaction may be partially or entirely offset by the premium received on the terminated option. A Fund may not be able to close out a put option that it has previously written.
When a Fund writes a call or put option, an amount equal to the premium received is recorded as a liability. Premiums received from writing options which expire are treated as realized gains. Premiums received from writing options which are exercised or closed are added to the proceeds or offset against the amount paid on the underlying investment to determine the realized gain or loss.
Purchasing put and call options. A Fund may purchase put options to protect portfolio holdings against a decline in market value of a security or securities held by it. A Fund may also purchase a put option hoping to profit from an anticipated decline in the value of the underlying security. If the Fund holds the security underlying the option, the option premium and any transaction costs will reduce any profit the Fund might have realized had it sold the underlying security instead of buying the put option. A Fund may purchase call options to hedge against an increase in the price of securities that the Fund wants ultimately to buy. A Fund may also purchase a call option as a long directional investment hoping to profit from an anticipated increase in the value of the underlying security. In order for a call option to be profitable, the market price of the underlying security must rise sufficiently above the exercise price to cover the premium and transaction costs. These costs will reduce any profit the Fund might have realized had it bought the underlying security at the time it purchased the call option.
When a Fund purchases an option, it runs the risk that it will lose its entire investment in the option in a relatively short period of time, unless the Fund exercises the option or enters into a closing sale transaction before the option’s expiration. If the price of the underlying security does not rise (in the case of a call) or fall (in the case of a put) to an extent sufficient to cover the option premium and transaction costs, the Fund will lose part or all of its investment in the option. This contrasts with an investment by a Fund in the underlying security, since the Fund will not realize a loss if the security’s price does not change. Premiums paid for purchasing options that expire are treated as realized losses.
OTC Options. OTC options purchased or sold by a Fund are not traded on securities or options exchanges or backed by clearinghouses. Rather, they are entered into directly between a Fund and the counterparty to the option. In the case of an OTC option purchased by the Fund, the value of the option to the Fund will depend on the willingness and ability of the option writer to perform its obligations to the Fund. In addition, OTC options may not be transferable and there may be little or no secondary market for them, so they may be considered illiquid. It may not be possible to enter into closing transactions with respect to OTC options or otherwise to terminate such options, and as a result a Fund may be required to remain obligated on an unfavorable OTC option until its expiration. OTC options are valued using prices supplied by a primary pricing source, selected pursuant to procedures approved by the Trustees.
Rights and Warrants. A Fund may purchase or hold warrants or rights in order to gain exposure to the underlying security without owning the security, including, for example, cases where the Fund hopes to lock in the price today of a security it may wish to purchase in the future. Warrants generally give the holder the right, but not the obligation, to buy a security at a stated price. In order for a warrant to be profitable, the market price of the underlying security must rise sufficiently above the exercise price to cover any premium and transaction costs. Rights may similarly confer on the holder the right to purchase or acquire securities, including through participation in a so-called rights offering. Bonds may be issued with warrants or other rights attached to purchase or acquire equity or other debt securities, typically of the bond issuer. The market prices of bonds with warrants or rights attached to purchase equity securities or bonds may, to some degree, reflect changes in the values of the underlying securities.
243
Notes to Financial Statements (Continued) |
When a Fund purchases or otherwise acquires warrants or other rights, it runs the risk that it will lose its entire investment in the warrants or rights, unless the Fund exercises the warrant or right, acquires the underlying securities, or enters into a closing transaction before expiration. If the price of the underlying security does not rise to an extent sufficient to cover any premium and transaction costs, the Fund will lose part or all of its investment. Any premiums or purchase price paid for warrants or other rights that expire are treated as realized losses. Warrants and similar rights differ from options in that they are typically written by the issuer of the security underlying the warrant or right. Although some warrants and rights may be non-transferable, others may be traded over-the-counter or on an exchange.
Inflation-Linked Securities
Inflation-linked securities are typically fixed income securities whose principal values are periodically adjusted according to a measure of inflation. If the index measuring inflation falls, the principal value of an inflation-linked security will be adjusted downward, and consequently the interest payable on the security (calculated with respect to a smaller principal amount) will be reduced. Repayment of the original principal of the security upon maturity (as adjusted for inflation) is guaranteed in the case of U.S. Treasury inflation-linked securities. For securities that do not provide a similar guarantee, the adjusted principal value of the security repaid at maturity may be less than the original principal.
Alternatively, the interest rates payable on certain inflation-linked securities may be adjusted according to a measure of inflation. As a result, the principal values of such securities do not adjust according to the rate of inflation, although the interest payable on such securities may decline during times of falling inflation.
The values of inflation-linked securities are expected to change in response to changes in real interest rates. Real interest rates are tied to the relationship between nominal interest rates and the rate of inflation. If nominal interest rates increase at a faster rate than inflation, real interest rates may rise, leading to a decrease in value of inflation-linked securities. Inflation-linked securities may cause a potential cash flow mismatch to investors, because an increase in the principal amount of an inflation-linked security will be treated as interest income currently subject to tax at ordinary income rates even though investors will not receive repayment of principal until maturity. If a Fund invests in such securities, it will be required to distribute such interest income in order to qualify for treatment as a regulated investment company and eliminate the Fund-level tax, without a corresponding receipt of cash, and therefore may be required to dispose of portfolio securities at a time when it may not be advantageous to do so in order to make such distributions.
Bank Loans
A Fund may invest in bank loans including, for example, corporate loans, loan participations, direct debt, bank debt, and bridge debt. A Fund may invest in a loan by lending money to a borrower directly as part of a syndicate of lenders. In a syndicated loan, the agent that originated and structured the loan typically administers and enforces the loan on behalf of the syndicate. Failure by the agent to fulfill its obligations may delay or adversely affect receipt of payment by a Fund. A Fund may also invest in loans through novations, assignments, and participation interests. In a novation, a Fund typically assumes all of the rights of a lending institution in a loan, including the right to receive payments of principal and interest and other amounts directly from the borrower and to enforce its rights as a lender directly against the borrower. When a Fund takes an assignment of a loan, the Fund acquires some or all of the interest of another lender (or assignee) in the loan. In such cases, the Fund may be required generally to rely upon the assignor to demand payment and enforce rights under the loan. If a Fund acquires a participation in the loan, the Fund purchases an indirect interest in a loan held by a third party and the Fund typically will have a contractual relationship only with the third party loan investor, not with the borrower. As a result, a Fund may have the right to receive payments of principal, interest, and any fees to which it is entitled only from the loan investor selling the participation and only upon receipt by such loan investor of such payments from the borrower. In such cases, a Fund assumes the credit risk of both the borrower and the loan investor selling the participation, and the Fund may be unable to realize some or all of the value of its interest in the loan in the event of the insolvency of the third party.
Changes in the financial condition of the borrower or economic conditions or other circumstances may reduce the capacity of the borrower to make principal and interest payments on such instruments and may lead to defaults. The value of any collateral securing a bank loan may decline after the Fund invests, and there is a risk that the value of the collateral may not be sufficient to cover the amount owed to the Fund.
244
Notes to Financial Statements (Continued) |
At September 30, 2020, the Funds had no unfunded loan commitments.
Repurchase Agreements
Each Fund may enter into repurchase agreements with certain banks and broker-dealers whereby a Fund acquires a security for cash and obtains a simultaneous commitment from the seller to repurchase the security at an agreed upon price and date. A Fund, through its custodian, takes possession of the securities collateralizing the repurchase agreement in a segregated account. Repurchase agreements must be fully collateralized at all times, but involve some risk to a Fund if the other party should default on its obligation and the Fund is delayed or prevented from recovering the collateral, or if the Fund is required to return collateral to a borrower at a time when it may realize a loss on the investment of that collateral. Collateral for certain tri-party repurchase agreements is held at the Fund’s custodian or sub-custodian in a segregated account for the benefit of the Fund and the counterparty.
When-Issued, Delayed-Delivery, Forward Commitment, and To-Be-Announced Transactions
A Fund may enter into when-issued, delayed-delivery, forward commitment, or to-be-announced (“TBA”) transactions (collectively, the “Forward Transactions”) in order to lock in the purchase price of the underlying security, or in order to adjust the interest rate exposure of the Fund’s existing portfolio. In Forward Transactions, a Fund commits to purchase or sell particular securities, with payment and delivery to take place at a future date. In the case of TBA purchase commitments, the unit price and the estimated principal amount are established when the Fund enters into a commitment, with the actual principal amount being within a specified range of the estimate. Although a Fund does not typically pay for the securities in these types of transactions until they are delivered, it immediately assumes the risks of ownership, including the risk of price fluctuation. As a result, each of these types of transactions may create investment leverage in a Fund’s portfolio and increase the volatility of the Fund. If a Fund’s counterparty fails to deliver a security purchased in a Forward Transaction, there may be a loss, and the Fund may have missed an opportunity to make an alternative investment.
These securities are valued on the basis of valuations furnished by a pricing service, selected pursuant to procedures approved by the Trustees, which determines valuations taking into account appropriate factors such as institutional-size trading in similar groups of securities, yield, quality, coupon rate, maturity, type of issue, trading characteristics, and other market data. Securities for which no market quotation is available are valued at fair value in accordance with procedures approved by the Trustees. The Funds record on a daily basis the unrealized appreciation (depreciation) based upon changes in the values of these securities. When a Forward Transaction is closed, the Funds record a realized gain or loss equal to the difference between the value of the transaction at the time it was opened and the value of the transaction at the time it was closed.
Dollar Roll Transactions
A Fund may enter into dollar roll transactions, in which the Fund sells mortgage-backed securities for delivery in the current month and simultaneously contracts to purchase substantially similar securities on a specified future date from the same party. A Fund may invest in dollar rolls in order to benefit from anticipated changes in pricing for the mortgage-backed securities during the term of the transaction, or for the purpose of creating investment leverage. In a dollar roll, the securities that are to be purchased will be of the same type as the securities sold, but will be supported by different pools of mortgages.
Dollar rolls involve the risk that the Fund’s counterparty will be unable to deliver the mortgage-backed securities underlying the dollar roll at the fixed time. If the counterparty files for bankruptcy or becomes insolvent, a Fund’s use of the transaction proceeds may be restricted pending a determination by the counterparty or its representative, whether to enforce the Fund’s obligation to repurchase the securities. A Fund can incur a loss on a dollar roll transaction (either because its counterparty fails to perform or because the value of the mortgages subject to the transaction declines) and on the investments made by the Fund with the proceeds of the dollar roll transaction.
A Fund accounts for a dollar roll transaction as a purchase and sale whereby the difference in the sales price and purchase price of the security sold is recorded as a realized gain (loss). If certain criteria are met, these dollar roll transactions may be considered financing transactions, whereby the difference in the sales price and the future purchase price is recorded as an adjustment to interest income. Dollar roll transactions generally have the effect of creating leverage in a Fund’s portfolio.
245
Notes to Financial Statements (Continued) |
Securities Lending
Each Fund, other than the U.S. Government Money Market Fund, may lend its securities; however, lending cannot exceed 33% of the total assets of the Fund taken at current value. The Funds’ securities lending activities are governed by a Securities Lending Agency Agreement (“Lending Agreement”) between each Fund and the lending agent (“Agent”). The Lending Agreement authorizes the Agent to lend portfolio securities held by a Fund to approved borrowers (each, a “Borrower”).
Each Fund expects that in connection with any securities on loan, the loan will be secured continuously by collateral consisting of cash (U.S. currency) and/or securities (U.S. Treasury and Agency obligations) adjusted daily to have value at least equal to the current market value of the securities loaned. The market value of the loaned securities is determined at the close of business of a Fund and any additional collateral is delivered to the Fund the next business day. The Funds bear the risk of loss with respect to the investment of cash collateral. As with other extensions of credit, the Funds may bear the risk of delay in recovery of the loaned securities or even loss of rights in the collateral should the Borrower of the securities fail financially. Pursuant to the Lending Agreement, the Agent has provided indemnification to the Funds in the event of default by a Borrower with respect to a loan. The Funds receive compensation for lending their securities in the form of a securities loan fee paid by the Borrower, as well as a share of the income earned on investment of the cash collateral received for the loaned securities. At September 30, 2020, the Funds’ collateral was equal to or greater than 100% of the market value of securities on loan.
Subject to the terms of the Lending Agreement and the agreement between the Agent and the applicable Borrower (“Borrowing Agreement”), security loans can be terminated by the Agent, the Fund, or the Borrower and the related securities must be returned within the earlier of the customary settlement period for such securities or the period of time specified in the Borrowing Agreement.
The Funds employ the Agent to implement their securities lending program and the Agent receives a fee from the Funds for its services. In addition, the Funds may be required to pay a rebate to the Borrower. Accordingly, a Fund’s compensation for lending its securities is reduced by any such fees or rebate paid to the Agent or Borrower, respectively. Income received by the Funds in securities lending transactions during the year ended September 30, 2020, is reflected as securities lending income on the Statement of Operations.
Accounting for Investment Transactions
Investment transactions are accounted for on the trade date. Realized gains and losses on sales of investments and unrealized appreciation and depreciation of investments are computed by the specific identification cost method. Proceeds received from litigation, if any, are included in realized gains on investment transactions for any investments that are no longer held in the portfolio and as a reduction in cost for investments that continue to be held in the portfolio. Interest income, adjusted for amortization of discounts and premiums on debt securities, is earned from the settlement date and is recorded on the accrual basis. Dividend income and realized capital gain distributions are recorded on the ex-dividend date. Non-cash dividends received in the form of stock are recorded as dividend income at market value. Withholding taxes on foreign interest, dividends, and capital gains have been provided for in accordance with the applicable country’s tax rules and rates. Foreign dividend income is recorded on the ex-dividend date or as soon as practicable after the Fund determines the existence of a dividend declaration after exercising reasonable due diligence. Distributions received on securities that represent a return of capital or capital gains are recorded as a reduction of cost of investments and/or as a realized gain. The Funds determine the classification of distributions received as return of capital distributions or capital gain distributions.
Foreign Currency Translation
The books and records of the Funds are maintained in U.S. dollars. The market values of foreign currencies, foreign securities, and other assets and liabilities denominated in foreign currencies are translated into U.S. dollars at the mean of the buying and selling rates of such currencies against the U.S. dollar at the end of each business day. Purchases and sales of foreign securities and income and expense items are translated at the rates of exchange prevailing on the respective dates of such transactions. The Funds do not isolate that portion of the results of operations arising from changes in the exchange rates from that portion arising from changes in the market prices of securities. Net realized foreign currency gains and losses resulting from changes
246
Notes to Financial Statements (Continued) |
in exchange rates include foreign currency gains and losses between trade date and settlement date on investment securities transactions, foreign currency transactions, and the difference between the amounts of dividends or interest recorded on the books of the Funds and the amount actually received.
Allocation of Operating Activity
In maintaining the records for the Funds, the income and expense accounts are allocated daily to each class of shares. Investment income and loss, and unrealized and realized gains or losses are prorated among the classes of shares based on the relative net assets of each. Expenses are allocated to each class of shares depending on the nature of the expenditures. Administration and service fees, if any, which are directly attributable to a class of shares, are charged to that class’s operations. Expenses of a Fund not directly attributable to the operations of any specific class of shares of the Fund are prorated among the classes to which the expense relates based on relative net assets or another alternative method.
Foreign Securities
The Global Fund invests a significant amount of its assets in foreign securities and each of the International Equity Fund and Strategic Emerging Markets Fund invests substantially all of its assets in foreign securities. The other Funds may also invest in foreign securities. Foreign securities, including American Depositary Receipts, are subject to additional risks compared to securities of U.S. issuers, including international trade, currency, political, regulatory, and diplomatic risks. In addition, fluctuations in currency exchange rates may adversely affect the values of foreign securities and the price of a Fund’s shares. Emerging markets securities are subject to greater risks than securities issued in developed foreign markets, including less liquidity, greater price volatility, higher relative rates of inflation, greater political, economic, and social instability, greater custody and operational risks, and greater volatility in currency exchange rates.
Federal Income Tax
It is each Fund’s intent to continue to comply with the provisions of Subchapter M of the Internal Revenue Code of 1986, as amended, applicable to a regulated investment company. Under such provisions, the Funds would not be subject to federal income taxes on their ordinary income and net realized capital gains to the extent they are distributed or deemed to have been distributed to their shareholders. Therefore, the Funds have not made any provision for federal income tax.
Dividends and Distributions to Shareholders
Dividends from net investment income of each Fund, other than the U.S. Government Money Market Fund, are declared and paid annually and at other times as may be required to satisfy tax or regulatory requirements. Dividends from net investment income are declared daily and paid monthly for the U.S. Government Money Market Fund. Distributions of any net realized capital gains of each Fund are declared and paid annually and at other times as may be required to satisfy tax or regulatory requirements.
Distributions to shareholders are recorded on the ex-dividend date. Income and capital gain distributions are determined in accordance with income tax regulations, which may differ from generally accepted accounting principles. As a result, net investment income and net realized capital gains on investment transactions for a reporting period may differ significantly from distributions during such period.
247
Notes to Financial Statements (Continued) |
3. | Advisory Fees and Other Transactions |
Investment Advisory Fees and Investment Subadvisers
MML Investment Advisers, LLC (“MML Advisers”), a wholly-owned subsidiary of Massachusetts Mutual Life Insurance Company (“MassMutual”), serves as investment adviser to each Fund. Under the investment advisory agreements between MML Advisers and the Trust on behalf of each Fund, MML Advisers is responsible for providing investment management services for each Fund. In return for these services, MML Advisers receives advisory fees, based upon each Fund’s average daily net assets, computed and accrued daily and payable monthly, at the following annual rates:
Fund | Investment Advisory Fee |
U.S. Government Money Market Fund | 0.35% on the first $1 billion; and |
| | 0.33% on any excess over $1 billion |
Short-Duration Bond Fund | 0.35% on the first $500 million; and |
| | 0.30% on any excess over $500 million |
Inflation-Protected and Income Fund | 0.38% on the first $350 million; and |
| | 0.33% on any excess over $350 million |
Core Bond Fund | 0.38% on the first $1.5 billion; |
| | 0.33% on the next $500 million; and |
| | 0.28% on any excess over $2 billion |
Diversified Bond Fund | 0.40% on the first $150 million; and |
| | 0.30% on any excess over $150 million |
High Yield Fund | 0.48% on the first $250 million; and |
| | 0.455% on any excess over $250 million |
Balanced Fund | 0.48% on the first $300 million; and |
| | 0.43% on any excess over $300 million |
Disciplined Value Fund | 0.45% on the first $400 million; and |
| | 0.40% on any excess over $400 million |
Main Street Fund | 0.55% on the first $300 million; and |
| | 0.50% on any excess over $300 million |
Disciplined Growth Fund | 0.45% on the first $400 million; and |
| | 0.40% on any excess over $400 million |
Small Cap Opportunities Fund | 0.58% on the first $300 million; and |
| | 0.53% on any excess over $300 million |
Global Fund | 0.75% on the first $400 million; and |
| | 0.70% on any excess over $400 million |
International Equity Fund* | 0.83% on the first $500 million; |
| | 0.78% on the next $500 million; and |
| | 0.73% on any excess over $1 billion |
Strategic Emerging Markets Fund | 1.00% on the first $350 million; and |
| | 0.95% on any excess over $350 million |
* | Prior to July 1, 2020, the advisory fee was 0.85% on the first $500 million; 0.80% on the next $500 million and 0.75% on any excess over $1 billion. |
248
Notes to Financial Statements (Continued) |
MML Advisers has entered into investment subadvisory agreements with Barings LLC (“Barings”), a wholly-owned subsidiary of MM Asset Management Holding LLC, itself a wholly-owned subsidiary of MassMutual Holding LLC, a controlled subsidiary of MassMutual, on behalf of certain Funds. These agreements provide that Barings manage the investment and reinvestment of assets of these Funds. Barings receives a subadvisory fee from MML Advisers, based upon each Fund’s average daily net assets, at the following annual rates:
U.S. Government Money Market Fund | 0.05% |
Short-Duration Bond Fund | 0.08% |
Inflation-Protected and Income Fund | 0.08% |
Core Bond Fund | 0.10% |
Diversified Bond Fund | 0.10% |
High Yield Fund | 0.20% |
Balanced Fund: fixed income portion | 0.09% |
Balanced Fund: equity portion* | 0.22% of the first $50 million; |
| | 0.21% of the next $50 million; and |
| | 0.20% of any excess over $100 million |
Disciplined Value Fund* | 0.25% of the first $50 million; |
| | 0.21% of the next $50 million; |
| | 0.17% of the next $650 million; and |
| | 0.14% of any excess over $750 million |
Disciplined Growth Fund* | 0.25% of the first $50 million; |
| | 0.21% of the next $50 million; |
| | 0.17% of the next $650 million; and |
| | 0.14% of any excess over $750 million |
* | Subadvisory fee based on Aggregate Assets. For purposes of these subadvisory agreements, “Aggregate Assets” means the aggregate of (i) the average daily net assets of the Fund determined at the close of the NYSE on each day that the NYSE is open for trading, and (ii) the average daily net assets of certain other funds or accounts of MML Advisers or its affiliates, including other funds registered under the 1940 Act, for which Barings provides investment advisory services, as agreed upon from time to time by MML Advisers and Barings, determined at the close of the NYSE on each day that the NYSE is open for trading. |
MML Advisers has entered into investment subadvisory agreements with Invesco Advisers, Inc. (“Invesco”), pursuant to which Invesco serves as the subadviser to the Global Fund, Main Street Fund, Small Cap Opportunities Fund, and Strategic Emerging Markets Fund. These agreements provide that Invesco manage the investment and reinvestment of the assets of each Fund. Invesco receives a subadvisory fee from MML Advisers, based upon the average daily net assets of each Fund.
Effective August 4, 2020, Thompson, Siegel & Walmsley LLC (“TSW”) and Wellington Management Company LLP (“Wellington Management”), replaced Invesco as subadvisers to the International Equity Fund. MML Advisers has entered into an investment subadvisory agreement with TSW and Wellington Management, pursuant to which TSW and Wellington Management serve as the subadvisers to the International Equity Fund. This agreement provides that TSW and Wellington Management manage the investment and reinvestment of the assets of the International Equity Fund. TSW and Wellington Management receive a subadvisory fee from MML Advisers, based upon the International Equity Fund’s average daily net assets.
Prior to August 4, 2020, MML Advisers had entered into an investment subadvisory agreement with Invesco, on behalf of the International Equity Fund. This agreement provided that Invesco manages the investment and reinvestment of the assets of the International Equity Fund.
The Funds’ subadvisory fees are paid monthly by MML Advisers out of the advisory fees previously disclosed above.
249
Notes to Financial Statements (Continued) |
Administration Fees
Under an Administrative and Shareholder Services Agreement between the Trust and MML Advisers, on behalf of each Fund, MML Advisers is obligated to provide certain administrative and shareholder services. In return for these services, MML Advisers receives an administrative services fee, based upon the average daily net assets of the applicable class of shares of the Funds, at the following annual rates:
| | Class I | Class R5 | Service
Class | Administrative
Class | Class A | Class R4 | Class R3 |
U.S. Government Money Market Fund | N/A | 0.10% | N/A | N/A | N/A | N/A | N/A |
Short-Duration Bond Fund | None | 0.10% | 0.15% | 0.15% | 0.15% | 0.20% | 0.20% |
Inflation-Protected and Income Fund | None | 0.10% | 0.15% | 0.15% | 0.15% | 0.20% | 0.20% |
Core Bond Fund | None | 0.10% | 0.15% | 0.15% | 0.15% | 0.20% | 0.20% |
Diversified Bond Fund | None | 0.10% | 0.15% | 0.15% | 0.15% | 0.20% | 0.20% |
High Yield Fund | None | 0.10% | 0.15% | 0.15% | 0.15% | 0.20% | 0.20% |
Balanced Fund | None | 0.10% | 0.15% | 0.15% | 0.15% | 0.20% | 0.20% |
Disciplined Value Fund | None | 0.10% | 0.15% | 0.15% | 0.15% | 0.20% | 0.20% |
Main Street Fund | None | 0.10% | 0.15% | 0.15% | 0.15% | 0.20% | 0.20% |
Disciplined Growth Fund | None | 0.10% | 0.15% | 0.15% | 0.15% | 0.20% | 0.20% |
Small Cap Opportunities Fund | None | 0.10% | 0.15% | 0.15% | 0.15% | 0.20% | 0.20% |
Global Fund | None | 0.10% | 0.15% | 0.15% | 0.15% | 0.20% | 0.20% |
International Equity Fund | None | 0.10% | 0.15% | 0.15% | 0.15% | 0.20% | 0.20% |
Strategic Emerging Markets Fund | None | 0.10% | 0.15% | 0.15% | 0.15% | 0.20% | 0.20% |
Distribution and Service Fees
MML Distributors, LLC (the “Distributor”) acts as distributor to each Fund. Pursuant to a 12b-1 Plan adopted by the Trust, Class A shares and Class R4 shares of each Fund pay an annual fee of 0.25% of the average daily net assets of the class; and Class R3 shares of each Fund pay an annual fee of 0.50% of the average daily net assets of the class, to the Distributor. Such payments compensate the Distributor for services provided and expenses incurred by it for purposes of promoting the sale of the relevant class of shares, reducing redemptions of shares, or maintaining or improving services provided to each Fund’s shareholders. The Distributor is a wholly-owned subsidiary of MassMutual.
Effective April 1, 2014, the Trust entered into a separate Supplemental Shareholder Services Agreement with MassMutual, on behalf of Service Class shares, Administrative Class shares, and Class A shares of each Fund. Fees payable under the Supplemental Shareholder Services Agreement are intended to compensate MassMutual for its provision of shareholder services to the Funds’ investors and are calculated and paid based on the average daily net assets attributable to the relevant share classes of the Funds separately, at the following annual rates: 0.05% for Service Class shares, and 0.15% for Administrative Class shares and Class A shares. MassMutual may pay these fees to other intermediaries for providing shareholder services to the Funds’ investors.
250
Notes to Financial Statements (Continued) |
Expense Caps and Waivers
MML Advisers contractually agreed to cap the fees and expenses of the Fund noted below (other than extraordinary litigation and legal expenses, Acquired Fund Fees and Expenses#, interest expense, short sale dividend and loan expense, or other non-recurring or unusual expenses such as organizational expenses and shareholder meeting expenses, as applicable) through January 31, 2021, based upon the average daily net assets of the applicable class of shares of the Fund, as follows:
| | Class I | Class R5 | Service
Class | Administrative
Class | Class A | Class R4 | Class R3 |
Inflation-Protected and Income Fund | 0.48% | 0.58% | 0.68% | 0.78% | 1.03% | 0.93% | 1.18% |
Strategic Emerging Markets Fund | 1.15% | 1.25% | 1.35% | 1.45% | 1.70% | 1.60% | 1.85% |
# | Acquired Fund Fees and Expenses are borne indirectly by a Fund through investments in other pooled investment vehicles. |
MML Advisers has agreed to waive 0.02% of the advisory fees of the International Equity Fund through January 31, 2021.
For the U.S. Government Money Market Fund, MML Advisers has agreed to voluntarily waive some or all of its fees in an attempt to allow the Fund to avoid a negative yield. There is no guarantee that the Fund will be able to avoid a negative yield. Payments made to intermediaries will be unaffected. MML Advisers may amend or discontinue this waiver at any time without advance notice.
Expense caps and waiver amounts are reflected as a reduction of expenses on the Statements of Operations.
Deferred Compensation
Trustees of the Funds who are not officers or employees of MassMutual may elect to defer receipt of their annual fees in accordance with terms of a Non-Qualified Deferred Compensation Plan. Amounts deferred shall accrue interest or earnings and shall be recorded on the Funds’ books as other liabilities. Deferred compensation is included within Trustees’ fees and expenses in the Statements of Assets and Liabilities.
Other
Certain officers and trustees of the Funds may also be employees of MassMutual. The compensation of a trustee who is not an employee of MassMutual is borne by the Funds.
The following table shows beneficial ownership of Funds’ shares by affiliated parties at September 30, 2020:
| | Total % Ownership
by Related Party |
U.S. Government Money Market Fund | 47.0% |
Short-Duration Bond Fund | 82.8% |
Inflation-Protected and Income Fund | 70.8% |
Core Bond Fund | 78.2% |
Diversified Bond Fund | 53.1% |
High Yield Fund | 73.7% |
Balanced Fund | 69.1% |
Disciplined Value Fund | 91.7% |
Main Street Fund | 73.9% |
Disciplined Growth Fund | 75.1% |
Small Cap Opportunities Fund | 64.2% |
Global Fund | 77.2% |
International Equity Fund | 82.9% |
Strategic Emerging Markets Fund | 98.2% |
251
Notes to Financial Statements (Continued) |
4. | Purchases and Sales of Investments |
Cost of purchases and proceeds from sales of investment securities (excluding short-term investments) for the year ended September 30, 2020, were as follows:
| | | Purchases | | | Sales | |
| | | Long-Term U.S.
Government
Securities | | | Other Long-
Term Securities | | | Long-Term U.S.
Government
Securities | | | Other Long-
Term Securities | |
Short-Duration Bond Fund | | $ | 3,204,500 | | | $ | 164,684,656 | | | $ | 4,899,529 | | | $ | 254,961,090 | |
Inflation-Protected and Income Fund | | | 99,302,609 | | | | 215,110,565 | | | | 180,485,525 | | | | 92,516,290 | |
Core Bond Fund | | | 2,800,532,787 | | | | 366,687,856 | | | | 2,906,551,819 | | | | 375,015,968 | |
Diversified Bond Fund | | | 360,653,591 | | | | 71,303,598 | | | | 376,152,976 | | | | 70,944,701 | |
High Yield Fund | | | — | | | | 452,194,774 | | | | — | | | | 410,204,943 | |
Balanced Fund | | | 105,431,818 | | | | 41,191,932 | | | | 104,912,583 | | | | 35,166,626 | |
Disciplined Value Fund | | | — | | | | 52,592,137 | | | | — | | | | 73,844,890 | |
Main Street Fund | | | — | | | | 42,900,306 | | | | — | | | | 56,324,545 | |
Disciplined Growth Fund | | | — | | | | 122,781,713 | | | | — | | | | 179,428,515 | |
Small Cap Opportunities Fund | | | — | | | | 121,024,816 | | | | — | | | | 101,758,515 | |
Global Fund | | | — | | | | 35,690,519 | | | | ��� | | | | 77,440,676 | |
International Equity Fund | | | — | | | | 234,746,713 | | | | — | | | | 374,477,352 | |
Strategic Emerging Markets Fund | | | — | | | | 133,850,411 | | | | — | | | | 111,236,422 | |
The Funds may purchase from, or sell securities to, other affiliated Funds under procedures adopted by the Trustees. These procedures have been designed to ensure that cross trades conducted by the Funds comply with Rule 17a-7 under the 1940 Act. The Funds did not have any cross trade activity during the period.
5. | Capital Share Transactions |
Changes in shares outstanding for each Fund were as follows:
| | | Year Ended September 30, 2020 | | | Year Ended September 30, 2019 | |
| | | Shares | | | Amount | | | Shares | | | Amount | |
U.S. Government Money Market Fund Class R5 | | | | | | | | | | | | | | | | |
Sold | | | 1,260,957,196 | | | $ | 1,260,957,196 | | | | 1,331,672,991 | | | $ | 1,331,672,991 | |
Issued as reinvestment of dividends | | | 1,857,069 | | | | 1,857,069 | | | | 6,237,689 | | | | 6,237,689 | |
Redeemed | | | (1,318,418,115 | ) | | | (1,318,418,115 | ) | | | (1,343,903,475 | ) | | | (1,343,903,475 | ) |
Net increase (decrease) | | | (55,603,850 | ) | | $ | (55,603,850 | ) | | | (5,992,795 | ) | | $ | (5,992,795 | ) |
Short-Duration Bond Fund Class I | | | | | | | | | | | | | | | | |
Sold | | | 12,835,373 | | | $ | 127,961,423 | | | | 11,237,045 | | | $ | 114,624,486 | |
Issued as reinvestment of dividends | | | 640,826 | | | | 6,427,487 | | | | 722,304 | | | | 7,172,482 | |
Redeemed | | | (14,479,311 | ) | | | (143,896,465 | ) | | | (8,009,695 | ) | | | (81,335,446 | ) |
Net increase (decrease) | | | (1,003,112 | ) | | $ | (9,507,555 | ) | | | 3,949,654 | | | $ | 40,461,522 | |
Short-Duration Bond Fund Class R5 | | | | | | | | | | | | | | | | |
Sold | | | 2,163,376 | | | $ | 21,647,086 | | | | 5,675,044 | | | $ | 57,906,445 | |
Issued as reinvestment of dividends | | | 499,588 | | | | 5,030,849 | | | | 471,038 | | | | 4,696,245 | |
Redeemed | | | (7,081,015 | ) | | | (70,146,705 | ) | | | (3,886,993 | ) | | | (39,752,303 | ) |
Net increase (decrease) | | | (4,418,051 | ) | | $ | (43,468,770 | ) | | | 2,259,089 | | | $ | 22,850,387 | |
252
Notes to Financial Statements (Continued) |
| | | Year Ended September 30, 2020 | | | Year Ended September 30, 2019 | |
| | | Shares | | | Amount | | | Shares | | | Amount | |
Short-Duration Bond Fund Service Class | | | | | | | | | | | | | | | | |
Sold | | | 1,339,391 | | | $ | 13,197,026 | | | | 1,403,928 | | | $ | 14,169,640 | |
Issued as reinvestment of dividends | | | 150,318 | | | | 1,504,685 | | | | 219,466 | | | | 2,172,717 | |
Redeemed | | | (2,640,975 | ) | | | (26,357,949 | ) | | | (3,697,465 | ) | | | (37,741,167 | ) |
Net increase (decrease) | | | (1,151,266 | ) | | $ | (11,656,238 | ) | | | (2,074,071 | ) | | $ | (21,398,810 | ) |
Short-Duration Bond Fund Administrative Class | | | | | | | | | | | | | | | | |
Sold | | | 1,351,878 | | | $ | 13,256,835 | | | | 603,747 | | | $ | 6,077,886 | |
Issued as reinvestment of dividends | | | 94,502 | | | | 942,181 | | | | 112,687 | | | | 1,112,224 | |
Redeemed | | | (1,743,706 | ) | | | (16,798,571 | ) | | | (1,018,975 | ) | | | (10,315,813 | ) |
Net increase (decrease) | | | (297,326 | ) | | $ | (2,599,555 | ) | | | (302,541 | ) | | $ | (3,125,703 | ) |
Short-Duration Bond Fund Class A | | | | | | | | | | | | | | | | |
Sold | | | 1,082,005 | | | $ | 10,695,588 | | | | 1,517,014 | | | $ | 15,272,722 | |
Issued as reinvestment of dividends | | | 163,448 | | | | 1,619,767 | | | | 196,382 | | | | 1,926,511 | |
Redeemed | | | (2,474,958 | ) | | | (23,925,927 | ) | | | (1,504,303 | ) | | | (15,041,585 | ) |
Net increase (decrease) | | | (1,229,505 | ) | | $ | (11,610,572 | ) | | | 209,093 | | | $ | 2,157,648 | |
Short-Duration Bond Fund Class R4 | | | | | | | | | | | | | | | | |
Sold | | | 298,178 | | | $ | 2,974,097 | | | | 338,663 | | | $ | 3,420,688 | |
Issued as reinvestment of dividends | | | 36,136 | | | | 362,441 | | | | 44,583 | | | | 442,706 | |
Redeemed | | | (404,170 | ) | | | (3,989,768 | ) | | | (500,995 | ) | | | (5,065,219 | ) |
Net increase (decrease) | | | (69,856 | ) | | $ | (653,230 | ) | | | (117,749 | ) | | $ | (1,201,825 | ) |
Short-Duration Bond Fund Class R3 | | | | | | | | | | | | | | | | |
Sold | | | 415,940 | | | $ | 4,079,377 | | | | 346,491 | | | $ | 3,499,365 | |
Issued as reinvestment of dividends | | | 18,897 | | | | 188,593 | | | | 25,912 | | | | 256,012 | |
Redeemed | | | (349,897 | ) | | | (3,433,807 | ) | | | (464,621 | ) | | | (4,677,821 | ) |
Net increase (decrease) | | | 84,940 | | | $ | 834,163 | | | | (92,218 | ) | | $ | (922,444 | ) |
Inflation-Protected and Income Fund Class I | | | | | | | | | | | | | | | | |
Sold | | | 7,760,605 | | | $ | 83,482,222 | | | | 4,769,855 | | | $ | 48,558,437 | |
Issued as reinvestment of dividends | | | 314,268 | | | | 3,271,533 | | | | 430,466 | | | | 4,218,564 | |
Redeemed | | | (7,142,665 | ) | | | (76,287,486 | ) | | | (3,634,908 | ) | | | (36,914,487 | ) |
Net increase (decrease) | | | 932,208 | | | $ | 10,466,269 | | | | 1,565,413 | | | $ | 15,862,514 | |
Inflation-Protected and Income Fund Class R5 | | | | | | | | | | | | | | | | |
Sold | | | 2,226,519 | | | $ | 24,025,442 | | | | 2,002,638 | | | $ | 20,550,947 | |
Issued as reinvestment of dividends | | | 141,751 | | | | 1,477,050 | | | | 191,642 | | | | 1,880,006 | |
Redeemed | | | (1,724,795 | ) | | | (18,575,443 | ) | | | (1,137,534 | ) | | | (11,677,300 | ) |
Net increase (decrease) | | | 643,475 | | | $ | 6,927,049 | | | | 1,056,746 | | | $ | 10,753,653 | |
Inflation-Protected and Income Fund Service Class | | | | | | | | | | | | | | | | |
Sold | | | 1,675,741 | | | $ | 18,087,230 | | | | 738,699 | | | $ | 7,545,447 | |
Issued as reinvestment of dividends | | | 83,858 | | | | 871,286 | | | | 148,067 | | | | 1,448,100 | |
Redeemed | | | (1,766,478 | ) | | | (18,806,959 | ) | | | (1,009,421 | ) | | | (10,234,536 | ) |
Net increase (decrease) | | | (6,879 | ) | | $ | 151,557 | | | | (122,655 | ) | | $ | (1,240,989 | ) |
Inflation-Protected and Income Fund Administrative Class | | | | | | | | | | | | | | | | |
Sold | | | 349,137 | | | $ | 3,795,425 | | | | 481,364 | | | $ | 4,895,076 | |
Issued as reinvestment of dividends | | | 25,080 | | | | 263,596 | | | | 42,796 | | | | 423,256 | |
Redeemed | | | (560,044 | ) | | | (6,025,901 | ) | | | (438,145 | ) | | | (4,458,680 | ) |
Net increase (decrease) | | | (185,827 | ) | | $ | (1,966,880 | ) | | | 86,015 | | | $ | 859,652 | |
253
Notes to Financial Statements (Continued) |
| | | Year Ended September 30, 2020 | | | Year Ended September 30, 2019 | |
| | | Shares | | | Amount | | | Shares | | | Amount | |
Inflation-Protected and Income Fund Class A | | | | | | | | | | | | | | | | |
Sold | | | 1,007,170 | | | $ | 10,700,612 | | | | 473,235 | | | $ | 4,758,574 | |
Issued as reinvestment of dividends | | | 26,021 | | | | 266,713 | | | | 51,135 | | | | 493,963 | |
Redeemed | | | (618,282 | ) | | | (6,556,206 | ) | | | (1,019,829 | ) | | | (10,188,262 | ) |
Net increase (decrease) | | | 414,909 | | | $ | 4,411,119 | | | | (495,459 | ) | | $ | (4,935,725 | ) |
Inflation-Protected and Income Fund Class R4 | | | | | | | | | | | | | | | | |
Sold | | | 235,320 | | | $ | 2,463,941 | | | | 233,527 | | | $ | 2,326,856 | |
Issued as reinvestment of dividends | | | 11,705 | | | | 119,159 | | | | 18,033 | | | | 173,122 | |
Redeemed | | | (527,910 | ) | | | (5,512,293 | ) | | | (263,174 | ) | | | (2,606,018 | ) |
Net increase (decrease) | | | (280,885 | ) | | $ | (2,929,193 | ) | | | (11,614 | ) | | $ | (106,040 | ) |
Inflation-Protected and Income Fund Class R3 | | | | | | | | | | | | | | | | |
Sold | | | 102,480 | | | $ | 1,081,508 | | | | 141,891 | | | $ | 1,412,120 | |
Issued as reinvestment of dividends | | | 5,707 | | | | 58,266 | | | | 11,444 | | | | 110,088 | |
Redeemed | | | (231,387 | ) | | | (2,397,866 | ) | | | (194,688 | ) | | | (1,923,350 | ) |
Net increase (decrease) | | | (123,200 | ) | | $ | (1,258,092 | ) | | | (41,353 | ) | | $ | (401,142 | ) |
Core Bond Fund Class I | | | | | | | | | | | | | | | | |
Sold | | | 24,413,460 | | | $ | 273,343,665 | | | | 24,647,274 | | | $ | 264,896,073 | |
Issued as reinvestment of dividends | | | 2,610,318 | | | | 28,739,602 | | | | 2,312,656 | | | | 23,843,483 | |
Redeemed | | | (34,269,903 | ) | | | (382,938,214 | ) | | | (17,383,135 | ) | | | (186,973,836 | ) |
Net increase (decrease) | | | (7,246,125 | ) | | $ | (80,854,947 | ) | | | 9,576,795 | | | $ | 101,765,720 | |
Core Bond Fund Class R5 | | | | | | | | | | | | | | | | |
Sold | | | 5,063,905 | | | $ | 56,714,126 | | | | 4,982,113 | | | $ | 54,433,354 | |
Issued as reinvestment of dividends | | | 941,162 | | | | 10,399,843 | | | | 847,450 | | | | 8,771,104 | |
Redeemed | | | (6,867,304 | ) | | | (76,932,435 | ) | | | (5,402,116 | ) | | | (57,734,793 | ) |
Net increase (decrease) | | | (862,237 | ) | | $ | (9,818,466 | ) | | | 427,447 | | | $ | 5,469,665 | |
Core Bond Fund Service Class | | | | | | | | | | | | | | | | |
Sold | | | 2,668,588 | | | $ | 29,923,393 | | | | 1,125,854 | | | $ | 12,212,574 | |
Issued as reinvestment of dividends | | | 229,976 | | | | 2,527,437 | | | | 274,078 | | | | 2,820,260 | |
Redeemed | | | (3,371,899 | ) | | | (37,423,756 | ) | | | (3,250,559 | ) | | | (35,348,490 | ) |
Net increase (decrease) | | | (473,335 | ) | | $ | (4,972,926 | ) | | | (1,850,627 | ) | | $ | (20,315,656 | ) |
Core Bond Fund Administrative Class | | | | | | | | | | | | | | | | |
Sold | | | 2,198,816 | | | $ | 24,708,162 | | | | 932,538 | | | $ | 10,063,209 | |
Issued as reinvestment of dividends | | | 190,504 | | | | 2,078,397 | | | | 204,168 | | | | 2,086,599 | |
Redeemed | | | (1,731,658 | ) | | | (18,941,292 | ) | | | (1,723,811 | ) | | | (18,338,331 | ) |
Net increase (decrease) | | | 657,662 | | | $ | 7,845,267 | | | | (587,105 | ) | | $ | (6,188,523 | ) |
Core Bond Fund Class A | | | | | | | | | | | | | | | | |
Sold | | | 963,175 | | | $ | 10,457,461 | | | | 1,004,600 | | | $ | 10,668,442 | |
Issued as reinvestment of dividends | | | 243,108 | | | | 2,632,864 | | | | 277,919 | | | | 2,820,882 | |
Redeemed | | | (4,810,509 | ) | | | (52,901,969 | ) | | | (2,739,046 | ) | | | (28,934,737 | ) |
Net increase (decrease) | | | (3,604,226 | ) | | $ | (39,811,644 | ) | | | (1,456,527 | ) | | $ | (15,445,413 | ) |
Core Bond Fund Class R4 | | | | | | | | | | | | | | | | |
Sold | | | 531,392 | | | $ | 5,876,894 | | | | 493,233 | | | $ | 5,135,939 | |
Issued as reinvestment of dividends | | | 39,456 | | | | 424,542 | | | | 34,573 | | | | 348,493 | |
Redeemed | | | (917,990 | ) | | | (10,171,340 | ) | | | (281,474 | ) | | | (2,958,999 | ) |
Net increase (decrease) | | | (347,142 | ) | | $ | (3,869,904 | ) | | | 246,332 | | | $ | 2,525,433 | |
254
Notes to Financial Statements (Continued) |
| | | Year Ended September 30, 2020 | | | Year Ended September 30, 2019 | |
| | | Shares | | | Amount | | | Shares | | | Amount | |
Core Bond Fund Class R3 | | | | | | | | | | | | | | | | |
Sold | | | 53,276 | | | $ | 580,775 | | | | 77,905 | | | $ | 868,497 | |
Issued as reinvestment of dividends | | | 3,293 | | | | 36,423 | | | | 2,087 | | | | 21,641 | |
Redeemed | | | (90,054 | ) | | | (1,022,341 | ) | | | (47,161 | ) | | | (516,604 | ) |
Net increase (decrease) | | | (33,485 | ) | | $ | (405,143 | ) | | | 32,831 | | | $ | 373,534 | |
Diversified Bond Fund Class I | | | | | | | | | | | | | | | | |
Sold | | | 4,134,009 | | | $ | 46,830,084 | | | | 4,432,486 | | | $ | 48,173,645 | |
Issued as reinvestment of dividends | | | 191,020 | | | | 2,101,217 | | | | 78,600 | | | | 803,296 | |
Redeemed | | | (1,286,060 | ) | | | (14,315,707 | ) | | | (1,159,866 | ) | | | (12,271,054 | ) |
Net increase (decrease) | | | 3,038,969 | | | $ | 34,615,594 | | | | 3,351,220 | | | $ | 36,705,887 | |
Diversified Bond Fund Class R5 | | | | | | | | | | | | | | | | |
Sold | | | 1,925,744 | | | $ | 19,642,775 | | | | 2,119,174 | | | $ | 20,940,783 | |
Issued as reinvestment of dividends | | | 370,860 | | | | 3,753,102 | | | | 366,569 | | | | 3,456,741 | |
Redeemed | | | (5,442,921 | ) | | | (55,944,628 | ) | | | (1,997,969 | ) | | | (19,459,573 | ) |
Net increase (decrease) | | | (3,146,317 | ) | | $ | (32,548,751 | ) | | | 487,774 | | | $ | 4,937,951 | |
Diversified Bond Fund Service Class | | | | | | | | | | | | | | | | |
Sold | | | 245,368 | | | $ | 2,548,809 | | | | 168,384 | | | $ | 1,696,825 | |
Issued as reinvestment of dividends | | | 36,833 | | | | 378,278 | | | | 49,353 | | | | 472,306 | |
Redeemed | | | (389,034 | ) | | | (4,058,029 | ) | | | (898,867 | ) | | | (8,857,395 | ) |
Net increase (decrease) | | | (106,833 | ) | | $ | (1,130,942 | ) | | | (681,130 | ) | | $ | (6,688,264 | ) |
Diversified Bond Fund Administrative Class | | | | | | | | | | | | | | | | |
Sold | | | 276,225 | | | $ | 2,862,991 | | | | 414,721 | | | $ | 4,131,180 | |
Issued as reinvestment of dividends | | | 64,311 | | | | 659,827 | | | | 69,720 | | | | 665,828 | |
Redeemed | | | (822,642 | ) | | | (8,542,597 | ) | | | (1,140,810 | ) | | | (11,396,359 | ) |
Net increase (decrease) | | | (482,106 | ) | | $ | (5,019,779 | ) | | | (656,369 | ) | | $ | (6,599,351 | ) |
Diversified Bond Fund Class A | | | | | | | | | | | | | | | | |
Sold | | | 384,376 | | | $ | 4,009,085 | | | | 388,197 | | | $ | 3,877,401 | |
Issued as reinvestment of dividends | | | 69,941 | | | | 716,898 | | | | 89,996 | | | | 858,563 | |
Redeemed | | | (1,836,895 | ) | | | (19,259,777 | ) | | | (1,008,253 | ) | | | (10,157,105 | ) |
Net increase (decrease) | | | (1,382,578 | ) | | $ | (14,533,794 | ) | | | (530,060 | ) | | $ | (5,421,141 | ) |
Diversified Bond Fund Class R4 | | | | | | | | | | | | | | | | |
Sold | | | 157,101 | | | $ | 1,603,381 | | | | 363,034 | | | $ | 3,570,002 | |
Issued as reinvestment of dividends | | | 21,265 | | | | 215,413 | | | | 20,459 | | | | 193,130 | |
Redeemed | | | (255,299 | ) | | | (2,569,657 | ) | | | (200,398 | ) | | | (1,992,151 | ) |
Net increase (decrease) | | | (76,933 | ) | | $ | (750,863 | ) | | | 183,095 | | | $ | 1,770,981 | |
Diversified Bond Fund Class R3 | | | | | | | | | | | | | | | | |
Sold | | | 163,943 | | | $ | 1,665,074 | | | | 85,656 | | | $ | 843,759 | |
Issued as reinvestment of dividends | | | 8,178 | | | | 82,760 | | | | 12,103 | | | | 114,013 | |
Redeemed | | | (147,477 | ) | | | (1,490,752 | ) | | | (219,953 | ) | | | (2,174,820 | ) |
Net increase (decrease) | | | 24,644 | | | $ | 257,082 | | | | (122,194 | ) | | $ | (1,217,048 | ) |
High Yield Fund Class I | | | | | | | | | | | | | | | | |
Sold | | | 23,198,015 | | | $ | 201,062,141 | | | | 13,454,925 | | | $ | 119,780,618 | |
Issued as reinvestment of dividends | | | 2,201,075 | | | | 19,281,414 | | | | 2,286,979 | | | | 19,347,843 | |
Redeemed | | | (17,349,295 | ) | | | (146,100,911 | ) | | | (21,562,709 | ) | | | (191,402,484 | ) |
Net increase (decrease) | | | 8,049,795 | | | $ | 74,242,644 | | | | (5,820,805 | ) | | $ | (52,274,023 | ) |
255
Notes to Financial Statements (Continued) |
| | | Year Ended September 30, 2020 | | | Year Ended September 30, 2019 | |
| | | Shares | | | Amount | | | Shares | | | Amount | |
High Yield Fund Class R5 | | | | | | | | | | | | | | | | |
Sold | | | 2,816,499 | | | $ | 24,326,317 | | | | 999,091 | | | $ | 8,984,134 | |
Issued as reinvestment of dividends | | | 299,974 | | | | 2,645,773 | | | | 267,401 | | | | 2,275,582 | |
Redeemed | | | (1,927,088 | ) | | | (16,243,944 | ) | | | (1,480,564 | ) | | | (13,166,309 | ) |
Net increase (decrease) | | | 1,189,385 | | | $ | 10,728,146 | | | | (214,072 | ) | | $ | (1,906,593 | ) |
High Yield Fund Service Class | | | | | | | | | | | | | | | | |
Sold | | | 816,911 | | | $ | 7,021,989 | | | | 823,525 | | | $ | 7,456,934 | |
Issued as reinvestment of dividends | | | 321,932 | | | | 2,839,443 | | | | 288,420 | | | | 2,454,456 | |
Redeemed | | | (2,545,940 | ) | | | (21,997,619 | ) | | | (662,544 | ) | | | (5,887,077 | ) |
Net increase (decrease) | | | (1,407,097 | ) | | $ | (12,136,187 | ) | | | 449,401 | | | $ | 4,024,313 | |
High Yield Fund Administrative Class | | | | | | | | | | | | | | | | |
Sold | | | 591,674 | | | $ | 5,006,524 | | | | 539,634 | | | $ | 4,801,988 | |
Issued as reinvestment of dividends | | | 172,142 | | | | 1,494,189 | | | | 175,196 | | | | 1,468,139 | |
Redeemed | | | (858,199 | ) | | | (7,257,413 | ) | | | (1,271,243 | ) | | | (11,177,491 | ) |
Net increase (decrease) | | | (94,383 | ) | | $ | (756,700 | ) | | | (556,413 | ) | | $ | (4,907,364 | ) |
High Yield Fund Class A | | | | | | | | | | | | | | | | |
Sold | | | 814,241 | | | $ | 6,961,351 | | | | 1,265,970 | | | $ | 11,204,745 | |
Issued as reinvestment of dividends | | | 196,591 | | | | 1,702,479 | | | | 162,228 | | | | 1,357,846 | |
Redeemed | | | (1,579,847 | ) | | | (13,342,010 | ) | | | (966,562 | ) | | | (8,519,965 | ) |
Net increase (decrease) | | | (569,015 | ) | | $ | (4,678,180 | ) | | | 461,636 | | | $ | 4,042,626 | |
High Yield Fund Class R4 | | | | | | | | | | | | | | | | |
Sold | | | 941,583 | | | $ | 7,788,215 | | | | 2,578,632 | | | $ | 22,111,480 | |
Issued as reinvestment of dividends | | | 315,597 | | | | 2,695,196 | | | | 216,148 | | | | 1,787,546 | |
Redeemed | | | (1,713,057 | ) | | | (14,096,600 | ) | | | (1,421,349 | ) | | | (12,310,460 | ) |
Net increase (decrease) | | | (455,877 | ) | | $ | (3,613,189 | ) | | | 1,373,431 | | | $ | 11,588,566 | |
High Yield Fund Class R3 | | | | | | | | | | | | | | | | |
Sold | | | 837,762 | | | $ | 7,144,883 | | | | 745,706 | | | $ | 6,655,229 | |
Issued as reinvestment of dividends | | | 242,579 | | | | 2,129,846 | | | | 263,316 | | | | 2,230,290 | |
Redeemed | | | (1,641,307 | ) | | | (13,932,102 | ) | | | (1,242,387 | ) | | | (10,964,684 | ) |
Net increase (decrease) | | | (560,966 | ) | | $ | (4,657,373 | ) | | | (233,365 | ) | | $ | (2,079,165 | ) |
Balanced Fund Class I | | | | | | | | | | | | | | | | |
Sold | | | 1,379,938 | | | $ | 16,405,193 | | | | 2,015,264 | | | $ | 23,672,797 | |
Issued as reinvestment of dividends | | | 173,528 | | | | 2,058,041 | | | | 103,704 | | | | 1,128,296 | |
Redeemed | | | (743,647 | ) | | | (8,643,855 | ) | | | (409,628 | ) | | | (4,762,291 | ) |
Net increase (decrease) | | | 809,819 | | | $ | 9,819,379 | | | | 1,709,340 | | | $ | 20,038,802 | |
Balanced Fund Class R5 | | | | | | | | | | | | | | | | |
Sold | | | 198,510 | | | $ | 2,366,990 | | | | 533,987 | | | $ | 6,498,013 | |
Issued as reinvestment of dividends | | | 236,763 | | | | 2,810,372 | | | | 322,811 | | | | 3,512,186 | |
Redeemed | | | (785,543 | ) | | | (9,194,993 | ) | | | (619,845 | ) | | | (7,255,273 | ) |
Net increase (decrease) | | | (350,270 | ) | | $ | (4,017,631 | ) | | | 236,953 | | | $ | 2,754,926 | |
Balanced Fund Service Class | | | | | | | | | | | | | | | | |
Sold | | | 248,919 | | | $ | 3,177,238 | | | | 56,864 | | | $ | 704,414 | |
Issued as reinvestment of dividends | | | 26,519 | | | | 333,607 | | | | 40,978 | | | | 470,839 | |
Redeemed | | | (92,023 | ) | | | (1,133,885 | ) | | | (159,632 | ) | | | (2,010,098 | ) |
Net increase (decrease) | | | 183,415 | | | $ | 2,376,960 | | | | (61,790 | ) | | $ | (834,845 | ) |
256
Notes to Financial Statements (Continued) |
| | | Year Ended September 30, 2020 | | | Year Ended September 30, 2019 | |
| | | Shares | | | Amount | | | Shares | | | Amount | |
Balanced Fund Administrative Class | | | | | | | | | | | | | | | | |
Sold | | | 83,672 | | | $ | 1,005,361 | | | | 87,979 | | | $ | 1,039,911 | |
Issued as reinvestment of dividends | | | 34,921 | | | | 416,607 | | | | 48,914 | | | | 535,122 | |
Redeemed | | | (224,831 | ) | | | (2,700,070 | ) | | | (191,364 | ) | | | (2,228,416 | ) |
Net increase (decrease) | | | (106,238 | ) | | $ | (1,278,102 | ) | | | (54,471 | ) | | $ | (653,383 | ) |
Balanced Fund Class A | | | | | | | | | | | | | | | | |
Sold | | | 127,744 | | | $ | 1,449,420 | | | | 160,969 | | | $ | 1,848,162 | |
Issued as reinvestment of dividends | | | 137,628 | | | | 1,592,357 | | | | 182,222 | | | | 1,935,198 | |
Redeemed | | | (351,203 | ) | | | (4,140,429 | ) | | | (483,832 | ) | | | (5,667,735 | ) |
Net increase (decrease) | | | (85,831 | ) | | $ | (1,098,652 | ) | | | (140,641 | ) | | $ | (1,884,375 | ) |
Balanced Fund Class R4 | | | | | | | | | | | | | | | | |
Sold | | | 35,848 | | | $ | 417,440 | | | | 67,879 | | | $ | 775,293 | |
Issued as reinvestment of dividends | | | 16,250 | | | | 186,064 | | | | 21,965 | | | | 231,293 | |
Redeemed | | | (46,044 | ) | | | (523,745 | ) | | | (126,383 | ) | | | (1,416,944 | ) |
Net increase (decrease) | | | 6,054 | | | $ | 79,759 | | | | (36,539 | ) | | $ | (410,358 | ) |
Balanced Fund Class R3 | | | | | | | | | | | | | | | | |
Sold | | | 136,736 | | | $ | 1,578,091 | | | | 168,771 | | | $ | 1,930,659 | |
Issued as reinvestment of dividends | | | 37,878 | | | | 431,814 | | | | 61,641 | | | | 645,997 | |
Redeemed | | | (166,963 | ) | | | (1,876,126 | ) | | | (252,274 | ) | | | (2,810,057 | ) |
Net increase (decrease) | | | 7,651 | | | $ | 133,779 | | | | (21,862 | ) | | $ | (233,401 | ) |
Disciplined Value Fund Class I | | | | | | | | | | | | | | | | |
Sold | | | 1,135,891 | | | $ | 13,574,006 | | | | 160,261 | | | $ | 2,202,983 | |
Issued as reinvestment of dividends | | | 87,394 | | | | 1,207,781 | | | | 233,069 | | | | 2,950,659 | |
Redeemed | | | (713,777 | ) | | | (9,091,696 | ) | | | (338,730 | ) | | | (4,714,167 | ) |
Net increase (decrease) | | | 509,508 | | | $ | 5,690,091 | | | | 54,600 | | | $ | 439,475 | |
Disciplined Value Fund Class R5 | | | | | | | | | | | | | | | | |
Sold | | | 113,957 | | | $ | 1,355,314 | | | | 123,108 | | | $ | 1,736,363 | |
Issued as reinvestment of dividends | | | 273,525 | | | | 3,793,792 | | | | 693,290 | | | | 8,804,772 | |
Redeemed | | | (1,542,362 | ) | | | (18,713,690 | ) | | | (493,934 | ) | | | (7,042,796 | ) |
Net increase (decrease) | | | (1,154,880 | ) | | $ | (13,564,584 | ) | | | 322,464 | | | $ | 3,498,339 | |
Disciplined Value Fund Service Class | | | | | | | | | | | | | | | | |
Sold | | | 124,315 | | | $ | 1,406,469 | | | | 326,225 | | | $ | 4,391,304 | |
Issued as reinvestment of dividends | | | 98,567 | | | | 1,356,284 | | | | 512,421 | | | | 6,451,380 | |
Redeemed | | | (723,853 | ) | | | (9,800,079 | ) | | | (2,324,597 | ) | | | (33,134,768 | ) |
Net increase (decrease) | | | (500,971 | ) | | $ | (7,037,326 | ) | | | (1,485,951 | ) | | $ | (22,292,084 | ) |
Disciplined Value Fund Administrative Class | | | | | | | | | | | | | | | | |
Sold | | | 63,218 | | | $ | 727,009 | | | | 35,597 | | | $ | 497,307 | |
Issued as reinvestment of dividends | | | 27,299 | | | | 384,917 | | | | 103,832 | | | | 1,338,400 | |
Redeemed | | | (151,052 | ) | | | (2,035,626 | ) | | | (265,367 | ) | | | (3,622,759 | ) |
Net increase (decrease) | | | (60,535 | ) | | $ | (923,700 | ) | | | (125,938 | ) | | $ | (1,787,052 | ) |
Disciplined Value Fund Class A | | | | | | | | | | | | | | | | |
Sold | | | 114,031 | | | $ | 1,542,202 | | | | 76,285 | | | $ | 1,015,797 | |
Issued as reinvestment of dividends | | | 33,935 | | | | 462,189 | | | | 102,118 | | | | 1,275,458 | |
Redeemed | | | (115,626 | ) | | | (1,413,414 | ) | | | (270,115 | ) | | | (3,700,038 | ) |
Net increase (decrease) | | | 32,340 | | | $ | 590,977 | | | | (91,712 | ) | | $ | (1,408,783 | ) |
257
Notes to Financial Statements (Continued) |
| | | Year Ended September 30, 2020 | | | Year Ended September 30, 2019 | |
| | | Shares | | | Amount | | | Shares | | | Amount | |
Disciplined Value Fund Class R4 | | | | | | | | | | | | | | | | |
Sold | | | 11,708 | | | $ | 144,273 | | | | 30,449 | | | $ | 407,194 | |
Issued as reinvestment of dividends | | | 20,004 | | | | 270,247 | | | | 76,557 | | | | 948,544 | |
Redeemed | | | (97,795 | ) | | | (1,316,545 | ) | | | (196,329 | ) | | | (2,640,631 | ) |
Net increase (decrease) | | | (66,083 | ) | | $ | (902,025 | ) | | | (89,323 | ) | | $ | (1,284,893 | ) |
Disciplined Value Fund Class R3 | | | | | | | | | | | | | | | | |
Sold | | | 93,605 | | | $ | 1,087,951 | | | | 62,163 | | | $ | 861,475 | |
Issued as reinvestment of dividends | | | 19,703 | | | | 271,118 | | | | 50,347 | | | | 634,881 | |
Redeemed | | | (93,455 | ) | | | (1,185,450 | ) | | | (46,924 | ) | | | (636,881 | ) |
Net increase (decrease) | | | 19,853 | | | $ | 173,619 | | | | 65,586 | | | $ | 859,475 | |
Main Street Fund Class I | | | | | | | | | | | | | | | | |
Sold | | | 994,249 | | | $ | 10,263,296 | | | | 707,690 | | | $ | 7,459,768 | |
Issued as reinvestment of dividends | | | 218,688 | | | | 2,335,592 | | | | 311,387 | | | | 2,939,489 | |
Redeemed | | | (755,303 | ) | | | (7,878,220 | ) | | | (795,786 | ) | | | (8,188,803 | ) |
Net increase (decrease) | | | 457,634 | | | $ | 4,720,668 | | | | 223,291 | | | $ | 2,210,454 | |
Main Street Fund Class R5 | | | | | | | | | | | | | | | | |
Sold | | | 386,916 | | | $ | 4,034,496 | | | | 320,187 | | | $ | 3,429,258 | |
Issued as reinvestment of dividends | | | 418,418 | | | | 4,468,709 | | | | 810,689 | | | | 7,652,907 | |
Redeemed | | | (1,140,364 | ) | | | (11,817,224 | ) | | | (2,396,090 | ) | | | (25,267,861 | ) |
Net increase (decrease) | | | (335,030 | ) | | $ | (3,314,019 | ) | | | (1,265,214 | ) | | $ | (14,185,696 | ) |
Main Street Fund Service Class | | | | | | | | | | | | | | | | |
Sold | | | 961 | | | $ | 10,148 | | | | 7,141 | | | $ | 83,854 | |
Issued as reinvestment of dividends | | | 4,458 | | | | 49,701 | | | | 7,635 | | | | 74,980 | |
Redeemed | | | (46,671 | ) | | | (540,230 | ) | | | (17,365 | ) | | | (202,749 | ) |
Net increase (decrease) | | | (41,252 | ) | | $ | (480,381 | ) | | | (2,589 | ) | | $ | (43,915 | ) |
Main Street Fund Administrative Class | | | | | | | | | | | | | | | | |
Sold | | | 159,554 | | | $ | 1,628,522 | | | | 169,186 | | | $ | 1,816,324 | |
Issued as reinvestment of dividends | | | 211,225 | | | | 2,255,886 | | | | 331,904 | | | | 3,133,171 | |
Redeemed | | | (695,524 | ) | | | (7,172,594 | ) | | | (642,203 | ) | | | (6,810,668 | ) |
Net increase (decrease) | | | (324,745 | ) | | $ | (3,288,186 | ) | | | (141,113 | ) | | $ | (1,861,173 | ) |
Main Street Fund Class A | | | | | | | | | | | | | | | | |
Sold | | | 95,643 | | | $ | 957,087 | | | | 89,198 | | | $ | 909,751 | |
Issued as reinvestment of dividends | | | 113,081 | | | | 1,188,476 | | | | 171,815 | | | | 1,597,879 | |
Redeemed | | | (297,116 | ) | | | (3,085,995 | ) | | | (303,230 | ) | | | (3,103,946 | ) |
Net increase (decrease) | | | (88,392 | ) | | $ | (940,432 | ) | | | (42,217 | ) | | $ | (596,316 | ) |
Main Street Fund Class R4 | | | | | | | | | | | | | | | | |
Sold | | | 34,580 | | | $ | 348,669 | | | | 41,075 | | | $ | 431,892 | |
Issued as reinvestment of dividends | | | 57,075 | | | | 593,581 | | | | 78,074 | | | | 719,840 | |
Redeemed | | | (97,355 | ) | | | (1,017,728 | ) | | | (71,044 | ) | | | (736,685 | ) |
Net increase (decrease) | | | (5,700 | ) | | $ | (75,478 | ) | | | 48,105 | | | $ | 415,047 | |
Main Street Fund Class R3 | | | | | | | | | | | | | | | | |
Sold | | | 6,232 | | | $ | 62,801 | | | | 8,724 | | | $ | 91,217 | |
Issued as reinvestment of dividends | | | 10,109 | | | | 106,551 | | | | 22,025 | | | | 205,497 | |
Redeemed | | | (20,066 | ) | | | (214,359 | ) | | | (69,865 | ) | | | (647,708 | ) |
Net increase (decrease) | | | (3,725 | ) | | $ | (45,007 | ) | | | (39,116 | ) | | $ | (350,994 | ) |
258
Notes to Financial Statements (Continued) |
| | | Year Ended September 30, 2020 | | | Year Ended September 30, 2019 | |
| | | Shares | | | Amount | | | Shares | | | Amount | |
Disciplined Growth Fund Class I | | | | | | | | | | | | | | | | |
Sold | | | 910,715 | | | $ | 10,042,476 | | | | 679,048 | | | $ | 7,752,566 | |
Issued as reinvestment of dividends | | | 388,407 | | | | 4,066,618 | | | | 693,240 | | | | 6,509,520 | |
Redeemed | | | (1,098,785 | ) | | | (11,581,970 | ) | | | (900,524 | ) | | | (9,857,631 | ) |
Net increase (decrease) | | | 200,337 | | | $ | 2,527,124 | | | | 471,764 | | | $ | 4,404,455 | |
Disciplined Growth Fund Class R5 | | | | | | | | | | | | | | | | |
Sold | | | 2,424,223 | | | $ | 27,834,294 | | | | 911,451 | | | $ | 10,250,074 | |
Issued as reinvestment of dividends | | | 1,016,326 | | | | 10,651,101 | | | | 2,380,302 | | | | 22,374,835 | |
Redeemed | | | (4,693,152 | ) | | | (50,909,381 | ) | | | (1,951,550 | ) | | | (21,737,682 | ) |
Net increase (decrease) | | | (1,252,603 | ) | | $ | (12,423,986 | ) | | | 1,340,203 | | | $ | 10,887,227 | |
Disciplined Growth Fund Service Class | | | | | | | | | | | | | | | | |
Sold | | | 296,296 | | | $ | 3,124,088 | | | | 772,192 | | | $ | 8,172,909 | |
Issued as reinvestment of dividends | | | 333,098 | | | | 3,510,848 | | | | 1,601,401 | | | | 15,117,227 | |
Redeemed | | | (1,531,596 | ) | | | (16,676,987 | ) | | | (4,642,422 | ) | | | (51,282,818 | ) |
Net increase (decrease) | | | (902,202 | ) | | $ | (10,042,051 | ) | | | (2,268,829 | ) | | $ | (27,992,682 | ) |
Disciplined Growth Fund Administrative Class | | | | | | | | | | | | | | | | |
Sold | | | 532,032 | | | $ | 6,171,096 | | | | 265,275 | | | $ | 3,046,171 | |
Issued as reinvestment of dividends | | | 420,793 | | | | 4,502,486 | | | | 892,271 | | | | 8,539,033 | |
Redeemed | | | (1,466,858 | ) | | | (16,922,659 | ) | | | (752,716 | ) | | | (8,456,239 | ) |
Net increase (decrease) | | | (514,033 | ) | | $ | (6,249,077 | ) | | | 404,830 | | | $ | 3,128,965 | |
Disciplined Growth Fund Class A | | | | | | | | | | | | | | | | |
Sold | | | 393,717 | | | $ | 4,306,687 | | | | 231,268 | | | $ | 2,609,037 | |
Issued as reinvestment of dividends | | | 345,514 | | | | 3,558,796 | | | | 862,355 | | | | 7,985,405 | |
Redeemed | | | (1,220,793 | ) | | | (13,089,935 | ) | | | (1,173,716 | ) | | | (12,206,478 | ) |
Net increase (decrease) | | | (481,562 | ) | | $ | (5,224,452 | ) | | | (80,093 | ) | | $ | (1,612,036 | ) |
Disciplined Growth Fund Class R4 | | | | | | | | | | | | | | | | |
Sold | | | 307,472 | | | $ | 3,317,709 | | | | 218,067 | | | $ | 2,411,721 | |
Issued as reinvestment of dividends | | | 295,967 | | | | 3,012,939 | | | | 706,552 | | | | 6,472,019 | |
Redeemed | | | (535,710 | ) | | | (5,775,801 | ) | | | (901,113 | ) | | | (9,430,716 | ) |
Net increase (decrease) | | | 67,729 | | | $ | 554,847 | | | | 23,506 | | | $ | (546,976 | ) |
Disciplined Growth Fund Class R3 | | | | | | | | | | | | | | | | |
Sold | | | 217,261 | | | $ | 2,285,159 | | | | 91,777 | | | $ | 1,001,124 | |
Issued as reinvestment of dividends | | | 61,111 | | | | 622,111 | | | | 164,124 | | | | 1,501,736 | |
Redeemed | | | (369,598 | ) | | | (4,138,562 | ) | | | (199,714 | ) | | | (2,079,642 | ) |
Net increase (decrease) | | | (91,226 | ) | | $ | (1,231,292 | ) | | | 56,187 | | | $ | 423,218 | |
Small Cap Opportunities Fund Class I | | | | | | | | | | | | | | | | |
Sold | | | 1,129,713 | | | $ | 14,966,938 | | | | 1,065,052 | | | $ | 14,069,847 | |
Issued as reinvestment of dividends | | | 22,012 | | | | 318,077 | | | | 296,313 | | | | 3,656,500 | |
Redeemed | | | (861,764 | ) | | | (11,534,053 | ) | | | (1,242,218 | ) | | | (16,867,073 | ) |
Net increase (decrease) | | | 289,961 | | | $ | 3,750,962 | | | | 119,147 | | | $ | 859,274 | |
Small Cap Opportunities Fund Class R5 | | | | | | | | | | | | | | | | |
Sold | | | 4,536,074 | | | $ | 63,396,996 | | | | 717,156 | | | $ | 10,241,766 | |
Issued as reinvestment of dividends | | | 60,213 | | | | 868,871 | | | | 527,091 | | | | 6,499,034 | |
Redeemed | | | (2,473,418 | ) | | | (32,634,713 | ) | | | (1,415,334 | ) | | | (19,422,056 | ) |
Net increase (decrease) | | | 2,122,869 | | | $ | 31,631,154 | | | | (171,087 | ) | | $ | (2,681,256 | ) |
259
Notes to Financial Statements (Continued) |
| | | Year Ended September 30, 2020 | | | Year Ended September 30, 2019 | |
| | | Shares | | | Amount | | | Shares | | | Amount | |
Small Cap Opportunities Fund Service Class | | | | | | | | | | | | | | | | |
Sold | | | 267,039 | | | $ | 3,571,361 | | | | 286,283 | | | $ | 3,814,895 | |
Issued as reinvestment of dividends | | | 8,411 | | | | 121,119 | | | | 121,291 | | | | 1,491,884 | |
Redeemed | | | (291,310 | ) | | | (3,970,351 | ) | | | (267,221 | ) | | | (3,606,025 | ) |
Net increase (decrease) | | | (15,860 | ) | | $ | (277,871 | ) | | | 140,353 | | | $ | 1,700,754 | |
Small Cap Opportunities Fund Administrative Class | | | | | | | | | | | | | | | | |
Sold | | | 217,960 | | | $ | 2,785,560 | | | | 262,124 | | | $ | 3,520,679 | |
Issued as reinvestment of dividends | | | 8,435 | | | | 120,787 | | | | 162,217 | | | | 1,983,912 | |
Redeemed | | | (393,462 | ) | | | (5,215,562 | ) | | | (549,601 | ) | | | (7,433,114 | ) |
Net increase (decrease) | | | (167,067 | ) | | $ | (2,309,215 | ) | | | (125,260 | ) | | $ | (1,928,523 | ) |
Small Cap Opportunities Fund Class A | | | | | | | | | | | | | | | | |
Sold | | | 332,943 | | | $ | 4,038,283 | | | | 543,203 | | | $ | 7,122,888 | |
Issued as reinvestment of dividends | | | 17,248 | | | | 240,612 | �� | | | 475,538 | | | | 5,673,168 | |
Redeemed | | | (1,008,003 | ) | | | (12,909,501 | ) | | | (1,539,107 | ) | | | (19,719,299 | ) |
Net increase (decrease) | | | (657,812 | ) | | $ | (8,630,606 | ) | | | (520,366 | ) | | $ | (6,923,243 | ) |
Small Cap Opportunities Fund Class R4 | | | | | | | | | | | | | | | | |
Sold | | | 162,115 | | | $ | 1,965,065 | | | | 121,027 | | | $ | 1,577,885 | |
Issued as reinvestment of dividends | | | 3,887 | | | | 53,838 | | | | 86,045 | | | | 1,018,771 | |
Redeemed | | | (267,510 | ) | | | (3,410,248 | ) | | | (144,511 | ) | | | (1,868,406 | ) |
Net increase (decrease) | | | (101,508 | ) | | $ | (1,391,345 | ) | | | 62,561 | | | $ | 728,250 | |
Small Cap Opportunities Fund Class R3 | | | | | | | | | | | | | | | | |
Sold | | | 84,454 | | | $ | 1,008,882 | | | | 125,331 | | | $ | 1,561,072 | |
Issued as reinvestment of dividends | | | 3,056 | | | | 41,924 | | | | 75,413 | | | | 886,852 | |
Redeemed | | | (286,498 | ) | | | (3,673,536 | ) | | | (215,349 | ) | | | (2,742,881 | ) |
Net increase (decrease) | | | (198,988 | ) | | $ | (2,622,730 | ) | | | (14,605 | ) | | $ | (294,957 | ) |
Global Fund Class I | | | | | | | | | | | | | | | | |
Sold | | | 1,095,137 | | | $ | 14,750,065 | | | | 2,716,764 | | | $ | 33,263,336 | |
Issued as reinvestment of dividends | | | 51,537 | | | | 704,508 | | | | 934,821 | | | | 10,142,807 | |
Redeemed | | | (1,782,887 | ) | | | (23,643,043 | ) | | | (1,108,583 | ) | | | (13,912,435 | ) |
Net increase (decrease) | | | (636,213 | ) | | $ | (8,188,470 | ) | | | 2,543,002 | | | $ | 29,493,708 | |
Global Fund Class R5 | | | | | | | | | | | | | | | | |
Sold | | | 827,558 | | | $ | 10,875,255 | | | | 1,193,730 | | | $ | 14,732,552 | |
Issued as reinvestment of dividends | | | 64,981 | | | | 889,589 | | | | 1,737,067 | | | | 18,881,920 | |
Redeemed | | | (1,476,603 | ) | | | (19,627,239 | ) | | | (1,279,751 | ) | | | (16,243,402 | ) |
Net increase (decrease) | | | (584,064 | ) | | $ | (7,862,395 | ) | | | 1,651,046 | | | $ | 17,371,070 | |
Global Fund Service Class | | | | | | | | | | | | | | | | |
Sold | | | 150,261 | | | $ | 2,068,706 | | | | 137,582 | | | $ | 1,743,409 | |
Issued as reinvestment of dividends | | | 3,398 | | | | 46,110 | | | | 206,208 | | | | 2,220,861 | |
Redeemed | | | (260,002 | ) | | | (3,464,342 | ) | | | (834,039 | ) | | | (10,776,346 | ) |
Net increase (decrease) | | | (106,343 | ) | | $ | (1,349,526 | ) | | | (490,249 | ) | | $ | (6,812,076 | ) |
Global Fund Administrative Class | | | | | | | | | | | | | | | | |
Sold | | | 335,946 | | | $ | 4,152,508 | | | | 531,169 | | | $ | 6,831,201 | |
Issued as reinvestment of dividends | | | 37,975 | | | | 520,255 | | | | 1,501,760 | | | | 16,324,130 | |
Redeemed | | | (1,258,463 | ) | | | (16,481,104 | ) | | | (1,404,831 | ) | | | (17,557,465 | ) |
Net increase (decrease) | | | (884,542 | ) | | $ | (11,808,341 | ) | | | 628,098 | | | $ | 5,597,866 | |
260
Notes to Financial Statements (Continued) |
| | | Year Ended September 30, 2020 | | | Year Ended September 30, 2019 | |
| | | Shares | | | Amount | | | Shares | | | Amount | |
Global Fund Class A | | | | | | | | | | | | | | | | |
Sold | | | 370,819 | | | $ | 4,911,097 | | | | 316,115 | | | $ | 3,994,179 | |
Issued as reinvestment of dividends | | | 7,138 | | | | 96,655 | | | | 540,734 | | | | 5,807,488 | |
Redeemed | | | (860,649 | ) | | | (11,280,891 | ) | | | (827,277 | ) | | | (10,216,642 | ) |
Net increase (decrease) | | | (482,692 | ) | | $ | (6,273,139 | ) | | | 29,572 | | | $ | (414,975 | ) |
Global Fund Class R4 | | | | | | | | | | | | | | | | |
Sold | | | 238,864 | | | $ | 3,003,018 | | | | 197,998 | | | $ | 2,453,024 | |
Issued as reinvestment of dividends | | | 2,803 | | | | 37,330 | | | | 151,487 | | | | 1,601,209 | |
Redeemed | | | (261,871 | ) | | | (3,283,137 | ) | | | (216,855 | ) | | | (2,616,744 | ) |
Net increase (decrease) | | | (20,204 | ) | | $ | (242,789 | ) | | | 132,630 | | | $ | 1,437,489 | |
Global Fund Class R3 | | | | | | | | | | | | | | | | |
Sold | | | 195,546 | | | $ | 2,567,993 | | | | 261,788 | | | $ | 3,012,181 | |
Issued as reinvestment of dividends | | | 2,453 | | | | 33,038 | | | | 188,126 | | | | 2,011,068 | |
Redeemed | | | (378,303 | ) | | | (4,626,338 | ) | | | (302,818 | ) | | | (3,580,543 | ) |
Net increase (decrease) | | | (180,304 | ) | | $ | (2,025,307 | ) | | | 147,096 | | | $ | 1,442,706 | |
International Equity Fund Class I | | | | | | | | | | | | | | | | |
Sold | | | 4,180,532 | | | $ | 51,140,629 | | | | 3,634,930 | | | $ | 42,635,723 | |
Issued as reinvestment of dividends | | | 449,133 | | | | 5,748,906 | | | | 1,237,647 | | | | 13,156,184 | |
Redeemed | | | (9,755,499 | ) | | | (121,420,945 | ) | | | (14,992,578 | ) | | | (175,347,987 | ) |
Net increase (decrease) | | | (5,125,834 | ) | | $ | (64,531,410 | ) | | | (10,120,001 | ) | | $ | (119,556,080 | ) |
International Equity Fund Class R5 | | | | | | | | | | | | | | | | |
Sold | | | 366,810 | | | $ | 4,608,798 | | | | 342,264 | | | $ | 3,957,527 | |
Issued as reinvestment of dividends | | | 286,457 | | | | 3,666,648 | | | | 585,665 | | | | 6,231,478 | |
Redeemed | | | (3,854,186 | ) | | | (48,275,299 | ) | | | (4,400,311 | ) | | | (51,578,933 | ) |
Net increase (decrease) | | | (3,200,919 | ) | | $ | (39,999,853 | ) | | | (3,472,382 | ) | | $ | (41,389,928 | ) |
International Equity Fund Service Class | | | | | | | | | | | | | | | | |
Sold | | | 49,413 | | | $ | 601,437 | | | | 104,243 | | | $ | 1,209,070 | |
Issued as reinvestment of dividends | | | 26,551 | | | | 339,316 | | | | 67,635 | | | | 718,289 | |
Redeemed | | | (513,944 | ) | | | (6,537,449 | ) | | | (1,170,201 | ) | | | (13,597,428 | ) |
Net increase (decrease) | | | (437,980 | ) | | $ | (5,596,696 | ) | | | (998,323 | ) | | $ | (11,670,069 | ) |
International Equity Fund Administrative Class | | | | | | | | | | | | | | | | |
Sold | | | 35,747 | | | $ | 435,111 | | | | 91,345 | | | $ | 1,054,123 | |
Issued as reinvestment of dividends | | | 16,406 | | | | 208,684 | | | | 43,583 | | | | 460,669 | |
Redeemed | | | (236,315 | ) | | | (2,955,297 | ) | | | (600,981 | ) | | | (6,827,189 | ) |
Net increase (decrease) | | | (184,162 | ) | | $ | (2,311,502 | ) | | | (466,053 | ) | | $ | (5,312,397 | ) |
International Equity Fund Class A | | | | | | | | | | | | | | | | |
Sold | | | 270,031 | | | $ | 3,232,288 | | | | 205,857 | | | $ | 2,323,334 | |
Issued as reinvestment of dividends | | | 61,598 | | | | 760,119 | | | | 118,131 | | | | 1,213,203 | |
Redeemed | | | (751,225 | ) | | | (8,910,416 | ) | | | (876,926 | ) | | | (9,588,312 | ) |
Net increase (decrease) | | | (419,596 | ) | | $ | (4,918,009 | ) | | | (552,938 | ) | | $ | (6,051,775 | ) |
International Equity Fund Class R4 | | | | | | | | | | | | | | | | |
Sold | | | 28,978 | | | $ | 324,669 | | | | 91,803 | | | $ | 1,012,410 | |
Issued as reinvestment of dividends | | | 14,225 | | | | 173,825 | | | | 44,423 | | | | 451,336 | |
Redeemed | | | (314,860 | ) | | | (3,691,453 | ) | | | (570,047 | ) | | | (6,392,679 | ) |
Net increase (decrease) | | | (271,657 | ) | | $ | (3,192,959 | ) | | | (433,821 | ) | | $ | (4,928,933 | ) |
261
Notes to Financial Statements (Continued) |
| | | Year Ended September 30, 2020 | | | Year Ended September 30, 2019 | |
| | | Shares | | | Amount | | | Shares | | | Amount | |
International Equity Fund Class R3 | | | | | | | | | | | | | | | | |
Sold | | | 33,535 | | | $ | 375,960 | | | | 88,507 | | | $ | 974,430 | |
Issued as reinvestment of dividends | | | 14,667 | | | | 178,640 | | | | 37,193 | | | | 377,140 | |
Redeemed | | | (327,850 | ) | | | (3,921,617 | ) | | | (381,182 | ) | | | (3,946,437 | ) |
Net increase (decrease) | | | (279,648 | ) | | $ | (3,367,017 | ) | | | (255,482 | ) | | $ | (2,594,867 | ) |
Strategic Emerging Markets Fund Class I | | | | | | | | | | | | | | | | |
Sold | | | 10,127,465 | | | $ | 132,216,588 | | | | 2,656,702 | | | $ | 34,135,959 | |
Issued as reinvestment of dividends | | | 1,034,165 | | | | 13,661,324 | | | | 114,592 | | | | 1,339,579 | |
Redeemed | | | (9,265,591 | ) | | | (109,834,837 | ) | | | (8,819,308 | ) | | | (111,427,031 | ) |
Net increase (decrease) | | | 1,896,039 | | | $ | 36,043,075 | | | | (6,048,014 | ) | | $ | (75,951,493 | ) |
Strategic Emerging Markets Fund Class R5 | | | | | | | | | | | | | | | | |
Sold | | | 219,944 | | | $ | 2,913,595 | | | | 11,142 | | | $ | 145,745 | |
Issued as reinvestment of dividends | | | 26,614 | | | | 357,160 | | | | 1,883 | | | | 22,332 | |
Redeemed | | | (336,221 | ) | | | (4,440,670 | ) | | | (933 | ) | | | (11,005 | ) |
Net increase (decrease) | | | (89,663 | ) | | $ | (1,169,915 | ) | | | 12,092 | | | $ | 157,072 | |
Strategic Emerging Markets Fund Service Class | | | | | | | | | | | | | | | | |
Sold | | | 166,762 | | | $ | 2,238,544 | | | | 24,803 | | | $ | 315,789 | |
Issued as reinvestment of dividends | | | 3,146 | | | | 41,689 | | | | 21 | | | | 247 | |
Redeemed | | | (15,462 | ) | | | (184,722 | ) | | | (10,805 | ) | | | (130,619 | ) |
Net increase (decrease) | | | 154,446 | | | $ | 2,095,511 | | | | 14,019 | | | $ | 185,417 | |
Strategic Emerging Markets Fund Administrative Class | | | | | | | | | | | | | | | | |
Sold | | | 16,959 | | | $ | 209,276 | | | | 11,605 | | | $ | 144,773 | |
Issued as reinvestment of dividends | | | 5,996 | | | | 79,749 | | | | 185 | | | | 2,174 | |
Redeemed | | | (19,416 | ) | | | (239,335 | ) | | | (9,726 | ) | | | (123,132 | ) |
Net increase (decrease) | | | 3,539 | | | $ | 49,690 | | | | 2,064 | | | $ | 23,815 | |
Strategic Emerging Markets Fund Class A | | | | | | | | | | | | | | | | |
Sold | | | 155,124 | | | $ | 1,998,164 | | | | 51,270 | | | $ | 639,433 | |
Issued as reinvestment of dividends | | | 6,859 | | | | 90,537 | | | | 155 | | | | 1,818 | |
Redeemed | | | (76,087 | ) | | | (938,758 | ) | | | (13,550 | ) | | | (179,393 | ) |
Net increase (decrease) | | | 85,896 | | | $ | 1,149,943 | | | | 37,875 | | | $ | 461,858 | |
Strategic Emerging Markets Fund Class R4 | | | | | | | | | | | | | | | | |
Sold | | | 19,713 | | | $ | 244,996 | | | | 50,999 | | | $ | 614,004 | |
Issued as reinvestment of dividends | | | 8,531 | | | | 112,016 | | | | 250 | | | | 2,905 | |
Redeemed | | | (37,453 | ) | | | (445,066 | ) | | | (50,142 | ) | | | (641,795 | ) |
Net increase (decrease) | | | (9,209 | ) | | $ | (88,054 | ) | | | 1,107 | | | $ | (24,886 | ) |
Strategic Emerging Markets Fund Class R3 | | | | | | | | | | | | | | | | |
Sold | | | 42,579 | | | $ | 524,514 | | | | 18,121 | | | $ | 228,206 | |
Issued as reinvestment of dividends | | | 4,650 | | | | 60,918 | | | | — | | | | — | |
Redeemed | | | (29,412 | ) | | | (363,228 | ) | | | (20,308 | ) | | | (252,485 | ) |
Net increase (decrease) | | | 17,817 | | | $ | 222,204 | | | | (2,187 | ) | | $ | (24,279 | ) |
262
Notes to Financial Statements (Continued) |
Purchases of Class A shares are subject to a front-end sales charge of up to 5.50% of the amount purchased. A portion of the front-end sales charge may be retained by the Distributor. The Distributor retained the following amounts during the year ended September 30, 2020:
| | | Front-End
Sales Charges
Retained by
Distributor | |
Core Bond Fund | | $ | 439 | |
International Equity Fund | | | 64 | |
Redemptions of Class A shares made within eighteen months of purchase from initial investments of $1 million or more are subject to a contingent deferred sales charge of 1% of the amount redeemed. The Distributor receives all contingent deferred sales charges. Any contingent deferred sales charges imposed during the year ended September 30, 2020, were waived for any redemptions subject to such a charge.
6. | Federal Income Tax Information |
At September 30, 2020, the aggregate cost of investments and the unrealized appreciation (depreciation) in the value of all investments owned by the Fund(s), as computed on a federal income tax basis, were as follows:
| | | Federal Income
Tax Cost | | | Tax Basis
Unrealized
Appreciation | | | Tax Basis
Unrealized
(Depreciation) | | | Net Unrealized
Appreciation
(Depreciation) | |
U.S. Government Money Market Fund | | $ | 278,141,228 | | | $ | — | | | $ | — | | | $ | — | |
Short-Duration Bond Fund | | | 430,554,172 | | | | 8,036,240 | | | | (9,706,882 | ) | | | (1,670,642 | ) |
Inflation-Protected and Income Fund | | | 361,159,012 | | | | 13,850,445 | | | | (2,564,117 | ) | | | 11,286,328 | |
Core Bond Fund | | | 1,516,878,776 | | | | 48,567,168 | | | | (24,702,693 | ) | | | 23,864,475 | |
Diversified Bond Fund | | | 250,079,605 | | | | 8,142,836 | | | | (6,819,587 | ) | | | 1,323,249 | |
High Yield Fund | | | 589,968,919 | | | | 19,911,794 | | | | (33,922,988 | ) | | | (14,011,194 | ) |
Balanced Fund | | | 126,010,810 | | | | 19,295,134 | | | | (5,234,569 | ) | | | 14,060,565 | |
Disciplined Value Fund | | | 85,031,041 | | | | 6,493,336 | | | | (10,209,006 | ) | | | (3,715,670 | ) |
Main Street Fund | | | 93,833,807 | | | | 26,600,488 | | | | (3,143,899 | ) | | | 23,456,589 | |
Disciplined Growth Fund | | | 179,796,896 | | | | 87,823,760 | | | | (2,787,535 | ) | | | 85,036,225 | |
Small Cap Opportunities Fund | | | 225,265,751 | | | | 37,405,273 | | | | (37,310,869 | ) | | | 94,404 | |
Global Fund | | | 166,681,146 | | | | 151,443,455 | | | | (1,376,537 | ) | | | 150,066,918 | |
International Equity Fund | | | 183,920,705 | | | | 6,507,400 | | | | (7,163,323 | ) | | | (655,923 | ) |
Strategic Emerging Markets Fund | | | 169,540,919 | | | | 22,091,040 | | | | (11,683,576 | ) | | | 10,407,464 | |
Note: The aggregate cost for investments for the U.S. Government Money Market Fund at September 30, 2020, is the same for financial reporting and federal income tax purposes.
Net capital loss carryforwards may be applied against any net realized taxable gains in succeeding years, subject to the carryforward period limitations, where applicable. On December 22, 2010, the Regulated Investment Company Modernization Act of 2010 (the “Modernization Act”) was signed by the President. The Modernization Act changed the capital loss carryforward rules as they relate to regulated investment companies. Capital losses generated in tax years beginning after the date of enactment may now be carried forward indefinitely, and retain the character of the original loss. Under pre-enactment law, capital losses could be carried forward for up to eight tax years as short-term capital losses. The provisions affecting the utilization of capital loss carryforwards under the Modernization Act also require the utilization of post-enactment losses prior to the utilization of pre-enactment losses.
At September 30, 2020, for federal income tax purposes, there were no unused capital losses.
263
Notes to Financial Statements (Continued) |
At September 30, 2020, the following Fund(s) had post-enactment accumulated capital loss carryforwards:
| | | Short Term
Capital Loss
Carryforward | | | Long Term
Capital Loss
Carryforward | |
Short-Duration Bond Fund | | $ | 7,030,277 | | | $ | 24,002,870 | |
High Yield Fund | | | 11,863,676 | | | | 33,648,988 | |
Disciplined Value Fund | | | 1,223,150 | | | | 670,427 | |
Net capital loss carryforwards for the Fund(s) shown in the above table are from post-enactment years and are, therefore, not subject to the eight-year carryforward period and possible expiration.
The following Fund(s) elected to defer to the fiscal year beginning October 1, 2020, late year ordinary losses:
| | | Amount | |
Global Fund | | $ | 346,647 | |
Strategic Emerging Markets Fund | | | 248,688 | |
Generally accepted accounting principles in the United States of America require that only distributions in excess of tax basis earnings and profits be reported in the financial statements as a return of capital.
The tax character of distributions (including capital gain dividends, if any, designated pursuant to Section 852 of the Code) paid during the year ended September 30, 2020, was as follows:
| | | Ordinary
Income | | | Long Term
Capital Gain | |
U.S. Government Money Market Fund | | $ | 1,857,173 | | | $ | — | |
Short-Duration Bond Fund | | | 16,088,439 | | | | — | |
Inflation-Protected and Income Fund | | | 6,327,704 | | | | — | |
Core Bond Fund | | | 46,839,258 | | | | — | |
Diversified Bond Fund | | | 7,907,495 | | | | — | |
High Yield Fund | | | 32,799,482 | | | | — | |
Balanced Fund | | | 2,773,051 | | | | 5,056,182 | |
Disciplined Value Fund | | | 2,190,398 | | | | 5,555,930 | |
Main Street Fund | | | 1,136,104 | | | | 9,873,026 | |
Disciplined Growth Fund | | | 2,181,534 | | | | 27,743,365 | |
Small Cap Opportunities Fund | | | 574,557 | | | | 1,192,223 | |
Global Fund | | | 1,587,972 | | | | 739,536 | |
International Equity Fund | | | 2,633,421 | | | | 8,442,845 | |
Strategic Emerging Markets Fund | | | 997,920 | | | | 13,413,672 | |
264
Notes to Financial Statements (Continued) |
The tax character of distributions (including capital gain dividends, if any, designated pursuant to Section 852 of the Code) paid during the year ended September 30, 2019, was as follows:
| | | Ordinary
Income | | | Long Term
Capital Gain | |
U.S. Government Money Market Fund | | $ | 6,235,386 | | | $ | — | |
Short-Duration Bond Fund | | | 17,809,014 | | | | — | |
Inflation-Protected and Income Fund | | | 8,747,260 | | | | — | |
Core Bond Fund | | | 40,712,602 | | | | — | |
Diversified Bond Fund | | | 6,563,877 | | | | — | |
High Yield Fund | | | 30,929,893 | | | | — | |
Balanced Fund | | | 2,960,247 | | | | 5,499,132 | |
Disciplined Value Fund | | | 8,020,020 | | | | 14,384,074 | |
Main Street Fund | | | 2,485,726 | | | | 13,838,038 | |
Disciplined Growth Fund | | | 22,346,107 | | | | 46,153,668 | |
Small Cap Opportunities Fund | | | 3,770,587 | | | | 17,439,806 | |
Global Fund | | | 1,949,949 | | | | 55,040,887 | |
International Equity Fund | | | 4,243,842 | | | | 18,364,608 | |
Strategic Emerging Markets Fund | | | 1,369,055 | | | | — | |
The following Fund(s) have elected to pass through the foreign tax credit for the year ended September 30, 2020:
| | | Amount | |
International Equity Fund | | $ | 368,565 | |
Strategic Emerging Markets Fund | | | 212,623 | |
Capital accounts within the financial statements are periodically adjusted for permanent differences between book and tax accounting. These adjustments have no impact on net assets or the results of operations. Temporary book and tax accounting differences will reverse in subsequent periods. At September 30, 2020, temporary book and tax accounting differences were primarily attributable to the deferral of wash sale losses, deferred Trustee compensation, and other temporary basis adjustments.
At September 30, 2020, the components of distributable earnings on a tax basis were as follows:
| | | Undistributed
Ordinary
Income | | | Undistributed
Long Term
Capital Gain
(Capital Loss
Carryover) | | | Other
Temporary
Differences | | | Unrealized
Appreciation
(Depreciation) | |
U.S. Government Money Market Fund | | $ | 5,411 | | | $ | — | | | $ | (49,351 | ) | | $ | — | |
Short-Duration Bond Fund | | | 12,835,373 | | | | (31,033,147 | ) | | | (52,919 | ) | | | (1,670,642 | ) |
Inflation-Protected and Income Fund | | | 17,935,589 | | | | — | | | | (28,246 | ) | | | 11,286,329 | |
Core Bond Fund | | | 62,332,631 | | | | 3,758,523 | | | | (143,285 | ) | | | 23,864,475 | |
Diversified Bond Fund | | | 10,922,079 | | | | 3,426,266 | | | | (18,544 | ) | | | 1,317,534 | |
High Yield Fund | | | 23,193,558 | | | | (45,512,664 | ) | | | (29,657 | ) | | | (14,011,194 | ) |
Balanced Fund | | | 2,006,178 | | | | 1,770,969 | | | | (15,525 | ) | | | 14,060,565 | |
Disciplined Value Fund | | | 1,294,893 | | | | (1,893,577 | ) | | | (24,475 | ) | | | (3,715,670 | ) |
Main Street Fund | | | 802,120 | | | | 2,071,832 | | | | (15,033 | ) | | | 23,456,687 | |
Disciplined Growth Fund | | | 557,495 | | | | 10,014,433 | | | | (29,878 | ) | | | 85,036,224 | |
Small Cap Opportunities Fund | | | 736,693 | | | | 17,204,870 | | | | (22,608 | ) | | | 94,404 | |
265
Notes to Financial Statements (Continued) |
| | | Undistributed
Ordinary
Income | | | Undistributed
Long Term
Capital Gain
(Capital Loss
Carryover) | | | Other
Temporary
Differences | | | Unrealized
Appreciation
(Depreciation) | |
Global Fund | | $ | — | | | $ | 16,859,727 | | | $ | (380,787 | ) | | $ | 150,080,221 | |
International Equity Fund | | | 12,178,079 | | | | 57,558,476 | | | | (57,772 | ) | | | (615,209 | ) |
Strategic Emerging Markets Fund | | | — | | | | 2,939,347 | | | | (263,478 | ) | | | 10,385,582 | |
During the year ended September 30, 2020, the following amounts were reclassified due to permanent differences between book and tax accounting:
| | | Paid-in
Capital | | | Accumulated
Net Realized
Gain (Loss) on
Investments | | | Undistributed
Net Investment
Income (Loss) | |
U.S. Government Money Market Fund | | $ | — | | | $ | (16,070 | ) | | $ | 16,070 | |
Short-Duration Bond Fund | | | 87,829 | | | | (2,082,954 | ) | | | 1,995,125 | |
Inflation-Protected and Income Fund | | | — | | | | 3,129,851 | | | | (3,129,851 | ) |
Core Bond Fund | | | (1 | ) | | | (3,092,558 | ) | | | 3,092,559 | |
Diversified Bond Fund | | | — | | | | (561,200 | ) | | | 561,200 | |
High Yield Fund | | | — | | | | (676,008 | ) | | | 676,008 | |
Balanced Fund | | | — | | | | (328,867 | ) | | | 328,867 | |
Disciplined Value Fund | | | — | | | | 23,207 | | | | (23,207 | ) |
Main Street Fund | | | (305 | ) | | | (83,363 | ) | | | 83,668 | |
Disciplined Growth Fund | | | — | | | | 377,754 | | | | (377,754 | ) |
Small Cap Opportunities Fund | | | (20,391 | ) | | | 461,203 | | | | (440,812 | ) |
Global Fund | | | (232,396 | ) | | | (478,241 | ) | | | 710,637 | |
International Equity Fund | | | — | | | | 190,241 | | | | (190,241 | ) |
Strategic Emerging Markets Fund | | | — | | | | (388,627 | ) | | | 388,627 | |
The Funds did not have any unrecognized tax benefits at September 30, 2020, nor were there any increases or decreases in unrecognized tax benefits for the year then ended. The Funds recognize interest and penalties, if any, related to unrecognized tax benefits as an income tax expense in the Statements of Operations. During the year ended September 30, 2020, the Funds did not incur any such interest or penalties. The Funds are subject to examination by U.S. federal and state tax authorities for returns filed for the prior three fiscal years. Foreign taxes are provided for based on the Funds’ understanding of the tax rules and rates that exist in the foreign markets in which they invest.
Under the Funds’ organizational documents, current and former Trustees and Officers are provided with specified rights to indemnification against liabilities arising in connection with the performance of their duties to the Funds, and shareholders are indemnified against personal liability for obligations of the Funds. In the normal course of business, the Funds may also enter into contracts that provide general indemnifications. The Funds’ maximum exposure under these arrangements is unknown as this would be dependent on future claims that may be made against the Funds. The risk of material loss from such claims is considered remote.
266
Notes to Financial Statements (Continued) |
8. | New Accounting Pronouncements |
In March 2017, FASB issued Accounting Standards Update 2017-08, Receivables — Nonrefundable Fees and Other Costs (Subtopic 310-20): Premium Amortization on Purchased Callable Debt Securities (“ASU 2017-08”). For entities that hold callable debt securities at a premium, ASU 2017-08 requires that the premium be amortized to the earliest call date. ASU 2017-08 is effective for the fiscal year ending September 30, 2020. Management has implemented the applicable changes, and they did not have a material impact on the Funds’ financial statements. In October 2020, ASU 2017-08 was amended by Accounting Standards Update 2020-08, Codification Improvements to Subtopic 310-20, Receivables—Nonrefundable Fees and Other Costs (“ASU 2020-08”). ASU 2020-08 requires entities to reevaluate whether callable debt securities fall within the scope of ASU 2017-08 at each reporting period. ASU 2020-08 also amends the relevant guidance to require premiums to be amortized to the “next call date” rather than the “earliest call date,” and further clarifies the definition of “next call date.” ASU 2020-08 is effective for fiscal years, and interim periods within those fiscal years, beginning after December 15, 2020. Early adoption of ASU 2020-08 is not permitted. Management is currently evaluating the impact, if any, of applying ASU 2020-08.
In March 2020, FASB issued Accounting Standards Update 2020-04 — Reference Rate Reform (Topic 848) — Facilitation of the Effects of Reference Rate Reform on Financial Reporting (“ASU 2020-04”). ASU 2020-04 provides optional temporary financial reporting relief from the effect of certain types of contract modifications due to the planned discontinuation of the London Interbank Offered Rate (“LIBOR”) and other interbank-offered based reference rates as of the end of 2021. ASU 2020-04 is effective for certain reference rate-related contract modifications that occur during the period March 12, 2020 through December 31, 2022. Management is currently evaluating the impact, if any, of applying ASU 2020-04.
On December 7, 2010, the Trust was named as a defendant and putative member of the proposed defendant class of shareholders named in an adversary proceeding brought by The Official Committee of Unsecured Creditors of Tribune Company (the “Official Committee”) in the U.S. Bankruptcy Court for the District of Delaware, in connection with Tribune Company’s Chapter 11 bankruptcy proceeding (In re Tribune Company). The proceeding relates to a leveraged buyout (“LBO”) transaction by which Tribune Company converted to a privately-held company in 2007, and the putative defendant class is comprised of beneficial owners of shares of Tribune Company who received proceeds (the “Proceeds”) of the LBO. The Official Committee seeks to recover payments of those Proceeds. On April 5, 2012, the adversary proceeding was transferred to the Southern District of New York for consolidated pretrial proceedings. The action is now being prosecuted by the litigation trustee (“Trustee”) for the Tribune Litigation Trust.
The potential amounts sought to be recovered from the Balanced Fund, Disciplined Value Fund, and Small Cap Opportunities Fund, are approximately $44,200, $299,880, and $414,800, respectively, plus interest and the Official Committee’s court costs.
In addition, on June 2, 2011, the Disciplined Value Fund and Small Cap Opportunities Fund were named as defendants in a closely related, parallel adversary proceeding brought in connection with the Tribune Company’s LBO by Deutsche Bank Trust Company Americas, in its capacity as successor indenture trustee for a certain series of Senior Notes, Law Debenture Trust Company of New York, in its capacity as successor indenture trustee for a certain series of Senior Notes, and Wilmington Trust Company, in its capacity as successor indenture trustee for the PHONES Notes (together, the “Plaintiffs”), in the United States District Court for the District of Massachusetts. The Plaintiffs also seek to recover payments of the Proceeds. On December 20, 2011, this action was transferred to the Southern District of New York for consolidated pretrial proceedings.
The Funds cannot predict the outcome of these proceedings. Accordingly, the Funds have not accrued any amounts related to these proceedings. If the proceedings were to be decided in a manner adverse to the Funds, or if the Funds were to enter into a settlement agreement with the Trustee or the Plaintiffs, as applicable, the payment of such judgment or settlement could potentially have a material adverse effect on the Funds’ net asset values depending on the net assets of each applicable Fund at the time of such judgment or settlement.
267
Notes to Financial Statements (Continued) |
10. | Coronavirus (COVID-19) Pandemic |
The global pandemic outbreak of the novel coronavirus known as COVID-19 has produced, and will likely continue to produce, substantial market volatility, severe market dislocations and liquidity constraints in many markets, and global business disruption, and it may result in future significant adverse effects, such as exchange trading suspensions and closures, declines in global financial markets, higher default rates, and a substantial economic downturn or recession throughout the world. Such factors may have a significant adverse effect on a Fund’s performance and have the potential to impair the ability of a Fund’s investment adviser, subadvisers, or other service providers to serve the Fund and could lead to disruptions that negatively impact the Fund.
In preparation of these financial statements, management has evaluated the events and transactions subsequent to September 30, 2020, through the date when the financial statements were issued, and determined that there are no subsequent events or transactions that would require adjustments to or disclosures in the Funds’ financial statements other than those disclosed below.
Effective November 18, 2020, Invesco replaced Barings as the subadviser of the Premier Balanced Fund.
Effective November 18, 2020, Wellington Management replaced Barings as the subadviser of the Premier Disciplined Value Fund and Premier Disciplined Growth Fund.
268
Report of Independent Registered Public Accounting Firm |
To the Board of Trustees of MassMutual Premier Funds and Shareholders of MassMutual Premier U.S. Government Money Market Fund, MassMutual Premier Short-Duration Bond Fund, MassMutual Premier Inflation- Protected and Income Fund, MassMutual Premier Core Bond Fund, MassMutual Premier Diversified Bond Fund, MassMutual Premier High Yield Fund, MassMutual Premier Balanced Fund, MassMutual Premier Disciplined Value Fund, MassMutual Premier Main Street Fund, MassMutual Premier Disciplined Growth Fund, MassMutual Premier Small Cap Opportunities Fund, MassMutual Premier Global Fund, MassMutual Premier International Equity Fund, and MassMutual Premier Strategic Emerging Markets Fund (collectively, the “Funds”):
Opinion on the Financial Statements and Financial Highlights
We have audited the accompanying statements of assets and liabilities of the Funds, including the portfolios of investments, as of September 30, 2020, the related statements of operations for the year then ended, the statements of changes in net assets for each of the two years in the period then ended, and the financial highlights for each of the five years in the period then ended, and the related notes. In our opinion, the financial statements and financial highlights present fairly, in all material respects, the financial position of each of the Funds as of September 30, 2020, and the results of their operations for the year then ended, the changes in their net assets for each of the two years in the period then ended, and the financial highlights for each of the five years in the period then ended, in conformity with accounting principles generally accepted in the United States of America.
Basis for Opinion
These financial statements and financial highlights are the responsibility of the Funds’ management. Our responsibility is to express an opinion on the Funds’ financial statements and financial highlights based on our audits. We are a public accounting firm registered with the Public Company Accounting Oversight Board (United States) (PCAOB) and are required to be independent with respect to the Funds in accordance with the U.S. federal securities laws and the applicable rules and regulations of the Securities and Exchange Commission and the PCAOB.
We conducted our audits in accordance with the standards of the PCAOB. Those standards require that we plan and perform the audit to obtain reasonable assurance about whether the financial statements and financial highlights are free of material misstatement, whether due to error or fraud. The Funds are not required to have, nor were we engaged to perform, an audit of their internal control over financial reporting. As part of our audits we are required to obtain an understanding of internal control over financial reporting but not for the purpose of expressing an opinion on the effectiveness of the Funds’ internal control over financial reporting. Accordingly, we express no such opinion.
Our audits included performing procedures to assess the risks of material misstatement of the financial statements and financial highlights, whether due to error or fraud, and performing procedures that respond to those risks. Such procedures included examining, on a test basis, evidence regarding the amounts and disclosures in the financial statements and financial highlights. Our audits also included evaluating the accounting principles used and significant estimates made by management, as well as evaluating the overall presentation of the financial statements and financial highlights. Our procedures included confirmation of securities owned as of September 30, 2020, by correspondence with the custodian and brokers; when replies were not received from brokers, we performed other auditing procedures. We believe that our audits provide a reasonable basis for our opinion.
/s/ Deloitte & Touche LLP
Boston, Massachusetts
November 24, 2020
We have served as the auditor of one or more MassMutual investment companies since 1995.
269
Trustees and Principal Officers (Unaudited) |
The following table lists the Trust’s Trustees and Principal Officers; their address and year of birth; their position with the Trust; the length of time holding that position with the Trust; their principal occupation(s) during at least the past five years; the number of portfolios in the fund complex they oversee; and other directorships they hold in companies subject to registration or reporting requirements of the Securities Exchange Act of 1934 (generally called “public companies”) or in registered investment companies. The Trust’s Statement of Additional Information includes additional information about the Trust’s Trustees and is available, without charge, upon request by calling 1-888-309-3539 or by writing MassMutual Premier Funds, c/o Massachusetts Mutual Life Insurance Company, 100 Bright Meadow Blvd., Enfield, Connecticut 06082-1981, Attention: MassMutual U.S. Product and Marketing.
Independent Trustees
Name, Address*,
and Year of Birth | Position(s)
Held with
Trust | Term of
Office** and
Length of
Time Served | Principal Occupation(s)
During Past 5 Years | Number of
Portfolios in
Fund Complex
Overseen by
Trustee | Other Directorships
Held by Trustee |
Allan W. Blair Year of birth: 1948 | Trustee | Since 2012 | Retired. | 109 | Trustee (since 2003), MassMutual Select Funds (open-end investment company); Trustee (since 2003), MML Series Investment Fund (open-end investment company); Trustee (since 2012), MML Series Investment Fund II (open-end investment company). |
Nabil N. El-Hage Year of birth: 1958 | Trustee Chairman | Since 2003 2006- 2012 | Founder and CEO (since 2018), AEE International LLC (a Puerto Rico LLC); Founder and sole member (2016-2018), PR Academy of Executive Education LLC (a Puerto Rico LLC); Chairman (2011-2016), Academy of Executive Education, LLC (a Massachusetts LLC). | 109 | Director (2011-2015), Argo Group International Holdings, Ltd. (underwriter of specialty insurance and reinsurance products); Trustee (since 2012), MassMutual Select Funds (open-end investment company); Trustee (since 2012), MML Series Investment Fund (open-end investment company); Trustee (since 2005), Chairman (2006-2012), MML Series Investment Fund II (open-end investment company). |
Maria D. Furman Year of birth: 1954 | Trustee | Since 2004 | Retired. | 109 | Trustee (since 2011), GMO Series Trust (open-end investment company); Trustee (since 2012), MassMutual Select Funds (open-end investment company); Trustee (since 2012), MML Series Investment Fund (open-end investment company); Trustee (since 2005), MML Series Investment Fund II (open-end investment company). |
R. Alan Hunter, Jr. Year of birth: 1946 | Chairperson Trustee | Since 2016 Since 2012 | Retired. | 109 | Director (2007-2018), Actuant Corporation (diversified industrial company); Chairperson (since 2016), Trustee (since 2003), MassMutual Select Funds (open-end investment company); Chairperson (since 2016), Trustee (since 2003), MML Series Investment Fund (open-end investment company); Chairperson (since 2016), Trustee (since 2012), MML Series Investment Fund II (open-end investment company). |
270
Trustees and Principal Officers (Unaudited) (Continued) |
Name, Address*,
and Year of Birth | Position(s)
Held with
Trust | Term of
Office** and
Length of
Time Served | Principal Occupation(s)
During Past 5 Years | Number of
Portfolios in
Fund Complex
Overseen by
Trustee | Other Directorships
Held by Trustee |
C. Ann Merrifield Year of birth: 1951 | Trustee | Since 2004 | Retired. | 109 | Director (2015-2018), Juniper Pharmaceuticals Inc. (specialty pharmaceutical company); Director (since 2014), Flexion Therapeutics (specialty pharmaceutical company); Chairperson (2017-2018), Director (since 2014), InVivo Therapeutics (research and clinical-stage biomaterials and biotechnology company); Trustee (since 2012), MassMutual Select Funds (open-end investment company); Trustee (since 2012), MML Series Investment Fund (open-end investment company); Trustee (since 2005), MML Series Investment Fund II (open-end investment company). |
Susan B. Sweeney Year of birth: 1952 | Trustee | Since 2012 | Retired. | 111^ | Trustee (since 2012), Barings Corporate Investors (closed-end investment company); Trustee (since 2012), Barings Participation Investors (closed-end investment company); Trustee (since 2009), MassMutual Select Funds (open-end investment company); Trustee (since 2009), MML Series Investment Fund (open-end investment company); Trustee (since 2012), MML Series Investment Fund II (open-end investment company). |
Interested Trustees
Name, Address*,
and Year of Birth | Position(s)
Held with
Trust | Term of
Office** and
Length of
Time Served | Principal Occupation(s)
During Past 5 Years | Number of
Portfolios in
Fund Complex
Overseen by
Trustee | Other Directorships
Held by Trustee |
Teresa A. Hassara^^ Year of birth: 1962 | Trustee | Since 2017 | Director (since 2017), MML Advisers; Head of Workplace Solutions (since 2017), MassMutual; President of Institutional Retirement (2009-2016), TIAA-CREF. | 109 | Trustee (since 2017), MassMutual Select Funds (open-end investment company); Trustee (since 2017), MML Series Investment Fund (open-end investment company); Trustee (since 2017), MML Series Investment Fund II (open-end investment company). |
271
Trustees and Principal Officers (Unaudited) (Continued) |
Name, Address*,
and Year of Birth | Position(s)
Held with
Trust | Term of
Office** and
Length of
Time Served | Principal Occupation(s)
During Past 5 Years | Number of
Portfolios in
Fund Complex
Overseen by
Trustee | Other Directorships
Held by Trustee |
Robert E. Joyal^^^ Year of birth: 1945 | Trustee | Since 2012 | Retired. | 111^ | Director (since 2018), Jefferies Financial Group Inc. (holding company); Director (2013-2018), Leucadia National Corporation (holding company); Director (2012-2017), Ormat Technologies, Inc. (provider of alternative energy technology); Director (2006-2014), Jefferies Group LLC (investment bank); Trustee (since 2003), Barings Corporate Investors (closed-end investment company); Trustee (since 2003), Barings Participation Investors (closed-end investment company); Trustee (since 2003), MassMutual Select Funds (open-end investment company); Trustee (since 2003), MML Series Investment Fund (open-end investment company); Trustee (since 2012), MML Series Investment Fund II (open-end investment company). |
Principal Officers
Name, Address*,
and Year of Birth | Position(s)
Held with
Trust | Term of
Office# and
Length of
Time Served | Principal Occupation(s)
During Past 5 Years | Number of
Portfolios in
Fund Complex
Overseen by
Officer |
Joseph Fallon Year of birth: 1975 | Vice President Assistant Vice President | Since 2017 2015- 2017 | Investment Director (since 2014), MML Advisers; Head of Investment Consulting & Strategy (since 2017), Investment Director (2006-2017), MassMutual; Vice President (since 2017), Assistant Vice President (2015-2017), MassMutual Select Funds (open-end investment company); Vice President (since 2017), Assistant Vice President (2015-2017), MML Series Investment Fund (open-end investment company); Vice President (since 2017), Assistant Vice President (2015-2017), MML Series Investment Fund II (open-end investment company). | 109 |
Andrew M. Goldberg Year of birth: 1966 | Vice President, Secretary (formerly known as “Clerk”), and Chief Legal Officer Assistant Clerk | Since 2008 2004- 2008 | Lead Counsel, Investment Adviser & Mutual Funds (since 2018), Assistant Vice President and Counsel (2004-2018), MassMutual; Secretary (since 2015), Assistant Secretary (2013-2015), MML Advisers; Vice President, Secretary, and Chief Legal Officer (since 2008), Assistant Secretary (2001-2008), MassMutual Select Funds (open-end investment company); Vice President, Secretary, and Chief Legal Officer (since 2008), Assistant Secretary (2001-2008), MML Series Investment Fund (open-end investment company); Vice President, Secretary (formerly known as “Clerk”), and Chief Legal Officer (since 2008), Assistant Clerk (2005-2008), MML Series Investment Fund II (open-end investment company). | 109 |
Renee Hitchcock Year of birth: 1970 | Chief Financial Officer and Treasurer Assistant Treasurer | Since 2016 2007- 2016 | Head of Mutual Fund Administration (since 2018), Assistant Vice President (2015-2018), Director (2007-2015), MassMutual; Chief Financial Officer and Treasurer (since 2016), Assistant Treasurer (2007-2016), MassMutual Select Funds (open-end investment company); Chief Financial Officer and Treasurer (since 2016), Assistant Treasurer (2007-2016), MML Series Investment Fund (open-end investment company); Chief Financial Officer and Treasurer (since 2016), Assistant Treasurer (2007-2016), MML Series Investment Fund II (open-end investment company). | 109 |
272
Trustees and Principal Officers (Unaudited) (Continued) |
Name, Address*,
and Year of Birth | Position(s)
Held with
Trust | Term of
Office# and
Length of
Time Served | Principal Occupation(s)
During Past 5 Years | Number of
Portfolios in
Fund Complex
Overseen by
Officer |
Jill Nareau Robert Year of birth: 1972 | Vice President and Assistant Secretary Assistant Secretary (formerly known as “Assistant Clerk”) | Since 2017 2008- 2017 | Lead Counsel, Investment Adviser & Mutual Funds (since 2018), Assistant Vice President and Counsel (2009-2018), MassMutual; Assistant Secretary (since 2015), MML Advisers; Vice President and Assistant Secretary (since 2017), Assistant Secretary (2008-2017), MassMutual Select Funds (open-end investment company); Vice President and Assistant Secretary (since 2017), Assistant Secretary (2008-2017), MML Series Investment Fund (open-end investment company); Vice President and Assistant Secretary (since 2017), Assistant Secretary (formerly known as “Assistant Clerk”) (2008-2017), MML Series Investment Fund II (open-end investment company). | 109 |
Douglas Steele Year of birth: 1975 | Vice President | Since 2016 | Vice President and Head of Investment Management (since 2017), Head of Investment Due Diligence (2016-2017), MML Advisers; Head of Investment Management (since 2017), Assistant Vice President (2013-2017), MassMutual; Vice President (since 2016), MassMutual Select Funds (open-end investment company); Vice President (since 2016), MML Series Investment Fund (open-end investment company); Vice President (since 2016), MML Series Investment Fund II (open-end investment company). | 109 |
Philip S. Wellman Year of birth: 1964 | Vice President and Chief Compliance Officer | Since 2007 | Vice President and Chief Compliance Officer (since 2013), MML Advisers; Head of Mutual Funds & RIA Compliance (since 2018), Vice President, Associate General Counsel, and Chief Compliance Officer (Mutual Funds) (2014-2018), Vice President, Associate General Counsel, and Chief Compliance Officer (Mutual Funds and Investment Advisory) (2008-2014), MassMutual; Vice President and Chief Compliance Officer (since 2007), MassMutual Select Funds (open-end investment company); Vice President and Chief Compliance Officer (since 2007), MML Series Investment Fund (open-end investment company); Vice President and Chief Compliance Officer (since 2007), MML Series Investment Fund II (open-end investment company). | 109 |
Eric H. Wietsma Year of birth: 1966 | President Vice President | Since 2008 2006- 2008 | President (2013-2018, since 2019), Vice President (2018-2019), Director (since 2013), MML Advisers; Head of Workplace Operations (since 2018), Senior Vice President (2010-2018), MassMutual; President (since 2008), Vice President (2006-2008), MassMutual Select Funds (open-end investment company); President (since 2019), Vice President (2006-2019), MML Series Investment Fund (open-end investment company); President (since 2019), Vice President (2006-2019), MML Series Investment Fund II (open-end investment company). | 109 |
* | The address of each Trustee and Principal Officer is the same as that for the Trust; 100 Bright Meadow Blvd., Enfield, Connecticut 06082-1981. |
** | Each Trustee of the Trust serves until the next meeting of shareholders called for the purpose of electing Trustees and until the election and qualification of his or her successor or until he or she dies, resigns, or is removed. Notwithstanding the foregoing, unless the Trustees determine that it is desirable and in the best interest of the Trust that an exception to the retirement policy of the Trust be made, a Trustee shall retire and cease to serve as a Trustee upon the conclusion of the calendar year in which such Trustee attains the age of seventy-five years, however, with the exception of Mr. Robert E. Joyal, an interested Trustee of the Trust shall no longer serve as a Trustee if or when they are no longer an employee of MassMutual or an affiliate. |
| The Chairperson is elected to hold such office for a term of three years or until their successor is elected and qualified to carry out the duties and responsibilities of their office, or until he or she retires, dies, resigns, is removed, or becomes disqualified. The Chairperson shall hold office at the pleasure of the Trustees. |
^ | Barings Participation Investors and Barings Corporate Investors are deemed to be a part of the Fund Complex, because they are managed by Barings LLC, an affiliate of MML Advisers. |
^^ | Ms. Hassara is an “Interested Person,” as that term is defined in the 1940 Act, as an employee of MassMutual. |
^^^ | Mr. Joyal is an Interested Person through his position as a director of Jefferies Financial Group Inc., which controls Jefferies Group LLC, a broker-dealer that may execute portfolio transactions and/or engage in principal transactions with the Funds, other investment companies advised by MML Advisers or holding themselves out to investors as related companies for purposes of investment or investor services, or any other advisory accounts over which MML Advisers has brokerage placement discretion. |
# | The President, Treasurer, and Secretary and such other officers as the Trustees may in their discretion from time to time elect are elected to hold such office until their successor is elected and qualified to carry out the duties and responsibilities of their office, or until he or she dies, resigns, is removed, or becomes disqualified. Each officer shall hold office at the pleasure of the Trustees. |
273
Federal Tax Information (Unaudited) |
For corporate shareholders, a portion of the ordinary dividends paid during the Fund(s)’ year ended September 30, 2020, qualified for the dividends received deduction, as follows:
| | | Dividends
Received
Deductions | |
Short-Duration Bond Fund | | | 0.05 | % |
Core Bond Fund | | | 0.37 | % |
Diversified Bond Fund | | | 0.20 | % |
Balanced Fund | | | 52.35 | % |
Disciplined Value Fund | | | 100.00 | % |
Main Street Fund | | | 100.00 | % |
Disciplined Growth Fund | | | 100.00 | % |
Small Cap Opportunities Fund | | | 100.00 | % |
Global Fund | | | 93.76 | % |
International Equity Fund | | | 0.80 | % |
Strategic Emerging Markets Fund | | | 6.83 | % |
For the year ended September 30, 2020, the following Fund(s) earned the following foreign sources of income:
| | | Amount | |
International Equity Fund | | $ | 791,713 | |
Strategic Emerging Markets Fund | | | 766,411 | |
Under Section 854(b)(2) of the Code, the Fund(s) hereby designate the maximum amounts as qualified dividends for purposes of the maximum rate under Section 1(h)(11) of the Code for the year ended September 30, 2020.
274
Other Information (Unaudited) |
Proxy Voting
A description of the policies and procedures that each Fund’s investment adviser and subadvisers use to vote proxies relating to the Fund’s portfolio securities is available, without charge, upon request, by calling 1-888-309-3539, and on the Securities and Exchange Commission’s (“SEC”) EDGAR database on its website at http://www.sec.gov.
Information regarding how the Funds voted proxies relating to portfolio securities during the most recent 12-month period ended June 30 is available, without charge, upon request, on the MassMutual website at http://www.massmutual.com/funds and on the SEC’s EDGAR database on its website at http://www.sec.gov.
Quarterly Reporting
The Funds, except for the U.S. Government Money Market Fund, file their complete schedule of portfolio holdings with the SEC for the first and third quarters of each fiscal year as an exhibit to their reports on Form N-PORT. The Funds’ Forms N-PORT are available on the SEC’s EDGAR database on its website at http://www.sec.gov.
Trustees’ Approval of Investment Advisory Contracts
At their meetings in May and June 2020, the Contract Committee (the “Committee”) and the Trustees, including the Trustees who are not “interested persons” (as such term is defined in the 1940 Act) of the Trust, MML Advisers, or the subadvisers (the “Independent Trustees”), re-approved the existing advisory and subadvisory agreements (collectively, the “Contracts”) for each of the U.S. Government Money Market Fund, Short-Duration Bond Fund, Inflation-Protected and Income Fund, Core Bond Fund, Diversified Bond Fund, High Yield Fund, Balanced Fund, Disciplined Value Fund, Main Street Fund, Disciplined Growth Fund, Small Cap Opportunities Fund, Global Fund, International Equity Fund, and Strategic Emerging Markets Fund. In preparation for the meetings, the Trustees requested, and MML Advisers and the subadvisers provided in advance, certain materials relevant to the consideration of the Contracts (the “Meeting Materials”). In all of their deliberations, the Trustees were advised by independent counsel.
The Committee received in advance of the meetings (i) a memorandum from MML Advisers discussing the nature and quality of the services it provides as investment adviser to the Funds; (ii) a profitability analysis prepared by MML Advisers; and (iii) a fee and performance study report (the “Third-Party Report”) with respect to each Fund prepared by an independent third-party vendor (the “Third-Party”). The Third-Party Report provided detailed comparative advisory fee, total expense, and performance information for each Fund to assist the Committee in its evaluation of the Contracts. The Committee also considered information presented to it throughout the year regarding MML Advisers and each of the subadvisers.
The Committee considered the nature, scope, and quality of services MML Advisers provides to the Funds, including: (i) the financial condition, stability, and business strategy of MML Advisers; (ii) the capabilities of MML Advisers with respect to regulatory compliance and its ability to monitor compliance with the investment policies of the Funds; (iii) MML Advisers’ ability to provide investment oversight and provide for administrative and shareholder services to the Funds; and (iv) the experience and qualifications of the personnel of MML Advisers that perform, or oversee the performance of, the services provided to the Funds, and the needs of the Funds for administrative and shareholder services.
The Committee then reviewed and considered, for each Fund separately, the detailed information presented in the Third-Party Report regarding: (i) Fund expenses, including, among other things, both the Fund’s net advisory fee and total net expense ratio against peer funds; and (ii) the Fund’s relative performance (over various time periods against funds in its “category” and a benchmark index). In connection with the Committee’s review, MML Advisers provided commentary and analysis regarding each Fund’s expenses and performance and a recommendation as to the action to be taken by the Committee. The Committee noted that it had received in the Meeting Materials or during the course of the past year: (i) detailed information regarding MML Advisers’ ability to provide investment oversight and provide for administrative and shareholder services to the Funds; and (ii) a wide range of information about the subadvisers and their personnel with responsibility for providing services to the Funds and the fees payable to each subadviser by MML Advisers. MML Advisers reviewed with the Committee in detail the work MML
275
Other Information (Unaudited) (Continued) |
Advisers does in its oversight roles, the expertise it brings to these roles, the size of its teams, and the financial commitment it has made to provide those services. Throughout the discussion, MML Advisers responded to Committee members’ questions and provided additional information concerning each Fund.
The Committee reviewed the expense and performance information for each Fund. (References to any one- or three-year period below are to periods ended December 31, 2019. In all cases, the comparative expense information is that of a Fund’s “peer group” and the comparative performance information is that of a Fund’s “performance category.”)
The Committee considered that the total net expense ratios for the U.S. Government Money Market Fund, Short-Duration Bond Fund, High Yield Fund, Balanced Fund, Disciplined Value Fund, Main Street Fund, Disciplined Growth Fund, Small Cap Opportunities Fund, Global Fund, and Strategic Emerging Markets Fund were within the top fifty percent of their peer groups, and in most cases in the top forty percent. Of those Funds, all had net advisory fees below the medians of their peers, or in the top sixty percent of their peer groups, except the Strategic Emerging Markets Fund and U.S. Government Money Market Fund, the levels of whose net advisory fees the Committee did not consider to be inconsistent with the advisory agreements’ continuation, in light of the Funds’ generally acceptable total net expense ratios and long-term relative performance records. In this regard, the Committee noted, with respect to the U.S. Government Money Market Fund, MML Advisers’ statement that, although the Fund’s performance was below the category median for the one- and three-year periods, money market fund expenses and performance have been affected over time by factors such as their sponsors’ willingness to reduce expenses and increase yields through fee waivers, particularly in periods of market turmoil, and that simple comparisons with peer advisory fees are not necessarily of value in determining the reasonableness of a money market fund’s fees. The Committee noted that MML Advisers had recently implemented a fee waiver in order to maintain the Fund’s positive yield.
As to the International Equity Fund, the Committee considered MML Advisers’ statement that, although the Fund’s net advisory fee was at the 89th comparative percentile, the Fund’s total net expense ratio, at the 64th comparative percentile, was only two basis points above the peer group median, and that MML Advisers was proposing the conversion of the Fund’s two basis point expense waiver to a permanent two basis point reduction in the Fund’s advisory fee. In the related discussion, the Committee requested that MML Advisers consider continuing the two basis point advisory fee waiver in addition to the permanent advisory fee reduction, to bring the Fund’s advisory fee more in line with the peer group median; MML Advisers agreed. As to the Inflation-Protected and Income Fund, the Committee considered MML Advisers’ statement that, although the Fund’s net advisory fee was at the 77th comparative percentile, the Fund’s total net expense ratio, at the 62nd comparative percentile, was only four basis points above the peer group median. As to the Core Bond Fund, the Committee considered MML Advisers’ statement that, although the Fund’s net advisory fee was at the 80th comparative percentile, the Fund’s total net expense ratio was at the peer group median. The Committee also considered that each of the Funds, other than the International Equity Fund, which MML Advisers reported is under close review due to recent underperformance, had achieved favorable three-year investment performance.
As to the Diversified Bond Fund, the Committee considered MML Advisers’ statement that, although the Fund had a net advisory fee at the 40th comparative percentile, its total net expense ratio was at the 67th comparative percentile. The Committee also considered MML Advisers’ statement that the Fund’s total net expense ratio was within five basis points of the peer group median, and that the Fund had experienced favorable three-year investment performance compared to its performance category.
The Committee determined on the basis of these factors that the Funds’ advisory fees, and the expenses of the Funds generally, were consistent with the continuation of their advisory agreements.
The Committee considered that the Short-Duration Bond Fund, Inflation-Protected and Income Fund, Core Bond Fund, Diversified Bond Fund, High Yield Fund, Balanced Fund, Disciplined Growth Fund, Small Cap Opportunities Fund, Global Fund, and Strategic Emerging Markets Fund had achieved three-year investment performance above the medians of their performance categories, or in the top sixty percent of their performance categories. The Committee considered that the Main Street Fund and International Equity Fund experienced three-year investment performance outside the top sixty percent of their performance categories, but experienced improved performance for the one-year period to a level above the median of its performance category in the case of the Main Street Fund and to the 57th comparative percentile in the case of the International Equity Fund.
276
Other Information (Unaudited) (Continued) |
As to the Disciplined Value Fund, the Committee noted that the Fund had experienced performance for the one- and three-year periods in the 80th and 86th comparative percentiles, respectively. The Committee considered MML Advisers’ statements that the Fund’s performance was adversely affected by the subadviser’s strong value bias during a period when value investing has underperformed generally, that the Fund has performed more favorably over the longer term, and that the Fund has a favorable total net expense ratio. The Committee also considered MML Advisers’ statement that it maintains’ conviction in the investment process of the Fund’s subadviser.
The Committee also reviewed and considered information included in the Meeting Materials, or discussed at the meeting and during the course of the year, concerning economies of scale and the profitability of MML Advisers’ advisory relationship with the various Funds, including: (i) a description of MML Advisers’ revenues from the Funds (including advisory fees and administrative and shareholder services fees, as applicable) and the expense allocation methodology employed by MML Advisers; and (ii) profitability information for each individual Fund. The discussions included consideration of the intangible benefits derived by MML Advisers and its affiliates resulting from their relationships with the Funds and any so-called “fallout benefits” to MML Advisers (which were not considered to be substantial in any event), such as any reputational value derived from serving as investment adviser to the Funds, and benefits accruing to subadvisers due to so-called “soft-dollar arrangements.”
Prior to the votes being taken to approve the Contracts, the Committee met separately in executive session to discuss the appropriateness of such contracts. The Committee weighed the foregoing matters in light of the advice given to them by their independent legal counsel as to the law applicable to the review of investment advisory contracts. In arriving at a decision, the Committee did not identify any single matter as all-important or controlling. The foregoing summary does not detail all of the matters considered.
As to each of the Funds, the Committee concluded that: (i) overall, it was satisfied with the nature, extent, and quality of services provided, and expected to be provided in the future, under the Contracts, including the level of MML Advisers’ oversight of each Fund and the subadvisory process; (ii) MML Advisers’ levels of profitability from its relationship with the various Funds are not excessive and the advisory fees payable under the advisory agreements and each Fund’s total net expenses are fair and reasonable; (iii) the investment processes, research capabilities, and philosophies of the subadvisers generally appear well suited to the Funds, given their investment objectives and policies; (iv) either the relative or absolute performance of a Fund (in each case, taking into account the applicable investment strategy and risk profile of the Fund), or the steps MML Advisers has proposed in respect of the underperformance of a Fund, are sufficient to warrant continuation of the Contracts for each of the Funds; and (v) the terms of the Contracts are fair and reasonable with respect to each Fund and are in the best interests of each Fund’s shareholders.
Also at their meeting in June 2020, the Trustees, including the Independent Trustees, approved new subadvisory agreements with Thompson, Siegel & Walmsley LLC (“TSW”) and Wellington Management Company LLP (“Wellington Management”) for the International Equity Fund (the “June New Subadvisory Agreements”). In preparation for the meeting, the Trustees requested, and MML Advisers provided in advance, certain materials relevant to the consideration of the June New Subadvisory Agreements. In all of their deliberations, the Trustees were advised by independent counsel. In reviewing the June New Subadvisory Agreements, the Independent Trustees discussed with MML Advisers and considered a wide range of information about, among other things: (i) TSW and Wellington Management and their personnel with responsibility for providing services to the International Equity Fund; (ii) the terms of the June New Subadvisory Agreements; (iii) the scope and quality of the services that TSW and Wellington Management will provide under the June New Subadvisory Agreements; (iv) the historical investment performance track records of TSW and Wellington Management and the complementary nature of their investment approaches; and (v) the fees payable to TSW and Wellington Management by MML Advisers for the Fund, the effect of such fees on the profitability to MML Advisers, and any information provided by TSW and Wellington Management regarding the fees paid to TSW and Wellington Management by other funds with similar investment objectives as the International Equity Fund. The Trustees also noted the fact that the International Equity Fund’s advisory fees and total expenses were not expected to change as a result of the June New Subadvisory Agreements, and that, as previously approved by the Board, the Fund’s advisory fee will be reduced as of July 1, 2020.
277
Other Information (Unaudited) (Continued) |
Prior to the votes being taken to approve the June New Subadvisory Agreements, the Independent Trustees met separately in executive session to discuss the appropriateness of such contracts. The Independent Trustees weighed the foregoing matters in light of the advice given to them by their independent legal counsel as to the law applicable to the review of investment advisory contracts. In arriving at a decision, the Trustees, including the Independent Trustees, did not identify any single matter as all-important or controlling. The foregoing summary does not detail all of the matters considered.
Based on the foregoing, and following their review, the Trustees concluded, with respect to the June New Subadvisory Agreements, that (i) overall, they were satisfied with the nature, extent, and quality of services expected to be provided under the June New Subadvisory Agreements; (ii) MML Advisers’ projected levels of profitability due to the June New Subadvisory Agreements are not excessive and the subadvisory fee amounts under the June New Subadvisory Agreements are fair and reasonable; (iii) the investment processes and strategies of each of TSW and Wellington Management appear well suited to the Fund given its investment objective and policies; and (iv) the terms of the June New Subadvisory Agreements are fair and reasonable with respect to the International Equity Fund, and are in the best interests of the International Equity Fund’s shareholders. After carefully considering the information summarized above, the Trustees, including a majority of the Independent Trustees voting separately, unanimously voted to approve the June New Subadvisory Agreements.
The June New Subadvisory Agreements became effective on August 4, 2020.
At their meeting in September 2020, the Trustees, including the Independent Trustees, approved new subadvisory agreements with (i) Invesco Advisers, Inc. (“Invesco”) for the Balanced Fund, and (ii) Wellington Management for the Disciplined Growth Fund and Disciplined Value Fund (the “September New Subadvisory Agreements”). In preparation for the meeting, the Trustees requested, and MML Advisers provided in advance, certain materials relevant to the consideration of the September New Subadvisory Agreements. In all of their deliberations, the Trustees were advised by independent counsel. In reviewing the September New Subadvisory Agreements, the Independent Trustees discussed with MML Advisers and considered a wide range of information about, among other things: (i) Invesco and Wellington Management and their personnel with responsibility for providing services to the respective funds; (ii) the terms of the September New Subadvisory Agreements; (iii) the scope and quality of the services that Invesco and Wellington Management will provide under the September New Subadvisory Agreements; (iv) the historical investment performance track records of Invesco and Wellington Management; and (v) the fees payable to Invesco and Wellington Management by MML Advisers for the respective funds, the effect of such fees on the profitability to MML Advisers, and any information provided by Invesco and Wellington Management regarding the fees paid to Invesco and Wellington Management by other funds with similar investment objectives as the respective funds. The Trustees also noted the fact that each Fund’s advisory fees and total expenses were not expected to change as a result of the September New Subadvisory Agreements. In addition, the Trustees also approved a new sub-subadvisory agreement between Invesco and Invesco Capital Management LLC for the Balanced Fund (the “New Sub-Subadvisory Agreement”)
Prior to the votes being taken to approve the September New Subadvisory Agreements and the New Sub-Subadvisory Agreement, the Independent Trustees met separately in executive session to discuss the appropriateness of such contracts. The Independent Trustees weighed the foregoing matters in light of the advice given to them by their independent legal counsel as to the law applicable to the review of investment advisory contracts. In arriving at a decision, the Trustees, including the Independent Trustees, did not identify any single matter as all-important or controlling. The foregoing summary does not detail all of the matters considered.
Based on the foregoing, and following their review, the Trustees concluded, with respect to the September New Subadvisory Agreements and New Sub-Subadvisory Agreement, that (i) overall, they were satisfied with the nature, extent, and quality of services expected to be provided under the September New Subadvisory Agreements and New Sub-Subadvisory Agreement; (ii) MML Advisers’ projected levels of profitability due to the September New Subadvisory Agreements are not excessive and the subadvisory fee amounts under the September New Subadvisory Agreements are fair and reasonable; (iii) the investment processes and strategies of each of Invesco and Wellington Management appear well suited to the respective funds given their investment objectives and policies; and (iv) the terms of the September New Subadvisory Agreements and New Sub-Subadvisory Agreement are fair and reasonable with respect to the respective funds, and are in the best interests of the respective funds’ shareholders. After carefully considering the information summarized above, the Trustees, including a majority of the Independent Trustees voting separately, unanimously voted to approve the September New Subadvisory Agreements and New Sub-Subadvisory Agreement.
The September New Subadvisory Agreements and New Sub-Subadvisory Agreement became effective on November 18, 2020.
278
Other Information (Unaudited) (Continued) |
Fund Expenses September 30, 2020
Expense Examples:
The following information is in regards to expenses for the six months ended September 30, 2020:
As a shareholder of the Funds, you may incur two types of costs: (1) transaction costs, including sales charges (loads) on purchase payments or redemptions; and (2) ongoing costs, including advisory fees, distribution and/or service (12b-1) fees, and other Fund expenses. These examples are intended to help you understand your ongoing costs (in dollars) of investing in the Funds and to compare these costs with the ongoing costs of investing in other mutual funds. These examples are based on an investment of $1,000 invested for the six months ended September 30, 2020.
Actual Expenses:
The first four columns of the table below provide information about actual account values and actual expenses. You may use this information, together with the amount you invested, to estimate the expenses that you paid over the period. Simply divide your account value by $1,000 (for example, an $8,600 account value divided by $1,000 = 8.6), then multiply the result by the number under the heading entitled “Operating Expenses Incurred” to estimate the expenses you paid on your account during this period.
Hypothetical Example for Comparison Purposes:
The last two columns of the table below provide information about hypothetical account values and hypothetical expenses based on the Fund’s actual expense ratio and an assumed rate of return of 5% per year before expenses, which is not the Fund’s actual return. The hypothetical account values and expenses may not be used to estimate the actual ending account balance or expenses you paid for the period. You may use this information to compare the ongoing costs of investing in the Fund and other funds. To do so, compare this 5% hypothetical example with the 5% hypothetical examples that appear in the shareholder reports of the other funds.
Please note that the expenses shown in the table are meant to highlight your ongoing costs only and do not reflect any transactional costs. Therefore, the last two columns of the table are useful in comparing ongoing costs only, and will not help you determine the relative total costs of owning different funds. In addition, if these transactional costs were included, your costs would have been higher.
| | Beginning
Value | Annualized
Expense
Ratio | Ending
Value (Based
on Actual
Returns and
Expenses) | Operating
Expenses
Incurred* | Ending Value
(Based on
Hypothetical
Returns and
Expenses) | Operating
Expenses
Incurred* |
U.S. Government Money Market Fund | | | | | | |
Class R5 | $1,000 | 0.28% | $1,000.00 | $1.40 | $1,023.60 | $1.42 |
Short-Duration Bond Fund | | | | | | |
Class I | 1,000 | 0.43% | 1,076.80 | 2.23 | 1,022.90 | 2.17 |
Class R5 | 1,000 | 0.53% | 1,076.60 | 2.75 | 1,022.40 | 2.68 |
Service Class | 1,000 | 0.63% | 1,074.90 | 3.27 | 1,021.90 | 3.18 |
Administrative Class | 1,000 | 0.73% | 1,075.30 | 3.79 | 1,021.40 | 3.69 |
Class A | 1,000 | 0.98% | 1,073.60 | 5.08 | 1,020.10 | 4.95 |
Class R4 | 1,000 | 0.88% | 1,073.70 | 4.56 | 1,020.60 | 4.45 |
Class R3 | 1,000 | 1.13% | 1,073.10 | 5.86 | 1,019.40 | 5.70 |
279
Other Information (Unaudited) (Continued) |
| | Beginning
Value | Annualized
Expense
Ratio | Ending
Value (Based
on Actual
Returns and
Expenses) | Operating
Expenses
Incurred* | Ending Value
(Based on
Hypothetical
Returns and
Expenses) | Operating
Expenses
Incurred* |
Inflation-Protected and Income Fund | | | | | | |
Class I | $1,000 | 0.48% | $1,103.60 | $2.52 | $1,022.60 | $2.43 |
Class R5 | 1,000 | 0.58% | 1,104.50 | 3.05 | 1,022.10 | 2.93 |
Service Class | 1,000 | 0.68% | 1,103.90 | 3.58 | 1,021.60 | 3.44 |
Administrative Class | 1,000 | 0.77% | 1,102.70 | 4.05 | 1,021.20 | 3.89 |
Class A | 1,000 | 1.03% | 1,101.40 | 5.41 | 1,019.90 | 5.20 |
Class R4 | 1,000 | 0.93% | 1,102.10 | 4.89 | 1,020.40 | 4.70 |
Class R3 | 1,000 | 1.17% | 1,099.90 | 6.14 | 1,019.20 | 5.91 |
Core Bond Fund | | | | | | |
Class I | 1,000 | 0.42% | 1,094.00 | 2.20 | 1,022.90 | 2.12 |
Class R5 | 1,000 | 0.52% | 1,093.60 | 2.72 | 1,022.40 | 2.63 |
Service Class | 1,000 | 0.62% | 1,092.30 | 3.24 | 1,021.90 | 3.13 |
Administrative Class | 1,000 | 0.72% | 1,092.00 | 3.77 | 1,021.40 | 3.64 |
Class A | 1,000 | 0.97% | 1,090.90 | 5.07 | 1,020.20 | 4.90 |
Class R4 | 1,000 | 0.87% | 1,091.50 | 4.55 | 1,020.70 | 4.40 |
Class R3 | 1,000 | 1.12% | 1,090.00 | 5.85 | 1,019.40 | 5.65 |
Diversified Bond Fund | | | | | | |
Class I | 1,000 | 0.51% | 1,107.80 | 2.69 | 1,022.50 | 2.58 |
Class R5 | 1,000 | 0.62% | 1,106.70 | 3.27 | 1,021.90 | 3.13 |
Service Class | 1,000 | 0.71% | 1,106.20 | 3.74 | 1,021.50 | 3.59 |
Administrative Class | 1,000 | 0.82% | 1,106.40 | 4.32 | 1,020.90 | 4.14 |
Class A | 1,000 | 1.07% | 1,105.50 | 5.63 | 1,019.70 | 5.40 |
Class R4 | 1,000 | 0.97% | 1,105.60 | 5.11 | 1,020.20 | 4.90 |
Class R3 | 1,000 | 1.21% | 1,103.80 | 6.36 | 1,019.00 | 6.11 |
High Yield Fund | | | | | | |
Class I | 1,000 | 0.54% | 1,120.80 | 2.86 | 1,022.30 | 2.73 |
Class R5 | 1,000 | 0.64% | 1,120.00 | 3.39 | 1,021.80 | 3.23 |
Service Class | 1,000 | 0.74% | 1,118.70 | 3.92 | 1,021.30 | 3.74 |
Administrative Class | 1,000 | 0.84% | 1,119.40 | 4.45 | 1,020.80 | 4.24 |
Class A | 1,000 | 1.09% | 1,117.10 | 5.77 | 1,019.60 | 5.50 |
Class R4 | 1,000 | 0.99% | 1,117.30 | 5.24 | 1,020.10 | 5.00 |
Class R3 | 1,000 | 1.24% | 1,116.90 | 6.56 | 1,018.80 | 6.26 |
Balanced Fund | | | | | | |
Class I | 1,000 | 0.70% | 1,210.90 | 3.87 | 1,021.50 | 3.54 |
Class R5 | 1,000 | 0.80% | 1,210.00 | 4.42 | 1,021.00 | 4.04 |
Service Class | 1,000 | 0.90% | 1,209.20 | 4.97 | 1,020.50 | 4.55 |
Administrative Class | 1,000 | 1.00% | 1,208.90 | 5.52 | 1,020.00 | 5.05 |
Class A | 1,000 | 1.25% | 1,206.60 | 6.90 | 1,018.80 | 6.31 |
Class R4 | 1,000 | 1.15% | 1,207.70 | 6.35 | 1,019.30 | 5.81 |
Class R3 | 1,000 | 1.40% | 1,206.70 | 7.72 | 1,018.00 | 7.06 |
Disciplined Value Fund | | | | | | |
Class I | 1,000 | 0.74% | 1,187.80 | 4.05 | 1,021.30 | 3.74 |
Class R5 | 1,000 | 0.84% | 1,187.30 | 4.59 | 1,020.80 | 4.24 |
Service Class | 1,000 | 0.95% | 1,186.00 | 5.19 | 1,020.30 | 4.80 |
Administrative Class | 1,000 | 1.04% | 1,185.30 | 5.68 | 1,019.80 | 5.25 |
Class A | 1,000 | 1.29% | 1,185.00 | 7.05 | 1,018.60 | 6.51 |
Class R4 | 1,000 | 1.20% | 1,185.50 | 6.56 | 1,019.00 | 6.06 |
Class R3 | 1,000 | 1.44% | 1,183.20 | 7.86 | 1,017.80 | 7.26 |
280
Other Information (Unaudited) (Continued) |
| | Beginning
Value | Annualized
Expense
Ratio | Ending
Value (Based
on Actual
Returns and
Expenses) | Operating
Expenses
Incurred* | Ending Value
(Based on
Hypothetical
Returns and
Expenses) | Operating
Expenses
Incurred* |
Main Street Fund | | | | | | |
Class I | $1,000 | 0.75% | $1,298.00 | $4.31 | $1,021.30 | $3.79 |
Class R5 | 1,000 | 0.85% | 1,296.90 | 4.88 | 1,020.80 | 4.29 |
Service Class | 1,000 | 0.97% | 1,296.90 | 5.57 | 1,020.20 | 4.90 |
Administrative Class | 1,000 | 1.05% | 1,296.10 | 6.03 | 1,019.80 | 5.30 |
Class A | 1,000 | 1.30% | 1,294.30 | 7.46 | 1,018.50 | 6.56 |
Class R4 | 1,000 | 1.20% | 1,294.70 | 6.88 | 1,019.00 | 6.06 |
Class R3 | 1,000 | 1.45% | 1,293.20 | 8.31 | 1,017.80 | 7.31 |
Disciplined Growth Fund | | | | | | |
Class I | 1,000 | 0.56% | 1,412.10 | 3.38 | 1,022.20 | 2.83 |
Class R5 | 1,000 | 0.66% | 1,410.50 | 3.98 | 1,021.70 | 3.34 |
Service Class | 1,000 | 0.76% | 1,410.50 | 4.58 | 1,021.20 | 3.84 |
Administrative Class | 1,000 | 0.86% | 1,410.10 | 5.18 | 1,020.70 | 4.34 |
Class A | 1,000 | 1.11% | 1,408.30 | 6.68 | 1,019.50 | 5.60 |
Class R4 | 1,000 | 1.01% | 1,408.40 | 6.08 | 1,020.00 | 5.10 |
Class R3 | 1,000 | 1.26% | 1,407.70 | 7.58 | 1,018.70 | 6.36 |
Small Cap Opportunities Fund | | | | | | |
Class I | 1,000 | 0.69% | 1,364.60 | 4.08 | 1,021.60 | 3.49 |
Class R5 | 1,000 | 0.79% | 1,364.30 | 4.67 | 1,021.10 | 3.99 |
Service Class | 1,000 | 0.89% | 1,363.10 | 5.26 | 1,020.60 | 4.50 |
Administrative Class | 1,000 | 0.99% | 1,362.30 | 5.85 | 1,020.10 | 5.00 |
Class A | 1,000 | 1.24% | 1,361.10 | 7.32 | 1,018.80 | 6.26 |
Class R4 | 1,000 | 1.14% | 1,362.60 | 6.73 | 1,019.30 | 5.76 |
Class R3 | 1,000 | 1.39% | 1,360.20 | 8.20 | 1,018.10 | 7.01 |
Global Fund | | | | | | |
Class I | 1,000 | 0.85% | 1,391.30 | 5.08 | 1,020.80 | 4.29 |
Class R5 | 1,000 | 0.95% | 1,389.70 | 5.68 | 1,020.30 | 4.80 |
Service Class | 1,000 | 1.05% | 1,389.60 | 6.27 | 1,019.80 | 5.30 |
Administrative Class | 1,000 | 1.15% | 1,387.80 | 6.86 | 1,019.30 | 5.81 |
Class A | 1,000 | 1.40% | 1,386.30 | 8.35 | 1,018.00 | 7.06 |
Class R4 | 1,000 | 1.30% | 1,386.90 | 7.76 | 1,018.50 | 6.56 |
Class R3 | 1,000 | 1.55% | 1,384.80 | 9.24 | 1,017.30 | 7.82 |
International Equity Fund | | | | | | |
Class I | 1,000 | 1.04% | 1,256.50 | 5.87 | 1,019.80 | 5.25 |
Class R5 | 1,000 | 1.13% | 1,256.50 | 6.37 | 1,019.40 | 5.70 |
Service Class | 1,000 | 1.25% | 1,255.10 | 7.05 | 1,018.80 | 6.31 |
Administrative Class | 1,000 | 1.32% | 1,254.40 | 7.44 | 1,018.40 | 6.66 |
Class A | 1,000 | 1.59% | 1,253.50 | 8.96 | 1,017.10 | 8.02 |
Class R4 | 1,000 | 1.51% | 1,255.00 | 8.51 | 1,017.50 | 7.62 |
Class R3 | 1,000 | 1.76% | 1,251.80 | 9.91 | 1,016.20 | 8.87 |
281
Other Information (Unaudited) (Continued) |
| | Beginning
Value | Annualized
Expense
Ratio | Ending
Value (Based
on Actual
Returns and
Expenses) | Operating
Expenses
Incurred* | Ending Value
(Based on
Hypothetical
Returns and
Expenses) | Operating
Expenses
Incurred* |
Strategic Emerging Markets Fund | | | | | | |
Class I | $1,000 | 1.15% | $1,274.60 | $6.54 | $1,019.30 | $5.81 |
Class R5 | 1,000 | 1.25% | 1,274.20 | 7.11 | 1,018.80 | 6.31 |
Service Class | 1,000 | 1.35% | 1,272.80 | 7.67 | 1,018.30 | 6.81 |
Administrative Class | 1,000 | 1.45% | 1,273.00 | 8.24 | 1,017.80 | 7.31 |
Class A | 1,000 | 1.70% | 1,271.20 | 9.65 | 1,016.50 | 8.57 |
Class R4 | 1,000 | 1.60% | 1,271.80 | 9.09 | 1,017.00 | 8.07 |
Class R3 | 1,000 | 1.85% | 1,270.70 | 10.50 | 1,015.80 | 9.32 |
* | Expenses are calculated using the annualized expense ratio for the six months ended September 30, 2020, multiplied by the average account value over the period, multiplied by 183 days in the period, divided by 366 days in the year, unless stated otherwise. |
282
[THIS PAGE INTENTIONALLY LEFT BLANK]
Underwriter:
MML Distributors, LLC
100 Bright Meadow Blvd.
Enfield, Connecticut 06082-1981

© 2020 Massachusetts Mutual Life Insurance Company (MassMutual®), Springfield, MA 01111-0001. All rights reserved. www.MassMutual.com. Investment Adviser: MML Investment Advisers, LLC | RS-50209-00 |
Item 2. Code of Ethics.
As of September 30, 2020, the Registrant adopted a Code of Ethics that applies to the Principal Executive Officer, Principal Financial Officer, and other senior financial officers pursuant to the Sarbanes-Oxley Act of 2002. For the year ended September 30, 2020, there were no reportable amendments to any provisions of the Code of Ethics and the Registrant did not grant any waivers, including implicit waivers, from any provisions of the Code of Ethics. A copy of its Code of Ethics is filed with this Form N-CSR under Item 13(a)(1).
Item 3. Audit Committee Financial Expert.
The Registrant’s Board of Trustees has determined that Susan B. Sweeney and Nabil N. El-Hage, both members of the Audit Committee, are audit committee financial experts as defined by the Securities and Exchange Commission (the “SEC”). Ms. Sweeney and Mr. El-Hage are both “independent” as defined by the SEC for purposes of audit committee financial expert determinations.
Item 4. Principal Accountant Fees and Services.
References below to Deloitte & Touche LLP include its affiliates where applicable.
| (a) | AUDIT FEES: The aggregate fees billed to the Registrant for professional services rendered by its independent auditors, Deloitte & Touche LLP, for the audit of the Registrant’s annual financial statements for the fiscal years ended 2020 and 2019 were $474,283 and $462,692, respectively. |
| (b) | AUDIT RELATED FEES: No such fees were billed to the Registrant by Deloitte & Touche LLP for the fiscal years ended 2020 and 2019. No such fees were billed to the Registrant’s adviser and any entity controlling, controlled by, or under common control with the adviser that provides ongoing services to the Registrant by Deloitte & Touche LLP* for the fiscal years ended 2020 and 2019. |
| (c) | TAX FEES: The aggregate fees billed to the Registrant for professional services rendered by Deloitte & Touche LLP for the review of Form 1120-RIC, Form 8613, excise distribution projections, distribution calculation and reasonable out of pocket expenses for the fiscal years ended 2020 and 2019 were $101,284 and $104,065, respectively. No such fees were billed to the Registrant’s adviser and any entity controlling, controlled by, or under common control with the adviser that provides ongoing services to the Registrant by Deloitte & Touche LLP* for the fiscal years ended 2020 and 2019. |
| (d) | ALL OTHER FEES: No such fees were billed to the Registrant by Deloitte & Touche LLP for the fiscal years ended 2020 and 2019. No such fees were billed to the Registrant’s adviser and any entity controlling, controlled by, or under common control with the adviser that provides ongoing services to the Registrant by Deloitte & Touche LLP* for the fiscal years ended 2020 and 2019. |
| (e) | (1) AUDIT COMMITTEE PRE-APPOVAL POLICY: All services to be performed for the Registrant by Deloitte & Touche LLP must be pre-approved by the audit committee. All services performed during the fiscal years ended 2020 and 2019 were pre-approved by the committee. |
(2) Not applicable.
| (g) | The aggregate non-audit fees billed by Deloitte & Touche LLP for services rendered to the Registrant, |
the Registrant’s adviser and any entity controlling, controlled by, or under common control with the adviser that provides ongoing services to the Registrant, for the fiscal years ended 2020 and 2019 were $767,136 and $1,346,488, respectively.
| (h) | The audit committee considers whether the provision of non-audit services by Deloitte & Touche LLP to the Registrant's adviser and any entity controlling, controlled by, or under common control with the adviser that provides ongoing services to the Registrant that were not pre-approved pursuant to paragraph (c)(7)(ii) of Rule 2-01 of Regulation S-X is compatible with maintaining Deloitte & Touche LLP's independence. |
| | * | Refers to fees that were required to be approved by the audit committee for services that relate directly to the operations and financial reporting of the Registrant. |
Item 5. Audit Committee of Listed Registrants.
Not applicable to this filing.
Item 6. Investments.
Please see portfolio of investments contained in the Reports to Stockholders included under Item 1 of this form N-CSR.
Item 7. Disclosure of Proxy Voting Policies and Procedures for Closed-End Management Investment Companies.
Not applicable to this filing.
Item 8. Portfolio Managers of Closed-End Management Investment Companies.
Not applicable to this filing.
Item 9. Purchases of Equity Securities by Closed-End Management Investment Company and Affiliated Purchasers.
Not applicable to this filing.
Item 10. Submission of Matters to a Vote of Security Holders.
Not applicable to this filing.
Item 11. Controls and Procedures.
(a) The Registrant’s Principal Executive Officer and Principal Financial Officer have concluded that the Registrant’s disclosure controls and procedures (as defined in Rule 30a-3(c) under the Investment Company Act of 1940, as amended (the “1940 Act”) (17 CFR 270.30a-3(c))) are effective, as of a date within 90 days of the filing date of this Form N-CSR, to provide reasonable assurance that the information required to be disclosed by the Registrant on Form N-CSR is recorded, processed, summarized, and reported within the time periods specified in the SEC’s rules and forms, based on their evaluation of these disclosure controls and procedures required by Rule 30a-3(b) under the 1940 Act (17 CFR 270.30a-3(b)) and Rules 13a-15(b) or 15d-15(b) under the Securities Exchange Act of 1934 (17 CFR 240.13a-15(b) or 240.15d-15(b)).
(b) There were no changes in the Registrant’s internal control over financial reporting (as defined in Rule 30a-3(d) under the 1940 Act (17 CFR 270.30a-3(d))) that occurred during the period covered by this report that has materially affected, or is reasonably likely to materially affect, the Registrant’s internal control over financial reporting.
Item 12. Disclosure of Securities Lending Activities for Closed-End Management Investment Companies
Not applicable to this filing.
Item 13. Exhibits.
(a)(1) Code of Ethics (Item 2) is attached.
(a)(2) Certifications of the Principal Executive Officer and Principal Financial Officer of the Registrant as required by Rule 30a-2(a) under the 1940 Act (17 CFR 270.30a-2(a)) are attached hereto as Exhibit 99CERT.
(a)(3) Not applicable to this filing.
(a)(4) Not applicable to this filing.
(b) Certifications pursuant to Section 906 of the Sarbanes-Oxley Act of 2002 as required by Rule 30a-2(b), under the 1940 Act (17 CFR 270.30a-2(b)), Rule 15d-14(b) under the Securities Exchange Act of 1934 (17 CFR 240.15d-14(b)) and Section 1350 of Chapter 63 of Title 18 of the United States Code (18 U.S.C. 1350) are attached hereto as Exhibit 99.906CERT.
SIGNATURES
Pursuant to the requirements of the Securities Exchange Act of 1934 and the Investment Company Act of 1940, the registrant has duly caused this report to be signed on its behalf by the undersigned, thereunto duly authorized.
| (Registrant) | MassMutual Premier Funds | |
| | | |
| By (Signature and Title) | /s/ Eric Wietsma | |
| | Eric Wietsma, President and Principal Executive Officer | |
| | | |
| Date | 11/24/2020 | |
Pursuant to the requirements of the Securities Exchange Act of 1934 and the Investment Company Act of 1940, this report has been signed below by the following persons on behalf of the registrant and in the capacities and on the dates indicated.
| By (Signature and Title) | /s/ Eric Wietsma | |
| | Eric Wietsma, President and Principal Executive Officer | |
| | | |
| Date | 11/24/2020 | |
| | | |
| By (Signature and Title) | /s/ Renee Hitchcock | |
| | Renee Hitchcock, Treasurer and Principal Financial Officer | |
| | | |
| Date | 11/24/2020 | |