Link to searchable text of slide shown above
Link to searchable text of slide shown above

Link to searchable text of slide shown above
Link to searchable text of slide shown above
Link to searchable text of slide shown above
Link to searchable text of slide shown above
Link to searchable text of slide shown above
Link to searchable text of slide shown above
Link to searchable text of slide shown above
Link to searchable text of slide shown above

Link to searchable text of slide shown above
Link to searchable text of slide shown above

Link to searchable text of slide shown above
Link to searchable text of slide shown above
Link to searchable text of slide shown above
Link to searchable text of slide shown above
Link to searchable text of slide shown above
Link to searchable text of slide shown above
Link to searchable text of slide shown above
Link to searchable text of slide shown above
Link to searchable text of slide shown above
Link to searchable text of slide shown above
Link to searchable text of slide shown above
Link to searchable text of slide shown above
Link to searchable text of slide shown above
Link to searchable text of slide shown above
Link to searchable text of slide shown above
Link to searchable text of slide shown above
Link to searchable text of slide shown above
Link to searchable text of slide shown above

Link to searchable text of slide shown above
Link to searchable text of slide shown above

Link to searchable text of slide shown above
Link to searchable text of slide shown above
Link to searchable text of slide shown above
Link to searchable text of slide shown above

Link to searchable text of slide shown above
Link to searchable text of slide shown above

Link to searchable text of slide shown above
Link to searchable text of slide shown above
Link to searchable text of slide shown above

Link to searchable text of slide shown above
Link to searchable text of slide shown above
Link to searchable text of slide shown above
Link to searchable text of slide shown above
Link to searchable text of slide shown above

Link to searchable text of slide shown above
Link to searchable text of slide shown above

Link to searchable text of slide shown above
Link to searchable text of slide shown above

Link to searchable text of slide shown above
Link to searchable text of slide shown above
Link to searchable text of slide shown above
Link to searchable text of slide shown above
Link to searchable text of slide shown above
Link to searchable text of slide shown above
Link to searchable text of slide shown above
Link to searchable text of slide shown above
Link to searchable text of slide shown above
Link to searchable text of slide shown above

Link to searchable text of slide shown above
Link to searchable text of slide shown above
Link to searchable text of slide shown above
Link to searchable text of slide shown above
Link to searchable text of slide shown above
Link to searchable text of slide shown above
Link to searchable text of slide shown above

Link to searchable text of slide shown above
Link to searchable text of slide shown above
Link to searchable text of slide shown above
Link to searchable text of slide shown above
Link to searchable text of slide shown above

Link to searchable text of slide shown above
Link to searchable text of slide shown above

Link to searchable text of slide shown above
Link to searchable text of slide shown above
Link to searchable text of slide shown above

Link to searchable text of slide shown above

Link to searchable text of slide shown above
Link to searchable text of slide shown above

Link to searchable text of slide shown above

Link to searchable text of slide shown above
Link to searchable text of slide shown above

Link to searchable text of slide shown above
Link to searchable text of slide shown above
Link to searchable text of slide shown above
Link to searchable text of slide shown above

Link to searchable text of slide shown above

Link to searchable text of slide shown above
Link to searchable text of slide shown above
Link to searchable text of slide shown above
Link to searchable text of slide shown above
Link to searchable text of slide shown above
Link to searchable text of slide shown above

Link to searchable text of slide shown above
Link to searchable text of slide shown above

Link to searchable text of slide shown above
Link to searchable text of slide shown above
Link to searchable text of slide shown above
Link to searchable text of slide shown above
Link to searchable text of slide shown above
Link to searchable text of slide shown above
Link to searchable text of slide shown above
Link to searchable text of slide shown above
Searchable text section of graphics shown above
Introduction
Peter Kirby
Managing Director and CEO
Analyst Presentation
10 February 2003
• Introduction
• Peter Kirby
MD & CEO, CSR Limited
• CSR Limited
• Alec Brennan
MD & CEO, CSR Limited (post-demerger)
Deputy MD and Director Strategy & Investments, CSR Limited (currently)
• Rinker Group Limited
• David Clarke
MD and CEO Rinker Group Limited (post-demerger)
Chief Executive, Rinker Materials Corporation (currently)
Questions & Answers
2
Item |
| Date |
Lodge Scheme Booklet |
| 10 February 2003 |
Transaction launch |
| 10 February 2003 |
Institutional and retail roadshow |
| 11 February - 27 March 2003 |
Shareholder meeting |
| 25 March 2003 |
Final court approval hearing |
| 28 March 2003 (est.) |
CSR and RGL shares begin trading separately |
| 31 March 2003 (est.) |
3
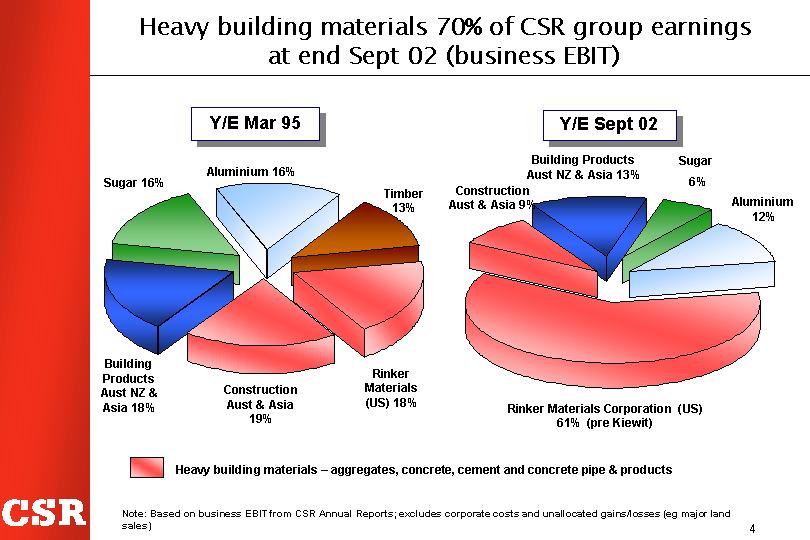
Heavy building materials 70% of CSR group earnings at end Sept 02 (business EBIT)
Y/E Mar 95
[CHART]
Y/E Sept 02
[CHART]
Note: Based on business EBIT from CSR Annual Reports; excludes corporate costs and unallocated gains/losses (eg major land sales)
4
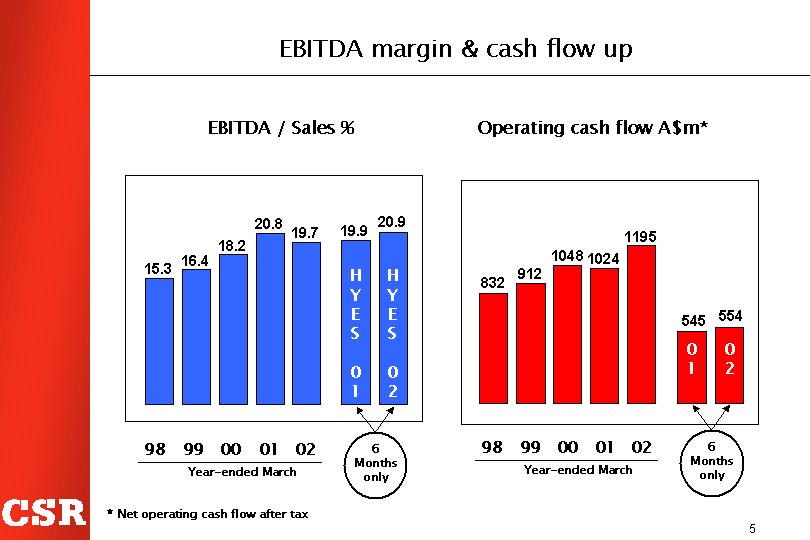
EBITDA / Sales %
[CHART]
Operating cash flow A$m*
[CHART]
* Net operating cash flow after tax
5
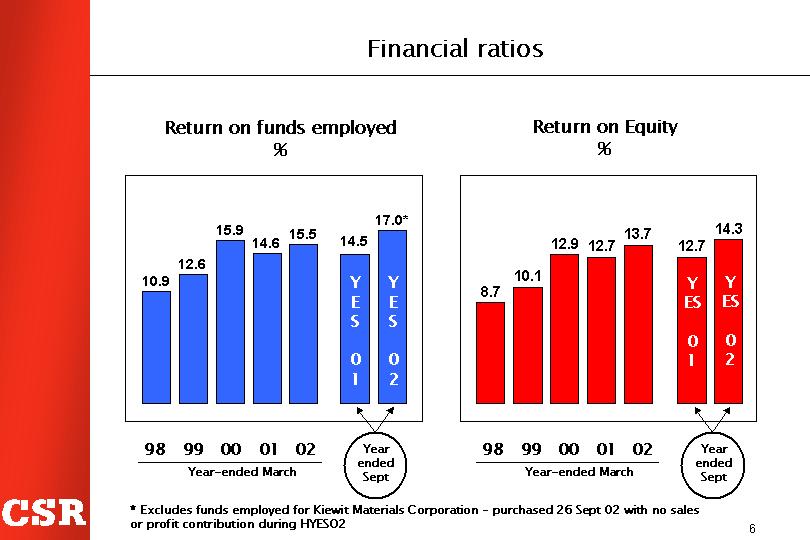
Return on funds employed %
[CHART]
Return on Equity %
[CHART]
* Excludes funds employed for Kiewit Materials Corporation - purchased 26 Sept 02 with no sales or profit contribution during HYESO2
6
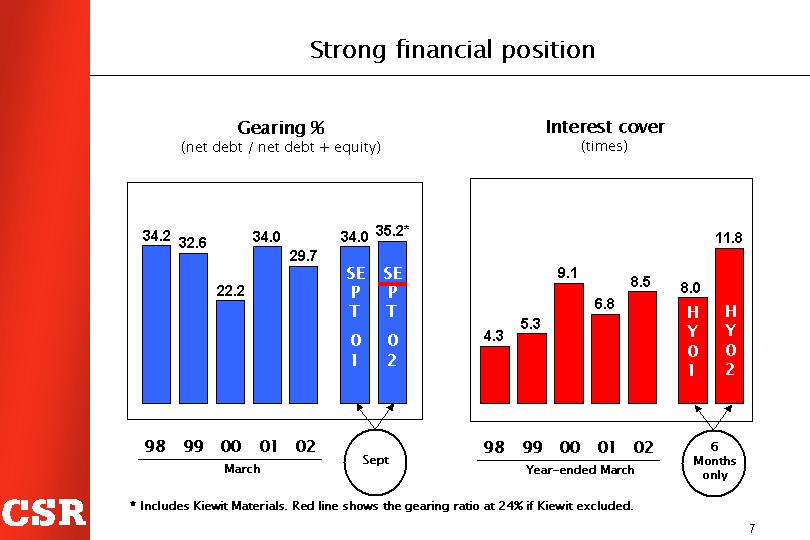
Gearing %
(net debt / net debt + equity)
[CHART]
Interest cover
(times)
[CHART]
* Includes Kiewit Materials. Red line shows the gearing ratio at 24% if Kiewit excluded.
7
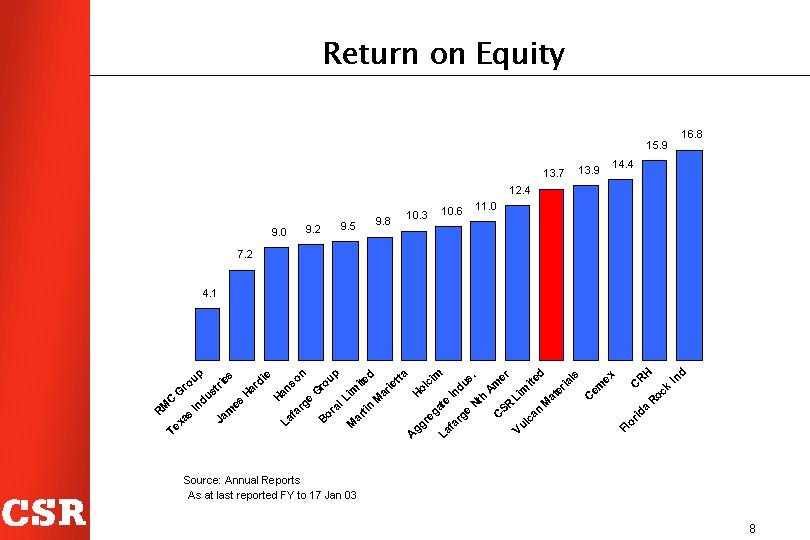
[CHART]
Source: Annual Reports
As at last reported FY to 17 Jan 03
8
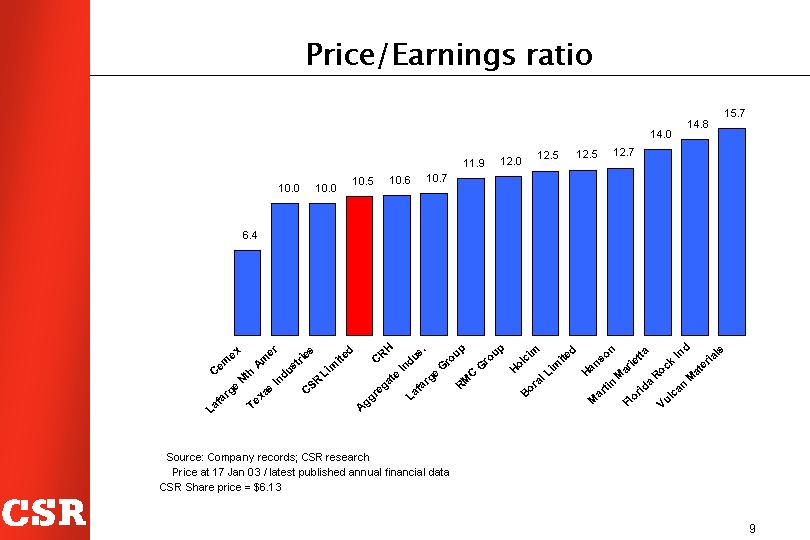
[CHART]
Source: Company records; CSR research
Price at 17 Jan 03 / latest published annual financial data
CSR Share price = $6.13
9
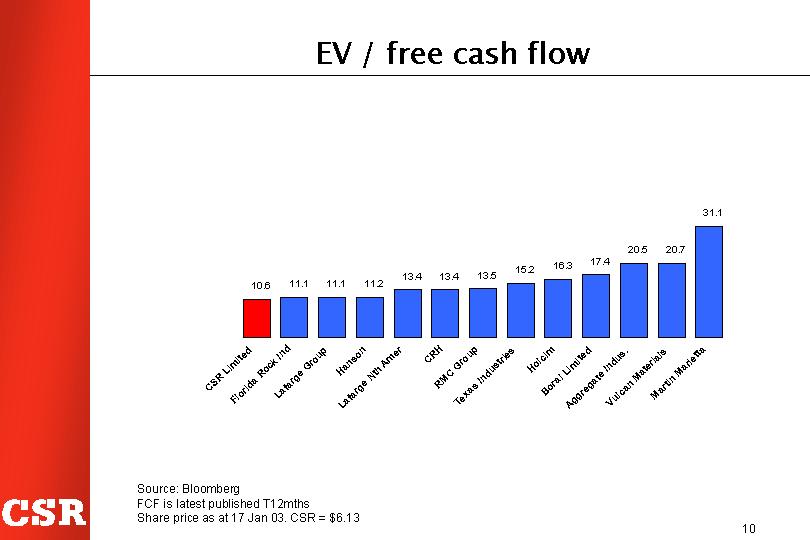
[CHART]
Source: Bloomberg
FCF is latest published T12mths
Share price as at 17 Jan 03. CSR = $6.13
10
[CHART]
Based on YES02 business EBIT from CSR Annual Reports; excludes corporate costs and unallocated gains/losses (eg major land sales)
11
Two strong Australian listed companies, appealing to different groups of investors
RINKER
Rinker Group Limited (RGL)
One of the world’s top 10 heavy building materials companies, growing strongly and building strong regional market positions in its key products…
CSR
CSR Limited
A higher dividend yielding, diversified company, with a stable earnings history, strong cash flows and some of Australia’s best known household brands…
12
Strategic rationale and benefits of a demerger
• In line with CSR strategy since 1998 for separation and growth of heavy building materials while lifting shareholder value
• Creates two strong, focused companies - both investment grade, and expected to be in ASX Top 100
• Precedents show step change in management and board focus lead to improved performance over time
• Improved ability to pursue growth options, including longer term flexibility for RGL equity as acquisition currency, if appropriate
• Separation offers a clear outcome and provides shareholder choice
• Dividend policy and capital allocation to better facilitate individual business strategies
• Clearer alignment of employee compensation plans with shareholder value for Rinker people
• Opportunity for stock market re-rating
13
• Transaction cost of $75 million before tax or est. A$54m after tax, ie a one-off impact of 5.8 cents per share
• adviser, legal and expert fees, stamp duty, insurance (A$32m)
• once-up cost of establishing RGL as a separate entity (A$28m)
• refinancing costs (including restructuring US bonds) (A$15m)
• Lower LT credit ratings but ratings agencies have indicated investment grade for both RGL and CSR
• Short term impact on CSR’s ability to pay fully-franked dividends; Rinker’s franking capacity will be lower but solid earnings from Readymix will underpin franking for shareholders
• Post-demerger, additional cost of RGL and CSR operating as independent, separately listed companies
14
• Improved performance over past 5 years
• Further opportunity to enhance value with a demerger
• Two strong companies – both likely investment grade, history of solid cash flows, leading market positions, strong management & proven performance versus peers
• Expect CSR to be a higher yield stock; Rinker a growth stock
• Rinker growth : plentiful bolt-on opportunities, solid acquisition track record and financial strength to support funding
• CSR growth : sensible growth options to supplement performance improvement focus
• Objective to deliver further value to current shareholders
15
Analyst Presentation
on CSR Limited demerger
Alec Brennan
Managing Director (post-demerger)
February 2003
Part 1 |
| Group overview |
|
|
|
Part 2 |
| Business strengths |
|
|
|
Part 3 |
| Business overview |
|
|
|
Part 4 |
| Board and management |
|
|
|
Part 5 |
| Strategy |
|
|
|
Part 6 |
| Financials |
2
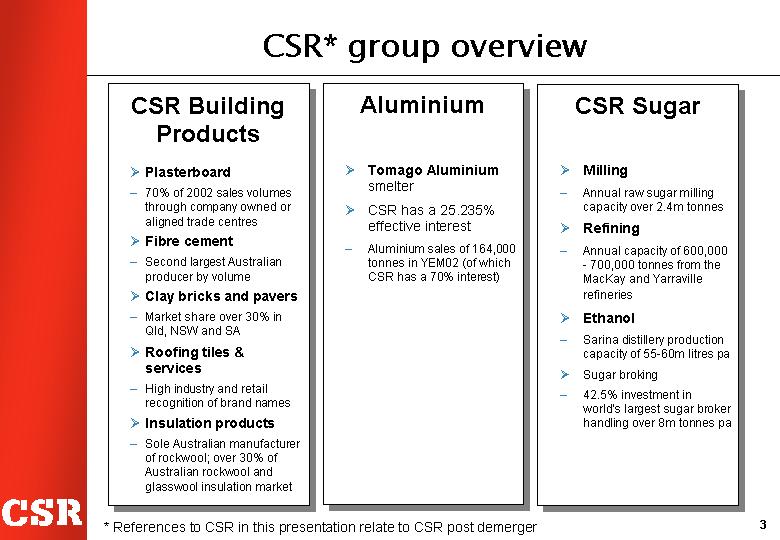
CSR Building Products
• Plasterboard
• 70% of 2002 sales volumes through company owned or aligned trade centres
• Fibre cement
• Second largest Australian producer by volume
• Clay bricks and pavers
• Market share over 30% in Qld, NSW and SA
• Roofing tiles & services
• High industry and retail recognition of brand names
• Insulation products
• Sole Australian manufacturer of rockwool; over 30% of Australian rockwool and glasswool insulation market
Aluminium
• Tomago Aluminium
smelter
• CSR has a 25.235% effective interest
• Aluminium sales of 164,000 tonnes in YEM02 (of which CSR has a 70% interest)
CSR Sugar
• Milling
• Annual raw sugar milling capacity over 2.4m tonnes
• Refining
• Annual capacity of 600,000 - 700,000 tonnes from the MacKay and Yarraville refineries
• Ethanol
• Sarina distillery production capacity of 55-60m litres pa
• Sugar broking
• 42.5% investment in world’s largest sugar broker handling over 8m tonnes pa
* References to CSR in this presentation relate to CSR post demerger
3
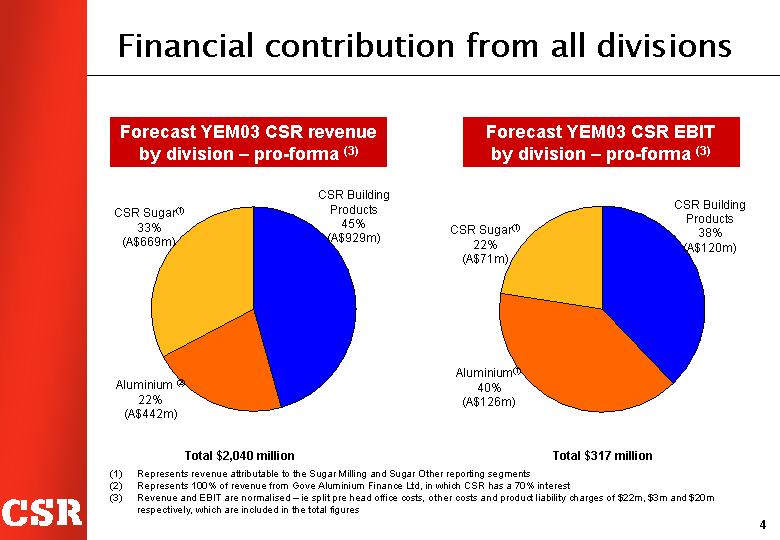
Financial contribution from all divisions
Forecast YEM03 CSR revenue by division – pro-forma(3)
[CHART]
Total $2,040 million
Forecast YEM03 CSR EBIT by division – pro-forma(3)
[CHART]
Total $317 million
(1) Represents revenue attributable to the Sugar Milling and Sugar Other reporting segments
(2) Represents 100% of revenue from Gove Aluminium Finance Ltd, in which CSR has a 70% interest
(3) Revenue and EBIT are normalised – iesplit pre head office costs, other costs and product liability charges of $22m, $3m and $20m respectively, which are included in the total figures
4
Part 1 |
| Group overview |
|
|
|
Part 2 |
| Business strengths |
|
|
|
Part 3 |
| Business overview |
|
|
|
Part 4 |
| Board and management |
|
|
|
Part 5 |
| Strategy |
|
|
|
Part 6 |
| Financials |
5
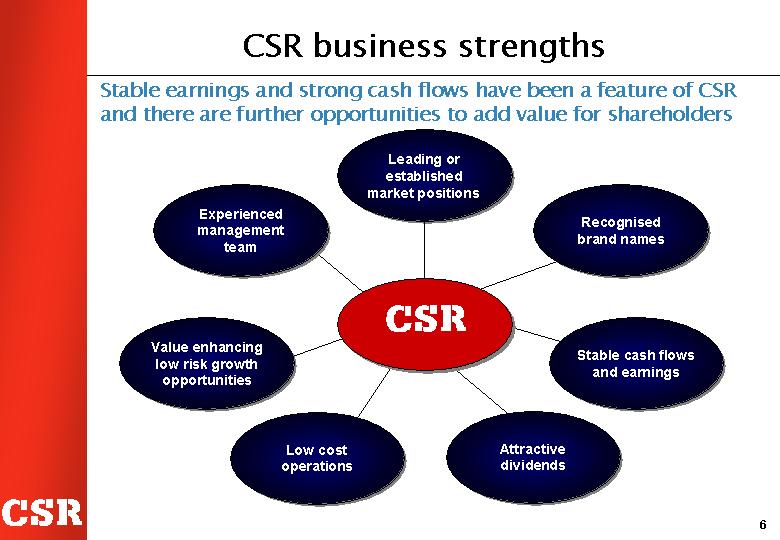
Stable earnings and strong cash flows have been a feature of CSR and there are further opportunities to add value for shareholders
[CHART]
6
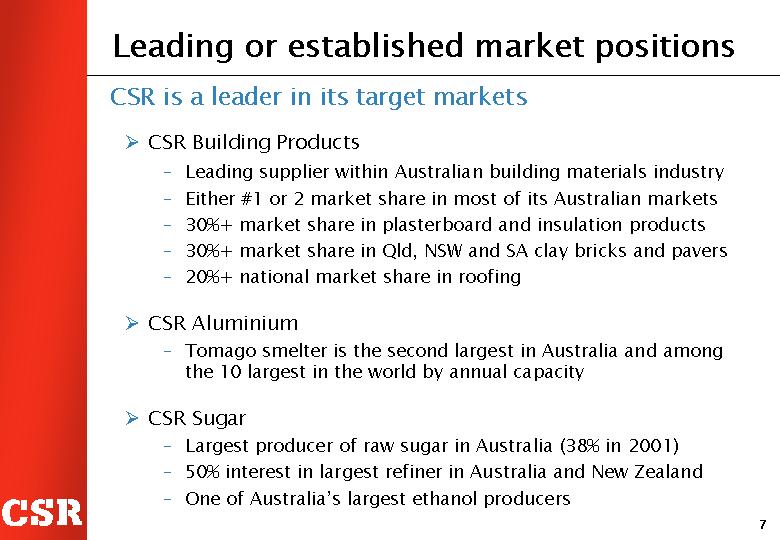
Leading or established market positions
CSR is a leader in its target markets
• CSR Building Products
• Leading supplier within Australian building materials industry
• Either #1 or 2 market share in most of its Australian markets
• 30%+ market share in plasterboard and insulation products
• 30%+ market share in Qld, NSW and SA clay bricks and pavers
• 20%+ national market share in roofing
• CSR Aluminium
• Tomago smelter is the second largest in Australia and among the 10 largest in the world by annual capacity
• CSR Sugar
• Largest producer of raw sugar in Australia (38% in 2001)
• 50% interest in largest refiner in Australia and New Zealand
• One of Australia’s largest ethanol producers
7
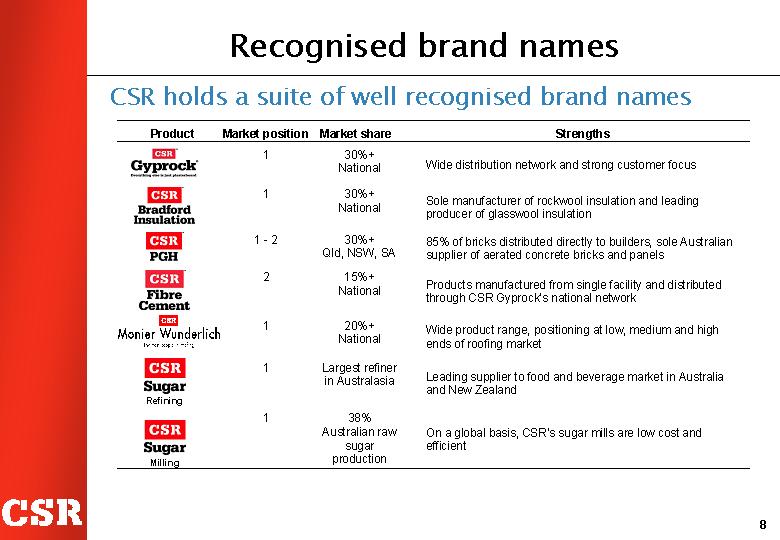
CSR holds a suite of well recognised brand names
Product |
| Market position |
| Market share |
| Strengths |
[CSRTM Gyprock(R) LOGO] |
| 1 |
| 30%+ |
| Wide distribution network and strong customer focus |
|
|
|
|
|
|
|
[CSRTM Bradford Insulation LOGO] |
| 1 |
| 30%+ |
| Sole manufacturer of rockwool insulation and leading producer of glasswool insulation |
|
|
|
|
|
|
|
[CSRTM PGH LOGO] |
| 1 - 2 |
| 30%+ |
| 85 of bricks distributed directly to builders, sole Australian supplier of aerated concrete bricks and panels% |
|
|
|
|
|
|
|
[CSRTM Fibre Cement LOGO] |
| 2 |
| 15%+ |
| Products manufactured from single facility and distributed through CSR Gyprock’s national network |
|
|
|
|
|
|
|
[CSRTM Monier Wunderlich LOGO] |
| 1 |
| 20%+ |
| Wide product range, positioning at low, medium and high ends of roofing market |
|
|
|
|
|
|
|
[CSRTM Sugar Refining LOGO] |
| 1 |
| Largest refiner in Australasia |
| Leading supplier to food and beverage market in Australia and New Zealand |
|
|
|
|
|
|
|
[CSRTM Sugar Milling LOGO] |
| 1 |
| 38% |
| On a global basis, CSR’s sugar mills are low cost and efficient |
8
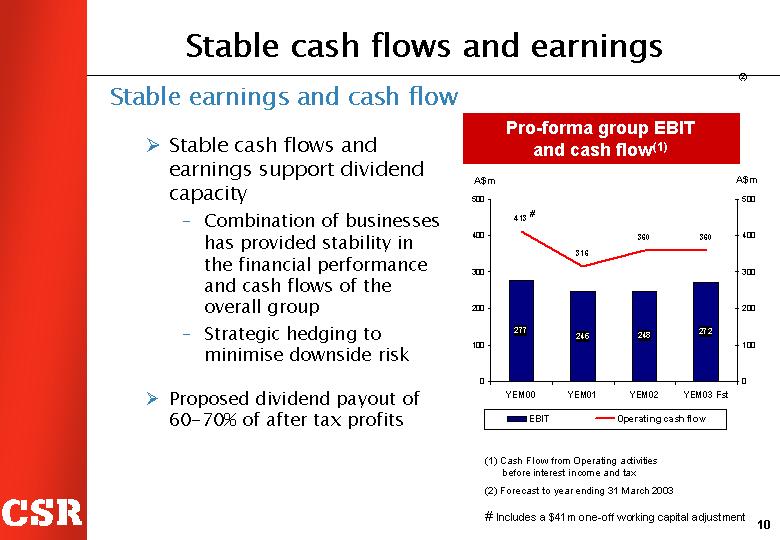
Stable cash flows and earnings
Stable earnings and cash flow
• Stable cash flows and earnings support dividend capacity
• Combination of businesses has provided stability in the financial performance and cash flows of the overall group
• Strategic hedging to minimise downside risk
• Proposed dividend payout of 60-70% of after tax profits
Pro-forma group EBIT and cash flow(1)
[CHART]
(1) Cash Flow from Operating activities before interest income and tax
(2) Forecast to year ending 31 March 2003
# Includes a $41m one-off working capital adjustment
9
Robust cash flows facilitate strong payout ratio
• Intended dividend policy to distribute between 60-70% of operating profit after income tax as dividends
• Interim dividend to be paid in December each year and final dividend to be paid in July each year
• The total 11 cent dividend paid for YEM03(f) is effectively attributed 5 cents to the interim dividend paid in Dec 02, and 6 cents to the final dividend, expected to be approved by the CSR Board for payment in July 03.
• Dividends expected to be highly franked
10
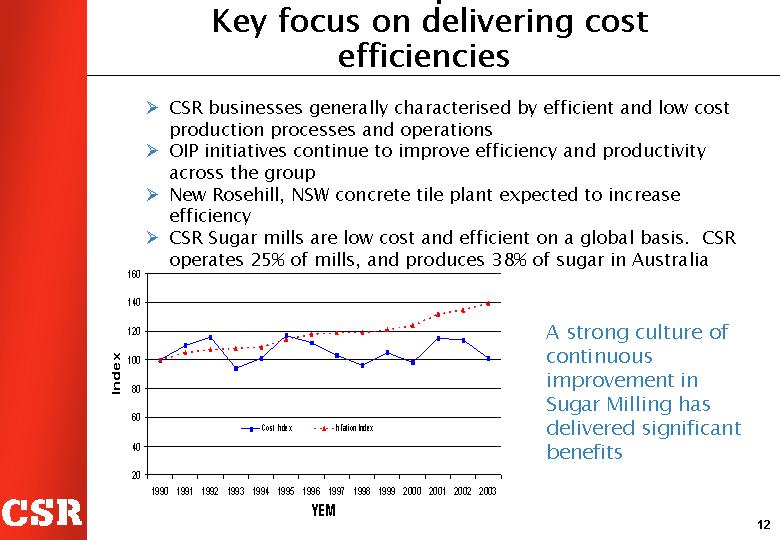
Key focus on delivering cost efficiencies
• CSR businesses generally characterised by efficient and low cost production processes and operations
• OIP initiatives continue to improve efficiency and productivity across the group
• New Rosehill, NSW concrete tile plant expected to increase efficiency
• CSR Sugar mills are low cost and efficient on a global basis. CSR operates 25% of mills, and produces 38% of sugar in Australia
[CHART]
A strong culture of continuous improvement in Sugar Milling has delivered significant benefits
11
Part 1 |
| Group overview |
|
|
|
Part 2 |
| Business strengths |
|
|
|
Part 3 |
| Business overview |
|
|
|
Part 4 |
| Board and management |
|
|
|
Part 5 |
| Strategy |
|
|
|
Part 6 |
| Financials |
12
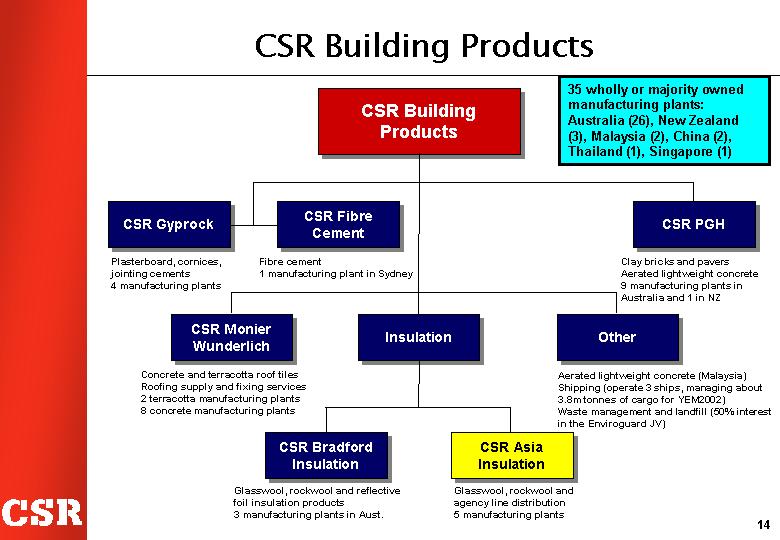
[CHART]
35 wholly or majority owned manufacturing plants:
Australia (26), New Zealand (3), Malaysia (2), China (2), Thailand (1), Singapore (1)
13
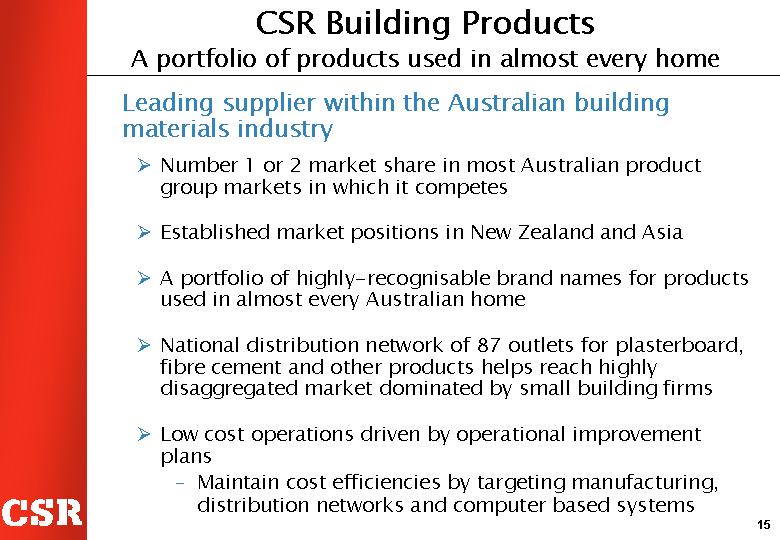
CSR Building Products
A portfolio of products used in almost every home
Leading supplier within the Australian building materials industry
• Number 1 or 2 market share in most Australian product group markets in which it competes
• Established market positions in New Zealand and Asia
• A portfolio of highly-recognisable brand names for products used in almost every Australian home
• National distribution network of 87 outlets for plasterboard, fibre cement and other products helps reach highly disaggregated market dominated by small building firms
• Low cost operations driven by operational improvement plans
• Maintain cost efficiencies by targeting manufacturing, distribution networks and computer based systems
14
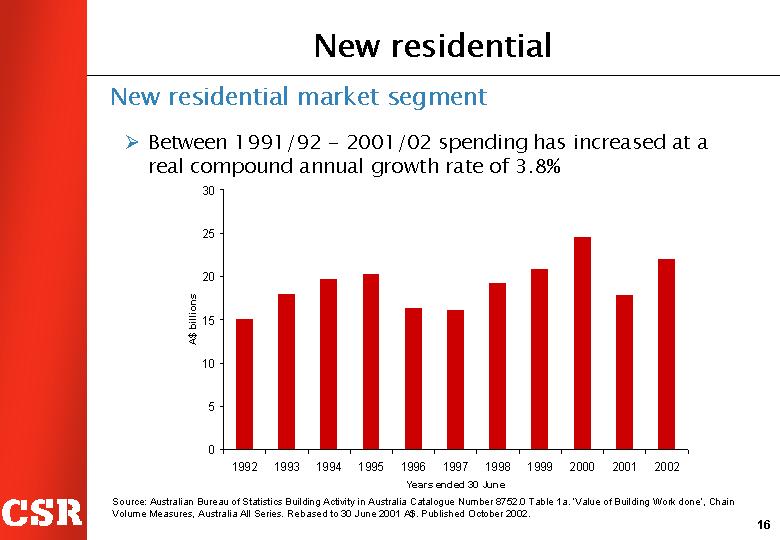
New residential market segment
• Between 1991/92 - 2001/02 spending has increased at a real compound annual growth rate of 3.8%
[CHART]
Source: Australian Bureau of Statistics Building Activity in Australia Catalogue Number 8752.0 Table 1a. ‘Value of Building Work done’, Chain Volume Measures, Australia All Series. Rebased to 30 June 2001 A$. Published October 2002.
15
Alterations and additions market segment
• Between 1991/92 - 2001/02 spending has increased at a real compound annual growth rate of 4.2%
[CHART]
Source: Australian Bureau of Statistics Building Activity in Australia Catalogue Number 8752.0 Table 1a. ‘Value of Building Work Done’, Chain Volume Measures, Australia All Series. Rebased to 30 June 2001 A$. Published October 2002.
16
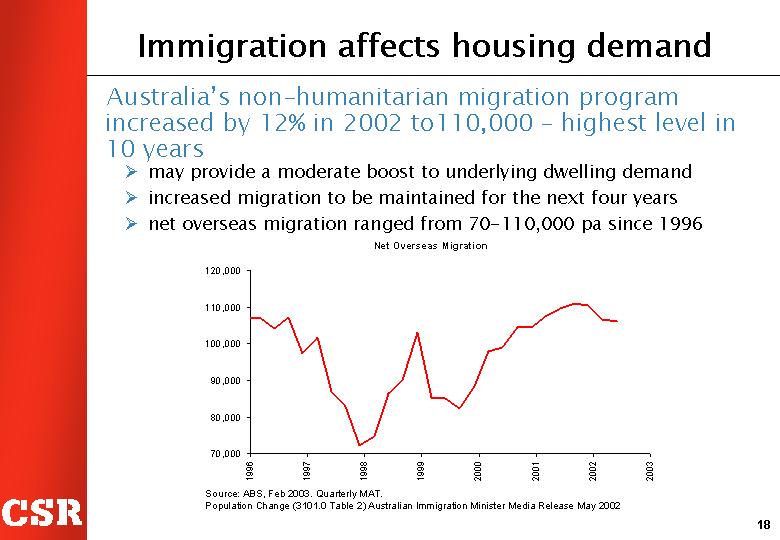
Immigration affects housing demand
Australia’s non-humanitarian migration program increased by 12% in 2002 to 110,000 – highest level in 10 years
• may provide a moderate boost to underlying dwelling demand
• increased migration to be maintained for the next four years
• net overseas migration ranged from 70-110,000 pa since 1996
Net Overseas Migration
[CHART]
Source: ABS, Feb 2003. Quarterly MAT.
Population Change (3101.0 Table 2) Australian Immigration Minister Media Release May 2002
17
Tomago is 2nd largest aluminium smelter in Australia and among the 10 largest in the world by capacity
[GRAPHIC]
Location: |
| Newcastle, NSW |
|
Site area: |
| 500 hectares |
|
Plant area: |
| 110 hectares |
|
Potline building dimensions: |
| 925m x 20m |
|
Potlines: |
| 3 (6 buildings) |
|
No. posts per potline: |
| 280 |
|
Stability of cash flow, earnings
• Long-term contract to ensure alumina supply
• Two-thirds of sales under long term arrangements
• Majority of exchange rate and price exposures hedged for 2-3 years forward
18
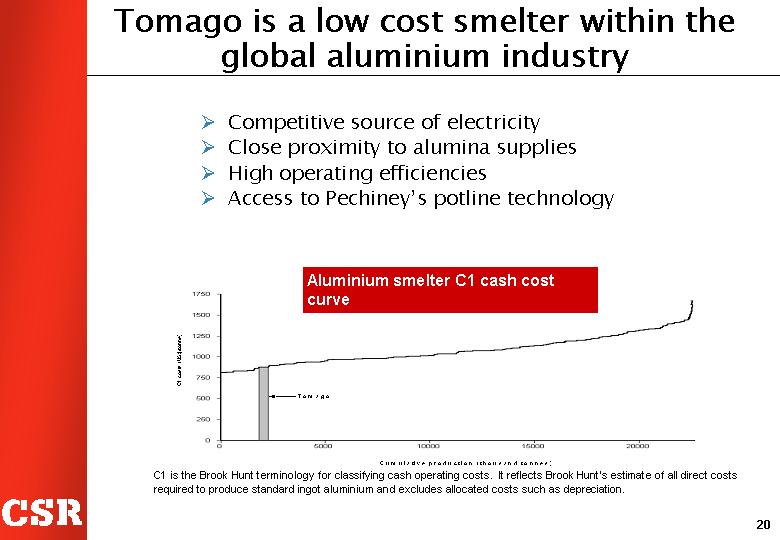
Tomago is a low cost smelter within the global aluminium industry
• Competitive source of electricity
• Close proximity to alumina supplies
• High operating efficiencies
• Access to Pechiney’s potline technology
Aluminium smelter C1 cash cost curve
[CHART]
C1 is the Brook Hunt terminology for classifying cash operating costs. It reflects Brook Hunt’s estimate of all direct costs required to produce standard ingot aluminium and excludes allocated costs such as depreciation.
19
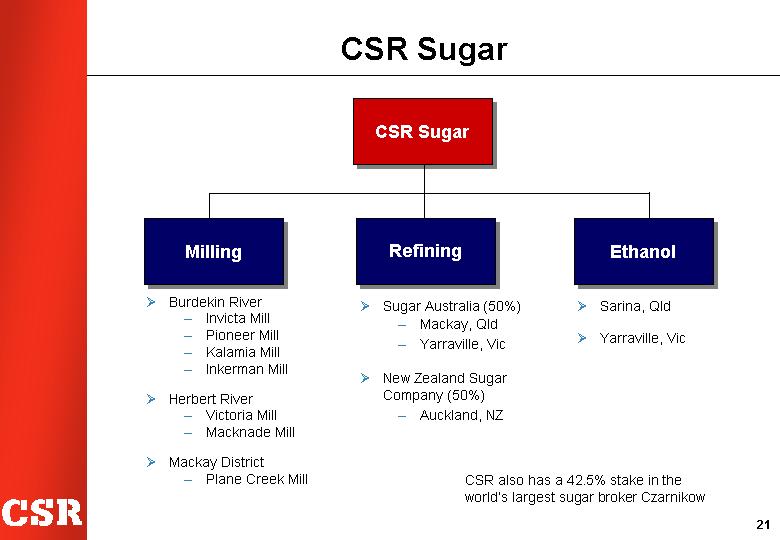
Milling
• Burdekin River
• Invicta Mill
• Pioneer Mill
• Kalamia Mill
• Inkerman Mill
• Herbert River
• Victoria Mill
• Macknade Mill
• Mackay District
• Plane Creek Mill
Refining
• Sugar Australia (50%)
• Mackay, Qld
• Yarraville, Vic
• New Zealand Sugar Company (50%)
• Auckland, NZ
Ethanol
• Sarina, Qld
• Yarraville, Vic
CSR also has a 42.5% stake in the world’s largest sugar broker Czarnikow
20
Australia’s largest raw sugar producer
• Annual raw sugar milling capacity of over 2.4m tonnes, producing about 38% of Australia’s raw sugar in 2001 from seven mills
• Leading share of the Australian and New Zealand retail branded sugar market, via the CSR and CHELSEA brand names
• Low cost and efficient milling operations, located in some of Australia’s most productive sugarcane regions
• Continued efficiencies being delivered through OIP initiatives
22
Focus to date has been milling; other parts offer significant value
[GRAPHIC]
• Focus to date has been improving milling; other parts of chain now to add value
• Benefits to CSR and growers from improvements in other parts of the chain
23
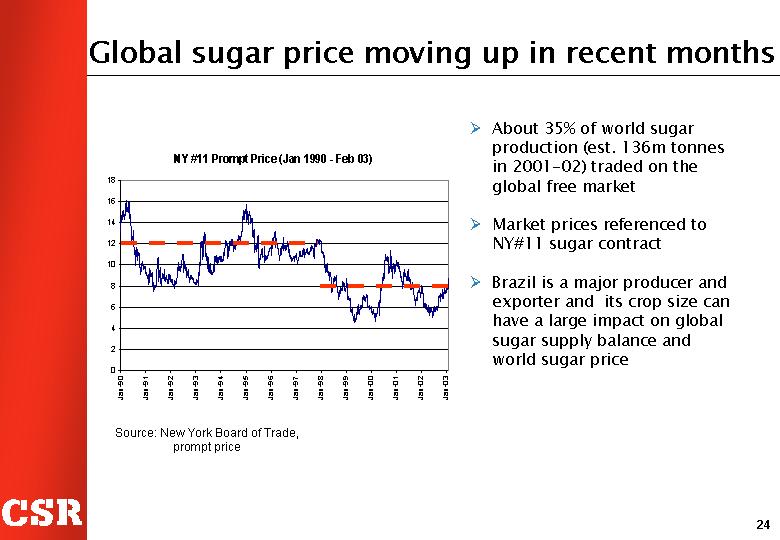
Global sugar price moving up in recent months
NY #11 Prompt Price (Jan 1990 - Feb 03)
[CHART]
• About 35% of world sugar production (est. 136m tonnes in 2001-02) traded on the global free market
• Market prices referenced to NY#11 sugar contract
• Brazil is a major producer and exporter and its crop size can have a large impact on global sugar supply balance and world sugar price
Source: New York Board of Trade, prompt price
24
• CSR and/or certain CSR subsidiaries have been named as defendants in litigation in Australia and the US by claimants alleging injury through exposure to asbestos
• As at 31 December 2002, there were approximately
• 602 claims pending against CSR and/or its subsidiaries in Australia
• 3,007 claims pending against CSR and/or its subsidiaries in the USA
• Provision of $333.8 million in CSR accounts as at 30 September 2002 in accordance with AASB1044
• Provision reviewed each accounting period
• Management believes asbestos litigation will not have a material adverse impact on the CSR group’s financial condition, results of operations or cash flows
25
Part 1 |
| Group overview |
|
|
|
Part 2 |
| Business strengths |
|
|
|
Part 3 |
| Business overview |
|
|
|
Part 4 |
| Board and management |
|
|
|
Part 4 |
| Strategy |
|
|
|
Part 5 |
| Financials |
26
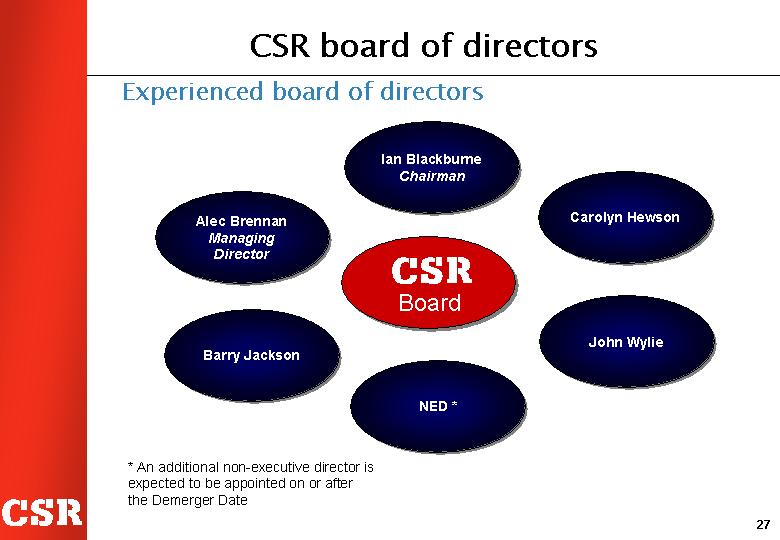
Experienced board of directors
[GRAPHIC]
* An additional non-executive director is expected to be appointed on or after the Demerger Date
27
Management team with extensive industry experience
[CHART]
28
Part 1 |
| Group overview |
|
|
|
Part 2 |
| Business strengths |
|
|
|
Part 3 |
| Business overview |
|
|
|
Part 4 |
| Board and management |
|
|
|
Part 5 |
| Strategy |
|
|
|
Part 6 |
| Financials |
29
CSR performance objectives
Adding value for shareholders
Work to generate total returns that meet or exceed cost of capital requirements
• Strive to be supplier of choice by satisfying customer demand
• Improve efficiency and productivity
• Disciplined capital management focused on shareholder value
• Pursue sensible industry rationalisation and restructuring opportunities
• Value-enhancing low risk growth opportunities allied to existing businesses
• Provide a safe and satisfying workplace that rewards people for enhancing shareholder returns
30
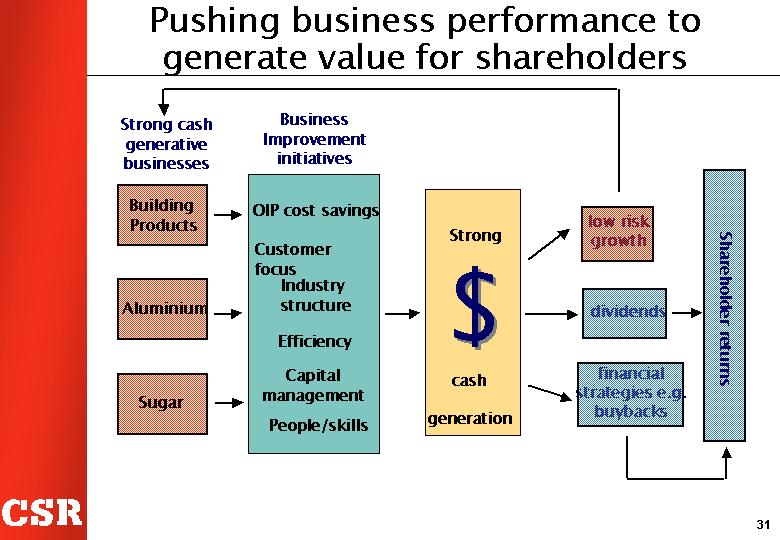
Pushing business performance to generate value for shareholders
[GRAPHIC]
31
Low risk growth an important objective
• Expand Australian and Asian presence in Building Products
• Value added product development opportunities
• Potential participation in expansion of capacity at Tomago
• Increase capacity by 70,000tpa to 530,000tpa
• Currently assessing economics of constructing fourth potline
• Complementary growth opportunities in Sugar
• Expand electricity co-generation assets to take advantage of federal legislation encouraging renewable energy production
• Expand ethanol production by construction of a new distillery to capitalise on potential market for ethanol as a fuel extender
• Extract value from CSR’s existing property assets
• All opportunities assessed against strict return criteria
32
Part 1 |
| Group overview |
|
|
|
Part 2 |
| Business strengths |
|
|
|
Part 3 |
| Business overview |
|
|
|
Part 4 |
| Board and management |
|
|
|
Part 5 |
| Strategy |
|
|
|
Part 6 |
| Financials |
33
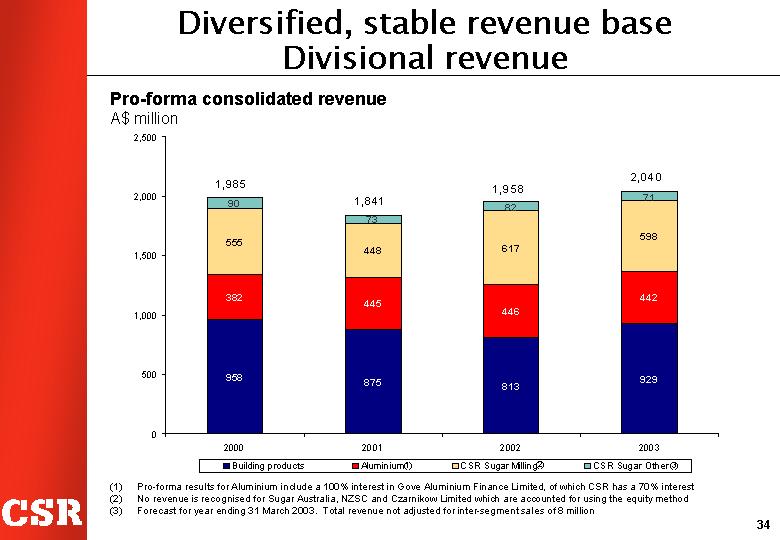
Diversified, stable revenue base
Divisional revenue
Pro-forma consolidated revenue
A$ million
[CHART]
(1) Pro-forma results for Aluminium include a 100% interest in Gove Aluminium Finance Limited, of which CSR has a 70% interest
(2) No revenue is recognised for Sugar Australia, NZSC and Czarnikow Limited which are accounted for using the equity method
(3) Forecast for year ending 31 March 2003. Total revenue not adjusted for inter-segment sales of 8 million
34
Stable profits and cash flow
Divisional EBITDA
Pro-forma divisional EBITDA
A$ million
[CHART]
(1) Pro-forma results for Aluminium include a 100% interest in Gove Aluminium Finance Limited, of which CSR has a 70% interest
(2) Reflects CSR’s share of net profit attributable to its interest in Sugar Australia, NZSC and Czarnikow Limited
(3) Other includes corporate, head office, product liability charges and other costs
35
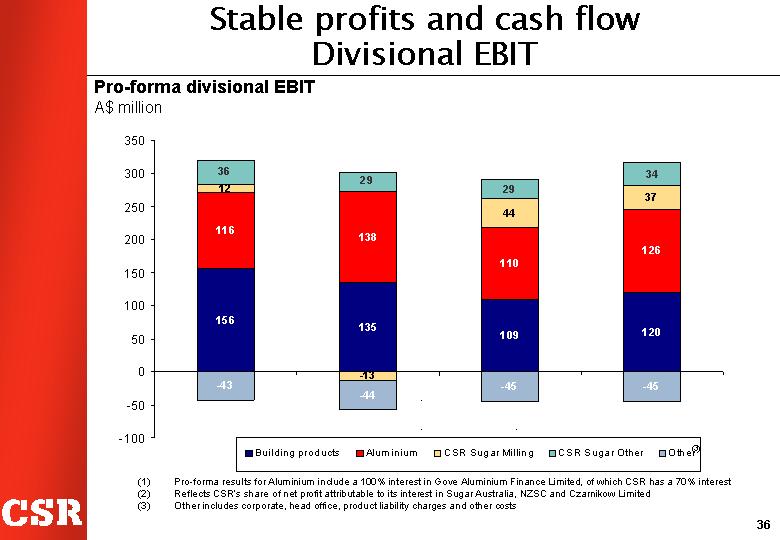
Stable profits and cash flow
Divisional EBIT
Pro-forma divisional EBIT
A$ million
[CHART]
(1) Pro-forma results for Aluminium include a 100% interest in Gove Aluminium Finance Limited, of which CSR has a 70% interest
(2) Reflects CSR’s share of net profit attributable to its interest in Sugar Australia, NZSC and Czarnikow Limited
(3) Other includes corporate, head office, product liability charges and other costs
36
CSR pro-forma financial performance
Pro-forma consolidated results
A$ million
|
| Year ended 31 March |
| Forecast |
| ||||
|
| 2000 |
| 2001 |
| 2002 |
|
| |
Revenue |
| 1,985 |
| 1,841 |
| 1,958 |
| 2,032 |
|
EBITDA |
| 382 |
| 349 |
| 347 |
| 374 |
|
EBITDA margin |
| 19 | % | 19 | % | 18 | % | 18 | % |
Depreciation and amortisation |
| 105 |
| 103 |
| 99 |
| 102 |
|
EBIT |
| 277 |
| 246 |
| 248 |
| 272 |
|
EBIT margin |
| 14 | % | 13 | % | 13 | % | 13 | % |
Outside equity interest share of EBIT(1) |
| 38 |
| 40 |
| 30 |
| 23 |
|
(1) Outside equity share of EBIT mainly represents minority interest holdings in Gove Aluminium Finance Limited and other minority interests in a variety of CSR Building Products entities. Numbers are pre-tax
37
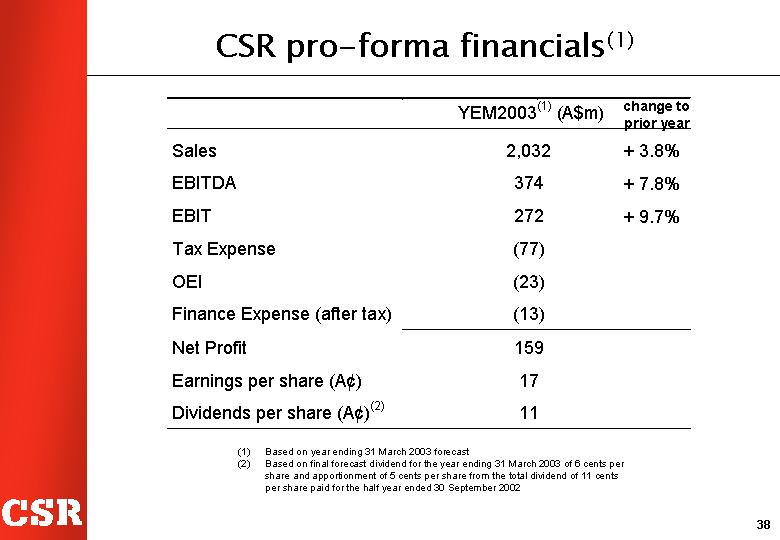
|
| YEM2003(1) (A$ m) |
| change to |
|
|
|
|
|
|
|
Sales |
| 2,032 |
| + 3.8 | % |
EBITDA |
| 374 |
| + 7.8 | % |
EBIT |
| 272 |
| + 9.7 | % |
Tax Expense |
| (77 | ) |
|
|
OEI |
| (23 | ) |
|
|
Finance Expense (after tax) |
| (13 | ) |
|
|
Net Profit |
| 159 |
|
|
|
Earnings per share (A¢) |
| 17 |
|
|
|
Dividends per share (A¢)(2) |
| 11 |
|
|
|
(1) Based on year ending 31 March 2003 forecast
(2) Based on final forecast dividend for the year ending 31 March 2003 of 6 cents per share and apportionment of 5 cents per share from the total dividend of 11 cents per share paid for the half year ended 30 September 2002
38
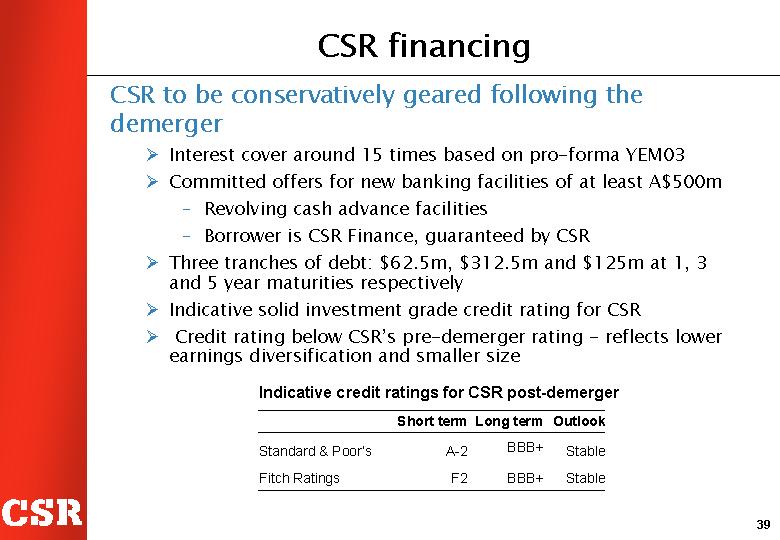
CSR to be conservatively geared following the demerger
• Interest cover around 15 times based on pro-forma YEM03
• Committed offers for new banking facilities of at least A$500m
• Revolving cash advance facilities
• Borrower is CSR Finance, guaranteed by CSR
• Three tranches of debt: $62.5m, $312.5m and $125m at 1, 3 and 5 year maturities respectively
• Indicative solid investment grade credit rating for CSR
• Credit rating below CSR’s pre-demerger rating - reflects lower earnings diversification and smaller size
Indicative credit ratings for CSR post-demerger
|
| Short term |
| Long term |
| Outlook |
|
Standard & Poor’s |
| A-2 |
| BBB+ |
| Stable |
|
Fitch Ratings |
| F2 |
| BBB+ |
| Stable |
|
39
• Management cautiously optimistic about CSR group prospects for YEM2004
• Building Products revenue impacted by housing starts
• 2003 sugarcane crop is expected to be similar to the 2002 crop
• Aluminium revenue will benefit from higher hedged prices in YEM2004 compared to YEM2003
• Property activity expected to provide an ongoing income stream in future years
40
• Expected to appeal to yield-driven investors; with a high level of franking
• Record shows stable earnings and strong cash flows
• Leading market positions in Australia, NZ and Asia
• Well-known brand names in almost every home
• Conservative gearing, strong balance sheet and investment grade credit ratings indicated
• Strong commitment to shareholder value
• Focus on improving existing businesses with low risk, value-enhancing growth options available
41
RINKER
RINKER GROUP LIMITED
(RGL)
Analyst presentation on demerger of RGL from CSR Limited
David Clarke
Managing Director & CEO (post-demerger )
February 2003
Part 1 |
| Introduction and overview |
|
|
|
Part 2 |
| Group business strengths |
|
|
|
Part 3 |
| Corporate overview and management |
|
|
|
Part 4 |
| Financial performance |
|
|
|
Part 5 |
| Strategy |
|
|
|
Part 6 |
| Rinker Materials |
|
|
|
Part 7 |
| Readymix |
|
|
|
Part 8 |
| Outlook |
2
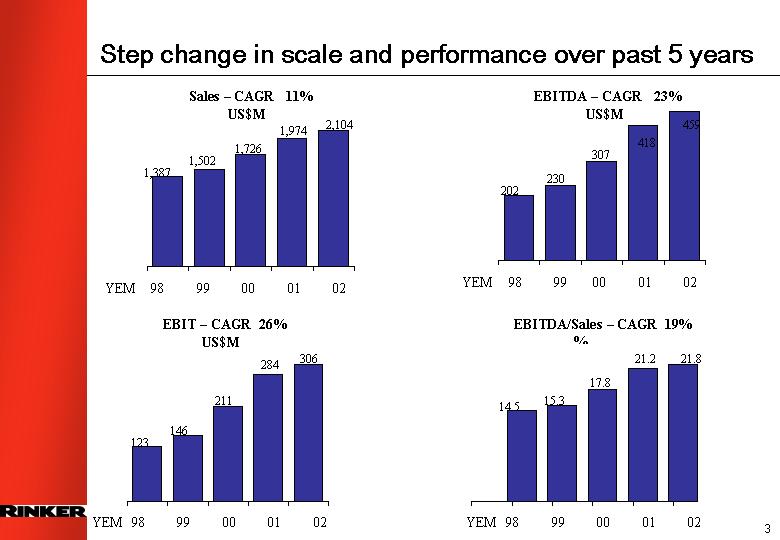
Step change in scale and performance over past 5 years
Sales – CAGR 11%
[CHART]
EBIT – CAGR 26%
[CHART]
EBITDA – CAGR 23%
[CHART]
EBITDA/Sales – CAGR 19%
[CHART]
3
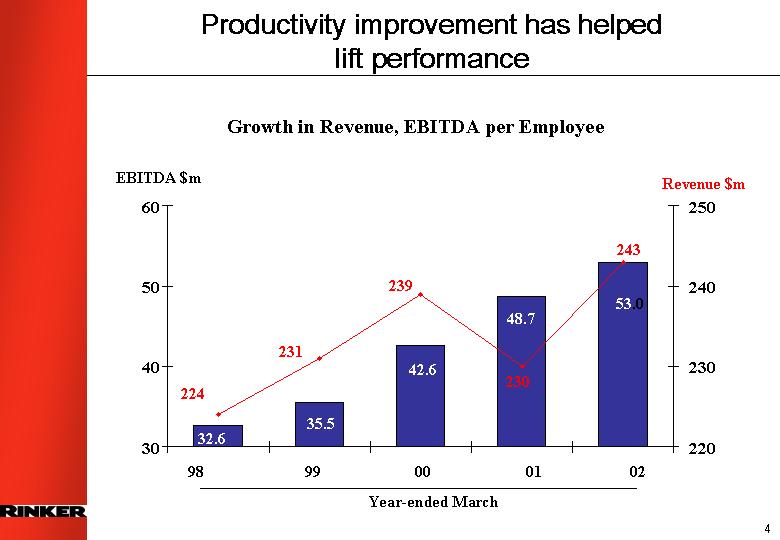
Productivity improvement has helped
lift performance
Growth in Revenue, EBITDA per Employee
[CHART]
4
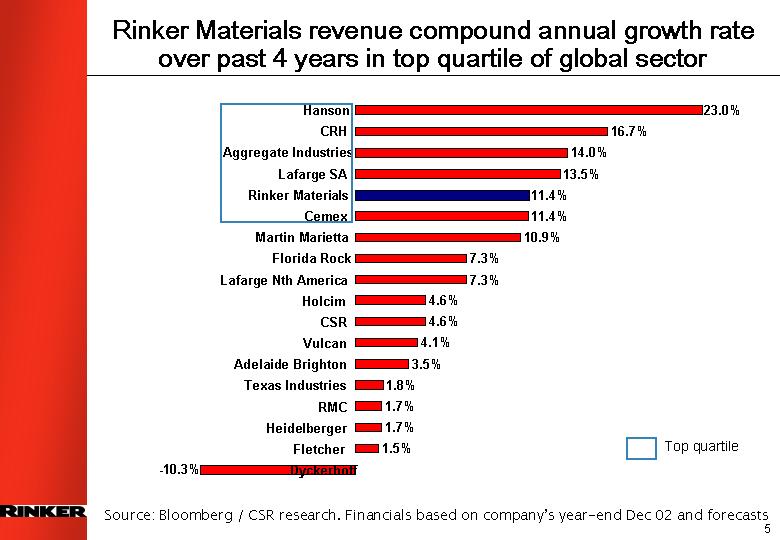
Rinker Materials revenue compound annual growth rate over past 4 years in top quartile of global sector
[CHART]
Source: Bloomberg / CSR research. Financials based on company’s year-end Dec 02 and forecasts
5
Rinker Materials EBITDA compound annual growth rate over past 4 years in top quartile of global sector
[CHART]
Source: Bloomberg / CSR research. Financials based on company’s year-end. Dec 02 and forecasts
6
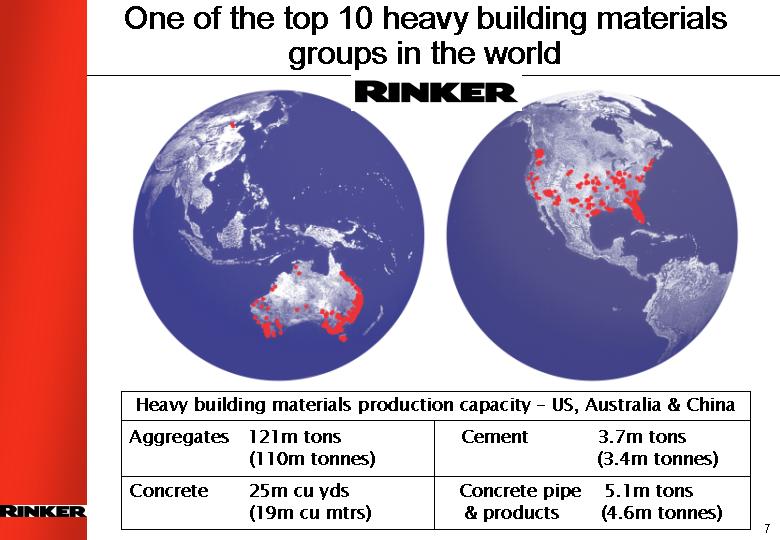
One of the top 10 heavy building materials groups in the world
RINKER
[GRAPHIC]
Heavy building materials production capacity - US, Australia & China
Aggregates 121m tons
(110m tonnes)
Concrete 25m cu yds
(19m cu mtrs)
Cement 3.7m tons
(3.4m tonnes)
Concrete pipe 5.1m tons
& products (4.6m tonnes)
7
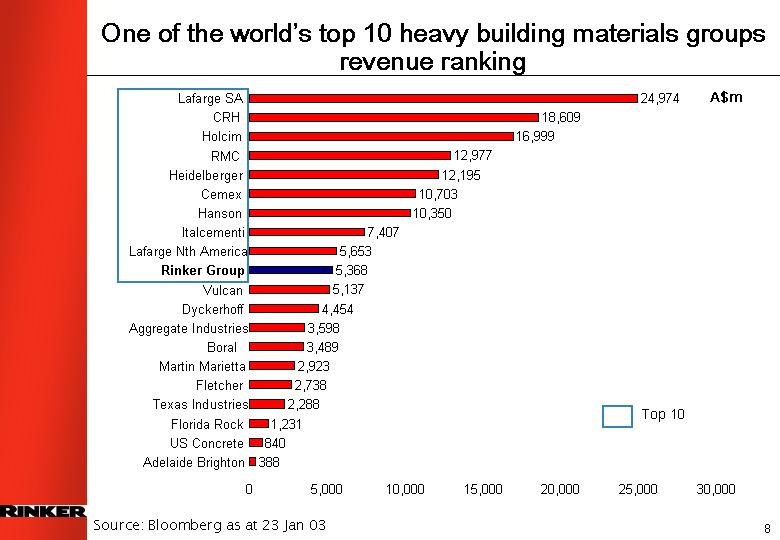
One of the world’s top 10 heavy building materials groups revenue ranking
[CHART]
Source: Bloomberg as at 23 Jan 03
8
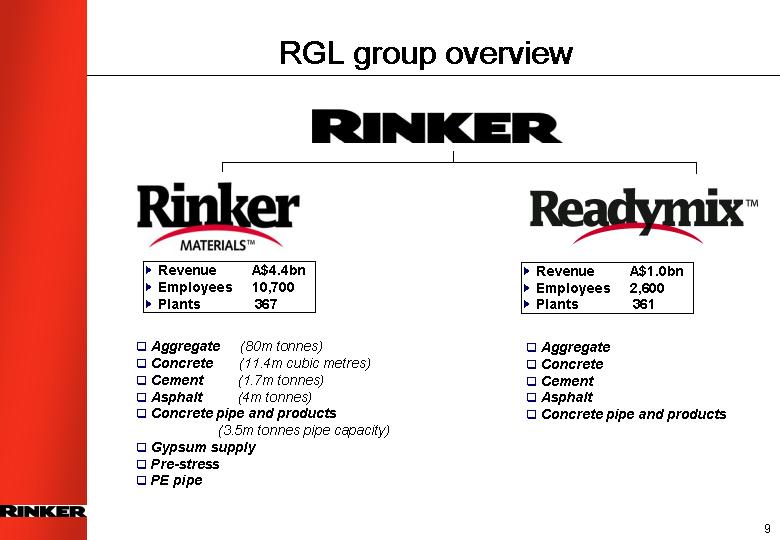
RINKER
[Rinker MATERIALS(TM) LOGO]
• |
| Revenue | A$4.4bn | |
• |
| Employees | 10,700 | |
• |
| Plants | 367 | |
|
|
| ||
|
|
| ||
• |
| Aggregate | (80m tonnes) | |
• |
| Concrete | (11.4m cubic metres) | |
• |
| Cement | (1.7m tonnes) | |
• |
| Asphalt | (4m tonnes) | |
• |
| Concrete pipe and products | ||
|
|
| (3.5m tonnes pipe capacity) | |
• |
| Gypsum supply | ||
• |
| Pre-stress | ||
• |
| PE pipe | ||
[Readymix(TM) LOGO]
• |
| Revenue | A$1.0bn |
• |
| Employees | 2,600 |
• |
| Plants | 361 |
|
|
|
|
• |
| Aggregate | |
• |
| Concrete | |
• |
| Cement | |
• |
| Asphalt | |
• |
| Concrete pipe and products | |
9
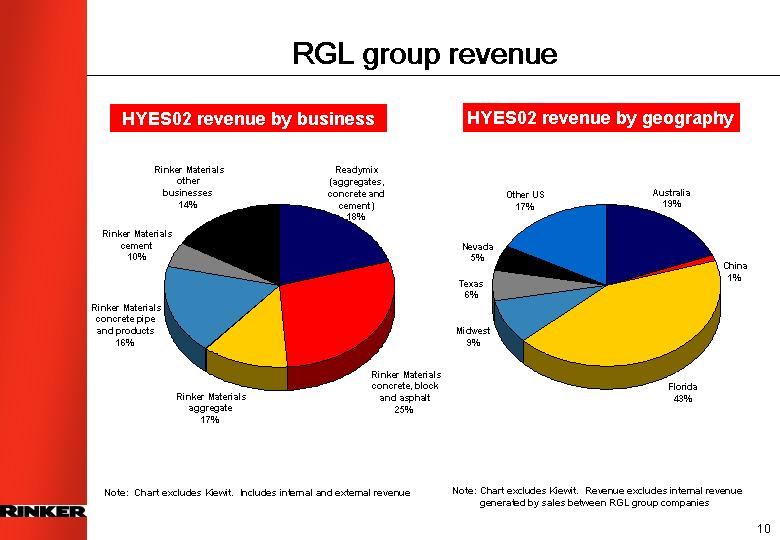
HYES02 revenue by business
[CHART]
Note: Chart excludes Kiewit. Includes internal and external revenue
HYES02 revenue by geography
[CHART]
Note: Chart excludes Kiewit. Revenue excludes internal revenue generated by sales between RGL group companies
10
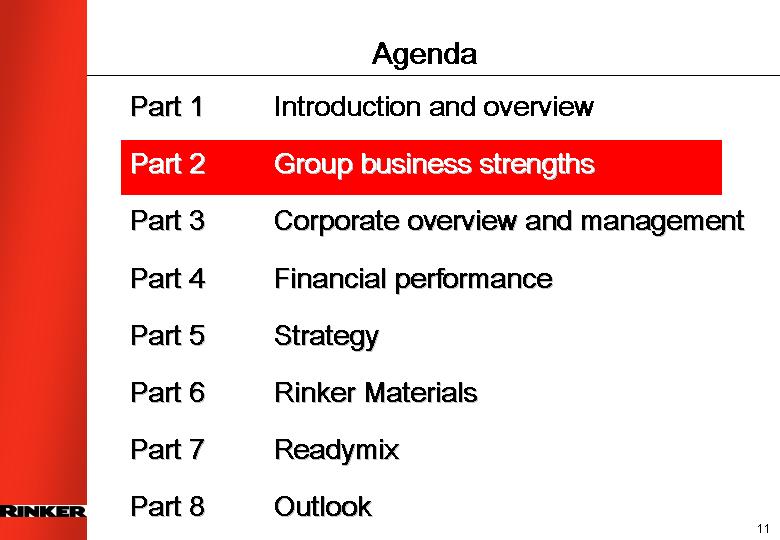
Part 1 |
| Introduction and overview |
|
|
|
Part 2 |
| Group business strengths |
|
|
|
Part 3 |
| Corporate overview and management |
|
|
|
Part 4 |
| Financial performance |
|
|
|
Part 5 |
| Strategy |
|
|
|
Part 6 |
| Rinker Materials |
|
|
|
Part 7 |
| Readymix |
|
|
|
Part 8 |
| Outlook |
11
[CHART]
12
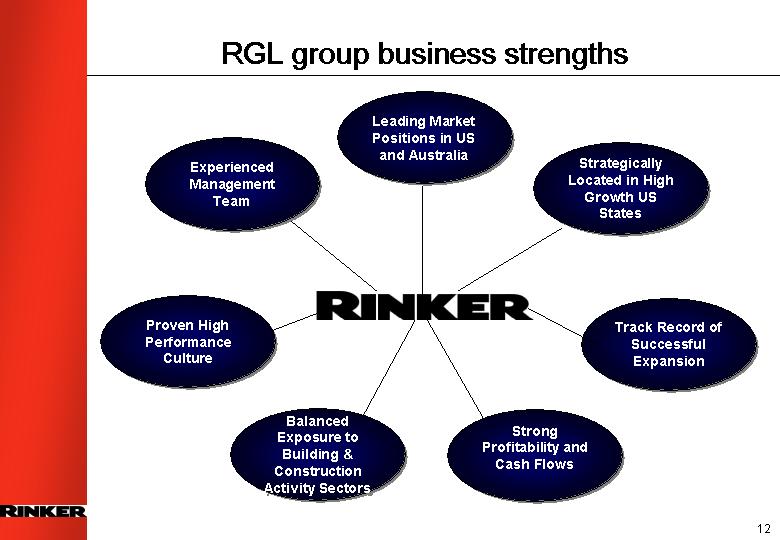
Leading market positions in US and Australia
US - Rinker Materials
|
| Estimated |
|
Concrete pipes & products |
| #2 |
|
Florida cement |
| #1 |
|
Concrete |
| #2 |
|
Aggregate |
| #5 |
|
Australia - Readymix
|
| Estimated |
|
Aggregate |
| Top 3 |
|
Concrete |
| Top 3 |
|
Concrete pipes & products |
| Top 2 |
|
Cement |
| Top 4 |
|
Asphalt |
| Top 3 |
|
• Rinker Materials is one of the largest heavy building materials companies in the US, by US revenue
• #1 or #2 in most of its markets with revenues from these regions accounting for more than 90% of Rinker Materials revenue in HYES02
• Significant strength in vertically integrated markets in Florida and Arizona
• Top three players account for majority of the heavy building materials market in Australia
• Industry discipline improved with significant price increases achieved in the last 12 months
• All major markets and participants vertically integrated
13
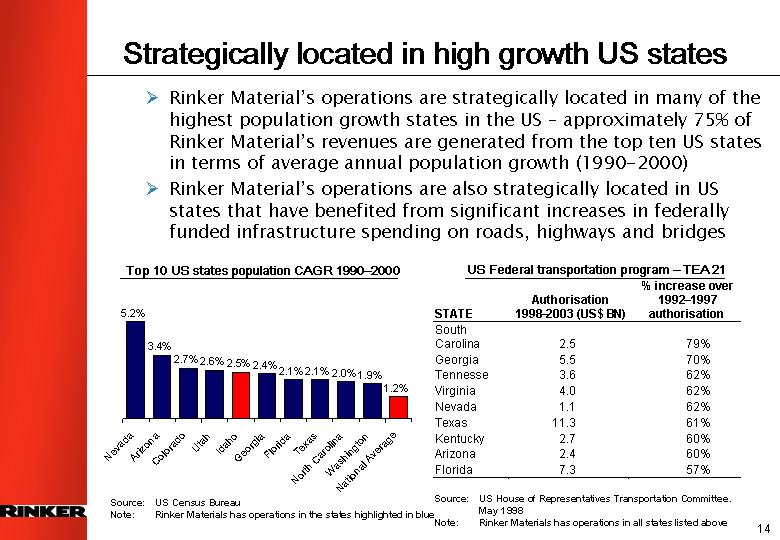
Strategically located in high growth US states
• Rinker Material’s operations are strategically located in many of the highest population growth states in the US – approximately 75% of Rinker Material’s revenues are generated from the top ten US states in terms of average annual population growth (1990-2000)
• Rinker Material’s operations are also strategically located in US states that have benefited from significant increases in federally funded infrastructure spending on roads, highways and bridges
Top 10 US states population CAGR 1990-2000
[CHART]
Source: US Census Bureau
Note: Rinker Materials has operations in the states highlighted in blue
US Federal transportation program - TEA 21
STATE |
| Authorisation |
| % increase over |
|
South |
|
|
|
|
|
Carolina |
| 2.5 |
| 79 | % |
Georgia |
| 5.5 |
| 70 | % |
Tennesse |
| 3.6 |
| 62 | % |
Virginia |
| 4.0 |
| 62 | % |
Nevada |
| 1.1 |
| 62 | % |
Texas |
| 11.3 |
| 61 | % |
Kentucky |
| 2.7 |
| 60 | % |
Arizona |
| 2.4 |
| 60 | % |
Florida |
| 7.3 |
| 57 | % |
Source: US House of Representatives Transportation Committee. May 1998
Note: Rinker Materials has operations in all states listed above
14
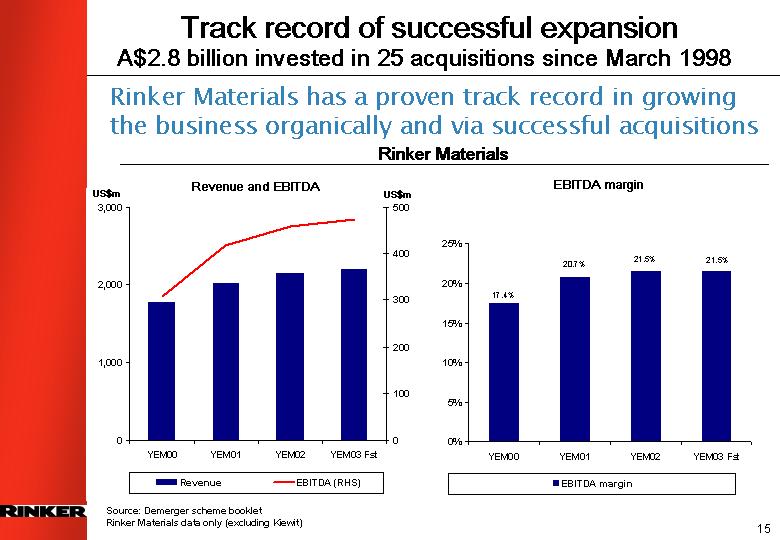
Track record of successful expansion
A$2.8 billion invested in 25 acquisitions since March 1998
Rinker Materials has a proven track record in growing the businss organically and via successul acquisitions
Rinker Materials
Revenue and EBITDA
[CHART]
Source: Demerger scheme booklet
Rinker Materials data only (excluding Kiewit)
EBITDA margin
[CHART]
15
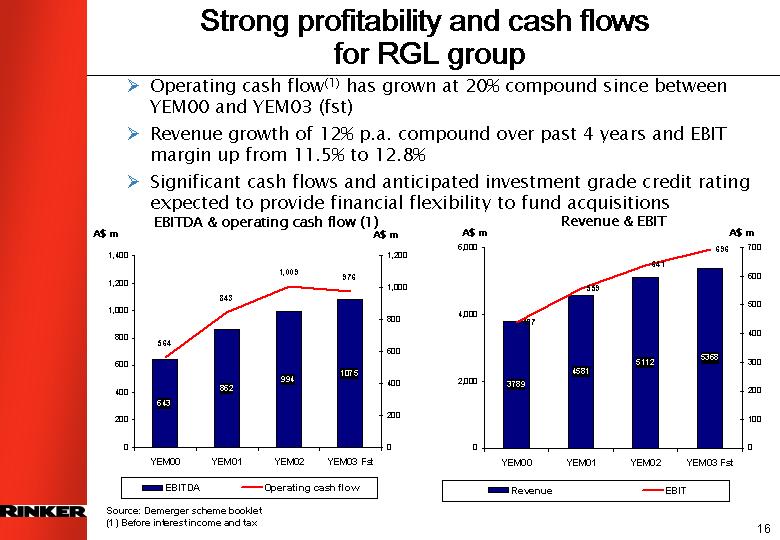
Strong profitability and cash flows
for RGL group
• Operating cash flow(1) has grown at 20% compound since between YEM00 and YEM03 (fst)
• Revenue growth of 12% p.a. compound over past 4 years and EBIT margin up from 11.5% to 12.8%
• Significant cash flows and anticipated investment grade credit rating expected to provide financial flexibility to fund acquisitions
EBITDA & operating cash flow(1)
[CHART]
Source: Demerger scheme booklet
Revenue & EBIT
[CHART]
(1) Before interest income and tax
16
High Performance Culture
Benchmarking against peers demonstrates impact
• Businesses in the US and Australia are broken down into over 100 local regional cell structures, so employees can act like mini-CEOs/owners. These market oriented performance cells are designed to improve accountability and reward strong performance
• Rinker group promotes a high performance culture through a number of initiatives including:
• Incentive schemes based squarely on the creation of shareholder value
• Incentives centred on achievement of “stretch” goals - beyond budget
• Benchmarking against peers shows significant performance improvement in business since 1998. We attribute a large part of this to the high performance culture we have been working to instil across the group
17
Balanced exposure to building and
construction activity market segments
Rinker Materials
[CHART]
Readymix
[CHART]
Note: The above chart for Rinker Materials excludes Kiewit. Revenue for the six months ended 30 September 2002
18
Part 1 |
| Introduction and overview |
|
|
|
Part 2 |
| Group business strengths |
|
|
|
Part 3 |
| Corporate overview and management |
|
|
|
Part 4 |
| Financial performance |
|
|
|
Part 5 |
| Strategy |
|
|
|
Part 6 |
| Rinker Materials |
|
|
|
Part 7 |
| Readymix |
|
|
|
Part 8 |
| Outlook |
19
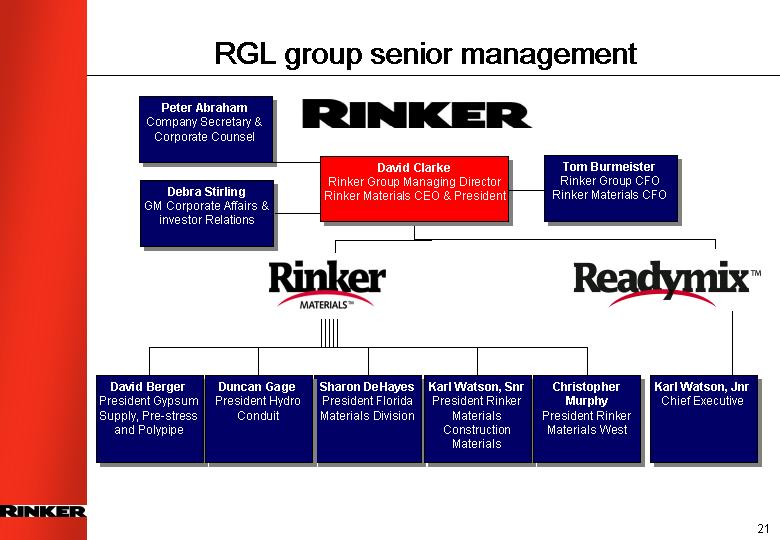
John Morschel * – Chairman
David Clarke * – Managing Director
John Ballard *
John Arthur *
Marshall Criser #
Walter Revell #
• Emphasis on transparency and timely disclosure
• Non-executive directors fees benchmarked to comparable companies
• Policies to manage financial risks
• Directors get comprehensive performance reports; unrestricted access to information
• Board committees with formal charters : Audit; SHE; Remuneration & HR
•* Currently on CSR Limited board
•# Currently on Rinker Materials Corporation board
20
[CHART]
21
Part 1 |
| Introduction and overview |
|
|
|
Part 2 |
| Group business strengths |
|
|
|
Part 3 |
| Corporate overview and management |
|
|
|
Part 4 |
| Financial performance |
|
|
|
Part 5 |
| Strategy |
|
|
|
Part 6 |
| Rinker Materials |
|
|
|
Part 7 |
| Readymix |
|
|
|
Part 8 |
| Outlook |
22
RGL group
Pro-forma historical performance
A$ million
|
| Year ended 31 March |
| ||||||
|
| 2000 |
| 2001 |
| 2002 |
| 2003* |
|
Revenue |
| 3,789 |
| 4,580 |
| 5,112 |
| 5,368 |
|
EBITDA |
| 643 |
| 862 |
| 994 |
| 1,075 |
|
Margin (%) |
| 17.0 | % | 18.8 | % | 19.5 | % | 20.0 | % |
Goodwill amortisation |
| 25 |
| 56 |
| 70 |
| 93 |
|
Other depreciation and amortisation |
| 181 |
| 247 |
| 283 |
| 286 |
|
EBIT |
| 437 |
| 559 |
| 641 |
| 696 |
|
Margin (%) |
| 11.5 | % | 12.2 | % | 12.5 | % | 13.0 | % |
* Based on forecast average A$/US$ exchange rate for YEM03 of 0.557
23
RGL group
Pro-forma forecast 2003 financial performance
|
| A$m |
| Change on |
|
Sales |
| 5,368 |
| + 5.0 | % |
EBITDA |
| 1,075 |
| + 8.1 | % |
EBIT |
| 696 |
| + 8.5 | % |
Tax Expense |
| (255 | ) |
|
|
Outside Equity Interest |
| (3 | ) |
|
|
Finance Expense (after tax) |
| (54 | ) |
|
|
Net Profit |
| 384 |
|
|
|
Earnings per Share (A¢) |
| 41 |
|
|
|
Dividends per Share (A¢)(1) |
| 13 |
|
|
|
(1) Represents sum of the apportioned interim dividend paid to CSR shareholders had the demerger been effective from 1 October 2002 of A ¢6 and a A ¢7 final dividend (which RGL directors expect to pay in July 2003)
Based on forecast average A$/US$ exchange rate for YEM03 of 0.557
24
RGL group
Financial performance objectives
One of the world’s top 10 heavy building materials groups, Rinker aims to be a high performing growth company, focused on delivering strong shareholder returns through top quartile growth in:
• Revenue
• EBITDA
• Shareholder Value Added
25
RGL group
Profit margins improving as growth continues
EBIT
[CHART]
EBITDA
[CHART]
Source : Demerger Scheme Booklet
* Forecast from Scheme booklet; includes Kiewit acquisition for HYEM03
26
Part 1 |
| Introduction and overview |
|
|
|
Part 2 |
| Group business strengths |
|
|
|
Part 3 |
| Corporate overview and management |
|
|
|
Part 4 |
| Financial performance |
|
|
|
Part 5 |
| Strategy |
|
|
|
Part 6 |
| Rinker Materials |
|
|
|
Part 7 |
| Readymix |
|
|
|
Part 8 |
| Outlook |
27
Strategy
Value-adding growth; improving base performance
RGL group aims to be in the top quartile of its heavy building materials industry peers re growth in revenue, EBITDA and SVA
• Achieve the #1 or #2 market position in regional markets
• Overall cost leadership
• Continue value-adding growth through acquisitions
• Continued performance improvement – high performance culture and benchmarking vs. peers
• Talented people with a high performance ethic
• A safe workplace
28
Strategy - - cost management
Cost leadership part of maintaining market leadership
• Companies in the RGL group aim to be the lowest cost producer in their markets
• A culture of continuous improvement through benchmarking performance against competitors and implementing operational improvement programs (OIP)
• Currently over 400 active OIPs across the RGL group
• Businesses in the RGL group have a track record of generating significant cost savings
• Estimated cost saving for year end March 2002 of A$85 million
• RGL management expect that cost savings from OIPs will continue to substantially offset inflationary cost increases
29
Strategy - - growth
Ongoing value-adding growth
• Strong cash flows provide basis for ongoing future growth
• Growth must be value-adding: earning cost of capital usually within first full year after acquisition
• Focus on high population growth US states, including bolt-on acquisitions in western US states, following Kiewit
• Small bolt-ons in Australia and low risk growth in China
• Vertical integration (concrete, cement, asphalt) in regions where quarrying operations have been established, if appropriate in those markets
• High level of due diligence pre-acquisition; stringent post acquisition management and integration plans
• If appropriate, equity funding an option for the future as growth continues
30
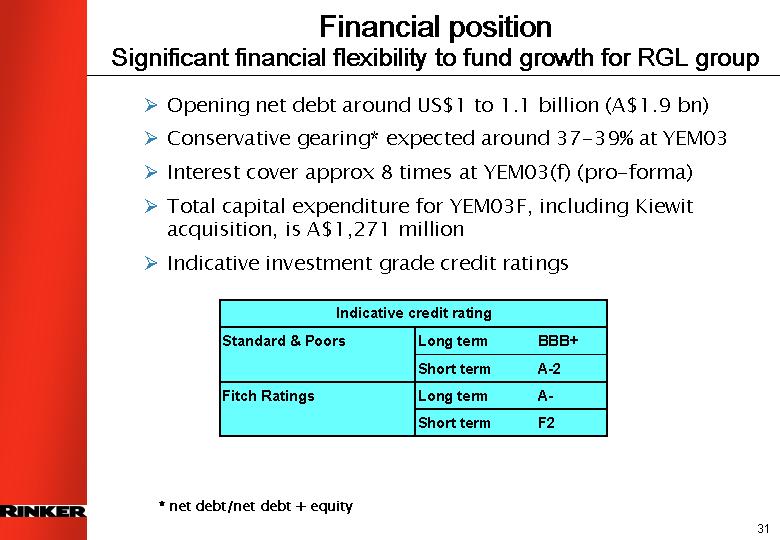
Financial position
Significant financial flexibility to fund growth for RGL group
• Opening net debt around US $1 to 1.1 billion (A$1.9 bn)
• Conservative gearing* expected around 37-39% at YEM03
• Interest cover approx 8 times at YEM03(f) (pro-forma)
• Total capital expenditure for YEM03F, including Kiewit acquisition, is A$ 1,271 million
• Indicative investment grade credit ratings
Indicative credit rating | |||||
Standard & Poors |
| Long term |
| BBB+ |
|
|
| Short term |
| A-2 |
|
Fitch Ratings |
| Long term |
| A- |
|
|
| Short term |
| F2 |
|
* net debt/net debt + equity
31
Dividends
Policy similar to peers; improving Readymix helps franking
• RGL group policy on dividends likely to be similar to international building materials peers
• Intended dividend policy to distribute between 20-30% of operating profit after tax as dividends
• Interim dividend to be paid in December and final dividend in July each year
• No franking credits available at time of demerger
• Franking expected to be low in year ending 31 March 2004, but increasing in future years
• Improving returns from Readymix will lift franking capability but high proportion of earnings outside Australia will impact
32
33
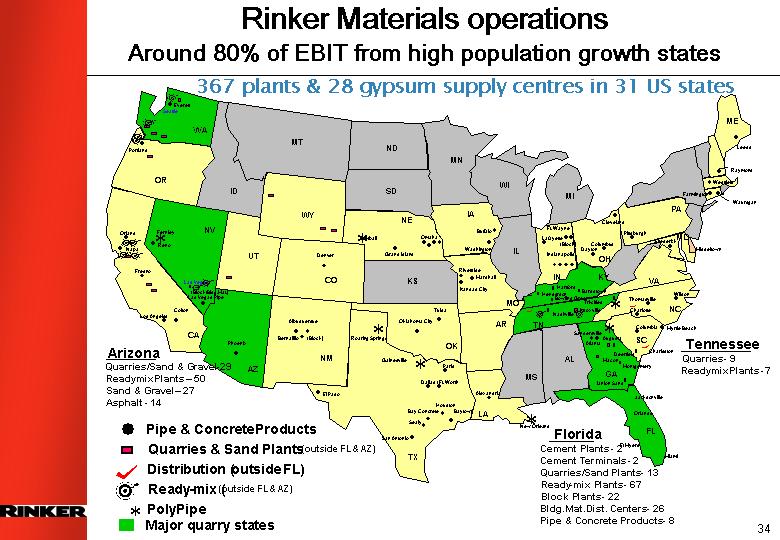
Rinker Materials operations
Around 80% of EBIT from high population growth states
367 plants & 28 gypsum supply centres in 31 US states
[GRAPHIC]
34
US construction and building materials industry
A cyclical market with a general upward trend
1980
[CHART]
2002
[CHART]
CAGR 1992-2001
[CHART]
Residential |
| 8.1 | % |
Commercial |
| 8.3 | % |
Civil |
| 6.5 | % |
TOTAL |
| 7.8 | % |
Source: Dodge 2002 (calendar year end)
35
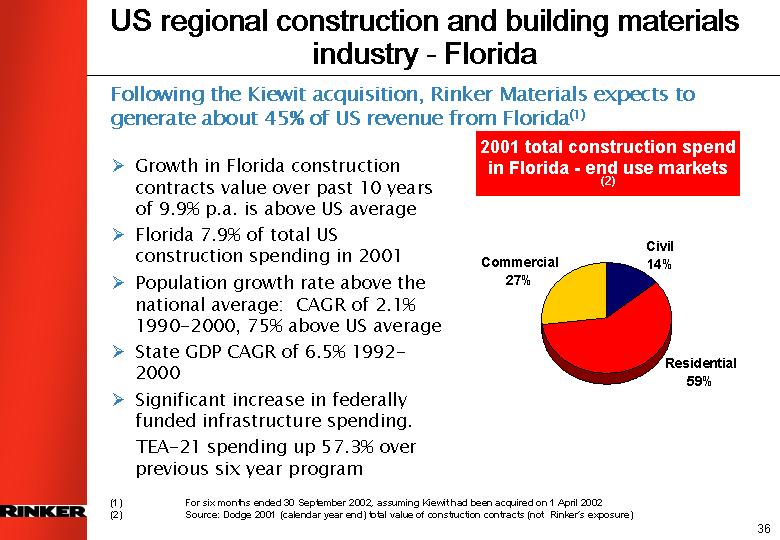
US regional construction and building materials industry - Florida
Following the Kiewit acquisition, Rinker Materials expects to generate about 45% of US revenue from Florida(1)
• Growth in Florida construction contracts value over past 10 years of 9.9% p.a. is above US average
• Florida 7.9% of total US construction spending in 2001
• Population growth rate above the national average: CAGR of 2.1% 1990-2000, 75% above US average
• State GDP CAGR of 6.5% 1992-2000
• Significant increase in federally funded infrastructure spending. TEA-21 spending up 57.3% over previous six year program
2001 total construction spend in florida - end use markets(2)
[CHART]
(1) For six months ended 30 September 2002, assuming Kiewit had been acquired on 1 April 2002
(2) Source: Dodge 2001 (calendar year end) total value of construction contracts (not Rinker’s exposure)
36
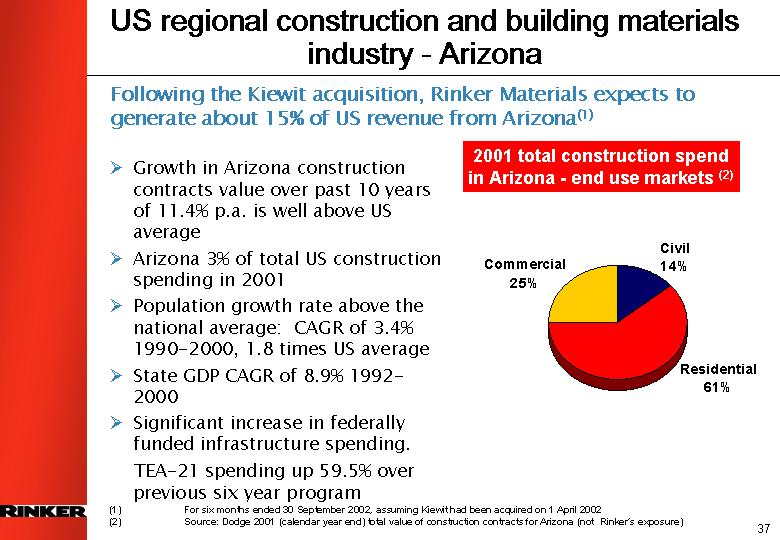
US regional construction and building materials industry - Arizona
Following the Kiewit acquisition, Rinker Materials expects to generate about 15% of US revenue from Arizona(1)
• Growth in Arizona construction contracts value over past 10 years of 11.4% p.a. is well above US average
• Arizona 3% of total US construction spending in 2001
• Population growth rate above the national average: CAGR of 3.4% 1990-2000, 1.8 times US average
• State GDP CAGR of 8.9% 1992-2000
• Significant increase in federally funded infrastructure spending. TEA-21 spending up 59.5% over previous six year program
2001 total construction spend in Arizona - end use markets(2)
[CHART]
(1) For six months ended 30 September 2002, assuming Kiewit had been acquired on 1 April 2002
(2) Source: Dodge 2001 (calendar year end) total value of construction contracts for Arizona (not Rinker’s exposure)
37
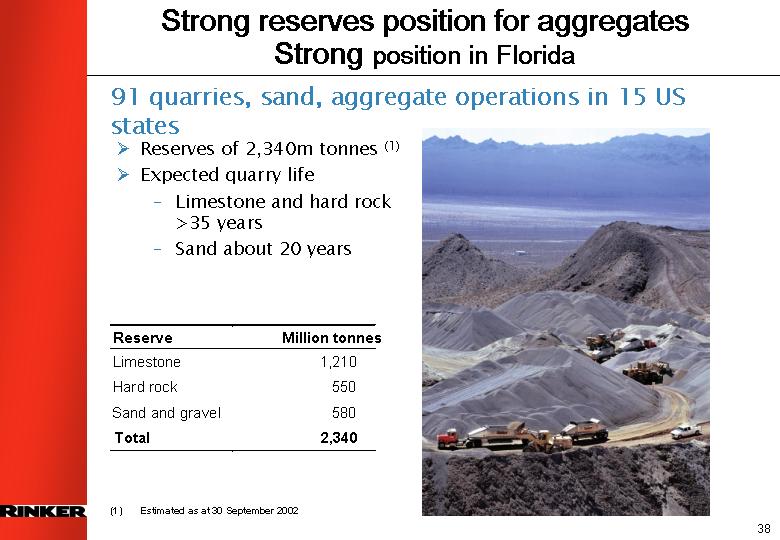
Strong reserves position for aggregates
Strong position in Florida
91 quarries, sand, aggregate operations in 15 US states
• Reserves of 2,340m tonnes(1)
• Expected quarry life
• Limestone and hard rock >35 years
• Sand about 20 years
Reserve |
| Million tonnes |
|
Limestone |
| 1,210 |
|
Hard rock |
| 550 |
|
Sand and gravel |
| 580 |
|
Total |
| 2,340 |
|
[GRAPHIC]
(1) Estimated as at 30 September 2002
38
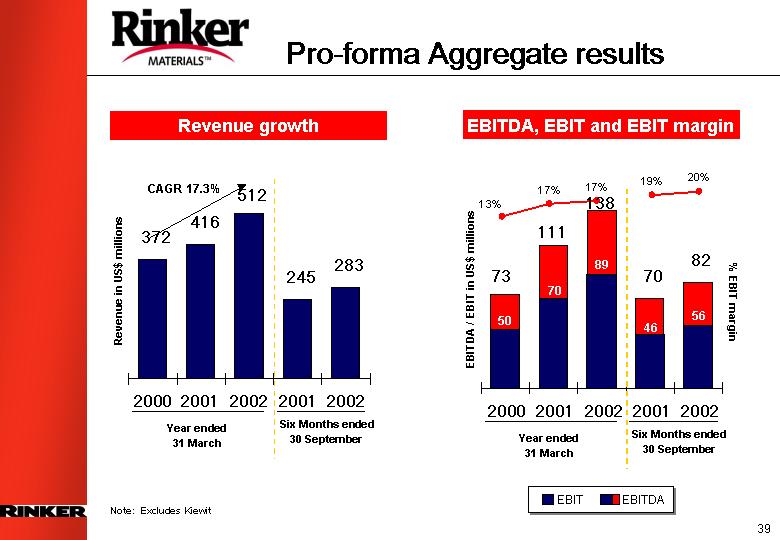
[Rinker MATERIALS(TM) LOGO]
Revenue growth
[CHART]
EBITDA, EBIT and EBIT margin
[CHART]
Note: Excludes Kiewit
39
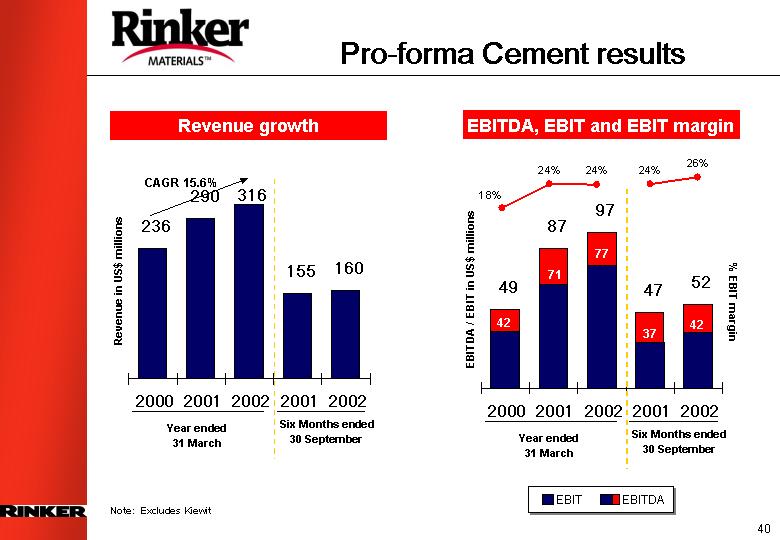
Revenue growth
[CHART]
EBITDA, EBIT and EBIT margin
[CHART]
Note: Excludes Kiewit
40
Pro-forma Concrete, block and asphalt results
Revenue growth
[CHART]
EBITDA, EBIT and EBIT margin
[CHART]
Note: Excludes Kiewit
41
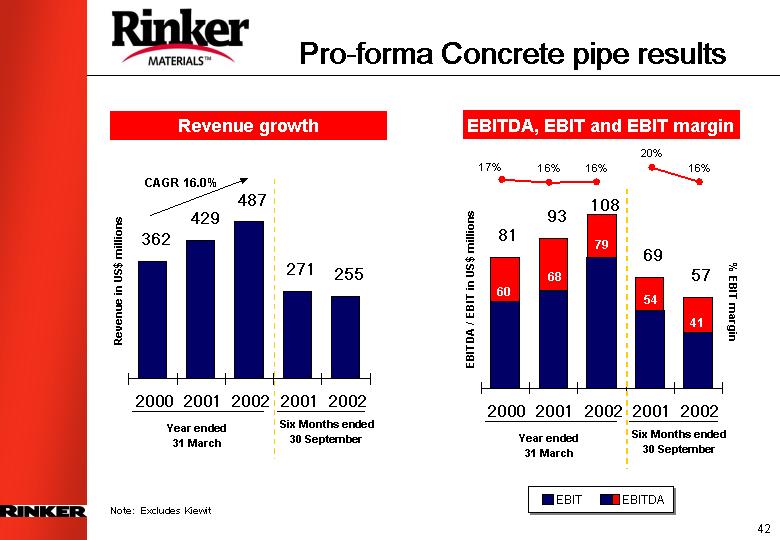
Pro-forma Concrete pipe results
Revenue growth
[CHART]
EBITDA, EBIT and EBIT margin
[CHART]
Note: Excludes Kiewit
42
Pro-forma other businesses results Gypsum supply, pre-stress, polyethylene pipe
Revenue growth
[CHART]
EBITDA, EBIT and EBIT margin
[CHART]
Note: Excludes Kiewit, EBIT and EBITDA excludes net Rinker Materials corporate costs
43
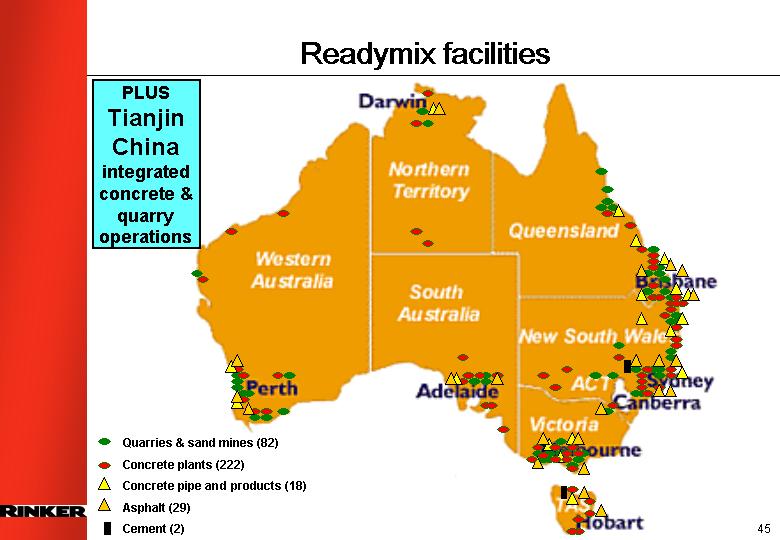
[RINKER LOGO]
PLUS Tianjin China integrated concrete & quarry operations
[GRAPHIC]
45
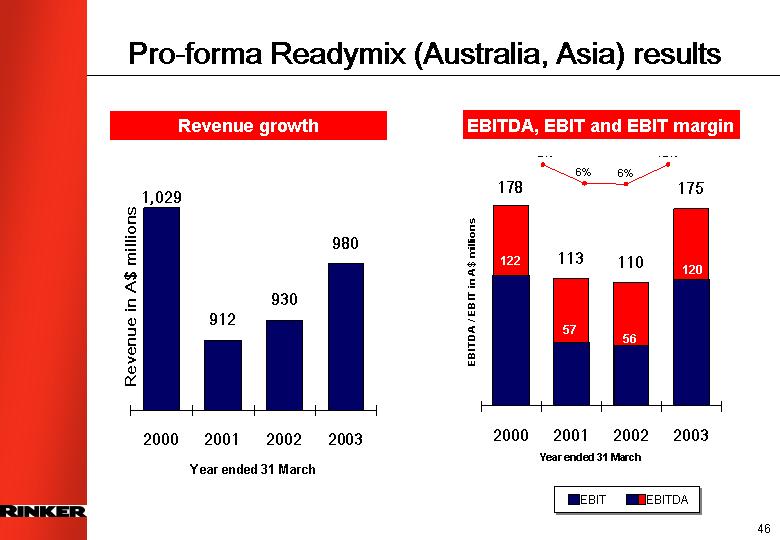
Pro-forma Readymix (Australia, Asia) results
Revenue growth
[CHART]
EBITDA, EBIT and EBIT margin
[CHART]
46
Part 1 |
| Introduction and overview |
|
|
|
Part 2 |
| Group business strengths |
|
|
|
Part 3 |
| Corporate overview and management |
|
|
|
Part 4 |
| Financial performance |
|
|
|
Part 5 |
| Strategy |
|
|
|
Part 6 |
| Rinker Materials |
|
|
|
Part 7 |
| Readymix |
|
|
|
Part 8 |
| Outlook |
47
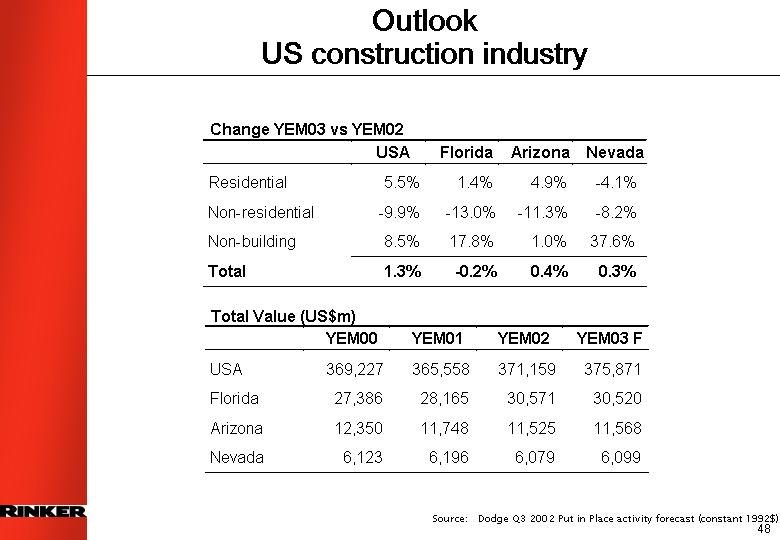
Outlook
US construction industry
Change YEM03 vs YEM02
|
| USA |
| Florida |
| Arizona |
| Nevada |
|
Residential |
| 5.5 | % | 1.4 | % | 4.9 | % | -4.1 | % |
Non-residential |
| -9.9 | % | -13.0 | % | -11.3 | % | -8.2 | % |
Non-building |
| 8.5 | % | 17.8 | % | 1.0 | % | 37.6 | % |
Total |
| 1.3 | % | -0.2 | % | 0.4 | % | 0.3 | % |
Total Value (US$m)
|
| YEM00 |
| YEM01 |
| YEM02 |
| YEM03 F |
|
USA |
| 369,227 |
| 365,558 |
| 371,159 |
| 375,871 |
|
Florida |
| 27,386 |
| 28,165 |
| 30,571 |
| 30,520 |
|
Arizona |
| 12,350 |
| 11,748 |
| 11,525 |
| 11,568 |
|
Nevada |
| 6,123 |
| 6,196 |
| 6,079 |
| 6,099 |
|
Source: Dodge Q3 2002 Put in Place activity forecast (constant 1992$)
48
Outlook
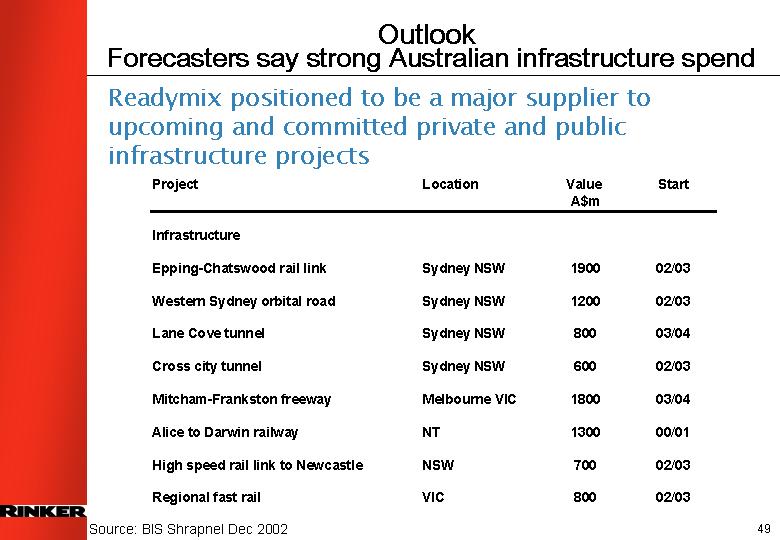
Forecasters say strong Australian infrastructure spend
Readymix positioned to be a major supplier to upcoming and committed private and public infrastructure projects
Project |
| Location |
| Value |
| Start |
|
Infrastructure |
|
|
|
|
|
|
|
Epping-Chatswood rail link |
| Sydney NSW |
| 1900 |
| 02/03 |
|
Western Sydney orbital road |
| Sydney NSW |
| 1200 |
| 02/03 |
|
Lane Cove tunnel |
| Sydney NSW |
| 800 |
| 03/04 |
|
Cross city tunnel |
| Sydney NSW |
| 600 |
| 02/03 |
|
Mitcham-Frankston freeway |
| Melbourne VIC |
| 1800 |
| 03/04 |
|
Alice to Darwin railway |
| NT |
| 1300 |
| 00/01 |
|
High speed rail link to Newcastle |
| NSW |
| 700 |
| 02/03 |
|
Regional fast rail |
| VIC |
| 800 |
| 02/03 |
|
Source: BIS Shrapnel Dec 2002
49
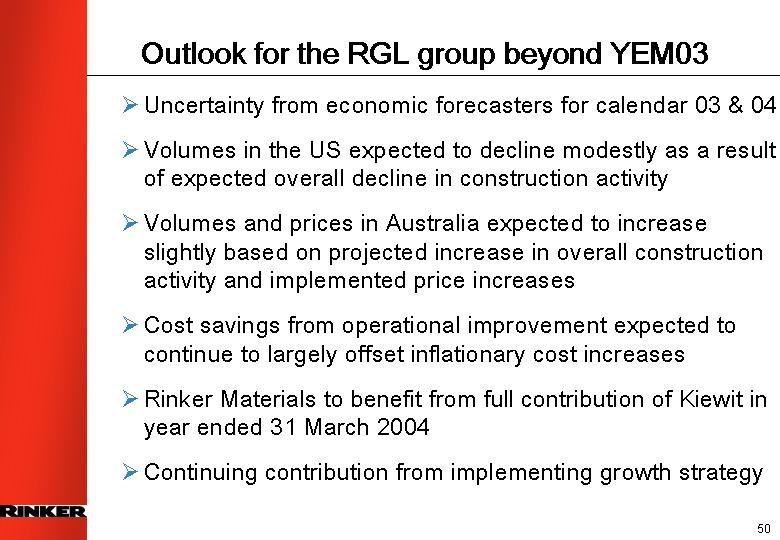
Outlook for the RGL group beyond YEM03
• Uncertainty from economic forecasters for calendar 03 & 04
• Volumes in the US expected to decline modestly as a result of expected overall decline in construction activity
• Volumes and prices in Australia expected to increase slightly based on projected increase in overall construction activity and implemented price increases
• Cost savings from operational improvement expected to continue to largely offset inflationary cost increases
• Rinker Materials to benefit from full contribution of Kiewit in year ended 31 March 2004
• Continuing contribution from implementing growth strategy
50
• Rinker Group expected to be a global top 10 heavy building materials group
• Attractive, strong positions, mainly in high growth markets with above average demand for construction activity
• Track record of successful acquisitions and organic growth and margin growth
• Strong balance sheet and cash flows give flexibility to continue growth
• High performance culture with shareholder value focus
• Rinker Group better placed as a separate company to participate in ongoing consolidation of the global heavy building materials sector
51