EXHIBIT 99.2
MANAGEMENT’S
DISCUSSION
AND ANALYSIS
OF RESULTS OF OPERATIONS AND FINANCIAL CONDITION
FOR THE YEAR ENDED JANUARY 2, 2005
Basis of Presentation
All amounts in this Management’s Discussion and Analysis of Results of Operations and Financial Condition (“MD&A“) of Wescast Industries Inc. (“Wescast”, the “Company”, “we” or “our”) are in Canadian dollars unless otherwise noted. This MD&A should be read in conjunction with the Company’s audited consolidated financial statements for the 2004 fiscal year, which are prepared in accordance with Canadian generally accepted accounting principles (GAAP).
For a discussion of the principal differences between Canadian and US GAAP, as they apply to the presentation of Wescast’s consolidated financial statements, see Note 25 to the Company’s consolidated financial statements. This MD&A contains commentary from Wescast’s management regarding strategy, operating results and financial condition. Management is responsible for its accuracy, integrity and objectivity, and has developed, maintains and supports the necessary systems and controls to provide reasonable assurance as to the accuracy of the comments contained herein. This MD&A is current as of February 23, 2005. Additional information relating to the Company, including the Company’s Annual Information Form (“AIF”), is available online at sedar.com.
(Wescast Industries Inc. 2004 Annual Report) 20
Company Overview
Wescast designs, casts, machines and assembles high-quality engineered iron products for automotive original equipment manufacturers (“OEMs”) and Tier 1 customers for the car and light truck markets in North America and Europe. The Company employs approximately 2,500 skilled and highly committed people in 8 production facilities and 5 sales and design centres in Canada, the United States, Japan and Europe.
Wescast’s research and development activities are focused on generating innovative solutions for its customers in product design and the use of high performance materials. The Company continues to focus on the conversion of tubular manifolds to cast with current and potential customers around the world. A number of initiatives are underway in this area and in the development of other hot-end solutions to better meet the needs of the customer.
The Company’s resources are strategically aligned to meet unique, customer-specific requirements. The Company believes that the combination of its design capability and high-quality manufacturing creates unique value for the customers in the markets that it serves. The Company believes this is the reason that it is the world’s largest supplier of exhaust manifolds for passenger cars and light truck applications.
During 2004, the Company announced its intention to focus its resources on the execution of its global powertrain strategy. The Company’s powertrain business is focused on the design and manufacture of exhaust system components for sale primarily to OEM and Tier 1 customers for application in the passenger car and light truck markets in North America and Europe. The Company’s powertrain operations in North America are well established and consist of 6 production facilities. The European powertrain operations are conducted through a production facility in Hungary, Wescast Hungary Rt., a relatively new operation. Prior to August 31, 2004 the facility, formerly named Weslin Hungary Rt., was jointly managed by Wescast and Linamar Corporation (“Linamar”). On August 31, 2004 Wescast acquired the remaining 50% interest in this operation from Linamar.
In July of 2004 the Company announced its decision to exit the chassis business conducted at its Cordele, Georgia facility. This business, which had represented the Company’s chassis segment, focused on the design and manufacture of brake and suspension components for sale to OEM and Tier 1 customers. This business was being marketed for sale and has been reflected as a discontinued operation. To date the company has been unable to complete a sale of the business; as a result, the Company has decided to wind down the facility. It is anticipated that all production activities will be concluded at the Cordele, Georgia operation by the end of the second quarter of 2005. The Company will be pursuing buyers for the manufacturing assets and property once the production activities are concluded.
The MD&A for fiscal 2004 focuses on the powertrain segment.
During 2004, Wescast continued its assessment of the risks and opportunities associated with the development of its powertrain business in Asia.
There are significant changes underway in the automotive industry. It is no longer just a North American business for Wescast. Asian based companies, both potential customers and competitors, are exerting a significant influence on the market. This is leading to a dramatic shift into sourcing and conducting business globally.
(Wescast Industries Inc. 2004 Annual Report) 21
MANAGEMENT’S DISCUSSION AND ANALYSIS
of Results of Operations and Financial Condition for the Year Ended January 2, 2005
The ability of automotive parts suppliers to manufacture cost-competitive, high-quality parts, supplied anywhere in the world, means that pricing, production, and even the cost and availability of raw materials, are now global considerations. While these changes are reshaping our industry and its players, Wescast is on the leading edge of this transformation.
We are restructuring our North American business to make it more cost-competitive and we are expanding our global capabilities in lower-cost, strategic markets. We believe a proactive strategy to take advantage of these significant market trends will bring opportunities for all Wescast stakeholders.
Overview of Current Market Conditions
Throughout 2004, the automotive industry, and the foundry sector of the industry in particular, faced significant challenges. Raw material and commodity prices rose to record levels during the year resulting in significant uncontrollable increases in manufacturing costs. In the midst of the rising cost structure, the sector continued to experience significant market price pressure stemming from growing competition from the supply base developing in low-cost offshore countries, in particular Asia. The impact of these pressures was particularly felt in North America, where the domestic automotive OEM customer base, perhaps in reaction to their continued market share declines and lower profits, seem more prepared to accept the logistical risk of moving a portion of their supply requirements to the developing offshore supply base. This backdrop created a very challenging environment for the Company in 2004. Entering 2005 there are no indications suggesting that these challenges will ease in the near-term. However, the Company recognizes that the current market challenges affect all participants in the industry and as a result create opportunities for some of those participants. Wescast’s strong financial position, the investments it has made in its workforce and facilities in recent years, combined with technology that has made it the world leader in its market, leaves Wescast well positioned to grow successfully in the future. The Company has and is taking steps and specific strategic actions that it believes will enable it to capitalize on these opportunities.
Strategic Actions
In 2004, Wescast took several significant steps to position itself for the future.
| | • | | In July the Company made the decision to exit the chassis business conducted at its facility in Cordele, Georgia. This decision allows the Company to focus its resources on its successful powertrain business and to further expand this business globally. |
| | • | | In August the Company took a major step toward solidifying its global position in powertrain components when it acquired the remaining interest in its facility in Hungary. This operation was previously jointly owned and managed with Linamar. The operation in Hungary provides the Company with a European cornerstone for a global powertrain strategy. |
| | • | | Throughout 2004 the Company continued the assessment of market opportunities in the emerging Asian market, specifically how best to strategically enter this market. The Company believes this emerging region presents two strategically important opportunities: |
| | | | — | | First, it would afford Wescast the opportunity to implement a low-cost manufacturing strategy to more completely meet the future needs of its customers. In the near-term the Company believes that its customer base will continue to resource a portion of their supply requirements to low-cost countries. |
(Wescast Industries Inc. 2004 Annual Report) 22
| | | | — | | Second, in the longer-term the domestic needs of this region are expected to grow significantly. The Company believes its technical capabilities and reputation as the market leader leave it well positioned to secure business should it establish a local manufacturing presence in the region. |
The Company expects to solidify its plans in 2005 on how best to participate in the Asian market.
| | • | | The Company has announced plans to close its foundry operation in Brantford, Ontario. A formal closure plan is being developed, but it is anticipated that the facility will be closed in late 2005. This decision is aimed at aligning the Company’s global production capacity with the projected needs of its customers. The Company believes that the effective utilization of existing foundry capacity in other Wescast facilities will enable it to satisfy the North America demand of its customers in the most efficient manner possible. |
These actions and others to be developed are critical to the development of a global manufacturing capability which management believes will allow Wescast to meet the longer-term needs of its customers, maximizing global market share, corporate profits, cash flow and return on investment.
Position in the Industry
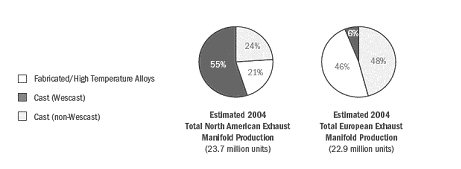
Wescast is the world’s largest producer of exhaust manifolds. The worldwide demand for exhaust manifolds is basically satisfied by two distinct types or styles of manifold designs: fabricated and cast. Wescast’s manifold production is exclusively focused on cast manifolds. A cast manifold is produced using various grades of ductile iron, each with different temperature and performance characteristics, using a green sand mould process. The manufacture of fabricated manifolds involves the bending and welding of steel tubes to meet the shape and style of the product design.
In North America, the use of cast iron manifolds has traditionally dominated the marketplace. Cast manifold designs are currently estimated to represent almost 80% of the overall demand for manifolds in North America. In other parts of the world fabricated manifolds command a far greater share of the marketplace. It is estimated that 45% of the current worldwide demand for exhaust manifold production is represented by fabricated designs. The difference in demand is influenced by customer preferences, historical use and production volume levels. In North America, Wescast holds a commanding market share, currently estimated at approximately 55%.
The supply base for fabricated manifolds in areas such as Europe, where historically the market comprised a larger number of automakers with smaller individual platform volumes, has evolved to include a larger number of suppliers than what is present in North America. The market is not dominated by any one supplier. The Company has remained focused on cast manifold designs, primarily because it has been able to demonstrate to the market that by applying its design capabilities it can design and manufacture a cast manifold that meets or improves the performance characteristics offered by a fabricated manifold design, generally at a lower total cost. In Europe, a relatively new and potentially strong market for Wescast, the Company currently holds an exhaust manifold market share of approximately 6%.
The Company’s primary North American customer base, the domestic Big 3 automakers (which includes General Motors, Ford Motor Company and DaimlerChrysler), has experienced market share declines in recent years. The Company is focused on expanding its sales base by targeting growth in North America with new domestic customers, many of whom currently use fabricated manifolds in their engine designs. In addition, the Company is targeting strategic international growth to meet the demand requirements in markets outside of North America where the Company believes it can demonstrate that superior performance characteristics exist in cast manifold designs.
(Wescast Industries Inc. 2004 Annual Report) 23
MANAGEMENT’S DISCUSSION AND ANALYSIS
of Results of Operations and Financial Condition for the Year Ended January 2, 2005
The engineering and design capabilities of the Company are well suited to meet the changing technical needs of its current and potential customers. Such customers are faced with the following specific needs:
| | • | | The need to reduce engine emission levels and fuel consumption; |
| | • | | The need to deal with higher engine temperatures; |
| | • | | The need to meet customer-driven demand for high horsepower levels, given the constraints above; and |
| | • | | The potential for an increased use of diesel-powered vehicles in North America to help meet corporate average fuel economy (“CAFE”) levels. |
The Company’s engineering and design efforts aimed at developing new higher-temperature alloys, its “hot-end solutions” efforts aimed at integrating the exhaust manifold with the catalytic converter, and the further expansion of integrated exhaust manifold-turbo charger designs for diesel engine applications that are already in use in Europe all support the Company’s current strategic direction.
The following charts illustrate our share of Exhaust Manifold production in North America and Europe:
(Wescast Industries Inc. 2004 Annual Report) 24
Risks and Uncertainties
Described below are some of the more significant risks and trends relating to the overall economy, the automotive industry and Company-specific matters that could affect the Company’s results.
| | • | | An economic downturn would have a negative impact on the Company’s profitability. The global automotive industry is cyclical and is sensitive to changes in economic conditions such as interest rates, consumer demand, oil prices and international conflicts. The current consensus of industry forecasts project relatively stable markets in Europe and North America in 2005. |
| | • | | Increasing price reduction pressures from the Company’s customers would reduce profit margins. Historically, the Company has entered into, and will continue to enter into, supply agreements with its customers that provide for, among other things, price concessions over the term of the agreement. In the past these concessions have been somewhat offset by cost reductions resulting from product and process improvements. The competitive global automotive industry environment has caused these pricing pressures to intensify. To the extent that these price reductions continue in the future and are not offset through cost reductions, the Company’s future profit margins would be adversely affected. |
| | • | | The Company has seen a change in the sourcing practices of its OEM customers, as it relates to the Company’s products. The historical experience was for a customer to award the supplier with the commercial production requirements for a product related to a specific engine program. Assuming delivery, quality, and other performance criteria were maintained, the supplier would retain and supply the product over the life of the engine program. Customers now routinely market test their purchasing requirements globally, and throughout the life of the engine program, to ensure they are continuing to receive globally competitive pricing. This accelerates the timeframe over which the Company’s current business can be impacted by global competition. |
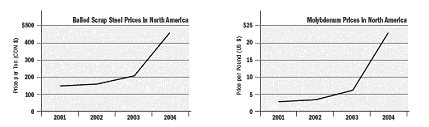
| | • | | The Company’s production costs are dependent on the price of certain raw materials and other commodities, including scrap steel, molybdenum (“moly”) and electricity. Increases in any or all of these costs will cause the cost of production to rise. Under current sales contracts the Company can pass only a portion of these cost increases on to customers. Incremental pass through arrangements with customers have been established recently which will lower the impact of further increases in these costs for 2005. For reference purposes, a CDN$10.00 increase in the per ton price of scrap steel, or a US$1.00 per pound increase in the price of moly, would result in estimated annualized increases in operating costs, net of recoveries from customers, of about CDN$0.5 million and CDN$1.0 million, respectively. |
The charts below illustrate the changes in scrap steel and moly prices over the past several years, in particular the significant increases experienced in 2003 and 2004.
(Wescast Industries Inc. 2004 Annual Report) 25
MANAGEMENT’S DISCUSSION AND ANALYSIS
of Results of Operations and Financial Condition for the Year Ended January 2, 2005
| | • | | The Company is currently dependent on one class of products, cast iron manifolds, and could be negatively impacted by heightened competition, given the likely intensification of price competition. This requires the entry of new competitors, both domestic and foreign, particularly those based in low-cost countries, capable of producing quality products and meeting the logistical requirements of the customers. The introduction by competitors of new manufacturing techniques or types of products could also have an adverse impact on the Company’s results. |
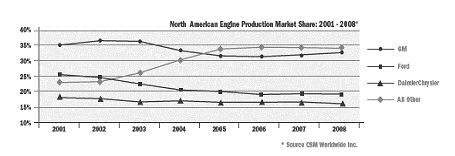
| | • | | The Company is largely dependent upon three customers, the domestic Big 3 automakers. As a result, it is exposed to any loss in market share or less-than-projected light vehicle sales by General Motors, Ford Motor Company and DaimlerChrysler, for which the Company supplies powertrain components. |
The chart which follows shows the trend in North American market share of the domestic Big 3 automakers versus the other automakers in North America. As the Company’s product focus is on powertrain components, this market share is measured based on engine production in North America.
The Company’s top five North American powertrain programs projected for 2005, based on unit production, are represented by the following customer platforms:
| | |
|---|
|
| OEM | | Platform/Program | | Vehicle Application(s) | |
|
| GM | | 4.8/5.3/6.0L GEN III V8 | | Silverado, Sierra, Suburban, | |
| | | | | Yukon, Escalade, etc. | |
|
| Ford | | 5.4 L 3V V8 | | F150, F250, Expedition, | |
| | | | | Navigator | |
|
| Ford/Navistar | | 6.0 L V8 Navistar Diesel | | F-250, F-350, Excursion | |
|
| GM | | 3500 V6 | | Malibu, G6 | |
|
| Nissan | | 3.5 L ZV5 V6 | | Maxima, Altima, Quest | |
|
Penetration of non-Big 3 customers would assist Wescast with diversifying its revenue base and reduce this concentration of risk. The expansion of the Company’s global business platform will aid in these diversification efforts.
(Wescast Industries Inc. 2004 Annual Report) 26
The Company’s top five powertrain programs in Europe projected for 2005, based on unit production are represented by the following customer platforms:
| | |
|---|
|
| OEM | | Platform/Program | | Vehicle Application(s) | |
|
| Ford | | 4.0L SOHC V6 | | Explorer, Ranger | |
|
| BorgWarner | | 1.5L Diesel I4 | | Turbo charger for 1.5L Diesel Renault | |
|
| | | | | Clio, Megane | |
|
| Ford | | 4.0L SOHC V6 | | Mustang | |
|
| BorgWarner | | 1.3L GM/Fiat | | Turbo charger for Fiat (Punto), Opel | |
| | | | | (Corsa), Suzuki (Wagon R+), Lancia | |
| | | | | (Epsilon) | |
|
| Audi | | 1.6L I4 | | Audi A3, VW Golf | |
|
| • | | The Company could be negatively impacted by government regulations, including U.S. CAFE standards or emissions regulations and Canadian, European and American federal, provincial, state and local environmental laws and regulations that have an adverse impact on the automotive industry. New product research at Wescast is focused on innovations that will allow the Company to take advantage of these changes. |
| • | | The Company’s financial results are reported in Canadian dollars. A portion of the Company’s sales, operating costs and capital investment requirements are realized in U.S. dollars and other currencies. As a result, fluctuations in the exchange rate between foreign currencies and the Canadian dollar may affect the Company’s profitability. |
| • | | The Company’s operation in Hungary is currently in a production ramp-up and faces the challenges typically encountered in the growth and development of foundry and machining operations, including inconsistent operating performance measured in terms of internal scrap rates, yield and equipment uptime. The financial performance of this operation is impacted by its ability to absorb these production requirement increases and by any customer driven changes associated with the timing of these production requirements. |
| • | | In 2005 the Company will launch new programs for customers. Financial performance levels will be impacted by the timeliness and the efficiency of these program launches. |
| • | | The Company has announced plans to close its foundry operation in Brantford, Ontario and shift the corresponding production to its other facilities. The failure to smoothly transition the production requirements of customers or execute the closure efficiently would negatively impact its ability to meet the needs of its customers and Wescast’s financial performance. The Company believes this closure and the transition of production requirements can be managed successfully. |
| • | | A collective labour agreement in place for two facilities in Canada expires in 2005. An inability to negotiate and secure a new collective agreement would negatively impact the Company’s ability to fulfill its obligations to its customers. At this time, management believes this collective agreement will be successfully renegotiated prior to its expiry. |
(Wescast Industries Inc. 2004 Annual Report) 27
MANAGEMENT’S DISCUSSION AND ANALYSIS
of Results of Operations and Financial Condition for the Year Ended January 2, 2005
Sources, Pricing and Availability of Raw Materials
The Company’s production activities and costs are dependent on the price and availability of certain key raw materials and other commodities, including scrap steel, molybdenum (“moly”) and electricity. Below is an overview of these raw material and commodity markets.
Scrap Steel Pricing
The key drivers to the significant upward price movement for steel has come from two fronts: one, the incremental demand of material moving off-shore, primarily to China; and, two, the strong US economy which has seen US steel mills operating at over 90% capacity. China’s exponential growth continues to push the Pacific Rim region to be a large importer of scrap steel, primarily from Europe and North America. Pricing of scrap steel in Canada is heavily influenced by this “export” pressure and has been somewhat softened by the rising Canadian dollar against the US currency. Market forecasters have had difficulty in making accurate predictions, as the circumstances in 2004 were unprecedented in recent history. Only recently has the price of steel shown some signs of stability. While prices are predicted to drop in 2005 from their high point of CDN$512 per ton in 2004, the prediction is that a new baseline will be established in the $300-$350 range. The Company has only limited ability to influence pricing partially due to its material specifications, but more importantly due to the global competition for Ontario’s scrap steel.
The factors that mainly influence the cost and supply of foundry scrap steel include: overseas demand, availability of scrap alternatives, increased use of high strength steel, offshore manufacturing and normal market factors.
However, Ontario is a net exporter of scrap steel and the Company believes that there is not an overall supply risk. The Company obtains the majority of its scrap steel from two producers in Ontario.
Molybdenum Pricing
The Company experienced an unprecedented upwards climb in molybdenum pricing throughout 2004. As a commodity that has no futures market, pricing has increased exponentially over the past 30 months. While the 15 year average price for moly prior to 2002 was under US$4 per pound, the average price per pound which the Company experienced in 2004 was US$15 per pound and spot prices have since reached US$34 per pound. Unlike previous years where the demand has been fairly stable, 2004 saw a large increase in demand and a supply base that has been unable to meet demand. There are two primary reasons for the rising prices witnessed in 2004. The first relates to global economic strength, specifically in China. Europe remains the largest consumer of moly followed by Asia (primarily China and Japan) and then North America. Europe and Japan’s appetite for moly used in stainless steel production facilities remains a key driver in this increasing demand. China has begun to reduce its exports of moly in order to support its own domestic requirements. The second reason is a lack of global capacity to convert moly concentrates to moly oxide and then finally to ferro-moly, which is the form used by the Company. The research and manufacturing groups are evaluating alternate materials to use in the Company’s production processes.
The primary sources of supply of molybdenum are the United States, China, Chile, Russia and Canada. There are currently three suppliers in North America and one broker in China. The factors that influence the cost and supply of molybdenum include: global demand, environmental issues and merchant activity.
(Wescast Industries Inc. 2004 Annual Report) 28
The Company has a current agreement with a North American supplier to ensure up to 110% coverage of the Company’s 2005 forecasted volume requirements. Additional volume can be supplemented by spot purchases.
Electricity Pricing
The Company’s Foundry Technology group maintains an electrical forecasting model for each plant which incorporates various operations data to estimate how much electrical energy is required and when it will be used. Energy cost varies on an hourly basis and its variability changes throughout the year. In order to manage the price risk, the Company’s approach has been to obtain a fixed-price contract for approximately 80% of the operating demand in the on-peak period equating to about 95% of the on-peak energy requirement. The remainder of the energy is purchased at the Hourly Ontario Energy Price (HOEP). Energy delivery costs are regulated by the Ontario Energy Board (OEB).
Natural Gas Pricing
The Company’s Foundry Technology and Materials & Procurement groups establish natural gas purchase contracts in September and November of each year. This fixes the Company’s cost of natural gas for the following year. Included in the total cost of gas are delivery and transportation charges which represent approximately 25% of the Company’s total cost of natural gas. The delivery tariffs are regulated by the OEB.
The inability to maintain current sources for raw materials or energy or to develop alternate sources at competitive prices and quality could adversely affect the Company’s financial condition and results of operations.
Financial Overview
In fiscal 2004 the Company reported consolidated revenues of $408.9 million, a decline of 5.9% compared to the $434.3 million reported in 2003. The lower revenues were primarily the result of: the impact of market-driven price reductions reducing year-over-year revenues by $13.5 million; the impact of programs re-sourced to offshore suppliers; and the reduced production requirements of its major customers in North America, who continue to lose market share. Offsetting these factors were increased volumes from the operation in Hungary, which became wholly-owned by the Company in August of 2004, and the continued expansion of the Company’s machining penetration.
The Company reported a net loss in 2004 of $26.7 million, compared with net earnings of $11.4 million in 2003. The loss included an after-tax loss from discontinued operations of $61.6 million. Included in this loss from discontinued operations was an after-tax charge related to the impairment of assets of $44.8 million. On a comparative basis, earnings from continuing operations in fiscal 2004 were $34.8 million compared with $54.3 million in 2003. The major factors resulting in the year-over-year earnings decline from continuing operations were: the impact of market-driven price reductions noted above; the impact of higher raw material and commodity prices that reduced after-tax earnings by approximately $14.0 million; and the impact of lower volumes. Offsetting a portion of the impact of these factors were improvements from manufacturing efficiencies and company-wide cost reduction efforts realized during 2004.
(Wescast Industries Inc. 2004 Annual Report) 29
MANAGEMENT’S DISCUSSION AND ANALYSIS
of Results of Operations and Financial Condition for the Year Ended January 2, 2005
Selected Annual Information
The following table sets forth for the fiscal years ended 2004, 2003 and 2002 selected information from the Company’s consolidated financial statements.
(in thousands of Canadian dollars, except per share amounts and where otherwise noted)
| | | |
|---|
| Fiscal Year Ended | | | | 2004 | | | 22003 | | | 22002 | |
|
| Sales | | | $ | 408,908 | | $ | 434,324 | | $ | 422,784 | |
|
| Earnings from continuing operations | | | $ | 34,848 | | $ | 54,320 | | $ | 61,503 | |
|
| Net earnings (loss) | | | | ($ 26,706 | ) | $ | 11,400 | | $ | 57,042 | |
|
| Earnings from continuing operations per share | | |
| Basic | | | $ | 2.67 | | $ | 4.16 | | $ | 4.71 | |
| Diluted | | | $ | 2.58 | | $ | 4.16 | | $ | 4.71 | |
| Net earnings (loss) per share | | |
| Basic | | | | ($ 2.04 | ) | $ | 0.87 | | $ | 4.36 | |
| Diluted | | | | ($ 2.11 | ) | $ | 0.87 | | $ | 4.36 | |
|
| Total assets | | | $ | 556,511 | | $ | 551,309 | | $ | 583,318 | |
|
| Total long-term interest bearing debt | | | | 1$28,472 | | $ | 36,072 | | $ | 46,576 | |
|
| Dividends declared per Class A subordinate voting shares | | |
| and Class B common shares | | | $ | 0.48 | | $ | 0.48 | | $ | 0.48 | |
|
| Issued and outstanding capital stock (thousands) | | |
| Class A subordinate voting shares | | | | 5,730 | | | 5,722 | | | 5,707 | |
| Class B common shares | | | | 7,377 | | | 7,377 | | | 7,377 | |
Stock options outstanding - Class A subordinate voting shares | | | | 671 | | | 931 | | | 944 |
|
| 1 does not include the revenue bonds of $30,687 associated with the discontinued operations – reflected as a current liability of discontinued operations in 2004. |
| 2 restated for discontinued operations and the change in accounting of pre-production costs. |
(Wescast Industries Inc. 2004 Annual Report) 30
Results of Operations: 2003 to 2004
Net Earnings (loss)
A net loss of $26.7 million was reported in the 2004 fiscal year compared with net earnings of $11.4 million in 2003.
Discontinued Operations
The results of both 2004 and 2003 were significantly impacted by the results of discontinued operations. In July, 2004 the Company announced its intention to exit the chassis business, represented by the foundry operation in Cordele, Georgia, in order to focus its resources fully on the further development of its global powertrain strategy. The net loss from discontinued operations was $61.6 million in 2004, compared to $42.9 million in 2003. The net losses reported from discontinued operations were comprised of both losses from operations and losses resulting from the impairment of assets and goodwill. The net loss from discontinued operations included net operating losses of $16.8 million in 2004 and $15.5 million in 2003. The impairment of net assets and goodwill resulted in further net losses of $44.8 million in 2004 and $27.4 million in 2003, respectively.
Net Earnings From Continuing Operations
Net earnings from continuing operations were $34.8 million in 2004 compared with $54.3 million in 2003. In comparing fiscal 2004 to 2003, the following highlights should be considered:
| | • | | The financial performance of the Company’s North American powertrain operations remained positive despite the challenging market conditions, generating net earnings of $41.1 million in 2004. However, this was a decline from the $61.2 million generated in 2003. |
| | • | | The powertrain operation in Europe, which continues to ramp-up production volumes, negatively impacted net earnings by $6.2 million in 2004, compared to a negative impact of $6.9 million in 2003. |
| | • | | As a result of a decline in the market price of the Company’s shares in 2004, stock-based compensation expense had a positive after-tax impact on net earnings of $1.0 million in 2004, compared to a negative impact of $0.5 million in 2003. |
Sales
Consolidated sales for fiscal 2004 decreased by 5.9% over 2003. The lower revenues were primarily the result of the following:
| | • | | Vehicle production volumes for the Company’s primary customer base, the domestic Big 3 automakers, declined by 2.6%. |
| | • | | Market-driven price reductions passed on to customers reduced year-over-year revenues by $13.5 million. |
| | • | | Programs resourced to offshore suppliers negatively impacted 2004 revenues by $11.0 million compared to 2003. |
(Wescast Industries Inc. 2004 Annual Report) 31
MANAGEMENT’S DISCUSSION AND ANALYSIS
of Results of Operations and Financial Condition for the Year Ended January 2, 2005
These factors were partially offset by:
| | • | | Sales in 2004 from the European business increased by 53.8% over the same period in 2003, reflecting the change in ownership and the benefit of programs launched this year. The Company’s ownership in this business was increased from 50% to 100% on August 31, 2004. The Company’s proportionate 50% share of the operation’s results has been reflected for periods prior to August 31, 2004, with a 100% share reflected thereafter. The change in ownership percentage increased revenues in 2004 by $7.1 million. |
| | • | | The Company has continued to expand its machining penetration. In 2004, the number of units machined increased by 2.7%, and the percentage of the Company’s North American powertrain production that were both cast and machined increased to 83.0%, up from 77.6% in 2003. |
| | • | | Wescast’s exhaust manifold sales volume in North America of 13.3 million units in 2004 represented a decrease of 3.9% compared to 2003. This compares to an overall decline in 2004 North American light vehicle production of 1% and a 2.6% decline in the production of the Company’s primary customers, the domestic Big 3 automakers, who collectively continued to lose North American market share. The Company’s overall North American market share rose slightly in 2004 to 55.1%, compared with 54.1% in 2003, due to increased business with non-Big 3 customers. |
Consolidated prototype and tooling sales were $14.9 million in 2004, down from the $28.5 million reported in 2003, reflecting changes in the year-over-year timing of new customer programs.
Gross Profit
Consolidated gross profit for fiscal 2004 was $94.5 million or 23.1% of sales, compared to $128.0 million or 29.5% of sales in 2003.
The profitability of the Company’s North American powertrain operations remained strong in 2004 in spite of lower casting volumes and market conditions that resulted in substantial uncontrollable increases to production costs. The major factors resulting in the year-over-year gross profit decline were:
| | • | | The impact of market-driven price reductions to customers that reduced gross profit by approximately $13.5 million; |
| | • | | The impact of higher raw material and commodity prices that reduced gross profit by approximately $21.8 million; and, |
| | • | | The impact of lower volumes and changes in product mix that resulted in a year-over-year reduction in gross profit of $4.2 million. |
These factors were partially offset through improved manufacturing efficiencies realized in 2004 and the impact of company-wide cost reduction efforts.
Depreciation and amortization charges included in cost of sales in fiscal 2004 of $29.7 million remained relatively consistent with the $27.4 million included in 2003. Depreciation costs have risen in recent years as a result of increased investment in new machine lines and the capital investments made at the Hungary facility.
(Wescast Industries Inc. 2004 Annual Report) 32
The gross profit associated with prototype and tooling sales in 2004 was $3.2 million or 21.6% of sales, up from $2.8 million or 9.8% of sales in 2003. The level of gross profit on prototype and tooling sales depends on the type of program launch and the volume of prototype tooling and castings necessary to validate production.
Selling, General and Administration
Selling, general and administration expenses were $33.8 million in 2004 compared to $34.0 million in 2003. Cost-reduction efforts within the administrative departments offset inflationary cost increases. A reduction in variable compensation amounts compared to 2003 reduced selling, general and administrative costs by $2.3 million. This offset the majority of the cost increase associated with severance costs of $2.1 million incurred during the year. Depreciation and amortization charges, included in selling, general and administration expenses, of $6.6 million were consistent with amounts incurred in 2003.
Stock-based Compensation
During 2002, the Company amended its stock option plan to authorize the grant of tandem stock appreciation rights in connection with options granted under the plan at or after the time of the grant of such options. Under the amended plan, participants have the choice of exercising stock options or receiving cash from the Company for the options equal to their intrinsic value, being the difference between the option exercise price and the current market value of the shares.
The increase or decrease in the intrinsic value of the stock options is reported as stock-based compensation expense. The market price of the Company’s shares decreased by approximately $6.00 per share during 2004, creating a positive impact on pre-tax earnings for the year of $1.5 million. The market price of the Company’s shares increased during 2003 causing stock-based compensation expense to reduce pre-tax earnings by $0.8 million in 2003.
Research, Development and Design
Research, development and design expenses decreased in fiscal 2004 by $1.3 million or 16.2% from 2003. The Company remains committed to funding research and development activities, including its “hot-end solutions” strategy and the continued development of high-temperature alloys. The decline primarily resulted from reduced development costs associated with the hot-end solutions initiative, aimed at advancing the integration of the exhaust manifold and closely coupled catalytic converter technologies. The major development stage of this initiative has been completed. In addition, the Company-wide focus on cost-reduction initiatives resulted in lower year-over-year discretionary spending.
Interest Expense
Interest expense in fiscal 2004 of $0.6 million was consistent with the amounts incurred in 2003.
Investment Income
The Company recorded investment income of $1.3 million in 2004, compared with $0.2 million in 2003. Of this increase, $0.7 million related to interest received related to taxes paid in previous years and refunded in 2004. In addition, during the year the Company’s balances of cash and cash equivalents on hand averaged higher than 2003 resulting in the higher investment income.
(Wescast Industries Inc. 2004 Annual Report) 33
MANAGEMENT’S DISCUSSION AND ANALYSIS
of Results of Operations and Financial Condition for the Year Ended January 2, 2005
Other (Income) Expense
Other income and expense represented a net expense of $1.9 million in 2004, compared with a net expense of $2.4 million in 2003. The change resulted from the following:
| | • | | In 2003, foreign exchange losses on working capital amounted to $1.9 million, compared with $0.2 million in 2004. |
| | • | | In 2004, the Company recorded losses on property, plant and equipment disposals of $4.4 million, compared with losses of $0.9 million in 2003. The increased loss in 2004 was the result of machine lines taken out of service during the year. These assets had supported customer programs which have been re-sourced to offshore suppliers. |
| | • | | During 2004, the Company received insurance proceeds of $2.3 million. The proceeds related to the settlement of a claim made during 2002 regarding a production equipment failure that occurred during that year. |
Income Taxes
Wescast’s effective income tax rate on earnings from continuing operations increased to 36.0% in 2004, compared to 34.4% in 2003. The higher rate was due to the following factors:
| | • | | No tax benefit has been recognized with respect to the losses realized by the operation in Hungary as the operation is subject to a tax holiday during the first ten years of operations. |
| | • | | Payments were lower in 2004, compared to 2003, under the cost-sharing arrangements with the operation in Hungary. Under these arrangements certain technology development, marketing and human resource development costs are funded by the Company. The tax holiday applicable to these amounts in Hungary results in a lower effective tax rate upon consolidation. |
| | • | | An increase in the statutory tax rate applicable to income earned in the province of Ontario. |
Results of Operations: 2002 to 2003
The following discussion provides significant highlights in comparing the Company’s results of operations from 2002 to 2003. A more detailed discussion is included in the Company’s Management Discussion and Analysis for the year ended December 28, 2003 contained in the 2003 Annual Report. The analysis below differs from that presented in the 2003 Annual Report to recognize the current accounting for the chassis segment as discontinued operations and the change in accounting of pre-production costs.
Net Earnings
Net earnings decreased from $57.0 million in 2002 to $11.4 million in 2003.
In comparing the level of earnings in 2003 to 2002, the following highlights should be considered:
| | • | | The Company’s North American powertrain operations delivered strong financial performance under challenging market conditions, generating net earnings of $61.2 million in 2003. |
| | • | | The European powertrain operations had a negative impact on net earnings of $6.9 million in 2003, compared to a negative impact of $6.7 million in 2002. |
(Wescast Industries Inc. 2004 Annual Report) 34
| | • | | The discontinued operations had a negative impact on net earnings of $42.9 million in 2003, compared to a negative impact of $4.5 million in 2002. Included in the 2003 impact was a goodwill impairment charge of $27.4 million, after tax. |
| | • | | The negative after-tax impact on earnings of stock-based compensation expense for 2003 was $0.5 million, compared to $3.5 million in 2002. |
Discontinued Operations
The Company’s chassis segment has been accounted for as discontinued operations. During 2003, the Company completed its impairment test of the goodwill acquired in conjunction with the acquisition of this business. As a result of that review, it was concluded that the goodwill was fully impaired. The Company recorded a non-cash net charge to earnings of $27.4 million to reflect the goodwill impairment charge. In addition, the after-tax impact of operating losses associated with the chassis business was $15.5 million in 2003. This resulted in a total net loss from discontinued operations in 2003 of $42.9 million. This compares to a loss of $4.5 million in 2002, the year the business was acquired.
Sales
Consolidated sales for 2003 were $434.3 million compared with $422.8 million in 2002, an increase of 2.7%, due to increased sales from the operation in Hungary in 2003.
The sale of powertrain products in North America, comprised mainly of cast and machined iron manifolds, decreased by 3.7% in 2003 compared to 2002. However, several positive trends emerged during 2003, including improved machining penetration and a favourable product mix. In addition, sales with a new domestic customer increased significantly in 2003. Sales of internally machined powertrain products increased 11.0% from 9.7 million units in 2002 to 10.7 million units in 2003. The level of powertrain products that were both cast and internally machined rose to 77.6% of total products produced, up from 63.0% in 2002. Wescast’s exhaust manifold sales volume in North America of 13.8 million units in 2003 decreased by 9.5% compared to 2002. This decrease compared to an overall decline in 2003 of 3.0% in North American light vehicle production and a 6.3% decline in the production of the Company’s primary customers, the domestic Big 3 automakers, who collectively continued to lose North American market share. The Company’s overall North American market share decreased from 60.9% in 2002 to 54.1% in 2003. The decrease in manifold sales volume and market share was mainly due to program losses with DaimlerChrysler, which occurred in the latter part of 2002. Also contributing to the decline in volume was the partial transfer of the production requirements for the Ford 4.0L program to the operation in Hungary during 2003. These decreases were partially offset by increased sales volumes to General Motors, primarily due to the strength of the GEN III light truck programs, and the growth of sales volumes with Nissan.
The Company’s proportionate share of powertrain component sales, excluding prototype and tooling sales, generated by its powertrain operations in Europe totalled $19.6 million, up from $6.2 million in 2002.
Consolidated prototype and tooling sales were $28.5 million in 2003, up from the $15.5 million reported in 2002, reflecting a significant increase in the number of new program launches in 2003 versus 2002.
(Wescast Industries Inc. 2004 Annual Report) 35
MANAGEMENT’S DISCUSSION AND ANALYSIS
of Results of Operations and Financial Condition for the Year Ended January 2, 2005
Gross Profit
Consolidated gross profit for 2003 was $128.0 million or 29.5% of sales, compared to $132.8 million or 31.4% of sales in 2002.
The profitability of the Company’s North American powertrain operations remained strong in 2003 compared to 2002 in spite of lower casting volumes. The negative pressure on gross profit during 2003 was due to lower volumes, market-driven price concessions, significant increases of raw material costs, and increased depreciation and amortization charges, partially offset by strong operating performance and the positive impact of cost-reduction activities in the Company’s manufacturing facilities. The impact from increased machining penetration and machining volume also resulted in an increased contribution to gross profit. In addition, government investment tax credits realized on qualifying scientific research and development expenditures of prior periods resulted in a positive impact on gross profit of $2.4 million for 2003.
The operation in Hungary had a negative impact on gross profit of $4.5 million during 2003. The operation was in a pre-production phase during 2002. During 2003, these European operations demonstrated improved operating performance in terms of foundry equipment uptime rates, finishing throughput and scrap levels. However, these improvements did not translate into improved financial performance due to the costs associated with a significant number of new product launches and other start-up-related expenses.
Depreciation and amortization charges, included in cost of sales, increased by $4.1 million from $23.3 million in 2002 to $27.4 million in 2003. The majority of the increase relates to depreciation charges on new machine lines and increased depreciation associated with the operation in Hungary.
The gross profit on prototype and tooling sales in 2003 was $2.8 million or 9.8% of sales, down from $4.6 million or 29.9% of sales in 2002. The level of gross profit on prototype and tooling sales depends on the type of program launch and the volume of prototype tooling and castings required to validate production.
Other Balance Sheet Items
Total assets increased from $551.3 million in 2003 to $556.5 million in 2004, primarily a result of acquiring the remaining interest in the operation in Hungary and offset by the asset impairment charges incurred in discontinued operations. Total long-term interest-bearing debt decreased from $36.1 million in 2003 to $28.5 million in 2004. The decline was a result of including the revenue bonds associated with discontinued operations with current liabilities of discontinued operations in 2004.
(Wescast Industries Inc. 2004 Annual Report) 36
Fourth Quarter 2004
The 2004 fourth quarter results were significantly impacted by the $28.2 million after-tax asset impairment charge related to discontinued operations.
The table below sets forth selected financial information of the Company for the specified periods.
Quarterly Results of Operations
(in thousands of Canadian dollars, except per share amounts)
| | First Quarter | Second Quarter | Third Quarter | Fourth Quarter | | | | |
| | 2004 | 2003 | 2004 | 2003 | 2004 | 2003 | 2004 | 2003 |
|---|
| | (Restated) | (Restated) | (Restated) | (Restated) | (Restated) | (Restated) | (Restated) | (Restated) |
|---|
|
| Sales | $106,632 | $113,953 | $108,189 | $104,679 | $88,720 | $101,601 | $105,367 | $114,091 |
Gross profit | 29,195 | 32,801 | 32,601 | 33,639 | 17,063 | 28,344 | 15,669 | 33,240 |
Earnings from |
| continuing operations | 11,749 | 15,710 | 15,599 | 15,008 | 4,105 | 10,558 | 3,395 | 13,044 |
Net earnings (loss) | $7,853 | $11,547 | $11,112 | $11,451 | ($17,607) | $6,068 | ($28,064) | ($17,666) |
Earnings from continuing |
| operations per share |
| Basic | $0.90 | $1.20 | $1.19 | $1.15 | $0.31 | $0.81 | $0.26 | $1.00 |
| Diluted | $0.90 | $1.14 | $1.10 | $1.15 | $0.31 | $0.81 | $0.25 | $0.96 |
Net earnings (loss) per share |
| Basic | $0.60 | $0.88 | $0.85 | $0.88 | ($ 1.35) | $0.47 | ($ 2.15) | ($1.35) |
| Diluted | $0.60 | $0.82 | $0.76 | $0.88 | ($ 1.35) | $0.47 | ($ 2.15) | ($1.36) |
|
Notes:
| 1. | The quarterly results of operations have been restated to account for discontinued operations and the accounting change related to pre-production costs. |
| 2. | The Company’s sales and production volumes are generally lower in the third quarter, in comparison to the other quarters, as North American vehicle production is lowest during the third quarter due to model changeovers by the domestic Big 3 automakers. Also, the Company’s facilities traditionally shut down for a period during the third quarter to allow for summer vacations. |
| 3. | An asset impairment charge of $16.6 million after-tax was recorded in the net loss of the third quarter of 2004. |
| 4. | An asset impairment charge of $28.2 million after-tax was recorded in the net loss of the fourth quarter of 2004. Of this amount $10.1 million reflected the recognition of the related cumulative translation adjustment balance. |
| 5. | A goodwill impairment charge of $27.4 million after-tax was recorded in the net earnings of the fourth quarter of 2003. |
(Wescast Industries Inc. 2004 Annual Report) 37
MANAGEMENT’S DISCUSSION AND ANALYSIS
of Results of Operations and Financial Condition for the Year Ended January 2, 2005
Liquidity and Capital Resources
The Company ended 2004 with cash balances of $3.7 million and net debt of $57.5 million, compared to cash balances of $28.4 million and net debt of $12.1 million at the end of 2003. The primary reason for the change in liquidity in 2004 was the acquisition of the remaining 50% interest in the operation in Hungary, the Company’s former joint venture with Linamar. Cash generated from continuing operations of $63.5 million exceeded capital spending and dividend requirements of $39.2 million, with the purchase of the Hungarian subsidiary for $52.7 million accounting for most of the increase in net debt. The Company’s chassis business, classified as discontinued operations in 2004, used cash of $22.4 million in 2004, due primarily to operating losses.
Financial Condition Highlights
(in thousands of Canadian dollars, except where otherwise noted)
| | 2004 | 2003 |
|---|
|
| Cash & cash equivalents | $ 3,745 | $ 28,358 |
| Debt of discontinued operations | $ 30,687 | $ 35,281 |
| Total debt (1) | $ 61,250 | $ 40,440 |
| Net debt (2) | $ 57,505 | $ 12,082 |
Current assets (3) | $120,240 | $125,333 |
| Current liabilities (4) | $ 46,452 | $ 44,872 |
| Current ratio | 2.6 : 1 | 2.8 : 1 |
| Net working capital | $ 73,788 | $ 80,461 |
Shareholders' equity | $405,597 | $427,949 |
| Total capital (5) | $466,847 | $468,389 |
| Ratio of total debt to total capital | 13.1% | 8.6% |
|
(1) Total debt is defined as the sum of short-term and long-term interest-bearing debt, including debt of discontinued
operations.
(2) Net debt is defined as total debt minus cash and cash equivalents.
(3) Current assets from continuing operations.
(4) Current liabilities from continuing operations.
(5) Total capital is defined as total debt plus shareholders’ equity.
Net working capital and the current ratio are used to monitor the Company’s ability to meet its short-term obligations. Both measures decreased year-over-year due to the reduction in cash balances. However, the Company’s ability to meet its short-term obligations remains strong. Wescast uses the ratio of total debt to total capital to monitor the capitalization of the Company. As a result of the increase in the Company’s debt due to the acquisition of the operation in Hungary and the decrease in shareholders’ equity due to the net loss in 2004, the ratio of total debt to total capital increased year-over-year to 13.1% at the end of 2004 from 8.6% at the end of 2003. The Company feels that the conservative use of leverage enhances its capital structure by reducing the cost of capital and has stated, as one of its financial objectives, to maintain a debt to total capital ratio of less than 30%.
(Wescast Industries Inc. 2004 Annual Report) 38
The chart below illustrates Wescast’s total debt to total capital position at the end of fiscal 2004:
Total debt as a % of total capitalization

Available Financing Sources
During the fourth quarter, the Company replaced its uncommitted demand operating facilities with a $125 million three-year committed facility maturing December 22, 2007 (the “New Facility”).
Draws under the New Facility are available as selected by the Company by way of: i) prime loans; ii) U.S. base rate loans; iii) LIBOR loans; iv) bankers’ acceptances; and v) letter of credit or letter of guarantee, bearing interest at applicable interest margin depending on the Company’s funded debt to EBITDA position. In addition, the Company pays a commitment fee on the undrawn portion of the New Facility. The commitment fee is also dependent on the funded debt to EBITDA ratio.
The New Facility contains a number of covenants including three financial covenants: i) maximum funded debt to EBITDA;
ii) minimum EBITDA interest coverage; and iii) maximum funded debt to total capital, each as defined in the credit agreement. These covenants are measured quarterly.
At January 2, 2005, the Company had $93.9 million of unused and available credit under the New Facility to fund operating needs and growth initiatives, if required.
Cash Flows
The table below provides information from the Company’s statements of cash flows.
Fiscal years ended
(in thousands of Canadian dollars)
| | 2004 | 2003 |
|---|
|
| Cash derived from continuing operations | $63,535 | $ 74,276 |
| Cash used for investing activities | $87,776 | $ 25,449 |
| Cash derived from (used in) financing activities | $17,466 | ($ 9,514) |
(Wescast Industries Inc. 2004 Annual Report) 39
MANAGEMENT’S DISCUSSION AND ANALYSIS
of Results of Operations and Financial Condition for the Year Ended January 2, 2005
Operating Activities
Cash flows from continuing operations were $63.5 million in 2004, down $10.8 million from the $74.3 million derived from continuing operations in 2003. A year-over-year reduction in earnings from continuing operations of $19.5 million was partially offset by improved non-cash working capital changes of $8.8 million in 2004 versus 2003. In 2003, significant payments were made related to the addition of new machine lines and the construction of the Company’s technical development centre and corporate office complex that were included in payables and accruals at the end of 2002. An increased emphasis on maximizing supplier payment terms has also contributed to a decreased investment in non-cash working capital.
Investing Activities
Cash flows used in investing activities were $87.8 million in 2004, up from $25.4 million in 2003 due mainly to the acquisition of the remaining 50% interest in the operation in Hungary. In 2004, the Company purchased the remaining 50% interest of Wescast Hungary Rt, for $52.7 million, net of cash acquired. There were no acquisitions in 2003.
Capital expenditures in 2004 were $32.9 million compared to $36.4 million in 2003. The Company spent more on machine lines in 2003 versus 2004 as more new programs were launched in 2003. The decrease in machine line spending was offset by an increase in capital spending at the operation in Hungary in 2004 versus 2003 as the Company now owns 100% of the Hungarian operation.
The Company has commitments to acquire capital assets of $2.9 million in 2005. Total capital expenditures, including the committed amount of $2.9 million, are expected to be approximately $35 million in 2005, excluding any potential investment in Asia. These expenditures will be funded by internally generated funds from operations and, if required, the New Facility. Capital expenditures for 2005 will consist primarily of machining expansion in North America and Europe and productivity projects exhibiting less than two-year paybacks.
Financing Activities
Cash provided by financing activities was $17.5 million in 2004. Last year, cash used for financing activities was $9.5 million. Net issuance of long-term debt in 2004 was $26.3 million as funds from the New Facility were used to pay off demand facilities utilized to complete the acquisition of the remaining interest in Wescast Hungary Rt.
Off-Balance Sheet Financing
The Company’s off-balance sheet financing arrangements are limited to standard operating lease contracts with various commercial enterprises relating primarily to equipment and office space. As at January 2, 2005, operating lease commitments totalled $2.0 million for 2005. The leases expire at various times through 2009, but will likely be renewed or replaced upon expiration. Management does not believe that the early termination of any of these lease contracts would have a material impact on its consolidated financial statements.
(Wescast Industries Inc. 2004 Annual Report) 40
Contractual Obligations
The following table summarizes the expected cash outflows resulting from certain financial contracts and commitments:
Payments Due by Period
(in thousands of Canadian Dollars)
| | | Within | | | After |
| | Total | Year 1 | Year 2 | Years 3 -5 | Year 5 |
|
| Revenue bond obligations | $33,046 | $31,277 | $ 590 | $ 1,179 | $ -- |
| Capital lease obligations | 737 | 435 | 269 | 33 | -- |
| Operating leases | 5,781 | 1,983 | 1,722 | 2,076 | -- |
| Bank loans | 27,467 | 1,226 | -- | 26,241 | -- |
Total contractual obligations | $67,031 | $34,921 | $2,581 | $29,529 | $ -- |
The revenue bond obligations relate to financings for the chassis business of $30,687 and the Company’s jointly controlled entity, United Machining Inc. (“UMI”), of $2,359. It is anticipated that the chassis business revenue bonds will be repaid by the Company upon sale or wind-up of the business, and as such are reflected as a current liability. The UMI revenue bonds are more fully described in Note 9 to the consolidated financial statements. The capital lease obligations relate to the Company’s fleet of vehicles provided to sales staff and executives. The operating leases are primarily for equipment and office space.
The bank loans relate to drawings under the New Facility and certain equipment financings of UMI.
Other Obligations
The Company’s employee benefit plans are described in Note 11 to the consolidated financial statements. Only one of the Company’s defined benefit plans is registered and funded. The most significant plans are not funded or registered. The total deficit related to the Company’s employee benefit plans at January 2, 2005 was $28.7 million. The benefit payments required during 2005 are not expected to be of a material amount and will be funded through cash flow from operations.
The Company has a Restricted Share Unit (“RSU”) plan. Under the RSU plan the Company has granted RSUs to certain employees. This entitles the employee to receive a cash payment for each RSU granted in an amount equal to the weighted average closing price of the Company’s Class A subordinate voting shares as traded on the Toronto Stock Exchange during the five-day period prior to the third anniversary date on which the RSU was granted. The RSUs vest, and the cash value is paid, on the third anniversary of the date on which such RSUs were granted. The related compensation expense is accrued over this period. As at January 2, 2005, there were 75,308 RSUs outstanding. Based on the year-end closing price of the Company’s Class A subordinate voting shares, the payments required to settle the RSUs would total $2.4 million.
(Wescast Industries Inc. 2004 Annual Report) 41
MANAGEMENT’S DISCUSSION AND ANALYSIS
of Results of Operations and Financial Condition for the Year Ended January 2, 2005
Shareholders’ Equity
Shareholders’ equity decreased $22.4 million in 2004 as compared to 2003. During the year, 13,606 Class A subordinate voting shares were issued under the Employee Share Purchase Plan, adding $0.4 million to shareholders’ equity. The net loss generated in 2004 reduced shareholders’ equity by $26.7 million. Dividends of $6.3 million or $0.48 per share on Class A subordinate voting and Class B common shares were paid during 2004. Reductions in director and employee share purchase plan loans increased shareholders’ equity by $0.4 million. The cumulative translation adjustment (“CTA”) component of shareholders’ equity represents the change in the unrealized foreign exchange gain on the Company’s net investment in its self-sustaining foreign subsidiaries. The positive balance at January 2, 2005 of $9.6 million represents a significant increase over the negative balance of $0.5 million at the end of 2003. The increase reflects the recognition of the portion of the account related to the net assets of the discontinued operations. The negative CTA balance associated with those assets was considered in the adjustment to write those assets down to the estimate of their realizable value. This resulted in a year-over-year increase in the CTA balance of $7.0 million.
Financial Instruments
The Company negotiates sales contracts with customers in a number of currencies. To the extent sales are made in U.S. dollars, the Company has a partial natural hedge against exchange rate fluctuations due to the purchase of certain raw materials and other inputs to the manufacturing process in U.S. dollars.
The Company believes its exposure to exchange rate fluctuations on these working capital items is not significant.
The Company also purchases certain capital equipment denominated in U.S. dollars and provides financial support to the discontinued operations located in Cordele, Georgia in U.S. dollars. In order to manage the exposure to exchange rate fluctuations on these expenditures, the Company employs a hedging program primarily through the use of foreign exchange forward contracts. The contracts are purchased based on committed purchase orders for capital equipment denominated in U.S. dollars and, prior to announcing its decision to exit the chassis business, included an estimate of the U.S. dollar requirements of the Cordele, Georgia operation on a rolling fifteen-month basis.
The Company does not use derivative instruments to hedge the long-term investments in its self-sustaining foreign subsidiaries. Accordingly, the Company’s cumulative translation adjustment account could be affected by a significant change in the relative values of the Canadian dollar, U.S. dollar and Hungarian forint.
Effective for the 2004 fiscal year, the Company was required under Canadian GAAP to adopt Accounting Guideline, AcG-13, “Hedging Relationships.”
The Company has performed a thorough review of its hedging program and has implemented measures to ensure compliance with the new guideline.
Note 23 to the consolidated financial statements contains additional information about financial instruments.
(Wescast Industries Inc. 2004 Annual Report) 42
Related-Party Transactions
In 2004, the Company paid freight and logistics charges of $4.4 million to a related company, Wingex Limited, 30% of whose shares are owned by a Class B shareholder of Wescast. These transactions were undertaken at market rates. As at January 2, 2005, $0.3 million was owed to this company. The current freight and logistics agreement was entered into by Wescast and the related company in 2004 and expires at the end of 2007.
Critical Accounting Estimates
The significant accounting policies of the Company are described in Note 2 to the consolidated financial statements. Note 25 to the Company’s consolidated financial statements sets out the material differences between Canadian and US GAAP.
The Company’s financial statements are based on the selection and application of accounting policies that require management to make significant estimates and assumptions that affect the reported amounts of assets, liabilities, revenues and expenses. The Company bases its estimates on historical experience and various other assumptions that are believed to be reasonable in the circumstances. Wescast evaluates its estimates on an ongoing basis. Actual results may differ from these estimates under different assumptions or conditions.
The Company believes the following accounting policies affect its significant estimates and assumptions used in the preparation of its consolidated financial statements. Management has discussed the selection of the following accounting policies with the Audit Committee of the Board of Directors. The Audit Committee has reviewed the Company’s disclosure related to accounting policies in this MD&A.
Future Income Tax Assets
As at January 2, 2005, the Company had recorded future income tax assets related to losses available to be carried forward, the tax basis of goodwill and the assets of discontinued operations in excess of book value and other deductible temporary differences of $18.3 million, $25.2 million and $8.1 million, respectively. The future income tax assets with respect to the loss carryforwards, the discontinued operations assets and goodwill tax basis relate mainly to the Company’s chassis business. The Company evaluates the carrying value of its future tax assets by assessing its valuation allowance and by adjusting the amount of such allowance, if necessary. The factors used to assess the likelihood of realization include the Company’s forecast of future taxable income and available tax-planning strategies that could be implemented to realize the future tax assets.
(Wescast Industries Inc. 2004 Annual Report) 43
MANAGEMENT’S DISCUSSION AND ANALYSIS
of Results of Operations and Financial Condition for the Year Ended January 2, 2005
Employee Benefits
The Company has a number of plans providing pension and other retirement benefits. The determination of the obligation and expense for these plans is dependent on the selection of certain assumptions used by actuaries. Those assumptions are included in Note 11 to the Company’s consolidated financial statements and include the discount rate, expected long-term rate of return on plan assets and the rate of increase in compensation costs. Actual results that differ from the assumptions used are amortized over future periods and, therefore, have an impact on the obligation and expense recognized in future periods. Significant changes in assumptions or significant plan enhancements could materially affect the Company’s future obligation and expense. As at January 2, 2005, the Company had net unrecognized past service costs, actuarial losses and transitional obligations totalling $13.7 million, which will be amortized to future benefit expense over the expected average remaining service life of the employees.
Accounting Changes
| a) | | During the fourth quarter of 2004, the Company amended its accounting policy in respect of pre-production costs incurred during the start-up phase associated with the launch of a new facility or new business. Under the new accounting these costs are expensed as incurred. The Company’s previous accounting was to defer these costs until commercial production levels had been attained. Subsequently, these costs were then amortized over a period not to exceed five years. The Company believes the new accounting better aligns with how it will manage and monitor future launch activities. |
| | | This change in accounting has been applied retroactively with restatement of prior periods. The retroactive changes to the Company’s consolidated balance sheet and statements of earnings and retained earnings for the 2003 and 2002 fiscal years are as follows: |
| Changes in the consolidated balance sheet | | |
| | | December 28, 2003 |
|
| Decrease in other assets | | $ 9,826 |
| Decrease in future income tax liability | | 554 |
| Decrease in retained earnings | | 9,272 |
Changes in the consolidated statements of earnings and retained earnings | | |
| | 2003 | 2002 |
|
| Increase in revenues | $ -- | $ 13,325 |
| Increase (decrease) in cost of sales | (3,610) | 2,525 |
| Increase in income tax expense | 478 | 473 |
| Increase (decrease) in net earnings | 3,132 | (2,998) |
Increase (decrease) in net earnings per share - basic | $ 0.24 | ($ 0.23) |
| Increase (decrease) in net earnings per share - diluted | $ 0.24 | ($ 0.23) |
(Wescast Industries Inc. 2004 Annual Report) 44
| | | Asa result of this accounting change, net earnings for the fiscal year ended January 2, 2005 were $3,258 ($0.22 diluted net earnings per share) higher than would have been reported under the previous accounting. |
| b) | | In December 2001, the Accounting Standards Board of the CICA issued Accounting Guideline 13, “Hedging Relationships” (“AcG-13”), which applies to fiscal years beginning on or after July 1, 2003. AcG-13 establishes specific criteria for derivatives to qualify for hedge accounting. Hedge accounting is a method for recognizing the gains, losses, revenues and expenses associated with the separate components in a hedging relationship, such that those gains, losses, revenues and expenses associated with the separate components are recognized in income in the same period when they would otherwise be recognized in different periods. A derivative will qualify as a hedge if the hedging relationship is designated and formally documented at inception. AcG-13 requires the documentation to identify the particular risk management objective and strategy for undertaking the hedge transaction, along with the specific asset, liability or cash flow being hedged, as well as how effectiveness is being assessed. The derivative must be highly effective in offsetting either changes in the fair value of on-balance sheet items or changes in the amount of future cash flows both at inception and over the life of the hedge for hedge accounting to continue. Hedge accounting is discontinued if a hedging relationship becomes ineffective; however, the hedge accounting applied to a hedging relationship in prior periods is not reversed. The adoption of AcG-13 has had an insignificant impact on our results of operations and financial position. |
| c) | | The Company adopted the fair value recognition provisions of CICA Handbook Section, 3870 “Stock-Based Compensation and Other Stock-Based Payments” (“CICA 3870”) in accounting for stock-based awards, effective December 29, 2003, without restatement of prior periods as the impact was immaterial. The fair value recognition provisions of CICA 3870 were applicable only to the Company’s employee share purchase plan described in Note 24. The impact of this accounting change was a decrease in earnings of $48 for the year ended January 2, 2005. |
(Wescast Industries Inc. 2004 Annual Report) 45
MANAGEMENT’S DISCUSSION AND ANALYSIS
of Results of Operations and Financial Condition for the Year Ended January 2, 2005
Outlook
Although there can be no certainty as to future levels of production, based on currently available information the Company views the economic outlook for the automotive industry in 2005 to be stable. North American light vehicle production levels for 2005 are currently projected at approximately 15.9 million units. This represents a very slight increase over 2004 levels. However, 2005 production estimates for the Company’s primary customer base, the domestic Big 3, are projected to decline. The Company anticipates that the 2005 production levels of its North American powertrain business will not achieve the levels reached in 2004, primarily as a result of the lower production volumes projected for its customer base and the annualized impact of production programs re-sourced to low-cost country suppliers during 2004. Management expects that new programs in North America will partially offset these declines and new product launches in Europe will bring Wescast’s consolidated production above 2004 levels.
The Company’s results are sensitive to raw material prices for scrap steel and moly. These costs have escalated significantly in recent months, and if this trend continues it will have a negative impact on future financial results.
The Company’s strategic direction is the pursuit of a global powertrain strategy capable of generating attractive growth and financial return prospects for our stakeholders:
| | • | | The focus of the core powertrain segment in North America will be on becoming more cost-competitive in an effort to address the significant pressure on pricing that is being exerted by the powertrain customer base. This pressure has intensified with the growing threat from competitors based in low-cost countries, specifically China. To meet this challenge the Company will continue to pursue aggressive year-over-year cost-reduction targets in these operations. Progress has been made toward achieving these targets by applying the Company’s HEART participative management process and continuous improvement focus. To date many cost-reduction initiatives have been proposed and are being implemented. |
| | • | | The Company will also focus on aligning its global capacity to meet the needs of its customers in the most efficient manner available. This includes the closure of the foundry operations in Brantford, Ontario. This element of the Company’s foundry optimization plan is anticipated to reduce fixed costs by approximately $25 million in 2006. There will be additional costs incurred during 2005 associated with the closure, the magnitude of those costs are currently being quantified. |
| | • | | The Company will continue to focus on expanding its powertrain business through the expansion of its customer base and geographic coverage. |
| | • | | The Company will maintain its commitment to fund research and development activities, including: |
— The deployment to customers of the “hot-end solutions” strategy; and,
— The continued development of high-temperature alloys.
| | • | | The Company will continue to evaluate the most effective method to gain entry into the Asian marketplace, including the development of a manufacturing presence in that region. |
The Company believes that maintaining the focus on these areas is the best means to ensure the long-term success of the business.
(Wescast Industries Inc. 2004 Annual Report) 46
Forward-Looking Information
Certain information provided by Wescast in this MD&A and in other documents published throughout the year that is not a recitation of historical facts may constitute forward-looking information, within the meaning of Section 21E of the Securities Exchange Act of 1934, as amended. The words “estimate,” “anticipate,” “believe,” “expect” and similar expressions are intended to identify forward-looking statements. Such forward-looking information involves important risks and uncertainties that could materially alter results in the future from those expressed in any forward-looking statements made by or on behalf of the Company.
These risks and uncertainties include, but are not limited to, global economic and industry conditions causing changes to production volumes, changes in raw material and other input costs, price reduction pressures, dependence on certain vehicles and major OEM customers, program launch delays, currency exposure, contract negotiations with the unionized workforce, failure in implementing Company strategy, technological developments by the Company’s competitors, government and regulatory policies and changes in the competitive environment in which the Company operates. While the Company believes that its forecasts and assumptions are reasonable, persons reading this report are cautioned that such statements are only predictions and that actual events or results may differ materially. In evaluating such forward-looking statements readers should specifically consider the various factors that could cause actual events or results to differ from those indicated by such forward-looking statements.
(Wescast Industries Inc. 2004 Annual Report) 47
MANAGEMENT’S RESPONSIBILITY FOR FINANCIAL REPORTING
The accompanying annual audited financial statements of Wescast Industries Inc. and all the information in this annual report are the responsibility of management and have been approved by the Board of Directors.
The financial statements have been prepared by management in accordance with Canadian generally accepted accounting principles. When alternative accounting methods exist, management has chosen those it deems most appropriate in the circumstances. Financial statements are not precise since they include certain amounts based on estimates and judgments.
Management has determined such amounts on a reasonable basis in order to ensure that the financial statements are presented fairly, in all material respects. Management has prepared the financial information presented elsewhere in the annual report and has ensured that it is consistent with that in the Þnancial statements.
Wescast Industries Inc. maintains high-quality, consistent systems of internal accounting and administrative controls. Such systems are designed to provide reasonable assurance that the financial information is relevant, reliable and accurate and that the Company’s assets are appropriately accounted for and adequately safeguarded.
The Board of Directors is responsible for ensuring that management fulfills its responsibilities for financial reporting and is ultimately responsible for reviewing and approving the financial statements. The Board is assisted in its responsibility by the Audit Committee and the external auditors.
The Audit Committee is appointed by the Board, and all of its members are independent for the purposes of Ontario Securities Commission MI 52-110 and for the purposes of Nasdaq’s Rule 4200. The Committee meets periodically with management, as well as the external auditors, to discuss internal controls over the financial reporting process, auditing matters and financial reporting issues, to satisfy itself that each party is properly discharging its responsibilities, and to review the annual report, the financial statements and the external auditors’ report.
The findings and recommendations of the Committee, as with all committees of the Board, are submitted to the full Board for approval or other disposition.
The Committee also considers, for review by the Board and approval by the shareholders, the engagement or re-appointment of the external auditors.
The annual financial statements have been audited by Deloitte & Touche LLP, the external auditors, for the years ended December 28, 2003 and January 2, 2005, in accordance with Canadian generally accepted auditing standards on behalf of the shareholders. Deloitte & Touche LLP has full and free access to the Audit Committee.
Sincerely,

Edward G. Frackowiak
Chairman and Chief Executive Officer
March 18, 2005
(Wescast Industries Inc. 2004 Annual Report) 48