Table of Contents
Exhibit 15.2
Annual Report and Financial Statements 2018 |
Table of Contents
RELX is a global provider of information-based
analytics and decision tools for professional and
business customers.
We help scientists make new discoveries, doctors and
nurses improve the lives of patients and lawyers win
cases. We prevent online fraud and money laundering,
and help insurance companies evaluate and predict risk.
Our events enable customers to learn about markets,
source products and complete transactions.
In short, we enable our customers to make better
decisions, get better results and be more productive.
Forward-looking statements
This Annual Report contains forward-looking statements within the meaning of Section 27A of the US Securities Act of 1933, as amended, and Section 21E of the US Securities Exchange Act of 1934, as amended. These statements are subject to risks and uncertainties that could cause actual results or outcomes of RELX PLC (together with its subsidiaries, “RELX”, “we” or “our”) to differ materially from those expressed in any forward-looking statement. The terms “outlook”, “estimate”, “project”, “plan”, “intend”, “expect”, “should”, “will”, “believe”, “trends” and similar expressions may indicate a forward-looking statement. Important factors that could cause actual results or outcomes to differ materially from estimates or forecasts contained in the forward-looking statements include, among others, current and future economic, political and market forces; changes in law and legal interpretations affecting RELX intellectual property rights and internet communications; regulatory and other changes regarding the collection, transfer or use of third-party content and data; demand for RELX products and services; competitive factors in the industries in which RELX operates; ability to realise the future anticipated benefits of acquisitions; significant failure or interruption of our systems; compromises of our data security systems or other unauthorised access to our databases; legislative, fiscal, tax and regulatory developments and political risks; exchange rate fluctuations; and other risks referenced from time to time in the filings of RELX PLC with the US Securities and Exchange Commission.
Table of Contents
RELX Annual report and financial statements 2018 | 1 | |
|
Get more information online
A PDF of the full Annual Report and further
information about our businesses can be
found online at our website:www.relx.com
* | Comprises the Strategic Report in accordance with The (UK) Companies Act 2006 (Strategic Report and Directors’ Report) Regulations 2013. |
Table of Contents
2 | RELX Annual report and financial statements 2018 |Overview | |
|
◾ | Underlying revenue growth of 4% |
◾ | Underlying adjusted operating profit growth of 6% |
◾ | Reported operating profit £1,964m (£1,905m) |
◾ | Adjusted EPS growth at constant currency up 7%; in sterling up 6% to 84.7p |
◾ | Reported EPS 71.9p (81.6p) |
◾ | Full-year dividend up 7% to 42.1p |
◾ | Strong financial position and cash flow; cash flow conversion at 96% |
RELX
RELX PLC and its subsidiaries, joint ventures and associates are together known as “RELX”
† 2017 restated for adoption of new accounting standards IFRS 9, IFRS 15 and IFRS 16. See note 1 on page 126 for further details.
RELX uses adjusted and underlying figures as additional performance measures. Adjusted figures primarily exclude the amortisation of acquired intangible assets and other items related to acquisitions and disposals, and the associated deferred tax movements. In 2018 and 2017, we also excluded exceptional tax credits, see note 9 on page 138. Reconciliations between the reported and adjusted figures are set out on page 176. Underlying growth rates are calculated at constant currencies, excluding the results of acquisitions until twelve months after purchase, and excluding the results of disposals and assets held for sale. Underlying revenue growth rates also exclude exhibition cycling. Constant currency growth rates are based on 2017 full-year average and hedge exchange rates.
Table of Contents
RELX Annual report and financial statements 2018 | 3 | |
|
Sir Anthony Habgood
Chairman
RELX continued its positive development in 2018. We simplified our corporate structure into a single parent company, removing complexity and increasing transparency for shareholders. Shares in the single parent company have a full weighting in the FTSE 100 and AEX indices.
RELX continued to execute its strategy aimed at achieving more predictable revenues, a higher growth profile and improving returns. As a result, underlying revenue growth was again 4%. Underlying adjusted operating profits grew 6%, as we continued to grow revenues ahead of costs. Adjusted earnings per share in constant currencies grew 7% and in sterling 6% to 84.7p (80.2p). Reported earnings per share were 71.9p (81.6p).
Dividends
We are proposing a full year dividend increase of 7% to 42.1p. The long-term dividend policy is unchanged.
Balance sheet
Net debt, including leases as per IFRS 16, was £6.2bn at 31 December 2018, compared with £5.0bn last year. Net debt/ EBITDA including pensions and leases was 2.4x, compared with 2.2x in 2017. Capital expenditure represented 5% of revenues.
Share buybacks
In 2018, we deployed £700m on share buybacks. In 2019, we intend to deploy a total of £600m. By 20 February, £100m of this year’s total had already been completed, leaving a further £500m to be deployed during the year.
The Board
We continue to refresh the Board. Ben van der Veer will stand down from the board after nine years’ service. He was replaced as Chairman of the Audit Committee, a position he had held since 2010, by Adrian Hennah. Adrian is Chief Financial Officer of Reckitt Benckiser, and was previously Chief Financial Officer of Smith & Nephew. Andrew Sukawaty will be appointed as aNon-Executive Director of RELX, subject to shareholder approval, with effect after the 2019 Annual General Meeting. Andrew has had a 30 year career in the telecoms industry. He is Chairman of Inmarsat and was aNon-Executive Director and the Senior Independent Director of Sky between 2013 and 2018. I would like to thank Ben for his advice over many years and am delighted that Andrew will be joining RELX.
Parent company structure
In September 2018, we completed the simplification of the company’s corporate structure by moving from a dual to a single parent structure. In June, shareholders of both parent companies, RELX PLC and RELX NV, voted 99.9% in favour of the measures which were cost and profit neutral on an ongoing basis and did not impact the economic interest of any shareholder. RELX NV shareholders received one new RELX PLC share in exchange for each RELX NV share, and can continue to trade their new shares on Euronext Amsterdam, priced in euros. They are also entitled to receive dividend payments in euros. RELX NV ADRs were convertedone-for-one to RELX PLC ADRs. Shares in the single parent company are now listed in London, Amsterdam and New York, and it was confirmed in December that RELX will have a full weighting in the AEX index in addition to the FTSE 100.
This latest change was a natural step for RELX, removing complexity and increasing transparency. In 2015, the company simplified its structure by combining all assets below the two parent companies into a single new group entity and eliminated parent company cross-shareholdings. We also increased share price transparency by moving all share listings to an equalisation ratio of one to one.
Corporate responsibility
We take our commitment to human rights seriously as evidenced by our Modern Slavery Act Statement, which outlines how we work to avoid slavery and trafficking in our direct employment and in our supply chain. In the year, we held RELX Rule of Law Cafés in the US, Europe and Asia to bring together the legal community, corporate peers, government representatives andnon-governmental organisations to share information on going beyond legal minimums to advance the rule of law.
We also created Access to Justice Law360, free content to support the legal community, including legal aid organisations, in helping citizens gain equal treatment within civil and criminal justice systems. As a United Nations Global Compact LEAD company, we joined the action platform, Peace, Justice & Strong Institutions, ensuring business supports good governance and legal frameworks.
Another critical priority for RELX is data privacy and security and in 2018 we expanded security incident response preparedness through technology, awareness training and simulations.
Anthony Habgood
Chairman
Table of Contents
4 | RELX Annual report and financial statements 2018 | Overview | |
|
Chief Executive Officer’s report
Erik Engstrom
Chief Executive Officer
Our number one priority remains the organic development of increasingly sophisticated information-based analytics and decision tools that deliver enhanced value to our customers.
Strategic direction
Our number one strategic priority is the organic development of increasingly sophisticated information-based analytics and decision tools that deliver enhanced value to professional and business customers across the industries that we serve.
Our goal is to help our customers make better decisions, get better results and be more productive. We do this by leveraging a deep understanding of our customers to create innovative solutions which combine content and data with analytics and technology in global platforms. These solutions often account for about 1% of our customers’ total cost base but can have a significant and positive impact on the economics of the remaining 99%.
We aim to build leading positions in long-term global growth markets and leverage our skills, assets and resources across RELX, both to build solutions for our customers and to pursue cost efficiencies.
We are systematically migrating all of our information solutions across RELX towards highervalue-add decision tools, adding broader data sets, embedding more sophisticated analytics and leveraging more powerful technology, primarily through organic development.
We are transforming our core business, building out new products and expanding into higher growth adjacencies and geographies. We are supplementing this organic development with selective acquisitions of targeted data sets and analytics, and assets in high-growth markets that support our organic growth strategies, and are natural additions to our existing businesses.
By focusing on evolving the fundamentals of our business we believe that, over time, we are improving our business profile and the quality of our earnings. This has led to more predictable revenues through a better asset mix and geographic balance; a higher growth profile as we expand in higher growth segments, exit from structurally challenged businesses, and gradually reduce the drag from print format declines; and improved returns by focusing on organic development with strong cash generation.
Table of Contents
RELX Annual report and financial statements 2018 | Chief Executive Officer’s report | 5 | |
|
2018 progress
We achieved another year of good underlying revenue growth in 2018, and continued to generate underlying adjusted operating profit growth ahead of underlying revenue growth, and adjusted earnings per share growth at constant currencies ahead of underlying profit growth. We also had an active year for acquisitions, focusing on targeted data sets, analytics and assets that support our organic growth strategies. The underlying growth rate reflects good growth in electronic andface-to-face revenues (90% of the total), and the further development of our analytics and decision tools.
With a strong balance sheet and an inherently cash-generative business, the strategic priority order for using our cash is unchanged. First, to invest in the organic development of our business to drive underlying revenue growth; second to support our organic growth strategy with targeted acquisitions; third to grow dividends predictably, broadly in line with EPS growth; fourth to maintain our leverage in a comfortable range; and finally use any remaining cash to buy back shares. As part of this we bought back shares for £700m in 2018, and announced £600m in buybacks for 2019.
In 2018 we completed nine acquisitions of content, data analytics and exhibition assets for a total consideration of £978m, and disposed of eight assets for a total of £45m. This included the acquisition of ThreatMetrix, a leader in the global risk-based authentification sector for £580m. Since the year end we have agreed to acquire Mack Brooks, a leading organiser of over 30 highly complementary events across key geographies and industrial verticals.
Financial performance
Our positive financial performance continued throughout 2018, with underlying revenue and adjusted operating profit growth across all four business areas. Underlying revenue growth was 4%. Underlying operating profit growth was 6%, and adjusted earnings per share grew 7% at constant currencies.
Key business trends in Scientific, Technical & Medical remained positive, with underlying revenue growth in line with the prior year and underlying profit growth matching underlying revenue growth.
At Risk & Business Analytics, underlying revenue growth remained strong, in line with the prior year. Underlying profit growth matched underlying revenue growth.
In Legal, underlying revenue growth was in line with the prior year, with continued efficiency gains driving strong underlying operating profit growth.
Exhibitions achieved strong underlying revenue growth, with underlying operating profit growth reflectingcycling-in effects.
Corporate responsibility
Business action is crucial to achieving the United Nations Sustainable Development Goals (SDGs), 17 goals for the world by 2030. Among the ways RELX is contributing is through the free SDG Resource Centre, which aggregates essential content from across the Group to advance the SDGs. In 2018, we produced original research, available on the Resource Centre, on the state
† 2017 and 2016 restated for the adoption of new accounting standards IFRS 9, IFRS 15 and IFRS 16.
Table of Contents
6 | RELX Annual report and financial statements 2018 | Overview | |
|
of science underpinning SDG 3, good health and well-being, and also launched the SDG Perspectives Project on the site showcasing how the SDGs are influencing scholarly debates.
In the year, we used our convening power to bring a wide range of stakeholders together to inspire collaboration on the SDGs including one on partnerships in Amsterdam and one on disruptive technology to advance the goals in Silicon Valley. In 2019, we will hold an SDG Inspiration Day on sustainable cities in Delhi.
We conducted our triennial Employee Opinion Survey to understand the views of our people. There was a 90% response rate, up three percentage points from 2015, with a three percentage point increase in engagement and a five percentage point increase in satisfaction; 85% of employees said we were a company that supports community involvement. All managers
have received their team’s scores and I will be reviewing progress on responding to employee feedback. In 2018, we updated our diversity and inclusion strategy, held our first-ever Diversity & Inclusion Awareness Month, and advanced our Women in Technology mentor programme.
Outlook
Key business trends in the early part of 2019 are consistent with 2018, and we are confident that, by continuing to execute on our strategy, we will deliver another year of underlying growth in revenue and in adjusted operating profit, together with growth in adjusted earnings per share on a constant currency basis.
Erik Engstrom
Chief Executive Officer
Table of Contents
RELX Annual report and financial statements 2018 | 7 | |
|
review | ||
In this section | ||
8 | RELX business overview | |
14 | Scientific, Technical & Medical | |
20 | Risk & Business Analytics | |
28 | Legal | |
34 | Exhibitions | |
41 | Corporate Responsibility |
Table of Contents
8 | RELX Annual report and financial statements 2018 | Business review | |
|
RELX is a global provider of information-based analytics and decision tools for professional and business customers.
The Group serves customers in more than 180 countries and has offices in about 40 countries. It employs over 30,000 people, of whom almost half are in North America.
RELX financial summary
REPORTED FIGURES | Change at | |||||||||||||||||||
2018 | 2017 | † | constant | Change | ||||||||||||||||
For the year ended 31 December | £m | £m | Change | currencies | underlying | |||||||||||||||
Revenue | 7,492 | 7,341 | +2% | +4% | +4% | |||||||||||||||
Operating profit | 1,964 | 1,905 | +3% | |||||||||||||||||
Profit before tax | 1,720 | 1,721 | 0% | |||||||||||||||||
Net profit attributable to RELX PLC shareholders | 1,422 | 1,648 | -14% | |||||||||||||||||
Net margin | 19.0% | 22.4% | ||||||||||||||||||
Net borrowings | 6,177 | 5,042 | ||||||||||||||||||
Reported earnings per share | 71.9p | 81.6p | -12% | |||||||||||||||||
Ordinary dividend per RELX PLC share | 42.1p | 39.4p | +7% | |||||||||||||||||
ADJUSTED FIGURES | Change at | |||||||||||||||||||
2018 | 2017 | † | constant | Change | ||||||||||||||||
For the year ended 31 December | £m | £m | Change | currencies | underlying | |||||||||||||||
Operating profit | 2,346 | 2,284 | +3% | +4% | +6% | |||||||||||||||
Operating margin | 31.3% | 31.1% | ||||||||||||||||||
Profit before tax | 2,145 | 2,101 | +2% | +3% | ||||||||||||||||
Net profit attributable to RELX PLC shareholders | 1,674 | 1,620 | +3% | +5% | ||||||||||||||||
Net margin | 22.3% | 22.1% | ||||||||||||||||||
Cash flow | 2,243 | 2,197 | +2% | |||||||||||||||||
Cash flow conversion | 96% | 96% | ||||||||||||||||||
Return on invested capital | 13.2% | 12.9% | ||||||||||||||||||
Adjusted earnings per share | 84.7p | 80.2p | +6% | +7% |
† 2017 numbers have been restated to reflect the adoption of new accounting standards. See note 1 on page 126 for further details.
The shares of RELX PLC are traded on the London, Amsterdam and New York stock exchanges. RELX PLC and its subsidiaries, joint ventures and associates are together known as ‘RELX’.
Table of Contents
RELX Annual report and financial statements 2018 | RELX business overview | 9 | |
|
Market segments*
Segment position | ||
Scientific, Technical & Medicalprovides information and analytics that help institutions and professionals progress science, advance healthcare and improve performance
|
Global #1 | |
Risk & Business Analyticsprovides customers with information-based analytics and decision tools that combine public and industry-specific content with advanced technology and algorithms to assist them in evaluating and predicting risk and enhancing operational efficiency
|
Key verticals #1 | |
Legalprovides legal, regulatory and business information and analytics that helps customers increase their productivity, improve decision-making and achieve better outcomes
|
US #2 Outside US #1 or 2
| |
Exhibitionsis a leading global events business. It combinesface-to-face with data and digital tools to help customers learn about markets, source products and complete transactions at over 500 events in almost 30 countries, attracting more than 7m participants
|
Global #2 |
* For additional information regarding revenue from our business activities and geographical markets, see market segments section starting on page 13.
Financial summary by market segment
Revenue | Adjusted operating profit | |||||||||||||||||
2018 £m | Change underlying | 2018 £m | Change underlying | |||||||||||||||
Scientific, Technical & Medical | 2,538 | +2% | 942 | +2% | ||||||||||||||
Risk & Business Analytics | 2,117 | +8% | 776 | +8% | ||||||||||||||
Legal | 1,618 | +2% | 320 | +10% | ||||||||||||||
Exhibitions | 1,219 | +6% | 313 | +10% | ||||||||||||||
Unallocated items | (5 | ) | ||||||||||||||||
7,492 | +4% | 2,346 | +6% |
RELX uses adjusted and underlying figures as additional performance measures. Adjusted figures primarily exclude the amortisation of acquired intangible assets and other items related to acquisitions and disposals, and the associated deferred tax movements. In 2018 and 2017, we also excluded exceptional tax credits, see note 9 on page 138. Reconciliations between the reported and adjusted figures are set out on page 176. Underlying growth rates are calculated at constant currencies, excluding the results of acquisitions until twelve months after purchase, and excluding the results of disposals and assets held for sale. Underlying revenue growth rates also exclude exhibition cycling. Constant currency growth rates are based on 2017 full-year average and hedge exchange rates.
Table of Contents
10 RELX Annual report and financial statements 2018 | Business review | ||||||
�� |
Harnessing technology across RELX |
Around 8,000 technologists, half of whom are software engineers, work at RELX. Annually, the company spends $1.4bn on technology. The combination of our rich data assets, technology infrastructure and knowledge of how to use next generation technologies, such as machine learning and natural language processing, allows us to create effective solutions for our customers. |
Helping research chemists with Elsevier’s Reaxys
Reaxys enables the shortest path to chemistry research answers, supporting the early stages of drug development in the pharmaceutical industry, exploratory chemistry research in academia, and product development in industries such as chemicals and oil & gas.
The amount of chemical information published each year is increasing exponentially, making it more and more challenging for research chemists to quickly find targeted and actionable information to help support their research.
To help researchers stay on top of their field, Elsevier developed a new chemistry text mining engine, usingstate-of-the-art natural language processing that identified 4.9m key substances in 5.2m documents from more than 15,000 journal titles in 2018.
This significantly increased the content coverage and substance information searchable on Reaxys, addressing a key pain point in customer efforts to find the data they need for drug discovery. | 4.9m
key chemical substances identified using Elsevier’s natural language processing technology |
Providing comprehensive and relevant information as fast as possible is a critical challenge for our customers in a highly competitive environment. Elsevier’s sophisticated automatic processing methods have helped make Reaxys, where this information is contained, an indispensable tool for chemical research.
Dr Juergen Swienty-Busch
Director of Product Management, Chemistry Solutions, Elsevier |
|
Table of Contents
RELX Annual report and financial statements 2018 | RELX business overview 11 | ||||||
|
|
Making legal research faster and more intuitive with Lexis Answers
Every year, an immense volume of legal data is generated, adding to the existing collection of more than 16m case law legal decisions and 91m statutes, regulations, constitutions and legislative documents in the US alone. As the amount of electronic data increases, legal research, analysis and discovery has become increasingly challengingand time-consuming.
Traditional legal database searches require legal researchers to make their query using precise key words or phrases. This can often produce multiple responses which may not give the specific answer needed.
As part of the Lexis Advance online legal research tool, LexisNexis developed the Lexis Answers service which allows users to enter their query in the form of a natural language question. Using machine learning, cognitive computing and advanced natural language processing technologies, Lexis Answers anticipates a user’s research path, curating and delivering relevant answers based on their question type. The result is faster answers in fewer searches. |
44%
time saved per research query using Lexis Answers |
Lexis Answers is one of several features within Lexis Advance that brings the power of artificial intelligence and machine learning to our customers – ultimately improving their research efficiency, enhancing their legal workflow and transforming legal research.
Jeff Pfeifer Vice President of Product Management, LexisNexis
|
|
RELX data centre
Table of Contents
12 RELX Annual report and financial statements 2018 | Business review | ||||||
|
Table of Contents
RELX Annual report and financial statements 2018 | 13 | |
|
segments | ||
In this section | ||
14 | Scientific, Technical & Medical | |
20 | Risk & Business Analytics | |
28 | Legal | |
34 | Exhibitions |
Table of Contents
14 | RELX Annual report and financial statements 2018 | Business review | |
|
Scientific, Technical & Medical
We help researchers make new discoveries, collaborate with their colleagues and give them the knowledge they need to find funding. We help governments and universities evaluate and improve their research strategies. We help doctors and nurses improve the lives of patients, providing insight to find the right clinical answers.
| ||||
◾ | We enhance the quality of scientific research output by organising the review, editing and dissemination of 18% of the world’s scientific articles | |||
◾ | ScienceDirect, the world’s largest database dedicated to peer-reviewed primary scientific and medical research, has 16m monthly unique visitors | |||
◾ | Scopus is a leading abstract and citation database of research literature, with over 73m records across 24,000 journals, sourced from more than 5,000 publishers | |||
◾ | SciVal offers insights into the research performance of over 10,000 research institutions | |||
◾ | ClinicalKey, the flagship clinical reference platform, is accessed in over 90 countries and territories, and by over 1,900 institutions in North America alone | |||
◾ | Elsevier journals have at some point featured articles by 183 of 184 science and economics Nobel prize winners since 2000
|
† | 2016 and 2017 restated for adoption of new accounting standards IFRS 9, IFRS 15 and IFRS 16. |
Business overview
Scientific, Technical & Medical provides information and analytics that help institutions and professionals progress science, advance healthcare and improve performance.
Elsevier is headquartered in Amsterdam, with further principal operations in Boston, New York, Philadelphia, St. Louis and Berkeley in North America, London, Oxford, Frankfurt, Munich, Madrid and Paris in Europe, Beijing, Chennai, Delhi, Singapore and Tokyo in Asia Pacific and Rio de Janeiro in South America. It has 7,900 employees and serves customers in around 180 countries.
Revenues for the year ended 31 December 2018 were £2,538m, compared with £2,473m† in 2017 and £2,318m† in 2016. In 2018, 44% of revenue came from North America, 24% from Europe and the remaining 32% from the rest of the world. Subscription sales generated 74% of revenue, transactional sales 24% and advertising 2%.
Elsevier serves the needs of scientific, technical and medical markets by organising the review, editing and dissemination of primary research, reference and professional education content. Building on its heritage of high-quality publishing, Elsevier today applies technology to authoritative information, providing tools that enable faster and more efficient ways of working, freeing up users to focus on their goals.
Elsevier’s customers are scientists, academic institutions, research leaders and administrators, medical researchers, doctors, nurses, allied health professionals and students, as well as hospitals, research institutions, health insurers, managed healthcare organisations, research-intensive corporations and governments.
Elsevier services fall into four market categories: Primary Research, Databases & Tools, Reference and Pharma Promotion.
Primary Research, accounts for around half of revenues. Elsevier serves the global scientific research community, publishing over 470,000 articles in 2018, 60% more than a decade ago. 2018 saw continued strong growth both in article submissions and usage, with 1.8m articles submitted and 1bn articles downloaded by researchers. In 2018, Elsevier published over 34,000 gold open access articles, a double-digit growth on the previous year, making it one of the largest open access publishers in the world.
Elsevier’s portfolio of 2,500 journals is managed by more than 20,000 editors and many are the foremost publications in their field. They include flagship titles such as Cell and The Lancet family of journals. In 2018, Elsevier’s article output accounted for 18% of global research output while garnering a 25% share of citations, demonstrating Elsevier’s commitment to delivering research quality significantly ahead of the industry average.
In 2018, Elsevier launched 9 new subscription and 45 full open access journals, including iScience and One Earth from Cell Press and the Lancet’s Eclinical Medicine.
Research content is distributed and accessed via ScienceDirect, the world’s largest database dedicated to peer-reviewed primary scientific and medical research, hosting over 16m pieces of content as well as 39,000e-books.
In 2018, Elsevier acquired Aries Systems, abest-in-class publication solutions provider, used for manuscript submission, peer review, production tracking ande-commerce of journals, books and other publications.
Table of Contents
RELX Annual report and financial statements 2018 | Scientific, Technical & Medical | 15 | |
|
InDatabases & Tools, Elsevier offers a suite of products for academic and corporate researchers. Significant products include Scopus, Reaxys and Knovel. Scopus is the largest abstract and citation database of peer reviewed literature curated by independent external academic advisers, with over 73m records across 24,000 journals, sourced from more than 5,000 publishers. It allows researchers to track, analyse and visualise the world’s research output with features such as CiteScore, providing comprehensive, transparent and current insights into journal impact. Reaxys enables the shortest path to chemistry research answers, supporting the early stages of drug development in the pharmaceutical industry, exploratory chemistry research in academia, and product development in industries such as chemicals and oil & gas. Knovel is a decision support tool for engineers that helps them to select the right materials, a mission-critical use case in product development across chemicals, oil & gas and other engineering-focused industries.
Elsevier serves academic and government research administrators through its Research Intelligence suite of products. Leveraging bibliometric data from Scopus and other data types such as patent citations and usage data, SciVal is a decision tool that helps institutions to establish, execute and evaluate research strategies. Pure is an enterprise research management solution that aggregates an organisation’s research information from numerous sources into a single platform, enabling research networking and expertise discovery while reducing the administrative burden for faculty and staff.
Elsevier’s flagship clinical reference platform, ClinicalKey, provides physicians, nurses and pharmacists with access to leading Elsevier and third-party reference and evidence-based medical content, including over 490 clinical overviews that provide quick clinical answers and summaries; over 4m images and 51,000 medical and surgical videos in a single, fully integrated site.
ClinicalKey is growing well and is accessed in over 90 countries and territories, and by over 1,900 institutions in North America alone.
In medical education, Elsevier serves students of medicine, nursing and allied health professions in multiple formats including electronic books and electronic solutions. For example Sherpath, an adaptive teaching and learning solution for nursing and health education, now provides highly focused, personalised and adaptive learning paths at over 400 institutions, supporting more than 37,000 enrolments.
For healthcare professionals, Elsevier’s clinical solutions include Interactive Patient Education and Care Planning. Arezzo, an active clinical decision support engine integrated with clinical care systems, matches evidence-based guidelines with patient and disease information and dynamically evaluates best-practice treatment options.
In 2018, Elsevier acquired Via Oncology, which provides decision support and best practices in cancer care management, bringing additional technology and innovation to Elsevier’s strength in clinical pathways.
In commercial healthcare, consumer, provider and medical claims data is used to deliver leading identity, fraud, compliance and health risk analytics solutions for payers, providers, pharmacies and life sciences organisations.
InReference, Elsevier is a global leader in providing authoritative and current professional reference content to scientific, technical and medical reference markets. Flagship titles include Gray’s Anatomy, Nelson’s Pediatrics and Netter’s Atlas of Human Anatomy. Reference content is delivered in both electronic and print formats, with print reference now accounting for less than 10% of Elsevier revenues.
|
| |||||||||||
Premier life sciences journal with the highest impact factor in biochemistry and molecular biology | An innovative research management and social collaboration platform | |||||||||||
|
|
| ||||||||||
The world’s largest database dedicated to peer-reviewed primary scientific and medical research | Combines leading reference and evidence based medical content into its fully integrated clinical insight engine specialised for doctors, nurses, or pharmacists | CiteScore™ metrics are a set of comprehensive, transparent, current and free metrics to help measure the citation impact of journals | ||||||||||
|
|
| ||||||||||
This chemical compound and reaction synthesis database enables the shortest path to chemistry research answers, supporting drug discovery, chemical R&D and education | Ready-to-use tools to analyse the world of research, and establish, execute and evaluate the best strategies for research organisations | A leader in scientific publication workflow solutions used by journals, books and other publications for manuscript submission, peer review, production tracking ande-commerce | ||||||||||
|
|
| ||||||||||
A leading abstract and citation database of peer-reviewed literature featuring smart tools to track, analyse and visualise research | One of the world’s leading medical journals since 1823 | Designed to help improve patient outcomes, Via Oncology provides clinical pathways delivering personalised, evidence-based guidance at the point of care
|
Table of Contents
16 | RELX Annual report and financial statements 2018 | Business review | |
|
Pharma Promotion offers customised commercial marketing services to pharmaceutical and medical device companies, building on Elsevier’s trusted global content brands to connect and engage with doctors, nurses and other healthcare professionals who are influential decision makers.
Market opportunities
Scientific, technical and medical information markets have good long-term growth characteristics. The importance of research and development to economic performance and competitive positioning is well understood by governments, academic institutions and corporations. This is reflected in the long-term growth in research and development spending and in the number of researchers worldwide. Growth in health markets is driven by ageing populations in developed markets, rising prosperity in developing markets and the increasing focus on improving medical outcomes and efficiency. Given that a significant proportion of scientific research and healthcare is funded directly or indirectly by governments, spending is influenced by governmental budgetary considerations. The commitment to research and health provision does, however, remain high, even in more difficult budgetary environments.
Strategic priorities
Elsevier’s strategic priorities are to: continue to increase content volume and quality; expand content coverage, building out integrated solutions and decision tools combining Elsevier, third-party and customer data; increase content utility, using ‘Smart Content’ to enable newe-solutions; combine content with analytics and technology, focused on measurably improved productivity and outcomes for customers; and continue to drive operational efficiency and effectiveness.
In the primary research market, Elsevier aims to deliver journal and article quality above the industry average at below average cost, leveraging the scale of its platform. We work directly with our customers to understand their objectives and help them reach their research goals in a way that is satisfactory from a content, service and economic perspective. Elsevier looks to enhance quality by building on our premium brands and grow article volume through new journal launches, the expansion of open access journals and growth from emerging markets; and add value to core platforms by implementing new capabilities such as advanced recommendations on ScienceDirect and social collaboration through reference manager and collaboration tool Mendeley.
In reference markets, Elsevier’s priorities are to expand content coverage and ensure consistent and seamless linking of content assets across products.
In every market, Elsevier is applying advanced machine learning (ML) and natural language processing (NLP) techniques to help researchers, engineers and clinicians perform their work better. For example, in research, ML and NLP techniques classify scientific content and organise it thematically, enabling users to get faster access to relevant results and related scientific topics. In parallel, advanced information extraction and NLP techniques are applied to extract the most important information for scientific concepts in concise summaries. Elsevier also applies advanced ML techniques that detect trending topics per domain, helping researchers make more informed decisions about their research. Coupled with the automated profiling and extraction of funding body information from scientific articles, this process supports the whole researcher journey; from planning, to execution and funding.
Similarly, in health, Elsevier is developing clinical decision support applications utilising cognitive technologies to map patient and claims data sets, and large image and text content repositories. These applications embedded in technology platforms will enhance the delivery of the right content, in the right care setting, to the right care providers. This will help health professionals perform their work better, make more accurate diagnoses, ensure appropriate care delivery, and save more human lives.
Business model, distribution channels and competition
In Primary Research, science and medical research is principally disseminated on a paid subscription basis to the research facilities of academic institutions, governments and corporations and, in the case of medical and healthcare journals, to individual practitioners and medical society members.
While researchers may continue to prefer paid subscription as the primary distribution model, alternative payment models for the dissemination of research have evolved over the past twenty years. Elsevier has long invested in all business models to serve researchers and research institutions. Author pays open access is one example, with over 1,900 of Elsevier’s journals now offering the option of funding publication and distribution via a sponsored article fee. In addition, Elsevier now publishes around 250 gold open access titles.
Table of Contents
RELX Annual report and financial statements 2018 | Scientific, Technical & Medical | 17 | |
|
For well over a decade, content has been provided free or at very low cost in more than 100 countries and territories in the developing world through Research4Life, a United Nations partnership initiative. For some journals, advertising and promotional income represents a small proportion of revenues, predominantly from pharmaceutical companies in healthcare titles.
Next to journals, Elsevier has also invested in other solutions to serve the needs of the research community. SSRN is an open access online preprint community where researchers post early-stage research, prior to publication in academic journals. Mendeley data enables researchers to make their research data publicly available by providing an open research data repository, while bepress helps academic libraries showcase and share their institutions’ research via institutional repositories for greatest impact.
Electronic products, such as ScienceDirect, Scopus and ClinicalKey, are generally sold direct to customers through a dedicated sales force that has offices around the world. Subscription agents sometimes facilitate the sales and administrative process for remaining print sales. Reference and educational content is sold directly to institutions and individuals and accessed on Elsevier platforms. Sometimes it is still sold in printed book form through retailers, wholesalers or directly to end users.
Competition within science and medical reference content is generally on atitle-by-title andproduct-by-product basis and is typically with learned societies and professional information providers, such as Springer Nature, Clarivate Analytics and Wolters Kluwer. Decision tools face similar competition, as well as from software companies and internal solutions developed by customers.
2018 financial performance
2018 | 2017† | Underlying | Portfolio | Currency | Total | |||||||||||||||||||
£m | £m | growth | changes | effects | growth | |||||||||||||||||||
Revenue | 2,538 | 2,473 | +2% | +2% | -1% | +3% | ||||||||||||||||||
Adjusted operating profit | 942 | 914 | +2% | 0% | +1% | +3% |
Key business trends remained positive in 2018, with underlying revenue growth in line with the prior year, and underlying profit growth matching revenue growth.
Underlying revenue growth was +2%. The difference between the constant currency and underlying growth rates reflects the impact of portfolio changes and the transfer of a small number of healthcare products from Risk & Business Analytics.
Underlying adjusted operating profit growth was +2% with underlying cost growth marginally below underlying revenue growth. The reported margin increased by 0.1 percentage points, with currency impacts largely offset by portfolio effects.
Electronic revenues saw continued good growth. In primary research we continued to enhance customer value by providing broader content sets across our research offering, increasing the sophistication of our analytics, and evolving our technology platforms. Databases & tools continued to drive growth across market segments through enhanced functionality and content development.
Print book sales, which represent around 10% of divisional revenues, reverted to historical levels of decline for the main selling season, with return rates also at historical levels. Print pharma promotion revenues, which represent less than 5% of the divisional total, saw a slightly steeper decline than in recent years.
In 2018 we made three small acquisitions in support of our organic growth strategy, Via Oncology, Aries Systems and Science-Metrix, and disposed of a minor pharma business in Japan.
2019 outlook
Our customer environment remains largely unchanged, and we expect another year of modest underlying revenue growth, with underlying operating profit growth exceeding underlying revenue growth.
† 2017 restated for adoption of new accounting standards IFRS 9, IFRS 15 and IFRS 16.
Table of Contents
18 RELX Annual report and financial statements 2018 | Business review | ||||||
|
Via Oncology
helping The Center for Cancer and Blood Disorders improve patient treatment |
The Center for Cancer and Blood Disorders in Fort Worth, Texas, treats more than 6,000 new cancer patients annually. That equates to more than 300,000 patient visits every year. It has over 25 specialist oncologists and 150 healthcare professionals across nine locations throughout North Texas. |
Elsevier’s Via Oncology partnered with The Center over ten years ago after oncologists at the clinic identified a need to ensure that patients experience consistent, standardised treatment across their many locations and oncologists.
Via Oncology’s sophisticated online clinical pathway system, Via Pathways, is an advanced clinical decision support system that provides points of care recommendations for diagnostics and treatment. By using Via Pathways, oncologists can follow evidence-based care maps based upon the most current medical evidence and reduce unwarranted care variability. |
Oncologists also are presented with all locally available clinical trials prior to starting a treatment pathway for new patients, ensuring they are presented with all options for treatment.
Since implementing Via Pathways, The Center’s oncologists can review more data on their patients’ outcomes, demonstrating that the care they deliver is consistent across their network. For example, The Center’s capture rate, which measures how consistently doctors use Via Pathways and tracks all patient visits, has reached 89% across 34 disease pathways representing over 95% of cancer types.
The Center considers Via Oncology to be at the crux of its value-based care initiatives, enabling participation in studies of new care models. |
25% clinical trials participation rate for lung cancer patients as a result of using Via Pathways, more than five times higher than the national average |
Table of Contents
RELX Annual report and financial statements 2018 | Scientific, Technical & Medical | 19 |
About Via Oncology
Part of Elsevier, Via Oncology is a Pittsburgh, Pennsylvania-based business that provides decision support and best practices in cancer care management.
It helps cancer centres demonstrate the value of their care to patients, doctors and payers by developing and implementing clinical pathways in collaboration with its network of more than 1,500 US cancer care providers. Via Oncology’s evidence-based proprietary content, Via Pathways, is developed by leading oncologists and forms the basis of clinical algorithms covering 95% of cancer types treated in the US. This content is deployed to doctors and their staff at the point of care through the Via Portal, a patient-specific decision support tool that is integrated with electronic medical records and provides seamless measurements of adherence to treatment. | Oncology doctor and nurse at The Center for Cancer and Blood Disorders | |||||
Via Pathways is a great tool that we can use to standardize our therapies. We can show that physicians are being congruent with standards of care and are taking into account the effectiveness, toxicity and cost, and making appropriate treatment choices. That means we’re providing the highest standard of care to our patients.
Dr Ray Page, DO, PhD President of The Center for Cancer and Blood Disorders, Texas | ||||||
Table of Contents
20 | RELX Annual report and financial statements 2018 | Business review | |
|
We combine data and analytics with deep industry expertise to help customers make better decisions and manage risk. We deliver insight to insurance companies and help detect and prevent online fraud and money laundering. We provide digital tools that help airlines and farmers improve their operations.
|
◾ More than 80% of new US auto insurance policies issued to consumers in 2017 benefited from our products
◾ LexisNexis Risk Solutions performs over 100m identity verification checks and over 100bn customer and transaction screening requests annually, supporting industries such as banking, fintech ande-commerce
◾ LexisNexis Risk Solutions works with more than 75% of Fortune 500 companies, seven out of ten of the world’s top banks and 95 out of the top 100 personal lines insurance companies
◾ With insight into over 900m ThreatMetrix ID anonymised user identities, ThreatMetrix delivers the intelligence behind over 30bn annual authentication and trust decisions to differentiate legitimate customers from fraudsters in real time
◾ Accuity has information on over 22,000 banks, and hosts over 600,000 financial counterparty due diligence documents. Over 95 of the world’s largest 100 banks use its data
◾ Cirium tracks 100,000 commercial flights every day and more than 70m passenger itineraries a year, while analysing 2.5bn travel segments per annum worth about $300bn. Cirium holds data on more than 100,000 commercial aircraft
|
† | 2016 and 2017 restated for adoption of new accounting standards IFRS 9, IFRS 15 and IFRS 16. |
Business overview
Risk & Business Analytics provides customers with information-based analytics and decision tools that combine public and industry-specific content with advanced technology and algorithms to assist them in evaluating and predicting risk and enhancing operational efficiency.
Risk & Business Analytics, headquartered in Alpharetta, Georgia, has principal operations in California, Florida, Illinois and Ohio in North America as well as London in Europe and Beijing in Asia Pacific. It has about 8,700 employees and serves customers in more than 170 countries.
Revenues for the year ended 31 December 2018 were £2,117m, compared with £2,073m† in 2017 and £1,905m† in 2016. In 2018, 79% of revenue came from North America, 15% from Europe and the remaining 6% from the rest of the world. Subscription sales generated 36% of revenues, transactional sales 63% and advertising 1%.
Risk & Business Analytics comprises the following market-facing industry/sector groups: Insurance Solutions, Business Services, Data Services (including banking, energy and chemicals, aviation, agriculture and human resources) and Government Solutions.
Insurance Solutions, the largest segment, provides comprehensive data, analytics and decision tools for personal, commercial and life insurance carriers in the US to improve critical aspects of their business. Information solutions, including the most comprehensive US personal loss history database, C.L.U.E., help insurers assess risks and provide important inputs to pricing and underwriting insurance policies. Additional key products include LexisNexis Data Prefill, which provides information on customers directly into the insurance work stream and LexisNexis Current Carrier, which identifies insurance coverage details and any lapses in coverage.
The focus is on delivering innovative decision tools through a single point of access within an insurer’s infrastructure. LexisNexis Active Insights, our solution for active risk management, connects proprietary linking algorithms with vast amounts of data to proactively inform insurers of key events impacting their policyholders. Insurance Solutions is advancing its strategy to drive more consistency and efficiency in claims through its solution suite, Claims Compass, with Claims Datafill providing data and decisions at first notice of loss and throughout the claim life cycle. Risk Classifier solution, which uses public and motor vehicle records and predictive modelling, is used by around a quarter of the top 50 life insurers to better understand risk and improve underwriting efficiency.
Insurance Solutions continues to make progress outside the US. In the UK, contributory solutions including No Claims Discount module, which automates verification of claims history and Policy Insights, a predictor of motor claims loss, are delivered through the LexisNexis Informed Quotes platform to provide real-time data in the quoting process. In China, Genilex is delivering key vehicle data to auto insurers and is looking to add more analytics solutions. In India, our Intelligence Exchange contributory platform and Risk Insights solution are used by life insurers to predict, better assess and manage risk within the underwriting and claims management processes. In Brazil, Insurance Solutions is delivering telematics solutions, data and analytics to help motor insurers in underwriting and working with health insurers to reduce claims costs and make faster, more focused decisions.
Table of Contents
RELX Annual report and financial statements 2018 | Risk & Business Analytics | 21 | |
|
Business Services works with customers to solve key issues, such as financial exclusion and financial transparency. Business Services leverages technology, data, advanced linking and analytics to help banks, telecommunications ande-commerce companies, retailers and other organisations to prevent fraud, manage identity risk, comply with financial crime regulations, assess credit risk and collect debt.
Customers rely on Business Services for identify verification, watch-list screening, due diligence, credit scoring and skip tracing. It leverages machine learning (ML) and artificial intelligence (AI) algorithms in its products to provide customers with clarity, enabling faster decisions with a greater degree of confidence.
In 2018, Business Services added digital identity data to its physical identity dataset through the acquisition of ThreatMetrix. As a result of the transaction, customers gained access to solutions that provide a360-degree view into an identity. This perspective helps customers make decisions that thwart bad actors while enabling legitimate consumers to transact frequently in a frictionless environment. The ThreatMetrix integration continues to hit its acquisition milestones, including: the creation of a combinedgo-to-market organisation that consists of global sales and marketing teams; the initiation of work to combine our physical and digital identity solutions into a holistic fraud prevention and identity management solution; and the undertaking of development efforts to expand the Digital Identity Network into financial crime compliance and credit risk assessment for developing economies.
Business Services continued to make progress in international markets outside the US, building scale in key geographies including the UK and Brazil.
Data Services provides indispensable business information, data and analytics solutions to professionals in many of the world’s biggest industries, including: Accuity, a provider of services and solutions to the banking and corporate sectors focused on payment efficiency, Know Your Customer (KYC), anti-money laundering (AML) and compliance; ICIS, an information and data service in chemicals, energy and fertilisers; Cirium, a leading provider of data and analytics for the global commercial aviation and travel industry; Proagrica, a provider of software, connectivity solutions, data, analytics and media streams for the global agriculture sector; XpertHR, an online service providing regulatory guidance, best practices and tools for human resource professionals; EG, which delivers a mix of high-quality data, decision tools and high-value news and information to the UK’s commercial real estate market; and Nextens, a provider of tools and services for tax professionals.
In 2018, Data Services completed the acquisitions of Safe Banking Systems, a specialist provider of AML and KYC compliance solutions with a particular focus on account screening and SST Solutions, a leading provider of precision agriculture technologies and tools in the US. Data Services also continued to reshape its portfolio, exiting areas not core to its strategy, divesting Boerderij, a Netherlands-based agriculture title, during the course of the year.
|
VerifyHCP |
World Compliance | ||
The VerifyHCP solution provides a proven approach to help payers keep their provider directories current and improve compliance with US state and federal regulations | Our leading-edge curated content related to economic sanctions, financial crime enforcement actions, politically exposed persons (PEPs), and adverse media enables customers to comprehensively and efficiently protect their enterprises from reputational, regulatory, legal and enforcement risks | |||
LexisNexis Active Insights |
| Risk Defense Platform | ||
An active risk management solution that provides timely alerts of recent changes occurring in the household to help insurers enhance customer relationships with better service | Innovative solutions for payments and compliance professionals, from comprehensive data and software to manage risk and compliance, to flexible tools that optimise payments pathways | An innovative fraud prevention and identity management platform that seamlessly delivers the broadest of solutions including the latest in machine learning that adapts to ever- changing fraud schemes, simplifying efforts to detect and prevent risks associated with the merging of digital and physical identities | ||
Claims Compass | Accurint®Virtual Crime Center | ThreatMetrix® Digital Identity Network® | ||
Data analytics suite with LexisNexis Claims Datafill and LexisNexis Police Records that improves the claims process from first notice of loss, triage, investigation and resolution through recovery | Policing platform used for analytics, crime analysis and investigations linking public records to national law enforcement data for a complete picture across jurisdictions | A network that provides insight into true digital identity, by analysing global shared intelligence across more than 30bn annual transactions to distinguish legitimate consumers versus fraudsters | ||
|
| |||
Data and analytics for the global commercial aviation and travel industry | Global provider of news, price benchmarks, data and research to the energy, chemical and fertiliser industries |
Table of Contents
22 | RELX Annual report and financial statements 2018 | Business review | |
|
Government Solutions provides a variety of identity management, fraud detection and prevention, collections and investigation solutions to US federal, state and local law enforcement and government agencies. These solutions help verify beneficiaries for government programmes, solve criminal cases, support national security initiatives and identify fraud, waste and abuse in government benefit programmes, as well as identity theft solutions for tax agencies to help ensure legitimate taxpayers receive refunds and business intelligence solutions allowing government agencies to find additional fraud and property tax.
Market opportunities
We operate in markets with strong long-term growth in demand for high-quality advanced analytics based on industry information and insight, including: insurance underwriting transactions; insurance acquisition, retention and claims handling; healthcare, tax and public benefits fraud; financial crime compliance; business risk; fraud and identity solutions; due diligence requirements surrounding customer enrolment; security and privacy considerations; and data and advanced analytics for the banking, energy and chemicals, aviation and human resources sectors.
In the insurance segment, growth is supported by increasing transactional activity in the auto, commercial and life insurance markets and the increasing adoption by insurance carriers of more sophisticated data and analytics in the prospecting, underwriting and claims evaluation processes, to assess risk, increase competitiveness and improve operating cost efficiency. Transactional activity is driven by growth in insurance quoting and policy switching, as consumers seek better policy terms.
This activity is stimulated by competition among insurance companies, high levels of carrier advertising and rising levels of internet quoting and policy binding. We continue to expand our services to make it easier for the consumer to transact with an insurer throughout the insurance process. We are developing solutions that bridge insurers and automakers, utilising connectivity as a means to leverage and monetise the data from Advanced Driver Assistance Systems (ADAS) and connected cars, and engage consumers with driving behaviour information, collision detection and other insurance-related services.
Mounting fraud losses, continuing AML fines, high-profile anti-bribery and corruption cases, growth through consumer and business credit expansion, and heightened regulatory scrutiny
create growth opportunities. The rise of fintech, alternative lending and digital economy companies is also creating opportunities. A number of factors support growth for compliance solutions in banking and financial services markets, including cross-border payments and trade finance levels. In collections, demand is driven mainly by the ongoing escalation of consumer debt and the prospect of recovering that debt.
The increasing demand for our contributory solutions to combat criminal activity, fraud and tax evasion is driving growth in government markets. The level and timing of demand in this market is influenced by government funding and revenue considerations.
Growth in the global energy and chemicals markets is led by increasing trade and demand for more sophisticated information solutions. Aviation information markets are being driven by increases in air traffic and in the number of aircraft transactions. Growth in agriculture markets is being driven by adoption of technology and data solutions plus increasing supply chain connectivity.
Strategic priorities
Our strategic goal is to help businesses and governments achieve better outcomes with information and decision support in their individual markets through better understanding of the risks and opportunities associated with individuals, other businesses, transactions and regulations. By providing high quality industry data and decision tools, we assist customers in understanding their markets and managing risks efficiently and cost effectively. To achieve this, we are focused on: delivering innovative new products; expanding the range of risk management solutions across adjacent markets; addressing international opportunities in selected markets to meet local needs; further growing our data services businesses; and continuing to strengthen our content, technology and analytical capabilities.
Risk & Business Analytics has been developing AI and ML techniques for a number of years to generate the actionable insights that help our customers to make accurate, better informed and more timely decisions. The successful deployment of AI and ML techniques starts with a deep understanding of customer needs, leverages the breadth and depth of our data sets, coupled with the expertise and domain knowledge to discern which AI/ML algorithm to use, in what context, to solve our customers’ business problems effectively.
Table of Contents
RELX Annual report and financial statements 2018 | Risk & Business Analytics | 23 | |
|
Business model, distribution channels and competition
Our products are mainly sold directly, typically on a subscription or transactional basis. Pricing is predominantly on a transactional basis for insurance carriers and corporations, and primarily on a subscription basis for government entities.
In the insurance sector, our competitor Verisk sells data and analytics solutions to insurance carriers but largely addresses different activities to ours. Principal competitors in the Business
Services and Government Solutions segments include the major credit bureaus, which in many cases address different activities in these segments as well.
Data Services competes with a number of information providers on a service andtitle-by-title basis including S&P Global Platts, Thomson Reuters and IHS Markit as well as number of niche and privately owned competitors.
2018 financial performance
2018 £m | 2017† £m | Underlying growth | Portfolio changes | Currency effects | Total growth | |||||||||||||||||||
Revenue | 2,117 | 2,073 | +8% | -3% | -3% | +2% | ||||||||||||||||||
Adjusted operating profit | 776 | 760 | +8% | -2% | -4% | +2% |
Underlying revenue growth was strong in 2018, in line with the prior year. Underlying profit growth matched underlying revenue growth.
Underlying revenue growth was +8%. The difference between the constant currency and underlying growth rates reflects portfolio changes and the transfer of a small number of healthcare products to Scientific Technical & Medical.
Underlying adjusted operating profit growth matched underlying revenue growth as we continued to pursue our strategy, with a primary focus on organic development.
Insurance grew strongly. We continued to drive growth through theroll-out of enhanced analytics, the extension of data sets, and by further expansion in adjacent verticals, in US market conditions that, over the year as a whole, were neutral to mildly positive. International initiatives continued to progress well.
In Business Services, further development of analytics that help our customers to detect and prevent fraud and to manage risk
across the financial and corporate sectors continued to drive growth, in a robust US and international market environment.
In Data Services, organic development of innovative new products and expansion of the range of risk management solutions drove growth across market verticals. In Government, which accounts for around 5% of divisional revenues, we continued to drive customer value through the introduction of sophisticated analytics.
Risk & Business Analytics acquired three data and analytics businesses that support our organic growth strategy in 2018, ThreatMetrix, SST and Safe Banking Systems, and disposed of a number of minor print and other assets.
2019 outlook
The fundamental growth drivers of Risk & Business Analytics remain strong, and we expect underlying operating profit growth to continue to broadly match underlying revenue growth.
† | 2017 restated for adoption of new accounting standards IFRS 9, IFRS 15 and IFRS 16. |
Table of Contents
24
| RELX Annual report and financial statements 2018 | Business review
|
Cirium
managing the cost
of disrupted flights
Gant Travel Management is an innovative travel
management company based in Bloomington,
Indiana, with more than 80 years of experience.
It is expert in optimising the performance of the
world’s largest travel and expense reporting
platform. Its people and technology help
manage the expense and experience of
corporate travel.
Labour strikes, natural disasters and extreme weather all cause flight disruption, which has a significant impact on traveller experience and travel industry costs. In 2017, 3.6m flights were cancelled or delayed by over 30 minutes. Every year, airlines lose approximately $35bn because of these irregular operations. This cost jumps to more than $60bn when considering the impact to travellers and the broader ecosystem.
When disruption happens, most airlines publish waivers to allow travellers to change their flight plans ahead of the disruption with no change fee. Most waivers are handled manually on a reactive basis. There isn’t a standardised format and travellers often aren’t alerted effectively or quickly enough.
Cirium’s Travel Waiver Services automate the process of matching trips to waivers, making it easier and quicker for agents to find waiver details and understand if a traveller’s flight qualifies. | These services allow agents to reallocate travellers proactively with new travel plans when needed, reducing the average handling time for incoming calls and ultimately saving the traveller time and worry about flight changes.
By integrating Cirium’s service, Gant reduced the amount of time needed to resolve a traveller’s disrupted flight by a third. It also contributed to a reduction in the number of calls agents had to make to airlines to solve problems by an average of 50%. Having the right information at the right time means that Gant could save costs and provide a superior level of service for travellers affected by disruption. | 30%
reduction in time spent resolving a traveller’s disrupted flight using Cirium’s services |
Table of Contents
RELX Annual report and financial statements 2018 | Risk & Business Analytics
| 25
| |
|
Cirium holds data on more than 100,000 commercial aircraft including the Airbus A330 |
About Cirium
Cirium brings together powerful data and analytics to keep the world in motion. Delivering insight, built from decades of experience in the sector, enabling travel companies, aircraft manufacturers, airports, airlines and financial institutions, among others, to make logical and informed decisions which shape the future of travel, growing revenues and enhancing customer experiences. | Cirium worked in concert with us and the travel ecosystem suppliers to fix a broken process that we all thought was unfixable. The results were innovation that saved us over 10% labor costs during key periods of disruption. This gave us a significant advantage in staffing and directly benefited our traveller experience. Cirium made our new process possible.
Patrick Linnihan President & CEO of Gant Travel Management |
Table of Contents
26
| RELX Annual report and financial statements 2018 | Business review
|
ThreatMetrix
identifying and blocking
fraud in real time
Gumtree was founded in 2000 as a classified
adverts site for travellers arriving in London.
From these modest beginnings, Gumtree.com
is now the UK’s leading classifieds site, with
16.4m unique visitors and 12.6m replies
to adverts each month.
Gumtree brings together an eclectic collection of like-minded buyers, sellers and other users ranging from flat-sharers looking to fill a vacant room to cars, clothes and vintage furniture sales. The platform does not process any payment transactions and therefore relies on the safety, trustworthiness and authenticity of users.
Historically fraudsters have seen a clear opportunity to exploit the platform. They sign up for accounts in order to make fake listings or dupe unsuspecting users into transferring money for an item that never materialises. Gumtree needed a solution that could maintain the integrity of the platform while keeping fraudsters out. It harnessed intelligence from the ThreatMetrix Digital Identity Network to better identify high-risk users before they opened a Gumtree account. | The ThreatMetrix Digital Identity Network crowdsources intelligence from millions of daily consumer interactions including logins, payments, and new account applications across thousands of global businesses. Using this information, ThreatMetrix creates a unique digital identity for each user by analysing the myriad connections between devices, locations and anonymised personal information.
Behaviour that deviates from this trusted digital identity can be accurately identified in real time, alerting Gumtree to new users who may be using stolen identity data, obfuscating their location or attempting to sign up for multiple accounts from the same device. | 84%
increased fraud detection rate forecasted by using ThreatMetrix’s data and analysis |
Table of Contents
RELX Annual report and financial statements 2018 | Risk & Business Analytics
| 27
| |
|
Gumtree was founded in London in 2000 |
About ThreatMetrix
ThreatMetrix, a LexisNexis Risk Solutions Company, empowers the global economy to grow profitably and securely without compromise.
With deep insight into anonymised digital identities, ThreatMetrix ID delivers the intelligence behind 30bn annual authentication and trust decisions, to differentiate legitimate customers from fraudsters in real time. | The ThreatMetrix team has been really proactive in helping us improve our rules for detecting fraud, so much so that we have seen a significant increase in the fraud detection rate since we worked together to improve the performance of the model.
Fergus Campbell Head of Communications, Gumtree
|
Table of Contents
28 | RELX Annual report and financial statements 2018 | Business review | |
|
We help lawyers win cases, manage their work more efficiently, serve their clients better and grow their practices. We assist corporations in better understanding their markets and preventing bribery and corruption within their supply chains. We partner with leading global associations and customers to help advance the rule of law across the world.
|
◾ | The LexisNexis legal and news database contains 109bn documents and records | |
◾ | 1.7m new legal documents are added daily to the database from 52,000 sources, generating 43bn connections. In all, 20m legal documents are processed daily | |
◾ | Nexis news and business content includes 40,000 premium sources in 30 languages, covering more than 150 countries. It has data including 320m company profiles with a content archive that dates back 40 years | |
◾ | The LexisNexis database includes more than 226m court dockets and documents, 122m patent documents, 2.1m State Trial Orders, and 1.2m Jury verdict and settlement documents | |
◾ | PatentSight’s database includes objective ratings of the innovative strength (Patent Asset Index) of more than 88m patent documents from more than 80 countries | |
◾ | In 2018, Law360 produced over 50,000 news and analysis articles | |
◾ | Legal analytics tool Lex Machina has normalised over 22m counsel mentions and 18m party mentions since 2016 | |
◾ | LexisNexis is committed to advancing the rule of law through operations and solutions that provide transparency into the law in more than 130 countries
|
† | 2016 and 2017 restated for adoption of new accounting standards IFRS 9, IFRS 15 and IFRS 16. |
Business overview
Legal provides legal, regulatory and business information and analytics that helps customers increase their productivity, improve decision-making and achieve better outcomes.
LexisNexis Legal & Professional is headquartered in New York and has further principal operations in Ohio, North Carolina and Toronto in North America, London and Paris in Europe, and cities in several other countries in Africa and Asia Pacific. It has 10,500 employees worldwide and serves customers in more than 130 countries.
Revenues for the year ended 31 December 2018 were £1,618m, compared with £1,686m† in 2017 and £1,619m† in 2016. In 2018, 67% of revenue came from North America, 21% from Europe and the remaining 12% from the rest of the world. Subscription sales generated 77% of revenue and transactional sales 23%.
LexisNexis Legal & Professional is organised in market-facing groups. These are supported by global shared services organisations providing platform and product development, operational and distribution services, and other support functions.
In North America, electronic reference, decision tools and analytics help legal and business professionals make better informed decisions in the practice of law and in managing their businesses. The flagship product for legal research and analytics is Lexis Advance, which provides statutes and case law together with analysis and expert commentaries from secondary sources, such as Matthew Bender. Furthermore, Lexis Advance includes the leading citation service, Shepard’s, which advises on the continuing relevance of case law precedents. In North America, LexisNexis also provides customers with news and business information, ranging from daily news to company filings, public records information, legal analytics tools, practical guidance, and efficiency solutions. LexisNexis also partners with law schools to provide services to students as part of their training.
In 2018, LexisNexis continued to release new versions of Lexis Advance, an innovative web and mobile application designed to transform how legal professionals conduct research and use analytics and data to drive decision making. Built on the New Lexis advanced technology platform, Lexis Advance allows customers within legal and professional organisations to find relevant information more easily and efficiently, helping to drive better outcomes. Future releases will further expand content and add new innovative analytical tools extensively using machine learning (ML) and natural language processing (NLP). LexisNexis employs lawyers and trained editors with professional legal backgrounds who review, annotate, and update its legal content to help ensure the collection is current and comprehensive. This domain expertise combined with artificial intelligence (AI) and RELX’s big data HPCC technology enables LexisNexis to update its entire legal collection faster and more efficiently than before, while also identifying and linking content, enabling customers to identify previously undiscovered relationships between documents.
LexisNexis continues to invest in advanced ML and AI capabilities that help power Lexis Advance. In 2018, these technologies were used to enhance the Lexis Answers solution which leverages advanced NLP technologies, with the introduction of additional question types and features.
Table of Contents
RELX Annual report and financial statements 2018 | Legal | 29 | |
|
In 2018, LexisNexis enhanced Lexis Advance by incorporating advanced visualisations including ‘Ravel View’, a visualisation enhanced by Shepard’s treatment insights that transforms traditional case law search lists into a map of the most authoritative cases. In 2018, LexisNexis also introduced Shepard’s Case Card, which visually displays key Shepard’s data such as the number of citing references, type of treatment and most cited headnote for case law search results.
LexisNexis also continues to expand the reach of its decision tools and analytics. In 2018, LexisNexis launched Lexis Analytics, a suite of analytics tools that incorporates the capabilities of Lex Machina, Intelligize, and Ravel Law. In conjunction with the launch of Lexis Analytics, LexisNexis also launched Context, a legal language analytics solution that enables users to extract language deemed most persuasive by judges from court opinions, challenges, and motions.
The legal analytics tool Lex Machina also extended its reach with the addition of four new modules in 2018, including Trade Secret and Insurance, taking the total number of practice areas covered to 13. Lexis Practice Advisor rolled out an additional eight modules, including Antitrust, Data Privacy and Security, and Trusts and Estates, taking the total to 17 active modules.
In the Intellectual Property analytics space, LexisNexis proprietary Patent Asset Index, created by PatentSight, is used by corporations worldwide to manage and value their intellectual property portfolios.
In 2018, LexisNexis also launched a State Law Comparison Tool on Lexis Practice Advisor, which covers four practice areas and 51 jurisdictions. The tool compares differences in the law across state jurisdictions and produces a customisable report to support complex research projects.
In Canada, LexisNexis enhanced Lexis Advance Quicklaw by incorporating advanced data visualisation with the introduction of Search Term Maps.
LexisNexis also supplies Business of Law Software Solutions to law firms and corporate legal departments. These solutions include practice management solutions, case management, and cost recovery services.
In international markets outside North America, LexisNexis serves legal, corporate, government, accounting and academic markets in Europe, Africa and Asia Pacific with local and international legal, regulatory and business information. The most significant of these businesses are in the UK, France, Australia and South Africa.
In the UK, LexisNexis is a leading legal information provider offering an extensive collection of primary and secondary legislation, case law, expert commentary, practical guidance, and current awareness. Its extensive portfolio includes a number of leading brands: Halsbury’s, Butterworths, Tolley, MLex, and Jordan Publishing. In 2018, LexisNexis has continued to bring increasingly sophisticated analytics to market, such as Tolley.AI, aquestion-and-answer research tool that uses NLP to understand and answer customer questions within the tax practice area.
In 2018, LexisNexis further increased practical guidance functionality. This included adding greater depth and practical overlay to the core content set, launching new content types such as interactive workflow documents, as well as further investment in LexisPSL’s search capability. Contract productivity and proofreading tool LexisDraft is widely used among the largest law firms, while MLex has become a leading source of regulatory news and insight for legal professionals. Tolley, the LexisNexis tax intelligence suite, continued to expand its reach in 2018, with tax firms of all sizes leveraging TolleyLibrary and TolleyGuidance.
In France, LexisNexis’ main offering, Lexis360, is an integrated solution combining legal information,in-depth analysis with JurisClasseur content, and practical guidance. In 2018, LexisNexis enhanced the Lexis360 solution, improving user experience, performance and search relevance.
|
| |||
LexisNexis UK legal practical guidance service | Critical analysis, checklists, forms and practice guides authored by industry experts covering over 50 major practice areas | |||
|
|
| ||
LexisNexis North American Research Solution’s practical guidance service | Premier citations service | Provides analytics and benchmarking of SEC filings to optimise compliance strategies | ||
|
|
| ||
Flagship online legal research tool that transforms the way legal professionals conduct research | LexisNexis UK flagship legal online product | Patent analytics solution that provides insights into the strength, quality and value of patent portfolios | ||
| ||||
Provides Legal Analytics to companies and law firms, enabling them to craft successful strategies, win cases and close business |
Table of Contents
30 | RELX Annual report and financial statements 2018 | Business review | |
|
In South Africa, LexisNexis launched a regulatory monitoring service for 13 African countries, through its online Lexis Assure product.
In Austria, LexisNexis launched two modules for Lexis360, targeting the tax and corporate segments, adding video content and webinar capabilities.
In the Middle East, LexisNexis launched Gulf Legal Advisor, an integrated practical guidance solution.
In the Asia Pacific region, LexisNexis continued its focus on providing authoritative local online content embedded in decision tools for legal professionals. In Australia, the New South Wales Court of Appeal Analyser was launched with data visualisation, and New Zealand launched ComplyHub, which is a regulatory compliance tool for small and medium sized businesses. Lexis China released a new version of its flagship online legal research platform with improved user experience features and expanded content.
Supporting our Rule of Law mission, LexisNexis has been named among the top ten companies for corporate social responsibility in the 2018 Annual Review of the State of CSR in Australia and New Zealand for a second year running. LexisNexis Australia is also an official project partner in a landmark inquiry led by the Australian Human Rights Commissioner into the challenges to human rights and freedoms presented by technologies such as AI, social media, and big data.
Market opportunities
Longer term growth in legal and regulatory markets worldwide is driven by increasing levels of legislation, regulation, regulatory complexity and litigation, and an increasing number of lawyers. Additional market opportunities are presented by the increasing demand for online information solutions, legal analytics and other solutions as well as decision support solutions that improve the quality and productivity of research, deliver better legal outcomes and improve business performance. Notwithstanding this, legal activity and legal information markets are also influenced by economic conditions and corporate activity, as has been seen with the continued subdued environment in North America and Europe.
Strategic priorities
LexisNexis Legal & Professional’s strategic goal is to enable better legal outcomes and be the leading provider of productivity-enhancing information, analytics and information-based decision
tools in its market. To achieve this, LexisNexis is focused on introducing next-generation products and solutions on the global New Lexis platform and infrastructure; incorporating advanced technologies including ML and NLP; leveraging New Lexis globally to driveprint-to-electronic migration and long-term international growth; and upgrading operational infrastructure, improving process efficiency and gradually improving margins.
In the US, LexisNexis is focused on the ongoing development of legal research and practice solutions that help lawyers make data-driven decisions. Over the coming years, progressive product introductions, based on the New Lexis platform and powered by big data HPCC Systems technology, will combine advanced technologies, enriched content and sophisticated analytics to enable LexisNexis customers to make data-driven legal decisions and drive better outcomes for their organisations and clients.
Outside the US, LexisNexis is focused on growing online services and developing further high-quality actionable content and decision tools, including the development of additional practical guidance and decision tools. In 2019, LexisNexis will continue to expand the New Lexis platform globally, including launches in Malaysia and Singapore. Additionally, LexisNexis is focusing on the expansion of its activities in emerging markets.
LexisNexis is also continuing the mission of spreading equality, transparency and access to legal remedies globally through the recently formed LexisNexis Rule of Law Foundation, anon-profit entity that will help provide financial and other support for projects that aim to advance the Rule of Law around the world.
Business model, distribution channels and competition
LexisNexis Legal & Professional products and services are generally sold directly to law firms and to corporate, government, accounting and academic customers on a paid subscription basis, with subscriptions with law firms often under multi-year contracts.
Principal competitors for LexisNexis in US legal markets are Westlaw (Thomson Reuters), CCH (Wolters Kluwer) and Bloomberg. In news and business information key competitors are Bloomberg and Factiva (News Corporation).
Significant international competitors include Thomson Reuters, Wolters Kluwer and Factiva.
Table of Contents
RELX Annual report and financial statements 2018 | Legal | 31 | |
|
2018 financial performance
2018 £m | 2017† £m | Underlying growth | Portfolio changes | Currency effects | Total growth | |||||||||||||||||||
Revenue | 1,618 | 1,686 | +2% | -3% | -3% | -4% | ||||||||||||||||||
Adjusted operating profit | 320 | 328 | +10% | -10% | -2% | -2% |
Underlying revenue growth in 2018 was in line with the prior year, with continued efficiency gains driving strong underlying operating profit growth.
Underlying revenue growth was +2%. The difference between the constant currency and underlying growth rates reflects portfolio changes.
Underlying adjusted operating profit growth was +10%. The increase in operating profit margin reflects ongoing organic process improvements as we enter the latter stages of systems decommissioning. This more than offset the absence of a profit contribution from joint ventures, and other portfolio effects.
The market environment for legal services, and for legal information providers, remained stable. Electronic revenues saw continued growth, partially offset by print declines.
Theroll-out of new platform releases with broader data sets and tools continued across our US and international markets.
In 2018 we supported the organic expansion of our leading legal analytics services with the acquisition of the German IP analytics business Patentsight, and disposed of two minor assets.
2019 outlook
Trends in our major customer markets are unchanged, continuing to limit the scope for underlying revenue growth. We expect good underlying profit growth.
† | 2017 restated for adoption of new accounting standards IFRS 9, IFRS 15 and IFRS 16. |
Table of Contents
32
| RELX Annual report and financial statements 2018 | Business review
|
Intelligize
helping law firms advise on complex financial disclosures
Mayer Brown is a global law firm that advises
the world’s leading companies and financial
institutions on their most complex deals and
disputes. With extensive reach across four
continents, it is the only integrated law firm in
the world with approximately 200 lawyers in
each of the world’s largest financial centres
– New York, London and Hong Kong.
Mayer Brown advises issuers, investment banks and investors in making disclosures to the US Securities and Exchange Commission (SEC). These disclosures relate to transactions such as public offerings. The firm’s clients are under constant pressure to stay up to date with regulatory change. They depend on Mayer Brown partner Anna Pinedo and her colleagues to help them ensure the disclosures are accurate and that they are aware of disclosure trends, peer company disclosures and related matters. However, researching relevant precedents can take a lot of time – so finding a more efficient way of working is critical to Mayer Brown and its clients.
When Mayer Brown is engaged on a new securities offering, it regularly uses Intelligize to quickly find peer companies in the same industry for insights on similar disclosures. Intelligize instantly provides links to relevant SEC comments and responses from multiple peer companies. This puts clients in a position to anticipate potential problems and put forward disclosures that avoid expensive and time consuming comment letters from the regulator. | About Intelligize
Intelligize pulls together and automatically links a broad set of SEC disclosure documents from filings to comment letters, agreements and other exhibits – enabling customers to navigate between related content with ease.
With advanced search tools and graphical analytical views, the solution rapidly delivers deep insights into filing and disclosure characteristics that would otherwise require extensive research effort. Intelligize makes it easy to identify market standard language and mitigate risk in disclosures by benchmarking output from multiple peer companies. |
Table of Contents
RELX Annual report and financial statements 2018 | Legal
| 33
| |
|
Mayer Brown LLP’s offices in New York |
Intelligize makes it easy to find the precedents you know are out there for specific transaction types and peer companies. It allows us to very efficiently analyze massive amounts of disclosure documents, efficiencies we can pass on to our clients.
Anna Pinedo Partner, Mayer Brown LLP
|
Table of Contents
34 | RELX Annual report and financial statements 2018 | Business review | |
|
Our events leverage industry expertise, large data sets and technology to enable our customers to generate billions of dollars of revenues for the economic development of local markets and national economies around the world.
|
◾ | More than 500 events are in the Reed Exhibitions portfolio | |||
◾ | 43 industry sectors are served in almost 30 countries across the globe | |||
◾ | Each year we host around 130,000 exhibitors attracting more than 7m participants | |||
◾ | In 2018 Reed Exhibitions launched 44 new events | |||
◾ | Our digital products increase the value of our events to participants, enabling them to make new contacts and meetface-to-face to do business. In 2018, 247 events offered proactive matchmaking and the vast majority of customers using the matchmaking service reported higher value and satisfaction
|
Business overview
Exhibitions is a leading global events business. It combinesface-to-face with data and digital tools to help customers learn about markets, source products and complete transactions at over 500 events in almost 30 countries, attracting more than 7m participants.
Reed Exhibitions has its headquarters in London and has further principal offices in Paris, Vienna, Düsseldorf, Moscow, Norwalk (Connecticut), Mexico City, São Paulo, Abu Dhabi, Beijing, Shanghai, Tokyo, Singapore and Sydney. Reed Exhibitions has 4,200 employees worldwide and its portfolio of events serves 43 industry sectors.
Revenues for the year ended 31 December 2018 were £1,219m compared with £1,109m† in 2017 and £1,047m† in 2016. In 2018, 18% of Reed Exhibitions’ revenue came from North America, 44% from Europe and the remaining 38% from the rest of the world on an event location basis.
Reed Exhibitions organises influential events in key markets focused on addressing the needs of the industry, where participants from around the world meetface-to-face to do business, to network and to learn. Its events encompass a wide range of sectors. They include construction, cosmetics, electronics, energy and alternative energy, engineering, entertainment, gifts and jewellery, healthcare, hospitality, interior design, logistics, manufacturing, media, pharmaceuticals, real estate, recreation, security and safety, transport and travel.
Market opportunities
Growth in the exhibitions market is influenced both bybusiness-to-business marketing spend and by business investment. Historically, these have been driven by levels of corporate profitability, which in turn has followed overall growth in gross domestic product. Emerging markets and higher growth sectors provide additional opportunities. Reed Exhibitions’ broad geographical footprint and sector coverage allows it to effectively and efficiently capture growth opportunities globally as they emerge.
As some events are held other than annually, growth in any one year is affected by the cycle ofnon-annual exhibitions.
Strategic priorities
Reed Exhibitions’ strategic goal is to deliver measurably higher value and improved outcomes to its customers. It is achieving this organically by being focused on understanding and responding to individual customers’ needs and business objectives and the changing markets it serves.
Reed Exhibitions delivers a platform for industry communities to conduct business, to network and to learn through a range of market-leading events in all major geographic markets and higher growth sectors, enabling exhibitors to target and reach new customers quickly and cost effectively.
† | 2016 and 2017 restated for adoption of new accounting standards IFRS 9, IFRS 15 and IFRS 16. |
Table of Contents
RELX Annual report and financial statements 2018 | Exhibitions | 35 | |
|
Organic growth will be achieved by continuing to generate greater customer value through combining the best offace-to-face with data and decision tools, launching new events, and by leveraging its global network and technology platforms for faster and more agile development and deployment of innovation. Reed Exhibitions is also actively shaping its portfolio through a combination of new launches, strategic partnerships and selective acquisitions in faster growing sectors and geographies, as well as by withdrawing from markets and industries with lower long-term growth prospects.
Reed Exhibitions is committed to continuously improving customer solutions and experience by developing global technology platforms based on industry databases, digital tools and analytics. By providing a variety of services, including its integrated web platform, the company continues to drive up customer value and satisfaction by proactively putting the right buyers and sellers together on the event floor. Increasingly, digital and multichannel services such as active matchmaking are becoming a normal part of the customer expectation and product offering, enhancing the value delivered through attendance at the event. Using customer insights, Reed Exhibitions has developed an innovative product offering that underpins the value proposition for exhibitors by broadening their options in terms of the type and location of stand they take and the channels through which they can address potential buyers.
In 2018 Reed Exhibitions launched 44 new events. These included many events which delivered on the strategy of taking sector expertise, customer relationships and leading brands from one market and extending them into new geographies using local operational capability.
Strong brands and value propositions in long established sectors continued to expand into new geographic markets with FIBO USA joining FIBO China and the original FIBO Germany in the fitness sector. There was also rapid extension of successful launches and recently acquired brands into new markets. Bar Convent Berlin, in the bar equipment sector, was extended into the USA in 2018 with Bar Convent Brooklyn. In property, the successful launch of MIPIM Property Tech Summit in New York was followed in 2018 by MIPIM Property in Paris.
The POP culture portfolio continued to grow strongly with launches in the USA (KeyStone Comic Con), South Africa (Comic Con Africa) and France (Play), and a further acquisition in the UK (Gamer Network).
Emerging high potential sectors and the evolution of existing industries were served through innovative and highly curated launches such as AI Expo (artificial intelligence), the Functional Fabric Fair (advanced fabrics), Lightweight Asia (advanced materials), Esports BAR(e-sports) and Travel Forward (travel technology).
Reed Exhibitions is active in developing exhibition markets with launches in Mexico, Brazil, South Korea, South Africa, Vietnam, Saudi Arabia and China during 2018.
Two small acquisitions were completed during 2018. As well as Gamer Network in the UK, Reed Exhibitions became the majority owner of the Automotive Manufacturing Technology & Material Show (AMTS) show in China and theco-located Shanghai International Assembly & Handling Technology Exhibition (AHTE).
In addition, in January 2019, Reed Exhibitions announced the acquisition of Mack Brooks, a business with a portfolio of more than 30 events in 14 countries, including Germany and the United Kingdom, serving nine industry sectors. Flagship brands include EuroBLECH (sheet metal working technology); inter airport (airport infrastructure and technology); Fastener Fair (fastener and fixing technology); and Chemspec (fine and speciality chemicals).
Business model, distribution channels and competition
Over 70% of Reed Exhibitions’ revenue is derived from exhibitor fees, with the balance primarily consisting of admission charges, conference fees, sponsorship fees and online and offline advertising. Exhibition space is sold directly or through local agents where applicable. Reed Exhibitions often works in collaboration with trade associations, which use the events to promote access for members to domestic and export markets, and with governments, for which events can provide important support to stimulate foreign investment and promote regional and national economic activity. Increasingly, Reed Exhibitions is offering visitors and exhibitors the opportunity to interact before and after the show through the use of digital tools such as online directories, matchmaking and mobile apps.
Reed Exhibitions is one of the largest global events organisers in a fragmented industry, holding a global market share of less than 10%. Other international exhibition organisers include Informa, Clarion and some of the larger German Messen, including Messe Frankfurt, Messe Düsseldorf and Messe Munich. Competition also comes from industry trade associations and convention centre and exhibition hall owners.
Table of Contents
36 | RELX Annual report and financial statements 2018 | Business review | |
|
|
|
| ||
MIPIM: The world’s property market | Everything about information security | China (Shenzhen) International Gifts, Handicrafts, Watches & Houseware Fair: One of the largest business gifts & home fairs in China | ||
|
|
| ||
World Travel Market: Premier global event for the travel industry | Salão Internacional do Automóvel: Brazil’s automobile event | Bar Convent Berlin: International bar & beverage trade show | ||
|
|
| ||
National Hardware Show: US home improvement and DIY trade fair | Interphex Japan: Japan’s pharmaceutical R&D and manufacturing show | Expoprotection: The exhibition for risk prevention & management | ||
|
|
| ||
One of the largest & longest standing electronics manufacturing trade shows | The world’s entertainment content market | The destination for the global aircraft interiors industry | ||
|
|
| ||
Leading international exhibition for personal care ingredients | International security conference | Focused on the culture & community that is gaming | ||
|
|
| ||
The golf business show | The trade show for the doors and windows industry | New York Comic Con: The East Coast’s largest pop culture convention
|
Table of Contents
RELX Annual report and financial statements 2018 | Exhibitions | 37 | |
|
2018 financial performance
2018 £m | 2017† £m | Underlying growth | Portfolio changes | Currency effects | Total growth | |||||||||||||||||||
Revenue | 1,219 | 1,109 | +6% | +1% | -2% | +10% | ||||||||||||||||||
Adjusted operating profit | 313 | 287 | +10% | +1% | -2% | +9% |
Underlying revenue growth rates exclude exhibition cycling effects.
Exhibitions achieved strong underlying revenue growth in 2018, with underlying operating profit growth reflectingcycling-in effects.
Underlying revenue growth was +6%. After portfolio changes and five percentage points ofcycling-in effects, constant currency revenue growth was +12%.
Underlying adjusted operating profit growth was +10% reflectingcycling-in effects.
In 2018 we continued to pursue organic growth opportunities, launching 44 new events and piloting and rolling out several data analytics initiatives.
Underlying growth was good in Europe and strong in Japan and China. The US continued to see differentiated growth rates by industry sector, and Brazil returned to growth. Most other markets continued to grow well.
We expect the Tokyo Olympic Games to constrain local venue capacity over the next 18 months, after which new and expanded exhibition space will become available. This could reduce the overall divisional underlying revenue growth rate by around one percentage point this year and next.
In 2018 we completed two small acquisitions, Gamer Network and AMTS, and made two minor disposals. Since the year end we have acquired Mack Brooks, a leading organiser of over 30 highly complementary events across key geographies and industrial verticals.
2019 outlook
We expect underlying revenue growth trends to continue, the above temporary venue constraints aside, and we expectcycling-out effects to reduce the reported revenue growth rate by around five percentage points.
† | 2017 restated for adoption of new accounting standards IFRS 9, IFRS 15 and IFRS 16. |
Table of Contents
38
| RELX Annual report and financial statements 2018 | Business review
|
Vision Expo
bringing clarity and vision
to small business growth
Coco and Breezy is a designer glasses and
sunglasses brandco-founded, owned and
designed by twins Corianna and Brianna
Dotson. The sisters launched their brand
in 2009 at the age of 19 and in a few short
years have built a successful and high-profile
business with innovative eyewear designs
that have been worn by celebrities including
Prince, Beyoncé, Lady Gaga and Rihanna.
Based in New York, the twins channel their unique style to create frames using a variety of materials, patterns and colours. Over the past four years, Coco and Breezy have presented their brand and unveiled new frames and products to an audience of experts at Vision Expo. They attribute a component of their growth to showcasing their products via multiple platforms at the show including fashion shows, panel discussions, style events, interviews, and press previews. Vision Expo has enabled Coco and Breezy to make the shift from being a fashion brand, sold only in fashion stores, to embedding their company into the eyewear and eye care industry. | 400
stores across North America now stock Coco and Breezy eyewear thanks in part to business growth opportunities at Vision Expo | About Vision Expo
Vision Expo is one of the leading shows for eye care professionals to discover and learn about the latest technologies, trends and products in the sector.
The exhibition has two locations – Vision Expo East based in New York and Vision Expo West in Las Vegas. Combined, the shows bring together over 700 exhibitors and 27,000 global industry professionals to network and share knowledge on the latest innovations in products, solutions and fashion in the industry. Through the collaboration of The Vision Council, the exhibition also invests in programmes to drive market growth and promote awareness of eye health. |
Table of Contents
RELX Annual report and financial statements 2018 | Exhibitions
| 39
| |
|
Coco and Breezy at Vision Expo West |
Before we started showing at Vision Expo our eyewear was sold in about 30 fashion stores. Now our eyewear is sold in about 400 optical practices in North America.
Corianna and Brianna Dotson Co-founders, Owners and Designers, Coco and Breezy
|
Table of Contents
40
| RELX Annual report and financial statements 2018 | Business review
|
Table of Contents
RELX Annual report and financial statements 2018 | 41
| |
|
Responsibility
The Corporate Responsibility Report is an integral part of our Annual Report and Financial Statements. This section highlights progress on our 2018 czorporate responsibility objectives. The full 2018 Corporate Responsibility Report is available at www.relx.com/go/CRReport
Non-financial information statement RELX is required to comply with the reporting requirements of sections 414CA and 414CB of the Companies Act 2006, which relate to non-financial information. The list below outlines for our stakeholders where this information for RELX can be found:
Reporting Requirement: | ||||
Environmental matters | 51 – 52 | |||
Employees | 47 | |||
Social matters | 43, 45, 49, 50 | |||
Human rights, | 42, 46, 49, 50 | |||
Anti-corruption and anti-bribery matters, | 42, 46, 49, 50 | |||
Policies, due diligence processes and outcomes | 45 – 46 | |||
Description and management of principal risks and impact of business activity, | 60 – 63 | |||
Description of business model | 16, 23, 30, 35 | |||
Non-financial metrics | 14 – 52 |
Table of Contents
42 | RELX Annual report and financial statements 2018 | Business review | |
|
Corporate responsibility
We define corporate responsibility (CR) as the way we do business, working to increase our positive impact and reduce any negative impact. It ensures good management of risks and opportunities, helps us attract and retain the best people and strengthens our corporate reputation.
It means performing to the highest commercial and ethical standards and channelling our knowledge and strengths, as global leaders in our industries, to make a difference to society. We regularly survey key stakeholders, including in 2018, shareholders, employees, governments and communities where we operate, to help us identify our material CR issues and to set and test our CR objectives. The Board of Directors, senior management and our Corporate Responsibility Forum oversee CR objectives and performance.
We concentrate on the contributions we make as a business and on good management of the material areas that affect all companies:
1. Our unique contributions
2. Governance
3. People
4. Customers
5. Community
6. Supply chain
7. Environment
We are committed to the United Nations Global Compact (UNGC) to which we are a signatory and are dedicated to advancing the UN’s Sustainable Development Goals (SDGs) by 2030.
1. Our unique contributions
We make a positive impact on society through our knowledge, resources and skills, including:
◾ | Universal sustainable access to information |
◾ | Advance of science and health |
◾ | Protection of society |
◾ | Promotion of the rule of law and justice |
◾ | Fostering communities |
Scientific, Technical & Medical
Elsevier, the world’s leading provider of scientific, technical and medical information, plays an important role in advancing human welfare and economic progress through its science and health information, which spurs innovation and enables critical decision-making. To broaden access to its content, Elsevier supports programmes where resources are often scarce. Among them is Research4Life, a partnership with UN agencies and up to 175 publishers; we provide core and cutting-edge scientific information to researchers in more than 100 developing countries. As a founding partner and the leading contributor, Elsevier provides over a quarter of the material available in Research4Life, encompassing approximately 3,000 Elsevier journals and 20,000e-books. In 2018, there were over 1.8m Research4Life downloads from ScienceDirect.
In 2018, Elsevier launched Scientific African, an open access collaboration between the Next Einstein Forum and the NEF Community of Scientists, which will provide African researchers with a new platform to boost the impact and discoverability of their research. Elsevier also continued involvement with Innovate for Life, an accelerator launched by Amref, an Africa-driven international health NGO, to help African entrepreneurs develop solutions to African health challenges. To support early-stage innovators, the Elsevier Foundation is providing funding, as well as access to knowledge and scientific networks.
Risk & Business Analytics
Risk & Business Analytics’ tools and resources help law enforcement keep communities safe and help protect society by detecting and preventing fraud across a range of business sectors and at US federal, state and local government levels. In the year, LexisNexis Risk Solutions provided the Police Department in Keene, Texas with a free Community Crime Map tool, enabling citizens to view incidences of crime in their neighbourhood.
Risk and Business Analytics colleagues developed the ADAM programme in 2000 to help the National Center for Missing and Exploited Children find missing children. ADAM distributes missing child alert posters to law enforcement, hospitals, libraries and businesses within specific geographic search areas. In 2018, we expanded an email alert function to allow those opting in, to receive an email notification when a child is reported missing near them. In 2018, five children were found through ADAM, bringing the total number of children recovered to 182 since the start of the programme in 2000. During the year, we supported the launch of a new training course for UK police to help find missing children more quickly, working with Amber Alert Europe’s Charlie Hedges and Missing People. We hosted pilot training for the London Metropolitan Police at our head office in London which covered such themes as mental health, child sexual exploitation, homelessness and family breakdown and how to provide additional support, including Missing People’s free, 24/7 helpline.
To address the US opioid epidemic, LexisNexis Risk Solutions is taking a multi-faceted approach to help customers address the problem. Using our healthcare, identity, and law enforcement data sets, we proactively identify risky providers and individuals, complex prescription drug diversion schemes, and aid care coordination efforts for the addicted.
Table of Contents
RELX Annual report and financial statements 2018 | Corporate responsibility | 43 | |
REACT
Digital expertise to deploy educational resources quickly in emergencies
The private sector wants to support children’s education in emergencies with their skills and expertise, but do not know how to be most effective. REACT matches leading corporations with education needs on the ground in real time. We are using tech solutions to tackle the global education crisis.”
Sarah Brown GBC-Education Executive Chair | The Global Business Coalition |
60 companies have joined REACT to ensure education for the most disadvantaged children around the world |
In 2018, LexisNexis Risk Solutions launched the Rapid Education Action (REACT) online platform for the Global Business Coalition for Education(GBC-Education) to allow companies to pledge and deploy their resources quickly in emergencies and disasters. The aim is to get millions of displaced and marginalised children whose learning has been disrupted by humanitarian crises back into education.
REACT was established to channel private sector engagement in support of Education Cannot Wait, a fund dedicated to education in emergencies launched at the 2016 World Humanitarian Summit in Istanbul, Turkey. |
To date more than 60 firms have signed up to the digital platform. One of them, software company Cerego, brokered a partnership with Thaki, a charity supporting education for refugee and migrant children in Lebanon. Thaki founder, Rudayna Abdo, says: “Providing online literacy training for dispersed migrant communities comes with many challenges. We were introduced to Cerego through REACT which is helping us pursue a successful, scalable, affordable, self-paced solution that can be replicated across geographies.” |
Table of Contents
44 | RELX Annual report and financial statements 2018 | Business review | |
|
1. Our unique contributions (continued)
Legal
LexisNexis Legal & Professional promotes the rule of law and access to justice through its products and services.
In the year, we expanded our Rule of Law Cafés – which bring a range of stakeholders together, including customers, government, NGOs and law societies to discuss opportunities to go beyond legal minimums to advance the rule of law – to new jurisdictions. In addition to London, there were Cafés in New York, Washington DC and Kuala Lumpur.
In the year, we supported the launch of the UNGC’s Peace, Justice & Strong Institutions Action Platform during UN General Assembly week and also hosted senior women lawyers from the Middle East region in London, Washington DC and New York City. Delegates met with judges, lawyers, law professors and representatives of professional organisations, legislative bodies, and governmental institutions and explored the approach of peers to human rights, intellectual property and sustainability.
Exhibitions
Reed Exhibitions’ events strengthen communities and support our CR focus areas. In 2018, we advanced show sustainability including with the launch of Proud Experiences in London, the first event of its kind focusing on the LGBTQ+ travel market, which will move to New York City in 2019. Over three days, attendees were matched with international exhibitors to explore opportunities in a LGBTQ+ global marketplace estimated by media partner The Telegraph, in attendance throughout the event, to be worth $211 billion. There were masterclasses on issues surrounding issues arising for LGBTQ+ travellers, including whether they should boycott or support local populations in destinations where LGBTQ+ rights are curtailed. In the year, Reed Exhibitions introducedBio-Mass Innovation Expo in Milan. PSI 2018, for the promotional products industry, became one of the first trade shows to ban plastic cups. Pollutec also celebrated its 40th anniversary, a showcase for environmental equipment, technologies and services. Circular economy was a key theme to reduce the health and environmental impacts of plastic waste and pollution.
Across RELX
We created new functionality for the free RELX SDG Resource Centre, which advances awareness, understanding and implementation of the UN’s 17 SDGs to end poverty, protect the planet and ensure prosperity for all people by 2030, with a new content management system to make it faster and easier to upload content on to the site. The RELX SDG Resource Centre site features articles, tools, news, events, networking and original research, including in 2018, a review of SDG 3 which showed that related research resulting from a collaboration between academic institutions and private industry represents a fraction of the total scholarly output (average of 1.5% over the period), however it has a field-weighted citation impact, a measure of quality, nearly four times that of research undertaken by academic institutions alone. We held two SDG Inspiration Days in the year which brought together business, government and civil society to scale engagement on the SDGs. To advance the SDGs, the theme in Silicon Valley was the role for disruptive technology and in Amsterdam, building partnerships. The SDG Resource Centre was a tool for women entrepreneurs participating in the WE Empower UN SDG Challenge, a global business competition for women entrepreneurs advancing the SDGs.
2018 marked the eighth year of the RELX Environmental Challenge, focused on providing improved and sustainable access to water and sanitation where it is presently at risk. The $50,000first-prize winner, Flexcrevator, will progress an innovative pit latrine emptying device developed by North Carolina State University. The $25,000second-prize winner was Handypod, an affordable sanitation solution by Cambodia-based social enterprise, Wetlands Work, developed for floating communities and those seasonally affected by flooding. The prize was announced during the UNGC’s CEO Water Mandate meeting during 2018 World Water Week in Stockholm; we supported the attendance of three former RELX Environmental Challenge winners at World Water Week, allowing them to meet founders and build networks in their field.
Table of Contents
RELX Annual report and financial statements 2018 | Corporate responsibility | 45 | |
|
2018 OBJECTIVES | Achievement | |||
Advance and make publicly available research on the state of science underpinning the SDGs | ◾ | Scientific African launched at the Next Einstein Forum in Kigali, Rwanda
| ||
◾ | Launched SDG Perspectives project, showcasing the impact of the SDGs on scholarly debate
| |||
◾ | Produced RELX SDG Graphic on the state of science underpinning SDG 3, good health and wellbeing | |||
Partner with the National Center for Missing and Exploited Children to expand ADAM programme email alerts to US consumers; advance course for UK policing on missing cases training | ◾ | Enabled ADAM email alerts; 500 registrations
| ||
◾ | Supported course for UK policing on missing cases, encompassing engaging the media and right to privacy, return processes and ongoing support and prevention
| |||
Roll out RELX Rule of Law Cafes across multiple jurisdictions | ◾ | Expanded Rule of Law Cafés to New York, Washington DC and Kuala Lumpur; quarterly in London
| ||
◾ | Advanced Rule of Law activities, including Middle Eastern women lawyer study tours and support for mobile courts in Malaysia | |||
Advance sustainability content across show portfolios | ◾ | Established Event Sustainability Committee comprised of Reed Exhibitions portfolio directors
| ||
◾ | Developed Environmental Event Charter
| |||
New functionality for SDG Resource Centre including integration of UN and other partner content | ◾ | Built new content management system
| ||
◾ | Reached 100 partner content sources from UN Development Programme, among others
|
2019 OBJECTIVES
◾ Meaningful support to advance SDG 3 (good health and wellbeing), including Elsevier Foundation Women in Water in Africa leadership workshops
◾ Workstream on improving financial inclusion forlow-income citizens
◾ Meaningful support of SDG 16 (peace, justice and strong institutions), including support for UNGC SDG 16 Action Platform
◾ Meaningful support of SDG 11 (sustainable cities), including focus of Reed Exhibition’s World Efficiency Solutions and a ‘Good Cities’ 2019 Inspiration Day India
◾ Create new RELX SDG Graphics on the state of science underpinning the SDGs
◾ Broaden RELX SDG Resource Centre to include content from new partners and enhance functionality, including of SDG News Tracker |
OUR 2030 VISION*
Use our products and expertise to advance the SDGs, among them:
◾ SDG3: Good health and wellbeing
◾ SDG4: Quality education
◾ SDG10: Reduced inequalities
◾ SDG13: Climate action
◾ SDG16: Peace, justice and strong institutions
Enrich the SDG Resource Centre to ensure essential content, tools and events on the SDGs are freely available to all |
* | 2030 is the deadline for the UN’s Sustainable Development Goals; we aim to do our part towards their achievement. |
2. Governance
In 2018, we launched the newly revised and updated RELX Code of Ethics and Business Conduct (the Code) with a message to all staff. The Code provides the standards for our corporate and individual conduct and, among key issues, covers fair competition, anti-bribery, conflicts of interest, employment practices, data protection and appropriate use of Company property and information. It also encourages reporting of violations – with an anonymous reporting option where legally permissible – and prohibits retaliation against anyone for reporting a violation he or she believes may have occurred.
The Code supports the principles of the UNGC and stresses our commitment to human rights. In accordance with the UN’s Guiding Principles on Business and Human Rights, we have considered where and how we operate to determine how we can have the greatest positive impact on the human rights issues of modern slavery and human trafficking. For more information on human rights see Supply chain on page 50. In 2018, we updated our Modern Slavery Act Statement which highlights how we are working internally through our supply chain and externally with partners to address the risk of slavery and human trafficking.
We maintain a comprehensive set of compliance policies and procedures in support of the Code. These are reviewed at least annually to ensure they remain current and effective. Our policies and procedures help us comply with the law and conduct our business in an open, honest, ethical and principled way. In the case of our anti-bribery efforts, they comprise part of our adequate procedures for compliance with applicable laws.
Employees receive mandatory training on the Code – both as new hires and at regular intervals during their tenure – in order to maintain a respectful workplace, prevent bribery and protect personal and Company data. Mandatory periodic training covers key Code topics in depth and is supplemented by advancedin-person training for higher-risk roles.
In 2018, we took a number of steps to further enhance and embed our culture of compliance across RELX, including the global delivery of multiple culture of compliance training sessions across the Company. We offer employees a confidential reporting line, managed by an independent third party, accessible by telephone or online 24 hours a day, 365 days a year (as allowed under applicable law, employees may submit reports to the confidential line anonymously).
Table of Contents
46 | RELX Annual report and financial statements 2018 | Business review | |
|
2. Governance (continued)
Reports of violations of the Code or related policies are promptly investigated, with careful tracking and monitoring of violations and related mitigation and remediation efforts by Compliance teams across the business.
We remained diligent in our ongoing efforts to comply with applicable bribery and sanctions laws and to mitigate risks in these areas. Our anti-bribery and sanctions program includes the enforcement of detailed, risk-based internal policies and procedures on topics such as doing business with government officials, gift and entertainment limits, gift registers, and complying with complex sanctions requirements. Relationships with third-parties and acquisition targets are evaluated for risk using questionnaires, references, detailed electronic searches, and Know Your Customer screening tools. We monitor and assess the implementation of our anti-bribery and sanctions programs by continually reviewing and updating our policies and procedures; conducting periodic programmatic risk-assessments, and conducting quality assurance reviews and internal audits on the operational aspects of the programmes.
Following the 2017roll-out of a Company email ‘PhishMe button’, which allows employees to make immediate reports, we marked our annual Cyber Security Awareness Month with the Great Phishing Challenge to help staff identify the difference between ‘phishy’ and legitimate emails. In the year, RELX won the PwC Building Public Trust Award for Cyber Security Reporting in the FTSE 350.
As a signatory to the UNGC and its principles, encompassing labour, environment, anti-corruption and human rights, we demonstrated leadership by maintaining our LEAD company status, participating in UNGC SDG Action Platforms: Health is Everyone’s Business; Decent Work in Global Supply Chains; Peace, Justice and Strong Institutions; and Water Security through Stewardship. We serve on the boards of the UNGC networks in the UK and Netherlands. We produce an annual Communication on Progress report, required of signatories annually, where we attained the Advanced Level.
Globally, in 2018, RELX paid £415m in corporate taxes. We are a responsible corporate taxpayer and conduct our tax affairs to ensure compliance with all laws and relevant regulations in the countries in which we operate. Tax is an important issue for our stakeholders and society at large. We have set out our approach to tax in our global tax strategy. This incorporates our Tax Principles along with additional disclosures around where we pay taxes and our broader contribution to society, available on our corporate website: www.relx.com/go/TaxPrinciples.
In the year, the RELX Tax team continued to engage with a range of policy makers and special interest groups to share practical experience of corporate engagement on tax laws and the ways such laws can advance government policy objectives. In the year, we also scoped projects on the rule of tax law both in the United Kingdom and South Africa.
The Statement of Investment Principles for the RELX UK pension scheme indicates that social, environmental or ethical issues that may have a financial impact on the portfolio or a detrimental effect on the strength of the employer covenant, are taken into account when making investment decisions. CR issues are relevant to other investment decisions we make. Among our sustainable investments is Agworld, a farm management software platform that allows farmers, agronomists and agricultural contractors to capture, manage and shareon-farm data and recommendations to improve land management sustainability and increase yields.
2018 OBJECTIVES | Achievement | |||
Expand corporate security incident response preparedness using a combination of technology, awareness training and simulations | ◾ | Business unit simulation training and response plan enhancements; updates to RELX Board
PwC Building Public Trust Award for Cyber Security Reporting in the FTSE 350 | ||
◾
| ||||
Establish risk mitigation framework for monitoring operational effectiveness of key internal compliance controls | ◾ | Completed enterprise-wide legal compliance risk assessment, identifying key risks and mitigation controls
Executed 2018 Compliance Testing and Monitoring Plan including completing quality assurance reviews of GDPR compliance and intermediary due diligence | ||
◾
| ||||
Engagement on rule of tax law |
◾
| RELX Tax and LexisNexis Legal & Professional South Africa collaboration on tax law codification in Africa
Supported Tax Aid and Tax Help for Older People, who provide free tax advice forlow-income and other beneficiaries | ||
◾
|
2019 OBJECTIVES
◾ Continue corporate security incident response preparedness; expand ISO 27001 data protection compliance certification
◾ New Culture of Compliance manager communications, training and resources
◾ Advance work on African tax law codification project |
OUR 2030 VISION
Continued progressive actions that advance excellence in corporate governance within our business and the marketplace |
Table of Contents
RELX Annual report and financial statements 2018 | Corporate responsibility | 47 | |
|
3. People
Our over 30,000 people are our strength. Our workforce is 51% female and 49% male, with an average length of service of 9.2 years. There were 42% female and 58% male managers, and 28% female and 72% male senior operational managers.
Female | Male | |||||||||||||||
Board of Directors | 4 | 36% | 7 | 64% | ||||||||||||
Senior operational managers* | 99 | 28% | 258 | 72% | ||||||||||||
All employees** | 16,400 | 51% | 15,700 | 49% |
* | Senior operational managers are defined as those managers up to and including three reporting lines from the CEO with a role in planning, directing or controlling the activities of the company. |
** | Full-time equivalent. |
At year end 2018, women made up 36% of the members of the Board. The two Executive Directors on the Board are male. The Nominations Committee considers the knowledge, experience and background of individual Board directors.
Our Diversity and Inclusion (D&I) Statement articulates our commitment to a diverse workforce and an environment that respects individuals and their contributions, regardless of gender, race or other characteristics. We updated our D&I Strategy to include nine progress indicators including pursuing best practice in candidate assessment to prevent unconscious bias in recruiting processes and ensuring positive gender portrayal in our marketing.
We maintain a D&I Advisory Group composed of a senior business and HR leader from each business unit, supported by a broader D&I Working Group with more than 150 participants. In 2018, our Employee Resource Groups grew to over 40 networks, such as women’s forums and pride groups, to facilitate support, mentoring and community involvement. We held our first-ever Diversity Awareness Month with a competition open to all employees in order to showcase commitment to D&I across RELX and a video with testimonials from senior leaders on why D&I matters to them.
RELX is a signatory to the Women’s Empowerment Principles, a UNGC and UN Women initiative to help companies empower women and promote gender equality. In 2018, we became a member of the Business in the Community Gender Campaign.
We comply with employee-related reporting requirements and, in 2018, we published our first UK gender pay gap data as part of the UK legislation. At RELX we commit to raising awareness and educate our employees on pay principles and equal pay. We invest in research to identify causes of pay differences and regularly evaluate our policies and processes to ensure they are aligned to our D&I vision. We commit to building a robust framework for monitoring pay equity across the enterprise. We have formally made these pledges to the Equal Pay International Coalition UN General Assembly week in New York.
Our employees have the right to a healthy and safe workplace, as outlined in our Global Health and Safety Policy. We concentrate on areas of greatest risk for example, warehouses, events and exhibitions. As a primarily office-based company, we also focus on manual handling, slips, trips and falls. To reduce our severity rate (lost days per 200,000 hours worked), we conduct risk assessments and work with a third party in the US to assign a nurse case manager to each complex or severe claim. There were 8 lost time incidents in the year.
In the US, where we have the largest concentration of employees, our programmes promote workplace wellbeing through health screenings, online assessments, stress awareness training and smoking cessation courses, with financial incentives for participation.
Dedicated health and wellbeing programmes are now available to more than 70% of our employees. We also maintain a network of more than 90 Wellness Champions. We provide a workplace wellbeing award scheme which allows all employees, in partnership with their local Wellbeing Champion, to submit a proposal for a wellbeing initiative at their location. The proposals are judged with the winning proposals granted funding. In the year, we developed a partnership with Shaw Mind Foundation to deliver a series of webinars to all staff on supporting mental health at work.
2018 OBJECTIVES | Achievement | |||
Conduct a Global Employee Opinion Survey including questions on culture, ethics and wellbeing | ◾ | Survey conducted globally; 90% response rate, highest to date
| ||
◾ | CEO review of results; cascaded to business leaders – action plans in development | |||
Update D&I Strategy including the launch of D&I progress indicators | ◾ | D&I Strategy approved by senior leadership; nine priority actions
| ||
◾ | D&I governance updates
| |||
◾ | First global Diversity Awareness Month | |||
External partnership to raise awareness of mental health across RELX | ◾ | Engagement with Shaw Mind Foundation; webinar made available to all employees
| ||
◾ | Research support for Foundation’s mental health and the SDGs project |
2019 OBJECTIVES
◾ Progress UN Equal Pay International Coalition commitments
◾ Establish a dashboard for D&I metrics
◾ Develop mental health metrics and response plans |
OUR 2030 VISION
Continued high-performing and satisfied workforce through talent development, D&I and wellbeing; scale support for external human capital initiatives |
Table of Contents
48
| RELX Annual report and financial statements 2018 | Business review
|
Advancing the RELX SDG Resource Centre
Access to critical knowledge to advance the United Nations Sustainable Development Goals |
The RELX SDG Resource Centre was an essential tool for the women entrepreneurs who took part in the We Empower UN SDG Challenge for women from around the world supporting the SDGs through their businesses who are helping to create the world we want by 2030.
Amanda Ellis Former New Zealand Ambassador to the United Nations in Geneva, Senior Special Adviser for International Diplomacy and the SDGs at the Julie Ann Wrigley Global Institute of Sustainability | ||||
The RELX SDG Resource Centre advances awareness, understanding and implementation of the 17 global goals |
75,000+
sources in the RELX SDG Resource Centre’s SDG News Tracker forup-to-the-minute news on the SDGs from around the world | The free RELX SDG Resource Centre (sdgresources.relx.com) advances awareness, understanding and implementation of the 17 UN SDGs which aim to end poverty, protect the planet and ensure prosperity for all people by 2030.
The site provides leading edge articles, reports, tools, events, videos and legal practical guidance from across RELX. It also features content from partners, including the UNGC and the United Nations Development Programme.
In 2018, we released original research on the state of science underpinning SDG 3 (good health and well-being) and added content from Scientific African. This is a partnership between the Next Einstein Forum and Elsevier, bringingstate-of-the-art technology and processes to create an open access megajournal to accelerate scientific capacity-building across Africa. | Scientific African will provide African researchers with a new platform to boost the impact and discoverability of their research.
Also in the year, we held two RELX SDG Inspiration Days to showcase the SDG Resource Centre and the importance of knowledge to advance the SDGs bringing together more than 100 business colleagues, government representatives, NGO leaders, and young people.
RELX SDG Inspiration Day Silicon Valley focused on disruptive technology to advance the SDGs and SDG Inspiration Day Amsterdam concentrated on The Power of Partnerships to advance the SDGs: what partners, what responsibilities, what innovation, and how to scale and measure impact. Partners on the events included the UNGC, the BanKi-Moon Centre for Global Citizens and the Responsible Media Forum. |
Table of Contents
RELX Annual report and financial statements 2018 | Corporate responsibility | 49 | |
|
4. Customers
In 2018, we surveyed more than 533,000 customers through Net Promoter Score (measuring customer advocacy) and business dashboard programmes. This allows us to deepen our understanding of customer needs and drives improvements. Results are reviewed by the CEO and senior operational managers and communicated to staff.
In the year, we updated our Editorial Policy to incorporate respect for human rights and to encourage pluralism of sources, ideas and participants. We strengthened the privacy provision, added in responsible use of artificial intelligence and our commitment to transparency. We are developing training to help colleagues understand the Editorial Policy in action.
The RELX Quality First Principles Working Group focuses on quality in content, data and business processes. In 2018, our operations in the Philippines won the Philippine Quality Award – Proficiency in Quality Management (Level 2), the highest national quality award in the Philippines for businesses demonstrating excellence in managing and delivering quality.
We are committed to improving access to our products and services for all users, regardless of physical ability. Our Accessibility Policy aims to lead the industry in providing accessibility solutions to customers, with products that are operable, understandable and robust. In 2018, members of the Accessibility Working Group logged over 200 accessibility projects and Elsevier’s Global Books Digital Archive fulfilled more than 5,000 disability requests, 84% of them through AccessText.org, a service we helped establish.
In 2018, we launched the first RELX Accessibility Awards to showcase how accessibility ensures more accessible products and services and a better user experience for all our customers, including people with disabilities. Among the winners were two colleagues from LexisNexis Risk Solutions who created a computer-automated, web accessibility code scanner that checks product code against the leading international accessibility standard: Section 508/WCAG 2.0AA.
For the first time, in 2018, Forbes named RELX as one of the World’s Most Innovative Companies, one of only 20 European companies to place among the top 100.
2018 OBJECTIVES | Achievement | |||
RELX Editorial Policy update and training | ◾ | RELX Editorial Policy Working Group, internal and external stakeholders, contribute to updated Policy
| ||
◾ | RELX Editorial Policy in Action training in development | |||
New CR as a Sales Tool curriculum: Customers and the SDGs | ◾ | CR as a Sales Tool Working Group demos
| ||
◾ | Outreach to business unit sales directors and employees from newly acquired companies
| |||
◾ | Recommendation to include the RELX SDG Resource Centre in client materials | |||
Introduce RELX Accessibility awards to recognise exceptional employee efforts to advance accessibility | ◾ | Winners chosen for the first Accessibility Leadership Award and Practioners Award
All-employee communications
| ||
◾
|
2019 OBJECTIVES
◾ Roll out new Editorial Policy
◾ Expand online content for CR as a Sales Tool
◾ Develop Accessibility Advisory Board |
OUR 2030 VISION
Continue to expand customer base across our four business units through excellence in products and services, the result of active listening and engagement, editorial and quality standards, and accessibility; a recognised advocate for ethical marketplace practice |
5. Community
RE Cares, our global community programme, supports employee volunteering and giving that makes a positive impact on society. In addition to local initiatives of importance to employees, the programme’s core focus is on education for disadvantaged young people that advances one or more of our unique contributions as a business. Staff have up to two days’ paid leave per year for their own community work. We donated £3.7m in cash (including through matching gifts) and the equivalent of £13.9m in products, services and staff time in 2018. 42% of employees were engaged in volunteering through RE Cares and we reached 25,000 disadvantaged young people through time,in-kind and cash donations. A network of 215 RE Cares Champions ensures the vibrancy of our community engagement.
Table of Contents
50 | RELX Annual report and financial statements 2018 | Business review | |
|
5. Community (continued)
Each September, we hold RE Cares Month to celebrate our community commitment. During the Month, we raised funds ($159,949 to date) to help global fundraising partner, SOS Children’s Villages, enable girls working in dangerous conditions in Yamoussoukro, Côte d’Ivoire to pursue an education. By the close of 2018, 50 girls were in school or receiving vocational training. Participants also received child rights training, with companion sessions for parents to help them safeguard their children’s rights. An awareness campaign involving parents and local leaders was conducted in collaboration with three community level committees, where girls involved in the project spoke out about the dangers of child labour based on their own experience.
We held our annual global book drive, yielding 7,200 books for local and developing world readers and announced the winners of the eighth Recognising Those Who Care Awards to highlight the exceptional contributions to RE Cares of ten individuals and three RE Cares teams. Individual winners from across the business travelled to RELX-supported projects in Phnom Penh, Cambodia with VOICE (www.voice.org.au/), a humanitarian organisation working with people in crisis in Cambodia.
2018 OBJECTIVES | Achievement | |||
Foster development of youth employability skills | ◾ | Focus of RE Cares, RELX global community programme, in 2018
| ||
◾ | Partnerships with charities focused on youth employability skills
| |||
◾ | $300,000 seed funding, over three years, through the Elsevier Foundation for Imperial College London’s Invention Rooms | |||
Research impact of RE Cares on staff retention | ◾ | Study of 9,000 employees showed positive correlation between volunteering and tenure, with reduced attrition
| ||
◾ | Average tenure: 10 years for volunteers vs 7 years RELX average |
2019 OBJECTIVES
◾ New RELX global fundraising partnership
◾ Create guidance for calculating pro bono contributions |
OUR 2030 VISION
Through our unique contributions, significant, measurable advancement of education for disadvantaged young people; investments with partners for maximum impact |
6. Supply chain
Given the importance of maintaining an ethical supply chain, we have a Socially Responsible Supplier (SRS) programme encompassing all our businesses, supported by colleagues with expertise in operations, distribution and procurement and a dedicated SRS Director from our global procurement function.
We have a comprehensive Supplier Code of Conduct (Supplier Code), available in 16 languages, which we ask suppliers to sign and display prominently in the workplace. It commits them to following applicable laws and best practice in areas such as human rights, labour and the environment. We ask suppliers to require the same standards in their supply chains, including requesting subcontractors to enter into a written commitment to uphold the Supplier Code. The Supplier Code states that where local industry standards are higher than applicable legal requirements, we expect suppliers to meet the higher standards.
Through our SRS database, we track key suppliers and those located in medium and high-risk countries as designated by our supplier risk tool. This incorporates eight indicators, including human trafficking information from the US State Department and Environmental Performance Index results produced by Yale University and partners. The tracking list changesyear-on-year based on the suppliers we engage to meet the needs of our business. We ended 2018 with 89% of suppliers on the SRS tracking list as signatories to the Supplier Code. We have embedded the Supplier Code into our sourcing process as a criterion for doing business with us and have a total of 3,082 suppliers who have agreed to the Supplier Code in 2018, up from 2,937 in 2017.
We engage a specialist supply chain auditor who undertook 84 external audits on our behalf in 2018. An incidence ofnon-compliance triggers continuous improvement reports summarising audit results, with remediation plans and submission dates agreed and signed by both the auditor and supplier.
Theroll-out of our US Supplier D&I programme continued in 2018 with efforts to improve the mix of diverse suppliers, with a focus on minority-, woman- and veteran-owned businesses. In total, 11% of US spend was with diverse suppliers. Among them was SHI International. SHI is both a minority-owned and woman-owned enterprise and provider of IT products and services. Their Diversity Business Development Initiative builds and maintains a community of diverse suppliers and partners. They continue to grow an effective Tier II program by accessing their Services Partner database utilising certified HUBZone, minority-, woman-,veteran-and small disadvantaged-owned businesses.
2018 OBJECTIVES | Achievement | |||
Increase number of suppliers as Code signatories | ◾ | 3,082 (2017: 2,937) | ||
Continue using audits to ensure continuous improvement in supplier performance and compliance | ◾ | 84 audits completed, including six 2nd tier audits | ||
◾ | 34% reduction since 2017 in open audit findings
| |||
Continue to advance the US Supplier D&I programme | ◾ | Proactive engagement with diverse suppliers with a focus on minority-, women- and veteran-owned businesses
| ||
◾ | 11% diversity spend; increases in spend with veteran- and minority-owned businesses |
Table of Contents
RELX Annual report and financial statements 2018 | Corporate responsibility | 51 | |
|
2019 OBJECTIVES
◾ Increase the number of suppliers as Code signatories
◾ Continue using audits to ensure continuous improvement in supplier performance and compliance
◾ Continue to advance US Supplier D&I programme |
OUR 2030 VISION
Reduce supply chain risks related to human rights, labour, the environment and anti-bribery by ensuring adherence to our Supplier Code of Conduct through training, auditing and remediation; drive supply chain innovation, quality and efficiencies through a strong, diverse network of suppliers |
7. Environment
Our environmental targets reflect our environmental impacts and were set following input from stakeholders. Targets are set using the science-based target methodology and include a commitment to certify 50% of the business against the ISO 14001 Environmental Management System standard by 2020. In 2018, we purchased 81% of our electricity from renewable energy and Renewable Energy Certificates. Full performance data can be found in the 2018 Corporate Responsibility Report (www.relx.com/go/ crreport). We attained an A in CDP’s Climate Change programme.
In 2018, RELX was one of 11 businesses which partnered with the Mayor of London on ambitious projects to cut pollution and emissions in excess of UK government thresholds.
Our Environmental Champions network,employee-led Green Teams and networks, such as the Publishers’ Database for Responsible Environmental Paper Sourcing, also provided significant insight into managing our environmental impacts. Our Environmental Standards programme sets benchmark performance and inspires green competition between offices. In 2018, 36 sites (41% of key locations) achieved five or more standards and attained green status. The RELX CFO, our most senior environmental champion, wrote to all staff on World Environment Day, sharing our environmental priorities and recognising environmental achievements across the business.
We have a positive environmental impact through our environmental products and services, which spread good practice, encourage debate and aid researchers and decision makers. The most recent results from the independent Market Analysis System show that our share of citations in environmental science represented 42% of the total market and 63% in energy and fuels.
The€50,000 winner of Elsevier’s 2018 Green and Sustainable Chemistry Challenge was Prajwal Rabhindari, President of the Research Institute for Bioscience & Biotechnology in Nepal. He is creating a water-based leaf extract of the guava plant – which possesses antioxidant and antibacterial properties – as a natural alternative to fungicides and chemical preservatives to minimise post-harvest food loss affecting smallholder farmers.
2018 OBJECTIVES | Achievement | |||
40% of locations to achieve five or more RELX Environmental Standards | ◾ | 41% achieved | ||
Purchase renewable electricity equal to 80% of global consumption | ◾ | Reached through purchase of European green tariff, USGreen-e certified and Asian Gold Power renewable energy certificates | ||
Achieve ISO 14001 Environmental Management System certification at three additional locations | ◾ | Certification achieved at additional sites (Philadelphia, Raleigh and Boca Raton)
Equivalent to 25% of employee headcount | ||
◾
|
2019 OBJECTIVES
◾ 55% of locations to achieve five or more RELX Environmental Standards
◾ Purchase renewable electricity equal to 90% of global consumption
◾ Achieve ISO 14001 Environmental Management System certification at three additional locations |
OUR 2030 VISION
Further environmental knowledge and positive action through our products and services and, accordingly, conduct our business with the lowest environmental impact possible |
2018 ENVIRONMENTAL PERFORMANCE | ||||||||||||||||||||||||
Absolute performance | Intensity ratio | |||||||||||||||||||||||
2018 | Variance | 2017 | 2018 | Variance | 2017 | |||||||||||||||||||
Scope 1 (direct emissions) tCO2e | 7,477 | -9% | 8,231 | 1.00 | -11% | 1.12 | ||||||||||||||||||
Scope 2 (location-based emissions) tCO2e | 74,279 | -12% | 84,590 | 9.91 | -14% | 11.50 | ||||||||||||||||||
Scope 2 (market-based emissions) tCO2e | 16,004 | -27% | 21,831 | 2.14 | -28% | 2.97 | ||||||||||||||||||
Total energy (MWh) | 179,228 | -4% | 186,228 | 23.92 | -6% | 25.32 | ||||||||||||||||||
Water (m3) | 332,490 | -4% | 344,918 | 44.38 | -5% | 46.90 | ||||||||||||||||||
Waste sent to landfill (%)* | 12% | -1%pts | 13% | 0.09 | -10% | 0.10 | ||||||||||||||||||
Production paper (t) | 35,555 | -3% | 36,484 | 4.75 | -4% | 4.96 |
* | From reporting locations. Intensity metric shows tonnes of waste sent to landfill/£m revenue. |
Table of Contents
52 | RELX Annual report and financial statements 2018 | Business review | |
|
7. Environment (continued)
ENVIRONMENTAL TARGETS | ||||||
Focus area | Targets 2020 | 2018 Performance | ||||
Climate change | Reduce Scope 1 and 2 location-based carbon emissions by 40% against a 2010 baseline | -49% | ||||
Energy | Reduce energy and fuel consumption by 30% against a 2010 baseline | -35% | ||||
Purchase renewable electricity equivalent to 100% of RELX’s global electricity consumption | 81% | |||||
Waste | Decrease total waste generated at reporting locations by 40% against a 2010 baseline | -52% | ||||
90% of waste from reporting locations to be diverted from landfill | 88% | |||||
Production paper* | 100% of RELX production papers, graded in PREPS, to be rated as ‘known and responsible sources’ | 100% | ||||
Environmental | Achieve ISO 14001 certification for 50% of the business by 2020 | 25% | ||||
Management System | Reporting locations achieving five or more RELX Environmental Standards | 41% |
* | All paper we graded in 2018 – 90% of total production stock – was graded 3 or 5 stars (known and responsible sources). |
We have reported on all emission sources required under the Companies Act 2006 (Strategic Report and Directors’ Report) Regulations 2013. We have included emissions from all operating companies within the Group.
We have used the GHG Protocol Corporate Accounting and Reporting Standard (revised edition) and the data has been assured by an independent third party, EY. Details on methodology and the assurance statement can be viewed in the 2018 Corporate Responsibility Report at www.relx.com/go/CRReport.
2018 investor and other recognition | ||||||
|
|
|
| |||
Constituent of the Ethibel | CDP | EPA Green Power Leader | FTSE4Good Index | |||
Sustainability Index | – Climate programme score: A | – Top 100 | Included in | |||
Included in | – Forest programme score: B | – FTSE4Good Global Index | ||||
– Excellence Europe | – Water programme score: B- | – FTSE4Good UK Index | ||||
– Excellence Global | – FTSE4Good Europe Index | |||||
|
|
|
| |||
RE100 | Dow Jones Sustainability | ISO 14001 | STOXX Global ESG | |||
– Member | Index Europe | – Certified | Leaders Indices | |||
– Constituent | – Included | |||||
|
|
|
| |||
ECPI Indices | Forbes | Oekom Corporate | Philippine Quality Award | |||
– Included | – The World’s Most Innovative | Responsibility Rating | – Recipient | |||
Companies 2018
| – Prime status |
The full 2018 Corporate Responsibility Report is available atwww.relx.com/go/CRReport |
Table of Contents
RELX Annual report and financial statements 2018
| 53
| |
|
review |
In this section | ||
54 | ||
60 |
Table of Contents
54 | RELX Annual report and financial statements 2018 | Financial review | |
|
Chief Financial Officer’s report
Nick Luff
Chief Financial Officer
Underlying revenue and adjusted operating profit growth in 2018 were 4% and 6% respectively, and adjusted earnings per share grew at 7% at constant currency, maintaining the financial performance trends seen in 2017. Our balance sheet remains strong, with Return on Invested Capital of 13.2% and we have maintained leverage at an appropriate level.
Comparative financial information in the following commentary has been restated following the adoption of IFRS 9 – Financial Instruments, IFRS 15 – Revenue from Contracts with Customers and IFRS 16 – Leases. See note 1 to the consolidated financial information on page 126 for further details.
Revenue
Underlying growth of revenue was 4%, with all four market segments contributing to underlying growth. The underlying growth rate reflects good growth in electronic andface-to-face revenues, partially offset by continued print revenue declines.
Reported revenue, including the effects of exhibition cycling, portfolio changes and currency movements, was £7,492m (2017: £7,341m), up 2%.
Exhibition cycling effects increased revenue growth by 1%, and the net impact of acquisitions and disposals reduced revenue growth by 1%. The impact of currency movements was to decrease revenue by 2%, principally due to the US dollar being weaker against sterling on average during 2018.
Profit
Underlying adjusted operating profit grew ahead of revenue at 6%, reflecting the benefit of tight cost control across the Group.
The net impact of acquisitions and disposals decreased adjusted operating profit by 2%. Currency effects decreased adjusted operating profit by 1%.
Total adjusted operating profit, including the impact of acquisitions and disposals and currency effects, was £2,346m (2017: £2,284m), up 3%.
Underlying operating cost growth was 4%, reflecting investment in global technology platforms and the launch of new products and services, partly offset by continued process innovation. Actions continue to be taken across our businesses to improve cost-efficiency. Total operating costs, including the impact of acquisitions, disposals and currency effects, increased by 2%.
The overall adjusted operating margin of 31.3% was 0.2 percentage points higher than in the prior year. On an underlying basis, including cycling effects, the margin improved by 0.4 percentage points. Acquisitions and disposals reduced the margin by 0.5 percentage points and currency effects increased the margin by 0.3 percentage points.
† | Restated for adoption of new accounting standards IFRS 9, IFRS 15 and IFRS 16. |
Table of Contents
RELX Annual report and financial statements 2018 | Chief Financial Officer’s report | 55 | |
|
2018 £m | Restated 2017 £m | Change | Change at constant currencies | Change underlying | ||||||||||||||||
Reported figures | ||||||||||||||||||||
Revenue | 7,492 | 7,341 | +2% | +4% | +4% | |||||||||||||||
Operating profit | 1,964 | 1,905 | +3% | |||||||||||||||||
Profit before tax | 1,720 | 1,721 | 0% | |||||||||||||||||
Net profit attributable to RELX PLC shareholders | 1,422 | 1,648 | -14% | |||||||||||||||||
Net margin | 19.0% | 22.4% | ||||||||||||||||||
Net borrowings | 6,177 | 5,042 | ||||||||||||||||||
Earnings per share | 71.9p | 81.6p | -12% | |||||||||||||||||
Adjusted figures | ||||||||||||||||||||
Operating profit | 2,346 | 2,284 | +3% | +4% | +6% | |||||||||||||||
Operating margin | 31.3% | 31.1% | ||||||||||||||||||
Profit before tax | 2,145 | 2,101 | +2% | |||||||||||||||||
Net profit attributable to RELX PLC shareholders | 1,674 | 1,620 | +3% | |||||||||||||||||
Net margin | 22.3% | 22.1% | ||||||||||||||||||
Cash flow | 2,243 | 2,197 | +2% | |||||||||||||||||
Cash flow conversion | 96% | 96% | ||||||||||||||||||
Return on invested capital | 13.2% | 12.9% | ||||||||||||||||||
Earnings per share | 84.7p | 80.2p | +6% | +7% |
RELX uses adjusted and underlying figures as additional performance measures. Adjusted figures primarily exclude the amortisation of acquired intangible assets and other items related to acquisitions and disposals, and the associated deferred tax movements. In 2018 and 2017, we also excluded exceptional tax credits, see note 9 on page 138. Reconciliations between the reported and adjusted figures are set out on page 176. Underlying growth rates are calculated at constant currencies, excluding the results of acquisitions until twelve months after purchase, and excluding the results of disposals and assets held for sale. Underlying revenue growth rates also exclude exhibition cycling. Constant currency growth rates are based on 2017 full-year average and hedge exchange rates.
Reported operating profit, after amortisation of acquired intangible assets and acquisition-related costs, was £1,964m (2017: £1,905m).
The amortisation charge in respect of acquired intangible assets, including the share of amortisation in joint ventures, decreased to £288m (2017: £314m), the reduction primarily reflects certain assets becoming fully amortised. Acquisition-related costs were £84m (2017: £56m), higher than the prior year as a result of increased transaction activity.
Adjusted interest expense, excluding the net pension financing charge of £9m (2017: £15m) and including finance income in joint ventures of £1m (2017: £1m), was £201m (2017: £183m). The increase primarily reflects a higher level of borrowings in 2018, partly offset by currency translation effects.
Reported net finance costs were £211m (2017: £199m).
Netpre-tax disposal losses were £33m (2017: £15m gain) arising largely from the write down of Legal businesses classified as held for sale and revaluation of investments held. These losses are offset by an associated tax credit of £14m (2017: £16m charge).
Adjusted profit before tax was £2,145m (2017: £2,101m), up 2%.
The reported profit before tax was £1,720m (2017: £1,721m).
The adjusted effective tax rate on adjusted profit before tax was 21.7%, 0.8 percentage points lower than the prior year rate of 22.5%. The adjusted effective tax rate excludes movements in deferred taxation assets and liabilities related to goodwill and acquired intangible assets, but includes the benefit of tax amortisation where available on those items. Adjusted operating profits and taxation are grossed up for the equity share of taxes in joint ventures. The application of tax law and practice is subject to some uncertainty and amounts are provided in respect of this.
† | Restated for adoption of new accounting standards IFRS 9, IFRS 15 and IFRS 16. |
Table of Contents
56 | RELX Annual report and financial statements 2018 | Financial review | |
|
Discussions with tax authorities relating to cross-border transactions and other matters are ongoing. Although the outcome of open items cannot be predicted, no significant impact on profitability is expected.
The reported tax charge was £292m (2017: £65m). The 2017 tax charge included aone-off £346m credit in relation to the US Tax Cuts and Jobs Act. Theyear-on-year impact of this credit is partially offset by the recognition of a £112m exceptional tax credit in 2018 as a result of the substantial resolution of certain prior year tax matters during the year and the deferred tax effect of tax rate reductions in the Netherlands and the US. On the basis of their size andnon-recurring nature these tax credits have been treated as exceptional items and excluded from the adjusted tax charge.
The adjusted net profit attributable to RELX PLC shareholders of £1,674m (2017: £1,620m) was up 3%. Adjusted earnings per share was up 6% at 84.7p (2017: 80.2p). At constant rates of exchange, adjusted earnings per share increased by 7%.
The reported net profit attributable to RELX PLC shareholders was £1,422m (2017: £1,648m).
Cash flows
Adjusted cash flow was £2,243m (2017: £2,197m), up 2% compared with the prior year and up 3% at constant currencies. As a result of the adoption of IFRS 16, adjusted cash flow includes the principal element of lease repayments. The rate of conversion of adjusted operating profit to adjusted cash flow was 96% (2017: 96%).
CONVERSION OF ADJUSTED OPERATING PROFIT INTO CASH
YEAR TO 31 DECEMBER | 2018 £m | Restated 2017 £m | ||||||
Adjusted operating profit | 2,346 | 2,284 | ||||||
Depreciation and amortisation of internally developed intangible assets | 287 | 268 | ||||||
Depreciation ofright-of-use assets | 77 | 75 | ||||||
Capital expenditure | (362 | ) | (354 | ) | ||||
Repayment of lease principal (net)* | (81 | ) | (76 | ) | ||||
Working capital and other items | (24 | ) | – | |||||
Adjusted cash flow | 2,243 | 2,197 | ||||||
Adjusted cash flow conversion | 96% | 96% |
* | Excludes repayments and receipts in respect of disposal-related vacant property and is net of sublease receipts. |
Capital expenditure was £362m (2017: £354m), including £306m (2017: £303m) in respect of capitalised development costs. This reflects sustained investment in new products and related infrastructure across the business. Depreciation and the amortisation of internally developed intangible assets was £287m (2017: £268m). Capital expenditure was 4.8% of revenue (2017: 4.8%). Depreciation and amortisation was 3.8% of revenue (2017: 3.7%). These percentages exclude depreciation of leasedright-of-use assets of £77m (2017: £75m) and principal lease repayments under IFRS 16 of £81m (2017: £76m).
Tax paid, excluding tax relief on acquisition-related costs and disposals, of £428m (2017: £472m) decreased due to the timing of payments and movements in exchange rates. Interest paid was £155m (2017: £163m).
Payments made in respect of acquisition-related costs amounted to £77m (2017: £42m).
Free cash flow before dividends was £1,593m (2017: £1,534m). Ordinary dividends paid to shareholders in the year, being the 2017 final and 2018 interim dividends, amounted to £796m (2017: £762m). Free cash flow after dividends was £797m (2017: £772m).
RECONCILIATION OF CASH GENERATED FROM OPERATIONS TO ADJUSTED CASH FLOW
YEAR TO 31 DECEMBER | 2018 £m | Restated 2017 £m | ||||||
Cash generated from operations | 2,555 | 2,526 | ||||||
Dividends received from joint ventures | 30 | 38 | ||||||
Purchases of property, plant and equipment | (56 | ) | (51 | ) | ||||
Expenditure on internally developed intangible assets | (306 | ) | (303 | ) | ||||
Payments in relation to acquisition-related costs/other | 97 | 62 | ||||||
Repayment of lease principal | (81 | ) | (76 | ) | ||||
Proceeds from disposals of property, plant and equipment | 4 | 1 | ||||||
Adjusted cash flow | 2,243 | 2,197 | ||||||
FREE CASH FLOW
| ||||||||
YEAR TO 31 DECEMBER | 2018 £m | Restated 2017 £m | ||||||
Adjusted cash flow | 2,243 | 2,197 | ||||||
Interest paid (net) | (155 | ) | (163 | ) | ||||
Tax paid | (428 | ) | (472 | ) | ||||
Acquisition-related costs* | (67 | ) | (28 | ) | ||||
Free cash flow before dividends | 1,593 | 1,534 | ||||||
Ordinary dividends | (796 | ) | (762 | ) | ||||
Free cash flow post dividends | 797 | 772 |
* | Including cash tax relief. |
Total consideration on acquisitions completed in the year was £978m (2017: £123m). Cash spent on acquisitions was £960m (2017: £141m), including deferred consideration of £16m (2017: £13m) on past acquisitions and spend on venture capital investments of £13m (2017: £10m).
Total consideration for the disposal ofnon-strategic assets in 2018 was £45m (2017: £87m). Net cash inflow after timing differences and separation and transaction costs was £5m (2017: £41m inflow).
Share repurchases in 2018 were £700m (2017: £700m), with a further £100m repurchased in 2019 as at 20 February. In addition, the Employee Benefit Trust purchased shares of RELX PLC to meet future obligations in respect of share based remuneration totalling £43m (2017: £39m). Proceeds from the exercise of share options were £21m (2017: £32m).
Table of Contents
RELX Annual report and financial statements 2018 | Chief Financial Officer’s report | 57 | |
|
RECONCILIATION OF NET DEBTYEAR-ON-YEAR
|
| |||||||
YEAR TO 31 DECEMBER | 2018 £m | Restated 2017 £m | ||||||
Net debt at 1 January | (5,042 | ) | (5,050 | ) | ||||
Free cash flow post dividends | 797 | 772 | ||||||
Net disposal proceeds | 5 | 41 | ||||||
Acquisition cash spend (including | (960 | ) | (141 | ) | ||||
borrowings in acquired businesses) | ||||||||
Share repurchases | (700 | ) | (700 | ) | ||||
Purchase of shares by the Employee Benefit Trust | (43 | ) | (39 | ) | ||||
Other* | 12 | 34 | ||||||
Currency translation | (246 | ) | 41 | |||||
Movement in net debt | (1,135 | ) | 8 | |||||
Net debt at 31 December | (6,177 | ) | (5,042 | ) |
* | Cash tax relief on disposals, distributions tonon-controlling interests, pension deficit payments, leases and share option exercise proceeds. |
Funding
Debt
Net borrowings at 31 December 2018 were £6,177m, an increase of £1,135m since 31 December 2017. The majority of our borrowings are denominated in US dollars and euros, and sterling being weaker at the end of the year contributed to higher net borrowings when translated into sterling. Excluding currency translation effects, net borrowings increased by £889m. Expressed in US dollars, net borrowings at 31 December 2018 were $7,874m, an increase of $1,055m.
Gross borrowings of £6,365m (31 December 2017: £5,253m) are comprised of bank and bond borrowings of £6,005m (31 December 2017: £4,862m) and lease liabilities under IFRS 16 of £360m (31 December 2017: £391m). The fair value of related derivative net assets was £25m (31 December 2017: £43m), finance lease receivables totalled £49m (31 December 2017: £57m) and cash and cash equivalents totalled £114m (31 December 2017: £111m). In aggregate, these give the net borrowings figure of £6,177m (31 December 2017: £5,042m).
The effective interest rate on gross bank and bond borrowings was 3.2% in 2018, in line with the prior year. This reflects increases in market interest rates offset by the benefit of refinancing historical bonds that had higher rates of interest. As at 31 December 2018, gross bank and bond borrowings had a weighted average life remaining of 4.1 years and a total of 45% of them were at fixed rates, after taking into account interest rate derivatives.
The ratio of net debt (including leases and pensions) to12-month trailing EBITDA (adjusted earnings before interest, tax, depreciation and amortisation) was 2.4x (31 December 2017: 2.2x), calculated in US dollars. Excluding leases and pensions, the ratio was 2.2x (31 December 2017: 1.9x).
Liquidity
During July 2018, the Group’s $2.0bn undrawn committed bank facility, maturing in July 2020, was cancelled and replaced with a new $3.0bn facility, consisting of a $1.75bn tranche maturing in July 2023 and a $1.25bn tranche maturing in July 2021. This facility provides security of funding for short-term debt.
In March 2018, $700m of dollar denominated fixed rate term debt was issued with a coupon of 3.5% and a maturity of five years, and€500m of euro denominated fixed rate term debt was issued with a coupon of 1.5% and a maturity of nine years. The Group has ample liquidity and access to debt capital markets, providing the ability to repay or refinance borrowings as they mature and to fund ongoing requirements.
Invested capital and returns
Net capital employed was £9,435m at 31 December 2018 (2017: £8,241m), an increase of £1,194m. The carrying value of goodwill and acquired intangible assets increased by £1,193m, reflecting increased acquisition spend in 2018 and the strengthening of the dollar against sterling from the beginning to the end of 2018. An amount of £423m was capitalised in the year in respect of acquired intangible assets and £626m was recorded as goodwill.
† | Restated for adoption of new accounting standards IFRS 9, IFRS 15 and IFRS 16. |
Table of Contents
58 | RELX Annual report and financial statements 2018 | Financial review | |
|
SUMMARY BALANCE SHEET
|
| |||||||
AS AT 31 DECEMBER | 2018 £m | Restated 2017 £m | ||||||
Goodwill and acquired intangible assets* | 9,216 | 8,023 | ||||||
Internally developed intangible assets* | 1,217 | 1,136 | ||||||
Property, plant and equipment*, | 716 | 724 | ||||||
Net assets held for sale | (3 | ) | – | |||||
Net pension obligations | (433 | ) | (328 | ) | ||||
Working capital | (1,278 | ) | (1,314 | ) | ||||
Net capital employed | 9,435 | 8,241 |
* | Net of accumulated depreciation and amortisation. |
Development costs of £304m (2017: £304m) were capitalised within internally developed intangible assets, most notably investment in new products and related infrastructure in the Legal and Scientific, Technical & Medical businesses.
Net pension obligations, i.e. pension obligations less pension assets, increased to £433m (2017: £328m). There was a net deficit of £203m (2017: £89m) in respect of funded schemes, which were on average 96% funded at the end of the year on an IFRS basis. The higher deficit mainly reflects weaker asset performance in the UK scheme. An £11m past service cost was recognised in the UK in relation to GMP equalisation.
Thepost-tax return on average invested capital in the year was 13.2% (2017: 12.9%).
RETURN ON INVESTED CAPITAL
AS AT 31 DECEMBER | 2018 £m | Restated 2017 £m | ||||||
Adjusted operating profit | 2,346 | 2,284 | ||||||
Tax at effective rate | 509 | 514 | ||||||
Effective tax rate | 21.7% | 22.5% | ||||||
Adjusted operating profit after tax | 1,837 | 1,770 | ||||||
Average invested capital* | 13,924 | 13,733 | ||||||
Return on invested capital | 13.2% | 12.9% |
* | Average of invested capital at the beginning and the end of the year, retranslated at average exchange rates for the year. Invested capital is calculated as net capital employed, adjusted to add back accumulated amortisation, impairment of acquired intangible assets and goodwill and to exclude the gross up to goodwill in respect of deferred tax. |
Reported earnings per share and dividends
2018 £m | Restated 2017 £m | Change | ||||||||||
Reported earnings per share | 71.9p | 81.6p | -12% | |||||||||
Ordinary dividend per share | 42.1p | 39.4p | 7% |
The reported earnings per share was 71.9p (2017: 81.6p). The decreaseyear-on-year reflects the impact of the exceptional tax credit recognised in 2017 as a result of the US Tax Cuts and Jobs Act.
The final dividend proposed by the Board is 29.7p per share, 7% higher than the dividend for the prior year. This gives total dividends for the year of 42.1p (2017: 39.4p).
Dividend cover, based on adjusted earnings per share and the total interim and proposed final dividends for the year, is 2.0x.
The dividend policy is, subject to currency considerations, to grow dividends broadly in line with adjusted earnings per share while maintaining dividend cover (being the number of times the annual dividend is covered by the adjusted earnings per share) of at least two times over the longer term.
On 8 September 2018, the corporate simplification was effective and RELX NV shareholders received one new RELX PLC share in exchange for each RELX NV share held. During 2018 a combined total of 44.4m of RELX PLC and RELX NV shares were repurchased (17.5m of these were repurchased by RELX NV prior to the corporate simplification). Total consideration for these repurchases was £700m. A further 2.9m shares were purchased by the Employee Benefit Trust. During 2018, 45m RELX PLC shares held in treasury were cancelled. As at 31 December 2018, total shares in issue, net of shares held in treasury and shares held by the Employee Benefit Trust, amounted to 1,962m. A further 6.0m RELX PLC shares have been repurchased in 2019 as at 20 February.
Distributable reserves
As at 31 December 2018, RELX PLC had distributable reserves of £2.7bn. In line with UK legislation, distributable reserves are derived from thenon-consolidated RELX PLC balance sheet. The consolidated reserves reflect adjustments such as the amortisation of acquired intangible assets that are not taken into account when calculating distributable reserves.
Further information on the distributable reserves can be found in the parent company financial statements on page 171.
Alternative performance measures
RELX uses adjusted figures, which are not defined by generally accepted accounting principles (‘GAAP’) such as IFRS. Adjusted figures and underlying growth rates are presented as additional performance measures used by management, as they provide relevant information in assessing the Group’s performance, position and cash flows. We believe that these measures enable investors to more clearly track the core operational performance of the Group by separating out items of income or expenditure relating to acquisitions, disposals and capital items, and by excluding exceptional tax credits. This provides our investors with a clear basis for assessing our ability to raise debt and invest in new business opportunities.
Management uses these financial measures, along with IFRS financial measures, in evaluating the operating performance of the Group as a whole and of the individual business segments. Adjusted financial measures should not be considered in isolation from, or as a substitute for, financial information presented in compliance with IFRS. The measures may not be directly comparable to similarly reported measures by other companies. Please see page 176 for reconciliations of adjusted measures.
The following changes to alternative performance measures have been made for the 2018 year end:
The definition of adjusted cash flow was updated as a result of the adoption of IFRS 16 to include the principal element of lease repayments. This is consistent with the inclusion of capital
Table of Contents
RELX Annual report and financial statements 2018 | Chief Financial Officer’s report | 59 | |
|
expenditure in relation to property, plant and equipment in this adjusted measure. Prior year comparatives have been restated on page 176.
Underlying growth rates now include the results of acquisitions starting twelve months after completion of a transaction. This change, which has brought us into line with comparable companies, had no impact on the 2018 underlying revenue growth rates at either the divisional or Group level.
Accounting policies
The consolidated financial statements are prepared in accordance with International Financial Reporting Standards as adopted by the European Union and as issued by the International Accounting Standards Board following the accounting policies shown in the notes to the financial statements on pages 126 to 167. The accounting policies and estimates which require the most significant judgement relate to the valuation of goodwill and intangible assets, the capitalisation of development costs, taxation and accounting for defined benefit pension schemes. Further detail is provided in the accounting policies on pages 126 to 128 and in the relevant notes to the accounts.
New accounting standards
RELX adopted IFRS 9, 15 and 16 from 1 January 2018. For IFRS 16 this is one year earlier than its mandatory adoption date. Please see note 1 to the consolidated financial statements for further details on the impact of these new standards.
Tax principles
Taxation is an important issue for us and our stakeholders, including our shareholders, governments, customers, suppliers, employees and the global communities in which we operate. We have set out our approach to tax in our global tax strategy. This incorporates our Tax Principles along with additional disclosures around where we pay taxes and our broader contribution to society. This is all made publicly available on our website: www.relx.com/go/TaxPrinciples
We maintain an open dialogue with tax authorities, and are vigilant in ensuring that we comply with current tax legislation. We have clear and consistent tax policies and tax matters are dealt with by a professional tax function, supported by external advisers. We proactively seek to agreearm’s-length pricing with tax authorities to mitigate tax risks of significant cross-border operations. We actively engage with policy makers, tax administrators, industry bodies and international institutions to provide informed input on proposed tax measures, so that we and they can understand how those proposals would affect our businesses. In addition, we participate in consultations with the Organisation for EconomicCo-operation and Development (‘OECD’), European bodies and the United Nations.
Treasury policies
The Board of RELX PLC agrees policies for managing treasury risks. The key policies address security of funding requirements, the target fixed/floating interest rate exposure for debt and foreign
currency hedging and place limits on counterparty exposures. A more extensive summary of these policies is provided in note 18 to the financial statements on pages 150 to 155. Financial instruments are used to finance the RELX businesses and to hedge transactions. The Group’s businesses do not enter into speculative transactions.
Capital and liquidity management
The capital structure is managed to support RELX’s objective of maximising long-term shareholder value through appropriate security of funding, ready access to debt and capital markets, cost-effective borrowing and flexibility to fund business and acquisition opportunities while maintaining appropriate leverage to ensure an efficient capital structure.
Over the long-term, RELX seeks to maintain cash flow conversion of 90% or higher and credit rating agency metrics that are consistent with a solid investment grade credit rating. These metrics as defined by the rating agencies include net debt to EBITDA, including and excluding pensions and leases, and various measures of cash flow as a percentage of net debt.
RELX uses the cash flow it generates to fund capital expenditure required to drive organic growth, to make selective acquisitions and to provide a growing dividend to shareholders, while retaining balance sheet strength to maintain access to cost-effective sources of borrowing. Share repurchases are undertaken to maintain an efficient balance sheet. Further detail on capital and liquidity management is provided on pages 150 and 151.
Corporate responsibility
Achieving our 2018 environmental objectives moves us closer to meeting our 2015-2020 environmental targets. In the year, these included reaching 42% of our locations (by employee headcount) achieving five or more of our Group Environmental Standards, which set environmental performance levels, and we purchased renewable electricity equivalent to 81% of our global consumption through a mixture of European green tariff, andgreen-e certified US and Asian Gold Power renewable energy certificates. In addition, 35% of our locations were covered by ISO 14001 environmental certification byyear-end.
Our most significant environmental impact is in the scientific knowledge and resources we provide that inform action and debate. In 2018, this encompassed the Journal of Environmental Management’s special issue on sustainable waste and wastewater management and the Oceanology International North America exhibition and conference which covers exploring, monitoring, developing and protecting the world’s oceans.
Alongside managing supply chain costs, we concentrate on ensuring an ethical supply chain. In 2018, we tracked 344 key suppliers and lowered auditnon-compliance findings with our Supplier Code of Conduct by 34%. We also increased our spend with veteran and minority owned business as part of on going efforts to increase supplier diversity.
Nick Luff
Chief Financial Officer
Table of Contents
60 | RELX Annual report and financial statements 2018 | Financial review | |
|
RELX has established risk management practices that are embedded into the operations of the businesses, based on the Internal Control-Integrated Framework (2013) by the Committee of Sponsoring Organisations of the Treadway Commission (COSO). The principal risks facing the business, which have been assessed by the Audit Committee and Board, are described below. The Directors confirm this process is robust and includes consideration of risks , including emerging risks, that could threaten RELX’s business models, future performance, solvency, liquidity or reputation
It is not possible to identify every risk that could affect our businesses, and the actions taken to mitigate the risks described below cannot provide absolute assurance that a risk will not materialise and/or adversely affect our business or financial performance. Our risk management and internal control
processes are described in the Corporate Governance section. A description of the business and a discussion of factors affecting performance is set out in the Chief Executive Officer’s report and the Business Review. Treasury risks are further discussed in the Chief Financial Officer’s report and in note 18 to the consolidated financial statements. Our assessment of RELX’s prospects and viability is on page 82. The Data Resources risk has been expanded as a Data Resources and Data Privacy risk which combines elements previously described in the Data Resources and Cyber Security risks. Given RELX’s reduced exposure, net of mitigation, to Environmental risk, this is no longer classified as a Principal Risk. Our approach to managing corporate responsibility, environmental and othernon-financial risks is set out in the Business Review and the separate Corporate Responsibility Report.
EXTERNAL RISKS | ||||
Risk | Description and impact | Mitigation | ||
Economy and market conditions | Demand for our products and services may be adversely impacted by factors beyond our control, such as the economic environment in the United States, Europe and other major economies, political uncertainties (including the potential consequences of the United Kingdom’s withdrawal from the European Union under Article 50 of the Treaty of Lisbon (“Brexit”)), acts of war and civil unrest as well as levels of government and private funding provided to academic and research institutions. | Our businesses are focused on professional markets which have generally been more resilient in periods of economic downturn. We deliver information solutions, many on a subscription and recurring revenue basis, which are important to our customers’ effectiveness and efficiency. We operate diversified businesses in terms of sectors, markets, customers, geographies and products and services. We have extended our position in long-term global growth markets through organic new launches supported by the selective acquisition of small content and data sets. We continue to dispose of businesses that no longer fit our strategy. | ||
We continuously monitor economic and political developments to assess their impact on our strategy which is designed to mitigate these risks. In response to specific uncertainties, such as Brexit, our businesses engage in scenario planning and develop contingency plans where relevant. | ||||
| ||||
Intellectual property rights | Our products and services include and utilise intellectual property. We rely on trademark, copyright, patent and other intellectual property laws to establish and protect our proprietary rights in this intellectual property. There is a risk that our proprietary rights could be challenged, limited, invalidated or circumvented, which may impact demand for and pricing of our products and services. Copyright laws are subject to national legislative initiatives, as well as cross border initiatives such as those from the European Commission and increased judicial scrutiny in several jurisdictions in which we operate. This creates additional challenges for us in protecting our proprietary rights in content delivered through the internet and electronic platforms. | We actively engage in developing and promoting the legal protection of intellectual property rights. Our subscription contracts with customers contain provisions regarding the use of proprietary content. We are vigilant as to the use of our intellectual property and, as appropriate, take legal action to challenge illegal content distribution sources. | ||
|
Table of Contents
RELX Annual report and financial statements 2018 | Principal risks | 61 | |
|
EXTERNAL RISKS | ||||
Risk | Description and impact | Mitigation | ||
Data resources and data privacy | Our businesses rely extensively upon content and data from external sources. Data is obtained from public records, governmental authorities, customers and other information companies, including competitors. The disruption or loss of data sources, either because of data privacy laws, such as the European Union’s General Data Protection Regulation (“GDPR”), relating to internet communications, privacy and data protection,e-commerce, information governance and use of public records, or because data suppliers decide not to supply them, may impose limits on our collection and use of certain kinds of information about individuals and our ability to communicate such information effectively with our customers.
Compromise of data privacy, through a failure of our cyber security measures (see “Cyber security” below), other data loss incidents or failure to comply with requirements for proper collection, storage and transmittal of data, by ourselves or our third-party service providers, may damage our reputation and expose us to risk of loss, fines and penalties, litigation and increased regulation. | We seek as far as possible to have proprietary content. Where content is supplied to us by third parties, we aim to have contracts which provide mutual commercial benefit. We also maintain an active dialogue with regulatory authorities on privacy and other data related issues, and promote, with others, the responsible use of data.
We have established data privacy principles, governance structures and control programmes designed to ensure data privacy requirements are met. We have put in place and test response plans to manage incidents where data privacy might be compromised. We embed our data privacy principles in agreements with third parties.
We have assurance programmes to monitor compliance and conduct training and awareness programmes. | ||
| ||||
Paid subscriptions | Our Scientific, Technical & Medical (“STM”) primary research content, like that of most of our competitors, is sold largely on a paid subscription basis. There is continued debate in government, academic and library communities, which are the principal customers for our STM content, regarding to what extent such content should be funded instead through fees charged to authors or authors’ funders and/or made freely available in some form after a period following publication. Some of these methods, if widely adopted, could adversely affect our revenue from paid subscriptions. | We engage extensively with stakeholders in the STM community to better understand their needs and deliver value to them. We are open to serving the STM community under any payment model that can sustainably provide researchers with the critical information tools that they need. In particular, the number of articles we publish on an author pays, open access basis is growing rapidly. We focus on the integrity and quality of research through the editorial and peer review process; we invest in efficient editorial and distribution platforms and in innovation in platforms and tools to make content and data more accessible and actionable; and we develop our research systems to provide capabilities to manage different payment models. We ensure vigilance on plagiarism and the long-term preservation of research findings. | ||
STRATEGIC RISKS | ||||
Risk | Description and impact | Mitigation | ||
Customer acceptance of products | Our businesses are dependent on the continued acceptance by our customers of our products and services and the value placed on them. Failure to meet evolving customer needs could impact demand for our products and services and consequently adversely affect our revenue or the long-term returns from our investment in electronic product and platform initiatives. | We are focused on the needs and economics of our customers. We leverage user centred design and development methods and customer analytics and invest in new and enhanced technologies to provide content and innovative solutions that help them achieve better outcomes and enhance productivity. | ||
| ||||
Market Disruption | Our businesses operate in highly competitive and dynamic markets, and the means of delivering our products and services, and the products and services themselves, continue to change in response to rapid technological innovations, legislative and regulatory changes, the entrance of new competitors and other factors. Failure to anticipate and quickly adapt to these changes could impact the competitiveness of our products and services and consequently adversely affect our revenue. | We gain insights into our markets, evolving customers’ needs, the potential application of new technologies and business models, and the actions of competitors and disrupters. These insights inform our market strategies and operational priorities. We continuously invest significant resources in our products and services, and the infrastructure to support them. | ||
| ||||
Acquisitions | We supplement our organic development with selected acquisitions. If we are unable to generate the anticipated benefits such as revenue growth and/or cost savings associated with these acquisitions this could adversely affect return on invested capital and financial condition or lead to an impairment of goodwill. | Acquisitions are made within the framework of our overall strategy, which emphasises organic development. We have a well formulated process for reviewing and executing acquisitions and for managing the post-acquisition integration. This process is underpinned with clear strategic, financial and ethical criteria. We closely monitor the integration and performance of acquisitions. |
Table of Contents
62 | RELX Annual report and financial statements 2018 | Financial review | |
|
OPERATIONAL RISKS | ||||
Risk | Description and impact | Mitigation | ||
Technology and business resilience | Our businesses are dependent on electronic platforms and networks, primarily the internet, for delivery of our products and services. These could be adversely affected if our electronic delivery platforms, networks or supporting infrastructure experience a significant failure, interruption or security breach. | We have established procedures for the protection of our businesses and technology assets. These include the development and testing of business continuity plans, including IT disaster recovery plans andback-up delivery systems, to reduce business disruption in the event of major technology or infrastructure failure, terrorism or adverse weather incidents. | ||
| ||||
Cyber security | Our businesses maintain online databases and platforms delivering our products and services, which we rely on, and provide data to third parties, including customers and service providers. These databases and information are a target for compromise and face a risk of unauthorised access and use by unauthorised parties.
Our cyber security measures, and the measures used by our third-party service providers, may not detect or prevent all attempts to compromise our systems, which may jeopardise the security of the data we maintain or may disrupt our systems. Failures of our cyber security measures could result in unauthorised access to our systems, misappropriation of our or our users’ data, deletion or modification of stored information or other interruption to our business operations. As techniques used to obtain unauthorised access to or to sabotage systems change frequently and may not be known until launched against us or our third-party service providers, we may be unable to anticipate or implement adequate measures to protect against these attacks and our service providers and customers may likewise be unable to do so.
Compromises of our or our third-party service providers’ systems, or failure to comply with applicable legislation or regulatory or contractual requirements could adversely affect our financial performance, damage our reputation and expose us to risk of loss, fines and penalties, litigation and increased regulation. | We have established security programmes with the aim of ensuring that data is protected, our business infrastructures continue to operate and that we comply with relevant legislative, regulatory and contractual requirements.
We have governance mechanisms in place to design and monitor common policies and standards across our businesses.
We invest in appropriate technological and physical controls which are applied across the enterprise in a risk-based security programme which operates at the infrastructure, application and user levels. These controls include, but are not limited to, infrastructure vulnerability management, application scanning and penetration testing, network segmentation, encryption and logging and monitoring. We provide regular training and communication initiatives to establish and maintain awareness of risks at all levels of our businesses. We have appropriate incident response plans to respond to threats and attacks. We maintain appropriate information security policies and contractual requirements for our businesses and run programmes monitoring the application of our data security policies by third-party service providers. We use independent internal and third-party auditors to test, evaluate, and help enhance our procedures and controls. | ||
| ||||
Supply Chain dependencies | Our organisational and operational structures depend on outsourced and offshored functions, including use of cloud service providers. Poor performance, failure or breach of third parties to whom we have outsourced activities, could adversely affect our business performance, reputation and financial condition. | We select our vendors with care and establish contractual service levels that we closely monitor, including through key performance indicators and targeted supplier audits and security assessments. We have developed business continuity plans to reduce disruption in the event of a major failure by a vendor. | ||
| ||||
Talent | The implementation and execution of our strategies and business plans depend on our ability to recruit, motivate and retain skilled employees and management. We compete globally and across business sectors for talented management and skilled individuals, particularly those with technology and data analytics capabilities. An inability to recruit, motivate or retain such people could adversely affect our business performance. Failure to recruit and develop talent regardless of gender, race or other characteristics could adversely affect our reputation and business performance. | We have well established management development and talent review programmes. We monitor capability needs and remuneration schemes are tailored to attract and motivate the best talent available at an appropriate level of cost. We actively seek feedback from employees, which feeds into plans to enhance employee engagement and motivation. Our Diversity and Inclusion Strategy creates a diverse workforce and environment that respects individuals and their contributions. |
Table of Contents
RELX Annual report and financial statements 2018 | Principal risks | 63 | |
|
FINANCIAL RISKS | ||||
Risk | Description and impact | Mitigation | ||
Pensions | We operate a number of pension schemes around the world, including local versions of the defined benefit type in the UK and the United States. The assets and obligations associated with those pension schemes are sensitive to changes in the market values of the scheme’s investments and the market-related assumptions used to value scheme liabilities. Adverse changes to asset values, discount rates, longevity assumptions or inflation could increase future pension costs and funding requirements. | We have professional management of our pension schemes and we focus on maintaining appropriate asset allocation and plan designs. We review our funding requirements on a regular basis with the assistance of independent actuaries and ensure that the funding plans are appropriate. We seek to manage pension liabilities by reviewing pension benefits provided to staff as well as the structure of scheme arrangements. | ||
| ||||
Tax | Our businesses operate globally, and our profits are subject to taxation in many different jurisdictions and at differing tax rates. The Organisation for EconomicCo-operation and Development (“OECD”)’s reports on Base Erosion and Profit Shifting, suggested a range of new approaches that national governments might adopt when taxing the activities of multinational enterprises. The OECD continues to explore options around the taxation of the digital economy. As a result of the OECD’s work and other international initiatives, tax laws that currently apply to our businesses may be amended by the relevant authorities or interpreted differently by them, and these changes could adversely affect our reported results. | We maintain an open dialogue with tax authorities and are vigilant in ensuring that we comply with current tax legislation. We have clear and consistent tax policies and tax matters are dealt with by a professional tax function, supported by external advisers. As outlined in the Chief Financial Officer’s report on page 59 we engage with tax authorities and international organisations. The principles we adopt in our approach to tax matters can be found on our website at www.relx.com/go/taxprinciples. | ||
| ||||
Treasury | The RELX consolidated financial statements are expressed in pounds sterling and are subject to movements in exchange rates on the translation of the financial information of businesses whose operational currencies are other than sterling. The United States is our most important market and, accordingly, significant fluctuations in the US dollar exchange rate could significantly affect our reported results. We also earn revenues and incur costs in a range of other currencies, including the euro and the yen and significant fluctuations in these exchange rates could also significantly impact our reported results.
Macroeconomic, political and market conditions may adversely affect the availability and terms of short and long-term funding, volatility of interest rates, the credit quality of our counterparties, currency exchange rates and inflation. The majority of our outstanding debt instruments are, and any of our future debt instruments may be, publicly rated by independent rating agencies. Our borrowing costs and access to capital may be adversely affected if the credit ratings assigned to our debt are downgraded. | Our approach to capital structure and funding are described in the Chief Financial Officer’s Report on pages 54 to 59. The approach to the management of treasury risks is described in note 18 to the consolidated financial statements. | ||
REPUTATIONAL RISKS | ||||
Risk | Description and impact | Mitigation | ||
Ethics | As a global provider of professional information solutions to the STM, risk & business analytics, legal and exhibitions markets we, our employees and major suppliers are expected to adhere to high standards of independence and ethical conduct, including those related to anti-bribery and anti-corruption, sanctions, promoting human rights and principled business conduct. A breach of generally accepted ethical business standards or applicable anti-bribery and anti-corruption, sanctions or competition statutes could adversely affect our business performance, reputation and financial condition. | Our Code of Ethics and Business Conduct is provided to every employee and is supported by training and communication. It encompasses such topics as competing fairly, prohibiting corrupt business practices, promoting human rights and fair employment practices and encouraging open and principled behaviour. We have well-established processes for monitoring, reporting and investigating instances of unethical conduct. Our major suppliers are required to adhere to our Supplier Code of Conduct. |
The Strategic Report, as set out on pages 2 to 63 has been approved by the Board of RELX PLC.
By order of the Board | Registered Office | |
Henry Udow | 1-3 Strand | |
Company Secretary | London | |
20 February 2019 | WC2N 5JR |
Table of Contents
64 | RELX Annual report and financial statements 2018 | Governance | |
Table of Contents
RELX Annual report and financial statements 2018 | 65 | |
Governance |
In this section | ||
66 | ||
68 | ||
70 | Chairman’s introduction to corporate governance | |
72 | ||
83 | ||
85 | ||
106 | ||
108 |
Table of Contents
66 | RELX Annual report and financial statements 2018 | Governance | |
|
Executive Directors | Non-Executive Directors | |||||||
Erik Engstrom (55) Chief Executive Officer
Appointed:Chief Executive Officer of RELX since November 2009. Joined as Chief Executive Officer of Elsevier in 2004. Other appointments:Non-Executive Director of Smith & Nephew plc. Past appointments:Prior to joining was a partner at General Atlantic Partners. Before that was President and Chief Operating Officer of Random House Inc and President and Chief Executive Officer of Bantam Doubleday Dell, North America. Began his career as a consultant with McKinsey. Served as aNon-Executive Director of Eniro AB and Svenska Cellulosa Aktiebolaget SCA. Education:Holds a BSc from Stockholm School of Economics, an MSc from the Royal Institute of Technology in Stockholm, and gained an MBA from Harvard Business School as a Fulbright Scholar. Nationality:Swedish | Sir Anthony Habgood (72) Chairman
Appointed:June 2009 Other appointments:Chairman of Preqin Holding Limited and Deputy Chairman of RG Carter Holdings Limited. Past appointments:Previously was Chairman of the Court of the Bank of England, Whitbread plc, Bunzl plc, Mölnlycke Health Care Limited and Norwich Research Partners LLP and served as Chief Executive of Bunzl plc, Chief Executive of Tootal Group plc and a Director of The Boston Consulting Group. FormerlyNon-Executive Director of Geest plc, Marks and Spencer plc, National Westminster Bank plc, Powergen plc, SVG Capital plc, and Norfolk and Norwich University Hospitals Trust. Education:Holds an MA in Economics from Cambridge University, an MS in Industrial Administration from Carnegie Mellon University and an Honorary Doctorate of Civil Law from the University of East Anglia. He is a visiting Fellow at Oxford University. Nationality:British | Wolfhart Hauser (69) Non-Executive Director Senior Independent Director Chairman of the Remuneration Committee
Appointed:April 2013 Other appointments:Chairman of FirstGroup plc and aNon-Executive Director of Associated British Foods plc. Past appointments:Chief Executive Officer of Intertek Group plc from 2005 until 2015. Prior to that he was Chief Executive Officer of TÜV Sud AG between 1998 and 2002 and Chief Executive Officer of TÜV Product Service GmbH for ten years. Formerly aNon-Executive Director of Logica plc. Education:Holds a master’s degree in Medicine from Ludwig-Maximilian- University Munich and a Medical Doctorate from Technical University Munich. Nationality:German | ||||||
Nick Luff (51) Chief Financial Officer
| Robert MacLeod (54) Non-Executive Director
| Carol Mills (65) Non-Executive Director
| ||||||
Appointed:September 2014 Other appointments:Non-Executive Director of Rolls-Royce Holdings plc. Past appointments:Prior to joining the Group was Group Finance Director of Centrica plc from 2007. Before that was Chief Financial Officer at The Peninsular & Oriental Steam Navigation Company (P&O) and its affiliated companies, having previously held a number of senior finance roles at P&O. Began his career as an accountant with KPMG. Formerly aNon-Executive Director of QinetiQ Group plc and Lloyds Banking Group plc. Education:Has a degree in Mathematics from Oxford University and is a qualified UK Chartered Accountant. Nationality:British |
Appointed:April 2016 Other appointments:Appointed as Chief Executive of Johnson Matthey plc in June 2014 after five years as Group Finance Director. Past appointments:Prior to joining Johnson Matthey, spent five years as Group Finance Director of WS Atkins plc, having joined as Group Financial Controller in 2003. From 1993 to 2002, held a variety of senior finance and M&A roles with Enterprise Oil plc in the UK and US. Formerly aNon-Executive Director of Aggreko plc. Nationality:British |
Appointed:April 2016 Other appointments:Independent Director of Zynga Inc and Entertainment Partners. Past appointments:A member of the Boards of Adobe Systems, Alaska Communications, Tekelec Corporation, Blue Coat Systems, Xactly Corporation, WhiteHat Security and Ingram Micro. From 2004 to 2006, was Executive Vice President and General Manager of the Infrastructure Products Group at Juniper Networks. From 1998 to 2002 was Chief Executive Officer of Acta Technology, and before Acta, spent 16 years at Hewlett-Packard in a number of executive roles. Nationality:American |
Table of Contents
RELX Annual report and financial statements 2018 | Board Directors | 67 | |
|
Adrian Hennah (61) |
Marike van Lier Lels (59) |
Suzanne Wood (58) | ||||||
Non-Executive Director Chairman of the Audit Committee
Appointed: April 2011 Other appointments:Chief Financial Officer of Reckitt Benckiser Group plc. Past appointments:Chief Financial Officer of Smith & Nephew plc from 2006 to 2012. Before that was Chief Financial Officer of Invensys plc, having previously held various senior finance and management positions with GlaxoSmithKline for 18 years. Formerly, aNon-Executive Director of Indivior PLC. Nationality:British | Non-Executive Director Workforce Engagement Director
Appointed: July 2015 Other appointments:Member of the Supervisory Boards of NS (Dutch Railways), Dura Vermeer and Innovation Quarter and a member of the Executive Committee of Aegon Association. Past appointments:Member of the Supervisory Boards of TKH Group NV, Royal Imtech NV, Maersk BV, KPN NV, USG People NV and Eneco Holding NV, and Executive Vice President and Chief Operating Officer of the Schiphol Group. Prior to joining Schiphol Group, was a member of the Executive Board of Deutsche Post Euro Express and held various senior positions with Nedlloyd. Member of various Dutch governmental advisory boards. Nationality:Dutch
| Non-Executive Director
Appointed: September 2017 Other appointments:Senior Vice President and Chief Financial Officer of Vulcan Materials Company. Past appointments:Served as Group Finance Director of Ashtead Group plc from 2012 to 2018. Chief Financial Officer of Ashtead Group’s largest subsidiary, Sunbelt Rentals Inc, from 2003 until 2012. Previously, she also served as Chief Financial Officer of two US publicly listed companies, Oakwood Homes Corporation and Tultex Corporation. Nationality:American
| ||||||
Linda Sanford (66) Non-Executive Director
|
Ben van der Veer (67) Non-Executive Director
| |||||||
Appointed: December 2012 Other appointments:An independent Director of Consolidated Edison, Inc, Pitney Bowes, Inc and ION Trading UK Limited. Serves on the board of trustees of the New York Hall of Science. Past appointments:Senior Vice President, Enterprise Transformation, IBM Corporation until 2014, having joined the company in 1975. A consultant to The Carlyle Group from 2015 to July 2018. Formerly aNon-Executive Director of ITT Corporation, served on the boards of directors of The Business Council of New York State and the Partnership for New York City, and on the boards of trustees of the State University of New York, St John’s University and Rensselaer Polytechnic Institute. Nationality:American
|
Appointed: September 2009 Other appointments:Member of the Supervisory Boards of Aegon NV, Koninklijke FrieslandCampina NV and Royal Vopak NV. Past appointments:Chairman of the Executive Board of KPMG in the Netherlands and a member of the Management Committee of the KPMG International board until his retirement in 2008, having joined KPMG in 1976. Formerly a member of the Supervisory Boards of Royal Imtech NV, Siemens Nederland NV and Tom Tom NV. Nationality:Dutch | Board Committee membership key Audit Committee Remuneration Committee Nominations Committee Corporate Governance Committee Committee Chairman
|
Table of Contents
68 | RELX Annual report and financial statements 2018 | Governance | |
|
Senior Business Executives
Kumsal Bayazit | Mark Kelsey | Chet Burchett | Mike Walsh | |||
Chief Executive Officer | Chief Executive Officer | Chief Executive Officer | Chief Executive Officer | |||
Scientific, Technical | Risk & Business Analytics | Exhibitions | Legal | |||
& Medical and Chairwoman, | ||||||
RELX Technology Forum | ||||||
|
|
|
| |||
Joined in 2004. Appointed to current position in 2019. | Joined in 1989. Appointed CEO Business Information in 2010 and CEO Risk Solutions in 2012. | Joined in 2004. Appointed to current position in 2015. | Joined in 2003. Appointed to current position in 2011. | |||
| ||||||
Previously President, Exhibitions Europe, Chief Strategy Officer, RELX, and Executive Vice President of Global Strategy and Business Development for LexisNexis. Prior to that worked with Bain & Company in New York, Los Angeles, Johannesburg and Sydney. Holds an MBA from Harvard Business School and is a Graduate of the University of California at Berkeley. | Has held a number of senior positions across the Group over the past 30 years. Previously Chief Operating Officer and then Chief Executive Officer of Reed Business Information. Studied at Liverpool University and received his MBA from Bradford University. | Previously President of the Americas for Reed Exhibitions. Prior to that was President and Chief Executive Officer, USA, for Burson-Marsteller, a leading global public relations agency. Holds a degree from Baylor University. | Previously CEO of LexisNexis US Legal Markets and Director of Strategic Business Development Home Depot. Prior to that was a practising attorney at Weil, Gotshal and Manges in Washington DC and served as a consultant with The Boston Consulting Group. Holds a Juris Doctor degree from Harvard Law School and is a graduate of Yale University. |
Table of Contents
RELX Annual report and financial statements 2018 | RELX Business Leaders | 69 | |
|
Corporate Executives
Youngsuk “YS” Chi | Gunjan Aggarwal | Henry Udow | Andrew Matuch | |||||||||
Director of RELX Corporate Affairs | Chief Human Resources Officer | Chief Legal Officer and | Chief Strategy Officer | |||||||||
and Chairman Elsevier | Company Secretary | |||||||||||
|
|
|
| |||||||||
Joined in 2005. Appointed to current position in 2011. | Joined in 2017. Appointed to current position at that time. | Joined in 2011. Appointed to current position at that time. | Joined in 2012. Appointed to current position in 2016. | |||||||||
Previously was President and Chief Operating Officer of Random House, founding Chairman of Random House Asia and Chief Operating Officer for Ingram Book Group. Holds an MBA from Columbia University and is a graduate of Princeton University. | Previously head of Human Resources for Ericsson’s global media business in California and for Ericsson North America. Prior Human Resources positions in Asia, Europe and North America at Unilever and Novartis. Holds an MBA from Xavier School of Management, Jamshedpur, India, and is a graduate from JMI Institute of Technology. | Previously Chief Legal Officer and Company Secretary of Cadbury plc having spent 23 years working with the company. Prior to that worked at Shearman & Sterling in New York and London. Holds a Juris Doctor degree from the University of Michigan Law School and a bachelor’s degree from the University of Rochester. | Previously was Executive Vice President Global Strategy and Business Development for LexisNexis Legal and Professional. Prior to that was a partner at OC&C Strategy Consultants. Holds an MBA from Harvard Business School and a bachelor’s degree from Williams College. |
Table of Contents
70 | RELX Annual report and financial statements 2018 | Governance | |
|
Chairman’s introduction to corporate governance
‘Our corporate governance focus in 2018 has been based around removing complexity and increasing transparency for our stakeholders through the completion of the Corporate Simplification, and reviewing the requirements of the new Corporate Governance Code which apply to RELX in 2019.’
Simplification of our governance framework
2018 was a significant year for RELX in respect of its corporate governance arrangements. After receiving overwhelming support at both shareholder meetings held in June, the Group simplified its corporate structure by way of a cross-border merger of RELX NV into RELX PLC. As a result, the Group moved from a dual parent holding company structure to a single parent company, with RELX PLC as the sole parent company of the Group (the Simplification). This Simplification has removed complexity and increased transparency for our stakeholders, and followed the significant measures completed in 2015. It was the natural next step in the evolution of our corporate governance arrangements. This has resulted in a simpler structure, with one Board of Directors, one market capitalisation, one class of shares and a single tax residence, whilst maintaining a robust, effective governance framework vital for delivering our long-term strategy.
Following the full harmonisation of the RELX PLC and RELX NV Boards in 2015, the Simplification did not change our Board composition or governance framework, and the Board delegates a number of its responsibilities to four principal Committees so that it may continue to dedicate adequate time to fulfilling its remaining responsibilities within its scheduled annual Board programme.
The Board’s Committee structure is set out on page 73.
Following the completion of the Simplification, the Company’s securities are listed in the UK, US and the Netherlands, and therefore the Company is subject to applicable corporate governance and regulatory requirements of those jurisdictions. These requirements, which are continually evolving, are reviewedand monitored by the Corporate Governance Committee.
Role and activities of the Board
My role is to lead the Board, ensuring that it carries out its principal functions effectively; providing leadership for the Group, overseeing its strategy and the management of risks to its delivery, and ultimately being accountable for delivering appropriate financial returns to shareholders over the long-term. This report sets out how the Board carried out its principal functions during the year, and summarises its activities and those of its Committees during that time. It also explains in more detail the Group’s simplified corporate governance arrangements, and how the Company has applied the main principles of the 2016 UK Corporate Governance Code (the Code) during the year. The Board continues to prioritise corporate governance across RELX, and views this as essential in underpinning the Group’s ability to deliver long-term success for its shareholders. I am therefore pleased to report that the Company complied with each of the provisions of the Code during the year.
As part of its leadership role, the Board is responsible for developing a corporate culture across RELX which promotes integrity and transparency, and an understanding of RELX’s responsibilities to its stakeholders and the societies in which it operates. In this regard, the Board sets the tone from the top of the organisation, by establishing comprehensive systems of corporate governance, and approving policies and procedures which promote corporate responsibility, transparency, accountability and ethical behaviour. Central to these policies is the Group’s Code of Ethics and Business Conduct, which sets out clearly the standards expected for corporate and individual behaviour. In 2018, following a comprehensive management review process, the Board approved an updated Code of Ethics and Business Conduct, which applies to all Directors and employees of the Group, is embedded into the Group’s operations through complementary policies, procedures and training, and is available on our website at www.relx.com.
Board changes
During the year, the Nominations Committee continued to keep the compositions of the Board and its Committees under review to ensure that they remained appropriate. There have been a small number of changes to the compositions of our Committees, and a change of chairmanship of the Audit Committee, with Adrian Hennah succeeding Ben van der Veer with effect from April 2018. Adrian was also appointed, alongside Marike van Lier Lels, as a member of the Nominations Committee from September 2018, with Ben van der Veer stepping down as a member of the Nominations Committee and the Audit Committee at that time. Having served on the Board for nine years, Ben van der Veer will step down as aNon-Executive Director at the conclusion of the Company’s Annual General Meeting in April 2019 and, on behalf of the Board, I would like to thank Ben for his dedication and major contributions during that time. In January, we announced that Andrew Sukawaty will join the Board as aNon-Executive Director, subject to shareholder approval. Andrew has considerable international experience in the technology sector, acquired through his experience intechnology-led businesses throughout his career in both executive andnon-executive roles. He will be a valuable addition to our Board.
Biographical details of each of the Directors are set out on pages 66 and 67.
Table of Contents
RELX Annual report and financial statements 2018 | Chairman’s introduction to Corporate Governance | 71 | |
|
Succession planning
The Nominations Committee will continue to monitor Board and Committee composition and review succession planning arrangements on an ongoing basis, ensuring that appointments continue to be based principally on merit, with due regard for the benefits of diversity. It will be led by the Senior Independent Director with respect to succession planning as it relates to the role of the Chairman. It will also ensure that an appropriate balance between continuity of service and the need for progressive refreshing of the Board, in a controlled and structured manner, is maintained.
Board evaluation and effectiveness
As Chairman, I am also responsible for ensuring that the effectiveness of the Board, its Committees and each individual Director is evaluated annually. An externally facilitated evaluation was completed last year and therefore for 2018/19, an internally conducted evaluation process has been carried out, overseen by the Corporate Governance Committee. The outcome of the evaluation confirmed that the Board and its Committees continue to function effectively, and that all of our Directors continue to be effective and demonstrate commitment to their role. The results of the evaluation are set out on page 79.
Having considered the results of the review, and taking into account the changes made to the Board and Committees during the year, I believe that the Board and its Committees continue to operate effectively, and have an appropriate balance of skills, experience, independence, knowledge of the Group and diversity to ensure that they continue to do so. I remain satisfied that theNon-Executive Directors have sufficient time to undertake their roles.
The New Code
The Board has noted the changes made by the new UK Corporate Governance Code (the New Code), published by the Financial Reporting Council in July 2018, and particularly its increased emphasis on relationships between a company and a wide range of its stakeholders. The Board has historically recognised and acknowledged that stakeholder relationships, such as those with suppliers, customers and our employees, are an important consideration at all levels of business interaction, and this has consistently been reflected in the Board’s decision-making.
In light of the new requirements, with effect from 1 January 2019, Marike van Lier Lels has been appointed by the Board as a designatedNon-Executive Director to facilitate engagement with the RELX workforce. In her role, Marike will provide an open channel of communication with representatives of our workforce, through which issues can be raised directly with the Board, and discussed and considered in the Board’s decision-making process.
All requirements under the New Code will apply to RELX from 1 January 2019, and therefore the Company will report on these in its 2019 Annual Report.
Sir Anthony Habgood
Chairman
20 February 2019
Table of Contents
72 | RELX Annual report and financial statements 2018 | Governance | |
|
Overview
Corporate simplification and structure
On 8 September 2018, the structure of RELX was further simplified from a dual parent structure to a single parent structure by way of a merger of RELX PLC (the Company) and RELX NV (the Simplification). Under the terms of the Simplification, RELX NV shareholders received one share in the Company in exchange for each RELX NV share owned. As a result of the Simplification, the Company is now the sole parent company of the Group, and its shares are traded through its primary listing on the London Stock Exchange and its secondary listing on Euronext Amsterdam, with its securities also traded on the New York Stock Exchange under its American Depositary Share Programme.
The Board of the Company has implemented standards of corporate governance and disclosure policies applicable to a UK incorporated company, with listings in London, Amsterdam and New York. The Company has already elected the United Kingdom as its EU home member state, and therefore, following the Simplification, most of its regulatory and corporate governance-related obligations arise in the UK and in the US.
Corporate governance compliance and statements
The 2016 UK Corporate Governance Code (the UK Code) applied to the Company during the year. The Board supports the principles of corporate governance set out in the UK Code. A revised version of the UK Corporate Governance Code (the New Code) was published by the Financial Reporting Council in July 2018, which applied to the Company from 1 January 2019.
The Company, which has its primary listing on the main market of the London Stock Exchange, has complied with the provisions of the UK Code throughout the year ended 31 December 2018.
A description of how the Company has applied the main principles of the UK Code is set out on pages 73 to 82. A copy of the UK Code can be found on the FRC website at |
The Directors of the Company are required by the UK Code to make certain statements in relation to provisions contained in the UK Code. The locations of those statements are as follows:
◾ Page 2 to 63 for the Strategic Report explaining the Group’s business model and the strategy for delivering the objectives of the Group
◾ Page 60 for confirmation that the Directors have carried out a robust assessment of the principal risks facing the Group, including those that would threaten its business model, future performance, solvency or liquidity
◾ Page 80 for confirmation that the Annual Report and Accounts is fair, balanced and understandable and provides the information necessary for shareholders to assess the Group’s position and performance, business model and strategy
◾ Page 82 for an explanation of how the Directors have assessed the prospects of the Group, taking into account the Group’s current position and its principal risks
◾ Page 80 for the statement on the status of the Group as a going concern
Table of Contents
RELX Annual report and financial statements 2018 | Corporate Governance Review | 73 | |
|
Application of UK Corporate Governance Code Principles
Leadership
Role of the Board and its Committees
The Board is responsible for providing leadership and stewardship of the Group within a framework of appropriate and effective controls that enable risk to be assessed, and then managed in a manner which promotes the success of the Group. The Board is also responsible for overseeing the Group’s strategy and performance, financial reporting, internal control and risk management framework, and corporate governance processes. It is also ultimately accountable to shareholders for the long-term performance of the business and the delivery of shareholder returns.
In order to facilitate the oversight role that it provides in these areas, and to ensure that it retains decision-making power in respect of matters which are deemed to be material to the current or future financial performance of the Group, the Board has put in place a clear and robust corporate governance framework. This includes a schedule of matters reserved for the approval of the Board, such as the approval of material acquisitions, major capital expenditure, Group strategy and budgets, the Group’s financial statements and its dividend policy. In order to allow the Board appropriate time to focus on these key matters within the constraints of its annual programme, a number of its other
responsibilities have been delegated to four principal committees. These are set out within the Terms of Reference for each Committee, which were updated during the year, to reflect that, from the time of completion of the Simplification, the former Dutch entity RELX NV ceased to exist, and to reflect the increased remit of the Remuneration and Nominations Committees, as prescribed by the 2018 UK Corporate Governance Code (the New Code). The current Terms of Reference for each Committee can be found on our website atwww.relx.com. The membership and activities of these Committees are described on pages 83, 85 and 106.
There are additionally a number of approved delegated authorities in place from the Board to the Chief Executive Officer and other senior executives which relate principally to theday-to-day management of the business.
The executive leadership team supports the Chief Executive Officer in the performance of his duties.
Chairman and Chief Executive – division of responsibilities
There is a clear separation of the roles of the Chairman, who leads the Board, and the Chief Executive Officer, who is responsible for theday-to-day management of the Group, which are set out in writing and included on page 74. The table on page 74 also illustrates the key responsibilities of the other Directors. This division of responsibilities, in addition to the Schedule of Matters Reserved for the Board and Terms of Reference for each Committee, ensures that there are appropriate controls in place to prevent any individual from having unfettered powers of decision.
Board Committees
The Board has established a number of Committees, to which it has delegated certain powers, and which focus on particular matters. The structure of these Committees and a summary of their key responsibilities are set out below. Each Committee has its own Chairman who reports back to the Board on its activities. Details on how these Committees have addressed these responsibilities are set out in pages 83 to 107. All the Committees have written Terms of Reference, which are available on our website,www.relx.com. Board Committees are principally supported by the Chief Executive Officer, Chief Financial Officer, Chief Legal Officer and Company Secretary, and the Chief Human Resources Officer, although senior managers within the Group are invited to attend meetings where appropriate. The Board’s annual programme and the agendas for the Committees are prepared by their respective Chairs with support from the Company Secretary. |
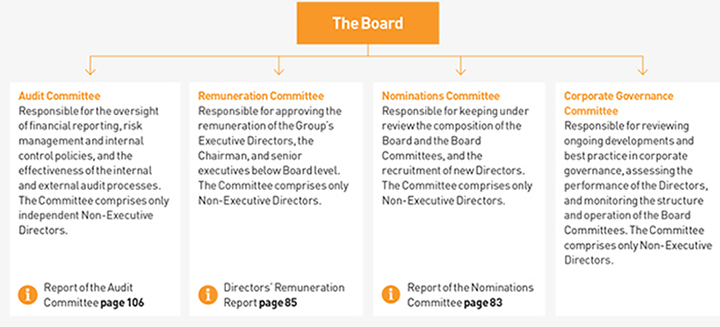
|
Table of Contents
74 | RELX Annual report and financial statements 2018 | Governance | |
|
Key roles of the Directors
Chairman
◾ Provides leadership of the Board, ensuring that it functions effectively
◾ Ensures that all Directors are sufficiently apprised of matters to make informed judgements, through the provision of accurate, timely and clear information
◾ Promotes high standards of corporate governance and a Board culture of openness and debate
◾ Sets the agenda and chairs meetings of the Board
◾ Chairs the Nominations and Corporate Governance Committees
◾ Facilitates the effective contribution of all of the Directors
◾ Ensures effective dialogue with shareholders
◾ Ensures the performance of the Board, its Committees and individual Directors is assessed annually
◾ Ensures effective induction and development of Directors
Chief Executive Officer
◾ Day-to-day management of the Group, within the delegated authority limits set by the Board
◾ Develops the Group’s strategy for consideration and approval by the Board
◾ Ensures that the decisions of the Board are implemented
◾ Informs and advises the Chairman and Nominations Committee on executive succession planning
◾ Leads communication with shareholders
◾ Promotes and conducts the affairs of the Company with the highest standards of integrity, probity and corporate governance |
Chief Financial Officer
◾ Day-to-day management of the Group’s financial affairs
◾ Responsible for the Group’s financial planning, reporting and analysis
◾ Ensures that a robust system of internal control and risk management is in place
◾ Maintains high-quality reporting of financial and environmental performance internally and externally
◾ Supports the Chief Executive Officer in developing and implementing strategy
Senior Independent Director
◾ Leads the Board’s annual assessment of the performance of the Chairman
◾ Available to meet with shareholders on matters where usual channels are deemed inappropriate
◾ Deputises for the Chairman, as necessary
◾ Serves as a sounding board for the Chairman and acts as an intermediary between the other Directors, when necessary
Non-Executive Directors
◾ Bring an external perspective and constructively challenge and provide advice to the Executive Directors
◾ Effectively contribute to the development of strategy
◾ Scrutinise the performance of management in meeting agreed goals and monitor the delivery of the Group’s strategy
◾ Serve as members of Board Committees and chair the Audit and Remuneration Committees
|
Effectiveness
Board composition
The membership of the Board remained unchanged throughout the year, and as at the date of the Annual Report was made up of the Chairman, two Executive Directors and eight otherNon-Executive Directors, who bring a wide range of skills, experience, industry expertise and professional knowledge to their roles. A summary of the balance and diversity of the skills, gender, length of tenure and nationality of the Board of Directors, which the Nominations Committee and Board considered as important factors when reviewing the composition of the Board,
can be found on page 75. The Nominations Committee reviews, on an ongoing basis, the composition of the Board and its Committees to ensure that this balance and diversity remains appropriate, and has concluded that the current composition of the Board allows it to discharge its duties to the Company and govern the Group effectively.
Currently, 36% of the Board is made up of women, compared to the Group’s target of at least 30%.
Table of Contents
RELX Annual report and financial statements 2018 | Corporate Governance Review | 75 | |
|
Balance of our Board
Areas of significant skills and expertise of theNon-Executive Directors on the Board
Knowledge of corporate governance issues for listed companies
Operational experience in the Group’s main geographical markets
Human resource management and executive remuneration
Corporate responsibility
Corporate strategy and organisation
Marketing and customer relations
Financial and organisational audit
Executive board experience in a large international listed company
Operational experience in the telecommunications and information technology sectors
Legal matters
Banking, tax and corporate finance
Operational experience in the Group’s product markets
| Percentage of the Non-Executive Directors
|
Table of Contents
76 | RELX Annual report and financial statements 2018 | Governance | |
|
Key activities of the Board
The Board met regularly through the year and, in 2018, held seven scheduled meetings. There was also one additional meeting held in February 2018, to deal with matters solely related to the Simplification. The Board’s programme ensures that all relevant matters are considered during scheduled meetings. Additionally, throughout the year, theNon-Executive Directors meet without the Executive Directors present on a regular basis.
In 2018, the Board considered the following:
Business and financial performance ◾ Reports from the Chief Executive Officer and Chief Financial Officer on the Group’s actual and forecast operational and financial performance
◾ Annual and interim financial results
◾ Annual review of invested capital |
Strategy, business and functional reviews ◾ Strategy and business presentations, including twofull-day strategy reviews
◾ Budgets and Annual Strategy
◾ Updates on major acquisitions, investments and disposals
◾ Capital structure and funding requirements
◾ Group tax strategy review
◾ Prospects of the Group and Viability Statement |
Risk, legal, governance and regulatory matters ◾ The Group’s principal risks and ongoing monitoring of risk management and internal control
◾ The Group’s operating and governance principles
◾ Board succession and executive talent management
◾ Appointments andre-appointments to the Board and appointments to Board Committees
◾ Litigation update
◾ Reports from the Committee Chairmen on the key activities of the Board’s Committees
◾ Matters Reserved for the Board and the Terms of Reference for each Board Committee
◾ Corporate structure simplification
◾ Modern Slavery Act Statement/Gender Pay Gap Report/General Data Protection Regulation readiness and compliance with data privacy legislation
◾ Cyber security
◾ Approve updated Group Ethics and Business Conduct Policy
◾ The requirements of the New Code and associated action for the Group |
Stakeholders ◾ Investor relations activities including feedback from investors
◾ Dividend declarations and policy
◾ Share buyback programme
◾ Approval of shareholder communications, such as the Annual Report, Notices of Meetings, and the Corporate Simplification Prospectus and Circular
◾ Review of Corporate Responsibility Programme
◾ Updates on media relations
◾ Assessing customer satisfaction
◾ Reviewing the Group’s Supply Chain
◾ Review of the results of 2018 group-wide employee engagement survey |
Table of Contents
RELX Annual report and financial statements 2018 | Corporate Governance Review | 77 | |
|
Independence of theNon-Executive Directors
TheNon-Executive Directors play an important role in our corporate governance framework, especially given their responsibility to constructively challenge the Executive Directors and monitor the performance of management in meeting agreed goals and objectives. In order to perform their role effectively, their independence and objectivity are vital. Through their membership of the Board and Committees, they also have a significant role to play in ensuring the interests of the Executive Directors are aligned with those of the Company’s shareholders. The Board and each of its Committees complies with the independence requirements set out in the UK Code. The Board reviews the independence of theNon-Executive Directors every year, based on the criteria as set out in the UK Code. In accordance with the UK Code, the independence criteria are not applied in respect of the Chairman after his appointment. Sir Anthony Habgood met the independence criteria contained in the UK Corporate Governance Code when he was appointed Chairman in 2009.
The Board considers allNon-Executive Directors (other than the Chairman whose independence was not assessed) to be independent of management and free from any business or other relationship which could materially interfere with their ability to exercise independent judgement. Although Ben van der Veer has served as aNon-Executive Director for over nine years, and will not be seekingre-election at the 2019 AGM, the Board does not believe that his independence has been compromised by the length of his tenure.
Following a review by the Nominations Committee, the Board has also noted the changes in external appointments of theNon-Executive Directors during the year and does not perceive these to have any impact on their independence or responsibilities to the Company.
The Company’s Articles of Association allow the Board to review and authorise situations where a Director has an interest that conflicts, or may possibly conflict, with those of the Group, and further to impose any conditions on that authorisation. The Board has in place formal procedures for managing and authorising actual or potential conflicts of interest.
Succession planning
The Nominations Committee regularly reviews the composition of the Board and the status of succession plans. The Board is updated annually on senior management succession planning, and during the year, it received a detailed presentation from the Chief Human Resources Officer on the first three tiers of management below the Chief Executive Officer. Directors also have regular contact with succession candidates for senior and executive management positions.
Board appointments
The Board may also appoint Directors (subject to a maximum upper limit) to fill a vacancy at any time, although any Director so appointed shall only hold office until the following Annual General Meeting of the Company, at which his or herre-election shall be voted upon by shareholders. Directors are then required to seekre-election by shareholders at each Annual General Meeting of the Company, in accordance with the UK Code. The notice of meeting for the 2019 AGM will set out information on the Directors standing for election orre-election, including their biographies.
As a general rule, letters of appointment forNon-Executive Directors provide that, subject to annualre-election by shareholders, individuals will serve for an initial period of three years, and are typically expected to be available to serve for a second three-year period. If invited to do so, they may also serve for a third period of three years. TheNon-Executive Directors’ letters of appointment set out the expected time commitment required by the Company to fulfil their duties. The notice period applicable to theNon-Executive Directors is one month. The notice period applicable to the Executive Directors is 12 months. Details of the terms of appointment and the remuneration of both Executive andNon-Executive Directors are set out in the Directors’ Remuneration Report, on pages 85 to 105.
The Company has in place a rigorous procedure for the appointment of new Directors to the Board. This involves the preparation of a search specification by the Nominations Committee and the engagement of an external search firm to identify and propose candidates based on that specification. Any candidates will initially be interviewed by a number of Board members, including the Chairman and Chief Executive Officer, and additionally the Chief Legal Officer and Company Secretary. The candidates are considered in detail by the Nominations Committee, and a recommendation made to the Board regarding any Director appointment. The Board then has a further opportunity to discuss and approve the recommended appointment of any Director.
Board and Committee changes
There were no changes in Board membership during 2018. The changes in the composition of Board Committee membership are set out in the table on page 78.
In anticipation of Ben van der Veer having served nine years on the Board as of September 2018, a review of the composition of the Board’s Committees was completed by the Nominations Committee. Following this, the Board accepted a recommendation from the Nominations Committee that with effect from 19 April 2018, Adrian Hennah succeed Ben van der Veer as the Chairman of the Audit Committee and also with effect from 1 September 2018: (i) Adrian Hennah and Marike van Lier Lels join the Nominations Committee; and (ii) Ben van der Veer step down from the Audit Committee and the Nominations Committee.
Table of Contents
78 | RELX Annual report and financial statements 2018 | Governance | |
|
Board induction and development
The Chairman and the Company Secretary are responsible for ensuring that an effective induction programme takes place for all new Directors. Following appointment and as required, all Directors receive a full, formal and tailored induction, which is designed to meet their individual needs based on their knowledge and experience. It includes meetings with members of the Group’s Executive and Senior Management teams, and visits to the offices of the Group’s main business areas in order to understand how they operate. It also includes the provision of a comprehensive briefing pack which contains information on the Group’s businesses, as well as other information to assist that Director in performing their duties.
To ensure that the Directors continually update their skills, knowledge and familiarity with the Group, they attend meetings in addition to scheduled Board and Committee meetings and participate in site visits. Additionally,Non-Executive Directors also have opportunities to meet RELX Business Leaders and other senior executives. As part of the annual Board evaluation, Directors are invited to discuss with the Chairman their training and development needs.
Board information and support
All Directors have complete and timely access to the information required to discharge their responsibilities fully and effectively. They have access to the services of the Company Secretary, who is responsible for the accurate and timely flow of information to the Board and advising the Board on all corporate governance matters, and ensuring that all Board procedures are followed correctly. The Company Secretary attends all of the Board and Committee meetings.
The Directors also have access to other members of the Group’s management, staff and external advisers, and may take independent professional advice in the furtherance of their duties, at the Company’s expense. Each of the Directors is expected to attend all meetings of the Board and Committees of which they are a member.
The Nominations Committee assesses the external commitments of each Board member to ensure that they have the time to properly fulfil the responsibilities to RELX which come with that position. Where a Director is unable to attend a Board or Committee meeting, they are provided with the papers relating to that meeting and are able to discuss issues arising with the respective Chairman and other Board and Committee members. They are also provided with a copy of the meeting minutes.
Attendance at meetings of the Board and Board Committees
The table below shows the attendance of Directors at meetings of the Board and the Board Committees during the year. Attendance is expressed as the number of meetings attended out of the number eligible to be attended.
Director | | Committee appointments |
| Board | (1) | Audit | Remuneration | Nominations | | Corporate Governance |
| |||||||||||||||
Anthony Habgood (Chairman) | 8/8 | – | 4/4 | 4/4 | 4/4 | Board Committee membership key Audit Remuneration Nominations Corporate Governance Committee Chairman | ||||||||||||||||||||
Erik Engstrom | – | 8/8 | – | – | – | – | ||||||||||||||||||||
Nick Luff | – | 8/8 | – | – | – | – | ||||||||||||||||||||
Wolfhart Hauser | 8/8 | – | 4/4 | 4/4 | 4/4 | |||||||||||||||||||||
Adrian Hennah(2) | 8/8 | 4/4 | – | 1/1 | 4/4 | |||||||||||||||||||||
Marike van Lier Lels(3) | 8/8 | 4/4 | – | 1/1 | 4/4 | |||||||||||||||||||||
Robert MacLeod | 8/8 | – | 4/4 | – | 4/4 | |||||||||||||||||||||
Carol Mills(4) | 7/8 | 4/4 | – | – | 4/4 | |||||||||||||||||||||
Linda Sanford | 8/8 | – | 4/4 | – | 4/4 | |||||||||||||||||||||
Ben van der Veer(5) | 8/8 | 2/3 | – | 3/3 | 4/4 | |||||||||||||||||||||
Suzanne Wood | 8/8 | 4/4 | – | – | 4/4 |
(1) | In addition to the seven scheduled meetings , there was an additional meeting to discuss matters related to the Simplification. Serving Directors also attended twofull-day strategy and business review meetings. |
(2) | Mr Hennah was appointed as Chairman of the Audit Committee with effect from 19 April 2018, and a member of the Nominations Committee with effect from 1 September 2018. |
(3) | Ms van Lier Lels was appointed as a member of the Nominations Committee with effect from 1 September 2018. |
(4) | Ms Mills was unable to attend the unscheduled February meeting of the Board, held at short notice to discuss matters related to the Simplification. She was provided with the papers in advance of the meeting for her review and comment (which was provided to the Chairman), and subsequent to the meeting taking place was provided with a copy of the minutes. |
(5) | Mr van der Veer stepped down as Chairman of the Audit Committee on 19 April 2018, and as a member of the Audit and Nominations Committees with effect from 1 September 2018. |
Table of Contents
RELX Annual report and financial statements 2018 | Corporate Governance Review | 79 | |
|
Board evaluation
The Directors consider the evaluation of the Board, its Committees and members to be an important aspect of corporate governance. The Board undertakes an annual evaluation of its own effectiveness and performance, and that of its Committees and individual Directors. In 2018, the Board undertook an internal evaluation, overseen by the Corporate Governance Committee and supported by the Company Secretary. Using questionnaires completed by all Directors, the Committee explored key areas including: the performance of the Board; Board composition and succession planning; talent management and executive leadership succession; risk management, corporate governance and compliance; quality of information provided by management; Board Committee effectiveness; and Board understanding and visibility of the views of the Group’s stakeholders, and incorporation of them into the Board’s decision-making process. The Chairman conducted interviews with each of the Directors. The review of the performance of the Chairman was led by the Senior Independent Director. The Chairman was not present during the discussion among theNon-Executive Directors relating to his performance. The conclusions of the review were presented and considered at the February 2019 meeting of the Board.
Conclusions of the 2018 Evaluation
The evaluation confirmed that, overall, the Directors believe that the Board and each of its Committees continue to function effectively, are well chaired and receive appropriate levels of administrative and advisory support. The Board is involved in key decisions. It is also adequately engaged in the development and approval of the Group’s strategic, financial and business objectives. The evaluation further confirmed that the Board believes it is appropriately involved in assessing performance against these objectives. Directors believe that the Board has the right blend of experience, skills and diversity in the context of the challenges currently facing the Group, although they noted that the evolution of the Board and the skills that individual Directors bring warrant continuing regular review. The evaluation also focused on the Board’s view of how the Group is positioned to address the requirements of the New Code, which apply from 1 January 2019. Directors expressed their support for a designatedNon-Executive Director to serve as the mechanism for the Board’s engagement with the Group’s employees, and the appointment of Marike van Lier Lels to this role, drawing on her experience fulfilling a similar role previously for RELX NV. The evaluation process confirmed that the Board believes it has adequate visibility of the views of its material stakeholders, such as employees, shareholders, customers and suppliers and appropriately applies its understanding of these in its decision making. An area of focus for the Board in 2019 will be further discussion around its role in setting and ensuring the maintenance of the Group’s culture.
All Directors commended the Chairman on his effective leadership of the Board, noting amongst other things that he facilitates: (i) the effective contribution of each NED; and (ii) the development of constructive relationships and communications within the Board.
Based on the findings of the review, the Corporate Governance Committee concluded that the Board and its Committees function effectively and collaboratively and with an appropriate level of engagement with management. The Committee also concluded that the performance of each Director continues to be effective and that they demonstrate commitment to their respective roles.
|
Accountability
Internal control and risk management
RELX has established internal controls and risk management practices that are embedded into the operations of the businesses, based on the Internal Control – Integrated Framework (2013) issued by the Committee of Sponsoring Organisations of the Treadway Commission. Details of the principal risks facing the Group and how these are mitigated are set out on pages 60 to 63.
Additionally, in order to provide reasonable assurance against material inaccuracies or loss, and on the effectiveness of the systems of internal control and risk management, the Group has adopted the three lines of defence assurance model shown below.
|
1st line of defence Group businesses maintain systems of internal control which are appropriate to the nature and scale of their activities and address all significant strategic, operational, financial and legal compliance risks that they face
2nd line of defence Central functions that are responsible for 1) designing policies, 2) introducing and sharing best practice, 3) monitoring and evaluating compliance with RELX policies and relevant legislation and regulation and appropriate remediation
3rd line of defence Internal audit provides independent assurance on the effectiveness of the 1st and 2nd lines of defence
The Board and Audit Committee |
Note: In addition to the Group’s internal controls, the Group is also audited externally. The report of the external auditor has been included from pages 113 to 120.
The Board has adopted a schedule of matters which are required to be brought to it for decision. The Board is responsible for the system of risk management and internal control of the Group and has implemented an ongoing process for identifying, assessing, monitoring and managing the principal risks faced by its businesses. This process was in place throughout the year ended 31 December 2018, and up to the date of the approval of the Annual Report and Financial Statements 2018. The Board monitors these systems of internal control and risk management and annually carries out a review of their effectiveness.
RELX has an established framework of procedures and internal control, with which the management of each business is required to comply. The Group operates authorisation and approval processes throughout all of its operations. Access controls exist where processes have been automated to ensure the security of data. Management information systems have been developed to identify risks and to enable assessment of the effectiveness of the systems of internal control.
Table of Contents
80 | RELX Annual report and financial statements 2018 | Governance | |
|
RELX has a Code of Ethics and Business Conduct that provides a guide for achieving its business goals and requires officers and employees to behave in an open, honest, ethical and principled manner. The Code also outlines confidential procedures enabling employees to report any concerns about compliance, or about the Group’s financial reporting practice. The Code is available on our website atwww.relx.com.
Each business area has identified and evaluated its principal risks, the controls in place to manage those risks and the levels of residual risk accepted. Risk management and control procedures are embedded into the operations of the business and include the monitoring of progress in areas for improvement that come to management and Board attention.
The principal risks facing RELX businesses are regularly reported to and assessed by the Board and Audit Committee. With the close involvement of business management and central functions, the risk management and control procedures ensure that the Group is managing its business risks effectively and in a coordinated manner across the businesses with clarity on the respective responsibilities and interdependencies. Litigation, and other legal and regulatory matters, are managed by legal directors in the businesses.
The Audit Committee also receives regular reports from both internal and external auditors on internal control and risk management matters. In addition, each business area is required, at the end of the financial year, to review the effectiveness of internal controls and risk management and report its findings on a detailed basis to the management of RELX. These reports are summarised and, as part of the annual review of effectiveness, submitted to the Audit Committee. The Chairman of the Audit Committee reports to the Board on any significant internal control matters arising.
Annual review
As part of theyear-end procedures, the Audit Committee and Board reviewed the effectiveness of the systems of internal control and risk management during the 2018 financial year. This included consideration of risk appetite (defined as the Group’s willingness to take on risk) for each principal risk. Risk appetite is based on an assessment of the level of residual risk, taking account of inherent risk and mitigation efforts. The assessment is rated, in relation to the Group’s objectives for the current level of residual risk, in three broad categories: reduce, accept and willing to extend. The level of residual risk which the Group is prepared to accept will vary, with a high level of mitigation effort over operational, financial and compliance risks. The residual risk level for external and strategic risks may be extended if doing so is in line with the Group’s strategic objectives, values and stakeholder interests and if shareholder returns could be increased. As part of the annual review, the Board considered the Group’s culture. The objective of these systems of internal control and risk management is to manage, rather than eliminate, the risk of failure to achieve business objectives. Accordingly, they can only provide reasonable, but not absolute, assurance against materialmis-statement or loss. The Board has confirmed, subject to the above, that as regards financial reporting risks, the respective risk management and control systems provide reasonable assurance
against material inaccuracies or loss and have functioned properly during the year. In accordance with the Code, the Board has also considered the Group’s long-term viability, following a robust and thorough assessment of its principal risks. The resulting Viability Statement is set out on page 82.
Responsibilities in respect of financial statements
The Directors are required to prepare financial statements as at the end of each financial period, in accordance with applicable laws and regulations, which give a true and fair view of the state of affairs, and of the profit or loss, of the Company and its subsidiaries, joint ventures and associates. They are responsible for maintaining proper accounting records, for safeguarding assets and for taking reasonable steps to prevent and detect fraud and other irregularities.
The Directors are also responsible for selecting suitable accounting policies and applying them on a consistent basis, and making judgements and estimates that are prudent and reasonable. Applicable accounting standards have been followed and the RELX consolidated financial statements, which are the responsibility of the Directors of the Company, are prepared using accounting policies which comply with International Financial Reporting Standards as issued by the International Accounting Standards Board and as adopted by the European Union. Having taken into account all of the matters considered by the Board and brought to the attention of the Board, the Directors are satisfied that the Annual Report and Financial Statements, taken as a whole, is fair, balanced and understandable, and provides the information necessary for shareholders to assess the Group’s position and performance, business model and strategy.
Going concern
The Directors, having made appropriate enquiries, consider that adequate resources exist for the Group to continue in operational existence for the foreseeable future and that, therefore, it is appropriate to adopt the going concern basis in preparing the 2018 financial statements. In reaching these conclusions, the Directors have had due regard to the Group’s financial position as at 31 December 2018, the strong free cash flow of the Group, the Group’s ability to access capital markets and the principal risks facing the Group.
A commentary on the Group’s cash flows, financial position and liquidity for the year ended 31 December 2018 is set out in the Chief Financial Officer’s report on pages 54 to 59. This shows that after taking account of available cash resources and committed bank facilities that back up short-term borrowings, all of the Group’s borrowings that mature within the next two years can be covered. The Group’s policies on liquidity, capital management and management of risks relating to interest rate, foreign exchange and credit exposures are set out on pages 150 to 155. The principal risks facing the Group are set out on pages 60 to 63.
Table of Contents
RELX Annual report and financial statements 2018 | Corporate Governance Review | 81 | |
|
US certificates
As required by Section 302 of the US Sarbanes-Oxley Act 2002 and by related rules issued by the US Securities and Exchange Commission (the Commission), the Chief Executive Officer and Chief Financial Officer of the Company certify in the Annual Report 2018 on Form20-F to be filed with the Commission that they are responsible for establishing and maintaining disclosure controls and procedures and that they have:
◾ | designed such disclosure controls and procedures to ensure that material information relating to the Group is made known to them |
◾ | evaluated the effectiveness of the Group’s disclosure controls and procedures |
◾ | based on their evaluation, disclosed to the Audit Committee and the external auditors all significant deficiencies in the design or operation of disclosure controls and procedures and any frauds, whether or not material, that involve management or other employees who have a significant role in the Group’s internal controls |
◾ | presented in the Annual Report 2018 on Form20-F their conclusions about the effectiveness of the disclosure controls and procedures |
A Disclosure Committee, comprising the Company Secretary and other senior managers of the Group, provides assurance to the Chief Executive Officer and Chief Financial Officer regarding their Section 302 certifications.
Section 404 of the US Sarbanes-Oxley Act 2002 requires the Chief Executive Officer and Chief Financial Officer of the Company to certify in the Annual Report 2018 on Form20-F that they are responsible for maintaining adequate internal control structures and procedures for financial reporting and to conduct an assessment of their effectiveness. The conclusions of the assessment of internal control structures and financial reporting procedures, which are unqualified, are presented in the Annual Report 2018 on Form20-F.
Shareholder engagement
The Board values regular dialogue with the Company’s shareholders. The Company reports to its shareholders through the publication of the interim and full-year reports, following which presentations are made by the Chairman, Chief Executive Officer and Chief Financial Officer on the Group’s business, and these are simultaneously webcast. In addition, quarterly trading updates are provided ahead of the Annual General Meeting and towards the end of the financial year, and a conference call with investors was held following the third-quarter trading update for 2018.
In addition, ateach-in focused on developments in the Risk & Business Analytics business was held for analysts and investors in November 2018, which was also made available on our website at
www.relx.com.
The Chief Executive Officer, the Chief Financial Officer and the investor relations team meet institutional shareholders on a regular basis and the Chairman also makes himself available to major institutions as appropriate. The interim and annual results announcements and presentations, together with the trading updates, other important announcements and corporate governance documents concerning the Group, are available on our website.
The Board commissions periodic reports on the attitudes and views of the Company’s institutional shareholders and the results are presented to the Board. The Board also receives regular updates from the Head of Investor Relations on the views of shareholders through a briefing which is a standing agenda item for all meetings of the Board.
Annual General Meeting
All holders of RELX PLC ordinary shares may attend the Company’s Annual General Meeting (AGM) in April 2019. The AGM provides an opportunity for the Board to communicate with individual shareholders, and for shareholders to provide their views on the performance and progress of the Group. The Chairman, the Chief Executive Officer, the Chief Financial Officer, the Chairmen of the Board Committees, other Directors and a representative of the external auditors are available to answer questions from shareholders. The Chief Executive also presents a review of the key business developments during the year. The Company offers electronic voting facilities in relation to proxy voting at shareholder meetings. In line with the UK Code, details of proxy voting by shareholders, including votes withheld, are given at the AGM and are posted on our website following the AGM. The notice of meeting for the 2019 AGM will set out in full the resolutions for consideration by shareholders, together with explanatory notes and information on the Directors standing for election orre-election.
Table of Contents
82 | RELX Annual report and financial statements 2018 | Governance | |
|
Viability statement
| ||
The UK Corporate Governance Code requires Directors to assess the prospects of the Group over a period significantly longer than twelve months and to state whether they have a reasonable expectation that the Company will be able to continue in operation and meet its liabilities as they fall due over the period of their assessment.
Assessing the Group’s Prospects The Group develops information-based analytics and decision tools for professional and business customers in the Scientific, Technical &Medical, Risk and Business Analytics, Legal and Exhibitions sectors. The Group has leading positions in long-term growth markets, deep customer understanding and has developed innovative solutions that often account for about 1% of our customers’ cost base but can have a significant and positive impact on the economics of the remaining 99%. Having effectively transitioned the business from print to digital, the Group is systematically migrating its information solutions toward highervalue-add decision tools, adding broader data sets, embedding more sophisticated analytics and leveraging more powerful technology. We believe this evolution is improving our business profile and positions the Group for future business success.
The Group’s prospects are assessed through the annual strategy planning process. This process includes a review of assumptions made and assesses each business area’s longer-term plan. The resulting three-year strategy plan forms the basis for Group and divisional targets andin-year budgets. Objectives are set with consideration given to the economic and regulatory environment, and to customer trends, as well as incorporating risks and opportunities. The most recent three-year strategy business plan was agreed by the Directors in September 2018.
In assessing the Group’s prospects, our current position and principal risks are considered as follows:
Current position and business model ◾ Diversified business in terms of sectors, markets, customers, geographies and products and services so that we are not dependent on any one business, customer, region or product
◾ High percentage of subscription and recurring revenue streams
◾ Leading positions in long-term global growth markets
◾ Low working capital and capital investment requirements leading to high levels of cash generation
◾ Clear strategy focused on organic growth supplemented by selective acquisitions in higher growth areas
◾ Continued development of increasingly sophisticated information-based analytics and decision tools
◾ Expansion into higher growth adjacencies and geographies primarily through organic investment augmented with selective acquisitions
Further details on our strategy and 2018 progress are on pages 4 and 5.
Principal risks related to our business model ◾ Challenges to the intellectual property rights of content embedded in our products and services
◾ Disruption or loss of data sources that our businesses rely on due to regulation or other reasons
◾ Changes to the paid subscription model for our primary research business within Scientific, Technical & Medical
| ◾ Technological failure of our electronic platforms and networks
◾ Failure of our cyber security measures resulting in unauthorised access to our systems and breach of data privacy
Detailed descriptions of all principal risks and mitigations are on pages 60 to 63.
Assessing the Group’s Viability The three-year strategy plan for our businesses includes management’s assessment of the anticipated operational risks affecting the business and assumes that current economic conditions broadly persist, financing will be available on similar terms to those negotiated recently and interest rates will follow market expectations. Management then considers the viability of the business should unexpected events, linked to the principal risks, occur. To first make the assessment, the financial impact of each principal risk on revenue and cashflow is estimated. Owing to the diversified nature of the Group, no individual risk was estimated to have an impact close to the amount, broadly estimated at one third of total Group cashflow, necessary for a breach of the covenant in the Group’s $3.0bn committed bank facility.
The assessment then considers various stress-test scenarios under which multiple risks occur simultaneously accompanied by an inability to access the debt capital markets to refinance scheduled liabilities as they become due, together with an increase in interest rates much faster than currently expected. The resulting analysis, which assumes share buybacks are suspended but dividends continue uninterrupted, then considers the impact on available headroom and whether any scenario results in breaching the covenant in the committed bank facility.
The worst-case stress case modelled a combination of the following risks: (a) the inability to use certain third-party data resources; (b) an adverse impact on revenue from a shift away from the paid subscription model; and (c) having our systems disrupted by a cyber security event. The analysis concluded that even with the simultaneous occurrence of these three risks, no access to the debt capital markets and a sharply rising interest rate environment, the Group would still have sufficient funds to trade, settle its liabilities as they come due and remain compliant with the covenant in its committed bank facility, whilst still paying forecast dividends.
In addition to scenario modelling, the Directorsbi-annually review the Group’s principal risks, assess the likelihood and impact of each risk together with the effectiveness of mitigating controls, and consider emerging risks. The Directors also receive regular updates from management on treasury, tax, acquisitions and divestments, and significant risk areas including information security, technology and legal and regulatory matters. Finally, separate from the annual strategy plan, the Directors periodically receive updates from business area management on their operations, prospects and risks. Whilst these reviews and discussions naturally focus more closely on the quantifiable risks facing the business within the three-year planning period, they also cover longer-term risks.
As a result of stress-testing the three-year strategy plan, supported by regular reviews of risk during the year, the Directors confirm that they have a reasonable expectation that the Group will be able to continue its operations and meet its liabilities as they fall due over the next three years and are not aware of any longer-term operational or strategic risks that would result in a different outcome from the three-year review. |
Table of Contents
RELX Annual report and financial statements 2018 | 83 | |
|
Report of the Nominations Committee
This report has been prepared by the Nominations Committee and has been approved by the Board.
Membership
The Committee comprises onlyNon-Executive Directors. The members of the Committee who served during the year were: | ||||
◾ | Sir Anthony Habgood (Committee Chairman) | |||
◾ | Wolfhart Hauser | |||
◾ | Ben van der Veer (until 1 September 2018) | |||
◾ | Adrian Hennah (from 1 September 2018) | |||
◾
| Marike van Lier Lels (from 1 September 2018)
|
Responsibilities
The principal role and responsibilities of the Committee are to provide assistance to the Board by identifying individuals qualified to become Directors and recommending to the Board the appointment of such individuals. The responsibilities of the Committee are set out in written Terms of Reference (available atwww.relx.com) and include: | ||||
◾ | to keep under review the size and composition of the Board | |||
◾ | to develop and agree the specification for the recruitment of new Directors | |||
◾ | to procure the recruitment of new Directors | |||
◾ | to recommend to the Board the appointment of candidates as RELX PLC Directors | |||
◾ | to recommend Directors to serve on the Committees of the Board, having regard to the criteria for service on each Committee as set out in the Terms of Reference for such Committees and to recommend members to serve as the Chair of those Committees | |||
◾ | to make recommendations to the Board in relation tothe re-appointment of anyNon-Executive Director at the conclusion of his/her specified term of office and the election orre-election of Directors at the AGM | |||
◾ | to review and make recommendations to the Board in relation to any Directors’ actual or potential conflicts of interest
|
Activities of the Committee
During the year, the Committee met four times and its main areas of focus were:
◾ there-appointment of Sir Anthony Habgood as Chairman at the conclusion of his specified term of office
◾ there-appointments of Marike van Lier Lels, Linda Sanford and Ben van der Veer asNon-Executive Directors at the conclusion of their specified terms of office
◾ the continued independence of Ben van der Veer as a Director following his nine years of service, with reference to guidance provided under the UK Corporate Governance Code
◾ a review of the composition of the Audit and Nomination Committees resulting in the following changes: Ben van der Veer stepped down as Chairman and member of the Audit Committee and stepped down as a member of the Nomination Committee; Adrian Hennah was appointed as the Chairman of the Audit Committee and a member of the Nominations Committee; and Marike van Lier Lels was appointed as a member of the Nominations Committee
◾ a review of the Committee’s Terms of Reference to reflect the corporate simplification carried out by the Group during the year, and the increased remit of the Committee proposed by the 2018 UK Corporate Governance Code (New Code)
◾ succession planning forNon-Executive Directors
◾ the recommendation to the Board of the suitability of Directors’ externalnon-executive director appointments
◾ a review of the provisions of the New Code impacting Board appointments and diversity
Table of Contents
84 | RELX Annual report and financial statements 2018 | Governance | |
|
Composition and diversity of the Board
The Committee seeks to ensure that the Board and its Committees comprise an appropriate balance of skills, experience, independence, knowledge of the Group’s businesses, and diversity, including gender, that enable them to execute their responsibilities. In light of Ben van der Veer stepping down as aNon-Executive Director at the 2019 AGM, the Committee considered succession planning for the Board. As part of the ongoing evolution of the composition of the Board, the Committee deemed that it would be desirable to appoint to the Board an additionalNon-Executive Director with significant executive and public company experience.
The Committee put together a specification for candidates, and engaged the independent global search and leadership advisory firm, Russell Reynolds (which has no other connection to RELX), to carry out the search for a newNon-Executive Director. Following a rigorous process of assessments and interviews, the Committee recommended to the Board that Andrew Sukawaty be appointed as aNon-Executive Director. The Board accepted this recommendation and therefore he will be put forward for election by shareholders as a Director with effect from the 2019 AGM.
The policy applied by the Board in respect of its diversity replicates that applied across RELX. The Board, and the Group more widely, are committed to a diverse workforce and an environment that respects individuals and their contributions, regardless of gender, race or other characteristics, and to ensure the implementation of that commitment. The Committee takes the policy into consideration when discussing the composition of the Board and its Committees, and any appointments or changes to them, and this helps the Committee ensure that there is an appropriate balance of skills, experience, independence, knowledge of the Group, and diversity including gender, background and nationality. The results of the application of the policy can be found within the ‘Balance of our Board’ section set out on page 75.
The Committee recognises the benefits that diversity on the Board can bring and will continue to monitor developments in relation to Board diversity. Details of the Group’s approach to diversity and inclusion more generally in its workforce can be found on page 47.
The Committee also considered the continued appointment of the Chairman, in light of the New Code provision applicable from 2019 relating to length of tenure for that position, and noting that Sir Anthony Habgood had served as aNon-Executive Director since 1 June 2009. In its deliberations the Committee noted that the corporate simplification involving the cross-border merger of RELX NV into RELX PLC, with the Company becoming the sole parent company of the Group, had completed in the third quarter of 2018. The Committee felt that continuity of Board leadership under our current experienced Chairman is important for a period of time following the merger while the new single parent company governance structure is established and embedded. Having been deeply involved in all aspects of the merger the Committee felt that the Chairman brings a unique ability to oversee its implementation. The Committee further took into account the Chairman’s strong leadership of the Board highlighted in recent Board evaluations, and also the respect and support that he had from the Company’s shareholders.
Given these circumstances, the Committee recommended to the Board that it would not be in the best interests of the Company or its shareholders for there to be a change in Chairman at this time (notwithstanding the New Code provision), provided no unforeseen circumstances arose, and that the position would be reviewed after 2019 by the Committee. The Board supported and approved the Committee’s recommendation.
The charts on page 75 illustrate in more detail the composition of the Board.
Succession planning
In light of the New Code, the Committee recommended to the Board that its remit should be widened to include monitoring and reviewing succession planning for senior management positions within the Group. This was previously undertaken by the Board, but will now be undertaken principally by the Committee, with detailed reports being provided to the Board from time to time to enable it to maintain appropriate levels of oversight in this area.
Conflicts of interest
During the year, the Committee monitored Directors’ conflicts of interest in respect of their external appointments, and undertook an annual review of these. No actual conflicts were identified. However, situations were identified which could potentially give rise to a conflict of interest, and the Board authorised those situations and put in place appropriate procedures to manage any potential conflicts at the recommendation of the Committee. More information on conflicts of interest can be found in the Directors’ Report on page 110.
Board and Committees Evaluation
The Committee reviewed the results of the evaluation of the effectiveness and performance of the Board, their Committees and the individual Directors, which had been overseen by the Corporate Governance Committee. Details of the 2018 Board evaluation can be found on page 79.
Table of Contents
RELX Annual report and financial statements 2018 | 85 | |
|
Directors’ Remuneration Report
The Directors’ Remuneration Report (the Report) has been prepared by the Remuneration Committee (the Committee) in accordance with the UK Corporate Governance Code, the UK Listing Rules and the Large andMedium-sized Companies and Groups (Accounts and Reports) (Amendment) Regulations 2013 (the UK Regulations).
The Report was approved by the Board.
Introduction from the Remuneration Committee Chairman
The attached Report reflects the 2018 annual incentives earned and the vesting outcomes for multi-year incentives granted under the remuneration policy applicable to the 2016–2018 cycle of the multi-year plans.
As you will have read in the Annual Report, the Company’s strategic priority is the organic development of increasingly sophisticated information-based analytics and decision tools that deliver enhanced value to professional and business customers across industries. During 2018, RELX continued to successfully execute this strategy, which is aimed at achieving more predictable revenues, a higher growth profile and improving returns. As a result, underlying revenue growth was 4%, underlying operating profits grew 6% and adjusted earnings per share (EPS) at constant currencies grew 7%.
The performance measures in the incentive plans align with and support the strategy by focussing on sustained earnings growth, return on invested capital and shareholder returns. The performance measures are based on adjusted figures as they provide relevant information in assessing the Company’s performance, position and cash flows and we believe they track the core operational performance of RELX and how it contributes to shareholder value creation. The Committee has confirmed that the adoption of new accounting standards in 2018 has had no impact on payouts under the annual or multi-year incentives. The Annual Report includes a reconciliation of adjusted measures to IFRS measures.
2018 Outcomes
The strong financial performance of the business is reflected in the 2018 annual incentive achievement for Executive Directors of marginally above the target level.Two-thirds of the amount earned will be paid in cash to the Executive Directors in March 2019 and the remainingone-third is deferred into RELX shares which will be released in Q1 2022.
The 2016–18 cycle of the Long Term Incentive Plan (LTIP) vested at 68.6%, with similar vesting levels achieved under both the EPS and total shareholder return (TSR) measures and return on invested capital (ROIC) in 2018 of 13.2%. With respect to the2016-18 cycle of the discontinued Bonus Investment Plan (BIP) and the Executive Share Option Scheme (ESOS), ROIC and EPS performance resulted in vesting percentages of 87.5% and 90.0% respectively. These outcomes reflect strong returns and earnings growth achieved by the business and how the challenging targets set by the Committee have been perceived by the market. In determining the level of payout under the annual incentive and the multi-year incentives, the Committee took into account RELX’s overall business performance and value created for shareholders over the period in review and other relevant factors.
2018 Implementation of simplified Remuneration Policy
The simplified remuneration policy for Executive Directors, which was approved by shareholders in April 2017 by a vote of 95% of the shares voted, was fully implemented in 2018.
For the 2018 annual incentive, it was decided that the KPOs for the Executive Directors would reflect solelynon-financial targets. As a result, the Committee increased the overall weighting of financial measures from 70% to 85% at target achievement and reduced the weighting of the individual KPOs from 30% to 15%. This was in accordance with our approved remuneration policy which contains flexibility to change the weightings, provided the financial targets have a weighting of at least 70%. Recognising the desire on the part of some shareholders for additional disclosures, you will see that we have provided expanded disclosures this year in connection with the KPOs.
A description of the Remuneration Policy, as approved by shareholders at the April 2017 Annual General Meetings, is included on pages 99 to 105 of this Report.
Corporate simplification
As a result of the corporate simplification to merge RELX NV into RELX PLC, which took effect on 8 September 2018, all awards and options over shares in RELX NV were exchanged for awards and options over shares in RELX PLC on aone-for-one basis. In respect of the euro TSR comparator group for LTIP awards (including the 2016–18 cycle), RELX NV shares were, subsequent to the merger, replaced with RELX PLC shares priced in euros and listed on Euronext Amsterdam. In respect of the US dollar TSR comparator group, RELX NV ADRs were, subsequent to the merger, replaced with RELX PLC ADRs. No other adjustments were made to the performance conditions attached to outstanding awards and options.
Table of Contents
86 | RELX Annual report and financial statements 2018 | Governance | |
|
2018 Corporate Governance Code
Following the publication by the FRC of the new Corporate Governance Code in July 2018, the Committee has reviewed the updated provisions relating to remuneration matters. The Committee will report on how these have been implemented in next year’s Report. You will see that with respect to workforce engagement, we have decided to designate anon-executive director to take on responsibility for this and have introduced a fee for this activity.
2019 Implementation of Remuneration Policy
In line with increases for the wider employee population, and consistent with the 2019 salary increase guidelines for UK based employees, the Committee has approved 2019 salary increases for the Executive Directors of 2.5%. As the CEO pays pension contributions and a participation fee which increase each year, after taking into account these increasing fees, his 2019 salary after these increasing deductions will decrease again in 2019 compared to 2018.
Following a review in 2019, we will propose a directors’ remuneration policy for approval by shareholders at the AGM in April 2020.
The audited sections of the Report are clearly marked.
Wolfhart Hauser
Chairman, Remuneration Committee
Table of Contents
RELX Annual report and financial statements 2018 | Directors’ Remuneration Report | 87 | |
|
Annual Remuneration Report
Single Total Figure of Remuneration – Executive Directors (audited)
(a) | (b) | (c) | (d) | (e) | (f) | |||||||||||||||||||||||||||
Annual incentive | ||||||||||||||||||||||||||||||||
Deferred | Share based | |||||||||||||||||||||||||||||||
£’000 | Salary | Benefits | (1) | Cash | Shares | (2) | awards | (3) | Pension | (4) | Total | |||||||||||||||||||||
Erik Engstrom | 2018 | 1,218 | 85 | 1,269 | 635 | 4,662 | 545 | 8,414 | ||||||||||||||||||||||||
2017 | 1,189 | 84 | 1,238 | n/a | 5,458 | 779 | 8,748 | |||||||||||||||||||||||||
Nick Luff | 2018 | 717 | 14 | 753 | 376 | 2,341 | 196 | 4,398 | ||||||||||||||||||||||||
2017 | 700 | 17 | 726 | n/a | 2,747 | 204 | 4,394 |
(1) | Benefits are typically comprised for each Executive Director of a car allowance and private medical/dental insurance and the company meets the cost of tax return preparation. |
(2) | Deferred shares earned under the Annual Incentive Plan are deferred for three years and not released to the Executive Directors until Q1 2022. They carry the right to payment of dividend equivalents when released. |
(3) | The figures for share based awards are calculated in accordance with the methodology set out in the UK Regulations. The figure for performance-related share based awards includes share price appreciation since the date the award was granted. In the case of Erik Engstrom’s figures, the amount included that directly reflects share price appreciation is £1.7m for 2017 and £1.5m for 2018 (of which £0.6m relates to the LTIP, £0.3m relates to the BIP and £0.6m relates to the ESOS). For Nick Luff, the amount included that relates to share price appreciation is £0.8m for 2017 and £0.7m for 2018 (of which £0.3m relates to the LTIP, £0.2m relates to the BIP and £0.3m relates to the ESOS). Please note that these figures add up to £0.8m instead of £0.7m solely due to rounding. |
The shared based awards figures for 2017 disclosed in last year’s Report were, as required by the UK Regulations, based on an estimate using prescribed average share prices and exchange rates and have been restated in this Report to reflect the actual amount vested and the actual share prices and exchange rates on the vesting dates of the 2015–17 cycle of BIP, LTIP and ESOS. The vesting percentages under these plans were determined on 16 February 2018 and were in line with those disclosed on page 86 in the 2017 Remuneration Report. Using the share prices and exchange rates on the vesting dates and the actual dividend equivalents paid in respect of this cycle decreased the 2017 disclosed figure by £1,172k for Erik Engstrom and by £578k for Nick Luff.
The 2018 figures reflect the vesting of the 2016–18 cycle of BIP, LTIP and ESOS. As the BIP, LTIP and ESOS vest after the approval date of this Report, the average share prices and exchange rates for the last quarter of 2018 have been used to arrive at an estimated figure in respect of these awards.
The exchange rates used to convert share based awards to pounds sterling are (i) those that applied at the vesting dates or, if vesting has not occurred at the time of sign off of this Report, the average exchange rates for the last quarter of 2018; (ii) for dividend equivalents, the actual gross pounds sterling payment; and (iii) for estimated dividend equivalents in respect of awards for which vesting has not occurred at the time of sign off of this Report and which are yet to be paid, the average exchange rates for the last quarter of 2018.
(4) | Erik Engstrom participates in the UK legacy defined benefit pension plan on the same basis as other UK executives who are participants in this legacy plan and accrues 1/30th of final year pensionable earnings for every year of service up to his 60th birthday, at which time benefits cease accruing. His annual increase in pensionable earnings is capped at 2%. |
The pension figure disclosed in the table has been calculated in accordance with the prescribed methodology set out in the UK Regulations. This figure does not represent a contribution by the Company to Mr Engstrom’s pension.
In 2018, the Company contributed £42,338 to the funded portion of Mr Engstrom’s defined benefit pension plan. The remainder of his accrued pension is an unfunded liability of the Company. In 2018, Mr Engstrom contributed a total of £151,306 by way of contributions and a participation fee as part of his ongoing membership of this plan. In line with all participants, his contributions and participation fee are increasing each year. The pension figure in the table is reduced by these contributions (11% of pensionable base salary up to the scheme earnings cap until 28 February 2018 and 13% from 1 March 2018) and the participation fee (10% of pensionable base salary in excess of the scheme earnings cap until 28 February 2018 and 13% from 1 March 2018).
For details of Mr Engstrom’s accrued pension as at 31 December 2018, see page 92.
Nick Luff receives a cash allowance in lieu of pension which reduced from 29% of salary to 27% of salary effective 1 March 2018.
The total remuneration for Directors is set out in note 27 to the consolidated financial statements on page 162.
Table of Contents
88 | RELX Annual report and financial statements 2018 | Governance | |
|
2018 Annual Incentive
Set out below is a summary of performance against each financial measure and Key Performance Objective and the resulting annual incentive payout for 2018:
Erik Engstrom | Nick Luff | |||||||||||||||
Performance measure | Relative weighting % at target | Achievement vs target | Payout % of target | Payout % of target | ||||||||||||
Revenue | 35% | Revenue was £7,492m versus a target(1)of £7,499m, resulting in achievement versus target of 99.9% and a payout(2)of 98.5% of 35%. | 34.5% | 34.5% | ||||||||||||
Adjusted net profit after tax | 35% | Adjusted net profit after tax was £1,674m versus a target(1)of £1,665m, resulting in achievement versus target of 100.5% and a payout(2)of 105.0% of 35%. | 36.8% | 36.8% | ||||||||||||
Cash conversion | 15% | Cash flow was £2,243m (96% conversion) versus a target(1)of £2,182m, resulting in achievement versus target of 102.8% and a payout(2)of 128.0% of 15%. | 19.2% | 19.2% | ||||||||||||
Key Performance Objectives (KPOs)(3) | 15% | A detailed description of the KPOs and achievement against those KPOs for each Executive Director is set out below. | 13.75% | 14.5% | ||||||||||||
Total | 100% | 104.2% | 104.9% | |||||||||||||
Total AIP payout as % of salary | ||||||||||||||||
Cash | 100% | 104.2% | 104.9% | |||||||||||||
Deferred Shares | 50% | 52.1% | 52.5% | |||||||||||||
Total | 150% | 156.3% | 157.4% |
The Cash AIP (£1,269,277 for the CEO and £752,818 for the CFO) will be paid in Q1 2019 and the Deferred Shares (with a current value of £634,639 in the case of the CEO and £376,409 in the case of the CFO) will be released in Q1 2022. The release of Deferred Shares is not subject to any further performance conditions, but is subject to malus and claw-back.
(1) | On an equivalent basis (at actual exchange rates and after the net impact of acquisitions and disposals completed during the year). |
(2) | For achievement above target, each 0.1% of overachievement increased the payout ratio for that component by 1 percentage point up to a maximum payout ratio of 150% at 105% achievement vs target. For achievement below target, each 0.1% of underachievement reduced the payout ratio by 1.5 percentage points down to a threshold payout ratio of 10% at 94% achievement vs target. |
KPOs – Erik Engstrom
KPO | Relative weighting % at target | Achievement vs KPO | Payout % of target | |||||||||
Risk Mitigation | 3% | This KPO was almost fully achieved. | 2.5% | |||||||||
◾ Cyber security training provided to 100% of employees, social engineering testing (e.g. phishing simulations) covering RELX globally completed and requirement to continuere-training andre-testing of employees introduced. Met target. ◾ Three cyber security incident response simulations completed at senior levels within the business divisions; six security awareness training sessions delivered; four penetration tests of financial integrity processes performed; lessons learned incorporated into Incident Response Plan. Met target. | ||||||||||||
◾ Five out of six elements of the Compliance Testing and Monitoring Plan were completed and anIn-Person Training Assessment was completed and recommendations for implementation were agreed. Target almost fully met. | ||||||||||||
Customers | 3% | This KPO was almost fully achieved. | 2.5% | |||||||||
◾ Expanded use of customer satisfaction and loyalty metrics in business reviews and in some of the business areas’ annual incentive plans. Target almost fully met. | ||||||||||||
◾ RELX Accessibility awards introduced to recognise exceptional employee efforts to advance accessibility. Met target. | ||||||||||||
◾ Increased the number and reach of our business community working groups and projects which focus on the advancement of the rule of law. Met target. | ||||||||||||
People | 3% | This KPO was fully achieved. | 3.0% | |||||||||
◾ Assessed and reported on employee engagement via employee opinion surveys, with the highest employee participation rates and employee satisfaction scores in the last 15 years. Exceeded target. | ||||||||||||
◾ Employee alignment with company strategy and values measured via employee opinion survey and workshops held throughout the business to further drive alignment. Met target. | ||||||||||||
◾ New diversity and inclusion (D&I) initiatives launched/existing initiatives expanded and indicators to track D&I progress established. Met target. |
Table of Contents
RELX Annual report and financial statements 2018 | Directors’ Remuneration Report | 89 | |
|
KPOs – Erik Engstrom | ||||||||
KPO | Relative weighting % at target | Achievement vs KPO | Payout % of target | |||||
Process | 3% | This KPO was almost fully achieved. | 2.75% | |||||
◾ Number of key suppliers signed up to the RELX Supplier Code of Conduct increased by 4.9%; number of supplier audits completed remained stable; number of significant audit findings reduced; spend with veteran and minority-owned businesses under the US Supplier D&I programme increased, with overall spend with diverse suppliers remaining relatively flat compared to previous year. Target almost fully met. | ||||||||
◾ Continued product migration to electronic decision tools, continued addition of broader data sets and expanded use of high performance computing cluster across all business areas. Met target. | ||||||||
◾ Expanded scale of company-owned shared services by 12%. Met target. | ||||||||
Environment | 3% | This KPO was fully achieved. | 3.0% | |||||
◾ Renewable energy purchased as a percentage of total electricity consumption increased to 81%. Met target. | ||||||||
◾ Over 40% of locations achieved five or more Group Environmental Standards. Exceeded target. | ||||||||
◾ ISO 14001 Environmental Management System certifications achieved at three additional locations. Met target. | ||||||||
Total | 15% | Payout as % of salary 13.75% |
| |||||
KPOs – Nick Luff | ||||||||
KPO | Relative weighting % at target | Achievement vs KPO | Payout % of target | |||||
Risk | 3% | This KPO was almost fully achieved. | 2.5% | |||||
Mitigation | ◾ Cyber security training provided to 100% of employees, social engineering testing (eg phishing simulations) covering RELX globally completed and requirement to continuere-training andre-testing of employees introduced. Met target. | |||||||
◾ Three cyber security incident response simulations completed at senior levels within the business divisions; six security awareness training sessions delivered; four penetration tests of financial integrity processes performed; lessons learned incorporated into Incident Response Plan. Met target. | ||||||||
◾ Five out of six elements of the Compliance Testing and Monitoring Plan were completed andIn-Person Training Assessment was completed and recommendations for implementation were agreed. Target almost fully met. | ||||||||
Corporate | 3% | This KPO was exceeded. | 3.5% | |||||
Structure Simplification | ◾ A proposal for simplification of the Group’s corporate structure (moving from a dual to a single parent holding company structure) was developed and proposed to shareholders for approval. The proposal was approved by over 99.9% of shareholders of both parent companies. Significantly exceeded target. | |||||||
◾ Simplification of corporate structure completed successfully in September 2018. Met target. | ||||||||
◾ Resulting new single parent company structure embedded, reducing complexity and increasing transparency. Met target. | ||||||||
Finance | 3% | This KPO was almost fully achieved. | 2.5% | |||||
Function | ◾ D&I actively promoted within the finance function resulting in increased employee diversity within the finance function. Target almost fully met. | |||||||
◾ Gender pay equity review of the finance function completed. Met target. | ||||||||
◾ Further organisational and process improvements completed within Treasury and Tax. Met target. | ||||||||
Process | 3% | This KPO was fully achieved. | 3.0% | |||||
◾ Number of key suppliers signed up to the RELX Supplier Code of Conduct increased by 4.9%; number of supplier audits completed remained stable; number of significant audit findings reduced; spend with veteran and minority-owned businesses under the US Supplier D&I programme increased, with overall spend with diverse suppliers remaining relatively flat compared to previous year. Target almost fully met. | ||||||||
◾ Structure of finance function reorganised to maximise effectiveness, process simplifications completed in several areas of finance and finance function costs reduced. Exceeded target. | ||||||||
◾ Expanded scale of company-owned shared services by 12%. Met target. | ||||||||
Environment | 3% | This KPO was fully achieved. | 3.0% | |||||
◾ Renewable energy purchased as a percentage of total electricity consumption increased to 81%. Met target. | ||||||||
◾ Over 40% of locations achieved five or more Group Environmental Standards. Exceeded target. | ||||||||
◾ ISO 14001 Environmental Management System certifications achieved at three additional locations. Met target. | ||||||||
Total | 15% | Payout as % of salary 14.5% |
|
Table of Contents
90 | RELX Annual report and financial statements 2018 | Governance | |
|
Multi-year incentives (granted under the Remuneration Policy in effect prior to the approval by shareholders of the current Remuneration Policy at the Annual General Meetings in April 2017)
Multi-year incentives with a performance period ended 31 December 2018 were the 2016–2018 cycles of BIP, LTIP and ESOS granted to Executive Directors.
The Committee assessed the performance measures for these awards and made an overall assessment of underlying business performance and other relevant factors. The vesting outcome resulting from this review is summarised below.
LTIP: 2016–18 cycle performance outcome
| ||||||||||||||||||||
Performance measure | Weighting | Performance range and vesting levels set at grant(1) | Achievement against the performance range | Resulting vesting percentage | ||||||||||||||||
TSR over the three-year | 1/3rd | below median | 0% | Near the upper | 59.8% | |||||||||||||||
performance period(2) | median | 30% | quartile of sterling | |||||||||||||||||
upper quartile | 100% | and euro comparator | ||||||||||||||||||
groups and below | ||||||||||||||||||||
median of US dollar | ||||||||||||||||||||
comparator group | ||||||||||||||||||||
Average growth in adjusted EPS over | 1/3rd | below 5% p.a. | 0% | 7.0% p.a. | 65.0% | |||||||||||||||
the three-year performance period(3) | 5% p.a. | 33% | ||||||||||||||||||
6% p.a. | 52.5% | |||||||||||||||||||
7% p.a. | 65% | |||||||||||||||||||
8% p.a. | 75% | |||||||||||||||||||
9% p.a. | 85% | |||||||||||||||||||
10% p.a. | 92.5% | |||||||||||||||||||
11% p.a. and above | 100% | |||||||||||||||||||
ROIC in the third year of the | 1/3rd | below 12.3% | 0% | 13.2%(4) | 81.0% | |||||||||||||||
performance period(3) | 12.3% | 33% | ||||||||||||||||||
12.55% | 52.5% | |||||||||||||||||||
12.8% | 65% | |||||||||||||||||||
13.05% | 75% | |||||||||||||||||||
13.3% | 85% | |||||||||||||||||||
13.55% | 92.5% | |||||||||||||||||||
13.8% and above | 100% | |||||||||||||||||||
Total vesting percentage: | 68.6% | |||||||||||||||||||
(1) Calculated on a straight-line basis for performance between the points. (2) In respect of the euro TSR comparator group, RELX NV shares were, subsequent to the merger of RELX NV into RELX PLC, replaced with Euronext Amsterdam listed RELX PLC shares priced in euros and, in respect of the US dollar TSR comparator group, RELX NV ADRs were, subsequent to the merger, replaced with RELX PLC ADRs. (3) Growth in adjusted EPS at constant currencies and ROIC are calculated as set out in the Chief Financial Officer’s report on pages 54 to 59 and note 10 to the consolidated financial statements on page 141, with adjustments made to remove the effect on ROIC of changes in exchange rates, pension deficits and accounting standards over the three-year performance period. (4) For 2018, ROIC on pages 57 to 58 of the Chief Financial Officer’s report of 13.2% is the same as ROIC under the plan methodology after adjustments for changes in exchange rates, pension deficits and accounting standards.
|
| |||||||||||||||||||
BIP: 2016–18 cycle performance outcome
| ||||||||||||||||||||
Performance measure | Weighting | Performance range and vesting levels set at grant (1) | Achievement against the performance range | Resulting vesting percentage | ||||||||||||||||
Average growth in adjusted EPS over | 50% | below 4% p.a. | 0% | 7.0% p.a. | 80.0% | |||||||||||||||
the three-year performance period(2) | 4% p.a. | 50% | ||||||||||||||||||
6.5% p.a. | 75% | |||||||||||||||||||
9% p.a. or above | 100% | |||||||||||||||||||
ROIC in the third year of the | 50% | below 12.3% | 0% | 13.2%(3) | 95.0% | |||||||||||||||
performance period(2) | 12.3% | 50% | ||||||||||||||||||
12.8% | 75% | |||||||||||||||||||
13.3% or above | 100% | |||||||||||||||||||
Total vesting percentage: | 87.5% |
(1) | Calculated on a straight-line basis for performance between the points. |
(2) | Growth in adjusted EPS at constant currencies and ROIC are calculated as set out in the Chief Financial Officer’s report on pages 54 to 59 and note 10 to the consolidated financial statements on page 141, with adjustments made to remove the effect on ROIC of changes in exchange rates, pension deficits and accounting standards over the three-year performance period. |
(3) | For 2018, ROIC on pages 57 to 58 of the Chief Financial Officer’s report of 13.2% is the same as ROIC under the plan methodology after adjustments for changes in exchange rates, pension deficits and accounting standards. |
Table of Contents
RELX Annual report and financial statements 2018 | Directors’ Remuneration Report | 91 | |
|
ESOS: 2016–18 cycle performance outcome
| ||||||||||||||||||||
Performance measure | Weighting | Performance range and vesting levels set at grant(1) | Achievement against the performance range | Resulting vesting percentage | ||||||||||||||||
Average growth in adjusted EPS over | 100% | below 4% p.a. | 0% | 7.0% p.a. | 90.0% | |||||||||||||||
the three-year performance period(2) | 4% p.a. | 33% | ||||||||||||||||||
6% p.a. | 80% | |||||||||||||||||||
8% p.a. or above | 100% |
(1) | Calculated on a straight-line basis for performance between the stated average adjusted EPS growth percentages. |
(2) | Growth in adjusted EPS at constant currencies is calculated as set out in the Chief Financial Officer’s report on pages 54 to 59 and note 10 to the consolidated financial statements on page 141. |
Single Total Figure of Remuneration –Non-Executive Directors (audited) |
| |||||||||||||||||||||||
Total fee | Benefits(1) | Total | ||||||||||||||||||||||
2018 | 2017 | 2018 | 2017 | 2018 | 2017 | |||||||||||||||||||
Anthony Habgood | £650,000 | £625,000 | £2,360 | £2,381 | £652,360 | £627,381 | ||||||||||||||||||
Wolfhart Hauser | £159,500 | £140,000 | £780 | £780 | £160,280 | £140,780 | ||||||||||||||||||
Adrian Hennah | £118,990 | £90,000 | £780 | £780 | £119,770 | £90,780 | ||||||||||||||||||
Marike van Lier Lels(2) | €126,651 | €115,000 | €949 | €958 | €127,600 | €115,958 | ||||||||||||||||||
Robert MacLeod | £107,000 | £90,000 | £780 | £780 | £107,780 | £90,780 | ||||||||||||||||||
Carol Mills | £125,000 | £101,000 | £1,620 | £1,620 | £126,620 | £102,620 | ||||||||||||||||||
Linda Sanford | £125,000 | £90,000 | £1,620 | £1,620 | £126,620 | £91,620 | ||||||||||||||||||
Ben van der Veer(2) | €124,696 | €142,500 | €949 | €958 | €125,645 | €143,458 | ||||||||||||||||||
Suzanne Wood(3) | £116,000 | £24,000 | £116,000 | £24,000 |
(1) | Benefits comprise the notional benefit of tax filing support provided to Non-Executive Directors for filings outside their home country resulting from their directorships with RELX. The incremental assessable benefit charge per tax return for 2018 was £840 (unchanged from 2017) for a UK tax return and £780 (unchanged from 2017) for a Netherlands tax return. Anthony Habgood’s benefits also include £1,580 (£1,601 in 2017) in respect of private medical insurance. Further, the Company meets all reasonable travel, subsistence, accommodation and other expenses, including any tax where such expenses are deemed taxable, incurred by the Non-Executive Directors and the Chairman in the course of performing their duties. |
(2) | The pound sterling equivalent of the total fees and benefits for Marike van Lier Lels and Ben van der Veer (converted at the average exchange rate applicable to the years of reporting) were £112,920 (£101,717 in 2017) and £111,190 (£125,840 in 2017) respectively for 2018. For the purposes of reporting the total fees and benefits for these two Directors, the pound sterling benefit relating to the UK tax return preparation has been converted into euros at the average exchange rate for the relevant year. |
(3) | Appointed on 26 September 2017. |
(4) | The total remuneration for Directors is set out in note 27 to the consolidated financial statements on page 162. |
Non-Executive Directors’ fees
The fees in the Single Total Figure table forNon-Executive Directors reflect the following fees in 2018:
Annual fee 2019 | Annual fee 2018 | |||||||
Chairman | £650,000 | £650,000 | ||||||
Non-Executive Directors | £85,000 | £85,000/€97,500 | ||||||
Senior Independent Director | £30,000 | £30,000 | ||||||
Chairman of: | ||||||||
– Audit Committee | £30,000 | £30,000/€37,500 | ||||||
– Remuneration Committee | £30,000 | £30,000 | ||||||
Workforce engagement fee | £17,500 | |||||||
Committee membership fee: | ||||||||
– Audit Committee | £17,500 | £17,500/€20,000 | ||||||
– Remuneration Committee | £17,500 | £17,500 | ||||||
– Nominations Committee | £10,000 | £10,000/€12,500 |
In addition, an intercontinental travel fee of £4,500/€5,000 was payable to anyNon-Executive Director (excluding the Chairman) in respect of each transatlantic journey made in order to attend a RELX Board or Committee meeting. In 2019, this fee will be £4,500.
From 2019, we have introduced a workforce engagement fee which is payable to theNon-Executive Director who undertakes the UK Corporate Governance Code responsibility to engage with the workforce across RELX and report back to the Board.
Fees may be reviewed annually, although in practice they have changed on a less frequent basis. There are no changes toNon-Executive Director and Chairman fees for 2019. The last review took place at the end of 2017, as a result of which a number of changes were approved which took effect on 1 January 2018 as set out above.
Table of Contents
92 | RELX Annual report and financial statements 2018 | Governance | |
|
Total pension entitlements (audited)
Erik Engstrom is a member of the legacy UK defined benefit pension plan. Mr Engstrom pays contributions on the amount of his pensionable base salary up to the scheme earnings cap, which were 11% until 28 February 2018, 13% from 1 March 2018 and will be 15% from 1 March 2019. He also pays a participation fee on the amount of his pensionable base salary which exceeds the scheme earnings cap. This fee was 10% until 28 February 2018, increased
to 13% on 1 March 2018 and will be 16% from 1 March 2019. Mr Engstrom is also subject to a cap of 2% on annual increases in pensionable earnings. Further details are provided in the Remuneration Policy on page 99.
Nick Luff receives a cash allowance in lieu of pension, which reduced from 29% of salary to 27% of salary on 1 March 2018 and reduces to 25% of salary on 1 March 2019.
Pension – Standard information
| ||||||||
Age at December 2018 | Normal retirement age | Director’s contributions | Participation fee | Total of Director’s contributions and participation fee | ||||
55 | 60 | £19,777 | £131,529 | £151,306 |
Pension – UK Regulations
| ||||
Accrued annual pension at 31 December 2017 | Accrued annual pension at 31 December 2018 | Single figure pensions value | ||
£414,683 | £449,519 | £545,409(1) |
(1) | Net of Director’s contribution and participation fee. |
Scheme interests awarded during the financial year (audited)
LTIP – PERFORMANCE SHARE AWARDS | ||||||||||||
Basis on which award is made | Face value of award at grant(1) | Value of awards if vest in line with expectations(2) | Percentage of maximum that would be received if threshold performance achieved(3) |
| End of performance period | |||||||
Erik Engstrom | 450% of salary | £5,348,499 | £2,674,250 | If the measure with the lowest payout at threshold pays out at threshold, the overall payout is 2%. If each measure pays out at threshold, the overall payout is 25% | 31 December 2020 | |||||||
Nick Luff | 375% of salary | £2,624,636 | £1,312,318 |
(1) | The face value of the LTIP awards granted in February 2018 was calculated using (i) the middle market quotation of a PLC ordinary share (£14.915); (ii) the closing price of an NV ordinary share (€16.87); and (iii) the GBP:EUR exchange rate on the trading day before the date of grant of 19 February 2018. These share prices were used to determine the number of awards granted. Subsequent to the corporate simplification which took effect on 8 September 2018, each award over an NV ordinary share has been exchanged for an award over the same number of PLC ordinary shares. |
(2) | Vesting in line with expectations for LTIP is as per the performance scenario chart disclosed on page 87 of the 2016 Remuneration Report, i.e. 50%. |
(3) | Threshold payout levels for each measure under LTIP have been included as it is possible to achieve threshold, and hence payout, in respect of just one of the measures (or, for TSR, in respect of one of the three TSR comparator groups). |
The LTIP awards granted in 2018 are based on ROIC, EPS and TSR weighted 40%:40%:20% respectively and assessed independently. The targets and vesting scales applicable to these awards are set out on page 94 of the 2017 Remuneration Report.
Table of Contents
RELX Annual report and financial statements 2018 | Directors’ Remuneration Report | 93 | |
|
External appointments
The Committee believes that the experience gained by allowing Executive Directors to serve asNon-Executive Directors on the boards of other organisations is of benefit to RELX.
Accordingly, Executive Directors may, subject to the approval of the Chairman and the CEO (or the Chairman only in the case of the CEO), serve asNon-Executive Directors on the boards of up to twonon-associated companies (of which only one may be a major company) and they may retain remuneration arising from such appointments.
Erik Engstrom is aNon-Executive Director of Smith & Nephew plc and received fees of £69,500 for 2018 (£75,135 in 2017).
Nick Luff has been aNon-Executive Director of Rolls-Royce Holdings plc since 3 May 2018, for which he received fees of £46,159 for time served in 2018 (in 2017 he received fees of £69,007 for time served as aNon-Executive Director of Lloyds Banking Group plc until 11 May 2017).
Payments to past Directors and payments for loss of office (audited)
There have been no payments for loss of office in 2018.
Statement of Directors’ shareholdings and other share interests (audited)
Shareholding requirement
The Committee believes that a closer alignment of interests can be created between senior management and shareholders if executives build and maintain a significant personal stake in RELX. The shareholding requirements applicable to the Executive Directors are set out in the table below. Shares that count for this purpose are any type of RELX security of which the Director, their spouse, civil partner or dependent child has beneficial ownership on an unencumbered basis. There has been no change to the interests reported below between 31 December 2018 and 20 February 2019.
Meeting the shareholding requirement is both a vesting condition for LTIP awards granted and a requirement to maintain eligibility for future LTIP awards.
On 31 December 2018, the Executive Directors’ shareholdings were as follows (valued using the middle market closing prices of the relevant securities):
Shareholding requirement (% of 31 December 2018 annual base salary) |
| Actual shareholding as at 31 December 2018 (% of 31 December 2018 annual base salary) | ||||
Erik Engstrom | 400% | 1,304% | ||||
Nick Luff | 300% | 594% |
Share interests (number of RELX ordinary shares held)(1)
1 January 2018 | 31 December 2018 | |||||||
Erik Engstrom | 1,004,671 | 1,010,617 | ||||||
Nick Luff | 260,942 | 265,971 | ||||||
Anthony Habgood | 88,450 | 88,450 | ||||||
Wolfhart Hauser | 14,633 | 14,633 | ||||||
Adrian Hennah | 10,508 | 10,508 | ||||||
Marike van Lier Lels | 8,000 | 8,000 | ||||||
Robert MacLeod | 6,950 | 6,950 | ||||||
Carol Mills | 9,700 | 9,700 | ||||||
Linda Sanford | 9,700 | 9,700 | ||||||
Ben van der Veer | 10,766 | 10,766 | ||||||
Suzanne Wood | 3,500 | 5,100 |
(1) | As a result of the corporate simplification to merge RELX NV into RELX PLC, which took effect on 8 September 2018, all shares in RELX NV were exchanged for shares in RELX PLC on aone-for-one basis. Therefore, all shares owned as at 31 December 2018 are RELX PLC shares. The number of shares held by each Director as at 1 January 2018 which were RELX PLC shares were as follows: Erik Engstrom: 200,490, Nick Luff: 124,847, Anthony Habgood: 50,000, Wolfhart Hauser: 11,542, Adrian Hennah: 10,508, Marike van Lier Lels: 0, Robert MacLeod: 6,950, Carol Mills: 9,700, Linda Sanford: 6,700, Ben van der Veer: 0, Suzanne Wood: 3,500. The remainder were RELX NV shares. |
Table of Contents
94 | RELX Annual report and financial statements 2018 | Governance | |
|
Multi-year incentive interests (audited)
The tables below and on page 95 set out vested but unexercised and unvested options and unvested share awards held by the Executive Directors including details of awards granted, options exercised and awards vested during the year of reporting.
All outstanding unvested options and share awards are subject to performance conditions. For disclosure purposes, any PLC ADRs awarded under the multi-year incentive plans are included as ordinary shares. Between 31 December 2018 and the date of this Report, there have been no changes in the options or share awards held by the Executive Directors.
As a result of the corporate simplification to merge RELX NV into RELX PLC, which took effect on 8 September 2018, all outstanding options and awards which were granted over shares in RELX NV were exchanged for outstanding options and awards over shares in RELX PLC priced in euros and listed on Euronext Amsterdam on aone-for-one basis.
Erik Engstrom
OPTIONS | Year of grant | No. of options held on 1 Jan 2018 | No. of options granted during 2018 | Option price on date of grant | No. of options exercised during 2018 | Market price per share at exercise | No. of options held on 31 Dec 2018 | Unvested options vesting on | Options exercisable until | |||||||||||||||||||||||||||
2014 | 145,604 | £9.245 | 145,604 | 07 Apr 24 | ||||||||||||||||||||||||||||||||
158,166 | €10.286 | 158,166 | 07 Apr 24 | |||||||||||||||||||||||||||||||||
2015 | (1) | 119,771 | £11.520 | 114,584 | 02 Apr 25 | |||||||||||||||||||||||||||||||
126,358 | €15.003 | 120,886 | 02 Apr 25 | |||||||||||||||||||||||||||||||||
2016 | 112,690 | £12.550 | 112,690 | Mar 19 | 15 Mar 26 | |||||||||||||||||||||||||||||||
119,312 | €15.285 | 119,312 | Mar 19 | 15 Mar 26 | ||||||||||||||||||||||||||||||||
2017 | 96,996 | £14.945 | 96,996 | Feb 20 | 27 Feb 27 | |||||||||||||||||||||||||||||||
102,405 | €16.723 | 102,405 | Feb 20 | 27 Feb 27 | ||||||||||||||||||||||||||||||||
Total | 981,302 | 970,643 | ||||||||||||||||||||||||||||||||||
SHARES | Year of grant | No. of unvested shares held on 1 Jan 2018 | No. of shares awarded during 2018 | Market price per share at award | No. of shares vested during 2018 | Market price per share at vesting | No. of unvested shares held on 31 Dec 2018 | End of performance period | Date of vesting | |||||||||||||||||||||||||||
BIP | 2015 | (1) | 97,607 | €15.003 | 90,608 | €16.870 | ||||||||||||||||||||||||||||||
2016 | 94,965 | €15.285 | 94,965 | Dec 2018 | Feb 2019 | |||||||||||||||||||||||||||||||
2017 | 81,781 | €16.723 | 81,781 | Dec 2019 | Feb 2020 | |||||||||||||||||||||||||||||||
LTIP | 2015 | (1) | 119,771 | £11.520 | 105,518 | £14.915 | ||||||||||||||||||||||||||||||
126,359 | €15.003 | 111,322 | €16.870 | |||||||||||||||||||||||||||||||||
2016 | 112,690 | £12.550 | 112,690 | Dec 2018 | Feb 2019 | |||||||||||||||||||||||||||||||
119,312 | €15.285 | 119,312 | Dec 2018 | Feb 2019 | ||||||||||||||||||||||||||||||||
2017 | 96,996 | £14.945 | 96,996 | Dec 2019 | Feb 2020 | |||||||||||||||||||||||||||||||
102,405 | €16.723 | 102,405 | Dec 2019 | Feb 2020 | ||||||||||||||||||||||||||||||||
2018 | 179,318 | £14.915 | 179,318 | Dec 2020 | Feb 2021 | |||||||||||||||||||||||||||||||
178,482 | €16.870 | 178,482 | Dec 2020 | Feb 2021 | ||||||||||||||||||||||||||||||||
Total | 951,886 | 357,800 | 307,448 | 965,949 |
(1) | The performance outcomes for the 2015 ESOS options, BIP and LTIP were disclosed on pages 86 and 87 of the 2017 Remuneration Report. |
Table of Contents
RELX Annual report and financial statements 2018 | Directors’ Remuneration Report | 95 | |
|
Nick Luff
OPTIONS | Year of grant | No. of options held on 1 Jan 2018 | No. of options granted during 2018 | Option price on date of grant | No. of options exercised during 2018 | Market price per share at exercise | No. of options held on 31 Dec 2018 | Unvested options vesting on | Options exercisable until | |||||||||||||||||||||||||||||||||||||||||||
ESOS | 2014 | 65,656 | £9.900 | 65,656 | 02 Sep 24 | |||||||||||||||||||||||||||||||||||||||||||||||
72,228 | €11.378 | 72,228 | 02 Sep 24 | |||||||||||||||||||||||||||||||||||||||||||||||||
2015 | (1) | 56,423 | £11.520 | 53,979 | 02 Apr 25 | |||||||||||||||||||||||||||||||||||||||||||||||
59,526 | €15.003 | 56,948 | 02 Apr 25 | |||||||||||||||||||||||||||||||||||||||||||||||||
2016 | 53,087 | £12.550 | 53,087 | Mar 19 | 15 Mar 26 | |||||||||||||||||||||||||||||||||||||||||||||||
56,207 | €15.285 | 56,207 | Mar 19 | 15 Mar 26 | ||||||||||||||||||||||||||||||||||||||||||||||||
2017 | 45,694 | £14.945 | 45,694 | Mar 20 | 27 Feb 27 | |||||||||||||||||||||||||||||||||||||||||||||||
48,242 | €16.723 | 48,242 | Mar 20 | 27 Feb 27 | ||||||||||||||||||||||||||||||||||||||||||||||||
Total | 457,063 | 452,041 | ||||||||||||||||||||||||||||||||||||||||||||||||||
SHARES | Year of grant | No. of unvested shares held on 1 Jan 2018 | No. of shares awarded during 2018 | Market price per share at award | No. of shares vested during 2018 | Market price per share at vesting | No. of held on | End of performance period | Date of vesting | |||||||||||||||||||||||||||||||||||||||||||
BIP | 2015 | (1) | 28,187 | £11.520 | 26,165 | £ | 14.915 | |||||||||||||||||||||||||||||||||||||||||||||
29,520 | €15.003 | 27,403 | € | 16.870 | ||||||||||||||||||||||||||||||||||||||||||||||||
2016 | 26,543 | £12.550 | 26,543 | Dec 2018 | Feb 2019 | |||||||||||||||||||||||||||||||||||||||||||||||
28,103 | €15.285 | 28,103 | Dec 2018 | Feb 2019 | ||||||||||||||||||||||||||||||||||||||||||||||||
2017 | 22,847 | £14.945 | 22,847 | Dec 2019 | Feb 2020 | |||||||||||||||||||||||||||||||||||||||||||||||
24,121 | €16.723 | 24,121 | Dec 2019 | Feb 2020 | ||||||||||||||||||||||||||||||||||||||||||||||||
LTIP | 2015 | (1) | 56,423 | £11.520 | 49,708 | £ | 14.915 | |||||||||||||||||||||||||||||||||||||||||||||
59,526 | €15.003 | 52,442 | € | 16.870 | ||||||||||||||||||||||||||||||||||||||||||||||||
2016 | 53,087 | £12.550 | 53,087 | Dec 2018 | Feb 2019 | |||||||||||||||||||||||||||||||||||||||||||||||
56,207 | €15.285 | 56,207 | Dec 2018 | Feb 2019 | ||||||||||||||||||||||||||||||||||||||||||||||||
2017 | 45,694 | £14.945 | 45,694 | Dec 2019 | Feb 2020 | |||||||||||||||||||||||||||||||||||||||||||||||
48,242 | €16.723 | 48,242 | Dec 2019 | Feb 2020 | ||||||||||||||||||||||||||||||||||||||||||||||||
2018 | 87,996 | £14.915 | 87,996 | Dec 2020 | Feb 2021 | |||||||||||||||||||||||||||||||||||||||||||||||
87,585 | €16.870 | 87,585 | Dec 2020 | Feb 2021 | ||||||||||||||||||||||||||||||||||||||||||||||||
Total | 478,500 | 175,581 | 155,718 | 480,425 |
(1) | The performance outcomes for the 2015 ESOS options, BIP and LTIP were disclosed on pages 86 and 87 of the 2017 Remuneration Report. |
Table of Contents
96 | RELX Annual report and financial statements 2018 | Governance | |
|
Performance graphs
The graphs below show total shareholder returns for RELX calculated on the basis of the average share price in the 30 trading days before the respective year end and assuming dividends were reinvested. RELX’s performance is compared with the FTSE 100. The three-year chart covers the performance period of the 2016–18 cycle of the LTIP.
3 years | 5 years | 10 years | ||
CEO historical pay table
The table below shows the historical CEO pay over an eleven-year period. The year 2008 has been included to show thepre-2009 position, as 2009 was a transition year with three CEO incumbents.
£’000 | 2008 | 2009(1) | 2010 | 2011 | 2012 | 2013 | 2014 | 2015 | 2016 | 2017 | 2018 | |||||||||||||||||||||||||||||||||||||||||
CEO | Sir Crispin Davis | Sir Crispin Davis | Ian Smith | Erik Engstrom | Erik Engstrom | Erik Engstrom | Erik Engstrom | Erik Engstrom | Erik Engstrom | Erik Engstrom | Erik Engstrom | Erik Engstrom | Erik Engstrom | |||||||||||||||||||||||||||||||||||||||
Annualised base salary | 1,181 | 1,181 | 900 | 1,000 | 1,000 | 1,025 | 1,051 | 1,077 | 1,104 | 1,131 | 1,160 | 1,189 | 1,218 | |||||||||||||||||||||||||||||||||||||||
Annual incentive payout as a % of maximum | 61% | 30% | 37% | 71% | 67% | 66% | 73% | 70% | 71% | 70% | 68% | 69% | 78% | |||||||||||||||||||||||||||||||||||||||
Multi-year incentive vesting as a % of maximum | 100% | 0% | 0% | 0% | 0% | 0% | 70% | (2) | 96% | (2) | 90% | (2) | 97% | (2) | 97% | (2) | 92% | (2) | 81% | (2) | ||||||||||||||||||||||||||||||||
CEO total | 7,193 | 706 | 1,033 | 426 | 3,140 | 2,738 | 11,145 | (3) | 5,463 | 17,447 | (4) | 11,416 | (5) | 11,399 | (6) | 8,748 | (7) | 8,414 | (8) |
(1) | Sir Crispin Davis was CEO from 1 January to 31 March, Ian Smith was CEO from 1 April to 10 November and Erik Engstrom was CEO from 11 November to 31 December. |
(2) | The 2018, 2017, 2016 and 2015 percentages reflect BIP, LTIP and ESOS. The 2014 percentage reflects the final tranche of the discontinued Reed Elsevier Growth Plan (REGP), BIP and ESOS. The 2013 percentage reflects BIP and ESOS only and the 2012 figure reflects BIP and the first tranche of the discontinued REGP. |
(3) | The 2012 figure reflects the vesting of the first tranche of the discontinued REGP and includes the entire amount that was performance tested over the 2010–12 period, including the 50% of shares deferred until 2015 in accordance with the plan rules including £3m attributed to share price appreciation. |
(4) | The 2014 figure includes the vesting of the second and final tranche of the discontinued REGP and includes £8.8m attributed to share price appreciation. |
(5) | The 2015 figure includes £4.4m attributed to share price appreciation. |
(6) | The 2016 figure includes £4.2m attributed to share price appreciation. |
(7) | The 2017 figure includes £1.7m attributed to share price appreciation. The share award value has been restated for actual share prices and exchange rates applicable on the dates of vesting (see page 87 for further detail). |
(8) | The 2018 figure includes £1.5m attributed to share price appreciation. |
Table of Contents
RELX Annual report and financial statements 2018 | Directors’ Remuneration Report | 97 | |
|
Comparison of change in CEO pay with change in employee pay
The table below shows the percentage change in remuneration (salary, benefits and annual cash incentive) from 2017 to 2018 for the CEO compared with the average employee.
% change from 2017 to 2018 | ||||
CEO | Average employee(1) | |||
Salary | 2.5%(2) | 3.0% | ||
Benefits | 0.2% | 3.1% | ||
Annual cash incentive | 2.5%(3) | 3.1% |
(1) | The average employee for salary and benefits has been determined based on a review of employees in our top five countries by number of employees. This represents over 70% of the total employee population. The average employee for annual cash incentive is based on all employees globally who received an annual cash incentive. The average salary increase in the UK, where the CEO is based, was 2.5%. |
(2) | The salary increase for the CEO was 2.5%. However, when the increase in his pension contributions and participation fee are taken into account, his salary after these deductions decreased by 0.6% between 2017 and 2018. |
(3) | As part of the simplified incentive structure for Executive Directors which was approved by shareholders at the April 2017 Annual General Meetings, with effect from 2018, a deferred share component was added to the AIP. This was to partly offset the discontinuation of the BIP. The percentage shown for the CEO in the table above relates to the cash AIP. If the deferred share component, which will be paid out in Q1 2022, is included in the 2018 AIP value, the percentage change from 2017 to 2018 for the CEO would be 53.8%. In the table above, the deferred share component of the AIP for senior management is also excluded from the calculation of the average employees’ AIP. |
Relative importance of spend on pay
The following table sets out the total employee costs for all employees, as well as the amounts paid in dividends and share repurchases.
2018 £m | 2017 £m | % change | ||||||||||
Employee costs(1) | 2,350 | 2,273 | +3% | |||||||||
Dividends | 796 | 762 | +4% | |||||||||
Share repurchases | 700 | 700 | – |
(1) | Employee costs include wages and salaries, social security costs, pensions and share based and related remuneration. |
Implementation of remuneration policy in 2019
Salary: The Committee has awarded a salary increase of 2.5% to each Executive Director, which means that, from 1 January 2019, Erik Engstrom’s salary rose to £1,248,863 and Nick Luff’s salary to £735,415. This is in line with the guidelines for 2019 for the generalUK-based employee population. When the increases in the CEO’s pension contributions and participation fee are taken into account, his salary after these deductions will decrease again in 2019 compared to 2018.
Benefits:The benefits provided to the Executive Directors are unchanged for 2019.
Annual incentive:The operation of the AIP in 2019 will be in accordance with the terms of the policy set out on page 100 of this Report. Details of the 2019 annual financial targets and KPOs will be disclosed in the 2019 Remuneration Report.
Pension: Erik Engstrom’s contributions to the pension plan on the amount of his pensionable base salary up to the scheme earnings cap increase from 13% to 15% from 1 March 2019 and his participation fee, which he pays on the amount of his pensionable earnings above the scheme earnings cap, increases from 13% to 16% from 1 March 2019 and will increase further in 2020. Mr Engstrom is also subject to a 2% cap on annual increases in pensionable earnings. The CFO’s cash allowance in lieu of pension reduces from 27% to 25% of salary from 1 March 2019 and will reduce below 25% in 2020.
Share based awards: As in 2018, we will be granting LTIP awards with face values of 450% of salary to Erik Engstrom and 375% to Nick Luff in 2019. The awards are subject to a three-year performance period and the net (after tax) vested shares are to be retained for a furthertwo-year holding period.
The following metrics, weightings, targets and vesting scales apply to LTIP awards granted in 2019.
The vesting of LTIP awards is dependent on three separate performance measures: ROIC, EPS and TSR weighted 40%:40%:20% respectively and assessed independently.
The TSR measure comprises three comparators (sterling, euro and US dollar) reflecting the fact that RELX accesses equity capital markets through three exchanges – London, Amsterdam and New York – in three currency zones. RELX’s TSR performance is measured separately against each comparator group and each ranking achieved will produce a payout, if any, in respect ofone-third of the TSR measure. The proportion of the TSR measure that vests will be the sum of the three payouts.
The averaging period applied for TSR measurement purposes is the three months before the start of the financial year in which the award is granted and the last three months of the third financial year of the performance period.
The companies for the TSR comparator groups for the 2019–21 LTIP cycle were selected on the following basis (substantially unchanged from prior year):
(a) | they were in a relevant market index or were the largest listed companies on the relevant exchanges at the end of the year before the start of the performance period: the FTSE 100 for the sterling group; the Euronext100 (including the AEX) and DAX30 for the euro group; and the S&P 500 for the US dollar group; |
(b) | certain companies were then excluded: |
◾ | those with mainly domestic or single country revenues (as they do not reflect the global nature of RELX’s customer base); |
◾ | those engaged in extractive industries (as they are exposed to commodity cycles); and |
◾ | financial services companies (as they have a different risk/ reward profile). |
(c) | the remaining companies were then ranked by market capitalisation and, for each comparator group, up to 50 companies with market capitalisations above and below that of RELX were taken; and |
(d) | relevant listed global peers operating in businesses similar to those of RELX, but not otherwise included, were added. |
Table of Contents
98 | RELX Annual report and financial statements 2018 | Governance | |
|
Vesting percentage of each third of the TSR tranche(1) | TSR ranking within the relevant TSR comparator group | |
0% | Below median | |
25% | Median | |
100% | Upper quartile |
(1) | Vesting is on a straight-line basis for performance between the minimum and maximum levels. |
The calculation methodology for the EPS and ROIC measures is set out in the footnotes on page 90 and in the 2013 Notices of Annual General Meetings, which can be found on RELX’s website. The targets and vesting scales applicable to the EPS and ROIC tranches of the 2019 LTIP awards reflect the company’s approach to acquisitions, disposals and share buybacks and are set out below. The ROIC targets for the 2019 LTIP awards reflect the adoption of IFRS 16 (lease accounting), which effectively makes the ROIC targets 20 basis points higher than under previous accounting standards.
Vesting percentage of EPS and ROIC tranches(1) | Average growth in adjusted EPS over the three-year performance period | ROIC in the third year of the performance period | ||
0% | below 5% p.a. | below 12.0% | ||
25% | 5% p.a. | 12.0% | ||
50% | 6% p.a. | 12.4% | ||
65% | 7% p.a. | 12.8% | ||
75% | 8% p.a. | 13.2% | ||
85% | 9% p.a. | 13.6% | ||
92.5% | 10% p.a. | 14.0% | ||
100% | 11% p.a. or above | 14.4% or above |
(1) | Vesting is on a straight-line basis for performance between the stated average adjusted EPS growth/ROIC percentages. |
Remuneration Committee advice
The Committee consists of independentNon-Executive Directors and the Chairman of RELX. Details of members and their attendance are contained in the Corporate Governance section on page 78. The Chief Legal Officer & Company Secretary attends meetings as secretary to the Committee. At the invitation of the Chairman of the Committee, the CEO attends appropriate parts of the meetings. The CEO is not in attendance during discussions about his remuneration.
The Chief Human Resources Officer advised the Committee during the year.
Willis Towers Watson is the external adviser, appointed by the Committee through a competitive process. Willis Towers Watson also provided actuarial and other human resources consultancy services to some RELX companies during the year. The Committee is satisfied that the firm’s advice continues to be objective and independent, and that no conflict of interest exists. The individual consultants who work with the Committee do not provide advice to the Executive Directors, or act on their behalf. Willis Towers Watson is a member of the Remuneration Consultants’ Group and conducts its work in line with the UK Code of Conduct for executive remuneration consulting. During 2018, Willis Towers Watson received fees of £10,500 for advice given to the Committee, charged on a time and expense basis.
Shareholder voting at 2018 Annual General Meeting
At the Annual General Meeting of RELX PLC, on 19 April 2018, votes cast by proxy and at the meeting in respect of the Directors’ remuneration were as follows:
Resolution | Votes For | % For | Votes Against | % Against | Total votes cast | Votes Withheld | ||||||||||||||||||||||||||||||||||||||
Remuneration Report (advisory) | 562,551,352 | 83.62% | 110,216,944 | 16.38% | 672,768,296 | 169,795,175 |
Wolfhart Hauser
Chairman, Remuneration Committee
20 February 2019
Table of Contents
RELX Annual report and financial statements 2018 | Directors’ Remuneration Report | 99 | |
|
Remuneration Policy Report
Set out in this section is a description of the Company’s remuneration policy for Directors, as approved by shareholders at the April 2017 Annual General Meetings. Its wording has been updated solely to reflect the passage of time since the policy was first published and the corporate simplification to merge RELX NV into RELX PLC, which took effect on 8 September 2018. The original wording, as first published, can be found on pages 84 to 90 of the 2016 Annual Reports and Financial Statements.
Remuneration policy table – Executive Directors
All footnotes to the policy table can be found on pages 101 to 102.
ANNUAL BASE SALARY
Purpose and link to strategy
To recruit and retain the best executive talent globally to execute our strategic objectives at appropriate cost.
Operation
Salaries for Executive Directors are set and reviewed annually by the Remuneration Committee (the Committee) with changes typically taking effect on 1 January. In exceptional circumstances, the Committee may review salaries more frequently.
When reviewing salaries, the Committee considers the executive’s role and sustained value to the company in terms of skill, experience and overall contribution and the Company’s guidelines for salaries for all employees for the year. Periodically, competitiveness with companies which are comparable in respect of industry, size, international scope and complexity is also considered in order to ensure the Company’s ability to attract and retain executives.
For the last seven years, Executive Directors’ salary increases have been 2.5% per annum.
Performance framework
N/A
Maximum value
Salary increases to Executive Directors will remain within the range of increases for the wider employee population. However, the Committee has discretion to exceed this to take account of individual circumstances such as change in responsibility, increases in scale or complexity of the business, inflation or alignment to market level.
Recovery of sums paid
No provision.
RETIREMENT BENEFITS
Purpose and link to strategy
Retirement plans are part of remuneration packages designed to recruit and retain the best executive talent at appropriate cost.
Operation
Our policy is to offer competitive long-term sustainable defined contribution plans. Any amount above applicable limits, for example HMRC’s annual allowance in the UK, will be paid in cash and will be subject to tax and social security deductions. In certain circumstances, executives can take cash instead of pension contributions.
The UK defined benefit schemes are closed to new hires. Continued membership of legacy defined benefit schemes requires annual increases to contributions and participation fees from all members, who have a choice to switch to the defined contribution plan at any time.
The CEO is a member of a UK legacy defined benefit pension arrangement, accruing 1/30th of final year pensionable earnings for each year(pro-rated for part years) of service, with a normal retirement age of 60. In line with all UK defined benefit scheme members, the CEO’s contributions have been increasing annually since 2011 and were 13% of pensionable earnings up to the base scheme’s earnings cap as of 1 March 2018. The contribution rate increases by two percentage points each year during the policy period to 15% as of 1 March 2019 and 17% as of 1 March 2020. The CEO also pays a participation fee which, from 1 March 2018, was 13% of the amount of his pensionable earnings in excess of the base scheme’s earnings cap. The participation fee increases by three percentage points each year during the policy period to 16% as of 1 March 2019 and 19% as of 1 March 2020. In addition, since March 2017, a cap applies of 2% per annum on the increase in the CEO’s pensionable earnings.
Performance framework
N/A
Maximum value
Defined contribution plan – maximum company contribution of 25% of salary per annum or equivalent cash in lieu. The CFO received 30% of salary under an arrangement which was made pursuant to the previous remuneration policy, which contained a 30% of salary maximum. During the policy period, the CFO’s company contribution decreased by one percentage point to 29% from March 2017, by two percentage points to 27% from March 2018 and will decrease by a further two percentage points to 25% from March 2019.
Defined benefit scheme – accrual of 1/30th of final year pensionable earnings for every year of service up to a maximum of 2/3rds of pensionable earnings. As noted above under ‘Operation’, the CEO is subject to increases in his contributions and in the participation fee, as well as a cap on annual increases in pensionable earnings, as part of his ongoing membership of this scheme.
Recovery of sums paid
No provision.
Table of Contents
100 | RELX Annual report and financial statements 2018 | Governance | |
|
OTHER BENEFITS
Purpose and link to strategy
To provide competitive benefits at appropriate cost.
Operation
Other benefits, subject to periodic review, may include private medical and dental cover, life assurance, tax return preparation costs, car benefits, directors’ and officers’ liability insurance, relocation benefits and expatriate allowances and other benefits available to employees generally, including, where appropriate, the tax on such benefits.
Performance framework
N/A
Maximum value
The maximum for ongoing benefits for Executive Directors will not normally exceed 10% of salary (excluding relocation benefits and any tax related charge on benefits which is met by the Company). However, the Committee may provide reasonable benefits beyond this amount in exceptional situations, such as a change in the individual’s circumstances caused by the Company, or if there is a significant increase in the cost of providing the agreed benefit.1
AIP (ANNUAL INCENTIVE PLAN)
Purpose and link to strategy
The annual incentive provides focus on the delivery of annual financial targets and the achievement of annual objectives and milestones which are chosen to align with the company’s strategy and create a platform for sustainable future performance. The compulsory deferral ofone-third of any annual incentive earned into RELX shares for three years promotes longer-term alignment of Executive Directors’ interests with shareholders’ interests, including an element of post-termination shareholding.
Why performance measures are chosen and how targets are set
Performance measures include a balanced set of financial targets and Key Performance Objectives (KPOs), which are appropriately weighted and which support current strategy and incentivise the Executive Directors to achieve the desired outcomes without undue risk of focusing on any one financial measure.
The targets are designed to be challenging. They are set with reference to the previous year’s performance and internal and external forecasts for the following year.
Operation
The Committee reviews and sets the financial targets and KPOs annually, taking into account internal forecasts and strategic plans. It approves four to six KPOs for each Executive Director, reflecting critical business priorities for which each is accountable. At least one KPO will relate to the achievement of sustainability targets.
Following year end, the Committee compares actual performance with the financial targets and assesses the achievement of individual KPOs.Two-thirds of any annual incentive earned is paid in cash to the Executive Director and the remainingone-third is deferred into RELX shares, which are not released to the Executive Director for three years.
Dividend equivalents accrued during the deferral period are payable in respect of the shares that vest.
On a change in control, the default position is that deferred shares vest. Alternatively, the Committee may determine that deferred shares will not vest and will instead be exchanged for equivalent awards in the acquiring company.
Performance framework
The measures include financial targets, which have a weighting of at least 70%, and individual KPOs, with each element assessed separately.
◾ | The minimum payout is zero. |
◾ | If threshold is reached for each of the financial measures, the overall payout for the financial measures is 10.5% of salary. If the financial measure with the lowest weighting pays out at threshold and the others do not pay out at all, the overall payout for financial measures is 1.5% of salary. There is no threshold level for KPOs. |
◾ | Payout for target performance is 150% of salary. |
Following an assessment of achievement and scoring of KPOs, the Committee agrees the overall level of earned incentive for each Executive Director.
Committee discretion applies.2,3,4
Maximum value
The maximum potential annual incentive is 200% of annual base salary. This includes the deferred share element but excludes dividend equivalents payable in respect of the deferred shares.
Recovery of sums paid
Claw-back applies.5
Table of Contents
RELX Annual report and financial statements 2018 | Directors’ Remuneration Report | 101 | |
|
LONG TERM INCENTIVE PLAN
Purpose and link to strategy
The Long Term Incentive Plan (LTIP) is designed to provide a long-term incentive for Executive Directors to achieve the key performance measures that support the company’s strategy, and to align their interests with shareholders.
Why performance measures are chosen and how targets are set
Our strategic focus is on continuing to transform the core business through organic investment and the build out of new products into adjacent markets and geographies, supplemented by selective portfolio acquisitions and divestments. The performance measures in the LTIP are chosen to support this strategy by focusing on sustained earnings growth, return on invested capital and shareholder return.
Targets are set with regard to previous results and internal and external forecasts for the performance period and the strategic plan for the business. They are designed to provide exceptional reward for exceptional performance, whilst allowing a reasonable expectation that reward at the lower end of the scale is attainable, subject to robust performance.
Operation
Annual awards of performance shares, with vesting subject to:
◾ | performance measured over three financial years |
◾ | continued employment (subject to the provisions set out in the Policy on payments for loss of office section) |
◾ | meeting shareholding requirements (400% of salary for the CEO and 300% of salary for the CFO) Executive Directors are to retain their net (after tax) vested shares for a holding period of two years after vesting. |
Dividend equivalents accrued during the performance period are payable in respect of the performance shares that vest.
On a change of control, the default position is that awards vest on apro-rated basis, subject to an assessment of performance against targets at that time. Alternatively, the Committee may determine that the awards will not vest and will instead be exchanged for equivalent awards in the acquiring company.
Performance framework
The performance measures are EPS, ROIC and relative TSR, weighted 40%:40%:20% respectively and assessed independently, such that a payout can be received under any one of the measures (or, for TSR, in respect of one of the three comparator groups).
◾ | The minimum payout is zero. |
◾ | If each of the measures vests at threshold, the overall payout is 25% of the award. If the measure with the lowest weighting vests at threshold and the others do not vest at all, the overall payout is 2% of the award. |
◾ | Payout in line with expectations is 50% of the maximum award. |
Dividend equivalents are not taken into account in the above payout levels.
Committee discretion applies.2,3,4
Maximum value
The maximum grant in any year is up to 450% of base salary for the CEO and up to 375% of base salary for other Executive Directors (not including dividend equivalents).
Recovery of sums paid
Claw-back applies.5
(1) | Other benefits:Maximum value was increased from 5% under the previous policy to 10% under the current policy to reflect increases in the cost of providing the agreed benefits. The level of benefits provided to Executive Directors was not changed. |
(2) | Discretion in respect of AIP and LTIP payout levels:In determining the level of payout under the AIP and vesting under the LTIP, the Committee takes into account RELX’s overall business performance and value created for shareholders over the period in review and other relevant factors. It has discretion to adjust the vesting and payout levels (subject always to the maximum individual limits) if it believes this would result in a fairer outcome. This discretion will only be used in exceptional circumstances and the Committee will explain in the next Remuneration Report the extent to which it has been exercised and the reasons for doing so. |
(3) | Discretion to vary performance measures under the AIP and the LTIP:The Committee may vary the financial measures applying to a current annual incentive year and performance measures for LTIP awards already granted if a change in circumstances leads it to believe that the arrangement is no longer a fair measure of performance. Any new measures will not be materially less, or more, challenging than the original ones. |
(4) | Discretion on termination of employment under the AIP and the LTIP:The Committee’s discretion on termination of employment is described under the ‘Policy on payments for loss of office’ section on page 104. |
(5) | Malus and claw-back under the AIP and the LTIP:Under the AIP and the LTIP, the Committee has discretion to apply malus and claw-back (i) if the payout (including the AIP deferred shares element) was calculated on the basis of materially misstated financial or other data, in which case it can withhold a payout and can seek to recover the difference in value between the incorrect payout and the amount that would have been paid had the correct data been used or (ii) if there has been serious misconduct on the part of the individual, in which case the Committee may withhold an AIP payout, lapse unvested LTIP awards and may require repayment of AIP and LTIP gains arising during a specified period. Under the LTIP, the Committee also has discretion to apply malus and claw-back if a participant breaches post-termination restrictive covenants, in which case unvested awards would lapse and the Committee may require repayment of gains arising during the period beginning six months before termination and ending on the date the post-termination restrictive covenants are stated to expire. Serious misconduct has been added as a trigger event under the AIP and the LTIP since the previous policy to increase the circumstances in which we can apply malus and claw-back. |
Table of Contents
102 | RELX Annual report and financial statements 2018 | Governance | |
|
(6) | Explanation of differences between the company’s policy on Executive Directors’ remuneration and the policy for other employees:Incentives:A larger percentage of Executive Directors’ remuneration is performance related than that of other employees. All managers participate in an annual incentive plan, but participation levels, measures and targets vary according to their role, seniority and local business priorities. Approximately 100 senior executives currently participate in the LTIP and about 1,000 participate in the Executive Share Option Scheme (ESOS). Grant levels under the plans vary according to role and seniority. In considering the remuneration policy for Executive Directors, under which the Executive Directors only participate in the AIP and the LTIP, the Committee considered the incentive plan participation for the wider senior management population.Other benefits:The range and level of retirement and other benefits provided to employees vary according to role, seniority and local market practice. This is to ensure that we provide competitive packages which are appropriate to specific roles. In reducing the maximum company contribution for Executive Directors under the defined contribution pension plan, the Committee took into account the contribution rates for Executive Directors and for the wider employee population. |
(7) | Changes to pay components:The changes which were made since the previous remuneration policy, together with the rationale for the changes, are described in the Committee Chairman’s introduction on pages 81 to 83 of the Annual Reports and Financial Statements 2016 and in notes 1 and 5 above. |
Remuneration outcomes in different performance scenarios
The Committee considers the level of remuneration that may be paid in the context of the performance delivered and value added for shareholders. The charts below are an illustration of how the CEO’s and CFO’s regular annual remuneration could vary under different performance scenarios. The salary, benefits and pension levels are the same in all three scenarios in each chart. Salary is based on 2017 salary. Benefits is based on the 2016 Single Total Figure table. Pension, annual incentive and LTIP are all based on the policy table’s award levels and percentages applied to the 2017 salary. Annual incentive amounts include theone-third portion which is subject to compulsory deferral into RELX shares for three years, although the deferral portion is separately identified within the annual incentive amount in the charts. The performance assumptions which have been used are as follows: Minimum means no AIP payout and no LTIP vesting. In line with expectations means AIP payout at 150% of salary (of whichone-third is deferred into shares) and LTIP vesting at half of the award. Maximum means AIP payout at 200% of salary (of whichone-third is deferred into shares) and LTIP vesting at 100% of the award.
No share price movement is assumed and any dividend equivalents payable in respect of the AIP deferred shares and the LTIP are not included.
Table of Contents
RELX Annual report and financial statements 2018 | Directors’ Remuneration Report | 103 | |
|
Approach to recruitment remuneration – Executive Directors
When agreeing the components of a remuneration package on the appointment of a new Executive Director, or an internal promotion to the Board, the Committee would seek to align the package with the remuneration policy stated in the policy table. However, on an internal promotion to the Board, any existing contractual obligations and commitments may continue to be honoured, even if not consistent with the prevailing policy. For example, if the individual is a member of the legacy defined benefit pension scheme, the Committee will consider the pension arrangements in the context of the package as a whole and may allow continued participation.
The Committee’s general principle on recruitment is to offer a competitive remuneration package to attract high-calibre candidates from a global talent pool. Basic salary would be set at an appropriate level for the candidate, taking into account all relevant factors. As a data analytics and technology-driven business, with half of its revenue in the US, the Company primarily competes for talent withUS-based information and technology companies.
The various components and the Company’s approach are as follows:
Standard package on recruitment*
To offer remuneration in line with the policy table (including the limits), taking into account the principles set out above.
Compensation for forfeited entitlements
The Committee may make awards and payments on hiring an external candidate to compensate him or her for entitlements forfeited on leaving the previous employer. If such a decision is made, the Committee will attempt to reflect previous entitlements as closely as possible using a variety of tools, including cash and share based awards. Malus and claw-back provisions will apply where appropriate. If necessary to facilitate the grant of awards, the Committee may rely on the one person exemption from shareholder approval in the UK Listing Rules.
Relocation allowances and expenses
The type and size of relocation allowances and expenses will be determined by the specific circumstances of the new recruit.
* The standard package comprises annual base salary, retirement benefits, other benefits, AIP and LTIP.
Shareholding requirement
The Executive Directors are subject to shareholding requirements. These are a minimum of 400% of annual base salary for the CEO and 300% of annual base salary for other Executive Directors. On joining or promotion to the Board, Executive Directors are given a period of time, typically up to five years, to build up to their requirement.
Policy on payments for loss of office
In line with the company’s policy, the service contracts of the existing Executive Directors contain12-month notice periods.
The circumstances in which an Executive Director’s employment is terminated will affect the Committee’s determination of any payment for loss of office, but it expects to apply the principles outlined in the table on the next page. The Committee reserves the right to depart from these principles where appropriate in light of any taxation requirements to which the Company or the Executive Director is subject (including, without limitation, section 409A of the US Internal Revenue Code), or other legal obligations. Treatment of legacy awards granted under multi-year incentive plans in which the Executive Directors no longer participate will be in accordance with those plans and the policy on payments for loss of office summarised in the Remuneration Policy Report in the 2013 Annual Reports and Financial Statements.
Table of Contents
104 | RELX Annual report and financial statements 2018 | Governance | |
|
Policy on payments for loss of office (continued)
GENERAL1 | INCENTIVES | |
Mutually agreed termination/termination by the Company other than for cause2 | ||
The Executive Director would be entitled to salary, benefits and other contractual payments in the normal way up to the termination date and would be paid for any accrued but untaken holiday.
Salary:Payment of up to 12 months’ salary to reflect the notice period or payment in lieu of notice.
Other benefits:Where possible, benefits would be continued for up to the duration of any unworked period of notice (not exceeding the maximum stated in the policy table) or the Executive Director would receive a cash payment (not exceeding the cost to the company of providing those benefits).
Pension:Deferred or immediate pension in accordance with scheme rules, with a credit in respect of, or payment for up to, the full period of any unworked period of notice. There is provision under the defined benefit pension scheme for members leaving company service by reason of permanent incapacity to make an application to the scheme trustee for early payment of their pension.
Other:The company may pay compensation in respect of any statutory employment rights and may make other appropriate and customary payments.
The company would have due regard to principles of mitigation of loss. Reductions would be applied to reflect any portion of the notice period that is worked and/or spent on gardening leave.
On injury, disability,ill-health or death, the Committee reserves the right to vary the treatment outlined in this section. | Annual incentive: Any unpaid annual incentive for the previous year and apro-rata payment in respect of the part of the financial year up to the termination date would generally be payable (subject to the deferral provisions), with the amount being determined by reference to the original performance criteria. However, the Committee has discretion to decide otherwise depending on the reason for termination and other specific circumstances. The company would not pay any annual incentive in respect of any part of the financial year following the termination date (e.g. for any unworked period of notice). Any unvested AIP deferred shares would vest in full at the end of the deferral period. The annual incentive claw-back provisions would apply.
LTIP:The default position is that unvested LTIP awards would bepro-rated to reflect time employed and would vest subject to performance measured at the end of the relevant performance period and subject to the Executive Director continuing to meet his shareholding requirement on apro-rated basis. The Committee has discretion to allow unvested LTIP awards to vest earlier and to adjust the application of timepro-rating and performance conditions, subject to the plan rules. |
Employee instigated resignation The Executive Director would not receive any payments for loss of office. The Executive Director would be entitled to salary, benefits and other contractual payments in the normal way up to the termination date and would be paid for any accrued but untaken holiday.
Pension:A deferred or immediate pension would be payable in accordance with the scheme rules. | Annual incentive:The Executive Director would be entitled to receive an annual incentive for a completed previous year (subject to the deferral provisions), but not apro-rated annual incentive in respect of a part year up to the termination date, unless the Committee decides otherwise in the specific circumstances. Any unvested AIP deferred shares would vest in full at the end of the deferral period. Annual incentive claw-back provisions would apply.
LTIP:All outstanding LTIP awards would lapse on the date of notice. | |
Dismissal for cause The Executive Director would be entitled to salary, benefits and other contractual payments in the normal way up to the termination date and would be paid for any accrued but untaken holiday, but would not receive any payments for loss of office.
Pension:A deferred or immediate pension would be payable in accordance with the scheme rules. | Annual incentive:The Executive Director would not receive any unpaid annual incentive. Any unvested AIP deferred shares lapse on the date of dismissal.
LTIP:All outstanding LTIP awards would lapse on the date of dismissal. |
(1) | In addition to what is set out in this section, on termination for any reason, Erik Engstrom will be entitled to payment of amounts held in his ‘Retirement Account’. Before he joined the company’s UK defined benefit scheme, he was not a member of any company pension scheme and RELX made annual contributions of 19.5% of base salary to a deferred compensation plan. Contributions to this Retirement Account ceased when he became a member of the UK defined benefit arrangement. |
(2) | In cases where the approved leaver treatment applies, the AIP and LTIP have a default position as well as giving the Committee discretion to adjust the default treatment within certain parameters. The Committee would only expect to exercise such discretion where the Committee believes the personal circumstances of the Executive Director so require. |
Table of Contents
RELX Annual report and financial statements 2018 | Directors’ Remuneration Report | 105 | |
|
Remuneration policy table –Non-Executive Directors
FEES
Purpose and link to strategy
To enable RELX to recruitNon-Executive Directors with the right balance of personal skills and experience to make a major contribution to the Board and Committees of a global business which is listed in London, Amsterdam and New York.
Operation
RELX Chairman: Receives an aggregate annual fee with no additional fees, for example, Committee Chairman fees. The Committee determines the Chairman’s fee on the advice of the Senior Independent Director.
OtherNon-Executive Directors: Receive an aggregate annual fee. Additional fees are payable to the Senior Independent Director and Committee Chairmen. Fees are also payable for membership of Board Committees and, with effect from 1 January 2018, international travel fees. In future, attendance fees may be paid. The Board determines the level of fees, subject to applicable law.
Fees may be reviewed annually, although in practice they have changed on a less frequent basis. When reviewing fees, consideration is given to the time commitment required, the complexity of the role and the calibre of the individual. Periodically, comparative market data is also reviewed, the primary source for which is the practice of FTSE 30 companies, with reference also to the Euronext Amsterdam (AEX) index andUS-listed companies.
Maximum value
The aggregate annual fee limit for fees paid to the Chairman and theNon-Executive Directors is £2m. Additional fees for membership of or chairing Board Committees and assuming additional responsibilities such as acting as Senior Independent Director, are not subject to this maximum limit.
OTHER BENEFITS
Purpose and link to strategy
To provide competitive benefits at appropriate cost.
Operation
Other benefits forNon-Executive Directors are reviewed periodically and may include private medical cover, tax return preparation costs, secretarial benefits, car benefits, travel and related subsistence costs, including, where appropriate, the tax on such benefits.
Maximum value
There is no prescribed maximum amount.
Approach to recruitment remuneration –Non-Executive Directors
Following recruitment, a newNon-Executive Director will be entitled to fees and other benefits in accordance with the Company’s remuneration policy. No additional remuneration is paid on recruitment. However, any reasonable expenses incurred during the recruitment process will be reimbursed.
Policy on payments for loss of office –Non-Executive Directors
In addition to unpaid accrued fees, theNon-Executive Directors are entitled to receive one month’s fees for loss of office if their appointment is terminated before the end of its term.
Service contracts and letters of appointment
There are no further obligations in the Directors’ service contracts and letters of appointment which are not otherwise disclosed in this Report which could give rise to a remuneration payment or loss of office payment. All Directors’ service contracts and letters of appointment are available for inspection at the Company’s registered office. The Executive Directors’ service contracts do not have a fixed expiry date.
Consideration of employment conditions elsewhere in the company
When the Committee reviews the Executive Directors’ salaries annually, it takes into account the Company’s guidelines for salaries for all employees for the forthcoming year. We do not currently use any other remuneration comparison metrics when determining the quantum and structure of Directors’ pay. We have not consulted with employees in connection with our policy on Directors’ remuneration.
Consideration of shareholder views
Our practice is to consult shareholders and consider their views when formulating, or changing, our policy. Before the current policy was approved by shareholders at the 2017 AGMs, the Committee consulted extensively with shareholders (representing a total of over 45% of the company’s combined PLC and NV issued share capital) and shareholder representative bodies in the UK, the Netherlands and the US on the proposed new remuneration policy. We were grateful for the constructive feedback, which was taken into account in our final proposals.
Previous remuneration policy and prior commitments
Any payments which are still to be made under arrangements made and awards granted under the previous remuneration policy (which is included in the 2013 Annual Reports and Financial Statements and was approved by RELX PLC shareholders at the 2014 Annual General Meeting) will be made consistent with that policy. The provisions of the previous policy which relate to arrangements and awards granted under the previous policy will therefore continue to apply until all payments in relation to those arrangements and awards have been made.
The Committee also reserves the right to make any remuneration or loss of office payments if the terms were agreed prior to the approval of the previous policy or prior to an individual being appointed as a Director.
Table of Contents
106 | RELX Annual report and financial statements 2018 | Governance | |
|
This report has been prepared by the Audit Committee of RELX PLC and has been approved by the Board. It provides an overview of the membership, responsibilities and activities of the Committee.
Membership
The Committee comprises at least three independentNon-Executive Directors. The members of the Committee who served during the year were:
◾ Adrian Hennah (Chairman of the Committee from 19 April 2018)
◾ Ben van der Veer (Chairman until 19 April 2018, member until 1 September 2018)
◾ Marike van Lier Lels
◾ Carol Mills
◾ Suzanne Wood
Of the current members of the Committee, Adrian Hennah, a UK chartered accountant and Suzanne Wood, a US chartered accountant are considered to have significant, recent and relevant financial experience.
The Committee as a whole is deemed to have competence relevant to the sectors in which RELX operates.
Please see pages 66 and 67 for full profiles of Audit Committee members.
|
Responsibilities
The main role and responsibility of the Committee is to assist the Board in fulfilling its oversight responsibilities regarding:
◾ the integrity of the interim and full-year financial statements and financial reporting processes;
◾ risk management and internal controls, and the effectiveness of the internal auditors; and
◾ the performance of the external auditors and the effectiveness of the external audit process, including monitoring the independence and objectivity of Ernst & Young.
The Committee reports to the Board on its activities, identifying any matters in respect of which it considers that action or improvement is needed and making recommendations as to the steps to be taken.
The terms of reference of the Audit Committee are reviewed annually and a copy is published on the RELX website, www.relx.com
|
Committee meetings
The Committee met four times during 2018. The Audit Committee meetings are typically attended by the RELX Chief Executive Officer, the RELX Chief Financial Officer, the RELX Financial Controller, the RELX Chief Legal Officer, the RELX Head of Audit and Risk, and audit partners from the external auditors.
Financial reporting
In discharging its responsibilities in respect of the 2018 interim and full-year financial statements, the Committee has:
◾ reviewed and discussed areas of significant judgement in the preparation of the financial statements, including in particular:
i. | the carrying values of goodwill and intangible assets – the significant judgements in respect of asset carrying values relate to the assumptions underlying the value in use calculations including discount rates and long-term growth assumptions. The Committee received and discussed reports from the RELX Financial Controller on the methodology and the basis of the assumptions used; |
ii. | capitalisation of internally generated intangible assets – the capitalisation of costs related to the development of new products and business infrastructure, together with the useful economic lives applied to the resulting assets, requires the exercise of judgement. The Committee received reports from the RELX Financial Controller on the amounts capitalised and asset lives selected for major projects; |
iii. | uncertain tax positions – assessing potential liabilities across numerous jurisdictions is complex and requires judgement in making tax determinations. The Committee received and discussed reports from the RELX Head of Taxation on the potential liabilities identified and judgements applied, including the exceptional tax credit; |
iv. | reviewed the recognition of certain pension scheme liabilities which are subject to judgement. The Committee received and discussed reports from the RELX Financial Controller on the methodology and the basis of the assumptions used; |
◾ reviewed the critical accounting policies and compliance with applicable accounting standards, including for the adoption of IFRS 9, 15 and 16, reviewed other disclosure requirements and received regular update reports on accounting and regulatory developments;
◾ reviewed the disclosures made in relation to internal control, risk management, the going concern statement and the viability statement. The Committee received and discussed reports from the RELX Head of Audit and Risk and the RELX Treasurer on the processes undertaken and assumptions used in formulating these disclosures;
◾ considered the calculation and presentation of alternative performance measures (including the exclusion of the exceptional tax credits) in the Annual Report and Accounts and results announcement; and
◾ considered whether the Annual Report and Accounts taken as a whole are fair, balanced and understandable.
The Committee also received detailed written and verbal reports from the external auditors on these matters. The Committee was satisfied with the explanations provided and conclusions reached.
Table of Contents
RELX Annual report and financial statements 2018 | Report of the Audit Committee | 107 | |
|
Risk management and internal controls
With respect to their oversight of risk management and internal controls, the Committee has:
◾ | received and discussed regular reports summarising the status of the Group’s risk management activities, including identification of emerging risks and actions to mitigate risks, and the findings from internal audits and the status of actions agreed with management. Areas of focus in 2018 included: cyber security; data privacy (including compliance with the EU General Data Protection Regulation); the operational, financial and IT control environment; regulatory compliance; business continuity and resilience; post acquisition integration; integrity of publishednon-financial data; and continued compliance with the requirements of Section 404 of the US Sarbanes-Oxley Act relating to the documentation and testing of internal controls over financial reporting; |
◾ | reviewed and approved the internal audit plan for 2019 and monitored execution of the 2018 plan, including progress in respect of recommendations made; |
◾ | reviewed the resources, terms of reference and effectiveness of the RELX risk management and internal audit functions; |
◾ | received presentations from: the RELX Chief Compliance Officer on the compliance programmes, including the operation of the RELX Code of Conduct, training programmes and whistleblowing arrangements and the RELX Chief Legal Officer on legal issues and claims; |
◾ | received updates from the RELX Treasurer on pension arrangements and funding, treasury policies and risk management and compliance with treasury policies; |
◾ | received presentations from the RELX Head of Taxation on tax policies and related matters; |
◾ | received regular updates from the RELX Chief Financial Officer on developments within the finance function; and |
◾ | received presentations from chief financial officers of major RELX businesses; and |
◾ | received a report on the major finance IT systems across RELX, together with an overview of the control environment. |
External audit effectiveness
The Group has a well-established policy on audit effectiveness and independence of auditors that sets out amongst other things: the responsibilities of the Audit Committee in the selection of auditors to be proposed for appointment orre-appointment and for agreement on the terms of their engagement, scope and remuneration; the auditor independence requirements and the policy on the provision ofnon-audit services; the rotation of audit partners and staff; and the conduct of meetings between the auditors and the Audit Committee. The policy is available on the website, www.relx.com
The auditors are precluded from engaging innon-audit services that would compromise their independence or violate any professional requirements or regulations affecting their appointment as auditors. The auditors may, however, providenon-audit services which do not conflict with their independence, and where their skills and experience make them a logical supplier, subject to approval by the Audit Committee.
The Committee will continue to review the policy on the provision ofnon-audit services in the light of ongoing regulatory developments.
The Committee has, each quarter, reviewed and agreed thenon-audit services provided in 2018, together with the associated fees which are set out in note 4 to the consolidated financial statements. Thenon-audit services provided were in the areas of audit-related activities, such as royalty assurance, and compliance, due diligence and other transaction-related services. Thenon-audit fees in 2018 were higher than previous years as a result of work relating to the corporate simplification and increased transaction-related activity. The fees remain below the 70% threshold as per the most recent FRC guidance.
The external auditors have confirmed their independence and compliance with the policy on auditor independence to the Audit Committee.
Ernst &Young LLP were first appointed auditor of RELX PLC for the financial year ended 31 December 2016. The auditor is required to rotate the lead audit partners responsible for the audit engagements every five years. The year ended 31 December 2018 was the first year for the lead engagement partner Hywel Ball. The Audit Committee confirms that they were in compliance with the provisions of The Statutory Audit Services for Large Companies Market Investigation (Mandatory Use of Competitive Tender Processes and Audit Committee Responsibilities) Order 2014 during the financial year ended 31 December 2018.
The Committee has conducted its review of the performance of the external auditors and the effectiveness of the external audit process for the year ended 31 December 2018. The review was based on a survey of key stakeholders across RELX, consideration of public reports by regulatory authorities on key Ernst & Young member firms and the quality of the auditors’ reporting to and interaction with the Audit Committee. Based on this review, the Audit Committee was satisfied with the performance of the auditors and the effectiveness of the audit process.
Audit Committee effectiveness
The effectiveness of the Audit Committee was reviewed as part of the 2018 evaluation of the Board which confirmed that the Committee continues to function effectively. Details of the evaluation are set out on page 79.
Adrian Hennah
Chairman of the Audit Committee
20 February 2019
Table of Contents
108 | RELX Annual report and financial statements 2018 | Governance | |
|
The Directors present their report, together with the financial statements of the Group and RELX PLC (the Company), for the year ended 31 December 2018. The Company is incorporated as a public limited company and is registered in England and Wales with registered number 77536. Its registered office is1-3 Strand, London, WC2N 5JR.
Corporate structure
Following the simplification of the Group’s corporate structure, the Company’s ordinary shares are traded on the London Stock Exchange and Euronext Amsterdam. It also has in place an American Depositary Share programme, under which its securities are traded on the New York Stock Exchange. The Company and its subsidiaries, joint ventures and associates are together known as ‘RELX’ or ‘the Group’.
Financial statement presentation
This Directors’ Report and the financial statements of the Group and Company should be read in conjunction with the other reports set out on pages 2 to 107. A review of the Group’s performance during the year is set out on pages 8 to 59, the principal risks facing the Group are set out on pages 60 to 63, and the Group statement on corporate responsibility is set out on pages 42 to 52.
In addition to the reported figures, adjusted figures are presented as additional performance measures used by management to assess the performance of the business. These exclude the Group’s share of amortisation of acquired intangible assets, acquisition-related costs, tax in joint ventures, disposal gains and losses and othernon-operating items, related tax effects, and movements in deferred taxation assets and liabilities related to acquired intangible assets, and include the benefit of tax amortisation where available on acquired goodwill and intangible assets.
Company financial statements
The individual company financial statements of the Company are presented on page 170, and were prepared under Financial Reporting Standard 101 (FRS 101). Distributable reserves as at 31 December 2018 were £2,689m (2017: £1,518m), comprising reserves less shares held in treasury. Shareholders’ funds as at 31 December 2018 were £19,739m (2017: £3,174m).
Strategic Report
The Companies Act 2006 requires the Company to present a fair review of the Group during the financial year. The Strategic Report which includes a review of the Group’s business areas, a financial review, the principal risks facing the Group, any important events affecting the Group since 31 December 2018, and the likely future developments in the Group’s business, is set out on pages 2 to 63 which are incorporated into this Directors’ Report by reference. The Directors’ Report, inclusive of the Strategic Report incorporated therein, forms the management report for the purposes of the Financial Conduct Authority’s Disclosure and Transparency Rule 4.1.8R.
Dividends
The Board is recommending a final dividend of 29.7p (2017: 27.7p) per ordinary share to be paid on 4 June 2019 to shareholders appearing on the Register at the close of business on 3 May 2019. Payment of this final dividend remains subject to the approval of
the Company’s shareholders at its 2019 Annual General Meeting (AGM). Together with the interim dividend of 12.4p (2017: 11.7p) per ordinary share, paid in August 2018, the total ordinary dividends for the year will be 42.1p (2017: 39.4p). Details of dividend cover and dividend policy are set out on page 58.
Corporate governance
The Company has complied throughout the year with the provisions of the UK Corporate Governance Code 2016 (the Code), which is publicly available on the Financial Reporting Council website (www.frc.org.uk). Details of how the main principles of the Code have been applied and the Directors’ statement on internal control are set out in the corporate governance review on pages 72 to 81, which are incorporated into this Directors’ Report by reference. The 2018 Corporate Governance Code, published by the Financial Reporting Council in July 2018, applied to the Company with effect from 1 January 2019.
Greenhouse gas emissions
The Company is required to state the annual quantity of emissions in tonnes of carbon dioxide equivalent from Group operational activities. Details of our emissions during the year ended 31 December 2018 and the actions being taken to reduce them are set out in the Corporate Responsibility section of the Strategic Report on pages 51 and 52, which are incorporated into the Directors’ Report by reference. Further details can be found in our online Corporate Responsibility Report atwww.relx.com/go/CRReport.
Directors
The names of the Directors who served on the Board during the year are set out on pages 66, 67, and 78, which are incorporated into this Directors’ Report by reference.
Share capital
The Company’s issued share capital comprises a single class of ordinary shares, all of which are listed on the London and Amsterdam stock exchanges. It also has securities, in the form of American Depositary Shares, traded on the New York Stock Exchange. All issued shares are fully paid up and carry no additional obligations or special rights. Each share carries the right to one vote at general meetings of the Company.
In a general meeting, subject to any rights and restrictions attached to any shares, on a show of hands every member who is present in person shall have one vote and every proxy present who has been duly appointed by one or more members entitled to vote on the resolution has one vote (although a proxy has one vote for and one vote against the resolution if: (i) the proxy has been duly appointed by more than one member entitled to vote on the resolution; and (ii) the proxy has been instructed by one or more of those members to vote for the resolution and by one or more other of those members to vote against it). Subject to any rights or restrictions attached to any shares, on a vote on a resolution on a poll every member present in person or by proxy shall have one vote for every share of which he/she is the holder.
Proxy appointments and voting instructions must be received by the registrars not less than 48 hours before a general meeting. There are no specific restrictions on the size of a holding nor on the transfer of shares, which are both governed by the general provisions of the Articles and prevailing legislation. The Company
Table of Contents
RELX Annual report and financial statements 2018 | Directors’ Report | 109 | |
|
is not aware of any agreements between shareholders that may result in restrictions on the transfer of shares or on voting rights attached to the shares. At the 2018 AGM, shareholders passed a resolution authorising the Directors to issue shares for cash on anon-pre-emptive basis up to a nominal value of £8.1m, representing less than 5% of the Company’s issued share capital, and authorising the Directors to issue up to an additional 5% of the issued share capital for cash on anon-pre-emptive basis in connection with an acquisition or specified investment. Since the 2018 AGM, no shares have been issued under this authority. The shareholder authority also permitted the Directors to issue shares in order to satisfy entitlements under employee share plans and details of such allotments are described below.
In addition to these authorities, at the general meeting of the Company held in June 2018, held for shareholders to approve certain matters relating to the cross-border merger between RELX PLC and RELX NV (the Merger), the Directors were unconditionally authorised to allot shares in the Company up to a nominal value of £136.3m only in connection with the Merger. As announced by the Company on 10 September 2018, following the completion of the Merger, 930,780,110 new RELX PLC shares were issued under this authority. To the extent that they are unused, each of the authorities to issue shares set out above will expire at the 2019 AGM. Resolutions authorising the Directors to: (i) issue shares for cash on anon-pre-emptive basis up to 5% of the issued share capital; and (ii) issue up to 5% of the issued share capital for cash on anon-pre-emptive basis in connection with an acquisition or specified investment, subject to certain conditions in accordance with thePre-Emption Group’s Statement of Principles, will be put forward for approval by shareholders at the Company’s 2019 AGM.
During the year, 2,465,983 ordinary shares in the Company were also issued in order to satisfy entitlements under employee share plans as follows: 603,094 under a UK Sharesave option scheme at prices between 439.20p and 1251.20p per share; 362,401 under the former RELX NV Dutch Debenture Scheme in place prior to the merger at prices between EUR4.781 and EUR18.47, which is now satisfied by way of Company shares; and 1,500,488 under executive share option schemes at prices between 466.50p and 1494.50p per share. The issued share capital as at 31 December 2018 is shown in note 25 to the consolidated financial statements.
Authority to purchase shares
At the 2018 AGM, shareholders passed a resolution authorising the purchase of up to 112.3m ordinary shares in the Company (representing less than 10% of the issued ordinary shares) by market purchase. During the year, 26,945,234 ordinary shares with a nominal value of 1451/116p (representing 1.4% of the ordinary shares in issue on 31 December 2018) were purchased under this and the previous authority, for a total consideration of £425m, including expenses, and subsequently transferred to be held in treasury. This represents the RELX PLC proportion of the £700m deployed by the Group on share buybacks during the year. The purpose of the share buyback is to reduce the capital of the Company.
On 6 December 2018, the Company cancelled 45m ordinary shares held in treasury. Therefore, as at 31 December 2018 there were 42,023,020 ordinary shares held in treasury, representing 2.1% of the issued ordinary shares. A further 5,960,856 ordinary shares were purchased between 2 January 2019 and the date of this
report. The authority to make market purchases will expire at the 2019 AGM, at which a resolution to further extend the authority will be submitted to shareholders.
Substantial share interests
As at 31 December 2018, the Company had been notified by the following shareholders that they held an interest of 3% or more in voting rights of its issued share capital pursuant to Rule 5 of the Disclosure and Transparency Rules (DTR):
Notifications received as at 31 December 2018 | % of voting rights | |||
◾ Black Rock Inc | 10.89% | |||
◾ Invesco Limited | 5.03% | |||
◾ Legal and General Group plc | 3.40% |
The percentage interests stated above are as disclosed at the date on which the interests were notified to the Company, and are based on voting rights prior to the corporate simplification. Between 31 December 2018 and 20 February 2019, the Company did not receive any notifications under DTR 5.
Employee Benefit Trust
The trustee of the Employee Benefit Trust held an interest in 7,130,366 ordinary shares in the Company (representing 0.3% of the issued ordinary shares) as at 31 December 2018. The trustee may vote or abstain from voting any shares it holds in any way it sees fit.
Significant agreements – change of control
There are a number of borrowing agreements including credit facilities that, in the event of a change of control of RELX PLC and, in some cases, a consequential credit rating downgrade tosub-investment grade may, at the option of the lenders, require repayment and/or cancellation as appropriate. There are no arrangements between the Company and its Directors or employees providing for compensation for loss of office or employment that occurs specifically because of a takeover, merger or amalgamation with the exception of provisions in the Company’s share plans which could result in options or awards vesting or becoming exercisable on a change of control.
Articles
The Company’s Articles of Association (the ‘Articles’), which were not amended during the year, may only be amended by a special resolution of shareholders passed at a general meeting of the Company. At the general meeting of shareholders held in connection with the corporate simplification on 27 June 2018, shareholders approved the increase in the maximum aggregate amount of ordinary remuneration payable to Directors who do not hold executive office for their services, as set out in Article 142 of the Articles, from £500,000 to £2,000,000.
Appointment and replacement of Directors
The appointment,re-appointment and replacement of Directors is governed by the Articles, the Companies Act 2006 and related legislation. Shareholders maintain their right to appoint andre-appoint Directors by way of an ordinary resolution in accordance with the Articles. The Directors may appoint additional or replacement Directors, who may only serve until the following AGM of the Company, at which time they must retire and, if appropriate, seek election by the Company’s shareholders. A Director may be removed from office by the Company as
Table of Contents
110 | RELX Annual report and financial statements 2018 | Governance | |
|
provided for by applicable law, in certain circumstances set out in the Articles, and at a general meeting of the Company by the passing of an ordinary resolution.
The Articles provide for a Board of Directors consisting of not fewer than two, but not more than 20 Directors, who manage the business and affairs of the Company.
Powers of Directors
Subject to the provisions of the Companies Act 2006, the Articles and any directions given by special resolutions, the business of the Company shall be managed by the Board which may exercise all the powers of the Company.
Directors’ indemnity
In accordance with its Articles, the Company has granted Directors an indemnity, to the extent permitted by law, in respect of liabilities incurred as a result of their office. This indemnity was in place for Directors that served at any time during the 2018 financial year, and also for each serving Director as at the date of approval of this report. The Company also purchased and maintained throughout the year directors’ and officers’ liability insurance in respect of itself and its Directors.
Related party transactions
Internal controls are in place to ensure that any related party transactions involving Directors or their connected persons are carried out on anarm’s-length basis and are properly recorded and disclosed where appropriate.
Conflicts of interest
Under the Companies Act 2006, the Directors have a duty to avoid situations in which they have, or could have, a direct or indirect interest that conflicts with the interests of the Company. The Board has established formal procedures for identifying, assessing and reviewing any situations where a Director has an interest that conflicts, or may possibly conflict, with the interests of the Company.
The Nominations Committee considers any such conflict or potential conflict and makes a recommendation to the Board on whether to authorise it, as permitted under the Company’s Articles. In reaching its decision, the Board is required to act in a way it considers would be most likely to promote the success of the Company and may impose limits or conditions when giving its authorisation, if it thinks this is appropriate. Actual or potential conflicts of interest are reviewed annually by the Nominations Committee.
No contract existed during the year in relation to the Company’s business in which any Director was materially interested.
Financial Instruments
The Group’s financial risk management objectives and policies, including hedging activities and exposure to risks, are described in note 18 to the consolidated financial statements on pages 150 to 155.
Political donations
The Group does not make donations to European Union (EU) political organisations or incur EU political expenditure. In the US, Group companies donated £58,763 (2017: £62,791) to political organisations. In line with US law, these donations were not made at federal level, but only to candidates and political parties at state and local levels.
Employee relations
The Group is committed to employee involvement and participation. Where appropriate, major announcements are communicated to employees through internal briefings. Information on performance, development, organisational changes and other matters of interest is communicated through briefings and electronic bulletins.
The Company is an equal opportunity employer and does not discriminate on the grounds of race, gender or other characteristics in its recruitment or employment policies. The Group seeks opinions from employees through a triennial survey. The last employee survey was carried out in 2018. Certain employees throughout the Group are eligible to participate in the Group’s share incentive plans.
Disabled persons
RELX has a positive approach to diversity and inclusion. Details of the Group’s Diversity and Inclusion policy are set out on page 47, which is incorporated into this Directors’ Report by reference. The Group is committed to the full and fair treatment of people with disabilities in relation to job applications, training, promotion and career development. Where existing employees become disabled, our policy is to provide continuing employment, support and training wherever practicable.
Disclosures required under UK Listing Rule 9.8.4
The information required by Listing Rule 9.8.4 is set out on the pages below:
Information required | Page | |
(1) Interest capitalised by the Group | n/a�� | |
(2) Publication of unaudited financial information | n/a | |
(4) Long-term incentive schemes | n/a | |
(5) Waiver of emoluments by a director | n/a | |
(6) Waiver of future emoluments by a director | n/a | |
(7) Nonpro-rata allotments for cash (issuer) | n/a | |
(8) Nonpro-rata allotments for cash (major subsidiaries) | n/a | |
(9) Parent participation in a placing by a listed subsidiary | n/a | |
(10) Contracts of significance | n/a | |
(11) Provision of services by a controlling shareholder | n/a | |
(12) Shareholder waiver of dividends | 144 | |
(13) Shareholder waiver of future dividends | 144 | |
(14) Agreements with controlling shareholders | n/a |
Table of Contents
RELX Annual report and financial statements 2018 | Directors’ Report | 111 | |
|
Financial statements and accounting records
The Directors are responsible for preparing the Directors’ Report and the financial statements in accordance with applicable law and regulations.
Company law requires the Directors to prepare financial statements for each financial year. Under that law the Directors are required to prepare the consolidated financial statements in accordance with International Financial Reporting Standards (IFRS) as adopted by the EU and Article 4 of the IAS Regulation. The Directors have elected to prepare the individual company financial statements in accordance with Financial Reporting Standard 101 Reduced Disclosure Framework. Under company law the Directors must not approve the accounts unless they are satisfied that they give a true and fair view of the state of affairs of the Company and of the profit or loss of the Company for that period.
In preparing the individual company financial statements, the Directors are required to: select suitable accounting policies and then apply them consistently; make judgements and accounting estimates that are reasonable and prudent; state whether Financial Reporting Standard 101 Reduced Disclosure Framework has been followed, subject to any material departures being disclosed and explained in the financial statements; and prepare the financial statements on a going concern basis unless it is inappropriate to presume that the Company will continue in business.
In preparing the Group financial statements, IAS1 requires that Directors: properly select and apply accounting policies; present information, including accounting policies, in a manner that provides relevant, reliable, comparable and understandable information; provide additional disclosures when compliance with the specific requirements of IFRS are insufficient to enable users to understand the impact of particular transactions, other events and conditions on the entity’s financial position and financial performance; and make an assessment of the Company’s ability to continue as a going concern.
The Directors are responsible for keeping adequate accounting records that are sufficient to show and explain the Company’s transactions and disclose with reasonable accuracy at any time the financial position of the Company and enable them to ensure that the financial statements comply with the Companies Act 2006. They are also responsible for safeguarding the assets of the Company and hence for taking reasonable steps for the prevention and detection of fraud and other irregularities.
Directors’ responsibility statement
Each of the Directors, whose names and roles can be found on pages 66 to 67, confirms that, to the best of their knowledge:
◾ | the consolidated financial statements, prepared in accordance with International Financial Reporting Standards as issued by the International Accounting Standards Board and as adopted by the European Union, give a true and fair view of the assets, liabilities, financial position and profit or loss of the Group; |
◾ | the individual company financial statements, prepared in accordance with Financial Reporting Standard 101 ‘Reduced Disclosure Framework’ (FRS 101), give a true and fair view of the assets, liabilities, financial position and profit or loss of the Company; and |
◾ | the Directors’ Report includes a fair review of the development and performance of the business and the position of the Group, together with a description of the principal risks and uncertainties that it faces. |
Having taken into account all the matters considered by the Board and brought to the attention of the Board during the year, the Directors are satisfied that the Annual Report and Financial Statements, taken as a whole, is fair, balanced and understandable and provides the information necessary for shareholders to assess the Company’s position and performance, business model and strategy.
Neither the Company nor the Directors accept any liability to any person in relation to the Annual Report except to the extent that such liability could arise under English law. Accordingly, any liability to a person who has demonstrated reliance on any untrue or misleading statement or omission shall be determined in accordance with Section 90A of the Financial Services and Markets Act 2000.
Disclosure of information to auditors
In accordance with Section 418 of the Companies Act 2006, each Director in office at the date the Directors’ Report is approved, confirms that:
◾ | so far as the Director is aware, there is no relevant audit information of which the Company’s auditors are unaware; and |
◾ | he/she has taken all the steps that he/she ought to have taken as a Director to make himself/herself aware of any relevant audit information and to establish that the Company’s auditors are aware of that information. |
Going concern
The Directors’ statement regarding the appropriateness of adopting the going concern basis of accounting is set out on page 80, which is incorporated into this Directors’ Report by reference.
Viability statement
The Directors’ statement regarding the long-term viability of the Group is set out on page 82, which is incorporated into this Directors’ Report by reference.
Auditors
Resolutions for there-appointment of Ernst & Young LLP as auditors of the Company and to authorise the Audit Committee, on behalf of the Board, to determine their remuneration will be submitted to shareholders at the 2019 AGM.
Annual General Meeting
The 2019 Annual General Meeting will be held at 10.00am on 25 April 2019 at Amba Hotel, Strand, London, WC2N 5HX.
By order of the Board
Henry Udow
Company Secretary
20 February 2019
Registered Office
1-3 Strand
London
WC2N 5JR
Table of Contents
112
| RELX Annual report and financial statements 2018 | Financial statements and other information
|
Financial statements and other information |
In this section | ||
113 | Independent auditor’s report | |
121 | Consolidated financial statements | |
126 | Notes to the consolidated financial statements | |
168 |
Table of Contents
RELX Annual report and financial statements 2018 | 113 | |
|
Independent auditor’s report to the members of RELX PLC
OPINION
In our opinion:
◾ RELX PLC and its subsidiaries, joint ventures and associates (“RELX”)’s group financial statements and parent company financial statements (the “financial statements”) give a true and fair view of the state of the group’s and of the parent company’s affairs as at 31 December 2018 and of the group’s profit for the year then ended;
◾ the group financial statements have been properly prepared in accordance with IFRSs as adopted by the European Union;
◾ the parent company financial statements have been properly prepared in accordance with United Kingdom Generally Accepted Accounting Practice; and
◾ the financial statements have been prepared in accordance with the requirements of the Companies Act 2006, and, as regards the group financial statements, Article 4 of the IAS Regulation.
We have audited the financial statements of RELX PLC which comprise:
Group | Parent company | |
Consolidated statement of financial position as at 31 December 2018 | Statement of financial position as at 31 December 2018 | |
Consolidated income statement for the year then ended | Statement of changes in equity for the year then ended | |
Consolidated statement of comprehensive income for the year then ended | Related notes 1 to 3 to the financial statements including a summary of significant accounting policies | |
Consolidated statement of changes in equity for the year then ended | ||
Consolidated statement of cash flows for the year then ended | ||
Related notes 1 to 30 to the financial statements, including a summary of significant accounting policies |
The financial reporting framework that has been applied in the preparation of the group financial statements is applicable law and International Financial Reporting Standards (IFRSs) as adopted by the European Union. The financial reporting framework that has been applied in the preparation of the parent company financial statements is applicable law and United Kingdom Accounting Standards, including FRS 101 “Reduced Disclosure Framework” (United Kingdom Generally Accepted Accounting Practice).
BASIS FOR OPINION
We conducted our audit in accordance with International Standards on Auditing (UK) (ISAs (UK)) and applicable law. Our responsibilities under those standards are further described in the Auditor’s responsibilities for the audit of the financial statements section of our report below. We are independent of the group and parent company in accordance with the ethical requirements that are relevant to our audit of the financial statements in the UK, including the FRC’s Ethical Standard as applied to listed public interest entities, and we have fulfilled our other ethical responsibilities in accordance with these requirements.
We believe that the audit evidence we have obtained is sufficient and appropriate to provide a basis for our opinion.
CONCLUSIONS RELATING TO PRINCIPAL RISKS, GOING CONCERN AND VIABILITY STATEMENT
We have nothing to report in respect of the following information in the annual report, in relation to which the ISAs(UK) require us to report to you whether we have anything material to add or draw attention to:
◾ | the disclosures in the annual report set out on pages 60 to 63 that describe the principal risks and explain how they are being managed or mitigated; |
◾ | the directors’ confirmation set out on page 60 in the annual report that they have carried out a robust assessment of the principal risks facing the entity, including those that would threaten its business model, future performance, solvency or liquidity; |
◾ | the directors’ statement set out on page 80 in the financial statements about whether they considered it appropriate to adopt the going concern basis of accounting in preparing them, and their identification of any material uncertainties to the entity’s ability to continue to do so over a period of at least twelve months from the date of approval of the financial statements; |
◾ | whether the directors’ statement in relation to going concern required under the Listing Rules in accordance with Listing Rule 9.8.6R(3) is materially inconsistent with our knowledge obtained in the audit; or |
◾ | the directors’ explanation set out on page 82 in the annual report as to how they have assessed the prospects of the entity, over what period they have done so and why they consider that period to be appropriate, and their statement as to whether they have a reasonable expectation that the entity will be able to continue in operation and meet its liabilities as they fall due over the period of their assessment, including any related disclosures drawing attention to any necessary qualifications or assumptions. |
Table of Contents
114 | RELX Annual report and financial statements 2018 | Financial statements and other information | |
|
OVERVIEW OF OUR AUDIT APPROACH
| ||
Key audit matters | ◾ Uncertain tax positions | |
◾ Internally developed intangible assets | ||
◾ Aspects of revenue recognition | ||
◾ Carrying value of goodwill and acquired intangible assets | ||
◾ Finance systems | ||
◾ Accounting for the corporate simplification | ||
◾ Acquisition accounting for significant new business combinations | ||
Audit scope | ◾ We performed an audit of the complete financial information of six components and audit procedures on specific balances for a further seven components. We also instructed two locations to perform specified procedures. | |
◾ The components where we performed full or specific audit procedures accounted for 81% of absolute profit before tax, 80% of revenue and 75% of total assets. | ||
Materiality | ◾ Overall Group materiality of £90m which represents 5% of profit before tax. |
KEY AUDIT MATTERS
Key audit matters are those matters that, in our professional judgment, were of most significance in our audit of the financial statements of the current period and include the most significant assessed risks of material misstatement (whether or not due to fraud) that we identified. These matters included those which had the greatest effect on: the overall audit strategy, the allocation of resources in the audit; and directing the efforts of the engagement team. These matters were addressed in the context of our audit of the financial statements as a whole, and in our opinion thereon, and we do not provide a separate opinion on these matters.
KEY OBSERVATIONS | ||||
COMMUNICATED | ||||
RISK | OUR RESPONSE TO THE RISK | TO THE AUDIT COMMITTEE | ||
Uncertain tax positions
Refer to the Audit Committee Report (page 106) and Note 9 of the Consolidated Financial Statements (page 138)
The group is subject to tax in numerous jurisdictions. Its complex organisation and operational structure gives rise to potential tax exposures that require management to exercise significant judgement in making determinations as to the amount of tax that is payable.
The group reports cross-border transactions undertaken between subsidiaries on anarm’s-length basis in tax returns in accordance with Organisation for EconomicCo-operation and Development (OECD) guidelines. However, transfer pricing relies on the exercise of judgement and it is frequently possible for there to be a range of legitimate and reasonable views.
The group is subject to tax authority audits as a matter of routine and has a number of open tax enquiries.
As a result, it has recognised a number of provisions against uncertain tax positions, the valuation of which requires significant judgement.
We focused on this area due to the significance of the balance and the subjectivity in the quantification of the provision and the judgement around the trigger for recognition or release. There is a risk that the tax provisions may be incorrectly quantified, impacting the provision and the effective tax rate. |
Our procedures on the uncertain tax positions were performed centrally by the group team supported by overseas teams including specialists, and included the following:
◾ We assessed the processes and tested controls over the tax provisioning process.
◾ We met with tax management to understand the group cross-border transactions, status of all significant provisions, and any changes to management’s judgements in the year.
◾ We read correspondence with tax authorities and external advisors to inform our assessment of recorded estimates and evaluate the completeness of the provisions recorded.
◾ We evaluated management’s methodology to record or release provisions following tax audits, settlements and the expiry of timeframes.
◾ We tested the calculation of the year end provisions by inspecting underlying documentation and supporting schedules. |
We reported our conclusions to the Audit Committee that we challenged the robustness of the key management judgements. We confirmed that we were satisfied that management’s judgements in relation to the extent of provisions for uncertain tax positions are appropriate. We noted further that there continues to be a high degree of uncertainty about the eventual outcome of many of these provisions. |
Table of Contents
RELX Annual report and financial statements 2018 | Independent auditors’ report to the members of RELX PLC | 115 | |
|
KEY OBSERVATIONS | ||||
COMMUNICATED | ||||
RISK | OUR RESPONSE TO THE RISK | TO THE AUDIT COMMITTEE | ||
Internally developed intangible assets
Refer to the Audit Committee Report (page 106) and Note 15 of the Consolidated Financial Statements (page 144)
The group capitalised internally developed intangible assets of £304 million in the current year (2017: £304 million) and has a year end net book value of £1,217 million (2017: 1,136 million). The capitalisation of costs related to the development of new products and business infrastructure, together with the useful economic lives applied to the resulting assets, requires the exercise of judgement.
We focused on this area as the group has invested significantly in several projects across the business. It is inherently judgemental with respect to technical feasibility, intention and ability to complete the intangible asset, ability to use or sell the asset, ability to generate future economic benefits and ability to measure the costs reliably. This results in a risk that expenditures may be inappropriately capitalised, amortised or valued. |
We performed full and specific scope audit procedures over internally developed intangible assets in 4 locations, which covered 75% of the account balance, including the following:
◾ We assessed the processes and tested controls for the capitalisation of internally generated intangible assets.
◾ We assessed the accounting policy and methodology for capitalisation of expenditures.
◾ We evaluated the accuracy and valuation of amounts capitalised to assess that costs are directly attributable and necessary to create, produce, and prepare the asset to be capable of operating in the manner intended by management. |
Based on the procedures performed, we did not identify any evidence of material misstatement in the capitalisation of internally developed intangible assets. | ||
Aspects of revenue recognition
Refer to Note 2 of the Consolidated Financial Statements (page 128)
The group earns revenue from a variety of sources among the different business areas, including annual subscriptions, transactional usage and exhibition fees. The nature of the risk associated with the accurate recording of revenue varies.
We recognise that revenue is a key metric upon which the group is judged, that the group has annual internal targets, and that the group has incentive schemes that are partially impacted by revenue growth.
We have determined that there is a risk in relation to each of the business areas related to the opportunity to commit fraud in the respective revenue streams through manual adjustments or override of controls by management. |
We performed full and specific scope audit procedures over revenue in 12 locations, which covered 80% of revenue. We performed procedures to address the specific risk in each business area, including the following:
◾ We assessed the processes and tested controls over each significant revenue stream.
◾ We evaluated the appropriateness of journal entries impacting revenue, as well as other adjustments made in the preparation of the financial statements. We also evaluated management’s controls over such adjustments.
◾ We inspected a sample of contracts to check that revenue recognition was in accordance with the contract terms and the group’s revenue recognition policies.
◾ We tested a sample of transactions around period end to test that revenue was recorded in the correct period.
◾ For revenue streams that have judgemental elements, we evaluated management’s assumptions. |
Based on the procedures performed, we did not identify evidence of material misstatement in the revenue recognised in the year. |
Table of Contents
116 | RELX Annual report and financial statements 2018 | Financial statements and other information | |
|
KEY OBSERVATIONS | ||||
COMMUNICATED | ||||
RISK | OUR RESPONSE TO THE RISK | TO THE AUDIT COMMITTEE | ||
Carrying value of goodwill and acquired intangible assets
Refer to the Audit Committee Report (page 106) and Note 14 of the Consolidated Financial Statements (page 144)
We focused on this area because of the size of the goodwill balance of £6,899 million (2017: £5,965 million); the size of the acquired intangible assets net book amount of £2,317 million (2017: £2,058 million); and the fact that management’s assessment of the value in use of the group’s Cash Generating Units (‘CGU’) and any possible consequential impairment involves judgement about the future results of the relevant CGUs and the discount rates applied to cash flow forecasts. |
Procedures on the carrying value of goodwill and acquired intangible assets were performed centrally by the group team supported by overseas teams including specialists, and included the following:
◾ We assessed the processes and tested controls over the goodwill and acquired intangible asset process.
◾ We assessed the key information and assumptions used in determining the valuation including the weighted average cost of capital, cash flow forecasts and the implicit growth, utilising our specialist support as necessary. We also conducted a sensitivity analysis to understand by how much these projections would need to change by for there to be an impairment.
◾ We assessed management’s annual goodwill and indefinite lived acquired intangible asset impairment review as well as management’s consideration as to whether indicators of impairment existed for finite lived acquired intangible assets. Where indicators were present for acquired intangible assets, we focused on the key judgements in the impairment review calculations, for example, the expected cash flows and future benefits as compared to the costs where applicable. |
We reported our conclusions to the Audit Committee that the assumptions relating to the impairment models fell within acceptable ranges.
Based on the procedures performed, we agree with management’s conclusion that no material impairment of goodwill or intangible assets was required in the year. | ||
Finance systems
The group has many IT systems that are vital to the ongoing operations and to the integrity of the financial reporting process. Owing to the global nature of the group and its operations, the applications, associated infrastructure and IT processes that support significant business and financial processes are spread across a number of locations. These are delivered by a mix ofin-house teams and third party support providers some of whom reside in different countries from the physical location of the IT infrastructure or the location of the RELX business users. Understanding the IT environment including interfaces between them was an area of audit focus to assess if transactions were being processed accurately. |
We utilised IT specialists to support our evaluation of the design and operation of IT controls to address the group’s control objectives and financial reporting risks, including the following:
◾ We made enquiries of management to understand the IT environment and walked through the financial processesend-to-end in order to understand where IT systems were integral to the group accounting processes, as applicable.
◾ We performed data analytic procedures in certain locations and business areas to understand the flow of transactions and perform specific test procedures.
◾ We tested the IT general controls environment for the key applications.
◾ Where appropriate, we received reports from the service auditors of the outsourced systems and evaluated the adequacy of the work performed and followed up on matters arising, performing further procedures as necessary.
◾ Where required, we tested compensating controls or performed alternative procedures to complement the controls based audit approach. |
Based on the procedures performed, we have not identified any misstatements in the financial statements due to any limitations of the IT environment. Our understanding and testing of IT systems and controls supported our audit approach. | ||
Accounting for the corporate simplification
Refer to Note 1 of the Consolidated Financial Statements (page 126)
On 8 September 2018, the structure of group was further simplified from a dual parent structure to a single parent structure by way of a merger of RELX PLC and RELX NV. Following the completion of the Simplification, RELX PLC is the sole parent company of the group. It owns 100% of the shares in RELX Group plc which, in turn, holds the operating businesses, subsidiaries and financing activities of the group.
We focused on this area as it was a significant and unusual transaction. |
Procedures on the accounting for the corporate simplification were performed centrally by the group team supported by our team in the Netherlands and specialists, as necessary.
We assessed the accounting for the transaction including whether the transaction was considered a merger or acquisition, the impact on earnings per share, share based payments and share capital.
We also evaluated the disclosure in the financial statements including accounting for the restructure in the parent company financial statements. |
Based on the procedures performed, we reported to the Audit Committee that management’s judgements in relation to the accounting for the corporate simplification of the group are appropriate, as are the related disclosures. |
Table of Contents
RELX Annual report and financial statements 2018 | Independent auditors’ report to the members of RELX PLC | 117 | |
|
KEY OBSERVATIONS | ||||
COMMUNICATED | ||||
RISK | OUR RESPONSE TO THE RISK | TO THE AUDIT COMMITTEE | ||
Acquisition accounting for significant new business combinations
Refer to Note 12 of the Consolidated Financial Statements (page 143)
During the year ended 31 December 2018, the group made several acquisitions totalling £955 million as detailed in Note 12. The most significant acquisition was ThreatMetrix for total consideration of £585 million.
The company assessed, with the assistance of third party valuation specialists where required, the completeness and fair value of identifiable assets acquired and liabilities assumed in these acquisitions.
We focused on this area due to the materiality of the acquisitions and because the assessment of fair value of identifiable assets is inherently judgemental. |
We performed audit procedures on 7 of the acquisitions made during the year, including ThreatMetrix. For each of the acquisitions tested:
◾ We assessed the processes and tested controls in the business combination process where acquisitions were significant.
◾ We assessed with the assistance of our internal valuation specialists as necessary, the methodology and key assumptions used in determining the purchase price allocation made by management. Key assumptions evaluated were discount rates, terminal growth rates, cash flow projections, net assets acquired and useful lives assigned.
◾ We read documents such as sale and purchase agreements, board papers and due diligence reports to assess the consistency and completeness of the fair value adjustments recorded.
We evaluated the adequacy of the disclosures provided by the group in Note 12 in relation to its acquisitions. |
We did not identify evidence of material misstatement in the allocation of the purchase price to identifiable assets acquired and liabilities assumed in these acquisitions recognised in the year. |
In the current year, our key audit matters introduced the Accounting for the corporate simplification of the group as it is a significant one-time transaction. Additionally, our key audit matters also introduced Acquisition accounting for significant new business combinations due to the total consideration expended in the year.
AN OVERVIEW OF THE SCOPE OF OUR AUDIT
Tailoring the scope
Our assessment of audit risk, our evaluation of materiality and our allocation of performance materiality determine our audit scope for each entity within the group. Taken together, this enables us to form an opinion on the consolidated financial statements. We take into account size, risk profile, the organisation of the group and effectiveness of group-wide controls, changes in the business environment and other factors such as recent Internal audit results when assessing the level of work to be performed at each entity.
The group has centralised processes for key judgements and determination of accounting policies. Certain areas of audit focus, namely internally developed intangible assets, revenue recognition, and IT system management are decentralised processes delineated by business area. We have tailored our audit response accordingly and procedures for the areas of focus were performed or directed by the group audit team.
In assessing the risk of material misstatement to the group financial statements, and to ensure we had adequate quantitative coverage of significant accounts in the financial statements, we selected thirteen components covering entities within United Kingdom, the Netherlands, the United States, France, Switzerland, and Japan, which represent the principal business units within the group.
Of the thirteen components selected, we performed an audit of the complete financial information of six components (“full scope components”) which were selected based on their size or risk characteristics. For the remaining seven components (“specific scope components”), we performed audit procedures on specific accounts within that component that we considered had the potential for the greatest impact on the significant accounts in the financial statements either because of the size of these accounts or their risk profile. We also instructed two locations to perform specified procedures over certain aspects of acquisition accounting for significant new business combinations, as described in the Risk section above.
The reporting components where we performed audit procedures accounted for 81% (2017: 79%) of the group’s profit before tax on an absolute basis1, 80% (2017: 78%) of the group’s Revenue and 75% (2017: 78%) of the group’s Total assets. For the current year, the full scope components contributed 57% (2017: 57%) of the group’s profit before tax on an absolute basis, 70% (2017: 70%) of the group’s Revenue and 67% (2017: 70%) of the group’s Total assets. The specific scope components contributed 23% (2017: 22%) of the group’s profit before tax on an absolute basis, 10% (2017: 8%) of the group’s Revenue and 8% (2017: 8%) of the group’s Total assets. The audit scope of these components may not have included testing of all significant accounts of the component but will have contributed to the coverage of significant tested for the group.
Of the remaining components that together represent 19% of the group’s profit before tax on an absolute basis, none are individually greater than 2% of the group’s profit before tax on an absolute basis. For these components, we performed other procedures, including analytical review, review of internal audit reports, and testing of consolidation journals, intercompany eliminations and foreign currency translation recalculations at the group level to respond to any potential risks of material misstatement to the group financial statements.
(1) | Coverage of profit before tax measured on an absolute basis for each component (components with a loss would be added to both the numerator and denominator). |
Table of Contents
118 | RELX Annual report and financial statements 2018 | Financial statements and other information | |
|
The charts below illustrate the coverage obtained from the work performed by our audit teams.
Changes from the prior year
Changes from the prior year include increasing scope of one component from other procedures scope to specific scope as part of risk focused approach. We have also added one component to specific scope and instructed two locations to perform specified procedures as a result of acquisitions. The corporate structure has also been simplified in the year to a single parent company structure, with RELX PLC as the surviving company.
Involvement with component teams
In establishing our overall approach to the group audit, we determined the type of work that needed to be undertaken at each of the components by us, as the primary audit engagement team, or by component auditors from other EY global network firms operating under our instruction. Of the six full scope components, audit procedures were performed on three of these directly by the primary audit team. For the seven specific scope components and two specified procedure locations, where the work was performed by component auditors, we determined the appropriate level of involvement to enable us to determine that sufficient audit evidence had been obtained as a basis for our opinion on the group as a whole.
The group audit team continued to follow a programme of planned visits that has been designed to ensure that the Senior Statutory Auditor, or another group audit partner, meet with the all full scope locations and specific scope locations on a rotational basis. During the current year’s audit cycle, visits were undertaken by the primary audit team to component teams in the United Kingdom, the Netherlands, the United States, France, Switzerland, and Japan. These visits involved meeting local management and discussing the audit approach and any issues arising with the component audit team. The group audit team also participated in key discussions, via conference calls with all full and specific scope locations. The primary team interacted regularly with the component teams where appropriate during various stages of the audit, reviewed key working papers and were responsible for the scope and direction of the audit process. This, together with the additional procedures performed at group level, gave us appropriate evidence for our opinion on the group financial statements.
OUR APPLICATION OF MATERIALITY
We apply the concept of materiality in planning and performing the audit, in evaluating the effect of identified misstatements on the audit and in forming our audit opinion.
Materiality
The magnitude of an omission or misstatement that, individually or in the aggregate, could reasonably be expected to influence the economic decisions of the users of the financial statements. Materiality provides a basis for determining the nature and extent of our audit procedures.
We determined materiality for the group to be £90 million (2017: £86.7 million), which is 5% (2017: 5%) of profit before tax. We believe that profit before tax provides us with the best assessment of the requirements of the users of the financial statements.
We determined materiality for the Parent Company to be £90 million (2017: £63.4 million), which is 0.5% (2017: 2%) of equity. Materiality has increased due to the changes in equity following the corporate simplification.
Performance materiality
The application of materiality at the individual account or balance level. It is set at an amount to reduce to an appropriately low level the probability that the aggregate of uncorrected and undetected misstatements exceeds materiality.
On the basis of our risk assessments, together with our assessment of the group’s overall control environment, our judgement was that performance materiality was 75% (2017: 75%) of our planning materiality, namely £67.5 million (2017: £65.0m). We have set performance materiality at this percentage due to our assessment of the control environment and the historic lack of significant audit findings.
Audit work at component locations for the purpose of obtaining audit coverage over significant financial statement accounts is undertaken based on a percentage of total performance materiality. The performance materiality set for each component is based on the relative scale and risk of the component to the group as a whole and our assessment of the risk of misstatement at that component. In the current year, the range of performance materiality allocated to components was £19.4 million to £48.4 million (2017: £19.5 million to £48.7 million).
Table of Contents
RELX Annual report and financial statements 2018 | Independent auditors’ report to the members of RELX PLC | 119 | |
|
Reporting threshold
An amount below which identified misstatements are considered as being clearly trivial.
We agreed with the Audit Committee that we would report to them all uncorrected audit differences in excess of £4.5 million (2017: £4.35 million), which is set at 5% of planning materiality, as well as differences below that threshold that, in our view, warranted reporting on qualitative grounds.
We evaluate any uncorrected misstatements against both the quantitative measures of materiality discussed above and in light of other relevant qualitative considerations in forming our opinion.
OTHER INFORMATION
The other information comprises the information included in the annual report set out on pages 2 to 111, other than the financial statements and our auditor’s report thereon. The directors are responsible for the other information.
Our opinion on the financial statements does not cover the other information and, except to the extent otherwise explicitly stated in this report, we do not express any form of assurance conclusion thereon.
In connection with our audit of the financial statements, our responsibility is to read the other information and, in doing so, consider whether the other information is materially inconsistent with the financial statements or our knowledge obtained in the audit or otherwise appears to be materially misstated. If we identify such material inconsistencies or apparent material misstatements, we are required to determine whether there is a material misstatement in the financial statements or a material misstatement of the other information. If, based on the work we have performed, we conclude that there is a material misstatement of the other information, we are required to report that fact.
We have nothing to report in this regard.
In this context, we also have nothing to report in regard to our responsibility to specifically address the following items in the other information and to report as uncorrected material misstatements of the other information where we conclude that those items meet the following conditions:
◾ | Fair, balanced and understandable set out on page 80– the statement given by the directors that they consider the annual report and financial statements taken as a whole is fair, balanced and understandable and provides the information necessary for shareholders to assess the group’s performance, business model and strategy, is materially inconsistent with our knowledge obtained in the audit; or |
◾ | Audit committee reporting set out on page 106– the section describing the work of the audit committee does not appropriately address matters communicated by us to the audit committee; or |
◾ | Directors’ statement of compliance with the UK Corporate Governance Code set out on page 72– the parts of the directors’ statement required under the Listing Rules relating to the company’s compliance with the UK Corporate Governance Code containing provisions specified for review by the auditor in accordance with Listing Rule 9.8.10R(2) do not properly disclose a departure from a relevant provision of the UK Corporate Governance Code. |
Opinions on other matters prescribed by the Companies Act 2006
In our opinion, the part of the directors’ remuneration report to be audited has been properly prepared in accordance with the Companies Act 2006.
In our opinion, based on the work undertaken in the course of the audit:
◾ | the information given in the strategic report and the directors’ report for the financial year for which the financial statements are prepared is consistent with the financial statements; and |
◾ | the strategic report and the directors’ report have been prepared in accordance with applicable legal requirements. |
Matters on which we are required to report by exception
In the light of the knowledge and understanding of the group and the parent company and its environment obtained in the course of the audit, we have not identified material misstatements in the strategic report or the directors’ report.
We have nothing to report in respect of the following matters in relation to which the Companies Act 2006 requires us to report to you if, in our opinion:
◾ | adequate accounting records have not been kept by the parent company, or returns adequate for our audit have not been received from branches not visited by us; or |
◾ | the parent company financial statements and the part of the Directors’ Remuneration Report to be audited are not in agreement with the accounting records and returns; or |
◾ | certain disclosures of directors’ remuneration specified by law are not made; or |
◾ | we have not received all the information and explanations we require for our audit. |
Responsibilities of directors
As explained more fully in the directors’ responsibilities statement set out on page 108, the directors are responsible for the preparation of the financial statements and for being satisfied that they give a true and fair view, and for such internal control as the directors determine is necessary to enable the preparation of financial statements that are free from material misstatement, whether due to fraud or error.
In preparing the financial statements, the directors are responsible for assessing the group and parent company’s ability to continue as a going concern, disclosing, as applicable, matters related to going concern and using the going concern basis of accounting unless the directors either intend to liquidate the group or the parent company or to cease operations, or have no realistic alternative but to do so.
Table of Contents
120 | RELX Annual report and financial statements 2018 | Financial statements and other information | |
|
Auditor’s responsibilities for the audit of the financial statements
Our objectives are to obtain reasonable assurance about whether the financial statements as a whole are free from material misstatement, whether due to fraud or error, and to issue an auditor’s report that includes our opinion. Reasonable assurance is a high level of assurance, but is not a guarantee that an audit conducted in accordance with ISAs (UK) will always detect a material misstatement when it exists. Misstatements can arise from fraud or error and are considered material if, individually or in the aggregate, they could reasonably be expected to influence the economic decisions of users taken on the basis of these financial statements.
Explanation as to what extent the audit was considered capable of detecting irregularities, including fraud
The objectives of our audit, in respect to fraud, are; to identify and assess the risks of material misstatement of the financial statements due to fraud; to obtain sufficient appropriate audit evidence regarding the assessed risks of material misstatement due to fraud, through designing and implementing appropriate responses; and to respond appropriately to fraud or suspected fraud identified during the audit. However, the primary responsibility for the prevention and detection of fraud rests with both those charged with governance of the entity and management.
Our approach was as follows:
◾ | We obtained an understanding of the legal and regulatory frameworks that are applicable to the group and determined that the most significant are those that relate to the reporting framework (IFRS, FRS 101, the Companies Act 2006 and UK Corporate Governance Code) and the relevant tax compliance regulations in the jurisdictions in which the group operates. |
◾ | We understood how RELX PLC is complying with those frameworks by making enquiries of management, internal audit, those responsible for legal and compliance procedures and the company secretary. We corroborated our enquiries through our review of board minutes and papers provided to the Audit Committee. |
◾ | We assessed the susceptibility of the group’s financial statements to material misstatement, including how fraud might occur by meeting with management from various parts of the business to understand where it considered there was susceptibility to fraud. |
We also considered performance targets and their propensity to influence on efforts made by management to manage earnings. We considered the programmes and controls that the group has established to address risks identified, or that otherwise prevent, deter and detect fraud; and how senior management monitors those programmes and controls. Where the risk was considered to be higher, we performed audit procedures to address each identified fraud risk. These procedures included testing manual journals and were designed to provide reasonable assurance that the financial statements were free from fraud or error. |
◾ | Based on this understanding we designed our audit procedures to identifynon-compliance with such laws and regulations. Our procedures involved: journal entry testing, with a focus on manual consolidation journals and journals indicating large or unusual transactions based on our understanding of the business; enquiries of legal counsel, Group management, internal audit, country management at all full and specific scope management; and focused testing. In addition, we completed procedures to conclude on the compliance of the disclosures in the annual report and accounts with all applicable requirements. |
◾ | Any instances ofnon-compliance with laws and regulations were communicated by/to components and considered in our audit approach, if applicable. |
A further description of our responsibilities for the audit of the financial statements is located on the Financial Reporting Council’s website at https://www.frc.org.uk/auditorsresponsibilities. This description forms part of our auditor’s report.
Other matters we are required to address
◾ | We were appointed by the company on 21 April 2016 to audit the financial statements for the year ending 31 December and subsequent financial periods. |
The period of total uninterrupted engagement including previous renewals and reappointments is three years, covering the years ending 2016 to 2018.
◾ | Thenon-audit services prohibited by the FRC’s Ethical Standard were not provided to the group or the parent company and we remain independent of the group and the parent company in conducting the audit. |
◾ | The audit opinion is consistent with the additional report to the audit committee. |
USE OF OUR REPORT
This report is made solely to the company’s members, as a body, in accordance with Chapter 3 of Part 16 of the Companies Act 2006. Our audit work has been undertaken so that we might state to the company’s members those matters we are required to state to them in an auditor’s report and for no other purpose. To the fullest extent permitted by law, we do not accept or assume responsibility to anyone other than the company and the company’s members as a body, for our audit work, for this report, or for the opinions we have formed.
Hywel Ball (Senior statutory auditor)
for and on behalf of Ernst & Young LLP, Statutory Auditor
London
20 February 2019
Notes:
(1) | The maintenance and integrity of the RELX PLC web site is the responsibility of the directors; the work carried out by the auditors does not involve consideration of these matters and, accordingly, the auditors accept no responsibility for any changes that may have occurred to the financial statements since they were initially presented on the web site. |
(2) | Legislation in the United Kingdom governing the preparation and dissemination of financial statements may differ from legislation in other jurisdictions. |
Table of Contents
RELX Annual report and financial statements 2018 | 121 | |
|
FOR THE YEAR ENDED 31 DECEMBER | Note | 2018 £m | Restated £m | Restated £m | ||||||||||||
Revenue | 2 | 7,492 | 7,341 | 6,889 | ||||||||||||
Cost of sales | (2,644 | ) | (2,628 | ) | (2,488 | ) | ||||||||||
Gross profit | 4,848 | 4,713 | 4,401 | |||||||||||||
Selling and distribution costs | (1,191 | ) | (1,163 | ) | (1,109 | ) | ||||||||||
Administration and other expenses | (1,725 | ) | (1,682 | ) | (1,621 | ) | ||||||||||
Share of results of joint ventures | 32 | 37 | 37 | |||||||||||||
Operating profit | 3 | 1,964 | 1,905 | 1,708 | ||||||||||||
Finance income | 7 | 6 | 6 | 10 | ||||||||||||
Finance costs | 7 | (217 | ) | (205 | ) | (223 | ) | |||||||||
Net finance costs | (211 | ) | (199 | ) | (213 | ) | ||||||||||
Disposals and othernon-operating items | 8 | (33 | ) | 15 | (36 | ) | ||||||||||
Profit before tax | 1,720 | 1,721 | 1,459 | |||||||||||||
Current tax | (297 | ) | (439 | ) | (374 | ) | ||||||||||
Deferred tax | 5 | 374 | 73 | |||||||||||||
Tax expense | 9 | (292 | ) | (65 | ) | (301 | ) | |||||||||
Net profit for the year | 1,428 | 1,656 | 1,158 | |||||||||||||
Attributable to: | ||||||||||||||||
RELX PLC shareholders | 1,422 | 1,648 | 1,150 | |||||||||||||
Non-controlling interests | 6 | 8 | 8 | |||||||||||||
Net profit for the year | 1,428 | 1,656 | 1,158 | |||||||||||||
Earnings per share | ||||||||||||||||
FOR THE YEAR ENDED 31 DECEMBER | 2018 | Restated 2017 | Restated 2016 | |||||||||||||
Basic earnings per share | ||||||||||||||||
RELX PLC | 10 | 71.9p | 81.6p | 55.8p | ||||||||||||
Diluted earnings per share | ||||||||||||||||
RELX PLC | 10 | 71.4p | 81.0p | 55.3p |
Table of Contents
122 | RELX Annual report and financial statements 2018 | Financial statements and other information | |
|
Consolidated statement of comprehensive income
FOR THE YEAR ENDED 31 DECEMBER | Note | 2018 £m | Restated £m | Restated £m | ||||||||||||
Net profit for the year | 1,428 | 1,656 | 1,158 | |||||||||||||
Items that will not be reclassified to profit or loss: | ||||||||||||||||
Actuarial (losses)/gains on defined benefit pension schemes | 6 | (91 | ) | 233 | (262 | ) | ||||||||||
Tax on items that will not be reclassified to profit or loss | 9 | 15 | (59 | ) | 45 | |||||||||||
Total items that will not be reclassified to profit or loss | (76 | ) | 174 | (217 | ) | |||||||||||
Items that may be reclassified subsequently to profit or loss: | ||||||||||||||||
Exchange differences on translation of foreign operations | 207 | (507 | ) | 667 | ||||||||||||
Fair value movements on cash flow hedges | 18 | (59 | ) | 137 | (165 | ) | ||||||||||
Transfer to net profit from cash flow hedge reserve | 18 | 17 | 25 | 46 | ||||||||||||
Tax on items that may be reclassified to profit or loss | 9 | 9 | (30 | ) | 19 | |||||||||||
Total items that may be reclassified to profit or loss | 174 | (375 | ) | 567 | ||||||||||||
Other comprehensive income/(loss) for the year | 98 | (201 | ) | 350 | ||||||||||||
Total comprehensive income for the year | 1,526 | 1,455 | 1,508 | |||||||||||||
Attributable to: | ||||||||||||||||
RELX PLC shareholders | 1,520 | 1,447 | 1,500 | |||||||||||||
Non-controlling interests | 6 | 8 | 8 | |||||||||||||
Total comprehensive income for the year | 1,526 | 1,455 | 1,508 |
Table of Contents
RELX Annual report and financial statements 2018 | 123 | |
|
Consolidated statement of cash flows
FOR THE YEAR ENDED 31 DECEMBER | Note | 2018 £m | Restated £m | Restated £m | ||||||||||||
Cash flows from operating activities | ||||||||||||||||
Cash generated from operations | 11 | 2,555 | 2,526 | 2,311 | ||||||||||||
Interest paid (including lease interest) | (179 | ) | (169 | ) | (178 | ) | ||||||||||
Interest received | 24 | 6 | 10 | |||||||||||||
Tax paid (net) | (415 | ) | (449 | ) | (402 | ) | ||||||||||
Net cash from operating activities | 1,985 | 1,914 | 1,741 | |||||||||||||
Cash flows from investing activities | ||||||||||||||||
Acquisitions | 11 | (935 | ) | (131 | ) | (361 | ) | |||||||||
Purchases of property, plant and equipment | (56 | ) | (51 | ) | (51 | ) | ||||||||||
Expenditure on internally developed intangible assets | (306 | ) | (303 | ) | (282 | ) | ||||||||||
Purchase of investments | (13 | ) | (10 | ) | (6 | ) | ||||||||||
Proceeds from disposals of property, plant and equipment | 4 | 1 | 1 | |||||||||||||
Gross proceeds from business disposals | 34 | 84 | 18 | |||||||||||||
Payments on business disposals | (29 | ) | (43 | ) | (23 | ) | ||||||||||
Dividends received from joint ventures | 30 | 38 | 44 | |||||||||||||
Net cash used in investing activities | (1,271 | ) | (415 | ) | (660 | ) | ||||||||||
Cash flows from financing activities | ||||||||||||||||
Dividends paid to shareholders | 13 | (796 | ) | (762 | ) | (683 | ) | |||||||||
Distributions tonon-controlling interests | (8 | ) | (10 | ) | (9 | ) | ||||||||||
Increase/(decrease) in short-term bank loans, overdrafts and commercial paper | 11 | 147 | (148 | ) | 271 | |||||||||||
Issuance of term debt | 11 | 958 | 873 | 603 | ||||||||||||
Repayment of term debt | 11 | (211 | ) | (712 | ) | (474 | ) | |||||||||
Repayment of leases | 11 | (95 | ) | (89 | ) | (82 | ) | |||||||||
Receipts in respect of subleases | 11 | 14 | 11 | 8 | ||||||||||||
Repurchase of ordinary shares | 25 | (700 | ) | (700 | ) | (700 | ) | |||||||||
Purchase of shares by Employee Benefit Trust | 25 | (43 | ) | (39 | ) | (29 | ) | |||||||||
Proceeds on issue of ordinary shares | 21 | 32 | 23 | |||||||||||||
Net cash used in financing activities | (713 | ) | (1,544 | ) | (1,072 | ) | ||||||||||
Increase/(decrease) in cash and cash equivalents | 11 | 1 | (45 | ) | 9 | |||||||||||
Movement in cash and cash equivalents | ||||||||||||||||
At start of year | 111 | 162 | 122 | |||||||||||||
Increase/(decrease) in cash and cash equivalents | 1 | (45 | ) | 9 | ||||||||||||
Exchange translation differences | 2 | (6 | ) | 31 | ||||||||||||
At end of year | 114 | 111 | 162 |
Table of Contents
124 | RELX Annual report and financial statements 2018 | Financial statements and other information | |
|
Consolidated statement of financial position
AS AT 31 DECEMBER | Note | 2018 £m | Restated £m | Restated £m | ||||||||||||
Non-current assets | ||||||||||||||||
Goodwill | 14 | 6,899 | 5,965 | 6,392 | ||||||||||||
Intangible assets | 15 | 3,534 | 3,194 | 3,604 | ||||||||||||
Investments in joint ventures | 16 | 104 | 102 | 102 | ||||||||||||
Other investments | 16 | 151 | 141 | 137 | ||||||||||||
Property, plant and equipment | 17 | 198 | 194 | 223 | ||||||||||||
Right of use assets | 23 | 263 | 287 | 326 | ||||||||||||
Deferred tax assets | 9 | 455 | 431 | 469 | ||||||||||||
Net pension assets | 6 | 6 | 22 | – | ||||||||||||
Derivative financial instruments | 18 | 37 | 86 | 49 | ||||||||||||
11,647 | 10,422 | 11,302 | ||||||||||||||
Current assets | ||||||||||||||||
Inventories andpre-publication costs | 19 | 212 | 197 | 209 | ||||||||||||
Trade and other receivables | 20 | 2,015 | 1,873 | 2,015 | ||||||||||||
Derivative financial instruments | 18 | 10 | 29 | 20 | ||||||||||||
Cash and cash equivalents | 11 | 114 | 111 | 162 | ||||||||||||
2,351 | 2,210 | 2,406 | ||||||||||||||
Assets held for sale | 1 | – | 6 | |||||||||||||
Total assets | 13,999 | 12,632 | 13,714 | |||||||||||||
Current liabilities | ||||||||||||||||
Trade and other payables | 21 | 3,432 | 3,298 | 3,479 | ||||||||||||
Derivative financial instruments | 18 | 32 | 32 | 85 | ||||||||||||
Borrowings | 22 | 1,392 | 762 | 1,169 | ||||||||||||
Taxation | 450 | 560 | 612 | |||||||||||||
Provisions | 24 | 15 | 12 | 17 | ||||||||||||
5,321 | 4,664 | 5,362 | ||||||||||||||
Non-current liabilities | ||||||||||||||||
Derivative financial instruments | 18 | 37 | 25 | 110 | ||||||||||||
Borrowings | 22 | 4,973 | 4,491 | 4,087 | ||||||||||||
Deferred tax liabilities | 9 | 830 | 738 | 1,137 | ||||||||||||
Net pension obligations | 6 | 439 | 350 | 636 | ||||||||||||
Provisions | 24 | 36 | 51 | 69 | ||||||||||||
6,315 | 5,655 | 6,039 | ||||||||||||||
Liabilities associated with assets held for sale | 4 | – | 5 | |||||||||||||
Total liabilities | 11,640 | 10,319 | 11,406 | |||||||||||||
Net assets | 2,359 | 2,313 | 2,308 | |||||||||||||
Capital and reserves | ||||||||||||||||
Share capital | 25 | 290 | 224 | 226 | ||||||||||||
Share premium | 25 | 1,415 | 3,104 | 3,003 | ||||||||||||
Shares held in treasury | 25 | (734 | ) | (1,631 | ) | (1,471 | ) | |||||||||
Translation reserve | 374 | 170 | 727 | |||||||||||||
Other reserves | 26 | 984 | 425 | (215 | ) | |||||||||||
Shareholders’ equity | 2,329 | 2,292 | 2,270 | |||||||||||||
Non-controlling interests | 30 | 21 | 38 | |||||||||||||
Total equity | 2,359 | 2,313 | 2,308 |
The consolidated balance sheet as presented as at 31 December 2016 is equivalent to the balance sheet as at 1 January 2017 and as such fulfils the requirements of IAS 1 Presentation of Financial Statements relating to the retrospective application of IFRS 9, IFRS 15 and IFRS 16.
The consolidated financial statements were approved by the Board of Directors and authorised for issue on 20 February 2019. They were signed on its behalf by:
A J Habgood | N L Luff | |
Chairman | Chief Financial Officer |
Table of Contents
RELX Annual report and financial statements 2018 | 125 | |
|
Consolidated statement of changes in equity
Note | Share capital £m | Share premium £m | Shares held in treasury £m | Translation £m | Other reserves £m | Shareholders’ equity £m | Non- controlling interests £m | Total equity £m | ||||||||||||||||||||||||||||
Balance at 1 January 2016 | 224 | 2,748 | (1,393 | ) | 224 | 341 | 2,144 | 34 | 2,178 | |||||||||||||||||||||||||||
Impact of adoption of new standards | – | – | – | – | (36 | ) | (36 | ) | – | (36 | ) | |||||||||||||||||||||||||
Total comprehensive income for the year | – | – | – | 667 | 833 | 1,500 | 8 | 1,508 | ||||||||||||||||||||||||||||
Dividends paid | 13 | – | – | – | – | (683 | ) | (683 | ) | (9 | ) | (692 | ) | |||||||||||||||||||||||
Issue of ordinary shares, net of expenses | – | 23 | – | – | – | 23 | – | 23 | ||||||||||||||||||||||||||||
Repurchase of ordinary shares | – | – | (722 | ) | – | – | (722 | ) | – | (722 | ) | |||||||||||||||||||||||||
Cancellation of shares | (6 | ) | – | 713 | – | (707 | ) | – | – | – | ||||||||||||||||||||||||||
Increase in share based remuneration reserve (net of tax) | – | – | – | – | 44 | 44 | – | 44 | ||||||||||||||||||||||||||||
Settlement of share awards | – | – | 39 | – | (39 | ) | – | – | – | |||||||||||||||||||||||||||
Exchange differences on translation of capital and reserves | 8 | 232 | (108 | ) | (164 | ) | 32 | – | 5 | 5 | ||||||||||||||||||||||||||
Balance at 1 January 2017 (restated) | 226 | 3,003 | (1,471 | ) | 727 | (215 | ) | 2,270 | 38 | 2,308 | ||||||||||||||||||||||||||
Total comprehensive income for the year | – | – | – | (507 | ) | 1,954 | 1,447 | 8 | 1,455 | |||||||||||||||||||||||||||
Dividends paid | 13 | – | – | – | – | (762 | ) | (762 | ) | (10 | ) | (772 | ) | |||||||||||||||||||||||
Issue of ordinary shares, net of expenses | – | 32 | – | – | – | 32 | – | 32 | ||||||||||||||||||||||||||||
Repurchase of ordinary shares | – | – | (737 | ) | – | – | (737 | ) | – | (737 | ) | |||||||||||||||||||||||||
Cancellation of shares | 25 | (4 | ) | – | 570 | – | (566 | ) | – | – | – | |||||||||||||||||||||||||
Increase in share based remuneration reserve (net of tax) | – | – | – | – | 42 | 42 | – | 42 | ||||||||||||||||||||||||||||
Settlement of share awards | – | – | 37 | – | (37 | ) | – | – | ||||||||||||||||||||||||||||
Acquisitions | – | – | – | – | – | – | 1 | 1 | ||||||||||||||||||||||||||||
Disposal of business | – | – | – | – | – | – | (15 | ) | (15 | ) | ||||||||||||||||||||||||||
Exchange differences on translation of capital and reserves | 2 | 69 | (30 | ) | (50 | ) | 9 | – | (1 | ) | (1 | ) | ||||||||||||||||||||||||
Balance at 1 January 2018 | 224 | 3,104 | (1,631 | ) | 170 | 425 | 2,292 | 21 | 2,313 | |||||||||||||||||||||||||||
Total comprehensive income for the year | – | – | – | 207 | 1,313 | 1,520 | 6 | 1,526 | ||||||||||||||||||||||||||||
Dividends paid | 13 | – | – | – | – | (796 | ) | (796 | ) | (8 | ) | (804 | ) | |||||||||||||||||||||||
Issue of ordinary shares, net of expenses | 25 | 134 | 114 | – | – | (227 | ) | 21 | – | 21 | ||||||||||||||||||||||||||
Repurchase of ordinary shares | – | – | (743 | ) | – | – | (743 | ) | – | (743 | ) | |||||||||||||||||||||||||
Cancellation of shares | 25 | (68 | ) | (1,795 | ) | 1,601 | – | 262 | – | – | – | |||||||||||||||||||||||||
Increase in share based remuneration reserve (net of tax) | – | – | – | – | 35 | 35 | – | 35 | ||||||||||||||||||||||||||||
Settlement of share awards | – | – | 35 | – | (35 | ) | – | – | – | |||||||||||||||||||||||||||
Acquisitions | – | – | – | – | – | – | 11 | 11 | ||||||||||||||||||||||||||||
Exchange differences on translation of capital and reserves | – | (8 | ) | 4 | (3 | ) | 7 | – | – | – | ||||||||||||||||||||||||||
Balance at 31 December 2018 | 290 | 1,415 | (734 | ) | 374 | 984 | 2,329 | 30 | 2,359 |
Table of Contents
126 | RELX Annual report and financial statements 2018 | Financial statements and other information | |
|
Notes to the consolidated financial statements
for the year ended 31 December 2018
1 Basis of preparation and accounting policies
Basis of preparation
The shares of RELX PLC are traded on the London, Amsterdam and New York stock exchanges. RELX PLC and its subsidiaries, joint ventures and associates are together known as ‘RELX’.
Up until the corporate simplification, consolidated accounts were prepared on the basis that all shareholders were regarded as having interests in a single economic entity, and as such the dual parent Group formed a single reporting entity for the presentation of consolidated financial statements. The corporate simplification as described on page 72 therefore has had no impact on the basis of preparation of the consolidated financial statements.
In preparing the consolidated financial statements, subsidiaries are accounted for under the acquisition method and investments in associates and joint ventures are accounted for under the equity method. All intra-group transactions and balances are eliminated.
On acquisition of a subsidiary, or interest in an associate or joint venture, fair values, reflecting conditions at the date of acquisition, are attributed to the net assets, including identifiable intangible assets acquired. Adjustments are made to bring accounting policies into line with those of the Group. The results of subsidiaries sold or acquired are included in the consolidated financial statements up to or from the date that control passes from or to the Group.
Non-controlling interests in the net assets of the Group are identified separately from shareholders’ equity.Non-controlling interests consist of the amount of those interests at the date of the original acquisition and thenon-controlling share of changes in equity since the date of acquisition.
The Directors of RELX PLC, having made appropriate enquiries, consider that adequate resources exist for the Group to continue in operational existence for the foreseeable future and that, therefore, it is appropriate to adopt the going concern basis in preparing the consolidated financial statements for the year ended 31 December 2018.
Accounting policies
The Group’s consolidated financial statements are prepared in accordance with International Financial Reporting Standards (IFRS) as adopted by the European Union and as issued by the International Accounting Standards Board (IASB). The accounting policies under IFRS are included in the relevant notes to the consolidated financial statements. The accounting policies below are applied throughout the financial statements and are unchanged from those applied in preparing the consolidated financial statements for the year ended 31 December 2017 and 2016, with the exception of policies relating to the adoption of IFRS 9 – Financial Instruments, IFRS 15 – Revenue from Contracts with Customers and IFRS 16 – Leases.
Restatement
The consolidated financial statements have been restated for the retrospective adoption of IFRS 9, IFRS 15 and IFRS 16. Each note identifies where comparatives have been restated.
Foreign exchange translation
The consolidated financial statements are presented in sterling.
Transactions in foreign currencies are recorded at the rate of exchange prevailing on the date of the transaction.Non-monetary assets and liabilities that are measured at historical cost in foreign currencies are translated using the exchange rate at the date of the transaction. At each statement of financial position date, monetary assets and liabilities that are denominated in foreign currencies are retranslated at the rate prevailing on the statement of financial position date. Exchange differences arising are recorded in the income statement other than where hedge accounting applies, as set out on pages 150 to 155.
Assets and liabilities of foreign operations are translated at exchange rates prevailing on the statement of financial position date. Income and expense items and cash flows of foreign operations are translated at the average exchange rate for the period. Significant individual items of income and expense and cash flows in foreign operations are translated at the rate prevailing on the date of transaction. Exchange differences arising are classified as equity and transferred to the translation reserve. When foreign operations are disposed of, the related cumulative translation differences are recognised within the income statement in the period.
The Group uses derivative financial instruments, primarily forward contracts, to hedge its exposure to certain foreign exchange risks. Details of the Group’s accounting policies in respect of derivative financial instruments are set out on page 150.
Critical judgements and key sources of estimation uncertainty
The most significant accounting policies in determining the financial condition and results of the Group, and those requiring the most subjective or complex judgement, relate to and are included in the following notes:
◾ | valuation of goodwill and intangible assets – notes 14 and 15; |
◾ | capitalisation of development spend – note 15; |
◾ | taxation – note 9; and |
◾ | accounting for defined benefit pension schemes – note 6. |
Table of Contents
RELX Annual report and financial statements 2018 | Notes to the consolidated financial statements | 127 | |||||
|
|
|
1 Basis of preparation and accounting policies (continued)
Other significant accounting policies
The accounting policy in respect of revenue recognition is also significant in determining the financial condition and results of the Group, although the application of this policy is more straightforward. This policy is included in note 2.
Standards and amendments effective for the year
New accounting standards and amendments effective for the period and adopted by the Group in 2018 are IFRS 9 – Financial Instruments and IFRS 15 – Revenue from Contracts with Customers. IFRS 16 – Leases has also been adopted in the period, a year earlier than its mandatory effective date of 1 January 2019.
The impact of the adoption of these standards on the full year 2016 and full year 2017 results is as follows:
2016 as reported £m | IFRS 9 impact £m | IFRS 15 impact £m | IFRS 16 impact £m | 2016 as restated £m | ||||||||||||||||
Income statement | ||||||||||||||||||||
Revenue | 6,895 | – | (6 | ) | – | 6,889 | ||||||||||||||
Reported operating profit | 1,708 | – | (6 | ) | 6 | 1,708 | ||||||||||||||
Net finance costs | (195 | ) | (2 | ) | – | (16 | ) | (213 | ) | |||||||||||
Reported net profit attributable to RELX PLC shareholders | 1,161 | (2 | ) | (4 | ) | (5 | ) | 1,150 | ||||||||||||
Reported EPS | 56.3p | (0.1p | ) | (0.2p | ) | (0.2p | ) | 55.8p | ||||||||||||
Statement of financial position | ||||||||||||||||||||
Right-of-use assets | 20 | – | – | 306 | 326 | |||||||||||||||
Borrowings (including lease liability) | (4,843 | ) | 17 | – | (430 | ) | (5,256 | ) | ||||||||||||
Finance lease receivable | – | – | – | 63 | 63 | |||||||||||||||
Deferred income | (1,941 | ) | – | (67 | ) | – | (2,008 | ) | ||||||||||||
2017 as reported £m | IFRS 9 impact £m | IFRS 15 impact £m | IFRS 16 impact £m | 2017 as restated £m | ||||||||||||||||
Income statement | ||||||||||||||||||||
Revenue | 7,355 | – | (14 | ) | – | 7,341 | ||||||||||||||
Adjusted operating profit | 2,284 | – | (11 | ) | 11 | 2,284 | ||||||||||||||
Reported operating profit | 1,905 | – | (11 | ) | 11 | 1,905 | ||||||||||||||
Net finance costs | (182 | ) | (2 | ) | – | (15 | ) | (199 | ) | |||||||||||
Adjusted net profit attributable to RELX PLC shareholders | 1,635 | (2 | ) | (9 | ) | (4 | ) | 1,620 | ||||||||||||
Reported net profit attributable to RELX PLC shareholders | 1,659 | (2 | ) | (9 | ) | – | 1,648 | |||||||||||||
Adjusted EPS | 81.0p | (0.1p | ) | (0.5p | ) | (0.2p | ) | 80.2p | ||||||||||||
Reported EPS | 82.2p | (0.1p | ) | (0.5p | ) | – | 81.6p | |||||||||||||
Statement of financial position | ||||||||||||||||||||
Right-of-use assets | 16 | – | – | 271 | 287 | |||||||||||||||
Borrowings (including lease liability) | (4,886 | ) | 14 | – | (381 | ) | (5,253 | ) | ||||||||||||
Finance lease receivable | – | – | – | 57 | 57 | |||||||||||||||
Deferred income | (1,834 | ) | – | (76 | ) | – | (1,910 | ) |
IFRS 9 – Financial Instruments
IFRS 9 replaces the classification and measurement requirements in IAS 39 – Financial Instruments: Recognition and Measurement. RELX has applied IFRS 9 retrospectively, with the exception of hedge accounting, which has been applied prospectively. The main impact on previously reported numbers results in a reduction to borrowings of £14m as at 31 December 2017 (31 December 2016: reduction of £17m), arising from a retrospective change in the treatment under IFRS 9 of certain debt modifications undertaken in 2012 and 2013.
IFRS 15 – Revenue from Contracts with Customers
IFRS 15 provides a single point of reference for revenue recognition, including guidance in relation to identification of the contract and licensing arrangements. RELX has adopted IFRS 15 on a fully retrospective basis. The main impact of IFRS 15 is a change in the timing of revenue recognition as a result of the guidance on identification and satisfaction of performance obligations under IFRS 15. The impact on the income statement for the 12 months to 31 December 2017 is a decrease of £11m to both reported and adjusted operating profit (31 December 2016: decrease of £6m to reported operating profit).
Table of Contents
128 | RELX Annual report and financial statements 2018 | Financial statements and other information | |
|
Notes to the consolidated financial statements
for the year ended 31 December 2018
1 Basis of preparation and accounting policies (continued)
IFRS 16 – Leases (early adopted and therefore effective for the 2018 financial year)
IFRS 16 eliminates the distinction between operating and finance leases and requires lessees to recognise all leases with a lease term of greater than 12 months in the statement of financial position. RELX has adopted this standard a year earlier than the mandatory effective date of 1 January 2019. IFRS 16 has been adopted on a fully retrospective basis.
The change in accounting standard results in both an asset and liability being brought onto the statement of financial position for the majority of leases where RELX is a lessee. The asset is then depreciated, and interest expense recognised over the life of the lease. The standard also gives guidance on the recognition of subleases, which results in finance sublease receivables being recognised on the balance sheet. As at 31 December 2017, the restated statement of financial position includes additionalright-of-use assets of £271m, finance lease receivables of £57m and additional lease liabilities of £381m (31 December 2016:right-of-use assets of £306m, finance lease receivables of £63m and lease liabilities of £430m).
The impact on the income statement for the 12 months to 31 December 2017 is an increase of £11m to both reported and adjusted operating profit (31 December 2016: £6m increase to reported operating profit) offset by a net increase to finance costs of £15m (31 December 2016: £16m). After taking into account additional gains from disposals ofright-of-use assets, there is no impact on reported net profit.
Opening balance sheet adjustment
An opening balance sheet adjustment has been made at 1 January 2016 to reflect the impact of adoption on prior years. The adjustment reduces opening retained earnings by £36m. This mainly relates to the recognition of lease expense earlier on in the lease under IFRS 16 and the deferral of revenue into future periods under IFRS 15.
Additionally, the other interpretations and amendments to IFRS effective for 2018 have not had a significant impact on the Group’s accounting policies or reporting.
Standards, amendments and interpretations not yet effective
A number of amendments and interpretations have been issued which are not expected to have any significant impact on the accounting policies and reporting.
2 Revenue and segment analysis
Accounting policy The Group’s reported segments are based on the internal reporting structure and financial information provided to the Board.
Adjusted operating profit is the key segmental profit measure used by the Group in assessing performance. Adjusted operating profit is reconciled to operating profit on page 131.
Revenue arises from the provision of products and services under contracts with customers. In all cases, revenue is recognised to depict the transfer of promised goods or services to customers in an amount that reflects the consideration to which the entity expects to be entitled in exchange for those goods or services, and is recognised when the customer obtains control of the good or service.
Revenue is stated at the transaction price, which includes allowance for anticipated discounts and returns and excludes customer sales taxes and other amounts to be collected on behalf of third parties.
Where the goods or services promised within a contract are distinct, they are identified as separate performance obligations and are accounted for separately.
Where separate performance obligations are identified, total revenue is allocated on the basis of relative stand-alone selling prices or management’s best estimate of relative value where stand-alone selling prices do not exist. Management estimates may include a cost-plus method or comparable product approach, but must be supported by objective evidence. A residual approach may be applied where it is not possible to derive a reliable management estimate for a specific component.
Revenue is recognised for the various categories as follows:
◾ Subscriptions – revenue comprises income derived from the periodic distribution or update of a product. Subscription revenue is generally invoiced in advance and recognised systematically over the period of the subscription. Recognition is either on a straight-line basis where the transaction involves the transfer of goods and services to the customer in a consistent manner over a specific period of time; or based on the value received by the customer where the goods and services are not delivered in a consistent manner.
◾ Transactional – revenue is recognised when control of the product is passed to the customer or the service has been performed. For exhibitions, revenue primarily comprises income from exhibitors and attendees at exhibitions. Exhibition revenue is recognised on occurrence of the exhibition.
◾ Advertising – revenue is recognised on publication or over the period of online display. |
Table of Contents
RELX Annual report and financial statements 2018 | Notes to the consolidated financial statements | 129 | |||
|
2 Revenue and segment analysis (continued)
RELX is a global provider of information-based analytics and decision tools for professional and business customers. Operating in four major market segments: Scientific, Technical & Medical provides information and analytics that help institutions and professionals progress science, advance healthcare and improve performance; Risk & Business Analytics provides customers with information-based analytics and decision tools that combine public and industry-specific content with advanced technology and algorithms to assist them in evaluating and predicting risk and enhancing operational efficiency; Legal provides legal, regulatory and business information and analytics that helps customers increase their productivity, improve decision-making and achieve better outcomes; and Exhibitions is a leading global events business. It combinesface-to-face with data and digital tools to help customers learn about markets, source products and complete transactions at over 500 events in almost 30 countries, attracting more than 7m participants.
ANALYSIS BY BUSINESS SEGMENT | Revenue | Adjusted operating profit | ||||||||||||||||||||||
2018 £m | Restated 2017 £m | Restated 2016 £m | 2018 £m | Restated 2017 £m | Restated 2016 £m | |||||||||||||||||||
Scientific, Technical & Medical | 2,538 | 2,473 | 2,318 | 942 | 914 | 854 | ||||||||||||||||||
Risk & Business Analytics | 2,117 | 2,073 | 1,905 | 776 | 760 | 685 | ||||||||||||||||||
Legal | 1,618 | 1,686 | 1,619 | 320 | 328 | 312 | ||||||||||||||||||
Exhibitions | 1,219 | 1,109 | 1,047 | 313 | 287 | 271 | ||||||||||||||||||
Sub-total | 7,492 | 7,341 | 6,889 | 2,351 | 2,289 | 2,122 | ||||||||||||||||||
Unallocated items | – | – | – | (5 | ) | (5 | ) | (8 | ) | |||||||||||||||
Total | 7,492 | 7,341 | 6,889 | 2,346 | 2,284 | 2,114 | ||||||||||||||||||
ANALYSIS OF REVENUE BY GEOGRAPHICAL ORIGIN | 2018 £m | Restated 2017 £m | Restated 2016 £m | |||||||||||||||||||||
North America | 4,013 | 3,998 | 3,697 | |||||||||||||||||||||
Europe | 2,790 | 2,644 | 2,568 | |||||||||||||||||||||
Rest of world | 689 | 699 | 624 | |||||||||||||||||||||
Total | 7,492 | 7,341 | 6,889 |
Revenue by geographical origin from the United Kingdom in 2018 was £1,144m (2017: £1,085m; 2016: £1,048m).
2018 | Scientific, Technical & Medical | Risk & Business Analytics | Legal | Exhibitions | Total | |||||||||||||||
Revenue by geographical market | ||||||||||||||||||||
North America | 1,118 | 1,669 | 1,083 | 221 | 4,091 | |||||||||||||||
Europe | 611 | 322 | 340 | 535 | 1,808 | |||||||||||||||
Rest of world | 809 | 126 | 195 | 463 | 1,593 | |||||||||||||||
Total revenue | 2,538 | 2,117 | 1,618 | 1,219 | 7,492 | |||||||||||||||
Revenue by format | ||||||||||||||||||||
Electronic | 2,094 | 2,030 | 1,338 | 51 | 5,513 | |||||||||||||||
Face-to-face | 7 | 36 | 10 | 1,168 | 1,221 | |||||||||||||||
437 | 51 | 270 | – | 758 | ||||||||||||||||
Total revenue | 2,538 | 2,117 | 1,618 | 1,219 | 7,492 | |||||||||||||||
Revenue by type | ||||||||||||||||||||
Subscriptions | 1,877 | 765 | 1,247 | – | 3,889 | |||||||||||||||
Transactional | 615 | 1,322 | 365 | 1,219 | 3,521 | |||||||||||||||
Advertising | 46 | 30 | 6 | – | 82 | |||||||||||||||
Total revenue | 2,538 | 2,117 | 1,618 | 1,219 | 7,492 |
Revenue by geographical market from the United Kingdom in 2018 was £527m (2017: £521m; 2016: £502m).
Table of Contents
130 | RELX Annual report and financial statements 2018 | Financial statements and other information | |
|
Notes to the consolidated financial statements
for the year ended 31 December 2018
2 Revenue and segment analysis (continued)
2017 | Scientific, Technical & Medical | Risk & Business Analytics | Legal | Exhibitions | Total | |||||||||||||||
Revenue by geographical market | ||||||||||||||||||||
North America | 1,045 | 1,658 | 1,145 | 230 | 4,078 | |||||||||||||||
Europe | 617 | 308 | 340 | 429 | 1,694 | |||||||||||||||
Rest of world | 811 | 107 | 201 | 450 | 1,569 | |||||||||||||||
Total revenue | 2,473 | 2,073 | 1,686 | 1,109 | 7,341 | |||||||||||||||
Revenue by format | ||||||||||||||||||||
Electronic | 1,995 | 1,967 | 1,384 | 42 | 5,388 | |||||||||||||||
Face-to-face | 10 | 38 | 7 | 1,067 | 1,122 | |||||||||||||||
468 | 68 | 295 | – | 831 | ||||||||||||||||
Total revenue | 2,473 | 2,073 | 1,686 | 1,109 | 7,341 | |||||||||||||||
Revenue by type | ||||||||||||||||||||
Subscriptions | 1,776 | 732 | 1,291 | 1 | 3,800 | |||||||||||||||
Transactional | 646 | 1,301 | 389 | 1,108 | 3,444 | |||||||||||||||
Advertising | 51 | 40 | 6 | – | 97 | |||||||||||||||
Total revenue | 2,473 | 2,073 | 1,686 | 1,109 | 7,341 | |||||||||||||||
2016 | Scientific, Technical & Medical | Risk & Business Analytics | Legal | Exhibitions | Total | |||||||||||||||
Revenue by geographical market | ||||||||||||||||||||
North America | 960 | 1,499 | 1,106 | 210 | 3,775 | |||||||||||||||
Europe | 605 | 322 | 330 | 454 | 1,711 | |||||||||||||||
Rest of world | 753 | 84 | 183 | 383 | 1,403 | |||||||||||||||
Total revenue | 2,318 | 1,905 | 1,619 | 1,047 | 6,889 | |||||||||||||||
Revenue by format | ||||||||||||||||||||
Electronic | 1,834 | 1,758 | 1,321 | 35 | 4,948 | |||||||||||||||
Face-to-face | 10 | 37 | 7 | 1,012 | 1,066 | |||||||||||||||
474 | 110 | 291 | – | 875 | ||||||||||||||||
Total revenue | 2,318 | 1,905 | 1,619 | 1,047 | 6,889 | |||||||||||||||
Revenue by type | ||||||||||||||||||||
Subscriptions | 1,628 | 684 | 1,299 | 1 | 3,612 | |||||||||||||||
Transactional | 631 | 1,172 | 314 | 1,046 | 3,163 | |||||||||||||||
Advertising | 59 | 49 | 6 | – | 114 | |||||||||||||||
Total revenue | 2,318 | 1,905 | 1,619 | 1,047 | 6,889 |
Around half of RELX’s revenue comes from subscription arrangements, and revenue for these is generally recognised on a straight line basis over the time period covered by the agreement, in line with the provision of services. There are a number of multi-year contracts, mainly in Risk & Business Analytics, where revenue is recognised on the achievement of delivery milestones or other specified performance obligations. As at 31 December 2018, the aggregate amount of the transaction price of such contracts which relates to performance obligations which have not yet been delivered was approximately £210m. It is expected that revenue will be recognised in relation to this amount over the next ten years.
Table of Contents
RELX Annual report and financial statements 2018 | Notes to the consolidated financial statements | 131 | |
|
2 Revenue and segment analysis (continued)
ANALYSIS BY BUSINESS SEGMENT | Expenditure on | |||||||||||||||||||||||||||||||||||||||||||||||
acquired goodwill and | Capital expenditure | Amortisation of acquired | Depreciation and other | |||||||||||||||||||||||||||||||||||||||||||||
intangible assets | additions | intangible assets | amortisation | |||||||||||||||||||||||||||||||||||||||||||||
Restated | Restated | Restated | Restated | |||||||||||||||||||||||||||||||||||||||||||||
2018 £m | 2017 £m | 2016 £m | 2018 £m | 2017 £m | 2016 £m | 2018 £m | 2017 £m | 2016 £m | 2018 £m | 2017 £m | 2016 £m | |||||||||||||||||||||||||||||||||||||
Scientific, Technical & Medical | 106 | 94 | 19 | 100 | 95 | 85 | 58 | 77 | 88 | 109 | 100 | 100 | ||||||||||||||||||||||||||||||||||||
Risk & Business Analytics | 852 | – | 288 | 92 | 83 | 67 | 161 | 141 | 147 | 73 | 64 | 56 | ||||||||||||||||||||||||||||||||||||
Legal | 30 | 6 | 83 | 145 | 153 | 154 | 33 | 52 | 73 | 147 | 142 | 135 | ||||||||||||||||||||||||||||||||||||
Exhibitions | 61 | 33 | 21 | 28 | 24 | 26 | 36 | 44 | 38 | 35 | 37 | 34 | ||||||||||||||||||||||||||||||||||||
Total | 1,049 | 133 | 411 | 365 | 355 | 332 | 288 | 314 | 346 | 364 | 343 | 325 |
Capital expenditure comprises additions to property, plant and equipment and internally developed intangible assets. Depreciation and other amortisation includes depreciation onright-of-use assets. Amortisation of acquired intangible assets includes amounts in respect of joint ventures of nil (2017: nil; 2016: £3m) in Legal and £1m (2017: £1m; 2016: £1m) in Exhibitions.
ANALYSIS OFNON-CURRENT ASSETS BY GEOGRAPHICAL LOCATION | 2018 £m | Restated 2017 £m | Restated 2016 £m | |||||||||
North America | 8,692 | 7,408 | 8,307 | |||||||||
Europe | 1,996 | 2,016 | 1,987 | |||||||||
Rest of world | 461 | 459 | 489 | |||||||||
Total | 11,149 | 9,883 | 10,783 |
Non-current assets held in the United Kingdom totalled £988m (2017: £1,026m; 2016: £961m).Non-current assets by geographical location exclude amounts relating to deferred tax, pension assets and derivative financial instruments.
Operating profit is reconciled to adjusted operating profit as follows:
RECONCILIATION OF OPERATING PROFIT TO ADJUSTED OPERATING PROFIT | 2018 £m | Restated 2017 £m | Restated 2016 £m | |||||||||
Operating profit | 1,964 | 1,905 | 1,708 | |||||||||
Adjustments: | ||||||||||||
Amortisation of acquired intangible assets | 288 | 314 | 346 | |||||||||
Acquisition-related costs | 84 | 56 | 51 | |||||||||
Reclassification of tax in joint ventures | 11 | 10 | 10 | |||||||||
Reclassification of finance income in joint ventures | (1 | ) | (1 | ) | (1 | ) | ||||||
Adjusted operating profit | 2,346 | 2,284 | 2,114 |
The share ofpost-tax results of joint ventures of £32m (2017: £37m; 2016: £37m) included in operating profit comprised nil (2017: £5m; 2016: £10m) relating to Legal, £31m (2017: £32m; 2016: £27m) relating to Exhibitions and £1m (2017: nil; 2016: nil) relating to Risk & Business Analytics.
3 Operating profit
Accounting policy
Share based remuneration The fair value of share based remuneration is determined at the date of grant and recognised as an expense in the income statement on a straight-line basis over the vesting period, taking account of the estimated number of shares that are expected to vest. Market based performance criteria are taken into account when determining the fair value at the date of grant.Non-market based performance criteria are taken into account when estimating the number of shares expected to vest. The fair value of share based remuneration is determined by use of a binomial or Monte Carlo simulation model as appropriate. All of the Group’s share based remuneration is equity settled. |
Table of Contents
132 | RELX Annual report and financial statements 2018 | Financial statements and other information | |
|
Notes to the consolidated financial statements
for the year ended 31 December 2018
3 Operating profit (continued)
Operating profit is stated after charging/(crediting) the following:
Note | 2018 £m | Restated £m | Restated £m | |||||||||||||
Staff costs | ||||||||||||||||
Wages and salaries | 1,959 | 1,926 | 1,767 | |||||||||||||
Social security costs | 215 | 213 | 198 | |||||||||||||
Pensions | 6 | 135 | 95 | 111 | ||||||||||||
Share based remuneration | 41 | 39 | 38 | |||||||||||||
Total staff costs | 2,350 | 2,273 | 2,114 | |||||||||||||
Depreciation and amortisation | ||||||||||||||||
Amortisation of acquired intangible assets | 15 | 287 | 313 | 342 | ||||||||||||
Share of joint ventures’ amortisation of acquired intangible assets | 1 | 1 | 4 | |||||||||||||
Amortisation of internally developed intangible assets | 15 | 225 | 203 | 189 | ||||||||||||
Depreciation of property, plant and equipment | 17 | 62 | 65 | 62 | ||||||||||||
Depreciation ofright-of-use assets | 77 | 75 | 74 | |||||||||||||
Total depreciation and amortisation | 652 | 657 | 671 | |||||||||||||
Other expenses and income | ||||||||||||||||
Cost of sales includingpre-publication costs and inventory expenses | 2,638 | 2,628 | 2,488 | |||||||||||||
Operating lease rentals expense | 18 | 28 | 35 | |||||||||||||
Operating lease rentals income | (3 | ) | (3 | ) | (6 | ) |
The amortisation of acquired intangible assets is included within administration and other expenses.
The Group provides a number of share based remuneration schemes to Directors and employees. The principal share based remuneration schemes are the Executive Share Option Schemes (ESOS), the Long-Term Incentive Plan (LTIP), the Retention Share Plan (RSP) and the Bonus Investment Plan (BIP). Share options granted under ESOS are exercisable after three years and up to ten years from the date of grant at a price equivalent to the market value of the respective shares at the date of grant. Conditional shares granted under LTIP, RSP and BIP are exercisable after three years for nil consideration if conditions are met. Other awards principally relate to all employee share based saving schemes in the UK and the Netherlands. Further details are provided in the remuneration report on pages 85 to 105.
4 Auditor’s remuneration
2018 £m | 2017 £m | 2016 £m | ||||||||||
Auditor’s remuneration | ||||||||||||
Payable to the auditors of RELX PLC | 0.9 | 0.9 | 0.9 | |||||||||
Payable to the auditors of the Group’s subsidiaries | 5.9 | 5.9 | 5.3 | |||||||||
Audit services | 6.8 | 6.8 | 6.2 | |||||||||
Audit-related assurance services | 0.9 | 0.8 | 0.6 | |||||||||
Total audit and audit-related assurance services | 7.7 | 7.6 | 6.8 | |||||||||
Tax services | – | – | 0.4 | |||||||||
Other services: Consulting | – | – | 0.1 | |||||||||
Other services: Due diligence and other transaction-related services | 2.7 | 0.3 | 0.4 | |||||||||
Totalnon-audit related services | 2.7 | 0.3 | 0.9 | |||||||||
Total auditor’s remuneration | 10.4 | 7.9 | 7.7 |
Amounts payable to the auditors of the Group’s subsidiaries include amounts for the audit of internal controls over financial reporting in accordance with the US Sarbanes-Oxley Act. Included in audit related assurance services for 2018 are £0.1m in fees for services relating to RELX pension plans (2017: £0.1m). The amounts payable in 2017 and 2016 to the auditors of RELX PLC also reflect amounts payable to the auditors of RELX NV. The previously reported 2017 fees paid to EY for audit services have been revised to include additional amounts for expenses incurred and final fees for statutory audits which took place subsequent to the audit of the RELX consolidated accounts.
Table of Contents
RELX Annual report and financial statements 2018 | Notes to the consolidated financial statements | 133 | |
|
5 Personnel
NUMBER OF PEOPLE EMPLOYED: FULL-TIME EQUIVALENTS | At 31 December | Average during the year | ||||||||||||||||||||||||||
2018 | 2017 | 2016 | 2018 | 2017 | 2016 | |||||||||||||||||||||||
Business segment | ||||||||||||||||||||||||||||
Scientific, Technical & Medical | 7,900 | 7,500 | 7,500 | 7,700 | 7,500 | 7,300 | ||||||||||||||||||||||
Risk & Business Analytics | 8,700 | 8,100 | 8,200 | 8,600 | 8,200 | 7,900 | ||||||||||||||||||||||
Legal | 10,500 | 10,600 | 10,700 | 10,600 | 10,700 | 10,600 | ||||||||||||||||||||||
Exhibitions | 4,200 | 4,000 | 4,000 | 4,100 | 4,000 | 3,900 | ||||||||||||||||||||||
Sub-total | 31,300 | 30,200 | 30,400 | 31,000 | 30,400 | 29,700 | ||||||||||||||||||||||
Corporate/shared functions | 800 | 800 | 800 | 800 | 800 | 900 | ||||||||||||||||||||||
Total | 32,100 | 31,000 | 31,200 | 31,800 | 31,200 | 30,600 | ||||||||||||||||||||||
Geographical location | ||||||||||||||||||||||||||||
North America | 13,800 | 13,500 | 13,700 | 13,700 | 13,600 | 13,500 | ||||||||||||||||||||||
United Kingdom | 5,200 | 5,000 | 4,900 | 5,100 | 5,000 | 4,800 | ||||||||||||||||||||||
The Netherlands | 1,200 | 1,300 | 1,400 | 1,300 | 1,400 | 1,500 | ||||||||||||||||||||||
Rest of Europe | 2,800 | 2,800 | 2,800 | 2,800 | 2,800 | 2,800 | ||||||||||||||||||||||
Rest of world | 9,100 | 8,400 | 8,400 | 8,900 | 8,400 | 8,000 | ||||||||||||||||||||||
Total | 32,100 | 31,000 | 31,200 | 31,800 | 31,200 | 30,600 |
6 Pension schemes
Accounting policy The expense of defined benefit pension schemes and other post-retirement employee benefits is determined using the projected unit credit method and charged in the income statement as an operating expense, based on actuarial assumptions reflecting market conditions at the beginning of the financial year. Actuarial gains and losses are recognised in full in the statement of comprehensive income in the period in which they occur.
Past service costs and credits are recognised immediately at the earlier of when plan amendments or curtailments occur and when related restructuring costs or termination benefits are recognised. Settlements are recognised when they occur.
Net pension obligations in respect of defined benefit schemes are included in the statement of financial position at the present value of scheme liabilities, less the fair value of scheme assets. Where schemes are in surplus, i.e. assets exceed liabilities, the net pension assets are separately included in the statement of financial position. Any net pension asset is limited to the extent that the asset is recoverable.
The expense of defined contribution pension schemes and other employee benefits is charged in the income statement as incurred.
Critical judgement and key source of estimation uncertainty At 31 December 2018, the Group operates defined benefit pension schemes in the UK and the US. These schemes require management to exercise judgement in estimating the ultimate cost of providing post-employment benefits, especially given the length of each scheme’s liabilities. Accounting for defined benefit pension schemes involves judgement about uncertain events, including the life expectancy of the members, salary and pension increases, inflation, the future operation of each scheme and the rate at which the future pension payments are discounted. Estimates for these factors are used in determining the pension cost and liabilities reported in the financial statements. The estimates made around future developments of each of the critical assumptions are made in conjunction with independent actuaries, and each scheme is subject to a periodic review by independent actuaries. Information regarding the more significant assumptions used for valuation is provided below, together with a sensitivity analysis. |
A number of pension schemes are operated around the world. The largest defined benefit schemes as at 31 December 2018 are in the UK and the US.
Major defined benefit schemes in place at 31 December 2018
The UK scheme is a final salary scheme and is closed to new hires. Members accrue a portion of their final pensionable earnings based on the number of years of service. The US scheme is a cash balance scheme and is closed to new hires. Members earn pay credits dependent on age and years of service up to certain limits which are added to an account balance that accrues interest at specified minimum rates. The US scheme was closed to future accruals effective 1 January 2019.
Each of the major defined benefit schemes is administered by a separate fund that is legally separated from the Group. The trustees of the pension funds in the UK and plan fiduciaries of the US scheme are required by law to act in the interest of the funds’ beneficiaries. In the UK, the trustees of the pension fund are responsible for the investment policy with regard to the assets of the fund. The board of trustees consists of an equal number of company-appointed and member-nominated Directors. In the US, the fiduciary duties for the scheme are allocated between committees which are staffed by senior employees of the Group; the investment committee has the primary responsibility for the investment and management of plan assets. The funding of the Group’s major schemes reflects the different rules within each jurisdiction.
Table of Contents
134 | RELX Annual report and financial statements 2018 | Financial statements and other information | |
|
Notes to the consolidated financial statements
for the year ended 31 December 2018
6 Pension schemes (continued)
In the UK, the level of funding is determined by statutory triennial actuarial valuations in accordance with pensions legislation. Where the scheme falls below 100% funded status, the Group and the scheme trustees must agree on how the deficit is to be remedied. The UK Pensions Regulator has significant powers and sets out in codes and guidance the parameters for scheme funding.
The US scheme has an annual statutory valuation which forms the basis for establishing the employer contribution each year (subject to ERISA and IRS minimums). Should the statutory funded status fall to below 100%, the US Pension Protection Act requires the deficit to be rectified with additional contributions over a seven-year period.
The Group and the scheme trustees have completed the 2018 triennial valuation under which the Group has committed to providing £176m of deficit funding contributions to the scheme over the period 2019 to 2022. Employer cash contributions to defined benefit pension schemes in respect of 2019 are expected to be approximately £62m including a £44m pension deficit funding contribution relating to the UK scheme recovery plan.
The pension expense in total, including amounts in relation to the UK and US defined benefit schemes, defined contribution schemes and GMP equalisation cost, recognised in the income statement consists of:
2018 £m | 2017 £m | 2016 £m | ||||||||||
Defined benefit pension expense (including past service cost for GMP equalisation in 2018) | 47 | 4 | 36 | |||||||||
Defined contribution pension expense | 95 | 91 | 75 | |||||||||
Total | 142 | 95 | 111 |
£135m (2017: £95m; 2016: £111m) of the total pension cost is recognised within operating profit. In 2018 a past service cost was recognised to account for the impact of GMP equalisation in the UK. In 2017 settlement and past service credits primarily relate to changes to the UK scheme.
The amounts recognised in the income statement in respect of defined benefit pension schemes during the year are presented by major scheme as follows:
2018 | 2017 | 2016 | ||||||||||||||||||||||||||||||||||||||||||
UK £m | US £m | Total £m | UK £m | US £m | Total £m | UK £m | US £m | Total £m | ||||||||||||||||||||||||||||||||||||
Service cost | 27 | 9 | 36 | 33 | 14 | 47 | 27 | 14 | 41 | |||||||||||||||||||||||||||||||||||
Settlement and past service cost/(credits) | 11 | – | 11 | (42 | ) | (1 | ) | (43 | ) | – | (5 | ) | (5 | ) | ||||||||||||||||||||||||||||||
Defined benefit pension expense | 38 | 9 | 47 | (9 | ) | 13 | 4 | 27 | 9 | 36 | ||||||||||||||||||||||||||||||||||
Net interest on net defined benefit obligation | 6 | 3 | 9 | 10 | 5 | 15 | 9 | 5 | 14 | |||||||||||||||||||||||||||||||||||
Net defined benefit pension expense | 44 | 12 | 56 | 1 | 18 | 19 | 36 | 14 | 50 |
Net interest on net defined benefit pension scheme liabilities is presented within net finance costs in the income statement.
The significant valuation assumptions, determined for each major scheme in conjunction with the respective independent actuaries, are presented below. The net defined benefit pension expense for each year is based on the assumptions and scheme valuations set at 31 December of the prior year.
AS AT 31 DECEMBER | 2018 | 2017 | 2016 | |||||||||||||||||||||||||||||
UK | US | UK | US | UK | US | |||||||||||||||||||||||||||
Discount rate | 2.85% | 4.20% | 2.60% | 3.55% | 2.65% | 4.00% | ||||||||||||||||||||||||||
Inflation | 3.15% | 2.50% | 3.15% | 2.50% | 3.25% | 2.50% |
Discount rates are set by reference to high-quality corporate bond yields.
Mortality assumptions make allowance for future improvements in longevity and have been determined by reference to applicable mortality statistics. The average life expectancy assumptions are set out below:
AS AT 31 DECEMBER 2018 | Male average life expectancy | Female average life expectancy | ||||||||||||||
UK | US | UK | US | |||||||||||||
Member currently aged 60 years | 85 | 86 | 88 | 88 | ||||||||||||
Member currently aged 45 years | 87 | 87 | 90 | 89 |
Table of Contents
RELX Annual report and financial statements 2018 | Notes to the consolidated financial statements | 135 | |
|
6 Pension schemes (continued)
The amount recognised in the statement of financial position in respect of defined benefit pension schemes at the start and end of the year and the movements during the year were as follows:
2018 | 2017 | |||||||||||||||||||||||
UK £m | US £m | Total £m | UK £m | US £m | Total £m | |||||||||||||||||||
Defined benefit obligation | ||||||||||||||||||||||||
At start of year | (3,854 | ) | (1,075 | ) | (4,929 | ) | (3,883 | ) | (1,120 | ) | (5,003 | ) | ||||||||||||
Service cost | (27 | ) | (9 | ) | (36 | ) | (33 | ) | (14 | ) | (47 | ) | ||||||||||||
Past service (cost)/credits | (11 | ) | – | (11 | ) | 42 | 1 | 43 | ||||||||||||||||
Interest on pension scheme liabilities | (98 | ) | (38 | ) | (136 | ) | (101 | ) | (42 | ) | (143 | ) | ||||||||||||
Actuarial gain/(loss) on financial assumptions | 91 | 85 | 176 | 45 | (61 | ) | (16 | ) | ||||||||||||||||
Actuarial gain/(loss) arising from experience assumptions | 4 | 2 | 6 | (39 | ) | 1 | (38 | ) | ||||||||||||||||
Contributions by employees | (8 | ) | – | (8 | ) | (8 | ) | – | (8 | ) | ||||||||||||||
Benefits paid | 131 | 56 | 187 | 123 | 60 | 183 | ||||||||||||||||||
Exchange translation differences | – | (61 | ) | (61 | ) | – | 100 | 100 | ||||||||||||||||
At end of year | (3,772 | ) | (1,040 | ) | (4,812 | ) | (3,854 | ) | (1,075 | ) | (4,929 | ) | ||||||||||||
Fair value of scheme assets | ||||||||||||||||||||||||
At start of year | 3,589 | 1,012 | 4,601 | 3,390 | 977 | 4,367 | ||||||||||||||||||
Interest income on plan assets | 92 | 35 | 127 | 91 | 37 | 128 | ||||||||||||||||||
Return on assets excluding amounts included in interest income | (184 | ) | (89 | ) | (273 | ) | 181 | 106 | 287 | |||||||||||||||
Contributions by employer | 39 | 7 | 46 | 42 | 43 | 85 | ||||||||||||||||||
Contributions by employees | 8 | – | 8 | 8 | – | 8 | ||||||||||||||||||
Benefits paid | (131 | ) | (56 | ) | (187 | ) | (123 | ) | (60 | ) | (183 | ) | ||||||||||||
Exchange translation differences | – | 57 | 57 | – | (91 | ) | (91 | ) | ||||||||||||||||
At end of year | 3,413 | 966 | 4,379 | 3,589 | 1,012 | 4,601 | ||||||||||||||||||
Opening net deficit | (265 | ) | (63 | ) | (328 | ) | (493 | ) | (143 | ) | (636 | ) | ||||||||||||
Service cost | (27 | ) | (9 | ) | (36 | ) | (33 | ) | (14 | ) | (47 | ) | ||||||||||||
Net interest on net defined benefit obligation | (6 | ) | (3 | ) | (9 | ) | (10 | ) | (5 | ) | (15 | ) | ||||||||||||
Settlement and past service (cost)/credits | (11 | ) | – | (11 | ) | 42 | 1 | 43 | ||||||||||||||||
Contributions by employer | 39 | 7 | 46 | 42 | 43 | 85 | ||||||||||||||||||
Actuarial (losses)/gains | (89 | ) | (2 | ) | (91 | ) | 187 | 46 | 233 | |||||||||||||||
Exchange translation differences | – | (4 | ) | (4 | ) | – | 9 | 9 | ||||||||||||||||
Overall net pension obligation | (359 | ) | (74 | ) | (433 | ) | (265 | ) | (63 | ) | (328 | ) |
As at 31 December 2018, the defined benefit obligations comprised £4,582m (2017: £4,690m) in relation to funded schemes and £230m (2017: £239m) in relation to unfunded schemes.
The weighted average duration of defined benefit scheme liabilities is 19 years in the UK (2017: 20 years) and 12 years in the US (2017: 13 years). Deferred tax assets of £86m (2017: £66m) are recognised in respect of the pension scheme deficits.
A net pension asset has been recognised in relation to the US funded scheme after considering the guidance in IAS 19 – Employee Benefits and IFRIC 14. The split between net pension obligations and net pension assets is as follows:
2018 £m | 2017 £m | |||||||
Net pension asset | 6 | 22 | ||||||
Net pension obligation | (439 | ) | (350 | ) | ||||
Overall net pension obligation | (433 | ) | (328 | ) |
Table of Contents
136 | RELX Annual report and financial statements 2018 | Financial statements and other information | |
|
Notes to the consolidated financial statements
for the year ended 31 December 2018
6 Pension schemes (continued)
Amounts recognised in the statement of comprehensive income are set out below:
2018 £m | 2017 £m | 2016 £m | ||||||||||
Gains and losses arising during the year: | ||||||||||||
Experience gains/(losses) on scheme liabilities | 6 | (38 | ) | 25 | ||||||||
Experience (losses)/gains on scheme assets | (273 | ) | 287 | 548 | ||||||||
Actuarial gains/ (losses) on the present value of scheme liabilities due to changes in: | ||||||||||||
– discount rates | 242 | (102 | ) | (873 | ) | |||||||
– inflation | – | 69 | (96 | ) | ||||||||
– other actuarial assumptions | (66 | ) | 17 | 134 | ||||||||
(91 | ) | 233 | (262 | ) | ||||||||
Net cumulative losses at start of year | (613 | ) | (846 | ) | (584 | ) | ||||||
Net cumulative losses at end of year | (704 | ) | (613 | ) | (846 | ) |
The major categories and fair values of scheme assets at the end of the reporting period are as follows:
FAIR VALUE OF SCHEME ASSETS | 2018 | 2017 | ||||||||||||||||||||||
UK £m | US £m | Total £m | UK £m | US £m | Total £m | |||||||||||||||||||
Equities | 1,128 | 115 | 1,243 | 1,252 | 143 | 1,395 | ||||||||||||||||||
Government bonds | 1,224 | 224 | 1,448 | 1,395 | 221 | 1,616 | ||||||||||||||||||
Corporate bonds | – | 607 | 607 | – | 622 | 622 | ||||||||||||||||||
Property funds and ground leases | 723 | – | 723 | 620 | – | 620 | ||||||||||||||||||
Structured debt and direct lending | 290 | – | 290 | 253 | – | 253 | ||||||||||||||||||
Cash and cash equivalents | 26 | 4 | 30 | 46 | 18 | 64 | ||||||||||||||||||
Other | 22 | 16 | 38 | 23 | 8 | 31 | ||||||||||||||||||
Total | 3,413 | 966 | 4,379 | 3,589 | 1,012 | 4,601 |
Assets and obligations associated with the schemes are sensitive to changes in the market values of assets and the market-related assumptions used to value scheme liabilities. In particular, adverse changes to asset values, discount rates or inflation could increase future pension costs and funding requirements.
Typically, the Group’s schemes are exposed to: investment risks, whereby actual rates of return on plan assets may be below those rates used to determine the defined benefit obligations, and interest rate risks, whereby scheme deficits may increase if bond yields in the UK and the US decline and are not offset by returns in government and corporate bond portfolios. The schemes are also exposed to other risks, such as unanticipated future increases in member longevity patterns and inflation, all potentially leading to an increase in scheme liabilities.
Investment policies of each scheme are intended to ensure continuous payment of defined benefit pensions in the short-term and long-term. Efforts are made to limit risks on marketable securities by adopting investment policies that diversify assets across geographies and among equities, government and corporate bonds, property funds and cash. Asset allocations are dependent on a variety of factors including the duration of scheme liabilities and the funded position of the plan.
All equities, government and corporate bonds have quoted prices in active markets.
Sensitivity analysis
The valuation of the Group’s pension scheme liabilities involves significant actuarial assumptions, being the life expectancy of the members, inflation and the rate at which the future pension payments are discounted. Differences arising from actual experience or future changes in assumptions may materially affect future pension charges. In particular, changes in assumptions for discount rates, inflation and life expectancies that are reasonably possible would have the following approximate effects on the defined benefit pension obligations:
£m | ||||
Increase/decrease of 0.25% in discount rate | 207 | |||
Increase/decrease of 0.25% in the expected inflation rate | 94 | |||
Increase/decrease of one year in assumed life expectancy | 177 |
The above analysis has been calculated on the same basis used to determine the defined benefit obligation recognised in the statement of financial position. There has been no change in the methods used to prepare the analysis compared with prior years. This sensitivity analysis may not be representative of the actual change in the defined benefit obligation as it is unlikely that changes in the above assumptions would occur in isolation as some of the assumptions may be correlated.
Table of Contents
RELX Annual report and financial statements 2018 | Notes to the consolidated financial statements | 137 | |
|
7 Net finance costs
Accounting policy Borrowing costs that are directly attributable to the acquisition, construction or production of an asset that takes a substantial period of time to bring to use are capitalised. All other interest on borrowings is expensed as incurred. The cost of issuing borrowings is generally expensed over the period of borrowing so as to produce a constant periodic rate of charge. |
2018 £m | Restated 2017 £m | Restated 2016 £m | ||||||||||
Interest on short-term bank loans, overdrafts and commercial paper | (22 | ) | (10 | ) | (15 | ) | ||||||
Interest on term debt | (161 | ) | (154 | ) | (161 | ) | ||||||
Interest on lease liabilities | (14 | ) | (17 | ) | (18 | ) | ||||||
Total borrowing costs | (197 | ) | (181 | ) | (194 | ) | ||||||
Losses on loans and derivatives not designated as hedges | (10 | ) | (9 | ) | (15 | ) | ||||||
Fair value losses on designated fair value hedge relationships | (1 | ) | – | – | ||||||||
Net financing charge on defined benefit pension schemes | (9 | ) | (15 | ) | (14 | ) | ||||||
Finance costs | (217 | ) | (205 | ) | (223 | ) | ||||||
Interest on bank deposits | 4 | 3 | 6 | |||||||||
Interest income on net finance lease receivables | 2 | 2 | 2 | |||||||||
Fair value gains on designated fair value hedge relationships | – | 1 | – | |||||||||
Gains on loans and derivatives not designated as hedges | – | – | 2 | |||||||||
Finance income | 6 | 6 | 10 | |||||||||
Net finance costs | (211 | ) | (199 | ) | (213 | ) |
Losses of £8m (2017: gains of £63m; 2016: losses of £26m) on interest rate derivatives designated as cash flow hedges were recognised in other comprehensive income and accumulated in the hedge reserve, and may be reclassified to the income statement in future periods. Gains of £3m (2017: gains of £65m; 2016: losses of £27m) in total were transferred from the hedge reserve in the period. The movements in 2017 included gains of £78m (2016: losses of £18m) related to foreign exchange movements on debt hedges which were reclassified immediately to the income statement and offset £78m (2016: £18m gains) of foreign exchange losses on the related debt.
8 Disposals and othernon-operating items
Accounting policy Assets of businesses that are available for immediate sale in their current condition and for which a sales process is considered highly probable to complete are classified as assets held for sale and are carried at the lower of carrying value and fair value less costs to sell. Fair value is based on anticipated disposal proceeds, typically derived from firm or indicative offers from potential acquirers.Non-current assets are not amortised or depreciated following their classification as held for sale. Liabilities of businesses held for sale are also separately classified on the statement of financial position. Fair value movements in the venture capital portfolio are reported within disposals and other items – see note 16. |
2018 £m | Restated £m | Restated £m | ||||||||||
Revaluation of investments | (11 | ) | 5 | (13 | ) | |||||||
(Loss)/gain on disposal of businesses and assets held for sale | (22 | ) | 10 | (23 | ) | |||||||
Net (loss)/gain on disposals and othernon-operating items | (33 | ) | 15 | (36 | ) |
Table of Contents
138 | RELX Annual report and financial statements 2018 | Financial statements and other information | |
|
Notes to the consolidated financial statements
for the year ended 31 December 2018
9 Taxation
Accounting policy Tax expense comprises current and deferred tax. Current and deferred tax are charged or credited in the income statement except to the extent that the tax arises from a transaction or event which is recognised, in the same or a different period, outside the income statement (either in other comprehensive income, directly in equity, or through a business combination), in which case the tax appears in the same statement as the transaction that gave rise to it.
Current tax is the amount of corporate income taxes expected to be payable or recoverable based on the profit for the period as adjusted for items that are not taxable or not deductible, and is calculated using tax rates and laws that were enacted or substantively enacted at the date of the statement of financial position. Management periodically evaluates positions taken in tax returns with respect to situations in which applicable tax regulation is subject to interpretation. Provisions are established where appropriate on the basis of amounts expected to be paid to the tax authorities.
Current tax includes amounts provided in respect of uncertain tax positions when management expects that, upon examination of the uncertainty by a tax authority in possession of all relevant knowledge, it is more likely than not that an economic outflow will occur. Changes in facts and circumstances underlying these provisions are reassessed at the date of each statement of financial position, and the provisions are remeasured as required to reflect current information.
Deferred tax is recognised on temporary differences arising between the tax bases of assets and liabilities and their carrying amounts in the statement of financial position. Deferred tax is calculated using tax rates and laws that have been enacted or substantively enacted at the end of the reporting period, and which are expected to apply when the related deferred tax asset is realised or the deferred tax liability is settled.
Deferred tax liabilities are generally recognised for all taxable temporary differences but not recognised for taxable temporary differences arising on investments in subsidiaries, associates and joint ventures where the reversal of the temporary difference can be controlled and it is probable that the difference will not reverse in the foreseeable future. Deferred tax liabilities are not recognised on temporary differences that arise from goodwill which is not deductible for tax purposes.
Deferred tax assets are recognised to the extent it is probable that taxable profits will be available against which the deductible temporary differences can be utilised, and are reviewed at the end of each reporting period and reduced to the extent that it is no longer probable that sufficient taxable profits will be available to allow all or part of the asset to be recovered.
Deferred tax assets and liabilities are not recognised in respect of temporary differences that arise on initial recognition of assets and liabilities acquired other than in a business combination. Deferred tax is not discounted.
Critical judgement and key source of estimation uncertainty The Group is subject to tax in numerous jurisdictions, giving rise to complex tax issues that require management to exercise judgement in making tax determinations. As a multinational enterprise, our tax returns in the countries in which we operate are subject to tax authority audits as a matter of routine. While the Group is confident that tax returns are appropriately prepared and filed, amounts are provided in respect of uncertain tax positions that reflect the risk with respect to tax matters under active discussion with tax authorities, or which are otherwise considered to involve uncertainty.
Provisions against uncertain tax positions are measured using one of the following methods, depending on which of the methods management expects will better predict the amount it will pay over to the tax authority: | ||||
◾ | The Single Best Estimate – where there is a single outcome that is more likely than not to occur. This will happen, for example, where the tax outcome is binary (such as whether an entity can deduct an item of expenditure) or the range of possible outcomes is narrow or concentrated on a single value. The most likely outcome may be that no tax is expected to be payable, in which case the provision is nil; or | |||
◾ | A Probability-Weighted Expected Value – where, on the balance of probabilities, something will be paid to the tax authority but the possible outcomes are widely dispersed with low individual probabilities (i.e. there is no single outcome more likely than not to occur). In this case, the provision is the sum of the probability-weighted amounts in the range. | |||
In assessing provisions against uncertain tax positions, management usesin-house tax experts, professional firms and previous experience to inform the evaluation of risk. However, it remains possible that uncertainties will ultimately be resolved at amounts greater or smaller than the liabilities recorded.
In particular, although we report cross-border transactions undertaken between Group subsidiaries on anarm’s-length basis in tax returns in accordance with OECD guidelines, transfer pricing relies on the exercise of judgement and it is frequently possible for there to be a range of legitimate and reasonable views. This means that it is impossible to be certain that the returns basis will be sustained on examination. Discussions with tax authorities relating to cross-border transactions and other matters are ongoing in each of our major trading jurisdictions. Although the timing and amount of final resolution of these uncertain tax positions cannot be reliably predicted, no significant impact on the profitability of the Group is expected in the near term.
Estimation of income taxes also includes assessments of the recoverability of deferred tax assets. Deferred tax assets are only recognised to the extent that they are considered recoverable based on existing tax laws and forecasts of future taxable profits against which the underlying tax deductions can be utilised. The recoverability of these assets is reassessed at the end of each reporting period, and changes in recognition of deferred tax assets will affect the tax liability in the period of that reassessment. |
Table of Contents
RELX Annual report and financial statements 2018 | Notes to the consolidated financial statements | 139 | |
|
9 Taxation (continued)
2018 £m | Restated £m | Restated £m | ||||||||||
Current tax | ||||||||||||
United Kingdom | (71 | ) | (104 | ) | (80 | ) | ||||||
The Netherlands | (72 | ) | (77 | ) | (51 | ) | ||||||
Rest of world | (154 | ) | (258 | ) | (243 | ) | ||||||
Total current tax charge | (297 | ) | (439 | ) | (374 | ) | ||||||
Deferred tax | 5 | 374 | 73 | |||||||||
Tax expense | (292 | ) | (65 | ) | (301 | ) |
Cash tax paid in the year was £415m (2017: £449m; 2016: £402m), which is different to the tax expense for the year set out above.
There are a number of reasons why the cash tax payments in a particular year will be different from the tax expense in the accounts:
Deferred tax:
◾ | Tax expense includes deferred tax, which is an accounting adjustment arising from temporary differences; |
◾ | Temporary differences occur when an item has to be included in the income statement in one year but is taxed in another year; and |
◾ | For the purposes of acquisition accounting only, the Group recognises deferred tax liabilities arising on intangible assets. Any unwind of these deferred tax liabilities from the amortisation of intangible assets does not result in cash tax payments. |
Timing differences:
◾ | Tax payments relating to a particular year’s profits are typically due partly in the year and partly in the following year. |
Prior period adjustments:
◾ | Current tax expense is the best estimate at the end of the period of cash tax expected to be paid; and |
◾ | To the extent the final liability is higher or lower than that estimate, any cash tax impact will occur in a later period. |
Items recorded in equity and other comprehensive income:
◾ | Some of the benefits of tax deductions related to share based payments, pensions and hedging are credited to equity or other comprehensive income rather than to tax expense, and so the cash tax liability will be different to the current tax expense in the income statement in years when those deductions are available. |
Set out below is a reconciliation of the difference between tax expense for the period and the theoretical expense calculated by multiplying accounting profit by the applicable tax rate.
We believe the most meaningful applicable rate is that obtained by multiplying the accounting profits and losses of all consolidated entities by the applicable domestic rate in each of those entities’ jurisdictions.
The net tax expense charged on profit before tax differs from the theoretical amount that would arise using the weighted average of tax rates applicable to accounting profits and losses of the consolidated entities, as follows:
2018 | Restated 2017 | Restated 2016 | ||||||||||||||||||||||
£m | % | £m | % | £m | % | |||||||||||||||||||
Profit before tax | 1,720 | 1,721 | 1,459 | |||||||||||||||||||||
Tax at average applicable rates | (342 | ) | 19.9% | (389 | ) | 22.6% | (326 | ) | 22.4% | |||||||||||||||
Tax effect of share of results of joint ventures | 8 | (0.5)% | 7 | (0.4)% | 7 | (0.5)% | ||||||||||||||||||
Expenses not deductible for tax purposes | (24 | ) | 1.4% | (15 | ) | 0.9% | (19 | ) | 1.3% | |||||||||||||||
US state taxes | (19 | ) | 1.1% | (18 | ) | 1.0% | (13 | ) | 0.9% | |||||||||||||||
Non-deductible costs of share based remuneration | (1 | ) | 0.1% | (1 | ) | 0.1% | (1 | ) | 0.1% | |||||||||||||||
Non-deductible disposal-related gains and losses | – | 0.0% | (36 | ) | 2.1% | (8 | ) | 0.5% | ||||||||||||||||
Deferred tax assets of the period not recognised | (24 | ) | 1.4% | (10 | ) | 0.6% | (2 | ) | 0.1% | |||||||||||||||
Change in recognition of deferred tax assets or liabilities | (15 | ) | 0.9% | 16 | (0.9)% | 33 | (2.3)% | |||||||||||||||||
Other adjustments in respect of prior periods | 13 | (0.8)% | 35 | (2.1)% | 28 | (1.9)% | ||||||||||||||||||
Exceptional tax credit | 112 | (6.5)% | 346 | (20.1)% | – | 0.0% | ||||||||||||||||||
Tax expense | (292 | ) | 17.0% | (65 | ) | 3.8% | (301 | ) | 20.6% |
The weighted average applicable tax rate for the year was 19.9% (2017: 22.6%, 2016: 22.4%), reflecting the applicable rates in the countries where the Group operates. The Group’s future tax charge will be sensitive to the geographic mix of profits and losses and the tax rates and laws in force in the jurisdictions in which we operate.
Table of Contents
140 | RELX Annual report and financial statements 2018 | Financial statements and other information | |
|
Notes to the consolidated financial statements
for the year ended 31 December 2018
9 Taxation (continued)
In the UK, a reduction in the corporate tax rate from 19% to 17% from April 2020 was enacted in September 2016. In the US, the Tax Cuts and Jobs Act which included a reduction in the federal corporate tax rate from 35% to 21% from January 2018 was enacted in December 2017. In the Netherlands, a reduction in the corporate tax rate from 25% to 22.55% from 2020 and to 20.5% from 2021 was substantively enacted in December 2018. In total, the deferred tax effect of changes in tax rates for the year was a tax credit of £8m (2017: £346m, 2016: £1m).
The effective tax rate of 17% (2017: 3.8%, 2016: 20.6%) is lower than the weighted average applicable tax rate mainly because of an exceptional tax credit arising from the substantial resolution of certain prior year tax matters and the deferred tax effect of tax rate reductions in the Netherlands and the US. In 2017, the exceptional tax credit related to aone-offnon-cash credit from a deferred tax adjustment arising from the US Tax Cuts and Jobs Act. On the basis of their size andnon-recurring nature, the exceptional tax credits have been excluded from adjusted earnings.
The following tax has been recognised in other comprehensive income or directly in equity during the year:
2018 £m | 2017 £m | 2016 £m | ||||||||||
Tax on items that will not be reclassified to profit or loss | ||||||||||||
Tax on actuarial movements on defined benefit pension schemes | 15 | (59 | ) | 45 | ||||||||
Tax on items that may be reclassified to profit or loss | ||||||||||||
Tax on fair value movements on cash flow hedges | 9 | (30 | ) | 19 | ||||||||
Net tax credit/(debit) recognised in other comprehensive income | 24 | (89 | ) | 64 | ||||||||
Tax (debit)/credit on share based remuneration recognised directly in equity | (3 | ) | 8 | 10 |
The measurement of the US deferred tax assets and liabilities has also resulted in a charge of £1m in other comprehensive income.
2018 £m | Restated £m | |||||||
Deferred tax assets | 455 | 431 | ||||||
Deferred tax liabilities | (830 | ) | (738 | ) | ||||
Total | (375 | ) | (307 | ) |
Movements in deferred tax liabilities and assets (before taking into consideration the offsetting of balances within the same jurisdiction) are summarised as follows:
Deferred tax liabilities | Deferred tax assets | |||||||||||||||||||||||||||||||
Excess of tax allowances over amortisation £m | Acquired £m | Other temporary differences £m | Excess of amortisation over tax allowances £m | Tax losses carried forward £m | Pension balances £m | Other temporary differences £m | Total £m | |||||||||||||||||||||||||
Deferred tax (liability)/asset at 1 January 2017 (restated) | (393 | ) | (767 | ) | (338 | ) | 263 | 70 | 145 | 352 | (668 | ) | ||||||||||||||||||||
Credit/(charge) to profit | 97 | 298 | 2 | (15 | ) | 22 | – | (30 | ) | 374 | ||||||||||||||||||||||
Credit/(charge) to equity/other comprehensive income | – | – | 7 | – | – | (76 | ) | (20 | ) | (89 | ) | |||||||||||||||||||||
Acquisitions | – | (2 | ) | – | – | – | – | – | (2 | ) | ||||||||||||||||||||||
Exchange translation differences | 29 | 45 | 27 | 9 | (5 | ) | (3 | ) | (24 | ) | 78 | |||||||||||||||||||||
Deferred tax (liability)/asset at 1 January 2018 (restated) | (267 | ) | (426 | ) | (302 | ) | 257 | 87 | 66 | 278 | (307 | ) | ||||||||||||||||||||
Credit/(charge) to profit | 75 | 13 | 13 | (51 | ) | (32 | ) | 3 | (16 | ) | 5 | |||||||||||||||||||||
Credit/(charge) to equity/other comprehensive income | – | – | – | – | – | 15 | (3 | ) | 12 | |||||||||||||||||||||||
Acquisitions | – | (88 | ) | – | – | 37 | – | – | (51 | ) | ||||||||||||||||||||||
Exchange translation differences | (12 | ) | (26 | ) | (17 | ) | 1 | 4 | 2 | 14 | (34 | ) | ||||||||||||||||||||
Deferred tax (liability)/asset at 31 December 2018 | (204 | ) | (527 | ) | (306 | ) | 207 | 96 | 86 | 273 | (375 | ) |
Other deferred tax liabilities include temporary differences in respect of property, plant and equipment, capitalised development spend and financial instruments. Other deferred tax assets include temporary differences in respect of share based remuneration provisions and financial instruments.
As a result of exemptions on dividends from subsidiaries and capital gains on disposal there are no significant taxable temporary differences associated with investments in subsidiaries, branches, associates and interests in joint arrangements.
Table of Contents
RELX Annual report and financial statements 2018 | Notes to the consolidated financial statements | 141 | |
|
9 Taxation (continued)
Deferred tax assets in respect of tax losses and other deductible temporary differences have only been recognised to the extent that it is more likely than not that sufficient taxable profits will be available to allow the asset to be recovered. Accordingly, no deferred tax asset has been recognised in respect of unused trading losses and interest expenses of approximately £213m (2017: £143m) carried forward at year end. The deferred tax asset not recognised in respect of these losses and interest expenses is approximately £52m (2017: £34m). Of the unrecognised losses and interest expenses, £93m (2017: £30m) will expire if not utilised within ten years and £121m (2017: £113m) will expire after more than ten years.
Deferred tax assets of approximately £4m (2017: £4m) have not been recognised in respect of tax losses and other temporary differences carried forward of £24m (2017: £23m), which can only be used to offset future capital gains.
10 Earnings per share
Accounting policy Earnings per share (‘EPS’) is calculated by taking the reported net profit attributable to shareholders and dividing this by the total weighted average number of shares.
Adjusted earnings per share is calculated by dividing adjusted net profit attributable to RELX PLC shareholders by the total weighted average number of shares. |
EARNINGS PER SHARE – FOR THE YEAR ENDED 31 DECEMBER | 2018 | Restated 2017 | Restated 2016 | |||||||||||||||||||||||||||||||||||||
Net profit attributable to RELX PLC shareholders £m | Weighted average number of shares (millions) | EPS (pence) | Net profit attributable to RELX PLC shareholders £m | Weighted average number of shares (millions) | EPS (pence) | Net profit attributable to RELX PLC shareholders £m | Weighted average number of shares (millions) | EPS (pence) | ||||||||||||||||||||||||||||||||
Basic earnings per share | 1,422 | 1,977.2 | 71.9p | 1,648 | 2,019.4 | 81.6p | 1,150 | 2,062.3 | 55.8p | |||||||||||||||||||||||||||||||
Diluted earnings per share | 1,422 | 1,990.8 | 71.4p | 1,648 | 2,035.2 | 81.0p | 1,150 | 2,079.8 | 55.3p |
The diluted figures are calculated after taking account of potential additional ordinary shares arising from share options and conditional shares.
Since 2016, earnings per share has been calculated by taking the total Group net profit attributable to shareholders, and dividing this by the total weighted average number of shares in issue. As the corporate simplification was done on the basis of a 1:1 share exchange, this has not impacted the calculation of earnings per share in 2018, or the comparatives presented.
ADJUSTED EARNINGS PER SHARE | 2018 | Restated 2017 | Restated 2016 | |||||||||||||||||||||||||||||||||||||||
Adjusted net profit attributable to RELX PLC shareholders £m | Weighted of shares | Adjusted EPS (pence) | Adjusted net profit attributable to RELX PLC shareholders £m | Weighted number of shares | Adjusted EPS (pence) | Adjusted net profit attributable to RELX PLC shareholders £m | Weighted number of shares | Adjusted EPS (pence) | ||||||||||||||||||||||||||||||||||
Adjusted earnings per share | 1,674 | 1,977.2 | 84.7p | 1,620 | 2,019.4 | 80.2p | 1,473 | 2,062.3 | 71.4p |
RECONCILIATION OF ADJUSTED NET PROFIT ATTRIBUTABLE TO RELX PLC SHAREHOLDERS | 2018 £m | Restated £m | Restated £m | |||||||||
Net profit attributable to RELX PLC shareholders | 1,422 | 1,648 | 1,150 | |||||||||
Adjustments(post-tax): | ||||||||||||
Amortisation of acquired intangible assets | 322 | 356 | 364 | |||||||||
Acquisition-related costs | 71 | 43 | 38 | |||||||||
Net financing charge on defined benefit pension schemes | 7 | 11 | 10 | |||||||||
Disposals and othernon-operating items | 19 | 1 | 2 | |||||||||
Other deferred tax credits from intangible assets* | (55 | ) | (93 | ) | (91 | ) | ||||||
Exceptional tax credit | (112 | ) | (346 | ) | – | |||||||
Adjusted net profit attributable to RELX PLC shareholders | 1,674 | 1,620 | 1,473 |
* | Movements on deferred tax liabilities arising on acquired intangible assets that do not qualify for tax amortisation. |
Table of Contents
142 | RELX Annual report and financial statements 2018 | Financial statements and other information | |
|
Notes to the consolidated financial statements
for the year ended 31 December 2018
11 Statement of cash flows
Accounting policy Cash and cash equivalents comprise cash balances, call deposits and other short-term highly liquid investments and are held in the statement of financial position at fair value. |
RECONCILIATION OF PROFIT BEFORE TAX TO CASH GENERATED FROM OPERATIONS | 2018 £m | Restated £m | Restated £m | |||||||||||||
Profit before tax | 1,720 | 1,721 | 1,459 | |||||||||||||
Disposals and othernon-operating items | 33 | (15 | ) | 36 | ||||||||||||
Net finance costs | 211 | 199 | 213 | |||||||||||||
Operating profit | 1,964 | 1,905 | 1,708 | |||||||||||||
Share of results of joint ventures | (32 | ) | (37 | ) | (37 | ) | ||||||||||
Amortisation of acquired intangible assets | 287 | 313 | 342 | |||||||||||||
Amortisation of internally developed intangible assets | 225 | 203 | 189 | |||||||||||||
Depreciation of property, plant and equipment | 62 | 65 | 62 | |||||||||||||
Depreciation of right of use assets | 77 | 75 | 74 | |||||||||||||
Share based remuneration | 41 | 39 | 38 | |||||||||||||
Totalnon-cash items | 692 | 695 | 705 | |||||||||||||
(Increase)/decrease in inventories andpre-publication costs | (7 | ) | 2 | (24 | ) | |||||||||||
(Increase)/decrease in receivables | (89 | ) | 37 | (145 | ) | |||||||||||
Increase/(decrease) in payables | 27 | (76 | ) | 104 | ||||||||||||
Increase in working capital | (69 | ) | (37 | ) | (65 | ) | ||||||||||
Cash generated from operations | 2,555 | 2,526 | 2,311 | |||||||||||||
CASH FLOW ON ACQUISITIONS | Note | 2018 £m | 2017 £m | 2016 £m | ||||||||||||
Purchase of businesses | 12 | (919 | ) | (117 | ) | (336 | ) | |||||||||
Investment in joint ventures | – | (1 | ) | (1 | ) | |||||||||||
Deferred payments relating to prior year acquisitions | (16 | ) | (13 | ) | (24 | ) | ||||||||||
Total | (935 | ) | (131 | ) | (361 | ) |
RECONCILIATION OF NET BORROWINGS | Cash and cash equivalents £m | Borrowings £m | Related instruments | Finance lease receivable £m | 2018 £m | Restated £m | Restated £m | |||||||||||||||||||||
At start of year | 111 | (5,253 | ) | 43 | 57 | (5,042 | ) | (5,050 | ) | (4,095 | ) | |||||||||||||||||
Increase/(decrease) in cash and cash equivalents | 1 | – | – | – | 1 | (45 | ) | 9 | ||||||||||||||||||||
(Increase)/decrease in short-term bank loans, overdrafts and commercial paper | – | (147 | ) | – | – | (147 | ) | 148 | (271 | ) | ||||||||||||||||||
Issuance of term debt | – | (958 | ) | – | – | (958 | ) | (873 | ) | (603 | ) | |||||||||||||||||
Repayment of term debt | – | 211 | – | – | 211 | 712 | 474 | |||||||||||||||||||||
Repayment of leases | – | 95 | – | (14 | ) | 81 | 78 | 74 | ||||||||||||||||||||
Change in net borrowings resulting from cash flows | 1 | (799 | ) | – | (14 | ) | (812 | ) | 20 | (317 | ) | |||||||||||||||||
Borrowings in acquired businesses | – | (12 | ) | – | – | (12 | ) | – | – | |||||||||||||||||||
Remeasurement and derecognition of leases | – | (12 | ) | – | – | (12 | ) | (6 | ) | (14 | ) | |||||||||||||||||
Inception of leases | – | (31 | ) | – | 3 | (28 | ) | (36 | ) | (49 | ) | |||||||||||||||||
Fair value and other adjustments to borrowings and related derivatives | – | (7 | ) | (18 | ) | – | (25 | ) | (11 | ) | (24 | ) | ||||||||||||||||
Exchange translation differences | 2 | (251 | ) | – | 3 | (246 | ) | 41 | (551 | ) | ||||||||||||||||||
At end of year | 114 | (6,365 | ) | 25 | 49 | (6,177 | ) | (5,042 | ) | (5,050 | ) |
Net borrowings comprise cash and cash equivalents, loan capital, lease liabilities and receivables, promissory notes, bank and other loans, derivative financial instruments that are used to hedge certain borrowings and adjustments in respect of cash collateral received/paid. The Group monitors net borrowings as part of capital and liquidity management.
Table of Contents
RELX Annual report and financial statements 2018 | Notes to the consolidated financial statements | 143 | |
|
12 Acquisitions
During the year, a number of acquisitions were made. The net assets of the businesses acquired are incorporated at their fair value to the Group. Provisional fair values of the consideration given and of the assets and liabilities acquired are summarised below.
Fair value £m | Fair value £m | Fair value £m | ||||||||||
Goodwill | 626 | 77 | 222 | |||||||||
Intangible assets | 423 | 56 | 189 | |||||||||
Property, plant and equipment | 5 | – | 1 | |||||||||
Current assets | 24 | 3 | 12 | |||||||||
Non current assets | 12 | – | – | |||||||||
Current liabilities | (72 | ) | (16 | ) | (20 | ) | ||||||
Borrowings | (12 | ) | – | – | ||||||||
Deferred tax | (51 | ) | (2 | ) | (35 | ) | ||||||
Net assets acquired | 955 | 118 | 369 | |||||||||
Consideration (after taking account of £27m (2017: £7m; 2016: £10m) net cash acquired) | 955 | 118 | 369 | |||||||||
Less: consideration deferred to future years | (36 | ) | (1 | ) | (15 | ) | ||||||
Less: acquisition date fair value of equity interest | – | – | (18 | ) | ||||||||
Net cash flow | 919 | 117 | 336 |
On 21 February 2018 RELX acquired 100% of the share capital of ThreatMetrix. ThreatMetrix’s technology analyses connections among devices, locations, anonymised identity information and threat intelligence, and combines this data with behavioural analytics to identify high-risk digital behaviour and transactions in real time. The total consideration for this acquisition, net of cash acquired, was £585m, which represents the fair value of the consideration translated at the acquisition date foreign exchange rate. The main assets and liabilities recognised on acquisition were £373m relating to goodwill, £279m relating to intangible assets, £41m relating to trade and other payables and £34m of net deferred tax liability. These balances are included in the table above.
Goodwill, being the excess of the consideration over the net tangible and intangible assets acquired, represents benefits which do not qualify for recognition as intangible assets, including: the ability of a business to generate higher returns than individual assets; skilled workforces; and acquisition synergies that are specific to the Group. In addition, goodwill arises on the recognition of deferred tax liabilities in respect of intangible assets for which amortisation does not qualify for tax deductions.
The fair values of the assets and liabilities acquired in the last 12 months are provisional pending the completion of the valuation exercises. Final fair values will be incorporated in the 2019 consolidated financial statements. There were no significant adjustments to the provisional fair values of prior year acquisitions established in 2017.
The businesses acquired in 2018 contributed £98m to revenue, increased adjusted operating profit by £7m, decreased net profit by £34m (after charging £41m of integration costs and amortisation of acquired intangibles) and contributed £4m to net cash outflow from operating activities for the part year under the Group’s ownership and before taking account of acquisition financing costs. Had the businesses been acquired at the beginning of the year, on a pro forma basis the Group revenues, adjusted operating profit and net profit attributable to RELX PLC shareholders for the year would have been £7,531m, £2,347m and £1,420m respectively, before taking account of acquisition financing costs.
Subsequent to the 31 December 2018, Reed Exhibitions acquired Mack Brooks.
13 Equity dividends
ORDINARY DIVIDENDS PAID IN THE YEAR | 2018 £m | 2017 £m | 2016 £m | |||||||||
RELX PLC | 420 | 400 | 356 | |||||||||
RELX NV | 376 | 362 | 327 | |||||||||
Total | 796 | 762 | 683 |
The RELX NV amount shown relates to dividends paid prior to the corporate simplification.
Ordinary dividends declared and paid in the year ended 31 December 2018, in amounts per ordinary share, comprise: a 2017 final dividend of 27.7p (2017: 25.7p; 2016: 22.3p) and a 2018 interim dividend of 12.4p (2017: 11.7p; 2016: 10.25p), giving a total of 40.1p (2017: 37.4p; 2016: 32.55p) for RELX PLC shareholders. Former shareholders in RELX NV received a 2017 final dividend of€0.316 (2017:€0.301; 2016:€0.288) and a 2018 interim dividend of€0.140 (2017:€0.132; 2016:€0.122).
The Directors of RELX PLC have proposed a final dividend of 29.7p (2017: 27.7p; 2016: 25.7p), giving a total for the financial year of 42.1p (2017: 39.4p; 2016: 35.95p). The total cost of funding the proposed final dividend is expected to be £583m, for which no liability has been recognised at the statement of financial position date.
Table of Contents
144 | RELX Annual report and financial statements 2018 | Financial statements and other information | |
|
Notes to the consolidated financial statements
for the year ended 31 December 2018
13 Equity dividends (continued)
The Employee Benefit Trust has currently waived the right to receive dividends on RELX PLC shares. This waiver has been applied to dividends paid in 2018, 2017 and 2016.
14 Goodwill
Accounting policy On the acquisition of a subsidiary or business, the purchase consideration is allocated between the net tangible and intangible assets on a fair value basis, with any excess purchase consideration representing goodwill. Goodwill arising on acquisitions also includes amounts corresponding to deferred tax liabilities recognised in respect of acquired intangible assets.
Goodwill is recognised as an asset and reviewed for impairment when there is an indicator that the asset may be impaired and at least annually. Any impairment is recognised immediately in the income statement and not subsequently reversed.
On disposal of a subsidiary or business, the attributable amount of goodwill is included in the determination of the profit or loss on disposal.
At each statement of financial position date, the carrying amounts of tangible and intangible assets and goodwill are reviewed to determine whether there is any indication that those assets have suffered an impairment loss. If any such indication exists, the recoverable amount, which is the higher of value in use and fair value less costs to sell, of the asset is estimated in order to determine the extent, if any, of the impairment loss. Where the asset does not generate cash flows that are independent from other assets, value in use estimates are made based on the cash flows of the cash generating unit to which the asset belongs. Intangible assets with an indefinite useful life are tested for impairment at least annually and whenever there is any indication that the asset may be impaired.
If the recoverable amount of an asset or cash generating unit is estimated to be less than its net carrying amount, the net carrying amount of the asset or cash generating unit is reduced to its recoverable amount. Impairment losses are recognised immediately in the income statement in administration and other expenses.
Critical judgement and key source of estimation uncertainty The carrying amounts of goodwill and indefinite lived intangible assets in each business are reviewed for impairment at least annually. The carrying amounts of all other intangible assets are reviewed where there are indications of possible impairment. An impairment review involves a comparison of the carrying value of the asset with estimated values in use based on the latest management cash flow projections, approved by the Board. Key areas of judgement in estimating the values in use of businesses are the growth in cash flows over a forecast period of up to five years, the long-term growth rate assumed thereafter and the discount rate applied to the forecast cash flows. A description of the key assumptions and sensitivities is provided below. |
2018 £m | 2017 £m | |||||||
At start of year | 5,965 | 6,392 | ||||||
Acquisitions | 626 | 77 | ||||||
Disposals/reclassified as held for sale | (25 | ) | (72 | ) | ||||
Transfers | – | 11 | ||||||
Exchange translation differences | 333 | (443 | ) | |||||
At end of year | 6,899 | 5,965 |
Transfers relate to movements in goodwill as a result of the finalisation of the accounting for prior year acquisitions.
The carrying amount of goodwill is after cumulative amortisation of £1,222m (2017: £1,173m), which was charged prior to the adoption of IFRS, and £9m (2017: £9m) of subsequent impairment charges recorded in prior years.
Table of Contents
RELX Annual report and financial statements 2018 | Notes to the consolidated financial statements | 145 | |
|
14 Goodwill (continued)
Impairment review
Impairment testing of goodwill and indefinite lived intangible assets is performed at least annually in accordance with the methodology described above. There were no charges for impairment of goodwill in 2018 (2017: nil).
Goodwill is compiled and assessed among groups of cash generating units, which represent the lowest level at which goodwill is monitored by management. Typically, acquisitions are integrated into existing business units, and the goodwill arising is allocated to the groups of cash generating units (CGUs) that are expected to benefit from the synergies of the acquisition. As the business areas have become increasingly integrated and globalised, the current CGU allocation reflects the global leverage of assets, skills, knowledge and technology platforms, and the monitoring of goodwill by management.
GOODWILL | 2018 £m | 2017 £m | ||||||
Scientific, Technical & Medical | 1,620 | 1,479 | ||||||
Risk & Business Analytics | 3,283 | 2,595 | ||||||
Legal | 1,465 | 1,390 | ||||||
Exhibitions | 531 | 501 | ||||||
Total | 6,899 | 5,965 |
The key assumptions used for each group of cash generating units are disclosed below:
KEY ASSUMPTIONS | 2018 | 2017 | ||||||||||||||||||
Pre-tax discount rate | Nominal long-term market growth rate | Pre-tax discount rate | Nominal long-term market growth rate | |||||||||||||||||
Scientific, Technical & Medical | 10.0% | 3% | 10.1% | 3% | ||||||||||||||||
Risk & Business Analytics | 11.5% | 3% | 12.3% | 3% | ||||||||||||||||
Legal | 12.2% | 2% | 12.7% | 2% | ||||||||||||||||
Exhibitions | 12.7% | 3% | 12.6% | 3% |
Thepre-tax discount rates used are based on the Group’s weighted average cost of capital, adjusted to reflect a risk premium specific to each business. Nominal long-term market growth rates, which are applied after the forecast period of up to five years, do not exceed the long-term average growth prospects for the sectors and territories in which the businesses operate.
A sensitivity analysis has been performed based on changes in key assumptions considered to be reasonably possible by management: an increase in the discount rate of 0.5%, a decrease in the compound annual growth rate for cash flow in the five-year forecast period of 2.0%, and a decrease in the nominal long-term market growth rates of 0.5%. The sensitivity analysis shows that no impairment charges would result from these scenarios.
Table of Contents
146 | RELX Annual report and financial statements 2018 | Financial statements and other information | |
|
Notes to the consolidated financial statements
for the year ended 31 December 2018
15 Intangible assets
Accounting policy Intangible assets acquired as part of a business combination are stated in the statement of financial position at their fair value as at the date of acquisition, less accumulated amortisation. Internally generated intangible assets are stated in the statement of financial position at the directly attributable cost of creation of the asset, less accumulated amortisation.
Intangible assets acquired as part of business combinations comprise: market-related assets (e.g. trademarks, imprints, brands); customer-related assets (e.g. subscription bases, customer lists, customer relationships); editorial content; software and systems (e.g. application infrastructure, product delivery platforms,in-process research and development); contract-based assets (e.g. publishing rights, exhibition rights, supply contracts); and other intangible assets. Internally generated intangible assets typically comprise software and systems development where an identifiable asset is created that is probable to generate future economic benefits.
Intangible assets, other than journal titles determined to have indefinite lives, are amortised on a straight-line basis over their estimated useful lives. The estimated useful lives of intangible assets with finite lives are as follows: market and customer-related assets – 3 to 40 years; content, software and other acquired intangible assets – 3 to 20 years; and internally developed intangible assets – 3 to 10 years. Journal titles determined to have indefinite lives are not amortised and are subject to impairment review at least annually, including a review of events and circumstances to ensure that they continue to support an indefinite useful life.
Critical judgements and key sources of estimation uncertainty On acquisition of a subsidiary or business, the purchase consideration is allocated between the net tangible and intangible assets other than goodwill on a fair value basis, with any excess purchase consideration representing goodwill. The valuation of acquired intangible assets represents the estimated economic value in use, using standard valuation methodologies, including as appropriate, discounted cash flow, relief from royalty and comparable market transactions. Acquired intangible assets are capitalised and amortised systematically over their estimated useful lives, subject to impairment review. The assumptions used are subject to management judgement.
Appropriate amortisation periods are selected based on assessments of the longevity of the brands and imprints, the strength and stability of customer relationships, the market positions of the acquired assets and the technological and competitive risks that they face. Certain intangible assets in relation to acquired science and medical publishing businesses have been determined to have indefinite lives. The longevity of these assets is evidenced by their long-established and well-regarded journal titles, and their characteristically stable market positions. The assumptions used are subject to management judgement.
Development spend encompasses investment in new products and other initiatives, ranging from the building of online delivery platforms, to launch costs of new services, to building new infrastructure and applications. Launch costs and other ongoing operating expenses of new products and services are expensed as incurred. The costs of building product applications, platforms and infrastructure are capitalised as intangible assets, where the investment they represent has demonstrable value and the technical and commercial feasibility is assured. Costs eligible for capitalisation must be incremental, clearly identified and directly attributable to a particular project. The resulting assets are amortised over their estimated useful lives. Impairment reviews are carried out at least annually where indicators of impairment are identified. Judgement is required in the assessment of the potential value of a development project, the identification of costs eligible for capitalisation and the selection of appropriate asset lives. |
Table of Contents
RELX Annual report and financial statements 2018 | Notes to the consolidated financial statements | 147 | |
|
15 Intangible assets (continued)
Market and £m | Content, software and other £m | Total acquired intangible assets £m | Internally £m | Total £m | ||||||||||||||||
Cost | ||||||||||||||||||||
At 1 January 2017 | 3,872 | 3,679 | 7,551 | 2,550 | 10,101 | |||||||||||||||
Acquisitions | 32 | 24 | 56 | – | 56 | |||||||||||||||
Additions | – | – | – | 304 | 304 | |||||||||||||||
Disposals/reclassified as held for sale | (26 | ) | (76 | ) | (102 | ) | (42 | ) | (144 | ) | ||||||||||
Transfers | (50 | ) | 27 | (23 | ) | – | (23 | ) | ||||||||||||
Exchange translation differences | (309 | ) | (162 | ) | (471 | ) | (121 | ) | (592 | ) | ||||||||||
At 1 January 2018 | 3,519 | 3,492 | 7,011 | 2,691 | 9,702 | |||||||||||||||
Acquisitions | 310 | 113 | 423 | – | 423 | |||||||||||||||
Additions | – | – | – | 304 | 304 | |||||||||||||||
Disposals/reclassified as held for sale | (15 | ) | (11 | ) | (26 | ) | (148 | ) | (174 | ) | ||||||||||
Exchange translation differences | 211 | 130 | 341 | 99 | 440 | |||||||||||||||
At 31 December 2018 | 4,025 | 3,724 | 7,749 | 2,946 | 10,695 | |||||||||||||||
Accumulated amortisation | ||||||||||||||||||||
At 1 January 2017 | 1,893 | 3,139 | 5,032 | 1,465 | 6,497 | |||||||||||||||
Charge for the year | 188 | 125 | 313 | 203 | 516 | |||||||||||||||
Disposals/reclassified as held for sale | (16 | ) | (72 | ) | (88 | ) | (43 | ) | (131 | ) | ||||||||||
Exchange translation differences | (158 | ) | (146 | ) | (304 | ) | (70 | ) | (374 | ) | ||||||||||
At 1 January 2018 | 1,907 | 3,046 | 4,953 | 1,555 | 6,508 | |||||||||||||||
Charge for the year | 169 | 118 | 287 | 225 | 512 | |||||||||||||||
Disposals/reclassified as held for sale | (15 | ) | (11 | ) | (26 | ) | (111 | ) | (137 | ) | ||||||||||
Exchange translation differences | 105 | 113 | 218 | 60 | 278 | |||||||||||||||
At 31 December 2018 | 2,166 | 3,266 | 5,432 | 1,729 | 7,161 | |||||||||||||||
Net book amount | ||||||||||||||||||||
At 31 December 2017 | 1,612 | 446 | 2,058 | 1,136 | 3,194 | |||||||||||||||
At 31 December 2018 | 1,859 | 458 | 2,317 | 1,217 | 3,534 |
Transfers relate to movements in intangible assets as a result of the finalisation of the accounting for prior year acquisitions.
Included in content, software and other acquired intangible assets are assets with a net book value of £80m (2017: £120m) that arose on acquisitions completed prior to the adoption of IFRS that have not been allocated to specific categories of intangible assets. Internally developed intangible assets typically comprise software and systems development where an identifiable asset is created that is expected to generate future economic benefits.
Included in market and customer-related intangible assets are £119m (2017: £112m) of journal titles relating to Scientific, Technical & Medical determined to have indefinite lives based on an assessment of their historical longevity and stable market positions. Indefinite lived intangibles are tested for impairment at least annually.
Table of Contents
148 | RELX Annual report and financial statements 2018 | Financial statements and other information | |
|
Notes to the consolidated financial statements
for the year ended 31 December 2018
16 Investments
Accounting policy Investments, other than investments in joint arrangements and associates, are stated in the statement of financial position at fair value. Changes in the fair value of investments held as part of the venture capital portfolio are reported in disposals and othernon-operating items in the income statement. All items recognised in the income statement relating to investments, other than investments in joint arrangements and associates, are reported as disposals and othernon-operating items.
Venture capital investments and equity investments represent interests in unlisted securities. The fair value of unlisted securities is based on management’s estimate of fair value based on standard valuation techniques, including market comparisons and discounts of future cash flows, having regard to maximising the use of observable inputs and adjusting for risk. Advice from valuation experts is used as appropriate.
All joint arrangements are classified as joint ventures because the Group shares joint control and has rights to the net assets of the arrangements. Investments in joint ventures and associates are accounted for under the equity method and stated in the statement of financial position at cost as adjusted for post-acquisition changes in the Group’s share of net assets, less any impairment in value. |
2018 £m | 2017 £m | |||||||
Investments in joint ventures | 104 | 102 | ||||||
Equity investments | – | 2 | ||||||
Venture capital investments | 151 | 139 | ||||||
Total | 255 | 243 |
The value of venture capital investments and equity investments has been determined by reference to other observable market inputs or, when these are not available, by reference to inputs we believe would reflect the assumptions market participants would use. Gains and losses included in the consolidated income statement are provided in note 8.
An analysis of changes in the carrying value of investments in joint ventures is set out below:
2018 £m | 2017 £m | |||||||
At start of year | 102 | 102 | ||||||
Share of results of joint ventures | 32 | 37 | ||||||
Dividends received from joint ventures | (30 | ) | (38 | ) | ||||
Additions | 2 | 2 | ||||||
Exchange translation differences | (2 | ) | (1 | ) | ||||
At end of year | 104 | 102 |
Summarised aggregate information in respect of the Group’s share of joint ventures is set out below:
RELX’s share | ||||||||
2018 £m | 2017 £m | |||||||
Revenue | 101 | 101 | ||||||
Net profit for the year | 32 | 37 | ||||||
Total assets | 96 | 85 | ||||||
Total liabilities | (49 | ) | (42 | ) | ||||
Net assets | 47 | 43 | ||||||
Goodwill | 57 | 59 | ||||||
Total | 104 | 102 |
The Group’s consolidated other comprehensive income includes no income or losses relating to joint ventures in either period.
Table of Contents
RELX Annual report and financial statements 2018 | Notes to the consolidated financial statements | 149 | |
|
17 Property, plant and equipment
Accounting policy Property, plant and equipment are stated in the statement of financial position at cost less accumulated depreciation. No depreciation is provided on freehold land. Freehold buildings and long leaseholds are depreciated over their estimated useful lives up to a maximum of 50 years. Short leases are written off over the duration of the lease. Depreciation is provided on other assets on a straight-line basis over their estimated useful lives as follows:
– land and buildings: land – not depreciated; leasehold improvements – shorter of life of lease and 10 years;
– fixtures and equipment: plant – 3 to 20 years; office furniture, fixtures and fittings – 5 to 10 years; computer systems, communication networks and equipment – 3 to 7 years.
|
2018 | Restated 2017 | |||||||||||||||||||||||||
Land and buildings £m | Fixtures and equipment £m | Total £m | Land and buildings £m | Fixtures and equipment £m | Total £m | |||||||||||||||||||||
Cost | ||||||||||||||||||||||||||
At start of year | 217 | 599 | 816 | 231 | 630 | 861 | ||||||||||||||||||||
Acquisitions | – | 5 | 5 | – | – | – | ||||||||||||||||||||
Capital expenditure | 5 | 51 | 56 | 5 | 46 | 51 | ||||||||||||||||||||
Disposals/reclassified as held for sale | (8 | ) | (40 | ) | (48 | ) | (3 | ) | (40 | ) | (43 | ) | ||||||||||||||
Exchange translation differences | 9 | 25 | 34 | (16 | ) | (37 | ) | (53 | ) | |||||||||||||||||
At end of year | 223 | 640 | 863 | 217 | 599 | 816 | ||||||||||||||||||||
Accumulated depreciation | ||||||||||||||||||||||||||
At start of year | 137 | 485 | 622 | 139 | 499 | 638 | ||||||||||||||||||||
Charge for the year | 9 | 53 | 62 | 9 | 56 | 65 | ||||||||||||||||||||
Disposals/reclassified as held for sale | (6 | ) | (40 | ) | (46 | ) | (1 | ) | (39 | ) | (40 | ) | ||||||||||||||
Exchange translation differences | 6 | 21 | 27 | (10 | ) | (31 | ) | (41 | ) | |||||||||||||||||
At end of year | 146 | 519 | 665 | 137 | 485 | 622 | ||||||||||||||||||||
Net book amount | 77 | 121 | 198 | 80 | 114 | 194 |
No depreciation is provided on freehold land of £14m (2017: £14m).
Amounts relating to right of use assets under IFRS 16 can be found in note 23.
Table of Contents
150 | RELX Annual report and financial statements 2018 | Financial statements and other information | |
|
Notes to the consolidated financial statements
for the year ended 31 December 2018
18 Financial instruments
Accounting policy Financial instruments comprise investments (other than investments in joint ventures or associates), trade receivables, cash and cash equivalents, payables and accruals, borrowings and derivative financial instruments.
Investments (other than investments in joint ventures and associates) are described in note 16. The fair value of such investments is based on standard valuation techniques, including market comparisons and discounts of future cash flows, having regard to maximising the use of observable inputs and adjusting for risk. (These investments are typically classified as either Level 2 or 3 in the IFRS 13 fair value hierarchy).
Trade receivables are carried in the statement of financial position at invoiced value less allowance for estimated irrecoverable amounts. Irrecoverable amounts are estimated based on the ageing of trade receivables, experience and circumstance. Borrowings and payables are recorded initially at fair value and subsequently carried at amortised cost (other than fixed rate borrowings in designated hedging relationships for which the carrying amount of the hedged portion of the borrowings is subsequently adjusted for the gain or loss attributable to the hedged risk).
Derivative financial instruments are used to hedge interest rate and foreign exchange risks. Where an effective hedge is in place against changes in the fair value of fixed rate borrowings, the hedged borrowings are adjusted for changes in fair value attributable to the risk being hedged with a corresponding income or expense included in the income statement within finance costs. The offsetting gains or losses from remeasuring the fair value of the related derivatives are also recognised in the income statement within finance costs. When the related derivative expires, is sold or terminated, or no longer qualifies for hedge accounting, the cumulative change in fair value of the hedged borrowing is amortised in the income statement over the period to maturity of the borrowing using the effective interest method.
Changes in the fair value of derivative financial instruments that are designated and effective as hedges of future cash flows are recognised (net of tax) in other comprehensive income and accumulated in the hedge reserve. With effect from 1 January 2018, the fair value amounts relating to foreign currency basis spreads are recorded in a separate component of equity in the cost of hedging reserve. If a hedged firm commitment or forecasted transaction results in the recognition of anon-financial asset or liability, then, at the time that the asset or liability is recognised, the associated gains or losses on the derivative that had previously been recognised in other comprehensive income are included in the initial measurement of the asset or liability. For hedges that do not result in the recognition of an asset or a liability, amounts deferred in the hedge reserve are recognised in the income statement in the same period in which the hedged item affects net profit or loss. Any ineffective portion of hedges is recognised immediately in the income statement.
Cash flow hedge accounting is discontinued when a hedging instrument expires or is sold, terminated or exercised, or no longer qualifies for hedge accounting. At that time, any cumulative gain or loss on the hedging instrument recognised in other comprehensive income is either retained in the hedge reserve until the firm commitment or forecasted transaction occurs, or, where a hedged transaction is no longer expected to occur, is immediately credited or expensed in the income statement.
Derivative financial instruments that are not designated as hedging instruments are recorded in the statement of financial position at fair value, with changes in fair value recognised in the income statement.
The fair values of derivative financial instruments represent the replacement costs calculated using observable market rates of interest and exchange. The fair value of long-term borrowings is calculated by discounting expected future cash flows at observable market rates. (These instruments are accordingly classified as Level 2 in the IFRS 13 fair value hierarchy.)
|
The main financial risks faced by the Group are liquidity risk, market risk – comprising interest rate risk and foreign exchange risk – and credit risk. Financial instruments are used to finance the Group’s businesses and to manage interest rate and foreign exchange risks. The Group’s businesses do not enter into speculative derivative transactions. Details of financial instruments subject to liquidity, market and credit risks are described below.
Liquidity risk
The Group maintains a range of borrowing facilities and debt programmes to fund its requirements at competitive rates.
The balance of long-term debt, short-term debt and committed bank facilities is managed to provide security of funding, taking into account the cash generation cycle of the business and the uncertain size and timing of acquisition spend. To accommodate the significant free cash flow generated by the Group and to capitalise on an inexpensive source of funding, a meaningful portion of the overall debt portfolio is typically kept short-term as long as there exists acceptable liquidity in the commercial paper markets and sufficient capacity under committed credit lines. The Group’s treasury policies ensure adequate liquidity by requiring that (a) no more than $1.5bn of term debt matures in any12-month period, (b) the sum of term debt maturing over the ensuing 12 months plus short-term borrowings is less than the sum of available cash plus committed facilities and (c) minimum levels of borrowing with maturities over three and five years are maintained.
The treasury policies ensure debt efficiency by (a) targeting certain levels of short-term borrowings across a given year, (b) maintaining a weighted average maturity of the gross debt portfolio of approximately five years and (c) minimising surplus cash balances. From time to time, based on cash flow and market conditions, the Group may redeem term debt early or repurchase outstanding debt in the open market.
Table of Contents
RELX Annual report and financial statements 2018 | Notes to the consolidated financial statements | 151 | |
|
18 Financial instruments (continued)
Debt is issued to meet the funding requirements of various jurisdictions and in the currencies that are needed. It is recognised that debt can act as a natural translation hedge of earnings, net assets and net cash flow in currencies other than the reporting currency. For this reason, the majority of the Group’s net debt is denominated in US dollars and euros, reflecting the Group’s largest geographical markets.
There were no changes to the Group’s long-term approach to capital and liquidity management during the year.
The remaining contractual maturities for borrowings and derivative financial instruments are shown in the table below. The table shows undiscounted principal and interest cash flows and includes contractual gross cash flows to be exchanged as part of cross-currency interest rate swaps and forward foreign exchange contracts where there is a legal right ofset-off.
AT 31 DECEMBER 2018 | Contractual cash flow | |||||||||||||||||||||||||||||||
Carrying amount £m | Within 1 year | 1-2 years £m | 2-3 years £m | 3-4 years £m | 4-5 years £m | More than 5 years £m | Total £m | |||||||||||||||||||||||||
Borrowings | ||||||||||||||||||||||||||||||||
Fixed rate borrowings | (5,315 | ) | (752 | ) | (610 | ) | (552 | ) | (879 | ) | (732 | ) | (2,555 | ) | (6,080 | ) | ||||||||||||||||
Floating rate borrowings | (690 | ) | (686 | ) | – | – | – | – | (4 | ) | (690 | ) | ||||||||||||||||||||
Lease liabilities | (360 | ) | (104 | ) | (92 | ) | (75 | ) | (47 | ) | (30 | ) | (63 | ) | (411 | ) | ||||||||||||||||
Derivative financial liabilities | ||||||||||||||||||||||||||||||||
Interest rate derivatives | (15 | ) | (2 | ) | (2 | ) | (2 | ) | (2 | ) | (3 | ) | (8 | ) | (19 | ) | ||||||||||||||||
Cross-currency interest rate swaps | (1 | ) | (48 | ) | (21 | ) | (21 | ) | (21 | ) | (39 | ) | (557 | ) | (707 | ) | ||||||||||||||||
Forward foreign exchange contracts | (53 | ) | (1,498 | ) | (375 | ) | (181 | ) | (25 | ) | – | – | (2,079 | ) | ||||||||||||||||||
Derivative financial assets | ||||||||||||||||||||||||||||||||
Interest rate derivatives | 21 | 12 | 13 | 3 | 1 | 5 | 3 | 37 | ||||||||||||||||||||||||
Cross-currency interest rate swaps | 13 | 33 | 8 | 8 | 8 | 25 | 553 | 635 | ||||||||||||||||||||||||
Forward foreign exchange contracts | 13 | 1,473 | 361 | 173 | 26 | – | – | 2,033 | ||||||||||||||||||||||||
Total | (6,387 | ) | (1,572 | ) | (718 | ) | (647 | ) | (939 | ) | (774 | ) | (2,631 | ) | (7,281 | ) |
AT 31 DECEMBER 2017 RESTATED | Contractual cash flow | |||||||||||||||||||||||||||||||
Carrying amount £m | Within 1 year £m | 1-2 years £m | 2-3 years £m | 3-4 years £m | 4-5 years £m | More than 5 years £m | Total £m | |||||||||||||||||||||||||
Borrowings | ||||||||||||||||||||||||||||||||
Fixed rate borrowings | (4,393 | ) | (331 | ) | (703 | ) | (575 | ) | (518 | ) | (805 | ) | (2,198 | ) | (5,130 | ) | ||||||||||||||||
Floating rate borrowings | (469 | ) | (464 | ) | – | – | – | – | (5 | ) | (469 | ) | ||||||||||||||||||||
Lease liabilities | (391 | ) | (100 | ) | (91 | ) | (79 | ) | (64 | ) | (34 | ) | (82 | ) | (450 | ) | ||||||||||||||||
Derivative financial liabilities | ||||||||||||||||||||||||||||||||
Interest rate derivatives | (13 | ) | (1 | ) | (1 | ) | (2 | ) | (2 | ) | (4 | ) | (8 | ) | (18 | ) | ||||||||||||||||
Cross-currency interest rate swaps | (2 | ) | (258 | ) | (17 | ) | (18 | ) | (18 | ) | (18 | ) | (541 | ) | (870 | ) | ||||||||||||||||
Forward foreign exchange contracts | (42 | ) | (2,148 | ) | (418 | ) | (188 | ) | (41 | ) | – | – | (2,795 | ) | ||||||||||||||||||
Derivative financial assets | ||||||||||||||||||||||||||||||||
Interest rate derivatives | 20 | 13 | 11 | 10 | 1 | – | – | 35 | ||||||||||||||||||||||||
Cross-currency interest rate swaps | 42 | 246 | 7 | 7 | 7 | 7 | 554 | 828 | ||||||||||||||||||||||||
Forward foreign exchange contracts | 53 | 2,139 | 422 | 193 | 42 | – | – | 2,796 | ||||||||||||||||||||||||
Total | (5,195 | ) | (904 | ) | (790 | ) | (652 | ) | (593 | ) | (854 | ) | (2,280 | ) | (6,073 | ) |
The carrying amount of derivative financial liabilities comprises £15m (2017: £15m) in relation to fair value hedges, £41m (2017: £30m) in relation to cash flow hedges and £13m (2017: £12m) not designated as hedging instruments. The carrying amount of derivative financial assets comprises £33m (2017: £20m) in relation to fair value hedges, £7m (2017: £81m) in relation to cash flow hedges and £7m (2017: £14m) not designated as hedging instruments.
Table of Contents
152 | RELX Annual report and financial statements 2018 | Financial statements and other information | |
|
Notes to the consolidated financial statements
for the year ended 31 December 2018
18 Financial instruments (continued)
At 31 December 2018, the Group had access to a $3,000m committed bank facility, consisting of a $1,750m tranche maturing in July 2023 and a $1,250m tranche maturing in July 2021, which was undrawn. This facility backs up short-term borrowings. All borrowings that mature within the next two years can be covered by the facility and by utilising available cash resources.
The committed bank facility is subject to a financial covenant typical to the Group’s size and financial strength. The Group had significant headroom within this covenant for the year ended 31 December 2018. There are no financial covenants in any outstanding public bonds.
Market risk
The Group’s primary market risks are interest rate fluctuations and exchange rate movements. Derivatives are used to manage the risks associated with interest rate and exchange rate movements and the Group does not enter into speculative derivatives. Where the impact of derivatives on the income statement and the statement of financial position could be significant, hedge accounting is applied (subject to satisfying the required criteria) as described in ‘Hedge accounting’ below. Derivatives used by the Group for hedging a particular risk are not specialised and are generally available from numerous sources. The impact of market risks on net post-employment benefit obligations and taxation is excluded from the following market risk sensitivity analysis.
Interest rate exposure management
The Group’s interest rate exposure management policy aims to minimise interest costs with an acceptable level of year on year volatility. To achieve this, the Group uses fixed rate term debt and interest rate swaps to give a target mix of fixed rate and floating rate borrowings. Interest rate derivatives are used only to hedge an underlying risk and no net market positions are held.
At 31 December 2018, 45% of gross bank and bond borrowings were at fixed rate. A 100 basis point reduction in interest rates would result in an estimated decrease in net finance costs of £32m (2017: £26m), based on the composition of financial instruments including cash, cash equivalents, bank loans and commercial paper borrowings at 31 December 2018. A 100 basis point rise in interest rates would result in an estimated increase in net finance costs of £32m (2017: £26m).
The impact on net equity of a theoretical change in interest rates as at 31 December 2018 is restricted to the change in carrying value of floating rate to fixed rate interest rate derivatives in a designated cash flow hedge relationship and undesignated interest rate derivatives. A 100 basis point reduction in interest rates would result in an estimated increase in net equity of £1m (2017: £2m) and a 100 basis point increase in interest rates would reduce net equity by an estimated £1m (2017: £2m). The impact of a change in interest rates on the carrying value of fixed rate borrowings in a designated fair value hedge relationship would be offset by the change in carrying value of the related interest rate derivative. Fixed rate borrowings not in a designated hedging relationship are carried at amortised cost.
Foreign currency exposure management
Translation exposures arise on the earnings and net assets of individual businesses whose operational currencies are other than sterling. Some of these exposures are offset by denominating borrowings in US dollars, euros and other currencies. Currency exposures on transactions denominated in a foreign currency are generally hedged using forward contracts. In addition, recurring transactions and future investment exposures may be hedged, in advance of becoming contractual. The precise policy differs according to the specific circumstances of the individual businesses. Highly predictable future cash flows may be covered for transactions expected to occur during the next 24 months (50 months for the Scientific, Technical & Medical subscription businesses) within limits defined according to the period before the transaction is expected to become contractual. Cover takes the form of foreign exchange forward contracts. Further information is provided in ‘Cash flow hedges’ below.
A theoretical weakening of all currencies by 10% against sterling at 31 December 2018 would decrease the carrying value of net assets, excluding net borrowings, by £782m (2017: £650m). This would be offset to a degree by a decrease in net borrowings of £625m (2017: £473m). A strengthening of all currencies by 10% against sterling at 31 December 2018 would increase the carrying value of net assets, excluding net borrowings, by £782m (2017: £650m) and increase net borrowings by £625m (2017: £473m).
A retranslation of the Group’s net profit for the year, assuming a 10% weakening of all foreign currencies against sterling but excluding transactional exposures, would reduce net profit by £127m (2017: £147m). A 10% strengthening of all foreign currencies against sterling on this basis would increase net profit for the year by £127m (2017: £147m).
Table of Contents
RELX Annual report and financial statements 2018 | Notes to the consolidated financial statements | 153 | |
|
18 Financial instruments (continued)
Credit risk
The Group seeks to manage interest rate risk and limit foreign exchange risks described above by the use of financial instruments and as a result has a credit risk from the potentialnon-performance by the counterparties to these financial instruments, which are unsecured. The amount of this credit risk is normally restricted to the amounts of any hedge gain and not the principal amount being hedged. The Group also has a credit exposure to counterparties for the full principal amount of cash and cash equivalents. Credit risks are controlled by monitoring the credit quality of these counterparties, principally licensed commercial banks and investment banks with strong long-term credit ratings, and the amounts outstanding with each of them.
The Group has treasury policies in place which do not allow concentrations of risk with individual counterparties and do not allow significant treasury exposures with counterparties which are rated lower thanA-/A3 by Standard & Poor’s, Moody’s and Fitch. At 31 December 2018, cash and cash equivalents totalled £114m (2017: £111m), of which 93% (2017: 90%) was held with banks ratedA-/A3 or better.
The Group also has credit risk with respect to trade receivables due from its customers, which include national and state governments, academic institutions and large and small enterprises including law firms, book stores and wholesalers. The concentration of credit risk from trade receivables is limited due to the large and broad customer base. Trade receivable exposures are managed locally in the business units where they arise. Where appropriate, business units seek to minimise this exposure by taking payment in advance and through management of credit terms. Allowance is made for bad and doubtful debts based on management’s assessment of the risk taking into account the ageing profile, experience and circumstance. The maximum exposure to credit risk is represented by the carrying amount of each financial asset, including derivative financial instruments, recorded in the statement of financial position.
Included within trade receivables are the following amounts which are past due, before considering loss allowance: past due up to one month £181m (2017: £220m); past due two to three months £93m (2017: £97m); past due four to six months £37m (2017: £44m); and past due greater than six months £35m (2017: £40m).
Hedge accounting
The hedging relationships that are designated under IFRS 9 – Financial Instruments with effect from 1 January 2018, and/or that were previously designated under IAS 39 – Financial Instruments are described below.
Fair value hedges
The Group has entered into interest rate swaps and cross-currency interest rate swaps to hedge the exposure to changes in the fair value of fixed rate borrowings due to interest rate and foreign currency movements which could affect the income statement. The table below details the designated fair value hedge relationships that were in place at 31 December 2018, swapping fixed rate term debt issues denominated in US dollars (USD) and euros to floating rate USD and euro debt respectively for the whole or part of their term, together with the related fixed and floating rates.
FAIR VALUE HEDGE RELATIONSHIPS | 31 December £m | 31 December Principal amount £m | Fixed rate | Floating rate | ||||||||||||
€550m loan notes and€550m interest rate swaps maturing 2020 | (494 | ) | (489 | ) | 2.5% | LIBOR+1.1% | ||||||||||
€500m bond and€500m interest rate swaps maturing 2021 | (449 | ) | (444 | ) | 0.4% | LIBOR+0.3% | ||||||||||
$700m bond and $700m interest rate swaps maturing 2023 | (549 | ) | 0 | 3.5% | LIBOR+0.8% | |||||||||||
€500m bond and€500m interest rate swaps maturing 2024 | (449 | ) | (444 | ) | 1.0% | LIBOR+0.7% | ||||||||||
€600m bond and€600m/$669.3m cross-currency interest rate swaps maturing 2025 | (525 | ) | (495 | ) | 1.3% | LIBOR+1.3% | ||||||||||
$200m bond and $200m interest rate swaps maturing 2027 | (157 | ) | (148 | ) | 7.2% | LIBOR+5.8% | ||||||||||
(2,623 | ) | (2,020 | ) |
Table of Contents
154 | RELX Annual report and financial statements 2018 | Financial statements and other information | |
|
Notes to the consolidated financial statements
for the year ended 31 December 2018
18 Financial instruments (continued)
The gains and losses on the borrowings and related derivatives designated as fair value hedges, which are included in the income statement as part of finance costs, together with the total carrying values of the borrowings and related derivatives included in the statement of financial position, for the three years ended 31 December 2018, 2017 and 2016 were as follows:
GAINS/(LOSSES) ON BORROWINGS AND RELATED DERIVATIVES AND CARRYING VALUES | 1 January £m | Fair value movement gain/(loss) £m | Exchange gain/(loss) £m | 31 December £m | Carrying values £m | |||||||||||||||
USD debt | 12 | – | 1 | 13 | (701 | ) | ||||||||||||||
Related interest rate swaps | (12 | ) | (1 | ) | (1 | ) | (14 | ) | (14 | ) | ||||||||||
– | (1 | ) | – | (1 | ) | (715 | ) | |||||||||||||
EUR debt | (17 | ) | (21 | ) | (1 | ) | (39 | ) | (1,952 | ) | ||||||||||
Related interest rate swaps | 17 | 21 | 1 | 39 | 39 | |||||||||||||||
– | – | – | – | (1,913 | ) | |||||||||||||||
Total relating to USD and EUR debt | (5 | ) | (21 | ) | – | (26 | ) | (2,653 | ) | |||||||||||
Total related interest rate swaps | 5 | 20 | – | 25 | 25 | |||||||||||||||
Net loss on borrowings and related derivatives/total carrying value | – | (1 | ) | – | (1 | ) | (2,628 | ) |
GAINS/(LOSSES) ON BORROWINGS AND RELATED DERIVATIVES AND CARRYING VALUES | 1 January £m | Fair value movement gain/(loss) £m | De-designated £m | Exchange gain/(loss) £m | 31 December £m | Carrying values £m | ||||||||||||||||||
USD debt | 16 | (1 | ) | (2 | ) | (1 | ) | 12 | (147 | ) | ||||||||||||||
Related interest rate swaps | (16 | ) | 1 | 2 | 1 | (12 | ) | (12 | ) | |||||||||||||||
– | – | – | – | – | (159 | ) | ||||||||||||||||||
EUR debt | (33 | ) | 17 | – | (1 | ) | (17 | ) | (1,922 | ) | ||||||||||||||
Related interest rate swaps | 32 | (16 | ) | – | 1 | 17 | 17 | |||||||||||||||||
(1 | ) | 1 | – | – | – | (1,905 | ) | |||||||||||||||||
Total relating to USD and EUR debt | (17 | ) | 16 | (2 | ) | (2 | ) | (5 | ) | (2,069 | ) | |||||||||||||
Total related interest rate swaps | 16 | (15 | ) | 2 | 2 | 5 | 5 | |||||||||||||||||
Net (loss)/gain on borrowings and related derivatives/total carrying value | (1 | ) | 1 | – | – | – | (2,064 | ) | ||||||||||||||||
GAINS/(LOSSES) ON BORROWINGS AND RELATED DERIVATIVES AND CARRYING VALUES | 1 January £m | Fair value movement gain/(loss) £m | De-designated £m | Exchange £m | 31 December £m | Carrying values £m | ||||||||||||||||||
USD debt | 2 | 13 | – | 1 | 16 | (387 | ) | |||||||||||||||||
Related interest rate swaps | (2 | ) | (13 | ) | – | (1 | ) | (16 | ) | (16 | ) | |||||||||||||
– | – | – | – | – | (403 | ) | ||||||||||||||||||
GBP debt | (14 | ) | – | 14 | – | – | – | |||||||||||||||||
Related interest rate swaps | 14 | – | (14 | ) | – | – | – | |||||||||||||||||
– | – | – | – | – | – | |||||||||||||||||||
EUR debt | (9 | ) | (21 | ) | – | (3 | ) | (33 | ) | (1,011 | ) | |||||||||||||
Related interest rate swaps | 8 | 21 | – | 3 | 32 | 32 | ||||||||||||||||||
(1 | ) | – | – | – | (1 | ) | (979 | ) | ||||||||||||||||
Total relating to USD, GBP and EUR debt | (21 | ) | (8 | ) | 14 | (2 | ) | (17 | ) | (1,398 | ) | |||||||||||||
Total related interest rate swaps | 20 | 8 | (14 | ) | 2 | 16 | 16 | |||||||||||||||||
Net loss on borrowings and related derivatives/total carrying value | (1 | ) | – | – | – | (1 | ) | (1,382 | ) |
All fair value hedges were highly effective throughout the three years ended 31 December 2018.
Table of Contents
RELX Annual report and financial statements 2018 | Notes to the consolidated financial statements | 155 | |
|
18 Financial instruments (continued)
Gross borrowings as at 31 December 2018 included £23m (2017: £24m) in relation to fair value adjustments to borrowings previously designated in a fair value hedge relationship which werede-designated in 2008. The related derivatives were closed out onde-designation with a cash inflow of £62m. £3m (2017: £3m) of these fair value adjustments were amortised in the year as a reduction to finance costs.
Cash flow hedges
As part of the Group’s interest rate exposure management, it has entered into certain cross-currency interest rate derivatives, individual components of which have been accounted for as cash flow hedges (with the remaining components accounted for as fair value hedges, as described above). These comprised the following:
1 | Interest rate derivatives which swapped a fixed rate CHF 275m bond, issued in June 2013 and maturing in December 2018, to floating rate USD debt for the whole of its term. The component relating to the swap of fixed rate CHF coupons to fixed rate USD cash flows was accounted for as a cash flow hedge under IAS 39 and wasde-designated on 31 December 2017. The gains which had accumulated in the cash flow hedge reserve up to the date ofde-designation were reclassified to the income statement as part of finance costs during 2018. |
2 | Interest rate derivatives which swapped a fixed rate€600m bond, issued in May 2015 and maturing in May 2025, to floating rate USD debt for the whole of its term. The component relating to the swap of floating rate euro cash flows to floating rate USD cash flows (including credit margin) was accounted for as a cash flow hedge under IAS 39 up to 31 December 2017. From 1 January 2018 the component relating to the swap of the euro credit margin to USD is being accounted for a cash flow hedge under IFRS 9, with the amount associated with foreign currency basis spreads recorded in the cost of hedging reserve. |
As part of the Group’s foreign currency exposure management, it has entered into forward foreign exchange contracts which fix the exchange rate on a portion of future foreign currency subscription revenues forecast by the businesses for up to 50 months. These have been accounted for as cash flow hedges under IAS 39 and under IFRS 9 of the forecast foreign currency revenues, with gains and losses on the forward contracts deferred in the hedge reserve until the related revenue is recognised, at which time the accumulated gains and losses are reclassified to the income statement.
Movements in the hedge reserve in 2017 and 2018 and, with effect from 1 January 2018, the cost of hedging reserve, including gains and losses on cash flow hedging instruments, were as follows:
Interest rate hedge reserve £m | Cost of £m | Foreign reserve £m | Total £m | |||||||||||||
Hedge reserve at 1 January 2017: gains/(losses) deferred | 8 | – | (169 | ) | (161 | ) | ||||||||||
Gains arising in 2017 | 63 | – | 74 | 137 | ||||||||||||
Amounts recognised in income statement | (65 | ) | – | 90 | 25 | |||||||||||
Exchange translation differences | (1 | ) | – | (2 | ) | (3 | ) | |||||||||
Hedge reserve at 31 December 2017: gains/(losses) deferred | 5 | – | (7 | ) | (2 | ) | ||||||||||
Reclassification on 1 January 2018 | (1 | ) | 1 | – | – | |||||||||||
Losses arising in 2018 | – | (8 | ) | (51 | ) | (59 | ) | |||||||||
Amounts recognised in income statement | (3 | ) | – | 20 | 17 | |||||||||||
Exchange translation differences | – | – | – | – | ||||||||||||
Hedge reserve at 31 December 2018: gains/(losses) deferred | 1 | (7 | ) | (38 | ) | (44 | ) |
All cash flow hedges were highly effective throughout the two years ended 31 December 2018.
A deferred tax credit of £8m (2017: charge of £1m) in respect of the above gains and losses at 31 December 2018 was also deferred in the hedge reserve.
Of the amounts recognised in the income statement in the year, losses of £20m (2017: £90m) were recognised in revenue, and gains of £3m (2017: £65m) were recognised in finance costs. A tax credit of £3m (2017: £1m) was recognised in relation to these items.
The deferred gains and losses on foreign currency cash flow hedges at 31 December 2018 are currently expected to be recognised in the income statement in future years as shown in the table below, together with the principal amount of hedges relating to each year and their total carrying values included within derivative assets and liabilities in the statement of financial position:
Foreign currency hedge reserve £m | Principal amount of hedges £m | Carrying values £m | ||||||||||
2019 | (14 | ) | 481 | (20 | ) | |||||||
2020 | (13 | ) |
| 486 |
| (13 | ) | |||||
2021 | (10 | ) | 228 | (10 | ) | |||||||
2022 | (1 | ) | 64 | (1 | ) | |||||||
Total | (38 | ) | 1,259 | (44 | ) |
The cash flows for these hedges are expected to occur in line with the recognition of the gains and losses in the income statement, or in the preceding year. These cash flows are included in the table on page 151.
Table of Contents
156 | RELX Annual report and financial statements 2018 | Financial statements and other information | |
|
Notes to the consolidated financial statements
for the year ended 31 December 2018
19 Inventories andpre-publication costs
Accounting policy Inventories andpre-publication costs are stated at the lower of cost, including appropriate attributable overhead, and estimated net realisable value. Such costs typically comprise direct internal labour costs and externally commissioned editorial and other fees.
Pre-publication costs, representing costs incurred in the origination of content prior to publication, are expensed systematically reflecting the expected sales profile over the estimated economic lives of the related products, generally up to five years.
Annual reviews are carried out to assess the recoverability of carrying amounts.
|
2018 £m | 2017 £m | |||||||
Raw materials | 2 | 2 | ||||||
Pre-publication costs | 171 | 157 | ||||||
Finished goods | 39 | 38 | ||||||
Total | 212 | 197 | ||||||
20 Trade and other receivables
| ||||||||
2018 £m | Restated £m | |||||||
Trade receivables | 1,829 | 1,682 | ||||||
Loss allowance | (87 | ) | (79 | ) | ||||
1,742 | 1,603 | |||||||
Prepayments and accrued income | 224 | 213 | ||||||
Net finance lease receivable | 49 | 57 | ||||||
Total | 2,015 | 1,873 | ||||||
Trade receivables are predominantlynon-interest bearing and their carrying amounts approximate to their fair value.
Trade receivables are stated net of a loss allowance for expected credit losses. The movements in the loss allowance during the year were as follows:
|
| |||||||
2018 £m | 2017 £m | |||||||
At start of year | 79 | 56 | ||||||
Charge for the year | 14 | 39 | ||||||
Trade receivables written off | (8 | ) | (15 | ) | ||||
Exchange translation differences | 2 | (1 | ) | |||||
At end of year | 87 | 79 | ||||||
21 Trade and other payables | ||||||||
Accounting policy Deferred income is recognised when either a customer has paid consideration, or RELX has an unconditional right to an amount of consideration, in advance of the goods and services being delivered.
|
| |||||||
2018 £m | Restated £m | |||||||
Trade payables | 187 | 240 | ||||||
Accruals | 711 | 663 | ||||||
Social security and other taxes | 127 | 114 | ||||||
Other payables | 407 | 371 | ||||||
Deferred income | 2,000 | 1,910 | ||||||
Total | 3,432 | 3,298 |
Trade and other payables are predominantlynon-interest bearing and their carrying amounts approximate to their fair value.
Table of Contents
RELX Annual report and financial statements 2018 | Notes to the consolidated financial statements | 157 | |
|
22 Borrowings
Accounting policy Borrowings are recorded initially at fair value and subsequently carried at amortised cost, other than fixed rate borrowings in designated hedging relationships for which the carrying amount of the hedged portion of the borrowings is subsequently adjusted for the gain or loss attributable to the hedged risk. When the related derivative in such a hedging relationship expires, is sold or terminated, or no longer qualifies for hedge accounting, the cumulative change in fair value of the hedged borrowing is amortised in the income statement over the period to maturity of the borrowing using the effective interest method.
|
2018 | Restated 2017 | |||||||||||||||||||||||||
Falling due £m | Falling due £m | Total £m | Falling due £m | Falling due in £m | Total £m | |||||||||||||||||||||
Financial liabilities measured at amortised cost: | ||||||||||||||||||||||||||
Short-term bank loans, overdrafts and commercial paper | 686 | – | 686 | 464 | – | 464 | ||||||||||||||||||||
Term debt | 614 | 1,808 | 2,422 | 209 | 1,682 | 1,891 | ||||||||||||||||||||
Lease liabilities | 92 | 268 | 360 | 89 | 302 | 391 | ||||||||||||||||||||
Term debt in fair value hedging relationships | – | 2,652 | 2,652 | – | 2,069 | 2,069 | ||||||||||||||||||||
Term debt previously in fair value hedging relationships | – | 245 | 245 | – | 438 | 438 | ||||||||||||||||||||
Total | 1,392 | 4,973 | 6,365 | 762 | 4,491 | 5,253 |
The total fair value of financial liabilities measured at amortised cost (excluding lease liabilities) is £3,254m (2017: £2,522m). The total fair value of term debt in fair value hedging relationships is £2,742m (2017: £2,148m). The total fair value of term debt previously in fair value hedging relationships is £283m (2017: £501m).
RELX PLC has given guarantees in respect of certain long-term and short-term borrowings issued by subsidiaries. Included within term debt above are debt securities issued by RELX Capital Inc., a 100% indirectly owned finance subsidiary of RELX PLC, which have been registered with the US Securities and Exchange Commission. RELX PLC has fully and unconditionally guaranteed these securities, which are not guaranteed by any other subsidiary of RELX PLC.
Analysis by year of repayment
2018 | Restated 2017 | |||||||||||||||||||||||||||||||||
Short-term £m | Term debt £m | Lease liabilities £m | Total £m | Short-term £m | Term debt £m | Lease liabilities £m | Total £m | |||||||||||||||||||||||||||
Within 1 year | 686 | 614 | 92 | 1,392 | 464 | 209 | 89 | 762 | ||||||||||||||||||||||||||
Within 1 to 2 years | – | 508 | 87 | 595 | – | 593 | 85 | 678 | ||||||||||||||||||||||||||
Within 2 to 3 years | – | 451 | 70 | 521 | – | 508 | 74 | 582 | ||||||||||||||||||||||||||
Within 3 to 4 years | – | 688 | 42 | 730 | – | 444 | 58 | 502 | ||||||||||||||||||||||||||
Within 4 to 5 years | – | 669 | 27 | 696 | – | 630 | 28 | 658 | ||||||||||||||||||||||||||
After 5 years | – | 2,389 | 42 | 2,431 | – | 2,014 | 57 | 2,071 | ||||||||||||||||||||||||||
After 1 year | – | 4,705 | 268 | 4,973 | – | 4,189 | 302 | 4,491 | ||||||||||||||||||||||||||
Total | 686 | 5,319 | 360 | 6,365 | 464 | 4,398 | 391 | 5,253 |
Short-term bank loans, overdrafts and commercial paper were backed up at 31 December 2018 by a $3,000m (£2,354m) committed bank facility, consisting of a $1,750m (£1,373m) tranche maturing in July 2023 and a $1,250m (£981m) tranche maturing in July 2021, which was undrawn.
Table of Contents
158 | RELX Annual report and financial statements 2018 | Financial statements and other information | |
|
Notes to the consolidated financial statements
for the year ended 31 December 2018
22 Borrowings (continued)
Analysis by currency
2018 | Restated 2017 | |||||||||||||||||||||||||||||||||
Short-term £m | Term debt £m | Lease liabilities £m | Total £m | Short-term £m | Term debt £m | Lease liabilities £m | Total £m | |||||||||||||||||||||||||||
US dollars | 19 | 2,493 | 177 | 2,689 | 103 | 2,044 | 187 | 2,334 | ||||||||||||||||||||||||||
£ sterling | 317 | 300 | 66 | 683 | 262 | 299 | 69 | 630 | ||||||||||||||||||||||||||
Euro | 318 | 2,526 | 85 | 2,929 | 76 | 2,055 | 97 | 2,228 | ||||||||||||||||||||||||||
Other currencies | 32 | – | 32 | 64 | 23 | – | 38 | 61 | ||||||||||||||||||||||||||
Total | 686 | 5,319 | 360 | 6,365 | 464 | 4,398 | 391 | 5,253 |
Included in the US dollar amounts for term debt above is £544m of debt denominated in euros (€600m) (2017: £742m of debt denominated in euros (€600m) and Swiss francs (CHF 275m)) that was swapped into US dollars on issuance and against which there are related derivative financial instruments, which, as at 31 December 2018, had a fair value of £19m (2017: £38m).
23 Lease arrangements
Accounting policy All leases where RELX is the lessee (with the exception of short-term andlow-value leases) are recognised in the statement of financial position. A lease liability is recognised based on the present value of the future lease payments, and a correspondingright-of-use asset is recognised. Theright-of-use asset is depreciated over the shorter of the lease term or the useful life of the asset. Lease payments are apportioned between finance charges and a reduction of the lease liability.
Low-value items and short-term leases with a term of 12 months or less are not required to be recognised on the balance sheet and payments made in relation to these leases are recognised on a straight-line basis in the income statement.
The leases held by the Group can be split into two categories: property andnon-property. The Group leases various properties, principally offices, which have varying terms and renewal rights that are typical to the territory in which they are located.Non-property includes all other leases, such as cars and printers.
|
Right-of-use assets
Property £m | Non- property £m | 2018 £m | Property £m | Non- property £m | Restated £m | |||||||||||||||||||
At start of year | 264 | 23 | 287 | 298 | 27 | 325 | ||||||||||||||||||
Additions | 26 | 5 | 31 | 41 | 5 | 46 | ||||||||||||||||||
Acquisitions | 7 | 5 | 12 | – | – | – | ||||||||||||||||||
Remeasurement | 13 | – | 13 | 8 | – | 8 | ||||||||||||||||||
Disposals | (2 | ) | (8 | ) | (10 | ) | (8 | ) | – | (8 | ) | |||||||||||||
Depreciation | (68 | ) | (9 | ) | (77 | ) | (67 | ) | (8 | ) | (75 | ) | ||||||||||||
Exchange translation differences | 6 | 1 | 7 | (8 | ) | (1 | ) | (9 | ) | |||||||||||||||
At end of year | 246 | 17 | 263 | 264 | 23 | 287 |
Table of Contents
RELX Annual report and financial statements 2018 | Notes to the consolidated financial statements | 159 | |
|
23 Lease arrangements (continued)
Lease liability
2018 £m | Restated £m | |||||||
Current | ||||||||
Property | (83 | ) | (81 | ) | ||||
Non-property | (9 | ) | (8 | ) | ||||
Non-current | ||||||||
Property | (260 | ) | (295 | ) | ||||
Non-property | (8 | ) | (7 | ) | ||||
Total | (360 | ) | (391 | ) |
Interest expense on the lease liabilities recognised within finance costs was £14m (2017: £17m, 2016: £18m).
As at 31 December 2018, RELX was committed to leases with future cash outflows totalling £40m which had not yet commenced and as such are not accounted for as a liability as at 31 December 2018. A liability and correspondingright-of-use asset will be recognised for these leases at the lease commencement date.
RELX subleases vacant space available within its leased properties. IFRS 16 specifies conditions whereby a sublease is classed as a finance lease for thesub-lessor. The finance lease receivable balance held is as follows:
2018 £m | Restated £m | |||||||
Net finance lease receivable | 49 | 57 |
Interest income recognised in relation to finance lease receivables is disclosed in note 7.
24 Provisions
Accounting policy Provisions are recognised when a present obligation exists as a result of a past event, the obligation is reasonably estimable, and it is probable that settlement will be required. Provisions are measured at the best estimate of the expenditure required to settle the obligation at the statement of financial position date.
|
2018 £m | Restated £m | |||||||
At start of year | 63 | 86 | ||||||
Utilised | (14 | ) | (17 | ) | ||||
Exchange translation differences | 2 | (6 | ) | |||||
Total | 51 | 63 |
The Group has exposures to shortfalls in respect of certain property leases for periods up to 2024. Provisions are recognised for net liabilities expected to arise on the exposures relating tonon-rent costs on these properties.
At 31 December 2018, provisions are included within current andnon-current liabilities as follows:
2018 £m | Restated £m | |||||||
Current liabilities | 15 | 12 | ||||||
Non-current liabilities | 36 | 51 | ||||||
Total | 51 | 63 |
Table of Contents
160 | RELX Annual report and financial statements 2018 | Financial statements and other information | |
|
Notes to the consolidated financial statements
for the year ended 31 December 2018
25 Share capital, share premium and shares held in treasury
Accounting policy Shares of RELX PLC that are repurchased and not cancelled are classified as shares held in treasury. The consideration paid, including directly attributable costs, is recognised as a deduction from equity. Shares of RELX PLC that are purchased by the Employee Benefit Trust are also classified as shares held in treasury, with the cost recognised as a deduction from equity.
|
RELX PLC
CALLED UP SHARE CAPITAL – ISSUED AND FULLY PAID | No. of shares | 2018 £m | No. of shares | 2017 £m | ||||||||||||
At start of year | 1,123,682,106 | 162 | 1,144,122,623 | 165 | ||||||||||||
Issue of ordinary shares | 1,580,885 | – | 2,019,483 | – | ||||||||||||
Issue of ordinary shares in exchange for RELX NV shares | 930,780,110 | 134 | – | – | ||||||||||||
Cancellation of shares | (45,000,000 | ) | (6 | ) | (22,460,000 | ) | (3 | ) | ||||||||
At end of year | 2,011,043,101 | 290 | 1,123,682,106 | 162 | ||||||||||||
RELX NV | ||||||||||||||||
CALLED UP SHARE CAPITAL – ISSUED AND FULLY PAID | No. of shares | 2018 €m | No. of shares | 2017 €m | ||||||||||||
At start of year | 999,961,098 | 70 | 1,019,893,404 | 71 | ||||||||||||
Issue of ordinary shares | 888,128 | – | 2,067,694 | – | ||||||||||||
Cancellation of shares | – | – | (22,000,000 | ) | (1 | ) | ||||||||||
Cancellation of ordinary shares on completion of the corporate simplification | (930,780,110 | ) | (65 | ) | – | – | ||||||||||
Cancellation of treasury shares on completion of the corporate simplification | (70,069,116 | ) | (5 | ) | – | – | ||||||||||
At end of year | – | – | 999,961,098 | 70 |
NUMBER OF ORDINARY SHARES | Year ended 31 December | |||||||||||||||
Shares in issue (millions) | Treasury shares (millions) | 2018 Shares in issue net of treasury shares (millions) | 2017 Shares in issue net of treasury shares (millions) | |||||||||||||
RELX PLC | ||||||||||||||||
At start of year | 1,123.6 | (63.5 | ) | 1,060.1 | 1,080.5 | |||||||||||
Issue of ordinary shares | 1.6 | – | 1.6 | 2.0 | ||||||||||||
Issue of ordinary shares in exchange for RELX NV shares | 930.8 | (3.5 | ) | 927.3 | – | |||||||||||
Repurchase of ordinary shares | – | (26.9 | ) | (26.9 | ) | (23.1 | ) | |||||||||
Net (purchase)/release of shares by the Employee Benefit Trust | – | (0.2 | ) | (0.2 | ) | 0.7 | ||||||||||
Cancellation of shares | (45.0 | ) | 45.0 | – | – | |||||||||||
At end of year | 2,011.0 | (49.1 | ) | 1,961.9 | 1,060.1 | |||||||||||
RELX NV | ||||||||||||||||
At start of year | 1,000.0 | (56.4 | ) | 943.6 | 962.2 | |||||||||||
Issue of ordinary shares | 0.9 | – | 0.9 | 2.1 | ||||||||||||
Repurchase of ordinary shares | – | (17.5 | ) | (17.5 | ) | (21.4 | ) | |||||||||
Net release of shares by the Employee Benefit Trust | – | 0.3 | 0.3 | 0.7 | ||||||||||||
Cancellation of ordinary shares on completion of the corporate simplification | (930.8 | ) | 3.5 | (927.3 | ) | – | ||||||||||
Cancellation of treasury shares on completion of the corporate simplification | (70.1 | ) | 70.1 | – | – | |||||||||||
At end of year | – | – | – | 943.6 | ||||||||||||
At end of year | 2,011.0 | (49.1 | ) | 1,961.9 | 2,003.7 |
Table of Contents
RELX Annual report and financial statements 2018 | Notes to the consolidated financial statements | 161 | |
|
25 Share capital, share premium and shares held in treasury (continued)
During the year, RELX PLC repurchased 26.9m (2017: 23.1m; 2016: 29.2m) RELX PLC ordinary shares for an average price of 1,578p; these shares are held in treasury.
On completion of the corporate simplification RELX NV shares were cancelled and replaced with RELX PLC shares. This amounted to 930,780,110 RELX NV shares being cancelled and the same number of RELX PLC shares issued in exchange. The RELX NV treasury shares were cancelled as part of the simplification. Prior to the corporate simplification, RELX NV repurchased 17.5m (2017: 21.4m; 2016: 26.1m) RELX NV ordinary shares for an average price of€17.73. These shares were held in treasury until their cancellation.
The total consideration for RELX PLC and RELX NV repurchases was £700m (2017: £700m; 2016: £700m).
The Employee Benefit Trust purchases RELX PLC shares which, at the trustees’ discretion, can be used in respect of the exercise of share options and to meet commitments under conditional share awards. During the year, the Employee Benefit Trust purchased 2.9m shares for a total cost of £43m (2017: £39m; 2016: £29m). At 31 December 2018, shares held by the Employee Benefit Trust were £90m (2017: £82m; 2016: £81m) at cost.
The issue of ordinary shares in the year relates to the exercise of share options. Details of share option and conditional share schemes are set out in note 7 on page 137.
All of the RELX PLC ordinary shares rank equally with respect to voting rights and rights to receive dividends, except for shares held in treasury, which do not attract voting or dividend rights. There are no restrictions on the rights to transfer shares.
At 31 December 2018, RELX PLC shares held in treasury related to 7,130,366 (2017: 3,493,817; 2016: 4,229,442) RELX PLC ordinary shares held by the Employee Benefit Trust; and 42,023,020 (2017: 60,077,786; 2016: 59,415,287) RELX PLC ordinary shares held by the parent company. During December 2018, 45m (2017: 22.5m) RELX PLC ordinary shares held in treasury were cancelled.
On 7 December 2018, RELX PLC announced anon-discretionary programme to repurchase further ordinary shares up to the value of £100m. At 31 December 2018, an accrual of £100m was recognised in respect of thisnon-discretionary commitment. A further 6.0m RELX PLC ordinary shares have been repurchased in January and February 2019 under this programme.
26 Other reserves
Hedge reserve 2018 £m | Other £m | Total 2018 £m | Restated 2017 £m | |||||||||||||
At start of year | (3 | ) | 428 | 425 | (215 | ) | ||||||||||
Profit attributable to RELX PLC shareholders | – | 1,422 | 1,422 | 1,648 | ||||||||||||
Dividends paid | – | (796 | ) | (796 | ) | (762 | ) | |||||||||
Actuarial (losses)/gains on defined benefit pension schemes | – | (91 | ) | (91 | ) | 233 | ||||||||||
Fair value movements on cash flow hedges | (59 | )�� | – | (59 | ) | 137 | ||||||||||
Transfer to net profit from cash flow hedge reserve | 17 | – | 17 | 25 | ||||||||||||
Tax recognised in other comprehensive income | 9 | 15 | 24 | (89 | ) | |||||||||||
Increase in share based remuneration reserve (net of tax) | – | 35 | 35 | 42 | ||||||||||||
Issue of ordinary shares, net of expenses | – | (227 | ) | (227 | ) | – | ||||||||||
Cancellation of shares | – | 262 | 262 | (566 | ) | |||||||||||
Settlement of share awards | – | (35 | ) | (35 | ) | (37 | ) | |||||||||
Exchange translation differences | – | 7 | 7 | 9 | ||||||||||||
At end of year | (36 | ) | 1,020 | 984 | 425 |
Other reserves principally comprise retained earnings and the share based remuneration reserve.
Table of Contents
162 | RELX Annual report and financial statements 2018 | Financial statements and other information | |
|
Notes to the consolidated financial statements
for the year ended 31 December 2018
27 Related party transactions
Transactions between RELX PLC and subsidiaries of the Group have been eliminated within the consolidated financial statements. Transactions with joint ventures were made on normal market terms of trading and comprise sales of goods and services of £3m (2017: £16m; 2016: £2m) and the rendering and receiving of goods and services of £0.1m (2017: £0.1m; 2016: nil). As at 31 December 2018, amounts owed by joint ventures were £2m (2017: £2m; 2016: nil) and amounts due to joint ventures were £0.9m (2017: £1m; 2016: nil). See note 6 for details of the Group’s participation in defined benefit pension schemes.
Key management personnel are also related parties as defined by IAS 24 – Related Party Disclosures and comprise the Executiveand Non-Executive Directors of RELX PLC. Key management personnel remuneration is set out below. For reporting purposes, salary, benefits and annual incentive payments are considered short-term employee benefits.
KEY MANAGEMENT PERSONNEL REMUNERATION | 2018 £m | 2017 £m | 2016 £m | |||||||||
Salaries, other short-term employee benefits andnon-executive fees | 7 | 5 | 5 | |||||||||
Post-employment benefits | 1 | 1 | 1 | |||||||||
Share based remuneration* | 7 | 8 | 12 | |||||||||
Total | 15 | 14 | 18 |
EXECUTIVE DIRECTORS | | Salary £’000 | | | Benefits £’000 | | | Annual incentive £’000 | | | Cost of share based remuneration £’000 | * | | Cost of pension provision |
* | | Total £’000 | | ||||||||||
Total Executive Directors | 2018 | 1,935 | 99 | 3,033 | 7,003 | 741 | 12,811 | |||||||||||||||||||||
2017 | 1,889 | 101 | 1,964 | 8,205 | 983 | 13,142 | ||||||||||||||||||||||
2016 | 1,843 | 88 | 1,881 | 12,038 | 1,052 | 16,902 |
* The figures for share based awards are calculated in accordance with the methodology set out in the UK Regulations. The figure for performance-related share based awards includes share price appreciation since the date the award was granted. Please see page 87 for further details. The cost of pension provision is calculated in accordance with the methodology set out in the UK Regulations. The amount is reduced by the Directors’ contributions and participation fee for defined benefit schemes and reduced by the payments made to defined contribution schemes or in lieu of pension.
NON-EXECUTIVE DIRECTORS | 2018 £’000 | 2017 £’000 | 2016 £’000 | |||||||||
Fees and benefits | 1,634 | 1,396 | 1,364 |
The remuneration ofnon-executive directors comprises fees for services, and benefits primarily relating to tax filing support in respect of filings resulting from their directorships. No deemed benefits were provided during 2018 to former Directors (2017: £2,460; 2016: nil). No loans, advances or guarantees have been provided on behalf of any Director. The aggregate gains made by Executive Directors on the exercise of options during 2018 were nil (2017: £2,804,358; 2016: £3,082,715).
28 Exchange rates
The following exchange rates have been applied in preparing the consolidated financial statements:
Income statement | Statement of financial position | |||||||||||||||||||||||
2018 | 2017 | 2016 | 2018 | 2017 | ||||||||||||||||||||
Euro to sterling | 1.13 | 1.14 | 1.22 | 1.11 | 1.12 | |||||||||||||||||||
US dollar to sterling | 1.34 | 1.29 | 1.36 | 1.27 | 1.35 |
29 Approval of financial statements
The consolidated financial statements were approved and authorised for issue by the Board of Directors on 20 February 2019.
Table of Contents
RELX Annual report and financial statements 2018 | Notes to the consolidated financial statements | 163 | |
|
A full list of related undertakings (comprising subsidiaries, joint ventures, associates and other significant holdings) is set out below. All are 100% owned directly or indirectly by the Group except where percentage ownership denoted in (x%).
Company name | Share class | Reg office | ||||
Australia | ||||||
Adaptris Pty Ltd | Ordinary | AUS1 | ||||
Elsevier (Australia) Pty Ltd | Ordinary | AUS3 | ||||
Fair Events Pty Ltd (49%) | Ordinary | AUS4 | ||||
Fitness Show Pty Ltd (80%) | Ordinary | AUS6 | ||||
Reed Business Information (Australia) Pty Ltd | Ordinary | AUS1 | ||||
Reed Exhibitions Australia Pty Ltd | Ordinary | AUS2 | ||||
Reed International Books Australia Pty Ltd | Ordinary | AUS3 | ||||
Reed OzComic-Con Pty Ltd (80%) | Ordinary | AUS2 | ||||
RELX Australia Pty Ltd | Ordinary | AUS2 | ||||
SST Software Australia Pty Ltd | Ordinary | AUS7 | ||||
Symbiotic Technologies Pty Ltd | Ordinary | AUS8 | ||||
Symbiotic Technologies Operation Pty Ltd | Ordinary | AUS8 | ||||
ThreatMetrix Pty Ltd | Ordinary | AUS8 | ||||
Austria | ||||||
Expoxx Messebau GmbH | Registered Capital | AUT1 | ||||
LexisNexis Verlag ARD ORAC GmbH & Co KG | Registered Capital | AUT2 | ||||
ORAC Gesellschaft m.b.H. | Registered Capital | AUT2 | ||||
Reed CEE GmbH | Registered Capital | AUT1 | ||||
Reed Messe Salzburg GmbH | Registered Capital | AUT3 | ||||
Reed Messe Wien GmbH | Registered Capital | AUT1 | ||||
RELX Austria GmbH | Registered Capital | AUT3 | ||||
System StandBau GmbH | Registered Capital | AUT4 | ||||
Belgium | ||||||
LexisNexis BVBA | Ordinary | BEL1 | ||||
First 4 Farming Europe NV | Ordinary | BEL2 | ||||
Brazil | ||||||
Elsevier Editora Ltda | Quotas | BRA1 | ||||
Fircosoft Brazil Consultoria e Servicos de Informatica Ltda | Ordinary | BRA2 | ||||
LexisNexis Informações e Sistemas Empresariais Ltda | Quotas shares | BRA3 | ||||
LexisNexis Serviços de Análise de Risco Ltda | Quotas shares | BRA3 | ||||
MLex Brasil Midia Mercadologica Ltda (91%) | Quotas | BRA4 | ||||
Reed Exhibitions Alcântara Machado Ltda | Quotas shares | BRA3 | ||||
SST Software do Brasil Ltda | Ordinary | BRA5 | ||||
Canada | ||||||
LexisNexis Canada Inc | Class A ordinary | CAN1 | ||||
RELX Canada Ltd | Unlimited Class A, | CAN3 | ||||
Unlimited Class B, | ||||||
Unlimited Class C, | ||||||
Unlimited Class D, | ||||||
Unlimited Class E, | ||||||
Unlimited Class F, | ||||||
Unlimited Class G, | ||||||
Unlimited Class H | ||||||
Science-Metrix Inc | Class A common | CAN4 | ||||
shares | ||||||
Class B common | ||||||
shares | ||||||
Class A preferred | ||||||
shares | ||||||
Class B preferred | ||||||
shares | ||||||
Class C preferred | ||||||
shares | ||||||
Class D preferred | ||||||
shares | ||||||
ThreatMetrix (Canada) Inc | Common shares | CAN2 | ||||
China | ||||||
Beijing Bakery China Exhibitions Co., Ltd (25%) | Registered Capital | CHN1 | ||||
Beijing Medtime Elsevier Education Technology Co., Ltd (49%) | Registered Capital | CHN2 | ||||
Beijing Reed Elsevier Science and Technology Co., Ltd | Registered Capital | CHN3 | ||||
Beijing Reed Guanghe Exhibition Co., Ltd (80%) | Registered Capital | CHN4 | ||||
C-One Energy Co., Ltd | Registered Capital | CHN6 | ||||
Genilex Information Technology Co., Ltd (40%) | Registered Capital | CHN7 | ||||
ICIS Consulting (Beijing) Co., Ltd | Registered Capital | CHN8 | ||||
KeAi Communications Co., Ltd (49%) | Registered Capital | CHN9 | ||||
LexisNexis Risk Solutions (Shanghai) Information | Registered Capital | CHN10 | ||||
Technologies Co., Ltd | ||||||
MLex Consulting (Beijing) Co., Ltd (91%) | Registered Capital | CHN11 | ||||
Reed Business Information (Shanghai) Co Ltd | Registered Captial | CHN20 | ||||
Reed Elsevier Information Technology (Beijing) Co., Ltd | Registered Capital | CHN3 | ||||
Reed Exhibitions (China) Co., Ltd | Registered Capital | CHN4 | ||||
Reed Exhibitions Henjin Co., Ltd | Registered Capital | CHN19 | ||||
Reed Exhibitions (Shanghai) Co., Ltd | Registered Capital | CHN12 | ||||
Reed Hongda Exhibitions (Henan) Co., Ltd (51%) | Registered Capital | CHN13 | ||||
Reed Huabai Exhibitions (Beijing) Co., Ltd (51%) | Registered Capital | CHN4 | ||||
Reed Huabo Exhibitions (Shenzhen) Co., Ltd (65%) | Registered Capital | CHN14 |
Company name | Share class | Reg office | ||||
Reed Huaqun Exhibitions Co., Ltd (52%) | Registered Capital | CHN4 | ||||
Reed Kuozhan Exhibitions (Shanghai) Co., Ltd (60%) | Registered Capital | CHN12 | ||||
Reed Sinopharm Exhibitions Co., Ltd (50%) | Registered Capital | CHN4 | ||||
RELX (China) Investment Co., Ltd | Registered Capital | CHN15 | ||||
Shanghai Datong Medical Information Technology Co., Ltd | Registered Capital | CHN17 | ||||
Shanghai SinoReal Exhibitions Co., Ltd (27.5%) | Registered Capital | CHN18 | ||||
Colombia | ||||||
LexisNexis Risk Solutions S.A.S. | Ordinary | COL1 | ||||
Denmark | ||||||
Elsevier A/S | Ordinary | DNK1 | ||||
Reed Elsevier Denmark ApS | Ordinary | DNK1 | ||||
Dubai, UAE | ||||||
Reed Exhibitions FreeZone-LLC | Ordinary | UAE1 | ||||
RELX Middle EastFZ-LLC | Ordinary | UAE2 | ||||
Egypt | ||||||
Elsevier Egypt LLC | Ordinary | EGY1 | ||||
France | ||||||
Elsevier Holding France SAS | Registered Capital | FRA1 | ||||
Elsevier Masson SAS | Registered Capital | FRA1 | ||||
Evoluprint SAS | Ordinary | FRA2 | ||||
Fircosoft SAS | Ordinary | FRA3 | ||||
GieEdi-Data (83%) | Ordinary | FRA4 | ||||
Gie Juris-Data | Ordinary | FRA4 | ||||
GIE PRK – Publicite Robert Krier | Registered capital | FRA5 | ||||
LexisNexis Business Information Solutions S.A. | Ordinary | FRA4 | ||||
LexisNexis Business Information Solutions Holding S.A. | Ordinary | FRA6 | ||||
LexisNexis International Development Services S.A. | Ordinary | FRA4 | ||||
LexisNexis SA | Ordinary | FRA4 | ||||
Reed Exhibitions ISG SARL | Registered capital | FRA7 | ||||
Reed Expositions France SAS | Ordinary | FRA5 | ||||
Reed Midem SAS | Registered capital | FRA7 | ||||
Reed Organisation SAS | Ordinary | FRA5 | ||||
RELX France S.A. | Registered capital | FRA7 | ||||
SAFI SA (50%) | Ordinary | FRA8 | ||||
Germany | ||||||
Aries Medical Knowledge GmbH & Co KG | Registered Capital | DEU9 | ||||
Aries Medical Knowledge Verwaltungsgesellschaft GmbH | Registered Capital | DEU9 | ||||
Elsevier GmbH | Registered Capital | DEU3 | ||||
Elsevier Information Systems GmbH | Registered Capital | DEU3 | ||||
LexisNexis GmbH | Registered Capital | DEU5 | ||||
PatentSight GmbH | Registered Capital | DEU8 | ||||
REC Publications GmbH | Registered Capital | DEU1 | ||||
Reed Exhibitions (Germany) GmbH | Registered Capital | DEU1 | ||||
Reed Exhibitions Deutschland GmbH | Registered Capital | DEU1 | ||||
Reed Travel Group (Germany) GmbH | Ordinary | DEU6 | ||||
RELX Deutschland GmbH | Registered Capital | DEU1 | ||||
Tschach Solutions GmbH | Ordinary | DEU7 | ||||
Hong Kong | ||||||
Ascend China Holding Ltd | Ordinary | HNK1 | ||||
Reed Business Information (China) Ltd | Ordinary | HNK2 | ||||
JC Exhibition and Promotion Ltd (65%) | Ordinary | HNK1 | ||||
JYLN Sager Ltd (40%) | Ordinary | HNK5 | ||||
MLex Asia Ltd (91%) | Ordinary | HNK6 | ||||
Reed Exhibitions Ltd | Ordinary | HNK5 | ||||
RELX (Greater China) Ltd | Ordinary | HNK7 | ||||
India | ||||||
Comic Con India Private Ltd (36%) | Ordinary | IND2 | ||||
FircoSoft India Private Ltd | Ordinary | IND3 | ||||
Reed Elsevier Publishing (India) Pvt Ltd | Ordinary | IND4 | ||||
Reed Manch Exhibitions Private Ltd (70%) | Ordinary | IND5 | ||||
Reed SI Exhibitions Private Ltd (51%) | Ordinary | IND6 | ||||
Reed Triune Exhibitions Private Ltd (72%) | Ordinary | IND7 | ||||
RELX India Private Ltd | Ordinary | IND1 | ||||
Indonesia | ||||||
PT Reed Exhibitions Indonesia (70%) | Class A | IDN2 | ||||
Class B | ||||||
PT Reed Panorama Exhibitions (50%) | Ordinary | IDN1 |
Table of Contents
164 | RELX Annual report and financial statements 2018 | Financial statements and other information | |
|
Notes to the consolidated financial statements
for the year ended 31 December 2018
30 Related undertakings (continued)
Company name | Share class | Reg office | ||||
Ireland | ||||||
Butterworth (Ireland) Ltd | Ordinary, A Ordinary | IRL2 | ||||
Elsevier Services Ireland Ltd | Ordinary | IRL4 | ||||
LexisNexis Risk Solutions (Ireland) Ltd | Ordinary | IRL1 | ||||
LexisNexis Risk Solutions (Europe) Ltd | Ordinary | IRL1 | ||||
Israel | ||||||
LexisNexis Israel Ltd | Ordinary | ISR1 | ||||
Italy | ||||||
Elsevier SRL | Registered Capital | ITA1 | ||||
ICIS Italia SRL | Ordinary | ITA2 | ||||
Reed Exhibitions ISG Italy SRL | Ordinary | ITA1 | ||||
Reed Exhibitions Italia SRL | Ordinary | ITA1 | ||||
Japan | ||||||
Ascend Japan KK | Ordinary | JPN1 | ||||
Elsevier Japan KK | Ordinary | JPN2 | ||||
LexisNexis Japan KK | Common Stock | JPN3 | ||||
PatentSight Japan Inc | Common Shares | JPN6 | ||||
Reed Exhibitions Japan KK | Ordinary | JPN4 | ||||
Reed ISG Japan KK | Ordinary | JPN5 | ||||
ThreatMetrix GK | Membership Interest | JPN7 | ||||
Korea (South) | ||||||
Elsevier Korea LLC | Ordinary | KOR1 | ||||
LexisNexis Legal and Professional Service Korea Ltd | Ordinary | KOR2 | ||||
Reed Exhibitions Korea Ltd | Ordinary | KOR3 | ||||
Reed Exporum Ltd (60%) | Ordinary | KOR4 | ||||
Reed K. Fairs Ltd (70%) | Ordinary | KOR3 | ||||
Luxembourg | ||||||
FIRCOSOFT Luxembourg Sàrl | Ordinary | LUX1 | ||||
Malaysia | ||||||
LexisNexis Malaysia Sdn Bhd | Ordinary | MYS1 | ||||
Reed Exhibitions Sdn Bhd | Ordinary | MYS1 | ||||
Mexico | ||||||
Masson-Doyma Mexico, S.A. | Ordinary | MEX1 | ||||
Reed Exhibitions Mexico S.A. de C.V. | Ordinary | MEX1 | ||||
Morocco | ||||||
Reed Exhibitions Morocco SARL | Ordinary | MAR1 | ||||
New Zealand | ||||||
LexisNexis NZ Ltd | Ordinary | NZL1 | ||||
Philippines | ||||||
Reed Elsevier Shared Services (Philippines) Inc. | Ordinary | PHL1 | ||||
Poland | ||||||
Elsevier sp. z.o.o. | Ordinary | POL1 | ||||
Russia | ||||||
Ecwatech Company ZAO | Ordinary | RUS1 | ||||
LexisNexis OOO | Registered Capital | RUS2 | ||||
Real Estate Events Direct OOO (80%) | Registered Capital | RUS3 | ||||
RELX OOO | Registered Capital | RUS2 | ||||
Saudi Arabia | ||||||
Reed Sunaidi Exhibitions (50%) | Ordinary | SAU1 | ||||
Singapore | ||||||
Elsevier (Singapore) Pte Ltd | Ordinary | SGP1 | ||||
F4F Agriculture (Asia Pacific) Pte Ltd | Ordinary | SGP2 | ||||
Lexis-Nexis Philippines Pte Ltd (75%) | Preference shares | SGP3 | ||||
Reed Business Information Pte Ltd | Ordinary | SGP4 | ||||
RE (HAPL) Pte Ltd | Ordinary | SGP1 | ||||
RELX (Singapore) Pte. Ltd | Ordinary | SGP3 | ||||
SAFI Asia Pte Ltd (50%) | Ordinary | SGP4 | ||||
ThreatMetrix PTE Ltd | Ordinary | SGP5 | ||||
South Africa | ||||||
Fircosoft South Africa (Pty) Ltd | Ordinary | ZAF1 | ||||
Globalrange SA (Pty) Ltd | Ordinary | ZAF2 | ||||
Korbitec (Pty) Ltd (90%) | Ordinary | ZAF3 | ||||
LegalPerfectTSoftware Solutions (Pty) Ltd (90%) | Ordinary | ZAF3 | ||||
LexisNexis Academic (Pty) Ltd (90%) | Ordinary | ZAF3 | ||||
LexisNexis (Pty) Ltd (90%) | Ordinary | ZAF3 | ||||
LexisNexis Risk Management (Pty) Ltd (90%) | Ordinary | ZAF3 | ||||
Property Payment Exchange (SA) (Pty) Ltd (90%) | Ordinary | ZAF3 |
Company name | Share class | Reg office | ||||
RELX (Pty) Ltd | Ordinary | ZAF3 | ||||
Reed Exhibitions (Pty) Ltd (90%) | A-shares | ZAF4 | ||||
Reed Events Management (Pty) Ltd (90%) | A-shares | ZAF4 | ||||
Reed Exhibitions Group(Pty) Ltd (90%) | Ordinary | ZAF4 | ||||
Reed Venue Management (Pty) Ltd (90%) | A-shares | ZAF4 | ||||
Winsearch Services (Pty) Ltd (90%) | Ordinary | ZAF3 | ||||
Spain | ||||||
Elsevier Espana, S.L. | Participations | ESP1 | ||||
Switzerland | ||||||
Elsevier Finance SA | Ordinary | CHE1 | ||||
Fircosoft Schweiz GmbH | Ordinary | CHE2 | ||||
RELX Risks SA | Ordinary | CHE1 | ||||
RELX Swiss Holdings SA | Ordinary | CHE1 | ||||
Taiwan | ||||||
Elsevier Taiwan LLC | Registered Capital | TWN1 | ||||
Thailand | ||||||
Reed Holding (Thailand) Co., Ltd | Ordinary | THA2 | ||||
Reed Tradex Company Ltd (49%) | Preference shares | THA1 | ||||
The Netherlands | ||||||
AGRM Solutions C.V. | Partnership Interest | NLD1 | ||||
Elsevier B.V. | Ordinary | NLD1 | ||||
Elsevier Employment Services B.V. | Ordinary | NLD1 | ||||
LexisNexis Business Information Solutions B.V. | Ordinary | NLD1 | ||||
LexisNexis Univentio B.V. | Ordinary | NLD2 | ||||
Misset Uitgeverij B.V.(49%) | Ordinary | NLD4 | ||||
One Business B.V. | Registered Capital | NLD5 | ||||
Reed Business B.V. | Ordinary | NLD1 | ||||
RELX Finance B.V. | Ordinary | NLD1 | ||||
RELX Holdings B.V. | Ordinary | NLD1 | ||||
RELX Nederland B.V. | E Shares / RE Shares | NLD1 | ||||
RELX Overseas B.V. | E Shares / RE Shares | NLD1 | ||||
RELX US Holdings (Amsterdam) B.V. | Ordinary | NLD1 | ||||
ThreatMetrix BV | Ordinary | NLD3 | ||||
Turkey | ||||||
Elsevier STM Bilgi Hizmetleri Limited Șirketi | Ordinary | TUR1 | ||||
Reed Tüyap Fuarcilik A.Ș.(50%) | A-shares /B-shares | TUR2 | ||||
United Kingdom | ||||||
Adaptris Group Ltd | Ordinary | GBR2 | ||||
Adaptris Ltd | Ordinary | GBR2 | ||||
Bradfield Brett Holdings Ltd | 7 1/2% Preferred | GBR1 | ||||
Income, Ordinary | ||||||
Butterworth & Co. (Overseas) Ltd | Ordinary | GBR1 | ||||
Butterworth & Co. (Publishers) Ltd | 4.5% Cum. | GBR1 | ||||
Preference, | ||||||
‘A’ Ordinary, | ||||||
‘B’ Ordinary | ||||||
Butterworths Ltd | Ordinary | GBR5 | ||||
Cordery Compliance Ltd (72%) | Ordinary | GBR5 | ||||
Cordery Ltd (72%) | Ordinary | GBR5 | ||||
Crediva Ltd | Ordinary | GBR6 | ||||
Dew Events Ltd | Ordinary | GBR4 | ||||
Digital Foundry Network (50%) | Ordinary | GBR4 | ||||
Drayton Legal Recoveries Ltd | Ordinary | GBR7 | ||||
E & P Events LLP (50%) | No Shares | GBR4 | ||||
Elsevier Ltd | Ordinary | GBR8 | ||||
Elsevier Life Sciences IP Ltd | Ordinary | GBR8 | ||||
Formpart (EPS) Ltd | Ordinary | GBR1 | ||||
Formpart (HPL) Ltd | Ordinary | GBR1 | ||||
Gamer Edition Ltd | Ordinary | GBR4 | ||||
Gamer Events Ltd | Ordinary | GBR4 | ||||
Gamer Network Ltd | Ordinary | GBR4 | ||||
Gamermania Ltd | Ordinary | GBR2 | ||||
Hallplaza Ltd | Ordinary | GBR4 | ||||
Imbibe Media Ltd | Ordinary | GBR4 | ||||
Indicium Financial Ltd | Ordinary | GBR10 | ||||
Information Handling Ltd (85%) | Ordinary | GBR1 | ||||
Insurance Initiatives Ltd | Ordinary | GBR10 | ||||
Legend Exhibitions Ltd | Ordinary | GBR4 | ||||
LexisNexis Risk Solutions UK Ltd | Ordinary | GBR11 | ||||
MCM Central Ltd | Ordinary | GBR2 | ||||
MCM Expo Ltd | Ordinary | GBR2 | ||||
MCM Stategy Ltd | Ordinary | GBR2 | ||||
Mendeley Ltd | Ordinary | GBR8 | ||||
MLex Ltd (91%) | A Ordinary Shares, | GBR5 | ||||
Ordinary | ||||||
Moreover Technologies Ltd | Ordinary | GBR1 | ||||
Mosby International Ltd | Ordinary | GBR1 | ||||
Newsflo Ltd | Ordinary | GBR1 |
Table of Contents
RELX Annual report and financial statements 2018 | Notes to the consolidated financial statements | 165 | |
|
30 Related undertakings (continued)
Company name | Share class | Reg office | ||||
NLife Ltd (23.5%) | Ordinary | GBR14 | ||||
Offshore Europe (Management) Ltd | Ordinary | GBR4 | ||||
Offshore Europe Partnership (50%) | Partnership Interest | GBR4 | ||||
Out There Gaming Ltd (70%) | Ordinary | GBR4 | ||||
Oxford Spires Management Co; Ltd (55%) | Ordinary | GBR12 | ||||
Peopletracer Ltd | Ordinary | GBR6 | ||||
Prean Holdings Ltd | Deferred, Ordinary | GBR1 | ||||
RE Directors (No.1) Limited | Ordinary | GBR1 | ||||
RE Directors (No.2) Limited | Ordinary | GBR1 | ||||
RE (SOE) Ltd | Ordinary | GBR4 | ||||
RE Secretaries Ltd | Ordinary | GBR1 | ||||
ReedAll-Energy Ltd | Ordinary | GBR4 | ||||
Reed Business Information (Holdings) Ltd | Ordinary | GBR2 | ||||
Reed Business Information Ltd | Ordinary | GBR2 | ||||
Reed Consumer Books Ltd | Ordinary | GBR1 | ||||
Reed Elsevier (UIG) Ltd | Ordinary | GBR1 | ||||
Reed Elsevier Pension Trustee Ltd | Ordinary | GBR1 | ||||
Reed Events Ltd | Ordinary | GBR4 | ||||
Reed Exhibitions Ltd | Deferred, Ordinary | GBR4 | ||||
Reed Midem Ltd | Ordinary | GBR4 | ||||
Reed Nominees Ltd | Ordinary | GBR1 | ||||
Reed Overseas Corporation Ltd | Ordinary | GBR1 | ||||
Reed Publishing Corporation Ltd | Ordinary | GBR1 | ||||
RELX (Holdings) Ltd | Ordinary | GBR1 | ||||
RELX (Investments) plc | Ordinary | GBR1 | ||||
RELX (UK) Ltd | Ordinary | GBR1 | ||||
RELX Finance Ltd | Ordinary | GBR1 | ||||
RELX Group plc | Ordinary | GBR1 | ||||
‘R’ Ordinary | ||||||
RELX Overseas Holdings Ltd | Ordinary, | GBR1 | ||||
REV Venture Partners Ltd | Ordinary | GBR1 | ||||
RPS Gaming Ltd | Ordinary | GBR4 | ||||
Symbiotic Technologies Operations Ltd | Ordinary | GBR11 | ||||
Tracesmart Group Ltd | Ordinary | GBR6 | ||||
Tracesmart Ltd | Ordinary | GBR6 | ||||
VG247 Ltd | Ordinary | GBR4 | ||||
Wunelli Ltd | Ordinary | GBR13 | ||||
United States | ||||||
Accuity Asset Verification Services Inc | Common Stock | USA1 | ||||
Accuity Inc | Common Stock | USA1 | ||||
Aries Systems Corporation | Common | USA3 | ||||
Ordinary | ||||||
Derman, Inc | Common Stock | USA4 | ||||
Dunlap-Hanna Publishers (50%) | Partnership Interest | USA8 | ||||
Elsevier Inc | Common Stock | USA3 | ||||
Elsevier Holdings Inc | Common Stock | USA3 | ||||
Elsevier Medical Information LLC | Membership Interest | USA3 | ||||
Elsevier STM Inc | Common Stock | USA3 | ||||
Enclarity, Inc | Common Stock | USA2 | ||||
ExitCare LLC | Membership Interest | USA3 | ||||
Flightstats, Inc | Common Stock | USA5 | ||||
Gamer Network Inc. | Common Stock | USA3 | ||||
Gaming Business Asia LLC (50%) | Membership Interest | USA3 | ||||
Health Market Science, Inc | Common Stock | USA2 | ||||
IDG-RBI China Publishers LLC (50%) | Membership Interest | USA3 | ||||
Intelligize, Inc | Common Stock | USA3 | ||||
Knovel Corporation | Common Stock | USA3 | ||||
Lex Machina Inc | Common Stock | USA3 | ||||
LexisNexis Claims Solutions Inc | Common Stock | USA2 | ||||
LexisNexis Coplogic Solutions Inc | Common Stock | USA2 | ||||
LexisNexis of Puerto Rico Inc | Common Stock | USA10 | ||||
LexisNexis Risk Assets Inc | Common Stock | USA2 | ||||
LexisNexis Risk Data Management Inc | Common Stock | USA2 | ||||
LexisNexis Risk Holdings Inc | Common Stock | �� | USA2 | |||
LexisNexis Risk Solutions Inc | Common Stock | USA2 | ||||
LexisNexis Special Services Inc | Common Stock | USA6 | ||||
LexisNexis Rule of Law Foundation | Non stock | USA10 | ||||
corporation | ||||||
LexisNexis VitalChek Network Inc | Common Stock | USA2 | ||||
Managed Technology Services LLC (51%) | Membership Interest | USA9 | ||||
Matthew Bender & Company, Inc. | Common Stock | USA3 | ||||
MLex US, Inc (91%) | Common Stock | USA3 | ||||
PoliceReports.US, LLC | Membership Interest | USA2 | ||||
Portfolio Media, Inc | Common Stock | USA3 | ||||
Reed Business Information Inc | Common Stock | USA5 | ||||
Reed Technology and Information Services Inc. | Common Stock | USA3 | ||||
RELX Capital Inc | Common Stock | USA4 | ||||
RELX Inc | Common Stock | USA3 | ||||
RELX US Holdings Inc | Common Stock | USA3 | ||||
Reman, Inc | Common Stock | USA3 | ||||
REV IV Partnership LP | No shares | USA4 | ||||
SAFI Americas LLC (50%) | Membership Interest | USA3 | ||||
Science-Metrix Corporation | Common Stock | USA3 | ||||
Symbiotic Technologies Operations Inc. | Common | USA2 | ||||
The Elsevier Foundation | No Shares | USA3 |
Company name | Share class | Reg office | ||||
The Reed Elsevier Ventures 2005 Partnership LP | Partnership Interest | USA4 | ||||
The Reed Elsevier Ventures 2006 Partnership LP | Partnership Interest | USA4 | ||||
The Reed Elsevier Ventures 2008 Partnership LP | Partnership Interest | USA4 | ||||
The Reed Elsevier Ventures 2009 Partnership LP | Partnership Interest | USA4 | ||||
The Reed Elsevier Ventures 2010 Partnership LP | Partnership Interest | USA4 | ||||
The Reed Elsevier Ventures 2011 Partnership LP | Partnership Interest | USA4 | ||||
The Reed Elsevier Ventures 2012 Partnership LP | Partnership Interest | USA4 | ||||
The Reed Elsevier Ventures 2013 Partnership LP | Partnership Interest | USA4 | ||||
The Remick Publishers (50%) | Partnership Interest | USA8 | ||||
ThreatMetrix, Inc. | Common | USA2 | ||||
Ordinary | ||||||
World Compliance, Inc | Common Stock | USA4 | ||||
Vietnam | ||||||
Reed Tradex Vietnam LLC (49%) | Ordinary | VIE1 | ||||
Table of Contents
166 | RELX Annual report and financial statements 2018 | Financial statements and other information | |
|
Notes to the consolidated financial statements
for the year ended 31 December 2018
30 Related undertakings (continued)
Registered offices | ||
Australia | ||
AUS1: | Building B, Level 2, Unit 11, 1 Maitland Place, Baulkham Hills NSW 2153,Australia | |
AUS2: | Level 10, 10 Help Street, Chatswood NSW 2067, Australia | |
AUS3: | ‘Tower 2’ Level 10, 475 Victoria Avenue, Chatswood NSW 2067 | |
AUS4: | Grant Thornton, Level 17, 393 Kent St, Sydney, NSW 2000, Australia | |
AUS5: | KPMG, 147 Collins Street, Melbourne, Vic, 3000 | |
AUS6: | Fordham Business Advisors Pty Ltd, Rialto South Tower Level 35, 525 Collins Street, Melbourne, Vic, 3000 | |
AUS7: | Level 1, 439 Gympie Road, Strathpine, QLD 4500 | |
AUS8: | 1303, 799 Pacific Highway, Chatswood, NSW 2067
| |
Austria | ||
AUT1: | Messeplatz 1, 1020, Wien, Austria | |
AUT2: | Marxergasse 25, 1030, Wien, Austria | |
AUT3: | Am Messezentrum 6, 5020, Salzburg, Austria
| |
Belgium | ||
BEL1: | Grotesteenweg-Zuid 39, 9052 Gent, Belgium | |
BEL2: | Leernseteenweg 128 Box E, 9800 Deinze, Belgium | |
BEL3: | 67 rue de la Loi, 1040 Etterbeek, Belgium
| |
Brazil | ||
BRA1: | Rua Sete de Setembro, nº 111, salas 601,1501/1502, 1601/1602, 1701/1702 e 802 – 8º Andar, Centro, cidade do Rio de Janeiro, estado do Rio de Janeiro, CEP20.050-006 | |
BRA2: | São Paulo, State of São Paulo, at Rua Bela Cintra, nº 1.200, 8th floor, CEP01415-002 | |
BRA3: | Rua Bela Cintra no. 1200, 10th floor, Sâo Paulo,01415-001, Brazil | |
BRA4: | Avenida paulista, 2300-Piso Pilotis room 28, Sao Paulo, Sao Paulo01310-300 | |
BRA5: | Rua Cel Fonseca, 203A-Centro, Botucatu, SP,18600-200
| |
Canada | ||
CAN1: | 123 Commerce Valley Drive East, Suite 700, Markham, Ontario, L3T 7W8, Canada | |
CAN2: | 160 Elgin Street, Suite 2600,Ottawa, Ontario, K1P 1C3, Canada | |
CAN3: | 555 RIichmond Street West, Toronto, Ontario, Canada, M5V 3B1 | |
CAN4: | 26E-1501 av. McGill College, Montreal, Quebec, H3A 3N9, Canada
| |
China | ||
CHN1: | Zhongkun Building, Room 612, Gaoliangqiaoxie Street, No. 59, Haidan District, Beijing, 100044, China | |
CHN2: | West Building of Administration Building, Xueyuan Road No. 38 Peking University Health Science Center, Haidan District, Beijing, 100191, China | |
CHN3: | Oriental Plaza, No. 1 East Chang An Ave, Tower W1, 7th Floor, Unit1-7, Dong Cheng District, Beijing, 100738, China | |
CHN4: | Ping An International Finance Center, Room 1504, 15th Floor, TowerA-101,3-24 floor, Xinyuan South Road, Chaoyang District, Beijing, 100027, China | |
CHN5: | 4/F Block C, No 999 Jingzhong Road, Changning District, Shanghai, China | |
CHN6: | 9/F, No 3 Zhongshan Er Road, Guangzhou, China | |
CHN7: | Unit 2480, Building 2, No. 7, Chuangxin Road, Science Park of Changping District, Beijing, China | |
CHN8: | Room 12B, 7th Floor, Oriental Plaza, 1 East Chang An Avenue, Beijing, China | |
CHN9: | 16 Donghuangchenggen North Street, Beijing, 100717, China | |
CHN10: | Room 5106, Raffle City, 268 Middle Xizang Road, Huangpu District, Shanghai, 200001, China | |
CHN11: | Room A 100 of Room 0307, Floor 3, Building 3, 7 Middle Dongsanhuan road, Chaoyang District, Beijing | |
CHN12: | Intercontinental Center, 42F, 100 Yutong Road, Zhabei District, Shanghai, 200070, China | |
CHN13: | World Expo Mansion, 14F,No. 04-05, No. 8 Business Out Ring Road, Zhengzou New District, Zhengzou, 450000, China | |
CHN14: | Shenzhen International Chamber of Commerce Tower, Room 1801-1802, 1805, Fuhua 3rd Road, Futian District, Shenzhen, 518048, China | |
CHN15: | Room 319, 238 Jiangchangsan Road, Jing’an District, Shanghai, China | |
CHN16: | Room702-2, 200 Huiyuan Road, Jiading Industrial Area, Shanghai | |
CHN17: | No 498, GouShouJing Road, Building 6 Unit12502-505, Shanghai, Pudong New District, 201203, China | |
CHN18: | Building 2, Room No. 3895, Changjiang Avenue, No. 161, Changliang Farm, Chongming County, Shanghai Municipality | |
CHN19: | FL2, No.979, Yunhan Road, Nicheng Town, Pudong New Area | |
CHN20: | 4/F Block C, No 999 Jingzhong Road, Changning District, Shanghai, China
| |
Colombia | ||
COL1: | Philippe Prietocarrizosa & Uria Abogados, Carrera 9No. 74-08 Oficina 105, Bogotá, | |
d.c., 76600, Colombia
| ||
Denmark | ||
DNK1: | Niels Jernes Vej 10, 9220, Aalborg Øst, Denmark
| |
Dubai, UAE | ||
UAE1: | Office No. 328, Building 02, third floor, P.O. Box 502425, Dubai, United Arab Emirates | |
UAE2: | Al Sufouh Complex, Floor 3, No. 304, Dubai, United Arab Emirates
| |
Egypt | ||
EGY1: | Land Mark Office Building, 2nd Floor, 90th Street, City Center, 5th Settlement, New Cairo, Cairo, Egypt | |
Registered offices | ||
France | ||
FRA1: | 65, rue Camille Desmoulins, 92130, Issy les Moulineaux, France | |
FRA2: | Parc Euronord – 10, rue du Parc – 31150 Bruguieres | |
FRA3: | 247 rue de Bercy 75012 Paris | |
FRA4: | 141 rue de Javel, 75015 Paris | |
FRA5: | 52 Quai de Dion Bouton 92800 Puteaux | |
FRA6: | Immeuble « Technopolis », 350 rue Georges Besse –Nîmes (30000) | |
FRA7: | 27 quai Alphonse Le Gallo, 92100, Boulogne-Billancourt, France | |
FRA8: | 6-8 Rue Chaptal, 75009 Paris
| |
Germany | ||
DEU1: | Völklinger Strasse 4, 40219, Düsseldorf, Germany | |
DEU3: | Theodor-Heuss-Allee 108,D-60488, Frankfurt am Main, Hesse, Germany | |
DEU4: | Hackerbrücke 6, 80335, Munich, Germany | |
DEU5: | Heerdter Sandberg 30, 40549, Düsseldorf, Germany | |
DEU6: | Schwannstr. 6, 40476 Düsseldorf | |
DEU7: | Steinhäuserstrasse 9, 76135, Karlsruhe, Germany | |
DEU8: | Joseph-Schumpeter-Allee 33, 53227, Bonn | |
DEU9: | Hauptstrasse 47, 40764, Lagenfeld
| |
Hong Kong | ||
HNK1: | 20/F Alexandra House, 18 Chater Road, Central, Hong Kong | |
HNK2: | Level 28, Building 8, 3 Pacific Place, 1 Queens Road East, HONG KONG, Hong Kong | |
HNK3: | Unit 204 2/F, Malaysia Bldg., 50 Gloucester Rd, Wanchai, Hong Kong | |
HNK4: | Level 54 Hopewell Center, 183 Queens Road East (Tricor Office), Hong Kong | |
HNK5: | Flat 2, 19/F Henan Building90-92, Jaffe Road Wanchai, Hong Kong, Hong Kong | |
HNK6: | 703 Silvercord, Tower 2, 30 Canton Road, Tsimshatsui, Kowloon, Hong Kong | |
HNK7: | 3901, 39th Floor Hopewell Center, 183 Queens Road East, Wanchai, Hong Kong, Hong Kong
| |
India | ||
IND1: | 818, 8th Floor, Indraprakash Builing, 21 Barakhamba Road, New Delhi, 110001, India | |
IND2: | B9/5 Vasant Vihar, New Delhi, 110057, India | |
IND3: | n°664 Level 6 – Chennai Regus – Citi Centre – 10/11 Dr Radhakrishnan Salai, Mylapore – Chennai 600004 | |
IND4: | 18, Kotla Lane, Rouse Avenue, New Delhi, 110002, India | |
IND5: | B-15/192, Pharma Apartments, Patparganj, I.P. Extension, New Delhi, 110092, India | |
IND6: | B-9, “A” Block, LSC, Naraina Vihar, Ring Road, New Delhi, 110028, India | |
IND7: | #25, 3rd floor, 8th Main Road, Vasanthnager, Bangalore, 560052, India
| |
Indonesia | ||
IDN1: | Panorama Building, 5th Floor, Jalan Tomang Raya No. 63, Jakarta, 11440, Indonesia | |
IDN2: | Menara Citicon Level 8. Unit 8011 & 8012 Jl. Letjen S. Parman No. 8 Kav 72 Slipi Palmerah Jakarta Barat 11410 Indonesia
| |
Ireland | ||
IRL1: | 80 Harcourt Street, Dublin 2, Ireland | |
IRL2: | Arthur Cox Building, Earlsfort Terrace, Dublin 2, Ireland | |
IRL3: | (A&L Goodbody Secretarial Services), 25/28 North Wall Quay, Dublin 1, D01 H104, Ireland | |
IRL4: | Suite 4320, Atlantic Avenue, Westpark Business Campus, Shannon, Clare, Ireland
| |
Israel | ||
ISR1: | Meitar, attorneys at Law, 16 Abba Hillel Road, Ramat Gan, 5250608, Israel
| |
Italy | ||
ITA1: | Via Marostica 1, 20146, Milan, Italy | |
ITA2: | Studio Colombo e Associati, Via Cino del Duca 5, 20122, Milano, Italy
| |
Japan | ||
JPN1: | Kyodo Tsushin Kaikam 2F,2-2-5 Toronomon,Minato-ku, Tokyo,105-0001 | |
JPN2: | Ark Mori Building,1-12-32 Akasaka,Minato-ku, Tokyo,107-6029, Japan | |
JPN3: | 1-9-15, Higashi Azabu,Minato-ku Tokyo Japan | |
JPN4: | Shinjuku-Nomura Bldg.,1-26-2 Nishi-shinjuku,Shinjuku-ku, Tokyo, Japan | |
JPN5: | 13-12 Rokubancho,Chiyoda-ku, Tokyo, Japan | |
JPN6: | 7F Cross Office Uchisaiwaicho,1-18-6 Nishi-Shinbashi,Minato-ku, Tokyo | |
JPN7: | 2-6, Kasumigaseki3-chome,Chiyoda-ku, Tokyo | |
Korea (South) | ||
KOR1: | Chunwoo Building, 4th floor, 534 Itaewon-dong,Yongsan-gu, Seoel,140-861, | |
Korea, Republic of | ||
KOR2: | 206 Noksapyeong-daero,Yongsan-gu, Seoel, Korea, Republic of | |
KOR3: | Room 4401, Trade Tower,159-1, Samseong-dong,Gangnam-gu Seoul,135-729, Republic of Korea | |
KOR4: | 1324 Block A Tera Tower II, 201, Songpa-daero,Songpa-gu, Seoul, 05854
| |
Luxembourg | ||
LUX1: | Bloc B19-21, Route d’Arlon,L-8009 Strassen, Luxembourg | |
Table of Contents
RELX Annual report and financial statements 2018 | Notes to the consolidated financial statements | 167 | |
|
30 Related undertakings (continued)
Registered offices | ||
Malaysia | ||
MYS1: | 6th Floor, Akademi Etiqa, No. 23 Jalan Melaka, 50100 Kuala Lumpur, Malaysia
| |
Mexico | ||
MEX1: | Insurgentes Sur # 1388 Piso 8, Col. Actipan, Deleg. Benito Juarez, C.P. 03230 Ciudad | |
de México, México
| ||
Morocco | ||
MAR1: | Forum Bab Abdelaziz au 62, Angle Blvd. d’Anfa, 6ème étage, Apt 61, Casablanca, Morocco
| |
New Zealand | ||
NZL1: | Level 1, 138 The Terrace, P.O. Box 472, Wellington 6011, New Zealand
| |
Philippines | ||
PHL1: | Building H, 2nd Floor, U.P. Ayalaland TechnoHub, Commonwealth Avenue, Quezon City, Metro Manila, 1101, Philippines
| |
Poland | ||
POL1: | Natpoll Building, ul. Migdalowa 4/59,02-796, Warsaw, Poland
| |
Russia | ||
RUS1: | Pokrovka Street 27, Building 1, Moscow, Russian Federation | |
RUS2: | 24 Bolshaya Nikitskaya Str., bldg. 5, Moscow 125009, Russian Federation | |
RUS3: | Petrozavodskaya street 28/4, Building VI, room 2, 125475, Moscow, Russian Federation
| |
Saudi Arabia | ||
SAU1: | Al Fadl Commercial Center, Jeddah, 21411, Saudi Arabia
| |
Singapore | ||
SGP1: | 3 Killiney Road,#08-01 Winsland House 1, Singapore, 239119, Singapore | |
SGP2: | 16 Raffles Quay,#33-03 Hong Leong Building, Singapore, 048581, Singapore | |
SGP3: | 80 Robinson Road,#02-00, Singapore, 068898, Singapore | |
SGP4: | 1 Changi Business Park Crescent,#06-01 Plaza 8 & CBP, Singapore, 48602551, Singapore | |
SGP5: | 8 Robinson Road#03-00 ASO Building Singapore 048544
| |
South Africa | ||
ZAF1: | Regus Brooklyn Bridge, 3rd Floor Steven House, Brooklyn Bridge Office Park, Fehrsen Street, Brooklyn, Pretoria | |
ZAF2: | Fourways Gold Park, 1st Floor – Wentworth Building, 32 Roos Street, Fourways, 2191, South Africa | |
ZAF3: | 215 Peter Mokaba Road (North Ridge Road), Morningside, Durban,Kwa-Zulu Natal, 4001, South Africa | |
ZAF4: | Thebe House, 2nd Floor, 166 Jan Smuts Avenue, Rosebank, Johannesburg, 2196, South Africa | |
ZAF5: | 14 Hertzog Street, Oranjeville, 9415
| |
Spain | ||
ESP1: | C/ Josep Tarradellas20-30, 1º / 20029, Barcelona, Spain | |
ESP2: | Calle Zancoeta 0009, 48013, Bilbao, Viscaya, Spain
| |
Switzerland | ||
CHE1: | Espace de L’Europe 3, 2002 Neuchatel, Switzerland | |
CHE2: | Bahnhofstrasse 100 – 8001 Zurich
| |
Taiwan | ||
TWN1: | SuiteN-818, 8/F, Chia Hsin Cement Building, 96 Zhong Shan North Road, Section 2, Taipei, 10449, Taiwan | |
Thailand | ||
THA1: | Sathorn Nakorn Building, Floor 32,No. 100/68-69 North Sathon Road, Silom, Bangrak, Bangkok, 10500, Thailand | |
THA2: | 540 Mercury Tower, 22nd Floor, Ploenchit Road, Lumpini, Pathumwan, Bangkok 10330
| |
The Netherlands | ||
NLD1: | Radarweg 29, 1043 NX Amsterdam, Netherlands | |
NLD2: | Galileiweg 8, 2333 BD Leiden, Netherlands | |
NLD3: | Evert van de Beekstraat 1 The Base 3 / F, 1118CL Schiphol | |
NLD4: | Prins Hendrikstraat 17, 7001GK Doetinchem | |
NLD5: | Spaklerweg 53, 1114 AE Amsterdam-Duivendrecht
| |
Turkey | ||
TUR1: | Maslak Mah. Bilim Sokak Sun Plaza Kat:13Șişli-Maslak, Istanbul, Turkey | |
TUR2: | Tüyap Fuar ve Kongre Merkezi, E – 5 Karayolu Üzeri, Gürpınar Kavşaği 34500, Büyükçekmece, Istanbul, 34500, Turkey | |
Registered offices | ||
United Kingdom | ||
GBR1: | 1-3 Strand, London, WC2N 5JR, United Kingdom | |
GBR2: | Quadrant House, The Quadrant, Sutton, Surrey, SM2 5AS, United Kingdom | |
GBR3: | AG Gateway Global Network, 85 Great Portland Street, First Floor, London, W1W 7LT, United Kingdom | |
GBR4: | Gateway House 28 The Quadrant, Richmond, Surrey, TW9 1DN, United Kingdom | |
GBR5: | Lexis House, 30 Farringdon Street, London, EC4A 4HH, United Kingdom | |
GBR6: | Global Reach, Dunleavy Drive, Cardiff, CF11 0SN, United Kingdom | |
GBR7: | The Eye, 1 Procter Street, London, WC1V 6EU, United Kingdom | |
GBR8: | The Boulevard, Langford Lane, Kidlington, Oxford, OX5 1GB, United Kingdom | |
GBR9: | c/o RELX (UK) Limited, Butterworths Limited, 4 Hill Street, Edinburgh, EH2 3JZ, Scotland | |
GBR10: | 35 – 37 St. Marys Gate, Nottingham, United Kingdom, NG1 1PU | |
GBR11: | 1st Floor 80 Moorbridge Road, Maidenhead, Berkshire, SL6 8BW | |
GBR12: | 40 Kimbolton Road, Bedford, England, MK40 2NR | |
GBR13: | 1000 Lakeside, Western Road, Portsmouth, PO6 3EN, United Kingdom | |
GBR14: | Unit18-19 Loughborough Technology Centre, Epinal Way, Loughborough, England, LE11 3GE
| |
United States | ||
USA1: | 1007 Church Street, Evanston IL 60201 | |
USA2: | 1000 Alderman Dr., Alpharetta, GA 30005 | |
USA3: | 230 Park Ave, New York, NY 10169 | |
USA4: | 1105 North Market St, Wilmington, DE 19801 | |
USA5: | 3355 West Alabama Street, Houston, TX 77098 | |
USA6: | Puerta Del Condado #1095, Wilson Ave, Local #3, San Juan, PR 00907 | |
USA7: | N909 N. Sepulveda Blvd., 11th Floor, El Segundo, CA 90245 | |
USA8: | 313 Washington Street, Suite 400, Newton, MA 02458 | |
USA9: | 1209 Orange Street, Wilmington, DE 19801 | |
USA10: | 9443 Springboro Pike, Miamisburg, OH 45342
| |
Vietnam | ||
VIE1: | 78 Nguyen Bieu, Ward 1, District 5, Ho Chi Minh City | |
Table of Contents
168 | RELX Annual report and financial statements 2018 | Financial statements and other information | |
|
Restated(3) | ||||||||||||||||||||||||
Note | 2018 £m | 2017 £m | 2016 £m | 2015 £m | 2014 £m | |||||||||||||||||||
RELX consolidated financial information | ||||||||||||||||||||||||
Revenue | 7,492 | 7,341 | 6,889 | 5,971 | 5,773 | |||||||||||||||||||
Reported operating profit | 1,964 | 1,905 | 1,708 | 1,497 | 1,402 | |||||||||||||||||||
Adjusted operating profit | 1 | 2,346 | 2,284 | 2,114 | 1,822 | 1,739 | ||||||||||||||||||
Reported net profit attributable to RELX PLC shareholders | 1,422 | 1,648 | 1,150 | 1,008 | 955 | |||||||||||||||||||
Adjusted net profit attributable to RELX PLC shareholders | 1 | 1,674 | 1,620 | 1,473 | 1,275 | 1,213 | ||||||||||||||||||
RELX PLC financial information | ||||||||||||||||||||||||
Reported earnings per ordinary share (pence) | 71.9p | 81.6p | 55.8p | 46.4p | 43.0p | |||||||||||||||||||
Adjusted earnings per ordinary share (pence) | 84.7p | 80.2p | 71.4p | 60.5p | 56.3p | |||||||||||||||||||
Dividend per ordinary share (pence) | 2 | 42.1p | 39.4p | 35.95p | 29.7p | 26.0p |
(1) | Adjusted figures are presented as additional performance measures used by management. A reconciliation of the adjusted measures to the comparable GAAP measures can be found on page 176. Adjusted measures are stated before amortisation and impairment of acquired intangible assets and goodwill, the net financing cost on defined benefit pension schemes and acquisition-related costs, exceptional tax credits and in respect of attributable net profit, reflect a tax rate that excludes the effect of movements in deferred taxation assets and liabilities that are not expected to crystallise in the near term and includes the benefit of tax amortisation where available on acquired goodwill and intangible assets. Acquisition-related financing costs and profit and loss from disposal gains and losses and othernon-operating items are also excluded from the adjusted figures. |
(2) | Dividend per ordinary share is based on the interim dividend and proposed final dividend for the relevant year. |
(3) | 2017 and 2016 numbers have been restated to reflect the adoption of new accounting standards. See note 1 on page 126 for further details. |
Table of Contents
RELX Annual report and financial statements 2018 | 169 | |
|
Annual Report and Financial Statements | ||
In this section |
170 | RELX PLC statement of financial position | |
171 | RELX PLC statement of changes in equity | |
171 | RELX PLC accounting policies | |
172 | Notes to the RELX PLC financial statements |
Table of Contents
170 | RELX Annual report and financial statements 2018 | Financial statements and other information | |
|
RELX PLC statement of financial position
AS AT 31 DECEMBER | Note | 2018 £m | 2017 £m | |||||||||
Non-current assets | ||||||||||||
Investments in subsidiary undertakings | 1 | 18,314 | – | |||||||||
Investments in joint ventures | 1 | – | 3,027 | |||||||||
18,314 | 3,027 | |||||||||||
Current assets | ||||||||||||
Cash and cash equivalents | 1 | – | ||||||||||
Trade and other receivables | 1 | – | ||||||||||
Receivables: amounts due from subsidiary undertakings | 1,536 | – | ||||||||||
Receivables: amounts due from joint venture | – | 205 | ||||||||||
Total assets | 19,852 | 3,232 | ||||||||||
Current liabilities | ||||||||||||
Taxation | 4 | 2 | ||||||||||
Other payables | 109 | 56 | ||||||||||
113 | 58 | |||||||||||
Net assets | 19,739 | 3,174 | ||||||||||
Capital and reserves | ||||||||||||
Share capital | 290 | 162 | ||||||||||
Share premium | 1,415 | 1,309 | ||||||||||
Shares held in treasury | (643 | ) | (753 | ) | ||||||||
Capital redemption reserve | 31 | 25 | ||||||||||
Other reserves | 164 | 160 | ||||||||||
Merger reserve | 15,150 | – | ||||||||||
Net profit | 2,063 | 817 | ||||||||||
Reserves | 1,269 | 1,454 | ||||||||||
Shareholders’ equity | 19,739 | 3,174 |
The RELX PLC Company financial statements were approved by the Board of Directors and authorised for issue on 20 February 2019. They were signed on its behalf by:
A J Habgood | N L Luff | |
Chairman | Chief Financial Officer |
Table of Contents
RELX Annual report and financial statements 2018 | 171 | |
|
RELX PLC statement of changes in equity
Share | Share | | Shares held in | | | Capital redemption |
| Other | Merger | Net | ||||||||||||||||||||||||||
capital | premium | treasury | reserve | (1) | reserves | (2) | reserve | (1) | profit | Reserves | (3) | Total | ||||||||||||||||||||||||
£m | £m | £m | £m | £m | £m | £m | £m | £m | ||||||||||||||||||||||||||||
Balance at 1 January 2017 | 165 | 1,295 | (645 | ) | 22 | 158 | – | 717 | 1,400 | 3,112 | ||||||||||||||||||||||||||
Total comprehensive income for the year | – | – | – | – | – | – | 817 | – | 817 | |||||||||||||||||||||||||||
Dividends paid(4) | – | – | – | – | – | – | – | (400 | ) | (400 | ) | |||||||||||||||||||||||||
Repurchase of ordinary shares | – | – | (371 | ) | – | – | – | – | – | (371 | ) | |||||||||||||||||||||||||
Cancellation of shares | (3 | ) | – | 263 | 3 | – | – | – | (263 | ) | – | |||||||||||||||||||||||||
Issue of ordinary shares, net of expenses | – | 14 | – | – | – | – | – | – | 14 | |||||||||||||||||||||||||||
Equity instruments granted to employees of the Group | – | – | – | – | 2 | – | – | – | 2 | |||||||||||||||||||||||||||
Transfer of net profit to reserves | – | – | – | – | – | – | (717 | ) | 717 | – | ||||||||||||||||||||||||||
Balance at 1 January 2018 | 162 | 1,309 | (753 | ) | 25 | 160 | – | 817 | 1,454 | 3,174 | ||||||||||||||||||||||||||
Total comprehensive income for the year | – | – | – | – | – | – | 2,063 | – | 2,063 | |||||||||||||||||||||||||||
Dividends paid(4) | – | – | – | – | – | – | – | (420 | ) | (420 | ) | |||||||||||||||||||||||||
Repurchase of ordinary shares | – | – | (472 | ) | – | – | – | – | (472 | ) | ||||||||||||||||||||||||||
Cancellation of shares | (6 | ) | – | 582 | 6 | – | – | – | (582 | ) | – | |||||||||||||||||||||||||
Issue of ordinary shares, net of expenses | – | 13 | – | – | – | – | – | – | 13 | |||||||||||||||||||||||||||
Issue of ordinary shares in exchange for RELX NV shares | 134 | 93 | – | – | – | 15,150 | – | – | 15,377 | |||||||||||||||||||||||||||
Equity instruments granted to employees of the Group | – | – | – | – | 4 | – | – | – | 4 | |||||||||||||||||||||||||||
Transfer of net profit to reserves | – | – | – | – | – | – | (817 | ) | 817 | – | ||||||||||||||||||||||||||
Balance at 31 December 2018 | 290 | 1,415 | (643 | ) | 31 | 164 | 15,150 | 2,063 | 1,269 | 19,739 |
(1) | The capital redemption and merger reserve do not form part of the distributable reserves balance. |
(2) | Other reserves relate to equity instruments granted to employees of the Group under share based remuneration arrangements, and do not form part of the distributable reserves balance. |
(3) | Distributable reserves at 31 December 2018 were £2,689m (2017: £1,518m) comprising net profit and reserves, net of shares held in treasury. |
(4) | Refer to note 13 of the RELX consolidated financial statements on page 143 for further dividend disclosure. |
Basis of preparation
RELX PLC meets the definition of a qualifying entity under FRS 100 (Financial Reporting Standard 100) issued by the Financial Reporting Council (FRC). Accordingly, the financial statements are prepared in accordance with FRS 101 (Financial Reporting Standard 101) – Reduced Disclosure Framework as issued by the Financial Reporting Council, incorporating the Amendments to FRS 101 issued by the FRC in July 2015 and the amendments to company law made by The Companies, Partnerships and Groups (Accounts and Reports) Regulations 2015.
As permitted by FRS 101, RELX PLC has taken advantage of the disclosure exemptions available under that standard in relation to share based payments, financial instruments, capital management, presentation of comparative information in respect of certain assets, presentation of a cash flow statement, standards not yet effective, impairment of assets and related party transactions.
The RELX PLC financial statements have been prepared on the historical cost basis.
Unless otherwise indicated, all amounts in the financial statements are in millions of pounds.
The RELX PLC financial statements should be read in conjunction with the Group consolidated financial statements and notes presented on pages 121 to 167, which are also presented as the RELX PLC consolidated financial statements. See the Basis of preparation of the consolidated financial statements on page 126.
The RELX PLC financial statements are prepared on a going concern basis, as explained on page 111.
As permitted by section 408 of the Companies Act 2006, and in compliance with The Companies, Partnerships and Groups (Accounts and Reports) Regulations 2015, the Company has not presented its own profit and loss account but has presented the net profit for the year on the statement of financial position.
The RELX PLC accounting policies under FRS 101 are set out below.
Investments
Fixed asset investments are stated at cost, less provision, if appropriate, for any impairment in value. The fair value of the award of share options and conditional shares over RELX PLC ordinary shares to employees of the Group are treated as a capital contribution.
Other assets and liabilities are stated at historical cost, less provision, if appropriate, for any impairment in value.
Shares held in treasury
The consideration paid, including directly attributable costs, for shares repurchased is recognised as shares held in treasury and presented as a deduction from total equity. Details of share capital and shares held in treasury are set out in note 25 of the Group consolidated financial statements.
Foreign exchange translation
Transactions entered into in foreign currencies are recorded at the exchange rates applicable at the time of the transaction.
Taxation
Refer to note 9 on pages 138 to 141 of the consolidated financial statements for the taxation accounting policies.
Table of Contents
172 | RELX Annual report and financial statements 2018 | Financial statements and other information | |
|
Notes to the RELX PLC financial statements
1 Investments
Subsidiary undertaking £m | Joint £m | Total £m | ||||||||||
At 1 January 2017 | 77 | 3,025 | 3,102 | |||||||||
Impairment | (77 | ) | – | (77 | ) | |||||||
Equity instruments granted to employees of the Group | – | 2 | 2 | |||||||||
At 1 January 2018 | – | 3,027 | 3,027 | |||||||||
Acquisition of interest in RELX Group plc not already owned | 18,310 | (3,027 | ) | 15,283 | ||||||||
Equity instruments granted to employees of the Group | 4 | – | 4 | |||||||||
At 31 December 2018 | 18,314 | – | 18,314 |
The acquisition of the remaining RELX Group plc interest relates to the transfer of RELX NV’s previously held interest in RELX Group plc as a result of the corporate simplification. Following the simplification, RELX Group plc is recognised as a 100% owned subsidiary of RELX PLC.
2 Related party transactions
All transactions with joint ventures, subsidiaries and the Group’s employees, which are related parties of RELX PLC, are reflected in these financial statements. Transactions with key management personnel including share based remuneration costs are set out in note 27 of the Group consolidated financial statements and details of the Directors’ remuneration are included in the Directors’ Remuneration Report on pages 85 to 105.
3 Contingent liabilities
There are contingent liabilities in respect of borrowings of subsidiaries guaranteed by RELX PLC as follows:
2018 £m | 2017 £m | |||||||
Contingent liabilities guaranteed by RELX PLC | 5,775 | 4,644 |
Financial instruments disclosures in respect of the borrowings covered by the above guarantees are given in note 18 of the Group’s consolidated financial statements.
Table of Contents
RELX Annual report and financial statements 2018 | 173 | |
|
Other financial information | ||
In this section | ||
174 | Summary financial information in euros | |
175 | Summary financial information in US dollars | |
176 | Reconciliation of adjusted to GAAP measures |
Table of Contents
174 | RELX Annual report and financial statements 2018 | Financial statements and other information | |
|
Summary financial information in euros
Basis of preparation
The Group’s consolidated financial information is presented in sterling. The summary financial information is a simple translation of the Group’s consolidated financial statements into euros at the stated rates of exchange.
EXCHANGE RATES FOR TRANSLATION | Income statement | Statement of financial position | ||||||||||||||||||||||||||
2018 | 2017 | 2016 | 2018 | 2017 | 2016 | |||||||||||||||||||||||
Euro to sterling | 1.13 | 1.14 | 1.22 | 1.11 | 1.12 | 1.17 |
Consolidated income statement
FOR THE YEAR ENDED 31 DECEMBER | 2018 €m | Restated €m | Restated €m | |||||||||
Revenue | 8,466 | 8,369 | 8,405 | |||||||||
Operating profit | 2,219 | 2,172 | 2,084 | |||||||||
Profit before tax | 1,944 | 1,962 | 1,780 | |||||||||
Net profit attributable to RELX PLC shareholders | 1,607 | 1,879 | 1,403 | |||||||||
Adjusted operating profit | 2,651 | 2,604 | 2,579 | |||||||||
Adjusted profit before tax | 2,424 | 2,395 | 2,338 | |||||||||
Adjusted net profit attributable to RELX PLC shareholders | 1,892 | 1,847 | 1,797 | |||||||||
Adjusted earnings per ordinary share | €0.957 | €0.915 | €0.871 | |||||||||
Basic earnings per ordinary share | €0.813 | €0.930 | €0.680 | |||||||||
Net dividend per ordinary RELX PLC share paid in the year | €0.453 | €0.426 | €0.397 | |||||||||
Net dividend per ordinary RELX PLC share paid and proposed in relation to the financial year | €0.476 | €0.449 | €0.439 | |||||||||
Consolidated statement of cash flows
| ||||||||||||
FOR THE YEAR ENDED 31 DECEMBER | 2018 €m | Restated €m | Restated €m | |||||||||
Net cash from operating activities | 2,243 | 2,182 | 2,124 | |||||||||
Net cash used in investing activities | (1,436 | ) | (473 | ) | (805 | ) | ||||||
Net cash used in financing activities | (806 | ) | (1,760 | ) | (1,308 | ) | ||||||
Increase/(decrease) in cash and cash equivalents | 1 | (51 | ) | 11 | ||||||||
Movement in cash and cash equivalents | ||||||||||||
At start of year | 124 | 190 | 166 | |||||||||
Increase/(decrease) in cash and cash equivalents | 1 | (51 | ) | 11 | ||||||||
Exchange translation differences | 2 | (15 | ) | 13 | ||||||||
At end of year | 127 | 124 | 190 | |||||||||
Adjusted cash flow | 2,535 | 2,505 | 2,463 | |||||||||
Consolidated statement of financial position
| ||||||||||||
AS AT 31 DECEMBER | 2018 €m | Restated €m | Restated €m | |||||||||
Non-current assets | 12,928 | 11,673 | 13,223 | |||||||||
Current assets | 2,609 | 2,475 | 2,815 | |||||||||
Assets held for sale | 1 | – | 7 | |||||||||
Total assets | 15,538 | 14,148 | 16,045 | |||||||||
Current liabilities | 5,906 | 5,224 | 6,274 | |||||||||
Non-current liabilities | 7,010 | 6,333 | 7,065 | |||||||||
Liabilities associated with assets held for sale | 4 | – | 6 | |||||||||
Total liabilities | 12,920 | 11,557 | 13,345 | |||||||||
Net assets | 2,618 | 2,591 | 2,700 |
Table of Contents
RELX Annual report and financial statements 2018 | 175 | |
|
Summary financial information in US dollars
Basis of preparation
The Group’s consolidated financial information is presented in sterling. The summary financial information is a simple translation of the Group’s consolidated financial statements into US dollars at the stated rates of exchange. It does not represent a restatement under US GAAP which would be different in some significant respects.
EXCHANGE RATES FOR TRANSLATION | Income statement | Statement of financial position | ||||||||||||||||||||||||||
2018 | 2017 | 2016 | 2018 | 2017 | 2016 | |||||||||||||||||||||||
US dollars to sterling | 1.34 | 1.29 | 1.36 | 1.27 | 1.35 | 1.23 |
Consolidated income statement
FOR THE YEAR ENDED 31 DECEMBER | 2018 US$m | Restated 2017 US$m | Restated 2016 US$m | |||||||||
Revenue | 10,039 | 9,470 | 9,369 | |||||||||
Operating profit | 2,632 | 2,457 | 2,323 | |||||||||
Profit before tax | 2,305 | 2,220 | 1,984 | |||||||||
Net profit attributable to RELX PLC shareholders | 1,905 | 2,126 | 1,564 | |||||||||
Adjusted operating profit | 3,144 | 2,946 | 2,875 | |||||||||
Adjusted profit before tax | 2,874 | 2,710 | 2,606 | |||||||||
Adjusted net profit attributable to RELX PLC shareholders | 2,243 | 2,090 | 2,003 | |||||||||
Adjusted earnings per American Depositary Share (ADS) | $1.134 | $1.035 | $0.971 | |||||||||
Basic earnings per ADS | $0.963 | $1.053 | $0.758 | |||||||||
Net dividend per RELX PLC ADS paid in the year | $0.537 | $0.482 | $0.443 | |||||||||
Net dividend per RELX PLC ADS paid and proposed in relation to the financial year | $0.564 | $0.508 | $0.489 | |||||||||
Consolidated statement of cash flows
| ||||||||||||
FOR THE YEAR ENDED 31 DECEMBER | 2018 US$m | Restated US$m | Restated US$m | |||||||||
Net cash from operating activities | 2,660 | 2,469 | 2,368 | |||||||||
Net cash used in investing activities | (1,703 | ) | (535 | ) | (898 | ) | ||||||
Net cash used in financing activities | (956 | ) | (1,992 | ) | (1,458 | ) | ||||||
Increase/(decrease) in cash and cash equivalents | 1 | (58 | ) | 12 | ||||||||
Movement in cash and cash equivalents | ||||||||||||
At start of year | 150 | 199 | 179 | |||||||||
Increase/(decrease) in cash and cash equivalents | 1 | (58 | ) | 12 | ||||||||
Exchange translation differences | (6 | ) | 9 | 8 | ||||||||
At end of year | 145 | 150 | 199 | |||||||||
Adjusted cash flow | 3,006 | 2,834 | 2,746 | |||||||||
Consolidated statement of financial position
| ||||||||||||
AS AT 31 DECEMBER | 2018 US $m | Restated US$m | Restated US$m | |||||||||
Non-current assets | 14,792 | 14,070 | 13,902 | |||||||||
Current assets | 2,986 | 2,984 | 2,959 | |||||||||
Assets held for sale | 1 | – | 7 | |||||||||
Total assets | 17,779 | 17,054 | 16,868 | |||||||||
Current liabilities | 6,758 | 6,296 | 6,595 | |||||||||
Non-current liabilities | 8,020 | 7,635 | 7,428 | |||||||||
Liabilities associated with assets held for sale | 5 | – | 6 | |||||||||
Total liabilities | 14,783 | 13,931 | 14,029 | |||||||||
Net assets | 2,996 | 3,123 | 2,839 |
Table of Contents
176 | RELX Annual report and financial statements 2018 |Financial statements and other information | |
|
Reconciliation of adjusted to GAAP measures
The Group uses adjusted figures, which are not defined by generally accepted accounting principles (“GAAP”) such as IFRS, as additional performance measures. These measures are used by management, alongside the comparable GAAP measures, in evaluating the business performance. The measures may not be comparable to similarly reported measures by other companies.
A reconciliation ofnon-GAAP measures to relevant GAAP measures is as follows:
YEAR ENDED 31 DECEMBER | 2018 £m | Restated £m | ||||||||||
Operating profit | 1,964 | 1,905 | ||||||||||
Adjustments: | ||||||||||||
Amortisation of acquired intangible assets | 288 | 314 | ||||||||||
Acquisition-related costs | 84 | 56 | ||||||||||
Reclassification of tax in joint ventures | 11 | 10 | ||||||||||
Reclassification of finance income in joint ventures | (1 | ) | (1 | ) | ||||||||
Adjusted operating profit | 2,346 | 2,284 | ||||||||||
Profit before tax | 1,720 | 1,721 | ||||||||||
Adjustments: | ||||||||||||
Amortisation of acquired intangible assets | 288 | 314 | ||||||||||
Acquisition-related costs | 84 | 56 | ||||||||||
Reclassification of tax in joint ventures | 11 | 10 | ||||||||||
Net interest on net defined benefit pension obligation | 9 | 15 | ||||||||||
Disposals and othernon-operating items | 33 | (15 | ) | |||||||||
Adjusted profit before tax | 2,145 | 2,101 | ||||||||||
Tax charge | (292 | ) | (65 | ) | ||||||||
Adjustments: | ||||||||||||
Deferred tax movements on goodwill and acquired intangible assets | 34 | 42 | ||||||||||
Tax on acquisition-related costs | (13 | ) | (13 | ) | ||||||||
Reclassification of tax in joint ventures | (11 | ) | (10 | ) | ||||||||
Tax on net interest on net defined benefit pension obligation | (2 | ) | (4 | ) | ||||||||
Tax on disposals and othernon-operating items | (14 | ) | 16 | |||||||||
Other deferred tax credits from intangible assets* | (55 | ) | (93 | ) | ||||||||
Exceptional tax credit** | (112 | ) | (346 | ) | ||||||||
Adjusted tax charge | (465 | ) | (473 | ) | ||||||||
Net profit attributable to RELX PLC shareholders | 1,422 | 1,648 | ||||||||||
Adjustments(post-tax): | ||||||||||||
Amortisation of acquired intangible assets | 322 | 356 | ||||||||||
Acquisition-related costs | 71 | 43 | ||||||||||
Net interest on net defined benefit pension obligation | 7 | 11 | ||||||||||
Disposals and othernon-operating items | 19 | 1 | ||||||||||
Other deferred tax credits from intangible assets* | (55 | ) | (93 | ) | ||||||||
Exceptional tax credit** | (112 | ) | (346 | ) | ||||||||
Adjusted net profit attributable to RELX PLC shareholders | 1,674 | 1,620 | ||||||||||
Cash generated from operations | 2,555 | 2,526 | ||||||||||
Adjustments: | ||||||||||||
Dividends received from joint ventures | 30 | 38 | ||||||||||
Purchases of property, plant and equipment | (56 | ) | (51 | ) | ||||||||
Proceeds on disposals of property, plant and equipment | 4 | 1 | ||||||||||
Expenditure on internally developed intangible assets | (306 | ) | (303 | ) | ||||||||
Payments in relation to acquisition-related costs/other | 97 | 62 | ||||||||||
Repayment of lease principal | (82 | ) | (76 | ) | ||||||||
Sublease payments received | 1 | – | ||||||||||
Adjusted cash flow | 2,243 | 2,197 |
* | Movements on deferred tax liabilities arising on acquired intangible assets that do not qualify for tax amortisation. |
** | In 2018 relates to the substantial resolution of certain prior year tax matters and deferred tax effect of tax rate reductions in the Netherlands and US. In 2017 relates to aone-offnon-cash credit from a deferred tax adjustment arising from the US Tax Cuts and Jobs Act. |
Table of Contents
RELX Annual report and financial statements 2018 | 177 | |
|
information | ||
In this section | ||
178 | Shareholder information | |
182 | Shareholder information and contacts | |
IBC | 2019 financial calendar |
Table of Contents
178 | RELX Annual report and financial statements 2018 | Financial statements and other information | |
|
Annual Report and Financial Statements 2018
The Annual Report and Financial Statements for RELX PLC for the year ended 31 December 2018 are available on the Group’s website, and from the registered office of RELX PLC shown on page 180. Additional financial information, including the interim and full-year results announcements, trading updates and presentations, is also available on the Group’s website,
www.relx.com
The consolidated financial statements set out in the Annual Report and Financial Statements are expressed in sterling, with summary financial information expressed in euros and US dollars.
Share price information
RELX PLC’s ordinary shares are traded on the London Stock Exchange.
PLC | ||
Trading symbol | REL | |
ISIN | GB00B2B0DG97 |
RELX PLC’s ordinary shares are also traded on the Euronext Amsterdam Stock Exchange.
PLC | ||
Trading symbol | REN | |
ISIN | GB00B2B0DG97 |
The RELX PLC ordinary shares are traded on the New York Stock Exchange in the form of American Depositary Shares (ADSs), evidenced by American Depositary Receipts (ADRs).
PLC ADRs | ||
Ratio to ordinary shares | 1:1 | |
Trading symbol | RELX | |
CUSIP code | 759530108 |
The RELX PLC ordinary share price and the ADS price may be obtained from the Group’s website, other online sources and the financial pages of some newspapers.
For further information visit the ‘Investor Centre’ section of the Group’s websitewww.relx.com/investorcentre |
Information for registered
ordinary shareholders
Shareholder services
The RELX PLC ordinary share register is administered by Equiniti Limited. Equiniti provides a free online portal for shareholders at www.shareview.co.uk. Shareview allows shareholders to monitor the value of their shareholdings, view their dividend payments and submit dividend mandate instructions. Shareholders can also submit their proxy voting instructions ahead of company meetings, as well as update their personal contact details. Shareview Dealing provides a share purchase and sale facility. Equiniti’s contact details are shown on page 180.
Electronic communications
While hard copy shareholder communications continue to be available to those shareholders requesting them, in accordance with the Companies Act 2006 and the Company’s articles of association, the Company uses the Group’s website as the main method of communicating with shareholders. By registering their details online at Shareview, shareholders can be notified by email when shareholder communications are published on the Group’s website. Shareholders can also use the Shareview website to appoint a proxy to vote on their behalf at shareholder meetings.
Shareholders who hold their Company shares through CREST may appoint proxies for shareholder meetings through the CREST electronic proxy appointment service by using the procedures described in the CREST manual.
Dividend mandates
Shareholders are encouraged to have their dividends paid directly into a UK bank or building society account. This method of payment reduces the risk of delay or loss of dividend cheques in the post and ensures the account is credited on the dividend payment date. A dividend mandate form can be obtained online at www.shareview.co.uk, or by contacting Equiniti at the address shown on page 180.
Equiniti has established a service for overseas shareholders in over 90 countries, which enables shareholders to have their dividends automatically converted from sterling and paid directly into their nominated bank account. Further details of this service, and the fees applicable, are available at www.shareview.co.uk/info/ops or by contacting Equiniti at the address shown on page 180.
Dividend Reinvestment Plan
Shareholders can choose to reinvest their Company dividends by purchasing further shares through the Dividend Reinvestment Plan (DRIP) provided by Equiniti. Further information concerning the DRIP facility, together with the terms and conditions and an application form can be obtained online at www.shareview.co.uk/info/drip or by contacting Equiniti at the address shown on page 180.
Table of Contents
RELX Annual report and financial statements 2018 | Shareholder information | 179 | |
|
Share dealing service
A telephone and internet dealing service is available through Equiniti, which provides a simple way for UK resident shareholders to buy or sell their shares. For telephone dealing call 0345 603 7037 between 8.30am and 5.30pm (UK time), Monday to Friday (excluding public holidays in England and Wales), and for internet dealing log on to www.shareview.co.uk/dealing. You will need your shareholder reference number shown on your dividend confirmation.
ShareGift
The Orr Mackintosh Foundation operates a charity share donation scheme for shareholders with small parcels of shares whose value makes it uneconomic to sell them. Details of the scheme can be obtained from the ShareGift website at www.sharegift.org, or by telephoning ShareGift on 020 7930 3737.
Sub-division of ordinary shares and share consolidation
On 28 July 1986, each RELX PLC ordinary share of £1 nominal value wassub-divided into four ordinary shares of 25p each. On 2 May 1997, each 25p ordinary share wassub-divided into two ordinary shares of 12.5p each. On 7 January 2008, the ordinary shares of 12.5p each were consolidated on the basis of 58 new ordinary shares of 1451⁄116p nominal value for every 67 ordinary shares of 12.5p each held.
Capital gains tax
Themid-market price of RELX PLC’s £1 ordinary shares on 31 March 1982 was 282p. Adjusting for thesub-divisions and share consolidation referred to above results in an equivalentmid-market price of 40.72p for each existing ordinary share of 1451⁄116p nominal value.
Warning to shareholders –
unsolicited investment advice
◾ | From time to time shareholders may receive unsolicited calls from fraudsters |
◾ | Fraudsters use persuasive and high-pressure tactics to lure investors into scams, sometimes known as boiler room scams |
◾ | They may offer to sell shares that turn out to be worthless ornon-existent, or to buy shares at an inflated price in return for an upfront payment |
◾ | While high profits are promised, if you buy or sell shares in this way you will probably lose your money |
◾ | Thousands of people contact the Financial Conduct Authority about investment fraud each year, with victims losing an average of £32,000 |
How to avoid share fraud and boiler room scams
The Financial Conduct Authority (FCA) has issued some guidance on how to recognise and avoid investment fraud:
◾ | Legitimate firms authorised by the FCA are unlikely to contact you unexpectedly with an offer to buy or sell shares |
◾ | If you receive an unsolicited phone call, do not get into a conversation, note the name of the person and firm contacting you and then end the call |
◾ | Check the Financial Services Register available at https://register.fca.org.uk/ to see if the person and firm contacting you is authorised by the FCA. If you wish to call the person or firm back, only use the contact details listed on the Register |
◾ | Call the FCA on 0800 111 6768 if the firm does not have any contact details on the Register, or if you are told that they are out of date |
◾ | Search the list of unauthorised firms to avoid at https://www.fca.org.uk/consumers/unauthorised-firms-individuals#list |
◾ | If you do buy or sell shares through an unauthorised firm, you will not have access to the Financial Ombudsman Service or the Financial Services Compensation Scheme |
◾ | Consider obtaining independent financial and professional advice before you hand over any money. If it sounds too good to be true it probably is. |
How to report a scam
If you are approached by fraudsters, please tell the FCA using the share fraud reporting form at www.fca.org.uk/consumers/ report-scam-unauthorised-firm, where you can find out more about investment scams. You can also call the FCA Consumer Helpline on 0800 111 6768.
If you have already paid money to share fraudsters, you should contact Action Fraud on 0300 123 2040 or use their online tool: http://www.actionfraud.police.uk/report_fraud
Table of Contents
180 | RELX Annual report and financial statements 2018 | Financial statements and other information | |
|
Shareholder information and contacts
Information for holders of ordinary sharesheld through Euroclear Nederland
Shareholders with enquiries concerning RELX PLC ordinary shares that are not held directly on the Register of Members and are ultimately held through Nederlands Centraal Instituut voor Giraal Effectenverkeer BV (Euroclear Nederland) should direct their enquiries to the broker, financial intermediary, bank or other financial institution that holds the shares on their behalf.
Dividend Reinvestment Plan
Shareholders can choose to reinvest their dividends by purchasing shares through the Dividend Reinvestment Plan (DRIP) provided by ABN AMRO Bank NV. Further information concerning the DRIP facility can be obtained online at www.securitiesinfo.com.
Information for ADR holders
ADR shareholder services
Enquiries concerning RELX PLC ADRs should be addressed to the ADR Depositary, Citibank NA, at the address shown below. Dividend payments on RELX PLC ADRs are converted into US dollars by the ADR Depositary.
Annual Report on Form20-F
The RELX Annual Report on Form20-F is filed electronically with the United States Securities and Exchange Commission. A copy of the Form20-F is available on the Group’s website, or from the ADR Depositary at the address shown below.
Dividend currency elections
Following the completion of the corporate simplification in September 2018, shareholders appearing on the Register of Members or holding their shares through CREST will continue to receive their dividends in Pounds Sterling, but will have the option to elect to receive their dividends in Euro. Euro payments will be made by cheque only.
Shareholders who appear on the Register of Members and wish to receive their dividend in Euro should contact our Registrar, Equiniti on 0371 384 2960 (UK) or +44 (0) 121 415 0165 (from outside the UK) for a dividend election form and further information regarding the Euro dividend option. Alternatively, shareholders can view and update their current dividend elections by registering for a Shareview Portfolio at www.shareview.co.uk/register. Shareholders who hold their shares through CREST and wish to receive their dividend in Euro, must do so by following the CREST Elections process.
Former RELX NV shareholders who now hold RELX PLC shares through Euroclear Nederland (via banks and brokers), will automatically receive their dividends in Euro, but will have the option to elect to receive their dividends in Pounds Sterling. Shareholders who hold their shares through Euroclear Nederland and wish to receive their dividends in Pounds Sterling should contact their broker, financial intermediary, bank or other financial institution that holds the shares on their behalf.
Contacts
RELX PLC
Head Office and Registered Office
1-3 Strand
London WC2N 5JR
United Kingdom
Tel: +44 (0)20 7166 5500
Fax: +44 (0)20 7166 5799
Auditors
Ernst & Young LLP
1 More London Place
London SE1 2AF
United Kingdom
Registrar
Equiniti Limited
Aspect House
Spencer Road
Lancing BN99 6DA
West Sussex
United Kingdom
www.shareview.co.uk |
Tel: 0371 384 2960 (UK callers)
Tel: +44 121 415 0165 (callers outside the UK)
Listing/paying agent for shares listed on Euronext Amsterdam
held through Euroclear Nederland
ABN AMRO Bank NV
Department Corporate Broking HQ7212
Gustav Mahlerlaan 10
1082 PP Amsterdam
The Netherlands
Email: corporate.broking@nl.abnamro.com
www.securitiesinfo.com |
RELX PLC ADR Depositary
Citibank Depositary Receipt Services
PO Box 43077
Providence, RI 02940-3077
USA
www.citi.com/dr |
Email: citibank@shareholders-online.com
Tel: +1 877 248 4327
+1 781 575 4555 (callers outside the US)
Table of Contents
21 February | Results announcement for the year ended 31 December 2018 | |
25 April | Trading update issued in relation to the 2019 financial year | |
25 April | Annual General Meeting – Amba Hotel , Strand, London WC2N 5HX | |
2 May | Ex-dividend date – 2018 final dividend, ordinary shares and ADRs | |
3 May | Record date – 2018 final dividend, ordinary shares and ADRs | |
20 May | Dividend currency and DRIP election deadline | |
23 May | Euro dividend equivalent announcement | |
4 June | Payment date – 2018 final dividend, ordinary shares | |
7 June | Payment date – 2018 final dividend, ADRs | |
25 July | Interim results announcement for the six months to 30 June 2019 | |
1 August* | Ex-dividend date – 2019 interim dividend, ordinary shares and ADRs | |
2 August * | Record date – 2019 interim dividend, ordinary shares and ADRs |
* | Please note that these dates are provisional and subject to change. The 2019 Interim Dividend payment dates in respect of ordinary shares and ADRs will be confirmed by the Company in its 2019 Interim Results announcement, currently scheduled for release on 25 July 2019. |
Dividend history
The following tables set out dividends paid (or proposed) in relation to the three financial years 2016–2018.
ORDINARY SHARES | pence per PLC ordinary share | Payment date | ||||||
Final dividend for 2018** | 29.70 | 4 June 2019 | ||||||
Interim dividend for 2018 | 12.40 | 24 August 2018 | ||||||
Final dividend for 2017 | 27.70 | 22 May 2018 | ||||||
Interim dividend for 2017 | 11.70 | 25 August 2017 | ||||||
Final dividend for 2016 | 25.70 | 22 May 2017 | ||||||
Interim dividend for 2016 | 10.25 | 26 August 2016 |
**Proposed | dividend, to be submitted for approval at the Annual General Meeting of RELX PLC in April 2019. |
ADRS | $ per PLC ADR | Payment date | ||||||
Final Dividend for 2018*** | *** | 7 June 2019 | ||||||
Interim Dividend for 2018 | 0.15914 | 29 August 2018 | ||||||
Final dividend for 2017 | 0.37159 | 25 May 2018 | ||||||
Interim dividend for 2017 | 0.15085 | 30 August 2017 | ||||||
Final dividend for 2016 | 0.33387 | 25 May 2017 | ||||||
Interim dividend for 2016 | 0.13452 | 31 August 2016 |
***Payment | will be determined using the appropriate £/US$ exchange rate on 4 June 2019. |
Credits
Designed and produced by
Conran Design Group
Board photography by
Douglas Fry, Piranha Photography
Printed by
Pureprint Group, ISO14001, FSC® certified and CarbonNeutral®
Printed on Revive 100 Silk which is made from 100% recovered waste. All of the pulp is bleached using an elemental chlorine free process (ECF). Printed in the UK by Pureprint using their environmental printing technology; vegetable inks were used throughout. Pureprint is a CarbonNeutral® company. Both manufacturing mill and printer are ISO14001 registered and are Forest Stewardship Council® (FSC)chain-of-custody certified.
Table of Contents
www.relx.com