UNITED STATES
SECURITIES AND EXCHANGE COMMISSION
Washington, D.C. 20549
FORM 6-K
REPORT OF FOREIGN PRIVATE ISSUER
Pursuant to Rule 13a-16 or 15d-16
under the Securities Exchange Act of 1934
For the month of October, 2015
Commission File Number: 333-13302
ETABLISSEMENTS DELHAIZE FRÈRES
ET CIE “LE LION” (GROUPE DELHAIZE)
(Exact name of registrant as specified in its charter)*
DELHAIZE BROTHERS AND CO.
“THE LION” (DELHAIZE GROUP)
(Translation of registrant’s name into English)*
SQUARE MARIE CURIE 40
1070 BRUSSELS, BELGIUM
(Address of principal executive offices)
| * | The registrant’s charter (articles of association) specifies the registrant’s name in French, Dutch and English. |
Indicate by check mark whether the registrant files or will file annual reports under cover of Form 20-F or Form 40-F.
Form 20-F x Form 40-F ¨
Indicate by check mark if the registrant is submitting the Form 6-K in paper as permitted by Regulation S-T Rule 101(b)(1): ¨
Indicate by check mark if the registrant is submitting the Form 6-K in paper as permitted by Regulation S-T Rule 101(b)(7): ¨
 | Interim Financial Reporting Third Quarter 2015 Regulated Information October 29, 2015 – 7:00 a.m. CET | |
DELHAIZE GROUP THIRD QUARTER 2015 RESULTS
Financial Summary Third Quarter 2015
| » | Revenue growth of 2.3% at identical exchange rates |
| » | Comparable store sales growth of 1.7% (or 4.1% excluding the positive impact from strikes at a competitor last year) in the U.S., 1.7% in Belgium and 5.1% in Southeastern Europe |
| » | Group underlying operating profit of €218 million, underlying operating margin of 3.5% (4.2% in the U.S., 1.4% in Belgium, 4.5% in Southeastern Europe) |
Highlights
| » | 162 Food Lion stores relaunched under the “Easy, Fresh & Affordable” strategy on October 14, 2015 in Raleigh, North Carolina |
| » | CEO Comments |
Frans Muller, President and Chief Executive Officer of Delhaize Group, commented: “We continue to report robust sales in this third quarter. At Delhaize America, while our revenue growth was driven by Food Lion, Hannaford also posted positive volume growth once adjusted for the competitive turmoil of last summer. We made significant progress with our key strategic initiative ‘Easy, Fresh & Affordable´ at Food Lion by further fine-tuning Wilmington and Greenville, relaunching 162 stores in the Raleigh market two weeks ago and preparing for our next market in 2016.”
“Our return to positive comparable store sales growth in Belgium is just a first step as we are putting our operations back onto a path of sustainable growth. During the third quarter, our stores were impacted by significant changes as a result of the agreed departure of many employees. We have started the roll-out of our new store organisation which will be implemented in 53 stores by mid-November. In Southeastern Europe, we continued to benefit from a strong summer in our Greek operations, excellent momentum in Romania, and Serbia also posted good comparable store sales growth.”
“We are looking forward to the important fourth quarter of the year and we are confident that we will deliver results and free cash flow in line with expectations. At the same time, we continue to make progress with the proposed merger with Ahold and we are on track to complete the transaction by mid-2016.”
| » | Financial Summary |
| Q3 2015(1) | YTD 2015(1) | |||||||||||||||||||||||
Actual | At Actual Rates | At Identical Rates | In millions of €, except EPS (in €) | Actual Results | At Actual Rates | At Identical Rates | ||||||||||||||||||
| 6 141 | +14.5 | % | +2.3 | % | Revenues | 18 075 | +16.1 | % | +2.6 | % | ||||||||||||||
| 383 | +13.7 | % | +0.5 | % | Underlying EBITDA | 1 115 | +15.7 | % | +1.1 | % | ||||||||||||||
| 167 | -9.2 | % | -23.2 | % | Operating profit | 498 | +33.2 | % | +11.8 | % | ||||||||||||||
| 2.7 | % | — | — | Operating margin | 2.8 | % | — | — | ||||||||||||||||
| 218 | +12.5 | % | -1.7 | % | Underlying operating profit | 614 | +14.4 | % | -1.2 | % | ||||||||||||||
| 3.5 | % | — | — | Underlying operating margin | 3.4 | % | — | — | ||||||||||||||||
| 115 | -20.9 | % | -33.9 | % | Profit before taxes and discontinued operations | 309 | +24.2 | % | +0.8 | % | ||||||||||||||
| 113 | +2.2 | % | -13.8 | % | Net profit from continuing operations | 255 | +58.7 | % | +29.5 | % | ||||||||||||||
| 118 | +8.9 | % | -8.4 | % | Group share in net profit | 252 | +76.0 | % | +43.4 | % | ||||||||||||||
| 1.15 | +7.5 | % | -9.6 | % | Basic earnings per share - Group share in net profit | 2.46 | +74.0 | % | +41.8 | % | ||||||||||||||
| (1) | The average exchange rate of the U.S. dollar against the euro strengthened by 19.2% in the third quarter of 2015 (€1 = $1.1117) compared to the third quarter of 2014 and strengthened by 21.6% in the first nine months of 2015 (€1 = $1.1144) compared to the same period in 2014. |
| Delhaize Group – Earnings Release – Third Quarter 2015 | 1 of 23 |
| » | Third Quarter 2015 Income Statement |
Revenues
In the third quarter of 2015, Delhaize Group’s revenues increased by 14.5% and 2.3% at actual and identical exchange rates, respectively. Organic revenue growth was 2.3%.
In the U.S., revenue growth in local currency was 0.1%, resulting from a 1.7% comparable store sales growth, partly offset by a 1.4% negative calendar impact. The 1.7% comparable store sales growth was driven by strong volume growth at Food Lion while Hannaford cycled last year’s temporary competitive turmoil, which had positively impacted Hannaford revenues. Excluding this impact, Hannaford also experienced positive comparable store sales and volume growth. Retail inflation remained negative (-0.4%), albeit less than in the second quarter. Revenues at Delhaize Belgium increased by 2.2%, supported by comparable store sales growth of 1.7% with modest retail inflation (+0.6% for the third quarter) and store expansion. Revenues in Southeastern Europe grew by 11.9% at identical exchange rates, driven by both robust comparable store sales growth (+5.1%) and store expansion (+6.8%).
Gross margin
Gross margin was 24.3% of revenues, down 3 basis points at identical exchange rates. The slight decrease is the result of price investments and higher shrink at Delhaize Belgium, while gross margin remained flat at Delhaize America and in Southeastern Europe. Our gross margin in Belgium and in Southeastern Europe was supported by better supplier terms as a result of our membership in the Coopernic buying alliance.
Other operating income
Other operating income was €27 million and remained broadly unchanged compared to last year.
Selling, general and administrative expenses
Selling, general and administrative expenses (SG&A) were 21.2% of revenues, an increase of 9 basis points compared to the third quarter of last year at identical exchange rates, mainly resulting from higher pre-opening expenses at Food Lion due to more stores being relaunched under the ‘Easy, Fresh & Affordable’ initiative, and an increase in IT expenses in the U.S.
Other operating expenses
Other operating expenses were €51 million compared to €12 million last year and included €29 million additional reorganization expenses relating to the Transformation Plan in Belgium, as a result of additional employees voluntary leaving the organization and €9 million costs related to the planned merger with Ahold.
Underlying operating profit
Underlying operating profit increased by 12.5% at actual exchange rates and decreased by 1.7% at identical exchange rates. Underlying operating margin was 3.5% of revenues compared to 3.6% last year.
Underlying EBITDA
Underlying EBITDA increased by 13.7% at actual exchange rates and 0.5% at identical exchange rates. EBITDA increased by 2.1% at actual exchange rates and decreased by 11.0% at identical exchange rates compared to the same period last year.
Operating profit
Operating profit decreased from €184 million last year to €167 million this year, mainly as a result of higher other operating expenses.
Net financial expenses
Net financial expenses of €54 million are €15 million higher compared to last year as a result of the strengthening of the U.S. dollar and the impact of a fair value change of currency derivatives.
Income tax
Tax expense of €2 million was recorded on a pre-tax profit of €115 million resulting in an effective tax rate of 2.3%. The decrease compared to last year relates primarily to the recognition of a $25 million previously unrecognized deferred tax asset on US state tax losses. This recognition occurs as a result of changes in the supply chain organization and those changes heighten the probability that the losses could be utilized for state income tax purposes.
| Delhaize Group – Earnings Release – Third Quarter 2015 | 2 of 23 |
Net profit from continuing operations
Net profit from continuing operations was €113 million compared to €111 million in last year´s third quarter. This resulted in a €1.10 basic profit per share compared to €1.09 in the third quarter of 2014.
Net profit
Group share in net profit amounted to €118 million. Basic and diluted net profit per share was €1.15 and €1.14 respectively, compared to a basic and diluted net profit per share of €1.07 in both cases in the third quarter of 2014.
| » | Year-to-Date 2015 Income Statement |
Revenues
In the first nine months of 2015, Delhaize Group’s revenues increased by 16.1% and 2.6% at actual and identical exchange rates, respectively. Organic revenue growth was 2.6%.
In the U.S., revenue growth in local currency was 2.1% and comparable store sales growth was 2.2%. Revenues at Delhaize Belgium decreased by 0.2% and comparable store sales declined by 0.5%. Revenues in Southeastern Europe grew by 8.9% at identical exchange rates as a result of a 2.0% comparable store sales growth and store expansion (+6.7%).
Gross margin
Gross margin was 24.4% of revenues and was almost flat at identical exchange rates as price investments in the U.S. and in Belgium were offset by better procurement conditions in Belgium and Southeastern Europe resulting from our membership in Coopernic.
Other operating income
Other operating income was €80 million and decreased by €4 million compared to last year.
Selling, general and administrative expenses
Selling, general and administrative expenses (SG&A) were 21.4% of revenues, an increase of 11 basis points compared to the first nine months of last year at identical exchange rates resulting from negative sales leverage, increased advertising and depreciation expenses in Belgium, and higher pre-opening costs at Food Lion.
Other operating expenses
Other operating expenses were €119 million compared to €171 million last year, which included €153 million of impairment charges primarily related to Delhaize Serbia’s goodwill and trade names. The current year expenses contain €31 million reorganization costs linked to the Transformation Plan in Belgium, a €25 million fine by the competition authority in Belgium and €28 million costs relating to the merger with Ahold.
Underlying operating profit
Underlying operating profit was €614 million and increased by 14.4% at actual exchange rates. At identical exchange rates, underlying operating profit decreased by 1.2% mainly due to negative sales leverage in Belgium and higher Corporate costs. Underlying operating margin was 3.4% of revenues, similar to last year.
Underlying EBITDA
Underlying EBITDA increased by 15.7% at actual exchange rates and by 1.1% at identical exchange rates. EBITDA increased by 5.8% at actual exchange rates but decreased by 8.7% at identical exchange rates.
Operating profit
Operating profit increased by 33.2% at actual exchange rates to €498 million (+11.8% at identical exchange rates). The increase is due to lower operating expenses.
Net financial expenses
Net financial expenses were €193 million compared to €127 million reported last year as a result of the strengthening of the U.S. dollar and a €41 million one-off charge relating to the February debt tender transaction.
| Delhaize Group – Earnings Release – Third Quarter 2015 | 3 of 23 |
Income tax
During the first nine months of 2015, the effective tax rate (on continued operations) was 17.8%, a decrease compared to last year’s rate of 35.9%. The decrease is mainly due to the non-deductible goodwill impairment charge in our Serbian operations last year and to the recognition of $25 million of previously unrecognized tax benefit on US state tax losses as a result of changes in supply chain organization this year.
Net profit from continuing operations
Net profit from continuing operations was €255 million in the first nine months of 2015 compared to €161 million in the same period of 2014. This resulted in €2.48 basic earnings per share compared to €1.58 last year.
Net profit
Group share in net profit amounted to €252 million in the first nine months of 2015. Basic and diluted net profit per share were €2.46 and €2.44 respectively, compared to €1.42 and €1.41 last year, respectively.
| » | Year-to-Date 2015 Cash Flow Statement and Balance Sheet |
Free cash flow
Free cash flow was €160 million in the first nine months of 2015 compared to €426 million in the same period last year. Excluding €14 million proceeds from the divestiture of Bottom Dollar Food in 2015 and €171 million proceeds from the divestiture of Sweetbay, Harveys and Reid’s in 2014, free cash flow was €146 million this year compared to €255 million last year. This is mainly explained by higher capital expenditures primarily related to Food Lion’s remodelings under the ‘Easy, Fresh & Affordable’ strategic initiative.
Net debt
Compared to year-end 2014, net debt increased by €101 million to €1.1 billion mainly as a result of the strengthening of the U.S. dollar against the euro and the payment of the dividend in the second quarter of 2015, which were partly offset by free cash flow generation.
| Delhaize Group – Earnings Release – Third Quarter 2015 | 4 of 23 |
| » | Segment Information (at actual exchange rates) |
Q3 2015 | Revenues | Underlying Operating Margin(3) | Underlying Operating Profit/(Loss) (3) | |||||||||||||||||||||||||||||||
(in millions) | Q3 2015 | Q3 2014 | 2015 /2014 | Q3 2015 | Q3 2014 | Q3 2015 | Q3 2014 | 2015 /2014 | ||||||||||||||||||||||||||
United States(1) | $ | 4 536 | 4 530 | +0.1 | % | 4.2 | % | 4.4 | % | 190 | 198 | -4.2 | % | |||||||||||||||||||||
United States(1) | € | 4 081 | 3 415 | +19.5 | % | 4.2 | % | 4.4 | % | 171 | 150 | +14.6 | % | |||||||||||||||||||||
Belgium | € | 1 224 | 1 199 | +2.2 | % | 1.4 | % | 1.4 | % | 18 | 16 | +3.6 | % | |||||||||||||||||||||
Southeastern Europe(2) | € | 836 | 751 | +11.2 | % | 4.5 | % | 4.3 | % | 38 | 32 | +16.2 | % | |||||||||||||||||||||
Corporate | € | — | — | N/A | N/A | N/A | (9 | ) | (4 | ) | -70.1 | % | ||||||||||||||||||||||
|
|
|
|
|
|
|
|
|
|
|
|
|
|
|
| |||||||||||||||||||
TOTAL | € | 6 141 | 5 365 | +14.5 | % | 3.5 | % | 3.6 | % | 218 | 194 | +12.5 | % | |||||||||||||||||||||
|
|
|
|
|
|
|
|
|
|
|
|
|
|
|
| |||||||||||||||||||
YTD 2015 | Revenues | Underlying Operating Margin(3) | Underlying Operating Profit/(Loss) (3) | |||||||||||||||||||||||||||||||
(in millions) | YTD 2015 | YTD 2014 | 2015 /2014 | YTD 2015 | YTD 2014 | YTD 2015 | YTD 2014 | 2015 /2014 | ||||||||||||||||||||||||||
United States(1) | $ | 13 358 | 13 079 | +2.1 | % | 4.0 | % | 4.0 | % | 530 | 521 | +1.7 | % | |||||||||||||||||||||
United States(1) | € | 11 987 | 9 653 | +24.2 | % | 4.0 | % | 4.0 | % | 476 | 385 | +23.6 | % | |||||||||||||||||||||
Belgium | € | 3 656 | 3 663 | -0.2 | % | 2.0 | % | 2.6 | % | 74 | 94 | -22.3 | % | |||||||||||||||||||||
Southeastern Europe(2) | € | 2 432 | 2 250 | +8.1 | % | 3.8 | % | 3.4 | % | 93 | 76 | +22.1 | % | |||||||||||||||||||||
Corporate | € | — | — | N/A | N/A | N/A | (29 | ) | (18 | ) | -48.9 | % | ||||||||||||||||||||||
|
|
|
|
|
|
|
|
|
|
|
|
|
|
|
| |||||||||||||||||||
TOTAL | € | 18 075 | 15 566 | +16.1 | % | 3.4 | % | 3.4 | % | 614 | 537 | +14.4 | % | |||||||||||||||||||||
|
|
|
|
|
|
|
|
|
|
|
|
|
|
|
| |||||||||||||||||||
| (1) | The segment “United States” includes the banners Food Lion and Hannaford. |
| (2) | The segment “Southeastern Europe” includes our operations in Greece, Serbia and Romania. |
| (3) | For a definition of underlying operating profit, please refer to the “Definitions” page of this document. A reconciliation with reported operating profit is provided on page 18 of this document. |
United States
In the third quarter of 2015, revenues in the U.S. increased by 0.1% to $4.5 billion (€4.1 billion), supported by comparable store sales growth of 1.7%, a negative calendar impact of 1.4% and some store closings at Food Lion. Retail inflation remained negative, albeit less so than in the second quarter (-0.4% in the third quarter compared to -0.9% in the second quarter). Food Lion saw strong sales momentum, partly helped by hurricane weather in September. Hannaford also recorded positive volume growth when excluding the temporary competitive dynamics which had positively impacted Hannaford’s revenues in the summer of 2014 by approximately $100 million.
In the third quarter of 2015, underlying operating profit decreased by 4.2% to $190 million (€171 million) resulting in an underlying operating margin of 4.2% compared to 4.4% last year. This decrease is mainly the result of higher SG&A expenses as a percentage of revenues due to higher pre-opening costs at Food Lion’s 162 ‘Easy, Fresh & Affordable’ stores in Raleigh and investments in IT projects. Gross margin was flat as price investments were offset by cost savings.
Belgium
Revenues in Belgium were €1.2 billion in the third quarter of 2015, an increase of 2.2% compared to the same quarter in 2014 driven by a comparable store sales growth of 1.7% and store expansion. Retail inflation remained unchanged compared to the second quarter at 0.6%. Our market share was slightly up in the third quarter compared to last year, driven by good performance at our affiliated stores.
In the third quarter of 2015, underlying operating profit increased by 3.6% and underlying operating margin remained flat at 1.4%. Higher shrink, price investments and increased advertising and depreciation expenses were offset by better procurement terms thanks to the Coopernic buying alliance and first Transformation Plan savings.
Southeastern Europe
In the third quarter of 2015, revenues in Southeastern Europe increased by 11.2% to €836 million at actual rates (+11.9% at identical exchange rates). Comparable store sales growth was robust at 5.1% and was positive in all three countries, especially in Romania driven by a lower VAT on food nationwide since the beginning of June 2015. Our market share continued to expand in all three countries.
| Delhaize Group – Earnings Release – Third Quarter 2015 | 5 of 23 |
In the third quarter of 2015, underlying operating profit increased by 16.2% to €38 million, while underlying operating margin increased from 4.3% to 4.5%, resulting from positive sales leverage across the segment and better procurement conditions.
| » | 2015 Outlook |
For the remainder of 2015, we will continue to focus on our two key strategic initiatives: ‘Easy, Fresh & Affordable’ at Food Lion, where we have just re-launched 162 stores in Raleigh, and the implementation of the Transformation Plan in Belgium.
For the fourth quarter of 2015, we expect positive volume growth in our three segments and a positive evolution of our market share and comparable store sales growth in Belgium in particular. In addition, for the full year 2015 we continue to expect Group capital expenditures of approximately €700 million (at identical exchange rates of $1.33) and will remain disciplined with respect to operating costs, capital allocation and working capital in order to generate a healthy level of free cash flow.
| » | Conference Call and Webcast |
Delhaize Group’s management will comment on the third quarter 2015 results during a conference call starting October 29, 2015 at 09:00 am CET. The conference call can be attended by calling +44 (0)20 3427 1906 (U.K.), +1 212 444 0481 (U.S.) or +32 2 402 3092 (Belgium), with “Delhaize” as password. The conference call will also be broadcast live over the internet athttp://www.delhaizegroup.com. An on-demand replay of the webcast will be available after the conference call athttp://www.delhaizegroup.com.
| » | Delhaize Group |
Delhaize Group is a Belgian international food retailer present in seven countries on three continents. At the end of the third quarter of 2015, Delhaize Group’s sales network consisted of 3 465 stores. In 2014, Delhaize Group posted €21.4 billion ($28.4 billion) in revenues and €89 million ($118 million) in net profit (Group share). At the end of 2014, Delhaize Group employed approximately 150 000 people. Delhaize Group’s stock is listed on NYSE Euronext Brussels (DELB) and the New York Stock Exchange (DEG).
This press release is available in English, French and Dutch. You can also find it on the websitehttp://www.delhaizegroup.com. Questions can be sent toinvestor@delhaizegroup.com.
| » | Financial Calendar |
| • | Press release – 2015 fourth quarter and full year revenues and preliminary results | January 22, 2016 | ||||
| • | Press release – 2015 fourth quarter and full year results | March 3, 2016 | ||||
| » | Contacts |
Investor Relations: + 32 2 412 2151
Media Relations: + 32 2 412 8669
| Delhaize Group – Earnings Release – Third Quarter 2015 | 6 of 23 |
DELHAIZE GROUP CONDENSED CONSOLIDATED FINANCIAL STATEMENT
| » | Condensed Consolidated Balance Sheet (Unaudited) |
(in millions of €) | September 30, 2015 | December 31, 2014 | September 30, 2014 | |||||||||
Assets | ||||||||||||
Non-current assets | 8 726 | 8 172 | 8 137 | |||||||||
Goodwill | 3 380 | 3 147 | 3 045 | |||||||||
Intangible assets | 784 | 763 | 739 | |||||||||
Property, plant and equipment | 4 263 | 4 015 | 4 081 | |||||||||
Investment property | 96 | 84 | 92 | |||||||||
Investments accounted for using the equity method | 31 | 30 | 28 | |||||||||
Financial assets | 21 | 29 | 30 | |||||||||
Derivative instruments | 15 | 9 | 25 | |||||||||
Other non-current assets | 136 | 95 | 97 | |||||||||
Current assets | 3 655 | 3 955 | 3 456 | |||||||||
Inventories | 1 466 | 1 399 | 1 377 | |||||||||
Receivables | 600 | 623 | 556 | |||||||||
Financial assets | 225 | 167 | 163 | |||||||||
Derivative instruments | — | 2 | 2 | |||||||||
Other current assets | 129 | 104 | 113 | |||||||||
Cash and cash equivalents | 1 232 | 1 600 | 1 239 | |||||||||
Assets classified as held for sale | 3 | 60 | 6 | |||||||||
|
|
|
|
|
| |||||||
Total assets | 12 381 | 12 127 | 11 593 | |||||||||
|
|
|
|
|
| |||||||
Liabilities | ||||||||||||
Total equity | 5 942 | 5 453 | 5 392 | |||||||||
Shareholders’ equity | 5 935 | 5 447 | 5 386 | |||||||||
Non-controlling interests | 7 | 6 | 6 | |||||||||
Non-current liabilities | 3 268 | 3 494 | 3 454 | |||||||||
Long-term debt | 1 918 | 2 201 | 2 147 | |||||||||
Obligations under finance lease | 474 | 475 | 494 | |||||||||
Deferred tax liabilities | 335 | 302 | 384 | |||||||||
Derivative instruments | 63 | 26 | 14 | |||||||||
Provisions | 414 | 432 | 356 | |||||||||
Other non-current liabilities | 64 | 58 | 59 | |||||||||
Current liabilities | 3 171 | 3 180 | 2 747 | |||||||||
Long-term debt - current portion | 9 | 1 | 1 | |||||||||
Obligations under finance lease | 72 | 69 | 65 | |||||||||
Short-term borrowings | 3 | — | — | |||||||||
Bank overdrafts | 17 | — | — | |||||||||
Accounts payable | 2 136 | 2 112 | 1 833 | |||||||||
Provisions | 211 | 188 | 108 | |||||||||
Other current liabilities | 723 | 770 | 740 | |||||||||
Liabilities associated with assets held for sale | — | 40 | — | |||||||||
|
|
|
|
|
| |||||||
Total liabilities and equity | 12 381 | 12 127 | 11 593 | |||||||||
|
|
|
|
|
| |||||||
$ per € exchange rate | 1.1203 | 1.2141 | 1.2583 | |||||||||
|
|
|
|
|
| |||||||
| Delhaize Group – Earnings Release – Third Quarter 2015 | 7 of 23 |
| » | Condensed Consolidated Income Statement (Unaudited) |
| Q3 2015 | Q3 2014 | (in millions of €) | YTD 2015 | YTD 2014 | ||||||||||||
| 6 141 | 5 365 | Revenues | 18 075 | 15 566 | ||||||||||||
| (4 651 | ) | (4 073 | ) | Cost of sales | (13 673 | ) | (11 815 | ) | ||||||||
|
|
|
|
|
|
|
| |||||||||
| 1 490 | 1 292 | Gross profit | 4 402 | 3 751 | ||||||||||||
| 24.3 | % | 24.1 | % | Gross margin | 24.4 | % | 24.1 | % | ||||||||
| 27 | 28 | Other operating income | 80 | 84 | ||||||||||||
| (1 299 | ) | (1 124 | ) | Selling, general and administrative expenses | (3 865 | ) | (3 290 | ) | ||||||||
| (51 | ) | (12 | ) | Other operating expenses | (119 | ) | (171 | ) | ||||||||
|
|
|
|
|
|
|
| |||||||||
| 167 | 184 | Operating profit | 498 | 374 | ||||||||||||
| 2.7 | % | 3.4 | % | Operating margin | 2.8 | % | 2.4 | % | ||||||||
| (49 | ) | (45 | ) | Finance costs | (191 | ) | (140 | ) | ||||||||
| (5 | ) | 6 | Income from investments | (2 | ) | 13 | ||||||||||
| 2 | 2 | Share of results of joint venture equity accounted | 4 | 3 | ||||||||||||
| 115 | 147 | Profit before taxes and discontinued operations | 309 | 250 | ||||||||||||
|
|
|
|
|
|
|
| |||||||||
| (2 | ) | (36 | ) | Income tax expense | (54 | ) | (89 | ) | ||||||||
|
|
|
|
|
|
|
| |||||||||
| 113 | 111 | Net profit from continuing operations | 255 | 161 | ||||||||||||
|
|
|
|
|
|
|
| |||||||||
| 6 | (1 | ) | Result from discontinued operations, net of tax | (2 | ) | (16 | ) | |||||||||
| 119 | 110 | Net profit | 253 | 145 | ||||||||||||
|
|
|
|
|
|
|
| |||||||||
| 1 | 1 | Net profit attributable to non-controlling interests | 1 | 1 | ||||||||||||
| 118 | 109 | Net profit attributable to equity holders of the Group - Group share in net profit | 252 | 144 | ||||||||||||
|
|
|
|
|
|
|
| |||||||||
(in €, except number of shares) | ||||||||||||||||
| Group share in net profit from continuing operations: | ||||||||||||||||
| 1.10 | 1.09 | Basic earnings per share | 2.48 | 1.58 | ||||||||||||
| 1.09 | 1.08 | Diluted earnings per share | 2.46 | 1.57 | ||||||||||||
|
|
|
|
|
|
|
| |||||||||
| Group share in net profit: | ||||||||||||||||
| 1.15 | 1.07 | Basic earnings per share | 2.46 | 1.42 | ||||||||||||
| 1.14 | 1.07 | Diluted earnings per share | 2.44 | 1.41 | ||||||||||||
|
|
|
|
|
|
|
| |||||||||
| Weighted average number of shares outstanding: | ||||||||||||||||
| 102 948 497 | 101 582 527 | Basic | 102 531 216 | 101 376 763 | ||||||||||||
| 103 909 850 | 101 965 406 | Diluted | 103 499 648 | 101 883 845 | ||||||||||||
|
|
|
|
|
|
|
| |||||||||
| 103 766 860 | 102 732 803 | Shares issued at the end of the period | 103 766 860 | 102 732 803 | ||||||||||||
|
|
|
|
|
|
|
| |||||||||
| 102 949 557 | 101 626 283 | Shares outstanding at the end of the period | 102 949 557 | 101 626 283 | ||||||||||||
|
|
|
|
|
|
|
| |||||||||
| 1.1117 | 1.3256 | Average $ per € exchange rate | 1.1144 | 1.3549 | ||||||||||||
|
|
|
|
|
|
|
| |||||||||
| Delhaize Group – Earnings Release – Third Quarter 2015 | 8 of 23 |
| » | Condensed Consolidated Statement of Comprehensive Income (Unaudited) |
Q3 2015 | Q3 2014 | (in millions of €) | YTD 2015 | YTD 2014 | ||||||||||||
| 119 | 110 | Net profit of the period | 253 | 145 | ||||||||||||
| Items that will not be reclassified to profit or loss | ||||||||||||||||
| — | 1 | Remeasurements of defined benefit liability (asset) | — | 1 | ||||||||||||
| — | — | Tax (expense) benefit | — | — | ||||||||||||
|
|
|
|
|
|
|
| |||||||||
| — | 1 | Remeasurements of defined liability (asset), net of tax | — | 1 | ||||||||||||
|
|
|
|
|
|
|
| |||||||||
| — | 1 | Total items that will not be reclassified to profit or loss | — | 1 | ||||||||||||
|
|
|
|
|
|
|
| |||||||||
| Items that are or may be reclassified subsequently to profit or loss | ||||||||||||||||
| 3 | 1 | Unrealized gain (loss) on financial assets available for sale | — | 1 | ||||||||||||
| — | — | Reclassification adjustment to net profit | — | — | ||||||||||||
| — | — | Tax (expense) benefit | — | — | ||||||||||||
|
|
|
|
|
|
|
| |||||||||
| 3 | 1 | Unrealized gain (loss) on financial assets available for sale, net of tax | — | 1 | ||||||||||||
| (3 | ) | 283 | Exchange gain (loss) on translation of foreign operations | 312 | 316 | |||||||||||
| — | (4 | ) | Reclassification adjustment to net profit | — | (5 | ) | ||||||||||
|
|
|
|
|
|
|
| |||||||||
| (3 | ) | 279 | Exchange gain (loss) on translation of foreign operations | 312 | 311 | |||||||||||
|
|
|
|
|
|
|
| |||||||||
| — | 280 | Total items that are or may be reclassified subsequently to profit or loss | 312 | 312 | ||||||||||||
|
|
|
|
|
|
|
| |||||||||
| — | 281 | Other comprehensive income | 312 | 313 | ||||||||||||
| — | — | Attributable to non-controlling interests | — | — | ||||||||||||
| — | 281 | Attributable to equity holders of the Group | 312 | 313 | ||||||||||||
|
|
|
|
|
|
|
| |||||||||
| 119 | 391 | Total comprehensive income for the period | 565 | 458 | ||||||||||||
| 1 | 1 | Attributable to non-controlling interests | 1 | 1 | ||||||||||||
| 118 | 390 | Attributable to equity holders of the Group | 564 | 457 | ||||||||||||
|
|
|
|
|
|
|
| |||||||||
| Delhaize Group – Earnings Release – Third Quarter 2015 | 9 of 23 |
| » | Condensed Consolidated Statement of Changes in Equity (Unaudited) |
(in millions of €, except number of shares) | Shareholders’ Equity | Non-controlling Interests | Total Equity | |||||||||
Balances at January 1, 2015 | 5 447 | 6 | 5 453 | |||||||||
|
|
|
|
|
| |||||||
Other comprehensive income | 312 | — | 312 | |||||||||
Net profit | 252 | 1 | 253 | |||||||||
|
|
|
|
|
| |||||||
Total comprehensive income for the period | 564 | 1 | 565 | |||||||||
|
|
|
|
|
| |||||||
Capital increases | 59 | — | 59 | |||||||||
Dividends declared | (165 | ) | — | (165 | ) | |||||||
Treasury shares purchased | (23 | ) | — | (23 | ) | |||||||
Treasury shares sold upon exercise of employee stock options | 36 | — | 36 | |||||||||
Tax payment for restricted stock units vested | (1 | ) | — | (1 | ) | |||||||
Excess tax benefit on employee stock options and restricted stock units | 7 | — | 7 | |||||||||
Share-based compensation expense | 11 | — | 11 | |||||||||
|
|
|
|
|
| |||||||
Balances at September 30, 2015 | 5 935 | 7 | 5 942 | |||||||||
|
|
|
|
|
| |||||||
Shares issued | 103 766 860 | |||||||||||
Treasury shares | 817 303 | |||||||||||
Shares outstanding | 102 949 557 | |||||||||||
|
| |||||||||||
(in millions of €, except number of shares) | Shareholders’ Equity | Non-controlling Interests | Total Equity | |||||||||
Balances at January 1, 2014 | 5 068 | 5 | 5 073 | |||||||||
|
|
|
|
|
| |||||||
Other comprehensive income | 313 | — | 313 | |||||||||
Net profit | 144 | 1 | 145 | |||||||||
|
|
|
|
|
| |||||||
Total comprehensive income for the period | 457 | 1 | 458 | |||||||||
|
|
|
|
|
| |||||||
Capital increases | 10 | — | 10 | |||||||||
Dividends declared | (158 | ) | — | (158 | ) | |||||||
Treasury shares purchased | (2 | ) | — | (2 | ) | |||||||
Treasury shares sold upon exercise of employee stock options | 4 | — | 4 | |||||||||
Tax payment for restricted stock units vested | (1 | ) | — | (1 | ) | |||||||
Excess tax benefit on employee stock options and restricted stock units | 1 | — | 1 | |||||||||
Share-based compensation expense | 7 | — | 7 | |||||||||
|
|
|
|
|
| |||||||
Balances at September 30, 2014 | 5 386 | 6 | 5 392 | |||||||||
|
|
|
|
|
| |||||||
Shares issued | 102 732 803 | |||||||||||
Treasury shares | 1 106 520 | |||||||||||
Shares outstanding | 101 626 283 | |||||||||||
|
| |||||||||||
| Delhaize Group – Earnings Release – Third Quarter 2015 | 10 of 23 |
| » | Condensed Consolidated Statement of Cash Flows (Unaudited) |
Q3 2015 | Q3 2014 | (in millions of €) | YTD 2015 | YTD 2014 | ||||||||||||
| Operating activities | ||||||||||||||||
| 119 | 110 | Net profit | 253 | 145 | ||||||||||||
| Adjustments for: | ||||||||||||||||
| (2 | ) | (2 | ) | Share of results of joint venture equity accounted | (4 | ) | (3 | ) | ||||||||
| 165 | 147 | Depreciation and amortization | 501 | 440 | ||||||||||||
| 3 | 1 | Impairment | 10 | 168 | ||||||||||||
| 50 | 76 | Income taxes, finance costs and income from investments | 238 | 215 | ||||||||||||
| 5 | 3 | Other non-cash items | 19 | 3 | ||||||||||||
| (115 | ) | (7 | ) | Changes in operating assets and liabilities | (169 | ) | (132 | ) | ||||||||
| (21 | ) | (21 | ) | Interest paid | (113 | ) | (113 | ) | ||||||||
| 4 | 1 | Interest received | 16 | 8 | ||||||||||||
| (36 | ) | (25 | ) | Income taxes paid | (98 | ) | (123 | ) | ||||||||
| 172 | 283 | Net cash provided by operating activities | 653 | 608 | ||||||||||||
|
|
|
|
|
|
|
| |||||||||
| Investing activities | ||||||||||||||||
| (2 | ) | — | Business acquisitions, net of cash and cash equivalents acquired | (10 | ) | (6 | ) | |||||||||
| — | (10 | ) | Business disposals, net of cash and cash equivalents disposed | 14 | 167 | |||||||||||
| (228 | ) | (160 | ) | Purchase of tangible and intangible assets (capital expenditures) | (509 | ) | (389 | ) | ||||||||
| 4 | 5 | Sale of tangible and intangible assets | 13 | 44 | ||||||||||||
| — | — | Investment in debt securities | (3 | ) | (3 | ) | ||||||||||
| 13 | 83 | Sale and maturity of (investment in) term deposits, net | (11 | ) | 6 | |||||||||||
| 5 | — | Other investing activities | (22 | ) | 2 | |||||||||||
| (208 | ) | (82 | ) | Net cash used in investing activities | (528 | ) | (179 | ) | ||||||||
|
|
|
|
|
|
|
| |||||||||
| Financing activities | ||||||||||||||||
| — | 2 | Proceeds from the exercise of share warrants and stock options | 94 | 13 | ||||||||||||
| — | (2 | ) | Treasury shares purchased | (23 | ) | (2 | ) | |||||||||
| — | — | Dividends paid | (165 | ) | (158 | ) | ||||||||||
| — | 1 | Escrow maturities | — | 1 | ||||||||||||
| (19 | ) | (14 | ) | Repayments of long-term loans, net of direct financing costs | (489 | ) | (253 | ) | ||||||||
| 3 | — | Borrowings under (repayments of) short-term loans, net | 3 | — | ||||||||||||
| — | 1 | Settlement of derivative instruments | 4 | 7 | ||||||||||||
| (16 | ) | (12 | ) | Net cash used in financing activities | (576 | ) | (392 | ) | ||||||||
|
|
|
|
|
|
|
| |||||||||
| (1 | ) | 49 | Effect of foreign currency translation | 66 | 55 | |||||||||||
|
|
|
|
|
|
|
| |||||||||
| (53 | ) | 238 | Net increase (decrease) in cash and cash equivalents | (385 | ) | 92 | ||||||||||
|
|
|
|
|
|
|
| |||||||||
| 1 268 | 1 001 | Cash and cash equivalents at beginning of period | 1 600 | 1 147 | ||||||||||||
| 1 215 | (1) | 1 239 | Cash and cash equivalents at end of period | 1 215 | (1) | 1 239 | ||||||||||
|
|
|
|
|
|
|
| |||||||||
| (1) | Net of €17 million bank overdrafts |
| Delhaize Group – Earnings Release – Third Quarter 2015 | 11 of 23 |
| » | Selected Explanatory Notes |
General information
Delhaize Group is a Belgian international food retailer with operations in seven countries on three continents. The Company’s stock is listed on NYSE Euronext Brussels (DELB) and the New York Stock Exchange (DEG).
The condensed interim financial statements of the Group for the nine months ended September 30, 2015 were authorized for issue by the Board of Directors on October 28, 2015.
This interim report only provides an explanation of events and transactions that are significant to an understanding of the changes in financial position and reporting since the last annual reporting period, and should therefore be read in conjunction with the consolidated financial statements for the financial year ended on December 31, 2014.
Basis of presentation and accounting policies
These condensed interim financial statements have been prepared in accordance with International Accounting Standard (IAS) 34Interim Financial Reporting, as issued by the International Accounting Standards Board (IASB), and as adopted by the European Union (EU).
The condensed interim financial statements are presented in millions of euros, the Group’s presentation currency, except where stated otherwise.
The accounting policies applied in this report are consistent with those of the previous financial year except for the following new, amended or revised IFRS standards and IFRIC interpretations that have been adopted as of January 1, 2015:
| • | Amendments to IAS 19Defined Benefit Plans: Employee Contributions; |
| • | Annual Improvements 2010-2012 Cycleand 2011-2013 Cycle. |
The adoption of these new, amended or revised pronouncements did not have a significant impact on the condensed financial statements of the Group.
Delhaize Group did not early adopt any new IASB pronouncements that were issued but not yet effective at the balance sheet date.
Segment reporting
Segment information, including a reconciliation from operating profit to underlying operating profit, required by IAS 34, can be found on page 19 of this press release and forms an integral part of this report.
Business combinations
During the first nine months of 2015, Delhaize Group made minor final payments relating to prior year business acquisitions and signed several new agreements in Southeastern Europe and the U.S. that were accounted for as business combinations. The total consideration transferred for these transactions was €10 million (of which €2 million in the third quarter) and resulted in an increase of goodwill of €8 million (of which €1 million in the third quarter).
Divestitures and discontinued operations
Disposal of Bottom Dollar Food
In the first quarter of 2015, Delhaize Group completed its agreement with ALDI Inc. to sell its 66 Bottom Dollar Food locations (“Bottom Dollar Food”), for a total sales price of $15 million (€14 million) in cash, which resulted in an insignificant settlement loss during 2015.
In addition, equipment relating to these stores (carrying amount of €2 million), classified as held for sale in 2014, was sold to third parties in the first quarter of 2015 and did not result in any impact on the profit and loss.
| Delhaize Group – Earnings Release – Third Quarter 2015 | 12 of 23 |
Discontinued operations
The overall “Result from discontinued operations” and corresponding net cash flows of the entities classified as discontinued operations are summarized as follows:
(in millions of €, except per share information) | YTD 2015 | YTD 2014(1) | ||||||
Revenues | 8 | 754 | ||||||
Cost of sales | (10 | ) | (587 | ) | ||||
Other operating income | — | 6 | ||||||
Selling, general and administrative expenses | (9 | ) | (173 | ) | ||||
Other operating expenses | — | (3 | ) | |||||
Net financial costs | (2 | ) | — | |||||
|
|
|
| |||||
Result before tax | (13 | ) | (3 | ) | ||||
Income taxes | 11 | 1 | ||||||
|
|
|
| |||||
Result of discontinued operations (net of tax) | (2 | ) | (2 | ) | ||||
Pre-tax loss recognized on re-measurement of assets of disposal groups | — | (14 | ) | |||||
Income taxes | — | — | ||||||
|
|
|
| |||||
Result from discontinued operations (net of tax), fully attributable to equity holders of the Group | (2 | ) | (16 | ) | ||||
Basic earnings per share from discontinued operations | (0.02 | ) | (0.16 | ) | ||||
Diluted earnings per share from discontinued operations | (0.02 | ) | (0.16 | ) | ||||
Operating cash flows | (2 | ) | (29 | ) | ||||
Investing cash flows | 2 | 6 | ||||||
Financing cash flows | — | 10 | ||||||
|
|
|
| |||||
Total cash flows | — | (13 | ) | |||||
| (1) | Includes, besides Bottom Dollar Food results, also the result of the U.S. banner Sweetbay, Harveys and Reid’s, the Bulgarian operations and Delhaize Bosnia & Herzegovina which were sold in 2014. |
During the third quarter, income tax gains increased by €6 million, due to the recognition of a previously unrecognized deferred tax asset relating to US state tax losses carried forward (see section “Income taxes” below).
While in the nine months of 2014, the Group recognized an impairment loss of €14 million to write down the carrying value of its Bulgarian operations and Delhaize Bosnia & Herzegovina to their estimated fair value less cost to sell, no similar write down was necessary during 2015.
| » | Balance Sheet and Cash Flow Statement |
Capital expenditures
During the first nine months of 2015, Delhaize Group incurred capital expenditures of €509 million, consisting of €461 million in property, plant and equipment and €48 million in intangible assets. In the third quarter of 2015, Delhaize Group incurred capital expenditures of €228 million, consisting of €211 million in property, plant and equipment and €17 million in intangible assets.
In addition, the Group added property under finance leases in the nine months of 2015 for a total amount of €18 million (€7 million in the third quarter of 2015). The carrying amount of tangible and intangible assets that were sold or disposed in 2015 was €14 million (€7 million for the third quarter of 2015).
| Delhaize Group – Earnings Release – Third Quarter 2015 | 13 of 23 |
Equity
In the first nine months of 2015, Delhaize Group issued 947 807 new shares (none during the third quarter), purchased 341 192 treasury shares (none during the third quarter) and used 638 983 treasury shares (4 127 during the third quarter) to satisfy the exercise of stock options that were granted as part of the share-based incentive plans. At September 30, 2015, the Group owned 817 303 treasury shares.
During 2015, the Group sold euro denominated call options on its own shares that it had acquired to partially hedge the potential exposure (for the grant years 2008 and 2009) arising from the possible future exercise of stock options granted to employees of non-U.S. operating companies for €4 million. At the same time, the Group acquired new euro denominated call options (for the grant years 2007, 2010 and 2011) for an identical amount. These call options met the requirements of IFRS to qualify as equity instruments and are recognized in share premium at their initial transaction cost.
Dividends
At Delhaize Group’s shareholders meeting on May 28, 2015, Delhaize Group’s shareholders approved the distribution of a €1.60 gross dividend per share for financial year 2014. After deduction of a 25% withholding tax, this resulted in a net dividend of €1.20 per share. The dividend was paid in June 2015.
Financial instruments
Repayment of long-term debts
During the first quarter of 2015, Delhaize Group completed a tender offer for cash and purchased (i) $278 million of the 6.50% bonds due 2017 at a price of 111.66% and (ii) $170 million of the 4.125% senior notes due 2019 at a price of 107.07%. This resulted in a one-time charge to profit and loss of €41 million.
Derivative financial instruments and hedging
As a result of the above mentioned partial repurchases, Delhaize Group entered into the following transactions during the first quarter of 2015:
| • | Unwinding of an amount of $170 million interest rate swaps relating to the 4.125% senior notes due 2019 that were entirely hedged by interest rate swaps for fair value hedge purposes. The unwinding resulted in a cash inflow of €2 million with an insignificant impact on profit and loss. |
| • | New counter cross-currency interest rate swaps (“CCIRS”), exchanging the principal and interests on the repurchased amounts of the 6.50% bonds due in 2017, to offset foreign currency exposure arising from a $450 million intragroup loan. |
Further, in the first quarter of 2015, Delhaize Group entered into interest rate swaps to hedge $72 million of its exposure to changes in the fair value of the remaining $172 million bonds due 2017 due to variability in market interest rates (“hedged risk”). The maturity date of the interest rate swap arrangements (“hedging instrument”) match those of the underlying debt (“hedged item”). The Group designated and documented these transactions as fair value hedges.
Finally, during the first quarter of 2015, a foreign exchange forward contract to purchase $12 million in exchange for €9 million matured and resulted in a cash inflow of €2 million, with insignificant impact on profit and loss.
| Delhaize Group – Earnings Release – Third Quarter 2015 | 14 of 23 |
Financial instruments measured at fair value by fair value hierarchy:
September 30, 2015 | ||||||||||||||||
(in millions of €) | Quoted prices in active markets (Level 1) | Significant other observable inputs (Level 2) | Significant unobservable inputs (Level 3) | Total | ||||||||||||
Financial Assets | ||||||||||||||||
Non-Current | ||||||||||||||||
Derivative instruments | — | 15 | — | 15 | ||||||||||||
Current | ||||||||||||||||
Financial assets – measured at fair value | 173 | — | — | 173 | ||||||||||||
|
|
|
|
|
|
|
| |||||||||
Total financial assets measured at fair value | 173 | 15 | — | 188 | ||||||||||||
Financial assets measured at amortized cost | 1 905 | |||||||||||||||
|
| |||||||||||||||
Total financial assets | 2 093 | |||||||||||||||
Financial Liabilities | ||||||||||||||||
Non-Current | ||||||||||||||||
Derivative instruments | — | 63 | — | 63 | ||||||||||||
|
|
|
|
|
|
|
| |||||||||
Total financial liabilities measured at fair value | — | 63 | — | 63 | ||||||||||||
Financial liabilities being part of a fair value hedge relationship | 407 | |||||||||||||||
Financial liabilities measured at amortized cost | 4 222 | |||||||||||||||
|
| |||||||||||||||
Total financial liabilities | 4 692 | |||||||||||||||
In 2015, there were no transfers between fair value hierarchy levels and there were no changes in the valuation techniques and inputs applied.
Fair value of financial instruments not measured at fair value:
(in millions of €) | Carrying amount | Fair value | ||||||
Financial liabilities being part of a fair value hedge relationship | 407 | 442 | ||||||
Financial liabilities at amortized cost | 1 520 | 1 918 | ||||||
|
|
|
| |||||
Total long-term debt | 1 927 | 2 360 | ||||||
The fair value of the receivables, other financial assets, cash and cash equivalents and accounts payable, all measured at amortized cost, approximate their carrying amounts.
Employee Benefits
In 2015, Delhaize Group granted 494 087 performance stock units (or 123 522 when expressed in Delhaize Group shares), to senior management of its U.S. operating companies under the “Delhaize America 2012 Restricted Stock Unit Plan” and 88 432 performance stock units to senior management of its non-U.S. operating companies under the “Delhaize Group 2014 European Performance Stock Unit Plan.” The fair value of the performance stock units was $20.88 for the U.S. operating companies and €76.46 for the non-U.S. operating companies, based on the share price at grant date. In 2015, Delhaize Group did not grant any stock options or warrants to its employees.
Performance stock units are restricted stock units, with additional performance conditions. The cliff-vesting of these performance stock units is linked to the achievement of a non-market financial performance condition (Shareholder Value Creation targets over a cumulative 3-year period) which is taken into account when estimating the number of awards that will vest. Shareholders Value Creation has been defined by the Group as six times underlying EBITDA minus the net debt. When the award vests, the associate receives – at no cost to the associate – ADRs or shares equal to the number of restricted stock units that have vested, free of any restrictions.
| Delhaize Group – Earnings Release – Third Quarter 2015 | 15 of 23 |
Provisions
In the second quarter of 2014, Delhaize Group announced its intention to implement significant changes to its Belgium operations (the Transformation Plan). The announcement fell under the so-called “Law Renault”, which requires that an employer that intends to implement a collective dismissal must first inform and consult its employees or their representatives before taking any decision on the collective dismissal. The consultation process is followed by negotiation and implementation phases. End 2014, the Group reached a protocol agreement with the blue collar work force and signed a preliminary agreement for its white collars, which was finalized at the beginning of 2015. In 2014, Delhaize Group recognized a provision of €137 million, representing management’s best estimate at that time of the expected costs in connection with the agreed upon voluntary early retirement and voluntary departure of approximately 1 800 employees. The Group is currently in the implementation phase. During a first wave which ended on March 31, 2015, approximately 1 500 employees applied (of which almost 1 000 opted for early retirement). As part of a second wave, approximately additional 500 employees applied, resulting in the situation that the total departures exceeds the agreed upon 1 800. The Group offered, to the employees that exceed the threshold of 1 800, a similar severance package under a common agreement of voluntary leave, which resulted in an increase of the provision by €20 million. Overall, during 2015 the total expected costs increased due to the above and updates in assumptions to €169 million, an increase of €32 million compared to December 31, 2014, of which €29 million were incurred during the third quarter. €35 million has been paid out until the end of the third quarter.
In June 2015, the Group accepted to pay a fine of €25 million imposed by the Belgian Competition Authority in final settlement of the antitrust investigation regarding the coordination of price increases of certain health and beauty products sold in Belgium between 2002 and 2007. The Group recognized a charge of €25 million to reflect the final outcome of the settlement. Payment was made in the third quarter of 2015.
| » | Income Statement |
Other operating income
Q3 2015 | Q3 2014 | (in millions of €) | YTD 2015 | YTD 2014 | ||||||||||||
| 15 | 13 | Rental income | 44 | 39 | ||||||||||||
| 5 | 4 | Income from waste recycling activities | 15 | 14 | ||||||||||||
| 1 | 1 | Services rendered to wholesale customers | 4 | 4 | ||||||||||||
| 1 | 1 | Gain on sale of property, plant and equipment | 3 | 7 | ||||||||||||
| 5 | 9 | Other | 14 | 20 | ||||||||||||
|
|
|
|
|
|
|
| |||||||||
| 27 | 28 | Total | 80 | 84 | ||||||||||||
|
|
|
|
|
|
|
| |||||||||
Other operating expenses
Q3 2015 | Q3 2014 | (in millions of €) | YTD 2015 | YTD 2014 | ||||||||||||
| (1 | ) | 2 | Store closing expenses | (2 | ) | 2 | ||||||||||
| (29 | ) | — | Reorganization expenses | (37 | ) | — | ||||||||||
| (3 | ) | (1 | ) | Impairment | (10 | ) | (153 | ) | ||||||||
| (5 | ) | (2 | ) | Loss on sale of property, plant and equipment | (9 | ) | (7 | ) | ||||||||
| (13 | ) | (11 | ) | Other | (61 | ) | (13 | ) | ||||||||
|
|
|
|
|
|
|
| |||||||||
| (51 | ) | (12 | ) | Total | (119 | ) | (171 | ) | ||||||||
|
|
|
|
|
|
|
| |||||||||
In the third quarter of 2015, the Group recognized reorganization expenses of €29 million in connection with its Belgian Transformation Plan – see section “Provisions” above, for further information.
For the first nine months of 2015, the caption “Other” mainly includes a fine of €25 million imposed by the Belgian Competition Authority and €28 million advisory and consulting costs incurred so far in connection with the planned merger with Royal Ahold N.V., announced in June 2015.
| Delhaize Group – Earnings Release – Third Quarter 2015 | 16 of 23 |
Income taxes
During the first nine months of 2015, the effective tax rate (on continued operations) was 17.8%, compared to previous year’s rate of 35.9% which relates primarily to (i) last year’s non-deductible goodwill impairment charge in our Serbian business, and (ii) the recognition of a €22 million previously unrecognized deferred tax asset relating to US state tax losses as a result of a change in supply chain management in the U.S., which makes it probable that future taxable profit will allow the deferred tax asset to be recovered.
Related party transactions
In the second quarter of 2015, an aggregate number of 22 005 (equivalent of 88 018 ADS) and 30 300 U.S. and European performance stock units, respectively, were granted to members of the Executive Committee.
| » | Contingencies, Commitments and Guarantees |
Following the closing of Delhaize Group’s agreed sale of Sweetbay, Harveys and Reid’s and Bottom Dollar Food, the Group will continue to provide guarantees for a number of existing operating or finance lease contracts, which extend through 2037. In the event of a future default of the buyer, Delhaize Group will be obligated to pay rent and otherwise perform the guaranteed leases. The future minimum lease payments over the non-cancellable lease term of the guaranteed leases, excluding other direct costs such as common area maintenance expenses and real estate taxes, amount to $410 million (€366 million) as of September 30, 2015. The Group closely monitors the risks associated with these guarantees and currently does not expect to be required to pay any amounts in the foreseeable future.
Except for changes mentioned in these interim financial statements, other contingencies are materially unchanged from those described in Note 34 on pages 151 and 152 of the 2014 Annual Report.
| » | Subsequent Events |
In October 2015, Delhaize Group unwound the $172 million interest rate swaps related to the $172 million debt maturing in 2017. The transaction did not result in any material impact on profit and loss.
No further significant events occurred after balance sheet date.
| Delhaize Group – Earnings Release – Third Quarter 2015 | 17 of 23 |
OTHER FINANCIAL AND OPERATING INFORMATION (UNAUDITED)
| » | Use of non-GAAP (Generally Accepted Accounting Principles) Financial Measures |
Delhaize Group uses certain non-GAAP measures in its financial communication. Delhaize Group does not consider these measures as alternative measures to net profit or other financial measures determined in accordance with IFRS. These measures as reported by Delhaize Group may differ from similarly titled measures used by other companies. We believe that these measures are important indicators of our business performance and are widely used by investors, analysts and other interested parties. In the press release, the non-GAAP measures are reconciled to financial measures prepared in accordance with IFRS.
| » | Number of Stores |
| End of 2014 | End of Q2 2015 | Change Q3 2015 | End of Q3 2015 | |||||||||||||
United States | 1 361 | 1 291 | — | 1 291 | ||||||||||||
Belgium & Luxembourg | 880 | 881 | +6 | 887 | ||||||||||||
Greece | 308 | 333 | +2 | 335 | ||||||||||||
Romania | 410 | 425 | +12 | 437 | ||||||||||||
Serbia | 387 | 389 | — | 389 | ||||||||||||
Indonesia | 122 | 126 | — | 126 | ||||||||||||
|
|
|
|
|
|
|
| |||||||||
Total | 3 468 | 3 445 | +20 | 3 465 | ||||||||||||
|
|
|
|
|
|
|
| |||||||||
| » | Organic Revenue Growth Reconciliation |
Q3 2015 | Q3 2014 | % Change | (in millions of €) | YTD 2015 | YTD 2014 | % Change | ||||||||||||||||||
| 6 141 | 5 365 | +14.5 | % | Revenues | 18 075 | 15 566 | +16.1 | % | ||||||||||||||||
| (655 | ) | Effect of exchange rates | (2 109 | ) | ||||||||||||||||||||
| 5 486 | 5 365 | +2.3 | % | Revenues at identical exchange rates | 15 966 | 15 566 | +2.6 | % | ||||||||||||||||
|
|
|
|
|
|
|
|
|
|
|
| |||||||||||||
| 5 486 | 5 365 | +2.3 | % | Organic revenue growth | 15 966 | 15 566 | +2.6 | % | ||||||||||||||||
|
|
|
|
|
|
|
|
|
|
|
| |||||||||||||
| » | Underlying operating profit reconciliation |
Delhaize Group believes “underlying operating profit” is a measure that, for external users of the financial statements, offers a more detailed view than “operating profit” of the operating performance of the period for the Group as it adjusts for a number of elements that management considers as non-representative of underlying operating performance.
| Q3 2015 | ||||||||||||||||||||||||
(in millions) | United States | United States | Belgium | SEE | Corporate | TOTAL | ||||||||||||||||||
| $ | € | € | € | € | € | |||||||||||||||||||
Operating profit (as reported) | 179 | 161 | (13 | ) | 37 | (18 | ) | 167 | ||||||||||||||||
|
|
|
|
|
|
|
|
|
|
|
| |||||||||||||
Add/(substract): | ||||||||||||||||||||||||
Store closing expenses (reversals) | 1 | 1 | — | — | — | 1 | ||||||||||||||||||
Reorganization expenses (reversals) | — | — | 29 | — | — | 29 | ||||||||||||||||||
Fixed assets impairment charges (reversals) | 1 | 1 | 2 | — | — | 3 | ||||||||||||||||||
(Gains)/losses on disposal of fixed assets | 3 | 3 | — | 1 | — | 4 | ||||||||||||||||||
Other | 6 | 5 | — | — | 9 | 14 | ||||||||||||||||||
|
|
|
|
|
|
|
|
|
|
|
| |||||||||||||
Underlying Operating Profit | 190 | 171 | 18 | 38 | (9 | ) | 218 | |||||||||||||||||
|
|
|
|
|
|
|
|
|
|
|
| |||||||||||||
| Delhaize Group – Earnings Release – Third Quarter 2015 | 18 of 23 |
| YTD Q3 2015 | ||||||||||||||||||||||||
(in millions) | United States | United States | Belgium | SEE | Corporate | TOTAL | ||||||||||||||||||
| $ | € | € | € | € | € | |||||||||||||||||||
Operating profit (as reported) | 507 | 455 | 9 | 91 | (57 | ) | 498 | |||||||||||||||||
|
|
|
|
|
|
|
|
|
|
|
| |||||||||||||
Add/(substract): | ||||||||||||||||||||||||
Store closing expenses (reversals) | 2 | 2 | — | — | — | 2 | ||||||||||||||||||
Reorganization expenses (reversals) | 6 | 6 | 31 | — | — | 37 | ||||||||||||||||||
Fixed assets impairment charges (reversals) | 4 | 4 | 6 | — | — | 10 | ||||||||||||||||||
(Gains)/losses on disposal of fixed assets | 5 | 4 | — | 2 | — | 6 | ||||||||||||||||||
Other | 6 | 5 | 28 | — | 28 | 61 | ||||||||||||||||||
|
|
|
|
|
|
|
|
|
|
|
| |||||||||||||
Underlying Operating Profit | 530 | 476 | 74 | 93 | (29 | ) | 614 | |||||||||||||||||
|
|
|
|
|
|
|
|
|
|
|
| |||||||||||||
The first nine months of 2015 were primarily impacted by €31 million reorganization expenses related to the Belgian Transformation Plan (see section “Provisions” above), a fine of €25 million imposed by the Belgian Competition Authority and €28 million advisory and consulting costs related to the planned merger with Royal Ahold N.V. The two latter items are included in the caption “Other”.
| Q3 2014 | ||||||||||||||||||||||||
(in millions) | United States | United States | Belgium | SEE | Corporate | TOTAL | ||||||||||||||||||
| $ | € | € | € | € | € | |||||||||||||||||||
Operating profit (as reported) | 200 | 151 | 16 | 21 | (4 | ) | 184 | |||||||||||||||||
|
|
|
|
|
|
|
|
|
|
|
| |||||||||||||
Add/(substract): | ||||||||||||||||||||||||
Store closing expenses (reversals) | (3 | ) | (2 | ) | — | — | — | (2 | ) | |||||||||||||||
Fixed assets impairment charges (reversals) | 1 | 1 | — | — | — | 1 | ||||||||||||||||||
(Gains)/losses on disposal of fixed assets | 2 | 1 | — | — | — | 1 | ||||||||||||||||||
Other | (2 | ) | (1 | ) | — | 11 | — | 10 | ||||||||||||||||
|
|
|
|
|
|
|
|
|
|
|
| |||||||||||||
Underlying Operating Profit | 198 | 150 | 16 | 32 | (4 | ) | 194 | |||||||||||||||||
|
|
|
|
|
|
|
|
|
|
|
| |||||||||||||
| YTD Q3 2014 | ||||||||||||||||||||||||
(in millions) | United States | United States | Belgium | SEE | Corporate | TOTAL | ||||||||||||||||||
| $ | € | € | € | € | € | |||||||||||||||||||
Operating profit (as reported) | 520 | 384 | 95 | (85 | ) | (20 | ) | 374 | ||||||||||||||||
|
|
|
|
|
|
|
|
|
|
|
| |||||||||||||
Add/(substract): | ||||||||||||||||||||||||
Store closing expenses (reversals) | (3 | ) | (2 | ) | — | — | — | (2 | ) | |||||||||||||||
Fixed assets impairment charges (reversals) | 4 | 3 | — | 150 | — | 153 | ||||||||||||||||||
(Gains)/losses on disposal of fixed assets | 3 | 2 | (2 | ) | — | — | — | |||||||||||||||||
Other | (3 | ) | (2 | ) | 1 | 11 | 2 | 12 | ||||||||||||||||
|
|
|
|
|
|
|
|
|
|
|
| |||||||||||||
Underlying Operating Profit | 521 | 385 | 94 | �� | 76 | (18 | ) | 537 | ||||||||||||||||
|
|
|
|
|
|
|
|
|
|
|
| |||||||||||||
The first nine months of 2014 were primarily impacted by €153 million impairment charges, of which €150 million in Serbia.
| » | EBITDA Reconciliation |
Q3 2015 | Q3 2014 | (in millions of €) | YTD Q3 2015 | YTD Q3 2014 | ||||||||||||
| 167 | 184 | Operating profit | 498 | 374 | ||||||||||||
| 165 | 143 | Depreciation and amortization | 501 | 427 | ||||||||||||
| 3 | 1 | Impairment | 10 | 153 | ||||||||||||
|
|
|
|
|
|
|
| |||||||||
| 335 | 328 | EBITDA | 1 009 | 954 | ||||||||||||
|
|
|
|
|
|
|
| |||||||||
| Delhaize Group – Earnings Release – Third Quarter 2015 | 19 of 23 |
| » | Underlying EBITDA Reconciliation |
Q3 2015 | Q3 2014 | (in millions of €) | YTD Q3 2015 | YTD Q3 2014 | ||||||||||||
| 218 | 194 | Underlying operating profit | 614 | 537 | ||||||||||||
| 165 | 143 | Depreciation and amortization | 501 | 427 | ||||||||||||
| — | — | Accelerated depreciation | — | — | ||||||||||||
|
|
|
|
|
|
|
| |||||||||
| 383 | 337 | Underlying EBITDA | 1 115 | 964 | ||||||||||||
|
|
|
|
|
|
|
| |||||||||
| » | Free Cash Flow Reconciliation |
Q3 2015 | Q3 2014 | (in millions of €) | YTD 2015 | YTD 2014 | ||||||||||||
| 172 | 283 | Net cash provided by operating activities | 653 | 608 | ||||||||||||
| (208 | ) | (82 | ) | Net cash used in investing activities | (528 | ) | (179 | ) | ||||||||
| (19 | ) | (83 | ) | Net investment in debt securities, term deposits and derivative related collaterals | 35 | (3 | ) | |||||||||
|
|
|
|
|
|
|
| |||||||||
| (55 | ) | 118 | Free cash flow | 160 | 426 | |||||||||||
|
|
|
|
|
|
|
| |||||||||
| » | Net Debt Reconciliation |
(in millions of €, except net debt ratio’s) | September 30, 2015 | December 31, 2014 | September 30, 2014 | |||||||||
Non-current financial liabilities | 2 392 | 2 676 | 2 641 | |||||||||
Current financial liabilities | 101 | 70 | 66 | |||||||||
Derivative liabilities | 63 | 26 | 14 | |||||||||
Derivative assets | (15 | ) | (11 | ) | (27 | ) | ||||||
Investment in securities - non-current | — | (8 | ) | (9 | ) | |||||||
Investment in securities - current | (173 | ) | (149 | ) | (141 | ) | ||||||
Term deposits - current | (18 | ) | (7 | ) | (10 | ) | ||||||
Collaterals on derivative instruments | (20 | ) | — | — | ||||||||
Cash and cash equivalents | (1 232 | ) | (1 600 | ) | (1 239 | ) | ||||||
|
|
|
|
|
| |||||||
Net debt | 1 098 | 997 | 1 295 | |||||||||
Net debt to equity ratio | 18.5 | % | 18.3 | % | 24.0 | % | ||||||
EBITDA (last 12 months) | 1 221 | 1 166 | 1 278 | |||||||||
Net debt to EBITDA ratio | 90.0 | % | 85.4 | % | 101.3 | % | ||||||
|
|
|
|
|
| |||||||
| Delhaize Group – Earnings Release – Third Quarter 2015 | 20 of 23 |
| » | Identical Exchange Rates Reconciliation |
(in millions of €, except per share amounts) | Q3 2015 | Q3 2014 | 2015/2014 | |||||||||||||||||||||
| At Actual Rates | Impact of Exchange Rates | At Identical Rates | At Actual Rates | At Actual Rates | At Identical Rates | |||||||||||||||||||
Revenues | 6 141 | (655 | ) | 5 486 | 5 365 | +14.5 | % | +2.3 | % | |||||||||||||||
Operating profit | 167 | (26 | ) | 141 | 184 | -9.2 | % | -23.2 | % | |||||||||||||||
Net profit from continuing operations | 113 | (17 | ) | 96 | 111 | +2.2 | % | -13.8 | % | |||||||||||||||
Basic EPS from continuing operations | 1.10 | (0.18 | ) | 0.92 | 1.09 | +0.9 | % | -15.0 | % | |||||||||||||||
Group share in net profit | 118 | (19 | ) | 99 | 109 | +8.9 | % | -8.4 | % | |||||||||||||||
Basic EPS from Group share in net profit | 1.15 | (0.18 | ) | 0.97 | 1.07 | +7.5 | % | -9.6 | % | |||||||||||||||
Free cash flow | (55 | ) | (11 | ) | (66 | ) | 118 | N/A | N/A | |||||||||||||||
(in millions of €, except per share amounts) | YTD 2015 | YTD 2014 | 2015/2014 | |||||||||||||||||||||
| At Actual Rates | Impact of Exchange Rates | At Identical Rates | At Actual Rates | At Actual Rates | At Identical Rates | |||||||||||||||||||
Revenues | 18 075 | (2 109 | ) | 15 966 | 15 566 | +16.1 | % | +2.6 | % | |||||||||||||||
Operating profit | 498 | (80 | ) | 418 | 374 | +33.2 | % | +11.8 | % | |||||||||||||||
Net profit from continuing operations | 255 | (47 | ) | 208 | 161 | +58.7 | % | +29.5 | % | |||||||||||||||
Basic EPS from continuing operations | 2.48 | (0.46 | ) | 2.02 | 1.58 | +57.5 | % | +28.4 | % | |||||||||||||||
Group share in net profit | 252 | (47 | ) | 205 | 144 | +76.0 | % | +43.4 | % | |||||||||||||||
Basic EPS from Group share in net profit | 2.46 | (0.45 | ) | 2.01 | 1.42 | +74.0 | % | +41.8 | % | |||||||||||||||
Free cash flow | 160 | (62 | ) | 98 | 426 | -62.6 | % | -77.0 | % | |||||||||||||||
(in millions of €) | September 30, 2015 | December 31, 2014 | Change | |||||||||||||||||||||
Net debt | 1 098 | 23 | 1 121 | 997 | +10.3 | % | +12.5 | % | ||||||||||||||||
CERTIFICATION OF RESPONSIBLE PERSONS
The undersigned Frans Muller, President and Chief Executive Officer of Delhaize Group, and Pierre Bouchut, Chief Financial Officer of Delhaize Group, confirm that to the best of their knowledge:
a) these interim condensed consolidated financial statements for the nine-month period ending September 30, 2015 are prepared in accordance with IFRS (International Financial Reporting Standards) and give, in all material respects, a true and fair view of the consolidated financial position and consolidated results of Delhaize Group;
b) the interim financial report gives, in all material respects, a true and fair view of all important events and significant transactions with related parties that have occurred in the first nine months of the financial year 2015 and their effects on the summary financial statements, as well as an overview of the most significant risks and uncertainties with which we are confronted.
| Brussels, October 28, 2015 | ||
| Frans Muller | Pierre Bouchut | |
| President and CEO | Executive Vice President and CFO | |
REPORT OF THE STATUTORY AUDITOR
We have reviewed the consolidated interim financial information of Delhaize Brothers and Co “The Lion” (Delhaize Group) SA (“the company”) and its subsidiaries (jointly “the group”), prepared in accordance with International Financial Reporting Standard IAS 34 – Interim Financial Reporting as adopted by the European Union.
The consolidated condensed statement of financial position shows total assets of €12 381 million and the consolidated condensed income statement shows a consolidated profit (group share) for the period then ended of €252 million.
| Delhaize Group – Earnings Release – Third Quarter 2015 | 21 of 23 |
The board of directors of the company is responsible for the preparation and fair presentation of the consolidated interim financial information in accordance with IAS 34 – Interim Financial Reporting as adopted by the European Union. Our responsibility is to express a conclusion on this consolidated interim financial information based on our review.
Scope of review
We conducted our review of the consolidated interim financial information in accordance with International Standard on Review Engagements (ISRE) 2410 – Review of interim financial information performed by the independent auditor of the entity. A review of interim financial information consists of making inquiries, primarily of persons responsible for financial and accounting matters, and applying analytical and other review procedures. A review is substantially less in scope than an audit performed in accordance with the International Standards on Auditing (ISA) and consequently does not enable us to obtain assurance that we would become aware of all significant matters that might be identified in an audit. Accordingly, we do not express an audit opinion on the consolidated interim financial information.
Conclusion
Based on our review, nothing has come to our attention that causes us to believe that the consolidated interim financial information of Delhaize Brothers and Co “The Lion” (Delhaize Group) SA for the nine-month period ended 30 September 2015 has not been prepared, in all material respects, in accordance with IAS 34 – Interim Financial Reporting as adopted by the European Union.
RISKS
In accordance with the Belgian Royal Decree of November 14, 2007, Delhaize Group states that the other fundamental risks confronting the Company are unchanged from those described on the pages 64 through 69 of the 2014 Annual Report. To the best of our knowledge as of October 28, 2015, there are no other fundamental risks confronting the Company and influencing the remaining months of the financial year 2015. On a regular basis, the Board of Directors and Company management evaluate the business risks that confront Delhaize Group.
| Delhaize Group – Earnings Release – Third Quarter 2015 | 22 of 23 |
DEFINITIONS
| • | American Depositary Share (ADS): An American Depositary Share represents ownership in the common share of a non-U.S. corporation. The underlying common shares are held by a U.S. bank, as depositary agent. The holder of an ADS benefits from dividend and voting rights pertaining to the underlying common share through the bank that issued the ADS. Four Delhaize ADSs represent one share of Delhaize Group common stock and are traded on the New York Stock Exchange |
| • | Basic earnings per share: profit or loss attributable to ordinary equity holders of the parent entity divided by the weighted average number of ordinary shares outstanding during the period. Basic earnings per share are calculated on profit (loss) from continuing operations less non-controlling interests attributable to continuing operations, and on the group share in net profit or loss |
| • | Comparable store sales: sales from the same stores, including relocations and expansions, and adjusted for calendar effects |
| • | Diluted earnings per share: is calculated by adjusting the profit or loss attributable to ordinary equity shareholders and the weighted average number of shares outstanding for the effects of all dilutive potential ordinary shares, including those related to convertible instruments, options or warrants or shares issued upon the satisfaction of specified conditions |
| • | EBITDA: operating profit plus depreciation, amortization and impairment |
| • | Free cash flow: cash flow before financing activities, investment in/sale and maturity of debt securities, term deposits and derivative related collaterals. |
| • | Net debt: non-current financial liabilities, plus current financial liabilities and derivatives liabilities, minus derivative assets, investments in securities, term deposits, derivative related collaterals, and cash and cash equivalents. |
| • | Net financial expenses: finance costs less income from investments |
| • | Organic revenue growth: sales growth, excluding sales from acquisitions and divestitures, at identical currency exchange rates |
| • | Outstanding shares: the number of shares issued by the Company, excluding treasury shares |
| • | Underlying EBITDA: Underlying operating profit plus depreciation and amortization less any depreciation or amortization that has been excluded from underlying operating profit |
| • | Underlying operating profit: operating profit excluding fixed assets impairment charges, reorganization charges, store closing expenses, gains/losses on disposal of fixed assets and businesses and other items that management considers as not being representative of the Group’s operating performance of the period. |
| • | Weighted average number of shares: number of shares outstanding at the beginning of the period less treasury shares, adjusted by the number of shares cancelled, repurchased or issued during the period multiplied by a time-weighting factor |
| • | Working capital: inventories plus receivables and other current assets, minus accounts payable and other current liabilities |
CAUTIONARY NOTE REGARDING FORWARD LOOKING STATEMENTS
Statements that are included or incorporated by reference in this press release and other written and oral statements made from time to time by Delhaize Group and its representatives, other than statements of historical fact, which address activities, events and developments that Delhaize Group expects or anticipates will or may occur in the future, including, without limitation, the intention to merge with Ahold, anticipated savings from any restructurings, anticipated investments in Delhaize Group’s operations, timing or savings from store closures, and the anticipated benefits from any new strategies and operating profit guidance, are “forward-looking statements” within the meaning of the U.S. federal securities laws that are subject to risks and uncertainties. These forward-looking statements generally can be identified as statements that include phrases such as “guidance,” “outlook,” “projected,” “believe,” “target,” “predict,” “estimate,” “forecast,” “strategy,” “may,” “goal,” “expect,” “anticipate,” “intend,” “plan,” “foresee,” “likely,” “will,” “should” or other similar words or phrases. Although such statements are based on current information, actual outcomes and results may differ materially from those projected depending upon a variety of factors, including, but not limited to, changes in the general economy or the markets of Delhaize Group, in strategy, in consumer spending, in inflation or currency exchange rates or in legislation or regulation; competitive factors; adverse determination with respect to claims; inability to timely develop, remodel, integrate, open, convert or close stores; and supply or quality control problems with vendors. Additional risks and uncertainties that could cause actual results to differ materially from those stated or implied by such forward-looking statements are described in Delhaize Group’s most recent Annual Report on Form 20-F and other filings made by Delhaize Group with the U.S. Securities and Exchange Commission, which risk factors are incorporated herein by reference. Delhaize Group disclaims any obligation to update developments of these risk factors or to announce publicly any revision to any of the forward-looking statements contained in this release, including guidance with respect to underlying operating profit, SG&A, net finance costs, capital expenditures, store openings and free cash flow, or to make corrections to reflect future events or developments.
| Delhaize Group – Earnings Release – Third Quarter 2015 | 23 of 23 |
 |
Q3 2015 results
October 29, 2015
 |
Disclaimers
Forward-Looking Statements
This presentation includes forward-looking statements within the meaning of the U.S. federal securities laws that are subject to risks and uncertainties. Forward-looking statements describe further expectations, plans, options, results or strategies. Actual outcomes and results may differ materially from those projected depending upon a variety of factors, including but not limited to changes in the general economy or the markets of Delhaize Group (“Delhaize”), in consumer spending, in inflation or currency exchange rates or in legislation or regulation; competitive factors; adverse determination with respect to claims; inability to timely develop, remodel, integrate or convert stores; and supply or quality control problems with vendors. Additional risks and uncertainties that could cause actual results to differ materially from those stated or implied by such forward-looking statements are described in our most recent annual report or Form 20-F and other filings with the Securities and Exchange Commission (the “SEC”). Delhaize disclaims any obligation to update or revise the information contained in this presentation. This presentation also contains forward-looking statements with respect to the financial condition, results of operations and business of Delhaize and Koninklijke Ahold N.V. also known as Royal Ahold (“Ahold”) and the merger of Delhaize and Ahold, including the expected effects of any proposed transaction. Such forward-looking statements are subject to known and unknown risks, uncertainties and other factors which are beyond the control of Delhaize and Ahold, including, among other things, the possibility that the expected synergies and value creation from the transaction will not be realized, or will not be realized within the expected time period; the risk that the businesses will not be integrated successfully; the possibility that the transaction will not receive the necessary approvals, that the expected timing of such approvals will be delayed or will require actions that adversely impact the benefits expected to be realized in the transaction; and the possibility that the transaction does not close. Neither Delhaize nor Ahold, nor any of their respective directors, officers, employees and advisors nor any other person is therefore in a position to make any representation as to the accuracy of the forward-looking statements included in this communication, such as economic projections and predictions or their impact on the financial condition, credit rating, financial profile, distribution policy or share buyback program of Delhaize, Ahold or the combined company, or the market for the shares of Delhaize, Ahold or the combined company. The actual performance, the success and the development over time of the business activities of Delhaize, Ahold and the combined company may differ materially from the performance, the success and the development over time expressed in or implied from the forward-looking statements contained in this presentation.
Important Information for Investors and Shareholders
The transaction will be submitted to the shareholders of Delhaize for their consideration. In connection with the transaction, Delhaize and Ahold will prepare a prospectus for Delhaize’s shareholders to be filed with the SEC and Delhaize will mail the prospectus to its shareholders and file other documents regarding the proposed transaction with the SEC. Investors and shareholders are urged to read the prospectus and the registration statement of which it forms a part when it becomes available, as well as other documents filed with the SEC, because they will contain important information. Investors and shareholders of Delhaize will be able to receive the prospectus and other documents free of charge at the SEC’s web site, http://www.sec.gov and from Delhaize by contacting Investor Relations at Investor@delhaizegroup.com or by calling +32 2 412 2151.
| 2 |
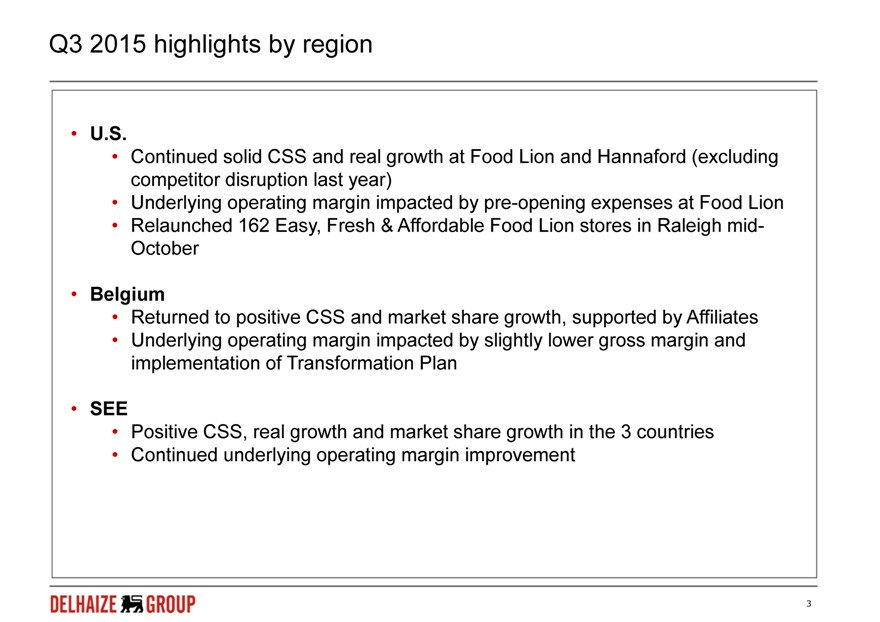 |
Q3 2015 highlights by region
| • |
| U.S. |
| • |
| Continued solid CSS and real growth at Food Lion and Hannaford (excluding competitor disruption last year) |
| • |
| Underlying operating margin impacted by pre-opening expenses at Food Lion |
| • |
| Relaunched 162 Easy, Fresh & Affordable Food Lion stores in Raleigh mid-October |
| • |
| Belgium |
| • |
| Returned to positive CSS and market share growth, supported by Affiliates |
| • |
| Underlying operating margin impacted by slightly lower gross margin and implementation of Transformation Plan |
| • |
| SEE |
| • |
| Positive CSS, real growth and market share growth in the 3 countries |
| • |
| Continued underlying operating margin improvement |
| 3 |
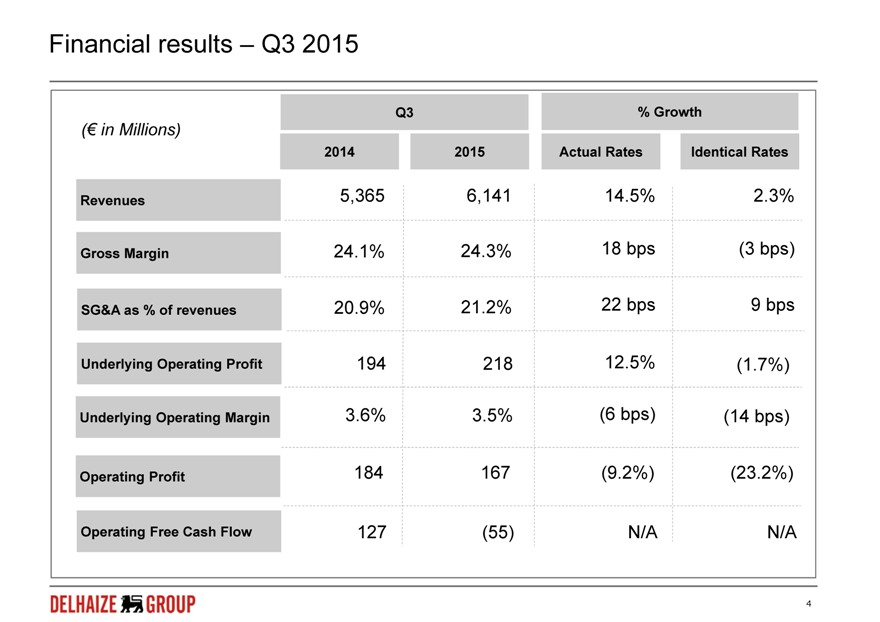 |
Financial results – Q3 2015
Q3 % Growth
(€ in Millions)
2014 2015 Actual Rates Identical Rates
Revenues 5,365 6,141 14.5% 2.3%
Gross Margin 24.1% 24.3% 18 bps (3 bps)
SG&A as % of revenues 20.9% 21.2% 22 bps 9 bps
Underlying Operating Profit 194 218 12.5% (1.7%)
Underlying Operating Margin 3.6% 3.5% (6 bps) (14 bps)
Operating Profit 184 167 (9.2%) (23.2%)
Operating Free Cash Flow 127 (55) N/A N/A
| 4 |
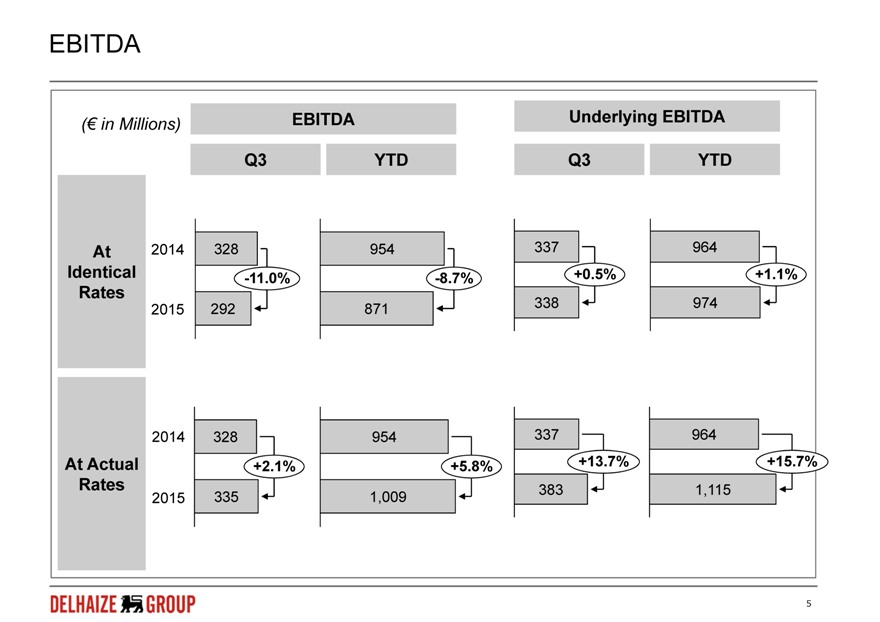 |
EBITDA
(€ in Millions) EBITDA Underlying EBITDA
Q3 YTD Q3 YTD
At 2014 328 954 337 964
Identical -11.0% -8.7% +0.5% +1.1%
Rates
2015 292 871 338 974
2014 328 954 337 964
At Actual +2.1% +5.8% +13.7% +15.7%
Rates 383 1,115
2015 335 1,009
| 5 |
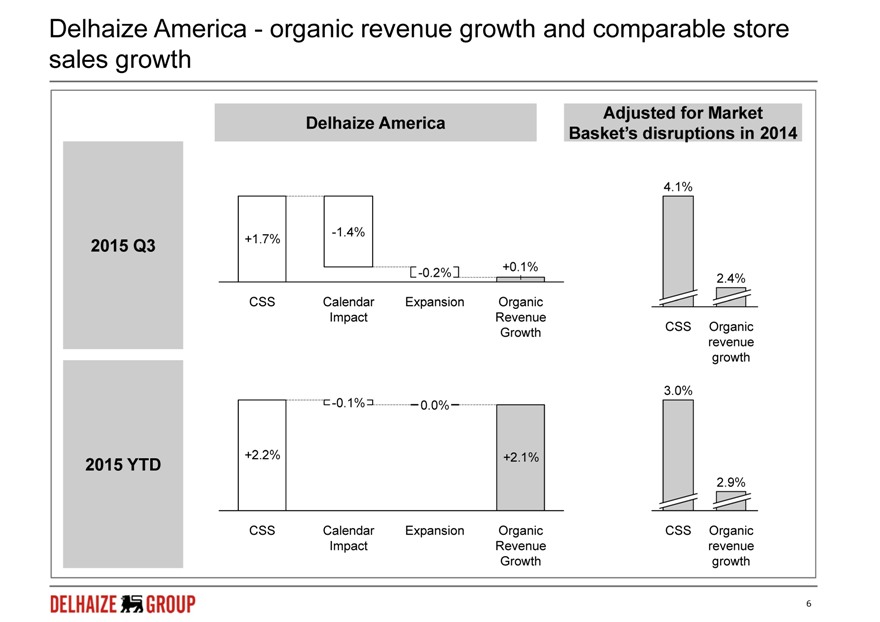 |
Delhaize America—organic revenue growth and comparable store
sales growth
Delhaize America Adjusted for Market
Basket’s disruptions in 2014
4.1%
-1.4%
2015 Q3 +1.7%
+0.1%
-0.2% 2.4%
CSS Calendar Expansion Organic
Impact Revenue
Growth CSS Organic revenue growth
3.0%
-0.1% 0.0%
2015 YTD +2.2% +2.1%
2.9%
CSS Calendar Expansion Organic CSS Organic
Impact Revenue revenue
Growth growth
| 6 |
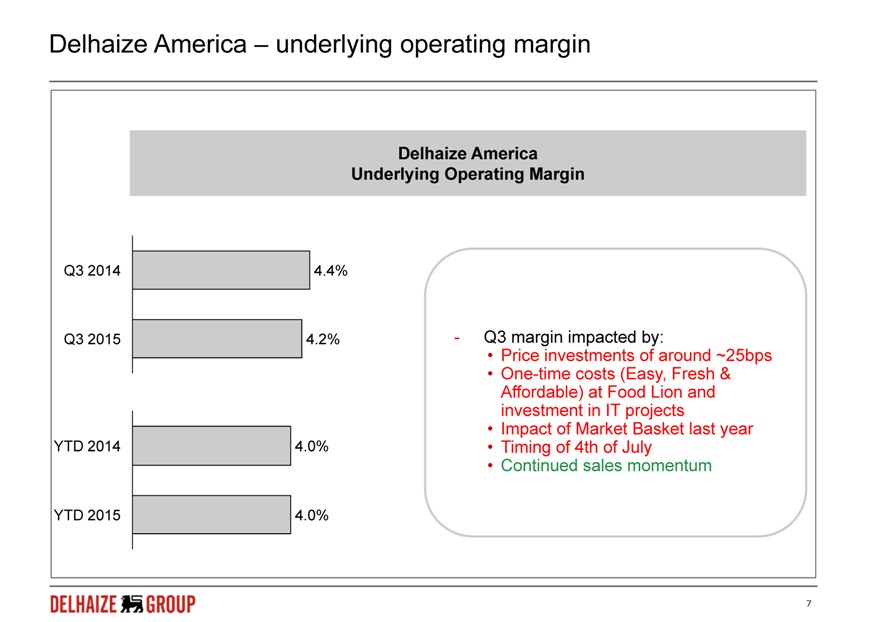 |
Delhaize America – underlying operating margin
Delhaize America Underlying Operating Margin
Q3 2014 4.4%
Q3 2015 4.2%—Q3 margin impacted by:
| • |
| Price investments of around ~25bps |
| • |
| One-time costs (Easy, Fresh & Affordable) at Food Lion and investment in IT projects |
| • |
| Impact of Market Basket last year YTD 2014 4.0% Timing of 4th of July |
| • |
| Continued sales momentum |
YTD 2015 4.0%
| 7 |
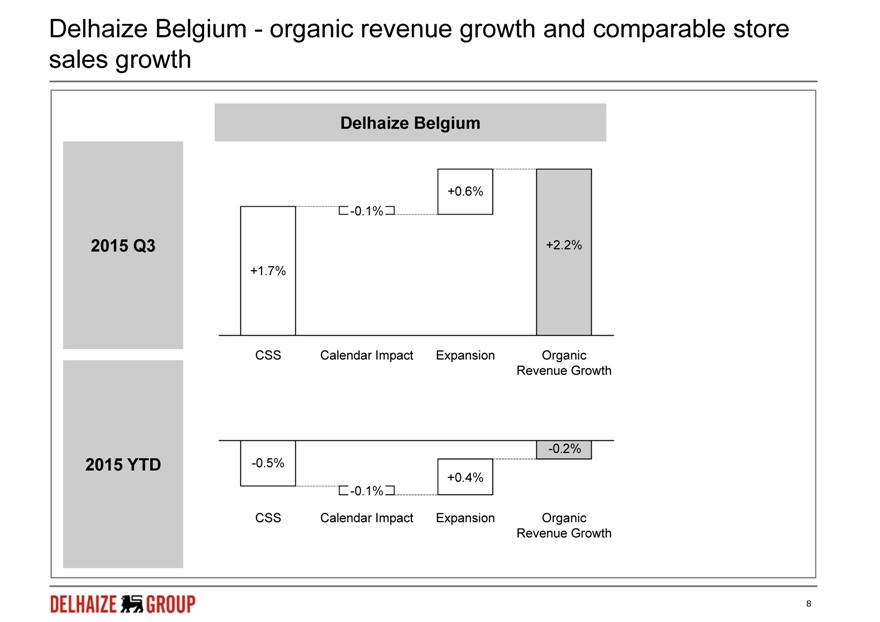 |
Delhaize Belgium—organic revenue growth and comparable store sales growth
Delhaize Belgium
+0.6% -0.1%
2015 Q3 +2.2%
+1.7%
CSS Calendar Impact Expansion Organic Revenue Growth
-0.2%
2015 YTD -0.5%
+0.4% -0.1%
CSS Calendar Impact Expansion Organic Revenue Growth
| 8 |
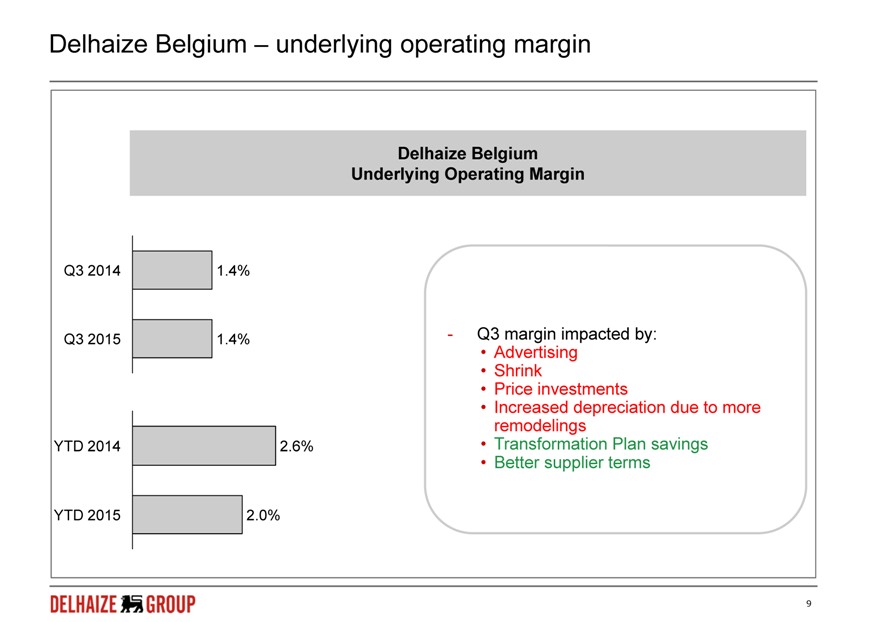 |
Delhaize Belgium – underlying operating margin
Delhaize Belgium Underlying Operating Margin
Q3 2014 1.4%
Q3 2015 1.4%—Q3 margin impacted by:
| • |
| Advertising |
| • |
| Shrink |
| • |
| Price investments |
| • |
| Increased depreciation due to more remodelings YTD 2014 2.6% Transformation Plan savings |
| • |
| Better supplier terms |
YTD 2015 2.0%
9
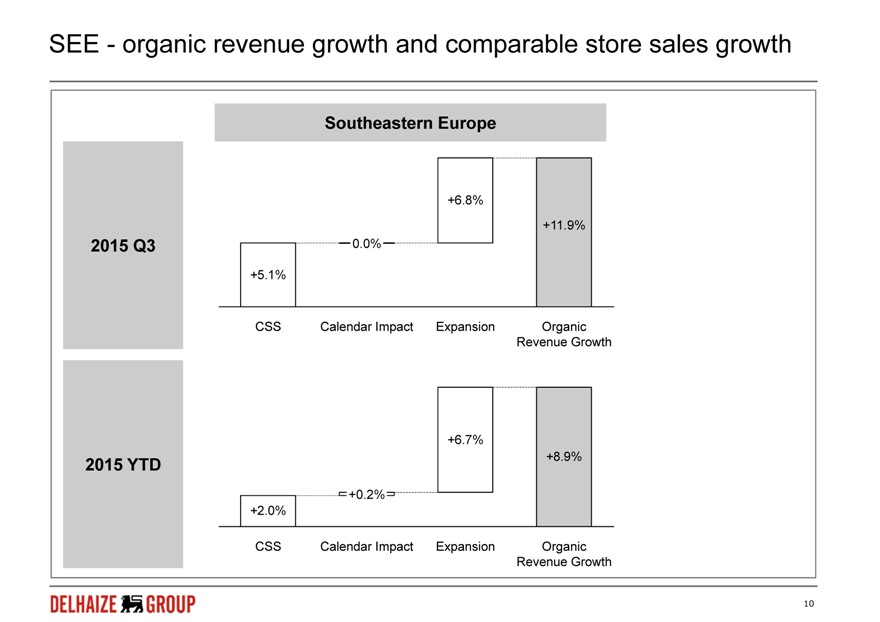 |
SEE—organic revenue growth and comparable store sales growth
Southeastern Europe
+6.8%
+11.9%
2015 Q3 0.0%
+5.1%
CSS Calendar Impact Expansion Organic Revenue Growth
+6.7%
+8.9%
2015 YTD
+0.2%
+2.0%
CSS Calendar Impact Expansion Organic Revenue Growth
10
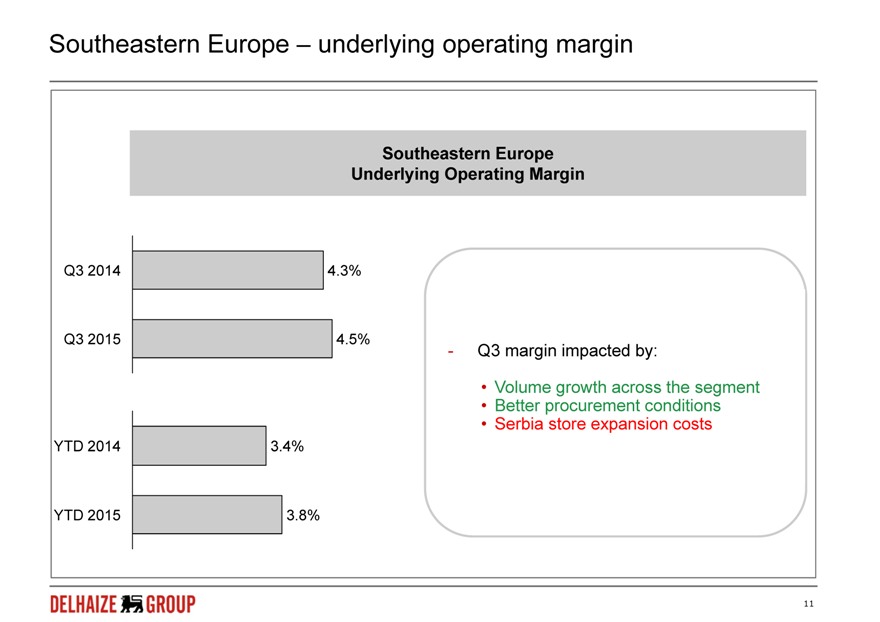 |
Southeastern Europe – underlying operating margin
Southeastern Europe Underlying Operating Margin
Q3 2014 4.3%
Q3 2015 4.5%
- Q3 margin impacted by:
| • |
| Volume growth across the segment |
| • |
| Better procurement conditions |
| • |
| Serbia store expansion costs |
YTD 2014 3.4%
YTD 2015 3.8%
11
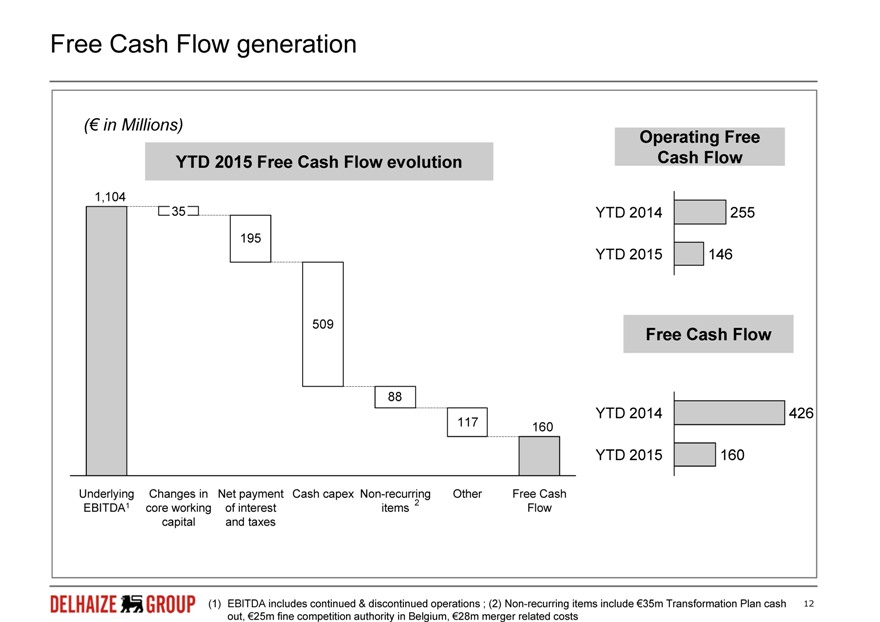 |
Free Cash Flow generation
(€ in Millions)
Operating Free YTD 2015 Free Cash Flow evolution Cash Flow
1,104
35 YTD 2014 255
195
YTD 2015 146
509
Free Cash Flow
88
YTD 2014 426
117 160
YTD 2015 160
Underlying Changes in Net payment Cash capex Non-recurring 2 Other Free Cash EBITDA1 core working of interest items Flow capital and taxes
(1) EBITDA includes continued & discontinued operations ; (2) Non-recurring items include €35m Transformation Plan cash 12 out, €25m fine competition authority in Belgium, €28m merger related costs
12
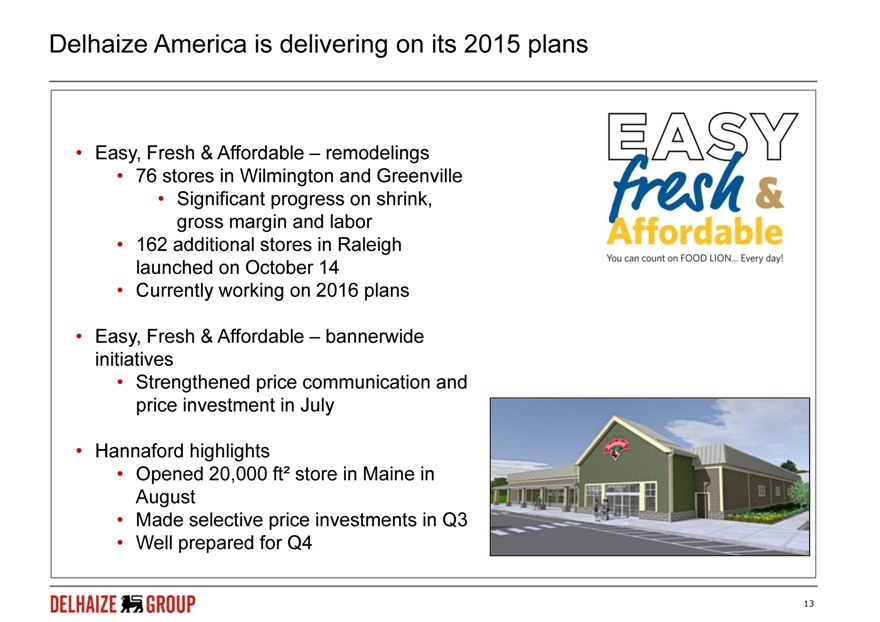 |
Delhaize America is delivering on its 2015 plans
| • |
| Easy, Fresh & Affordable – remodelings |
| • |
| 76 stores in Wilmington and Greenville |
| • |
| Significant progress on shrink, gross margin and labor |
| • |
| 162 additional stores in Raleigh launched on October 14 |
| • |
| Currently working on 2016 plans |
| • |
| Easy, Fresh & Affordable – bannerwide initiatives |
| • |
| Strengthened price communication and price investment in July |
| • |
| Hannaford highlights |
| • |
| Opened 20,000 ft² store in Maine in August |
| • |
| Made selective price investments in Q3 |
| • |
| Well prepared for Q4 |
13
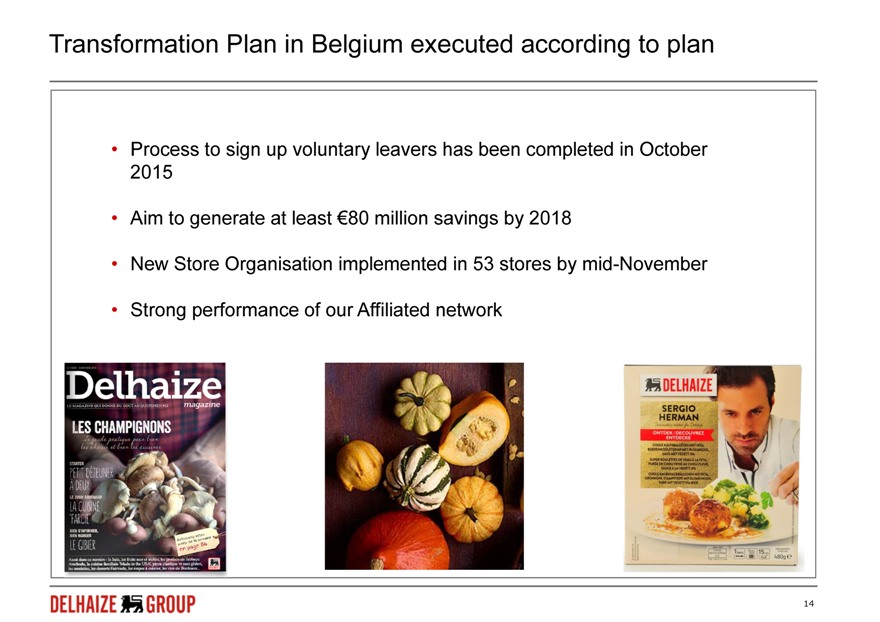 |
Transformation Plan in Belgium executed according to plan
| • |
| Process to sign up voluntary leavers has been completed in October 2015 |
| • |
| Aim to generate at least €80 million savings by 2018 |
| • |
| New Store Organisation implemented in 53 stores by mid-November |
| • |
| Strong performance of our Affiliated network |
14
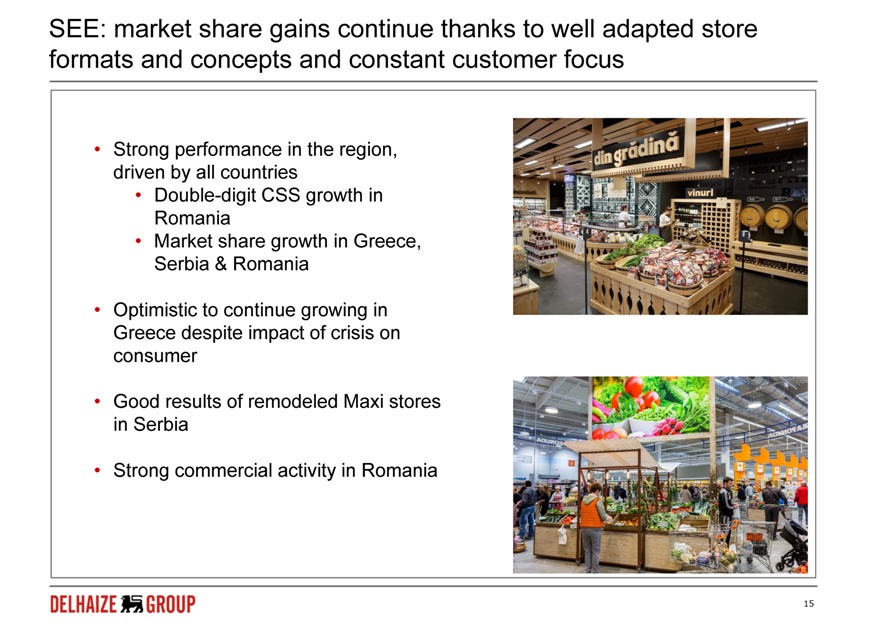 |
SEE: market share gains continue thanks to well adapted store formats and concepts and constant customer focus
| • |
| Strong performance in the region, driven by all countries |
| • |
| Double-digit CSS growth in Romania |
| • |
| Market share growth in Greece, Serbia & Romania |
| • |
| Optimistic to continue growing in Greece despite impact of crisis on consumer |
| • |
| Good results of remodeled Maxi stores in Serbia |
| • |
| Strong commercial activity in Romania |
15
 |
Ahold Delhaize merger process is on track
| • |
| Moving forward with the integration planning |
| • |
| Closing still foreseen for mid 2016 |
| • |
| Different workstreams underway on key topics (synergies, strategy, operating model, …) |
| • |
| Key milestones |
| • |
| Ahold F-4 (US SEC), Dutch prospectus (AFM) |
| • |
| EGMs |
| • |
| Competition authorities in the U.S. and Belgium |
| • |
| Upcoming joint roadshows with CEOs of both groups |
16
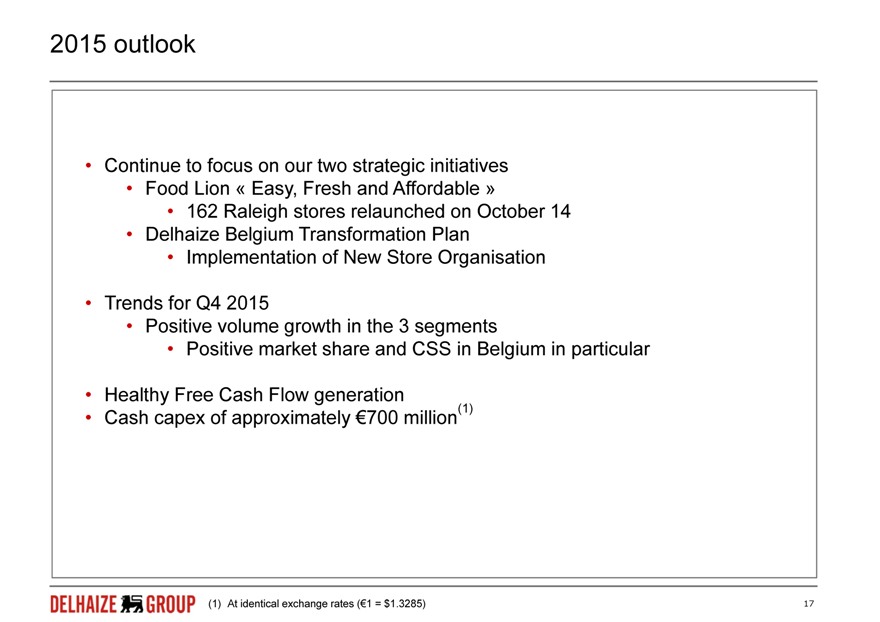 |
2015 outlook
| • |
| Continue to focus on our two strategic initiatives |
| • |
| Food Lion « Easy, Fresh and Affordable » |
| • |
| 162 Raleigh stores relaunched on October 14 |
| • |
| Delhaize Belgium Transformation Plan |
| • |
| Implementation of New Store Organisation |
| • |
| Trends for Q4 2015 |
| • |
| Positive volume growth in the 3 segments |
| • |
| Positive market share and CSS in Belgium in particular |
| • |
| Healthy Free Cash Flow generation (1) |
| • |
| Cash capex of approximately €700 million |
At identical exchange rates (€1 = $1.3285)
17
SIGNATURES
Pursuant to the requirements of the Securities Exchange Act of 1934, the registrant has duly caused this report to be signed on its behalf by the undersigned hereunto duly authorized.
ETABLISSEMENTS DELHAIZE FRÈRES ET CIE “LE LION” (GROUPE DELHAIZE) | ||||||
| Date: November 2, 2015 | By: | /s/ G. Linn Evans | ||||
| G. Linn Evans | ||||||
| Senior Vice President | ||||||