Table of Contents
UNITED STATES
SECURITIES AND EXCHANGE COMMISSION
Washington, D.C. 20549
FORM N-CSR
CERTIFIED SHAREHOLDER REPORT OF REGISTERED
MANAGEMENT INVESTMENT COMPANIES
Investment Company Act file number 811-09102
iShares, Inc.
(Exact name of registrant as specified in charter)
c/o: State Street Bank and Trust Company
200 Clarendon Street, Boston, MA 02116
(Address of principal executive offices) (Zip code)
Corporation Trust Incorporated
300 East Lombard Street, Baltimore, MD 21202
(Name and address of agent for service)
Registrant’s telephone number, including area code: 1-800-474-2737
Date of fiscal year end: August 31, 2007
Date of reporting period: August 31, 2007
Table of Contents
| Item 1. | Reports to Stockholders. |
Table of Contents
| 1 | ||
| 23 | ||
| 25 | ||
| 25 | ||
| 27 | ||
| 28 | ||
| 33 | ||
| 36 | ||
| 38 | ||
| 40 | ||
| 41 | ||
| 43 | ||
| 45 | ||
| 47 | ||
| 51 | ||
| 63 | ||
| 74 | ||
| 83 | ||
| 84 | ||
Board Review and Approval of Investment Advisory Contract (Unaudited) | 85 | |
| 88 | ||
| 94 | ||
| 98 |
Table of Contents
Management’s Discussion of Fund Performance
iSHARES® MSCI AUSTRIA INDEX FUND
Performance as of August 31, 2007
| Average Annual Total Returns | ||||||||||||||||
| Year Ended 8/31/07 | Five Years Ended 8/31/07 | Ten Years Ended 8/31/07 | ||||||||||||||
| NAV | MARKET | INDEX | NAV | MARKET | INDEX | NAV | MARKET | INDEX | ||||||||
| 22.35% | 21.81% | 22.88% | 37.03% | 37.35% | 37.69% | 15.25% | 15.27% | 16.23% | ||||||||
| Cumulative Total Returns | ||||||||||||||||
| Year Ended 8/31/07 | Five Years Ended 8/31/07 | Ten Years Ended 8/31/07 | ||||||||||||||
| NAV | MARKET | INDEX | NAV | MARKET | INDEX | NAV | MARKET | INDEX | ||||||||
| 22.35% | 21.81% | 22.88% | 383.12% | 388.78% | 394.81% | 313.26% | 314.01% | 350.10% | ||||||||
“Average Annual Total Returns” represent the average annual change in value of an investment over the periods indicated. “Cumulative Total Returns” represent the total change in value of an investment over the periods indicated.
The Fund’s per share net asset value or “NAV” is the value of one share of the Fund as calculated in accordance with the standard formula for valuing mutual fund shares. The NAV return is based on the NAV of the Fund, and the market return is based on the market price per share of the Fund. The price used to calculate market return (“Market Price”) is determined by using the midpoint between the highest bid and the lowest offer on the stock exchange on which the shares of the Fund are listed for trading, as of the time that the Fund’s NAV is calculated. Market and NAV returns assume that dividends and capital gain distributions have been reinvested in the Fund at Market Price and NAV, respectively.
An index is a statistical composite that tracks a specified financial market or sector. Unlike the Fund, an index does not actually hold a portfolio of securities and therefore does not incur the expenses incurred by the Fund. These expenses negatively impact the performance of the Fund. Also, market returns do not include brokerage commissions that may be payable on secondary market transactions. If brokerage commissions were included, market returns would be lower. The returns shown in the tables above do not reflect the deduction of taxes that a shareholder would pay on fund distributions or the redemption or sale of fund shares. The investment return and principal value of shares of the Fund will vary with changes in market conditions. Shares of the Fund may be worth more or less than their original cost when they are redeemed or sold in the market. The Fund’s past performance is no guarantee of future results.
Performance figures assume reinvestment of all dividends and capital gain distributions and do not reflect the deduction of taxes that a shareholder would pay on fund distributions or the redemption of fund shares. An index is a statistical composite that tracks a specified financial market or sector. Unlike the Fund, an index does not actually hold a portfolio of securities and therefore does not incur the expenses incurred by the Fund. These expenses negatively impact the performance of the Fund. The Fund’s past performance is no guarantee of future results.
MANAGEMENT’S DISCUSSIONSOF FUND PERFORMANCE | 1 |
Table of Contents
Management’s Discussion of Fund Performance (Continued)
iSHARES® MSCI AUSTRIA INDEX FUND
PORTFOLIO ALLOCATION As of 8/31/07 | |||
| Sector | Percentage of Net Assets | ||
Financial | 43.88 | % | |
Industrial | 17.90 | ||
Energy | 12.17 | ||
Communications | 10.54 | ||
Basic Materials | 7.90 | ||
Utilities | 5.74 | ||
Consumer Cyclical | 0.82 | ||
Short-Term and Other Net Assets | 1.05 | ||
TOTAL | 100.00 | % | |
TEN LARGEST FUND HOLDINGS As of 8/31/07 | |||
| Security | Percentage of Net Assets | ||
Erste Bank der Oesterreichischen Sparkassen AG | 16.74 | % | |
OMVAG | 12.17 | ||
Telekom Austria AG | 10.54 | ||
Meinl European Land Ltd. | 5.09 | ||
voestalpine AG | 4.92 | ||
Raiffeisen International Bank Holding AG | 4.90 | ||
Oesterreichische Elektrizitaetswirtschafts AG Class A | 4.88 | ||
Wienerberger AG | 4.82 | ||
Andritz AG | 4.78 | ||
Immoeast AG | 4.59 | ||
TOTAL | 73.43 | % | |
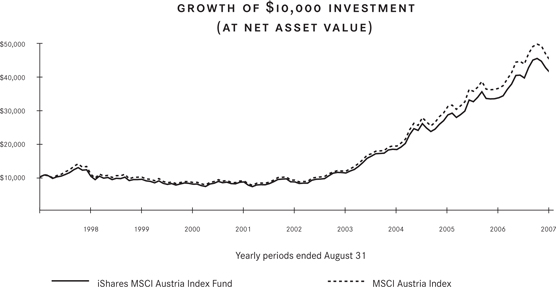
The iShares MSCI Austria Index Fund (the “Fund”) seeks to provide investment results that correspond generally to the price and yield performance, before fees and expenses, of publicly traded securities in the aggregate in the Austrian market, as measured by the MSCI Austria Index (the “Index”). The Fund invests in a representative sample of securities included in the Index that collectively has an investment profile similar to the Index. Due to the use of representative sampling, the Fund may or may not hold all of the securities that are included in the Index. For the 12-month period ended August 31, 2007 (the “reporting period”), the Fund returned 22.35%, while the Index returned 22.88%.
The Austrian stock market experienced sound gains for the reporting period, due largely to the healthy economic environment of its European neighbors. Because Austria relies on the European Union for the vast majority of its exports, it is sensitive to the economic health of the constituent markets of the European Union. In particular, economic expansion in Germany, Europe’s largest economy and Austria’s leading export market, translated into rising demand for Austrian goods. Increased export growth contributed largely to 2006 gross domestic product (“GDP”) growth of 3.2%, according to the National Bank of Austria. Continued strength in the first half of 2007 led the National Bank of Austria to revise its expectations for 2007 GDP growth upward, from 2.8% to 3.2%.
The Fund’s ten largest holdings represented more than 73% of Fund net assets as of August 31, 2007. Most of the Fund’s ten largest holdings as of August 31, 2007 posted gains for the reporting period. Steel maker voestalpine AG was the strongest performer, logging triple-digit gains. Machinery company Andritz AG and bank Raiffeisen International Bank Holding AG also delivered solid gains, as did Wienerberger AG, the world’s largest producer of bricks. Real estate company Meinl European Land Ltd. declined for the reporting period.
2 | 2007 iSHARES ANNUAL REPORTTO SHAREHOLDERS |
Table of Contents
Management’s Discussion of Fund Performance
iSHARES® MSCI BELGIUM INDEX FUND
Performance as of August 31, 2007
| Average Annual Total Returns | ||||||||||||||||
| Year Ended 8/31/07 | Five Years Ended 8/31/07 | Ten Years Ended 8/31/07 | ||||||||||||||
| NAV | MARKET | INDEX | NAV | MARKET | INDEX | NAV | MARKET | INDEX | ||||||||
| 15.36% | 14.81% | 14.97% | 23.90% | 24.03% | 23.17% | 10.70% | 10.73% | 10.80% | ||||||||
| Cumulative Total Returns | ||||||||||||||||
| Year Ended 8/31/07 | Five Years Ended 8/31/07 | Ten Years Ended 8/31/07 | ||||||||||||||
| NAV | MARKET | INDEX | NAV | MARKET | INDEX | NAV | MARKET | INDEX | ||||||||
| 15.36% | 14.81% | 14.97% | 191.98% | 193.53% | 183.53% | 176.33% | 177.16% | 178.91% | ||||||||
“Average Annual Total Returns” represent the average annual change in value of an investment over the periods indicated. “Cumulative Total Returns” represent the total change in value of an investment over the periods indicated.
The Fund’s per share net asset value or “NAV” is the value of one share of the Fund as calculated in accordance with the standard formula for valuing mutual fund shares. The NAV return is based on the NAV of the Fund, and the market return is based on the market price per share of the Fund. The price used to calculate market return (“Market Price”) is determined by using the midpoint between the highest bid and the lowest offer on the stock exchange on which the shares of the Fund are listed for trading, as of the time that the Fund’s NAV is calculated. Market and NAV returns assume that dividends and capital gain distributions have been reinvested in the Fund at Market Price and NAV, respectively.
An index is a statistical composite that tracks a specified financial market or sector. Unlike the Fund, an index does not actually hold a portfolio of securities and therefore does not incur the expenses incurred by the Fund. These expenses negatively impact the performance of the Fund. Also, market returns do not include brokerage commissions that may be payable on secondary market transactions. If brokerage commissions were included, market returns would be lower. The returns shown in the tables above do not reflect the deduction of taxes that a shareholder would pay on fund distributions or the redemption or sale of fund shares. The investment return and principal value of shares of the Fund will vary with changes in market conditions. Shares of the Fund may be worth more or less than their original cost when they are redeemed or sold in the market. The Fund’s past performance is no guarantee of future results.
Performance figures assume reinvestment of all dividends and capital gain distributions and do not reflect the deduction of taxes that a shareholder would pay on fund distributions or the redemption of fund shares. An index is a statistical composite that tracks a specified financial market or sector. Unlike the Fund, an index does not actually hold a portfolio of securities and therefore does not incur the expenses incurred by the Fund. These expenses negatively impact the performance of the Fund. The Fund’s past performance is no guarantee of future results.
MANAGEMENT’S DISCUSSIONSOF FUND PERFORMANCE | 3 |
Table of Contents
Management’s Discussion of Fund Performance (Continued)
iSHARES® MSCI BELGIUM INDEX FUND
PORTFOLIO ALLOCATION As of 8/31/07 | |||
| Sector | Percentage of Net Assets | ||
Financial | 47.14 | % | |
Consumer Non-Cyclical | 22.51 | ||
Basic Materials | 9.28 | ||
Diversified | 7.92 | ||
Communications | 6.82 | ||
Industrial | 4.59 | ||
Consumer Cyclical | 1.09 | ||
Short-Term and Other Net Assets | 0.65 | ||
TOTAL | 100.00 | % | |
TEN LARGEST FUND HOLDINGS As of 8/31/07 | |||
| Security | Percentage of Net Assets | ||
Fortis | 23.51 | % | |
KBC Group NV | 15.04 | ||
InBev | 9.03 | ||
Belgacom SA | 5.04 | ||
Dexia SA | 4.93 | ||
Groupe Bruxelles Lambert SA | 4.93 | ||
Solvay SA | 4.88 | ||
Delhaize Group | 4.76 | ||
Umicore | 4.40 | ||
UCB SA | 4.23 | ||
TOTAL | 80.75 | % | |
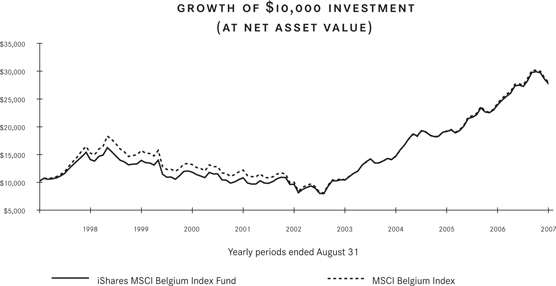
The iShares MSCI Belgium Index Fund (the “Fund”) seeks to provide investment results that correspond generally to the price and yield performance, before fees and expenses, of publicly traded securities in the aggregate in the Belgian market, as measured by the MSCI Belgium Index (the “Index”). The Fund invests in a representative sample of securities included in the Index that collectively has an investment profile similar to the Index. Due to the use of representative sampling, the Fund may or may not hold all of the securities that are included in the Index. For the 12-month period ended August 31, 2007 (the “reporting period”), the Fund returned 15.36%, while the Index returned 14.97%.
Belgium’s equity market benefited from healthy economic conditions during the reporting period. Belgium enjoyed a period of economic expansion, reporting 2.9% annualized gross domestic product (GDP) growth for the second quarter of 2007. Supporting economic growth, Belgium experienced increased export levels with trading partners both within Europe and globally. Private investment and private consumption, which increased largely as a result of a multi-year tax reform plan, also contributed to the healthy economic climate.
Within the Fund, the ten largest holdings accounted for approximately 81% of the net assets of the Fund as of August 31, 2007. Among the ten largest Fund holdings, performance was largely positive for the reporting period. InBev, the world’s largest brewer, and metals and mining company Umicore both delivered strong gains for the reporting period. Retail food chain Delhaize Group also performed well, as did telecommunications company Belgacom SA and chemical company Solvay SA. Biopharmaceutical company UCB SA and financial company Fortis, the Fund’s largest holding, both posted modest declines for the reporting period.
4 | 2007 iSHARES ANNUAL REPORTTO SHAREHOLDERS |
Table of Contents
Management’s Discussion of Fund Performance
iSHARES® MSCI EMU INDEX FUND
Performance as of August 31, 2007
| Average Annual Total Returns | ||||||||||||||||
| Year Ended 8/31/07 | Five Years Ended 8/31/07 | Inception to 8/31/07 | ||||||||||||||
| NAV | MARKET | INDEX | NAV | MARKET | INDEX | NAV | MARKET | INDEX | ||||||||
| 26.10% | 25.79% | 26.12% | 21.80% | 21.90% | 22.16% | 6.32% | 6.32% | 6.63% | ||||||||
| Cumulative Total Returns | ||||||||||||||||
| Year Ended 8/31/07 | Five Years Ended 8/31/07 | Inception to 8/31/07 | ||||||||||||||
| NAV | MARKET | INDEX | NAV | MARKET | INDEX | NAV | MARKET | INDEX | ||||||||
| 26.10% | 25.79% | 26.12% | 168.08% | 169.15% | 172.01% | 54.57% | 54.57% | 57.77% | ||||||||
Total returns for the period since inception are calculated from the inception date of the Fund (7/25/00). “Average Annual Total Returns” represent the average annual change in value of an investment over the periods indicated. “Cumulative Total Returns” represent the total change in value of an investment over the periods indicated.
The Fund’s per share net asset value or “NAV” is the value of one share of the Fund as calculated in accordance with the standard formula for valuing mutual fund shares. The NAV return is based on the NAV of the Fund, and the market return is based on the market price per share of the Fund. The price used to calculate market return (“Market Price”) is determined by using the midpoint between the highest bid and the lowest offer on the stock exchange on which the shares of the Fund are listed for trading, as of the time that the Fund’s NAV is calculated. Since shares of the Fund did not trade in the secondary market until several days after the Fund’s inception, for the period from inception to the first day of secondary market trading in shares of the Fund (7/31/00), the NAV of the Fund is used as a proxy for secondary market trading price to calculate market returns. Market and NAV returns assume that dividends and capital gain distributions have been reinvested in the Fund at Market Price and NAV, respectively.
An index is a statistical composite that tracks a specified financial market or sector. Unlike the Fund, an index does not actually hold a portfolio of securities and therefore does not incur the expenses incurred by the Fund. These expenses negatively impact the performance of the Fund. Also, market returns do not include brokerage commissions that may be payable on secondary market transactions. If brokerage commissions were included, market returns would be lower. The returns shown in the tables above do not reflect the deduction of taxes that a shareholder would pay on fund distributions or the redemption or sale of fund shares. The investment return and principal value of shares of the Fund will vary with changes in market conditions. Shares of the Fund may be worth more or less than their original cost when they are redeemed or sold in the market. The Fund’s past performance is no guarantee of future results.
Performance figures assume reinvestment of all dividends and capital gain distributions and do not reflect the deduction of taxes that a shareholder would pay on fund distributions or the redemption of fund shares. An index is a statistical composite that tracks a specified financial market or sector. Unlike the Fund, an index does not actually hold a portfolio of securities and therefore does not incur the expenses incurred by the Fund. These expenses negatively impact the performance of the Fund. The Fund’s past performance is no guarantee of future results.
MANAGEMENT’S DISCUSSIONSOF FUND PERFORMANCE | 5 |
Table of Contents
Management’s Discussion of Fund Performance (Continued)
iSHARES® MSCI EMU INDEX FUND
PORTFOLIO ALLOCATION As of 8/31/07 | |||
| Sector | Percentage of Net Assets | ||
Financial | 30.42 | % | |
Communications | 12.96 | ||
Industrial | 11.60 | ||
Consumer Non-Cyclical | 10.97 | ||
Utilities | 9.04 | ||
Consumer Cyclical | 7.69 | ||
Basic Materials | 6.99 | ||
Energy | 6.79 | ||
Technology | 2.53 | ||
Diversified | 0.82 | ||
Short-Term and Other Net Assets | 0.19 | ||
TOTAL | 100.00 | % | |
TEN LARGEST FUND HOLDINGS As of 8/31/07 | |||
| Security | Percentage of Net Assets | ||
Total SA (France) | 3.39 | % | |
Nokia OYJ (Finland) | 2.79 | ||
Banco Santander SA (Spain) | 2.38 | ||
Telefonica SA (Spain) | 2.26 | ||
Siemens AG (Germany) | 2.24 | ||
E.ON AG (Germany) | 2.16 | ||
Allianz SE (Germany) | 2.00 | ||
Eni SpA (Italy) | 1.87 | ||
BNP Paribas (France) | 1.85 | ||
ABN AMRO Holding NV (Netherlands) | 1.77 | ||
TOTAL | 22.71 | % | |
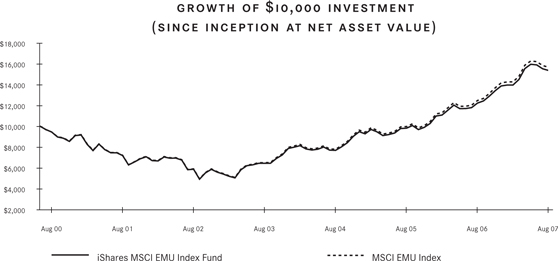
The iShares MSCI EMU Index Fund (the “Fund”) seeks to provide investment results that correspond generally to the price and yield performance, before fees and expenses, of publicly traded securities in the aggregate in the European Monetary Union (“EMU”) markets, as measured by the MSCI EMU Index (the “Index”). The Fund invests in a representative sample of securities included in the Index that collectively has an investment profile similar to the Index. Due to the use of representative sampling, the Fund may or may not hold all of the securities that are included in the Index. For the 12-month period ended August 31, 2007 (the “reporting period”), the Fund returned 26.10%, while the Index returned 26.12%.
European markets generally delivered strong gains for the reporting period, driven by a sound global economic environment. In August 2007, as concerns grew about the sub-prime mortgage market in the U.S. and its possible effect on international markets, European stocks generally weakened, trimming some of the gains achieved earlier in the reporting period.
Within Europe, healthy economic growth led the European Central Bank to raise rates four times during the reporting period. Germany, whose stock market advanced in 11 of the past 12 months, registered annualized gross domestic product (“GDP”) growth of 3% for the first quarter of 2007, its highest rate since 2000. In addition, Germany’s unemployment rate declined to 9% in July 2007, its lowest level in 12 years. France also experienced economic expansion during the reporting period, although GDP growth in the second quarter of 2007 slowed amid growing import levels and declining investment levels. France’s jobless rate dropped to its lowest rate in 25 years by June 2007. Against the backdrop of economic growth, the euro appreciated against the U.S. dollar during the reporting period.
Among the Fund’s ten largest holdings as of August 31, 2007, performance was positive for the reporting period. Bank ABN AMRO Holding NV (Netherlands) delivered the strongest returns among the ten largest holdings, followed by mobile phone maker Nokia OYJ (Finland). Industrial conglomerate Siemens AG (Germany) and Telefonica SA (Spain) also performed well. The most modest return among the Fund’s ten largest holdings came from bank BNP Paribas (France).
6 | 2007 iSHARES ANNUAL REPORTTO SHAREHOLDERS |
Table of Contents
Management’s Discussion of Fund Performance
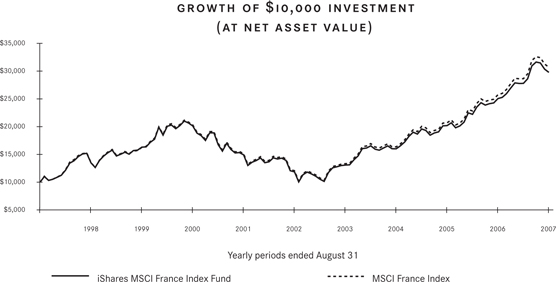
iSHARES® MSCI FRANCE INDEX FUND
Performance as of August 31, 2007
| Average Annual Total Returns | ||||||||||||||||
| Year Ended 8/31/07 | Five Years Ended 8/31/07 | Ten Years Ended 8/31/07 | ||||||||||||||
| NAV | MARKET | INDEX | NAV | MARKET | INDEX | NAV | MARKET | INDEX | ||||||||
| 18.83% | 18.59% | 19.20% | 20.22% | 20.34% | 20.55% | 11.53% | 11.57% | 11.87% | ||||||||
| Cumulative Total Returns | ||||||||||||||||
| Year Ended 8/31/07 | Five Years Ended 8/31/07 | Ten Years Ended 8/31/07 | ||||||||||||||
| NAV | MARKET | INDEX | NAV | MARKET | INDEX | NAV | MARKET | INDEX | ||||||||
| 18.83% | 18.59% | 19.20% | 151.08% | 152.37% | 154.55% | 197.84% | 198.76% | 207.06% | ||||||||
“Average Annual Total Returns” represent the average annual change in value of an investment over the periods indicated. “Cumulative Total Returns ”represent the total change in value of an investment over the periods indicated.
The Fund’s per share net asset value or “NAV” is the value of one share of the Fund as calculated in accordance with the standard formula for valuing mutual fund shares. The NAV return is based on the NAV of the Fund, and the market return is based on the market price per share of the Fund. The price used to calculate market return (“Market Price”) is determined by using the midpoint between the highest bid and the lowest offer on the stock exchange on which the shares of the Fund are listed for trading, as of the time that the Fund’s NAV is calculated. Market and NAV returns assume that dividends and capital gain distributions have been reinvested in the Fund at Market Price and NAV, respectively.
An index is a statistical composite that tracks a specified financial market or sector. Unlike the Fund, an index does not actually hold a portfolio of securities and therefore does not incur the expenses incurred by the Fund. These expenses negatively impact the performance of the Fund. Also, market returns do not include brokerage commissions that may be payable on secondary market transactions. If brokerage commissions were included, market returns would be lower. The returns shown in the tables above do not reflect the deduction of taxes that a shareholder would pay on fund distributions or the redemption or sale of fund shares. The investment return and principal value of shares of the Fund will vary with changes in market conditions. Shares of the Fund may be worth more or less than their original cost when they are redeemed or sold in the market. The Fund’s past performance is no guarantee of future results.
Performance figures assume reinvestment of all dividends and capital gain distributions and do not reflect the deduction of taxes that a shareholder would pay on fund distributions or the redemption of fund shares. An index is a statistical composite that tracks a specified financial market or sector. Unlike the Fund, an index does not actually hold a portfolio of securities and therefore does not incur the expenses incurred by the Fund. These expenses negatively impact the performance of the Fund. The Fund’s past performance is no guarantee of future results.
MANAGEMENT’S DISCUSSIONSOF FUND PERFORMANCE | 7 |
Table of Contents
Management’s Discussion of Fund Performance (Continued)
iSHARES® MSCI FRANCE INDEX FUND
PORTFOLIO ALLOCATION As of 8/31/07 | |||
| Sector | Percentage of Net Assets | ||
Financial | 19.59 | % | |
Consumer Non-Cyclical | 16.57 | ||
Industrial | 14.13 | ||
Energy | 12.34 | ||
Communications | 11.00 | ||
Consumer Cyclical | 8.16 | ||
Utilities | 6.87 | ||
Basic Materials | 6.59 | ||
Technology | 2.71 | ||
Diversified | 1.98 | ||
Short-Term and Other Net Assets | 0.06 | ||
TOTAL | 100.00 | % | |
TEN LARGEST FUND HOLDINGS As of 8/31/07 | |||
| Security | Percentage of Net Assets | ||
Total SA | 11.76 | % | |
BNP Paribas | 6.43 | ||
Sanofi-Aventis | 6.04 | ||
AXA | 4.57 | ||
Arcelor Mittal | 4.36 | ||
Societe Generale Class A | 4.32 | ||
Suez SA | 4.22 | ||
France Telecom SA | 3.98 | ||
Vivendi SA | 3.43 | ||
Carrefour SA | 3.04 | ||
TOTAL | 52.15 | % | |
The iShares MSCI France Index Fund (the “Fund”) seeks to provide investment results that correspond generally to the price and yield performance, before fees and expenses, of publicly traded securities in the aggregate in the French market, as measured by the MSCI France Index (the “Index”). The Fund invests in a representative sample of securities included in the Index that collectively has an investment profile similar to the Index. Due to the use of representative sampling, the Fund may or may not hold all of the securities that are included in the Index. For the 12-month period ended August 31, 2007 (the “reporting period”), the Fund returned 18.83%, while the Index returned 19.20%.
French equities posted sound gains during the reporting period, amid a backdrop of generally healthy economic conditions for most of the period. France’s jobless rate dropped during the reporting period, reaching its lowest rate in 25 years by June 2007, and this drop appeared to spur consumer spending. The euro continued to appreciate against the U.S. dollar, enhancing returns for U.S. investors. The French economy experienced modest expansion during the reporting period, although gross domestic product (GDP) growth in the second quarter of 2007 slowed modestly and failed to meet the Bank of France’s estimate amid growing imports and declining investment levels.
The ten largest Fund holdings represented approximately 52% of the net assets of the Fund as of August 31, 2007. Among the Fund’s ten largest holdings, performance was largely positive for the reporting period. Steel company Arcelor Mittal was the strongest performer among the ten largest holdings, posting triple-digit gains. France Telecom SA also delivered healthy returns, as its mobile telephone unit Orange® won the rights to market the Apple iPhone® in France. Utilities company Suez SA and entertainment company Vivendi SA also both performed well, as did retail chain Carrefour SA. Pharmaceutical company Sanofi-Aventis declined for the reporting period.
8 | 2007 iSHARES ANNUAL REPORTTO SHAREHOLDERS |
Table of Contents
Management’s Discussion of Fund Performance
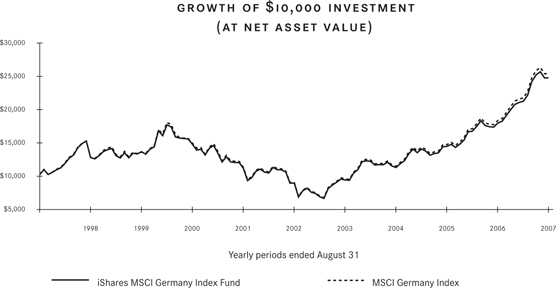
iSHARES® MSCI GERMANY INDEX FUND
Performance as of August 31, 2007
| Average Annual Total Returns | ||||||||||||||||
| Year Ended 8/31/07 | Five Years Ended 8/31/07 | Ten Years Ended 8/31/07 | ||||||||||||||
| NAV | MARKET | INDEX | NAV | MARKET | INDEX | NAV | MARKET | INDEX | ||||||||
| 38.47% | 38.40% | 39.03% | 23.13% | 23.20% | 23.43% | 9.44% | 9.49% | 9.73% | ||||||||
| Cumulative Total Returns | ||||||||||||||||
| Year Ended 8/31/07 | Five Years Ended 8/31/07 | Ten Years Ended 8/31/07 | ||||||||||||||
| NAV | MARKET | INDEX | NAV | MARKET | INDEX | NAV | MARKET | INDEX | ||||||||
| 38.47% | 38.40% | 39.03% | 182.99% | 183.80% | 186.53% | 146.49% | 147.59% | 153.02% | ||||||||
“Average Annual Total Returns” represent the average annual change in value of an investment over the periods indicated. “Cumulative Total Returns ”represent the total change in value of an investment over the periods indicated.
Certain sectors and markets performed exceptionally well based on market conditions during the one-year period. Achieving such exceptional returns involves the risk of volatility and investors should not expect that such exceptional returns will be repeated.
The Fund’s per share net asset value or “NAV” is the value of one share of the Fund as calculated in accordance with the standard formula for valuing mutual fund shares. The NAV return is based on the NAV of the Fund, and the market return is based on the market price per share of the Fund. The price used to calculate market return (“Market Price”) is determined by using the midpoint between the highest bid and the lowest offer on the stock exchange on which the shares of the Fund are listed for trading, as of the time that the Fund’s NAV is calculated. Market and NAV returns assume that dividends and capital gain distributions have been reinvested in the Fund at Market Price and NAV, respectively.
An index is a statistical composite that tracks a specified financial market or sector. Unlike the Fund, an index does not actually hold a portfolio of securities and therefore does not incur the expenses incurred by the Fund. These expenses negatively impact the performance of the Fund. Also, market returns do not include brokerage commissions that may be payable on secondary market transactions. If brokerage commissions were included, market returns would be lower. The returns shown in the tables above do not reflect the deduction of taxes that a shareholder would pay on fund distributions or the redemption or sale of fund shares. The investment return and principal value of shares of the Fund will vary with changes in market conditions. Shares of the Fund may be worth more or less than their original cost when they are redeemed or sold in the market. The Fund’s past performance is no guarantee of future results.
Performance figures assume reinvestment of all dividends and capital gain distributions and do not reflect the deduction of taxes that a shareholder would pay on fund distributions or the redemption of fund shares. An index is a statistical composite that tracks a specified financial market or sector. Unlike the Fund, an index does not actually hold a portfolio of securities and therefore does not incur the expenses incurred by the Fund. These expenses negatively impact the performance of the Fund. The Fund’s past performance is no guarantee of future results.
MANAGEMENT’S DISCUSSIONSOF FUND PERFORMANCE | 9 |
Table of Contents
Management’s Discussion of Fund Performance (Continued)
iSHARES® MSCI GERMANY INDEX FUND
PORTFOLIO ALLOCATION As of 8/31/07 | |||
| Sector | Percentage of Net Assets | ||
Financial | 23.70 | % | |
Consumer Cyclical | 16.94 | ||
Industrial | 15.33 | ||
Utilities | 14.01 | ||
Basic Materials | 13.42 | ||
Technology | 5.52 | ||
Consumer Non-Cyclical | 5.43 | ||
Communications | 5.07 | ||
Energy | 0.37 | ||
Short-Term and Other Net Assets | 0.21 | ||
TOTAL | 100.00 | % | |
TEN LARGEST FUND HOLDINGS As of 8/31/07 | |||
| Security | Percentage of Net Assets | ||
Siemens AG | 9.46 | % | |
E.ON AG | 9.24 | ||
Allianz SE | 8.54 | ||
DaimlerChrysler AG Registered | 7.27 | ||
BASF AG | 5.88 | ||
Deutsche Bank AG | 5.57 | ||
Bayer AG | 4.95 | ||
Deutsche Telekom AG | 4.66 | ||
RWE AG | 4.42 | ||
SAP AG | 4.23 | ||
TOTAL | 64.22 | % | |
The iShares MSCI Germany Index Fund (the “Fund”) seeks to provide investment results that correspond generally to the price and yield performance, before fees and expenses, of publicly traded securities in the aggregate in the German market, as measured by the MSCI Germany Index (the “Index”). The Fund invests in a representative sample of securities included in the Index that collectively has an investment profile similar to the Index. Due to the use of representative sampling, the Fund may or may not hold all of the securities that are included in the Index. For the 12-month period ended August 31, 2007 (the “reporting period”), the Fund returned 38.47%, while the Index returned 39.03%.
The German stock market posted strong gains for the reporting period against a backdrop of healthy economic conditions. Europe’s largest economy, Germany was also Europe’s strongest performing market, advancing in 11 of the past 12 months and posting a positive return in August 2007 even as developed markets as a whole declined. Germany’s economy expanded during the reporting period, registering annualized gross domestic product (GDP) growth of 3% for the first quarter of 2007, its highest rate since 2000. Additionally, Germany’s jobless rate declined throughout the reporting period, dipping to 9% in July 2007, the lowest level in 12 years.
The ten largest Fund holdings represented approximately 64% of the net assets of the Fund as of August 31, 2007. All of the Fund’s ten largest holdings posted double-digit gains for the reporting period. The strongest performer was car maker DaimlerChrysler AG. Chemical company BASF AG and Bayer AG, Germany’s largest drug maker, both delivered strong results. The Fund’s largest holding and Germany’s largest engineering company, Siemens AG, also logged solid gains for the reporting period. Additionally, utility company E.ON AG performed well. The most modest return among the ten largest holdings came from Deutsche Bank AG.
10 | 2007 iSHARES ANNUAL REPORTTO SHAREHOLDERS |
Table of Contents
Management’s Discussion of Fund Performance
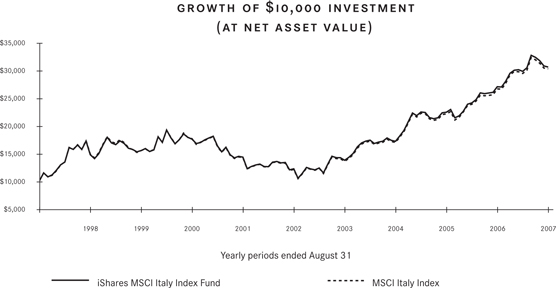
iSHARES® MSCI ITALY INDEX FUND
Performance as of August 31, 2007
| Average Annual Total Returns | ||||||||||||||||
| Year Ended 8/31/07 | Five Years Ended 8/31/07 | Ten Years Ended 8/31/07 | ||||||||||||||
| NAV | MARKET | INDEX | NAV | MARKET | INDEX | NAV | MARKET | INDEX | ||||||||
| 13.20% | 13.04% | 13.68% | 20.29% | 20.38% | 20.27% | 11.88% | 12.02% | 11.76% | ||||||||
| Cumulative Total Returns | ||||||||||||||||
| Year Ended 8/31/07 | Five Years Ended 8/31/07 | Ten Years Ended 8/31/07 | ||||||||||||||
| NAV | MARKET | INDEX | NAV | MARKET | INDEX | NAV | MARKET | INDEX | ||||||||
| 13.20% | 13.04% | 13.68% | 151.86% | 152.85% | 151.62% | 207.21% | 211.16% | 203.98% | ||||||||
“Average Annual Total Returns” represent the average annual change in value of an investment over the periods indicated. “Cumulative Total Returns” represent the total change in value of an investment over the periods indicated.
The Fund’s per share net asset value or ”NAV” is the value of one share of the Fund as calculated in accordance with the standard formula for valuing mutual fund shares. The NAV return is based on the NAV of the Fund, and the market return is based on the market price per share of the Fund. The price used to calculate market return (“Market Price”) is determined by using the midpoint between the highest bid and the lowest offer on the stock exchange on which the shares of the Fund are listed for trading, as of the time that the Fund’s NAV is calculated. Market and NAV returns assume that dividends and capital gain distributions have been reinvested in the Fund at Market Price and NAV, respectively.
An index is a statistical composite that tracks a specified financial market or sector. Unlike the Fund, an index does not actually hold a portfolio of securities and therefore does not incur the expenses incurred by the Fund. These expenses negatively impact the performance of the Fund. Also, market returns do not include brokerage commissions that may be payable on secondary market transactions. If brokerage commissions were included, market returns would be lower. The returns shown in the tables above do not reflect the deduction of taxes that a shareholder would pay on fund distributions or the redemption or sale of fund shares. The investment return and principal value of shares of the Fund will vary with changes in market conditions. Shares of the Fund may be worth more or less than their original cost when they are redeemed or sold in the market. The Fund’s past performance is no guarantee of future results.
Performance figures assume reinvestment of all dividends and capital gain distributions and do not reflect the deduction of taxes that a shareholder would pay on fund distributions or the redemption of fund shares. An index is a statistical composite that tracks a specified financial market or sector. Unlike the Fund, an index does not actually hold a portfolio of securities and therefore does not incur the expenses incurred by the Fund. These expenses negatively impact the performance of the Fund. The Fund’s past performance is no guarantee of future results.
MANAGEMENT’S DISCUSSIONSOF FUND PERFORMANCE | 11 |
Table of Contents
Management’s Discussion of Fund Performance (Continued)
iSHARES® MSCI ITALY INDEX FUND
| PORTFOLIO ALLOCATION As of 8/31/07 | |||
| Sector | Percentage of Net Assets | ||
Financial | 49.31 | % | |
Energy | 17.03 | ||
Communications | 10.46 | ||
Utilities | 8.81 | ||
Consumer Cyclical | 6.20 | ||
Consumer Non-Cyclical | 5.20 | ||
Industrial | 2.84 | ||
Short-Term and Other Net Assets | 0.15 | ||
TOTAL | 100.00 | % | |
| TEN LARGEST FUND HOLDINGS As of 8/31/07 | |||
| Security | Percentage of Net Assets | ||
Eni SpA | 17.03 | % | |
UniCredito Italiano SpA | 12.42 | ||
Intesa Sanpaolo SpA | 10.66 | ||
Telecom Italia SpA | 5.72 | ||
Assicurazioni Generali SpA | 4.85 | ||
Enel SpA | 4.78 | ||
Terna SpA | 4.03 | ||
Fiat SpA | 3.84 | ||
Unione di Banche Italiane ScpA | 3.59 | ||
Capitalia SpA | 3.29 | ||
TOTAL | 70.21 | % | |
The iShares MSCI Italy Index Fund (the “Fund”) seeks to provide investment results that correspond generally to the price and yield performance, before fees and expenses, of publicly traded securities in the aggregate in the Italian market, as measured by the MSCI Italy Index (the “Index”). The Fund invests in a representative sample of securities included in the Index that collectively has an investment profile similar to the Index. Due to the use of representative sampling, the Fund may or may not hold all of the securities that are included in the Index. For the 12-month period ended August 31, 2007 (the “reporting period”), the Fund returned 13.20%, while the Index returned 13.68%.
Italy’s equity market delivered gains for the reporting period against a backdrop of moderate economic growth. The first half of the reporting period saw economic recovery for Italy, which benefited from increasing export levels. During the second half of the reporting period, however, Italy experienced lower levels of gross domestic product (“GDP”) growth, which were already low in comparison with neighboring European countries. For the second quarter of 2007, annualized GDP growth registered 1.8%, below official forecasts, as net export levels shrank. Countering lower levels of export demand, though, personal consumption levels increased late in the reporting period. Helped by a strong euro, inflation levels remained benign.
The ten largest Fund holdings represented approximately 70% of the net assets of the Fund as of August 31, 2007. Performance among the Fund’s ten largest holdings was mostly positive for the reporting period. The strongest returns by far came from car maker Fiat SpA, which reintroduced its popular 500 model during the reporting period. Electricity transmission firm Terna SpA, insurance company Assicurazioni Generali SpA, and power company Enel SpA all delivered solid returns. Banking group Intesa Sanpaolo SpA also performed well, as did the Fund’s largest holding, oil company Eni SpA. Bank Unione di Banche Italiane ScpA declined for the reporting period.
12 | 2007 iSHARES ANNUAL REPORTTO SHAREHOLDERS |
Table of Contents
Management’s Discussion of Fund Performance
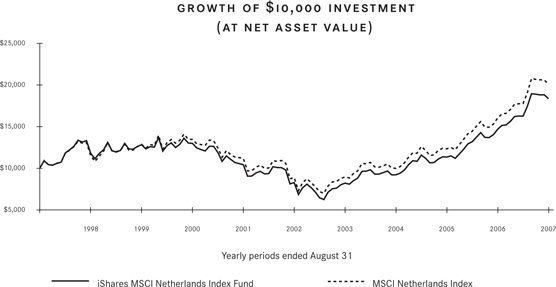
iSHARES® MSCI NETHERLANDS INDEX FUND
Performance as of August 31, 2007
| Average Annual Total Returns | ||||||||||||||||
| Year Ended 8/31/07 | Five Years Ended 8/31/07 | Ten Years Ended 8/31/07 | ||||||||||||||
| NAV | MARKET | INDEX | NAV | MARKET | INDEX | NAV | MARKET | INDEX | ||||||||
| 25.22% | 24.74% | 25.54% | 17.40% | 17.44% | 17.86% | 6.26% | 6.22% | 7.23% | ||||||||
| Cumulative Total Returns | ||||||||||||||||
| Year Ended 8/31/07 | Five Years Ended 8/31/07 | Ten Years Ended 8/31/07 | ||||||||||||||
| NAV | MARKET | INDEX | NAV | MARKET | INDEX | NAV | MARKET | INDEX | ||||||||
| 25.22% | 24.74% | 25.54% | 122.99% | 123.44% | 127.46% | 83.52% | 82.78% | 101.06% | ||||||||
“Average Annual Total Returns” represent the average annual change in value of an investment over the periods indicated. “Cumulative Total Returns” represent the total change in value of an investment over the periods indicated.
The Fund’s per share net asset value or “NAV” is the value of one share of the Fund as calculated in accordance with the standard formula for valuing mutual fund shares. The NAV return is based on the NAV of the Fund, and the market return is based on the market price per share of the Fund. The price used to calculate market return (“Market Price”) is determined by using the midpoint between the highest bid and the lowest offer on the stock exchange on which the shares of the Fund are listed for trading, as of the time that the Fund’s NAV is calculated. Market and NAV returns assume that dividends and capital gain distributions have been reinvested in the Fund at Market Price and NAV, respectively.
An index is a statistical composite that tracks a specified financial market or sector. Unlike the Fund, an index does not actually hold a portfolio of securities and therefore does not incur the expenses incurred by the Fund. These expenses negatively impact the performance of the Fund. Also, market returns do not include brokerage commissions that may be payable on secondary market transactions. If brokerage commissions were included, market returns would be lower. The returns shown in the tables above do not reflect the deduction of taxes that a shareholder would pay on fund distributions or the redemption or sale of fund shares. The investment return and principal value of shares of the Fund will vary with changes in market conditions. Shares of the Fund may be worth more or less than their original cost when they are redeemed or sold in the market. The Fund’s past performance is no guarantee of future results.
Performance figures assume reinvestment of all dividends and capital gain distributions and do not reflect the deduction of taxes that a shareholder would pay on fund distributions or the redemption of fund shares. An index is a statistical composite that tracks a specified financial market or sector. Unlike the Fund, an index does not actually hold a portfolio of securities and therefore does not incur the expenses incurred by the Fund. These expenses negatively impact the performance of the Fund. The Fund’s past performance is no guarantee of future results.
MANAGEMENT’S DISCUSSIONSOF FUND PERFORMANCE | 13 |
Table of Contents
Management’s Discussion of Fund Performance (Continued)
iSHARES® MSCI NETHERLANDS INDEX FUND
PORTFOLIO ALLOCATION As of 8/31/07 | |||
| Sector | Percentage of Net Assets | ||
Financial | 38.74 | % | |
Consumer Non-Cyclical | 21.83 | ||
Industrial | 13.31 | ||
Communications | 11.48 | ||
Basic Materials | 7.34 | ||
Technology | 3.79 | ||
Energy | 2.25 | ||
Consumer Cyclical | 0.99 | ||
Short-Term and Other Net Assets | 0.27 | ||
TOTAL | 100.00 | % | |
TEN LARGEST FUND HOLDINGS As of 8/31/07 | |||
| Security | Percentage of Net Assets | ||
ABN AMRO Holding NV | 16.25 | % | |
ING Groep NV | 14.71 | ||
Unilever NV | 8.63 | ||
Koninklijke Philips Electronics NV | 8.56 | ||
Akzo Nobel NV | 4.97 | ||
Heineken NV | 4.84 | ||
TNT NV | 4.75 | ||
Aegon NV | 4.74 | ||
Koninklijke KPN NV | 4.66 | ||
Reed Elsevier NV | 4.52 | ||
TOTAL | 76.63 | % | |
The iShares MSCI Netherlands Index Fund (the “Fund”) seeks to provide investment results that correspond generally to the price and yield performance, before fees and expenses, of publicly traded securities in the aggregate in the Dutch market, as measured by the MSCI Netherlands Index (the “Index”). The Fund invests in a representative sample of securities included in the Index that collectively has an investment profile similar to the Index. Due to the use of representative sampling, the Fund may or may not hold all of the securities that are included in the Index. For the 12-month period ended August 31, 2007 (the “reporting period”), the Fund returned 25.22%, while the Index returned 25.54%.
The Dutch stock market posted strong gains for the reporting period, supported by a generally healthy economic climate. Because the Dutch economy relies heavily on its export trade for its livelihood, it is sensitive to the economic health of its trading partners, particularly its neighboring European countries, which account for roughly 75% of its export market. During the reporting period, these European trading partners generally enjoyed solid economic expansion. As their economies grew, so did their demand for Dutch products. This demand was reflected in annualized gross domestic product (GDP) growth, which, according to official estimates, registered 2.4% for each of the first and second quarters of 2007. Unemployment levels declined during the reporting period, and inflation levels remained below the average in Europe.
The ten largest Fund holdings accounted for approximately 77% of the net assets of the Fund as of August 31, 2007. Among the ten largest holdings, performance was mostly positive for the reporting period. The top performer among the ten largest holdings was the Fund’s largest holding, financial company ABN AMRO Holding NV. Chemicals company Akzo Nobel NV and brewer Heineken NV also delivered sound gains. Consumer product company Unilever NV and telecommunications company Koninklijke KPN NV both performed well. Financial conglomerate ING Groep NV posted a slight decline for the reporting period.
14 | 2007 iSHARES ANNUAL REPORTTO SHAREHOLDERS |
Table of Contents
Management’s Discussion of Fund Performance
iSHARES® MSCI SPAIN INDEX FUND
Performance as of August 31, 2007
| Average Annual Total Returns | ||||||||||||||||
| Year Ended 8/31/07 | Five Years Ended 8/31/07 | Ten Years Ended 8/31/07 | ||||||||||||||
| NAV | MARKET | INDEX | NAV | MARKET | INDEX | NAV | MARKET | INDEX | ||||||||
| 30.47% | 30.36% | 30.93% | 28.07% | 28.20% | 28.49% | 14.29% | 14.30% | 14.42% | ||||||||
| Cumulative Total Returns | ||||||||||||||||
| Year Ended 8/31/07 | Five Years Ended 8/31/07 | Ten Years Ended 8/31/07 | ||||||||||||||
| NAV | MARKET | INDEX | NAV | MARKET | INDEX | NAV | MARKET | INDEX | ||||||||
| 30.47% | 30.36% | 30.93% | 244.53% | 246.24% | 250.19% | 280.15% | 280.58% | 284.72% | ||||||||
“Average Annual Total Returns” represent the average annual change in value of an investment over the periods indicated. “Cumulative Total Returns” represent the total change in value of an investment over the periods indicated.
The Fund’s per share net asset value or “NAV” is the value of one share of the Fund as calculated in accordance with the standard formula for valuing mutual fund shares. The NAV return is based on the NAV of the Fund, and the market return is based on the market price per share of the Fund. The price used to calculate market return (“Market Price”) is determined by using the midpoint between the highest bid and the lowest offer on the stock exchange on which the shares of the Fund are listed for trading, as of the time that the Fund’s NAV is calculated. Market and NAV returns assume that dividends and capital gain distributions have been reinvested in the Fund at Market Price and NAV, respectively.
An index is a statistical composite that tracks a specified financial market or sector. Unlike the Fund, an index does not actually hold a portfolio of securities and therefore does not incur the expenses incurred by the Fund. These expenses negatively impact the performance of the Fund. Also, market returns do not include brokerage commissions that may be payable on secondary market transactions. If brokerage commissions were included, market returns would be lower. The returns shown in the tables above do not reflect the deduction of taxes that a shareholder would pay on fund distributions or the redemption or sale of fund shares. The investment return and principal value of shares of the Fund will vary with changes in market conditions. Shares of the Fund may be worth more or less than their original cost when they are redeemed or sold in the market. The Fund’s past performance is no guarantee of future results.
Performance figures assume reinvestment of all dividends and capital gain distributions and do not reflect the deduction of taxes that a shareholder would pay on fund distributions or the redemption of fund shares. An index is a statistical composite that tracks a specified financial market or sector. Unlike the Fund, an index does not actually hold a portfolio of securities and therefore does not incur the expenses incurred by the Fund. These expenses negatively impact the performance of the Fund. The Fund’s past performance is no guarantee of future results.
MANAGEMENT’S DISCUSSIONSOF FUND PERFORMANCE | 15 |
Table of Contents
Management’s Discussion of Fund Performance (Continued)
iSHARES® MSCI SPAIN INDEX FUND
PORTFOLIO ALLOCATION As of 8/31/07 | |||
| Sector | Percentage of Net Assets | ||
Financial | 37.15 | % | |
Communications | 20.66 | ||
Utilities | 15.46 | ||
Consumer Non-Cyclical | 7.64 | ||
Industrial | 7.61 | ||
Energy | 6.35 | ||
Consumer Cyclical | 3.18 | ||
Basic Materials | 0.94 | ||
Technology | 0.75 | ||
Short-Term and Other Net Assets | 0.26 | ||
TOTAL | 100.00 | % | |
TEN LARGEST FUND HOLDINGS As of 8/31/07 | |||
| Security | Percentage of Net Assets | ||
Telefonica SA | 18.68 | % | |
Banco Santander SA | 18.32 | ||
Banco Bilbao Vizcaya Argentaria SA | 12.03 | ||
Iberdrola SA | 4.95 | ||
Repsol YPF SA | 4.89 | ||
Endesa SA | 4.81 | ||
Banco Popular Espanol SA | 4.58 | ||
Altadis SA | 3.63 | ||
Gas Natural SDG SA | 2.95 | ||
Actividades de Construcciones y Servicios SA | 2.74 | ||
TOTAL | 77.58 | % | |
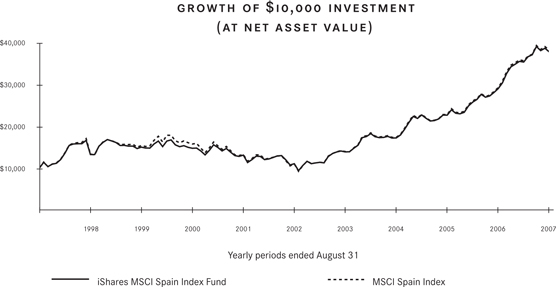
The iShares MSCI Spain Index Fund (the “Fund”) seeks to provide investment results that correspond generally to the price and yield performance, before fees and expenses, of publicly traded securities in the aggregate in the Spanish market, as measured by the MSCI Spain Index (the “Index”). The Fund invests in a representative sample of securities included in the Index that collectively has an investment profile similar to the Index. Due to the use of representative sampling, the Fund may or may not hold all of the securities that are included in the Index. For the 12-month period ended August 31, 2007 (the “reporting period”), the Fund returned 30.47%, while the Index returned 30.93%.
The Spanish equity market delivered strong gains for the reporting period, reflecting solid economic growth in the country. Because Spain’s trade with neighboring European countries accounts for the vast majority of its exports, it benefited from the economic expansion in major European countries during the reporting period. Export trade outside of Europe also grew, reflecting demand from the U.S. and Asia. According to the Bank of Spain, annualized gross domestic product (GDP) growth for Spain was 4.1% for the first quarter of 2007 and is estimated to be 4.0% for the second quarter of 2007. Unemployment levels dropped throughout the reporting period, investment in capital goods expanded, and inflation levels remained below 2.5%, all contributing to positive market performance.
The ten largest Fund holdings represented approximately 78% of the net assets of the Fund as of August 31, 2007. Performance among the ten largest holdings as of August 31, 2007 was positive for the reporting period. Gas Natural SDG SA delivered the strongest returns, followed by electric utility companies Endesa SA and Iberdrola SA. Telecommunications company Telefonica SA, the Fund’s largest holding, and tobacco company Altadis SA also posted solid gains. The most modest gain among the ten largest holdings for the reporting period came from bank Banco Bilbao Vizcaya Argentaria SA.
16 | 2007 iSHARES ANNUAL REPORTTO SHAREHOLDERS |
Table of Contents
Management’s Discussion of Fund Performance
iSHARES® MSCI SWEDEN INDEX FUND
Performance as of August 31, 2007
| Average Annual Total Returns | ||||||||||||||||
| Year Ended 8/31/07 | Five Years Ended 8/31/07 | Ten Years Ended 8/31/07 | ||||||||||||||
| NAV | MARKET | INDEX | NAV | MARKET | INDEX | NAV | MARKET | INDEX | ||||||||
| 35.01% | 35.43% | 35.29% | 30.15% | 30.18% | 30.38% | 10.80% | 10.81% | 12.01% | ||||||||
| Cumulative Total Returns | ||||||||||||||||
| Year Ended 8/31/07 | Five Years Ended 8/31/07 | Ten Years Ended 8/31/07 | ||||||||||||||
| NAV | MARKET | INDEX | NAV | MARKET | INDEX | NAV | MARKET | INDEX | ||||||||
| 35.01% | 35.43% | 35.29% | 273.48% | 273.82% | 276.73% | 178.84% | 179.06% | 210.79% | ||||||||
“Average Annual Total Returns” represent the average annual change in value of an investment over the periods indicated. “Cumulative Total Returns” represent the total change in value of an investment over the periods indicated.
Certain sectors and markets performed exceptionally well based on market conditions during the one-year period. Achieving such exceptional returns involves the risk of volatility and investors should not expect that such exceptional returns will be repeated.
The Fund’s per share net asset value or “NAV” is the value of one share of the Fund as calculated in accordance with the standard formula for valuing mutual fund shares. The NAV return is based on the NAV of the Fund, and the market return is based on the market price per share of the Fund. The price used to calculate market return (“Market Price”) is determined by using the midpoint between the highest bid and the lowest offer on the stock exchange on which the shares of the Fund are listed for trading, as of the time that the Fund’s NAV is calculated. Market and NAV returns assume that dividends and capital gain distributions have been reinvested in the Fund at Market Price and NAV, respectively.
An index is a statistical composite that tracks a specified financial market or sector. Unlike the Fund, an index does not actually hold a portfolio of securities and therefore does not incur the expenses incurred by the Fund. These expenses negatively impact the performance of the Fund. Also, market returns do not include brokerage commissions that may be payable on secondary market transactions. If brokerage commissions were included, market returns would be lower. The returns shown in the tables above do not reflect the deduction of taxes that a shareholder would pay on fund distributions or the redemption or sale of fund shares. The investment return and principal value of shares of the Fund will vary with changes in market conditions. Shares of the Fund may be worth more or less than their original cost when they are redeemed or sold in the market. The Fund’s past performance is no guarantee of future results.

Performance figures assume reinvestment of all dividends and capital gain distributions and do not reflect the deduction of taxes that a shareholder would pay on fund distributions or the redemption of fund shares. An index is a statistical composite that tracks a specified financial market or sector. Unlike the Fund, an index does not actually hold a portfolio of securities and therefore does not incur the expenses incurred by the Fund. These expenses negatively impact the performance of the Fund. The Fund’s past performance is no guarantee of future results.
MANAGEMENT’S DISCUSSIONSOF FUND PERFORMANCE | 17 |
Table of Contents
Management’s Discussion of Fund Performance (Continued)
iSHARES® MSCI SWEDEN INDEX FUND
PORTFOLIO ALLOCATION As of 8/31/07 | |||
| Sector | Percentage of Net Assets | ||
Industrial | 27.39 | % | |
Communications | 24.17 | ||
Financial | 20.09 | ||
Consumer Cyclical | 12.78 | ||
Basic Materials | 8.02 | ||
Consumer Non-Cyclical | 6.74 | ||
Energy | 0.66 | ||
Short-Term and Other Net Assets | 0.15 | ||
TOTAL | 100.00 | % | |
TEN LARGEST FUND HOLDINGS As of 8/31/07 | |||
| Security | Percentage of Net Assets | ||
Telefonaktiebolaget LM Ericsson AB Class B | 16.00 | % | |
Nordea Bank AB | 9.19 | ||
Hennes & Mauritz AB Class B | 7.79 | ||
Sandvik AB | 5.63 | ||
Volvo AB Class B | 5.49 | ||
TeliaSonera AB | 5.03 | ||
Skandinaviska Enskilda Banken AB Class A | 4.08 | ||
Svenska Handelsbanken AB Class A | 3.98 | ||
Atlas Copco AB Class A | 3.11 | ||
Svenska Cellulosa AB Class B | 2.84 | ||
TOTAL | 63.14 | % | |
The iShares MSCI Sweden Index Fund (the “Fund”) seeks to provide investment results that correspond generally to the price and yield performance, before fees and expenses, of publicly traded securities in the aggregate in the Swedish market, as measured by the MSCI Sweden Index (the “Index”). The Fund invests in a representative sample of securities included in the Index that collectively has an investment profile similar to the Index. Due to the use of representative sampling, the Fund may or may not hold all of the securities that are included in the Index. For the 12-month period ended August 31, 2007 (the “reporting period”), the Fund returned 35.01%, while the Index returned 35.29%.
Sweden’s equity market delivered very healthy returns for the reporting period. Supporting market strength, economic growth was solid, unemployment levels dropped, and inflation levels remained among the lowest in Europe. Swedish gross domestic product (GDP) growth for 2006 was 4.4%, and is anticipated to be 3.7% for 2007, according to the Swedish Ministry of Finance. A decline in unemployment levels during the reporting period also helped to spur strength in personal consumption. In response to the strong economic activity, the Riksbank, Sweden’s central bank, raised its short-term repo rate throughout the reporting period in order to curb inflation. During the course of the period, the Riksbank raised the rate five times, moving from a low of 2.25% to a high of 3.50%.
The ten largest Fund holdings represented about 63% of the net assets of the Fund as of August 31, 2007. Performance was positive among the Fund’s ten largest holdings for the reporting period. Machinery company Sandvik AB delivered the strongest returns among the ten largest holdings. The class B shares of car maker Volvo AB also logged solid gains, as did Atlas Copco AB Class A. The class B shares of clothing retailer Hennes & Mauritz AB and mobile telephone operator TeliaSonera AB also both performed well. The most modest gain among the Fund’s ten largest holdings came from the class A shares of bank Svenska Handelsbanken AB.
18 | 2007 iSHARES ANNUAL REPORTTO SHAREHOLDERS |
Table of Contents
Management’s Discussion of Fund Performance
iSHARES® MSCI SWITZERLAND INDEX FUND
Performance as of August 31, 2007
| Average Annual Total Returns | ||||||||||||||||
| Year Ended 8/31/07 | Five Years Ended 8/31/07 | Ten Years Ended 8/31/07 | ||||||||||||||
| NAV | MARKET | INDEX | NAV | MARKET | INDEX | NAV | MARKET | INDEX | ||||||||
| 15.53% | 14.83% | 13.16% | 17.94% | 17.89% | 17.91% | 7.96% | 7.90% | 9.17% | ||||||||
| Cumulative Total Returns | ||||||||||||||||
| Year Ended 8/31/07 | Five Years Ended 8/31/07 | Ten Years Ended 8/31/07 | ||||||||||||||
| NAV | MARKET | INDEX | NAV | MARKET | INDEX | NAV | MARKET | INDEX | ||||||||
| 15.53% | 14.83% | 13.16% | 128.18% | 127.71% | 127.91% | 115.07% | 113.90% | 140.49% | ||||||||
“Average Annual Total Returns” represent the average annual change in value of an investment over the periods indicated. “Cumulative Total Returns” represent the total change in value of an investment over the periods indicated.
The Fund’s per share net asset value or “NAV” is the value of one share of the Fund as calculated in accordance with the standard formula for valuing mutual fund shares. The NAV return is based on the NAV of the Fund, and the market return is based on the market price per share of the Fund. The price used to calculate market return (“Market Price”) is determined by using the midpoint between the highest bid and the lowest offer on the stock exchange on which the shares of the Fund are listed for trading, as of the time that the Fund’s NAV is calculated. Market and NAV returns assume that dividends and capital gain distributions have been reinvested in the Fund at Market Price and NAV, respectively.
An index is a statistical composite that tracks a specified financial market or sector. Unlike the Fund, an index does not actually hold a portfolio of securities and therefore does not incur the expenses incurred by the Fund. These expenses negatively impact the performance of the Fund. Also, market returns do not include brokerage commissions that may be payable on secondary market transactions. If brokerage commissions were included, market returns would be lower. The returns shown in the tables above do not reflect the deduction of taxes that a shareholder would pay on fund distributions or the redemption or sale of fund shares. The investment return and principal value of shares of the Fund will vary with changes in market conditions. Shares of the Fund may be worth more or less than their original cost when they are redeemed or sold in the market. The Fund’s past performance is no guarantee of future results.
Performance figures assume reinvestment of all dividends and capital gain distributions and do not reflect the deduction of taxes that a shareholder would pay on fund distributions or the redemption of fund shares. An index is a statistical composite that tracks a specified financial market or sector. Unlike the Fund, an index does not actually hold a portfolio of securities and therefore does not incur the expenses incurred by the Fund. These expenses negatively impact the performance of the Fund. The Fund’s past performance is no guarantee of future results.
MANAGEMENT’S DISCUSSIONSOF FUND PERFORMANCE | 19 |
Table of Contents
Management’s Discussion of Fund Performance (Continued)
iSHARES® MSCI SWITZERLAND INDEX FUND
| PORTFOLIO ALLOCATION As of 8/31/07 | |||
| Sector | Percentage of Net Assets | ||
Consumer Non-Cyclical | 45.93 | % | |
Financial | 26.79 | ||
Industrial | 10.94 | ||
Consumer Cyclical | 6.73 | ||
Basic Materials | 6.02 | ||
Communications | 2.53 | ||
Technology | 0.60 | ||
Short-Term and Other Net Assets | 0.46 | ||
TOTAL | 100.00 | % | |
| TEN LARGEST FUND HOLDINGS As of 8/31/07 | |||
| Security | Percentage of Net Assets | ||
Nestle SA Registered | 15.99 | % | |
Roche Holding AG | 12.12 | ||
Novartis AG Registered | 11.01 | ||
UBS AG Registered | 9.33 | ||
ABB Ltd. Registered | 4.98 | ||
Zurich Financial Services AG Registered | 4.74 | ||
Credit Suisse Group Registered | 4.67 | ||
Swiss Reinsurance Co. Registered | 4.32 | ||
Compagnie Financiere Richemont AG Class A | 4.14 | ||
Holcim Ltd. Registered | 3.11 | ||
TOTAL | 74.41 | % | |
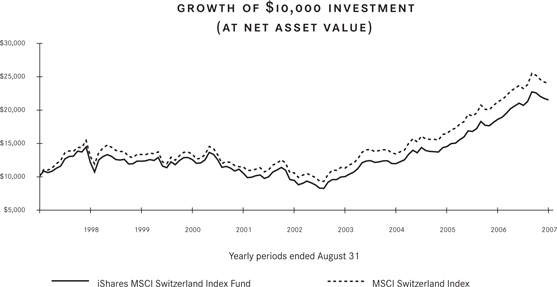
The iShares MSCI Switzerland Index Fund (the “Fund”) seeks to provide investment results that correspond generally to the price and yield performance, before fees and expenses, of publicly traded securities in the aggregate in the Swiss market, as measured by the MSCI Switzerland Index (the “Index”). The Fund invests in a representative sample of securities included in the Index that collectively has an investment profile similar to the Index. Due to the use of representative sampling, the Fund may or may not hold all of the securities that are included in the Index. For the 12-month period ended August 31, 2007 (the “reporting period”), the Fund returned 15.53%, while the Index returned 13.16%.
Switzerland posted sound results for the reporting period. Because it relies on countries in the euro zone for more than half of its exports, Switzerland benefited from economic expansion in some of its neighboring countries. A declining Swiss franc (which dropped against the euro) also appeared to contribute to Switzerland’s economic health, as it helped Switzerland’s exports become more affordable to its trading partners. In addition, the jobless rate declined during the reporting period, dipping to 2.5%, its lowest level in five years and well below the euro zone average. Economic growth, combined with the second lowest borrowing costs among industrialized nations, helped the Swiss market, as measured by the Index, reach an all-time record level during the reporting period.
The ten largest Fund holdings accounted for approximately 74% of the net assets of the Fund as of August 31, 2007. The top performer among the ten largest holdings for the reporting period was ABB Ltd., the world’s largest producer of power grids. Holcim Ltd., a manufacturer and supplier of building materials, also performed well, as did the Class A shares of apparel company Compagnie Financiere Richemont AG. The Fund’s largest holding, Nestle SA also contributed positively to Fund performance. Financial companies generally performed well, as insurance company Zurich Financial Services AG and Credit Suisse Group both provided healthy returns. Healthcare company Novartis AG declined for the reporting period.
20 | 2007 iSHARES ANNUAL REPORTTO SHAREHOLDERS |
Table of Contents
Management’s Discussion of Fund Performance
iSHARES® MSCI UNITED KINGDOM INDEX FUND
Performance as of August 31, 2007
| Average Annual Total Returns | ||||||||||||||||
| Year Ended 8/31/07 | Five Years Ended 8/31/07 | Ten Years Ended 8/31/07 | ||||||||||||||
| NAV | MARKET | INDEX | NAV | MARKET | INDEX | NAV | MARKET | INDEX | ||||||||
| 16.77% | 15.89% | 17.56% | 17.35% | 17.24% | 18.24% | 7.48% | 7.49% | 8.15% | ||||||||
| Cumulative Total Returns | ||||||||||||||||
| Year Ended 8/31/07 | Five Years Ended 8/31/07 | Ten Years Ended 8/31/07 | ||||||||||||||
| NAV | MARKET | INDEX | NAV | MARKET | INDEX | NAV | MARKET | INDEX | ||||||||
| 16.77% | 15.89% | 17.56% | 122.53% | 121.52% | 131.12% | 105.81% | 105.93% | 118.93% | ||||||||
“Average Annual Total Returns” represent the average annual change in value of an investment over the periods indicated. “Cumulative Total Returns” represent the total change in value of an investment over the periods indicated.
The Fund’s per share net asset value or “NAV” is the value of one share of the Fund as calculated in accordance with the standard formula for valuing mutual fund shares. The NAV return is based on the NAV of the Fund, and the market return is based on the market price per share of the Fund. The price used to calculate market return (“Market Price”) is determined by using the midpoint between the highest bid and the lowest offer on the stock exchange on which the shares of the Fund are listed for trading, as of the time that the Fund’s NAV is calculated. Market and NAV returns assume that dividends and capital gain distributions have been reinvested in the Fund at Market Price and NAV, respectively.
An index is a statistical composite that tracks a specified financial market or sector. Unlike the Fund, an index does not actually hold a portfolio of securities and therefore does not incur the expenses incurred by the Fund. These expenses negatively impact the performance of the Fund. Also, market returns do not include brokerage commissions that may be payable on secondary market transactions. If brokerage commissions were included, market returns would be lower. The returns shown in the tables above do not reflect the deduction of taxes that a shareholder would pay on fund distributions or the redemption or sale of fund shares. The investment return and principal value of shares of the Fund will vary with changes in market conditions. Shares of the Fund may be worth more or less than their original cost when they are redeemed or sold in the market. The Fund’s past performance is no guarantee of future results.
Performance figures assume reinvestment of all dividends and capital gain distributions and do not reflect the deduction of taxes that a shareholder would pay on fund distributions or the redemption of fund shares. An index is a statistical composite that tracks a specified financial market or sector. Unlike the Fund, an index does not actually hold a portfolio of securities and therefore does not incur the expenses incurred by the Fund. These expenses negatively impact the performance of the Fund. The Fund’s past performance is no guarantee of future results.
MANAGEMENT’S DISCUSSIONSOF FUND PERFORMANCE | 21 |
Table of Contents
Management’s Discussion of Fund Performance (Continued)
iSHARES® MSCI UNITED KINGDOM INDEX FUND
PORTFOLIO ALLOCATION As of 8/31/07 | |||
| Sector | Percentage of Net Assets | ||
Financial | 25.42 | % | |
Consumer Non-Cyclical | 21.20 | ||
Energy | 16.72 | ||
Communications | 10.92 | ||
Basic Materials | 8.94 | ||
Consumer Cyclical | 6.24 | ||
Utilities | 4.47 | ||
Industrial | 4.02 | ||
Technology | 0.63 | ||
Diversified | 0.14 | ||
Short-Term and Other Net Assets | 1.30 | ||
TOTAL | 100.00 | % | |
TEN LARGEST FUND HOLDINGS As of 8/31/07 | |||
| Security | Percentage of Net Assets | ||
BP PLC | 6.93 | % | |
HSBC Holdings PLC | 6.83 | ||
Vodafone Group PLC | 5.49 | ||
GlaxoSmithKline PLC | 4.81 | ||
Royal Dutch Shell PLC Class A | 4.59 | ||
Royal Bank of Scotland Group PLC | 3.53 | ||
Royal Dutch Shell PLC Class B | 3.45 | ||
Barclays PLC | 2.61 | ||
Anglo American PLC | 2.49 | ||
AstraZeneca PLC | 2.37 | ||
TOTAL | 43.10 | % | |
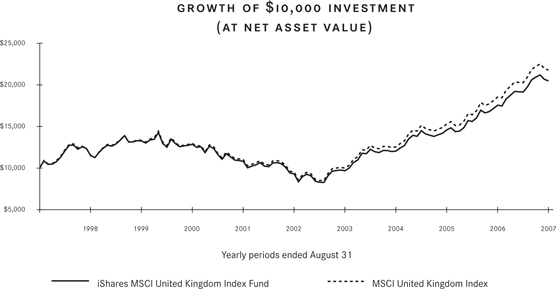
The iShares MSCI United Kingdom Index Fund (the “Fund”) seeks to provide investment results that correspond generally to the price and yield performance, before fees and expenses, of publicly traded securities in the aggregate in the British market, as measured by the MSCI United Kingdom Index (the “Index”). The Fund invests in a representative sample of securities included in the Index that collectively has an investment profile similar to the Index. Due to the use of representative sampling, the Fund may or may not hold all of the securities that are included in the Index. For the 12-month period ended August 31, 2007 (the “reporting period”), the Fund returned 16.77%, while the Index returned 17.56%.
The United Kingdom experienced healthy equity market gains for the reporting period, helped by economic growth and a strong currency. The British pound reached its highest level versus the U.S. dollar in 25 years during the period. The appreciating currency had a dampening effect on exports: because the higher currency value raised the price of British exports, the UK’s trade deficit widened. Economic growth accelerated during the reporting period, pushing inflation levels above the 2% target rate. In response, the Bank of England raised its benchmark lending rate four times during the reporting period, moving from a low of 4.75% to a high of 5.75%, its highest rate since 2001.
The ten largest Fund holdings represented approximately 43% of the net assets of the Fund as of August 31, 2007. Among the Fund’s ten largest holdings, performance was mostly positive for the reporting period. Wireless telecommunications company Vodafone Group PLC was the strongest performer among the ten largest holdings, followed by mining company Anglo American PLC. The Fund held both the A and B shares of Royal Dutch Shell PLC, and both share classes performed well as oil prices remained high. Pharmaceutical company AstraZeneca PLC suffered a double-digit decline for the reporting period, while GlaxoSmithKline PLC posted a modest decline.
22 | 2007 iSHARES ANNUAL REPORTTO SHAREHOLDERS |
Table of Contents
Shareholder Expenses (Unaudited)
iSHARES®, INC.
As a shareholder of a Fund, you incur two types of costs: (1) transaction costs, including brokerage commissions on purchases and sales of fund shares and (2) ongoing costs, including management fees and other fund expenses. The following Example is intended to help you understand your ongoing costs (in dollars and cents) of investing in a Fund and to compare these costs with the ongoing costs of investing in other funds.
The Example is based on an investment of $1,000 invested at the beginning of the period and held for the entire period from March 1, 2007 to August 31, 2007.
ACTUAL EXPENSES
The first line under each Fund in the table below provides information about actual account values and actual expenses. You may use the information in this line, together with the amount you invested, to estimate the expenses that you paid over the period. Simply divide your account value by $1,000 (for example, an $8,600 account value divided by $1,000 = 8.6), then multiply the result by the number in the first line for your Fund under the heading entitled “Expenses Paid During Period” to estimate the expenses you paid on your account during this period.
HYPOTHETICAL EXAMPLE FOR COMPARISON PURPOSES
The second line under each Fund in the table below provides information about hypothetical account values and hypothetical expenses based on each Fund’s actual expense ratio and an assumed rate of return of 5% per year before expenses, which is not the Fund’s actual return. The hypothetical account values and expenses may not be used to estimate the actual ending account balance or expenses you paid for the period. You may use this information to compare the ongoing costs of investing in your Fund and other funds. To do so, compare this 5% hypothetical example with the 5% hypothetical examples that appear in the shareholder reports of the other funds.
Please note that the expenses shown in the table are meant to highlight your ongoing costs only and do not reflect any transactional costs, such as brokerage commissions paid on purchases and sales of fund shares. Therefore, the second line under each Fund in the table is useful in comparing ongoing costs only and will not help you determine the relative total costs of owning different funds. In addition, if these transactional costs were included, your costs would have been higher.
| iShares MSCI Index Fund | Beginning Account Value (3/1/07) | Ending Account Value (8/31/07) | Annualized Expense Ratio | Expenses Paid During Perioda (3/1/07 to 8/31/07) | |||||
Austria | |||||||||
Actual | $ 1,000.00 | $ 1,041.00 | 0.51 | % | $ 2.62 | ||||
Hypothetical (5% return before expenses) | 1,000.00 | 1,022.60 | 0.51 | 2.60 | |||||
Belgium | |||||||||
Actual | 1,000.00 | 1,014.50 | 0.51 | 2.59 | |||||
Hypothetical (5% return before expenses) | 1,000.00 | 1,022.60 | 0.51 | 2.60 | |||||
EMU | |||||||||
Actual | 1,000.00 | 1,101.70 | 0.51 | 2.70 | |||||
Hypothetical (5% return before expenses) | 1,000.00 | 1,022.60 | 0.51 | 2.60 | |||||
France | |||||||||
Actual | 1,000.00 | 1,071.60 | 0.51 | 2.66 | |||||
Hypothetical (5% return before expenses) | 1,000.00 | 1,022.60 | 0.51 | 2.60 |
SHAREHOLDER EXPENSES | 23 |
Table of Contents
Shareholder Expenses (Unaudited) (Continued)
iSHARES®, INC.
| iShares MSCI Index Fund | Beginning Account Value (3/1/07) | Ending Account Value (8/31/07) | Annualized Expense Ratio | Expenses Paid (3/1/07 to 8/31/07) | |||||||
Germany | |||||||||||
Actual | $ | 1,000.00 | $ | 1,168.10 | 0.51 | % | $ 2.79 | ||||
Hypothetical (5% return before expenses) | 1,000.00 | 1,022.60 | 0.51 | 2.60 | |||||||
Italy | |||||||||||
Actual | 1,000.00 | 1,026.10 | 0.51 | 2.60 | |||||||
Hypothetical (5% return before expenses) | 1,000.00 | 1,022.60 | 0.51 | 2.60 | |||||||
Netherlands | |||||||||||
Actual | 1,000.00 | 1,129.50 | 0.51 | 2.74 | |||||||
Hypothetical (5% return before expenses) | 1,000.00 | 1,022.60 | 0.51 | 2.60 | |||||||
Spain | |||||||||||
Actual | 1,000.00 | 1,069.50 | 0.51 | 2.66 | |||||||
Hypothetical (5% return before expenses) | 1,000.00 | 1,022.60 | 0.51 | 2.60 | |||||||
Sweden | |||||||||||
Actual | 1,000.00 | 1,099.60 | 0.51 | 2.70 | |||||||
Hypothetical (5% return before expenses) | 1,000.00 | 1,022.60 | 0.51 | 2.60 | |||||||
Switzerland | |||||||||||
Actual | 1,000.00 | 1,038.70 | 0.51 | 2.62 | |||||||
Hypothetical (5% return before expenses) | 1,000.00 | 1,022.60 | 0.51 | 2.60 | |||||||
United Kingdom | |||||||||||
Actual | 1,000.00 | 1,070.60 | 0.51 | 2.66 | |||||||
Hypothetical (5% return before expenses) | 1,000.00 | 1,022.60 | 0.51 | 2.60 | |||||||
a | Expenses are calculated using each Fund’s annualized expense ratio (as disclosed in the table), multiplied by the average account value for the period, multiplied by the number of days in the period (184 days) and divided by the number of days in the year (365 days). |
24 | 2007 iSHARES ANNUAL REPORTTO SHAREHOLDERS |
Table of Contents
iSHARES® MSCI AUSTRIA INDEX FUND
August 31, 2007
| Security | Shares | Value | |||
COMMON STOCKS – 98.95% | |||||
BANKS – 21.64% | |||||
Erste Bank der Oesterreichischen Sparkassen AG | 1,093,223 | $ | 79,270,985 | ||
Raiffeisen International Bank Holding AG | 160,691 | 23,220,573 | |||
| 102,491,558 | |||||
BUILDING MATERIALS – 4.82% | |||||
Wienerberger AG | 319,966 | 22,843,461 | |||
| 22,843,461 | |||||
CHEMICALS – 0.19% | |||||
Lenzing AG | 1,746 | 880,687 | |||
| 880,687 | |||||
ELECTRIC – 5.74% | |||||
EVN AGa | 34,494 | 4,062,869 | |||
Oesterreichische | 465,159 | 23,101,283 | |||
| 27,164,152 | |||||
ENGINEERING & CONSTRUCTION – 3.60% | |||||
Flughafen Wien AG | 170,003 | 17,034,109 | |||
| 17,034,109 | |||||
ENTERTAINMENT – 0.82% | |||||
Bwin Interactive Entertainment AGa,b | 150,318 | 3,903,745 | |||
| 3,903,745 | |||||
ENVIRONMENTAL CONTROL – 0.63% | |||||
BWT AG | 41,895 | 2,541,545 | |||
Christ Water Technology AGb | 22,745 | 429,449 | |||
| 2,970,994 | |||||
FOREST PRODUCTS & PAPER – 2.79% | |||||
Mayr-Melnhof Karton AGa | 122,287 | 13,203,254 | |||
| 13,203,254 | |||||
INSURANCE – 3.75% | |||||
Wiener Staedtische Allgemeine | 258,167 | 17,745,126 | |||
| 17,745,126 | |||||
IRON & STEEL – 4.92% | |||||
voestalpine AG | 284,950 | 23,311,370 | |||
| 23,311,370 | |||||
| Security | Shares | Value | ||||
MACHINERY – 4.78% | ||||||
Andritz AG | 349,247 | $ | 22,620,032 | |||
| 22,620,032 | ||||||
MACHINERY - CONSTRUCTION & |
| |||||
Palfinger AG | 117,998 | 5,646,213 | ||||
| 5,646,213 | ||||||
MANUFACTURING – 2.88% |
| |||||
RHI AGa,b | 278,959 | 13,656,245 | ||||
| 13,656,245 | ||||||
OIL & GAS – 12.17% | ||||||
OMV AG | 927,897 | 57,618,727 | ||||
| 57,618,727 | ||||||
REAL ESTATE – 18.49% | ||||||
CA Immobilien Anlagen AGb | 809,418 | 21,009,480 | ||||
Immoeast AGb | 1,773,337 | 21,733,340 | ||||
IMMOFINANZ AGb | 1,673,830 | 20,719,187 | ||||
Meinl European Land Ltd.b | 1,317,355 | 24,082,807 | ||||
| 87,544,814 | ||||||
TELECOMMUNICATIONS – 10.54% |
| |||||
Telekom Austria AG | 1,935,452 | 49,920,513 | ||||
| 49,920,513 | ||||||
TOTAL COMMON STOCKS | 468,555,000 | |||||
SHORT-TERM INVESTMENTS – 4.42% |
| |||||
MONEY MARKET FUNDS – 4.42% |
| |||||
Barclays Global Investors Funds | 66,690 | 66,690 | ||||
BGI Cash Premier Fund LLC | 20,831,439 | 20,831,439 | ||||
| 20,898,129 | ||||||
TOTAL SHORT-TERM INVESTMENTS 20,898,129 |
| |||||
TOTAL INVESTMENTS IN | 489,453,129 | |||||
Other Assets, Less Liabilities – (3.37)% | (15,939,309 | ) | ||||
NET ASSETS – 100.00% | $ | 473,513,820 | ||||
SCHEDULESOF INVESTMENTS | 25 |
Table of Contents
Schedule of Investments (Continued)
iSHARES® MSCI AUSTRIA INDEX FUND
August 31, 2007
a | All or a portion of this security represents a security on loan. See Note 5. |
b | Non-income earning security. |
c | Affiliated issuer. See Note 2. |
d | The rate quoted is the annualized seven-day yield of the fund at period end. |
e | This security represents an investment of securities lending collateral. See Note 5. |
See notes to financial statements.
26 | 2007 iSHARES ANNUAL REPORTTO SHAREHOLDERS |
Table of Contents
Schedule of Investments
iSHARES® MSCI BELGIUM INDEX FUND
August 31, 2007
| Security | Shares | Value | |||
COMMON STOCKS – 99.35% | |||||
BANKS – 43.93% | |||||
Banque Nationale de Belgique | 293 | $ | 1,354,063 | ||
Dexia SA | 543,353 | 14,970,072 | |||
Fortis | 1,944,833 | 71,346,310 | |||
KBC Group NV | 363,916 | 45,651,903 | |||
| 133,322,348 | |||||
BEVERAGES – 9.03% | |||||
InBev | 333,850 | 27,398,285 | |||
| 27,398,285 | |||||
CHEMICALS – 4.88% | |||||
Solvay SA | 99,760 | 14,808,803 | |||
| 14,808,803 | |||||
ELECTRICAL COMPONENTS & | |||||
NV Bekaert SA | 32,191 | 4,234,843 | |||
| 4,234,843 | |||||
ELECTRONICS – 0.65% | |||||
Barco NV | 20,829 | 1,977,153 | |||
| 1,977,153 | |||||
FOOD – 7.94% | |||||
Colruyt SA | 45,266 | 9,662,993 | |||
Delhaize Group | 147,456 | 14,431,182 | |||
| 24,094,175 | |||||
HOLDING COMPANIES - DIVERSIFIED – 7.92% | |||||
Groupe Bruxelles Lambert SA | 126,491 | 14,955,622 | |||
Sofina SA | 78,316 | 9,074,964 | |||
| 24,030,586 | |||||
MANUFACTURING – 1.51% | |||||
AGFA-Gevaert NV | 218,871 | 4,571,119 | |||
| 4,571,119 | |||||
MINING – 4.40% | |||||
Umicore | 58,235 | 13,345,268 | |||
| 13,345,268 | |||||
PHARMACEUTICALS – 5.54% | |||||
Omega Pharma SA | 45,229 | 3,989,301 | |||
UCB SA | 227,828 | 12,827,223 | |||
| 16,816,524 | |||||
| Security | Shares | Value | |||
REAL ESTATE INVESTMENT TRUSTS – 3.21% | |||||
Cofinimmo | 56,723 | $ | 9,754,107 | ||
| 9,754,107 | |||||
RETAIL – 1.09% | |||||
SA D’Ieteren NV | 8,326 | 3,314,323 | |||
| 3,314,323 | |||||
TELECOMMUNICATIONS – 6.82% | |||||
Belgacom SA | 349,349 | 15,316,201 | |||
Mobistar SA | 66,393 | 5,392,601 | |||
| 20,708,802 | |||||
TRANSPORTATION – 1.03% | |||||
Compagnie Maritime Belge SA | 32,282 | 2,116,806 | |||
Euronav SA | 31,938 | 1,008,374 | |||
| 3,125,180 | |||||
TOTAL COMMON STOCKS | 301,501,516 | ||||
SHORT-TERM INVESTMENTS – 0.00% | |||||
MONEY MARKET FUNDS – 0.00% | |||||
Barclays Global Investors Funds | 9,787 | 9,787 | |||
| 9,787 | |||||
TOTAL SHORT-TERM INVESTMENTS | 9,787 | ||||
TOTAL INVESTMENTS IN SECURITIES – 99.35% | 301,511,303 | ||||
Other Assets, Less Liabilities – 0.65% | 1,972,096 | ||||
NET ASSETS – 100.00% | $ | 303,483,399 | |||
a | Affiliated issuer. See Note 2. |
b | The rate quoted is the annualized seven-day yield of the fund at period end. |
See notes to financial statements.
SCHEDULESOF INVESTMENTS | 27 |
Table of Contents
Schedule of Investments
August 31, 2007
| Security | Shares | Value | |||
COMMON STOCKS – 98.42% | |||||
AUSTRIA – 1.72% | |||||
Andritz AG | 27,412 | $ | 1,775,421 | ||
Bwin Interactive Entertainment AGa | 19,144 | 497,168 | |||
Erste Bank der Oesterreichischen Sparkassen AG | 123,809 | 8,977,548 | |||
Flughafen Wien AG | 6,534 | 654,699 | |||
Immoeast AGa | 307,596 | 3,769,779 | |||
IMMOFINANZ AGa | 383,952 | 4,752,677 | |||
Mayr-Melnhof Karton AG | 11,205 | 1,209,797 | |||
Oesterreichische Elektrizitaetswirtschafts AG | 52,554 | 2,610,000 | |||
OMV AG | 108,182 | 6,717,674 | |||
Raiffeisen International Bank Holding AG | 24,440 | 3,531,690 | |||
RHI AGa | 22,092 | 1,081,498 | |||
Telekom Austria AG | 215,222 | 5,551,154 | |||
voestalpine AG | 69,277 | 5,667,457 | |||
Wiener Staedtische Allgemeine Versicherung AG | 18,756 | 1,289,195 | |||
Wienerberger AG | 42,481 | 3,032,863 | |||
| 51,118,620 | |||||
BELGIUM – 3.42% | |||||
AGFA-Gevaert NV | 88,400 | 1,846,233 | |||
Barco NV | 8,366 | 794,127 | |||
Belgacom SA | 78,882 | 3,458,354 | |||
Cofinimmo | 15,179 | 2,610,186 | |||
Colruyt SA | 10,156 | 2,168,015 | |||
Compagnie Maritime Belge SA | 15,642 | 1,025,682 | |||
Delhaize Group | 47,827 | 4,680,719 | |||
Dexia SA | 363,588 | 10,017,316 | |||
Euronav SA | 13,938 | 440,063 | |||
Fortis | 762,072 | 27,956,655 | |||
Groupe Bruxelles Lambert SA | 49,280 | 5,826,605 | |||
InBev | 102,814 | 8,437,703 | |||
KBC Group NV | 114,264 | 14,333,992 | |||
Mobistar SA | 19,836 | 1,611,128 | |||
NV Bekaert SA | 9,567 | 1,258,574 | |||
Omega Pharma SA | 13,000 | 1,146,630 | |||
SA D’Ieteren NV | 1,608 | 640,095 | |||
Solvay SA | 41,052 | 6,093,935 | |||
| Security | Shares | Value | |||
UCB SA | 66,966 | $ | 3,770,335 | ||
Umicore | 14,872 | 3,408,102 | |||
| 101,524,449 | |||||
FINLAND – 5.11% | |||||
Amer Group OYJb | 39,225 | 891,938 | |||
Cargotec Corp. Class B | 27,245 | 1,324,475 | |||
Elisa OYJ Class A | 96,570 | 2,688,274 | |||
Fortum OYJ | 263,718 | 8,728,989 | |||
Kesko OYJ Class B | 35,496 | 2,082,218 | |||
Kone OYJ Class B | 51,254 | 3,348,267 | |||
Konecranes OYJ | 43,932 | 1,669,143 | |||
Metso OYJ | 77,778 | 4,985,571 | |||
Neste Oil OYJ | 92,394 | 3,196,766 | |||
Nokia OYJ | 2,513,160 | 82,808,000 | |||
Nokian Renkaat OYJ | 70,720 | 2,487,353 | |||
OKO Bank PLC Class A | 48,546 | 966,895 | |||
Orion OYJ | 54,288 | 1,294,402 | |||
Outokumpu OYJ | 73,320 | 2,218,967 | |||
Rautaruukki OYJ | 56,898 | 3,099,545 | |||
Sampo OYJ | 249,661 | 7,143,954 | |||
SanomaWSOY OYJ Class B | 20,358 | 621,113 | |||
Stora Enso OYJ Class R | 398,970 | 7,114,158 | |||
TietoEnator OYJb | 47,502 | 1,103,461 | |||
UPM-Kymmene OYJ | 336,798 | 7,635,496 | |||
Uponor OYJ | 46,458 | 1,782,215 | |||
Wartsila OYJ Class B | 38,237 | 2,379,579 | |||
YIT OYJ | 71,128 | 2,146,810 | |||
| 151,717,589 | |||||
FRANCE – 28.65% | |||||
Accor SA | 117,584 | 10,100,275 | |||
Aeroports de Paris | 21,308 | 2,439,753 | |||
Air France-KLM | 72,558 | 3,006,018 | |||
Alcatel-Lucent | 1,421,160 | 15,557,293 | |||
ALSTOM | 68,904 | 12,462,141 | |||
Arcelor Mittal | 551,200 | 36,346,350 | |||
Atos Origin SAa | 42,142 | 2,372,688 | |||
AXA | 970,572 | 38,913,320 | |||
BNP Paribas | 522,225 | 55,117,097 | |||
Bouygues SA | 128,466 | 10,124,339 | |||
Business Objects SAa | 59,702 | 2,628,043 | |||
Cap Gemini SA | 81,954 | 5,306,880 | |||
Carrefour SA | 376,002 | 26,331,477 | |||
28 | 2007 iSHARES ANNUAL REPORTTO SHAREHOLDERS |
Table of Contents
Schedule of Investments (Continued)
iSHARES® MSCI EMU INDEX FUND
August 31, 2007
| Security | Shares | Value | |||
Casino Guichard-Perrachon SAb | 25,921 | $ | 2,650,260 | ||
CNP Assurances SA | 22,673 | 2,898,025 | |||
Compagnie de Saint-Gobain | 203,508 | 22,155,742 | |||
Compagnie Generale des Etablissements Michelin Class B | 89,960 | 11,340,333 | |||
Credit Agricole SA | 418,444 | 15,801,293 | |||
Dassault Systemes SA | 31,048 | 1,826,798 | |||
Essilor International SA | 121,104 | 7,354,984 | |||
European Aeronautic Defence and Space Co.b | 200,809 | 5,962,337 | |||
France Telecom SA | 1,120,080 | 33,806,652 | |||
Gaz de France | 124,968 | 6,269,345 | |||
Gecina SA | 4,720 | 775,169 | |||
Groupe Danone | 267,496 | 20,388,360 | |||
Hermes Internationalb | 40,716 | 4,394,417 | |||
Imerys SA | 21,591 | 1,978,254 | |||
Klepierre | 13,656 | 2,155,609 | |||
Lafarge SA | 96,570 | 15,006,675 | |||
Lagardere SCA | 73,220 | 5,980,046 | |||
L’Air Liquide SA | 150,419 | 19,183,242 | |||
L’Oreal SA | 159,840 | 18,735,204 | |||
LVMH Moet Hennessy Louis Vuitton SA | 150,390 | 16,809,522 | |||
M6-Metropole Television | 38,628 | 1,166,411 | |||
Neopost SA | 19,314 | 2,956,574 | |||
PagesJaunes SA | 69,765 | 1,415,194 | |||
Pernod Ricard SA | 55,133 | 11,614,484 | |||
PPR SAb | 42,804 | 7,404,939 | |||
PSA Peugeot Citroen SA | 97,490 | 8,306,453 | |||
Publicis Groupe SA | 86,139 | 3,724,848 | |||
Renault SA | 115,362 | 15,572,603 | |||
Safran SA | 102,688 | 2,426,017 | |||
Sanofi-Aventis | 631,890 | 51,616,529 | |||
Schneider Electric SA | 136,177 | 18,100,221 | |||
SCOR SE | 109,200 | 2,675,138 | |||
Societe BIC | 15,283 | 1,160,484 | |||
Societe des Autoroutes Paris-Rhin-Rhone | 18,309 | 1,869,485 | |||
Societe Generale Class A | 231,712 | 37,390,879 | |||
Societe Television Francaise 1 | 75,168 | 2,192,917 | |||
Sodexho Alliance SA | 65,909 | 4,346,964 | |||
STMicroelectronics NV | 436,032 | 7,596,696 | |||
| Security | Shares | Value | |||
Suez SA | 627,714 | $ | 35,718,216 | ||
Technip SA | 56,898 | 4,544,604 | |||
Thales SA | 69,382 | 3,939,466 | |||
Thomson | 160,081 | 2,629,677 | |||
Total SA | 1,337,099 | 100,709,712 | |||
Unibail-Rodamco | 45,953 | 11,072,579 | |||
Valeo SA | 46,218 | 2,241,148 | |||
Vallourec SA | 28,903 | 7,738,556 | |||
Veolia Environnement | 200,900 | 15,413,793 | |||
Vinci SA | 248,580 | 17,702,918 | |||
Vivendi SA | 720,630 | 29,481,789 | |||
Zodiac SA | 36,089 | 2,607,511 | |||
| 851,514,746 | |||||
GERMANY – 22.48% | |||||
Adidas AG | 125,334 | 7,372,677 | |||
Allianz SEb | 276,946 | 59,395,637 | |||
ALTANA AG | 48,360 | 1,106,251 | |||
Arcandor AGa,b | 42,282 | 1,152,819 | |||
BASF AG | 309,654 | 41,002,052 | |||
Bayer AG | 452,736 | 35,747,781 | |||
Beiersdorf AG | 54,287 | 3,646,313 | |||
Bilfinger Berger AG | 20,880 | 1,715,850 | |||
Celesio AG | 44,978 | 2,817,482 | |||
Commerzbank AG | 393,750 | 16,151,701 | |||
Continental AG | 84,042 | 10,931,148 | |||
DaimlerChrysler AG Registered | 569,196 | 50,576,841 | |||
Deutsche Bank AG | 326,358 | 40,321,971 | |||
Deutsche Boerse AG | 128,960 | 14,240,182 | |||
Deutsche Lufthansa AG | 142,560 | 4,162,868 | |||
Deutsche Post AG | 486,720 | 14,152,904 | |||
Deutsche Postbank AG | 55,640 | 4,036,803 | |||
Deutsche Telekom AG | 1,691,460 | 31,452,242 | |||
Douglas Holding AG | 18,305 | 1,100,484 | |||
E.ON AG | 382,788 | 64,264,072 | |||
Fresenius Medical Care AG & Co. KGaA | 119,016 | 5,850,683 | |||
HeidelbergerDruckmaschinen AG | 40,716 | 1,846,688 | |||
Henkel KGaA | 38,480 | 1,804,550 | |||
Hochtief AG | 28,080 | 2,818,561 | |||
Hypo Real Estate Holding AG | 91,002 | 4,999,557 | |||
Infineon Technologies AGa,b | 471,120 | 7,334,545 | |||
IVG Immobilien AG | 55,854 | 1,999,514 | |||
SCHEDULESOF INVESTMENTS | 29 |
Table of Contents
Schedule of Investments (Continued)
iSHARES® MSCI EMU INDEX FUND
August 31, 2007
| Security | Shares | Value | |||
Linde AG | 71,760 | $ | 8,427,780 | ||
MAN AG | 72,800 | 10,449,464 | |||
Merck KGaA | 37,440 | 4,804,913 | |||
METRO AG | 98,166 | 8,511,257 | |||
MLP AG | 42,640 | 680,109 | |||
Muenchener Rueckversicherungs- Gesellschaft AG | 135,108 | 23,351,099 | |||
Premiere AGa | 50,157 | 1,089,922 | |||
Puma AG | 4,680 | 1,880,444 | |||
Rheinmetall AG | 21,924 | 1,821,069 | |||
RWE AG | 273,114 | 30,731,512 | |||
Salzgitter AG | 26,100 | 5,159,220 | |||
SAP AG | 557,712 | 30,054,694 | |||
Siemens AG | 528,480 | 66,418,319 | |||
SolarWorld AG | 50,440 | 2,489,196 | |||
Suedzucker AG | 54,339 | 1,045,976 | |||
ThyssenKrupp AG | 224,038 | 13,102,510 | |||
TUI AGa,b | 152,478 | 3,959,840 | |||
Volkswagen AG | 98,800 | 20,418,868 | |||
Wincor Nixdorf AG | 17,782 | 1,529,869 | |||
| 667,928,237 | |||||
GREECE – 1.66% | |||||
Coca-Cola Hellenic Bottling Co. SA ADR | 190,584 | 9,149,938 | |||
Hellenic Telecommunications Organization SA SP ADR | 925,893 | 15,249,458 | |||
National Bank of Greece SA ADR | 2,085,333 | 25,023,996 | |||
| 49,423,392 | |||||
IRELAND – 2.34% | |||||
Allied Irish Banks PLC | 559,278 | 14,288,046 | |||
Bank of Ireland | 625,104 | 11,589,553 | |||
C&C Group PLC | 206,960 | 1,520,725 | |||
CRH PLC | 340,452 | 14,759,054 | |||
DCC PLC | 53,346 | 1,410,844 | |||
DEPFA Bank PLC | 236,520 | 4,488,308 | |||
Elan Corp. PLCa | 290,579 | 5,545,846 | |||
Grafton Group PLCa | 136,410 | 1,822,417 | |||
Greencore Group PLC | 126,473 | 793,106 | |||
IAWS Group PLC | 68,382 | 1,339,876 | |||
Independent News & Media PLC | 385,401 | 1,812,623 | |||
Irish Life & Permanent PLC | 178,103 | 4,431,080 | |||
Kerry Group PLC Class A | 79,866 | 1,943,460 | |||
| Security | Shares | Value | |||
Kingspan Group PLC | 78,303 | $ | 2,028,185 | ||
Paddy Power PLC | 49,920 | 1,507,384 | |||
Ryanair Holdings PLCa | 43,520 | 316,874 | |||
| 69,597,381 | |||||
ITALY – 10.38% | |||||
Alleanza Assicurazioni SpAb | 240,441 | 3,102,449 | |||
Arnoldo Mondadori Editore SpA | 62,540 | 589,557 | |||
Assicurazioni Generali SpA | 635,380 | 26,011,439 | |||
Atlantia SpA | 181,972 | 6,070,354 | |||
Autogrill SpA | 103,199 | 2,162,344 | |||
Banca Monte dei Paschi di Siena SpAb | 709,229 | 4,510,385 | |||
Banca Popolare di Milano Scrl | 275,724 | 4,006,889 | |||
Banco Popolare SpAa | 413,439 | 10,348,076 | |||
Bulgari SpA | 90,206 | 1,266,625 | |||
Capitalia SpA | 1,052,480 | 10,036,380 | |||
Enel SpA | 2,660,483 | 27,491,928 | |||
Eni SpA | 1,602,414 | 55,442,379 | |||
Fiat SpA | 440,686 | 11,714,921 | |||
Finmeccanica SpA | 214,760 | 6,297,517 | |||
Fondiaria-Sai SpA | 46,426 | 2,180,982 | |||
Intesa Sanpaolo SpA | 4,780,292 | 36,037,534 | |||
Italcementi SpA | 54,740 | 1,354,431 | |||
Lottomatica SpA | 66,040 | 2,374,966 | |||
Luxottica Group SpA | 79,287 | 2,708,685 | |||
Mediaset SpA | 460,893 | 4,894,553 | |||
Mediobanca SpAb | 301,000 | 6,487,448 | |||
Mediolanum SpAb | 166,172 | 1,215,355 | |||
Parmalat SpA | 894,642 | 3,231,995 | |||
Pirelli & C. SpAa | 1,615,199 | 1,815,483 | |||
Seat Pagine Gialle SpAb | 2,560,576 | 1,411,990 | |||
Snam Rete Gas SpA | 519,588 | 3,061,749 | |||
Telecom Italia SpAb | 6,330,372 | 17,971,724 | |||
Terna SpA | 739,347 | 2,615,539 | |||
UniCredito Italiano SpA | 4,847,895 | 41,569,936 | |||
Unione di Banche Italiane ScpA | 408,720 | 10,452,838 | |||
| 308,436,451 | |||||
NETHERLANDS – 9.76% | |||||
ABN AMRO Holding NV | 1,127,304 | 52,450,888 | |||
Aegon NV | 901,872 | 16,462,697 | |||
Akzo Nobel NV | 170,748 | 13,447,251 | |||
ASML Holding NVa | 291,200 | 8,626,341 | |||
30 | 2007 iSHARES ANNUAL REPORTTO SHAREHOLDERS |
Table of Contents
Schedule of Investments (Continued)
iSHARES® MSCI EMU INDEX FUND
August 31, 2007
| Security | Shares | Value | |||
Corio NV | 24,156 | $ | 1,882,975 | ||
Corporate Express NV | 81,997 | 921,087 | |||
Fugro NV | 33,195 | 2,307,907 | |||
Hagemeyer NV | 339,930 | 1,441,204 | |||
Heineken NV | 145,365 | 9,210,887 | |||
ING Groep NV | 1,160,370 | 46,696,932 | |||
Koninklijke Ahold NVa | 777,891 | 10,392,507 | |||
Koninklijke DSM NV | 93,538 | 4,785,663 | |||
Koninklijke KPN NV | 1,170,288 | 18,251,320 | |||
Koninklijke Philips Electronics NV | 706,755 | 27,873,585 | |||
Oce NV | 55,848 | 1,202,930 | |||
QIAGEN NVa,b | 104,213 | 1,791,482 | |||
Randstad Holding NV | 26,191 | 1,466,757 | |||
Reed Elsevier NV | 424,181 | 7,656,225 | |||
Royal Numico NV | 106,620 | 7,847,431 | |||
SBM Offshore NV | 76,721 | 2,877,268 | |||
TNT NV | 258,498 | 10,924,319 | |||
Unilever NV | 1,057,899 | 32,348,116 | |||
Vedior NV | 101,682 | 2,310,762 | |||
Wereldhave NV | 13,050 | 1,563,599 | |||
Wolters Kluwer NV CVA | 177,012 | 5,159,242 | |||
| 289,899,375 | |||||
PORTUGAL – 1.12% | |||||
Banco BPI SA Registered | 210,132 | 1,853,412 | |||
Banco Comercial Portugues SA Class R | 1,479,920 | 6,920,028 | |||
Banco Espirito Santo SA | 158,411 | 3,429,346 | |||
Brisa-Auto Estradas de Portugal SA | 206,244 | 2,651,359 | |||
CIMPOR-Cimentos de Portugal SGPS SA | 151,026 | 1,420,615 | |||
Energias de Portugal SA | 1,223,606 | 6,722,366 | |||
Jeronimo Martins SGPS SA | 134,457 | 768,021 | |||
Portugal Telecom SGPS SA | 456,515 | 6,260,781 | |||
PT Multimedia Servicos de Telecomunicacoes e Multimedia SGPS SAb | 57,668 | 943,391 | |||
Sonae Industria SGPS SAa | 66,560 | 862,918 | |||
Sonae SGPS SA | 555,616 | 1,484,589 | |||
| 33,316,826 | |||||
SPAIN – 11.78% | |||||
Abertis Infraestructuras SAb | 165,367 | 5,018,218 | |||
Acciona SA | 17,748 | 4,454,292 | |||
| Security | Shares | Value | |||
Acerinox SAb | 113,796 | $ | 2,863,744 | ||
Actividades de Construcciones y Servicios SA | 152,162 | 8,365,847 | |||
Altadis SA | 163,256 | 10,849,739 | |||
Antena 3 de Television SAa,b | 77,071 | 1,441,520 | |||
Banco Bilbao Vizcaya Argentaria SA | 2,239,640 | 51,568,366 | |||
Banco Popular Espanol SA | 567,320 | 10,355,812 | |||
Banco Santander SA | 3,877,407 | 70,830,726 | |||
Cintra Concesiones de Infraestructuras de Transporte SAb | 156,208 | 2,457,450 | |||
Ebro Puleva SA | 68,932 | 1,515,761 | |||
Endesa SAb | 384,253 | 20,895,694 | |||
Fomento de Construcciones y Contratas SA | 26,520 | 2,312,009 | |||
Gamesa Corporacion Tecnologica SA | 117,520 | 4,687,720 | |||
Gas Natural SDG SA | 91,520 | 4,875,802 | |||
Gestevision Telecinco SA | 55,032 | 1,462,936 | |||
Grupo Ferrovial SAb | 39,748 | 3,489,608 | |||
Iberdrola SA | 565,240 | 31,361,932 | |||
Iberia Lineas Aereas de Espana SA | 283,133 | 1,289,177 | |||
Indra Sistemas SA | 85,608 | 2,238,404 | |||
Industria de Diseno Textil SA | 133,686 | 7,845,752 | |||
Mapfre SA | 368,996 | 1,629,830 | |||
Promotora de Informaciones SA | 51,777 | 1,108,185 | |||
Repsol YPF SA | 519,481 | 18,752,672 | |||
SacyrVallehermoso SAb | 58,986 | 2,340,008 | |||
Sociedad General de Aguas de Barcelona SA Class A | 41,705 | 1,518,011 | |||
Sogecable SAa,b | 31,842 | 1,205,891 | |||
Telefonica SA | 2,709,324 | 67,295,314 | |||
Union Fenosa SA | 74,124 | 4,053,097 | |||
Zardoya Otis SAb | 31,000 | 977,914 | |||
Zeltia SAb | 109,748 | 1,093,678 | |||
| 350,155,109 | |||||
TOTAL COMMON STOCKS | 2,924,632,175 | ||||
SCHEDULESOF INVESTMENTS | 31 |
Table of Contents
Schedule of Investments (Continued)
iSHARES® MSCI EMU INDEX FUND
August 31, 2007
| Security | Shares | Value | ||||
PREFERRED STOCKS – 1.39% | ||||||
GERMANY – 0.93% | ||||||
Henkel KGaA | 106,488 | $ | 5,488,869 | |||
Porsche AG | 5,230 | 9,350,587 | ||||
ProSiebenSat.1 Media AG | 55,332 | 1,897,098 | ||||
RWE AG | 22,968 | 2,340,194 | ||||
Volkswagen AG | 66,949 | 8,382,986 | ||||
| 27,459,734 | ||||||
ITALY – 0.46% | ||||||
Intesa Sanpaolo SpA RNC | 606,798 | 4,218,808 | ||||
Telecom Italia SpA RNC | 3,598,476 | 8,069,749 | ||||
Unipol SpA | 440,440 | 1,400,503 | ||||
| 13,689,060 | ||||||
TOTAL PREFERRED STOCKS | 41,148,794 | |||||
SHORT-TERM INVESTMENTS – 2.31% |
| |||||
MONEY MARKET FUNDS – 2.31% |
| |||||
Barclays Global Investors Funds | 447,660 | 447,660 | ||||
BGI Cash Premier Fund LLC | 68,317,861 | 68,317,861 | ||||
| 68,765,521 | ||||||
TOTAL SHORT-TERM | 68,765,521 | |||||
TOTAL INVESTMENTS IN | 3,034,546,490 | |||||
Other Assets, Less Liabilities – (2.12)% | (62,981,160 | ) | ||||
NET ASSETS – 100.00% | $ | 2,971,565,330 | ||||
ADR – American Depositary Receipts
SP ADR – Sponsored American Depositary Receipts
a | Non-income earning security. |
b | All or a portion of this security represents a security on loan. See Note 5. |
c | Affiliated issuer. See Note 2. |
d | The rate quoted is the annualized seven-day yield of the fund at period end. |
e | This security represents an investment of securities lending collateral. See Note 5. |
See notes to financial statements.
32 | 2007 iSHARES ANNUAL REPORTTO SHAREHOLDERS |
Table of Contents
Schedule of Investments
iSHARES® MSCI FRANCE INDEX FUND
August 31, 2007
| Security | Shares | Value | |||
COMMON STOCKS – 99.94% | |||||
ADVERTISING – 0.61% | |||||
PagesJaunes SA | 38,126 | $ | 773,392 | ||
Publicis Groupe SA | 45,283 | 1,958,141 | |||
| 2,731,533 | |||||
AEROSPACE & DEFENSE – 1.57% | |||||
European Aeronautic Defence and Space Co. | 105,957 | 3,146,031 | |||
Safran SA | 54,351 | 1,284,049 | |||
Thales SA | 28,853 | 1,638,255 | |||
Zodiac SA | 12,688 | 916,737 | |||
| 6,985,072 | |||||
AIRLINES – 0.38% | |||||
Air France-KLM | 40,593 | 1,681,734 | |||
| 1,681,734 | |||||
APPAREL – 0.55% | |||||
Hermes Internationala | 22,521 | 2,430,658 | |||
| 2,430,658 | |||||
AUTO MANUFACTURERS – 2.75% | |||||
PSA Peugeot Citroen SA | 49,015 | 4,176,231 | |||
Renault SA | 59,747 | 8,065,189 | |||
| 12,241,420 | |||||
AUTO PARTS & EQUIPMENT – 1.56% | |||||
Compagnie Generale des Etablissements Michelin Class B | 46,371 | 5,845,516 | |||
Valeo SA | 22,814 | 1,106,269 | |||
| 6,951,785 | |||||
BANKS – 12.55% | |||||
BNP Paribas | 271,298 | 28,633,555 | |||
Credit Agricole SA | 212,956 | 8,041,650 | |||
Societe Generale Class A | 119,356 | 19,260,227 | |||
| 55,935,432 | |||||
BEVERAGES – 1.39% | |||||
Pernod Ricard SA | 29,341 | 6,181,064 | |||
| 6,181,064 | |||||
BUILDING MATERIALS – 4.53% | |||||
Compagnie de Saint-Gobain | 107,671 | 11,722,050 | |||
Imerys SA | 10,370 | 950,141 | |||
Lafarge SA | 48,450 | 7,528,978 | |||
| 20,201,169 | |||||
| Security | Shares | Value | |||
CHEMICALS – 2.23% | |||||
L’Air Liquide SA | 77,953 | $ | 9,941,505 | ||
| 9,941,505 | |||||
COMMERCIAL SERVICES – 0.17% | |||||
Societe des Autoroutes Paris-Rhin-Rhone | 7,442 | 759,883 | |||
| 759,883 | |||||
COMPUTERS – 0.93% | |||||
Atos Origin SAb | 22,529 | 1,268,433 | |||
Cap Gemini SA | 44,561 | 2,885,520 | |||
| 4,153,953 | |||||
COSMETICS & PERSONAL CARE – 2.13% | |||||
L’Oreal SA | 80,910 | 9,483,642 | |||
| 9,483,642 | |||||
ENGINEERING & CONSTRUCTION – 3.64% | |||||
Aeroports de Paris | 11,369 | 1,301,743 | |||
Bouygues SA | 71,963 | 5,671,367 | |||
Vinci SA | 129,625 | 9,231,397 | |||
| 16,204,507 | |||||
FOOD – 5.82% | |||||
Carrefour SA | 193,564 | 13,555,316 | |||
Casino Guichard-Perrachon SA | 14,173 | 1,449,101 | |||
Groupe Danone | 143,219 | 10,916,053 | |||
| 25,920,470 | |||||
FOOD SERVICE – 0.46% | |||||
Sodexho Alliance SA | 31,191 | 2,057,172 | |||
| 2,057,172 | |||||
GAS – 0.72% | |||||
Gaz de France | 63,867 | 3,204,054 | |||
| 3,204,054 | |||||
HAND & MACHINE TOOLS – 2.09% | |||||
Schneider Electric SA | 70,057 | 9,311,758 | |||
| 9,311,758 | |||||
HEALTH CARE - PRODUCTS – 0.87% | |||||
Essilor International SA | 64,050 | 3,889,935 | |||
| 3,889,935 | |||||
HOLDING COMPANIES - DIVERSIFIED – 1.98% | |||||
LVMH Moet Hennessy Louis Vuitton SA | 79,044 | 8,834,975 | |||
| 8,834,975 | |||||
SCHEDULESOF INVESTMENTS | 33 |
Table of Contents
Schedule of Investments (Continued)
iSHARES® MSCI FRANCE INDEX FUND
August 31, 2007
| Security | Shares | Value | |||
HOME FURNISHINGS – 0.30% | |||||
Thomson | 80,180 | $ | 1,317,130 | ||
| 1,317,130 | |||||
HOUSEHOLD PRODUCTS & WARES – 0.15% | |||||
Societe BIC | 8,869 | 673,450 | |||
| 673,450 | |||||
INSURANCE – 5.29% | |||||
AXA | 507,566 | 20,349,936 | |||
CNP Assurances SA | 14,457 | 1,847,869 | |||
SCOR SE | 57,137 | 1,399,719 | |||
| 23,597,524 | |||||
IRON & STEEL – 4.36% | |||||
Arcelor Mittal | 294,705 | 19,432,966 | |||
| 19,432,966 | |||||
LODGING – 1.19% | |||||
Accor SA | 61,756 | 5,304,740 | |||
| 5,304,740 | |||||
MACHINERY – 1.37% | |||||
ALSTOM | 33,868 | 6,125,447 | |||
| 6,125,447 | |||||
MEDIA – 4.58% | |||||
Lagardere SCA | 41,481 | 3,387,849 | |||
M6-Metropole Television | 21,472 | 648,368 | |||
Societe Television Francaise 1 | 38,554 | 1,124,757 | |||
Vivendi SA | 373,358 | 15,274,499 | |||
| 20,435,473 | |||||
METAL FABRICATE & HARDWARE – 0.93% | |||||
Vallourec SA | 15,455 | 4,137,957 | |||
| 4,137,957 | |||||
OFFICE & BUSINESS EQUIPMENT – 0.36% | |||||
Neopost SA | 10,444 | 1,598,761 | |||
| 1,598,761 | |||||
OIL & GAS – 11.76% | |||||
Total SA | 695,660 | 52,396,807 | |||
| 52,396,807 | |||||
OIL & GAS SERVICES – 0.58% | |||||
Technip SA | 32,662 | 2,608,806 | |||
| 2,608,806 | |||||
| Security | Shares | Value | |||
PHARMACEUTICALS – 6.04% | |||||
Sanofi-Aventis | 329,394 | $ | 26,906,859 | ||
| 26,906,859 | |||||
REAL ESTATE – 1.75% | |||||
Gecina SA | 4,410 | 724,257 | |||
Klepierre | 7,942 | 1,253,650 | |||
Unibail-Rodamco | 24,229 | 5,838,085 | |||
| 7,815,992 | |||||
RETAIL – 0.97% | |||||
PPR SA | 25,021 | 4,328,544 | |||
| 4,328,544 | |||||
SEMICONDUCTORS – 0.86% | |||||
STMicroelectronics NV | 219,423 | 3,822,861 | |||
| 3,822,861 | |||||
SOFTWARE – 0.56% | |||||
Business Objects SAb | 31,842 | 1,401,664 | |||
Dassault Systemes SA | 18,790 | 1,105,564 | |||
| 2,507,228 | |||||
TELECOMMUNICATIONS – 5.81% | |||||
Alcatel-Lucent | 746,563 | 8,172,549 | |||
France Telecom SA | 586,819 | 17,711,579 | |||
| 25,884,128 | |||||
WATER – 6.15% | |||||
Suez SA | 330,873 | 18,827,354 | |||
Veolia Environnement | 112,015 | 8,594,206 | |||
| 27,421,560 | |||||
TOTAL COMMON STOCKS | 445,417,954 | ||||
SHORT-TERM INVESTMENTS – 0.33% | |||||
MONEY MARKET FUNDS – 0.33% | |||||
Barclays Global Investors Funds | 54,520 | 54,520 | |||
BGI Cash Premier Fund LLC 5.47%c,d,e | 1,420,965 | 1,420,965 | |||
| 1,475,485 | |||||
TOTAL SHORT-TERM INVESTMENTS | 1,475,485 | ||||
34 | 2007 iSHARES ANNUAL REPORTTO SHAREHOLDERS |
Table of Contents
Schedule of Investments (Continued)
iSHARES® MSCI FRANCE INDEX FUND
August 31, 2007
| Value | ||||||
TOTAL INVESTMENTS IN SECURITIES – 100.27% | $ | 446,893,439 | ||||
Other Assets, Less Liabilities – (0.27)% | (1,197,679 | ) | ||||
NET ASSETS – 100.00% | $ | 445,695,760 | ||||
a | All or a portion of this security represents a security on loan. See Note 5. |
b | Non-income earning security. |
c | Affiliated issuer. See Note 2. |
d | The rate quoted is the annualized seven-day yield of the fund at period end. |
e | This security represents an investment of securities lending collateral. See Note 5. |
See notes to financial statements.
SCHEDULESOF INVESTMENTS | 35 |
Table of Contents
Schedule of Investments
iSHARES® MSCI GERMANY INDEX FUND
August 31, 2007
| Security | Shares | Value | |||
COMMON STOCKS – 95.84% | |||||
AIRLINES – 0.59% | |||||
Deutsche Lufthansa AG | 331,973 | $ | 9,693,882 | ||
| 9,693,882 | |||||
APPAREL – 1.30% | |||||
Adidas AG | 296,573 | 17,445,682 | |||
Puma AG | 9,690 | 3,893,484 | |||
| 21,339,166 | |||||
AUTO MANUFACTURERS – 10.18% | |||||
DaimlerChrysler AG Registered | 1,343,090 | 119,342,458 | |||
Volkswagen AG | 230,690 | 47,676,402 | |||
| 167,018,860 | |||||
AUTO PARTS & EQUIPMENT – 1.52% | |||||
Continental AG | 192,376 | 25,021,900 | |||
| 25,021,900 | |||||
BANKS – 9.58% | |||||
Commerzbank AG | 904,741 | 37,112,650 | |||
DEPFA Bank PLC | 487,279 | 9,246,821 | |||
Deutsche Bank AG | 740,010 | 91,429,233 | |||
Deutsche Postbank AG | 119,851 | 8,695,449 | |||
Hypo Real Estate Holding AGa | 195,315 | 10,730,406 | |||
| 157,214,559 | |||||
BIOTECHNOLOGY – 0.27% | |||||
QIAGEN NVa,b | 260,510 | 4,478,319 | |||
| 4,478,319 | |||||
CHEMICALS – 10.83% | |||||
BASF AG | 728,978 | 96,525,779 | |||
Bayer AG | 1,029,010 | 81,250,053 | |||
| 177,775,832 | |||||
COMPUTERS – 0.25% | |||||
Wincor Nixdorf AG | 47,940 | 4,124,504 | |||
| 4,124,504 | |||||
COSMETICS & PERSONAL CARE – 0.52% | |||||
Beiersdorf AG | 127,220 | 8,545,027 | |||
| 8,545,027 | |||||
DIVERSIFIED FINANCIAL SERVICES – 2.06% | |||||
Deutsche Boerse AG | 293,420 | 32,400,390 | |||
MLP AGa | 83,470 | 1,331,349 | |||
| 33,731,739 | |||||
| Security | Shares | Value | |||
ELECTRIC – 13.66% | |||||
E.ON AG | 903,134 | $ | 151,621,963 | ||
RWE AG | 644,916 | 72,567,661 | |||
| 224,189,624 | |||||
ENERGY - ALTERNATE SOURCES – 0.37% | |||||
SolarWorld AG | 121,850 | 6,013,255 | |||
| 6,013,255 | |||||
ENGINEERING & CONSTRUCTION – 1.91% | |||||
Bilfinger Berger AG | 53,867 | 4,426,613 | |||
Hochtief AG | 60,414 | 6,064,121 | |||
Linde AG | 177,990 | 20,903,855 | |||
| 31,394,589 | |||||
FOOD – 1.38% | |||||
METRO AG | 237,490 | 20,591,024 | |||
Suedzucker AG | 109,055 | 2,099,209 | |||
| 22,690,233 | |||||
HEALTH CARE - PRODUCTS – 0.83% | |||||
Fresenius Medical Care AG & Co. KGaA | 276,420 | 13,588,474 | |||
| 13,588,474 | |||||
HOUSEHOLD PRODUCTS & WARES – 0.42% | |||||
Henkel KGaA | 148,750 | 6,975,750 | |||
| 6,975,750 | |||||
INSURANCE – 11.77% | |||||
Allianz SE | 653,310 | 140,113,103 | |||
Muenchener Rueckversicherungs- Gesellschaft AG | 307,020 | 53,063,137 | |||
| 193,176,240 | |||||
IRON & STEEL – 2.59% | |||||
Salzgitter AG | 59,673 | 11,795,637 | |||
ThyssenKrupp AG | 524,790 | 30,691,517 | |||
| 42,487,154 | |||||
LEISURE TIME – 0.49% | |||||
TUI AGb | 312,320 | 8,110,923 | |||
| 8,110,923 | |||||
MACHINERY - DIVERSIFIED – 1.95% | |||||
Heidelberger Druckmaschinen AG | 86,406 | 3,918,972 | |||
MAN AG | 164,075 | 23,550,766 | |||
Rheinmetall AG | 53,751 | 4,464,710 | |||
| 31,934,448 | |||||
36 | 2007 iSHARES ANNUAL REPORTTO SHAREHOLDERS |
Table of Contents
Schedule of Investments (Continued)
iSHARES® MSCI GERMANY INDEX FUND
August 31, 2007
| Security | Shares | Value | |||
MANUFACTURING – 9.46% | |||||
Siemens AG | 1,235,272 | $ | 155,246,536 | ||
| 155,246,536 | |||||
MEDIA – 0.16% | |||||
Premiere AGb | 121,012 | 2,629,616 | |||
| 2,629,616 | |||||
PHARMACEUTICALS – 1.20% | |||||
Celesio AG | 122,837 | 7,694,674 | |||
Merck KGaA | 93,569 | 12,008,304 | |||
| 19,702,978 | |||||
REAL ESTATE – 0.29% | |||||
IVG Immobilien AG | 134,611 | 4,818,932 | |||
| 4,818,932 | |||||
RETAIL – 0.32% | |||||
Arcandor AGa,b | 92,187 | 2,513,479 | |||
Douglas Holding AG | 45,498 | 2,735,309 | |||
| 5,248,788 | |||||
SEMICONDUCTORS – 1.04% | |||||
Infineon Technologies AGb | 1,091,570 | 16,993,906 | |||
| 16,993,906 | |||||
SOFTWARE – 4.23% | |||||
SAP AG | 1,287,761 | 69,396,503 | |||
| 69,396,503 | |||||
TELECOMMUNICATIONS – 4.66% | |||||
Deutsche Telekom AG | 4,109,279 | 76,410,933 | |||
| 76,410,933 | |||||
TRANSPORTATION – 2.01% | |||||
Deutsche Post AG | 1,136,790 | 33,055,719 | |||
| 33,055,719 | |||||
TOTAL COMMON STOCKS | 1,573,008,389 | ||||
PREFERRED STOCKS – 3.95% | |||||
AUTO MANUFACTURERS – 2.54% | |||||
Porsche AG | 12,674 | 22,659,529 | |||
Volkswagen AG | 152,516 | 19,097,216 | |||
| 41,756,745 | |||||
| Security | Shares | Value | ||||
ELECTRIC – 0.35% | ||||||
RWE AG | 56,019 | $ | 5,707,737 | |||
| 5,707,737 | ||||||
HOUSEHOLD PRODUCTS & WARES – 0.81% |
| |||||
Henkel KGaA | 257,274 | 13,261,055 | ||||
| 13,261,055 | ||||||
MEDIA – 0.25% |
| |||||
ProSiebenSat.1 Media AG | 120,938 | 4,146,449 | ||||
| 4,146,449 | ||||||
TOTAL PREFERRED STOCKS | 64,871,986 | |||||
SHORT-TERM INVESTMENTS – 0.47% |
| |||||
MONEY MARKET FUNDS – 0.47% |
| |||||
Barclays Global Investors Funds | 55,019 | 55,019 | ||||
BGI Cash Premier Fund LLC | 7,617,411 | 7,617,411 | ||||
| 7,672,430 | ||||||
TOTAL SHORT-TERM INVESTMENTS | 7,672,430 | |||||
TOTAL INVESTMENTS IN | 1,645,552,805 | |||||
Other Assets, Less Liabilities – (0.26)% | (4,307,692 | ) | ||||
NET ASSETS – 100.00% | $ | 1,641,245,113 | ||||
a | All or a portion of this security represents a security on loan. See Note 5. |
b | Non-income earning security. |
c | Affiliated issuer. See Note 2. |
d | The rate quoted is the annualized seven-day yield of the fund at period end. |
e | This security represents an investment of securities lending collateral. See Note 5. |
See notes to financial statements.
SCHEDULESOF INVESTMENTS | 37 |
Table of Contents
Schedule of Investments
iSHARES® MSCI ITALY INDEX FUND
August 31, 2007
| Security | Shares | Value | |||
COMMON STOCKS – 94.96% | |||||
AEROSPACE & DEFENSE – 2.27% | |||||
Finmeccanica SpA | 133,756 | $ | 3,922,194 | ||
| 3,922,194 | |||||
AUTO MANUFACTURERS – 3.84% | |||||
Fiat SpA | 248,982 | 6,618,782 | |||
| 6,618,782 | |||||
AUTO PARTS & EQUIPMENT – 0.78% | |||||
Pirelli & C. SpAa | 1,191,274 | 1,338,992 | |||
| 1,338,992 | |||||
BANKS – 36.63% | |||||
Banca Monte dei Paschi di Siena SpAb | 507,453 | 3,227,178 | |||
Banca Popolare di Milano Scrl | 182,036 | 2,645,392 | |||
Banco Popolare SpAa | 225,285 | 5,638,719 | |||
Capitalia SpA | 594,630 | 5,670,352 | |||
Intesa Sanpaolo SpA | 2,439,878 | 18,393,685 | |||
UniCredito Italiano SpA | 2,498,902 | 21,427,691 | |||
Unione di Banche Italiane ScpA | 241,984 | 6,188,637 | |||
| 63,191,654 | |||||
BUILDING MATERIALS – 0.57% | |||||
Italcementi SpA | 39,696 | 982,198 | |||
| 982,198 | |||||
COMMERCIAL SERVICES – 2.31% | |||||
Atlantia SpA | 119,704 | 3,993,173 | |||
| 3,993,173 | |||||
DIVERSIFIED FINANCIAL SERVICES – 2.94% | |||||
Mediobanca SpAb | 235,450 | 5,074,650 | |||
| 5,074,650 | |||||
ELECTRIC – 8.81% | |||||
Enel SpA | 798,209 | 8,248,241 | |||
Terna SpA | 1,962,345 | 6,942,058 | |||
| 15,190,299 | |||||
ENTERTAINMENT – 0.46% | |||||
Lottomatica SpA | 21,930 | 788,658 | |||
| 788,658 | |||||
FOOD – 1.28% | |||||
Parmalat SpA | 611,864 | 2,210,428 | |||
| 2,210,428 | |||||
| Security | Shares | Value | |||
HEALTH CARE - PRODUCTS – 1.61% | |||||
Luxottica Group SpA | 81,206 | $ | 2,774,244 | ||
| 2,774,244 | |||||
INSURANCE – 6.93% | |||||
Assicurazioni Generali SpA | 204,317 | 8,364,411 | |||
Fondiaria-Sai SpA | 47,040 | 2,209,826 | |||
Mediolanum SpAb | 188,724 | 1,380,297 | |||
| 11,954,534 | |||||
MEDIA – 2.66% | |||||
Arnoldo Mondadori Editore SpA | 45,494 | 428,866 | |||
Mediaset SpA | 303,116 | 3,219,006 | |||
Seat Pagine Gialle SpA | 1,710,582 | 943,274 | |||
| 4,591,146 | |||||
OIL & GAS – 17.03% | |||||
Eni SpA | 848,914 | 29,371,818 | |||
| 29,371,818 | |||||
RETAIL – 1.12% | |||||
Autogrill SpA | 56,494 | 1,183,727 | |||
Bulgari SpA | 53,150 | 746,304 | |||
| 1,930,031 | |||||
TELECOMMUNICATIONS – 5.72% | |||||
Telecom Italia SpA | 3,475,800 | 9,867,685 | |||
| 9,867,685 | |||||
TOTAL COMMON STOCKS | 163,800,486 | ||||
PREFERRED STOCKS – 4.89% | |||||
BANKS – 1.03% | |||||
Intesa Sanpaolo SpA RNC | 254,889 | 1,772,135 | |||
| 1,772,135 | |||||
INSURANCE – 1.78% | |||||
Unipol SpA | 966,819 | 3,074,272 | |||
| 3,074,272 | |||||
TELECOMMUNICATIONS – 2.08% | |||||
Telecom Italia SpA RNC | 1,599,947 | 3,587,955 | |||
| 3,587,955 | |||||
TOTAL PREFERRED STOCKS | �� | 8,434,362 | |||
38 | 2007 iSHARES ANNUAL REPORTTO SHAREHOLDERS |
Table of Contents
Schedule of Investments (Continued)
iSHARES® MSCI ITALY INDEX FUND
August 31, 2007
| Security | Shares | Value | ||||
SHORT-TERM INVESTMENTS – 3.67% |
| |||||
MONEY MARKET FUNDS – 3.67% |
| |||||
Barclays Global Investors Funds | 29,985 | $ | 29,985 | |||
BGI Cash Premier Fund LLC | 6,299,869 | 6,299,869 | ||||
| 6,329,854 | ||||||
TOTAL SHORT-TERM INVESTMENTS | 6,329,854 | |||||
TOTAL INVESTMENTS IN SECURITIES – 103.52% | 178,564,702 | |||||
Other Assets, Less Liabilities – (3.52)% | (6,069,486 | ) | ||||
NET ASSETS – 100.00% | $ | 172,495,216 | ||||
a | Non-income earning security. |
b | All or a portion of this security represents a security on loan. See Note 5. |
c | Affiliated issuer. See Note 2. |
d | The rate quoted is the annualized seven-day yield of the fund at period end. |
e | This security represents an investment of securities lending collateral. See Note 5. |
See notes to financial statements.
SCHEDULESOF INVESTMENTS | 39 |
Table of Contents
Schedule of Investments
iSHARES® MSCI NETHERLANDS INDEX FUND
August 31, 2007
| Security | Shares | Value | |||
COMMON STOCKS – 99.73% | |||||
BANKS – 16.25% | |||||
ABN AMRO Holding NV | 877,790 | $ | 40,841,569 | ||
| 40,841,569 | |||||
BEVERAGES – 4.84% | |||||
Heineken NV | 191,815 | 12,154,139 | |||
| 12,154,139 | |||||
CHEMICALS – 7.34% | |||||
Akzo Nobel NVa | 158,522 | 12,484,393 | |||
Koninklijke DSM NV | 116,441 | 5,957,444 | |||
| 18,441,837 | |||||
COMMERCIAL SERVICES – 1.51% | |||||
Randstad Holding NV | 19,874 | 1,112,990 | |||
Vedior NV | 118,300 | 2,688,412 | |||
| 3,801,402 | |||||
DISTRIBUTION & WHOLESALE – 0.99% | |||||
Corporate Express NV | 89,908 | 1,009,953 | |||
Hagemeyer NV | 350,506 | 1,486,043 | |||
| 2,495,996 | |||||
ELECTRONICS – 8.56% | |||||
Koninklijke Philips Electronics NV | 545,651 | 21,519,833 | |||
| 21,519,833 | |||||
FOOD – 15.48% | |||||
Koninklijke Ahold NVb | 751,205 | 10,035,986 | |||
Royal Numico NV | 97,513 | 7,177,139 | |||
Unilever NV | 709,774 | 21,703,255 | |||
| 38,916,380 | |||||
INSURANCE – 19.45% | |||||
Aegon NV | 652,678 | 11,913,930 | |||
ING Groep NV | 918,853 | 36,977,530 | |||
| 48,891,460 | |||||
MEDIA – 6.82% | |||||
Reed Elsevier NV | 629,356 | 11,359,517 | |||
Wolters Kluwer NV CVA | 198,744 | 5,792,649 | |||
| 17,152,166 | |||||
OFFICE & BUSINESS EQUIPMENT – 0.58% | |||||
Oce NV | 67,600 | 1,456,060 | |||
| 1,456,060 | |||||
| Security | Shares | Value | ||||
OIL & GAS SERVICES – 2.25% | ||||||
Fugro NV | 34,814 | $ | 2,420,470 | |||
SBM Offshore NV | 86,190 | 3,232,384 | ||||
| 5,652,854 | ||||||
REAL ESTATE INVESTMENT TRUSTS – 3.04% |
| |||||
Corio NV | 53,797 | 4,193,510 | ||||
Wereldhave NV | 28,660 | 3,433,928 | ||||
| 7,627,438 | ||||||
SEMICONDUCTORS – 3.21% |
| |||||
ASML Holding NVb | 272,259 | 8,065,243 | ||||
| 8,065,243 | ||||||
TELECOMMUNICATIONS – 4.66% |
| |||||
Koninklijke KPN NV | 751,230 | 11,715,868 | ||||
| 11,715,868 | ||||||
TRANSPORTATION – 4.75% |
| |||||
TNT NV | 282,490 | 11,938,239 | ||||
| 11,938,239 | ||||||
TOTAL COMMON STOCKS | 250,670,484 | |||||
SHORT-TERM INVESTMENTS – 2.26% |
| |||||
MONEY MARKET FUNDS – 2.26% |
| |||||
Barclays Global Investors Funds | 50,472 | 50,472 | ||||
BGI Cash Premier Fund LLC | 5,630,400 | 5,630,400 | ||||
| 5,680,872 | ||||||
TOTAL SHORT-TERM INVESTMENTS | 5,680,872 | |||||
TOTAL INVESTMENTS IN SECURITIES – 101.99% | 256,351,356 | |||||
Other Assets, Less Liabilities – (1.99)% | (4,997,494 | ) | ||||
NET ASSETS – 100.00% | $ | 251,353,862 | ||||
a | All or a portion of this security represents a security on loan. See Note 5. |
b | Non-income earning security. |
c | Affiliated issuer. See Note 2. |
d | The rate quoted is the annualized seven-day yield of the fund at period end. |
e | This security represents an investment of securities lending collateral. See Note 5. |
See notes to financial statements.
40 | 2007 iSHARES ANNUAL REPORTTO SHAREHOLDERS |
Table of Contents
Schedule of Investments
iSHARES® MSCI SPAIN INDEX FUND
August 31, 2007
| Security | Shares | Value | |||
COMMON STOCKS – 99.74% | |||||
AGRICULTURE – 3.63% | |||||
Altadis SA | 285,743 | $ | 18,990,033 | ||
| 18,990,033 | |||||
AIRLINES – 0.48% | |||||
Iberia Lineas Aereas de Espana SA | 546,720 | 2,489,355 | |||
| 2,489,355 | |||||
BANKS – 35.88% | |||||
Banco Bilbao Vizcaya Argentaria SA | 2,729,569 | 62,849,125 | |||
Banco Popular Espanol SA | 1,311,318 | 23,936,691 | |||
Banco Santander SA | 5,240,523 | 95,731,516 | |||
Bankinter SAa | 324,455 | 4,989,294 | |||
| 187,506,626 | |||||
BIOTECHNOLOGY – 0.30% | |||||
Zeltia SAa | 158,380 | 1,578,313 | |||
| 1,578,313 | |||||
COMMERCIAL SERVICES – 2.59% | |||||
Abertis Infraestructuras SAa | 334,726 | 10,157,577 | |||
Cintra Concesiones de Infraestructuras de Transporte SAa | 212,769 | 3,347,262 | |||
| 13,504,839 | |||||
COMPUTERS – 0.75% | |||||
Indra Sistemas SA | 150,629 | 3,938,517 | |||
| 3,938,517 | |||||
ELECTRIC – 11.44% | |||||
Endesa SAa | 461,687 | 25,106,559 | |||
Iberdrola SA | 466,253 | 25,869,710 | |||
Union Fenosa SA | 160,914 | 8,798,771 | |||
| 59,775,040 | |||||
ENERGY – ALTERNATE SOURCES – 1.46% | |||||
Gamesa Corporacion Tecnologica SA | 191,348 | 7,632,622 | |||
| 7,632,622 | |||||
ENGINEERING & CONSTRUCTION – 7.11% | |||||
Acciona SA | 37,264 | 9,352,307 | |||
Actividades de Construcciones y Servicios SA | 260,501 | 14,322,312 | |||
| Security | Shares | Value | |||
Fomento de Construcciones y Contratas SA | 56,680 | $ | 4,941,353 | ||
Grupo Ferrovial SAa | 60,837 | 5,341,081 | |||
Sacyr Vallehermoso SAa | 81,010 | 3,213,713 | |||
| 37,170,766 | |||||
FOOD – 0.79% | |||||
Ebro Puleva SA | 154,208 | 3,390,914 | |||
Viscofan SA | 30,246 | 725,698 | |||
| 4,116,612 | |||||
FOREST PRODUCTS & PAPER – 0.20% | |||||
Grupo Empresarial ENCE SAa | 89,200 | 1,064,017 | |||
| 1,064,017 | |||||
GAS – 2.95% | |||||
Gas Natural SDG SA | 289,731 | 15,435,654 | |||
| 15,435,654 | |||||
INSURANCE – 1.27% | |||||
Mapfre SA | 1,497,128 | 6,612,709 | |||
| 6,612,709 | |||||
IRON & STEEL – 0.74% | |||||
Acerinox SAa | 153,448 | 3,861,610 | |||
| 3,861,610 | |||||
MACHINERY – 0.50% | |||||
Zardoya Otis SA | 82,521 | 2,603,175 | |||
| 2,603,175 | |||||
MEDIA – 1.98% | |||||
Antena 3 de Television SAb | 58,643 | 1,096,846 | |||
Gestevision Telecinco SA | 180,996 | 4,811,484 | |||
Promotora de Informaciones SA | 127,910 | 2,737,661 | |||
Sogecable SAb | 44,229 | 1,675,000 | |||
| 10,320,991 | |||||
OIL & GAS – 4.89% | |||||
Repsol YPF SA | 707,840 | 25,552,217 | |||
| 25,552,217 | |||||
PHARMACEUTICALS – 0.33% | |||||
FAES FARMA SAa | 88,598 | 1,729,587 | |||
| 1,729,587 | |||||
RETAIL – 2.70% | |||||
Industria de Diseno Textil SA | 240,744 | 14,128,763 | |||
| 14,128,763 | |||||
SCHEDULESOF INVESTMENTS | 41 |
Table of Contents
Schedule of Investments (Continued)
iSHARES® MSCI SPAIN INDEX FUND
August 31, 2007
| Security | Shares | Value | ||||
TELECOMMUNICATIONS – 18.68% |
| |||||
Telefonica SA | 3,929,785 | $ | 97,609,631 | |||
| 97,609,631 | ||||||
WATER – 1.07% |
| |||||
Sociedad General de Aguas de Barcelona SA Class Aa | 153,097 | 5,572,543 | ||||
| 5,572,543 | ||||||
TOTAL COMMON STOCKS | 521,193,620 | |||||
SHORT-TERM INVESTMENTS – 8.32% |
| |||||
MONEY MARKET FUNDS – 8.32% |
| |||||
Barclays Global Investors Funds | 55,951 | 55,951 | ||||
BGI Cash Premier Fund LLC | 43,415,105 | 43,415,105 | ||||
| 43,471,056 | ||||||
TOTAL SHORT-TERM INVESTMENTS | 43,471,056 | |||||
TOTAL INVESTMENTS IN SECURITIES – 108.06% | 564,664,676 | |||||
Other Assets, Less Liabilities – (8.06)% | (42,108,660 | ) | ||||
NET ASSETS – 100.00% | $ | 522,556,016 | ||||
a | All or a portion of this security represents a security on loan. See Note 5. |
b | Non-income earning security. |
c | Affiliated issuer. See Note 2. |
d | The rate quoted is the annualized seven-day yield of the fund at period end. |
e | This security represents an investment of securities lending collateral. See Note 5. |
See notes to financial statements.
42 | 2007 iSHARES ANNUAL REPORTTO SHAREHOLDERS |
Table of Contents
Schedule of Investments
iSHARES® MSCI SWEDEN INDEX FUND
August 31, 2007
| Security | Shares | Value | |||
COMMON STOCKS – 99.85% | |||||
AGRICULTURE – 1.50% | |||||
Swedish Match AB | 446,048 | $ | 8,629,093 | ||
| 8,629,093 | |||||
AIRLINES – 0.41% | |||||
SAS ABa | 122,656 | 2,341,698 | |||
| 2,341,698 | |||||
AUTO MANUFACTURERS – 2.45% | |||||
Scania AB Class B | 603,566 | 14,020,422 | |||
| 14,020,422 | |||||
BANKS – 17.25% | |||||
Nordea Bank AB | 3,455,724 | 52,679,867 | |||
Skandinaviska Enskilda Banken AB Class A | 773,178 | 23,348,508 | |||
Svenska Handelsbanken AB Class A | 821,096 | 22,828,587 | |||
| 98,856,962 | |||||
COMMERCIAL SERVICES – 1.78% | |||||
Securitas AB Class B | 523,330 | 6,914,063 | |||
Securitas Direct AB Class Ba | 519,132 | 1,469,700 | |||
Securitas Systems AB Class B | 518,936 | 1,823,247 | |||
| 10,207,010 | |||||
COSMETICS & PERSONAL CARE – 0.65% | |||||
Oriflame Cosmetics SA | 67,639 | 3,711,977 | |||
| 3,711,977 | |||||
DIVERSIFIED FINANCIAL SERVICES – 1.18% | |||||
D. Carnegie & Co. ABb | 115,988 | 1,881,815 | |||
OMX AB | 141,415 | 4,886,397 | |||
| 6,768,212 | |||||
ENGINEERING & CONSTRUCTION – 2.22% | |||||
Skanska AB Class B | 628,481 | 12,751,471 | |||
| 12,751,471 | |||||
FOOD – 0.30% | |||||
Axfood AB | 47,968 | 1,713,180 | |||
| 1,713,180 | |||||
FOREST PRODUCTS & PAPER – 3.61% | |||||
Billerud AB | 70,756 | 988,736 | |||
Holmen AB Class B | 88,847 | 3,398,910 | |||
Svenska Cellulosa AB Class B | 938,370 | 16,280,148 | |||
| 20,667,794 | |||||
| Security | Shares | Value | |||
HAND & MACHINE TOOLS – 5.63% | |||||
Sandvik AB | 1,584,414 | $ | 32,261,746 | ||
| 32,261,746 | |||||
HEALTH CARE - PRODUCTS – 1.46% | |||||
Elekta AB Class Bb | 142,115 | 2,171,593 | |||
Getinge AB Class B | 284,437 | 6,214,968 | |||
| 8,386,561 | |||||
HOME FURNISHINGS – 2.13% | |||||
Electrolux AB Series B | 423,515 | 9,499,781 | |||
Nobia AB | 244,527 | 2,724,718 | |||
| 12,224,499 | |||||
HOUSEHOLD PRODUCTS & WARES – 1.05% | |||||
Husqvarna AB | 470,322 | 6,008,890 | |||
| 6,008,890 | |||||
IRON & STEEL – 2.64% | |||||
SSAB Svenskt Stal AB Class A | 259,701 | 8,822,787 | |||
SSAB Svenskt Stal AB Class B | 115,008 | 3,606,601 | |||
SSAB Svenskt Stal AB Class B Newa,c | 24,722 | 775,271 | |||
SSAB Svenskt Stal AB Newa,c | 56,140 | 1,907,237 | |||
| 15,111,896 | |||||
MACHINERY – 12.79% | |||||
Atlas Copco AB Class A | 1,072,306 | 17,825,452 | |||
Atlas Copco AB Class B | 648,114 | 10,256,383 | |||
Volvo AB Class A | 794,109 | 13,748,484 | |||
Volvo AB Class B | 1,815,935 | 31,439,455 | |||
| 73,269,774 | |||||
MANUFACTURING – 2.24% | |||||
Alfa Laval AB | 158,501 | 9,538,341 | |||
Trelleborg AB Class B | 137,208 | 3,306,769 | |||
| 12,845,110 | |||||
MEDIA – 1.51% | |||||
Eniro AB | 306,029 | 3,709,927 | |||
Modern Times Group MTG AB Class B | 86,194 | 4,936,741 | |||
| 8,646,668 | |||||
SCHEDULESOF INVESTMENTS | 43 |
Table of Contents
Schedule of Investments (Continued)
iSHARES® MSCI SWEDEN INDEX FUND
August 31, 2007
| Security | Shares | Value | |||
METAL FABRICATE & HARDWARE – 4.51% | |||||
Assa Abloy AB Class Bb | 521,218 | $ | 10,802,191 | ||
Hoganas AB Class Bb | 40,508 | 1,161,513 | |||
SKF AB | 681,028 | 13,891,771 | |||
| 25,855,475 | |||||
MINING – 1.77% | |||||
Boliden AB | 482,046 | 10,147,821 | |||
| 10,147,821 | |||||
OIL & GAS – 0.66% | |||||
Lundin Petroleum ABa,b | 390,069 | 3,765,992 | |||
| 3,765,992 | |||||
REAL ESTATE – 1.66% | |||||
Castellum AB | 256,512 | 3,184,125 | |||
Fabege AB | 236,062 | 2,656,098 | |||
Kungsleden AB | 226,138 | 2,774,256 | |||
Wihlborgs Fastigheter AB | 48,451 | 881,042 | |||
| 9,495,521 | |||||
RETAIL – 7.79% | |||||
Hennes & Mauritz AB Class B | 791,191 | 44,626,074 | |||
| 44,626,074 | |||||
TELECOMMUNICATIONS – 22.66% | |||||
Tele2 AB Class B | 510,373 | 9,336,295 | |||
Telefonaktiebolaget LM Ericsson AB Class B | 24,673,127 | 91,702,353 | |||
TeliaSonera AB | 3,696,197 | 28,843,629 | |||
| 129,882,277 | |||||
TOTAL COMMON STOCKS | 572,196,123 | ||||
| Security | Shares | Value | ||||
SHORT-TERM INVESTMENTS – 0.78% |
| |||||
MONEY MARKET FUNDS – 0.78% |
| |||||
Barclays Global Investors Funds | 379,453 | $ | 379,453 | |||
BGI Cash Premier Fund LLC | 4,077,844 | 4,077,844 | ||||
| 4,457,297 | ||||||
TOTAL SHORT-TERM INVESTMENTS | 4,457,297 | |||||
TOTAL INVESTMENTS IN SECURITIES – 100.63% | 576,653,420 | |||||
Other Assets, Less Liabilities – (0.63)% | (3,627,220 | ) | ||||
NET ASSETS – 100.00% | $ | 573,026,200 | ||||
a | Non-income earning security. |
b | All or a portion of this security represents a security on loan. See Note 5. |
c | Security valued at fair value in accordance with procedures approved by the Board of Directors. See Note 1. |
d | Affiliated issuer. See Note 2. |
e | The rate quoted is the annualized seven-day yield of the fund at period end. |
| f | This security represents an investment of securities lending collateral. See Note 5. |
See notes to financial statements.
44 | 2007 iSHARES ANNUAL REPORTTO SHAREHOLDERS |
Table of Contents
Schedule of Investments
iSHARES® MSCI SWITZERLAND INDEX FUND
August 31, 2007
| Security | Shares | Value | |||
COMMON STOCKS – 99.54% | |||||
BANKS – 6.16% | |||||
Banque Cantonale Vaudoise | 1,417 | $ | 669,624 | ||
Credit Suisse Group Registered | 227,908 | 14,891,448 | |||
Julius Baer Holding AG | 36,521 | 2,418,009 | |||
Vontobel Holding AG Registered | 33,913 | 1,655,936 | |||
| 19,635,017 | |||||
BUILDING MATERIALS – 3.76% | |||||
Geberit AG Registered | 14,001 | 2,062,549 | |||
Holcim Ltd. Registered | 91,896 | 9,932,647 | |||
| 11,995,196 | |||||
CHEMICALS – 6.02% | |||||
Ciba Specialty Chemicals AG Registered | 34,223 | 1,872,168 | |||
Clariant AG Registereda | 63,716 | 848,984 | |||
Givaudan SA Registered | 6,231 | 5,626,104 | |||
Lonza Group AG Registered | 15,277 | 1,498,241 | |||
Syngenta AG Registered | 49,963 | 9,349,197 | |||
| 19,194,694 | |||||
COMMERCIAL SERVICES – 1.88% | |||||
Adecco SA Registered | 45,693 | 2,978,005 | |||
SGS SA Registered | 2,537 | 3,031,886 | |||
| 6,009,891 | |||||
COMPUTERS – 0.39% | |||||
Logitech International SA Registereda | 45,614 | 1,230,668 | |||
| 1,230,668 | |||||
DIVERSIFIED FINANCIAL SERVICES – 9.33% | |||||
UBS AG Registered | 570,558 | 29,748,534 | |||
| 29,748,534 | |||||
ENGINEERING & CONSTRUCTION – 4.98% | |||||
ABB Ltd. Registered | 646,065 | 15,880,270 | |||
| 15,880,270 | |||||
FOOD – 15.99% | |||||
Nestle SA Registered | 117,311 | 51,019,557 | |||
| 51,019,557 | |||||
| Security | Shares | Value | |||
HAND & MACHINE TOOLS – 0.81% | |||||
Schindler Holding AG Participation Certificates | 31,936 | $ | 1,955,859 | ||
Schindler Holding AG Registered | 9,778 | 611,378 | |||
| 2,567,237 | |||||
HEALTH CARE - PRODUCTS – 4.93% | |||||
Nobel Biocare Holding AG | 15,360 | 4,185,451 | |||
Sonova Holding AG Registered | 32,235 | 2,849,208 | |||
Straumann Holding AG Registered | 8,219 | 2,254,902 | |||
Synthes Inc. | 56,366 | 6,442,228 | |||
| 15,731,789 | |||||
INSURANCE – 10.03% | |||||
Swiss Life Holdinga | 13,101 | 3,109,089 | |||
Swiss Reinsurance Co. Registered | 163,793 | 13,786,103 | |||
Zurich Financial Services AG Registered | 52,805 | 15,109,930 | |||
| 32,005,122 | |||||
LEISURE TIME – 0.04% | |||||
Kuoni Reisen Holding AG Registered | 247 | 124,696 | |||
| 124,696 | |||||
MACHINERY – 0.24% | |||||
Rieter Holding AG | 1,457 | 776,552 | |||
| 776,552 | |||||
MANUFACTURING – 0.43% | |||||
Sulzer AG Registered | 1,024 | 1,358,497 | |||
| 1,358,497 | |||||
PHARMACEUTICALS – 23.13% | |||||
Novartis AG Registered | 666,067 | 35,141,746 | |||
Roche Holding AG | 222,422 | 38,656,476 | |||
| 73,798,222 | |||||
REAL ESTATE – 1.27% | |||||
PSP Swiss Property AGa | 75,409 | 4,065,957 | |||
| 4,065,957 | |||||
RETAIL – 6.69% | |||||
Compagnie Financiere Richemont AG Class A | 213,466 | 13,214,646 | |||
Swatch Group (The) AG Class B | 16,718 | 5,005,161 | |||
Swatch Group (The) AG Registered | 55,635 | 3,126,390 | |||
| 21,346,197 | |||||
SCHEDULESOF INVESTMENTS | 45 |
Table of Contents
Schedule of Investments (Continued)
iSHARES® MSCI SWITZERLAND INDEX FUND
August 31, 2007
| Security | Shares | Value | |||
SEMICONDUCTORS – 0.21% | |||||
OC Oerlikon Corp. AG Registereda | 2,075 | $ | 668,025 | ||
| 668,025 | |||||
TELECOMMUNICATIONS – 2.53% | |||||
Swisscom AG Registered | 22,950 | 8,062,795 | |||
| 8,062,795 | |||||
TRANSPORTATION – 0.72% | |||||
Kuehne & Nagel International AG Registered | 24,524 | 2,297,539 | |||
| 2,297,539 | |||||
TOTAL COMMON STOCKS | 317,516,455 | ||||
SHORT-TERM INVESTMENTS – 0.02% | |||||
MONEY MARKET FUNDS – 0.02% | |||||
Barclays Global Investors Funds | 73,619 | 73,619 | |||
| 73,619 | |||||
TOTAL SHORT-TERM INVESTMENTS | 73,619 | ||||
TOTAL INVESTMENTS IN SECURITIES – 99.56% | 317,590,074 | ||||
Other Assets, Less Liabilities – 0.44% | 1,407,982 | ||||
NET ASSETS – 100.00% | $ | 318,998,056 | |||
a | Non-income earning security. |
b | Affiliated issuer. See Note 2. |
c | The rate quoted is the annualized seven-day yield of the fund at period end. |
See notes to financial statements.
46 | 2007 iSHARES ANNUAL REPORTTO SHAREHOLDERS |
Table of Contents
Schedule of Investments
iSHARES® MSCI UNITED KINGDOM INDEX FUND
August 31, 2007
| Security | Shares | Value | |||
COMMON STOCKS – 98.70% | |||||
ADVERTISING – 0.61% | |||||
Aegis Group PLC | 307,572 | $ | 817,361 | ||
WPP Group PLC | 424,841 | 6,049,894 | |||
| 6,867,255 | |||||
AEROSPACE & DEFENSE – 1.96% | |||||
BAE Systems PLC | 1,221,556 | 11,389,560 | |||
BBA Aviation PLC | 149,420 | 726,344 | |||
Cobham PLC | 419,064 | 1,698,999 | |||
Meggitt PLC | 233,856 | 1,501,183 | |||
Rolls-Royce Group PLCa | 658,498 | 6,787,222 | |||
| 22,103,308 | |||||
AGRICULTURE – 2.62% | |||||
British American Tobacco PLC | 557,557 | 18,500,005 | |||
Imperial Tobacco Group PLC | 244,872 | 11,068,726 | |||
| 29,568,731 | |||||
AIRLINES – 0.16% | |||||
British Airways PLCa | 210,312 | 1,799,710 | |||
| 1,799,710 | |||||
APPAREL – 0.17% | |||||
Burberry Group PLC | 156,864 | 1,931,637 | |||
| 1,931,637 | |||||
AUTO PARTS & EQUIPMENT – 0.17% | |||||
GKN PLC | 251,397 | 1,866,056 | |||
| 1,866,056 | |||||
BANKS – 17.11% | |||||
Barclays PLCb | 2,376,453 | 29,407,659 | |||
HBOS PLC | 1,361,130 | 24,132,657 | |||
HSBC Holdings PLC | 4,254,637 | 76,978,886 | |||
Lloyds TSB Group PLC | 2,052,040 | 22,557,917 | |||
Royal Bank of Scotland Group PLC | 3,436,595 | 39,823,099 | |||
| 192,900,218 | |||||
BEVERAGES – 2.95% | |||||
Diageo PLC | 966,273 | 20,640,132 | |||
SABMiller PLC | 328,083 | 8,999,933 | |||
Scottish & Newcastle PLC | 291,156 | 3,635,240 | |||
| 33,275,305 | |||||
| Security | Shares | Value | |||
BUILDING MATERIALS – 0.13% | |||||
Travis Perkins PLC | 41,233 | $ | 1,484,567 | ||
| 1,484,567 | |||||
CHEMICALS – 0.72% | |||||
Imperial Chemical Industries PLC | 434,679 | 5,558,717 | |||
Johnson Matthey PLC | 79,916 | 2,587,173 | |||
| 8,145,890 | |||||
COMMERCIAL SERVICES – 1.91% | |||||
Aggreko PLC | 92,112 | 994,930 | |||
Bunzl PLC | 120,477 | 1,674,326 | |||
Capita Group PLC | 227,942 | 3,450,577 | |||
Davis Service Group PLC (The) | 65,732 | 782,913 | |||
De La Rue PLC | 53,203 | 798,409 | |||
Experian Group Ltd. | 373,802 | 3,943,301 | |||
G4S PLC | 415,413 | 1,661,154 | |||
Hays PLC | 520,752 | 1,670,109 | |||
Intertek Group PLC | 56,316 | 1,115,475 | |||
Michael Page International PLC | 122,892 | 1,189,201 | |||
Rank Group PLC | 144,962 | 490,494 | |||
Rentokil Initial PLC | 663,252 | 2,317,091 | |||
Serco Group PLC | 171,971 | 1,464,676 | |||
| 21,552,656 | |||||
COMPUTERS – 0.16% | |||||
LogicaCMG PLC | 548,358 | 1,802,887 | |||
| 1,802,887 | |||||
DISTRIBUTION & WHOLESALE – 0.58% | |||||
Inchcape PLC | 158,340 | 1,507,472 | |||
Wolseley PLC | 241,360 | 5,063,086 | |||
| 6,570,558 | |||||
DIVERSIFIED FINANCIAL SERVICES – 1.63% | |||||
Cattles PLC | 138,060 | 1,015,734 | |||
Close Brothers Group PLC | 47,880 | 745,087 | |||
ICAP PLC | 184,734 | 1,818,374 | |||
INVESCO PLC | 291,842 | 3,546,676 | |||
Investec PLC | 143,403 | 1,563,402 | |||
London Stock Exchange Group PLCc | 54,482 | 1,501,137 | |||
Man Group PLC | 657,454 | 6,544,390 | |||
Schroders PLC | 40,355 | 1,077,710 | |||
Tullett Prebon PLC | 64,442 | 543,328 | |||
| 18,355,838 | |||||
SCHEDULESOF INVESTMENTS | 47 |
Table of Contents
Schedule of Investments (Continued)
iSHARES® MSCI UNITED KINGDOM INDEX FUND
August 31, 2007
| Security | Shares | Value | |||
ELECTRIC – 2.79% | |||||
British Energy Group PLC | 372,653 | $ | 3,483,943 | ||
International Power PLC | 541,956 | 4,421,801 | |||
National Grid PLC | 982,875 | 14,720,122 | |||
Scottish & Southern Energy PLC | 310,856 | 8,891,031 | |||
| 31,516,897 | |||||
ELECTRONICS – 0.11% | |||||
Electrocomponents PLC | 158,692 | 810,627 | |||
Premier Farnell PLC | 124,944 | 458,673 | |||
| 1,269,300 | |||||
ENGINEERING & CONSTRUCTION – 0.27% | |||||
AMEC PLC | 119,928 | 1,578,402 | |||
Balfour Beatty PLC | 153,519 | 1,466,219 | |||
| 3,044,621 | |||||
ENTERTAINMENT – 0.34% | |||||
Ladbrokes PLC | 228,132 | 2,003,969 | |||
PartyGaming PLCa | 422,918 | 240,986 | |||
William Hill PLC | 131,312 | 1,628,907 | |||
| 3,873,862 | |||||
ENVIRONMENTAL CONTROL – 0.06% | |||||
Biffa PLC | 124,531 | 633,615 | |||
| 633,615 | |||||
FOOD – 5.06% | |||||
Cadbury Schweppes PLC | 764,237 | 9,033,215 | |||
J Sainsbury PLC | 569,790 | 6,367,094 | |||
Tate & Lyle PLC | 176,565 | 2,010,413 | |||
Tesco PLC | 2,875,692 | 24,651,762 | |||
Unilever PLC | 475,065 | 14,977,133 | |||
| 57,039,617 | |||||
FOOD SERVICE – 0.42% | |||||
Compass Group PLC | 720,103 | 4,720,572 | |||
| 4,720,572 | |||||
FOREST PRODUCTS & PAPER – 0.12% | |||||
Mondi PLC | 133,324 | 1,316,369 | |||
| 1,316,369 | |||||
GAS – 0.92% | |||||
Centrica PLC | 1,330,813 | 10,348,040 | |||
| 10,348,040 | |||||
HEALTH CARE - PRODUCTS – 0.41% | |||||
Smith & Nephew PLC | 339,820 | 4,002,934 | |||
| Security | Shares | Value | |||
SSL International PLC | 73,644 | $ | 655,077 | ||
| 4,658,011 | |||||
HOLDING COMPANIES - DIVERSIFIED – 0.14% | |||||
Tomkins PLC | 325,881 | 1,569,347 | |||
| 1,569,347 | |||||
HOME BUILDERS – 0.89% | |||||
Barratt Developments PLC | 106,932 | 2,002,656 | |||
Bellway PLC | 40,812 | 1,045,462 | |||
Berkeley Group Holdings PLC (The)a | 30,198 | 978,838 | |||
Bovis Homes Group PLC | 43,548 | 675,478 | |||
Persimmon PLC | 104,424 | 2,436,971 | |||
Taylor Wimpey PLC | 411,740 | 2,883,912 | |||
| 10,023,317 | |||||
HOME FURNISHINGS – 0.05% | |||||
Galiform PLCa | 227,982 | 597,806 | |||
| 597,806 | |||||
HOUSEHOLD PRODUCTS & WARES – 1.07% | |||||
Reckitt Benckiser PLC | 221,329 | 12,049,190 | |||
| 12,049,190 | |||||
INSURANCE – 4.67% | |||||
Aviva PLC | 942,082 | 13,463,105 | |||
Friends Provident PLC | 668,892 | 2,413,698 | |||
Legal & General Group PLC | 2,378,310 | 6,960,694 | |||
Old Mutual PLC | 1,908,699 | 6,148,356 | |||
Prudential PLC | 894,158 | 12,679,037 | |||
Resolution PLC | 251,424 | 3,136,629 | |||
Royal & Sun Alliance Insurance Group PLC | 1,144,981 | 3,267,920 | |||
Standard Life PLC | 763,572 | 4,624,339 | |||
| 52,693,778 | |||||
LEISURE TIME – 0.44% | |||||
Carnival PLC | 62,129 | 2,754,474 | |||
First Choice Holidays PLC | 206,187 | 1,229,993 | |||
Thomas Cook Group PLCa | 175,585 | 1,012,908 | |||
| 4,997,375 | |||||
LODGING – 0.20% | |||||
InterContinental Hotels Group PLC | 106,985 | 2,237,785 | |||
| 2,237,785 | |||||
48 | 2007 iSHARES ANNUAL REPORTTO SHAREHOLDERS |
Table of Contents
Schedule of Investments (Continued)
iSHARES® MSCI UNITED KINGDOM INDEX FUND
August 31, 2007
| Security | Shares | Value | |||
MANUFACTURING – 0.80% | |||||
Charter PLCa | 59,736 | $ | 1,343,469 | ||
Cookson Group PLC | 69,925 | 1,082,499 | |||
FKI PLC | 200,640 | 426,960 | |||
IMI PLC | 124,716 | 1,417,532 | |||
Invensys PLCa | 284,088 | 1,958,295 | |||
Smiths Group PLC | 140,609 | 2,799,284 | |||
| 9,028,039 | |||||
MEDIA – 2.88% | |||||
British Sky Broadcasting Group PLC | 413,136 | 5,629,049 | |||
Daily Mail & General Trust PLC Class A | 105,043 | 1,437,585 | |||
Emap PLC | 77,292 | 1,411,691 | |||
ITV PLC | 1,408,812 | 3,117,284 | |||
Pearson PLC | 292,752 | 4,399,191 | |||
Reed Elsevier PLC | 466,278 | 5,628,929 | |||
Reuters Group PLC | 455,821 | 5,875,054 | |||
Trinity Mirror PLC | 107,296 | 1,014,475 | |||
United Business Media PLC | 90,025 | 1,373,690 | |||
Yell Group PLC | 284,367 | 2,588,291 | |||
| 32,475,239 | |||||
MINING – 8.10% | |||||
Anglo American PLC | 488,956 | 28,048,913 | |||
BHP Billiton PLC | 838,805 | 24,684,991 | |||
Rio Tinto PLC | 363,617 | 25,156,775 | |||
Xstrata PLC | 229,422 | 13,443,051 | |||
| 91,333,730 | |||||
OIL & GAS – 16.72% | |||||
BG Group PLC | 1,234,381 | 19,769,077 | |||
BP PLC | 6,949,229 | 78,144,454 | |||
Royal Dutch Shell PLC Class A | 1,331,966 | 51,717,859 | |||
Royal Dutch Shell PLC Class B | 999,042 | 38,972,376 | |||
| 188,603,766 | |||||
PACKAGING & CONTAINERS – 0.22% | |||||
Rexam PLC | 236,797 | 2,495,624 | |||
| 2,495,624 | |||||
PHARMACEUTICALS – 7.18% | |||||
AstraZeneca PLC | 543,246 | 26,791,194 | |||
GlaxoSmithKline PLC | 2,075,824 | 54,222,178 | |||
| 81,013,372 | |||||
| Security | Shares | Value | |||
REAL ESTATE – 1.58% | |||||
British Land Co. PLC | 190,239 | $ | 4,961,520 | ||
Brixton PLC | 96,475 | 769,623 | |||
Great Portland Estates PLC | 67,443 | 880,152 | |||
Hammerson PLC | 106,047 | 2,840,620 | |||
Land Securities Group PLC | 170,316 | 6,224,870 | |||
Liberty International PLC | 90,665 | 2,192,681 | |||
| 17,869,466 | |||||
REAL ESTATE INVESTMENT TRUSTS – 0.16% | |||||
SEGRO PLC | 158,267 | 1,746,202 | |||
| 1,746,202 | |||||
RETAIL – 2.82% | |||||
Carphone Warehouse Group PLC (The) | 145,464 | 1,000,522 | |||
DSG International PLC | 671,460 | 2,099,271 | |||
Enterprise Inns PLC | 197,342 | 2,565,424 | |||
Home Retail Group PLC | 314,499 | 2,627,837 | |||
Kesa Electricals PLC | 190,608 | 1,188,000 | |||
Kingfisher PLC | 844,535 | 3,551,734 | |||
Marks & Spencer Group PLC | 618,204 | 7,793,427 | |||
Mitchells & Butlers PLC | 144,921 | 2,082,729 | |||
Next PLC | 81,116 | 3,159,406 | |||
Punch Taverns PLC | 95,103 | 2,108,184 | |||
Signet Group PLC | 639,732 | 1,219,401 | |||
Whitbread PLC | 71,151 | 2,357,954 | |||
| 31,753,889 | |||||
SEMICONDUCTORS – 0.19% | |||||
ARM Holdings PLC | 496,356 | 1,474,230 | |||
CSR PLCa | 48,216 | 631,179 | |||
| 2,105,409 | |||||
SOFTWARE – 0.28% | |||||
Misys PLC | 190,545 | 886,862 | |||
Sage Group PLC | 472,127 | 2,249,818 | |||
| 3,136,680 | |||||
TELECOMMUNICATIONS – 7.43% | |||||
BT Group PLC | 2,973,702 | 18,939,018 | |||
Cable & Wireless PLC | 872,967 | 3,012,760 | |||
Vodafone Group PLC | 19,199,161 | 61,883,617 | |||
| 83,835,395 | |||||
SCHEDULESOF INVESTMENTS | 49 |
Table of Contents
Schedule of Investments (Continued)
iSHARES® MSCI UNITED KINGDOM INDEX FUND
August 31, 2007
| Security | Shares | Value | |||
TRANSPORTATION – 0.47% | |||||
Arriva PLC | 71,902 | $ | 1,097,151 | ||
FirstGroup PLC | 161,539 | 2,122,797 | |||
National Express Group PLC | 47,880 | 1,211,067 | |||
Stagecoach Group PLC | 187,763 | 840,775 | |||
Stagecoach Group PLC Class C Deferredd | 303,597 | 61 | |||
| 5,271,851 | |||||
VENTURE CAPITAL – 0.27% | |||||
3i Group PLC | 144,842 | 3,082,220 | |||
| 3,082,220 | |||||
WATER – 0.76% | |||||
Kelda Group PLC | 102,356 | 1,800,307 | |||
Kelda Group PLC Deferredd | 132,009 | 27 | |||
Severn Trent PLC | 84,668 | 2,331,141 | |||
United Utilities PLC | 316,433 | 4,416,767 | |||
| 8,548,242 | |||||
TOTAL COMMON STOCKS | 1,113,113,242 | ||||
SHORT-TERM INVESTMENTS – 0.14% | |||||
MONEY MARKET FUNDS – 0.14% | |||||
Barclays Global Investors Funds | 94,249 | 94,249 | |||
BGI Cash Premier Fund LLC | 1,485,604 | 1,485,604 | |||
| 1,579,853 | |||||
TOTAL SHORT-TERM INVESTMENTS | 1,579,853 | ||||
TOTAL INVESTMENTS IN | 1,114,693,095 | ||||
Other Assets, Less Liabilities – 1.16% | 13,045,243 | ||||
NET ASSETS – 100.00% | $ | 1,127,738,338 | |||
a | Non-income earning security. |
b | Affiliated issuer. See Note 2. |
c | All or a portion of this security represents a security on loan. See Note 5. |
d | Security valued at fair value in accordance with procedures approved by the Board of Directors. See Note 1. |
e | The rate quoted is the annualized seven-day yield of the fund at period end. |
f | This security represents an investment of securities lending collateral. See Note 5. |
See notes to financial statements.
50 | 2007 iSHARES ANNUAL REPORTTO SHAREHOLDERS |
Table of Contents
Statements of Assets and Liabilities
iSHARES®, INC.
August 31, 2007
| iShares MSCI | ||||||||||||||||
| Austria Index Fund | Belgium Index Fund | EMU Index Fund | France Index Fund | |||||||||||||
ASSETS | ||||||||||||||||
Investments, at cost: | ||||||||||||||||
Unaffiliated issuers | $ | 461,520,903 | $ | 274,807,471 | $ | 2,414,766,899 | $ | 437,782,839 | ||||||||
Affiliated issuers (Note 2) | 20,898,129 | 9,787 | 68,765,521 | 1,475,485 | ||||||||||||
Total cost of investments | $ | 482,419,032 | $ | 274,817,258 | $ | 2,483,532,420 | $ | 439,258,324 | ||||||||
Investments in securities, at value (including securities on loana) (Note 1): | ||||||||||||||||
Unaffiliated issuers | $ | 468,555,000 | $ | 301,501,516 | $ | 2,965,780,969 | $ | 445,417,954 | ||||||||
Affiliated issuers (Note 2) | 20,898,129 | 9,787 | 68,765,521 | 1,475,485 | ||||||||||||
Total value of investments | 489,453,129 | 301,511,303 | 3,034,546,490 | 446,893,439 | ||||||||||||
Foreign currencies, at valueb | 310,423 | 68,741 | 7,613,407 | 322,889 | ||||||||||||
Receivables: | ||||||||||||||||
Investment securities sold | 16,487,691 | 14,801,734 | 13,792,190 | 1,615,681 | ||||||||||||
Dividends and interest | 1,907,950 | 1,776,954 | 3,372,055 | 107,272 | ||||||||||||
Capital shares sold | – | – | – | 71,265 | ||||||||||||
Total Assets | 508,159,193 | 318,158,732 | 3,059,324,142 | 449,010,546 | ||||||||||||
LIABILITIES | ||||||||||||||||
Payables: | ||||||||||||||||
Investment securities purchased | 13,598,087 | 14,544,288 | 18,159,958 | 1,714,125 | ||||||||||||
Collateral for securities on loan (Note 5) | 20,831,439 | – | 68,317,861 | 1,420,965 | ||||||||||||
Investment advisory fees (Note 2) | 215,847 | 131,045 | 1,280,993 | 179,696 | ||||||||||||
Total Liabilities | 34,645,373 | 14,675,333 | 87,758,812 | 3,314,786 | ||||||||||||
NET ASSETS | $ | 473,513,820 | $ | 303,483,399 | $ | 2,971,565,330 | $ | 445,695,760 | ||||||||
Net assets consist of: | ||||||||||||||||
Paid-in capital | $ | 477,138,685 | $ | 272,804,022 | $ | 2,372,670,897 | $ | 440,360,295 | ||||||||
Undistributed net investment income | 6,668,789 | 6,750,550 | 62,166,681 | 5,048,619 | ||||||||||||
Accumulated net realized loss | (17,393,861 | ) | (2,769,497 | ) | (14,307,240 | ) | (7,353,090 | ) | ||||||||
Net unrealized appreciation on investments and translation of assets and liabilities in foreign currencies | 7,100,207 | 26,698,324 | 551,034,992 | 7,639,936 | ||||||||||||
NET ASSETS | $ | 473,513,820 | $ | 303,483,399 | $ | 2,971,565,330 | $ | 445,695,760 | ||||||||
Shares outstandingc | 12,700,000 | 11,720,000 | 26,000,000 | 12,200,000 | ||||||||||||
Net asset value per share | $ | 37.28 | $ | 25.89 | $ | 114.29 | $ | 36.53 | ||||||||
a | Securities on loan with market values of $19,535,280, $–, $66,030,657 and $1,350,617, respectively. See Note 5. |
b | Cost of foreign currencies: $309,102, $69,426, $7,615,383 and $319,265, respectively. |
c | $0.001 par value, number of shares authorized: 19.8 million, 136.2 million, 500 million and 340.2 million, respectively. |
See notes to financial statements.
FINANCIAL STATEMENTS | 51 |
Table of Contents
Statements of Assets and Liabilities (Continued)
iSHARES®, INC.
August 31, 2007
| iShares MSCI | ||||||||||||||||
Germany Index Fund | Italy Index Fund | Netherlands Index Fund | Spain Index Fund | |||||||||||||
ASSETS | ||||||||||||||||
Investments, at cost: | ||||||||||||||||
Unaffiliated issuers | $ | 1,425,056,922 | $ | 182,419,034 | $ | 232,907,988 | $ | 499,856,632 | ||||||||
Affiliated issuers (Note 2) | 7,672,430 | 6,329,854 | 5,680,872 | 43,471,056 | ||||||||||||
Total cost of investments | $ | 1,432,729,352 | $ | 188,748,888 | $ | 238,588,860 | $ | 543,327,688 | ||||||||
Investments in securities, at value | ||||||||||||||||
(including securities on loana) (Note 1): | ||||||||||||||||
Unaffiliated issuers | $ | 1,637,880,375 | $ | 172,234,848 | $ | 250,670,484 | $ | 521,193,620 | ||||||||
Affiliated issuers (Note 2) | 7,672,430 | 6,329,854 | 5,680,872 | 43,471,056 | ||||||||||||
Total value of investments | 1,645,552,805 | 178,564,702 | 256,351,356 | 564,664,676 | ||||||||||||
Foreign currencies, at valueb | 1,356,170 | 43,635 | 3,268,430 | 636,057 | ||||||||||||
Receivables: | ||||||||||||||||
Investment securities sold | 9,533,674 | 5,310,620 | – | 15,103,087 | ||||||||||||
Dividends and interest | 2,240,460 | 73,294 | 301,054 | 108,177 | ||||||||||||
Total Assets | 1,658,683,109 | 183,992,251 | 259,920,840 | 580,511,997 | ||||||||||||
LIABILITIES | ||||||||||||||||
Payables: | ||||||||||||||||
Investment securities purchased | 9,079,856 | 5,121,904 | 2,823,154 | 14,315,537 | ||||||||||||
Collateral for securities on loan (Note 5) | 7,617,411 | 6,299,869 | 5,630,400 | 43,415,105 | ||||||||||||
Investment advisory fees (Note 2) | 740,729 | 75,262 | 113,424 | 225,339 | ||||||||||||
Total Liabilities | 17,437,996 | 11,497,035 | 8,566,978 | 57,955,981 | ||||||||||||
NET ASSETS | $ | 1,641,245,113 | $ | 172,495,216 | $ | 251,353,862 | $ | 522,556,016 | ||||||||
Net assets consist of: | ||||||||||||||||
Paid-in capital | $ | 1,439,537,051 | $ | 181,937,427 | $ | 235,066,386 | $ | 495,114,603 | ||||||||
Undistributed net investment income | 27,920,700 | 7,309,944 | 8,180,561 | 10,548,212 | ||||||||||||
Accumulated net realized loss | (39,058,595 | ) | (6,590,139 | ) | (9,656,499 | ) | (4,442,877 | ) | ||||||||
Net unrealized appreciation (depreciation) on investments and translation of assets and liabilities in foreign currencies | 212,845,957 | (10,162,016 | ) | 17,763,414 | 21,336,078 | |||||||||||
NET ASSETS | $ | 1,641,245,113 | $ | 172,495,216 | $ | 251,353,862 | $ | 522,556,016 | ||||||||
Shares outstandingc | 51,000,000 | 5,100,000 | 8,450,000 | 9,000,000 | ||||||||||||
Net asset value per share | $ | 32.18 | $ | 33.82 | $ | 29.75 | $ | 58.06 | ||||||||
a | Securities on loan with market values of $7,584,277, $6,017,887, $5,434,092 and $41,598,052, respectively. See Note 5. |
b | Cost of foreign currencies: $1,344,524, $43,730, $3,269,974 and $636,923, respectively. |
c | $0.001 par value, number of shares authorized: 382.2 million, 63.6 million, 255 million and 127.8 million, respectively. |
See notes to financial statements.
52 | 2007 iSHARES ANNUAL REPORTTO SHAREHOLDERS |
Table of Contents
Statements of Assets and Liabilities (Continued)
iSHARES®, INC.
August 31, 2007
| iShares MSCI | ||||||||||||
| Sweden Index Fund | Switzerland Index Fund | United Kingdom Index Fund | ||||||||||
ASSETS | ||||||||||||
Investments, at cost: | ||||||||||||
Unaffiliated issuers | $ | 541,353,926 | $ | 261,851,055 | $ | 882,840,896 | ||||||
Affiliated issuers (Note 2) | 4,457,297 | 73,619 | 28,567,159 | |||||||||
Total cost of investments | $ | 545,811,223 | $ | 261,924,674 | $ | 911,408,055 | ||||||
Investments in securities, at value (including securities on loana) (Note 1): | ||||||||||||
Unaffiliated issuers | $ | 572,196,123 | $ | 317,516,455 | $ | 1,083,705,583 | ||||||
Affiliated issuers (Note 2) | 4,457,297 | 73,619 | 30,987,512 | |||||||||
Total value of investments | 576,653,420 | 317,590,074 | 1,114,693,095 | |||||||||
Foreign currencies, at valueb | 157,660 | 687,353 | 8,124,751 | |||||||||
Receivables: | ||||||||||||
Investment securities sold | 2,911,312 | 1,849,599 | 3,338,947 | |||||||||
Dividends and interest | 4,235 | 916,482 | 7,968,799 | |||||||||
Capital shares sold | 86,892 | 153,810 | – | |||||||||
Total Assets | 579,813,519 | 321,197,318 | 1,134,125,592 | |||||||||
LIABILITIES | ||||||||||||
Payables: | ||||||||||||
Investment securities purchased | 2,470,547 | 1,885,654 | 4,343,465 | |||||||||
Securities related to in-kind transactions (Note 4) | – | – | 68,937 | |||||||||
Collateral for securities on loan (Note 5) | 4,077,844 | – | 1,485,604 | |||||||||
Capital shares redeemed | – | 174,019 | – | |||||||||
Investment advisory fees (Note 2) | 238,928 | 139,589 | 489,248 | |||||||||
Total Liabilities | 6,787,319 | 2,199,262 | 6,387,254 | |||||||||
NET ASSETS | $ | 573,026,200 | $ | 318,998,056 | $ | 1,127,738,338 | ||||||
Net assets consist of: | ||||||||||||
Paid-in capital | $ | 533,247,608 | $ | 266,092,374 | $ | 924,686,581 | ||||||
Undistributed net investment income | 13,788,192 | 3,929,999 | 32,407,502 | |||||||||
Accumulated net realized loss | (4,848,282 | ) | (6,693,025 | ) | (32,666,239 | ) | ||||||
Net unrealized appreciation on investments and translation of assets and liabilities in foreign currencies | 30,838,682 | 55,668,708 | 203,310,494 | |||||||||
NET ASSETS | $ | 573,026,200 | $ | 318,998,056 | $ | 1,127,738,338 | ||||||
Shares outstandingc | 16,575,000 | 12,375,000 | 45,600,000 | |||||||||
Net asset value per share | $ | 34.57 | $ | 25.78 | $ | 24.73 | ||||||
a | Securities on loan with market values of $3,798,619, $– and $1,441,292, respectively. See Note 5. |
b | Cost of foreign currencies: $161,169, $688,604 and $8,105,285, respectively. |
c | $0.001 par value, number of shares authorized: 63.6 million, 318.625 million and 943.2 million, respectively. |
See notes to financial statements.
FINANCIAL STATEMENTS | 53 |
Table of Contents
Statements of Operations
iSHARES®, INC.
Year ended August 31, 2007
| iShares MSCI | ||||||||||||||||
Austria Index Fund | Belgium Index Fund | EMU Index Fund | France Index Fund | |||||||||||||
NET INVESTMENT INCOME | ||||||||||||||||
Dividends from unaffiliated issuersa | $ | 9,430,851 | $ | 8,814,132 | $ | 77,381,976 | $ | 6,619,316 | ||||||||
Interest from affiliated issuers (Note 2) | 10,155 | 8,445 | 59,897 | 6,487 | ||||||||||||
Securities lending income from unaffiliated issuers | 19,097 | 6,081 | 190,332 | 4,526 | ||||||||||||
Securities lending income from affiliated issuers (Note 2) | 48,264 | 3,978 | 104,142 | 2,589 | ||||||||||||
Total investment income | 9,508,367 | 8,832,636 | 77,736,347 | 6,632,918 | ||||||||||||
EXPENSES | ||||||||||||||||
Investment advisory fees (Note 2) | 2,601,711 | 1,332,129 | 12,839,319 | 1,269,129 | ||||||||||||
Total expenses | 2,601,711 | 1,332,129 | 12,839,319 | 1,269,129 | ||||||||||||
Net investment income | 6,906,656 | 7,500,507 | 64,897,028 | 5,363,789 | ||||||||||||
NET REALIZED AND UNREALIZED GAIN (LOSS) | ||||||||||||||||
Net realized gain (loss) from: | ||||||||||||||||
Investments in unaffiliated issuers | (9,903,652 | ) | (363,935 | ) | (15,482 | ) | (1,882,369 | ) | ||||||||
In-kind redemptions | 99,817,913 | 5,065,909 | 77,978,980 | 18,755,055 | ||||||||||||
Foreign currency transactions | 15,084 | (3,457 | ) | 437,798 | 29,445 | |||||||||||
Net realized gain | 89,929,345 | 4,698,517 | 78,401,296 | 16,902,131 | ||||||||||||
Net change in unrealized appreciation (depreciation) on: | ||||||||||||||||
Investments | (27,298,952 | ) | 13,473,422 | 371,998,534 | 127,437 | |||||||||||
Translation of assets and liabilities in foreign currencies | 60,179 | (2,284 | ) | 2,964 | 3,960 | |||||||||||
Net change in unrealized appreciation (depreciation) | (27,238,773 | ) | 13,471,138 | 372,001,498 | 131,397 | |||||||||||
Net realized and unrealized gain | 62,690,572 | 18,169,655 | 450,402,794 | 17,033,528 | ||||||||||||
NET INCREASE IN NET ASSETS RESULTING FROM OPERATIONS | $ | 69,597,228 | $ | 25,670,162 | $ | 515,299,822 | $ | 22,397,317 | ||||||||
a | Net of foreign withholding tax of $1,664,268, $1,538,709, $12,426,148 and $1,150,608, respectively. |
See notes to financial statements.
54 | 2007 iSHARES ANNUAL REPORTTO SHAREHOLDERS |
Table of Contents
Statements of Operations (Continued)
iSHARES®, INC.
Year ended August 31, 2007
| iShares MSCI | ||||||||||||||||
| Germany Index Fund | Italy Index Fund | Netherlands Index Fund | Spain Index Fund | |||||||||||||
NET INVESTMENT INCOME | ||||||||||||||||
Dividends from unaffiliated issuersa | $ | 34,096,149 | $ | 9,268,474 | $ | 8,881,380 | $ | 15,115,729 | ||||||||
Interest from affiliated issuers (Note 2) | 34,774 | 6,644 | 5,653 | 12,443 | ||||||||||||
Securities lending income from unaffiliated issuers | 116,547 | 15,117 | 2,935 | 172,099 | ||||||||||||
Securities lending income from affiliated issuers (Note 2) | 40,627 | 10,113 | 1,423 | 97,528 | ||||||||||||
Total investment income | 34,288,097 | 9,300,348 | 8,891,391 | 15,397,799 | ||||||||||||
EXPENSES | ||||||||||||||||
Investment advisory fees (Note 2) | 6,219,398 | 1,055,455 | 1,140,068 | 2,757,796 | ||||||||||||
Total expenses | 6,219,398 | 1,055,455 | 1,140,068 | 2,757,796 | ||||||||||||
Net investment income | 28,068,699 | 8,244,893 | 7,751,323 | 12,640,003 | ||||||||||||
NET REALIZED AND UNREALIZED GAIN (LOSS) | ||||||||||||||||
Net realized gain (loss) from: | ||||||||||||||||
Investments in unaffiliated issuers | (7,243,668 | ) | (2,300,792 | ) | 348,261 | (1,061,371 | ) | |||||||||
In-kind redemptions | 159,192,620 | 48,056,432 | 25,202,247 | 114,051,981 | ||||||||||||
Foreign currency transactions | 95,641 | 56,244 | 16,143 | 56,359 | ||||||||||||
Net realized gain | 152,044,593 | 45,811,884 | 25,566,651 | 113,046,969 | ||||||||||||
Net change in unrealized appreciation (depreciation) on: | ||||||||||||||||
Investments | 148,405,583 | (31,578,205 | ) | 4,801,818 | (7,853,194 | ) | ||||||||||
Translation of assets and liabilities in foreign currencies | 890 | 3,303 | (121 | ) | (2,527 | ) | ||||||||||
Net change in unrealized appreciation (depreciation) | 148,406,473 | (31,574,902 | ) | 4,801,697 | (7,855,721 | ) | ||||||||||
Net realized and unrealized gain | 300,451,066 | 14,236,982 | 30,368,348 | 105,191,248 | ||||||||||||
NET INCREASE IN NET ASSETS RESULTING FROM OPERATIONS | $ | 328,519,765 | $ | 22,481,875 | $ | 38,119,671 | $ | 117,831,251 | ||||||||
a | Net of foreign withholding tax of $5,775,511, $1,583,482, $1,164,141 and $2,635,913, respectively. |
See notes to financial statements.
FINANCIAL STATEMENTS | 55 |
Table of Contents
Statements of Operations (Continued)
iSHARES®, INC.
Year ended August 31, 2007
| iShares MSCI | ||||||||||||
| Sweden Index Fund | Switzerland Index Fund | United Kingdom Index Fund | ||||||||||
NET INVESTMENT INCOME | ||||||||||||
Dividends from unaffiliated issuersa | $ | 15,839,331 | $ | 5,309,006 | $ | 41,567,003 | ||||||
Dividends from affiliated issuers (Note 2) | – | – | 1,492,094 | |||||||||
Interest from affiliated issuers (Note 2) | 11,146 | 5,509 | 29,956 | |||||||||
Securities lending income from unaffiliated issuers | 10,534 | 939 | – | |||||||||
Securities lending income from affiliated issuers (Note 2) | 10,508 | 733 | 2,087 | |||||||||
Total investment income | 15,871,519 | 5,316,187 | 43,091,140 | |||||||||
EXPENSES | ||||||||||||
Investment advisory fees (Note 2) | 2,071,508 | 1,413,051 | 5,507,753 | |||||||||
Total expenses | 2,071,508 | 1,413,051 | 5,507,753 | |||||||||
Net investment income | 13,800,011 | 3,903,136 | 37,583,387 | |||||||||
NET REALIZED AND UNREALIZED GAIN (LOSS) | ||||||||||||
Net realized gain (loss) from: | ||||||||||||
Investments in unaffiliated issuers | 2,112,379 | 335,301 | 8,190,777 | |||||||||
Investments in affiliated issuers (Note 2) | – | – | 1,012,481 | |||||||||
In-kind redemptions | 33,226,378 | 8,429,365 | 30,998,050 | |||||||||
Foreign currency transactions | (13,082 | ) | 27,071 | 418,872 | ||||||||
Net realized gain | 35,325,675 | 8,791,737 | 40,620,180 | |||||||||
Net change in unrealized appreciation (depreciation) on: | ||||||||||||
Investments | 28,150,049 | 19,148,861 | 76,390,949 | |||||||||
Translation of assets and liabilities in foreign currencies | (2,327 | ) | (6,128 | ) | (5,371 | ) | ||||||
Net change in unrealized appreciation (depreciation) | 28,147,722 | 19,142,733 | 76,385,578 | |||||||||
Net realized and unrealized gain | 63,473,397 | 27,934,470 | 117,005,758 | |||||||||
NET INCREASE IN NET ASSETS RESULTING FROM OPERATIONS | $ | 77,273,408 | $ | 31,837,606 | $ | 154,589,145 | ||||||
a | Net of foreign withholding tax of $2,348,241, $1,156,225 and $285,740, respectively. |
See notes to financial statements.
56 | 2007 iSHARES ANNUAL REPORTTO SHAREHOLDERS |
Table of Contents
Statements of Changes in Net Assets
iSHARES®, INC.
| iShares MSCI Austria Index Fund | iShares MSCI Belgium Index Fund | |||||||||||||||
| Year ended August 31, 2007 | Year ended August 31, 2006 | Year ended August 31, 2007 | Year ended August 31, 2006 | |||||||||||||
INCREASE (DECREASE) IN NET ASSETS | ||||||||||||||||
OPERATIONS: | ||||||||||||||||
Net investment income | $ | 6,906,656 | $ | 4,573,969 | $ | 7,500,507 | $ | 3,228,861 | ||||||||
Net realized gain | 89,929,345 | 34,514,511 | 4,698,517 | 2,556,361 | ||||||||||||
Net change in unrealized appreciation (depreciation) | (27,238,773 | ) | (8,534,884 | ) | 13,471,138 | 12,287,153 | ||||||||||
Net increase in net assets resulting from operations | 69,597,228 | 30,553,596 | 25,670,162 | 18,072,375 | ||||||||||||
DISTRIBUTIONS TO SHAREHOLDERS: | ||||||||||||||||
From net investment income | (8,705,133 | ) | (2,357,719 | ) | (4,042,358 | ) | (2,145,588 | ) | ||||||||
Total distributions to shareholders | (8,705,133 | ) | (2,357,719 | ) | (4,042,358 | ) | (2,145,588 | ) | ||||||||
CAPITAL SHARE TRANSACTIONS: | ||||||||||||||||
Proceeds from shares sold | 345,391,061 | 289,063,151 | 145,006,107 | 103,356,773 | ||||||||||||
Cost of shares redeemed | (324,406,725 | ) | (122,573,813 | ) | (15,634,722 | ) | (13,758,909 | ) | ||||||||
Net increase in net assets from capital share transactions | 20,984,336 | 166,489,338 | 129,371,385 | 89,597,864 | ||||||||||||
INCREASE IN NET ASSETS | 81,876,431 | 194,685,215 | 150,999,189 | 105,524,651 | ||||||||||||
NET ASSETS | ||||||||||||||||
Beginning of year | 391,637,389 | 196,952,174 | 152,484,210 | 46,959,559 | ||||||||||||
End of year | $ | 473,513,820 | $ | 391,637,389 | $ | 303,483,399 | $ | 152,484,210 | ||||||||
Undistributed net investment income included in net assets at end of year | $ | 6,668,789 | $ | 5,185,808 | $ | 6,750,550 | $ | 3,029,133 | ||||||||
SHARES ISSUED AND REDEEMED | ||||||||||||||||
Shares sold | 8,800,000 | 9,400,000 | 5,640,000 | 4,880,000 | ||||||||||||
Shares redeemed | (8,700,000 | ) | (4,200,000 | ) | (600,000 | ) | (680,000 | ) | ||||||||
Net increase in shares outstanding | 100,000 | 5,200,000 | 5,040,000 | 4,200,000 | ||||||||||||
See notes to financial statements.
FINANCIAL STATEMENTS | 57 |
Table of Contents
Statements of Changes in Net Assets (Continued)
iSHARES®, INC.
| iShares MSCI EMU Index Fund | iShares MSCI France Index Fund | |||||||||||||||
| Year ended August 31, 2007 | Year ended August 31, 2006 | Year ended August 31, 2007 | Year ended August 31, 2006 | |||||||||||||
INCREASE (DECREASE) IN NET ASSETS | ||||||||||||||||
OPERATIONS: | ||||||||||||||||
Net investment income | $ | 64,897,028 | $ | 36,506,832 | $ | 5,363,789 | $ | 2,234,907 | ||||||||
Net realized gain | 78,401,296 | 83,839,198 | 16,902,131 | 24,946,517 | ||||||||||||
Net change in unrealized appreciation (depreciation) | 372,001,498 | 101,409,737 | 131,397 | (236,936 | ) | |||||||||||
Net increase in net assets resulting from operations | 515,299,822 | 221,755,767 | 22,397,317 | 26,944,488 | ||||||||||||
DISTRIBUTIONS TO SHAREHOLDERS: | ||||||||||||||||
From net investment income | (39,632,439 | ) | (12,287,252 | ) | (2,600,180 | ) | (1,093,386 | ) | ||||||||
Total distributions to shareholders | (39,632,439 | ) | (12,287,252 | ) | (2,600,180 | ) | (1,093,386 | ) | ||||||||
CAPITAL SHARE TRANSACTIONS: | ||||||||||||||||
Proceeds from shares sold | 890,425,624 | 1,281,531,733 | 308,549,207 | 193,944,708 | ||||||||||||
Cost of shares redeemed | (189,448,664 | ) | (243,363,438 | ) | (94,536,345 | ) | (89,235,841 | ) | ||||||||
Net increase in net assets from capital share transactions | 700,976,960 | 1,038,168,295 | 214,012,862 | 104,708,867 | ||||||||||||
INCREASE IN NET ASSETS | 1,176,644,343 | 1,247,636,810 | 233,809,999 | 130,559,969 | ||||||||||||
NET ASSETS | ||||||||||||||||
Beginning of year | 1,794,920,987 | 547,284,177 | 211,885,761 | 81,325,792 | ||||||||||||
End of year | $ | 2,971,565,330 | $ | 1,794,920,987 | $ | 445,695,760 | $ | 211,885,761 | ||||||||
Undistributed net investment income included in net assets at end of year | $ | 62,166,681 | $ | 35,261,892 | $ | 5,048,619 | $ | 2,255,565 | ||||||||
SHARES ISSUED AND REDEEMED | ||||||||||||||||
Shares sold | 8,300,000 | 15,050,000 | 8,200,000 | 6,800,000 | ||||||||||||
Shares redeemed | (1,750,000 | ) | (2,900,000 | ) | (2,800,000 | ) | (3,200,000 | ) | ||||||||
Net increase in shares outstanding | 6,550,000 | 12,150,000 | 5,400,000 | 3,600,000 | ||||||||||||
See notes to financial statements.
58 | 2007 iSHARES ANNUAL REPORTTO SHAREHOLDERS |
Table of Contents
Statements of Changes in Net Assets (Continued)
iSHARES®, INC.
| iShares MSCI Germany Index Fund | iShares MSCI Italy Index Fund | |||||||||||||||
| Year ended August 31, 2007 | Year ended August 31, 2006 | Year ended August 31, 2007 | Year ended August 31, 2006 | |||||||||||||
INCREASE (DECREASE) IN NET ASSETS | ||||||||||||||||
OPERATIONS: | ||||||||||||||||
Net investment income | $ | 28,068,699 | $ | 16,579,393 | $ | 8,244,893 | $ | 3,283,210 | ||||||||
Net realized gain | 152,044,593 | 43,262,838 | 45,811,884 | 2,217,054 | ||||||||||||
Net change in unrealized appreciation (depreciation) | 148,406,473 | 55,951,665 | (31,574,902 | ) | 13,029,731 | |||||||||||
Net increase in net assets resulting from operations | 328,519,765 | 115,793,896 | 22,481,875 | 18,529,995 | ||||||||||||
DISTRIBUTIONS TO SHAREHOLDERS: | ||||||||||||||||
From net investment income | (17,227,480 | ) | (2,745,191 | ) | (4,310,712 | ) | (1,062,571 | ) | ||||||||
Total distributions to shareholders | (17,227,480 | ) | (2,745,191 | ) | (4,310,712 | ) | (1,062,571 | ) | ||||||||
CAPITAL SHARE TRANSACTIONS: | ||||||||||||||||
Proceeds from shares sold | 972,720,932 | 611,158,486 | 255,824,310 | 90,441,632 | ||||||||||||
Cost of shares redeemed | (445,562,698 | ) | (236,206,028 | ) | (247,823,971 | ) | (4,111,384 | ) | ||||||||
Net increase in net assets from capital share transactions | 527,158,234 | 374,952,458 | 8,000,339 | 86,330,248 | ||||||||||||
INCREASE IN NET ASSETS | 838,450,519 | 488,001,163 | 26,171,502 | 103,797,672 | ||||||||||||
NET ASSETS | ||||||||||||||||
Beginning of year | 802,794,594 | 314,793,431 | 146,323,714 | 42,526,042 | ||||||||||||
End of year | $ | 1,641,245,113 | $ | 802,794,594 | $ | 172,495,216 | $ | 146,323,714 | ||||||||
Undistributed net investment income included in net assets at end of year | $ | 27,920,700 | $ | 16,624,623 | $ | 7,309,944 | $ | 3,319,519 | ||||||||
SHARES ISSUED AND REDEEMED | ||||||||||||||||
Shares sold | 31,800,000 | 28,500,000 | 7,500,000 | 3,300,000 | ||||||||||||
Shares redeemed | (14,700,000 | ) | (11,100,000 | ) | (7,200,000 | ) | (150,000 | ) | ||||||||
Net increase in shares outstanding | 17,100,000 | 17,400,000 | 300,000 | 3,150,000 | ||||||||||||
See notes to financial statements.
FINANCIAL STATEMENTS | 59 |
Table of Contents
Statements of Changes in Net Assets (Continued)
iSHARES®, INC.
iShares MSCI Netherlands Index Fund | iShares MSCI Spain Index Fund | |||||||||||||||
| Year ended August 31, 2007 | Year ended August 31, 2006 | Year ended August 31, 2007 | Year ended August 31, 2006 | |||||||||||||
INCREASE (DECREASE) IN NET ASSETS | ||||||||||||||||
OPERATIONS: | ||||||||||||||||
Net investment income | $ | 7,751,323 | $ | 2,460,966 | $ | 12,640,003 | $ | 2,816,735 | ||||||||
Net realized gain | 25,566,651 | 8,002,115 | 113,046,969 | 7,154,162 | ||||||||||||
Net change in unrealized appreciation (depreciation) | 4,801,697 | 11,681,549 | (7,855,721 | ) | 15,105,957 | |||||||||||
Net increase in net assets resulting from operations | 38,119,671 | 22,144,630 | 117,831,251 | 25,076,854 | ||||||||||||
DISTRIBUTIONS TO SHAREHOLDERS: | ||||||||||||||||
From net investment income | (3,524,849 | ) | (1,617,341 | ) | (4,483,132 | ) | (1,611,053 | ) | ||||||||
Total distributions to shareholders | (3,524,849 | ) | (1,617,341 | ) | (4,483,132 | ) | (1,611,053 | ) | ||||||||
CAPITAL SHARE TRANSACTIONS: | ||||||||||||||||
Proceeds from shares sold | 202,315,940 | 63,102,133 | 743,582,607 | 102,462,370 | ||||||||||||
Cost of shares redeemed | (95,548,185 | ) | (37,612,147 | ) | (512,504,767 | ) | (14,743,172 | ) | ||||||||
Net increase in net assets from capital share transactions | 106,767,755 | 25,489,986 | 231,077,840 | 87,719,198 | ||||||||||||
INCREASE IN NET ASSETS | 141,362,577 | 46,017,275 | 344,425,959 | 111,184,999 | ||||||||||||
NET ASSETS | ||||||||||||||||
Beginning of year | 109,991,285 | 63,974,010 | 178,130,057 | 66,945,058 | ||||||||||||
End of year | $ | 251,353,862 | $ | 109,991,285 | $ | 522,556,016 | $ | 178,130,057 | ||||||||
Undistributed net investment income included in net assets at end of year | $ | 8,180,561 | $ | 2,661,198 | $ | 10,548,212 | $ | 2,334,982 | ||||||||
SHARES ISSUED AND REDEEMED | ||||||||||||||||
Shares sold | 7,350,000 | 2,850,000 | 14,100,000 | 2,475,000 | ||||||||||||
Shares redeemed | (3,450,000 | ) | (1,650,000 | ) | (9,075,000 | ) | (375,000 | ) | ||||||||
Net increase in shares outstanding | 3,900,000 | 1,200,000 | 5,025,000 | 2,100,000 | ||||||||||||
See notes to financial statements.
60 | 2007 iSHARES ANNUAL REPORTTO SHAREHOLDERS |
Table of Contents
Statements of Changes in Net Assets (Continued)
iSHARES®, INC.
| iShares MSCI Sweden Index Fund | iShares MSCI Switzerland Index Fund | |||||||||||||||
| Year ended August 31, 2007 | Year ended August 31, 2006 | Year ended August 31, 2007 | Year ended August 31, 2006 | |||||||||||||
INCREASE (DECREASE) IN NET ASSETS | ||||||||||||||||
OPERATIONS: | ||||||||||||||||
Net investment income | $ | 13,800,011 | $ | 3,522,482 | $ | 3,903,136 | $ | 1,856,248 | ||||||||
Net realized gain | 35,325,675 | 18,268,143 | 8,791,737 | 6,236,495 | ||||||||||||
Net change in unrealized appreciation (depreciation) | 28,147,722 | (9,543,135 | ) | 19,142,733 | 25,594,505 | |||||||||||
Net increase in net assets resulting from operations | 77,273,408 | 12,247,490 | 31,837,606 | 33,687,248 | ||||||||||||
DISTRIBUTIONS TO SHAREHOLDERS: | ||||||||||||||||
From net investment income | (3,600,238 | ) | (1,227,638 | ) | (1,891,314 | ) | (773,209 | ) | ||||||||
Total distributions to shareholders | (3,600,238 | ) | (1,227,638 | ) | (1,891,314 | ) | (773,209 | ) | ||||||||
CAPITAL SHARE TRANSACTIONS: | ||||||||||||||||
Proceeds from shares sold | 453,975,174 | 133,924,232 | 119,606,280 | 94,447,210 | ||||||||||||
Cost of shares redeemed | (106,048,705 | ) | (55,030,029 | ) | (18,873,671 | ) | (18,366,262 | ) | ||||||||
Net increase in net assets from capital share transactions | 347,926,469 | 78,894,203 | 100,732,609 | 76,080,948 | ||||||||||||
INCREASE IN NET ASSETS | 421,599,639 | 89,914,055 | 130,678,901 | 108,994,987 | ||||||||||||
NET ASSETS | ||||||||||||||||
Beginning of year | 151,426,561 | 61,512,506 | 188,319,155 | 79,324,168 | ||||||||||||
End of year | $ | 573,026,200 | $ | 151,426,561 | $ | 318,998,056 | $ | 188,319,155 | ||||||||
Undistributed net investment income included in net assets at end of year | $ | 13,788,192 | $ | 3,601,501 | $ | 3,929,999 | $ | 1,891,106 | ||||||||
SHARES ISSUED AND REDEEMED | ||||||||||||||||
Shares sold | 13,725,000 | 5,250,000 | 4,750,000 | 4,750,000 | ||||||||||||
Shares redeemed | (3,000,000 | ) | (2,250,000 | ) | (750,000 | ) | (875,000 | ) | ||||||||
Net increase in shares outstanding | 10,725,000 | 3,000,000 | 4,000,000 | 3,875,000 | ||||||||||||
See notes to financial statements.
FINANCIAL STATEMENTS | 61 |
Table of Contents
Statements of Changes in Net Assets (Continued)
iSHARES®, INC.
| iShares MSCI United Kingdom Index Fund | ||||||||
| Year ended August 31, 2007 | Year ended August 31, 2006 | |||||||
INCREASE (DECREASE) IN NET ASSETS | ||||||||
OPERATIONS: | ||||||||
Net investment income | $ | 37,583,387 | $ | 31,286,621 | ||||
Net realized gain | 40,620,180 | 6,097,571 | ||||||
Net change in unrealized appreciation (depreciation) | 76,385,578 | 85,793,247 | ||||||
Net increase in net assets resulting from operations | 154,589,145 | 123,177,439 | ||||||
DISTRIBUTIONS TO SHAREHOLDERS: | ||||||||
From net investment income | (34,304,512 | ) | (16,085,262 | ) | ||||
Total distributions to shareholders | (34,304,512 | ) | (16,085,262 | ) | ||||
CAPITAL SHARE TRANSACTIONS: | ||||||||
Proceeds from shares sold | 229,005,308 | 344,797,700 | ||||||
Cost of shares redeemed | (93,960,543 | ) | (44,331,266 | ) | ||||
Net increase in net assets from capital share transactions | 135,044,765 | 300,466,434 | ||||||
INCREASE IN NET ASSETS | 255,329,398 | 407,558,611 | ||||||
NET ASSETS | ||||||||
Beginning of year | 872,408,940 | 464,850,329 | ||||||
End of year | $ | 1,127,738,338 | $ | 872,408,940 | ||||
Undistributed net investment income included in net assets at end of year | $ | 32,407,502 | $ | 28,709,755 | ||||
SHARES ISSUED AND REDEEMED | ||||||||
Shares sold | 9,800,000 | 17,200,000 | ||||||
Shares redeemed | (4,000,000 | ) | (2,200,000 | ) | ||||
Net increase in shares outstanding | 5,800,000 | 15,000,000 | ||||||
See notes to financial statements.
62 | 2007 iSHARES ANNUAL REPORTTO SHAREHOLDERS |
Table of Contents
iSHARES®, INC.
(For a share outstanding throughout each period)
| iShares MSCI Austria Index Fund | ||||||||||||||||||||
| Year ended Aug. 31, 2007 | Year ended Aug. 31, 2006 | Year ended Aug. 31, 2005 | Year ended Aug. 31, 2004 | Year ended Aug. 31, 2003 | ||||||||||||||||
Net asset value, beginning of year | $ | 31.08 | $ | 26.62 | $ | 17.04 | $ | 10.61 | $ | 8.19 | ||||||||||
Income from investment operations: | ||||||||||||||||||||
Net investment incomea | 0.51 | 0.44 | 0.29 | 0.21 | 0.09 | |||||||||||||||
Net realized and unrealized gainb | 6.42 | 4.31 | 9.38 | 6.39 | 2.43 | |||||||||||||||
Total from investment operations | 6.93 | 4.75 | 9.67 | 6.60 | 2.52 | |||||||||||||||
Less distributions from: | ||||||||||||||||||||
Net investment income | (0.73 | ) | (0.29 | ) | (0.09 | ) | (0.17 | ) | (0.10 | ) | ||||||||||
Total distributions | (0.73 | ) | (0.29 | ) | (0.09 | ) | (0.17 | ) | (0.10 | ) | ||||||||||
Net asset value, end of year | $ | 37.28 | $ | 31.08 | $ | 26.62 | $ | 17.04 | $ | 10.61 | ||||||||||
Total return | 22.35 | % | 18.00 | % | 56.82 | % | 62.70 | % | 31.15 | % | ||||||||||
Ratios/Supplemental data: | ||||||||||||||||||||
Net assets, end of year (000s) | $ | 473,514 | $ | 391,637 | $ | 196,952 | $ | 57,920 | $ | 22,288 | ||||||||||
Ratio of expenses to average net assets | 0.51 | % | 0.54 | % | 0.57 | % | 0.77 | % | 0.84 | % | ||||||||||
Ratio of net investment income to average net assets | 1.36 | % | 1.48 | % | 1.26 | % | 1.37 | % | 0.98 | % | ||||||||||
Portfolio turnover ratec | 21 | % | 32 | % | 21 | % | 11 | % | 26 | % | ||||||||||
a | Based on average shares outstanding throughout each period. |
b | The amounts reported may not accord with the change in aggregate gains and losses in securities due to the timing of capital share transactions. |
c | Portfolio turnover rates exclude portfolio securities received or delivered as a result of processing capital share transactions in Creation Units. |
See notes to financial statements.
FINANCIAL HIGHLIGHTS | 63 |
Table of Contents
Financial Highlights (Continued)
iSHARES®, INC.
(For a share outstanding throughout each period)
| iShares MSCI Belgium Index Fund | ||||||||||||||||||||
| Year ended Aug. 31, 2007 | Year ended Aug. 31, 2006 | Year ended Aug. 31, 2005 | Year ended Aug. 31, 2004 | Year ended Aug. 31, 2003 | ||||||||||||||||
Net asset value, beginning of year | $ | 22.83 | $ | 18.94 | $ | 14.77 | $ | 11.16 | $ | 10.43 | ||||||||||
Income from investment operations: | ||||||||||||||||||||
Net investment incomea | 0.76 | 0.75 | 0.71 | 0.37 | 0.41 | |||||||||||||||
Net realized and unrealized gainb | 2.74 | 3.95 | 3.75 | 4.25 | 0.43 | |||||||||||||||
Total from investment operations | 3.50 | 4.70 | 4.46 | 4.62 | 0.84 | |||||||||||||||
Less distributions from: | ||||||||||||||||||||
Net investment income | (0.44 | ) | (0.81 | ) | (0.29 | ) | (1.01 | ) | (0.11 | ) | ||||||||||
Total distributions | (0.44 | ) | (0.81 | ) | (0.29 | ) | (1.01 | ) | (0.11 | ) | ||||||||||
Net asset value, end of year | $ | 25.89 | $ | 22.83 | $ | 18.94 | $ | 14.77 | $ | 11.16 | ||||||||||
Total return | 15.36 | % | 25.66 | % | 30.22 | % | 42.88 | % | 8.25 | % | ||||||||||
Ratios/Supplemental data: | ||||||||||||||||||||
Net assets, end of year (000s) | $ | 303,483 | $ | 152,484 | $ | 46,960 | $ | 24,813 | $ | 21,871 | ||||||||||
Ratio of expenses to average net assets | 0.51 | % | 0.54 | % | 0.57 | % | 0.78 | % | 0.84 | % | ||||||||||
Ratio of net investment income to average net assets | 2.90 | % | 3.60 | % | 3.89 | % | 2.79 | % | 4.10 | % | ||||||||||
Portfolio turnover ratec | 12 | % | 10 | % | 10 | % | 21 | % | 8 | % | ||||||||||
a | Based on average shares outstanding throughout each period. |
b | The amounts reported may not accord with the change in aggregate gains and losses in securities due to the timing of capital share transactions. |
c | Portfolio turnover rates exclude portfolio securities received or delivered as a result of processing capital share transactions in Creation Units. |
See notes to financial statements.
64 | 2007 iSHARES ANNUAL REPORTTO SHAREHOLDERS |
Table of Contents
Financial Highlights (Continued)
iSHARES®, INC.
(For a share outstanding throughout each period)
| iShares MSCI EMU Index Fund | ||||||||||||||||||||
| Year ended Aug. 31, 2007 | Year ended Aug. 31, 2006 | Year ended Aug. 31, 2005 | Year ended Aug. 31, 2004 | Year ended Aug. 31, 2003 | ||||||||||||||||
Net asset value, beginning of year | $ | 92.28 | $ | 74.97 | $ | 59.38 | $ | 50.12 | $ | 46.02 | ||||||||||
Income from investment operations: | ||||||||||||||||||||
Net investment incomea | 2.80 | 2.73 | 1.76 | 1.36 | 0.93 | |||||||||||||||
Net realized and unrealized gainb | 21.06 | 15.90 | 15.13 | 8.69 | 3.62 | |||||||||||||||
Total from investment operations | 23.86 | 18.63 | 16.89 | 10.05 | 4.55 | |||||||||||||||
Less distributions from: | ||||||||||||||||||||
Net investment income | (1.85 | ) | (1.32 | ) | (1.30 | ) | (0.79 | ) | (0.45 | ) | ||||||||||
Total distributions | (1.85 | ) | (1.32 | ) | (1.30 | ) | (0.79 | ) | (0.45 | ) | ||||||||||
Net asset value, end of year | $ | 114.29 | $ | 92.28 | $ | 74.97 | $ | 59.38 | $ | 50.12 | ||||||||||
Total return | 26.10 | % | 25.18 | % | 28.54 | % | 20.07 | % | 10.05 | % | ||||||||||
Ratios/Supplemental data: | ||||||||||||||||||||
Net assets, end of year (000s) | $ | 2,971,565 | $ | 1,794,921 | $ | 547,284 | $ | 326,606 | $ | 165,388 | ||||||||||
Ratio of expenses to average net assets | 0.51 | % | 0.54 | % | 0.58 | % | 0.79 | % | 0.84 | % | ||||||||||
Ratio of expenses to average net assets exclusive of foreign taxes | n/a | n/a | 0.57 | % | 0.79 | % | n/a | |||||||||||||
Ratio of net investment income to average net assets | 2.60 | % | 3.23 | % | 2.50 | % | 2.29 | % | 2.08 | % | ||||||||||
Portfolio turnover ratec | 5 | % | 8 | % | 8 | % | 11 | % | 7 | % | ||||||||||
a | Based on average shares outstanding throughout each period. |
b | The amounts reported may not accord with the change in aggregate gains and losses in securities due to the timing of capital share transactions. |
c | Portfolio turnover rates exclude portfolio securities received or delivered as a result of processing capital share transactions in Creation Units. |
See notes to financial statements.
FINANCIAL HIGHLIGHTS | 65 |
Table of Contents
Financial Highlights (Continued)
iSHARES®, INC.
(For a share outstanding throughout each period)
| iShares MSCI France Index Fund | ||||||||||||||||||||
| Year ended Aug. 31, 2007 | Year ended Aug. 31, 2006 | Year ended Aug. 31, 2005 | Year ended Aug. 31, 2004 | Year ended Aug. 31, 2003 | ||||||||||||||||
Net asset value, beginning of year | $ | 31.16 | $ | 25.41 | $ | 20.40 | $ | 16.90 | $ | 15.52 | ||||||||||
Income from investment operations: | ||||||||||||||||||||
Net investment incomea | 0.77 | 0.55 | 0.47 | 0.24 | 0.23 | |||||||||||||||
Net realized and unrealized gainb | 5.06 | 5.52 | 4.84 | 3.54 | 1.33 | |||||||||||||||
Total from investment operations | 5.83 | 6.07 | 5.31 | 3.78 | 1.56 | |||||||||||||||
Less distributions from: | ||||||||||||||||||||
Net investment income | (0.46 | ) | (0.32 | ) | (0.30 | ) | (0.28 | ) | (0.18 | ) | ||||||||||
Total distributions | (0.46 | ) | (0.32 | ) | (0.30 | ) | (0.28 | ) | (0.18 | ) | ||||||||||
Net asset value, end of year | $ | 36.53 | $ | 31.16 | $ | 25.41 | $ | 20.40 | $ | 16.90 | ||||||||||
Total return | 18.83 | % | 24.13 | % | 26.13 | % | 22.44 | % | 10.22 | % | ||||||||||
Ratios/Supplemental data: | ||||||||||||||||||||
Net assets, end of year (000s) | $ | 445,696 | $ | 211,886 | $ | 81,326 | $ | 61,201 | $ | 54,075 | ||||||||||
Ratio of expenses to average net assets | 0.51 | % | 0.54 | % | 0.57 | % | 0.79 | % | 0.84 | % | ||||||||||
Ratio of net investment income to average net assets | 2.17 | % | 1.95 | % | 1.98 | % | 1.23 | % | 1.56 | % | ||||||||||
Portfolio turnover ratec | 6 | % | 10 | % | 7 | % | 9 | % | 9 | % | ||||||||||
a | Based on average shares outstanding throughout each period. |
b | The amounts reported may not accord with the change in aggregate gains and losses in securities due to the timing of capital share transactions. |
c | Portfolio turnover rates exclude portfolio securities received or delivered as a result of processing capital share transactions in Creation Units. |
See notes to financial statements.
66 | 2007 iSHARES ANNUAL REPORTTO SHAREHOLDERS |
Table of Contents
Financial Highlights (Continued)
iSHARES®, INC.
(For a share outstanding throughout each period)
| iShares MSCI Germany Index Fund | ||||||||||||||||||||
| Year ended Aug. 31, 2007 | Year ended Aug. 31, 2006 | Year ended Aug. 31, 2005 | Year ended Aug. 31, 2004 | Year ended Aug. 31, 2003 | ||||||||||||||||
Net asset value, beginning of year | $ | 23.68 | $ | 19.08 | $ | 14.96 | $ | 12.57 | $ | 12.07 | ||||||||||
Income from investment operations: | ||||||||||||||||||||
Net investment incomea | 0.68 | 0.57 | 0.28 | 0.19 | 0.21 | |||||||||||||||
Net realized and unrealized gainb | 8.33 | 4.15 | 4.03 | 2.40 | 0.41 | |||||||||||||||
Total from investment operations | 9.01 | 4.72 | 4.31 | 2.59 | 0.62 | |||||||||||||||
Less distributions from: | ||||||||||||||||||||
Net investment income | (0.51 | ) | (0.12 | ) | (0.19 | ) | (0.20 | ) | (0.12 | ) | ||||||||||
Total distributions | (0.51 | ) | (0.12 | ) | (0.19 | ) | (0.20 | ) | (0.12 | ) | ||||||||||
Net asset value, end of year | $ | 32.18 | $ | 23.68 | $ | 19.08 | $ | 14.96 | $ | 12.57 | ||||||||||
Total return | 38.47 | % | 24.82 | % | 28.89 | % | 20.55 | % | 5.39 | % | ||||||||||
Ratios/Supplemental data: | ||||||||||||||||||||
Net assets, end of year (000s) | $ | 1,641,245 | $ | 802,795 | $ | 314,793 | $ | 98,764 | $ | 101,800 | ||||||||||
Ratio of expenses to average net assets | 0.51 | % | 0.54 | % | 0.57 | % | 0.80 | % | 0.84 | % | ||||||||||
Ratio of net investment income to | 2.32 | % | 2.62 | % | 1.54 | % | 1.27 | % | 1.98 | % | ||||||||||
Portfolio turnover ratec | 4 | % | 12 | % | 9 | % | 9 | % | 11 | % | ||||||||||
a | Based on average shares outstanding throughout each period. |
b | The amounts reported may not accord with the change in aggregate gains and losses in securities due to the timing of capital share transactions. |
c | Portfolio turnover rates exclude portfolio securities received or delivered as a result of processing capital share transactions in Creation Units. |
See notes to financial statements.
FINANCIAL HIGHLIGHTS | 67 |
Table of Contents
Financial Highlights (Continued)
iSHARES®, INC.
(For a share outstanding throughout each period)
| iShares MSCI Italy Index Fund | ||||||||||||||||||||
| Year ended Aug. 31, 2007 | Year ended Aug. 31, 2006 | Year ended Aug. 31, 2005 | Year ended Aug. 31, 2004 | Year ended Aug. 31, 2003 | ||||||||||||||||
Net asset value, beginning of year | $ | 30.48 | $ | 25.77 | $ | 20.21 | $ | 16.67 | $ | 15.15 | ||||||||||
Income from investment operations: | ||||||||||||||||||||
Net investment incomea | 1.35 | 1.07 | 0.78 | 0.56 | 0.43 | |||||||||||||||
Net realized and unrealized gainb | 2.66 | 4.15 | 5.42 | 3.59 | 1.47 | |||||||||||||||
Total from investment operations | 4.01 | 5.22 | 6.20 | 4.15 | 1.90 | |||||||||||||||
Less distributions from: | ||||||||||||||||||||
Net investment income | (0.67 | ) | (0.51 | ) | (0.64 | ) | (0.61 | ) | (0.38 | ) | ||||||||||
Total distributions | (0.67 | ) | (0.51 | ) | (0.64 | ) | (0.61 | ) | (0.38 | ) | ||||||||||
Net asset value, end of year | $ | 33.82 | $ | 30.48 | $ | 25.77 | $ | 20.21 | $ | 16.67 | ||||||||||
Total return | 13.20 | % | 20.61 | % | 30.74 | % | 25.09 | % | 12.79 | % | ||||||||||
Ratios/Supplemental data: | ||||||||||||||||||||
Net assets, end of year (000s) | $ | 172,495 | $ | 146,324 | $ | 42,526 | $ | 27,279 | $ | 29,997 | ||||||||||
Ratio of expenses to average net assets | 0.52 | % | 0.54 | % | 0.57 | % | 0.83 | % | 0.84 | % | ||||||||||
Ratio of expenses to average net assets exclusive of foreign taxes | n/a | n/a | n/a | 0.79 | % | n/a | ||||||||||||||
Ratio of net investment income to average net assets | 4.02 | % | 3.87 | % | 3.18 | % | 2.85 | % | 2.84 | % | ||||||||||
Portfolio turnover ratec | 16 | % | 15 | % | 18 | % | 9 | % | 22 | % | ||||||||||
a | Based on average shares outstanding throughout each period. |
b | The amounts reported may not accord with the change in aggregate gains and losses in securities due to the timing of capital share transactions. |
c | Portfolio turnover rates exclude portfolio securities received or delivered as a result of processing capital share transactions in Creation Units. |
See notes to financial statements.
68 | 2007 iSHARES ANNUAL REPORTTO SHAREHOLDERS |
Table of Contents
Financial Highlights (Continued)
iSHARES®, INC.
(For a share outstanding throughout each period)
| iShares MSCI Netherlands Index Fund | ||||||||||||||||||||
| Year ended Aug. 31, 2007 | Year ended Aug. 31, 2006 | Year ended Aug. 31, 2005 | Year ended Aug. 31, 2004 | Year ended Aug. 31, 2003 | ||||||||||||||||
Net asset value, beginning of year | $ | 24.17 | $ | 19.10 | $ | 15.70 | $ | 14.31 | $ | 14.69 | ||||||||||
Income from investment operations: | ||||||||||||||||||||
Net investment incomea | 0.98 | 0.60 | 0.57 | 0.39 | 0.30 | |||||||||||||||
Net realized and unrealized gain (loss)b | 5.05 | 4.95 | 3.09 | 1.37 | (0.43 | ) | ||||||||||||||
Total from investment operations | 6.03 | 5.55 | 3.66 | 1.76 | (0.13 | ) | ||||||||||||||
Less distributions from: | ||||||||||||||||||||
Net investment income | (0.45 | ) | (0.48 | ) | (0.26 | ) | (0.37 | ) | (0.25 | ) | ||||||||||
Total distributions | (0.45 | ) | (0.48 | ) | (0.26 | ) | (0.37 | ) | (0.25 | ) | ||||||||||
Net asset value, end of year | $ | 29.75 | $ | 24.17 | $ | 19.10 | $ | 15.70 | $ | 14.31 | ||||||||||
Total return | 25.22 | % | 29.53 | % | 23.40 | % | 12.28 | % | (0.78 | )% | ||||||||||
Ratios/Supplemental data: | ||||||||||||||||||||
Net assets, end of year (000s) | $ | 251,354 | $ | 109,991 | $ | 63,974 | $ | 28,265 | $ | 18,599 | ||||||||||
Ratio of expenses to average net assets | 0.51 | % | 0.54 | % | 0.57 | % | 0.78 | % | 0.84 | % | ||||||||||
Ratio of net investment income to average net assets | 3.50 | % | 2.78 | % | 3.13 | % | 2.45 | % | 2.37 | % | ||||||||||
Portfolio turnover ratec | 8 | % | 17 | % | 6 | % | 9 | % | 18 | % | ||||||||||
a | Based on average shares outstanding throughout each period. |
b | The amounts reported may not accord with the change in aggregate gains and losses in securities due to the timing of capital share transactions. |
c | Portfolio turnover rates exclude portfolio securities received or delivered as a result of processing capital share transactions in Creation Units. |
See notes to financial statements.
FINANCIAL HIGHLIGHTS | 69 |
Table of Contents
Financial Highlights (Continued)
iSHARES®, INC.
(For a share outstanding throughout each period)
| iShares MSCI Spain Index Fund | ||||||||||||||||||||
| Year ended Aug. 31, 2007 | Year ended Aug. 31, 2006 | Year ended Aug. 31, 2005 | Year ended Aug. 31, 2004 | Year ended Aug. 31, 2003 | ||||||||||||||||
Net asset value, beginning of year | $ | 44.81 | $ | 35.70 | $ | 27.55 | $ | 22.39 | $ | 17.95 | ||||||||||
Income from investment operations: | ||||||||||||||||||||
Net investment incomea | 1.30 | 1.07 | 0.79 | 0.44 | 0.24 | |||||||||||||||
Net realized and unrealized gainb | 12.33 | 8.78 | 7.97 | 4.99 | 4.36 | |||||||||||||||
Total from investment operations | 13.63 | 9.85 | 8.76 | 5.43 | 4.60 | |||||||||||||||
Less distributions from: | ||||||||||||||||||||
Net investment income | (0.38 | ) | (0.74 | ) | (0.61 | ) | (0.27 | ) | (0.16 | ) | ||||||||||
Total distributions | (0.38 | ) | (0.74 | ) | (0.61 | ) | (0.27 | ) | (0.16 | ) | ||||||||||
Net asset value, end of year | $ | 58.06 | $ | 44.81 | $ | 35.70 | $ | 27.55 | $ | 22.39 | ||||||||||
Total return | 30.47 | % | 28.09 | % | 31.85 | % | 24.28 | % | 25.81 | % | ||||||||||
Ratios/Supplemental data: | ||||||||||||||||||||
Net assets, end of year (000s) | $ | 522,556 | $ | 178,130 | $ | 66,945 | $ | 45,456 | $ | 50,372 | ||||||||||
Ratio of expenses to average net assets | 0.51 | % | 0.54 | % | 0.57 | % | 0.80 | % | 0.84 | % | ||||||||||
Ratio of net investment income to average net assets | 2.36 | % | 2.67 | % | 2.33 | % | 1.64 | % | 1.22 | % | ||||||||||
Portfolio turnover ratec | 12 | % | 6 | % | 8 | % | 6 | % | 17 | % | ||||||||||
a | Based on average shares outstanding throughout each period. |
b | The amounts reported may not accord with the change in aggregate gains and losses in securities due to the timing of capital share transactions. |
c | Portfolio turnover rates exclude portfolio securities received or delivered as a result of processing capital share transactions in Creation Units. |
See notes to financial statements.
70 | 2007 iSHARES ANNUAL REPORTTO SHAREHOLDERS |
Table of Contents
Financial Highlights (Continued)
iSHARES®, INC.
(For a share outstanding throughout each period)
| iShares MSCI Sweden Index Fund | ||||||||||||||||||||
| Year ended Aug. 31, 2007 | Year ended Aug. 31, 2006 | Year ended Aug. 31, 2005 | Year ended Aug. 31, 2004 | Year ended Aug. 31, 2003 | ||||||||||||||||
Net asset value, beginning of year | $ | 25.88 | $ | 21.58 | $ | 16.82 | $ | 12.59 | $ | 9.88 | ||||||||||
Income from investment operations: | ||||||||||||||||||||
Net investment incomea | 1.15 | 0.76 | 0.46 | 0.28 | 0.25 | |||||||||||||||
Net realized and unrealized gainb | 7.88 | 3.96 | 4.45 | 4.20 | 2.58 | |||||||||||||||
Total from investment operations | 9.03 | 4.72 | 4.91 | 4.48 | 2.83 | |||||||||||||||
Less distributions from: | ||||||||||||||||||||
Net investment income | (0.34 | ) | (0.42 | ) | (0.15 | ) | (0.25 | ) | (0.12 | ) | ||||||||||
Total distributions | (0.34 | ) | (0.42 | ) | (0.15 | ) | (0.25 | ) | (0.12 | ) | ||||||||||
Net asset value, end of year | $ | 34.57 | $ | 25.88 | $ | 21.58 | $ | 16.82 | $ | 12.59 | ||||||||||
Total return | 35.01 | % | 22.16 | % | 29.21 | % | 35.81 | % | 29.04 | % | ||||||||||
Ratios/Supplemental data: | ||||||||||||||||||||
Net assets, end of year (000s) | $ | 573,026 | $ | 151,427 | $ | 61,513 | $ | 27,758 | $ | 16,992 | ||||||||||
Ratio of expenses to average net assets | 0.51 | % | 0.54 | % | 0.58 | % | 0.92 | % | 0.84 | % | ||||||||||
Ratio of expenses to average net assets exclusive of foreign taxes | n/a | n/a | 0.57 | % | 0.79 | % | n/a | |||||||||||||
Ratio of net investment income to average net assets | 3.42 | % | 3.13 | % | 2.28 | % | 1.74 | % | 2.44 | % | ||||||||||
Portfolio turnover ratec | 7 | % | 14 | % | 6 | % | 9 | % | 12 | % | ||||||||||
a | Based on average shares outstanding throughout each period. |
b | The amounts reported may not accord with the change in aggregate gains and losses in securities due to the timing of capital share transactions. |
c | Portfolio turnover rates exclude portfolio securities received or delivered as a result of processing capital share transactions in Creation Units. |
See notes to financial statements.
FINANCIAL HIGHLIGHTS | 71 |
Table of Contents
Financial Highlights (Continued)
iSHARES®, INC.
(For a share outstanding throughout each period)
| iShares MSCI Switzerland Index Fund | ||||||||||||||||||||
| Year ended Aug. 31, 2007 | Year ended Aug. 31, 2006 | Year ended Aug. 31, 2005 | Year ended Aug. 31, 2004 | Year ended Aug. 31, 2003 | ||||||||||||||||
Net asset value, beginning of year | $ | 22.49 | $ | 17.63 | $ | 14.58 | $ | 12.23 | $ | 11.59 | ||||||||||
Income from investment operations: | ||||||||||||||||||||
Net investment incomea | 0.36 | 0.27 | 0.22 | 0.09 | 0.05 | |||||||||||||||
Net realized and unrealized gainb | 3.12 | 4.71 | 2.92 | 2.31 | 0.62 | |||||||||||||||
Total from investment operations | 3.48 | 4.98 | 3.14 | 2.40 | 0.67 | |||||||||||||||
Less distributions from: | ||||||||||||||||||||
Net investment income | (0.19 | ) | (0.12 | ) | (0.09 | ) | (0.05 | ) | (0.03 | ) | ||||||||||
Total distributions | (0.19 | ) | (0.12 | ) | (0.09 | ) | (0.05 | ) | (0.03 | ) | ||||||||||
Net asset value, end of year | $ | 25.78 | $ | 22.49 | $ | 17.63 | $ | 14.58 | $ | 12.23 | ||||||||||
Total return | 15.53 | % | 28.36 | % | 21.54 | % | 19.56 | % | 5.89 | % | ||||||||||
Ratios/Supplemental data: | ||||||||||||||||||||
Net assets, end of year (000s) | $ | 318,998 | $ | 188,319 | $ | 79,324 | $ | 41,920 | $ | 33,643 | ||||||||||
Ratio of expenses to average net assets | 0.51 | % | 0.54 | % | 0.57 | % | 0.79 | % | 0.84 | % | ||||||||||
Ratio of net investment income to average net assets | 1.42 | % | 1.34 | % | 1.34 | % | 0.64 | % | 0.43 | % | ||||||||||
Portfolio turnover ratec | 5 | % | 11 | % | 5 | % | 4 | % | 10 | % | ||||||||||
a | Based on average shares outstanding throughout each period. |
b | The amounts reported may not accord with the change in aggregate gains and losses in securities due to the timing of capital share transactions. |
c | Portfolio turnover rates exclude portfolio securities received or delivered as a result of processing capital share transactions in Creation Units. |
See notes to financial statements.
72 | 2007 iSHARES ANNUAL REPORTTO SHAREHOLDERS |
Table of Contents
Financial Highlights (Continued)
iSHARES®, INC.
(For a share outstanding throughout each period)
| iShares MSCI United Kingdom Index Fund | ||||||||||||||||||||
| Year ended Aug. 31, 2007 | Year ended Aug. 31, 2006 | Year ended Aug. 31, 2005 | Year ended Aug. 31, 2004 | Year ended Aug. 31, 2003 | ||||||||||||||||
Net asset value, beginning of year | $ | 21.92 | $ | 18.74 | $ | 15.72 | $ | 13.00 | $ | 12.77 | ||||||||||
Income from investment operations: | ||||||||||||||||||||
Net investment incomea | 0.84 | 0.97 | 0.60 | 0.48 | 0.39 | |||||||||||||||
Net realized and unrealized gainb | 2.78 | 2.79 | 2.76 | 2.72 | 0.12 | |||||||||||||||
Total from investment operations | 3.62 | 3.76 | 3.36 | 3.20 | 0.51 | |||||||||||||||
Less distributions from: | ||||||||||||||||||||
Net investment income | (0.81 | ) | (0.58 | ) | (0.34 | ) | (0.48 | ) | (0.28 | ) | ||||||||||
Total distributions | (0.81 | ) | (0.58 | ) | (0.34 | ) | (0.48 | ) | (0.28 | ) | ||||||||||
Net asset value, end of year | $ | 24.73 | $ | 21.92 | $ | 18.74 | $ | 15.72 | $ | 13.00 | ||||||||||
Total return | 16.77 | % | 20.61 | % | 21.53 | % | 24.77 | % | 4.20 | % | ||||||||||
Ratios/Supplemental data: | ||||||||||||||||||||
Net assets, end of year (000s) | $ | 1,127,738 | $ | 872,409 | $ | 464,850 | $ | 452,870 | $ | 150,809 | ||||||||||
Ratio of expenses to average net assets | 0.51 | % | 0.54 | % | 0.57 | % | 0.77 | % | 0.84 | % | ||||||||||
Ratio of net investment income to average net assets | 3.51 | % | 4.81 | % | 3.39 | % | 3.11 | % | 3.23 | % | ||||||||||
Portfolio turnover ratec | 8 | % | 10 | % | 11 | % | 6 | % | 6 | % | ||||||||||
a | Based on average shares outstanding throughout each period. |
b | The amounts reported may not accord with the change in aggregate gains and losses in securities due to the timing of capital share transactions. |
c | Portfolio turnover rates exclude portfolio securities received or delivered as a result of processing capital share transactions in Creation Units. |
See notes to financial statements.
FINANCIAL HIGHLIGHTS | 73 |
Table of Contents
iSHARES®, INC.
iShares, Inc. (the “Company”) is registered under the Investment Company Act of 1940, as amended (the “1940 Act”), as an open-end management investment company. The Company was incorporated under the laws of the State of Maryland on September 1, 1994 pursuant to amended and restated Articles of Incorporation. As of August 31, 2007, the Company offered 24 investment portfolios or funds.
These financial statements relate only to the iShares MSCI Austria, iShares MSCI Belgium, iShares MSCI EMU, iShares MSCI France, iShares MSCI Germany, iShares MSCI Italy, iShares MSCI Netherlands, iShares MSCI Spain, iShares MSCI Sweden, iShares MSCI Switzerland and iShares MSCI United Kingdom Index Funds (each, a “Fund,” collectively, the “Funds”).
The investment objective of each Fund is to seek investment results that correspond generally to the price and yield performance, before fees and expenses, of publicly traded equity securities in the aggregate in a particular market, as measured by that market’s equity securities index compiled by MSCI Inc. (“MSCI”). The investment adviser uses a “passive” or index approach to achieve each Fund’s investment objective. Each of the Funds is classified as a non-diversified fund under the 1940 Act. Non-diversified funds generally hold securities of fewer companies than diversified funds and may be more susceptible to the risks associated with these particular companies, or to a single economic, political or regulatory occurrence affecting these companies.
Each Fund invests in the securities of foreign issuers of a single country or region, which may involve certain considerations and risks not typically associated with securities of U.S. issuers. Such risks include, but are not limited to: generally less liquid and less efficient securities markets; generally greater price volatility; exchange rate fluctuations and exchange controls; imposition of restrictions on the expatriation of funds or other assets of the Fund; less publicly available information about issuers; the imposition of withholding or other taxes; higher transaction and custody costs; settlement delays and risk of loss attendant in settlement procedures; difficulties in enforcing contractual obligations; less regulation of securities markets; different accounting, disclosure and reporting requirements; more substantial governmental involvement in the economy; higher inflation rates; greater social, economic and political uncertainties; the risk of nationalization or expropriation of assets and the risk of war.
Pursuant to the Company’s organizational documents, the Funds’ officers and directors are indemnified against certain liabilities that may arise out of the performance of their duties to the Funds. Additionally, in the normal course of business, the Funds enter into contracts with service providers that contain general indemnification clauses. The Funds’ maximum exposure under these arrangements is unknown as this would involve future claims that may be made against the Funds that have not yet occurred.
1. SIGNIFICANT ACCOUNTING POLICIES
The following significant accounting policies are consistently followed by the Company in the preparation of its financial statements in conformity with accounting principles generally accepted in the United States of America (“U.S. GAAP”) for investment companies. The preparation of the financial statements in conformity with U.S. GAAP requires management to make certain estimates and assumptions that affect the reported amounts of assets and liabilities and disclosures of contingent assets and liabilities at the date of the financial statements and the reported amounts of revenue and expenses during the reporting period. Actual results could differ from those estimates.
SECURITY VALUATION
The securities and other assets of each Fund are generally valued using market valuations. A market valuation generally means a valuation (i) obtained from an exchange, a pricing service or a major market maker (or dealer), (ii) based on a price quotation or other equivalent indication of value supplied by an exchange, a pricing service or a major market maker (or dealer) or (iii) based on amortized cost. In the case of shares of funds that are not traded on an exchange, a market valuation means such fund’s published net asset value per share. The investment adviser may use various pricing services or discontinue the use of any pricing service. A price obtained from a pricing
74 | 2007 iSHARES ANNUAL REPORTTO SHAREHOLDERS |
Table of Contents
Notes to Financial Statements (Continued)
iSHARES®, INC.
service based on such pricing service’s valuation matrix may be considered a market valuation. In the event that current market valuations are not readily available or such valuations do not reflect current market values, the affected investments will be valued using fair value pricing pursuant to the pricing policy and procedures approved by the Board of Directors of the Company (the “Board”).
Investments that may be valued using fair value pricing include, but are not limited to: (i) an unlisted security related to corporate actions; (ii) a restricted security (i.e., one that may not be publicly sold without registration under the Securities Act of 1933, as amended); (iii) a security whose trading has been suspended or which has been de-listed from its primary trading exchange; (iv) a security that is thinly traded; (v) a security in default or bankruptcy proceedings for which there is no current market quotation; (vi) a security affected by currency controls or restrictions; and (vii) a security affected by a significant event (i.e., an event that occurs after the close of the markets on which the security is traded but before the time as of which the Fund’s NAV is computed and that may materially affect the value of the Fund’s investments). Examples of events that may be “significant events” are government actions, natural disasters, armed conflict, acts of terrorism, and significant market fluctuations.
Valuing a Fund’s investments using fair value pricing will result in using prices for those investments that may differ from current market valuations. Accordingly, fair value pricing could result in a difference between the prices used to calculate a Fund’s net asset value and the prices used by the Fund’s benchmark index, which, in turn, could result in a difference between the Fund’s performance and the performance of the Fund’s benchmark index.
SECURITY TRANSACTIONS AND INCOME RECOGNITION
Security transactions are accounted for on trade date. Dividend income is recognized on the ex-dividend date, net of any foreign taxes withheld at source, and interest income is accrued daily. Realized gains and losses on investment transactions are determined using the specific identification method.
FOREIGN CURRENCY TRANSLATION
The accounting records of the Funds are maintained in U.S. dollars. Foreign currencies, as well as investment securities and other assets and liabilities denominated in foreign currencies are translated into U.S. dollars using exchange rates deemed appropriate by the investment adviser. Any use of a rate different from the rates used by MSCI may adversely affect a Fund’s ability to track its underlying index. Purchases and sales of securities, income receipts and expense payments are translated into U.S. dollars on the respective dates of such transactions.
Each Fund does not isolate the effect of fluctuations in foreign exchange rates from the effect of fluctuations in the market prices of securities. Such fluctuations are reflected by the Funds as a component of realized and unrealized gains and losses from investments for financial reporting purposes.
FOREIGN TAXES
The Funds may be subject to foreign taxes (a portion of which may be reclaimable) on income, corporate events, capital gains on investments or currency repatriation. All foreign taxes are recorded in accordance with the applicable foreign tax regulations and rates that exist in the foreign markets in which the Funds invest. These foreign taxes, if any, are paid by the Funds and are disclosed in their Statements of Operations. Foreign taxes payable as of August 31, 2007, if any, are reflected in the Funds’ Statements of Assets and Liabilities.
NOTESTO FINANCIAL STATEMENTS | 75 |
Table of Contents
Notes to Financial Statements (Continued)
iSHARES®, INC.
DISTRIBUTIONS TO SHAREHOLDERS
Distributions to shareholders from net investment income, if any, including any net foreign currency gains, are declared and distributed at least annually by each Fund. Distributions of net realized capital gains, if any, generally are declared and distributed once a year. Distributions are determined on a tax basis and may differ from net investment income and net realized capital gains for financial reporting purposes. Dividends and distributions are paid in U.S. dollars and cannot be automatically reinvested in additional shares of the Funds.
As of August 31, 2007, the tax year-end of the Funds, the components of net distributable earnings (accumulated losses) on a tax basis were as follows:
| iShares MSCI Index Fund | Undistributed Ordinary Income | Unrealized Appreciation (Depreciation) | Capital and Other Losses | Net Distributable Earnings (Accumulated Losses) | |||||||||||
Austria | $ | 6,768,337 | $ | 2,756,738 | $ | (13,149,940 | ) | $ | (3,624,865 | ) | |||||
Belgium | 8,182,646 | 24,872,512 | (2,375,781 | ) | 30,679,377 | ||||||||||
EMU | 63,668,545 | 542,488,302 | (7,262,414 | ) | 598,894,433 | ||||||||||
France | 5,048,619 | 5,696,645 | (5,409,799 | ) | 5,335,465 | ||||||||||
Germany | 28,435,651 | 205,009,672 | (31,737,261 | ) | 201,708,062 | ||||||||||
Italy | 7,309,944 | (11,713,397 | ) | (5,038,758 | ) | (9,442,211 | ) | ||||||||
Netherlands | 8,180,561 | 16,749,951 | (8,643,036 | ) | 16,287,476 | ||||||||||
Spain | 10,548,212 | 19,458,639 | (2,565,437 | ) | 27,441,414 | ||||||||||
Sweden | 13,788,192 | 29,538,550 | (3,548,150 | ) | 39,778,592 | ||||||||||
Switzerland | 3,929,999 | 54,744,853 | (5,769,170 | ) | 52,905,682 | ||||||||||
United Kingdom | 32,430,562 | 190,779,452 | (20,158,257 | ) | 203,051,757 | ||||||||||
For the years ended August 31, 2007 and August 31, 2006, the tax characterization of distributions paid for each Fund represents ordinary income. The total distributions and distributions per share are disclosed in the accompanying Statements of Changes in Net Assets and the Financial Highlights for all Funds.
FEDERAL INCOME TAXES
Each Fund is treated as a separate entity for federal income tax purposes. It is the policy of each Fund to qualify as a regulated investment company by complying with the provisions applicable to regulated investment companies, as defined under Subchapter M of the Internal Revenue Code of 1986, as amended, and to annually distribute substantially all of its ordinary income and any net capital gains (taking into account any capital loss carryforwards) sufficient to relieve it from all, or substantially all, federal income and excise taxes. Accordingly, no provision for federal income taxes was required for the year ended August 31, 2007.
76 | 2007 iSHARES ANNUAL REPORTTO SHAREHOLDERS |
Table of Contents
Notes to Financial Statements (Continued)
iSHARES®, INC.
From November 1, 2006 to August 31, 2007, certain Funds incurred net realized capital losses. As permitted by tax regulations, these Funds have elected to defer these losses and treat them as arising in the year ending August 31, 2008, as follows:
| iShares MSCI Index Fund | Deferred Net Realized Capital Losses | ||
Austria | $ | 8,377 | |
Belgium | 310,710 | ||
EMU | 2,511,594 | ||
France | 177,085 | ||
| iShares MSCI Index Fund | Deferred Net Realized Capital Losses | ||
Germany | $ | 2,444,190 | |
Italy | 472,268 | ||
Netherlands | 586,997 | ||
Spain | 140,758 | ||
The Funds had tax basis net capital loss carryforwards as of August 31, 2007, the tax year-end of the Funds, as follows:
| iShares MSCI Index Fund | Expiring 2008 | Expiring 2009 | Expiring 2010 | Expiring 2011 | Expiring 2012 | Expiring 2013 | Expiring 2014 | Expiring 2015 | Total | ||||||||||||||||||
Austria | $ | 491,457 | $ | 336,553 | $ | 1,291,324 | $ | 370,948 | $ | 855,364 | $ | – | $ | – | $ | 9,795,917 | $ | 13,141,563 | |||||||||
Belgium | – | 59,876 | 1,677,678 | 117,767 | 175,781 | 33,969 | – | – | 2,065,071 | ||||||||||||||||||
EMU | – | – | – | – | 2,876,857 | 1,873,963 | – | – | 4,750,820 | ||||||||||||||||||
France | – | – | 2,436,748 | 236,944 | 2,400,550 | – | – | 158,472 | 5,232,714 | ||||||||||||||||||
Germany | – | – | 8,697,227 | 5,469,732 | 8,656,712 | 2,241,687 | – | 4,227,713 | 29,293,071 | ||||||||||||||||||
Italy | – | – | 2,648,775 | 848,408 | 541,980 | 527,327 | – | – | 4,566,490 | ||||||||||||||||||
Netherlands | – | 60,885 | 3,222,792 | 1,497,810 | 2,481,175 | 129,137 | 403,525 | 260,715 | 8,056,039 | ||||||||||||||||||
Spain | – | – | 163,675 | 678,910 | 1,582,094 | – | – | – | 2,424,679 | ||||||||||||||||||
Sweden | – | – | 713,472 | 1,577,551 | 1,149,514 | – | 107,613 | – | 3,548,150 | ||||||||||||||||||
Switzerland | – | – | 2,247,442 | 1,018,305 | 2,149,171 | 354,252 | – | – | 5,769,170 | ||||||||||||||||||
United Kingdom | – | – | 856,798 | 6,448,554 | 4,272,059 | 1,517,783 | 7,063,063 | – | 20,158,257 | ||||||||||||||||||
Net capital loss carryforwards may be applied against any net realized taxable gains in each succeeding year or until their respective expiration dates, whichever occurs first.
The Funds may own shares in certain foreign investment entities, referred to, under U.S. tax law, as “passive foreign investment companies.” The Funds may elect to mark-to-market annually the shares of each passive foreign investment company and would be required to distribute to shareholders any such marked-to-market gains.
Each Fund reclassifies at the end of its tax year certain amounts to paid-in-capital from accumulated net realized gain (loss) on investments and foreign currency transactions and accumulated net investment income (loss), respectively, as a result of permanent book and tax differences primarily attributed to net investment loss, return of capital, passive foreign investment companies, realized foreign currency gains and losses and gains and losses on in-kind redemptions. These reclassifications have no effect on net assets or net asset values per share.
NOTESTO FINANCIAL STATEMENTS | 77 |
Table of Contents
Notes to Financial Statements (Continued)
iSHARES®, INC.
As of August 31, 2007, gross unrealized appreciation and gross unrealized depreciation based on cost for federal income tax purposes were as follows:
| iShares MSCI Index Fund | Tax Cost | Gross Unrealized Appreciation | Gross Unrealized Depreciation | Net Unrealized Appreciation (Depreciation) | ||||||||||
Austria | $ | 486,762,501 | $ | 24,844,230 | $ | (22,153,602 | ) | $ | 2,690,628 | |||||
Belgium | 276,643,070 | 30,232,422 | (5,364,189 | ) | 24,868,233 | |||||||||
EMU | 2,492,079,110 | 559,030,477 | (16,563,097 | ) | 542,467,380 | |||||||||
France | 441,201,615 | 18,745,471 | (13,053,647 | ) | 5,691,824 | |||||||||
Germany | 1,440,565,637 | 215,321,827 | (10,334,659 | ) | 204,987,168 | |||||||||
Italy | 190,300,269 | – | (11,735,567 | ) | (11,735,567 | ) | ||||||||
Netherlands | 239,602,323 | 22,652,238 | (5,903,205 | ) | 16,749,033 | |||||||||
Spain | 545,205,128 | 28,828,783 | (9,369,235 | ) | 19,459,548 | |||||||||
Sweden | 547,111,355 | 38,655,351 | (9,113,286 | ) | 29,542,065 | |||||||||
Switzerland | 262,848,529 | 55,543,285 | (801,740 | ) | 54,741,545 | |||||||||
United Kingdom | 923,939,097 | 195,262,068 | (4,508,070 | ) | 190,753,998 | |||||||||
REPURCHASE AGREEMENTS
Each Fund may enter into repurchase agreements with banks and securities dealers. These transactions involve the purchase of securities with a simultaneous commitment to resell the securities to the bank or the dealer at an agreed-upon date and price. A repurchase agreement is accounted for as an investment by the Fund, collateralized by securities, which are delivered to the Fund’s custodian or to an agent bank under a tri-party agreement. The securities are marked-to-market daily and additional securities are acquired as needed, to ensure that their value equals or exceeds the repurchase price plus accrued interest.
2. AGREEMENTS AND OTHER TRANSACTIONS WITH AFFILIATES
Pursuant to an Investment Advisory Agreement with the Company, Barclays Global Fund Advisors (“BGFA”) manages the investment of each Fund’s assets. BGFA is a California corporation indirectly owned by Barclays Bank PLC. Under the Investment Advisory Agreement, BGFA is responsible for all expenses (“Covered Expenses”) of each of the Funds, including the cost of transfer agency, custody, fund administration, legal, audit and other services, except interest, taxes, brokerage commissions and other expenses connected with the execution of portfolio transactions, distribution fees and extraordinary expenses.
For its investment advisory services to each Fund, BGFA is entitled to an annual investment advisory fee based on each Fund’s allocable portion of the aggregate of the average daily net assets of all the Funds offered by the Company (except for the iShares MSCI Brazil, iShares MSCI Emerging Markets, iShares MSCI Pacific ex-Japan, iShares MSCI South Africa, iShares MSCI South Korea and iShares MSCI Taiwan Index Funds) as follows:
| Investment Advisory Fee | Aggregate Average Daily Net Assets | |
0.59% | First $7 billion | |
0.54 | Over $7 billion, up to and including $11 billion | |
0.49 | Over $11 billion, up to and including $24 billion | |
0.44 | Over $24 billion |
78 | 2007 iSHARES ANNUAL REPORTTO SHAREHOLDERS |
Table of Contents
Notes to Financial Statements (Continued)
iSHARES®, INC.
State Street Bank and Trust Company (“State Street”) serves as administrator, custodian and transfer agent for the Company. As compensation for its services, State Street receives certain out-of-pocket costs, transaction fees and asset-based fees which are accrued daily and paid monthly. These fees and expenses are Covered Expenses as defined above.
SEI Investments Distribution Co. (“SEI”) serves as each Fund’s underwriter and distributor of the shares of each Fund, pursuant to a Distribution Agreement with the Company. SEI does not receive a fee from the Funds for its distribution services.
Pursuant to an exemptive order issued by the U.S. Securities and Exchange Commission (“SEC”), the Funds are permitted to lend portfolio securities to Barclays Capital Inc. (“BarCap”). Pursuant to the same exemptive order, Barclays Global Investors, N.A. (“BGI”) serves as securities lending agent for the Company. BarCap and BGI are affiliates of BGFA, the Funds’ investment adviser. As securities lending agent, BGI receives, as fees, a share of the income earned on investment of the cash collateral received for the loan of securities. For the year ended August 31, 2007, BGI earned securities lending agent fees as follows:
| iShares MSCI Index Fund | Securities Lending Agent Fees | ||
Austria | $ | 67,361 | |
Belgium | 10,059 | ||
EMU | 294,474 | ||
France | 7,115 | ||
Germany | 157,174 | ||
Italy | 25,230 | ||
| iShares MSCI Index Fund | Securities Lending Agent Fees | ||
Netherlands | $ | 4,358 | |
Spain | 269,627 | ||
Sweden | 21,042 | ||
Switzerland | 1,672 | ||
United Kingdom | 2,087 | ||
Cross trades for the year ended August 31, 2007, if any, were executed by the Funds pursuant to Rule 17a-7 under the 1940 Act. Cross trading is the buying or selling of portfolio securities between funds to which BGFA (or an affiliate) serves as investment adviser. At its regularly scheduled quarterly meetings, the Board reviews such transactions as of the most recent calendar quarter for compliance with the requirements and restrictions set forth by Rule 17a-7.
Each Fund may invest in the Institutional Shares of certain money market funds managed by BGFA, the Funds’ investment adviser, including the Government Money Market Fund (“GMMF”), Institutional Money Market Fund (“IMMF”), Prime Money Market Fund (“PMMF”) and Treasury Money Market Fund (“TMMF”) of Barclays Global Investors Funds. The GMMF, IMMF, PMMF and TMMF are feeder funds in a master/feeder fund structure that invest substantially all of their assets in the Government Money Market Master Portfolio, Money Market Master Portfolio, Prime Money Market Master Portfolio and Treasury Money Market Master Portfolio (collectively, the “Money Market Master Portfolios”), respectively, which are also managed by BGFA. While the GMMF, IMMF, PMMF and TMMF do not directly charge an investment advisory fee, the Money Market Master Portfolios in which they invest do charge an investment advisory fee. Income distributions from the GMMF, IMMF, PMMF and TMMF are declared daily and paid monthly from net investment income. Income distributions earned by the Funds from temporary cash investments are recorded as interest from affiliated issuers in the accompanying Statements of Operations. Income distributions earned by the Funds from the investment of securities lending collateral, if any, are included in securities lending income in the accompanying Statements of Operations.
Each Fund may invest its securities lending cash collateral, if any, in the BGI Cash Premier Fund LLC (“Premier Fund”), an affiliated private money market fund managed by BGFA. Although the Premier Fund is not registered as an investment company under the 1940 Act, it intends to operate as a money market fund in compliance with Rule 2a-7 under the 1940 Act. See Note 5 for additional information regarding the Premier Fund.
NOTESTO FINANCIAL STATEMENTS | 79 |
Table of Contents
Notes to Financial Statements (Continued)
iSHARES®, INC.
The following table provides information about the direct investment by the iShares MSCI United Kingdom Index Fund (exclusive of short-term investments) in issuers of which BGFA is an affiliate, for the year ended August 31, 2007.
| Name of Affiliated Issuer | Number of Shares Held Beginning of Year (in 000s) | Gross Additions (in 000s) | Gross Reductions (in 000s) | Number of Shares Held End of Year (in 000s) | Value at End of Year | Dividend Income | Net Realized Gain | ||||||||||
Barclays PLC | 1,993 | 663 | 280 | 2,376 | $ | 29,407,659 | $ | 1,492,094 | $ | 1,012,481 | |||||||
As of August 31, 2007, certain directors and officers of the Company are also officers of BGI and/or BGFA.
3. INVESTMENT PORTFOLIO TRANSACTIONS
Purchases and sales of investments (excluding in-kind transactions and short-term investments) for the year ended August 31, 2007, were as follows:
| iShares MSCI Index Fund | Purchases | Sales | ||||
Austria | $ | 103,951,933 | $ | 121,201,357 | ||
Belgium | 42,458,950 | 30,432,602 | ||||
EMU | 168,753,285 | 126,069,590 | ||||
France | 21,871,238 | 16,379,569 | ||||
Germany | 67,003,290 | 54,098,356 | ||||
Italy | 51,972,967 | 32,265,273 | ||||
Netherlands | 34,988,412 | 16,832,683 | ||||
Spain | 64,498,903 | 62,711,901 | ||||
Sweden | 38,150,611 | 28,567,381 | ||||
Switzerland | 24,705,273 | 13,796,424 | ||||
United Kingdom | 90,486,904 | 81,088,109 | ||||
80 | 2007 iSHARES ANNUAL REPORTTO SHAREHOLDERS |
Table of Contents
Notes to Financial Statements (Continued)
iSHARES®, INC.
In-kind transactions (see Note 4) for the year ended August 31, 2007, were as follows:
| iShares MSCI Index Fund | In-kind Purchases | In-kind Sales | ||||
Austria | $ | 339,979,430 | $ | 307,581,914 | ||
Belgium | 135,255,049 | 15,489,469 | ||||
EMU | 871,560,506 | 186,749,441 | ||||
France | 305,584,488 | 94,076,788 | ||||
Germany | 968,696,683 | 444,593,589 | ||||
Italy | 234,311,816 | 242,104,379 | ||||
Netherlands | 187,563,341 | 94,932,261 | ||||
Spain | 741,284,064 | 504,920,418 | ||||
Sweden | 450,859,577 | 105,467,376 | ||||
Switzerland | 109,691,851 | 18,581,984 | ||||
United Kingdom | 227,679,530 | 93,226,386 | ||||
4. CAPITAL SHARE TRANSACTIONS
The Company issues and redeems capital shares of each Fund only in aggregations of a specified number of shares (each, a “Creation Unit”) at net asset value. Except when aggregated in Creation Units, shares of each Fund are not redeemable. Transactions in capital shares for each Fund are disclosed in detail in the Statements of Changes in Net Assets.
The consideration for the purchase of Creation Units of a Fund generally consists of the in-kind deposit of a designated portfolio of equity securities, which constitutes a substantial replication, or a portfolio sampling representation, of the corresponding MSCI Index and an amount of cash. Investors purchasing and redeeming Creation Units pay a purchase transaction fee and a redemption transaction fee directly to State Street, the administrator, to offset transfer and other transaction costs associated with the issuance and redemption of Creation Units.
From time to time, settlement of securities related to in-kind contributions or in-kind redemptions may be delayed. In such cases, securities related to in-kind contributions are reflected as “Due from custodian” and securities related to in-kind redemptions are reflected as “Securities related to in-kind transactions” in the Statements of Assets and Liabilities.
5. LOANS OF PORTFOLIO SECURITIES
Each Fund may lend its investment securities to approved borrowers, such as brokers, dealers and other financial institutions. The borrower pledges and maintains with the Fund collateral consisting of cash, an irrevocable letter of credit issued by a bank, or securities issued or guaranteed by the U.S. government. The initial collateral received by each Fund is required to have a value of at least 102% of the market value of the loaned securities for securities traded on U.S. exchanges and a value of at least 105% for all other securities. The collateral is maintained thereafter, at a value equal to at least 100% of the current market value of the securities on loan. The risks to the Funds of securities lending are that the borrower may not provide additional collateral when required or may not return the securities when due.
During the year ended August 31, 2007, the Funds received cash as collateral for securities loaned. The cash collateral received was invested in a joint account and/or in the Premier Fund. Pursuant to an exemptive order issued by the SEC, a portion of the cash collateral received was invested in a joint account with other investment funds managed by BGFA. The joint account invests in securities with
NOTESTO FINANCIAL STATEMENTS | 81 |
Table of Contents
Notes to Financial Statements (Continued)
iSHARES®, INC.
remaining maturities of 397 days or less, repurchase agreements and money market mutual funds, including money market funds managed by BGFA. Repurchase agreements are fully collateralized by U.S. government securities or non-U.S. government debt securities. The Premier Fund seeks to achieve its investment objective by investing in a portfolio of high-quality, short-term fixed-income instruments, including money market funds (which may be managed by BGFA or its affiliate) and other instruments that, at the time of investment, have remaining maturities of 397 calendar days or less from the date of acquisition.
The market value of the securities on loan as of August 31, 2007 and the value of the related collateral are disclosed in the Statements of Assets and Liabilities. Securities lending income, as disclosed in the Funds’ Statements of Operations, represents the income earned from the investment of the cash collateral, net of rebates paid to, or fees paid by, borrowers and less the fees paid to BGI as securities lending agent.
6. RECENTLY ISSUED ACCOUNTING PRONOUNCEMENTS
In June 2006, the Financial Accounting Standards Board (“FASB”) issued FASB Interpretation No. 48 (“FIN 48”), “Accounting for Uncertainty in Income Taxes – an interpretation of FASB Statement No. 109.” FIN 48 clarifies the accounting for uncertainty in income taxes recognized in accordance with FASB Statement No. 109, “Accounting for Income Taxes.” This interpretation prescribes a recognition threshold and measurement attribute for the financial statement recognition and measurement of a tax position taken or expected to be taken in a tax return. It also provides guidance on de-recognition, classification, interest and penalties, accounting in interim periods, disclosure and transition. FIN 48 is effective for fiscal years beginning after December 15, 2006. The SEC staff has stated that it would not object if a fund does not implement FIN 48 in its NAV calculation until the date of the fund’s last NAV calculation in the first required financial statement reporting period for its fiscal year beginning after December 15, 2006. The Company is currently evaluating the impact of applying the various provisions of FIN 48.
In September 2006, FASB issued Statement of Financial Accounting Standards No. 157 (“FAS 157”), “Fair Value Measurements.” FAS 157 defines fair value, establishes a framework for measuring fair value in accordance with generally accepted accounting principles and expands disclosure about fair value measurements. FAS 157 is effective for fiscal years beginning after November 15, 2007. The Company is currently evaluating the impact the adoption of FAS 157 will have on the Funds’ financial statement disclosures.
82 | 2007 iSHARES ANNUAL REPORTTO SHAREHOLDERS |
Table of Contents
Report of Independent Registered Public Accounting Firm
To the Shareholders and Board of Directors of
iShares, Inc.
In our opinion, the accompanying statements of assets and liabilities, including the schedules of investments, and the related statements of operations and of changes in net assets and the financial highlights present fairly, in all material respects, the financial position of the iShares MSCI Austria Index Fund, iShares MSCI Belgium Index Fund, iShares MSCI EMU Index Fund, iShares MSCI France Index Fund, iShares MSCI Germany Index Fund, iShares MSCI Italy Index Fund, iShares MSCI Netherlands Index Fund, iShares MSCI Spain Index Fund, iShares MSCI Sweden Index Fund, iShares MSCI Switzerland Index Fund and iShares MSCI United Kingdom Index Fund, each a portfolio of the iShares MSCI Fund Series (the “Funds”) at August 31, 2007, the results of each of their operations, the changes in each of their net assets and their financial highlights for each of the periods presented, in conformity with accounting principles generally accepted in the United States of America. These financial statements and financial highlights (hereafter referred to as “financial statements”) are the responsibility of the Funds’ management; our responsibility is to express an opinion on these financial statements based on our audits. We conducted our audits of these financial statements in accordance with the standards of the Public Company Accounting Oversight Board (United States). Those standards require that we plan and perform the audits to obtain reasonable assurance about whether the financial statements are free of material misstatement. An audit includes examining, on a test basis, evidence supporting the amounts and disclosures in the financial statements, assessing the accounting principles used and significant estimates made by management, and evaluating the overall financial statement presentation. We believe that our audits, which included confirmation of securities at August 31, 2007 by correspondence with the custodian and brokers, provide a reasonable basis for our opinion.
PricewaterhouseCoopers LLP
San Francisco, California
October 23, 2007
REPORTOF INDEPENDENT REGISTERED PUBLIC ACCOUNTING FIRM | 83 |
Table of Contents
iSHARES®, INC.
For the fiscal year ended August 31, 2007, certain Funds earned foreign source income and paid foreign taxes which they intend to pass through to their shareholders pursuant to Section 853 of the Internal Revenue Code (the “Code”) as follows:
| iShares MSCI Index Fund | Foreign Source Income Earned | Foreign Taxes Paid | ||||
Austria | $ | 11,095,118 | $ | 1,624,325 | ||
Belgium | 10,352,842 | 1,538,709 | ||||
EMU | 89,808,124 | 12,179,559 | ||||
France | 7,769,924 | 1,112,837 | ||||
Germany | 39,871,660 | 5,772,220 | ||||
| iShares MSCI Index Fund | Foreign Source Income Earned | Foreign Taxes Paid | ||||
Italy | $ | 10,851,956 | $ | 1,540,655 | ||
Netherlands | 10,045,521 | 1,163,577 | ||||
Spain | 17,751,642 | 2,635,913 | ||||
Sweden | 18,187,573 | 1,728,830 | ||||
Switzerland | 6,433,637 | 1,132,990 | ||||
Under Section 854(b)(2) of the Code, the Funds hereby designate the following maximum amounts as qualified dividend income for purposes of the maximum rate under Section 1(h)(11) of the Code for the fiscal year ended August 31, 2007:
| iShares MSCI Index Fund | Qualified Dividend Income | ||
Austria | $ | 8,675,729 | |
Belgium | 4,042,358 | ||
EMU | 39,632,439 | ||
France | 2,600,180 | ||
Germany | 17,227,480 | ||
Italy | 4,310,712 | ||
| iShares MSCI Index Fund | Qualified Dividend Income | ||
Netherlands | $ | 3,524,849 | |
Spain | 4,483,132 | ||
Sweden | 3,600,238 | ||
Switzerland | 1,891,314 | ||
United Kingdom | 34,304,512 | ||
In January 2008, shareholders will receive Form 1099-DIV which will include their share of qualified dividend income distributed during the calendar year 2007. Shareholders are advised to check with their tax advisers for information on the treatment of these amounts on their income tax returns.
84 | 2007 iSHARES ANNUAL REPORTTO SHAREHOLDERS |
Table of Contents
Board Review and Approval of Investment Advisory
Contract (Unaudited)
iSHARES®, INC.
Under Section 15(c) of the Investment Company Act of 1940 (the “1940 Act”), the Company’s Board of Directors (the “Board”), including a majority of Directors who are not “interested persons” of the Company (as that term is defined in the 1940 Act) (the “Independent Directors”), is required annually to consider the Investment Advisory Contract between the Company and BGFA (the “Advisory Contract”) on behalf of the Funds. As required by Section 15(c), the Board requested and BGFA provided such information as the Board deemed reasonably necessary to evaluate the terms of the Advisory Contract. At a meeting held on June 13, 2007, the Board approved the selection of BGFA and the continuance of the Advisory Contract, based on its review of qualitative and quantitative information provided by BGFA. In selecting BGFA and approving the Advisory Contract for the Funds, the Board, including the Independent Directors, advised by their independent counsel, considered the following factors, none of which was controlling, and made the following conclusions:
NATURE, EXTENT AND QUALITY OF SERVICES PROVIDED BY BGFA
The Board determined that there would be no diminution in the scope of services required of BGFA under the Advisory Contract for the coming year as compared to the scope of services provided by BGFA over the past year. In reviewing the scope of these services, the Board considered BGFA’s investment philosophy and experience, noting that BGFA and its affiliates have committed significant resources over time, including over the past year, including investment in technology and increasing the number of their employees supporting the Funds. The Board also considered BGFA’s compliance program and its compliance record with respect to the Funds. In that regard, the Board noted that BGFA reports to the Board about portfolio management and compliance matters on a periodic basis in connection with regularly scheduled meetings of the Board, and has made appropriate officers available as needed to provide further assistance with these matters. The Board also reviewed the background and experience of the persons responsible for the day-to-day management of the Funds. In addition to the above considerations, the Board considered BGFA’s investment processes and strategies, and matters related to BGFA’s portfolio transaction policies and procedures. The Board further noted that BGFA does not serve as investment adviser for any other series of registered investment companies with substantially similar investment objectives and strategies as the Funds; therefore, comparative performance information was generally not available. However, the Board also noted that the Funds had met their investment objectives consistently since their respective inception dates. Based on review of this information, the Board concluded that the nature, extent and quality of services to be provided by BGFA to the Funds under the Advisory Contract were appropriate and mitigated in favor of the Board’s approval of the Advisory Contract for the coming year.
FUNDS’ EXPENSES AND PERFORMANCE OF THE FUNDS
The Board reviewed statistical information prepared by Lipper Inc. (“Lipper”), an independent provider of investment company data, regarding the expense ratio components, including advisory fees, waivers/reimbursements, and gross and net total expenses of each Fund in comparison with the same information for other funds registered under the 1940 Act objectively selected solely by Lipper as comprising each Fund’s applicable comparative group (the “Lipper Group”). In addition, the Board reviewed statistical information prepared by Lipper regarding the performance of each Fund for the one-, three-, five- and ten-year periods, as applicable, and the “last quarter” period ended March 31, 2007, and a comparison of each Fund’s performance to that of the funds in its Lipper Group for the same periods. Because there are few, if any, exchange traded funds or index funds that track indexes similar to those tracked by the Funds, the Lipper Groups included in part, at the request of BGFA, mutual funds, closed-end funds, exchange traded funds, and funds with differing investment objective classifications, investment focuses and other characteristics (e.g., actively managed funds and funds sponsored by “at cost” service providers). In support of its review of the statistical information, the Board was provided with a detailed description of the methodology used by Lipper to determine the applicable Lipper Groups and to prepare this information. The Board further noted that due to the limitations in providing comparable funds in the various Lipper Groups, the statistical information may or may not provide meaningful direct comparisons to the Funds. The Board noted that most of the Funds generally performed in line with the funds in their respective Lipper Groups over the relevant periods; however, certain of the Funds may have underperformed or outperformed funds in their respective Lipper Groups over such periods. In considering this information, the Board noted that the Lipper Groups include funds that may have different
BOARD REVIEW AND APPROVAL OF INVESTMENT ADVISORY CONTRACT | 85 |
Table of Contents
Board Review and Approval of Investment Advisory
Contract (Unaudited) (Continued)
iSHARES®, INC.
investment objectives and/or benchmarks from the Funds. In addition, the Board noted that each Fund seeks to track an index and that during the prior year the Board received periodic reports on the Funds’ performance in comparison with their relevant benchmark indexes. Such comparative performance information was also considered by the Board.
The Board also noted that the investment advisory fees and overall expenses for the Funds were generally lower than the median or average investment advisory fee rates and overall expense components of the funds in their respective Lipper Groups. The Board also reviewed statistical information from Lipper displaying the effects of the current breakpoints in the investment advisory fee rates for the Funds (as discussed below) at various assets levels of such Funds as compared to their Lipper Groups. Based on this review, the Board concluded that the investment advisory fees and expense levels and the historical performance of each Fund, as managed by BGFA, as compared to the investment advisory fees and expense levels and performance of the funds in the relevant Lipper Group, were satisfactory for the purposes of approving the Advisory Contract for the coming year.
COSTS OF SERVICES PROVIDED TO FUNDS AND PROFITS REALIZED BY BGFA AND AFFILIATES
The Board reviewed information about the profitability to BGFA of the Funds based on the fees payable to BGFA and its affiliates (including fees under the Advisory Contract), and all other sources of revenue and expense to BGFA and its affiliates for the last calendar year. The Board discussed the sources of direct and ancillary revenue with management, including the revenues to BGI from securities lending by the Company (including any securities lending by the Funds). The Board also discussed BGFA’s profit margin as reflected in the Funds’ profitability analysis and reviewed information regarding economies of scale (as discussed below). Based on this review, the Board concluded that the profits to be realized by BGFA and its affiliates under the Advisory Contract and from other relationships between the Funds and BGFA and/or its affiliates, if any, were within the range the Board considered reasonable and appropriate.
ECONOMIES OF SCALE
In connection with its review of the Funds’ profitability analysis, the Board reviewed information regarding economies of scale or other efficiencies that may result from increases in the Funds’ assets. The Board noted that the Advisory Contract already provided for breakpoints in the Funds’ investment advisory fee rates as the assets of the Funds, on an aggregated basis with the assets of certain other iShares funds, increase. The Board also discussed the substantial growth in assets of certain iShares funds, including the iShares funds in the group with which the Funds’ assets are aggregated for the purpose of applying breakpoints in the investment advisory fee rates, over the last few years. The Board also reviewed BGFA’s historic profitability as investment adviser to the iShares fund complex and noted that BGFA had made a significant investment in the iShares funds and had incurred operating losses during earlier years when the iShares funds, including the Funds, had not yet reached scale. In light of this history, the Board determined that the current breakpoints were appropriate and warranted at this juncture for the Funds. Based on this review, as well as the discussions described above in connection with the Lipper Group comparisons, the Board, recognizing its responsibility to consider this issue at least annually, concluded that the structure of the investment advisory fees, with the current breakpoints for the Funds, reflects the current sharing and potential further sharing of economies of scale with the Funds’ shareholders.
FEES AND SERVICES PROVIDED FOR OTHER COMPARABLE FUNDS/ACCOUNTS MANAGED BY BGFA AND ITS AFFILIATES
The Board received and considered certain information regarding the Funds’ annual investment advisory fee rates under the Advisory Contract in comparison to the investment advisory/management fee rates for other funds/accounts for which BGFA or BGI, an affiliate of BGFA, provides investment advisory/management services, including other funds registered under the 1940 Act, collective funds and separate accounts (together, the “Other Accounts”). The Board noted that comparative investment advisory/management fee information
86 | 2007 iSHARES ANNUAL REPORTTO SHAREHOLDERS |
Table of Contents
Board Review and Approval of Investment Advisory
Contract (Unaudited) (Continued)
iSHARES®, INC.
was not available, as BGFA and its affiliates do not manage any Other Accounts with substantially similar investment objectives and strategies as the Funds. However, the Board noted that BGFA provided the Board with general information regarding how the level of services provided to the Other Accounts differed from the level of services provided to the Funds. Based on this review, the Board determined that the investment advisory fee rates under the Advisory Contract do not constitute fees that are so disproportionately large as to bear no reasonable relationship to the services rendered and that could not have been the product of arm’s-length bargaining, and concluded that the investment advisory fee rates under the Advisory Contract are fair and reasonable.
OTHER BENEFITS TO BGFA AND/OR ITS AFFILIATES
The Board reviewed any ancillary revenue received by BGFA and/or its affiliates in connection with the services provided to the Funds by BGFA, such as any payment of revenue to BGI, the Company’s securities lending agent, for loaning any portfolio securities, and payment of advisory fees and/or administration fees to BGFA and BGI in connection with any investments by the Funds in other funds for which BGFA provides investment advisory services and/or BGI provides administration services. The Board noted that BGFA does not use soft dollars or consider the value of research or other services that may be provided to BGFA (including its affiliates) in selecting brokers for portfolio transactions for the Funds. The Board further noted that any portfolio transactions on behalf of the Funds placed through a BGFA affiliate are reported to the Board pursuant to Rule 10f-3 and Rule 17e-1, as applicable under the 1940 Act. The Board concluded that any such ancillary benefits would not be disadvantageous to the Funds’ shareholders.
Based on this analysis, the Board determined that the Advisory Contract, including the investment advisory fee rates, with the current breakpoints, is fair and reasonable in light of all relevant circumstances and concluded that it is in the best interest of the Funds and their shareholders to approve the Advisory Contract for the coming year.
BOARD REVIEW AND APPROVAL OF INVESTMENT ADVISORY CONTRACT | 87 |
Table of Contents
Supplemental Information (Unaudited)
iSHARES®, INC.
The tables that follow present information about the differences between the daily market price on secondary markets for shares of a Fund and that Fund’s net asset value. Net asset value, or “NAV,” is the price per share at which each Fund issues and redeems shares. It is calculated in accordance with the standard formula for valuing mutual fund shares. The “Market Price” of each Fund generally is determined using the midpoint between the highest bid and the lowest offer on the stock exchange on which the shares of such Fund is listed for trading, as of the time that the Fund’s NAV is calculated. Each Fund’s Market Price may be at, above or below its NAV. The NAV of each Fund will fluctuate with changes in the market value of its portfolio holdings. The Market Price of each Fund will fluctuate in accordance with changes in its NAV, as well as market supply and demand.
Premiums or discounts are the differences (expressed as a percentage) between the NAV and Market Price of a Fund on a given day, generally at the time the NAV is calculated. A premium is the amount that a Fund is trading above the reported NAV, expressed as a percentage of the NAV. A discount is the amount that a Fund is trading below the reported NAV, expressed as a percentage of the NAV.
The following information shows the frequency distributions of premiums and discounts for each of the Funds included in this report. The information shown for each Fund is for five calendar years (or for each full calendar quarter completed after inception date of such Fund if less than five years) through the date of the most recent calendar quarter-end. The specific periods covered for each Fund are disclosed in the table for such Fund.
Each line in the table shows the number of trading days in which the Fund traded within the premium/discount range indicated. The number of trading days in each premium/discount range is also shown as a percentage of the total number of trading days in the period covered by each table. All data presented here represents past performance, which cannot be used to predict future results.
iShares MSCI Austria Index Fund
Period Covered: January 1, 2002 through June 30, 2007
Premium/Discount Range | Number of Days | Percentage of Total Days | |||
Greater than 2.5% | 3 | 0.22 | % | ||
Greater than 2.0% and Less than 2.5% | 3 | 0.22 | |||
Greater than 1.5% and Less than 2.0% | 22 | 1.59 | |||
Greater than 1.0% and Less than 1.5% | 62 | 4.49 | |||
Greater than 0.5% and Less than 1.0% | 232 | 16.80 | |||
Between 0.5% and –0.5% | 820 | 59.38 | |||
Less than –0.5% and Greater than –1.0% | 158 | 11.44 | |||
Less than –1.0% and Greater than –1.5% | 61 | 4.42 | |||
Less than –1.5% and Greater than –2.0% | 11 | 0.80 | |||
Less than –2.0% and Greater than –2.5% | 4 | 0.29 | |||
Less than –2.5% and Greater than –3.0% | 2 | 0.14 | |||
Less than –3.0% and Greater than –3.5% | 1 | 0.07 | |||
Less than –3.5% and Greater than –4.0% | 2 | 0.14 | |||
| 1,381 | 100.00 | % | |||
88 | 2007 iSHARES ANNUAL REPORTTO SHAREHOLDERS |
Table of Contents
Supplemental Information (Unaudited) (Continued)
iSHARES®, INC.
iShares MSCI Belgium Index Fund
Period Covered: January 1, 2002 through June 30, 2007
Premium/Discount Range | Number of Days | Percentage of Total Days | |||
Greater than 3.0% | 1 | 0.07 | % | ||
Greater than 2.5% and Less than 3.0% | 3 | 0.22 | |||
Greater than 2.0% and Less than 2.5% | 11 | 0.80 | |||
Greater than 1.5% and Less than 2.0% | 19 | 1.38 | |||
Greater than 1.0% and Less than 1.5% | 72 | 5.21 | |||
Greater than 0.5% and Less than 1.0% | 224 | 16.22 | |||
Between 0.5% and –0.5% | 880 | 63.73 | |||
Less than –0.5% and Greater than –1.0% | 134 | 9.70 | |||
Less than –1.0% and Greater than –1.5% | 25 | 1.81 | |||
Less than –1.5% and Greater than –2.0% | 5 | 0.36 | |||
Less than –2.0% and Greater than –2.5% | 3 | 0.22 | |||
Less than –2.5% and Greater than –3.0% | 2 | 0.14 | |||
Less than –3.0% | 2 | 0.14 | |||
| 1,381 | 100.00 | % | |||
iShares MSCI EMU Index Fund
Period Covered: January 1, 2002 through June 30, 2007
Premium/Discount Range | Number of Days | Percentage of Total Days | |||
Greater than 3.0% and Less than 3.5% | 2 | 0.14 | % | ||
Greater than 2.5% and Less than 3.0% | 3 | 0.22 | |||
Greater than 2.0% and Less than 2.5% | 7 | 0.51 | |||
Greater than 1.5% and Less than 2.0% | 19 | 1.38 | |||
Greater than 1.0% and Less than 1.5% | 63 | 4.56 | |||
Greater than 0.5% and Less than 1.0% | 276 | 19.99 | |||
Between 0.5% and –0.5% | 867 | 62.77 | |||
Less than –0.5% and Greater than –1.0% | 102 | 7.39 | |||
Less than –1.0% and Greater than –1.5% | 32 | 2.32 | |||
Less than –1.5% and Greater than –2.0% | 7 | 0.51 | |||
Less than –2.0% and Greater than –2.5% | 1 | 0.07 | |||
Less than –2.5% and Greater than –3.0% | 1 | 0.07 | |||
Less than –3.0% | 1 | 0.07 | |||
| 1,381 | 100.00 | % | |||
SUPPLEMENTAL INFORMATION | 89 |
Table of Contents
Supplemental Information (Unaudited) (Continued)
iSHARES®, INC.
iShares MSCI France Index Fund
Period Covered: January 1, 2002 through June 30, 2007
Premium/Discount Range | Number of Days | Percentage of Total Days | |||
Greater than 2.5% | 1 | 0.07 | % | ||
Greater than 2.0% and Less than 2.5% | 3 | 0.22 | |||
Greater than 1.5% and Less than 2.0% | 6 | 0.43 | |||
Greater than 1.0% and Less than 1.5% | 19 | 1.38 | |||
Greater than 0.5% and Less than 1.0% | 121 | 8.76 | |||
Between 0.5% and –0.5% | 1,078 | 78.05 | |||
Less than –0.5% and Greater than –1.0% | 119 | 8.62 | |||
Less than –1.0% and Greater than –1.5% | 27 | 1.96 | |||
Less than –1.5% and Greater than –2.0% | 3 | 0.22 | |||
Less than –2.0% and Greater than –2.5% | 1 | 0.07 | |||
Less than –2.5% and Greater than –3.0% | 3 | 0.22 | |||
| 1,381 | 100.00 | % | |||
iShares MSCI Germany Index Fund
Period Covered: January 1, 2002 through June 30, 2007
Premium/Discount Range | Number of Days | Percentage of Total Days | |||
Greater than 3.0% | 2 | 0.14 | % | ||
Greater than 2.5% and Less than 3.0% | 1 | 0.07 | |||
Greater than 2.0% and Less than 2.5% | 1 | 0.07 | |||
Greater than 1.5% and Less than 2.0% | 12 | 0.87 | |||
Greater than 1.0% and Less than 1.5% | 34 | 2.46 | |||
Greater than 0.5% and Less than 1.0% | 162 | 11.73 | |||
Between 0.5% and –0.5% | 959 | 69.46 | |||
Less than –0.5% and Greater than –1.0% | 144 | 10.43 | |||
Less than –1.0% and Greater than –1.5% | 50 | 3.62 | |||
Less than –1.5% and Greater than –2.0% | 8 | 0.58 | |||
Less than –2.0% and Greater than –2.5% | 5 | 0.36 | |||
Less than –2.5% and Greater than –3.0% | 2 | 0.14 | |||
Less than –3.0% | 1 | 0.07 | |||
| 1,381 | 100.00 | % | |||
90 | 2007 iSHARES ANNUAL REPORTTO SHAREHOLDERS |
Table of Contents
Supplemental Information (Unaudited) (Continued)
iSHARES®, INC.
iShares MSCI Italy Index Fund
Period Covered: January 1, 2002 through June 30, 2007
Premium/Discount Range | Number of Days | Percentage of Total Days | |||
Greater than 2.5% | 1 | 0.07 | % | ||
Greater than 2.0% and Less than 2.5% | 2 | 0.14 | |||
Greater than 1.5% and Less than 2.0% | 7 | 0.51 | |||
Greater than 1.0% and Less than 1.5% | 22 | 1.59 | |||
Greater than 0.5% and Less than 1.0% | 120 | 8.69 | |||
Between 0.5% and –0.5% | 1,076 | 77.92 | |||
Less than –0.5% and Greater than –1.0% | 124 | 8.98 | |||
Less than –1.0% and Greater than –1.5% | 19 | 1.38 | |||
Less than –1.5% and Greater than –2.0% | 4 | 0.29 | |||
Less than –2.0% and Greater than –2.5% | 3 | 0.22 | |||
Less than –2.5% and Greater than –3.0% | 1 | 0.07 | |||
Less than –3.0% and Greater than –3.5% | 1 | 0.07 | |||
Less than –3.5% | 1 | 0.07 | |||
| 1,381 | 100.00 | % | |||
iShares MSCI Netherlands Index Fund
Period Covered: January 1, 2002 through June 30, 2007
Premium/Discount Range | Number of Days | Percentage of Total Days | |||
Greater than 4.0% | 2 | 0.14 | % | ||
Greater than 3.5% and Less than 4.0% | 1 | 0.07 | |||
Greater than 3.0% and Less than 3.5% | 1 | 0.07 | |||
Greater than 2.5% and Less than 3.0% | 2 | 0.14 | |||
Greater than 2.0% and Less than 2.5% | 5 | 0.36 | |||
Greater than 1.5% and Less than 2.0% | 10 | 0.72 | |||
Greater than 1.0% and Less than 1.5% | 44 | 3.19 | |||
Greater than 0.5% and Less than 1.0% | 204 | 14.77 | |||
Between 0.5% and –0.5% | 935 | 67.72 | |||
Less than –0.5% and Greater than –1.0% | 119 | 8.62 | |||
Less than –1.0% and Greater than –1.5% | 41 | 2.97 | |||
Less than –1.5% and Greater than –2.0% | 10 | 0.72 | |||
Less than –2.0% and Greater than –2.5% | 3 | 0.22 | |||
Less than –2.5% and Greater than –3.0% | 1 | 0.07 | |||
Less than –3.0% | 3 | 0.22 | |||
| 1,381 | 100.00 | % | |||
SUPPLEMENTAL INFORMATION | 91 |
Table of Contents
Supplemental Information (Unaudited) (Continued)
iSHARES®, INC.
iShares MSCI Spain Index Fund Period
Covered: January 1, 2002 through June 30, 2007
Premium/Discount Range | Number of Days | Percentage of Total Days | |||
Greater than 3.0% | 3 | 0.22 | % | ||
Greater than 2.5% and Less than 3.0% | 2 | 0.14 | |||
Greater than 2.0% and Less than 2.5% | 5 | 0.36 | |||
Greater than 1.5% and Less than 2.0% | 5 | 0.36 | |||
Greater than 1.0% and Less than 1.5% | 38 | 2.75 | |||
Greater than 0.5% and Less than 1.0% | 167 | 12.09 | |||
Between 0.5% and –0.5% | 984 | 71.26 | |||
Less than –0.5% and Greater than –1.0% | 131 | 9.49 | |||
Less than –1.0% and Greater than –1.5% | 33 | 2.39 | |||
Less than –1.5% and Greater than –2.0% | 7 | 0.51 | |||
Less than –2.0% and Greater than –2.5% | 4 | 0.29 | |||
Less than –2.5% | 2 | 0.14 | |||
| 1,381 | 100.00 | % | |||
iShares MSCI Sweden Index Fund
Period Covered: January 1, 2002 through June 30, 2007
Premium/Discount Range | Number of Days | Percentage of Total Days | |||
Greater than 3.5% | 4 | 0.29 | % | ||
Greater than 3.0% and Less than 3.5% | 1 | 0.07 | |||
Greater than 2.5% and Less than 3.0% | 4 | 0.29 | |||
Greater than 2.0% and Less than 2.5% | 19 | 1.38 | |||
Greater than 1.5% and Less than 2.0% | 28 | 2.03 | |||
Greater than 1.0% and Less than 1.5% | 77 | 5.58 | |||
Greater than 0.5% and Less than 1.0% | 243 | 17.60 | |||
Between 0.5% and –0.5% | 815 | 59.00 | |||
Less than –0.5% and Greater than –1.0% | 119 | 8.62 | |||
Less than –1.0% and Greater than –1.5% | 44 | 3.19 | |||
Less than –1.5% and Greater than –2.0% | 11 | 0.80 | |||
Less than –2.0% and Greater than –2.5% | 10 | 0.72 | |||
Less than –2.5% and Greater than –3.0% | 4 | 0.29 | |||
Less than –3.0% and Greater than –3.5% | 1 | 0.07 | |||
Less than –3.5% | 1 | 0.07 | |||
| 1,381 | 100.00 | % | |||
92 | 2007 iSHARES ANNUAL REPORTTO SHAREHOLDERS |
Table of Contents
Supplemental Information (Unaudited) (Continued)
iSHARES®, INC.
iShares MSCI Switzerland Index Fund
Period Covered: January 1, 2002 through June 30, 2007
Premium/Discount Range | Number of Days | Percentage of Total Days | |||
Greater than 3.0% | 2 | 0.14 | % | ||
Greater than 2.5% and Less than 3.0% | 3 | 0.22 | |||
Greater than 2.0% and Less than 2.5% | 5 | 0.36 | |||
Greater than 1.5% and Less than 2.0% | 35 | 2.53 | |||
Greater than 1.0% and Less than 1.5% | 84 | 6.08 | |||
Greater than 0.5% and Less than 1.0% | 275 | 19.91 | |||
Between 0.5% and –0.5% | 841 | 60.92 | |||
Less than –0.5% and Greater than –1.0% | 92 | 6.66 | |||
Less than –1.0% and Greater than –1.5% | 26 | 1.88 | |||
Less than –1.5% and Greater than –2.0% | 13 | 0.94 | |||
Less than –2.0% and Greater than –2.5% | 2 | 0.14 | |||
Less than –2.5% | 3 | 0.22 | |||
| 1,381 | 100.00 | % | |||
iShares MSCI United Kingdom Index Fund
Period Covered: January 1, 2002 through June 30, 2007
Premium/Discount Range | Number of Days | Percentage of Total Days | |||
Greater than 4.0% and Less than 4.5% | 2 | 0.14 | % | ||
Greater than 3.5% and Less than 4.0% | 3 | 0.22 | |||
Greater than 3.0% and Less than 3.5% | 2 | 0.14 | |||
Greater than 2.5% and Less than 3.0% | 1 | 0.07 | |||
Greater than 2.0% and Less than 2.5% | 10 | 0.72 | |||
Greater than 1.5% and Less than 2.0% | 42 | 3.04 | |||
Greater than 1.0% and Less than 1.5% | 156 | 11.30 | |||
Greater than 0.5% and Less than 1.0% | 376 | 27.23 | |||
Between 0.5% and –0.5% | 697 | 50.48 | |||
Less than –0.5% and Greater than –1.0% | 71 | 5.14 | |||
Less than –1.0% and Greater than –1.5% | 15 | 1.09 | |||
Less than –1.5% and Greater than –2.0% | 3 | 0.22 | |||
Less than –2.0% and Greater than –2.5% | 1 | 0.07 | |||
Less than –2.5% and Greater than –3.0% | 1 | 0.07 | |||
Less than –3.0% | 1 | 0.07 | |||
| 1,381 | 100.00 | % | |||
SUPPLEMENTAL INFORMATION | 93 |
Table of Contents
Director and Officer Information (Unaudited)
iSHARES®, INC.
The Board of Directors has responsibility for the overall management and operations of the Company, including general supervision of the duties performed by BGFA and other service providers. Each Director serves until his or her successor is duly elected or appointed and qualified.
iShares, Inc., iShares Trust, Barclays Global Investors Funds (“BGIF”), Master Investment Portfolio (“MIP”) and Barclays Foundry Investment Trust (“BFIT”) are considered to be members of the same fund complex, as defined in Form N-1A under the 1940 Act. Each Director of iShares, Inc. also serves as a Trustee for iShares Trust and oversees 138 portfolios within the fund complex. In addition, Lee T. Kranefuss serves as a Trustee for BGIF, MIP and BFIT and oversees an additional 24 portfolios within the fund complex.
Unless otherwise noted in the tables below, the address for each Director and Officer is c/o Barclays Global Investors, N.A., 45 Fremont Street, San Francisco, California 94105. The Board has designated George G.C. Parker as its Lead Independent Director. Additional information about the Funds’ Directors and Officers may be found in the Funds’ combined Statement of Additional Information, which is available without charge, upon request, by calling toll-free 1-800-474-2737.
Interested Directors and Officers
| Name, Year of Birth | Position(s), Length of Service | Principal Occupation(s) During Past 5 Years | Other Directorships Held | |||
*Lee T. Kranefuss, 1961 | Director and Chairman (since 2003). | Chief Executive Officer of the Intermediary Investor and Exchange Traded Products Business of BGI (since 2003); Director of Barclays Global Fund Advisers (since 2005); Director, President and Chief Executive Officer of Barclays Global Investors International, Inc. (since 2005); Director, Chairman and Chief Executive Officer of Barclays Global Investors Services (since 2005); Chief Executive Officer of the Individual Investor Business of BGI (1999-2003). | Trustee (since 2003) of iShares Trust; Trustee (since 2001) of BGIF and MIP; Trustee (since 2007) of BFIT; Director (since 2003) of BGI Cayman Prime Money Market Fund, Ltd. | |||
*John E. Martinez, 1962 | Director, (since 2003). | Co-Chief Executive Officer of Global Index and Markets Group of BGI (2000-2003); Chairman of Barclays Global Investors Services (2000-2003). | Trustee (since 2003) of iShares Trust; Director (since 2005) of Real Estate Equity Exchange. | |||
| * | Lee T. Kranefuss and John E. Martinez are deemed to be “interested persons” (as defined in the 1940 Act) of the Company due to their affiliations with BGFA, the Funds’ investment adviser, BGI, the parent company of BGFA, and Barclays Global Investors Services, an affiliate of BGFA and BGI. |
94 | 2007 iSHARES ANNUAL REPORTTO SHAREHOLDERS |
Table of Contents
Director and Officer Information (Unaudited) (Continued)
iSHARES®, INC.
Independent Directors
| Name, Year of Birth | Position(s), Length of Service | Principal Occupation(s) During Past 5 Years | Other Directorships Held | |||
George G.C. Parker, 1939 | Director (since 2002). Lead Independent Director (since 2006). | Dean Witter Distinguished Professor of Finance, Emeritus (since 1994). | Trustee (since 2000) of iShares Trust; Lead Independent Trustee (since 2006) of iShares Trust; Director (since 1996) of Continental Airlines, Inc.; Director (since 1995) of Community First Financial Group; Director (since 1999) of Tejon Ranch Company; Director (since 2004) of Threshold Pharmaceuticals; Director (since 2007) of NETGEAR, Inc. | |||
Cecilia H. Herbert, 1949 | Director (since 2005). | Member of Finance Council, Archdiocese of San Francisco (1999-2006); Chair of Investment Committee, Archdiocese of San Francisco (1994-2005); Director (since 1998) and President (since 2007) of the Board of Directors, Catholic Charities CYO; Trustee (2004-2005) of Pacific Select Funds; Trustee (1992-2003) of the Montgomery Funds; Trustee (since 2002) and Chair of Finance and Investment Committee (since 2006) of the Thacher School. | Trustee (since 2005) of iShares Trust. | |||
Charles A. Hurty, 1943 | Director (since 2005). | Retired; Partner, KPMG LLP (1968-2001). | Trustee (since 2005) of iShares Trust; Director (since 2002) of GMAM Absolute Return Strategy Fund (1 portfolio); Director (since 2002) of Citigroup Alternative Investments Multi-Adviser Hedge Fund Portfolios LLC (1 portfolio); Director (since 2005) of CSFB Alternative Investments Fund (6 portfolios). | |||
John E. Kerrigan, 1955 | Director (since 2005). | Chief Investment Officer, Santa Clara University (since 2002); Managing Director, Merrill Lynch (1994-2002). | Trustee (since 2005) of iShares Trust; Member (since 2004) of Advisory Council for Commonfund Distressed Debt Partners II. | |||
DIRECTORAND OFFICER INFORMATION | 95 |
Table of Contents
Director and Officer Information (Unaudited) (Continued)
iSHARES®, INC.
Independent Directors (Continued)
| Name, Year of Birth | Position(s), Length of Service | Principal Occupation(s) During Past 5 Years | Other Directorships Held | |||
Robert H. Silver, 1955 | Director (since 2007). | President and Co-Founder of The Bravitas Group, Inc. (since 2006); Member, Non-Investor Advisory Board of Russia Partners II, LP (since 2006); President and Chief Operating Officer (2003-2005) and Director (1999-2005) of UBS Financial Services, Inc.; President and Chief Executive Officer of UBS Services USA, LLC (1999-2005); Managing Director, UBS America, Inc. (2000-2005); Director and Vice Chairman of the YMCA of Greater NYC (since 2001); Broadway Producer (since 2006). | Trustee (since 2007) of iShares Trust; Director and Member (since 2006) of the Audit and Compensation Committee of EPAM Systems, Inc. | |||
Officers
| ||||||
| Name, Year of Birth | Position(s), Length of Service | Principal Occupation(s) During Past 5 Years | Other Directorships Held | |||
Michael A. Latham, 1965 | President (since 2007). | Head of Americas iShares (since 2007); Chief Operating Officer of the Intermediary Investor and Exchange Traded Products Business of BGI (2003-2007); Director and Chief Financial Officer of Barclays Global Investors International, Inc. (since 2005); Director of Mutual Fund Delivery in the U.S. Individual Investor Business of BGI (2000-2003). | None. | |||
Geoffrey D. Flynn, 1956 | Treasurer and Chief Financial Officer (since 2007). | Director of Mutual Fund Operations of BGI (since 2007); President of Van Kampen Investor Services (2003-2007); Managing Director of Morgan Stanley (2002-2007); President of Morgan Stanley Trust, FSB (2002-2007). | None. | |||
96 | 2007 iSHARES ANNUAL REPORTTO SHAREHOLDERS |
Table of Contents
Director and Officer Information (Unaudited) (Continued)
iSHARES®, INC.
Officers (Continued)
| Name, Year of Birth | Position(s), Length of Service | Principal Occupation(s) During Past 5 Years | Other Directorships Held | |||
Eilleen M. Clavere, 1952 | Secretary (since 2007). | Head of Legal Administration of Intermediary Investor Business of BGI (since 2006); Legal Counsel and Vice President of Atlas Funds, Atlas Advisers, Inc. and Atlas Securities, Inc. (2005-2006); Counsel of Kirkpatrick & Lockhart LLP (2001-2005). | None. | |||
Ira P. Shapiro, 1963 | Vice President and Chief Legal Officer (since 2007). | Associate General Counsel of BGI (since 2004); First Vice President of Merrill Lynch Investment Managers (1993-2004). | None. | |||
Amy Schioldager, 1962 | Executive Vice President (since 2007). | Head of U.S. Indexing of BGI (since 2006); Head of Domestic Equity Portfolio Management of BGI (2001-2006). | None. | |||
H. Michael Williams, 1960 | Executive Vice President (since 2007). | Head of Global Index and Markets Group of BGI (since 2006); Global Head of Securities Lending of BGI (2002-2006). | Trustee (since 2007) of BFIT. | |||
Patrick O’Connor, 1967 | Vice President (since 2007). | Head of iShares Portfolio Management of BGI (since 2006); Senior Portfolio Manager of BGI (1999-2006). | None. | |||
Lee Sterne, 1965 | Vice President (since 2007). | Senior Portfolio Manager of BGI (since 2004); Portfolio Manager of BGI (2001-2004). | None. | |||
Matt Tucker, 1972 | Vice President (since 2007). | Head of U.S. Fixed-Income Investment Solutions of BGI (since 2005); Fixed- Income Investment Strategist of BGI (2003-2005); Fixed-Income Portfolio Manager of BGI (1997-2003). | None. | |||
DIRECTORAND OFFICER INFORMATION | 97 |
Table of Contents
The following is a list of iShares Funds being offered, along with their respective exchange trading symbols. Please call 1-800-iShares (1-800-474-2737) to obtain a prospectus for any iShares Fund. The prospectus contains more complete information, including charges, expenses, investment objectives and risk factors that should be carefully considered to determine if the Fund(s) are an appropriate investment for you. Read the prospectu(es) carefully before investing. Investing involves risk, including possible loss of principal.
iShares S&P Domestic Index Funds
iShares S&P 1500 (ISI)
iShares S&P 100 (OEF)
iShares S&P 500 (IVV)
iShares S&P 500 Growth (IVW)
iShares S&P 500 Value (IVE)
iShares S&P MidCap 400 (IJH)
iShares S&P MidCap 400 Growth (IJK)
iShares S&P MidCap 400 Value (IJJ)
iShares S&P SmallCap 600 (IJR)
iShares S&P SmallCap 600 Growth (IJT)
iShares S&P SmallCap 600 Value (IJS)
iShares S&P GSSI™ Natural Resources (IGE)
iShares S&P GSTI™ Networking (IGN)
iShares S&P GSTI™ Semiconductor (IGW)
iShares S&P GSTI™ Software (IGV)
iShares S&P GSTI™ Technology (IGM)
iShares Domestic Sector Index Funds
iShares Cohen & Steers Realty Majors (ICF)
iShares Dow Jones U.S. Basic Materials Sector (IYM)
iShares Dow Jones U.S. Consumer Services Sector (IYC)
iShares Dow Jones U.S. Consumer Goods Sector (IYK)
iShares Dow Jones U.S. Energy Sector (IYE)
iShares Dow Jones U.S. Financial Sector (IYF)
iShares Dow Jones U.S. Financial Services (IYG)
iShares Dow Jones U.S. Healthcare Sector (IYH)
iShares Dow Jones U.S. Industrial Sector (IYJ)
iShares Dow Jones U.S. Real Estate (IYR)
iShares Dow Jones U.S. Technology Sector (IYW)
iShares Dow Jones U.S. Telecommunications Sector (IYZ)
iShares Dow Jones Transportation Average (IYT)
iShares Dow Jones U.S. Utilities Sector (IDU)
iShares Dow Jones U.S. Total Market (IYY)
iShares Nasdaq Biotechnology (IBB)
iShares Domestic Subsector Index Funds
iShares Dow Jones U.S. Aerospace & Defense (ITA)
iShares Dow Jones U.S. Broker-Dealers (IAI)
iShares Dow Jones U.S. Healthcare Providers (IHF)
iShares Dow Jones U.S. Home Construction (ITB)
iShares Dow Jones U.S. Insurance (IAK)
iShares Dow Jones U.S. Medical Devices (IHI)
iShares Dow Jones U.S. Oil & Gas Exploration & Production (IEO)
iShares Dow Jones U.S. Oil Equipment & Services (IEZ)
iShares Dow Jones U.S. Pharmaceuticals (IHE)
iShares Dow Jones U.S. Regional Banks (IAT)
iShares FTSE NAREIT Industrial/Office (FIO)
iShares FTSE NAREIT Mortgage REITs (REM)
iShares FTSE NAREIT Real Estate 50 (FTY)
iShares FTSE NAREIT Residential (REZ)
iShares FTSE NAREIT Retail (RTL)
iShares Global Index Funds
iShares S&P Global 100 (IOO)
iShares S&P Global Consumer Discretionary Sector (RXI)
iShares S&P Global Consumer Staples Sector (KXI)
iShares S&P Global Energy Sector (IXC)
iShares S&P Global Financials Sector (IXG)
iShares S&P Global Healthcare Sector (IXJ)
iShares S&P Global Industrials Sector (EXI)
iShares S&P Global Materials Sector (MXI)
iShares S&P Global Technology Sector (IXN)
iShares S&P Global Telecommunications Sector (IXP)
iShares S&P Global Utilities Sector (JXI)
iShares Russell Index Funds
iShares Russell 3000 (IWV)
iShares Russell 3000 Growth (IWZ)
iShares Russell 3000 Value (IWW)
iShares Russell 1000 (IWB)
iShares Russell 1000 Growth (IWF)
iShares Russell 1000 Value (IWD)
iShares Russell Midcap (IWR)
iShares Russell Midcap Growth (IWP)
iShares Russell Midcap Value (IWS)
iShares Russell 2000 (IWM)
iShares Russell 2000 Growth (IWO)
iShares Russell 2000 Value (IWN)
iShares Russell Microcap™ (IWC)
iShares International Country Index Funds
iShares FTSE/Xinhua China 25 (FXI)
iShares MSCI Australia (EWA)
iShares MSCI Austria (EWO)
iShares MSCI Belgium (EWK)
iShares MSCI Brazil (EWZ)
iShares MSCI Canada (EWC)
iShares MSCI France (EWQ)
iShares MSCI Germany (EWG)
iShares MSCI Hong Kong (EWH)
iShares MSCI Italy (EWI)
iShares MSCI Japan (EWJ)
iShares MSCI Malaysia (EWM)
iShares MSCI Mexico (EWW)
iShares MSCI Netherlands (EWN)
iShares MSCI Singapore (EWS)
iShares MSCI South Africa (EZA)
iShares MSCI South Korea (EWY)
iShares MSCI Spain (EWP)
iShares MSCI Sweden (EWD)
iShares MSCI Switzerland (EWL)
iShares MSCI Taiwan (EWT)
iShares MSCI United Kingdom (EWU)
iShares S&P/TOPIX 150 (ITF)
iShares Bond Funds
iShares Lehman Aggregate (AGG)
iShares Lehman Short Treasury (SHV)
iShares Lehman 1-3 Year Treasury (SHY)
iShares Lehman 3-7 Year Treasury (IEI)
iShares Lehman 7-10 Year Treasury (IEF)
iShares Lehman 10-20 Year Treasury (TLH)
iShares Lehman 20+ Year Treasury (TLT)
iShares Lehman TIPS (TIP)
iShares Lehman Credit (CFT)
iShares Lehman 1-3 Year Credit (CSJ)
iShares Lehman Intermediate Credit (CIU)
iShares iBoxx $ Investment Grade Corporate (LQD)
iShares Lehman Government/Credit (GBF)
iShares Lehman Intermediate Government/Credit (GVI)
iShares Lehman MBS (MBB)
iShares iBoxx $ High Yield Corporate (HYG)
iShares S&P National Municipal (MUB)
iShares S&P California Municipal (CMF)
iShares S&P New York Municipal (NYF)
iShares Specialty Index Funds
iShares KLD Select Social SM (KLD)
iShares KLD 400 Social (DSI)
iShares Dow Jones Select Dividend (DVY)
iShares Dow Jones EPAC Select Dividend (IDV)
iShares S&P U.S. Preferred Stock (PFF)
iShares International Index Funds
iShares MSCI EAFE (EFA)
iShares MSCI EAFE Growth (EFG)
iShares MSCI EAFE Value (EFV)
iShares MSCI Emerging Markets (EEM)
iShares MSCI EMU (EZU)
iShares MSCI Pacific ex-Japan (EPP)
iShares S&P Europe 350 (IEV)
iShares S&P Latin America 40 (ILF)
iShares S&P World ex-U.S. Property (WPS)
iShares Morningstar Index Funds
iShares Morningstar Large Core (JKD)
iShares Morningstar Large Growth (JKE)
iShares Morningstar Large Value (JKF)
iShares Morningstar Mid Core (JKG)
iShares Morningstar Mid Growth (JKH)
iShares Morningstar Mid Value (JKI)
iShares Morningstar Small Core (JKJ)
iShares Morningstar Small Growth (JKK)
iShares Morningstar Small Value (JKL)
iShares NYSE Index Funds
iShares NYSE Composite (NYC)
iShares NYSE 100 (NY)
iShares® is a registered trade mark of Barclays Global Investors, N.A. The iShares Funds are not sponsored, endorsed or issued by Lehman Brothers, nor are they sponsored, endorsed, issued, sold or promoted by Cohen & Steers Capital Management, Inc., Dow Jones & Company, Inc., FTSE International Limited (“FTSE”), FTSE/Xinhua Index Limited (“FXI”), iBoxx, KLD Research & Analytics, Inc., MSCI Inc., Morningstar, Inc., The NASDAQ Stock Market, Inc., National Association of Real Estate Investment Trusts (“NAREIT”), New York Stock Exchange, Inc., Frank Russell Company, or Standard & Poor’s. None of these companies make any representation regarding the advisability of investing in the iShares Funds. Neither SEI nor BGI, nor any of their affiliates, are affiliated with the companies listed above. iBoxx is a registered trademark of International Index Company Limited. FXI does not make any warranty regarding the FTSE/Xinhua Index. All rights in the FTSE/Xinhua Index vest in FXI. Neither FTSE nor
NAREIT makes any warranty regarding the FTSE NAREIT Real Estate 50 Index, FTSE NAREIT Residential Index, FTSE NAREIT Retail Index, FTSE NAREIT Mortgage REITs Index or FTSE NAREIT Industrial/Office Index; all rights vest in NAREIT. “FTSE” is a trade and service mark of London Stock Exchange and The Financial Times; “Xinhua” is a trade and service mark of Xinhua Financial Network Limited. “NAREIT®” is a trademark of NAREIT.
An investment in the Fund(s) is not a deposit of a bank and it is not insured or guaranteed by the Federal Deposit Insurance Corporation or any other government agency. This advertising section does not constitute part of the 2007 Annual Report.
5508-iS-1007
98 | 2007 iSHARES ANNUAL REPORTTO SHAREHOLDERS |
Table of Contents
Table of Contents
Table of Contents
iShares®
iShares, Inc.
Supplement dated October 30, 2007
to the Prospectus dated January 1, 2007
for the iShares MSCI Australia Index Fund, iShares MSCI Brazil Index Fund, iShares MSCI Canada Index Fund, iShares MSCI Emerging Markets Index Fund, iShares MSCI Hong Kong Index Fund, iShares MSCI Japan Index Fund, iShares MSCI Malaysia Index Fund, iShares MSCI Mexico Index Fund, iShares MSCI Pacific ex-Japan Index Fund, iShares MSCI Singapore Index Fund, iShares MSCI South Africa Index Fund, iShares MSCI South Korea Index Fund and iShares MSCI Taiwan Index Fund (the “Prospectus”).
The information in this Supplement updates the information in, and should be read in conjunction with, the Prospectus for the iShares MSCI Brazil Index Fund, iShares MSCI South Africa Index Fund, iShares MSCI South Korea Index Fund and iShares MSCI Taiwan Index Fund.
The following information replaces the second paragraph found under the heading “Investment Adviser” on page 46:
For its investment advisory services to the iShares MSCI Pacific ex-Japan Index Fund, BGFA is paid advisory fees equal to 0.50% per year of the average daily net assets of that Fund; for its investment advisory services to the iShares MSCI Emerging Markets Index Fund, BGFA is paid advisory fees equal to 0.75% per year of the average daily net assets of that Fund less than or equal to $14.0 billion, plus 0.68% per year of the average daily net assets of that Fund between $14.0 billion and $28.0 billion, plus 0.61% per year of the average daily net assets of that Fund in excess of $28.0 billion; for its investment advisory services to each of the other Funds included in this Prospectus, BGFA is paid a fee based on each Fund’s allocable portion of the aggregate of the average daily net assets of iShares MSCI Australia Index Fund, iShares MSCI Austria Index Fund, iShares MSCI Belgium Index Fund, iShares MSCI Canada Index Fund, iShares MSCI EMU Index Fund, iShares MSCI France Index Fund, iShares MSCI Germany Index Fund, iShares MSCI Hong Kong Index Fund, iShares MSCI Italy Index Fund, iShares MSCI Japan Index Fund, iShares MSCI Malaysia Index Fund, iShares MSCI Mexico Index Fund, iShares MSCI Netherlands Index Fund, iShares MSCI Singapore Index Fund, iShares MSCI Spain Index Fund, iShares MSCI Sweden Index Fund, iShares MSCI Switzerland Index Fund, and iShares MSCI United Kingdom Index Fund (iShares MSCI Austria Index Fund, iShares MSCI Belgium Index Fund, iShares MSCI EMU Index Fund, iShares MSCI France Index Fund, iShares MSCI Germany Index Fund, iShares MSCI Italy Index Fund, iShares MSCI Netherlands Index Fund, iShares MSCI Spain Index Fund, iShares MSCI Sweden Index Fund, iShares MSCI Switzerland Index Fund, and iShares MSCI United Kingdom Index Fund are offered in a separate Prospectus) equal to each of those Funds’ allocable portion of: 0.59% per year of the aggregate of the average daily net assets of those Funds less than or equal to $7.0 billion, plus 0.54% per year of the aggregate of the average daily net assets of those Funds between $7.0 billion and $11.0 billion, plus 0.49% per year of the aggregate of the average daily net assets of those Funds between $11.0 billion and $24.0 billion, plus 0.44% per year of the aggregate of the average daily net assets of those Funds in excess of $24.0 billion.
Effective September 1, 2007, for its investment advisory services to the iShares MSCI Brazil Index Fund, iShares MSCI South Africa Index Fund, iShares MSCI South Korea Index Fund, and iShares MSCI Taiwan Index Fund, BGFA is paid advisory fees equal to each of those Funds’ allocable portion of: 0.74% per year of the aggregate of the average daily net assets of those Funds less than or equal to $2 billion, plus 0.69% per year of the aggregate of the average daily net assets of those Funds between $2 billion and $4 billion, plus 0.64% per year of the aggregate of the average daily net assets of those Funds between $4 billion and $8 billion, plus 0.57% per year of the aggregate of the average daily net assets of those Funds in excess of $8 billion.
If you have any additional questions, please call 1-800-iShares (1-800-474-2737).
iShares® is a registered trademark of Barclays Global Investors, N.A. |
PLEASE RETAIN THIS SUPPLEMENT
FOR FUTURE REFERENCE
Table of Contents
| 1 | ||
| 27 | ||
| 29 | ||
| 29 | ||
| 32 | ||
| 35 | ||
| 38 | ||
| 45 | ||
| 47 | ||
| 49 | ||
| 51 | ||
| 54 | ||
| 56 | ||
| 58 | ||
| 61 | ||
| 64 | ||
| 76 | ||
| 88 | ||
| 97 | ||
| 98 | ||
Board Review and Approval of Investment Advisory Contract (Unaudited) | 99 | |
| 102 | ||
| 109 | ||
| 116 |
Table of Contents
Management’s Discussion of Fund Performance
iSHARES® MSCI AUSTRALIA INDEX FUND
Performance as of August 31, 2007
| Average Annual Total Returns | ||||||||||||||||
| Year Ended 8/31/07 | Five Years Ended 8/31/07 | Ten Years Ended 8/31/07 | ||||||||||||||
| NAV | MARKET | INDEX | NAV | MARKET | INDEX | NAV | MARKET | INDEX | ||||||||
| 33.97% | 35.85% | 33.51% | 28.66% | 28.88% | 28.14% | 13.45% | 13.56% | 13.62% | ||||||||
| Cumulative Total Returns | ||||||||||||||||
| Year Ended 8/31/07 | Five Years Ended 8/31/07 | Ten Years Ended 8/31/07 | ||||||||||||||
| NAV | MARKET | INDEX | NAV | MARKET | INDEX | NAV | MARKET | INDEX | ||||||||
| 33.97% | 35.85% | 33.51% | 252.57% | 255.51% | 245.52% | 253.31% | 256.66% | 258.44% | ||||||||
“Average Annual Total Returns” represent the average annual change in value of an investment over the periods indicated. “Cumulative Total Returns” represent the total change in value of an investment over the periods indicated.
The Fund’s per share net asset value or “NAV” is the value of one share of the Fund as calculated in accordance with the standard formula for valuing mutual fund shares. The NAV return is based on the NAV of the Fund, and the market return is based on the market price per share of the Fund. The price used to calculate market return (“Market Price”) is determined by using the midpoint between the highest bid and the lowest offer on the stock exchange on which the shares of the Fund are listed for trading, as of the time that the Fund’s NAV is calculated. Market and NAV returns assume that dividends and capital gain distributions have been reinvested in the Fund at Market Price and NAV, respectively.
An index is a statistical composite that tracks a specified financial market or sector. Unlike the Fund, an index does not actually hold a portfolio of securities and therefore does not incur the expenses incurred by the Fund. These expenses negatively impact the performance of the Fund. Also, market returns do not include brokerage commissions that may be payable on secondary market transactions. If brokerage commissions were included, market returns would be lower. The returns shown in the tables above do not reflect the deduction of taxes that a shareholder would pay on fund distributions or the redemption or sale of fund shares. The investment return and principal value of shares of the Fund will vary with changes in market conditions. Shares of the Fund may be worth more or less than their original cost when they are redeemed or sold in the market. The Fund’s past performance is no guarantee of future results.
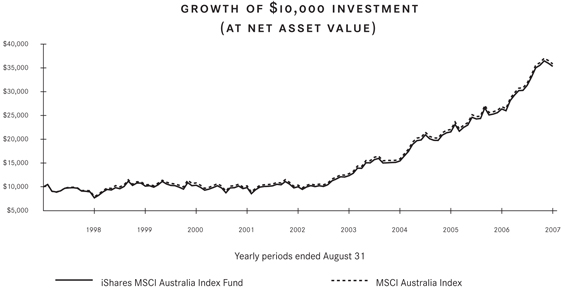
Performance figures assume reinvestment of all dividends and capital gain distributions and do not reflect the deduction of taxes that a shareholder would pay on fund distributions or the redemption of fund shares. An index is a statistical composite that tracks a specified financial market or sector. Unlike the Fund, an index does not actually hold a portfolio of securities and therefore does not incur the expenses incurred by the Fund. These expenses negatively impact the performance of the Fund. The Fund’s past performance is no guarantee of future results.
MANAGEMENT’S DISCUSSIONS OF FUND PERFORMANCE | 1 |
Table of Contents
Management’s Discussion of Fund Performance (Continued)
iSHARES® MSCI AUSTRALIA INDEX FUND
PORTFOLIO ALLOCATION As of 8/31/07 | |||
| Sector | Percentage of Net Assets | ||
Financial | 47.33 | % | |
Basic Materials | 19.94 | ||
Consumer Non-Cyclical | 11.76 | ||
Industrial | 7.31 | ||
Consumer Cyclical | 4.36 | ||
Energy | 4.09 | ||
Communications | 3.15 | ||
Utilities | 0.66 | ||
Technology | 0.51 | ||
Short-Term and Other Net Assets | 0.89 | ||
TOTAL | 100.00 | % | |
TEN LARGEST FUND HOLDINGS As of 8/31/07 | |||
| Security | Percentage of Net Assets | ||
BHP Billiton Ltd. | 12.68 | % | |
Commonwealth Bank of Australia | 7.06 | ||
National Australia Bank Ltd. | 6.41 | ||
Australia and New Zealand Banking Group Ltd. | 5.27 | ||
Westpac Banking Corp. | 4.95 | ||
Westfield Group | 3.60 | ||
Woolworths Ltd. | 3.55 | ||
QBE Insurance Group Ltd. | 2.96 | ||
Rio Tinto Ltd. | 2.63 | ||
Woodside Petroleum Ltd. | 2.13 | ||
TOTAL | 51.24 | % | |
The iShares MSCI Australia Index Fund (the “Fund”) seeks to provide investment results that correspond generally to the price and yield performance, before fees and expenses, of publicly traded securities in the aggregate in the Australian market, as measured by the MSCI Australia Index (the “Index”). The Fund invests in a representative sample of securities included in the Index that collectively has an investment profile similar to the Index. Due to the use of representative sampling, the Fund may or may not hold all of the securities that are included in the Index. For the 12-month period ended August 31, 2007 (the “reporting period”), the Fund returned 33.97%, while the Index returned 33.51%.
The Australian stock market enjoyed robust returns for the reporting period. The Australian economy, now in its 16th consecutive year of expansion, grew by 4.3% for the 12 months ended June 30, 2007. The growth was paced by strong commodity exports, especially to China but also elsewhere in Asia and Europe. The inflation rate also increased modestly, leading the Reserve Bank of Australia to raise interest rates twice during the reporting period. The Australian central bank boosted its cash rate target to 6.5%, its highest level in 11 years.
The stock market’s strong gains reflected the favorable economic environment and strength in commodity-based industries, such as mining and metals producers. In addition, currency fluctuations enhanced Australian stock returns for U.S. investors; the U.S. dollar declined by approximately 6.9% versus the Australian dollar during the reporting period.
Each of the Fund’s ten largest holdings as of August 31, 2007, posted double-digit gains for the reporting period. The leading performers included retailer Woolworths Ltd., which reported strong sales and improving profit margins, and QBE Insurance Group Ltd., which exceeded earnings expectations in the first half of 2007. Two mining companies among the ten largest holdings, BHP Billiton Ltd. and Rio Tinto Ltd., also delivered strong returns due to high demand for metals and minerals. The weaker performers among the ten largest holdings were commercial bank Australia and New Zealand Banking Group Ltd. and energy producer Woodside Petroleum Ltd.
2 | 2007 iSHARES ANNUAL REPORT TO SHAREHOLDERS |
Table of Contents
Management’s Discussion of Fund Performance
iSHARES® MSCI BRAZIL INDEX FUND
Performance as of August 31, 2007
| Average Annual Total Returns | ||||||||||||||||
| Year Ended 8/31/07 | Five Years Ended 8/31/07 | Inception to 8/31/07 | ||||||||||||||
| NAV | MARKET | INDEX | NAV | MARKET | INDEX | NAV | MARKET | INDEX | ||||||||
| 60.82% | 58.64% | 61.26% | 51.98% | 52.42% | 54.03% | 19.57% | 19.45% | 21.96% | ||||||||
| Cumulative Total Returns | ||||||||||||||||
| Year Ended 8/31/07 | Five Years Ended 8/31/07 | Inception to 8/31/07 | ||||||||||||||
| NAV | MARKET | INDEX | NAV | MARKET | INDEX | NAV | MARKET | INDEX | ||||||||
| 60.82% | 58.64% | 61.26% | 710.96% | 722.60% | 766.98% | 258.51% | 255.95% | 313.51% | ||||||||
Total returns for the periods since inception are calculated from the inception date of the Fund (7/10/00). “Average Annual Total Returns” represent the average annual change in value of an investment over the periods indicated. “Cumulative Total Returns” represent the total change in value of an investment over the periods indicated.
Certain sectors and markets performed exceptionally well based on market conditions during the one-year period. Achieving such exceptional returns involves the risk of volatility and investors should not expect that such exceptional returns will be repeated.
The Fund’s per share net asset value or “NAV” is the value of one share of the Fund as calculated in accordance with the standard formula for valuing mutual fund shares. The NAV return is based on the NAV of the Fund, and the market return is based on the market price per share of the Fund. The price used to calculate market return (“Market Price”) is determined by using the midpoint between the highest bid and the lowest offer on the stock exchange on which the shares of the Fund are listed for trading, as of the time that the Fund’s NAV is calculated. Since shares of the Fund did not trade in the secondary market until several days after the Fund’s inception, for the period from inception to the first day of secondary market trading in shares of the Fund (7/14/00), the NAV of the Fund is used as a proxy for secondary market trading price to calculate market returns. Market and NAV returns assume that dividends and capital gain distributions have been reinvested in the Fund at Market Price and NAV, respectively.
An index is a statistical composite that tracks a specified financial market or sector. Unlike the Fund, an index does not actually hold a portfolio of securities and therefore does not incur the expenses incurred by the Fund. These expenses negatively impact the performance of the Fund. Also, market returns do not include brokerage commissions that may be payable on secondary market transactions. If brokerage commissions were included, market returns would be lower. The returns shown in the tables above do not reflect the deduction of taxes that a shareholder would pay on fund distributions or the redemption or sale of fund shares. The investment return and principal value of shares of the Fund will vary with changes in market conditions. Shares of the Fund may be worth more or less than their original cost when they are redeemed or sold in the market. The Fund’s past performance is no guarantee of future results.
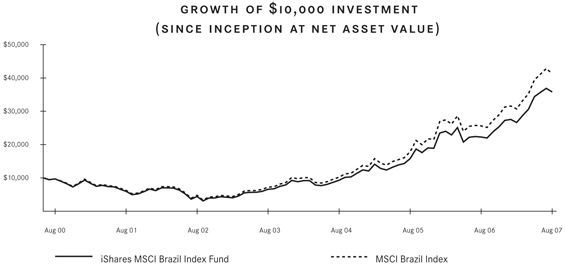
Performance figures assume reinvestment of all dividends and capital gain distributions and do not reflect the deduction of taxes that a shareholder would pay on fund distributions or the redemption of fund shares. An index is a statistical composite that tracks a specified financial market or sector. Unlike the Fund, an index does not actually hold a portfolio of securities and therefore does not incur the expenses incurred by the Fund. These expenses negatively impact the performance of the Fund. The Fund’s past performance is no guarantee of future results.
MANAGEMENT’S DISCUSSIONS OF FUND PERFORMANCE | 3 |
Table of Contents
Management’s Discussion of Fund Performance (Continued)
iSHARES® MSCI BRAZIL INDEX FUND
| PORTFOLIO ALLOCATION As of 8/31/07 | |||
| Sector | Percentage of Net Assets | ||
Basic Materials | 31.14 | % | |
Energy | 22.13 | ||
Financial | 17.46 | ||
Consumer Non-Cyclical | 8.27 | ||
Utilities | 7.51 | ||
Communications | 7.02 | ||
Industrial | 3.66 | ||
Consumer Cyclical | 2.10 | ||
Short-Term and Other Net Assets | 0.71 | ||
TOTAL | 100.00 | % | |
| TEN LARGEST FUND HOLDINGS As of 8/31/07 | |||
| Security | Percentage of Net Assets | ||
Petroleo Brasileiro SA Preferred | 12.02 | % | |
Companhia Vale do Rio Doce Class A Preferred | 11.37 | ||
Petroleo Brasileiro SA | 10.11 | ||
Companhia Vale do Rio Doce ADR | 9.56 | ||
Banco Bradesco SA Preferred | 6.65 | ||
Banco Itau Holding Financeira SA Preferred | 4.85 | ||
Companhia de Bebidas das Americas Preferred | 4.41 | ||
Unibanco-Uniao de Bancos Brasileiros SA | 4.19 | ||
Gerdau SA Preferred | 2.47 | ||
Companhia Siderurgica Nacional | 2.27 | ||
TOTAL | 67.90 | % | |
The iShares MSCI Brazil Index Fund (the “Fund”) seeks to provide investment results that correspond generally to the price and yield performance, before fees and expenses, of publicly traded securities in the aggregate in the Brazilian market, as measured by the MSCI Brazil Index (the “Index”). The Fund invests in a representative sample of securities included in the Index that collectively has an investment profile similar to the Index. Due to the use of representative sampling, the Fund may or may not hold all of the securities that are included in the Index. For the 12-month period ended August 31, 2007 (the “reporting period”), the Fund returned 60.82%, while the Index returned 61.26%.
The Brazilian stock market enjoyed robust returns for the reporting period. The Brazilian economy grew by 5.4% for the 12 months ended June 30, 2007, driven largely by strong commodity exports, particularly metals and oil. The inflation rate came in at 3.9%, below the government’s 4.5% target. As a result, the Brazilian central bank lowered its benchmark interest rate seven times during the reporting period. Since November 2005, the central bank has enacted 17 interest rate cuts, bringing the benchmark interest rate down from 19.75% to a 20-year low of 11.50%.
The sharp rise in the Brazilian stock market resulted from surging commodity exports and foreign investment in the country’s stocks and bonds. In addition, currency fluctuations enhanced Brazilian stock returns for U.S. investors; the Brazilian real hit a seven-year high versus the U.S. dollar in July 2007 and gained 8.8% overall against the U.S. currency during the reporting period.
Each of the Fund’s ten largest holdings as of August 31, 2007, posted returns of more than 35% for the reporting period. The leading performers were the Class A preferred and ADR shares of Companhia Vale do Rio Doce, the world’s largest iron-ore and nickel exporter, which benefited from very strong global demand for metals. Also benefiting from this trend were steelmakers Companhia Siderurgica Nacional and the preferred shares of Gerdau SA. The lowest returns for the reporting period came from the Fund’s largest holding, the preferred shares of energy producer Petroleo Brasileiro SA.
4 | 2007 iSHARES ANNUAL REPORT TO SHAREHOLDERS |
Table of Contents
Management’s Discussion of Fund Performance
iSHARES® MSCI CANADA INDEX FUND
Performance as of August 31, 2007
| Average Annual Total Returns | ||||||||||||||||
| Year Ended 8/31/07 | Five Years Ended 8/31/07 | Ten Years Ended 8/31/07 | ||||||||||||||
| NAV | MARKET | INDEX | NAV | MARKET | INDEX | NAV | MARKET | INDEX | ||||||||
| 22.33% | 22.28% | 22.69% | 26.97% | 26.75% | 27.40% | 13.30% | 13.31% | 13.74% | ||||||||
| Cumulative Total Returns | ||||||||||||||||
| Year Ended 8/31/07 | Five Years Ended 8/31/07 | Ten Years Ended 8/31/07 | ||||||||||||||
| NAV | MARKET | INDEX | NAV | MARKET | INDEX | NAV | MARKET | INDEX | ||||||||
| 22.33% | 22.28% | 22.69% | 230.05% | 227.19% | 235.63% | 248.71% | 248.89% | 262.31% | ||||||||
“Average Annual Total Returns” represent the average annual change in value of an investment over the periods indicated. “Cumulative Total Returns” represent the total change in value of an investment over the periods indicated.
The Fund’s per share net asset value or “NAV” is the value of one share of the Fund as calculated in accordance with the standard formula for valuing mutual fund shares. The NAV return is based on the NAV of the Fund, and the market return is based on the market price per share of the Fund. The price used to calculate market return (“Market Price”) is determined by using the midpoint between the highest bid and the lowest offer on the stock exchange on which the shares of the Fund are listed for trading, as of the time that the Fund’s NAV is calculated. Market and NAV returns assume that dividends and capital gain distributions have been reinvested in the Fund at Market Price and NAV, respectively.
An index is a statistical composite that tracks a specified financial market or sector. Unlike the Fund, an index does not actually hold a portfolio of securities and therefore does not incur the expenses incurred by the Fund. These expenses negatively impact the performance of the Fund. Also, market returns do not include brokerage commissions that may be payable on secondary market transactions. If brokerage commissions were included, market returns would be lower. The returns shown in the tables above do not reflect the deduction of taxes that a shareholder would pay on fund distributions or the redemption or sale of fund shares. The investment return and principal value of shares of the Fund will vary with changes in market conditions. Shares of the Fund may be worth more or less than their original cost when they are redeemed or sold in the market. The Fund’s past performance is no guarantee of future results.
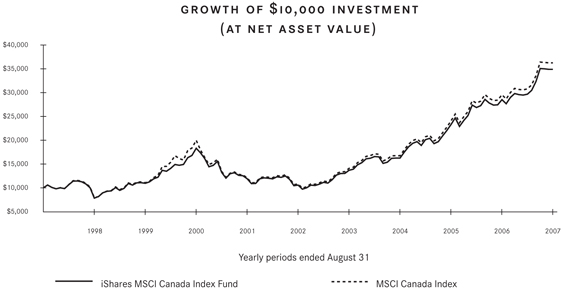
Performance figures assume reinvestment of all dividends and capital gain distributions and do not reflect the deduction of taxes that a shareholder would pay on fund distributions or the redemption of fund shares. An index is a statistical composite that tracks a specified financial market or sector. Unlike the Fund, an index does not actually hold a portfolio of securities and therefore does not incur the expenses incurred by the Fund. These expenses negatively impact the performance of the Fund. The Fund’s past performance is no guarantee of future results.
MANAGEMENT’S DISCUSSIONS OF FUND PERFORMANCE | 5 |
Table of Contents
Management’s Discussion of Fund Performance (Continued)
iSHARES® MSCI CANADA INDEX FUND
PORTFOLIO ALLOCATION As of 8/31/07 | |||
| Sector | Percentage of Net Assets | ||
Financial | 29.75 | % | |
Energy | 26.82 | ||
Basic Materials | 17.49 | ||
Communications | 6.82 | ||
Industrial | 5.64 | ||
Technology | 4.65 | ||
Consumer Cyclical | 3.49 | ||
Diversified | 2.15 | ||
Consumer Non-Cyclical | 1.83 | ||
Utilities | 1.08 | ||
Short-Term and Other Net Assets | 0.28 | ||
TOTAL | 100.00 | % | |
TEN LARGEST FUND HOLDINGS As of 8/31/07 | |||
| Security | Percentage of Net Assets | ||
Royal Bank of Canada | 6.01 | % | |
Manulife Financial Corp. | 5.47 | ||
Bank of Nova Scotia | 4.46 | ||
EnCana Corp. | 4.08 | ||
Research In Motion Ltd. | 3.91 | ||
Suncor Energy Inc. | 3.76 | ||
Canadian Natural Resources Ltd. | 3.36 | ||
Alcan Inc. | 3.31 | ||
Bank of Montreal | 2.80 | ||
Canadian Imperial Bank of Commerce | 2.79 | ||
TOTAL | 39.95 | % | |
The iShares MSCI Canada Index Fund (the “Fund”) seeks to provide investment results that correspond generally to the price and yield performance, before fees and expenses, of publicly traded securities in the aggregate in the Canadian market, as measured by the MSCI Canada Index (the “Index”). The Fund invests in a representative sample of securities included in the Index that collectively has an investment profile similar to the Index. Due to the use of representative sampling, the Fund may or may not hold all of the securities that are included in the Index. For the 12-month period ended August 31, 2007 (the “reporting period”), the Fund returned 22.33%, while the Index returned 22.69%.
The Canadian stock market enjoyed strong returns for the reporting period. The Canadian economy grew by 2.5% for the 12 months ended June 30, 2007, boosted by strong global demand for commodities such as oil, natural gas, and metals. Rising commodity exports, especially to China and other countries outside of the U.S., helped lower the Canadian unemployment rate to 6%, its lowest level in 30 years, and boosted domestic consumption. In addition, Canada continued to generate a federal budget surplus, as it has every year since 1998. As a result, the Canadian dollar strengthened to a 30-year high versus the U.S. dollar, rising 5% for the reporting period and 35% since its 2002 low.
The Canadian stock market benefited from the favorable economic environment, as well as healthy corporate earnings growth and increasing merger activity. However, Canadian shares fell late in the reporting period amid concerns about the sub-prime lending crisis in the U.S., which is Canada’s largest trading partner.
Each of the Fund’s ten largest holdings as of August 31, 2007, posted positive returns for the reporting period, and two delivered returns of more than 100%. The leading performers were wireless handheld device maker Research In Motion Ltd., which continued to benefit from the success of its Blackberry® wireless device, and aluminum producer Alcan Inc., which was the subject of a bidding war before agreeing to be acquired by Australian mining company Rio Tinto Ltd. Other top performers included energy producer Canadian Natural Resources Ltd. and commercial bank Canadian Imperial Bank of Commerce. The only stock among the ten largest holdings to post a single-digit gain during the reporting period was Bank of Montreal.
6 | 2007 iSHARES ANNUAL REPORT TO SHAREHOLDERS |
Table of Contents
Management’s Discussion of Fund Performance
iSHARES® MSCI EMERGING MARKETS INDEX FUND
Performance as of August 31, 2007
| Average Annual Total Returns | Cumulative Total Returns | |||||||||||||||
| Year Ended 8/31/07 | Inception to 8/31/07 | Inception to 8/31/07 | ||||||||||||||
| NAV | MARKET | INDEX | NAV | MARKET | INDEX | NAV | MARKET | INDEX | ||||||||
| 39.86% | 39.06% | 43.63% | 38.18% | 38.06% | 38.75% | 315.33% | 313.67% | 322.50% | ||||||||
Total returns for the periods since inception are calculated from the inception date of the Fund (4/7/03). “Average Annual Total Returns” represent the average annual change in value of an investment over the periods indicated. “Cumulative Total Returns” represent the total change in value of an investment over the periods indicated.
Certain sectors and markets performed exceptionally well based on market conditions during the one-year period. Achieving such exceptional returns involves the risk of volatility and investors should not expect that such exceptional returns will be repeated.
The Fund’s per share net asset value or “NAV” is the value of one share of the Fund as calculated in accordance with the standard formula for valuing mutual fund shares. The NAV return is based on the NAV of the Fund, and the market return is based on the market price per share of the Fund. The price used to calculate market return (“Market Price”) is determined by using the midpoint between the highest bid and the lowest offer on the stock exchange on which the shares of the Fund are listed for trading, as of the time that the Fund’s NAV is calculated. Since shares of the Fund did not trade in the secondary market until several days after the Fund’s inception, for the period from inception to the first day of secondary market trading in shares of the Fund (4/11/03), the NAV of the Fund is used as a proxy for secondary market trading price to calculate market returns. Market and NAV returns assume that dividends and capital gain distributions have been reinvested in the Fund at Market Price and NAV, respectively.
An index is a statistical composite that tracks a specified financial market or sector. Unlike the Fund, an index does not actually hold a portfolio of securities and therefore does not incur the expenses incurred by the Fund. These expenses negatively impact the performance of the Fund. Also, market returns do not include brokerage commissions that may be payable on secondary market transactions. If brokerage commissions were included, market returns would be lower. The returns shown in the tables above do not reflect the deduction of taxes that a shareholder would pay on fund distributions or the redemption or sale of fund shares. The investment return and principal value of shares of the Fund will vary with changes in market conditions. Shares of the Fund may be worth more or less than their original cost when they are redeemed or sold in the market. The Fund’s past performance is no guarantee of future results.
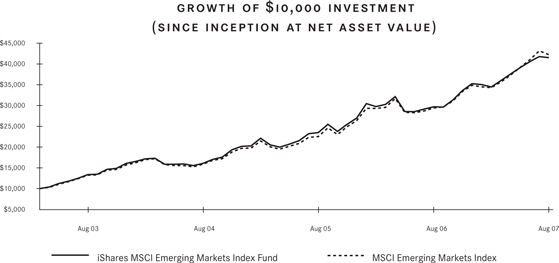
Performance figures assume reinvestment of all dividends and capital gain distributions and do not reflect the deduction of taxes that a shareholder would pay on fund distributions or the redemption of fund shares. An index is a statistical composite that tracks a specified financial market or sector. Unlike the Fund, an index does not actually hold a portfolio of securities and therefore does not incur the expenses incurred by the Fund. These expenses negatively impact the performance of the Fund. The Fund’s past performance is no guarantee of future results.
MANAGEMENT’S DISCUSSIONS OF FUND PERFORMANCE | 7 |
Table of Contents
Management’s Discussion of Fund Performance (Continued)
iSHARES® MSCI EMERGING MARKETS INDEX FUND
| PORTFOLIO ALLOCATION As of 8/31/07 | |||
| Sector | Percentage of Net Assets | ||
Financial | 21.12 | % | |
Energy | 14.95 | ||
Basic Materials | 14.79 | ||
Communications | 14.02 | ||
Industrial | 10.18 | ||
Technology | 8.90 | ||
Utilities | 4.48 | ||
Consumer Non-Cyclical | 4.39 | ||
Consumer Cyclical | 3.92 | ||
Diversified | 2.22 | ||
Funds | 0.55 | ||
Short-Term and Other Net Assets | 0.48 | ||
TOTAL | 100.00 | % | |
| TEN LARGEST FUND HOLDINGS As of 8/31/07 | |||
| Security | Percentage of Net Assets | ||
POSCO ADR (South Korea) | 4.33 | % | |
Samsung Electronics Co. Ltd. GDR | 3.54 | ||
OAO Gazprom SP ADR (Russia) | 3.47 | ||
Taiwan Semiconductor Manufacturing Co. Ltd. SP ADR (Taiwan) | 2.74 | ||
China Mobile Ltd. (Hong Kong) | 2.33 | ||
Siliconware Precision Industries Co. | 2.23 | ||
Kookmin Bank SP ADR (South Korea) | 2.23 | ||
Chunghwa Telecom Co. Ltd. ADR (Taiwan) | 1.87 | ||
United Microelectronics Corp. SP ADR (Taiwan) | 1.67 | ||
Companhia Vale do Rio Doce Preferred SP ADR (Brazil) | 1.63 | ||
TOTAL | 26.04 | % | |
The iShares MSCI Emerging Markets Index Fund (the “Fund”) seeks to provide investment results that correspond generally to the price and yield performance, before fees and expenses, of the MSCI Emerging Markets Index (the “Index”). The Index is designed to measure equity market performance in the global emerging markets. The Fund invests in a representative sample of securities included in the Index that collectively has an investment profile similar to the Index. Due to the use of representative sampling, the Fund may or may not hold all of the securities that are included in the Index. For the 12-month period ended August 31, 2007 (the “reporting period”), the Fund returned 39.86%, while the Index returned 43.63%.
Emerging markets stocks continued to enjoy robust returns during the reporting period, extending a 4 1/2-year rally. From the rally’s start in March 2003 through the end of the reporting period, the Index had a cumulative total return of over 340%.
The key to the strong performance of emerging equity markets during the reporting period was healthy economic growth, particularly in China and India, but also across Latin America and the rest of Asia. With global growth on the rise, demand for energy and commodities increased from already strong levels. Many emerging markets are major exporters of commodities – primarily oil, gas, and metals – and rising prices boosted profits for companies that produce and export these commodities.
Despite the sizable overall returns, however, many emerging markets gave up some of their gains toward the end of the reporting period. Concerns about the sub-prime lending crisis in the U.S. led to a “flight to quality” as many investors shifted assets out of riskier markets, including many emerging markets.
Latin American markets delivered the best returns for the reporting period. Peru was the top performer in the region due to very strong economic growth and a rapidly growing trade surplus. Brazil, the largest market in Latin America, also rallied sharply as base metals exports soared, and Mexico also fared well, led by telecommunications and materials stocks.
8 | 2007 iSHARES ANNUAL REPORT TO SHAREHOLDERS |
Table of Contents
Management’s Discussion of Fund Performance (Continued)
iSHARES® MSCI EMERGING MARKETS INDEX FUND
Emerging markets in Asia also produced large-sized returns for the reporting period. In China, the stock market surged, as the Chinese economy continued to grow at a double-digit annualized pace, driven by soaring exports. In addition, outsourcing contributed to the strong performance of the stock markets in the Philippines and India.
Markets in Eastern Europe and the Middle East generally posted sound gains for the reporting period. Russia was one of the weaker performers, rising only slightly for the reporting period. On the positive side, Turkey and the Czech Republic both delivered strong gains.
Among the Fund’s ten largest holdings as of August 31, 2007, eight registered positive returns for the reporting period, and three returned more than 100%. The two best performers were metals companies – the ADR shares of South Korean steelmaker POSCO and the sponsored ADR shares of the preferred shares of the Brazilian nickel and iron-ore producer Companhia Vale do Rio Doce – both of which benefited from strong global demand for metals and rising prices. The other top ten holding with a triple-digit return was Chinese wireless telecommunications services provider China Mobile Ltd., which enjoyed a strong increase in its subscriber base. The only two stocks among the ten largest holdings to decline for the reporting period were OAO Gazprom SP ADR and Samsung Electronics Co. Ltd. GDR.
MANAGEMENT’S DISCUSSIONS OF FUND PERFORMANCE | 9 |
Table of Contents
Management’s Discussion of Fund Performance
iSHARES® MSCI HONG KONG INDEX FUND
Performance as of August 31, 2007
| Average Annual Total Returns | ||||||||||||||||
| Year Ended 8/31/07 | Five Years Ended 8/31/07 | Ten Years Ended 8/31/07 | ||||||||||||||
| NAV | MARKET | INDEX | NAV | MARKET | INDEX | NAV | MARKET | INDEX | ||||||||
| 31.44% | 32.64% | 32.17% | 20.50% | 20.97% | 21.39% | 4.70% | 4.78% | 6.31% | ||||||||
| Cumulative Total Returns | ||||||||||||||||
| Year Ended 8/31/07 | Five Years Ended 8/31/07 | Ten Years Ended 8/31/07 | ||||||||||||||
| NAV | MARKET | INDEX | NAV | MARKET | INDEX | NAV | MARKET | INDEX | ||||||||
| 31.44% | 32.64% | 32.17% | 154.08% | 159.02% | 163.61% | 58.26% | 59.54% | 84.32% | ||||||||
“Average Annual Total Returns” represent the average annual change in value of an investment over the periods indicated. “Cumulative Total Returns” represent the total change in value of an investment over the periods indicated.
The Fund’s per share net asset value or ”NAV” is the value of one share of the Fund as calculated in accordance with the standard formula for valuing mutual fund shares. The NAV return is based on the NAV of the Fund, and the market return is based on the market price per share of the Fund. The price used to calculate market return (“Market Price”) is determined by using the midpoint between the highest bid and the lowest offer on the stock exchange on which the shares of the Fund are listed for trading, as of the time that the Fund’s NAV is calculated. Market and NAV returns assume that dividends and capital gain distributions have been reinvested in the Fund at Market Price and NAV, respectively.
An index is a statistical composite that tracks a specified financial market or sector. Unlike the Fund, an index does not actually hold a portfolio of securities and therefore does not incur the expenses incurred by the Fund. These expenses negatively impact the performance of the Fund. Also, market returns do not include brokerage commissions that may be payable on secondary market transactions. If brokerage commissions were included, market returns would be lower. The returns shown in the tables above do not reflect the deduction of taxes that a shareholder would pay on fund distributions or the redemption or sale of fund shares. The investment return and principal value of shares of the Fund will vary with changes in market conditions. Shares of the Fund may be worth more or less than their original cost when they are redeemed or sold in the market. The Fund’s past performance is no guarantee of future results.
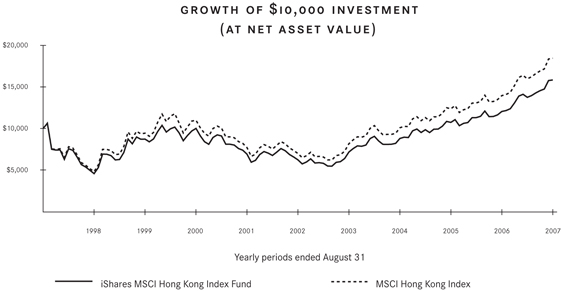
Performance figures assume reinvestment of all dividends and capital gain distributions and do not reflect the deduction of taxes that a shareholder would pay on fund distributions or the redemption of fund shares. An index is a statistical composite that tracks a specified financial market or sector. Unlike the Fund, an index does not actually hold a portfolio of securities and therefore does not incur the expenses incurred by the Fund. These expenses negatively impact the performance of the Fund. The Fund’s past performance is no guarantee of future results.
10 | 2007 iSHARES ANNUAL REPORT TO SHAREHOLDERS |
Table of Contents
Management’s Discussion of Fund Performance (Continued)
iSHARES® MSCI HONG KONG INDEX FUND
| PORTFOLIO ALLOCATION As of 8/31/07 | |||
| Sector | Percentage of Net Assets | ||
Financial | 47.85 | % | |
Diversified | 14.05 | ||
Consumer Cyclical | 13.35 | ||
Utilities | 9.41 | ||
Communications | 6.21 | ||
Industrial | 5.84 | ||
Basic Materials | 1.32 | ||
Consumer Non-Cyclical | 0.93 | ||
Technology | 0.66 | ||
Short-Term and Other Net Assets | 0.38 | ||
TOTAL | 100.00 | % | |
| TEN LARGEST FUND HOLDINGS As of 8/31/07 | |||
| Security | Percentage of Net Assets | ||
Cheung Kong (Holdings) Ltd. | 8.57 | % | |
Hutchison Whampoa Ltd. | 8.15 | ||
Hong Kong Exchanges and Clearing Ltd. | 7.55 | ||
Sun Hung Kai Properties Ltd. | 7.00 | ||
Esprit Holdings Ltd. | 5.86 | ||
Hang Seng Bank Ltd. | 4.61 | ||
Swire Pacific Ltd. Class A | 3.55 | ||
CLP Holdings Ltd. | 3.52 | ||
BOC Hong Kong Holdings Ltd. | 3.43 | ||
Hong Kong and China Gas Co. Ltd. (The) | 3.23 | ||
TOTAL | 55.47 | % | |
The iShares MSCI Hong Kong Index Fund (the “Fund”) seeks to provide investment results that correspond generally to the price and yield performance, before fees and expenses, of publicly traded securities in the aggregate in the Hong Kong market, as measured by the MSCI Hong Kong Index (the “Index”). The Fund invests in a representative sample of securities included in the Index that collectively has an investment profile similar to the Index. Due to the use of representative sampling, the Fund may or may not hold all of the securities that are included in the Index. For the 12-month period ended August 31, 2007 (the “reporting period”), the Fund returned 31.44%, while the Index returned 32.17%.
The Hong Kong stock market enjoyed robust returns for the reporting period. The Hong Kong economy grew by 6.9% for the 12 months ended June 30, 2007, in line with the 6.8% growth rate for all of 2006. Hong Kong’s close relationship and trade partnership with mainland China appeared to be the key driver behind this healthy growth rate. The Chinese economy surged during the reporting period – its 11.9% annualized growth rate in the second quarter of 2007 was the fastest rate in 12 years – and this helped lift economic activity in Hong Kong. The Hong Kong market also appeared to benefit from the expansion of China’s Qualified Domestic Institutional Investors program, which allows institutional investors (banks, insurance companies, and asset managers) to place funds in foreign securities.
Hong Kong’s ties with China led to some stock market volatility during the reporting period. A sharp drop in the Chinese market in late February 2007 – triggered by a government statement threatening to crackdown on stock market speculation – caused a similar decline in the Hong Kong market. Hong Kong shares also fell late in the reporting period as concerns about the sub-prime lending crisis in the U.S. led to a re-pricing of risk in markets around the world.
Each of the Fund’s ten largest holdings as of August 31, 2007, gained ground for the reporting period. By far, the leading performer was stock exchange Hong Kong Exchanges and Clearing Ltd., which delivered triple-digit gains for the reporting period as increased trading boosted profits. Other top performers included apparel maker Esprit Holdings Ltd. and property developer Cheung Kong (Holdings) Ltd.; the Fund’s largest holding as of August 31, 2007. The class A shares of diversified conglomerate Swire Pacific Ltd. posted the most modest return among the ten largest holdings for the reporting period.
MANAGEMENT’S DISCUSSIONS OF FUND PERFORMANCE | 11 |
Table of Contents
Management’s Discussion of Fund Performance
iSHARES® MSCI MALAYSIA INDEX FUND
Performance as of August 31, 2007
| Average Annual Total Returns | ||||||||||||||||
| Year Ended 8/31/07 | Five Years Ended 8/31/07 | Ten Years Ended 8/31/07 | ||||||||||||||
| NAV | MARKET | INDEX | NAV | MARKET | INDEX | NAV | MARKET | INDEX | ||||||||
| 44.64% | 48.05% | 45.66% | 16.84% | 17.38% | 17.80% | 5.57% | 5.75% | 6.64% | ||||||||
| Cumulative Total Returns | ||||||||||||||||
| Year Ended 8/31/07 | Five Years Ended 8/31/07 | Ten Years Ended 8/31/07 | ||||||||||||||
| NAV | MARKET | INDEX | NAV | MARKET | INDEX | NAV | MARKET | INDEX | ||||||||
| 44.64% | 48.05% | 45.66% | 117.72% | 122.80% | 126.87% | 71.88% | 74.83% | 90.26% | ||||||||
“Average Annual Total Returns” represent the average annual change in value of an investment over the periods indicated. “Cumulative Total Returns” represent the total change in value of an investment over the periods indicated.
Certain sectors and markets performed exceptionally well based on market conditions during the one-year period. Achieving such exceptional returns involves the risk of volatility and investors should not expect that such exceptional returns will be repeated.
The Fund’s per share net asset value or “NAV” is the value of one share of the Fund as calculated in accordance with the standard formula for valuing mutual fund shares. The NAV return is based on the NAV of the Fund, and the market return is based on the market price per share of the Fund. The price used to calculate market return (“Market Price”) is determined by using the midpoint between the highest bid and the lowest offer on the stock exchange on which the shares of the Fund are listed for trading, as of the time that the Fund’s NAV is calculated. As the Fund has a NAV which is determined prior to the opening of the regular trading day on the stock exchange on which it is listed, the market return is calculated using the midpoint of the bid/ask spread as of the opening of regular trading on the exchange. Market and NAV returns assume that dividends and capital gain distributions have been reinvested in the Fund at Market Price and NAV, respectively.
An index is a statistical composite that tracks a specified financial market or sector. Unlike the Fund, an index does not actually hold a portfolio of securities and therefore does not incur the expenses incurred by the Fund. These expenses negatively impact the performance of the Fund. Also, market returns do not include brokerage commissions that may be payable on secondary market transactions. If brokerage commissions were included, market returns would be lower. The returns shown in the tables above do not reflect the deduction of taxes that a shareholder would pay on fund distributions or the redemption or sale of fund shares. The investment return and principal value of shares of the Fund will vary with changes in market conditions. Shares of the Fund may be worth more or less than their original cost when they are redeemed or sold in the market. The Fund’s past performance is no guarantee of future results.
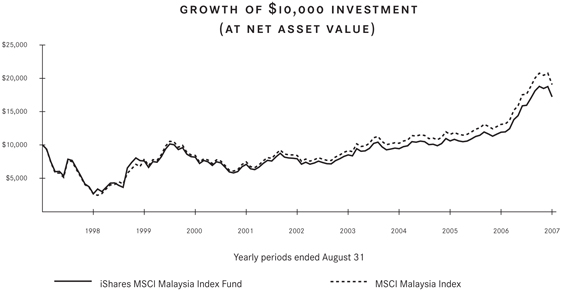
Performance figures assume reinvestment of all dividends and capital gain distributions and do not reflect the deduction of taxes that a shareholder would pay on fund distributions or the redemption of fund shares. An index is a statistical composite that tracks a specified financial market or sector. Unlike the Fund, an index does not actually hold a portfolio of securities and therefore does not incur the expenses incurred by the Fund. These expenses negatively impact the performance of the Fund. The Fund’s past performance is no guarantee of future results.
12 | 2007 iSHARES ANNUAL REPORT TO SHAREHOLDERS |
Table of Contents
Management’s Discussion of Fund Performance (Continued)
iSHARES® MSCI MALAYSIA INDEX FUND
| PORTFOLIO ALLOCATION As of 8/31/07 | |||
| Sector | Percentage of Net Assets | ||
Financial | 32.23 | % | |
Consumer Non-Cyclical | 16.13 | ||
Consumer Cyclical | 15.90 | ||
Industrial | 13.33 | ||
Diversified | 7.17 | ||
Utilities | 6.92 | ||
Communications | 5.62 | ||
Energy | 1.76 | ||
Technology | 0.28 | ||
Short-Term and Other Net Assets | 0.66 | ||
TOTAL | 100.00 | % | |
| TEN LARGEST FUND HOLDINGS As of 8/31/07 | |||
| Security | Percentage of Net Assets | ||
Bumiputra-Commerce Holdings Bhd | 10.59 | % | |
Malayan Banking Bhd | 8.62 | ||
IOI Corp. Bhd | 6.77 | ||
Sime Darby Bhd | 5.41 | ||
Genting Bhd | 5.20 | ||
Tenaga Nasional Bhd | 4.90 | ||
Telekom Malaysia Bhd | 3.82 | ||
MISC Bhd | 3.81 | ||
Public Bank Bhd | 3.74 | ||
Resorts World Bhd | 3.72 | ||
TOTAL | 56.58 | % | |
The iShares MSCI Malaysia Index Fund (the “Fund”) seeks to provide investment results that correspond generally to the price and yield performance, before fees and expenses, of publicly traded securities in the aggregate in the Malaysian market, as measured by the MSCI Malaysia Index (the “Index”). The Fund invests in a representative sample of securities included in the Index that collectively has an investment profile similar to the Index. Due to the use of representative sampling, the Fund may or may not hold all of the securities included in the Index. For the 12-month period ended August 31, 2007 (the “reporting period”), the Fund returned 44.64%, while the Index returned 45.66%.
The Malaysian stock market enjoyed robust returns for the reporting period. The Malaysian economy grew at a 5.7% annualized rate in the second quarter of 2007, down slightly from its 5.9% growth rate for all of 2006. Exports appeared to be the key to Malaysia’s strong economy and stock market as commodity prices rose sharply during the reporting period. Malaysia is the world’s leading producer of palm oil, whose prices hit record highs during the reporting period. Malaysia’s energy and mining operations also benefited from strong global demand, especially from China. Currency fluctuations enhanced Malaysian stock returns for U.S. investors; the U.S. dollar declined by 4.9% versus the Malaysian ringgit for the reporting period.
Despite its strong overall performance, the Malaysian stock market experienced some volatility during the reporting period. A sharp drop in the Chinese market in late February 2007 – triggered by a government statement threatening to crackdown on stock market speculation – caused a similar decline in the Malaysian market. Malaysian shares also fell late in the reporting period as concerns about the sub-prime lending crisis in the U.S. – Malaysia’s largest trading partner – led to a re-pricing of risk in markets around the world.
Each of the Fund’s ten largest holdings as of August 31, 2007, posted positive returns for the reporting period. The leading performers were commercial bank Bumiputra-Commerce Holdings Bhd, the Fund’s largest holding, and conglomerate Sime Darby Bhd, which benefited from its exposure to both palm oil and energy production. Other top performers included resort operator Resorts World Bhd and Public Bank Bhd. The lowest returns among the ten largest holdings came from Malayan Banking Bhd and shipping company MISC Bhd, although both firms still produced double-digit returns.
MANAGEMENT’S DISCUSSIONS OF FUND PERFORMANCE | 13 |
Table of Contents
Management’s Discussion of Fund Performance
iSHARES® MSCI MEXICO INDEX FUND
Performance as of August 31, 2007
| Average Annual Total Returns | ||||||||||||||||
| Year Ended 8/31/07 | Five Years Ended 8/31/07 | Ten Years Ended 8/31/07 | ||||||||||||||
| NAV | MARKET | INDEX | NAV | MARKET | INDEX | NAV | MARKET | INDEX | ||||||||
| 42.58% | 42.24% | 40.85% | 36.02% | 35.86% | 35.10% | 16.53% | 16.60% | 17.69% | ||||||||
| Cumulative Total Returns | ||||||||||||||||
| Year Ended 8/31/07 | Five Years Ended 8/31/07 | Ten Years Ended 8/31/07 | ||||||||||||||
| NAV | MARKET | INDEX | NAV | MARKET | INDEX | NAV | MARKET | INDEX | ||||||||
| 42.58% | 42.24% | 40.85% | 365.59% | 362.92% | 350.10% | 361.89% | 364.59% | 409.85% | ||||||||
“Average Annual Total Returns” represent the average annual change in value of an investment over the periods indicated. “Cumulative Total Returns” represent the total change in value of an investment over the periods indicated.
Certain sectors and markets performed exceptionally well based on market conditions during the one-year period. Achieving such exceptional returns involves the risk of volatility and investors should not expect that such exceptional returns will be repeated.
The Fund’s per share net asset value or “NAV” is the value of one share of the Fund as calculated in accordance with the standard formula for valuing mutual fund shares. The NAV return is based on the NAV of the Fund, and the market return is based on the market price per share of the Fund. The price used to calculate market return (“Market Price”) is determined by using the midpoint between the highest bid and the lowest offer on the stock exchange on which the shares of the Fund are listed for trading, as of the time that the Fund’s NAV is calculated. Market and NAV returns assume that dividends and capital gain distributions have been reinvested in the Fund at Market Price and NAV, respectively.
An index is a statistical composite that tracks a specified financial market or sector. Unlike the Fund, an index does not actually hold a portfolio of securities and therefore does not incur the expenses incurred by the Fund. These expenses negatively impact the performance of the Fund. Also, market returns do not include brokerage commissions that may be payable on secondary market transactions. If brokerage commissions were included, market returns would be lower. The returns shown in the tables above do not reflect the deduction of taxes that a shareholder would pay on fund distributions or the redemption or sale of fund shares. The investment return and principal value of shares of the Fund will vary with changes in market conditions. Shares of the Fund may be worth more or less than their original cost when they are redeemed or sold in the market. The Fund’s past performance is no guarantee of future results.
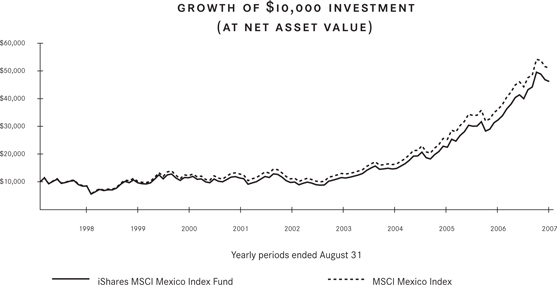
Performance figures assume reinvestment of all dividends and capital gain distributions and do not reflect the deduction of taxes that a shareholder would pay on fund distributions or the redemption of fund shares. An index is a statistical composite that tracks a specified financial market or sector. Unlike the Fund, an index does not actually hold a portfolio of securities and therefore does not incur the expenses incurred by the Fund. These expenses negatively impact the performance of the Fund. The Fund’s past performance is no guarantee of future results.
14 | 2007 iSHARES ANNUAL REPORT TO SHAREHOLDERS |
Table of Contents
Management’s Discussion of Fund Performance (Continued)
iSHARES® MSCI MEXICO INDEX FUND
PORTFOLIO ALLOCATION As of 8/31/07 | |||
| Sector | Percentage of Net Assets | ||
Communications | 42.25 | % | |
Industrial | 18.95 | ||
Consumer Cyclical | 12.01 | ||
Consumer Non-Cyclical | 9.81 | ||
Basic Materials | 8.15 | ||
Diversified | 4.73 | ||
Financial | 3.96 | ||
Short-Term and Other Net Assets | 0.14 | ||
TOTAL | 100.00 | % | |
TEN LARGEST FUND HOLDINGS As of 8/31/07 | |||
| Security | Percentage of Net Assets | ||
America Movil SAB de CV Series L | 24.09 | % | |
Cemex SA de CV Series CPO | 14.84 | ||
Telefonos de Mexico SA de CV Series L | 10.23 | ||
Wal-Mart de Mexico SAB de CV Series V | 4.97 | ||
Grupo Televisa SA Series CPO | 4.96 | ||
Grupo Mexico SA de CV Series B | 4.83 | ||
Fomento Economico Mexicano SAB | 4.76 | ||
Grupo Financiero Banorte SAB de CV Series O | 3.96 | ||
Carso Global Telecom SAB de CV Class A1 | 2.97 | ||
Grupo Carso SA de CV Series A1 | 2.91 | ||
TOTAL | 78.52 | % | |
The iShares MSCI Mexico Index Fund (the “Fund”) seeks to provide investment results that correspond generally to the price and yield performance, before fees and expenses, of publicly traded securities in the aggregate in the Mexican market, as measured by the MSCI Mexico Index (the “Index”). The Fund invests in a representative sample of securities included in the Index that collectively has an investment profile similar to the Index. Due to the use of representative sampling, the Fund may or may not hold all of the securities that are included in the Index. For the 12-month period ended August 31, 2007 (the “reporting period”), the Fund returned 42.58%, while the Index returned 40.85%.
The Mexican stock market enjoyed robust returns for the reporting period, despite a deceleration in the Mexican economy in 2007. The economy grew at a 2.7% annualized rate in the first half of 2007, down from 4.8% for all of 2006. Growth was driven primarily by a strong export market, particularly for commodities such as oil – by volume, Mexico’s government-owned energy company Pemex is the third-largest oil producer in the world. Inflation in Mexico came in at 4% for the reporting period, up from 3.5% for the previous 12 months. Much of the increase resulted from higher food prices as ethanol production in the U.S. and elsewhere led to a sharp increase in the price of corn. The Mexican central bank raised interest rates to 7.25% in April 2007 to keep inflation in check.
The healthy export market provided a lift to the Mexican stock market, as did strong results for companies in the telecommunications and materials sectors. However, Mexico’s close ties with the U.S. led to a decline late in the reporting period amid concerns about the sub-prime lending crisis in the U.S.
Each of the Fund’s ten largest holdings as of August 31, 2007, posted positive returns for the reporting period. The leading performers included the Series B shares of metals producer Grupo Mexico SA de CV, which benefited from a sharp increase in global demand for metals, and the Series L shares of wireless telecommunications services provider America Movil SAB de CV, which reported very strong subscriber growth and better-than-expected profits. Other top performers included Carso Global Telecom SAB de CV Class A1 and the Series L shares of telecommunications provider Telefonos de Mexico SA de CV. The series V shares of the discount retailer Wal-Mart de Mexico SAB de CV posted the most modest return among the ten largest holdings during the reporting period.
MANAGEMENT’S DISCUSSIONS OF FUND PERFORMANCE | 15 |
Table of Contents
Management’s Discussion of Fund Performance
iSHARES® MSCI PACIFIC EX-JAPAN INDEX FUND
Performance as of August 31, 2007
| Average Annual Total Returns | ||||||||||||||||
| Year Ended 8/31/07 | Five Years Ended 8/31/07 | Inception to 8/31/07 | ||||||||||||||
| NAV | MARKET | INDEX | NAV | MARKET | INDEX | NAV | MARKET | INDEX | ||||||||
| 34.86% | 36.24% | 34.89% | 26.27% | 26.10% | 26.15% | 23.17% | 23.33% | 23.12% | ||||||||
| Cumulative Total Returns | ||||||||||||||||
| Year Ended 8/31/07 | Five Years Ended 8/31/07 | Inception to 8/31/07 | ||||||||||||||
| NAV | MARKET | INDEX | NAV | MARKET | INDEX | NAV | MARKET | INDEX | ||||||||
| 34.86% | 36.24% | 34.89% | 220.95% | 218.79% | 219.45% | 238.63% | 241.21% | 237.57% | ||||||||
Total returns for the periods since inception are calculated from the inception date of the Fund (10/25/01). “Average Annual Total Returns” represent the average annual change in value of an investment over the periods indicated. “Cumulative Total Returns” represent the total change in value of an investment over the periods indicated.
The Fund’s per share net asset value or “NAV” is the value of one share of the Fund as calculated in accordance with the standard formula for valuing mutual fund shares. The NAV return is based on the NAV of the Fund, and the market return is based on the market price per share of the Fund. The price used to calculate market return (“Market Price”) is determined by using the midpoint between the highest bid and the lowest offer on the stock exchange on which the shares of the Fund are listed for trading, as of the time that the Fund’s NAV is calculated. Since shares of the Fund did not trade in the secondary market until several days after the Fund’s inception, for the period from inception to the first day of secondary market trading in shares of the Fund (10/26/01), the NAV of the Fund is used as a proxy for secondary market trading price to calculate market returns. Market and NAV returns assume that dividends and capital gain distributions have been reinvested in the Fund at Market Price and NAV, respectively.
An index is a statistical composite that tracks a specified financial market or sector. Unlike the Fund, an index does not actually hold a portfolio of securities and therefore does not incur the expenses incurred by the Fund. These expenses negatively impact the performance of the Fund. Also, market returns do not include brokerage commissions that may be payable on secondary market transactions. If brokerage commissions were included, market returns would be lower. The returns shown in the tables above do not reflect the deduction of taxes that a shareholder would pay on fund distributions or the redemption or sale of fund shares. The investment return and principal value of shares of the Fund will vary with changes in market conditions. Shares of the Fund may be worth more or less than their original cost when they are redeemed or sold in the market. The Fund’s past performance is no guarantee of future results.
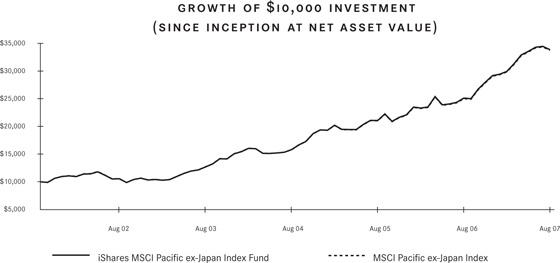
Performance figures assume reinvestment of all dividends and capital gain distributions and do not reflect the deduction of taxes that a shareholder would pay on fund distributions or the redemption of fund shares. An index is a statistical composite that tracks a specified financial market or sector. Unlike the Fund, an index does not actually hold a portfolio of securities and therefore does not incur the expenses incurred by the Fund. These expenses negatively impact the performance of the Fund. The Fund’s past performance is no guarantee of future results.
16 | 2007 iSHARES ANNUAL REPORT TO SHAREHOLDERS |
Table of Contents
Management’s Discussion of Fund Performance (Continued)
iSHARES® MSCI PACIFIC EX-JAPAN INDEX FUND
PORTFOLIO ALLOCATION As of 8/31/07 | |||
| Sector | Percentage of Net Assets | ||
Financial | 47.33 | % | |
Basic Materials | 13.28 | ||
Consumer Non-Cyclical | 8.55 | ||
Industrial | 8.14 | ||
Consumer Cyclical | 6.56 | ||
Communications | 5.76 | ||
Diversified | 3.75 | ||
Energy | 2.75 | ||
Utilities | 2.55 | ||
Technology | 0.56 | ||
Short-Term and Other Net Assets | 0.77 | ||
TOTAL | 100.00 | % | |
| TEN LARGEST FUND HOLDINGS As of 8/31/07 | |||
| Security | Percentage of Net Assets | ||
BHP Billiton Ltd. (Australia) | 8.38 | % | |
Commonwealth Bank of Australia (Australia) | 4.65 | ||
National Australia Bank Ltd. (Australia) | 4.22 | ||
Australia and New Zealand Banking Group Ltd. (Australia) | 3.47 | ||
Westpac Banking Corp. (Australia) | 3.25 | ||
Westfield Group (Australia) | 2.36 | ||
Woolworths Ltd. (Australia) | 2.35 | ||
QBE Insurance Group Ltd. (Australia) | 1.95 | ||
Cheung Kong (Holdings) Ltd. | 1.82 | ||
Rio Tinto Ltd. (Australia) | 1.75 | ||
TOTAL | 34.20 | % | |
The iShares MSCI Pacific ex-Japan Index Fund (the “Fund”) seeks to provide investment results that correspond generally to the price and yield performance, before fees and expenses, of publicly traded securities in the aggregate in the Australia, Hong Kong, New Zealand and Singapore markets, as measured by the MSCI Pacific ex-Japan Index (the “Index”). The Fund invests in a representative sample of securities included in the Index that collectively has an investment profile similar to the Index. Due to the use of representative sampling, the Fund may or may not hold all of the securities that are included in the Index. For the 12-month period ended August 31, 2007 (the “reporting period”), the Fund returned 34.86%, while the Index returned 34.89%.
The Fund enjoyed robust returns during the reporting period as the four markets comprising the Fund – Australia, Hong Kong, New Zealand, and Singapore – delivered very strong results.
The Australian stock market benefited from the strength of the Australian economy, now in its 16th consecutive year of expansion. The economy grew by 4.3% for the 12 months ended June 30, 2007, paced by strong commodity exports, especially to China but also elsewhere in Asia and Europe. The stock market’s strong gains reflected the favorable economic environment and strength in commodity-based industries, such as mining and metals producers. In addition, currency fluctuations enhanced Australian stock returns for U.S. investors; the U.S. dollar declined by 6.9% versus the Australian dollar during the reporting period.
In Hong Kong, the economy grew by 6.9% for the 12 months ended June 30, 2007, driven largely by its close relationship and trade partnership with mainland China. The Chinese economy surged during the reporting period – its 11.9% annualized growth rate in the second quarter of 2007 was the fastest rate in 12 years – and this helped lift economic activity in Hong Kong. The Hong Kong market also appeared to benefit from the expansion of China’s Qualified Domestic Institutional Investors program, which allows institutional investors (banks, insurance companies, and asset managers) to place funds in foreign securities.
The Singapore economy grew by 7.9% in 2006 and followed that with a 7.6% annualized growth rate in the first half of 2007 – one of the fastest growth rates in Asia. Singapore’s trade-reliant economy appeared to benefit from strong growth in China, as well as solid expansion in Europe and the rest of Asia. The rally in the Singapore stock market was broad-based, producing strong results across a variety of economic sectors. As in Australia, currency fluctuations boosted Singapore stock returns for U.S. investors; the U.S. dollar declined by 3.1% versus the Singaporean dollar for the reporting period.
MANAGEMENT’S DISCUSSIONS OF FUND PERFORMANCE | 17 |
Table of Contents
Management’s Discussion of Fund Performance (Continued)
iSHARES® MSCI PACIFIC EX-JAPAN INDEX FUND
The New Zealand market posted the lowest return among the four markets represented in the Fund, though it still gained 25%. The most recent economic growth figures show the New Zealand economy growing by 2.2% for the 12 months ended June 30, 2007, a slower pace than many of the region’s economies. Nonetheless, the New Zealand market benefited from the strength of its trading partners, particularly China and other emerging Asian markets. In addition, investors borrowing at low interest rates in Japan were attracted to the relatively high interest rates in New Zealand – a practice known as the “carry trade.” In part because of this demand, the New Zealand dollar reached a 22-year high against the U.S. dollar in July 2007 and rose 7.3% overall against the U.S. currency for the reporting period.
Each of the Fund’s ten largest holdings (nine of which are Australian companies) as of August 31, 2007, posted double-digit returns for the reporting period. The leading performers included retailer Woolworths Ltd., which reported strong sales and improving profit margins, and QBE Insurance Group Ltd., which exceeded earnings expectations in the first half of 2007. Mining companies BHP Billiton Ltd. and Rio Tinto Ltd. also delivered strong returns due to high demand for metals and minerals. The weakest performers among the ten largest holdings were commercial banks Australia and New Zealand Banking Group Ltd. and National Australia Bank Ltd.
18 | 2007 iSHARES ANNUAL REPORT TO SHAREHOLDERS |
Table of Contents
Management’s Discussion of Fund Performance
iSHARES® MSCI SINGAPORE INDEX FUND
Performance as of August 31, 2007
| Average Annual Total Returns | ||||||||||||||||
| Year Ended 8/31/07 | Five Years Ended 8/31/07 | Ten Years Ended 8/31/07 | ||||||||||||||
| NAV | MARKET | INDEX | NAV | MARKET | INDEX | NAV | MARKET | INDEX | ||||||||
| 49.92% | 50.40% | 51.08% | 25.00% | 24.83% | 24.71% | 6.88% | 6.91% | 7.64% | ||||||||
| Cumulative Total Returns | ||||||||||||||||
| Year Ended 8/31/07 | Five Years Ended 8/31/07 | Ten Years Ended 8/31/07 | ||||||||||||||
| NAV | MARKET | INDEX | NAV | MARKET | INDEX | NAV | MARKET | INDEX | ||||||||
| 49.92% | 50.40% | 51.08% | 205.23% | 203.12% | 201.63% | 94.49% | 95.06% | 108.85% | ||||||||
“Average Annual Total Returns” represent the average annual change in value of an investment over the periods indicated. “Cumulative Total Returns” represent the total change in value of an investment over the periods indicated.
Certain sectors and markets performed exceptionally well based on market conditions during the one-year period. Achieving such exceptional returns involves the risk of volatility and investors should not expect that such exceptional returns will be repeated.
The Fund’s per share net asset value or ”NAV” is the value of one share of the Fund as calculated in accordance with the standard formula for valuing mutual fund shares. The NAV return is based on the NAV of the Fund, and the market return is based on the market price per share of the Fund. The price used to calculate market return (“Market Price”) is determined by using the midpoint between the highest bid and the lowest offer on the stock exchange on which the shares of the Fund are listed for trading, as of the time that the Fund’s NAV is calculated. Market and NAV returns assume that dividends and capital gain distributions have been reinvested in the Fund at Market Price and NAV, respectively.
An index is a statistical composite that tracks a specified financial market or sector. Unlike the Fund, an index does not actually hold a portfolio of securities and therefore does not incur the expenses incurred by the Fund. These expenses negatively impact the performance of the Fund. Also, market returns do not include brokerage commissions that may be payable on secondary market transactions. If brokerage commissions were included, market returns would be lower. The returns shown in the tables above do not reflect the deduction of taxes that a shareholder would pay on fund distributions or the redemption or sale of fund shares. The investment return and principal value of shares of the Fund will vary with changes in market conditions. Shares of the Fund may be worth more or less than their original cost when they are redeemed or sold in the market. The Fund’s past performance is no guarantee of future results.
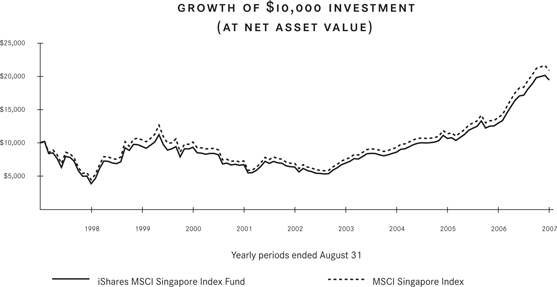
Performance figures assume reinvestment of all dividends and capital gain distributions and do not reflect the deduction of taxes that a shareholder would pay on fund distributions or the redemption of fund shares. An index is a statistical composite that tracks a specified financial market or sector. Unlike the Fund, an index does not actually hold a portfolio of securities and therefore does not incur the expenses incurred by the Fund. These expenses negatively impact the performance of the Fund. The Fund’s past performance is no guarantee of future results.
MANAGEMENT’S DISCUSSIONS OF FUND PERFORMANCE | 19 |
Table of Contents
Management’s Discussion of Fund Performance (Continued)
iSHARES® MSCI SINGAPORE INDEX FUND
PORTFOLIO ALLOCATION As of 8/31/07 | |||
| Sector | Percentage of Net Assets | ||
Financial | 51.08 | % | |
Communications | 15.94 | ||
Industrial | 13.70 | ||
Diversified | 7.02 | ||
Consumer Cyclical | 5.75 | ||
Consumer Non-Cyclical | 4.06 | ||
Energy | 0.58 | ||
Technology | 0.51 | ||
Short-Term and Other Net Assets | 1.36 | ||
TOTAL | 100.00 | % | |
TEN LARGEST FUND HOLDINGS As of 8/31/07 | |||
| Security | Percentage of Net Assets | ||
Singapore Telecommunications Ltd. | 12.73 | % | |
United Overseas Bank Ltd. | 11.27 | ||
DBS Group Holdings Ltd. | 9.85 | ||
Oversea-Chinese Banking Corp. | 8.96 | ||
Keppel Corp. Ltd. | 5.82 | ||
Singapore Airlines Ltd. | 4.78 | ||
CapitaLand Ltd. | 4.74 | ||
City Developments Ltd. | 3.67 | ||
Singapore Exchange Ltd. | 3.47 | ||
Singapore Press Holdings Ltd. | 3.21 | ||
TOTAL | 68.50 | % | |
The iShares MSCI Singapore Index Fund (the “Fund”) seeks to provide investment results that correspond generally to the price and yield performance, before fees and expenses, of publicly traded securities in the aggregate in the Singaporean market, as measured by the MSCI Singapore Index (the “Index”). The Fund invests in a representative sample of securities included in the Index that collectively has an investment profile similar to the Index. Due to the use of representative sampling, the Fund may or may not hold all of the securities that are included in the Index. For the 12-month period ended August 31, 2007 (the “reporting period”), the Fund returned 49.92%, while the Index returned 51.08%.
The Singapore stock market enjoyed robust returns for the reporting period. The Singapore economy grew by 7.9% in 2006 and followed with a 7.6% annualized growth rate in the first half of 2007 – one of the fastest growth rates in Asia. Singapore’s trade-reliant economy appeared to benefit from strong growth in China, as well as solid expansion in Europe and the rest of Asia. Meanwhile, the inflation rate in Singapore rose to its highest level in 12 years, increasing 2.6% for the 12 months ended July 31, 2007, though much of the increase resulted from a recent sales tax increase.
The rally in the Singapore stock market was broad-based, producing strong results across a variety of economic sectors. In addition, currency fluctuations enhanced Singapore stock returns for U.S. investors; the U.S. dollar declined by 3.1% versus the Singaporean dollar for the reporting period. Despite its steady rise, the Singapore market experienced some volatility during the reporting period. A sharp drop in the Chinese market in late February 2007 – triggered by a government statement threatening to crack down on stock market speculation – caused a similar decline in the Singapore market. Singapore shares also fell late in the reporting period as concerns about the sub-prime lending crisis in the U.S. led to a re-pricing of risk in markets around the world.
Each of the Fund’s ten largest holdings as of August 31, 2007, posted at least double-digit gains for the reporting period. By far, the leading performer was stock exchange Singapore Exchange Ltd., which soared by well over 100% for the reporting period as increased trading boosted profits. Other top performers among the ten largest holdings included energy and shipping conglomerate Keppel Corp. Ltd. and property developer CapitaLand Ltd. The weaker returns among the Fund’s ten largest positions came from financial services provider DBS Group Holdings Ltd. and newspaper publisher Singapore Press Holdings Ltd.
20 | 2007 iSHARES ANNUAL REPORT TO SHAREHOLDERS |
Table of Contents
Management’s Discussion of Fund Performance
iSHARES® MSCI SOUTH AFRICA INDEX FUND
Performance as of August 31, 2007
| Average Annual Total Returns | Cumulative Total Returns | |||||||||||||||
| Year Ended 8/31/07 | Inception to 8/31/07 | Inception to 8/31/07 | ||||||||||||||
| NAV | MARKET | INDEX | NAV | MARKET | INDEX | NAV | MARKET | INDEX | ||||||||
| 30.34% | 29.60% | 31.42% | 31.43% | 31.55% | 32.90% | 249.20% | 250.71% | 267.91% | ||||||||
Total returns for the periods since inception are calculated from the inception date of the Fund (2/3/03). “Average Annual Total Returns” represent the average annual change in value of an investment over the periods indicated. “Cumulative Total Returns” represent the total change in value of an investment over the periods indicated.
The Fund’s per share net asset value or “NAV” is the value of one share of the Fund as calculated in accordance with the standard formula for valuing mutual fund shares. The NAV return is based on the NAV of the Fund, and the market return is based on the market price per share of the Fund. The price used to calculate market return (“Market Price”) is determined by using the midpoint between the highest bid and the lowest offer on the stock exchange on which the shares of the Fund are listed for trading, as of the time that the Fund’s NAV is calculated. Since shares of the Fund did not trade in the secondary market until several days after the Fund’s inception, for the period from inception to the first day of secondary market trading in shares of the Fund (2/7/03), the NAV of the Fund is used as a proxy for secondary market trading price to calculate market returns. Market and NAV returns assume that dividends and capital gain distributions have been reinvested in the Fund at Market Price and NAV, respectively.
An index is a statistical composite that tracks a specified financial market or sector. Unlike the Fund, an index does not actually hold a portfolio of securities and therefore does not incur the expenses incurred by the Fund. These expenses negatively impact the performance of the Fund. Also, market returns do not include brokerage commissions that may be payable on secondary market transactions. If brokerage commissions were included, market returns would be lower. The returns shown in the tables above do not reflect the deduction of taxes that a shareholder would pay on fund distributions or the redemption or sale of fund shares. The investment return and principal value of shares of the Fund will vary with changes in market conditions. Shares of the Fund may be worth more or less than their original cost when they are redeemed or sold in the market. The Fund’s past performance is no guarantee of future results.
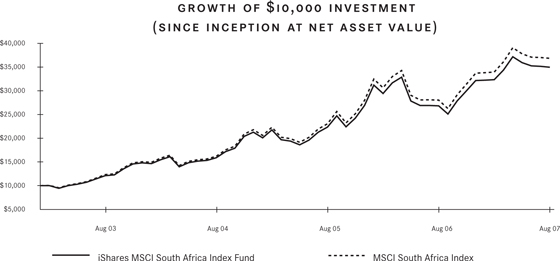
Performance figures assume reinvestment of all dividends and capital gain distributions and do not reflect the deduction of taxes that a shareholder would pay on fund distributions or the redemption of fund shares. An index is a statistical composite that tracks a specified financial market or sector. Unlike the Fund, an index does not actually hold a portfolio of securities and therefore does not incur the expenses incurred by the Fund. These expenses negatively impact the performance of the Fund. The Fund’s past performance is no guarantee of future results.
MANAGEMENT’S DISCUSSIONS OF FUND PERFORMANCE | 21 |
Table of Contents
Management’s Discussion of Fund Performance (Continued)
iSHARES® MSCI SOUTH AFRICA INDEX FUND
PORTFOLIO ALLOCATION As of 8/31/07 | |||
| Sector | Percentage of Net Assets | ||
Basic Materials | 24.93 | % | |
Financial | 20.91 | ||
Communications | 17.76 | ||
Energy | 11.07 | ||
Consumer Cyclical | 7.61 | ||
Industrial | 6.57 | ||
Diversified | 5.97 | ||
Consumer Non-Cyclical | 4.96 | ||
Short-Term and Other Net Assets | 0.22 | ||
TOTAL | 100.00 | % | |
TEN LARGEST FUND HOLDINGS As of 8/31/07 | |||
| Security | Percentage of Net Assets | ||
Sasol Ltd. | 11.07 | % | |
MTN Group Ltd. | 10.42 | ||
Standard Bank Group Ltd. | 8.27 | ||
Impala Platinum Holdings Ltd. | 7.32 | ||
Gold Fields Ltd. | 4.36 | ||
Anglo Platinum Ltd. | 4.32 | ||
FirstRand Ltd. | 4.23 | ||
Naspers Ltd. | 4.01 | ||
Telkom South Africa Ltd. | 3.33 | ||
Sanlam Ltd. | 3.18 | ||
TOTAL | 60.51 | % | |
The iShares MSCI South Africa Index Fund (the “Fund”) seeks to provide investment results that correspond generally to the price and yield performance, before fees and expenses, of publicly traded securities in the aggregate in the South African market, as measured by the MSCI South Africa Index (the “Index”). The Fund invests in a representative sample of securities included in the Index that collectively has an investment profile similar to the Index. Due to the use of representative sampling, the Fund may or may not hold all of the securities that are included in the Index. For the 12-month period ended August 31, 2007 (the “reporting period”), the Fund returned 30.34%, while the Index returned 31.42%.
The South African stock market enjoyed robust returns for the reporting period. The South African economy grew by 5% for the 12 months ended June 30, 2007, extending an economic expansion that began in 1999. Exports make up nearly 30% of South African economic output, most notably in commodities such as metals and minerals. Strong global demand for these commodities helped boost both the economy and stock market in South Africa. Currency fluctuations added modestly to South African stock returns for U.S. investors; the U.S. dollar declined by 0.5% versus the South African rand for the reporting period.
Despite its strong overall performance, the South African stock market experienced some volatility during the reporting period. A sharp drop in the Chinese market in late February 2007 – triggered by a government statement threatening to crack down on stock market speculation – caused a similar decline in the South African market. South African shares also fell late in the reporting period as concerns about the sub-prime lending crisis in the U.S. led to a re-pricing of risk in markets around the world.
All but one of the Fund’s ten largest holdings as of August 31, 2007, posted double-digit gains for the reporting period. The leading performers were wireless telecommunications services provider MTN Group Ltd., which benefited from strong subscriber growth across Africa and the Middle East, and diversified financial services company Sanlam Ltd., which reported strong results due to burgeoning growth in its life insurance business. Other top performers included electronic media company Naspers Ltd. and Standard Bank Group Ltd. The only stock among the ten largest holdings to decline for the reporting period was gold producer Gold Fields Ltd.
22 | 2007 iSHARES ANNUAL REPORT TO SHAREHOLDERS |
Table of Contents
Management’s Discussion of Fund Performance
iSHARES® MSCI SOUTH KOREA INDEX FUND
Performance as of August 31, 2007
| Average Annual Total Returns | ||||||||||||||||
| Year Ended 8/31/07 | Five Years Ended 8/31/07 | Inception to 8/31/07 | ||||||||||||||
| NAV | MARKET | INDEX | NAV | MARKET | INDEX | NAV | MARKET | INDEX | ||||||||
| 39.18% | 41.04% | 38.94% | 25.25% | 25.95% | 27.16% | 17.38% | 17.53% | 18.02% | ||||||||
| Cumulative Total Returns | ||||||||||||||||
| Year Ended 8/31/07 | Five Years Ended 8/31/07 | Inception to 8/31/07 | ||||||||||||||
| NAV | MARKET | INDEX | NAV | MARKET | INDEX | NAV | MARKET | INDEX | ||||||||
| 39.18% | 41.04% | 38.94% | 208.28% | 216.90% | 232.53% | 222.97% | 225.86% | 236.28% | ||||||||
Total returns for the periods since inception are calculated from the inception date of the Fund (5/9/00). “Average Annual Total Returns” represent the average annual change in value of an investment over the periods indicated. “Cumulative Total Returns” represent the total change in value of an investment over the periods indicated.
Certain sectors and markets performed exceptionally well based on market conditions during the one-year period. Achieving such exceptional returns involves the risk of volatility and investors should not expect that such exceptional returns will be repeated.
The Fund’s per share net asset value or “NAV” is the value of one share of the Fund as calculated in accordance with the standard formula for valuing mutual fund shares. The NAV return is based on the NAV of the Fund, and the market return is based on the market price per share of the Fund. The price used to calculate market return (“Market Price”) is determined by using the midpoint between the highest bid and the lowest offer on the stock exchange on which the shares of the Fund are listed for trading, as of the time that the Fund’s NAV is calculated. As the Fund has a NAV which is determined prior to the opening of the regular trading day on the stock exchange on which it is listed, the market return is calculated using the midpoint of the bid/ask spread as of the opening of regular trading on the exchange. Since shares of the Fund did not trade in the secondary market until several days after the Fund’s inception, for the period from inception to the first day of secondary market trading in shares of the Fund (5/12/00), the NAV of the Fund is used as a proxy for secondary market trading price to calculate market returns. Market and NAV returns assume that dividends and capital gain distributions have been reinvested in the Fund at Market Price and NAV, respectively.
An index is a statistical composite that tracks a specified financial market or sector. Unlike the Fund, an index does not actually hold a portfolio of securities and therefore does not incur the expenses incurred by the Fund. These expenses negatively impact the performance of the Fund. Also, market returns do not include brokerage commissions that may be payable on secondary market transactions. If brokerage commissions were included, market returns would be lower. The returns shown in the tables above do not reflect the deduction of taxes that a shareholder would pay on fund distributions or the redemption or sale of fund shares. The investment return and principal value of shares of the Fund will vary with changes in market conditions. Shares of the Fund may be worth more or less than their original cost when they are redeemed or sold in the market. The Fund’s past performance is no guarantee of future results.
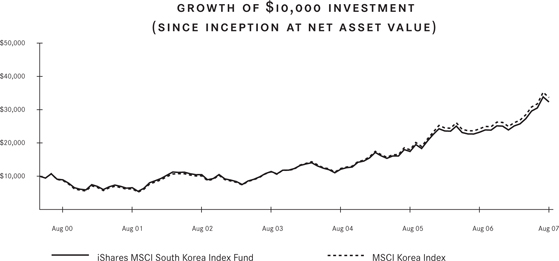
Performance figures assume reinvestment of all dividends and capital gain distributions and do not reflect the deduction of taxes that a shareholder would pay on fund distributions or the redemption of fund shares. An index is a statistical composite that tracks a specified financial market or sector. Unlike the Fund, an index does not actually hold a portfolio of securities and therefore does not incur the expenses incurred by the Fund. These expenses negatively impact the performance of the Fund. The Fund’s past performance is no guarantee of future results.
MANAGEMENT’S DISCUSSIONS OF FUND PERFORMANCE | 23 |
Table of Contents
Management’s Discussion of Fund Performance (Continued)
iSHARES® MSCI SOUTH KOREA INDEX FUND
| PORTFOLIO ALLOCATION As of 8/31/07 | |||
| Sector | Percentage of Net Assets | ||
Industrial | 35.95 | % | |
Financial | 19.13 | ||
Consumer Cyclical | 13.87 | ||
Basic Materials | 13.70 | ||
Communications | 5.81 | ||
Consumer Non-Cyclical | 4.97 | ||
Energy | 3.36 | ||
Utilities | 2.39 | ||
Technology | 0.75 | ||
Short-Term and Other Net Assets | 0.07 | ||
TOTAL | 100.00 | % | |
| TEN LARGEST FUND HOLDINGS As of 8/31/07 | |||
| Security | Percentage of Net Assets | ||
Samsung Electronics Co. Ltd. | 14.26 | % | |
POSCO | 9.43 | ||
Kookmin Bank | 5.64 | ||
Shinhan Financial Group Ltd. | 3.99 | ||
Hyundai Heavy Industries Co. Ltd. | 3.47 | ||
Korea Electric Power Corp. | 2.39 | ||
Hyundai Motor Co. Ltd. | 2.35 | ||
Samsung Corp. | 1.97 | ||
Shinsegae Co. Ltd. | 1.93 | ||
Samsung Heavy Industries Co. Ltd. | 1.85 | ||
TOTAL | 47.28 | % | |
The iShares MSCI South Korea Index Fund (the “Fund”) seeks to provide investment results that correspond generally to the price and yield performance, before fees and expenses, of publicly traded securities in the aggregate in the South Korean market, as measured by the MSCI Korea Index (the “Index”). The Fund invests in a representative sample of securities included in the Index that collectively has an investment profile similar to the Index. Due to the use of representative sampling, the Fund may or may not hold all of the securities that are included in the Index. For the 12-month period ended August 31, 2007 (the “reporting period”), the Fund returned 39.18%, while the Index returned 38.94%.
The South Korean stock market enjoyed robust returns for the reporting period. The South Korean economy grew by a stronger-than-expected 4.9% for the 12 months ended June 30, 2007. Exports, which comprise approximately 40% of South Korea’s economy, were a key contributing factor to the solid economic growth, surging by 16%. The economy and stock market also appeared to benefit from the free trade agreement between South Korea and the U.S., signed in April 2007. The accord is South Korea’s largest trade deal ever – as well as the biggest deal for the U.S. in 13 years – and is expected to facilitate trade between the two countries.
Despite its strong overall performance, the South Korean stock market experienced some volatility during the reporting period. Geopolitical instability resulting from tensions between North and South Korea weighed on the market early in the period. North Korea tested a nuclear weapon in October 2006, but later pledged to end its nuclear program. South Korean shares also fell late in the reporting period amid concerns about the sub-prime lending crisis in the U.S. since South Korea has substantial exposure to the U.S. consumer.
Among the Fund’s ten largest holdings as of August 31, 2007, four posted triple-digit returns for the reporting period. The leading performers were shipbuilder Hyundai Heavy Industries Co. Ltd., which reported a record increase in profits, and steelmaker POSCO, which benefited from strong global demand for metals and higher steel prices. Other top performers included conglomerate Samsung Corp. and shipbuilder Samsung Heavy Industries Co. Ltd. The only two stocks among the ten largest holdings to decline during the reporting period were electronics manufacturer Samsung Electronics Co. Ltd. and auto maker Hyundai Motor Co. Ltd.
24 | 2007 iSHARES ANNUAL REPORT TO SHAREHOLDERS |
Table of Contents
Management’s Discussion of Fund Performance
iSHARES® MSCI TAIWAN INDEX FUND
Performance as of August 31, 2007
| Average Annual Total Returns | ||||||||||||||||
| Year Ended 8/31/07 | Five Years Ended 8/31/07 | Inception to 8/31/07 | ||||||||||||||
| NAV | MARKET | INDEX | NAV | MARKET | INDEX | NAV | MARKET | INDEX | ||||||||
| 29.91% | 30.70% | 30.22% | 13.56% | 15.17% | 14.59% | (1.57)% | (1.53)% | (0.63)% | ||||||||
| Cumulative Total Returns | ||||||||||||||||
| Year Ended 8/31/07 | Five Years Ended 8/31/07 | Inception to 8/31/07 | ||||||||||||||
| NAV | MARKET | INDEX | NAV | MARKET | INDEX | NAV | MARKET | INDEX | ||||||||
| 29.91% | 30.70% | 30.22% | 88.84% | 102.59% | 97.61% | (10.79)% | (10.51)% | (4.45)% | ||||||||
Total returns for the periods since inception are calculated from the inception date of the Fund (6/20/00). “Average Annual Total Returns” represent the average annual change in value of an investment over the periods indicated. “Cumulative Total Returns” represent the total change in value of an investment over the periods indicated.
The Fund’s per share net asset value or “NAV” is the value of one share of the Fund as calculated in accordance with the standard formula for valuing mutual fund shares. The NAV return is based on the NAV of the Fund, and the market return is based on the market price per share of the Fund. The price used to calculate market return (“Market Price”) is determined by using the midpoint between the highest bid and the lowest offer on the stock exchange on which the shares of the Fund are listed for trading, as of the time that the Fund’s NAV is calculated. As the Fund has a NAV which is determined prior to the opening of the regular trading day on the stock exchange on which it is listed, the market return is calculated using the midpoint of the bid/ask spread as of the opening of regular trading on the exchange. Since shares of the Fund did not trade in the secondary market until several days after the Fund’s inception, for the period from inception to the first day of secondary market trading in shares of the Fund (6/23/00), the NAV of the Fund is used as a proxy for secondary market trading price to calculate market returns. Market and NAV returns assume that dividends and capital gain distributions have been reinvested in the Fund at Market Price and NAV, respectively.
An index is a statistical composite that tracks a specified financial market or sector. Unlike the Fund, an index does not actually hold a portfolio of securities and therefore does not incur the expenses incurred by the Fund. These expenses negatively impact the performance of the Fund. Also, market returns do not include brokerage commissions that may be payable on secondary market transactions. If brokerage commissions were included, market returns would be lower. The returns shown in the tables above do not reflect the deduction of taxes that a shareholder would pay on fund distributions or the redemption or sale of fund shares. The investment return and principal value of shares of the Fund will vary with changes in market conditions. Shares of the Fund may be worth more or less than their original cost when they are redeemed or sold in the market. The Fund’s past performance is no guarantee of future results.

Performance figures assume reinvestment of all dividends and capital gain distributions and do not reflect the deduction of taxes that a shareholder would pay on fund distributions or the redemption of fund shares. An index is a statistical composite that tracks a specified financial market or sector. Unlike the Fund, an index does not actually hold a portfolio of securities and therefore does not incur the expenses incurred by the Fund. These expenses negatively impact the performance of the Fund. The Fund’s past performance is no guarantee of future results.
MANAGEMENT’S DISCUSSIONS OF FUND PERFORMANCE | 25 |
Table of Contents
Management’s Discussion of Fund Performance (Continued)
iSHARES® MSCI TAIWAN INDEX FUND
| PORTFOLIO ALLOCATION As of 8/31/07 | |||
| Sector | Percentage of Net Assets | ||
Technology | 36.61 | % | |
Industrial | 26.20 | ||
Financial | 14.13 | ||
Basic Materials | 11.84 | ||
Communications | 4.32 | ||
Consumer Cyclical | 3.20 | ||
Energy | 1.72 | ||
Consumer Non-Cyclical | 1.01 | ||
Short-Term and Other Net Assets | 0.97 | ||
TOTAL | 100.00 | % | |
| TEN LARGEST FUND HOLDINGS As of 8/31/07 | |||
| Security | Percentage of Net Assets | ||
Taiwan Semiconductor Manufacturing Co. Ltd. | 10.81 | % | |
Hon Hai Precision Industry Co. Ltd. | 10.03 | ||
MediaTek Inc. | 3.90 | ||
Cathay Financial Holding Co. Ltd. | 3.41 | ||
Nan Ya Plastic Corp. | 3.26 | ||
China Steel Corp. | 3.18 | ||
Formosa Plastic Co. | 2.72 | ||
United Microelectronics Corp. | 2.65 | ||
Chunghwa Telecom Co. Ltd. | 2.56 | ||
Asustek Computer Inc. | 2.52 | ||
TOTAL | 45.04 | % | |
The iShares MSCI Taiwan Index Fund (the “Fund”) seeks to provide investment results that correspond generally to the price and yield performance, before fees and expenses, of publicly traded securities in the aggregate in the Taiwanese market, as measured by the MSCI Taiwan Index (the “Index”). The Fund invests in a representative sample of securities included in the Index that collectively has an investment profile similar to the Index. Due to the use of representative sampling, the Fund may or may not hold all of the securities that are included in the Index. For the 12-month period ended August 31, 2007 (the “reporting period”), the Fund returned 29.91%, while the Index returned 30.22%.
The Taiwanese stock market enjoyed robust returns for the reporting period, though it lagged many other emerging Asian markets. The Taiwan economy grew by 5.1% for the 12 months ended June 30, 2007, exceeding expectations as exports rose sharply. Growing demand from China and Europe more than offset a decline in exports to the U.S. Although inflation remained generally below the government’s target, concerns about rising inflation in the second half of 2007 led the Taiwan central bank to extend its program of interest rate increases. The central bank raised rates four times during the reporting period, for a total of 12 rate hikes since June 2003, boosting its discount rate to a six-year high of 3.125%. Nonetheless, with the exception of Japan, Taiwan still has the lowest interest rates in Asia. As a result, investment outflows have weighed on the Taiwanese dollar, which declined by 0.5% versus the U.S. dollar during the reporting period.
Materials and industrials were the leading export sectors in Taiwan during the reporting period, and consequently they were also the major drivers of equity market performance. Technology, especially contract manufacturing of semiconductors and consumer electronics, also comprised a substantial portion of the country’s exported goods, and a number of technology companies are expanding production capacity.
Each of the Fund’s ten largest holdings as of August 31, 2007, posted positive returns for the reporting period. The leading performer was chipmaker MediaTek Inc., which benefited from strong demand for its wireless and digital media chips. Other top performers included steelmaker China Steel Corp. and plastics manufacturers Nan Ya Plastic Corp. and Formosa Plastic Co. The lowest returns among the ten largest holdings came from chipmakers United Microelectronics Corp. and Taiwan Semiconductor Manufacturing Co. Ltd., the Fund’s largest holding.
26 | 2007 iSHARES ANNUAL REPORT TO SHAREHOLDERS |
Table of Contents
Shareholder Expenses (Unaudited)
iSHARES®, INC.
As a shareholder of a Fund, you incur two types of costs: (1) transaction costs, including brokerage commissions on purchases and sales of fund shares and (2) ongoing costs, including management fees and other fund expenses. The following Example is intended to help you understand your ongoing costs (in dollars and cents) of investing in a Fund and to compare these costs with the ongoing costs of investing in other funds.
The Example is based on an investment of $1,000 invested at the beginning of the period and held for the entire period from March 1, 2007 to August 31, 2007.
ACTUAL EXPENSES
The first line under each Fund in the table below provides information about actual account values and actual expenses. You may use the information in this line, together with the amount you invested, to estimate the expenses that you paid over the period. Simply divide your account value by $1,000 (for example, an $8,600 account value divided by $1,000 = 8.6), then multiply the result by the number in the first line for your Fund under the heading entitled “Expenses Paid During Period” to estimate the expenses you paid on your account during this period.
HYPOTHETICAL EXAMPLE FOR COMPARISON PURPOSES
The second line under each Fund in the table below provides information about hypothetical account values and hypothetical expenses based on each Fund’s actual expense ratio and an assumed rate of return of 5% per year before expenses, which is not the Fund’s actual return. The hypothetical account values and expenses may not be used to estimate the actual ending account balance or expenses you paid for the period. You may use this information to compare the ongoing costs of investing in your Fund and other funds. To do so, compare this 5% hypothetical example with the 5% hypothetical examples that appear in the shareholder reports of the other funds.
Please note that the expenses shown in the table are meant to highlight your ongoing costs only and do not reflect any transactional costs, such as brokerage commissions paid on purchases and sales of fund shares. Therefore, the second line under each Fund in the table is useful in comparing ongoing costs only and will not help you determine the relative total costs of owning different funds. In addition, if these transactional costs were included, your costs would have been higher.
| iShares MSCI Index Fund | Beginning Account Value (3/1/07) | Ending Account Value (8/31/07) | Annualized Expense Ratio | Expenses Paid During Perioda (3/1/07 to 8/31/07) | |||||
Australia | |||||||||
Actual | $1,000.00 | $1,126.90 | 0.51 | % | $2.73 | ||||
Hypothetical (5% return before expenses) | 1,000.00 | 1,022.60 | 0.51 | 2.60 | |||||
Brazil | |||||||||
Actual | 1,000.00 | 1,345.10 | 0.68 | 4.02 | |||||
Hypothetical (5% return before expenses) | 1,000.00 | 1,021.80 | 0.68 | 3.47 | |||||
Canada | |||||||||
Actual | 1,000.00 | 1,176.00 | 0.51 | 2.80 | |||||
Hypothetical (5% return before expenses) | 1,000.00 | 1,022.60 | 0.51 | 2.60 | |||||
Emerging Markets | |||||||||
Actual | 1,000.00 | 1,204.70 | 0.73 | 4.06 | |||||
Hypothetical (5% return before expenses) | 1,000.00 | 1,021.50 | 0.73 | 3.72 |
SHAREHOLDER EXPENSES | 27 |
Table of Contents
Shareholder Expenses (Unaudited) (Continued)
iSHARES®, INC.
| iShares MSCI Index Fund | Beginning Account Value (3/1/07) | Ending Account Value (8/31/07) | Annualized Expense Ratio | Expenses��Paid During Perioda (3/1/07 to 8/31/07) | |||||
Hong Kong | |||||||||
Actual | $1,000.00 | $1,151.70 | 0.51 | % | $2.77 | ||||
Hypothetical (5% return before expenses) | 1,000.00 | 1,022.60 | 0.51 | 2.60 | |||||
Malaysia | |||||||||
Actual | 1,000.00 | 1,079.70 | 0.51 | 2.67 | |||||
Hypothetical (5% return before expenses) | 1,000.00 | 1,022.60 | 0.51 | 2.60 | |||||
Mexico | |||||||||
Actual | 1,000.00 | 1,155.20 | 0.51 | 2.77 | |||||
Hypothetical (5% return before expenses) | 1,000.00 | 1,022.60 | 0.51 | 2.60 | |||||
Pacific ex-Japan | |||||||||
Actual | 1,000.00 | 1,131.00 | 0.50 | 2.69 | |||||
Hypothetical (5% return before expenses) | 1,000.00 | 1,022.70 | 0.50 | 2.55 | |||||
Singapore | |||||||||
Actual | 1,000.00 | 1,133.10 | 0.51 | 2.74 | |||||
Hypothetical (5% return before expenses) | 1,000.00 | 1,022.60 | 0.51 | 2.60 | |||||
South Africa | |||||||||
Actual | 1,000.00 | 1,081.00 | 0.68 | 3.57 | |||||
Hypothetical (5% return before expenses) | 1,000.00 | 1,021.80 | 0.68 | 3.47 | |||||
South Korea | |||||||||
Actual | 1,000.00 | 1,287.20 | 0.68 | 3.92 | |||||
Hypothetical (5% return before expenses) | 1,000.00 | 1,021.80 | 0.68 | 3.47 | |||||
Taiwan | |||||||||
Actual | 1,000.00 | 1,115.90 | 0.85 | 4.53 | |||||
Hypothetical (5% return before expenses) | 1,000.00 | 1,020.90 | 0.85 | 4.33 |
| a | Expenses are calculated using each Fund’s annualized expense ratio (as disclosed in the table), multiplied by the average account value for the period, multiplied by the number of days in the period (184 days) and divided by the number of days in the year (365 days). |
28 | 2007 iSHARES ANNUAL REPORT TO SHAREHOLDERS |
Table of Contents
iSHARES® MSCI AUSTRALIA INDEX FUND
August 31, 2007
| Security | Shares | Value | |||
COMMON STOCKS – 99.11% | |||||
AIRLINES – 0.53% | |||||
Qantas Airways Ltd. | 1,721,765 | $ | 7,816,140 | ||
| 7,816,140 | |||||
APPAREL – 0.26% | |||||
Billabong International Ltd. | 293,534 | 3,785,053 | |||
| 3,785,053 | |||||
BANKS – 25.83% | |||||
Australia and New Zealand Banking Group Ltd. | 3,274,511 | 77,228,735 | |||
Commonwealth Bank of Australia | 2,302,179 | 103,292,515 | |||
Macquarie Office Trust | 3,511,769 | 4,485,489 | |||
National Australia Bank Ltd. | 2,888,682 | 93,862,484 | |||
Suncorp-Metway Ltd. | 1,637,020 | 26,769,132 | |||
Westpac Banking Corp. | 3,275,736 | 72,487,321 | |||
| 378,125,676 | |||||
BEVERAGES – 1.98% | |||||
Coca-Cola Amatil Ltd. | 931,010 | 7,203,095 | |||
Foster’s Group Ltd. | 3,488,257 | 17,935,348 | |||
Lion Nathan Ltd. | 520,008 | 3,879,392 | |||
| 29,017,835 | |||||
BIOTECHNOLOGY – 0.47% | |||||
Sonic Healthcare Ltd. | 552,672 | 6,928,741 | |||
| 6,928,741 | |||||
BUILDING MATERIALS – 1.13% | |||||
Boral Ltd. | 1,068,400 | 6,857,963 | |||
CSR Ltd. | 1,548,098 | 4,231,769 | |||
James Hardie Industries NV | 826,478 | 5,446,288 | |||
| 16,536,020 | |||||
COMMERCIAL SERVICES – 2.93% | |||||
A.B.C. Learning Centres Ltd.a | 667,236 | 3,729,241 | |||
Brambles Ltd.b | 2,512,783 | 28,210,990 | |||
Transurban Group | 1,886,801 | 10,990,650 | |||
| 42,930,881 | |||||
COMPUTERS – 0.51% | |||||
Computershare Ltd. | 889,998 | 7,457,796 | |||
| 7,457,796 | |||||
| Security | Shares | Value | |||
DIVERSIFIED FINANCIAL SERVICES – 3.69% | |||||
ASX Ltd. | 302,230 | $ | 11,408,796 | ||
Babcock & Brown Ltd.a | 409,762 | 7,887,342 | |||
Challenger Financial Services Group Ltd. | 634,184 | 2,806,716 | |||
Macquarie Bank Ltd. | 466,292 | 27,806,491 | |||
Perpetual Ltd.a | 65,732 | 4,098,956 | |||
| 54,008,301 | |||||
ELECTRIC – 0.66% | |||||
AGL Energy Ltd. | 767,358 | 9,613,975 | |||
| 9,613,975 | |||||
ENGINEERING & CONSTRUCTION – 1.66% | |||||
Downer EDI Ltd. | 529,229 | 2,789,992 | |||
Leighton Holdings Ltd. | 246,181 | 8,780,299 | |||
Multiplex Group | 1,111,701 | 4,513,077 | |||
WorleyParsons Ltd. | 261,809 | 8,221,596 | |||
| 24,304,964 | |||||
ENTERTAINMENT – 1.71% | |||||
Aristocrat Leisure Ltd.a | 619,959 | 7,061,147 | |||
Tabcorp Holdings Ltd. | 930,943 | 11,580,167 | |||
Tattersall’s Ltd. | 1,892,650 | 6,451,617 | |||
| 25,092,931 | |||||
FOOD – 3.82% | |||||
Goodman Fielder Ltd. | 1,876,457 | 3,969,138 | |||
Woolworths Ltd. | 2,137,694 | 52,034,499 | |||
| 56,003,637 | |||||
FOREST PRODUCTS & PAPER – 0.15% | |||||
PaperlinX Ltd. | 784,337 | 2,156,769 | |||
| 2,156,769 | |||||
HEALTH CARE - PRODUCTS – 0.36% | |||||
Cochlear Ltd. | 97,201 | 5,298,217 | |||
| 5,298,217 | |||||
HOUSEHOLD PRODUCTS & WARES – 0.17% | |||||
Pacific Brands Ltd. | 889,291 | 2,430,902 | |||
| 2,430,902 | |||||
INSURANCE – 6.43% | |||||
AMP Ltd. | 3,319,048 | 28,406,225 | |||
AXA Asia Pacific Holdings Ltd. | 1,526,774 | 9,365,487 | |||
SCHEDULESOF INVESTMENTS | 29 |
Table of Contents
Schedule of Investments (Continued)
iSHARES® MSCI AUSTRALIA INDEX FUND
August 31, 2007
| Security | Shares | Value | |||
Insurance Australia Group Ltd. | 3,177,513 | $ | 13,002,880 | ||
QBE Insurance Group Ltd. | 1,527,152 | 43,298,146 | |||
| 94,072,738 | |||||
INVESTMENT COMPANIES – 1.39% | |||||
Macquarie Airports | 1,213,050 | 4,292,914 | |||
Macquarie Communications Infrastructure Groupa | 753,558 | 3,555,731 | |||
Macquarie Infrastructure Group | 4,682,683 | 12,571,669 | |||
| 20,420,314 | |||||
IRON & STEEL – 1.21% | |||||
BlueScope Steel Ltd. | 1,300,278 | 11,287,165 | |||
OneSteel Ltd. | 1,310,651 | 6,461,658 | |||
| 17,748,823 | |||||
MANUFACTURING – 2.67% | |||||
Ansell Ltd. | 259,607 | 2,766,763 | |||
Futuris Corp. Ltd. | 1,026,766 | 2,046,547 | |||
Orica Ltd. | 548,682 | 12,784,330 | |||
Wesfarmers Ltd. | 687,399 | 21,564,042 | |||
| 39,161,682 | |||||
MEDIA – 1.49% | |||||
APN News & Media Ltd. | 531,014 | 2,376,035 | |||
John Fairfax Holdings Ltd. | 2,100,538 | 7,929,262 | |||
Publishing and Broadcasting Ltd. | 794,367 | 11,580,930 | |||
| 21,886,227 | |||||
MINING – 18.58% | |||||
Alumina Ltd. | 1,998,498 | 11,283,594 | |||
BHP Billiton Ltd. | 5,940,720 | 185,686,656 | |||
Fortescue Metals Group Ltd.b | 222,288 | 6,148,642 | |||
Iluka Resources Ltd. | 430,732 | 1,944,842 | |||
Newcrest Mining Ltd. | 595,301 | 11,865,525 | |||
Paladin Resources Ltd.a,b | 959,964 | 4,732,731 | |||
Rio Tinto Ltd.a | 505,922 | 38,492,163 | |||
Zinifex Ltd. | 861,852 | 11,835,576 | |||
| 271,989,729 | |||||
OIL & GAS – 4.09% | |||||
Caltex Australia Ltd. | 238,880 | 4,703,048 | |||
Origin Energy Ltd. | 1,544,946 | 12,531,201 | |||
Santos Ltd. | 1,065,343 | 11,483,905 | |||
Woodside Petroleum Ltd. | 843,973 | 31,103,625 | |||
| 59,821,779 | |||||
| Security | Shares | Value | |||
PACKAGING & CONTAINERS – 0.67% | |||||
Amcor Ltd. | 1,577,776 | $ | 9,755,357 | ||
| 9,755,357 | |||||
PHARMACEUTICALS – 2.03% | |||||
CSL Ltd. | 323,748 | 25,864,425 | |||
Symbion Health Ltd. | 1,142,400 | 3,866,302 | |||
| 29,730,727 | |||||
REAL ESTATE – 9.99% | |||||
Centro Properties Group | 1,495,855 | 9,966,844 | |||
CFS Retail Property Trust | 2,449,029 | 4,722,006 | |||
Commonwealth Property Office Fund | 2,574,206 | 3,518,332 | |||
DB RREEF Trust | 5,127,445 | 8,384,580 | |||
Goodman Group | 2,546,607 | 13,963,879 | |||
GPT Group | 3,633,482 | 14,129,772 | |||
ING Industrial Fund | 1,766,951 | 3,852,508 | |||
Lend Lease Corp. Ltd. | 637,420 | 9,961,788 | |||
Mirvac Group | 1,806,112 | 7,905,170 | |||
Stockland | 2,457,500 | 17,173,980 | |||
Westfield Group | 3,093,712 | 52,678,495 | |||
| 146,257,354 | |||||
RETAIL – 1.86% | |||||
Coles Group Ltd. | 2,016,450 | 23,245,643 | |||
Harvey Norman Holdings Ltd. | 936,914 | 4,055,044 | |||
| 27,300,687 | |||||
TELECOMMUNICATIONS – 1.66% | |||||
Telstra Corp. Ltd. | 5,077,496 | 18,051,582 | |||
Telstra Corp. Ltd. Installment Receipt | 2,632,079 | 6,209,851 | |||
| 24,261,433 | |||||
TRANSPORTATION – 1.18% | |||||
Asciano Groupb | 951,851 | 6,620,935 | |||
Toll Holdings Ltd. | 957,426 | 10,593,229 | |||
| 17,214,164 | |||||
TOTAL COMMON STOCKS | 1,451,128,852 | ||||
30 | 2007 iSHARES ANNUAL REPORT TO SHAREHOLDERS |
Table of Contents
Schedule of Investments (Continued)
iSHARES® MSCI AUSTRALIA INDEX FUND
August 31, 2007
| Security | Shares | Value | ||||
SHORT-TERM INVESTMENTS – 4.13% |
| |||||
MONEY MARKET FUNDS – 4.13% |
| |||||
Barclays Global Investors Funds | ||||||
Institutional Money Market Fund, Institutional Shares | 196,327 | $ | 196,327 | |||
BGI Cash Premier Fund LLC | 60,181,361 | 60,181,361 | ||||
| 60,377,688 | ||||||
TOTAL SHORT-TERM | 60,377,688 | |||||
TOTAL INVESTMENTS IN | 1,511,506,540 | |||||
Other Assets, Less Liabilities – (3.24)% | (47,394,064 | ) | ||||
NET ASSETS – 100.00% | $ | 1,464,112,476 | ||||
a | All or a portion of this security represents a security on loan. See Note 5. |
b | Non-income earning security. |
c | Affiliated issuer. See Note 2. |
d | The rate quoted is the annualized seven-day yield of the fund at period end. |
e | This security represents an investment of securities lending collateral. See Note 5. |
See notes to financial statements.
SCHEDULESOF INVESTMENTS | 31 |
Table of Contents
Schedule of Investments
iSHARES® MSCI BRAZIL INDEX FUND
August 31, 2007
| Security | Shares | Value | |||
COMMON STOCKS – 40.17% | |||||
AEROSPACE & DEFENSE – 1.63% | |||||
Empresa Brasileira de Aeronautica SA | 6,449,760 | $ | 72,395,265 | ||
| 72,395,265 | |||||
AGRICULTURE – 0.61% | |||||
Souza Cruz SA | 1,296,000 | 27,103,592 | |||
| 27,103,592 | |||||
BANKS – 4.44% | |||||
Banco Nossa Caixa SA | 720,000 | 11,020,408 | |||
Unibanco-Uniao de Bancos Brasileiros SA | 16,560,020 | 185,877,776 | |||
| 196,898,184 | |||||
COMMERCIAL SERVICES – 0.85% | |||||
Companhia de Concessoes Rodoviarias | 2,160,000 | 37,469,388 | |||
| 37,469,388 | |||||
COSMETICS & PERSONAL CARE – 0.48% | |||||
Natura Cosmeticos SA | 2,016,000 | 21,291,429 | |||
| 21,291,429 | |||||
DIVERSIFIED FINANCIAL SERVICES – 0.75% | |||||
Redecard SAa | 2,160,000 | 33,061,225 | |||
| 33,061,225 | |||||
ELECTRIC – 2.41% | |||||
Centrais Eletricas Brasileiras SA | 3,456,000 | 44,769,306 | |||
CPFL Energia SA | 1,259,564 | 22,569,330 | |||
EDP Energias do Brasil SA | 1,152,000 | 18,220,408 | |||
Tractebel Energia SA | 1,861,800 | 21,277,714 | |||
| 106,836,758 | |||||
FOOD – 0.70% | |||||
Cosan SA Industria e Comercio | 90 | 1,001 | |||
Perdigao SA | 1,584,000 | 30,871,837 | |||
| 30,872,838 | |||||
HEALTH CARE - SERVICES – 0.30% | |||||
Diagnosticos da America SA | 596,300 | 13,383,284 | |||
| 13,383,284 | |||||
INTERNET – 0.75% | |||||
B2W - Companhia Global do Varejo | 864,030 | 33,282,788 | |||
| 33,282,788 | |||||
| Security | Shares | Value | |||
IRON & STEEL – 2.74% | |||||
Companhia Siderurgica Nacional | 1,769,784 | $ | 100,534,567 | ||
Gerdau SA | 1,035,600 | 20,918,063 | |||
| 121,452,630 | |||||
MINING – 9.56% | |||||
Companhia Vale do Rio Doce ADR | 8,595,360 | 424,009,109 | |||
| 424,009,109 | |||||
OIL & GAS – 10.11% | |||||
Petroleo Brasileiro SA | 14,400,000 | 448,163,265 | |||
| 448,163,265 | |||||
REAL ESTATE – 0.77% | |||||
Cyrela Brazil Realty SA | 2,448,000 | 23,168,571 | |||
Cyrela Commercial Properties SA Empreendimentose e Participacoesa | 1,208,700 | 1,480,041 | |||
Gafisa SA | 803,500 | 9,715,791 | |||
| 34,364,403 | |||||
RETAIL – 0.73% | |||||
Lojas Renner SA | 1,872,000 | 32,311,102 | |||
| 32,311,102 | |||||
TELECOMMUNICATIONS – 1.15% | |||||
Brasil Telecom Participacoes SA | 901,000 | 20,410,408 | |||
Tele Norte Leste Participacoes SA | 897,938 | 30,690,238 | |||
| 51,100,646 | |||||
TRANSPORTATION – 1.39% | |||||
All America Latina Logistica SA | 5,328,000 | 61,706,939 | |||
| 61,706,939 | |||||
WATER – 0.80% | |||||
Companhia de Saneamento Basico do Estado de Sao Paulo | 1,458,000 | 35,557,347 | |||
| 35,557,347 | |||||
TOTAL COMMON STOCKS | 1,781,260,192 | ||||
32 | 2007 iSHARES ANNUAL REPORT TO SHAREHOLDERS |
Table of Contents
Schedule of Investments (Continued)
iSHARES® MSCI BRAZIL INDEX FUND
August 31, 2007
| Security | Shares | Value | |||
PREFERRED STOCKS – 59.12% | |||||
AIRLINES – 0.35% | |||||
Gol Linhas Aereas Inteligentes SA | 295,000 | $ | 6,547,194 | ||
Tam SA | 399,700 | 9,105,411 | |||
| 15,652,605 | |||||
BANKS – 11.50% | |||||
Banco Bradesco SA | 11,808,000 | 294,898,776 | |||
Banco Itau Holding Financeira SA | 4,896,070 | 214,827,561 | |||
| 509,726,337 | |||||
BEVERAGES – 4.41% | |||||
Companhia de Bebidas das Americas | 2,819,891 | 195,665,906 | |||
| 195,665,906 | |||||
BUILDING MATERIALS – 0.64% | |||||
Duratex SA | 1,152,000 | 28,564,898 | |||
| 28,564,898 | |||||
CHEMICALS – 0.48% | |||||
Braskem SA Class A | 2,304,036 | 21,277,067 | |||
| 21,277,067 | |||||
ELECTRIC – 4.30% | |||||
Centrais Eletricas Brasileiras SA Class B | 2,880,200 | 35,561,653 | |||
Companhia Energetica de Minas Gerais | 3,950,500 | 76,188,214 | |||
Companhia Energetica de Sao Paulo Class Ba | 2,016,000,000 | 34,446,848 | |||
Companhia Paranaense de Energia Class B | 1,584,000 | 25,861,225 | |||
Eletropaulo Metropolitana Electricidade de Sao Paulo SA Class B | 331,200,000 | 18,689,142 | |||
| 190,747,082 | |||||
FOOD – 0.92% | |||||
Companhia Brasileira de Distribuicao Grupo Pao de Acucar | 221,700,000 | 7,114,761 | |||
Sadia SA | 6,717,000 | 33,859,163 | |||
| 40,973,924 | |||||
| Security | Shares | Value | |||
FOREST PRODUCTS & PAPER – 2.39% | |||||
Aracruz Celulose SA Class B | 7,200,400 | $ | 45,553,551 | ||
Klabin SA | 8,816,000 | 25,998,204 | |||
Votorantim Celulose e Papel SA | 1,440,100 | 34,400,756 | |||
| 105,952,511 | |||||
IRON & STEEL – 4.60% | |||||
Gerdau SA | 4,464,373 | 109,331,584 | |||
Usinas Siderurgicas de Minas Gerais SA Class A | 1,584,000 | 94,450,041 | |||
| 203,781,625 | |||||
MEDIA – 0.82% | |||||
Net Servicos de Comunicacao SAa | 2,410,560 | 36,281,388 | |||
| 36,281,388 | |||||
MINING – 11.37% | |||||
Companhia Vale do Rio Doce Class A | 12,164,400 | 503,953,714 | |||
| 503,953,714 | |||||
OIL & GAS – 12.02% | |||||
Petroleo Brasileiro SA | 20,016,000 | 533,079,184 | |||
| 533,079,184 | |||||
RETAIL – 0.82% | |||||
Lojas Americanas SA | 4,464,000 | 36,440,816 | |||
| 36,440,816 | |||||
TELECOMMUNICATIONS – 4.30% | |||||
Brasil Telecom Participacoes SA | 3,312,000 | 48,159,184 | |||
Tele Norte Leste Participacoes SA | 3,515,139 | 78,821,612 | |||
Telesp Celular Participacoes SA | 6,912,083 | 32,832,394 | |||
TIM Participacoes SA | 8,784,000 | 30,923,265 | |||
| 190,736,455 | |||||
TEXTILES – 0.20% | |||||
Companhia de Tecidos Norte de Minas | 1,467,908 | 9,062,085 | |||
| 9,062,085 | |||||
TOTAL PREFERRED STOCKS | 2,621,895,597 | ||||
SCHEDULESOF INVESTMENTS | 33 |
Table of Contents
Schedule of Investments (Continued)
iSHARES® MSCI BRAZIL INDEX FUND
August 31, 2007
| Security | Shares | Value | |||
SHORT-TERM INVESTMENTS – 0.25% | |||||
MONEY MARKET FUNDS – 0.25% | |||||
Barclays Global Investors Funds Institutional Money Market Fund, Institutional Shares | 10,991,195 | $ | 10,991,195 | ||
| 10,991,195 | |||||
TOTAL SHORT-TERM | 10,991,195 | ||||
TOTAL INVESTMENTS IN | 4,414,146,984 | ||||
Other Assets, Less Liabilities – 0.46% | 20,186,654 | ||||
NET ASSETS – 100.00% | $ | 4,434,333,638 | |||
ADR – American Depositary Receipts
a | Non-income earning security. |
b | Affiliated issuer. See Note 2. |
c | The rate quoted is the annualized seven-day yield of the fund at period end. |
See notes to financial statements.
34 | 2007 iSHARES ANNUAL REPORT TO SHAREHOLDERS |
Table of Contents
Schedule of Investments
iSHARES® MSCI CANADA INDEX FUND
August 31, 2007
| Security | Shares | Value | |||
COMMON STOCKS – 99.72% | |||||
ADVERTISING – 0.02% | |||||
Aeroplan Income Funda | 16,282 | $ | 325,532 | ||
| 325,532 | |||||
AEROSPACE & DEFENSE – 0.30% | |||||
CAE Inc. | 307,797 | 3,971,668 | |||
| 3,971,668 | |||||
AIRLINES – 0.18% | |||||
ACEAviation Holdings Inc. Class Ab | 97,520 | 2,285,315 | |||
Jazz Air Income Funda | 20,078 | 146,526 | |||
| 2,431,841 | |||||
APPAREL – 0.34% | |||||
Gildan Activewear Inc.b | 137,223 | 4,442,868 | |||
| 4,442,868 | |||||
AUTO PARTS & EQUIPMENT – 0.89% | |||||
Magna International Inc. Class A | 131,443 | 11,781,846 | |||
| 11,781,846 | |||||
BANKS – 16.82% | |||||
Bank of Montreal | 604,092 | 37,090,112 | |||
Bank of Nova Scotia | 1,196,050 | 59,064,756 | |||
Canadian Imperial Bank of Commerce | 407,807 | 36,892,877 | |||
National Bank of Canada | 192,913 | 10,015,392 | |||
Royal Bank of Canada | 1,547,398 | 79,487,269 | |||
| 222,550,406 | |||||
BEVERAGES – 0.07% | |||||
Cott Corp.b | 86,063 | 964,888 | |||
| 964,888 | |||||
CHEMICALS – 3.59% | |||||
Agrium Inc. | 161,567 | 7,369,294 | |||
Methanex Corp. | 124,684 | 2,788,697 | |||
NOVA Chemicals Corp. | 99,266 | 3,611,805 | |||
Potash Corp. of Saskatchewan Inc. | 380,897 | 33,695,081 | |||
| 47,464,877 | |||||
COAL – 0.45% | |||||
Fording Canadian Coal Trust | 179,528 | 5,907,614 | |||
| 5,907,614 | |||||
| Security | Shares | Value | |||
COMMERCIAL SERVICES – 0.25% | |||||
QuebecorWorld Inc.b | 101,498 | $ | 903,825 | ||
Ritchie Bros. Auctioneers Inc. | 36,389 | 2,352,205 | |||
| 3,256,030 | |||||
COMPUTERS – 4.21% | |||||
CGI Group Inc.b | 354,768 | 3,923,794 | |||
Research In Motion Ltd.b | 606,906 | 51,754,966 | |||
| 55,678,760 | |||||
DIVERSIFIED FINANCIAL SERVICES – 0.93% | |||||
CI Financial Income Fund | 72,118 | 1,733,668 | |||
IGM Financial Inc. | 144,438 | 7,070,000 | |||
TSX Group Inc. | 83,758 | 3,523,402 | |||
| 12,327,070 | |||||
ELECTRIC – 0.88% | |||||
Fortis Inc. | 186,560 | 4,682,297 | |||
TransAlta Corp. | 245,179 | 6,929,954 | |||
| 11,612,251 | |||||
ELECTRONICS – 0.11% | |||||
Celestica Inc.b | 238,222 | 1,416,473 | |||
| 1,416,473 | |||||
ENGINEERING & CONSTRUCTION – 0.54% | |||||
SNC-Lavalin Group Inc. | 182,980 | 7,161,102 | |||
| 7,161,102 | |||||
FOOD – 1.06% | |||||
George Weston Ltd. | 62,209 | 4,210,582 | |||
Loblaw Companies Ltd. | 132,040 | 5,635,587 | |||
Saputo Inc. | 87,460 | 4,195,864 | |||
| 14,042,033 | |||||
FOREST PRODUCTS & PAPER – 0.17% | |||||
Abitibi-Consolidated Inc.b | 480,623 | 931,396 | |||
Canfor Corp.b | 111,273 | 1,300,122 | |||
| 2,231,518 | |||||
GAS – 0.20% | |||||
Canadian Utilities Ltd. Class A | 58,373 | 2,684,545 | |||
| 2,684,545 | |||||
HAND & MACHINE TOOLS – 0.48% | |||||
Finning International Inc. | 216,531 | 6,314,677 | |||
| 6,314,677 | |||||
SCHEDULESOF INVESTMENTS | 35 |
Table of Contents
Schedule of Investments (Continued)
iSHARES® MSCI CANADA INDEX FUND
August 31, 2007
| Security | Shares | Value | |||
HEALTH CARE - SERVICES – 0.22% | |||||
MDS Inc. | 147,560 | $ | 2,887,453 | ||
| 2,887,453 | |||||
HOLDING COMPANIES - DIVERSIFIED – 2.15% | |||||
Brookfield Asset Management Inc. Class A | 598,164 | 20,260,166 | |||
Onex Corp. | 123,583 | 4,042,134 | |||
Sherritt International Corp. | 279,555 | 4,215,061 | |||
| 28,517,361 | |||||
INSURANCE – 11.20% | |||||
Fairfax Financial Holdings Ltd. | 20,480 | 4,247,202 | |||
Great-West Lifeco Inc. | 323,056 | 10,917,665 | |||
Manulife Financial Corp. | 1,872,723 | 72,405,701 | |||
Power Corp. of Canada | 414,625 | 15,874,001 | |||
Power Financial Corp. | 298,681 | 11,570,589 | |||
Sun Life Financial Inc. | 690,369 | 33,146,327 | |||
| 148,161,485 | |||||
MANUFACTURING – 0.77% | |||||
Bombardier Inc. Class Bb | 1,736,208 | 10,175,819 | |||
| 10,175,819 | |||||
MEDIA – 4.15% | |||||
Astral Media Inc. Class A | 60,237 | 2,422,918 | |||
Rogers Communications Inc. Class B | 603,341 | 27,365,223 | |||
Shaw Communications Inc. Class B | 422,286 | 9,788,205 | |||
Thomson Corp. | 271,575 | 11,475,542 | |||
Yellow Pages Income Fund | 305,056 | 3,933,416 | |||
| 54,985,304 | |||||
MINING – 13.73% | |||||
Aber Diamond Corp. | 71,073 | 2,529,563 | |||
Agnico-Eagle Mines Ltd. | 162,213 | 7,240,817 | |||
Alcan Inc. | 444,964 | 43,850,732 | |||
Barrick Gold Corp. | 1,044,969 | 33,911,978 | |||
Cameco Corp. | 428,374 | 17,271,022 | |||
Eldorado Gold Corp.b | 412,595 | 2,032,065 | |||
First Quantum Minerals Ltd. | 81,515 | 6,164,579 | |||
Goldcorp Inc. | 851,399 | 20,064,638 | |||
Ivanhoe Mines Ltd.b | 294,627 | 3,300,402 | |||
Kinross Gold Corp.b | 717,074 | 8,757,949 | |||
Lundin Mining Corp.b | 397,780 | 4,549,925 | |||
| Security | Shares | Value | |||
Meridian Gold Inc.b | 121,389 | $ | 3,344,982 | ||
Pan American Silver Corp.b | 88,291 | 2,203,415 | |||
Teck Cominco Ltd. Class B | 521,737 | 22,194,229 | |||
Yamana Gold Inc. | 385,576 | 4,260,891 | |||
| 181,677,187 | |||||
OIL & GAS – 23.39% | |||||
ARC Energy Trust | 124,175 | 2,393,466 | |||
Canadian Natural Resources Ltd. | 652,089 | 44,499,981 | |||
Canadian Oil Sands Trust | 284,371 | 8,196,315 | |||
Canetic Resources Trust | 276,554 | 3,845,639 | |||
Duvernay Oil Corp.b | 55,173 | 1,655,946 | |||
EnCana Corp. | 922,653 | 53,980,237 | |||
Enerplus Resources Fund | 149,748 | 6,327,679 | |||
Ensign Resource Service Group | 156,120 | 2,730,274 | |||
First Calgary Petroleums Ltd.b | 304,964 | 1,455,847 | |||
Harvest Energy Trust | 157,816 | 4,087,686 | |||
Husky Energy Inc. | 307,301 | 11,256,713 | |||
Imperial Oil Ltd. | 396,903 | 17,337,891 | |||
Nexen Inc. | 573,128 | 15,998,932 | |||
Niko Resources Ltd. | 52,696 | 4,632,725 | |||
OPTI Canada Inc.b | 208,131 | 3,836,607 | |||
Penn West Energy Trust | 287,885 | 8,283,991 | |||
Petro-Canada | 599,688 | 30,532,869 | |||
Precision Drilling Trust | 74,469 | 1,445,241 | |||
PrimeWest Energy Trust | 173,565 | 3,547,266 | |||
Provident Energy Trust | 262,104 | 3,035,188 | |||
Suncor Energy Inc. | 556,601 | 49,774,972 | |||
Talisman Energy Inc. | 1,267,600 | 21,712,825 | |||
UTS Energy Corp.b | 514,310 | 2,722,632 | |||
Western Oil Sands Inc. Class Ab | 175,890 | 6,221,869 | |||
| 309,512,791 | |||||
OIL & GAS SERVICES – 0.20% | |||||
Trican Well Service Ltd. | 146,893 | 2,610,567 | |||
| 2,610,567 | |||||
PHARMACEUTICALS – 0.23% | |||||
Biovail Corp. | 174,097 | 3,064,410 | |||
| 3,064,410 | |||||
PIPELINES – 2.78% | |||||
Enbridge Inc. | 422,887 | 14,231,486 | |||
TransCanada Corp. | 648,150 | 22,547,545 | |||
| 36,779,031 | |||||
36 | 2007 iSHARES ANNUAL REPORT TO SHAREHOLDERS |
Table of Contents
Schedule of Investments (Continued)
iSHARES® MSCI CANADA INDEX FUND
August 31, 2007
| Security | Shares | Value | |||
REAL ESTATE – 0.59% | |||||
Brookfield Properties Corp. | 265,232 | $ | 6,055,067 | ||
MI Developments Inc. Class A | 57,383 | 1,817,748 | |||
| 7,872,815 | |||||
REAL ESTATE INVESTMENT TRUSTS – 0.21% | |||||
RioCan Real Estate Investment Trust | 123,911 | 2,756,181 | |||
| 2,756,181 | |||||
RETAIL – 2.08% | |||||
Alimentation Couche-Tard Inc. Class B | 167,776 | 3,441,640 | |||
Canadian Tire Corp. Ltd. Class A | 93,899 | 6,888,974 | |||
Jean Coutu Group Inc. Class A | 173,236 | 2,546,505 | |||
RONA Inc.b | 137,910 | 2,804,220 | |||
Shoppers Drug Mart Corp. | 235,027 | 11,832,999 | |||
| 27,514,338 | |||||
SOFTWARE – 0.44% | |||||
Cognos Inc.b | 109,032 | 4,364,991 | |||
Open Text Corp.b | 59,140 | 1,468,088 | |||
| 5,833,079 | |||||
TELECOMMUNICATIONS – 2.65% | |||||
BCE Inc. | 318,891 | 12,175,646 | |||
Nortel Networks Corp.b | 528,119 | 9,240,897 | |||
TELUS Corp. | 70,995 | 3,748,235 | |||
TELUS Corp. NVS | 190,624 | 9,858,713 | |||
| 35,023,491 | |||||
TRANSPORTATION – 3.44% | |||||
Canadian National Railway Co. | 613,600 | 32,308,475 | |||
Canadian Pacific Railway Ltd. | 188,276 | 13,206,106 | |||
| 45,514,581 | |||||
TOTAL COMMON STOCKS (Cost: $1,062,442,389) | 1,319,451,892 | ||||
| Security | Shares | Value | |||
SHORT-TERM INVESTMENTS – 0.02% | |||||
MONEY MARKET FUNDS – 0.02% | |||||
Barclays Global Investors Funds Institutional Money Market Fund, Institutional Shares | 234,233 | $ | 234,233 | ||
| 234,233 | |||||
TOTAL SHORT-TERM INVESTMENTS | 234,233 | ||||
TOTAL INVESTMENTS IN SECURITIES – 99.74% (Cost: $1,062,676,622) | 1,319,686,125 | ||||
Other Assets, Less Liabilities – 0.26% | 3,436,018 | ||||
NET ASSETS – 100.00% | $ | 1,323,122,143 | |||
NVS – Non-Voting Shares
a | Security valued at fair value in accordance with procedures approved by the Board of Directors. See Note 1. |
b | Non-income earning security. |
c | Affiliated issuer. See Note 2. |
d | The rate quoted is the annualized seven-day yield of the fund at period end. |
See notes to financial statements.
SCHEDULESOF INVESTMENTS | 37 |
Table of Contents
Schedule of Investments
iSHARES® MSCI EMERGING MARKETS INDEX FUND
August 31, 2007
| Security | Shares | Value | |||
COMMON STOCKS – 91.17% | |||||
ARGENTINA – 0.75% | |||||
BBVA Banco Frances SA ADR | 978,195 | $ | 8,960,266 | ||
Petrobras Energia Participaciones SA SP ADR | 1,840,503 | 17,061,463 | |||
Tenaris SA ADR | 2,355,927 | 110,563,654 | |||
| 136,585,383 | |||||
BRAZIL – 3.54% | |||||
Companhia Vale do Rio Doce ADR | 5,235,650 | 258,274,615 | |||
Empresa Brasileira de Aeronautica SA ADR | 1,233,498 | 55,704,770 | |||
Petroleo Brasileiro SA ADR | 4,087,010 | 252,740,698 | |||
Unibanco-Uniao de Bancos Brasileiros SA GDR | 697,116 | 77,784,203 | |||
| 644,504,286 | |||||
CHILE – 1.88% | |||||
Banco Santander | |||||
Chile SA ADR | 1,788,916 | 85,152,402 | |||
Compania de Telecomunicacionesde Chile SA SP ADR | 2,160,444 | 18,515,005 | |||
Enersis SA SP ADR | 5,261,514 | 94,602,022 | |||
LAN Airlines SA SP ADR | 2,425,110 | 38,923,016 | |||
Sociedad Quimica y Minerade Chile SA SP ADR | 655,878 | 104,540,394 | |||
| 341,732,839 | |||||
CHINA – 8.96% | |||||
Aluminum Corporation of China Ltd. Class H | 5,418,000 | 14,836,220 | |||
BBVA Banco | |||||
Angang New Steel Co. Ltd. Class Ha | 12,642,000 | 42,481,855 | |||
Bank of China Ltd. Class Ha | 153,510,000 | 78,952,781 | |||
Bank of Communications Co. Ltd. Class Ha | 42,547,000 | 47,803,472 | |||
Beijing Capital International Airport Co. Ltd. Class Ha | 14,452,000 | 23,503,557 | |||
China Communications Construction Co. Ltd. Class H | 9,039,000 | 19,546,290 | |||
| Security | Shares | Value | |||
China Construction Bank Class Ha | 181,503,000 | $ | 152,013,928 | ||
China Eastern Airlines Corp. Ltd. Class Ha,b,c | 62,370,000 | 29,838,086 | |||
China Foods Ltd.a | 5,424,000 | 3,457,502 | |||
China Life Insurance Co. Ltd. Class H | 46,956,000 | 226,747,478 | |||
China Petroleum & Chemical Corp. Class H | 117,474,000 | 128,069,901 | |||
China Shenhua Energy Co. Ltd. Class H | 5,535,500 | 23,997,166 | |||
China Shipping Development Co. Ltd. Class H | 16,272,000 | 49,149,402 | |||
COSCO Pacific Ltd. | 7,224,000 | 20,059,589 | |||
Datang International Power Generation Co. Ltd. Class H | 14,464,000 | 15,304,838 | |||
Guangshen Railway Co. Ltd. Class Ha | 57,862,363 | 45,344,411 | |||
Guangzhou R&F Properties Co. Ltd. Class H | 722,400 | 2,918,601 | |||
Huadian Power International Corp. Ltd.a | 30,736,000 | 17,700,278 | |||
Huaneng Power International Inc. Class Ha | 21,672,000 | 24,933,189 | |||
Hunan Non-Ferrous Metal Corp. Ltd. Class Ha | 25,312,000 | 14,739,023 | |||
Industrial and Commercial Bank of China Class Ha | 186,939,000 | 121,800,765 | |||
Jiangsu Expressway Co. Ltd. Class H | 5,424,000 | 5,648,877 | |||
Jiangxi Copper Co. Ltd.a | 18,078,000 | 41,782,225 | |||
Maanshan Iron & Steel Co. Ltd. Class Ha | 19,866,000 | 17,708,494 | |||
PetroChina Co. Ltd. Class H | 122,822,000 | 179,583,904 | |||
Ping An Insurance (Group) Co. of China Ltd. Class H | 9,936,500 | 103,357,187 | |||
Shanghai Forte Land Co. Class Ha | 5,418,000 | 3,231,308 | |||
Sinopec Shanghai Petrochemical Co. Ltd. Class Ha | 21,696,000 | 14,776,126 | |||
Sinotrans Ltd.a | 21,672,000 | 11,896,772 | |||
38 | 2007 iSHARES ANNUAL REPORT TO SHAREHOLDERS |
Table of Contents
Schedule of Investments (Continued)
iSHARES® MSCI EMERGING MARKETS INDEX FUND
August 31, 2007
| Security | Shares | Value | |||
Travelsky Technology Ltd. Class H | 3,616,000 | $ | 2,907,919 | ||
Tsingtao Brewery Co. Ltd. Class Ha | 3,616,000 | 12,614,897 | |||
Weichai Power Co. Ltd. Class Ha | 3,613,000 | 28,730,689 | |||
XinAo Gas Holdings Ltd.a | 3,624,000 | 5,977,444 | |||
Yanzhou Coal Mining Co. Ltd. Class Ha | 21,672,800 | 38,137,790 | |||
Zhejiang Expressway Co. Ltd. Class H | 21,696,000 | 28,884,404 | |||
Zijin Mining Group Co. Ltd. Class H | 36,120,000 | 31,872,973 | |||
| 1,630,309,341 | |||||
CZECH REPUBLIC – 1.83% | |||||
Central European Media Enterprises Ltd. Class Ab | 17,090 | 1,539,602 | |||
CEZ AS | 3,990,357 | 211,448,909 | |||
Komercni Banka AS | 253,759 | 55,035,261 | |||
Philip Morris CR AS | 10,839 | 5,202,822 | |||
Unipetrol ASb | 3,895,100 | 54,024,615 | |||
Zentiva NVa | 110,742 | 6,538,402 | |||
| 333,789,611 | |||||
EGYPT – 0.61% | |||||
Orascom Construction Industries Co. GDR | 497,883 | 66,218,439 | |||
Orascom Telecom Holding SAE GDR | 790,829 | 45,630,833 | |||
| 111,849,272 | |||||
HONG KONG – 6.72% | |||||
Agile Property Holdings Ltd.a | 5,418,000 | 9,867,650 | |||
Air China Ltd.a | 27,090,000 | 33,702,889 | |||
Beijing Enterprises Holdings Ltd.a | 3,616,000 | 15,745,432 | |||
Brilliance China Automotive Holdings Ltd.a,b | 23,214,000 | 5,537,954 | |||
Chaoda Modern Agriculture (Holdings) Ltd. | 1,806,000 | 1,392,126 | |||
China Agri-Industries Holdings Ltd.a,b | 5,424,000 | 3,123,579 | |||
| Security | Shares | Value | |||
China Everbright Pacific Ltd.a,b | 20,094,000 | $ | 62,884,356 | ||
China Mengniu Dairy Co. Ltd. | 3,612,000 | 13,620,137 | |||
China Merchants Holdings International Co. Ltd. | 7,224,000 | 37,756,501 | |||
China Mobile Ltd. | 31,153,500 | 423,544,554 | |||
China Overseas Land & Investment Ltd. | 28,954,000 | 60,531,658 | |||
China Resources Enterprises Ltd. | 12,656,000 | 51,537,884 | |||
China Resources Land Ltd. | 28,928,000 | 50,014,357 | |||
China Resources Power Holdings Co. Ltd. | 5,418,000 | 15,287,908 | |||
China Travel International Investment Hong Kong Ltd.a | 63,496,951 | 40,068,618 | |||
Citic Pacific Ltd. | 9,933,000 | 54,335,775 | |||
CNOOC Ltd. | 108,360,000 | 132,448,880 | |||
Country Garden Holdings Co.b | 18,060,000 | 27,796,197 | |||
Denway Motors Ltd.a | 34,314,000 | 16,063,886 | |||
FU JI Food and Catering Services Holdings Ltd.a | 2,709,000 | 7,991,407 | |||
Global Bio-Chem Technology Group Co. Ltd. | 9,030,000 | 3,949,376 | |||
GOME Electrical Appliances Holdings Ltd.a | 8,127,000 | 12,820,996 | |||
Guangdong Investment Ltd. | 12,646,110 | 7,931,443 | |||
Guangzhou Investment Co. Ltd. | 30,702,000 | 8,505,636 | |||
Lenovo Group Ltd.a | 37,926,000 | 25,148,609 | |||
Li Ning Co. Ltd.a | 3,612,000 | 10,261,430 | |||
Nine Dragons Paper Holdings Ltd.a | 9,933,000 | 29,684,022 | |||
Shanghai Industrial Holdings Ltd.a | 3,616,000 | 15,815,000 | |||
Shenzhen Investment Ltd. | 28,918,000 | 23,737,480 | |||
Sinofert Holdings Ltd.a | 30,390,000 | 21,554,712 | |||
| 1,222,660,452 | |||||
HUNGARY – 1.72% | |||||
Gedeon Richter Rta | 421,983 | 83,476,843 | |||
Magyar Telekom Telecommunications PLC | 2,848,512 | 14,285,328 | |||
SCHEDULESOF INVESTMENTS | 39 |
Table of Contents
Schedule of Investments (Continued)
iSHARES® MSCI EMERGING MARKETS INDEX FUND
August 31, 2007
| Security | Shares | Value | |||
MOL Magyar Olaj-es Gazipari Rta | 571,046 | $ | 81,822,967 | ||
OTP Bank Ltd.a | 2,643,081 | 133,540,076 | |||
| 313,125,214 | |||||
INDIA – 5.79% | |||||
HDFC Bank Ltd. ADR | 2,289,105 | 202,929,158 | |||
ICICI Bank Ltd. SP ADR | 3,666,180 | 162,961,701 | |||
Infosys Technologies Ltd. SP ADR | 3,635,868 | 173,467,262 | |||
Mahanagar Telephone Nigam Ltd. ADR | 5,410,951 | 37,443,781 | |||
Reliance Industries Ltd. GDRd | 1,749,557 | 167,082,694 | |||
Satyam Computer Services Ltd. ADR | 5,298,860 | 135,014,953 | |||
Videsh Sanchar Nigam Ltd. ADRa | 4,958,373 | 100,109,551 | |||
Wipro Ltd. ADRa | 5,142,042 | 75,228,074 | |||
| 1,054,237,174 | |||||
INDONESIA – 2.19% | |||||
PT Aneka Tambang Tbk | 228,007,500 | 54,634,384 | |||
PT Astra Agro Lestari Tbk | 2,257,500 | 3,437,939 | |||
PT Astra International Inc. Tbk | 14,003,500 | 26,620,072 | |||
PT Bank Central Asia Tbk | 40,670,000 | 25,987,221 | |||
PT Bank Danamon Indonesia Tbk | 14,007,487 | 12,008,548 | |||
PT Bank Internasional Indonesia Tbk | 126,871,500 | 2,729,291 | |||
PT Bank Mandiri Tbk | 30,250,500 | 10,470,088 | |||
PT Bank Pan Indonesia Tbkb | 228,533,522 | 16,306,438 | |||
PT Bank Rakyat Indonesia Tbk | 36,449,061 | 24,260,557 | |||
PT Berlian Laju Tanker Tbk | 23,956,000 | 3,954,398 | |||
PT Bumi Resources Tbk | 133,403,500 | 36,227,788 | |||
PT Indosat Tbk | 1,354,500 | 1,038,594 | |||
PT Kalbe Farma Tbk | 262,863,156 | 38,071,767 | |||
PT Perusahaan Gas Negara Tbk | 17,157,000 | 18,728,355 | |||
PT Ramayana Lestari Sentosa Tbk | 90,409,870 | 8,184,067 | |||
PT Semen Gresik (Persero) Tbk | 4,675,000 | 2,464,457 | |||
PT Telekomunikasi Indonesia Tbk | 84,882,000 | 98,079,840 | |||
PT United Tractors Tbk | 17,672,271 | 15,244,451 | |||
| 398,448,255 | |||||
| Security | Shares | Value | |||
ISRAEL – 3.26% | |||||
Africa Israel Investments Ltd. | 82,264 | $ | 6,995,663 | ||
Aladdin Knowledge Systems Ltd.b | 90,300 | 1,928,808 | |||
Alvarion Ltd.b | 605,913 | 7,131,596 | |||
AudioCodes Ltd.b | 202,156 | 1,000,672 | |||
Bank Hapoalim Ltd. | 10,488,512 | 49,438,652 | |||
Bank Leumi Le-Israel | 13,732,076 | 53,049,871 | |||
Check Point Software Technologies Ltd.b | 1,461,957 | 34,297,511 | |||
Clal Industries and Investments Ltd. | 492,135 | 2,682,036 | |||
Clal Insurance Co. Ltd. | 89,397 | 2,098,220 | |||
Discount Investment Corp. Ltd. | 75,936 | 2,193,717 | |||
ECI Telecom Ltd.b | 443,373 | 4,145,538 | |||
Elbit Systems Ltd. | 691,698 | 30,755,205 | |||
Elite Industries Ltd. | 203,175 | 2,396,683 | |||
Israel Chemicals Ltd. | 7,385,637 | 57,710,523 | |||
Israel Corp. Ltd. (The) | 9,933 | 6,902,358 | |||
Israel Discount Bank Class Ab | 15,504,067 | 31,454,525 | |||
Koor Industries Ltd. | 292,629 | 20,121,243 | |||
Makhteshim-Agan | 3,175,072 | 24,300,497 | |||
Mizrahi Tefahot Bank Ltd. | 4,941,388 | 34,013,125 | |||
NICE Systems Ltd.b | 180,800 | 6,215,927 | |||
Orbotech Ltd.b | 610,281 | 13,212,584 | |||
Super-Sol Ltd.b | 1,774,538 | 6,527,730 | |||
Syneron Medical Ltd.a,b | 180,600 | 4,085,172 | |||
Teva Pharmaceutical Industries Ltd. | 4,457,208 | 190,060,136 | |||
| 592,717,992 | |||||
MEXICO – 6.43% | |||||
Alfa SAB de CV Class Aa | 3,882,900 | 27,936,987 | |||
America Movil SAB de CV Series La | 96,621,000 | 292,056,267 | |||
Carso Infraestructura y | 3,044,400 | 3,176,823 | |||
Cemex SA de CV Series CPOa,b | 43,184,664 | 139,218,300 | |||
Consorcio ARA SAB de CVa | 25,312,000 | 38,610,671 | |||
Controladora Comercial | 10,113,600 | 27,913,675 | |||
40 | 2007 iSHARES ANNUAL REPORT TO SHAREHOLDERS |
Table of Contents
Schedule of Investments (Continued)
iSHARES® MSCI EMERGING MARKETS INDEX FUND
August 31, 2007
| Security | Shares | Value | |||
Corporacion Geo SAB de | 6,035,100 | $ | 31,395,115 | ||
Desarrolladora Homex SAB de CVa,b | 1,160,700 | 10,708,282 | |||
Empresas ICA SAB de CVa,b | 5,556,000 | 30,583,717 | |||
Fomento Economico Mexicano SABa | 16,543,200 | 57,527,622 | |||
Grupo Carso SA de CV | 814,341 | 3,212,427 | |||
Grupo Financiero Banorte SAB de CV Series Oa | 10,852,456 | 44,226,526 | |||
Grupo Mexico SA de CV | 9,842,700 | 61,544,736 | |||
Grupo Modelo SAB de | 11,856,598 | 58,027,499 | |||
Grupo Televisa SA Series CPOa | 18,692,100 | 97,779,740 | |||
Industrias Penoles SAB de CVa | 814,588 | 10,870,962 | |||
Kimberly-Clark de | 6,682,200 | 28,472,498 | |||
Telefonos de Mexico | 50,846,600 | 90,088,543 | |||
Urbi Desarrollos Urbanos | 3,672,300 | 13,748,090 | |||
Wal-Mart de Mexico SAB de CV Series Va | 29,076,600 | 103,402,898 | |||
| 1,170,501,378 | |||||
PERU – 0.34% | |||||
Compania de Minas | 1,598,312 | 61,103,468 | |||
| 61,103,468 | |||||
PHILIPPINE ISLANDS – 1.56% | |||||
Ayala Corp. | 3,283,248 | 34,744,298 | |||
Ayala Land Inc. Class B | 40,089,200 | 12,490,189 | |||
Bank of the Philippine Islands | 21,452,100 | 27,886,808 | |||
Filinvest Land Inc.b | 352,234,375 | 11,958,107 | |||
Globe Telecom Inc. | 415,380 | 12,272,185 | |||
Jollibee Foods Corp. | 34,285,500 | 40,149,543 | |||
Manila Electric Co. Class B | 10,023,300 | 22,398,436 | |||
Megaworld Corp. | 254,420,040 | 19,133,438 | |||
Metropolitan Bank & Trust Co. | 40 | 47 | |||
Petron Corp. | 181,503,000 | 22,229,633 | |||
| Security | Shares | Value | |||
Philippine Long Distance | 577,920 | $ | 32,969,007 | ||
SM Investments Corp. | 1,798,401 | 14,297,558 | |||
SM Prime Holdings Inc. | 126,636,820 | 32,652,382 | |||
| 283,181,631 | |||||
RUSSIA – 9.08% | |||||
Comstar United Telesystems GDR | 210,399 | 2,310,181 | |||
JSC MMC Norilsk Nickel ADR | 548,240 | 122,257,520 | |||
LUKOIL SP ADR | 3,250,805 | 241,209,731 | |||
Mobile TeleSystems SP ADR | 812,700 | 53,768,232 | |||
OAO NOVATEK SP GDR Reg S | 434,343 | 21,717,150 | |||
OAO Gazprom SP ADR | 15,193,758 | 631,300,645 | |||
OAO Tatneft SP ADR | 255,530 | 25,808,530 | |||
Polyus Gold SP ADR | 589,659 | 23,704,292 | |||
RAO Unified Energy System of Russia GDRb | 491,232 | 61,895,232 | |||
Rostelecom SP ADRa | 646,551 | 38,560,302 | |||
Sberbank GDRa | 356,685 | 152,925,885 | |||
Surgutneftegaz SP ADRa | 1,742,790 | 108,924,375 | |||
Vimpel-Communications SP ADR | 4,257,645 | 103,886,538 | |||
VTB Bank OJSC GDR Reg Sa,b | 4,018,350 | 37,732,307 | |||
Wimm-Bill-Dann Foods OJSC ADR | 261,870 | 26,805,013 | |||
| 1,652,805,933 | |||||
SOUTH AFRICA – 8.26% | |||||
African Bank Investments Ltd.a | 8,789,897 | 38,590,987 | |||
Anglo Platinum Ltd. | 381,801 | 50,782,594 | |||
AVI Ltd. | 3,641,296 | 9,899,655 | |||
Barloworld Ltd. | 1,895,565 | 32,374,585 | |||
Bidvest Group Ltd. | 2,253,179 | 43,697,065 | |||
FirstRand Ltd. | 23,865,399 | 77,693,561 | |||
Foschini Ltd. | 5,042,704 | 40,742,377 | |||
Gold Fields Ltd. | 2,975,431 | 45,424,844 | |||
Harmony Gold Mining Co. Ltd.b | 1,303,932 | 11,653,125 | |||
Impala Platinum Holdings Ltd. | 3,417,344 | 101,055,233 | |||
Imperial Holdings Ltd. | 2,171,293 | 43,289,634 | |||
Investec Ltd. | 3,758,630 | 42,184,694 | |||
Liberty Group Ltd. | 669,125 | 8,369,077 | |||
Metropolitan Holdings Ltd. | 7,999,844 | 16,507,172 | |||
Mittal Steel South Africa Ltd. | 2,911,272 | 50,127,862 | |||
SCHEDULESOF INVESTMENTS | 41 |
Table of Contents
Schedule of Investments (Continued)
iSHARES® MSCI EMERGING MARKETS INDEX FUND
August 31, 2007
| Security | Shares | Value | |||
MTN Group Ltd. | 9,423,756 | $ | 142,949,412 | ||
Nampak Ltd. | 6,253,548 | 17,655,538 | |||
Naspers Ltd. | 3,111,213 | 77,688,149 | |||
Nedbank Group Ltd. | 2,846,257 | 53,472,726 | |||
Network Healthcare Holdings Ltd.b | 15,623,850 | 27,816,879 | |||
Pick’n Pay Stores Ltd. | 4,139,366 | 19,160,258 | |||
Pretoria Portland Cement Co. Ltd. | 3,517,200 | 22,189,376 | |||
Reunert Ltd. | 1,433,061 | 13,346,598 | |||
Sanlam Ltd. | 14,461,545 | 43,470,326 | |||
Sappi Ltd. | 369,821 | 5,787,718 | |||
Sasol Ltd. | 3,881,498 | 156,396,364 | |||
Shoprite Holdings Ltd. | 9,424,611 | 44,807,143 | |||
SPAR Group Ltd. (The) | 1,452,148 | 10,566,414 | |||
Standard Bank Group Ltd. | 8,119,858 | 118,291,246 | |||
Steinhoff International | 1,517,943 | 4,865,460 | |||
Telkom South Africa Ltd. | 1,093,684 | 26,867,497 | |||
Tiger Brands Ltd. | 1,393,901 | 36,390,096 | |||
Truworths International Ltd. | 8,070,114 | 36,871,054 | |||
Woolworths Holdings Ltd. | 11,731,037 | 32,220,485 | |||
| 1,503,205,204 | |||||
SOUTH KOREA – 15.44% | |||||
Hyundai Heavy Industries Co. Ltd. | 375,500 | 148,078,870 | |||
Kookmin Bank SP ADR | 4,989,075 | 406,360,159 | |||
Korea Electric Power Corp. SP ADR | 11,966,556 | 269,606,507 | |||
KT Corp. SP ADR | 6,388,725 | 152,179,430 | |||
LG.Philips LCD Co. Ltd. ADRa,b | 5,661,810 | 120,936,262 | |||
POSCO ADR | 5,145,610 | 788,873,469 | |||
Samsung Electronics Co. Ltd. GDRd | 2,031,750 | 645,080,627 | |||
Samsung Heavy Industries Co. Ltd. | 2,036,070 | 102,644,403 | |||
Shinhan Financial Group Co. Ltd. ADR | 144,480 | 17,915,520 | |||
SK Telecom Co. Ltd. ADR | 5,790,192 | 158,477,555 | |||
| 2,810,152,802 | |||||
| Security | Shares | Value | |||
TAIWAN – 9.55% | |||||
AU Optronics Corp. SP ADR | 12,752,778 | $ | 187,338,309 | ||
Chunghwa Telecom Co. Ltd. ADR | 19,469,678 | 341,108,759 | |||
Siliconware Precision Industries Co. SP ADRa,e | 37,663,985 | 406,394,398 | |||
Taiwan Semiconductor Manufacturing Co. Ltd. SP ADR | 50,258,465 | 498,563,973 | |||
United Microelectronics Corp. SP ADRa | 92,121,351 | 304,000,458 | |||
| 1,737,405,897 | |||||
THAILAND – 2.12% | |||||
Aromatics Thailand PCL | 9,068,300 | 19,955,018 | |||
Bangkok Bank PCL | 7,865,600 | 27,280,863 | |||
Bangkok Expressway PCL | 16,719,900 | 11,841,841 | |||
Banpu PCL | 2,511,000 | 21,955,698 | |||
Charoen Pokphand Foods PCL | 28,000 | 3,819 | |||
Electricity Generating PCL | 3,378,700 | 11,620,128 | |||
IRPC PCLb | 71,156,400 | 13,791,607 | |||
Kasikornbank PCL | 12,854,200 | 29,597,254 | |||
Krung Thai Bank PCL | 14,309,100 | 4,712,703 | |||
Precious Shipping PCL | 1,514,300 | 1,489,584 | |||
PTT Chemical PCL | 5,485,968 | 17,588,355 | |||
PTT Exploration & Production PCL | 14,382,500 | 51,141,504 | |||
PTT PCL | 7,990,700 | 68,005,957 | |||
Ratchaburi Electricity Generating Holding PCL | 29,642,800 | 39,526,613 | |||
Siam Cement PCL | 2,511,000 | 18,589,158 | |||
Siam City Cement PCL | 543,800 | 4,342,792 | |||
Siam Makro PCL | 9,842,700 | 25,818,799 | |||
Thai Airways International PCL | 2,512,900 | 3,204,296 | |||
Thanachart Capital PCL | 16,175,000 | 7,307,272 | |||
True Corp. PCLb | 27,157,400 | 5,421,982 | |||
United Broadcasting Corp. PCLb,c | 5,658,800 | 2,968,767 | |||
| 386,164,010 | |||||
TURKEY – 1.14% | |||||
Adana Cimento Sanayi TAS Class Aa | 3,360,689 | 23,332,746 | |||
Akbank TASa | 4,267,752 | 27,174,792 | |||
42 | 2007 iSHARES ANNUAL REPORT TO SHAREHOLDERS |
Table of Contents
Schedule of Investments (Continued)
iSHARES® MSCI EMERGING MARKETS INDEX FUND
August 31, 2007
| Security | Shares | Value | |||
Akcansa Cimento Sanayi | 459,737 | $ | 3,509,311 | ||
Arcelik ASa | 824,370 | 5,786,717 | |||
Dogan Yayin Holding ASa,b | 2,437,800 | 8,864,727 | |||
Eregli Demir ve Celik | 2,722,214 | 21,301,558 | |||
Hurriyet Gazetecilik ve | 1,944,181 | 5,160,619 | |||
Migros Turk TAS | 381,000 | 6,313,464 | |||
Tofas Turk Otomobil | 5,811,462 | 26,527,195 | |||
Trakya Cam Sanayii ASa | 151,272 | 515,264 | |||
Tupras-Turkiye Petrol | 780,302 | 17,808,964 | |||
Turk Sise ve Cam | 2,968,351 | 12,410,827 | |||
Turkiye Garanti Bankasi ASa | 4,155,257 | 26,617,872 | |||
Yapi ve Kredi Bankasi ASa,b | 7,872,518 | 22,587,814 | |||
| 207,911,870 | |||||
TOTAL COMMON STOCKS | 16,592,392,012 | ||||
PREFERRED STOCKS – 7.79% | |||||
BRAZIL – 7.79% | |||||
Aracruz Celulose SA SP ADR | 599,620 | 37,434,277 | |||
Banco Bradesco SA SP ADR | 10,345,042 | 255,315,636 | |||
Banco Itau Holding | 5,891,485 | 256,456,342 | |||
Brasil Telecom | 721,660 | 51,584,257 | |||
Companhia Brasileira de Distribuicao Grupo Pao de Acucar SP ADR | 878,744 | 28,234,045 | |||
Companhia de Bebidas | 1,117,011 | 78,157,260 | |||
Companhia Energetica de Minas Gerais SP ADR | 447,008 | 8,493,152 | |||
Companhia Vale do Rio | 7,123,911 | 297,423,284 | |||
Gerdau SA SP ADR | 1,964,025 | 47,215,161 | |||
Net Servicos de | 641,384 | 9,678,484 | |||
| Security | Shares | Value | |||
Petroleo Brasileiro SA SPADR | 5,313,572 | $ | 282,841,438 | ||
Tele Norte Leste | 2,053,192 | 45,355,011 | |||
Votorantim Celulose e | 832,566 | 19,465,393 | |||
| 1,417,653,740 | |||||
TOTAL PREFERRED STOCKS | 1,417,653,740 | ||||
RIGHTS – 0.00% | |||||
HONG KONG – 0.00% | |||||
Global Bio-chem Technology Group Co. Ltd.c | 58,636 | 1 | |||
| 1 | |||||
PHILIPPINE ISLANDS – 0.00% | |||||
Ayala Land Inc.c | 41,453,200 | 89 | |||
| 89 | |||||
TOTAL RIGHTS | 90 | ||||
WARRANTS – 0.01% | |||||
HONG KONG – 0.01% | |||||
China Overseas Land & Investment Ltd. (Expires 8/27/08) | 2,421,333 | 1,509,306 | |||
| 1,509,306 | |||||
TOTAL WARRANTS | 1,509,306 | ||||
EXCHANGE-TRADED FUNDS – 0.55% | |||||
iShares MSCI Malaysia Index Funda,e | 1,099,526 | 12,182,748 | |||
iShares MSCI South Korea Index Funda,e | 601,591 | 38,561,983 | |||
iShares MSCI Taiwan Index Funde | 3,100,003 | 49,414,048 | |||
TOTAL EXCHANGE-TRADED FUNDS | 100,158,779 | ||||
SCHEDULESOF INVESTMENTS | 43 |
Table of Contents
Schedule of Investments (Continued)
iSHARES® MSCI EMERGING MARKETS INDEX FUND
August 31, 2007
| Security | Shares | Value | ||||
SHORT-TERM INVESTMENTS – 7.78% |
| |||||
MONEY MARKET FUNDS – 7.78% |
| |||||
Barclays Global Investors Funds Institutional Money Market Fund, Institutional Shares | 25,663,971 | $ | 25,663,971 | |||
BGI Cash Premier Fund LLC | ||||||
5.47%e,f,g | 1,389,487,748 | 1,389,487,748 | ||||
| 1,415,151,719 | ||||||
TOTAL SHORT-TERM INVESTMENTS | ||||||
(Cost: $1,415,151,719) | 1,415,151,719 | |||||
TOTAL INVESTMENTS | ||||||
IN SECURITIES – 107.30% | ||||||
(Cost: $15,446,187,644) | 19,526,865,646 | |||||
Other Assets, Less Liabilities – (7.30)% | (1,328,494,514 | ) | ||||
NET ASSETS – 100.00% | $ | 18,198,371,132 | ||||
ADR – American Depositary Receipts
GDR – Global Depositary Receipts
SP ADR – Sponsored American Depositary Receipts
SP GDR – Sponsored Global Depositary Receipts
a | All or a portion of this security represents a security on loan. See Note 5. |
b | Non-income earning security. |
c | Security valued at fair value in accordance with procedures approved by the Board of Directors. See Note 1. |
d | This security may be resold to qualified institutional buyers under Rule 144A of the Securities Act of 1933. |
e | Affiliated issuer. See Note 2. |
f | The rate quoted is the annualized seven-day yield of the fund at period end. |
g | This security represents an investment of securities lending collateral. See Note 5. |
See notes to financial statements.
44 | 2007 iSHARES ANNUAL REPORT TO SHAREHOLDERS |
Table of Contents
Schedule of Investments
iSHARES® MSCI HONG KONG INDEX FUND
August 31, 2007
| Security | Shares | Value | |||
COMMON STOCKS – 99.62% | |||||
AIRLINES – 1.39% | |||||
Cathay Pacific Airways Ltd.a | 7,641,000 | $ | 20,041,485 | ||
| 20,041,485 | |||||
APPAREL – 0.67% | |||||
Yue Yuen Industrial Holdings Ltd.a | 3,215,000 | 9,710,873 | |||
| 9,710,873 | |||||
BANKS – 11.94% | |||||
Bank of East Asia Ltd.a | 7,792,300 | 43,475,172 | |||
BOC Hong Kong Holdings Ltd. | 20,641,500 | 49,560,250 | |||
Hang Seng Bank Ltd.a | 4,251,000 | 66,681,284 | |||
Wing Hang Bank Ltd. | 985,500 | 12,842,120 | |||
| 172,558,826 | |||||
CHEMICALS – 1.32% | |||||
Kingboard Chemical Holdings Co. Ltd. | 3,235,500 | 19,089,108 | |||
| 19,089,108 | |||||
DISTRIBUTION & WHOLESALE – 9.02% | |||||
Esprit Holdings Ltd. | 5,815,000 | 84,650,976 | |||
Li & Fung Ltd. | 12,311,000 | 45,632,847 | |||
| 130,283,823 | |||||
DIVERSIFIED FINANCIAL SERVICES – 7.55% | |||||
Hong Kong Exchanges and Clearing Ltd.a | 5,931,000 | 109,160,676 | |||
| 109,160,676 | |||||
ELECTRIC – 6.18% | |||||
CLP Holdings Ltd. | 7,371,200 | 50,816,302 | |||
Hongkong Electric Holdings Ltd. | 7,678,500 | 38,506,987 | |||
| 89,323,289 | |||||
ELECTRICAL COMPONENTS & | |||||
Johnson Electric Holdings Ltd.a | 8,424,000 | 4,386,628 | |||
| 4,386,628 | |||||
ENGINEERING & CONSTRUCTION – 2.83% | |||||
Cheung Kong Infrastructure Holdings Ltd.a | 2,471,000 | 9,143,342 | |||
New World Development Co. Ltd.a | 13,310,800 | 31,788,514 | |||
| 40,931,856 | |||||
| Security | Shares | Value | |||
FOOD – 0.93% | |||||
Tingyi (Cayman Islands) Holding Corp.a | 9,346,000 | $ | 13,425,491 | ||
| 13,425,491 | |||||
GAS – 3.23% | |||||
Hong Kong and China Gas Co. Ltd. (The)a | 20,203,829 | 46,643,656 | |||
| 46,643,656 | |||||
HAND & MACHINE TOOLS – 0.48% | |||||
Techtronic Industries Co. Ltd.a | 6,197,500 | 6,994,966 | |||
| 6,994,966 | |||||
HOLDING COMPANIES - DIVERSIFIED – 14.05% | |||||
Hutchison Whampoa Ltd. | 11,842,800 | 117,793,842 | |||
Melco International Development Ltd.a | 4,069,000 | 6,231,296 | |||
Swire Pacific Ltd. Class A | 4,646,000 | 51,365,659 | |||
Wharf Holdings Ltd. (The) | 6,733,000 | 27,720,435 | |||
| 203,111,232 | |||||
INTERNET – 1.77% | |||||
Tencent Holdings Ltd.a | 4,930,000 | 25,608,747 | |||
| 25,608,747 | |||||
LODGING – 1.07% | |||||
Shangri-La Asia Ltd.a | 6,440,000 | 15,396,364 | |||
| 15,396,364 | |||||
MEDIA – 0.66% | |||||
Television Broadcasts Ltd. | 1,557,000 | 9,505,653 | |||
| 9,505,653 | |||||
REAL ESTATE – 26.71% | |||||
Cheung Kong (Holdings) Ltd. | 8,424,000 | 123,927,637 | |||
Hang Lung Properties Ltd. | 11,583,000 | 42,414,423 | |||
Henderson Land Development Co. Ltd. | 4,820,000 | 33,444,961 | |||
Hopewell Holdings Ltd. | 3,477,000 | 16,567,230 | |||
Hysan Development Co. Ltd. | 3,474,000 | 8,751,000 | |||
Kerry Properties Ltd.a | 3,180,000 | 23,533,652 | |||
Shui On Land Ltd.a | 10,530,000 | 11,128,637 | |||
Shun Tak Holdings Ltd.a | 4,815,000 | 7,237,862 | |||
Sino Land Co. Ltd. | 7,618,000 | 17,821,826 | |||
Sun Hung Kai Properties Ltd. | 7,587,000 | 101,202,167 | |||
| 386,029,395 | |||||
SCHEDULESOF INVESTMENTS | 45 |
Table of Contents
Schedule of Investments (Continued)
iSHARES® MSCI HONG KONG INDEX FUND
August 31, 2007
| Security | Shares | Value | |||
REAL ESTATE INVESTMENT TRUSTS – 1.65% | |||||
Link REIT (The) | 11,966,000 | $ | 23,880,586 | ||
| 23,880,586 | |||||
RETAIL – 1.20% | |||||
Belle International Holdings Ltd.a,b | 11,583,000 | 13,296,290 | |||
Giordano International Ltd.a | 8,424,000 | 4,073,297 | |||
| 17,369,587 | |||||
SEMICONDUCTORS – 0.66% | |||||
ASM Pacific Technology Ltd.a | 1,073,000 | 9,516,523 | |||
| 9,516,523 | |||||
TELECOMMUNICATIONS – 3.78% | |||||
Foxconn International Holdings Ltd.a,b | 11,671,000 | 30,462,032 | |||
Hutchison Telecommunications International Ltd.a | 8,066,000 | 10,531,552 | |||
PCCW Ltd. | 22,463,576 | 13,656,633 | |||
| 54,650,217 | |||||
TRANSPORTATION – 2.23% | |||||
MTR Corp. Ltd.a | 7,830,083 | 19,061,144 | |||
Orient Overseas International Ltd. | 1,216,200 | 13,173,193 | |||
| 32,234,337 | |||||
TOTAL COMMON STOCKS | 1,439,853,318 | ||||
SHORT-TERM INVESTMENTS – 19.17% | |||||
MONEY MARKET FUNDS – 19.17% | |||||
Barclays Global Investors Funds Institutional Money Market Fund, Institutional Shares | 3,139,655 | 3,139,655 | |||
BGI Cash Premier Fund LLC | 273,919,378 | 273,919,378 | |||
| 277,059,033 | |||||
TOTAL SHORT-TERM INVESTMENTS | 277,059,033 | ||||
| Value | ||||||
TOTAL INVESTMENTS | $ | 1,716,912,351 | ||||
Other Assets, Less Liabilities – (18.79)% | (271,603,459 | ) | ||||
NET ASSETS – 100.00% | $ | 1,445,308,892 | ||||
a | All or a portion of this security represents a security on loan. See Note 5. |
b | Non-income earning security. |
c | Affiliated issuer. See Note 2. |
d | The rate quoted is the annualized seven-day yield of the fund at period end. |
e | This security represents an investment of securities lending collateral. See Note 5. |
See notes to financial statements.
46 | 2007 iSHARES ANNUAL REPORT TO SHAREHOLDERS |
Table of Contents
Schedule of Investments
iSHARES® MSCI MALAYSIA INDEX FUND
August 31, 2007
| Security | Shares | Value | |||
COMMON STOCKS – 99.34% | |||||
AGRICULTURE – 12.76% | |||||
British American Tobacco (Malaysia) Bhd | 1,271,400 | $ | 15,159,489 | ||
Golden Hope Plantations Bhd | 5,766,400 | 13,010,013 | |||
Highlands & Lowlands Bhd | 1,441,600 | 2,923,136 | |||
IOI Corp. Bhd | 35,139,030 | 50,177,110 | |||
Kuala Lumpur Kepong Bhd | 4,234,800 | 13,303,670 | |||
| 94,573,418 | |||||
AIRLINES – 1.04% | |||||
AirAsia Bhda | 8,289,200 | 4,474,250 | |||
Malaysian Airline System Bhda | 2,432,700 | 3,209,788 | |||
| 7,684,038 | |||||
AUTO MANUFACTURERS – 0.95% | |||||
DRB-Hicom Bhdb | 6,036,700 | 2,999,817 | |||
Proton Holdings Bhd | 2,703,000 | 4,014,165 | |||
| 7,013,982 | |||||
AUTO PARTS & EQUIPMENT – 1.26% | |||||
UMW Holdings Bhd | 2,342,600 | 9,299,483 | |||
| 9,299,483 | |||||
BANKS – 27.07% | |||||
AMMB Holdings Bhda | 13,695,200 | 16,974,773 | |||
Bumiputra-Commerce Holdings Bhd | 25,228,032 | 78,533,642 | |||
Hong Leong Bank Bhd | 4,685,200 | 7,961,428 | |||
Malayan Banking Bhd | 19,281,400 | 63,876,693 | |||
Public Bank Bhd | 10,271,400 | 27,720,900 | |||
RHB Capital Bhd | 3,694,100 | 5,644,277 | |||
| 200,711,713 | |||||
BEVERAGES – 0.27% | |||||
Guinness Anchor Bhd | 1,261,400 | 1,999,363 | |||
| 1,999,363 | |||||
BUILDING MATERIALS – 0.71% | |||||
Lafarge Malayan Cement Bhd | 11,352,600 | 5,252,381 | |||
| 5,252,381 | |||||
COMMERCIAL SERVICES – 1.82% | |||||
PLUS Expressways Bhd | 14,866,500 | 13,501,491 | |||
| 13,501,491 | |||||
| Security | Shares | Value | |||
DIVERSIFIED FINANCIAL SERVICES – 2.09% | |||||
Bursa Malaysia Bhd | 3,063,400 | $ | 8,836,310 | ||
Hong Leong Credit Bhd | 2,072,300 | 3,314,260 | |||
TA Enterprise Bhd | 7,568,400 | 3,350,284 | |||
| 15,500,854 | |||||
ELECTRIC – 4.90% | |||||
Tenaga Nasional Bhd | 12,794,250 | 36,356,644 | |||
| 36,356,644 | |||||
ENGINEERING & CONSTRUCTION – 7.93% | |||||
Gamuda Bhd | 7,658,500 | 16,404,041 | |||
IJM Corp. Bhd | 5,856,500 | 12,209,753 | |||
Malaysian Resources Corp. Bhda | 8,289,200 | 6,226,073 | |||
MMC Corp. Bhd | 3,063,400 | 6,430,384 | |||
YTL Corp. Bhd | 8,289,288 | 17,518,415 | |||
| 58,788,666 | |||||
ENTERTAINMENT – 3.73% | |||||
Berjaya Sports Toto Bhd | 7,388,200 | 10,507,850 | |||
Magnum Corp. Bhd | 8,018,900 | 6,366,569 | |||
Tanjong PLC | 2,252,500 | 10,807,368 | |||
| 27,681,787 | |||||
FOOD – 1.28% | |||||
PPB Group Bhd | 4,595,166 | 9,514,481 | |||
| 9,514,481 | |||||
GAS – 2.02% | |||||
Petronas Gas Bhd | 4,955,500 | 15,001,656 | |||
| 15,001,656 | |||||
HOLDING COMPANIES - DIVERSIFIED – 7.17% | |||||
Mulpha International Bhda | 7,388,200 | 2,954,014 | |||
Multi-Purpose Holdings Bhd | 5,586,200 | 2,791,903 | |||
Sime Darby Bhd | 14,956,600 | 40,151,946 | |||
UEM World Bhd | 6,216,900 | 7,279,535 | |||
| 53,177,398 | |||||
LODGING – 8.92% | |||||
Genting Bhd | 18,380,400 | 38,582,305 | |||
Resorts World Bhd | 25,408,200 | 27,574,228 | |||
| 66,156,533 | |||||
SCHEDULESOF INVESTMENTS | 47 |
Table of Contents
Schedule of Investments (Continued)
iSHARES® MSCI MALAYSIA INDEX FUND
August 31, 2007
| Security | Shares | Value | |||
MEDIA – 1.80% | |||||
Astro All Asia Networks PLC | 3,694,100 | $ | 3,587,017 | ||
Media Prima Bhd | 6,847,600 | 5,280,171 | |||
Star Publications (Malaysia) Bhd | 4,595,160 | 4,461,958 | |||
| 13,329,146 | |||||
OIL & GAS – 1.39% | |||||
Petronas Dagangan Bhd | 2,522,800 | 6,052,126 | |||
Shell Refining Co. | 1,351,500 | 4,207,154 | |||
| 10,259,280 | |||||
OIL & GAS SERVICES – 0.37% | |||||
Scomi Group Bhd | 6,577,300 | 2,761,283 | |||
| 2,761,283 | |||||
REAL ESTATE – 3.07% | |||||
IGB Corp. Bhd | 7,388,200 | 5,169,524 | |||
IOI Properties Bhd | 818,150 | 3,294,564 | |||
KLCC Property Holdings Bhd | 4,144,600 | 4,095,478 | |||
SP Setia Bhd | 4,955,500 | 10,189,804 | |||
| 22,749,370 | |||||
SEMICONDUCTORS – 0.28% | |||||
Malaysian Pacific Industries Bhd | 810,900 | 2,095,858 | |||
| 2,095,858 | |||||
TELECOMMUNICATIONS – 3.82% | |||||
Telekom Malaysia Bhd | 10,181,300 | 28,350,043 | |||
| 28,350,043 | |||||
TRANSPORTATION – 4.69% | |||||
Malaysian Bulk Carriers Bhd | 3,063,450 | 3,412,096 | |||
MISC Bhd | 10,992,200 | 28,253,549 | |||
Pos Malaysia Bhda | 3,604,000 | 3,128,990 | |||
| 34,794,635 | |||||
TOTAL COMMON STOCKS | 736,553,503 | ||||
| Security | Shares | Value | |||
SHORT-TERM INVESTMENTS – 0.09% | |||||
MONEY MARKET FUNDS – 0.09% | |||||
Barclays Global Investors Funds Institutional Money Market Fund, Institutional Shares | 643,520 | $ | 643,520 | ||
| 643,520 | |||||
TOTAL SHORT-TERM INVESTMENTS | 643,520 | ||||
TOTAL INVESTMENTS IN SECURITIES – 99.43% | 737,197,023 | ||||
Other Assets, Less Liabilities – 0.57% | 4,242,498 | ||||
NET ASSETS – 100.00% | $ | 741,439,521 | |||
a | Non-income earning security. |
b | Security valued at fair value in accordance with procedures approved by the Board of Directors. See Note 1. |
c | Affiliated issuer. See Note 2. |
d | The rate quoted is the annualized seven-day yield of the fund at period end. |
See notes to financial statements.
48 | 2007 iSHARES ANNUAL REPORT TO SHAREHOLDERS |
Table of Contents
Schedule of Investments
iSHARES® MSCI MEXICO INDEX FUND
August 31, 2007
| Security | Shares | Value | |||
COMMON STOCKS – 99.86% | |||||
BEVERAGES – 7.87% | |||||
Coca-Cola FEMSA SAB de CV SP ADRa | 284,400 | $ | 11,546,640 | ||
Fomento Economico Mexicano SABa | 18,912,608 | 65,767,045 | |||
Grupo Modelo SAB de CV Series Ca | 6,446,400 | 31,549,393 | |||
| 108,863,078 | |||||
BUILDING MATERIALS – 14.84% | |||||
Cemex SA de CV Series CPOa,b | 63,647,903 | 205,187,492 | |||
| 205,187,492 | |||||
DIVERSIFIED FINANCIAL SERVICES – 3.96% | |||||
Grupo Financiero Banorte SAB de CV Series Oa | 13,437,900 | 54,762,869 | |||
| 54,762,869 | |||||
ENGINEERING & CONSTRUCTION – 4.61% | |||||
Carso Infraestructura y Construccion SA de CVa,b | 6,612,300 | 6,899,916 | |||
Empresas ICA SAB de CVa,b | 3,294,374 | 18,134,306 | |||
Grupo Aeroportuario del Pacifico SA de CV Class Ha | 4,527,400 | 22,850,661 | |||
Grupo Aeroportuario del Sureste SA de CV ADRa | 317,817 | 15,776,436 | |||
| 63,661,319 | |||||
FOOD – 1.94% | |||||
Grupo Bimbo SAB de CV Series Aa | 4,550,400 | 26,775,302 | |||
| 26,775,302 | |||||
FOREST PRODUCTS & PAPER – 1.95% | |||||
Kimberly-Clark de Mexico SA de CV Class Aa | 6,332,900 | 26,984,150 | |||
| 26,984,150 | |||||
HOLDING COMPANIES - DIVERSIFIED – 4.73% | |||||
Alfa SAB de CV Class Aa | 3,507,600 | 25,236,751 | |||
Grupo Carso SA de CV Series A1a | 10,191,030 | 40,201,757 | |||
| 65,438,508 | |||||
| Security | Shares | Value | |||
HOME BUILDERS – 4.70% | |||||
Consorcio ARA SAB de CVa | 10,238,400 | $ | 15,617,552 | ||
Corporacion Geo SAB de CV Series Ba,b | 4,005,300 | 20,835,919 | |||
Desarrolladora Homex SAB de CVa,b | 1,493,130 | 13,775,185 | |||
Urbi Desarrollos Urbanos SA de CVa,b | 3,934,200 | 14,728,572 | |||
| 64,957,228 | |||||
MEDIA – 4.96% | |||||
Grupo Televisa SA Series CPOa | 13,106,199 | 68,559,484 | |||
| 68,559,484 | |||||
MINING – 5.70% | |||||
Grupo Mexico SA de CV Series Ba | 10,688,700 | 66,834,631 | |||
Industrias Penoles SAB de CVa | 900,600 | 12,018,823 | |||
| 78,853,454 | |||||
RETAIL – 7.31% | |||||
Controladora Comercial Mexicana SA de CVa | 5,166,600 | 14,259,887 | |||
Organizacion Soriana SAB de CV Class Ba | 5,611,565 | 18,049,845 | |||
Wal-Mart de Mexico SAB de CV Series Va | 19,339,200 | 68,774,524 | |||
| 101,084,256 | |||||
TELECOMMUNICATIONS – 37.29% | |||||
America Movil SAB de CV Series La | 110,205,040 | 333,116,740 | |||
Carso Global Telecom SAB de CV Class A1a,b | 8,655,031 | 41,096,462 | |||
Telefonos de Mexico SA de CV Series La | 79,845,300 | 141,467,605 | |||
| 515,680,807 | |||||
TOTAL COMMON STOCKS | 1,380,807,947 | ||||
SCHEDULESOF INVESTMENTS | 49 |
Table of Contents
Schedule of Investments (Continued)
iSHARES® MSCI MEXICO INDEX FUND
August 31, 2007
| Security | Shares | Value | ||||
SHORT-TERM INVESTMENTS – 10.23% |
| |||||
MONEY MARKET FUNDS – 10.23% |
| |||||
Barclays Global Investors Funds Institutional Money Market Fund, Institutional Shares | 568,513 | $ | 568,513 | |||
BGI Cash Premier Fund LLC | 140,955,798 | 140,955,798 | ||||
| 141,524,311 | ||||||
TOTAL SHORT-TERM | 141,524,311 | |||||
TOTAL INVESTMENTS | 1,522,332,258 | |||||
Other Assets, Less Liabilities – (10.09)% | (139,522,608 | ) | ||||
NET ASSETS – 100.00% | $ | 1,382,809,650 | ||||
ADR – American Depositary Receipts
SP ADR – Sponsored American Depositary Receipts
a | All or a portion of this security represents a security on loan. See Note 5. |
b | Non-income earning security. |
c | Affiliated issuer. See Note 2. |
d | The rate quoted is the annualized seven-day yield of the fund at period end. |
e | This security represents an investment of securities lending collateral. See Note 5. |
See notes to financial statements.
50 | 2007 iSHARES ANNUAL REPORT TO SHAREHOLDERS |
Table of Contents
Schedule of Investments
iSHARES® MSCI PACIFIC EX-JAPAN INDEX FUND
August 31, 2007
| Security | Shares | Value | |||
COMMON STOCKS – 99.23% | |||||
AUSTRALIA – 65.41% | |||||
A.B.C. Learning Centres Ltd.a | 1,078,724 | $ | 6,029,084 | ||
AGL Energy Ltd. | 1,232,154 | 15,437,251 | |||
Alumina Ltd. | 3,341,568 | 18,866,617 | |||
Amcor Ltd. | 2,590,304 | 16,015,798 | |||
AMP Ltd. | 5,283,330 | 45,217,623 | |||
Ansell Ltd. | 419,904 | 4,475,129 | |||
APN News & Media Ltd. | 861,362 | 3,854,186 | |||
Aristocrat Leisure Ltd.a | 987,396 | 11,246,144 | |||
Asciano Groupb | 1,573,068 | 10,942,029 | |||
ASX Ltd. | 493,856 | 18,642,432 | |||
Australia and New Zealand Banking Group Ltd. | 5,196,813 | 122,565,871 | |||
AXA Asia Pacific Holdings Ltd. | 2,452,500 | 15,044,044 | |||
Babcock & Brown Ltd. | 656,576 | 12,638,164 | |||
BHP Billiton Ltd. | 9,483,768 | 296,430,258 | |||
Billabong International Ltd. | 469,101 | 6,048,948 | |||
BlueScope Steel Ltd. | 2,215,244 | 19,229,599 | |||
Boral Ltd. | 1,715,808 | 11,013,616 | |||
Brambles Ltd.b | 4,029,430 | 45,238,370 | |||
Caltex Australia Ltd. | 384,972 | 7,579,294 | |||
Centro Properties Group | 2,402,668 | 16,008,915 | |||
CFS Retail Property Trust | 3,896,697 | 7,513,274 | |||
Challenger Financial Services Group Ltd. | 1,053,104 | 4,660,735 | |||
Coca-Cola Amatil Ltd. | 1,490,840 | 11,534,421 | |||
Cochlear Ltd.a | 154,501 | 8,421,517 | |||
Coles Group Ltd. | 3,201,768 | 36,909,993 | |||
Commonwealth Bank of Australia | 3,663,720 | 164,381,160 | |||
Commonwealth Property Office Fund | 4,099,389 | 5,602,897 | |||
Computershare Ltd. | 1,456,924 | 12,208,389 | |||
CSL Ltd. | 518,256 | 41,403,788 | |||
CSR Ltd. | 2,533,120 | 6,924,355 | |||
DB RREEF Trust | 8,144,964 | 13,318,934 | |||
Downer EDI Ltd. | 871,711 | 4,595,490 | |||
Foster’s Group Ltd. | 5,606,304 | 28,825,575 | |||
Futuris Corp. Ltd. | 1,701,920 | 3,392,263 | |||
Goodman Fielder Ltd. | 3,000,315 | 6,346,356 | |||
Goodman Group | 4,053,192 | 22,224,977 | |||
GPT Group | 5,728,323 | 22,276,125 | |||
| Security | Shares | Value | |||
Harvey Norman Holdings Ltd. | 1,549,876 | $ | 6,707,997 | ||
Iluka Resources Ltd.a | 721,503 | 3,257,732 | |||
ING Industrial Funda | 2,662,941 | 5,806,048 | |||
Insurance Australia Group Ltd. | 5,044,117 | 20,641,316 | |||
James Hardie Industries NV | 1,368,596 | 9,018,712 | |||
John Fairfax Holdings Ltd. | 3,405,996 | 12,857,199 | |||
Leighton Holdings Ltd. | 398,208 | 14,202,499 | |||
Lend Lease Corp. Ltd. | 1,026,996 | 16,050,197 | |||
Lion Nathan Ltd. | 832,179 | 6,208,266 | |||
Macquarie Airports | 1,949,457 | 6,899,016 | |||
Macquarie Bank Ltd. | 739,972 | 44,126,910 | |||
Macquarie Communications Infrastructure Group | 1,236,104 | 5,832,668 | |||
Macquarie Infrastructure Group | 7,514,193 | 20,173,467 | |||
Macquarie Office Trust | 5,360,274 | 6,846,536 | |||
Mirvac Group | 2,857,728 | 12,507,987 | |||
Multiplex Group | 1,783,659 | 7,240,968 | |||
National Australia Bank Ltd. | 4,590,277 | 149,152,729 | |||
Newcrest Mining Ltd. | 952,820 | 18,991,584 | |||
OneSteel Ltd.a | 2,430,484 | 11,982,561 | |||
Orica Ltd. | 894,992 | 20,853,378 | |||
Origin Energy Ltd. | 2,489,288 | 20,190,848 | |||
Pacific Brands Ltd. | 1,542,812 | 4,217,320 | |||
Paladin Resources Ltd.a,b | 1,532,917 | 7,557,454 | |||
PaperlinX Ltd. | 1,305,400 | 3,589,588 | |||
Perpetual Ltd. | 105,531 | 6,580,766 | |||
Publishing and Broadcasting Ltd. | 1,264,872 | 18,440,336 | |||
Qantas Airways Ltd. | 2,866,268 | 13,011,736 | |||
QBE Insurance Group Ltd. | 2,431,816 | 68,947,376 | |||
Rio Tinto Ltd.a | 814,032 | 61,934,156 | |||
Santos Ltd. | 1,699,216 | 18,316,763 | |||
Sonic Healthcare Ltd. | 862,333 | 10,810,901 | |||
Stockland | 4,023,316 | 28,116,519 | |||
Suncorp-Metway Ltd. | 2,587,379 | 42,309,740 | |||
Symbion Health Ltd. | 1,815,941 | 6,145,813 | |||
Tabcorp Holdings Ltd. | 1,474,698 | 18,344,033 | |||
Tattersall’s Ltd. | 3,128,324 | 10,663,751 | |||
Telstra Corp. Ltd. | 8,120,564 | 28,870,339 | |||
Telstra Corp. Ltd. Installment Receipt | 4,191,144 | 9,888,145 | |||
Toll Holdings Ltd.a | 1,543,300 | 17,075,503 | |||
Transurban Group | 3,049,316 | 17,762,320 | |||
SCHEDULESOF INVESTMENTS | 51 |
Table of Contents
Schedule of Investments (Continued)
iSHARES® MSCI PACIFIC EX-JAPAN INDEX FUND
August 31, 2007
| Security | Shares | Value | |||
Wesfarmers Ltd.a | 1,098,295 | $ | 34,454,050 | ||
Westfield Group | 4,896,932 | 83,383,006 | |||
Westpac Banking Corp. | 5,201,348 | 115,098,341 | |||
Woodside Petroleum Ltd. | 1,346,775 | 49,633,797 | |||
Woolworths Ltd. | 3,408,360 | 82,964,309 | |||
WorleyParsons Ltd. | 429,928 | 13,501,042 | |||
Zinifex Ltd. | 1,366,225 | 18,761,991 | |||
| 2,312,991,334 | |||||
HONG KONG – 20.77% | |||||
ASM Pacific Technology Ltd.a | 610,000 | 5,410,139 | |||
Bank of East Asia Ltd.a | 3,998,000 | 22,305,832 | |||
Belle International Holdings Ltd.a,b | 5,860,000 | 6,726,777 | |||
BOC Hong Kong Holdings Ltd. | 10,332,000 | 24,807,136 | |||
Cathay Pacific Airways Ltd.a | 3,997,000 | 10,483,682 | |||
Cheung Kong (Holdings) Ltd.a | 4,363,000 | 64,185,218 | |||
Cheung Kong Infrastructure Holdings Ltd.a | 1,235,000 | 4,569,821 | |||
CLP Holdings Ltd. | 3,690,500 | 25,441,931 | |||
Esprit Holdings Ltd. | 2,952,000 | 42,973,290 | |||
Foxconn International Holdings Ltd.a,b | 5,966,000 | 15,571,629 | |||
Giordano International Ltd.a | 4,428,000 | 2,141,092 | |||
Hang Lung Properties Ltd. | 5,968,736 | 21,856,211 | |||
Hang Seng Bank Ltd. | 2,140,200 | 33,571,227 | |||
Henderson Land Development Co. Ltd.a | 2,460,000 | 17,069,420 | |||
Hong Kong and China Gas Co. Ltd. (The)a | 10,223,419 | 23,602,340 | |||
Hong Kong Exchanges and Clearing Ltd. | 3,050,000 | 56,135,569 | |||
Hongkong Electric Holdings Ltd.a | 3,867,500 | 19,395,165 | |||
Hopewell Holdings Ltd. | 1,793,000 | 8,543,297 | |||
Hutchison Telecommunications International Ltd.a | 4,273,000 | 5,579,138 | |||
Hutchison Whampoa Ltd. | 6,150,000 | 61,170,680 | |||
Hysan Development Co. Ltd. | 1,781,000 | 4,486,336 | |||
Kerry Properties Ltd. | 1,628,000 | 12,048,046 | |||
Kingboard Chemical Holdings Co. Ltd. | 1,638,500 | 9,666,977 | |||
| Security | Shares | Value | |||
Li & Fung Ltd.a | 6,397,600 | $ | 23,713,809 | ||
Link REIT (The) | 6,075,500 | 12,124,896 | |||
MTR Corp. Ltd.a | 3,905,500 | 9,507,345 | |||
New World Development Co. Ltd.a | 6,774,941 | 16,179,742 | |||
Noble Group Ltd.a | 2,856,000 | 3,130,017 | |||
Orient Overseas International Ltd. | 634,000 | 6,867,130 | |||
PCCW Ltd. | 11,838,845 | 7,197,374 | |||
Shangri-La Asia Ltd.a | 3,444,000 | 8,233,708 | |||
Shui On Land Ltd.a | 5,450,000 | 5,759,836 | |||
Shun Tak Holdings Ltd.a | 2,460,000 | 3,697,848 | |||
Sino Land Co. Ltd.a | 3,936,000 | 9,208,021 | |||
Sun Hung Kai Properties Ltd.a | 3,808,000 | 50,794,498 | |||
Swire Pacific Ltd. Class A | 2,353,000 | 26,014,506 | |||
Techtronic Industries Co. Ltd.a | 3,217,500 | 3,631,513 | |||
Television Broadcasts Ltd. | 811,000 | 4,951,242 | |||
Tencent Holdings Ltd. | 2,530,000 | 13,142,014 | |||
Tingyi (Cayman Islands) Holding Corp.a | 4,790,000 | 6,880,816 | |||
Wharf Holdings Ltd. (The) | 3,395,000 | 13,977,555 | |||
Wing Hang Bank Ltd. | 510,000 | 6,645,846 | |||
Yue Yuen Industrial Holdings Ltd.a | 1,677,500 | 5,066,871 | |||
| 734,465,540 | |||||
NEW ZEALAND – 1.54% | |||||
Auckland International Airport Ltd. | 2,797,654 | 5,947,811 | |||
Contact Energy Ltd. | 794,036 | 5,097,789 | |||
Fisher & Paykel Appliances Holdings Ltd. | 758,965 | 1,965,028 | |||
Fisher & Paykel Healthcare Corp. Ltd. | 1,486,260 | 3,524,780 | |||
Fletcher Building Ltd. | 1,460,064 | 12,047,578 | |||
Kiwi Income Property Trust | 1,999,019 | 2,033,787 | |||
Sky City Entertainment Group Ltd. | 1,228,188 | 3,946,852 | |||
Sky NetworkTelevision Ltd. | 541,060 | 2,118,362 | |||
Telecom Corp. of New Zealand Ltd. | 5,567,631 | 16,719,941 | |||
Vector Ltd. | 699,515 | 1,251,577 | |||
| 54,653,505 | |||||
SINGAPORE – 11.51% | |||||
Allgreen Properties Ltd. | 2,196,000 | 2,464,339 | |||
52 | 2007 iSHARES ANNUAL REPORT TO SHAREHOLDERS |
Table of Contents
Schedule of Investments (Continued)
iSHARES® MSCI PACIFIC EX-JAPAN INDEX FUND
August 31, 2007
| Security | Shares | Value | |||
Ascendas Real Estate Investment Trusta | 2,952,000 | $ | 4,552,566 | ||
CapitaCommercial Trusta | 2,706,000 | 4,475,075 | |||
CapitaLand Ltd. | 4,392,000 | 21,328,783 | |||
CapitaMall Trust Management Ltd.a | 2,928,622 | 6,534,529 | |||
Chartered Semiconductor Manufacturing Ltd.a,b | 2,931,000 | 2,077,359 | |||
City Developments Ltd. | 1,442,000 | 14,100,144 | |||
ComfortDelGro Corp. Ltd. | 5,166,000 | 6,610,907 | |||
COSCO Corp. (Singapore) Ltd. | 2,264,104 | 7,503,429 | |||
DBS Group Holdings Ltd. | 3,198,000 | 41,974,012 | |||
Fraser and Neave Ltd. | 2,291,150 | 7,457,740 | |||
Haw Par Corp. Ltd. | 278,397 | 1,461,593 | |||
Jardine Cycle & Carriage Ltd. | 382,000 | 3,935,818 | |||
Keppel Corp. Ltd. | 3,172,000 | 26,644,967 | |||
Keppel Land Ltd.a | 1,020,000 | 5,154,220 | |||
Neptune Orient Lines Ltd. | 1,288,000 | 4,141,751 | |||
Olam International Ltd.a | 1,730,000 | 3,428,665 | |||
Oversea-Chinese Banking Corp. | 7,107,600 | 39,880,548 | |||
Parkway Holdings Ltd.a | 1,722,251 | 4,475,728 | |||
SembCorp Industries Ltd. | 2,505,240 | 9,289,018 | |||
SembCorp Marine Ltd.a | 2,391,200 | 6,559,401 | |||
Singapore Airlines Ltd. | 1,578,000 | 19,675,811 | |||
Singapore Exchange Ltd. | 2,249,000 | 14,390,176 | |||
Singapore Land Ltd.a | 343,000 | 2,228,442 | |||
Singapore Petroleum Co. Ltd.a | 492,000 | 1,904,974 | |||
Singapore Post Ltd. | 3,936,000 | 3,202,940 | |||
Singapore Press Holdings Ltd.a | 4,119,517 | 11,732,973 | |||
Singapore Technologies Engineering Ltd.a | 3,690,000 | 8,911,406 | |||
Singapore Telecommunications Ltd.a | 22,207,328 | 53,048,086 | |||
SMRT Corp. Ltd. | 1,952,000 | 2,228,954 | |||
Suntec REIT | 2,952,000 | 3,428,954 | |||
United Overseas Bank Ltd.a | 3,444,000 | 47,010,894 | |||
UOL Group Ltd. | 1,426,000 | 4,660,376 | |||
| Security | Shares | Value | ||||
Venture Corp. Ltd. | 732,695 | $ | 7,501,012 | |||
Wing Tai Holdings Ltd. | 1,302,333 | 2,974,222 | ||||
| 406,949,812 | ||||||
TOTAL COMMON STOCKS | 3,509,060,191 | |||||
SHORT-TERM INVESTMENTS – 9.39% |
| |||||
MONEY MARKET FUNDS – 9.39% |
| |||||
Barclays Global Investors Funds Institutional Money Market Fund, Institutional Shares | 555,636 | 555,636 | ||||
BGI Cash Premier Fund LLC | 331,361,817 | 331,361,817 | ||||
| 331,917,453 | ||||||
TOTAL SHORT-TERM INVESTMENTS | 331,917,453 | |||||
TOTAL INVESTMENTS IN | 3,840,977,644 | |||||
Other Assets, Less Liabilities – (8.62)% | (304,682,341 | ) | ||||
NET ASSETS – 100.00% | $ | 3,536,295,303 | ||||
a | All or a portion of this security represents a security on loan. See Note 5. |
b | Non-income earning security. |
c | Affiliated issuer. See Note 2. |
d | The rate quoted is the annualized seven-day yield of the fund at period end. |
e | This security represents an investment of securities lending collateral. See Note 5. |
See notes to financial statements.
SCHEDULESOF INVESTMENTS | 53 |
Table of Contents
Schedule of Investments
iSHARES® MSCI SINGAPORE INDEX FUND
August 31, 2007
| Security | Shares | Value | |||
COMMON STOCKS – 98.64% | |||||
AIRLINES – 4.78% | |||||
Singapore Airlines Ltd. | 6,398,000 | $ | 79,775,561 | ||
| 79,775,561 | |||||
BANKS – 30.08% | |||||
DBS Group Holdings Ltd. | 12,530,000 | 164,457,278 | |||
Oversea-Chinese Banking Corp.a | 26,633,000 | 149,437,033 | |||
United Overseas Bank Ltd.a | 13,784,000 | 188,152,776 | |||
| 502,047,087 | |||||
BEVERAGES – 1.98% | |||||
Fraser and Neave Ltd. | 10,128,000 | 32,966,846 | |||
| 32,966,846 | |||||
DISTRIBUTION & WHOLESALE – 0.97% | |||||
Jardine Cycle & Carriage Ltd.a | 1,577,000 | 16,248,130 | |||
| 16,248,130 | |||||
DIVERSIFIED FINANCIAL SERVICES – 3.47% | |||||
Singapore Exchange Ltd.a | 9,043,000 | 57,861,432 | |||
| 57,861,432 | |||||
ELECTRONICS – 1.62% | |||||
Venture Corp. Ltd. | 2,646,522 | 27,093,938 | |||
| 27,093,938 | |||||
ENGINEERING & CONSTRUCTION – 4.67% | |||||
SembCorp Industries Ltd. | 10,418,000 | 38,628,232 | |||
Singapore Technologies Engineering Ltd.a | 16,289,000 | 39,338,181 | |||
| 77,966,413 | |||||
FOOD – 0.90% | |||||
Olam International Ltd. | 7,558,000 | 14,979,105 | |||
| 14,979,105 | |||||
HEALTH CARE - SERVICES – 1.18% | |||||
Parkway Holdings Ltd.a | 7,596,500 | 19,741,528 | |||
| 19,741,528 | |||||
HOLDING COMPANIES - DIVERSIFIED – 7.02% | |||||
Haw Par Corp. Ltd.a | 1,443,000 | 7,575,797 | |||
Keppel Corp. Ltd. | 11,571,000 | 97,197,008 | |||
Noble Group Ltd.a | 11,394,000 | 12,487,190 | |||
| 117,259,995 | |||||
MEDIA – 3.21% | |||||
Singapore Press Holdings Ltd. | 18,795,000 | 53,530,844 | |||
| 53,530,844 | |||||
| Security | Shares | Value | |||
OIL & GAS – 0.58% | |||||
Singapore Petroleum Co. Ltd.a | 2,506,000 | $ | 9,702,980 | ||
| 9,702,980 | |||||
REAL ESTATE – 13.93% | |||||
Allgreen Properties Ltd. | 8,771,000 | 9,842,768 | |||
CapitaCommercial Trusta | 11,394,000 | 18,842,945 | |||
CapitaLand Ltd.a | 16,289,000 | 79,103,951 | |||
City Developments Ltd. | 6,266,000 | 61,270,114 | |||
Keppel Land Ltd.a | 4,162,000 | 21,031,238 | |||
Singapore Land Ltd. | 1,569,000 | 10,193,660 | |||
UOL Group Ltd. | 6,330,000 | 20,687,361 | |||
Wing Tai Holdings Ltd.a | 5,064,000 | 11,564,982 | |||
| 232,537,019 | |||||
REAL ESTATE INVESTMENT TRUSTS – 3.60% | |||||
Ascendas Real Estate Investment Trusta | 11,394,000 | 17,571,794 | |||
CapitaMall Trust Management Ltd.a | 12,530,000 | 27,957,737 | |||
Suntec REIT | 12,530,000 | 14,554,469 | |||
| 60,084,000 | |||||
SEMICONDUCTORS – 0.51% | |||||
Chartered Semiconductor Manufacturing Ltd.a,b | 12,050,000 | 8,540,491 | |||
| 8,540,491 | |||||
SHIPBUILDING – 1.54% | |||||
SembCorp Marine Ltd.a | 9,375,000 | 25,716,957 | |||
| 25,716,957 | |||||
TELECOMMUNICATIONS – 12.73% | |||||
Singapore Telecommunications Ltd. | 88,963,568 | 212,513,051 | |||
| 212,513,051 | |||||
TRANSPORTATION – 5.87% | |||||
ComfortDelGro Corp. Ltd.a | 21,922,000 | 28,053,484 | |||
COSCO Corp. (Singapore) Ltd.a | 8,862,000 | 29,369,405 | |||
Neptune Orient Lines Ltd.a | 5,064,000 | 16,284,027 | |||
Singapore Post Ltd. | 17,542,000 | 14,274,892 | |||
SMRT Corp. Ltd.a | 8,771,000 | 10,015,448 | |||
| 97,997,256 | |||||
TOTAL COMMON STOCKS | 1,646,562,633 | ||||
54 | 2007 iSHARES ANNUAL REPORT TO SHAREHOLDERS |
Table of Contents
Schedule of Investments (Continued)
iSHARES® MSCI SINGAPORE INDEX FUND
August 31, 2007
| Security | Shares | Value | ||||
SHORT-TERM INVESTMENTS – 17.84% |
| |||||
MONEY MARKET FUNDS – 17.84% |
| |||||
Barclays Global Investors Funds Institutional Money Market Fund, Institutional Shares | 759,387 | $ | 759,387 | |||
BGI Cash Premier Fund LLC | 297,019,475 | 297,019,475 | ||||
| 297,778,862 | ||||||
TOTAL SHORT-TERM | 297,778,862 | |||||
TOTAL INVESTMENTS IN | 1,944,341,495 | |||||
Other Assets, Less Liabilities – (16.48)% | (275,131,311 | ) | ||||
NET ASSETS – 100.00% | $ | 1,669,210,184 | ||||
a | All or a portion of this security represents a security on loan. See Note 5. |
b | Non-income earning security. |
c | Affiliated issuer. See Note 2. |
d | The rate quoted is the annualized seven-day yield of the fund at period end. |
e | This security represents an investment of securities lending collateral. See Note 5. |
See notes to financial statements.
SCHEDULESOF INVESTMENTS | 55 |
Table of Contents
Schedule of Investments
iSHARES® MSCI SOUTH AFRICA INDEX FUND
August 31, 2007
| Security | Shares | Value | |||
COMMON STOCKS – 99.78% | |||||
BANKS – 14.28% | |||||
FirstRand Ltd. | 6,072,225 | $ | 19,768,066 | ||
Nedbank Group Ltd. | 441,150 | 8,287,900 | |||
Standard Bank Group Ltd. | 2,652,225 | 38,637,991 | |||
| 66,693,957 | |||||
BUILDING MATERIALS – 1.57% | |||||
Pretoria Portland Cement Co. Ltd. | 1,162,050 | 7,331,162 | |||
| 7,331,162 | |||||
DIVERSIFIED FINANCIAL SERVICES – 1.80% | |||||
African Bank Investments Ltd. | 966,825 | 4,244,729 | |||
Investec Ltd. | 369,300 | 4,144,810 | |||
| 8,389,539 | |||||
ELECTRONICS – 0.76% | |||||
Reunert Ltd. | 380,550 | 3,544,195 | |||
| 3,544,195 | |||||
ENGINEERING & CONSTRUCTION – 2.80% | |||||
Aveng Ltd. | 855,825 | 6,312,045 | |||
Murray & Roberts Holdings Ltd. | 643,275 | 6,753,379 | |||
| 13,065,424 | |||||
FOOD – 3.49% | |||||
Shoprite Holdings Ltd. | 936,750 | 4,453,562 | |||
SPAR Group Ltd. (The) | 369,600 | 2,689,358 | |||
Tiger Brands Ltd. | 350,775 | 9,157,563 | |||
| 16,300,483 | |||||
FOREST PRODUCTS & PAPER – 2.14% | |||||
Mondi Ltd. | 321,300 | 3,090,931 | |||
Sappi Ltd. | 441,375 | 6,907,542 | |||
| 9,998,473 | |||||
HEALTH CARE - PRODUCTS – 0.49% | |||||
Aspen Pharmacare Holdings Ltd.a | 461,325 | 2,278,164 | |||
| 2,278,164 | |||||
HEALTH CARE - SERVICES – 0.98% | |||||
Network Healthcare Holdings Ltd.a | 2,576,625 | 4,587,452 | |||
| 4,587,452 | |||||
HOLDING COMPANIES - DIVERSIFIED – 5.97% | |||||
AVI Ltd. | 709,050 | 1,927,707 | |||
Barloworld Ltd. | 438,000 | 7,480,655 | |||
Bidvest Group Ltd. | 561,675 | 10,892,854 | |||
Imperial Holdings Ltd. | 381,000 | 7,596,096 | |||
| 27,897,312 | |||||
| Security | Shares | Value | |||
HOME FURNISHINGS – 1.82% | |||||
Lewis Group Ltd. | 203,775 | $ | 1,758,616 | ||
Steinhoff International Holdings Ltd. | 2,098,650 | 6,726,799 | |||
| 8,485,415 | |||||
INSURANCE – 4.41% | |||||
Liberty Group Ltd. | 250,050 | 3,127,499 | |||
Metropolitan Holdings Ltd. | 1,265,325 | 2,610,918 | |||
Sanlam Ltd. | 4,934,250 | 14,831,987 | |||
| 20,570,404 | |||||
IRON & STEEL – 2.65% | |||||
Kumba Iron Ore Ltd. | 169,800 | 4,924,141 | |||
Mittal Steel South Africa Ltd. | 432,975 | 7,455,199 | |||
| 12,379,340 | |||||
MEDIA – 4.01% | |||||
Naspers Ltd. | 749,625 | 18,718,416 | |||
| 18,718,416 | |||||
MINING – 20.14% | |||||
Anglo Platinum Ltd. | 151,800 | 20,190,617 | |||
AngloGold Ashanti Ltd. | 327,750 | 12,758,603 | |||
Gold Fields Ltd. | 1,332,675 | 20,345,474 | |||
Harmony Gold Mining Co. Ltd.a | 734,025 | 6,559,917 | |||
Impala Platinum Holdings Ltd. | 1,156,350 | 34,194,749 | |||
| 94,049,360 | |||||
OIL & GAS – 11.07% | |||||
Sasol Ltd. | 1,283,100 | 51,699,672 | |||
| 51,699,672 | |||||
PACKAGING & CONTAINERS – 0.69% | |||||
Nampak Ltd. | 1,137,075 | 3,210,285 | |||
| 3,210,285 | |||||
REAL ESTATE – 0.42% | |||||
Fountainhead Property Trust | 2,181,750 | 1,946,769 | |||
| 1,946,769 | |||||
RETAIL – 5.79% | |||||
Ellerine Holdings Ltd. | 265,575 | 2,777,013 | |||
Foschini Ltd. | 440,175 | 3,556,381 | |||
JD Group Ltd. | 388,125 | 3,771,671 | |||
Massmart Holdings Ltd. | 434,175 | 5,569,062 | |||
Pick’n Pay Stores Ltd. | 473,550 | 2,191,964 | |||
Truworths International Ltd. | 967,875 | 4,422,065 | |||
Woolworths Holdings Ltd. | 1,733,400 | 4,760,959 | |||
| 27,049,115 | |||||
56 | 2007 iSHARES ANNUAL REPORT TO SHAREHOLDERS |
Table of Contents
Schedule of Investments (Continued)
iSHARES® MSCI SOUTH AFRICA INDEX FUND
August 31, 2007
| Security | Shares | Value | |||
TELECOMMUNICATIONS – 13.75% | |||||
MTN Group Ltd. | 3,208,725 | $ | 48,673,305 | ||
Telkom South Africa Ltd. | 632,175 | 15,530,043 | |||
| 64,203,348 | |||||
TRANSPORTATION – 0.75% | |||||
Grindrod Ltd. | 716,100 | 2,465,041 | |||
Super Group Ltd. | 619,200 | 1,061,856 | |||
| 3,526,897 | |||||
TOTAL COMMON STOCKS | 465,925,182 | ||||
SHORT-TERM INVESTMENTS – 0.03% | |||||
MONEY MARKET FUNDS – 0.03% | |||||
Barclays Global Investors Funds Institutional Money Market Fund, Institutional Shares | 116,686 | 116,686 | |||
| 116,686 | |||||
TOTAL SHORT-TERM INVESTMENTS | 116,686 | ||||
TOTAL INVESTMENTS IN | 466,041,868 | ||||
Other Assets, Less Liabilities – 0.19% | 898,388 | ||||
NET ASSETS – 100.00% | $ | 466,940,256 | |||
a | Non-income earning security. |
b | Affiliated issuer. See Note 2. |
c | The rate quoted is the annualized seven-day yield of the fund at period end. |
See notes to financial statements.
SCHEDULESOF INVESTMENTS | 57 |
Table of Contents
Schedule of Investments
iSHARES® MSCI SOUTH KOREA INDEX FUND
August 31, 2007
| Security | Shares | Value | |||
COMMON STOCKS – 97.54% | |||||
ADVERTISING – 0.18% | |||||
Cheil Communications Inc. | 15,280 | $ | 4,429,694 | ||
| 4,429,694 | |||||
AEROSPACE & DEFENSE – 0.42% | |||||
Hyundai Merchant Marine Co. Ltd.a | 191,000 | 10,117,453 | |||
| 10,117,453 | |||||
AGRICULTURE – 1.78% | |||||
KT&G Corp. | 567,652 | 43,197,818 | |||
| 43,197,818 | |||||
AIRLINES – 0.73% | |||||
Asiana Airlines Inc. | 473,680 | 4,573,984 | |||
Korean Air Co. Ltd. | 192,642 | 13,037,854 | |||
| 17,611,838 | |||||
APPAREL – 0.15% | |||||
LG Fashion Corp.a | 124,194 | 3,699,677 | |||
| 3,699,677 | |||||
AUTO MANUFACTURERS – 2.88% | |||||
Hyundai Motor Co. Ltd.a | 771,640 | 57,240,761 | |||
Kia Motors Corp.a,b | 947,360 | 12,823,312 | |||
| 70,064,073 | |||||
AUTO PARTS & EQUIPMENT – 1.74% | |||||
Hankook Tire Co. Ltd.a | 504,240 | 11,044,105 | |||
Hyundai Mobis | 290,326 | 31,252,785 | |||
| 42,296,890 | |||||
BANKS – 7.31% | |||||
Daegu Banka | 611,200 | 11,399,947 | |||
Kookmin Bank | 1,696,089 | 137,024,829 | |||
Korea Exchange Bank | 1,191,840 | 18,863,655 | |||
Pusan Bank | 550,080 | 10,259,952 | |||
| 177,548,383 | |||||
BEVERAGES – 0.38% | |||||
Hite Brewery Co. Ltd.a | 53,480 | 6,982,467 | |||
Lotte Chilsung Beverage Co. Ltd. | 1,500 | 2,310,152 | |||
| 9,292,619 | |||||
CHEMICALS – 3.05% | |||||
Hanwha Chemical Corp. | 252,120 | 6,596,905 | |||
Honam Petrochemical Corp. | 68,760 | 10,626,379 | |||
KCC Corp.a | 22,920 | 11,725,659 | |||
| Security | Shares | Value | |||
Korea Zinc Co. Ltd.a | 61,120 | $ | 12,246,800 | ||
LG Chem Ltd.a | 229,200 | 23,866,603 | |||
LG Petrochemical Co. Ltd.a | 106,975 | 5,176,302 | |||
Samsung Fine Chemicals Co. Ltd.a | 68,760 | 3,884,125 | |||
| 74,122,773 | |||||
COMMERCIAL SERVICES – 0.22% | |||||
S1 Corp.a | 99,320 | 5,441,032 | |||
| 5,441,032 | |||||
COSMETICS & PERSONAL CARE – 0.56% | |||||
AmorePacific Corp.a | 17,030 | 12,070,290 | |||
Pacific Corp.a | 7,649 | 1,520,425 | |||
| 13,590,715 | |||||
DISTRIBUTION & WHOLESALE – 3.42% | |||||
Daewoo International Corp.a | 221,560 | 9,374,828 | |||
Hanwha Corp. | 213,920 | 13,771,136 | |||
Hyosung Corp. | 91,685 | 6,703,534 | |||
LG International Corp.a | 160,445 | 5,318,241 | |||
Samsung Corp.a | 702,880 | 47,870,005 | |||
| 83,037,744 | |||||
DIVERSIFIED FINANCIAL SERVICES – 9.51% | |||||
Daewoo Securities Co. Ltd.a | 588,280 | 18,151,565 | |||
Daishin Securities Co. Ltd.a | 191,000 | 6,493,898 | |||
Hana Financial Group Inc. | 588,281 | 27,838,717 | |||
Hyundai Securities Co. Ltd.a | 565,360 | 17,233,462 | |||
Korea Investment Holdings Co. Ltd.a | 191,005 | 12,295,979 | |||
Mirae Asset Securities Co. Ltd.a | 90,274 | 8,033,977 | |||
Samsung Securities Co.a | 275,040 | 23,422,005 | |||
Shinhan Financial Group Ltd.a | 1,589,120 | 96,880,004 | |||
Tong Yang Investment Banka | 404,922 | 7,660,395 | |||
Woori Investment & Securities Co. Ltd.a | 466,040 | 13,088,360 | |||
| 231,098,362 | |||||
ELECTRIC – 2.39% | |||||
Korea Electric Power Corp.a | 1,298,800 | 58,001,300 | |||
| 58,001,300 | |||||
ELECTRICAL COMPONENTS & EQUIPMENT – 16.20% | |||||
LG Electronics Inc.a | 481,326 | 36,936,288 | |||
LS Cable Ltd.a | 99,320 | 10,204,581 | |||
Samsung Electronics Co. Ltd. | 550,080 | 346,493,237 | |||
| 393,634,106 | |||||
58 | 2007 iSHARES ANNUAL REPORT TO SHAREHOLDERS |
Table of Contents
Schedule of Investments (Continued)
iSHARES® MSCI SOUTH KOREA INDEX FUND
August 31, 2007
| Security | Shares | Value | |||
ELECTRONICS – 2.34% | |||||
Hyundai Autonet Co. Ltd.a | 504,240 | $ | 3,976,953 | ||
LG.Philips LCD Co. Ltd.a,b | 504,240 | 21,443,300 | |||
Samsung Electro-Mechanics Co. Ltd.a | 366,720 | 20,285,391 | |||
Samsung SDI Co. Ltd.a | 168,080 | 11,053,063 | |||
| 56,758,707 | |||||
ENGINEERING & CONSTRUCTION – 5.78% | |||||
Daelim Industrial Co. Ltd.a | 129,880 | 21,733,184 | |||
Daewoo Engineering & Construction Co. Ltd.a | 786,920 | 22,561,309 | |||
Doosan Heavy Industries & Construction Co. Ltd.a | 137,520 | 13,191,367 | |||
GS Engineering & Construction Corp.a | 183,360 | 28,923,293 | |||
Hanjin Heavy Industries & Construction Co. Ltd.a,b | 174,966 | 15,011,738 | |||
Hanjin Heavy Industries & Construction Holdings Co. Ltd.a | 64,714 | 2,941,702 | |||
Hyundai Engineering & Construction Co. Inc.a,b | 213,920 | 17,282,319 | |||
Samsung Engineering Co. Ltd. | 162,710 | 18,729,209 | |||
| 140,374,121 | |||||
ENVIRONMENTAL CONTROL – 0.28% | |||||
Woongjin Coway Co. Ltd.a | 213,920 | 6,725,969 | |||
| 6,725,969 | |||||
FOOD – 1.08% | |||||
CJ Corp.a,c | 91,680 | 12,116,515 | |||
Lotte Confectionery Co. Ltd.a | 3,500 | 5,968,558 | |||
Nong Shim Co. Ltd.a | 15,282 | 3,909,065 | |||
ORION Corp.a | 15,289 | 4,138,989 | |||
| 26,133,127 | |||||
HOME BUILDERS – 1.21% | |||||
Hyundai Development Co.a | 328,527 | 29,412,489 | |||
| 29,412,489 | |||||
HOUSEHOLD PRODUCTS & WARES – 0.38% | |||||
LG Household & Health Care Ltd.a | 61,120 | 9,315,385 | |||
| 9,315,385 | |||||
INSURANCE – 2.31% | |||||
Dongbu Insurance Co. Ltd. | 191,000 | 7,990,141 | |||
Hyundai Marine & Fire Insurance Co. Ltd.a | 374,360 | 7,660,764 | |||
Korean Reinsurance Co. | 359,080 | 4,879,584 | |||
| Security | Shares | Value | |||
Samsung Fire & Marine Insurance Co. Ltd.a | 183,360 | $ | 35,665,548 | ||
| 56,196,037 | |||||
INTERNET – 1.90% | |||||
Daum Communications Corp.a,b | 50,424 | 3,584,632 | |||
NCsoft Corp.a,b | 76,400 | 6,351,399 | |||
NHN Corp.b | 187,944 | 36,256,716 | |||
| 46,192,747 | |||||
IRON & STEEL – 10.54% | |||||
Dongkuk Steel Mill Co. Ltd. | 175,731 | 8,081,847 | |||
Hyundai Steel Co. | 236,840 | 18,932,054 | |||
POSCO | 374,360 | 229,024,929 | |||
| 256,038,830 | |||||
LODGING – 0.54% | |||||
Kangwon Land Inc.a | 542,442 | 13,008,201 | |||
| 13,008,201 | |||||
MACHINERY - DIVERSIFIED – 0.49% | |||||
Doosan Infracore Co. Ltd.a | 328,520 | 11,957,323 | |||
| 11,957,323 | |||||
MANUFACTURING – 0.52% | |||||
Cheil Industries Inc.a | 229,200 | 12,556,227 | |||
| 12,556,227 | |||||
MINING – 0.11% | |||||
Poongsan Corp.a | 99,338 | 2,699,834 | |||
| 2,699,834 | |||||
MULTIPLE UTILITIES – 0.51% | |||||
KT Freetel Co. Ltd. | 382,000 | 12,417,799 | |||
| 12,417,799 | |||||
OIL & GAS – 3.36% | |||||
SK Corp.a | 131,284 | 20,219,065 | |||
SK Energy Co. Ltd.b | 313,244 | 42,900,990 | |||
S-Oil Corp.a | 229,200 | 18,467,914 | |||
| 81,587,969 | |||||
PHARMACEUTICALS – 0.57% | |||||
Hanmi Pharm Co. Ltd.a | 31,873 | 5,197,516 | |||
Yuhan Corp.a | 39,848 | 8,706,464 | |||
| 13,903,980 | |||||
RETAIL – 2.88% | |||||
Hyundai Department Store Co. Ltd. | 76,400 | 8,631,388 | |||
Lotte Shopping Co. Ltd.a | 38,200 | 14,270,290 | |||
Shinsegae Co. Ltd.a | 71,090 | 46,976,605 | |||
| 69,878,283 | |||||
SCHEDULESOF INVESTMENTS | 59 |
Table of Contents
Schedule of Investments (Continued)
iSHARES® MSCI SOUTH KOREA INDEX FUND
August 31, 2007
| Security | Shares | Value | |||
SEMICONDUCTORS – 0.75% | |||||
Samsung Techwin Co. Ltd.a | 252,120 | $ | 18,218,743 | ||
| 18,218,743 | |||||
SHIPBUILDING – 7.27% | |||||
Daewoo Shipbuilding & Marine Engineering Co. Ltd.a | 488,960 | 29,183,864 | |||
Hyundai Heavy Industries Co. Ltd.a | 213,920 | 84,359,606 | |||
Hyundai Mipo Dockyard Co. Ltd. | 61,120 | 18,109,630 | |||
Samsung Heavy Industries Co. Ltd.a | 893,880 | 45,063,175 | |||
| 176,716,275 | |||||
TELECOMMUNICATIONS – 3.22% | |||||
KT Corp. | 474,501 | 22,530,263 | |||
KT Corp. SP ADR | 458,400 | 10,919,088 | |||
SKTelecom Co. Ltd. | 117,540 | 25,869,448 | |||
SKTelecom Co. Ltd. ADR | 688,364 | 18,840,523 | |||
| 78,159,322 | |||||
TRANSPORTATION – 0.58% | |||||
Hanjin Shipping Co. Ltd.a | 252,120 | 14,107,434 | |||
| 14,107,434 | |||||
TOTAL COMMON STOCKS | 2,369,543,279 | ||||
PREFERRED STOCKS – 2.39% | |||||
AUTO MANUFACTURERS – 0.32% | |||||
Hyundai Motor Co. Ltd. | 198,640 | 7,907,492 | |||
| 7,907,492 | |||||
ELECTRICAL COMPONENTS | |||||
LG Electronics Inc. | 122,240 | 5,393,803 | |||
Samsung Electronics Co. Ltd.a | 95,680 | 44,818,929 | |||
| 50,212,732 | |||||
TOTAL PREFERRED STOCKS | 58,120,224 | ||||
| Security | Shares | Value | ||||
SHORT-TERM INVESTMENTS – 24.06% | ||||||
MONEY MARKET FUNDS – 24.06% | ||||||
Barclays Global Investors Funds Institutional Money Market Fund, Institutional Shares | 2,202,657 | $ | 2,202,657 | |||
BGI Cash Premier Fund LLC 5.47%d,e,f | 582,296,616 | 582,296,616 | ||||
| 584,499,273 | ||||||
TOTAL SHORT-TERM INVESTMENTS | 584,499,273 | |||||
TOTAL INVESTMENTS | 3,012,162,776 | |||||
Other Assets, Less Liabilities – (23.99)% | (582,709,987 | ) | ||||
NET ASSETS – 100.00% | $ | 2,429,452,789 | ||||
ADR – American Depositary Receipts
SP ADR – Sponsored American Depositary Receipts
a | All or a portion of this security represents a security on loan. See Note 5. |
b | Non-income earning security. |
c | Security valued at fair value in accordance with procedures approved by the Board of Directors. See Note 1. |
d | Affiliated issuer. See Note 2. |
e | The rate quoted is the annualized seven-day yield of the fund at period end. |
| f | This security represents an investment of securities lending collateral. See Note 5. |
See notes to financial statements.
60 | 2007 iSHARES ANNUAL REPORT TO SHAREHOLDERS |
Table of Contents
iSHARES® MSCI TAIWAN INDEX FUND
August 31, 2007
| Security | Shares | Value | |||
COMMON STOCKS – 99.03% | |||||
AIRLINES – 0.27% | |||||
China Airlines | 9,809,588 | $ | 3,849,637 | ||
EVA Airways Corp.a | 9,526,396 | 3,521,986 | |||
| 7,371,623 | |||||
APPAREL – 0.53% | |||||
Pou Chen Corp. | 14,722,272 | 14,722,718 | |||
| 14,722,718 | |||||
AUTO MANUFACTURERS – 0.35% | |||||
China Motor Co. Ltd. | 4,352,287 | 3,857,826 | |||
Yulon Motor Co. Ltd. | 5,274,838 | 5,770,528 | |||
| 9,628,354 | |||||
AUTO PARTS & EQUIPMENT – 0.34% | |||||
Cheng Shin Rubber Industry Co. Ltd. | 5,196,291 | 9,526,822 | |||
| 9,526,822 | |||||
BANKS – 5.96% | |||||
Chang Hwa Commercial Bank Ltd. | 26,846,446 | 16,840,554 | |||
Chinatrust Financial Holding Co. Ltd.a | 51,960,566 | 39,050,336 | |||
E.Sun Financial Holding Co. Ltd.a | 20,784,378 | 10,959,368 | |||
First Financial Holding Co. Ltd. | 32,042,324 | 22,139,004 | |||
Hua Nan Financial Holdings Co. Ltd. | 25,114,965 | 16,553,547 | |||
Mega Financial Holding Co. Ltd. | 63,218,136 | 39,273,063 | |||
Taishin Financial Holdings Co. Ltd.a | 40,703,439 | 20,352,336 | |||
| 165,168,208 | |||||
BUILDING MATERIALS – 1.66% | |||||
Asia Cement Corp. | 11,234,848 | 15,763,310 | |||
Taiwan Cement Corp. | 19,246,197 | 24,729,196 | |||
Taiwan Glass Industrial Corp. | 6,062,923 | 5,511,915 | |||
| 46,004,421 | |||||
CHEMICALS – 8.53% | |||||
Eternal Chemical Co. Ltd. | 4,330,060 | 5,025,646 | |||
Formosa Chemicals & Fibre Co. | 20,784,393 | 50,639,874 | |||
| Security | Shares | Value | |||
Formosa Plastic Co. | 30,310,111 | $ | 75,318,316 | ||
Nan Ya Plastic Corp. | 37,238,447 | 90,277,759 | |||
Oriental Union Chemical Corp. | 4,330,704 | 4,396,454 | |||
Taiwan Fertilizer Co. Ltd. | 5,196,000 | 10,628,504 | |||
| 236,286,553 | |||||
COMMERCIAL SERVICES – 0.16% | |||||
Taiwan Secom Co. Ltd. | 2,598,610 | 4,291,774 | |||
| 4,291,774 | |||||
COMPUTER SYSTEMS – 0.30% | |||||
Mosel Vitelic Inc. | 6,928,750 | 8,220,266 | |||
| 8,220,266 | |||||
COMPUTERS – 11.51% | |||||
Acer Inc. | 17,320,617 | 30,390,731 | |||
Advantech Co. Ltd. | 1,820,588 | 5,500,549 | |||
CMC Magnetics Corp.a | 20,784,400 | 9,164,309 | |||
Compal Electronics Inc. | 23,500,944 | 26,136,690 | |||
Foxconn Technology Co. Ltd. | 2,991,824 | 27,199,224 | |||
High Tech Computer Corp. | 3,464,760 | 46,985,669 | |||
Innolux Display Corp. | 14,722,648 | 62,015,457 | |||
Inotera Memories Inc. | 22,516,000 | 22,482,566 | |||
Inventec Co. Ltd. | 10,895,098 | 6,949,963 | |||
Lite-On Technology Corp. | 13,856,998 | 21,877,923 | |||
MiTAC International Corp. | 8,422,952 | 10,490,722 | |||
Qisda Corp.a | 15,588,019 | 7,321,867 | |||
Quanta Computer Inc. | 14,136,716 | 23,004,990 | |||
Ritek Corp.a | 17,320,389 | 5,206,772 | |||
Wistron Corp. | 7,794,884 | 14,172,946 | |||
| 318,900,378 | |||||
DIVERSIFIED FINANCIAL SERVICES – 2.79% | |||||
Fubon Financial Holding Co. Ltd. | 25,980,000 | 22,398,588 | |||
Polaris Securities Co. Ltd.a | 12,990,227 | 6,633,090 | |||
SinoPac Financial Holdings Co. Ltd. | 45,898,193 | 21,767,530 | |||
Waterland Financial Holdings | 10,602,000 | 3,277,081 | |||
Yuanta Financial Holdings Co. Ltd.a | 40,702,076 | 23,188,552 | |||
| 77,264,841 | |||||
ELECTRICAL COMPONENTS & EQUIPMENT – 2.35% | |||||
Delta Electronics Inc. | 11,258,675 | 41,965,424 | |||
Pacific Electric Wire & Cable Co. Ltd.b | 986 | – | |||
SCHEDULESOF INVESTMENTS | 61 |
Table of Contents
Schedule of Investments (Continued)
iSHARES® MSCI TAIWAN INDEX FUND
August 31, 2007
| Security | Shares | Value | |||
Tatung Co. Ltd.a | 28,578,120 | $ | 13,423,463 | ||
Walsin Lihwa Corp. | 19,918,069 | 9,778,258 | |||
| 65,167,145 | |||||
ELECTRONICS – 20.10% | |||||
Asia Optical Co. Inc. | 874,672 | 3,246,987 | |||
Asustek Computer Inc. | 23,382,764 | 69,796,123 | |||
AU Optronics Corp. | 46,813,097 | 67,810,116 | |||
Cheng Uei Precision Industry Co. Ltd. | 1,821,500 | 4,454,530 | |||
Chi Mei Optoelectronics Corp. | 31,176,504 | 31,555,357 | |||
Chunghwa Picture Tubes Ltd.a | 43,300,105 | 11,127,152 | |||
Compeq Manufacturing Co. Ltd. | 6,928,200 | 2,970,818 | |||
Gigabyte Technology Co. Ltd. | 4,330,017 | 3,936,498 | |||
HannStar Display Corp.a | 36,372,000 | 9,798,693 | |||
Hon Hai Precision Industry Co. Ltd. | 37,409,860 | 277,748,286 | |||
Kinsus Interconnect Technology Corp. | 1,905,600 | 6,583,181 | |||
Micro-Star International Co. Ltd. | 5,510,989 | 5,703,211 | |||
Nan Ya Printed Circuit Board Corp. | 866,000 | 5,629,171 | |||
Phoenix Precision Technology Corp. | 4,352,698 | 5,038,730 | |||
Synnex Technology International Corp. | 5,460,093 | 14,990,891 | |||
Tripod Technology Corp. | 2,598,039 | 10,707,394 | |||
Unimicron Technology Corp. | 6,185,480 | 9,709,623 | |||
Wintek Corp. | 6,928,537 | 7,936,565 | |||
Ya Hsin Industrial Co. Ltd.b | 6,845,461 | 1,236,369 | |||
Yageo Corp. | 17,320,100 | 6,639,573 | |||
| 556,619,268 | |||||
ENERGY - ALTERNATE SOURCES – 0.32% | |||||
Motech Industries Inc. | 1,052,366 | 8,993,218 | |||
| 8,993,218 | |||||
FOOD – 0.85% | |||||
Uni-President Enterprises Co. | 20,198,675 | 23,412,810 | |||
| 23,412,810 | |||||
FOREST PRODUCTS & PAPER – 0.13% | |||||
Yuen Foong Yu Paper Manufacturing Co. Ltd. | 8,747,863 | 3,698,072 | |||
| 3,698,072 | |||||
| Security | Shares | Value | |||
HOME FURNISHINGS – 0.26% | |||||
Teco Electric and Machinery Co. Ltd. | 12,990,092 | $ | 7,282,545 | ||
| 7,282,545 | |||||
INSURANCE – 4.32% | |||||
Cathay Financial Holding Co. Ltd. | 42,434,905 | 94,516,971 | |||
Shin Kong Financial Holding Co. Ltd. | 25,844,772 | 25,140,676 | |||
| 119,657,647 | |||||
INVESTMENT COMPANIES – 0.94% | |||||
China Development Financial Holding Co. | 64,084,808 | 26,120,206 | |||
| 26,120,206 | |||||
IRON & STEEL – 3.18% | |||||
China Steel Corp. | 64,950,762 | 88,178,252 | |||
| 88,178,252 | |||||
MANUFACTURING – 0.26% | |||||
Largan Precision Co. Ltd. | 883,540 | 7,189,021 | |||
| 7,189,021 | |||||
METAL FABRICATE & HARDWARE – 0.86% | |||||
Catcher Technology Co. Ltd.a | 2,598,707 | 20,790,286 | |||
Yieh Phui Enterprise Co. Ltd. | 6,928,413 | 3,065,391 | |||
| 23,855,677 | |||||
OFFICE & BUSINESS EQUIPMENT – 0.12% | |||||
Kinpo Electronics Inc. | 8,660,624 | 3,306,884 | |||
| 3,306,884 | |||||
OIL & GAS – 1.40% | |||||
Formosa Petrochemical Corp. | 13,856,000 | 38,630,019 | |||
| 38,630,019 | |||||
REAL ESTATE – 0.12% | |||||
Cathay Real Estate Development Co. Ltd. | 6,928,493 | 3,233,395 | |||
| 3,233,395 | |||||
RETAIL – 0.33% | |||||
President Chain Store Corp. | 3,464,640 | 8,997,838 | |||
| 8,997,838 | |||||
SEMICONDUCTORS – 24.68% | |||||
Advanced Semiconductor Engineering Inc. | 27,834,715 | 27,540,333 | |||
Epistar Corp. | 2,648,364 | 12,439,662 | |||
Macronix International Co. Ltd.a | 20,784,492 | 12,911,970 | |||
62 | 2007 iSHARES ANNUAL REPORT TO SHAREHOLDERS |
Table of Contents
Schedule of Investments (Continued)
iSHARES® MSCI TAIWAN INDEX FUND
August 31, 2007
| Security | Shares | Value | |||
MediaTek Inc. | 6,371,535 | $ | 108,126,295 | ||
Nanya Technology Corp. | 18,186,690 | 13,392,423 | |||
Novatek Microelectronics Corp. Ltd. | 3,533,718 | 14,242,386 | |||
Powerchip Semiconductor Corp. | 54,232,901 | 26,788,578 | |||
Powertech Technology Inc. | 2,992,650 | 12,016,307 | |||
ProMOS Technologies Inc. | 45,032,000 | 13,919,404 | |||
Realtek Semiconductor Corp. | 2,727,623 | 13,349,226 | |||
Siliconware Precision Industries Co. Ltd. | 18,552,074 | 37,386,373 | |||
Taiwan Semiconductor Manufacturing Co. Ltd. | 157,612,920 | 299,473,624 | |||
United Microelectronics Corp. | 130,766,262 | 73,310,581 | |||
Vanguard International Semiconductor Corp. | 6,928,156 | 5,899,609 | |||
Via Technologies Inc.a | 6,928,861 | 4,955,336 | |||
Winbond Electronics Corp. | 25,980,280 | 7,817,939 | |||
| 683,570,046 | |||||
TELECOMMUNICATIONS – 4.32% | |||||
Chunghwa Telecom Co. Ltd. | 39,836,180 | 70,741,542 | |||
Compal Communications Inc. | 1,794,200 | 4,219,216 | |||
D-Link Corp. | 5,301,961 | 11,680,735 | |||
Inventec Appliances Corp. | 1,817,800 | 3,679,779 | |||
Taiwan Cellular Corp. | 18,186,920 | 23,147,691 | |||
Zyxel Communications Corp. | 3,534,255 | 6,147,648 | |||
| 119,616,611 | |||||
TEXTILES – 1.12% | |||||
Far Eastern Textile Ltd. | 20,509,270 | 24,114,660 | |||
Formosa Taffeta Co. Ltd. | 6,062,515 | 6,889,430 | |||
| 31,004,090 | |||||
TRANSPORTATION – 0.97% | |||||
Evergreen Marine Corp. Ltd. | 7,794,467 | 5,054,747 | |||
U-Ming Marine Transport Corp.a | 3,464,800 | 10,310,717 | |||
Wan Hai Lines Ltd. | 7,794,794 | 5,503,764 | |||
Yang Ming Marine Transport Corp.a | 8,660,667 | 6,115,141 | |||
| 26,984,369 | |||||
TOTAL COMMON STOCKS (Cost: $2,051,841,836) | 2,742,903,071 | ||||
| Security | Shares | Value | |||
SHORT-TERM INVESTMENTS – 0.05% | |||||
MONEY MARKET FUNDS – 0.05% | |||||
Barclays Global Investors Funds Institutional Money Market Fund, Institutional Shares | 1,473,944 | $ | 1,473,944 | ||
| 1,473,944 | |||||
TOTAL SHORT-TERM INVESTMENTS | 1,473,944 | ||||
TOTAL INVESTMENTS IN SECURITIES – 99.08% | 2,744,377,015 | ||||
Other Assets, Less Liabilities – 0.92% | 25,387,339 | ||||
NET ASSETS – 100.00% | $ | 2,769,764,354 | |||
a | Non-income earning security. |
b | Security valued at fair value in accordance with procedures approved by the Board of Directors. See Note 1. |
c | Affiliated issuer. See Note 2. |
d | The rate quoted is the annualized seven-day yield of the fund at period end. |
See notes to financial statements.
SCHEDULESOF INVESTMENTS | 63 |
Table of Contents
Statements of Assets and Liabilities
iSHARES®, INC.
August 31, 2007
| iShares MSCI | ||||||||||||||||
Australia Index Fund | Brazil Index Fund | Canada Index Fund | Emerging Markets Index Fund | |||||||||||||
ASSETS | ||||||||||||||||
Investments, at cost: | ||||||||||||||||
Unaffiliated issuers | $ | 1,282,017,415 | $ | 2,661,078,337 | $ | 1,062,442,389 | $ | 13,693,701,783 | ||||||||
Affiliated issuers (Note 2) | 60,377,688 | 10,991,195 | 234,233 | 1,752,485,861 | ||||||||||||
Total cost of investments | $ | 1,342,395,103 | $ | 2,672,069,532 | $ | 1,062,676,622 | $ | 15,446,187,644 | ||||||||
Investments in securities, at value (including securities on loana) (Note 1): | ||||||||||||||||
Unaffiliated issuers | $ | 1,451,128,852 | $ | 4,403,155,789 | $ | 1,319,451,892 | $ | 17,605,160,750 | ||||||||
Affiliated issuers (Note 2) | 60,377,688 | 10,991,195 | 234,233 | 1,921,704,896 | ||||||||||||
Total value of investments | 1,511,506,540 | 4,414,146,984 | 1,319,686,125 | 19,526,865,646 | ||||||||||||
Foreign currencies, at valueb | 2,369,836 | 771,599 | 2,523,950 | 22,225,245 | ||||||||||||
Receivables: | ||||||||||||||||
Investment securities sold | 10,776,108 | 32,369,210 | 2,991,746 | 103,415,275 | ||||||||||||
Due from custodian (Note 4) | – | 25,436 | – | 59,253,280 | ||||||||||||
Dividends and interest | 11,197,575 | 18,123,550 | 1,543,610 | 57,659,042 | ||||||||||||
Capital shares sold | – | 2,961,474 | – | – | ||||||||||||
Total Assets | 1,535,850,059 | 4,468,398,253 | 1,326,745,431 | 19,769,418,488 | ||||||||||||
LIABILITIES | ||||||||||||||||
Payables: | ||||||||||||||||
Investment securities purchased | 10,906,703 | 31,681,662 | 3,054,114 | 152,148,819 | ||||||||||||
Securities related to in-kind transactions (Note 4) | – | – | – | 18,588,207 | ||||||||||||
Collateral for securities on loan (Note 5) | 60,181,361 | – | – | 1,389,487,748 | ||||||||||||
Investment advisory fees (Note 2) | 649,519 | 2,382,953 | 569,174 | 10,822,582 | ||||||||||||
Total Liabilities | 71,737,583 | 34,064,615 | 3,623,288 | 1,571,047,356 | ||||||||||||
NET ASSETS | $ | 1,464,112,476 | $ | 4,434,333,638 | $ | 1,323,122,143 | $ | 18,198,371,132 | ||||||||
Net assets consist of: | ||||||||||||||||
Paid-in capital | $ | 1,288,847,470 | $ | 2,656,731,679 | $ | 1,074,106,349 | $ | 14,032,237,942 | ||||||||
Undistributed net investment income | 21,502,107 | 45,390,560 | 10,427,097 | 203,060,062 | ||||||||||||
Accumulated net realized loss | (15,263,042 | ) | (10,244,694 | ) | (18,426,256 | ) | (117,716,143 | ) | ||||||||
Net unrealized appreciation on investments and translation of assets and liabilities in foreign currencies | 169,025,941 | 1,742,456,093 | 257,014,953 | 4,080,789,271 | ||||||||||||
NET ASSETS | $ | 1,464,112,476 | $ | 4,434,333,638 | $ | 1,323,122,143 | $ | 18,198,371,132 | ||||||||
Shares outstandingc | 53,000,000 | 72,000,000 | 44,300,000 | 135,450,000 | ||||||||||||
Net asset value per share | $ | 27.62 | $ | 61.59 | $ | 29.87 | $ | 134.35 | ||||||||
a | Securities on loan with market values of $56,427,222, $–, $– and $1,324,090,538, respectively. See Note 5. |
b | Cost of foreign currencies: $2,374,791, $758,337, $2,524,260 and $22,177,947, respectively. |
c | $0.001 par value, number of shares authorized: 127.8 million, 500 million, 340.2 million and 500 million, respectively. |
See notes to financial statements.
64 | 2007 iSHARES ANNUAL REPORT TO SHAREHOLDERS |
Table of Contents
Statements of Assets and Liabilities (Continued)
iSHARES®, INC.
August 31, 2007
| iShares MSCI | ||||||||||||||||
Hong Kong Index Fund | Malaysia Index Fund | Mexico Index Fund | Pacific ex-Japan Index Fund | |||||||||||||
ASSETS | ||||||||||||||||
Investments, at cost: | ||||||||||||||||
Unaffiliated issuers | $ | 1,206,634,031 | $ | 479,638,443 | $ | 1,354,172,287 | $ | 2,497,886,231 | ||||||||
Affiliated issuers (Note 2) | 277,059,033 | 643,520 | 141,524,311 | 331,917,453 | ||||||||||||
Total cost of investments | $ | 1,483,693,064 | $ | 480,281,963 | $ | 1,495,696,598 | $ | 2,829,803,684 | ||||||||
Investments in securities, at value (including securities on loana) (Note 1): | ||||||||||||||||
Unaffiliated issuers | $ | 1,439,853,318 | $ | 736,553,503 | $ | 1,380,807,947 | $ | 3,509,060,191 | ||||||||
Affiliated issuers (Note 2) | 277,059,033 | 643,520 | 141,524,311 | 331,917,453 | ||||||||||||
Total value of investments | 1,716,912,351 | 737,197,023 | 1,522,332,258 | 3,840,977,644 | ||||||||||||
Foreign currencies, at valueb | 759,021 | 6,857,327 | 902,579 | 5,483,670 | ||||||||||||
Receivables: | ||||||||||||||||
Investment securities sold | – | 3,967,415 | 87,001,405 | 16,585,998 | ||||||||||||
Due from custodian (Note 4) | – | – | – | 43,695 | ||||||||||||
Dividends and interest | 2,121,544 | 2,338,682 | 1,080,030 | 23,532,797 | ||||||||||||
Total Assets | 1,719,792,916 | 750,360,447 | 1,611,316,272 | 3,886,623,804 | ||||||||||||
LIABILITIES | ||||||||||||||||
Payables: | ||||||||||||||||
Investment securities purchased | – | 8,567,036 | 29,940,986 | 17,503,349 | ||||||||||||
Securities related to in-kind transactions (Note 4) | – | – | 57,009,952 | – | ||||||||||||
Collateral for securities on loan (Note 5) | 273,919,378 | – | 140,955,798 | 331,361,817 | ||||||||||||
Capital shares redeemed | – | – | 14,929 | – | ||||||||||||
Investment advisory fees (Note 2) | 564,646 | 353,890 | 584,957 | 1,463,335 | ||||||||||||
Total Liabilities | 274,484,024 | 8,920,926 | 228,506,622 | 350,328,501 | ||||||||||||
NET ASSETS | $ | 1,445,308,892 | $ | 741,439,521 | $ | 1,382,809,650 | $ | 3,536,295,303 | ||||||||
Net assets consist of: | ||||||||||||||||
Paid-in capital | $ | 1,211,576,260 | $ | 508,503,278 | $ | 1,358,519,960 | $ | 2,494,602,481 | ||||||||
Undistributed net investment income | 25,204,852 | 18,518,153 | 8,312,387 | 43,439,186 | ||||||||||||
Accumulated net realized loss | (24,694,158 | ) | (42,481,828 | ) | (10,662,263 | ) | (12,768,262 | ) | ||||||||
Net unrealized appreciation on investments and translation of assets and liabilities in foreign currencies | 233,221,938 | 256,899,918 | 26,639,566 | 1,011,021,898 | ||||||||||||
NET ASSETS | $ | 1,445,308,892 | $ | 741,439,521 | $ | 1,382,809,650 | $ | 3,536,295,303 | ||||||||
Shares outstandingc | 78,975,000 | 67,575,000 | 23,700,000 | 24,400,000 | ||||||||||||
Net asset value per share | $ | 18.30 | $ | 10.97 | $ | 58.35 | $ | 144.93 | ||||||||
a | Securities on loan with market values of $259,750,524, $–, $136,818,025 and $312,297,872, respectively. See Note 5. |
b | Cost of foreign currencies: $758,636, $6,864,034, $907,838 and $5,483,916, respectively. |
c | $0.001 par value, number of shares authorized: 191.4 million, 127.8 million, 255 million and 500 million, respectively. |
See notes to financial statements.
FINANCIAL STATEMENTS | 65 |
Table of Contents
Statements of Assets and Liabilities (Continued)
iSHARES®, INC.
August 31, 2007
| iShares MSCI | ||||||||||||||||
Singapore Index Fund | South Africa Index Fund | South Korea Index Fund | Taiwan Index Fund | |||||||||||||
ASSETS | ||||||||||||||||
Investments, at cost: | ||||||||||||||||
Unaffiliated issuers | $ | 1,420,262,590 | $ | 432,895,740 | $ | 1,318,079,899 | $ | 2,051,841,836 | ||||||||
Affiliated issuers (Note 2) | 297,778,862 | 116,686 | 584,499,273 | 1,473,944 | ||||||||||||
Total cost of investments | $ | 1,718,041,452 | $ | 433,012,426 | $ | 1,902,579,172 | $ | 2,053,315,780 | ||||||||
Investments in securities, at value (including securities on loana) (Note 1): | ||||||||||||||||
Unaffiliated issuers | $ | 1,646,562,633 | $ | 465,925,182 | $ | 2,427,663,503 | $ | 2,742,903,071 | ||||||||
Affiliated issuers (Note 2) | 297,778,862 | 116,686 | 584,499,273 | 1,473,944 | ||||||||||||
Total value of investments | 1,944,341,495 | 466,041,868 | 3,012,162,776 | 2,744,377,015 | ||||||||||||
Foreign currencies, at valueb | 3,009,105 | 1,023,342 | – | 8,973,167 | ||||||||||||
Receivables: | ||||||||||||||||
Investment securities sold | 28,815,954 | 638,645 | 11,761,430 | – | ||||||||||||
Due from custodian (Note 4) | 1,069,002 | – | – | – | ||||||||||||
Dividends and interest | 18,186,459 | 747,774 | 408,246 | 22,126,432 | ||||||||||||
Capital shares sold | – | 82,877 | – | 31,983,365 | ||||||||||||
Total Assets | 1,995,422,015 | 468,534,506 | 3,024,332,452 | 2,807,459,979 | ||||||||||||
LIABILITIES | ||||||||||||||||
Payables: | ||||||||||||||||
Investment securities purchased | 28,442,512 | 1,361,508 | 11,224,870 | 34,796,821 | ||||||||||||
Collateral for securities on loan (Note 5) | 297,019,475 | – | 582,296,616 | – | ||||||||||||
Foreign taxes | – | – | – | 1,357,643 | ||||||||||||
Investment advisory fees (Note 2) | 749,844 | 232,742 | 1,358,177 | 1,541,161 | ||||||||||||
Total Liabilities | 326,211,831 | 1,594,250 | 594,879,663 | 37,695,625 | ||||||||||||
NET ASSETS | $ | 1,669,210,184 | $ | 466,940,256 | $ | 2,429,452,789 | $ | 2,769,764,354 | ||||||||
Net assets consist of: | ||||||||||||||||
Paid-in capital | $ | 1,419,146,376 | $ | 433,562,025 | $ | 1,391,792,758 | $ | 2,214,305,017 | ||||||||
Undistributed net investment income | 43,749,612 | 6,792,504 | 17,559,332 | 58,442,597 | ||||||||||||
Accumulated net realized loss | (19,930,006 | ) | (6,449,874 | ) | (89,482,762 | ) | (193,998,132 | ) | ||||||||
Net unrealized appreciation on investments and translation of assets and liabilities in foreign currencies | 226,244,202 | 33,035,601 | 1,109,583,461 | 691,014,872 | ||||||||||||
NET ASSETS | $ | 1,669,210,184 | $ | 466,940,256 | $ | 2,429,452,789 | $ | 2,769,764,354 | ||||||||
Shares outstandingc | 125,700,000 | 3,750,000 | 38,200,000 | 173,200,000 | ||||||||||||
Net asset value per share | $ | 13.28 | $ | 124.52 | $ | 63.60 | $ | 15.99 | ||||||||
a | Securities on loan with market values of $283,623,758, $–, $558,597,793 and $–, respectively. See Note 5. |
b | Cost of foreign currencies: $3,007,837, $1,021,969, $– and $8,969,798, respectively. |
c | $0.001 par value, number of shares authorized: 191.4 million, 200 million, 200 million and 200 million, respectively. |
See notes to financial statements.
66 | 2007 iSHARES ANNUAL REPORT TO SHAREHOLDERS |
Table of Contents
Statements of Operations
iSHARES®, INC.
Year ended August 31, 2007
| iShares MSCI | |||||||||||||||
Australia Index Fund | Brazil Index Fund | Canada Index Fund | Emerging Markets Index Fund | ||||||||||||
NET INVESTMENT INCOME | |||||||||||||||
Dividends from unaffiliated issuersa | $ | 41,724,172 | $ | 90,135,763 | $ | 21,176,330 | $ | 332,793,891 | |||||||
Dividends from affiliated issuers (Note 2) | – | – | – | 20,955,667 | |||||||||||
Interest from affiliated issuers (Note 2) | 32,120 | 323,866 | 36,407 | 1,096,015 | |||||||||||
Securities lending income from unaffiliated issuers | 73,270 | – | – | 6,730,075 | |||||||||||
Securities lending income from affiliated issuers (Note 2) | 43,383 | 2,245 | – | 3,308,502 | |||||||||||
Total investment income | 41,872,945 | 90,461,874 | 21,212,737 | 364,884,150 | |||||||||||
EXPENSES | |||||||||||||||
Investment advisory fees (Note 2) | 5,418,181 | 21,514,644 | 5,946,553 | 114,234,720 | |||||||||||
Foreign taxes (Note 1) | – | 279,113 | 1,367 | 293,974 | |||||||||||
Total expenses | 5,418,181 | 21,793,757 | 5,947,920 | 114,528,694 | |||||||||||
Less investment advisory fees waived | – | – | – | (558,945 | ) | ||||||||||
Net expenses | 5,418,181 | 21,793,757 | 5,947,920 | 113,969,749 | |||||||||||
Net investment income | 36,454,764 | 68,668,117 | 15,264,817 | 250,914,401 | |||||||||||
NET REALIZED AND UNREALIZED GAIN (LOSS) | |||||||||||||||
Net realized gain (loss) from: | |||||||||||||||
Investments in unaffiliated issuers | (4,442,009 | ) | 58,029,884 | (8,223,785 | ) | (79,804,856 | ) | ||||||||
Investments in affiliated issuers (Note 2) | – | – | – | 79,689,076 | |||||||||||
In-kind redemptions | 127,522,283 | – | 118,324,552 | 2,360,331,511 | |||||||||||
Foreign currency transactions | 774,109 | 914,930 | 82,541 | (524,668 | ) | ||||||||||
Net realized gain | 123,854,383 | 58,944,814 | 110,183,308 | 2,359,691,063 | |||||||||||
Net change in unrealized appreciation (depreciation) on: | |||||||||||||||
Investments | 84,194,178 | 1,248,875,549 | 94,925,393 | 2,303,531,678 | |||||||||||
Translation of assets and liabilities in foreign currencies | (111,228 | ) | 365,370 | (5,592 | ) | (148,417 | ) | ||||||||
Net change in unrealized appreciation (depreciation) | 84,082,950 | 1,249,240,919 | 94,919,801 | 2,303,383,261 | |||||||||||
Net realized and unrealized gain | 207,937,333 | 1,308,185,733 | 205,103,109 | 4,663,074,324 | |||||||||||
NET INCREASE IN NET ASSETS RESULTING FROM OPERATIONS | $ | 244,392,097 | $ | 1,376,853,850 | $ | 220,367,926 | $ | 4,913,988,725 | |||||||
a | Net of foreign withholding tax of $1,455,873, $9,911,889, $3,482,219 and $41,650,645, respectively. |
See notes to financial statements.
FINANCIAL STATEMENTS | 67 |
Table of Contents
Statements of Operations (Continued)
iSHARES®, INC.
Year ended August 31, 2007
| iShares MSCI | ||||||||||||||||
Hong Kong Index Fund | Malaysia Index Fund | Mexico Index Fund | Pacific ex-Japan Index Fund | |||||||||||||
NET INVESTMENT INCOME | ||||||||||||||||
Dividends from unaffiliated issuersa | $ | 40,759,039 | $ | 27,897,087 | $ | 19,218,567 | $ | 111,776,834 | ||||||||
Interest from affiliated issuers (Note 2) | 72,567 | 32,747 | 52,760 | 80,986 | ||||||||||||
Securities lending income from unaffiliated issuers | 258,233 | – | 734,949 | 276,064 | ||||||||||||
Securities lending income from affiliated issuers (Note 2) | 164,887 | – | 265,465 | 188,656 | ||||||||||||
Total investment income | 41,254,726 | 27,929,834 | 20,271,741 | 112,322,540 | ||||||||||||
EXPENSES | ||||||||||||||||
Investment advisory fees (Note 2) | 6,192,082 | 3,843,835 | 6,123,156 | 14,285,783 | ||||||||||||
Total expenses | 6,192,082 | 3,843,835 | 6,123,156 | 14,285,783 | ||||||||||||
Net investment income | 35,062,644 | 24,085,999 | 14,148,585 | 98,036,757 | ||||||||||||
NET REALIZED AND UNREALIZED GAIN (LOSS) | ||||||||||||||||
Net realized gain (loss) from: | ||||||||||||||||
Investments in unaffiliated issuers | (10,005,877 | ) | 7,596,414 | (2,275,522 | ) | 8,721,822 | ||||||||||
In-kind redemptions | 160,693,706 | – | 291,090,456 | 97,532,116 | ||||||||||||
Foreign currency transactions | (10,842 | ) | 80,874 | (110,850 | ) | 1,717,017 | ||||||||||
Net realized gain | 150,676,987 | 7,677,288 | 288,704,084 | 107,970,955 | ||||||||||||
Net change in unrealized appreciation (depreciation) on: | ||||||||||||||||
Investments | 128,691,119 | 151,608,958 | 6,644,711 | 559,947,642 | ||||||||||||
Translation of assets and liabilities in foreign currencies | 2,499 | (13,663 | ) | 3,860 | (265,518 | ) | ||||||||||
Net change in unrealized appreciation (depreciation) | 128,693,618 | 151,595,295 | 6,648,571 | 559,682,124 | ||||||||||||
Net realized and unrealized gain | 279,370,605 | 159,272,583 | 295,352,655 | 667,653,079 | ||||||||||||
NET INCREASE IN NET ASSETS RESULTING FROM OPERATIONS | $ | 314,433,249 | $ | 183,358,582 | $ | 309,501,240 | $ | 765,689,836 | ||||||||
a | Net of foreign withholding tax of $–, $–, $– and $3,025,859, respectively. |
See notes to financial statements.
68 | 2007 iSHARES ANNUAL REPORT TO SHAREHOLDERS |
Table of Contents
Statements of Operations (Continued)
iSHARES®, INC.
Year ended August 31, 2007
| iShares MSCI | ||||||||||||||||
| Singapore Index Fund | South Africa Index Fund | South Korea Index Fund | Taiwan Index Fund | |||||||||||||
NET INVESTMENT INCOME | ||||||||||||||||
Dividends from unaffiliated issuersa | $ | 58,666,324 | $ | 12,249,206 | $ | 28,271,826 | $ | 76,016,901 | ||||||||
Interest from affiliated issuers (Note 2) | 65,855 | 6,986 | 135,118 | 108,920 | ||||||||||||
Securities lending income from unaffiliated issuers | 253,867 | – | 704,305 | – | ||||||||||||
Securities lending income from affiliated issuers (Note 2) | 207,027 | – | 1,071,014 | – | ||||||||||||
Total investment income | 59,193,073 | 12,256,192 | 30,182,263 | 76,125,821 | ||||||||||||
EXPENSES | ||||||||||||||||
Investment advisory fees (Note 2) | 7,038,174 | 2,554,012 | 12,507,997 | 15,295,138 | ||||||||||||
Foreign taxes (Note 1) | – | – | 5,918 | 2,144,022 | ||||||||||||
Total expenses | 7,038,174 | 2,554,012 | 12,513,915 | 17,439,160 | ||||||||||||
Net investment income | 52,154,899 | 9,702,180 | 17,668,348 | 58,686,661 | ||||||||||||
NET REALIZED AND UNREALIZED GAIN (LOSS) | ||||||||||||||||
Net realized gain (loss) from: | ||||||||||||||||
Investments in unaffiliated issuers | (3,745,050 | ) | (2,392,410 | ) | (2,011,293 | ) | (35,817,797 | ) | ||||||||
In-kind redemptions | 209,375,938 | 11,763,327 | – | – | ||||||||||||
Foreign currency transactions | (172,828 | ) | (12,770 | ) | (159,049 | ) | (244,063 | ) | ||||||||
Net realized gain (loss) | 205,458,060 | 9,358,147 | (2,170,342 | ) | (36,061,860 | ) | ||||||||||
Net change in unrealized appreciation (depreciation) on: | ||||||||||||||||
Investments | 154,100,193 | 76,026,963 | 592,662,922 | 510,479,175 | ||||||||||||
Translation of assets and liabilities in foreign currencies | (77,951 | ) | 15,911 | (143 | ) | 79,920 | ||||||||||
Net change in unrealized appreciation (depreciation) | 154,022,242 | 76,042,874 | 592,662,779 | 510,559,095 | ||||||||||||
Net realized and unrealized gain | 359,480,302 | 85,401,021 | 590,492,437 | 474,497,235 | ||||||||||||
NET INCREASE IN NET ASSETS RESULTING FROM OPERATIONS | $ | 411,635,201 | $ | 95,103,201 | $ | 608,160,785 | $ | 533,183,896 | ||||||||
a | Net of foreign withholding tax of $–, $–, $5,452,858 and $18,113,281, respectively. |
See notes to financial statements.
FINANCIAL STATEMENTS | 69 |
Table of Contents
Statements of Changes in Net Assets
iSHARES®, INC.
iShares MSCI Australia Index Fund | iShares MSCI Brazil Index Fund | |||||||||||||||
| Year ended August 31, 2007 | Year ended August 31, 2006 | Year ended August 31, 2007 | Year ended August 31, 2006 | |||||||||||||
INCREASE (DECREASE) IN NET ASSETS | ||||||||||||||||
OPERATIONS: | ||||||||||||||||
Net investment income | $ | 36,454,764 | $ | 20,156,434 | $ | 68,668,117 | $ | 43,261,595 | ||||||||
Net realized gain (loss) | 123,854,383 | 30,254,258 | 58,944,814 | (13,454,900 | ) | |||||||||||
Net change in unrealized appreciation (depreciation) | 84,082,950 | 40,835,313 | 1,249,240,919 | 276,489,590 | ||||||||||||
Net increase in net assets resulting from operations | 244,392,097 | 91,246,005 | 1,376,853,850 | 306,296,285 | ||||||||||||
DISTRIBUTIONS TO SHAREHOLDERS: | ||||||||||||||||
From net investment income | (35,850,508 | ) | (16,397,050 | ) | (59,308,876 | ) | (20,219,476 | ) | ||||||||
Total distributions to shareholders | (35,850,508 | ) | (16,397,050 | ) | (59,308,876 | ) | (20,219,476 | ) | ||||||||
CAPITAL SHARE TRANSACTIONS: | ||||||||||||||||
Proceeds from shares sold | 964,074,872 | 336,128,324 | 1,012,054,259 | 1,649,177,320 | ||||||||||||
Cost of shares redeemed | (394,910,991 | ) | (93,925,541 | ) | (363,560,519 | ) | (19,244,643 | ) | ||||||||
Net increase in net assets from capital share transactions | 569,163,881 | 242,202,783 | 648,493,740 | 1,629,932,677 | ||||||||||||
INCREASE IN NET ASSETS | 777,705,470 | 317,051,738 | 1,966,038,714 | 1,916,009,486 | ||||||||||||
NET ASSETS | ||||||||||||||||
Beginning of year | 686,407,006 | 369,355,268 | 2,468,294,924 | 552,285,438 | ||||||||||||
End of year | $ | 1,464,112,476 | $ | 686,407,006 | $ | 4,434,333,638 | $ | 2,468,294,924 | ||||||||
Undistributed net investment income included in net assets at end of year | $ | 21,502,107 | $ | 13,312,374 | $ | 45,390,560 | $ | 35,080,996 | ||||||||
SHARES ISSUED AND REDEEMED | ||||||||||||||||
Shares sold | 37,000,000 | 16,200,000 | 16,700,000 | 44,050,000 | ||||||||||||
Shares redeemed | (15,800,000 | ) | (4,600,000 | ) | (7,850,000 | ) | (500,000 | ) | ||||||||
Net increase in shares outstanding | 21,200,000 | 11,600,000 | 8,850,000 | 43,550,000 | ||||||||||||
See notes to financial statements.
70 | 2007 iSHARES ANNUAL REPORT TO SHAREHOLDERS |
Table of Contents
Statements of Changes in Net Assets (Continued)
iSHARES®, INC.
iShares MSCI Canada Index Fund | iShares MSCI Emerging Markets Index Fund | |||||||||||||||
| Year ended August 31, 2007 | Year ended August 31, 2006 | Year ended August 31, 2007 | Year ended August 31, 2006 | |||||||||||||
INCREASE (DECREASE) IN NET ASSETS | ||||||||||||||||
OPERATIONS: | ||||||||||||||||
Net investment income | $ | 15,264,817 | $ | 9,118,778 | $ | 250,914,401 | $ | 192,922,376 | ||||||||
Net realized gain | 110,183,308 | 88,304,312 | 2,359,691,063 | 1,340,943,115 | ||||||||||||
Net change in unrealized appreciation (depreciation) | 94,919,801 | 43,740,392 | 2,303,383,261 | 667,014,214 | ||||||||||||
Net increase in net assets resulting from operations | 220,367,926 | 141,163,482 | 4,913,988,725 | 2,200,879,705 | ||||||||||||
DISTRIBUTIONS TO SHAREHOLDERS: | ||||||||||||||||
From net investment income | (12,092,201 | ) | (4,108,502 | ) | (209,458,860 | ) | (113,762,995 | ) | ||||||||
Total distributions to shareholders | (12,092,201 | ) | (4,108,502 | ) | (209,458,860 | ) | (113,762,995 | ) | ||||||||
CAPITAL SHARE TRANSACTIONS: | ||||||||||||||||
Proceeds from shares sold | 285,559,364 | 727,046,964 | 7,873,614,616 | 6,532,568,942 | ||||||||||||
Cost of shares redeemed | (271,873,681 | ) | (183,241,984 | ) | (6,349,153,507 | ) | (3,651,163,544 | ) | ||||||||
Net increase in net assets from capital share transactions | 13,685,683 | 543,804,980 | 1,524,461,109 | 2,881,405,398 | ||||||||||||
INCREASE IN NET ASSETS | 221,961,408 | 680,859,960 | 6,228,990,974 | 4,968,522,108 | ||||||||||||
NET ASSETS | ||||||||||||||||
Beginning of year | 1,101,160,735 | 420,300,775 | 11,969,380,158 | 7,000,858,050 | ||||||||||||
End of year | $ | 1,323,122,143 | $ | 1,101,160,735 | $ | 18,198,371,132 | $ | 11,969,380,158 | ||||||||
Undistributed net investment income included in net assets at end of year | $ | 10,427,097 | $ | 7,159,513 | $ | 203,060,062 | $ | 156,423,079 | ||||||||
SHARES ISSUED AND REDEEMED | ||||||||||||||||
Shares sold | 9,900,000 | 31,900,000 | 67,200,000 | 71,850,000 | ||||||||||||
Shares redeemed | (10,200,000 | ) | (8,000,000 | ) | (54,600,000 | ) | (38,850,000 | ) | ||||||||
Net increase (decrease) in shares outstanding | (300,000 | ) | 23,900,000 | 12,600,000 | 33,000,000 | |||||||||||
See notes to financial statements.
FINANCIAL STATEMENTS | 71 |
Table of Contents
Statements of Changes in Net Assets (Continued)
iSHARES®, INC.
iShares MSCI Hong Kong Index Fund | iShares MSCI Malaysia Index Fund | |||||||||||||||
| Year ended August 31, 2007 | Year ended August 31, 2006 | Year ended August 31, 2007 | Year ended August 31, 2006 | |||||||||||||
INCREASE (DECREASE) IN NET ASSETS | ||||||||||||||||
OPERATIONS: | ||||||||||||||||
Net investment income | $ | 35,062,644 | $ | 21,409,153 | $ | 24,085,999 | $ | 14,348,448 | ||||||||
Net realized gain (loss) | 150,676,987 | 45,228,751 | 7,677,288 | (17,343,416 | ) | |||||||||||
Net change in unrealized appreciation (depreciation) | 128,693,618 | 17,114,750 | 151,595,295 | 40,249,132 | ||||||||||||
Net increase in net assets resulting from operations | 314,433,249 | 83,752,654 | 183,358,582 | 37,254,164 | ||||||||||||
DISTRIBUTIONS TO SHAREHOLDERS: | ||||||||||||||||
From net investment income | (25,623,625 | ) | (17,872,090 | ) | (11,518,123 | ) | (14,088,338 | ) | ||||||||
Total distributions to shareholders | (25,623,625 | ) | (17,872,090 | ) | (11,518,123 | ) | (14,088,338 | ) | ||||||||
CAPITAL SHARE TRANSACTIONS: | ||||||||||||||||
Proceeds from shares sold | 828,936,976 | 385,690,233 | 709,128,181 | 210,424,492 | ||||||||||||
Cost of shares redeemed | (555,149,687 | ) | (206,843,656 | ) | (513,863,061 | ) | (246,831,356 | ) | ||||||||
Net increase (decrease) in net assets from capital share transactions | 273,787,289 | 178,846,577 | 195,265,120 | (36,406,864 | ) | |||||||||||
INCREASE (DECREASE) IN NET ASSETS | 562,596,913 | 244,727,141 | 367,105,579 | (13,241,038 | ) | |||||||||||
NET ASSETS | ||||||||||||||||
Beginning of year | 882,711,979 | 637,984,838 | 374,333,942 | 387,574,980 | ||||||||||||
End of year | $ | 1,445,308,892 | $ | 882,711,979 | $ | 741,439,521 | $ | 374,333,942 | ||||||||
Undistributed net investment income included in net assets at end of year | $ | 25,204,852 | $ | 14,227,248 | $ | 18,518,153 | $ | 5,608,095 | ||||||||
SHARES ISSUED AND REDEEMED | ||||||||||||||||
Shares sold | 51,075,000 | 28,575,000 | 68,475,000 | 27,900,000 | ||||||||||||
Shares redeemed | (34,275,000 | ) | (15,450,000 | ) | (49,200,000 | ) | (33,525,000 | ) | ||||||||
Net increase (decrease) in shares outstanding | 16,800,000 | 13,125,000 | 19,275,000 | (5,625,000 | ) | |||||||||||
See notes to financial statements.
72 | 2007 iSHARES ANNUAL REPORT TO SHAREHOLDERS |
Table of Contents
Statements of Changes in Net Assets (Continued)
iSHARES®, INC.
| iShares MSCI Mexico Index Fund | iShares MSCI Pacific ex-Japan Index Fund | |||||||||||||||
| Year ended August 31, 2007 | Year ended August 31, 2006 | Year ended August 31, 2007 | Year ended August 31, 2006 | |||||||||||||
INCREASE (DECREASE) IN NET ASSETS | ||||||||||||||||
OPERATIONS: | ||||||||||||||||
Net investment income | $ | 14,148,585 | $ | 9,375,502 | $ | 98,036,757 | $ | 67,346,500 | ||||||||
Net realized gain | 288,704,084 | 128,613,827 | 107,970,955 | 71,241,794 | ||||||||||||
Net change in unrealized appreciation (depreciation) | 6,648,571 | (14,767,360 | ) | 559,682,124 | 163,112,452 | |||||||||||
Net increase in net assets resulting from operations | 309,501,240 | 123,221,969 | 765,689,836 | 301,700,746 | ||||||||||||
DISTRIBUTIONS TO SHAREHOLDERS: | ||||||||||||||||
From net investment income | (11,694,155 | ) | (6,377,728 | ) | (101,866,512 | ) | (62,872,256 | ) | ||||||||
Total distributions to shareholders | (11,694,155 | ) | (6,377,728 | ) | (101,866,512 | ) | (62,872,256 | ) | ||||||||
CAPITAL SHARE TRANSACTIONS: | ||||||||||||||||
Proceeds from shares sold | 1,841,107,484 | 939,038,789 | 979,796,715 | 508,919,684 | ||||||||||||
Cost of shares redeemed | (1,520,212,071 | ) | (547,333,327 | ) | (202,255,658 | ) | (174,924,729 | ) | ||||||||
Net increase in net assets from capital share transactions | 320,895,413 | 391,705,462 | 777,541,057 | 333,994,955 | ||||||||||||
INCREASE IN NET ASSETS | 618,702,498 | 508,549,703 | 1,441,364,381 | 572,823,445 | ||||||||||||
NET ASSETS | ||||||||||||||||
Beginning of year | 764,107,152 | 255,557,449 | 2,094,930,922 | 1,522,107,477 | ||||||||||||
End of year | $ | 1,382,809,650 | $ | 764,107,152 | $ | 3,536,295,303 | $ | 2,094,930,922 | ||||||||
Undistributed net investment income included in net assets at end of year | $ | 8,312,387 | $ | 5,968,807 | $ | 43,439,186 | $ | 37,257,104 | ||||||||
SHARES ISSUED AND REDEEMED | ||||||||||||||||
Shares sold | 34,500,000 | 24,400,000 | 7,300,000 | 4,800,000 | ||||||||||||
Shares redeemed | (29,300,000 | ) | (14,700,000 | ) | (1,600,000 | ) | (1,700,000 | ) | ||||||||
Net increase in shares outstanding | 5,200,000 | 9,700,000 | 5,700,000 | 3,100,000 | ||||||||||||
See notes to financial statements.
FINANCIAL STATEMENTS | 73 |
Table of Contents
Statements of Changes in Net Assets (Continued)
iSHARES®, INC.
| iShares MSCI Singapore Index Fund | iShares MSCI South Africa Index Fund | |||||||||||||||
| Year ended August 31, 2007 | Year ended August 31, 2006 | Year ended August 31, 2007 | Year ended August 31, 2006 | |||||||||||||
INCREASE (DECREASE) IN NET ASSETS | ||||||||||||||||
OPERATIONS: | ||||||||||||||||
Net investment income | $ | 52,154,899 | $ | 22,841,028 | $ | 9,702,180 | $ | 8,177,584 | ||||||||
Net realized gain | 205,458,060 | 31,826,561 | 9,358,147 | 99,303,479 | ||||||||||||
Net change in unrealized appreciation (depreciation) | 154,022,242 | 28,410,392 | 76,042,874 | (95,009,170 | ) | |||||||||||
Net increase in net assets resulting from operations | 411,635,201 | 83,077,981 | 95,103,201 | 12,471,893 | ||||||||||||
DISTRIBUTIONS TO SHAREHOLDERS: | ||||||||||||||||
From net investment income | (29,331,787 | ) | (14,378,298 | ) | (9,144,852 | ) | (4,618,354 | ) | ||||||||
Total distributions to shareholders | (29,331,787 | ) | (14,378,298 | ) | (9,144,852 | ) | (4,618,354 | ) | ||||||||
CAPITAL SHARE TRANSACTIONS: | ||||||||||||||||
Proceeds from shares sold | 1,229,979,919 | 245,347,020 | 151,649,200 | 395,411,010 | ||||||||||||
Cost of shares redeemed | (517,692,912 | ) | (80,563,776 | ) | (68,565,161 | ) | (258,896,840 | ) | ||||||||
Net increase in net assets from capital share transactions | 712,287,007 | 164,783,244 | 83,084,039 | 136,514,170 | ||||||||||||
INCREASE IN NET ASSETS | 1,094,590,421 | 233,482,927 | 169,042,388 | 144,367,709 | ||||||||||||
NET ASSETS | ||||||||||||||||
Beginning of year | 574,619,763 | 341,136,836 | 297,897,868 | 153,530,159 | ||||||||||||
End of year | $ | 1,669,210,184 | $ | 574,619,763 | $ | 466,940,256 | $ | 297,897,868 | ||||||||
Undistributed net investment income included in net assets at end of year | $ | 43,749,612 | $ | 18,893,779 | $ | 6,792,504 | $ | 6,243,135 | ||||||||
SHARES ISSUED AND REDEEMED | ||||||||||||||||
Shares sold | 105,300,000 | 28,700,000 | 1,300,000 | 3,650,000 | ||||||||||||
Shares redeemed | (42,700,000 | ) | (9,500,000 | ) | (600,000 | ) | (2,450,000 | ) | ||||||||
Net increase in shares outstanding | 62,600,000 | 19,200,000 | 700,000 | 1,200,000 | ||||||||||||
See notes to financial statements.
74 | 2007 iSHARES ANNUAL REPORT TO SHAREHOLDERS |
Table of Contents
Statements of Changes in Net Assets (Continued)
iSHARES®, INC.
| iShares MSCI South Korea Index Fund | iShares MSCI Taiwan Index Fund | |||||||||||||||
| Year ended August 31, 2007 | Year ended August 31, 2006 | Year ended August 31, 2007 | Year ended August 31, 2006 | |||||||||||||
INCREASE (DECREASE) IN NET ASSETS | ||||||||||||||||
OPERATIONS: | ||||||||||||||||
Net investment income | $ | 17,668,348 | $ | 10,350,623 | $ | 58,686,661 | $ | 45,072,947 | ||||||||
Net realized loss | (2,170,342 | ) | (54,701,832 | ) | (36,061,860 | ) | (76,184,152 | ) | ||||||||
Net change in unrealized appreciation (depreciation) | 592,662,779 | 299,045,492 | 510,559,095 | 123,093,505 | ||||||||||||
Net increase in net assets resulting from operations | 608,160,785 | 254,694,283 | 533,183,896 | 91,982,300 | ||||||||||||
DISTRIBUTIONS TO SHAREHOLDERS: | ||||||||||||||||
From net investment income | (10,954,387 | ) | (7,841,332 | ) | (44,460,389 | ) | (16,050,567 | ) | ||||||||
Total distributions to shareholders | (10,954,387 | ) | (7,841,332 | ) | (44,460,389 | ) | (16,050,567 | ) | ||||||||
CAPITAL SHARE TRANSACTIONS: | ||||||||||||||||
Proceeds from shares sold | 471,567,107 | 1,159,560,093 | 890,014,349 | 1,391,773,216 | ||||||||||||
Cost of shares redeemed | (260,654,404 | ) | (483,534,641 | ) | (502,724,067 | ) | (326,594,755 | ) | ||||||||
Net increase in net assets from capital share transactions | 210,912,703 | 676,025,452 | 387,290,282 | 1,065,178,461 | ||||||||||||
INCREASE IN NET ASSETS | 808,119,101 | 922,878,403 | 876,013,789 | 1,141,110,194 | ||||||||||||
NET ASSETS | ||||||||||||||||
Beginning of year | 1,621,333,688 | 698,455,285 | 1,893,750,565 | 752,640,371 | ||||||||||||
End of year | $ | 2,429,452,789 | $ | 1,621,333,688 | $ | 2,769,764,354 | $ | 1,893,750,565 | ||||||||
Undistributed net investment income included in net assets at end of year | $ | 17,559,332 | $ | 10,954,387 | $ | 58,442,597 | $ | 44,460,389 | ||||||||
SHARES ISSUED AND REDEEMED | ||||||||||||||||
Shares sold | 8,200,000 | 26,100,000 | 58,100,000 | 111,950,000 | ||||||||||||
Shares redeemed | (5,250,000 | ) | (10,950,000 | ) | (35,550,000 | ) | (26,350,000 | ) | ||||||||
Net increase in shares outstanding | 2,950,000 | 15,150,000 | 22,550,000 | 85,600,000 | ||||||||||||
See notes to financial statements.
FINANCIAL STATEMENTS | 75 |
Table of Contents
iSHARES®, INC.
(For a share outstanding throughout each period)
| iShares MSCI Australia Index Fund | ||||||||||||||||||||
| Year ended Aug. 31, 2007 | Year ended Aug. 31, 2006 | Year ended Aug. 31, 2005 | Year ended Aug. 31, 2004 | Year ended Aug. 31, 2003 | ||||||||||||||||
Net asset value, beginning of year | $ | 21.59 | $ | 18.28 | $ | 13.56 | $ | 11.22 | $ | 9.36 | ||||||||||
Income from investment operations: | ||||||||||||||||||||
Net investment incomea | 0.89 | 0.75 | 0.70 | 0.45 | 0.32 | |||||||||||||||
Net realized and unrealized gainb | 6.24 | 3.23 | 4.60 | 2.32 | 1.81 | |||||||||||||||
Total from investment operations | 7.13 | 3.98 | 5.30 | 2.77 | 2.13 | |||||||||||||||
Less distributions from: | ||||||||||||||||||||
Net investment income | (1.10 | ) | (0.67 | ) | (0.58 | ) | (0.43 | ) | (0.27 | ) | ||||||||||
Total distributions | (1.10 | ) | (0.67 | ) | (0.58 | ) | (0.43 | ) | (0.27 | ) | ||||||||||
Net asset value, end of year | $ | 27.62 | $ | 21.59 | $ | 18.28 | $ | 13.56 | $ | 11.22 | ||||||||||
Total return | 33.97 | % | 22.35 | % | 39.58 | % | 24.95 | % | 23.33 | % | ||||||||||
Ratios/Supplemental data: | ||||||||||||||||||||
Net assets, end of year (000s) | $ | 1,464,112 | $ | 686,407 | $ | 369,355 | $ | 178,998 | $ | 87,541 | ||||||||||
Ratio of expenses to average net assets | 0.51 | % | 0.54 | % | 0.57 | % | 0.79 | % | 0.84 | % | ||||||||||
Ratio of net investment income to average net assets | 3.46 | % | 3.75 | % | 4.13 | % | 3.37 | % | 3.21 | % | ||||||||||
Portfolio turnover ratec | 10 | % | 7 | % | 17 | % | 9 | % | 8 | % | ||||||||||
a | Based on average shares outstanding throughout each period. |
b | The amounts reported may not accord with the change in aggregate gains and losses in securities due to the timing of capital share transactions. |
c | Portfolio turnover rates exclude portfolio securities received or delivered as a result of processing capital share transactions in Creation Units. |
See notes to financial statements.
76 | 2007 iSHARES ANNUAL REPORT TO SHAREHOLDERS |
Table of Contents
Financial Highlights (Continued)
iSHARES®, INC.
(For a share outstanding throughout each period)
| iShares MSCI Brazil Index Fund | ||||||||||||||||||||
| Year ended Aug. 31, 2007 | Year ended Aug. 31, 2006 | Year ended Aug. 31, 2005 | Year ended Aug. 31, 2004 | Year ended Aug. 31, 2003 | ||||||||||||||||
Net asset value, beginning of year | $ | 39.09 | $ | 28.18 | $ | 16.96 | $ | 12.19 | $ | 8.30 | ||||||||||
Income from investment operations: | ||||||||||||||||||||
Net investment incomea | 1.09 | 1.00 | 0.89 | 0.55 | 0.32 | |||||||||||||||
Net realized and unrealized gainb | 22.35 | 10.49 | 10.79 | 4.49 | 3.68 | |||||||||||||||
Total from investment operations | 23.44 | 11.49 | 11.68 | 5.04 | 4.00 | |||||||||||||||
Less distributions from: | ||||||||||||||||||||
Net investment income | (0.94 | ) | (0.58 | ) | (0.46 | ) | (0.27 | ) | (0.11 | ) | ||||||||||
Total distributions | (0.94 | ) | (0.58 | ) | (0.46 | ) | (0.27 | ) | (0.11 | ) | ||||||||||
Net asset value, end of year | $ | 61.59 | $ | 39.09 | $ | 28.18 | $ | 16.96 | $ | 12.19 | ||||||||||
Total return | 60.82 | % | 41.13 | % | 69.72 | % | 41.42 | % | 48.85 | % | ||||||||||
Ratios/Supplemental data: | ||||||||||||||||||||
Net assets, end of year (000s) | $ | 4,434,334 | $ | 2,468,295 | $ | 552,285 | $ | 209,504 | $ | 103,035 | ||||||||||
Ratio of expenses to average net assets | 0.69 | % | 0.70 | % | 0.74 | % | 0.96 | % | 0.99 | % | ||||||||||
Ratio of expenses to average net assets exclusive of foreign taxes | 0.68 | % | n/a | n/a | n/a | n/a | ||||||||||||||
Ratio of net investment income to average net assets | 2.17 | % | 2.65 | % | 3.94 | % | 3.59 | % | 3.59 | % | ||||||||||
Portfolio turnover ratec | 22 | % | 15 | % | 48 | % | 106 | % | 85 | % | ||||||||||
a | Based on average shares outstanding throughout each period. |
b | The amounts reported may not accord with the change in aggregate gains and losses in securities due to the timing of capital share transactions. |
c | Portfolio turnover rates include portfolio transactions that are executed as a result of the Fund processing capital share transactions in Creation Units solely for cash in U.S. dollars. Excluding such transactions, the portfolio turn over rate for the years ended August 31, 2007, August 31, 2006 and August 31, 2005 would have been 6%, 13% and 9%, respectively. See Note 4. |
See notes to financial statements.
FINANCIAL HIGHLIGHTS | 77 |
Table of Contents
Financial Highlights (Continued)
iSHARES®, INC.
(For a share outstanding throughout each period)
| iShares MSCI Canada Index Fund | ||||||||||||||||||||
| Year ended Aug. 31, 2007 | Year ended Aug. 31, 2006 | Year ended Aug. 31, 2005 | Year ended Aug. 31, 2004 | Year ended Aug. 31, 2003 | ||||||||||||||||
Net asset value, beginning of year | $ | 24.69 | $ | 20.30 | $ | 14.33 | $ | 12.25 | $ | 9.49 | ||||||||||
Income from investment operations: | ||||||||||||||||||||
Net investment incomea | 0.35 | 0.25 | 0.17 | 0.11 | 0.10 | |||||||||||||||
Net realized and unrealized gainb | 5.11 | 4.29 | 6.00 | 2.17 | 2.69 | |||||||||||||||
Total from investment operations | 5.46 | 4.54 | 6.17 | 2.28 | 2.79 | |||||||||||||||
Less distributions from: | ||||||||||||||||||||
Net investment income | (0.28 | ) | (0.15 | ) | (0.20 | ) | (0.20 | ) | (0.03 | ) | ||||||||||
Total distributions | (0.28 | ) | (0.15 | ) | (0.20 | ) | (0.20 | ) | (0.03 | ) | ||||||||||
Net asset value, end of year | $ | 29.87 | $ | 24.69 | $ | 20.30 | $ | 14.33 | $ | 12.25 | ||||||||||
Total return | 22.33 | % | 22.46 | % | 43.35 | % | 18.70 | % | 29.47 | % | ||||||||||
Ratios/Supplemental data: | ||||||||||||||||||||
Net assets, end of year (000s) | $ | 1,323,122 | $ | 1,101,161 | $ | 420,301 | $ | 325,298 | $ | 503,407 | ||||||||||
Ratio of expenses to average net assets | 0.52 | % | 0.54 | % | 0.57 | % | 0.70 | %c | 0.84 | % | ||||||||||
Ratio of expenses to average net assets exclusive of foreign taxes | 0.52 | % | n/a | n/a | n/a | n/a | ||||||||||||||
Ratio of net investment income to average net assets | 1.32 | % | 1.09 | % | 1.00 | % | 0.81 | % | 0.98 | % | ||||||||||
Portfolio turnover rated | 8 | % | 20 | % | 9 | % | 10 | % | 10 | % | ||||||||||
a | Based on average shares outstanding throughout each period. |
b | The amounts reported may not accord with the change in aggregate gains and losses in securities due to the timing of capital share transactions. |
c | Ratio of expenses to average net assets prior to voluntary reimbursed distribution fees for the year ended August 31, 2004 was 0.80%. |
d | Portfolio turnover rates exclude portfolio securities received or delivered as a result of processing capital share transactions in Creation Units. |
See notes to financial statements.
78 | 2007 iSHARES ANNUAL REPORT TO SHAREHOLDERS |
Table of Contents
Financial Highlights (Continued)
iSHARES®, INC.
(For a share outstanding throughout each period)
| iShares MSCI Emerging Markets Index Fund | ||||||||||||||||||||
| Year ended Aug. 31, 2007 | Year ended Aug. 31, 2006 | Year ended Aug. 31, 2005 | Year ended Aug. 31, 2004 | Period from Apr. 7, 2003a to Aug. 31, 2003 | ||||||||||||||||
Net asset value, beginning of period | $ | 97.43 | $ | 77.92 | $ | 53.96 | $ | 45.13 | $ | 33.75 | ||||||||||
Income from investment operations: | ||||||||||||||||||||
Net investment incomeb | 1.91 | 1.65 | 1.65 | 1.13 | 0.26 | |||||||||||||||
Net realized and unrealized gainc | 36.58 | 18.85 | 24.72 | 7.97 | 11.12 | |||||||||||||||
Total from investment operations | 38.49 | 20.50 | 26.37 | 9.10 | 11.38 | |||||||||||||||
Less distributions from: | ||||||||||||||||||||
Net investment income | (1.57 | ) | (0.99 | ) | (2.41 | ) | (0.27 | ) | – | |||||||||||
Total distributions | (1.57 | ) | (0.99 | ) | (2.41 | ) | (0.27 | ) | – | |||||||||||
Net asset value, end of period | $ | 134.35 | $ | 97.43 | $ | 77.92 | $ | 53.96 | $ | 45.13 | ||||||||||
Total return | 39.86 | % | 26.44 | % | 46.17 | % | 20.21 | % | 33.72 | %d | ||||||||||
Ratios/Supplemental data: | ||||||||||||||||||||
Net assets, end of period (000s) | $ | 18,198,371 | $ | 11,969,380 | $ | 7,000,858 | $ | 1,958,596 | $ | 297,846 | ||||||||||
Ratio of expenses to average net assets prior to waived feese | 0.74 | % | 0.77 | % | 0.78 | % | 0.77 | % | 0.78 | % | ||||||||||
Ratio of expenses to average net assets after waived feese | 0.74 | % | 0.77 | % | 0.77 | % | 0.76 | % | 0.78 | % | ||||||||||
Ratio of expenses to average net assets after waived fees and exclusive of foreign taxese | 0.74 | % | 0.75 | % | 0.74 | % | 0.74 | % | 0.72 | % | ||||||||||
Ratio of net investment income to average net assetse | 1.63 | % | 1.77 | % | 2.40 | % | 2.10 | % | 1.58 | % | ||||||||||
Portfolio turnover ratef | 5 | % | 12 | % | 9 | % | 8 | % | 10 | % | ||||||||||
a | Commencement of operations. |
b | Based on average shares outstanding throughout each period. |
c | The amounts reported may not accord with the change in aggregate gains and losses in securities due to the timing of capital share transactions. |
d | Not annualized. |
e | Annualized for periods of less than one year. |
f | Portfolio turnover rates exclude portfolio securities received or delivered as a result of processing capital share transactions in Creation Units. |
See notes to financial statements.
FINANCIAL HIGHLIGHTS | 79 |
Table of Contents
Financial Highlights (Continued)
iSHARES®, INC.
(For a share outstanding throughout each period)
| �� | iShares MSCI Hong Kong Index Fund | |||||||||||||||||||
| Year ended Aug. 31, 2007 | Year ended Aug. 31, 2006 | Year ended Aug. 31, 2005 | Year ended Aug. 31, 2004 | Year ended Aug. 31, 2003 | ||||||||||||||||
Net asset value, beginning of year | $ | 14.20 | $ | 13.01 | $ | 10.91 | $ | 9.03 | $ | 7.99 | ||||||||||
Income from investment operations: | ||||||||||||||||||||
Net investment incomea | 0.47 | 0.38 | 0.33 | 0.28 | 0.23 | |||||||||||||||
Net realized and unrealized gainb | 3.94 | 1.17 | 2.04 | 1.75 | 0.95 | |||||||||||||||
Total from investment operations | 4.41 | 1.55 | 2.37 | 2.03 | 1.18 | |||||||||||||||
Less distributions from: | ||||||||||||||||||||
Net investment income | (0.31 | ) | (0.36 | ) | (0.27 | ) | (0.15 | ) | (0.14 | ) | ||||||||||
Total distributions | (0.31 | ) | (0.36 | ) | (0.27 | ) | (0.15 | ) | (0.14 | ) | ||||||||||
Net asset value, end of year | $ | 18.30 | $ | 14.20 | $ | 13.01 | $ | 10.91 | $ | 9.03 | ||||||||||
Total return | 31.44 | % | 12.20 | % | 21.96 | % | 22.69 | % | 15.14 | % | ||||||||||
Ratios/Supplemental data: | ||||||||||||||||||||
Net assets, end of year (000s) | $ | 1,445,309 | $ | 882,712 | $ | 637,985 | $ | 449,923 | $ | 250,627 | ||||||||||
Ratio of expenses to average net assets | 0.52 | % | 0.54 | % | 0.57 | % | 0.80 | % | 0.84 | % | ||||||||||
Ratio of net investment income to average net assets | 2.92 | % | 2.87 | % | 2.75 | % | 2.78 | % | 3.06 | % | ||||||||||
Portfolio turnover ratec | 9 | % | 10 | % | 6 | % | 5 | % | 10 | % | ||||||||||
a | Based on average shares outstanding throughout each period. |
b | The amounts reported may not accord with the change in aggregate gains and losses in securities due to the timing of capital share transactions. |
c | Portfolio turnover rates exclude portfolio securities received or delivered as a result of processing capital share transactions in Creation Units. |
See notes to financial statements.
80 | 2007 iSHARES ANNUAL REPORT TO SHAREHOLDERS |
Table of Contents
Financial Highlights (Continued)
iSHARES®, INC.
(For a share outstanding throughout each period)
| iShares MSCI Malaysia Index Fund | ||||||||||||||||||||
| Year ended Aug. 31, 2007 | Year ended Aug. 31, 2006 | Year ended Aug. 31, 2005 | Year ended Aug. 31, 2004 | Year ended Aug. 31, 2003 | ||||||||||||||||
Net asset value, beginning of year | $ | 7.75 | $ | 7.19 | $ | 6.54 | $ | 5.99 | $ | 5.68 | ||||||||||
Income from investment operations: | ||||||||||||||||||||
Net investment incomea | 0.34 | 0.26 | 0.20 | 0.13 | 0.10 | |||||||||||||||
Net realized and unrealized gainb | 3.08 | 0.59 | 0.61 | 0.52 | 0.30 | |||||||||||||||
Total from investment operations | 3.42 | 0.85 | 0.81 | 0.65 | 0.40 | |||||||||||||||
Less distributions from: | ||||||||||||||||||||
Net investment income | (0.20 | ) | (0.29 | ) | (0.16 | ) | (0.10 | ) | (0.09 | ) | ||||||||||
Total distributions | (0.20 | ) | (0.29 | ) | (0.16 | ) | (0.10 | ) | (0.09 | ) | ||||||||||
Net asset value, end of year | $ | 10.97 | $ | 7.75 | $ | 7.19 | $ | 6.54 | $ | 5.99 | ||||||||||
Total return | 44.64 | % | 12.35 | % | 12.39 | % | 11.01 | % | 7.39 | % | ||||||||||
Ratios/Supplemental data: | ||||||||||||||||||||
Net assets, end of year (000s) | $ | 741,440 | $ | 374,334 | $ | 387,575 | $ | 224,218 | $ | 99,730 | ||||||||||
Ratio of expenses to average net assets | 0.51 | % | 0.54 | % | 0.57 | % | 0.79 | % | 0.84 | % | ||||||||||
Ratio of net investment income to average net assets | 3.21 | % | 3.46 | % | 2.85 | % | 1.97 | % | 1.91 | % | ||||||||||
Portfolio turnover ratec | 87 | % | 60 | % | 15 | % | 39 | % | 35 | % | ||||||||||
a | Based on average shares outstanding throughout each period. |
b | The amounts reported may not accord with the change in aggregate gains and losses in securities due to the timing of capital share transactions. |
c | Portfolio turnover rates include portfolio transactions that are executed as a result of the Fund processing capital share transactions in Creation Units solely for cash in U.S. dollars. Excluding such transactions, the portfolio turnover rate for the years ended August 31, 2007, August 31, 2006 and August 31, 2005 would have been 3%, 9% and 9%, respectively. See Note 4. |
See notes to financial statements.
FINANCIAL HIGHLIGHTS | 81 |
Table of Contents
Financial Highlights (Continued)
iSHARES®, INC.
(For a share outstanding throughout each period)
| iShares MSCI Mexico Index Fund | ||||||||||||||||||||
| Year ended Aug. 31, 2007 | Year ended Aug. 31, 2006 | Year ended Aug. 31, 2005 | Year ended Aug. 31, 2004 | Year ended Aug. 31, 2003 | ||||||||||||||||
Net asset value, beginning of year | $ | 41.30 | $ | 29.04 | $ | 19.35 | $ | 15.04 | $ | 13.65 | ||||||||||
Income from investment operations: | ||||||||||||||||||||
Net investment incomea | 0.64 | 0.76 | 0.42 | 0.26 | 0.19 | |||||||||||||||
Net realized and unrealized gainb | 16.87 | 11.98 | 9.55 | 4.26 | 1.72 | |||||||||||||||
Total from investment operations | 17.51 | 12.74 | 9.97 | 4.52 | 1.91 | |||||||||||||||
Less distributions from: | ||||||||||||||||||||
Net investment income | (0.46 | ) | (0.48 | ) | (0.28 | ) | (0.21 | ) | (0.52 | ) | ||||||||||
Total distributions | (0.46 | ) | (0.48 | ) | (0.28 | ) | (0.21 | ) | (0.52 | ) | ||||||||||
Net asset value, end of year | $ | 58.35 | $ | 41.30 | $ | 29.04 | $ | 19.35 | $ | 15.04 | ||||||||||
Total return | 42.58 | % | 44.11 | % | 51.77 | % | 30.28 | % | 14.60 | % | ||||||||||
Ratios/Supplemental data: | ||||||||||||||||||||
Net assets, end of year (000s) | $ | 1,382,810 | $ | 764,107 | $ | 255,557 | $ | 129,623 | $ | 60,155 | ||||||||||
Ratio of expenses to average net assets | 0.51 | % | 0.54 | % | 0.57 | % | 0.78 | % | 0.84 | % | ||||||||||
Ratio of net investment income to average net assets | 1.19 | % | 2.06 | % | 1.70 | % | 1.40 | % | 1.43 | % | ||||||||||
Portfolio turnover ratec | 14 | % | 12 | % | 9 | % | 12 | % | 13 | % | ||||||||||
a | Based on average shares outstanding throughout each period. |
b | The amounts reported may not accord with the change in aggregate gains and losses in securities due to the timing of capital share transactions. |
c | Portfolio turnover rates exclude portfolio securities received or delivered as a result of processing capital share transactions in Creation Units. |
See notes to financial statements.
82 | 2007 iSHARES ANNUAL REPORT TO SHAREHOLDERS |
Table of Contents
Financial Highlights (Continued)
iSHARES®, INC.
(For a share outstanding throughout each period)
| iShares MSCI Pacific ex-Japan Index Fund | ||||||||||||||||||||
| Year ended Aug. 31, 2007 | Year ended Aug. 31, 2006 | Year ended Aug. 31, 2005 | Year ended Aug. 31, 2004 | Year ended Aug. 31, 2003 | ||||||||||||||||
Net asset value, beginning of year | $ | 112.03 | $ | 97.57 | $ | 75.73 | $ | 62.03 | $ | 52.51 | ||||||||||
Income from investment operations: | ||||||||||||||||||||
Net investment incomea | 4.55 | 3.83 | 3.70 | 2.68 | 1.87 | |||||||||||||||
Net realized and unrealized gainb | 33.55 | 14.33 | 21.15 | 12.53 | 8.53 | |||||||||||||||
Total from investment operations | 38.10 | 18.16 | 24.85 | 15.21 | 10.40 | |||||||||||||||
Less distributions from: | ||||||||||||||||||||
Net investment income | (5.20 | ) | (3.70 | ) | (3.01 | ) | (1.51 | ) | (0.88 | ) | ||||||||||
Total distributions | (5.20 | ) | (3.70 | ) | (3.01 | ) | (1.51 | ) | (0.88 | ) | ||||||||||
Net asset value, end of year | $ | 144.93 | $ | 112.03 | $ | 97.57 | $ | 75.73 | $ | 62.03 | ||||||||||
Total return | 34.86 | % | 19.17 | % | 33.27 | % | 24.74 | % | 20.15 | % | ||||||||||
Ratios/Supplemental data: | ||||||||||||||||||||
Net assets, end of year (000s) | $ | 3,536,295 | $ | 2,094,931 | $ | 1,522,107 | $ | 651,250 | $ | 223,298 | ||||||||||
Ratio of expenses to average net assets | 0.50 | % | 0.50 | % | 0.50 | % | 0.50 | % | 0.50 | % | ||||||||||
Ratio of net investment income to average net assets | 3.43 | % | 3.67 | % | 4.09 | % | 3.68 | % | 3.47 | % | ||||||||||
Portfolio turnover ratec | 11 | % | 8 | % | 16 | % | 8 | % | 8 | % | ||||||||||
a | Based on average shares outstanding throughout each period. |
b | The amounts reported may not accord with the change in aggregate gains and losses in securities due to the timing of capital share transactions. |
c | Portfolio turnover rates exclude portfolio securities received or delivered as a result of processing capital share transactions in Creation Units. |
See notes to financial statements.
FINANCIAL HIGHLIGHTS | 83 |
Table of Contents
Financial Highlights (Continued)
iSHARES®, INC.
(For a share outstanding throughout each period)
| iShares MSCI Singapore Index Fund | ||||||||||||||||||||
| Year ended Aug. 31, 2007 | Year ended Aug. 31, 2006 | Year ended Aug. 31, 2005 | Year ended Aug. 31, 2004 | Year ended Aug. 31, 2003 | ||||||||||||||||
Net asset value, beginning of year | $ | 9.11 | $ | 7.77 | $ | 6.52 | $ | 5.38 | $ | 5.01 | ||||||||||
Income from investment operations: | ||||||||||||||||||||
Net investment incomea | 0.47 | 0.40 | 0.38 | 0.22 | 0.12 | |||||||||||||||
Net realized and unrealized gainb | 4.01 | 1.23 | 1.15 | 1.04 | 0.33 | |||||||||||||||
Total from investment operations | 4.48 | 1.63 | 1.53 | 1.26 | 0.45 | |||||||||||||||
Less distributions from: | ||||||||||||||||||||
Net investment income | (0.31 | ) | (0.29 | ) | (0.28 | ) | (0.12 | ) | (0.08 | ) | ||||||||||
Total distributions | (0.31 | ) | (0.29 | ) | (0.28 | ) | (0.12 | ) | (0.08 | ) | ||||||||||
Net asset value, end of year | $ | 13.28 | $ | 9.11 | $ | 7.77 | $ | 6.52 | $ | 5.38 | ||||||||||
Total return | 49.92 | % | 21.61 | % | 24.06 | % | 23.47 | % | 9.30 | % | ||||||||||
Ratios/Supplemental data: | ||||||||||||||||||||
Net assets, end of year (000s) | $ | 1,669,210 | $ | 574,620 | $ | 341,137 | $ | 170,047 | $ | 108,202 | ||||||||||
Ratio of expenses to average net assets | 0.51 | % | 0.54 | % | 0.57 | % | 0.79 | % | 0.84 | % | ||||||||||
Ratio of net investment income to average net assets | 3.80 | % | 4.74 | % | 5.19 | % | 3.50 | % | 2.67 | % | ||||||||||
Portfolio turnover ratec | 8 | % | 6 | % | 8 | % | 9 | % | 14 | % | ||||||||||
a | Based on average shares outstanding throughout each period. |
b | The amounts reported may not accord with the change in aggregate gains and losses in securities due to the timing of capital share transactions. |
c | Portfolio turnover rates exclude portfolio securities received or delivered as a result of processing capital share transactions in Creation Units. |
See notes to financial statements.
84 | 2007 iSHARES ANNUAL REPORT TO SHAREHOLDERS |
Table of Contents
Financial Highlights (Continued)
iSHARES®, INC.
(For a share outstanding throughout each period)
| iShares MSCI South Africa Index Fund | ||||||||||||||||||||
| Year ended Aug. 31, 2007 | Year ended Aug. 31, 2006 | Year ended Aug. 31, 2005 | Year ended Aug. 31, 2004 | Period from Feb. 3, 2003a Aug. 31, 2003 | ||||||||||||||||
Net asset value, beginning of period | $ | 97.67 | $ | 82.99 | $ | 59.92 | $ | 46.81 | $ | 38.72 | ||||||||||
Income from investment operations: | ||||||||||||||||||||
Net investment incomeb | 2.99 | 2.87 | 1.92 | 1.23 | 0.89 | |||||||||||||||
Net realized and unrealized gainc | 26.37 | 13.78 | 22.36 | 13.24 | 7.20 | |||||||||||||||
Total from investment operations | 29.36 | 16.65 | 24.28 | 14.47 | 8.09 | |||||||||||||||
Less distributions from: | ||||||||||||||||||||
Net investment income | (2.51 | ) | (1.97 | ) | (1.21 | ) | (1.36 | ) | – | |||||||||||
Total distributions | (2.51 | ) | (1.97 | ) | (1.21 | ) | (1.36 | ) | – | |||||||||||
Net asset value, end of period | $ | 124.52 | $ | 97.67 | $ | 82.99 | $ | 59.92 | $ | 46.81 | ||||||||||
Total return | 30.34 | % | 20.06 | % | 40.62 | % | 31.30 | % | 20.89 | %d | ||||||||||
Ratios/Supplemental data: | ||||||||||||||||||||
Net assets, end of period (000s) | $ | 466,940 | $ | 297,898 | $ | 153,530 | $ | 92,882 | $ | 81,914 | ||||||||||
Ratio of expenses to average net assetse | 0.68 | % | 0.70 | % | 0.74 | % | 0.95 | % | 0.99 | % | ||||||||||
Ratio of net investment income to average net assetse | 2.58 | % | 2.79 | % | 2.62 | % | 2.23 | % | 3.86 | % | ||||||||||
Portfolio turnover ratef | 8 | % | 7 | % | 32 | % | 13 | % | 17 | % | ||||||||||
a | Commencement of operations. |
b | Based on average shares outstanding throughout each period. |
c | The amounts reported may not accord with the change in aggregate gains and losses in securities due to the timing of capital share transactions. |
d | Not annualized. |
e | Annualized for periods of less than one year. |
f | Portfolio turnover rates exclude portfolio securities received or delivered as a result of processing capital share transactions in Creation Units. |
See notes to financial statements.
FINANCIAL HIGHLIGHTS | 85 |
Table of Contents
Financial Highlights (Continued)
iSHARES®, INC.
(For a share outstanding throughout each period)
| iShares MSCI South Korea Index Fund | ||||||||||||||||||||
| Year ended Aug. 31, 2007 | Year ended Aug. 31, 2006 | Year ended Aug. 31, 2005 | Year ended Aug. 31, 2004 | Year ended Aug. 31, 2003 | ||||||||||||||||
Net asset value, beginning of year | $ | 46.00 | $ | 34.75 | $ | 24.17 | $ | 23.06 | $ | 21.17 | ||||||||||
Income from investment operations: | ||||||||||||||||||||
Net investment incomea | 0.51 | 0.31 | 0.46 | 0.22 | 0.19 | |||||||||||||||
Net realized and unrealized gainb | 17.42 | 11.20 | 10.22 | 1.13 | 1.70 | |||||||||||||||
Total from investment operations | 17.93 | 11.51 | 10.68 | 1.35 | 1.89 | |||||||||||||||
Less distributions from: | ||||||||||||||||||||
Net investment income | (0.33 | ) | (0.26 | ) | (0.10 | ) | (0.24 | ) | – | |||||||||||
Total distributions | (0.33 | ) | (0.26 | ) | (0.10 | ) | (0.24 | ) | – | |||||||||||
Net asset value, end of year | $ | 63.60 | $ | 46.00 | $ | 34.75 | $ | 24.17 | $ | 23.06 | ||||||||||
Total return | 39.18 | % | 33.16 | % | 44.29 | % | 5.83 | % | 8.93 | % | ||||||||||
Ratios/Supplemental data: | ||||||||||||||||||||
Net assets, end of year (000s) | $ | 2,429,453 | $ | 1,621,334 | $ | 698,455 | $ | 315,464 | $ | 154,486 | ||||||||||
Ratio of expenses to average net assets | 0.68 | % | 0.70 | % | 0.74 | % | 0.94 | % | 0.99 | % | ||||||||||
Ratio of expenses to average net assets exclusive of foreign taxes | 0.68 | % | 0.70 | % | 0.74 | % | 0.94 | % | 0.99 | % | ||||||||||
Ratio of net investment income to average net assets | 0.96 | % | 0.71 | % | 1.49 | % | 0.87 | % | 0.98 | % | ||||||||||
Portfolio turnover ratec | 20 | % | 47 | % | 30 | % | 29 | % | 39 | % | ||||||||||
a | Based on average shares outstanding throughout each period. |
b | The amounts reported may not accord with the change in aggregate gains and losses in securities due to the timing of capital share transactions. |
c | Portfolio turnover rates include portfolio transactions that are executed as a result of the Fund processing capital share transactions in Creation Units solely for cash in U.S. dollars. Excluding such transactions, the portfolio turnover rate for the years ended August 31, 2007, August 31, 2006 and August 31, 2005 would have been 6%, 14% and 9%, respectively. See Note 4. |
See notes to financial statements.
86 | 2007 iSHARES ANNUAL REPORT TO SHAREHOLDERS |
Table of Contents
Financial Highlights (Continued)
iSHARES®, INC.
(For a share outstanding throughout each period)
| iShares MSCI Taiwan Index Fund | ||||||||||||||||||||
| Year ended Aug. 31, 2007 | Year ended Aug. 31, 2006 | Year ended Aug. 31, 2005 | Year ended Aug. 31, 2004 | Year ended Aug. 31, 2003 | ||||||||||||||||
Net asset value, beginning of year | $ | 12.57 | $ | 11.57 | $ | 10.66 | $ | 10.79 | $ | 8.82 | ||||||||||
Income from investment operations: | ||||||||||||||||||||
Net investment incomea | 0.38 | 0.34 | 0.27 | 0.14 | 0.04 | |||||||||||||||
Net realized and unrealized gain (loss)b | 3.34 | 0.80 | 0.72 | (0.25 | ) | 1.93 | ||||||||||||||
Total from investment operations | 3.72 | 1.14 | 0.99 | (0.11 | ) | 1.97 | ||||||||||||||
Less distributions from: | ||||||||||||||||||||
Net investment income | (0.30 | ) | (0.14 | ) | (0.08 | ) | (0.02 | ) | – | |||||||||||
Total distributions | (0.30 | ) | (0.14 | ) | (0.08 | ) | (0.02 | ) | – | |||||||||||
Net asset value, end of year | $ | 15.99 | $ | 12.57 | $ | 11.57 | $ | 10.66 | $ | 10.79 | ||||||||||
Total return | 29.91 | % | 9.84 | % | 9.28 | % | (1.10 | )% | 22.45 | % | ||||||||||
Ratios/Supplemental data: | ||||||||||||||||||||
Net assets, end of year (000s) | $ | 2,769,764 | $ | 1,893,751 | $ | 752,640 | $ | 390,228 | $ | 234,727 | ||||||||||
Ratio of expenses to average net assets | 0.77 | % | 0.85 | % | 1.03 | % | 1.19 | %c | 1.31 | % | ||||||||||
Ratio of expenses to average net assets exclusive of foreign taxes | 0.68 | % | 0.70 | % | 0.74 | % | 0.92 | % | 0.99 | % | ||||||||||
Ratio of net investment income to average net assets | 2.61 | % | 2.74 | % | 2.34 | % | 1.23 | % | 0.43 | % | ||||||||||
Portfolio turnover rated | 35 | % | 29 | % | 20 | % | 19 | % | 15 | % | ||||||||||
a | Based on average shares outstanding throughout each period. |
b | The amounts reported may not accord with the change in aggregate gains and losses in securities due to the timing of capital share transactions. |
c | Ratio of expenses to average net assets prior to voluntary reimbursed distribution fees for the year ended August 31, 2004 was 1.22%. |
d | Portfolio turnover rates include portfolio transactions that are executed as a result of the Fund processing capital share transactions in Creation Units solely for cash in U.S. dollars. Excluding such transactions, the portfolio turnover rate for the years ended August 31, 2007, August 31, 2006 and August 31, 2005 would have been 12%, 10% and 10%, respectively. See Note 4. |
See notes to financial statements.
FINANCIAL HIGHLIGHTS | 87 |
Table of Contents
iSHARES®, INC.
iShares, Inc. (the “Company”) is registered under the Investment Company Act of 1940, as amended (the “1940 Act”), as an open-end management investment company. The Company was incorporated under the laws of the State of Maryland on September 1, 1994 pursuant to amended and restated Articles of Incorporation. As of August 31, 2007, the Company offered 24 investment portfolios or funds.
These financial statements relate only to the iShares MSCI Australia, iShares MSCI Brazil, iShares MSCI Canada, iShares MSCI Emerging Markets, iShares MSCI Hong Kong, iShares MSCI Malaysia, iShares MSCI Mexico, iShares MSCI Pacific ex-Japan, iShares MSCI Singapore, iShares MSCI South Africa, iShares MSCI South Korea and iShares MSCI Taiwan Index Funds (each, a “Fund,” collectively, the “Funds”).
The investment objective of each Fund is to seek investment results that correspond generally to the price and yield performance, before fees and expenses, of publicly traded equity securities in the aggregate in a particular market, as measured by that market’s equity securities index compiled by MSCI Inc. (“MSCI”). The investment adviser uses a “passive” or index approach to achieve each Fund’s investment objective. Each of the Funds is classified as a non-diversified fund under the 1940 Act. Non-diversified funds generally hold securities of fewer companies than diversified funds and may be more susceptible to the risks associated with these particular companies, or to a single economic, political or regulatory occurrence affecting these companies.
Each Fund invests in the securities of foreign issuers of a single country or region, which may involve certain considerations and risks not typically associated with securities of U.S. issuers. Such risks include, but are not limited to: generally less liquid and less efficient securities markets; generally greater price volatility; exchange rate fluctuations and exchange controls; imposition of restrictions on the expatriation of funds or other assets of the Fund; less publicly available information about issuers; the imposition of withholding or other taxes; higher transaction and custody costs; settlement delays and risk of loss attendant in settlement procedures; difficulties in enforcing contractual obligations; less regulation of securities markets; different accounting, disclosure and reporting requirements; more substantial governmental involvement in the economy; higher inflation rates; greater social, economic and political uncertainties; the risk of nationalization or expropriation of assets and the risk of war.
Pursuant to the Company’s organizational documents, the Funds’ officers and directors are indemnified against certain liabilities that may arise out of the performance of their duties to the Funds. Additionally, in the normal course of business, the Funds enter into contracts with service providers that contain general indemnification clauses. The Funds’ maximum exposure under these arrangements is unknown as this would involve future claims that may be made against the Funds that have not yet occurred.
1. SIGNIFICANT ACCOUNTING POLICIES
The following significant accounting policies are consistently followed by the Company in the preparation of its financial statements in conformity with accounting principles generally accepted in the United States of America (“U.S. GAAP”) for investment companies. The preparation of the financial statements in conformity with U.S. GAAP requires management to make certain estimates and assumptions that affect the reported amounts of assets and liabilities and disclosures of contingent assets and liabilities at the date of the financial statements and the reported amounts of revenue and expenses during the reporting period. Actual results could differ from those estimates.
SECURITY VALUATION
The securities and other assets of each Fund are generally valued using market valuations. A market valuation generally means a valuation (i) obtained from an exchange, a pricing service or a major market maker (or dealer), (ii) based on a price quotation or other equivalent indication of value supplied by an exchange, a pricing service or a major market maker (or dealer) or (iii) based on amortized cost. In the case of shares of funds that are not traded on an exchange, a market valuation means such fund’s published net asset value per share. The investment adviser may use various pricing services or discontinue the use of any pricing service. A price obtained from a pricing service based on such pricing service’s valuation matrix may be considered a market valuation. In the event that current market valuations
88 | 2007 iSHARES ANNUAL REPORT TO SHAREHOLDERS |
Table of Contents
Notes to Financial Statements (Continued)
iSHARES®, INC.
are not readily available or such valuations do not reflect current market values, the affected investments will be valued using fair value pricing pursuant to the pricing policy and procedures approved by the Board of Directors of the Company (the “Board”).
Investments that may be valued using fair value pricing include, but are not limited to: (i) an unlisted security related to corporate actions; (ii) a restricted security (i.e., one that may not be publicly sold without registration under the Securities Act of 1933, as amended); (iii) a security whose trading has been suspended or which has been de-listed from its primary trading exchange; (iv) a security that is thinly traded; (v) a security in default or bankruptcy proceedings for which there is no current market quotation; (vi) a security affected by currency controls or restrictions; and (vii) a security affected by a significant event (i.e., an event that occurs after the close of the markets on which the security is traded but before the time as of which the Fund’s NAV is computed and that may materially affect the value of the Fund’s investments). Examples of events that may be “significant events” are government actions, natural disasters, armed conflict, acts of terrorism, and significant market fluctuations.
Valuing a Fund’s investments using fair value pricing will result in using prices for those investments that may differ from current market valuations. Accordingly, fair value pricing could result in a difference between the prices used to calculate a Fund’s net asset value and the prices used by the Fund’s benchmark index, which, in turn, could result in a difference between the Fund’s performance and the performance of the Fund’s benchmark index.
SECURITY TRANSACTIONS AND INCOME RECOGNITION
Security transactions are accounted for on trade date. Dividend income is recognized on the ex-dividend date, net of any foreign taxes withheld at source, and interest income is accrued daily. Realized gains and losses on investment transactions are determined using the specific identification method.
FOREIGN CURRENCY TRANSLATION
The accounting records of the Funds are maintained in U.S. dollars. Foreign currencies, as well as investment securities and other assets and liabilities denominated in foreign currencies are translated into U.S. dollars using exchange rates deemed appropriate by the investment adviser. Any use of a rate different from the rates used by MSCI may adversely affect a Fund’s ability to track its underlying index. Purchases and sales of securities, income receipts and expense payments are translated into U.S. dollars on the respective dates of such transactions.
Each Fund does not isolate the effect of fluctuations in foreign exchange rates from the effect of fluctuations in the market prices of securities. Such fluctuations are reflected by the Funds as a component of realized and unrealized gains and losses from investments for financial reporting purposes.
FOREIGN TAXES
The Funds may be subject to foreign taxes (a portion of which may be reclaimable) on income, corporate events, capital gains on investments or currency repatriation. All foreign taxes are recorded in accordance with the applicable foreign tax regulations and rates that exist in the foreign markets in which the Funds invest. These foreign taxes, if any, are paid by the Funds and are disclosed in their Statements of Operations. Foreign taxes payable as of August 31, 2007, if any, are reflected in the Funds’ Statements of Assets and Liabilities.
DISTRIBUTIONS TO SHAREHOLDERS
Distributions to shareholders from net investment income, if any, including any net foreign currency gains, are declared and distributed at least annually by each Fund. Distributions of net realized capital gains, if any, generally are declared and distributed once a year. Distributions are determined on a tax basis and may differ from net investment income and net realized capital gains for financial reporting purposes. Dividends and distributions are paid in U.S. dollars and cannot be automatically reinvested in additional shares of the Funds.
NOTESTO FINANCIAL STATEMENTS | 89 |
Table of Contents
Notes to Financial Statements (Continued)
iSHARES®, INC.
As of August 31, 2007, the tax year-end of the Funds, the components of net distributable earnings on a tax basis were as follows:
| iShares MSCI Index Fund | Undistributed Ordinary Income | Undistributed Long-Term Capital Gains | Unrealized Appreciation | Capital and Other Losses | Net Distributable Earnings | ||||||||||||
Australia | $ | 37,193,706 | $ | – | $ | 145,879,476 | $ | (7,808,176 | ) | $ | 175,265,006 | ||||||
Brazil | 45,390,657 | 4,077,697 | a | 1,728,133,605 | – | 1,777,601,959 | |||||||||||
Canada | 12,448,856 | – | 250,094,438 | (13,527,499 | ) | 249,015,795 | |||||||||||
Emerging Markets | 208,631,193 | – | 4,019,851,898 | (62,349,901 | ) | 4,166,133,190 | |||||||||||
Hong Kong | 25,472,751 | – | 225,411,678 | (17,151,797 | ) | 233,732,632 | |||||||||||
Malaysia | 24,207,294 | – | 234,010,029 | (25,281,080 | ) | 232,936,243 | |||||||||||
Mexico | 8,312,387 | – | 22,203,236 | (6,225,933 | ) | 24,289,690 | |||||||||||
Pacific ex-Japan | 103,374,975 | 4,616,285 | a | 933,701,562 | – | 1,041,692,822 | |||||||||||
Singapore | 49,324,253 | – | 213,916,759 | (13,177,204 | ) | 250,063,808 | |||||||||||
South Africa | 6,809,623 | – | 28,964,804 | (2,396,196 | ) | 33,378,231 | |||||||||||
South Korea | 19,890,901 | – | 1,075,719,901 | (57,950,771 | ) | 1,037,660,031 | |||||||||||
Taiwan | 58,442,597 | – | 630,624,792 | (133,608,052 | ) | 555,459,337 | |||||||||||
a | The Undistributed Long-Term Capital Gains have been reduced by the application of tax equalization. |
For the years ended August 31, 2007 and August 31, 2006, the tax characterization of distributions paid for each Fund represents ordinary income. The total distributions and distributions per share are disclosed in the accompanying Statements of Changes in Net Assets and the Financial Highlights for all Funds.
FEDERAL INCOME TAXES
Each Fund is treated as a separate entity for federal income tax purposes. It is the policy of each Fund to qualify as a regulated investment company by complying with the provisions applicable to regulated investment companies, as defined under Subchapter M of the Internal Revenue Code of 1986, as amended, and to annually distribute substantially all of its ordinary income and any net capital gains (taking into account any capital loss carryforwards) sufficient to relieve it from all, or substantially all, federal income and excise taxes. Accordingly, no provision for federal income taxes was required for the year ended August 31, 2007.
From November 1, 2006 to August 31, 2007, certain Funds incurred net realized capital losses and net foreign currency losses. As permitted by tax regulations, these Funds have elected to defer these losses and treat them as arising in the year ending August 31, 2008, as follows:
| iShares MSCI Index Fund | Deferred Net Realized Capital/Net Foreign Currency Losses | ||
Australia | $ | 502,148 | |
Canada | 5,232,560 | ||
Hong Kong | 3,185,408 | ||
Mexico | 67,468 | ||
Taiwan | 11,797,863 | ||
90 | 2007 iSHARES ANNUAL REPORT TO SHAREHOLDERS |
Table of Contents
Notes to Financial Statements (Continued)
iSHARES®, INC.
The Funds had tax basis net capital loss carryforwards as of August 31, 2007, the tax year-end of the Funds, as follows:
| iShares MSCI Index Fund | Expiring 2008 | Expiring 2009 | Expiring 2010 | Expiring 2011 | Expiring 2012 | Expiring 2013 | Expiring 2014 | Expiring 2015 | Total | ||||||||||||||||||
Australia | $ | 71,019 | $ | 1,971,994 | $ | 3,625,203 | $ | 650,082 | $ | 596,240 | $ | 384,424 | $ | – | $ | 7,066 | $ | 7,306,028 | |||||||||
Canada | – | – | – | – | – | 2,931,648 | – | 5,363,291 | 8,294,939 | ||||||||||||||||||
Emerging Markets | – | – | – | – | 840,778 | 20,296,564 | 11,239,258 | 29,973,301 | 62,349,901 | ||||||||||||||||||
Hong Kong | – | – | 4,971,970 | 2,870,602 | 2,330,414 | 468,716 | 425,440 | 2,899,247 | 13,966,389 | ||||||||||||||||||
Malaysia | – | – | 9,819,029 | 2,898,105 | 775,477 | 6,820,474 | 1,543,708 | 3,424,287 | 25,281,080 | ||||||||||||||||||
Mexico | – | – | 47,326 | 2,329,290 | 3,136,171 | 12,912 | 632,766 | – | 6,158,465 | ||||||||||||||||||
Singapore | – | – | 1,934,119 | 4,428,316 | 4,256,421 | 2,558,348 | – | – | 13,177,204 | ||||||||||||||||||
South Africa | – | – | – | – | 527,613 | – | 260,738 | 1,607,845 | 2,396,196 | ||||||||||||||||||
South Korea | – | 556,540 | 666,642 | 504,041 | 3,363,449 | 11,590,303 | 3,172,573 | 38,097,223 | 57,950,771 | ||||||||||||||||||
Taiwan | – | – | 12,532,361 | 8,689,663 | 9,129,874 | 12,022,719 | 14,435,986 | 64,999,586 | 121,810,189 | ||||||||||||||||||
Net capital loss carryforwards may be applied against any net realized taxable gains in each succeeding year or until their respective expiration dates, whichever occurs first.
The Funds may own shares in certain foreign investment entities, referred to, under U.S. tax law, as “passive foreign investment companies.” The Funds may elect to mark-to-market annually the shares of each passive foreign investment company and would be required to distribute to shareholders any such marked-to-market gains.
Each Fund reclassifies at the end of its tax year certain amounts to paid-in-capital from accumulated net realized gain (loss) on investments and foreign currency transactions and accumulated net investment income (loss), respectively, as a result of permanent book and tax differences primarily attributed to net investment loss, return of capital, passive foreign investment companies, realized foreign currency gains and losses and gains and losses on in-kind redemptions. These reclassifications have no effect on net assets or net asset values per share.
As of August 31, 2007, gross unrealized appreciation and gross unrealized depreciation based on cost for federal income tax purposes were as follows:
| iShares MSCI Index Fund | Tax Cost | Gross Unrealized Appreciation | Gross Unrealized Depreciation | Net Unrealized Appreciation | |||||||||
Australia | $ | 1,365,541,568 | $ | 158,620,888 | $ | (12,655,916 | ) | $ | 145,964,972 | ||||
Brazil | 2,686,392,020 | 1,732,147,892 | (4,392,928 | ) | 1,727,754,964 | ||||||||
Canada | 1,069,597,137 | 270,399,632 | (20,310,644 | ) | 250,088,988 | ||||||||
Emerging Markets | 15,507,125,017 | 4,179,384,280 | (159,643,651 | ) | 4,019,740,629 | ||||||||
Hong Kong | 1,491,503,324 | 244,912,176 | (19,503,149 | ) | 225,409,027 | ||||||||
Malaysia | 503,171,852 | 235,608,418 | (1,583,247 | ) | 234,025,171 | ||||||||
Mexico | 1,500,132,928 | 70,467,640 | (48,268,310 | ) | 22,199,330 | ||||||||
Pacific ex-Japan | 2,907,124,020 | 943,347,886 | (9,494,262 | ) | 933,853,624 | ||||||||
Singapore | 1,730,368,895 | 223,709,356 | (9,736,756 | ) | 213,972,600 | ||||||||
South Africa | 437,083,223 | 49,222,977 | (20,264,332 | ) | 28,958,645 | ||||||||
South Korea | 1,936,442,732 | 1,084,586,972 | (8,866,928 | ) | 1,075,720,044 | ||||||||
Taiwan | 2,113,705,860 | 676,898,860 | (46,227,705 | ) | 630,671,155 | ||||||||
NOTESTO FINANCIAL STATEMENTS | 91 |
Table of Contents
Notes to Financial Statements (Continued)
iSHARES®, INC.
REPURCHASE AGREEMENTS
Each Fund may enter into repurchase agreements with banks and securities dealers. These transactions involve the purchase of securities with a simultaneous commitment to resell the securities to the bank or the dealer at an agreed-upon date and price. A repurchase agreement is accounted for as an investment by the Fund, collateralized by securities, which are delivered to the Fund’s custodian or to an agent bank under a tri-party agreement. The securities are marked-to-market daily and additional securities are acquired as needed, to ensure that their value equals or exceeds the repurchase price plus accrued interest.
2. AGREEMENTS AND OTHER TRANSACTIONS WITH AFFILIATES
Pursuant to an Investment Advisory Agreement with the Company, Barclays Global Fund Advisors (“BGFA”) manages the investment of each Fund’s assets. BGFA is a California corporation indirectly owned by Barclays Bank PLC. Under the Investment Advisory Agreement, BGFA is responsible for all expenses (“Covered Expenses”) of each of the Funds, including the cost of transfer agency, custody, fund administration, legal, audit and other services, except interest, taxes, brokerage commissions and other expenses connected with the execution of portfolio transactions, distribution fees and extraordinary expenses.
For its investment advisory services to the iShares MSCI Australia, iShares MSCI Canada, iShares MSCI Hong Kong, iShares MSCI Malaysia, iShares MSCI Mexico and iShares MSCI Singapore Index Funds, BGFA is entitled to an annual investment advisory fee based on each Fund’s allocable portion of the aggregate of the average daily net assets of all the funds offered by the Company (except for the iShares MSCI Brazil, iShares MSCI Emerging Markets, iShares MSCI Pacific ex-Japan, iShares MSCI South Africa, iShares MSCI South Korea and iShares MSCI Taiwan Index Funds) as follows:
| Investment Advisory Fee | Aggregate Average Daily Net Assets | |
0.59% | First $7 billion | |
0.54 | Over $7 billion, up to and including $11 billion | |
0.49 | Over $11 billion, up to and including $24 billion | |
0.44 | Over $24 billion |
For its investment advisory services to the iShares MSCI Brazil, iShares MSCI South Africa, iShares MSCI South Korea and iShares MSCI Taiwan Index Funds, BGFA is entitled to an annual investment advisory fee based on each Fund’s allocable portion of the aggregate of the average daily net assets of these four Funds as follows:
| Investment Advisory Fee | Aggregate Average Daily Net Assets | |
0.74% | First $2 billion | |
0.69 | Over $2 billion, up to and including $4 billion | |
0.64 | Over $4 billion |
92 | 2007 iSHARES ANNUAL REPORT TO SHAREHOLDERS |
Table of Contents
Notes to Financial Statements (Continued)
iSHARES®, INC.
The Board approved a change to the investment advisory fee rates for the iShares MSCI Brazil, iShares MSCI South Africa, iShares MSCI South Korea and iShares MSCI Taiwan Index Funds effective September 1, 2007. For its investment advisory services to each Fund, BGFA will be entitled to be paid annual investment advisory fees based on each Fund’s allocable portion of the aggregate of the average daily net assets of these four Funds as follows:
| Investment Advisory Fee | Aggregate Average Daily Net Assets | |
| 0.74% | First $2 billion | |
| 0.69 | Over $2 billion, up to and including $4 billion | |
| 0.64 | Over $4 billion, up to and including $8 billion | |
| 0.57 | Over $8 billion |
For its investment advisory services to the iShares MSCI Emerging Markets Index Fund, BGFA is entitled to an annual investment advisory fee based on the average daily net assets of the Fund as follows:
| Investment Advisory Fee | Average Daily Net Assets | |
| 0.75% | First $14 billion | |
| 0.68 | Over $14 billion, up to and including $28 billion | |
| 0.61 | Over $28 billion |
BGFA voluntarily waived its advisory fees for the iShares MSCI Emerging Markets Index Fund in an amount equal to the investment advisory fees payable on the amount of the Fund’s investment in other iShares MSCI Index Funds.
For its investment advisory services to the iShares MSCI Pacific ex-Japan Index Fund, BGFA is entitled to an annual investment advisory fee of 0.50% of the average daily net assets of the Fund.
State Street Bank and Trust Company (“State Street”) serves as administrator, custodian and transfer agent for the Company. As compensation for its services, State Street receives certain out-of-pocket costs, transaction fees and asset-based fees which are accrued daily and paid monthly. These fees and expenses are Covered Expenses as defined above.
SEI Investments Distribution Co. (“SEI”) serves as each Fund’s underwriter and distributor of the shares of each Fund, pursuant to a Distribution Agreement with the Company. SEI does not receive a fee from the Funds for its distribution services.
Pursuant to an exemptive order issued by the U.S. Securities and Exchange Commission (“SEC”), the Funds are permitted to lend portfolio securities to Barclays Capital Inc. (“BarCap”). Pursuant to the same exemptive order, Barclays Global Investors, N.A. (“BGI”) serves as securities lending agent for the Company. BarCap and BGI are affiliates of BGFA, the Funds’ investment adviser. As securities lending agent, BGI receives, as fees, a share of the income earned on investment of the cash collateral received for the loan of securities. For the year ended August 31, 2007, BGI earned securities lending agent fees as follows:
| iShares MSCI Index Fund | Securities Lending Agent Fees | ||
Australia | $ | 116,653 | |
Brazil | 2,245 | ||
Emerging Markets | 10,038,577 | ||
Hong Kong | 423,120 | ||
| iShares MSCI Index Fund | Securities Lending Agent Fees | ||
Mexico | $ | 1,000,414 | |
Pacific ex-Japan | 464,720 | ||
Singapore | 460,894 | ||
South Korea | 1,775,319 | ||
NOTESTO FINANCIAL STATEMENTS | 93 |
Table of Contents
Notes to Financial Statements (Continued)
iSHARES®, INC.
Cross trades for the year ended August 31, 2007, if any, were executed by the Funds pursuant to Rule 17a-7 under the 1940 Act. Cross trading is the buying or selling of portfolio securities between funds to which BGFA (or an affiliate) serves as investment adviser. At its regularly scheduled quarterly meetings, the Board reviews such transactions as of the most recent calendar quarter for compliance with the requirements and restrictions set forth by Rule 17a-7.
Each Fund may invest in the Institutional Shares of certain money market funds managed by BGFA, the Funds’ investment adviser, including the Government Money Market Fund (“GMMF”), Institutional Money Market Fund (“IMMF”), Prime Money Market Fund (“PMMF”) and Treasury Money Market Fund (“TMMF”) of Barclays Global Investors Funds. The GMMF, IMMF, PMMF and TMMF are feeder funds in a master/feeder fund structure that invest substantially all of their assets in the Government Money Market Master Portfolio, Money Market Master Portfolio, Prime Money Market Master Portfolio and Treasury Money Market Master Portfolio (collectively, the “Money Market Master Portfolios”), respectively, which are also managed by BGFA. While the GMMF, IMMF, PMMF and TMMF do not directly charge an investment advisory fee, the Money Market Master Portfolios in which they invest do charge an investment advisory fee. Income distributions from the GMMF, IMMF, PMMF and TMMF are declared daily and paid monthly from net investment income. Income distributions earned by the Funds from temporary cash investments are recorded as interest from affiliated issuers in the accompanying Statements of Operations. Income distributions earned by the Funds from the investment of securities lending collateral, if any, are included in securities lending income in the accompanying Statements of Operations.
Each Fund may invest its securities lending cash collateral, if any, in the BGI Cash Premier Fund LLC (“Premier Fund”), an affiliated private money market fund managed by BGFA. Although the Premier Fund is not registered as an investment company under the 1940 Act, it intends to operate as a money market fund in compliance with Rule 2a-7 under the 1940 Act. See Note 5 for additional information regarding the Premier Fund.
The iShares MSCI Emerging Markets Index Fund, in order to improve its portfolio liquidity and its ability to track the MSCI Emerging Markets Index, may invest in shares of other iShares MSCI Index Funds that invest in securities in the Fund’s benchmark index. As of August 31, 2007, the iShares MSCI Emerging Markets Index Fund held shares of the iShares MSCI Malaysia, iShares MSCI South Korea and iShares MSCI Taiwan Index Funds.
The following table provides information about the direct investment by the iShares Emerging Markets Index Fund (exclusive of short-term investments) in issuers of which BGFA is an affiliate, or issuers of which the Fund owns 5% or more of the outstanding voting securities, for the year ended August 31, 2007.
| Name of Affiliated Issuer | Number of Shares Held Beginning of Year (in 000s) | Gross Additions (in 000s) | Gross Reductions (in 000s) | Number of Shares Held End of Year (in 000s) | Value at End of Year | Dividend Income | Net Realized Gain | ||||||||||
iShares MSCI Malaysia Index Fund | 1,039 | 198 | 137 | 1,100 | $ | 12,182,748 | $ | 176,251 | $ | 101,664 | |||||||
iShares MSCI South Korea Index Fund | 546 | 298 | 242 | 602 | 38,561,983 | 197,279 | 5,959,835 | ||||||||||
iShares MSCI Taiwan Index Fund | 2,812 | 1,538 | 1,250 | 3,100 | 49,414,048 | 919,525 | 3,282,492 | ||||||||||
Siliconware Precision Industries Co. ADR | 33,802 | 19,285 | 15,423 | 37,664 | 406,394,398 | 19,662,612 | 70,345,085 | ||||||||||
As of August 31, 2007, certain directors and officers of the Company are also officers of BGI and/or BGFA.
94 | 2007 iSHARES ANNUAL REPORT TO SHAREHOLDERS |
Table of Contents
Notes to Financial Statements (Continued)
iSHARES®, INC.
3. INVESTMENT PORTFOLIO TRANSACTIONS
Purchases and sales of investments (excluding in-kind transactions and short-term investments) for the year ended August 31, 2007, were as follows:
| iShares MSCI Index Fund | Purchases | Sales | ||||
Australia | $ | 100,573,052 | $ | 102,158,798 | ||
Brazil | 1,325,204,669 | 688,314,722 | ||||
Canada | 121,617,566 | 94,150,958 | ||||
Emerging Markets | 991,726,211 | 820,839,488 | ||||
Hong Kong | 121,269,474 | 103,949,189 | ||||
Malaysia | 866,465,379 | 639,940,015 | ||||
Mexico | 157,179,215 | 159,800,238 | ||||
Pacific ex-Japan | 323,311,070 | 334,558,347 | ||||
Singapore | 126,972,940 | 102,565,312 | ||||
South Africa | 38,493,274 | 28,871,556 | ||||
South Korea | 581,062,061 | 363,946,916 | ||||
Taiwan | 1,177,379,851 | 775,307,045 | ||||
In-kind transactions (see Note 4) for the year ended August 31, 2007, were as follows:
| iShares MSCI Index Fund | In-kind Purchases | In-kind Sales | ||||
Australia | $ | 952,619,920 | $ | 390,898,487 | ||
Canada | 281,931,122 | 269,944,712 | ||||
Emerging Markets | 7,704,491,920 | 6,220,866,034 | ||||
Hong Kong | 791,910,891 | 529,276,727 | ||||
Mexico | 1,835,948,165 | 1,511,706,332 | ||||
Pacific ex-Japan | 967,839,366 | 195,826,583 | ||||
Singapore | 1,203,283,551 | 507,053,313 | ||||
South Africa | 151,100,541 | 68,462,949 | ||||
4. CAPITAL SHARE TRANSACTIONS
The Company issues and redeems capital shares of each Fund only in aggregations of a specified number of shares (each, a “Creation Unit”) at net asset value. Except when aggregated in Creation Units, shares of each Fund are not redeemable. Transactions in capital shares for each Fund are disclosed in detail in the Statements of Changes in Net Assets.
The consideration for the purchase of Creation Units of a Fund generally consists of the in-kind deposit of a designated portfolio of equity securities, which constitutes a substantial replication, or a portfolio sampling representation, of the corresponding MSCI Index and an amount of cash (except for the iShares MSCI Brazil, iShares MSCI Malaysia, iShares MSCI South Korea and iShares MSCI Taiwan Index Funds which are offered in Creation Units solely for cash in U.S. dollars). Investors purchasing and redeeming Creation Units pay a purchase transaction fee and a redemption transaction fee directly to State Street, the administrator, to offset transfer and other transaction costs associated with the issuance and redemption of Creation Units, including Creation Units for cash. Investors transacting
NOTESTO FINANCIAL STATEMENTS | 95 |
Table of Contents
Notes to Financial Statements (Continued)
iSHARES®, INC.
in Creation Units for cash pay an additional variable charge to compensate the relevant Fund for brokerage and market impact expenses relating to investing in portfolio securities.
From time to time, settlement of securities related to in-kind contributions or in-kind redemptions may be delayed. In such cases, securities related to in-kind contributions are reflected as “Due from custodian” and securities related to in-kind redemptions are reflected as “Securities related to in-kind transactions” in the Statements of Assets and Liabilities.
5. LOANS OF PORTFOLIO SECURITIES
Each Fund may lend its investment securities to approved borrowers, such as brokers, dealers and other financial institutions. The borrower pledges and maintains with the Fund collateral consisting of cash, an irrevocable letter of credit issued by a bank, or securities issued or guaranteed by the U.S. government. The initial collateral received by each Fund is required to have a value of at least 102% of the market value of the loaned securities for securities traded on U.S. exchanges and a value of at least 105% for all other securities. The collateral is maintained thereafter, at a value equal to at least 100% of the current market value of the securities on loan. The risks to the Funds of securities lending are that the borrower may not provide additional collateral when required or may not return the securities when due.
During the year ended August 31, 2007, certain Funds received cash as collateral for securities loaned. The cash collateral received was invested in a joint account and/or in the Premier Fund. Pursuant to an exemptive order issued by the SEC, a portion of the cash collateral received was invested in a joint account with other investment funds managed by BGFA. The joint account invests in securities with remaining maturities of 397 days or less, repurchase agreements and money market mutual funds, including money market funds managed by BGFA. Repurchase agreements are fully collateralized by U.S. government securities or non-U.S. government debt securities. The Premier Fund seeks to achieve its investment objective by investing in a portfolio of high-quality, short-term fixed-income instruments, including money market funds (which may be managed by BGFA or its affiliate) and other instruments that, at the time of investment, have remaining maturities of 397 calendar days or less from the date of acquisition.
The market value of the securities on loan as of August 31, 2007 and the value of the related collateral are disclosed in the Statements of Assets and Liabilities. Securities lending income, as disclosed in the Funds’ Statements of Operations, represents the income earned from the investment of the cash collateral, net of rebates paid to, or fees paid by, borrowers and less the fees paid to BGI as securities lending agent.
6. RECENTLY ISSUED ACCOUNTING PRONOUNCEMENTS
In June 2006, the Financial Accounting Standards Board (“FASB”) issued FASB Interpretation No. 48 (“FIN 48”), “Accounting for Uncertainty in Income Taxes – an interpretation of FASB Statement No. 109. ”FIN 48 clarifies the accounting for uncertainty in income taxes recognized in accordance with FASB Statement No. 109, “Accounting for Income Taxes.” This interpretation prescribes a recognition threshold and measurement attribute for the financial statement recognition and measurement of a tax position taken or expected to be taken in a tax return. It also provides guidance on de-recognition, classification, interest and penalties, accounting in interim periods, disclosure and transition. FIN 48 is effective for fiscal years beginning after December 15, 2006. The SEC staff has stated that it would not object if a fund does not implement FIN 48 in its NAV calculation until the date of the fund’s last NAV calculation in the first required financial statement reporting period for its fiscal year beginning after December 15, 2006. The Company is currently evaluating the impact of applying the various provisions of FIN 48.
In September 2006, FASB issued Statement of Financial Accounting Standards No. 157 (“FAS 157”), “Fair Value Measurements.” FAS 157 defines fair value, establishes a framework for measuring fair value in accordance with generally accepted accounting principles and expands disclosure about fair value measurements. FAS 157 is effective for fiscal years beginning after November 15, 2007. The Company is currently evaluating the impact the adoption of FAS 157 will have on the Funds’ financial statement disclosures.
96 | 2007 iSHARES ANNUAL REPORT TO SHAREHOLDERS |
Table of Contents
Report of Independent Registered Public Accounting Firm
To the Shareholders and Board of Directors of
iShares, Inc.
In our opinion, the accompanying statements of assets and liabilities, including the schedules of investments, and the related statements of operations and of changes in net assets and the financial highlights present fairly, in all material respects, the financial position of the iShares MSCI Australia Index Fund, iShares MSCI Brazil Index Fund, iShares MSCI Canada Index Fund, iShares MSCI Emerging Markets Index Fund, iShares MSCI Hong Kong Index Fund, iShares MSCI Malaysia Index Fund, iShares MSCI Mexico Index Fund, iShares MSCI Pacific ex-Japan Index Fund, iShares MSCI Singapore Index Fund, iShares MSCI South Africa Index Fund, iShares MSCI South Korea Index Fund and iShares MSCI Taiwan Index Fund, each a portfolio of the iShares MSCI Series (the “Funds”), at August 31, 2007, the results of each of their operations and the changes in each of their net assets and the financial highlights for each of the periods presented, in conformity with accounting principles generally accepted in the United States of America. These financial statements and financial highlights (hereafter referred to as “financial statements”) are the responsibility of the Funds’ management. Our responsibility is to express an opinion on these financial statements based on our audits. We conducted our audits of these financial statements in accordance with the standards of the Public Company Accounting Oversight Board (United States). Those standards require that we plan and perform the audits to obtain reasonable assurance about whether the financial statements are free of material misstatement. An audit includes examining, on a test basis, evidence supporting the amounts and disclosures in the financial statements, assessing the accounting principles used and significant estimates made by management, and evaluating the overall financial statement presentation. We believe that our audits, which included confirmation of securities at August 31, 2007 by correspondence with the custodian and brokers, provide a reasonable basis for our opinion.
PricewaterhouseCoopers LLP
San Francisco, California
October 23, 2007
REPORTOF INDEPENDENT REGISTERED PUBLIC ACCOUNTING FIRM | 97 |
Table of Contents
Tax Information (Unaudited)
iSHARES®, INC.
For the fiscal year ended August 31, 2007, the Funds earned foreign source income and paid foreign taxes which they intend to pass through to their shareholders pursuant to Section 853 of the Internal Revenue Code (the “Code”) as follows:
| iShares MSCI Index Fund | Foreign Source Income Earned | Foreign Taxes Paid | ||||
Australia | $ | 43,055,749 | $ | 1,455,873 | ||
Brazil | 100,047,652 | 9,136,802 | ||||
Canada | 24,646,130 | 3,477,925 | ||||
Emerging Markets | 394,107,148 | 41,646,422 | ||||
Pacific ex-Japan | 114,802,692 | 3,006,614 | ||||
South Korea | 33,724,684 | 5,264,974 | ||||
Taiwan | 94,130,182 | 20,157,009 | ||||
Under Section 852(b)(3)(C) of the Code, the iShares MSCI Brazil and iShares MSCI Pacific ex-Japan Index Funds designate $225,864 and $661,407, respectively, as long-term capital gain dividends for the fiscal year ended August 31, 2007.
Under Section 854(b)(2) of the Code, the Funds hereby designate the following maximum amounts as qualified dividend income for purposes of the maximum rate under Section 1(h)(11) of the Code for the fiscal year ended August 31, 2007:
| iShares MSCI Index Fund | Qualified Dividend Income | ||
Australia | $ | 31,659,633 | |
Brazil | 3,799,329 | ||
Canada | 12,092,201 | ||
Emerging Markets | 209,458,860 | ||
| iShares MSCI Index Fund | Qualified Dividend Income | ||
Mexico | $ | 11,694,155 | |
Pacific ex-Japan | 61,097,971 | ||
South Africa | 9,144,852 | ||
South Korea | 10,954,387 | ||
In January 2008, shareholders will receive Form 1099-DIV which will include their share of qualified dividend income distributed during the calendar year 2007. Shareholders are advised to check with their tax advisers for information on the treatment of these amounts on their income tax returns.
98 | 2007 iSHARES ANNUAL REPORT TO SHAREHOLDERS |
Table of Contents
Board Review and Approval of Investment Advisory Contract (Unaudited)
iSHARES®, INC.
Under Section 15(c) of the Investment Company Act of 1940 (the “1940 Act”), the Company’s Board of Directors (the “Board”), including a majority of Directors who are not “interested persons” of the Company (as that term is defined in the 1940 Act) (the “Independent Directors”), is required annually to consider the Investment Advisory Contract between the Company and BGFA (the “Advisory Contract”) on behalf of the Funds. As required by Section 15(c), the Board requested and BGFA provided such information as the Board deemed reasonably necessary to evaluate the terms of the Advisory Contract. At a meeting held on June 13, 2007, the Board approved the selection of BGFA and the continuance of the Advisory Contract, based on its review of qualitative and quantitative information provided by BGFA. In selecting BGFA and approving the Advisory Contract for the Funds, the Board, including the Independent Directors, advised by their independent counsel, considered the following factors, none of which was controlling, and made the following conclusions:
NATURE, EXTENT AND QUALITY OF SERVICES PROVIDED BY BGFA
The Board determined that there would be no diminution in the scope of services required of BGFA under the Advisory Contract for the coming year as compared to the scope of services provided by BGFA over the past year. In reviewing the scope of these services, the Board considered BGFA’s investment philosophy and experience, noting that BGFA and its affiliates have committed significant resources over time, including over the past year, including investment in technology and increasing the number of their employees supporting the Funds. The Board also considered BGFA’s compliance program and its compliance record with respect to the Funds. In that regard, the Board noted that BGFA reports to the Board about portfolio management and compliance matters on a periodic basis in connection with regularly scheduled meetings of the Board, and has made appropriate officers available as needed to provide further assistance with these matters. The Board also reviewed the background and experience of the persons responsible for the day-to-day management of the Funds. In addition to the above considerations, the Board considered BGFA’s investment processes and strategies, and matters related to BGFA’s portfolio transaction policies and procedures. The Board further noted that BGFA does not serve as investment adviser for any other series of registered investment companies with substantially similar investment objectives and strategies as the Funds; therefore, comparative performance information was generally not available. However, the Board also noted that the Funds had met their investment objectives consistently since their respective inception dates. Based on review of this information, the Board concluded that the nature, extent and quality of services to be provided by BGFA to the Funds under the Advisory Contract were appropriate and mitigated in favor of the Board’s approval of the Advisory Contract for the coming year.
FUNDS’ EXPENSES AND PERFORMANCE OF THE FUNDS
The Board reviewed statistical information prepared by Lipper Inc. (“Lipper”), an independent provider of investment company data, regarding the expense ratio components, including advisory fees, waivers/reimbursements, and gross and net total expenses of each Fund in comparison with the same information for other funds registered under the 1940 Act objectively selected solely by Lipper as comprising each Fund’s applicable peer group (the “Lipper Group”). In addition, the Board reviewed statistical information prepared by Lipper regarding the performance of each Fund for the one-, three-, five- and ten-year periods, as applicable, and the “last quarter” period ended March 31, 2007, and a comparison of each Fund’s performance to that of the funds in its Lipper Group for the same periods. Because there are few, if any, exchange traded funds or index funds that track indexes similar to those tracked by the Funds, the Lipper Groups included in part, at the request of BGFA, mutual funds, closed-end funds, exchange traded funds, and funds with differing investment objective classifications, investment focuses and other characteristics (e.g., actively managed funds and funds sponsored by “at cost” service providers). In support of its review of the statistical information, the Board was provided with a detailed description of the methodology used by Lipper to determine the applicable Lipper Groups and to prepare this information. The Board further noted that due to the limitations in providing comparable funds in the various Lipper Groups, the statistical information may or may not provide meaningful direct comparisons to the Funds. The Board noted that most of the Funds generally performed in line with the funds in their respective Lipper Groups over the relevant periods; however, certain of the Funds may have underperformed or outperformed funds in the irrespective Lipper Groups over such periods. In considering this information, the Board noted that the Lipper Groups include funds that may have different
BOARD REVIEW AND APPROVAL OF INVESTMENT ADVISORY CONTRACT | 99 |
Table of Contents
Board Review and Approval of Investment Advisory
Contract (Unaudited) (Continued)
iSHARES®, INC.
investment objectives and/or benchmarks from the Funds. In addition, the Board noted that each Fund seeks to track an index and that during the prior year the Board received periodic reports on the Funds’ performance in comparison with their relevant benchmark indexes. Such comparative performance information was also considered by the Board.
The Board also noted that the investment advisory fees and overall expense components for the Funds were generally lower than the median or average investment advisory fee rates and overall expenses of the funds in their respective Lipper Groups. The Board also reviewed statistical information from Lipper displaying the effects of the proposed extension of breakpoints in the investment advisory fee rates for certain of the Funds (as discussed below) at various assets levels of such Funds as compared to their respective Lipper Groups. Based on this review, the Board concluded that the investment advisory fees and expense levels and the historical performance of each Fund, as managed by BGFA, as compared to the investment advisory fees and expense levels and performance of the funds in the relevant Lipper Group, were satisfactory for the purposes of approving the Advisory Contract for the coming year.
COSTS OF SERVICES PROVIDED TO FUNDS AND PROFITS REALIZED BY BGFA AND AFFILIATES
The Board reviewed information about the profitability to BGFA of the Funds based on the fees payable to BGFA and its affiliates (including fees under the Advisory Contract), and all other sources of revenue and expense to BGFA and its affiliates for the last calendar year. The Board discussed the sources of direct and ancillary revenue with management, including the revenues to BGI from securities lending by the Company (including any securities lending by the Funds). The Board also discussed BGFA’s profit margin as reflected in the Funds’ profitability analysis and reviewed information regarding economies of scale (as discussed below). Based on this review, the Board concluded that the profits to be realized by BGFA and its affiliates under the Advisory Contract and from other relationships between the Funds and BGFA and/or its affiliates, if any, were within the range the Board considered reasonable and appropriate.
ECONOMIES OF SCALE
In connection with its review of the Funds’ profitability analysis, the Board reviewed information regarding economies of scale or other efficiencies that may result from increases in the Funds’ assets. The Board was also presented with materials regarding the proposed extension of breakpoints in the investment advisory fee rates at certain asset levels for the iShares MSCI Brazil Index Fund, the iShares MSCI South Africa Index Fund, the iShares MSCI South Korea Index Fund and the iShares MSCI Taiwan Index Fund. The Board noted that the Advisory Contract already provided for breakpoints in the investment advisory fee rates for most of the Funds as the assets of such Funds, on an aggregated basis with the assets of certain other iShares funds, increased, but also noted that the Advisory Contract did not currently provide for any breakpoints in the investment advisory fee rates for the iShares MSCI Pacific ex-Japan Index Fund as possible future economies of scale for that Fund had been taken into consideration by fixing the investment advisory fees at rates at the lower end of the marketplace, effectively giving Fund shareholders, from inception, the benefits of the lower average fee shareholders would have received from a fee structure with declining breakpoints where the initial fee was higher. The Board also reviewed BGFA’s historic profitability as investment adviser to the iShares fund complex and noted that BGFA had made a significant investment in the iShares funds and had incurred operating losses during earlier years when the iShares funds, including the Funds, had not yet reached scale. In light of this history, the Board determined that the proposed extension of breakpoints was appropriate and warranted at this juncture for the identified Funds but that reductions in fee rates or further extensions of breakpoints were not warranted at this juncture for the other Funds. Based on this review, as well as the discussions described above in connection with the Lipper Group comparisons, the Board, recognizing its responsibility to consider this issue at least annually, concluded that the structure of the investment advisory fees, with the proposed extension of breakpoints for certain of the Funds, reflects the current sharing and potential further sharing of economies of scale with the Funds’ shareholders.
100 | 2007 iSHARES ANNUAL REPORT TO SHAREHOLDERS |
Table of Contents
Board Review and Approval of Investment Advisory
Contract (Unaudited) (Continued)
iSHARES®, INC.
FEES AND SERVICES PROVIDED FOR OTHER COMPARABLE FUNDS/ACCOUNTS MANAGED BY BGFA AND ITS AFFILIATES
The Board received and considered certain information regarding the Funds’ annual investment advisory fee rates under the Advisory Contract in comparison to the investment advisory/management fee rates for other funds/accounts for which BGFA or BGI, an affiliate of BGFA, provides investment advisory/management services, including other funds registered under the 1940 Act, collective funds and separate accounts (together, the “Other Accounts”). The Board noted that comparative investment advisory/management fee information was not available, as BGFA and its affiliates do not manage any Other Accounts with substantially similar investment objectives and strategies as the Funds. However, the Board noted that BGFA provided the Board with general information regarding how the level of services provided to the Other Accounts differed from the level of services provided to the Funds. Based on this review, the Board determined that the investment advisory fee rates under the Advisory Contracts, with the proposed extension of breakpoints, do not constitute fees that are so disproportionately large as to bear no reasonable relationship to the services rendered and that could not have been the product of arm’s-length bargaining, and concluded that the investment advisory fee rates under the Advisory Contracts are fair and reasonable.
OTHER BENEFITS TO BGFA AND/OR ITS AFFILIATES
The Board reviewed any ancillary revenue received by BGFA and/or its affiliates in connection with the services provided to the Funds by BGFA, such as any payment of revenue to BGI, the Company’s securities lending agent, for loaning any portfolio securities, and payment of advisory fees and/or administration fees to BGFA and BGI in connection with any investments by the Funds in other funds for which BGFA provides investment advisory services and/or BGI provides administration services. The Board noted that BGFA does not use soft dollars or consider the value of research or other services that may be provided to BGFA (including its affiliates) in selecting brokers for portfolio transactions for the Funds. The Board further noted that any portfolio transactions on behalf of the Funds placed through a BGFA affiliate are reported to the Board pursuant to Rule 10f-3 and Rule 17e-1, as applicable, under the 1940 Act. The Board concluded that any such ancillary benefits would not be disadvantageous to the Funds’ shareholders.
Based on this analysis, the Board determined that the Advisory Contract, including the investment advisory fee rates, with the proposed extension of breakpoints, is fair and reasonable in light of all relevant circumstances, and concluded that it is in the best interest of the Funds and their shareholders to approve the Advisory Contract, with the fee schedule to the Advisory Contract as proposed to be amended to reflect the extension of breakpoints, for the coming year.
BOARD REVIEWAND APPROVALOF INVESTMENT ADVISORY CONTRACT | 101 |
Table of Contents
Supplemental Information (Unaudited)
iSHARES®, INC.
The tables that follow present information about the differences between the daily market price on secondary markets for shares of a Fund and that Fund’s net asset value. Net asset value, or “NAV,” is the price per share at which each Fund issues and redeems shares. It is calculated in accordance with the standard formula for valuing mutual fund shares. The “Market Price” of each Fund generally is determined using the midpoint between the highest bid and the lowest offer on the stock exchange on which the shares of such Fund is listed for trading (the “Exchange”), as of the time that the Fund’s NAV is calculated. In the case of the iShares MSCI Malaysia, iShares MSCI South Korea and iShares MSCI Taiwan Index Funds, the NAVs of which are determined prior to the opening of the regular trading day on the Exchange, the Market Price is determined using the midpoint of the bid/ask spread as of the opening of regular trading on the Exchange. Each Fund’s Market Price may be at, above or below its NAV. The NAV of each Fund will fluctuate with changes in the market value of its portfolio holdings. The Market Price of each Fund will fluctuate in accordance with changes in its NAV, as well as market supply and demand.
Premiums or discounts are the differences (expressed as a percentage) between the NAV and Market Price of a Fund on a given day, generally at the time the NAV is calculated. A premium is the amount that a Fund is trading above the reported NAV, expressed as a percentage of the NAV. A discount is the amount that a Fund is trading below the reported NAV, expressed as a percentage of the NAV.
The following information shows the frequency distributions of premiums and discounts for each of the Funds included in this report. The information shown for each Fund is for five calendar years (or for each full calendar quarter completed after the inception date of such Fund if less than five years) through the date of the most recent calendar quarter-end. The specific periods covered for each Fund are disclosed in the table for such Fund.
Each line in the table shows the number of trading days in which the Fund traded within the premium/discount range indicated. The number of trading days in each premium/discount range is also shown as a percentage of the total number of trading days in the period covered by each table. All data presented here represents past performance, which cannot be used to predict future results.
iShares MSCI Australia Index Fund
Period Covered: January 1, 2002 through June 30, 2007
Premium/Discount Range | Number of Days | Percentage of Total Days | |||
Greater than 3.5% | 2 | 0.14 | % | ||
Greater than 3.0% and Less than 3.5% | 2 | 0.14 | |||
Greater than 2.5% and Less than 3.0% | 2 | 0.14 | |||
Greater than 2.0% and Less than 2.5% | 8 | 0.58 | |||
Greater than 1.5% and Less than 2.0% | 32 | 2.32 | |||
Greater than 1.0% and Less than 1.5% | 127 | 9.20 | |||
Greater than 0.5% and Less than 1.0% | 323 | 23.39 | |||
Between 0.5% and –0.5% | 682 | 49.38 | |||
Less than –0.5% and Greater than –1.0% | 121 | 8.76 | |||
Less than –1.0% and Greater than –1.5% | 50 | 3.62 | |||
Less than –1.5% and Greater than –2.0% | 19 | 1.38 | |||
Less than –2.0% and Greater than –2.5% | 7 | 0.51 | |||
Less than –2.5% and Greater than –3.0% | 3 | 0.22 | |||
Less than –3.0% and Greater than –3.5% | 3 | 0.22 | |||
| 1,381 | 100.00 | % | |||
102 | 2007 iSHARES ANNUAL REPORT TO SHAREHOLDERS |
Table of Contents
Supplemental Information (Unaudited) (Continued)
iSHARES®, INC.
iShares MSCI Brazil Index Fund
Period Covered: January 1, 2002 through June 30, 2007
Premium/Discount Range | Number of Days | Percentage of Total Days | |||
Greater than 3.0% | 2 | 0.14 | % | ||
Greater than 2.5% and Less than 3.0% | 5 | 0.36 | |||
Greater than 2.0% and Less than 2.5% | 11 | 0.80 | |||
Greater than 1.5% and Less than 2.0% | 24 | 1.74 | |||
Greater than 1.0% and Less than 1.5% | 61 | 4.42 | |||
Greater than 0.5% and Less than 1.0% | 157 | 11.37 | |||
Between 0.5% and –0.5% | 870 | 63.00 | |||
Less than –0.5% and Greater than –1.0% | 128 | 9.27 | |||
Less than –1.0% and Greater than –1.5% | 32 | 2.32 | |||
Less than –1.5% and Greater than –2.0% | 26 | 1.88 | |||
Less than –2.0% and Greater than –2.5% | 23 | 1.67 | |||
Less than –2.5% and Greater than –3.0% | 12 | 0.87 | |||
Less than –3.0% and Greater than –3.5% | 8 | 0.58 | |||
Less than –3.5% and Greater than –4.0% | 7 | 0.51 | |||
Less than –4.0% and Greater than –4.5% | 6 | 0.43 | |||
Less than –4.5% and Greater than –5.0% | 6 | 0.43 | |||
Less than –5.0% and Greater than –5.5% | 1 | 0.07 | |||
Less than –5.5% | 2 | 0.14 | |||
| 1,381 | 100.00 | % | |||
iShares MSCI Canada Index Fund
Period Covered: January 1, 2002 through June 30, 2007
Premium/Discount Range | Number of Days | Percentage of Total Days | |||
Greater than 3.5% | 1 | 0.07 | % | ||
Greater than 3.0% and Less than 3.5% | 4 | 0.29 | |||
Greater than 2.5% and Less than 3.0% | 10 | 0.72 | |||
Greater than 2.0% and Less than 2.5% | 11 | 0.80 | |||
Greater than 1.5% and Less than 2.0% | 22 | 1.59 | |||
Greater than 1.0% and Less than 1.5% | 61 | 4.42 | |||
Greater than 0.5% and Less than 1.0% | 184 | 13.32 | |||
Between 0.5% and –0.5% | 1,019 | 73.80 | |||
Less than –0.5% and Greater than –1.0% | 62 | 4.49 | |||
Less than –1.0% and Greater than –1.5% | 6 | 0.43 | |||
Less than –1.5% | 1 | 0.07 | |||
| 1,381 | 100.00 | % | |||
SUPPLEMENTAL INFORMATION | 103 |
Table of Contents
Supplemental Information (Unaudited) (Continued)
iSHARES®, INC.
iShares MSCI Emerging Markets Index Fund
Period Covered: July 1, 2003 through June 30, 2007
Premium/Discount Range | Number of Days | Percentage of Total Days | |||
Greater than 2.5% and Less than 3.0% | 1 | 0.10 | % | ||
Greater than 2.0% and Less than 2.5% | 1 | 0.10 | |||
Greater than 1.5% and Less than 2.0% | 17 | 1.69 | |||
Greater than 1.0% and Less than 1.5% | 53 | 5.27 | |||
Greater than 0.5% and Less than 1.0% | 247 | 24.55 | |||
Between 0.5% and –0.5% | 537 | 53.38 | |||
Less than –0.5% and Greater than –1.0% | 100 | 9.94 | |||
Less than –1.0% and Greater than –1.5% | 30 | 2.98 | |||
Less than –1.5% and Greater than –2.0% | 15 | 1.49 | |||
Less than –2.0% and Greater than –2.5% | 4 | 0.40 | |||
Less than –2.5% | 1 | 0.10 | |||
| 1,006 | 100.00 | % | |||
iShares MSCI Hong Kong Index Fund
Period Covered: January 1, 2002 through June 30, 2007
Premium/Discount Range | Number of Days | Percentage of Total Days | |||
Greater than 3.0% and Less than 3.5% | 2 | 0.14 | % | ||
Greater than 2.5% and Less than 3.0% | 4 | 0.29 | |||
Greater than 2.0% and Less than 2.5% | 17 | 1.23 | |||
Greater than 1.5% and Less than 2.0% | 43 | 3.11 | |||
Greater than 1.0% and Less than 1.5% | 111 | 8.04 | |||
Greater than 0.5% and Less than 1.0% | 249 | 18.03 | |||
Between 0.5% and –0.5% | 644 | 46.63 | |||
Less than –0.5% and Greater than –1.0% | 149 | 10.79 | |||
Less than –1.0% and Greater than –1.5% | 73 | 5.29 | |||
Less than –1.5% and Greater than –2.0% | 48 | 3.48 | |||
Less than –2.0% and Greater than –2.5% | 16 | 1.16 | |||
Less than –2.5% and Greater than –3.0% | 12 | 0.87 | |||
Less than –3.0% and Greater than –3.5% | 6 | 0.43 | |||
Less than –3.5% and Greater than –4.0% | 4 | 0.29 | |||
Less than –4.0% | 3 | 0.22 | |||
| 1,381 | 100.00 | % | |||
104 | 2007 iSHARES ANNUAL REPORT TO SHAREHOLDERS |
Table of Contents
Supplemental Information (Unaudited) (Continued)
iSHARES®, INC.
iShares MSCI Malaysia Index Fund
Period Covered: January 1, 2002 through June 30, 2007
Premium/Discount Range | Number of Days | Percentage of Total Days | |||
Greater than 3.5% | 1 | 0.07 | % | ||
Greater than 3.0% and Less than 3.5% | 2 | 0.14 | |||
Greater than 2.5% and Less than 3.0% | 6 | 0.43 | |||
Greater than 2.0% and Less than 2.5% | 35 | 2.53 | |||
Greater than 1.5% and Less than 2.0% | 63 | 4.56 | |||
Greater than 1.0% and Less than 1.5% | 136 | 9.85 | |||
Greater than 0.5% and Less than 1.0% | 210 | 15.21 | |||
Between 0.5% and –0.5% | 468 | 33.90 | |||
Less than –0.5% and Greater than –1.0% | 180 | 13.03 | |||
Less than –1.0% and Greater than –1.5% | 135 | 9.78 | |||
Less than –1.5% and Greater than –2.0% | 70 | 5.07 | |||
Less than –2.0% and Greater than –2.5% | 45 | 3.26 | |||
Less than –2.5% and Greater than –3.0% | 18 | 1.30 | |||
Less than –3.0% and Greater than –3.5% | 4 | 0.29 | |||
Less than –3.5% and Greater than –4.0% | 4 | 0.29 | |||
Less than –4.0% and Greater than –4.5% | 3 | 0.22 | |||
Less than –4.5% | 1 | 0.07 | |||
| 1,381 | 100.00 | % | |||
iShares MSCI Mexico Index Fund
Period Covered: January 1, 2002 through June 30, 2007
Premium/Discount Range | Number of Days | Percentage of Total Days | |||
Greater than 2.5% | 1 | 0.07 | % | ||
Greater than 2.0% and Less than 2.5% | 1 | 0.07 | |||
Greater than 1.5% and Less than 2.0% | 11 | 0.80 | |||
Greater than 1.0% and Less than 1.5% | 43 | 3.11 | |||
Greater than 0.5% and Less than 1.0% | 175 | 12.67 | |||
Between 0.5% and –0.5% | 891 | 64.53 | |||
Less than –0.5% and Greater than –1.0% | 170 | 12.31 | |||
Less than –1.0% and Greater than –1.5% | 64 | 4.63 | |||
Less than –1.5% and Greater than –2.0% | 19 | 1.38 | |||
Less than –2.0% and Greater than –2.5% | 4 | 0.29 | |||
Less than –2.5% and Greater than –3.0% | 2 | 0.14 | |||
| 1,381 | 100.00 | % | |||
SUPPLEMENTAL INFORMATION | 105 |
Table of Contents
Supplemental Information (Unaudited) (Continued)
iSHARES®, INC.
iShares MSCI Pacific ex-Japan Index Fund
Period Covered: January 1, 2002 through June 30, 2007
Premium/Discount Range | Number of Days | Percentage of Total Days | |||
Greater than 3.5% and Less than 4.0% | 2 | 0.14 | % | ||
Greater than 3.0% and Less than 3.5% | 2 | 0.14 | |||
Greater than 2.5% and Less than 3.0% | 8 | 0.58 | |||
Greater than 2.0% and Less than 2.5% | 11 | 0.80 | |||
Greater than 1.5% and Less than 2.0% | 62 | 4.49 | |||
Greater than 1.0% and Less than 1.5% | 212 | 15.35 | |||
Greater than 0.5% and Less than 1.0% | 329 | 23.82 | |||
Between 0.5% and –0.5% | 642 | 46.51 | |||
Less than –0.5% and Greater than –1.0% | 72 | 5.21 | |||
Less than –1.0% and Greater than –1.5% | 27 | 1.96 | |||
Less than –1.5% and Greater than –2.0% | 10 | 0.72 | |||
Less than –2.0% and Greater than –2.5% | 2 | 0.14 | |||
Less than –2.5% and Greater than –3.0% | 1 | 0.07 | |||
Less than –3.0% | 1 | 0.07 | |||
| 1,381 | 100.00 | % | |||
iShares MSCI Singapore Index Fund
Period Covered: January 1, 2002 through June 30, 2007
Premium/Discount Range | Number of Days | Percentage of Total Days | |||
Greater than 3.5% and Less than 4.0% | 1 | 0.07 | % | ||
Greater than 3.0% and Less than 3.5% | 1 | 0.07 | |||
Greater than 2.5% and Less than 3.0% | 9 | 0.65 | |||
Greater than 2.0% and Less than 2.5% | 23 | 1.67 | |||
Greater than 1.5% and Less than 2.0% | 70 | 5.07 | |||
Greater than 1.0% and Less than 1.5% | 182 | 13.18 | |||
Greater than 0.5% and Less than 1.0% | 252 | 18.25 | |||
Between 0.5% and –0.5% | 525 | 38.02 | |||
Less than –0.5% and Greater than –1.0% | 121 | 8.76 | |||
Less than –1.0% and Greater than –1.5% | 95 | 6.88 | |||
Less than –1.5% and Greater than –2.0% | 40 | 2.90 | |||
Less than –2.0% and Greater than –2.5% | 24 | 1.74 | |||
Less than –2.5% and Greater than –3.0% | 14 | 1.01 | |||
Less than –3.0% and Greater than –3.5% | 9 | 0.65 | |||
Less than –3.5% and Greater than –4.0% | 8 | 0.58 | |||
Less than –4.0% and Greater than –4.5% | 2 | 0.14 | |||
Less than –4.5% and Greater than –5.0% | 3 | 0.22 | |||
Less than –5.0% and Greater than –5.5% | 1 | 0.07 | |||
Less than –5.5% | 1 | 0.07 | |||
| 1,381 | 100.00 | % | |||
106 | 2007 iSHARES ANNUAL REPORT TO SHAREHOLDERS |
Table of Contents
Supplemental Information (Unaudited) (Continued)
iSHARES®, INC.
iShares MSCI South Africa Index Fund
Period Covered: April 1, 2003 through June 30, 2007
Premium/Discount Range | Number of Days | Percentage of Total Days | |||
Greater than 3.0% | 2 | 0.19 | % | ||
Greater than 2.5% and Less than 3.0% | 6 | 0.56 | |||
Greater than 2.0% and Less than 2.5% | 9 | 0.84 | |||
Greater than 1.5% and Less than 2.0% | 25 | 2.34 | |||
Greater than 1.0% and Less than 1.5% | 83 | 7.77 | |||
Greater than 0.5% and Less than 1.0% | 212 | 19.85 | |||
Between 0.5% and –0.5% | 576 | 53.94 | |||
Less than –0.5% and Greater than –1.0% | 77 | 7.21 | |||
Less than –1.0% and Greater than –1.5% | 42 | 3.93 | |||
Less than –1.5% and Greater than –2.0% | 15 | 1.40 | |||
Less than –2.0% and Greater than –2.5% | 10 | 0.94 | |||
Less than –2.5% and Greater than –3.0% | 5 | 0.47 | |||
Less than –3.0% and Greater than –3.5% | 3 | 0.28 | |||
Less than –3.5% | 3 | 0.28 | |||
| 1,068 | 100.00 | % | |||
iShares MSCI South Korea Index Fund
Period Covered: January 1, 2002 through June 30, 2007
Premium/Discount Range | Number of Days | Percentage of Total Days | |||
Greater than 4.5% and Less than 5.0% | 1 | 0.07 | % | ||
Greater than 4.0% and Less than 4.5% | 1 | 0.07 | |||
Greater than 3.5% and Less than 4.0% | 6 | 0.43 | |||
Greater than 3.0% and Less than 3.5% | 6 | 0.43 | |||
Greater than 2.5% and Less than 3.0% | 12 | 0.87 | |||
Greater than 2.0% and Less than 2.5% | 40 | 2.90 | |||
Greater than 1.5% and Less than 2.0% | 75 | 5.43 | |||
Greater than 1.0% and Less than 1.5% | 147 | 10.64 | |||
Greater than 0.5% and Less than 1.0% | 241 | 17.45 | |||
Between 0.5% and –0.5% | 504 | 36.51 | |||
Less than –0.5% and Greater than –1.0% | 148 | 10.72 | |||
Less than –1.0% and Greater than –1.5% | 91 | 6.59 | |||
Less than –1.5% and Greater than –2.0% | 44 | 3.19 | |||
Less than –2.0% and Greater than –2.5% | 28 | 2.03 | |||
Less than –2.5% and Greater than –3.0% | 17 | 1.23 | |||
Less than –3.0% and Greater than –3.5% | 9 | 0.65 | |||
Less than –3.5% and Greater than –4.0% | 5 | 0.36 | |||
Less than –4.0% and Greater than –4.5% | 2 | 0.14 | |||
Less than –4.5% | 4 | 0.29 | |||
| 1,381 | 100.00 | % | |||
SUPPLEMENTAL INFORMATION | 107 |
Table of Contents
Supplement Information (Unaudited) (Continued)
iSHARES®, INC.
iShares MSCI Taiwan Index Fund
Period Covered: January 1, 2002 through June 30, 2007
Premium/Discount Range | Number of Days | Percentage of Total Days | |||
Greater than 6.0% | 4 | 0.29 | % | ||
Greater than 5.5% and Less than 6.0% | 2 | 0.14 | |||
Greater than 5.0% and Less than 5.5% | 1 | 0.07 | |||
Greater than 4.5% and Less than 5.0% | 8 | 0.58 | |||
Greater than 4.0% and Less than 4.5% | 3 | 0.22 | |||
Greater than 3.5% and Less than 4.0% | 15 | 1.09 | |||
Greater than 3.0% and Less than 3.5% | 20 | 1.45 | |||
Greater than 2.5% and Less than 3.0% | 31 | 2.24 | |||
Greater than 2.0% and Less than 2.5% | 45 | 3.26 | |||
Greater than 1.5% and Less than 2.0% | 104 | 7.53 | |||
Greater than 1.0% and Less than 1.5% | 130 | 9.41 | |||
Greater than 0.5% and Less than 1.0% | 211 | 15.28 | |||
Between 0.5% and –0.5% | 421 | 30.49 | |||
Less than –0.5% and Greater than –1.0% | 156 | 11.30 | |||
Less than –1.0% and Greater than –1.5% | 99 | 7.17 | |||
Less than –1.5% and Greater than –2.0% | 62 | 4.49 | |||
Less than –2.0% and Greater than –2.5% | 17 | 1.23 | |||
Less than –2.5% and Greater than –3.0% | 30 | 2.17 | |||
Less than –3.0% and Greater than –3.5% | 10 | 0.72 | |||
Less than –3.5% and Greater than –4.0% | 4 | 0.29 | |||
Less than –4.0% and Greater than –4.5% | 1 | 0.07 | |||
Less than –4.5% and Greater than –5.0% | 3 | 0.22 | |||
Less than –5.0% and Greater than –5.5% | 1 | 0.07 | |||
Less than –5.5% | 3 | 0.22 | |||
| 1,381 | 100.00 | % | |||
108 | 2007 iSHARES ANNUAL REPORT TO SHAREHOLDERS |
Table of Contents
Director and Officer Information (Unaudited)
iSHARES®, INC.
The Board of Directors has responsibility for the overall management and operations of the Company, including general supervision of the duties performed by BGFA and other service providers. Each Director serves until his or her successor is duly elected or appointed and qualified.
iShares, Inc., iShares Trust, Barclays Global Investors Funds (“BGIF”), Master Investment Portfolio (“MIP”) and Barclays Foundry Investment Trust (“BFIT”) are considered to be members of the same fund complex, as defined in Form N-1A under the 1940 Act. Each Director of iShares, Inc. also serves as a Trustee for iShares Trust and oversees 138 portfolios within the fund complex. In addition, Lee T. Kranefuss serves as a Trustee for BGIF, MIP and BFIT and oversees an additional 24 portfolios within the fund complex.
Unless otherwise noted in the tables below, the address for each Director and Officer is c/o Barclays Global Investors, N.A., 45 Fremont Street, San Francisco, California 94105. The Board has designated George G.C. Parker as its Lead Independent Director. Additional information about the Funds’ Directors and Officers may be found in the Funds’ combined Statement of Additional Information, which is available without charge, upon request, by calling toll-free 1-800-474-2737.
Interested Directors and Officers
| Name, Year of Birth | Position(s), Length of Service | Principal Occupation(s) During Past 5 Years | Other Directorships Held | |||
*Lee T. Kranefuss, 1961 | Director and Chairman (since 2003). | Chief Executive Officer of the Intermediary Investor and Exchange Traded Products Business of BGI (since 2003); Director of Barclays Global Fund Advisers (since 2005); Director, President and Chief Executive Officer of Barclays Global Investors International, Inc. (since 2005); Director, Chairman and Chief Executive Officer of Barclays Global Investors Services (since 2005); Chief Executive Officer of the Individual Investor Business of BGI (1999-2003). | Trustee (since 2003) of iShares Trust; Trustee (since 2001) of BGIF and MIP; Trustee (since 2007) of BFIT; Director (since 2003) of BGI Cayman Prime Money Market Fund, Ltd. | |||
*John E. Martinez, 1962 | Director, (since 2003). | Co-Chief Executive Officer of Global Index and Markets Group of BGI (2001-2003); Chairman of Barclays Global Investors Services (2000-2003). | Trustee (since 2003) of iShares Trust; Director (since 2005) of Real Estate Equity Exchange. | |||
| * | Lee T. Kranefuss and John E. Martinez are deemed to be “interested persons” (as defined in the 1940 Act) of the Company due to their affiliations with BGFA, the Funds’ investment adviser, BGI, the parent company of BGFA, and Barclays Global Investors Services, an affiliate of BGFA and BGI. |
DIRECTORAND OFFICER INFORMATION | 109 |
Table of Contents
Director and Officer Information (Unaudited) (Continued)
iSHARES®, INC.
Independent Directors
| Name, Year of Birth | Position(s), Length of Service | Principal Occupation(s) During Past 5 Years | Other Directorships Held | |||
George G.C. Parker, 1939 | Director (since 2002). Lead Independent Director (since 2006). | Dean Witter Distinguished Professor of Finance, Emeritus (since 1994). | Trustee (since 2000) of iShares Trust; Lead Independent Trustee (since 2006) of iShares Trust; Director (since 1996) of Continental Airlines, Inc.; Director (since 1995) of Community First Financial Group; Director (since 1999) of Tejon Ranch Company; Director (since 2004) of Threshold Pharmaceuticals; Director (since 2007) of NETGEAR, Inc. | |||
Cecilia H. Herbert, 1949 | Director (since 2005). | Member of Finance Council, Archdiocese of San Francisco (1999- 2006); Chair of Investment Committee, Archdiocese of San Francisco (1994-2005); Director (since 1998) and President (since 2007) of the Board of Directors, Catholic Charities CYO; Trustee (2004-2005) of Pacific Select Funds; Trustee (1992-2003) of the Montgomery Funds; Trustee (since 2002) and Chair of Finance and Investment Committee (since 2006) of the Thacher School. | Trustee (since 2005) of iShares Trust. | |||
Charles A. Hurty, 1943 | Director (since 2005). | Retired; Partner, KPMG LLP (1968-2001). | Trustee (since 2005) of iShares Trust; Director (since 2002) of GMAM Absolute Return Strategy Fund (1 portfolio); Director (since 2002) of Citigroup Alternative Investments Multi-Adviser Hedge Fund Portfolios LLC (1 portfolio); Director (since 2005) of CSFB Alternative Investments Fund (6 portfolios). | |||
John E. Kerrigan, 1955 | Director (since 2005). | Chief Investment Officer, Santa Clara University (since 2002); Managing Director, Merrill Lynch (1994-2002). | Trustee (since 2005) of iShares Trust; Member (since 2004) of Advisory Council for Commonfund Distressed Debt Partners II. | |||
110 | 2007 iSHARES ANNUAL REPORT TO SHAREHOLDERS |
Table of Contents
Director and Officer Information (Unaudited) (Continued)
iSHARES®, INC.
Independent Directors (Continued)
| Name, Year of Birth | Position(s), Length of Service | Principal Occupation(s) During Past 5 Years | Other Directorships Held | |||
Robert H. Silver, 1955 | Director (since 2007). | President and Co-Founder of The Bravitas Group, Inc. (since 2006); Member, Non-Investor Advisory Board of Russia Partners II, LP (since 2006); President and Chief Operating Officer (2003-2005) and Director (1999-2005) of UBS Financial Services, Inc.; President and Chief Executive Officer of UBS Services USA, LLC (1999-2005); Managing Director, UBS America, Inc. (2000-2005); Director and Vice Chairman of the YMCA of Greater NYC (since 2001); Broadway Producer (since 2006). | Trustee (since 2007) of iShares Trust; Director and Member (since 2006) of the Audit and Compensation Committee of EPAM Systems, Inc. |
Officers
| ||||||
| Name, Year of Birth | Position(s), Length of Service | Principal Occupation(s) During Past 5 Years | Other Directorships Held | |||
Michael A. Latham, 1965 | President (since 2007). | Head of Americas iShares (since 2007); Chief Operating Officer of the Intermediary Investor and Exchange Traded Products Business of BGI (2003-2007); Director and Chief Financial Officer of Barclays Global Investors International, Inc. (since 2005); Director of Mutual Fund Delivery in the U.S. Individual Investor Business of BGI (2000-2003). | None. | |||
Geoffrey D. Flynn, 1956 | Treasurer and Chief Financial Officer (since 2007). | Director of Mutual Fund Operations of BGI (since 2007); President of Van Kampen Investor Services (2003-2007); Managing Director of Morgan Stanley (2002-2007); President of Morgan Stanley Trust, FSB (2002-2007). | None. | |||
DIRECTORAND OFFICER INFORMATION | 111 |
Table of Contents
Director and Officer Information (Unaudited) (Continued)
iSHARES®, INC.
Officers (Continued)
| Name, Year of Birth | Position(s), Length of Service | Principal Occupation(s) During Past 5 Years | Other Directorships Held | |||
Eilleen M. Clavere, 1952 | Secretary (since 2007). | Head of Legal Administration of Intermediary Investor Business of BGI (since 2006); Legal Counsel and Vice President of Atlas Funds, Atlas Advisers, Inc. and Atlas Securities, Inc. (2005-2006); Counsel of Kirkpatrick & Lockhart LLP (2001-2005). | None. | |||
Ira P. Shapiro, 1963 | Vice President and Chief Legal Officer (since 2007). | Associate General Counsel of BGI (since 2004); First Vice President of Merrill Lynch Investment Managers (1993-2004). | None. | |||
Amy Schioldager, 1962 | Executive Vice President (since 2007). | Head of U.S. Indexing of BGI (since 2006); Head of Domestic Equity Portfolio Management of BGI (2001-2006). | None. | |||
H. Michael Williams, 1960 | Executive Vice President (since 2007). | Head of Global Index and Markets Group of BGI (since 2006); Global Head of Securities Lending of BGI (2002-2006). | Trustee (since 2007) of BFIT. | |||
Patrick O’Connor, 1967 | Vice President (since 2007). | Head of iShares Portfolio Management of BGI (since 2006); Senior Portfolio Manager of BGI (1999-2006). | None. | |||
Lee Sterne, 1965 | Vice President (since 2007). | Senior Portfolio Manager of BGI (since 2004); Portfolio Manager of BGI (2001-2004). | None. | |||
Matt Tucker, 1972 | Vice President (since 2007). | Head of U.S. Fixed-Income Investment Solutions of BGI (since 2005); Fixed- Income Investment Strategist of BGI (2003-2005); Fixed-Income Portfolio Manager of BGI (1997-2003). | None. | |||
112 | 2007 iSHARES ANNUAL REPORT TO SHAREHOLDERS |
Table of Contents
Notes:
NOTES | 113 |
Table of Contents
Notes:
114 | 2007 iSHARES ANNUAL REPORT TO SHAREHOLDERS |
Table of Contents
Notes:
NOTES | 115 |
Table of Contents
The following is a list of iShares Funds being offered, along with their respective exchange trading symbols. Please call 1-800-iShares (1-800-474-2737) to obtain a prospectus for any iShares Fund. The prospectus contains more complete information, including charges, expenses, investment objectives and risk factors that should be carefully considered to determine if the Fund(s) are an appropriate investment for you. Read the prospectus(es) carefully before investing. Investing involves risk, including possible loss of principal.
iShares S&P Domestic Index Funds
iShares S&P 1500 (ISI)
iShares S&P 100 (OEF)
iShares S&P 500 (IVV)
iShares S&P 500 Growth (IVW)
iShares S&P 500 Value (IVE)
iShares S&P MidCap 400 (IJH)
iShares S&P MidCap 400 Growth (IJK)
iShares S&P MidCap 400 Value (IJJ)
iShares S&P SmallCap 600 (IJR)
iShares S&P SmallCap 600 Growth (IJT)
iShares S&P SmallCap 600 Value (IJS)
iShares S&P GSSITM Natural Resources (IGE)
iShares S&P GSTITM Networking (IGN)
iShares S&P GSTITM Semiconductor (IGW)
iShares S&P GSTITM Software (IGV)
iShares S&P GSTITM Technology (IGM)
iShares Domestic Sector Index Funds
iShares Cohen & Steers Realty Majors (ICF)
iShares Dow Jones U.S. Basic Materials Sector (IYM)
iShares Dow Jones U.S. Consumer Services Sector (IYC)
iShares Dow Jones U.S. Consumer Goods Sector (IYK)
iShares Dow Jones U.S. Energy Sector (IYE)
iShares Dow Jones U.S. Financial Sector (IYF)
iShares Dow Jones U.S. Financial Services (IYG)
iShares Dow Jones U.S. Healthcare Sector (IYH)
iShares Dow Jones U.S. Industrial Sector (IYJ)
iShares Dow Jones U.S. Real Estate (IYR)
iShares Dow Jones U.S. Technology Sector (IYW)
iShares Dow Jones U.S. Telecommunications Sector (IYZ)
iShares Dow Jones Transportation Average (IYT)
iShares Dow Jones U.S. Utilities Sector (IDU)
iShares Dow Jones U.S. Total Market (IYY)
iShares Nasdaq Biotechnology (IBB)
iShares Domestic Subsector Index Funds
iShares Dow Jones U.S. Aerospace & Defense (ITA)
iShares Dow Jones U.S. Broker-Dealers (IAI)
iShares Dow Jones U.S. Healthcare Providers (IHF)
iShares Dow Jones U.S. Home Construction (ITB)
iShares Dow Jones U.S. Insurance (IAK)
iShares Dow Jones U.S. Medical Devices (IHI)
iShares Dow Jones U.S. Oil & Gas Exploration & Production (IEO)
iShares Dow Jones U.S. Oil Equipment & Services (IEZ)
iShares Dow Jones U.S. Pharmaceuticals (IHE)
iShares Dow Jones U.S. Regional Banks (IAT)
iShares FTSE NAREIT Industrial/Office (FIO)
iShares FTSE NAREIT Mortgage REITs (REM)
iShares FTSE NAREIT Real Estate 50 (FTY)
iShares FTSE NAREIT Residential (REZ)
iShares FTSE NAREIT Retail (RTL)
iShares Global Index Funds
iShares S&P Global 100 (IOO)
iShares S&P Global Consumer Discretionary Sector (RXI)
iShares S&P Global Consumer Staples Sector (KXI)
iShares S&P Global Energy Sector (IXC)
iShares S&P Global Financials Sector (IXG)
iShares S&P Global Healthcare Sector (IXJ)
iShares S&P Global Industrials Sector (EXI)
iShares S&P Global Materials Sector (MXI)
iShares S&P Global Technology Sector (IXN)
iShares S&P Global Telecommunications Sector (IXP)
iShares S&P Global Utilities Sector (JXI)
iShares Russell Index Funds
iShares Russell 3000 (IWV)
iShares Russell 3000 Growth (IWZ)
iShares Russell 3000 Value (IWW)
iShares Russell 1000 (IWB)
iShares Russell 1000 Growth (IWF)
iShares Russell 1000 Value (IWD)
iShares Russell Midcap (IWR)
iShares Russell Midcap Growth (IWP)
iShares Russell Midcap Value (IWS)
iShares Russell 2000 (IWM)
iShares Russell 2000 Growth (IWO)
iShares Russell 2000 Value (IWN)
iShares Russell MicrocapTM (IWC)
iShares International Country Index Funds
iShares FTSE/Xinhua China 25 (FXI)
iShares MSCI Australia (EWA)
iShares MSCI Austria (EWO)
iShares MSCI Belgium (EWK)
iShares MSCI Brazil (EWZ)
iShares MSCI Canada (EWC)
iShares MSCI France (EWQ)
iShares MSCI Germany (EWG)
iShares MSCI Hong Kong (EWH)
iShares MSCI Italy (EWI)
iShares MSCI Japan (EWJ)
iShares MSCI Malaysia (EWM)
iShares MSCI Mexico (EWW)
iShares MSCI Netherlands (EWN)
iShares MSCI Singapore (EWS)
iShares MSCI South Africa (EZA)
iShares MSCI South Korea (EWY)
iShares MSCI Spain (EWP)
iShares MSCI Sweden (EWD)
iShares MSCI Switzerland (EWL)
iShares MSCI Taiwan (EWT)
iShares MSCI United Kingdom (EWU)
iShares S&P/TOPIX 150 (ITF)
iShares Bond Funds
iShares Lehman Aggregate (AGG)
iShares Lehman Short Treasury (SHV)
iShares Lehman 1-3 Year Treasury (SHY)
iShares Lehman 3-7 Year Treasury (IEI)
iShares Lehman 7-10 Year Treasury (IEF)
iShares Lehman 10-20 Year Treasury (TLH)
iShares Lehman 20+ Year Treasury (TLT)
iShares Lehman TIPS (TIP)
iShares Lehman Credit (CFT)
iShares Lehman 1-3 Year Credit (CSJ)
iShares Lehman Intermediate Credit (CIU)
iShares iBoxx $ Investment Grade Corporate (LQD)
iShares Lehman Government/Credit (GBF)
iShares Lehman Intermediate Government/Credit (GVI)
iShares Lehman MBS (MBB)
iShares iBoxx $ High Yield Corporate (HYG)
iShares S&P National Municipal (MUB)
iShares S&P California Municipal (CMF)
iShares S&P New York Municipal (NYF)
iShares Specialty Index Funds
iShares KLD Select Social SM (KLD)
iShares KLD 400 Social (DSI)
iShares Dow Jones Select Dividend (DVY)
iShares Dow Jones EPAC Select Dividend (IDV)
iShares S&P U.S. Preferred Stock (PFF)
iShares International Index Funds
iShares MSCI EAFE (EFA)
iShares MSCI EAFE Growth (EFG)
iShares MSCI EAFE Value (EFV)
iShares MSCI Emerging Markets (EEM)
iShares MSCI EMU (EZU)
iShares MSCI Pacific ex-Japan (EPP)
iShares S&P Europe 350 (IEV)
iShares S&P Latin America 40 (ILF)
iShares S&P World ex-U.S. Property (WPS)
iShares Morningstar Index Funds
iShares Morningstar Large Core (JKD)
iShares Morningstar Large Growth (JKE)
iShares Morningstar Large Value (JKF)
iShares Morningstar Mid Core (JKG)
iShares Morningstar Mid Growth (JKH)
iShares Morningstar Mid Value (JKI)
iShares Morningstar Small Core (JKJ)
iShares Morningstar Small Growth (JKK)
iShares Morningstar Small Value (JKL)
iShares NYSE Index Funds
iShares NYSE Composite (NYC)
iShares NYSE 100 (NY)
iShares® is a registered trademark of Barclays Global Investors, N.A. The iShares Funds are not sponsored, endorsed or issued by Lehman Brothers, nor are they sponsored, endorsed, issued, sold or promoted by Cohen & Steers Capital Management, Inc., Dow Jones & Company, Inc., FTSE International Limited (“FTSE”), FTSE/Xinhua Index Limited (“FXI”), iBoxx, KLD Research & Analytics, Inc., MSCI Inc., Morningstar, Inc., The NASDAQ Stock Market, Inc., National Association of Real Estate Investment Trusts (“NAREIT”), New York Stock Exchange, Inc., Frank Russell Company, or Standard & Poor’s. None of these companies make any representation regarding the advisability of investing in the iShares Funds. Neither SEI nor BGI, nor any of their affiliates, are affiliated with the companies listed above. iBoxx is a registered trademark of International Index Company Limited. FXI does not make any warranty regarding the FTSE/Xinhua Index. All rights in the FTSE/Xinhua Index vest in FXI. Neither FTSE nor
NAREIT makes any warranty regarding the FTSE NAREIT Real Estate 50 Index, FTSE NAREIT Residential Index, FTSE NAREIT Retail Index, FTSE NAREIT Mortgage REITs Index or FTSE NAREIT Industrial/Office Index; all rights vest in NAREIT. “FTSE” is a trade and service mark of London Stock Exchange and The Financial Times; “Xinhua” is a trade and service mark of Xinhua Financial Network Limited. “NAREIT®” is a trademark of NAREIT.
An investment in the Fund(s) is not a deposit of a bank and it is not insured or guaranteed by the Federal Deposit Insurance Corporation or any other government agency. This advertising section does not constitute part of the 2007 Annual Report.
5508-iS-1007
116 | 2007 iSHARES ANNUAL REPORT TO SHAREHOLDERS |
Table of Contents
Table of Contents
Table of Contents
| 1 | ||
| 3 | ||
| 4 | ||
| 11 | ||
| 14 | ||
| 15 | ||
| 21 | ||
| 22 | ||
Board Review and Approval of Investment Advisory Contract (Unaudited) | 23 | |
| 26 | ||
| 27 | ||
| 34 |
Table of Contents
Management’s Discussion of Fund Performance
iSHARES® MSCI JAPAN INDEX FUND
Performance as of August 31, 2007
| Average Annual Total Returns | ||||||||||||||||
| Year Ended 8/31/07 | Five Years Ended 8/31/07 | Ten Years Ended 8/31/07 | ||||||||||||||
| NAV | MARKET | INDEX | NAV | MARKET | INDEX | NAV | MARKET | INDEX | ||||||||
| 2.68% | 2.98% | 2.94% | 12.96% | 12.75% | 13.53% | 1.71% | 1.73% | 2.46% | ||||||||
| Cumulative Total Returns | ||||||||||||||||
| Year Ended 8/31/07 | Five Years Ended 8/31/07 | Ten Years Ended 8/31/07 | ||||||||||||||
| NAV | MARKET | INDEX | NAV | MARKET | INDEX | NAV | MARKET | INDEX | ||||||||
| 2.68% | 2.98% | 2.94% | 83.92% | 82.24% | 88.57% | 18.48% | 18.75% | 27.51% | ||||||||
“Average Annual Total Returns” represent the average annual change in value of an investment over the periods indicated. “Cumulative Total Returns” represent the total change in value of an investment over the periods indicated.
The Fund’s per share net asset value or “NAV” is the value of one share of the Fund as calculated in accordance with the standard formula for valuing mutual fund shares. The NAV return is based on the NAV of the Fund, and the market return is based on the market price per share of the Fund. The price used to calculate market return (“Market Price”) is determined by using the midpoint between the highest bid and the lowest offer on the stock exchange on which the shares of the Fund are listed for trading, as of the time that the Fund’s NAV is calculated. Market and NAV returns assume that dividends and capital gain distributions have been reinvested in the Fund at Market Price and NAV, respectively.
An index is a statistical composite that tracks a specified financial market or sector. Unlike the Fund, an index does not actually hold a portfolio of securities and therefore does not incur the expenses incurred by the Fund. These expenses negatively impact the performance of the Fund. Also, market returns do not include brokerage commissions that may be payable on secondary market transactions. If brokerage commissions were included, market returns would be lower. The returns shown in the tables above do not reflect the deduction of taxes that a shareholder would pay on fund distributions or the redemption or sale of fund shares. The investment return and principal value of shares of the Fund will vary with changes in market conditions. Shares of the Fund may be worth more or less than their original cost when they are redeemed or sold in the market. The Fund’s past performance is no guarantee of future results.
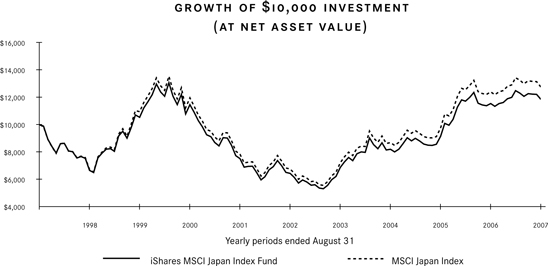
Performance figures assume reinvestment of all dividends and capital gain distributions and do not reflect the deduction of taxes that a shareholder would pay on fund distributions or the redemption of fund shares. An index is a statistical composite that tracks a specified financial market or sector. Unlike the Fund, an index does not actually hold a portfolio of securities and therefore does not incur the expenses incurred by the Fund. These expenses negatively impact the performance of the Fund. The Fund’s past performance is no guarantee of future results.
MANAGEMENT’S DISCUSSIONOF FUND PERFORMANCE | 1 |
Table of Contents
Management’s Discussion of Fund Performance (Continued)
iSHARES® MSCI JAPAN INDEX FUND
| PORTFOLIO ALLOCATION As of 8/31/07 | |||
| Sector | Percentage of Net Assets | ||
Consumer Cyclical | 24.13 | % | |
Industrial | 23.38 | ||
Financial | 18.50 | ||
Consumer Non-Cyclical | 10.10 | ||
Basic Materials | 9.35 | ||
Technology | 5.21 | ||
Communications | 4.10 | ||
Utilities | 4.03 | ||
Energy | 1.10 | ||
Short-Term and Other Net Assets | 0.10 | ||
TOTAL | 100.00 | % | |
| TEN LARGEST FUND HOLDINGS As of 8/31/07 | |||
| Security | Percentage of Net Assets | ||
Toyota Motor Corp. | 5.53 | % | |
Mitsubishi UFJ Financial Group Inc. | 2.72 | ||
Mizuho Financial Group Inc. | 2.10 | ||
Canon Inc. | 2.10 | ||
Takeda Pharmaceutical Co. Ltd. | 2.02 | ||
Honda Motor Co. Ltd. | 1.80 | ||
Sumitomo Mitsui Financial Group Inc. | 1.79 | ||
Sony Corp. | 1.71 | ||
Nintendo Co. Ltd. | 1.65 | ||
Nippon Steel Corp. | 1.41 | ||
TOTAL | 22.83 | % | |
The iShares MSCI Japan Index Fund (the “Fund”) seeks to provide investment results that correspond generally to the price and yield performance, before fees and expenses, of publicly traded securities in the aggregate in the Japanese market, as measured by the MSCI Japan Index (the “Index”). The Fund invests in a representative sample of securities included in the Index that collectively has an investment profile similar to the Index. Due to the use of representative sampling, the Fund may or may not hold all of the securities that are included in the Index. For the 12-month period ended August 31, 2007 (the “reporting period”), the Fund returned 2.68%, while the Index returned 2.94%.
The Japanese equity market delivered almost flat returns for the reporting period, lagging the returns of many other developed markets. After more than a decade of economic recession, Japan had appeared to be in economic recovery in the early part of the reporting period. Fourth quarter2006 gross domestic product (GDP) growth was reported at a healthy 5.50% rate. In February 2007, the Bank of Japan raised its key interest rate from 0.25% to 0.50%, its highest level in a decade. As the reporting period progressed, however, Japan’s economy made little progress; consumer spending remained low as wages declined. Business investment dipped, raising concerns that the economy might slow.
By late summer, the same concerns surrounding sub-prime mortgage lenders in the U.S. appeared to contribute further problems to Japan’s economy, as several Japanese banks reported large losses linked to sub-prime investments. As a cautionary measure, the Bank of Japan, which had been expected by many to raise rates again, kept its key interest rate unchanged at 0.50% throughout the remainder of the reporting period.
Among the Fund’s ten largest holdings as of August 31, 2007, performance was mixed for the reporting period. The strongest performer by far was video game maker Nintendo Co. Ltd., which logged triple-digit gains. Nintendo’s interactive Wii® game console was launched during the reporting period. Nippon Steel Corp. also posted strong results for the reporting period. Canon Inc. and consumer electronics company Sony Corp. both posted solid gains. The three financial companies among the ten largest holdings – Mitsubishi UFJ Financial Group Inc., Mizuho Financial Group Inc., and Sumitomo Mitsui Financial Group Inc. – all posted sharp declines for the reporting period.
2 | 2007 iSHARES ANNUAL REPORTTO SHAREHOLDERS |
Table of Contents
Shareholder Expenses (Unaudited)
iSHARES® MSCI JAPAN INDEX FUND
As a shareholder of the Fund, you incur two types of costs: (1) transaction costs, including brokerage commissions on purchases and sales of fund shares and (2) ongoing costs, including management fees and other fund expenses. The following Example is intended to help you understand your ongoing costs (in dollars and cents) of investing in the Fund and to compare these costs with the ongoing costs of investing in other funds.
The Example is based on an investment of $1,000 invested at the beginning of the period and held for the entire period from March 1, 2007 to August 31, 2007.
ACTUAL EXPENSES
The first line in the table below provides information about actual account values and actual expenses. You may use the information in this line, together with the amount you invested, to estimate the expenses that you paid over the period. Simply divide your account value by $1,000 (for example, an $8,600 account value divided by $1,000 = 8.6), then multiply the result by the number in the first line under the heading entitled “Expenses Paid During Period” to estimate the expenses you paid on your account during this period.
HYPOTHETICAL EXAMPLE FOR COMPARISON PURPOSES
The second line in the table below provides information about hypothetical account values and hypothetical expenses based on the Fund’s actual expense ratio and an assumed rate of return of 5% per year before expenses, which is not the Fund’s actual return. The hypothetical account values and expenses may not be used to estimate the actual ending account balance or expenses you paid for the period. You may use this information to compare the ongoing costs of investing in your Fund and other funds. To do so, compare this 5% hypothetical example with the 5% hypothetical examples that appear in the shareholder reports of the other funds.
Please note that the expenses shown in the table are meant to highlight your ongoing costs only and do not reflect any transactional costs, such as brokerage commissions paid on purchases and sales of fund shares. Therefore, the second line in the table is useful in comparing ongoing costs only and will not help you determine the relative total costs of owning different funds. In addition, if these transactional costs were included, your costs would have been higher.
| Beginning Account Value (3/1/07) | Ending Account Value (8/31/07) | Annualized Expense Ratio | Expenses Paid During Perioda (3/1/07 to 8/31/07) | ||||||
Actual | $1,000.00 | $949.40 | 0.51 | % | $2.51 | ||||
Hypothetical (5% return before expenses) | 1,000.00 | 1,022.60 | 0.51 | 2.60 |
a | Expenses are calculated using the Fund’s annualized expense ratio (as disclosed in the table), multiplied by the average account value for the period, multiplied by the number of days in the period (184 days) and divided by the number of days in the year (365 days). |
SHAREHOLDER EXPENSES | 3 |
Table of Contents
iSHARES® MSCI JAPAN INDEX FUND
August 31, 2007
| Security | Shares | Value | |||
COMMON STOCKS – 99.89% | |||||
ADVERTISING – 0.26% | |||||
Asatsu-DK Inc. | 139,500 | $ | 4,669,456 | ||
Dentsu Inc. | 6,975 | 19,436,009 | |||
Hakuhodo DY Holdings Inc. | 97,650 | 6,781,542 | |||
| 30,887,007 | |||||
AGRICULTURE – 0.92% | |||||
Japan Tobacco Inc. | 19,530 | 108,336,195 | |||
| 108,336,195 | |||||
AIRLINES – 0.15% | |||||
All Nippon Airways Co. Ltd. | 2,790,000 | 11,120,045 | |||
Japan Airlines Corp.a,b | 2,790,000 | 6,354,311 | |||
| 17,474,356 | |||||
APPAREL – 0.22% | |||||
ASICS Corp. | 461,000 | 5,965,578 | |||
Gunze Ltd. | 1,395,000 | 7,004,184 | |||
Onward Kashiyama Co. Ltd. | 1,105,000 | 13,050,468 | |||
| 26,020,230 | |||||
AUTO MANUFACTURERS – 8.17% | |||||
Hino Motors Ltd. | 1,395,000 | 9,976,750 | |||
Honda Motor Co. Ltd. | 6,417,000 | 211,473,407 | |||
Nissan Motor Co. Ltd. | 9,346,800 | 89,827,332 | |||
Toyota Motor Corp. | 11,160,000 | 650,835,521 | |||
| 962,113,010 | |||||
AUTO PARTS & EQUIPMENT – 1.74% | |||||
Aisin Seiki Co. Ltd. | 837,200 | 31,562,472 | |||
Bridgestone Corp. | 2,511,000 | 50,256,826 | |||
Denso Corp. | 2,093,200 | 73,315,723 | |||
JTEKT Corp. | 418,500 | 6,643,144 | |||
NGK Spark Plug Co. Ltd. | 629,000 | 10,391,537 | |||
NHK Spring Co. Ltd. | 406,000 | 3,635,664 | |||
NOK Corp. | 418,500 | 8,105,357 | |||
Sumitomo Rubber Industries Inc. | 418,500 | 4,650,201 | |||
Tokai Rika Co. Ltd. | 139,500 | 3,742,786 | |||
Toyoda Gosei Co. Ltd. | 279,000 | 9,001,941 | |||
Toyota Boshoku Corp. | 139,500 | 4,248,242 | |||
| 205,553,893 | |||||
BANKS – 9.80% | |||||
Bank of Kyoto Ltd. (The) | 1,395,000 | 16,619,894 | |||
Bank of Yokohama Ltd. (The) | 5,580,000 | 39,618,168 | |||
| Security | Shares | Value | |||
Chiba Bank Ltd. (The) | 2,790,000 | $ | 22,480,783 | ||
Fukuoka Financial Group Inc.a | 2,796,000 | 16,016,426 | |||
Gunma Bank Ltd. | 1,395,000 | 9,663,849 | |||
Hachijuni Bank Ltd. (The) | 1,395,000 | 10,783,074 | |||
Hiroshima Bank Ltd. (The) | 1,395,000 | 7,942,889 | |||
Hokuhoku Financial Group Inc. | 5,585,000 | 16,333,649 | |||
Joyo Bank Ltd. (The) | 2,790,000 | 15,284,045 | |||
Mitsubishi UFJ Financial Group Inc. | 33,480 | 320,603,891 | |||
Mitsubishi UFJ Securities Co. Ltd. | 1,395,000 | 13,502,912 | |||
Mitsui Trust Holdings Inc. | 2,795,000 | 23,292,672 | |||
Mizuho Financial Group Inc. | 39,060 | 246,999,784 | |||
Nishi-Nippon City Bank Ltd. (The) | 2,790,000 | 8,761,247 | |||
Resona Holdings Inc.b | 22,320 | 46,983,393 | |||
Sapporo Hokuyo Holdings Inc. | 1,395 | 14,923,004 | |||
77 Bank Ltd. (The) | 1,395,000 | 9,411,120 | |||
Shinsei Bank Ltd. | 5,580,000 | 18,629,686 | |||
Shizuoka Bank Ltd. (The) | 2,790,000 | 29,147,996 | |||
Sumitomo Mitsui Financial Group Inc. | 26,695 | 210,722,728 | |||
Sumitomo Trust and Banking Co. Ltd. (The) | 5,580,000 | 46,020,618 | |||
Suruga Bank Ltd. | 776,000 | 10,182,427 | |||
| 1,153,924,255 | |||||
BEVERAGES – 0.65% | |||||
Asahi Breweries Ltd. | 1,395,000 | 20,663,547 | |||
Coca-Cola West Japan Co. Ltd. | 279,000 | 6,173,791 | |||
ITO EN Ltd.b | 279,000 | 6,980,115 | |||
Kirin Holdings Co. Ltd. | 2,790,000 | 34,732,088 | |||
Sapporo Holdings Ltd.b | 1,395,000 | 8,003,062 | |||
| 76,552,603 | |||||
BUILDING MATERIALS – 1.46% | |||||
Asahi Glass Co. Ltd. | 4,185,000 | 52,386,965 | |||
Daikin Industries Ltd. | 983,500 | 44,120,260 | |||
JS Group Corp. | 1,116,000 | 22,143,812 | |||
Matsushita Electric Works Ltd. | 1,395,000 | 17,053,142 | |||
Nippon Sheet Glass Co. Ltd. | 2,790,000 | 16,439,374 | |||
Sumitomo Osaka Cement Co. Ltd. | 1,395,000 | 3,441,919 | |||
4 | 2007 iSHARES ANNUAL REPORTTO SHAREHOLDERS |
Table of Contents
Schedule of Investments (Continued)
iSHARES® MSCI JAPAN INDEX FUND
August 31, 2007
| Security | Shares | Value | |||
Taiheiyo Cement Corp. | 4,185,000 | $ | 16,535,651 | ||
| 172,121,123 | |||||
CHEMICALS – 4.15% | |||||
Asahi Kasei Corp. | 5,580,000 | 41,880,689 | |||
Daicel Chemical Industries Ltd. | 1,395,000 | 9,844,369 | |||
Dainippon Ink & Chemical Inc. | 2,790,000 | 11,529,224 | |||
Denki Kagaku Kogyo Kabushiki Kaisha | 2,790,000 | 14,224,993 | |||
Hitachi Chemical Co. Ltd. | 279,000 | 5,692,404 | |||
JSR Corp. | 697,500 | 15,614,998 | |||
Kaneka Corp. | 1,395,000 | 11,300,565 | |||
Mitsubishi Chemical Holdings Corp. | 4,882,500 | 45,659,578 | |||
Mitsubishi Gas Chemical Co. Inc. | 1,395,000 | 11,757,883 | |||
Mitsui Chemicals Inc. | 2,790,000 | 25,320,968 | |||
Nippon Kayaku Co. Ltd. | 1,395,000 | 11,095,975 | |||
Nissan Chemical Industries Ltd. | 1,103,000 | 13,797,610 | |||
Nitto Denko Corp. | 697,500 | 32,493,637 | |||
Shin-Etsu Chemical Co. Ltd. | 1,674,000 | 121,020,748 | |||
Showa Denko K.K. | 4,185,000 | 15,235,906 | |||
Sumitomo Chemical Co. Ltd. | 5,580,000 | 41,639,995 | |||
Taiyo Nippon Sanso Corp. | 1,395,000 | 12,323,513 | |||
Tokuyama Corp.b | 908,000 | 12,321,822 | |||
Tosoh Corp. | 2,790,000 | 17,065,177 | |||
Ube Industries Ltd. | 4,193,000 | 13,130,821 | |||
Zeon Corp. | 566,000 | 5,732,511 | |||
| 488,683,386 | |||||
COMMERCIAL SERVICES – 0.88% | |||||
Benesse Corp. | 279,000 | 10,229,479 | |||
Dai Nippon Printing Co. Ltd. | 2,790,000 | 40,701,290 | |||
Goodwill Group Inc. (The)a,b | 5,580 | 1,160,625 | |||
Kamigumi Co. Ltd. | 1,395,000 | 11,974,507 | |||
KK DaVinci Advisorsa | 4,185 | 2,902,765 | |||
Park 24 Co. Ltd.b | 279,000 | 2,683,734 | |||
TIS Inc. | 279,000 | 6,017,340 | |||
Toppan Printing Co. Ltd. | 2,790,000 | 27,968,597 | |||
| 103,638,337 | |||||
COMPUTERS – 1.05% | |||||
CSK Holdings Corp. | 279,000 | 10,229,479 | |||
Fujitsu Ltd. | 6,975,000 | 47,597,162 | |||
Itochu Techno-Science Corp. | 139,500 | 5,487,814 | |||
| Security | Shares | Value | |||
Meitec Corp.b | 139,500 | $ | 4,476,901 | ||
Obic Co. Ltd. | 13,950 | 2,755,942 | |||
Otsuka Corp. | 62,000 | 6,252,685 | |||
TDK Corp. | 558,000 | 47,416,641 | |||
| 124,216,624 | |||||
COSMETICS & PERSONAL CARE – 0.90% | |||||
Aderans Co. Ltd.b | 139,500 | 2,545,335 | |||
Kao Corp. | 2,325,000 | 65,990,165 | |||
Shiseido Co. Ltd. | 1,395,000 | 29,063,753 | |||
Uni-Charm Corp. | 139,500 | 8,039,167 | |||
| 105,638,420 | |||||
DISTRIBUTION & WHOLESALE – 4.38% | |||||
Canon Marketing Japan Inc. | 139,500 | 2,719,838 | |||
Hitachi High-Technologies Corp. | 139,500 | 3,261,398 | |||
ITOCHU Corp. | 5,580,000 | 60,462,235 | |||
Marubeni Corp. | 5,584,000 | 45,523,703 | |||
Mitsubishi Corp. | 5,440,500 | 153,008,929 | |||
Mitsui & Co. Ltd. | 6,975,000 | 145,017,901 | |||
Sojitz Corp. | 3,906,000 | 16,309,399 | |||
Sumitomo Corp. | 4,185,000 | 72,388,603 | |||
Toyota Tsusho Corp. | 697,500 | 17,269,767 | |||
| 515,961,773 | |||||
DIVERSIFIED FINANCIAL SERVICES – 3.03% | |||||
Acom Co. Ltd.b | 292,950 | 8,744,399 | |||
Aeon Credit Service Co. Ltd. | 419,370 | 5,159,140 | |||
AIFUL Corp.b | 279,000 | 5,572,057 | |||
Credit Saison Co. Ltd. | 697,500 | 18,292,715 | |||
Daiwa Securities Group Inc. | 5,580,000 | 55,263,254 | |||
Mitsubishi UFJ Lease & Finance Co. Ltd. | 125,550 | 4,949,864 | |||
Nikko Cordial Corp. | 2,092,500 | 26,969,719 | |||
Nomura Holdings Inc. | 7,254,000 | 128,289,695 | |||
ORIX Corp. | 348,750 | 74,645,106 | |||
Promise Co. Ltd.b | 348,950 | 9,603,162 | |||
Shinko Securities Co. Ltd. | 1,395,000 | 6,643,144 | |||
Takefuji Corp. | 460,470 | 12,354,412 | |||
| 356,486,667 | |||||
ELECTRIC – 3.36% | |||||
Chubu Electric Power Co. Inc. | 2,650,500 | 70,655,610 | |||
Electric Power Development Co. Ltd. | 697,500 | 25,573,696 | |||
SCHEDULEOF INVESTMENTS | 5 |
Table of Contents
Schedule of Investments (Continued)
iSHARES® MSCI JAPAN INDEX FUND
August 31, 2007
| Security | Shares | Value | |||
Hokkaido Electric Power Co. Inc. | 697,500 | $ | 15,765,432 | ||
Kansai Electric Power Co. Inc. (The) | 3,069,000 | 71,618,384 | |||
Kyushu Electric Power Co. Inc. | 1,534,500 | 40,905,879 | |||
Tohoku Electric Power Co. Inc. | 1,813,600 | 43,261,045 | |||
Tokyo Electric Power Co. Inc. (The) | 4,882,500 | 128,049,001 | |||
| 395,829,047 | |||||
ELECTRICAL COMPONENTS & | |||||
Casio Computer Co. Ltd. | 976,500 | 14,860,424 | |||
Fujikura Ltd. | 1,395,000 | 8,291,895 | |||
Furukawa Electric Co. Ltd. (The) | 2,790,000 | 13,238,148 | |||
Hitachi Cable Ltd. | 1,395,000 | 8,135,444 | |||
Hitachi Ltd. | 13,950,000 | 90,019,411 | |||
Mitsubishi Electric Corp. | 8,370,000 | 98,275,202 | |||
SANYO Electric Co. Ltd.a,b | 5,631,000 | 8,744,166 | |||
Sharp Corp. | 4,185,000 | 72,749,644 | |||
Stanley Electric Co. Ltd. | 559,200 | 12,229,409 | |||
Sumitomo Electric Industries Ltd. | 3,069,000 | 48,795,816 | |||
Toshiba Corp. | 12,555,000 | 113,077,859 | |||
Ushio Inc. | 418,500 | 8,159,513 | |||
| 496,576,931 | |||||
ELECTRONICS – 4.61% | |||||
Advantest Corp. | 558,000 | 20,507,096 | |||
Alps Electric Co. Ltd. | 697,500 | 8,177,565 | |||
Dainippon Screen Manufacturing Co. Ltd. | 815,000 | 5,695,121 | |||
Fanuc Ltd. | 697,500 | �� | 67,815,425 | ||
Hirose Electric Co. Ltd. | 139,500 | 16,800,414 | |||
IBIDEN Co. Ltd. | 558,000 | 47,416,641 | |||
Keyence Corp. | 139,592 | 30,937,484 | |||
Kyocera Corp. | 697,500 | 63,783,807 | |||
Mabuchi Motor Co. Ltd. | 139,500 | 9,074,149 | |||
Minebea Co. Ltd. | 1,395,000 | 8,508,519 | |||
Mitsumi Electric Co. Ltd. | 139,500 | 5,247,121 | |||
Murata Manufacturing Co. Ltd. | 837,000 | 58,632,964 | |||
NEC Corp. | 8,370,000 | 39,497,821 | |||
NGK Insulators Ltd. | 1,395,000 | 46,092,827 | |||
Nippon Electric Glass Co. Ltd. | 1,395,500 | 20,201,432 | |||
Omron Corp. | 976,500 | 25,862,529 | |||
Secom Co. Ltd. | 837,000 | 40,580,943 | |||
Tokyo Seimitsu Co. Ltd.b | 139,500 | 4,176,034 | |||
Yaskawa Electric Corp. | 1,142,000 | 13,940,646 | |||
Yokogawa Electric Corp. | 837,000 | 10,376,302 | |||
| 543,324,840 | |||||
| Security | Shares | Value | |||
ENGINEERING & CONSTRUCTION – 0.97% | |||||
Chiyoda Corp. | 609,000 | $ | 10,470,923 | ||
JGC Corp. | 1,202,000 | 21,154,122 | |||
Kajima Corp. | 4,185,000 | 17,402,148 | |||
Nishimatsu Construction Co. Ltd.b | 1,395,000 | 4,537,074 | |||
Obayashi Corp. | 2,790,000 | 14,393,478 | |||
Okumura Corp.b | 1,395,000 | 7,798,473 | |||
Shimizu Corp. | 2,790,000 | 17,763,189 | |||
Taisei Corp. | 4,185,000 | 13,358,495 | |||
Toda Corp.b | 1,395,000 | 7,569,814 | |||
| 114,447,716 | |||||
ENTERTAINMENT – 0.23% | |||||
Oriental Land Co. Ltd. | 279,000 | 15,741,362 | |||
Toho Co. Ltd. | 559,200 | 11,795,229 | |||
| 27,536,591 | |||||
ENVIRONMENTAL CONTROL – 0.07% | |||||
Kurita Water Industries Ltd. | 279,000 | 8,472,415 | |||
| 8,472,415 | |||||
FOOD – 0.96% | |||||
Ajinomoto Co. Inc. | 2,790,000 | 35,261,614 | |||
Kikkoman Corp.b | 1,395,000 | 18,846,310 | |||
Meiji Dairies Corp. | 1,395,000 | 7,750,335 | |||
Meiji Seika Kaisha Ltd. | 1,395,000 | 6,486,693 | |||
Nichirei Corp. | 1,395,000 | 6,534,832 | |||
Nippon Meat Packers Inc. | 1,118,000 | 12,085,184 | |||
Nisshin Seifun Group Inc. | 699,500 | 6,402,704 | |||
Nissin Food Products Co. Ltd.b | 419,300 | 13,311,685 | |||
Yakult Honsha Co. Ltd.b | 279,000 | 6,414,485 | |||
| 113,093,842 | |||||
FOREST PRODUCTS & PAPER – 0.24% | |||||
Nippon Paper Group Inc. | 4,185 | 14,080,576 | |||
Oji Paper Co. Ltd. | 2,790,000 | 13,936,160 | |||
| 28,016,736 | |||||
6 | 2007 iSHARES ANNUAL REPORTTO SHAREHOLDERS |
Table of Contents
Schedule of Investments (Continued)
iSHARES® MSCI JAPAN INDEX FUND
August 31, 2007
| Security | Shares | Value | |||
GAS – 0.67% | |||||
Osaka Gas Co. Ltd. | 8,370,000 | $ | 31,049,476 | ||
Tokyo Gas Co. Ltd. | 9,765,000 | 48,439,589 | |||
| 79,489,065 | |||||
HAND & MACHINE TOOLS – 0.96% | |||||
Fuji Electric Holdings Co. Ltd. | 2,790,000 | 12,082,820 | |||
Makita Corp. | 418,500 | 16,174,611 | |||
Nidec Corp. | 467,300 | 32,734,987 | |||
OSG Corp.b | 279,000 | 3,470,802 | |||
SMC Corp. | 279,000 | 36,970,539 | |||
THK Co. Ltd. | 558,600 | 11,421,145 | |||
| 112,854,904 | |||||
HEALTH CARE - PRODUCTS – 0.77% | |||||
Hoya Corp. | 1,674,000 | 58,055,299 | |||
Terumo Corp. | 697,500 | 32,734,331 | |||
| 90,789,630 | |||||
HOME BUILDERS – 0.67% | |||||
Daiwa House Industry Co. Ltd. | 2,381,000 | 31,550,843 | |||
Haseko Corp.a | 4,185,000 | 11,264,461 | |||
Sekisui Chemical Co. Ltd. | 2,371,000 | 17,550,084 | |||
Sekisui House Ltd. | 1,395,000 | 18,100,160 | |||
| 78,465,548 | |||||
HOME FURNISHINGS – 3.15% | |||||
Matsushita Electric Industrial Co. Ltd. | 8,370,015 | 145,860,590 | |||
Pioneer Corp. | 697,900 | 8,489,315 | |||
Sony Corp. | 4,185,000 | 201,460,553 | |||
Yamaha Corp. | 697,500 | 14,742,484 | |||
| 370,552,942 | |||||
HOUSEWARES – 0.09% | |||||
TOTO Ltd.b | 1,395,000 | 11,120,045 | |||
| 11,120,045 | |||||
INSURANCE – 2.22% | |||||
Millea Holdings Inc. | 3,069,000 | 118,613,812 | |||
Mitsui Sumitomo Insurance Co. Ltd. | 4,931,000 | 55,556,969 | |||
Sompo Japan Insurance Inc. | 3,509,000 | 39,202,476 | |||
T&D Holdings Inc. | 837,000 | 48,596,040 | |||
| 261,969,297 | |||||
INTERNET – 1.08% | |||||
Access Co. Ltd.a,b | 995 | 2,377,734 | |||
E*Trade Securities Co. Ltd. | 5,580 | 5,006,427 | |||
| Security | Shares | Value | |||
eAccess Ltd. | 4,185 | $ | 2,166,242 | ||
Matsui Securities Co. Ltd.b | 418,500 | 3,487,650 | |||
SBI Holdings Inc. | 39,060 | 10,446,103 | |||
SoftBank Corp. | 3,069,800 | 58,925,118 | |||
Trend Micro Inc. | 533,500 | 21,907,950 | |||
Yahoo! Japan Corp. | 62,775 | 23,232,951 | |||
| 127,550,175 | |||||
IRON & STEEL – 4.02% | |||||
Daido Steel Co. Ltd. | 1,395,000 | 11,673,640 | |||
JFE Holdings Inc. | 2,232,250 | 145,587,802 | |||
Kobe Steel Ltd. | 11,160,000 | 40,629,082 | |||
Nippon Steel Corp. | 23,715,000 | 166,126,731 | |||
Nisshin Steel Co. Ltd. | 4,193,000 | 16,784,299 | |||
Sumitomo Metal Industries Ltd. | 16,740,000 | 84,772,290 | |||
Tokyo Steel Manufacturing Co. Ltd. | 558,600 | 7,397,239 | |||
| 472,971,083 | |||||
LEISURE TIME – 0.49% | |||||
Namco Bandai Holdings Inc. | 837,098 | 12,125,157 | |||
Round One Corp.b | 1,395 | 3,273,433 | |||
Sankyo Co. Ltd. | 279,000 | 11,505,155 | |||
Shimano Inc. | 279,000 | 8,953,802 | |||
Yamaha Motor Co. Ltd. | 837,200 | 22,028,728 | |||
| 57,886,275 | |||||
MACHINERY – 0.36% | |||||
Hitachi Construction Machinery Co. Ltd. | 418,500 | 14,730,449 | |||
Japan Steel Works Ltd. (The) | 1,395,000 | 20,651,512 | |||
Okuma Corp.b | 493,000 | 7,336,626 | |||
| 42,718,587 | |||||
MACHINERY - CONSTRUCTION & MINING – 0.98% | |||||
Komatsu Ltd. | 3,766,500 | 116,002,286 | |||
| 116,002,286 | |||||
MACHINERY - DIVERSIFIED – 1.02% | |||||
Amada Co. Ltd. | 1,395,000 | 15,103,525 | |||
Ebara Corp.b | 1,395,000 | 6,270,069 | |||
Kubota Corp. | 4,185,000 | 32,421,430 | |||
Sumitomo Heavy Industries Ltd. | 2,790,000 | 31,217,961 | |||
SCHEDULEOF INVESTMENTS | 7 |
Table of Contents
Schedule of Investments (Continued)
iSHARES® MSCI JAPAN INDEX FUND
August 31, 2007
| Security | Shares | Value | |||
Toyota Industries Corp. | 837,000 | $ | 35,454,169 | ||
| 120,467,154 | |||||
MANUFACTURING – 3.02% | |||||
FUJIFILM Holdings Corp. | 2,092,500 | 90,982,185 | |||
Glory Ltd. | 139,500 | 4,091,791 | |||
IHI Corp. | 5,586,000 | 18,119,621 | |||
Kawasaki Heavy Industries Ltd. | 5,580,000 | 21,903,118 | |||
Konica Minolta Holdings Inc. | 2,092,500 | 32,818,574 | |||
Mitsubishi Heavy Industries Ltd. | 13,950,000 | 85,325,886 | |||
Nikon Corp. | 1,395,000 | 43,565,543 | |||
Olympus Corp. | 1,395,000 | 59,451,322 | |||
| 356,258,040 | |||||
MEDIA – 0.10% | |||||
Fuji Television Network Inc. | 1,655 | 3,398,094 | |||
Jupiter Telecommunications Co. Ltd.a | 5,580 | 4,284,346 | |||
Tokyo Broadcasting System Inc.b | 139,500 | 4,163,999 | |||
| 11,846,439 | |||||
METAL FABRICATE & HARDWARE – 0.30% | |||||
NSK Ltd. | 2,790,000 | 23,973,084 | |||
NTN Corp. | 1,395,000 | 11,420,912 | |||
| 35,393,996 | |||||
MINING – 0.94% | |||||
DOWA HOLDINGS Co. Ltd.b | 1,395,000 | 15,572,876 | |||
Mitsubishi Materials Corp. | 4,185,000 | 23,251,003 | |||
Mitsui Mining & Smelting Co. Ltd. | 2,790,000 | 11,360,739 | |||
Nippon Light Metal Co. Ltd. | 1,395,000 | 3,056,809 | |||
Sumitomo Metal Mining Co. Ltd. | 2,322,000 | 46,073,416 | |||
Sumitomo Titanium Corp.b | 78,400 | 6,141,328 | |||
Toho Titanium Co. Ltd.b | 139,500 | 4,886,080 | |||
| 110,342,251 | |||||
OFFICE & BUSINESS EQUIPMENT – 2.74% | |||||
Canon Inc. | 4,324,550 | 246,978,571 | |||
Ricoh Co. Ltd. | 2,790,000 | 61,617,565 | |||
Seiko Epson Corp. | 558,000 | 14,537,894 | |||
| 323,134,030 | |||||
| Security | Shares | Value | |||
OIL & GAS – 1.10% | |||||
INPEX Holdings Inc. | 3,488 | $ | 31,896,476 | ||
Nippon Mining Holdings Inc. | 3,487,500 | 31,500,776 | |||
Nippon Oil Corp. | 5,580,500 | 47,035,746 | |||
Showa Shell Sekiyu K.K. | 418,500 | 5,076,228 | |||
TonenGeneral Sekiyu K.K. | 1,395,000 | 13,803,779 | |||
| 129,313,005 | |||||
PACKAGING & CONTAINERS – 0.11% | |||||
Toyo Seikan Kaisha Ltd. | 697,500 | 13,238,149 | |||
| 13,238,149 | |||||
PHARMACEUTICALS – 5.01% | |||||
Alfresa Holdings Corp. | 139,500 | 9,266,704 | |||
Astellas Pharma Inc. | 2,232,030 | 103,403,365 | |||
Chugai Pharmaceutical Co. Ltd.b | 1,116,000 | 20,025,708 | |||
Daiichi Sankyo Co. Ltd. | 2,929,569 | 79,864,022 | |||
Eisai Co. Ltd. | 1,116,000 | 46,405,729 | |||
Kyowa Hakko Kogyo Co. Ltd. | 1,395,000 | 13,526,981 | |||
Mediceo Paltac Holdings Co. Ltd. | 558,000 | 8,568,693 | |||
Santen Pharmaceutical Co. Ltd. | 139,500 | 3,453,953 | |||
Shionogi & Co. Ltd. | 1,395,000 | 20,290,471 | |||
Suzuken Co. Ltd. | 279,000 | 9,218,565 | |||
Taisho Pharmaceutical Co. Ltd. | 1,098,000 | 21,455,118 | |||
Takeda Pharmaceutical Co. Ltd. | 3,488,200 | 238,334,504 | |||
Tanabe Seiyaku Co. Ltd. | 1,395,000 | 16,872,622 | |||
| 590,686,435 | |||||
REAL ESTATE – 2.89% | |||||
Aeon Mall Co. Ltd. | 139,500 | 4,200,104 | |||
Daito Trust Construction Co. Ltd. | 418,500 | 19,748,911 | |||
Leopalace21 Corp. | 558,000 | 17,233,663 | |||
Mitsubishi Estate Co. Ltd. | 4,484,000 | 119,918,906 | |||
Mitsui Fudosan Co. Ltd. | 3,644,000 | 95,253,591 | |||
NTT Urban Development Corp. | 4,185 | 7,509,641 | |||
Sumitomo Realty & Development Co. Ltd. | 1,395,000 | 45,611,439 | |||
Tokyo Tatemono Co. Ltd. | 1,395,000 | 18,425,096 | |||
Tokyu Land Corp. | 1,395,000 | 12,853,039 | |||
| 340,754,390 | |||||
REAL ESTATE INVESTMENT TRUSTS – 0.51% | |||||
Japan Real Estate Investment Corp. | 1,395 | 15,524,738 | |||
8 | 2007 iSHARES ANNUAL REPORTTO SHAREHOLDERS |
Table of Contents
Schedule of Investments (Continued)
iSHARES® MSCI JAPAN INDEX FUND
August 31, 2007
| Security | Shares | Value | |||
Japan Retail Fund Investment Corp. | 1,395 | $ | 11,432,947 | ||
Nippon Building Fund Inc. | 2,173 | 27,932,278 | |||
Nomura Real Estate Office Fund Inc. | 520 | 4,934,650 | |||
| 59,824,613 | |||||
RETAIL – 2.71% | |||||
AEON Co. Ltd. | 2,371,500 | 32,366,070 | |||
Aoyama Trading Co. Ltd. | 279,000 | 7,533,710 | |||
Autobacs Seven Co. Ltd. | 139,500 | 3,682,613 | |||
Citizen Watch Co. Ltd. | 1,534,500 | 14,270,724 | |||
Daimaru Inc. (The)c | 1,400,000 | 15,218,048 | |||
EDION Corp. | 279,000 | 2,953,311 | |||
FamilyMart Co. Ltd. | 279,000 | 7,172,670 | |||
Fast Retailing Co. Ltd. | 248,700 | 14,568,201 | |||
Isetan Co. Ltd. | 837,000 | 11,026,174 | |||
Lawson Inc. | 279,000 | 9,266,704 | |||
Marui Co. Ltd. | 1,255,500 | 14,362,188 | |||
Mitsukoshi Ltd.b | 1,395,000 | 6,197,860 | |||
Nitori Co. Ltd. | 139,500 | 7,256,912 | |||
Ryohin Keikaku Co. Ltd. | 139,500 | 9,013,976 | |||
Seven & I Holdings Co. Ltd. | 3,348,080 | 89,251,324 | |||
Shimachu Co. Ltd. | 279,000 | 7,557,779 | |||
Shimamura Co. Ltd. | 47,700 | 4,419,601 | |||
Takashimaya Co. Ltd.b | 1,395,000 | 14,947,074 | |||
UNY Co. Ltd. | 1,245,000 | 10,837,294 | |||
USS Co. Ltd. | 97,650 | 6,562,511 | |||
Yamada Denki Co. Ltd. | 306,900 | 30,765,457 | |||
| 319,230,201 | |||||
SEMICONDUCTORS – 1.17% | |||||
Elpida Memory Inc.a | 418,500 | 16,174,611 | |||
NEC Electronics Corp.a,b | 139,500 | 3,839,063 | |||
Rohm Co. Ltd. | 418,900 | 37,258,845 | |||
Sanken Electric Co. Ltd. | 332,000 | 2,299,927 | |||
Shinko Electric Industries Co. Ltd. | 279,000 | 6,173,791 | |||
Sumco Corp. | 418,500 | 22,348,402 | |||
Tokyo Electron Ltd. | 697,552 | 49,827,292 | |||
| 137,921,931 | |||||
SHIPBUILDING – 0.12% | |||||
Mitsui Engineering & Shipbuilding Co. Ltd. | 2,790,000 | 14,586,033 | |||
| 14,586,033 | |||||
| Security | Shares | Value | |||
SOFTWARE – 0.25% | |||||
Fuji Soft ABC Inc. | 139,500 | $ | 2,882,306 | ||
Konami Corp. | 419,300 | 10,526,360 | |||
Nomura Research Institute Ltd. | 279,000 | 9,387,051 | |||
Oracle Corp.b | 139,500 | 6,125,652 | |||
| 28,921,369 | |||||
STORAGE & WAREHOUSING – 0.04% | |||||
Mitsubishi Logistics Corp. | 319,000 | 4,350,938 | |||
| 4,350,938 | |||||
TELECOMMUNICATIONS – 2.66% | |||||
Hikari Tsushin Inc. | 139,500 | 4,055,687 | |||
KDDI Corp. | 9,765 | 75,397,274 | |||
Nippon Telegraph and Telephone Corp. | 20,925 | 97,119,872 | |||
NTT Data Corp. | 5,580 | 26,957,685 | |||
NTT DoCoMo Inc. | 68,355 | 104,376,785 | |||
Oki Electric Industry Co. Ltd.a,b | 2,790,000 | 4,982,358 | |||
| 312,889,661 | |||||
TEXTILES – 1.05% | |||||
Kuraray Co. Ltd. | 1,395,000 | 18,316,784 | |||
Mitsubishi Rayon Co. Ltd. | 2,790,000 | 17,763,189 | |||
Nisshinbo Industries Inc. | 1,395,000 | 17,101,281 | |||
Teijin Ltd. | 4,185,000 | 20,904,241 | |||
Toray Industries Inc. | 5,580,000 | 42,602,769 | |||
Toyobo Co. Ltd. | 2,790,000 | 6,474,658 | |||
| 123,162,922 | |||||
TOYS, GAMES & HOBBIES – 1.65% | |||||
Nintendo Co. Ltd. | 418,500 | 193,878,704 | |||
| 193,878,704 | |||||
TRANSPORTATION – 4.57% | |||||
Central Japan Railway Co. | 6,975 | 78,225,424 | |||
East Japan Railway Co. | 13,950 | 111,080,101 | |||
Hankyu Hanshin Holdings Inc. | 4,190,800 | 21,258,598 | |||
Kawasaki Kisen Kaisha Ltd. | 2,790,000 | 36,007,764 | |||
Keihin Electric Express Railway Co. Ltd.b | 1,399,000 | 8,810,508 | |||
Keio Corp. | 2,790,000 | 17,161,455 | |||
Kintetsu Corp.b | 6,979,000 | 20,831,938 | |||
Mitsui O.S.K. Lines Ltd. | 4,185,000 | 61,593,495 | |||
Nippon Express Co. Ltd. | 4,185,000 | 22,023,465 | |||
SCHEDULEOF INVESTMENTS | 9 |
Table of Contents
Schedule of Investments (Continued)
iSHARES® MSCI JAPAN INDEX FUND
August 31, 2007
| Security | Shares | Value | ||||
Nippon Yusen Kabushiki | 4,185,000 | $ | 41,339,128 | |||
Odakyu Electric Railway | 1,395,000 | 8,508,519 | ||||
Seino Holdings Co. Ltd. | 1,243,000 | 12,267,541 | ||||
Tobu Railway Co. Ltd. | 4,185,000 | 18,810,206 | ||||
Tokyu Corp. | 4,185,000 | 26,103,222 | ||||
West Japan Railway Co. | 6,975 | 33,636,932 | ||||
Yamato Holdings Co. Ltd. | 1,395,000 | 20,446,922 | ||||
| 538,105,218 | ||||||
VENTURE CAPITAL – 0.05% |
| |||||
JAFCO Co. Ltd. | 139,500 | 5,728,508 | ||||
| 5,728,508 | ||||||
TOTAL COMMON STOCKS | 11,767,309,821 | |||||
PREFERRED STOCKS – 0.01% |
| |||||
BEVERAGES – 0.01% |
| |||||
ITO EN Ltd.a,c | 84,000 | 1,630,505 | ||||
| 1,630,505 | ||||||
TOTAL PREFERRED STOCKS | 1,630,505 | |||||
SHORT-TERM INVESTMENTS – 1.51% |
| |||||
MONEY MARKET FUNDS – 1.51% |
| |||||
Barclays Global Investors Funds Institutional Money Market | 2,620,807 | 2,620,807 | ||||
BGI Cash Premier Fund LLC | 174,969,065 | 174,969,065 | ||||
| 177,589,872 | ||||||
TOTAL SHORT-TERM INVESTMENTS | 177,589,872 | |||||
TOTAL INVESTMENTS IN SECURITIES – 101.41% | 11,946,530,198 | |||||
Other Assets, Less Liabilities – (1.41)% | (166,524,269 | ) | ||||
NET ASSETS – 100.00% | $ | 11,780,005,929 | ||||
a | Non-income earning security. |
b | All or a portion of this security represents a security on loan. See Note 5. |
c | Security valued at fair value in accordance with procedures approved by the Board of Directors. See Note 1. |
d | Affiliated issuer. See Note 2. |
e | The rate quoted is the annualized seven-day yield of the fund at period end. |
f | This security represents an investment of securities lending collateral. See Note 5. |
See notes to financial statements.
10 | 2007 iSHARES ANNUAL REPORTTO SHAREHOLDERS |
Table of Contents
Statement of Assets and Liabilities
iSHARES®, INC.
August 31, 2007
| iShares MSCI Japan Index Fund | ||||
ASSETS | ||||
Investments, at cost: | ||||
Unaffiliated issuers | $ | 9,920,610,864 | ||
Affiliated issuers (Note 2) | 177,589,872 | |||
Total cost of investments | $ | 10,098,200,736 | ||
Investments in securities, at value (including securities on loana) (Note 1): | ||||
Unaffiliated issuers | $ | 11,768,940,326 | ||
Affiliated issuers (Note 2) | 177,589,872 | |||
Total value of investments | 11,946,530,198 | |||
Foreign currency, at valueb | 10,255,878 | |||
Receivables: | ||||
Investment securities sold | 10,114 | |||
Dividends and interest | 4,917,774 | |||
Total Assets | 11,961,713,964 | |||
LIABILITIES | ||||
Payables: | ||||
Securities related to in-kind transactions (Note 4) | 10,114 | |||
Collateral for securities on loan (Note 5) | 174,969,065 | |||
Capital shares redeemed | 1,457,881 | |||
Investment advisory fees (Note 2) | 5,270,975 | |||
Total Liabilities | 181,708,035 | |||
NET ASSETS | $ | 11,780,005,929 | ||
Net assets consist of: | ||||
Paid-in capital | $ | 10,177,961,758 | ||
Undistributed net investment income | 30,074,213 | |||
Accumulated net realized loss | (276,442,960 | ) | ||
Net unrealized appreciation on investments and translation of assets and liabilities in foreign currencies | 1,848,412,918 | |||
NET ASSETS | $ | 11,780,005,929 | ||
Shares outstandingc | 837,000,000 | |||
Net asset value per share | $ | 14.07 | ||
a | Securities on loan with market value of $166,804,096. See Note 5. |
b | Cost of foreign currency: $10,335,172. |
c | $0.001 par value, number of shares authorized: 2,124,600,000. |
See notes to financial statements.
FINANCIAL STATEMENTS | 11 |
Table of Contents
Statement of Operations
iSHARES®, INC.
Year ended August 31, 2007
| iShares MSCI Japan Index Fund | ||||
NET INVESTMENT INCOME | ||||
Dividends from unaffiliated issuersa | $ | 162,797,217 | ||
Interest from affiliated issuers (Note 2) | 288,662 | |||
Securities lending income from unaffiliated issuers | 1,479,648 | |||
Securities lending income from affiliated issuers (Note 2) | 545,457 | |||
Total investment income | 165,110,984 | |||
EXPENSES | ||||
Investment advisory fees (Note 2) | 70,930,669 | |||
Total expenses | 70,930,669 | |||
Net investment income | 94,180,315 | |||
NET REALIZED AND UNREALIZED GAIN (LOSS) | ||||
Net realized gain (loss) from: | ||||
Investments in unaffiliated issuers | (59,633,850 | ) | ||
In-kind redemptions | 1,221,189,258 | |||
Foreign currency transactions | (2,820,743 | ) | ||
Net realized gain | 1,158,734,665 | |||
Net change in unrealized appreciation (depreciation) on: | ||||
Investments | (877,961,535 | ) | ||
Translation of assets and liabilities in foreign currencies | 319,770 | |||
Net change in unrealized appreciation (depreciation) | (877,641,765 | ) | ||
Net realized and unrealized gain | 281,092,900 | |||
NET INCREASE IN NET ASSETS RESULTING FROM OPERATIONS | $ | 375,273,215 | ||
a | Net of foreign withholding tax of $12,195,485. |
See notes to financial statements.
12 | 2007 iSHARES ANNUAL REPORTTO SHAREHOLDERS |
Table of Contents
Statements of Changes in Net Assets
iSHARES®, INC.
| iShares MSCI Japan Index Fund | ||||||||
| Year ended August 31, 2007 | Year ended August 31, 2006 | |||||||
INCREASE (DECREASE) IN NET ASSETS | ||||||||
OPERATIONS: | ||||||||
Net investment income | $ | 94,180,315 | $ | 60,448,936 | ||||
Net realized gain | 1,158,734,665 | 448,842,325 | ||||||
Net change in unrealized appreciation (depreciation) | (877,641,765 | ) | 1,877,307,601 | |||||
Net increase in net assets resulting from operations | 375,273,215 | 2,386,598,862 | ||||||
DISTRIBUTIONS TO SHAREHOLDERS: | ||||||||
From net investment income | (97,091,876 | ) | (55,636,178 | ) | ||||
Total distributions to shareholders | (97,091,876 | ) | (55,636,178 | ) | ||||
CAPITAL SHARE TRANSACTIONS: | ||||||||
Proceeds from shares sold | 1,146,746,106 | 5,381,707,859 | ||||||
Cost of shares redeemed | (3,369,511,925 | ) | (1,236,187,530 | ) | ||||
Net increase (decrease) in net assets from capital share transactions | (2,222,765,819 | ) | 4,145,520,329 | |||||
INCREASE (DECREASE) IN NET ASSETS | (1,944,584,480 | ) | 6,476,483,013 | |||||
NET ASSETS | ||||||||
Beginning of year | 13,724,590,409 | 7,248,107,396 | ||||||
End of year | $ | 11,780,005,929 | $ | 13,724,590,409 | ||||
Undistributed net investment income included in net assets at end of year | $ | 30,074,213 | $ | 29,465,062 | ||||
SHARES ISSUED AND REDEEMED | ||||||||
Shares sold | 79,800,000 | 426,600,000 | ||||||
Shares redeemed | (237,000,000 | ) | (91,800,000 | ) | ||||
Net increase (decrease) in shares outstanding | (157,200,000 | ) | 334,800,000 | |||||
See notes to financial statements.
FINANCIAL STATEMENTS | 13 |
Table of Contents
iSHARES®, INC.
(For a share outstanding throughout each period)
| iShares MSCI Japan Index Fund | ||||||||||||||||||||
| Year ended Aug. 31, 2007 | Year ended Aug. 31, 2006 | Year ended Aug. 31, 2005 | Year ended Aug. 31, 2004 | Year ended Aug. 31, 2003 | ||||||||||||||||
Net asset value, beginning of year | $ | 13.80 | $ | 10.99 | $ | 9.89 | $ | 8.29 | $ | 7.77 | ||||||||||
Income from investment operations: | ||||||||||||||||||||
Net investment incomea | 0.10 | 0.06 | 0.06 | 0.03 | 0.00 | b | ||||||||||||||
Net realized and unrealized gainc | 0.27 | 2.81 | 1.08 | 1.57 | 0.52 | |||||||||||||||
Total from investment operations | 0.37 | 2.87 | 1.14 | 1.60 | 0.52 | |||||||||||||||
Less distributions from: | ||||||||||||||||||||
Net investment income | (0.10 | ) | (0.06 | ) | (0.04 | ) | (0.00 | )b | – | |||||||||||
Total distributions | (0.10 | ) | (0.06 | ) | (0.04 | ) | (0.00 | )b | – | |||||||||||
Net asset value, end of year | $ | 14.07 | $ | 13.80 | $ | 10.99 | $ | 9.89 | $ | 8.29 | ||||||||||
Total return | 2.68 | % | 26.10 | % | 11.58 | % | 19.32 | % | 6.69 | % | ||||||||||
Ratios/Supplemental data: | ||||||||||||||||||||
Net assets, end of year (000s) | $ | 11,780,006 | $ | 13,724,590 | $ | 7,248,107 | $ | 5,863,332 | $ | 1,726,855 | ||||||||||
Ratio of expenses to average net assets | 0.52 | % | 0.54 | % | 0.57 | % | 0.64 | %d | 0.84 | % | ||||||||||
Ratio of net investment income to average net assets | 0.68 | % | 0.48 | % | 0.59 | % | 0.28 | % | 0.03 | % | ||||||||||
Portfolio turnover ratee | 3 | % | 8 | % | 6 | % | 5 | % | 2 | % | ||||||||||
a | Based on average shares outstanding throughout each period. |
b | Rounds to less than $0.01. |
c | The amounts reported may not accord with the change in aggregate gains and losses in securities due to the timing of capital share transactions. |
d | Ratio of expenses to average net assets prior to voluntarily reimbursed distribution fees for the year ended August 31, 2004 was 0.78%. |
e | Portfolio turnover rates exclude portfolio securities received or delivered as a result of processing capital share transactions in Creation Units. |
See notes to financial statements.
14 | 2007 iSHARESANNUAL REPORTTO SHAREHOLDERS |
Table of Contents
iSHARES®, INC.
iShares, Inc. (the “Company”) is registered under the Investment Company Act of 1940, as amended (the “1940 Act”), as an open-end management investment company. The Company was incorporated under the laws of the State of Maryland on September 1, 1994 pursuant to amended and restated Articles of Incorporation. As of August 31, 2007, the Company offered 24 investment portfolios or funds.
These financial statements relate only to the iShares MSCI Japan Index Fund (the “Fund”).
The Fund’s investment objective is to seek investment results that correspond generally to the price and yield performance, before fees and expenses, of publicly traded equity securities in the aggregate in the Japanese equity market, as measured by the MSCI Japan Index compiled by MSCI Inc. (“MSCI”). The investment adviser uses a “passive” or index approach to achieve the Fund’s investment objective. The Fund is classified as a non-diversified fund under the 1940 Act. Non-diversified funds generally hold securities of fewer companies than diversified funds and may be more susceptible to the risks associated with these particular companies, or to a single economic, political or regulatory occurrence affecting these companies.
The Fund invests in the securities of foreign issuers of a single country, which may involve certain considerations and risks not typically associated with securities of U.S. issuers. Such risks include, but are not limited to: generally less liquid and less efficient securities markets; generally greater price volatility; exchange rate fluctuations and exchange controls; imposition of restrictions on the expatriation of funds or other assets of the Fund; less publicly available information about issuers; the imposition of withholding or other taxes; higher transaction and custody costs; settlement delays and risk of loss attendant in settlement procedures; difficulties in enforcing contractual obligations; less regulation of securities markets; different accounting, disclosure and reporting requirements; more substantial governmental involvement in the economy; higher inflation rates; greater social, economic and political uncertainties; the risk of nationalization or expropriation of assets and the risk of war.
Pursuant to the Company’s organizational documents, the Fund’s officers and directors are indemnified against certain liabilities that may arise out of the performance of their duties to the Fund. Additionally, in the normal course of business, the Fund enters into contracts with service providers that contain general indemnification clauses. The Fund’s maximum exposure under these arrangements is unknown as this would involve future claims that may be made against the Fund that have not yet occurred.
1. SIGNIFICANT ACCOUNTING POLICIES
The following significant accounting policies are consistently followed by the Company in the preparation of its financial statements in conformity with accounting principles generally accepted in the United States of America (“U.S. GAAP”) for investment companies. The preparation of financial statements in conformity with U.S. GAAP requires management to make certain estimates and assumptions that affect the reported amounts of assets and liabilities and disclosures of contingent assets and liabilities at the date of the financial statements and the reported amounts of revenue and expenses during the reporting period. Actual results could differ from those estimates.
SECURITY VALUATION
The securities and other assets of the Fund are generally valued using market valuations. A market valuation generally means a valuation (i) obtained from an exchange, a pricing service or a major market maker (or dealer), (ii) based on a price quotation or other equivalent indication of value supplied by an exchange, a pricing service or a major market maker (or dealer) or (iii) based on amortized cost. In the case of shares of funds that are not traded on an exchange, a market valuation means such fund’s published net asset value per share. The investment adviser may use various pricing services or discontinue the use of any pricing service. A price obtained from a pricing service based on such pricing service’s valuation matrix may be considered a market valuation. In the event that current market valuations
NOTESTO FINANCIAL STATEMENTS | 15 |
Table of Contents
Notes to Financial Statements (Continued)
iSHARES®, INC.
are not readily available or such valuations do not reflect current market values, the affected investments will be valued using fair value pricing pursuant to the pricing policy and procedures approved by the Board of Directors of the Company (the “Board”).
Investments that may be valued using fair value pricing include, but are not limited to: (i) an unlisted security related to corporate actions; (ii) a restricted security (i.e., one that may not be publicly sold without registration under the Securities Act of 1933, as amended); (iii) a security whose trading has been suspended or which has been de-listed from its primary trading exchange; (iv) a security that is thinly traded; (v) a security in default or bankruptcy proceedings for which there is no current market quotation; (vi) a security affected by currency controls or restrictions; and (vii) a security affected by a significant event (i.e., an event that occurs after the close of the markets on which the security is traded but before the time as of which the Fund’s NAV is computed and that may materially affect the value of the Fund’s investments). Examples of events that may be “significant events” are government actions, natural disasters, armed conflict, acts of terrorism, and significant market fluctuations.
Valuing a Fund’s investments using fair value pricing will result in using prices for those investments that may differ from current market valuations. Accordingly, fair value pricing could result in a difference between the prices used to calculate a Fund’s net asset value and the prices used by the Fund’s benchmark index, which, in turn, could result in a difference between the Fund’s performance and the performance of the Fund’s benchmark index.
SECURITY TRANSACTIONS AND INCOME RECOGNITION
Security transactions are accounted for on trade date. Dividend income is recognized on the ex-dividend date, net of any foreign taxes withheld at source, and interest income is accrued daily. Realized gains and losses on investment transactions are determined using the specific identification method.
FOREIGN CURRENCY TRANSLATION
The accounting records of the Fund are maintained in U.S. dollars. Foreign currencies, as well as investment securities and other assets and liabilities denominated in foreign currencies are translated into U.S. dollars using exchange rates deemed appropriate by the investment adviser. Any use of a rate different from the rates used by MSCI may adversely affect the Fund’s ability to track its underlying index. Purchases and sales of securities, income receipts and expense payments are translated into U.S. dollars on the respective dates of such transactions.
The Fund does not isolate the effect of fluctuations in foreign exchange rates from the effect of fluctuations in the market prices of securities. Such fluctuations are reflected by the Fund as a component of realized and unrealized gains and losses from investments for financial reporting purposes.
DISTRIBUTIONS TO SHAREHOLDERS
Distributions to shareholders from net investment income, if any, including any net foreign currency gains, are declared and distributed at least annually by the Fund. Distributions of net realized capital gains, if any, generally are declared and distributed once a year. Distributions are determined on a tax basis and may differ from net investment income and net realized capital gains for financial reporting purposes. Dividends and distributions are paid in U.S. dollars and cannot be automatically reinvested in additional shares of the Fund.
As of August 31, 2007, the tax year-end of the Fund, the components of net distributable earnings on a tax basis consisted of undistributed ordinary income of $53,910,777, unrealized appreciation of $1,773,377,463, and capital and other losses of $225,244,069, for net distributable earnings of $1,602,044,171.
16 | 2007 iSHARES ANNUAL REPORTTO SHAREHOLDERS |
Table of Contents
Notes to Financial Statements (Continued)
iSHARES®, INC.
For the years ended August 31, 2007 and August 31, 2006, the tax characterization of distributions paid for the Fund represents ordinary income. The total distributions and distributions per share are disclosed in the accompanying Statements of Changes in Net Assets and the Financial Highlights for the Fund.
FEDERAL INCOME TAXES
The Fund is treated as an entity separate from the Company’s other funds for federal income tax purposes. It is the policy of the Fund to qualify as a regulated investment company by complying with the provisions applicable to regulated investment companies, as defined under Subchapter M of the Internal Revenue Code of 1986, as amended, and to annually distribute substantially all of its ordinary income and any net capital gains (taking into account any capital loss carry forwards) sufficient to relieve it from all, or substantially all, federal income and excise taxes. Accordingly, no provision for federal income taxes was required for the year ended August 31, 2007.
From November 1, 2006 to August 31, 2007, the Fund incurred net realized capital losses and net foreign currency losses of $45,822,642. As permitted by tax regulations, the Fund has elected to defer those losses and treat them as arising in the year ending August 31, 2008.
As of August 31, 2007, the tax year-end of the Fund, the Fund had tax basis net capital loss carryforwards of $2,959,030, $62,572,173, $3,621,148, $5,594,562, $8,733,802, $68,122,871 and $27,817,841 expiring in 2009, 2010, 2011, 2012, 2013, 2014 and 2015, respectively. Such losses may be applied against any net realized taxable gains in each succeeding year or until their respective expiration dates, whichever occurs first.
The Fund may own shares in certain foreign investment entities, referred to, under U.S. tax law, as “passive foreign investment companies.” The Fund may elect to mark-to-market annually the shares of each passive foreign investment company and would be required to distribute to shareholders any such marked-to-market gains.
The Fund reclassifies at the end of its tax year certain amounts to paid-in-capital from accumulated net realized gain (loss) on investments and foreign currency transactions and accumulated net investment income (loss), respectively, as a result of permanent book and tax differences primarily attributed to net investment loss, return of capital, passive foreign investment companies, realized foreign currency gains and losses and gains and losses on in-kind redemptions. These reclassifications have no effect on net assets or net asset value per share.
As of August 31, 2007, the cost of investments for federal income tax purposes was $10,173,236,191. Net unrealized appreciation was $1,773,294,007, of which $2,363,480,896 represented gross unrealized appreciation on securities and $590,186,889 represented gross unrealized depreciation on securities.
REPURCHASE AGREEMENTS
The Fund may enter into repurchase agreements with banks and securities dealers. These transactions involve the purchase of securities with a simultaneous commitment to resell the securities to the bank or the dealer at an agreed-upon date and price. A repurchase agreement is accounted for as an investment by the Fund, collateralized by securities, which are delivered to the Fund’s custodian or to an agent bank under a tri-party agreement. The securities are marked-to-market daily and additional securities are acquired as needed, to ensure that their value equals or exceeds the repurchase price plus accrued interest.
NOTESTO FINANCIAL STATEMENTS | 17 |
Table of Contents
Notes to Financial Statements (Continued)
iSHARES®, INC.
2. AGREEMENTS AND OTHER TRANSACTIONS WITH AFFILIATES
Pursuant to an Investment Advisory Agreement with the Company, Barclays Global Fund Advisors (“BGFA”) manages the investment of the Fund’s assets. BGFA is a California corporation indirectly owned by Barclays Bank PLC. Under the Investment Advisory Agreement, BGFA is responsible for all expenses (“Covered Expenses”) of the Company, including the cost of transfer agency, custody, fund administration, legal, audit and other services, except interest, taxes, brokerage commissions and other expenses connected with the execution of portfolio transactions, distribution fees and extraordinary expenses.
For its investment advisory services to the Fund, BGFA is entitled to an annual investment advisory fee based on the Fund’s allocable portion of the aggregate of the average daily net assets of all the funds offered by the Company (except for the iShares MSCI Brazil, iShares MSCI Emerging Markets, iShares MSCI Pacific ex-Japan, iShares MSCI South Africa, iShares MSCI South Korea and iShares MSCI Taiwan Index Funds) as follows:
| Investment Advisory Fee | Aggregate Average Daily Net Assets | |
0.59% | First $7 billion | |
0.54 | Over $7 billion, up to and including $11 billion | |
0.49 | Over $11 billion, up to and including $24 billion | |
0.44 | Over $24 billion |
State Street Bank and Trust Company (“State Street”) serves as administrator, custodian and transfer agent for the Company. As compensation for its services, State Street receives certain out-of-pocket costs, transaction fees and asset-based fees which are accrued daily and paid monthly. These fees and expenses are Covered Expenses as defined above.
SEI Investments Distribution Co. (“SEI”) serves as the Fund’s underwriter and distributor of the shares of the Fund, pursuant to a Distribution Agreement with the Company. SEI does not receive a fee from the Fund for its distribution services.
Pursuant to an exemptive order issued by the U.S. Securities and Exchange Commission (“SEC”), the Fund is permitted to lend portfolio securities to Barclays Capital Inc. (“BarCap”). Pursuant to the same exemptive order, Barclays Global Investors, N.A. (“BGI”) serves as securities lending agent for the Company. BarCap and BGI are affiliates of BGFA, the Fund’s investment adviser. As securities lending agent, BGI receives, as fees, a share of the income earned on investment of the cash collateral received for the loan of securities. For the year ended August 31, 2007, BGI earned securities lending agent fees of $2,025,105.
Cross trades for the year ended August 31, 2007 were executed by the Fund pursuant to Rule 17a-7 under the 1940 Act. Cross trading is the buying or selling of portfolio securities between funds to which BGFA (or an affiliate) serves as investment adviser. At its regularly scheduled quarterly meetings, the Board reviews such transactions as of the most recent calendar quarter for compliance with the requirements and restrictions set forth by Rule 17a-7.
The Fund may invest in the Institutional Shares of certain money market funds managed by BGFA, the Fund’s investment adviser, including the Government Money Market Fund (“GMMF”), Institutional Money Market Fund (“IMMF”), Prime Money Market Fund (“PMMF”) and Treasury Money Market Fund (“TMMF”) of Barclays Global Investors Funds. The GMMF, IMMF, PMMF and TMMF are feeder funds in a master/feeder fund structure that invest substantially all of their assets in the Government Money Market Master Portfolio, Money Market Master Portfolio, Prime Money Market Master Portfolio and Treasury Money Market Master Portfolio (collectively, the “Money Market Master Portfolios”), respectively, which are also managed by BGFA. While the GMMF, IMMF, PMMF and TMMF do not directly charge an investment advisory fee, the Money Market Master Portfolios in which they invest do charge an investment advisory fee. Income distributions from
18 | 2007 iSHARES ANNUAL REPORTTO SHAREHOLDERS |
Table of Contents
Notes to Financial Statements (Continued)
iSHARES®, INC.
the GMMF, IMMF, PMMF and TMMF are declared daily and paid monthly from net investment income. Income distributions earned by the Fund from temporary cash investments are recorded as interest from affiliated issuers in the accompanying Statement of Operations. Income distributions earned by the Fund from the investment of securities lending collateral, if any, are included in securities lending income in the accompanying Statement of Operations.
The Fund may invest its securities lending cash collateral, if any, in the BGI Cash Premier Fund LLC (“Premier Fund”), an affiliated private money market fund managed by BGFA. Although the Premier Fund is not registered as an investment company under the 1940 Act, it intends to operate as a money market fund in compliance with Rule 2a-7 under the 1940 Act. See Note 5 for additional information regarding the Premier Fund.
As of August 31, 2007, certain directors and officers of the Company are also officers of BGI and/or BGFA.
3. INVESTMENT PORTFOLIO TRANSACTIONS
Purchases and sales of investments (excluding in-kind transactions and short-term investments) for the year ended August 31, 2007, aggregated $342,318,146 and $433,721,834, respectively.
In-kind purchases and sales (see Note 4) for the year ended August 31, 2007, aggregated $1,097,506,892 and $3,235,132,609, respectively.
4. CAPITAL SHARE TRANSACTIONS
The Company issues and redeems capital shares of the Fund only in aggregations of a specified number of shares (each, a “Creation Unit”) at net asset value. Except when aggregated in Creation Units, shares of the Fund are not redeemable. Transactions in capital shares for the Fund are disclosed in detail in the Statements of Changes in Net Assets.
The consideration for the purchase of Creation Units of the Fund generally consists of the in-kind deposit of a designated portfolio of equity securities, which constitutes a substantial replication, or a portfolio sampling representation of the securities involved in the MSCI Japan Index and an amount of cash. Investors purchasing and redeeming Creation Units pay a purchase transaction fee and a redemption transaction fee directly to State Street, the administrator, to offset transfer and other transaction costs associated with the issuance and redemption of Creation Units.
From time to time, settlement of securities related to in-kind contributions or in-kind redemptions may be delayed. In such cases, securities related to in-kind contributions are reflected as “Due from custodian” and securities related to in-kind redemptions are reflected as “Securities related to in-kind transactions” in the Statement of Assets and Liabilities.
5. LOANS OF PORTFOLIO SECURITIES
The Fund may lend its investment securities to approved borrowers, such as brokers, dealers and other financial institutions. The borrower pledges and maintains with the Fund collateral consisting of cash, an irrevocable letter of credit issued by a bank, or securities issued or guaranteed by the U.S. government. The initial collateral received by the Fund is required to have a value of at least 102% of the market value of the loaned securities for securities traded on U.S. exchanges and a value of at least 105% for all other securities. The collateral is maintained thereafter, at a value equal to at least 100% of the current market value of the securities on loan. The risks to the Fund of securities lending are that the borrower may not provide additional collateral when required or may not return the securities when due.
NOTESTO FINANCIAL STATEMENTS | 19 |
Table of Contents
Notes to Financial Statements (Continued)
iSHARES®, INC.
During the year ended August 31, 2007, the Fund received cash as collateral for securities loaned. The cash collateral received was invested in a joint account and/or in the Premier Fund. Pursuant to an exemptive order issued by the SEC, a portion of the cash collateral received was invested in a joint account with other investment funds managed by BGFA. The joint account invests in securities with remaining maturities of 397 days or less, repurchase agreements and money market mutual funds, including money market funds managed by BGFA. Repurchase agreements are fully collateralized by U.S. government securities or non-U.S. government debt securities. The Premier Fund seeks to achieve its investment objective by investing in a portfolio of high-quality, short-term fixed-income instruments, including money market funds (which may be managed by BGFA or its affiliate) and other instruments that, at the time of investment, have remaining maturities of 397 calendar days or less from the date of acquisition.
The market value of the securities on loan as of August 31, 2007 and the value of the related collateral are disclosed in the Statement of Assets and Liabilities. Securities lending income, as disclosed in the Fund’s Statement of Operations, represents the income earned from the investment of the cash collateral, net of rebates paid to, or fees paid by, borrowers and less the fees paid to BGI as securities lending agent.
6. RECENTLY ISSUED ACCOUNTING PRONOUNCEMENTS
In June 2006, the Financial Accounting Standards Board (“FASB”) issued FASB Interpretation No. 48 (“FIN 48”), “Accounting for Uncertainty in Income Taxes – an interpretation of FASB Statement No. 109.” FIN 48 clarifies the accounting for uncertainty in income taxes recognized in accordance with FASB Statement No. 109, “Accounting for Income Taxes.” This interpretation prescribes a recognition threshold and measurement attribute for the financial statement recognition and measurement of a tax position taken or expected to be taken in a tax return. It also provides guidance on de-recognition, classification, interest and penalties, accounting in interim periods, disclosure and transition. FIN 48 is effective for fiscal years beginning after December 15, 2006. The SEC staff has stated that it would not object if a fund does not implement FIN 48 in its NAV calculation until the date of the fund’s last NAV calculation in the first required financial statement reporting period for its fiscal year beginning after December 15, 2006. The Company is currently evaluating the impact of applying the various provisions of FIN 48.
In September 2006, FASB issued Statement of Financial Accounting Standards No. 157 (“FAS 157”), “Fair Value Measurements.” FAS 157 defines fair value, establishes a framework for measuring fair value in accordance with generally accepted accounting principles and expands disclosure about fair value measurements. FAS 157 is effective for fiscal years beginning after November 15, 2007. The Company is currently evaluating the impact the adoption of FAS 157 will have on the Fund’s financial statement disclosures.
20 | 2007 iSHARES ANNUAL REPORTTO SHAREHOLDERS |
Table of Contents
Report of Independent Registered Public Accounting Firm
To the Shareholders and Board of Directors of
iShares, Inc.
In our opinion, the accompanying statement of assets and liabilities, including the schedule of investments, and the related statements of operations and of changes in net assets and the financial highlights present fairly, in all material respects, the financial position of the iShares MSCI Japan Index Fund, a portfolio of the iShares MSCI Series (the “Fund”) at August 31, 2007, the results of its operations and the changes in its net assets and the financial highlights for each of the periods presented, in conformity with accounting principles generally accepted in the United States of America. These financial statements and financial highlights (hereafter referred to as “financial statements”) are the responsibility of the Fund’s management; our responsibility is to express an opinion on these financial statements based on our audit. We conducted our audit of these financial statements in accordance with standards of the Public Company Accounting Oversight Board (United States). Those standards require that we plan and perform the audit to obtain reasonable assurance about whether the financial statements are free of material misstatement. An audit includes examining, on a test basis, evidence supporting the amounts and disclosures in the financial statements, assessing the accounting principles used and significant estimates made by management, and evaluating the overall financial statement presentation. We believe that our audit, which included confirmation of securities at August 31, 2007 by correspondence with the custodian and brokers, provide a reasonable basis for our opinion.
PricewaterhouseCoopers LLP
San Francisco, California
October 23, 2007
REPORTOF INDEPENDENT REGISTERED PUBLIC ACCOUNTING FIRM | 21 |
Table of Contents
iSHARES®, INC.
For the fiscal year ended August 31, 2007, the iShares MSCI Japan Index Fund earned foreign source income of $174,992,702 and paid foreign taxes of $12,164,174 which it intends to pass through to its shareholders pursuant to Section 853 of the Internal Revenue Code (the “Code”).
Under Section 854(b)(2) of the Code, the Fund hereby designates the maximum amount of $97,091,876 as qualified dividend income for purposes of the maximum rate under Section 1(h)(11) of the Code for the fiscal year ended August 31, 2007.
In January 2008, shareholders will receive Form 1099-DIV which will include their share of qualified dividend income distributed during the calendar year 2007. Shareholders are advised to check with their tax advisers for information on the treatment of these amounts on their income tax returns.
22 | 2007 iSHARES ANNUAL REPORTTO SHAREHOLDERS |
Table of Contents
Board Review and Approval of Investment Advisory
Contract (Unaudited)
iSHARES®, INC.
Under Section 15(c) of the Investment Company Act of 1940 (the “1940 Act”), the Company’s Board of Directors (the “Board”), including a majority of Directors who are not “interested persons” of the Company (as that term is defined in the 1940 Act) (the “Independent Directors”), is required annually to consider the Investment Advisory Contract between the Company and BGFA (the “Advisory Contract”) on behalf of the Fund. As required by Section 15(c), the Board requested and BGFA provided such information as the Board deemed reasonably necessary to evaluate the terms of the Advisory Contract. At a meeting held on June 13, 2007, the Board approved the selection of BGFA and the continuance of the Advisory Contract, based on its review of qualitative and quantitative information provided by BGFA. In selecting BGFA and approving the Advisory Contract for the Fund, the Board, including the Independent Directors, advised by their independent counsel, considered the following factors, none of which was controlling, and made the following conclusions:
NATURE, EXTENT AND QUALITY OF SERVICES PROVIDED BY BGFA
The Board determined that there would be no diminution in the scope of services required of BGFA under the Advisory Contract for the coming year as compared to the scope of services provided by BGFA over the past year. In reviewing the scope of these services, the Board considered BGFA’s investment philosophy and experience, noting that BGFA and its affiliates have committed significant resources over time, including over the past year, including investment in technology and increasing the number of their employees supporting the Fund. The Board also considered BGFA’s compliance program and its compliance record with respect to the Fund. In that regard, the Board noted that BGFA reports to the Board about portfolio management and compliance matters on a periodic basis in connection with regularly scheduled meetings of the Board, and has made appropriate officers available as needed to provide further assistance with these matters. The Board also reviewed the background and experience of the persons responsible for the day-to-day management of the Fund. In addition to the above considerations, the Board considered BGFA’s investment processes and strategies, and matters related to BGFA’s portfolio transaction policies and procedures. The Board further noted that BGFA does not serve as investment adviser for any other series of registered investment companies with substantially similar investment objectives and strategies as the Fund; therefore, comparative performance information was generally not available. However, the Board also noted that the Fund had met its investment objective consistently since its inception date. Based on review of this information, the Board concluded that the nature, extent and quality of services to be provided by BGFA to the Fund under the Advisory Contract were appropriate and mitigated in favor of the Board’s approval of the Advisory Contract for the coming year.
FUND’S EXPENSES AND PERFORMANCE OF THE FUND
The Board reviewed statistical information prepared by Lipper Inc. (“Lipper”), an independent provider of investment company data, regarding the expense ratio components, including advisory fees, waivers/reimbursements, and gross and net total expenses of the Fund in comparison with the same information for other funds registered under the 1940 Act objectively selected solely by Lipper as comprising the Fund’s peer group (the “Lipper Group”). In addition, the Board reviewed statistical information prepared by Lipper regarding the performance of the Fund for the one-, three-, five- and ten-year, and “last quarter” periods ended March 31, 2007 and a comparison of the Fund’s performance to that of the funds in its Lipper Group for the same periods. Because there are few, if any, exchange traded funds or index funds that track indexes similar to those tracked by the Fund, the Lipper Group included in part, at the request of BGFA, mutual funds, closed-end funds, exchange traded funds, and funds with differing investment objective classifications, investment focuses and other characteristics (e.g., actively managed funds and funds sponsored by “at cost” service providers). In support of its review of the statistical information, the Board was provided with a detailed description of the methodology used by Lipper to determine the Lipper Group and to prepare this information. The Board further noted that due to the limitations in providing comparable funds in the Lipper Group, the statistical information may or may not provide meaningful direct comparisons to the Fund. The Board noted that the Fund generally performed in line with the funds in its Lipper Group over relevant periods. The Board also noted that the investment advisory fees and overall expense components for the Fund were generally lower than the median or average investment advisory fee rates and overall expenses of the funds in its respective Lipper Group. The Board also reviewed statistical information from Lipper displaying the effects of the
BOARD REVIEWAND APPROVALOF INVESTMENT ADVISORY CONTRACT | 23 |
Table of Contents
Board Review and Approval of Investment Advisory
Contract (Unaudited) (Continued)
iSHARES®, INC.
current breakpoints in the investment advisory fee rates for the Fund (as discussed below) at various assets levels of the Fund as compared to its Lipper Group. Based on this review, the Board concluded that the investment advisory fees and expense levels and the historical performance of the Fund, as managed by BGFA, as compared to the investment advisory fees and expense levels and performance of the funds in its Lipper Group, were satisfactory for the purposes of approving the Advisory Contract for the coming year.
COSTS OF SERVICES PROVIDED TO THE FUND AND PROFITS REALIZED BY BGFA AND AFFILIATES
The Board reviewed information about the profitability to BGFA of the Fund based on the fees payable to BGFA and its affiliates (including fees under the Advisory Contract), and all other sources of revenue and expense to BGFA and its affiliates for the last calendar year. The Board discussed the sources of direct and ancillary revenue with management, including the revenues to BGI from securities lending by the Company (including any securities lending by the Fund). The Board also discussed BGFA’s profit margin as reflected in the Fund’s profitability analysis and reviewed information regarding economies of scale (as discussed below). Based on this review, the Board concluded that the profits to be realized by BGFA and its affiliates under the Advisory Contract and from other relationships between the Fund and BGFA and/or its affiliates, if any, were within the range the Board considered reasonable and appropriate.
ECONOMIES OF SCALE
In connection with its review of the Fund’s profitability analysis, the Board reviewed information regarding economies of scale or other efficiencies that may result from increases in the Fund’s assets. The Board noted that the Advisory Contract already provided for breakpoints in the Fund’s investment advisory fee rates as the assets of the Fund, on an aggregated basis with the assets of certain other iShares funds, increase. The Board also discussed the substantial growth in assets of certain iShares funds, including the Fund, over the last few years. The Board also reviewed BGFA’s historic profitability as investment adviser to the iShares fund complex and noted that BGFA had made a significant investment in the iShares funds and had incurred operating losses during earlier years when the iShares funds, including the Fund, had not yet reached scale. In light of this history, the Board determined that the current breakpoints were appropriate and warranted at this juncture for the Fund. Based on this review, as well as the discussions described above in connection with the Lipper Group comparisons, the Board, recognizing its responsibility to consider this issue at least annually, concluded that the structure of the investment advisory fees, with the current breakpoints for the Fund, reflects the current sharing and potential further sharing of economies of scale with the Fund’s shareholders.
FEES AND SERVICES PROVIDED FOR OTHER COMPARABLE FUNDS/ACCOUNTS MANAGED BY BGFA AND ITS AFFILIATES
The Board received and considered certain information regarding the Fund’s annual investment advisory fee rates under the Advisory Contract in comparison to the investment advisory/management fee rates for other funds/accounts for which BGFA or BGI, an affiliate of BGFA, provides investment advisory/management services, including other funds registered under the 1940 Act, collective funds and separate accounts (together, the “Other Accounts”). The Board noted that comparative investment advisory/management fee information was not available, as BGFA and its affiliates do not manage any Other Accounts with substantially similar investment objectives and strategies as the Fund. However, the Board noted that BGFA provided the Board with general information regarding how the level of services provided to the Other Accounts differed from the level of services provided to the Fund. Based on this review, the Board determined that the investment advisory fee rates under the Advisory Contract, with the current breakpoints, do not constitute fees that are so disproportionately large as to bear no reasonable relationship to the services rendered and that could not have been the product of arm’s-length bargaining, and concluded that the investment advisory fee rates under the Advisory Contract are fair and reasonable.
24 | 2007 iSHARES ANNUAL REPORTTO SHAREHOLDERS |
Table of Contents
Board Review and Approval of Investment Advisory
Contract (Unaudited) (Continued)
iSHARES®, INC.
OTHER BENEFITS TO BGFA AND/OR ITS AFFILIATES
The Board reviewed any ancillary revenue received by BGFA and/or its affiliates in connection with the services provided to the Fund by BGFA, such as any payment of revenue to BGI, the Company’s securities lending agent, for loaning any portfolio securities, and payment of advisory fees and/or administration fees to BGFA and BGI in connection with any investments by the Fund in other funds for which BGFA provides investment advisory services and/or BGI provides administration services. The Board noted that BGFA does not use soft dollars or consider the value of research or other services that may be provided to BGFA (including its affiliates) in selecting brokers for portfolio transactions for the Fund. The Board further noted that any portfolio transactions on behalf of the Fund placed through a BGFA affiliate are reported to the Board pursuant to Rule 10f-3 and Rule 17e-1, as applicable, under the 1940 Act. The Board concluded that any such ancillary benefits would not be disadvantageous to the Fund’s shareholders.
Based on this analysis, the Board determined that the Advisory Contract, including the investment advisory fee rates, with the current breakpoints, is fair and reasonable in light of all relevant circumstances, and concluded that it is in the best interest of the Fund and its shareholders to approve the Advisory Contract, with the fee schedule to the Advisory Contract for the coming year.
BOARD REVIEWAND APPROVALOF INVESTMENT ADVISORY CONTRACT | 25 |
Table of Contents
Supplemental Information (Unaudited)
iSHARES®, INC.
The table that follows presents information about the differences between the daily market price on secondary markets for shares of the iShares MSCI Japan Index Fund (the “Fund”) and the Fund’s net asset value. Net asset value, or ”NAV,” is the price per share at which the Fund issues and redeems shares. It is calculated in accordance with the standard formula for valuing mutual fund shares. The “Market Price” of the Fund generally is determined using the midpoint between the highest bid and the lowest offer on the stock exchange on which the shares of the Fund is listed for trading, as of the time that the Fund’s NAV is calculated. The Fund’s Market Price may be at, above or below its NAV. The NAV of the Fund will fluctuate with changes in the market value of its portfolio holdings. The Market Price of the Fund will fluctuate in accordance with changes in its NAV, as well as market supply and demand.
Premiums or discounts are the differences (expressed as a percentage) between the NAV and Market Price of the Fund on a given day, generally at the time the NAV is calculated. A premium is the amount that the Fund is trading above the reported NAV, expressed as a percentage of the NAV. A discount is the amount that the Fund is trading below the reported NAV, expressed as a percentage of the NAV.
The following information shows the frequency distributions of premiums and discounts for the Fund. The information shown for the Fund is for five calendar years through the date of the most recent calendar quarter-end.
Each line in the table shows the number of trading days in which the Fund traded within the premium/discount range indicated. The number of trading days in each premium/discount range is also shown as a percentage of the total number of trading days in the period covered by the table. All data presented here represents past performance, which cannot be used to predict future results.
iShares MSCI Japan Index Fund
Period Covered: January 1, 2002 through June 30, 2007
Premium/Discount Range | Number of Days | Percentage of Total Days | |||
Greater than 3.5% and Less than 4.0% | 1 | 0.07 | % | ||
Greater than 3.0% and Less than 3.5% | 5 | 0.36 | |||
Greater than 2.5% and Less than 3.0% | 4 | 0.29 | |||
Greater than 2.0% and Less than 2.5% | 15 | 1.09 | |||
Greater than 1.5% and Less than 2.0% | 45 | 3.26 | |||
Greater than 1.0% and Less than 1.5% | 135 | 9.78 | |||
Greater than 0.5% and Less than 1.0% | 258 | 18.68 | |||
Between 0.5% and –0.5% | 660 | 47.80 | |||
Less than –0.5% and Greater than –1.0% | 154 | 11.15 | |||
Less than –1.0% and Greater than –1.5% | 64 | 4.63 | |||
Less than –1.5% and Greater than –2.0% | 30 | 2.17 | |||
Less than –2.0% and Greater than –2.5% | 7 | 0.51 | |||
Less than –2.5% and Greater than –3.0% | 1 | 0.07 | |||
Less than –3.0% and Greater than –3.5% | 1 | 0.07 | |||
Less than –3.5% and Greater than –4.0% | 1 | 0.07 | |||
| 1,381 | 100.00 | % | |||
26 | 2007 iSHARES ANNUAL REPORTTO SHAREHOLDERS |
Table of Contents
Director and Officer Information (Unaudited)
iSHARES®, INC.
The Board of Directors has responsibility for the overall management and operations of the Company, including general supervision of the duties performed by BGFA and other service providers. Each Director serves until his or her successor is duly elected or appointed and qualified.
iShares, Inc., iShares Trust, Barclays Global Investors Funds (“BGIF”), Master Investment Portfolio (“MIP”) and Barclays Foundry Investment Trust (“BFIT”) are considered to be members of the same fund complex, as defined in Form N-1A under the 1940 Act. Each Director of iShares, Inc. also serves as a Trustee for iShares Trust and oversees 138 portfolios within the fund complex. In addition, Lee T. Kranefuss serves as a Trustee for BGIF, MIP and BFIT and oversees an additional 24 portfolios within the fund complex.
Unless otherwise noted in the tables below, the address for each Director and Officer is c/o Barclays Global Investors, N.A., 45 Fremont Street, San Francisco, California 94105. The Board has designated George G.C. Parker as its Lead Independent Director. Additional information about the Funds’ Directors and Officers may be found in the Funds’ combined Statement of Additional Information, which is available without charge, upon request, by calling toll-free 1-800-474-2737.
Interested Directors and Officers
| Name, Year of Birth | Position(s), Length of Service | Principal Occupation(s) During Past 5 Years | Other Directorships Held | |||
*Lee T. Kranefuss, 1961 | Director and Chairman (since 2003). | Chief Executive Officer of the Intermediary Investor and Exchange Traded Products Business of BGI (since 2003); Director of Barclays Global Fund Advisers (since 2005); Director, President and Chief Executive Officer of Barclays Global Investors International, Inc. (since 2005); Director, Chairman and Chief Executive Officer of Barclays Global Investors Services (since 2005); Chief Executive Officer of the Individual Investor Business of BGI (1999-2003). | Trustee (since 2003) of iShares Trust; Trustee (since 2001) of BGIF and MIP; Trustee (since 2007) of BFIT; Director (since 2003) of BGI Cayman Prime Money Market Fund, Ltd. | |||
*John E. Martinez, 1962 | Director, (since 2003). | Co-Chief Executive Officer of Global Index and Markets Group of BGI (2001-2003); Chairman of Barclays Global Investors Services (2000-2003). | Trustee (since 2003) of iShares Trust; Director (since 2005) of Real Estate Equity Exchange. | |||
| * | Lee T. Kranefuss and John E. Martinez are deemed to be “interested persons” (as defined in the 1940 Act) of the Company due to their affiliations with BGFA, the Funds’ investment adviser, BGI, the parent company of BGFA, and Barclays Global Investors Services, an affiliate of BGFA and BGI. |
DIRECTORAND OFFICER INFORMATION | 27 |
Table of Contents
Director and Officer Information (Unaudited) (Continued)
iSHARES®, INC.
Independent Directors
| Name, Year of Birth | Position(s), Length of Service | Principal Occupation(s) During Past 5 Years | Other Directorships Held | |||
George G.C. Parker, 1939 | Director (since 2002). Lead Independent Director (since 2006). | Dean Witter Distinguished Professor of Finance, Emeritus (since 1994). | Trustee (since 2000) of iShares Trust; Lead Independent Trustee (since 2006) of iShares Trust; Director (since 1996) of Continental Airlines, Inc.; Director (since 1995) of Community First Financial Group; Director (since 1999) of Tejon Ranch Company; Director (since 2004) of Threshold Pharmaceuticals; Director (since 2007) of NETGEAR, Inc. | |||
Cecilia H. Herbert, 1949 | Director (since 2005). | Member of Finance Council, Archdiocese of San Francisco (1999- 2006); Chair of Investment Committee, Archdiocese of San Francisco (1994-2005); Director (since 1998) and President (since 2007) of the Board of Directors, Catholic Charities CYO; Trustee (2004-2005) of Pacific Select Funds; Trustee (1992-2003) of the Montgomery Funds; Trustee (since 2002) and Chair of Finance and Investment Committee (since 2006) of the Thacher School. | Trustee (since 2005) of iShares Trust. | |||
Charles A. Hurty, 1943 | Director (since 2005). | Retired; Partner, KPMG LLP (1968-2001). | Trustee (since 2005) of iShares Trust; Director (since 2002) of GMAM Absolute Return Strategy Fund (1 portfolio); Director (since 2002) of Citigroup Alternative Investments Multi-Adviser Hedge Fund Portfolios LLC (1 portfolio); Director (since 2005) of CSFB Alternative Investments Fund (6 portfolios). | |||
John E. Kerrigan, 1955 | Director (since 2005). | Chief Investment Officer, Santa Clara University (since 2002); Managing Director, Merrill Lynch (1994-2002). | Trustee (since 2005) of iShares Trust; Member (since 2004) of Advisory Council for Commonfund Distressed Debt Partners II. | |||
28 | 2007 iSHARES ANNUAL REPORTTO SHAREHOLDERS |
Table of Contents
Director and Officer Information (Unaudited) (Continued)
iSHARES®, INC.
Independent Directors (Continued)
| Name, Year of Birth | Position(s), Length of Service | Principal Occupation(s) During Past 5 Years | Other Directorships Held | |||
Robert H. Silver, 1955 | Director (since 2007). | President and Co-Founder of The Bravitas Group, Inc. (since 2006); Member, Non-Investor Advisory Board of Russia Partners II, LP (since 2006); President and Chief Operating Officer (2003-2005) and Director (1999-2005) of UBS Financial Services, Inc.; President and Chief Executive Officer of UBS Services USA, LLC (1999-2005); Managing Director, UBS America, Inc. (2000-2005); Director and Vice Chairman of the YMCA of Greater NYC (since 2001); Broadway Producer (since 2006).
| Trustee (since 2007) of iShares Trust; Director and Member (since 2006) of the Audit and Compensation Committee of EPAM Systems, Inc. |
Officers
| Name, Year of Birth | Position(s), Length of Service | Principal Occupation(s) During Past 5 Years | Other Directorships Held | |||
Michael A. Latham, 1965 | President (since 2007). | Head of Americas iShares (since 2007); Chief Operating Officer of the Intermediary Investor and Exchange Traded Products Business of BGI (2003-2007); Director and Chief Financial Officer of Barclays Global Investors International, Inc. (since 2005); Director of Mutual Fund Delivery in the U.S. Individual Investor Business of BGI (2000-2003). | None. | |||
Geoffrey D. Flynn, 1956 | Treasurer and Chief Financial Officer (since 2007). | Director of Mutual Fund Operations of BGI (since 2007); President of Van Kampen Investor Services (2003-2007); Managing Director of Morgan Stanley (2002-2007); President of Morgan Stanley Trust, FSB (2002- 2007). | None. | |||
DIRECTORAND OFFICER INFORMATION | 29 |
Table of Contents
Director and Officer Information (Unaudited) (Continued)
iSHARES®, INC.
Officers (Continued)
| Name, Year of Birth | Position(s), Length of Service | Principal Occupation(s) During Past 5 Years | Other Directorships Held | |||
Eilleen M. Clavere, 1952 | Secretary (since 2007). | Head of Legal Administration of Intermediary Investor Business of BGI (since 2006); Legal Counsel and Vice President of Atlas Funds, Atlas Advisers, Inc. and Atlas Securities, Inc. (2005-2006); Counsel of Kirkpatrick & Lockhart LLP (2001-2005). | None. | |||
Ira P. Shapiro, 1963 | Vice President and Chief Legal Officer (since 2007). | Associate General Counsel of BGI (since 2004); First Vice President of Merrill Lynch Investment Managers (1993-2004). | None. | |||
Amy Schioldager, 1962 | Executive Vice President (since 2007). | Head of U.S. Indexing of BGI (since 2006); Head of Domestic Equity Portfolio Management of BGI (2001-2006). | None. | |||
H. Michael Williams, 1960 | Executive Vice President (since 2007). | Head of Global Index and Markets Group of BGI (since 2006); Global Head of Securities Lending of BGI (2002-2006). | Trustee (since 2007) of BFIT. | |||
Patrick O’Connor, 1967 | Vice President (since 2007). | Head of iShares Portfolio Management of BGI (since 2006); Senior Portfolio Manager of BGI (1999-2006). | None. | |||
Lee Sterne, 1965 | Vice President (since 2007). | Senior Portfolio Manager of BGI (since 2004); Portfolio Manager of BGI (2001-2004). | None. | |||
Matt Tucker, 1972 | Vice President (since 2007). | Head of U.S. Fixed-Income Investment Solutions of BGI (since 2005); Fixed- Income Investment Strategist of BGI (2003-2005); Fixed-Income Portfolio Portfolio Manager of BGI (1997-2003). | None. | |||
30 | 2007 iSHARES ANNUAL REPORTTO SHAREHOLDERS |
Table of Contents
Notes:
NOTES | 31 |
Table of Contents
Notes:
32 | 2007 iSHARES ANNUAL REPORTTO SHAREHOLDERS |
Table of Contents
Notes:
NOTES | 33 |
Table of Contents
The following is a list of iShares Funds being offered, along with their respective exchange trading symbols. Please call 1-800-iShares (1-800-474-2737) to obtain a prospectus for any iShares Fund. The prospectus contains more complete information, including charges, expenses, investment objectives and risk factors that should be carefully considered to determine if the Fund(s) are an appropriate investment for you. Read the prospectus(es) carefully before investing. Investing involves risk, including possible loss of principal.
iShares S&P Domestic Index Funds
iShares S&P 1500 (ISI)
iShares S&P 100 (OEF)
iShares S&P 500 (IVV)
iShares S&P 500 Growth (IVW)
iShares S&P 500 Value (IVE)
iShares S&P MidCap 400 (IJH)
iShares S&P MidCap 400 Growth (IJK)
iShares S&P MidCap 400 Value (IJJ)
iShares S&P SmallCap 600 (IJR)
iShares S&P SmallCap 600 Growth (IJT)
iShares S&P SmallCap 600 Value (IJS)
iShares S&P GSSITM Natural Resources (IGE)
iShares S&P GSTITM Networking (IGN)
iShares S&P GSTITM Semiconductor (IGW)
iShares S&P GSTITM Software (IGV)
iShares S&P GSTITM Technology (IGM)
iShares Domestic Sector Index Funds
iShares Cohen & Steers Realty Majors (ICF)
iShares Dow Jones U.S. Basic Materials Sector (IYM)
iShares Dow Jones U.S. Consumer Services Sector (IYC)
iShares Dow Jones U.S. Consumer Goods Sector (IYK)
iShares Dow Jones U.S. Energy Sector (IYE)
iShares Dow Jones U.S. Financial Sector (IYF)
iShares Dow Jones U.S. Financial Services (IYG)
iShares Dow Jones U.S. Healthcare Sector (IYH)
iShares Dow Jones U.S. Industrial Sector (IYJ)
iShares Dow Jones U.S. Real Estate (IYR)
iShares Dow Jones U.S. Technology Sector (IYW)
iShares Dow Jones U.S. Telecommunications Sector (IYZ)
iShares Dow Jones Transportation Average (IYT)
iShares Dow Jones U.S. Utilities Sector (IDU)
iShares Dow Jones U.S. Total Market (IYY)
iShares Nasdaq Biotechnology (IBB)
iShares Domestic Subsector Index Funds
iShares Dow Jones U.S. Aerospace & Defense (ITA)
iShares Dow Jones U.S. Broker-Dealers (IAI)
iShares Dow Jones U.S. Healthcare Providers (IHF)
iShares Dow Jones U.S. Home Construction (ITB)
iShares Dow Jones U.S. Insurance (IAK)
iShares Dow Jones U.S. Medical Devices (IHI)
iShares Dow Jones U.S. Oil & Gas Exploration & Production (IEO)
iShares Dow Jones U.S. Oil Equipment & Services (IEZ)
iShares Dow Jones U.S. Pharmaceuticals (IHE)
iShares Dow Jones U.S. Regional Banks (IAT)
iShares FTSE NAREIT Industrial/Office (FIO)
iShares FTSE NAREIT Mortgage REITs (REM)
iShares FTSE NAREIT Real Estate 50 (FTY)
iShares FTSE NAREIT Residential (REZ)
iShares FTSE NAREIT Retail (RTL)
iShares Global Index Funds
iShares S&P Global 100 (IOO)
iShares S&P Global Consumer Discretionary Sector (RXI)
iShares S&P Global Consumer Staples Sector (KXI)
iShares S&P Global Energy Sector (IXC)
iShares S&P Global Financials Sector (IXG)
iShares S&P Global Healthcare Sector (IXJ)
iShares S&P Global Industrials Sector (EXI)
iShares S&P Global Materials Sector (MXI)
iShares S&P Global Technology Sector (IXN)
iShares S&P Global Telecommunications Sector (IXP)
iShares S&P Global Utilities Sector (JXI)
iShares Russell Index Funds
iShares Russell 3000 (IWV)
iShares Russell 3000 Growth (IWZ)
iShares Russell 3000 Value (IWW)
iShares Russell 1000 (IWB)
iShares Russell 1000 Growth (IWF)
iShares Russell 1000 Value (IWD)
iShares Russell Midcap (IWR)
iShares Russell Midcap Growth (IWP)
iShares Russell Midcap Value (IWS)
iShares Russell 2000 (IWM)
iShares Russell 2000 Growth (IWO)
iShares Russell 2000 Value (IWN)
iShares Russell MicrocapTM (IWC)
iShares International Country Index Funds
iShares FTSE/Xinhua China 25 (FXI)
iShares MSCI Australia (EWA)
iShares MSCI Austria (EWO)
iShares MSCI Belgium (EWK)
iShares MSCI Brazil (EWZ)
iShares MSCI Canada (EWC)
iShares MSCI France (EWQ)
iShares MSCI Germany (EWG)
iShares MSCI Hong Kong (EWH)
iShares MSCI Italy (EWI)
iShares MSCI Japan (EWJ)
iShares MSCI Malaysia (EWM)
iShares MSCI Mexico (EWW)
iShares MSCI Netherlands (EWN)
iShares MSCI Singapore (EWS)
iShares MSCI South Africa (EZA)
iShares MSCI South Korea (EWY)
iShares MSCI Spain (EWP)
iShares MSCI Sweden (EWD)
iShares MSCI Switzerland (EWL)
iShares MSCI Taiwan (EWT)
iShares MSCI United Kingdom (EWU)
iShares S&P/TOPIX 150 (ITF)
iShares Bond Funds
iShares Lehman Aggregate (AGG)
iShares Lehman Short Treasury (SHV)
iShares Lehman 1-3 Year Treasury (SHY)
iShares Lehman 3-7 Year Treasury (IEI)
iShares Lehman 7-10 Year Treasury (IEF)
iShares Lehman 10-20 Year Treasury (TLH)
iShares Lehman 20+ Year Treasury (TLT)
iShares Lehman TIPS (TIP)
iShares Lehman Credit (CFT)
iShares Lehman 1-3 Year Credit (CSJ)
iShares Lehman Intermediate Credit (CIU)
iShares iBoxx $ Investment Grade Corporate (LQD)
iShares Lehman Government/Credit (GBF)
iShares Lehman Intermediate Government/Credit (GVI)
iShares Lehman MBS (MBB)
iShares iBoxx $ High Yield Corporate (HYG)
iShares S&P National Municipal (MUB)
iShares S&P California Municipal (CMF)
iShares S&P New York Municipal (NYF)
iShares Specialty Index Funds
iShares KLD Select Social SM (KLD)
iShares KLD 400 Social (DSI)
iShares Dow Jones Select Dividend (DVY)
iShares Dow Jones EPAC Select Dividend (IDV)
iShares S&P U.S. Preferred Stock (PFF)
iShares International Index Funds
iShares MSCI EAFE (EFA)
iShares MSCI EAFE Growth (EFG)
iShares MSCI EAFEValue (EFV)
iShares MSCI Emerging Markets (EEM)
iShares MSCI EMU (EZU)
iShares MSCI Pacific ex-Japan (EPP)
iShares S&P Europe 350 (IEV)
iShares S&P Latin America 40 (ILF)
iShares S&P World ex-U.S. Property (WPS)
iShares Morningstar Index Funds
iShares Morningstar Large Core (JKD)
iShares Morningstar Large Growth (JKE)
iShares Morningstar Large Value (JKF)
iShares Morningstar Mid Core (JKG)
iShares Morningstar Mid Growth (JKH)
iShares Morningstar Mid Value (JKI)
iShares Morningstar Small Core (JKJ)
iShares Morningstar Small Growth (JKK)
iShares Morningstar Small Value (JKL)
iShares NYSE Index Funds
iShares NYSE Composite (NYC)
iShares NYSE 100 (NY)
iShares® is a registered trademark of Barclays Global Investors, N.A. The iShares Funds are not sponsored, endorsed or issued by Lehman Brothers, nor are they sponsored, endorsed, issued, sold or promoted by Cohen & Steers Capital Management, Inc., Dow Jones & Company, Inc., FTSE International Limited (“FTSE”), FTSE/Xinhua Index Limited (“FXI”), iBoxx, KLD Research & Analytics, Inc., MSCI Inc., Morningstar, Inc., The NASDAQ Stock Market, Inc., National Association of Real Estate Investment Trusts (“NAREIT”), New York Stock Exchange, Inc., Frank Russell Company, or Standard & Poor’s. None of these companies make any representation regarding the advisability of investing in the iShares Funds. Neither SEI nor BGI, nor any of their affiliates, are affiliated with the companies listed above. iBoxx is a registered trademark of International Index Company Limited. FXI does not make any warranty regarding the FTSE/Xinhua Index. All rights in the FTSE/Xinhua Index vest in FXI. Neither FTSE nor
NAREIT makes any warranty regarding the FTSE NAREIT Real Estate 50 Index, FTSE NAREIT Residential Index, FTSE NAREIT Retail Index, FTSE NAREIT Mortgage REITs Index or FTSE NAREIT Industrial/Office Index; all rights vest in NAREIT. “FTSE” Is a trade and service mark of London Stock Exchange and The Financial Times; “Xinhua” is a trade and service mark of Xinhua Financial Network Limited. “NAREIT®” is a trademark of NAREIT.
An investment in the Fund(s) is not a deposit of a bank and it is not insured or guaranteed by the Federal Deposit Insurance Corporation or any other government agency. This advertising section does not constitute part of the 2007 Annual Report.
5508-iS-1007
34 | 2007 iSHARES ANNUAL REPORTTO SHAREHOLDERS |
Table of Contents
Table of Contents
| Item 2. | Code of Ethics. |
iShares, Inc. (the “Registrant”) has adopted a code of ethics that applies to persons appointed by the Registrant’s Board of Directors as the President and/or Chief Financial Officer, and any persons performing similar functions. For the fiscal year ended August 31, 2007, there were no amendments to any provision of this code of ethics, nor were there any waivers granted from any provision of this code of ethics. A copy of this code of ethics is filed with this Form N-CSR under Item 12(a)(1).
| Item 3. | Audit Committee Financial Expert. |
The Registrant’s Board of Directors has determined that the Registrant has more than one audit committee financial expert, as that term is defined under Item 3(b) and 3(c), serving on its audit committee. The audit committee financial experts serving on the Registrant’s audit committee are Charles A. Hurty, John E. Kerrigan, George G.C. Parker and Robert H. Silver, all of whom are independent, as that term is defined under Item 3(a)(2).
| Item 4. | Principal Accountant Fees and Services. |
(a) Audit Fees – The aggregate fees billed for each of the last two fiscal years for professional services rendered by the principal accountant for the audit of the Funds’ annual financial statements or services that are normally provided by the accountant in connection with statutory and regulatory filings or engagements for those fiscal years, were $374,100 for the fiscal year ended August 31, 2006 and $392,808 for the fiscal year ended August 31, 2007.
(b) Audit-Related Fees – There were no fees billed for the fiscal years ended August 31, 2006 and August 31, 2007 for assurance and related services by the principal accountant that were reasonably related to the performance of the audit of the Funds’ financial statements and are not reported under (a) of this Item.
(c) Tax Fees – The aggregate fees billed in each of the last two fiscal years for professional services rendered by the principal accountant for the review of the Funds’ tax returns and excise tax calculations, were $179,310 for the fiscal year ended August 31, 2006 and $188,280 for the fiscal year ended August 31, 2007.
(d) All Other Fees – There were no other fees billed for the fiscal years ended August 31, 2006 and August 31, 2007 for products and services provided by the principal accountant, other than the services reported in (a) through (c) of this Item.
(e) (1) The Registrant’s audit committee charter, as amended, provides that the audit committee is responsible for the approval, prior to appointment, of the engagement of the principal accountant to annually audit and provide their opinion on the Registrant’s financial statements. The audit committee must also approve, prior to appointment, the engagement of the principal accountant to provide non-audit services to the Registrant or to any entity controlling, controlled by or under common control with the Registrant’s investment adviser (“Adviser Affiliate”) that provides ongoing services to the Registrant, if the engagement relates directly to the operations and financial reporting of the Registrant.
(2) There were no services described in (b) through (d) above (including services required by the audit committee pursuant to paragraph (c)(7)(ii) of Rule 2-01 of Regulation S-X) that were approved by the audit committee pursuant to paragraph (c)(7)(i)(C) of Rule 2-01 of Regulation S-X.
(f) None of the hours expended on the principal accountant’s engagement to audit the Funds’ financial statements for the fiscal year ended August 31, 2007 were attributable to work performed by persons other than the principal accountant’s full-time, permanent employees.
(g) The aggregate non-audit fees billed by the Registrant’s principal accountant for services rendered to the Funds, to the Registrant’s investment adviser and to any Adviser Affiliate that provides ongoing services to the Registrant for the last two fiscal years, were $1,866,533 for the fiscal year ended August 31, 2006 and $2,459,117 for the fiscal year ended August 31, 2007.
(h) The Registrant’s audit committee has considered whether the provision of non-audit services rendered to the Registrant’s investment adviser and any Adviser Affiliate that were not pre-approved pursuant to paragraph (c)(7)(ii) of Rule 2-01 of Regulation S-X, if any, are compatible with maintaining the principal accountant’s independence, and has determined that the provision of these services do not compromise the principal accountant’s independence.
| Item 5. | Audit Committee of Listed Registrants. |
The Registrant is a listed issuer as defined in Rule 10A-3 under the Exchange Act and has a separately-designated standing audit committee established in accordance with Section 3(a)(58)(A) of the Exchange Act. The Registrant’s audit committee members are George G.C. Parker, Cecilia H. Herbert, Charles A. Hurty, John E. Kerrigan and Robert H. Silver.
Table of Contents
| Item 6. | Schedule of Investments. |
The Funds’ full schedules of investments are included as part of the reports to shareholders filed under Item 1 of this Form.
| Item 7. | Disclosure of Proxy Voting Policies and Procedures for Closed-End Management Investment Companies. |
Not applicable to the Registrant.
| Item 8. | Portfolio Managers of Closed-End Management Investment Companies. |
Not applicable to the Registrant.
| Item 9. | Purchases of Equity Securities by Closed-End Management Investment Company and Affiliated Purchasers. |
Not applicable to the Registrant.
| Item 10. | Submission of Matters to a Vote of Security Holders. |
There were no material changes to the procedures by which shareholders may recommend nominees to the Registrant’s Board of Directors.
| Item 11. | Controls and Procedures. |
(a) The President (the Registrant’s Principal Executive Officer) and Chief Financial Officer (the Registrant’s Principal Financial Officer) have concluded that, based on their evaluation as of a date within 90 days of the filing date of this report, the disclosure controls and procedures of the Registrant (as defined in Rule 30a-3(c) under the Investment Company Act of 1940) are reasonably designed to achieve the purposes described in Section 4(a) of the attached certification.
(b) There were no changes in the Registrant’s internal control over financial reporting (as defined in Rule 30a-3(d) under the Investment Company Act of 1940) that occurred during the Registrant’s second fiscal quarter of the period covered by this report that have materially affected, or are reasonably likely to materially affect, the Registrant’s internal control over financial reporting.
| Item 12. | Exhibits. |
(a) (1) Code of Ethics for Senior Officers that is the subject of Item 2 is attached.
(a) (2) Section 302 Certifications are attached.
(a) (3) Not applicable to the Registrant.
(b) Section 906 Certifications are attached.
Table of Contents
Pursuant to the requirements of the Securities Exchange Act of 1934 and the Investment Company Act of 1940, the Registrant has duly caused this report to be signed on its behalf by the undersigned, thereunto duly authorized.
iShares, Inc. | ||
| By: | /s/ Michael A. Latham | |
| Michael A. Latham, President (Principal Executive Officer) | ||
| Date: October 30, 2007 | ||
Pursuant to the requirements of the Securities Exchange Act of 1934 and the Investment Company Act of 1940, this report has been signed below by the following persons on behalf of the Registrant and in the capacities and on the dates indicated.
| By: | /s/ Michael A. Latham | |
| Michael A. Latham, President (Principal Executive Officer) | ||
| Date: October 30, 2007 | ||
| By: | /s/ Geoffrey D. Flynn | |
| Geoffrey D. Flynn, Treasurer and Chief Financial Officer (Principal Financial Officer) | ||
| Date: October 30, 2007 | ||