Table of Contents
UNITED STATES
SECURITIES AND EXCHANGE COMMISSION
Washington, D.C. 20549
FORM N-CSR
CERTIFIED SHAREHOLDER REPORT OF REGISTERED
MANAGEMENT INVESTMENT COMPANIES
Investment Company Act file number 811-09102
iShares, Inc.
(Exact name of registrant as specified in charter)
c/o: State Street Bank and Trust Company
200 Clarendon Street, Boston, MA 02116
(Address of principal executive offices) (Zip code)
The Corporation Trust Company
300 East Lombard Street, Baltimore, MD 21202
(Name and address of agent for service)
Registrant’s telephone number, including area code: 1-800-474-2737
Date of fiscal year end: August 31, 2009
Date of reporting period: August 31, 2009
Table of Contents
Item 1. Reports to Stockholders.
2009 ANNUAL REPORT TO SHAREHOLDERS
iSHARES® MSCI SERIES
AUGUST 31, 2009
Would you prefer to receive materials like this electronically?
See inside cover for details.
iShares MSCI Austria Investable Market Index Fund
iShares MSCI Belgium Investable Market Index Fund
iShares MSCI EMU Index Fund
iShares MSCI France Index Fund
iShares MSCI Germany Index Fund
iShares MSCI Italy Index Fund
iShares MSCI Netherlands Investable Market Index Fund
iShares MSCI Spain Index Fund
iShares MSCI Sweden Index Fund
iShares MSCI Switzerland Index Fund
iShares MSCI United Kingdom Index Fund
iShares®
Table of Contents

iShares
Dear iShares Shareholder:
Electronic delivery is the easiest, most convenient way to receive reporting on your iShares holdings. In addition, it’s a way we can all care for our environment. To that end, we are pleased to offer shareholder reports and prospectuses online.
To sign up for electronic delivery, please follow these simple steps:
1. Go to www.icsdelivery.com.
2. From the main page, select the first letter of your brokerage firm’s name.
3. Select your brokerage institution from the list that follows. If your brokerage firm is not listed, electronic delivery may not be available. Please contact your brokerage firm or financial adviser.
4. Fill out the appropriate information and provide the e-mail address where you would like your information sent.
Your information and email address will be kept confidential and only used to deliver documents to you. If at any time you are not satisfied, you can cancel electronic delivery at www.icsdelivery.com and once again receive physical delivery of your materials. If you have any questions, please contact your brokerage firm or financial adviser.
Once you have enrolled, you will no longer receive prospectuses and shareholder reports in the mail. Instead, you will receive e-mail notifications announcing that the shareholder report or prospectuses has been posted on the iShares website at www.iShares.com.
Table of Contents
| 1 | ||
| 34 | ||
| 36 | ||
| 36 | ||
| 38 | ||
| 40 | ||
| 45 | ||
| 48 | ||
| �� | 50 | |
| 52 | ||
| 54 | ||
| 56 | ||
| 58 | ||
| 60 | ||
| 63 | ||
| 75 | ||
| 86 | ||
| 96 | ||
| 97 | ||
Board Review and Approval of Current Investment Advisory Contract (Unaudited) | 98 | |
Board Review and Approval of New Investment Advisory Agreements (Unaudited) | 101 | |
| 107 | ||
| 116 | ||
| 124 |
Table of Contents
Management’s Discussion of Fund Performance
iSHARES® MSCI AUSTRIA INVESTABLE MARKET INDEX FUND
(TICKER: EWO)
INVESTMENT OBJECTIVE
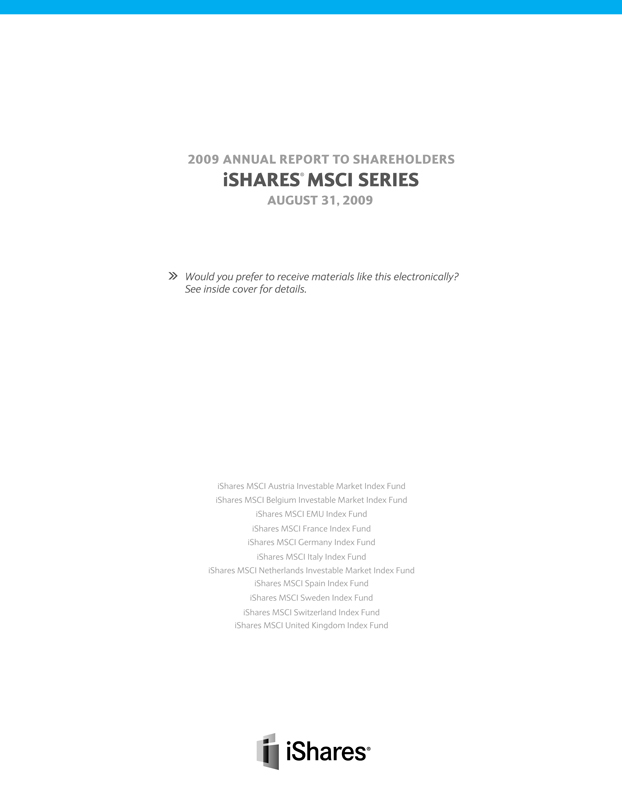
The iShares MSCI Austria Investable Market Index Fund (the “Fund”) seeks to provide investment results that correspond generally to the price and yield performance, before fees and expenses, of publicly traded securities in the aggregate in the Austrian market, as measured by the MSCI Austria Investable Market IndexSM (the “Index”). The Fund invests in a representative sample of securities included in the Index that collectively has an investment profile similar to the Index. Due to the use of representative sampling, the Fund may or may not hold all of the securities that are included in the Index. For the 12-month period ended August 31, 2009 (the “reporting period”), the total return for the Fund was (28.52)%, while the total return for the Index was (31.11)%.
MARKET OVERVIEW AND DISCUSSION OF PERFORMANCE
A slowing global economic environment and ongoing credit crisis weighed on stock markets around the world during much of the reporting period. Early in the reporting period, the credit crisis that had begun with problems within the U.S. mortgage industry spurred extreme turmoil in the global financial sector, leading to a series of bankruptcies and takeovers among several major financial institutions in late 2008. The events impacted markets worldwide, pushing major indices downward and sapping strength from already weak economies. Unemployment rates climbed in most major economies as industrial output declined and levels of imports and exports fell. In an effort to stabilize markets, key central banks around the world took decisive steps, initiating debt purchase programs and easing monetary policy. In the U.S., the Federal Reserve Board cut the federal funds rate to an unprecedented range of 0.00% – 0.25% during the course of the reporting period. The European Central Bank echoed these actions, lowering its key lending rate from 4.25% to a historically low 1.00%.
After dipping to multi-year lows in early March 2009, most international markets rebounded strongly, as many investors appeared confident that the threats surrounding financial markets were beginning to recede. European markets followed these trends. Market strength continued through the end of the reporting period as early, yet uneven, signs of economic recovery emerged in key European markets. Germany and the U.K. experienced increases in industrial output, while consumer spending increased in France. In Switzerland, the KOF broad measure of economic activity reported large jumps in July and August.
Austria’s equity market finished the reporting period with a double-digit decline, despite rebounding sharply in the second half of the reporting period. Austria relies on its European neighbors for most of its exports, and it is vulnerable to the economic health of the constituent markets of the European Union. During the reporting period, Austria’s economic conditions slowed along with the economies of its trading partners, but appeared to be nearing the end of a slowdown as the health of its partners improved. In particular, shifting economic conditions in Germany, Europe’s largest economy and Austria’s leading export market, significantly affected Austria’s GDP growth. For the first quarter of 2009, annual GDP growth declined 2.6%, followed by a decline of a more modest 1.8% for the second quarter of 2009. The U.S dollar depreciated against the euro in the final months of the reporting period, benefiting dollar-denominated performance returns.
All of the Fund’s ten largest holdings as of August 31, 2009 declined for the reporting period. Raiffeisen International Bank Holding AG experienced the steepest decline among the ten largest holdings. Steel maker voestalpine AG, and oil and gas company OMV AG also delivered significant negative returns, as did the Fund’s largest holding, retail bank Erste Group Bank AG. Telecommunications company Telekom Austria AG logged more modest, although double-digit, declines. Vienna Insurance Group and Wienerberger AG, the world’s largest producer of bricks, also experienced relatively modest declines.
| MANAGEMENT’S DISCUSSIONSOF FUND PERFORMANCE | 1 |
Table of Contents
Management’s Discussion of Fund Performance (Continued)
iSHARES® MSCI AUSTRIA INVESTABLE MARKET INDEX FUND
Performance as of August 31, 2009
| Average Annual Total Returns | ||||||||||||||||
| Year Ended 8/31/09 | Five Years Ended 8/31/09 | Ten Years Ended 8/31/09 | ||||||||||||||
| NAV | MARKET | INDEX | NAV | MARKET | INDEX | NAV | MARKET | INDEX | ||||||||
| (28.52)% | (27.71)% | (31.11)% | 5.92% | 5.79% | 5.54% | 10.06% | 10.08% | 9.71% | ||||||||
| Cumulative Total Returns | ||||||||||||||||
| Year Ended 8/31/09 | Five Years Ended 8/31/09 | Ten Years Ended 8/31/09 | ||||||||||||||
| NAV | MARKET | INDEX | NAV | MARKET | INDEX | NAV | MARKET | INDEX | ||||||||
| (28.52)% | (27.71)% | (31.11)% | 33.30% | 32.49% | 30.94% | 160.82% | 161.21% | 152.62% | ||||||||
“Average Annual Total Returns” represent the average annual change in value of an investment over the period(s) indicated. “Cumulative Total Returns” represent the total change in value of an investment over the period(s) indicated.
The Fund’s per share net asset value or “NAV” is the value of one share of the Fund as calculated in accordance with the standard formula for valuing mutual fund shares. The NAV return is based on the NAV of the Fund and the market return is based on the market price per share of the Fund. The price used to calculate market return (“Market Price”) is determined by using the midpoint between the highest bid and the lowest offer on the primary stock exchange on which the shares of the Fund are listed for trading, as of the time that the Fund’s NAV is calculated. Market and NAV returns assume that dividends and capital gain distributions have been reinvested in the Fund at Market Price and NAV, respectively.
An index is a statistical composite that tracks a specified financial market or sector. Unlike the Fund, an index does not actually hold a portfolio of securities and therefore does not incur the expenses incurred by the Fund. These expenses negatively impact the performance of the Fund. Also, market returns do not include brokerage commissions that may be payable on secondary market transactions. If brokerage commissions were included, market returns would be lower. The performance shown in the table(s) and chart(s) above assumes reinvestment of all dividends and capital gain distributions and does not reflect the deduction of taxes that a shareholder would pay on fund distributions or the redemption or sale of fund shares. The investment return and principal value of shares of the Fund will vary with changes in market conditions. Shares of the Fund may be worth more or less than their original cost when they are redeemed or sold in the market. The Fund’s past performance is no guarantee of future results.
| 2 | 2009 iSHARES ANNUAL REPORT TO SHAREHOLDERS |
Table of Contents
Management’s Discussion of Fund Performance (Continued)
iSHARES® MSCI AUSTRIA INVESTABLE MARKET INDEX FUND
PORTFOLIO ALLOCATION As of 8/31/09 | |||
| Sector | Percentage of Net Assets | ||
Financial | 37.17 | % | |
Industrial | 16.63 | ||
Energy | 12.21 | ||
Communications | 10.25 | ||
Basic Materials | 8.85 | ||
Utilities | 7.08 | ||
Consumer Non-Cyclical | 4.36 | ||
Consumer Cyclical | 2.66 | ||
Short-Term and Other Net Assets | 0.79 | ||
TOTAL | 100.00 | % | |
TEN LARGEST FUND HOLDINGS As of 8/31/09 | |||
| Security | Percentage of Net Assets | ||
Erste Group Bank AG | 14.23 | % | |
OMV AG | 11.06 | ||
Telekom Austria AG | 10.25 | ||
voestalpine AG | 7.10 | ||
Oesterreichische Elektrizitaetswirtschafts AG Class A | 6.68 | ||
Raiffeisen International Bank Holding AG | 4.70 | ||
Vienna Insurance Group | 4.33 | ||
Wienerberger AG | 3.97 | ||
Andritz AG | 3.45 | ||
Immoeast AG | 3.06 | ||
TOTAL | 68.83 | % | |
| MANAGEMENT’S DISCUSSIONSOF FUND PERFORMANCE | 3 |
Table of Contents
Management’s Discussion of Fund Performance
iSHARES® MSCI BELGIUM INVESTABLE MARKET INDEX FUND
(TICKER: EWK)
INVESTMENT OBJECTIVE
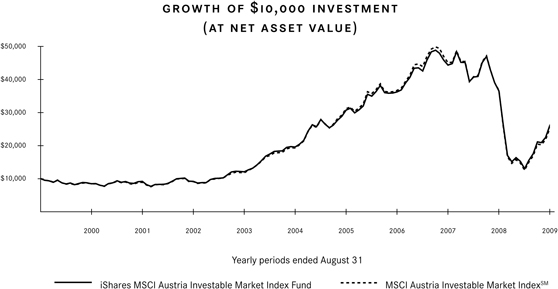
The iShares MSCI Belgium Investable Market Index Fund (the “Fund”) seeks to provide investment results that correspond generally to the price and yield performance, before fees and expenses, of publicly traded securities in the aggregate in the Belgian market, as measured by the MSCI Belgium Investable Market IndexSM (the “Index”). The Fund invests in a representative sample of securities included in the Index that collectively has an investment profile similar to the Index. Due to the use of representative sampling, the Fund may or may not hold all of the securities that are included in the Index. For the 12-month period ended August 31, 2009 (the “reporting period”), the total return for the Fund was (29.15)%, while the total return for the Index was (29.98)%.
MARKET OVERVIEW AND DISCUSSION OF PERFORMANCE
A slowing global economic environment and ongoing credit crisis weighed on stock markets around the world during much of the reporting period. Early in the reporting period, the credit crisis that had begun with problems within the U.S. mortgage industry spurred extreme turmoil in the global financial sector, leading to a series of bankruptcies and takeovers among several major financial institutions in late 2008. The events impacted markets worldwide, pushing major indices downward and sapping strength from already weak economies. Unemployment rates climbed in most major economies as industrial output declined and levels of imports and exports fell. In an effort to stabilize markets, key central banks around the world took decisive steps, initiating debt purchase programs and easing monetary policy. In the U.S., the Federal Reserve Board cut the federal funds rate to an unprecedented range of 0.00% - 0.25% during the course of the reporting period. The European Central Bank echoed these actions, lowering its key lending rate from 4.25% to a historically low 1.00%.
After dipping to multi-year lows in early March 2009, most international markets rebounded strongly, as many investors appeared confident that the threats surrounding financial markets were beginning to recede. European markets followed these trends. Market strength continued through the end of the reporting period as early, yet uneven, signs of economic recovery emerged in key European markets. Germany and the U.K. experienced increases in industrial output, while consumer spending increased in France. In Switzerland, the KOF broad measure of economic activity reported large jumps in July and August.
Belgium’s equity market experienced a double-digit decline during the reporting period, despite a sharp rebound in the final months of the period. With few natural resources, Belgium imports raw materials and exports end products, and is highly sensitive to the economic state of its trading partners. Sluggish economic conditions in Europe and the U.S., Belgium’s largest export destinations, hurt Belgium’s economy during the reporting period. High commodity prices further dampened economic conditions, as evidenced by GDP rates. In the first two quarters of 2009, Belgium’s GDP fell at annualized rates of 3.1% and 3.7%, respectively, as its export levels dropped sharply, the unemployment rate topped 8% and industrial production decreased. Consumer confidence levels sank to their lowest levels in more than 10 years. The U.S dollar depreciated against the euro in the final months of the reporting period, benefiting dollar-denominated performance returns.
Seven of the ten largest Fund holdings as of August 31, 2009 delivered negative performance for the reporting period. Four financial companies among the Fund’s ten largest holdings declined for the reporting period, including the Fund’s second largest holding, Fortis and KBC Groep NV. The Fund’s largest holding, Anheuser-Busch InBev NV, the world’s largest brewer, posted only a slight decline. Retail food chain Delhaize Group logged a gain for the reporting period, as did biopharmaceutical company UCB SA. Telecommunications company Belgacom SA finished the reporting period with a slight gain.
| 4 | 2009 iSHARES ANNUAL REPORT TO SHAREHOLDERS |
Table of Contents
Management’s Discussion of Fund Performance (Continued)
iSHARES® MSCI BELGIUM INVESTABLE MARKET INDEX FUND
Performance as of August 31, 2009
| Average Annual Total Returns | ||||||||||||||||
| Year Ended 8/31/09 | Five Years Ended 8/31/09 | Ten Years Ended 8/31/09 | ||||||||||||||
| NAV | MARKET | INDEX | NAV | MARKET | INDEX | NAV | MARKET | INDEX | ||||||||
| (29.15)% | (28.62)% | (29.98)% | (0.26)% | (0.44)% | (1.08)% | 0.46% | 0.37% | (1.20)% | ||||||||
| Cumulative Total Returns | ||||||||||||||||
| Year Ended 8/31/09 | Five Years Ended 8/31/09 | Ten Years Ended 8/31/09 | ||||||||||||||
| NAV | MARKET | INDEX | NAV | MARKET | INDEX | NAV | MARKET | INDEX | ||||||||
| (29.15)% | (28.62)% | (29.98)% | (1.29)% | (2.16)% | (5.28)% | 4.67% | 3.81% | (11.37)% | ||||||||
“Average Annual Total Returns” represent the average annual change in value of an investment over the period(s) indicated. “Cumulative Total Returns” represent the total change in value of an investment over the period(s) indicated.
The Fund’s per share net asset value or “NAV” is the value of one share of the Fund as calculated in accordance with the standard formula for valuing mutual fund shares. The NAV return is based on the NAV of the Fund and the market return is based on the market price per share of the Fund. The price used to calculate market return (“Market Price”) is determined by using the midpoint between the highest bid and the lowest offer on the primary stock exchange on which the shares of the Fund are listed for trading, as of the time that the Fund’s NAV is calculated. Market and NAV returns assume that dividends and capital gain distributions have been reinvested in the Fund at Market Price and NAV, respectively.
An index is a statistical composite that tracks a specified financial market or sector. Unlike the Fund, an index does not actually hold a portfolio of securities and therefore does not incur the expenses incurred by the Fund. These expenses negatively impact the performance of the Fund. Also, market returns do not include brokerage commissions that may be payable on secondary market transactions. If brokerage commissions were included, market returns would be lower. The performance shown in the table(s) and chart(s) above assumes reinvestment of all dividends and capital gain distributions and does not reflect the deduction of taxes that a shareholder would pay on fund distributions or the redemption or sale of fund shares. The investment return and principal value of shares of the Fund will vary with changes in market conditions. Shares of the Fund may be worth more or less than their original cost when they are redeemed or sold in the market. The Fund’s past performance is no guarantee of future results.
| MANAGEMENT’S DISCUSSIONSOF FUND PERFORMANCE | 5 |
Table of Contents
Management’s Discussion of Fund Performance (Continued)
iSHARES® MSCI BELGIUM INVESTABLE MARKET INDEX FUND
PORTFOLIO ALLOCATION As of 8/31/09 | |||
| Sector | Percentage of Net Asset | ||
Consumer Non-Cyclical | 40.62 | % | |
Financial | 22.64 | ||
Diversified | 10.71 | ||
Basic Materials | 9.66 | ||
Communications | 8.51 | ||
Industrial | 4.62 | ||
Consumer Cyclical | 1.24 | ||
Technology | 0.17 | ||
Short-Term and Other Net Assets | 1.83 | ||
TOTAL | 100.00 | % | |
TEN LARGEST FUND HOLDINGS As of 8/31/09 | |||
| Security | Percentage of Net Assets | ||
Anheuser-Busch InBev NV | 24.16 | % | |
Fortis | 8.64 | ||
Groupe Bruxelles Lambert SA | 7.14 | ||
Delhaize Group | 6.26 | ||
Solvay SA | 4.87 | ||
Belgacom SA | 4.67 | ||
KBC Groep NV | 4.61 | ||
Dexia SA | 4.23 | ||
UCB SA | 3.80 | ||
Colruyt SA | 3.76 | ||
TOTAL | 72.14 | % | |
| 6 | 2009 iSHARES ANNUAL REPORTTO SHAREHOLDERS |
Table of Contents
Management’s Discussion of Fund Performance
iSHARES® MSCI EMU INDEX FUND
(TICKER: EZU)
INVESTMENT OBJECTIVE
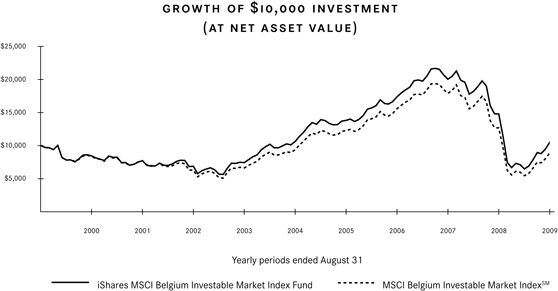
The iShares MSCI EMU Index Fund (the “Fund”) seeks to provide investment results that correspond generally to the price and yield performance, before fees and expenses, of publicly traded securities in the aggregate in the EMU markets, as measured by the MSCI EMU IndexSM (the “Index”). The Fund invests in a representative sample of securities included in the Index that collectively has an investment profile similar to the Index. Due to the use of representative sampling, the Fund may or may not hold all of the securities that are included in the Index. For the 12-month period ended August 31, 2009 (the “reporting period”), the total return for the Fund was (19.05)%, while the total return for the Index was (19.02)%.
MARKET OVERVIEW AND DISCUSSION OF PERFORMANCE
A slowing global economic environment and ongoing credit crisis weighed on stock markets around the world during much of the reporting period. Early in the reporting period, the credit crisis that had begun within the U.S. mortgage industry spurred turmoil in the global financial sector, leading to a series of bankruptcies and takeovers among several major financial institutions in late 2008. The events negatively affected markets in the United States and throughout Europe, pushing major indices downward and sapping strength from already weak economies. Unemployment rates climbed in most major economies as industrial output declined and levels of imports and exports fell. In an effort to stabilize markets, key central banks took decisive steps, initiating debt purchase programs and easing monetary policy. In the U.S., the Federal Reserve Board cut the federal funds rate to an unprecedented range of 0.00% - 0.25% during the course of the reporting period. The European Central Bank echoed these actions, lowering its key lending rate from 4.25% to a historically low 1.00%.
Countries across the European Monetary Union endured a difficult economic environment, with several key nations experiencing recessions. The German economy faced a challenging recession during the reporting period, as evidenced by a contraction in annualized GDP levels for the third and fourth quarters of 2008 and first quarter of 2009. Industrial production declined and the unemployment rate surpassed 8%. The U.K. also struggled with recession during the reporting period. For the fourth quarter of 2008, in particular, annualized GDP declined by its largest level since 1980. Consumer confidence fell to a near record low, and the unemployment rate climbed above 7%. In an effort to stimulate economic activity, the Bank of England cut its key lending rate, the repo rate, aggressively throughout the period, bringing the rate from 5.00% to an unprecedented 0.50%. France experienced its first recession in 16 years. Economic activity, as measured by annualized GDP, contracted for the third and fourth quarters of 2008 and for the first quarter of 2009 as industrial production dropped and the unemployment rate surpassed 9%.
After dipping to multi-year lows in early March 2009, major European markets rebounded, as many investors appeared confident that the threats surrounding financial markets had begun to be mitigated. Market strength continued through the end of the reporting period as early, yet uneven, signs of economic recovery emerged in key European markets. For example, Germany and the U.K. experienced increases in industrial output, while consumer spending climbed in France.
The Fund’s ten largest holdings represented approximately 26% of Fund net assets as of August 31, 2009. Among the Fund’s ten largest holdings performance was mixed for the reporting period. Two financial companies, Allianz SE (Germany) and BNP Paribas (France) both declined. Utility companies E.ON AG (Germany) and ENI SpA (Italy) also lost ground during the period, as did Europe’s largest engineering company, Siemens AG (Germany). On the positive side, two of the four financial companies among the ten largest holdings posted gains: Banco Bilbao Vizcaya Argentaria SA (Spain) delivered a double-digit gain, and the Fund’s largest holding, Banco Santander SA (Spain) also finished the reporting period in positive territory. Telecommunications company Telefonica SA (Spain) also gained ground.
| MANAGEMENT’S DISCUSSIONSOF FUND PERFORMANCE | 7 |
Table of Contents
Management’s Discussion of Fund Performance (Continued)
iSHARES® MSCI EMU INDEX FUND
Performance as of August 31, 2009
| Average Annual Total Returns | ||||||||||||||||
| Year Ended 8/31/09 | Five Years Ended 8/31/09 | Inception to 8/31/09 | ||||||||||||||
| NAV | MARKET | INDEX | NAV | MARKET | INDEX | NAV | MARKET | INDEX | ||||||||
| (19.05)% | (18.31)% | (19.02)% | 7.02% | 6.88% | 7.22% | 0.74% | 0.77% | 1.01% | ||||||||
| Cumulative Total Returns | ||||||||||||||||
| Year Ended 8/31/09 | Five Years Ended 8/31/09 | Inception to 8/31/09 | ||||||||||||||
| NAV | MARKET | INDEX | NAV | MARKET | INDEX | NAV | MARKET | INDEX | ||||||||
| (19.05)% | (18.31)% | (19.02)% | 40.38% | 39.48% | 41.70% | 6.95% | 7.20% | 9.54% | ||||||||
Total returns for the period since inception are calculated from the inception date of the Fund (7/25/00). “Average Annual Total Returns” represent the average annual change in value of an investment over the period(s) indicated. “Cumulative Total Returns” represent the total change in value of an investment over the period(s) indicated.
The Fund’s per share net asset value or “NAV” is the value of one share of the Fund as calculated in accordance with the standard formula for valuing mutual fund shares. The NAV return is based on the NAV of the Fund and the market return is based on the market price per share of the Fund. The price used to calculate market return (“Market Price”) is determined by using the midpoint between the highest bid and the lowest offer on the primary stock exchange on which the shares of the Fund are listed for trading, as of the time that the Fund’s NAV is calculated. Since shares of the Fund did not trade in the secondary market until after the Fund’s inception, for the period from inception to the first day of secondary market trading in shares of the Fund (7/31/00), the NAV of the Fund is used as a proxy for the Market Price to calculate market returns. Market and NAV returns assume that dividends and capital gain distributions have been reinvested in the Fund at Market Price and NAV, respectively.
An index is a statistical composite that tracks a specified financial market or sector. Unlike the Fund, an index does not actually hold a portfolio of securities and therefore does not incur the expenses incurred by the Fund. These expenses negatively impact the performance of the Fund. Also, market returns do not include brokerage commissions that may be payable on secondary market transactions. If brokerage commissions were included, market returns would be lower. The performance shown in the table(s) and chart(s) above assumes reinvestment of all dividends and capital gain distributions and does not reflect the deduction of taxes that a shareholder would pay on fund distributions or the redemption or sale of fund shares. The investment return and principal value of shares of the Fund will vary with changes in market conditions. Shares of the Fund may be worth more or less than their original cost when they are redeemed or sold in the market. The Fund’s past performance is no guarantee of future results.
| 8 | 2009 iSHARES ANNUAL REPORT TO SHAREHOLDERS |
Table of Contents
Management’s Discussion of Fund Performance (Continued)
iSHARES® MSCI EMU INDEX FUND
PORTFOLIO ALLOCATION As of 8/31/09 | |||
| Sector | Percentage of Net Assets | ||
Financial | 26.96 | % | |
Consumer Non-Cyclical | 13.36 | ||
Communications | 12.85 | ||
Industrial | 10.97 | ||
Utilities | 10.33 | ||
Energy | 7.94 | ||
Basic Materials | 7.31 | ||
Consumer Cyclical | 6.13 | ||
Technology | 2.60 | ||
Diversified | 1.21 | ||
Short-Term and Other Net Assets | 0.34 | ||
TOTAL | 100.00 | % | |
TEN LARGEST FUND HOLDINGS As of 8/31/09 | |||
| Security | Percentage of Net Assets | ||
Banco Santander SA (Spain) | 3.99 | % | |
Total SA (France) | 3.86 | ||
Telefonica SA (Spain) | 3.35 | ||
E.ON AG (Germany) | 2.54 | ||
Siemens AG Registered (Germany) | 2.26 | ||
Sanofi-Aventis (France) | 2.25 | ||
BNP Paribas (France) | 2.13 | ||
Banco Bilbao Vizcaya Argentaria SA (Spain) | 2.04 | ||
Eni SpA (Italy) | 1.95 | ||
Allianz SE Registered (Germany) | 1.66 | ||
TOTAL | 26.03 | % | |
| MANAGEMENT’S DISCUSSIONSOF FUND PERFORMANCE | 9 |
Table of Contents
Management’s Discussion of Fund Performance
iSHARES® MSCI FRANCE INDEX FUND
(TICKER: EWQ)
INVESTMENT OBJECTIVE
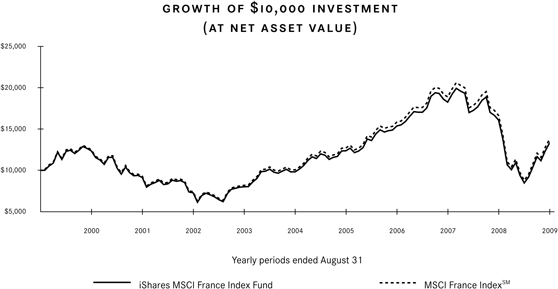
The iShares MSCI France Index Fund (the “Fund”) seeks to provide investment results that correspond generally to the price and yield performance, before fees and expenses, of publicly traded securities in the aggregate in the French market, as measured by the MSCI France IndexSM (the “Index”). The Fund invests in a representative sample of securities included in the Index that collectively has an investment profile similar to the Index. Due to the use of representative sampling, the Fund may or may not hold all of the securities that are included in the Index. For the 12-month period ended August 31, 2009 (the “reporting period”), the total return for both the Fund and the Index was (17.11)%.
MARKET OVERVIEW AND DISCUSSION OF PERFORMANCE
A slowing global economic environment and ongoing credit crisis weighed on stock markets around the world during much of the reporting period. Early in the reporting period, the credit crisis that had begun with problems within the U.S. mortgage industry spurred extreme turmoil in the global financial sector, leading to a series of bankruptcies and takeovers among several major financial institutions in late 2008. The events impacted markets worldwide, pushing major indices downward and sapping strength from already weak economies. Unemployment rates climbed in most major economies as industrial output declined and levels of imports and exports fell. In an effort to stabilize markets, key central banks around the world took decisive steps, initiating debt purchase programs and easing monetary policy. In the U.S., the Federal Reserve Board cut the federal funds rate to an unprecedented range of 0.00% - 0.25% during the course of the reporting period. The European Central Bank echoed these actions, lowering its key lending rate from 4.25% to a historically low 1.00%.
After dipping to multi-year lows in early March 2009, most international markets rebounded strongly, as many investors appeared confident that the threats surrounding financial markets were beginning to recede. European markets followed these trends. Market strength continued through the end of the reporting period as early, yet uneven, signs of economic recovery emerged in key European markets. Germany and the U.K. experienced increases in industrial output, while consumer spending increased in France. In Switzerland, the KOF broad measure of economic activity reported large jumps in July and August.
French equity markets declined during the reporting period, despite a strong rebound in the second half of the period. During the reporting period, France experienced its first recession in 16 years. Economic activity, as measured by annualized GDP, contracted for the third and fourth quarters of 2008 and for the first quarter of 2009 as industrial production dropped and the unemployment rate surpassed 9%. In the final months of the reporting period, however, early signs of economic recovery emerged. By June, consumer spending levels rose, the contraction in manufacturing and services slowed, and industrial production increased. For the second quarter of 2009, GDP grew at an annualized 0.3% rate, its first gain in five quarters. The U.S dollar depreciated against the euro in the final months of the reporting period, benefiting dollar-denominated performance returns.
Nine of the Fund’s ten largest holdings as of August 31, 2009 experienced share price declines for the reporting period. Steelmaker ArcelorMittal posted the largest decline of the ten largest holdings during the reporting period. Financial companies, including insurer AXA and investment bank Societe Generale, also suffered double-digit declines in share prices, as did natural gas producer GDF Suez. The Fund’s largest holding, oil company Total SA, declined for the reporting period. Media conglomerate Vivendi SA also lost ground. On the positive side, pharmaceutical company Sanofi-Aventis delivered a slight gain.
| 10 | 2009 iSHARES ANNUAL REPORT TO SHAREHOLDERS |
Table of Contents
Management’s Discussion of Fund Performance (Continued)
iSHARES® MSCI FRANCE INDEX FUND
Performance as of August 31, 2009
| Average Annual Total Returns | ||||||||||||||||
| Year Ended 8/31/09 | Five Years Ended 8/31/09 | Ten Years Ended 8/31/09 | ||||||||||||||
| NAV | MARKET | INDEX | NAV | MARKET | INDEX | NAV | MARKET | INDEX | ||||||||
| (17.11)% | (16.44)% | (17.11)% | 6.31% | 6.25% | 6.53% | 2.91% | 2.90% | 3.27% | ||||||||
| Cumulative Total Returns | ||||||||||||||||
| Year Ended 8/31/09 | Five Years Ended 8/31/09 | Ten Years Ended 8/31/09 | ||||||||||||||
| NAV | MARKET | INDEX | NAV | MARKET | INDEX | NAV | MARKET | INDEX | ||||||||
| (17.11)% | (16.44)% | (17.11)% | 35.77% | 35.40% | 37.20% | 33.26% | 33.08% | 37.96% | ||||||||
“Average Annual Total Returns” represent the average annual change in value of an investment over the period(s) indicated. “Cumulative Total Returns” represent the total change in value of an investment over the period(s) indicated.
The Fund’s per share net asset value or “NAV” is the value of one share of the Fund as calculated in accordance with the standard formula for valuing mutual fund shares. The NAV return is based on the NAV of the Fund and the market return is based on the market price per share of the Fund. The price used to calculate market return (“Market Price”) is determined by using the midpoint between the highest bid and the lowest offer on the primary stock exchange on which the shares of the Fund are listed for trading, as of the time that the Fund’s NAV is calculated. Market and NAV returns assume that dividends and capital gain distributions have been reinvested in the Fund at Market Price and NAV, respectively.
An index is a statistical composite that tracks a specified financial market or sector. Unlike the Fund, an index does not actually hold a portfolio of securities and therefore does not incur the expenses incurred by the Fund. These expenses negatively impact the performance of the Fund. Also, market returns do not include brokerage commissions that may be payable on secondary market transactions. If brokerage commissions were included, market returns would be lower. The performance shown in the table(s) and chart(s) above assumes reinvestment of all dividends and capital gain distributions and does not reflect the deduction of taxes that a shareholder would pay on fund distributions or the redemption or sale of fund shares. The investment return and principal value of shares of the Fund will vary with changes in market conditions. Shares of the Fund may be worth more or less than their original cost when they are redeemed or sold in the market. The Fund’s past performance is no guarantee of future results.
| MANAGEMENT’S DISCUSSIONSOF FUND PERFORMANCE | 11 |
Table of Contents
Management’s Discussion of Fund Performance (Continued)
iSHARES® MSCI FRANCE INDEX FUND
PORTFOLIO ALLOCATION As of 8/31/09 | |||
| Sector | Percentage of Net Assets | ||
Consumer Non-Cyclical | 19.49 | % | |
Financial | 19.21 | ||
Industrial | 13.39 | ||
Energy | 12.90 | ||
Communications | 11.17 | ||
Utilities | 8.00 | ||
Basic Materials | 5.79 | ||
Consumer Cyclical | 5.41 | ||
Diversified | 2.29 | ||
Technology | 2.05 | ||
Short-Term and Other Net Assets | 0.30 | ||
TOTAL | 100.00 | % | |
TEN LARGEST FUND HOLDINGS As of 8/31/09 | |||
| Security | Percentage of Net Assets | ||
Total SA | 11.97 | % | |
Sanofi-Aventis | 6.99 | ||
BNP Paribas | 6.59 | ||
GDF Suez | 4.97 | ||
France Telecom SA | 4.56 | ||
Societe Generale | 3.67 | ||
AXA | 3.49 | ||
Vivendi SA | 3.27 | ||
ArcelorMittal | 3.01 | ||
Danone SA | 2.93 | ||
TOTAL | 51.45 | % | |
| �� | |||
| 12 | 2009 iSHARES ANNUAL REPORTTO SHAREHOLDERS |
Table of Contents
Management’s Discussion of Fund Performance
iSHARES® MSCI GERMANY INDEX FUND
(TICKER: EWG)
INVESTMENT OBJECTIVE
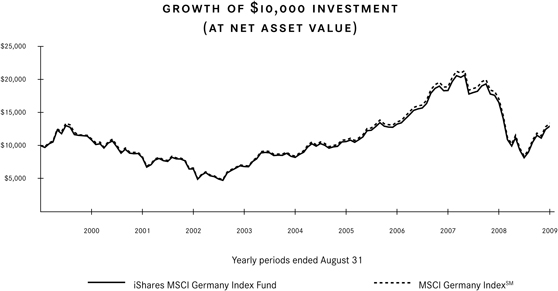
The iShares MSCI Germany Index Fund (the “Fund”) seeks to provide investment results that correspond generally to the price and yield performance, before fees and expenses, of publicly traded securities in the aggregate in the German market, as measured by the MSCI Germany IndexSM (the “Index”). The Fund invests in a representative sample of securities included in the Index that collectively has an investment profile similar to the Index. Due to the use of representative sampling, the Fund may or may not hold all of the securities that are included in the Index. For the 12-month period ended August 31, 2009 (the “reporting period”), the total return for the Fund was (21.62)%, while the total return for the Index was (21.71)%.
MARKET OVERVIEW AND DISCUSSION OF PERFORMANCE
A slowing global economic environment and ongoing credit crisis weighed on stock markets around the world during much of the reporting period. Early in the reporting period, the credit crisis that had begun with problems within the U.S. mortgage industry spurred extreme turmoil in the global financial sector, leading to a series of bankruptcies and takeovers among several major financial institutions in late 2008. The events impacted markets worldwide, pushing major indices downward and sapping strength from already weak economies. Unemployment rates climbed in most major economies as industrial output declined and levels of imports and exports fell. In an effort to stabilize markets, key central banks around the world took decisive steps, initiating debt purchase programs and easing monetary policy. In the U.S., the Federal Reserve Board cut the federal funds rate to an unprecedented range of 0.00% - 0.25% during the course of the reporting period. The European Central Bank echoed these actions, lowering its key lending rate from 4.25% to a historically low 1.00%.
After dipping to multi-year lows in early March 2009, most international markets rebounded strongly, as many investors appeared confident that the threats surrounding financial markets were beginning to recede. European markets followed these trends. Market strength continued through the end of the reporting period as early, yet uneven, signs of economic recovery emerged in key European markets. Germany and the U.K. experienced increases in industrial output, while consumer spending increased in France. In Switzerland, the KOF broad measure of economic activity reported large jumps in July and August.
Germany’s market finished the reporting period with a double-digit decline, despite rebounding sharply in the second half of the reporting period. The German economy was challenged with a recession during the reporting period, as evidenced by a contraction in annualized GDP levels for the third and fourth quarters of 2008 and first quarter of 2009. Industrial production declined throughout the period, and the unemployment rate surpassed 8%. In the final months of the reporting period, though, early signs of economic recovery began to surface. Industrial production improved and the unemployment rate stabilized at 8.3%. German retail sales rose as consumer confidence reached its highest level in more than a year. For the second quarter of 2009, GDP grew at an annualized 0.3% rate. The U.S dollar depreciated against the euro in the final months of the reporting period, benefiting dollar-denominated performance returns.
All of the Fund’s ten largest holdings as of August 31, 2009 delivered negative returns for the reporting period. Financial companies Allianz SE and Deutsche Bank AG both posted double-digit declines, as did the Fund’s largest holding, utility company E.ON AG. Bayer AG, Germany’s largest drug maker, and car maker Daimler AG also experienced significant declines. Telecommunications company Deutsche Telekom AG lost ground as well. Chemical company BASF SE posted only a modest drop in share price for the reporting period.
| MANAGEMENT’S DISCUSSIONSOF FUND PERFORMANCE | 13 |
Table of Contents
Management’s Discussion of Fund Performance (Continued)
iSHARES® MSCI GERMANY INDEX FUND
Performance as of August 31, 2009
| Average Annual Total Returns | ||||||||||||||||
| Year Ended 8/31/09 | Five Years Ended 8/31/09 | Ten Years Ended 8/31/09 | ||||||||||||||
| NAV | MARKET | INDEX | NAV | MARKET | INDEX | NAV | MARKET | INDEX | ||||||||
| (21.62)% | (21.00)% | (21.71)% | 9.51% | 9.46% | 9.73% | 2.62% | 2.70% | 2.94% | ||||||||
| Cumulative Total Returns | ||||||||||||||||
| Year Ended 8/31/09 | Five Years Ended 8/31/09 | Ten Years Ended 8/31/09 | ||||||||||||||
| NAV | MARKET | INDEX | NAV | MARKET | INDEX | NAV | MARKET | INDEX | ||||||||
| (21.62)% | (21.00)% | (21.71)% | 57.47% | 57.14% | 59.08% | 29.51% | 30.53% | 33.61% | ||||||||
“Average Annual Total Returns” represent the average annual change in value of an investment over the period(s) indicated. “Cumulative Total Returns” represent the total change in value of an investment over the period(s) indicated.
The Fund’s per share net asset value or “NAV” is the value of one share of the Fund as calculated in accordance with the standard formula for valuing mutual fund shares. The NAV return is based on the NAV of the Fund and the market return is based on the market price per share of the Fund. The price used to calculate market return (“Market Price”) is determined by using the midpoint between the highest bid and the lowest offer on the primary stock exchange on which the shares of the Fund are listed for trading, as of the time that the Fund’s NAV is calculated. Market and NAV returns assume that dividends and capital gain distributions have been reinvested in the Fund at Market Price and NAV, respectively.
An index is a statistical composite that tracks a specified financial market or sector. Unlike the Fund, an index does not actually hold a portfolio of securities and therefore does not incur the expenses incurred by the Fund. These expenses negatively impact the performance of the Fund. Also, market returns do not include brokerage commissions that may be payable on secondary market transactions. If brokerage commissions were included, market returns would be lower. The performance shown in the table(s) and chart(s) above assumes reinvestment of all dividends and capital gain distributions and does not reflect the deduction of taxes that a shareholder would pay on fund distributions or the redemption or sale of fund shares. The investment return and principal value of shares of the Fund will vary with changes in market conditions. Shares of the Fund may be worth more or less than their original cost when they are redeemed or sold in the market. The Fund’s past performance is no guarantee of future results.
| 14 | 2009 iSHARES ANNUAL REPORT TO SHAREHOLDERS |
Table of Contents
Management’s Discussion of Fund Performance (Continued)
iSHARES® MSCI GERMANY INDEX FUND
PORTFOLIO ALLOCATION As of 8/31/09 | |||
| Sector | Percentage of Net Assets | ||
Financial | 19.63 | % | |
Basic Materials | 15.63 | ||
Utilities | 15.60 | ||
Industrial | 15.36 | ||
Consumer Cyclical | 14.18 | ||
Consumer Non-Cyclical | 7.64 | ||
Technology | 5.94 | ||
Communications | 5.06 | ||
Diversified | 0.35 | ||
Energy | 0.24 | ||
Short-Term and Other Net Assets | 0.37 | ||
TOTAL | 100.00 | % | |
TEN LARGEST FUND HOLDINGS As of 8/31/09 | |||
| Security | Percentage of Net Assets | ||
E.ON AG | 10.71 | % | |
Siemens AG Registered | 9.37 | ||
Allianz SE Registered | 6.85 | ||
BASF SE | 6.21 | ||
Bayer AG | 6.11 | ||
Daimler AG Registered | 5.24 | ||
SAP AG | 5.22 | ||
Deutsche Telekom AG Registered | 4.79 | ||
RWE AG | 4.71 | ||
Deutsche Bank AG Registered | 4.70 | ||
TOTAL | 63.91 | % | |
| MANAGEMENT’S DISCUSSIONSOF FUND PERFORMANCE | 15 |
Table of Contents
Management’s Discussion of Fund Performance
iSHARES® MSCI ITALY INDEX FUND
(TICKER: EWI)
INVESTMENT OBJECTIVE
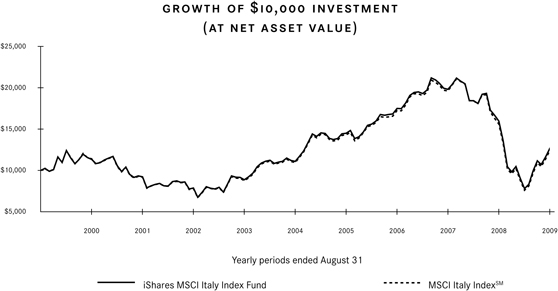
The iShares MSCI Italy Index Fund (the “Fund”) seeks to provide investment results that correspond generally to the price and yield performance, before fees and expenses, of publicly traded securities in the aggregate in the Italian market, as measured by the MSCI Italy IndexSM (the “Index”). The Fund invests in a representative sample of securities included in the Index that collectively has an investment profile similar to the Index. Due to the use of representative sampling, the Fund may or may not hold all of the securities that are included in the Index. For the 12-month period ended August 31, 2009 (the “reporting period”), the total return for the Fund was (20.78)%, while the total return for the Index was (20.48)%.
MARKET OVERVIEW AND DISCUSSION OF PERFORMANCE
A slowing global economic environment and ongoing credit crisis weighed on stock markets around the world during much of the reporting period. Early in the reporting period, the credit crisis that had begun with problems within the U.S. mortgage industry spurred extreme turmoil in the global financial sector, leading to a series of bankruptcies and takeovers among several major financial institutions in late 2008. The events impacted markets worldwide, pushing major indices downward and sapping strength from already weak economies. Unemployment rates climbed in most major economies as industrial output declined and levels of imports and exports fell. In an effort to stabilize markets, key central banks around the world took decisive steps, initiating debt purchase programs and easing monetary policy. In the U.S., the Federal Reserve Board cut the federal funds rate to an unprecedented range of 0.00% - 0.25% during the course of the reporting period. The European Central Bank echoed these actions, lowering its key lending rate from 4.25% to a historically low 1.00%.
After dipping to multi-year lows in early March 2009, most international markets rebounded strongly, as many investors appeared confident that the threats surrounding financial markets were beginning to recede. European markets followed these trends. Market strength continued through the end of the reporting period as early, yet uneven, signs of economic recovery emerged in key European markets. Germany and the U.K. experienced increases in industrial output, while consumer spending increased in France. In Switzerland, the KOF broad measure of economic activity reported large jumps in July and August.
Italy’s equity market finished the reporting period with a double-digit decline, despite rebounding sharply in the second half of the reporting period. Already one of the slowest economies in the euro zone, Italy’s economic growth declined further during the reporting period. Annualized GDP contracted for the third and fourth quarters of 2008, as well as the first two quarters of 2009, as industrial production declined and unemployment levels rose above 7%. For the second quarter of 2009, though, the decline in GDP was a relatively modest 0.5%, compared to declines of 2.1% and 2.7% for the fourth quarter of 2008 and first quarter of 2009, respectively. The U.S dollar depreciated against the euro in the final months of the reporting period, benefiting dollar-denominated performance returns.
For the reporting period, performance was mostly negative among the Fund’s ten largest holdings. The Fund’s largest holding, utility company ENI SpA, detracted significantly from performance. Financial companies Assicurazioni Generali SpA, UniCredit SpA, and Intesa Sanpaolo SpA all posted double-digit declines, as did car maker Fiat SpA. Enel SpA, Italy’s largest power company, also delivered negative returns for the period. On the positive side, telecommunications company Telecom Italia SpA and financial company Mediobanca SpA both produced positive returns for the reporting period.
| 16 | 2009 iSHARES ANNUAL REPORT TO SHAREHOLDERS |
Table of Contents
Management’s Discussion of Fund Performance (Continued)
iSHARES® MSCI ITALY INDEX FUND
Performance as of August 31, 2009
| Average Annual Total Returns | ||||||||||||||||
| Year Ended 8/31/09 | Five Years Ended 8/31/09 | Ten Years Ended 8/31/09 | ||||||||||||||
| NAV | MARKET | INDEX | NAV | MARKET | INDEX | NAV | MARKET | INDEX | ||||||||
| (20.78)% | (19.43)% | (20.48)% | 2.65% | 2.53% | 2.51% | 2.36% | 2.39% | 2.17% | ||||||||
| Cumulative Total Returns | ||||||||||||||||
| Year Ended 8/31/09 | Five Years Ended 8/31/09 | Ten Years Ended 8/31/09 | ||||||||||||||
| NAV | MARKET | INDEX | NAV | MARKET | INDEX | NAV | MARKET | INDEX | ||||||||
| (20.78)% | (19.43)% | (20.48)% | 13.94% | 13.30% | 13.20% | 26.32% | 26.64% | 23.95% | ||||||||
“Average Annual Total Returns” represent the average annual change in value of an investment over the period(s) indicated. “Cumulative Total Returns” represent the total change in value of an investment over the period(s) indicated.
The Fund’s per share net asset value or “NAV” is the value of one share of the Fund as calculated in accordance with the standard formula for valuing mutual fund shares. The NAV return is based on the NAV of the Fund and the market return is based on the market price per share of the Fund. The price used to calculate market return (“Market Price”) is determined by using the midpoint between the highest bid and the lowest offer on the primary stock exchange on which the shares of the Fund are listed for trading, as of the time that the Fund’s NAV is calculated. Market and NAV returns assume that dividends and capital gain distributions have been reinvested in the Fund at Market Price and NAV, respectively.
An index is a statistical composite that tracks a specified financial market or sector. Unlike the Fund, an index does not actually hold a portfolio of securities and therefore does not incur the expenses incurred by the Fund. These expenses negatively impact the performance of the Fund. Also, market returns do not include brokerage commissions that may be payable on secondary market transactions. If brokerage commissions were included, market returns would be lower. The performance shown in the table(s) and chart(s) above assumes reinvestment of all dividends and capital gain distributions and does not reflect the deduction of taxes that a shareholder would pay on fund distributions or the redemption or sale of fund shares. The investment return and principal value of shares of the Fund will vary with changes in market conditions. Shares of the Fund may be worth more or less than their original cost when they are redeemed or sold in the market. The Fund’s past performance is no guarantee of future results.
| MANAGEMENT’S DISCUSSIONSOF FUND PERFORMANCE | 17 |
Table of Contents
Management’s Discussion of Fund Performance (Continued)
iSHARES® MSCI ITALY INDEX FUND
PORTFOLIO ALLOCATION As of 8/31/09 | |||
| Sector | Percentage of Net Assets | ||
Financial | 43.01 | % | |
Energy | 20.07 | ||
Utilities | 14.43 | ||
Communications | 7.09 | ||
Industrial | 5.66 | ||
Consumer Non-Cyclical | 5.25 | ||
Consumer Cyclical | 3.88 | ||
Diversified | 0.46 | ||
Short-Term and Other Net Assets | 0.15 | ||
TOTAL | 100.00 | % | |
TEN LARGEST FUND HOLDINGS As of 8/31/09 | |||
| Security | Percentage of Net Assets | ||
Eni SpA | 17.00 | % | |
UniCredit SpA | 14.43 | ||
Enel SpA | 9.76 | ||
Intesa Sanpaolo SpA | 8.35 | ||
Assicurazioni Generali SpA | 4.75 | ||
Telecom Italia SpA | 3.78 | ||
Unione di Banche Italiane ScpA | 3.29 | ||
Terna SpA | 3.29 | ||
Mediobanca SpA | 2.71 | ||
Fiat SpA | 2.68 | ||
TOTAL | 70.04 | % | |
| 18 | 2009 iSHARES ANNUAL REPORTTO SHAREHOLDERS |
Table of Contents
Management’s Discussion of Fund Performance
iSHARES® MSCI NETHERLANDS INVESTABLE MARKET INDEX FUND
(TICKER: EWN)
INVESTMENT OBJECTIVE
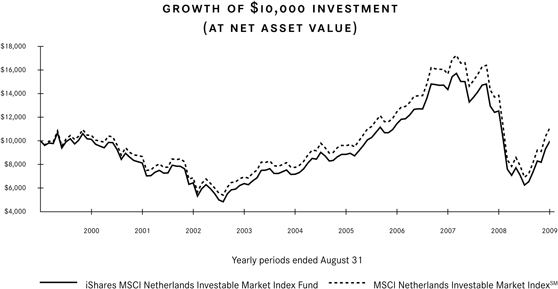
The iShares MSCI Netherlands Investable Market Index Fund (the “Fund”) seeks to provide investment results that correspond generally to the price and yield performance, before fees and expenses, of publicly traded securities in the aggregate in the Dutch market, as measured by the MSCI Netherlands Investable Market IndexSM (the “Index”). The Fund invests in a representative sample of securities included in the Index that collectively has an investment profile similar to the Index. Due to the use of representative sampling, the Fund may or may not hold all of the securities that are included in the Index. For the 12-month period ended August 31, 2009 (the “reporting period”), the total return for the Fund was (20.59)%, while the total return for the Index was (20.01)%.
MARKET OVERVIEW AND DISCUSSION OF PERFORMANCE
A slowing global economic environment and ongoing credit crisis weighed on stock markets around the world during much of the reporting period. Early in the reporting period, the credit crisis that had begun with problems within the U.S. mortgage industry spurred extreme turmoil in the global financial sector, leading to a series of bankruptcies and takeovers among several major financial institutions in late 2008. The events impacted markets worldwide, pushing major indices downward and sapping strength from already weak economies. Unemployment rates climbed in most major economies as industrial output declined and levels of imports and exports fell. In an effort to stabilize markets, key central banks around the world took decisive steps, initiating debt purchase programs and easing monetary policy. In the U.S., the Federal Reserve Board cut the federal funds rate to an unprecedented range of 0.00% - 0.25% during the course of the reporting period. The European Central Bank echoed these actions, lowering its key lending rate from 4.25% to a historically low 1.00%.
After dipping to multi-year lows in early March 2009, most international markets rebounded strongly, as many investors appeared confident that the threats surrounding financial markets were beginning to recede. European markets followed these trends. Market strength continued through the end of the reporting period as early, yet uneven, signs of economic recovery emerged in key European markets. Germany and the U.K. experienced increases in industrial output, while consumer spending increased in France. In Switzerland, the KOF broad measure of economic activity reported large jumps in July and August.
Although the Netherlands’ equity market rebounded strongly in the final months of the reporting period, this was not sufficient to fully offset the substantial decline experienced in the first half of the period. Because the Dutch economy is based heavily on export trade, it is sensitive to the economic health of its trading partners. Neighboring European countries, in particular, account for roughly 75% of the Netherlands’ export market. During the reporting period, the economic sluggishness experienced across key European countries appears to have resulted in decreased demand for Dutch products. This, in turn, dampened economic growth for the country. Industrial production contracted throughout the period as export levels generally declined. Economic activity, as measured by GDP, dropped by an annualized 0.7% for the fourth quarter of 2008, and by a more severe 4.5% in the first quarter of 2009. The U.S dollar depreciated against the euro in the final months of the reporting period, benefiting dollar-denominated performance returns.
Eight of the ten largest Fund holdings as of August 31, 2009 delivered negative returns for the reporting period. Financial companies ING Groep NV and Aegon NV were the largest decliners. Express delivery service company TNT NV and Koninklijke Philips Electronics NV also posted double-digit declines. Beer maker Heineken NV experienced a moderate decline. On the positive side, ASML Holding NV and the Fund’s largest holding, consumer products company Unilever NV, posted positive returns for the reporting period.
| MANAGEMENT’S DISCUSSIONSOF FUND PERFORMANCE | 19 |
Table of Contents
Management’s Discussion of Fund Performance (Continued)
iSHARES® MSCI NETHERLANDS INVESTABLE MARKET INDEX FUND
Performance as of August 31, 2009
| Average Annual Total Returns | ||||||||||||||||
| Year Ended 8/31/09 | Five Years Ended 8/31/09 | Ten Years Ended 8/31/09 | ||||||||||||||
| NAV | MARKET | INDEX | NAV | MARKET | INDEX | NAV | MARKET | INDEX | ||||||||
| (20.59)% | (19.93)% | (20.01)% | 6.78% | 6.78% | 7.41% | (0.05)% | (0.04)% | 1.02% | ||||||||
| Cumulative Total Returns | ||||||||||||||||
| Year Ended 8/31/09 | Five Years Ended 8/31/09 | Ten Years Ended 8/31/09 | ||||||||||||||
| NAV | MARKET | INDEX | NAV | MARKET | INDEX | NAV | MARKET | INDEX | ||||||||
| (20.59)% | (19.93)% | (20.01)% | 38.81% | 38.83% | 42.96% | (0.54)% | (0.43)% | 10.68% | ||||||||
“Average Annual Total Returns” represent the average annual change in value of an investment over the period(s) indicated. “Cumulative Total Returns” represent the total change in value of an investment over the period(s) indicated.
The Fund’s per share net asset value or “NAV” is the value of one share of the Fund as calculated in accordance with the standard formula for valuing mutual fund shares. The NAV return is based on the NAV of the Fund and the market return is based on the market price per share of the Fund. The price used to calculate market return (“Market Price”) is determined by using the midpoint between the highest bid and the lowest offer on the primary stock exchange on which the shares of the Fund are listed for trading, as of the time that the Fund’s NAV is calculated. Market and NAV returns assume that dividends and capital gain distributions have been reinvested in the Fund at Market Price and NAV, respectively.
An index is a statistical composite that tracks a specified financial market or sector. Unlike the Fund, an index does not actually hold a portfolio of securities and therefore does not incur the expenses incurred by the Fund. These expenses negatively impact the performance of the Fund. Also, market returns do not include brokerage commissions that may be payable on secondary market transactions. If brokerage commissions were included, market returns would be lower. The performance shown in the table(s) and chart(s) above assumes reinvestment of all dividends and capital gain distributions and does not reflect the deduction of taxes that a shareholder would pay on fund distributions or the redemption or sale of fund shares. The investment return and principal value of shares of the Fund will vary with changes in market conditions. Shares of the Fund may be worth more or less than their original cost when they are redeemed or sold in the market. The Fund’s past performance is no guarantee of future results.
| 20 | 2009 iSHARES ANNUAL REPORTTO SHAREHOLDERS |
Table of Contents
Management’s Discussion of Fund Performance (Continued)
iSHARES® MSCI NETHERLANDS INVESTABLE MARKET INDEX FUND
PORTFOLIO ALLOCATION As of 8/31/09 | |||
| Sector | Percentage of Net Assets | ||
Consumer Non-Cyclical | 31.81 | % | |
Financial | 19.81 | ||
Industrial | 15.78 | ||
Communications | 15.35 | ||
Basic Materials | 7.20 | ||
Technology | 6.15 | ||
Energy | 2.52 | ||
Diversified | 0.76 | ||
Consumer Cyclical | 0.31 | ||
Short-Term and Other Net Assets | 0.31 | ||
TOTAL | 100.00 | % | |
TEN LARGEST FUND HOLDINGS As of 8/31/09 | |||
| Security | Percentage of Net Assets | ||
Unilever NV | 16.80 | % | |
ING Groep NV | 11.00 | ||
Koninklijke KPN NV | 9.50 | ||
Koninklijke Philips Electronics NV | 7.45 | ||
Koninklijke Ahold NV | 4.85 | ||
Akzo Nobel NV | 4.80 | ||
ASML Holding NV | 4.75 | ||
Aegon NV | 4.37 | ||
TNT NV | 3.97 | ||
Heineken NV | 3.79 | ||
TOTAL | 71.28 | % | |
| MANAGEMENT’S DISCUSSIONOF FUND PERFORMANCE | 21 |
Table of Contents
Management’s Discussion of Fund Performance
iSHARES® MSCI SPAIN INDEX FUND
(TICKER: EWP)
INVESTMENT OBJECTIVE
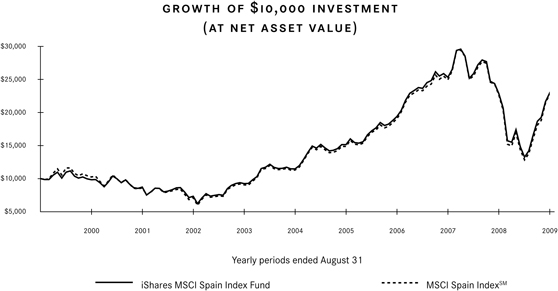
The iShares MSCI Spain Index Fund (the “Fund”) seeks to provide investment results that correspond generally to the price and yield performance, before fees and expenses, of publicly traded securities in the aggregate in the Spanish market, as measured by the MSCI Spain IndexSM (the “Index”). The Fund invests in a representative sample of securities included in the Index that collectively has an investment profile similar to the Index. Due to the use of representative sampling, the Fund may or may not hold all of the securities that are included in the Index. For the 12-month period ended August 31, 2009 (the “reporting period”), the total return for the Fund was 0.64%, while the total return for the Index was 0.71%.
MARKET OVERVIEW AND DISCUSSION OF PERFORMANCE
A slowing global economic environment and ongoing credit crisis weighed on stock markets around the world during much of the reporting period. Early in the reporting period, the credit crisis that had begun with problems within the U.S. mortgage industry spurred extreme turmoil in the global financial sector, leading to a series of bankruptcies and takeovers among several major financial institutions in late 2008. The events impacted markets worldwide, pushing major indices downward and sapping strength from already weak economies. Unemployment rates climbed in most major economies as industrial output declined and levels of imports and exports fell. In an effort to stabilize markets, key central banks around the world took decisive steps, initiating debt purchase programs and easing monetary policy. In the U.S., the Federal Reserve Board cut the federal funds rate to an unprecedented range of 0.00% - 0.25% during the course of the reporting period. The European Central Bank echoed these actions, lowering its key lending rate from 4.25% to a historically low 1.00%.
After dipping to multi-year lows in early March 2009, most international markets rebounded strongly, as many investors appeared confident that the threats surrounding financial markets were beginning to recede. European markets followed these trends. Market strength continued through the end of the reporting period as early, yet uneven, signs of economic recovery emerged in key European markets. Germany and the U.K. experienced increases in industrial output, while consumer spending increased in France. In Switzerland, the KOF broad measure of economic activity reported large jumps in July and August.
Although the Spanish equity market declined sharply in the first half of the reporting period, it rebounded soundly in the final months and finished the period with a positive return. Because Spain’s neighboring European countries account for the vast majority of its exports, the country was hurt by the tumultuous economic environments in major European countries during the reporting period. Export trade slowed throughout the reporting period, but climbed in the final months of the period. Economic activity, as measured by GDP, contracted for the third and fourth quarters of 2008 and for the first two quarters of 2009. In the second quarter of 2009, annualized GDP declined 1.06%. As the country struggled with recession, unemployment levels rose. For the second quarter of 2009, the unemployment rate reached 18%, the highest level of all European countries. The U.S dollar depreciated against the euro in the final months of the reporting period, benefiting dollar-denominated performance returns.
Performance among the ten largest holdings as of August 31, 2009 was mostly positive for the reporting period. Among the ten largest holdings, infrastructure construction company Actividades de Construccion y Servicios SA delivered the largest gains, followed by clothing retailer Industria de Diseno Textil SA. Four financial companies posted positive returns, including Banco Bilbao Vizcaya Argentaria SA and the Fund’s largest holding, Banco Santander SA. The Fund’s second largest holding, Telefonica SA, also contributed meaningfully to Fund performance. On the negative side, electric utility company Iberdrola SA and oil and gas company Repsol YPF SA both declined for the reporting period.
| 22 | 2009 iSHARES ANNUAL REPORTTO SHAREHOLDERS |
Table of Contents
Management’s Discussion of Fund Performance (Continued)
iSHARES® MSCI SPAIN INDEX FUND
Performance as of August 31, 2009
| Average Annual Total Returns | ||||||||||||||||
| Year Ended 8/31/09 | Five Years Ended 8/31/09 | Ten Years Ended 8/31/09 | ||||||||||||||
| NAV | MARKET | INDEX | NAV | MARKET | INDEX | NAV | MARKET | INDEX | ||||||||
| 0.64% | 1.35% | 0.71% | 14.88% | 14.75% | 15.04% | 8.67% | 8.70% | 8.57% | ||||||||
| Cumulative Total Returns | ||||||||||||||||
| Year Ended 8/31/09 | Five Years Ended 8/31/09 | Ten Years Ended 8/31/09 | ||||||||||||||
| NAV | MARKET | INDEX | NAV | MARKET | INDEX | NAV | MARKET | INDEX | ||||||||
| 0.64% | 1.35% | 0.71% | 100.12% | 98.95% | 101.49% | 129.66% | 130.37% | 127.56% | ||||||||
“Average Annual Total Returns” represent the average annual change in value of an investment over the period(s) indicated. “Cumulative Total Returns” represent the total change in value of an investment over the period(s) indicated.
The Fund’s per share net asset value or ”NAV” is the value of one share of the Fund as calculated in accordance with the standard formula for valuing mutual fund shares. The NAV return is based on the NAV of the Fund and the market return is based on the market price per share of the Fund. The price used to calculate market return (“Market Price”) is determined by using the midpoint between the highest bid and the lowest offer on the primary stock exchange on which the shares of the Fund are listed for trading, as of the time that the Fund’s NAV is calculated. Market and NAV returns assume that dividends and capital gain distributions have been reinvested in the Fund at Market Price and NAV, respectively.
An index is a statistical composite that tracks a specified financial market or sector. Unlike the Fund, an index does not actually hold a portfolio of securities and therefore does not incur the expenses incurred by the Fund. These expenses negatively impact the performance of the Fund. Also, market returns do not include brokerage commissions that may be payable on secondary market transactions. If brokerage commissions were included, market returns would be lower. The performance shown in the table(s) and chart(s) above assumes reinvestment of all dividends and capital gain distributions and does not reflect the deduction of taxes that a shareholder would pay on fund distributions or the redemption or sale of fund shares. The investment return and principal value of shares of the Fund will vary with changes in market conditions. Shares of the Fund may be worth more or less than their original cost when they are redeemed or sold in the market. The Fund’s past performance is no guarantee of future results.
| MANAGEMENT’S DISCUSSIONSOF FUND PERFORMANCE | 23 |
Table of Contents
Management’s Discussion of Fund Performance (Continued)
iSHARES® MSCI SPAIN INDEX FUND
PORTFOLIO ALLOCATION As of 8/31/09 | |||
| Sector | Percentage of Net Assets | ||
Financial | 46.17 | % | |
Communications | 19.50 | ||
Utilities | 10.27 | ||
Industrial | 6.64 | ||
Energy | 5.64 | ||
Consumer Cyclical | 4.96 | ||
Consumer Non-Cyclical | 4.52 | ||
Technology | 1.61 | ||
Basic Materials | 0.53 | ||
Short-Term and Other Net Assets | 0.16 | ||
TOTAL | 100.00 | % | |
TEN LARGEST FUND HOLDINGS As of 8/31/09 | |||
| Security | Percentage of Net Assets | ||
Banco Santander SA | 23.18 | % | |
Telefonica SA | 18.80 | ||
Banco Bilbao Vizcaya Argentaria SA | 7.43 | ||
Iberdrola SA | 4.86 | ||
Repsol YPF SA | 4.64 | ||
Industria de Diseno Textil SA | 4.58 | ||
Banco Popular Espanol SA | 3.44 | ||
Banco de Sabadell SA | 3.39 | ||
Abertis Infraestructuras SA | 3.16 | ||
Actividades de Construcciones y Servicios SA | 2.95 | ||
TOTAL | 76.43 | % | |
| 24 | 2009 iSHARES ANNUAL REPORTTO SHAREHOLDERS |
Table of Contents
Management’s Discussion of Fund Performance
iSHARES® MSCI SWEDEN INDEX FUND
(TICKER: EWD)
INVESTMENT OBJECTIVE
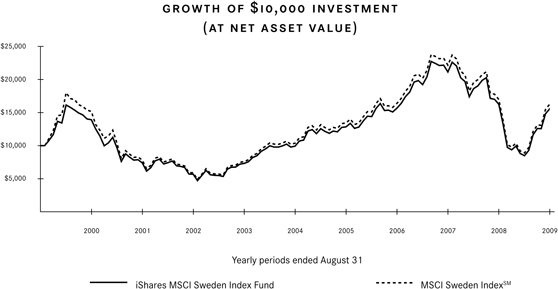
The iShares MSCI Sweden Index Fund (the “Fund”) seeks to provide investment results that correspond generally to the price and yield performance, before fees and expenses, of publicly traded securities in the aggregate in the Swedish market, as measured by the MSCI Sweden IndexSM (the “Index”). The Fund invests in a representative sample of securities included in the Index that collectively has an investment profile similar to the Index. Due to the use of representative sampling, the Fund may or may not hold all of the securities that are included in the Index. For the 12-month period ended August 31, 2009 (the “reporting period”), the total return for the Fund was (4.04)%, while the total return for the Index was (4.16)%.
MARKET OVERVIEW AND DISCUSSION OF PERFORMANCE
A slowing global economic environment and ongoing credit crisis weighed on stock markets around the world during much of the reporting period. Early in the reporting period, the credit crisis that had begun with problems within the U.S. mortgage industry spurred extreme turmoil in the global financial sector, leading to a series of bankruptcies and takeovers among several major financial institutions in late 2008. The events impacted markets worldwide, pushing major indices downward and sapping strength from already weak economies. Unemployment rates climbed in most major economies as industrial output declined and levels of imports and exports fell. In an effort to stabilize markets, key central banks around the world took decisive steps, initiating debt purchase programs and easing monetary policy. In the U.S., the Federal Reserve Board cut the federal funds rate to an unprecedented range of 0.00% - 0.25% during the course of the reporting period. The European Central Bank echoed these actions, lowering its key lending rate from 4.25% to a historically low 1.00%.
After dipping to multi-year lows in early March 2009, most international markets rebounded strongly, as many investors appeared confident that the threats surrounding financial markets were beginning to recede. European markets followed these trends. Market strength continued through the end of the reporting period as early, yet uneven, signs of economic recovery emerged in key European markets. Germany and the U.K. experienced increases in industrial output, while consumer spending increased in France. In Switzerland, the KOF broad measure of economic activity reported large jumps in July and August.
Although it rebounded strongly in the final months of the reporting period, Sweden’s equity market declined modestly for the reporting period. Sweden’s economy relies heavily on exports, and it is sensitive to the economic health of its export partners. During the reporting period, the economic slowdown in neighboring European countries and in the U.S. appears to have resulted in reduced export levels for Sweden, which in turn translated into slowing economic conditions during the reporting period. For the fourth quarter of 2008 and first two quarters of 2009, annualized GDP contracted, declining 5.1%, 5.6%, and 6.1%, respectively. Unemployment levels escalated, topping 9% by July 2009. Consistent with central banks around the world, Sweden’s Riksbank lowered its key interest rate from 4.50% to 0.25% during the course of the reporting period in an effort to stimulate economic activity.
Seven of the Fund’s ten largest holdings delivered negative returns for the reporting period. Among the ten largest holdings, financial company Skandinaviska Enskilda Banken AB logged the largest decline. Machinery company Sandvik AB and car maker Volvo AB also experienced double-digit declines, as did the mobile phone maker Telefonaktiebolaget LM Ericsson. On the positive side, the clothing retailer Hennes & Mauritz AB contributed positively to Fund performance. Banks Svenska Handelsbanken AB and the Fund’s largest holding, Nordea Bank AB, both posted gains for the reporting period.
| MANAGEMENT’S DISCUSSIONSOF FUND PERFORMANCE | 25 |
Table of Contents
Management’s Discussion of Fund Performance (Continued)
iSHARES® MSCI SWEDEN INDEX FUND
Performance as of August 31, 2009
| Average Annual Total Returns | ||||||||||||||||
| Year Ended 8/31/09 | Five Years Ended 8/31/09 | Ten Years Ended 8/31/09 | ||||||||||||||
| NAV | MARKET | INDEX | NAV | MARKET | INDEX | NAV | MARKET | INDEX | ||||||||
| (4.04)% | (3.30)% | (4.16)% | 9.46% | 9.37% | 9.45% | 4.54% | 4.58% | 4.99% | ||||||||
| Cumulative Total Returns | ||||||||||||||||
| Year Ended 8/31/09 | Five Years Ended 8/31/09 | Ten Years Ended 8/31/09 | ||||||||||||||
| NAV | MARKET | INDEX | NAV | MARKET | INDEX | NAV | MARKET | INDEX | ||||||||
| (4.04)% | (3.30)% | (4.16)% | 57.13% | 56.47% | 57.06% | 55.83% | 56.45% | 62.73% | ||||||||
“Average Annual Total Returns” represent the average annual change in value of an investment over the period(s) indicated. “Cumulative Total Returns” represent the total change in value of an investment over the period(s) indicated.
The Fund’s per share net asset value or ”NAV” is the value of one share of the Fund as calculated in accordance with the standard formula for valuing mutual fund shares. The NAV return is based on the NAV of the Fund and the market return is based on the market price per share of the Fund. The price used to calculate market return (“Market Price”) is determined by using the midpoint between the highest bid and the lowest offer on the primary stock exchange on which the shares of the Fund are listed for trading, as of the time that the Fund’s NAV is calculated. Market and NAV returns assume that dividends and capital gain distributions have been reinvested in the Fund at Market Price and NAV, respectively.
An index is a statistical composite that tracks a specified financial market or sector. Unlike the Fund, an index does not actually hold a portfolio of securities and therefore does not incur the expenses incurred by the Fund. These expenses negatively impact the performance of the Fund. Also, market returns do not include brokerage commissions that may be payable on secondary market transactions. If brokerage commissions were included, market returns would be lower. The performance shown in the table(s) and chart(s) above assumes reinvestment of all dividends and capital gain distributions and does not reflect the deduction of taxes that a shareholder would pay on fund distributions or the redemption or sale of fund shares. The investment return and principal value of shares of the Fund will vary with changes in market conditions. Shares of the Fund may be worth more or less than their original cost when they are redeemed or sold in the market. The Fund’s past performance is no guarantee of future results.
| 26 | 2009 iSHARES ANNUAL REPORTTO SHAREHOLDERS |
Table of Contents
Management’s Discussion of Fund Performance (Continued)
iSHARES® MSCI SWEDEN INDEX FUND
PORTFOLIO ALLOCATION As of 8/31/09 | |||
| Sector | Percentage of Net Assets | ||
Financial | 28.11 | % | |
Industrial | 22.97 | ||
Communications | 21.46 | ||
Consumer Cyclical | 15.34 | ||
Consumer Non-Cyclical | 5.90 | ||
Basic Materials | 5.22 | ||
Energy | 0.82 | ||
Short-Term and Other Net Assets | 0.18 | ||
TOTAL | 100.00 | % | |
TEN LARGEST FUND HOLDINGS As of 8/31/09 | |||
| Security | Percentage of Net Assets | ||
Nordea Bank AB | 13.86 | % | |
Hennes & Mauritz AB Class B | 11.63 | ||
Telefonaktiebolaget LM Ericsson AB Class B | 11.60 | ||
TeliaSonera AB | 5.97 | ||
Svenska Handelsbanken AB Class A | 4.84 | ||
Skandinaviska Enskilda Banken AB Class A | 4.38 | ||
Sandvik AB | 4.20 | ||
Volvo AB Class B | 3.92 | ||
Investor AB Class B | 3.59 | ||
Atlas Copco AB Class A | 3.18 | ||
TOTAL | 67.17 | % | |
| MANAGEMENT’S DISCUSSIONSOF FUND PERFORMANCE | 27 |
Table of Contents
Management’s Discussion of Fund Performance
iSHARES® MSCI SWITZERLAND INDEX FUND
(TICKER: EWL)
INVESTMENT OBJECTIVE
The iShares MSCI Switzerland Index Fund (the “Fund”) seeks to provide investment results that correspond generally to the price and yield performance, before fees and expenses, of publicly traded securities in the aggregate in the Swiss market, as measured by the MSCI Switzerland IndexSM (the “Index”). The Fund invests in a representative sample of securities included in the Index that collectively has an investment profile similar to the Index. Due to the use of representative sampling, the Fund may or may not hold all of the securities that are included in the Index. For the 12-month period ended August 31, 2009 (the “reporting period”), the total return for the Fund was (8.63)%, while the total return for the Index was (9.30)%.
MARKET OVERVIEW AND DISCUSSION OF PERFORMANCE
A slowing global economic environment and ongoing credit crisis weighed on stock markets around the world during much of the reporting period. Early in the reporting period, the credit crisis that had begun with problems within the U.S. mortgage industry spurred extreme turmoil in the global financial sector, leading to a series of bankruptcies and takeovers among several major financial institutions in late 2008. The events impacted markets worldwide, pushing major indices downward and sapping strength from already weak economies. Unemployment rates climbed in most major economies as industrial output declined and levels of imports and exports fell. In an effort to stabilize markets, key central banks around the world took decisive steps, initiating debt purchase programs and easing monetary policy. In the U.S., the Federal Reserve Board cut the federal funds rate to an unprecedented range of 0.00% – 0.25% during the course of the reporting period. The European Central Bank echoed these actions, lowering its key lending rate from 4.25% to a historically low 1.00%.
After dipping to multi-year lows in early March 2009, most international markets rebounded strongly, as many investors appeared confident that the threats surrounding financial markets were beginning to recede. European markets followed these trends. Market strength continued through the end of the reporting period as early, yet uneven, signs of economic recovery emerged in key European markets. Germany and the U.K. experienced increases in industrial output, while consumer spending increased in France. In Switzerland, the KOF broad measure of economic activity reported large jumps in July and August.
Switzerland’s equity market declined for the reporting period, despite rebounding sharply in the second half of the reporting period. Switzerland’s economy relies on countries in the euro zone for the majority of its exports, and appears to have been negatively affected by the difficult economic conditions in some of its neighboring countries during the reporting period. As export levels came under pressure, economic activity slowed. For the fourth quarter of 2008, annualized GDP contracted 0.2%. In the first and second quarters of 2009, GDP declined by 1.6% and 2.1%, respectively. Switzerland’s central bank took decisive steps to lower rates and weaken the Swiss franc in an effort to stimulate export activity. During the course of the reporting period, short term rates were dropped from 2.75% to 0.25%. In the last months of the period, the Swiss economy showed signs of moving toward a potential recovery. In July, the KOF economic indicators that aim to predict the economy’s direction several months in advance posted a record jump of 1.66% in its third consecutive monthly advance.
Nine of the ten largest Fund holdings delivered negative performance for the reporting period. ABB Ltd., the world’s largest producer of power grids, experienced the steepest share price decline among the Fund’s ten largest holdings. The share prices of pharmaceutical companies Novartis AG and Roche Holding AG also fell. The Fund’s largest holding, packaged food company Nestle SA, posted a modest decline. Performance among financial companies was mixed: UBS AG and Zurich Financial Services AG both lost ground during the reporting period, while Credit Suisse Group AG posted solid gains.
| 28 | 2009 iSHARES ANNUAL REPORTTO SHAREHOLDERS |
Table of Contents
Management’s Discussion of Fund Performance (Continued)
iSHARES® MSCI SWITZERLAND INDEX FUND
Performance as of August 31, 2009
| Average Annual Total Returns | ||||||||||||||||
| Year Ended 8/31/09 | Five Years Ended 8/31/09 | Ten Years Ended 8/31/09 | ||||||||||||||
| NAV | MARKET | INDEX | NAV | MARKET | INDEX | NAV | MARKET | INDEX | ||||||||
| (8.63)% | (8.02)% | (9.30)% | 8.67% | 8.71% | 8.17% | 3.93% | 3.91% | 4.06% | ||||||||
| Cumulative Total Returns | ||||||||||||||||
| Year Ended 8/31/09 | Five Years Ended 8/31/09 | Ten Years Ended 8/31/09 | ||||||||||||||
| NAV | MARKET | INDEX | NAV | MARKET | INDEX | NAV | MARKET | INDEX | ||||||||
| (8.63)% | (8.02)% | (9.30)% | 51.56% | 51.84% | 48.09% | 47.01% | 46.78% | 48.88% | ||||||||
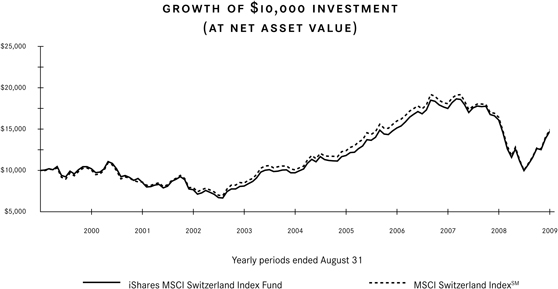
“Average Annual Total Returns” represent the average annual change in value of an investment over the period(s) indicated. “Cumulative Total Returns” represent the total change in value of an investment over the period(s) indicated.
The Fund’s per share net asset value or ”NAV” is the value of one share of the Fund as calculated in accordance with the standard formula for valuing mutual fund shares. The NAV return is based on the NAV of the Fund and the market return is based on the market price per share of the Fund. The price used to calculate market return (“Market Price”) is determined by using the midpoint between the highest bid and the lowest offer on the primary stock exchange on which the shares of the Fund are listed for trading, as of the time that the Fund’s NAV is calculated. Market and NAV returns assume that dividends and capital gain distributions have been reinvested in the Fund at Market Price and NAV, respectively.
An index is a statistical composite that tracks a specified financial market or sector. Unlike the Fund, an index does not actually hold a portfolio of securities and therefore does not incur the expenses incurred by the Fund. These expenses negatively impact the performance of the Fund. Also, market returns do not include brokerage commissions that may be payable on secondary market transactions. If brokerage commissions were included, market returns would be lower. The performance shown in the table(s) and chart(s) above assumes reinvestment of all dividends and capital gain distributions and does not reflect the deduction of taxes that a shareholder would pay on fund distributions or the redemption or sale of fund shares. The investment return and principal value of shares of the Fund will vary with changes in market conditions. Shares of the Fund may be worth more or less than their original cost when they are redeemed or sold in the market. The Fund’s past performance is no guarantee of future results.
MANAGEMENT’S DISCUSSIONSOF FUND PERFORMANCE | 29 |
Table of Contents
Management’s Discussion of Fund Performance (Continued)
iSHARES® MSCI SWITZERLAND INDEX FUND
PORTFOLIO ALLOCATION As of 8/31/09 | |||
| Sector | Percentage of Net Assets | ||
Consumer Non-Cyclical | 52.55 | % | |
Financial | 23.57 | ||
Industrial | 9.42 | ||
Basic Materials | 6.19 | ||
Consumer Cyclical | 4.05 | ||
Communications | 2.42 | ||
Technology | 0.44 | ||
Utilities | 0.25 | ||
Short-Term and Other Net Assets | 1.11 | ||
TOTAL | 100.00 | % | |
TEN LARGEST FUND HOLDINGS As of 8/31/09 | |||
| Security | Percentage of Net Assets | ||
Nestle SA Registered | 17.66 | % | |
Roche Holding AG Genusschein | 13.91 | ||
Novartis AG Registered | 10.58 | ||
Credit Suisse Group AG Registered | 7.16 | ||
UBS AG Registered | 4.90 | ||
Zurich Financial Services AG Registered | 4.76 | ||
ABB Ltd. Registered | 4.72 | ||
Syngenta AG Registered | 3.73 | ||
Compagnie Financiere Richemont SA Class A Bearer Units | 2.60 | ||
Synthes Inc. | 2.54 | ||
TOTAL | 72.56 | % | |
| 30 | 2009 iSHARES ANNUAL REPORTTO SHAREHOLDERS |
Table of Contents
Management’s Discussion of Fund Performance
iSHARES® MSCI UNITED KINGDOM INDEX FUND
(TICKER: EWU)
INVESTMENT OBJECTIVE
The iShares MSCI United Kingdom Index Fund (the “Fund”) seeks to provide investment results that correspond generally to the price and yield performance, before fees and expenses, of publicly traded securities in the aggregate in the British market, as measured by the MSCI United Kingdom IndexSM (the “Index”). The Fund invests in a representative sample of securities included in the Index that collectively has an investment profile similar to the Index. Due to the use of representative sampling, the Fund may or may not hold all of the securities that are included in the Index. For the 12-month period ended August 31, 2009 (the “reporting period”), the total return for the Fund was (18.68)%, while the total return for the Index was (18.27)%.
MARKET OVERVIEW AND DISCUSSION OF PERFORMANCE
A slowing global economic environment and ongoing credit crisis weighed on stock markets around the world during much of the reporting period. Early in the reporting period, the credit crisis that had begun with problems within the U.S. mortgage industry spurred extreme turmoil in the global financial sector, leading to a series of bankruptcies and takeovers among several major financial institutions in late 2008. The events impacted markets worldwide, pushing major indices downward and sapping strength from already weak economies. Unemployment rates climbed in most major economies as industrial output declined and levels of imports and exports fell. In an effort to stabilize markets, key central banks around the world took decisive steps, initiating debt purchase programs and easing monetary policy. In the U.S., the Federal Reserve Board cut the federal funds rate to an unprecedented range of 0.00% - 0.25% during the course of the reporting period. The European Central Bank echoed these actions, lowering its key lending rate from 4.25% to a historically low 1.00%.
After dipping to multi-year lows in early March 2009, most international markets rebounded strongly, as many investors appeared confident that the threats surrounding financial markets were beginning to recede. European markets followed these trends. Market strength continued through the end of the reporting period as early, yet uneven, signs of economic recovery emerged in key European markets. Germany and the U.K. experienced increases in industrial output, while consumer spending increased in France. In Switzerland, the KOF broad measure of economic activity reported large jumps in July and August.
The United Kingdom’s equity market finished the reporting period with a double-digit decline, despite rebounding sharply in the second half of the reporting period. As did many of its European neighbors, the U.K. faced a challenging recession during the reporting period. For the fourth quarter of 2008, in particular, annualized GDP declined by its largest level since 1980. Consumer confidence fell to a near record low, and the unemployment rate climbed above 7%. In an apparent effort to stimulate economic activity, the Bank of England cut its key lending rate, the repo rate, aggressively throughout the period, bringing the rate from 5.0% to an unprecedented 0.50%. In the final months of the reporting period, encouraging signs began to emerge. In June 2009, manufacturing output reached its best results since the beginning of 2008, and the Purchasing Managers’ Index for services rose, implying increased business activity.
All of the Fund’s ten largest holdings as of August 31, 2009 declined for the reporting period. The Fund’s largest holding, financial company HSBC Holdings PLC, experienced the steepest decline among the ten largest holdings. The oil company Royal Dutch Shell PLC and pharmaceutical company GlaxoSmithKline PLC also posted double-digit declines, as did wireless telecommunications company Vodafone Group PLC. Pharmaceutical company AstraZeneca PLC finished the reporting period with only a slight decline.
MANAGEMENT’S DISCUSSIONSOF FUND PERFORMANCE | 31 |
Table of Contents
Management’s Discussion of Fund Performance (Continued)
iSHARES® MSCI UNITED KINGDOM INDEX FUND
Performance as of August 31, 2009
| Average Annual Total Returns | ||||||||||||||||
| Year Ended 8/31/09 | Five Years Ended 8/31/09 | Ten Years Ended 8/31/09 | ||||||||||||||
| NAV | MARKET | INDEX | NAV | MARKET | INDEX | NAV | MARKET | INDEX | ||||||||
| (18.68)% | (18.37)% | (18.27)% | 2.89% | 2.58% | 3.52% | 0.45% | 0.33% | 1.13% | ||||||||
| Cumulative Total Returns | ||||||||||||||||
| Year Ended 8/31/09 | Five Years Ended 8/31/09 | Ten Years Ended 8/31/09 | ||||||||||||||
| NAV | MARKET | INDEX | NAV | MARKET | INDEX | NAV | MARKET | INDEX | ||||||||
| (18.68)% | (18.37)% | (18.27)% | 15.31% | 13.57% | 18.88% | 4.57% | 3.37% | 11.89% | ||||||||
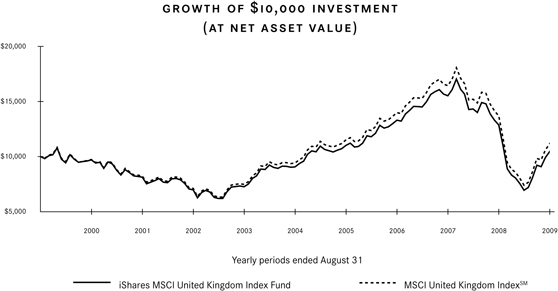
“Average Annual Total Returns” represent the average annual change in value of an investment over the period(s) indicated. “Cumulative Total Returns” represent the total change in value of an investment over the period(s) indicated.
The Fund’s per share net asset value or “NAV” is the value of one share of the Fund as calculated in accordance with the standard formula for valuing mutual fund shares. The NAV return is based on the NAV of the Fund and the market return is based on the market price per share of the Fund. The price used to calculate market return (“Market Price”) is determined by using the midpoint between the highest bid and the lowest offer on the primary stock exchange on which the shares of the Fund are listed for trading, as of the time that the Fund’s NAV is calculated. Market and NAV returns assume that dividends and capital gain distributions have been reinvested in the Fund at Market Price and NAV, respectively.
An index is a statistical composite that tracks a specified financial market or sector. Unlike the Fund, an index does not actually hold a portfolio of securities and therefore does not incur the expenses incurred by the Fund. These expenses negatively impact the performance of the Fund. Also, market returns do not include brokerage commissions that may be payable on secondary market transactions. If brokerage commissions were included, market returns would be lower. The performance shown in the table(s) and chart(s) above assumes reinvestment of all dividends and capital gain distributions and does not reflect the deduction of taxes that a shareholder would pay on fund distributions or the redemption or sale of fund shares. The investment return and principal value of shares of the Fund will vary with changes in market conditions. Shares of the Fund may be worth more or less than their original cost when they are redeemed or sold in the market. The Fund’s past performance is no guarantee of future results.
| 32 | 2009 iSHARES ANNUAL REPORTTO SHAREHOLDERS |
Table of Contents
Management’s Discussion of Fund Performance (Continued)
iSHARES® MSCI UNITED KINGDOM INDEX FUND
PORTFOLIO ALLOCATION As of 8/31/09 | |||
| Sector | Percentage of Net Assets | ||
Consumer Non-Cyclical | 24.86 | % | |
Financial | 23.48 | ||
Energy | 20.40 | ||
Basic Materials | 10.51 | ||
Communications | 8.98 | ||
Utilities | 3.95 | ||
Consumer Cyclical | 3.60 | ||
Industrial | 2.84 | ||
Technology | 0.46 | ||
Diversified | 0.13 | ||
Short-Term and Other Net Assets | 0.79 | ||
TOTAL | 100.00 | % | |
TEN LARGEST FUND HOLDINGS As of 8/31/09 | |||
| Security | Percentage of Net Assets | ||
HSBC Holdings PLC | 9.36 | % | |
BP PLC | 8.02 | ||
Vodafone Group PLC | 5.61 | ||
GlaxoSmithKline PLC | 5.02 | ||
Royal Dutch Shell PLC Class A | 4.88 | ||
Royal Dutch Shell PLC Class B | 3.63 | ||
Barclays PLC | 3.38 | ||
AstraZeneca PLC | 3.31 | ||
British American Tobacco PLC | 3.01 | ||
BHP Billiton PLC | 2.89 | ||
TOTAL | 49.11 | % | |
| MANAGEMENT’S DISCUSSIONSOF FUND PERFORMANCE | 33 |
Table of Contents
Shareholder Expenses (Unaudited)
iSHARES®, INC.
As a shareholder of a Fund, you incur two types of costs: (1) transaction costs, including brokerage commissions on purchases and sales of Fund shares and (2) ongoing costs, including management fees and other Fund expenses. The following Example is intended to help you understand your ongoing costs (in dollars and cents) of investing in a Fund and to compare these costs with the ongoing costs of investing in other Funds.
The Example is based on an investment of $1,000 invested at the beginning of the period and held for the entire period from March 1, 2009 to August 31, 2009.
ACTUAL EXPENSES
The first line under each Fund in the table below provides information about actual account values and actual expenses. You may use the information in this line, together with the amount you invested, to estimate the expenses that you paid over the period. Simply divide your account value by $1,000 (for example, an $8,600 account value divided by $1,000 = 8.6), then multiply the result by the number in the first line for your Fund under the heading entitled “Expenses Paid During Period” to estimate the expenses you paid on your account during this period.
HYPOTHETICAL EXAMPLE FOR COMPARISON PURPOSES
The second line under each Fund in the table below provides information about hypothetical account values and hypothetical expenses based on each Fund’s actual expense ratio and an assumed rate of return of 5% per year before expenses, which is not the Fund’s actual return. The hypothetical account values and expenses may not be used to estimate the actual ending account balance or expenses you paid for the period. You may use this information to compare the ongoing costs of investing in your Fund and other Funds. To do so, compare this 5% hypothetical example with the 5% hypothetical examples that appear in the shareholder reports of the other Funds.
Please note that the expenses shown in the table are meant to highlight your ongoing costs only and do not reflect any transactional costs, such as brokerage commissions paid on purchases and sales of Fund shares. Therefore, the second line under each Fund in the table is useful in comparing ongoing costs only and will not help you determine the relative total costs of owning different Funds. In addition, if these transactional costs were included, your costs would have been higher.
| iShares MSCI Index Fund | Beginning Account Value (3/1/09) | Ending Account Value (8/31/09) | Annualized Expense Ratio | Expenses Paid During Perioda (3/1/09 to 8/31/09) | |||||
Austria Investable Market | |||||||||
Actual | $1,000.00 | $2,005.40 | 0.55 | % | $4.17 | ||||
Hypothetical (5% return before expenses) | 1,000.00 | 1,022.40 | 0.55 | 2.80 | |||||
Belgium Investable Market | |||||||||
Actual | 1,000.00 | 1,618.10 | 0.56 | 3.70 | |||||
Hypothetical (5% return before expenses) | 1,000.00 | 1,022.40 | 0.56 | 2.85 | |||||
EMU | |||||||||
Actual | 1,000.00 | 1,618.80 | 0.57 | 3.76 | |||||
Hypothetical (5% return before expenses) | 1,000.00 | 1,022.30 | 0.57 | 2.91 | |||||
France | |||||||||
Actual | 1,000.00 | 1,570.30 | 0.55 | 3.56 | |||||
Hypothetical (5% return before expenses) | 1,000.00 | 1,022.40 | 0.55 | 2.80 |
| 34 | 2009 iSHARES ANNUAL REPORT TO SHAREHOLDERS |
Table of Contents
Shareholder Expenses (Unaudited) (Continued)
iSHARES®, INC.
| iShares MSCI Index Fund | Beginning Account Value (3/1/09) | Ending Account Value (8/31/09) | Annualized Expense Ratio | Expenses Paid During Perioda (3/1/09 to 8/31/09) | |||||
Germany | |||||||||
Actual | $1,000.00 | $1,588.40 | 0.55 | % | $3.59 | ||||
Hypothetical (5% return before expenses) | 1,000.00 | 1,022.40 | 0.55 | 2.80 | |||||
Italy | |||||||||
Actual | 1,000.00 | 1,622.80 | 0.64 | 3.64 | |||||
Hypothetical (5% return before expenses) | 1,000.00 | 1,022.40 | 0.64 | 2.80 | |||||
Netherlands Investable Market | |||||||||
Actual | 1,000.00 | 1,590.20 | 0.56 | 3.66 | |||||
Hypothetical (5% return before expenses) | 1,000.00 | 1,022.40 | 0.56 | 2.85 | |||||
Spain | |||||||||
Actual | 1,000.00 | 1,735.80 | 0.55 | 3.79 | |||||
Hypothetical (5% return before expenses) | 1,000.00 | 1,022.40 | 0.55 | 2.80 | |||||
Sweden | |||||||||
Actual | 1,000.00 | 1,838.50 | 0.55 | 3.94 | |||||
Hypothetical (5% return before expenses) | 1,000.00 | 1,022.40 | 0.55 | 2.80 | |||||
Switzerland | |||||||||
Actual | 1,000.00 | 1,473.00 | 0.56 | 3.49 | |||||
Hypothetical (5% return before expenses) | 1,000.00 | 1,022.40 | 0.56 | 2.85 | |||||
United Kingdom | |||||||||
Actual | 1,000.00 | 1,503.70 | 0.55 | 3.47 | |||||
Hypothetical (5% return before expenses) | 1,000.00 | 1,022.40 | 0.55 | 2.80 |
| a | Expenses are calculated using each Fund’s annualized expense ratio (as disclosed in the table), multiplied by the average account value for the period, multiplied by the number of days in the period (184 days) and divided by the number of days in the year (365 days). |
| SHAREHOLDER EXPENSES | 35 |
Table of Contents
iSHARES® MSCI AUSTRIA INVESTABLE MARKET INDEX FUND
August 31, 2009
| Security | Shares | Value | |||
COMMON STOCKS – 99.21% | |||||
AUTO MANUFACTURERS – 0.50% | |||||
Rosenbauer International AG | 18,644 | $ | 807,736 | ||
| 807,736 | |||||
BANKS – 18.93% | |||||
Erste Group Bank AGa | 535,778 | 22,727,745 | |||
Raiffeisen International Bank Holding AGa | 141,805 | 7,498,874 | |||
| 30,226,619 | |||||
BIOTECHNOLOGY – 2.89% | |||||
Intercell AGa,b | 128,849 | 4,622,619 | |||
| 4,622,619 | |||||
BUILDING MATERIALS – 3.97% | |||||
Wienerberger AGa,b | 277,606 | 6,342,186 | |||
| 6,342,186 | |||||
COMMERCIAL SERVICES – 0.32% | |||||
Kapsch TrafficCom AG | 16,152 | 514,572 | |||
| 514,572 | |||||
ELECTRIC – 7.08% | |||||
EVN AG | 31,186 | 648,030 | |||
Oesterreichische Elektrizitaetswirtschafts AG Class A | 209,903 | 10,660,222 | |||
| 11,308,252 | |||||
ELECTRICAL COMPONENTS & | |||||
Zumtobel AGb | 112,338 | 1,625,003 | |||
| 1,625,003 | |||||
ENGINEERING & CONSTRUCTION – 1.90% | |||||
A1 Airports International Ltd.a,b | 279,786 | 1,124,219 | |||
Flughafen Wien AG | 45,188 | 1,912,988 | |||
| 3,037,207 | |||||
ENTERTAINMENT – 2.16% | |||||
bwin Interactive Entertainment AGb | 87,848 | 3,444,131 | |||
| 3,444,131 | |||||
ENVIRONMENTAL CONTROL – 0.80% | |||||
BWT AGa | 46,202 | 1,272,339 | |||
| 1,272,339 | |||||
FOOD – 1.15% | |||||
Agrana Beteiligungs AG | 18,633 | 1,829,769 | |||
| 1,829,769 | |||||
| Security | Shares | Value | |||
FOREST PRODUCTS & PAPER – 1.75% | |||||
Mayr-Melnhof Karton AG | 29,230 | $ | 2,789,443 | ||
| 2,789,443 | |||||
INSURANCE – 4.33% | |||||
Vienna Insurance Group | 132,799 | 6,908,279 | |||
| 6,908,279 | |||||
IRON & STEEL – 7.10% | |||||
voestalpine AG | 351,787 | 11,333,477 | |||
| 11,333,477 | |||||
MACHINERY – 3.88% | |||||
Andritz AG | 121,186 | 5,512,883 | |||
A-TEC Industries AGb | 42,028 | 682,735 | |||
| 6,195,618 | |||||
MACHINERY – CONSTRUCTION & MINING – 0.78% | |||||
Palfinger AGa | 51,745 | 1,246,027 | |||
| 1,246,027 | |||||
MANUFACTURING – 2.27% | |||||
RHI AGb | 83,977 | 2,229,457 | |||
Semperit AG Holding | 40,527 | 1,395,799 | |||
| 3,625,256 | |||||
OIL & GAS – 11.06% | |||||
OMV AG | 447,693 | 17,654,851 | |||
| 17,654,851 | |||||
OIL & GAS SERVICES – 1.15% | |||||
Schoeller-Bleckmann Oilfield Equipment AG | 44,951 | 1,837,157 | |||
| 1,837,157 | |||||
REAL ESTATE – 13.91% | |||||
Atrium European Real Estate Ltd.b | 743,548 | 4,673,585 | |||
CA Immo International AGb | 100,962 | 736,018 | |||
CA Immobilien Anlagen AGa,b | 297,356 | 3,686,867 | |||
conwert Immobilien Invest SEb | 256,592 | 3,148,301 | |||
ECO Business-Immobilien AGb | 139,988 | 823,648 | |||
Immoeast AGb | 953,135 | 4,883,033 | |||
IMMOFINANZ AGa,b | 816,860 | 2,590,639 | |||
Sparkassen Immobilien AGb | 231,628 | 1,668,637 | |||
| 22,210,728 | |||||
TELECOMMUNICATIONS – 10.25% | |||||
Telekom Austria AG | 935,439 | 16,363,877 | |||
| 16,363,877 | |||||
| 36 | 2009 iSHARES ANNUAL REPORTTO SHAREHOLDERS |
Table of Contents
Schedule of Investments (Continued)
iSHARES® MSCI AUSTRIA INVESTABLE MARKET INDEX FUND
August 31, 2009
| Security | Shares | Value | ||||
TRANSPORTATION – 2.01% |
| |||||
Oesterreichische Post AG | 119,527 | $ | 3,216,135 | |||
| 3,216,135 | ||||||
TOTAL COMMON STOCKS |
| |||||
(Cost: $218,122,926) | 158,411,281 | |||||
SHORT-TERM INVESTMENTS – 20.43% |
| |||||
MONEY MARKET FUNDS – 20.43% |
| |||||
Barclays Global Investors Funds |
| |||||
Institutional Money Market |
| |||||
Fund, SL Agency Shares |
| |||||
0.26%c,d,e | 28,439,681 | 28,439,681 | ||||
Barclays Global Investors Funds |
| |||||
Prime Money Market |
| |||||
Fund, SL Agency Shares |
| |||||
0.21%c,d,e | 4,011,865 | 4,011,865 | ||||
Barclays Global Investors Funds |
| |||||
Treasury Money Market |
| |||||
Fund, SL Agency Shares |
| |||||
0.08%c,d | 160,970 | 160,970 | ||||
| 32,612,516 | ||||||
TOTAL SHORT-TERM INVESTMENTS |
| |||||
(Cost: $32,612,516) | 32,612,516 | |||||
TOTAL INVESTMENTS IN |
| |||||
(Cost: $250,735,442) | 191,023,797 | |||||
Other Assets, Less Liabilities – (19.64)% | (31,357,870 | ) | ||||
NET ASSETS – 100.00% | $ | 159,665,927 | ||||
| a | All or a portion of this security represents a security on loan. See Note 5. |
| b | Non-income earning security. |
| c | Affiliated issuer. See Note 2. |
| d | The rate quoted is the annualized seven-day yield of the fund at period end. |
| e | All or a portion of this security represents an investment of securities lending collateral. See Note 5. |
See notes to financial statements.
| SCHEDULESOF INVESTMENTS | 37 |
Table of Contents
iSHARES® MSCI BELGIUM INVESTABLE MARKET INDEX FUND
August 31, 2009
| Security | Shares | Value | |||
COMMON STOCKS – 98.17% | |||||
AGRICULTURE – 0.49% | |||||
SIPEF NV | 5,060 | $ | 257,778 | ||
| 257,778 | |||||
APPAREL – 0.38% | |||||
Van de Velde NV | 4,730 | 198,814 | |||
| 198,814 | |||||
BANKS – 17.48% | |||||
Dexia SAa | 262,240 | 2,245,546 | |||
Fortisa | 1,069,420 | 4,579,459 | |||
KBC Groep NVa | 65,230 | 2,445,517 | |||
| 9,270,522 | |||||
BEVERAGES – 24.16% | |||||
Anheuser-Busch InBev NV | 296,560 | 12,816,294 | |||
| 12,816,294 | |||||
BIOTECHNOLOGY – 0.23% | |||||
Devgen NVa,b | 10,681 | 124,155 | |||
| 124,155 | |||||
CHEMICALS – 5.72% | |||||
Recticel SA | 10,261 | 79,810 | |||
Solvay SA | 24,530 | 2,585,571 | |||
Tessenderlo Chemie NV | 10,562 | 368,770 | |||
| 3,034,151 | |||||
DIVERSIFIED FINANCIAL SERVICES – 0.57% | |||||
KBC Ancora SCAa | 15,070 | 300,388 | |||
| 300,388 | |||||
ELECTRICAL COMPONENTS & | |||||
NV Bekaert SA | 6,270 | 834,543 | |||
| 834,543 | |||||
ELECTRONICS – 1.26% | |||||
Barco NVa | 6,270 | 306,014 | |||
EVS Broadcast Equipment SA | 5,720 | 364,539 | |||
| 670,553 | |||||
ENGINEERING & CONSTRUCTION – 0.38% | |||||
Compagnie d’Entreprises CFE | 3,080 | 153,372 | |||
Hamon & Cie (International) SA | 1,320 | 50,236 | |||
| 203,608 | |||||
ENTERTAINMENT – 0.16% | |||||
Kinepolis | 2,311 | 86,392 | |||
| 86,392 | |||||
| Security | Shares | Value | |||
FOOD – 10.02% | |||||
Colruyt SA | 8,690 | $ | 1,995,293 | ||
Delhaize Group | 49,500 | 3,320,530 | |||
| 5,315,823 | |||||
HEALTH CARE - PRODUCTS – 0.21% | |||||
Ion Beam Applications SA | 10,340 | 112,624 | |||
| 112,624 | |||||
HOLDING COMPANIES - DIVERSIFIED – 10.71% | |||||
Ackermans & van Haaren NV | 11,660 | 856,713 | |||
Compagnie Nationale a Portefeuille SA | 19,910 | 1,034,444 | |||
Groupe Bruxelles Lambert SA | 43,230 | 3,788,613 | |||
| 5,679,770 | |||||
INVESTMENT COMPANIES – 0.41% | |||||
RHJ International SAa | 28,491 | 218,331 | |||
| 218,331 | |||||
MANUFACTURING – 0.64% | |||||
Agfa-Gevaert NVa | 65,560 | 339,636 | |||
| 339,636 | |||||
MEDIA – 0.07% | |||||
Roularta Media Group NVa | 1,540 | 34,255 | |||
| 34,255 | |||||
MINING – 3.94% | |||||
Nyrstar NVa | 46,438 | 479,814 | |||
Umicore | 59,400 | 1,610,221 | |||
| 2,090,035 | |||||
PHARMACEUTICALS – 5.51% | |||||
Arseus NV | 11,770 | 132,591 | |||
Galapagos NVa | 18,040 | 199,340 | |||
Omega Pharma SA | 9,020 | 348,521 | |||
ThromboGenics NVa | 12,540 | 224,944 | |||
UCB SA | 51,810 | 2,017,857 | |||
| 2,923,253 | |||||
REAL ESTATE – 0.25% | |||||
Atenor Group SA | 2,437 | 133,594 | |||
| 133,594 | |||||
REAL ESTATE INVESTMENT TRUSTS – 3.23% | |||||
Befimmo SCA | 6,600 | 615,636 | |||
Cofinimmo SA | 5,280 | 700,121 | |||
Intervest Offices NV | 3,190 | 109,867 | |||
| 38 | 2009 iSHARES ANNUAL REPORTTO SHAREHOLDERS |
Table of Contents
Schedule of Investments (Continued)
iSHARES® MSCI BELGIUM INVESTABLE MARKET INDEX FUND
August 31, 2009
| Security | Shares | Value | |||
Leasinvest Real Estate SCA | 480 | $ | 43,052 | ||
Warehouses De Pauw SCA | 3,544 | 164,119 | |||
Wereldhave Belgium NV | 1,008 | 78,098 | |||
| 1,710,893 | |||||
RETAIL – 0.70% | |||||
SA D’Ieteren NV | 1,210 | 369,734 | |||
| 369,734 | |||||
SEMICONDUCTORS – 0.17% | |||||
Melexis NV | 10,347 | 88,200 | |||
| 88,200 | |||||
TELECOMMUNICATIONS – 8.44% | |||||
Belgacom SA | 66,000 | 2,477,700 | |||
Mobistar SA | 17,930 | 1,155,297 | |||
Option NVa | 26,732 | 72,887 | |||
Telenet Group Holding NVa | 32,340 | 770,630 | |||
| 4,476,514 | |||||
TRANSPORTATION – 0.77% | |||||
Compagnie Maritime Belge SA | 6,716 | 208,658 | |||
Euronav SAb | 10,340 | 201,802 | |||
| 410,460 | |||||
VENTURE CAPITAL – 0.70% | |||||
GIMV NV | 7,260 | 373,502 | |||
| 373,502 | |||||
TOTAL COMMON STOCKS | |||||
(Cost: $94,765,307) | 52,073,822 | ||||
RIGHTS – 0.00% | |||||
BANKS – 0.00% | |||||
Fortisa,b,c | 1,513,303 | 217 | |||
| 217 | |||||
TOTAL RIGHTS | |||||
(Cost: $0) | 217 | ||||
SHORT-TERM INVESTMENTS – 0.76% | |||||
MONEY MARKET FUNDS – 0.76% | |||||
Barclays Global Investors Funds | |||||
Institutional Money Market | |||||
Fund, SL Agency Shares | |||||
0.26%d,e,f | 297,433 | 297,433 | |||
| Security | Shares | Value | |||
Barclays Global Investors Funds | |||||
Prime Money Market | |||||
Fund, SL Agency Shares | |||||
0.21%d,e,f | 41,958 | $ | 41,958 | ||
Barclays Global Investors Funds | |||||
Treasury Money Market | |||||
Fund, SL Agency Shares | |||||
0.08%d,e | 61,251 | 61,251 | |||
| 400,642 | |||||
TOTAL SHORT-TERM INVESTMENTS | |||||
(Cost: $400,642) | 400,642 | ||||
TOTAL INVESTMENTS | 52,474,681 | ||||
Other Assets, Less Liabilities – 1.07% | 567,566 | ||||
NET ASSETS – 100.00% | $ | 53,042,247 | |||
| a | Non-income earning security. |
| b | All or a portion of this security represents a security on loan. See Note 5. |
| c | Security valued using Level 3 inputs. See Note 1. |
| d | Affiliated issuer. See Note 2. |
| e | The rate quoted is the annualized seven-day yield of the fund at period end. |
| f | All or a portion of this security represents an investment of securities lending collateral. See Note 5. |
See notes to financial statements.
| SCHEDULESOF INVESTMENTS | 39 |
Table of Contents
iSHARES® MSCI EMU INDEX FUND
August 31, 2009
| Security | Shares | Value | |||
COMMON STOCKS – 98.31% | |||||
AUSTRIA – 1.06% | |||||
Erste Group Bank AG | 42,848 | $ | 1,817,616 | ||
Oesterreichische Elektrizitaetswirtschafts AG Class A | 19,344 | 982,412 | |||
OMV AG | 37,648 | 1,484,655 | |||
Raiffeisen International Bank Holding AGa | 14,976 | 791,955 | |||
Telekom Austria AG | 74,672 | 1,306,257 | |||
Vienna Insurance Group | 10,608 | 551,834 | |||
voestalpine AG | 29,328 | 944,856 | |||
| 7,879,585 | |||||
BELGIUM – 2.97% | |||||
Anheuser-Busch InBev NV | 168,688 | 7,290,110 | |||
Belgacom SA | 32,656 | 1,225,936 | |||
Colruyt SA | 3,536 | 811,894 | |||
Compagnie Nationale a Portefeuille SA | 11,440 | 594,376 | |||
Delhaize Group | 23,920 | 1,604,587 | |||
Dexia SAb | 129,792 | 1,111,401 | |||
Fortisb | 546,521 | 2,340,306 | |||
Groupe Bruxelles Lambert SA | 22,048 | 1,932,254 | |||
KBC Groep NVb | 38,480 | 1,442,641 | |||
Mobistar SA | 5,200 | 335,055 | |||
Solvay SA | 14,768 | 1,556,613 | |||
UCB SA | 23,920 | 931,618 | |||
Umicore | 30,784 | 834,496 | |||
| 22,011,287 | |||||
FINLAND – 3.64% | |||||
Elisa OYJ | 27,456 | 542,154 | |||
Fortum OYJ | 106,080 | 2,773,632 | |||
Kesko OYJ Class B | 15,565 | 457,899 | |||
Kone OYJ Class B | 34,944 | 1,216,050 | |||
Metso OYJ | 30,992 | 779,648 | |||
Neste Oil OYJ | 32,864 | 546,130 | |||
Nokia OYJ | 858,000 | 11,943,347 | |||
Nokian Renkaat OYJ | 25,584 | 576,048 | |||
Orion OYJ Class B | 22,048 | 374,934 | |||
Outokumpu OYJ | 26,624 | 563,168 | |||
Pohjola Bank PLC | 40,144 | 464,326 | |||
Rautaruukki OYJ | 21,216 | 495,661 | |||
| Security | Shares | Value | |||
Sampo OYJ Class A | 99,216 | $ | 2,377,745 | ||
Sanoma OYJ | 20,078 | 397,618 | |||
Stora Enso OYJ Class Rb | 155,376 | 1,068,037 | |||
UPM-Kymmene OYJ | 134,368 | 1,615,872 | |||
Wartsila OYJ Class B | 20,592 | 779,248 | |||
| 26,971,517 | |||||
FRANCE – 32.21% | |||||
Accor SA | 37,024 | 1,950,981 | |||
Aeroports de Paris | 6,865 | 590,900 | |||
Air France-KLMb | 28,080 | 428,953 | |||
Alcatel-Lucentb | 546,832 | 2,079,538 | |||
ALSTOM | 48,256 | 3,393,585 | |||
ArcelorMittal | 202,592 | 7,259,519 | |||
Atos Origin SAb | 11,024 | 517,947 | |||
AXA | 367,120 | 8,366,149 | |||
BioMerieux SA | 2,704 | 264,021 | |||
BNP Paribas | 196,144 | 15,810,532 | |||
Bouygues SA | 52,000 | 2,583,061 | |||
Bureau Veritas SA | 11,440 | 577,713 | |||
Cap Gemini SA | 33,696 | 1,631,513 | |||
Carrefour SA | 147,056 | 6,931,369 | |||
Casino Guichard-Perrachon SA | 11,856 | 898,337 | |||
Christian Dior SA | 14,352 | 1,331,315 | |||
CNP Assurances SA | 8,944 | 894,092 | |||
Compagnie de Saint-Gobain Compagnie Generale de | 86,944 | 3,916,498 | |||
Geophysique-Veritasb | 35,360 | 758,613 | |||
Compagnie Generale des Etablissements Michelin Class B | 33,696 | 2,538,177 | |||
Credit Agricole SA | 211,328 | 3,918,200 | |||
Danone SA | 127,271 | 6,927,545 | |||
Dassault Systemes SA | 12,896 | 659,753 | |||
Eiffage SA | 9,776 | 695,350 | |||
Electricite de France | 53,248 | 2,792,915 | |||
Erameta | 1,248 | 402,604 | |||
Essilor International SA | 45,552 | 2,462,465 | |||
Eurazeo | 7,488 | 406,025 | |||
European Aeronautic Defence and Space Co.a | 93,392 | 1,937,961 | |||
Eutelsat Communications | 15,352 | 410,876 | |||
Fonciere des Regions | 5,824 | 610,114 | |||
France Telecom SA | 422,240 | 10,749,296 | |||
| 40 | 2009 iSHARES ANNUAL REPORTTO SHAREHOLDERS |
Table of Contents
Schedule of Investments (Continued)
iSHARES® MSCI EMU INDEX FUND
August 31, 2009
| Security | Shares | Value | |||
GDF Suez | 282,048 | $ | 11,895,690 | ||
Gecina SA | 4,992 | 495,590 | |||
Hermes Internationala | 12,272 | 1,820,090 | |||
Icade | 4,992 | 465,645 | |||
Iliad SA | 3,541 | 363,125 | |||
Imerys SA | 8,528 | 447,303 | |||
Ipsen SA | 5,824 | 288,342 | |||
JCDecaux SAb | 14,360 | 311,377 | |||
Klepierre | 23,712 | 892,042 | |||
Lafarge SA | 46,800 | 3,983,280 | |||
Lagardere SCA | 27,872 | 1,201,531 | |||
L’Air Liquide SA | 58,032 | 6,200,108 | |||
Legrand SA | 28,288 | 694,981 | |||
L’Oreal SA | 56,576 | 5,576,087 | |||
LVMH Moet Hennessy Louis Vuitton SA | 56,576 | 5,414,520 | |||
M6-Metropole Television | 15,392 | 349,658 | |||
Natixisb | 228,176 | 1,040,944 | |||
Neopost SA | 7,488 | 617,875 | |||
PagesJaunes Groupe SA | 30,368 | 339,311 | |||
Pernod Ricard SA | 44,304 | 3,456,761 | |||
PPR SA | 17,888 | 2,079,541 | |||
PSA Peugeot Citroen SAb | 35,568 | 1,030,790 | |||
Publicis Groupe SA | 26,832 | 987,660 | |||
Renault SAb | 43,264 | 1,949,501 | |||
Safran SA | 47,840 | 879,786 | |||
Sanofi-Aventis | 245,440 | 16,666,988 | |||
Schneider Electric SA | 54,288 | 5,009,355 | |||
SCOR SE | 40,352 | 1,062,886 | |||
SES SA | 66,352 | 1,301,160 | |||
Societe BIC | 5,824 | 358,129 | |||
Societe des Autoroutes Paris-Rhin-Rhone | 5,616 | 419,403 | |||
Societe Generale | 109,616 | 8,842,083 | |||
Societe Television Francaise 1 | 27,876 | 451,639 | |||
Sodexo | 24,960 | 1,439,201 | |||
STMicroelectronics NV | 157,040 | 1,360,500 | |||
Suez Environnement SA | 62,816 | 1,293,568 | |||
Technip SA | 24,336 | 1,506,420 | |||
Thales SA | 22,696 | 1,042,237 | |||
Total SA | 498,784 | 28,609,726 | |||
Unibail-Rodamco SE | 19,552 | 3,870,615 | |||
Vallourec SA | 13,104 | 1,992,379 | |||
| Security | Shares | Value | |||
Veolia Environnement | 87,776 | $ | 3,039,486 | ||
Vinci SA | 98,384 | 5,283,885 | |||
Vivendi SA | 272,272 | 7,763,685 | |||
| 238,790,800 | |||||
GERMANY – 22.93% | |||||
Adidas AG | 45,552 | 2,148,038 | |||
Allianz SE Registered | 106,288 | 12,296,855 | |||
BASF SE | 217,568 | 11,361,721 | |||
Bayer AG | 178,256 | 10,956,183 | |||
Bayerische Motoren Werke AG | 78,000 | 3,556,700 | |||
Beiersdorf AG | 22,048 | 1,120,055 | |||
Celesio AG | 19,552 | 532,823 | |||
Commerzbank AGa,b | 172,016 | 1,589,724 | |||
Daimler AG Registered | 211,744 | 9,580,808 | |||
Deutsche Bank AG Registered | 137,280 | 9,328,123 | |||
Deutsche Boerse AG | 46,176 | 3,528,604 | |||
Deutsche Lufthansa AG Registered | 50,752 | 815,715 | |||
Deutsche Post AG Registered | 198,848 | 3,434,269 | |||
Deutsche Postbank AGb | 21,632 | 768,625 | |||
Deutsche Telekom AG Registered | 654,784 | 8,715,233 | |||
E.ON AG | 445,120 | 18,850,087 | |||
Fraport AG | 9,360 | 473,077 | |||
Fresenius Medical Care AG & Co. KGaA | 44,096 | 1,983,194 | |||
Fresenius SE | 6,032 | 305,391 | |||
GEA Group AG | 38,688 | 686,218 | |||
Hamburger Hafen und Logistik AG | 6,392 | 267,388 | |||
Hannover Rueckversicherung AG Registeredb | 14,560 | 641,456 | |||
Henkel AG & Co. KGaA | 30,368 | 1,017,584 | |||
Hochtief AG | 10,192 | 754,849 | |||
Infineon Technologies AGb | 248,144 | 1,305,103 | |||
K+S AG | 35,152 | 1,783,731 | |||
Linde AG | 33,488 | 3,368,793 | |||
MAN SE | 24,752 | 1,893,235 | |||
Merck KGaA | 15,184 | 1,378,205 | |||
METRO AG | 26,832 | 1,457,039 | |||
Muenchener Rueckversicherungs- Gesellschaft AG Registered | 48,880 | 7,297,210 | |||
Puma AG | 1,248 | 353,174 | |||
QIAGEN NVb | 48,048 | 988,072 | |||
RWE AG | 99,008 | 9,178,460 | |||
| SCHEDULESOF INVESTMENTS | 41 |
Table of Contents
Schedule of Investments (Continued)
iSHARES® MSCI EMU INDEX FUND
August 31, 2009
| Security | Shares | Value | |||
Salzgitter AG | 9,360 | $ | 891,755 | ||
SAP AG | 200,928 | 9,820,919 | |||
Siemens AG Registered | 193,440 | 16,780,683 | |||
SolarWorld AGa | 20,386 | 434,143 | |||
Suedzucker AG | 16,016 | 312,579 | |||
ThyssenKrupp AG | 79,456 | 2,702,353 | |||
TUI AGa,b | 47,632 | 414,569 | |||
United Internet AG Registeredb | 28,914 | 409,121 | |||
Volkswagen AGa | 20,800 | 4,031,113 | |||
Wacker Chemie AG | 3,952 | 476,447 | |||
| 169,989,424 | |||||
GREECE – 1.52% | |||||
Coca-Cola Hellenic Bottling Co. SA SP ADR | 87,314 | 2,012,588 | |||
Hellenic Telecommunications Organization SA SP ADR | 316,373 | 2,309,523 | |||
National Bank of Greece SA SP ADR | 1,087,912 | 6,951,758 | |||
| 11,273,869 | |||||
IRELAND – 0.82% | |||||
Anglo Irish Bank Corp. Ltd.c | 446,666 | 64 | |||
CRH PLC | 162,656 | 4,178,209 | |||
Elan Corp. PLCb | 110,656 | 803,671 | |||
Kerry Group PLC Class A | 33,696 | 882,487 | |||
Ryanair Holdings PLCb | 43,520 | 194,855 | |||
| 6,059,286 | |||||
ITALY – 10.70% | |||||
A2A SpA | 238,576 | 462,197 | |||
ACEA SpA | 21,216 | 258,943 | |||
Alleanza Assicurazioni SpA | 93,035 | 764,344 | |||
Assicurazioni Generali SpA | 244,816 | 6,102,484 | |||
Atlantia SpA | 61,568 | 1,371,241 | |||
Autogrill SpAb | 39,936 | 449,885 | |||
Banca Carige SpA | 162,448 | 491,885 | |||
Banca Monte dei Paschi di Siena SpA | 577,824 | 1,215,616 | |||
Banca Popolare di Milano Scrl | 109,408 | 825,066 | |||
Banco Popolare SpAb | 156,000 | 1,383,503 | |||
Enel SpA | 1,522,953 | 8,982,461 | |||
Eni SpA | 608,400 | 14,440,816 | |||
Exor SpA | 23,265 | 400,303 | |||
Fiat SpAb | 180,544 | 2,140,081 | |||
Finmeccanica SpA | 98,592 | 1,576,137 | |||
| Security | Shares | Value | |||
Fondiaria-Sai SpA | 12,480 | $ | 239,986 | ||
Intesa Sanpaolo SpAb | 1,818,336 | 7,886,921 | |||
Italcementi SpA | 19,847 | 297,916 | |||
Lottomatica SpA | 17,888 | 402,765 | |||
Luxottica Group SpAb | 23,920 | 580,803 | |||
Mediaset SpA | 167,648 | 1,103,676 | |||
Mediobanca SpA | 110,448 | 1,516,830 | |||
Mediolanum SpA | 40,976 | 259,761 | |||
Parmalat SpA | 395,419 | 1,015,728 | |||
Pirelli & C. SpAb | 699,920 | 335,476 | |||
Prysmian SpA | 21,632 | 404,490 | |||
Saipem SpA | 61,984 | 1,660,699 | |||
Saras SpA | 60,736 | 210,272 | |||
Snam Rete Gas SpA | 340,496 | 1,583,157 | |||
Telecom Italia SpA | 2,278,432 | 3,684,911 | |||
Tenaris SA | 110,656 | 1,616,552 | |||
Terna SpA | 286,416 | 1,056,325 | |||
UniCredit SpAb | 3,368,352 | 12,217,312 | |||
Unione di Banche Italiane ScpA | 139,984 | 2,117,318 | |||
Unipol Gruppo Finanziario SpAb | 192,192 | 255,396 | |||
| 79,311,256 | |||||
NETHERLANDS – 7.30% | |||||
Aegon NVb | 366,496 | 2,762,763 | |||
Akzo Nobel NV | 54,704 | 3,101,260 | |||
ASML Holding NV | 99,008 | 2,718,728 | |||
Corio NV | 12,480 | 763,926 | |||
Fugro NV CVA | 15,184 | 818,207 | |||
Heineken Holding NV | 21,632 | 767,383 | |||
Heineken NV | 55,120 | 2,329,098 | |||
ING Groep NV CVAb | 466,752 | 7,063,172 | |||
Koninklijke Ahold NV | 276,432 | 3,241,385 | |||
Koninklijke Boskalis Westminster NV | 17,056 | 537,008 | |||
Koninklijke DSM NV | 37,024 | 1,350,863 | |||
Koninklijke KPN NV | 390,416 | 6,000,454 | |||
Koninklijke Philips Electronics NV | 226,096 | 5,113,475 | |||
Randstad Holding NVb | 24,752 | 1,023,874 | |||
Reed Elsevier NV | 169,936 | 1,801,931 | |||
SBM Offshore NV | 36,169 | 752,613 | |||
TNT NV | 86,528 | 2,137,000 | |||
Unilever NV CVA | 377,936 | 10,573,251 | |||
Wolters Kluwer NV | 63,024 | 1,249,012 | |||
| 54,105,403 | |||||
| 42 | 2009 iSHARES ANNUAL REPORTTO SHAREHOLDERS |
Table of Contents
Schedule of Investments (Continued)
iSHARES® MSCI EMU INDEX FUND
August 31, 2009
| Security | Shares | Value | |||
PORTUGAL – 0.98% | |||||
Banco Comercial Portugues SA Registered | 621,712 | $ | 814,568 | ||
Banco Espirito Santo SA Registered | 138,944 | 915,207 | |||
BRISA – Auto-estradas de Portugal SA | 51,584 | 457,478 | |||
CIMPOR – Cimentos de Portugal SGPS SA | 64,480 | 472,839 | |||
EDP Renovaveis SAb | 50,960 | 506,061 | |||
Energias de Portugal SA | 433,680 | 1,876,393 | |||
Galp Energia SGPS SA Class B | 42,016 | 608,980 | |||
Jeronimo Martins SGPS SA | 49,920 | 389,781 | |||
Portugal Telecom SGPS SA Registered | 116,688 | 1,207,337 | |||
| 7,248,644 | |||||
SPAIN – 14.18% | |||||
Abertis Infraestructuras SA | 67,808 | 1,476,647 | |||
Acciona SA | 6,448 | 836,027 | |||
Acerinox SA | 32,656 | 691,229 | |||
Actividades de Construcciones y Servicios SA | 33,280 | 1,716,439 | |||
Banco Bilbao Vizcaya Argentaria SA | 849,056 | 15,096,444 | |||
Banco de Sabadell SA | 225,056 | 1,698,804 | |||
Banco de Valencia SA | 56,368 | 566,236 | |||
Banco Popular Espanol SA | 186,052 | 2,005,124 | |||
Banco Santander SA | 1,918,384 | 29,553,208 | |||
Bankinter SA | 66,768 | 888,209 | |||
Cintra Concesiones de Infraestructuras de Transporte SA | 45,968 | 407,342 | |||
Criteria CaixaCorp SA | 204,464 | 1,026,956 | |||
Enagas SA | 43,339 | 856,095 | |||
Fomento de Construcciones y Contratas SA | 7,072 | 285,888 | |||
Gamesa Corporacion Tecnologica SA | 45,344 | 993,633 | |||
Gas Natural SDG SA | 59,280 | 1,246,697 | |||
Gestevision Telecinco SA | 24,752 | 277,592 | |||
Grifols SA | 30,045 | 528,819 | |||
Grupo Ferrovial SAa | 11,648 | 427,916 | |||
Iberdrola Renovables SA | 227,344 | 1,044,000 | |||
Iberdrola SA | 838,032 | 7,768,911 | |||
Iberia Lineas Aereas de Espana SAb | 102,544 | 255,904 | |||
Indra Sistemas SA | 25,972 | 616,837 | |||
| Security | Shares | Value | |||
Industria de Diseno Textil SA | 49,712 | $ | 2,708,036 | ||
Mapfre SAa | 176,807 | 728,196 | |||
Red Electrica Corporacion SA | 25,792 | 1,210,319 | |||
Repsol YPF SA | 173,056 | 4,296,351 | |||
Sacyr Vallehermoso SA | 21,216 | 354,087 | |||
Telefonica SA | 984,048 | 24,839,861 | |||
Zardoya Otis SA | 30,576 | 668,702 | |||
| 105,070,509 | |||||
TOTAL COMMON STOCKS | |||||
(Cost: $1,037,059,687) | 728,711,580 | ||||
PREFERRED STOCKS – 1.35% | |||||
GERMANY – 1.05% | |||||
Bayerische Motoren Werke AG | 12,688 | 381,638 | |||
Fresenius SE | 18,512 | 1,045,092 | |||
Henkel AG & Co. KGaA | 42,016 | 1,661,732 | |||
Porsche Automobil Holding SE | 21,424 | 1,580,268 | |||
RWE AG NVS | 9,984 | 814,664 | |||
Volkswagen AG | 24,752 | 2,325,518 | |||
| 7,808,912 | |||||
ITALY – 0.30% | |||||
Intesa Sanpaolo SpA RNC | 231,920 | 757,158 | |||
Telecom Italia SpA RNC | 1,290,016 | 1,462,478 | |||
| 2,219,636 | |||||
TOTAL PREFERRED STOCKS | |||||
(Cost: $16,402,827) | 10,028,548 | ||||
RIGHTS – 0.00% | |||||
BELGIUM – 0.00% | |||||
Fortisa,b,c | 619,476 | 89 | |||
| 89 | |||||
TOTAL RIGHTS | 89 | ||||
WARRANTS – 0.00% | |||||
ITALY – 0.00% | |||||
Unione di Banche Italiane ScpA (Expires 6/30/11)b | 148,938 | 14,790 | |||
| 14,790 | |||||
TOTALWARRANTS | 14,790 | ||||
| SCHEDULESOF INVESTMENTS | 43 |
Table of Contents
Schedule of Investments (Continued)
iSHARES® MSCI EMU INDEX FUND
August 31, 2009
| Security | Shares | Value | ||||
SHORT-TERM INVESTMENTS – 1.03% |
| |||||
MONEY MARKET FUNDS – 1.03% |
| |||||
Barclays Global Investors Funds | ||||||
Institutional Money Market | ||||||
Fund, SL Agency Shares | ||||||
0.26%d,e,f | 6,176,059 | $ | 6,176,059 | |||
Barclays Global Investors Funds |
| |||||
Prime Money Market | ||||||
Fund, SL Agency Shares | ||||||
0.21%d,e,f | 871,231 | 871,231 | ||||
Barclays Global Investors Funds |
| |||||
Treasury Money Market | ||||||
Fund, SL Agency Shares | ||||||
0.08%d,e | 546,876 | 546,876 | ||||
| 7,594,166 | ||||||
TOTAL SHORT-TERM INVESTMENTS |
| |||||
(Cost: $7,594,166) | 7,594,166 | |||||
TOTAL INVESTMENTS IN | 746,349,173 | |||||
Other Assets, Less Liabilities – (0.69)% | (5,079,283 | ) | ||||
NET ASSETS – 100.00% | $ | 741,269,890 | ||||
NVS – Non-Voting Shares
SP ADR – Sponsored American Depositary Receipts
| a | All or a portion of this security represents a security on loan. See Note 5. |
| b | Non-income earning security. |
| c | Security valued using Level 3 inputs. See Note 1. |
| d | Affiliated issuer. See Note 2. |
| e | The rate quoted is the annualized seven-day yield of the fund at period end. |
| f | All or a portion of this security represents an investment of securities lending collateral. See Note 5. |
See notes to financial statements.
| 44 | 2009 iSHARES ANNUAL REPORTTO SHAREHOLDERS |
Table of Contents
iSHARES® MSCI FRANCE INDEX FUND
August 31, 2009
| Security | Shares | Value | |||
COMMON STOCKS – 99.70% | |||||
ADVERTISING – 0.70% | |||||
JCDecaux SAa | 11,818 | $ | 256,257 | ||
PagesJaunes Groupe SA | 23,028 | 257,299 | |||
Publicis Groupe SAb | 21,242 | 781,897 | |||
| 1,295,453 | |||||
AEROSPACE & DEFENSE – 1.56% | |||||
European Aeronautic Defence and Space Co.b | 73,302 | 1,521,077 | |||
Safran SA | 33,896 | 623,353 | |||
Thales SA | 16,074 | 738,144 | |||
| 2,882,574 | |||||
AIRLINES – 0.20% | |||||
Air France-KLMa | 24,206 | 369,773 | |||
| 369,773 | |||||
APPAREL – 0.76% | |||||
Hermes Internationalb | 9,500 | 1,408,968 | |||
| 1,408,968 | |||||
AUTO MANUFACTURERS – 1.25% | |||||
PSA Peugeot Citroen SAa | 27,550 | 798,422 | |||
Renault SAa | 33,288 | 1,499,976 | |||
| 2,298,398 | |||||
AUTO PARTS & EQUIPMENT – 1.07% | |||||
Compagnie Generale des Etablissements Michelin Class B | 26,106 | 1,966,455 | |||
| 1,966,455 | |||||
BANKS – 12.26% | |||||
BNP Paribas | 150,898 | 12,163,399 | |||
Credit Agricole SA | 160,626 | 2,978,142 | |||
Natixisa | 157,358 | 717,871 | |||
Societe Generale | 83,828 | 6,761,915 | |||
| 22,621,327 | |||||
BEVERAGES – 1.48% | |||||
Pernod Ricard SA | 34,960 | 2,727,708 | |||
| 2,727,708 | |||||
BUILDING MATERIALS – 3.45% | |||||
Compagnie de Saint-Gobain | 66,348 | 2,988,727 | |||
Imerys SA | 6,080 | 318,903 | |||
Lafarge SA | 36,024 | 3,066,104 | |||
| 6,373,734 | |||||
| Security | Shares | Value | |||
CHEMICALS – 2.61% | |||||
L’Air Liquide SA | 45,106 | $ | 4,819,101 | ||
| 4,819,101 | |||||
COMMERCIAL SERVICES – 0.41% | |||||
Bureau Veritas SA | 8,816 | 445,203 | |||
Societe des Autoroutes Paris-Rhin-Rhone | 4,106 | 306,636 | |||
| 751,839 | |||||
COMPUTERS – 0.90% | |||||
Atos Origin SAa | 8,132 | 382,070 | |||
Cap Gemini SA | 26,372 | 1,276,895 | |||
| 1,658,965 | |||||
COSMETICS & PERSONAL CARE – 2.88% | |||||
Christian Dior SA | 11,552 | 1,071,582 | |||
L’Oreal SA | 43,130 | 4,250,860 | |||
| 5,322,442 | |||||
ELECTRIC – 1.21% | |||||
Electricite de France | 42,712 | 2,240,290 | |||
| 2,240,290 | |||||
ELECTRICAL COMPONENTS & | |||||
Legrand SA | 18,848 | 463,059 | |||
| 463,059 | |||||
ENGINEERING & CONSTRUCTION – 3.83% | |||||
Aeroports de Paris | 5,358 | 461,186 | |||
Bouygues SA | 40,242 | 1,998,991 | |||
Eiffage SA | 7,296 | 518,952 | |||
Vinci SA | 76,152 | 4,089,876 | |||
| 7,069,005 | |||||
FOOD – 6.26% | |||||
Carrefour SA | 114,342 | 5,389,421 | |||
Casino Guichard-Perrachon SA | 9,994 | 757,252 | |||
Danone SA | 99,180 | 5,398,511 | |||
| 11,545,184 | |||||
FOOD SERVICE – 0.53% | |||||
Sodexo | 17,100 | 985,991 | |||
| 985,991 | |||||
GAS – 4.97% | |||||
GDF Suez | 217,626 | 9,178,620 | |||
| 9,178,620 | |||||
| SCHEDULESOF INVESTMENTS | 45 |
Table of Contents
Schedule of Investments (Continued)
iSHARES® MSCI FRANCE INDEX FUND
August 31, 2009
| Security | Shares | Value | |||
HAND & MACHINE TOOLS – 2.11% | |||||
Schneider Electric SA | 42,142 | $ | 3,888,599 | ||
| 3,888,599 | |||||
HEALTH CARE – PRODUCTS – 1.06% | |||||
Essilor International SA | 36,138 | 1,953,560 | |||
| 1,953,560 | |||||
HEALTH CARE – SERVICES – 0.13% | |||||
BioMerieux SA | 2,508 | 244,883 | |||
| 244,883 | |||||
HOLDING COMPANIES – DIVERSIFIED – 2.29% | |||||
LVMH Moet Hennessy Louis Vuitton SA | 44,194 | 4,229,520 | |||
| 4,229,520 | |||||
HOUSEHOLD PRODUCTS & WARES – 0.16% | |||||
Societe BIC | 4,864 | 299,097 | |||
| 299,097 | |||||
INSURANCE – 4.28% | |||||
AXA | 282,530 | 6,438,461 | |||
CNP Assurances SA | 6,688 | 668,570 | |||
SCOR SE | 29,906 | 787,734 | |||
| 7,894,765 | |||||
INTERNET – 0.16% | |||||
Iliad SA | 2,926 | 300,057 | |||
| 300,057 | |||||
INVESTMENT COMPANIES – 0.15% | |||||
Eurazeo | 5,054 | 274,045 | |||
| 274,045 | |||||
IRON & STEEL – 3.01% | |||||
ArcelorMittal | 154,964 | 5,552,856 | |||
| 5,552,856 | |||||
LODGING – 0.74% | |||||
Accor SA | 25,802 | 1,359,637 | |||
| 1,359,637 | |||||
MACHINERY – 1.39% | |||||
ALSTOM | 36,442 | 2,562,770 | |||
| 2,562,770 | |||||
MEDIA – 4.09% | |||||
Lagardere SCA | 21,242 | 915,719 | |||
M6-Metropole Television | 11,628 | 264,151 | |||
Societe Television Francaise 1 | 20,976 | 339,847 | |||
Vivendi SA | 211,242 | 6,023,448 | |||
| 7,543,165 | |||||
| Security | Shares | Value | |||
MEDICAL – DRUGS – 0.12% | |||||
Ipsen SA | 4,598 | $ | 227,643 | ||
| 227,643 | |||||
METAL FABRICATE & HARDWARE – 0.80% | |||||
Vallourec SA | 9,690 | 1,473,302 | |||
| 1,473,302 | |||||
MINING – 0.17% | |||||
Eramet | 950 | 306,469 | |||
| 306,469 | |||||
OFFICE & BUSINESS EQUIPMENT – 0.25% | |||||
Neopost SA | 5,624 | 464,067 | |||
| 464,067 | |||||
OIL & GAS – 12.27% | |||||
Compagnie Generale de Geophysique-Veritasa | 25,916 | 556,002 | |||
Total SA | 385,016 | 22,084,113 | |||
| 22,640,115 | |||||
OIL & GAS SERVICES – 0.63% | |||||
Technip SA | 18,696 | 1,157,299 | |||
| 1,157,299 | |||||
PHARMACEUTICALS – 6.99% | |||||
Sanofi-Aventis | 189,810 | 12,889,345 | |||
| 12,889,345 | |||||
REAL ESTATE – 2.10% | |||||
Gecina SA | 3,382 | 335,754 | |||
Klepierre | 16,454 | 618,997 | |||
Unibail-Rodamco SE | 14,706 | 2,911,275 | |||
| 3,866,026 | |||||
REAL ESTATE INVESTMENT TRUSTS – 0.42% | |||||
Fonciere des Regions | 4,180 | 437,891 | |||
Icade | 3,534 | 329,645 | |||
| 767,536 | |||||
RETAIL – 0.86% | |||||
PPR SA | 13,680 | 1,590,347 | |||
| 1,590,347 | |||||
SEMICONDUCTORS – 0.58% | |||||
STMicroelectronics NV | 123,538 | 1,070,259 | |||
| 1,070,259 | |||||
SOFTWARE – 0.32% | |||||
Dassault Systemes SA | 11,704 | 598,771 | |||
| 598,771 | |||||
| 46 | 2009 iSHARES ANNUAL REPORTTO SHAREHOLDERS |
Table of Contents
Schedule of Investments (Continued)
iSHARES® MSCI FRANCE INDEX FUND
August 31, 2009
| Security | Shares | Value | ||||
TELECOMMUNICATIONS – 6.22% | ||||||
Alcatel-Lucenta | 418,646 | $ | 1,592,062 | |||
Eutelsat Communications | 17,784 | 475,965 | ||||
France Telecom SA | 330,144 | 8,404,736 | ||||
SES SA | 50,882 | 997,794 | ||||
| 11,470,557 | ||||||
WATER – 1.82% | ||||||
Suez Environnement SA | 48,754 | 1,003,990 | ||||
Veolia Environnement | 68,172 | 2,360,643 | ||||
| 3,364,633 | ||||||
TOTAL COMMON STOCKS | 183,968,209 | |||||
SHORT-TERM INVESTMENTS – 1.56% |
| |||||
MONEY MARKET FUNDS – 1.56% |
| |||||
Barclays Global Investors Funds | 2,488,436 | 2,488,436 | ||||
Barclays Global Investors Funds | 351,033 | 351,033 | ||||
Barclays Global Investors Funds | 35,278 | 35,278 | ||||
| 2,874,747 | ||||||
TOTAL SHORT-TERM INVESTMENTS |
| |||||
(Cost: $2,874,747) | 2,874,747 | |||||
TOTAL INVESTMENTS IN SECURITIES – 101.26% | 186,842,956 | |||||
Other Assets, Less Liabilities – (1.26)% | (2,331,564 | ) | ||||
NET ASSETS – 100.00% | $ | 184,511,392 | ||||
| a | Non-income earning security. |
| b | All or a portion of this security represents a security on loan. See Note 5. |
| c | Affiliated issuer. See Note 2. |
| d | The rate quoted is the annualized seven-day yield of the fund at period end. |
| e | All or a portion of this security represents an investment of securities lending collateral. See Note 5. |
See notes to financial statements.
| SCHEDULESOF INVESTMENTS | 47 |
Table of Contents
iSHARES® MSCI GERMANY INDEX FUND
August 31, 2009
| Security | Shares | Value | |||
COMMON STOCKS – 95.30% | |||||
AIRLINES – 0.54% | |||||
Deutsche Lufthansa AG Registered | 208,653 | $ | 3,353,588 | ||
| 3,353,588 | |||||
APPAREL – 1.46% | |||||
Adidas AG | 161,823 | 7,630,884 | |||
Puma AG | 4,914 | 1,390,622 | |||
| 9,021,506 | |||||
AUTO MANUFACTURERS – 9.60% | |||||
Bayerische Motoren Werke AG | 280,398 | 12,785,788 | |||
Daimler AG Registered | 717,951 | 32,485,220 | |||
Volkswagen AG | 73,446 | 14,234,092 | |||
| 59,505,100 | |||||
BANKS – 6.01% | |||||
Commerzbank AGa,b | 592,236 | 5,473,280 | |||
Deutsche Bank AG Registered | 428,235 | 29,098,404 | |||
Deutsche Postbank AGa | 74,436 | 2,644,848 | |||
| 37,216,532 | |||||
BIOTECHNOLOGY – 0.58% | |||||
QIAGEN NVa | 174,915 | 3,596,999 | |||
| 3,596,999 | |||||
CHEMICALS – 13.61% | |||||
BASF SE | 736,737 | 38,473,489 | |||
Bayer AG | 615,585 | 37,835,819 | |||
K+S AG | 123,453 | 6,264,421 | |||
Wacker Chemie AG | 14,580 | 1,757,744 | |||
| 84,331,473 | |||||
COMMERCIAL SERVICES – 0.15% | |||||
Hamburger Hafen und Logistik AG | 22,374 | 935,943 | |||
| 935,943 | |||||
COSMETICS & PERSONAL CARE – 0.65% | |||||
Beiersdorf AG | 78,672 | 3,996,598 | |||
| 3,996,598 | |||||
DIVERSIFIED FINANCIAL SERVICES – 2.10% | |||||
Deutsche Boerse AG | 170,316 | 13,014,938 | |||
| 13,014,938 | |||||
ELECTRIC – 15.42% | |||||
E.ON AG | 1,567,341 | 66,374,267 | |||
RWE AG | 314,445 | 29,150,382 | |||
| 95,524,649 | |||||
| Security | Shares | Value | |||
ENERGY - ALTERNATE SOURCES – 0.24% | |||||
SolarWorld AGb | 70,686 | $ | 1,505,339 | ||
| 1,505,339 | |||||
ENGINEERING & CONSTRUCTION – 2.92% | |||||
Fraport AG | 35,637 | 1,801,182 | |||
Hochtief AG | 36,615 | 2,711,814 | |||
Linde AG | 135,048 | 13,585,424 | |||
| 18,098,420 | |||||
FOOD – 1.13% | |||||
METRO AG | 100,431 | 5,453,633 | |||
Suedzucker AG | 80,523 | 1,571,542 | |||
| 7,025,175 | |||||
HEALTH CARE - PRODUCTS – 1.54% | |||||
Fresenius Medical Care AG & Co. KGaA | 181,071 | 8,143,572 | |||
Fresenius SE | 28,170 | 1,426,207 | |||
| 9,569,779 | |||||
HOLDING COMPANIES - DIVERSIFIED – 0.35% | |||||
GEA Group AG | 123,750 | 2,194,981 | |||
| 2,194,981 | |||||
HOUSEHOLD PRODUCTS & WARES – 0.69% | |||||
Henkel AG & Co. KGaA | 126,771 | 4,247,895 | |||
| 4,247,895 | |||||
INSURANCE – 11.52% | |||||
Allianz SE Registered | 367,071 | 42,467,813 | |||
Hannover Rueckversicherung AG Registereda | 55,860 | 2,460,970 | |||
Muenchener Rueckversicherungs- Gesellschaft AG Registered | 177,174 | 26,449,997 | |||
| 71,378,780 | |||||
INTERNET – 0.27% | |||||
United Internet AG Registereda,b | 120,186 | 1,700,583 | |||
| 1,700,583 | |||||
IRON & STEEL – 2.02% | |||||
Salzgitter AG | 32,571 | 3,103,136 | |||
ThyssenKrupp AG | 276,606 | 9,407,559 | |||
| 12,510,695 | |||||
LEISURE TIME – 0.16% | |||||
TUI AGa,b | 115,236 | 1,002,965 | |||
| 1,002,965 | |||||
| 48 | 2009 iSHARES ANNUAL REPORTTO SHAREHOLDERS |
Table of Contents
Schedule of Investments (Continued)
iSHARES® MSCI GERMANY INDEX FUND
August 31, 2009
| Security | Shares | Value | |||
MACHINERY - DIVERSIFIED – 1.09% | |||||
MAN SE | 88,137 | $ | 6,741,437 | ||
| 6,741,437 | |||||
MANUFACTURING – 9.37% | |||||
Siemens AG Registered | 668,979 | 58,033,107 | |||
| 58,033,107 | |||||
PHARMACEUTICALS – 1.17% | |||||
Celesio AG | 76,311 | 2,079,597 | |||
Merck KGaA | 57,162 | 5,188,418 | |||
| 7,268,015 | |||||
SEMICONDUCTORS – 0.72% | |||||
Infineon Technologies AGa | 850,578 | 4,473,579 | |||
| 4,473,579 | |||||
SOFTWARE – 5.22% | |||||
SAP AG | 662,094 | 32,361,700 | |||
| 32,361,700 | |||||
TELECOMMUNICATIONS – 4.79% | |||||
Deutsche Telekom AG Registered | 2,228,517 | 29,661,759 | |||
| 29,661,759 | |||||
TRANSPORTATION – 1.98% | |||||
Deutsche Post AG Registered | 711,144 | 12,282,045 | |||
| 12,282,045 | |||||
TOTAL COMMON STOCKS | |||||
(Cost: $763,440,626) | 590,553,580 | ||||
PREFERRED STOCKS – 4.33% | |||||
AUTO MANUFACTURERS – 2.42% | |||||
Bayerische Motoren Werke AG | 52,890 | 1,590,860 | |||
Porsche Automobil Holding SE | 70,674 | 5,213,025 | |||
Volkswagen AG | 87,324 | 8,204,328 | |||
| 15,008,213 | |||||
ELECTRIC – 0.18% | |||||
RWE AG NVS | 13,659 | 1,114,533 | |||
| 1,114,533 | |||||
HEALTH CARE - SERVICES – 0.68% | |||||
Fresenius SE | 73,992 | 4,177,208 | |||
| 4,177,208 | |||||
| Security | Shares | Value | ||||
HOUSEHOLD PRODUCTS & WARES – 1.05% |
| |||||
Henkel AG & Co. KGaA | 164,712 | $ | 6,514,356 | |||
| 6,514,356 | ||||||
TOTAL PREFERRED STOCKS |
| |||||
(Cost: $34,671,307) | 26,814,310 | |||||
SHORT-TERM INVESTMENTS – 1.23% |
| |||||
MONEY MARKET FUNDS – 1.23% |
| |||||
Barclays Global Investors Funds | 6,264,694 | 6,264,694 | ||||
Barclays Global Investors Funds | 883,734 | 883,734 | ||||
Barclays Global Investors Funds | 450,646 | 450,646 | ||||
| 7,599,074 | ||||||
TOTAL SHORT-TERM INVESTMENTS |
| |||||
(Cost: $7,599,074) | 7,599,074 | |||||
TOTAL INVESTMENTS IN | ||||||
(Cost: $805,711,007) | 624,966,964 | |||||
Other Assets, Less Liabilities – (0.86)% | (5,329,217 | ) | ||||
NET ASSETS – 100.00% | $ | 619,637,747 | ||||
NVS – Non-Voting Shares
| a | Non-income earning security. |
| b | All or a portion of this security represents a security on loan. See Note 5. |
| c | Affiliated issuer. See Note 2. |
| d | The rate quoted is the annualized seven-day yield of the fund at period end. |
| e | All or a portion of this security represents an investment of securities lending collateral. See Note 5. |
See notes to financial statements.
| SCHEDULESOF INVESTMENTS | 49 |
Table of Contents
iSHARES® MSCI ITALY INDEX FUND
August 31, 2009
| Security | Shares | Value | |||
COMMON STOCKS – 98.38% | |||||
AEROSPACE & DEFENSE – 2.22% | |||||
Finmeccanica SpA | 174,944 | $ | 2,796,735 | ||
| 2,796,735 | |||||
AUTO MANUFACTURERS – 2.68% | |||||
Fiat SpAa | 284,636 | 3,373,936 | |||
| 3,373,936 | |||||
AUTO PARTS & EQUIPMENT – 0.42% | |||||
Pirelli & C. SpAa | 1,096,235 | 525,433 | |||
| 525,433 | |||||
BANKS – 32.13% | |||||
Banca Carige SpA | 337,128 | 1,020,809 | |||
Banca Monte dei Paschi di | |||||
Siena SpA | 1,222,980 | 2,572,885 | |||
Banca Popolare di Milano Scrl | 225,320 | 1,699,180 | |||
Banco Popolare SpAa | 261,712 | 2,321,021 | |||
Intesa Sanpaolo SpAa | 2,420,132 | 10,497,174 | |||
UniCredit SpAa | 5,002,624 | 18,144,962 | |||
Unione di Banche Italiane ScpA | 273,768 | 4,140,858 | |||
| 40,396,889 | |||||
BUILDING MATERIALS – 0.53% | |||||
Italcementi SpAb | 44,528 | 668,393 | |||
| 668,393 | |||||
COMMERCIAL SERVICES – 2.31% | |||||
Atlantia SpA | 130,094 | 2,897,450 | |||
| 2,897,450 | |||||
DIVERSIFIED FINANCIAL SERVICES – 2.71% | |||||
Mediobanca SpA | 248,424 | 3,411,713 | |||
| 3,411,713 | |||||
ELECTRIC – 14.43% | |||||
A2A SpA | 899,316 | 1,742,261 | |||
Enel SpA | 2,079,555 | 12,265,331 | |||
Terna SpA | 1,120,812 | 4,133,643 | |||
| 18,141,235 | |||||
ELECTRICAL COMPONENTS & | |||||
Prysmian SpA | 56,892 | 1,063,807 | |||
| 1,063,807 | |||||
ENTERTAINMENT – 0.37% | |||||
Lottomatica SpA | 20,856 | 469,592 | |||
| 469,592 | |||||
| Security | Shares | Value | |||
FOOD – 1.42% | |||||
Parmalat SpA | 694,100 | $ | 1,782,962 | ||
| 1,782,962 | |||||
HEALTH CARE - PRODUCTS – 1.52% | |||||
Luxottica Group SpAa | 78,716 | 1,911,307 | |||
| 1,911,307 | |||||
HOLDING COMPANIES - DIVERSIFIED – 0.46% | |||||
Exor SpA | 33,525 | 576,839 | |||
| 576,839 | |||||
INSURANCE – 7.73% | |||||
Assicurazioni Generali SpA | 239,492 | 5,969,774 | |||
Fondiaria-Sai SpA | 81,488 | 1,566,987 | |||
Mediolanum SpA | 195,624 | 1,240,126 | |||
Unipol Gruppo Finanziario SpAa | 703,384 | 934,696 | |||
| 9,711,583 | |||||
MEDIA – 2.28% | |||||
Mediaset SpA | 435,646 | 2,867,985 | |||
| 2,867,985 | |||||
METAL FABRICATE & HARDWARE – 2.06% | |||||
Tenaris SA | 177,320 | 2,590,434 | |||
| 2,590,434 | |||||
OIL & GAS – 17.41% | |||||
Eni SpA | 900,592 | 21,376,206 | |||
Saras SpA | 147,488 | 510,612 | |||
| 21,886,818 | |||||
OIL & GAS SERVICES – 2.13% | |||||
Saipem SpA | 99,792 | 2,673,666 | |||
| 2,673,666 | |||||
RETAIL – 0.41% | |||||
Autogrill SpAa | 45,628 | 514,006 | |||
| 514,006 | |||||
TELECOMMUNICATIONS – 3.78% | |||||
Telecom Italia SpA | 2,934,228 | 4,745,531 | |||
| 4,745,531 | |||||
UTILITIES – 0.53% | |||||
ACEA SpA | 54,736 | 668,058 | |||
| 668,058 | |||||
TOTAL COMMON STOCKS | |||||
(Cost: $167,679,118) | 123,674,372 | ||||
| 50 | 2009 iSHARES ANNUAL REPORTTO SHAREHOLDERS |
Table of Contents
Schedule of Investments (Continued)
iSHARES® MSCI ITALY INDEX FUND
August 31, 2009
| Security | Shares | Value | |||
PREFERRED STOCKS – 1.45% | |||||
BANKS – 0.42% | |||||
Intesa Sanpaolo SpA RNC | 162,272 | $ | 529,776 | ||
| 529,776 | |||||
TELECOMMUNICATIONS – 1.03% | |||||
Telecom Italia SpA RNC | 1,141,052 | 1,293,598 | |||
| 1,293,598 | |||||
TOTAL PREFERRED STOCKS | |||||
(Cost: $2,248,425) | 1,823,374 | ||||
WARRANTS – 0.02% | |||||
BANKS – 0.02% | |||||
Unione di Banche Italiane | 199,104 | 19,772 | |||
| 19,772 | |||||
TOTAL WARRANTS | |||||
(Cost: $0) | 19,772 | ||||
SHORT-TERM INVESTMENTS – 0.06% | |||||
MONEY MARKET FUNDS – 0.06% | |||||
Barclays Global Investors Funds | |||||
Institutional Money Market | |||||
Fund, SL Agency Shares | |||||
0.26%c,d,e | 43,726 | 43,726 | |||
Barclays Global Investors Funds | |||||
Prime Money Market | |||||
Fund, SL Agency Shares | |||||
0.21%c,d,e | 6,168 | 6,168 | |||
Barclays Global Investors Funds | |||||
Treasury Money Market | |||||
Fund, SL Agency Shares | |||||
0.08%c,d | 29,754 | 29,754 | |||
| 79,648 | |||||
TOTAL SHORT-TERM INVESTMENTS | |||||
(Cost: $79,648) | 79,648 | ||||
TOTAL INVESTMENTS | |||||
IN SECURITIES – 99.91% | |||||
(Cost: $170,007,191) | 125,597,166 | ||||
Other Assets, Less Liabilities – 0.09% | 118,759 | ||||
NET ASSETS – 100.00% | $ | 125,715,925 | |||
| a | Non-income earning security. |
| b | All or a portion of this security represents a security on loan. See Note 5. |
| c | Affiliated issuer. See Note 2. |
| d | The rate quoted is the annualized seven-day yield of the fund at period end. |
| e | All or a portion of this security represents an investment of securities lending collateral. See Note 5. |
See notes to financial statements.
| SCHEDULESOF INVESTMENTS | 51 |
Table of Contents
iSHARES® MSCI NETHERLANDS INVESTABLE MARKET INDEX FUND
August 31, 2009
| Security | Shares | Value | |||
COMMON STOCKS – 99.69% | |||||
BANKS – 0.39% | |||||
SNS REAAL NVa | 42,300 | $ | 326,216 | ||
| 326,216 | |||||
BEVERAGES – 4.87% | |||||
Heineken Holding NV | 25,470 | 903,534 | |||
Heineken NV | 74,700 | 3,156,452 | |||
| 4,059,986 | |||||
BIOTECHNOLOGY – 0.60% | |||||
Crucell NVa | 22,770 | 498,310 | |||
| 498,310 | |||||
BUILDING MATERIALS – 0.19% | |||||
Wavin NV | 71,370 | 154,756 | |||
| 154,756 | |||||
CHEMICALS – 7.20% | |||||
Akzo Nobel NV | 70,560 | 4,000,163 | |||
Koninklijke DSM NV | 54,810 | 1,999,806 | |||
| 5,999,969 | |||||
COMMERCIAL SERVICES – 2.24% | |||||
Brunel International NV | 1,800 | 49,169 | |||
Randstad Holding NVa | 35,730 | 1,477,983 | |||
USG People NVa,b | 20,853 | 337,705 | |||
| 1,864,857 | |||||
DIVERSIFIED FINANCIAL SERVICES – 0.43% | |||||
BinckBank NV | 16,200 | 252,471 | |||
KAS Bank NV CVA | 5,850 | 108,884 | |||
| 361,355 | |||||
ELECTRICAL COMPONENTS & | |||||
Draka Holding NVa | 5,638 | 101,176 | |||
InnoConcepts NVa,b | 2,296 | 10,445 | |||
TKH Group NV | 13,950 | 218,207 | |||
| 329,828 | |||||
ELECTRONICS – 7.45% | |||||
Koninklijke Philips Electronics NV | 274,590 | 6,210,234 | |||
| 6,210,234 | |||||
ENGINEERING & CONSTRUCTION – 1.58% | |||||
Arcadis NV | 17,100 | 319,870 | |||
Koninklijke BAM Groep NV | 37,080 | 389,562 | |||
Koninklijke Boskalis Westminster NV | 19,212 | 604,890 | |||
| 1,314,322 | |||||
| Security | Shares | Value | |||
FOOD – 23.65% | |||||
CSM NV | 27,180 | $ | 591,506 | ||
Koninklijke Ahold NV | 344,520 | 4,039,770 | |||
Koninklijke Wessanen NVa | 33,390 | 181,603 | |||
Nutreco Holding NV | 12,330 | 555,508 | |||
Sligro Food Group NV | 9,000 | 253,143 | |||
Super de Boer NVa | 22,061 | 90,227 | |||
Unilever NV CVA | 500,580 | 14,004,376 | |||
| 19,716,133 | |||||
HOLDING COMPANIES - DIVERSIFIED – 0.76% | |||||
Imtech NV | 23,130 | 560,791 | |||
Ordina NVa | 12,251 | 72,995 | |||
| 633,786 | |||||
INSURANCE – 15.37% | |||||
Aegon NVa | 483,750 | 3,646,661 | |||
ING Groep NV CVAa | 605,700 | 9,165,817 | |||
| 12,812,478 | |||||
INVESTMENT COMPANIES – 0.14% | |||||
Kardan NVa,b | 18,000 | 120,140 | |||
| 120,140 | |||||
LEISURE TIME – 0.12% | |||||
Accell Group NV | 2,070 | 99,811 | |||
| 99,811 | |||||
MANUFACTURING – 0.72% | |||||
Aalberts Industries NV | 31,231 | 383,642 | |||
Koninklijke Ten Cate NV | 10,080 | 213,291 | |||
| 596,933 | |||||
MEDIA – 5.85% | |||||
Reed Elsevier NV | 255,780 | 2,712,185 | |||
Telegraaf Media Groep NV | 5,490 | 102,262 | |||
Wolters Kluwer NV | 104,130 | 2,063,653 | |||
| 4,878,100 | |||||
METAL FABRICATE & HARDWARE – 0.08% | |||||
Advanced Metallurgical Group NVa,b | 4,230 | 66,560 | |||
| 66,560 | |||||
OFFICE & BUSINESS EQUIPMENT – 0.17% | |||||
Oce NV | 24,660 | 144,738 | |||
| 144,738 | |||||
| 52 | 2009 iSHARES ANNUAL REPORTTO SHAREHOLDERS |
Table of Contents
Schedule of Investments (Continued)
iSHARES® MSCI NETHERLANDS INVESTABLE MARKET INDEX FUND
August 31, 2009
| Security | Shares | Value | |||
OIL & GAS SERVICES – 2.52% | |||||
Fugro NV CVA | 21,420 | $ | 1,154,241 | ||
SBM Offshore NV | 45,630 | 949,479 | |||
| 2,103,720 | |||||
PHARMACEUTICALS – 0.45% | |||||
Mediq NV | 23,580 | 373,238 | |||
| 373,238 | |||||
REAL ESTATE INVESTMENT TRUSTS – 3.48% | |||||
Corio NV | 20,160 | 1,234,035 | |||
Eurocommercial Properties NV | 9,900 | 393,250 | |||
VastNed Offices/Industrial NV | 4,050 | 69,104 | |||
VastNed Retail NV | 5,490 | 333,651 | |||
Wereldhave NV | 8,910 | 874,455 | |||
| 2,904,495 | |||||
RETAIL – 0.19% | |||||
Beter Bed Holding NV | 3,600 | 67,057 | |||
Macintosh Retail Group NV | 5,400 | 87,567 | |||
| 154,624 | |||||
SEMICONDUCTORS – 5.07% | |||||
ASM International NVa | 14,130 | 260,867 | |||
ASML Holding NV | 144,270 | 3,961,608 | |||
| 4,222,475 | |||||
SOFTWARE – 0.91% | |||||
Exact Holding NV | 4,680 | 125,388 | |||
TomTom NVa | 36,810 | 543,297 | |||
Unit 4 Agresso NVa | 4,950 | 93,766 | |||
| 762,451 | |||||
TELECOMMUNICATIONS – 9.50% | |||||
Koninklijke KPN NV | 514,980 | 7,914,926 | |||
| 7,914,926 | |||||
TRANSPORTATION – 5.36% | |||||
Royal Vopak NVa | 13,696 | 880,519 | |||
Smit Internationale NV | 3,780 | 274,859 | |||
TNT NV | 134,190 | 3,314,119 | |||
| 4,469,497 | |||||
TOTAL COMMON STOCKS | |||||
(Cost: $124,556,545) | 83,093,938 | ||||
| Security | Shares | Value | ||||
SHORT-TERM INVESTMENTS – 0.70% |
| |||||
MONEY MARKET FUNDS – 0.70% |
| |||||
Barclays Global Investors Funds | 445,555 | $ | 445,555 | |||
Barclays Global Investors Funds | 62,853 | 62,853 | ||||
Barclays Global Investors Funds | 74,636 | 74,636 | ||||
| 583,044 | ||||||
TOTAL SHORT-TERM INVESTMENTS |
| |||||
(Cost: $583,044) | 583,044 | |||||
TOTAL INVESTMENTS IN | 83,676,982 | |||||
Other Assets, Less Liabilities – (0.39)% | (325,839 | ) | ||||
NET ASSETS – 100.00% | $ | 83,351,143 | ||||
| a | Non-income earning security. |
| b | All or a portion of this security represents a security on loan. See Note 5. |
| c | Affiliated issuer. See Note 2. |
| d | The rate quoted is the annualized seven-day yield of the fund at period end. |
| e | All or a portion of this security represents an investment of securities lending collateral. See Note 5. |
See notes to financial statements.
| SCHEDULESOF INVESTMENTS | 53 |
Table of Contents
iSHARES® MSCI SPAIN INDEX FUND
August 31, 2009
| Security | Shares | Value | |||
COMMON STOCKS – 99.84% | |||||
AIRLINES – 0.38% | |||||
Iberia Lineas Aereas de Espana SAa | 419,484 | $ | 1,046,844 | ||
| 1,046,844 | |||||
BANKS – 40.73% | |||||
Banco Bilbao Vizcaya Argentaria SA | 1,165,632 | 20,725,251 | |||
Banco de Sabadell SA | 1,251,198 | 9,444,497 | |||
Banco de Valencia SA | 458,016 | 4,600,931 | |||
Banco Popular Espanol SAb | 888,576 | 9,576,384 | |||
Banco Santander SA | 4,193,592 | 64,603,382 | |||
Bankinter SA | 343,590 | 4,570,748 | |||
| 113,521,193 | |||||
COMMERCIAL SERVICES – 3.84% | |||||
Abertis Infraestructuras SA | 404,898 | 8,817,417 | |||
Cintra Concesiones de Infraestructuras de Transporte SA | 213,486 | 1,891,792 | |||
| 10,709,209 | |||||
COMPUTERS – 1.61% | |||||
Indra Sistemas SAb | 188,682 | 4,481,212 | |||
| 4,481,212 | |||||
DIVERSIFIED FINANCIAL SERVICES – 2.58% | |||||
Criteria CaixaCorp SA | 1,432,470 | 7,194,831 | |||
| 7,194,831 | |||||
ELECTRIC – 6.77% | |||||
Iberdrola SA | 1,459,926 | 13,534,132 | |||
Red Electrica Corporacion SA | 113,490 | 5,325,647 | |||
| 18,859,779 | |||||
ENERGY - ALTERNATE SOURCES – 1.00% | |||||
Gamesa Corporacion Tecnologica SA | 126,906 | 2,780,918 | |||
| 2,780,918 | |||||
ENGINEERING & CONSTRUCTION – 5.99% | |||||
Acciona SA | 31,356 | 4,065,518 | |||
Actividades de Construcciones y Servicios SA | 159,510 | 8,226,839 | |||
Fomento de Construcciones y Contratas SA | 45,396 | 1,835,150 | |||
Grupo Ferrovial SAb | 41,106 | 1,510,123 | |||
SacyrVallehermoso SA | 63,838 | 1,065,433 | |||
| 16,703,063 | |||||
| Security | Shares | Value | |||
GAS – 3.50% | |||||
Enagas SA | 185,562 | $ | 3,665,492 | ||
Gas Natural SDG SA | 289,536 | 6,089,132 | |||
| 9,754,624 | |||||
INSURANCE – 2.86% | |||||
Mapfre SAb | 1,937,598 | 7,980,179 | |||
| 7,980,179 | |||||
IRON & STEEL – 0.53% | |||||
Acerinox SA | 69,420 | 1,469,412 | |||
| 1,469,412 | |||||
MACHINERY – 0.65% | |||||
Zardoya Otis SAb | 82,482 | 1,803,895 | |||
| 1,803,895 | |||||
MEDIA – 0.70% | |||||
Gestevision Telecinco SA | 175,266 | 1,965,593 | |||
| 1,965,593 | |||||
OIL & GAS – 4.64% | |||||
Repsol YPF SA | 520,884 | 12,931,656 | |||
| 12,931,656 | |||||
PHARMACEUTICALS – 0.68% | |||||
Grifols SA | 107,796 | 1,897,305 | |||
| 1,897,305 | |||||
RETAIL – 4.58% | |||||
Industria de Diseno Textil SAb | 234,624 | 12,781,025 | |||
| 12,781,025 | |||||
TELECOMMUNICATIONS – 18.80% | |||||
Telefonica SA | 2,076,048 | 52,404,703 | |||
| 52,404,703 | |||||
TOTAL COMMON STOCKS | |||||
(Cost: $356,679,725) | 278,285,441 | ||||
SHORT-TERM INVESTMENTS – 6.08% | |||||
MONEY MARKET FUNDS – 6.08% | |||||
Barclays Global Investors Funds | 14,754,759 | 14,754,759 | |||
| 54 | 2009 iSHARES ANNUAL REPORTTO SHAREHOLDERS |
Table of Contents
Schedule of Investments (Continued)
iSHARES® MSCI SPAIN INDEX FUND
August 31, 2009
| Security | Shares | Value | ||||
Barclays Global Investors Funds | ||||||
0.21%c,d,e | 2,081,392 | $ | 2,081,392 | |||
Barclays Global Investors Funds | ||||||
0.08%c,d | 108,630 | 108,630 | ||||
| 16,944,781 | ||||||
TOTAL SHORT-TERM INVESTMENTS |
| |||||
(Cost: $16,944,781) | 16,944,781 | |||||
TOTAL INVESTMENTS IN | ||||||
(Cost: $373,624,506) | 295,230,222 | |||||
Other Assets, Less Liabilities – (5.92)% | (16,495,789 | ) | ||||
NET ASSETS – 100.00% | $ | 278,734,433 | ||||
| a | Non-income earning security. |
| b | All or a portion of this security represents a security on loan. See Note 5. |
| c | Affiliated issuer. See Note 2. |
| d | The rate quoted is the annualized seven-day yield of the fund at period end. |
| e | All or a portion of this security represents an investment of securities lending collateral. See Note 5. |
See notes to financial statements.
| SCHEDULESOF INVESTMENTS | 55 |
Table of Contents
iSHARES® MSCI SWEDEN INDEX FUND
August 31, 2009
| Security | Shares | Value | |||
COMMON STOCKS – 99.82% | |||||
AGRICULTURE – 2.04% | |||||
Swedish Match AB | 201,687 | $ | 3,891,378 | ||
| 3,891,378 | |||||
AUTO MANUFACTURERS – 1.65% | |||||
Scania AB Class B | 253,857 | 3,137,193 | |||
| 3,137,193 | |||||
BANKS – 24.52% | |||||
Nordea Bank AB | 2,513,262 | 26,369,324 | |||
Skandinaviska Enskilda Banken AB Class Aa | 1,184,925 | 8,343,837 | |||
Svenska Handelsbanken AB Class A | 350,649 | 9,209,931 | |||
Swedbank AB Class Aa,b | 261,738 | 2,746,174 | |||
| 46,669,266 | |||||
COMMERCIAL SERVICES – 1.26% | |||||
Securitas AB Class B | 246,309 | 2,407,380 | |||
| 2,407,380 | |||||
ENGINEERING & CONSTRUCTION – 2.37% | |||||
Skanska AB Class B | 310,800 | 4,508,408 | |||
| 4,508,408 | |||||
FOREST PRODUCTS & PAPER – 3.67% | |||||
Holmen AB Class B | 42,624 | 1,212,580 | |||
Svenska Cellulosa AB Class B | 441,780 | 5,773,763 | |||
| 6,986,343 | |||||
HAND & MACHINE TOOLS – 4.20% | |||||
Sandvik AB | 790,986 | 7,987,170 | |||
| 7,987,170 | |||||
HEALTH CARE - PRODUCTS – 1.41% | |||||
Getinge AB Class B | 155,733 | 2,675,749 | |||
| 2,675,749 | |||||
HOME FURNISHINGS – 2.06% | |||||
Electrolux AB Class Ba | 188,589 | 3,917,539 | |||
| 3,917,539 | |||||
HOUSEHOLD PRODUCTS & WARES – 1.19% | |||||
Husqvarna AB Class Ba,b | 318,459 | 2,264,904 | |||
| 2,264,904 | |||||
INVESTMENT COMPANIES – 3.59% | |||||
Investor AB Class B | 366,633 | 6,841,517 | |||
| 6,841,517 | |||||
| Security | Shares | Value | |||
IRON & STEEL – 1.55% | |||||
SSAB AB Class A | 141,525 | $ | 2,067,884 | ||
SSAB AB Class B | 66,489 | 882,543 | |||
| 2,950,427 | |||||
MACHINERY – 10.23% | |||||
Atlas Copco AB Class A | 479,298 | 6,041,345 | |||
Atlas Copco AB Class B | 262,182 | 2,942,837 | |||
Volvo AB Class A | 350,871 | 3,014,271 | |||
Volvo AB Class B | 851,925 | 7,468,711 | |||
| 19,467,164 | |||||
MANUFACTURING – 1.60% | |||||
Alfa Laval AB | 271,839 | 3,039,745 | |||
| 3,039,745 | |||||
METAL FABRICATE & HARDWARE – 4.57% | |||||
Assa Abloy AB Class B | 247,308 | 3,970,525 | |||
SKF AB Class Bb | 309,468 | 4,737,511 | |||
| 8,708,036 | |||||
OIL & GAS – 0.82% | |||||
Lundin Petroleum ABa | 171,384 | 1,571,290 | |||
| 1,571,290 | |||||
RETAIL – 11.63% | |||||
Hennes & Mauritz AB Class B | 398,268 | 22,127,247 | |||
| 22,127,247 | |||||
TELECOMMUNICATIONS – 21.46% | |||||
Millicom International Cellular SA SDRa | 58,719 | 4,114,117 | |||
Tele2 AB Class B | 236,652 | 3,292,851 | |||
Telefonaktiebolaget LM Ericsson Class B | 2,301,696 | 22,074,965 | |||
TeliaSonera AB | 1,745,919 | 11,359,809 | |||
| 40,841,742 | |||||
TOTAL COMMON STOCKS | |||||
(Cost: $250,556,582) | 189,992,498 | ||||
SHORT-TERM INVESTMENTS – 2.64% | |||||
MONEY MARKET FUNDS – 2.64% | |||||
Barclays Global Investors Funds | |||||
0.26%c,d,e | 4,391,756 | 4,391,756 | |||
| 56 | 2009 iSHARES ANNUAL REPORTTO SHAREHOLDERS |
Table of Contents
Schedule of Investments (Continued)
iSHARES® MSCI SWEDEN INDEX FUND
August 31, 2009
| Security | Shares | Value | ||||
Barclays Global Investors Funds | ||||||
0.21%c,d,e | 619,526 | $ | 619,526 | |||
Barclays Global Investors Funds | ||||||
0.08%c,d | 17,942 | 17,942 | ||||
| 5,029,224 | ||||||
TOTAL SHORT-TERM INVESTMENTS |
| |||||
(Cost: $5,029,224) | 5,029,224 | |||||
TOTAL INVESTMENTS IN | ||||||
(Cost: $255,585,806) | 195,021,722 | |||||
Other Assets, Less Liabilities – (2.46)% | (4,688,991 | ) | ||||
NET ASSETS – 100.00% | $ | 190,332,731 | ||||
SDR – Swedish Depositary Receipts
| a | Non-income earning security. |
| b | All or a portion of this security represents a security on loan. See Note 5. |
| c | Affiliated issuer. See Note 2. |
| d | The rate quoted is the annualized seven-day yield of the fund at period end. |
| e | All or a portion of this security represents an investment of securities lending collateral. See Note 5. |
See notes to financial statements.
| SCHEDULESOF INVESTMENTS | 57 |
Table of Contents
iSHARES® MSCI SWITZERLAND INDEX FUND
August 31, 2009
| Security | Shares | Value | |||
COMMON STOCKS – 98.89% | |||||
BANKS – 10.18% | |||||
Baloise Holding Registered | 26,355 | $ | 2,391,488 | ||
Credit Suisse Group AG Registered | 381,150 | 19,456,917 | |||
Julius Baer Holding AG Registered | 114,240 | 5,820,906 | |||
| 27,669,311 | |||||
BUILDING MATERIALS – 3.43% | |||||
Geberit AG Registered | 15,960 | 2,460,031 | |||
Holcim Ltd. Registereda | 101,502 | 6,857,400 | |||
| 9,317,431 | |||||
CHEMICALS – 6.19% | |||||
Givaudan SA Registered | 4,651 | 3,349,019 | |||
Lonza Group AG Registered | 33,915 | 3,337,427 | |||
Syngenta AG Registered | 43,050 | 10,142,830 | |||
| 16,829,276 | |||||
COMMERCIAL SERVICES – 2.39% | |||||
Adecco SA Registered | 59,115 | 2,844,299 | |||
SGS SA Registered | 2,940 | 3,641,444 | |||
| 6,485,743 | |||||
COMPUTERS – 0.44% | |||||
Logitech International SA Registereda,b | 64,575 | 1,192,699 | |||
| 1,192,699 | |||||
DIVERSIFIED FINANCIAL SERVICES – 4.90% | |||||
UBS AG Registereda | 720,090 | 13,313,676 | |||
| 13,313,676 | |||||
ELECTRIC – 0.25% | |||||
BKW FMB Energie AG | 8,525 | 674,353 | |||
| 674,353 | |||||
ENGINEERING & CONSTRUCTION – 4.72% | |||||
ABB Ltd. Registereda | 666,645 | 12,817,549 | |||
| 12,817,549 | |||||
FOOD – 19.84% | |||||
Aryzta AGa | 34,965 | 1,303,516 | |||
Lindt & Spruengli AG | 725 | 1,543,502 | |||
Lindt & Spruengli AG Registered | 125 | 3,075,176 | |||
Nestle SA Registered | 1,154,055 | 48,025,111 | |||
| 53,947,305 | |||||
| Security | Shares | Value | |||
HAND & MACHINE TOOLS – 0.70% | |||||
Schindler Holding AG | 22,247 | $ | 1,446,155 | ||
Schindler Holding AG Registered | 6,825 | 452,697 | |||
| 1,898,852 | |||||
HEALTH CARE - PRODUCTS – 4.72% | |||||
Nobel Biocare Holding AG Registered | 60,480 | 1,850,710 | |||
Sonova Holding AG Registered | 28,770 | 2,757,630 | |||
Straumann Holding AG Registered | 5,880 | 1,339,740 | |||
Synthes Inc. | 58,800 | 6,893,429 | |||
| 12,841,509 | |||||
INSURANCE – 7.54% | |||||
Swiss Life Holding AG Registereda | 11,550 | 1,309,259 | |||
Swiss Reinsurance Co. Registered | 135,555 | 6,261,811 | |||
Zurich Financial Services AG | 58,695 | 12,923,619 | |||
| 20,494,689 | |||||
INVESTMENT COMPANIES – 0.95% | |||||
Pargesa Holding SA Bearer | 32,550 | 2,590,202 | |||
| 2,590,202 | |||||
PHARMACEUTICALS – 25.60% | |||||
Actelion Ltd. Registereda | 52,290 | 3,023,058 | |||
Novartis AG Registered | 619,605 | 28,774,389 | |||
Roche Holding AG Genusschein | 237,405 | 37,805,991 | |||
| 69,603,438 | |||||
RETAIL – 4.05% | |||||
Compagnie Financiere Richemont | 258,825 | 7,058,084 | |||
Swatch Group AG (The) Bearer | 13,908 | 3,001,764 | |||
Swatch Group AG (The) Registered | 22,443 | 952,423 | |||
| 11,012,271 | |||||
TELECOMMUNICATIONS – 2.42% | |||||
Swisscom AG Registered | 19,005 | 6,581,663 | |||
| 6,581,663 | |||||
TRANSPORTATION – 0.57% | |||||
Kuehne & Nagel International | 19,635 | 1,562,477 | |||
| 1,562,477 | |||||
TOTAL COMMON STOCKS | |||||
(Cost: $305,856,222) | 268,832,444 | ||||
| 58 | 2009 iSHARES ANNUAL REPORTTO SHAREHOLDERS |
Table of Contents
Schedule of Investments (Continued)
iSHARES® MSCI SWITZERLAND INDEX FUND
August 31, 2009
| Security | Shares | Value | |||
SHORT-TERM INVESTMENTS – 0.27% | |||||
MONEY MARKET FUNDS – 0.27% | |||||
Barclays Global Investors Funds | 614,950 | $ | 614,950 | ||
Barclays Global Investors Funds | 86,748 | 86,748 | |||
Barclays Global Investors Funds | 28,528 | 28,528 | |||
| 730,226 | |||||
TOTAL SHORT-TERM INVESTMENTS | |||||
(Cost: $730,226) | 730,226 | ||||
TOTAL INVESTMENTS IN | |||||
(Cost: $306,586,448) | 269,562,670 | ||||
Other Assets, Less Liabilities – 0.84% | 2,292,270 | ||||
NET ASSETS – 100.00% | $ | 271,854,940 | |||
| a | Non-income earning security. |
| b | All or a portion of this security represents a security on loan. See Note 5. |
| c | Affiliated issuer. See Note 2. |
| d | The rate quoted is the annualized seven-day yield of the fund at period end. |
| e | All or a portion of this security represents an investment of securities lending collateral. See Note 5. |
See notes to financial statements.
| SCHEDULESOF INVESTMENTS | 59 |
Table of Contents
iSHARES® MSCI UNITED KINGDOM INDEX FUND
August 31, 2009
| Security | Shares | Value | |||
COMMON STOCKS – 99.21% | |||||
AEROSPACE & DEFENSE – 1.75% | |||||
BAE Systems PLC | 1,286,580 | $ | 6,546,422 | ||
Cobham PLC | 418,200 | 1,378,160 | |||
Rolls-Royce Group PLCa | 674,778 | 4,978,583 | |||
| 12,903,165 | |||||
AGRICULTURE – 4.43% | |||||
British American Tobacco PLC | 728,406 | 22,247,305 | |||
Imperial Tobacco Group PLC | 370,968 | 10,459,643 | |||
| 32,706,948 | |||||
AIRLINES – 0.09% | |||||
British Airways PLCa | 211,560 | 660,293 | |||
| 660,293 | |||||
APPAREL – 0.17% | |||||
Burberry Group PLC | 159,162 | 1,254,210 | |||
| 1,254,210 | |||||
BANKS – 17.24% | |||||
Barclays PLCa,b | 4,025,298 | 24,946,038 | |||
HSBC Holdings PLC | 6,318,510 | 69,212,237 | |||
Lloyds Banking Group PLCa | 5,935,980 | 10,771,544 | |||
Royal Bank of Scotland | 6,156,888 | 5,784,887 | |||
Standard Chartered PLC | 733,326 | 16,684,639 | |||
| 127,399,345 | |||||
BEVERAGES – 3.00% | |||||
Diageo PLC | 912,168 | 14,182,654 | |||
SABMiller PLC | 343,662 | 7,987,031 | |||
| 22,169,685 | |||||
CHEMICALS – 0.25% | |||||
Johnson Matthey PLC | 78,720 | 1,816,698 | |||
| 1,816,698 | |||||
COMMERCIAL SERVICES – 1.34% | |||||
Bunzl PLC | 120,048 | 1,149,469 | |||
Capita Group PLC | 227,796 | 2,530,150 | |||
Experian PLC | 371,706 | 3,135,048 | |||
G4S PLC | 464,694 | 1,691,938 | |||
Serco Group PLC | 178,596 | 1,363,108 | |||
| 9,869,713 | |||||
| Security | Shares | Value | |||
DISTRIBUTION & WHOLESALE – 0.33% | |||||
Wolseley PLCa | 104,058 | $ | 2,457,413 | ||
| 2,457,413 | |||||
DIVERSIFIED FINANCIAL SERVICES – 1.30% | |||||
ICAP PLC | 190,650 | 1,334,548 | |||
Investec PLC | 154,488 | 1,092,241 | |||
London Stock Exchange Group PLC | 54,612 | 716,949 | |||
Man Group PLC | 618,198 | 2,710,280 | |||
Old Mutual PLC | 1,912,158 | 2,924,774 | |||
Schroders PLC | 45,018 | 793,133 | |||
| 9,571,925 | |||||
ELECTRIC – 2.48% | |||||
Drax Group PLC | 134,070 | 1,047,742 | |||
International Power PLC | 556,944 | 2,556,104 | |||
National Grid PLC | 886,830 | 8,563,732 | |||
Scottish & Southern Energy PLC | 335,790 | 6,123,957 | |||
| 18,291,535 | |||||
ENGINEERING & CONSTRUCTION – 0.33% | |||||
AMEC PLC | 122,016 | 1,499,417 | |||
Balfour Beatty PLC | 175,152 | 961,153 | |||
| 2,460,570 | |||||
ENTERTAINMENT – 0.09% | |||||
Ladbrokes PLC | 219,186 | 695,883 | |||
| 695,883 | |||||
FOOD – 5.54% | |||||
Cadbury PLC | 496,428 | 4,700,745 | |||
J Sainsbury PLC | 433,944 | 2,303,487 | |||
Tesco PLC | 2,884,350 | 17,670,734 | |||
Unilever PLC | 468,384 | 12,824,654 | |||
Wm Morrison Supermarkets PLC | 770,964 | 3,480,552 | |||
| 40,980,172 | |||||
FOOD SERVICE – 0.71% | |||||
Associated British Foods PLC | 130,872 | 1,707,428 | |||
Compass Group PLC | 670,104 | 3,564,730 | |||
| 5,272,158 | |||||
GAS – 1.04% | |||||
Centrica PLC | 1,864,434 | 7,654,371 | |||
| 7,654,371 | |||||
| 60 | 2009 iSHARES ANNUAL REPORTTO SHAREHOLDERS |
Table of Contents
Schedule of Investments (Continued)
iSHARES® MSCI UNITED KINGDOM INDEX FUND
August 31, 2009
| Security | Shares | Value | |||
HEALTH CARE - PRODUCTS – 0.37% | |||||
Smith & Nephew PLC | 323,982 | $ | 2,766,856 | ||
| 2,766,856 | |||||
HOLDING COMPANIES - DIVERSIFIED – 0.13% | |||||
Tomkins PLC | 322,752 | 938,948 | |||
| 938,948 | |||||
HOME BUILDERS – 0.09% | |||||
Berkeley Group Holdings PLC | 45,018 | 694,450 | |||
| 694,450 | |||||
HOUSEHOLD PRODUCTS & WARES – 1.39% | |||||
Reckitt Benckiser PLC | 221,154 | 10,283,262 | |||
| 10,283,262 | |||||
INSURANCE – 3.37% | |||||
Admiral Group PLC | 67,896 | 1,182,922 | |||
Aviva PLC | 999,990 | 6,620,181 | |||
Friends Provident Group PLC | 852,390 | 1,187,788 | |||
Legal & General Group PLC | 2,122,242 | 2,663,299 | |||
Prudential PLC | 921,270 | 8,062,979 | |||
RSA Insurance Group PLC | 1,221,390 | 2,599,752 | |||
Standard Life PLC | 809,832 | 2,596,173 | |||
| 24,913,094 | |||||
LEISURE TIME – 0.44% | |||||
Carnival PLC | 59,532 | 1,845,420 | |||
Thomas Cook Group PLC | 158,178 | 595,772 | |||
TUI Travel PLC | 205,164 | 803,172 | |||
| 3,244,364 | |||||
LODGING – 0.16% | |||||
InterContinental Hotels Group PLC | 94,218 | 1,175,475 | |||
| 1,175,475 | |||||
MANUFACTURING – 0.42% | |||||
Invensys PLC | 293,970 | 1,312,768 | |||
Smiths Group PLC | 139,728 | 1,826,384 | |||
| 3,139,152 | |||||
MEDIA – 2.21% | |||||
British Sky Broadcasting Group PLC | 413,526 | 3,679,847 | |||
Pearson PLC | 293,970 | 3,602,925 | |||
Reed Elsevier PLC | 440,094 | 3,206,175 | |||
Thomson Reuters PLC | 63,222 | 1,995,870 | |||
WPP PLC | 456,084 | 3,861,577 | |||
| 16,346,394 | |||||
| Security | Shares | Value | |||
MINING – 10.26% | |||||
Anglo American PLCa | 480,438 | $ | 15,824,791 | ||
Antofagasta PLC | 144,648 | 1,807,003 | |||
BHP Billiton PLC | 804,912 | 21,356,846 | |||
Eurasian Natural Resources Corp. | 94,464 | 1,331,732 | |||
Fresnillo PLC | 65,682 | 667,448 | |||
Kazakhmys PLC | 78,720 | 1,268,224 | |||
Lonmin PLCa | 56,580 | 1,347,248 | |||
Randgold Resources Ltd. | 29,767 | 1,757,186 | |||
Rio Tinto PLC | 500,118 | 19,672,253 | |||
Vedanta Resources PLC | 50,184 | 1,465,675 | |||
Xstrata PLC | 695,196 | 9,364,497 | |||
| 75,862,903 | |||||
OIL & GAS – 20.25% | |||||
BG Group PLC | 1,225,818 | 20,318,014 | |||
BP PLC | 6,836,094 | 59,272,599 | |||
Cairn Energy PLCa | 50,430 | 2,060,524 | |||
Royal Dutch Shell PLC Class A | 1,293,468 | 36,069,491 | |||
Royal Dutch Shell PLC Class B | 983,508 | 26,832,903 | |||
Tullow Oil PLC | 291,510 | 5,116,859 | |||
| 149,670,390 | |||||
OIL & GAS SERVICES – 0.15% | |||||
Petrofac Ltd. | 75,276 | 1,077,786 | |||
| 1,077,786 | |||||
PACKAGING & CONTAINERS – 0.19% | |||||
Rexam PLC | 321,365 | 1,401,060 | |||
| 1,401,060 | |||||
PHARMACEUTICALS – 8.79% | |||||
AstraZeneca PLC | 528,408 | 24,458,062 | |||
GlaxoSmithKline PLC | 1,893,216 | 37,119,328 | |||
Shire PLC | 203,196 | 3,387,857 | |||
| 64,965,247 | |||||
REAL ESTATE – 0.89% | |||||
British Land Co. PLC | 307,746 | 2,432,588 | |||
Land Securities Group PLC | 273,552 | 2,753,031 | |||
Liberty International PLCa | 166,050 | 1,418,092 | |||
| 6,603,711 | |||||
REAL ESTATE INVESTMENT TRUSTS – 0.44% | |||||
Hammerson PLC | 255,102 | 1,683,434 | |||
SEGRO PLC | 269,125 | 1,577,277 | |||
| 3,260,711 | |||||
| SCHEDULESOF INVESTMENTS | 61 |
Table of Contents
Schedule of Investments (Continued)
iSHARES® MSCI UNITED KINGDOM INDEX FUND
August 31, 2009
| Security | Shares | Value | |||
RETAIL – 1.52% | |||||
Carphone Warehouse Group PLC (The) | 151,290 | $ | 452,214 | ||
Home Retail Group PLC | 321,768 | 1,637,231 | |||
Kingfisher PLC | 855,588 | 2,952,024 | |||
Marks & Spencer Group PLC | 572,196 | 3,168,856 | |||
Next PLC | 72,324 | 1,933,128 | |||
Whitbread PLC | 63,960 | 1,091,414 | |||
| 11,234,867 | |||||
SOFTWARE – 0.46% | |||||
Autonomy Corp. PLCa | 78,474 | 1,663,939 | |||
Sage Group PLC (The) | 480,684 | 1,729,005 | |||
| 3,392,944 | |||||
TELECOMMUNICATIONS – 6.77% | |||||
BT Group PLC | 2,823,834 | 6,369,562 | |||
Cable & Wireless PLC | 930,864 | 2,251,409 | |||
Vodafone Group PLC | 19,149,378 | 41,446,423 | |||
| 50,067,394 | |||||
TRANSPORTATION – 0.15% | |||||
FirstGroup PLC | 176,628 | 1,092,172 | |||
| 1,092,172 | |||||
VENTURE CAPITAL – 0.24% | |||||
3i Group PLC | 353,502 | 1,748,577 | |||
| 1,748,577 | |||||
WATER – 0.43% | |||||
Severn Trent PLC | 86,592 | 1,381,640 | |||
United Utilities Group PLC | 245,508 | 1,811,784 | |||
| 3,193,424 | |||||
TOTAL COMMON STOCKS | |||||
(Cost: $915,956,645) | 733,237,265 | ||||
SHORT-TERM INVESTMENTS – 0.32% | |||||
MONEY MARKET FUNDS – 0.32% | |||||
Barclays Global Investors Funds | 2,057,582 | 2,057,582 | |||
Barclays Global Investors Funds | 290,254 | 290,254 | |||
| Security | Shares | Value | |||
Barclays Global Investors Funds | 29,714 | $ | 29,714 | ||
| 2,377,550 | |||||
TOTAL SHORT-TERM INVESTMENTS | |||||
(Cost: $2,377,550) | 2,377,550 | ||||
TOTAL INVESTMENTS IN SECURITIES – 99.53% | |||||
(Cost: $918,334,195) | 735,614,815 | ||||
Other Assets, Less Liabilities – 0.47% | 3,509,546 | ||||
NET ASSETS – 100.00% | $ | 739,124,361 | |||
| a | Non-income earning security. |
| b | Affiliated issuer. See Note 2. |
| c | The rate quoted is the annualized seven-day yield of the fund at period end. |
| d | All or a portion of this security represents an investment of securities lending collateral. See Note 5. |
See notes to financial statements.
| 62 | 2009 iSHARES ANNUAL REPORTTO SHAREHOLDERS |
Table of Contents
Statements of Assets and Liabilities
iSHARES®, INC.
August 31, 2009
| iShares MSCI | ||||||||||||||||
| Austria Investable Market Index Fund | Belgium Investable Market Index Fund | EMU Index Fund | France Index Fund | |||||||||||||
ASSETS | ||||||||||||||||
Investments, at cost: | ||||||||||||||||
Unaffiliated issuers | $ | 218,122,926 | $ | 94,765,307 | $ | 1,053,462,514 | $ | 269,506,931 | ||||||||
Affiliated issuers (Note 2) | 32,612,516 | 400,642 | 7,594,166 | 2,874,747 | ||||||||||||
Total cost of investments | $ | 250,735,442 | $ | 95,165,949 | $ | 1,061,056,680 | $ | 272,381,678 | ||||||||
Investments in securities, at fair value | ||||||||||||||||
(including securities on loana) (Note 1): | ||||||||||||||||
Unaffiliated issuers | $ | 158,411,281 | $ | 52,074,039 | $ | 738,755,007 | $ | 183,968,209 | ||||||||
Affiliated issuers (Note 2) | 32,612,516 | 400,642 | 7,594,166 | 2,874,747 | ||||||||||||
Total fair value of investments | 191,023,797 | 52,474,681 | 746,349,173 | 186,842,956 | ||||||||||||
Foreign currencies, at valueb | 177,336 | 48,556 | 562,787 | 76,883 | ||||||||||||
Receivables: | ||||||||||||||||
Investment securities sold | 4,386,428 | 931,342 | 2,024,826 | 334,093 | ||||||||||||
Due from custodian (Note 4) | 182,275 | – | – | 803,048 | ||||||||||||
Dividends and interest | 1,041,190 | 866,953 | 1,350,782 | 277,855 | ||||||||||||
Capital shares sold | 96,472 | – | – | – | ||||||||||||
Interest from affiliate (Note 2) | 20,682 | 10,806 | 98,796 | 14,058 | ||||||||||||
Total Assets | 196,928,180 | 54,332,338 | 750,386,364 | 188,348,893 | ||||||||||||
LIABILITIES | ||||||||||||||||
Payables: | ||||||||||||||||
Investment securities purchased | 4,757,011 | 928,378 | 1,745,268 | 918,306 | ||||||||||||
Collateral for securities on loan (Note 5) | 32,451,546 | 339,391 | 7,047,290 | 2,839,469 | ||||||||||||
Investment advisory fees (Note 2) | 53,696 | 22,322 | 323,916 | 79,726 | ||||||||||||
Total Liabilities | 37,262,253 | 1,290,091 | 9,116,474 | 3,837,501 | ||||||||||||
NET ASSETS | $ | 159,665,927 | $ | 53,042,247 | $ | 741,269,890 | $ | 184,511,392 | ||||||||
Net assets consist of: | ||||||||||||||||
Paid-in capital | $ | 280,076,052 | $ | 118,658,016 | $ | 1,171,792,947 | $ | 291,552,048 | ||||||||
Undistributed net investment income | 1,306,425 | 124,156 | 3,153,761 | 559,560 | ||||||||||||
Accumulated net realized loss | (61,958,169 | ) | (22,998,169 | ) | (118,992,008 | ) | (22,062,462 | ) | ||||||||
Net unrealized depreciation on investments and translation of assets and liabilities in foreign currencies | (59,758,381 | ) | (42,741,756 | ) | (314,684,810 | ) | (85,537,754 | ) | ||||||||
NET ASSETS | $ | 159,665,927 | $ | 53,042,247 | $ | 741,269,890 | $ | 184,511,392 | ||||||||
Shares outstandingc | 7,900,000 | 4,400,000 | 20,800,000 | 7,600,000 | ||||||||||||
Net asset value per share | $ | 20.21 | $ | 12.06 | $ | 35.64 | $ | 24.28 | ||||||||
| a | Securities on loan with values of $29,729,764, $260,362, $6,592,068 and $2,685,296, respectively. See Note 5. |
| b | Cost of foreign currencies: $176,938, $47,916, $558,607 and $76,310, respectively. |
| c | $0.001 par value, number of shares authorized: 100 million, 136.2 million, 1 billion and 340.2 million, respectively. |
See notes to financial statements.
| FINANCIAL STATEMENTS | 63 |
Table of Contents
Statements of Assets and Liabilities (Continued)
iSHARES®, INC.
August 31, 2009
| iShares MSCI | ||||||||||||||||
Germany Index Fund | Italy Index Fund | Netherlands Index Fund | Spain Index Fund | |||||||||||||
ASSETS | ||||||||||||||||
Investments, at cost: | ||||||||||||||||
Unaffiliated issuers | $ | 798,111,933 | $ | 169,927,543 | $ | 124,556,545 | $ | 356,679,725 | ||||||||
Affiliated issuers (Note 2) | 7,599,074 | 79,648 | 583,044 | 16,944,781 | ||||||||||||
Total cost of investments | $ | 805,711,007 | $ | 170,007,191 | $ | 125,139,589 | $ | 373,624,506 | ||||||||
Investments in securities, at fair value (including securities on loana) (Note 1): | ||||||||||||||||
Unaffiliated issuers | $ | 617,367,890 | $ | 125,517,518 | $ | 83,093,938 | $ | 278,285,441 | ||||||||
Affiliated issuers (Note 2) | 7,599,074 | 79,648 | 583,044 | 16,944,781 | ||||||||||||
Total fair value of investments | 624,966,964 | 125,597,166 | 83,676,982 | 295,230,222 | ||||||||||||
Foreign currencies, at valueb | 372,467 | 46,674 | 157,814 | 265,475 | ||||||||||||
Receivables: | ||||||||||||||||
Investment securities sold | 14,932,648 | 493,929 | 225,945 | 11,308,728 | ||||||||||||
Due from custodian (Note 4) | 3,078,377 | – | 4,049 | – | ||||||||||||
Dividends and interest | 1,687,847 | 12 | 30,763 | 82,293 | ||||||||||||
Capital shares sold | 147,612 | – | 17,445 | 12,137 | ||||||||||||
Interest from affiliate (Note 2) | 55,681 | 10,140 | 9,711 | 19,288 | ||||||||||||
Total Assets | 645,241,596 | 126,147,921 | 84,122,709 | 306,918,143 | ||||||||||||
LIABILITIES | ||||||||||||||||
Payables: | ||||||||||||||||
Investment securities purchased | 18,214,498 | 326,536 | 226,212 | 11,232,022 | ||||||||||||
Collateral for securities on loan (Note 5) | 7,148,428 | 49,894 | 508,408 | 16,836,151 | ||||||||||||
Investment advisory fees (Note 2) | 240,923 | 55,566 | 36,946 | 115,537 | ||||||||||||
Total Liabilities | 25,603,849 | 431,996 | 771,566 | 28,183,710 | ||||||||||||
NET ASSETS | $ | 619,637,747 | $ | 125,715,925 | $ | 83,351,143 | $ | 278,734,433 | ||||||||
Net assets consist of: | ||||||||||||||||
Paid-in capital | $ | 922,932,639 | $ | 202,323,901 | $ | 162,920,086 | $ | 384,460,490 | ||||||||
Undistributed net investment income | 487,996 | 481,431 | 431,321 | 3,516,332 | ||||||||||||
Accumulated net realized loss | (123,158,201 | ) | (32,679,577 | ) | (38,538,498 | ) | (30,847,290 | ) | ||||||||
Net unrealized depreciation on investments and translation of assets and liabilities in foreign currencies | (180,624,687 | ) | (44,409,830 | ) | (41,461,766 | ) | (78,395,099 | ) | ||||||||
NET ASSETS | $ | 619,637,747 | $ | 125,715,925 | $ | 83,351,143 | $ | 278,734,433 | ||||||||
Shares outstandingc | 29,700,000 | 6,600,000 | 4,500,000 | 5,850,000 | ||||||||||||
Net asset value per share | $ | 20.86 | $ | 19.05 | $ | 18.52 | $ | 47.65 | ||||||||
| a | Securities on loan with values of $6,711,454, $47,103, $462,257 and $16,024,325, respectively. See Note 5. |
| b | Cost of foreign currencies: $370,078, $46,210, $157,218 and $266,369, respectively. |
| c | $0.001 par value, number of shares authorized: 382.2 million, 63.6 million, 255 million and 127.8 million, respectively. |
See notes to financial statements.
| 64 | 2009 iSHARES ANNUAL REPORTTO SHAREHOLDERS |
Table of Contents
Statements of Assets and Liabilities (Continued)
iSHARES®, INC.
August 31, 2009
| iShares MSCI | ||||||||||||
Sweden Index Fund | Switzerland Index Fund | United Kingdom Index Fund | ||||||||||
ASSETS | ||||||||||||
Investments, at cost: | ||||||||||||
Unaffiliated issuers | $ | 250,556,582 | $ | 305,856,222 | $ | 885,855,482 | ||||||
Affiliated issuers (Note 2) | 5,029,224 | 730,226 | 32,478,713 | |||||||||
Total cost of investments | $ | 255,585,806 | $ | 306,586,448 | $ | 918,334,195 | ||||||
Investments in securities, at fair value (including securities on loana) (Note 1): | ||||||||||||
Unaffiliated issuers | $ | 189,992,498 | $ | 268,832,444 | $ | 708,291,227 | ||||||
Affiliated issuers (Note 2) | 5,029,224 | 730,226 | 27,323,588 | |||||||||
Total fair value of investments | 195,021,722 | 269,562,670 | 735,614,815 | |||||||||
Foreign currencies, at valueb | 27,593 | 240,930 | 946,695 | |||||||||
Receivables: | ||||||||||||
Investment securities sold | 1,751,549 | 4,127,975 | 3,038,062 | |||||||||
Due from custodian (Note 4) | 54,541 | – | – | |||||||||
Dividends and interest | 3,594 | 2,547,956 | 4,692,068 | |||||||||
Capital shares sold | 5,837 | 135,232 | – | |||||||||
Interest from affiliate (Note 2) | 15,539 | 13,079 | 52,366 | |||||||||
Total Assets | 196,880,375 | 276,627,842 | 744,344,006 | |||||||||
LIABILITIES | ||||||||||||
Payables: | ||||||||||||
Investment securities purchased | 1,460,958 | 3,955,061 | 2,538,863 | |||||||||
Collateral for securities on loan (Note 5) | 5,011,282 | 701,698 | 2,347,836 | |||||||||
Investment advisory fees (Note 2) | 75,404 | 116,143 | 332,946 | |||||||||
Total Liabilities | 6,547,644 | 4,772,902 | 5,219,645 | |||||||||
NET ASSETS | $ | 190,332,731 | $ | 271,854,940 | $ | 739,124,361 | ||||||
Net assets consist of: | ||||||||||||
Paid-in capital | $ | 278,969,760 | $ | 347,269,106 | $ | 1,040,854,353 | ||||||
Undistributed net investment income | 299,283 | 373,773 | 4,727,610 | |||||||||
Accumulated net realized loss | (28,374,619 | ) | (38,797,443 | ) | (123,660,365 | ) | ||||||
Net unrealized depreciation on investments and translation of assets and liabilities in foreign currencies | (60,561,693 | ) | (36,990,496 | ) | (182,797,237 | ) | ||||||
NET ASSETS | $ | 190,332,731 | $ | 271,854,940 | $ | 739,124,361 | ||||||
Shares outstandingc | 8,325,000 | 13,125,000 | 49,200,000 | |||||||||
Net asset value per share | $ | 22.86 | $ | 20.71 | $ | 15.02 | ||||||
| a | Securities on loan with values of $4,597,484, $652,914 and $2,222,580, respectively. See Note 5. |
| b | Cost of foreign currencies: $25,202, $234,789 and $963,929, respectively. |
| c | $0.001 par value, number of shares authorized: 63.6 million, 318.625 million and 934.2 million, respectively. |
See notes to financial statements.
| FINANCIAL STATEMENTS | 65 |
Table of Contents
Statements of Operations
iSHARES®, INC.
Year ended August 31, 2009
| iShares MSCI | ||||||||||||||||
| Austria Investable Market Index Fund | Belgium Investable Market Index Fund | EMU Index Fund | France Index Fund | |||||||||||||
NET INVESTMENT INCOME | ||||||||||||||||
Dividends from unaffiliated issuersa | $ | 3,259,994 | $ | 1,657,850 | $ | 25,015,284 | $ | 5,951,609 | ||||||||
Interest from affiliated issuers (Note 2) | 573 | 155 | 797 | 151 | ||||||||||||
Securities lending income from affiliated issuers (Note 2) | 345,958 | 37,058 | 456,059 | 93,885 | ||||||||||||
Interest from affiliate (Note 2) | 20,682 | 10,806 | 98,796 | 14,058 | ||||||||||||
Total investment income | 3,627,207 | 1,705,869 | 25,570,936 | 6,059,703 | ||||||||||||
EXPENSES | ||||||||||||||||
Investment advisory fees (Note 2) | 527,579 | 339,987 | 3,909,074 | 900,092 | ||||||||||||
Foreign taxes (Note 1) | – | – | 31,782 | – | ||||||||||||
Total expenses | 527,579 | 339,987 | 3,940,856 | 900,092 | ||||||||||||
Net investment income | 3,099,628 | 1,365,882 | 21,630,080 | 5,159,611 | ||||||||||||
NET REALIZED AND UNREALIZED GAIN (LOSS) | ||||||||||||||||
Net realized gain (loss) from: | ||||||||||||||||
Investments in unaffiliated issuers | (52,969,733 | ) | (40,263,781 | ) | (101,408,901 | ) | (13,415,473 | ) | ||||||||
In-kind redemptions | (34,975,618 | ) | (6,938,422 | ) | (129,289,646 | ) | (48,886,145 | ) | ||||||||
Foreign currency transactions | 87,338 | 13,921 | 42,006 | 49,674 | ||||||||||||
Net realized loss | (87,858,013 | ) | (47,188,282 | ) | (230,656,541 | ) | (62,251,944 | ) | ||||||||
Net change in unrealized appreciation (depreciation) on: | ||||||||||||||||
Investments | 5,510,516 | 7,892,557 | (85,589,634 | ) | (18,845,481 | ) | ||||||||||
Translation of assets and liabilities in foreign currencies | (107,697 | ) | (27,717 | ) | 126,262 | 5,508 | ||||||||||
Net change in unrealized appreciation (depreciation) | 5,402,819 | 7,864,840 | (85,463,372 | ) | (18,839,973 | ) | ||||||||||
Net realized and unrealized loss | (82,455,194 | ) | (39,323,442 | ) | (316,119,913 | ) | (81,091,917 | ) | ||||||||
NET DECREASE IN NET ASSETS RESULTING FROM OPERATIONS | $ | (79,355,566 | ) | $ | (37,957,560 | ) | $ | (294,489,833 | ) | $ | (75,932,306 | ) | ||||
| a | Net of foreign withholding tax of $438,279, $287,618, $4,011,291 and $824,389, respectively. |
See notes to financial statements.
| 66 | 2009 iSHARES ANNUAL REPORTTO SHAREHOLDERS |
Table of Contents
Statements of Operations (Continued)
iSHARES®, INC.
Year ended August 31, 2009
| iShares MSCI | ||||||||||||||||
Germany Index Fund | Italy Index Fund | Netherlands Investable Market Index Fund | Spain Index Fund | |||||||||||||
NET INVESTMENT INCOME | ||||||||||||||||
Dividends from unaffiliated issuersa | $ | 15,683,488 | $ | 3,514,985 | $ | 2,975,276 | $ | 10,825,880 | ||||||||
Interest from affiliated issuers (Note 2) | 506 | 127 | 171 | 564 | ||||||||||||
Securities lending income from affiliated issuers (Note 2) | 199,365 | 17,461 | 5,969 | 849,849 | ||||||||||||
Interest from affiliate (Note 2) | 55,681 | 10,140 | 9,711 | 19,288 | ||||||||||||
Total investment income | 15,939,040 | 3,542,713 | 2,991,127 | 11,695,581 | ||||||||||||
EXPENSES | ||||||||||||||||
Investment advisory fees (Note 2) | 2,369,432 | 570,682 | 594,140 | 1,236,278 | ||||||||||||
Foreign taxes (Note 1) | – | 39,931 | – | – | ||||||||||||
Total expenses | 2,369,432 | 610,613 | 594,140 | 1,236,278 | ||||||||||||
Net investment income | 13,569,608 | 2,932,100 | 2,396,987 | 10,459,303 | ||||||||||||
NET REALIZED AND UNREALIZED GAIN (LOSS) | ||||||||||||||||
Net realized gain (loss) from: | ||||||||||||||||
Investments in unaffiliated issuers | (74,719,406 | ) | (31,919,176 | ) | (29,173,650 | ) | (30,623,519 | ) | ||||||||
In-kind redemptions | (59,956,101 | ) | (39,723,243 | ) | (33,581,477 | ) | (45,320,752 | ) | ||||||||
Foreign currency transactions | (337,459 | ) | (79,413 | ) | (918 | ) | 225,187 | |||||||||
Net realized loss | (135,012,966 | ) | (71,721,832 | ) | (62,756,045 | ) | (75,719,084 | ) | ||||||||
Net change in unrealized appreciation (depreciation) on: | ||||||||||||||||
Investments | (22,461,468 | ) | 17,642,637 | (4,712,365 | ) | 22,767,180 | ||||||||||
Translation of assets and liabilities in foreign currencies | 317,957 | (5,670 | ) | 9,091 | 38,847 | |||||||||||
Net change in unrealized appreciation (depreciation) | (22,143,511 | ) | 17,636,967 | (4,703,274 | ) | 22,806,027 | ||||||||||
Net realized and unrealized loss | (157,156,477 | ) | (54,084,865 | ) | (67,459,319 | ) | (52,913,057 | ) | ||||||||
NET DECREASE IN NET ASSETS RESULTING FROM OPERATIONS | $ | (143,586,869 | ) | $ | (51,152,765 | ) | $ | (65,062,332 | ) | $ | (42,453,754 | ) | ||||
| a | Net of foreign withholding tax of $2,249,692, $643,001, $517,224 and $1,741,576, respectively. |
See notes to financial statements.
| FINANCIAL STATEMENTS | 67 |
Table of Contents
Statements of Operations (Continued)
iSHARES®, INC.
Year ended August 31, 2009
| iShares MSCI | ||||||||||||
Sweden Index Fund | Switzerland Index Fund | United Kingdom Index Fund | ||||||||||
NET INVESTMENT INCOME | ||||||||||||
Dividends from unaffiliated issuersa | $ | 3,830,993 | $ | 5,091,585 | $ | 25,243,084 | ||||||
Interest from affiliated issuers (Note 2) | 201 | 523 | 518 | |||||||||
Securities lending income from affiliated issuers (Note 2) | 90,142 | 18,262 | 31,262 | |||||||||
Interest from affiliate (Note 2) | 15,539 | 13,079 | 52,366 | |||||||||
Total investment income | 3,936,875 | 5,123,449 | 25,327,230 | |||||||||
EXPENSES | ||||||||||||
Investment advisory fees (Note 2) | 754,249 | 1,439,437 | 3,150,913 | |||||||||
Total expenses | 754,249 | 1,439,437 | 3,150,913 | |||||||||
Net investment income | 3,182,626 | 3,684,012 | 22,176,317 | |||||||||
NET REALIZED AND UNREALIZED GAIN (LOSS) | ||||||||||||
Net realized gain (loss) from: | ||||||||||||
Investments in unaffiliated issuers | (17,607,172 | ) | (42,571,031 | ) | (76,008,857 | ) | ||||||
Investments in affiliated issuers (Note 2) | – | – | (3,751,912 | ) | ||||||||
In-kind redemptions | (34,901,090 | ) | (23,533,072 | ) | (28,251,989 | ) | ||||||
Foreign currency transactions | 223,838 | (32,024 | ) | (739,538 | ) | |||||||
Net realized loss | (52,284,424 | ) | (66,136,127 | ) | (108,752,296 | ) | ||||||
Net change in unrealized appreciation (depreciation) on: | ||||||||||||
Investments | 18,455,887 | (2,843,480 | ) | (66,559,027 | ) | |||||||
Translation of assets and liabilities in foreign currencies | 9,013 | 146,933 | 209,004 | |||||||||
Net change in unrealized appreciation (depreciation) | 18,464,900 | (2,696,547 | ) | (66,350,023 | ) | |||||||
Net realized and unrealized loss | (33,819,524 | ) | (68,832,674 | ) | (175,102,319 | ) | ||||||
NET DECREASE IN NET ASSETS RESULTING FROM OPERATIONS | $ | (30,636,898 | ) | $ | (65,148,662 | ) | $ | (152,926,002 | ) | |||
| a | Net of foreign withholding tax of $676,057, $1,003,303 and $225,568, respectively. |
See notes to financial statements.
| 68 | 2009 iSHARES ANNUAL REPORTTO SHAREHOLDERS |
Table of Contents
Statements of Changes in Net Assets
iSHARES®, INC.
| iShares MSCI Austria Investable Market Index Fund | iShares MSCI Belgium Investable Market Index Fund | |||||||||||||||
| Year ended August 31, 2009 | Year ended August 31, 2008 | Year ended August 31, 2009 | Year ended August 31, 2008 | |||||||||||||
INCREASE (DECREASE) IN NET ASSETS | ||||||||||||||||
OPERATIONS: | ||||||||||||||||
Net investment income | $ | 3,099,628 | $ | 5,489,871 | $ | 1,365,882 | $ | 8,943,391 | ||||||||
Net realized gain (loss) | (87,858,013 | ) | 827,676 | (47,188,282 | ) | 10,301,055 | ||||||||||
Net change in unrealized appreciation (depreciation) | 5,402,819 | (72,261,407 | ) | 7,864,840 | (77,304,920 | ) | ||||||||||
Net decrease in net assets resulting from operations | (79,355,566 | ) | (65,943,860 | ) | (37,957,560 | ) | (58,060,474 | ) | ||||||||
DISTRIBUTIONS TO SHAREHOLDERS: | ||||||||||||||||
From net investment income | (4,361,827 | ) | (10,677,774 | ) | (1,992,257 | ) | (16,629,945 | ) | ||||||||
Total distributions to shareholders | (4,361,827 | ) | (10,677,774 | ) | (1,992,257 | ) | (16,629,945 | ) | ||||||||
CAPITAL SHARE TRANSACTIONS: | ||||||||||||||||
Proceeds from shares sold | 153,297,660 | 202,420,621 | 71,837,760 | 83,185,830 | ||||||||||||
Cost of shares redeemed | (103,516,511 | ) | (405,710,636 | ) | (98,800,329 | ) | (192,024,177 | ) | ||||||||
Net increase (decrease) in net assets from capital share transactions | 49,781,149 | (203,290,015 | ) | (26,962,569 | ) | (108,838,347 | ) | |||||||||
DECREASE IN NET ASSETS | (33,936,244 | ) | (279,911,649 | ) | (66,912,386 | ) | (183,528,766 | ) | ||||||||
NET ASSETS | ||||||||||||||||
Beginning of year | 193,602,171 | 473,513,820 | 119,954,633 | 303,483,399 | ||||||||||||
End of year | $ | 159,665,927 | $ | 193,602,171 | $ | 53,042,247 | $ | 119,954,633 | ||||||||
Undistributed net investment income included in net assets at end of year | $ | 1,306,425 | $ | 1,801,453 | $ | 124,156 | $ | 623,146 | ||||||||
SHARES ISSUED AND REDEEMED | ||||||||||||||||
Shares sold | 8,000,000 | 5,700,000 | 7,480,000 | 3,320,000 | ||||||||||||
Shares redeemed | (6,600,000 | ) | (11,900,000 | ) | (9,880,000 | ) | (8,240,000 | ) | ||||||||
Net increase (decrease) in shares outstanding | 1,400,000 | (6,200,000 | ) | (2,400,000 | ) | (4,920,000 | ) | |||||||||
See notes to financial statements.
| FINANCIAL STATEMENTS | 69 |
Table of Contents
Statements of Changes in Net Assets (Continued)
iSHARES®, INC.
| iShares MSCI EMU Index Fund | iShares MSCI France Index Fund | |||||||||||||||
| Year ended August 31, 2009 | Year ended August 31, 2008 | Year ended August 31, 2009 | Year ended August 31, 2008 | |||||||||||||
INCREASE (DECREASE) IN NET ASSETS | ||||||||||||||||
OPERATIONS: | ||||||||||||||||
Net investment income | $ | 21,630,080 | $ | 77,988,337 | $ | 5,159,611 | $ | 12,303,626 | ||||||||
Net realized gain (loss) | (230,656,541 | ) | 420,891,072 | (62,251,944 | ) | 20,272,014 | ||||||||||
Net change in unrealized appreciation (depreciation) | (85,463,372 | ) | (780,256,430 | ) | (18,839,973 | ) | (74,337,717 | ) | ||||||||
Net decrease in net assets resulting from operations | (294,489,833 | ) | (281,377,021 | ) | (75,932,306 | ) | (41,762,077 | ) | ||||||||
DISTRIBUTIONS TO SHAREHOLDERS: | ||||||||||||||||
From net investment income | (28,747,455 | ) | (132,228,318 | ) | (6,641,215 | ) | (15,471,999 | ) | ||||||||
Total distributions to shareholders | (28,747,455 | ) | (132,228,318 | ) | (6,641,215 | ) | (15,471,999 | ) | ||||||||
CAPITAL SHARE TRANSACTIONS: | ||||||||||||||||
Proceeds from shares sold | 245,678,933 | 935,523,497 | 138,974,524 | 392,494,736 | ||||||||||||
Cost of shares redeemed | (472,979,784 | ) | (2,201,675,459 | ) | (99,092,138 | ) | (553,753,893 | ) | ||||||||
Net increase (decrease) in net assets from capital share transactions | (227,300,851 | ) | (1,266,151,962 | ) | 39,882,386 | (161,259,157 | ) | |||||||||
DECREASE IN NET ASSETS | (550,538,139 | ) | (1,679,757,301 | ) | (42,691,135 | ) | (218,493,233 | ) | ||||||||
NET ASSETS | ||||||||||||||||
Beginning of year | 1,291,808,029 | 2,971,565,330 | 227,202,527 | 445,695,760 | ||||||||||||
End of year | $ | 741,269,890 | $ | 1,291,808,029 | $ | 184,511,392 | $ | 227,202,527 | ||||||||
Undistributed net investment income included in net assets at end of year | $ | 3,153,761 | $ | 10,227,903 | $ | 559,560 | $ | 1,991,490 | ||||||||
SHARES ISSUED AND REDEEMED | ||||||||||||||||
Shares sold | 8,100,000 | 17,500,000 | 5,600,000 | 10,800,000 | ||||||||||||
Shares redeemed | (15,400,000 | ) | (41,400,000 | ) | (5,400,000 | ) | (15,600,000 | ) | ||||||||
Net increase (decrease) in shares outstanding | (7,300,000 | ) | (23,900,000 | ) | 200,000 | (4,800,000 | ) | |||||||||
See notes to financial statements.
| 70 | 2009 iSHARES ANNUAL REPORTTO SHAREHOLDERS |
Table of Contents
Statements of Changes in Net Assets (Continued)
iSHARES®, INC.
| iShares MSCI Germany Index Fund | iShares MSCI Italy Index Fund | |||||||||||||||
| Year ended August 31, 2009 | Year ended August 31, 2008 | Year ended August 31, 2009 | Year ended August 31, 2008 | |||||||||||||
INCREASE (DECREASE) IN NET ASSETS | ||||||||||||||||
OPERATIONS: | ||||||||||||||||
Net investment income | $ | 13,569,608 | $ | 46,008,248 | $ | 2,932,100 | $ | 11,898,862 | ||||||||
Net realized gain (loss) | (135,012,966 | ) | 227,568,876 | (71,721,832 | ) | (6,321,261 | ) | |||||||||
Net change in unrealized appreciation (depreciation) | (22,143,511 | ) | (371,327,133 | ) | 17,636,967 | (51,884,781 | ) | |||||||||
Net decrease in net assets resulting from operations | (143,586,869 | ) | (97,750,009 | ) | (51,152,765 | ) | (46,307,180 | ) | ||||||||
DISTRIBUTIONS TO SHAREHOLDERS: | ||||||||||||||||
From net investment income | (14,693,409 | ) | (72,915,709 | ) | (3,732,985 | ) | (18,054,401 | ) | ||||||||
Total distributions to shareholders | (14,693,409 | ) | (72,915,709 | ) | (3,732,985 | ) | (18,054,401 | ) | ||||||||
CAPITAL SHARE TRANSACTIONS: | ||||||||||||||||
Proceeds from shares sold | 443,092,148 | 961,273,471 | 100,094,796 | 499,630,008 | ||||||||||||
Cost of shares redeemed | (334,626,102 | ) | (1,762,400,887 | ) | (163,647,572 | ) | (363,609,192 | ) | ||||||||
Net increase (decrease) in net assets from capital share transactions | 108,466,046 | (801,127,416 | ) | (63,552,776 | ) | 136,020,816 | ||||||||||
INCREASE (DECREASE) IN NET ASSETS | (49,814,232 | ) | (971,793,134 | ) | (118,438,526 | ) | 71,659,235 | |||||||||
NET ASSETS | ||||||||||||||||
Beginning of year | 669,451,979 | 1,641,245,113 | 244,154,451 | 172,495,216 | ||||||||||||
End of year | $ | 619,637,747 | $ | 669,451,979 | $ | 125,715,925 | $ | 244,154,451 | ||||||||
Undistributed net investment income included in net assets at end of year | $ | 487,996 | $ | 1,949,256 | $ | 481,431 | $ | 1,358,007 | ||||||||
SHARES ISSUED AND REDEEMED | ||||||||||||||||
Shares sold | 23,400,000 | 29,100,000 | 5,850,000 | 16,800,000 | ||||||||||||
Shares redeemed | (18,000,000 | ) | (55,800,000 | ) | (9,000,000 | ) | (12,150,000 | ) | ||||||||
Net increase (decrease) in shares outstanding | 5,400,000 | (26,700,000 | ) | (3,150,000 | ) | 4,650,000 | ||||||||||
See notes to financial statements.
| FINANCIAL STATEMENTS | 71 |
Table of Contents
Statements of Changes in Net Assets (Continued)
iSHARES®, INC.
| iShares MSCI Netherlands Investable Market Index Fund | iShares MSCI Spain Index Fund | |||||||||||||||
| Year ended August 31, 2009 | Year ended August 31, 2008 | Year ended August 31, 2009 | Year ended August 31, 2008 | |||||||||||||
INCREASE (DECREASE) IN NET ASSETS | ||||||||||||||||
OPERATIONS: | ||||||||||||||||
Net investment income | $ | 2,396,987 | $ | 9,878,532 | $ | 10,459,303 | $ | 19,885,704 | ||||||||
Net realized gain (loss) | (62,756,045 | ) | 13,136,127 | (75,719,084 | ) | 24,027,821 | ||||||||||
Net change in unrealized appreciation (depreciation) | (4,703,274 | ) | (54,521,906 | ) | 22,806,027 | (122,537,204 | ) | |||||||||
Net decrease in net assets resulting from operations | (65,062,332 | ) | (31,507,247 | ) | (42,453,754 | ) | (78,623,679 | ) | ||||||||
DISTRIBUTIONS TO SHAREHOLDERS: | ||||||||||||||||
From net investment income | (4,230,257 | ) | (15,733,536 | ) | (13,662,798 | ) | (24,006,924 | ) | ||||||||
Total distributions to shareholders | (4,230,257 | ) | (15,733,536 | ) | (13,662,798 | ) | (24,006,924 | ) | ||||||||
CAPITAL SHARE TRANSACTIONS: | ||||||||||||||||
Proceeds from shares sold | 43,167,203 | 108,417,983 | 168,127,511 | 1,073,349,945 | ||||||||||||
Cost of shares redeemed | (100,176,018 | ) | (102,878,515 | ) | (154,625,074 | ) | (1,171,926,810 | ) | ||||||||
Net increase (decrease) in net assets from capital share transactions | (57,008,815 | ) | 5,539,468 | 13,502,437 | (98,576,865 | ) | ||||||||||
DECREASE IN NET ASSETS | (126,301,404 | ) | (41,701,315 | ) | (42,614,115 | ) | (201,207,468 | ) | ||||||||
NET ASSETS | ||||||||||||||||
Beginning of year | 209,652,547 | 251,353,862 | 321,348,548 | 522,556,016 | ||||||||||||
End of year | $ | 83,351,143 | $ | 209,652,547 | $ | 278,734,433 | $ | 321,348,548 | ||||||||
Undistributed net investment income included in net assets at end of year | $ | 431,321 | $ | 2,265,509 | $ | 3,516,332 | $ | 6,489,523 | ||||||||
SHARES ISSUED AND REDEEMED | ||||||||||||||||
Shares sold | 2,350,000 | 3,550,000 | 4,200,000 | 17,250,000 | ||||||||||||
Shares redeemed | (6,450,000 | ) | (3,400,000 | ) | (4,725,000 | ) | (19,875,000 | ) | ||||||||
Net increase (decrease) in shares outstanding | (4,100,000 | ) | 150,000 | (525,000 | ) | (2,625,000 | ) | |||||||||
See notes to financial statements.
| 72 | 2009 iSHARES ANNUAL REPORTTO SHAREHOLDERS |
Table of Contents
Statements of Changes in Net Assets (Continued)
iSHARES®, INC.
| iShares MSCI Sweden Index Fund | iShares MSCI Switzerland Index Fund | |||||||||||||||
| Year ended August 31, 2009 | Year ended August 31, 2008 | Year ended August 31, 2009 | Year ended August 31, 2008 | |||||||||||||
INCREASE (DECREASE) IN NET ASSETS | ||||||||||||||||
OPERATIONS: | ||||||||||||||||
Net investment income | $ | 3,182,626 | $ | 10,430,468 | $ | 3,684,012 | $ | 7,419,424 | ||||||||
Net realized gain (loss) | (52,284,424 | ) | 5,147,723 | (66,136,127 | ) | 55,472,783 | ||||||||||
Net change in unrealized appreciation (depreciation) | 18,464,900 | (109,865,275 | ) | (2,696,547 | ) | (89,962,657 | ) | |||||||||
Net decrease in net assets resulting from operations | (30,636,898 | ) | (94,287,084 | ) | (65,148,662 | ) | (27,070,450 | ) | ||||||||
DISTRIBUTIONS TO SHAREHOLDERS: | ||||||||||||||||
From net investment income | (3,282,327 | ) | (24,097,389 | ) | (4,322,291 | ) | (10,490,319 | ) | ||||||||
Total distributions to shareholders | (3,282,327 | ) | (24,097,389 | ) | (4,322,291 | ) | (10,490,319 | ) | ||||||||
CAPITAL SHARE TRANSACTIONS: | ||||||||||||||||
Proceeds from shares sold | 119,540,017 | 281,026,512 | 105,041,546 | 294,689,801 | ||||||||||||
Cost of shares redeemed | (122,941,857 | ) | (508,014,443 | ) | (130,240,566 | ) | (209,602,175 | ) | ||||||||
Net increase (decrease) in net assets from capital share transactions | (3,401,840 | ) | (226,987,931 | ) | (25,199,020 | ) | 85,087,626 | |||||||||
INCREASE (DECREASE) IN NET ASSETS | (37,321,065 | ) | (345,372,404 | ) | (94,669,973 | ) | 47,526,857 | |||||||||
NET ASSETS | ||||||||||||||||
Beginning of year | 227,653,796 | 573,026,200 | 366,524,913 | 318,998,056 | ||||||||||||
End of year | $ | 190,332,731 | $ | 227,653,796 | $ | 271,854,940 | $ | 366,524,913 | ||||||||
Undistributed net investment income included in net assets at end of year | $ | 299,283 | $ | 175,146 | $ | 373,773 | $ | 1,044,066 | ||||||||
SHARES ISSUED AND REDEEMED | ||||||||||||||||
Shares sold | 6,675,000 | 9,300,000 | 5,125,000 | 11,750,000 | ||||||||||||
Shares redeemed | (7,650,000 | ) | (16,575,000 | ) | (7,875,000 | ) | (8,250,000 | ) | ||||||||
Net increase (decrease) in shares outstanding | (975,000 | ) | (7,275,000 | ) | (2,750,000 | ) | 3,500,000 | |||||||||
See notes to financial statements.
| FINANCIAL STATEMENTS | 73 |
Table of Contents
Statements of Changes in Net Assets (Continued)
iSHARES®, INC.
| iShares MSCI United Kingdom Index Fund | ||||||||
| Year ended August 31, 2009 | Year ended August 31, 2008 | |||||||
INCREASE (DECREASE) IN NET ASSETS | ||||||||
OPERATIONS: | ||||||||
Net investment income | $ | 22,176,317 | $ | 39,928,967 | ||||
Net realized gain (loss) | (108,752,296 | ) | 89,735,490 | |||||
Net change in unrealized appreciation (depreciation) | (66,350,023 | ) | (319,757,708 | ) | ||||
Net decrease in net assets resulting from operations | (152,926,002 | ) | (190,093,251 | ) | ||||
DISTRIBUTIONS TO SHAREHOLDERS: | ||||||||
From net investment income | (25,389,028 | ) | (63,131,140 | ) | ||||
Total distributions to shareholders | (25,389,028 | ) | (63,131,140 | ) | ||||
CAPITAL SHARE TRANSACTIONS: | ||||||||
Proceeds from shares sold | 148,897,281 | 463,470,489 | ||||||
Cost of shares redeemed | (113,959,957 | ) | (455,482,369 | ) | ||||
Net increase in net assets from capital share transactions | 34,937,324 | 7,988,120 | ||||||
DECREASE IN NET ASSETS | (143,377,706 | ) | (245,236,271 | ) | ||||
NET ASSETS | ||||||||
Beginning of year | 882,502,067 | 1,127,738,338 | ||||||
End of year | $ | 739,124,361 | $ | 882,502,067 | ||||
Undistributed net investment income included in net assets at end of year | $ | 4,727,610 | $ | 8,677,006 | ||||
SHARES ISSUED AND REDEEMED | ||||||||
Shares sold | 12,400,000 | 20,200,000 | ||||||
Shares redeemed | (8,800,000 | ) | (20,200,000 | ) | ||||
Net increase in shares outstanding | 3,600,000 | – | ||||||
See notes to financial statements.
| 74 | 2009 iSHARES ANNUAL REPORTTO SHAREHOLDERS |
Table of Contents
iSHARES®, INC.
(For a share outstanding throughout each period)
| iShares MSCI Austria Investable Market Index Fund | ||||||||||||||||||||
| Year ended Aug. 31, 2009 | Year ended Aug. 31, 2008 | Year ended Aug. 31, 2007 | Year ended Aug. 31, 2006 | Year ended Aug. 31, 2005 | ||||||||||||||||
Net asset value, beginning of year | $ | 29.78 | $ | 37.28 | $ | 31.08 | $ | 26.62 | $ | 17.04 | ||||||||||
Income from investment operations: | ||||||||||||||||||||
Net investment incomea | 0.51 | 0.56 | 0.51 | 0.44 | 0.29 | |||||||||||||||
Net realized and unrealized gain (loss)b | (9.36 | ) | (6.98 | ) | 6.42 | 4.31 | 9.38 | |||||||||||||
Total from investment operations | (8.85 | ) | (6.42 | ) | 6.93 | 4.75 | 9.67 | |||||||||||||
Less distributions from: | ||||||||||||||||||||
Net investment income | (0.72 | ) | (1.08 | ) | (0.73 | ) | (0.29 | ) | (0.09 | ) | ||||||||||
Total distributions | (0.72 | ) | (1.08 | ) | (0.73 | ) | (0.29 | ) | (0.09 | ) | ||||||||||
Net asset value, end of year | $ | 20.21 | $ | 29.78 | $ | 37.28 | $ | 31.08 | $ | 26.62 | ||||||||||
Total return | (28.52 | )% | (17.64 | )% | 22.35 | % | 18.00 | % | 56.82 | % | ||||||||||
Ratios/Supplemental data: | ||||||||||||||||||||
Net assets, end of year (000s) | $ | 159,666 | $ | 193,602 | $ | 473,514 | $ | 391,637 | $ | 196,952 | ||||||||||
Ratio of expenses to average net assets | 0.55 | % | 0.52 | % | 0.51 | % | 0.54 | % | 0.57 | % | ||||||||||
Ratio of net investment income to average net assets | 3.25 | % | 1.57 | % | 1.36 | % | 1.48 | % | 1.26 | % | ||||||||||
Portfolio turnover ratec | 26 | % | 26 | % | 21 | % | 32 | % | 21 | % | ||||||||||
| a | Based on average shares outstanding throughout each period. |
| b | The amounts reported may not accord with the change in aggregate gains and losses in securities due to the timing of capital share transactions. |
| c | Portfolio turnover rates exclude portfolio securities received or delivered as a result of processing capital share transactions in Creation Units. |
See notes to financial statements.
| FINANCIAL HIGHLIGHTS | 75 |
Table of Contents
Financial Highlights (Continued)
iSHARES®, INC.
(For a share outstanding throughout each period)
| iShares MSCI Belgium Investable Market Index Fund | ||||||||||||||||||||
| Year ended Aug. 31, 2009 | Year ended Aug. 31, 2008 | Year ended Aug. 31, 2007 | Year ended Aug. 31, 2006 | Year ended Aug. 31, 2005 | ||||||||||||||||
Net asset value, beginning of year | $ | 17.64 | $ | 25.89 | $ | 22.83 | $ | 18.94 | $ | 14.77 | ||||||||||
Income from investment operations: | ||||||||||||||||||||
Net investment incomea | 0.22 | 0.78 | 0.76 | 0.75 | 0.71 | |||||||||||||||
Net realized and unrealized gain (loss)b | (5.46 | ) | (7.27 | ) | 2.74 | 3.95 | 3.75 | |||||||||||||
Total from investment operations | (5.24 | ) | (6.49 | ) | 3.50 | 4.70 | 4.46 | |||||||||||||
Less distributions from: | ||||||||||||||||||||
Net investment income | (0.34 | ) | (1.76 | ) | (0.44 | ) | (0.81 | ) | (0.29 | ) | ||||||||||
Total distributions | (0.34 | ) | (1.76 | ) | (0.44 | ) | (0.81 | ) | (0.29 | ) | ||||||||||
Net asset value, end of year | $ | 12.06 | $ | 17.64 | $ | 25.89 | $ | 22.83 | $ | 18.94 | ||||||||||
Total return | (29.15 | )% | (26.21 | )% | 15.36 | % | 25.66 | % | 30.22 | % | ||||||||||
Ratios/Supplemental data: | ||||||||||||||||||||
Net assets, end of year (000s) | $ | 53,042 | $ | 119,955 | $ | 303,483 | $ | 152,484 | $ | 46,960 | ||||||||||
Ratio of expenses to average net assets | 0.56 | % | 0.52 | % | 0.51 | % | 0.54 | % | 0.57 | % | ||||||||||
Ratio of net investment income to average net assets | 2.23 | % | 3.32 | % | 2.90 | % | 3.60 | % | 3.89 | % | ||||||||||
Portfolio turnover ratec | 33 | % | 31 | % | 12 | % | 10 | % | 10 | % | ||||||||||
| a | Based on average shares outstanding throughout each period. |
| b | The amounts reported may not accord with the change in aggregate gains and losses in securities due to the timing of capital share transactions. |
| c | Portfolio turnover rates exclude portfolio securities received or delivered as a result of processing capital share transactions in Creation Units. |
See notes to financial statements.
| 76 | 2009 iSHARES ANNUAL REPORTTO SHAREHOLDERS |
Table of Contents
Financial Highlights (Continued)
iSHARES®, INC.
(For a share outstanding throughout each period)
| iShares MSCI EMU Index Fund | ||||||||||||||||||||
| Year ended Aug. 31, 2009 | Year ended Aug. 31, 2008a | Year ended Aug. 31, 2007a | Year ended Aug. 31, 2006a | Year ended Aug. 31, 2005a | ||||||||||||||||
Net asset value, beginning of year | $ | 45.97 | $ | 57.15 | $ | 46.14 | $ | 37.49 | $ | 29.69 | ||||||||||
Income from investment operations: | ||||||||||||||||||||
Net investment incomeb | 0.93 | 1.71 | 1.40 | 1.37 | 0.88 | |||||||||||||||
Net realized and unrealized gain (loss)c | (9.97 | ) | (9.59 | ) | 10.54 | 7.94 | 7.57 | |||||||||||||
Total from investment operations | (9.04 | ) | (7.88 | ) | 11.94 | 9.31 | 8.45 | |||||||||||||
Less distributions from: | ||||||||||||||||||||
Net investment income | (1.29 | ) | (3.30 | ) | (0.93 | ) | (0.66 | ) | (0.65 | ) | ||||||||||
Total distributions | (1.29 | ) | (3.30 | ) | (0.93 | ) | (0.66 | ) | (0.65 | ) | ||||||||||
Net asset value, end of year | $ | 35.64 | $ | 45.97 | $ | 57.15 | $ | 46.14 | $ | 37.49 | ||||||||||
Total return | (19.05 | )% | (14.52 | )% | 26.10 | % | 25.18 | % | 28.54 | % | ||||||||||
Ratios/Supplemental data: | ||||||||||||||||||||
Net assets, end of year (000s) | $ | 741,270 | $ | 1,291,808 | $ | 2,971,565 | $ | 1,794,921 | $ | 547,284 | ||||||||||
Ratio of expenses to average net assets | 0.56 | % | 0.52 | % | 0.51 | % | 0.54 | % | 0.58 | % | ||||||||||
Ratio of expenses to average net assets exclusive of foreign taxes | 0.56 | % | n/a | n/a | n/a | 0.57 | % | |||||||||||||
Ratio of net investment income to average net assets | 3.07 | % | 3.06 | % | 2.60 | % | 3.23 | % | 2.50 | % | ||||||||||
Portfolio turnover rated | 8 | % | 27 | % | 5 | % | 8 | % | 8 | % | ||||||||||
| a | Per share amounts were adjusted to reflect a two-for-one stock split effective July 24, 2008. |
| b | Based on average shares outstanding throughout each period. |
| c | The amounts reported may not accord with the change in aggregate gains and losses in securities due to the timing of capital share transactions. |
| d | Portfolio turnover rates exclude portfolio securities received or delivered as a result of processing capital share transactions in Creation Units. |
See notes to financial statements.
| FINANCIAL HIGHLIGHTS | 77 |
Table of Contents
Financial Highlights (Continued)
iSHARES®, INC.
(For a share outstanding throughout each period)
| iShares MSCI France Index Fund | ||||||||||||||||||||
| Year ended Aug. 31, 2009 | Year ended Aug. 31, 2008 | Year ended Aug. 31, 2007 | Year ended Aug. 31, 2006 | Year ended Aug. 31, 2005 | ||||||||||||||||
Net asset value, beginning of year | $ | 30.70 | $ | 36.53 | $ | 31.16 | $ | 25.41 | $ | 20.40 | ||||||||||
Income from investment operations: | ||||||||||||||||||||
Net investment incomea | 0.66 | 0.93 | 0.77 | 0.55 | 0.47 | |||||||||||||||
Net realized and unrealized gain (loss)b | (6.13 | ) | (5.17 | ) | 5.06 | 5.52 | 4.84 | |||||||||||||
Total from investment operations | (5.47 | ) | (4.24 | ) | 5.83 | 6.07 | 5.31 | |||||||||||||
Less distributions from: | ||||||||||||||||||||
Net investment income | (0.95 | ) | (1.59 | ) | (0.46 | ) | (0.32 | ) | (0.30 | ) | ||||||||||
Total distributions | (0.95 | ) | (1.59 | ) | (0.46 | ) | (0.32 | ) | (0.30 | ) | ||||||||||
Net asset value, end of year | $ | 24.28 | $ | 30.70 | $ | 36.53 | $ | 31.16 | $ | 25.41 | ||||||||||
Total return | (17.11 | )% | (11.96 | )% | 18.83 | % | 24.13 | % | 26.13 | % | ||||||||||
Ratios/Supplemental data: | ||||||||||||||||||||
Net assets, end of year (000s) | $ | 184,511 | $ | 227,203 | $ | 445,696 | $ | 211,886 | $ | 81,326 | ||||||||||
Ratio of expenses to average net assets | 0.55 | % | 0.52 | % | 0.51 | % | 0.54 | % | 0.57 | % | ||||||||||
Ratio of net investment income to average net assets | 3.18 | % | 2.60 | % | 2.17 | % | 1.95 | % | 1.98 | % | ||||||||||
Portfolio turnover ratec | 6 | % | 10 | % | 6 | % | 10 | % | 7 | % | ||||||||||
| a | Based on average shares outstanding throughout each period. |
| b | The amounts reported may not accord with the change in aggregate gains and losses in securities due to the timing of capital share transactions. |
| c | Portfolio turnover rates exclude portfolio securities received or delivered as a result of processing capital share transactions in Creation Units. |
See notes to financial statements.
| 78 | 2009 iSHARES ANNUAL REPORTTO SHAREHOLDERS |
Table of Contents
Financial Highlights (Continued)
iSHARES®, INC.
(For a share outstanding throughout each period)
| iShares MSCI Germany Index Fund | ||||||||||||||||||||
| Year ended Aug. 31, 2009 | Year ended Aug. 31, 2008 | Year ended Aug. 31, 2007 | Year ended Aug. 31, 2006 | Year ended Aug. 31, 2005 | ||||||||||||||||
Net asset value, beginning of year | $ | 27.55 | $ | 32.18 | $ | 23.68 | $ | 19.08 | $ | 14.96 | ||||||||||
Income from investment operations: | ||||||||||||||||||||
Net investment incomea | 0.58 | 0.88 | 0.68 | 0.57 | 0.28 | |||||||||||||||
Net realized and unrealized gain (loss)b | (6.65 | ) | (3.84 | ) | 8.33 | 4.15 | 4.03 | |||||||||||||
Total from investment operations | (6.07 | ) | (2.96 | ) | 9.01 | 4.72 | 4.31 | |||||||||||||
Less distributions from: | ||||||||||||||||||||
Net investment income | (0.62 | ) | (1.67 | ) | (0.51 | ) | (0.12 | ) | (0.19 | ) | ||||||||||
Total distributions | (0.62 | ) | (1.67 | ) | (0.51 | ) | (0.12 | ) | (0.19 | ) | ||||||||||
Net asset value, end of year | $ | 20.86 | $ | 27.55 | $ | 32.18 | $ | 23.68 | $ | 19.08 | ||||||||||
Total return | (21.62 | )% | (9.81 | )% | 38.47 | % | 24.82 | % | 28.89 | % | ||||||||||
Ratios/Supplemental data: | ||||||||||||||||||||
Net assets, end of year (000s) | $ | 619,638 | $ | 669,452 | $ | 1,641,245 | $ | 802,795 | $ | 314,793 | ||||||||||
Ratio of expenses to average net assets | 0.55 | % | 0.52 | % | 0.51 | % | 0.54 | % | 0.57 | % | ||||||||||
Ratio of net investment income to average net assets | 3.18 | % | 2.72 | % | 2.32 | % | 2.62 | % | 1.54 | % | ||||||||||
Portfolio turnover ratec | 15 | % | 11 | % | 4 | % | 12 | % | 9 | % | ||||||||||
| a | Based on average shares outstanding throughout each period. |
| b | The amounts reported may not accord with the change in aggregate gains and losses in securities due to the timing of capital share transactions. |
| c | Portfolio turnover rates exclude portfolio securities received or delivered as a result of processing capital share transactions in Creation Units. |
See notes to financial statements.
| FINANCIAL HIGHLIGHTS | 79 |
Table of Contents
Financial Highlights (Continued)
iSHARES®, INC.
(For a share outstanding throughout each period)
| iShares MSCI Italy Index Fund | ||||||||||||||||||||
| Year ended Aug. 31, 2009 | Year ended Aug. 31, 2008 | Year ended Aug. 31, 2007 | Year ended Aug. 31, 2006 | Year ended Aug. 31, 2005 | ||||||||||||||||
Net asset value, beginning of year | $ | 25.04 | $ | 33.82 | $ | 30.48 | $ | 25.77 | $ | 20.21 | ||||||||||
Income from investment operations: | ||||||||||||||||||||
Net investment incomea | 0.47 | 1.53 | 1.35 | 1.07 | 0.78 | |||||||||||||||
Net realized and unrealized gain (loss)b | (5.82 | ) | (7.71 | ) | 2.66 | 4.15 | 5.42 | |||||||||||||
Total from investment operations | (5.35 | ) | (6.18 | ) | 4.01 | 5.22 | 6.20 | |||||||||||||
Less distributions from: | ||||||||||||||||||||
Net investment income | (0.64 | ) | (2.60 | ) | (0.67 | ) | (0.51 | ) | (0.64 | ) | ||||||||||
Total distributions | (0.64 | ) | (2.60 | ) | (0.67 | ) | (0.51 | ) | (0.64 | ) | ||||||||||
Net asset value, end of year | $ | 19.05 | $ | 25.04 | $ | 33.82 | $ | 30.48 | $ | 25.77 | ||||||||||
Total return | (20.78 | )% | (19.43 | )% | 13.20 | % | 20.61 | % | 30.74 | % | ||||||||||
Ratios/Supplemental data: | ||||||||||||||||||||
Net assets, end of year (000s) | $ | 125,716 | $ | 244,154 | $ | 172,495 | $ | 146,324 | $ | 42,526 | ||||||||||
Ratio of expenses to average net assets | 0.59 | % | 0.52 | % | 0.52 | % | 0.54 | % | 0.57 | % | ||||||||||
Ratio of expenses to average net assets exclusive of foreign taxes | 0.55 | % | n/a | n/a | n/a | n/a | ||||||||||||||
Ratio of net investment income to average net assets | 2.85 | % | 5.06 | % | 4.02 | % | 3.87 | % | 3.18 | % | ||||||||||
Portfolio turnover ratec | 18 | % | 29 | % | 16 | % | 15 | % | 18 | % | ||||||||||
| a | Based on average shares outstanding throughout each period. |
| b | The amounts reported may not accord with the change in aggregate gains and losses in securities due to the timing of capital share transactions. |
| c | Portfolio turnover rates exclude portfolio securities received or delivered as a result of processing capital share transactions in Creation Units. |
See notes to financial statements.
| 80 | 2009 iSHARES ANNUAL REPORTTO SHAREHOLDERS |
Table of Contents
Financial Highlights (Continued)
iSHARES®, INC.
(For a share outstanding throughout each period)
| iShares MSCI Netherlands Investable Market Index Fund | ||||||||||||||||||||
| Year ended Aug. 31, 2009 | Year ended Aug. 31, 2008 | Year ended Aug. 31, 2007 | Year ended Aug. 31, 2006 | Year ended Aug. 31, 2005 | ||||||||||||||||
Net asset value, beginning of year | $ | 24.38 | $ | 29.75 | $ | 24.17 | $ | 19.10 | $ | 15.70 | ||||||||||
Income from investment operations: | ||||||||||||||||||||
Net investment incomea | 0.35 | 1.10 | 0.98 | 0.60 | 0.57 | |||||||||||||||
Net realized and unrealized gain (loss)b | (5.55 | ) | (4.68 | ) | 5.05 | 4.95 | 3.09 | |||||||||||||
Total from investment operations | (5.20 | ) | (3.58 | ) | 6.03 | 5.55 | 3.66 | |||||||||||||
Less distributions from: | ||||||||||||||||||||
Net investment income | (0.66 | ) | (1.79 | ) | (0.45 | ) | (0.48 | ) | (0.26 | ) | ||||||||||
Total distributions | (0.66 | ) | (1.79 | ) | (0.45 | ) | (0.48 | ) | (0.26 | ) | ||||||||||
Net asset value, end of year | $ | 18.52 | $ | 24.38 | $ | 29.75 | $ | 24.17 | $ | 19.10 | ||||||||||
Total return | (20.59 | )% | (12.67 | )% | 25.22 | % | 29.53 | % | 23.40 | % | ||||||||||
Ratios/Supplemental data: | ||||||||||||||||||||
Net assets, end of year (000s) | $ | 83,351 | $ | 209,653 | $ | 251,354 | $ | 109,991 | $ | 63,974 | ||||||||||
Ratio of expenses to average net assets | 0.55 | % | 0.52 | % | 0.51 | % | 0.54 | % | 0.57 | % | ||||||||||
Ratio of net investment income to average net assets | 2.24 | % | 3.86 | % | 3.50 | % | 2.78 | % | 3.13 | % | ||||||||||
Portfolio turnover ratec | 15 | % | 26 | % | 8 | % | 17 | % | 6 | % | ||||||||||
| a | Based on average shares outstanding throughout each period. |
| b | The amounts reported may not accord with the change in aggregate gains and losses in securities due to the timing of capital share transactions. |
| c | Portfolio turnover rates exclude portfolio securities received or delivered as a result of processing capital share transactions in Creation Units. |
See notes to financial statements.
| FINANCIAL HIGHLIGHTS | 81 |
Table of Contents
Financial Highlights (Continued)
iSHARES®, INC.
(For a share outstanding throughout each period)
| iShares MSCI Spain Index Fund | ||||||||||||||||||||
| Year ended Aug. 31, 2009 | Year ended Aug. 31, 2008 | Year ended Aug. 31, 2007 | Year ended Aug. 31, 2006 | Year ended Aug. 31, 2005 | ||||||||||||||||
Net asset value, beginning of year | $ | 50.41 | $ | 58.06 | $ | 44.81 | $ | 35.70 | $ | 27.55 | ||||||||||
Income from investment operations: | ||||||||||||||||||||
Net investment incomea | 1.75 | 1.98 | 1.30 | 1.07 | 0.79 | |||||||||||||||
Net realized and unrealized gain (loss)b | (2.14 | ) | (7.33 | ) | 12.33 | 8.78 | 7.97 | |||||||||||||
Total from investment operations | (0.39 | ) | (5.35 | ) | 13.63 | 9.85 | 8.76 | |||||||||||||
Less distributions from: | ||||||||||||||||||||
Net investment income | (2.37 | ) | (2.30 | ) | (0.38 | ) | (0.74 | ) | (0.61 | ) | ||||||||||
Total distributions | (2.37 | ) | (2.30 | ) | (0.38 | ) | (0.74 | ) | (0.61 | ) | ||||||||||
Net asset value, end of year | $ | 47.65 | $ | 50.41 | $ | 58.06 | $ | 44.81 | $ | 35.70 | ||||||||||
Total return | 0.64 | % | (9.76 | )% | 30.47 | % | 28.09 | % | 31.85 | % | ||||||||||
Ratios/Supplemental data: | ||||||||||||||||||||
Net assets, end of year (000s) | $ | 278,734 | $ | 321,349 | $ | 522,556 | $ | 178,130 | $ | 66,945 | ||||||||||
Ratio of expenses to average net assets | 0.56 | % | 0.52 | % | 0.51 | % | 0.54 | % | 0.57 | % | ||||||||||
Ratio of net investment income to average net assets | 4.70 | % | 3.28 | % | 2.36 | % | 2.67 | % | 2.33 | % | ||||||||||
Portfolio turnover ratec | 19 | % | 22 | % | 12 | % | 6 | % | 8 | % | ||||||||||
| a | Based on average shares outstanding throughout each period. |
| b | The amounts reported may not accord with the change in aggregate gains and losses in securities due to the timing of capital share transactions. |
| c | Portfolio turnover rates exclude portfolio securities received or delivered as a result of processing capital share transactions in Creation Units. |
See notes to financial statements.
| 82 | 2009 iSHARES ANNUAL REPORTTO SHAREHOLDERS |
Table of Contents
Financial Highlights (Continued)
iSHARES®, INC.
(For a share outstanding throughout each period)
| iShares MSCI Sweden Index Fund | ||||||||||||||||||||
| Year ended Aug. 31, 2009 | Year ended Aug. 31, 2008 | Year ended Aug. 31, 2007 | Year ended Aug. 31, 2006 | Year ended Aug. 31, 2005 | ||||||||||||||||
Net asset value, beginning of year | $ | 24.48 | $ | 34.57 | $ | 25.88 | $ | 21.58 | $ | 16.82 | ||||||||||
Income from investment operations: | ||||||||||||||||||||
Net investment incomea | 0.40 | 0.91 | 1.15 | 0.76 | 0.46 | |||||||||||||||
Net realized and unrealized gain (loss)b | (1.56 | ) | (8.63 | ) | 7.88 | 3.96 | 4.45 | |||||||||||||
Total from investment operations | (1.16 | ) | (7.72 | ) | 9.03 | 4.72 | 4.91 | |||||||||||||
Less distributions from: | ||||||||||||||||||||
Net investment income | (0.46 | ) | (2.37 | ) | (0.34 | ) | (0.42 | ) | (0.15 | ) | ||||||||||
Total distributions | (0.46 | ) | (2.37 | ) | (0.34 | ) | (0.42 | ) | (0.15 | ) | ||||||||||
Net asset value, end of year | $ | 22.86 | $ | 24.48 | $ | 34.57 | $ | 25.88 | $ | 21.58 | ||||||||||
Total return | (4.04 | )% | (23.16 | )% | 35.01 | % | 22.16 | % | 29.21 | % | ||||||||||
Ratios/Supplemental data: | ||||||||||||||||||||
Net assets, end of year (000s) | $ | 190,333 | $ | 227,654 | $ | 573,026 | $ | 151,427 | $ | 61,513 | ||||||||||
Ratio of expenses to average net assets | 0.55 | % | 0.51 | % | 0.51 | % | 0.54 | % | 0.58 | % | ||||||||||
Ratio of expenses to average net assets exclusive of foreign taxes | n/a | n/a | n/a | n/a | 0.57 | % | ||||||||||||||
Ratio of net investment income to average net assets | 2.34 | % | 2.91 | % | 3.42 | % | 3.13 | % | 2.28 | % | ||||||||||
Portfolio turnover ratec | 9 | % | 17 | % | 7 | % | 14 | % | 6 | % | ||||||||||
| a | Based on average shares outstanding throughout each period. |
| b | The amounts reported may not accord with the change in aggregate gains and losses in securities due to the timing of capital share transactions. |
| c | Portfolio turnover rates exclude portfolio securities received or delivered as a result of processing capital share transactions in Creation Units. |
See notes to financial statements.
| FINANCIAL HIGHLIGHTS | 83 |
Table of Contents
Financial Highlights (Continued)
iSHARES®, INC.
(For a share outstanding throughout each period)
| iShares MSCI Switzerland Index Fund | ||||||||||||||||||||
| Year ended Aug. 31, 2009 | Year ended Aug. 31, 2008 | Year ended Aug. 31, 2007 | Year ended Aug. 31, 2006 | Year ended Aug. 31, 2005 | ||||||||||||||||
Net asset value, beginning of year | $ | 23.09 | $ | 25.78 | $ | 22.49 | $ | 17.63 | $ | 14.58 | ||||||||||
Income from investment operations: | ||||||||||||||||||||
Net investment incomea | 0.25 | 0.49 | 0.36 | 0.27 | 0.22 | |||||||||||||||
Net realized and unrealized gain (loss)b | (2.30 | ) | (2.51 | ) | 3.12 | 4.71 | 2.92 | |||||||||||||
Total from investment operations | (2.05 | ) | (2.02 | ) | 3.48 | 4.98 | 3.14 | |||||||||||||
Less distributions from: | ||||||||||||||||||||
Net investment income | (0.33 | ) | (0.67 | ) | (0.19 | ) | (0.12 | ) | (0.09 | ) | ||||||||||
Total distributions | (0.33 | ) | (0.67 | ) | (0.19 | ) | (0.12 | ) | (0.09 | ) | ||||||||||
Net asset value, end of year | $ | 20.71 | $ | 23.09 | $ | 25.78 | $ | 22.49 | $ | 17.63 | ||||||||||
Total return | (8.63 | )% | (7.97 | )% | 15.53 | % | 28.36 | % | 21.54 | % | ||||||||||
Ratios/Supplemental data: | ||||||||||||||||||||
Net assets, end of year (000s) | $ | 271,855 | $ | 366,525 | $ | 318,998 | $ | 188,319 | $ | 79,324 | ||||||||||
Ratio of expenses to average net assets | 0.56 | % | 0.52 | % | 0.51 | % | 0.54 | % | 0.57 | % | ||||||||||
Ratio of net investment income to average net assets | 1.42 | % | 1.93 | % | 1.42 | % | 1.34 | % | 1.34 | % | ||||||||||
Portfolio turnover ratec | 16 | % | 11 | % | 5 | % | 11 | % | 5 | % | ||||||||||
| a | Based on average shares outstanding throughout each period. |
| b | The amounts reported may not accord with the change in aggregate gains and losses in securities due to the timing of capital share transactions. |
| c | Portfolio turnover rates exclude portfolio securities received or delivered as a result of processing capital share transactions in Creation Units. |
See notes to financial statements.
| 84 | 2009 iSHARES ANNUAL REPORTTO SHAREHOLDERS |
Table of Contents
Financial Highlights (Continued)
iSHARES®, INC.
(For a share outstanding throughout each period)
| iShares MSCI United Kingdom Index Fund | ||||||||||||||||||||
| Year ended Aug. 31, 2009 | Year ended Aug. 31, 2008 | Year ended Aug. 31, 2007 | Year ended Aug. 31, 2006 | Year ended Aug. 31, 2005 | ||||||||||||||||
Net asset value, beginning of year | $ | 19.35 | $ | 24.73 | $ | 21.92 | $ | 18.74 | $ | 15.72 | ||||||||||
Income from investment operations: | ||||||||||||||||||||
Net investment incomea | 0.50 | 0.83 | 0.84 | 0.97 | 0.60 | |||||||||||||||
Net realized and unrealized gain (loss)b | (4.26 | ) | (4.89 | ) | 2.78 | 2.79 | 2.76 | |||||||||||||
Total from investment operations | (3.76 | ) | (4.06 | ) | 3.62 | 3.76 | 3.36 | |||||||||||||
Less distributions from: | ||||||||||||||||||||
Net investment income | (0.57 | ) | (1.32 | ) | (0.81 | ) | (0.58 | ) | (0.34 | ) | ||||||||||
Total distributions | (0.57 | ) | (1.32 | ) | (0.81 | ) | (0.58 | ) | (0.34 | ) | ||||||||||
Net asset value, end of year | $ | 15.02 | $ | 19.35 | $ | 24.73 | $ | 21.92 | $ | 18.74 | ||||||||||
Total return | (18.68 | )% | (17.16 | )% | 16.77 | % | 20.61 | % | 21.53 | % | ||||||||||
Ratios/Supplemental data: | ||||||||||||||||||||
Net assets, end of year (000s) | $ | 739,124 | $ | 882,502 | $ | 1,127,738 | $ | 872,409 | $ | 464,850 | ||||||||||
Ratio of expenses to average net assets | 0.55 | % | 0.52 | % | 0.51 | % | 0.54 | % | 0.57 | % | ||||||||||
Ratio of net investment income to average net assets | 3.90 | % | 3.64 | % | 3.51 | % | 4.81 | % | 3.39 | % | ||||||||||
Portfolio turnover ratec | 11 | % | 14 | % | 8 | % | 10 | % | 11 | % | ||||||||||
| a | Based on average shares outstanding throughout each period. |
| b | The amounts reported may not accord with the change in aggregate gains and losses in securities due to the timing of capital share transactions. |
| c | Portfolio turnover rates exclude portfolio securities received or delivered as a result of processing capital share transactions in Creation Units. |
See notes to financial statements.
| FINANCIAL HIGHLIGHTS | 85 |
Table of Contents
iSHARES®, INC.
iShares, Inc. (the “Company”) is registered under the Investment Company Act of 1940, as amended (the “1940 Act”), as an open-end management investment company. The Company was incorporated under the laws of the State of Maryland on September 1, 1994 pursuant to amended and restated Articles of Incorporation.
These financial statements relate only to the iShares MSCI Austria Investable Market, iShares MSCI Belgium Investable Market, iShares MSCI EMU, iShares MSCI France, iShares MSCI Germany, iShares MSCI Italy, iShares MSCI Netherlands Investable Market, iShares MSCI Spain, iShares MSCI Sweden, iShares MSCI Switzerland and iShares MSCI United Kingdom Index Funds (each, a “Fund,” collectively, the “Funds”).
The investment objective of each Fund is to seek investment results that correspond generally to the price and yield performance, before fees and expenses, of publicly traded equity securities in the aggregate in a particular market, as measured by that market’s equity securities index compiled by MSCI Inc. (“MSCI”). The investment adviser uses a “passive” or index approach to achieve each Fund’s investment objective. Each of the Funds is classified as a non-diversified fund under the 1940 Act. Non-diversified funds generally hold securities of fewer companies than diversified funds and may be more susceptible to the risks associated with these particular companies, or to a single economic, political or regulatory occurrence affecting these companies.
Each Fund invests in the securities of foreign issuers, which may involve certain considerations and risks not typically associated with securities of U.S. issuers. Such risks include, but are not limited to: generally less liquid and less efficient securities markets; generally greater price volatility; exchange rate fluctuations and exchange controls; imposition of restrictions on the expatriation of funds or other assets of the Fund; less publicly available information about issuers; the imposition of withholding or other taxes; higher transaction and custody costs; settlement delays and risk of loss attendant in settlement procedures; difficulties in enforcing contractual obligations; less regulation of securities markets; different accounting, disclosure and reporting requirements; more substantial governmental involvement in the economy; higher inflation rates; greater social, economic and political uncertainties; the risk of nationalization or expropriation of assets and the risk of war.
Pursuant to the Company’s organizational documents, the Funds’ officers and directors are indemnified against certain liabilities that may arise out of the performance of their duties to the Funds. Additionally, in the normal course of business, the Funds enter into contracts with service providers that contain general indemnification clauses. The Funds’ maximum exposure under these arrangements is unknown as this would involve future claims that may be made against the Funds that have not yet occurred.
1. SIGNIFICANT ACCOUNTING POLICIES
The following significant accounting policies are consistently followed by the Company in the preparation of its financial statements in conformity with accounting principles generally accepted in the United States of America (“U.S. GAAP”). The preparation of financial statements in conformity with U.S. GAAP requires management to make certain estimates and assumptions that affect the reported amounts of assets and liabilities and disclosures of contingent assets and liabilities at the date of the financial statements and the reported amounts of revenue and expenses during the reporting period. Actual results could differ from those estimates.
SECURITY VALUATION
The securities and other assets of each Fund are valued pursuant to the pricing policy and procedures approved by the Board of Directors of the Company (the “Board”). Effective September 1, 2008, the Funds adopted Financial Accounting Standards Board (“FASB”) Statement of Financial Accounting Standards No. 157 (“FAS 157”), “Fair Value Measurements.” This standard establishes a fair value hierarchy that prioritizes the inputs to valuation techniques used to measure fair value into three broad levels. Inputs may be based on independent market data (“observable inputs”) or they may be internally developed (“unobservable inputs”). The hierarchy gives the highest priority to
| 86 | 2009 iSHARES ANNUAL REPORTTO SHAREHOLDERS |
Table of Contents
Notes to Financial Statements (Continued)
iSHARES®, INC.
unadjusted quoted prices in active markets for identical assets or liabilities (Level 1 measurements) and the lowest priority to unobservable inputs (Level 3 measurements). The three levels of the fair value hierarchy under FAS 157 are as follows:
| • | Level 1 – Inputs that reflect unadjusted quoted prices in active markets for identical assets or liabilities that the Fund has the ability to access at the measurement date (a “Level 1 Price”); |
| • | Level 2 – Inputs other than quoted prices included within Level 1 that are observable for the asset or liability either directly or indirectly, including quoted prices for similar assets or liabilities in active markets, quoted prices for identical or similar assets or liabilities in markets that are not considered to be active, inputs other than quoted prices that are observable for the asset or liability, and inputs that are derived principally from or corroborated by observable market data by correlation or other means (a “Level 2 Price”); |
| • | Level 3 – Inputs that are unobservable for the asset or liability (a “Level 3 Price”). |
The availability of observable inputs can vary from security to security and is affected by a wide variety of factors, including, for example, the type of security, whether the security is new and not yet established in the marketplace, the liquidity of markets, and other characteristics particular to the security. Inputs may include price information, volatility statistics, specific and broad credit data, liquidity statistics, and other factors. To the extent that valuation is based on models or inputs that are less observable or unobservable in the market, the determination of fair value requires more judgment. Accordingly, the degree of judgment exercised in determining fair value is greatest for instruments categorized in Level 3 of the fair value hierarchy.
The level of a value determined for a financial instrument within the fair value hierarchy is based on the lowest level of any input that is significant to the fair value measurement in its entirety. The categorization of a value determined for a financial instrument within the hierarchy is based upon the pricing transparency of the instrument and does not necessarily correspond to the Funds’ perceived risk of that instrument.
Investments whose values are based on quoted market prices in active markets, and whose values are therefore classified as Level 1 Prices, include active listed equities. The Funds do not adjust the quoted price for such instruments, even in situations where the Funds hold a large position and a sale could reasonably impact the quoted price.
Investments that trade in markets that are not considered to be active, but whose values are based on inputs such as quoted market prices, dealer quotations or valuations provided by alternative pricing sources supported by observable inputs are classified within Level 2. These generally include U.S. government and sovereign obligations, most government agency securities, investment-grade corporate bonds, certain mortgage products, less liquid listed equities, and state, municipal and provincial obligations. As Level 2 investments include positions that are not traded in active markets and/or are subject to transfer restrictions, valuations may be adjusted to reflect illiquidity and/or non-transferability, which are generally based on available market information.
Investments whose values are classified as Level 3 Prices have significant unobservable inputs, as they may trade infrequently or not at all. Investments whose values are classified as Level 3 Prices may include unlisted securities related to corporate actions, securities whose trading have been suspended or which have been de-listed from their primary trading exchange, less liquid corporate debt securities (including distressed debt instruments), collateralized debt obligations, and less liquid mortgage securities (backed by either commercial or residential real estate). When observable prices are not available for these securities, the Funds use one or more valuation techniques (e.g., the market approach or the income approach) for which sufficient and reliable data is available. Within Level 3 of the fair value hierarchy, the use of the market approach generally consists of using comparable market transactions, while the use of the income approach generally consists of the net present value of estimated future cash flows, adjusted as appropriate for liquidity, credit, market and/or other risk factors.
| NOTESTO FINANCIAL STATEMENTS | 87 |
Table of Contents
Notes to Financial Statements (Continued)
iSHARES®, INC.
The inputs used by the Funds in estimating the value of Level 3 Prices may include the original transaction price, recent transactions in the same or similar investments, completed or pending third-party transactions in the underlying investment or comparable issuers, and changes in financial ratios or cash flows. Level 3 Prices may also be adjusted to reflect illiquidity and/or non-transferability, with the amount of such discount estimated by the Funds in the absence of market information. The fair value measurement of Level 3 Prices does not include transaction costs that may have been capitalized as part of the security’s cost basis. Assumptions used by the Funds due to the lack of observable inputs may significantly impact the resulting fair value and therefore the Funds’ results of operations.
Fair value pricing could result in a difference between the prices used to calculate a Fund’s net asset value and the prices used by the Fund’s underlying index, which in turn could result in a difference between the Fund’s performance and the performance of the Fund’s underlying index.
As of August 31, 2009, the values of each Fund’s investments were classified as Level 1 Prices. The breakdown of each Fund’s investments into major categories is disclosed in its respective Schedule of Investments.
SECURITY TRANSACTIONS AND INCOME RECOGNITION
Security transactions are accounted for on trade date. Dividend income is recognized on the ex-dividend date, net of any foreign taxes withheld at source, and interest income is accrued daily. Non-cash dividends received in the form of stock in an elective dividend, if any, are recorded as dividend income at fair value. Distributions received by the Funds may include a return of capital that is estimated by management. Such amounts are recorded as a reduction of the cost of investments or reclassified to capital gains. Realized gains and losses on investment transactions are determined using the specific identification method.
FOREIGN CURRENCY TRANSLATION
The accounting records of the Funds are maintained in U.S. dollars. Foreign currencies, as well as investment securities and other assets and liabilities denominated in foreign currencies are translated into U.S. dollars using exchange rates deemed appropriate by the investment adviser. Any use of a rate different from the rates used by MSCI may adversely affect a Fund’s ability to track its underlying index. Purchases and sales of securities, income receipts and expense payments are translated into U.S. dollars on the respective dates of such transactions.
Each Fund does not isolate the effect of fluctuations in foreign exchange rates from the effect of fluctuations in the market prices of securities. Such fluctuations are reflected by the Funds as a component of realized and unrealized gains and losses from investments for financial reporting purposes.
FOREIGN TAXES
The Funds may be subject to foreign taxes (a portion of which may be reclaimable) on income, corporate events, capital gains on investments or currency repatriation. All foreign taxes are recorded in accordance with the applicable foreign tax regulations and rates that exist in the foreign markets in which the Funds invest. These foreign taxes, if any, are paid by the Funds and are disclosed in their Statements of Operations. Foreign taxes payable as of August 31, 2009, if any, are reflected in the Funds’ Statements of Assets and Liabilities.
| 88 | 2009 iSHARES ANNUAL REPORTTO SHAREHOLDERS |
Table of Contents
Notes to Financial Statements (Continued)
iSHARES®, INC.
DISTRIBUTIONS TO SHAREHOLDERS
Distributions to shareholders from net investment income, if any, including any net foreign currency gains, are declared and distributed at least annually by each Fund. Distributions of net realized capital gains, if any, generally are declared and distributed once a year. Distributions are determined on a tax basis and may differ from net investment income and net realized capital gains for financial reporting purposes. Dividends and distributions are paid in U.S. dollars and cannot be automatically reinvested in additional shares of the Funds.
As of August 31, 2009, the tax year-end of the Funds, the components of net accumulated losses on a basis were as follows:
| iShares MSCI Index Fund | Undistributed Ordinary Income | Unrealized Depreciation | Capital and Other Losses | Net Accumulated Losses | |||||||||||
Austria Investable Market | $ | 2,819,697 | $ | (84,588,643 | ) | $ | (38,661,861 | ) | $ | (120,430,807 | ) | ||||
Belgium Investable Market | 144,377 | (45,290,656 | ) | (20,480,296 | ) | (65,626,575 | ) | ||||||||
EMU | 3,297,297 | (336,777,480 | ) | (97,141,670 | ) | (430,621,853 | ) | ||||||||
France | 556,005 | (91,629,315 | ) | (15,981,404 | ) | (107,054,714 | ) | ||||||||
Germany | 580,444 | (214,926,251 | ) | (89,004,766 | ) | (303,350,573 | ) | ||||||||
Italy | 498,041 | (51,134,581 | ) | (25,981,576 | ) | (76,618,116 | ) | ||||||||
Netherlands Investable Market | 421,610 | (42,734,471 | ) | (37,265,793 | ) | (79,578,654 | ) | ||||||||
Spain | 3,630,824 | (86,978,812 | ) | (22,397,357 | ) | (105,745,345 | ) | ||||||||
Sweden | 458,198 | (63,261,471 | ) | (25,849,295 | ) | (88,652,568 | ) | ||||||||
Switzerland | 533,632 | (45,058,390 | ) | (30,902,487 | ) | (75,427,245 | ) | ||||||||
United Kingdom | 4,783,959 | (245,605,264 | ) | (60,961,053 | ) | (301,782,358 | ) | ||||||||
For the years ended August 31, 2009 and August 31, 2008, the tax characterization of distributions paid for each Fund was equal to the book characterization of distributions paid. The total distributions and distributions per share are disclosed in the accompanying Statements of Changes in Net Assets and the Financial Highlights for all Funds.
FEDERAL INCOME TAXES
Each Fund is treated as a separate entity for federal income tax purposes. It is the policy of each Fund to qualify as a regulated investment company by complying with the provisions applicable to regulated investment companies, as defined under Subchapter M of the Internal Revenue Code of 1986, as amended, and to annually distribute substantially all of its ordinary income and any net capital gains (taking into account any capital loss carry forwards) sufficient to relieve it from all, or substantially all, federal income and excise taxes. Accordingly, no provision for federal income taxes was required for the year ended August 31, 2009.
| NOTESTO FINANCIAL STATEMENTS | 89 |
Table of Contents
Notes to Financial Statements (Continued)
iSHARES®, INC.
From November 1, 2008 to August 31, 2009 the Funds incurred net realized capital losses. As permitted by tax regulations, these Funds have elected to defer those losses and treat them as arising in the year ending August 31, 2010, as follows:
| iShares MSCI Index Fund | Deferred Net Realized Capital Losses | ||
Austria Investable Market | $ | 16,658,026 | |
Belgium Investable Market | 10,823,537 | ||
EMU | 67,963,859 | ||
France | 7,004,521 | ||
Germany | 28,526,910 | ||
Italy | 18,199,168 | ||
| iShares MSCI Index Fund | Deferred Net Realized Capital Losses | ||
Netherlands Investable Market | $ | 22,256,324 | |
Spain | 15,454,759 | ||
Sweden | 8,514,384 | ||
Switzerland | 22,571,994 | ||
United Kingdom | 24,400,730 | ||
The Funds had tax basis net capital loss carryforwards as of August 31, 2009, the tax year-end of the Funds, as follows:
| iShares MSCI Index Fund | Expiring 2010 | Expiring 2011 | Expiring 2012 | Expiring 2013 | Expiring 2014 | Expiring 2015 | Expiring 2016 | Expiring 2017 | Total | ||||||||||||||||||
Austria Investable Market | $ | 1,291,324 | $ | 370,948 | $ | 855,364 | $ | – | $ | – | $ | 9,795,917 | $ | 2,587,916 | $ | 7,102,366 | $ | 22,003,835 | |||||||||
Belgium Investable Market | 1,677,678 | 117,767 | 175,781 | 33,969 | – | – | 1,698,444 | 5,953,120 | 9,656,759 | ||||||||||||||||||
EMU | – | – | 659,648 | 1,873,963 | – | – | – | 26,644,200 | 29,177,811 | ||||||||||||||||||
France | 2,436,748 | 236,944 | 2,400,550 | – | – | 158,472 | 335,795 | 3,408,374 | 8,976,883 | ||||||||||||||||||
Germany | 8,697,227 | 5,469,732 | 8,656,712 | 2,241,687 | – | 4,227,713 | 3,394,735 | 27,790,050 | 60,477,856 | ||||||||||||||||||
Italy | 2,648,775 | 848,408 | 541,980 | 527,327 | – | – | 472,268 | 2,743,650 | 7,782,408 | ||||||||||||||||||
Netherlands Investable Market | 3,222,792 | 1,497,810 | 2,481,175 | 129,137 | 403,525 | 260,715 | 1,195,162 | 5,819,153 | 15,009,469 | ||||||||||||||||||
Spain | – | – | 995,671 | – | – | – | – | 5,946,927 | 6,942,598 | ||||||||||||||||||
Sweden | 713,472 | 1,577,551 | 1,149,514 | – | 107,613 | – | 100,015 | 13,686,746 | 17,334,911 | ||||||||||||||||||
Switzerland | 1,970,979 | 1,018,305 | 2,149,171 | 354,252 | – | – | – | 2,837,786 | 8,330,493 | ||||||||||||||||||
United Kingdom | 856,798 | 6,448,554 | 4,272,059 | 1,517,783 | 7,063,063 | – | 261,754 | 16,140,312 | 36,560,323 | ||||||||||||||||||
Net capital loss carryforwards may be applied against any net realized taxable gains in each succeeding year or until their respective expiration dates, whichever occurs first.
The Funds may own shares in certain foreign investment entities, referred to, under U.S. tax law, as “passive foreign investment companies.” The Funds may elect to mark-to-market annually the shares of each passive foreign investment company and would be required to distribute to shareholders any such marked-to-market gains.
Each Fund reclassifies at the end of its tax year certain amounts to paid-in-capital from accumulated net realized gain (loss) on investments and foreign currency transactions and accumulated net investment income (loss), respectively, as a result of permanent book and tax differences primarily attributed to net investment loss, return of capital, passive foreign investment companies, realized foreign currency
| 90 | 2009 iSHARES ANNUAL REPORTTO SHAREHOLDERS |
Table of Contents
Notes to Financial Statements (Continued)
iSHARES®, INC.
gains and losses and gains and losses on in-kind redemptions. These reclassifications have no effect on net assets or net asset values per share.
As of August 31, 2009, gross unrealized appreciation and gross unrealized depreciation based on cost for federal income tax purposes were as follows:
| iShares MSCI Index Fund | Tax Cost | Gross Unrealized Appreciation | Gross Unrealized Depreciation | Net Unrealized Depreciation | ||||||||||
Austria Investable Market | $ | 275,565,704 | $ | – | $ | (84,541,907 | ) | $ | (84,541,907 | ) | ||||
Belgium Investable Market | 97,714,849 | 686,400 | (45,926,568 | ) | (45,240,168 | ) | ||||||||
EMU | 1,083,149,350 | – | (336,800,177 | ) | (336,800,177 | ) | ||||||||
France | 278,473,239 | – | (91,630,283 | ) | (91,630,283 | ) | ||||||||
Germany | 840,012,571 | – | (215,045,607 | ) | (215,045,607 | ) | ||||||||
Italy | 176,731,942 | – | (51,134,776 | ) | (51,134,776 | ) | ||||||||
Netherlands Investable Market | 126,412,294 | – | (42,735,312 | ) | (42,735,312 | ) | ||||||||
Spain | 382,208,219 | – | (86,977,997 | ) | (86,977,997 | ) | ||||||||
Sweden | 258,285,584 | – | (63,263,862 | ) | (63,263,862 | ) | ||||||||
Switzerland | 314,654,342 | – | (45,091,672 | ) | (45,091,672 | ) | ||||||||
United Kingdom | 981,142,222 | – | (245,527,407 | ) | (245,527,407 | ) | ||||||||
Management has reviewed the tax positions as of August 31, 2009, inclusive of the prior three open tax return years, and has determined that no provision for income tax is required in the Funds’ financial statements.
2. AGREEMENTS AND OTHER TRANSACTIONS WITH AFFILIATES
Pursuant to an Investment Advisory Agreement with the Company, Barclays Global Fund Advisors (“BGFA”) manages the investment of each Fund’s assets. BGFA is a California corporation indirectly owned by Barclays Bank PLC. Under the Investment Advisory Agreement, BGFA is responsible for all expenses (“Covered Expenses”) of the Company, including the cost of transfer agency, custody, fund administration, legal, audit and other services, except interest, taxes, brokerage commissions and other expenses connected with the execution of portfolio transactions, distribution fees and extraordinary expenses.
For its investment advisory services to the Funds, BGFA is entitled to an annual investment advisory fee based on each Fund’s allocable portion of the aggregate of the average daily net assets of the Funds and certain other iShares Funds as follows:
| Investment Advisory Fee | Aggregate Average Daily Net Assets | |
| 0.59% | First $7 billion | |
| 0.54 | Over $7 billion, up to and including $11 billion | |
| 0.49 | Over $11 billion, up to and including $24 billion | |
| 0.44 | Over $24 billion, up to and including $48 billion | |
| 0.40 | Over $48 billion |
| NOTESTO FINANCIAL STATEMENTS | 91 |
Table of Contents
Notes to Financial Statements (Continued)
iSHARES®, INC.
Under the terms of the Investment Advisory Agreement, the Funds are required to remit payment of accrued fees to BGFA on a quarterly basis. BGFA has determined that in certain cases such payments to BGFA by the Funds were made earlier than provided for under the Investment Advisory Agreement. BGFA will reimburse the Funds for interest that would have been earned had such payments been made on a quarterly basis. The amounts to be reimbursed are included under receivables and investment income as “Interest from affiliate” in the Statements of Assets and Liabilities and Statements of Operations, respectively. The reimbursements do not have a material effect on net asset value per share or the total return shown in the Financial Highlights.
State Street Bank and Trust Company (“State Street”) serves as administrator, custodian and transfer agent for the Company. As compensation for its services, State Street receives certain out-of-pocket costs, transaction fees and asset-based fees which are accrued daily and paid monthly. These fees and expenses are Covered Expenses as defined above.
SEI Investments Distribution Co. (“SEI”) serves as each Fund’s underwriter and distributor of the shares of each Fund, pursuant to a Distribution Agreement with the Company. SEI does not receive a fee from the Funds for its distribution services.
Pursuant to an exemptive order issued by the U.S. Securities and Exchange Commission (“SEC”), the Funds are permitted to lend portfolio securities to Barclays Capital Inc. (“BarCap”). Pursuant to the same exemptive order, Barclays Global Investors, N.A. (“BGI”) serves as securities lending agent for the Funds. BarCap and BGI are affiliates of BGFA, the Funds’ investment adviser. As securities lending agent, BGI receives, as fees, a share of the income earned on investment of the cash collateral received for the loan of securities. For the year ended August 31, 2009, BGI earned securities lending agent fees as follows:
| iShares MSCI Index Fund | Securities Lending Agent Fees | |
Austria Investable Market | $345,958 | |
Belgium Investable Market | 37,058 | |
EMU | 456,059 | |
France | 93,885 | |
Germany | 199,365 | |
Italy | 17,461 |
| iShares MSCI Index Fund | Securities Lending Agent Fees | |
Netherlands Investable Market | $ 5,969 | |
Spain | 849,849 | |
Sweden | 90,142 | |
Switzerland | 18,262 | |
United Kingdom | 31,262 |
Cross trades for the year ended August 31, 2009, if any, were executed by the Funds pursuant to Rule 17a-7 under the 1940 Act. Cross trading is the buying or selling of portfolio securities between funds to which BGFA (or an affiliate) serves as investment adviser. At its regularly scheduled quarterly meetings, the Board reviews such transactions as of the most recent calendar quarter for compliance with the requirements and restrictions set forth by Rule 17a-7.
Each Fund may invest in certain money market funds managed by BGFA, the Funds’ investment adviser, including the Government Money Market Fund (“GMMF”), Institutional Money Market Fund (“IMMF”), Prime Money Market Fund (“PMMF”) and Treasury Money Market Fund (“TMMF”) of Barclays Global Investors Funds. These money market funds seek to achieve their investment objectives by investing in high-quality, short-term money market instruments that, at the time of investment, have remaining maturities of 397 calendar days or less from the date of acquisition. The GMMF, IMMF, PMMF and TMMF are feeder funds in a master/feeder fund structure that invest substantially all of their assets in the Government Money Market Master Portfolio, Money Market Master Portfolio, Prime Money Market Master Portfolio and Treasury Money Market Master Portfolio (collectively, the “Money Market Master Portfolios”), respectively, which are also managed by BGFA. While the GMMF, IMMF, PMMF and TMMF do not directly charge an investment advisory fee, the Money Market Master Portfolios in which they invest do charge an investment advisory fee. Income distributions from the GMMF, IMMF, PMMF and TMMF are declared daily and paid monthly from net investment income. Income distributions earned by the Funds from temporary cash investments are
| 92 | 2009 iSHARES ANNUAL REPORTTO SHAREHOLDERS |
Table of Contents
Notes to Financial Statements (Continued)
iSHARES®, INC.
recorded as interest from affiliated issuers in the accompanying Statements of Operations. Income distributions earned by the Funds from the investment of securities lending collateral, if any, are included in securities lending income in the accompanying Statements of Operations.
For the year ended August 31, 2009, the iShares MSCI United Kingdom Index Fund had direct investments (exclusive of short-term investments) in issuers of which BGFA is an affiliate or issuers of which the Fund owns 5% or more of the outstanding voting securities as follows:
| Name of Affiliated Issuer | Number of (in 000s) | Gross Additions (in 000s) | Gross Reductions | Number of Shares Held End of Year | Value at End of Year | Net Realized | |||||||||
Barclays PLC | 2,878 | 1,940 | 793 | 4,025 | $ | 24,946,038 | $ | (3,751,912 | ) | ||||||
Certain directors and officers of the Company are also officers of BGI and/or BGFA.
3. INVESTMENT PORTFOLIO TRANSACTIONS
Purchases and sales of investments (excluding in-kind transactions and short-term investments) for the year ended August 31, 2009 were as follows:
| iShares MSCI Index Fund | Purchases | Sales | ||||
Austria Investable Market | $ | 26,496,480 | $ | 27,171,954 | ||
Belgium Investable Market | 20,626,231 | 23,547,368 | ||||
EMU | 55,349,306 | 64,342,037 | ||||
France | 9,816,843 | 11,534,352 | ||||
Germany | 69,637,930 | 69,020,178 | ||||
Italy | 20,321,698 | 21,626,679 | ||||
Netherlands Investable Market | 17,101,489 | 18,624,236 | ||||
Spain | 43,100,417 | 46,598,085 | ||||
Sweden | 13,580,550 | 12,442,629 | ||||
Switzerland | 43,019,188 | 43,806,134 | ||||
United Kingdom | 64,425,392 | 64,315,873 | ||||
| NOTESTO FINANCIAL STATEMENTS | 93 |
Table of Contents
Notes to Financial Statements (Continued)
iSHARES®, INC.
In-kind transactions (see Note 4) for the year ended August 31, 2009 were as follows:
| iShares MSCI Index Fund | In-kind Purchases | In-kind Sales | ||||
Austria Investable Market | $ | 145,860,870 | $ | 95,893,123 | ||
Belgium Investable Market | 64,620,039 | 89,203,400 | ||||
EMU | 244,047,014 | 468,204,067 | ||||
France | 138,713,195 | 98,885,798 | ||||
Germany | 440,931,250 | 332,259,105 | ||||
Italy | 97,310,138 | 160,329,289 | ||||
Netherlands Investable Market | 43,008,815 | 99,731,764 | ||||
Spain | 167,362,736 | 153,125,062 | ||||
Sweden | 117,804,255 | 122,330,891 | ||||
Switzerland | 101,378,557 | 127,389,825 | ||||
United Kingdom | 145,671,167 | 113,087,643 | ||||
4. CAPITAL SHARE TRANSACTIONS
The Company issues and redeems capital shares of each Fund only in aggregations of a specified number of shares (each, a “Creation Unit”) at net asset value. Except when aggregated in Creation Units, shares of each Fund are not redeemable. Transactions in capital shares for each Fund are disclosed in detail in the Statements of Changes in Net Assets.
The consideration for the purchase of Creation Units of a Fund generally consists of the in-kind deposit of a designated portfolio of equity securities, which constitutes an optimized representation of the corresponding MSCI Index and an amount of cash. Investors purchasing and redeeming Creation Units pay a purchase transaction fee and a redemption transaction fee directly to State Street, the administrator, to offset transfer and other transaction costs associated with the issuance and redemption of Creation Units.
From time to time, settlement of securities related to in-kind contributions or in-kind redemptions may be delayed. In such cases, securities related to in-kind contributions are reflected as “Due from custodian” and securities related to in-kind redemptions are reflected as “Securities related to in-kind transactions” in the Statements of Assets and Liabilities.
5. LOANS OF PORTFOLIO SECURITIES
Each Fund may lend its investment securities to approved borrowers, such as brokers, dealers and other financial institutions. The borrower pledges and maintains with the Fund collateral consisting of cash, an irrevocable letter of credit issued by a bank, or securities issued or guaranteed by the U.S. government. The initial collateral received by each Fund is required to have a value of at least 102% of the market value of the loaned securities for securities traded on U.S. exchanges and a value of at least 105% for all other securities. The collateral is maintained thereafter, at a value equal to at least 100% of the current market value of the securities on loan. The risks to the Funds of securities lending include the risk that the borrower may not provide additional collateral when required or may not return the securities when due. Any securities lending cash collateral may be reinvested in certain short-term instruments either directly on behalf of a Fund or through one or more joint accounts or money market funds, including those managed by BGFA; such reinvestments are subject to investment risk.
| 94 | 2009 iSHARES ANNUAL REPORTTO SHAREHOLDERS |
Table of Contents
Notes to Financial Statements (Continued)
iSHARES®, INC.
As of August 31, 2009, the Funds had loaned securities which were collateralized by cash. The cash collateral received was invested in money market funds managed by BGFA. The market value of the securities on loan as of August 31, 2009 and the value of the related collateral are disclosed in the Statements of Assets and Liabilities. Securities lending income, as disclosed in the Funds’ Statements of Operations, represents the income earned from the investment of the cash collateral, net of rebates paid to, or fees paid by, borrowers and less the fees paid to BGI as securities lending agent.
6. BLACKROCK TRANSACTION
On June 16, 2009, Barclays PLC, the ultimate parent company of BGI and BGFA, accepted a binding offer and entered into an agreement to sell its interests in BGFA, BGI and certain affiliated companies, to BlackRock, Inc., (the “BlackRock Transaction”). The BlackRock Transaction is subject to certain regulatory approvals, as well as other conditions to closing.
Under the 1940 Act, completion of the BlackRock Transaction will cause the automatic termination of each Fund’s current investment advisory agreement with BGFA. In order for the management of each Fund to continue uninterrupted, the Board approved a new investment advisory agreement for each Fund subject to shareholder approval. A special meeting of shareholders of the Funds is scheduled to be held on November 4, 2009. Each shareholder of record as of the close of business on August 25, 2009 will receive notice of and be entitled to vote at the meeting.
7. REVIEW OF SUBSEQUENT EVENTS
In connection with the preparation of the financial statements of the Funds as of and for the year ended August 31, 2009, events and transactions through October 23, 2009, the date the financial statements are available to be issued, have been evaluated by the Funds’ management for possible adjustment and/or disclosure. No subsequent events requiring financial statement disclosure have been identified.
| NOTESTO FINANCIAL STATEMENTS | 95 |
Table of Contents
Report of Independent Registered Public Accounting Firm
To the Shareholders and Board of Directors of
iShares, Inc.:
In our opinion, the accompanying statements of assets and liabilities, including the schedules of investments, and the related statements of operations and of changes in net assets and the financial highlights present fairly, in all material respects, the financial position of the iShares MSCI Austria Investable Market Index Fund, iShares MSCI Belgium Investable Market Index Fund, iShares MSCI EMU Index Fund, iShares MSCI France Index Fund, iShares MSCI Germany Index Fund, iShares MSCI Italy Index Fund, iShares MSCI Netherlands Investable Market Index Fund, iShares MSCI Spain Index Fund, iShares MSCI Sweden Index Fund, iShares MSCI Switzerland Index Fund and iShares MSCI United Kingdom Index Fund, each a portfolio of the iShares MSCI Fund Series (the “Funds”) at August 31, 2009, the results of each of their operations, the changes in each of their net assets and their financial highlights for each of the periods presented, in conformity with accounting principles generally accepted in the United States of America. These financial statements and financial highlights (hereafter referred to as “financial statements”) are the responsibility of the Funds’ management; our responsibility is to express an opinion on these financial statements based on our audits. We conducted our audits of these financial statements in accordance with the standards of the Public Company Accounting Oversight Board (United States). Those standards require that we plan and perform the audits to obtain reasonable assurance about whether the financial statements are free of material misstatement. An audit includes examining, on a test basis, evidence supporting the amounts and disclosures in the financial statements, assessing the accounting principles used and significant estimates made by management, and evaluating the overall financial statement presentation. We believe that our audits, which included confirmation of securities at August 31, 2009 by correspondence with the custodian, transfer agent and brokers, provide a reasonable basis for our opinion.
PricewaterhouseCoopers LLP
San Francisco, California
October 23, 2009
| 96 | 2009 iSHARES ANNUAL REPORTTO SHAREHOLDERS |
Table of Contents
iSHARES®, INC.
For corporate shareholders, 1.33% of the income dividends paid by the iShares MSCI Switzerland Index Fund during the fiscal year ended August 31, 2009 qualified for the dividends-received deduction.
For the fiscal year ended August 31, 2009, certain Funds earned foreign source income and paid foreign taxes which they intend to pass through to their shareholders pursuant to Section 853 of the Internal Revenue Code (the “Code”) as follows:
| iShares MSCI Index Fund | Foreign Source Income Earned | Foreign Taxes Paid | ||||
Austria Investable Market | $ | 3,698,273 | $ | 438,279 | ||
Belgium Investable Market | 1,945,468 | 284,856 | ||||
EMU | 29,026,610 | 4,022,237 | ||||
France | 6,775,998 | 814,028 | ||||
Germany | 17,933,178 | 2,242,079 | ||||
| iShares MSCI Index Fund | Foreign Source Income Earned | Foreign Taxes Paid | ||||
Italy | $ | 4,157,986 | $ | 669,158 | ||
Netherlands Investable Market | 3,492,500 | 515,300 | ||||
Spain | 12,567,456 | 1,741,130 | ||||
Sweden | 4,507,050 | 669,887 | ||||
Switzerland | 6,037,409 | 991,789 | ||||
Under Section 854(b)(2) of the Code, the Funds hereby designate the following maximum amounts as qualified dividend income for purposes of the maximum rate under Section 1(h)(11) of the Code for the fiscal year ended August 31, 2009:
| iShares MSCI Index Fund | Qualified Dividend Income | ||
Austria Investable Market | $ | 3,071,015 | |
Belgium Investable Market | 1,478,513 | ||
EMU | 26,928,554 | ||
France | 5,674,647 | ||
Germany | 14,693,409 | ||
Italy | 3,732,985 | ||
| iShares MSCI Index Fund | Qualified Dividend Income | ||
Netherlands Investable Market | $ | 3,445,180 | |
Spain | 10,820,622 | ||
Sweden | 3,282,327 | ||
Switzerland | 4,322,291 | ||
United Kingdom | 25,389,028 | ||
In January 2010, shareholders will receive Form 1099-DIV which will include their share of qualified dividend income distributed during the calendar year 2009. Shareholders are advised to check with their tax advisers for information on the treatment of these amounts on their income tax returns.
| TAX INFORMATION | 97 |
Table of Contents
Board Review and Approval of Current Investment Advisory Contract (Unaudited)
iSHARES®, INC.
Under Section 15(c) of the Investment Company Act of 1940 (the “1940 Act”), the Company’s Board of Directors (the “Board”), including a majority of Directors who are not “interested persons” of the Company (as that term is defined in the 1940 Act) (the “Independent Directors”), is required annually to consider the Investment Advisory Contract between the Company and BGFA (the “Advisory Contract”) on behalf of the Funds. As required by Section 15(c), the Board requested and BGFA provided such information as the Board deemed reasonably necessary to evaluate the terms of the Advisory Contract. At a meeting held on June 16-17, 2009, the Board approved the selection of BGFA and the continuance of the Advisory Contract, based on its review of qualitative and quantitative information provided by BGFA. In selecting BGFA and approving the Advisory Contract for the Funds, the Board, including the Independent Directors, advised by their independent counsel, considered the following factors, no one of which was controlling, and made the following conclusions:
NATURE, EXTENT AND QUALITY OF SERVICES PROVIDED BY BGFA
Based on management’s representations, the Board expected that there will be no diminution in the scope of services required of or provided by BGFA under the Advisory Contract for the coming year as compared to the scope of services provided by BGFA over the past year. In reviewing the scope of these services, the Board considered BGFA’s investment philosophy and experience, noting that BGFA and its affiliates have committed significant resources overtime, including over the past year, including investment in technology and increasing the number of their employees supporting the Funds. The Board also considered BGFA’s compliance program and its compliance record with respect to the Funds. In that regard, the Board noted that BGFA reports to the Board about portfolio management and compliance matters on a periodic basis in connection with regularly scheduled meetings of the Board, and has made appropriate officers available as needed to provide further assistance with these matters. The Board also reviewed the background and experience of the persons responsible for the day-to-day management of the Funds. In addition to the above considerations, the Board considered BGFA’s investment processes and strategies, and matters related to BGFA’s portfolio transaction policies and procedures. The Board further noted that BGFA does not serve as investment adviser for any other series of registered investment companies with substantially similar investment objectives and strategies as any of the Funds; therefore, directly comparable performance information was generally not available. However, the Board also noted that the Funds had met their investment objectives consistently since their respective inception dates. Based on review of this information, the Board concluded that the nature, extent and quality of services to be provided by BGFA to the Funds under the Advisory Contract were appropriate and mitigated in favor of the Board’s approval of the Advisory Contract for the coming year.
FUNDS’ EXPENSES AND PERFORMANCE OF THE FUNDS
The Board reviewed statistical information prepared by Lipper Inc. (“Lipper”), an independent provider of investment company data, regarding the expense ratio components, including advisory fees, waivers/reimbursements, and gross and net total expenses of each Fund in comparison with the same information for other registered investment companies objectively selected by Lipper as comprising such Fund’s applicable peer group (the “Lipper Group”). Because there are few, if any, exchange traded funds or index funds that track indexes similar to those tracked by the Funds, the Lipper Groups included in part mutual funds, closed-end funds, exchange traded funds, or funds with differing investment objective classifications, investment focuses and other characteristics (e.g., actively managed funds and funds sponsored by “at cost” service providers). In support of its review of the statistical information, the Board was provided with a detailed description of the methodology used by Lipper to determine the applicable Lipper Groups and to prepare this information. The Board further noted that due to the limitations in providing comparable funds in the various Lipper Groups, the statistical information may or may not provide meaningful direct comparisons to the Funds. In addition, the Board reviewed statistical information prepared by Lipper regarding the performance of each Fund for the one-, three-, five- and ten-year periods, as applicable, and the “last quarter” period ended March 31, 2009, and a comparison of each Fund’s performance to its performance benchmark index for the same periods. To the extent that any of the comparison funds included in the Lipper Groups track the same index as any particular Fund, Lipper also provided, and the Board reviewed, a comparison of such Fund’s performance to that of such relevant comparison funds for the same periods. The Board noted that
| 98 | 2009 iSHARES ANNUAL REPORTTO SHAREHOLDERS |
Table of Contents
Board Review and Approval of Current Investment Advisory Contract (Unaudited) (Continued)
iSHARES®, INC.
the Funds generally performed in line with their respective performance benchmark indexes over the relevant periods. In considering this information, the Board noted that the Lipper Groups include funds that may have different investment objectives and/or benchmarks from the Funds. In addition, the Board noted that each Fund seeks to track its benchmark index and that during the prior year the Board received periodic reports on the Funds’ performance in comparison with their relevant benchmark indexes. Such comparative performance information was also considered by the Board.
The Board also noted that the investment advisory fees and overall expenses for the Funds were generally lower than the median or average investment advisory fee rates and overall expenses of the funds in their respective Lipper Groups. Based on this review, the Board concluded that the investment advisory fees and expense levels and the historical performance of each Fund, as managed by BGFA, as compared to the investment advisory fees and expense levels and performance of the funds in the relevant Lipper Group, were satisfactory for the purposes of approving the Advisory Contract for the coming year.
COSTS OF SERVICES PROVIDED TO FUNDS AND PROFITS REALIZED BY BGFA AND AFFILIATES
The Board reviewed information about the profitability to BGFA of the Funds based on the fees payable to BGFA and its affiliates (including fees under the Advisory Contract), and all other sources of revenue and expense to BGFA and its affiliates from the Funds’ operations for the last calendar year. The Board discussed the sources of direct and ancillary revenue with management, including the revenues to BGI from securities lending by the Company (including any securities lending by the Funds). The Board also discussed BGFA’s profit margin as reflected in the Funds’ profitability analysis and reviewed information regarding economies of scale (as discussed below). Based on this review, the Board concluded that the profits realized by BGFA and its affiliates under the Advisory Contract and from other relationships between the Funds and BGFA and/or its affiliates, if any, were within the range the Board considered reasonable and appropriate.
ECONOMIES OF SCALE
In connection with its review of the Funds’ profitability analysis, the Board reviewed information regarding economies of scale or other efficiencies that may result from increases in the Funds’ assets. The Board noted that the Advisory Contract already provided for breakpoints in the Funds’ investment advisory fee rates as the assets of the Funds, on an aggregated basis with the assets of certain other iShares funds, increase, and that extended breakpoints were implemented the previous year. The Board noted that the Funds’ asset size decreased over the past twelve months. The Board also reviewed BGFA’s historic profitability as investment adviser to the iShares fund complex and noted that BGFA had continued to make significant investments in the iShares fund complex, that expenses had grown at a pace similar to the growth in revenue, and that BGFA had incurred operating losses during earlier years when the iShares funds, including the Funds, had not yet reached scale. Based on this review, as well as the discussions described above in connection with the Lipper Group and performance benchmark comparisons, the Board, recognizing its responsibility to consider this issue at least annually, concluded that the structure of the investment advisory fees, reflects appropriate sharing of economies of scale with the Funds’ shareholders.
FEES AND SERVICES PROVIDED FOR OTHER COMPARABLE FUNDS/ACCOUNTS MANAGED BY BGFA AND ITS AFFILIATES
The Board received and considered certain information regarding the Funds’ annual investment advisory fee rates under the Advisory Contract in comparison to the investment advisory/management fee rates for other funds/accounts for which BGFA or BGI, an affiliate of BGFA, provides investment advisory/management services, including other funds registered under the 1940 Act, collective funds and separate accounts (together, the “Other Accounts”). The Board noted that directly comparable investment advisory/management fee information was not available for the Funds, as BGFA and its affiliates do not manage any Other Accounts with substantially similar investment objectives and strategies as any of the Funds. However, the Board noted that BGFA provided the Board with general information
| BOARD REVIEWAND APPROVALOF CURRENT INVESTMENT ADVISORY CONTRACT | 99 |
Table of Contents
Board Review and Approval of Current Investment Advisory Contract (Unaudited) (Continued)
iSHARES®, INC.
regarding how the level of services provided to the Other Accounts differed from the level of services provided to the Funds. Based on this review, the Board determined that the investment advisory fee rates under the Advisory Contract do not constitute fees that are so disproportionately large as to bear no reasonable relationship to the services rendered and that could not have been the product of arm’s-length bargaining, and concluded that the investment advisory fee rates under the Advisory Contract are fair and reasonable.
OTHER BENEFITS TO BGFA AND/OR ITS AFFILIATES
The Board reviewed any ancillary revenue received by BGFA and/or its affiliates in connection with the services provided to the Funds by BGFA, such as any payment of revenue to BGI, the Company’s securities lending agent, for loaning any portfolio securities, and payment of advisory fees and/or administration fees to BGFA and BGI in connection with any investments by the Funds in other funds for which BGFA provides investment advisory services and/or BGI provides administration services. The Board noted that while revenue to BGI in connection with securities lending agency services to the iShares funds increased overall as against the previous year, overall revenue increased by approximately the same percentage as overall expenses. The Board noted that BGFA does not use soft dollars or consider the value of research or other services that may be provided to BGFA (including its affiliates) in selecting brokers for portfolio transactions for the Funds. The Board further noted that any portfolio transactions on behalf of the Funds placed through a BGFA affiliate or purchased from an underwriting syndicate in which a BGFA affiliate participates, are reported to the Board pursuant to Rule 17e-1 or Rule 10f-3, as applicable, under the 1940 Act. The Board concluded that any such ancillary benefits would not be disadvantageous to the Funds’ shareholders.
Based on this analysis, the Board determined that the Advisory Contract, including the investment advisory fee rates thereunder, is fair and reasonable in light of all relevant circumstances and concluded that it is in the best interest of the Funds and their shareholders to approve the Advisory Contract for the coming year.
| 100 | 2009 iSHARES ANNUAL REPORTTO SHAREHOLDERS |
Table of Contents
Board Review and Approval of New Investment Advisory Agreements (Unaudited)
iSHARES®, INC.
On June 16, 2009, Barclays Bank PLC (“Barclays”) entered into an agreement to sell its interest in the Barclays Global Investors asset management business, which includes BGI and BGI’s business of advising, sponsoring and distributing exchange-traded funds, to BlackRock, Inc. (“BlackRock”). Assuming receipt of the requisite regulatory approvals and the satisfaction of other conditions to the closing, the subsidiaries of Barclays operating the BGI business, including BGFA (the “Adviser”), will be sold to BlackRock (the “Transaction”) for cash and BlackRock stock.
The Adviser currently serves as the investment adviser to each Fund pursuant to an investment advisory agreement with the Company (the “Current Advisory Agreement”). Under the 1940 Act, the Transaction, if consummated, will result in the automatic termination of the Current Advisory Agreement. In order for the management of each Fund to continue uninterrupted, the Board approved interim and new investment advisory agreements (the “New Advisory Agreements”) with the Company, subject to shareholder approval.
BOARD CONSIDERATIONS IN APPROVING THE NEW ADVISORY AGREEMENTS
At an in-person Board meeting held on August 13, 2009, the Board, including the Independent Directors, unanimously approved the New Advisory Agreements between the Adviser and the Company, on behalf of its Funds after consideration of all factors determined to be relevant to the Board’s deliberations, including those discussed below.
The Approval Process – At telephonic and in-person meetings held in June, July and August of this year, the Board, including the Independent Directors, discussed the Transaction and the New Advisory Agreements for the Funds.
In preparation for their consideration of the New Advisory Agreements, the Directors received, in response to a written due diligence request prepared by the Board and its independent counsel and provided to BlackRock, BGI and the Adviser, comprehensive written information covering a range of issues and received, in response to their additional requests, further information in advance of and at the August 13, 2009 in-person Board meeting. To assist the Board in its consideration of the New Advisory Agreements, BlackRock provided materials and information about itself, including its history, management, investment, risk management and compliance capabilities and processes, and financial condition, and the Adviser provided materials and information about the Transaction. In addition, the Independent Directors consulted with their independent legal counsel and Fund counsel on numerous occasions, discussing, among other things, the legal standards and certain other considerations relevant to the Board’s deliberations.
In June 2009, the Board had performed a full annual review of, or initially approved, as applicable, the current Investment Advisory Agreement between the Adviser and the Company, on behalf of its Funds for each Fund as required by the 1940 Act and, after reviewing, among other things, the investment capabilities, resources and personnel of the Adviser, determined that the nature, extent and quality of the services provided by the Adviser under the Current Advisory Agreements were appropriate. The Board also determined that the advisory fees paid by each Fund, taking into account any applicable agreed-upon fee waivers and breakpoints, were fair and reasonable in light of the services provided, the costs to the Adviser of providing those services, economies of scale, the fees and other expenses paid by similar funds (including information provided by Lipper, Inc. (“Lipper”)), and such other circumstances as the Directors considered relevant in the exercise of their reasonable judgment. The Board approved the Current Advisory Agreements on June 17, 2009.
In advance of the June 2009 Board meeting, the Board requested and received materials specifically relating to each Fund’s Current Advisory Agreement. These materials were prepared for each Fund, and included information (i) compiled by Lipper on the fees and expenses and the investment performance of the Fund as compared to a comparable group of funds as classified by Lipper; (ii) prepared by the Adviser discussing market conditions generally; (iii) on the profitability to the Adviser of the Current Advisory Agreements and other payments received by the Adviser and its affiliates from the Funds; and (iv) provided by the Adviser concerning services related to the valuation and pricing of Fund portfolio holdings, and direct and indirect benefits to the Adviser and its affiliates from their relationship with the Fund.
| BOARD REVIEW AND APPROVAL OF NEW INVESTMENT ADVISORY AGREEMENTS | 101 |
Table of Contents
Board Review and Approval of New Investment Advisory Agreements (Unaudited) (Continued)
iSHARES®, INC.
At the June 17, July 29 and August 13, 2009 Board meetings, the Directors discussed with representatives of BGI, the Adviser and BlackRock, the management, investment, risk management and compliance capabilities and processes, and financial condition of BlackRock, the Transaction and its rationale, and BlackRock’s general plans and intentions regarding the Adviser and the Funds. At these Board meetings, representatives of BGI, the Adviser and BlackRock made various presentations to, and responded to questions from, the Board. The Board also inquired about the plans for, and anticipated roles and responsibilities of, the employees and officers of the Adviser in connection with the Transaction, including the anticipated senior management structure of the Adviser following the completion of the Transaction. The Independent Directors also conferred separately and with their independent legal counsel about the Transaction and other matters related to the Transaction on a number of occasions. After the presentations and after reviewing the written materials provided, the Independent Directors met in executive sessions with their independent legal counsel at the June, July and August 2009 Board meetings to consider the Transaction, its expected impact on the Adviser and the Funds, and the New Advisory Agreements.
In connection with the Board’s review of the New Advisory Agreements, BGI, the Adviser and/or BlackRock, as applicable, provided the Board with information about a variety of matters. The Board considered, among other things, the following information:
| • | the reputation, financial strength and resources of BlackRock and its investment advisory subsidiaries and the anticipated financial strength and resources of the combined company; |
| • | that there is not expected to be any diminution in the nature, quality and extent of services provided to the Funds and their shareholders by the Adviser, including portfolio management and compliance services; |
| • | that the Adviser and BlackRock have no present intention to alter the advisory fee rates and expense arrangements currently in effect for the Funds for a period of two years from the date of the closing of the Transaction; |
| • | that it is expected that substantially all of the current employees of the Adviser will remain employees of the Adviser and will continue to provide services to the Funds following the Transaction; |
| • | that the Funds may benefit from having direct access to BlackRock’s state of the art technology and risk management analytic tools, including investment tools, provided under the BlackRock Solutions® brand name; |
| • | that the Funds are expected to continue to be sold through existing distribution channels; |
| • | that the Funds will have access to greater distribution resources through BlackRock’s relationships with third party brokers and retirement plan platforms; |
| • | that the parties to the Transaction Agreement have agreed to conduct their respective businesses in compliance with the conditions of Section 15(f) of the 1940 Act in relation to the Funds; |
| • | that Barclays or one of its affiliates has agreed to pay all expenses of the Funds in connection with the Board’s consideration of the New Advisory Agreements and all costs of seeking shareholder approval of the New Advisory Agreements; and |
| • | that Barclays and BlackRock would derive benefits from the Transaction and that, as a result, they may have a different financial interest in the matters that were being considered than do Fund shareholders. |
The Board did not identify any particular information that was all-important or controlling, and each Director may have attributed different weights to the various factors discussed below. The Directors evaluated all information available to them on a Fund-by-Fund basis, and their determinations were made separately in respect of each Fund. In their deliberations, the Directors considered information received
| 102 | 2009 iSHARES ANNUAL REPORTTO SHAREHOLDERS |
Table of Contents
Board Review and Approval of New Investment Advisory Agreements (Unaudited) (Continued)
iSHARES®, INC.
in connection with their most recent approval or continuation of each Current Advisory Agreement at the June 2009 Board meeting, in addition to information provided by BGI, the Adviser and BlackRock regarding BlackRock and the Transaction, in connection with their evaluation of the terms and conditions of the New Advisory Agreements. The Directors, including a majority of the Independent Directors, concluded that the terms of the New Advisory Agreements are appropriate, that the fees to be paid are reasonable in light of the services to be provided to each Fund, and that the New Advisory Agreements should be approved and recommended to Fund shareholders. In voting to approve the New Advisory Agreements in respect of each Fund, the Board considered in particular the following factors:
The nature, extent and quality of services to be provided by the Adviser and its affiliates – In connection with their consideration of the New Advisory Agreements, the Board considered representations by the Adviser, BGI and BlackRock that there would be no diminution in the scope of services required of or provided by the Adviser under the New Advisory Agreements for each Fund as compared to the scope of services provided by the Adviser under the Current Advisory Agreement. In reviewing the scope of these services at the June and August 2009 Board meetings, the Board considered the Adviser’s investment philosophy and experience, noting that the Adviser and its affiliates have committed significant resources over time, including over the past year, including investments in technology and increasing the number of their employees supporting the Funds. The Board also considered the Adviser’s compliance program and its compliance record with respect to the Funds. In that regard, the Board noted that the Adviser reports to the Board about portfolio management and compliance matters on a periodic basis in connection with regularly scheduled meetings of the Board, and has made appropriate officers available as needed to provide further assistance with these matters. The Board noted that it expects that these reports and discussions will continue following the consummation of the Transaction. In addition to the above considerations, the Board considered the Adviser’s investment processes and strategies, and matters related to the Adviser’s portfolio transaction policies and procedures. The Board further took into account that, with respect to most of the Funds, the Adviser does not serve as investment adviser for other series of registered investment companies with substantially similar investment objectives and strategies; therefore, directly comparable performance information was generally not available for most Funds. The Board also considered each Fund’s record of performing in accordance with its investment objective.
In connection with the investment advisory services to be provided under the New Advisory Agreements, the Board took into account detailed discussions with representatives of the Adviser at the June 2009 Board meeting and at prior Board meetings regarding the management of each Fund. In addition to the investment advisory services to be provided to the Funds, the Board, at the August 2009 Board meeting, considered that the Adviser also will continue to provide management and administrative services, shareholder services, oversight of Fund accounting, marketing services, assistance in meeting legal and regulatory requirements and other services necessary for the operation of the Funds, and that these services were expected to be consistent with the services the Adviser currently performs under the Current Advisory Agreements.
The Board noted the representations of the Adviser, BGI and BlackRock that the Transaction was not expected to have any adverse effect on the resources and strengths of the Adviser in managing the Funds. The Board also considered that the Funds and their shareholders may benefit from having direct access to BlackRock’s state of the art technology and risk management analytic tools, including the investment tools provided under the BlackRock Solutions® brand name. The Board discussed BlackRock’s current financial condition, its anticipated financial condition following the completion of the Transaction and its lines of business. The Board also discussed the Adviser’s anticipated financial condition following the completion of the Transaction. The Board discussed BlackRock’s current ownership structure and expected ownership structure following the completion of the Transaction. The Board was advised that BlackRock operates as an independent firm, with its own Board of Directors and no majority shareholder. The Board was also advised that while BlackRock’s largest shareholders, Merrill Lynch, a wholly owned subsidiary of Bank of America, and PNC, are important clients and strategic partners of BlackRock, they are not involved in the firm’s day-to-day management or operations.
| BOARD REVIEWAND APPROVALOF NEW INVESTMENT ADVISORY AGREEMENTS | 103 |
Table of Contents
Board Review and Approval of New Investment Advisory Agreements (Unaudited) (Continued)
iSHARES®, INC.
Based on the discussions held and the materials presented at the June, July and August 2009 Board meetings and prior Board meetings, the Board determined that the Transaction would not likely cause an adverse change in the nature, extent and quality of the services to be provided by the Adviser under the New Advisory Agreements compared with the services provided by the Adviser under the Current Advisory Agreements and that the Board expects that the quality of such services will continue to be appropriate.
Funds’ expenses and performance of the Funds – The Board received and reviewed statistical information prepared by Lipper at the June 2009 meeting and also received information at prior meetings regarding the expense ratio components of the Funds, including advisory fees, waivers and reimbursements, and gross and net total expenses, in comparison with the same information for other registered investment companies objectively selected by Lipper as comprising a Fund’s peer group pursuant to Lipper’s proprietary methodology and, for certain Funds, registered investment companies that would otherwise have been excluded from Lipper’s comparison group due to certain differentiating factors, but were nonetheless included at the request of the Adviser (the “Lipper Group”). Because there are few, if any, exchange traded funds or index funds that track indexes similar to those tracked by most of the Funds, the Lipper Groups sometimes included mutual funds, closed-end funds, exchange traded funds, or funds with differing investment objective classifications, investment focuses and other characteristics (e.g., actively managed funds and funds sponsored by “at cost” service providers). In support of its review of the statistical information, the Board was provided with a detailed description of the methodology used by Lipper to determine the applicable Lipper Groups and to prepare this information. The Board further noted that due to the limitations in providing comparable funds in the various Lipper Groups, the statistical information may or may not provide meaningful direct comparisons to certain Funds.
The Board noted that the investment advisory fees and overall expenses for the Funds were generally lower than the median or average investment advisory fee rates and overall expenses of the Funds in their Lipper Groups with respect to the Current and New Advisory Agreements. The Board took into account that the fee rates for each Fund under the New Advisory Agreements are identical to the fee rates under the respective Current Advisory Agreements. Further, the Board noted that representatives of the Adviser and BlackRock had confirmed that there is no present intention to alter the advisory fee rates, expense waivers or expense reimbursements currently in effect for the Funds for a period of two years from the date of the closing of the Transaction.
In addition to reviewing the fees and expenses, the Board noted that it regularly reviews each Fund’s performance and at the June 2009 meeting reviewed statistical information prepared by Lipper regarding the performance of each Fund for the quarter-end, one-, three-, five- and ten-year periods, as applicable, and a comparison of each Fund’s performance to its performance benchmark index for the same periods. To the extent that any of the comparison funds included in the Lipper Groups track the same index as any particular Fund, Lipper also provided, and the Board reviewed, a comparison of the Fund’s performance to that of the relevant comparison funds for the same periods. The Board noted that the Funds generally performed in line with their performance benchmark indices over the relevant periods. In considering this information, the Board took into account that the Lipper Groups include funds that may have different investment objectives and/or benchmarks from the Funds. In addition, the Board noted that each Fund seeks to track its benchmark index and that during the prior year the Board received periodic reports on the Funds’ performance in comparison with their relevant benchmark indices. This comparative performance information was also considered by the Board. The Board considered the Adviser’s substantial investment advisory experience and capabilities, as well as the possibility of additional resources and support from BlackRock following the completion of the Transaction, but noted that the effect, if any, the consummation of the Transaction would have on the future performance of the Funds could not be predicted.
Based on this review, the Board had concluded that the investment advisory fee rates and expense levels and the historical performance of each Fund, as compared to the investment advisory fee rates and expense levels and performance of the funds in the relevant Lipper Group, were satisfactory for the purposes of approving the Current Advisory Agreements and concluded that these comparisons continued to be satisfactory for the purpose of approving the New Advisory Agreements.
| 104 | 2009 iSHARES ANNUAL REPORTTO SHAREHOLDERS |
Table of Contents
Board Review and Approval of New Investment Advisory Agreements (Unaudited) (Continued)
iSHARES®, INC.
Cost of services provided and profits realized by the Adviser from the relationship with each Fund – The Board considered that at the June 2009 Board meeting and at prior meetings, it had reviewed information about the profitability of the Adviser with respect to the Funds based on the fees payable to the Adviser and its affiliates (including fees under the Current Advisory Agreements), and all other sources of revenue and expense to the Adviser and its affiliates from the Funds’ operations for the last calendar year. The Board discussed the sources of direct and ancillary revenue with management, including the revenues to BGI from securities lending by the Companies (including any securities lending by the Funds). The Board also discussed the Adviser’s profit margin as reflected in the Funds’ profitability analysis and reviewed information regarding economies of scale (as discussed below).
In evaluating the costs of the services to be provided by the Adviser under the New Advisory Agreements, the Board considered, among other things, whether advisory fee rates or other expenses would change as a result of the Transaction. The Board noted that the New Advisory Agreements are similar to the Current Advisory Agreements, including the fact that the fee rates under the Agreements are identical and that representatives of the Adviser and BlackRock represented that there is no present intention due to the Transaction to alter the advisory fee rates, expense waiver or expense reimbursements currently in effect for the Funds for a period of two years from the date of the closing of the Transaction. It was noted that it was not possible to predict how the Transaction would affect the Adviser’s profitability from its relationship with the Funds. Potential cost savings had been described by BlackRock representatives that may be achieved by BlackRock immediately following the Transaction, but even if all of such savings were realized by the Adviser in connection with the management of the Funds, the Adviser’s profitability in respect of the Funds was not expected to increase in a significant respect. The Adviser, BlackRock and the Board discussed how profitability will be calculated and presented to the Board following the Transaction, and the Board reviewed BlackRock’s 2008 profitability methodology with respect to its registered funds. The Board expects to receive profitability information from the Adviser on at least an annual basis following the completion of the Transaction and thus be in a position to evaluate whether any adjustments in Fund fees would be appropriate.
The extent to which economies of scale would be realized as a Fund grows and whether fee levels would reflect such economies of scale – In connection with its review of the Funds’ profitability analysis at the June 2009 meeting, the Board reviewed information regarding potential economies of scale or other efficiencies that may result from increases in the Funds’ assets. At the June 2009 Board meeting, the Board also reviewed the Adviser’s historic profitability as investment adviser to the iShares fund complex and noted that the Adviser had continued to make significant investments in the iShares fund complex, that expenses had grown at a pace similar to the growth in revenue, and that the Adviser had incurred operating losses during earlier years when the iShares funds, including the Funds, had not yet reached scale. The Board further noted that the Current and New Advisory Agreements provide for breakpoints in certain Funds’ investment advisory fee rates as the assets of the Funds, on an aggregated basis with the assets of certain other Funds, increase and that breakpoints were implemented the previous year for certain Funds. The Board noted that for certain other Funds, the Current and New Advisory Agreements do not provide for any breakpoints in the Funds’ investment advisory fee rates as the assets of the Funds increase; however, the Board further noted that possible future economies of scale for those Funds had, in many cases, been taken into consideration by fixing the investment advisory fees at rates at the lower end of the marketplace, effectively giving Fund shareholders, from inception, the benefits of the lower average fee shareholders may have received from a fee structure with declining breakpoints where the initial fee was higher. At the June 2009 Board meeting, the Board, recognizing its responsibility to consider this issue at least annually, concluded that the structure of the investment advisory fee rates, with the breakpoints for certain Funds, reflected appropriate sharing of economies of scale with the Funds’ shareholders.
The Board noted representations from the Adviser and BlackRock that the Adviser will continue to make significant investments in the iShares fund complex and the infrastructure supporting the Funds. The Board determined that changes to the fee structure were not currently necessary and that the Funds appropriately participate in economies of scale. It was noted that it was not possible to evaluate how the Transaction would create opportunities for additional economies of scale. The Board expects to consider economies of scale on at least an annual basis following completion of the Transaction and thus be in a position to evaluate additional economies of scale, if any.
| BOARD REVIEWAND APPROVALOF NEW INVESTMENT ADVISORY AGREEMENTS | 105 |
Table of Contents
Board Review and Approval of New Investment Advisory Agreements (Unaudited) (Continued)
iSHARES®, INC.
Fees and services provided for other comparable funds/accounts managed by the Adviser and its Affiliates – At the June 2009 Board meeting, the Board received and considered certain information regarding the Funds’ annual investment advisory fee rates under the Current Advisory Agreements in comparison to the investment advisory/management fee rates for other funds/accounts for which the Adviser or BGI provides investment advisory/management services, including other funds registered under the 1940 Act, collective funds and separate accounts (together, the “Other Accounts”). The Board noted that directly comparable investment advisory/management fee information was not available for many of the Funds, as the Adviser and its affiliates do not manage any Other Accounts with substantially similar investment objectives and strategies as many of the Funds. The Board noted, however, that the Adviser provided the Board with general information regarding how the level of services provided to the Other Accounts differed from the level of services provided to the Funds. Furthermore, in reviewing the comparative investment advisory/management fee information for the Funds for which such information was available, the Board considered the general structure of investment advisory/management fees in relation to the nature and extent of services provided to the Funds in comparison with the nature and extent of services provided to the Other Accounts, including, among other things, the level of complexity in managing the Funds and the Other Accounts under differing regulatory requirements and client guidelines. The Board noted that the investment advisory fee rates under the Current Advisory Agreements for the Funds were generally higher than the investment advisory/management fee rates for the Other Accounts for which the Adviser or BGI provides investment advisory/management services, but that the differences appeared to be attributable to, among other things, the type and level of services provided and/or the asset levels of the Other Accounts. Based on this review, the Board determined that the investment advisory fee rates under the Current and New Advisory Agreements do not constitute fees that are so disproportionately large as to bear no reasonable relationship to the services rendered and that could not have been the product of arm’s-length bargaining, and concluded that the investment advisory fee rates under the Current and New Advisory Agreements are fair and reasonable.
Other benefits to the Adviser and its affiliates, including fall-out benefits – In evaluating the fall-out and any other ancillary benefits received by the Adviser under the Current Advisory Agreements, the Board reviewed any ancillary revenue received by the Adviser and/or its affiliates in connection with the services provided to the Funds by the Adviser or its affiliates, such as any payment of revenue to BGI, the Company’s current securities lending agent, for loaning any portfolio securities, and payment of advisory fees and/or administration fees to the Adviser and BGI in connection with any investments by the Funds in other funds for which the Adviser provides investment advisory services and/or BGI provides administration services. The Board noted that while revenue to BGI in connection with securities lending agency services to the Funds increased overall as against the previous year, overall revenue increased by approximately the same percentage as overall expenses. The Board noted that the Adviser does not use soft dollars or consider the value of research or other services that may be provided to the Adviser (including its affiliates) in selecting brokers for portfolio transactions for the Funds. The Board further noted that any portfolio transactions on behalf of the Funds placed through an affiliate of the Adviser or purchased from an underwriting syndicate in which an Adviser affiliate participates, are reported to the Board pursuant to Rule 17e-1 or Rule 10f-3, as applicable, under the 1940 Act. Any fall-out or ancillary benefits as a result of the Transaction were difficult to quantify with certainty at this time, and the Board indicated that it would continue to evaluate them going forward.
Conclusion – The Board examined the totality of the information they were provided at the June, July and August 2009 Board meetings, and information they received at other meetings held during the past year, and did not identify any single factor discussed previously as controlling. Based on this analysis, the Board determined that the New Advisory Agreements, including the investment advisory fee rates thereunder, are fair and reasonable in light of all relevant circumstances and concluded that it is in the best interest of the Funds and their shareholders to unanimously approve the New Advisory Agreements.
| 106 | 2009 iSHARES ANNUAL REPORTTO SHAREHOLDERS |
Table of Contents
Supplemental Information (Unaudited)
iSHARES®, INC.
The tables that follow present information about the differences between the daily market price on secondary markets for shares of a Fund and that Fund’s net asset value. Net asset value, or “NAV”, is the price per share at which each Fund issues and redeems shares. It is calculated in accordance with the standard formula for valuing mutual fund shares. The “Market Price” of each Fund generally is determined using the midpoint between the highest bid and the lowest offer on the primary stock exchange on which the shares of such Fund is listed for trading, as of the time that the Fund’s NAV is calculated. Each Fund’s Market Price may be at, above or below its NAV. The NAV of each Fund will fluctuate with changes in the market value of its portfolio holdings. The Market Price of each Fund will fluctuate in accordance with changes in its NAV, as well as market supply and demand.
Premiums or discounts are the differences (expressed as a percentage) between the NAV and Market Price of a Fund on a given day, generally at the time NAV is calculated. A premium is the amount that a Fund is trading above the reported NAV, expressed as a percentage of the NAV. A discount is the amount that a Fund is trading below the reported NAV, expressed as a percentage of the NAV.
The following information shows the frequency distributions of premiums and discounts for each of the Funds included in this report. The information shown for each Fund is for five calendar years (or for each full calendar quarter completed after the inception date of such Fund if less than five years) through the date of the most recent calendar quarter-end. The specific periods covered for each Fund are disclosed in the table for such Fund.
Each line in the table shows the number of trading days in which the Fund traded within the premium/discount range indicated. The number of trading days in each premium/discount range is also shown as a percentage of the total number of trading days in the period covered by each table. All data presented here represents past performance, which cannot be used to predict future results.
iShares MSCI Austria Investable Market Index Fund
Period Covered: January 1, 2004 through June 30, 2009
Premium/Discount Range | Number of Days | Percentage of Total Days | |||
Greater than 5.5% | 4 | 0.29 | % | ||
Greater than 5.0% and Less than 5.5% | 1 | 0.07 | |||
Greater than 4.5% and Less than 5.0% | 2 | 0.14 | |||
Greater than 4.0% and Less than 4.5% | 1 | 0.07 | |||
Greater than 3.5% and Less than 4.0% | 4 | 0.29 | |||
Greater than 3.0% and Less than 3.5% | 3 | 0.22 | |||
Greater than 2.5% and Less than 3.0% | 3 | 0.22 | |||
Greater than 2.0% and Less than 2.5% | 11 | 0.80 | |||
Greater than 1.5% and Less than 2.0% | 32 | 2.32 | |||
Greater than 1.0% and Less than 1.5% | 86 | 6.22 | |||
Greater than 0.5% and Less than 1.0% | 224 | 16.21 | |||
Between 0.5% and –0.5% | 737 | 53.32 | |||
Less than –0.5% and Greater than –1.0% | 144 | 10.42 | |||
Less than –1.0% and Greater than –1.5% | 71 | 5.14 | |||
Less than –1.5% and Greater than –2.0% | 23 | 1.66 | |||
Less than –2.0% and Greater than –2.5% | 15 | 1.09 | |||
Less than –2.5% and Greater than –3.0% | 4 | 0.29 | |||
Less than –3.0% and Greater than –3.5% | 7 | 0.51 | |||
Less than –3.5% and Greater than –4.0% | 4 | 0.29 | |||
Less than –4.0% and Greater than –4.5% | 1 | 0.07 | |||
Less than –4.5% | 5 | 0.36 | |||
| 1,382 | 100.00 | % | |||
| SUPPLEMENTAL INFORMATION | 107 |
Table of Contents
Supplemental Information (Unaudited) (Continued)
iSHARES®, INC.
iShares MSCI Belgium Investable Market Index Fund
Period Covered: January 1, 2004 through June 30, 2009
Premium/Discount Range | Number of Days | Percentage of Total Days | |||
Greater than 4.5% | 3 | 0.22 | % | ||
Greater than 4.0% and Less than 4.5% | 3 | 0.22 | |||
Greater than 3.5% and Less than 4.0% | 1 | 0.07 | |||
Greater than 3.0% and Less than 3.5% | 4 | 0.29 | |||
Greater than 2.5% and Less than 3.0% | 8 | 0.58 | |||
Greater than 2.0% and Less than 2.5% | 16 | 1.16 | |||
Greater than 1.5% and Less than 2.0% | 24 | 1.74 | |||
Greater than 1.0% and Less than 1.5% | 76 | 5.50 | |||
Greater than 0.5% and Less than 1.0% | 211 | 15.27 | |||
Between 0.5% and –0.5% | 812 | 58.74 | |||
Less than –0.5% and Greater than –1.0% | 134 | 9.70 | |||
Less than –1.0% and Greater than –1.5% | 47 | 3.40 | |||
Less than –1.5% and Greater than –2.0% | 22 | 1.59 | |||
Less than –2.0% and Greater than –2.5% | 4 | 0.29 | |||
Less than –2.5% and Greater than –3.0% | 6 | 0.43 | |||
Less than –3.0% and Greater than –3.5% | 3 | 0.22 | |||
Less than –3.5% and Greater than –4.0% | 3 | 0.22 | |||
Less than –4.0% | 5 | 0.36 | |||
| 1,382 | 100.00 | % | |||
iShares MSCI EMU Index Fund
Period Covered: January 1, 2004 through June 30, 2009
Premium/Discount Range | Number of Days | Percentage of Total Days | |||
Greater than 3.5% | 12 | 0.87 | % | ||
Greater than 3.0% and Less than 3.5% | 5 | 0.36 | |||
Greater than 2.5% and Less than 3.0% | 3 | 0.22 | |||
Greater than 2.0% and Less than 2.5% | 9 | 0.65 | |||
Greater than 1.5% and Less than 2.0% | 24 | 1.74 | |||
Greater than 1.0% and Less than 1.5% | 54 | 3.91 | |||
Greater than 0.5% and Less than 1.0% | 203 | 14.69 | |||
Between 0.5% and –0.5% | 849 | 61.42 | |||
Less than –0.5% and Greater than –1.0% | 135 | 9.77 | |||
Less than –1.0% and Greater than –1.5% | 49 | 3.55 | |||
Less than –1.5% and Greater than –2.0% | 21 | 1.52 | |||
Less than –2.0% and Greater than –2.5% | 3 | 0.22 | |||
Less than –2.5% and Greater than –3.0% | 5 | 0.36 | |||
Less than –3.0% and Greater than –3.5% | 4 | 0.29 | |||
Less than –3.5% | 6 | 0.43 | |||
| 1,382 | 100.00 | % | |||
| 108 | 2009 iSHARES ANNUAL REPORTTO SHAREHOLDERS |
Table of Contents
Supplemental Information (Unaudited) (Continued)
iSHARES®, INC.
iShares MSCI France Index Fund
Period Covered: January 1, 2004 through June 30, 2009
Premium/Discount Range | Number of Days | Percentage of Total Days | |||
Greater than 5.0% | 3 | 0.22 | % | ||
Greater than 4.5% and Less than 5.0% | 1 | 0.07 | |||
Greater than 4.0% and Less than 4.5% | 4 | 0.29 | |||
Greater than 3.5% and Less than 4.0% | 1 | 0.07 | |||
Greater than 3.0% and Less than 3.5% | 2 | 0.14 | |||
Greater than 2.5% and Less than 3.0% | 5 | 0.36 | |||
Greater than 2.0% and Less than 2.5% | 8 | 0.58 | |||
Greater than 1.5% and Less than 2.0% | 20 | 1.45 | |||
Greater than 1.0% and Less than 1.5% | 47 | 3.40 | |||
Greater than 0.5% and Less than 1.0% | 151 | 10.93 | |||
Between 0.5% and –0.5% | 929 | 67.24 | |||
Less than –0.5% and Greater than –1.0% | 122 | 8.83 | |||
Less than –1.0% and Greater than –1.5% | 51 | 3.69 | |||
Less than –1.5% and Greater than –2.0% | 18 | 1.30 | |||
Less than –2.0% and Greater than –2.5% | 5 | 0.36 | |||
Less than –2.5% and Greater than –3.0% | 7 | 0.51 | |||
Less than –3.0% and Greater than –3.5% | 1 | 0.07 | |||
Less than –3.5% and Greater than –4.0% | 2 | 0.14 | |||
Less than –4.0% and Greater than –4.5% | 2 | 0.14 | |||
Less than –4.5% and Greater than –5.0% | 2 | 0.14 | |||
Less than –5.0% and Greater than –5.5% | 1 | 0.07 | |||
| 1,382 | 100.00 | % | |||
| SUPPLEMENTAL INFORMATION | 109 |
Table of Contents
Supplemental Information (Unaudited) (Continued)
iSHARES®, INC.
iShares MSCI Germany Index Fund
Period Covered: January 1, 2004 through June 30, 2009
Premium/Discount Range | Number of Days | Percentage of Total Days | |||
Greater than 5.0% | 5 | 0.36 | % | ||
Greater than 4.5% and Less than 5.0% | 2 | 0.14 | |||
Greater than 4.0% and Less than 4.5% | 1 | 0.07 | |||
Greater than 3.5% and Less than 4.0% | 2 | 0.14 | |||
Greater than 3.0% and Less than 3.5% | 3 | 0.22 | |||
Greater than 2.5% and Less than 3.0% | 4 | 0.29 | |||
Greater than 2.0% and Less than 2.5% | 10 | 0.72 | |||
Greater than 1.5% and Less than 2.0% | 14 | 1.01 | |||
Greater than 1.0% and Less than 1.5% | 55 | 3.98 | |||
Greater than 0.5% and Less than 1.0% | 167 | 12.08 | |||
Between 0.5% and –0.5% | 907 | 65.67 | |||
Less than –0.5% and Greater than –1.0% | 126 | 9.12 | |||
Less than –1.0% and Greater than –1.5% | 55 | 3.98 | |||
Less than –1.5% and Greater than –2.0% | 10 | 0.72 | |||
Less than –2.0% and Greater than –2.5% | 9 | 0.65 | |||
Less than –2.5% and Greater than –3.0% | 4 | 0.29 | |||
Less than –3.0% and Greater than –3.5% | 2 | 0.14 | |||
Less than –3.5% and Greater than –4.0% | 2 | 0.14 | |||
Less than –4.0% and Greater than –4.5% | 2 | 0.14 | |||
Less than –4.5% and Greater than –5.0% | 2 | 0.14 | |||
| 1,382 | 100.00 | % | |||
| 110 | 2009 iSHARES ANNUAL REPORTTO SHAREHOLDERS |
Table of Contents
Supplemental Information (Unaudited) (Continued)
iSHARES®, INC.
iShares MSCI Italy Index Fund
Period Covered: January 1, 2004 through June 30, 2009
Premium/Discount Range | Number of Days | Percentage of Total Days | |||
Greater than 5.5% | 2 | 0.14 | % | ||
Greater than 5.0% and Less than 5.5% | 1 | 0.07 | |||
Greater than 4.5% and Less than 5.0% | 3 | 0.22 | |||
Greater than 4.0% and Less than 4.5% | 2 | 0.14 | |||
Greater than 3.5% and Less than 4.0% | 2 | 0.14 | |||
Greater than 3.0% and Less than 3.5% | 4 | 0.29 | |||
Greater than 2.5% and Less than 3.0% | 2 | 0.14 | |||
Greater than 2.0% and Less than 2.5% | 10 | 0.72 | |||
Greater than 1.5% and Less than 2.0% | 19 | 1.37 | |||
Greater than 1.0% and Less than 1.5% | 52 | 3.76 | |||
Greater than 0.5% and Less than 1.0% | 137 | 9.91 | |||
Between 0.5% and –0.5% | 934 | 67.62 | |||
Less than –0.5% and Greater than –1.0% | 123 | 8.90 | |||
Less than –1.0% and Greater than –1.5% | 49 | 3.55 | |||
Less than –1.5% and Greater than –2.0% | 17 | 1.23 | |||
Less than –2.0% and Greater than –2.5% | 7 | 0.51 | |||
Less than –2.5% and Greater than –3.0% | 5 | 0.36 | |||
Less than –3.0% and Greater than –3.5% | 7 | 0.51 | |||
Less than –3.5% and Greater than –4.0% | 2 | 0.14 | |||
Less than –4.0% and Greater than –4.5% | 2 | 0.14 | |||
Less than –4.5% | 2 | 0.14 | |||
| 1,382 | 100.00 | % | |||
| SUPPLEMENTAL INFORMATION | 111 |
Table of Contents
Supplemental Information (Unaudited) (Continued)
iSHARES®, INC.
iShares MSCI Netherlands Investable Market Index Fund
Period Covered: January 1, 2004 through June 30, 2009
Premium/Discount Range | Number of Days | Percentage of Total Days | |||
Greater than 5.0% | 3 | 0.22 | % | ||
Greater than 4.5% and Less than 5.0% | 2 | 0.14 | |||
Greater than 4.0% and Less than 4.5% | 1 | 0.07 | |||
Greater than 3.5% and Less than 4.0% | 2 | 0.14 | |||
Greater than 3.0% and Less than 3.5% | 2 | 0.14 | |||
Greater than 2.5% and Less than 3.0% | 4 | 0.29 | |||
Greater than 2.0% and Less than 2.5% | 12 | 0.87 | |||
Greater than 1.5% and Less than 2.0% | 14 | 1.01 | |||
Greater than 1.0% and Less than 1.5% | 60 | 4.34 | |||
Greater than 0.5% and Less than 1.0% | 200 | 14.47 | |||
Between 0.5% and –0.5% | 851 | 61.60 | |||
Less than –0.5% and Greater than –1.0% | 136 | 9.84 | |||
Less than –1.0% and Greater than –1.5% | 54 | 3.91 | |||
Less than –1.5% and Greater than –2.0% | 18 | 1.30 | |||
Less than –2.0% and Greater than –2.5% | 5 | 0.36 | |||
Less than –2.5% and Greater than –3.0% | 7 | 0.51 | |||
Less than –3.0% and Greater than –3.5% | 4 | 0.29 | |||
Less than –3.5% and Greater than –4.0% | 2 | 0.14 | |||
Less than –4.0% and Greater than –4.5% | 2 | 0.14 | |||
Less than –4.5% | 3 | 0.22 | |||
| 1,382 | 100.00 | % | |||
| 112 | 2009 iSHARES ANNUAL REPORTTO SHAREHOLDERS |
Table of Contents
Supplemental Information (Unaudited) (Continued)
iSHARES®, INC.
iShares MSCI Spain Index Fund
Period Covered: January 1, 2004 through June 30, 2009
Premium/Discount Range | Number of Days | Percentage of Total Days | |||
Greater than 3.5% | 10 | 0.72 | % | ||
Greater than 3.0% and Less than 3.5% | 2 | 0.14 | |||
Greater than 2.5% and Less than 3.0% | 4 | 0.29 | |||
Greater than 2.0% and Less than 2.5% | 13 | 0.94 | |||
Greater than 1.5% and Less than 2.0% | 14 | 1.01 | |||
Greater than 1.0% and Less than 1.5% | 55 | 3.98 | |||
Greater than 0.5% and Less than 1.0% | 174 | 12.59 | |||
Between 0.5% and –0.5% | 877 | 63.49 | |||
Less than –0.5% and Greater than –1.0% | 144 | 10.42 | |||
Less than –1.0% and Greater than –1.5% | 53 | 3.84 | |||
Less than –1.5% and Greater than –2.0% | 16 | 1.16 | |||
Less than –2.0% and Greater than –2.5% | 6 | 0.43 | |||
Less than –2.5% and Greater than –3.0% | 5 | 0.36 | |||
Less than –3.0% and Greater than –3.5% | 2 | 0.14 | |||
Less than –3.5% and Greater than –4.0% | 2 | 0.14 | |||
Less than –4.0% and Greater than –4.5% | 1 | 0.07 | |||
Less than –4.5% and Greater than –5.0% | 2 | 0.14 | |||
Less than –5.0% | 2 | 0.14 | |||
| 1,382 | 100.00 | % | |||
| SUPPLEMENTAL INFORMATION | 113 |
Table of Contents
Supplemental Information (Unaudited) (Continued)
iSHARES®, INC.
iShares MSCI Sweden Index Fund
Period Covered: January 1, 2004 through June 30, 2009
Premium/Discount Range | Number of Days | Percentage of Total Days | |||
Greater than 6.0% | 3 | 0.22 | % | ||
Greater than 5.5% and Less than 6.0% | 2 | 0.14 | |||
Greater than 5.0% and Less than 5.5% | 3 | 0.22 | |||
Greater than 4.5% and Less than 5.0% | 2 | 0.14 | |||
Greater than 4.0% and Less than 4.5% | 2 | 0.14 | |||
Greater than 3.5% and Less than 4.0% | 3 | 0.22 | |||
Greater than 3.0% and Less than 3.5% | 6 | 0.43 | |||
Greater than 2.5% and Less than 3.0% | 9 | 0.65 | |||
Greater than 2.0% and Less than 2.5% | 16 | 1.16 | |||
Greater than 1.5% and Less than 2.0% | 32 | 2.32 | |||
Greater than 1.0% and Less than 1.5% | 70 | 5.07 | |||
Greater than 0.5% and Less than 1.0% | 226 | 16.35 | |||
Between 0.5% and –0.5% | 741 | 53.62 | |||
Less than –0.5% and Greater than –1.0% | 139 | 10.06 | |||
Less than –1.0% and Greater than –1.5% | 67 | 4.85 | |||
Less than –1.5% and Greater than –2.0% | 26 | 1.88 | |||
Less than –2.0% and Greater than –2.5% | 11 | 0.80 | |||
Less than –2.5% and Greater than –3.0% | 6 | 0.43 | |||
Less than –3.0% and Greater than –3.5% | 5 | 0.36 | |||
Less than –3.5% and Greater than –4.0% | 3 | 0.22 | |||
Less than –4.0% and Greater than –4.5% | 3 | 0.22 | |||
Less than –4.5% and Greater than –5.0% | 3 | 0.22 | |||
Less than –5.0% and Greater than –5.5% | 2 | 0.14 | |||
Less than –5.5% and Greater than –6.0% | 1 | 0.07 | |||
Less than –6.0% | 1 | 0.07 | |||
| 1,382 | 100.00 | % | |||
| 114 | 2009 iSHARES ANNUAL REPORTTO SHAREHOLDERS |
Table of Contents
Supplemental Information (Unaudited) (Continued)
iSHARES®, INC.
iShares MSCI Switzerland Index Fund
Period Covered: January 1, 2004 through June 30, 2009
Premium/Discount Range | Number of Days | Percentage of Total Days | |||
Greater than 4.0% | 5 | 0.36 | % | ||
Greater than 3.5% and Less than 4.0% | 3 | 0.22 | |||
Greater than 3.0% and Less than 3.5% | 5 | 0.36 | |||
Greater than 2.5% and Less than 3.0% | 2 | 0.14 | |||
Greater than 2.0% and Less than 2.5% | 8 | 0.58 | |||
Greater than 1.5% and Less than 2.0% | 30 | 2.17 | |||
Greater than 1.0% and Less than 1.5% | 69 | 4.99 | |||
Greater than 0.5% and Less than 1.0% | 239 | 17.29 | |||
Between 0.5% and –0.5% | 838 | 60.66 | |||
Less than –0.5% and Greater than –1.0% | 111 | 8.03 | |||
Less than –1.0% and Greater than –1.5% | 41 | 2.97 | |||
Less than –1.5% and Greater than –2.0% | 10 | 0.72 | |||
Less than –2.0% and Greater than –2.5% | 13 | 0.94 | |||
Less than –2.5% and Greater than –3.0% | 2 | 0.14 | |||
Less than –3.0% | 6 | 0.43 | |||
| 1,382 | 100.00 | % | |||
iShares MSCI United Kingdom Index Fund
Period Covered: January 1, 2004 through June 30, 2009
Premium/Discount Range | Number of Days | Percentage of Total Days | |||
Greater than 3.0% | 13 | 0.94 | % | ||
Greater than 2.5% and Less than 3.0% | 3 | 0.22 | |||
Greater than 2.0% and Less than 2.5% | 12 | 0.87 | |||
Greater than 1.5% and Less than 2.0% | 41 | 2.97 | |||
Greater than 1.0% and Less than 1.5% | 152 | 11.00 | |||
Greater than 0.5% and Less than 1.0% | 348 | 25.18 | |||
Between 0.5% and –0.5% | 643 | 46.52 | |||
Less than –0.5% and Greater than –1.0% | 100 | 7.24 | |||
Less than –1.0% and Greater than –1.5% | 34 | 2.46 | |||
Less than –1.5% and Greater than –2.0% | 16 | 1.16 | |||
Less than –2.0% and Greater than –2.5% | 4 | 0.29 | |||
Less than –2.5% and Greater than –3.0% | 7 | 0.51 | |||
Less than –3.0% and Greater than –3.5% | 3 | 0.22 | |||
Less than –3.5% and Greater than –4.0% | 2 | 0.14 | |||
Less than –4.0% and Greater than –4.5% | 1 | 0.07 | |||
Less than –4.5% and Greater than –5.0% | 2 | 0.14 | |||
Less than –5.0% | 1 | 0.07 | |||
| 1,382 | 100.00 | % | |||
| SUPPLEMENTAL INFORMATION | 115 |
Table of Contents
Director and Officer Information (Unaudited)
iSHARES®, INC.
The Board of Directors has responsibility for the overall management and operations of the Company, including general supervision of the duties performed by BGFA and other service providers. Each Director serves until his or her successor is duly elected or appointed and qualified. Each Officer serves until he or she resigns, is removed, dies, retires or becomes disqualified.
iShares, Inc., iShares Trust, Barclays Global Investors Funds (“BGIF”) and Master Investment Portfolio (“MIP”) are considered to be members of the same fund complex, as defined in Form N-1A under the 1940 Act. Each Director of iShares, Inc. also serves as a Trustee for iShares Trust and oversees 183 portfolios within the fund complex. In addition, Lee T. Kranefuss serves as a Trustee for BGIF and MIP and oversees an additional 26 portfolios within the fund complex.
The address of each Director and Officer is c/o Barclays Global Investors, N.A., 400 Howard Street, San Francisco, California 94105. The Board has designated George G.C. Parker as its Lead Independent Director. Additional information about the Funds’ Directors and Officers may be found in the Funds’ combined Statement of Additional Information, which is available without charge, upon request, by calling toll-free 1-800-474-2737.
Interested Directors and Officers
Name, Age | Position(s), Length of Service | Principal Occupation(s) During Past 5 Years | Other Directorships Held | |||
*Lee T. Kranefuss, 48 | Director and Chairman (since 2003). | Non-Executive Chairman (since 2009), iShares; Global Chief Executive Officer (2008-2009) of iShares/Intermediary Groups of BGI; Chief Executive Officer (2005-2008) of iShares Intermediary Index and Market Group of BGI; Chief Executive Officer (2003-2005) of the Intermediary Investor and Exchange Traded Products Business of BGI; Director (since 2005) of BGFA; Director, President and Chief Executive Officer (since 2005) of Barclays Global Investors International, Inc.; Director and Chairman (since 2005) of Barclays Global Investors Services. | Trustee (since 2003) of iShares Trust; Trustee (since 2001) of BGlF and MIP. |
| * | Lee T. Kranefuss is deemed to be an “interested person” (as defined in the 1940 Act) of the Company due to his affiliations with BGFA, the Funds’ investment adviser; BGI, the parent company of BGFA; and Barclays Global Investors Services, an affiliate of BGFA and BGI. |
| 116 | 2009 iSHARES ANNUAL REPORTTO SHAREHOLDERS |
Table of Contents
Director and Officer Information (Unaudited) (Continued)
iSHARES®, INC.
Independent Directors
| Name, Age | Position(s), Length of Service | Principal Occupation(s) During Past 5 Years | Other Directorships Held | |||
George G.C. Parker, 70 | Director (since 2002); Lead Independent Director (since 2006). | Dean Witter Distinguished Professor of Finance (since 1994), Emeritus, Stanford University: Graduate School of Business. | Trustee (since 2000) of iShares Trust; Lead Independent Trustee (since 2006) of iShares Trust; Director (since 1995) of Community First Financial Group; Director (since 1999) of Tejon Ranch Company; Director (since 2004) of Threshold Pharmaceuticals; Director (since 2007) of NETGEAR, Inc. | |||
J. Darrell Duffie, 55 | Director (since 2008). | Professor (since 1984) of Stanford University: Graduate School of Business. | Trustee (since 2008) of iShares Trust; Director (since 2008) of Moody’s Corp. | |||
Cecilia H. Herbert, 60 | Director (since 2005). | Chair (1994-2005) of Investment Committee, Archdiocese of San Francisco; Director (since 1998) and President (since 2007) of the Board of Directors, Catholic Charities CYO; Trustee (2004-2005) of Pacific Select Funds; Trustee (since 2002) and Chair (2006-2007) of the Finance and Investment Committees (since 2006) of the Thacher School. | Trustee (since 2005) of iShares Trust; Advisory Board Member (since 2009) of Forward Funds. | |||
Charles A. Hurty, 66 | Director (since 2005). | Retired; Partner, KPMG LLP (1968-2001). | Trustee (since 2005) of iShares Trust; Director (since 2002) of ProMark Absolute Return Strategies Fund LLC (1 portfolio); Director (since 2002) of Citigroup Alternative Investments Multi-Adviser Hedge Fund Portfolios LLC (1 portfolio); Director (since 2005) of CSFB Alternative Investments Fund (6 portfolios). | |||
John E. Kerrigan, 54 | Director (since 2005). | Chief Investment Officer (since 2002) of Santa Clara University. | Trustee (since 2005) of iShares Trust. | |||
*John E. Martinez, 48 | Director (since 2003). | Director (since 2005) of EquityRock Capital Management; Director (since 2003) of Larkin Street Youth Services. | Trustee (since 2003) of iShares Trust; Chairman (since 2007) of Independent Review Committee, Canadian iShares Funds. | |||
| DIRECTORAND OFFICER INFORMATION | 117 |
Table of Contents
Director and Officer Information (Unaudited) (Continued)
iSHARES®, INC.
Independent Directors (Continued)
Name, Age | Position(s), Length of Service | Principal Occupation(s) During Past 5 Years | Other Directorships Held | |||
Robert H. Silver, 54 | Director (since 2007). | President and Co-Founder (since 2006) of The Bravitas Group, Inc.; Member (since 2006) of Non-Investor Advisory Board of Russia Partners II, LP; Director and member (2006-2009) of the Audit and Compensation Committee of EPAM Systems, Inc.; President and Chief Operating Officer (2003-2005) and Director (1999-2005) of UBS Financial Services, Inc.; President and Chief Executive Officer (1999-2005) of UBS Services USA, LLC; Managing Director (2000-2005) of UBS America, Inc.; Director and Vice Chairman (since 2001) of the YMCA of Greater NYC; Broadway Producer (since 2006); Co-Founder and Vice President (since 2008) of Parentgiving Inc. | Trustee (since 2007) of iShares Trust. |
| * | Prior to August 13, 2009, John E. Martinez was deemed to be an “interested person” (as defined in the 1940 Act) of the Trust due to his affiliations with BGFA, the Funds’ investment adviser; BGI, the parent company of BGFA; and Barclays Global Investors Services, an affiliate of BGFA and BGI. Effective August 13, 2009, John E. Martinez is a non-interested person notwithstanding his former affiliation with BGFA and its affiliates prior to 2002. |
Officers
| Name, Age | Position(s), Length of Service | Principal Occupation(s) During Past 5 Years | Other Directorships Held | |||
Michael A. Latham, 44 | President (since 2007). | Head (since 2007) of Americas iShares, BGI; Chief Operating Officer (2003-2007) of the Intermediary Investor and Exchange Traded Products Business of BGI; Director and Chief Financial Officer (since 2005) of Barclays Global Investors International, Inc. | None. |
| 118 | 2009 iSHARES ANNUAL REPORTTO SHAREHOLDERS |
Table of Contents
Director and Officer Information (Unaudited) (Continued)
iSHARES®, INC.
Officers (Continued)
| Name, Age | Position(s), Length of Service | Principal Occupation(s) During Past 5 Years | Other Directorships Held | |||
Geoffrey D. Flynn, 52 | Executive Vice President and Chief Operating Officer (since 2008). | Chief Operating Officer (since 2008) of U.S. iShares, BGI; Director (2007-2008) of Mutual Fund Operations of BGI; President (2003-2007) of Van Kampen Investors Services; Managing Director (2002-2007) of Morgan Stanley; President (2002-2007) of Morgan Stanley Trust, FSB. | None. | |||
Jack Gee, 50 | Treasurer and Chief Financial Officer (since 2008). | Senior Director (since 2009) of Fund Administration of Intermediary Investor Business of BGI; Director (2004-2009) of Fund Administration of Intermediary Investor Business of BGI; Treasurer and Chief Financial Officer (2004) of Parnassus Investments. | None. | |||
Eilleen M. Clavere, 57 | Secretary (since 2007). | Director (since 2006) of Legal Administration of Intermediary Investors Business of BGI; Legal Counsel and Vice President (2005-2006) of Atlas Funds, Atlas Advisers, Inc. and Atlas Securities, Inc.; Counsel (2001-2005) of Kirkpatrick & Lockhart LLP. | None. | |||
Ira P. Shapiro, 46 | Vice President and Chief Legal Officer (since 2007). | Associate General Counsel (since 2004) of BGI; First Vice President (1993-2004) of Merrill Lynch Investment Managers. | None. | |||
Amy Schioldager, 47 | Executive Vice President (since 2007). | Global Head (since 2008) of Index Equity, BGI; Global Head (2006-2008) of U.S. Indexing, BGI; Head (2001-2006) of Domestic Equity Portfolio Management, BGI. | None. | |||
Patrick O’Connor, 42 | Vice President (since 2007). | Head (since 2006) of iShares Portfolio Management, BGI; Senior Portfolio Manager (1999-2006) of BGI. | None. | |||
| DIRECTORAND OFFICER INFORMATION | 119 |
Table of Contents
Director and Officer Information (Unaudited) (Continued)
iSHARES®, INC.
Officers (Continued)
| ||||||
| Name, Age | Position(s), Length of Service | Principal Occupation(s) During Past 5 Years | Other Directorships Held | |||
Lee Sterne, 44 | Vice President (since 2007). | Head (since 2007) of U.S. Fixed Income Index and iShares, BGI; Senior Portfolio Manager (2004-2007) of BGI; Portfolio Manager (2001-2004) of BGI. | None. | |||
Matt Tucker, 37 | Vice President (since 2007). | Director (since 2009) of Fixed Income Investment Strategy, BGI; Head (2005-2008) of U.S. Fixed Income Investment Solutions, BGI; Fixed Income Investment Strategist (2003-2005) of BGI. | None. | |||
| 120 | 2009 iSHARES ANNUAL REPORTTO SHAREHOLDERS |
Table of Contents
Notes:
| NOTES | 121 |
Table of Contents
Notes:
| 122 | 2009 iSHARES ANNUAL REPORTTO SHAREHOLDERS |
Table of Contents
Notes:
| NOTES | 123 |
Table of Contents
The following is a list of iShares Funds being offered, along with their respective exchange trading symbols. Please call 1-800-iShares (1-800-474-2737) to obtain a prospectus for any iShares Fund. The prospectus contains more complete information, including charges, expenses, investment objectives and risk factors that should be carefully considered to determine if the Fund(s) are an appropriate investment for you. Read the prospectus(es) carefully before investing. Investing involves risk, including possible loss of principal.
iShares Russell Domestic Index Funds | Trading Symbol | |
iShares Russell 3000 | IWV | |
iShares Russell 3000 Growth | IWZ | |
iShares Russell 3000 Value | IWW | |
iShares Russell Top 200 | IWL | |
iShares Russell Top 200 Growth | IWY | |
iShares Russell Top 200 Value | IWX | |
iShares Russell 1000 | IWB | |
iShares Russell 1000 Growth | IWF | |
iShares Russell 1000 Value | IWD | |
iShares Russell Midcap | IWR | |
iShares Russell Midcap Growth | IWP | |
iShares Russell Midcap Value | IWS | |
iShares Russell 2000 | IWM | |
iShares Russell 2000 Growth | IWO | |
iShares Russell 2000 Value | IWN | |
iShares Russell Microcap | IWC | |
| iShares S&P Domestic Index Funds | ||
iShares S&P 1500 | ISI | |
iShares S&P 100 | OEF | |
iShares S&P 500 | IVV | |
iShares S&P 500 Growth | IVW | |
iShares S&P 500 Value | IVE | |
iShares S&P MidCap 400 | IJH | |
iShares S&P MidCap 400 Growth | IJK | |
iShares S&P MidCap 400 Value | IJJ | |
iShares S&P SmallCap 600 | IJR | |
iShares S&P SmallCap 600 Growth | IJT | |
iShares S&P SmallCap 600 Value | IJS | |
| iShares Morningstar Domestic Index Funds | ||
iShares Morningstar Large Core | JKD | |
iShares Morningstar Large Growth | JKE | |
iShares Morningstar Large Value | JKF | |
iShares Morningstar Mid Core | JKG | |
iShares Morningstar Mid Growth | JKH | |
iShares Morningstar Mid Value | JKI | |
iShares Morningstar Small Core | JKJ | |
iShares Morningstar Small Growth | JKK | |
iShares Morningstar Small Value | JKL | |
| iShares Dow Jones Domestic Index Funds | ||
iShares Dow Jones U.S. | IYY | |
| iShares KLD Socially Responsible Index Funds | ||
iShares FTSE KLD 400 Social | DSI | |
iShares FTSE KLD Select Social | KLD | |
| iShares NYSE Domestic Index Funds | ||
iShares NYSE Composite | NYC | |
iShares NYSE 100 | NY | |
| iShares Domestic Specialty Index Funds | Trading Symbol | |
iShares S&P U.S. Preferred Stock | PFF | |
iShares Dow Jones Select Dividend | DVY | |
| iShares North American Sector/Subsector Index Funds | ||
iShares S&P North American Technology Sector | IGM | |
iShares S&P North American Technology-Multimedia Networking | IGN | |
iShares S&P North American Technology- Semiconductors | IGW | |
iShares S&P North American Technology-Software | IGV | |
iShares S&P North American Natural Resources Sector | IGE | |
| iShares Domestic Sector Index Funds | ||
iShares Dow Jones U.S. Basic Materials Sector | IYM | |
iShares Dow Jones U.S. Consumer Goods Sector | IYK | |
iShares Dow Jones U.S. Consumer Services Sector | IYC | |
iShares Dow Jones U.S. Energy Sector | IYE | |
iShares Dow Jones U.S. Financial Sector | IYF | |
iShares Dow Jones U.S. Healthcare Sector | IYH | |
iShares Dow Jones U.S. Industrial Sector | IYJ | |
iShares Dow Jones U.S. Technology Sector | IYW | |
iShares Dow Jones U.S. Telecommunications Sector | IYZ | |
iShares Dow Jones U.S. Utilities Sector | IDU | |
| iShares Domestic Subsector Index Funds | ||
iShares Dow Jones Transportation Average | IYT | |
iShares Dow Jones U.S. Aerospace & Defense | ITA | |
iShares Dow Jones U.S. Broker-Dealers | IAI | |
iShares Dow Jones U.S. Financial Services | IYG | |
iShares Dow Jones U.S. Healthcare Providers | IHF | |
iShares Dow Jones U.S. Home Construction | ITB | |
iShares Dow Jones U.S. Insurance | IAK | |
iShares Dow Jones U.S. Medical Devices | IHI | |
iShares Dow Jones U.S. Oil & Gas Exploration & Production | IEO | |
iShares Dow Jones U.S. Oil Equipment & Services | IEZ | |
iShares Dow Jones U.S. Pharmaceuticals | IHE | |
iShares Dow Jones U.S. Regional Banks | IAT | |
iShares Nasdaq Biotechnology | IBB | |
| iShares Domestic Real Estate Index Funds | ||
iShares Cohen & Steers Realty Majors | ICF | |
iShares Dow Jones U.S. Real Estate | IYR | |
iShares FTSE NAREIT Real Estate 50 | FTY | |
iShares FTSE NAREIT Industrial/Office Capped | FIO | |
iShares FTSE NAREIT Mortgage Plus Capped | REM | |
iShares FTSE NAREIT Residential Plus Capped | REZ | |
iShares FTSE NAREIT Retail Capped | RTL | |
| iShares Target Risk Index Funds | ||
iShares S&P Conservative Allocation | AOK | |
iShares S&P Moderate Allocation | AOM | |
iShares S&P Growth Allocation | AOR | |
iShares S&P Aggressive Allocation | AOA | |
| 124 | 2009 iSHARES ANNUAL REPORTTO SHAREHOLDERS |
Table of Contents
The iShares® Family of Funds (Continued)
| iShares International Country Index Funds | Trading Symbol | |
iShares FTSE China (HK Listed) | FCHI | |
iShares FTSE/Xinhua China 25 | FXI | |
iShares MSCI Australia | EWA | |
iShares MSCI Austria Investable Market | EWO | |
iShares MSCI Belgium Investable Market | EWK | |
iShares MSCI Brazil | EWZ | |
iShares MSCI Canada | EWC | |
iShares MSCI Chile Investable Market | ECH | |
iShares MSCI France | EWQ | |
iShares MSCI Germany | EWG | |
iShares MSCI Hong Kong | EWH | |
iShares MSCI Israel Capped Investable Market | EIS | |
iShares MSCI Italy | EWI | |
iShares MSCI Japan | EWJ | |
iShares MSCI Japan Small Cap | SCJ | |
iShares S&P/TOPIX 150 | ITF | |
iShares MSCI Malaysia | EWM | |
iShares MSCI Mexico Investable Market | EWW | |
iShares MSCI Netherlands Investable Market | EWN | |
iShares MSCI All Peru Capped | EPU | |
iShares MSCI Singapore | EWS | |
iShares MSCI South Africa | EZA | |
iShares MSCI South Korea | EWY | |
iShares MSCI Spain | EWP | |
iShares MSCI Sweden | EWD | |
iShares MSCI Switzerland | EWL | |
iShares MSCI Taiwan | EWT | |
iShares MSCI Thailand Investable Market | THD | |
iShares MSCI Turkey Investable Market | TUR | |
iShares MSCI United Kingdom | EWU | |
| iShares International Index Funds | ||
iShares MSCI ACWI ex US | ACWX | |
iShares MSCI EAFE | EFA | |
iShares MSCI EAFE Growth | EFG | |
iShares MSCI EAFE Value | EFV | |
iShares MSCI EAFE Small Cap | SCZ | |
iShares FTSE Developed Small Cap ex-North America | IFSM | |
iShares MSCI Emerging Markets | EEM | |
iShares MSCI Emerging Markets Eastern Europe | ESR | |
iShares S&P Emerging Markets Infrastructure | EMIF | |
iShares MSCI BRIC | BKF | |
iShares MSCI EMU | EZU | |
iShares MSCI All Country Asia ex Japan | AAXJ | |
iShares MSCI Pacific ex-Japan | EPP | |
iShares S&P Asia 50 | AIA | |
iShares S&P Europe 350 | IEV | |
iShares S&P Latin America 40 | ILF | |
| iShares International/Global Real Estate Index Funds | ||
iShares S&P Developed ex-U.S. Property | WPS | |
iShares FTSE EPRA/NAREIT Developed Real Estate ex-U.S. | IFGL | |
iShares FTSE EPRA/NAREIT Developed Asia | IFAS | |
iShares FTSE EPRA/NAREIT Developed Europe | IFEU | |
iShares FTSE EPRA/NAREIT North America | IFNA | |
| iShares International Specialty Index Funds | ||
iShares Dow Jones International Select Dividend | IDV | |
| iShares Target Date Index Funds | Trading Symbol | |
iShares S&P Target Date Retirement Income | TGR | |
iShares S&P Target Date 2010 | TZD | |
iShares S&P Target Date 2015 | TZE | |
iShares S&P Target Date 2020 | TZG | |
iShares S&P Target Date 2025 | TZI | |
iShares S&P Target Date 2030 | TZL | |
iShares S&P Target Date 2035 | TZO | |
iShares S&P Target Date 2040 | TZV | |
| iShares Global Index Funds | ||
iShares MSCI ACWI | ACWI | |
iShares S&P Global 100 | IOO | |
iShares MSCI Kokusai | TOK | |
| iShares Global Sector Index Funds | ||
iShares S&P Global Consumer Discretionary Sector | RXI | |
iShares S&P Global Consumer Staples Sector | KXI | |
iShares S&P Global Energy Sector | IXC | |
iShares S&P Global Financials Sector | IXG | |
iShares S&P Global Healthcare Sector | IXJ | |
iShares S&P Global Industrials Sector | EXI | |
iShares S&P Global Materials Sector | MXI | |
iShares S&P Global Technology Sector | IXN | |
iShares S&P Global Telecommunications Sector | IXP | |
iShares S&P Global Utilities Sector | JXI | |
| iShares Global Theme Based Index Funds | ||
iShares S&P Global Clean Energy | ICLN | |
iShares S&P Global Infrastructure | IGF | |
iShares S&P Global Nuclear Energy | NUCL | |
iShares S&P Global Timber & Forestry | WOOD | |
| iShares U.S. Multisector Bond Funds | ||
iShares Barclays Aggregate | AGG | |
iShares Barclays Government/Credit | GBF | |
iShares Barclays Intermediate Government/Credit | GVI | |
| iShares U.S. Government Bond Funds | ||
iShares Barclays Short Treasury | SHV | |
iShares Barclays 1-3 Year Treasury | SHY | |
iShares Barclays 3-7 Year Treasury | IEI | |
iShares Barclays 7-10 Year Treasury | IEF | |
iShares Barclays 10-20 Year Treasury | TLH | |
iShares Barclays 20+ Year Treasury | TLT | |
iShares Barclays TIPS | TIP | |
iShares Barclays Agency | AGZ | |
| iShares U.S. Credit Bond Funds | ||
iShares Barclays Credit | CFT | |
iShares Barclays 1-3 Year Credit | CSJ | |
iShares Barclays Intermediate Credit | CIU | |
iShares iBoxx $ Investment Grade Corporate | LQD | |
iShares iBoxx $ High Yield Corporate | HYG | |
| iShares U.S. Securitized Bond Funds | ||
iShares Barclays MBS | MBB | |
iSHARES FAMILYOF FUNDS | 125 |
Table of Contents
The iShares® Family of Funds (Continued)
| iShares AMT-Free Municipal Bond Funds | Trading Symbol | |
iShares S&P National AMT-Free Municipal | MUB | |
iShares S&P Short Term National AMT-Free Municipal | SUB | |
iShares S&P California AMT-Free Municipal | CMF | |
iShares S&P New York AMT-Free Municipal | NYF |
| iShares International Bond Funds | Trading Symbol | |
iShares JPMorgan USD Emerging Markets | EMB | |
iShares S&P/Citigroup International Treasury | IGOV | |
iShares S&P/Citigroup 1-3 Year International Treasury | ISHG |
iShares® is a registered trademark of Barclays Global Investors, N.A. (“BGI”). The iShares Funds are not sponsored, endorsed, issued, sold or promoted by Cohen & Steers Capital Management, Inc., Dow Jones & Company, Inc., European Public Real Estate Association (“EPRA®”), FTSE International Limited (“FTSE”), FTSE/Xinhua Index Limited (“FXI”), iBoxx®, J.P. Morgan Securities Inc., MSCI Inc., Morningstar Inc., The NASDAQ OMX Group, Inc., National Association of Real Estate Investment Trusts (“NAREIT”), New York Stock Exchange, Inc., Frank Russell Company or Standard & Poor’s, nor are they sponsored or endorsed by Barclays Capital. None of these companies make any representation regarding the advisability of investing in the iShares Funds. Neither SEI nor BGI, nor any of their affiliates, are affiliated with the companies listed above except Barclays Capital, which is an affiliate of BGI. FXI does not make any warranty regarding the FTSE/Xinhua Index. All rights in the FTSE/Xinhua Index vest in FXI. Neither FTSE nor NAREIT makes any warranty regarding the FTSE NAREIT Real Estate 50/Residential/Retail/Mortgage REITs or Industrial/Office Index; all rights vest in NAREIT. Neither FTSE nor NAREIT makes any warranty regarding the FTSE EPRA/NAREIT Global Real Estate ex-US/North America/Europe/Asia Index; all rights vest in FTSE, NAREIT, and EPRA. All rights in the FTSE Developed Small Cap ex-North America Index vest in FTSE. “FTSE” is a trade- and servicemark of London Stock Exchange and The Financial Times Limited; “Xinhua” is a trade- and servicemark of Xinhua Financial Network Limited. “NAREIT®” is a trademark of NAREIT; “EPRA®” is a trademark of EPRA.
An investment in the Fund(s) is not a deposit of a bank and it is not insured or guaranteed by the Federal Deposit Insurance Corporation or any other government agency.
This advertising section does not constitute part of the 2009 Annual Report.
iS-1437-1009
| 126 | 2009 iSHARES ANNUAL REPORTTO SHAREHOLDERS |
Table of Contents

For more information:
WWW.iSHARES.COM
1-800-iShares (1-800-474-2737)
The iShares Funds are distributed by SEI Investments Distribution Co. (SEI). Barclays Global Fund Advisors (BGFA) serves as an advisor to the iShares Funds. BGFA is a subsidiary of Barclays Global Investors, N.A. (BGI), neither of which is affiliated with SEI.
The iShares Funds are not sponsored, endorsed, issued, sold or promoted by MSCI Inc., nor does this company make any representation regarding the advisability of investing in the iShares Funds. Neither SEI nor BGI, nor any of their affiliates, are affiliated with the company listed above.
©2009 Barclays Global Investors. All rights reserved. iShares® is a registered trademark of Barclays Global Investors, N.A. All other trademarks, servicemarks or registered trademarks are the property of their respective owners.
Investing involves risk, including possible loss of principal.
A description of the policies that the Funds use to determine how to vote proxies relating to portfolio securities and information about how the Funds voted proxies relating to portfolio securities during the most recent twelve-month period ended June 30 is available without charge, upon request, by calling toll-free 1-800-474-2737; on the Funds’ website at www.iShares.com; and on the U.S. Securities and Exchange Commission (SEC) website at www.sec.gov.
The Funds file their complete schedules of portfolio holdings with the SEC for the first and third quarters of each fiscal year on Form N-Q. The Funds’ Forms N-Q are available on the SEC’s website or may be reviewed and copied at the SEC’s Public Reference Room in Washington, D.C. Information on the operation of the Public Reference Room may be obtained by calling 1-800-SEC-0330. The Funds also disclose their complete schedules of portfolio holdings on a monthly basis on the Funds’ website.
This report is intended for the Funds’ shareholders. It may not be distributed to prospective investors unless it is preceded or accompanied by the current prospectus.
BGI-AR-82-0809
iShares®
LET’S BUILD A BETTER INVESTMENT WORLD®.
BARCLAYS
GLOBAL INVESTORS
Table of Contents
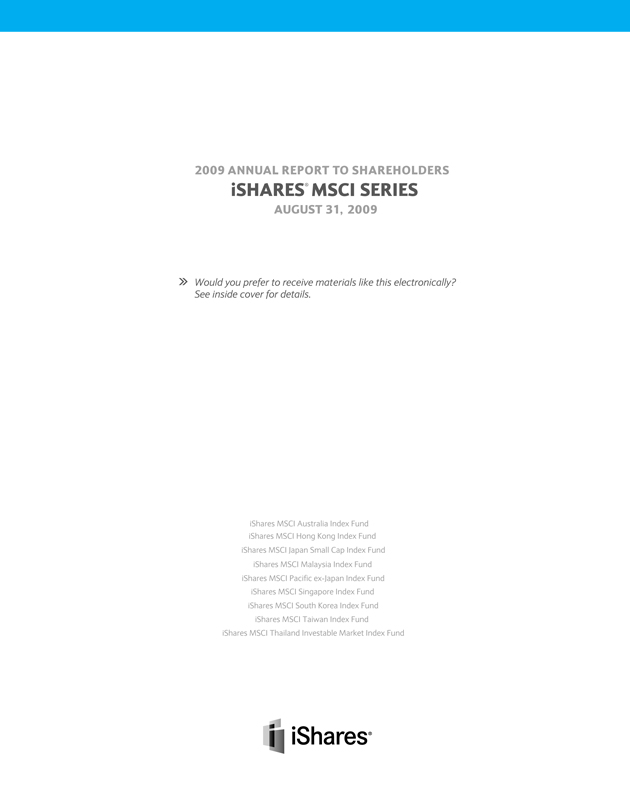
Table of Contents

Table of Contents
| 1 | ||
| 28 | ||
| 30 | ||
| 30 | ||
| 33 | ||
| 35 | ||
| 44 | ||
| 46 | ||
| 49 | ||
| 51 | ||
| 55 | ||
| 59 | ||
| 62 | ||
| 73 | ||
| 82 | ||
| 91 | ||
| 92 | ||
Board Review and Approval of Current Investment Advisory Contract (Unaudited) | 93 | |
Board Review and Approval of New Investment Advisory Agreements (Unaudited) | 96 | |
| 102 | ||
| 112 | ||
| 120 |
Table of Contents
Management’s Discussion of Fund Performance
iSHARES® MSCI AUSTRALIA INDEX FUND
(TICKER: EWA)
INVESTMENT OBJECTIVE
The iShares MSCI Australia Index Fund (the “Fund”) seeks to provide investment results that correspond generally to the price and yield performance, before fees and expenses, of publicly traded securities in the aggregate in the Australian market, as measured by the MSCI Australia IndexSM (the “Index”). The Fund invests in a representative sample of securities included in the Index that collectively has an investment profile similar to the Index. Due to the use of representative sampling, the Fund may or may not hold all of the securities that are included in the Index. For the 12-month period ended August 31, 2009 (the “reporting period”), the total return for the Fund was (8.91)%, while the total return for the Index was (9.04)%.
MARKET OVERVIEW AND DISCUSSION OF PERFORMANCE
Australia’s economy emerged from the global financial crisis in relatively strong condition. However, the Australian equity market declined along with many of its Pacific region counterparts during the reporting period.
Gross domestic product (“GDP”) did not decline more than 1% in any quarter compared to prior year results. After contracting 0.6% in the fourth quarter of 2008, GDP grew 0.4% during the first quarter of 2009 and 0.6% in the second quarter compared to the year-ago period. Australia generally benefited from relatively healthy consumer and business spending, as well as its trading relationship with China – where the economy recovered relatively rapidly. For example, during the period, China agreed to buy $41 billion in liquefied natural gas from Australia in the largest-ever trade contract between the two countries. China’s investment in Australia, while still small compared to its investment in the U.S., is growing rapidly.
Although trade with China has grown this decade, there have been political tensions between the two countries. China detained four employees of a major Australian mining company, accusing them of stealing state secrets, while Australia granted a visa to a Chinese rights advocate at odds with the Chinese government. The Australian Prime Minister indicated that although China and Australia’s relationship is “full of challenges,” their broader ties will endure. Meanwhile, China’s economy appears back on track as factories begin to rehire workers. Its second quarter 2009 GDP advanced nearly 15% on an annualized basis as bank lending was liberalized, government support for exports was strengthened and fiscal stimulus was enacted.
Australia also embarked on an early fiscal stimulus program which included a tax break on equipment investment that appears to have boosted job creation in the retail and construction sectors. In addition, Australia’s central bank lowered interest rates by 4.25 percentage points from September 2008, bringing the interest rate to a nearly 50-year low of 3% in April 2009. The unemployment rate in Australia ended the reporting period at 5.8%, significantly below its 30-year average of 7.2%. In contrast, U.S. unemployment was nearing 10%.
Despite these positive signs, the Australian Prime Minister warned that the global economic recession would continue to have an adverse impact on Australia. For example, he noted that a sluggish world economy has depressed world prices for Australian iron ore, a major export. In addition, he warned that the government stimulus program has not come without cost, leading to a federal budget deficit of nearly 5% of GDP, the largest since World War II. Still, Australia’s domestic economy remained relatively strong, as banks did not hold a significant amount of sub-prime mortgages and other poorly performing assets.
The ten largest holdings of the Fund posted mixed results during the reporting period. In banking, Commonwealth Bank of Australia, National Australia Bank Ltd., and Australia and New Zealand Banking Group Ltd. posted the most positive returns for the period. In contrast, shares of Rio Tinto Ltd. (mining), Westfield Group (shopping centers) and Woodside Petroleum Ltd. declined significantly.
| MANAGEMENT’S DISCUSSIONSOF FUND PERFORMANCE | 1 |
Table of Contents
Management’s Discussion of Fund Performance (Continued)
iSHARES® MSCI AUSTRALIA INDEX FUND
Performance as of August 31, 2009
| Average Annual Total Returns | ||||||||||||||||
| Year Ended 8/31/09 | Five Years Ended 8/31/09 | Ten Years Ended 8/31/09 | ||||||||||||||
| NAV | MARKET | INDEX | NAV | MARKET | INDEX | NAV | MARKET | INDEX | ||||||||
| (8.91)% | (8.48)% | (9.04)% | 13.59% | 13.57% | 13.06% | 11.14% | 11.07% | 10.88% | ||||||||
| Cumulative Total Returns | ||||||||||||||||
| Year Ended 8/31/09 | Five Years Ended 8/31/09 | Ten Years Ended 8/31/09 | ||||||||||||||
| NAV | MARKET | INDEX | NAV | MARKET | INDEX | NAV | MARKET | INDEX | ||||||||
| (8.91)% | (8.48)% | (9.04)% | 89.13% | 88.94% | 84.73% | 187.57% | 185.68% | 180.89% | ||||||||
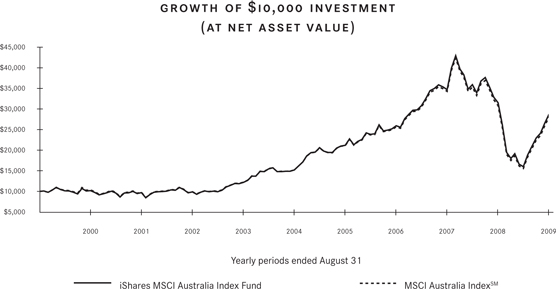
“Average Annual Total Returns” represent the average annual change in value of an investment over the period(s) indicated. “Cumulative Total Returns” represent the total change in value of an investment over the period(s) indicated.
The Fund’s per share net asset value or “NAV” is the value of one share of the Fund as calculated in accordance with the standard formula for valuing mutual fund shares. The NAV return is based on the NAV of the Fund and the market return is based on the market price per share of the Fund. The price used to calculate market return (“Market Price”) is determined by using the midpoint between the highest bid and the lowest offer on the primary stock exchange on which the shares of the Fund are listed for trading, as of the time that the Fund’s NAV is calculated. Market and NAV returns assume that dividends and capital gain distributions have been reinvested in the Fund at Market Price and NAV, respectively.
An index is a statistical composite that tracks a specified financial market or sector. Unlike the Fund, an index does not actually hold a portfolio of securities and therefore does not incur the expenses incurred by the Fund. These expenses negatively impact the performance of the Fund. Also, market returns do not include brokerage commissions that may be payable on secondary market transactions. If brokerage commissions were included, market returns would be lower. The performance shown in the table(s) and chart(s) above assumes reinvestment of all dividends and capital gain distributions and does not reflect the deduction of taxes that a shareholder would pay on fund distributions or the redemption or sale of fund shares. The investment return and principal value of shares of the Fund will vary with changes in market conditions. Shares of the Fund may be worth more or less than their original cost when they are redeemed or sold in the market. The Fund’s past performance is no guarantee of future results.
| 2 | 2009 iSHARES ANNUAL REPORT TO SHAREHOLDERS |
Table of Contents
Management’s Discussion of Fund Performance (Continued)
iSHARES® MSCI AUSTRALIA INDEX FUND
| PORTFOLIO ALLOCATION As of 8/31/09 | |||
| Sector | Percentage of Net Assets | ||
Financial | 43.96 | % | |
Basic Materials | 22.31 | ||
Consumer Non-Cyclical | 11.97 | ||
Industrial | 8.91 | ||
Energy | 6.25 | ||
Consumer Cyclical | 2.22 | ||
Communications | 1.99 | ||
Utilities | 0.83 | ||
Technology | 0.51 | ||
Short-Term and Other Net Assets | 1.05 | ||
TOTAL | 100.00 | % | |
| TEN LARGEST FUND HOLDINGS As of 8/31/09 | |||
| Security | Percentage of Net Assets | ||
BHP Billiton Ltd. | 14.07 | % | |
Westpac Banking Corp. | 8.09 | ||
Commonwealth Bank of Australia | 7.95 | ||
National Australia Bank Ltd. | 6.23 | ||
Australia and New Zealand Banking Group Ltd. | 5.66 | ||
Woolworths Ltd. | 3.92 | ||
Westfield Group | 2.95 | ||
Wesfarmers Ltd. | 2.88 | ||
Rio Tinto Ltd. | 2.78 | ||
Woodside Petroleum Ltd. | 2.76 | ||
TOTAL | 57.29 | % | |
| MANAGEMENT’S DISCUSSIONSOF FUND PERFORMANCE | 3 |
Table of Contents
Management’s Discussion of Fund Performance
iSHARES® MSCI HONG KONG INDEX FUND
(TICKER: EWH)
INVESTMENT OBJECTIVE
The iShares MSCI Hong Kong Index Fund (the “Fund”) seeks to provide investment results that correspond generally to the price and yield performance, before fees and expenses, of publicly traded securities in the aggregate in the Hong Kong market, as measured by the MSCI Hong Kong IndexSM (the “Index”). The Fund invests in a representative sample of securities included in the Index that collectively has an investment profile similar to the Index. Due to the use of representative sampling, the Fund may or may not hold all of the securities that are included in the Index. For the 12-month period ended August 31, 2009 (the “reporting period”), the total return for the Fund was (4.77)%, while the total return for the Index was (4.09)%.
MARKET OVERVIEW AND DISCUSSION OF PERFORMANCE
After four quarters of negative growth, Hong Kong emerged from its deepest recession since the Asian financial crisis of a decade ago, and the stock market rebounded accordingly. Gross domestic product (“GDP”) advanced 3.3% in the second quarter compared to the first quarter of 2009. Hong Kong benefited from its proximity to mainland China, as exports to China – where GDP growth was 15% in the second quarter – rebounded. Meanwhile, inflation has remained low at 1.5%. Real estate in Hong Kong has recovered to pre-crash prices, while consumer spending increased 4% in the second quarter. Unemployment remained at 5.4% as of the end of the reporting period.
China’s economy appears to have benefited from a government-encouraged stimulus in bank lending to consumers and businesses, financing auto loans, factory construction, and other spending. In addition, the government has offered tax breaks to exporters and acted to depress the value of the local currency, which makes exports more attractive. China’s trade surplus remains the largest in the world. One measure of Hong Kong/China’s financial health is the success of its investment banking activities. In 2009, companies that went public in China and Hong Kong raised four times more money than U.S. and European issues combined.
However, Hong Kong still faced challenges as the reporting period drew to a close. Although GDP advanced in the most recent quarter, it was still significantly weaker than the year ago period, when GDP surged 7.1%. Total exports declined in the second quarter by 12% versus the prior year period. Still, that was better than the first quarter of 2009, when the decline year over year was 23%. Most of the improvement was accounted for by China, and to a lesser extent in some other Asian countries. Exports to the U.S. and Europe were down sharply. In September 2009, the Asian Development Bank (“ADB”) cut its 2009 growth forecast for the Hong Kong economy to -4% from its prior projection of -2%, saying that Asia’s trade dependent economies, including Hong Kong, were hit harder than expected by the financial crisis.
The ten largest holdings of the Fund posted mixed results during the reporting period. The highest return was posted by the Hong Kong Exchanges and Clearing Ltd., the stock exchange of Hong Kong. The second highest return among the top ten holdings was produced by Li & Fung Ltd., which searches for high quality and cost effective manufacturing operations for its retail clients. Swire Pacific Ltd., which has diversified interests including aviation, beverages, marine services, property and trading, also produced positive returns. However, shares of Hang Seng Bank Ltd., a leading commercial bank offering corporate lending and private wealth management services, declined notably. Hutchison Whampoa Ltd., a conglomerate with interests in telecommunications, property development and port operations, also declined in share price. CLP Holdings Ltd., one of Asia’s largest electric utilities, saw its shares decline during the reporting period.
| 4 | 2009 iSHARES ANNUAL REPORT TO SHAREHOLDERS |
Table of Contents
Management’s Discussion of Fund Performance (Continued)
iSHARES® MSCI HONG KONG INDEX FUND
Performance as of August 31, 2009
| Average Annual Total Returns | ||||||||||||||||
| Year Ended 8/31/09 | Five Years Ended 8/31/09 | Ten Years Ended 8/31/09 | ||||||||||||||
| NAV | MARKET | INDEX | NAV | MARKET | INDEX | NAV | MARKET | INDEX | ||||||||
| (4.77)% | (4.67)% | (4.09)% | 8.91% | 8.86% | 9.50% | 4.45% | 4.47% | 5.34% | ||||||||
| Cumulative Total Returns | ||||||||||||||||
| Year Ended 8/31/09 | Five Years Ended 8/31/09 | Ten Years Ended 8/31/09 | ||||||||||||||
| NAV | MARKET | INDEX | NAV | MARKET | INDEX | NAV | MARKET | INDEX | ||||||||
| (4.77)% | (4.67)% | (4.09)% | 53.22% | 52.86% | 57.42% | 54.59% | 54.87% | 68.24% | ||||||||
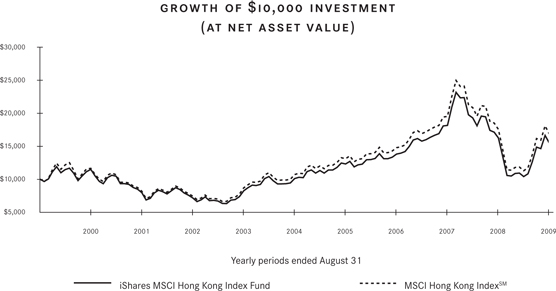
“Average Annual Total Returns” represent the average annual change in value of an investment over the period(s) indicated. “Cumulative Total Returns” represent the total change in value of an investment over the period(s) indicated.
The Fund’s per share net asset value or “NAV” is the value of one share of the Fund as calculated in accordance with the standard formula for valuing mutual fund shares. The NAV return is based on the NAV of the Fund and the market return is based on the market price per share of the Fund. The price used to calculate market return (“Market Price”) is determined by using the midpoint between the highest bid and the lowest offer on the primary stock exchange on which the shares of the Fund are listed for trading, as of the time that the Fund’s NAV is calculated. Market and NAV returns assume that dividends and capital gain distributions have been reinvested in the Fund at Market Price and NAV, respectively.
An index is a statistical composite that tracks a specified financial market or sector. Unlike the Fund, an index does not actually hold a portfolio of securities and therefore does not incur the expenses incurred by the Fund. These expenses negatively impact the performance of the Fund. Also, market returns do not include brokerage commissions that may be payable on secondary market transactions. If brokerage commissions were included, market returns would be lower. The performance shown in the table(s) and chart(s) above assumes reinvestment of all dividends and capital gain distributions and does not reflect the deduction of taxes that a shareholder would pay on fund distributions or the redemption or sale of fund shares. The investment return and principal value of shares of the Fund will vary with changes in market conditions. Shares of the Fund may be worth more or less than their original cost when they are redeemed or sold in the market. The Fund’s past performance is no guarantee of future results.
| MANAGEMENT’S DISCUSSIONSOF FUND PERFORMANCE | 5 |
Table of Contents
Management’s Discussion of Fund Performance (Continued)
iSHARES® MSCI HONG KONG INDEX FUND
| PORTFOLIO ALLOCATION As of 8/31/09 | |||
| Sector | Percentage of Net Assets | ||
Financial | 52.58 | % | |
Diversified | 14.67 | ||
Utilities | 14.15 | ||
Consumer Cyclical | 9.74 | ||
Industrial | 5.97 | ||
Communications | 1.46 | ||
Technology | 0.59 | ||
Basic Materials | 0.49 | ||
Short-Term and Other Net Assets | 0.35 | ||
TOTAL | 100.00 | % | |
| TEN LARGEST FUND HOLDINGS As of 8/31/09 | |||
| Security | Percentage of Net Assets | ||
Sun Hung Kai Properties Ltd. | 8.92 | % | |
Hong Kong Exchanges and Clearing Ltd. | 8.29 | ||
Cheung Kong (Holdings) Ltd. | 7.70 | ||
Hutchison Whampoa Ltd. | 7.17 | ||
CLP Holdings Ltd. | 6.52 | ||
Hang Seng Bank Ltd. | 5.00 | ||
Hong Kong and China Gas Co. Ltd. (The) | 4.01 | ||
Swire Pacific Ltd. Class A | 3.87 | ||
Li & Fung Ltd. | 3.69 | ||
Hongkong Electric Holdings Ltd. | 3.62 | ||
TOTAL | 58.79 | % | |
| 6 | 2009 iSHARES ANNUAL REPORT TO SHAREHOLDERS |
Table of Contents
Management’s Discussion of Fund Performance
iSHARES® MSCI JAPAN SMALL CAP INDEX FUND
(TICKER: SCJ)
INVESTMENT OBJECTIVE
The iShares MSCI Japan Small Cap Index Fund (the “Fund”) seeks to provide investment results that correspond generally to the price and yield performance, before fees and expenses, of the MSCI Japan Small Cap IndexSM (the “Index”). The Index targets 40% of the eligible small-cap universe within each industry group in the MSCI Japan IndexSM. The small-cap universe is defined as all listed securities that have a market capitalization in the range of $200 million to $1,500 million. The Fund invests in a representative sample of securities included in the Index that collectively has an investment profile similar to the Index. Due to the use of representative sampling, the Fund may or may not hold all of the securities that are included in the Index. For the 12-month period ended August 31, 2009 (the “reporting period”), the total return for the Fund was 4.62%, while the total return for the Index was 4.80%.
MARKET OVERVIEW AND DISCUSSION OF PERFORMANCE
Japan’s economy was among the weakest in Asia, as the country experienced high unemployment, lagging business investment and deflation fears. Accordingly, the broad Japanese equity market performed relatively poorly compared to its Asian counterparts during the reporting period. However, small capitalization stocks significantly outperformed large capitalization stocks, as these smaller companies were generally less reliant on exporting activity, which declined amid the challenging global economic environment.
Although Japan’s gross domestic product (“GDP”) rose 3.7% in the second quarter of 2009 compared to the year ago quarter, it declined a record 13.5% during the fourth quarter of 2008 and 14.2% in the first quarter of 2009. Even though GDP has shown signs of stabilizing, other economic statistics did not rebound.
Business investment contracted at a 4.8% annual rate in the second quarter of 2009. Core machinery orders dropped 9.3% in July, hitting the lowest level since recordkeeping began in April 1987. According to the Ministry of Internal Affairs, unemployment reached 5.7% in July, a post-World War II record. Household spending decreased 2% compared to the same month a year ago. Deflation was also a major concern, as Japan’s wholesale prices fell 8.5% in August compared to a year ago.
One of Japan’s most important economic activities is exporting, particularly to the rest of Asia as well as to the U.S. However, Japan’s exports dropped about 50% in the first half of 2009. Trouble continued into the second half of the year, as exports shrank for the 10th straight month in July, down 38% year over year, while imports posted the second-largest contraction since records began in 1986, dropping by 41%. At the end of the period the country’s public debt stood at about 170% of GDP, the worst ratio in the industrialized world.
In the midst of this economic environment, there was a major shift in the political environment during the reporting period. Japan elected a more liberal new government during the reporting period, one that promised increased social benefits and favored policies that were seen as disadvantageous to large corporations. The Democratic Party of Japan was elected into power, beating the Liberal Democratic Party that had ruled Japan since World War II. Yukio Hatoyama, the new Japanese Prime Minister, has promised to reverse Japan’s weak economy, blaming the government bureaucracy for the country’s woes. Meanwhile, the global economic environment began to improve at the end of the reporting period, which was a positive development for a country so dependent on exports.
The ten largest holdings of the Fund represented approximately 5% of Fund net assets as of August 31, 2009. Performance for these ten holdings was mixed for the reporting period. Ebara Corp. (engineering & construction), Autobacs Seven Co. Ltd. (retail auto parts) and Miraca Holdings Inc. (life sciences) posted strong returns, while shares of Rengo Co. Ltd. (packaging) and AirWater Inc. (air conditioners) declined notably in value.
| MANAGEMENT’S DISCUSSIONSOF FUND PERFORMANCE | 7 |
Table of Contents
Management’s Discussion of Fund Performance (Continued)
iSHARES® MSCI JAPAN SMALL CAP INDEX FUND
Performance as of August 31, 2009
| Average Annual Total Returns | Cumulative Total Returns | |||||||||||||||
| Year Ended 8/31/09 | Inception to 8/31/09 | Inception to 8/31/09 | ||||||||||||||
| NAV | MARKET | INDEX | NAV | MARKET | INDEX | NAV | MARKET | INDEX | ||||||||
| 4.62% | 4.79% | 4.80% | (4.23)% | (4.59)% | (3.96)% | (7.08)% | (7.69)% | (6.64)% | ||||||||
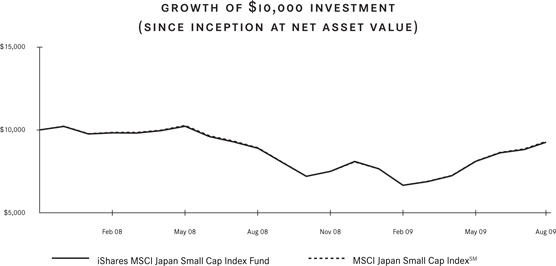
Total returns for the period since inception are calculated from the inception date of the Fund (12/20/07). “Average Annual Total Returns” represent the average annual change in value of an investment over the period(s) indicated. “Cumulative Total Returns” represent the total change in value of an investment over the period(s) indicated.
The Fund’s per share net asset value or “NAV” is the value of one share of the Fund as calculated in accordance with the standard formula for valuing mutual fund shares. The NAV return is based on the NAV of the Fund and the market return is based on the market price per share of the Fund. The price used to calculate market return (“Market Price”) is determined by using the midpoint between the highest bid and the lowest offer on the primary stock exchange on which the shares of the Fund are listed for trading, as of the time that the Fund’s NAV is calculated. Since shares of the Fund did not trade in the secondary market until after the Fund’s inception, for the period from inception to the first day of secondary market trading in shares of the Fund (12/21/07), the NAV of the Fund is used as a proxy for the Market Price to calculate market returns. Market and NAV returns assume that dividends and capital gain distributions have been reinvested in the Fund at Market Price and NAV, respectively.
An index is a statistical composite that tracks a specified financial market or sector. Unlike the Fund, an index does not actually hold a portfolio of securities and therefore does not incur the expenses incurred by the Fund. These expenses negatively impact the performance of the Fund. Also, market returns do not include brokerage commissions that may be payable on secondary market transactions. If brokerage commissions were included, market returns would be lower. The performance shown in the table(s) and chart(s) above assumes reinvestment of all dividends and capital gain distributions and does not reflect the deduction of taxes that a shareholder would pay on fund distributions or the redemption or sale of fund shares. The investment return and principal value of shares of the Fund will vary with changes in market conditions. Shares of the Fund may be worth more or less than their original cost when they are redeemed or sold in the market. The Fund’s past performance is no guarantee of future results.
| 8 | 2009 iSHARES ANNUAL REPORT TO SHAREHOLDERS |
Table of Contents
Management’s Discussion of Fund Performance (Continued)
iSHARES® MSCI JAPAN SMALL CAP INDEX FUND
| PORTFOLIO ALLOCATION As of 8/31/09 | |||
| Sector | Percentage of Net Assets | ||
Industrial | 26.38 | % | |
Consumer Cyclical | 24.67 | ||
Financial | 18.05 | ||
Consumer Non-Cyclical | 13.42 | ||
Basic Materials | 9.97 | ||
Communications | 3.58 | ||
Technology | 2.90 | ||
Utilities | 0.72 | ||
Energy | 0.10 | ||
Short-Term and Other Net Assets | 0.21 | ||
TOTAL | 100.00 | % | |
| TEN LARGEST FUND HOLDINGS As of 8/31/09 | |||
| Security | Percentage of Net Assets | ||
AirWater Inc. | 0.52 | % | |
Ebara Corp. | 0.51 | ||
Sagami Railway Co. Ltd. | 0.49 | ||
Nipro Corp. | 0.48 | ||
Fujikura Ltd. | 0.48 | ||
COMSYS Holdings Corp. | 0.47 | ||
Miraca Holdings Inc. | 0.46 | ||
Shiga Bank Ltd. (The) | 0.43 | ||
Autobacs Seven Co. Ltd. | 0.42 | ||
Rengo Co. Ltd. | 0.42 | ||
TOTAL | 4.68 | % | |
| MANAGEMENT’S DISCUSSIONSOF FUND PERFORMANCE | 9 |
Table of Contents
Management’s Discussion of Fund Performance
iSHARES® MSCI MALAYSIA INDEX FUND
(TICKER: EWM)
INVESTMENT OBJECTIVE
The iShares MSCI Malaysia Index Fund (the “Fund”) seeks to provide investment results that correspond generally to the price and yield performance, before fees and expenses, of publicly traded securities in the aggregate in the Malaysian market, as measured by the MSCI Malaysia IndexSM (the “Index”). The Fund invests in a representative sample of securities included in the Index that collectively has an investment profile similar to the Index. Due to the use of representative sampling, the Fund may or may not hold all of the securities that are included in the Index. For the 12-month period ended August 31, 2009 (the “reporting period”), the total return for the Fund was 8.00%, while the total return for the Index was 8.45%.
MARKET OVERVIEW AND DISCUSSION OF PERFORMANCE
After hitting a low in March 2009, the Malaysian equity market rebounded sharply and posted a gain for the reporting period as market performance was among the best in Southeast Asia. However, the Malaysian economy did not perform as well as the stock market during the period. During 2009, the Malaysian economy entered its first recession in more than a decade, with second quarter 2009 gross domestic product (“GDP”) declining 3.9% from the year-ago quarter and first quarter 2009 GDP contracting by 6.2%. In contrast, GDP was flat the fourth quarter of 2008 and up anywhere from 4 to 7% in the prior three quarters of 2008. In addition, manufacturing activity contracted about 15% in the second quarter of 2009 while exports dropped 17%.
Despite these statistics, there were some stable signs for the economy. June industrial production fell by the least amount in seven months, while exports posted the smallest decline in three months. This improvement mirrored that of other countries in Southeast Asia whose economies have improved due to government stimulus policies in the region.
The Malaysian government enacted two stimulus plans in November 2008 and March 2009 worth a total of about $19 billion aimed at the construction industry. About 90,000 projects were awarded, and half have been completed. Malaysia’s budget deficit is currently about 7% of GDP, its highest level since the mid-1980s. Meanwhile, in August, the country’s central bank kept short-term interest rates at 2% for a fourth straight meeting.
As a provider of manufacturing and financial services, Malaysia faces intense competition with other Southeast Asian countries. The government has taken steps to help the economy. For example, regulators have encouraged companies in the brokerage industry to merge to create the scale and strength to compete on a global basis. Liberalization of rules in the past two years have been aimed at getting more companies to list shares on the Malaysia stock exchange, which has lost market share to the Singapore exchange. Recently, in an effort to broaden distribution of shares, the government announced that local companies listing on the Kuala LumpurStock Exchange would be required to allocate only 12.5% of their equity to ethnic Malaysians, down from 30%. All of these steps were intended to increase interest in the Malaysian stock market, which performed particularly well towards the end of the reporting period.
All but one of the Fund’s top ten holdings posted market gains for the reporting period. Shares of Malayan Banking Bhd, the country’s largest commercial bank, declined moderately. Bumiputra-Commerce Holdings Bhd, the country’s second largest financial services provider, was one of the Fund’s best performers within the top ten holdings. Shares of PPB Group Bhd, which owns movie theatres, sugar refineries and flour mills, performed strongly during the period, as did Sime Darby Bhd, a conglomerate with interests in agriculture, automobiles, real estate and utilities.
| 10 | 2009 iSHARES ANNUAL REPORT TO SHAREHOLDERS |
Table of Contents
Management’s Discussion of Fund Performance (Continued)
iSHARES® MSCI MALAYSIA INDEX FUND
Performance as of August 31, 2009
| Average Annual Total Returns | ||||||||||||||||
| Year Ended 8/31/09 | Five Years Ended 8/31/09 | Ten Years Ended 8/31/09 | ||||||||||||||
| NAV | MARKET | INDEX | NAV | MARKET | INDEX | NAV | MARKET | INDEX | ||||||||
| 8.00% | 7.73% | 8.45% | 12.20% | 12.32% | 12.77% | 8.27% | 7.99% | 9.01% | ||||||||
| Cumulative Total Returns | ||||||||||||||||
| Year Ended 8/31/09 | Five Years Ended 8/31/09 | Ten Years Ended 8/31/09 | ||||||||||||||
| NAV | MARKET | INDEX | NAV | MARKET | INDEX | NAV | MARKET | INDEX | ||||||||
| 8.00% | 7.73% | 8.45% | 77.80% | 78.79% | 82.38% | 121.26% | 115.78% | 136.95% | ||||||||
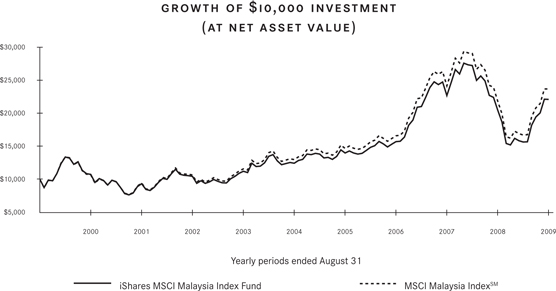
“Average Annual Total Returns” represent the average annual change in value of an investment over the period(s) indicated. “Cumulative Total Returns” represent the total change in value of an investment over the period(s) indicated.
The Fund’s per share net asset value or “NAV” is the value of one share of the Fund as calculated in accordance with the standard formula for valuing mutual fund shares. The NAV return is based on the NAV of the Fund and the market return is based on the market price per share of the Fund. The price used to calculate market return (“Market Price”) is determined by using the midpoint between the highest bid and the lowest offer on the primary stock exchange on which the shares of the Fund are listed for trading, as of the time that the Fund’s NAV is calculated. As the Fund has a NAV which is determined prior to the opening of the regular trading day on the primary stock exchange on which it is listed, the market return is calculated using the midpoint of the bid/ask spread as of the opening of regular trading on the exchange. Market and NAV returns assume that dividends and capital gain distributions have been reinvested in the Fund at Market Price and NAV, respectively.
An index is a statistical composite that tracks a specified financial market or sector. Unlike the Fund, an index does not actually hold a portfolio of securities and therefore does not incur the expenses incurred by the Fund. These expenses negatively impact the performance of the Fund. Also, market returns do not include brokerage commissions that may be payable on secondary market transactions. If brokerage commissions were included, market returns would be lower. The performance shown in the table(s) and chart(s) above assumes reinvestment of all dividends and capital gain distributions and does not reflect the deduction of taxes that a shareholder would pay on fund distributions or the redemption or sale of fund shares. The investment return and principal value of shares of the Fund will vary with changes in market conditions. Shares of the Fund may be worth more or less than their original cost when they are redeemed or sold in the market. The Fund’s past performance is no guarantee of future results.
| MANAGEMENT’S DISCUSSIONSOF FUND PERFORMANCE | 11 |
Table of Contents
Management’s Discussion of Fund Performance (Continued)
iSHARES® MSCI MALAYSIA INDEX FUND
| PORTFOLIO ALLOCATION As of 8/31/09 | |||
| Sector | Percentage of Net Assets | ||
Financial | 29.63 | % | |
Consumer Non-Cyclical | 17.05 | ||
Consumer Cyclical | 13.74 | ||
Industrial | 10.89 | ||
Utilities | 9.45 | ||
Diversified | 9.35 | ||
Communications | 7.77 | ||
Basic Materials | 1.05 | ||
Energy | 0.80 | ||
Short-Term and Other Net Assets | 0.27 | ||
TOTAL | 100.00 | % | |
| TEN LARGEST FUND HOLDINGS As of 8/31/09 | |||
| Security | Percentage of Net Assets | ||
Sime Darby Bhd | 9.35 | % | |
Malayan Banking Bhd | 8.71 | ||
Bumiputra-Commerce Holdings Bhd | 7.43 | ||
IOI Corp. Bhd | 6.64 | ||
Tenaga Nasional Bhd | 5.92 | ||
Genting Bhd | 5.61 | ||
Public Bank Bhd | 3.97 | ||
MISC Bhd Foreign | 3.68 | ||
Genting Malaysia Bhd | 3.40 | ||
PPB Group Bhd | 3.09 | ||
TOTAL | 57.80 | % | |
| 12 | 2009 iSHARES ANNUAL REPORT TO SHAREHOLDERS |
Table of Contents
Management’s Discussion of Fund Performance
iSHARES® MSCI PACIFIC EX-JAPAN INDEX FUND
(TICKER: EPP)
INVESTMENT OBJECTIVE
The iShares MSCI Pacific ex-Japan Index Fund (the “Fund”) seeks to provide investment results that correspond generally to the price and yield performance, before fees and expenses, of publicly traded securities in the aggregate in the Australia, Hong Kong, New Zealand and Singapore markets, as measured by the MSCI Pacific ex-Japan IndexSM (the “Index”). The Fund invests in a representative sample of securities included in the Index that collectively has an investment profile similar to the Index. Due to the use of representative sampling, the Fund may or may not hold all of the securities that are included in the Index. For the 12-month period ended August 31, 2009 (the “reporting period”), the total return for the Fund was (7.23)%, while the total return for the Index was (7.36)%.
MARKET OVERVIEW AND DISCUSSION OF PERFORMANCE
After declining significantly during the first half of the reporting period, Pacific region equity markets generally rebounded by August 31, 2009, but still posted a modest negative return for the year. The Hong Kong and Singapore markets were more volatile than those of Australia and New Zealand.
Australia’s economy emerged from the global financial crisis in relatively strong condition. Gross domestic product (“GDP”) did not decline more than 1% in any quarter compared to its prior year results. After contracting 0.6% in the fourth quarter of 2008, GDP grew 0.4% during the first quarter of 2009 and 0.6% in the second quarter compared to the year-ago period. Australia generally appears to have benefited from relatively healthy consumer and business spending, as well as its trading relationship with China – where the economy recovered relatively rapidly.
Australia also embarked on an early fiscal stimulus program which included a tax break on equipment investment that appears to have boosted job creation in the retail and construction sectors. In addition, Australia’s central bank lowered interest rates by 4.25% from September 2008 to bring rates to a nearly 50-year low of 3 percent in April 2009. The unemployment rate in Australia ended the reporting period at 5.8%, significantly below its 30-year average of 7.2%. In contrast, U.S. unemployment was nearing 10%.
Despite these positive signs, the Australian Prime Minister warned that the global economic recession would continue to have an adverse impact on Australia. For example, he noted that a sluggish world economy has depressed world prices for Australian iron ore, a major export. In addition, he warned that the government stimulus program has not come without cost, leading to a federal budget deficit of nearly 5% of GDP, the largest since World War II. Still, Australia’s domestic economy remained relatively strong, as banks did not hold a significant amount of sub-prime mortgages and other poorly performing assets.
Australia’s neighbor, New Zealand, also reported modest declines in its economy, with GDP declines in the 1% range during the fourth quarter of 2008 and first quarter of 2009 – and roughly flat in the second quarter of 2009, with the largest detractors from GDP coming from the construction and manufacturing sectors. However, most of the increase in consumption came from government spending, not private spending. Indeed, a major concern in New Zealand is the country’s expanding national debt.
In Hong Kong, the real estate market has recovered to pre-financial crisis levels, as demand reflected the rebounding economy and stock markets in mainland China. Meanwhile, Singapore’s export-dependent economy declined at about a 15% annual rate during the height of the crisis, but has since rebounded. According to the Singapore Ministry of Trade and Industry, second quarter 2009 GDP advanced 21%.
The ten largest holdings of the Fund posted mixed results during the reporting period. In banking, Commonwealth Bank of Australia, National Australia Bank Ltd., and Australia and New Zealand Banking Group Ltd. posted the most positive returns for the period. In contrast, shares of Rio Tinto Ltd. (mining), Westfield Group (shopping centers) and Woodside Petroleum Ltd. declined significantly.
| MANAGEMENT’S DISCUSSIONSOF FUND PERFORMANCE | 13 |
Table of Contents
Management’s Discussion of Fund Performance (Continued)
iSHARES® MSCI PACIFIC EX-JAPAN INDEX FUND
Performance as of August 31, 2009
| Average Annual Total Returns | ||||||||||||||||
| Year Ended 8/31/09 | Five Years Ended 8/31/09 | Inception to 8/31/09 | ||||||||||||||
| NAV | MARKET | INDEX | NAV | MARKET | INDEX | NAV | MARKET | INDEX | ||||||||
| (7.23)% | (6.41)% | (7.36)% | 12.36% | 12.36% | 12.18% | 14.17% | 14.17% | 14.05% | ||||||||
| Cumulative Total Returns | ||||||||||||||||
| Year Ended 8/31/09 | Five Years Ended 8/31/09 | Inception to 8/31/09 | ||||||||||||||
| NAV | MARKET | INDEX | NAV | MARKET | INDEX | NAV | MARKET | INDEX | ||||||||
| (7.23)% | (6.41)% | (7.36)% | 79.11% | 79.08% | 77.65% | 183.10% | 183.08% | 180.59% | ||||||||
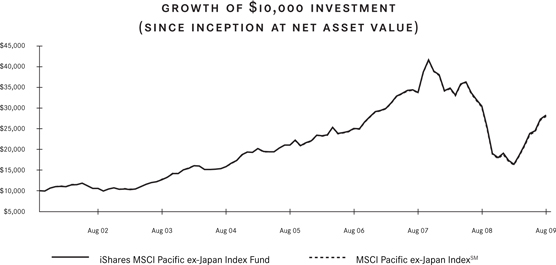
Total returns for the period since inception are calculated from the inception date of the Fund (10/25/01). “Average Annual Total Returns” represent the average annual change in value of an investment over the period(s) indicated. “Cumulative Total Returns” represent the total change in value of an investment over the period(s) indicated.
The Fund’s per share net asset value or “NAV” is the value of one share of the Fund as calculated in accordance with the standard formula for valuing mutual fund shares. The NAV return is based on the NAV of the Fund and the market return is based on the market price per share of the Fund. The price used to calculate market return (“Market Price”) is determined by using the midpoint between the highest bid and the lowest offer on the primary stock exchange on which the shares of the Fund are listed for trading, as of the time that the Fund’s NAV is calculated. Since shares of the Fund did not trade in the secondary market until after the Fund’s inception, for the period from inception to the first day of secondary market trading in shares of the Fund (10/26/01), the NAV of the Fund is used as a proxy for the Market Price to calculate market returns. Market and NAV returns assume that dividends and capital gain distributions have been reinvested in the Fund at Market Price and NAV, respectively.
An index is a statistical composite that tracks a specified financial market or sector. Unlike the Fund, an index does not actually hold a portfolio of securities and therefore does not incur the expenses incurred by the Fund. These expenses negatively impact the performance of the Fund. Also, market returns do not include brokerage commissions that may be payable on secondary market transactions. If brokerage commissions were included, market returns would be lower. The performance shown in the table(s) and chart(s) above assumes reinvestment of all dividends and capital gain distributions and does not reflect the deduction of taxes that a shareholder would pay on fund distributions or the redemption or sale of fund shares. The investment return and principal value of shares of the Fund will vary with changes in market conditions. Shares of the Fund may be worth more or less than their original cost when they are redeemed or sold in the market. The Fund’s past performance is no guarantee of future results.
| 14 | 2009 iSHARES ANNUAL REPORT TO SHAREHOLDERS |
Table of Contents
Management’s Discussion of Fund Performance (Continued)
iSHARES® MSCI PACIFIC EX-JAPAN INDEX FUND
| PORTFOLIO ALLOCATION As of 8/31/09 | |||
| Sector | Percentage of Net Assets | ||
Financial | 46.06 | % | |
Basic Materials | 15.22 | ||
Consumer Non-Cyclical | 9.29 | ||
Industrial | 8.62 | ||
Energy | 4.23 | ||
Communications | 4.05 | ||
Consumer Cyclical | 4.04 | ||
Diversified | 3.63 | ||
Utilities | 3.42 | ||
Technology | 0.47 | ||
Short-Term and Other Net Assets | 0.97 | ||
TOTAL | 100.00 | % | |
| TEN LARGEST FUND HOLDINGS As of 8/31/09 | |||
| Security | Percentage of Net Assets | ||
BHP Billiton Ltd. (Australia) | 9.53 | % | |
Westpac Banking Corp. (Australia) | 5.48 | ||
Commonwealth Bank of Australia (Australia) | 5.37 | ||
National Australia Bank Ltd. (Australia) | 4.22 | ||
Australia and New Zealand Banking Group | 3.83 | ||
Woolworths Ltd. (Australia) | 2.68 | ||
Westfield Group (Australia) | 2.00 | ||
Wesfarmers Ltd. (Australia) | 1.95 | ||
Rio Tinto Ltd. (Australia) | 1.89 | ||
Woodside Petroleum Ltd. (Australia) | 1.87 | ||
TOTAL | 38.82 | % | |
| MANAGEMENT’S DISCUSSIONSOF FUND PERFORMANCE | 15 |
Table of Contents
Management’s Discussion of Fund Performance
iSHARES® MSCI SINGAPORE INDEX FUND
(TICKER: EWS)
INVESTMENT OBJECTIVE
The iShares MSCI Singapore Index Fund (the “Fund”) seeks to provide investment results that correspond generally to the price and yield performance, before fees and expenses, of publicly traded securities in the aggregate in the Singaporean market, as measured by the MSCI Singapore IndexSM (the “Index”). The Fund invests in a representative sample of securities included in the Index that collectively has an investment profile similar to the Index. Due to the use of representative sampling, the Fund may or may not hold all of the securities that are included in the Index. For the 12-month period ended August 31, 2009 (the “reporting period”), the total return for the Fund was (5.87)%, while the total return for the Index was (6.02)%.
MARKET OVERVIEW AND DISCUSSION OF PERFORMANCE
After hitting a low in March 2009, the Singapore stock market recouped most of its losses by the end of the reporting period. As a result, the market’s performance was in line with other countries in the region, posting a modest decline.
Singapore’s economy hit a low in the fourth quarter of 2008, when gross domestic product (“GDP”) contracted at a 16% annualized rate, the worst performance in more than 40 years. For the first half of 2009, non-oil exports, which account for about 60% of Singapore’s GDP, declined as demand from Japan, the U.S. and Europe fell sharply. However, some of the slack was taken up by Indonesia, Malaysia and China, where economic growth was stronger than in developed countries.
Singapore’s economy staged a rally during the second quarter of 2009, growing at a seasonally adjusted annualized rate of nearly 21% compared to the prior quarter, its first advance in a year. Unemployment was expected to reach 3.8% in 2009, up from only 2.6% in 2008. By August 2009, the end of the reporting period, the outlook for the economy appeared to be better, particularly in the pharmaceutical industry. A major drug company opened a large factory in Singapore in June – the first of its kind in Asia – to produce a vaccine for meningitis.
To monitor the economy, the Monetary Authority of Singapore conducts a quarterly survey of 21 economists. The most recent survey forecast a drop in manufacturing of 7% in 2009, a 3% decline in financial services activity and a drop of nearly 12% in wholesale and retail trade. Only construction, which received a boost of $14 billion in government stimulus, was expected to grow in 2009. However, the economic forecasts changed sharply in three months. In June, the median forecast from these economists predicted that the Singapore economy would contract 6.5% in 2009 and that consumer prices would decline 0.5%. Three months later, the survey showed a forecast of a 3.6% decline in GDP for 2009 and an inflation rate of zero.
The ten largest holdings of the Fund posted mixed results during the reporting period. On the positive side, Wilmar International Ltd., an agricultural firm, produced the strongest returns. Wilmar operates more than 250 food processing plants, employs about 70,000 people and conducts business with about 50 countries. Singapore Exchange Ltd., the stock exchange of Singapore, also produced positive returns. On the negative side, shares of Keppel Corp. Ltd., a conglomerate, declined notably. Keppel has interests in shipbuilding, real estate development, environmental engineering and telecommunications. Shares of DBS Group Holdings Ltd. (financial services) also declined.
| 16 | 2009 iSHARES ANNUAL REPORT TO SHAREHOLDERS |
Table of Contents
Management’s Discussion of Fund Performance (Continued)
iSHARES® MSCI SINGAPORE INDEX FUND
Performance as of August 31, 2009
| Average Annual Total Returns | ||||||||||||||||
| Year Ended 8/31/09 | Five Years Ended 8/31/09 | Ten Years Ended 8/31/09 | ||||||||||||||
| NAV | MARKET | INDEX | NAV | MARKET | INDEX | NAV | MARKET | INDEX | ||||||||
| (5.87)% | (4.40)% | (6.02)% | 14.00% | 13.88% | 13.83% | 5.75% | 5.61% | 5.46% | ||||||||
| Cumulative Total Returns | ||||||||||||||||
| Year Ended 8/31/09 | Five Years Ended 8/31/09 | Ten Years Ended 8/31/09 | ||||||||||||||
| NAV | MARKET | INDEX | NAV | MARKET | INDEX | NAV | MARKET | INDEX | ||||||||
| (5.87)% | (4.40)% | (6.02)% | 92.55% | 91.54% | 91.11% | 74.93% | 72.66% | 70.17% | ||||||||
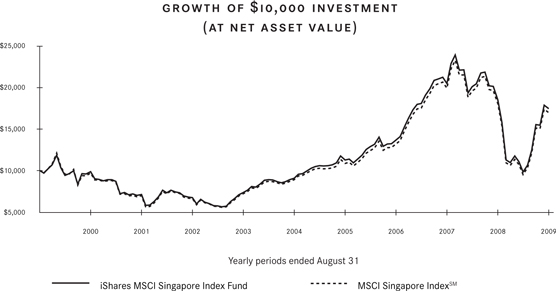
“Average Annual Total Returns” represent the average annual change in value of an investment over the period(s) indicated. “Cumulative Total Returns” represent the total change in value of an investment over the period(s) indicated.
The Fund’s per share net asset value or ”NAV” is the value of one share of the Fund as calculated in accordance with the standard formula for valuing mutual fund shares. The NAV return is based on the NAV of the Fund and the market return is based on the market price per share of the Fund. The price used to calculate market return (“Market Price”) is determined by using the midpoint between the highest bid and the lowest offer on the primary stock exchange on which the shares of the Fund are listed for trading, as of the time that the Fund’s NAV is calculated. Market and NAV returns assume that dividends and capital gain distributions have been reinvested in the Fund at Market Price and NAV, respectively.
An index is a statistical composite that tracks a specified financial market or sector. Unlike the Fund, an index does not actually hold a portfolio of securities and therefore does not incur the expenses incurred by the Fund. These expenses negatively impact the performance of the Fund. Also, market returns do not include brokerage commissions that may be payable on secondary market transactions. If brokerage commissions were included, market returns would be lower. The performance shown in the table(s) and chart(s) above assumes reinvestment of all dividends and capital gain distributions and does not reflect the deduction of taxes that a shareholder would pay on fund distributions or the redemption or sale of fund shares. The investment return and principal value of shares of the Fund will vary with changes in market conditions. Shares of the Fund may be worth more or less than their original cost when they are redeemed or sold in the market. The Fund’s past performance is no guarantee of future results.
| MANAGEMENT’S DISCUSSIONSOF FUND PERFORMANCE | 17 |
Table of Contents
Management’s Discussion of Fund Performance (Continued)
iSHARES® MSCI SINGAPORE INDEX FUND
| PORTFOLIO ALLOCATION As of 8/31/09 | |||
| Sector | Percentage of Net Assets | ||
Financial | 51.25 | % | |
Communications | 17.58 | ||
Consumer Non-Cyclical | 9.93 | ||
Industrial | 8.98 | ||
Diversified | 6.22 | ||
Consumer Cyclical | 5.26 | ||
Short-Term and Other Net Assets | 0.78 | ||
TOTAL | 100.00 | % | |
| TEN LARGEST FUND HOLDINGS As of 8/31/09 | |||
| Security | Percentage of Net Assets | ||
Singapore Telecommunications Ltd. | 13.61 | % | |
DBS Group Holdings Ltd. | 11.99 | ||
United Overseas Bank Ltd. | 11.31 | ||
Oversea-Chinese Banking Corp. Ltd. | 10.48 | ||
Keppel Corp. Ltd. | 4.64 | ||
CapitaLand Ltd. | 4.60 | ||
Wilmar International Ltd. | 4.43 | ||
Singapore Exchange Ltd. | 3.96 | ||
Singapore Airlines Ltd. | 3.69 | ||
Singapore Press Holdings Ltd. | 3.22 | ||
TOTAL | 71.93 | % | |
| 18 | 2009 iSHARES ANNUAL REPORT TO SHAREHOLDERS |
Table of Contents
Management’s Discussion of Fund Performance
iSHARES® MSCI SOUTH KOREA INDEX FUND
(TICKER: EWY)
INVESTMENT OBJECTIVE
The iShares MSCI South Korea Index Fund (the “Fund”) seeks to provide investment results that correspond generally to the price and yield performance, before fees and expenses, of publicly traded securities in the aggregate in the South Korean market, as measured by the MSCI Korea IndexSM (the “Index”). The Fund invests in a representative sample of securities included in the Index that collectively has an investment profile similar to the Index. Due to the use of representative sampling, the Fund may or may not hold all of the securities that are included in the Index. For the 12-month period ended August 31, 2009 (the “reporting period”), the total return for the Fund was (2.31)%, while the total return for the Index was (1.83)%.
MARKET OVERVIEW AND DISCUSSION OF PERFORMANCE
After hitting a low in March 2009, the South Korea stock market recouped most of its losses by the end of the reporting period. As a result, the country’s market performance was in line with other countries in the region, posting a modest decline.
South Korea posted gross domestic product growth of 2.3% during the second quarter of 2009 compared to the previous quarter. However, domestic consumption has been weak, unemployment has increased, and consumer confidence has not returned to pre-crisis levels. Although the country’s prospects show signs of improving, it is highly dependent on the performance of its trading partners. Exports are expected to contract in the single digit range in 2009, with a potential to rise modestly in 2010, although the rate of growth will likely be well below what was recorded before the recession. In addition, imports are falling in 2009 as companies along with consumers find it harder to obtain bank financing.
Inflation averaged 4.7% in 2008, its highest rate since 1998. However, as domestic demand declines and commodity prices fall, inflationary pressures appear to be easing. This is offset somewhat by the stronger imported inflation resulting from the weaknesses in South Korea’s currency. During the second half of 2008 and the first quarter of 2009, investors withdrew investment from the country amid concerns about South Korea’s export status, causing weakness in the currency against the U.S. dollar. However these factors started to reverse in early 2009. The government’s efforts to strengthen the South Korean banking system have appeared to increase investor confidence, and the currency has strengthened.
The global recession has helped the South Korean automobile industry gain a foothold in the U.S. and Japanese auto markets. Hyundai Motor Co.’s sales were up 47% from August 2008 to August 2009, eclipsing the market share of Chrysler, one of the traditional Big Three U.S. automakers. Hyundai Motor America, along with its affiliate, Kia Motors America, has been able to accomplish this through aggressive pricing in the U.S. market and improved brand reputation.
Hyundai Motor Co. Ltd. was among the top performers in the Fund’s ten largest holdings during the reporting period. In addition Samsung Electronics Co. Ltd., a large semiconductor company, posted strong gains. LG Chem Ltd., a chemicals and electronic materials maker, and LG Display Co. Ltd., a maker of television and computer monitors also generated strong returns. Detractors from performance included two diversified financial services companies – KB Financial Group Inc. and Shinhan Financial Group Co. Ltd. – as well as POSCO, a large steelmaker.
| MANAGEMENT’S DISCUSSIONSOF FUND PERFORMANCE | 19 |
Table of Contents
Management’s Discussion of Fund Performance (Continued)
iSHARES® MSCI SOUTH KOREA INDEX FUND
Performance as of August 31, 2009
| Average Annual Total Returns | ||||||||||||||||
| Year Ended 8/31/09 | Five Years Ended 8/31/09 | Inception to 8/31/09 | ||||||||||||||
| NAV | MARKET | INDEX | NAV | MARKET | INDEX | NAV | MARKET | INDEX | ||||||||
| (2.31)% | (2.49)% | (1.83)% | 12.72% | 12.49% | 13.36% | 8.82% | 8.71% | 9.37% | ||||||||
| Cumulative Total Returns | ||||||||||||||||
| Year Ended 8/31/09 | Five Years Ended 8/31/09 | Inception to 8/31/09 | ||||||||||||||
| NAV | MARKET | INDEX | NAV | MARKET | INDEX | NAV | MARKET | INDEX | ||||||||
| (2.31)% | (2.49)% | (1.83)% | 81.95% | 80.12% | 87.20% | 119.75% | 117.78% | 130.36% | ||||||||
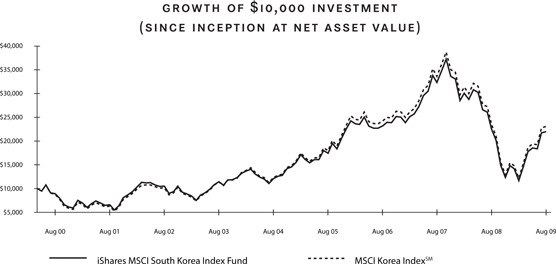
Total returns for the period since inception are calculated from the inception date of the Fund (5/9/00). “Average Annual Total Returns” represent the average annual change in value of an investment over the period(s) indicated. “Cumulative Total Returns” represent the total change in value of an investment over the period(s) indicated.
The Fund’s per share net asset value or “NAV” is the value of one share of the Fund as calculated in accordance with the standard formula for valuing mutual fund shares. The NAV return is based on the NAV of the Fund and the market return is based on the market price per share of the Fund. The price used to calculate market return (“Market Price”) is determined by using the midpoint between the highest bid and the lowest offer on the primary stock exchange on which the shares of the Fund are listed for trading, as of the time that the Fund’s NAV is calculated. As the Fund has a NAV which is determined prior to the opening of the regular trading day on the primary stock exchange on which it is listed, the market return is calculated using the midpoint of the bid/ask spread as of the opening of regular trading on the exchange. Since shares of the Fund did not trade in the secondary market until after the Fund’s inception, for the period from inception to the first day of secondary market trading in shares of the Fund (5/12/00), the NAV of the Fund is used as a proxy for the Market Price to calculate market returns. Market and NAV returns assume that dividends and capital gain distributions have been reinvested in the Fund at Market Price and NAV, respectively.
An index is a statistical composite that tracks a specified financial market or sector. Unlike the Fund, an index does not actually hold a portfolio of securities and therefore does not incur the expenses incurred by the Fund. These expenses negatively impact the performance of the Fund. Also, market returns do not include brokerage commissions that may be payable on secondary market transactions. If brokerage commissions were included, market returns would be lower. The performance shown in the table(s) and chart(s) above assumes reinvestment of all dividends and capital gain distributions and does not reflect the deduction of taxes that a shareholder would pay on fund distributions or the redemption or sale of fund shares. The investment return and principal value of shares of the Fund will vary with changes in market conditions. Shares of the Fund may be worth more or less than their original cost when they are redeemed or sold in the market. The Fund’s past performance is no guarantee of future results.
| 20 | 2009 iSHARES ANNUAL REPORT TO SHAREHOLDERS |
Table of Contents
Management’s Discussion of Fund Performance (Continued)
iSHARES® MSCI SOUTH KOREA INDEX FUND
| PORTFOLIO ALLOCATION As of 8/31/09 | |||
| Sector | Percentage of Net Assets | ||
Technology | 24.31 | % | |
Financial | 17.28 | ||
Industrial | 17.24 | ||
Consumer Cyclical | 13.77 | ||
Basic Materials | 11.64 | ||
Communications | 5.17 | ||
Consumer Non-Cyclical | 4.01 | ||
Energy | 2.47 | ||
Utilities | 2.06 | ||
Diversified | 1.97 | ||
Short-Term and Other Net Assets | 0.08 | ||
TOTAL | 100.00 | % | |
| TEN LARGEST FUND HOLDINGS As of 8/31/09 | |||
| Security | Percentage of Net Assets | ||
Samsung Electronics Co. Ltd. | 19.11 | % | |
POSCO | 6.69 | ||
KB Financial Group Inc. | 3.75 | ||
Shinhan Financial Group Co. Ltd. | 3.67 | ||
Hyundai Motor Co. Ltd. | 3.66 | ||
LG Electronics Inc. | 3.00 | ||
Hynix Semiconductor Inc. | 2.30 | ||
Samsung Electronics Co. Ltd. Preferred | 2.25 | ||
LG Chem Ltd. | 1.94 | ||
LG Display Co. Ltd. | 1.91 | ||
TOTAL | 48.28 | % | |
| MANAGEMENT’S DISCUSSIONSOF FUND PERFORMANCE | 21 |
Table of Contents
Management’s Discussion of Fund Performance
iSHARES® MSCI TAIWAN INDEX FUND
(TICKER: EWT)
INVESTMENT OBJECTIVE
The iShares MSCI Taiwan Index Fund (the “Fund”) seeks to provide investment results that correspond generally to the price and yield performance, before fees and expenses, of publicly traded securities in the aggregate in the Taiwanese market, as measured by the MSCI Taiwan IndexSM (the “Index”). The Fund invests in a representative sample of securities included in the Index that collectively has an investment profile similar to the Index. Due to the use of representative sampling, the Fund may or may not hold all of the securities that are included in the Index. For the 12-month period ended August 31, 2009 (the “reporting period”), the total return for the Fund was (9.67)%, while the total return for the Index was (9.20)%.
MARKET OVERVIEW AND DISCUSSION OF PERFORMANCE
After hitting a low in March 2009, the Taiwan market rebounded in the second half of the reporting period, although not enough to avoid a decline for the year.
While stocks were still in negative territory, the Taiwan economy rebounded briskly during the second quarter of 2009. Taiwan’s central bank reported that although the economy contracted about 7.5% compared to the same quarter in 2008, it advanced more than 20% compared to the first quarter of 2009.
As a result of this fast growth, the central bank announced recently that it was leaving short-term interest rates at 1.25%, after having lowered rates from about 3.6% in early 2009. Lowering the rate further would indicate that the government wasn’t satisfied with the growth rate. Raising the rate would suggest that the government was worried about inflation. Currently, inflation is about zero in Taiwan while unemployment reached 6.1% in August 2009.
The country faced natural disasters and political turmoil during 2009. The Taiwan premier resigned shortly after the end of the reporting period, taking responsibility for the government’s slow response to a deadly typhoon in August that caused 700 casualties. The new cabinet pledged to continue improved relations with China, a conflict whose origins date back a century, including the elimination of most tariffs between the two countries.
Like most of its Southeast Asia counterparts, Taiwan’s economic results are tied to the global economy. And there is evidence that the global economy may be improving at a faster pace than was widely anticipated a few months ago. While challenges remain, notably unemployment levels in the U.S. and Europe, manufacturing activity grew in the U.S., France, China and Australia in August, the first time that has happened since January 2008. In addition, Japan recently reported an increase in industrial production, the best monthly performance since late 2007.
Most of the Fund’s ten largest holdings declined during the reporting period. Shares of Chunghwa Telecom Co. Ltd., a telecommunications manufacturer, declined significantly during the period. Cathay Financial Holding Co. Ltd., which owns banks, insurance companies, venture capital funds and other financial services, also saw its shares decline notably. On the positive side, MediaTek Inc., a semiconductor manufacturer, posted a strong return during the period. Other positive performers included Taiwan Semiconductor Manufacturing Co. Ltd. and Formosa Plastics Corp., a maker of specialty chemicals and resins.
| 22 | 2009 iSHARES ANNUAL REPORT TO SHAREHOLDERS |
Table of Contents
Management’s Discussion of Fund Performance (Continued)
iSHARES® MSCI TAIWAN INDEX FUND
Performance as of August 31, 2009
| Average Annual Total Returns | ||||||||||||||||
| Year Ended 8/31/09 | Five Years Ended 8/31/09 | Inception to 8/31/09 | ||||||||||||||
| NAV | MARKET | INDEX | NAV | MARKET | INDEX | NAV | MARKET | INDEX | ||||||||
| (9.67)% | (9.69)% | (9.20)% | 3.50% | 3.60% | 4.33% | (4.11)% | (4.21)% | (3.27)% | ||||||||
| Cumulative Total Returns | ||||||||||||||||
| Year Ended 8/31/09 | Five Years Ended 8/31/09 | Inception to 8/31/09 | ||||||||||||||
| NAV | MARKET | INDEX | NAV | MARKET | INDEX | NAV | MARKET | INDEX | ||||||||
| (9.67)% | (9.69)% | (9.20)% | 18.77% | 19.33% | 23.61% | (32.06)% | (32.66)% | (26.32)% | ||||||||
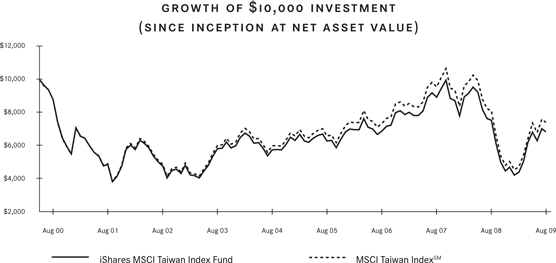
Total returns for the period since inception are calculated from the inception date of the Fund (6/20/00). “Average Annual Total Returns” represent the average annual change in value of an investment over the period(s) indicated. “Cumulative Total Returns” represent the total change in value of an investment over the period(s) indicated.
The Fund’s per share net asset value or “NAV” is the value of one share of the Fund as calculated in accordance with the standard formula for valuing mutual fund shares. The NAV return is based on the NAV of the Fund and the market return is based on the market price per share of the Fund. The price used to calculate market return (“Market Price”) is determined by using the midpoint between the highest bid and the lowest offer on the primary stock exchange on which the shares of the Fund are listed for trading, as of the time that the Fund’s NAV is calculated. As the Fund has a NAV which is determined prior to the opening of the regular trading day on the primary stock exchange on which it is listed, the market return is calculated using the midpoint of the bid/ask spread as of the opening of regular trading on the exchange. Since shares of the Fund did not trade in the secondary market until after the Fund’s inception, for the period from inception to the first day of secondary market trading in shares of the Fund (6/23/00), the NAV of the Fund is used as a proxy for the Market Price to calculate market returns. Market and NAV returns assume that dividends and capital gain distributions have been reinvested in the Fund at Market Price and NAV, respectively.
An index is a statistical composite that tracks a specified financial market or sector. Unlike the Fund, an index does not actually hold a portfolio of securities and therefore does not incur the expenses incurred by the Fund. These expenses negatively impact the performance of the Fund. Also, market returns do not include brokerage commissions that may be payable on secondary market transactions. If brokerage commissions were included, market returns would be lower. The performance shown in the table(s) and chart(s) above assumes reinvestment of all dividends and capital gain distributions and does not reflect the deduction of taxes that a shareholder would pay on fund distributions or the redemption or sale of fund shares. The investment return and principal value of shares of the Fund will vary with changes in market conditions. Shares of the Fund may be worth more or less than their original cost when they are redeemed or sold in the market. The Fund’s past performance is no guarantee of future results.
| MANAGEMENT’S DISCUSSIONSOF FUND PERFORMANCE | 23 |
Table of Contents
Management’s Discussion of Fund Performance (Continued)
iSHARES® MSCI TAIWAN INDEX FUND
| PORTFOLIO ALLOCATION As of 8/31/09 | |||
| Sector | Percentage of Net Assets | ||
Technology | 38.39 | % | |
Industrial | 24.15 | ||
Financial | 14.82 | ||
Basic Materials | 10.63 | ||
Communications | 4.58 | ||
Consumer Cyclical | 3.87 | ||
Consumer Non-Cyclical | 1.27 | ||
Energy | 1.21 | ||
Short-Term and Other Net Assets | 1.08 | ||
TOTAL | 100.00 | % | |
| TEN LARGEST FUND HOLDINGS As of 8/31/09 | |||
| Security | Percentage of Net Assets | ||
Taiwan Semiconductor Manufacturing Co. Ltd. | 14.38 | % | |
Hon Hai Precision Industry Co. Ltd. | 8.48 | ||
MediaTek Inc. | 4.25 | ||
China Steel Corp. | 2.95 | ||
Chunghwa Telecom Co. Ltd. | 2.93 | ||
Cathay Financial Holding Co. Ltd. | 2.68 | ||
AU Optronics Corp. | 2.47 | ||
Nan Ya Plastic Corp. | 2.36 | ||
Formosa Plastics Corp. | 2.30 | ||
HTC Corp. | 2.30 | ||
TOTAL | 45.10 | % | |
| 24 | 2009 iSHARES ANNUAL REPORT TO SHAREHOLDERS |
Table of Contents
Management’s Discussion of Fund Performance
iSHARES® MSCI THAILAND INVESTABLE MARKET INDEX FUND
(TICKER: THD)
INVESTMENT OBJECTIVE
The iShares MSCI Thailand Investable Market Index Fund (the “Fund”) seeks to provide investment results that correspond generally to the price and yield performance, before fees and expenses, of the MSCI Thailand Investable Market IndexSM (the “Index”). The Index is a free float adjusted market capitalization index designed to measure broad based equity market performance in Thailand. The Fund invests in a representative sample of securities included in the Index that collectively has an investment profile similar to the Index. Due to the use of representative sampling, the Fund may or may not hold all of the securities that are included in the Index. For the 12-month period ended August 31, 2009 (the “reporting period”), the total return for the Fund was (0.33)%, while the total return for the Index was 0.12%.
MARKET OVERVIEW AND DISCUSSION OF PERFORMANCE
After hitting a low in March 2009, the Thailand stock market recouped virtually all of its decline for the reporting period, resulting in performance that was among the best in the region. However, Thailand’s economy struggled along with other countries in Asia. Gross domestic product fell by 4.9% in the second quarter of 2009 compared to the year ago period. That compared to a decline of 7.1% in the first quarter. At the same time, the country saw deflation of about 3% as recently as May 2009.
Because Thailand’s economy is highly export dependent, its fortunes depend on the economies of its trading partners. Some of those trading partners, including the U.S., were in the midst of their own recessions during the reporting period. Thai exports fell by 22% in the second quarter, while imports declined 25%. The reporting period brought to an end six years of double-digit annual export growth.
The Thai government responded with a significant expansion in spending, including a subsidy to electricity and transportation fares as well as payments to low income wage earners. During the first half of 2009, the government spent about $3.4 billion on subsidies, and recently decided to expand the program. In August, the cabinet approved a new three-year spending package of about $45 billion, much of it on infrastructure, health care and education. However, the government is now running a significant budget deficit.
Meanwhile, the Thai Central Bank decided in late August to maintain short-term interest rates at 1.25%, as deflation fears continued. The government had previously cut interest rates from 4% earlier in the reporting period.
In addition, the economy has appeared to be adversely affected by political tensions within the country. Supporters and opponents of a former prime minister who was ousted in a military coup three years ago continue to stage major protests, costing the country billions in tourist dollars. To lure back tourists, the Tourism Authority of Thailand offered free round trips to the country’s most popular resort areas.
There were other positive signs towards the end of the reporting period, including Ford Motor’s announced $500 million investment in a Thai manufacturing plant and Mitsubishi’s decision to hire 1,300 workers in Thailand, reflecting signs of a potential recovery in the global auto industry. Indeed, the manufacturing sector had already begun to grow in the second quarter, expanding by about 6%, following two quarters of contraction when world demand for cars and electronics made in Thailand was moribund.
The ten largest holdings of the Fund posted mixed results during the reporting period. Retailer CPAll PCL, formerly CP Seven Eleven, posted the best return for the Fund. Siam Cement PCL, the country’s largest cement company, also posted a positive double-digit return. On the negative side, shares of PTT Exploration & Production PCL, a major energy company and two Thai-based commercial banks – Bank of Ayudhya PCL and Bangkok Bank PCL – declined notably during the period.
| MANAGEMENT’S DISCUSSIONSOF FUND PERFORMANCE | 25 |
Table of Contents
Management’s Discussion of Fund Performance (Continued)
iSHARES® MSCI THAILAND INVESTABLE MARKET INDEX FUND
Performance as of August 31, 2009
| Average Annual Total Returns | Cumulative Total Returns | |||||||||||||||
| Year Ended 8/31/09 | Inception to 8/31/09 | Inception to 8/31/09 | ||||||||||||||
| NAV | MARKET | INDEX | NAV | MARKET | INDEX | NAV | MARKET | INDEX | ||||||||
| (0.33)% | 0.73% | 0.12% | (16.37)% | (16.18)% | (16.14)% | (22.64)% | (22.38)% | (22.33)% | ||||||||
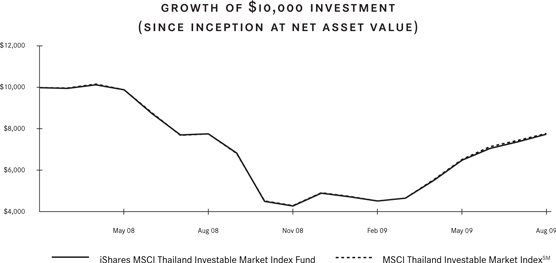
Total returns for the period since inception are calculated from the inception date of the Fund (3/26/08). “Average Annual Total Returns” represent the average annual change in value of an investment over the period(s) indicated. “Cumulative Total Returns” represent the total change in value of an investment over the period(s) indicated.
The Fund’s per share net asset value or “NAV” is the value of one share of the Fund as calculated in accordance with the standard formula for valuing mutual fund shares. The NAV return is based on the NAV of the Fund and the market return is based on the market price per share of the Fund. The price used to calculate market return (“Market Price”) is determined by using the midpoint between the highest bid and the lowest offer on the primary stock exchange on which the shares of the Fund are listed for trading, as of the time that the Fund’s NAV is calculated. Since shares of the Fund did not trade in the secondary market until after the Fund’s inception, for the period from inception to the first day of secondary market trading in shares of the Fund (3/28/08), the NAV of the Fund is used as a proxy for the Market Price to calculate market returns. Market and NAV returns assume that dividends and capital gain distributions have been reinvested in the Fund at Market Price and NAV, respectively.
An index is a statistical composite that tracks a specified financial market or sector. Unlike the Fund, an index does not actually hold a portfolio of securities and therefore does not incur the expenses incurred by the Fund. These expenses negatively impact the performance of the Fund. Also, market returns do not include brokerage commissions that may be payable on secondary market transactions. If brokerage commissions were included, market returns would be lower. The performance shown in the table(s) and chart(s) above assumes reinvestment of all dividends and capital gain distributions and does not reflect the deduction of taxes that a shareholder would pay on fund distributions or the redemption or sale of fund shares. The investment return and principal value of shares of the Fund will vary with changes in market conditions. Shares of the Fund may be worth more or less than their original cost when they are redeemed or sold in the market. The Fund’s past performance is no guarantee of future results.
| 26 | 2009 iSHARES ANNUAL REPORT TO SHAREHOLDERS |
Table of Contents
Management’s Discussion of Fund Performance (Continued)
iSHARES® MSCI THAILAND INVESTABLE MARKET INDEX FUND
| PORTFOLIO ALLOCATION As of 8/31/09 | |||
| Sector | Percentage of Net Assets | ||
Energy | 30.28 | % | |
Financial | 30.18 | ||
Consumer Cyclical | 8.59 | ||
Communications | 8.21 | ||
Industrial | 7.91 | ||
Basic Materials | 6.39 | ||
Consumer Non-Cyclical | 4.63 | ||
Utilities | 2.77 | ||
Technology | 0.42 | ||
Short-Term and Other Net Assets | 0.62 | ||
TOTAL | 100.00 | % | |
| TEN LARGEST FUND HOLDINGS As of 8/31/09 | |||
| Security | Percentage of Net Assets | ||
PTT PCL NVDR | 12.84 | % | |
PTT Exploration & Production PCL NVDR | 10.29 | ||
Bangkok Bank PCL NVDR | 8.93 | ||
Siam Commercial Bank PCL NVDR | 5.39 | ||
Kasikornbank PCL NVDR | 5.04 | ||
Advanced Info Service PCL NVDR | 4.55 | ||
Siam Cement PCL NVDR | 4.40 | ||
Banpu PCL NVDR | 4.07 | ||
Bank of Ayudhya PCL NVDR | 2.68 | ||
CP All PCL NVDR | 2.64 | ||
TOTAL | 60.83 | % | |
| MANAGEMENT’S DISCUSSIONSOF FUND PERFORMANCE | 27 |
Table of Contents
Shareholder Expenses (Unaudited)
iSHARES®, INC.
As a shareholder of a Fund, you incur two types of costs: (1) transaction costs, including brokerage commissions on purchases and sales of Fund shares and (2) ongoing costs, including management fees and other Fund expenses. The following Example is intended to help you understand your ongoing costs (in dollars and cents) of investing in a Fund and to compare these costs with the ongoing costs of investing in other Funds.
The Example is based on an investment of $1,000 invested at the beginning of the period and held for the entire period from March 1, 2009 to August 31, 2009.
ACTUAL EXPENSES
The first line under each Fund in the table below provides information about actual account values and actual expenses. You may use the information in this line, together with the amount you invested, to estimate the expenses that you paid over the period. Simply divide your account value by $1,000 (for example, an $8,600 account value divided by $1,000 = 8.6), then multiply the result by the number in the first line for your Fund under the heading entitled “Expenses Paid During Period” to estimate the expenses you paid on your account during this period.
HYPOTHETICAL EXAMPLE FOR COMPARISON PURPOSES
The second line under each Fund in the table below provides information about hypothetical account values and hypothetical expenses based on each Fund’s actual expense ratio and an assumed rate of return of 5% per year before expenses, which is not the Fund’s actual return. The hypothetical account values and expenses may not be used to estimate the actual ending account balance or expenses you paid for the period. You may use this information to compare the ongoing costs of investing in your Fund and other Funds. To do so, compare this 5% hypothetical example with the 5% hypothetical examples that appear in the shareholder reports of the other Funds.
Please note that the expenses shown in the table are meant to highlight your ongoing costs only and do not reflect any transactional costs, such as brokerage commissions paid on purchases and sales of Fund shares. Therefore, the second line under each Fund in the table is useful in comparing ongoing costs only and will not help you determine the relative total costs of owning different Funds. In addition, if these transactional costs were included, your costs would have been higher.
| iShares MSCI Index Fund | Beginning Account Value (3/1/09) | Ending Account Value (8/31/09) | Annualized Expense Ratio | Expenses Paid During Perioda (3/1/09 to 8/31/09) | |||||
Australia | |||||||||
Actual | $1,000.00 | $1,795.00 | 0.55 | % | $3.87 | ||||
Hypothetical (5% return before expenses) | 1,000.00 | 1,022.40 | 0.55 | 2.80 | |||||
Hong Kong | |||||||||
Actual | 1,000.00 | 1,488.00 | 0.55 | 3.45 | |||||
Hypothetical (5% return before expenses) | 1,000.00 | 1,022.40 | 0.55 | 2.80 | |||||
Japan Small Cap | |||||||||
Actual | 1,000.00 | 1,399.20 | 0.55 | 3.33 | |||||
Hypothetical (5% return before expenses) | 1,000.00 | 1,022.40 | 0.55 | 2.80 | |||||
Malaysia | |||||||||
Actual | 1,000.00 | 1,413.90 | 0.55 | 3.35 | |||||
Hypothetical (5% return before expenses) | 1,000.00 | 1,022.40 | 0.55 | 2.80 |
| 28 | 2009 iSHARES ANNUAL REPORT TO SHAREHOLDERS |
Table of Contents
Shareholder Expenses (Unaudited) (Continued)
iSHARES®, INC.
| iShares MSCI Index Fund | Beginning Account Value (3/1/09) | Ending Account Value (8/31/09) | Annualized Expense Ratio | Expenses Paid During Perioda (3/1/09 to 8/31/09) | |||||
Pacific ex-Japan | |||||||||
Actual | $1,000.00 | $1,724.00 | 0.50 | % | $3.43 | ||||
Hypothetical (5% return before expenses) | 1,000.00 | 1,022.70 | 0.50 | 2.55 | |||||
Singapore | |||||||||
Actual | 1,000.00 | 1,780.50 | 0.55 | 3.85 | |||||
Hypothetical (5% return before expenses) | 1,000.00 | 1,022.40 | 0.55 | 2.80 | |||||
South Korea | |||||||||
Actual | 1,000.00 | 1,887.90 | 0.64 | 4.66 | |||||
Hypothetical (5% return before expenses) | 1,000.00 | 1,022.00 | 0.64 | 3.26 | |||||
Taiwan | |||||||||
Actual | 1,000.00 | 1,562.90 | 0.86 | 5.56 | |||||
Hypothetical (5% return before expenses) | 1,000.00 | 1,020.90 | 0.86 | 4.38 | |||||
Thailand Investable Market | |||||||||
Actual | 1,000.00 | 1,724.40 | 0.64 | 4.39 | |||||
Hypothetical (5% return before expenses) | 1,000.00 | 1,022.00 | 0.64 | 3.26 |
| a | Expenses are calculated using each Fund’s annualized expense ratio (as disclosed in the table), multiplied by the average account value for the period, multiplied by the number of days in the period (184 days) and divided by the number of days in the year (365 days). |
| SHAREHOLDER EXPENSES | 29 |
Table of Contents
iSHARES® MSCI AUSTRALIA INDEX FUND
August 31, 2009
| Security | Shares | Value | |||
COMMON STOCKS – 98.95% | |||||
AIRLINES – 0.31% | |||||
Qantas Airways Ltd. | 2,352,784 | $ | 5,018,292 | ||
| 5,018,292 | |||||
APPAREL – 0.24% | |||||
Billabong International Ltd. | 425,712 | 3,768,413 | |||
| 3,768,413 | |||||
BANKS – 29.35% | |||||
Australia and New Zealand Banking Group Ltd. | 5,023,480 | 90,164,104 | |||
Bendigo and Adelaide Bank Ltd. | 645,624 | 4,517,634 | |||
Bendigo and Adelaide Bank Ltd. Newa | 52,398 | 360,019 | |||
Commonwealth Bank of Australia | 3,266,928 | 126,692,448 | |||
National Australia Bank Ltd. | 4,132,464 | 99,220,725 | |||
Suncorp-Metway Ltd. | 2,707,152 | 17,870,131 | |||
Westpac Banking Corp. | 6,272,392 | 128,867,100 | |||
| 467,692,161 | |||||
BEVERAGES – 2.23% | |||||
Coca-Cola Amatil Ltd. | 1,199,520 | 10,021,540 | |||
Foster’s Group Ltd. | 4,150,888 | 19,176,745 | |||
Lion Nathan Ltd. | 639,352 | 6,365,657 | |||
| 35,563,942 | |||||
BIOTECHNOLOGY – 0.59% | |||||
Sonic Healthcare Ltd. | 792,624 | 9,341,739 | |||
| 9,341,739 | |||||
BUILDING MATERIALS – 1.02% | |||||
Boral Ltd. | 1,267,336 | 6,186,196 | |||
CSR Ltd. | 2,663,640 | 4,580,987 | |||
James Hardie Industries NVa | 931,784 | 5,459,507 | |||
| 16,226,690 | |||||
CHEMICALS – 0.76% | |||||
Incitec Pivot Ltd. | 3,446,464 | 8,745,680 | |||
Nufarm Ltd. | 368,331 | 3,325,685 | |||
| 12,071,365 | |||||
| Security | Shares | Value | |||
COMMERCIAL SERVICES – 2.06% | |||||
Brambles Ltd. | 3,010,560 | $ | 18,857,731 | ||
Macquarie Infrastructure Group | 4,946,648 | 5,546,461 | |||
Transurban Group | 2,492,728 | 8,490,037 | |||
| 32,894,229 | |||||
COMPUTERS – 0.51% | |||||
Computershare Ltd. | 956,088 | 8,148,963 | |||
| 8,148,963 | |||||
DIVERSIFIED FINANCIAL SERVICES – 2.59% | |||||
ASX Ltd. | 371,224 | 10,358,989 | |||
Macquarie Group Ltd. | 654,248 | 28,019,440 | |||
Perpetual Ltd. | 81,536 | 2,828,607 | |||
| 41,207,036 | |||||
ELECTRIC – 0.71% | |||||
AGL Energy Ltd. | 966,280 | 11,372,128 | |||
| 11,372,128 | |||||
ELECTRIC - DISTRIBUTION – 0.12% | |||||
SP AusNet | 2,865,128 | 1,859,893 | |||
| 1,859,893 | |||||
ENGINEERING & CONSTRUCTION – 1.16% | |||||
Leighton Holdings Ltd. | 319,872 | 9,964,236 | |||
WorleyParsons Ltd. | 352,408 | 8,458,368 | |||
| 18,422,604 | |||||
ENTERTAINMENT – 1.00% | |||||
Aristocrat Leisure Ltd. | 851,509 | 3,316,535 | |||
Tabcorp Holdings Ltd. | 1,284,192 | 7,264,501 | |||
Tatts Group Ltd. | 2,600,920 | 5,437,910 | |||
| 16,018,946 | |||||
FOOD – 4.52% | |||||
Goodman Fielder Ltd. | 2,699,312 | 3,504,509 | |||
Metcash Ltd. | 1,667,960 | 6,018,423 | |||
Woolworths Ltd. | 2,646,000 | 62,504,503 | |||
| 72,027,435 | |||||
HEALTH CARE - PRODUCTS – 0.36% | |||||
Cochlear Ltd. | 121,520 | 5,764,717 | |||
| 5,764,717 | |||||
| 30 | 2009 iSHARES ANNUAL REPORT TO SHAREHOLDERS |
Table of Contents
Schedule of Investments (Continued)
iSHARES® MSCI AUSTRALIA INDEX FUND
August 31, 2009
| Security | Shares | Value | |||
INSURANCE – 5.41% | |||||
AMP Ltd. | 4,324,152 | $ | 23,185,230 | ||
AXA Asia Pacific Holdings Ltd. | 2,206,176 | 7,997,642 | |||
Insurance Australia Group Ltd. | 4,430,776 | 13,372,609 | |||
QBE Insurance Group Ltd. | 2,158,352 | 41,632,417 | |||
| 86,187,898 | |||||
IRON & STEEL – 1.09% | |||||
BlueScope Steel Ltd. | 3,923,920 | 9,461,054 | |||
OneSteel Ltd. | 2,867,088 | 7,855,570 | |||
| 17,316,624 | |||||
LODGING – 0.43% | |||||
Crown Ltd. | 1,034,880 | 6,901,124 | |||
| 6,901,124 | |||||
MANUFACTURING – 4.24% | |||||
Orica Ltd. | 775,376 | 14,760,111 | |||
Wesfarmers Ltd. | 2,165,016 | 45,867,697 | |||
Wesfarmers Ltd. Partially Protected | 326,928 | 6,973,101 | |||
| 67,600,909 | |||||
MEDIA – 0.36% | |||||
Fairfax Media Ltd.b | 4,605,608 | 5,707,654 | |||
| 5,707,654 | |||||
METAL FABRICATE & HARDWARE – 0.39% | |||||
Sims Metal Management Ltd. | 316,344 | 6,195,297 | |||
| 6,195,297 | |||||
MINING – 20.46% | |||||
Alumina Ltd. | 5,263,776 | 7,410,836 | |||
BHP Billiton Ltd. | 7,224,168 | 224,124,322 | |||
Energy Resources of Australia Ltd. | 146,608 | 3,213,545 | |||
Fortescue Metals Group Ltd.a | 2,658,936 | 9,885,526 | |||
Newcrest Mining Ltd. | 1,041,152 | 26,341,073 | |||
OZ Minerals Ltd.a | 6,714,960 | 6,000,710 | |||
Paladin Energy Ltd.a | 1,205,400 | 4,674,577 | |||
Rio Tinto Ltd. | 937,664 | 44,354,822 | |||
| 326,005,411 | |||||
| Security | Shares | Value | |||
OIL & GAS – 6.25% | |||||
Arrow Energy Ltd.a | 1,236,368 | $ | 4,784,249 | ||
Caltex Australia Ltd. | 292,824 | 3,053,723 | |||
Origin Energy Ltd. | 1,884,344 | 24,321,408 | |||
Santos Ltd. | 1,762,824 | 23,481,151 | |||
Woodside Petroleum Ltd. | 1,066,240 | 44,045,788 | |||
| 99,686,319 | |||||
PACKAGING & CONTAINERS – 0.80% | |||||
Amcor Ltd. | 2,610,192 | 12,697,014 | |||
| 12,697,014 | |||||
PHARMACEUTICALS – 2.21% | |||||
CSL Ltd. | 1,298,696 | 35,265,623 | |||
| 35,265,623 | |||||
REAL ESTATE – 6.24% | |||||
BGP Holdings PLCc | 18,888,372 | 2,711 | |||
Dexus Property Group | 9,966,992 | 6,259,991 | |||
Goodman Group | 12,865,832 | 6,724,855 | |||
GPT Group | 18,547,872 | 9,616,622 | |||
Lend Lease Corp. Ltd. | 928,256 | 7,379,600 | |||
Mirvac Group | 5,497,016 | 6,858,704 | |||
Stockland Corp. Ltd. | 4,930,184 | 15,711,160 | |||
Westfield Group | 4,398,240 | 46,942,473 | |||
| 99,496,116 | |||||
REAL ESTATE INVESTMENT TRUSTS – 0.37% | |||||
CFS Retail Property Trustb | 3,718,512 | 5,956,294 | |||
| 5,956,294 | |||||
RETAIL – 0.24% | |||||
Harvey Norman Holdings Ltd.b | 1,145,424 | 3,804,660 | |||
| 3,804,660 | |||||
TELECOMMUNICATIONS – 1.63% | |||||
Telstra Corp. Ltd. | 9,460,528 | 26,000,776 | |||
| 26,000,776 | |||||
TRANSPORTATION – 1.30% | |||||
Asciano Groupa | 5,841,584 | 7,830,348 | |||
Macquarie Airports | 1,505,808 | 3,249,847 | |||
Toll Holdings Ltd. | 1,427,664 | 9,592,629 | |||
| 20,672,824 | |||||
TOTAL COMMON STOCKS | 1,576,893,096 | ||||
| SCHEDULESOF INVESTMENTS | 31 |
Table of Contents
Schedule of Investments (Continued)
iSHARES® MSCI AUSTRALIA INDEX FUND
August 31, 2009
| Security | Shares | Value | |||
SHORT-TERM INVESTMENTS – 0.38% | |||||
MONEY MARKET FUNDS – 0.38% | |||||
Barclays Global Investors Funds | 5,105,560 | $ | 5,105,560 | ||
Barclays Global Investors Funds | 720,220 | 720,220 | |||
Barclays Global Investors Funds | 265,283 | 265,283 | |||
| 6,091,063 | |||||
TOTAL SHORT-TERM INVESTMENTS | |||||
(Cost: $6,091,063) | 6,091,063 | ||||
TOTAL INVESTMENTS IN | |||||
(Cost: $1,574,274,313) | 1,582,984,159 | ||||
Other Assets, Less Liabilities – 0.67% | 10,692,238 | ||||
NET ASSETS – 100.00% | $ | 1,593,676,397 | |||
| a | Non-income earning security. |
| b | All or a portion of this security represents a security on loan. See Note 5. |
| c | Security valued using Level 3 inputs. See Note 1. |
| d | Affiliated issuer. See Note 2. |
| e | The rate quoted is the annualized seven-day yield of the fund at period end. |
| f | All or a portion of this security represents an investment of securities lending collateral. See Note 5. |
See notes to financial statements.
| 32 | 2009 iSHARES ANNUAL REPORT TO SHAREHOLDERS |
Table of Contents
iSHARES® MSCI HONG KONG INDEX FUND
August 31, 2009
| Security | Shares | Value | |||
COMMON STOCKS – 99.65% | |||||
AIRLINES – 0.81% | |||||
Cathay Pacific Airways Ltd.a,b | 10,854,000 | $ | 15,740,481 | ||
| 15,740,481 | |||||
APPAREL – 0.86% | |||||
Yue Yuen Industrial Holdings Ltd. | 6,331,500 | 16,705,589 | |||
| 16,705,589 | |||||
BANKS – 11.43% | |||||
Bank of East Asia Ltd. | 13,024,910 | 42,012,315 | |||
BOC Hong Kong (Holdings) Ltd. | 33,466,500 | 67,100,103 | |||
Hang Seng Bank Ltd. | 6,874,200 | 97,649,800 | |||
Wing Hang Bank Ltd. | 1,809,000 | 16,337,984 | |||
| 223,100,202 | |||||
DISTRIBUTION & WHOLESALE – 6.85% | |||||
Esprit Holdings Ltd. | 10,130,400 | 61,626,878 | |||
Li & Fung Ltd.b | 21,709,000 | 72,123,854 | |||
| 133,750,732 | |||||
DIVERSIFIED FINANCIAL SERVICES – 8.29% | |||||
Hong Kong Exchanges and Clearing Ltd.b | 9,295,000 | 161,899,325 | |||
| 161,899,325 | |||||
ELECTRIC – 10.14% | |||||
CLP Holdings Ltd. | 18,994,700 | 127,192,549 | |||
Hongkong Electric Holdings Ltd. | 12,663,000 | 70,743,473 | |||
| 197,936,022 | |||||
ENGINEERING & CONSTRUCTION – 3.35% | |||||
Cheung Kong Infrastructure Holdings Ltd. | 3,618,000 | 13,163,748 | |||
Hong Kong Aircraft Engineering Co. Ltd. | 723,600 | 8,467,744 | |||
New World Development Co. Ltd. | 21,708,800 | 43,806,085 | |||
| 65,437,577 | |||||
GAS – 4.01% | |||||
Hong Kong and China Gas Co. Ltd. (The)b | 36,180,712 | 78,330,507 | |||
| 78,330,507 | |||||
| Security | Shares | Value | |||
HOLDING COMPANIES - DIVERSIFIED – 14.67% | |||||
Hutchison Whampoa Ltd. | 19,899,800 | $ | 139,928,793 | ||
NWS Holdings Ltd. | 7,236,000 | 14,097,347 | |||
Swire Pacific Ltd. Class A | 7,236,000 | 75,481,489 | |||
Wharf (Holdings) Ltd. (The) | 12,663,500 | 56,776,738 | |||
| 286,284,367 | |||||
LODGING – 0.82% | |||||
Shangri-La Asia Ltd.b | 10,854,000 | 15,964,545 | |||
| 15,964,545 | |||||
MEDIA – 0.48% | |||||
Television Broadcasts Ltd. | 2,209,000 | 9,419,526 | |||
| 9,419,526 | |||||
MINING – 0.49% | |||||
Mongolia Energy Corp. Ltd.a,b | 27,135,000 | 9,627,741 | |||
| 9,627,741 | |||||
REAL ESTATE – 30.61% | |||||
Cheung Kong (Holdings) Ltd. | 12,663,000 | 150,227,768 | |||
Chinese Estates Holdings Ltd.b | 7,236,000 | 13,313,124 | |||
Hang Lung Group Ltd. | 7,236,000 | 33,329,488 | |||
Hang Lung Properties Ltd.b | 19,899,000 | 62,002,651 | |||
Henderson Land Development Co. Ltd. | 9,595,332 | 56,391,060 | |||
Hopewell Holdings Ltd. | 5,427,000 | 16,419,674 | |||
Hysan Development Co. Ltd. | 5,427,000 | 12,729,624 | |||
Kerry Properties Ltd. | 6,331,500 | 29,980,202 | |||
Sino Land Co. Ltd.b | 14,472,000 | 24,721,704 | |||
Sun Hung Kai Properties Ltd. | 12,863,000 | 174,092,328 | |||
Wheelock and Co. Ltd.b | 9,045,000 | 24,331,927 | |||
| 597,539,550 | |||||
REAL ESTATE INVESTMENT TRUSTS – 2.25% | |||||
Link REIT (The)b | 19,899,000 | 43,851,150 | |||
| 43,851,150 | |||||
RETAIL – 0.40% | |||||
Lifestyle International Holdings Ltd. | 5,427,000 | 7,730,201 | |||
| 7,730,201 | |||||
SEMICONDUCTORS – 0.59% | |||||
ASM Pacific Technology Ltd.b | 1,809,000 | 11,588,299 | |||
| 11,588,299 | |||||
| SCHEDULESOF INVESTMENTS | 33 |
Table of Contents
Schedule of Investments (Continued)
iSHARES® MSCI HONG KONG INDEX FUND
August 31, 2009
| Security | Shares | Value | ||||
TELECOMMUNICATIONS – 0.98% |
| |||||
Foxconn International Holdings Ltd.a | 18,090,000 | $ | 11,109,829 | |||
PCCW Ltd. | 30,753,000 | 7,975,271 | ||||
| 19,085,100 | ||||||
TRANSPORTATION – 2.62% | ||||||
MTR Corp. Ltd.b | 12,663,083 | 42,560,729 | ||||
Orient Overseas International Ltd.b | 1,809,200 | 8,496,691 | ||||
| 51,057,420 | ||||||
TOTAL COMMON STOCKS | 1,945,048,334 | |||||
SHORT-TERM INVESTMENTS – 4.87% |
| |||||
MONEY MARKET FUNDS – 4.87% |
| |||||
Barclays Global Investors Funds | 82,770,853 | 82,770,853 | ||||
Barclays Global Investors Funds | 11,676,133 | 11,676,133 | ||||
Barclays Global Investors Funds | 554,354 | 554,354 | ||||
| 95,001,340 | ||||||
TOTAL SHORT-TERM INVESTMENTS |
| |||||
(Cost: $95,001,340) | 95,001,340 | |||||
TOTAL INVESTMENTS IN | 2,040,049,674 | |||||
Other Assets, Less Liabilities – (4.52)% | (88,272,809 | ) | ||||
NET ASSETS – 100.00% | $ | 1,951,776,865 | ||||
| a | Non-income earning security. |
| b | All or a portion of this security represents a security on loan. See Note 5. |
| c | Affiliated issuer. See Note 2. |
| d | The rate quoted is the annualized seven-day yield of the fund at period end. |
| e | All or a portion of this security represents an investment of securities lending collateral. See Note 5. |
See notes to financial statements.
| 34 | 2009 iSHARES ANNUAL REPORT TO SHAREHOLDERS |
Table of Contents
iSHARES® MSCI JAPAN SMALL CAP INDEX FUND
August 31, 2009
| Security | Shares | Value | |||
COMMON STOCKS – 99.79% | |||||
ADVERTISING – 0.33% | |||||
Asatsu-DK Inc. | 3,200 | $ | 69,336 | ||
Moshi Moshi Hotline Inc. | 2,400 | 46,828 | |||
| 116,164 | |||||
AEROSPACE & DEFENSE – 0.14% | |||||
Japan Aviation Electronics Industry Ltd. | 8,000 | 51,485 | |||
| 51,485 | |||||
AGRICULTURE – 0.47% | |||||
Hokuto Corp. | 2,400 | 56,659 | |||
Sakata Seed Corp. | 7,200 | 110,369 | |||
| 167,028 | |||||
APPAREL – 1.14% | |||||
Descente Ltd. | 8,000 | 37,687 | |||
Gunze Ltd. | 16,000 | 72,959 | |||
Japan Wool Textile Co. Ltd. (The) | 8,000 | 61,920 | |||
Katakura Industries Co. Ltd. | 3,200 | 36,876 | |||
Sanyo Shokai Ltd. | 8,000 | 26,993 | |||
Tokyo Style Co. Ltd. | 8,000 | 67,267 | |||
Wacoal Holdings Corp. | 8,000 | 101,331 | |||
| 405,033 | |||||
AUTO MANUFACTURERS – 0.73% | |||||
Kanto Auto Works Ltd. | 4,800 | 49,415 | |||
Nissan Shatai Co. Ltd. | 8,000 | 66,059 | |||
Shinmaywa Industries Ltd. | 16,000 | 66,404 | |||
Toyota Auto Body Co. Ltd. | 4,000 | 78,909 | |||
| 260,787 | |||||
AUTO PARTS & EQUIPMENT – 3.60% | |||||
Aisan Industry Co. Ltd. | 2,400 | 19,223 | |||
Akebono Brake Industry Co. Ltd.a | 6,400 | 50,364 | |||
Calsonic Kansei Corp. | 16,000 | 39,843 | |||
Exedy Corp. | 3,200 | 68,302 | |||
FCC Co. Ltd. | 4,000 | 62,136 | |||
Kayaba Industry Co. Ltd. | 16,000 | 43,292 | |||
Keihin Corp. | 4,000 | 66,663 | |||
Koito Manufacturing Co. Ltd. | 8,000 | 106,506 | |||
Musashi Seimitsu Industry Co. Ltd. | 2,400 | 43,698 | |||
Nifco Inc. | 4,000 | 71,492 | |||
Nissin Kogyo Co. Ltd. | 4,000 | 52,261 | |||
Press Kogyo Co. Ltd. | 8,000 | 19,231 | |||
| Security | Shares | Value | |||
Riken Corp. | 16,000 | $ | 54,331 | ||
Sanden Corp.b | 16,000 | 48,467 | |||
Showa Corp. | 6,400 | 41,119 | |||
T.RAD Co. Ltd. | 8,000 | 22,077 | |||
Takata Corp. | 3,200 | 61,023 | |||
Tokai Rika Co. Ltd. | 3,200 | 57,608 | |||
Topre Corp. | 6,400 | 60,299 | |||
Toyo Tire & Rubber Co. Ltd.b | 16,000 | 38,118 | |||
TS Tech Co. Ltd. | 4,800 | 87,085 | |||
Unipres Corp. | 3,200 | 43,154 | |||
Yokohama Rubber Co. Ltd. (The) | 24,000 | 125,478 | |||
| 1,281,770 | |||||
BANKS – 10.42% | |||||
Aichi Bank Ltd. (The) | 800 | 73,390 | |||
Akita Bank Ltd. (The) | 24,000 | 97,278 | |||
Aomori Bank Ltd. (The) | 16,000 | 65,887 | |||
Awa Bank Ltd. (The) | 24,000 | 144,106 | |||
Bank of Ikeda Ltd. (The)b | 1,600 | 61,575 | |||
Bank of Iwate Ltd. (The) | 1,600 | 94,001 | |||
Bank of Nagoya Ltd. (The) | 16,000 | 72,786 | |||
Bank of Okinawa Ltd. (The) | 2,400 | 95,208 | |||
Bank of Saga Ltd. (The) | 16,000 | 55,366 | |||
Bank of the Ryukyus Ltd. | 4,000 | 55,668 | |||
Chiba Kogyo Bank Ltd. (The)b | 4,000 | 34,582 | |||
Chukyo Bank Ltd. (The) | 16,000 | 50,536 | |||
Daishi Bank Ltd. (The) | 32,000 | 132,464 | |||
Ehime Bank Ltd. (The) | 16,000 | 46,224 | |||
Eighteenth Bank Ltd. (The) | 16,000 | 52,261 | |||
Fukui Bank Ltd. (The) | 32,000 | 107,627 | |||
Higashi-Nippon Bank Ltd. (The) | 16,000 | 37,255 | |||
Higo Bank Ltd. (The) | 16,000 | 103,660 | |||
Hokkoku Bank Ltd. (The) | 24,000 | 92,104 | |||
Hokuetsu Bank Ltd. (The) | 24,000 | 48,898 | |||
Hyakugo Bank Ltd. (The) | 24,000 | 125,996 | |||
Hyakujushi Bank Ltd. (The) | 24,000 | 118,234 | |||
Juroku Bank Ltd. (The) | 32,000 | 120,045 | |||
Kagoshima Bank Ltd. (The) | 16,000 | 129,877 | |||
Kansai Urban Banking Corp. | 16,000 | 26,044 | |||
Kanto Tsukuba Bank Ltd. (The)b | 5,600 | 19,197 | |||
Keiyo Bank Ltd. (The) | 24,000 | 130,653 | |||
Kiyo Holdings Inc. | 64,000 | 82,100 | |||
Michinoku Bank Ltd. (The) | 16,000 | 35,703 | |||
| SCHEDULESOF INVESTMENTS | 35 |
Table of Contents
Schedule of Investments (Continued)
iSHARES® MSCI JAPAN SMALL CAP INDEX FUND
August 31, 2009
| Security | Shares | Value | |||
Mie Bank Ltd. (The) | 8,000 | $ | 28,890 | ||
Minato Bank Ltd. (The)b | 16,000 | 23,112 | |||
Miyazaki Bank Ltd. (The) | 16,000 | 67,784 | |||
Musashino Bank Ltd. (The) | 3,200 | 113,836 | |||
Nanto Bank Ltd. (The) | 24,000 | 141,778 | |||
Ogaki Kyoritsu Bank Ltd. (The) | 24,000 | 96,502 | |||
Oita Bank Ltd. (The) | 16,000 | 70,371 | |||
San-in Godo Bank Ltd. (The) | 16,000 | 148,332 | |||
Shiga Bank Ltd. (The) | 24,000 | 154,196 | |||
Shikoku Bank Ltd. (The) | 16,000 | 59,850 | |||
Shonai Bank Ltd. (The) | 8,000 | 14,057 | |||
Tochigi Bank Ltd. (The) | 8,000 | 42,775 | |||
Toho Bank Ltd. (The) | 24,000 | 109,955 | |||
Tokushima Bank Ltd. (The) | 8,000 | 42,516 | |||
Tokyo Tomin Bank Ltd. (The) | 3,200 | 58,298 | |||
Yachiyo Bank Ltd. (The) | 1,600 | 47,863 | |||
Yamagata Bank Ltd. (The) | 16,000 | 90,724 | |||
Yamanashi Chuo Bank Ltd. (The) | 16,000 | 86,584 | |||
| 3,706,148 | |||||
BEVERAGES – 0.70% | |||||
Kagome Co. Ltd. | 7,200 | 134,973 | |||
Takara Holdings Inc. | 16,000 | 113,491 | |||
| 248,464 | |||||
BIOTECHNOLOGY – 0.19% | |||||
AnGes MG Inc.b | 16 | 29,804 | |||
OncoTherapy Science Inc.b | 8 | 17,507 | |||
Takara Bio Inc.b | 8 | 19,783 | |||
| 67,094 | |||||
BUILDING MATERIALS – 1.32% | |||||
Central Glass Co. Ltd. | 24,000 | 118,493 | |||
Chofu Seisakusho Co. Ltd. | 2,400 | 51,614 | |||
Nichias Corp. | 8,000 | 30,874 | |||
Sanwa Holdings Corp. | 24,000 | 88,482 | |||
Sumitomo Osaka Cement Co. Ltd. | 40,000 | 85,377 | |||
Takara Standard Co. Ltd. | 16,000 | 94,346 | |||
| 469,186 | |||||
CHEMICALS – 6.15% | |||||
Adeka Corp. | 9,600 | 96,761 | |||
Aica Kogyo Co. Ltd. | 8,000 | 83,049 | |||
Air Water Inc. | 16,000 | 184,552 | |||
C. Uyemura & Co. Ltd. | 800 | 34,496 | |||
| Security | Shares | Value | |||
Chugoku Marine Paints Ltd. | 8,000 | $ | 50,709 | ||
Dainichiseika Color & Chemicals Manufacturing Co. Ltd. | 8,000 | 28,114 | |||
Earth Chemical Co. Ltd. | 1,600 | 46,224 | |||
Fujimi Inc. | 2,400 | 37,359 | |||
Ishihara Sangyo Kaisha Ltd.b | 40,000 | 42,689 | |||
Lintec Corp. | 4,800 | 100,952 | |||
Nihon Nohyaku Co. Ltd.a | 8,000 | 66,491 | |||
Nihon Parkerizing Co. Ltd. | 8,000 | 98,399 | |||
Nippon Carbon Co. Ltd. | 16,000 | 57,608 | |||
Nippon Kayaku Co. Ltd. | 16,000 | 140,743 | |||
Nippon Paint Co. Ltd. | 24,000 | 136,603 | |||
Nippon Shokubai Co. Ltd. | 8,000 | 75,804 | |||
Nippon Soda Co. Ltd. | 16,000 | 76,236 | |||
Nippon Synthetic Chemical Industry Co. Ltd. (The) | 8,000 | 53,727 | |||
NOF Corp. | 16,000 | 91,414 | |||
Sakai Chemical Industry Co. Ltd. | 8,000 | 38,808 | |||
Sumitomo Bakelite Co. Ltd. | 24,000 | 122,632 | |||
Taiyo Ink Manufacturing Co. Ltd. | 1,600 | 40,791 | |||
Takasago International Corp. | 8,000 | 43,810 | |||
Toagosei Co. Ltd. | 24,000 | 78,909 | |||
Tokai Carbon Co. Ltd. | 16,000 | 82,445 | |||
Tokyo Ohka Kogyo Co. Ltd. | 4,800 | 113,836 | |||
Toyo Ink Manufacturing Co. Ltd. | 24,000 | 85,377 | |||
Zeon Corp. | 16,000 | 78,823 | |||
| 2,187,361 | |||||
COMMERCIAL SERVICES – 2.20% | |||||
Aeon Delight Co. Ltd. | 1,600 | 23,526 | |||
Daiseki Co. Ltd. | 3,260 | 70,988 | |||
Meitec Corp. | 4,000 | 79,728 | |||
Nichii Gakkan Co. | 4,800 | 55,676 | |||
Nishio Rent All Co. Ltd. | 2,400 | 22,612 | |||
Nissha Printing Co. Ltd. | 2,400 | 127,031 | |||
Park 24 Co. Ltd. | 10,400 | 105,385 | |||
Pasona Group Inc. | 32 | 23,112 | |||
Sohgo Security Services Co. Ltd. | 6,400 | 80,237 | |||
So-net M3 Inc.a | 8 | 26,044 | |||
TKC Corp. | 2,400 | 46,957 | |||
Toppan Forms Co. Ltd. | 6,400 | 89,965 | |||
Zenrin Co. Ltd. | 2,400 | 32,495 | |||
| 783,756 | |||||
| 36 | 2009 iSHARES ANNUAL REPORT TO SHAREHOLDERS |
Table of Contents
Schedule of Investments (Continued)
iSHARES® MSCI JAPAN SMALL CAP INDEX FUND
August 31, 2009
| Security | Shares | Value | |||
COMPUTERS – 0.89% | |||||
CSK Holdings Corp.a,b | 7,200 | $ | 34,849 | ||
DTS Corp. | 3,200 | 29,425 | |||
Hitachi Information Systems Ltd. | 2,400 | 74,770 | |||
Ines Corp. | 2,400 | 21,267 | |||
Net One Systems Co. Ltd. | 48 | 79,116 | |||
NS Solutions Corp. | 2,400 | 42,249 | |||
Vic Tokai Corp. | 2,400 | 33,375 | |||
| 315,051 | |||||
COSMETICS & PERSONAL CARE – 1.24% | |||||
Aderans Holdings Co. Ltd. | 4,000 | 54,676 | |||
Fancl Corp. | 4,800 | 67,888 | |||
Kose Corp. | 3,200 | 77,443 | |||
Lion Corp. | 16,000 | 82,100 | |||
Mandom Corp. | 3,200 | 93,311 | |||
Pigeon Corp. | 1,600 | 66,404 | |||
| 441,822 | |||||
DISTRIBUTION & WHOLESALE – 2.35% | |||||
Doshisha Co. Ltd. | 2,400 | 44,422 | |||
F&A Aqua Holdings Inc. | 3,200 | 36,255 | |||
Hanwa Co. Ltd. | 24,000 | 94,950 | |||
Inaba Denki Sangyo Co. Ltd. | 3,200 | 73,993 | |||
Itochu Enex Co. Ltd. | 8,800 | 54,262 | |||
Iwatani Corp. | 32,000 | 95,208 | |||
Japan Pulp & Paper Co. Ltd. | 16,000 | 60,195 | |||
Japan Wind Development Co. Ltd.a | 8 | 30,787 | |||
JFE Shoji Holdings Inc. | 8,000 | 32,599 | |||
Kanematsu Corp.b | 48,000 | 47,087 | |||
Matsuda Sangyo Co. Ltd. | 2,460 | 37,603 | |||
Nagase & Co. Ltd. | 8,000 | 95,812 | |||
Nippon Gas Co. Ltd. | 4,800 | 74,200 | |||
Sumikin Bussan Corp. | 8,000 | 18,455 | |||
Trusco Nakayama Corp. | 2,400 | 40,386 | |||
| 836,214 | |||||
DIVERSIFIED FINANCIAL SERVICES – 2.51% | |||||
AIFUL Corp. | 8,000 | 23,975 | |||
Aizawa Securities Co. Ltd. | 4,800 | 11,849 | |||
Cedyna Financial Corp.b | 12,000 | 22,509 | |||
Century Tokyo Leasing Corp. | 5,680 | 65,639 | |||
Fuyo General Lease Co. Ltd. | 1,600 | 35,876 | |||
Hitachi Credit Corp. | 4,000 | 57,694 | |||
IBJ Leasing Co. Ltd. | 2,400 | 34,591 | |||
| Security | Shares | Value | |||
Ichiyoshi Securities Co. Ltd. | 4,800 | $ | 34,099 | ||
Jaccs Co. Ltd. | 16,000 | 40,705 | |||
Japan Securities Finance Co. Ltd. | 8,800 | 72,001 | |||
Marusan Securities Co. Ltd. | 7,200 | 49,829 | |||
Mizuho Investors Securities Co. Ltd.b | 32,000 | 37,945 | |||
Okasan Securities Group Inc. | 16,000 | 79,685 | |||
Orient Corp.b | 20,000 | 21,991 | |||
Osaka Securities Exchange Co. Ltd. | 24 | 109,955 | |||
Ricoh Leasing Co. Ltd. | 2,400 | 52,261 | |||
SPARX Group Co. Ltd.b | 88 | 13,376 | |||
Takefuji Corp.a | 10,160 | 52,133 | |||
Tokai Tokyo Financial Holdings Inc. | 16,000 | 57,953 | |||
Toyo Securities Co. Ltd.b | 8,000 | 19,145 | |||
| 893,211 | |||||
ELECTRIC – 0.27% | |||||
Okinawa Electric Power Co. Inc. (The) | 1,600 | 95,553 | |||
| 95,553 | |||||
ELECTRICAL COMPONENTS & | |||||
Fujikura Ltd. | 32,000 | 169,029 | |||
Funai Electric Co. Ltd. | 2,400 | 95,984 | |||
Hitachi Cable Ltd. | 16,000 | 53,641 | |||
Nippon Signal Co. Ltd. (The) | 4,000 | 40,144 | |||
Sinfonia Technology Co. Ltd. | 16,000 | 42,602 | |||
Takaoka Electric Manufacturing Co. Ltd. | 8,000 | 28,287 | |||
Tokyo Rope Manufacturing Co. Ltd. | 8,000 | 27,165 | |||
Toshiba Tec Corp. | 16,000 | 69,336 | |||
| 526,188 | |||||
ELECTRONICS – 5.88% | |||||
Alps Electric Co. Ltd. | 12,800 | 77,409 | |||
Anritsu Corp. | 16,000 | 62,092 | |||
Chiyoda Integre Co. Ltd.b | 2,400 | 28,433 | |||
CMK Corp. | 5,600 | 48,717 | |||
Cosel Co. Ltd. | 4,000 | 47,432 | |||
Dainippon Screen Manufacturing Co. Ltd.b | 24,000 | 83,049 | |||
Eizo Nanao Corp. | 2,400 | 54,978 | |||
Fujitsu General Ltd. | 8,000 | 26,993 | |||
Furuno Electric Co. Ltd. | 3,200 | 18,145 | |||
Futaba Corp. | 4,000 | 69,078 | |||
Hamamatsu Photonics K.K. | 6,400 | 136,948 | |||
HORIBA Ltd. | 3,200 | 72,786 | |||
| SCHEDULESOF INVESTMENTS | 37 |
Table of Contents
Schedule of Investments (Continued)
iSHARES® MSCI JAPAN SMALL CAP INDEX FUND
August 31, 2009
| Security | Shares | Value | |||
Hosiden Corp. | 6,400 | $ | 94,587 | ||
JEOL Ltd. | 8,000 | 37,514 | |||
Kaga Electronics Co. Ltd. | 4,000 | 48,208 | |||
Koa Corp. | 5,600 | 54,210 | |||
Kuroda Electric Co. Ltd. | 4,000 | 56,314 | |||
Macnica Inc. | 2,400 | 41,240 | |||
Meiko Electronics Co. Ltd. | 800 | 17,196 | |||
Micronics Japan Co. Ltd. | 1,600 | 28,632 | |||
Nichicon Corp. | 7,200 | 100,512 | |||
Nihon Dempa Kogyo Co. Ltd. | 1,600 | 36,393 | |||
Nippon Chemi-Con Corp. | 16,000 | 62,092 | |||
Nitto Kogyo Corp. | 3,200 | 30,701 | |||
Ryosan Co. Ltd. | 4,800 | 122,374 | |||
Sanyo Denki Co. Ltd. | 8,000 | 35,876 | |||
Sodick Co. Ltd. | 7,200 | 17,308 | |||
Star Micronics Co. Ltd. | 4,800 | 50,450 | |||
Taiyo Yuden Co. Ltd. | 8,000 | 95,726 | |||
Tamura Corp. | 8,000 | 30,615 | |||
Tokyo Seimitsu Co. Ltd. | 4,000 | 57,263 | |||
Toyo Corp. | 4,000 | 41,309 | |||
ULVAC Inc.a | 3,200 | 92,449 | |||
Wacom Co. Ltd.a | 40 | 80,763 | |||
Yamatake Corp. | 6,400 | 131,153 | |||
| 2,088,945 | |||||
ENGINEERING & CONSTRUCTION – 4.60% | |||||
Chiyoda Corp. | 16,000 | 129,704 | |||
Chudenko Corp. | 3,200 | 53,882 | |||
COMSYS Holdings Corp. | 14,400 | 166,873 | |||
Hitachi Plant Engineering & Construction Co. Ltd. | 8,000 | 52,434 | |||
Japan Airport Terminal Co. Ltd. | 6,400 | 74,442 | |||
Kandenko Co. Ltd. | 8,000 | 55,538 | |||
Kyowa Exeo Corp. | 8,000 | 80,893 | |||
Maeda Corp. | 24,000 | 79,685 | |||
Maeda Road Construction Co. Ltd. | 8,000 | 70,544 | |||
Nippo Corp. | 8,000 | 69,423 | |||
Nippon Road Co. Ltd. (The) | 8,000 | 20,697 | |||
Nishimatsu Construction Co. Ltd. | 32,000 | 57,263 | |||
Okumura Corp. | 16,000 | 66,404 | |||
Penta-Ocean Construction Co. Ltd.b | 28,000 | 38,333 | |||
Shinko Plantech Co. Ltd. | 4,800 | 46,466 | |||
SHO-BOND Holdings Co. Ltd. | 3,200 | 62,161 | |||
| Security | Shares | Value | |||
Taihei Kogyo Co. Ltd. | 8,000 | $ | 24,578 | ||
Taikisha Ltd. | 4,000 | 54,374 | |||
Takasago Thermal Engineering Co. Ltd. | 8,000 | 71,579 | |||
Takuma Co. Ltd.b | 8,000 | 21,474 | |||
Toa Corp. | 16,000 | 19,663 | |||
Toda Corp. | 24,000 | 97,019 | |||
Tokyu Construction Co. Ltd.b | 10,080 | 31,077 | |||
Toshiba Plant Systems & Services Corp. | 8,000 | 108,920 | |||
Toyo Construction Co. Ltd. | 40,000 | 24,147 | |||
Toyo Engineering Corp. | 16,000 | 57,435 | |||
| 1,635,008 | |||||
ENTERTAINMENT – 0.84% | |||||
Avex Group Holdings Inc. | 4,000 | 36,221 | |||
Resorttrust Inc. | 4,000 | 49,760 | |||
Shochiku Co. Ltd.a | 8,000 | 69,509 | |||
Toei Co. Ltd. | 8,000 | 45,621 | |||
Tokyotokeiba Co. Ltd. | 16,000 | 25,872 | |||
Yomiuri Land Co. Ltd. | 8,000 | 26,821 | |||
Yoshimoto Kogyo Co. Ltd. | 4,000 | 46,397 | |||
| 300,201 | |||||
ENVIRONMENTAL CONTROL – 0.12% | |||||
Asahi Holdings Inc.b | 2,400 | 41,395 | |||
| 41,395 | |||||
FOOD – 3.88% | |||||
Ariake Japan Co. Ltd. | 2,400 | 37,669 | |||
Ezaki Glico Co. Ltd. | 8,000 | 88,395 | |||
Fuji Oil Co. Ltd. | 9,600 | 135,154 | |||
House Foods Corp. | 7,200 | 112,154 | |||
Itoham Foods Inc. | 16,000 | 56,228 | |||
J-Oil Mills Inc. | 8,000 | 29,753 | |||
Kato Sangyo Co. Ltd. | 1,600 | 27,096 | |||
Maruha Nichiro Holdings Inc. | 40,000 | 60,799 | |||
Mitsui Sugar Co. Ltd. | 8,000 | 29,580 | |||
Morinaga & Co. Ltd. | 32,000 | 68,992 | |||
Morinaga Milk Industry Co. Ltd. | 24,000 | 105,040 | |||
Nichirei Corp. | 24,000 | 93,139 | |||
Nippon Beet Sugar Manufacturing Co. Ltd. | 16,000 | 45,017 | |||
Nippon Flour Mills Co. Ltd. | 16,000 | 82,445 | |||
Nippon Suisan Kaisha Ltd. | 23,200 | 69,776 | |||
| 38 | 2009 iSHARES ANNUAL REPORT TO SHAREHOLDERS |
Table of Contents
Schedule of Investments (Continued)
iSHARES® MSCI JAPAN SMALL CAP INDEX FUND
August 31, 2009
| Security | Shares | Value | |||
Nisshin OilliO Group Ltd. (The) | 16,000 | $ | 85,377 | ||
Prima Meat Packers Ltd. | 16,000 | 19,145 | |||
Q.P. Corp. | 9,600 | 103,487 | |||
Snow Brand Milk Products Co. Ltd. | 20,000 | 72,441 | |||
Unicharm Petcare Corp. | 1,600 | 57,608 | |||
| 1,379,295 | |||||
FOREST PRODUCTS & PAPER – 1.32% | |||||
Daio Paper Corp. | 8,000 | 76,667 | |||
Hokuetsu Paper Mills Ltd. | 12,000 | 65,326 | |||
Mitsubishi Paper Mills Ltd. | 32,000 | 45,189 | |||
Rengo Co. Ltd. | 24,000 | 150,057 | |||
Sumitomo Forestry Co. Ltd. | 16,000 | 132,809 | |||
| 470,048 | |||||
GAS – 0.45% | |||||
Saibu Gas Co. Ltd. | 48,000 | 130,911 | |||
Shizuoka Gas Co. Ltd. | 4,000 | 29,968 | |||
| 160,879 | |||||
HAND & MACHINE TOOLS – 1.60% | |||||
DISCO Corp. | 2,400 | 143,589 | |||
Hitachi Koki Co. Ltd. | 5,600 | 59,402 | |||
Meidensha Corp.a | 24,000 | 131,688 | |||
Mori Seiki Co. Ltd. | 8,000 | 91,586 | |||
OSG Corp. | 8,800 | 91,638 | |||
Union Tool Co. | 1,600 | 49,243 | |||
| 567,146 | |||||
HEALTH CARE - PRODUCTS – 1.76% | |||||
Hogy Medical Co. Ltd. | 1,600 | 90,034 | |||
Nakanishi Inc. | 800 | 69,681 | |||
Nihon Kohden Corp. | 4,000 | 65,758 | |||
Nipro Corp. | 8,000 | 171,185 | |||
Paramount Bed Co. Ltd. | 2,400 | 50,191 | |||
Sysmex Corp. | 3,200 | 145,227 | |||
Topcon Corp.a | 6,400 | 32,909 | |||
| 624,985 | |||||
HOME BUILDERS – 0.57% | |||||
Haseko Corp.b | 104,000 | 117,717 | |||
PanaHome Corp. | 8,000 | 50,881 | |||
Token Corp. | 960 | 34,875 | |||
| 203,473 | |||||
| Security | Shares | Value | |||
HOME FURNISHINGS – 1.41% | |||||
Alpine Electronics Inc. | 4,800 | $ | 46,311 | ||
Canon Electronics Inc. | 2,400 | 41,291 | |||
Daiwa Industries Ltd. | 8,000 | 43,206 | |||
Foster Electric Co. Ltd. | 2,400 | 48,691 | |||
France Bed Holdings Co. Ltd. | 16,000 | 26,217 | |||
Hitachi Maxell Ltd. | 4,800 | 89,672 | |||
Juki Corp. | 16,000 | 21,560 | |||
JVC KENWOOD Holdings Inc.b | 78,400 | 43,948 | |||
Nidec Sankyo Corp. | 8,000 | 46,828 | |||
Noritz Corp. | 3,200 | 42,602 | |||
Pioneer Corp.a,b | 16,000 | 51,744 | |||
| 502,070 | |||||
HOUSEHOLD PRODUCTS & WARES – 0.08% | |||||
Pilot Corp. | 24 | 28,174 | |||
| 28,174 | |||||
HOUSEWARES – 0.41% | |||||
Noritake Co. Ltd. | 16,000 | 56,573 | |||
Sangetsu Co. Ltd. | 4,000 | 90,336 | |||
| 146,909 | |||||
INSURANCE – 0.03% | |||||
Fuji Fire & Marine Insurance Co. Ltd. (The)b | 8,000 | 11,125 | |||
| 11,125 | |||||
INTERNET – 1.60% | |||||
Access Co. Ltd.b | 24 | 64,550 | |||
CyberAgent Inc. | 56 | 53,305 | |||
Dwango Co. Ltd. | 8 | 13,859 | |||
eAccess Ltd. | 136 | 100,426 | |||
En-Japan Inc. | 16 | 19,318 | |||
GMO Internet Inc. | 5,600 | 24,570 | |||
Gourmet Navigator Inc. | 16 | 38,515 | |||
Internet Initiative Japan Inc. | 16 | 38,394 | |||
kabu.com Securities Co. Ltd. | 40 | 50,019 | |||
Kakaku.com Inc. | 16 | 60,023 | |||
Monex Group Inc. | 112 | 47,509 | |||
Opt Inc. | 8 | 12,099 | |||
So-net Entertainment Corp. | 16 | 32,047 | |||
VeriSign Japan K.K. | 32 | 14,230 | |||
| 568,864 | |||||
| SCHEDULESOF INVESTMENTS | 39 |
Table of Contents
Schedule of Investments (Continued)
iSHARES® MSCI JAPAN SMALL CAP INDEX FUND
August 31, 2009
| Security | Shares | Value | |||
IRON & STEEL – 1.33% | |||||
Aichi Steel Corp. | 16,000 | $ | 68,647 | ||
Godo Steel Ltd. | 16,000 | 39,325 | |||
Kyoei Steel Ltd. | 1,600 | 38,290 | |||
Mitsubishi Steel Manufacturing Co. Ltd. | 16,000 | 37,255 | |||
Nakayama Steel Works Ltd. | 8,000 | 17,075 | |||
Nippon Metal Industry Co. Ltd. | 16,000 | 35,703 | |||
Nippon Yakin Kogyo Co. Ltd. | 12,000 | 70,371 | |||
Sanyo Special Steel Co. Ltd. | 8,000 | 32,599 | |||
TOPY Industries Ltd. | 24,000 | 60,281 | |||
Yodogawa Steel Works Ltd. | 16,000 | 72,269 | |||
| 471,815 | |||||
LEISURE TIME – 1.50% | |||||
Accordia Golf Co. Ltd. | 64 | 63,817 | |||
Daiichikosho Co. Ltd. | 4,800 | 63,645 | |||
Fields Corp. | 16 | 24,026 | |||
Heiwa Corp. | 5,600 | 62,782 | |||
HIS Co. Ltd. | 3,200 | 68,164 | |||
Mars Engineering Corp. | 1,600 | 51,744 | |||
Mizuno Corp. | 8,000 | 36,134 | |||
Pacific Golf Group International Holdings K.K. | 56 | 40,446 | |||
Roland Corp. | 2,400 | 28,200 | |||
Round One Corp. | 4,800 | 43,672 | |||
Tokyo Dome Corp. | 16,000 | 48,984 | |||
| 531,614 | |||||
LODGING – 0.10% | |||||
Fujita Kanko Inc. | 8,000 | 34,668 | |||
| 34,668 | |||||
MACHINERY – 3.89% | |||||
Aida Engineering Ltd. | 8,000 | 27,942 | |||
Chugai Ro Co. Ltd. | 8,000 | 24,578 | |||
CKD Corp. | 7,200 | 41,912 | |||
Daifuku Co. Ltd. | 8,000 | 55,366 | |||
Daihen Corp. | 16,000 | 66,059 | |||
Fuji Machine Manufacturing Co. Ltd. | 4,800 | 67,008 | |||
Furukawa Co. Ltd. | 32,000 | 46,569 | |||
Harmonic Drive Systems Inc. | 8 | 21,077 | |||
Iseki & Co. Ltd.b | 24,000 | 109,697 | |||
Komori Corp. | 6,400 | 76,167 | |||
Makino Milling Machine Co. Ltd. | 8,000 | 31,822 | |||
| Security | Shares | Value | |||
Max Co. Ltd. | 8,000 | $ | 86,757 | ||
Miura Co. Ltd. | 3,200 | 80,548 | |||
Modec Inc. | 2,400 | 47,164 | |||
Nabtesco Corp. | 8,000 | 89,344 | |||
Nippon Sharyo Ltd. | 8,000 | 53,037 | |||
Nippon Thompson Co. Ltd. | 8,000 | 49,157 | |||
Obara Corp. | 1,600 | 12,936 | |||
Okuma Corp. | 16,000 | 81,065 | |||
Shima Seiki Manufacturing Ltd. | 2,400 | 56,013 | |||
Sintokogio Ltd. | 6,400 | 53,261 | |||
Tadano Ltd. | 8,000 | 39,411 | |||
Toshiba Machine Co. Ltd. | 16,000 | 64,335 | |||
Toyo Kanetsu K.K. | 16,000 | 32,254 | |||
Tsubakimoto Chain Co. | 16,000 | 69,854 | |||
| 1,383,333 | |||||
MACHINERY - DIVERSIFIED – 0.51% | |||||
Ebara Corp.b | 40,000 | 179,809 | |||
| 179,809 | |||||
MANUFACTURING – 1.62% | |||||
Amano Corp. | 8,000 | 72,441 | |||
Glory Ltd. | 6,400 | 143,502 | |||
Kureha Corp. | 16,000 | 97,451 | |||
Nikkiso Co. Ltd. | 8,000 | 63,300 | |||
Nitta Corp. | 3,200 | 51,295 | |||
Tamron Co. Ltd. | 1,600 | 21,198 | |||
Tenma Corp. | 3,200 | 40,360 | |||
Tokai Rubber Industries Ltd. | 3,200 | 39,670 | |||
Toyo Tanso Co. Ltd. | 800 | 45,189 | |||
| 574,406 | |||||
MEDIA – 0.43% | |||||
Gakken Co. Ltd. | 8,000 | 18,110 | |||
Kadokawa Group Holdings Inc. | 2,400 | 55,366 | |||
SKY Perfect JSAT Holdings Inc. | 160 | 64,938 | |||
Usen Corp.b | 11,448 | 15,179 | |||
| 153,593 | |||||
METAL FABRICATE & HARDWARE – 1.57% | |||||
Kitz Corp. | 8,000 | 36,479 | |||
Misumi Group Inc. | 8,000 | 148,763 | |||
Nachi-Fujikoshi Corp. | 24,000 | 55,624 | |||
Neturen Co. Ltd. | 4,800 | 37,204 | |||
Oiles Corp. | 4,080 | 67,425 | |||
| 40 | 2009 iSHARES ANNUAL REPORT TO SHAREHOLDERS |
Table of Contents
Schedule of Investments (Continued)
iSHARES® MSCI JAPAN SMALL CAP INDEX FUND
August 31, 2009
| Security | Shares | Value | |||
Onoken Co. Ltd. | 1,600 | $ | 16,454 | ||
Ryobi Ltd. | 16,000 | 47,604 | |||
Tocalo Co. Ltd. | 2,400 | 42,585 | |||
Toho Zinc Co. Ltd. | 16,000 | 78,650 | |||
Yamezen Corp. | 7,200 | 29,183 | |||
| 559,971 | |||||
MINING – 1.17% | |||||
Nippon Coke & Engineering Co. Ltd. | 20,000 | 26,303 | |||
Nippon Denko Co. Ltd. | 8,000 | 61,575 | |||
Nippon Light Metal Co. Ltd.b | 64,000 | 73,821 | |||
Nittetsu Mining Co. Ltd. | 8,000 | 39,325 | |||
Pacific Metals Co. Ltd. | 16,000 | 134,706 | |||
Sumitomo Light Metal Industries Ltd.b | 40,000 | 42,689 | |||
Toho Titanium Co. Ltd. | 2,400 | 39,066 | |||
| 417,485 | |||||
OFFICE & BUSINESS EQUIPMENT – 0.11% | |||||
Canon Finetech Inc. | 3,200 | 38,946 | |||
| 38,946 | |||||
OFFICE FURNISHINGS – 0.42% | |||||
Itoki Corp. | 5,600 | 15,092 | |||
Kokuyo Co. Ltd. | 9,600 | 87,136 | |||
Okamura Corp. | 8,000 | 45,621 | |||
| 147,849 | |||||
OIL & GAS – 0.10% | |||||
AOC Holdings Inc. | 4,800 | 37,255 | |||
| 37,255 | |||||
PACKAGING & CONTAINERS – 0.36% | |||||
FP Corp. | 1,600 | 76,236 | |||
Fuji Seal International Inc. | 2,400 | 51,071 | |||
| 127,307 | |||||
PHARMACEUTICALS – 2.90% | |||||
EPS Co. Ltd. | 8 | 33,030 | |||
Kaken Pharmaceutical Co. Ltd. | 8,000 | 73,304 | |||
Kobayashi Pharmaceutical Co. Ltd. | 3,200 | 144,192 | |||
Miraca Holdings Inc. | 5,600 | 162,087 | |||
Mochida Pharmaceutical Co. Ltd. | 8,000 | 82,876 | |||
Nichi-Iko Pharmaceutical Co. Ltd. | 2,400 | 83,566 | |||
Nippon Shinyaku Co. Ltd. | 8,000 | 103,660 | |||
Rohto Pharmaceutical Co. Ltd. | 8,000 | 102,711 | |||
Sawai Pharmaceutical Co. Ltd. | 1,600 | 92,621 | |||
| Security | Shares | Value | |||
Seikagaku Corp. | 4,000 | $ | 51,356 | ||
Toho Holdings Co. Ltd. | 4,000 | 59,505 | |||
Towa Pharmaceutical Co. Ltd. | 800 | 40,446 | |||
| 1,029,354 | |||||
REAL ESTATE – 1.10% | |||||
Daibiru Corp. | 5,600 | 50,709 | |||
Daikyo Inc.b | 24,000 | 62,610 | |||
Goldcrest Co. Ltd. | 2,080 | 61,101 | |||
Heiwa Real Estate Co. Ltd. | 20,000 | 70,070 | |||
Sankei Building Co. Ltd. (The) | 3,200 | 24,906 | |||
Shoei Co. Ltd. | 3,200 | 25,872 | |||
Sumitomo Real Estate Sales Co. Ltd. | 800 | 34,582 | |||
TOC Co. Ltd. | 8,000 | 38,463 | |||
Tokyu Livable Inc. | 2,400 | 21,939 | |||
| 390,252 | |||||
REAL ESTATE INVESTMENT TRUSTS – 3.99% | |||||
DA Office Investment Corp. | 24 | 76,296 | |||
Frontier Real Estate Investment Corp. | 16 | 114,526 | |||
Fukuoka REIT Corp. | 8 | 42,602 | |||
Global One Real Estate Investment Corp. | 8 | 59,764 | |||
Hankyu REIT Inc. | 8 | 37,255 | |||
Japan Excellent Inc. | 16 | 78,305 | |||
Japan Logistics Fund Inc. | 16 | 109,524 | |||
Kenedix Realty Investment Corp. | 16 | 60,195 | |||
MID REIT Inc. | 16 | 35,600 | |||
Mori Hills REIT Investment Corp. | 8 | 30,787 | |||
MORI TRUST Sogo REIT Inc. | 16 | 129,359 | |||
Nippon Accommodations Fund Inc. | 16 | 88,309 | |||
Nippon Commercial Investment Corp. | 32 | 57,677 | |||
Nippon Residential Investment Corp. | 24 | 60,023 | |||
ORIX JREIT Inc. | 24 | 125,220 | |||
Premier Investment Corp. | 16 | 67,612 | |||
TOKYU REIT Inc. | 16 | 90,724 | |||
Top REIT Inc. | 16 | 66,749 | |||
United Urban Investment Corp. | 16 | 89,517 | |||
| 1,420,044 | |||||
RETAIL – 9.66% | |||||
Alpen Co. Ltd. | 800 | 13,548 | |||
Aoki Holdings Inc. | 3,200 | 35,772 | |||
Aoyama Trading Co. Ltd. | 6,400 | 119,010 | |||
Arcs Co. Ltd. | 3,200 | 48,950 | |||
Askul Corp. | 2,400 | 47,992 | |||
| SCHEDULESOF INVESTMENTS | 41 |
Table of Contents
Schedule of Investments (Continued)
iSHARES® MSCI JAPAN SMALL CAP INDEX FUND
August 31, 2009
| Security | Shares | Value | |||
Autobacs Seven Co. Ltd. | 4,000 | $ | 150,057 | ||
Best Denki Co. Ltd. | 8,000 | 41,222 | |||
BIC Camera Inc. | 72 | 28,951 | |||
Cawachi Ltd. | 1,600 | 34,496 | |||
Chiyoda Co. Ltd. | 3,200 | 45,051 | |||
Circle K Sunkus Co. Ltd. | 4,800 | 78,288 | |||
Colowide Co. Ltd. | 4,000 | 28,459 | |||
Culture Convenience Club Co. Ltd.a | 9,600 | 71,199 | |||
Daiei Inc. (The)a,b | 7,200 | 32,055 | |||
DCM Japan Holdings Co. Ltd. | 7,200 | 48,665 | |||
Don Quijote Co. Ltd. | 4,800 | 115,388 | |||
Doutor Nichires Holdings Co. Ltd. | 4,800 | 72,596 | |||
Duskin Co. Ltd. | 5,600 | 103,530 | |||
EDION Corp. | 8,000 | 68,647 | |||
GEO Corp. | 48 | 49,674 | |||
H2O Retailing Corp. | 16,000 | 101,073 | |||
Heiwado Co. Ltd. | 4,000 | 58,858 | |||
Izumi Co. Ltd. | 6,400 | 93,622 | |||
Izumiya Co. Ltd. | 8,000 | 49,157 | |||
Joshin Denki Co. Ltd.a | 8,000 | 64,593 | |||
Keiyo Co. Ltd. | 4,000 | 20,137 | |||
Kisoji Co. Ltd. | 4,000 | 88,611 | |||
Kohnan Shoji Co. Ltd. | 2,400 | 27,295 | |||
Komeri Co. Ltd. | 3,200 | 85,377 | |||
K’s Holdings Corp. | 4,000 | 123,107 | |||
Maruetsu Inc. (The) | 8,000 | 40,878 | |||
Matsumotokiyoshi Co. Ltd. | 4,800 | 120,821 | |||
Matsuya Co. Ltd.a,b | 3,200 | 30,805 | |||
Megane Top Co. Ltd. | 1,600 | 26,062 | |||
Nishimatsuya Chain Co. Ltd. | 5,600 | 56,202 | |||
Nissen Holdings Co. Ltd. | 5,600 | 18,714 | |||
Parco Co. Ltd. | 8,000 | 79,340 | |||
Paris Miki Holdings Inc. | 4,000 | 39,239 | |||
Plenus Co. Ltd. | 3,200 | 47,466 | |||
Point Inc. | 1,440 | 88,326 | |||
Right On Co. Ltd. | 2,400 | 22,741 | |||
Ryohin Keikaku Co. Ltd. | 2,400 | 109,955 | |||
Saizeriya Co. Ltd. | 3,200 | 53,158 | |||
San-A & Co. Ltd. | 800 | 31,132 | |||
Sankyo-Tateyama Holdings Inc.b | 40,000 | 43,551 | |||
Seiko Corp. | 8,000 | 21,732 | |||
Senshukai Co. Ltd. | 4,800 | 33,789 | |||
Shimachu Co. Ltd. | 4,800 | 113,577 | |||
| Security | Shares | Value | |||
St. Marc Holdings Co. Ltd. | 800 | $ | 25,829 | ||
Sugi Pharmacy Co. Ltd. | 3,200 | 73,476 | |||
Sundrug Co. Ltd. | 3,200 | 82,445 | |||
Tsuruha Holdings Inc. | 1,600 | 62,782 | |||
Valor Co. Ltd. | 4,000 | 36,781 | |||
Watami Co. Ltd. | 3,200 | 67,267 | |||
Xebio Co. Ltd. | 2,400 | 52,390 | |||
Yoshinoya Holdings Co. Ltd. | 48 | 58,988 | |||
Zensho Co. Ltd. | 7,200 | 52,623 | |||
| 3,435,449 | |||||
SEMICONDUCTORS – 0.48% | |||||
Megachips Corp. | 1,600 | 36,134 | |||
Mimasu Semiconductor Industry Co. Ltd. | 2,400 | 33,219 | |||
NEC Electronics Corp.b | 3,200 | 31,564 | |||
Sanken Electric Co. Ltd. | 8,000 | 29,063 | |||
Shindengen Electric Manufacturing Co. Ltd. | 16,000 | 39,325 | |||
| 169,305 | |||||
SHIPBUILDING – 0.50% | |||||
Hitachi Zosen Corp.b | 84,000 | 112,284 | |||
Namura Shipbuilding Co. Ltd. | 4,800 | 31,615 | |||
Sasebo Heavy Industries Co. Ltd. | 16,000 | 33,978 | |||
| 177,877 | |||||
SOFTWARE – 1.42% | |||||
Capcom Co. Ltd. | 4,800 | 94,691 | |||
Fuji Soft Inc. | 3,200 | 60,747 | |||
Hitachi Software Engineering Co. Ltd. | 3,200 | 91,069 | |||
Nihon Unisys Ltd. | 6,400 | 54,986 | |||
NSD Co. Ltd. | 4,000 | 42,559 | |||
Obic Business Consultants Co. Ltd. | 800 | 38,808 | |||
Sumisho Computer Systems Corp. | 2,400 | 39,946 | |||
Tecmo Koei Holdings Co. Ltd.b | 2,400 | 20,128 | |||
Trans Cosmos Inc.b | 3,200 | 36,462 | |||
Works Applications Co. Ltd. | 40 | 26,260 | |||
| 505,656 | |||||
STORAGE & WAREHOUSING – 0.48% | |||||
Mitsui-Soko Co. Ltd. | 16,000 | 62,265 | |||
Shibusawa Warehouse Co. Ltd. (The) | 8,000 | 30,701 | |||
Sumitomo Warehouse Co. Ltd. (The) | 16,000 | 78,133 | |||
| 171,099 | |||||
| 42 | 2009 iSHARES ANNUAL REPORT TO SHAREHOLDERS |
Table of Contents
Schedule of Investments (Continued)
iSHARES® MSCI JAPAN SMALL CAP INDEX FUND
August 31, 2009
| Security | Shares | Value | |||
TELECOMMUNICATIONS – 1.22% | |||||
Denki Kogyo Co. Ltd. | 8,000 | $ | 40,705 | ||
Hitachi Kokusai Electric Inc. | 8,000 | 57,953 | |||
IT Holdings Corp. | 8,048 | 114,172 | |||
Japan Radio Co. Ltd. | 8,000 | 20,180 | |||
MTI Ltd. | 8 | 18,723 | |||
Oki Electric Industry Co. Ltd.b | 80,000 | 84,515 | |||
Okinawa Cellular Telephone Co. | 16 | 31,822 | |||
Telepark Corp. | 24 | 42,430 | |||
Uniden Corp.b | 8,000 | 22,250 | |||
| 432,750 | |||||
TEXTILES – 1.15% | |||||
Daiwabo Holdings Co. Ltd.a | 16,000 | 73,648 | |||
Kurabo Industries Ltd. | 24,000 | 53,037 | |||
Nitto Boseki Co. Ltd. | 32,000 | 63,472 | |||
Seiren Co. Ltd. | 6,400 | 41,671 | |||
Toyobo Co. Ltd. | 64,000 | 122,805 | |||
Unitika Ltd.b | 56,000 | 54,331 | |||
| 408,964 | |||||
TOYS, GAMES & HOBBIES – 0.31% | |||||
Sanrio Co. Ltd. | 4,800 | 42,533 | |||
Tomy Co. Ltd. | 8,000 | 68,215 | |||
| 110,748 | |||||
TRANSPORTATION – 2.79% | |||||
Daiichi Chuo Kisen Kaishaa | 16,000 | 44,155 | |||
Fukuyama Transporting Co. Ltd. | 16,000 | 87,274 | |||
Hitachi Transport System Ltd. | 4,800 | 65,145 | |||
Iino Kaiun Kaisha Ltd. | 8,800 | 45,819 | |||
Inui Steamship Co. Ltd. | 2,400 | 17,075 | |||
Kintetsu World Express Inc. | 1,600 | 36,738 | |||
Nippon Konpo Unyu Soko Co. Ltd. | 8,000 | 98,399 | |||
Nishi-Nippon Railroad Co. Ltd. | 32,000 | 128,324 | |||
Sagami Railway Co. Ltd. | 40,000 | 172,910 | |||
Sankyu Inc. | 24,000 | 108,403 | |||
Seino Holdings Co. Ltd. | 16,000 | 142,985 | |||
Shinwa Kaiun Kaisha Ltd. | 8,000 | 22,164 | |||
Yusen Air & Sea Service Co. Ltd. | 1,600 | 22,388 | |||
| 991,779 | |||||
TOTAL COMMON STOCKS | |||||
(Cost: $35,290,408) | 35,482,160 | ||||
| Security | Shares | Value | ||||
SHORT-TERM INVESTMENTS – 2.38% |
| |||||
MONEY MARKET FUNDS – 2.38% |
| |||||
Barclays Global Investors Funds | 733,632 | $ | 733,632 | |||
Barclays Global Investors Funds | 103,490 | 103,490 | ||||
Barclays Global Investors Funds | 6,946 | 6,946 | ||||
| 844,068 | ||||||
TOTAL SHORT-TERM INVESTMENTS |
| |||||
(Cost: $844,068) | 844,068 | |||||
TOTAL INVESTMENTS IN | ||||||
(Cost: $36,134,476) | 36,326,228 | |||||
Other Assets, Less Liabilities – (2.17)% | (770,042 | ) | ||||
NET ASSETS – 100.00% | $ | 35,556,186 | ||||
| a | All or a portion of this security represents a security on loan. See Note 5. |
| b | Non-income earning security. |
| c | Affiliated issuer. See Note 2. |
| d | The rate quoted is the annualized seven-day yield of the fund at period end. |
| e | All or a portion of this security represents an investment of securities lending collateral. See Note 5. |
See notes to financial statements.
| SCHEDULESOF INVESTMENTS | 43 |
Table of Contents
iSHARES® MSCI MALAYSIA INDEX FUND
August 31, 2009
| Security | Shares | Value | |||
COMMON STOCKS – 99.73% | |||||
AGRICULTURE – 12.05% | |||||
British American Tobacco (Malaysia) Bhd | 978,600 | $ | 12,755,286 | ||
Genting Plantations Bhd | 1,537,800 | 2,576,465 | |||
IOI Corp. Bhd | 23,486,430 | 34,080,834 | |||
Kuala Lumpur Kepong Bhd | 3,285,300 | 12,407,920 | |||
| 61,820,505 | |||||
AIRLINES – 1.04% | |||||
AirAsia Bhda | 7,269,600 | 2,828,156 | |||
Malaysian Airline System Bhda | 2,796,000 | 2,501,036 | |||
| 5,329,192 | |||||
AUTO PARTS & EQUIPMENT – 1.29% | |||||
UMW Holdings Bhd | 3,774,600 | 6,613,455 | |||
| 6,613,455 | |||||
BANKS – 25.54% | |||||
Alliance Financial Group Bhd | 6,360,900 | 4,317,067 | |||
AMMB Holdings Bhd | 12,092,737 | 14,113,630 | |||
Bumiputra-Commerce Holdings Bhd | 13,490,732 | 38,118,070 | |||
Hong Leong Bank Bhd | 3,215,400 | 5,478,461 | |||
Malayan Banking Bhd | 24,185,420 | 44,710,233 | |||
Public Bank Bhd Foreign | 7,199,700 | 20,342,756 | |||
RHB Capital Bhd | 2,935,800 | 3,943,301 | |||
| 131,023,518 | |||||
BUILDING MATERIALS – 0.79% | |||||
Lafarge Malayan Cement Bhd | 2,306,760 | 4,061,312 | |||
| 4,061,312 | |||||
COMMERCIAL SERVICES – 1.91% | |||||
PLUS Expressways Bhd | 10,205,400 | 9,795,329 | |||
| 9,795,329 | |||||
DIVERSIFIED FINANCIAL SERVICES – 1.52% | |||||
Bursa Malaysia Bhd | 2,306,700 | 5,109,260 | |||
Hong Leong Financial Group Bhd | 1,817,400 | 2,683,652 | |||
| 7,792,912 | |||||
ELECTRIC – 7.64% | |||||
Tenaga Nasional Bhd | 13,350,950 | 30,405,969 | |||
YTL Power International Bhd | 14,049,975 | 8,817,392 | |||
| 39,223,361 | |||||
| Security | Shares | Value | |||
ENGINEERING & CONSTRUCTION – 6.42% | |||||
Gamuda Bhd | 10,974,300 | $ | 9,567,259 | ||
IJM Corp. Bhd | 5,452,200 | 9,258,599 | |||
MMC Corp. Bhd | 5,172,600 | 3,451,827 | |||
YTL Corp. Bhd | 5,102,788 | 10,664,921 | |||
| 32,942,606 | |||||
ENTERTAINMENT – 2.40% | |||||
Berjaya Sports Toto Bhd | 5,102,750 | 6,216,328 | |||
Tanjong PLC | 1,398,000 | 6,081,886 | |||
| 12,298,214 | |||||
FOOD – 3.09% | |||||
PPB Group Bhd | 3,634,866 | 15,875,121 | |||
| 15,875,121 | |||||
GAS – 1.81% | |||||
Petronas Gas Bhd | 3,355,200 | 9,270,509 | |||
| 9,270,509 | |||||
HOLDING COMPANIES - DIVERSIFIED – 9.35% | |||||
Sime Darby Bhd | 20,477,282 | 47,973,187 | |||
| 47,973,187 | |||||
IRON & STEEL – 1.05% | |||||
Parkson Holdings Bhd | 3,564,900 | 5,395,688 | |||
| 5,395,688 | |||||
LODGING – 9.01% | |||||
Genting Bhd | 15,168,300 | 28,773,035 | |||
Genting Malaysia Bhd | 22,018,500 | 17,444,729 | |||
| 46,217,764 | |||||
MEDIA – 0.63% | |||||
Astro All Asia Networks PLC | 3,285,300 | 3,246,584 | |||
| 3,246,584 | |||||
OIL & GAS – 0.80% | |||||
Petronas Dagangan Bhd | 1,677,600 | 4,106,464 | |||
| 4,106,464 | |||||
REAL ESTATE – 2.57% | |||||
IGB Corp. Bhd | 6,081,300 | 3,125,700 | |||
KLCC Property Holdings Bhd | 3,215,400 | 3,013,153 | |||
SP Setia Bhd | 5,522,100 | 7,025,134 | |||
| 13,163,987 | |||||
| 44 | 2009 iSHARES ANNUAL REPORT TO SHAREHOLDERS |
Table of Contents
Schedule of Investments (Continued)
iSHARES® MSCI MALAYSIA INDEX FUND
August 31, 2009
| Security | Shares | Value | |||
TELECOMMUNICATIONS – 7.14% | |||||
Axiata Group Bhda | 17,265,300 | $ | 15,443,900 | ||
DiGi.Com Bhd | 2,376,600 | 14,914,911 | |||
Telekom Malaysia Bhd | 7,059,900 | 6,254,973 | |||
| 36,613,784 | |||||
TRANSPORTATION – 3.68% | |||||
MISC Bhd Foreign | 7,619,100 | 18,866,549 | |||
| 18,866,549 | |||||
TOTAL COMMON STOCKS | 511,630,041 | ||||
SHORT-TERM INVESTMENTS – 0.02% | |||||
MONEY MARKET FUNDS – 0.02% | |||||
Barclays Global Investors Funds | 104,102 | 104,102 | |||
| 104,102 | |||||
TOTAL SHORT-TERM INVESTMENTS | |||||
(Cost: $104,102) | 104,102 | ||||
TOTAL INVESTMENTS IN | 511,734,143 | ||||
Other Assets, Less Liabilities – 0.25% | 1,265,506 | ||||
NET ASSETS – 100.00% | $ | 512,999,649 | |||
| a | Non-income earning security. |
| b | Affiliated issuer. See Note 2. |
| c | The rate quoted is the annualized seven-day yield of the fund at period end. |
See notes to financial statements.
| SCHEDULESOF INVESTMENTS | 45 |
Table of Contents
iSHARES® MSCI PACIFIC EX-JAPAN INDEX FUND
August 31, 2009
| Security | Shares | Value | |||
COMMON STOCKS – 99.03% | |||||
AUSTRALIA – 67.04% | |||||
AGL Energy Ltd. | 1,396,890 | $ | 16,439,968 | ||
Alumina Ltd. | 7,629,498 | 10,741,521 | |||
Amcor Ltd. | 3,726,659 | 18,127,954 | |||
AMP Ltd. | 6,227,406 | 33,390,093 | |||
Aristocrat Leisure Ltd. | 1,191,564 | 4,641,012 | |||
Arrow Energy Ltd.a | 1,780,614 | 6,890,263 | |||
Asciano Groupa | 8,259,552 | 11,071,512 | |||
ASX Ltd. | 532,746 | 14,866,253 | |||
Australia and New Zealand Banking Group Ltd. | 7,219,152 | 129,573,199 | |||
AXA Asia Pacific Holdings Ltd. | 3,156,696 | 11,443,386 | |||
Bendigo and Adelaide Bank Ltd. | 930,852 | 6,513,465 | |||
Bendigo and Adelaide Bank Ltd. Newa | 76,304 | 524,274 | |||
BGP Holdings PLCb | 27,004,595 | 3,875 | |||
BHP Billiton Ltd. | 10,390,536 | 322,358,482 | |||
Billabong International Ltd. | 613,243 | 5,428,442 | |||
BlueScope Steel Ltd. | 5,649,372 | 13,621,331 | |||
Boral Ltd. | 1,842,732 | 8,994,853 | |||
Brambles Ltd. | 4,321,332 | 27,068,225 | |||
Caltex Australia Ltd. | 418,302 | 4,362,274 | |||
CFS Retail Property Trust | 5,402,736 | 8,654,076 | |||
Coca-Cola Amatil Ltd.c | 1,730,430 | 14,457,095 | |||
Cochlear Ltd. | 175,338 | 8,317,758 | |||
Commonwealth Bank of Australia | 4,684,248 | 181,656,543 | |||
Computershare Ltd. | 1,386,486 | 11,817,347 | |||
Crown Ltd. | 1,460,538 | 9,739,635 | |||
CSL Ltd. | 1,867,212 | 50,703,471 | |||
CSR Ltd. | 3,908,844 | 6,722,516 | |||
Dexus Property Group | 14,094,621 | 8,852,440 | |||
Energy Resources of Australia Ltd. | 211,752 | 4,641,456 | |||
Fairfax Media Ltd.c | 6,582,978 | 8,158,176 | |||
Fortescue Metals Group Ltd.a | 3,811,536 | 14,170,721 | |||
Foster’s Group Ltd. | 5,974,650 | 27,602,369 | |||
Goodman Fielder Ltd. | 3,963,312 | 5,145,556 | |||
Goodman Group | 18,262,080 | 9,545,425 | |||
| Security | Shares | Value | |||
GPT Group | 26,909,640 | $ | 13,951,996 | ||
Harvey Norman Holdings Ltd.c | 1,686,978 | 5,603,495 | |||
Incitec Pivot Ltd. | 4,974,336 | 12,622,778 | |||
Insurance Australia Group Ltd. | 6,370,308 | 19,226,348 | |||
James Hardie Industries NVa | 1,339,668 | 7,849,379 | |||
Leighton Holdings Ltd. | 463,284 | 14,431,620 | |||
Lend Lease Corp. Ltd. | 1,359,864 | 10,810,866 | |||
Lion Nathan Ltd. | 914,022 | 9,100,387 | |||
Macquarie Airports | 2,116,602 | 4,568,067 | |||
Macquarie Group Ltd.c | 938,502 | 40,193,169 | |||
Macquarie Infrastructure Group | 7,113,582 | 7,976,150 | |||
Metcash Ltd. | 2,386,188 | 8,609,972 | |||
Mirvac Group | 7,903,674 | 9,861,525 | |||
National Australia Bank Ltd. | 5,941,296 | 142,650,897 | |||
Newcrest Mining Ltd. | 1,496,952 | 37,872,782 | |||
Nufarm Ltd. | 528,156 | 4,768,755 | |||
OneSteel Ltd. | 4,113,252 | 11,269,951 | |||
Orica Ltd. | 1,112,004 | 21,168,185 | |||
Origin Energy Ltd. | 2,712,996 | 35,016,899 | |||
OZ Minerals Ltd.a | 9,747,630 | 8,710,804 | |||
Paladin Energy Ltd.a | 1,757,970 | 6,817,460 | |||
Perpetual Ltd. | 115,362 | 4,002,082 | |||
Qantas Airways Ltd. | 3,265,326 | 6,964,668 | |||
QBE Insurance Group Ltd. | 3,101,922 | 59,832,924 | |||
Rio Tinto Ltd. | 1,349,154 | 63,819,754 | |||
Santos Ltd. | 2,537,658 | 33,802,087 | |||
Sims Metal Management Ltd. | 457,164 | 8,953,123 | |||
Sonic Healthcare Ltd. | 1,128,528 | 13,300,649 | |||
SP AusNet | 3,953,644 | 2,566,502 | |||
Stockland Corp. Ltd. | 7,113,888 | 22,670,033 | |||
Suncorp-Metway Ltd. | 3,899,970 | 25,744,020 | |||
Tabcorp Holdings Ltd. | 1,823,454 | 10,315,034 | |||
Tatts Group Ltd. | 3,803,886 | 7,953,028 | |||
Telstra Corp. Ltd. | 13,691,970 | 37,630,230 | |||
Toll Holdings Ltd. | 2,052,648 | 13,791,965 | |||
Transurban Group | 3,613,554 | 12,307,483 | |||
Wesfarmers Ltd. | 3,108,042 | 65,846,501 | |||
Wesfarmers Ltd. Partially Protected | 469,412 | 10,012,166 | |||
Westfield Group | 6,325,938 | 67,516,819 | |||
Westpac Banking Corp. | 9,015,984 | 185,234,550 | |||
Woodside Petroleum Ltd. | 1,529,388 | 63,178,177 | |||
| 46 | 2009 iSHARES ANNUAL REPORT TO SHAREHOLDERS |
Table of Contents
Schedule of Investments (Continued)
iSHARES® MSCI PACIFIC EX-JAPAN INDEX FUND
August 31, 2009
| Security | Shares | Value | |||
Woolworths Ltd. | 3,832,956 | $ | 90,543,087 | ||
WorleyParsons Ltd. | 510,714 | 12,257,970 | |||
| 2,267,569,303 | |||||
HONG KONG – 19.49% | |||||
ASM Pacific Technology Ltd. | 612,000 | 3,920,420 | |||
Bank of East Asia Ltd. | 4,528,920 | 14,608,194 | |||
BOC Hong Kong (Holdings) Ltd. | 11,475,000 | 23,007,296 | |||
Cathay Pacific Airways Ltd.a | 3,366,000 | 4,881,376 | |||
Cheung Kong (Holdings) Ltd.c | 4,284,000 | 50,823,324 | |||
Cheung Kong Infrastructure Holdings Ltd. | 1,530,000 | 5,566,759 | |||
Chinese Estates Holdings Ltd. | 2,142,000 | 3,940,949 | |||
CLP Holdings Ltd. | 6,273,000 | 42,005,341 | |||
Esprit Holdings Ltd. | 3,457,800 | 21,035,045 | |||
Foxconn International Holdings Ltd.a | 6,732,000 | 4,134,404 | |||
Hang Lung Group Ltd. | 2,448,000 | 11,275,648 | |||
Hang Lung Properties Ltd. | 6,426,736 | 20,024,859 | |||
Hang Seng Bank Ltd. | 2,356,200 | 33,470,434 | |||
Henderson Land Development Co. Ltd. | 3,366,056 | 19,782,063 | |||
Hong Kong Aircraft Engineering Co. Ltd. | 244,800 | 2,864,709 | |||
Hong Kong and China Gas Co. Ltd. (The) | 12,240,661 | 26,500,783 | |||
Hong Kong Exchanges and Clearing Ltd. | 3,213,000 | 55,963,693 | |||
Hongkong Electric Holdings Ltd. | 4,284,000 | 23,933,115 | |||
Hopewell Holdings Ltd. | 1,836,000 | 5,554,915 | |||
Hutchison Whampoa Ltd. | 6,732,000 | 47,337,191 | |||
Hysan Development Co. Ltd. | 1,836,000 | 4,306,540 | |||
Kerry Properties Ltd. | 2,295,000 | 10,867,024 | |||
Li & Fung Ltd. | 6,733,600 | 22,371,053 | |||
Lifestyle International Holdings Ltd. | 2,142,000 | 3,051,058 | |||
Link REIT (The) | 6,732,000 | 14,835,215 | |||
Mongolia Energy Corp. Ltd.a | 9,180,000 | 3,257,146 | |||
MTR Corp. Ltd.c | 4,437,000 | 14,912,794 | |||
New World Development Co. Ltd. | 7,650,941 | 15,438,798 | |||
NWS Holdings Ltd. | 2,448,000 | 4,769,252 | |||
| Security | Shares | Value | |||
Orient Overseas International Ltd. | 612,000 | $ | 2,874,185 | ||
PCCW Ltd. | 11,322,000 | 2,936,169 | |||
Shangri-La Asia Ltd. | 4,284,000 | 6,301,097 | |||
Sino Land Co. Ltd. | 5,508,000 | 9,409,007 | |||
Sun Hung Kai Properties Ltd.c | 4,284,000 | 57,981,150 | |||
Swire Pacific Ltd. Class A | 2,295,000 | 23,940,025 | |||
Television Broadcasts Ltd. | 918,000 | 3,914,498 | |||
Wharf (Holdings) Ltd. (The) | 4,284,000 | 19,207,292 | |||
Wheelock and Co. Ltd. | 2,754,000 | 7,408,527 | |||
Wing Hang Bank Ltd. | 612,000 | 5,527,278 | |||
Yue Yuen Industrial Holdings Ltd. | 1,989,000 | 5,247,953 | |||
| 659,186,579 | |||||
NEW ZEALAND – 0.93% | |||||
Auckland International Airport Ltd. | 2,596,104 | 3,079,882 | |||
Contact Energy Ltd. | 950,130 | 4,072,198 | |||
Fletcher Building Ltd. | 1,796,220 | 9,681,617 | |||
Sky City Entertainment Group Ltd. | 1,675,832 | 3,746,398 | |||
Telecom Corp. of New Zealand Ltd. | 5,836,950 | 11,007,393 | |||
| 31,587,488 | |||||
SINGAPORE – 11.57% | |||||
Ascendas Real Estate Investment Trust | 3,978,813 | 4,555,735 | |||
CapitaLand Ltd.c | 7,956,000 | 20,482,814 | |||
CapitaMall Trust Management Ltd. | 7,038,781 | 7,961,704 | |||
City Developments Ltd. | 1,530,000 | 10,553,555 | |||
ComfortDelGro Corp. Ltd. | 5,814,000 | 6,253,565 | |||
COSCO Corp. (Singapore) Ltd.c | 3,060,104 | 2,654,405 | |||
DBS Group Holdings Ltd. | 5,202,000 | 45,628,729 | |||
Fraser and Neave Ltd. | 3,060,150 | 8,175,690 | |||
Genting Singapore PLCa,c | 11,934,000 | 8,364,276 | |||
Golden Agri-Resources Ltd.a | 20,743,987 | 6,837,649 | |||
Jardine Cycle & Carriage Ltd. | 372,000 | 5,988,966 | |||
Keppel Corp. Ltd. | 3,978,000 | 21,007,307 | |||
Neptune Orient Lines Ltd.c | 2,754,750 | 3,077,719 | |||
Noble Group Ltd.c | 4,284,400 | 6,302,993 | |||
Olam International Ltd.c | 3,672,600 | 6,269,454 | |||
| SCHEDULESOF INVESTMENTS | 47 |
Table of Contents
Schedule of Investments (Continued)
iSHARES® MSCI PACIFIC EX-JAPAN INDEX FUND
August 31, 2009
| Security | Shares | Value | |||
Oversea-Chinese Banking Corp. Ltd.c | 7,956,600 | $ | 42,735,564 | ||
SembCorp Industries Ltd. | 3,060,240 | 6,816,814 | |||
SembCorp Marine Ltd. | 2,448,200 | 5,249,601 | |||
Singapore Airlines Ltd. | 1,530,800 | 13,660,933 | |||
Singapore Airport Terminal Services Ltd. | 1,318,964 | 2,260,741 | |||
Singapore Exchange Ltd.c | 2,754,000 | 15,976,850 | |||
Singapore Press Holdings Ltd.c | 4,896,517 | 12,436,246 | |||
Singapore Technologies Engineering Ltd.c | 3,978,000 | 7,149,662 | |||
Singapore Telecommunications Ltd. | 24,786,328 | 54,008,584 | |||
StarHub Ltd. | 1,836,000 | 2,802,956 | |||
United Overseas Bank Ltd. | 3,672,000 | 42,553,971 | |||
UOL Group Ltd. | 1,530,000 | 3,641,719 | |||
Wilmar International Ltd.c | 3,978,000 | 18,053,586 | |||
| 391,461,788 | |||||
TOTAL COMMON STOCKS | 3,349,805,158 | ||||
SHORT-TERM INVESTMENTS – 4.51% | |||||
MONEY MARKET FUNDS – 4.51% | |||||
Barclays Global Investors Funds | 133,594,273 | 133,594,273 | |||
Barclays Global Investors Funds Prime Money Market | 18,845,577 | 18,845,577 | |||
Barclays Global Investors Funds Treasury Money Market | 209,734 | 209,734 | |||
| 152,649,584 | |||||
TOTAL SHORT-TERM INVESTMENTS | |||||
(Cost: $152,649,584) | 152,649,584 | ||||
| Security | Value | |||||
TOTAL INVESTMENTS IN | $ | 3,502,454,742 | ||||
Other Assets, Less Liabilities – (3.54)% | (119,901,123 | ) | ||||
NET ASSETS – 100.00% | $ | 3,382,553,619 | ||||
| a | Non-income earning security. |
| b | Security valued using Level 3 inputs. See Note 1. |
| c | All or a portion of this security represents a security on loan. See Note 5. |
| d | Affiliated issuer. See Note 2. |
| e | The rate quoted is the annualized seven-day yield of the fund at period end. |
| f | All or a portion of this security represents an investment of securities lending collateral. See Note 5. |
See notes to financial statements.
| 48 | 2009 iSHARES ANNUAL REPORT TO SHAREHOLDERS |
Table of Contents
iSHARES® MSCI SINGAPORE INDEX FUND
August 31, 2009
| Security | Shares | Value | |||
COMMON STOCKS – 99.22% | |||||
AGRICULTURE – 6.17% | |||||
Golden Agri-Resources Ltd.a | 68,202,628 | $ | 22,481,002 | ||
Wilmar International Ltd.b | 12,630,000 | 57,319,455 | |||
| 79,800,457 | |||||
AIRLINES – 3.69% | |||||
Singapore Airlines Ltd.b | 5,352,467 | 47,765,675 | |||
| 47,765,675 | |||||
BANKS – 33.78% | |||||
DBS Group Holdings Ltd. | 17,682,500 | 155,099,962 | |||
Oversea-Chinese Banking Corp. Ltd.b | 25,260,000 | 135,673,571 | |||
United Overseas Bank Ltd. | 12,630,000 | 146,366,191 | |||
| 437,139,724 | |||||
BEVERAGES – 2.09% | |||||
Fraser and Neave Ltd. | 10,104,000 | 26,994,483 | |||
| 26,994,483 | |||||
DISTRIBUTION & WHOLESALE – 1.57% | |||||
Jardine Cycle & Carriage Ltd. | 1,263,000 | 20,333,507 | |||
| 20,333,507 | |||||
DIVERSIFIED FINANCIAL SERVICES – 3.96% | |||||
Singapore Exchange Ltd. | 8,841,000 | 51,289,518 | |||
| 51,289,518 | |||||
ENGINEERING & CONSTRUCTION – 4.40% | |||||
SembCorp Industries Ltd. | 11,367,000 | 25,320,475 | |||
Singapore Airport Terminal Services Ltd. | 3,907,300 | 6,697,222 | |||
Singapore Technologies Engineering Ltd.b | 13,893,000 | 24,969,897 | |||
| 56,987,594 | |||||
FOOD – 1.67% | |||||
Olam International Ltd.b | 12,630,000 | 21,560,529 | |||
| 21,560,529 | |||||
HOLDING COMPANIES - DIVERSIFIED – 6.22% | |||||
Keppel Corp. Ltd. | 11,367,000 | 60,027,667 | |||
Noble Group Ltd.b | 13,893,000 | 20,438,680 | |||
| 80,466,347 | |||||
MEDIA – 3.22% | |||||
Singapore Press Holdings Ltd.b | 16,419,000 | 41,701,218 | |||
| 41,701,218 | |||||
| Security | Shares | Value | |||
REAL ESTATE – 10.41% | |||||
CapitaLand Ltd.b | 23,094,000 | $ | 59,455,772 | ||
City Developments Ltd.b | 5,052,000 | 34,847,424 | |||
Genting Singapore PLCa,b | 40,416,000 | 28,326,678 | |||
UOL Group Ltd. | 5,052,000 | 12,024,815 | |||
| 134,654,689 | |||||
REAL ESTATE INVESTMENT TRUSTS – 3.10% | |||||
Ascendas Real Estate Investment Trust | 12,630,335 | 14,461,714 | |||
CapitaMall Trust Management Ltd. | 22,734,800 | 25,715,779 | |||
| 40,177,493 | |||||
SHIPBUILDING – 1.46% | |||||
SembCorp Marine Ltd.b | 8,841,000 | 18,957,489 | |||
| 18,957,489 | |||||
TELECOMMUNICATIONS – 14.36% | |||||
Singapore Telecommunications Ltd. | 80,832,568 | 176,131,476 | |||
StarHub Ltd. | 6,315,000 | 9,640,887 | |||
| 185,772,363 | |||||
TRANSPORTATION – 3.12% | |||||
ComfortDelGro Corp. Ltd. | 20,208,000 | 21,735,818 | |||
COSCO Corp. (Singapore) Ltd.b | 10,104,000 | 8,764,443 | |||
Neptune Orient Lines Ltd.b | 8,841,499 | 9,878,084 | |||
| 40,378,345 | |||||
TOTAL COMMON STOCKS | 1,283,979,431 | ||||
| SCHEDULESOF INVESTMENTS | 49 |
Table of Contents
Schedule of Investments (Continued)
iSHARES® MSCI SINGAPORE INDEX FUND
August 31, 2009
| Security | Shares | Value | ||||
SHORT-TERM INVESTMENTS – 21.07% |
| |||||
MONEY MARKET FUNDS – 21.07% | ||||||
Barclays Global Investors Funds | 238,501,923 | $ | 238,501,923 | |||
Barclays Global Investors Funds | 33,644,454 | 33,644,454 | ||||
Barclays Global Investors Funds | 477,170 | 477,170 | ||||
| 272,623,547 | ||||||
TOTAL SHORT-TERM INVESTMENTS | 272,623,547 | |||||
TOTAL INVESTMENTS IN | 1,556,602,978 | |||||
Other Assets, Less Liabilities – (20.29)% | (262,564,406 | ) | ||||
NET ASSETS – 100.00% | $ | 1,294,038,572 | ||||
| a | Non-income earning security. |
| b | All or a portion of this security represents a security on loan. See Note 5. |
| c | Affiliated issuer. See Note 2. |
| d | The rate quoted is the annualized seven-day yield of the fund at period end. |
| e | All or a portion of this security represents an investment of securities lending collateral. See Note 5. |
See notes to financial statements.
| 50 | 2009 iSHARES ANNUAL REPORT TO SHAREHOLDERS |
Table of Contents
iSHARES® MSCI SOUTH KOREA INDEX FUND
August 31, 2009
| Security | Shares | Value | |||
COMMON STOCKS – 97.08% | |||||
AGRICULTURE – 1.67% | |||||
KT&G Corp. | 742,306 | $ | 40,000,956 | ||
| 40,000,956 | |||||
AIRLINES – 0.34% | |||||
Korean Air Co. Ltd.a | 239,822 | 8,026,711 | |||
| 8,026,711 | |||||
AUTO MANUFACTURERS – 4.42% | |||||
Hyundai Motor Co. Ltd.b | 1,034,652 | 87,815,767 | |||
Kia Motors Corp.a,b | 1,347,560 | 18,235,058 | |||
| 106,050,825 | |||||
AUTO PARTS & EQUIPMENT – 2.24% | |||||
Hankook Tire Co. Ltd. | 502,480 | 8,931,905 | |||
Hyundai Mobis | 422,546 | 44,829,326 | |||
| 53,761,231 | |||||
BANKS – 1.92% | |||||
Busan Bank | 1,062,062 | 9,566,977 | |||
Daegu Bank | 799,400 | 9,313,212 | |||
Industrial Bank of Koreaa | 1,084,900 | 11,727,240 | |||
Korea Exchange Bankb | 1,724,420 | 15,395,374 | |||
| 46,002,803 | |||||
BEVERAGES – 0.19% | |||||
Hite Brewery Co. Ltd.b | 35,402 | 4,634,660 | |||
| 4,634,660 | |||||
BIOTECHNOLOGY – 0.20% | |||||
Celltrion Inc.a,b | 359,730 | 4,853,431 | |||
| 4,853,431 | |||||
CHEMICALS – 3.74% | |||||
Hanwha Chemical Corp. | 513,900 | 5,349,267 | |||
Honam Petrochemical Corp.b | 91,360 | 6,861,693 | |||
KCC Corp. | 34,260 | 8,723,420 | |||
Korea Zinc Co. Ltd.b | 57,100 | 6,240,812 | |||
LG Chem Ltd. | 308,345 | 46,539,381 | |||
OCI Co. Ltd.b | 79,940 | 15,970,078 | |||
| 89,684,651 | |||||
COMMERCIAL SERVICES – 0.19% | |||||
S1 Corp. | 114,208 | 4,608,922 | |||
| 4,608,922 | |||||
| Security | Shares | Value | |||
COSMETICS & PERSONAL CARE – 0.56% | |||||
AmorePacific Corp.b | 22,840 | $ | 13,313,730 | ||
| 13,313,730 | |||||
DISTRIBUTION & WHOLESALE – 2.99% | |||||
Daewoo International Corp.b | 331,189 | 7,650,575 | |||
Hanwha Corp.b | 319,760 | 11,214,259 | |||
Hyosung Corp.b | 148,465 | 10,734,558 | |||
Samsung C&T Corp. | 833,660 | 37,380,863 | |||
SK Networks Co. Ltd. | 491,060 | 4,836,286 | |||
| 71,816,541 | |||||
DIVERSIFIED FINANCIAL SERVICES – 13.15% | |||||
Daewoo Securities Co. Ltd.b | �� | 822,240 | 15,109,623 | ||
Hana Financial Group Inc.b | 1,267,621 | 33,240,922 | |||
Hyundai Securities Co. Ltd. | 799,407 | 10,689,484 | |||
KB Financial Group Inc.a | 2,181,224 | 89,945,581 | |||
Korea Investment Holdings Co. Ltd. | 251,245 | 7,201,995 | |||
Mirae Asset Securities Co. Ltd.b | 148,469 | 8,678,226 | |||
Samsung Card Co. Ltd. | 251,245 | 10,259,825 | |||
Samsung Securities Co.b | 331,180 | 19,835,266 | |||
Shinhan Financial Group Co. Ltd.a | 2,683,707 | 88,103,120 | |||
Tong Yang Securities Inc. | 468,220 | 6,092,221 | |||
Woori Finance Holdings Co. Ltd.a | 1,621,640 | 18,243,288 | |||
Woori Investment & Securities Co. Ltd. | 571,000 | 8,001,041 | |||
| 315,400,592 | |||||
ELECTRIC – 1.79% | |||||
Korea Electric Power Corp.a,b | 1,713,000 | 42,999,880 | |||
| 42,999,880 | |||||
ELECTRICAL COMPONENTS & | |||||
LG Electronics Inc.b | 628,106 | 71,918,615 | |||
LS Corp. | 114,200 | 7,552,983 | |||
LS Industrial Systems Co. Ltd. | 103,922 | 6,698,471 | |||
Taihan Electric Wire Co. Ltd.b | 148,460 | 2,716,239 | |||
| 88,886,308 | |||||
| SCHEDULESOF INVESTMENTS | 51 |
Table of Contents
Schedule of Investments (Continued)
iSHARES® MSCI SOUTH KOREA INDEX FUND
August 31, 2009
| Security | Shares | Value | |||
ELECTRONICS – 4.23% | |||||
LG Display Co. Ltd.b | 1,553,122 | $ | 45,888,543 | ||
Samsung Electro-Mechanics Co. Ltd. | 399,700 | 28,579,718 | |||
Samsung SDI Co. Ltd.b | 228,400 | 27,066,378 | |||
| 101,534,639 | |||||
ENGINEERING & CONSTRUCTION – 3.41% | |||||
Daelim Industrial Co. Ltd. | 182,720 | 10,548,572 | |||
Daewoo Engineering & Construction Co. Ltd.b | 765,144 | 8,577,161 | |||
Doosan Heavy Industries & Construction Co. Ltd.b | 205,560 | 10,435,186 | |||
GS Engineering & Construction Corp. | 239,820 | 18,376,791 | |||
Hanjin Heavy Industries & Construction Co. Ltd.b | 205,564 | 4,542,851 | |||
Hyundai Engineering & Construction Co. Inc.b | 331,188 | 15,964,062 | |||
Samsung Engineering Co. Ltd. | 205,560 | 13,364,939 | |||
| 81,809,562 | |||||
ENVIRONMENTAL CONTROL – 0.37% | |||||
Woongjin Coway Co. Ltd.b | 319,760 | 8,845,951 | |||
| 8,845,951 | |||||
FOOD – 0.41% | |||||
CJ CheilJedang Corp. | 52,532 | 7,024,457 | |||
Lotte Confectionery Co. Ltd.b | 3,500 | 2,903,355 | |||
| 9,927,812 | |||||
GAS – 0.27% | |||||
Korea Gas Corp. | 159,880 | 6,413,634 | |||
| 6,413,634 | |||||
HOLDING COMPANIES - DIVERSIFIED – 1.97% | |||||
GS Holdings Corp.b | 342,600 | 9,052,606 | |||
LG Corp.b | 628,101 | 38,272,469 | |||
| 47,325,075 | |||||
HOME BUILDERS – 0.57% | |||||
Hyundai Development Co.b | 376,867 | 13,760,217 | |||
| 13,760,217 | |||||
HOUSEHOLD PRODUCTS & WARES – 0.41% | |||||
LG Household & Health Care Ltd.b | 57,100 | 9,898,431 | |||
| 9,898,431 | |||||
| Security | Shares | Value | |||
INSURANCE – 2.21% | |||||
Dongbu Insurance Co. Ltd. | 262,660 | $ | 7,991,897 | ||
Samsung Fire & Marine Insurance Co. Ltd. | 251,245 | 45,062,759 | |||
| 53,054,656 | |||||
INTERNET – 2.28% | |||||
LG Dacom Corp. | 274,080 | 4,038,011 | |||
NCsoft Corp.b | 89,076 | 9,771,328 | |||
NHN Corp.a,b | 271,796 | 36,996,813 | |||
SK Broadband Co. Ltd.a | 970,703 | 3,979,501 | |||
| 54,785,653 | |||||
IRON & STEEL – 7.90% | |||||
Dongkuk Steel Mill Co. Ltd. | 251,241 | 5,874,159 | |||
Hyundai Steel Co.b | 365,445 | 23,204,251 | |||
POSCO | 433,960 | 160,359,148 | |||
| 189,437,558 | |||||
LODGING – 0.36% | |||||
Kangwon Land Inc. | 650,942 | 8,600,002 | |||
| 8,600,002 | |||||
MACHINERY – 0.29% | |||||
Doosan Infracore Co. Ltd.b | 502,480 | 7,061,033 | |||
| 7,061,033 | |||||
MANUFACTURING – 0.74% | |||||
Cheil Industries Inc. | 319,760 | 13,108,905 | |||
Doosan Corp.b | 68,520 | 4,570,195 | |||
| 17,679,100 | |||||
METAL PROCESSORS & FABRICATORS – 0.13% | |||||
Taewoong Co. Ltd.b | 49,106 | 3,165,212 | |||
| 3,165,212 | |||||
OIL & GAS – 2.47% | |||||
SK Corp.b | 159,884 | 13,442,085 | |||
SK Energy Co. Ltd. | 399,702 | 32,164,346 | |||
S-Oil Corp. | 296,920 | 13,670,350 | |||
| 59,276,781 | |||||
PHARMACEUTICALS – 0.38% | |||||
Yuhan Corp.b | 58,242 | 9,023,803 | |||
| 9,023,803 | |||||
| 52 | 2009 iSHARES ANNUAL REPORT TO SHAREHOLDERS |
Table of Contents
Schedule of Investments (Continued)
iSHARES® MSCI SOUTH KOREA INDEX FUND
August 31, 2009
| Security | Shares | Value | |||
RETAIL – 2.48% | |||||
Hyundai Department Store Co. Ltd. | 102,780 | $ | 7,867,538 | ||
Lotte Shopping Co. Ltd. | 57,105 | 13,008,546 | |||
Shinsegae Co. Ltd.b | 92,860 | 38,515,078 | |||
| 59,391,162 | |||||
SEMICONDUCTORS – 22.06% | |||||
Hynix Semiconductor Inc.a,b | 3,140,500 | 55,195,752 | |||
Samsung Electronics Co. Ltd. | 742,300 | 458,253,903 | |||
Samsung Techwin Co. Ltd. | 251,241 | 15,651,013 | |||
| 529,100,668 | |||||
SHIPBUILDING – 3.50% | |||||
Daewoo Shipbuilding & Marine Engineering Co. Ltd.b | 639,520 | 10,241,332 | |||
Hyundai Heavy Industries Co. Ltd.b | 251,240 | 38,322,700 | |||
Hyundai Mipo Dockyard Co. Ltd. | 68,520 | 6,775,739 | |||
Samsung Heavy Industries Co. Ltd.b | 1,073,480 | 25,227,511 | |||
STX Offshore & Shipbuilding Co. Ltd.b | 285,500 | 3,394,727 | |||
| 83,962,009 | |||||
TELECOMMUNICATIONS – 2.89% | |||||
KT Corp. | 639,522 | 19,970,661 | |||
KT Corp. SP ADRb | 427,108 | 6,650,072 | |||
LG Telecom Ltd. | 913,603 | 5,705,904 | |||
SKTelecom Co. Ltd. | 159,880 | 22,402,915 | |||
SKTelecom Co. Ltd. SP ADR | 932,575 | 14,510,867 | |||
| 69,240,419 | |||||
TRANSPORTATION – 0.64% | |||||
Hanjin Shipping Co. Ltd.b | 388,280 | 6,746,478 | |||
Korea Express Co. Ltd.a,b | 44,538 | 2,492,759 | |||
STX Pan Ocean Co. Ltd.b | 685,230 | 6,090,202 | |||
| 15,329,439 | |||||
TOTAL COMMON STOCKS | 2,328,664,057 | ||||
| Security | Shares | Value | |||
PREFERRED STOCKS – 2.84% | |||||
AUTO MANUFACTURERS – 0.37% | |||||
Hyundai Motor Co. Ltd.b | 251,240 | $ | 8,801,145 | ||
| 8,801,145 | |||||
ELECTRICAL COMPONENTS & | |||||
LG Electronics Inc.b | 114,206 | 5,331,259 | |||
| 5,331,259 | |||||
SEMICONDUCTORS – 2.25% | |||||
Samsung Electronics Co. Ltd.b | 137,040 | 53,931,588 | |||
| 53,931,588 | |||||
TOTAL PREFERRED STOCKS | 68,063,992 | ||||
SHORT-TERM INVESTMENTS – 9.24% | |||||
MONEY MARKET FUNDS – 9.24% | |||||
Barclays Global Investors Funds Institutional Money Market | 191,437,649 | 191,437,649 | |||
Barclays Global Investors Funds | 27,005,297 | 27,005,297 | |||
Barclays Global Investors Funds Treasury Money Market | 3,124,083 | 3,124,083 | |||
| 221,567,029 | |||||
TOTAL SHORT-TERM INVESTMENTS | |||||
(Cost: $221,567,029) | 221,567,029 | ||||
| SCHEDULESOF INVESTMENTS | 53 |
Table of Contents
Schedule of Investments (Continued)
iSHARES® MSCI SOUTH KOREA INDEX FUND
August 31, 2009
| Value | ||||||
TOTAL INVESTMENTS IN | ||||||
(Cost: $1,809,758,521) | $ | 2,618,295,078 | ||||
Other Assets, Less Liabilities – (9.16)% | (219,745,067 | ) | ||||
NET ASSETS – 100.00% | $ | 2,398,550,011 | ||||
SP ADR – Sponsored American Depositary Receipts
| a | Non-income earning security. |
| b | All or a portion of this security represents a security on loan. See Note 5. |
| c | Affiliated issuer. See Note 2. |
| d | The rate quoted is the annualized seven-day yield of the fund at period end. |
| e | All or a portion of this security represents an investment of securities lending collateral. See Note 5. |
See notes to financial statements.
| 54 | 2009 iSHARES ANNUAL REPORT TO SHAREHOLDERS |
Table of Contents
iSHARES® MSCI TAIWAN INDEX FUND
August 31, 2009
| Security | Shares | Value | |||
COMMON STOCKS – 98.92% | |||||
AIRLINES – 0.30% | |||||
China Airlines Ltd.a | 19,390,588 | $ | 4,565,402 | ||
EVA Airways Corp.a | 19,418,396 | 4,459,863 | |||
| 9,025,265 | |||||
APPAREL – 0.59% | |||||
Pou Chen Corp. | 23,579,023 | 14,613,099 | |||
Ruentex Industries Ltd.a | 2,774,000 | 3,219,261 | |||
| 17,832,360 | |||||
AUTO MANUFACTURERS – 0.24% | |||||
Yulon Motor Co. Ltd. | 8,322,362 | 7,281,577 | |||
| 7,281,577 | |||||
AUTO PARTS & EQUIPMENT – 0.52% | |||||
Cheng Shin Rubber Industry Co. Ltd. | 8,322,892 | 15,878,894 | |||
| 15,878,894 | |||||
BANKS – 6.42% | |||||
Chang Hwa Commercial Bank Ltd. | 45,771,446 | 19,119,815 | |||
Chinatrust Financial Holding Co. Ltd. | 81,833,342 | 45,495,425 | |||
E.Sun Financial Holding Co. Ltd.a | 31,427,060 | 9,738,460 | |||
First Financial Holding Co. Ltd. | 47,158,816 | 25,573,341 | |||
Hua Nan Financial Holdings Co. Ltd. | 33,288,428 | 18,102,254 | |||
Mega Financial Holding Co. Ltd. | 77,672,136 | 38,698,617 | |||
Taishin Financial Holdings Co. Ltd.a | 40,223,439 | 13,319,627 | |||
Taiwan Business Banka | 20,805,000 | 4,866,815 | |||
Taiwan Cooperative Bank Ltd. | 36,062,650 | 19,884,772 | |||
| 194,799,126 | |||||
BUILDING MATERIALS – 1.84% | |||||
Asia Cement Corp. | 17,143,236 | 18,280,424 | |||
Taiwan Cement Corp. | 29,127,558 | 31,590,656 | |||
Taiwan Glass Industrial Corp. | 9,709,791 | 6,047,141 | |||
| 55,918,221 | |||||
| Security | Shares | Value | |||
CHEMICALS – 7.23% | |||||
Eternal Chemical Co. Ltd. | 7,002,916 | $ | 6,073,952 | ||
Formosa Chemicals & Fibre Corp. | 27,740,204 | 48,626,366 | |||
Formosa Plastics Corp. | 38,836,768 | 69,847,543 | |||
Nan Ya Plastic Corp. | 51,427,860 | 71,634,815 | |||
Taiwan Fertilizer Co. Ltd. | 6,935,000 | 20,099,312 | |||
TSRC Corp. | 2,774,000 | 3,189,765 | |||
| 219,471,753 | |||||
COMMERCIAL SERVICES – 0.13% | |||||
Taiwan Secom Co. Ltd. | 2,774,610 | 4,075,536 | |||
| 4,075,536 | |||||
COMPUTERS – 11.87% | |||||
Acer Inc. | 25,210,781 | 57,442,577 | |||
Advantech Co. Ltd. | 2,787,883 | 4,488,867 | |||
Chicony Electronics Co. Ltd. | 4,161,015 | 9,961,204 | |||
Clevo Co.a | 4,366,300 | 5,339,072 | |||
CMC Magnetics Corp.a | 27,740,400 | 6,025,667 | |||
Compal Electronics Inc. | 36,242,399 | 36,554,544 | |||
Foxconn Technology Co. Ltd. | 5,548,300 | 14,158,772 | |||
HTC Corp. | 6,935,077 | 69,737,381 | |||
Innolux Display Corp. | 20,805,189 | 23,291,395 | |||
Inotera Memories Inc.a | 15,257,000 | 8,574,864 | |||
Inventec Co. Ltd. | 16,780,717 | 9,278,296 | |||
Lite-On Technology Corp. | 20,909,772 | 23,440,237 | |||
MiTAC International Corp. | 9,709,585 | 3,952,681 | |||
Qisda Corp.a | 15,257,211 | 7,045,391 | |||
Quanta Computer Inc. | 22,192,240 | 45,980,306 | |||
Wistron Corp. | 18,031,755 | 34,949,827 | |||
| 360,221,081 | |||||
DIVERSIFIED FINANCIAL SERVICES – 4.26% | |||||
Capital Securities Corp.a | 8,322,000 | 3,463,655 | |||
Fubon Financial Holding Co. Ltd.a | 44,384,000 | 41,462,732 | |||
KGI Securities Co. Ltd. | 27,740,000 | 11,714,064 | |||
Polaris Securities Co. Ltd.a | 20,805,991 | 10,081,739 | |||
SinoPac Financial Holdings Co. Ltd.a | 56,867,193 | 17,051,606 | |||
Yuanta Financial Holding Co. Ltd. | 73,511,076 | 45,446,824 | |||
| 129,220,620 | |||||
| SCHEDULESOF INVESTMENTS | 55 |
Table of Contents
Schedule of Investments (Continued)
iSHARES® MSCI TAIWAN INDEX FUND
August 31, 2009
| Security | Shares | Value | |||
ELECTRICAL COMPONENTS & | |||||
Delta Electronics Inc. | 16,644,180 | $ | 44,497,071 | ||
Pacific Electric Wire & Cable Co. Ltd.b | 197 | – | |||
Simplo Technology Co. Ltd. | 1,524,300 | 6,876,750 | |||
Tatung Co. Ltd.a | 36,062,120 | 7,679,901 | |||
Walsin Lihwa Corp.a | 27,740,069 | 9,143,735 | |||
Young Fast | |||||
Optoelectronics Co. Ltd. | 700,000 | 7,368,645 | |||
| 75,566,102 | |||||
ELECTRONICS – 17.89% | |||||
ASUSTeK Computer Inc. | 37,449,803 | 59,616,596 | |||
AU Optronics Corp. | 74,285,830 | 74,925,631 | |||
Cheng Uei Precision Industry Co. Ltd. | 4,161,871 | 7,801,177 | |||
Chi Mei Optoelectronics Corp.a | 47,158,629 | 23,137,693 | |||
Chunghwa Picture Tubes Ltd.a | 95,703,105 | 10,612,196 | |||
Coretronic Corp. | 5,548,000 | 6,404,812 | |||
HannStar Display Corp.a | 47,158,675 | 9,885,463 | |||
Hon Hai Precision Industry Co. Ltd. | 76,350,827 | 257,467,889 | |||
Kinsus Interconnect Technology Corp. | 2,774,043 | 5,772,848 | |||
Micro-Star International Co. Ltd. | 8,322,855 | 5,170,732 | |||
Nan Ya Printed Circuit Board Corp. | 1,415,453 | 4,622,642 | |||
Phison Electronics Corp. | 1,387,968 | 9,698,256 | |||
Pixart Imaging Inc. | 1,400,682 | 10,233,895 | |||
Prime View International Co. Ltd. | 3,087,000 | 4,736,029 | |||
Synnex Technology International Corp. | 10,676,952 | 18,650,973 | |||
Tripod Technology Corp. | 4,202,488 | 9,345,529 | |||
Unimicron Technology Corp. | 8,322,794 | 8,761,102 | |||
Wintek Corp.a | 9,709,000 | 7,108,499 | |||
WPG Holdings Co. Ltd. | 6,935,000 | 8,954,096 | |||
Ya Hsin Industrial Co. Ltd.b | 6,845,461 | 21 | |||
| 542,906,079 | |||||
ENERGY - ALTERNATE SOURCES – 0.23% | |||||
Motech Industries Inc. | 2,774,403 | 6,936,745 | |||
| 6,936,745 | |||||
| Security | Shares | Value | |||
FOOD – 1.14% | |||||
Uni-President Enterprises Co. | 33,305,567 | $ | 34,503,056 | ||
| 34,503,056 | |||||
HOME FURNISHINGS – 0.21% | |||||
Teco Electric and Machinery Co. Ltd. | 15,257,092 | 6,280,546 | |||
| 6,280,546 | |||||
INSURANCE – 3.26% | |||||
Cathay Financial Holding Co. Ltd.a | 58,254,200 | 81,497,301 | |||
Shin Kong Financial Holding Co. Ltd.a | 51,319,490 | 17,617,615 | |||
| 99,114,916 | |||||
INVESTMENT COMPANIES – 0.73% | |||||
China Development Financial Holding Corp.a | 95,703,496 | 22,067,642 | |||
| 22,067,642 | |||||
IRON & STEEL – 3.40% | |||||
China Steel Corp. | 98,477,902 | 89,453,292 | |||
Feng Hsin Iron & Steel Co. Ltd. | 4,161,050 | 6,560,797 | |||
Tung Ho Steel Enterprise Corp. | 7,142,300 | 7,290,607 | |||
| 103,304,696 | |||||
LEISURE TIME – 0.19% | |||||
Giant Manufacturing Co. Ltd. | 2,230,800 | 5,706,359 | |||
| 5,706,359 | |||||
MANUFACTURING – 0.56% | |||||
Largan Precision Co. Ltd. | 1,387,794 | 16,864,418 | |||
| 16,864,418 | |||||
METAL FABRICATE & HARDWARE – 0.35% | |||||
Catcher Technology Co. Ltd. | 4,161,130 | 10,745,251 | |||
| 10,745,251 | |||||
OIL & GAS – 0.98% | |||||
Formosa Petrochemical Corp. | 12,483,950 | 29,658,223 | |||
| 29,658,223 | |||||
REAL ESTATE – 0.15% | |||||
Farglory Land Development Co. Ltd. | 2,589,000 | 4,593,368 | |||
| 4,593,368 | |||||
| 56 | 2009 iSHARES ANNUAL REPORT TO SHAREHOLDERS |
Table of Contents
Schedule of Investments (Continued)
iSHARES® MSCI TAIWAN INDEX FUND
August 31, 2009
| Security | Shares | Value | |||
RETAIL – 0.72% | |||||
Far Eastern Department Stores Co. Ltd. | 8,570,735 | $ | 7,472,851 | ||
President Chain Store Corp. | 6,306,215 | 14,521,930 | |||
| 21,994,781 | |||||
SEMICONDUCTORS – 26.52% | |||||
Advanced Semiconductor Engineering Inc. | 41,610,372 | 29,706,796 | |||
Epistar Corp. | 4,161,047 | 12,224,059 | |||
Everlight Electronics Co. Ltd.a | 2,823,592 | 7,806,020 | |||
Formosa Sumco Technology Corp. | 1,455,000 | 2,873,179 | |||
Macronix International Co. Ltd. | 33,288,527 | 15,826,879 | |||
MediaTek Inc. | 8,878,319 | 128,927,331 | |||
Nanya Technology Corp.a | 6,781,371 | 3,502,295 | |||
Novatek Microelectronics Corp. Ltd. | 5,548,544 | 13,030,014 | |||
Powerchip Semiconductor Corp.a | 77,495,901 | 7,675,076 | |||
Powertech Technology Inc. | 5,548,760 | 15,154,513 | |||
Realtek Semiconductor Corp. | 4,203,150 | 8,874,544 | |||
Richtek Technology Corp. | 1,387,635 | 11,002,772 | |||
Siliconware Precision Industries Co. Ltd. | 29,127,214 | 36,457,133 | |||
Sino-American Silicon Products Inc. | 2,041,323 | 4,068,197 | |||
Taiwan Semiconductor Manufacturing Co. Ltd. | 242,725,882 | 436,540,102 | |||
Transcend Information Inc. | 2,774,015 | 9,228,036 | |||
United Microelectronics Corp.a | 123,443,501 | 50,627,717 | |||
Vanguard International Semiconductor Corp. | 9,709,416 | 4,129,595 | |||
Via Technologies Inc.a | 7,968,000 | 2,686,944 | |||
Winbond Electronics Corp.a | 27,740,000 | 4,660,344 | |||
| 805,001,546 | |||||
SHIPBUILDING – 0.09% | |||||
CSBC Corp.a | 2,774,000 | 2,734,686 | |||
| 2,734,686 | |||||
| Security | Shares | Value | |||
TELECOMMUNICATIONS – 4.58% | |||||
Chunghwa Telecom Co. Ltd. | 51,868,417 | $ | 88,872,715 | ||
Compal Communications Inc.a | 2,869,810 | 2,550,148 | |||
Far EasTone Telecommunications Co. Ltd. | 15,257,259 | 17,219,546 | |||
Taiwan Cellular Corp. | 19,418,677 | 30,499,767 | |||
| 139,142,176 | |||||
TEXTILES – 1.10% | |||||
Far Eastern Textile Ltd. | 28,294,198 | 28,194,058 | |||
Formosa Taffeta Co. Ltd. | 8,322,515 | 5,233,730 | |||
| 33,427,788 | |||||
TRANSPORTATION – 0.93% | |||||
Evergreen International Storage & Transport Corp.a | 2,774,000 | 2,014,145 | |||
Evergreen Marine Corp. Ltd.a | 11,096,467 | 6,708,480 | |||
Sincere Navigation Corp. | 1,387,000 | 1,580,135 | |||
U-Ming Marine Transport Corp. | 4,161,800 | 6,738,989 | |||
Wan Hai Lines Ltd.a | 11,096,433 | 5,511,724 | |||
Yang Ming Marine Transport Corp. | 15,257,305 | 5,678,064 | |||
| 28,231,537 | |||||
TOTAL COMMON STOCKS | 3,002,504,348 | ||||
SHORT-TERM INVESTMENTS – 0.42% | |||||
MONEY MARKET FUNDS – 0.42% | |||||
Barclays Global Investors Funds Treasury Money Market | 12,660,393 | 12,660,393 | |||
| 12,660,393 | |||||
TOTAL SHORT-TERM INVESTMENTS | |||||
(Cost: $12,660,393) | 12,660,393 | ||||
| SCHEDULESOF INVESTMENTS | 57 |
Table of Contents
Schedule of Investments (Continued)
iSHARES® MSCI TAIWAN INDEX FUND
August 31, 2009
| Value | |||||
TOTAL INVESTMENTS IN | $ | 3,015,164,741 | |||
Other Assets, Less Liabilities – 0.66% | 20,166,575 | ||||
NET ASSETS – 100.00% | $ | 3,035,331,316 | |||
| a | Non-income earning security. |
| b | Security valued using Level 3 inputs. See Note 1. |
| c | Affiliated issuer. See Note 2. |
| d | The rate quoted is the annualized seven-day yield of the fund at period end. |
See notes to financial statements.
| 58 | 2009 iSHARES ANNUAL REPORT TO SHAREHOLDERS |
Table of Contents
iSHARES® MSCI THAILAND INVESTABLE MARKET INDEX FUND
August 31, 2009
| Security | Shares | Value | |||
COMMON STOCKS – 99.34% | |||||
AGRICULTURE – 1.30% | |||||
Charoen Pokphand Foods PCL NVDR | 6,930,900 | $ | 1,222,740 | ||
| 1,222,740 | |||||
AIRLINES – 0.68% | |||||
Thai Airways International PCL NVDRa | 1,111,800 | 637,463 | |||
| 637,463 | |||||
AUTO PARTS & EQUIPMENT – 0.09% | |||||
Thai Stanley Electric PCL NVDR | 30,600 | 83,675 | |||
| 83,675 | |||||
BANKS – 26.46% | |||||
Bangkok Bank PCL NVDR | 2,595,900 | 8,396,031 | |||
Bank of Ayudhya PCL NVDR | 4,819,500 | 2,522,408 | |||
Kasikornbank PCL NVDR | 2,223,600 | 4,740,106 | |||
Kiatnakin Bank PCL NVDR | 545,700 | 301,651 | |||
Krung Thai Bank PCL NVDR | 6,905,400 | 1,746,146 | |||
Siam City Bank PCL NVDR | 1,387,200 | 881,021 | |||
Siam Commercial Bank PCL NVDR | 2,238,900 | 5,068,959 | |||
TMB Bank PCL NVDRa | 39,280,200 | 1,224,258 | |||
| 24,880,580 | |||||
BUILDING MATERIALS – 4.88% | |||||
Dynasty Ceramic PCL NVDR | 382,500 | 236,181 | |||
Siam Cement PCL NVDR | 724,200 | 4,130,985 | |||
TPI Polene PCL NVDRa | 958,800 | 218,486 | |||
| 4,585,652 | |||||
CHEMICALS – 5.15% | |||||
Indorama Polymers PCL NVDR | 887,400 | 328,763 | |||
IRPC PCL NVDR | 21,787,200 | 2,459,949 | |||
PTT Chemical PCL NVDR | 887,400 | 1,722,093 | |||
Thai Plastic & Chemical PCL NVDR | 617,100 | 326,604 | |||
| 4,837,409 | |||||
COAL – 4.07% | |||||
Banpu PCL NVDR | 326,400 | 3,829,274 | |||
| 3,829,274 | |||||
| Security | Shares | Value | |||
COMMERCIAL SERVICES – 0.52% | |||||
Bangkok Expressway PCL NVDR | 907,800 | $ | 491,136 | ||
| 491,136 | |||||
COMPUTERS – 0.42% | |||||
Cal-Comp Electronics (Thailand) PCL NVDR | 3,967,800 | 398,997 | |||
| 398,997 | |||||
DIVERSIFIED FINANCIAL SERVICES – 1.57% | |||||
Kim Eng Securities (Thailand) PCL NVDR | 673,200 | 257,324 | |||
Phatra Securities PCL NVDR | 260,100 | 136,130 | |||
Thanachart Capital PCL NVDR | 1,672,800 | 723,027 | |||
TISCO Financial Group PCL NVDR | 683,400 | 357,675 | |||
| 1,474,156 | |||||
ELECTRIC – 2.40% | |||||
Glow Energy PCL NVDR | 1,285,200 | 1,162,008 | |||
Ratchaburi Electricity Generating Holding PCL NVDR | 989,400 | 1,098,202 | |||
| 2,260,210 | |||||
ELECTRONICS – 1.23% | |||||
Delta Electronics (Thailand) PCL NVDR | 948,600 | 488,106 | |||
Hana Microelectronics PCL NVDR | 1,147,500 | 668,054 | |||
| 1,156,160 | |||||
ENGINEERING & CONSTRUCTION – 0.57% | |||||
CH. Karnchang PCL NVDR | 851,700 | 102,174 | |||
Italian-Thai Development PCL NVDRa | 2,974,400 | 248,377 | |||
Sino Thai Engineering & Construction PCL NVDRa | 1,320,900 | 182,541 | |||
| 533,092 | |||||
ENTERTAINMENT – 0.22% | |||||
Major Cineplex Group PCL NVDR | 953,700 | 208,911 | |||
| 208,911 | |||||
FOOD – 1.65% | |||||
Khon Kaen Sugar Industry PCL NVDR | 1,229,100 | 516,793 | |||
Thai Union Frozen Products PCL NVDR | 1,009,800 | 771,973 | |||
Thai Vegetable Oil PCL NVDR | 530,400 | 266,682 | |||
| 1,555,448 | |||||
| SCHEDULESOF INVESTMENTS | 59 |
Table of Contents
Schedule of Investments (Continued)
iSHARES® MSCI THAILAND INVESTABLE MARKET INDEX FUND
August 31, 2009
| Security | Shares | Value | |||
HEALTH CARE - SERVICES – 1.15% | |||||
Bangkok Chain Hospital PCL NVDR | 693,600 | $ | 175,388 | ||
Bangkok Dusit Medical Services PCL NVDR | 581,400 | 423,955 | |||
Bumrungrad Hospital PCL NVDR | 617,100 | 480,834 | |||
| 1,080,177 | |||||
HOME BUILDERS – 1.34% | |||||
Asian Property Development PCL NVDR | 1,397,400 | 230,092 | |||
Land and Houses PCL NVDR | 5,814,000 | 1,025,698 | |||
| 1,255,790 | |||||
IRON & STEEL – 1.24% | |||||
G J Steel PCL NVDRa | 41,891,400 | 234,030 | |||
G Steel PCL NVDRa | 11,444,400 | 141,330 | |||
Sahaviriya Steel Industries PCL NVDRa | 12,178,800 | 325,866 | |||
Tata Steel (Thailand) PCL NVDRa | 5,324,400 | 277,100 | |||
Thainox Stainless PCL NVDRa | 5,431,500 | 186,853 | |||
| 1,165,179 | |||||
LODGING – 0.81% | |||||
Central Plaza Hotel PCL NVDR | 489,600 | 54,128 | |||
Minor International PCL NVDR | 2,269,500 | 707,342 | |||
| 761,470 | |||||
MEDIA – 1.35% | |||||
BEC World PCL NVDR | 2,106,300 | 1,158,124 | |||
MCOT PCL NVDR | 188,700 | 109,858 | |||
| 1,267,982 | |||||
OIL & GAS – 26.21% | |||||
Esso (Thailand) PCL NVDR | 2,896,800 | 600,483 | |||
PTT Exploration & Production PCL NVDR | 2,376,600 | 9,678,303 | |||
PTT PCL NVDR | 1,683,000 | 12,074,448 | |||
Thai Oil PCL NVDR | 1,922,700 | 2,289,602 | |||
| 24,642,836 | |||||
REAL ESTATE – 2.12% | |||||
Amata Corp. PCL NVDR | 1,071,000 | 223,584 | |||
Bangkok Land PCL NVDRa | 14,897,100 | 219,011 | |||
Hemaraj Land and Development PCL NVDR | 9,603,300 | 254,130 | |||
LPN Development PCL NVDR | 1,137,300 | 210,673 | |||
Preuksa Real Estate PCL NVDR | 1,137,300 | 331,058 | |||
| Security | Shares | Value | |||
Quality House PCL NVDR | 7,114,500 | $ | 435,112 | ||
Rojana Industrial Park PCL NVDR | 688,500 | 155,879 | |||
Ticon Industrial Connection PCL NVDR | 637,500 | 166,826 | |||
| 1,996,273 | |||||
RETAIL – 5.45% | |||||
CP All PCL NVDR | 4,998,000 | 2,483,569 | |||
Home Product Center PCL NVDR | 1,326,000 | 272,920 | |||
PTT Aromatics & Refining PCL NVDR | 2,560,200 | 1,633,530 | |||
Robinson Department Store PCL NVDR | 765,000 | 229,432 | |||
Siam Makro PCL NVDR | 244,800 | 505,651 | |||
| 5,125,102 | |||||
TELECOMMUNICATIONS – 6.86% | |||||
Advanced Info Service PCL NVDR | 1,688,100 | 4,281,053 | |||
Samart Corp. PCL NVDR | 933,300 | 168,768 | |||
Thaicom PCL NVDRa | 1,127,100 | 248,552 | |||
Total Access Communication PCL NVDR | 1,203,600 | 1,212,094 | |||
True Corp. PCL NVDRa | 7,634,700 | 538,762 | |||
| 6,449,229 | |||||
TRANSPORTATION – 1.23% | |||||
Bangkok Metro PCL NVDRa | 5,946,600 | 129,388 | |||
Precious Shipping PCL NVDR | 892,500 | 435,622 | |||
Regional Container Lines PCL NVDRa | 362,100 | 117,116 | |||
Thoresen Thai Agencies PCL NVDR | 698,730 | 474,586 | |||
| 1,156,712 | |||||
WATER – 0.37% | |||||
Thai Tap Water Supply PCL NVDR | 2,876,400 | 346,758 | |||
| 346,758 | |||||
TOTAL COMMON STOCKS | 93,402,411 | ||||
WARRANTS – 0.04% | |||||
FOOD – 0.01% | |||||
Thai Vegetable Oil PCL NVDR | 49,680 | 9,568 | |||
| 9,568 | |||||
| 60 | 2009 iSHARES ANNUAL REPORT TO SHAREHOLDERS |
Table of Contents
Schedule of Investments (Continued)
iSHARES® MSCI THAILAND INVESTABLE MARKET INDEX FUND
August 31, 2009
| Security | Shares | Value | |||
REAL ESTATE – 0.03% | |||||
Bangkok Land PCL NVDR | 1,083,411 | $ | 2,230 | ||
Rojana Industrial Park PCL NVDR (Expires 7/30/14)a,b | 162,000 | 17,624 | |||
Ticon Industrial Connection | 79,167 | – | |||
Ticon Industrial Connection | 52,083 | 1,379 | |||
| 21,233 | |||||
TOTAL WARRANTS | 30,801 | ||||
SHORT-TERM INVESTMENTS – 0.14% | |||||
MONEY MARKET FUNDS – 0.14% | |||||
Barclays Global Investors Funds | 133,091 | 133,091 | |||
| 133,091 | |||||
TOTAL SHORT-TERM INVESTMENTS | 133,091 | ||||
TOTAL INVESTMENTS IN | 93,566,303 | ||||
Other Assets, Less Liabilities – 0.48% | 454,573 | ||||
NET ASSETS – 100.00% | $ | 94,020,876 | |||
| NVDR | – Non-Voting Depositary Receipts |
| a | Non-income earning security. |
| b | Security valued using Level 3 inputs. See Note 1. |
| c | Affiliated issuer. See Note 2. |
| d | The rate quoted is the annualized seven-day yield of the fund at period end. |
See notes to financial statements.
| SCHEDULESOF INVESTMENTS | 61 |
Table of Contents
Statements of Assets and Liabilities
iSHARES®, INC.
August 31, 2009
| iShares MSCI | ||||||||||||||||
| Australia Index Fund | Hong Kong Index Fund | Japan Small Cap Index Fund | Malaysia Index Fund | |||||||||||||
ASSETS | ||||||||||||||||
Investments, at cost: | ||||||||||||||||
Unaffiliated issuers | $ | 1,568,183,250 | $ | 2,305,121,236 | $ | 35,290,408 | $ | 316,242,208 | ||||||||
Affiliated issuers (Note 2) | 6,091,063 | 95,001,340 | 844,068 | 104,102 | ||||||||||||
Total cost of investments | $ | 1,574,274,313 | $ | 2,400,122,576 | $ | 36,134,476 | $ | 316,346,310 | ||||||||
Investments in securities, at fair value | ||||||||||||||||
Unaffiliated issuers | $ | 1,576,893,096 | $ | 1,945,048,334 | $ | 35,482,160 | $ | 511,630,041 | ||||||||
Affiliated issuers (Note 2) | 6,091,063 | 95,001,340 | 844,068 | 104,102 | ||||||||||||
Total fair value of investments | 1,582,984,159 | 2,040,049,674 | 36,326,228 | 511,734,143 | ||||||||||||
Foreign currencies, at valueb | 2,357,453 | 2,169,858 | 31,839 | 974,027 | ||||||||||||
Receivables: | ||||||||||||||||
Investment securities sold | 9,964,686 | 4,664,075 | – | 12,516,183 | ||||||||||||
Dividends and interest | 14,658,718 | 3,612,791 | 50,900 | 606,688 | ||||||||||||
Capital shares sold | 130,044 | – | – | 11,734,854 | ||||||||||||
Interest from affiliate (Note 2) | 50,401 | 66,275 | 97 | 36,147 | ||||||||||||
Total Assets | 1,610,145,461 | 2,050,562,673 | 36,409,064 | 537,602,042 | ||||||||||||
LIABILITIES | ||||||||||||||||
Payables: | ||||||||||||||||
Investment securities purchased | 9,952,731 | 3,175,608 | – | 24,374,444 | ||||||||||||
Collateral for securities on loan (Note 5) | 5,825,780 | 94,446,986 | 837,122 | – | ||||||||||||
Capital shares redeemed | – | 213,058 | – | – | ||||||||||||
Investment advisory fees (Note 2) | 690,553 | 950,156 | 15,756 | 227,949 | ||||||||||||
Total Liabilities | 16,469,064 | 98,785,808 | 852,878 | 24,602,393 | ||||||||||||
NET ASSETS | $ | 1,593,676,397 | $ | 1,951,776,865 | $ | 35,556,186 | $ | 512,999,649 | ||||||||
Net assets consist of: | ||||||||||||||||
Paid-in capital | $ | 1,701,016,771 | $ | 2,505,176,184 | $ | 35,942,450 | $ | 419,987,987 | ||||||||
Undistributed net investment income | 12,740,394 | 4,275,742 | 73,258 | 1,906,004 | ||||||||||||
Accumulated net realized loss | (128,960,727 | ) | (197,602,365 | ) | (653,341 | ) | (104,287,368 | ) | ||||||||
Net unrealized appreciation (depreciation) on investments and translation of assets and liabilities in foreign currencies | 8,879,959 | (360,072,696 | ) | 193,819 | 195,393,026 | |||||||||||
NET ASSETS | $ | 1,593,676,397 | $ | 1,951,776,865 | $ | 35,556,186 | $ | 512,999,649 | ||||||||
Shares outstandingc | 78,400,000 | 135,675,000 | 800,000 | 52,425,000 | ||||||||||||
Net asset value per share | $ | 20.33 | $ | 14.39 | $ | 44.45 | $ | 9.79 | ||||||||
| a | Securities on loan with values of $5,547,286, $89,137,708, $792,077 and $–, respectively. See Note 5. |
| b | Cost of foreign currencies: $2,352,630, $2,169,797, $31,144 and $973,110, respectively. |
| c | $0.001 par value, number of shares authorized: 127.8 million, 250 million, 500 million and 300 million, respectively. |
See notes to financial statements.
| 62 | 2009 iSHARES ANNUAL REPORT TO SHAREHOLDERS |
Table of Contents
Statements of Assets and Liabilities (Continued)
iSHARES®, INC.
August 31, 2009
| iShares MSCI | ||||||||||||||||
| Pacific ex-Japan Index Fund | Singapore Index Fund | South Korea Index Fund | Taiwan Index Fund | |||||||||||||
ASSETS | ||||||||||||||||
Investments, at cost: | ||||||||||||||||
Unaffiliated issuers | $ | 3,054,146,100 | $ | 1,406,535,547 | $ | 1,588,191,492 | $ | 2,681,363,020 | ||||||||
Affiliated issuers (Note 2) | 152,649,584 | 272,623,547 | 221,567,029 | 12,660,393 | ||||||||||||
Total cost of investments | $ | 3,206,795,684 | $ | 1,679,159,094 | $ | 1,809,758,521 | $ | 2,694,023,413 | ||||||||
Investments in securities, at fair value | ||||||||||||||||
(including securities on loana) (Note 1): | ||||||||||||||||
Unaffiliated issuers | $ | 3,349,805,158 | $ | 1,283,979,431 | $ | 2,396,728,049 | $ | 3,002,504,348 | ||||||||
Affiliated issuers (Note 2) | 152,649,584 | 272,623,547 | 221,567,029 | 12,660,393 | ||||||||||||
Total fair value of investments | 3,502,454,742 | 1,556,602,978 | 2,618,295,078 | 3,015,164,741 | ||||||||||||
Foreign currencies, at valueb | 6,231,510 | 5,840,351 | – | 2,136,025 | ||||||||||||
Cash | – | – | 2,546 | – | ||||||||||||
Receivables: | ||||||||||||||||
Investment securities sold | 23,435,862 | 14,723,251 | 16,825,005 | 9,670,062 | ||||||||||||
Dividends and interest | 25,269,504 | 7,673,948 | 248,254 | 23,395,160 | ||||||||||||
Capital shares sold | – | – | – | 6,568,466 | ||||||||||||
Interest from affiliate (Note 2) | 114,680 | 56,182 | 118,949 | 137,794 | ||||||||||||
Total Assets | 3,557,506,298 | 1,584,896,710 | 2,635,489,832 | 3,057,072,248 | ||||||||||||
LIABILITIES | ||||||||||||||||
Payables: | ||||||||||||||||
Investment securities purchased | 21,125,204 | 18,117,539 | 17,248,902 | 16,597,159 | ||||||||||||
Collateral for securities on loan (Note 5) | 152,439,850 | 272,146,377 | 218,442,946 | – | ||||||||||||
Capital shares redeemed | – | – | – | 2,188,301 | ||||||||||||
Foreign taxes (Note 1) | – | – | – | 1,347,480 | ||||||||||||
Investment advisory fees (Note 2) | 1,387,625 | 594,222 | 1,247,973 | 1,607,992 | ||||||||||||
Total Liabilities | 174,952,679 | 290,858,138 | 236,939,821 | 21,740,932 | ||||||||||||
NET ASSETS | $ | 3,382,553,619 | $ | 1,294,038,572 | $ | 2,398,550,011 | $ | 3,035,331,316 | ||||||||
Net assets consist of: | ||||||||||||||||
Paid-in capital | $ | 3,423,651,495 | $ | 1,611,290,622 | $ | 2,617,961,634 | $ | 3,718,288,554 | ||||||||
Undistributed (distributions in excess of) net investment income | 12,221,049 | 14,645,717 | (1,028,101 | ) | 55,542,497 | |||||||||||
Accumulated net realized loss | (349,261,598 | ) | (209,375,406 | ) | (1,026,919,943 | ) | (1,059,587,175 | ) | ||||||||
Net unrealized appreciation (depreciation) on investments and translation of assets and liabilities in foreign currencies | 295,942,673 | (122,522,361 | ) | 808,536,421 | 321,087,440 | |||||||||||
NET ASSETS | $ | 3,382,553,619 | $ | 1,294,038,572 | $ | 2,398,550,011 | $ | 3,035,331,316 | ||||||||
Shares outstandingc | 91,800,000 | 126,300,000 | 57,100,000 | 277,400,000 | ||||||||||||
Net asset value per share | $ | 36.85 | $ | 10.25 | $ | 42.01 | $ | 10.94 | ||||||||
| a | Securities on loan with values of $144,320,340, $251,851,928, $207,139,504 and $–, respectively. See Note 5. |
| b | Cost of foreign currencies: $6,214,235, $5,827,965, $– and $2,139,581, respectively. |
| c | $0.001 par value, number of shares authorized: 1 billion, 300 million, 200 million and 400 million, respectively. |
See notes to financial statements.
| FINANCIAL STATEMENTS | 63 |
Table of Contents
Statements of Assets and Liabilities (Continued)
iSHARES®, INC.
August 31, 2009
| iShares MSCI | ||||
| Thailand Investable Market Index Fund | ||||
ASSETS | ||||
Investments, at cost: | ||||
Unaffiliated issuers | $ | 93,673,833 | ||
Affiliated issuers (Note 2) | 133,091 | |||
Total cost of investments | $ | 93,806,924 | ||
Investments in securities, at fair value (Note 1): | ||||
Unaffiliated issuers | $ | 93,433,212 | ||
Affiliated issuers (Note 2) | 133,091 | |||
Total fair value of investments | 93,566,303 | |||
Foreign currency, at valuea | 66,590 | |||
Receivables: | ||||
Dividends and interest | 433,747 | |||
Interest from affiliate (Note 2) | 205 | |||
Total Assets | 94,066,845 | |||
LIABILITIES | ||||
Payables: | ||||
Investment advisory fees (Note 2) | 45,969 | |||
Total Liabilities | 45,969 | |||
NET ASSETS | $ | 94,020,876 | ||
Net assets consist of: | ||||
Paid-in capital | $ | 99,443,846 | ||
Undistributed net investment income | 542,360 | |||
Accumulated net realized loss | (5,725,097 | ) | ||
Net unrealized depreciation on investments and translation of assets and liabilities in foreign currencies | (240,233 | ) | ||
NET ASSETS | $ | 94,020,876 | ||
Shares outstandingb | 2,550,000 | |||
Net asset value per share | $ | 36.87 | ||
| a | Cost of foreign currency: $66,483. |
| b | $0.001 par value, number of shares authorized: 200 million. |
See notes to financial statements.
| 64 | 2009 iSHARES ANNUAL REPORT TO SHAREHOLDERS |
Table of Contents
Statements of Operations
iSHARES®, INC.
Year Ended August 31, 2009
| iShares MSCI | ||||||||||||||||
Australia Index Fund | Hong Kong Index Fund | Japan Small Cap Index Fund | Malaysia Index Fund | |||||||||||||
NET INVESTMENT INCOME | ||||||||||||||||
Dividends from unaffiliated issuersa | $ | 42,932,950 | $ | 67,198,296 | $ | 569,362 | $ | 14,489,575 | ||||||||
Interest from affiliated issuers (Note 2) | 824 | 2,469 | 32 | 228 | ||||||||||||
Securities lending income from affiliated issuers (Note 2) | 179,862 | 636,758 | 15,463 | – | ||||||||||||
Interest from affiliate (Note 2) | 50,401 | 66,275 | 97 | 36,147 | ||||||||||||
Total investment income | 43,164,037 | 67,903,798 | 584,954 | 14,525,950 | ||||||||||||
EXPENSES | ||||||||||||||||
Investment advisory fees (Note 2) | 4,365,698 | 7,779,500 | 151,508 | 2,012,558 | ||||||||||||
Total expenses | 4,365,698 | 7,779,500 | 151,508 | 2,012,558 | ||||||||||||
Net investment income | 38,798,339 | 60,124,298 | 433,446 | 12,513,392 | ||||||||||||
NET REALIZED AND UNREALIZED GAIN (LOSS) | ||||||||||||||||
Net realized gain (loss) from: | ||||||||||||||||
Investments in unaffiliated issuers | (159,386,832 | ) | (150,159,397 | ) | (599,655 | ) | (15,963,255 | ) | ||||||||
In-kind redemptions | (42,535,915 | ) | 15,542,407 | (1,171,691 | ) | – | ||||||||||
Foreign currency transactions | (895,538 | ) | 54,003 | 35,492 | 9,547 | |||||||||||
Net realized loss | (202,818,285 | ) | (134,562,987 | ) | (1,735,854 | ) | (15,953,708 | ) | ||||||||
Net change in unrealized appreciation (depreciation) on: | ||||||||||||||||
Investments | 205,318,167 | (10,344,904 | ) | 2,188,324 | 36,845,989 | |||||||||||
Translation of assets and liabilities in foreign currencies | 343,159 | (2,722 | ) | 1,977 | 39,997 | |||||||||||
Net change in unrealized appreciation (depreciation) | 205,661,326 | (10,347,626 | ) | 2,190,301 | 36,885,986 | |||||||||||
Net realized and unrealized gain (loss) | 2,843,041 | (144,910,613 | ) | 454,447 | 20,932,278 | |||||||||||
NET INCREASE (DECREASE) IN NET ASSETS RESULTING FROM OPERATIONS | $ | 41,641,380 | $ | (84,786,315 | ) | $ | 887,893 | $ | 33,445,670 | |||||||
| a | Net of foreign withholding tax of $540,557, $–, $42,273 and $–, respectively. |
See notes to financial statements.
| FINANCIAL STATEMENTS | 65 |
Table of Contents
Statements of Operations (Continued)
iSHARES®, INC.
Year Ended August 31, 2009
| iShares MSCI | ||||||||||||||||
| Pacific ex-Japan Index Fund | Singapore Index Fund | South Korea Index Fund | Taiwan Index Fund | |||||||||||||
NET INVESTMENT INCOME | ||||||||||||||||
Dividends from unaffiliated issuersa | $ | 120,673,687 | $ | 40,555,433 | $ | 20,038,303 | $ | 78,175,064 | ||||||||
Interest from unaffiliated issuers | – | – | 16,890 | 3,110 | ||||||||||||
Interest from affiliated issuers (Note 2) | 3,745 | 1,238 | 6,401 | 15,920 | ||||||||||||
Securities lending income from affiliated issuers (Note 2) | 1,073,117 | 921,370 | 3,878,123 | – | ||||||||||||
Interest from affiliate (Note 2) | 114,680 | 56,182 | 118,949 | 137,794 | ||||||||||||
Total investment income | 121,865,229 | 41,534,223 | 24,058,666 | 78,331,888 | ||||||||||||
EXPENSES | ||||||||||||||||
Investment advisory fees (Note 2) | 11,437,463 | 5,088,402 | 10,039,046 | 12,738,136 | ||||||||||||
Foreign taxes (Note 1) | – | – | 5,555 | 3,315,900 | ||||||||||||
Total expenses | 11,437,463 | 5,088,402 | 10,044,601 | 16,054,036 | ||||||||||||
Net investment income | 110,427,766 | 36,445,821 | 14,014,065 | 62,277,852 | ||||||||||||
NET REALIZED AND UNREALIZED GAIN (LOSS) | ||||||||||||||||
Net realized gain (loss) from: | ||||||||||||||||
Investments in unaffiliated issuers | (268,299,190 | ) | (196,109,858 | ) | (685,942,723 | ) | (679,893,183 | ) | ||||||||
In-kind redemptions | 51,310,571 | (81,796,758 | ) | – | – | |||||||||||
Foreign currency transactions | (2,270,354 | ) | (552,715 | ) | (1,329,556 | ) | (1,421,575 | ) | ||||||||
Net realized loss | (219,258,973 | ) | (278,459,331 | ) | (687,272,279 | ) | (681,314,758 | ) | ||||||||
Net change in unrealized appreciation (depreciation) on: | ||||||||||||||||
Investments | (61,871,135 | ) | 61,379,043 | 558,389,314 | 178,866,744 | |||||||||||
Translation of assets and liabilities in foreign currencies | 616,123 | 16,559 | (56,216 | ) | 368,592 | |||||||||||
Net change in unrealized appreciation (depreciation) | (61,255,012 | ) | 61,395,602 | 558,333,098 | 179,235,336 | |||||||||||
Net realized and unrealized loss | (280,513,985 | ) | (217,063,729 | ) | (128,939,181 | ) | (502,079,422 | ) | ||||||||
NET DECREASE IN NET ASSETS RESULTING FROM OPERATIONS | $ | (170,086,219 | ) | $ | (180,617,908 | ) | $ | (114,925,116 | ) | $ | (439,801,570 | ) | ||||
| a | Net of foreign withholding tax of $1,220,964, $–, $3,433,839 and $19,010,732, respectively. |
See notes to financial statements.
| 66 | 2009 iSHARES ANNUAL REPORT TO SHAREHOLDERS |
Table of Contents
Statements of Operations (Continued)
iSHARES®, INC.
Year Ended August 31, 2009
| iShares MSCI | ||||
| Thailand Investable Market Index Fund | ||||
NET INVESTMENT INCOME | ||||
Dividends from unaffiliated issuersa | $ | 1,842,514 | ||
Interest from affiliated issuers (Note 2) | 287 | |||
Interest from affiliate (Note 2) | 205 | |||
Total investment income | 1,843,006 | |||
EXPENSES | ||||
Investment advisory fees (Note 2) | 257,410 | |||
Total expenses | 257,410 | |||
Net investment income | 1,585,596 | |||
NET REALIZED AND UNREALIZED GAIN (LOSS) | ||||
Net realized gain (loss) from: | ||||
Investments in unaffiliated issuers | (6,172,312 | ) | ||
In-kind redemptions | (12,561,586 | ) | ||
Foreign currency transactions | 12,085 | |||
Net realized loss | (18,721,813 | ) | ||
Net change in unrealized appreciation (depreciation) on: | ||||
Investments | 20,812,203 | |||
Translation of assets and liabilities in foreign currencies | 3,412 | |||
Net change in unrealized appreciation (depreciation) | 20,815,615 | |||
Net realized and unrealized gain | 2,093,802 | |||
NET INCREASE IN NET ASSETS RESULTING FROM OPERATIONS | $ | 3,679,398 | ||
| a | Net of foreign withholding tax of $204,655. |
See notes to financial statements.
| FINANCIAL STATEMENTS | 67 |
Table of Contents
Statements of Changes in Net Assets
iSHARES®, INC.
| iShares MSCI Australia Index Fund | iShares MSCI Hong Kong Index Fund | |||||||||||||||
| Year ended August 31, 2009 | Year ended August 31, 2008 | Year ended August 31, 2009 | Year ended August 31, 2008 | |||||||||||||
INCREASE (DECREASE) IN NET ASSETS | ||||||||||||||||
OPERATIONS: | ||||||||||||||||
Net investment income | $ | 38,798,339 | $ | 53,814,337 | $ | 60,124,298 | $ | 50,723,883 | ||||||||
Net realized gain (loss) | (202,818,285 | ) | 153,528,689 | (134,562,987 | ) | 231,716,450 | ||||||||||
Net change in unrealized appreciation (depreciation) | 205,661,326 | (365,807,308 | ) | (10,347,626 | ) | (582,947,008 | ) | |||||||||
Net increase (decrease) in net assets resulting from operations | 41,641,380 | (158,464,282 | ) | (84,786,315 | ) | (300,506,675 | ) | |||||||||
DISTRIBUTIONS TO SHAREHOLDERS: | ||||||||||||||||
From net investment income | (36,574,071 | ) | (81,749,137 | ) | (63,227,759 | ) | (69,181,586 | ) | ||||||||
Total distributions to shareholders | (36,574,071 | ) | (81,749,137 | ) | (63,227,759 | ) | (69,181,586 | ) | ||||||||
CAPITAL SHARE TRANSACTIONS: | ||||||||||||||||
Proceeds from shares sold | 845,682,054 | 709,635,261 | 788,711,422 | 1,671,011,829 | ||||||||||||
Cost of shares redeemed | (316,165,212 | ) | (874,442,072 | ) | (364,104,881 | ) | (1,071,448,062 | ) | ||||||||
Net increase (decrease) in net assets from capital share transactions | 529,516,842 | (164,806,811 | ) | 424,606,541 | 599,563,767 | |||||||||||
INCREASE (DECREASE) IN NET ASSETS | 534,584,151 | (405,020,230 | ) | 276,592,467 | 229,875,506 | |||||||||||
NET ASSETS | ||||||||||||||||
Beginning of year | 1,059,092,246 | 1,464,112,476 | 1,675,184,398 | 1,445,308,892 | ||||||||||||
End of year | $ | 1,593,676,397 | $ | 1,059,092,246 | $ | 1,951,776,865 | $ | 1,675,184,398 | ||||||||
Undistributed net investment income included in net assets at end of year | $ | 12,740,394 | $ | 9,698,082 | $ | 4,275,742 | $ | 6,974,052 | ||||||||
SHARES ISSUED AND REDEEMED | ||||||||||||||||
Shares sold | 53,800,000 | 23,200,000 | 61,575,000 | 82,050,000 | ||||||||||||
Shares redeemed | (19,600,000 | ) | (32,000,000 | ) | (31,425,000 | ) | (55,500,000 | ) | ||||||||
Net increase (decrease) in shares outstanding | 34,200,000 | (8,800,000 | ) | 30,150,000 | 26,550,000 | |||||||||||
See notes to financial statements.
| 68 | 2009 iSHARES ANNUAL REPORT TO SHAREHOLDERS |
Table of Contents
Statements of Changes in Net Assets (Continued)
iSHARES®, INC.
| iShares MSCI Japan Small Cap Index Fund | iShares MSCI Malaysia Index Fund | |||||||||||||||
Year ended August 31, 2009 | Period from December 20, 2007a | Year ended August 31, 2009 | Year ended August 31, 2008 | |||||||||||||
INCREASE (DECREASE) IN NET ASSETS | ||||||||||||||||
OPERATIONS: | ||||||||||||||||
Net investment income | $ | 433,446 | $ | 91,139 | $ | 12,513,392 | $ | 27,165,781 | ||||||||
Net realized loss | (1,735,854 | ) | (107,449 | ) | (15,953,708 | ) | (42,591,881 | ) | ||||||||
Net change in unrealized appreciation (depreciation) | 2,190,301 | (1,996,482 | ) | 36,885,986 | (98,392,878 | ) | ||||||||||
Net increase (decrease) in net assets resulting from operations | 887,893 | (2,012,792 | ) | 33,445,670 | (113,818,978 | ) | ||||||||||
DISTRIBUTIONS TO SHAREHOLDERS: | ||||||||||||||||
From net investment income | (458,327 | ) | (56,942 | ) | (12,659,798 | ) | (46,957,845 | ) | ||||||||
Total distributions to shareholders | (458,327 | ) | (56,942 | ) | (12,659,798 | ) | (46,957,845 | ) | ||||||||
CAPITAL SHARE TRANSACTIONS: | ||||||||||||||||
Proceeds from shares sold | 14,997,836 | 36,663,666 | 162,777,082 | 714,281,254 | ||||||||||||
Cost of shares redeemed | (14,465,148 | ) | – | (143,654,071 | ) | (821,853,186 | ) | |||||||||
Net increase (decrease) in net assets from capital share transactions | 532,688 | 36,663,666 | 19,123,011 | (107,571,932 | ) | |||||||||||
INCREASE (DECREASE) IN NET ASSETS | 962,254 | 34,593,932 | 39,908,883 | (268,348,755 | ) | |||||||||||
NET ASSETS | ||||||||||||||||
Beginning of period | 34,593,932 | – | 473,090,766 | 741,439,521 | ||||||||||||
End of period | $ | 35,556,186 | $ | 34,593,932 | $ | 512,999,649 | $ | 473,090,766 | ||||||||
Undistributed net investment income included in net assets at end of period | $ | 73,258 | $ | 29,166 | $ | 1,906,004 | $ | 1,897,270 | ||||||||
SHARES ISSUED AND REDEEMED | ||||||||||||||||
Shares sold | 400,000 | 800,000 | 19,725,000 | 56,250,000 | ||||||||||||
Shares redeemed | (400,000 | ) | – | (17,700,000 | ) | (73,425,000 | ) | |||||||||
Net increase (decrease) in shares outstanding | – | 800,000 | 2,025,000 | (17,175,000 | ) | |||||||||||
| a | Commencement of operations. |
See notes to financial statements.
| FINANCIAL STATEMENTS | 69 |
Table of Contents
Statements of Changes in Net Assets (Continued)
iSHARES®, INC.
| iShares MSCI Pacific ex-Japan Index Fund | iShares MSCI Singapore Index Fund | |||||||||||||||
| Year ended August 31, 2009 | Year ended August 31, 2008 | Year ended August 31, 2009 | Year ended August 31, 2008 | |||||||||||||
INCREASE (DECREASE) IN NET ASSETS | ||||||||||||||||
OPERATIONS: | ||||||||||||||||
Net investment income | $ | 110,427,766 | $ | 128,526,593 | $ | 36,445,821 | $ | 65,504,376 | ||||||||
Net realized gain (loss) | (219,258,973 | ) | 102,089,773 | (278,459,331 | ) | 132,846,334 | ||||||||||
Net change in unrealized appreciation (depreciation) | (61,255,012 | ) | (653,824,213 | ) | 61,395,602 | (410,162,165 | ) | |||||||||
Net decrease in net assets resulting from operations | (170,086,219 | ) | (423,207,847 | ) | (180,617,908 | ) | (211,811,455 | ) | ||||||||
DISTRIBUTIONS TO SHAREHOLDERS: | ||||||||||||||||
From net investment income | (89,338,841 | ) | (199,385,029 | ) | (40,706,510 | ) | (95,160,270 | ) | ||||||||
From net realized gain | – | (4,628,288 | ) | – | – | |||||||||||
Total distributions to shareholders | (89,338,841 | ) | (204,013,317 | ) | (40,706,510 | ) | (95,160,270 | ) | ||||||||
CAPITAL SHARE TRANSACTIONS: | ||||||||||||||||
Proceeds from shares sold | 606,264,055 | 726,432,412 | 368,595,441 | 810,998,513 | ||||||||||||
Cost of shares redeemed | (228,256,529 | ) | (371,535,398 | ) | (330,200,942 | ) | (696,268,481 | ) | ||||||||
Net increase in net assets from capital share transactions | 378,007,526 | 354,897,014 | 38,394,499 | 114,730,032 | ||||||||||||
INCREASE (DECREASE) IN NET ASSETS | 118,582,466 | (272,324,150 | ) | (182,929,919 | ) | (192,241,693 | ) | |||||||||
NET ASSETS | ||||||||||||||||
Beginning of year | 3,263,971,153 | 3,536,295,303 | 1,476,968,491 | 1,669,210,184 | ||||||||||||
End of year | $ | 3,382,553,619 | $ | 3,263,971,153 | $ | 1,294,038,572 | $ | 1,476,968,491 | ||||||||
Undistributed (distributions in excess of) net investment income included in net assets at end of year | $ | 12,221,049 | $ | (11,255,053 | ) | $ | 14,645,717 | $ | 19,330,971 | |||||||
SHARES ISSUED AND REDEEMED | ||||||||||||||||
Shares sold | 20,400,000 | 13,800,000 | 41,900,000 | 58,500,000 | ||||||||||||
Shares redeemed | (7,500,000 | ) | (8,100,000 | ) | (44,700,000 | ) | (55,100,000 | ) | ||||||||
Net increase (decrease) in shares outstanding | 12,900,000 | 5,700,000 | (2,800,000 | ) | 3,400,000 | |||||||||||
See notes to financial statements.
| 70 | 2009 iSHARES ANNUAL REPORT TO SHAREHOLDERS |
Table of Contents
Statements of Changes in Net Assets (Continued)
iSHARES®, INC.
| iShares MSCI South Korea Index Fund | iShares MSCI Taiwan Index Fund | |||||||||||||||
Year ended August 31, 2009 | Year ended August 31, 2008 | Year ended August 31, 2009 | Year ended August 31, 2008 | |||||||||||||
INCREASE (DECREASE) IN NET ASSETS | ||||||||||||||||
OPERATIONS: | ||||||||||||||||
Net investment income | $ | 14,014,065 | $ | 40,026,865 | $ | 62,277,852 | $ | 111,484,150 | ||||||||
Net realized loss | (687,272,279 | ) | (254,209,320 | ) | (681,314,758 | ) | (187,544,546 | ) | ||||||||
Net change in unrealized appreciation (depreciation) | 558,333,098 | (859,380,138 | ) | 179,235,336 | (549,162,768 | ) | ||||||||||
Net decrease in net assets resulting from operations | (114,925,116 | ) | (1,073,562,593 | ) | (439,801,570 | ) | (625,223,164 | ) | ||||||||
DISTRIBUTIONS TO SHAREHOLDERS: | ||||||||||||||||
From net investment income | (19,134,761 | ) | (49,844,649 | ) | (105,890,576 | ) | (68,184,922 | ) | ||||||||
Total distributions to shareholders | (19,134,761 | ) | (49,844,649 | ) | (105,890,576 | ) | (68,184,922 | ) | ||||||||
CAPITAL SHARE TRANSACTIONS: | ||||||||||||||||
Proceeds from shares sold | 1,407,195,537 | 1,462,000,429 | 1,421,796,026 | 1,558,478,632 | ||||||||||||
Cost of shares redeemed | (860,348,791 | ) | (782,282,834 | ) | (758,780,360 | ) | (716,827,104 | ) | ||||||||
Net increase in net assets from capital share transactions | 546,846,746 | 679,717,595 | 663,015,666 | 841,651,528 | ||||||||||||
INCREASE (DECREASE) IN NET ASSETS | 412,786,869 | (443,689,647 | ) | 117,323,520 | 148,243,442 | |||||||||||
NET ASSETS | ||||||||||||||||
Beginning of year | 1,985,763,142 | 2,429,452,789 | 2,918,007,796 | 2,769,764,354 | ||||||||||||
End of year | $ | 2,398,550,011 | $ | 1,985,763,142 | $ | 3,035,331,316 | $ | 2,918,007,796 | ||||||||
Undistributed (distributions in excess of) net investment income included in net assets at end of year | $ | (1,028,101 | ) | $ | 5,324,787 | $ | 55,542,497 | $ | 100,550,924 | |||||||
SHARES ISSUED AND REDEEMED | ||||||||||||||||
Shares sold | 43,400,000 | 21,550,000 | 140,800,000 | 98,600,000 | ||||||||||||
Shares redeemed | (31,900,000 | ) | (14,150,000 | ) | (85,600,000 | ) | (49,600,000 | ) | ||||||||
Net increase in shares outstanding | 11,500,000 | 7,400,000 | 55,200,000 | 49,000,000 | ||||||||||||
See notes to financial statements.
| FINANCIAL STATEMENTS | 71 |
Table of Contents
Statements of Changes in Net Assets (Continued)
iSHARES®, INC.
| iShares MSCI Thailand Investable Market Index Fund | ||||||||
| Year ended August 31, 2009 | Period from March 26, 2008a to | |||||||
INCREASE (DECREASE) IN NET ASSETS | ||||||||
OPERATIONS: | ||||||||
Net investment income | $ | 1,585,596 | $ | 412,262 | ||||
Net realized loss | (18,721,813 | ) | (7,034,262 | ) | ||||
Net change in unrealized appreciation (depreciation) | 20,815,615 | (21,055,848 | ) | |||||
Net increase (decrease) in net assets resulting from operations | 3,679,398 | (27,677,848 | ) | |||||
DISTRIBUTIONS TO SHAREHOLDERS: | ||||||||
From net investment income | (1,466,522 | ) | – | |||||
Total distributions to shareholders | (1,466,522 | ) | – | |||||
CAPITAL SHARE TRANSACTIONS: | ||||||||
Proceeds from shares sold | 57,023,862 | 147,211,231 | ||||||
Cost of shares redeemed | (23,464,139 | ) | (61,285,106 | ) | ||||
Net increase in net assets from capital share transactions | 33,559,723 | 85,926,125 | ||||||
INCREASE IN NET ASSETS | 35,772,599 | 58,248,277 | ||||||
NET ASSETS | ||||||||
Beginning of period | 58,248,277 | – | ||||||
End of period | $ | 94,020,876 | $ | 58,248,277 | ||||
Undistributed net investment income included in net assets at end of period | $ | 542,360 | $ | 411,201 | ||||
SHARES ISSUED AND REDEEMED | ||||||||
Shares sold | 1,900,000 | 2,900,000 | ||||||
Shares redeemed | (850,000 | ) | (1,400,000 | ) | ||||
Net increase in shares outstanding | 1,050,000 | 1,500,000 | ||||||
| a | Commencement of operations. |
See notes to financial statements.
| 72 | 2009 iSHARES ANNUAL REPORT TO SHAREHOLDERS |
Table of Contents
iSHARES®, INC.
(For a share outstanding throughout each period)
| iShares MSCI Australia Index Fund | ||||||||||||||||||||
| Year ended Aug. 31, 2009 | Year ended Aug. 31, 2008 | Year ended Aug. 31, 2007 | Year ended Aug. 31, 2006 | Year ended Aug. 31, 2005 | ||||||||||||||||
Net asset value, beginning of year | $ | 23.96 | $ | 27.62 | $ | 21.59 | $ | 18.28 | $ | 13.56 | ||||||||||
Income from investment operations: | ||||||||||||||||||||
Net investment incomea | 0.78 | 0.96 | 0.89 | 0.75 | 0.70 | |||||||||||||||
Net realized and unrealized gain (loss)b | (3.47 | ) | (3.34 | ) | 6.24 | 3.23 | 4.60 | |||||||||||||
Total from investment operations | (2.69 | ) | (2.38 | ) | 7.13 | 3.98 | 5.30 | |||||||||||||
Less distributions from: | ||||||||||||||||||||
Net investment income | (0.94 | ) | (1.28 | ) | (1.10 | ) | (0.67 | ) | (0.58 | ) | ||||||||||
Total distributions | (0.94 | ) | (1.28 | ) | (1.10 | ) | (0.67 | ) | (0.58 | ) | ||||||||||
Net asset value, end of year | $ | 20.33 | $ | 23.96 | $ | 27.62 | $ | 21.59 | $ | 18.28 | ||||||||||
Total return | (8.91 | )% | (9.25 | )% | 33.97 | % | 22.35 | % | 39.58 | % | ||||||||||
Ratios/Supplemental data: | ||||||||||||||||||||
Net assets, end of year (000s) | $ | 1,593,676 | $ | 1,059,092 | $ | 1,464,112 | $ | 686,407 | $ | 369,355 | ||||||||||
Ratio of expenses to average net assets | 0.55 | % | 0.52 | % | 0.51 | % | 0.54 | % | 0.57 | % | ||||||||||
Ratio of net investment income to average net assets | 4.92 | % | 3.38 | % | 3.46 | % | 3.75 | % | 4.13 | % | ||||||||||
Portfolio turnover ratec | 14 | % | 10 | % | 10 | % | 7 | % | 17 | % | ||||||||||
| a | Based on average shares outstanding throughout each period. |
| b | The amounts reported may not accord with the change in aggregate gains and losses in securities due to the timing of capital share transactions. |
| c | Portfolio turnover rates exclude portfolio securities received or delivered as a result of processing capital share transactions in Creation Units. |
See notes to financial statements.
| FINANCIAL HIGHLIGHTS | 73 |
Table of Contents
Financial Highlights (Continued)
iSHARES®, INC.
(For a share outstanding throughout each period)
| iShares MSCI Hong Kong Index Fund | ||||||||||||||||||||
| Year ended Aug. 31, 2009 | Year ended Aug. 31, 2008 | Year ended Aug. 31, 2007 | Year ended Aug. 31, 2006 | Year ended Aug. 31, 2005 | ||||||||||||||||
Net asset value, beginning of year | $ | 15.87 | $ | 18.30 | $ | 14.20 | $ | 13.01 | $ | 10.91 | ||||||||||
Income from investment operations: | ||||||||||||||||||||
Net investment incomea | 0.52 | 0.45 | 0.47 | 0.38 | 0.33 | |||||||||||||||
Net realized and unrealized gain (loss)b | (1.46 | ) | (2.25 | ) | 3.94 | 1.17 | 2.04 | |||||||||||||
Total from investment operations | (0.94 | ) | (1.80 | ) | 4.41 | 1.55 | 2.37 | |||||||||||||
Less distributions from: | ||||||||||||||||||||
Net investment income | (0.54 | ) | (0.63 | ) | (0.31 | ) | (0.36 | ) | (0.27 | ) | ||||||||||
Total distributions | (0.54 | ) | (0.63 | ) | (0.31 | ) | (0.36 | ) | (0.27 | ) | ||||||||||
Net asset value, end of year | $ | 14.39 | $ | 15.87 | $ | 18.30 | $ | 14.20 | $ | 13.01 | ||||||||||
Total return | (4.77 | )% | (10.54 | )% | 31.44 | % | 12.20 | % | 21.96 | % | ||||||||||
Ratios/Supplemental data: | ||||||||||||||||||||
Net assets, end of year (000s) | $ | 1,951,777 | $ | 1,675,184 | $ | 1,445,309 | $ | 882,712 | $ | 637,985 | ||||||||||
Ratio of expenses to average net assets | 0.55 | % | 0.52 | % | 0.52 | % | 0.54 | % | 0.57 | % | ||||||||||
Ratio of net investment income to average net assets | 4.29 | % | 2.34 | % | 2.92 | % | 2.87 | % | 2.75 | % | ||||||||||
Portfolio turnover ratec | 9 | % | 17 | % | 9 | % | 10 | % | 6 | % | ||||||||||
| a | Based on average shares outstanding throughout each period. |
| b | The amounts reported may not accord with the change in aggregate gains and losses in securities due to the timing of capital share transactions. |
| c | Portfolio turnover rates exclude portfolio securities received or delivered as a result of processing capital share transactions in Creation Units. |
See notes to financial statements.
| 74 | 2009 iSHARES ANNUAL REPORT TO SHAREHOLDERS |
Table of Contents
Financial Highlights (Continued)
iSHARES®, INC.
(For a share outstanding throughout each period)
| iShares MSCI Japan Small Cap Index Fund | ||||||||
| Year ended Aug. 31, 2009 | Period from Dec. 20, 2007a to Aug. 31, 2008 | |||||||
Net asset value, beginning of period | $ | 43.24 | $ | 48.85 | ||||
Income from investment operations: | ||||||||
Net investment incomeb | 0.60 | 0.29 | ||||||
Net realized and unrealized gain (loss)c | 1.29 | (5.74 | ) | |||||
Total from investment operations | 1.89 | (5.45 | ) | |||||
Less distributions from: | ||||||||
Net investment income | (0.68 | ) | (0.16 | ) | ||||
Total distributions | (0.68 | ) | (0.16 | ) | ||||
Net asset value, end of period | $ | 44.45 | $ | 43.24 | ||||
Total return | 4.62 | % | (11.19 | )%d | ||||
Ratios/Supplemental data: | ||||||||
Net assets, end of period (000s) | $ | 35,556 | $ | 34,594 | ||||
Ratio of expenses to average net assetse | 0.56 | % | 0.53 | % | ||||
Ratio of net investment income to average net assetse | 1.59 | % | 0.93 | % | ||||
Portfolio turnover ratef | 7 | % | 7 | % | ||||
| a | Commencement of operations. |
| b | Based on average shares outstanding throughout each period. |
| c | The amounts reported may not accord with the change in aggregate gains and losses in securities due to the timing of capital share transactions. |
| d | Not annualized. |
| e | Annualized for periods of less than one year. |
| f | Portfolio turnover rates exclude portfolio securities received or delivered as a result of processing capital share transactions in Creation Units. |
See notes to financial statements.
| FINANCIAL HIGHLIGHTS | 75 |
Table of Contents
Financial Highlights (Continued)
iSHARES®, INC.
(For a share outstanding throughout each period)
| iShares MSCI Malaysia Index Fund | ||||||||||||||||||||
| Year ended Aug. 31, 2009 | Year ended Aug. 31, 2008 | Year ended Aug. 31, 2007 | Year ended Aug. 31, 2006 | Year ended Aug. 31, 2005 | ||||||||||||||||
Net asset value, beginning of year | $ | 9.39 | $ | 10.97 | $ | 7.75 | $ | 7.19 | $ | 6.54 | ||||||||||
Income from investment operations: | ||||||||||||||||||||
Net investment incomea | 0.28 | 0.34 | 0.34 | 0.26 | 0.20 | |||||||||||||||
Net realized and unrealized gain (loss)b | 0.40 | (1.31 | ) | 3.08 | 0.59 | 0.61 | ||||||||||||||
Total from investment operations | 0.68 | (0.97 | ) | 3.42 | 0.85 | 0.81 | ||||||||||||||
Less distributions from: | ||||||||||||||||||||
Net investment income | (0.28 | ) | (0.61 | ) | (0.20 | ) | (0.29 | ) | (0.16 | ) | ||||||||||
Total distributions | (0.28 | ) | (0.61 | ) | (0.20 | ) | (0.29 | ) | (0.16 | ) | ||||||||||
Net asset value, end of year | $ | 9.79 | $ | 9.39 | $ | 10.97 | $ | 7.75 | $ | 7.19 | ||||||||||
Total return | 8.00 | % | (9.86 | )% | 44.64 | % | 12.35 | % | 12.39 | % | ||||||||||
Ratios/Supplemental data: | ||||||||||||||||||||
Net assets, end of year (000s) | $ | 513,000 | $ | 473,091 | $ | 741,440 | $ | 374,334 | $ | 387,575 | ||||||||||
Ratio of expenses to average net assets | 0.56 | % | 0.52 | % | 0.51 | % | 0.54 | % | 0.57 | % | ||||||||||
Ratio of net investment income to average net assets | 3.45 | % | 2.84 | % | 3.21 | % | 3.46 | % | 2.85 | % | ||||||||||
Portfolio turnover ratec | 52 | % | 92 | % | 87 | % | 60 | % | 15 | % | ||||||||||
| a | Based on average shares outstanding throughout each period. |
| b | The amounts reported may not accord with the change in aggregate gains and losses in securities due to the timing of capital share transactions. |
| c | Portfolio turnover rates include portfolio transactions that are executed as a result of the Fund processing capital share transactions in Creation Units solely for cash in U.S. dollars. Excluding such transactions, the portfolio turnover rate for the years ended August 31, 2009, August 31, 2008, August 31, 2007, August 31, 2006 and August 31, 2005 would have been 12%, 16%, 3%, 9% and 9%, respectively. See Note 4. |
See notes to financial statements.
| 76 | 2009 iSHARES ANNUAL REPORT TO SHAREHOLDERS |
Table of Contents
Financial Highlights (Continued)
iSHARES®, INC.
(For a share outstanding throughout each period)
| iShares MSCI Pacific ex-Japan Index Fund | ||||||||||||||||||||
| Year ended Aug. 31, 2009 | Year ended Aug. 31, 2008a | Year ended Aug. 31, 2007a | Year ended Aug. 31, 2006a | Year ended Aug. 31, 2005a | ||||||||||||||||
Net asset value, beginning of year | $ | 41.37 | $ | 48.31 | $ | 37.34 | $ | 32.52 | $ | 25.24 | ||||||||||
Income from investment operations: | ||||||||||||||||||||
Net investment incomeb | 1.38 | 1.64 | 1.52 | 1.28 | 1.23 | |||||||||||||||
Net realized and unrealized gain (loss)c | (4.79 | ) | (6.01 | ) | 11.18 | 4.77 | 7.05 | |||||||||||||
Total from investment operations | (3.41 | ) | (4.37 | ) | 12.70 | 6.05 | 8.28 | |||||||||||||
Less distributions from: | ||||||||||||||||||||
Net investment income | (1.11 | ) | (2.51 | ) | (1.73 | ) | (1.23 | ) | (1.00 | ) | ||||||||||
Net realized gain | – | (0.06 | ) | – | – | – | ||||||||||||||
Total distributions | (1.11 | ) | (2.57 | ) | (1.73 | ) | (1.23 | ) | (1.00 | ) | ||||||||||
Net asset value, end of year | $ | 36.85 | $ | 41.37 | $ | 48.31 | $ | 37.34 | $ | 32.52 | ||||||||||
Total return | (7.23 | )% | (9.87 | )% | 34.86 | % | 19.17 | % | 33.27 | % | ||||||||||
Ratios/Supplemental data: | ||||||||||||||||||||
Net assets, end of year (000s) | $ | 3,382,554 | $ | 3,263,971 | $ | 3,536,295 | $ | 2,094,931 | $ | 1,522,107 | ||||||||||
Ratio of expenses to average net assets | 0.50 | % | 0.50 | % | 0.50 | % | 0.50 | % | 0.50 | % | ||||||||||
Ratio of net investment income to average net assets | 4.83 | % | 3.35 | % | 3.43 | % | 3.67 | % | 4.09 | % | ||||||||||
Portfolio turnover rated | 10 | % | 14 | % | 11 | % | 8 | % | 16 | % | ||||||||||
| a | Per share amounts were adjusted to reflect a three-for-one stock split effective July 24, 2008. |
| b | Based on average shares outstanding throughout each period. |
| c | The amounts reported may not accord with the change in aggregate gains and losses in securities due to the timing of capital share transactions. |
| d | Portfolio turnover rates exclude portfolio securities received or delivered as a result of processing capital share transactions in Creation Units. |
See notes to financial statements.
| FINANCIAL HIGHLIGHTS | 77 |
Table of Contents
Financial Highlights (Continued)
iSHARES®, INC.
(For a share outstanding throughout each period)
| iShares MSCI Singapore Index Fund | ||||||||||||||||||||
| Year ended Aug. 31, 2009 | Year ended Aug. 31, 2008 | Year ended Aug. 31, 2007 | Year ended Aug. 31, 2006 | Year ended Aug. 31, 2005 | ||||||||||||||||
Net asset value, beginning of year | $ | 11.44 | $ | 13.28 | $ | 9.11 | $ | 7.77 | $ | 6.52 | ||||||||||
Income from investment operations: | ||||||||||||||||||||
Net investment incomea | 0.32 | 0.47 | 0.47 | 0.40 | 0.38 | |||||||||||||||
Net realized and unrealized gain (loss)b | (1.16 | ) | (1.67 | ) | 4.01 | 1.23 | 1.15 | |||||||||||||
Total from investment operations | (0.84 | ) | (1.20 | ) | 4.48 | 1.63 | 1.53 | |||||||||||||
Less distributions from: | ||||||||||||||||||||
Net investment income | (0.35 | ) | (0.64 | ) | (0.31 | ) | (0.29 | ) | (0.28 | ) | ||||||||||
Total distributions | (0.35 | ) | (0.64 | ) | (0.31 | ) | (0.29 | ) | (0.28 | ) | ||||||||||
Net asset value, end of year | $ | 10.25 | $ | 11.44 | $ | 13.28 | $ | 9.11 | $ | 7.77 | ||||||||||
Total return | (5.87 | )% | (9.55 | )% | 49.92 | % | 21.61 | % | 24.06 | % | ||||||||||
Ratios/Supplemental data: | ||||||||||||||||||||
Net assets, end of year (000s) | $ | 1,294,039 | $ | 1,476,968 | $ | 1,669,210 | $ | 574,620 | $ | 341,137 | ||||||||||
Ratio of expenses to average net assets | 0.55 | % | 0.52 | % | 0.51 | % | 0.54 | % | 0.57 | % | ||||||||||
Ratio of net investment income to average net assets | 3.97 | % | 3.56 | % | 3.80 | % | 4.74 | % | 5.19 | % | ||||||||||
Portfolio turnover ratec | 15 | % | 16 | % | 8 | % | 6 | % | 8 | % | ||||||||||
| a | Based on average shares outstanding throughout each period. |
| b | The amounts reported may not accord with the change in aggregate gains and losses in securities due to the timing of capital share transactions. |
| c | Portfolio turnover rates exclude portfolio securities received or delivered as a result of processing capital share transactions in Creation Units. |
See notes to financial statements.
| 78 | 2009 iSHARES ANNUAL REPORT TO SHAREHOLDERS |
Table of Contents
Financial Highlights (Continued)
iSHARES®, INC.
(For a share outstanding throughout each period)
| iShares MSCI South Korea Index Fund | ||||||||||||||||||||
| Year ended Aug. 31, 2009 | Year ended Aug. 31, 2008 | Year ended Aug. 31, 2007 | Year ended Aug. 31, 2006 | Year ended Aug. 31, 2005 | ||||||||||||||||
Net asset value, beginning of year | $ | 43.55 | $ | 63.60 | $ | 46.00 | $ | 34.75 | $ | 24.17 | ||||||||||
Income from investment operations: | ||||||||||||||||||||
Net investment incomea | 0.30 | 0.80 | 0.51 | 0.31 | 0.46 | |||||||||||||||
Net realized and unrealized gain (loss)b | (1.45 | ) | (19.87 | ) | 17.42 | 11.20 | 10.22 | |||||||||||||
Total from investment operations | (1.15 | ) | (19.07 | ) | 17.93 | 11.51 | 10.68 | |||||||||||||
Less distributions from: | ||||||||||||||||||||
Net investment income | (0.39 | ) | (0.98 | ) | (0.33 | ) | (0.26 | ) | (0.10 | ) | ||||||||||
Total distributions | (0.39 | ) | (0.98 | ) | (0.33 | ) | (0.26 | ) | (0.10 | ) | ||||||||||
Net asset value, end of year | $ | 42.01 | $ | 43.55 | $ | 63.60 | $ | 46.00 | $ | 34.75 | ||||||||||
Total return | (2.31 | )% | (30.35 | )% | 39.18 | % | 33.16 | % | 44.29 | % | ||||||||||
Ratios/Supplemental data: | ||||||||||||||||||||
Net assets, end of year (000s) | $ | 2,398,550 | $ | 1,985,763 | $ | 2,429,453 | $ | 1,621,334 | $ | 698,455 | ||||||||||
Ratio of expenses to average net assets | 0.65 | % | 0.63 | % | 0.68 | % | 0.70 | % | 0.74 | % | ||||||||||
Ratio of expenses to average net assets exclusive of foreign taxes | 0.65 | % | 0.63 | % | 0.68 | % | 0.70 | % | 0.74 | % | ||||||||||
Ratio of net investment income to average net assets | 0.91 | % | 1.35 | % | 0.96 | % | 0.71 | % | 1.49 | % | ||||||||||
Portfolio turnover ratec | 62 | % | 42 | % | 20 | % | 47 | % | 30 | % | ||||||||||
| a | Based on average shares outstanding throughout each period. |
| b | The amounts reported may not accord with the change in aggregate gains and losses in securities due to the timing of capital share transactions. |
| c | Portfolio turnover rates include portfolio transactions that are executed as a result of the Fund processing capital share transactions in Creation Units solely for cash in U.S. dollars. Excluding such transactions, the portfolio turnover rate for the years ended August 31, 2009, August 31, 2008, August 31, 2007, August 31, 2006 and August 31, 2005 would have been 8%, 15%, 6%, 14% and 9%, respectively. See Note 4. |
See notes to financial statements.
| FINANCIAL HIGHLIGHTS | 79 |
Table of Contents
Financial Highlights (Continued)
iSHARES®, INC.
(For a share outstanding throughout each period)
| iShares MSCI Taiwan Index Fund | ||||||||||||||||||||
| Year ended Aug. 31, 2009 | Year ended Aug. 31, 2008 | Year ended Aug. 31, 2007 | Year ended Aug. 31, 2006 | Year ended Aug. 31, 2005 | ||||||||||||||||
Net asset value, beginning of year | $ | 13.13 | $ | 15.99 | $ | 12.57 | $ | 11.57 | $ | 10.66 | ||||||||||
Income from investment operations: | ||||||||||||||||||||
Net investment incomea | 0.30 | 0.54 | 0.38 | 0.34 | 0.27 | |||||||||||||||
Net realized and unrealized gain (loss)b | (1.89 | ) | (3.01 | ) | 3.34 | 0.80 | 0.72 | |||||||||||||
Total from investment operations | (1.59 | ) | (2.47 | ) | 3.72 | 1.14 | 0.99 | |||||||||||||
Less distributions from: | ||||||||||||||||||||
Net investment income | (0.60 | ) | (0.39 | ) | (0.30 | ) | (0.14 | ) | (0.08 | ) | ||||||||||
Total distributions | (0.60 | ) | (0.39 | ) | (0.30 | ) | (0.14 | ) | (0.08 | ) | ||||||||||
Net asset value, end of year | $ | 10.94 | $ | 13.13 | $ | 15.99 | $ | 12.57 | $ | 11.57 | ||||||||||
Total return | (9.67 | )% | (15.69 | )% | 29.91 | % | 9.84 | % | 9.28 | % | ||||||||||
Ratios/Supplemental data: | ||||||||||||||||||||
Net assets, end of year (000s) | $ | 3,035,331 | $ | 2,918,008 | $ | 2,769,764 | $ | 1,893,751 | $ | 752,640 | ||||||||||
Ratio of expenses to average net assets | 0.82 | % | 0.73 | % | 0.77 | % | 0.85 | % | 1.03 | % | ||||||||||
Ratio of expenses to average net assets exclusive of foreign taxes | 0.65 | % | 0.63 | % | 0.68 | % | 0.70 | % | 0.74 | % | ||||||||||
Ratio of net investment income to average net assets | 3.18 | % | 3.54 | % | 2.61 | % | 2.74 | % | 2.34 | % | ||||||||||
Portfolio turnover ratec | 52 | % | 33 | % | 35 | % | 29 | % | 20 | % | ||||||||||
| a | Based on average shares outstanding throughout each period. |
| b | The amounts reported may not accord with the change in aggregate gains and losses in securities due to the timing of capital share transactions. |
| c | Portfolio turnover rates include portfolio transactions that are executed as a result of the Fund processing capital share transactions in Creation Units solely for cash in U.S. dollars. Excluding such transactions, the portfolio turnover rate for the years ended August 31, 2009, August 31, 2008, August 31, 2007, August 31, 2006 and August 31, 2005 would have been 14%, 11%, 12%, 10% and 10%, respectively. See Note 4. |
See notes to financial statements.
| 80 | 2009 iSHARES ANNUAL REPORT TO SHAREHOLDERS |
Table of Contents
Financial Highlights (Continued)
iSHARES®, INC.
(For a share outstanding throughout each period)
| iShares MSCI Thailand Investable Market Index Fund | ||||||||
| Year��ended Aug. 31, 2009 | Period from Mar. 26, 2008a to Aug. 31, 2008 | |||||||
Net asset value, beginning of period | $ | 38.83 | $ | 50.03 | ||||
Income from investment operations: | ||||||||
Net investment incomeb | 1.17 | 0.32 | ||||||
Net realized and unrealized lossc | (1.88 | ) | (11.52 | ) | ||||
Total from investment operations | (0.71 | ) | (11.20 | ) | ||||
Less distributions from: | ||||||||
Net investment income | (1.25 | ) | – | |||||
Total distributions | (1.25 | ) | – | |||||
Net asset value, end of period | $ | 36.87 | $ | 38.83 | ||||
Total return | (0.33 | )% | (22.39 | )%d | ||||
Ratios/Supplemental data: | ||||||||
Net assets, end of period (000s) | $ | 94,021 | $ | 58,248 | ||||
Ratio of expenses to average net assetse | 0.65 | % | 0.63 | % | ||||
Ratio of net investment income to average net assetse | 4.00 | % | 1.68 | % | ||||
Portfolio turnover ratef | 15 | % | 19 | % | ||||
| a | Commencement of operations. |
| b | Based on average shares outstanding throughout each period. |
| c | The amounts reported may not accord with the change in aggregate gains and losses in securities due to the timing of capital share transactions. |
| d | Not annualized. |
| e | Annualized for periods of less than one year. |
| f | Portfolio turnover rates exclude portfolio securities received or delivered as a result of processing capital share transactions in Creation Units. |
See notes to financial statements.
| FINANCIAL HIGHLIGHTS | 81 |
Table of Contents
iSHARES®, INC.
iShares, Inc. (the “Company”) is registered under the Investment Company Act of 1940, as amended (the “1940 Act”), as an open-end management investment company. The Company was incorporated under the laws of the State of Maryland on September 1, 1994 pursuant to amended and restated Articles of Incorporation.
These financial statements relate only to the iShares MSCI Australia, iShares MSCI Hong Kong, iShares MSCI Japan Small Cap, iShares MSCI Malaysia, iShares MSCI Pacific ex-Japan, iShares MSCI Singapore, iShares MSCI South Korea, iShares MSCI Taiwan and iShares MSCI Thailand Investable Market Index Funds (each, a “Fund,” collectively, the “Funds”).
The investment objective of each Fund is to seek investment results that correspond generally to the price and yield performance, before fees and expenses, of publicly traded equity securities in the aggregate in a particular market, as measured by that market’s equity securities index compiled by MSCI Inc. (“MSCI”). The investment adviser uses a “passive” or index approach to achieve each Fund’s investment objective. Each of the Funds is classified as a non-diversified fund under the 1940 Act. Non-diversified funds generally hold securities of fewer companies than diversified funds and may be more susceptible to the risks associated with these particular companies, or to a single economic, political or regulatory occurrence affecting these companies.
Each Fund invests in the securities of foreign issuers, which may involve certain considerations and risks not typically associated with securities of U.S. issuers. Such risks include, but are not limited to: generally less liquid and less efficient securities markets; generally greater price volatility; exchange rate fluctuations and exchange controls; imposition of restrictions on the expatriation of funds or other assets of the Fund; less publicly available information about issuers; the imposition of withholding or other taxes; higher transaction and custody costs; settlement delays and risk of loss attendant in settlement procedures; difficulties in enforcing contractual obligations; less regulation of securities markets; different accounting, disclosure and reporting requirements; more substantial governmental involvement in the economy; higher inflation rates; greater social, economic and political uncertainties; the risk of nationalization or expropriation of assets and the risk of war.
Pursuant to the Company’s organizational documents, the Funds’ officers and directors are indemnified against certain liabilities that may arise out of the performance of their duties to the Funds. Additionally, in the normal course of business, the Funds enter into contracts with service providers that contain general indemnification clauses. The Funds’ maximum exposure under these arrangements is unknown as this would involve future claims that may be made against the Funds that have not yet occurred.
1. SIGNIFICANT ACCOUNTING POLICIES
The following significant accounting policies are consistently followed by the Company in the preparation of its financial statements in conformity with accounting principles generally accepted in the United States of America (“U.S. GAAP”). The preparation of financial statements in conformity with U.S. GAAP requires management to make certain estimates and assumptions that affect the reported amounts of assets and liabilities and disclosures of contingent assets and liabilities at the date of the financial statements and the reported amounts of revenue and expenses during the reporting period. Actual results could differ from those estimates.
SECURITY VALUATION
The securities and other assets of each Fund are valued pursuant to the pricing policy and procedures approved by the Board of Directors of the Company (the “Board”). Effective September 1, 2008, the Funds adopted Financial Accounting Standards Board (“FASB”) Statement of Financial Accounting Standards No. 157 (“FAS 157”), “Fair Value Measurements.” This standard establishes a fair value hierarchy that prioritizes the inputs to valuation techniques used to measure fair value into three broad levels. Inputs may be based on independent market data (“observable inputs”) or they may be internally developed (“unobservable inputs”). The hierarchy gives the highest priority to
| 82 | 2009 iSHARES ANNUAL REPORT TO SHAREHOLDERS |
Table of Contents
Notes to Financial Statements (Continued)
iSHARES®, INC.
unadjusted quoted prices in active markets for identical assets or liabilities (Level 1 measurements) and the lowest priority to unobservable inputs (Level 3 measurements). The three levels of the fair value hierarchy under FAS 157 are as follows:
| • | Level 1 – Inputs that reflect unadjusted quoted prices in active markets for identical assets or liabilities that the Fund has the ability to access at the measurement date (a “Level 1 Price”); |
| • | Level 2 – Inputs other than quoted prices included within Level 1 that are observable for the asset or liability either directly or indirectly, including quoted prices for similar assets or liabilities in active markets, quoted prices for identical or similar assets or liabilities in markets that are not considered to be active, inputs other than quoted prices that are observable for the asset or liability, and inputs that are derived principally from or corroborated by observable market data by correlation or other means (a “Level 2 Price”); |
| • | Level 3 – Inputs that are unobservable for the asset or liability (a “Level 3 Price”). |
The availability of observable inputs can vary from security to security and is affected by a wide variety of factors, including, for example, the type of security, whether the security is new and not yet established in the marketplace, the liquidity of markets, and other characteristics particular to the security. Inputs may include price information, volatility statistics, specific and broad credit data, liquidity statistics, and other factors. To the extent that valuation is based on models or inputs that are less observable or unobservable in the market, the determination of fair value requires more judgment. Accordingly, the degree of judgment exercised in determining fair value is greatest for instruments categorized in Level 3 of the fair value hierarchy.
The level of a value determined for a financial instrument within the fair value hierarchy is based on the lowest level of any input that is significant to the fair value measurement in its entirety. The categorization of a value determined for a financial instrument within the hierarchy is based upon the pricing transparency of the instrument and does not necessarily correspond to the Funds’ perceived risk of that instrument.
Investments whose values are based on quoted market prices in active markets, and whose values are therefore classified as Level 1 Prices, include active listed equities. The Funds do not adjust the quoted price for such instruments, even in situations where the Funds hold a large position and a sale could reasonably impact the quoted price.
Investments that trade in markets that are not considered to be active, but whose values are based on inputs such as quoted market prices, dealer quotations or valuations provided by alternative pricing sources supported by observable inputs are classified within Level 2. These generally include U.S. government and sovereign obligations, most government agency securities, investment-grade corporate bonds, certain mortgage products, less liquid listed equities, and state, municipal and provincial obligations. As Level 2 investments include positions that are not traded in active markets and/or are subject to transfer restrictions, valuations may be adjusted to reflect illiquidity and/or non-transferability, which are generally based on available market information.
Investments whose values are classified as Level 3 Prices have significant unobservable inputs, as they may trade infrequently or not at all. Investments whose values are classified as Level 3 Prices may include unlisted securities related to corporate actions, securities whose trading have been suspended or which have been de-listed from their primary trading exchange, less liquid corporate debt securities (including distressed debt instruments), collateralized debt obligations, and less liquid mortgage securities (backed by either commercial or residential real estate). When observable prices are not available for these securities, the Funds use one or more valuation techniques (e.g., the market approach or the income approach) for which sufficient and reliable data is available. Within Level 3 of the fair value hierarchy, the use of the market approach generally consists of using comparable market transactions, while the use of the income approach generally consists of the net present value of estimated future cash flows, adjusted as appropriate for liquidity, credit, market and/or other risk factors.
| NOTESTO FINANCIAL STATEMENTS | 83 |
Table of Contents
Notes to Financial Statements (Continued)
iSHARES®, INC.
The inputs used by the Funds in estimating the value of Level 3 Prices may include the original transaction price, recent transactions in the same or similar instruments, completed or pending third-party transactions in the underlying investment or comparable issuers, and changes in financial ratios or cash flows. Level 3 Prices may also be adjusted to reflect illiquidity and/or non-transferability, with the amount of such discount estimated by the Funds in the absence of market information. The fair value measurement of Level 3 Prices does not include transaction costs that may have been capitalized as part of the security’s cost basis. Assumptions used by the Funds due to the lack of observable inputs may significantly impact the resulting fair value and therefore the Funds’ results of operations.
Fair value pricing could result in a difference between the prices used to calculate a Fund’s net asset value and the prices used by the Fund’s underlying index, which in turn could result in a difference between the Fund’s performance and the performance of the Fund’s underlying index.
As of August 31, 2009, the values of each Fund’s investments were classified as Level 1 Prices. The breakdown of each Fund’s investments into major categories is disclosed in its respective Schedule of Investments.
SECURITY TRANSACTIONS AND INCOME RECOGNITION
Security transactions are accounted for on trade date. Dividend income is recognized on the ex-dividend date, net of any foreign taxes withheld at source, and interest income is accrued daily. Non-cash dividends received in the form of stock in an elective dividend, if any, are recorded as dividend income at fair value. Distributions received by the Funds may include a return of capital that is estimated by management. Such amounts are recorded as a reduction of the cost of investments or reclassified to capital gains. Realized gains and losses on investment transactions are determined using the specific identification method.
FOREIGN CURRENCY TRANSLATION
The accounting records of the Funds are maintained in U.S. dollars. Foreign currencies, as well as investment securities and other assets and liabilities denominated in foreign currencies are translated into U.S. dollars using exchange rates deemed appropriate by the investment adviser. Any use of a rate different from the rates used by MSCI may adversely affect a Fund’s ability to track its underlying index. Purchases and sales of securities, income receipts and expense payments are translated into U.S. dollars on the respective dates of such transactions.
Each Fund does not isolate the effect of fluctuations in foreign exchange rates from the effect of fluctuations in the market prices of securities. Such fluctuations are reflected by the Funds as a component of realized and unrealized gains and losses from investments for financial reporting purposes.
FOREIGN TAXES
The Funds may be subject to foreign taxes (a portion of which may be reclaimable) on income, corporate events, capital gains on investments or currency repatriation. All foreign taxes are recorded in accordance with the applicable foreign tax regulations and rates that exist in the foreign markets in which the Funds invest. These foreign taxes, if any, are paid by the Funds and are disclosed in their Statements of Operations. Foreign taxes payable as of August 31, 2009, if any, are reflected in the Funds’ Statements of Assets and Liabilities.
DISTRIBUTIONS TO SHAREHOLDERS
Distributions to shareholders from net investment income, if any, including any net foreign currency gains, are declared and distributed at least annually by each Fund. Distributions of net realized capital gains, if any, generally are declared and distributed once a year.
| 84 | 2009 iSHARES ANNUAL REPORT TO SHAREHOLDERS |
Table of Contents
Notes to Financial Statements (Continued)
iSHARES®, INC.
Distributions are determined on a tax basis and may differ from net investment income and net realized capital gains for financial reporting purposes. Dividends and distributions are paid in U.S. dollars and cannot be automatically reinvested in additional shares of the Funds.
As of August 31, 2009, the tax year-end of the Funds, the components of net distributable earnings (accumulated losses) on a tax basis were as follows:
| iShares MSCI Index Fund | Undistributed Ordinary Income | Unrealized Appreciation (Depreciation) | Capital and Other Losses | Net Distributable Earnings (Accumulated Losses) | |||||||||||
Australia | $ | 32,111,373 | $ | (85,005,882 | ) | $ | (54,496,266 | ) | $ | (107,390,775 | ) | ||||
Hong Kong | 6,689,574 | (399,411,566 | ) | (160,743,602 | ) | (553,465,594 | ) | ||||||||
Japan Small Cap | 262,682 | (41,743 | ) | (607,300 | ) | (386,361 | ) | ||||||||
Malaysia | 3,145,927 | 166,390,469 | (76,560,881 | ) | 92,975,515 | ||||||||||
Pacific ex-Japan | 38,045,763 | 94,997,735 | (174,256,054 | ) | (41,212,556 | ) | |||||||||
Singapore | 18,776,670 | (177,427,151 | ) | (158,657,751 | ) | (317,308,232 | ) | ||||||||
South Korea | 7,113,247 | 236,713,726 | (463,357,545 | ) | (219,530,572 | ) | |||||||||
Taiwan | 57,586,103 | 105,285,434 | (845,966,569 | ) | (683,095,032 | ) | |||||||||
Thailand Investable Market | 542,155 | (3,088,458 | ) | (2,876,872 | ) | (5,423,175 | ) | ||||||||
For the years ended August 31, 2009 and August 31, 2008, the tax characterization of distributions paid for each Fund was equal to the book characterization of distributions paid except for the iShares MSCI Pacific ex-Japan Index Fund. The tax character of distributions paid during the years ended August 31, 2009 and August 31, 2008 for the iShares MSCI Pacific ex-Japan Index Fund was as follows:
| 2009 | 2008 | |||||
Distributions paid from: | ||||||
Ordinary income | $ | 89,338,841 | $ | 199,397,032 | ||
Long-term capital gain | – | 4,616,285 | ||||
Total Distributions | $ | 89,338,841 | $ | 204,013,317 | ||
The total distributions and distributions per share are disclosed in the accompanying Statements of Changes in Net Assets and the Financial Highlights for all the Funds.
FEDERAL INCOME TAXES
Each Fund is treated as a separate entity for federal income tax purposes. It is the policy of each Fund to qualify as a regulated investment company by complying with the provisions applicable to regulated investment companies, as defined under Subchapter M of the Internal Revenue Code of 1986, as amended, and to annually distribute substantially all of its ordinary income and any net capital gains (taking into account any capital loss carryforwards) sufficient to relieve it from all, or substantially all, federal income and excise taxes. Accordingly, no provision for federal income taxes was required for the year ended August 31, 2009.
| NOTESTO FINANCIAL STATEMENTS | 85 |
Table of Contents
Notes to Financial Statements (Continued)
iSHARES®, INC.
From November 1, 2008 to August 31, 2009, the Funds incurred net realized capital losses. As permitted by tax regulations, these Funds have elected to defer those losses and treat them as arising in the year ending August 31, 2010, as follows:
| iShares MSCI Index Fund | Deferred Net Realized Capital Losses | ||
Australia | $ | 24,697,258 | |
Hong Kong | 114,356,249 | ||
Japan Small Cap | 475,582 | ||
Malaysia | 9,994,880 | ||
Pacific ex-Japan | 108,048,226 | ||
Singapore | 128,992,922 | ||
South Korea | 227,074,012 | ||
Taiwan | 364,046,657 | ||
Thailand Investable Market | 2,321,428 | ||
The Funds had tax basis net capital loss carryforwards as of August 31, 2009, the tax year-end of the Funds, as follows:
| iShares MSCI Index Fund | Expiring 2010 | Expiring 2011 | Expiring 2012 | Expiring 2013 | Expiring 2014 | Expiring 2015 | Expiring 2016 | Expiring 2017 | Total | ||||||||||||||||||
Australia | $ | 3,625,203 | $ | 650,082 | $ | 596,240 | $ | 384,424 | $ | – | $ | 7,066 | $ | 529,868 | $ | 24,006,125 | $ | 29,799,008 | |||||||||
Hong Kong | 4,971,970 | 2,870,602 | 2,330,414 | 468,716 | 425,440 | 2,899,247 | 3,185,408 | 29,235,556 | 46,387,353 | ||||||||||||||||||
Japan Small Cap | – | – | – | – | – | – | – | 131,718 | 131,718 | ||||||||||||||||||
Malaysia | 9,819,029 | 2,898,105 | 775,477 | 6,820,474 | 1,543,708 | 3,357,786 | 1,127,892 | 40,223,530 | 66,566,001 | ||||||||||||||||||
Pacific | – | – | – | – | – | – | – | 66,207,828 | 66,207,828 | ||||||||||||||||||
Singapore | 1,934,119 | 4,428,316 | 4,256,421 | 2,558,348 | – | – | 807,115 | 15,680,510 | 29,664,829 | ||||||||||||||||||
South Korea | 666,642 | 504,041 | 3,363,449 | 11,590,303 | 3,172,573 | 38,097,223 | – | 178,889,302 | 236,283,533 | ||||||||||||||||||
Taiwan | 12,532,361 | 8,689,663 | 9,129,874 | 12,022,719 | 14,435,986 | 64,999,586 | 16,734,578 | 343,375,145 | 481,919,912 | ||||||||||||||||||
Thailand Investable Market | – | – | – | – | – | – | – | 555,444 | 555,444 | ||||||||||||||||||
Net capital loss carryforwards may be applied against any net realized taxable gains in each succeeding year or until their respective expiration dates, whichever occurs first.
The Funds may own shares in certain foreign investment entities, referred to, under U.S. tax law, as “passive foreign investment companies.” The Funds may elect to mark-to-market annually the shares of each passive foreign investment company and would be required to distribute to shareholders any such marked-to-market gains.
Each Fund reclassifies at the end of its tax year certain amounts to paid-in-capital from accumulated net realized gain (loss) on investments and foreign currency transactions and accumulated net investment income (loss), respectively, as a result of permanent book and tax differences primarily attributed to net investment loss, return of capital, passive foreign investment companies, realized foreign currency gains and losses and gains and losses on in-kind redemptions. These reclassifications have no effect on net assets or net asset values per share.
| 86 | 2009 iSHARES ANNUAL REPORT TO SHAREHOLDERS |
Table of Contents
Notes to Financial Statements (Continued)
iSHARES®, INC.
As of August 31, 2009, gross unrealized appreciation and gross unrealized depreciation based on cost for federal income tax purposes were as follows:
| iShares MSCI Index Fund | Tax Cost | Gross Unrealized Appreciation | Gross Unrealized Depreciation | Net Unrealized Appreciation (Depreciation) | ||||||||||
Australia | $ | 1,668,160,154 | $ | – | $ | (85,175,995 | ) | $ | (85,175,995 | ) | ||||
Hong Kong | 2,439,461,446 | – | (399,411,772 | ) | (399,411,772 | ) | ||||||||
Japan Small Cap | 36,370,038 | 2,753,870 | (2,797,680 | ) | (43,810 | ) | ||||||||
Malaysia | 345,348,867 | 168,518,363 | (2,133,087 | ) | 166,385,276 | |||||||||
Pacific ex-Japan | 3,407,740,622 | 309,091,518 | (214,377,398 | ) | 94,714,120 | |||||||||
Singapore | 1,734,063,884 | – | (177,460,906 | ) | (177,460,906 | ) | ||||||||
South Korea | 2,381,581,216 | 261,244,577 | (24,530,715 | ) | 236,713,862 | |||||||||
Taiwan | 2,909,825,419 | 246,713,659 | (141,374,337 | ) | 105,339,322 | |||||||||
Thailand Investable Market | 96,655,149 | 2,193,446 | (5,282,292 | ) | (3,088,846 | ) | ||||||||
Management has reviewed the tax positions as of August 31, 2009, inclusive of the prior three open tax return years, and has determined that no provision for income tax is required in the Funds’ financial statements.
2. AGREEMENTS AND OTHER TRANSACTIONS WITH AFFILIATES
Pursuant to an Investment Advisory Agreement with the Company, Barclays Global Fund Advisors (“BGFA”) manages the investment of each Fund’s assets. BGFA is a California corporation indirectly owned by Barclays Bank PLC. Under the Investment Advisory Agreement, BGFA is responsible for all expenses (“Covered Expenses”) of the Company, including the cost of transfer agency, custody, fund administration, legal, audit and other services, except interest, taxes, brokerage commissions and other expenses connected with the execution of portfolio transactions, distribution fees and extraordinary expenses.
For its investment advisory services to the iShares MSCI Australia, iShares MSCI Hong Kong, iShares MSCI Japan Small Cap, iShares MSCI Malaysia and iShares MSCI Singapore Index Funds, BGFA is entitled to an annual investment advisory fee based on each Fund’s allocable portion of the aggregate of the average daily net assets of these Funds and certain other iShares Funds as follows:
| Investment Advisory Fee | Aggregate Average Daily Net Assets | |
| 0.59% | First $7 billion | |
| 0.54 | Over $7 billion, up to and including $11 billion | |
| 0.49 | Over $11 billion, up to and including $24 billion | |
| 0.44 | Over $24 billion, up to and including $48 billion | |
| 0.40 | Over $48 billion |
| NOTESTO FINANCIAL STATEMENTS | 87 |
Table of Contents
Notes to Financial Statements (Continued)
iSHARES®, INC.
For its investment advisory services to the iShares MSCI South Korea, iShares MSCI Taiwan and iShares MSCI Thailand Investable Market Index Funds, BGFA is entitled to an annual investment advisory fee based on each Fund’s allocable portion of the aggregate of the average daily net assets of these Funds and certain other iShares Funds as follows:
| Investment Advisory Fee | Aggregate Average Daily Net Assets | |
| 0.74% | First $2 billion | |
| 0.69 | Over $2 billion, up to and including $4 billion | |
| 0.64 | Over $4 billion, up to and including $8 billion | |
| 0.57 | Over $8 billion, up to and including $16 billion | |
| 0.51 | Over $16 billion |
For its investment advisory services to the iShares MSCI Pacific ex-Japan Index Fund, BGFA is entitled to an annual investment advisory fee of 0.50% of the average daily net assets of the Fund.
Under the terms of the Investment Advisory Agreement, the Funds are required to remit payment of accrued fees to BGFA on a quarterly basis. BGFA has determined that in certain cases such payments to BGFA by the Funds were made earlier than provided for under the Investment Advisory Agreement. BGFA will reimburse the Funds for interest that would have been earned had such payments been made on a quarterly basis. The amounts to be reimbursed are included under receivables and investment income as “Interest from affiliate” in the Statements of Assets and Liabilities and Statements of Operations, respectively. The reimbursements do not have a material effect on net asset value per share or the total return shown in the Financial Highlights.
State Street Bank and Trust Company (“State Street”) serves as administrator, custodian and transfer agent for the Company. As compensation for its services, State Street receives certain out-of-pocket costs, transaction fees and asset-based fees which are accrued daily and paid monthly. These fees and expenses are Covered Expenses as defined above.
SEI Investments Distribution Co. (“SEI”) serves as each Fund’s underwriter and distributor of the shares of each Fund, pursuant to a Distribution Agreement with the Company. SEI does not receive a fee from the Funds for its distribution services.
Pursuant to an exemptive order issued by the U.S. Securities and Exchange Commission (“SEC”), the Funds are permitted to lend portfolio securities to Barclays Capital Inc. (“BarCap”). Pursuant to the same exemptive order, Barclays Global Investors, N.A. (“BGI”) serves as securities lending agent for the Funds. BarCap and BGI are affiliates of BGFA, the Funds’ investment adviser. As securities lending agent, BGI receives, as fees, a share of the income earned on investment of the cash collateral received for the loan of securities. For the year ended August 31, 2009, BGI earned securities lending agent fees as follows:
| iShares MSCI Index Fund | Securities Lending Agent Fees | |
Australia | $ 179,862 | |
Hong Kong | 636,758 | |
Japan Small Cap | 15,463 | |
Pacific ex-Japan | 1,073,117 | |
Singapore | 921,370 | |
South Korea | 3,878,123 |
Cross trades for the year ended August 31, 2009, if any, were executed by the Funds pursuant to Rule 17a-7 under the 1940 Act. Cross trading is the buying or selling of portfolio securities between funds to which BGFA (or an affiliate) serves as investment adviser. At its regularly scheduled quarterly meetings, the Board reviews such transactions as of the most recent calendar quarter for compliance with the requirements and restrictions set forth by Rule 17a-7.
| 88 | 2009 iSHARES ANNUAL REPORT TO SHAREHOLDERS |
Table of Contents
Notes to Financial Statements (Continued)
iSHARES®, INC.
Each Fund may invest in certain money market funds managed by BGFA, the Funds’ investment adviser, including the Government Money Market Fund (“GMMF”), Institutional Money Market Fund (“IMMF”), Prime Money Market Fund (“PMMF”) and Treasury Money Market Fund (“TMMF”) of Barclays Global Investors Funds. These money market funds seek to achieve their investment objectives by investing in high-quality, short-term money market instruments that, at the time of investment, have remaining maturities of 397 calendar days or less from the date of acquisition. The GMMF, IMMF, PMMF and TMMF are feeder funds in a master/feeder fund structure that invest substantially all of their assets in the Government Money Market Master Portfolio, Money Market Master Portfolio, Prime Money Market Master Portfolio and Treasury Money Market Master Portfolio (collectively, the “Money Market Master Portfolios”), respectively, which are also managed by BGFA. While the GMMF, IMMF, PMMF and TMMF do not directly charge an investment advisory fee, the Money Market Master Portfolios in which they invest do charge an investment advisory fee. Income distributions from the GMMF, IMMF, PMMF and TMMF are declared daily and paid monthly from net investment income. Income distributions earned by the Funds from temporary cash investments are recorded as interest from affiliated issuers in the accompanying Statements of Operations. Income distributions earned by the Funds from the investment of securities lending collateral, if any, are included in securities lending income in the accompanying Statements of Operations.
Certain directors and officers of the Company are also officers of BGI and/or BGFA.
3. INVESTMENT PORTFOLIO TRANSACTIONS
Purchases and sales of investments (excluding in-kind transactions and short-term investments) for the year ended August 31, 2009, were as follows:
| iShares MSCI Index Fund | Purchases | Sales | ||||
Australia | $ | 114,315,659 | $ | 115,462,767 | ||
Hong Kong | 134,823,794 | 130,566,934 | ||||
Japan Small Cap | 1,906,564 | 1,933,327 | ||||
Malaysia | 212,826,713 | 192,392,499 | ||||
Pacific ex-Japan | 261,153,964 | 248,956,039 | ||||
Singapore | 147,654,916 | 154,328,615 | ||||
South Korea | 1,520,458,734 | 980,225,720 | ||||
Taiwan | 1,684,584,662 | 1,059,066,946 | ||||
Thailand Investable Market | 6,090,933 | 6,139,897 | ||||
In-kind transactions (see Note 4) for the year ended August 31, 2009, were as follows:
| iShares MSCI Index Fund | In-kind Purchases | In-kind Sales | ||||
Australia | $ | 837,006,545 | $ | 312,326,694 | ||
Hong Kong | 776,747,217 | 358,446,383 | ||||
Japan Small Cap | 14,868,622 | 14,313,131 | ||||
Pacific ex-Japan | 601,025,840 | 225,641,092 | ||||
Singapore | 362,202,138 | 321,817,318 | ||||
Thailand Investable Market | 56,813,208 | 23,278,846 | ||||
| NOTESTO FINANCIAL STATEMENTS | 89 |
Table of Contents
Notes to Financial Statements (Continued)
iSHARES®, INC.
4. CAPITAL SHARE TRANSACTIONS
The Company issues and redeems capital shares of each Fund only in aggregations of a specified number of shares (each, a “Creation Unit”) at net asset value. Except when aggregated in Creation Units, shares of each Fund are not redeemable. Transactions in capital shares for each Fund are disclosed in detail in the Statements of Changes in Net Assets.
The consideration for the purchase of Creation Units of a Fund generally consists of the in-kind deposit of a designated portfolio of equity securities, which constitutes an optimized representation of the corresponding MSCI Index and an amount of cash (except for the iShares MSCI Malaysia, iShares MSCI South Korea and iShares MSCI Taiwan Index Funds which are offered in Creation Units solely for cash in U.S. dollars). Investors purchasing and redeeming Creation Units pay a purchase transaction fee and a redemption transaction fee directly to State Street, the administrator, to offset transfer and other transaction costs associated with the issuance and redemption of Creation Units, including Creation Units for cash. Investors transacting in Creation Units for cash pay an additional variable charge to compensate the relevant Fund for brokerage and market impact expenses relating to investing in portfolio securities.
5. LOANS OF PORTFOLIO SECURITIES
Each Fund may lend its investment securities to approved borrowers, such as brokers, dealers and other financial institutions. The borrower pledges and maintains with the Fund collateral consisting of cash, an irrevocable letter of credit issued by a bank, or securities issued or guaranteed by the U.S. government. The initial collateral received by each Fund is required to have a value of at least 102% of the market value of the loaned securities for securities traded on U.S. exchanges and a value of at least 105% for all other securities. The collateral is maintained thereafter, at a value equal to at least 100% of the current market value of the securities on loan. The risks to the Funds of securities lending include the risk that the borrower may not provide additional collateral when required or may not return the securities when due. Any securities lending cash collateral may be reinvested in certain short-term instruments either directly on behalf of a Fund or through one or more joint accounts or money market funds, including those managed by BGFA; such reinvestments are subject to investment risk.
As of August 31, 2009, certain Funds had loaned securities which were collateralized by cash. The cash collateral received was invested in money market funds managed by BGFA. The market value of the securities on loan as of August 31, 2009 and the value of the related collateral are disclosed in the Statements of Assets and Liabilities. Securities lending income, as disclosed in the Funds’ Statements of Operations, represents the income earned from the investment of the cash collateral, net of rebates paid to, or fees paid by, borrowers and less the fees paid to BGI as securities lending agent.
6. BLACKROCK TRANSACTION
On June 16, 2009, Barclays PLC, the ultimate parent company of BGI and BGFA, accepted a binding offer and entered into an agreement to sell its interests in BGFA, BGI and certain affiliated companies, to BlackRock, Inc., (the “BlackRock Transaction”). The BlackRock Transaction is subject to certain regulatory approvals, as well as other conditions to closing.
Under the 1940 Act, completion of the BlackRock Transaction will cause the automatic termination of each Fund’s current investment advisory agreement with BGFA. In order for the management of each Fund to continue uninterrupted, the Board approved a new investment advisory agreement for each Fund subject to shareholder approval. A special meeting of shareholders of the Funds is scheduled to be held on November 4, 2009. Each shareholder of record as of the close of business on August 25, 2009 will receive notice of and be entitled to vote at the meeting.
7. REVIEW OF SUBSEQUENT EVENTS
In connection with the preparation of the financial statements of the Funds as of and for the year ended August 31, 2009, events and transactions through October 23, 2009, the date the financial statements are available to be issued, have been evaluated by the Funds’ management for possible adjustment and/or disclosure. No subsequent events requiring financial statement disclosure have been identified.
| 90 | 2009 iSHARES ANNUAL REPORT TO SHAREHOLDERS |
Table of Contents
Report of Independent Registered Public Accounting Firm
To the Shareholders and Board of Directors of
iShares, Inc.:
In our opinion, the accompanying statements of assets and liabilities, including the schedules of investments, and the related statements of operations and of changes in net assets and the financial highlights present fairly, in all material respects, the financial position of the iShares MSCI Australia Index Fund, iShares MSCI Hong Kong Index Fund, iShares MSCI Japan Small Cap Index Fund, iShares MSCI Malaysia Index Fund, iShares MSCI Pacific ex-Japan Index Fund, iShares MSCI Singapore Index Fund, iShares MSCI South Korea Index Fund, iShares MSCI Taiwan Index Fund and iShares MSCI Thailand Investable Market Index Fund, each a portfolio of the iShares MSCI Series (the “Funds”), at August 31, 2009, the results of each of their operations, the changes in each of their net assets and their financial highlights for each of the periods presented, in conformity with accounting principles generally accepted in the United States of America. These financial statements and financial highlights (hereafter referred to as “financial statements”) are the responsibility of the Funds’ management; our responsibility is to express an opinion on these financial statements based on our audits. We conducted our audits of these financial statements in accordance with the standards of the Public Company Accounting Oversight Board (United States). Those standards require that we plan and perform the audits to obtain reasonable assurance about whether the financial statements are free of material misstatement. An audit includes examining, on a test basis, evidence supporting the amounts and disclosures in the financial statements, assessing the accounting principles used and significant estimates made by management, and evaluating the overall financial statement presentation. We believe that our audits, which included confirmation of securities at August 31, 2009 by correspondence with the custodian, transfer agent and brokers, provide a reasonable basis for our opinion.
PricewaterhouseCoopers LLP
San Francisco, California
October 23, 2009
| REPORTOF INDEPENDENT REGISTERED PUBLIC ACCOUNTING FIRM | 91 |
Table of Contents
iSHARES®, INC.
For the fiscal year ended August 31, 2009, certain Funds earned foreign source income and paid foreign taxes which they intend to pass through to their shareholders pursuant to Section 853 of the Internal Revenue Code (the “Code”) as follows:
| iShares MSCI Index Fund | Foreign Source Income Earned | Foreign Taxes Paid | ||||
Australia | $ | 43,473,507 | $ | 538,879 | ||
Japan Small Cap | 611,635 | 42,043 | ||||
Pacific ex-Japan | 121,894,649 | 1,201,161 | ||||
South Korea | 23,472,142 | 3,220,543 | ||||
Taiwan | 97,185,797 | 22,307,164 | ||||
Thailand Investable Market | 2,047,168 | 202,173 | ||||
Under Section 854(b)(2) of the Code, certain Funds hereby designate the following maximum amounts as qualified dividend income for purposes of the maximum rate under Section 1(h)(11) of the Code for the fiscal year ended August 31, 2009:
| iShares MSCI Index Fund | Qualified Dividend Income | ||
Australia | $ | 36,574,071 | |
Japan Small Cap | 458,327 | ||
Pacific ex-Japan | 74,074,461 | ||
South Korea | 19,134,761 | ||
Thailand Investable Market | 1,466,522 | ||
In January 2010, shareholders will receive Form 1099-DIV which will include their share of qualified dividend income distributed during the calendar year 2009. Shareholders are advised to check with their tax advisers for information on the treatment of these amounts on their income tax returns.
| 92 | 2009 iSHARES ANNUAL REPORT TO SHAREHOLDERS |
Table of Contents
Board Review and Approval of Current Investment Advisory Contract (Unaudited)
iSHARES®, INC.
Under Section 15(c) of the Investment Company Act of 1940 (the “1940 Act”), the Company’s Board of Directors (the “Board”), including a majority of Directors who are not “interested persons” of the Company (as that term is defined in the 1940 Act) (the “Independent Directors”), is required annually to consider the Investment Advisory Contract between the Company and BGFA (the “Advisory Contract”) on behalf of the Funds. As required by Section 15(c), the Board requested and BGFA provided such information as the Board deemed reasonably necessary to evaluate the terms of the Advisory Contract. At a meeting held on
June 16-17, 2009, the Board approved the selection of BGFA and the continuance of the Advisory Contract, based on its review of qualitative and quantitative information provided by BGFA. In selecting BGFA and approving the Advisory Contract for the Funds, the Board, including the Independent Directors, advised by their independent counsel, considered the following factors, no one of which was controlling, and made the following conclusions:
NATURE, EXTENT AND QUALITY OF SERVICES PROVIDED BY BGFA
Based on management’s representations, the Board expected that there will be no diminution in the scope of services required of or provided by BGFA under the Advisory Contract for the coming year as compared to the scope of services provided by BGFA over the past year. In reviewing the scope of these services, the Board considered BGFA’s investment philosophy and experience, noting that BGFA and its affiliates have committed significant resources over time, including over the past year, including investment in technology and increasing the number of their employees supporting the Funds. The Board also considered BGFA’s compliance program and its compliance record with respect to the Funds. In that regard, the Board noted that BGFA reports to the Board about portfolio management and compliance matters on a periodic basis in connection with regularly scheduled meetings of the Board, and has made appropriate officers available as needed to provide further assistance with these matters. The Board also reviewed the background and experience of the persons responsible for the day-to-day management of the Funds. In addition to the above considerations, the Board considered BGFA’s investment processes and strategies, and matters related to BGFA’s portfolio transaction policies and procedures. The Board further noted that BGFA does not serve as investment adviser for any other series of registered investment companies with substantially similar investment objectives and strategies as any of the Funds; therefore, directly comparable performance information was generally not available. However, the Board also noted that the Funds had met their investment objectives consistently since their respective inception dates. Based on review of this information, the Board concluded that the nature, extent and quality of services to be provided by BGFA to the Funds under the Advisory Contract were appropriate and mitigated in favor of the Board’s approval of the Advisory Contract for the coming year.
FUNDS’ EXPENSES AND PERFORMANCE OF THE FUNDS
The Board reviewed statistical information prepared by Lipper Inc. (“Lipper”), an independent provider of investment company data, regarding the expense ratio components, including advisory fees, waivers/reimbursements, and gross and net total expenses of each Fund in comparison with the same information for other registered investment companies objectively selected by Lipper as comprising such Fund’s applicable peer group pursuant to Lipper’s proprietary methodology and any registered investment companies that would otherwise have been excluded from Lipper’s comparison group due to certain differentiating factors, but were nonetheless included at the request of BGFA (the “Lipper Group”). Because there are few, if any, exchange traded funds or index funds that track indexes similar to those tracked by the Funds, the Lipper Groups included in part mutual funds, closed-end funds, exchange traded funds, or funds with differing investment objective classifications, investment focuses and other characteristics (e.g., actively managed funds and funds sponsored by “at cost” service providers). In support of its review of the statistical information, the Board was provided with a detailed description of the methodology used by Lipper to determine the applicable Lipper Groups and to prepare this information. The Board further noted that due to the limitations in providing comparable funds in the various Lipper Groups, the statistical information may or may not provide meaningful direct comparisons to the Funds. In addition, the Board reviewed statistical information prepared by Lipper regarding the performance of
| BOARD REVIEWAND APPROVALOF CURRENT INVESTMENT ADVISORY CONTRACT | 93 |
Table of Contents
Board Review and Approval of Current Investment Advisory Contract (Unaudited) (Continued)
iSHARES®, INC.
each Fund for the one-, three-, five- and ten-year periods, as applicable, and the “last quarter” period ended March 31, 2009, and a comparison of each Fund’s performance to its performance benchmark index for the same periods. To the extent that any of the comparison funds included in the Lipper Group track the same index as any particular Fund, Lipper also provided, and the Board reviewed, a comparison of such Fund’s performance to that of such relevant comparison funds for the same periods. The Board noted that the Funds generally performed in line with their respective performance benchmark indexes over the relevant periods. In considering this information, the Board noted that the Lipper Groups include funds that may have different investment objectives and/or benchmarks from the Funds. In addition, the Board noted that each Fund seeks to track its benchmark index and that during the prior year the Board received periodic reports on the Funds’ performance in comparison with their relevant benchmark indexes. Such comparative performance information was also considered by the Board.
The Board also noted that the investment advisory fees and overall expenses for the Funds were generally lower than the median or average investment advisory fee rates and overall expenses of the funds in their respective Lipper Groups. Based on this review, the Board concluded that the investment advisory fees and expense levels and the historical performance of each Fund, as managed by BGFA, as compared to the investment advisory fees and expense levels and performance of the funds in the relevant Lipper Group, were satisfactory for the purposes of approving the Advisory Contract for the coming year.
COSTS OF SERVICES PROVIDED TO FUNDS AND PROFITS REALIZED BY BGFA AND AFFILIATES
The Board reviewed information about the profitability to BGFA of the Funds based on the fees payable to BGFA and its affiliates (including fees under the Advisory Contract), and all other sources of revenue and expense to BGFA and its affiliates from the Funds’ operations for the last calendar year. The Board discussed the sources of direct and ancillary revenue with management, including the revenues to BGI from securities lending by the Company (including any securities lending by the Funds). The Board also discussed BGFA’s profit margin as reflected in the Funds’ profitability analysis and reviewed information regarding economies of scale (as discussed below). Based on this review, the Board concluded that the profits realized by BGFA and its affiliates under the Advisory Contract and from other relationships between the Funds and BGFA and/or its affiliates, if any, were within the range the Board considered reasonable and appropriate.
ECONOMIES OF SCALE
In connection with its review of the Funds’ profitability analysis, the Board reviewed information regarding economies of scale or other efficiencies that may result from increases in the Funds’ assets. The Board noted that the Advisory Contract already provided for breakpoints in the investment advisory fee rates for most of the Funds as the assets of such Funds, on an aggregated basis with the assets of certain other iShares funds, increase, and that extended breakpoints were implemented for such Funds the previous year. The Board also noted that the Advisory Contract did not currently provide for any breakpoints in the investment advisory fee rates for the iShares MSCI Pacific ex-Japan Index Fund as possible future economies of scale for that Fund had been taken into consideration by fixing the investment advisory fees at rates at the lower end of the marketplace, effectively giving Fund shareholders, from inception, the benefits of the lower average fee shareholders would have received from a fee structure with declining breakpoints where the initial fee was higher. The Board noted that the asset size of each of the Funds except the iShares MSCI Japan Small Cap Index Fund decreased over the past twelve months. The Board also reviewed BGFA’s historic profitability as investment adviser to the iShares fund complex and noted that BGFA had continued to make significant investments in the iShares fund complex, that expenses had grown at a pace similar to the growth in revenue, and that BGFA had incurred operating losses during earlier years when the iShares funds, including the Funds, had not yet reached scale. Based on this review, as well as the discussions described above in connection with the Lipper Group and performance benchmark index comparisons, the Board, recognizing its responsibility to consider this issue at least annually, concluded that the structure of the investment advisory fees reflects appropriate sharing of economies of scale with the Funds’ shareholders.
| 94 | 2009 iSHARES ANNUAL REPORT TO SHAREHOLDERS |
Table of Contents
Board Review and Approval of Current Investment Advisory Contract (Unaudited) (Continued)
iSHARES®, INC.
FEES AND SERVICES PROVIDED FOR OTHER COMPARABLE FUNDS/ACCOUNTS MANAGED BY BGFA AND ITS AFFILIATES
The Board received and considered certain information regarding the Funds’ annual investment advisory fee rates under the Advisory Contract in comparison to the investment advisory/management fee rates for other funds/accounts for which BGFA or BGI, an affiliate of BGFA, provides investment advisory/management services, including other funds registered under the 1940 Act, collective funds and separate accounts (together, the “Other Accounts”). The Board noted that directly comparable investment advisory/management fee information was not available for the Funds, as BGFA and its affiliates do not manage any Other Accounts with substantially similar investment objectives and strategies as any of the Funds. However, the Board noted that BGFA provided the Board with general information regarding how the level of services provided to the Other Accounts differed from the level of services provided to the Funds. Based on this review, the Board determined that the investment advisory fee rates under the Advisory Contract do not constitute fees that are so disproportionately large as to bear no reasonable relationship to the services rendered and that could not have been the product of arm’s-length bargaining, and concluded that the investment advisory fee rates under the Advisory Contract are fair and reasonable.
OTHER BENEFITS TO BGFA AND/OR ITS AFFILIATES
The Board reviewed any ancillary revenue received by BGFA and/or its affiliates in connection with the services provided to the Funds by BGFA, such as any payment of revenue to BGI, the Company’s securities lending agent, for loaning any portfolio securities, and payment of advisory fees and/or administration fees to BGFA and BGI in connection with any investments by the Funds in other funds for which BGFA provides investment advisory services and/or BGI provides administration services. The Board noted that while revenue to BGI in connection with securities lending agency services to the iShares funds increased overall as against the previous year, overall revenue increased by approximately the same percentage as overall expenses. The Board noted that BGFA does not use soft dollars or consider the value of research or other services that may be provided to BGFA (including its affiliates) in selecting brokers for portfolio transactions for the Funds. The Board further noted that any portfolio transactions on behalf of the Funds placed through a BGFA affiliate or purchased from an underwriting syndicate in which a BGFA affiliate participates, are reported to the Board pursuant to Rule 17e-1 or Rule 10f-3, as applicable, under the 1940 Act. The Board concluded that any such ancillary benefits would not be disadvantageous to the Funds’ shareholders.
Based on this analysis, the Board determined that the Advisory Contract, including the investment advisory fee rates thereunder, is fair and reasonable in light of all relevant circumstances, and concluded that it is in the best interest of the Funds and their shareholders to approve the Advisory Contract for the coming year.
| BOARD REVIEWAND APPROVALOF CURRENT INVESTMENT ADVISORY CONTRACT | 95 |
Table of Contents
Board Review and Approval of New Investment Advisory Agreements (Unaudited)
iSHARES®, INC.
On June 16, 2009, Barclays Bank PLC (“Barclays”) entered into an agreement to sell its interest in the Barclays Global Investors asset management business, which includes BGI and BGI’s business of advising, sponsoring and distributing exchange-traded funds, to BlackRock, Inc. (“BlackRock”). Assuming receipt of the requisite regulatory approvals and the satisfaction of other conditions to the closing, the subsidiaries of Barclays operating the BGI business, including BGFA (the “Adviser”), will be sold to BlackRock (the “Transaction”) for cash and BlackRock stock.
The Adviser currently serves as the investment adviser to each Fund pursuant to an investment advisory agreement with the Company (the “Current Advisory Agreement”). Under the 1940 Act, the Transaction, if consummated, will result in the automatic termination of the Current Advisory Agreement. In order for the management of each Fund to continue uninterrupted, the Board approved interim and new investment advisory agreements (the “New Advisory Agreements”) with the Company, subject to shareholder approval.
BOARD CONSIDERATIONS IN APPROVING THE NEW ADVISORY AGREEMENTS
At an in-person Board meeting held on August 13, 2009, the Board, including the Independent Directors, unanimously approved the New Advisory Agreements between the Adviser and the Company, on behalf of its Funds after consideration of all factors determined to be relevant to the Board’s deliberations, including those discussed below.
The Approval Process – At telephonic and in-person meetings held in June, July and August of this year, the Board, including the Independent Directors, discussed the Transaction and the New Advisory Agreements for the Funds.
In preparation for their consideration of the New Advisory Agreements, the Directors received, in response to a written due diligence request prepared by the Board and its independent counsel and provided to BlackRock, BGI and the Adviser, comprehensive written information covering a range of issues and received, in response to their additional requests, further information in advance of and at the August 13, 2009 in-person Board meeting. To assist the Board in its consideration of the New Advisory Agreements, BlackRock provided materials and information about itself, including its history, management, investment, risk management and compliance capabilities and processes, and financial condition, and the Adviser provided materials and information about the Transaction. In addition, the Independent Directors consulted with their independent legal counsel and Fund counsel on numerous occasions, discussing, among other things, the legal standards and certain other considerations relevant to the Board’s deliberations.
In June 2009, the Board had performed a full annual review of, or initially approved, as applicable, the current Investment Advisory Agreement between the Adviser and the Company, on behalf of its Funds for each Fund as required by the 1940 Act and, after reviewing, among other things, the investment capabilities, resources and personnel of the Adviser, determined that the nature, extent and quality of the services provided by the Adviser under the Current Advisory Agreements were appropriate. The Board also determined that the advisory fees paid by each Fund, taking into account any applicable agreed-upon fee waivers and breakpoints, were fair and reasonable in light of the services provided, the costs to the Adviser of providing those services, economies of scale, the fees and other expenses paid by similar funds (including information provided by Lipper, Inc. (“Lipper”)), and such other circumstances as the Directors considered relevant in the exercise of their reasonable judgment. The Board approved the Current Advisory Agreements on June 17, 2009.
In advance of the June 2009 Board meeting, the Board requested and received materials specifically relating to each Fund’s Current Advisory Agreement. These materials were prepared for each Fund, and included information (i) compiled by Lipper on the fees and expenses and the investment performance of the Fund as compared to a comparable group of funds as classified by Lipper; (ii) prepared by the Adviser discussing market conditions generally; (iii) on the profitability to the Adviser of the Current Advisory Agreements and other payments received by the Adviser and its affiliates from the Funds; and (iv) provided by the Adviser concerning services related to the valuation and pricing of Fund portfolio holdings, and direct and indirect benefits to the Adviser and its affiliates from their relationship with the Fund.
| 96 | 2009 iSHARES ANNUAL REPORT TO SHAREHOLDERS |
Table of Contents
Board Review and Approval of New Investment Advisory Agreements (Unaudited) (Continued)
iSHARES®, INC.
At the June 17, July 29 and August 13, 2009 Board meetings, the Directors discussed with representatives of BGI, the Adviser and BlackRock, the management, investment, risk management and compliance capabilities and processes, and financial condition of BlackRock, the Transaction and its rationale, and BlackRock’s general plans and intentions regarding the Adviser and the Funds. At these Board meetings, representatives of BGI, the Adviser and BlackRock made various presentations to, and responded to questions from, the Board. The Board also inquired about the plans for, and anticipated roles and responsibilities of, the employees and officers of the Adviser in connection with the Transaction, including the anticipated senior management structure of the Adviser following the completion of the Transaction. The Independent Directors also conferred separately and with their independent legal counsel about the Transaction and other matters related to the Transaction on a number of occasions. After the presentations and after reviewing the written materials provided, the Independent Directors met in executive sessions with their independent legal counsel at the June, July and August 2009 Board meetings to consider the Transaction, its expected impact on the Adviser and the Funds, and the New Advisory Agreements.
In connection with the Board’s review of the New Advisory Agreements, BGI, the Adviser and/or BlackRock, as applicable, provided the Board with information about a variety of matters. The Board considered, among other things, the following information:
| • | the reputation, financial strength and resources of BlackRock and its investment advisory subsidiaries and the anticipated financial strength and resources of the combined company; |
| • | that there is not expected to be any diminution in the nature, quality and extent of services provided to the Funds and their shareholders by the Adviser, including portfolio management and compliance services; |
| • | that the Adviser and BlackRock have no present intention to alter the advisory fee rates and expense arrangements currently in effect for the Funds for a period of two years from the date of the closing of the Transaction; |
| • | that it is expected that substantially all of the current employees of the Adviser will remain employees of the Adviser and will continue to provide services to the Funds following the Transaction; |
| • | that the Funds may benefit from having direct access to BlackRock’s state of the art technology and risk management analytic tools, including investment tools, provided under the BlackRock Solutions® brand name; |
| • | that the Funds are expected to continue to be sold through existing distribution channels; |
| • | that the Funds will have access to greater distribution resources through BlackRock’s relationships with third party brokers and retirement plan platforms; |
| • | that the parties to the Transaction Agreement have agreed to conduct their respective businesses in compliance with the conditions of Section 15(f) of the 1940 Act in relation to the Funds; |
| • | that Barclays or one of its affiliates has agreed to pay all expenses of the Funds in connection with the Board’s consideration of the New Advisory Agreements and all costs of seeking shareholder approval of the New Advisory Agreements; and |
| • | that Barclays and BlackRock would derive benefits from the Transaction and that, as a result, they may have a different financial interest in the matters that were being considered than do Fund shareholders. |
The Board did not identify any particular information that was all-important or controlling, and each Director may have attributed different weights to the various factors discussed below. The Directors evaluated all information available to them on a Fund-by-Fund basis, and their determinations were made separately in respect of each Fund. In their deliberations, the Directors considered information received
| BOARD REVIEWAND APPROVALOF NEW INVESTMENT ADVISORY AGREEMENTS | 97 |
Table of Contents
Board Review and Approval of New Investment Advisory Agreements (Unaudited) (Continued)
iSHARES®, INC.
in connection with their most recent approval or continuation of each Current Advisory Agreement at the June 2009 Board meeting, in addition to information provided by BGI, the Adviser and BlackRock regarding BlackRock and the Transaction, in connection with their evaluation of the terms and conditions of the New Advisory Agreements. The Directors, including a majority of the Independent Directors, concluded that the terms of the New Advisory Agreements are appropriate, that the fees to be paid are reasonable in light of the services to be provided to each Fund, and that the New Advisory Agreements should be approved and recommended to Fund shareholders. In voting to approve the New Advisory Agreements in respect of each Fund, the Board considered in particular the following factors:
The nature, extent and quality of services to be provided by the Adviser and its affiliates – In connection with their consideration of the New Advisory Agreements, the Board considered representations by the Adviser, BGI and BlackRock that there would be no diminution in the scope of services required of or provided by the Adviser under the New Advisory Agreements for each Fund as compared to the scope of services provided by the Adviser under the Current Advisory Agreement. In reviewing the scope of these services at the June and August 2009 Board meetings, the Board considered the Adviser’s investment philosophy and experience, noting that the Adviser and its affiliates have committed significant resources over time, including over the past year, including investments in technology and increasing the number of their employees supporting the Funds. The Board also considered the Adviser’s compliance program and its compliance record with respect to the Funds. In that regard, the Board noted that the Adviser reports to the Board about portfolio management and compliance matters on a periodic basis in connection with regularly scheduled meetings of the Board, and has made appropriate officers available as needed to provide further assistance with these matters. The Board noted that it expects that these reports and discussions will continue following the consummation of the Transaction. In addition to the above considerations, the Board considered the Adviser’s investment processes and strategies, and matters related to the Adviser’s portfolio transaction policies and procedures. The Board further took into account that, with respect to most of the Funds, the Adviser does not serve as investment adviser for other series of registered investment companies with substantially similar investment objectives and strategies; therefore, directly comparable performance information was generally not available for most Funds. The Board also considered each Fund’s record of performing in accordance with its investment objective.
In connection with the investment advisory services to be provided under the New Advisory Agreements, the Board took into account detailed discussions with representatives of the Adviser at the June 2009 Board meeting and at prior Board meetings regarding the management of each Fund. In addition to the investment advisory services to be provided to the Funds, the Board, at the August 2009 Board meeting, considered that the Adviser also will continue to provide management and administrative services, shareholder services, oversight of Fund accounting, marketing services, assistance in meeting legal and regulatory requirements and other services necessary for the operation of the Funds, and that these services were expected to be consistent with the services the Adviser currently performs under the Current Advisory Agreements.
The Board noted the representations of the Adviser, BGI and BlackRock that the Transaction was not expected to have any adverse effect on the resources and strengths of the Adviser in managing the Funds. The Board also considered that the Funds and their shareholders may benefit from having direct access to BlackRock’s state of the art technology and risk management analytic tools, including the investment tools provided under the BlackRock Solutions® brand name. The Board discussed BlackRock’s current financial condition, its anticipated financial condition following the completion of the Transaction and its lines of business. The Board also discussed the Adviser’s anticipated financial condition following the completion of the Transaction. The Board discussed BlackRock’s current ownership structure and expected ownership structure following the completion of the Transaction. The Board was advised that BlackRock operates as an independent firm, with its own Board of Directors and no majority shareholder. The Board was also advised that while BlackRock’s largest shareholders, Merrill Lynch, a wholly owned subsidiary of Bank of America, and PNC, are important clients and strategic partners of BlackRock, they are not involved in the firm’s day-to-day management or operations.
| 98 | 2009 iSHARES ANNUAL REPORT TO SHAREHOLDERS |
Table of Contents
Board Review and Approval of New Investment Advisory Agreements (Unaudited) (Continued)
iSHARES®, INC.
Based on the discussions held and the materials presented at the June, July and August 2009 Board meetings and prior Board meetings, the Board determined that the Transaction would not likely cause an adverse change in the nature, extent and quality of the services to be provided by the Adviser under the New Advisory Agreements compared with the services provided by the Adviser under the Current Advisory Agreements and that the Board expects that the quality of such services will continue to be appropriate.
Funds’ expenses and performance of the Funds – The Board received and reviewed statistical information prepared by Lipper at the June 2009 meeting and also received information at prior meetings regarding the expense ratio components of the Funds, including advisory fees, waivers and reimbursements, and gross and net total expenses, in comparison with the same information for other registered investment companies objectively selected by Lipper as comprising a Fund’s peer group pursuant to Lipper’s proprietary methodology and, for certain Funds, registered investment companies that would otherwise have been excluded from Lipper’s comparison group due to certain differentiating factors, but were nonetheless included at the request of the Adviser (the “Lipper Group”). Because there are few, if any, exchange traded funds or index funds that track indexes similar to those tracked by most of the Funds, the Lipper Groups sometimes included mutual funds, closed-end funds, exchange traded funds, or funds with differing investment objective classifications, investment focuses and other characteristics (e.g., actively managed funds and funds sponsored by “at cost” service providers). In support of its review of the statistical information, the Board was provided with a detailed description of the methodology used by Lipper to determine the applicable Lipper Groups and to prepare this information. The Board further noted that due to the limitations in providing comparable funds in the various Lipper Groups, the statistical information may or may not provide meaningful direct comparisons to certain Funds.
The Board noted that the investment advisory fees and overall expenses for the Funds were generally lower than the median or average investment advisory fee rates and overall expenses of the Funds in their Lipper Groups with respect to the Current and New Advisory Agreements. The Board took into account that the fee rates for each Fund under the New Advisory Agreements are identical to the fee rates under the respective Current Advisory Agreements. Further, the Board noted that representatives of the Adviser and BlackRock had confirmed that there is no present intention to alter the advisory fee rates, expense waivers or expense reimbursements currently in effect for the Funds for a period of two years from the date of the closing of the Transaction.
In addition to reviewing the fees and expenses, the Board noted that it regularly reviews each Fund’s performance and at the June 2009 meeting reviewed statistical information prepared by Lipper regarding the performance of each Fund for the quarter-end, one-, three-, five-and ten-year periods, as applicable, and a comparison of each Fund’s performance to its performance benchmark index for the same periods. To the extent that any of the comparison funds included in the Lipper Groups track the same index as any particular Fund, Lipper also provided, and the Board reviewed, a comparison of the Fund’s performance to that of the relevant comparison funds for the same periods. The Board noted that the Funds generally performed in line with their performance benchmark indices over the relevant periods. In considering this information, the Board took into account that the Lipper Groups include funds that may have different investment objectives and/or benchmarks from the Funds. In addition, the Board noted that each Fund seeks to track its benchmark index and that during the prior year the Board received periodic reports on the Funds’ performance in comparison with their relevant benchmark indices. This comparative performance information was also considered by the Board. The Board considered the Adviser’s substantial investment advisory experience and capabilities, as well as the possibility of additional resources and support from BlackRock following the completion of the Transaction, but noted that the effect, if any, the consummation of the Transaction would have on the future performance of the Funds could not be predicted.
Based on this review, the Board had concluded that the investment advisory fee rates and expense levels and the historical performance of each Fund, as compared to the investment advisory fee rates and expense levels and performance of the funds in the relevant Lipper Group, were satisfactory for the purposes of approving the Current Advisory Agreements and concluded that these comparisons continued to be satisfactory for the purpose of approving the New Advisory Agreements.
| BOARD REVIEWAND APPROVALOF NEW INVESTMENT ADVISORY AGREEMENTS | 99 |
Table of Contents
Board Review and Approval of New Investment Advisory Agreements (Unaudited) (Continued)
iSHARES®, INC.
Cost of services provided and profits realized by the Adviser from the relationship with each Fund – The Board considered that at the June 2009 Board meeting and at prior meetings, it had reviewed information about the profitability of the Adviser with respect to the Funds based on the fees payable to the Adviser and its affiliates (including fees under the Current Advisory Agreements), and all other sources of revenue and expense to the Adviser and its affiliates from the Funds’ operations for the last calendar year. The Board discussed the sources of direct and ancillary revenue with management, including the revenues to BGI from securities lending by the Companies (including any securities lending by the Funds). The Board also discussed the Adviser’s profit margin as reflected in the Funds’ profitability analysis and reviewed information regarding economies of scale (as discussed below).
In evaluating the costs of the services to be provided by the Adviser under the New Advisory Agreements, the Board considered, among other things, whether advisory fee rates or other expenses would change as a result of the Transaction. The Board noted that the New Advisory Agreements are similar to the Current Advisory Agreements, including the fact that the fee rates under the Agreements are identical and that representatives of the Adviser and BlackRock represented that there is no present intention due to the Transaction to alter the advisory fee rates, expense waiver or expense reimbursements currently in effect for the Funds for a period of two years from the date of the closing of the Transaction. It was noted that it was not possible to predict how the Transaction would affect the Adviser’s profitability from its relationship with the Funds. Potential cost savings had been described by BlackRock representatives that may be achieved by BlackRock immediately following the Transaction, but even if all of such savings were realized by the Adviser in connection with the management of the Funds, the Adviser’s profitability in respect of the Funds was not expected to increase in a significant respect. The Adviser, BlackRock and the Board discussed how profitability will be calculated and presented to the Board following the Transaction, and the Board reviewed BlackRock’s 2008 profitability methodology with respect to its registered funds. The Board expects to receive profitability information from the Adviser on at least an annual basis following the completion of the Transaction and thus be in a position to evaluate whether any adjustments in Fund fees would be appropriate.
The extent to which economies of scale would be realized as a Fund grows and whether fee levels would reflect such economies of scale – In connection with its review of the Funds’ profitability analysis at the June 2009 meeting, the Board reviewed information regarding potential economies of scale or other efficiencies that may result from increases in the Funds’ assets. At the June 2009 Board meeting, the Board also reviewed the Adviser’s historic profitability as investment adviser to the iShares fund complex and noted that the Adviser had continued to make significant investments in the iShares fund complex, that expenses had grown at a pace similar to the growth in revenue, and that the Adviser had incurred operating losses during earlier years when the iShares funds, including the Funds, had not yet reached scale. The Board further noted that the Current and New Advisory Agreements provide for breakpoints in certain Funds’ investment advisory fee rates as the assets of the Funds, on an aggregated basis with the assets of certain other Funds, increase and that breakpoints were implemented the previous year for certain Funds. The Board noted that for certain other Funds, the Current and New Advisory Agreements do not provide for any breakpoints in the Funds’ investment advisory fee rates as the assets of the Funds increase; however, the Board further noted that possible future economies of scale for those Funds had, in many cases, been taken into consideration by fixing the investment advisory fees at rates at the lower end of the marketplace, effectively giving Fund shareholders, from inception, the benefits of the lower average fee shareholders may have received from a fee structure with declining breakpoints where the initial fee was higher. At the June 2009 Board meeting, the Board, recognizing its responsibility to consider this issue at least annually, concluded that the structure of the investment advisory fee rates, with the breakpoints for certain Funds, reflected appropriate sharing of economies of scale with the Funds’ shareholders.
The Board noted representations from the Adviser and BlackRock that the Adviser will continue to make significant investments in the iShares fund complex and the infrastructure supporting the Funds. The Board determined that changes to the fee structure were not currently necessary and that the Funds appropriately participate in economies of scale. It was noted that it was not possible to evaluate how the Transaction would create opportunities for additional economies of scale. The Board expects to consider economies of scale on at least an annual basis following completion of the Transaction and thus be in a position to evaluate additional economies of scale, if any.
| 100 | 2009 iSHARES ANNUAL REPORT TO SHAREHOLDERS |
Table of Contents
Board Review and Approval of New Investment Advisory Agreements (Unaudited) (Continued)
iSHARES®, INC.
Fees and services provided for other comparable funds/accounts managed by the Adviser and its Affiliates – At the June 2009 Board meeting, the Board received and considered certain information regarding the Funds’ annual investment advisory fee rates under the Current Advisory Agreements in comparison to the investment advisory/management fee rates for other funds/accounts for which the Adviser or BGI provides investment advisory/management services, including other funds registered under the 1940 Act, collective funds and separate accounts (together, the “Other Accounts”). The Board noted that directly comparable investment advisory/management fee information was not available for many of the Funds, as the Adviser and its affiliates do not manage any Other Accounts with substantially similar investment objectives and strategies as many of the Funds. The Board noted, however, that the Adviser provided the Board with general information regarding how the level of services provided to the Other Accounts differed from the level of services provided to the Funds. Furthermore, in reviewing the comparative investment advisory/management fee information for the Funds for which such information was available, the Board considered the general structure of investment advisory/management fees in relation to the nature and extent of services provided to the Funds in comparison with the nature and extent of services provided to the Other Accounts, including, among other things, the level of complexity in managing the Funds and the Other Accounts under differing regulatory requirements and client guidelines. The Board noted that the investment advisory fee rates under the Current Advisory Agreements for the Funds were generally higher than the investment advisory/management fee rates for the Other Accounts for which the Adviser or BGI provides investment advisory/management services, but that the differences appeared to be attributable to, among other things, the type and level of services provided and/or the asset levels of the Other Accounts. Based on this review, the Board determined that the investment advisory fee rates under the Current and New Advisory Agreements do not constitute fees that are so disproportionately large as to bear no reasonable relationship to the services rendered and that could not have been the product of arm’s-length bargaining, and concluded that the investment advisory fee rates under the Current and New Advisory Agreements are fair and reasonable.
Other benefits to the Adviser and its affiliates, including fall-out benefits – In evaluating the fall-out and any other ancillary benefits received by the Adviser under the Current Advisory Agreements, the Board reviewed any ancillary revenue received by the Adviser and/or its affiliates in connection with the services provided to the Funds by the Adviser or its affiliates, such as any payment of revenue to BGI, the Company’s current securities lending agent, for loaning any portfolio securities, and payment of advisory fees and/or administration fees to the Adviser and BGI in connection with any investments by the Funds in other funds for which the Adviser provides investment advisory services and/or BGI provides administration services. The Board noted that while revenue to BGI in connection with securities lending agency services to the Funds increased overall as against the previous year, overall revenue increased by approximately the same percentage as overall expenses. The Board noted that the Adviser does not use soft dollars or consider the value of research or other services that may be provided to the Adviser (including its affiliates) in selecting brokers for portfolio transactions for the Funds. The Board further noted that any portfolio transactions on behalf of the Funds placed through an affiliate of the Adviser or purchased from an underwriting syndicate in which an Adviser affiliate participates, are reported to the Board pursuant to Rule 17e-1 or Rule 10f-3, as applicable, under the 1940 Act. Any fall-out or ancillary benefits as a result of the Transaction were difficult to quantify with certainty at this time, and the Board indicated that it would continue to evaluate them going forward.
Conclusion – The Board examined the totality of the information they were provided at the June, July and August 2009 Board meetings, and information they received at other meetings held during the past year, and did not identify any single factor discussed previously as controlling. Based on this analysis, the Board determined that the New Advisory Agreements, including the investment advisory fee rates thereunder, are fair and reasonable in light of all relevant circumstances and concluded that it is in the best interest of the Funds and their shareholders to unanimously approve the New Advisory Agreements.
| BOARD REVIEWAND APPROVALOF NEW INVESTMENT ADVISORY AGREEMENTS | 101 |
Table of Contents
Supplemental Information (Unaudited)
iSHARES®, INC.
The tables that follow present information about the differences between the daily market price on secondary markets for shares of a Fund and that Fund’s net asset value. Net asset value, or “NAV,” is the price per share at which each Fund issues and redeems shares. It is calculated in accordance with the standard formula for valuing mutual fund shares. The “Market Price” of each Fund generally is determined using the midpoint between the highest bid and the lowest offer on the primary stock exchange on which the shares of such Fund is listed for trading (the “Exchange”), as of the time that the Fund’s NAV is calculated. In the case of the iShares MSCI Malaysia, iShares MSCI South Korea and iShares MSCI Taiwan Index Funds, the NAVs of which are determined prior to the opening of the regular trading day on the Exchange, the Market Price is determined using the midpoint of the bid/ask spread as of the opening of regular trading on the Exchange. Each Fund’s Market Price may be at, above or below its NAV. The NAV of each Fund will fluctuate with changes in the market value of its portfolio holdings. The Market Price of each Fund will fluctuate in accordance with changes in its NAV, as well as market supply and demand.
Premiums or discounts are the differences (expressed as a percentage) between the NAV and Market Price of a Fund on a given day, generally at the time NAV is calculated. A premium is the amount that a Fund is trading above the reported NAV, expressed as a percentage of the NAV. A discount is the amount that a Fund is trading below the reported NAV, expressed as a percentage of the NAV.
The following information shows the frequency distributions of premiums and discounts for each of the Funds included in this report. The information shown for each Fund is for five calendar years (or for each full calendar quarter completed after the inception date of such Fund if less than five years) through the date of the most recent calendar quarter-end. The specific periods covered for each Fund are disclosed in the table for such Fund.
Each line in the table shows the number of trading days in which the Fund traded within the premium/discount range indicated. The number of trading days in each premium/discount range is also shown as a percentage of the total number of trading days in the period covered by each table. All data presented here represents past performance, which cannot be used to predict future results.
| 102 | 2009 iSHARES ANNUAL REPORT TO SHAREHOLDERS |
Table of Contents
Supplemental Information (Unaudited) (Continued)
iSHARES®, INC.
iShares MSCI Australia Index Fund
Period Covered: January 1, 2004 through June 30, 2009
Premium/Discount Range | Number of Days | Percentage of Total Days | |||
Greater than 5.0% | 5 | 0.36 | % | ||
Greater than 4.5% and Less than 5.0% | 3 | 0.22 | |||
Greater than 4.0% and Less than 4.5% | 4 | 0.29 | |||
Greater than 3.5% and Less than 4.0% | 6 | 0.43 | |||
Greater than 3.0% and Less than 3.5% | 12 | 0.87 | |||
Greater than 2.5% and Less than 3.0% | 15 | 1.09 | |||
Greater than 2.0% and Less than 2.5% | 19 | 1.37 | |||
Greater than 1.5% and Less than 2.0% | 44 | 3.18 | |||
Greater than 1.0% and Less than 1.5% | 107 | 7.74 | |||
Greater than 0.5% and Less than 1.0% | 274 | 19.83 | |||
Between 0.5% and –0.5% | 606 | 43.86 | |||
Less than –0.5% and Greater than –1.0% | 117 | 8.47 | |||
Less than –1.0% and Greater than –1.5% | 71 | 5.14 | |||
Less than –1.5% and Greater than –2.0% | 31 | 2.24 | |||
Less than –2.0% and Greater than –2.5% | 22 | 1.59 | |||
Less than –2.5% and Greater than –3.0% | 19 | 1.37 | |||
Less than –3.0% and Greater than –3.5% | 7 | 0.51 | |||
Less than –3.5% and Greater than –4.0% | 5 | 0.36 | |||
Less than –4.0% and Greater than –4.5% | 1 | 0.07 | |||
Less than –4.5% and Greater than –5.0% | 3 | 0.22 | |||
Less than –5.0% and Greater than –5.5% | 4 | 0.29 | |||
Less than –5.5% and Greater than –6.0% | 2 | 0.14 | |||
Less than –6.0% | 5 | 0.36 | |||
| 1,382 | 100.00 | % | |||
| SUPPLEMENTAL INFORMATION | 103 |
Table of Contents
Supplemental Information (Unaudited) (Continued)
iSHARES®, INC.
iShares MSCI Hong Kong Index Fund
Period Covered: January 1, 2004 through June 30, 2009
Premium/Discount Range | Number of Days | Percentage of Total Days | |||
Greater than 5.0% | 7 | 0.51 | % | ||
Greater than 4.5% and Less than 5.0% | 2 | 0.14 | |||
Greater than 4.0% and Less than 4.5% | 5 | 0.36 | |||
Greater than 3.5% and Less than 4.0% | 4 | 0.29 | |||
Greater than 3.0% and Less than 3.5% | 10 | 0.72 | |||
Greater than 2.5% and Less than 3.0% | 17 | 1.23 | |||
Greater than 2.0% and Less than 2.5% | 30 | 2.17 | |||
Greater than 1.5% and Less than 2.0% | 47 | 3.40 | |||
Greater than 1.0% and Less than 1.5% | 105 | 7.60 | |||
Greater than 0.5% and Less than 1.0% | 226 | 16.35 | |||
Between 0.5% and –0.5% | 585 | 42.35 | |||
Less than –0.5% and Greater than –1.0% | 133 | 9.62 | |||
Less than –1.0% and Greater than –1.5% | 75 | 5.43 | |||
Less than –1.5% and Greater than –2.0% | 57 | 4.12 | |||
Less than –2.0% and Greater than –2.5% | 31 | 2.24 | |||
Less than –2.5% and Greater than –3.0% | 14 | 1.01 | |||
Less than –3.0% and Greater than –3.5% | 13 | 0.94 | |||
Less than –3.5% and Greater than –4.0% | 3 | 0.22 | |||
Less than –4.0% and Greater than –4.5% | 4 | 0.29 | |||
Less than –4.5% and Greater than –5.0% | 5 | 0.36 | |||
Less than –5.0% and Greater than –5.5% | 3 | 0.22 | |||
Less than –5.5% and Greater than –6.0% | 1 | 0.07 | |||
Less than –6.0% | 5 | 0.36 | |||
| 1,382 | 100.00 | % | |||
| 104 | 2009 iSHARES ANNUAL REPORT TO SHAREHOLDERS |
Table of Contents
Supplemental Information (Unaudited) (Continued)
iSHARES®, INC.
iShares MSCI Japan Small Cap Index Fund
Period Covered: January 1, 2008 through June 30, 2009
Premium/Discount Range | Number of Days | Percentage of Total Days | |||
Greater than 6.0% | 7 | 1.86 | % | ||
Greater than 5.5% and Less than 6.0% | 2 | 0.53 | |||
Greater than 4.5% and Less than 5.0% | 3 | 0.80 | |||
Greater than 4.0% and Less than 4.5% | 3 | 0.80 | |||
Greater than 3.5% and Less than 4.0% | 5 | 1.33 | |||
Greater than 3.0% and Less than 3.5% | 10 | 2.66 | |||
Greater than 2.5% and Less than 3.0% | 10 | 2.66 | |||
Greater than 2.0% and Less than 2.5% | 16 | 4.26 | |||
Greater than 1.5% and Less than 2.0% | 36 | 9.57 | |||
Greater than 1.0% and Less than 1.5% | 42 | 11.17 | |||
Greater than 0.5% and Less than 1.0% | 45 | 11.97 | |||
Between 0.5% and –0.5% | 88 | 23.40 | |||
Less than –0.5% and Greater than –1.0% | 29 | 7.71 | |||
Less than –1.0% and Greater than –1.5% | 17 | 4.52 | |||
Less than –1.5% and Greater than –2.0% | 15 | 3.99 | |||
Less than –2.0% and Greater than –2.5% | 13 | 3.46 | |||
Less than –2.5% and Greater than –3.0% | 5 | 1.33 | |||
Less than –3.0% and Greater than –3.5% | 12 | 3.19 | |||
Less than –3.5% and Greater than –4.0% | 5 | 1.33 | |||
Less than –4.0% and Greater than –4.5% | 2 | 0.53 | |||
Less than –4.5% and Greater than –5.0% | 2 | 0.53 | |||
Less than –5.0% and Greater than –5.5% | 3 | 0.80 | |||
Less than –5.5% and Greater than –6.0% | 3 | 0.80 | |||
Less than –6.0% | 3 | 0.80 | |||
| 376 | 100.00 | % | |||
| SUPPLEMENTAL INFORMATION | 105 |
Table of Contents
Supplemental Information (Unaudited) (Continued)
iSHARES®, INC.
iShares MSCI Malaysia Index Fund
Period Covered: January 1, 2004 through June 30, 2009
Premium/Discount Range | Number of Days | Percentage of Total Days | |||
Greater than 6.0% | 1 | 0.07 | % | ||
Greater than 5.5% and Less than 6.0% | 2 | 0.14 | |||
Greater than 5.0% and Less than 5.5% | 3 | 0.22 | |||
Greater than 4.5% and Less than 5.0% | 1 | 0.07 | |||
Greater than 4.0% and Less than 4.5% | 1 | 0.07 | |||
Greater than 3.5% and Less than 4.0% | 1 | 0.07 | |||
Greater than 3.0% and Less than 3.5% | 7 | 0.51 | |||
Greater than 2.5% and Less than 3.0% | 6 | 0.43 | |||
Greater than 2.0% and Less than 2.5% | 35 | 2.53 | |||
Greater than 1.5% and Less than 2.0% | 65 | 4.70 | |||
Greater than 1.0% and Less than 1.5% | 136 | 9.84 | |||
Greater than 0.5% and Less than 1.0% | 215 | 15.56 | |||
Between 0.5% and –0.5% | 471 | 34.10 | |||
Less than –0.5% and Greater than –1.0% | 190 | 13.75 | |||
Less than –1.0% and Greater than –1.5% | 118 | 8.54 | |||
Less than –1.5% and Greater than –2.0% | 52 | 3.76 | |||
Less than –2.0% and Greater than –2.5% | 42 | 3.04 | |||
Less than –2.5% and Greater than –3.0% | 14 | 1.01 | |||
Less than –3.0% and Greater than –3.5% | 8 | 0.58 | |||
Less than –3.5% and Greater than –4.0% | 3 | 0.22 | |||
Less than –4.0% and Greater than –4.5% | 7 | 0.51 | |||
Less than –4.5% and Greater than –5.0% | 2 | 0.14 | |||
Less than –5.0% and Greater than –5.5% | 2 | 0.14 | |||
| 1,382 | 100.00 | % | |||
| 106 | 2009 iSHARES ANNUAL REPORT TO SHAREHOLDERS |
Table of Contents
Supplemental Information (Unaudited) (Continued)
iSHARES®, INC.
iShares MSCI Pacific ex-Japan Index Fund
Period Covered: January 1, 2004 through June 30, 2009
Premium/Discount Range | Number of Days | Percentage of Total Days | |||
Greater than 4.5% | 7 | 0.51 | % | ||
Greater than 4.0% and Less than 4.5% | 3 | 0.22 | |||
Greater than 3.5% and Less than 4.0% | 8 | 0.58 | |||
Greater than 3.0% and Less than 3.5% | 9 | 0.65 | |||
Greater than 2.5% and Less than 3.0% | 11 | 0.80 | |||
Greater than 2.0% and Less than 2.5% | 21 | 1.52 | |||
Greater than 1.5% and Less than 2.0% | 48 | 3.47 | |||
Greater than 1.0% and Less than 1.5% | 123 | 8.90 | |||
Greater than 0.5% and Less than 1.0% | 262 | 18.96 | |||
Between 0.5% and –0.5% | 617 | 44.66 | |||
Less than –0.5% and Greater than –1.0% | 103 | 7.45 | |||
Less than –1.0% and Greater than –1.5% | 69 | 4.99 | |||
Less than –1.5% and Greater than –2.0% | 39 | 2.82 | |||
Less than –2.0% and Greater than –2.5% | 14 | 1.01 | |||
Less than –2.5% and Greater than –3.0% | 18 | 1.30 | |||
Less than –3.0% and Greater than –3.5% | 9 | 0.65 | |||
Less than –3.5% and Greater than –4.0% | 5 | 0.36 | |||
Less than –4.0% and Greater than –4.5% | 4 | 0.29 | |||
Less than –4.5% and Greater than –5.0% | 2 | 0.14 | |||
Less than –5.0% and Greater than –5.5% | 3 | 0.22 | |||
Less than –5.5% and Greater than –6.0% | 2 | 0.14 | |||
Less than –6.0% | 5 | 0.36 | |||
| 1,382 | 100.00 | % | |||
| SUPPLEMENTAL INFORMATION | 107 |
Table of Contents
Supplemental Information (Unaudited) (Continued)
iSHARES®, INC.
iShares MSCI Singapore Index Fund
Period Covered: January 1, 2004 through June 30, 2009
Premium/Discount Range | Number of Days | Percentage of Total Days | |||
Greater than 4.5% | 6 | 0.43 | % | ||
Greater than 4.0% and Less than 4.5% | 3 | 0.22 | |||
Greater than 3.5% and Less than 4.0% | 3 | 0.22 | |||
Greater than 3.0% and Less than 3.5% | 2 | 0.14 | |||
Greater than 2.5% and Less than 3.0% | 13 | 0.94 | |||
Greater than 2.0% and Less than 2.5% | 38 | 2.75 | |||
Greater than 1.5% and Less than 2.0% | 57 | 4.12 | |||
Greater than 1.0% and Less than 1.5% | 155 | 11.22 | |||
Greater than 0.5% and Less than 1.0% | 269 | 19.46 | |||
Between 0.5% and –0.5% | 520 | 37.65 | |||
Less than –0.5% and Greater than –1.0% | 127 | 9.19 | |||
Less than –1.0% and Greater than –1.5% | 78 | 5.64 | |||
Less than –1.5% and Greater than –2.0% | 43 | 3.11 | |||
Less than –2.0% and Greater than –2.5% | 31 | 2.24 | |||
Less than –2.5% and Greater than –3.0% | 13 | 0.94 | |||
Less than –3.0% and Greater than –3.5% | 7 | 0.51 | |||
Less than –3.5% and Greater than –4.0% | 4 | 0.29 | |||
Less than –4.0% and Greater than –4.5% | 6 | 0.43 | |||
Less than –4.5% and Greater than –5.0% | 3 | 0.22 | |||
Less than –5.0% and Greater than –5.5% | 2 | 0.14 | |||
Less than –5.5% | 2 | 0.14 | |||
| 1,382 | 100.00 | % | |||
| 108 | 2009 iSHARES ANNUAL REPORT TO SHAREHOLDERS |
Table of Contents
Supplemental Information (Unaudited) (Continued)
iSHARES®, INC.
iShares MSCI South Korea Index Fund
Period Covered: January 1, 2004 through June 30, 2009
Premium/Discount Range | Number of Days | Percentage of Total Days | |||
Greater than 5.5% | 9 | 0.65 | % | ||
Greater than 5.0% and Less than 5.5% | 1 | 0.07 | |||
Greater than 4.5% and Less than 5.0% | 4 | 0.29 | |||
Greater than 4.0% and Less than 4.5% | 4 | 0.29 | |||
Greater than 3.5% and Less than 4.0% | 10 | 0.72 | |||
Greater than 3.0% and Less than 3.5% | 12 | 0.87 | |||
Greater than 2.5% and Less than 3.0% | 19 | 1.37 | |||
Greater than 2.0% and Less than 2.5% | 40 | 2.89 | |||
Greater than 1.5% and Less than 2.0% | 64 | 4.63 | |||
Greater than 1.0% and Less than 1.5% | 134 | 9.70 | |||
Greater than 0.5% and Less than 1.0% | 231 | 16.71 | |||
Between 0.5% and –0.5% | 457 | 33.09 | |||
Less than –0.5% and Greater than –1.0% | 151 | 10.93 | |||
Less than –1.0% and Greater than –1.5% | 98 | 7.09 | |||
Less than –1.5% and Greater than –2.0% | 44 | 3.18 | |||
Less than –2.0% and Greater than –2.5% | 29 | 2.10 | |||
Less than –2.5% and Greater than –3.0% | 26 | 1.88 | |||
Less than –3.0% and Greater than –3.5% | 13 | 0.94 | |||
Less than –3.5% and Greater than –4.0% | 10 | 0.72 | |||
Less than –4.0% and Greater than –4.5% | 5 | 0.36 | |||
Less than –4.5% and Greater than –5.0% | 3 | 0.22 | |||
Less than –5.0% and Greater than –5.5% | 2 | 0.14 | |||
Less than –5.5% and Greater than –6.0% | 5 | 0.36 | |||
Less than –6.0% | 11 | 0.80 | |||
| 1,382 | 100.00 | % | |||
| SUPPLEMENTAL INFORMATION | 109 |
Table of Contents
Supplemental Information (Unaudited) (Continued)
iSHARES®, INC.
iShares MSCI Taiwan Index Fund
Period Covered: January 1, 2004 through June 30, 2009
Premium/Discount Range | Number of Days | Percentage of Total Days | |||
Greater than 5.0% | 7 | 0.51 | % | ||
Greater than 4.5% and Less than 5.0% | 9 | 0.65 | |||
Greater than 4.0% and Less than 4.5% | 5 | 0.36 | |||
Greater than 3.5% and Less than 4.0% | 10 | 0.72 | |||
Greater than 3.0% and Less than 3.5% | 15 | 1.09 | |||
Greater than 2.5% and Less than 3.0% | 17 | 1.23 | |||
Greater than 2.0% and Less than 2.5% | 37 | 2.68 | |||
Greater than 1.5% and Less than 2.0% | 76 | 5.50 | |||
Greater than 1.0% and Less than 1.5% | 113 | 8.18 | |||
Greater than 0.5% and Less than 1.0% | 203 | 14.69 | |||
Between 0.5% and –0.5% | 424 | 30.68 | |||
Less than –0.5% and Greater than –1.0% | 194 | 14.04 | |||
Less than –1.0% and Greater than –1.5% | 107 | 7.74 | |||
Less than –1.5% and Greater than –2.0% | 62 | 4.49 | |||
Less than –2.0% and Greater than –2.5% | 35 | 2.53 | |||
Less than –2.5% and Greater than –3.0% | 24 | 1.74 | |||
Less than –3.0% and Greater than –3.5% | 19 | 1.37 | |||
Less than –3.5% and Greater than –4.0% | 7 | 0.51 | |||
Less than –4.0% and Greater than –4.5% | 2 | 0.14 | |||
Less than –4.5% and Greater than –5.0% | 4 | 0.29 | |||
Less than –5.0% and Greater than –5.5% | 2 | 0.14 | |||
Less than –5.5% and Greater than –6.0% | 2 | 0.14 | |||
Less than –6.0% | 8 | 0.58 | |||
| 1,382 | 100.00 | % | |||
| 110 | 2009 iSHARES ANNUAL REPORT TO SHAREHOLDERS |
Table of Contents
Supplemental Information (Unaudited) (Continued)
iSHARES®, INC.
iShares MSCI Thailand Investable Market Index Fund
Period Covered: April 1, 2008 through June 30, 2009
Premium/Discount Range | Number of Days | Percentage of Total Days | |||
Greater than 5.0% | 1 | 0.32 | % | ||
Greater than 4.5% and Less than 5.0% | 2 | 0.63 | |||
Greater than 4.0% and Less than 4.5% | 3 | 0.95 | |||
Greater than 3.5% and Less than 4.0% | 3 | 0.95 | |||
Greater than 3.0% and Less than 3.5% | 5 | 1.59 | |||
Greater than 2.5% and Less than 3.0% | 10 | 3.17 | |||
Greater than 2.0% and Less than 2.5% | 10 | 3.17 | |||
Greater than 1.5% and Less than 2.0% | 21 | 6.67 | |||
Greater than 1.0% and Less than 1.5% | 37 | 11.75 | |||
Greater than 0.5% and Less than 1.0% | 42 | 13.33 | |||
Between 0.5% and –0.5% | 71 | 22.57 | |||
Less than –0.5% and Greater than –1.0% | 31 | 9.84 | |||
Less than –1.0% and Greater than –1.5% | 23 | 7.30 | |||
Less than –1.5% and Greater than –2.0% | 22 | 6.98 | |||
Less than –2.0% and Greater than –2.5% | 8 | 2.54 | |||
Less than –2.5% and Greater than –3.0% | 6 | 1.90 | |||
Less than –3.0% and Greater than –3.5% | 6 | 1.90 | |||
Less than –3.5% and Greater than –4.0% | 1 | 0.32 | |||
Less than –4.0% and Greater than –4.5% | 2 | 0.63 | |||
Less than –4.5% and Greater than –5.0% | 3 | 0.95 | |||
Less than –5.0% and Greater than –5.5% | 3 | 0.95 | |||
Less than –5.5% and Greater than –6.0% | 1 | 0.32 | |||
Less than –6.0% | 4 | 1.27 | |||
| 315 | 100.00 | % | |||
| SUPPLEMENTAL INFORMATION | 111 |
Table of Contents
Director and Officer Information (Unaudited)
iSHARES®, INC.
The Board of Directors has responsibility for the overall management and operations of the Company, including general supervision of the duties performed by BGFA and other service providers. Each Director serves until his or her successor is duly elected or appointed and qualified. Each Officer serves until he or she resigns, is removed, dies, retires or becomes disqualified.
iShares, Inc., iShares Trust, Barclays Global Investors Funds (“BGIF”) and Master Investment Portfolio (“MIP”) are considered to be members of the same fund complex, as defined in Form N-1A under the 1940 Act. Each Director of iShares, Inc. also serves as a Trustee for iShares Trust and oversees 183 portfolios within the fund complex. In addition, Lee T. Kranefuss serves as a Trustee for BGIF and MIP and oversees an additional 26 portfolios within the fund complex.
The address of each Director and Officer is c/o Barclays Global Investors, N.A., 400 Howard Street, San Francisco, California 94105. The Board has designated George G.C. Parker as its Lead Independent Director. Additional information about the Funds’ Directors and Officers may be found in the Funds’ combined Statement of Additional Information, which is available without charge, upon request, by calling toll-free 1-800-474-2737.
Interested Directors and Officers
| Name, Age | Position(s), Length of Service | Principal Occupation(s) During Past 5 Years | Other Directorships Held | |||
*Lee T. Kranefuss, 48 | Director and Chairman (since 2003). | Non-Executive Chairman (since 2009), iShares; Global Chief Executive Officer (2008-2009) of iShares/Intermediary Groups of BGI; Chief Executive Officer (2005-2008) of iShares Intermediary Index and Market Group of BGI; Chief Executive Officer (2003-2005) of the Intermediary Investor and Exchange Traded Products Business of BGI; Director (since 2005) of BGFA; Director, President and Chief Executive Officer (since 2005) of Barclays Global Investors International, Inc.; Director and Chairman (since 2005) of Barclays Global Investors Services. | Trustee (since 2003) of iShares Trust; Trustee (since 2001) of BGlF and MIP. |
| * | Lee T. Kranefuss is deemed to be an “interested person” (as defined in the 1940 Act) of the Company due to his affiliations with BGFA, the Funds’ investment adviser; BGI, the parent company of BGFA; and Barclays Global Investors Services, an affiliate of BGFA and BGI. |
| 112 | 2009 iSHARES ANNUAL REPORT TO SHAREHOLDERS |
Table of Contents
Director and Officer Information (Unaudited) (Continued)
iSHARES®, INC.
Independent Directors
| Name, Age | Position(s), Length of Service | Principal Occupation(s) During Past 5 Years | Other Directorships Held | |||
George G.C. Parker, 70 | Director (since 2002); Lead Independent Director (since 2006). | Dean Witter Distinguished Professor of Finance (since 1994), Emeritus, Stanford University: Graduate School of Business. | Trustee (since 2000) of iShares Trust; Lead Independent Trustee (since 2006) of iShares Trust; Director (since 1995) of Community First Financial Group; Director (since 1999) of Tejon Ranch Company; Director (since 2004) of Threshold Pharmaceuticals; Director (since 2007) of NETGEAR, Inc. | |||
J. Darrell Duffie, 55 | Director (since 2008). | Professor (since 1984) of Stanford University: Graduate School of Business. | Trustee (since 2008) of iShares Trust; Director (since 2008) of Moody’s Corp. | |||
Cecilia H. Herbert, 60 | Director (since 2005). | Chair (1994-2005) of Investment Committee, Archdiocese of San Francisco; Director (since 1998) and President (since 2007) of the Board of Directors, Catholic Charities CYO; Trustee (2004-2005) of Pacific Select Funds; Trustee (since 2002) and Chair (2006-2007) of the Finance and Investment Committees (since 2006) of the Thacher School. | Trustee (since 2005) of iShares Trust; Advisory Board Member (since 2009) of Forward Funds. | |||
Charles A. Hurty, 66 | Director (since 2005). | Retired; Partner, KPMG LLP (1968-2001). | Trustee (since 2005) of iShares Trust; Director (since 2002) of ProMark Absolute Return Strategies Fund LLC (1 portfolio); Director (since 2002) of Citigroup Alternative Investments Multi- Adviser Hedge Fund Portfolios LLC (1 portfolio); Director (since 2005) of CSFB Alternative Investments Fund (6 portfolios). | |||
John E. Kerrigan, 54 | Director (since 2005). | Chief Investment Officer (since 2002) of Santa Clara University. | Trustee (since 2005) of iShares Trust. | |||
John E. Martinez, 48 | Director (since 2003). | Director (since 2005) of EquityRock Capital Management; Director (since 2003) of Larkin Street Youth Services. | Trustee (since 2003) of iShares Trust; Chairman (since 2007) of Independent Review Committee, Canadian iShares Funds. | |||
| DIRECTORAND OFFICER INFORMATION | 113 |
Table of Contents
Director and Officer Information (Unaudited) (Continued)
iSHARES®, INC.
Independent Directors (Continued)
| Name, Age | Position(s), Length of Service | Principal Occupation(s) During Past 5 Years | Other Directorships Held | |||
Robert H. Silver, 54 | Director (since 2007). | President and Co-Founder (since 2006) of The Bravitas Group, Inc.; Member (since 2006) of Non-Investor Advisory Board of Russia Partners II, LP; Director and member (2006-2009) of the Audit and Compensation Committee of EPAM Systems, Inc.; President and Chief Operating Officer (2003-2005) and Director (1999-2005) of UBS Financial Services, Inc.; President and Chief Executive Officer (1999-2005) of UBS Services USA, LLC; Managing Director (2000-2005) of UBS America, Inc.; Director and Vice Chairman (since 2001) of the YMCA of Greater NYC; Broadway Producer (since 2006); Co- Founder and Vice President (since 2008) of Parentgiving Inc. | Trustee (since 2007) of iShares Trust. |
| * | Prior to August 13, 2009, John E. Martinez was deemed to be an “interested person” (as defined in the 1940 Act) of the Trust due to his affiliations with BGFA, the Funds’ investment adviser; BGI, the parent company of BGFA; and Barclays Global Investors Services, an affiliate of BGFA and BGI. Effective August 13, 2009, John E. Martinez is a non-interested person notwithstanding his former affiliation with BGFA and its affiliates prior to 2002. |
Officers
| ||||||
| Name, Age | Position(s), Length of Service | Principal Occupation(s) During Past 5 Years | Other Directorships Held | |||
Michael A. Latham, 44 | President (since 2007). | Head (since 2007) of Americas iShares, BGI; Chief Operating Officer (2003-2007) of the Intermediary Investor and Exchange Traded Products Business of BGI; Director and Chief Financial Officer (since 2005) of Barclays Global Investors International, Inc. | None. | |||
| 114 | 2009 iSHARES ANNUAL REPORT TO SHAREHOLDERS |
Table of Contents
Director and Officer Information (Unaudited) (Continued)
iSHARES®, INC.
Officers (Continued)
| Name, Age | Position(s), Length of Service | Principal Occupation(s) During Past 5 Years | Other Directorships Held | |||
Geoffrey D. Flynn, 52 | Executive Vice President and Chief Operating Officer (since 2008). | Chief Operating Officer (since 2008) of U.S. iShares, BGI; Director (2007-2008) of Mutual Fund Operations of BGI; President (2003-2007) of Van Kampen Investors Services; Managing Director (2002-2007) of Morgan Stanley; President (2002-2007) of Morgan Stanley Trust, FSB. | None. | |||
Jack Gee, 50 | Treasurer and Chief Financial Officer (since 2008). | Senior Director (since 2009) of Fund Administration of Intermediary Investor Business of BGI; Director (2004-2009) of Fund Administration of Intermediary Investor Business of BGI; Treasurer and Chief Financial Officer (2004) of Parnassus Investments. | None. | |||
Eilleen M. Clavere, 57 | Secretary (since 2007). | Director (since 2006) of Legal Administration of Intermediary Investors Business of BGI; Legal Counsel and Vice President (2005-2006) of Atlas Funds, Atlas Advisers, Inc. and Atlas Securities, Inc.; Counsel (2001-2005) of Kirkpatrick & Lockhart LLP. | None. | |||
Ira P. Shapiro, 46 | Vice President and Chief Legal Officer (since 2007). | Associate General Counsel (since 2004) of BGI; First Vice President (1993-2004) of Merrill Lynch Investment Managers. | None. | |||
Amy Schioldager, 47 | Executive Vice President (since 2007). | Global Head (since 2008) of Index Equity, BGI; Global Head (2006-2008) of U.S. Indexing, BGI; Head (2001-2006) of Domestic Equity Portfolio Management, BGI. | None. | |||
Patrick O’Connor, 42 | Vice President (since 2007). | Head (since 2006) of iShares Portfolio Management, BGI; Senior Portfolio Manager (1999-2006) of BGI. | None. | |||
| DIRECTORAND OFFICER INFORMATION | 115 |
Table of Contents
Director and Officer Information (Unaudited) (Continued)
iSHARES®, INC.
Officers (Continued)
| Name, Age | Position(s), Length of Service | Principal Occupation(s) During Past 5 Years | Other Directorships Held | |||
Lee Sterne, 44 | Vice President (since 2007). | Head (since 2007) of U.S. Fixed Income Index and iShares, BGI; Senior Portfolio Manager (2004-2007) of BGI; Portfolio Manager (2001-2004) of BGI. | None. | |||
Matt Tucker, 37 | Vice President (since 2007). | Director (since 2009) of Fixed Income Investment Strategy, BGI; Head (2005-2008) of U.S. Fixed Income Investment Solutions, BGI; Fixed Income Investment Strategist (2003-2005) of BGI. | None. | |||
| 116 | 2009 iSHARES ANNUAL REPORT TO SHAREHOLDERS |
Table of Contents
Notes:
| NOTES | 117 |
Table of Contents
Notes:
| 118 | 2009 iSHARES ANNUAL REPORT TO SHAREHOLDERS |
Table of Contents
Notes:
| NOTES | 119 |
Table of Contents
The following is a list of iShares Funds being offered, along with their respective exchange trading symbols. Please call 1-800-iShares (1-800-474-2737) to obtain a prospectus for any iShares Fund. The prospectus contains more complete information, including charges, expenses, investment objectives and risk factors that should be carefully considered to determine if the Fund(s) are an appropriate investment for you. Read the prospectus(es) carefully before investing. Investing involves risk, including possible loss of principal.
| iShares Russell Domestic Index Funds | Trading Symbol | |
iShares Russell 3000 | IWV | |
iShares Russell 3000 Growth | IWZ | |
iShares Russell 3000 Value | IWW | |
iShares Russell Top 200 | IWL | |
iShares Russell Top 200 Growth | IWY | |
iShares Russell Top 200 Value | IWX | |
iShares Russell 1000 | IWB | |
iShares Russell 1000 Growth | IWF | |
iShares Russell 1000 Value | IWD | |
iShares Russell Midcap | IWR | |
iShares Russell Midcap Growth | IWP | |
iShares Russell Midcap Value | IWS | |
iShares Russell 2000 | IWM | |
iShares Russell 2000 Growth | IWO | |
iShares Russell 2000 Value | IWN | |
iShares Russell Microcap | IWC | |
| iShares S&P Domestic Index Funds | ||
iShares S&P 1500 | ISI | |
iShares S&P 100 | OEF | |
iShares S&P 500 | IVV | |
iShares S&P 500 Growth | IVW | |
iShares S&P 500 Value | IVE | |
iShares S&P MidCap 400 | IJH | |
iShares S&P MidCap 400 Growth | IJK | |
iShares S&P MidCap 400 Value | IJJ | |
iShares S&P SmallCap 600 | IJR | |
iShares S&P SmallCap 600 Growth | IJT | |
iShares S&P SmallCap 600 Value | IJS | |
| iShares Morningstar Domestic Index Funds | ||
iShares Morningstar Large Core | JKD | |
iShares Morningstar Large Growth | JKE | |
iShares Morningstar Large Value | JKF | |
iShares Morningstar Mid Core | JKG | |
iShares Morningstar Mid Growth | JKH | |
iShares Morningstar Mid Value | JKI | |
iShares Morningstar Small Core | JKJ | |
iShares Morningstar Small Growth | JKK | |
iShares Morningstar Small Value | JKL | |
| iShares Dow Jones Domestic Index Funds | ||
iShares Dow Jones U.S. | IYY | |
| iShares KLD Socially Responsible Index Funds | ||
iShares FTSE KLD 400 Social | DSI | |
iShares FTSE KLD Select Social | KLD | |
| iShares NYSE Domestic Index Funds | ||
iShares NYSE Composite | NYC | |
iShares NYSE 100 | NY | |
| iShares Domestic Specialty Index Funds | ||
iShares S&P U.S. Preferred Stock | PFF | |
iShares Dow Jones Select Dividend | DVY | |
| iShares North American Sector/Subsector Index Funds | Trading Symbol | |
iShares S&P North American Technology Sector | IGM | |
iShares S&P North American Technology-Multimedia Networking | IGN | |
iShares S&P North American Technology-Semiconductors | IGW | |
iShares S&P North American Technology-Software | IGV | |
iShares S&P North American Natural Resources Sector | IGE | |
| iShares Domestic Sector Index Funds | ||
iShares Dow Jones U.S. Basic Materials Sector | IYM | |
iShares Dow Jones U.S. Consumer Goods Sector | IYK | |
iShares Dow Jones U.S. Consumer Services Sector | IYC | |
iShares Dow Jones U.S. Energy Sector | IYE | |
iShares Dow Jones U.S. Financial Sector | IYF | |
iShares Dow Jones U.S. Healthcare Sector | IYH | |
iShares Dow Jones U.S. Industrial Sector | IYJ | |
iShares Dow Jones U.S. Technology Sector | IYW | |
iShares Dow Jones U.S. Telecommunications Sector | IYZ | |
iShares Dow Jones U.S. Utilities Sector | IDU | |
| iShares Domestic Subsector Index Funds | ||
iShares Dow Jones Transportation Average | IYT | |
iShares Dow Jones U.S. Aerospace & Defense | ITA | |
iShares Dow Jones U.S. Broker-Dealers | IAI | |
iShares Dow Jones U.S. Financial Services | IYG | |
iShares Dow Jones U.S. Healthcare Providers | IHF | |
iShares Dow Jones U.S. Home Construction | ITB | |
iShares Dow Jones U.S. Insurance | IAK | |
iShares Dow Jones U.S. Medical Devices | IHI | |
iShares Dow Jones U.S. Oil & Gas Exploration & Production | IEO | |
iShares Dow Jones U.S. Oil Equipment & Services | IEZ | |
iShares Dow Jones U.S. Pharmaceuticals | IHE | |
iShares Dow Jones U.S. Regional Banks | IAT | |
iShares Nasdaq Biotechnology | IBB | |
| iShares Domestic Real Estate Index Funds | ||
iShares Cohen & Steers Realty Majors | ICF | |
iShares Dow Jones U.S. Real Estate | IYR | |
iShares FTSE NAREIT Real Estate 50 | FTY | |
iShares FTSE NAREIT Industrial/Office Capped | FIO | |
iShares FTSE NAREIT Mortgage Plus Capped | REM | |
iShares FTSE NAREIT Residential Plus Capped | REZ | |
iShares FTSE NAREIT Retail Capped | RTL | |
| iShares Target Risk Index Funds | ||
iShares S&P Conservative Allocation | AOK | |
iShares S&P Moderate Allocation | AOM | |
iShares S&P Growth Allocation | AOR | |
iShares S&P Aggressive Allocation | AOA | |
| 120 | 2009 iSHARES ANNUAL REPORT TO SHAREHOLDERS |
Table of Contents
The iShares® Family of Funds (Continued)
| iShares International Country Index Funds | Trading Symbol | |
iShares FTSE China (HK Listed) | FCHI | |
iShares FTSE/Xinhua China 25 | FXI | |
iShares MSCI Australia | EWA | |
iShares MSCI Austria Investable Market | EWO | |
iShares MSCI Belgium Investable Market | EWK | |
iShares MSCI Brazil | EWZ | |
iShares MSCI Canada | EWC | |
iShares MSCI Chile Investable Market | ECH | |
iShares MSCI France | EWQ | |
iShares MSCI Germany | EWG | |
iShares MSCI Hong Kong | EWH | |
iShares MSCI Israel Capped Investable Market | EIS | |
iShares MSCI Italy | EWI | |
iShares MSCI Japan | EWJ | |
iShares MSCI Japan Small Cap | SCJ | |
iShares S&P/TOPIX 150 | ITF | |
iShares MSCI Malaysia | EWM | |
iShares MSCI Mexico Investable Market | EWW | |
iShares MSCI Netherlands Investable Market | EWN | |
iShares MSCI All Peru Capped | EPU | |
iShares MSCI Singapore | EWS | |
iShares MSCI South Africa | EZA | |
iShares MSCI South Korea | EWY | |
iShares MSCI Spain | EWP | |
iShares MSCI Sweden | EWD | |
iShares MSCI Switzerland | EWL | |
iShares MSCI Taiwan | EWT | |
iShares MSCI Thailand Investable Market | THD | |
iShares MSCI Turkey Investable Market | TUR | |
iShares MSCI United Kingdom | EWU | |
| iShares International Index Funds | ||
iShares MSCI ACWI ex US | ACWX | |
iShares MSCI EAFE | EFA | |
iShares MSCI EAFE Growth | EFG | |
iShares MSCI EAFE Value | EFV | |
iShares MSCI EAFE Small Cap | SCZ | |
iShares FTSE Developed Small Cap ex-North America | IFSM | |
iShares MSCI Emerging Markets | EEM | |
iShares MSCI Emerging Markets Eastern Europe | ESR | |
iShares S&P Emerging Markets Infrastructure | EMIF | |
iShares MSCI BRIC | BKF | |
iShares MSCI EMU | EZU | |
iShares MSCI All Country Asia ex Japan | AAXJ | |
iShares MSCI Pacific ex-Japan | EPP | |
iShares S&P Asia 50 | AIA | |
iShares S&P Europe 350 | IEV | |
iShares S&P Latin America 40 | ILF | |
| iShares International/Global Real Estate Index Funds | ||
iShares S&P Developed ex-U.S. Property | WPS | |
iShares FTSE EPRA/NAREIT Developed Real Estate ex-U.S. | IFGL | |
iShares FTSE EPRA/NAREIT Developed Asia | IFAS | |
iShares FTSE EPRA/NAREIT Developed Europe | IFEU | |
iShares FTSE EPRA/NAREIT North America | IFNA | |
| iShares International Specialty Index Funds | ||
iShares Dow Jones International Select Dividend | IDV | |
| iShares Target Date Index Funds | Trading Symbol | |
iShares S&P Target Date Retirement Income | TGR | |
iShares S&P Target Date 2010 | TZD | |
iShares S&P Target Date 2015 | TZE | |
iShares S&P Target Date 2020 | TZG | |
iShares S&P Target Date 2025 | TZI | |
iShares S&P Target Date 2030 | TZL | |
iShares S&P Target Date 2035 | TZO | |
iShares S&P Target Date 2040 | TZV | |
| iShares Global Index Funds | ||
iShares MSCI ACWI | ACWI | |
iShares S&P Global 100 | IOO | |
iShares MSCI Kokusai | TOK | |
| iShares Global Sector Index Funds | ||
iShares S&P Global Consumer Discretionary Sector | RXI | |
iShares S&P Global Consumer Staples Sector | KXI | |
iShares S&P Global Energy Sector | IXC | |
iShares S&P Global Financials Sector | IXG | |
iShares S&P Global Healthcare Sector | IXJ | |
iShares S&P Global Industrials Sector | EXI | |
iShares S&P Global Materials Sector | MXI | |
iShares S&P Global Technology Sector | IXN | |
iShares S&P Global Telecommunications Sector | IXP | |
iShares S&P Global Utilities Sector | JXI | |
| iShares Global Theme Based Index Funds | ||
iShares S&P Global Clean Energy | ICLN | |
iShares S&P Global Infrastructure | IGF | |
iShares S&P Global Nuclear Energy | NUCL | |
iShares S&P Global Timber & Forestry | WOOD | |
| iShares U.S. Multisector Bond Funds | ||
iShares Barclays Aggregate | AGG | |
iShares Barclays Government/Credit | GBF | |
iShares Barclays Intermediate Government/Credit | GVI | |
| iShares U.S. Government Bond Funds | ||
iShares Barclays Short Treasury | SHV | |
iShares Barclays 1-3 Year Treasury | SHY | |
iShares Barclays 3-7 Year Treasury | IEI | |
iShares Barclays 7-10 Year Treasury | IEF | |
iShares Barclays 10-20 Year Treasury | TLH | |
iShares Barclays 20+ Year Treasury | TLT | |
iShares Barclays TIPS | TIP | |
iShares Barclays Agency | AGZ | |
| iShares U.S. Credit Bond Funds | ||
iShares Barclays Credit | CFT | |
iShares Barclays 1-3 Year Credit | CSJ | |
iShares Barclays Intermediate Credit | CIU | |
iShares iBoxx $ Investment Grade Corporate | LQD | |
iShares iBoxx $ High Yield Corporate | HYG | |
| iShares U.S. Securitized Bond Funds | ||
iShares Barclays MBS | MBB | |
iSHARES FAMILYOF FUNDS | 121 |
Table of Contents
The iShares® Family of Funds (Continued)
| iShares AMT-Free Municipal Bond Funds | Trading Symbol | |
iShares S&P National AMT-Free Municipal | MUB | |
iShares S&P Short Term National AMT-Free Municipal | SUB | |
iShares S&P California AMT-Free Municipal | CMF | |
iShares S&P New York AMT-Free Municipal | NYF |
| iShares International Bond Funds | Trading Symbol | |
iShares JPMorgan USD Emerging Markets | EMB | |
iShares S&P/Citigroup International Treasury | IGOV | |
iShares S&P/Citigroup 1-3 Year International Treasury | ISHG |
iShares® is a registered trademark of Barclays Global Investors, N.A. (“BGI”). The iShares Funds are not sponsored, endorsed, issued, sold or promoted by Cohen & Steers Capital Management, Inc., Dow Jones & Company, Inc., European Public Real Estate Association (“EPRA®”), FTSE International Limited (“FTSE”), FTSE/Xinhua Index Limited (“FXI”), iBoxx®, J.P. Morgan Securities Inc., MSCI Inc., Morningstar Inc., The NASDAQ OMX Group, Inc., National Association of Real Estate Investment Trusts (“NAREIT”), New York Stock Exchange, Inc., Frank Russell Company or Standard & Poor’s, nor are they sponsored or endorsed by Barclays Capital. None of these companies make any representation regarding the advisability of investing in the iShares Funds. Neither SEI nor BGI, nor any of their affiliates, are affiliated with the companies listed above except Barclays Capital, which is an affiliate of BGI. FXI does not make any warranty regarding the FTSE/Xinhua Index. All rights in the FTSE/Xinhua Index vest in FXI. Neither FTSE nor NAREIT makes any warranty regarding the FTSE NAREIT Real Estate 50/Residential/Retail/Mortgage REITs or Industrial/Office Index; all rights vest in NAREIT. Neither FTSE nor NAREIT makes any warranty regarding the FTSE EPRA/NAREIT Global Real Estate ex-US/North America/Europe/Asia Index; all rights vest in FTSE, NAREIT, and EPRA. All rights in the FTSE Developed Small Cap ex-North America Index vest in FTSE. “FTSE” is a trade- and servicemark of London Stock Exchange and The Financial Times Limited; “Xinhua”is a trade- and servicemark of Xinhua Financial Network Limited. “NAREIT®” is a trademark of NAREIT; “EPRA®” is a trademark of EPRA.
An investment in the Fund(s) is not a deposit of a bank and it is not insured or guaranteed by the Federal Deposit Insurance Corporation or any other government agency.
This advertising section does not constitute part of the 2009 Annual Report.
iS-1437-1009
| 122 | 2009 iSHARES ANNUAL REPORT TO SHAREHOLDERS |
Table of Contents

Table of Contents
2009 ANNUAL REPORT TO SHAREHOLDERS iSHARES® MSCI SERIES AUGUST 31, 2009
Would you prefer to receive materials like this electronically? See inside cover for details.
iShares MSCI Brazil Index Fund
iShares MSCI BRIC Index Fund
iShares MSCI Canada Index Fund
iShares MSCI Chile Investable Market Index Fund
iShares MSCI Israel Capped Investable Market Index Fund
iShares MSCI Mexico Investable Market Index Fund
iShares MSCI South Africa Index Fund
iShares MSCI Turkey Investable Market Index Fund
iShares®
Table of Contents

iShares®
Dear iShares Shareholder:
Electronic delivery is the easiest, most convenient way to receive reporting on your iShares holdings. In addition, it’s a way we can all care for our environment. To that end, we are pleased to offer shareholder reports and prospectuses online.
To sign up for electronic delivery, please follow these simple steps:
1. Go to www.icsdelivery.com.
2. From the main page, select the first letter of your brokerage firm’s name.
3. Select your brokerage institution from the list that follows. If your brokerage firm is not listed, electronic delivery may not be available. Please contact your brokerage firm or financial adviser.
4. Fill out the appropriate information and provide the e-mail address where you would like your information sent.
Your information and email address will be kept confidential and only used to deliver documents to you. If at any time you are not satisfied, you can cancel electronic delivery at www.icsdelivery.com and once again receive physical delivery of your materials. If you have any questions, please contact your brokerage firm or financial adviser.
Once you have enrolled, you will no longer receive prospectuses and shareholder reports in the mail. Instead, you will receive e-mail notifications announcing that the shareholder report or prospectus has been posted on the iShares website at www.iShares.com.
Table of Contents
| 1 | ||
| 25 | ||
| 27 | ||
| 27 | ||
| 30 | ||
| 34 | ||
| 37 | ||
| 39 | ||
| 42 | ||
| 44 | ||
| 46 | ||
| 49 | ||
| 57 | ||
| 65 | ||
| 75 | ||
| 76 | ||
Board Review and Approval of Current Investment Advisory Contract (Unaudited) | 77 | |
Board Review and Approval of New Investment Advisory Agreements (Unaudited) | 80 | |
| 86 | ||
| 93 | ||
| 100 |
Table of Contents
Management’s Discussion of Fund Performance
iSHARES® MSCI BRAZIL INDEX FUND
(TICKER: EWZ)
INVESTMENT OBJECTIVE
The iShares MSCI Brazil Index Fund (the “Fund”) seeks to provide investment results that correspond generally to the price and yield performance, before fees and expenses, of publicly traded securities in the aggregate in the Brazilian market, as measured by the MSCI Brazil IndexSM (the “Index”). The Fund invests in a representative sample of securities included in the Index that collectively has an investment profile similar to the Index. Due to the use of representative sampling, the Fund may or may not hold all of the securities that are included in the Index. For the 12-month period ended August 31, 2009 (the “reporting period”), the total return for the Fund was (16.05)%, while the total return for the Index was (15.42)%.
MARKET OVERVIEW AND DISCUSSION OF PERFORMANCE
The Brazilian stock market posted a double-digit decline during the reporting period, reflecting an intense and volatile global investment environment. Brazil’s market retracted in the last four months of 2008 amid one of the worst global economic downturns since World War II and a liquidity challenge in the credit markets softened the country’s exports and put downward pressure on the Brazilian currency. In particular, a substantial drop in global demand for oil and other commodities, which comprise two-thirds of Brazil’s exports, appears to have contributed to a marked slowdown in Brazil’s economy, which contracted by 1.2% for the 12 months ended June 30, 2009. Increased risk aversion among investors may also have contributed to the stock market decline in Brazil and many other emerging markets.
The Brazilian government implemented several policies in early 2009 apparently intended to revive the economy. The country’s central bank reduced interest rates from 13.75% to a record low of 8.75% to stimulate domestic consumption and boost economic growth. In addition, the bank injected capital into the financial system to stimulate the credit markets, and the government provided tax breaks for purchases of large durable goods such as appliances and cars.
The government’s efforts appeared to produce results in the last half of the reporting period as industrial production increased and the unemployment rate fell. Early signs of economic stabilization elsewhere, primarily in the U.S., boosted expectations of a nascent global recovery and helped restore investor confidence. Commodity prices stabilized and began to retrace some of their declines, which was also supportive for the Brazilian economy. As a result, Brazil’s equity market staged a sharp recovery. However, it was insufficient to fully offset the steep decline in late 2008 and early 2009.
Seven of the Fund’s ten largest holdings as of August 31, 2009 declined for the reporting period, led by steelmaker Gerdau SA and metals and mining company Vale SA, both of which struggled with falling commodity prices. Other notable decliners that were hurt by lower commodity prices included energy producer Petroleo Brasileiro SA and steelmaker Companhia Siderurgica Nacional SA. By far, the best performer among the Fund’s top ten holdings was beverage maker Companhia de Bebidas das Americas, which was relatively immune to the economic downturn. The other two positive performers were financial stocks, investment bank Itausa – Investimentos Itau SA and financial conglomerate Itau Unibanco Holding SA.
| MANAGEMENT’S DISCUSSIONSOF FUND PERFORMANCE | 1 |
Table of Contents
Management’s Discussion of Fund Performance (Continued)
iSHARES® MSCI BRAZIL INDEX FUND
Performance as of August 31, 2009
| Average Annual Total Returns | ||||||||||||||||
| Year Ended 8/31/09 | Five Years Ended 8/31/09 | Inception to 8/31/09 | ||||||||||||||
| NAV | MARKET | INDEX | NAV | MARKET | INDEX | NAV | MARKET | INDEX | ||||||||
| (16.05)% | (16.32)% | (15.42)% | 31.50% | 31.33% | 33.39% | 15.24% | 15.21% | 17.33% | ||||||||
| Cumulative Total Returns | ||||||||||||||||
| Year Ended 8/31/09 | Five Years Ended 8/31/09 | Inception to 8/31/09 | ||||||||||||||
| NAV | MARKET | INDEX | NAV | MARKET | INDEX | NAV | MARKET | INDEX | ||||||||
| (16.05)% | (16.32)% | (15.42)% | 293.24% | 290.63% | 322.30% | 265.95% | 264.90% | 331.51% | ||||||||
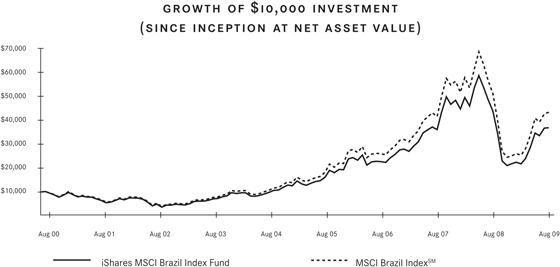
Total returns for the period since inception are calculated from the inception date of the Fund (7/10/00). “Average Annual Total Returns” represent the average annual change in value of an investment over the period(s) indicated. “Cumulative Total Returns” represent the total change in value of an investment over the period(s) indicated.
The Fund’s per share net asset value or “NAV” is the value of one share of the Fund as calculated in accordance with the standard formula for valuing mutual fund shares. The NAV return is based on the NAV of the Fund and the market return is based on the market price per share of the Fund. The price used to calculate market return (“Market Price”) is determined by using the midpoint between the highest bid and the lowest offer on the primary stock exchange on which the shares of the Fund are listed for trading, as of the time that the Fund’s NAV is calculated. Since shares of the Fund did not trade in the secondary market until after the Fund’s inception, for the period from inception to the first day of secondary market trading in shares of the Fund (7/14/00), the NAV of the Fund is used as a proxy for the Market Price to calculate market returns. Market and NAV returns assume that dividends and capital gain distributions have been reinvested in the Fund at Market Price and NAV, respectively.
An index is a statistical composite that tracks a specified financial market or sector. Unlike the Fund, an index does not actually hold a portfolio of securities and therefore does not incur the expenses incurred by the Fund. These expenses negatively impact the performance of the Fund. Also, market returns do not include brokerage commissions that may be payable on secondary market transactions. If brokerage commissions were included, market returns would be lower. The performance shown in the table(s) and chart(s) above assumes reinvestment of all dividends and capital gain distributions and does not reflect the deduction of taxes that a shareholder would pay on fund distributions or the redemption or sale of fund shares. The investment return and principal value of shares of the Fund will vary with changes in market conditions. Shares of the Fund may be worth more or less than their original cost when they are redeemed or sold in the market. The Fund’s past performance is no guarantee of future results.
| 2 | 2009 iSHARES ANNUAL REPORT TO SHAREHOLDERS |
Table of Contents
Management’s Discussion of Fund Performance (Continued)
iSHARES® MSCI BRAZIL INDEX FUND
PORTFOLIO ALLOCATION As of 8/31/09 | |||
| Sector | Percentage of Net Assets | ||
Basic Materials | 27.20 | % | |
Energy | 24.13 | ||
Financial | 20.52 | ||
Consumer Non-Cyclical | 9.30 | ||
Utilities | 8.16 | ||
Communications | 5.09 | ||
Diversified | 2.13 | ||
Industrial | 1.67 | ||
Consumer Cyclical | 1.10 | ||
Short-Term and Other Net Assets | 0.70 | ||
TOTAL | 100.00 | % | |
| TEN LARGEST FUND HOLDINGS As of 8/31/09 | |||
| Security | Percentage of Net Assets | ||
Petroleo Brasileiro SA Preferred | 11.88 | % | |
Petroleo Brasileiro SA | 10.38 | ||
Vale SA Class A Preferred | 8.62 | ||
Itau Unibanco Holding | 8.07 | ||
Vale SA SP ADR | 6.23 | ||
Banco Bradesco SA Preferred | 4.98 | ||
Companhia de Bebidas das Americas Preferred | 3.08 | ||
Companhia Siderurgica | 2.77 | ||
Gerdau SA Preferred | 2.21 | ||
Itausa – Investimentos Itau | 2.13 | ||
TOTAL | 60.35 | % | |
| MANAGEMENT’S DISCUSSIONSOF FUND PERFORMANCE | 3 |
Table of Contents
Management’s Discussion of Fund Performance
iSHARES® MSCI BRIC INDEX FUND
(TICKER: BKF)
INVESTMENT OBJECTIVE
The iShares MSCI BRIC Index Fund (the “Fund”) seeks to provide investment results that correspond generally to the price and yield performance, before fees and expenses, of the MSCI BRIC IndexSM (the “Index”). The Index is designed to measure the combined equity market performance in Brazil, Russia, India and China (“BRIC”). The Fund invests in a representative sample of securities included in the Index that collectively has an investment profile similar to the Index. Due to the use of representative sampling, the Fund may or may not hold all of the securities that are included in the Index. For the 12-month period ended August 31, 2009 (the “reporting period”), the total return for the Fund was (13.08)%, while the total return for the Index was (13.43)%.
MARKET OVERVIEW AND DISCUSSION OF PERFORMANCE
The Fund posted a double-digit decline for the reporting period in an intense and volatile investment environment. Equity markets worldwide retracted early in the reporting period amid one of the worst global economic downturns since World War II and a credit challenge that led to the near-collapse of some of the world’s largest financial institutions. However, in the last six months of the reporting period, global stock markets reversed course, enjoying a tremendous recovery as initial signs of economic stabilization – mainly in the U.S. – and an easing of the credit crunch boosted investor confidence.
Three of the four markets comprising the Index – Brazil, Russia, and India – declined overall for the reporting period. The exception was China, though it produced only a modest positive return for the period. All four countries faced sharp declines in export demand as the global economy weakened in late 2008 and early 2009. In particular, Brazil and Russia were affected negatively by declining demand for commodities, especially oil and metals. The result was a pronounced drop in each of the four stock markets in the first half of the reporting period.
Each country’s government took steps to resuscitate its respective economy. The Chinese government implemented a domestic spending plan, including increased investment in infrastructure and greater lending activity, to offset the drop in exports and restore the country’s robust economic growth rate. India expanded government subsidies to sustain economic activity, while Brazil’s central bank reduced interest rates and Russia limited speculation that could harm its currency. These efforts, combined with improving economic conditions worldwide, helped generated a substantial rebound in BRIC markets in the last half of the reporting period.
China and India held up the best, with China advancing modestly and India declining modestly for the reporting period. Both of these countries had the least exposure to falling commodity prices and the greatest success maintaining their economic growth rates. Brazil’s equity market suffered a double-digit decline, while Russia posted the largest losses – the world’s largest oil producer felt the impact of a 30% decline in the price of oil.
Six of the Fund’s ten largest holdings as of August 31, 2009 declined for the reporting period, led by energy producers OAO Gazprom of Russia and Petroleo Brasileiro SA of Brazil, which struggled with reduced demand for energy and falling oil prices. Other notable decliners that were hurt by falling commodity prices included Brazilian metals and mining company Vale SA and Indian energy conglomerate Reliance Industries Ltd. On the positive side, the best performer among the top ten holdings was Chinese insurer China Life Insurance Co. Ltd. Commercial banks HDFC Bank Ltd. in India and Itau Unibanco Holding SA in Brazil also fared well.
| 4 | 2009 iSHARES ANNUAL REPORTTO SHAREHOLDERS |
Table of Contents
Management’s Discussion of Fund Performance (Continued)
iSHARES® MSCI BRIC INDEX FUND
Performance as of August 31, 2009
| Average Annual Total Returns | Cumulative Total Returns | |||||||||||||||
| Year Ended 8/31/09 | Inception to 8/31/09 | Inception to 8/31/09 | ||||||||||||||
| NAV | MARKET | INDEX | NAV | MARKET | INDEX | NAV | MARKET | INDEX | ||||||||
| (13.08)% | (13.48)% | (13.43)% | (19.17)% | (19.42)% | (19.76)% | (31.90)% | (32.29)% | (32.80)% | ||||||||
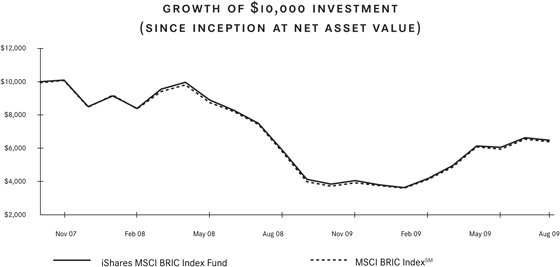
Total returns for the period since inception are calculated from the inception date of the Fund (11/12/07). “Average Annual Total Returns” represent the average annual change in value of an investment over the period(s) indicated. “Cumulative Total Returns” represent the total change in value of an investment over the period(s) indicated.
The Fund’s per share net asset value or “NAV” is the value of one share of the Fund as calculated in accordance with the standard formula for valuing mutual fund shares. The NAV return is based on the NAV of the Fund and the market return is based on the market price per share of the Fund. The price used to calculate market return (“Market Price”) is determined by using the midpoint between the highest bid and the lowest offer on the primary stock exchange on which the shares of the Fund are listed for trading, as of the time that the Fund’s NAV is calculated. Since shares of the Fund did not trade in the secondary market until after the Fund’s inception, for the period from inception to the first day of secondary market trading in shares of the Fund (11/16/07), the NAV of the Fund is used as a proxy for the Market Price to calculate market returns. Market and NAV returns assume that dividends and capital gain distributions have been reinvested in the Fund at Market Price and NAV, respectively.
An index is a statistical composite that tracks a specified financial market or sector. Unlike the Fund, an index does not actually hold a portfolio of securities and therefore does not incur the expenses incurred by the Fund. These expenses negatively impact the performance of the Fund. Also, market returns do not include brokerage commissions that may be payable on secondary market transactions. If brokerage commissions were included, market returns would be lower. The performance shown in the table(s) and chart(s) above assumes reinvestment of all dividends and capital gain distributions and does not reflect the deduction of taxes that a shareholder would pay on fund distributions or the redemption or sale of fund shares. The investment return and principal value of shares of the Fund will vary with changes in market conditions. Shares of the Fund may be worth more or less than their original cost when they are redeemed or sold in the market. The Fund’s past performance is no guarantee of future results.
| MANAGEMENT’S DISCUSSIONS OF FUND PERFORMANCE | 5 |
Table of Contents
Management’s Discussion of Fund Performance (Continued)
iSHARES® MSCI BRIC INDEX FUND
| PORTFOLIO ALLOCATION As of 8/31/09 | |||
| Sector | Percentage of Net Assets | ||
Financial | 27.35 | % | |
Energy | 27.22 | ||
Basic Materials | 11.61 | ||
Communications | 10.33 | ||
Consumer Non-Cyclical | 6.11 | ||
Technology | 5.81 | ||
Industrial | 4.14 | ||
Utilities | 2.51 | ||
Diversified | 2.43 | ||
Consumer Cyclical | 2.16 | ||
Short-Term and Other Net Assets | 0.33 | ||
TOTAL | 100.00 | % | |
| TEN LARGEST FUND HOLDINGS As of 8/31/09 | |||
| Security | Percentage of Net Assets | ||
China Mobile Ltd. (China) | 4.66 | % | |
Petroleo Brasileiro SA | 4.25 | ||
OAO Gazprom SP ADR (Russia) | 4.14 | ||
Petroleo Brasileiro SA (Brazil) | 3.60 | ||
Reliance Industries Ltd. SP | 3.59 | ||
Vale SA Class A Preferred (Brazil) | 2.97 | ||
Itau Unibanco Holding SA Preferred (Brazil) | 2.88 | ||
Infosys Technologies Ltd. SP ADR (India) | 2.76 | ||
China Life Insurance Co. Ltd. Class H (China) | 2.69 | ||
HDFC Bank Ltd. SP ADR (India) | 2.43 | ||
TOTAL | 33.97 | % | |
| 6 | 2009 iSHARES ANNUAL REPORTTO SHAREHOLDERS |
Table of Contents
Management’s Discussion of Fund Performance
iSHARES® MSCI CANADA INDEX FUND
(TICKER: EWC)
INVESTMENT OBJECTIVE
The iShares MSCI Canada Index Fund (the “Fund”) seeks to provide investment results that correspond generally to the price and yield performance, before fees and expenses, of publicly traded securities in the aggregate in the Canadian market, as measured by the MSCI Canada IndexSM (the “Index”). The Fund invests in a representative sample of securities included in the Index that collectively has an investment profile similar to the Index. Due to the use of representative sampling, the Fund may or may not hold all of the securities that are included in the Index. For the 12-month period ended August 31, 2009 (the “reporting period”), the total return for the Fund was (20.51)%, while the total return for the Index was (20.43)%.
MARKET OVERVIEW AND DISCUSSION OF PERFORMANCE
The Canadian stock market declined by more than 20% for the reporting period, reflecting an intense and volatile global investment environment. Canada’s equity market declined in the last four months of 2008 amid one of the worst global economic downturns since World War II and a liquidity challenge in the credit markets. The economic malaise was particularly acute in the U.S., Canada’s neighbor and largest trading partner – more than three-quarters of Canada’s exports are sent to the U.S. A substantial drop in global demand for oil and other commodities, which are a major portion of Canada’s exports, also contributed to the slowdown in the Canadian economy, which contracted by 3.2% for the 12 months ended June 30, 2009.
On the positive side, the Canadian banking industry mitigated the mortgage-related problems that afflicted financial companies in the U.S. and elsewhere in the world, remaining profitable despite a global credit crunch. In addition, the Bank of Canada, the country’s central bank, lowered its overnight lending rate from 3.0% to 0.25% during the reporting period to help boost domestic spending and stimulate economic activity. The federal government enacted some fiscal measures to help shore up the auto industry and other struggling segments of the economy.
Market conditions improved in the last half of the reporting period. Early signs of economic stabilization, both in Canada and the U.S., boosted expectations of a nascent global recovery and helped restore investor confidence. Commodity prices stabilized and began to retrace some of their declines, which was also supportive for the Canadian economy. As a result, the Canadian stock market staged a sharp recovery, as the Index returned more than 50% for the last six months of the reporting period. However, it was insufficient to fully offset the steep decline in late 2008 and early 2009.
Seven of the Fund’s ten largest holdings as of August 31, 2009 declined for the reporting period, led by energy producers Suncor Energy Inc. and Canadian Natural Resources Ltd., both of which struggled with reduced demand for energy and falling oil prices. Other notable decliners included financial services firm Manulife Financial Corp. and wireless products maker Research in Motion Ltd. The best performers among the Fund’s top ten holdings were banking stocks Royal Bank of Canada and Toronto-Dominion Bank, which were the Fund’s two largest holdings as of August 31, 2009.
| MANAGEMENT’S DISCUSSIONSOF FUND PERFORMANCE | 7 |
Table of Contents
Management’s Discussion of Fund Performance (Continued)
iSHARES® MSCI CANADA INDEX FUND
Performance as of August 31, 2009
| Average Annual Total Returns | ||||||||||||||||
| Year Ended 8/31/09 | Five Years Ended 8/31/09 | Ten Years Ended 8/31/09 | ||||||||||||||
| NAV | MARKET | INDEX | NAV | MARKET | INDEX | NAV | MARKET | INDEX | ||||||||
| (20.51)% | (20.12)% | (20.43)% | 12.14% | 12.06% | 12.40% | 10.16% | 10.16% | 10.50% | ||||||||
| Cumulative Total Returns | ||||||||||||||||
| Year Ended 8/31/09 | Five Years Ended 8/31/09 | Ten Years Ended 8/31/09 | ||||||||||||||
| NAV | MARKET | INDEX | NAV | MARKET | INDEX | NAV | MARKET | INDEX | ||||||||
| (20.51)% | (20.12)% | (20.43)% | 77.34% | 76.70% | 79.40% | 163.18% | 163.08% | 171.41% | ||||||||
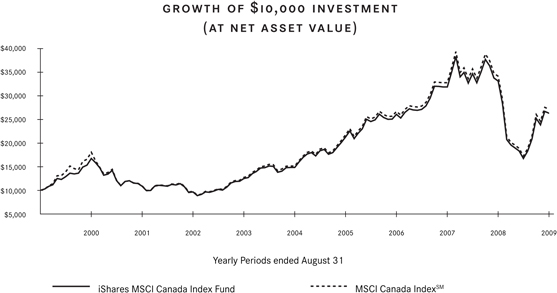
“Average Annual Total Returns” represent the average annual change in value of an investment over the period(s) indicated. “Cumulative Total Returns” represent the total change in value of an investment over the period(s) indicated.
The Fund’s per share net asset value or “NAV” is the value of one share of the Fund as calculated in accordance with the standard formula for valuing mutual fund shares. The NAV return is based on the NAV of the Fund and the market return is based on the market price per share of the Fund. The price used to calculate market return (“Market Price”) is determined by using the midpoint between the highest bid and the lowest offer on the primary stock exchange on which the shares of the Fund are listed for trading, as of the time that the Fund’s NAV is calculated. Market and NAV returns assume that dividends and capital gain distributions have been reinvested in the Fund at Market Price and NAV, respectively.
An index is a statistical composite that tracks a specified financial market or sector. Unlike the Fund, an index does not actually hold a portfolio of securities and therefore does not incur the expenses incurred by the Fund. These expenses negatively impact the performance of the Fund. Also, market returns do not include brokerage commissions that may be payable on secondary market transactions. If brokerage commissions were included, market returns would be lower. The performance shown in the table(s) and chart(s) above assumes reinvestment of all dividends and capital gain distributions and does not reflect the deduction of taxes that a shareholder would pay on fund distributions or the redemption or sale of fund shares. The investment return and principal value of shares of the Fund will vary with changes in market conditions. Shares of the Fund may be worth more or less than their original cost when they are redeemed or sold in the market. The Fund’s past performance is no guarantee of future results.
| 8 | 2009 iSHARES ANNUAL REPORT TO SHAREHOLDERS |
Table of Contents
Management’s Discussion of Fund Performance (Continued)
iSHARES® MSCI CANADA INDEX FUND
PORTFOLIO ALLOCATION As of 8/31/09 | |||
| Sector | Percentage of Net Assets | ||
Financial | 34.99 | % | |
Energy | 24.51 | ||
Basic Materials | 18.53 | ||
Industrial | 5.33 | ||
Communications | 4.78 | ||
Technology | 4.60 | ||
Consumer Cyclical | 2.35 | ||
Consumer Non-Cyclical | 2.05 | ||
Diversified | 1.50 | ||
Utilities | 1.15 | ||
Short-Term and Other Net Assets | 0.21 | ||
TOTAL | 100.00 | % | |
TEN LARGEST FUND HOLDINGS As of 8/31/09 | |||
| Security | Percentage of Net Assets | ||
Royal Bank of Canada | 7.89 | % | |
Toronto-Dominion Bank (The) | 5.73 | ||
Suncor Energy Inc. | 5.18 | ||
Bank of Nova Scotia | 4.52 | ||
EnCana Corp. | 4.26 | ||
Research In Motion Ltd. | 4.08 | ||
Manulife Financial Corp. | 3.61 | ||
Canadian Natural Resources Ltd. | 3.38 | ||
Barrick Gold Corp. | 3.28 | ||
Goldcorp Inc. | 2.89 | ||
TOTAL | 44.82 | % | |
| MANAGEMENT’S DISCUSSIONSOF FUND PERFORMANCE | 9 |
Table of Contents
Management’s Discussion of Fund Performance
iSHARES® MSCI CHILE INVESTABLE MARKET INDEX FUND
(TICKER: ECH)
INVESTMENT OBJECTIVE
The iShares MSCI Chile Investable Market Index Fund (the “Fund”) seeks to provide investment results that correspond generally to the price and yield performance, before fees and expenses, of the MSCI Chile Investable Market IndexSM (the “Index”). The Index is designed to measure broad based equity market performance in Chile. The Fund invests in a representative sample of securities included in the Index that collectively has an investment profile similar to the Index. Due to the use of representative sampling, the Fund may or may not hold all of the securities that are included in the Index. For the 12-month period ended August 31, 2009 (the “reporting period”), the total return for the Fund was 0.89%, while the total return for the Index was 0.52%.
MARKET OVERVIEW AND DISCUSSION OF PERFORMANCE
The Chilean stock market advanced modestly for the reporting period, but its relatively flat return masked considerable volatility in an intense investment environment. Chile’s equity market declined in the first two months of the reporting period amid one of the worst global economic downturns since World War II and a liquidity challenge in the credit markets. In particular, a substantial drop in global demand for commodities – particularly copper, which comprises nearly half of Chile’s exports – contributed to a marked slowdown in the country’s economy. After years of robust growth, the Chilean economy contracted by 4.5% for the 12 months ended June 30, 2009. Increased risk aversion among investors was another contributing factor to the stock market decline in Chile and many other emerging markets.
However, the Chilean government maintained a fiscal policy that appears to have forced the country to save much of the revenues earned when copper prices rise. As a result, Chile has a large sovereign wealth fund that allowed the government to enact fiscal stimulus to boost the economy without increasing the country’s debt. Chile’s central bank also reduced interest rates sharply to stimulate domestic consumption. These actions appear to have contributed to the modest recovery of Chile’s stock market in late 2008 and early 2009, while many other emerging markets were still declining.
The recovery in the Chilean equity market accelerated during the last six months of the reporting period. Early signs of economic stabilization elsewhere, primarily in the U.S., may have raised expectations of a nascent global recovery and helped restore investor confidence. Commodity prices firmed up and began to retrace some of their declines, which was also supportive for the Chilean economy. By the end of the reporting period, Chile’s stock market had returned to the same levels as at the beginning of the period.
Among the Fund’s ten largest holdings as of August 31, 2009 the top performer was commercial bank Banco Santander Chile SA, which held up well by largely avoiding the mortgage-related problems that afflicted financial companies in many other regions of the world. Other positive performers included electric utilities Colbun SA and Enersis SA, which were relatively immune to the economic downturn as demand and prices for power remained relatively steady. On the downside, steel and iron producer CAP SA suffered the largest declines, weighed down by the broad decline in commodity prices. Chemicals producer Sociedad Quimica y Minera de Chile SA and food retailer Cencosud SA also declined during the reporting period.
| 10 | 2009 iSHARES ANNUAL REPORTTO SHAREHOLDERS |
Table of Contents
Management’s Discussion of Fund Performance (Continued)
iSHARES® MSCI CHILE INVESTABLE MARKET INDEX FUND
Performance as of August 31, 2009
| Average Annual Total Returns | Cumulative Total Returns | |||||||||||||||
| Year Ended 8/31/09 | Inception to 8/31/09 | Inception to 8/31/09 | ||||||||||||||
| NAV | MARKET | INDEX | NAV | MARKET | INDEX | NAV | MARKET | INDEX | ||||||||
| 0.89% | 1.57% | 0.52% | (3.55)% | (3.78)% | (3.68)% | (6.32)% | (6.73)% | (6.54)% | ||||||||
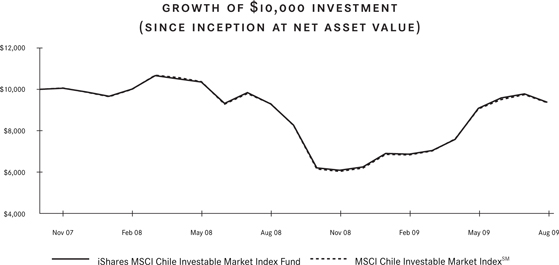
Total returns for the period since inception are calculated from the inception date of the Fund (11/12/07). “Average Annual Total Returns” represent the average annual change in value of an investment over the period(s) indicated. “Cumulative Total Returns” represent the total change in value of an investment over the period(s) indicated.
The Fund’s per share net asset value or “NAV” is the value of one share of the Fund as calculated in accordance with the standard formula for valuing mutual fund shares. The NAV return is based on the NAV of the Fund and the market return is based on the market price per share of the Fund. The price used to calculate market return (“Market Price”) is determined by using the midpoint between the highest bid and the lowest offer on the primary stock exchange on which the shares of the Fund are listed for trading, as of the time that the Fund’s NAV is calculated. Since shares of the Fund did not trade in the secondary market until after the Fund’s inception, for the period from inception to the first day of secondary market trading in shares of the Fund (11/16/07), the NAV of the Fund is used as a proxy for the Market Price to calculate market returns. Market and NAV returns assume that dividends and capital gain distributions have been reinvested in the Fund at Market Price and NAV, respectively.
An index is a statistical composite that tracks a specified financial market or sector. Unlike the Fund, an index does not actually hold a portfolio of securities and therefore does not incur the expenses incurred by the Fund. These expenses negatively impact the performance of the Fund. Also, market returns do not include brokerage commissions that may be payable on secondary market transactions. If brokerage commissions were included, market returns would be lower. The performance shown in the table(s) and chart(s) above assumes reinvestment of all dividends and capital gain distributions and does not reflect the deduction of taxes that a shareholder would pay on fund distributions or the redemption or sale of fund shares. The investment return and principal value of shares of the Fund will vary with changes in market conditions. Shares of the Fund may be worth more or less than their original cost when they are redeemed or sold in the market. The Fund’s past performance is no guarantee of future results.
| MANAGEMENT’S DISCUSSIONSOF FUND PERFORMANCE | 11 |
Table of Contents
Management’s Discussion of Fund Performance (Continued)
iSHARES® MSCI CHILE INVESTABLE MARKET INDEX FUND
PORTFOLIO ALLOCATION As of 8/31/09 | |||
| Sector | Percentage of Net Assets | ||
Utilities | 31.69 | % | |
Basic Materials | 19.47 | ||
Diversified | 12.40 | ||
Consumer Cyclical | 10.89 | ||
Consumer Non-Cyclical | 9.74 | ||
Financial | 9.06 | ||
Communications | 3.02 | ||
Industrial | 2.55 | ||
Technology | 1.08 | ||
Short-Term and Other Net Assets | 0.10 | ||
TOTAL | 100.00 | % | |
TEN LARGEST FUND HOLDINGS As of 8/31/09 | |||
| Security | Percentage of Net Assets | ||
Empresas Copec SA | 12.40 | % | |
Empresa Nacional de Electricidad SA | 11.48 | ||
Enersis SA | 10.30 | ||
Sociedad Quimica y Minera de Chile SA Series B | 7.59 | ||
Empresas CMPC SA | 6.37 | ||
Banco Santander Chile SA | 4.98 | ||
Cencosud SA | 4.73 | ||
CAP SA | 4.35 | ||
Colbun SA | 4.07 | ||
LAN Airlines SA | 4.00 | ||
TOTAL | 70.27 | % | |
| 12 | 2009 iSHARES ANNUAL REPORTTO SHAREHOLDERS |
Table of Contents
Management’s Discussion of Fund Performance
iSHARES® MSCI ISRAEL CAPPED INVESTABLE MARKET INDEX FUND
(TICKER: EIS)
INVESTMENT OBJECTIVE
The iShares MSCI Israel Capped Investable Market Index Fund (the “Fund”) seeks to provide investment results that correspond generally to the price and yield performance, before fees and expenses, of the MSCI Israel Capped Investable Market IndexSM (the “Index”). The Index is a custom, free float adjusted market capitalization index designed to measure broad based equity market performance in Israel. The Fund invests in a representative sample of securities included in the Index that collectively has an investment profile similar to the Index. Due to the use of representative sampling, the Fund may or may not hold all of the securities that are included in the Index. For the 12-month period ended August 31, 2009 (the “reporting period”), the total return for the Fund was (0.63)%, while the total return for the Index was (1.25)%.
MARKET OVERVIEW AND DISCUSSION OF PERFORMANCE
The Israel stock market declined fractionally for the reporting period, but experienced considerable volatility in an intense investment environment. Israel’s equity market declined in the first three months of the reporting period amid one of the worst global economic downturns since World War II and a liquidity challenge in the credit markets. The economic malaise was particularly acute in the U.S., Israel’s largest trading partner, but also had a substantial impact on other regions of the world. Consequently, exports from Israel, which comprise nearly half of the country’s economic growth, weakened significantly, and foreign investment and tourism also waned. The end result was an economic growth rate of just 0.1% for the 12 months ended June 30, 2009.
However, virtually every developed country, and many emerging economies, faced economic contraction during the reporting period; Israel was one of the few countries to generate flat or positive growth despite the global downturn. One factor in Israel’s favor was a stable financial industry that appears to have mitigated the mortgage-related problems afflicting financial companies in the U.S. and elsewhere in the world. Increased government spending on infrastructure, including road and school construction, also appear to have helped sustain Israel’s economic growth.
The Israel stock market staged a healthy rebound during the last six months of the reporting period. Early signs of economic stabilization, primarily in the U.S., may have raised expectations of a nascent global recovery. Increased risk aversion, which had been a contributing factor to the stock market decline in Israel and many other emerging markets in late 2008, appeared to give way to renewed investor confidence. By the end of the reporting period, Israel’s stock market had recovered nearly its entire decline from earlier in the period.
Among the Fund’s ten largest holdings as of August 31, 2009 the top performer was Bezeq Israeli Telecommunication Corp. Ltd., Israel’s largest telecommunication services provider, which benefited from strength in its wireless business. Other positive performers included aerospace and defense company Elbit Systems Ltd., which was largely unaffected by the economic downturn, and commercial bank Mizrahi Tefahot Bank Ltd. On the downside, chemicals producer Israel Chemicals Ltd. posted the largest decline as the company struggled with reduced demand for commodities and lower commodity prices. Commercial bank Bank Hapoalim Ltd. was among the few Israeli banks with exposure to the U.S. mortgage market, which forced the company to take losses on some of its mortgage-backed securities and other assets.
| MANAGEMENT’S DISCUSSIONSOF FUND PERFORMANCE | 13 |
Table of Contents
Management’s Discussion of Fund Performance (Continued)
iSHARES® MSCI ISRAEL CAPPED INVESTABLE MARKET INDEX FUND
Performance as of August 31, 2009
| Average Annual Total Returns | Cumulative Total Returns | |||||||||||||||
| Year Ended 8/31/09 | Inception to 8/31/09 | Inception to 8/31/09 | ||||||||||||||
| NAV | MARKET | INDEX | NAV | MARKET | INDEX | NAV | MARKET | INDEX | ||||||||
| (0.63)% | 1.44% | (1.25)% | (2.81)% | (2.76)% | (1.87)% | (4.01)% | (3.94)% | (2.67)% | ||||||||
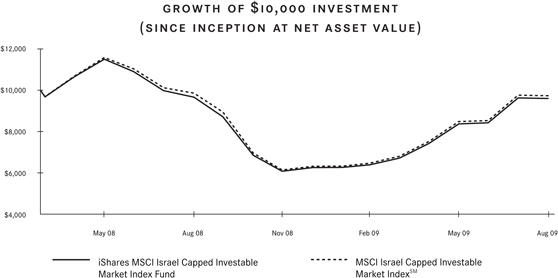
Total returns for the period since inception are calculated from the inception date of the Fund (3/26/08). “Average Annual Total Returns” represent the average annual change in value of an investment over the period(s) indicated. “Cumulative Total Returns” represent the total change in value of an investment over the period(s) indicated.
The Fund’s per share net asset value or “NAV” is the value of one share of the Fund as calculated in accordance with the standard formula for valuing mutual fund shares. The NAV return is based on the NAV of the Fund and the market return is based on the market price per share of the Fund. The price used to calculate market return (“Market Price”) is determined by using the midpoint between the highest bid and the lowest offer on the primary stock exchange on which the shares of the Fund are listed for trading, as of the time that the Fund’s NAV is calculated. Since shares of the Fund did not trade in the secondary market until after the Fund’s inception, for the period from inception to the first day of secondary market trading in shares of the Fund (3/28/08), the NAV of the Fund is used as a proxy for the Market Price to calculate market returns. Market and NAV returns assume that dividends and capital gain distributions have been reinvested in the Fund at Market Price and NAV, respectively.
An index is a statistical composite that tracks a specified financial market or sector. Unlike the Fund, an index does not actually hold a portfolio of securities and therefore does not incur the expenses incurred by the Fund. These expenses negatively impact the performance of the Fund. Also, market returns do not include brokerage commissions that may be payable on secondary market transactions. If brokerage commissions were included, market returns would be lower. The performance shown in the table(s) and chart(s) above assumes reinvestment of all dividends and capital gain distributions and does not reflect the deduction of taxes that a shareholder would pay on fund distributions or the redemption or sale of fund shares. The investment return and principal value of shares of the Fund will vary with changes in market conditions. Shares of the Fund may be worth more or less than their original cost when they are redeemed or sold in the market. The Fund’s past performance is no guarantee of future results.
| 14 | 2009 iSHARES ANNUAL REPORT TO SHAREHOLDERS |
Table of Contents
Management’s Discussion of Fund Performance (Continued)
iSHARES® MSCI ISRAEL CAPPED INVESTABLE MARKET INDEX FUND
PORTFOLIO ALLOCATION As of 8/31/09 | |||
| Sector | Percentage of Net Assets | ||
Financial | 26.24 | % | |
Consumer Non-Cyclical | 25.43 | ||
Communications | 24.37 | ||
Basic Materials | 13.17 | ||
Industrial | 6.18 | ||
Energy | 1.32 | ||
Consumer Cyclical | 1.24 | ||
Technology | 1.01 | ||
Diversified | 0.61 | ||
Short-Term and Other Net Assets | 0.43 | ||
TOTAL | 100.00 | % | |
TEN LARGEST FUND HOLDINGS As of 8/31/09 | |||
| Security | Percentage of Net Assets | ||
Teva Pharmaceutical Industries Ltd. | 23.02 | % | |
Israel Chemicals Ltd. | 9.83 | ||
Check Point Software Technologies Ltd. | 7.78 | ||
Bank Leumi le-Israel | 6.47 | ||
Bezeq Israeli Telecommunication Corp. Ltd. | 4.96 | ||
Bank Hapoalim Ltd. | 4.69 | ||
NICE Systems Ltd. | 3.36 | ||
Partner Communications Co. Ltd. | 3.26 | ||
Elbit Systems Ltd. | 2.91 | ||
Mizrahi Tefahot Bank Ltd. | 2.53 | ||
TOTAL | 68.81 | % | |
| MANAGEMENT’S DISCUSSIONSOF FUND PERFORMANCE | 15 |
Table of Contents
Management’s Discussion of Fund Performance
iSHARES® MSCI MEXICO INVESTABLE MARKET INDEX FUND
(TICKER: EWW)
INVESTMENT OBJECTIVE
The iShares MSCI Mexico Investable Market Index Fund (the “Fund”) seeks to provide investment results that correspond generally to the price and yield performance, before fees and expenses, of publicly traded securities in the aggregate in the Mexican market, as measured by the MSCI Mexico Investable Market IndexSM (the “Index”). The Fund invests in a representative sample of securities included in the Index that collectively has an investment profile similar to the Index. Due to the use of representative sampling, the Fund may or may not hold all of the securities that are included in the Index. For the 12-month period ended August 31, 2009 (the “reporting period”), the total return for the Fund was (16.50)%, while the total return for the Index was (16.23)%.
MARKET OVERVIEW AND DISCUSSION OF PERFORMANCE
The Mexican stock market posted a double-digit decline during the reporting period, reflecting an intense and volatile global investment environment. Mexico’s equity market retracted by more than 40% in the first three months of the reporting period amid one of the worst global economic downturns since World War II and a liquidity challenge in the credit markets. The economic malaise was particularly acute in the U.S., Mexico’s neighbor and largest trading partner as 85% of Mexico’s exports are sent to the U.S. A substantial drop in global demand for oil – Mexico’s state-owned oil company is the world’s third-largest oil producer – also contributed to a marked slowdown in the Mexican economy. Meanwhile, an outbreak of the H1N1 virus and an increase in drug-related violence dampened tourism, another critical component of Mexico’s economy. At the same time, a flight of foreign capital out of Mexico led to a lack of liquidity in the country’s financial system, which hampered lending activity. The end result was a 10.3% contraction in Mexico’s economy for the 12 months ended June 30, 2009; only Russia experienced a greater economic contraction over the same period.
Nonetheless, Mexico’s stock market enjoyed a strong recovery in the last half of the reporting period. Early signs of economic stabilization, primarily in the U.S., may have boosted expectations of a nascent global recovery. Increased risk aversion, which appears to have been a contributing factor to the stock market decline in Mexico and many other emerging markets in late 2008, appeared to give way to renewed investor confidence. The prices of oil and other commodities stabilized and began to retrace some of their declines, which was supportive for the Mexican economy. Ultimately, the improving outlook helped the Mexican stock market surge by approximately 80% over the last six months of the reporting period. Even this robust gain, though, was insufficient to fully offset the steep decline in late 2008.
Each of the Fund’s ten largest holdings as of August 31, 2009 declined for the reporting period, led by cement producer Cemex SAB de CV, which struggled with declining demand and lower prices. Two telecommunication services stocks, Telefonos de Mexico SAB de CV and Carso Global Telecom SAB de CV, and financial services stock Grupo Financiero Banorte SAB de CV were also among the largest decliners during the reporting period. The best performer among the Fund’s top ten holdings was discount retailer Wal-Mart de Mexico SAB de CV, which declined modestly for the reporting period. Wal-Mart benefited from increased demand as consumers traded down to lower-priced goods during a recession. Metals and mining company Grupo Mexico SAB de CV and telecom services provider Telmex Internacional SAB de CV also held up well during the reporting period.
| 16 | 2009 iSHARES ANNUAL REPORTTO SHAREHOLDERS |
Table of Contents
Management’s Discussion of Fund Performance (Continued)
iSHARES® MSCI MEXICO INVESTABLE MARKET INDEX FUND
Performance as of August 31, 2009
| Average Annual Total Returns | ||||||||||||||||
| Year Ended 8/31/09 | Five Years Ended 8/31/09 | Ten Years Ended 8/31/09 | ||||||||||||||
| NAV | MARKET | INDEX | NAV | MARKET | INDEX | NAV | MARKET | INDEX | ||||||||
| (16.50)% | (16.91)% | (16.23)% | 18.98% | 18.81% | 18.78% | 14.25% | 14.28% | 14.71% | ||||||||
| Cumulative Total Returns | ||||||||||||||||
| Year Ended 8/31/09 | Five Years Ended 8/31/09 | Ten Years Ended 8/31/09 | ||||||||||||||
| NAV | MARKET | INDEX | NAV | MARKET | INDEX | NAV | MARKET | INDEX | ||||||||
| (16.50)% | (16.91)% | (16.23)% | 138.42% | 136.77% | 136.44% | 279.05% | 279.98% | 294.47% | ||||||||
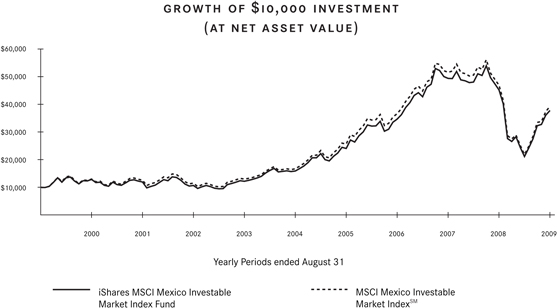
“Average Annual Total Returns “represent the average annual change in value of an investment over the period(s) indicated. “Cumulative Total Returns” represent the total change in value of an investment over the period(s) indicated.
The Fund’s per share net asset value or “NAV” is the value of one share of the Fund as calculated in accordance with the standard formula for valuing mutual fund shares. The NAV return is based on the NAV of the Fund and the market return is based on the market price per share of the Fund. The price used to calculate market return (“Market Price”) is determined by using the midpoint between the highest bid and the lowest offer on the primary stock exchange on which the shares of the Fund are listed for trading, as of the time that the Fund’s NAV is calculated. Market and NAV returns assume that dividends and capital gain distributions have been reinvested in the Fund at Market Price and NAV, respectively.
An index is a statistical composite that tracks a specified financial market or sector. Unlike the Fund, an index does not actually hold a portfolio of securities and therefore does not incur the expenses incurred by the Fund. These expenses negatively impact the performance of the Fund. Also, market returns do not include brokerage commissions that may be payable on secondary market transactions. If brokerage commissions were included, market returns would be lower. The performance shown in the table(s) and chart(s) above assumes reinvestment of all dividends and capital gain distributions and does not reflect the deduction of taxes that a shareholder would pay on fund distributions or the redemption or sale of fund shares. The investment return and principal value of shares of the Fund will vary with changes in market conditions. Shares of the Fund may be worth more or less than their original cost when they are redeemed or sold in the market. The Fund’s past performance is no guarantee of future results.
| MANAGEMENT’S DISCUSSIONSOF FUND PERFORMANCE | 17 |
Table of Contents
Management’s Discussion of Fund Performance (Continued)
iSHARES® MSCI MEXICO INVESTABLE MARKET INDEX FUND
PORTFOLIO ALLOCATION As of 8/31/09 | |||
| Sector | Percentage of Net Assets | ||
Communications | 42.86 | % | |
Consumer Cyclical | 14.45 | ||
Consumer Non-Cyclical | 12.25 | ||
Basic Materials | 10.18 | ||
Industrial | 9.08 | ||
Financial | 6.95 | ||
Diversified | 4.11 | ||
Short-Term and Other Net Assets | 0.12 | ||
TOTAL | 100.00 | % | |
TEN LARGEST FUND HOLDINGS As of 8/31/09 | |||
| Security | Percentage of Net Assets | ||
America Movil SAB de CV Series L | 24.30 | % | |
Wal-Mart de Mexico SAB de CV Series V | 7.91 | ||
Fomento Economico Mexicano SAB de CV BD Units | 5.61 | ||
Telefonos de Mexico SAB de CV Series L | 5.03 | ||
Cemex SAB de CV CPO | 4.98 | ||
Grupo Televisa SA CPO | 4.84 | ||
Grupo Mexico SAB de CV Series B | 4.80 | ||
Telmex Internacional SAB de CV Series L | 3.88 | ||
Grupo Financiero Banorte SAB de CV Series O | 3.86 | ||
Carso Global Telecom SAB de CV Series A1 | 3.30 | ||
TOTAL | 68.51 | % | |
| 18 | 2009 iSHARES ANNUAL REPORTTO SHAREHOLDERS |
Table of Contents
Management’s Discussion of Fund Performance
iSHARES® MSCI SOUTH AFRICA INDEX FUND
(TICKER: EZA)
INVESTMENT OBJECTIVE
The iShares MSCI South Africa Index Fund (the “Fund”) seeks to provide investment results that correspond generally to the price and yield performance, before fees and expenses, of publicly traded securities in the aggregate in the South African market, as measured by the MSCI South Africa IndexSM (the “Index”). The Fund invests in a representative sample of securities included in the Index that collectively has an investment profile similar to the Index. Due to the use of representative sampling, the Fund may or may not hold all of the securities that are included in the Index. For the 12-month period ended August 31, 2009 (the “reporting period”), the total return for the Fund was (2.23)%, while the total return for the Index was (0.18)%.
MARKET OVERVIEW AND DISCUSSION OF PERFORMANCE
The South African stock market declined modestly for the reporting period, but experienced considerable volatility in an intense investment environment. South Africa’s equity market declined in the first two months of the reporting period amid one of the worst global economic downturn since World War II and a liquidity challenge in the credit markets. In particular, a substantial drop in global demand for commodities, a major component of South Africa’s exports, contributed to a marked slowdown in the country’s economy. Manufacturing and retail sales also declined, and unemployment hovered around 25% by the end of the reporting period. The end result was a 2.8% contraction in the South African economy for the 12 months ended June 30, 2009, the country’s first recession in 17 years.
South Africa’s central bank reduced interest rates from 12% to 7% in an effort to boost the economy. In addition, the country’s banking system remained sound, with little exposure to the mortgage-related problems that afflicted financial companies in the U.S. and elsewhere in the world. Finally, the government embarked on a three-year infrastructure build-out to help create jobs and stimulate economic activity. These factors helped keep the South African economy from the global recession.
The South African stock market staged a healthy rebound during the last half of the reporting period. Early signs of economic stabilization, primarily in the U.S., may have raised expectations of a nascent global recovery. Increased risk aversion, which had been a contributing factor to the stock market decline in South Africa and many other emerging markets in late 2008, appeared to give way to renewed investor confidence. Commodity prices firmed up and began to retrace some of their declines, which was also supportive for the South African economy. By the end of the reporting period, South African’s stock market had regained nearly all of its losses from late 2008.
Seven of the Fund’s ten largest holdings as of August 31, 2009 advanced for the reporting period. The top performers were gold producers Gold Fields Ltd. and AngloGold Ashanti Ltd., both of which benefited from a 15% increase in the price of gold during the reporting period. Electronic media company Naspers Ltd. and financial services firm Sanlam Ltd. were also among the better performers. On the downside, the three decliners among the Fund’s top ten holdings were all commodity-related stocks, energy producer Sasol Ltd. and metals and mining companies Anglo Platinum Ltd. and Impala Platinum Holdings Ltd. All three companies struggled with reduced demand for commodities and lower commodity prices.
| MANAGEMENT’S DISCUSSIONSOF FUND PERFORMANCE | 19 |
Table of Contents
Management’s Discussion of Fund Performance (Continued)
iSHARES® MSCI SOUTH AFRICA INDEX FUND
Performance as of August 31, 2009
| Average Annual Total Returns | ||||||||||||||||
| Year Ended 8/31/09 | Five Years Ended 8/31/09 | Inception to 8/31/09 | ||||||||||||||
| NAV | MARKET | INDEX | NAV | MARKET | INDEX | NAV | MARKET | INDEX | ||||||||
| (2.23)% | (0.51)% | (0.18)% | 15.07% | 14.98% | 16.42% | 19.37% | 19.44% | 20.77% | ||||||||
| Cumulative Total Returns | ||||||||||||||||
| Year Ended 8/31/09 | Five Years Ended 8/31/09 | Inception to 8/31/09 | ||||||||||||||
| NAV | MARKET | INDEX | NAV | MARKET | INDEX | NAV | MARKET | INDEX | ||||||||
| (2.23)% | (0.51)% | (0.18)% | 101.76% | 100.94% | 113.86% | 220.30% | 221.58% | 246.16% | ||||||||
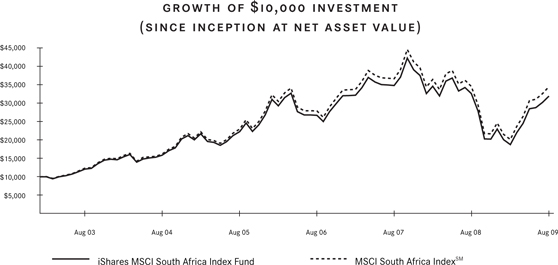
Total returns for the period since inception are calculated from the inception date of the Fund (2/3/03). “Average Annual Total Returns” represent the average annual change in value of an investment over the period(s) indicated. “Cumulative Total Returns” represent the total change in value of an investment over the period(s) indicated.
The Fund’s per share net asset value or “NAV” is the value of one share of the Fund as calculated in accordance with the standard formula for valuing mutual fund shares. The NAV return is based on the NAV of the Fund and the market return is based on the market price per share of the Fund. The price used to calculate market return (“Market Price”) is determined by using the midpoint between the highest bid and the lowest offer on the primary stock exchange on which the shares of the Fund are listed for trading, as of the time that the Fund’s NAV is calculated. Since shares of the Fund did not trade in the secondary market until after the Fund’s inception, for the period from inception to the first day of secondary market trading in shares of the Fund (2/7/03), the NAV of the Fund is used as a proxy for the Market Price to calculate market returns. Market and NAV returns assume that dividends and capital gain distributions have been reinvested in the Fund at Market Price and NAV, respectively.
An index is a statistical composite that tracks a specified financial market or sector. Unlike the Fund, an index does not actually hold a portfolio of securities and therefore does not incur the expenses incurred by the Fund. These expenses negatively impact the performance of the Fund. Also, market returns do not include brokerage commissions that may be payable on secondary market transactions. If brokerage commissions were included, market returns would be lower. The performance shown in the table(s) and chart(s) above assumes reinvestment of all dividends and capital gain distributions and does not reflect the deduction of taxes that a shareholder would pay on fund distributions or the redemption or sale of fund shares. The investment return and principal value of shares of the Fund will vary with changes in market conditions. Shares of the Fund may be worth more or less than their original cost when they are redeemed or sold in the market. The Fund’s past performance is no guarantee of future results.
| 20 | 2009 iSHARES ANNUAL REPORT TO SHAREHOLDERS |
Table of Contents
Management’s Discussion of Fund Performance (Continued)
iSHARES® MSCI SOUTH AFRICA INDEX FUND
PORTFOLIO ALLOCATION As of 8/31/09 | |||
| Sector | Percentage of Net Assets | ||
Basic Materials | 26.08 | % | |
Financial | 23.77 | ||
Communications | 20.30 | ||
Energy | 10.72 | ||
Consumer Cyclical | 5.39 | ||
Diversified | 5.26 | ||
Consumer Non-Cyclical | 4.56 | ||
Industrial | 3.75 | ||
Short-Term and Other Net Assets | 0.17 | ||
TOTAL | 100.00 | % | |
TEN LARGEST FUND HOLDINGS As of 8/31/09 | |||
| Security | Percentage of Net Assets | ||
MTN Group Ltd. | 11.97 | % | |
Sasol Ltd. | 10.72 | ||
Standard Bank Group Ltd. | 7.48 | ||
Naspers Ltd. Class N | 6.24 | ||
Impala Platinum Holdings Ltd. | 6.23 | ||
AngloGold Ashanti Ltd. | 5.72 | ||
Gold Fields Ltd. | 4.04 | ||
FirstRand Ltd. | 2.86 | ||
Sanlam Ltd. | 2.68 | ||
Anglo Platinum Ltd. | 2.62 | ||
TOTAL | 60.56 | % | |
| MANAGEMENT’S DISCUSSIONS OF FUND PERFORMANCE | 21 |
Table of Contents
Management’s Discussion of Fund Performance
iSHARES® MSCI TURKEY INVESTABLE MARKET INDEX FUND
(TICKER: TUR)
INVESTMENT OBJECTIVE
The iShares MSCI Turkey Investable Market Index Fund (the “Fund”) seeks to provide investment results that correspond generally to the price and yield performance, before fees and expenses, of the MSCI Turkey Investable Market IndexSM (the “Index”). The Index is a free float adjusted market capitalization index designed to measure broad based equity market performance in Turkey. The Fund invests in a representative sample of securities included in the Index that collectively has an investment profile similar to the Index. Due to the use of representative sampling, the Fund may or may not hold all of the securities that are included in the Index. For the 12-month period ended August 31, 2009 (the “reporting period”), the total return for the Fund was (5.56)%, while the total return for the Index was (5.59)%.
MARKET OVERVIEW AND DISCUSSION OF PERFORMANCE
The Turkish stock market declined for the reporting period, reflecting an intense and volatile global investment environment. Turkey’s equity market declined in the first three months of the reporting period amid one of the worst global economic downturns since World War II and a liquidity challenge in the credit markets. The economic malaise was particularly acute in the U.S., but it also significantly impacted Europe, which receives half of Turkey’s exports. Foreign investment in Turkey declined substantially, while the country’s fiscal deficit increased during the reporting period. As a result, the Turkish economy contracted by 7% for the 12 months ended June 30, 2009.
On the positive side, however, the Turkish central bank reduced interest rates from 16.75% to 8.25% which may have helped to revive domestic economic activity. Turkey’s banking industry weathered the credit crunch well and mitigated the mortgage-related problems that afflicted financial companies in the U.S. and elsewhere in the world. In addition, discussions regarding a renewed lending facility with the International Monetary Fund and a relatively stable political situation in Turkey may have helped retain the confidence of some foreign investors.
Turkey’s stock market enjoyed a recovery in the last half of the reporting period. Early signs of economic stabilization, primarily in the U.S., boosted expectations of a nascent global recovery. Increased risk aversion, which appears to have been a contributing factor to the stock market decline in Turkey and many other emerging markets in late 2008, gave way to renewed investor confidence. The improving outlook helped the Turkish stock market surge over the last six months of the reporting period. Even this robust recovery, though, was insufficient to fully offset the market’s steep decline in late 2008.
Among the Fund’s ten largest holdings as of August 31, 2009 the top performers were banks, including Turkiye Garanti Bankasi AS (the Fund’s largest holding as of August 31, 2009), Turkiye Vakiflar Bankasi TAO, and Akbank TAS. The relative stability of the banking sector and its lack of exposure to financial assets helped boost these stocks. Wireless services provider Turkcell Iletisim Hizmetleri AS and beverage maker Anadolu Efes Biracilik ve Malt Sanayii AS also advanced for the reporting period. By far, the biggest decliner among the Fund’s top ten holdings was oil producer Turkiye Petrol Rafinerileri AS, which struggled with reduced demand for energy and falling oil prices. Other noteworthy decliners included financial stocks Yapi ve Kredi Bankasi AS and Turkiye Is Bankasi AS.
| 22 | 2009 iSHARES ANNUAL REPORTTO SHAREHOLDERS |
Table of Contents
Management’s Discussion of Fund Performance (Continued)
iSHARES® MSCI TURKEY INVESTABLE MARKET INDEX FUND
Performance as of August 31, 2009
| Average Annual Total Returns | Cumulative Total Returns | |||||||||||||||
| Year Ended 8/31/09 | Inception to 8/31/09 | Inception to 8/31/09 | ||||||||||||||
| NAV | MARKET | INDEX | NAV | MARKET | INDEX | NAV | MARKET | INDEX | ||||||||
| (5.56)% | (4.95)% | (5.59)% | (1.10)% | (0.62)% | (0.92)% | (1.58)% | (0.89)% | (1.32)% | ||||||||
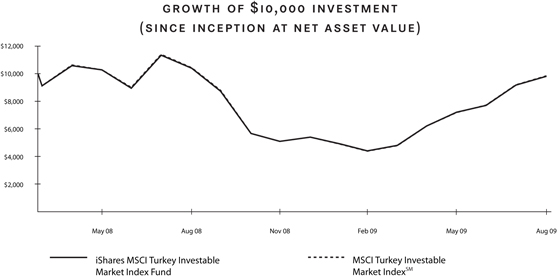
Total returns for the period since inception are calculated from the inception date of the Fund (3/26/08). “Average Annual Total Returns” represent the average annual change in value of an investment over the period(s) indicated. “Cumulative Total Returns” represent the total change in value of an investment over the period(s) indicated.
The Fund’s per share net asset value or “NAV” is the value of one share of the Fund as calculated in accordance with the standard formula for valuing mutual fund shares. The NAV return is based on the NAV of the Fund and the market return is based on the market price per share of the Fund. The price used to calculate market return (“Market Price”) is determined by using the midpoint between the highest bid and the lowest offer on the primary stock exchange on which the shares of the Fund are listed for trading, as of the time that the Fund’s NAV is calculated. Since shares of the Fund did not trade in the secondary market until after the Fund’s inception, for the period from inception to the first day of secondary market trading in shares of the Fund (3/28/08), the NAV of the Fund is used as a proxy for the Market Price to calculate market returns. Market and NAV returns assume that dividends and capital gain distributions have been reinvested in the Fund at Market Price and NAV, respectively.
An index is a statistical composite that tracks a specified financial market or sector. Unlike the Fund, an index does not actually hold a portfolio of securities and therefore does not incur the expenses incurred by the Fund. These expenses negatively impact the performance of the Fund. Also, market returns do not include brokerage commissions that may be payable on secondary market transactions. If brokerage commissions were included, market returns would be lower. The performance shown in the table(s) and chart(s) above assumes reinvestment of all dividends and capital gain distributions and does not reflect the deduction of taxes that a shareholder would pay on fund distributions or the redemption or sale of fund shares. The investment return and principal value of shares of the Fund will vary with changes in market conditions. Shares of the Fund may be worth more or less than their original cost when they are redeemed or sold in the market. The Fund’s past performance is no guarantee of future results.
| MANAGEMENT’S DISCUSSIONS OF FUND PERFORMANCE | 23 |
Table of Contents
Management’s Discussion of Fund Performance (Continued)
iSHARES® MSCI TURKEY INVESTABLE MARKET INDEX FUND
PORTFOLIO ALLOCATION As of 8/31/09 | |||
| Sector | Percentage of Net Assets | ||
Financial | 45.68 | % | |
Communications | 13.88 | ||
Consumer Non-Cyclical | 10.22 | ||
Diversified | 9.02 | ||
Industrial | 5.23 | ||
Consumer Cyclical | 4.83 | ||
Basic Materials | 4.64 | ||
Energy | 3.61 | ||
Utilities | 0.47 | ||
Short-Term and Other Net Assets | 2.42 | ||
TOTAL | 100.00 | % | |
TEN LARGEST FUND HOLDINGS As of 8/31/09 | |||
| Security | Percentage of Net Assets | ||
Turkiye Garanti Bankasi AS | 12.80 | % | |
Turkcell Iletisim Hizmetleri AS | 9.62 | ||
Akbank TAS | 8.27 | ||
Turkiye Is Bankasi AS | 8.22 | ||
Anadolu Efes Biracilik ve Malt Sanayii AS | 4.26 | ||
Turkiye Petrol Rafinerileri AS | 3.61 | ||
Haci Omer Sabanci Holding AS | 3.53 | ||
Yapi ve Kredi Bankasi AS | 3.52 | ||
Turkiye Halk Bankasi AS | 3.24 | ||
Turkiye Vakiflar Bankasi TAO | 3.19 | ||
TOTAL | 60.26 | % | |
| 24 | 2009 iSHARES ANNUAL REPORTTO SHAREHOLDERS |
Table of Contents
Shareholder Expenses (Unaudited)
iSHARES®, INC.
As a shareholder of a Fund, you incur two types of costs: (1) transaction costs, including brokerage commissions on purchases and sales of Fund shares and (2) ongoing costs, including management fees and other Fund expenses. The following Example is intended to help you understand your ongoing costs (in dollars and cents) of investing in a Fund and to compare these costs with the ongoing costs of investing in other Funds.
The Example is based on an investment of $1,000 invested at the beginning of the period and held for the entire period from March 1, 2009 to August 31, 2009.
ACTUAL EXPENSES
The first line under each Fund in the table below provides information about actual account values and actual expenses. You may use the information in this line, together with the amount you invested, to estimate the expenses that you paid over the period. Simply divide your account value by $1,000 (for example, an $8,600 account value divided by $1,000 = 8.6), then multiply the result by the number in the first line for your Fund under the heading entitled “Expenses Paid During Period” to estimate the expenses you paid on your account during this period.
HYPOTHETICAL EXAMPLE FOR COMPARISON PURPOSES
The second line under each Fund in the table below provides information about hypothetical account values and hypothetical expenses based on each Fund’s actual expense ratio and an assumed rate of return of 5% per year before expenses, which is not the Fund’s actual return. The hypothetical account values and expenses may not be used to estimate the actual ending account balance or expenses you paid for the period. You may use this information to compare the ongoing costs of investing in your Fund and other Funds. To do so, compare this 5% hypothetical example with the 5% hypothetical examples that appear in the shareholder reports of the other Funds.
Please note that the expenses shown in the table are meant to highlight your ongoing costs only and do not reflect any transactional costs, such as brokerage commissions paid on purchases and sales of Fund shares. Therefore, the second line under each Fund in the table is useful in comparing ongoing costs only and will not help you determine the relative total costs of owning different Funds. In addition, if these transactional costs were included, your costs would have been higher.
| iShares MSCI Index Fund | Beginning Account Value (3/1/09) | Ending Account Value (8/31/09) | Annualized Expense Ratio | Expenses Paid During Perioda (3/1/09 to 8/31/09) | |||||
Brazil | |||||||||
Actual | $1,000.00 | $1,713.40 | 0.64 | % | $4.38 | ||||
Hypothetical (5% return before expenses) | 1,000.00 | 1,022.00 | 0.64 | 3.26 | |||||
BRIC | |||||||||
Actual | 1,000.00 | 1,725.10 | 0.71 | 4.88 | |||||
Hypothetical (5% return before expenses) | 1,000.00 | 1,021.60 | 0.71 | 3.62 | |||||
Canada | |||||||||
Actual | 1,000.00 | 1,572.20 | 0.55 | 3.57 | |||||
Hypothetical (5% return before expenses) | 1,000.00 | 1,022.40 | 0.55 | 2.80 | |||||
Chile Investable Market | |||||||||
Actual | 1,000.00 | 1,368.20 | 0.64 | 3.82 | |||||
Hypothetical (5% return before expenses) | 1,000.00 | 1,022.00 | 0.64 | 3.26 |
| SHAREHOLDER EXPENSES | 25 |
Table of Contents
Shareholder Expenses (Unaudited) (Continued)
iSHARES®, INC.
| iShares MSCI Index Fund | Beginning Account Value (3/1/09) | Ending Account Value (8/31/09) | Annualized Expense Ratio | Expenses Paid During Perioda (3/1/09 to 8/31/09) | |||||
Israel Capped Investable Market | |||||||||
Actual | $1,000.00 | $1,506.10 | 0.64 | % | $4.04 | ||||
Hypothetical (5% return before expenses) | 1,000.00 | 1,022.00 | 0.64 | 3.26 | |||||
Mexico Investable Market | |||||||||
Actual | 1,000.00 | 1,790.90 | 0.55 | 3.87 | |||||
Hypothetical (5% return before expenses) | 1,000.00 | 1,022.40 | 0.55 | 2.80 | |||||
South Africa | |||||||||
Actual | 1,000.00 | 1,704.80 | 0.64 | 4.36 | |||||
Hypothetical (5% return before expenses) | 1,000.00 | 1,022.00 | 0.64 | 3.26 | |||||
Turkey Investable Market | |||||||||
Actual | 1,000.00 | 2,230.50 | 0.64 | 5.21 | |||||
Hypothetical (5% return before expenses) | 1,000.00 | 1,022.00 | 0.64 | 3.26 |
| a | Expenses are calculated using each Fund’s annualized expense ratio (as disclosed in the table), multiplied by the average account value for the period, multiplied by the number of days in the period (184 days) and divided by the number of days in the year (365 days). |
| 26 | 2009 iSHARES ANNUAL REPORTTO SHAREHOLDERS |
Table of Contents
iSHARES® MSCI BRAZIL INDEX FUND
August 31, 2009
| Security | Shares | Value | |||
COMMON STOCKS – 41.12% | |||||
AEROSPACE & DEFENSE – 0.83% | |||||
Empresa Brasileira de Aeronautica SA | 13,558,532 | $ | 72,753,099 | ||
| 72,753,099 | |||||
AGRICULTURE – 0.87% | |||||
Souza Cruz SA | 2,410,400 | 76,478,439 | |||
| 76,478,439 | |||||
BANKS – 1.94% | |||||
Banco do Brasil SA | 9,641,660 | 133,735,857 | |||
Banco Nossa Caixa SA | 903,900 | 36,294,988 | |||
| 170,030,845 | |||||
COMMERCIAL SERVICES – 1.87% | |||||
Companhia Brasileira de Meios de Pagamento | 12,052,000 | 105,055,610 | |||
Companhia de Concessoes Rodoviarias | 3,615,600 | 59,525,122 | |||
| 164,580,732 | |||||
COSMETICS & PERSONAL CARE – 0.78% | |||||
Natura Cosmeticos SA | 4,218,200 | 68,193,488 | |||
| 68,193,488 | |||||
DIVERSIFIED FINANCIAL SERVICES – 3.10% | |||||
BM&F Bovespa SA | 26,815,700 | 165,216,561 | |||
Redecard SA | 7,833,800 | 107,164,390 | |||
| 272,380,951 | |||||
ELECTRIC – 2.68% | |||||
Centrais Eletricas Brasileiras SA | 6,327,399 | 92,428,336 | |||
CPFL Energia SA | 4,218,250 | 74,367,345 | |||
EDP Energias do Brasil SA | 1,807,800 | 27,126,585 | |||
Tractebel Energia SA | 3,916,900 | 41,432,744 | |||
| 235,355,010 | |||||
FOOD – 2.11% | |||||
BRF - Brasil Foods SAa | 3,916,975 | 87,228,499 | |||
Cosan SA Industria e Comercioa | 2,711,790 | 30,353,068 | |||
JBS SA | 10,244,287 | 42,476,312 | |||
Marfrig Alimentos SAa | 3,013,000 | 25,241,463 | |||
| 185,299,342 | |||||
| Security | Shares | Value | |||
FOREST PRODUCTS & PAPER – 0.44% | |||||
Votorantim Celulose e Papel SAa | 2,468,407 | $ | 38,491,967 | ||
| 38,491,967 | |||||
HOME BUILDERS – 0.50% | |||||
MRV Engenharia e | 2,410,449 | 43,633,472 | |||
| 43,633,472 | |||||
INSURANCE – 0.25% | |||||
Porto Seguro SA | 2,410,400 | 22,110,244 | |||
| 22,110,244 | |||||
INTERNET – 0.53% | |||||
B2W Companhia Global | 1,807,830 | 46,604,822 | |||
| 46,604,822 | |||||
IRON & STEEL – 3.93% | |||||
Companhia Siderurgica | 9,340,327 | 242,769,263 | |||
Gerdau SA | 4,218,200 | 38,133,781 | |||
Usinas Siderurgicas de | 2,711,700 | 63,896,049 | |||
| 344,799,093 | |||||
MINING – 6.23% | |||||
Vale SA SP ADRb | 28,493,941 | 547,368,607 | |||
| 547,368,607 | |||||
OIL & GAS – 12.25% | |||||
OGX Petroleo e Gas | 301,300 | 163,750,000 | |||
Petroleo Brasileiro SA | 45,797,644 | 911,339,120 | |||
| 1,075,089,120 | |||||
REAL ESTATE – 0.65% | |||||
Cyrela Brazil Realty SA | 4,519,500 | 56,769,329 | |||
| 56,769,329 | |||||
TELECOMMUNICATIONS – 0.75% | |||||
GVT (Holding) SAa | 2,109,103 | 37,574,688 | |||
Tele Norte Leste | 1,506,538 | 28,205,650 | |||
| 65,780,338 | |||||
| SCHEDULESOF INVESTMENTS | 27 |
Table of Contents
Schedule of Investments (Continued)
iSHARES® MSCI BRAZIL INDEX FUND
August 31, 2009
| Security | Shares | Value | |||
TRANSPORTATION – 0.84% | |||||
ALL - America Latina | 10,244,200 | $ | 73,979,854 | ||
| 73,979,854 | |||||
WATER – 0.57% | |||||
Companhia de Saneamento | 2,711,700 | 49,891,829 | |||
| 49,891,829 | |||||
TOTAL COMMON STOCKS | 3,609,590,581 | ||||
PREFERRED STOCKS – 58.18% | |||||
BANKS – 13.35% | |||||
Banco Bradesco SA | 26,815,700 | 437,212,500 | |||
Banco do Estado do Rio | 4,820,810 | 26,685,714 | |||
Itau Unibanco Holding SA | 41,760,249 | 708,108,570 | |||
| 1,172,006,784 | |||||
BEVERAGES – 3.08% | |||||
Companhia de Bebidas | 3,615,680 | 270,313,298 | |||
| 270,313,298 | |||||
CHEMICALS – 1.63% | |||||
Braskem SA Class Aa | 4,820,836 | 26,736,980 | |||
Fertilizantes Fosfatados SAa | 4,218,280 | 39,476,480 | |||
Ultrapar Participacoes SA | 2,109,100 | 77,095,098 | |||
| 143,308,558 | |||||
ELECTRIC – 4.91% | |||||
AES Tiete SA | 2,164,600 | 23,252,808 | |||
Centrais Eletricas Brasileiras SA Class B | 6,026,000 | 79,079,268 | |||
Companhia de Transmissao de Energia Eletrica Paulista | 914,176 | 23,232,479 | |||
Companhia Energetica de Minas Gerais | 10,244,232 | 150,730,349 | |||
Companhia Energetica de Sao Paulo Class B | 3,916,970 | 41,931,932 | |||
Companhia Paranaense de Energia Class B | 3,314,300 | 51,542,110 | |||
| Security | Shares | Value | |||
Eletropaulo Metropolitana | 3,314,320 | $ | 61,453,749 | ||
| 431,222,695 | |||||
FOOD – 0.59% | |||||
Companhia Brasileira de | 2,124,128 | 51,931,889 | |||
| 51,931,889 | |||||
FOREST PRODUCTS & PAPER – 1.01% | |||||
Aracruz Celulose SA | 11,148,100 | 23,407,463 | |||
Klabin SA | 15,968,900 | 30,904,817 | |||
Suzano Bahia Sul | 3,615,685 | 34,124,705 | |||
| 88,436,985 | |||||
HOLDING COMPANIES - DIVERSIFIED – 2.13% | |||||
Itausa - Investimentos | 36,457,336 | 187,119,307 | |||
| 187,119,307 | |||||
INVESTMENT COMPANIES – 1.23% | |||||
Bradespar SA | 6,929,900 | 107,475,915 | |||
| 107,475,915 | |||||
IRON & STEEL – 5.34% | |||||
Gerdau SA | 16,571,546 | 193,832,611 | |||
Metalurgica Gerdau SA | 8,135,190 | 119,137,830 | |||
Usinas Siderurgicas de Minas Gerais SA Class A | 6,628,600 | 155,698,293 | |||
| 468,668,734 | |||||
MEDIA – 0.62% | |||||
Net Servicos de | 5,122,182 | 53,856,240 | |||
| 53,856,240 | |||||
MINING – 8.62% | |||||
Vale SA Class A | 43,387,200 | 756,860,488 | |||
| 756,860,488 | |||||
OIL & GAS – 11.88% | |||||
Petroleo Brasileiro SA | 62,670,450 | 1,042,735,271 | |||
| 1,042,735,271 | |||||
RETAIL – 0.60% | |||||
Lojas Americanas SA | 8,737,700 | 52,120,427 | |||
| 52,120,427 | |||||
| 28 | 2009 iSHARES ANNUAL REPORTTO SHAREHOLDERS |
Table of Contents
Schedule of Investments (Continued)
iSHARES® MSCI BRAZIL INDEX FUND
August 31, 2009
| Security | Shares | Value | |||
TELECOMMUNICATIONS – 3.19% | |||||
Brasil Telecom | 4,820,830 | $ | 42,175,872 | ||
Brasil Telecom SA | 3,916,959 | 28,349,147 | |||
Tele Norte Leste | 6,327,339 | 101,317,941 | |||
TIM Participacoes SA | 15,366,319 | 32,264,381 | |||
Vivo Participacoes SA | 3,314,380 | 76,005,798 | |||
| 280,113,139 | |||||
TOTAL PREFERRED STOCKS | 5,106,169,730 | ||||
SHORT-TERM INVESTMENTS – 0.41% | |||||
MONEY MARKET FUNDS – 0.41% | |||||
Barclays Global Investors Funds | 26,801,172 | 26,801,172 | |||
Barclays Global Investors Funds | 3,780,728 | 3,780,728 | |||
Barclays Global Investors Funds | 5,360,938 | 5,360,938 | |||
| 35,942,838 | |||||
TOTAL SHORT-TERM INVESTMENTS | |||||
(Cost: $35,942,838) | 35,942,838 | ||||
TOTAL INVESTMENTS IN | 8,751,703,149 | ||||
Other Assets, Less Liabilities – 0.29% | 25,663,334 | ||||
NET ASSETS – 100.00% | $ | 8,777,366,483 | |||
SP ADR – Sponsored American Depositary Receipts
| a | Non-income earning security. |
| b | All or a portion of this security represents a security on loan. See Note 5. |
| c | Affiliated issuer. See Note 2. |
| d | The rate quoted is the annualized seven-day yield of the fund at period end. |
| e | All or a portion of this security represents an investment of securities lending collateral. See Note 5. |
See notes to financial statements.
| SCHEDULESOF INVESTMENTS | 29 |
Table of Contents
Schedule of Investments
August 31, 2009
| Security | Shares | Value | |||
COMMON STOCKS – 80.42% | |||||
BRAZIL – 12.36% | |||||
ALL - America Latina | 185,500 | $ | 1,339,613 | ||
B2W Companhia Global do Varejo | 26,500 | 683,155 | |||
Banco do Brasil SA | 159,000 | 2,205,430 | |||
BM&F Bovespa SA | 477,069 | 2,939,312 | |||
BRF - Brasil Foods SAa | 79,500 | 1,770,414 | |||
Centrais Eletricas Brasileiras SA | 106,000 | 1,548,409 | |||
Companhia Brasileira de Meios de Pagamento | 212,000 | 1,847,975 | |||
Companhia de Concessoes Rodoviarias | 79,500 | 1,308,841 | |||
Companhia Siderurgica Nacional SA | 159,000 | 4,132,651 | |||
Cosan SA Industria e Comercioa | 53,000 | 593,229 | |||
CPFL Energia SA | 53,000 | 934,385 | |||
Cyrela Brazil Realty SA | 106,000 | 1,331,463 | |||
Empresa Brasileira de Aeronautica SA | 212,000 | 1,137,561 | |||
Gerdau SA | 106,000 | 958,272 | |||
GVT (Holding) SAa | 26,500 | 472,110 | |||
JBS SA | 159,052 | 659,484 | |||
MRV Engenharia e Participacoes SA | 53,000 | 959,395 | |||
OGX Petroleo e Gas Participacoes SAa | 1,200 | 652,174 | |||
Petroleo Brasileiro SA | 901,000 | 17,929,231 | |||
Redecard SA | 132,500 | 1,812,566 | |||
Souza Cruz SA | 53,000 | 1,681,612 | |||
Tele Norte Leste Participacoes SA | 26,500 | 496,137 | |||
Tractebel Energia SA | 79,500 | 840,946 | |||
Usinas Siderurgicas de Minas Gerais SA | 53,000 | 1,248,844 | |||
Vale SA | 583,000 | 11,338,515 | |||
Votorantim Celulose e Papel SAa | 45,854 | 715,040 | |||
| 61,536,764 | |||||
CHINA – 39.48% | |||||
Agile Property Holdings Ltd. | 1,060,000 | 1,204,880 | |||
Air China Ltd. Class Ha,b | 1,590,000 | 935,457 | |||
Alibaba.com Ltd.b | 530,000 | 1,315,657 | |||
Aluminum Corp. of China Ltd. Class H | 1,590,000 | 1,686,284 | |||
| Security | Shares | Value | |||
Angang New Steel Co. Ltd. Class H | 530,000 | $ | 1,005,206 | ||
Anhui Conch Cement Co. Ltd. Class H | 38,000 | 240,483 | |||
Bank of China Ltd. Class H | 22,260,000 | 10,827,505 | |||
Bank of Communications Co. Ltd. Class H | 2,915,000 | 3,437,531 | |||
Beijing Capital International Airport Co. Ltd. Class Ha,b | 530,000 | 294,724 | |||
Belle International Holdings Ltd.b | 1,855,000 | 1,672,950 | |||
BYD Co. Ltd. Class Ha,b | 265,000 | 1,661,667 | |||
Chaoda Modern Agriculture (Holdings) Ltd. | 734,556 | 435,958 | |||
China Agri-Industries | 1,060,000 | 743,989 | |||
China CITIC Bank Class H | 2,120,000 | 1,277,364 | |||
China Coal Energy Co. Class H | 1,590,000 | 2,012,463 | |||
China Communications Construction Co. Ltd. Class Hb | 1,855,000 | 2,120,506 | |||
China Construction Bank Class H | 14,840,000 | 11,200,867 | |||
China COSCO Holdings Co. Ltd. Class H | 1,192,500 | 1,444,727 | |||
China Dongxiang Group Co. | 1,590,000 | 982,640 | |||
China Everbright Ltd. | 530,000 | 1,248,644 | |||
China High Speed Transmission Equipment Group Co. Ltd. | 530,000 | 1,143,336 | |||
China Life Insurance Co. Ltd. Class H | 3,180,000 | 13,416,423 | |||
China Mengniu Dairy Co. Ltd.a | 530,000 | 1,255,482 | |||
China Merchants Bank Co. Ltd. Class H | 1,497,400 | 3,261,160 | |||
China Merchants Holdings (International) Co. Ltd.b | 530,000 | 1,719,791 | |||
China Mobile Ltd. | 2,385,000 | 23,201,796 | |||
China National Building Material Co. Ltd. Class H | 530,000 | 1,120,087 | |||
China Oilfield Services Ltd. Class H | 1,060,000 | 925,884 | |||
China Overseas Land & Investment Ltd. | 1,590,800 | 3,234,698 | |||
China Petroleum & Chemical Corp. Class H | 6,890,000 | 5,751,556 | |||
China Railway Construction Corp. Class H | 1,060,000 | 1,567,301 | |||
| 30 | 2009 iSHARES ANNUAL REPORTTO SHAREHOLDERS |
Table of Contents
Schedule of Investments (Continued)
iSHARES® MSCI BRIC INDEX FUND
August 31, 2009
| Security | Shares | Value | |||
China Railway Group Ltd. Class Ha | 1,590,000 | $ | 1,372,414 | ||
China Resources Enterprise Ltd. | 530,000 | 1,243,173 | |||
China Resources Land Ltd. | 1,060,000 | 2,218,291 | |||
China Resources Power Holdings Co. Ltd. | 564,200 | 1,377,260 | |||
China Shenhua Energy Co. Ltd. Class H | 1,325,000 | 5,342,294 | |||
China Shipping Container Lines Co. Ltd. Class Ha,b | 1,590,000 | 576,455 | |||
China Shipping Development Co. Ltd. Class Hb | 530,000 | 663,983 | |||
China South Locomotive and Rolling Stock Corp. Ltd. Class H | 530,000 | 312,503 | |||
China Telecom Corp. Ltd. Class H | 4,252,000 | 2,177,939 | |||
China Unicom (Hong Kong) Ltd. | 2,147,900 | 3,020,664 | |||
China Yurun Food Group Ltd. | 530,000 | 914,943 | |||
China Zhongwang Holdings Ltd.a,b | 530,000 | 576,455 | |||
CITIC Pacific Ltd.b | 530,000 | 1,415,494 | |||
CNOOC Ltd. | 6,625,000 | 8,701,528 | |||
CNPC Hong Kong Ltd.b | 2,650,000 | 2,212,137 | |||
Country Garden Holdings Co. Ltd.b | 1,590,000 | 652,358 | |||
Datang International Power Generation Co. Ltd. Class H | 1,590,000 | 845,194 | |||
Denway Motors Ltd. | 2,650,000 | 1,179,579 | |||
Dongfeng Motor Group Co. Ltd. Class H | 1,590,000 | 1,645,255 | |||
Fosun International Ltd. | 1,722,500 | 1,324,547 | |||
Franshion Properties (China) Ltd. | 1,060,000 | 298,143 | |||
Fushan International Energy Group Ltd.a | 1,060,000 | 720,740 | |||
Geely Automobile Holdings Ltd. | 1,325,000 | 319,683 | |||
GOME Electrical Appliances Holdings Ltd.a | 2,650,400 | 704,434 | |||
Guangdong Investment Ltd. | 1,590,000 | 814,422 | |||
Guangshen Railway Co. Ltd. Class H | 530,000 | 230,445 | |||
Guangzhou R&F Properties Co. Ltd. Class Hb | 530,000 | 865,708 | |||
Harbin Power Equipment Co. Ltd. Class H | 530,000 | 526,536 | |||
Hengan International Group Co. Ltd. | 530,000 | 2,933,561 | |||
| Security | Shares | Value | |||
Hidili Industry International Development Ltd.a | 795,000 | $ | 787,753 | ||
Huaneng Power International Inc. Class Hb | 1,060,000 | 742,622 | |||
Industrial and Commercial Bank of China Ltd. Class H | 17,490,000 | 11,937,334 | |||
Jiangsu Expressway Co. Ltd. Class H | 1,060,000 | 836,988 | |||
Jiangxi Copper Co. Ltd. Class Hb | 795,000 | 1,659,616 | |||
Kingboard Chemical Holdings Co. Ltd.b | 132,500 | 417,981 | |||
Lenovo Group Ltd. | 1,590,000 | 670,821 | |||
Li Ning Co. Ltd.b | 530,000 | 1,473,618 | |||
Maanshan Iron & Steel Co. Ltd. Class Ha | 1,060,000 | 653,726 | |||
Parkson Retail Group Ltd. | 397,500 | 579,532 | |||
PetroChina Co. Ltd. Class H | 8,480,000 | 9,365,511 | |||
PICC Property and Casualty Co. Ltd. Class Ha,b | 1,060,000 | 666,035 | |||
Ping An Insurance (Group) Co. of China Ltd. Class H | 457,000 | 3,419,842 | |||
Shanghai Electric Group Co. Ltd. Class H | 1,590,000 | 732,365 | |||
Shanghai Industrial Holdings Ltd. | 265,000 | 1,268,474 | |||
Shimao Property Holdings Ltd. | 795,000 | 1,183,681 | |||
Shui On Land Ltd.b | 1,855,000 | 1,026,746 | |||
Sinofert Holdings Ltd. | 1,060,000 | 480,037 | |||
Sino-Ocean Land Holdings Ltd. | 1,722,500 | 1,560,121 | |||
Soho China Ltd. | 1,325,000 | 704,328 | |||
Tencent Holdings Ltd. | 275,000 | 4,090,947 | |||
Tingyi (Cayman Islands) Holding Corp. | 530,000 | 949,133 | |||
Yanzhou Coal Mining Co. Ltd. Class H | 1,036,000 | 1,473,001 | |||
Zhejiang Expressway Co. Ltd. Class H | 1,060,000 | 1,007,941 | |||
Zijin Mining Group Co. Ltd. Class H | 1,590,000 | 1,329,334 | |||
| 196,550,641 | |||||
INDIA – 15.45% | |||||
Dr. Reddy’s Laboratories Ltd. SP ADRb | 385,575 | 6,215,469 | |||
HDFC Bank Ltd. SP ADRb | 122,960 | 12,112,790 | |||
| SCHEDULESOF INVESTMENTS | 31 |
Table of Contents
Schedule of Investments (Continued)
iSHARES® MSCI BRIC INDEX FUND
August 31, 2009
| Security | Shares | Value | |||
ICICI Bank Ltd. SP ADR | 325,950 | $ | 9,947,994 | ||
Infosys Technologies Ltd. SP ADR | 318,265 | 13,758,596 | |||
Mahanagar Telephone Nigam Ltd. SP ADRb | 296,270 | 1,143,602 | |||
Reliance Industries Ltd. SP GDRa,c | 210,145 | 17,862,325 | |||
Satyam Computer Services Ltd. SP ADRb | 748,360 | 4,984,078 | |||
Tata Communications Ltd. | 64,395 | 1,313,014 | |||
Wipro Ltd. SP ADRb | 607,645 | 9,570,409 | |||
| 76,908,277 | |||||
RUSSIA – 13.13% | |||||
Cherepovets MK Severstal SP GDRd | 120,575 | 895,872 | |||
JSC MMC Norilsk Nickel SP ADRa | 361,865 | 4,016,702 | |||
LUKOIL SP ADR | 199,015 | 10,070,159 | |||
Mechel OAO SP ADR | 88,510 | 1,080,707 | |||
Mobile TeleSystems SP ADR | 79,500 | 3,448,710 | |||
Novolipetsk Steel SP GDRa,d | 42,930 | 1,030,320 | |||
OAO Gazprom SP ADR | 971,490 | 20,595,588 | |||
OAO NovaTek SP GDRd | 39,220 | 1,552,720 | |||
OAO Tatneft SP ADR | 98,826 | 2,470,650 | |||
OAO TMK SP GDRd | 43,990 | 505,885 | |||
OJSC Comstar United Telesystems SP GDR | 111,300 | 550,935 | |||
OJSC Rosneft Oil Co. SP GDR | 537,420 | 3,466,359 | |||
Pharmstandard SP GDRa,d | 36,570 | 630,833 | |||
Polyus Gold SP ADR | 59,890 | 1,204,987 | |||
Rostelecom SP ADR | 13,780 | 416,432 | |||
Sberbank GDRb,d | 29,680 | 5,053,574 | |||
Sistema JSFC SP GDRa,d | 46,375 | 742,000 | |||
Surgutneftegaz SP ADR | 283,550 | 2,438,530 | |||
Uralkali SP GDRa,d | 73,670 | 1,407,097 | |||
Vimpel-Communications SP ADRa | 156,350 | 2,414,044 | |||
VTB Bank OJSC SP GDRd | 262,085 | 733,838 | |||
Wimm-Bill-Dann Foods OJSC SP ADRa | 10,070 | 637,532 | |||
| 65,363,474 | |||||
TOTAL COMMON STOCKS | |||||
(Cost: $419,705,497) | 400,359,156 | ||||
| Security | Shares | Value | |||
PREFERRED STOCKS – 19.25% | |||||
BRAZIL – 19.25% | |||||
AES Tiete SA | 26,500 | $ | 284,671 | ||
Aracruz Celulose SA Class Ba | 291,500 | 612,057 | |||
Banco Bradesco SA | 636,000 | 10,369,565 | |||
Banco do Estado do Rio Grande do Sul SA | 26,500 | 146,691 | |||
Bradespar SA | 106,000 | 1,643,955 | |||
Brasil Telecom Participacoes SA | 82,021 | 717,575 | |||
Brasil Telecom SA | 30,953 | 224,024 | |||
Braskem SA Class Aa | 79,500 | 440,917 | |||
Centrais Eletricas Brasileiras SA Class B | 79,500 | 1,043,279 | |||
Companhia de Bebidas das Americas | 79,595 | 5,950,634 | |||
Companhia de Transmissao de Energia Eletrica Paulista | 26,671 | 677,805 | |||
Companhia Energetica de Minas Gerais | 132,903 | 1,955,492 | |||
Companhia Energetica de Sao Paulo Class B | 79,500 | 851,063 | |||
Companhia Paranaense de Energia Class B | 53,000 | 824,226 | |||
Eletropaulo Metropolitana Electricidade de Sao Paulo SA Class B | 26,500 | 491,360 | |||
Fertilizantes Fosfatados SAa | 53,020 | 496,184 | |||
Gerdau SA | 291,500 | 3,409,592 | |||
Itau Unibanco Holding SA | 845,367 | 14,334,484 | |||
Itausa - Investimentos Itau SA | 965,173 | 4,953,804 | |||
Klabin SA | 159,000 | 307,715 | |||
Lojas Americanas SA | 159,000 | 948,436 | |||
Metalurgica Gerdau SA | 112,800 | 1,651,928 | |||
Net Servicos de Comunicacao SAa | 79,840 | 839,463 | |||
Petroleo Brasileiro SA | 1,272,000 | 21,164,030 | |||
Tele Norte Leste Participacoes SA | 106,000 | 1,697,349 | |||
Telemar Norte Leste SA Class A | 26,500 | 726,432 | |||
TIM Participacoes SA | 238,657 | 501,104 | |||
Usinas Siderurgicas de Minas Gerais SA Class A | 108,150 | 2,540,321 | |||
| 32 | 2009 iSHARES ANNUAL REPORTTO SHAREHOLDERS |
Table of Contents
Schedule of Investments (Continued)
iSHARES® MSCI BRIC INDEX FUND
August 31, 2009
| Security | Shares | Value | ||||
Vale SA Class A | 848,000 | $ | 14,792,789 | |||
Vivo Participacoes SA | 55,319 | 1,268,583 | ||||
| 95,865,528 | ||||||
TOTAL PREFERRED STOCKS |
| |||||
(Cost: $99,093,888) | 95,865,528 | |||||
SHORT-TERM INVESTMENTS – 3.70% |
| |||||
MONEY MARKET FUNDS – 3.70% |
| |||||
Barclays Global Investors Funds | 15,245,936 | 15,245,936 | ||||
Barclays Global Investors Funds | 2,150,679 | 2,150,679 | ||||
Barclays Global Investors Funds Treasury Money Market | 1,014,835 | 1,014,835 | ||||
| 18,411,450 | ||||||
TOTAL SHORT-TERM INVESTMENTS |
| |||||
(Cost: $18,411,450) | 18,411,450 | |||||
TOTAL INVESTMENTS IN | 514,636,134 | |||||
Other Assets, Less Liabilities – (3.37)% | (16,797,261 | ) | ||||
NET ASSETS – 100.00% | $ | 497,838,873 | ||||
GDR – Global Depositary Receipts
SP ADR – Sponsored American Depositary Receipts
SP GDR – Sponsored Global Depositary Receipts
| a | Non-income earning security. |
| b | All or a portion of this security represents a security on loan. See Note 5. |
| c | This security may be resold to qualified institutional buyers under Rule 144A of the Securities Act of 1933. |
| d | This security may be resold to qualified foreign investors and foreign institutional buyers under Regulation S of the Securities Act of 1933. |
| e | Affiliated issuer. See Note 2. |
| f | The rate quoted is the annualized seven-day yield of the fund at period end. |
| g | All or a portion of this security represents an investment of securities lending collateral. See Note 5. |
See notes to financial statements.
| SCHEDULESOF INVESTMENTS | 33 |
Table of Contents
Schedule of Investments
iSHARES® MSCI CANADA INDEX FUND
August 31, 2009
| Security | Shares | Value | |||
COMMON STOCKS – 99.79% | |||||
ADVERTISING – 0.18% | |||||
Groupe Aeroplan Inc. | 516,110 | $ | 4,304,637 | ||
| 4,304,637 | |||||
AEROSPACE & DEFENSE – 0.23% | |||||
CAE Inc. | 669,630 | 5,377,771 | |||
| 5,377,771 | |||||
AIRLINES – 0.00% | |||||
Jazz Air Income Funda | 20,078 | 63,438 | |||
| 63,438 | |||||
APPAREL – 0.26% | |||||
Gildan Activewear Inc.b | 301,980 | 6,200,454 | |||
| 6,200,454 | |||||
AUTO PARTS & EQUIPMENT – 0.53% | |||||
Magna International Inc. Class A | 278,760 | 12,589,571 | |||
| 12,589,571 | |||||
BANKS – 24.42% | |||||
Bank of Montreal | 1,423,070 | 68,675,356 | |||
Bank of Nova Scotia | 2,593,680 | 108,305,181 | |||
Canadian Imperial Bank of Commerce | 995,860 | 58,259,964 | |||
National Bank of Canada | 418,140 | 23,396,042 | |||
Royal Bank of Canada | 3,672,360 | 188,759,137 | |||
Toronto-Dominion Bank (The) | 2,224,008 | 137,055,189 | |||
| 584,450,869 | |||||
CHEMICALS – 3.67% | |||||
Agrium Inc. | 411,070 | 19,594,368 | |||
Potash Corp. of Saskatchewan Inc. | 770,630 | 68,190,142 | |||
| 87,784,510 | |||||
COMMERCIAL SERVICES – 0.27% | |||||
Ritchie Bros. Auctioneers Inc.c | 258,560 | 6,474,300 | |||
| 6,474,300 | |||||
COMPUTERS – 4.39% | |||||
CGI Group Inc. Class Ab | 713,060 | 7,349,728 | |||
Research In Motion Ltd.b | 1,334,204 | 97,612,831 | |||
| 104,962,559 | |||||
DIVERSIFIED FINANCIAL SERVICES – 1.07% | |||||
CI Financial Corp. | 422,180 | 7,784,334 | |||
IGM Financial Inc. | 309,060 | 11,509,724 | |||
TMX Group Inc. | 193,920 | 6,241,814 | |||
| 25,535,872 | |||||
| Security | Shares | Value | |||
ELECTRIC – 0.84% | |||||
Fortis Inc. | 442,380 | $ | 10,033,859 | ||
TransAlta Corp. | 518,130 | 10,058,303 | |||
| 20,092,162 | |||||
ENGINEERING & CONSTRUCTION – 0.70% | |||||
SNC-Lavalin Group Inc. | 395,920 | 16,705,607 | |||
| 16,705,607 | |||||
FOOD – 1.58% | |||||
Empire Co. Ltd. Class A | 75,750 | 2,890,674 | |||
George Weston Ltd. | 135,340 | 7,031,642 | |||
Loblaw Companies Ltd. | 286,840 | 8,684,207 | |||
Metro Inc. Class A | 290,880 | 9,783,844 | |||
Saputo Inc. | 379,760 | 9,533,333 | |||
| 37,923,700 | |||||
FOREST PRODUCTS & PAPER – 0.29% | |||||
Sino-Forest Corp. Class Ab | 565,123 | 6,998,109 | |||
| 6,998,109 | |||||
GAS – 0.31% | |||||
Canadian Utilities Ltd. Class A | 219,170 | 7,475,628 | |||
| 7,475,628 | |||||
HAND & MACHINE TOOLS – 0.27% | |||||
Finning International Inc. | 447,430 | 6,567,331 | |||
| 6,567,331 | |||||
HOLDING COMPANIES - DIVERSIFIED – 1.50% | |||||
Brookfield Asset Management Inc. Class A | 1,267,560 | 25,772,470 | |||
Onex Corp. | 256,540 | 5,349,206 | |||
Sherritt International Corp. | 758,477 | 4,654,801 | |||
| 35,776,477 | |||||
INSURANCE – 9.03% | |||||
Fairfax Financial Holdings Ltd. | 44,438 | 15,059,353 | |||
Great-West Lifeco Inc. | 741,340 | 17,523,502 | |||
Industrial Alliance Insurance and Financial Services Inc. | 211,090 | 5,670,071 | |||
Intact Financial Corp. | 217,158 | 6,718,897 | |||
Manulife Financial Corp. | 4,207,660 | 86,317,851 | |||
Power Corp. of Canada | 902,948 | 23,999,137 | |||
Power Financial Corp. | 645,390 | 17,653,099 | |||
Sun Life Financial Inc. | 1,462,480 | 43,145,324 | |||
| 216,087,234 | |||||
| 34 | 2009 iSHARES ANNUAL REPORTTO SHAREHOLDERS |
Table of Contents
Schedule of Investments (Continued)
iSHARES® MSCI CANADA INDEX FUND
August 31, 2009
| Security | Shares | Value | |||
IRON & STEEL – 0.12% | |||||
Gerdau Ameristeel Corp. | 394,910 | $ | 2,858,670 | ||
| 2,858,670 | |||||
MANUFACTURING – 0.57% | |||||
Bombardier Inc. Class B | 3,753,160 | 13,669,602 | |||
| 13,669,602 | |||||
MEDIA – 3.20% | |||||
Astral Media Inc. Class A | 126,250 | 3,638,345 | |||
Rogers Communications Inc. Class B | 1,299,870 | 35,673,191 | |||
Shaw Communications Inc. Class B | 904,960 | 15,482,994 | |||
Thomson Reuters Corp. | 592,870 | 18,856,316 | |||
Yellow Pages Income Fund | 641,350 | 2,954,911 | |||
| 76,605,757 | |||||
MINING – 14.45% | |||||
Agnico-Eagle Mines Ltd. | 407,026 | 23,270,806 | |||
Barrick Gold Corp. | 2,280,580 | 78,452,367 | |||
Cameco Corp. | 1,025,134 | 27,190,670 | |||
Eldorado Gold Corp.b,c | 986,770 | 10,152,972 | |||
First Quantum Minerals Ltd. | 204,016 | 12,043,121 | |||
Franco-Nevada Corp. | 288,860 | 7,409,229 | |||
Goldcorp Inc. | 1,906,880 | 69,260,590 | |||
IAMGOLD Corp. | 906,952 | 10,504,375 | |||
Inmet Mining Corp. | 131,300 | 5,674,025 | |||
Ivanhoe Mines Ltd.b | 644,380 | 7,111,209 | |||
Kinross Gold Corp. | 1,815,952 | 34,359,647 | |||
Pan American Silver Corp.b | 214,120 | 4,176,144 | |||
Silver Wheaton Corp.b | 752,412 | 7,796,448 | |||
Teck Resources Ltd. Class Bb | 1,286,740 | 30,954,401 | |||
Yamana Gold Inc. | 1,916,980 | 17,577,044 | |||
| 345,933,048 | |||||
OIL & GAS – 20.77% | |||||
ARC Energy Trust | 294,920 | 4,667,161 | |||
Canadian Natural Resources Ltd. | 1,416,016 | 80,854,417 | |||
Canadian Oil Sands Trust | 617,110 | 15,452,333 | |||
Crescent Point Energy Corp. | 382,790 | 12,791,617 | |||
EnCana Corp. | 1,960,410 | 101,853,853 | |||
Enerplus Resources Fund | 426,232 | 8,895,276 | |||
Ensign Energy Services Inc. | 342,390 | 5,006,859 | |||
Husky Energy Inc. | 667,610 | 17,920,458 | |||
Imperial Oil Ltd. | 776,700 | 27,843,095 | |||
| Security | Shares | Value | |||
Nexen Inc. | 1,224,120 | $ | 23,964,106 | ||
Niko Resources Ltd. | 116,150 | 7,508,900 | |||
Penn West Energy Trust | 1,081,672 | 13,897,011 | |||
Progress Energy Resources Corp. | 409,050 | 3,862,371 | |||
Provident Energy Trust | 667,610 | 3,477,104 | |||
Suncor Energy Inc. | 4,069,578 | 124,097,593 | |||
Talisman Energy Inc. | 2,662,360 | 42,665,637 | |||
Vermilion Energy Trust | 89,890 | 2,385,062 | |||
| 497,142,853 | |||||
OIL & GAS SERVICES – 0.13% | |||||
Trican Well Service Ltd. | 333,300 | 3,077,316 | |||
| 3,077,316 | |||||
PHARMACEUTICALS – 0.20% | |||||
Biovail Corp. | 368,650 | 4,696,029 | |||
| 4,696,029 | |||||
PIPELINES – 3.61% | |||||
Enbridge Inc. | 926,170 | 34,491,558 | |||
TransCanada Corp. | 1,749,320 | 51,926,093 | |||
| 86,417,651 | |||||
REAL ESTATE – 0.29% | |||||
Brookfield Properties Corp. | 632,878 | 6,938,175 | |||
| 6,938,175 | |||||
REAL ESTATE INVESTMENT TRUSTS – 0.18% | |||||
RioCan Real Estate Investment Trust | 285,830 | 4,385,373 | |||
| 4,385,373 | |||||
RETAIL – 1.56% | |||||
Alimentation Couche-Tard Inc. Class B | 331,308 | 5,659,311 | |||
Canadian Tire Corp. Ltd. Class A | 204,020 | 10,607,368 | |||
Shoppers Drug Mart Corp. | 540,350 | 21,156,431 | |||
| 37,423,110 | |||||
SOFTWARE – 0.21% | |||||
Open Text Corp.b | 145,440 | 5,106,457 | |||
| 5,106,457 | |||||
TELECOMMUNICATIONS – 1.40% | |||||
BCE Inc. | 661,614 | 16,205,251 | |||
Manitoba Telecom Services Inc. | 56,560 | 1,683,539 | |||
TELUS Corp. | 151,158 | 4,672,719 | |||
TELUS Corp. NVS | 372,690 | 11,011,874 | |||
| 33,573,383 | |||||
| SCHEDULESOF INVESTMENTS | 35 |
Table of Contents
Schedule of Investments (Continued)
iSHARES® MSCI CANADA INDEX FUND
August 31, 2009
| Security | Shares | Value | ||||
TRANSPORTATION – 3.56% |
| |||||
Canadian National | 1,224,120 | $ | 58,985,140 | |||
Canadian Pacific Railway Ltd. | 439,344 | 20,970,100 | ||||
Viterra Inc.b | 607,010 | 5,328,091 | ||||
| 85,283,331 | ||||||
TOTAL COMMON STOCKS | ||||||
(Cost: $2,766,636,910) | 2,388,480,984 | |||||
SHORT-TERM INVESTMENTS – 0.42% |
| |||||
MONEY MARKET FUNDS – 0.42% |
| |||||
Barclays Global Investors Funds Institutional Money Market | 8,152,755 | 8,152,755 | ||||
Barclays Global Investors Funds | 1,150,075 | 1,150,075 | ||||
Barclays Global Investors Funds Treasury Money Market | 811,492 | 811,492 | ||||
| 10,114,322 | ||||||
TOTAL SHORT-TERM INVESTMENTS |
| |||||
(Cost: $10,114,322) | 10,114,322 | |||||
TOTAL INVESTMENTS IN |
| |||||
(Cost: $2,776,751,232) | 2,398,595,306 | |||||
Other Assets, Less Liabilities – (0.21)% | (4,957,750 | ) | ||||
NET ASSETS – 100.00% | $ | 2,393,637,556 | ||||
NVS – Non-Voting Shares
| a | Security valued using Level 3 inputs. See Note 1. |
| b | Non-income earning security. |
| c | All or a portion of this security represents a security on loan. See Note 5. |
| d | Affiliated issuer. See Note 2. |
| e | The rate quoted is the annualized seven-day yield of the fund at period end. |
| f | All or a portion of this security represents an investment of securities lending collateral. See Note 5. |
See notes to financial statements.
| 36 | 2009 iSHARES ANNUAL REPORTTO SHAREHOLDERS |
Table of Contents
Schedule of Investments
iSHARES® MSCI CHILE INVESTABLE MARKET INDEX FUND
August 31, 2009
| Security | Shares | Value | |||
COMMON STOCKS – 99.90% | |||||
AIRLINES – 4.00% | |||||
LAN Airlines SA | 887,478 | $ | 10,530,978 | ||
| 10,530,978 | |||||
APPAREL – 0.20% | |||||
Forus SA | 533,506 | 530,612 | |||
| 530,612 | |||||
BANKS – 8.55% | |||||
Banco de Credito | 223,374 | 6,099,362 | |||
Banco Santander Chile SA | 266,710,285 | 13,099,188 | |||
CorpBanca SA | 565,444,940 | 3,302,690 | |||
| 22,501,240 | |||||
BEVERAGES – 4.69% | |||||
Compania Cervecerias | 971,494 | 6,350,725 | |||
Vina Concha y Toro SA | 3,073,428 | 6,002,355 | |||
| 12,353,080 | |||||
BUILDING MATERIALS – 0.48% | |||||
SalfaCorp SA | 952,891 | 1,275,116 | |||
| 1,275,116 | |||||
CHEMICALS – 7.59% | |||||
Sociedad Quimica y Minera de Chile SA Series B | 572,923 | 19,974,603 | |||
| 19,974,603 | |||||
COMPUTERS – 1.08% | |||||
Sonda SA | 2,087,055 | 2,845,641 | |||
| 2,845,641 | |||||
ELECTRIC – 29.98% | |||||
AES Gener SA | 15,206,594 | 6,544,610 | |||
Almendral SA | 40,708,405 | 3,607,810 | |||
Colbun SA | 47,241,182 | 10,712,557 | |||
Empresa Electrica del Norte | 490,584 | 603,250 | |||
Empresa Electrica | 34,706 | 138,071 | |||
Empresa Nacional de | 19,701,252 | 30,207,399 | |||
Enersis SA | 77,867,600 | 27,105,810 | |||
| 78,919,507 | |||||
ENGINEERING & CONSTRUCTION – 0.36% | |||||
Socovesa SA | 3,217,039 | 936,606 | |||
| 936,606 | |||||
| Security | Shares | Value | |||
FOOD – 4.73% | |||||
Cencosud SA | 4,803,103 | $ | 12,455,063 | ||
| 12,455,063 | |||||
FOREST PRODUCTS & PAPER – 7.53% | |||||
Empresas CMPC SA | 579,268 | 16,770,490 | |||
Masisa SA | 23,181,518 | 3,039,168 | |||
| 19,809,658 | |||||
HEALTH CARE - SERVICES – 0.32% | |||||
Banmedica SA | 875,814 | 831,469 | |||
| 831,469 | |||||
HOLDING COMPANIES - DIVERSIFIED – 12.40% | |||||
Empresas Copec SA | 2,738,734 | 32,636,993 | |||
| 32,636,993 | |||||
IRON & STEEL – 4.35% | |||||
CAP SA | 477,074 | 11,439,424 | |||
| 11,439,424 | |||||
METAL FABRICATE & HARDWARE – 0.57% | |||||
Madeco SA | 22,505,196 | 1,489,494 | |||
| 1,489,494 | |||||
REAL ESTATE – 0.51% | |||||
Parque Arauco SA | 1,510,877 | 1,340,118 | |||
| 1,340,118 | |||||
RETAIL – 6.69% | |||||
La Polar SA | 1,581,236 | 6,690,944 | |||
Ripley Corp. SA | 2,812,564 | 2,003,888 | |||
S.A.C.I. Falabella SA | 2,160,462 | 8,919,231 | |||
| 17,614,063 | |||||
TELECOMMUNICATIONS – 3.02% | |||||
Empresa Nacional de Telecomunicaciones SA | 623,767 | 7,940,904 | |||
| 7,940,904 | |||||
TRANSPORTATION – 1.14% | |||||
Compania SudAmericana de Vapores SAa | 3,969,748 | 3,000,641 | |||
| 3,000,641 | |||||
WATER – 1.71% | |||||
Inversiones Aguas | 4,078,906 | 4,514,161 | |||
| 4,514,161 | |||||
TOTAL COMMON STOCKS | |||||
(Cost: $228,811,699) | 262,939,371 | ||||
| SCHEDULESOF INVESTMENTS | 37 |
Table of Contents
Schedule of Investments (Continued)
iSHARES® MSCI CHILE INVESTABLE MARKET INDEX FUND
August 31, 2009
| Security | Shares | Value | ||||
SHORT-TERM INVESTMENTS – 0.17% |
| |||||
MONEY MARKET FUNDS – 0.17% | ||||||
Barclays Global Investors Funds | 451,456 | $ | 451,456 | |||
| 451,456 | ||||||
TOTAL SHORT-TERM INVESTMENTS |
| |||||
(Cost: $451,456) | 451,456 | |||||
TOTAL INVESTMENTS IN | ||||||
(Cost: $229,263,155) | 263,390,827 | |||||
Other Assets, Less Liabilities – (0.07)% | (185,948 | ) | ||||
NET ASSETS – 100.00% | $ | 263,204,879 | ||||
| a | Non-income earning security. |
| b | Affiliated issuer. See Note 2. |
| c | The rate quoted is the annualized seven-day yield of the fund at period end. |
See notes to financial statements.
| 38 | 2009 iSHARES ANNUAL REPORTTO SHAREHOLDERS |
Table of Contents
Schedule of Investments
iSHARES® MSCI ISRAEL CAPPED INVESTABLE MARKET INDEX FUND
August 31, 2009
| Security | Shares | Value | |||
COMMON STOCKS – 99.57% | |||||
AEROSPACE & DEFENSE – 2.91% | |||||
Elbit Systems Ltd. | 48,208 | $ | 3,142,589 | ||
| 3,142,589 | |||||
AIRLINES – 0.12% | |||||
El Al Israel Airlines Ltd.a | 555,358 | 133,286 | |||
| 133,286 | |||||
BANKS – 15.82% | |||||
Bank Hapoalim Ltd.a,b | 1,568,812 | 5,053,335 | |||
Bank Leumi le-Israela | 2,035,132 | 6,979,898 | |||
Israel Discount Bank Ltd. | 1,162,512 | 2,041,110 | |||
Mizrahi Tefahot Bank Ltd.a | 357,236 | 2,723,011 | |||
Union Bank of Israela | 61,245 | 255,491 | |||
| 17,052,845 | |||||
CHEMICALS – 12.96% | |||||
Frutaromb | 94,024 | 727,367 | |||
Israel Chemicals Ltd. | 947,554 | 10,595,092 | |||
Makhteshim-Agan Industries Ltd. | 575,368 | 2,643,275 | |||
| 13,965,734 | |||||
COMMERCIAL SERVICES – 0.62% | |||||
AL-ROV Israel Ltd.a | 9,200 | 206,930 | |||
Nitsba Holdings 1995 Ltd.a | 52,933 | 461,198 | |||
| 668,128 | |||||
COMPUTERS – 0.02% | |||||
MATRIX IT Ltd. | 6,992 | 24,497 | |||
| 24,497 | |||||
DIVERSIFIED FINANCIAL SERVICES – 0.53% | |||||
FIBI Holdings Ltd.a | 26,312 | 438,360 | |||
Mivtach Shamir Holdings Ltd.a | 5,152 | 130,014 | |||
| 568,374 | |||||
ELECTRICAL COMPONENTS & | |||||
Electra (Israel) Ltd. | 2,333 | 300,595 | |||
| 300,595 | |||||
ELECTRONICS – 1.10% | |||||
Elron Electronic Industries Ltd.a | 41,998 | 195,048 | |||
Ituran Location and Control Ltd. | 36,572 | 343,777 | |||
Orbotech Ltd.a | 70,196 | 645,101 | |||
| 1,183,926 | |||||
| Security | Shares | Value | |||
ENGINEERING & CONSTRUCTION – 0.61% | |||||
Shikun & Binui Ltd. | 390,586 | $ | 654,844 | ||
| 654,844 | |||||
FOOD – 0.71% | �� | ||||
Blue Square-Israel Ltd. | 23,598 | 223,924 | |||
Maabarot Products Ltd. | 2,760 | 39,926 | |||
Shufersal Ltd.b | 124,982 | 499,928 | |||
| 763,778 | |||||
FOREST PRODUCTS & PAPER – 0.21% | |||||
Hadera Paper Ltd.a | 3,864 | 221,893 | |||
| 221,893 | |||||
HEALTH CARE - PRODUCTS – 1.08% | |||||
Given Imaging Ltd. | 47,840 | 564,990 | |||
Syneron Medical Ltd.a | 61,207 | 597,380 | |||
| 1,162,370 | |||||
HOLDING COMPANIES - DIVERSIFIED – 0.61% | |||||
Clal Industries and Investments Ltd. | 88,552 | 397,695 | |||
Elco Holdings Ltd. | 18,217 | 193,497 | |||
Granite Hacarmel Investments Ltd.a | 36,202 | 67,864 | |||
| 659,056 | |||||
HOME BUILDERS – 0.44% | |||||
Bayside Land Corp. Ltd. | 968 | 213,663 | |||
Property & Building Corp. Ltd. | 3,880 | 256,106 | |||
| 469,769 | |||||
INSURANCE – 2.27% | |||||
Clal Insurance Enterprises | 23,828 | 497,006 | |||
Harel Insurance | 20,361 | 981,091 | |||
Menorah Mivtachim Holdings Ltd. Class La | 53,652 | 648,782 | |||
Phoenix Holdings Ltd.a | 127,114 | 319,169 | |||
| 2,446,048 | |||||
INTERNET – 8.69% | |||||
Check Point Software Technologies Ltd.a,b | 300,932 | 8,386,975 | |||
NetVision Ltd. | 8,096 | 85,524 | |||
RADVision Ltd.a | 38,557 | 348,941 | |||
Radware Ltd.a | 49,174 | 543,864 | |||
| 9,365,304 | |||||
| SCHEDULESOF INVESTMENTS | 39 |
Table of Contents
Schedule of Investments (Continued)
iSHARES® MSCI ISRAEL CAPPED INVESTABLE MARKET INDEX FUND
August 31, 2009
| Security | Shares | Value | |||
INVESTMENT COMPANIES – 4.52% | |||||
Delek Group Ltd. (The) | 8,234 | $ | 1,375,486 | ||
Discount Investment Corp. Ltd. | 35,282 | 820,592 | |||
Elbit Imaging Ltd.a | 26,124 | 658,014 | |||
Israel Corp. Ltd. (The) | 3,267 | 1,958,044 | |||
Queenco Ltd. | 35,162 | 57,875 | |||
| 4,870,011 | |||||
MACHINERY – 0.96% | |||||
Ormat Industries Ltd. | 128,938 | 1,033,206 | |||
| 1,033,206 | |||||
MANUFACTURING – 0.32% | |||||
FMS Enterprises Migun Ltd. | 7,163 | 246,048 | |||
Plasson Industries Ltd. | 4,968 | 95,504 | |||
| 341,552 | |||||
MEDIA – 0.59% | |||||
Hot Telecommunication Systems Ltd.a | 69,061 | 640,558 | |||
| 640,558 | |||||
OIL & GAS – 1.32% | |||||
Delek Drilling LP | 444,452 | 698,919 | |||
Oil Refineries Ltd.b | 1,731,578 | 729,663 | |||
| 1,428,582 | |||||
PHARMACEUTICALS – 23.02% | |||||
Teva Pharmaceutical | 481,068 | 24,818,663 | |||
| 24,818,663 | |||||
REAL ESTATE – 3.10% | |||||
Adgar Investments & Development Ltd. | 15,410 | 16,747 | |||
Africa Israel Properties Ltd.a | 13,350 | 213,248 | |||
Airport City Ltd.a | 15,778 | 63,487 | |||
Alony Hetz Properties & Investments Ltd. | 121,027 | 402,625 | |||
Amot Investments Ltd. | 109,100 | 227,965 | |||
Azorim-Investment Development & Construction Co. Ltd.a | 19,506 | 121,697 | |||
British Israel Investments Ltd. | 91,632 | 238,304 | |||
Delek Real Estate Ltd.a,b | 199,536 | 287,121 | |||
Electra Real Estate Ltd. | 10,718 | 98,478 | |||
Gazit Globe Ltd.b | 100,586 | 815,311 | |||
Gazit Inc. | 16,078 | 259,625 | |||
| Security | Shares | Value | |||
Jerusalem Economy Ltd.a | 37,628 | $ | 285,128 | ||
Melisron Ltd. | 14,904 | 312,443 | |||
| 3,342,179 | |||||
RETAIL – 0.68% | |||||
Delek Automotive Systems Ltd. | 65,458 | 738,314 | |||
| 738,314 | |||||
SEMICONDUCTORS – 0.49% | |||||
Mellanox Technologies Ltd.a | 36,616 | 527,754 | |||
| 527,754 | |||||
SOFTWARE – 0.50% | |||||
Fundtech Ltd.a | 13,242 | 122,356 | |||
Retalix Ltd.a | 42,524 | 413,170 | |||
| 535,526 | |||||
TELECOMMUNICATION EQUIPMENT – 0.14% | |||||
AudioCodes Ltd.a | 77,787 | 151,685 | |||
| 151,685 | |||||
TELECOMMUNICATIONS – 14.95% | |||||
Alvarion Ltd.a | 96,416 | 375,058 | |||
Bezeq Israeli Telecommunication Corp. Ltd. | 2,548,575 | 5,342,755 | |||
Cellcom Israel Ltd. | 81,186 | 2,297,564 | |||
Ceragon Networks Ltd.a | 65,194 | 460,270 | |||
Gilat Satellite Networks Ltd.a | 77,179 | 328,011 | |||
NICE Systems Ltd.a,b | 131,100 | 3,620,610 | |||
Partner Communications | 184,690 | 3,517,765 | |||
RRSat Global Communications Network Ltd. | 15,134 | 168,139 | |||
| 16,110,172 | |||||
TOTAL COMMON STOCKS | 107,321,238 | ||||
SHORT-TERM INVESTMENTS – 11.18% | |||||
MONEY MARKET FUNDS – 11.18% | |||||
Barclays Global Investors Funds | 10,546,366 | 10,546,366 | |||
| 40 | 2009 iSHARES ANNUAL REPORTTO SHAREHOLDERS |
Table of Contents
Schedule of Investments (Continued)
iSHARES® MSCI ISRAEL CAPPED INVESTABLE MARKET INDEX FUND
August 31, 2009
| Security | Shares | Value | ||||
Barclays Global Investors Funds | 1,487,731 | $ | 1,487,731 | |||
Barclays Global Investors Funds | 20,173 | 20,173 | ||||
| 12,054,270 | ||||||
TOTAL SHORT-TERM INVESTMENTS |
| |||||
(Cost: $12,054,270) | 12,054,270 | |||||
TOTAL INVESTMENTS IN | 119,375,508 | |||||
Other Assets, Less Liabilities – (10.75)% | (11,583,483 | ) | ||||
NET ASSETS – 100.00% | $ | 107,792,025 | ||||
| a | Non-income earning security. |
| b | All or a portion of this security represents a security on loan. See Note 5. |
| c | Affiliated issuer. See Note 2. |
| d | The rate quoted is the annualized seven-day yield of the fund at period end. |
| e | All or a portion of this security represents an investment of securities lending collateral. See Note 5. |
See notes to financial statements.
| SCHEDULESOF INVESTMENTS | 41 |
Table of Contents
Schedule of Investments
iSHARES® MSCI MEXICO INVESTABLE MARKET INDEX FUND
August 31, 2009
| Security | Shares | Value | |||
COMMON STOCKS – 99.88% | |||||
BANKS – 0.81% | |||||
Banco Compartamos SA de CVa | 1,630,000 | $ | 5,591,634 | ||
| 5,591,634 | |||||
BEVERAGES – 8.80% | |||||
Coca-Cola FEMSA SAB de CV | 162,916 | 7,262,795 | |||
Fomento Economico Mexicano SAB de CV BD Units | 10,692,808 | 38,929,064 | |||
Grupo Modelo SAB de CV | 4,091,356 | 14,901,451 | |||
| 61,093,310 | |||||
BUILDING MATERIALS – 4.98% | |||||
Cemex SAB de CV CPOb | 26,063,770 | 34,578,313 | |||
| 34,578,313 | |||||
CHEMICALS – 0.71% | |||||
Mexichem SAB de CVa | 3,767,231 | 4,915,889 | |||
| 4,915,889 | |||||
DIVERSIFIED FINANCIAL SERVICES – 6.14% | |||||
Bolsa Mexicana de Valores SAB de CVa,b | 1,450,700 | 1,737,274 | |||
Financiera Independencia SAB de CVa | 425,642 | 255,981 | |||
Grupo Financiero Banorte SAB de CV Series O | 9,111,700 | 26,810,486 | |||
Grupo Financiero Inbursa SAB de CV Series O | 5,118,200 | 13,799,478 | |||
| 42,603,219 | |||||
ENGINEERING & CONSTRUCTION – 4.22% | |||||
Carso Infraestructura y | 5,509,400 | 2,771,463 | |||
Empresas ICA SAB de CVb | 2,950,374 | 6,280,007 | |||
Grupo Aeroportuario del Centro Norte SAB de CVa | 1,157,300 | 1,664,836 | |||
Grupo Aeroportuario del Pacifico SAB de CV Series B | 3,667,500 | 9,604,541 | |||
Grupo Aeroportuario del Sureste SA de CV Series B SP ADR | 198,860 | 8,173,146 | |||
Promotora y Operadora de Infraestructura SAB de CVa,b | 407,500 | 784,469 | |||
| 29,278,462 | |||||
| Security | Shares | Value | |||
ENVIRONMENTAL CONTROL – 0.01% | |||||
Promotora Ambiental SAB | 32,600 | $ | 33,802 | ||
| 33,802 | |||||
FOOD – 3.38% | |||||
Alsea SAB de CVa,b | 2,396,145 | 1,484,216 | |||
Gruma SAB de CV Series Ba,b | 1,418,169 | 2,182,790 | |||
Grupo Bimbo SAB de CV | 3,390,400 | 19,763,619 | |||
| 23,430,625 | |||||
FOREST PRODUCTS & PAPER – 2.72% | |||||
Kimberly-Clark de Mexico SAB de CV Series A | 4,368,400 | 18,862,349 | |||
| 18,862,349 | |||||
HOLDING COMPANIES - DIVERSIFIED – 4.11% | |||||
Alfa SAB de CV Series A | 2,249,400 | 9,819,101 | |||
Grupo Carso SAB de CV | 5,802,830 | 18,721,266 | |||
| 28,540,367 | |||||
HOME BUILDERS – 3.82% | |||||
Consorcio ARA SAB de CVa,b | 5,835,400 | 3,364,820 | |||
Corporacion Geo SAB de CV Series Ba,b | 2,689,960 | 6,367,952 | |||
Desarrolladora Homex SAB | 1,532,230 | 9,057,205 | |||
Sare Holding SAB de CV Series Ba,b | 929,100 | 369,018 | |||
Urbi Desarrollos Urbanos SAB de CVb | 3,846,800 | 7,390,944 | |||
| 26,549,939 | |||||
HOUSEWARES – 0.02% | |||||
Vitro SAB de CV Series Aa,b | 293,400 | 163,233 | |||
| 163,233 | |||||
IRON & STEEL – 0.24% | |||||
Compania Minera Autlan SAB de CV Series Ba | 297,200 | 617,653 | |||
Grupo Simec SAB de CV Series Ba,b | 391,200 | 1,070,598 | |||
| 1,688,251 | |||||
| 42 | 2009 iSHARES ANNUAL REPORTTO SHAREHOLDERS |
Table of Contents
Schedule of Investments (Continued)
iSHARES® MSCI MEXICO INVESTABLE MARKET INDEX FUND
August 31, 2009
| Security | Shares | Value | |||
MACHINERY – 0.27% | |||||
Industrias CH SAB de CV Series Ba,b | 521,600 | $ | 1,899,761 | ||
| 1,899,761 | |||||
MEDIA – 5.67% | |||||
Grupo Televisa SA CPO | 9,600,799 | 33,634,279 | |||
Megacable Holdings SAB de CV CPOa,b | 1,760,400 | 3,037,326 | |||
TV Azteca SAB de CV CPOa | 6,414,000 | 2,706,421 | |||
| 39,378,026 | |||||
MINING – 6.11% | |||||
Grupo Mexico SAB de CV Series Bb | 22,918,210 | 33,295,970 | |||
Industrias Penoles SAB de CV | 586,800 | 9,124,314 | |||
| 42,420,284 | |||||
PHARMACEUTICALS – 0.07% | |||||
Genomma Lab Internacional SAB de CV Series Bb | 358,600 | 507,249 | |||
| 507,249 | |||||
RETAIL – 10.61% | |||||
Grupo Elektra SA de CVa | 423,830 | 16,099,173 | |||
Grupo Famsa SAB de CV Series Aa,b | 1,689,316 | 2,676,230 | |||
Wal-Mart de Mexico SAB de CV Series V | 15,452,400 | 54,911,393 | |||
| 73,686,796 | |||||
TELECOMMUNICATIONS – 37.19% | |||||
America Movil SAB de CV Series L | 74,686,640 | 168,731,094 | |||
Axtel SAB de CV CPOa,b | 6,878,600 | 4,456,982 | |||
Carso Global Telecom SAB de CV Series A1b | 5,656,131 | 22,919,328 | |||
Maxcom Telecomunicaciones SAB de CVa,b | 587,000 | 282,064 | |||
Telefonos de Mexico SAB de CV Series L | 37,473,700 | 34,916,312 | |||
Telmex Internacional SAB de CV Series L | 41,402,000 | 26,919,638 | |||
| 258,225,418 | |||||
TOTAL COMMON STOCKS | |||||
(Cost: $901,517,035) | 693,446,927 | ||||
| Security | Shares | Value | ||||
SHORT-TERM INVESTMENTS – 4.27% |
| |||||
MONEY MARKET FUNDS – 4.27% |
| |||||
Barclays Global Investors Funds | 25,836,318 | $ | 25,836,318 | |||
Barclays Global Investors Funds | 3,644,619 | 3,644,619 | ||||
Barclays Global Investors Funds | 166,138 | 166,138 | ||||
| 29,647,075 | ||||||
TOTAL SHORT-TERM INVESTMENTS |
| |||||
(Cost: $29,647,075) | 29,647,075 | |||||
TOTAL INVESTMENTS IN |
| |||||
(Cost: $931,164,110) | 723,094,002 | |||||
Other Assets, Less Liabilities – (4.15)% | (28,816,383 | ) | ||||
NET ASSETS – 100.00% | $ | 694,277,619 | ||||
SP ADR – Sponsored American Depositary Receipts
| a | All or a portion of this security represents a security on loan. See Note 5. |
| b | Non-income earning security. |
| c | Affiliated issuer. See Note 2. |
| d | The rate quoted is the annualized seven-day yield of the fund at period end. |
| e | All or a portion of this security represents an investment of securities lending collateral. See Note 5. |
See notes to financial statements.
| SCHEDULESOF INVESTMENTS | 43 |
Table of Contents
Schedule of Investments
iSHARES® MSCI SOUTH AFRICA INDEX FUND
August 31, 2009
| Security | Shares | Value | |||
COMMON STOCKS – 99.83% | |||||
BANKS – 14.36% | |||||
Absa Group Ltd. | 783,678 | $ | 12,752,998 | ||
FirstRand Ltd. | 6,847,618 | 13,961,005 | |||
Nedbank Group Ltd. | 466,240 | 6,900,054 | |||
Standard Bank Group Ltd. | 2,832,314 | 36,545,518 | |||
| 70,159,575 | |||||
BUILDING MATERIALS – 1.02% | |||||
Pretoria Portland | 1,210,720 | 4,994,374 | |||
| 4,994,374 | |||||
DIVERSIFIED FINANCIAL SERVICES – 3.43% | |||||
African Bank Investments Ltd. | 1,855,748 | 6,873,714 | |||
Investec Ltd. | 521,606 | 3,906,261 | |||
RMB Holdings Ltd. | 1,762,218 | 5,984,281 | |||
| 16,764,256 | |||||
ELECTRONICS – 0.58% | |||||
Reunert Ltd. | 430,708 | 2,809,140 | |||
| 2,809,140 | |||||
ENGINEERING & CONSTRUCTION – 2.15% | |||||
Aveng Ltd. | 960,210 | 5,079,139 | |||
Murray & Roberts Holdings Ltd. | 765,912 | 5,408,393 | |||
| 10,487,532 | |||||
FOOD – 3.14% | |||||
Shoprite Holdings Ltd. | 990,102 | 7,371,565 | |||
Tiger Brands Ltd. | 399,688 | 7,977,493 | |||
| 15,349,058 | |||||
FOREST PRODUCTS & PAPER – 0.98% | |||||
Sappi Ltd. | 1,239,484 | 4,805,898 | |||
| 4,805,898 | |||||
HEALTH CARE - PRODUCTS – 0.81% | |||||
Aspen Pharmacare | 526,494 | 3,954,358 | |||
| 3,954,358 | |||||
HEALTH CARE - SERVICES – 0.61% | |||||
Netcare Ltd.a | 2,246,506 | 2,982,324 | |||
| 2,982,324 | |||||
HOLDING COMPANIES - DIVERSIFIED – 5.26% | |||||
Bidvest Group Ltd. | 693,720 | 10,064,433 | |||
Imperial Holdings Ltd. | 404,012 | 3,843,608 | |||
Remgro Ltd. | 1,067,558 | 11,787,361 | |||
| 25,695,402 | |||||
| Security | Shares | Value | |||
HOME FURNISHINGS – 1.29% | |||||
Steinhoff International | 2,823,854 | $ | 6,315,635 | ||
| 6,315,635 | |||||
INSURANCE – 3.63% | |||||
Discovery Holdings Ltd. | 648,130 | 2,321,630 | |||
Liberty Holdings Ltd. | 277,958 | 2,301,789 | |||
Sanlam Ltd. | 4,984,538 | 13,119,142 | |||
| 17,742,561 | |||||
IRON & STEEL – 2.61% | |||||
ArcelorMittal South | 433,152 | 6,495,459 | |||
Kumba Iron Ore Ltd. | 194,016 | 6,264,479 | |||
| 12,759,938 | |||||
MEDIA – 6.24% | |||||
Naspers Ltd. Class N | 933,044 | 30,487,132 | |||
| 30,487,132 | |||||
MINING – 22.49% | |||||
African Rainbow | 257,372 | 5,320,027 | |||
Anglo Platinum Ltd.a | 144,572 | 12,807,369 | |||
AngloGold Ashanti Ltd. | 730,850 | 27,966,881 | |||
Exxaro Resources Ltd. | 302,304 | 3,586,266 | |||
Gold Fields Ltd. | 1,625,166 | 19,765,688 | |||
Harmony Gold Mining Co. Ltd.a | 879,370 | 8,240,654 | |||
Impala Platinum Holdings Ltd. | 1,304,062 | 30,438,187 | |||
Northam Platinum Ltd. | 349,680 | 1,798,492 | |||
| 109,923,564 | |||||
OIL & GAS – 10.72% | |||||
Sasol Ltd. | 1,393,174 | 52,410,037 | |||
| 52,410,037 | |||||
REAL ESTATE – 2.35% | |||||
Growthpoint Properties Ltd. | 3,422,540 | 6,063,931 | |||
Redefine Income Fund Ltd. | 5,790,588 | 5,419,720 | |||
| 11,483,651 | |||||
RETAIL – 4.10% | |||||
Foschini Ltd. | 496,602 | 3,888,604 | |||
Massmart Holdings Ltd. | 487,578 | 4,851,460 | |||
Pick’n Pay Stores Ltd. | 553,284 | 2,678,034 | |||
Truworths International Ltd. | 1,048,100 | 5,295,099 | |||
Woolworths Holdings Ltd. | 1,650,452 | 3,337,414 | |||
| 20,050,611 | |||||
| 44 | 2009 iSHARES ANNUAL REPORTTO SHAREHOLDERS |
Table of Contents
Schedule of Investments (Continued)
iSHARES® MSCI SOUTH AFRICA INDEX FUND
August 31, 2009
| Security | Shares | Value | ||||
TELECOMMUNICATIONS – 14.06% |
| |||||
MTN Group Ltd. | 3,575,384 | $ | 58,527,441 | |||
Telkom South Africa Ltd. | 630,082 | 3,511,669 | ||||
Vodacom Group Pty Ltd.a | 903,622 | 6,682,453 | ||||
| 68,721,563 | ||||||
TOTAL COMMON STOCKS | 487,896,609 | |||||
SHORT-TERM INVESTMENTS – 0.50% |
| |||||
MONEY MARKET FUNDS – 0.50% |
| |||||
Barclays Global Investors Funds Institutional Money Market | 2,147,116 | 2,147,116 | ||||
Barclays Global Investors Funds | 302,884 | 302,884 | ||||
Barclays Global Investors Funds | 12,156 | 12,156 | ||||
| 2,462,156 | ||||||
TOTAL SHORT-TERM INVESTMENTS |
| |||||
(Cost: $2,462,156) | 2,462,156 | |||||
TOTAL INVESTMENTS IN | 490,358,765 | |||||
Other Assets, Less Liabilities – (0.33)% | (1,630,496 | ) | ||||
NET ASSETS – 100.00% | $ | 488,728,269 | ||||
| a | Non-income earning security. |
| b | All or a portion of this security represents a security on loan. See Note 5. |
| c | Affiliated issuer. See Note 2. |
| d | The rate quoted is the annualized seven-day yield of the fund at period end. |
| e | All or a portion of this security represents an investment of securities lending collateral. See Note 5. |
See notes to financial statements.
| SCHEDULESOF INVESTMENTS | 45 |
Table of Contents
Schedule of Investments
iSHARES® MSCI TURKEY INVESTABLE MARKET INDEX FUND
August 31, 2009
| Security | Shares | Value | |||
COMMON STOCKS – 97.58% | |||||
AEROSPACE & DEFENSE – 0.17% | |||||
Aselsan Elektronik | 108,371 | $ | 411,673 | ||
| 411,673 | |||||
AIRLINES – 1.29% | |||||
Turk Hava Yollari AOa | 1,633,506 | 3,135,286 | |||
| 3,135,286 | |||||
AUTO MANUFACTURERS – 0.73% | |||||
Otokar Otobus Karoseri | 38,214 | 318,344 | |||
TOFAS Turk Otomobil | 581,242 | 1,456,495 | |||
| 1,774,839 | |||||
BANKS – 42.57% | |||||
Akbank TASa | 3,498,622 | 20,052,082 | |||
Albaraka Turk Katilim | 896,512 | 1,236,774 | |||
Asya Katilim Bankasi ASb | 2,095,200 | 3,881,810 | |||
Sekerbank TASa,b | 827,193 | 1,345,119 | |||
Tekstil Bankasi ASa,b | 551,668 | 338,244 | |||
Turk Ekonomi Bankasi ASa,b | 1,023,765 | 1,248,578 | |||
Turkiye Garanti Bankasi ASb | 8,392,789 | 31,042,972 | |||
Turkiye Halk Bankasi AS | 1,456,530 | 7,862,641 | |||
Turkiye Is Bankasi AS | 5,025,840 | 19,929,189 | |||
Turkiye Vakiflar Bankasi TAOb | 3,498,758 | 7,741,337 | |||
Yapi ve Kredi Bankasi ASa,b | 4,052,687 | 8,534,816 | |||
| 103,213,562 | |||||
BEVERAGES – 5.11% | |||||
Anadolu Efes Biracilik ve | 944,006 | 10,317,693 | |||
Coca-Cola Icecek ASa | 295,512 | 2,067,895 | |||
| 12,385,588 | |||||
BUILDING MATERIALS – 1.60% | |||||
Adana Cimento Sanayii TAS Class A | 206,145 | 707,529 | |||
Adana Cimento Sanayii TAS Class C | 577,530 | 219,388 | |||
Akcansa Cimento | 220,058 | 777,279 | |||
Bolu Cimento Sanayii AS | 307,185 | 302,988 | |||
Cimsa Cimento | 185,689 | 680,633 | |||
Goltas Goller Bolgesi | 13,391 | 359,205 | |||
Mardin Cimento | 191,301 | 835,069 | |||
| 3,882,091 | |||||
| Security | Shares | Value | |||
CHEMICALS – 1.25% | |||||
Aksa Akrilik Kimya | 391,659 | $ | 378,478 | ||
Bagfas Bandirma Gubre | 8,508 | 430,928 | |||
Gubre Fabrikalari TASa,b | 75,625 | 408,241 | |||
Petkim Petrokimya | 381,826 | 1,819,431 | |||
| 3,037,078 | |||||
COMMERCIAL SERVICES – 0.59% | |||||
Ihlas Holding ASa,b | 1,371,066 | 493,419 | |||
Koza Anadolu Metal Madencilik Isletmeleri ASa,b | 451,530 | 926,833 | |||
| 1,420,252 | |||||
DISTRIBUTION & WHOLESALE – 0.49% | |||||
Aygaz ASa | 417,794 | 1,180,570 | |||
| 1,180,570 | |||||
DIVERSIFIED FINANCIAL SERVICES – 0.46% | |||||
Finans Finansal Kiralama ASa,b | 263,596 | 293,372 | |||
Turkiye Sinai Kalkinma Bankasi ASb | 997,227 | 830,745 | |||
| 1,124,117 | |||||
ELECTRIC – 0.47% | |||||
Akenerji Elektrik Uretim ASa | 90,354 | 716,570 | |||
Zorlu Enerji Elektrik Uretim ASa,b | 117,144 | 425,481 | |||
| 1,142,051 | |||||
ENGINEERING & CONSTRUCTION – 2.68% | |||||
Enka Insaat ve Sanayi ASa | 1,088,852 | 4,390,240 | |||
TAV Havalimanlari | 759,610 | 2,116,075 | |||
| 6,506,315 | |||||
ENTERTAINMENT – 0.24% | |||||
Galatasaray Sportif Sinai ve Ticari Yatirimlar ASa | 3,831 | 393,185 | |||
Trabzonspor Sportif | 28,762 | 190,724 | |||
| 583,909 | |||||
FOOD – 3.50% | |||||
Banvit Bandirma Vitaminli Yem Sanayii ASa,b | 167,287 | 363,449 | |||
BIM Birlesik Magazalar ASa | 176,770 | 6,597,214 | |||
Tat Konserve Sanayii ASa,b | 283,835 | 518,299 | |||
Ulker Biskuvi Sanayi ASa | 433,571 | 1,005,550 | |||
| 8,484,512 | |||||
| 46 | 2009 iSHARES ANNUAL REPORTTO SHAREHOLDERS |
Table of Contents
Schedule of Investments (Continued)
iSHARES® MSCI TURKEY INVESTABLE MARKET INDEX FUND
August 31, 2009
| Security | Shares | Value | |||
FOREST PRODUCTS & PAPER – 0.17% | |||||
Kartonsan Karton | 8,557 | $ | 404,896 | ||
| 404,896 | |||||
HOLDING COMPANIES - DIVERSIFIED – 9.02% | |||||
Alarko Holding ASa | 308,134 | 726,954 | |||
Dogan Sirketler Grubu | 3,997,657 | 3,756,545 | |||
Haci Omer Sabanci | 2,213,162 | 8,554,708 | |||
KOC Holding ASa,b | 2,247,436 | 5,961,211 | |||
Tekfen Holding ASa,b | 609,657 | 1,673,967 | |||
Yazicilar Holding ASa | 187,681 | 1,181,996 | |||
| 21,855,381 | |||||
HOME FURNISHINGS – 0.46% | |||||
Vestel Beyaz Esya | 263,253 | 480,715 | |||
Vestel Elektronik | 409,076 | 629,768 | |||
| 1,110,483 | |||||
HOUSEWARES – 1.03% | |||||
Anadolu Cam Sanayii ASa,b | 535,188 | 613,478 | |||
Turk Sise ve Cam | 1,772,586 | 1,878,315 | |||
| 2,491,793 | |||||
INSURANCE – 1.65% | |||||
Aksigorta ASa | 568,575 | 1,932,511 | |||
Anadolu Anonim Turk | 891,335 | 748,472 | |||
Anadolu Hayat Emeklilik AS | 175,262 | 345,735 | |||
Gunes Sigorta ASa,b | 176,624 | 223,649 | |||
Yapi Kredi Sigorta ASa | 134,312 | 747,421 | |||
| 3,997,788 | |||||
IRON & STEEL – 3.06% | |||||
Eregli Demir ve Celik | 1,337,103 | 5,302,076 | |||
Izmir Demir Celik Sanayi ASb | 208,144 | 339,855 | |||
Kardemir Karabuk Demir Celik Sanayi ve TAS Class Ab | 813,442 | 444,533 | |||
Kardemir Karabuk Demir Celik Sanayi ve TAS Class Bb | 424,029 | 228,899 | |||
Kardemir Karabuk Demir Celik Sanayi ve TAS Class Da,b | 2,645,982 | 1,093,308 | |||
| 7,408,671 | |||||
| Security | Shares | Value | |||
MACHINERY – 0.12% | |||||
Turk Traktor ve Ziraat | 61,635 | $ | 295,749 | ||
| 295,749 | |||||
MEDIA – 1.19% | |||||
Dogan Gazetecilik ASa,b | 273,605 | 417,565 | |||
Dogan Yayin Holding ASa,b | 1,180,291 | 1,290,022 | |||
Hurriyet Gazetecilik ve Matbaacilik ASa,b | 1,133,658 | 1,186,167 | |||
| 2,893,754 | |||||
METAL FABRICATE & HARDWARE – 0.13% | |||||
Borusan Mannesmann Boru Sanayi ve TASb | 40,253 | 321,917 | |||
| 321,917 | |||||
MINING – 0.16% | |||||
Park Elektrik Madencilik Sanayi ve TASa,b | 194,516 | 394,088 | |||
| 394,088 | |||||
MISCELLANEOUS - MANUFACTURING – 0.44% | |||||
Trakya Cam Sanayii ASa,b | 938,451 | 1,056,970 | |||
| 1,056,970 | |||||
OIL & GAS – 3.61% | |||||
Turkiye Petrol Rafinerileri AS | 583,055 | 8,742,911 | |||
| 8,742,911 | |||||
PHARMACEUTICALS – 1.02% | |||||
Deva Holding ASb | 268,739 | 684,161 | |||
EIS Eczacibasi Ilac Sanayi ve TASa | 760,659 | 765,475 | |||
Selcuk Ecza Deposu Ticaret ve Sanayi ASa | 481,498 | 1,026,853 | |||
| 2,476,489 | |||||
REAL ESTATE INVESTMENT TRUSTS – 1.00% | |||||
Is Gayrimenkul Yatirim Ortakligi ASa | 1,147,905 | 1,231,674 | |||
Sinpas Gayrimenkul Yatirim Ortakligi ASa | 348,293 | 1,179,159 | |||
| 2,410,833 | |||||
RETAIL – 0.45% | |||||
Dogus Otomotiv Servis ve TASa,b | 178,349 | 534,869 | |||
Turcas Petrolculuk ASa | 191,718 | 546,854 | |||
| 1,081,723 | |||||
| SCHEDULESOF INVESTMENTS | 47 |
Table of Contents
Schedule of Investments (Continued)
iSHARES® MSCI TURKEY INVESTABLE MARKET INDEX FUND
August 31, 2009
| Security | Shares | Value | ||||
TELECOMMUNICATIONS – 12.69% |
| |||||
Turk Telekomunikasyon AS | 2,440,315 | $ | 7,448,612 | |||
Turkcell Iletisim Hizmetleri AS | 3,588,320 | 23,316,308 | ||||
| 30,764,920 | ||||||
TEXTILES – 0.14% |
| |||||
Bossa Ticaret ve Sanayi Isletmeleri TASa | 185,859 | 346,821 | ||||
| 346,821 | ||||||
TRANSPORTATION – 0.09% |
| |||||
Celebi Hava Servisi AS | 28,182 | 217,868 | ||||
| 217,868 | ||||||
TOTAL COMMON STOCKS | 236,554,898 | |||||
SHORT-TERM INVESTMENTS – 13.13% |
| |||||
MONEY MARKET FUNDS – 13.13% | ||||||
Barclays Global Investors Funds | 25,502,056 | 25,502,056 | ||||
Barclays Global Investors Funds | 3,597,467 | 3,597,467 | ||||
Barclays Global Investors Funds | 2,734,052 | 2,734,052 | ||||
| 31,833,575 | ||||||
TOTAL SHORT-TERM INVESTMENTS |
| |||||
(Cost: $31,833,575) | 31,833,575 | |||||
TOTAL INVESTMENTS IN | 268,388,473 | |||||
Other Assets, Less Liabilities – (10.71)% | (25,953,664 | ) | ||||
NET ASSETS – 100.00% | $ | 242,434,809 | ||||
| a | All or a portion of this security represents a security on loan. See Note 5. |
| b | Non-income earning security. |
| c | Affiliated issuer. See Note 2. |
| d | The rate quoted is the annualized seven-day yield of the fund at period end. |
| e | All or a portion of this security represents an investment of securities lending collateral. See Note 5. |
See notes to financial statements.
| 48 | 2009 iSHARES ANNUAL REPORTTO SHAREHOLDERS |
Table of Contents
Statements of Assets and Liabilities
iSHARES®, INC.
August 31, 2009
| iShares MSCI | ||||||||||||||||
Brazil Index Fund | BRIC Index Fund | Canada Index Fund | Chile Investable Market Index Fund | |||||||||||||
ASSETS | ||||||||||||||||
Investments, at cost: | ||||||||||||||||
Unaffiliated issuers | $ | 6,133,552,174 | $ | 518,799,385 | $ | 2,766,636,910 | $ | 228,811,699 | ||||||||
Affiliated issuers (Note 2) | 35,942,838 | 18,411,450 | 10,114,322 | 451,456 | ||||||||||||
Total cost of investments | $ | 6,169,495,012 | $ | 537,210,835 | $ | 2,776,751,232 | $ | 229,263,155 | ||||||||
Investments in securities, at fair value (including securities on loana) (Note 1): | ||||||||||||||||
Unaffiliated issuers | $ | 8,715,760,311 | $ | 496,224,684 | $ | 2,388,480,984 | $ | 262,939,371 | ||||||||
Affiliated issuers (Note 2) | 35,942,838 | 18,411,450 | 10,114,322 | 451,456 | ||||||||||||
Total fair value of investments | 8,751,703,149 | 514,636,134 | 2,398,595,306 | 263,390,827 | ||||||||||||
Foreign currencies, at valueb | 12,920,541 | 492,170 | 4,124,076 | – | ||||||||||||
Cash | – | – | 137,568 | – | ||||||||||||
Receivables: | ||||||||||||||||
Investment securities sold | 118,424,661 | 2,565,231 | 1,671,575 | 22,412,337 | ||||||||||||
Due from custodian (Note 4) | – | 89,099 | – | – | ||||||||||||
Dividends and interest | 48,836,441 | 913,926 | 2,533,129 | 34,655 | ||||||||||||
Capital shares sold | – | – | 31,945 | – | ||||||||||||
Interest from affiliate (Note 2) | 202,198 | 865 | 61,546 | 559 | ||||||||||||
Total Assets | 8,932,086,990 | 518,697,425 | 2,407,155,145 | 285,838,378 | ||||||||||||
LIABILITIES | ||||||||||||||||
Payables: | ||||||||||||||||
Investment securities purchased | – | 3,170,130 | 3,107,020 | 2,090,900 | ||||||||||||
Collateral for securities on loan (Note 5) | 30,581,900 | 17,396,615 | 9,302,830 | – | ||||||||||||
Capital shares redeemed | 119,274,588 | – | – | 20,373,745 | ||||||||||||
Investment advisory fees (Note 2) | 4,864,019 | 291,807 | 1,107,739 | 168,854 | ||||||||||||
Total Liabilities | 154,720,507 | 20,858,552 | 13,517,589 | 22,633,499 | ||||||||||||
NET ASSETS | $ | 8,777,366,483 | $ | 497,838,873 | $ | 2,393,637,556 | $ | 263,204,879 | ||||||||
Net assets consist of: | ||||||||||||||||
Paid-in capital | $ | 7,142,377,956 | $ | 538,313,483 | $ | 2,914,334,836 | $ | 252,166,060 | ||||||||
Undistributed net investment income | 71,899,211 | 1,242,283 | 9,728,466 | 553,151 | ||||||||||||
Accumulated net realized loss | (1,020,608,105 | ) | (19,156,333 | ) | (152,206,990 | ) | (23,642,017 | ) | ||||||||
Net unrealized appreciation (depreciation) on investments and translation of assets and liabilities in foreign currencies | 2,583,697,421 | (22,560,560 | ) | (378,218,756 | ) | 34,127,685 | ||||||||||
NET ASSETS | $ | 8,777,366,483 | $ | 497,838,873 | $ | 2,393,637,556 | $ | 263,204,879 | ||||||||
Shares outstandingc | 150,650,000 | 13,250,000 | 101,000,000 | 5,900,000 | ||||||||||||
Net asset value per share | $ | 58.26 | $ | 37.57 | $ | 23.70 | $ | 44.61 | ||||||||
| a | Securities on loan with values of $30,656,490, $16,505,912, $8,500,569 and $–, respectively. See Note 5. |
| b | Cost of foreign currencies: $13,000,521, $494,086, $4,167,667 and $–, respectively. |
| c | $0.001 par value, number of shares authorized: 500 million, 500 million, 340.2 million and 200 million, respectively. |
See notes to financial statements.
| FINANCIAL STATEMENTS | 49 |
Table of Contents
Statements of Assets and Liabilities (Continued)
iSHARES®, INC.
August 31, 2009
| iShares MSCI | ||||||||||||||||
| Israel Capped Investable Market Index Fund | Mexico Investable Market Index Fund | South Africa Index Fund | Turkey Investable Market Index Fund | |||||||||||||
ASSETS | ||||||||||||||||
Investments, at cost: | ||||||||||||||||
Unaffiliated issuers | $ | 129,708,160 | $ | 901,517,035 | $ | 547,579,081 | $ | 230,417,506 | ||||||||
Affiliated issuers (Note 2) | 12,054,270 | 29,647,075 | 2,462,156 | 31,833,575 | ||||||||||||
Total cost of investments | $ | 141,762,430 | $ | 931,164,110 | $ | 550,041,237 | $ | 262,251,081 | ||||||||
Investments in securities, at fair value (including securities on loana) (Note 1): | ||||||||||||||||
Unaffiliated issuers | $ | 107,321,238 | $ | 693,446,927 | $ | 487,896,609 | $ | 236,554,898 | ||||||||
Affiliated issuers (Note 2) | 12,054,270 | 29,647,075 | 2,462,156 | 31,833,575 | ||||||||||||
Total fair value of investments | 119,375,508 | 723,094,002 | 490,358,765 | 268,388,473 | ||||||||||||
Foreign currencies, at valueb | 190,976 | 478,638 | 1,062,860 | 5,501 | ||||||||||||
Receivables: | ||||||||||||||||
Investment securities sold | 5,078,800 | 9,241,464 | 3,948,733 | 292,961 | ||||||||||||
Due from custodian (Note 4) | – | – | – | 14,431,110 | ||||||||||||
Dividends and interest | 134,341 | 33,065 | 58,716 | 85,779 | ||||||||||||
Capital shares sold | – | – | – | 5,784,810 | ||||||||||||
Interest from affiliate (Note 2) | 506 | 49,220 | 24,520 | 313 | ||||||||||||
Total Assets | 124,780,131 | 732,896,389 | 495,453,594 | 288,988,947 | ||||||||||||
LIABILITIES | ||||||||||||||||
Payables: | ||||||||||||||||
Investment securities purchased | 4,896,473 | 8,825,666 | 4,028,729 | 17,004,486 | ||||||||||||
Collateral for securities on loan (Note 5) | 12,034,097 | 29,480,937 | 2,450,000 | 29,099,523 | ||||||||||||
Capital shares redeemed | – | – | – | 347,183 | ||||||||||||
Investment advisory fees (Note 2) | 57,536 | 312,167 | 246,596 | 102,946 | ||||||||||||
Total Liabilities | 16,988,106 | 38,618,770 | 6,725,325 | 46,554,138 | ||||||||||||
NET ASSETS | $ | 107,792,025 | $ | 694,277,619 | $ | 488,728,269 | $ | 242,434,809 | ||||||||
Net assets consist of: | ||||||||||||||||
Paid-in capital | $ | 143,079,922 | $ | 937,212,839 | $ | 599,820,942 | $ | 246,708,527 | ||||||||
Undistributed net investment income | 339,150 | 2,841,028 | 2,312,820 | 181,540 | ||||||||||||
Accumulated net realized loss | (13,244,801 | ) | (37,690,252 | ) | (53,722,704 | ) | (10,593,609 | ) | ||||||||
Net unrealized appreciation (depreciation) on investments and translation of assets and liabilities in foreign currencies | (22,382,246 | ) | (208,085,996 | ) | (59,682,789 | ) | 6,138,351 | |||||||||
NET ASSETS | $ | 107,792,025 | $ | 694,277,619 | $ | 488,728,269 | $ | 242,434,809 | ||||||||
Shares outstandingc | 2,300,000 | 16,300,000 | 9,400,000 | 5,050,000 | ||||||||||||
Net asset value per share | $ | 46.87 | $ | 42.59 | $ | 51.99 | $ | 48.01 | ||||||||
| a | Securities on loan with values of $11,577,954, $27,589,271, $2,236,530 and $26,868,070, respectively. See Note 5. |
| b | Cost of foreign currencies: $186,483, $493,152, $1,063,181 and $5,474, respectively. |
| c | $0.001 par value, number of shares authorized: 500 million, 255 million, 400 million and 200 million, respectively. |
See notes to financial statements.
| 50 | 2009 iSHARES ANNUAL REPORTTO SHAREHOLDERS |
Table of Contents
Statements of Operations
iSHARES®, INC.
Year ended August 31, 2009
| iShares MSCI | ||||||||||||||||
Brazil Index Fund | BRIC Index Fund | Canada Index Fund | Chile Investable Market Index Fund | |||||||||||||
NET INVESTMENT INCOME | ||||||||||||||||
Dividends from unaffiliated issuersa | $ | 229,640,985 | $ | 4,727,135 | $ | 37,058,043 | $ | 4,934,078 | ||||||||
Interest from affiliated issuers (Note 2) | 31,370 | 643 | 1,770 | 924 | ||||||||||||
Securities lending income from affiliated issuers (Note 2) | 115,096 | 118,351 | 12,523 | – | ||||||||||||
Interest from affiliate (Note 2) | 202,198 | 865 | 61,546 | 559 | ||||||||||||
Total investment income | 229,989,649 | 4,846,994 | 37,133,882 | 4,935,561 | ||||||||||||
EXPENSES | ||||||||||||||||
Investment advisory fees (Note 2) | 37,144,779 | 1,342,844 | 8,045,646 | 1,223,935 | ||||||||||||
Foreign taxes (Note 1) | – | – | 2,647 | – | ||||||||||||
Total expenses | 37,144,779 | 1,342,844 | 8,048,293 | 1,223,935 | ||||||||||||
Net investment income | 192,844,870 | 3,504,150 | 29,085,589 | 3,711,626 | ||||||||||||
NET REALIZED AND UNREALIZED GAIN (LOSS) | ||||||||||||||||
Net realized gain (loss) from: | ||||||||||||||||
Investments in unaffiliated issuers | (966,983,543 | ) | (17,535,795 | ) | (130,780,450 | ) | (21,906,472 | ) | ||||||||
In-kind redemptions | – | 28,138 | 42,179,958 | – | ||||||||||||
Foreign currency transactions | 3,709,324 | 58,270 | (64,888 | ) | 63,861 | |||||||||||
Net realized loss | (963,274,219 | ) | (17,449,387 | ) | (88,665,380 | ) | (21,842,611 | ) | ||||||||
Net change in unrealized appreciation (depreciation) on: | ||||||||||||||||
Investments | 236,653,772 | 15,986,069 | (320,304,868 | ) | 41,660,146 | |||||||||||
Translation of assets and liabilities in foreign currencies | 1,523,504 | 14,546 | 29,272 | (243 | ) | |||||||||||
Net change in unrealized appreciation (depreciation) | 238,177,276 | 16,000,615 | (320,275,596 | ) | 41,659,903 | |||||||||||
Net realized and unrealized gain (loss) | (725,096,943 | ) | (1,448,772 | ) | (408,940,976 | ) | 19,817,292 | |||||||||
NET INCREASE (DECREASE) IN NET ASSETS RESULTING FROM OPERATIONS | $ | (532,252,073 | ) | $ | 2,055,378 | $ | (379,855,387 | ) | $ | 23,528,918 | ||||||
| a | Net of foreign withholding tax of $16,381,092, $384,996, $6,538,576 and $1,740,144, respectively. |
See notes to financial statements.
| FINANCIAL STATEMENTS | 51 |
Table of Contents
Statements of Operations (Continued)
iSHARES®, INC.
Year ended August 31, 2009
| iShares MSCI | ||||||||||||||||
| Israel Capped Investable Market Index Fund | Mexico Investable Market Index Fund | South Africa Index Fund | Turkey Investable Market Index Fund | |||||||||||||
NET INVESTMENT INCOME | ||||||||||||||||
Dividends from unaffiliated issuersa | $ | 3,341,215 | $ | 9,158,822 | $ | 17,571,976 | $ | 2,499,826 | ||||||||
Interest from affiliated issuers (Note 2) | 431 | 852 | 371 | 341 | ||||||||||||
Securities lending income from affiliated issuers (Note 2) | 144,631 | 426,787 | 9,329 | 678,779 | ||||||||||||
Interest from affiliate (Note 2) | 506 | 49,220 | 24,520 | 313 | ||||||||||||
Total investment income | 3,486,783 | 9,635,681 | 17,606,196 | 3,179,259 | ||||||||||||
EXPENSES | ||||||||||||||||
Investment advisory fees (Note 2) | 692,048 | 2,962,618 | 2,109,421 | 680,004 | ||||||||||||
Total expenses | 692,048 | 2,962,618 | 2,109,421 | 680,004 | ||||||||||||
Net investment income | 2,794,735 | 6,673,063 | 15,496,775 | 2,499,255 | ||||||||||||
NET REALIZED AND UNREALIZED GAIN (LOSS) | ||||||||||||||||
Net realized gain (loss) from: | ||||||||||||||||
Investments in unaffiliated issuers | (14,793,418 | ) | (112,684,788 | ) | (41,624,499 | ) | (15,513,679 | ) | ||||||||
In-kind redemptions | (17,382,150 | ) | (153,865,339 | ) | (10,357,558 | ) | 9,734,589 | |||||||||
Foreign currency transactions | 30,349 | (277,498 | ) | 372,386 | 139 | |||||||||||
Net realized loss | (32,145,219 | ) | (266,827,625 | ) | (51,609,671 | ) | (5,778,951 | ) | ||||||||
Net change in unrealized appreciation (depreciation) on: | ||||||||||||||||
Investments | 2,012,777 | 12,188,628 | 22,379,479 | 4,881,902 | ||||||||||||
Translation of assets and liabilities in foreign currencies | 2,288 | 13,790 | (9,145 | ) | (2,269 | ) | ||||||||||
Net change in unrealized appreciation (depreciation) | 2,015,065 | 12,202,418 | 22,370,334 | 4,879,633 | ||||||||||||
Net realized and unrealized loss | (30,130,154 | ) | (254,625,207 | ) | (29,239,337 | ) | (899,318 | ) | ||||||||
NET INCREASE (DECREASE) IN NET ASSETS RESULTING FROM OPERATIONS | $ | (27,335,419 | ) | $ | (247,952,144 | ) | $ | (13,742,562 | ) | $ | 1,599,937 | |||||
| a | Net of foreign withholding tax of $721,049, $–, $– and $251,218, respectively. |
See notes to financial statements.
| 52 | 2009 iSHARES ANNUAL REPORTTO SHAREHOLDERS |
Table of Contents
Statements of Changes in Net Assets
iSHARES®, INC.
| iShares MSCI Brazil Index Fund | iShares MSCI BRIC Index Fund | |||||||||||||||
| Year ended August 31, 2009 | Year ended August 31, 2008 | Year ended August 31, 2009 | Period from November 12, 2007a to August 31, 2008 | |||||||||||||
INCREASE (DECREASE) IN NET ASSETS | ||||||||||||||||
OPERATIONS: | ||||||||||||||||
Net investment income | $ | 192,844,870 | $ | 177,141,014 | $ | 3,504,150 | $ | 1,398,623 | ||||||||
Net realized gain (loss) | (963,274,219 | ) | 6,541,539 | (17,449,387 | ) | (1,479,711 | ) | |||||||||
Net change in unrealized appreciation (depreciation) | 238,177,276 | 603,064,052 | 16,000,615 | (38,561,175 | ) | |||||||||||
Net increase (decrease) in net assets resulting from operations | (532,252,073 | ) | 786,746,605 | 2,055,378 | (38,642,263 | ) | ||||||||||
DISTRIBUTIONS TO SHAREHOLDERS: | ||||||||||||||||
From net investment income | (222,728,833 | ) | (134,522,596 | ) | (3,193,491 | ) | (531,173 | ) | ||||||||
From net realized gain | – | (39,856,665 | ) | – | – | |||||||||||
Total distributions to shareholders | (222,728,833 | ) | (174,379,261 | ) | (3,193,491 | ) | (531,173 | ) | ||||||||
CAPITAL SHARE TRANSACTIONS: | ||||||||||||||||
Proceeds from shares sold | 3,187,809,782 | 2,833,440,415 | 340,101,221 | 205,181,301 | ||||||||||||
Cost of shares redeemed | (897,722,395 | ) | (637,881,395 | ) | (2,215,782 | ) | (4,916,318 | ) | ||||||||
Net increase in net assets from capital share transactions | 2,290,087,387 | 2,195,559,020 | 337,885,439 | 200,264,983 | ||||||||||||
INCREASE IN NET ASSETS | 1,535,106,481 | 2,807,926,364 | 336,747,326 | 161,091,547 | ||||||||||||
NET ASSETS | ||||||||||||||||
Beginning of period | 7,242,260,002 | 4,434,333,638 | 161,091,547 | – | ||||||||||||
End of period | $ | 8,777,366,483 | $ | 7,242,260,002 | $ | 497,838,873 | $ | 161,091,547 | ||||||||
Undistributed net investment income included in net assets at end of period | $ | 71,899,211 | $ | 96,234,801 | $ | 1,242,283 | $ | 873,068 | ||||||||
SHARES ISSUED AND REDEEMED | ||||||||||||||||
Shares sold | 69,150,000 | 35,200,000 | 9,700,000 | 3,750,000 | ||||||||||||
Shares redeemed | (17,350,000 | ) | (8,350,000 | ) | (100,000 | ) | (100,000 | ) | ||||||||
Net increase in shares outstanding | 51,800,000 | 26,850,000 | 9,600,000 | 3,650,000 | ||||||||||||
| a | Commencement of operations. |
See notes to financial statements.
| FINANCIAL STATEMENTS | 53 |
Table of Contents
Statements of Changes in Net Assets (Continued)
iSHARES®, INC.
| iShares MSCI Canada Index Fund | iShares MSCI Chile Investable Market Index Fund | |||||||||||||||
| Year ended August 31, 2009 | Year ended August 31, 2008 | Year ended August 31, 2009 | Period from November 12, 2007a to August 31, 2008 | |||||||||||||
INCREASE (DECREASE) IN NET ASSETS | ||||||||||||||||
OPERATIONS: | ||||||||||||||||
Net investment income | $ | 29,085,589 | $ | 28,262,646 | $ | 3,711,626 | $ | 1,031,995 | ||||||||
Net realized gain (loss) | (88,665,380 | ) | 226,766,651 | (21,842,611 | ) | (1,749,702 | ) | |||||||||
Net change in unrealized appreciation (depreciation) | (320,275,596 | ) | (314,958,113 | ) | 41,659,903 | (7,532,218 | ) | |||||||||
Net increase (decrease) in net assets resulting from operations | (379,855,387 | ) | (59,928,816 | ) | 23,528,918 | (8,249,925 | ) | |||||||||
DISTRIBUTIONS TO SHAREHOLDERS: | ||||||||||||||||
From net investment income | (29,274,634 | ) | (30,808,204 | ) | (3,316,556 | ) | (923,618 | ) | ||||||||
Total distributions to shareholders | (29,274,634 | ) | (30,808,204 | ) | (3,316,556 | ) | (923,618 | ) | ||||||||
CAPITAL SHARE TRANSACTIONS: | ||||||||||||||||
Proceeds from shares sold | 1,115,573,096 | 1,696,598,321 | 234,309,554 | 85,331,722 | ||||||||||||
Cost of shares redeemed | (383,866,414 | ) | (857,922,549 | ) | (67,475,216 | ) | – | |||||||||
Net increase in net assets from capital share transactions | 731,706,682 | 838,675,772 | 166,834,338 | 85,331,722 | ||||||||||||
INCREASE IN NET ASSETS | 322,576,661 | 747,938,752 | 187,046,700 | 76,158,179 | ||||||||||||
NET ASSETS | ||||||||||||||||
Beginning of period | 2,071,060,895 | 1,323,122,143 | 76,158,179 | – | ||||||||||||
End of period | $ | 2,393,637,556 | $ | 2,071,060,895 | $ | 263,204,879 | $ | 76,158,179 | ||||||||
Undistributed net investment income included in net assets at end of period | $ | 9,728,466 | $ | 9,982,399 | $ | 553,151 | $ | 94,220 | ||||||||
SHARES ISSUED AND REDEEMED | ||||||||||||||||
Shares sold | 50,600,000 | 51,400,000 | 5,850,000 | 1,700,000 | ||||||||||||
Shares redeemed | (17,400,000 | ) | (27,900,000 | ) | (1,650,000 | ) | – | |||||||||
Net increase in shares outstanding | 33,200,000 | 23,500,000 | 4,200,000 | 1,700,000 | ||||||||||||
| a | Commencement of operations. |
See notes to financial statements.
| 54 | 2009 iSHARES ANNUAL REPORTTO SHAREHOLDERS |
Table of Contents
Statements of Changes in Net Assets (Continued)
iSHARES®, INC.
| iShares MSCI Israel Capped Investable Market Index Fund | iShares MSCI Mexico Investable Market Index Fund | |||||||||||||||
| Year ended August 31, 2009 | Period from August 31, 2008 | Year ended August 31, 2009 | Year ended August 31, 2008 | |||||||||||||
INCREASE (DECREASE) IN NET ASSETS | ||||||||||||||||
OPERATIONS: | ||||||||||||||||
Net investment income | $ | 2,794,735 | $ | 391,358 | $ | 6,673,063 | $ | 33,095,718 | ||||||||
Net realized gain (loss) | (32,145,219 | ) | (725,469 | ) | (266,827,625 | ) | 92,956,713 | |||||||||
Net change in unrealized appreciation (depreciation) | 2,015,065 | (24,397,311 | ) | 12,202,418 | (246,927,980 | ) | ||||||||||
Net decrease in net assets resulting from operations | (27,335,419 | ) | (24,731,422 | ) | (247,952,144 | ) | (120,875,549 | ) | ||||||||
DISTRIBUTIONS TO SHAREHOLDERS: | ||||||||||||||||
From net investment income | (2,877,576 | ) | – | (9,905,910 | ) | (35,045,653 | ) | |||||||||
Total distributions to shareholders | (2,877,576 | ) | – | (9,905,910 | ) | (35,045,653 | ) | |||||||||
CAPITAL SHARE TRANSACTIONS: | ||||||||||||||||
Proceeds from shares sold | 1,502,612 | 246,546,176 | 800,186,831 | 1,921,692,035 | ||||||||||||
Cost of shares redeemed | (67,698,624 | ) | (17,613,722 | ) | (803,735,494 | ) | (2,192,896,147 | ) | ||||||||
Net increase (decrease) in net assets from capital share transactions | (66,196,012 | ) | 228,932,454 | (3,548,663 | ) | (271,204,112 | ) | |||||||||
INCREASE (DECREASE) IN NET ASSETS | (96,409,007 | ) | 204,201,032 | (261,406,717 | ) | (427,125,314 | ) | |||||||||
NET ASSETS | ||||||||||||||||
Beginning of period | 204,201,032 | – | 955,684,336 | 1,382,809,650 | ||||||||||||
End of period | $ | 107,792,025 | $ | 204,201,032 | $ | 694,277,619 | $ | 955,684,336 | ||||||||
Undistributed net investment income included in net assets at end of period | $ | 339,150 | $ | 386,993 | $ | 2,841,028 | $ | 6,351,373 | ||||||||
SHARES ISSUED AND REDEEMED | ||||||||||||||||
Shares sold | 50,000 | 4,550,000 | 22,900,000 | 33,000,000 | ||||||||||||
Shares redeemed | (1,950,000 | ) | (350,000 | ) | (25,000,000 | ) | (38,300,000 | ) | ||||||||
Net increase (decrease) in shares outstanding | (1,900,000 | ) | 4,200,000 | (2,100,000 | ) | (5,300,000 | ) | |||||||||
| a | Commencement of operations. |
See notes to financial statements.
| FINANCIAL STATEMENTS | 55 |
Table of Contents
Statements of Changes in Net Assets (Continued)
iSHARES®, INC.
| iShares MSCI South Africa Index Fund | iShares MSCI Turkey Investable Market Index Fund | |||||||||||||||
| Year ended August 31, 2009 | Year ended August 31, 2008 | Year ended August 31, 2009 | Period from August 31, 2008 | |||||||||||||
INCREASE (DECREASE) IN NET ASSETS | ||||||||||||||||
OPERATIONS: | ||||||||||||||||
Net investment income | $ | 15,496,775 | $ | 21,715,225 | $ | 2,499,255 | $ | 889,219 | ||||||||
Net realized gain (loss) | (51,609,671 | ) | 18,841,989 | (5,778,951 | ) | (461,842 | ) | |||||||||
Net change in unrealized appreciation (depreciation) | 22,370,334 | (115,088,724 | ) | 4,879,633 | 1,258,718 | |||||||||||
Net increase (decrease) in net assets resulting from operations | (13,742,562 | ) | (74,531,510 | ) | 1,599,937 | 1,686,095 | ||||||||||
DISTRIBUTIONS TO SHAREHOLDERS: | ||||||||||||||||
From net investment income | (16,108,974 | ) | (25,634,161 | ) | (3,253,085 | ) | – | |||||||||
Total distributions to shareholders | (16,108,974 | ) | (25,634,161 | ) | (3,253,085 | ) | – | |||||||||
CAPITAL SHARE TRANSACTIONS: | ||||||||||||||||
Proceeds from shares sold | 240,171,487 | 405,639,896 | 172,031,636 | 152,861,063 | ||||||||||||
Cost of shares redeemed | (151,246,258 | ) | (342,759,905 | ) | (79,964,959 | ) | (2,525,878 | ) | ||||||||
Net increase in net assets from capital share transactions | 88,925,229 | 62,879,991 | 92,066,677 | 150,335,185 | ||||||||||||
INCREASE (DECREASE) IN NET ASSETS | 59,073,693 | (37,285,680 | ) | 90,413,529 | 152,021,280 | |||||||||||
NET ASSETS | ||||||||||||||||
Beginning of period | 429,654,576 | 466,940,256 | 152,021,280 | – | ||||||||||||
End of period | $ | 488,728,269 | $ | 429,654,576 | $ | 242,434,809 | $ | 152,021,280 | ||||||||
Undistributed net investment income included in net assets at end of period | $ | 2,312,820 | $ | 2,552,633 | $ | 181,540 | $ | 911,749 | ||||||||
SHARES ISSUED AND REDEEMED | ||||||||||||||||
Shares sold | 5,600,000 | 5,800,000 | 4,250,000 | 2,950,000 | ||||||||||||
Shares redeemed | (3,900,000 | ) | (5,600,000 | ) | (2,100,000 | ) | (50,000 | ) | ||||||||
Net increase in shares outstanding | 1,700,000 | 200,000 | 2,150,000 | 2,900,000 | ||||||||||||
| a | Commencement of operations. |
See notes to financial statements.
| 56 | 2009 iSHARES ANNUAL REPORTTO SHAREHOLDERS |
Table of Contents
iSHARES®, INC.
(For a share outstanding throughout each period)
| iShares MSCI Brazil Index Fund | ||||||||||||||||||||
| Year ended Aug. 31, 2009 | Year ended Aug. 31, 2008 | Year ended Aug. 31, 2007 | Year ended Aug. 31, 2006 | Year ended Aug. 31, 2005 | ||||||||||||||||
Net asset value, beginning of year | $ | 73.27 | $ | 61.59 | $ | 39.09 | $ | 28.18 | $ | 16.96 | ||||||||||
Income from investment operations: | ||||||||||||||||||||
Net investment incomea | 1.56 | 1.93 | 1.09 | 1.00 | 0.89 | |||||||||||||||
Net realized and unrealized gain (loss)b | (14.63 | ) | 11.59 | 22.35 | 10.49 | 10.79 | ||||||||||||||
Total from investment operations | (13.07 | ) | 13.52 | 23.44 | 11.49 | 11.68 | ||||||||||||||
Less distributions from: | ||||||||||||||||||||
Net investment income | (1.94 | ) | (1.41 | ) | (0.94 | ) | (0.58 | ) | (0.46 | ) | ||||||||||
Net realized gain | – | (0.43 | ) | – | – | – | ||||||||||||||
Total distributions | (1.94 | ) | (1.84 | ) | (0.94 | ) | (0.58 | ) | (0.46 | ) | ||||||||||
Net asset value, end of year | $ | 58.26 | $ | 73.27 | $ | 61.59 | $ | 39.09 | $ | 28.18 | ||||||||||
Total return | (16.05 | )% | 21.58 | % | 60.82 | % | 41.13 | % | 69.72 | % | ||||||||||
Ratios/Supplemental data: | ||||||||||||||||||||
Net assets, end of year (000s) | $ | 8,777,366 | $ | 7,242,260 | $ | 4,434,334 | $ | 2,468,295 | $ | 552,285 | ||||||||||
Ratio of expenses to average net assets | 0.65 | % | 0.63 | % | 0.69 | % | 0.70 | % | 0.74 | % | ||||||||||
Ratio of expenses to average net assets exclusive of foreign taxes | n/a | 0.63 | % | 0.68 | % | n/a | n/a | |||||||||||||
Ratio of net investment income to average net assets | 3.38 | % | 2.37 | % | 2.17 | % | 2.65 | % | 3.94 | % | ||||||||||
Portfolio turnover ratec | 30 | % | 30 | % | 22 | % | 15 | % | 48 | % | ||||||||||
| a | Based on average shares outstanding throughout each period. |
| b | The amounts reported may not accord with the change in aggregate gains and losses in securities due to the timing of capital share transactions. |
| c | Portfolio turnover rates include portfolio transactions that are executed as a result of the Fund processing capital share transactions in Creation Units solely for cash in U.S. dollars. Excluding such transactions, the portfolio turnover rate for the years ended August 31, 2009, August 31, 2008, August 31, 2007, August 31, 2006 and August 31, 2005 would have been 14%, 19%, 6%, 13% and 9%, respectively. See Note 4. |
See notes to financial statements.
| FINANCIAL HIGHLIGHTS | 57 |
Table of Contents
Financial Highlights (Continued)
iSHARES®, INC.
(For a share outstanding throughout each period)
| iShares MSCI BRIC Index Fund | ||||||||
| Year ended Aug. 31, 2009 | Period from Aug. 31, 2008 | |||||||
Net asset value, beginning of period | $ | 44.13 | $ | 56.50 | ||||
Income from investment operations: | ||||||||
Net investment incomeb | 0.58 | 0.72 | ||||||
Net realized and unrealized lossc | (6.60 | ) | (12.93 | ) | ||||
Total from investment operations | (6.02 | ) | (12.21 | ) | ||||
Less distributions from: | ||||||||
Net investment income | (0.54 | ) | (0.16 | ) | ||||
Total distributions | (0.54 | ) | (0.16 | ) | ||||
Net asset value, end of period | $ | 37.57 | $ | 44.13 | ||||
Total return | (13.08 | )% | (21.65 | )%d | ||||
Ratios/Supplemental data: | ||||||||
Net assets, end of period (000s) | $ | 497,839 | $ | 161,092 | ||||
Ratio of expenses to average net assetse | 0.72 | % | 0.72 | % | ||||
Ratio of expenses to average net assets exclusive of foreign taxes | n/a | 0.72 | % | |||||
Ratio of net investment income to average net assetse | 1.87 | % | 1.74 | % | ||||
Portfolio turnover ratef | 7 | % | 9 | % | ||||
| a | Commencement of operations. |
| b | Based on average shares outstanding throughout each period. |
| c | The amounts reported may not accord with the change in aggregate gains and losses in securities due to the timing of capital share transactions. |
| d | Not annualized. |
| e | Annualized for periods of less than one year. |
| f | Portfolio turnover rates exclude portfolio securities received or delivered in Creation Units but include portfolio transactions that are executed as a result of the Fund processing capital share transactions in Creation Units partially for cash in U.S. dollars. Excluding such cash transactions, the portfolio turnover rate for the year ended August 31, 2009 and the period ended August 31, 2008 would have been 6% and 2%, respectively. See Note 4. |
See notes to financial statements.
| 58 | 2009 iSHARES ANNUAL REPORTTO SHAREHOLDERS |
Table of Contents
Financial Highlights (Continued)
iSHARES®, INC.
(For a share outstanding throughout each period)
| iShares MSCI Canada Index Fund | ||||||||||||||||||||
| Year ended Aug. 31, 2009 | Year ended Aug. 31, 2008 | Year ended Aug. 31, 2007 | Year ended Aug. 31, 2006 | Year ended Aug. 31, 2005 | ||||||||||||||||
Net asset value, beginning of year | $ | 30.55 | $ | 29.87 | $ | 24.69 | $ | 20.30 | $ | 14.33 | ||||||||||
Income from investment operations: | ||||||||||||||||||||
Net investment incomea | 0.41 | 0.47 | 0.35 | 0.25 | 0.17 | |||||||||||||||
Net realized and unrealized gain (loss)b | (6.84 | ) | 0.72 | 5.11 | 4.29 | 6.00 | ||||||||||||||
Total from investment operations | (6.43 | ) | 1.19 | 5.46 | 4.54 | 6.17 | ||||||||||||||
Less distributions from: | ||||||||||||||||||||
Net investment income | (0.42 | ) | (0.51 | ) | (0.28 | ) | (0.15 | ) | (0.20 | ) | ||||||||||
Total distributions | (0.42 | ) | (0.51 | ) | (0.28 | ) | (0.15 | ) | (0.20 | ) | ||||||||||
Net asset value, end of year | $ | 23.70 | $ | 30.55 | $ | 29.87 | $ | 24.69 | $ | 20.30 | ||||||||||
Total return | (20.51 | )% | 3.88 | % | 22.33 | % | 22.46 | % | 43.35 | % | ||||||||||
Ratios/Supplemental data: | ||||||||||||||||||||
Net assets, end of year (000s) | $ | 2,393,638 | $ | 2,071,061 | $ | 1,323,122 | $ | 1,101,161 | $ | 420,301 | ||||||||||
Ratio of expenses to average net assets | 0.55 | % | 0.52 | % | 0.52 | % | 0.54 | % | 0.57 | % | ||||||||||
Ratio of expenses to average net assets exclusive of foreign taxes | 0.55 | % | n/a | 0.52 | % | n/a | n/a | |||||||||||||
Ratio of net investment income to average net assets | 2.00 | % | 1.46 | % | 1.32 | % | 1.09 | % | 1.00 | % | ||||||||||
Portfolio turnover ratec | 6 | % | 11 | % | 8 | % | 20 | % | 9 | % | ||||||||||
| a | Based on average shares outstanding throughout each period. |
| b | The amounts reported may not accord with the change in aggregate gains and losses in securities due to the timing of capital share transactions. |
| c | Portfolio turnover rates exclude portfolio securities received or delivered as a result of processing capital share transactions in Creation Units. |
See notes to financial statements.
| FINANCIAL HIGHLIGHTS | 59 |
Table of Contents
Financial Highlights (Continued)
iSHARES®, INC.
(For a share outstanding throughout each period)
| iShares MSCI Chile Investable Market Index Fund | ||||||||
| Year ended Aug. 31, 2009 | Period from Nov. 12, 2007a to | |||||||
Net asset value, beginning of period | $ | 44.80 | $ | 48.84 | ||||
Income from investment operations: | ||||||||
Net investment incomeb | 0.76 | 0.92 | ||||||
Net realized and unrealized lossc | (0.42 | ) | (4.38 | ) | ||||
Total from investment operations | 0.34 | (3.46 | ) | |||||
Less distributions from: | ||||||||
Net investment income | (0.53 | ) | (0.58 | ) | ||||
Total distributions | (0.53 | ) | (0.58 | ) | ||||
Net asset value, end of period | $ | 44.61 | $ | 44.80 | ||||
Total return | 0.89 | % | (7.15 | )%d | ||||
Ratios/Supplemental data: | ||||||||
Net assets, end of period (000s) | $ | 263,205 | $ | 76,158 | ||||
Ratio of expenses to average net assetse | 0.65 | % | 0.63 | % | ||||
Ratio of net investment income to average net assetse | 1.98 | % | 2.38 | % | ||||
Portfolio turnover ratef | 53 | % | 16 | % | ||||
| a | Commencement of operations. |
| b | Based on average shares outstanding throughout each period. |
| c | The amounts reported may not accord with the change in aggregate gains and losses in securities due to the timing of capital share transactions. |
| d | Not annualized. |
| e | Annualized for periods of less than one year. |
| f | Portfolio turnover rates include portfolio transactions that are executed as a result of the Fund processing capital share transactions in Creation Units solely for cash in U.S. dollars. Excluding such transactions, the portfolio turnover rate for the year ended August 31, 2009 and the period ended August 31, 2008 would have been 14% and 16%, respectively. See Note 4. |
See notes to financial statements.
| 60 | 2009 iSHARES ANNUAL REPORTTO SHAREHOLDERS |
Table of Contents
Financial Highlights (Continued)
iSHARES®, INC.
(For a share outstanding throughout each period)
| iShares MSCI Israel Capped Investable Market Index Fund | ||||||||
Year ended Aug. 31, 2009 | Period from Mar. 26, 2008a to | |||||||
Net asset value, beginning of period | $ | 48.62 | $ | 50.33 | ||||
Income from investment operations: | ||||||||
Net investment incomeb | 0.98 | 0.21 | ||||||
Net realized and unrealized lossc | (1.75 | ) | (1.92 | ) | ||||
Total from investment operations | (0.77 | ) | (1.71 | ) | ||||
Less distributions from: | ||||||||
Net investment income | (0.98 | ) | – | |||||
Total distributions | (0.98 | ) | – | |||||
Net asset value, end of period | $ | 46.87 | $ | 48.62 | ||||
Total return | (0.63 | )% | (3.40 | )%d | ||||
Ratios/Supplemental data: | ||||||||
Net assets, end of period (000s) | $ | 107,792 | $ | 204,201 | ||||
Ratio of expenses to average net assetse | 0.66 | % | 0.63 | % | ||||
Ratio of net investment income to average net assetse | 2.66 | % | 0.93 | % | ||||
Portfolio turnover ratef | 27 | % | 8 | % | ||||
| a | Commencement of operations. |
| b | Based on average shares outstanding throughout each period. |
| c | The amounts reported may not accord with the change in aggregate gains and losses in securities due to the timing of capital share transactions. |
| d | Not annualized. |
| e | Annualized for periods of less than one year. |
| f | Portfolio turnover rates exclude portfolio securities received or delivered as a result of processing capital share transactions in Creation Units. |
See notes to financial statements.
| FINANCIAL HIGHLIGHTS | 61 |
Table of Contents
Financial Highlights (Continued)
iSHARES®, INC.
(For a share outstanding throughout each period)
| iShares MSCI Mexico Investable Market Index Fund | ||||||||||||||||||||
| Year ended Aug. 31, 2009 | Year ended Aug. 31, 2008 | Year ended Aug. 31, 2007 | Year ended Aug. 31, 2006 | Year ended Aug. 31, 2005 | ||||||||||||||||
Net asset value, beginning of year | $ | 51.94 | $ | 58.35 | $ | 41.30 | $ | 29.04 | $ | 19.35 | ||||||||||
Income from investment operations: | ||||||||||||||||||||
Net investment incomea | 0.43 | 1.40 | 0.64 | 0.76 | 0.42 | |||||||||||||||
Net realized and unrealized gain (loss)b | (9.17 | ) | (6.21 | ) | 16.87 | 11.98 | 9.55 | |||||||||||||
Total from investment operations | (8.74 | ) | (4.81 | ) | 17.51 | 12.74 | 9.97 | |||||||||||||
Less distributions from: | ||||||||||||||||||||
Net investment income | (0.61 | ) | (1.60 | ) | (0.46 | ) | (0.48 | ) | (0.28 | ) | ||||||||||
Total distributions | (0.61 | ) | (1.60 | ) | (0.46 | ) | (0.48 | ) | (0.28 | ) | ||||||||||
Net asset value, end of year | $ | 42.59 | $ | 51.94 | $ | 58.35 | $ | 41.30 | $ | 29.04 | ||||||||||
Total return | (16.50 | )% | (8.44 | )% | 42.58 | % | 44.11 | % | 51.77 | % | ||||||||||
Ratios/Supplemental data: | ||||||||||||||||||||
Net assets, end of year (000s) | $ | 694,278 | $ | 955,684 | $ | 1,382,810 | $ | 764,107 | $ | 255,557 | ||||||||||
Ratio of expenses to average net assets | 0.55 | % | 0.52 | % | 0.51 | % | 0.54 | % | 0.57 | % | ||||||||||
Ratio of net investment income to average net assets | 1.25 | % | 2.42 | % | 1.19 | % | 2.06 | % | 1.70 | % | ||||||||||
Portfolio turnover ratec | 13 | % | 13 | % | 14 | % | 12 | % | 9 | % | ||||||||||
| a | Based on average shares outstanding throughout each period. |
| b | The amounts reported may not accord with the change in aggregate gains and losses in securities due to the timing of capital share transactions. |
| c | Portfolio turnover rates exclude portfolio securities received or delivered as a result of processing capital share transactions in Creation Units. |
See notes to financial statements.
| 62 | 2009 iSHARES ANNUAL REPORTTO SHAREHOLDERS |
Table of Contents
Financial Highlights (Continued)
iSHARES®, INC.
(For a share outstanding throughout each period)
| iShares MSCI South Africa Index Fund | ||||||||||||||||||||
| Year ended Aug. 31, 2009 | Year ended Aug. 31, 2008a | Year ended Aug. 31, 2007a | Year ended Aug. 31, 2006a | Year ended Aug. 31, 2005a | ||||||||||||||||
Net asset value, beginning of year | $ | 55.80 | $ | 62.26 | $ | 48.84 | $ | 41.50 | $ | 29.96 | ||||||||||
Income from investment operations: | ||||||||||||||||||||
Net investment incomeb | 1.94 | 2.28 | 1.50 | 1.44 | 0.96 | |||||||||||||||
Net realized and unrealized gain (loss)c | (3.84 | ) | (6.02 | ) | 13.18 | 6.89 | 11.18 | |||||||||||||
Total from investment operations | (1.90 | ) | (3.74 | ) | 14.68 | 8.33 | 12.14 | |||||||||||||
Less distributions from: | ||||||||||||||||||||
Net investment income | (1.91 | ) | (2.72 | ) | (1.26 | ) | (0.99 | ) | (0.60 | ) | ||||||||||
Total distributions | (1.91 | ) | (2.72 | ) | (1.26 | ) | (0.99 | ) | (0.60 | ) | ||||||||||
Net asset value, end of year | $ | 51.99 | $ | 55.80 | $ | 62.26 | $ | 48.84 | $ | 41.50 | ||||||||||
Total return | (2.23 | )% | (6.18 | )% | 30.34 | % | 20.06 | % | 40.62 | % | ||||||||||
Ratios/Supplemental data: | ||||||||||||||||||||
Net assets, end of year (000s) | $ | 488,728 | $ | 429,655 | $ | 466,940 | $ | 297,898 | $ | 153,530 | ||||||||||
Ratio of expenses to average net assets | 0.66 | % | 0.63 | % | 0.68 | % | 0.70 | % | 0.74 | % | ||||||||||
Ratio of net investment income to average net assets | 4.81 | % | 3.61 | % | 2.58 | % | 2.79 | % | 2.62 | % | ||||||||||
Portfolio turnover rated | 16 | % | 21 | % | 8 | % | 7 | % | 32 | % | ||||||||||
| a | Per share amounts were adjusted to reflect a two-for-one stock split effective July 24, 2008. |
| b | Based on average shares outstanding throughout each period. |
| c | The amounts reported may not accord with the change in aggregate gains and losses in securities due to the timing of capital share transactions. |
| d | Portfolio turnover rates exclude portfolio securities received or delivered as a result of processing capital share transactions in Creation Units. |
See notes to financial statements.
| FINANCIAL HIGHLIGHTS | 63 |
Table of Contents
Financial Highlights (Continued)
iSHARES®, INC.
(For a share outstanding throughout each period)
| iShares MSCI Turkey Investable Market Index Fund | ||||||||
Year ended Aug. 31, 2009 | Period from Mar. 26, 2008a to Aug. 31, 2008 | |||||||
Net asset value, beginning of period | $ | 52.42 | $ | 50.30 | ||||
Income from investment operations: | ||||||||
Net investment incomeb | 0.78 | 0.83 | ||||||
Net realized and unrealized gain (loss)c | (4.22 | ) | 1.29 | |||||
Total from investment operations | (3.44 | ) | 2.12 | |||||
Less distributions from: | ||||||||
Net investment income | (0.97 | ) | – | |||||
Total distributions | (0.97 | ) | – | |||||
Net asset value, end of period | $ | 48.01 | $ | 52.42 | ||||
Total return | (5.56 | )% | 4.22 | %d | ||||
Ratios/Supplemental data: | ||||||||
Net assets, end of period (000s) | $ | 242,435 | $ | 152,021 | ||||
Ratio of expenses to average net assetse | 0.65 | % | 0.63 | % | ||||
Ratio of net investment income to average net assetse | 2.39 | % | 3.78 | % | ||||
Portfolio turnover ratef | 16 | % | 27 | % | ||||
| a | Commencement of operations. |
| b | Based on average shares outstanding throughout each period. |
| c | The amounts reported may not accord with the change in aggregate gains and losses in securities due to the timing of capital share transactions. |
| d | Not annualized. |
| e | Annualized for periods of less than one year. |
| f | Portfolio turnover rates exclude portfolio securities received or delivered as a result of processing capital share transactions in Creation Units. |
See notes to financial statements.
| 64 | 2009 iSHARES ANNUAL REPORTTO SHAREHOLDERS |
Table of Contents
iSHARES®, INC.
iShares, Inc. (the “Company”) is registered under the Investment Company Act of 1940, as amended (the “1940 Act”), as an open-end management investment company. The Company was incorporated under the laws of the State of Maryland on September 1, 1994 pursuant to amended and restated Articles of Incorporation.
These financial statements relate only to the iShares MSCI Brazil, iShares MSCI BRIC, iShares MSCI Canada, iShares MSCI Chile Investable Market, iShares MSCI Israel Capped Investable Market, iShares MSCI Mexico Investable Market, iShares MSCI South Africa and iShares MSCI Turkey Investable Market Index Funds (each, a “Fund,” collectively, the “Funds”).
The investment objective of each Fund is to seek investment results that correspond generally to the price and yield performance, before fees and expenses, of publicly traded equity securities in the aggregate in a particular market, as measured by that market’s equity securities index compiled by MSCI Inc. (“MSCI”). The investment adviser uses a “passive” or index approach to achieve each Fund’s investment objective. Each of the Funds is classified as a non-diversified fund under the 1940 Act. Non-diversified funds generally hold securities of fewer companies than diversified funds and may be more susceptible to the risks associated with these particular companies, or to a single economic, political or regulatory occurrence affecting these companies.
Each Fund invests in the securities of foreign issuers, which may involve certain considerations and risks not typically associated with securities of U.S. issuers. Such risks include, but are not limited to: generally less liquid and less efficient securities markets; generally greater price volatility; exchange rate fluctuations and exchange controls; imposition of restrictions on the expatriation of funds or other assets of the Fund; less publicly available information about issuers; the imposition of withholding or other taxes; higher transaction and custody costs; settlement delays and risk of loss attendant in settlement procedures; difficulties in enforcing contractual obligations; less regulation of securities markets; different accounting, disclosure and reporting requirements; more substantial governmental involvement in the economy; higher inflation rates; greater social, economic and political uncertainties; the risk of nationalization or expropriation of assets and the risk of war.
Pursuant to the Company’s organizational documents, the Funds’ officers and directors are indemnified against certain liabilities that may arise out of the performance of their duties to the Funds. Additionally, in the normal course of business, the Funds enter into contracts with service providers that contain general indemnification clauses. The Funds’ maximum exposure under these arrangements is unknown as this would involve future claims that may be made against the Funds that have not yet occurred.
1. SIGNIFICANT ACCOUNTING POLICIES
The following significant accounting policies are consistently followed by the Company in the preparation of its financial statements in conformity with accounting principles generally accepted in the United States of America (“U.S. GAAP”). The preparation of financial statements in conformity with U.S. GAAP requires management to make certain estimates and assumptions that affect the reported amounts of assets and liabilities and disclosures of contingent assets and liabilities at the date of the financial statements and the reported amounts of revenue and expenses during the reporting period. Actual results could differ from those estimates.
SECURITY VALUATION
The securities and other assets of each Fund are valued pursuant to the pricing policy and procedures approved by the Board of Directors of the Company (the “Board”). Effective September 1, 2008, the Funds adopted Financial Accounting Standards Board (“FASB”) Statement of Financial Accounting Standards No. 157 (“FAS 157”), “Fair Value Measurements.” This standard establishes a fair value hierarchy that prioritizes the inputs to valuation techniques used to measure fair value into three broad levels. Inputs may be based on independent market data (“observable inputs”) or they may be internally developed (“unobservable inputs”). The hierarchy gives the highest priority to
| NOTESTO FINANCIAL STATEMENTS | 65 |
Table of Contents
Notes to Financial Statements (Continued)
iSHARES®, INC.
unadjusted quoted prices in active markets for identical assets or liabilities (Level 1 measurements) and the lowest priority to unobservable inputs (Level 3 measurements). The three levels of the fair value hierarchy under FAS 157 are as follows:
| • | Level 1 – Inputs that reflect unadjusted quoted prices in active markets for identical assets or liabilities that the Fund has the ability to access at the measurement date (a “Level 1 Price”); |
| • | Level 2 – Inputs other than quoted prices included within Level 1 that are observable for the asset or liability either directly or indirectly, including quoted prices for similar assets or liabilities in active markets, quoted prices for identical or similar assets or liabilities in markets that are not considered to be active, inputs other than quoted prices that are observable for the asset or liability, and inputs that are derived principally from or corroborated by observable market data by correlation or other means (a “Level 2 Price”); |
| • | Level 3 – Inputs that are unobservable for the asset or liability (a “Level 3 Price”). |
The availability of observable inputs can vary from security to security and is affected by a wide variety of factors, including, for example, the type of security, whether the security is new and not yet established in the marketplace, the liquidity of markets, and other characteristics particular to the security. Inputs may include price information, volatility statistics, specific and broad credit data, liquidity statistics, and other factors. To the extent that valuation is based on models or inputs that are less observable or unobservable in the market, the determination of fair value requires more judgment. Accordingly, the degree of judgment exercised in determining fair value is greatest for instruments categorized in Level 3 of the fair value hierarchy.
The level of a value determined for a financial instrument within the fair value hierarchy is based on the lowest level of any input that is significant to the fair value measurement in its entirety. The categorization of a value determined for a financial instrument within the hierarchy is based upon the pricing transparency of the instrument and does not necessarily correspond to the Funds’ perceived risk of that instrument.
Investments whose values are based on quoted market prices in active markets, and whose values are therefore classified as Level 1 Prices, include active listed equities. The Funds do not adjust the quoted price for such instruments, even in situations where the Funds hold a large position and a sale could reasonably impact the quoted price.
Investments that trade in markets that are not considered to be active, but whose values are based on inputs such as quoted market prices, dealer quotations or valuations provided by alternative pricing sources supported by observable inputs are classified within Level 2. These generally include U.S. government and sovereign obligations, most government agency securities, investment-grade corporate bonds, certain mortgage products, less liquid listed equities, and state, municipal and provincial obligations. As Level 2 investments include positions that are not traded in active markets and/or are subject to transfer restrictions, valuations may be adjusted to reflect illiquidity and/or non-transferability, which are generally based on available market information.
Investments whose values are classified as Level 3 Prices have significant unobservable inputs, as they may trade infrequently or not at all. Investments whose values are classified as Level 3 Prices may include unlisted securities related to corporate actions, securities whose trading have been suspended or which have been de-listed from their primary trading exchange, less liquid corporate debt securities (including distressed debt instruments), collateralized debt obligations, and less liquid mortgage securities (backed by either commercial or residential real estate). When observable prices are not available for these securities, the Funds use one or more valuation techniques (e.g., the market approach or the income approach) for which sufficient and reliable data is available. Within Level 3 of the fair value hierarchy, the use of the market approach generally consists of using comparable market transactions, while the use of the income approach generally consists of the net present value of estimated future cash flows, adjusted as appropriate for liquidity, credit, market and/or other risk factors.
The inputs used by the Funds in estimating the value of Level 3 Prices may include the original transaction price, recent transactions in the same or similar instruments, completed or pending third-party transactions in the underlying investment or comparable issuers, and
| 66 | 2009 iSHARES ANNUAL REPORTTO SHAREHOLDERS |
Table of Contents
Notes to Financial Statements (Continued)
iSHARES®, INC.
changes in financial ratios or cash flows. Level 3 Prices may also be adjusted to reflect illiquidity and/or non-transferability, with the amount of such discount estimated by the Funds in the absence of market information. The fair value measurement of Level 3 Prices does not include transaction costs that may have been capitalized as part of the security’s cost basis. Assumptions used by the Funds due to the lack of observable inputs may significantly impact the resulting fair value and therefore the Funds’ results of operations.
Fair value pricing could result in a difference between the prices used to calculate a Fund’s net asset value and the prices used by the Fund’s underlying index, which in turn, could result in a difference between the Fund’s performance and the performance of the Fund’s underlying index.
As of August 31, 2009, the values of each Fund’s investments were classified as Level 1 Prices. The breakdown of each Fund’s investments into major categories is disclosed in its respective Schedule of Investments.
SECURITY TRANSACTIONS AND INCOME RECOGNITION
Security transactions are accounted for on trade date. Dividend income is recognized on the ex-dividend date, net of any foreign taxes withheld at source, and interest income is accrued daily. Non-cash dividends received in the form of stock in an elective dividend, if any, are recorded as dividend income at fair value. Distributions received by the Funds may include a return of capital that is estimated by management. Such amounts are recorded as a reduction of the cost of investments or reclassified to capital gains. Realized gains and losses on investment transactions are determined using the specific identification method.
FOREIGN CURRENCY TRANSLATION
The accounting records of the Funds are maintained in U.S. dollars. Foreign currencies, as well as investment securities and other assets and liabilities denominated in foreign currencies are translated into U.S. dollars using exchange rates deemed appropriate by the investment adviser. Any use of a rate different from the rates used by MSCI may adversely affect a Fund’s ability to track its underlying index. Purchases and sales of securities, income receipts and expense payments are translated into U.S. dollars on the respective dates of such transactions.
Each Fund does not isolate the effect of fluctuations in foreign exchange rates from the effect of fluctuations in the market prices of securities. Such fluctuations are reflected by the Funds as a component of realized and unrealized gains and losses from investments for financial reporting purposes.
FOREIGN TAXES
The Funds may be subject to foreign taxes (a portion of which may be reclaimable) on income, corporate events, capital gains on investments or currency repatriation. All foreign taxes are recorded in accordance with the applicable foreign tax regulations and rates that exist in the foreign markets in which the Funds invest. These foreign taxes, if any, are paid by the Funds and are disclosed in their Statements of Operations. Foreign taxes payable as of August 31, 2009, if any, are reflected in the Funds’ Statements of Assets and Liabilities.
DISTRIBUTIONS TO SHAREHOLDERS
Distributions to shareholders from net investment income, if any, including any net foreign currency gains, are declared and distributed at least annually by each Fund. Distributions of net realized capital gains, if any, generally are declared and distributed once a year. Distributions are determined on a tax basis and may differ from net investment income and net realized capital gains for financial reporting purposes. Dividends and distributions are paid in U.S. dollars and cannot be automatically reinvested in additional shares of the Funds.
| NOTESTO FINANCIAL STATEMENTS | 67 |
Table of Contents
Notes to Financial Statements (Continued)
iSHARES®, INC.
As of August 31, 2009, the tax year-end of the Funds, the components of net distributable earnings (accumulated losses) on a tax basis were as follows:
| iShares MSCI Index Fund | Undistributed Ordinary Income | Unrealized Appreciation (Depreciation) | Capital Losses and Other Losses | Net Distributable Earnings (Accumulated Losses) | |||||||||||
Brazil | $ | 186,944,880 | $ | 1,960,161,121 | $ | (512,319,672 | ) | $ | 1,634,786,329 | ||||||
BRIC | 1,791,521 | (30,148,532 | ) | (12,118,464 | ) | (40,475,475 | ) | ||||||||
Canada | 9,676,888 | (419,845,407 | ) | (110,590,307 | ) | (520,758,826 | ) | ||||||||
Chile Investable Market | 552,592 | 23,617,169 | (13,131,501 | ) | 11,038,260 | ||||||||||
Israel Capped Investable Market | 573,424 | (24,222,515 | ) | (11,639,312 | ) | (35,288,403 | ) | ||||||||
Mexico Investable Market | 2,791,808 | (227,001,173 | ) | (18,775,075 | ) | (242,984,440 | ) | ||||||||
South Africa | 2,502,953 | (80,056,097 | ) | (33,564,049 | ) | (111,117,193 | ) | ||||||||
Turkey Investable Market | 839,167 | 1,590,175 | (6,703,373 | ) | (4,274,031 | ) | |||||||||
For the years ended August 31, 2009 and August 31, 2008, the tax characterization of distributions paid for each Fund was equal to the book characterization of distributions paid except for the iShares MSCI Brazil Index Fund. The tax character of distributions paid during the years ended August 31, 2009 and August 31, 2008 for the iShares MSCI Brazil Index Fund was as follows:
| 2009 | 2008 | |||||
Distributions paid from: | ||||||
Ordinary income | $ | 222,728,833 | $ | 146,451,597 | ||
Long-term capital gain | – | 27,927,664 | ||||
Total Distributions | $ | 222,728,833 | $ | 174,379,261 | ||
The total distributions and distributions per share are disclosed in the accompanying Statements of Changes in Net Assets and the Financial Highlights for all Funds.
FEDERAL INCOME TAXES
Each Fund is treated as a separate entity for federal income tax purposes. It is the policy of each Fund to qualify as a regulated investment company by complying with the provisions applicable to regulated investment companies, as defined under Subchapter M of the Internal Revenue Code of 1986, as amended, and to annually distribute substantially all of its ordinary income and any net capital gains (taking into account any capital loss carry forwards) sufficient to relieve it from all, or substantially all, federal income and excise taxes. Accordingly, no provision for federal income taxes was required for the year ended August 31, 2009.
| 68 | 2009 iSHARES ANNUAL REPORTTO SHAREHOLDERS |
Table of Contents
Notes to Financial Statements (Continued)
iSHARES®, INC.
From November 1, 2008 to August 31, 2009, the Funds incurred net realized capital losses. As permitted by tax regulations, these Funds have elected to defer those losses and treat them as arising in the year ending August 31, 2010 as follows:
| iShares MSCI Index Fund | Deferred Net Realized | ||
Brazil | $ | 483,032,219 | |
BRIC | 10,577,724 | ||
Canada | 69,301,014 | ||
Chile Investable Market | 11,244,620 | ||
| iShares MSCI Index Fund | Deferred Net Realized | ||
Israel Capped Investable Market | $ | 10,854,833 | |
Mexico Investable Market | 2,789,472 | ||
South Africa | 14,856,365 | ||
Turkey Investable Market | 5,982,737 | ||
The Funds had tax basis net capital loss carry forwards as of August 31, 2009, the tax year-end of the Funds, as follows:
iShares MSCI Index Fund | Expiring 2010 | Expiring 2011 | Expiring 2012 | Expiring 2013 | Expiring 2014 | Expiring 2015 | Expiring 2016 | Expiring 2017 | Total | ||||||||||||||||||
Brazil | $ | – | $ | – | $ | – | $ | – | $ | – | $ | – | $ | – | $ | 29,287,453 | $ | 29,287,453 | |||||||||
BRIC | – | – | – | – | – | – | – | 1,540,740 | 1,540,740 | ||||||||||||||||||
Canada | – | – | – | 2,931,648 | – | 5,363,291 | 5,107,471 | 27,886,883 | 41,289,293 | ||||||||||||||||||
Chile Investable | – | – | – | – | – | – | – | 1,886,881 | 1,886,881 | ||||||||||||||||||
Israel Capped Investable Market | – | – | – | – | – | – | – | 784,479 | 784,479 | ||||||||||||||||||
Mexico Investable Market | 47,326 | 2,329,290 | 3,136,171 | 12,912 | 632,766 | – | 853,150 | 8,973,988 | 15,985,603 | ||||||||||||||||||
South Africa | – | – | 527,613 | – | 260,738 | 1,607,845 | 972,024 | 15,339,464 | 18,707,684 | ||||||||||||||||||
Turkey Investable Market | – | – | – | – | – | – | – | 720,636 | 720,636 | ||||||||||||||||||
Net capital loss carry forwards may be applied against any net realized taxable gains in each succeeding year or until their respective expiration dates, whichever occurs first.
The Funds may own shares in certain foreign investment entities, referred to, under U.S. tax law, as “passive foreign investment companies.” The Funds may elect to mark-to-market annually the shares of each passive foreign investment company and would be required to distribute to shareholders any such marked-to-market gains.
Each Fund reclassifies at the end of its tax year certain amounts to paid-in-capital from accumulated net realized gain (loss) on investments and foreign currency transactions and accumulated net investment income (loss), respectively, as a result of permanent book and tax differences primarily attributed to net investment loss, return of capital, passive foreign investment companies, realized foreign currency gains and losses and gains and losses on in-kind redemptions. These reclassifications have no effect on net assets or net asset values per share.
| NOTESTO FINANCIAL STATEMENTS | 69 |
Table of Contents
Notes to Financial Statements (Continued)
iSHARES®, INC.
As of August 31, 2009, gross unrealized appreciation and gross unrealized depreciation based on cost for federal income tax purposes were as follows:
| iShares MSCI Index Fund | Tax Cost | Gross Unrealized Appreciation | Gross Unrealized Depreciation | Net Unrealized | ||||||||||
Brazil | $ | 6,793,031,312 | $ | 2,011,165,402 | $ | (52,493,565 | ) | $ | 1,958,671,837 | |||||
BRIC | 544,798,807 | 13,238,909 | (43,401,582 | ) | (30,162,673 | ) | ||||||||
Canada | 2,818,377,883 | – | (419,782,577 | ) | (419,782,577 | ) | ||||||||
Chile Investable Market | 239,773,671 | 23,977,825 | (360,669 | ) | 23,617,156 | |||||||||
Israel Capped Investable Market | 143,602,699 | 5,334,095 | (29,561,286 | ) | (24,227,191 | ) | ||||||||
Mexico Investable Market | 950,079,287 | – | (226,985,285 | ) | (226,985,285 | ) | ||||||||
South Africa | 570,414,545 | – | (80,055,780 | ) | (80,055,780 | ) | ||||||||
Turkey Investable Market | 266,799,257 | 10,121,511 | (8,532,295 | ) | 1,589,216 | |||||||||
Management has reviewed the tax positions as of August 31, 2009, inclusive of the prior three open tax return years, and has determined that no provision for income tax is required in the Funds’ financial statements.
2. AGREEMENTS AND OTHER TRANSACTIONS WITH AFFILIATES
Pursuant to an Investment Advisory Agreement with the Company, Barclays Global Fund Advisors (“BGFA”) manages the investment of each Fund’s assets. BGFA is a California corporation indirectly owned by Barclays Bank PLC. Under the Investment Advisory Agreement, BGFA is responsible for all expenses (“Covered Expenses”) of the Company, including the cost of transfer agency, custody, fund administration, legal, audit and other services, except interest, taxes, brokerage commissions and other expenses connected with the execution of portfolio transactions, distribution fees and extraordinary expenses.
For its investment advisory services to the iShares MSCI Canada and iShares MSCI Mexico Investable Market Index Funds, BGFA is entitled to an annual investment advisory fee based on each Fund’s allocable portion of the aggregate of the average daily net assets of these Funds and certain other iShares Funds as follows:
| Investment Advisory Fee | Aggregate Average Daily Net Assets | |
| 0.59% | First $7 billion | |
| 0.54 | Over $7 billion, up to and including $11 billion | |
| 0.49 | Over $11 billion, up to and including $24 billion | |
| 0.44 | Over $24 billion, up to and including $48 billion | |
| 0.40 | Over $48 billion |
| 70 | 2009 iSHARES ANNUAL REPORTTO SHAREHOLDERS |
Table of Contents
Notes to Financial Statements (Continued)
iSHARES®, INC.
For its investment advisory services to the iShares MSCI Brazil, iShares MSCI Chile Investable Market, iShares MSCI Israel Capped Investable Market, iShares MSCI South Africa and iShares MSCI Turkey Investable Market Index Funds, BGFA is entitled to an annual investment advisory fee based on each Fund’s allocable portion of the aggregate of the average daily net assets of these Funds and certain other iShares Funds as follows:
| Investment Advisory Fee | Aggregate Average Daily Net Assets | |
| 0.74% | First $2 billion | |
| 0.69 | Over $2 billion, up to and including $4 billion | |
| 0.64 | Over $4 billion, up to and including $8 billion | |
| 0.57 | Over $8 billion, up to and including $16 billion | |
| 0.51 | Over $16 billion |
For its investment advisory services to the iShares MSCI BRIC Index Fund, BGFA is entitled to an annual investment advisory fee based on the Fund’s allocable portion of the aggregate of the average daily net assets of the Fund and certain other iShares Funds as follows:
| Investment Advisory Fee | Aggregate Average Daily Net Assets | |
| 0.75% | First $14 billion | |
| 0.68 | Over $14 billion, up to and including $28 billion | |
| 0.61 | Over $28 billion |
Under the terms of the Investment Advisory Agreement, the Funds are required to remit payment of accrued fees to BGFA on a quarterly basis. BGFA has determined that in certain cases such payments to BGFA by the Funds were made earlier than provided for under the Investment Advisory Agreement. BGFA will reimburse the Funds for interest that would have been earned had such payments been made on a quarterly basis. The amounts to be reimbursed are included under receivables and investment income as “Interest from affiliate” in the Statements of Assets and Liabilities and Statements of Operations, respectively. The reimbursements do not have a material effect on net asset value per share or the total return shown in the Financial Highlights.
State Street Bank and Trust Company (“State Street”) serves as administrator, custodian and transfer agent for the Company. As compensation for its services, State Street receives certain out-of-pocket costs, transaction fees and asset-based fees which are accrued daily and paid monthly. These fees and expenses are Covered Expenses as defined above.
SEI Investments Distribution Co. (“SEI”) serves as each Fund’s underwriter and distributor of the shares of each Fund, pursuant to a Distribution Agreement with the Company. SEI does not receive a fee from the Funds for its distribution services.
Pursuant to an exemptive order issued by the U.S. Securities and Exchange Commission (“SEC”), the Funds are permitted to lend portfolio securities to Barclays Capital Inc. (“BarCap”). Pursuant to the same exemptive order, Barclays Global Investors, N.A. (“BGI”) serves as securities lending agent for the Funds. BarCap and BGI are affiliates of BGFA, the Funds’ investment adviser. As securities lending agent, BGI receives, as fees, a share of the income earned on investment of the cash collateral received for the loan of securities. For the year ended August 31, 2009, BGI earned securities lending agent fees as follows:
| iShares MSCI Index Fund | Securities Lending Agent Fees | ||
Brazil | $ | 115,096 | |
BRIC | 118,351 | ||
Canada | 12,523 | ||
Israel Capped Investable Market | 144,631 | ||
Mexico Investable Market | 426,787 | ||
South Africa | 9,329 | ||
Turkey Investable Market | 678,779 | ||
| NOTESTO FINANCIAL STATEMENTS | 71 |
Table of Contents
Notes to Financial Statements (Continued)
iSHARES®, INC.
Cross trades for the year ended August 31, 2009, if any, were executed by the Funds pursuant to Rule 17a-7 under the 1940 Act. Cross trading is the buying or selling of portfolio securities between funds to which BGFA (or an affiliate) serves as investment adviser. At its regularly scheduled quarterly meetings, the Board reviews such transactions as of the most recent calendar quarter for compliance with the requirements and restrictions set forth by Rule 17a-7.
Each Fund may invest in certain money market funds managed by BGFA, the Funds’ investment adviser, including the Government Money Market Fund (“GMMF”), Institutional Money Market Fund (“IMMF”), Prime Money Market Fund (“PMMF”) and Treasury Money Market Fund (“TMMF”) of Barclays Global Investors Funds. These money market funds seek to achieve their investment objectives by investing in high-quality, short-term money market instruments that, at the time of investment, have remaining maturities of 397 calendar days or less from the date of acquisition. The GMMF, IMMF, PMMF and TMMF are feeder funds in a master/feeder fund structure that invest substantially all of their assets in the Government Money Market Master Portfolio, Money Market Master Portfolio, Prime Money Market Master Portfolio and Treasury Money Market Master Portfolio (collectively, the “Money Market Master Portfolios”), respectively, which are also managed by BGFA. While the GMMF, IMMF, PMMF and TMMF do not directly charge an investment advisory fee, the Money Market Master Portfolios in which they invest do charge an investment advisory fee. Income distributions from the GMMF, IMMF, PMMF and TMMF are declared daily and paid monthly from net investment income. Income distributions earned by the Funds from temporary cash investments are recorded as interest from affiliated issuers in the accompanying Statements of Operations. Income distributions earned by the Funds from the investment of securities lending collateral, if any, are included in securities lending income in the accompanying Statements of Operations.
Certain directors and officers of the Company are also officers of BGI and/or BGFA.
3. INVESTMENT PORTFOLIO TRANSACTIONS
Purchases and sales of investments (excluding in-kind transactions and short-term investments) for the year ended August 31, 2009 were as follows:
| iShares MSCI Index Fund | Purchases | Sales | ||||
Brazil | $ | 3,996,665,118 | $ | 1,756,894,885 | ||
BRIC | 123,415,820 | 13,444,682 | ||||
Canada | 103,851,187 | 99,098,486 | ||||
Chile Investable Market | 264,444,582 | 97,344,027 | ||||
Israel Capped Investable Market | 29,823,274 | 29,643,071 | ||||
Mexico Investable Market | 71,691,505 | 74,949,711 | ||||
South Africa | 54,057,827 | 53,924,515 | ||||
Turkey Investable Market | 26,948,893 | 18,747,391 | ||||
| 72 | 2009 iSHARES ANNUAL REPORTTO SHAREHOLDERS |
Table of Contents
Notes to Financial Statements (Continued)
iSHARES®, INC.
In-kind transactions (see Note 4) for the year ended August 31, 2009 were as follows:
| iShares MSCI Index Fund | In-kind Purchases | In-kind Sales | ||||
BRIC | $ | 228,624,505 | $ | 1,439,655 | ||
Canada | 1,108,587,910 | 381,288,412 | ||||
Israel Capped Investable Market | 1,493,955 | 67,383,457 | ||||
Mexico Investable Market | 798,376,981 | 802,271,196 | ||||
South Africa | 239,104,614 | 150,621,191 | ||||
Turkey Investable Market | 153,492,024 | 76,076,302 | ||||
4. CAPITAL SHARE TRANSACTIONS
The Company issues and redeems capital shares of each Fund only in aggregations of a specified number of shares (each, a “Creation Unit”) at net asset value. Except when aggregated in Creation Units, shares of each Fund are not redeemable. Transactions in capital shares for each Fund are disclosed in detail in the Statements of Changes in Net Assets.
The consideration for the purchase of Creation Units of a Fund generally consists of the in-kind deposit of a designated portfolio of equity securities, which constitutes an optimized representation of the corresponding MSCI Index and an amount of cash (except for the iShares MSCI Brazil, iShares MSCI BRIC and iShares MSCI Chile Investable Market Index Funds which are offered in Creation Units solely or partially for cash in U.S. dollars). Investors purchasing and redeeming Creation Units pay a purchase transaction fee and a redemption transaction fee directly to State Street, the administrator, to offset transfer and other transaction costs associated with the issuance and redemption of Creation Units, including Creation Units for cash. Investors transacting in Creation Units for cash pay an additional variable charge to compensate the relevant Fund for brokerage and market impact expenses relating to investing in portfolio securities.
From time to time, settlement of securities related to in-kind contributions or in-kind redemptions may be delayed. In such cases, securities related to in-kind contributions are reflected as “Due from custodian” and securities related to in-kind redemptions are reflected as “Securities related to in-kind transactions” in the Statements of Assets and Liabilities.
5. LOANS OF PORTFOLIO SECURITIES
Each Fund may lend its investment securities to approved borrowers, such as brokers, dealers and other financial institutions. The borrower pledges and maintains with the Fund collateral consisting of cash, an irrevocable letter of credit issued by a bank, or securities issued or guaranteed by the U.S. government. The initial collateral received by each Fund is required to have a value of at least 102% of the market value of the loaned securities for securities traded on U.S. exchanges and a value of at least 105% for all other securities. The collateral is maintained thereafter, at a value equal to at least 100% of the current market value of the securities on loan. The risks to the Funds of securities lending include the risk that the borrower may not provide additional collateral when required or may not return the securities when due. Any securities lending cash collateral may be reinvested in certain short-term instruments either directly on behalf of a Fund or through one or more joint accounts or money market funds, including those managed by BGFA; such reinvestments are subject to investment risk.
As of August 31, 2009, certain Funds had loaned securities which were collateralized by cash. The cash collateral received was invested in money market funds managed by BGFA. The market value of the securities on loan as of August 31, 2009 and the value of the related collateral are disclosed in the Statements of Assets and Liabilities. Securities lending income, as disclosed in the Funds’ Statements of
| NOTESTO FINANCIAL STATEMENTS | 73 |
Table of Contents
Notes to Financial Statements (Continued)
iSHARES®, INC.
Operations, represents the income earned from the investment of the cash collateral, net of rebates paid to, or fees paid by, borrowers and less the fees paid to BGI as securities lending agent.
6. BLACKROCK TRANSACTION
On June 16, 2009, Barclays PLC, the ultimate parent company of BGFA and BGI, accepted a binding offer and entered into an agreement to sell its interests in BGFA, BGI and certain affiliated companies, to BlackRock, Inc., (the “BlackRock Transaction”). The BlackRock Transaction is subject to certain regulatory approvals, as well as other conditions to closing.
Under the 1940 Act, completion of the BlackRock Transaction will cause the automatic termination of each Fund’s current investment advisory agreement with BGFA. In order for the management of each Fund to continue uninterrupted, the Board approved a new investment advisory agreement for each Fund subject to shareholder approval. A special meeting of shareholders of the Funds is scheduled to be held on November 4, 2009. Each shareholder of record as of the close of business on August 25, 2009 will receive notice of and be entitled to vote at the meeting.
7. REVIEW OF SUBSEQUENT EVENTS
In connection with the preparation of the financial statements of the Funds as of and for the year ended August 31, 2009, events and transactions through October 23, 2009, the date the financial statements are available to be issued, have been evaluated by the Funds’ management for possible adjustment and/or disclosure. No subsequent events requiring financial statement disclosure have been identified.
| 74 | 2009 iSHARES ANNUAL REPORTTO SHAREHOLDERS |
Table of Contents
Report of Independent Registered Public Accounting Firm
To the Shareholders and Board of Directors of
iShares, Inc.:
In our opinion, the accompanying statements of assets and liabilities, including the schedules of investments, and the related statements of operations and of changes in net assets and the financial highlights present fairly, in all material respects, the financial position of the iShares MSCI Brazil Index Fund, iShares MSCI BRIC Index Fund, iShares MSCI Canada Index Fund, iShares MSCI Chile Investable Market Index Fund, iShares MSCI Israel Capped Investable Market Index Fund, iShares MSCI Mexico Investable Market Index Fund, iShares MSCI South Africa Index Fund, and iShares MSCI Turkey Investable Market Index Fund, each a portfolio of the iShares MSCI Series (the “Funds”), at August 31, 2009, the results of each of their operations, the changes in each of their net assets and their financial highlights for each of the periods presented, in conformity with accounting principles generally accepted in the United States of America. These financial statements and financial highlights (hereafter referred to as “financial statements”) are the responsibility of the Funds’ management; our responsibility is to express an opinion on these financial statements based on our audits. We conducted our audits of these financial statements in accordance with the standards of the Public Company Accounting Oversight Board (United States). Those standards require that we plan and perform the audits to obtain reasonable assurance about whether the financial statements are free of material misstatement. An audit includes examining, on a test basis, evidence supporting the amounts and disclosures in the financial statements, assessing the accounting principles used and significant estimates made by management, and evaluating the overall financial statement presentation. We believe that our audits, which included confirmation of securities at August 31, 2009 by correspondence with the custodian, transfer agent and brokers, provide a reasonable basis for our opinion.
PricewaterhouseCoopers LLP
San Francisco, California
October 23, 2009
| REPORT OF INDEPENDENT REGISTERED PUBLIC ACCOUNTING FIRM | 75 |
Table of Contents
iSHARES®, INC.
For the fiscal year ended August 31, 2009, certain Funds earned foreign source income and paid foreign taxes which they intend to pass through to their shareholders pursuant to Section 853 of the Internal Revenue Code (the “Code”) as follows:
| iShares MSCI Index Fund | Foreign Source Income Earned | Foreign Taxes Paid | ||||
Brazil | $ | 246,022,077 | $ | 15,261,417 | ||
BRIC | 5,112,131 | 378,011 | ||||
Canada | 43,596,619 | 6,399,747 | ||||
Chile Investable Market | 6,674,222 | 1,733,849 | ||||
Israel Capped Investable Market | 4,062,264 | 721,014 | ||||
Turkey Investable Market | 2,751,044 | 250,270 | ||||
Under Section 854(b)(2) of the Code, certain Funds hereby designate the following maximum amounts as qualified dividend income for purposes of the maximum rate under Section 1(h)(11) of the Code for the fiscal year ended August 31, 2009:
| iShares MSCI Index Fund | Qualified Dividend Income | ||
Brazil | $ | 8,503,096 | |
BRIC | 1,632,493 | ||
Canada | 29,274,634 | ||
Israel Capped Investable Market | 2,877,576 | ||
| iShares MSCI Index Fund | Qualified Dividend Income | ||
Mexico Investable Market | $ | 8,148,710 | |
South Africa | 16,108,974 | ||
Turkey Investable Market | 2,174,278 | ||
In January 2010, shareholders will receive Form 1099-DIV which will include their share of qualified dividend income distributed during the calendar year 2009. Shareholders are advised to check with their tax advisers for information on the treatment of these amounts on their income tax returns.
| 76 | 2009 iSHARES ANNUAL REPORTTO SHAREHOLDERS |
Table of Contents
Board Review and Approval of Current Investment Advisory
Contract (Unaudited)
iSHARES®, INC.
Under Section 15(c) of the Investment Company Act of 1940 (the “1940 Act”), the Company’s Board of Directors (the “Board”), including a majority of Directors who are not “interested persons” of the Company (as that term is defined in the 1940 Act) (the “Independent Directors”), is required annually to consider the Investment Advisory Contract between the Company and BGFA (the “Advisory Contract”) on behalf of the Funds. As required by Section 15(c), the Board requested and BGFA provided such information as the Board deemed reasonably necessary to evaluate the terms of the Advisory Contract. At a meeting held on June 16-17, 2009, the Board approved the selection of BGFA and the continuance of the Advisory Contract, based on its review of qualitative and quantitative information provided by BGFA. In selecting BGFA and approving the Advisory Contract for the Funds, the Board, including the Independent Directors, advised by their independent counsel, considered the following factors, no one of which was controlling, and made the following conclusions:
NATURE, EXTENT AND QUALITY OF SERVICES PROVIDED BY BGFA
Based on management’s representations, the Board expected that there will be no diminution in the scope of services required of or provided by BGFA under the Advisory Contract for the coming year as compared to the scope of services provided by BGFA over the past year. In reviewing the scope of these services, the Board considered BGFA’s investment philosophy and experience, noting that BGFA and its affiliates have committed significant resources over time, including over the past year, including investment in technology and increasing the number of their employees supporting the Funds. The Board also considered BGFA’s compliance program and its compliance record with respect to the Funds. In that regard, the Board noted that BGFA reports to the Board about portfolio management and compliance matters on a periodic basis in connection with regularly scheduled meetings of the Board, and has made appropriate officers available as needed to provide further assistance with these matters. The Board also reviewed the background and experience of the persons responsible for the day-to-day management of the Funds. In addition to the above considerations, the Board considered BGFA’s investment processes and strategies, and matters related to BGFA’s portfolio transaction policies and procedures. The Board further noted that BGFA does not serve as investment adviser for any other series of registered investment companies with substantially similar investment objectives and strategies as any of the Funds; therefore, directly comparable performance information was generally not available. However, the Board also noted that the Funds had met their investment objectives consistently since their respective inception dates. Based on review of this information, the Board concluded that the nature, extent and quality of services to be provided by BGFA to the Funds under the Advisory Contract were appropriate and mitigated in favor of the Board’s approval of the Advisory Contract for the coming year.
FUNDS’ EXPENSES AND PERFORMANCE OF THE FUNDS
The Board reviewed statistical information prepared by Lipper Inc. (“Lipper”), an independent provider of investment company data, regarding the expense ratio components, including advisory fees, waivers/reimbursements, and gross and net total expenses of each Fund in comparison with the same information for other registered investment companies objectively selected by Lipper as comprising such Fund’s applicable peer group pursuant to Lipper’s proprietary methodology and any registered investment companies that would otherwise have been excluded from Lipper’s comparison group due to certain differentiating factors, but were nonetheless included at the request of BGFA (the “Lipper Group”). Because there are few, if any, exchange traded funds or index funds that track indexes similar to those tracked by the Funds, the Lipper Groups included in part mutual funds, closed-end funds, exchange traded funds, or funds with differing investment objective classifications, investment focuses and other characteristics (e.g., actively managed funds and funds sponsored by “at cost” service providers). In support of its review of the statistical information, the Board was provided with a detailed description of the methodology used by Lipper to determine the applicable Lipper Groups and to prepare this information. The Board further noted that due to the limitations in providing comparable funds in the various Lipper Groups, the statistical information may or may not provide meaningful direct comparisons to the Funds. In addition, the Board reviewed statistical information prepared by Lipper regarding the performance of each Fund for the one-, three-, five- and ten-year periods, as applicable, and the “last quarter” period ended March 31, 2009, and a comparison of each Fund’s performance to its performance benchmark index for the same periods. To the extent that any of the comparison
| BOARD REVIEWAND APPROVALOF CURRENT INVESTMENT ADVISORY CONTRACT | 77 |
Table of Contents
Board Review and Approval of Current Investment Advisory
Contract (Unaudited) (Continued)
iSHARES®, INC.
funds included in the Lipper Group track the same index as any particular Fund, Lipper also provided, and the Board reviewed, a comparison of such Fund’s performance to that of such relevant comparison funds for the same periods. The Board noted that the Funds generally performed in line with their respective performance benchmark indexes over the relevant periods. In considering this information, the Board noted that the Lipper Groups include funds that may have different investment objectives and/or benchmarks from the Funds. In addition, the Board noted that each Fund seeks to track its benchmark index and that during the prior year the Board received periodic reports on the Funds’ performance in comparison with their relevant benchmark indexes. Such comparative performance information was also considered by the Board.
The Board also noted that the investment advisory fees and overall expenses for the Funds were generally lower than the median or average investment advisory fee rates and overall expenses of the funds in their respective Lipper Groups. Based on this review, the Board concluded that the investment advisory fees and expense levels and the historical performance of each Fund, as managed by BGFA, as compared to the investment advisory fees and expense levels and performance of the funds in the relevant Lipper Group, were satisfactory for the purposes of approving the Advisory Contract for the coming year.
COSTS OF SERVICES PROVIDED TO FUNDS AND PROFITS REALIZED BY BGFA AND AFFILIATES
The Board reviewed information about the profitability to BGFA of the Funds based on the fees payable to BGFA and its affiliates (including fees under the Advisory Contract), and all other sources of revenue and expense to BGFA and its affiliates from the Funds’ operations for the last calendar year. The Board discussed the sources of direct and ancillary revenue with management, including the revenues to BGI from securities lending by the Company (including any securities lending by the Funds). The Board also discussed BGFA’s profit margin as reflected in the Funds’ profitability analysis and reviewed information regarding economies of scale (as discussed below). Based on this review, the Board concluded that the profits realized by BGFA and its affiliates under the Advisory Contract and from other relationships between the Funds and BGFA and/or its affiliates, if any, were within the range the Board considered reasonable and appropriate.
ECONOMIES OF SCALE
In connection with its review of the Funds’ profitability analysis, the Board reviewed information regarding economies of scale or other efficiencies that may result from increases in the Funds’ assets. The Board noted that the Advisory Contract already provided for breakpoints in the investment advisory fee rates for each of the Funds as the assets of such Funds, on an aggregated basis with the assets of certain other iShares funds, increase, and that extended breakpoints were implemented for the Funds (except the iShares MSCI BRIC Index Fund) the previous year. The Board noted that the asset size of each of the Funds except the iShares MSCI BRIC Index Fund, the iShares MSCI Chile Investable Market Index Fund and the iShares MSCI Turkey Investable Market Index Fund decreased over the past twelve months. The Board also reviewed BGFA’s historic profitability as investment adviser to the iShares fund complex and noted that BGFA had continued to make significant investments in the iShares fund complex, that expenses had grown at a pace similar to the growth in revenue, and that BGFA had incurred operating losses during earlier years when the iShares funds, including the Funds, had not yet reached scale. Based on this review, as well as the discussions described above in connection with the Lipper Group and performance benchmark index comparisons, the Board, recognizing its responsibility to consider this issue at least annually, concluded that the structure of the investment advisory fees, reflects appropriate sharing of economies of scale with the Funds’ shareholders.
FEES AND SERVICES PROVIDED FOR OTHER COMPARABLE FUNDS/ACCOUNTS MANAGED BY BGFA AND ITS AFFILIATES
The Board received and considered certain information regarding the Funds’ annual investment advisory fee rates under the Advisory Contract in comparison to the investment advisory/management fee rates for other funds/accounts for which BGFA or BGI, an affiliate
| 78 | 2009 iSHARES ANNUAL REPORTTO SHAREHOLDERS |
Table of Contents
Board Review and Approval of Current Investment Advisory
Contract (Unaudited) (Continued)
iSHARES®, INC.
of BGFA, provides investment advisory/management services, including other funds registered under the 1940 Act, collective funds and separate accounts (together, the “Other Accounts”). The Board noted that directly comparable investment advisory/management fee information was not available for the Funds, as BGFA and its affiliates do not manage any Other Accounts with substantially similar investment objectives and strategies as any of the Funds. However, the Board noted that BGFA provided the Board with general information regarding how the level of services provided to the Other Accounts differed from the level of services provided to the Funds. Based on this review, the Board determined that the investment advisory fee rates under the Advisory Contract do not constitute fees that are so disproportionately large as to bear no reasonable relationship to the services rendered and that could not have been the product of arm’s-length bargaining, and concluded that the investment advisory fee rates under the Advisory Contract are fair and reasonable.
OTHER BENEFITS TO BGFA AND/OR ITS AFFILIATES
The Board reviewed any ancillary revenue received by BGFA and/or its affiliates in connection with the services provided to the Funds by BGFA, such as any payment of revenue to BGI, the Company’s securities lending agent, for loaning any portfolio securities, and payment of advisory fees and/or administration fees to BGFA and BGI in connection with any investments by the Funds in other funds for which BGFA provides investment advisory services and/or BGI provides administration services. The Board noted that while revenue to BGI in connection with securities lending agency services to the iShares funds increased overall as against the previous year, overall revenue increased by approximately the same percentage as overall expenses. The Board noted that BGFA does not use soft dollars or consider the value of research or other services that may be provided to BGFA (including its affiliates) in selecting brokers for portfolio transactions for the Funds. The Board further noted that any portfolio transactions on behalf of the Funds placed through a BGFA affiliate or purchased from an underwriting syndicate in which a BGFA affiliate participates, are reported to the Board pursuant to Rule 17e-1 or Rule 10f-3, as applicable, under the 1940 Act. The Board concluded that any such ancillary benefits would not be disadvantageous to the Funds’ shareholders.
Based on this analysis, the Board determined that the Advisory Contract, including the investment advisory fee rates thereunder is fair and reasonable in light of all relevant circumstances, and concluded that it is in the best interest of the Funds and their shareholders to approve the Advisory Contract for the coming year.
| BOARD REVIEWAND APPROVALOF CURRENT INVESTMENT ADVISORY CONTRACT | 79 |
Table of Contents
Board Review and Approval of New Investment Advisory
Agreements (Unaudited)
iSHARES®, INC.
On June 16, 2009, Barclays Bank PLC (“Barclays”) entered into an agreement to sell its interest in the Barclays Global Investors asset management business, which includes BGI and BGI’s business of advising, sponsoring and distributing exchange-traded funds, to BlackRock, Inc. (“BlackRock”). Assuming receipt of the requisite regulatory approvals and the satisfaction of other conditions to the closing, the subsidiaries of Barclays operating the BGI business, including BGFA (the “Adviser”), will be sold to BlackRock (the “Transaction”) for cash and BlackRock stock.
The Adviser currently serves as the investment adviser to each Fund pursuant to an investment advisory agreement with the Company (the “Current Advisory Agreement”). Under the 1940 Act, the Transaction, if consummated, will result in the automatic termination of the Current Advisory Agreement. In order for the management of each Fund to continue uninterrupted, the Board approved interim and new investment advisory agreements (the “New Advisory Agreements”) with the Company, subject to shareholder approval.
BOARD CONSIDERATIONS IN APPROVING THE NEW ADVISORY AGREEMENTS
At an in-person Board meeting held on August 13, 2009, the Board, including the Independent Directors, unanimously approved the New Advisory Agreements between the Adviser and the Company, on behalf of its Funds after consideration of all factors determined to be relevant to the Board’s deliberations, including those discussed below.
The Approval Process – At telephonic and in-person meetings held in June, July and August of this year, the Board, including the Independent Directors, discussed the Transaction and the New Advisory Agreements for the Funds.
In preparation for their consideration of the New Advisory Agreements, the Directors received, in response to a written due diligence request prepared by the Board and its independent counsel and provided to BlackRock, BGI and the Adviser, comprehensive written information covering a range of issues and received, in response to their additional requests, further information in advance of and at the August 13, 2009 in-person Board meeting. To assist the Board in its consideration of the New Advisory Agreements, BlackRock provided materials and information about itself, including its history, management, investment, risk management and compliance capabilities and processes, and financial condition, and the Adviser provided materials and information about the Transaction. In addition, the Independent Directors consulted with their independent legal counsel and Fund counsel on numerous occasions, discussing, among other things, the legal standards and certain other considerations relevant to the Board’s deliberations.
In June 2009, the Board had performed a full annual review of, or initially approved, as applicable, the current Investment Advisory Agreement between the Adviser and the Company, on behalf of its Funds for each Fund as required by the 1940 Act and, after reviewing, among other things, the investment capabilities, resources and personnel of the Adviser, determined that the nature, extent and quality of the services provided by the Adviser under the Current Advisory Agreements were appropriate. The Board also determined that the advisory fees paid by each Fund, taking into account any applicable agreed-upon fee waivers and breakpoints, were fair and reasonable in light of the services provided, the costs to the Adviser of providing those services, economies of scale, the fees and other expenses paid by similar funds (including information provided by Lipper, Inc. (“Lipper”)), and such other circumstances as the Directors considered relevant in the exercise of their reasonable judgment. The Board approved the Current Advisory Agreements on June 17, 2009.
In advance of the June 2009 Board meeting, the Board requested and received materials specifically relating to each Fund’s Current Advisory Agreement. These materials were prepared for each Fund, and included information (i) compiled by Lipper on the fees and expenses and the investment performance of the Fund as compared to a comparable group of funds as classified by Lipper; (ii) prepared by the Adviser discussing market conditions generally; (iii) on the profitability to the Adviser of the Current Advisory Agreements and other payments received by the Adviser and its affiliates from the Funds; and (iv) provided by the Adviser concerning services related to the valuation and pricing of Fund portfolio holdings, and direct and indirect benefits to the Adviser and its affiliates from their relationship with the Fund.
| 80 | 2009 iSHARES ANNUAL REPORTTO SHAREHOLDERS |
Table of Contents
Board Review and Approval of New Investment Advisory
Agreements (Unaudited) (Continued)
iSHARES®, INC.
At the June 17, July 29 and August 13, 2009 Board meetings, the Directors discussed with representatives of BGI, the Adviser and BlackRock, the management, investment, risk management and compliance capabilities and processes, and financial condition of BlackRock, the Transaction and its rationale, and BlackRock’s general plans and intentions regarding the Adviser and the Funds. At these Board meetings, representatives of BGI, the Adviser and BlackRock made various presentations to, and responded to questions from, the Board. The Board also inquired about the plans for, and anticipated roles and responsibilities of, the employees and officers of the Adviser in connection with the Transaction, including the anticipated senior management structure of the Adviser following the completion of the Transaction. The Independent Directors also conferred separately and with their independent legal counsel about the Transaction and other matters related to the Transaction on a number of occasions. After the presentations and after reviewing the written materials provided, the Independent Directors met in executive sessions with their independent legal counsel at the June, July and August 2009 Board meetings to consider the Transaction, its expected impact on the Adviser and the Funds, and the New Advisory Agreements.
In connection with the Board’s review of the New Advisory Agreements, BGI, the Adviser and/or BlackRock, as applicable, provided the Board with information about a variety of matters. The Board considered, among other things, the following information:
| • | the reputation, financial strength and resources of BlackRock and its investment advisory subsidiaries and the anticipated financial strength and resources of the combined company; |
| • | that there is not expected to be any diminution in the nature, quality and extent of services provided to the Funds and their shareholders by the Adviser, including portfolio management and compliance services; |
| • | that the Adviser and BlackRock have no present intention to alter the advisory fee rates and expense arrangements currently in effect for the Funds for a period of two years from the date of the closing of the Transaction; |
| • | that it is expected that substantially all of the current employees of the Adviser will remain employees of the Adviser and will continue to provide services to the Funds following the Transaction; |
| • | that the Funds may benefit from having direct access to BlackRock’s state of the art technology and risk management analytic tools, including investment tools, provided under the BlackRock Solutions® brand name; |
| • | that the Funds are expected to continue to be sold through existing distribution channels; |
| • | that the Funds will have access to greater distribution resources through BlackRock’s relationships with third party brokers and retirement plan platforms; |
| • | that the parties to the Transaction Agreement have agreed to conduct their respective businesses in compliance with the conditions of Section 15(f) of the 1940 Act in relation to the Funds; |
| • | that Barclays or one of its affiliates has agreed to pay all expenses of the Funds in connection with the Board’s consideration of the New Advisory Agreements and all costs of seeking shareholder approval of the New Advisory Agreements; and |
| • | that Barclays and BlackRock would derive benefits from the Transaction and that, as a result, they may have a different financial interest in the matters that were being considered than do Fund shareholders. |
The Board did not identify any particular information that was all-important or controlling, and each Director may have attributed different weights to the various factors discussed below. The Directors evaluated all information available to them on a Fund-by-Fund basis, and their determinations were made separately in respect of each Fund. In their deliberations, the Directors considered information received
| BOARD REVIEWAND APPROVALOF NEW INVESTMENT ADVISORY AGREEMENTS | 81 |
Table of Contents
Board Review and Approval of New Investment Advisory
Agreements (Unaudited) (Continued)
iSHARES®, INC.
in connection with their most recent approval or continuation of each Current Advisory Agreement at the June 2009 Board meeting, in addition to information provided by BGI, the Adviser and BlackRock regarding BlackRock and the Transaction, in connection with their evaluation of the terms and conditions of the New Advisory Agreements. The Directors, including a majority of the Independent Directors, concluded that the terms of the New Advisory Agreements are appropriate, that the fees to be paid are reasonable in light of the services to be provided to each Fund, and that the New Advisory Agreements should be approved and recommended to Fund shareholders. In voting to approve the New Advisory Agreements in respect of each Fund, the Board considered in particular the following factors:
The nature, extent and quality of services to be provided by the Adviser and its affiliates – In connection with their consideration of the New Advisory Agreements, the Board considered representations by the Adviser, BGI and BlackRock that there would be no diminution in the scope of services required of or provided by the Adviser under the New Advisory Agreements for each Fund as compared to the scope of services provided by the Adviser under the Current Advisory Agreement. In reviewing the scope of these services at the June and August 2009 Board meetings, the Board considered the Adviser’s investment philosophy and experience, noting that the Adviser and its affiliates have committed significant resources over time, including over the past year, including investments in technology and increasing the number of their employees supporting the Funds. The Board also considered the Adviser’s compliance program and its compliance record with respect to the Funds. In that regard, the Board noted that the Adviser reports to the Board about portfolio management and compliance matters on a periodic basis in connection with regularly scheduled meetings of the Board, and has made appropriate officers available as needed to provide further assistance with these matters. The Board noted that it expects that these reports and discussions will continue following the consummation of the Transaction. In addition to the above considerations, the Board considered the Adviser’s investment processes and strategies, and matters related to the Adviser’s portfolio transaction policies and procedures. The Board further took into account that, with respect to most of the Funds, the Adviser does not serve as investment adviser for other series of registered investment companies with substantially similar investment objectives and strategies; therefore, directly comparable performance information was generally not available for most Funds. The Board also considered each Fund’s record of performing in accordance with its investment objective.
In connection with the investment advisory services to be provided under the New Advisory Agreements, the Board took into account detailed discussions with representatives of the Adviser at the June 2009 Board meeting and at prior Board meetings regarding the management of each Fund. In addition to the investment advisory services to be provided to the Funds, the Board, at the August 2009 Board meeting, considered that the Adviser also will continue to provide management and administrative services, shareholder services, oversight of Fund accounting, marketing services, assistance in meeting legal and regulatory requirements and other services necessary for the operation of the Funds, and that these services were expected to be consistent with the services the Adviser currently performs under the Current Advisory Agreements.
The Board noted the representations of the Adviser, BGI and BlackRock that the Transaction was not expected to have any adverse effect on the resources and strengths of the Adviser in managing the Funds. The Board also considered that the Funds and their shareholders may benefit from having direct access to BlackRock’s state of the art technology and risk management analytic tools, including the investment tools provided under the BlackRock Solutions® brand name. The Board discussed BlackRock’s current financial condition, its anticipated financial condition following the completion of the Transaction and its lines of business. The Board also discussed the Adviser’s anticipated financial condition following the completion of the Transaction. The Board discussed BlackRock’s current ownership structure and expected ownership structure following the completion of the Transaction. The Board was advised that BlackRock operates as an independent firm, with its own Board of Directors and no majority shareholder. The Board was also advised that while BlackRock’s largest shareholders, Merrill Lynch, a wholly owned subsidiary of Bank of America, and PNC, are important clients and strategic partners of BlackRock, they are not involved in the firm’s day-to-day management or operations.
| 82 | 2009 iSHARES ANNUAL REPORTTO SHAREHOLDERS |
Table of Contents
Board Review and Approval of New Investment Advisory
Agreements (Unaudited) (Continued)
iSHARES®, INC.
Based on the discussions held and the materials presented at the June, July and August 2009 Board meetings and prior Board meetings, the Board determined that the Transaction would not likely cause an adverse change in the nature, extent and quality of the services to be provided by the Adviser under the New Advisory Agreements compared with the services provided by the Adviser under the Current Advisory Agreements and that the Board expects that the quality of such services will continue to be appropriate.
Funds’ expenses and performance of the Funds – The Board received and reviewed statistical information prepared by Lipper at the June 2009 meeting and also received information at prior meetings regarding the expense ratio components of the Funds, including advisory fees, waivers and reimbursements, and gross and net total expenses, in comparison with the same information for other registered investment companies objectively selected by Lipper as comprising a Fund’s peer group pursuant to Lipper’s proprietary methodology and, for certain Funds, registered investment companies that would otherwise have been excluded from Lipper’s comparison group due to certain differentiating factors, but were nonetheless included at the request of the Adviser (the “Lipper Group”). Because there are few, if any, exchange traded funds or index funds that track indexes similar to those tracked by most of the Funds, the Lipper Groups sometimes included mutual funds, closed-end funds, exchange traded funds, or funds with differing investment objective classifications, investment focuses and other characteristics (e.g., actively managed funds and funds sponsored by “at cost” service providers). In support of its review of the statistical information, the Board was provided with a detailed description of the methodology used by Lipper to determine the applicable Lipper Groups and to prepare this information. The Board further noted that due to the limitations in providing comparable funds in the various Lipper Groups, the statistical information may or may not provide meaningful direct comparisons to certain Funds.
The Board noted that the investment advisory fees and overall expenses for the Funds were generally lower than the median or average investment advisory fee rates and overall expenses of the Funds in their Lipper Groups with respect to the Current and New Advisory Agreements. The Board took into account that the fee rates for each Fund under the New Advisory Agreements are identical to the fee rates under the respective Current Advisory Agreements. Further, the Board noted that representatives of the Adviser and BlackRock had confirmed that there is no present intention to alter the advisory fee rates, expense waivers or expense reimbursements currently in effect for the Funds for a period of two years from the date of the closing of the Transaction.
In addition to reviewing the fees and expenses, the Board noted that it regularly reviews each Fund’s performance and at the June 2009 meeting reviewed statistical information prepared by Lipper regarding the performance of each Fund for the quarter-end, one-, three-, five-and ten-year periods, as applicable, and a comparison of each Fund’s performance to its performance benchmark index for the same periods. To the extent that any of the comparison funds included in the Lipper Groups track the same index as any particular Fund, Lipper also provided, and the Board reviewed, a comparison of the Fund’s performance to that of the relevant comparison funds for the same periods. The Board noted that the Funds generally performed in line with their performance benchmark indices over the relevant periods. In considering this information, the Board took into account that the Lipper Groups include funds that may have different investment objectives and/or benchmarks from the Funds. In addition, the Board noted that each Fund seeks to track its benchmark index and that during the prior year the Board received periodic reports on the Funds’ performance in comparison with their relevant benchmark indices. This comparative performance information was also considered by the Board. The Board considered the Adviser’s substantial investment advisory experience and capabilities, as well as the possibility of additional resources and support from BlackRock following the completion of the Transaction, but noted that the effect, if any, the consummation of the Transaction would have on the future performance of the Funds could not be predicted.
Based on this review, the Board had concluded that the investment advisory fee rates and expense levels and the historical performance of each Fund, as compared to the investment advisory fee rates and expense levels and performance of the funds in the relevant Lipper Group, were satisfactory for the purposes of approving the Current Advisory Agreements and concluded that these comparisons continued to be satisfactory for the purpose of approving the New Advisory Agreements.
| BOARD REVIEWAND APPROVALOF NEW INVESTMENT ADVISORY AGREEMENTS | 83 |
Table of Contents
Board Review and Approval of New Investment Advisory
Agreements (Unaudited) (Continued)
iSHARES®, INC.
Cost of services provided and profits realized by the Adviser from the relationship with each Fund – The Board considered that at the June 2009 Board meeting and at prior meetings, it had reviewed information about the profitability of the Adviser with respect to the Funds based on the fees payable to the Adviser and its affiliates (including fees under the Current Advisory Agreements), and all other sources of revenue and expense to the Adviser and its affiliates from the Funds’ operations for the last calendar year. The Board discussed the sources of direct and ancillary revenue with management, including the revenues to BGI from securities lending by the Companies (including any securities lending by the Funds). The Board also discussed the Adviser’s profit margin as reflected in the Funds’ profitability analysis and reviewed information regarding economies of scale (as discussed below).
In evaluating the costs of the services to be provided by the Adviser under the New Advisory Agreements, the Board considered, among other things, whether advisory fee rates or other expenses would change as a result of the Transaction. The Board noted that the New Advisory Agreements are similar to the Current Advisory Agreements, including the fact that the fee rates under the Agreements are identical and that representatives of the Adviser and BlackRock represented that there is no present intention due to the Transaction to alter the advisory fee rates, expense waiver or expense reimbursements currently in effect for the Funds for a period of two years from the date of the closing of the Transaction. It was noted that it was not possible to predict how the Transaction would affect the Adviser’s profitability from its relationship with the Funds. Potential cost savings had been described by BlackRock representatives that may be achieved by BlackRock immediately following the Transaction, but even if all of such savings were realized by the Adviser in connection with the management of the Funds, the Adviser’s profitability in respect of the Funds was not expected to increase in a significant respect. The Adviser, BlackRock and the Board discussed how profitability will be calculated and presented to the Board following the Transaction, and the Board reviewed BlackRock’s 2008 profitability methodology with respect to its registered funds. The Board expects to receive profitability information from the Adviser on at least an annual basis following the completion of the Transaction and thus be in a position to evaluate whether any adjustments in Fund fees would be appropriate.
The extent to which economies of scale would be realized as a Fund grows and whether fee levels would reflect such economies of scale – In connection with its review of the Funds’ profitability analysis at the June 2009 meeting, the Board reviewed information regarding potential economies of scale or other efficiencies that may result from increases in the Funds’ assets. At the June 2009 Board meeting, the Board also reviewed the Adviser’s historic profitability as investment adviser to the iShares fund complex and noted that the Adviser had continued to make significant investments in the iShares fund complex, that expenses had grown at a pace similar to the growth in revenue, and that the Adviser had incurred operating losses during earlier years when the iShares funds, including the Funds, had not yet reached scale. The Board further noted that the Current and New Advisory Agreements provide for breakpoints in certain Funds’ investment advisory fee rates as the assets of the Funds, on an aggregated basis with the assets of certain other Funds, increase and that breakpoints were implemented the previous year for certain Funds. The Board noted that for certain other Funds, the Current and New Advisory Agreements do not provide for any breakpoints in the Funds’ investment advisory fee rates as the assets of the Funds increase; however, the Board further noted that possible future economies of scale for those Funds had, in many cases, been taken into consideration by fixing the investment advisory fees at rates at the lower end of the marketplace, effectively giving Fund shareholders, from inception, the benefits of the lower average fee shareholders may have received from a fee structure with declining breakpoints where the initial fee was higher. At the June 2009 Board meeting, the Board, recognizing its responsibility to consider this issue at least annually, concluded that the structure of the investment advisory fee rates, with the breakpoints for certain Funds, reflected appropriate sharing of economies of scale with the Funds’ shareholders.
The Board noted representations from the Adviser and BlackRock that the Adviser will continue to make significant investments in the iShares fund complex and the infrastructure supporting the Funds. The Board determined that changes to the fee structure were not currently necessary and that the Funds appropriately participate in economies of scale. It was noted that it was not possible to evaluate how the Transaction would create opportunities for additional economies of scale. The Board expects to consider economies of scale on at least an annual basis following completion of the Transaction and thus be in a position to evaluate additional economies of scale, if any.
| 84 | 2009 iSHARES ANNUAL REPORTTO SHAREHOLDERS |
Table of Contents
Board Review and Approval of New Investment Advisory
Agreements (Unaudited) (Continued)
iSHARES®, INC.
Fees and services provided for other comparable funds/accounts managed by the Adviser and its Affiliates – At the June 2009 Board meeting, the Board received and considered certain information regarding the Funds’ annual investment advisory fee rates under the Current Advisory Agreements in comparison to the investment advisory/management fee rates for other funds/accounts for which the Adviser or BGI provides investment advisory/management services, including other funds registered under the 1940 Act, collective funds and separate accounts (together, the “Other Accounts”). The Board noted that directly comparable investment advisory/management fee information was not available for many of the Funds, as the Adviser and its affiliates do not manage any Other Accounts with substantially similar investment objectives and strategies as many of the Funds. The Board noted, however, that the Adviser provided the Board with general information regarding how the level of services provided to the Other Accounts differed from the level of services provided to the Funds. Furthermore, in reviewing the comparative investment advisory/management fee information for the Funds for which such information was available, the Board considered the general structure of investment advisory/management fees in relation to the nature and extent of services provided to the Funds in comparison with the nature and extent of services provided to the Other Accounts, including, among other things, the level of complexity in managing the Funds and the Other Accounts under differing regulatory requirements and client guidelines. The Board noted that the investment advisory fee rates under the Current Advisory Agreements for the Funds were generally higher than the investment advisory/management fee rates for the Other Accounts for which the Adviser or BGI provides investment advisory/management services, but that the differences appeared to be attributable to, among other things, the type and level of services provided and/or the asset levels of the Other Accounts. Based on this review, the Board determined that the investment advisory fee rates under the Current and New Advisory Agreements do not constitute fees that are so disproportionately large as to bear no reasonable relationship to the services rendered and that could not have been the product of arm’s-length bargaining, and concluded that the investment advisory fee rates under the Current and New Advisory Agreements are fair and reasonable.
Other benefits to the Adviser and its affiliates, including fall-out benefits – In evaluating the fall-out and any other ancillary benefits received by the Adviser under the Current Advisory Agreements, the Board reviewed any ancillary revenue received by the Adviser and/or its affiliates in connection with the services provided to the Funds by the Adviser or its affiliates, such as any payment of revenue to BGI, the Company’s current securities lending agent, for loaning any portfolio securities, and payment of advisory fees and/or administration fees to the Adviser and BGI in connection with any investments by the Funds in other funds for which the Adviser provides investment advisory services and/or BGI provides administration services. The Board noted that while revenue to BGI in connection with securities lending agency services to the Funds increased overall as against the previous year, overall revenue increased by approximately the same percentage as overall expenses. The Board noted that the Adviser does not use soft dollars or consider the value of research or other services that may be provided to the Adviser (including its affiliates) in selecting brokers for portfolio transactions for the Funds. The Board further noted that any portfolio transactions on behalf of the Funds placed through an affiliate of the Adviser or purchased from an underwriting syndicate in which an Adviser affiliate participates, are reported to the Board pursuant to Rule 17e-1 or Rule 10f-3, as applicable, under the 1940 Act. Any fall-out or ancillary benefits as a result of the Transaction were difficult to quantify with certainty at this time, and the Board indicated that it would continue to evaluate them going forward.
Conclusion – The Board examined the totality of the information they were provided at the June, July and August 2009 Board meetings, and information they received at other meetings held during the past year, and did not identify any single factor discussed previously as controlling. Based on this analysis, the Board determined that the New Advisory Agreements, including the investment advisory fee rates thereunder, are fair and reasonable in light of all relevant circumstances and concluded that it is in the best interest of the Funds and their shareholders to unanimously approve the New Advisory Agreements.
| BOARD REVIEWAND APPROVALOF NEW INVESTMENT ADVISORY AGREEMENTS | 85 |
Table of Contents
Supplemental Information (Unaudited)
iSHARES®, INC.
The tables that follow present information about the differences between the daily market price on secondary markets for shares of a Fund and that Fund’s net asset value. Net asset value, or “NAV”, is the price per share at which each Fund issues and redeems shares. It is calculated in accordance with the standard formula for valuing mutual fund shares. The “Market Price” of each Fund generally is determined using the midpoint between the highest bid and the lowest offer on the primary stock exchange on which the shares of such Fund is listed for trading, as of the time that the Fund’s NAV is calculated. Each Fund’s Market Price may be at, above or below its NAV. The NAV of each Fund will fluctuate with changes in the market value of its portfolio holdings. The Market Price of each Fund will fluctuate in accordance with changes in its NAV, as well as market supply and demand.
Premiums or discounts are the differences (expressed as a percentage) between the NAV and Market Price of a Fund on a given day, generally at the time NAV is calculated. A premium is the amount that a Fund is trading above the reported NAV, expressed as a percentage of the NAV. A discount is the amount that a Fund is trading below the reported NAV, expressed as a percentage of the NAV.
The following information shows the frequency distributions of premiums and discounts for each of the Funds included in this report. The information shown for each Fund is for five calendar years (or for each full calendar quarter completed after the inception date of such Fund if less than five years) through the date of the most recent calendar quarter-end. The specific periods covered for each Fund are disclosed in the table for such Fund.
Each line in the table shows the number of trading days in which the Fund traded within the premium/discount range indicated. The number of trading days in each premium/discount range is also shown as a percentage of the total number of trading days in the period covered by each table. All data presented here represents past performance, which cannot be used to predict future results.
iShares MSCI Brazil Index Fund
Period Covered: January 1, 2004 through June 30, 2009
Premium/Discount Range | Number of Days | Percentage of Total Days | |||
Greater than 4.0% | 3 | 0.22 | % | ||
Greater than 3.5% and Less than 4.0% | 1 | 0.07 | |||
Greater than 3.0% and Less than 3.5% | 3 | 0.22 | |||
Greater than 2.5% and Less than 3.0% | 5 | 0.36 | |||
Greater than 2.0% and Less than 2.5% | 5 | 0.36 | |||
Greater than 1.5% and Less than 2.0% | 13 | 0.94 | |||
Greater than 1.0% and Less than 1.5% | 27 | 1.95 | |||
Greater than 0.5% and Less than 1.0% | 113 | 8.18 | |||
Between 0.5% and –0.5% | 1,040 | 75.26 | |||
Less than –0.5% and Greater than –1.0% | 117 | 8.47 | |||
Less than –1.0% and Greater than –1.5% | 19 | 1.37 | |||
Less than –1.5% and Greater than –2.0% | 15 | 1.09 | |||
Less than –2.0% and Greater than –2.5% | 7 | 0.51 | |||
Less than –2.5% and Greater than –3.0% | 3 | 0.22 | |||
Less than –3.0% and Greater than –3.5% | 2 | 0.14 | |||
Less than –3.5% and Greater than –4.0% | 4 | 0.29 | |||
Less than –4.0% and Greater than –4.5% | 1 | 0.07 | |||
Less than –4.5% and Greater than –5.0% | 2 | 0.14 | |||
Less than –5.0% | 2 | 0.14 | |||
| 1,382 | 100.00 | % | |||
| 86 | 2009 iSHARES ANNUAL REPORTTO SHAREHOLDERS |
Table of Contents
Supplemental Information (Unaudited) (Continued)
iSHARES®, INC.
iShares MSCI BRIC Index Fund
Period Covered: January 1, 2008 through June 30, 2009
Premium/Discount Range | Number of Days | Percentage of Total Days | |||
Greater than 5.5% | 3 | 0.80 | % | ||
Greater than 5.0% and Less than 5.5% | 1 | 0.27 | |||
Greater than 4.5% and Less than 5.0% | 2 | 0.53 | |||
Greater than 4.0% and Less than 4.5% | 2 | 0.53 | |||
Greater than 3.5% and Less than 4.0% | 2 | 0.53 | |||
Greater than 3.0% and Less than 3.5% | 5 | 1.33 | |||
Greater than 2.5% and Less than 3.0% | 8 | 2.13 | |||
Greater than 2.0% and Less than 2.5% | 19 | 5.05 | |||
Greater than 1.5% and Less than 2.0% | 23 | 6.12 | |||
Greater than 1.0% and Less than 1.5% | 38 | 10.11 | |||
Greater than 0.5% and Less than 1.0% | 71 | 18.88 | |||
Between 0.5% and –0.5% | 123 | 32.70 | |||
Less than –0.5% and Greater than –1.0% | 40 | 10.64 | |||
Less than –1.0% and Greater than –1.5% | 16 | 4.26 | |||
Less than –1.5% and Greater than –2.0% | 5 | 1.33 | |||
Less than –2.0% and Greater than –2.5% | 8 | 2.13 | |||
Less than –2.5% and Greater than –3.0% | 1 | 0.27 | |||
Less than –3.5% and Greater than –4.0% | 2 | 0.53 | |||
Less than –4.0% and Greater than –4.5% | 2 | 0.53 | |||
Less than –4.5% and Greater than –5.0% | 2 | 0.53 | |||
Less than –5.0% and Greater than –5.5% | 1 | 0.27 | |||
Less than –5.5% | 2 | 0.53 | |||
| 376 | 100.00 | % | |||
iShares MSCI Canada Index Fund
Period Covered: January 1, 2004 through June 30, 2009
Premium/Discount Range | Number of Days | Percentage of Total Days | |||
Greater than 4.0% | 1 | 0.07 | % | ||
Greater than 3.5% and Less than 4.0% | 1 | 0.07 | |||
Greater than 3.0% and Less than 3.5% | 1 | 0.07 | |||
Greater than 2.5% and Less than 3.0% | 2 | 0.14 | |||
Greater than 2.0% and Less than 2.5% | 3 | 0.22 | |||
Greater than 1.5% and Less than 2.0% | 3 | 0.22 | |||
Greater than 1.0% and Less than 1.5% | 23 | 1.66 | |||
Greater than 0.5% and Less than 1.0% | 148 | 10.71 | |||
Between 0.5% and –0.5% | 1,102 | 79.75 | |||
Less than –0.5% and Greater than –1.0% | 75 | 5.43 | |||
Less than –1.0% and Greater than –1.5% | 18 | 1.30 | |||
Less than –1.5% and Greater than –2.0% | 3 | 0.22 | |||
Less than –2.0% | 2 | 0.14 | |||
| 1,382 | 100.00 | % | |||
| SUPPLEMENTAL INFORMATION | 87 |
Table of Contents
Supplemental Information (Unaudited) (Continued)
iSHARES®, INC.
iShares MSCI Chile Investable Market Index Fund
Period Covered: January 1, 2008 through June 30, 2009
Premium/Discount Range | Number of Days | Percentage of Total Days | |||
Greater than 4.0% | 3 | 0.80 | % | ||
Greater than 3.5% and Less than 4.0% | 2 | 0.53 | |||
Greater than 3.0% and Less than 3.5% | 1 | 0.27 | |||
Greater than 2.5% and Less than 3.0% | 4 | 1.06 | |||
Greater than 2.0% and Less than 2.5% | 7 | 1.86 | |||
Greater than 1.5% and Less than 2.0% | 11 | 2.93 | |||
Greater than 1.0% and Less than 1.5% | 39 | 10.37 | |||
Greater than 0.5% and Less than 1.0% | 98 | 26.06 | |||
Between 0.5% and –0.5% | 138 | 36.70 | |||
Less than –0.5% and Greater than –1.0% | 36 | 9.57 | |||
Less than –1.0% and Greater than –1.5% | 13 | 3.46 | |||
Less than –1.5% and Greater than –2.0% | 11 | 2.93 | |||
Less than –2.0% and Greater than –2.5% | 3 | 0.80 | |||
Less than –2.5% and Greater than –3.0% | 4 | 1.06 | |||
Less than –3.5% and Greater than –4.0% | 3 | 0.80 | |||
Less than –4.0% and Greater than –4.5% | 1 | 0.27 | |||
Less than –5.0% and Greater than –5.5% | 2 | 0.53 | |||
| 376 | 100.00 | % | |||
| 88 | 2009 iSHARES ANNUAL REPORTTO SHAREHOLDERS |
Table of Contents
Supplemental Information (Unaudited) (Continued)
iSHARES®, INC.
iShares MSCI Israel Capped Investable Market Index Fund
Period Covered: April 1, 2008 through June 30, 2009
Premium/Discount Range | Number of Days | Percentage of Total Days | |||
Greater than 4.5% | 2 | 0.63 | % | ||
Greater than 4.0% and Less than 4.5% | 3 | 0.95 | |||
Greater than 3.5% and Less than 4.0% | 1 | 0.32 | |||
Greater than 3.0% and Less than 3.5% | 5 | 1.59 | |||
Greater than 2.5% and Less than 3.0% | 4 | 1.27 | |||
Greater than 2.0% and Less than 2.5% | 8 | 2.54 | |||
Greater than 1.5% and Less than 2.0% | 16 | 5.08 | |||
Greater than 1.0% and Less than 1.5% | 26 | 8.25 | |||
Greater than 0.5% and Less than 1.0% | 41 | 13.02 | |||
Between 0.5% and –0.5% | 119 | 37.79 | |||
Less than –0.5% and Greater than –1.0% | 32 | 10.16 | |||
Less than –1.0% and Greater than –1.5% | 16 | 5.08 | |||
Less than –1.5% and Greater than –2.0% | 21 | 6.67 | |||
Less than –2.0% and Greater than –2.5% | 4 | 1.27 | |||
Less than –2.5% and Greater than –3.0% | 5 | 1.59 | |||
Less than –3.0% and Greater than –3.5% | 2 | 0.63 | |||
Less than –3.5% and Greater than –4.0% | 1 | 0.32 | |||
Less than –4.0% and Greater than –4.5% | 1 | 0.32 | |||
Less than –4.5% and Greater than –5.0% | 2 | 0.63 | |||
Less than –5.0% and Greater than –5.5% | 2 | 0.63 | |||
Less than –5.5% and Greater than –6.0% | 2 | 0.63 | |||
Less than –6.0% | 2 | 0.63 | |||
| 315 | 100.00 | % | |||
| SUPPLEMENTAL INFORMATION | 89 |
Table of Contents
Supplemental Information (Unaudited) (Continued)
iSHARES®, INC.
iShares MSCI Mexico Investable Market Index Fund
Period Covered: January 1, 2004 through June 30, 2009
Premium/Discount Range | Number of Days | Percentage of Total Days | |||
Greater than 3.5% | 2 | 0.14 | % | ||
Greater than 3.0% and Less than 3.5% | 3 | 0.22 | |||
Greater than 2.5% and Less than 3.0% | 3 | 0.22 | |||
Greater than 2.0% and Less than 2.5% | 1 | 0.07 | |||
Greater than 1.5% and Less than 2.0% | 10 | 0.72 | |||
Greater than 1.0% and Less than 1.5% | 24 | 1.74 | |||
Greater than 0.5% and Less than 1.0% | 143 | 10.35 | |||
Between 0.5% and –0.5% | 959 | 69.40 | |||
Less than –0.5% and Greater than –1.0% | 169 | 12.23 | |||
Less than –1.0% and Greater than –1.5% | 41 | 2.97 | |||
Less than –1.5% and Greater than –2.0% | 13 | 0.94 | |||
Less than –2.0% and Greater than –2.5% | 5 | 0.36 | |||
Less than –2.5% and Greater than –3.0% | 6 | 0.43 | |||
Less than –3.0% and Greater than –3.5% | 2 | 0.14 | |||
Less than –3.5% | 1 | 0.07 | |||
| 1,382 | 100.00 | % | |||
| 90 | 2009 iSHARES ANNUAL REPORTTO SHAREHOLDERS |
Table of Contents
Supplemental Information (Unaudited) (Continued)
iSHARES®, INC.
iShares MSCI South Africa Index Fund
Period Covered: January 1, 2004 through June 30, 2009
Premium/Discount Range | Number of Days | Percentage of Total Days | |||
Greater than 4.5% | 10 | 0.72 | % | ||
Greater than 4.0% and Less than 4.5% | 4 | 0.29 | |||
Greater than 3.5% and Less than 4.0% | 4 | 0.29 | |||
Greater than 3.0% and Less than 3.5% | 12 | 0.87 | |||
Greater than 2.5% and Less than 3.0% | 13 | 0.94 | |||
Greater than 2.0% and Less than 2.5% | 34 | 2.46 | |||
Greater than 1.5% and Less than 2.0% | 60 | 4.34 | |||
Greater than 1.0% and Less than 1.5% | 125 | 9.04 | |||
Greater than 0.5% and Less than 1.0% | 236 | 17.08 | |||
Between 0.5% and –0.5% | 574 | 41.54 | |||
Less than –0.5% and Greater than –1.0% | 120 | 8.68 | |||
Less than –1.0% and Greater than –1.5% | 69 | 4.99 | |||
Less than –1.5% and Greater than –2.0% | 46 | 3.33 | |||
Less than –2.0% and Greater than –2.5% | 25 | 1.81 | |||
Less than –2.5% and Greater than –3.0% | 14 | 1.01 | |||
Less than –3.0% and Greater than –3.5% | 15 | 1.09 | |||
Less than –3.5% and Greater than –4.0% | 3 | 0.22 | |||
Less than –4.0% and Greater than –4.5% | 4 | 0.29 | |||
Less than –4.5% and Greater than –5.0% | 1 | 0.07 | |||
Less than –5.0% and Greater than –5.5% | 2 | 0.14 | |||
Less than –5.5% and Greater than –6.0% | 3 | 0.22 | |||
Less than –6.0% | 8 | 0.58 | |||
| 1,382 | 100.00 | % | |||
| SUPPLEMENTAL INFORMATION | 91 |
Table of Contents
Supplemental Information (Unaudited) (Continued)
iSHARES®, INC.
iShares MSCI Turkey Investable Market Index Fund
Period Covered: April 1, 2008 through June 30, 2009
Premium/Discount Range | Number of Days | Percentage of Total Days | |||
Greater than 6.0% | 7 | 2.22 | % | ||
Greater than 5.5% and Less than 6.0% | 3 | 0.95 | |||
Greater than 5.0% and Less than 5.5% | 1 | 0.32 | |||
Greater than 4.5% and Less than 5.0% | 2 | 0.63 | |||
Greater than 4.0% and Less than 4.5% | 3 | 0.95 | |||
Greater than 3.5% and Less than 4.0% | 1 | 0.32 | |||
Greater than 3.0% and Less than 3.5% | 8 | 2.54 | |||
Greater than 2.5% and Less than 3.0% | 14 | 4.44 | |||
Greater than 2.0% and Less than 2.5% | 12 | 3.81 | |||
Greater than 1.5% and Less than 2.0% | 14 | 4.44 | |||
Greater than 1.0% and Less than 1.5% | 31 | 9.84 | |||
Greater than 0.5% and Less than 1.0% | 39 | 12.38 | |||
Between 0.5% and –0.5% | 70 | 22.24 | |||
Less than –0.5% and Greater than –1.0% | 23 | 7.30 | |||
Less than –1.0% and Greater than –1.5% | 29 | 9.21 | |||
Less than –1.5% and Greater than –2.0% | 18 | 5.71 | |||
Less than –2.0% and Greater than –2.5% | 10 | 3.17 | |||
Less than –2.5% and Greater than –3.0% | 5 | 1.59 | |||
Less than –3.0% and Greater than –3.5% | 5 | 1.59 | |||
Less than –3.5% and Greater than –4.0% | 5 | 1.59 | |||
Less than –4.0% and Greater than –4.5% | 2 | 0.63 | |||
Less than –4.5% and Greater than –5.0% | 1 | 0.32 | |||
Less than –5.0% and Greater than –5.5% | 1 | 0.32 | |||
Less than –5.5% and Greater than –6.0% | 4 | 1.27 | |||
Less than –6.0% | 7 | 2.22 | |||
| 315 | 100.00 | % | |||
| 92 | 2009 iSHARES ANNUAL REPORTTO SHAREHOLDERS |
Table of Contents
Director and Officer Information (Unaudited)
iSHARES®, INC.
The Board of Directors has responsibility for the overall management and operations of the Company, including general supervision of the duties performed by BGFA and other service providers. Each Director serves until his or her successor is duly elected or appointed and qualified. Each Officer serves until he or she resigns, is removed, dies, retires or becomes disqualified.
iShares, Inc., iShares Trust, Barclays Global Investors Funds (“BGIF”) and Master Investment Portfolio (“MIP”) are considered to be members of the same fund complex, as defined in Form N-1A under the 1940 Act. Each Director of iShares, Inc. also serves as a Trustee for iShares Trust and oversees 183 portfolios within the fund complex. In addition, Lee T. Kranefuss serves as a Trustee for BGIF and MIP and oversees an additional 26 portfolios within the fund complex.
The address of each Director and Officer is c/o Barclays Global Investors, N.A., 400 Howard Street, San Francisco, California 94105. The Board has designated George G.C. Parker as its Lead Independent Director. Additional information about the Funds’ Directors and Officers may be found in the Funds’ combined Statement of Additional Information, which is available without charge, upon request, by calling toll-free 1-800-474-2737.
Interested Directors and Officers
| Name, Age | Position(s), Length of Service | Principal Occupation(s) During Past 5 Years | Other Directorships Held | |||
*Lee T. Kranefuss, 48 | Director and Chairman (since 2003). | Non-Executive Chairman (since 2009), iShares; Global Chief Executive Officer (2008-2009) of iShares /Intermediary Groups of BGI; Chief Executive Officer (2005-2008) of iShares Intermediary Index and Market Group of BGI; Chief Executive Officer (2003-2005) of the Intermediary Investor and Exchange Traded Products Business of BGI; Director (since 2005) of BGFA; Director, President and Chief Executive Officer (since 2005) of Barclays Global Investors International, Inc.; Director and Chairman (since 2005) of Barclays Global Investors Services. | Trustee (since 2003) of iShares Trust; Trustee (since 2001) of BGlF and MIP. |
| * | Lee T. Kranefuss is deemed to be an “interested person” (as defined in the 1940 Act) of the Company due to his affiliations with BGFA, the Funds’ investment adviser; BGI, the parent company of BGFA; and Barclays Global Investors Services, an affiliate of BGFA and BGI. |
| DIRECTORAND OFFICER INFORMATION | 93 |
Table of Contents
Director and Officer Information (Unaudited) (Continued)
iSHARES®, INC.
Independent Directors
| ||||||
| Name, Age | Position(s), Length of Service | Principal Occupation(s) During Past 5 Years | Other Directorships Held | |||
George G.C. Parker, 70 | Director (since 2006). | Dean Witter Distinguished Professor of Finance (since 1994), Emeritus, Stanford University: Graduate School of Business. | Trustee (since 2000) of iShares Trust; Lead Independent Trustee (since 2006) of iShares Trust; Director (since 1995) of Community First Financial Group; Director (since 1999) of Tejon Ranch Company; Director (since 2004) of Threshold Pharmaceuticals; Director (since 2007) of NETGEAR, Inc. | |||
J. Darrell Duffie, 55 | Director (since 2008). | Professor (since 1984) of Stanford University: Graduate School of Business. | Trustee (since 2008) of iShares Trust; Director (since 2008) of Moody’s Corp. | |||
Cecilia H. Herbert, 60 | Director (since 2005). | Chair (1994-2005) of Investment Committee, Archdiocese of San Francisco; Director (since 1998) and President (since 2007) of the Board of Directors, Catholic Charities CYO; Trustee (2004-2005) of Pacific Select Funds; Trustee (since 2002) and Chair (2006-2007) of the Finance and Investment Committees (since 2006) of the Thacher School. | Trustee (since 2005) of iShares Trust; Advisory Board Member (since 2009) of Forward Funds. | |||
Charles A. Hurty, 66 | Director (since 2005). | Retired; Partner, KPMG LLP (1968-2001). | Trustee (since 2005) of iShares Trust; Director (since 2002) of ProMark Absolute Return Strategies Fund LLC (1 portfolio); Director (since 2002) of Citigroup Alternative Investments Multi-Adviser Hedge Fund Portfolios LLC (1 portfolio); Director (since 2005) of CSFB Alternative Investments Fund (6 portfolios). | |||
John E. Kerrigan, 54 | Director (since 2005). | Chief Investment Officer (since 2002) of Santa Clara University. | Trustee (since 2005) of iShares Trust. | |||
*John E. Martinez, 48 | Director (since 2003). | Director (since 2005) of Equity Rock Capital Management; Director (since 2003) of Larkin Street Youth Services. | Trustee (since 2003) of iShares Trust; Chairman (since 2007) of Independent Review Committee, Canadian iShares Funds. | |||
| 94 | 2009 iSHARES ANNUAL REPORTTO SHAREHOLDERS |
Table of Contents
Director and Officer Information (Unaudited) (Continued)
iSHARES®, INC.
Independent Directors (Continued)
| ||||||
| Name, Age | Position(s), Length of Service | Principal Occupation(s) During Past 5 Years | Other Directorships Held | |||
Robert H. Silver, 54 | Director (since 2007). | President and Co-Founder (since 2006) of The Bravitas Group, Inc.; Member (since 2006) of Non-Investor Advisory Board of Russia Partners II, LP; Director and member (2006-2009) of the Audit and Compensation Committee of EPAM Systems, Inc.; President and Chief Operating Officer (2003-2005) and Director (1999-2005) of UBS Financial Services, Inc.; President and Chief Executive Officer (1999-2005) of UBS Services USA, LLC; Managing Director (2000-2005) of UBS America, Inc.; Director and Vice Chairman (since 2001) of the YMCA of Greater NYC; Broadway Producer (since 2006); Co-Founder and Vice President (since 2008) of Parent giving Inc. | Trustee (since 2007) of iShares Trust. | |||
| * | Prior to August 13, 2009, John E. Martinez was deemed to be an “interested person” (as defined in the 1940 Act) of the Trust due to his affiliations with BGFA, the Funds’ investment adviser; BGI, the parent company of BGFA; and Barclays Global Investors Services, an affiliate of BGFA and BGI. Effective August 13, 2009, John E. Martinez is a non-interested person notwithstanding his former affiliation with BGFA and its affiliates prior to 2002. |
Officers
| ||||||
| Name, Age | Position(s), Length of Service | Principal Occupation(s) During Past 5 Years | Other Directorships Held | |||
Michael A. Latham, 44 | President (since 2007). | Head (since 2007) of Americas iShares, BGI; Chief Operating Officer (2003-2007) of the Intermediary Investor and Exchange Traded Products Business of BGI; Director and Chief Financial Officer (since 2005) of Barclays Global Investors International, Inc. | None. | |||
| DIRECTORAND OFFICER INFORMATION | 95 |
Table of Contents
Director and Officer Information (Unaudited) (Continued)
iSHARES®, INC.
Officers (Continued)
| ||||||
| Name, Age | Position(s), Length of Service | Principal Occupation(s) During Past 5 Years | Other Directorships Held | |||
Geoffrey D. Flynn, 52 | Executive Vice President and Chief Operating Officer (since 2008). | Chief Operating Officer (since 2008) of U.S. iShares, BGI; Director (2007-2008) of Mutual Fund Operations of BGI; President (2003-2007) of Van Kampen Investors Services; Managing Director (2002-2007) of Morgan Stanley; President (2002-2007) of Morgan Stanley Trust, FSB. | None. | |||
Jack Gee, 50 | Treasurer and Chief Financial Officer (since 2008). | Senior Director (since 2009) of Fund Administration of Intermediary Investor Business of BGI; Director (2004-2009) of Fund Administration of Intermediary Investor Business of BGI; Treasurer and Chief Financial Officer (2004) of Parnassus Investments. | None. | |||
Eilleen M. Clavere, 57 | Secretary (since 2007). | Director (since 2006) of Legal Administration of Intermediary Investors Business of BGI; Legal Counsel and Vice President (2005-2006) of Atlas Funds, Atlas Advisers, Inc. and Atlas Securities, Inc.; Counsel (2001-2005) of Kirkpatrick & Lockhart LLP. | None. | |||
Ira P. Shapiro, 46 | Vice President and Chief Legal Officer (since 2007). | Associate General Counsel (since 2004) of BGI; First Vice President (1993-2004) of Merrill Lynch Investment Managers. | None. | |||
Amy Schioldager, 47 | Executive Vice President (since 2007). | Global Head (since 2008) of Index Equity, BGI; Global Head (2006-2008) of U.S. Indexing, BGI; Head (2001-2006) of Domestic Equity Portfolio Management, BGI. | None. | |||
Patrick O’Connor, 42 | Vice President (since 2007). | Head (since 2006) of iShares Portfolio Management, BGI; Senior Portfolio Manager (1999-2006) of BGI. | None. | |||
| 96 | 2009 iSHARES ANNUAL REPORTTO SHAREHOLDERS |
Table of Contents
Director and Officer Information (Unaudited) (Continued)
iSHARES®, INC.
Officers (Continued)
| ||||||
| Name, Age | Position(s), Length of Service | Principal Occupation(s) During Past 5 Years | Other Directorships Held | |||
Lee Sterne, 44 | Vice President (since 2007). | Head (since 2007) of U.S. Fixed Income Index and iShares, BGI; Senior Portfolio Manager (2004-2007) of BGI; Portfolio Manager (2001-2004) of BGI. | None. | |||
Matt Tucker, 37 | Vice President (since 2007). | Director (since 2009) of Fixed Income Investment Strategy, BGI; Head (2005-2008) of U.S. Fixed Income Investment Solutions, BGI; Fixed Income Investment Strategist (2003-2005) of BGI. | None. | |||
| DIRECTORAND OFFICER INFORMATION | 97 |
Table of Contents
Notes:
| 98 | 2009 iSHARES ANNUAL REPORTTO SHAREHOLDERS |
Table of Contents
Notes:
| NOTES | 99 |
Table of Contents
The following is a list of iShares Funds being offered, along with their respective exchange trading symbols. Please call 1-800-iShares (1-800-474-2737) to obtain a prospectus for any iShares Fund. The prospectus contains more complete information, including charges, expenses, investment objectives and risk factors that should be carefully considered to determine if the Fund(s) are an appropriate investment for you. Read the prospectus(es) carefully before investing. Investing involves risk, including possible loss of principal.
Trading Symbol | ||
| iShares Russell Domestic Index Funds | ||
iShares Russell 3000 | IWV | |
iShares Russell 3000 Growth | IWZ | |
iShares Russell 3000 Value | IWW | |
iShares Russell Top 200 | IWL | |
iShares Russell Top 200 Growth | IWY | |
iShares Russell Top 200 Value | IWX | |
iShares Russell 1000 | IWB | |
iShares Russell 1000 Growth | IWF | |
iShares Russell 1000 Value | IWD | |
iShares Russell Midcap | IWR | |
iShares Russell Midcap Growth | IWP | |
iShares Russell Midcap Value | IWS | |
iShares Russell 2000 | IWM | |
iShares Russell 2000 Growth | IWO | |
iShares Russell 2000 Value | IWN | |
iShares Russell Microcap | IWC | |
| iShares S&P Domestic Index Funds | ||
iShares S&P 1500 | ISI | |
iShares S&P 100 | OEF | |
iShares S&P 500 | IVV | |
iShares S&P 500 Growth | IVW | |
iShares S&P 500 Value | IVE | |
iShares S&P MidCap 400 | IJH | |
iShares S&P MidCap 400 Growth | IJK | |
iShares S&P MidCap 400 Value | IJJ | |
iShares S&P SmallCap 600 | IJR | |
iShares S&P SmallCap 600 Growth | IJT | |
iShares S&P SmallCap 600 Value | IJS | |
| iShares Morningstar Domestic Index Funds | ||
iShares Morningstar Large Core | JKD | |
iShares Morningstar Large Growth | JKE | |
iShares Morningstar Large Value | JKF | |
iShares Morningstar Mid Core | JKG | |
iShares Morningstar Mid Growth | JKH | |
iShares Morningstar Mid Value | JKI | |
iShares Morningstar Small Core | JKJ | |
iShares Morningstar Small Growth | JKK | |
iShares Morningstar Small Value | JKL | |
| iShares Dow Jones Domestic Index Funds | ||
iShares Dow Jones U.S. | IYY | |
| iShares KLD Socially Responsible Index Funds | ||
iShares FTSE KLD 400 Social | DSI | |
iShares FTSE KLD Select Social | KLD | |
| iShares NYSE Domestic Index Funds | ||
iShares NYSE Composite | NYC | |
iShares NYSE 100 | NY | |
Trading Symbol | ||
| iShares Domestic Specialty Index Funds | ||
iShares S&P U.S. Preferred Stock | PFF | |
iShares Dow Jones Select Dividend | DVY | |
| iShares North American Sector/Subsector Index Funds | ||
iShares S&P North American Technology Sector | IGM | |
iShares S&P North American | IGN | |
iShares S&P North American Technology-Semiconductors | IGW | |
iShares S&P North American Technology-Software | IGV | |
iShares S&P North American Natural Resources Sector | IGE | |
| iShares Domestic Sector Index Funds | ||
iShares Dow Jones U.S. Basic Materials Sector | IYM | |
iShares Dow Jones U.S. Consumer Goods Sector | IYK | |
iShares Dow Jones U.S. Consumer Services Sector | IYC | |
iShares Dow Jones U.S. Energy Sector | IYE | |
iShares Dow Jones U.S. Financial Sector | IYF | |
iShares Dow Jones U.S. Healthcare Sector | IYH | |
iShares Dow Jones U.S. Industrial Sector | IYJ | |
iShares Dow Jones U.S. Technology Sector | IYW | |
iShares Dow Jones U.S. Telecommunications Sector | IYZ | |
iShares Dow Jones U.S. Utilities Sector | IDU | |
| iShares Domestic Subsector Index Funds | ||
iShares Dow Jones Transportation Average | IYT | |
iShares Dow Jones U.S. Aerospace & Defense | ITA | |
iShares Dow Jones U.S. Broker-Dealers | IAI | |
iShares Dow Jones U.S. Financial Services | IYG | |
iShares Dow Jones U.S. Healthcare Providers | IHF | |
iShares Dow Jones U.S. Home Construction | ITB | |
iShares Dow Jones U.S. Insurance | IAK | |
iShares Dow Jones U.S. Medical Devices | IHI | |
iShares Dow Jones U.S. Oil & Gas Exploration & Production | IEO | |
iShares Dow Jones U.S. Oil Equipment & Services | IEZ | |
iShares Dow Jones U.S. Pharmaceuticals | IHE | |
iShares Dow Jones U.S. Regional Banks | IAT | |
iShares Nasdaq Biotechnology | IBB | |
| iShares Domestic Real Estate Index Funds | ||
iShares Cohen & Steers Realty Majors | ICF | |
iShares Dow Jones U.S. Real Estate | IYR | |
iShares FTSE NAREIT Real Estate 50 | FTY | |
iShares FTSE NAREIT Industrial/Office Capped | FIO | |
iShares FTSE NAREIT Mortgage Plus Capped | REM | |
iShares FTSE NAREIT Residential Plus Capped | REZ | |
iShares FTSE NAREIT Retail Capped | RTL | |
| iShares Target Risk Index Funds | ||
iShares S&P Conservative Allocation | AOK | |
iShares S&P Moderate Allocation | AOM | |
iShares S&P Growth Allocation | AOR | |
iShares S&P Aggressive Allocation | AOA | |
| 100 | 2009 iSHARES ANNUAL REPORTTO SHAREHOLDERS |
Table of Contents
The iShares® Family of Funds (Continued)
| Trading Symbol | ||
| iShares International Country Index Funds | ||
iShares FTSE China (HK Listed) | FCHI | |
iShares FTSE/Xinhua China 25 | FXI | |
iShares MSCI Australia | EWA | |
iShares MSCI Austria Investable Market | EWO | |
iShares MSCI Belgium Investable Market | EWK | |
iShares MSCI Brazil | EWZ | |
iShares MSCI Canada | EWC | |
iShares MSCI Chile Investable Market | ECH | |
iShares MSCI France | EWQ | |
iShares MSCI Germany | EWG | |
iShares MSCI Hong Kong | EWH | |
iShares MSCI Israel Capped Investable Market | EIS | |
iShares MSCI Italy | EWI | |
iShares MSCI Japan | EWJ | |
iShares MSCI Japan Small Cap | SCJ | |
iShares S&P/TOPIX 150 | ITF | |
iShares MSCI Malaysia | EWM | |
iShares MSCI Mexico Investable Market | EWW | |
iShares MSCI Netherlands Investable Market | EWN | |
iShares MSCI All Peru Capped | EPU | |
iShares MSCI Singapore | EWS | |
iShares MSCI South Africa | EZA | |
iShares MSCI South Korea | EWY | |
iShares MSCI Spain | EWP | |
iShares MSCI Sweden | EWD | |
iShares MSCI Switzerland | EWL | |
iShares MSCI Taiwan | EWT | |
iShares MSCI Thailand Investable Market | THD | |
iShares MSCI Turkey Investable Market | TUR | |
iShares MSCI United Kingdom | EWU | |
| iShares International Index Funds | ||
iShares MSCI ACWI ex US | ACWX | |
iShares MSCI EAFE | EFA | |
iShares MSCI EAFE Growth | EFG | |
iShares MSCI EAFE Value | EFV | |
iShares MSCI EAFE Small Cap | SCZ | |
iShares FTSE Developed Small Cap ex-North America | IFSM | |
iShares MSCI Emerging Markets | EEM | |
iShares MSCI Emerging Markets Eastern Europe | ESR | |
iShares S&P Emerging Markets Infrastructure | EMIF | |
iShares MSCI BRIC | BKF | |
iShares MSCI EMU | EZU | |
iShares MSCI All Country Asia ex Japan | AAXJ | |
iShares MSCI Pacific ex-Japan | EPP | |
iShares S&P Asia 50 | AIA | |
iShares S&P Europe 350 | IEV | |
iShares S&P Latin America 40 | ILF | |
| iShares International/Global Real Estate Index Funds | ||
iShares S&P Developed ex-U.S. Property | WPS | |
iShares FTSE EPRA/NAREIT Developed Real Estate ex-U.S. | IFGL | |
iShares FTSE EPRA/NAREIT Developed Asia | IFAS | |
iShares FTSE EPRA/NAREIT Developed Europe | IFEU | |
iShares FTSE EPRA/NAREIT North America | IFNA | |
| iShares International Specialty Index Funds | ||
iShares Dow Jones International Select Dividend | IDV | |
| Trading Symbol | ||
| iShares Target Date Index Funds | ||
iShares S&P Target Date Retirement Income | TGR | |
iShares S&P Target Date 2010 | TZD | |
iShares S&P Target Date 2015 | TZE | |
iShares S&P Target Date 2020 | TZG | |
iShares S&P Target Date 2025 | TZI | |
iShares S&P Target Date 2030 | TZL | |
iShares S&P Target Date 2035 | TZO | |
iShares S&P Target Date 2040 | TZV | |
| iShares Global Index Funds | ||
iShares MSCI ACWI | ACWI | |
iShares S&P Global 100 | IOO | |
iShares MSCI Kokusai | TOK | |
| iShares Global Sector Index Funds | ||
iShares S&P Global Consumer Discretionary Sector | RXI | |
iShares S&P Global Consumer Staples Sector | KXI | |
iShares S&P Global Energy Sector | IXC | |
iShares S&P Global Financials Sector | IXG | |
iShares S&P Global Healthcare Sector | IXJ | |
iShares S&P Global Industrials Sector | EXI | |
iShares S&P Global Materials Sector | MXI | |
iShares S&P Global Technology Sector | IXN | |
iShares S&P Global Telecommunications Sector | IXP | |
iShares S&P Global Utilities Sector | JXI | |
| iShares Global Theme Based Index Funds | ||
iShares S&P Global Clean Energy | ICLN | |
iShares S&P Global Infrastructure | IGF | |
iShares S&P Global Nuclear Energy | NUCL | |
iShares S&P Global Timber & Forestry | WOOD | |
| iShares U.S. Multisector Bond Funds | ||
iShares Barclays Aggregate | AGG | |
iShares Barclays Government/Credit | GBF | |
iShares Barclays Intermediate Government/Credit | GVI | |
| iShares U.S. Government Bond Funds | ||
iShares Barclays Short Treasury | SHV | |
iShares Barclays 1-3 Year Treasury | SHY | |
iShares Barclays 3-7 Year Treasury | IEI | |
iShares Barclays 7-10 Year Treasury | IEF | |
iShares Barclays 10-20 Year Treasury | TLH | |
iShares Barclays 20+ Year Treasury | TLT | |
iShares Barclays TIPS | TIP | |
iShares Barclays Agency | AGZ | |
| iShares U.S. Credit Bond Funds | ||
iShares Barclays Credit | CFT | |
iShares Barclays 1-3 Year Credit | CSJ | |
iShares Barclays Intermediate Credit | CIU | |
iShares iBoxx $ Investment Grade Corporate | LQD | |
iShares iBoxx $ High Yield Corporate | HYG | |
| iShares U.S. Securitized Bond Funds | ||
iShares Barclays MBS | MBB | |
iSHARES FAMILYOF FUNDS | 101 |
Table of Contents
The iShares® Family of Funds (Continued)
Trading Symbol | ||
| iShares AMT-Free Municipal Bond Funds | ||
iShares S&P National AMT-Free Municipal | MUB | |
iShares S&P Short Term National AMT-Free Municipal | SUB | |
iShares S&P California AMT-Free Municipal | CMF | |
iShares S&P New York AMT-Free Municipal | NYF |
Trading Symbol | ||
| iShares International Bond Funds | ||
iShares JPMorgan USD Emerging Markets | EMB | |
iShares S&P/Citigroup International Treasury | IGOV | |
iShares S&P/Citigroup 1-3 Year International Treasury | ISHG |
iShares® is a registered trademark of Barclays Global Investors, N.A. (“BGI”). The iShares Funds are not sponsored, endorsed, issued, sold or promoted by Cohen & Steers Capital Management, Inc., Dow Jones & Company, Inc., European Public Real Estate Association (“EPRA®”), FTSE International Limited (“FTSE”), FTSE/Xinhua Index Limited (“FXI”), iBoxx®, J.P. Morgan Securities Inc., MSCI Inc., Morningstar Inc., The NASDAQ OMX Group, Inc., National Association of Real Estate Investment Trusts (“NAREIT”), New York Stock Exchange, Inc., Frank Russell Company or Standard & Poor’s, nor are they sponsored or endorsed by Barclays Capital. None of these companies make any representation regarding the advisability of investing in the iShares Funds. Neither SEI nor BGI, nor any of their affiliates, are affiliated with the companies listed above except Barclays Capital, which is an affiliate of BGI. FXI does not make any warranty regarding the FTSE/Xinhua Index. All rights in the FTSE/Xinhua Index vest in FXI. Neither FTSE nor NAREIT makes any warranty regarding the FTSE NAREIT Real Estate 50/Residential/Retail/Mortgage REITs or Industrial/Office Index; all rights vest in NAREIT. Neither FTSE nor NAREIT makes any warranty regarding the FTSE EPRA/NAREIT Global Real Estate ex-US/North America/Europe/Asia Index; all rights vest in FTSE, NAREIT, and EPRA. All rights in the FTSE Developed Small Cap ex-North America Index vest in FTSE. “FTSE” is a trade- and servicemark of London Stock Exchange and The Financial Times Limited; “Xinhua” is a trade- and servicemark of Xinhua Financial Network Limited. “NAREIT®” is a trademark of NAREIT; “EPRA®” is a trademark of EPRA.
An investment in the Fund(s) is not a deposit of a bank and it is not insured or guaranteed by the Federal Deposit Insurance Corporation or any other government agency.
This advertising section does not constitute part of the 2009 Annual Report.
iS-1437-1009
| 102 | 2009 iSHARES ANNUAL REPORTTO SHAREHOLDERS |
Table of Contents
For more information: WWW.iSHARES.COM 1-800-iShares (1-800-474-2737)
The iShares Funds are distributed by SEI Investments Distribution Co. (SEI). Barclays Global Fund Advisors (BGFA) serves as an advisor to the iShares Funds. BGFA is a subsidiary of Barclays Global Investors, N.A. (BGI), neither of which is affiliated with SEI.
The iShares Funds are not sponsored, endorsed, issued, sold or promoted by MSCI Inc., nor does this company make any representation regarding the advisability of investing in the iShares Funds. Neither SEI nor BGI, nor any of their affiliates, are affiliated with the company listed above.
©2009 Barclays Global Investors. All rights reserved. iShares® is a registered trademark of Barclays Global Investors, N.A. All other trademarks, servicemarks or registered trademarks are the property of their respective owners.
Investing involves risk, including possible loss of principal.
A description of the policies that the Funds use to determine how to vote proxies relating to portfolio securities and information about how the Funds voted proxies relating to portfolio securities during the most recent twelve-month period ended June 30 is available without charge, upon request, by calling toll-free 1-800-474-2737; on the Funds’ website at www.iShares.com; and on the U.S. Securities and Exchange Commission (SEC) website at www.sec.gov.
The Funds file their complete schedules of portfolio holdings with the SEC for the first and third quarters of each fiscal year on Form N-Q. The Funds’ Forms N-Q are available on the SEC’s website or may be reviewed and copied at the SEC’s Public Reference Room in Washington, D.C. Information on the operation of the Public Reference Room may be obtained by calling 1-800-SEC-0330. The Funds also disclose their complete schedules of portfolio holdings on a monthly basis on the Funds’ website.
Certain financial information required by regulations or listing exchange rules in jurisdictions outside the U.S. in which iShares Funds are cross-listed may be publicly filed in those jurisdictions. This information is available upon request by calling 1-800-474-2737.
This report is intended for the Funds’ shareholders. It may not be distributed to prospective investors unless it is preceded or accompanied by the current prospectus.
BGI-AR-84-0809 iShares® LET’S BUILD A BETTER INVESTMENT WORLD®. BARCLAYS GLOBAL INVESTORS
Table of Contents
2009 ANNUAL REPORT TO SHAREHOLDERS
ISHARES® MSCI SERIES
AUGUST 31, 2009
Would you prefer to receive materials like this electronically? See inside cover for details.
iShares MSCI Japan Index Fund
Table of Contents

Table of Contents
| 1 | ||
| 4 | ||
| 5 | ||
| 12 | ||
| 15 | ||
| 16 | ||
| 23 | ||
| 24 | ||
Board Review and Approval of Current Investment Advisory Contract (Unaudited) | 25 | |
Board Review and Approval of New Investment Advisory Agreements (Unaudited) | 28 | |
| 34 | ||
| 35 | ||
| 40 |
Table of Contents
Management’s Discussion of Fund Performance
iSHARES® MSCI JAPAN INDEX FUND
(TICKER: EWJ)
INVESTMENT OBJECTIVE
The iShares MSCI Japan Index Fund (the “Fund”) seeks to provide investment results that correspond generally to the price and yield performance, before fees and expenses, of publicly traded securities in the aggregate in the Japanese market, as measured by the MSCI Japan IndexSM (the “Index”). The Fund invests in a representative sample of securities included in the Index that collectively has an investment profile similar to the Index. Due to the use of representative sampling, the Fund may or may not hold all of the securities that are included in the Index. For the 12-month period ended August 31, 2009 (the “reporting period”), the total return for the Fund was (10.68)%, while the total return for the Index was (10.17)%.
MARKET OVERVIEW AND DISCUSSION OF PERFORMANCE
Japan’s economy was among the weakest in Asia, as the country experienced high unemployment, lagging business investment and deflation fears. Accordingly, the broad Japanese equity market performed relatively poorly compared to its Asian counterparts during the reporting period. In particular, large capitalization stocks significantly lagged small capitalization stocks.
Although Japan’s gross domestic product (“GDP”) rose 3.7% in the second quarter of 2009 compared to the year ago quarter, it declined a record 13.5% during the fourth quarter of 2008 and 14.2% in the first quarter of 2009. Even though GDP has shown signs of stabilizing, other economic statistics did not rebound.
Business investment contracted at a 4.8% annual rate in the second quarter of 2009. Core machinery orders dropped 9.3% in July, hitting the lowest level since recordkeeping began in April 1987. According to the Ministry of Internal Affairs, unemployment reached 5.7% in July, a post-World War II record. Household spending decreased 2% compared to the same month a year ago. Deflation was also a major concern, as Japan’s wholesale prices fell 8.5% in August compared to a year ago.
One of Japan’s most important economic activities is exporting, particularly to the rest of Asia as well as to the U.S. However, Japan’s exports dropped about 50% in the first half of 2009. Trouble continued into the second half of the year, as exports shrank for the 10th straight month in July, down 38% year over year, while imports posted the second-largest contraction since records began in 1986, dropping by 41%. At the end of the period the country’s public debt stood at about 170% of GDP, the worst ratio in the industrialized world.
In the midst of this economic environment, there was a major shift in the political environment during the reporting period. Japan elected a more liberal new government during the reporting period, one that promised increased social benefits and favored policies that were seen as disadvantageous to large corporations. The Democratic Party of Japan was elected into power, beating the Liberal Democratic Party that had ruled Japan since World War II. Yukio Hatoyama, the new Japanese Prime Minister, has promised to reverse Japan’s weak economy, blaming the government bureaucracy for the country’s woes. Meanwhile, the global economic environment began to improve at the end of the reporting period, which was a positive development for a country so dependent on exports.
The ten largest holdings of the Fund represented approximately 21% of Fund net assets as of August 31, 2009. Performance for all ten holdings was negative for the reporting period. Toyota Motor Corp., Honda Motor Co. Ltd. and The Tokyo Electric Power Co. Inc. posted the least negative returns. Shares of Mizuho Financial Group Inc. and Nintendo Co. Ltd. declined the most in value.
| MANAGEMENT’S DISCUSSIONOF FUND PERFORMANCE | 1 |
Table of Contents
Management’s Discussion of Fund Performance (Continued)
iSHARES® MSCI JAPAN INDEX FUND
Performance as of August 31, 2009
| Average Annual Total Returns | ||||||||||||||||
| Year Ended 8/31/09 | Five Years Ended 8/31/09 | Ten Years Ended 8/31/09 | ||||||||||||||
| NAV | MARKET | INDEX | NAV | MARKET | INDEX | NAV | MARKET | INDEX | ||||||||
| (10.68)% | (9.45)% | (10.17)% | 1.59% | 1.37% | 2.11% | (1.70)% | (1.83)% | (1.26)% | ||||||||
| Cumulative Total Returns | ||||||||||||||||
| Year Ended 8/31/09 | Five Years Ended 8/31/09 | Ten Years Ended 8/31/09 | ||||||||||||||
| NAV | MARKET | INDEX | NAV | MARKET | INDEX | NAV | MARKET | INDEX | ||||||||
| (10.68)% | (9.45)% | (10.17)% | 8.22% | 7.03% | 11.00% | (15.77)% | (16.87)% | (11.91)% | ||||||||
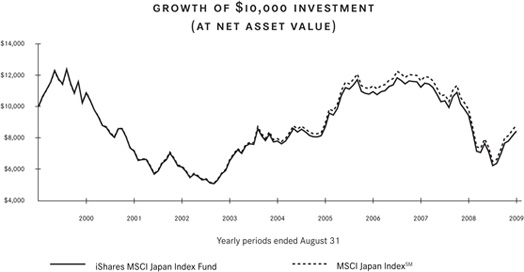
“Average Annual Total Returns” represent the average annual change in value of an investment over the period(s) indicated. “Cumulative Total Returns” represent the total change in value of an investment over the period(s) indicated.
The Fund’s per share net asset value or “NAV” is the value of one share of the Fund as calculated in accordance with the standard formula for valuing mutual fund shares. The NAV return is based on the NAV of the Fund and the market return is based on the market price per share of the Fund. The price used to calculate market return (“Market Price”) is determined by using the midpoint between the highest bid and the lowest offer on the primary stock exchange on which the shares of the Fund are listed for trading, as of the time that the Fund’s NAV is calculated. Market and NAV returns assume that dividends and capital gain distributions have been reinvested in the Fund at Market Price and NAV, respectively.
An index is a statistical composite that tracks a specified financial market or sector. Unlike the Fund, an index does not actually hold a portfolio of securities and therefore does not incur the expenses incurred by the Fund. These expenses negatively impact the performance of the Fund. Also, market returns do not include brokerage commissions that may be payable on secondary market transactions. If brokerage commissions were included, market returns would be lower. The performance shown in the table(s) and chart(s) above assumes reinvestment of all dividends and capital gain distributions and does not reflect the deduction of taxes that a shareholder would pay on fund distributions or the redemption or sale of fund shares. The investment return and principal value of shares of the Fund will vary with changes in market conditions. Shares of the Fund may be worth more or less than their original cost when they are redeemed or sold in the market. The Fund’s past performance is no guarantee of future results.
| 2 | 2009 iSHARES ANNUAL REPORTTO SHAREHOLDERS |
Table of Contents
Management’s Discussion of Fund Performance (Continued)
iSHARES® MSCI JAPAN INDEX FUND
PORTFOLIO ALLOCATION As of 8/31/09 | |||
| Sector | Percentage of Net Assets | ||
Consumer Cyclical | 26.08 | % | |
Industrial | 21.54 | ||
Financial | 17.29 | ||
Consumer Non-Cyclical | 10.62 | ||
Basic Materials | 7.26 | ||
Utilities | 5.83 | ||
Communications | 5.32 | ||
Technology | 4.65 | ||
Energy | 1.29 | ||
Short-Term and Other Net Assets | 0.12 | ||
TOTAL | 100.00 | % | |
TEN LARGEST FUND HOLDINGS As of 8/31/09 | |||
| Security | Percentage of Net Assets | ||
Toyota Motor Corp. | 5.46 | % | |
Mitsubishi UFJ Financial Group Inc. | 2.78 | ||
Honda Motor Co. Ltd. | 2.42 | ||
Canon Inc. | 1.88 | ||
Sumitomo Mitsui Financial Group Inc. | 1.83 | ||
Tokyo Electric Power Co. Inc. (The) | 1.49 | ||
Panasonic Corp. | 1.41 | ||
Mizuho Financial Group Inc. | 1.38 | ||
Takeda Pharmaceutical Co. Ltd. | 1.38 | ||
Nintendo Co. Ltd. | 1.32 | ||
TOTAL | 21.35 | % | |
| MANAGEMENT’S DISCUSSIONOF FUND PERFORMANCE | 3 |
Table of Contents
Shareholder Expenses (Unaudited)
iSHARES® MSCI JAPAN INDEX FUND
As a shareholder of the Fund, you incur two types of costs: (1) transaction costs, including brokerage commissions on purchases and sales of Fund shares and (2) ongoing costs, including management fees and other Fund expenses. The following Example is intended to help you understand your ongoing costs (in dollars and cents) of investing in the Fund and to compare these costs with the ongoing costs of investing in other Funds.
The Example is based on an investment of $1,000 invested at the beginning of the period and held for the entire period from March 1, 2009 to August 31, 2009.
ACTUAL EXPENSES
The first line in the table below provides information about actual account values and actual expenses. You may use the information in this line, together with the amount you invested, to estimate the expenses that you paid over the period. Simply divide your account value by $1,000 (for example, an $8,600 account value divided by $1,000 = 8.6), then multiply the result by the number in the first line under the heading entitled “Expenses Paid During Period” to estimate the expenses you paid on your account during this period.
HYPOTHETICAL EXAMPLE FOR COMPARISON PURPOSES
The second line in the table below provides information about hypothetical account values and hypothetical expenses based on the Fund’s actual expense ratio and an assumed rate of return of 5% per year before expenses, which is not the Fund’s actual return. The hypothetical account values and expenses may not be used to estimate the actual ending account balance or expenses you paid for the period. You may use this information to compare the ongoing costs of investing in your Fund and other Funds. To do so, compare this 5% hypothetical example with the 5% hypothetical examples that appear in the shareholder reports of the other Funds.
Please note that the expenses shown in the table are meant to highlight your ongoing costs only and do not reflect any transactional costs, such as brokerage commissions paid on purchases and sales of Fund shares. Therefore, the second line in the table is useful in comparing ongoing costs only and will not help you determine the relative total costs of owning different Funds. In addition, if these transactional costs were included, your costs would have been higher.
| Beginning Account Value (3/1/09) | Ending Account Value (8/31/09) | Annualized Expense Ratio | Expenses Paid During Perioda (3/1/09 to 8/31/09) | ||||||
Actual | $1,000.00 | $1,356.40 | 0.56 | % | $3.33 | ||||
Hypothetical (5% return before expenses) | 1,000.00 | 1,022.40 | 0.56 | 2.85 |
| a | Expenses are calculated using the Fund’s annualized expense ratio (as disclosed in the table), multiplied by the average account value for the period, multiplied by the number of days in the period (184 days) and divided by the number of days in the year (365 days). |
| 4 | 2009 iSHARES ANNUAL REPORTTO SHAREHOLDERS |
Table of Contents
iSHARES® MSCI JAPAN INDEX FUND
August 31, 2009
| Security | Shares | Value | |||
COMMON STOCKS – 99.88% | |||||
ADVERTISING – 0.21% | |||||
Dentsu Inc. | 401,200 | $ | 9,276,926 | ||
Hakuhodo DY Holdings Inc. | 70,210 | 3,912,960 | |||
| 13,189,886 | |||||
AGRICULTURE – 0.62% | |||||
Japan Tobacco Inc. | 13,039 | 37,937,003 | |||
| 37,937,003 | |||||
AIRLINES – 0.19% | |||||
All Nippon Airways Co. Ltd. | 2,008,000 | 6,212,430 | |||
Japan Airlines Corp.a,b | 3,009,000 | 5,416,946 | |||
| 11,629,376 | |||||
APPAREL – 0.28% | |||||
ASICS Corp. | 1,003,000 | 9,893,225 | |||
Onward Holdings Co. Ltd. | 1,003,000 | 7,341,530 | |||
| 17,234,755 | |||||
AUTO MANUFACTURERS – 9.82% | |||||
Fuji Heavy Industries Ltd. | 2,006,000 | 8,693,063 | |||
Hino Motors Ltd. | 1,003,000 | 4,162,723 | |||
Honda Motor Co. Ltd. | 4,714,100 | 149,149,824 | |||
Isuzu Motors Ltd. | 3,009,000 | 7,006,349 | |||
Mazda Motor Corp. | 3,009,000 | 8,368,695 | |||
Mitsubishi Motors Corp.a,b | 10,030,000 | 18,272,732 | |||
Nissan Motor Co. Ltd. | 7,021,000 | 49,195,817 | |||
Suzuki Motor Corp. | 1,003,000 | 24,003,234 | |||
Toyota Motor Corp. | 7,823,900 | 336,520,894 | |||
| 605,373,331 | |||||
AUTO PARTS & EQUIPMENT – 2.14% | |||||
Aisin Seiki Co. Ltd. | 501,700 | 12,601,315 | |||
Bridgestone Corp. | 1,705,100 | 31,265,834 | |||
Denso Corp. | 1,404,200 | 40,946,057 | |||
JTEKT Corp. | 401,200 | 5,189,888 | |||
NGK Spark Plug Co. Ltd. | 428,000 | 5,402,770 | |||
NHK Spring Co. Ltd. | 1,003,000 | 7,417,215 | |||
NOK Corp. | 300,900 | 4,112,987 | |||
Sumitomo Rubber Industries Inc. | 401,200 | 3,862,142 | |||
Toyoda Gosei Co. Ltd. | 200,600 | 5,817,000 | |||
Toyota Boshoku Corp. | 100,300 | 1,776,456 | |||
Toyota Industries Corp. | 501,500 | 13,569,396 | |||
| 131,961,060 | |||||
| Security | Shares | Value | |||
BANKS – 9.56% | |||||
Aozora Bank Ltd.a | 1,003,000 | $ | 1,492,093 | ||
Bank of Kyoto Ltd. (The) | 1,003,000 | 9,774,290 | |||
Bank of Yokohama Ltd. (The) | 4,012,000 | 22,705,762 | |||
Chiba Bank Ltd. (The) | 2,006,000 | 12,671,978 | |||
Chuo Mitsui Trust Holdings Inc. | 3,009,000 | 12,715,227 | |||
Fukuoka Financial Group Inc. | 2,012,000 | 9,066,092 | |||
Gunma Bank Ltd. | 1,003,000 | 5,687,253 | |||
Hachijuni Bank Ltd. (The) | 1,003,000 | 5,773,751 | |||
Hiroshima Bank Ltd. (The) | 1,003,000 | 4,292,470 | |||
Hokuhoku Financial Group Inc. | 4,017,000 | 10,046,289 | |||
Iyo Bank Ltd. (The) | 1,003,000 | 9,871,600 | |||
Joyo Bank Ltd. (The) | 2,006,000 | 10,293,279 | |||
Mitsubishi UFJ Financial Group Inc. | 26,780,180 | 171,480,913 | |||
Mizuho Financial Group Inc. | 34,703,800 | 85,295,816 | |||
Mizuho Trust & Banking Co. Ltd.a | 5,015,000 | 6,487,361 | |||
Nishi-Nippon City Bank Ltd. (The) | 2,006,000 | 5,362,884 | |||
Resona Holdings Inc.b | 1,504,500 | 20,581,151 | |||
Sapporo Hokuyo Holdings Inc.a | 1,006,000 | 3,665,477 | |||
Seven Bank Ltd. | 1,003 | 2,552,776 | |||
77 Bank Ltd. (The) | 1,003,000 | 6,076,495 | |||
Shinsei Bank Ltd.a | 3,009,000 | 5,125,015 | |||
Shizuoka Bank Ltd. (The) | 2,006,000 | 20,997,424 | |||
Sumitomo Mitsui Financial Group Inc.b | 2,607,800 | 112,728,702 | |||
Sumitomo Trust and Banking Co. Ltd. (The) | 4,012,000 | 24,608,721 | |||
Suruga Bank Ltd. | 1,003,000 | 9,860,788 | |||
| 589,213,607 | |||||
BEVERAGES – 0.98% | |||||
Asahi Breweries Ltd. | 1,003,000 | 17,494,249 | |||
Coca-Cola West Co. Ltd. | 200,600 | 3,907,554 | |||
ITO EN Ltd. | 200,600 | 3,691,308 | |||
Kirin Holdings Co. Ltd. | 2,006,000 | 29,474,241 | |||
Sapporo Holdings Ltd. | 1,003,000 | 5,752,126 | |||
| 60,319,478 | |||||
BUILDING MATERIALS – 1.48% | |||||
Asahi Glass Co. Ltd. | 3,009,000 | 26,273,810 | |||
Daikin Industries Ltd. | 709,100 | 25,072,473 | |||
| SCHEDULEOF INVESTMENTS | 5 |
Table of Contents
Schedule of Investments (Continued)
iSHARES® MSCI JAPAN INDEX FUND
August 31, 2009
| Security | Shares | Value | |||
JS Group Corp. | 702,100 | $ | 12,473,032 | ||
Nippon Sheet Glass Co. Ltd. | 2,006,000 | 7,049,598 | |||
Panasonic Electric Works | 1,003,000 | 12,055,679 | |||
Rinnai Corp. | 100,300 | 4,995,268 | |||
Taiheiyo Cement Corp. | 2,006,000 | 3,481,550 | |||
| 91,401,410 | |||||
CHEMICALS – 3.55% | |||||
Asahi Kasei Corp. | 3,009,000 | 14,531,687 | |||
Daicel Chemical Industries Ltd. | 1,003,000 | 6,508,985 | |||
Denki Kagaku Kogyo Kabushiki Kaisha | 2,006,000 | 8,520,067 | |||
DIC Corp. | 2,006,000 | 3,135,558 | |||
Hitachi Chemical Co. Ltd. | 200,600 | 4,154,073 | |||
JSR Corp. | 501,500 | 8,849,841 | |||
Kaneka Corp. | 1,003,000 | 7,406,403 | |||
Mitsubishi Chemical | 3,510,500 | 16,007,562 | |||
Mitsubishi Gas Chemical | 1,003,000 | 5,914,310 | |||
Mitsui Chemicals Inc. | 2,006,000 | 7,611,837 | |||
Nitto Denko Corp. | 501,500 | 15,245,297 | |||
Shin-Etsu Chemical Co. Ltd. | 1,103,300 | 65,414,219 | |||
Showa Denko K.K. | 3,009,000 | 6,519,798 | |||
Sumitomo Chemical Co. Ltd. | 4,012,000 | 19,289,085 | |||
Taiyo Nippon Sanso Corp. | 1,003,000 | 10,650,084 | |||
Tokuyama Corp. | 1,003,000 | 7,027,974 | |||
Tosoh Corp. | 1,003,000 | 2,919,312 | |||
Ube Industries Ltd. | 3,009,000 | 9,341,799 | |||
| 219,047,891 | |||||
COMMERCIAL SERVICES – 1.10% | |||||
Benesse Corp. | 200,600 | 9,882,412 | |||
Dai Nippon Printing Co. Ltd. | 2,006,000 | 29,387,743 | |||
Kamigumi Co. Ltd. | 1,003,000 | 8,509,254 | |||
Toppan Printing Co. Ltd. | 2,008,000 | 19,892,761 | |||
| 67,672,170 | |||||
COMPUTERS – 0.91% | |||||
Fujitsu Ltd. | 5,015,000 | 33,842,397 | |||
Itochu Techno-Solutions Corp. | 100,300 | 2,962,561 | |||
OBIC Co. Ltd. | 10,030 | 1,644,546 | |||
TDK Corp. | 300,900 | 17,548,310 | |||
| 55,997,814 | |||||
| Security | Shares | Value | |||
COSMETICS & PERSONAL CARE – 1.02% | |||||
Kao Corp. | 1,415,200 | $ | 36,003,579 | ||
Shiseido Co. Ltd. | 1,003,000 | 17,710,494 | |||
Uni-Charm Corp. | 100,300 | 9,017,431 | |||
| 62,731,504 | |||||
DISTRIBUTION & WHOLESALE – 4.02% | |||||
Canon Marketing Japan Inc. | 100,300 | 1,692,120 | |||
Hitachi High-Technologies Corp. | 100,300 | 2,025,138 | |||
ITOCHU Corp. | 4,012,000 | 28,544,386 | |||
Marubeni Corp. | 5,015,000 | 25,030,399 | |||
Mitsubishi Corp. | 3,811,400 | 77,448,273 | |||
Mitsui & Co. Ltd. | 4,914,700 | 64,211,895 | |||
Sojitz Corp. | 3,309,900 | 7,100,416 | |||
Sumitomo Corp. | 3,109,300 | 31,942,682 | |||
Toyota Tsusho Corp. | 601,900 | 9,804,031 | |||
| 247,799,340 | |||||
DIVERSIFIED FINANCIAL SERVICES – 2.24% | |||||
Acom Co. Ltd.b | 120,368 | 2,482,229 | |||
AEON Credit Service Co. Ltd. | 200,670 | 2,275,695 | |||
Credit Saison Co. Ltd. | 501,500 | 6,746,854 | |||
Daiwa Securities Group Inc. | 5,015,000 | 31,031,208 | |||
Mitsubishi UFJ Lease & Finance Co. Ltd. | 160,480 | 5,112,040 | |||
Mizhuo Securities Co. Ltd. | 1,003,000 | 3,784,294 | |||
Nomura Holdings Inc. | 7,021,000 | 62,289,473 | |||
ORIX Corp. | 290,870 | 22,419,237 | |||
Promise Co. Ltd.b | 200,600 | 1,972,158 | |||
| 138,113,188 | |||||
ELECTRIC – 4.96% | |||||
Chubu Electric Power Co. Inc. | 1,905,700 | 44,476,263 | |||
Chugoku Electric Power Co. Inc. (The) | 702,200 | 15,479,966 | |||
Electric Power Development Co. Ltd. | 401,200 | 12,217,862 | |||
Hokkaido Electric Power Co. Inc. | 501,500 | 10,374,371 | |||
Hokuriku Electric Power Co. | 501,500 | 12,190,832 | |||
Kansai Electric Power Co. Inc. (The) | 2,206,600 | 50,904,156 | |||
Kyushu Electric Power Co. Inc. | 1,103,300 | 24,441,131 | |||
Shikoku Electric Power Co. Inc. | 501,500 | 15,569,665 | |||
Tohoku Electric Power Co. Inc. | 1,303,900 | 28,322,735 | |||
| 6 | 2009 iSHARES ANNUAL REPORTTO SHAREHOLDERS |
Table of Contents
Schedule of Investments (Continued)
iSHARES® MSCI JAPAN INDEX FUND
August 31, 2009
| Security | Shares | Value | |||
Tokyo Electric Power Co. Inc. (The) | 3,510,500 | $ | 91,769,121 | ||
| 305,746,102 | |||||
ELECTRICAL COMPONENTS & | |||||
Brother Industries Ltd. | 601,800 | 6,059,195 | |||
Casio Computer Co. Ltd. | 601,800 | 5,974,859 | |||
Furukawa Electric Co. Ltd. (The) | 2,006,000 | 8,909,308 | |||
GS Yuasa Corp.b | 1,003,000 | 8,768,749 | |||
Hitachi Ltd. | 9,027,000 | 31,917,814 | |||
Mitsubishi Electric Corp. | 5,015,000 | 37,410,446 | |||
SANYO Electric Co. Ltd.a,b | 5,015,000 | 13,569,396 | |||
Sharp Corp. | 3,009,000 | 34,869,563 | |||
Stanley Electric Co. Ltd. | 402,400 | 8,137,793 | |||
Sumitomo Electric Industries Ltd. | 1,905,700 | 24,693,057 | |||
Toshiba Corp. | 11,033,000 | 56,850,903 | |||
Ushio Inc. | 300,900 | 5,562,912 | |||
| 242,723,995 | |||||
ELECTRONICS – 5.13% | |||||
Advantest Corp. | 401,200 | 10,033,784 | |||
Fanuc Ltd. | 501,500 | 41,032,556 | |||
Hirose Electric Co. Ltd. | 100,300 | 12,423,296 | |||
Hoya Pentax HD Corp. | 1,203,600 | 27,246,914 | |||
IBIDEN Co. Ltd. | 401,200 | 14,315,442 | |||
Keyence Corp. | 100,351 | 21,267,727 | |||
Kyocera Corp. | 501,500 | 41,897,537 | |||
Mabuchi Motor Co. Ltd. | 100,300 | 5,125,015 | |||
Minebea Co. Ltd. | 1,003,000 | 4,670,900 | |||
Mitsumi Electric Co. Ltd. | 200,600 | 4,670,900 | |||
Murata Manufacturing Co. Ltd. | 601,800 | 28,544,386 | |||
NEC Corp.a | 6,024,000 | 21,819,263 | |||
NGK Insulators Ltd. | 1,003,000 | 23,462,620 | |||
Nippon Electric Glass Co. Ltd. | 1,003,500 | 10,449,857 | |||
Omron Corp. | 601,800 | 10,295,441 | |||
Secom Co. Ltd. | 601,800 | 27,246,914 | |||
Yaskawa Electric Corp. | 1,003,000 | 7,265,844 | |||
Yokogawa Electric Corp. | 501,500 | 4,324,907 | |||
| 316,093,303 | |||||
ENGINEERING & CONSTRUCTION – 0.83% | |||||
JGC Corp. | 1,003,000 | 18,672,786 | |||
Kajima Corp. | 3,009,000 | 8,466,005 | |||
Obayashi Corp. | 2,006,000 | 9,060,680 | |||
| Security | Shares | Value | |||
Shimizu Corp. | 2,006,000 | $ | 8,303,821 | ||
Taisei Corp. | 3,009,000 | 6,617,108 | |||
| 51,120,400 | |||||
ENTERTAINMENT – 0.30% | |||||
Oriental Land Co. Ltd. | 200,600 | 13,601,833 | |||
Toho Co. Ltd. | 300,900 | 5,056,898 | |||
| 18,658,731 | |||||
ENVIRONMENTAL CONTROL – 0.16% | |||||
Kurita Water Industries Ltd. | 300,900 | 10,055,409 | |||
| 10,055,409 | |||||
FOOD – 1.22% | |||||
Ajinomoto Co. Inc. | 2,006,000 | 20,521,684 | |||
Kikkoman Corp. | 1,003,000 | 12,466,545 | |||
Meiji Holdings Co. Ltd.a | 200,628 | 8,218,471 | |||
Nippon Meat Packers Inc. | 1,003,000 | 12,174,613 | |||
Nisshin Seifun Group Inc. | 503,500 | 6,703,202 | |||
Nissin Foods Holdings Co. Ltd. | 301,700 | 9,984,574 | |||
Yakult Honsha Co. Ltd. | 200,600 | 4,973,643 | |||
| 75,042,732 | |||||
FOREST PRODUCTS & PAPER – 0.30% | |||||
Nippon Paper Group Inc. | 301,800 | 8,898,000 | |||
Oji Paper Co. Ltd. | 2,006,000 | 9,493,171 | |||
| 18,391,171 | |||||
GAS – 0.87% | |||||
Osaka Gas Co. Ltd. | 6,018,000 | 20,889,301 | |||
Toho Gas Co. Ltd. | 1,003,000 | 4,670,900 | |||
Tokyo Gas Co. Ltd. | 7,021,000 | 28,230,830 | |||
| 53,791,031 | |||||
HAND & MACHINE TOOLS – 0.99% | |||||
Fuji Electric Holdings Co. Ltd. | 1,003,000 | 1,924,584 | |||
Makita Corp. | 300,900 | 8,530,879 | |||
Nidec Corp. | 300,900 | 21,700,221 | |||
SMC Corp. | 200,600 | 23,462,621 | |||
THK Co. Ltd.b | 301,500 | 5,668,259 | |||
| 61,286,564 | |||||
HEALTH CARE - PRODUCTS – 0.43% | |||||
Terumo Corp. | 501,500 | 26,490,055 | |||
| 26,490,055 | |||||
HOME BUILDERS – 0.44% | |||||
Daiwa House Industry Co. Ltd. | 1,003,000 | 11,212,321 | |||
| SCHEDULEOF INVESTMENTS | 7 |
Table of Contents
Schedule of Investments (Continued)
iSHARES® MSCI JAPAN INDEX FUND
August 31, 2009
| Security | Shares | Value | |||
Sekisui Chemical Co. Ltd. | 1,003,000 | $ | 6,422,487 | ||
Sekisui House Ltd. | 1,003,000 | 9,666,167 | |||
| 27,300,975 | |||||
HOME FURNISHINGS – 2.73% | |||||
Panasonic Corp. | 5,416,215 | 86,995,746 | |||
Sony Corp. | 2,808,400 | 76,139,988 | |||
Yamaha Corp. | 401,200 | 5,168,264 | |||
| 168,303,998 | |||||
HOUSEWARES – 0.11% | |||||
TOTO Ltd. | 1,003,000 | 7,006,349 | |||
| 7,006,349 | |||||
INSURANCE – 2.50% | |||||
Aioi Insurance Co. Ltd. | 1,003,000 | 4,973,643 | |||
Mitsui Sumitomo Insurance Group Holdings Inc. | 1,203,600 | 34,058,643 | |||
Nipponkoa Insurance Co. Ltd. | 2,006,000 | 12,520,606 | |||
Sompo Japan Insurance Inc. | 2,006,000 | 13,731,580 | |||
Sony Financial Holdings Inc. | 2,006 | 6,111,094 | |||
T&D Holdings Inc. | 651,950 | 19,643,187 | |||
Tokio Marine Holdings Inc. | 2,106,300 | 62,894,960 | |||
| 153,933,713 | |||||
INTERNET – 1.78% | |||||
Dena Co. Ltd. | 1,003 | 3,185,294 | |||
Matsui Securities Co. Ltd. | 401,200 | 3,728,070 | |||
Rakuten Inc. | 19,179 | 11,619,251 | |||
SBI Holdings Inc. | 47,141 | 10,600,563 | |||
SoftBank Corp. | 2,106,300 | 47,341,513 | |||
Trend Micro Inc. | 501,500 | 19,786,450 | |||
Yahoo! Japan Corp. | 39,117 | 13,346,123 | |||
| 109,607,264 | |||||
IRON & STEEL – 2.62% | |||||
Daido Steel Co. Ltd. | 1,003,000 | 4,054,600 | |||
JFE Holdings Inc. | 1,404,250 | 49,197,569 | |||
Kobe Steel Ltd. | 7,021,000 | 13,017,970 | |||
Nippon Steel Corp. | 15,045,000 | 59,197,165 | |||
Nisshin Steel Co. Ltd. | 2,006,000 | 4,087,037 | |||
Sumitomo Metal Industries Ltd. | 10,030,000 | 25,192,583 | |||
Tokyo Steel Manufacturing Co. Ltd. | 301,500 | 3,981,432 | |||
Yamato Kogyo Co. Ltd. | 100,300 | 3,005,810 | |||
| 161,734,166 | |||||
| Security | Shares | Value | |||
LEISURE TIME – 0.65% | |||||
Namco Bandai Holdings Inc. | 501,598 | $ | 5,342,304 | ||
Sankyo Co. Ltd. | 200,600 | 12,671,978 | |||
Sega Sammy Holdings Inc. | 501,500 | 6,563,046 | |||
Shimano Inc. | 200,600 | 8,584,940 | |||
Yamaha Motor Co. Ltd. | 601,800 | 7,116,635 | |||
| 40,278,903 | |||||
MACHINERY – 0.30% | |||||
Hitachi Construction Machinery Co. Ltd. | 303,900 | 6,188,402 | |||
Japan Steel Works Ltd. (The) | 1,003,000 | 12,498,981 | |||
| 18,687,383 | |||||
MACHINERY - CONSTRUCTION & MINING – 0.74% | |||||
Komatsu Ltd. | 2,507,500 | 45,357,463 | |||
| 45,357,463 | |||||
MACHINERY - DIVERSIFIED – 0.68% | |||||
Amada Co. Ltd. | 1,003,000 | 7,060,411 | |||
Kubota Corp. | 3,009,000 | 24,943,901 | |||
Sumitomo Heavy Industries Ltd. | 2,006,000 | 10,185,156 | |||
| 42,189,468 | |||||
MANUFACTURING – 2.31% | |||||
FUJIFILM Holdings Corp. | 1,404,200 | 42,005,660 | |||
IHI Corp.a | 4,012,000 | 8,217,324 | |||
Kawasaki Heavy Industries Ltd. | 4,012,000 | 10,682,520 | |||
Konica Minolta Holdings Inc. | 1,504,500 | 14,272,193 | |||
Mitsubishi Heavy Industries Ltd. | 8,024,000 | 33,301,784 | |||
Nikon Corp. | 1,003,000 | 17,310,440 | |||
Olympus Corp. | 601,800 | 16,413,022 | |||
| 142,202,943 | |||||
MEDIA – 0.16% | |||||
Fuji Media Holdings Inc. | 1,655 | 2,608,322 | |||
Jupiter Telecommunications Co. Ltd. | 6,018 | 5,254,762 | |||
Tokyo Broadcasting System Holdings Inc. | 100,300 | 1,752,669 | |||
| 9,615,753 | |||||
METAL FABRICATE & HARDWARE – 0.22% | |||||
Maruichi Steel Tube Ltd. | 100,300 | 2,099,742 | |||
NSK Ltd. | 1,003,000 | 6,584,671 | |||
NTN Corp. | 1,003,000 | 4,692,524 | |||
| 13,376,937 | |||||
| 8 | 2009 iSHARES ANNUAL REPORTTO SHAREHOLDERS |
Table of Contents
Schedule of Investments (Continued)
iSHARES® MSCI JAPAN INDEX FUND
August 31, 2009
| Security | Shares | Value | |||
MINING – 0.79% | |||||
Dowa Holdings Co. Ltd. | 1,003,000 | $ | 5,676,440 | ||
Mitsubishi Materials Corp. | 3,009,000 | 9,212,052 | |||
Mitsui Mining & Smelting | 2,006,000 | 5,752,126 | |||
OSAKA Titanium technologies Co. Ltd.b | 100,300 | 3,405,864 | |||
Sumitomo Metal Mining Co. Ltd. | 1,577,000 | 24,394,923 | |||
| 48,441,405 | |||||
OFFICE & BUSINESS EQUIPMENT – 2.45% | |||||
Canon Inc. | 3,009,050 | 115,801,310 | |||
Ricoh Co. Ltd. | 2,006,000 | 28,998,502 | |||
Seiko Epson Corp. | 401,200 | 5,955,397 | |||
| 150,755,209 | |||||
OIL & GAS – 1.29% | |||||
Cosmo Oil Co. Ltd. | 2,006,000 | 6,184,617 | |||
Idemitsu Kosan Co. Ltd. | 100,300 | 8,314,634 | |||
INPEX Corp. | 2,006 | 16,434,647 | |||
Japan Petroleum Exploration Co. Ltd. | 100,300 | 5,254,762 | |||
Nippon Mining Holdings Inc. | 2,507,500 | 12,542,230 | |||
Nippon Oil Corp. | 3,009,500 | 17,259,247 | |||
Showa Shell Sekiyu K.K. | 401,200 | 4,199,485 | |||
TonenGeneral Sekiyu K.K. | 1,003,000 | 9,622,918 | |||
| 79,812,540 | |||||
PACKAGING & CONTAINERS – 0.14% | |||||
Toyo Seikan Kaisha Ltd. | 401,200 | 8,398,969 | |||
| 8,398,969 | |||||
PHARMACEUTICALS – 5.25% | |||||
Alfresa Holdings Corp. | 100,300 | 4,551,965 | |||
Astellas Pharma Inc. | 1,303,930 | 52,429,892 | |||
Chugai Pharmaceutical Co. Ltd. | 601,800 | 12,325,985 | |||
Daiichi Sankyo Co. Ltd. | 1,905,769 | 40,779,944 | |||
Dainippon Pharmaceutical Co. Ltd. | 300,900 | 3,409,108 | |||
Eisai Co. Ltd. | 702,100 | 25,808,883 | |||
Hisamitsu Pharmaceutical Co. Inc. | 100,300 | 3,881,604 | |||
Kyowa Hakko Kirin Co. Ltd. | 1,003,000 | 12,217,863 | |||
Mediceo Paltac Holdings Co. Ltd. | 401,200 | 5,756,451 | |||
| Security | Shares | Value | |||
Mitsubishi Tanabe Pharma Corp. | 1,003,000 | $ | 13,201,779 | ||
Ono Pharmaceutical Co. Ltd. | 200,600 | 9,882,413 | |||
Santen Pharmaceutical Co. Ltd. | 200,600 | 6,768,479 | |||
Shionogi & Co. Ltd. | 1,003,000 | 24,651,970 | |||
Suzuken Co. Ltd. | 200,600 | 6,638,732 | |||
Taisho Pharmaceutical Co. Ltd. | 654,000 | 12,880,483 | |||
Takeda Pharmaceutical Co. Ltd. | 2,106,300 | 85,146,607 | |||
Tsumura & Co. | 101,100 | 3,596,507 | |||
| 323,928,665 | |||||
REAL ESTATE – 2.42% | |||||
AEON Mall Co. Ltd. | 200,600 | 4,746,585 | |||
Daito Trust Construction Co. Ltd. | 200,600 | 9,601,294 | |||
Leopalace21 Corp. | 401,200 | 3,641,572 | |||
Mitsubishi Estate Co. Ltd. | 3,009,000 | 50,049,987 | |||
Mitsui Fudosan Co. Ltd. | 2,112,000 | 40,024,751 | |||
Nomura Real Estate Holdings Inc. | 300,900 | 5,287,199 | |||
NTT Urban Development Corp. | 4,012 | 3,978,914 | |||
Sumitomo Realty & Development Co. Ltd. | 1,003,000 | 21,181,232 | |||
Tokyo Tatemono Co. Ltd. | 1,003,000 | 5,946,747 | |||
Tokyu Land Corp. | 1,003,000 | 4,714,149 | |||
| 149,172,430 | |||||
REAL ESTATE INVESTMENT TRUSTS – 0.52% | |||||
Japan Prime Realty Investment Corp. | 1,003 | 2,405,729 | |||
Japan Real Estate Investment Corp. | 1,003 | 8,195,699 | |||
Japan Retail Fund Investment Corp. | 1,003 | 5,362,885 | |||
Nippon Building Fund Inc. | 1,003 | 8,866,059 | |||
Nomura Real Estate Office Fund Inc. | 1,003 | 6,973,913 | |||
| 31,804,285 | |||||
RETAIL – 3.04% | |||||
ABC-Mart Inc. | 100,300 | 2,919,312 | |||
AEON Co. Ltd. | 1,705,100 | 18,141,904 | |||
Citizen Watch Co. Ltd. | 702,100 | 4,230,840 | |||
FamilyMart Co. Ltd. | 200,600 | 6,227,866 | |||
Fast Retailing Co. Ltd. | 100,300 | 12,055,678 | |||
| SCHEDULEOF INVESTMENTS | 9 |
Table of Contents
Schedule of Investments (Continued)
iSHARES® MSCI JAPAN INDEX FUND
August 31, 2009
| Security | Shares | Value | |||
Isetan Mitsukoshi Holdings Ltd.b | 902,760 | $ | 9,994,444 | ||
J. Front Retailing Co. Ltd. | 2,006,000 | 11,396,130 | |||
Lawson Inc. | 200,600 | 8,714,688 | |||
Marui Group Co. Ltd. | 601,800 | 4,190,835 | |||
McDonald’s Holdings Co. (Japan) Ltd. | 200,600 | 3,762,669 | |||
Nitori Co. Ltd. | 100,300 | 7,784,833 | |||
Seven & I Holdings Co. Ltd. | 2,206,680 | 53,522,664 | |||
Shimamura Co. Ltd. | 100,300 | 9,006,619 | |||
Takashimaya Co. Ltd. | 1,003,000 | 8,433,568 | |||
UNY Co. Ltd. | 702,100 | 5,964,047 | |||
USS Co. Ltd. | 80,240 | 5,068,791 | |||
Yamada Denki Co. Ltd. | 230,690 | 15,766,449 | |||
| 187,181,337 | |||||
SEMICONDUCTORS – 1.01% | |||||
Elpida Memory Inc.a,b | 300,900 | 4,719,555 | |||
Rohm Co. Ltd. | 301,300 | 20,364,911 | |||
Shinko Electric Industries Co. Ltd. | 200,600 | 3,754,019 | |||
Sumco Corp. | 300,900 | 6,162,993 | |||
Tokyo Electron Ltd. | 501,552 | 27,357,873 | |||
| 62,359,351 | |||||
SHIPBUILDING – 0.09% | |||||
Mitsui Engineering & Shipbuilding Co. Ltd. | 2,006,000 | 5,471,007 | |||
| 5,471,007 | |||||
SOFTWARE – 0.28% | |||||
Konami Corp. | 300,900 | 5,945,666 | |||
Nomura Research Institute Ltd. | 200,600 | 4,800,647 | |||
Oracle Corp. | 100,300 | 4,173,535 | |||
Square Enix Holdings Co. Ltd. | 100,300 | 2,589,538 | |||
| 17,509,386 | |||||
STORAGE & WAREHOUSING – 0.07% | |||||
Mitsubishi Logistics Corp. | 319,000 | 4,209,087 | |||
| 4,209,087 | |||||
TELECOMMUNICATIONS – 3.17% | |||||
Hikari Tsushin Inc. | 100,300 | 2,173,266 | |||
KDDI Corp. | 8,024 | 45,757,516 | |||
| Security | Shares | Value | |||
Nippon Telegraph and Telephone Corp. | 1,509,000 | $ | 67,670,350 | ||
NTT Data Corp. | 3,009 | 10,282,467 | |||
NTT DoCoMo Inc. | 45,135 | 69,722,907 | |||
| 195,606,506 | |||||
TEXTILES – 0.97% | |||||
Kuraray Co. Ltd. | 1,003,000 | 10,974,452 | |||
Mitsubishi Rayon Co. Ltd. | 1,003,000 | 3,319,366 | |||
Nisshinbo Holdings Inc. | 1,003,000 | 11,752,935 | |||
Teijin Ltd. | 3,009,000 | 9,958,098 | |||
Toray Industries Inc.b | 4,012,000 | 23,527,494 | |||
| 59,532,345 | |||||
TOYS, GAMES & HOBBIES – 1.32% | |||||
Nintendo Co. Ltd. | 300,900 | 81,610,995 | |||
| 81,610,995 | |||||
TRANSPORTATION – 4.53% | |||||
Central Japan Railway Co. | 5,021 | 34,045,265 | |||
East Japan Railway Co. | 1,006,000 | 65,935,213 | |||
Hankyu Hanshin Holdings Inc. | 3,014,800 | 14,494,699 | |||
Kawasaki Kisen Kaisha Ltd. | 2,006,000 | 8,844,435 | |||
Keihin Electric Express Railway Co. Ltd. | 1,007,000 | 8,369,503 | |||
Keio Corp. | 2,006,000 | 13,601,833 | |||
Kintetsu Corp.b | 5,019,000 | 21,804,096 | |||
Mitsui O.S.K. Lines Ltd. | 3,009,000 | 19,299,897 | |||
Nippon Express Co. Ltd. | 2,006,000 | 8,995,807 | |||
Nippon Yusen Kabushiki Kaisha | 3,009,000 | 13,072,031 | |||
Odakyu Electric Railway Co. Ltd. | 1,003,000 | 9,039,056 | |||
Tobu Railway Co. Ltd. | 2,006,000 | 12,650,353 | |||
Tokyu Corp. | 3,009,000 | 14,823,619 | |||
West Japan Railway Co. | 5,015 | 17,407,751 | |||
Yamato Holdings Co. Ltd. | 1,003,000 | 16,650,892 | |||
| 279,034,450 | |||||
VENTURE CAPITAL – 0.05% | |||||
JAFCO Co. Ltd. | 100,300 | 3,395,052 | |||
| 3,395,052 | |||||
TOTAL COMMON STOCKS | |||||
(Cost: $7,346,859,712) | 6,156,839,640 | ||||
| 10 | 2009 iSHARES ANNUAL REPORTTO SHAREHOLDERS |
Table of Contents
Schedule of Investments (Continued)
iSHARES® MSCI JAPAN INDEX FUND
August 31, 2009
| Security | Shares | Value | ||||
SHORT-TERM INVESTMENTS – 2.46% |
| |||||
MONEY MARKET FUNDS – 2.46% |
| |||||
Barclays Global Investors Funds | 131,379,800 | $ | 131,379,800 | |||
Barclays Global Investors Funds | 18,533,190 | 18,533,190 | ||||
Barclays Global Investors Funds | 1,585,728 | 1,585,728 | ||||
| 151,498,718 | ||||||
TOTAL SHORT-TERM INVESTMENTS |
| |||||
(Cost: $151,498,718) | 151,498,718 | |||||
TOTAL INVESTMENTS IN |
| |||||
(Cost: $7,498,358,430) | 6,308,338,358 | |||||
Other Assets, Less Liabilities – (2.34)% | (144,168,117 | ) | ||||
NET ASSETS – 100.00% | $ | 6,164,170,241 | ||||
| a | Non-income earning security. |
| b | All or a portion of this security represents a security on loan. See Note 5. |
| c | Affiliated issuer. See Note 2. |
| d | The rate quoted is the annualized seven-day yield of the fund at period end. |
| e | All or a portion of this security represents an investment of securities lending collateral. See Note 5. |
See notes to financial statements.
| SCHEDULEOF INVESTMENTS | 11 |
Table of Contents
Statement of Assets and Liabilities
iSHARES®, INC.
August 31, 2009
iShares MSCI Japan Index Fund | ||||
ASSETS | ||||
Investments, at cost: | ||||
Unaffiliated issuers | $ | 7,346,859,712 | ||
Affiliated issuers (Note 2) | 151,498,718 | |||
Total cost of investments | $ | 7,498,358,430 | ||
Investments in securities, at fair value (including securities on loana) (Note 1): | ||||
Unaffiliated issuers | $ | 6,156,839,640 | ||
Affiliated issuers (Note 2) | 151,498,718 | |||
Total fair value of investments | 6,308,338,358 | |||
Foreign currency, at valueb | 4,238,264 | |||
Receivables: | ||||
Dividends and interest | 3,137,545 | |||
Capital shares sold | 1,322,273 | |||
Interest from affiliate (Note 2) | 662,420 | |||
Total Assets | 6,317,698,860 | |||
LIABILITIES | ||||
Payables: | ||||
Investment securities purchased | 631,912 | |||
Collateral for securities on loan (Note 5) | 149,912,990 | |||
Capital shares redeemed | 264,335 | |||
Investment advisory fees (Note 2) | 2,719,382 | |||
Total Liabilities | 153,528,619 | |||
NET ASSETS | $ | 6,164,170,241 | ||
Net assets consist of: | ||||
Paid-in capital | $ | 7,928,579,076 | ||
Undistributed net investment income | 11,285,164 | |||
Accumulated net realized loss | (585,837,043 | ) | ||
Net unrealized depreciation on investments and translation of assets and liabilities in foreign currencies | (1,189,856,956 | ) | ||
NET ASSETS | $ | 6,164,170,241 | ||
Shares outstandingc | 601,800,000 | |||
Net asset value per share | $ | 10.24 | ||
| a | Securities on loan with a value of $142,751,312. See Note 5. |
| b | Cost of foreign currency: $4,164,422. |
| c | $0.001 par value, number of shares authorized: 2,124,600,000. |
See notes to financial statements.
| 12 | 2009 iSHARES ANNUAL REPORTTO SHAREHOLDERS |
Table of Contents
Statement of Operations
iSHARES®, INC.
Year ended August 31, 2009
| iShares MSCI Japan Index Fund | ||||
NET INVESTMENT INCOME | ||||
Dividends from unaffiliated issuersa | $ | 105,129,906 | ||
Interest from affiliated issuers (Note 2) | 4,907 | |||
Securities lending income from affiliated issuers (Note 2) | 1,996,868 | |||
Interest from affiliate (Note 2) | 662,420 | |||
Total investment income | 107,794,101 | |||
EXPENSES | ||||
Investment advisory fees (Note 2) | 29,763,035 | |||
Total expenses | 29,763,035 | |||
Net investment income | 78,031,066 | |||
NET REALIZED AND UNREALIZED GAIN (LOSS) | ||||
Net realized gain (loss) from: | ||||
Investments in unaffiliated issuers | (230,732,438 | ) | ||
In-kind redemptions | (249,251,461 | ) | ||
Foreign currency transactions | 8,678,914 | |||
Net realized loss | (471,304,985 | ) | ||
Net change in unrealized appreciation (depreciation) on: | ||||
Investments | (579,675,166 | ) | ||
Translation of assets and liabilities in foreign currencies | 141,239 | |||
Net change in unrealized appreciation (depreciation) | (579,533,927 | ) | ||
Net realized and unrealized loss | (1,050,838,912 | ) | ||
NET DECREASE IN NET ASSETS RESULTING FROM OPERATIONS | $ | (972,807,846 | ) | |
| a | Net of foreign withholding tax of $7,831,522. |
See notes to financial statements.
| FINANCIAL STATEMENTS | 13 |
Table of Contents
Statements of Changes in Net Assets
iSHARES®, INC.
| iShares MSCI Japan Index Fund | ||||||||
| Year ended August 31, 2009 | Year ended August 31, 2008 | |||||||
INCREASE (DECREASE) IN NET ASSETS | ||||||||
OPERATIONS: | ||||||||
Net investment income | $ | 78,031,066 | $ | 101,126,035 | ||||
Net realized gain (loss) | (471,304,985 | ) | 632,241,422 | |||||
Net change in unrealized appreciation (depreciation) | (579,533,927 | ) | (2,458,735,947 | ) | ||||
Net decrease in net assets resulting from operations | (972,807,846 | ) | (1,725,368,490 | ) | ||||
DISTRIBUTIONS TO SHAREHOLDERS: | ||||||||
From net investment income | (73,264,843 | ) | (145,335,547 | ) | ||||
Total distributions to shareholders | (73,264,843 | ) | (145,335,547 | ) | ||||
CAPITAL SHARE TRANSACTIONS: | ||||||||
Proceeds from shares sold | 2,197,765,511 | 1,033,469,389 | ||||||
Cost of shares redeemed | (2,487,058,899 | ) | (3,443,234,963 | ) | ||||
Net decrease in net assets from capital share transactions | (289,293,388 | ) | (2,409,765,574 | ) | ||||
DECREASE IN NET ASSETS | (1,335,366,077 | ) | (4,280,469,611 | ) | ||||
NET ASSETS | ||||||||
Beginning of year | 7,499,536,318 | 11,780,005,929 | ||||||
End of year | $ | 6,164,170,241 | $ | 7,499,536,318 | ||||
Undistributed (distributions in excess of) net investment income included in net assets at end of year | $ | 11,285,164 | $ | (4,799,303 | ) | |||
SHARES ISSUED AND REDEEMED | ||||||||
Shares sold | 239,400,000 | 79,200,000 | ||||||
Shares redeemed | (283,200,000 | ) | (270,600,000 | ) | ||||
Net decrease in shares outstanding | (43,800,000 | ) | (191,400,000 | ) | ||||
See notes to financial statements.
| 14 | 2009 iSHARES ANNUAL REPORTTO SHAREHOLDERS |
Table of Contents
iSHARES®, INC.
(For a share outstanding throughout each period)
| iShares MSCI Japan Index Fund | ||||||||||||||||||||
| Year ended Aug. 31, 2009 | Year ended Aug. 31, 2008 | Year ended Aug. 31, 2007 | Year ended Aug. 31, 2006 | Year ended Aug. 31, 2005 | ||||||||||||||||
Net asset value, beginning of year | $ | 11.62 | $ | 14.07 | $ | 13.80 | $ | 10.99 | $ | 9.89 | ||||||||||
Income from investment operations: | ||||||||||||||||||||
Net investment incomea | 0.13 | 0.14 | 0.10 | 0.06 | 0.06 | |||||||||||||||
Net realized and unrealized gain (loss)b | (1.39 | ) | (2.39 | ) | 0.27 | 2.81 | 1.08 | |||||||||||||
Total from investment operations | (1.26 | ) | (2.25 | ) | 0.37 | 2.87 | 1.14 | |||||||||||||
Less distributions from: | ||||||||||||||||||||
Net investment income | (0.12 | ) | (0.20 | ) | (0.10 | ) | (0.06 | ) | (0.04 | ) | ||||||||||
Total distributions | (0.12 | ) | (0.20 | ) | (0.10 | ) | (0.06 | ) | (0.04 | ) | ||||||||||
Net asset value, end of year | $ | 10.24 | $ | 11.62 | $ | 14.07 | $ | 13.80 | $ | 10.99 | ||||||||||
Total return | (10.68 | )% | (16.13 | )% | 2.68 | % | 26.10 | % | 11.58 | % | ||||||||||
Ratios/Supplemental data: | ||||||||||||||||||||
Net assets, end of year (000s) | $ | 6,164,170 | $ | 7,499,536 | $ | 11,780,006 | $ | 13,724,590 | $ | 7,248,107 | ||||||||||
Ratio of expenses to average net assets | 0.56 | % | 0.52 | % | 0.52 | % | 0.54 | % | 0.57 | % | ||||||||||
Ratio of net investment income to average net assets | 1.46 | % | 1.11 | % | 0.68 | % | 0.48 | % | 0.59 | % | ||||||||||
Portfolio turnover ratec | 4 | % | 4 | % | 3 | % | 8 | % | 6 | % | ||||||||||
| a | Based on average shares outstanding throughout each period. |
| b | The amounts reported may not accord with the change in aggregate gains and losses in securities due to the timing of capital share transactions. |
| c | Portfolio turnover rates exclude portfolio securities received or delivered as a result of processing capital share transactions in Creation Units. |
See notes to financial statements.
| FINANCIAL HIGHLIGHTS | 15 |
Table of Contents
iSHARES®, INC.
iShares, Inc. (the “Company”) is registered under the Investment Company Act of 1940, as amended (the “1940 Act”), as an open-end management investment company. The Company was incorporated under the laws of the State of Maryland on September 1, 1994 pursuant to amended and restated Articles of Incorporation.
These financial statements relate only to the iShares MSCI Japan Index Fund (the “Fund”).
The Fund’s investment objective is to seek investment results that correspond generally to the price and yield performance, before fees and expenses, of publicly traded equity securities in the aggregate in the Japanese equity market, as measured by the MSCI Japan Index compiled by MSCI Inc. (“MSCI”). The investment adviser uses a “passive” or index approach to achieve the Fund’s investment objective. The Fund is classified as a non-diversified fund under the 1940 Act. Non-diversified funds generally hold securities of fewer companies than diversified funds and may be more susceptible to the risks associated with these particular companies, or to a single economic, political or regulatory occurrence affecting these companies.
The Fund invests in the securities of foreign issuers of a single country, which may involve certain considerations and risks not typically associated with securities of U.S. issuers. Such risks include, but are not limited to: generally less liquid and less efficient securities markets; generally greater price volatility; exchange rate fluctuations and exchange controls; imposition of restrictions on the expatriation of funds or other assets of the Fund; less publicly available information about issuers; the imposition of withholding or other taxes; higher transaction and custody costs; settlement delays and risk of loss attendant in settlement procedures; difficulties in enforcing contractual obligations; less regulation of securities markets; different accounting, disclosure and reporting requirements; more substantial governmental involvement in the economy; higher inflation rates; greater social, economic and political uncertainties; the risk of nationalization or expropriation of assets and the risk of war.
Pursuant to the Company’s organizational documents, the Fund’s officers and directors are indemnified against certain liabilities that may arise out of the performance of their duties to the Fund. Additionally, in the normal course of business, the Fund enters into contracts with service providers that contain general indemnification clauses. The Fund’s maximum exposure under these arrangements is unknown as this would involve future claims that may be made against the Fund that have not yet occurred.
1. SIGNIFICANT ACCOUNTING POLICIES
The following significant accounting policies are consistently followed by the Company in the preparation of its financial statements in conformity with accounting principles generally accepted in the United States of America (“U.S. GAAP”). The preparation of financial statements in conformity with U.S. GAAP requires management to make certain estimates and assumptions that affect the reported amounts of assets and liabilities and disclosures of contingent assets and liabilities at the date of the financial statements and the reported amounts of revenue and expenses during the reporting period. Actual results could differ from those estimates.
SECURITY VALUATION
The securities and other assets of the Fund are valued pursuant to the pricing policy and procedures approved by the Board of Directors of the Company (the “Board”). Effective September 1, 2008, the Fund adopted Financial Accounting Standards Board (“FASB”) Statement of Financial Accounting Standards No. 157 (“FAS 157”), “Fair Value Measurements.” This standard establishes a fair value hierarchy that prioritizes the inputs to valuation techniques used to measure fair value into three broad levels. Inputs may be based on independent market data (“observable inputs”) or they may be internally developed (“unobservable inputs”). The hierarchy gives the highest priority to unadjusted quoted prices in active markets for identical assets or liabilities (Level 1 measurements) and the lowest priority to unobservable inputs (Level 3 measurements). The three levels of the fair value hierarchy under FAS 157 are as follows:
| • | Level 1 – Inputs that reflect unadjusted quoted prices in active markets for identical assets or liabilities that the Fund has the ability to access at the measurement date (a “Level 1 Price”); |
| 16 | 2009 iSHARES ANNUAL REPORTTO SHAREHOLDERS |
Table of Contents
Notes to Financial Statements (Continued)
iSHARES®, INC.
| • | Level 2 – Inputs other than quoted prices included within Level 1 that are observable for the asset or liability either directly or indirectly, including quoted prices for similar assets or liabilities in active markets, quoted prices for identical or similar assets or liabilities in markets that are not considered to be active, inputs other than quoted prices that are observable for the asset or liability, and inputs that are derived principally from or corroborated by observable market data by correlation or other means (a “Level 2 Price”); |
| • | Level 3 – Inputs that are unobservable for the asset or liability (a “Level 3 Price”). |
The availability of observable inputs can vary from security to security and is affected by a wide variety of factors, including, for example, the type of security, whether the security is new and not yet established in the marketplace, the liquidity of markets, and other characteristics particular to the security. Inputs may include price information, volatility statistics, specific and broad credit data, liquidity statistics, and other factors. To the extent that valuation is based on models or inputs that are less observable or unobservable in the market, the determination of fair value requires more judgment. Accordingly, the degree of judgment exercised in determining fair value is greatest for instruments categorized in Level 3 of the fair value hierarchy.
The level of a value determined for a financial instrument within the fair value hierarchy is based on the lowest level of any input that is significant to the fair value measurement in its entirety. The categorization of a value determined for a financial instrument within the hierarchy is based upon the pricing transparency of the instrument and does not necessarily correspond to the Fund’s perceived risk of that instrument.
Investments whose values are based on quoted market prices in active markets, and whose values are therefore classified as Level 1 Prices, include active listed equities. The Fund does not adjust the quoted price for such instruments, even in situations where the Fund holds a large position and a sale could reasonably impact the quoted price.
Investments that trade in markets that are not considered to be active, but whose values are based on quoted market prices, dealer quotations or valuations provided by alternative pricing sources supported by observable inputs are classified within Level 2. These generally include U.S. government and sovereign obligations, most government agency securities, investment-grade corporate bonds, certain mortgage products, less liquid listed equities, and state, municipal and provincial obligations. As Level 2 investments include positions that are not traded in active markets and/or are subject to transfer restrictions, valuations may be adjusted to reflect illiquidity and/or non-transferability, which are generally based on available market information.
Investments whose values are classified as Level 3 Prices have significant unobservable inputs, as they may trade infrequently or not at all. Investments whose values are classified as Level 3 Prices may include unlisted securities related to corporate actions, securities whose trading have been suspended or which have been de-listed from their primary trading exchange, less liquid corporate debt securities (including distressed debt instruments), collateralized debt obligations, and less liquid mortgage securities (backed by either commercial or residential real estate). When observable prices are not available for these securities, the Fund uses one or more valuation techniques (e.g., the market approach or the income approach) for which sufficient and reliable data is available. Within Level 3 of the fair value hierarchy, the use of the market approach generally consists of using comparable market transactions, while the use of the income approach generally consists of the net present value of estimated future cash flows, adjusted as appropriate for liquidity, credit, market and/or other risk factors.
The inputs used by the Fund in estimating the value of Level 3 Prices may include the original transaction price, recent transactions in the same or similar instruments, completed or pending third-party transactions in the underlying investment or comparable issuers, and changes in financial ratios or cash flows. Level 3 Prices may also be adjusted to reflect illiquidity and/or non-transferability, with the amount of such discount estimated by the Fund in the absence of market information. The fair value measurement of Level 3 Prices does not include
| NOTESTO FINANCIAL STATEMENTS | 17 |
Table of Contents
Notes to Financial Statements (Continued)
iSHARES®, INC.
transaction costs that may have been capitalized as part of the security’s cost basis. Assumptions used by the Fund due to the lack of observable inputs may significantly impact the resulting fair value and therefore the Fund’s results of operations.
Fair value pricing could result in a difference between the prices used to calculate the Fund’s net asset value and the prices used by the Fund’s underlying index, which in turn could result in a difference between the Fund’s performance and the performance of the Fund’s underlying index.
As of August 31, 2009, the value of each of the Fund’s investments was classified as a Level 1 Price. The breakdown of the Fund’s investments into major categories is disclosed in the Schedule of Investments.
SECURITY TRANSACTIONS AND INCOME RECOGNITION
Security transactions are accounted for on trade date. Dividend income is recognized on the ex-dividend date, net of any foreign taxes withheld at source, and interest income is accrued daily. Non-cash dividends received in the form of stock in an elective dividend, if any, are recorded as dividend income at fair value. Distributions received by the Fund may include a return of capital that is estimated by management. Such amounts are recorded as a reduction of the cost of investments or reclassified to capital gains. Realized gains and losses on investment transactions are determined using the specific identification method.
FOREIGN CURRENCY TRANSLATION
The accounting records of the Fund are maintained in U.S. dollars. Foreign currencies, as well as investment securities and other assets and liabilities denominated in foreign currencies are translated into U.S. dollars using exchange rates deemed appropriate by the investment adviser. Any use of a rate different from the rates used by MSCI may adversely affect the Fund’s ability to track its underlying index. Purchases and sales of securities, income receipts and expense payments are translated into U.S. dollars on the respective dates of such transactions.
The Fund does not isolate the effect of fluctuations in foreign exchange rates from the effect of fluctuations in the market prices of securities. Such fluctuations are reflected by the Fund as a component of realized and unrealized gains and losses from investments for financial reporting purposes.
DISTRIBUTIONS TO SHAREHOLDERS
Distributions to shareholders from net investment income, if any, including any net foreign currency gains, are declared and distributed at least annually by the Fund. Distributions of net realized capital gains, if any, generally are declared and distributed once a year. Distributions are determined on a tax basis and may differ from net investment income and net realized capital gains for financial reporting purposes. Dividends and distributions are paid in U.S. dollars and cannot be automatically reinvested in additional shares of the Fund.
As of August 31, 2009, the tax year-end of the Fund, the components of net accumulated losses on a tax basis consisted of undistributed ordinary income of $15,301,373, unrealized depreciation of $1,287,320,427, and capital and other losses of $493,052,201, for net accumulated losses of $1,765,071,255.
For the years ended August 31, 2009 and August 31, 2008, the tax characterization of distributions paid for the Fund represents ordinary income. The total distributions and distributions per share are disclosed in the accompanying Statements of Changes in Net Assets and the Financial Highlights for the Fund.
| 18 | 2009 iSHARES ANNUAL REPORTTO SHAREHOLDERS |
Table of Contents
Notes to Financial Statements (Continued)
iSHARES®, INC.
FEDERAL INCOME TAXES
It is the policy of the Fund to qualify as a regulated investment company by complying with the provisions applicable to regulated investment companies, as defined under Subchapter M of the Internal Revenue Code of 1986, as amended, and to annually distribute substantially all of its ordinary income and any net capital gains (taking into account any capital loss carryforwards) sufficient to relieve it from all, or substantially all, federal income and excise taxes. Accordingly, no provision for federal income taxes was required for the year ended August 31, 2009.
From November 1, 2008 to August 31, 2009, the Fund incurred net realized capital losses of $155,850,799. As permitted by tax regulations, the Fund has elected to defer those losses and treat them as arising in the year ending August 31, 2010.
As of August 31, 2009, the tax year-end of the Fund, the Fund had tax basis net capital loss carryforwards of $62,572,173, $3,621,148, $5,594,562, $8,733,802, $68,122,871, $27,817,841, $44,443,527 and $116,295,478 expiring in 2010, 2011, 2012, 2013, 2014, 2015, 2016 and 2017, respectively. Such losses may be applied against any net realized taxable gains in each succeeding year or until their respective expiration dates, whichever occurs first.
The Fund may own shares in certain foreign investment entities, referred to, under U.S. tax law, as “passive foreign investment companies.” The Fund may elect to mark-to-market annually the shares of each passive foreign investment company and would be required to distribute to shareholders any such marked-to-market gains.
The Fund reclassifies at the end of its tax year certain amounts to paid-in-capital from accumulated net realized gain (loss) on investments and foreign currency transactions and accumulated net investment income (loss), respectively, as a result of permanent book and tax differences primarily attributed to net investment loss, return of capital, passive foreign investment companies, realized foreign currency gains and losses and gains and losses on in-kind redemptions. These reclassifications have no effect on net assets or net asset value per share.
As of August 31, 2009, the cost of investments for federal income tax purposes was $7,595,821,901. Net unrealized depreciation was $1,287,483,543, of which $59,671,536 represented gross unrealized appreciation on securities and $1,347,155,079 represented gross unrealized depreciation on securities.
Management has reviewed the tax positions as of August 31, 2009, inclusive of the prior three open tax return years, and has determined that no provision for income tax is required in the Fund’s financial statements.
2. AGREEMENTS AND OTHER TRANSACTIONS WITH AFFILIATES
Pursuant to an Investment Advisory Agreement with the Company, Barclays Global Fund Advisors (“BGFA”) manages the investment of the Fund’s assets. BGFA is a California corporation indirectly owned by Barclays Bank PLC. Under the Investment Advisory Agreement, BGFA is responsible for all expenses (“Covered Expenses”) of the Company, including the cost of transfer agency, custody, fund administration, legal, audit and other services, except interest, taxes, brokerage commissions and other expenses connected with the execution of portfolio transactions, distribution fees and extraordinary expenses.
| NOTESTO FINANCIAL STATEMENTS | 19 |
Table of Contents
Notes to Financial Statements (Continued)
iSHARES®, INC.
For its investment advisory services to the Fund, BGFA is entitled to an annual investment advisory fee based on the Fund’s allocable portion of the aggregate of the average daily net assets of the Fund and certain other iShares Funds as follows:
| Investment Advisory Fee | Aggregate Average Daily Net Assets | |
| 0.59% | First $7 billion | |
| 0.54 | Over $7 billion, up to and including $11 billion | |
| 0.49 | Over $11 billion, up to and including $24 billion | |
| 0.44 | Over $24 billion, up to and including $48 billion | |
| 0.40 | Over $48 billion |
Under the terms of the Investment Advisory Agreement, the Fund is required to remit payment of accrued fees to BGFA on a quarterly basis. BGFA has determined that in certain cases such payments to BGFA by the Fund were made earlier than provided for under the Investment Advisory Agreement. BGFA will reimburse the Fund for interest that would have been earned had such payments been made on a quarterly basis. The amount to be reimbursed is included under receivables and investment income as “Interest from affiliate” in the Statement of Assets and Liabilities and Statement of Operations, respectively. The reimbursement does not have a material effect on net asset value per share or the total return shown in the Financial Highlights.
State Street Bank and Trust Company (“State Street”) serves as administrator, custodian and transfer agent for the Company. As compensation for its services, State Street receives certain out-of-pocket costs, transaction fees and asset-based fees which are accrued daily and paid monthly. These fees and expenses are Covered Expenses as defined above.
SEI Investments Distribution Co. (“SEI”) serves as the Fund’s underwriter and distributor of the shares of the Fund, pursuant to a Distribution Agreement with the Company. SEI does not receive a fee from the Fund for its distribution services.
Pursuant to an exemptive order issued by the U.S. Securities and Exchange Commission (“SEC”), the Fund is permitted to lend portfolio securities to Barclays Capital Inc. (“BarCap”). Pursuant to the same exemptive order, Barclays Global Investors, N.A. (“BGI”) serves as securities lending agent for the Fund. BarCap and BGI are affiliates of BGFA, the Fund’s investment adviser. As securities lending agent, BGI receives, as fees, a share of the income earned on investment of the cash collateral received for the loan of securities. For the year ended August 31, 2009, BGI earned securities lending agent fees of $1,996,868.
Cross trades for the year ended August 31, 2009 were executed by the Fund pursuant to Rule 17a-7 under the 1940 Act. Cross trading is the buying or selling of portfolio securities between funds to which BGFA (or an affiliate) serves as investment adviser. At its regularly scheduled quarterly meetings, the Board reviews such transactions as of the most recent calendar quarter for compliance with the requirements and restrictions set forth by Rule 17a-7.
The Fund may invest in certain money market funds managed by BGFA, the Fund’s investment adviser, including the Government Money Market Fund (“GMMF”), Institutional Money Market Fund (“IMMF”), Prime Money Market Fund (“PMMF”) and Treasury Money Market Fund (“TMMF”) of Barclays Global Investors Funds. These money market funds seek to achieve their investment objectives by investing in high-quality, short-term money market instruments that, at the time of investment, have remaining maturities of 397 calendar days or less from the date of acquisition. The GMMF, IMMF, PMMF and TMMF are feeder funds in a master/feeder fund structure that invest substantially all of their assets in the Government Money Market Master Portfolio, Money Market Master Portfolio, Prime Money Market Master Portfolio and Treasury Money Market Master Portfolio (collectively, the “Money Market Master Portfolios”), respectively, which are also managed by BGFA. While the GMMF, IMMF, PMMF and TMMF do not directly charge an investment advisory fee, the Money Market Master Portfolios in which they invest do charge an investment advisory fee. Income distributions from the GMMF, IMMF, PMMF and TMMF are declared daily
| 20 | 2009 iSHARES ANNUAL REPORTTO SHAREHOLDERS |
Table of Contents
Notes to Financial Statements (Continued)
iSHARES®, INC.
and paid monthly from net investment income. Income distributions earned by the Fund from temporary cash investments are recorded as interest from affiliated issuers in the accompanying Statement of Operations. Income distributions earned by the Fund from the investment of securities lending collateral, if any, are included in securities lending income in the accompanying Statement of Operations.
Certain directors and officers of the Company are also officers of BGI and/or BGFA.
3. INVESTMENT PORTFOLIO TRANSACTIONS
Purchases and sales of investments (excluding in-kind transactions and short-term investments) for the year ended August 31, 2009, aggregated $239,941,816 and $232,558,866, respectively.
In-kind purchases and sales (see Note 4) for the year ended August 31, 2009, aggregated $2,133,523,288 and $2,416,440,479, respectively.
4. CAPITAL SHARE TRANSACTIONS
The Company issues and redeems capital shares of the Fund only in aggregations of a specified number of shares (each, a “Creation Unit”) at net asset value. Except when aggregated in Creation Units, shares of the Fund are not redeemable. Transactions in capital shares for the Fund are disclosed in detail in the Statements of Changes in Net Assets.
The consideration for the purchase of Creation Units of the Fund generally consists of the in-kind deposit of a designated portfolio of equity securities, which constitutes an optimized representation of the securities involved in the Fund’s underlying index and an amount of cash. Investors purchasing and redeeming Creation Units pay a purchase transaction fee and a redemption transaction fee directly to State Street, the administrator, to offset transfer and other transaction costs associated with the issuance and redemption of Creation Units.
5. LOANS OF PORTFOLIO SECURITIES
The Fund may lend its investment securities to approved borrowers, such as brokers, dealers and other financial institutions. The borrower pledges and maintains with the Fund collateral consisting of cash, an irrevocable letter of credit issued by a bank, or securities issued or guaranteed by the U.S. government. The initial collateral received by the Fund is required to have a value of at least 102% of the market value of the loaned securities for securities traded on U.S. exchanges and a value of at least 105% for all other securities. The collateral is maintained thereafter, at a value equal to at least 100% of the current market value of the securities on loan. The risks to the Fund of securities lending include the risk that the borrower may not provide additional collateral when required or may not return the securities when due. Any securities lending cash collateral may be reinvested in certain short-term instruments either directly on behalf of the Fund or through one or more joint accounts or money market funds, including those managed by BGFA; such reinvestments are subject to investment risk.
As of August 31, 2009, the Fund had loaned securities which were collateralized by cash. The cash collateral received was invested in money market funds managed by BGFA. The market value of the securities on loan as of August 31, 2009 and the value of the related collateral are disclosed in the Statement of Assets and Liabilities. Securities lending income, as disclosed in the Fund’s Statement of Operations, represents the income earned from the investment of the cash collateral, net of rebates paid to, or fees paid by, borrowers and less the fees paid to BGI as securities lending agent.
| NOTESTO FINANCIAL STATEMENTS | 21 |
Table of Contents
Notes to Financial Statements (Continued)
iSHARES®, INC.
6. BLACKROCK TRANSACTION
On June 16, 2009, Barclays PLC, the ultimate parent company of BGI and BGFA, accepted a binding offer and entered into an agreement to sell its interests in BGFA, BGI and certain affiliated companies, to BlackRock, Inc., (the “BlackRock Transaction”). The BlackRock Transaction is subject to certain regulatory approvals, as well as other conditions to closing.
Under the 1940 Act, completion of the BlackRock Transaction will cause the automatic termination of the Fund’s current investment advisory agreement with BGFA. In order for the management of the Fund to continue uninterrupted, the Board approved a new investment advisory agreement for the Fund subject to shareholder approval. A special meeting of shareholders of the Fund is scheduled to be held on November 4, 2009. Each shareholder of record as of the close of business on August 25, 2009 will receive notice of and be entitled to vote at the meeting.
7. REVIEW OF SUBSEQUENT EVENTS
In connection with the preparation of the financial statements of the Fund as of and for the year ended August 31, 2009, events and transactions through October 23, 2009, the date the financial statements are available to be issued, have been evaluated by the Fund’s management for possible adjustment and/or disclosure. No subsequent events requiring financial statement disclosure have been identified.
| 22 | 2009 iSHARES ANNUAL REPORTTO SHAREHOLDERS |
Table of Contents
Report of Independent Registered Public Accounting Firm
To the Shareholders and Board of Directors of
iShares, Inc.:
In our opinion, the accompanying statement of assets and liabilities, including the schedule of investments, and the related statements of operations and of changes in net assets and the financial highlights present fairly, in all material respects, the financial position of the iShares MSCI Japan Index Fund, a portfolio of the iShares MSCI Series (the “Fund”), at August 31, 2009, the results of its operations, the changes in its net assets and its financial highlights for each of the periods presented, in conformity with accounting principles generally accepted in the United States of America. These financial statements and financial highlights (hereafter referred to as “financial statements”) are the responsibility of the Fund’s management; our responsibility is to express an opinion on these financial statements based on our audits. We conducted our audits of these financial statements in accordance with the standards of the Public Company Accounting Oversight Board (United States). Those standards require that we plan and perform the audit to obtain reasonable assurance about whether the financial statements are free of material misstatement. An audit includes examining, on a test basis, evidence supporting the amounts and disclosures in the financial statements, assessing the accounting principles used and significant estimates made by management, and evaluating the overall financial statement presentation. We believe that our audits, which included confirmation of securities at August 31, 2009 by correspondence with the custodian, transfer agent and brokers, provide a reasonable basis for our opinion.
PricewaterhouseCoopers LLP
San Francisco, California
October 23, 2009
| REPORT OF INDEPENDENT REGISTERED PUBLIC ACCOUNTING FIRM | 23 |
Table of Contents
iSHARES®, INC.
For the fiscal year ended August 31, 2009, the Fund earned foreign source income of $112,961,426 and paid foreign taxes of $7,826,643 which it intends to pass through to its shareholders pursuant to Section 853 of the Internal Revenue Code (the “Code”).
Under Section 854(b)(2) of the Code, the Fund hereby designates the maximum amount of $73,264,843 as qualified dividend income for purposes of the maximum rate under Section 1(h)(11) of the Code for the fiscal year ended August 31, 2009.
In January 2010, shareholders will receive Form 1099-DIV which will include their share of qualified dividend income distributed during the calendar year 2009. Shareholders are advised to check with their tax advisers for information on the treatment of these amounts on their income tax returns.
| 24 | 2009 iSHARES ANNUAL REPORTTO SHAREHOLDERS |
Table of Contents
Board Review and Approval of Current Investment Advisory
Contract (Unaudited)
iSHARES®, INC.
Under Section 15(c) of the Investment Company Act of 1940 (the “1940 Act”), the Company’s Board of Directors (the “Board”), including a majority of Directors who are not “interested persons” of the Company (as that term is defined in the 1940 Act) (the “Independent Directors”), is required annually to consider the Investment Advisory Contract between the Company and BGFA (the “Advisory Contract”) on behalf of the Fund. As required by Section 15(c), the Board requested and BGFA provided such information as the Board deemed reasonably necessary to evaluate the terms of the Advisory Contract. At a meeting held on June 16-17, 2009, the Board approved the selection of BGFA and the continuance of the Advisory Contract, based on its review of qualitative and quantitative information provided by BGFA. In selecting BGFA and approving the Advisory Contract for the Fund, the Board, including the Independent Directors, advised by their independent counsel, considered the following factors, no one of which was controlling, and made the following conclusions:
NATURE, EXTENT AND QUALITY OF SERVICES PROVIDED BY BGFA
Based on management’s representations, the Board expected that there will be no diminution in the scope of services required of or provided by BGFA under the Advisory Contract for the coming year as compared to the scope of services provided by BGFA over the past year. In reviewing the scope of these services, the Board considered BGFA’s investment philosophy and experience, noting that BGFA and its affiliates have committed significant resources over time, including over the past year, including investment in technology and increasing the number of their employees supporting the Fund. The Board also considered BGFA’s compliance program and its compliance record with respect to the Fund. In that regard, the Board noted that BGFA reports to the Board about portfolio management and compliance matters on a periodic basis in connection with regularly scheduled meetings of the Board, and has made appropriate officers available as needed to provide further assistance with these matters. The Board also reviewed the background and experience of the persons responsible for the day-to-day management of the Fund. In addition to the above considerations, the Board considered BGFA’s investment processes and strategies, and matters related to BGFA’s portfolio transaction policies and procedures. The Board further noted that BGFA does not serve as investment adviser for any other series of registered investment companies with substantially similar investment objectives and strategies as the Fund; therefore, directly comparable performance information was generally not available. However, the Board also noted that the Fund had met its investment objective consistently since its inception date. Based on review of this information, the Board concluded that the nature, extent and quality of services to be provided by BGFA to the Fund under the Advisory Contract were appropriate and mitigated in favor of the Board’s approval of the Advisory Contract for the coming year.
FUND’S EXPENSES AND PERFORMANCE OF THE FUND
The Board reviewed statistical information prepared by Lipper Inc. (“Lipper”), an independent provider of investment company data, regarding the expense ratio components, including advisory fees, waivers/reimbursements, and gross and net total expenses of the Fund in comparison with the same information for other registered investment companies objectively selected by Lipper as comprising the Fund’s peer group pursuant to Lipper’s proprietary methodology and any registered investment companies that would otherwise have been excluded from Lipper’s comparison group due to certain differentiating factors, but were nonetheless included at the request of BGFA (the “Lipper Group”). Because there are few, if any, exchange traded funds or index funds that track indexes similar to that tracked by the Fund, the Lipper Group included in part mutual funds, closed-end funds, exchange traded funds, or funds with differing investment objective classifications, investment focuses and other characteristics (e.g., actively managed funds and funds sponsored by “at cost” service providers). In support of its review of the statistical information, the Board was provided with a detailed description of the methodology used by Lipper to determine the Lipper Group and to prepare this information. The Board further noted that due to the limitations in providing comparable funds in the Lipper Group, the statistical information may or may not provide meaningful direct comparisons to the Fund. In addition, the Board reviewed statistical information prepared by Lipper regarding the performance of the Fund for the one-, three-, five- and ten-year, and “last quarter” periods ended March 31, 2009, and a comparison of the Fund’s performance to its performance benchmark index for the same periods. To the extent that any of the comparison funds included in the Lipper Group track the same index as the Fund, Lipper provided, and the Board reviewed, a comparison of the Fund’s performance to that of such relevant comparison funds for the same
| BOARD REVIEWAND APPROVALOF CURRENT INVESTMENT ADVISORY CONTRACT | 25 |
Table of Contents
Board Review and Approval of Current Investment Advisory
Contract (Unaudited) (Continued)
iSHARES®, INC.
periods. The Board noted that the Fund performed in line with its performance benchmark index over relevant periods. In considering this information, the Board noted that the Lipper Group includes funds that may have different investment objectives and/or benchmarks from the Fund. In addition, the Board noted that the Fund seeks to track its benchmark index and that during the prior year the Board received periodic reports on the Fund’s performance in comparison with its relevant benchmark index. Such comparative performance information was also considered by the Board.
The Board also noted that the investment advisory fees and overall expenses for the Fund were generally lower than the median or average investment advisory fee rates and overall expenses of the funds in its respective Lipper Group. Based on this review, the Board concluded that the investment advisory fees and expense levels and the historical performance of the Fund, as managed by BGFA, as compared to the investment advisory fees and expense levels and performance of the funds in its Lipper Group, were satisfactory for the purposes of approving the Advisory Contract for the coming year.
COSTS OF SERVICES PROVIDED TO THE FUND AND PROFITS REALIZED BY BGFA AND AFFILIATES
The Board reviewed information about the profitability to BGFA of the Fund based on the fees payable to BGFA and its affiliates (including fees under the Advisory Contract), and all other sources of revenue and expense to BGFA and its affiliates from the Fund’s operations for the last calendar year. The Board discussed the sources of direct and ancillary revenue with management, including the revenues to BGI from securities lending by the Company (including any securities lending by the Fund). The Board also discussed BGFA’s profit margin as reflected in the Fund’s profitability analysis and reviewed information regarding economies of scale (as discussed below). Based on this review, the Board concluded that the profits realized by BGFA and its affiliates under the Advisory Contract and from other relationships between the Fund and BGFA and/or its affiliates, if any, were within the range the Board considered reasonable and appropriate.
ECONOMIES OF SCALE
In connection with its review of the Fund’s profitability analysis, the Board reviewed information regarding economies of scale or other efficiencies that may result from increases in the Fund’s assets. The Board noted that the Advisory Contract already provided for breakpoints in the Fund’s investment advisory fee rates as the assets of the Fund, on an aggregated basis with the assets of certain other iShares funds, increase, and that extended breakpoints were implemented for the Fund the previous year. The Board also discussed the substantial growth in assets of certain iShares funds, including the Fund, over the last few years. The Board noted that the Fund’s asset size decreased over the past twelve months. The Board also reviewed BGFA’s historic profitability as investment adviser to the iShares fund complex and noted that BGFA had continued to make significant investments in the iShares fund complex, that expenses had grown at a pace similar to the growth in revenue, and that BGFA had incurred operating losses during earlier years when the iShares funds, including the Fund, had not yet reached scale. Based on this review, as well as the discussions described above in connection with the Lipper Group and performance benchmark comparisons, the Board, recognizing its responsibility to consider this issue at least annually, concluded that the structure of the investment advisory fees reflects appropriate sharing of economies of scale with the Fund’s shareholders.
FEES AND SERVICES PROVIDED FOR OTHER COMPARABLE FUNDS/ACCOUNTS MANAGED BY BGFA AND ITS AFFILIATES
The Board received and considered certain information regarding the Fund’s annual investment advisory fee rates under the Advisory Contract in comparison to the investment advisory/management fee rates for other funds/accounts for which BGFA or BGI, an affiliate of BGFA, provides investment advisory/management services, including other funds registered under the 1940 Act, collective funds and separate accounts (together, the “Other Accounts”). In reviewing the comparative investment advisory/management fee information, the Board considered the general structure of investment advisory/management fees in relation to the nature and extent of services provided
| 26 | 2009 iSHARES ANNUAL REPORTTO SHAREHOLDERS |
Table of Contents
Board Review and Approval of Current Investment Advisory
Contract (Unaudited) (Continued)
iSHARES®, INC.
to the Fund in comparison with the nature and extent of services provided to the Other Accounts, including, among other things, the level of complexity in managing the Fund and the Other Accounts under differing regulatory requirements and client guidelines. Based on this review, the Board determined that the investment advisory fee rates under the Advisory Contract do not constitute fees that are so disproportionately large as to bear no reasonable relationship to the services rendered and that could not have been the product of arm’s-length bargaining, and concluded that the investment advisory fee rates under the Advisory Contract are fair and reasonable.
OTHER BENEFITS TO BGFA AND/OR ITS AFFILIATES
The Board reviewed any ancillary revenue received by BGFA and/or its affiliates in connection with the services provided to the Fund by BGFA, such as any payment of revenue to BGI, the Company’s securities lending agent, for loaning any portfolio securities, and payment of advisory fees and/or administration fees to BGFA and BGI in connection with any investments by the Fund in other funds for which BGFA provides investment advisory services and/or BGI provides administration services. The Board noted that while revenue to BGI in connection with securities lending agency services to the iShares funds increased overall as against the previous year, overall revenue increased by approximately the same percentage as overall expenses. The Board noted that BGFA does not use soft dollars or consider the value of research or other services that may be provided to BGFA (including its affiliates) in selecting brokers for portfolio transactions for the Fund. The Board further noted that any portfolio transactions on behalf of the Fund placed through a BGFA affiliate or purchased from an underwriting syndicate in which a BGFA affiliate participates, are reported to the Board pursuant to Rule 17e-1 or Rule 10f-3, as applicable, under the 1940 Act. The Board concluded that any such ancillary benefits would not be disadvantageous to the Fund’s shareholders.
Based on this analysis, the Board determined that the Advisory Contract, including the investment advisory fee rates there under, is fair and reasonable in light of all relevant circumstances, and concluded that it is in the best interest of the Fund and its shareholders to approve the Advisory Contract for the coming year.
| BOARD REVIEWAND APPROVALOF CURRENT INVESTMENT ADVISORY CONTRACT | 27 |
Table of Contents
Board Review and Approval of New Investment Advisory
Agreements (Unaudited)
iSHARES®, INC.
On June 16, 2009, Barclays Bank PLC (“Barclays”) entered into an agreement to sell its interest in the Barclays Global Investors asset management business, which includes BGI and BGI’s business of advising, sponsoring and distributing exchange-traded funds, to BlackRock, Inc. (“BlackRock”). Assuming receipt of the requisite regulatory approvals and the satisfaction of other conditions to the closing, the subsidiaries of Barclays operating the BGI business, including BGFA (the “Adviser”), will be sold to BlackRock (the “Transaction”) for cash and BlackRock stock.
The Adviser currently serves as the investment adviser to each Fund pursuant to an investment advisory agreement with the Company (the “Current Advisory Agreement”). Under the 1940 Act, the Transaction, if consummated, will result in the automatic termination of the Current Advisory Agreement. In order for the management of each Fund to continue uninterrupted, the Board approved interim and new investment advisory agreements (the “New Advisory Agreements”) with the Company, subject to shareholder approval.
BOARD CONSIDERATIONS IN APPROVING THE NEW ADVISORY AGREEMENTS
At an in-person Board meeting held on August 13, 2009, the Board, including the Independent Directors, unanimously approved the New Advisory Agreements between the Adviser and the Company, on behalf of its Funds after consideration of all factors determined to be relevant to the Board’s deliberations, including those discussed below.
The Approval Process – At telephonic and in-person meetings held in June, July and August of this year, the Board, including the Independent Directors, discussed the Transaction and the New Advisory Agreements for the Funds.
In preparation for their consideration of the New Advisory Agreements, the Directors received, in response to a written due diligence request prepared by the Board and its independent counsel and provided to BlackRock, BGI and the Adviser, comprehensive written information covering a range of issues and received, in response to their additional requests, further information in advance of and at the August 13, 2009 in-person Board meeting. To assist the Board in its consideration of the New Advisory Agreements, BlackRock provided materials and information about itself, including its history, management, investment, risk management and compliance capabilities and processes, and financial condition, and the Adviser provided materials and information about the Transaction. In addition, the Independent Directors consulted with their independent legal counsel and Fund counsel on numerous occasions, discussing, among other things, the legal standards and certain other considerations relevant to the Board’s deliberations.
In June 2009, the Board had performed a full annual review of, or initially approved, as applicable, the current Investment Advisory Agreement between the Adviser and the Company, on behalf of its Funds for each Fund as required by the 1940 Act and, after reviewing, among other things, the investment capabilities, resources and personnel of the Adviser, determined that the nature, extent and quality of the services provided by the Adviser under the Current Advisory Agreements were appropriate. The Board also determined that the advisory fees paid by each Fund, taking into account any applicable agreed-upon fee waivers and breakpoints, were fair and reasonable in light of the services provided, the costs to the Adviser of providing those services, economies of scale, the fees and other expenses paid by similar funds (including information provided by Lipper, Inc. (“Lipper”)), and such other circumstances as the Directors considered relevant in the exercise of their reasonable judgment. The Board approved the Current Advisory Agreements on June 17, 2009.
In advance of the June 2009 Board meeting, the Board requested and received materials specifically relating to each Fund’s Current Advisory Agreement. These materials were prepared for each Fund, and included information (i) compiled by Lipper on the fees and expenses and the investment performance of the Fund as compared to a comparable group of funds as classified by Lipper; (ii) prepared by the Adviser discussing market conditions generally; (iii) on the profitability to the Adviser of the Current Advisory Agreements and other payments received by the Adviser and its affiliates from the Funds; and (iv) provided by the Adviser concerning services related to the valuation and pricing of Fund portfolio holdings, and direct and indirect benefits to the Adviser and its affiliates from their relationship with the Fund.
| 28 | 2009 iSHARES ANNUAL REPORTTO SHAREHOLDERS |
Table of Contents
Board Review and Approval of New Investment Advisory
Agreements (Unaudited) (Continued)
iSHARES®, INC.
At the June 17, July 29 and August 13, 2009 Board meetings, the Directors discussed with representatives of BGI, the Adviser and BlackRock, the management, investment, risk management and compliance capabilities and processes, and financial condition of BlackRock, the Transaction and its rationale, and BlackRock’s general plans and intentions regarding the Adviser and the Funds. At these Board meetings, representatives of BGI, the Adviser and BlackRock made various presentations to, and responded to questions from, the Board. The Board also inquired about the plans for, and anticipated roles and responsibilities of, the employees and officers of the Adviser in connection with the Transaction, including the anticipated senior management structure of the Adviser following the completion of the Transaction. The Independent Directors also conferred separately and with their independent legal counsel about the Transaction and other matters related to the Transaction on a number of occasions. After the presentations and after reviewing the written materials provided, the Independent Directors met in executive sessions with their independent legal counsel at the June, July and August 2009 Board meetings to consider the Transaction, its expected impact on the Adviser and the Funds, and the New Advisory Agreements.
In connection with the Board’s review of the New Advisory Agreements, BGI, the Adviser and/or BlackRock, as applicable, provided the Board with information about a variety of matters. The Board considered, among other things, the following information:
| • | the reputation, financial strength and resources of BlackRock and its investment advisory subsidiaries and the anticipated financial strength and resources of the combined company; |
| • | that there is not expected to be any diminution in the nature, quality and extent of services provided to the Funds and their shareholders by the Adviser, including portfolio management and compliance services; |
| • | that the Adviser and BlackRock have no present intention to alter the advisory fee rates and expense arrangements currently in effect for the Funds for a period of two years from the date of the closing of the Transaction; |
| • | that it is expected that substantially all of the current employees of the Adviser will remain employees of the Adviser and will continue to provide services to the Funds following the Transaction; |
| • | that the Funds may benefit from having direct access to BlackRock’s state of the art technology and risk management analytic tools, including investment tools, provided under the BlackRock Solutions® brand name; |
| • | that the Funds are expected to continue to be sold through existing distribution channels; |
| • | that the Funds will have access to greater distribution resources through BlackRock’s relationships with third party brokers and retirement plan platforms; |
| • | that the parties to the Transaction Agreement have agreed to conduct their respective businesses in compliance with the conditions of Section 15(f) of the 1940 Act in relation to the Funds; |
| • | that Barclays or one of its affiliates has agreed to pay all expenses of the Funds in connection with the Board’s consideration of the New Advisory Agreements and all costs of seeking shareholder approval of the New Advisory Agreements; and |
| • | that Barclays and BlackRock would derive benefits from the Transaction and that, as a result, they may have a different financial interest in the matters that were being considered than do Fund shareholders. |
The Board did not identify any particular information that was all-important or controlling, and each Director may have attributed different weights to the various factors discussed below. The Directors evaluated all information available to them on a Fund-by-Fund basis, and their determinations were made separately in respect of each Fund. In their deliberations, the Directors considered information received
| BOARD REVIEWAND APPROVALOF NEW INVESTMENT ADVISORY AGREEMENTS | 29 |
Table of Contents
Board Review and Approval of New Investment Advisory
Agreements (Unaudited) (Continued)
iSHARES®, INC.
in connection with their most recent approval or continuation of each Current Advisory Agreement at the June 2009 Board meeting, in addition to information provided by BGI, the Adviser and BlackRock regarding BlackRock and the Transaction, in connection with their evaluation of the terms and conditions of the New Advisory Agreements. The Directors, including a majority of the Independent Directors, concluded that the terms of the New Advisory Agreements are appropriate, that the fees to be paid are reasonable in light of the services to be provided to each Fund, and that the New Advisory Agreements should be approved and recommended to Fund shareholders. In voting to approve the New Advisory Agreements in respect of each Fund, the Board considered in particular the following factors:
The nature, extent and quality of services to be provided by the Adviser and its affiliates – In connection with their consideration of the New Advisory Agreements, the Board considered representations by the Adviser, BGI and BlackRock that there would be no diminution in the scope of services required of or provided by the Adviser under the New Advisory Agreements for each Fund as compared to the scope of services provided by the Adviser under the Current Advisory Agreement. In reviewing the scope of these services at the June and August 2009 Board meetings, the Board considered the Adviser’s investment philosophy and experience, noting that the Adviser and its affiliates have committed significant resources over time, including over the past year, including investments in technology and increasing the number of their employees supporting the Funds. The Board also considered the Adviser’s compliance program and its compliance record with respect to the Funds. In that regard, the Board noted that the Adviser reports to the Board about portfolio management and compliance matters on a periodic basis in connection with regularly scheduled meetings of the Board, and has made appropriate officers available as needed to provide further assistance with these matters. The Board noted that it expects that these reports and discussions will continue following the consummation of the Transaction. In addition to the above considerations, the Board considered the Adviser’s investment processes and strategies, and matters related to the Adviser’s portfolio transaction policies and procedures. The Board further took into account that, with respect to most of the Funds, the Adviser does not serve as investment adviser for other series of registered investment companies with substantially similar investment objectives and strategies; therefore, directly comparable performance information was generally not available for most Funds. The Board also considered each Fund’s record of performing in accordance with its investment objective.
In connection with the investment advisory services to be provided under the New Advisory Agreements, the Board took into account detailed discussions with representatives of the Adviser at the June 2009 Board meeting and at prior Board meetings regarding the management of each Fund. In addition to the investment advisory services to be provided to the Funds, the Board, at the August 2009 Board meeting, considered that the Adviser also will continue to provide management and administrative services, shareholder services, oversight of Fund accounting, marketing services, assistance in meeting legal and regulatory requirements and other services necessary for the operation of the Funds, and that these services were expected to be consistent with the services the Adviser currently performs under the Current Advisory Agreements.
The Board noted the representations of the Adviser, BGI and BlackRock that the Transaction was not expected to have any adverse effect on the resources and strengths of the Adviser in managing the Funds. The Board also considered that the Funds and their shareholders may benefit from having direct access to BlackRock’s state of the art technology and risk management analytic tools, including the investment tools provided under the BlackRock Solutions® brand name. The Board discussed BlackRock’s current financial condition, its anticipated financial condition following the completion of the Transaction and its lines of business. The Board also discussed the Adviser’s anticipated financial condition following the completion of the Transaction. The Board discussed BlackRock’s current ownership structure and expected ownership structure following the completion of the Transaction. The Board was advised that BlackRock operates as an independent firm, with its own Board of Directors and no majority shareholder. The Board was also advised that while BlackRock’s largest shareholders, Merrill Lynch, a wholly owned subsidiary of Bank of America, and PNC, are important clients and strategic partners of BlackRock, they are not involved in the firm’s day-to-day management or operations.
| 30 | 2009 iSHARES ANNUAL REPORTTO SHAREHOLDERS |
Table of Contents
Board Review and Approval of New Investment Advisory
Agreements (Unaudited) (Continued)
iSHARES®, INC.
Based on the discussions held and the materials presented at the June, July and August 2009 Board meetings and prior Board meetings, the Board determined that the Transaction would not likely cause an adverse change in the nature, extent and quality of the services to be provided by the Adviser under the New Advisory Agreements compared with the services provided by the Adviser under the Current Advisory Agreements and that the Board expects that the quality of such services will continue to be appropriate.
Funds’ expenses and performance of the Funds – The Board received and reviewed statistical information prepared by Lipper at the June 2009 meeting and also received information at prior meetings regarding the expense ratio components of the Funds, including advisory fees, waivers and reimbursements, and gross and net total expenses, in comparison with the same information for other registered investment companies objectively selected by Lipper as comprising a Fund’s peer group pursuant to Lipper’s proprietary methodology and, for certain Funds, registered investment companies that would otherwise have been excluded from Lipper’s comparison group due to certain differentiating factors, but were nonetheless included at the request of the Adviser (the “Lipper Group”). Because there are few, if any, exchange traded funds or index funds that track indexes similar to those tracked by most of the Funds, the Lipper Groups sometimes included mutual funds, closed-end funds, exchange traded funds, or funds with differing investment objective classifications, investment focuses and other characteristics (e.g., actively managed funds and funds sponsored by “at cost” service providers). In support of its review of the statistical information, the Board was provided with a detailed description of the methodology used by Lipper to determine the applicable Lipper Groups and to prepare this information. The Board further noted that due to the limitations in providing comparable funds in the various Lipper Groups, the statistical information may or may not provide meaningful direct comparisons to certain Funds.
The Board noted that the investment advisory fees and overall expenses for the Funds were generally lower than the median or average investment advisory fee rates and overall expenses of the Funds in their Lipper Groups with respect to the Current and New Advisory Agreements. The Board took into account that the fee rates for each Fund under the New Advisory Agreements are identical to the fee rates under the respective Current Advisory Agreements. Further, the Board noted that representatives of the Adviser and BlackRock had confirmed that there is no present intention to alter the advisory fee rates, expense waivers or expense reimbursements currently in effect for the Funds for a period of two years from the date of the closing of the Transaction.
In addition to reviewing the fees and expenses, the Board noted that it regularly reviews each Fund’s performance and at the June 2009 meeting reviewed statistical information prepared by Lipper regarding the performance of each Fund for the quarter-end, one-, three-, five- and ten-year periods, as applicable, and a comparison of each Fund’s performance to its performance benchmark index for the same periods. To the extent that any of the comparison funds included in the Lipper Groups track the same index as any particular Fund, Lipper also provided, and the Board reviewed, a comparison of the Fund’s performance to that of the relevant comparison funds for the same periods. The Board noted that the Funds generally performed in line with their performance benchmark indices over the relevant periods. In considering this information, the Board took into account that the Lipper Groups include funds that may have different investment objectives and/or benchmarks from the Funds. In addition, the Board noted that each Fund seeks to track its benchmark index and that during the prior year the Board received periodic reports on the Funds’ performance in comparison with their relevant benchmark indices. This comparative performance information was also considered by the Board. The Board considered the Adviser’s substantial investment advisory experience and capabilities, as well as the possibility of additional resources and support from BlackRock following the completion of the Transaction, but noted that the effect, if any, the consummation of the Transaction would have on the future performance of the Funds could not be predicted.
Based on this review, the Board had concluded that the investment advisory fee rates and expense levels and the historical performance of each Fund, as compared to the investment advisory fee rates and expense levels and performance of the funds in the relevant Lipper Group, were satisfactory for the purposes of approving the Current Advisory Agreements and concluded that these comparisons continued to be satisfactory for the purpose of approving the New Advisory Agreements.
| BOARD REVIEWAND APPROVALOF NEW INVESTMENT ADVISORY AGREEMENTS | 31 |
Table of Contents
Board Review and Approval of New Investment Advisory
Agreements (Unaudited) (Continued)
iSHARES®, INC.
Cost of services provided and profits realized by the Adviser from the relationship with each Fund – The Board considered that at the June 2009 Board meeting and at prior meetings, it had reviewed information about the profitability of the Adviser with respect to the Funds based on the fees payable to the Adviser and its affiliates (including fees under the Current Advisory Agreements), and all other sources of revenue and expense to the Adviser and its affiliates from the Funds’ operations for the last calendar year. The Board discussed the sources of direct and ancillary revenue with management, including the revenues to BGI from securities lending by the Companies (including any securities lending by the Funds). The Board also discussed the Adviser’s profit margin as reflected in the Funds’ profitability analysis and reviewed information regarding economies of scale (as discussed below).
In evaluating the costs of the services to be provided by the Adviser under the New Advisory Agreements, the Board considered, among other things, whether advisory fee rates or other expenses would change as a result of the Transaction. The Board noted that the New Advisory Agreements are similar to the Current Advisory Agreements, including the fact that the fee rates under the Agreements are identical and that representatives of the Adviser and BlackRock represented that there is no present intention due to the Transaction to alter the advisory fee rates, expense waiver or expense reimbursements currently in effect for the Funds for a period of two years from the date of the closing of the Transaction. It was noted that it was not possible to predict how the Transaction would affect the Adviser’s profitability from its relationship with the Funds. Potential cost savings had been described by BlackRock representatives that may be achieved by BlackRock immediately following the Transaction, but even if all of such savings were realized by the Adviser in connection with the management of the Funds, the Adviser’s profitability in respect of the Funds was not expected to increase in a significant respect. The Adviser, BlackRock and the Board discussed how profitability will be calculated and presented to the Board following the Transaction, and the Board reviewed BlackRock’s 2008 profitability methodology with respect to its registered funds. The Board expects to receive profitability information from the Adviser on at least an annual basis following the completion of the Transaction and thus be in a position to evaluate whether any adjustments in Fund fees would be appropriate.
The extent to which economies of scale would be realized as a Fund grows and whether fee levels would reflect such economies of scale – In connection with its review of the Funds’ profitability analysis at the June 2009 meeting, the Board reviewed information regarding potential economies of scale or other efficiencies that may result from increases in the Funds’ assets. At the June 2009 Board meeting, the Board also reviewed the Adviser’s historic profitability as investment adviser to the iShares fund complex and noted that the Adviser had continued to make significant investments in the iShares fund complex, that expenses had grown at a pace similar to the growth in revenue, and that the Adviser had incurred operating losses during earlier years when the iShares funds, including the Funds, had not yet reached scale. The Board further noted that the Current and New Advisory Agreements provide for breakpoints in certain Funds’ investment advisory fee rates as the assets of the Funds, on an aggregated basis with the assets of certain other Funds, increase and that breakpoints were implemented the previous year for certain Funds. The Board noted that for certain other Funds, the Current and New Advisory Agreements do not provide for any breakpoints in the Funds’ investment advisory fee rates as the assets of the Funds increase; however, the Board further noted that possible future economies of scale for those Funds had, in many cases, been taken into consideration by fixing the investment advisory fees at rates at the lower end of the marketplace, effectively giving Fund shareholders, from inception, the benefits of the lower average fee shareholders may have received from a fee structure with declining breakpoints where the initial fee was higher. At the June 2009 Board meeting, the Board, recognizing its responsibility to consider this issue at least annually, concluded that the structure of the investment advisory fee rates, with the breakpoints for certain Funds, reflected appropriate sharing of economies of scale with the Funds’ shareholders.
The Board noted representations from the Adviser and BlackRock that the Adviser will continue to make significant investments in the iShares fund complex and the infrastructure supporting the Funds. The Board determined that changes to the fee structure were not currently necessary and that the Funds appropriately participate in economies of scale. It was noted that it was not possible to evaluate how the Transaction would create opportunities for additional economies of scale. The Board expects to consider economies of scale on at least an annual basis following completion of the Transaction and thus be in a position to evaluate additional economies of scale, if any.
| 32 | 2009 iSHARES ANNUAL REPORTTO SHAREHOLDERS |
Table of Contents
Board Review and Approval of New Investment Advisory
Agreements (Unaudited) (Continued)
iSHARES®, INC.
Fees and services provided for other comparable funds/accounts managed by the Adviser and its Affiliates – At the June 2009 Board meeting, the Board received and considered certain information regarding the Funds’ annual investment advisory fee rates under the Current Advisory Agreements in comparison to the investment advisory/management fee rates for other funds/accounts for which the Adviser or BGI provides investment advisory/management services, including other funds registered under the 1940 Act, collective funds and separate accounts (together, the “Other Accounts”). The Board noted that directly comparable investment advisory/management fee information was not available for many of the Funds, as the Adviser and its affiliates do not manage any Other Accounts with substantially similar investment objectives and strategies as many of the Funds. The Board noted, however, that the Adviser provided the Board with general information regarding how the level of services provided to the Other Accounts differed from the level of services provided to the Funds. Furthermore, in reviewing the comparative investment advisory/management fee information for the Funds for which such information was available, the Board considered the general structure of investment advisory/management fees in relation to the nature and extent of services provided to the Funds in comparison with the nature and extent of services provided to the Other Accounts, including, among other things, the level of complexity in managing the Funds and the Other Accounts under differing regulatory requirements and client guidelines. The Board noted that the investment advisory fee rates under the Current Advisory Agreements for the Funds were generally higher than the investment advisory/management fee rates for the Other Accounts for which the Adviser or BGI provides investment advisory/management services, but that the differences appeared to be attributable to, among other things, the type and level of services provided and/or the asset levels of the Other Accounts. Based on this review, the Board determined that the investment advisory fee rates under the Current and New Advisory Agreements do not constitute fees that are so disproportionately large as to bear no reasonable relationship to the services rendered and that could not have been the product of arm’s-length bargaining, and concluded that the investment advisory fee rates under the Current and New Advisory Agreements are fair and reasonable.
Other benefits to the Adviser and its affiliates, including fall-out benefits – In evaluating the fall-out and any other ancillary benefits received by the Adviser under the Current Advisory Agreements, the Board reviewed any ancillary revenue received by the Adviser and/or its affiliates in connection with the services provided to the Funds by the Adviser or its affiliates, such as any payment of revenue to BGI, the Company’s current securities lending agent, for loaning any portfolio securities, and payment of advisory fees and/or administration fees to the Adviser and BGI in connection with any investments by the Funds in other funds for which the Adviser provides investment advisory services and/or BGI provides administration services. The Board noted that while revenue to BGI in connection with securities lending agency services to the Funds increased overall as against the previous year, overall revenue increased by approximately the same percentage as overall expenses. The Board noted that the Adviser does not use soft dollars or consider the value of research or other services that may be provided to the Adviser (including its affiliates) in selecting brokers for portfolio transactions for the Funds. The Board further noted that any portfolio transactions on behalf of the Funds placed through an affiliate of the Adviser or purchased from an underwriting syndicate in which an Adviser affiliate participates, are reported to the Board pursuant to Rule 17e-1 or Rule 10f-3, as applicable, under the 1940 Act. Any fall-out or ancillary benefits as a result of the Transaction were difficult to quantify with certainty at this time, and the Board indicated that it would continue to evaluate them going forward.
Conclusion – The Board examined the totality of the information they were provided at the June, July and August 2009 Board meetings, and information they received at other meetings held during the past year, and did not identify any single factor discussed previously as controlling. Based on this analysis, the Board determined that the New Advisory Agreements, including the investment advisory fee rates there under, are fair and reasonable in light of all relevant circumstances and concluded that it is in the best interest of the Funds and their shareholders to unanimously approve the New Advisory Agreements.
| BOARD REVIEWAND APPROVALOF NEW INVESTMENT ADVISORY AGREEMENTS | 33 |
Table of Contents
Supplemental Information (Unaudited)
iSHARES®, INC.
The table that follows presents information about the differences between the daily market price on secondary markets for shares of the Fund and the Fund’s net asset value. Net asset value, or “NAV,” is the price per share at which the Fund issues and redeems shares. It is calculated in accordance with the standard formula for valuing mutual fund shares. The “Market Price” of the Fund generally is determined using the midpoint between the highest bid and the lowest offer on the primary stock exchange on which the shares of the Fund is listed for trading, as of the time that the Fund’s NAV is calculated. The Fund’s Market Price may be at, above or below its NAV. The NAV of the Fund will fluctuate with changes in the market value of its portfolio holdings. The Market Price of the Fund will fluctuate in accordance with changes in its NAV, as well as market supply and demand.
Premiums or discounts are the differences (expressed as a percentage) between the NAV and Market Price of the Fund on a given day, generally at the time NAV is calculated. A premium is the amount that the Fund is trading above the reported NAV, expressed as a percentage of the NAV. A discount is the amount that the Fund is trading below the reported NAV, expressed as a percentage of the NAV.
The following information shows the frequency distributions of premiums and discounts for the Fund. The information shown for the Fund is for five calendar years through the date of the most recent calendar quarter-end.
Each line in the table shows the number of trading days in which the Fund traded within the premium/discount range indicated. The number of trading days in each premium/discount range is also shown as a percentage of the total number of trading days in the period covered by the table. All data presented here represents past performance, which cannot be used to predict future results.
iShares MSCI Japan Index Fund
Period Covered: January 1, 2004 through June 30, 2009
Premium/Discount Range | Number of Days | Percentage of Total Days | |||
Greater than 6.0% | 2 | 0.14 | % | ||
Greater than 5.5% and Less than 6.0% | 1 | 0.07 | |||
Greater than 5.0% and Less than 5.5% | 2 | 0.14 | |||
Greater than 4.5% and Less than 5.0% | 3 | 0.22 | |||
Greater than 4.0% and Less than 4.5% | 4 | 0.29 | |||
Greater than 3.5% and Less than 4.0% | 8 | 0.58 | |||
Greater than 3.0% and Less than 3.5% | 5 | 0.36 | |||
Greater than 2.5% and Less than 3.0% | 11 | 0.80 | |||
Greater than 2.0% and Less than 2.5% | 16 | 1.16 | |||
Greater than 1.5% and Less than 2.0% | 50 | 3.62 | |||
Greater than 1.0% and Less than 1.5% | 99 | 7.16 | |||
Greater than 0.5% and Less than 1.0% | 225 | 16.28 | |||
Between 0.5% and –0.5% | 604 | 43.73 | |||
Less than –0.5% and Greater than –1.0% | 153 | 11.07 | |||
Less than –1.0% and Greater than –1.5% | 81 | 5.86 | |||
Less than –1.5% and Greater than –2.0% | 47 | 3.40 | |||
Less than –2.0% and Greater than –2.5% | 26 | 1.88 | |||
Less than –2.5% and Greater than –3.0% | 14 | 1.01 | |||
Less than –3.0% and Greater than –3.5% | 8 | 0.58 | |||
Less than –3.5% and Greater than –4.0% | 6 | 0.43 | |||
Less than –4.0% and Greater than –4.5% | 6 | 0.43 | |||
Less than –4.5% and Greater than –5.0% | 2 | 0.14 | |||
Less than –5.0% and Greater than –5.5% | 4 | 0.29 | |||
Less than –5.5% | 5 | 0.36 | |||
| 1,382 | 100.00 | % | |||
| 34 | 2009 iSHARES ANNUAL REPORTTO SHAREHOLDERS |
Table of Contents
Director and Officer Information (Unaudited)
iSHARES®, INC.
The Board of Directors has responsibility for the overall management and operations of the Company, including general supervision of the duties performed by BGFA and other service providers. Each Director serves until his or her successor is duly elected or appointed and qualified. Each Officer serves until he or she resigns, is removed, dies, retires or becomes disqualified.
iShares, Inc., iShares Trust, Barclays Global Investors Funds (“BGIF”) and Master Investment Portfolio (“MIP”) are considered to be members of the same fund complex, as defined in Form N-1A under the 1940 Act. Each Director of iShares, Inc. also serves as a Trustee for iShares Trust and oversees 183 portfolios within the fund complex. In addition, Lee T. Kranefuss serves as a Trustee for BGIF and MIP and oversees an additional 26 portfolios within the fund complex.
The address of each Director and Officer is c/o Barclays Global Investors, N.A., 400 Howard Street, San Francisco, California 94105. The Board has designated George G.C. Parker as its Lead Independent Director. Additional information about the Funds’ Directors and Officers may be found in the Funds’ combined Statement of Additional Information, which is available without charge, upon request, by calling toll-free 1-800-474-2737.
Interested Directors and Officers
| Name, Age | Position(s), Length of Service | Principal Occupation(s) During Past 5 Years | Other Directorships Held | |||
*Lee T. Kranefuss, 48 | Director and Chairman (since 2003). | Non-Executive Chairman (since 2009), iShares; Global Chief Executive Officer (2008-2009) of iShares/Intermediary Groups of BGI; Chief Executive Officer (2005-2008) of iShares Intermediary Index and Market Group of BGI; Chief Executive Officer (2003-2005) of the Intermediary Investor and Exchange Traded Products Business of BGI; Director (since 2005) of BGFA; Director, President and Chief Executive Officer (since 2005) of Barclays Global Investors International, Inc.; Director and Chairman (since 2005) of Barclays Global Investors Services. | Trustee (since 2003) of iShares Trust; Trustee (since 2001) of BGlF and MIP. | |||
| * | Lee T. Kranefuss is deemed to be an “interested person” (as defined in the 1940 Act) of the Company due to his affiliations with BGFA, the Funds’ investment adviser; BGI, the parent company of BGFA; and Barclays Global Investors Services, an affiliate of BGFA and BGI. |
| DIRECTORAND OFFICER INFORMATION | 35 |
Table of Contents
Director and Officer Information (Unaudited) (Continued)
iSHARES®, INC.
Independent Directors
| Name, Age | Position(s), Length of Service | Principal Occupation(s) During Past 5 Years | Other Directorships Held | |||
George G.C. Parker, 70 | Director (since 2002); Lead Independent Director (since 2006). | Dean Witter Distinguished Professor of Finance (since 1994), Emeritus, Stanford University: Graduate School of Business. | Trustee (since 2000) of iShares Trust; Lead Independent Trustee (since 2006) of iShares Trust; Director (since 1995) of Community First Financial Group; Director (since 1999) of Tejon Ranch Company; Director (since 2004) of Threshold Pharmaceuticals; Director (since 2007) of NETGEAR, Inc. | |||
J. Darrell Duffie, 55 | Director (since 2008). | Professor (since 1984) of Stanford University: Graduate School of Business. | Trustee (since 2008) of iShares Trust; Director (since 2008) of Moody’s Corp. | |||
Cecilia H. Herbert, 60 | Director (since 2005). | Chair (1994-2005) of Investment Committee, Archdiocese of San Francisco; Director (since 1998) and President (since 2007) of the Board of Directors, Catholic Charities CYO; Trustee (2004-2005) of Pacific Select Funds; Trustee (since 2002) and Chair (2006-2007) of the Finance and Investment Committees (since 2006) of the Thacher School. | Trustee (since 2005) of iShares Trust; Advisory Board Member (since 2009) of Forward Funds. | |||
Charles A. Hurty, 66 | Director (since 2005). | Retired; Partner, KPMG LLP (1968-2001). | Trustee (since 2005) of iShares Trust; Director (since 2002) of ProMark Absolute Return Strategies Fund LLC (1 portfolio); Director (since 2002) of Citigroup Alternative Investments Multi-Adviser Hedge Fund Portfolios LLC (1 portfolio); Director (since 2005) of CSFB Alternative Investments Fund (6 portfolios). | |||
John E. Kerrigan, 54 | Director (since 2005). | Chief Investment Officer (since 2002) of Santa Clara University. | Trustee (since 2005) of iShares Trust. | |||
*John E. Martinez, 48 | Director (since 2003). | Director (since 2005) of EquityRock Capital Management; Director (since 2003) of Larkin Street Youth Services. | Trustee (since 2003) of iShares Trust; Chairman (since 2007) of Independent Review Committee, Canadian iShares Funds. | |||
| 36 | 2009 iSHARES ANNUAL REPORTTO SHAREHOLDERS |
Table of Contents
Director and Officer Information (Unaudited) (Continued)
iSHARES®, INC.
Independent Directors (Continued)
| Name, Age | Position(s), Length of Service | Principal Occupation(s) During Past 5 Years | Other Directorships Held | |||
Robert H. Silver, 54 | Director (since 2007). | President and Co-Founder (since 2006) of The Bravitas Group, Inc.; Member (since 2006) of Non-Investor Advisory Board of Russia Partners II, LP; Director and member (2006-2009) of the Audit and Compensation Committee of EPAM Systems, Inc.; President and Chief Operating Officer (2003-2005) and Director (1999-2005) of UBS Financial Services, Inc.; President and Chief Executive Officer (1999-2005) of UBS Services USA, LLC; Managing Director (2000-2005) of UBS America, Inc.; Director and Vice Chairman (since 2001) of the YMCA of Greater NYC; Broadway Producer (since 2006); Co-Founder and Vice President (since 2008) of Parentgiving Inc. | Trustee (since 2007) of iShares Trust. |
| * | Prior to August 13, 2009, John E. Martinez was deemed to be an “interested person” (as defined in the 1940 Act) of the Trust due to his affiliations with BGFA, the Funds’ investment adviser; BGI, the parent company of BGFA; and Barclays Global Investors Services, an affiliate of BGFA and BGI. Effective August 13, 2009, John E. Martinez is a non-interested person notwithstanding his former affiliation with BGFA and its affiliates prior to 2002. |
Officers
| Name, Age | Position(s), Length of Service | Principal Occupation(s) During Past 5 Years | Other Directorships Held | |||
Michael A. Latham, 44 | President (since 2007). | Head (since 2007) of Americas iShares, BGI; Chief Operating Officer (2003-2007) of the Intermediary Investor and Exchange Traded Products Business of BGI; Director and Chief Financial Officer (since 2005) of Barclays Global Investors International, Inc. | None. |
| DIRECTORAND OFFICER INFORMATION | 37 |
Table of Contents
Director and Officer Information (Unaudited) (Continued)
iSHARES®, INC.
Officers (Continued)
| Name, Age | Position(s), Length of Service | Principal Occupation(s) During Past 5 Years | Other Directorships Held | |||
Geoffrey D. Flynn, 52 | Executive Vice President and Chief Operating Officer (since 2008). | Chief Operating Officer (since 2008) of U.S. iShares, BGI; Director (2007-2008) of Mutual Fund Operations of BGI; President (2003-2007) of Van Kampen Investors Services; Managing Director (2002-2007) of Morgan Stanley; President (2002-2007) of Morgan Stanley Trust, FSB. | None. | |||
Jack Gee, 50 | Treasurer and Chief Financial Officer (since 2008). | Senior Director (since 2009) of Fund Administration of Intermediary Investor Business of BGI; Director (2004-2009) of Fund Administration of Intermediary Investor Business of BGI; Treasurer and Chief Financial Officer (2004) of Parnassus Investments. | None. | |||
Eilleen M. Clavere, 57 | Secretary (since 2007). | Director (since 2006) of Legal Administration of Intermediary Investors Business of BGI; Legal Counsel and Vice President (2005-2006) of Atlas Funds, Atlas Advisers, Inc. and Atlas Securities, Inc.; Counsel (2001-2005) of Kirkpatrick & Lockhart LLP. | None. | |||
Ira P. Shapiro, 46 | Vice President and Chief Legal Officer (since 2007). | Associate General Counsel (since 2004) of BGI; First Vice President (1993-2004) of Merrill Lynch Investment Managers. | None. | |||
Amy Schioldager, 47 | Executive Vice President (since 2007). | Global Head (since 2008) of Index Equity, BGI; Global Head (2006-2008) of U.S. Indexing, BGI; Head (2001-2006) of Domestic Equity Portfolio Management, BGI. | None. | |||
Patrick O’Connor, 42 | Vice President (since 2007). | Head (since 2006) of iShares Portfolio Management, BGI; Senior Portfolio Manager (1999-2006) of BGI. | None. | |||
| 38 | 2009 iSHARES ANNUAL REPORTTO SHAREHOLDERS |
Table of Contents
Director and Officer Information (Unaudited) (Continued)
iSHARES®, INC.
Officers (Continued)
| Name, Age | Position(s), Length of Service | Principal Occupation(s) During Past 5 Years | Other Directorships Held | |||
Lee Sterne, 44 | Vice President (since 2007). | Head (since 2007) of U.S. Fixed Income Index and iShares, BGI; Senior Portfolio Manager (2004-2007) of BGI; Portfolio Manager (2001-2004) of BGI. | None. | |||
Matt Tucker, 37 | Vice President (since 2007). | Director (since 2009) of Fixed Income Investment Strategy, BGI; Head (2005-2008) of U.S. Fixed Income Investment Solutions, BGI; Fixed Income Investment Strategist (2003-2005) of BGI. | None. | |||
| DIRECTORAND OFFICER INFORMATION | 39 |
Table of Contents
The following is a list of iShares Funds being offered, along with their respective exchange trading symbols. Please call 1-800-iShares (1-800-474-2737) to obtain a prospectus for any iShares Fund. The prospectus contains more complete information, including charges, expenses, investment objectives and risk factors that should be carefully considered to determine if the Fund(s) are an appropriate investment for you. Read the prospectus(es) carefully before investing. Investing involves risk, including possible loss of principal.
Trading Symbol | ||
| iShares Russell Domestic Index Funds | ||
iShares Russell 3000 | IWV | |
iShares Russell 3000 Growth | IWZ | |
iShares Russell 3000 Value | IWW | |
iShares Russell Top 200 | IWL | |
iShares Russell Top 200 Growth | IWY | |
iShares Russell Top 200 Value | IWX | |
iShares Russell 1000 | IWB | |
iShares Russell 1000 Growth | IWF | |
iShares Russell 1000 Value | IWD | |
iShares Russell Midcap | IWR | |
iShares Russell Midcap Growth | IWP | |
iShares Russell Midcap Value | IWS | |
iShares Russell 2000 | IWM | |
iShares Russell 2000 Growth | IWO | |
iShares Russell 2000 Value | IWN | |
iShares Russell Microcap | IWC | |
| iShares S&P Domestic Index Funds | ||
iShares S&P 1500 | ISI | |
iShares S&P 100 | OEF | |
iShares S&P 500 | IVV | |
iShares S&P 500 Growth | IVW | |
iShares S&P 500 Value | IVE | |
iShares S&P MidCap 400 | IJH | |
iShares S&P MidCap 400 Growth | IJK | |
iShares S&P MidCap 400 Value | IJJ | |
iShares S&P SmallCap 600 | IJR | |
iShares S&P SmallCap 600 Growth | IJT | |
iShares S&P SmallCap 600 Value | IJS | |
| iShares Morningstar Domestic Index Funds | ||
iShares Morningstar Large Core | JKD | |
iShares Morningstar Large Growth | JKE | |
iShares Morningstar Large Value | JKF | |
iShares Morningstar Mid Core | JKG | |
iShares Morningstar Mid Growth | JKH | |
iShares Morningstar Mid Value | JKI | |
iShares Morningstar Small Core | JKJ | |
iShares Morningstar Small Growth | JKK | |
iShares Morningstar Small Value | JKL | |
| iShares Dow Jones Domestic Index Funds | ||
iShares Dow Jones U.S. | IYY | |
| iShares KLD Socially Responsible Index Funds | ||
iShares FTSE KLD 400 Social | DSI | |
iShares FTSE KLD Select Social | KLD | |
| iShares NYSE Domestic Index Funds | ||
iShares NYSE Composite | NYC | |
iShares NYSE 100 | NY | |
Trading Symbol | ||
| iShares Domestic Specialty Index Funds | ||
iShares S&P U.S. Preferred Stock | PFF | |
iShares Dow Jones Select Dividend | DVY | |
| iShares North American Sector/Subsector Index Funds | ||
iShares S&P North American Technology Sector | IGM | |
iShares S&P North American Technology-Multimedia Networking | IGN | |
iShares S&P North American Technology- Semiconductors | IGW | |
iShares S&P North American Technology-Software | IGV | |
iShares S&P North American Natural Resources Sector | IGE | |
| iShares Domestic Sector Index Funds | ||
iShares Dow Jones U.S. Basic Materials Sector | IYM | |
iShares Dow Jones U.S. Consumer Goods Sector | IYK | |
iShares Dow Jones U.S. Consumer Services Sector | IYC | |
iShares Dow Jones U.S. Energy Sector | IYE | |
iShares Dow Jones U.S. Financial Sector | IYF | |
iShares Dow Jones U.S. Healthcare Sector | IYH | |
iShares Dow Jones U.S. Industrial Sector | IYJ | |
iShares Dow Jones U.S. Technology Sector | IYW | |
iShares Dow Jones U.S. Telecommunications Sector | IYZ | |
iShares Dow Jones U.S. Utilities Sector | IDU | |
| iShares Domestic Subsector Index Funds | ||
iShares Dow Jones Transportation Average | IYT | |
iShares Dow Jones U.S. Aerospace & Defense | ITA | |
iShares Dow Jones U.S. Broker-Dealers | IAI | |
iShares Dow Jones U.S. Financial Services | IYG | |
iShares Dow Jones U.S. Healthcare Providers | IHF | |
iShares Dow Jones U.S. Home Construction | ITB | |
iShares Dow Jones U.S. Insurance | IAK | |
iShares Dow Jones U.S. Medical Devices | IHI | |
iShares Dow Jones U.S. Oil & Gas Exploration & Production | IEO | |
iShares Dow Jones U.S. Oil Equipment & Services | IEZ | |
iShares Dow Jones U.S. Pharmaceuticals | IHE | |
iShares Dow Jones U.S. Regional Banks | IAT | |
iShares Nasdaq Biotechnology | IBB | |
| iShares Domestic Real Estate Index Funds | ||
iShares Cohen & Steers Realty Majors | ICF | |
iShares Dow Jones U.S. Real Estate | IYR | |
iShares FTSE NAREIT Real Estate 50 | FTY | |
iShares FTSE NAREIT Industrial/Office Capped | FIO | |
iShares FTSE NAREIT Mortgage Plus Capped | REM | |
iShares FTSE NAREIT Residential Plus Capped | REZ | |
iShares FTSE NAREIT Retail Capped | RTL | |
| iShares Target Risk Index Funds | ||
iShares S&P Conservative Allocation | AOK | |
iShares S&P Moderate Allocation | AOM | |
iShares S&P Growth Allocation | AOR | |
iShares S&P Aggressive Allocation | AOA | |
40 | 2009 iSHARES ANNUAL REPORTTO SHAREHOLDERS |
Table of Contents
The iShares® Family of Funds (Continued)
Trading Symbol | ||
| iShares International Country Index Funds | ||
iShares FTSE China (HK Listed) | FCHI | |
iShares FTSE/Xinhua China 25 | FXI | |
iShares MSCI Australia | EWA | |
iShares MSCI Austria Investable Market | EWO | |
iShares MSCI Belgium Investable Market | EWK | |
iShares MSCI Brazil | EWZ | |
iShares MSCI Canada | EWC | |
iShares MSCI Chile Investable Market | ECH | |
iShares MSCI France | EWQ | |
iShares MSCI Germany | EWG | |
iShares MSCI Hong Kong | EWH | |
iShares MSCI Israel Capped Investable Market | EIS | |
iShares MSCI Italy | EWI | |
iShares MSCI Japan | EWJ | |
iShares MSCI Japan Small Cap | SCJ | |
iShares S&P/TOPIX 150 | ITF | |
iShares MSCI Malaysia | EWM | |
iShares MSCI Mexico Investable Market | EWW | |
iShares MSCI Netherlands Investable Market | EWN | |
iShares MSCI All Peru Capped | EPU | |
iShares MSCI Singapore | EWS | |
iShares MSCI South Africa | EZA | |
iShares MSCI South Korea | EWY | |
iShares MSCI Spain | EWP | |
iShares MSCI Sweden | EWD | |
iShares MSCI Switzerland | EWL | |
iShares MSCI Taiwan | EWT | |
iShares MSCI Thailand Investable Market | THD | |
iShares MSCI Turkey Investable Market | TUR | |
iShares MSCI United Kingdom | EWU | |
| iShares International Index Funds | ||
iShares MSCI ACWI ex US | ACWX | |
iShares MSCI EAFE | EFA | |
iShares MSCI EAFE Growth | EFG | |
iShares MSCI EAFE Value | EFV | |
iShares MSCI EAFE Small Cap | SCZ | |
iShares FTSE Developed Small Cap ex-North America | IFSM | |
iShares MSCI Emerging Markets | EEM | |
iShares MSCI Emerging Markets Eastern Europe | ESR | |
iShares S&P Emerging Markets Infrastructure | EMIF | |
iShares MSCI BRIC | BKF | |
iShares MSCI EMU | EZU | |
iShares MSCI All Country Asia ex Japan | AAXJ | |
iShares MSCI Pacific ex-Japan | EPP | |
iShares S&P Asia 50 | AIA | |
iShares S&P Europe 350 | IEV | |
iShares S&P Latin America 40 | ILF | |
| iShares International/Global Real Estate Index Funds | ||
iShares S&P Developed ex-U.S. Property | WPS | |
iShares FTSE EPRA/NAREIT Developed Real Estate ex-U.S. | IFGL | |
iShares FTSE EPRA/NAREIT Developed Asia | IFAS | |
iShares FTSE EPRA/NAREIT Developed Europe | IFEU | |
iShares FTSE EPRA/NAREIT North America | IFNA | |
| iShares International Specialty Index Funds | ||
iShares Dow Jones International Select Dividend | IDV | |
Trading Symbol | ||
| iShares Target Date Index Funds | ||
iShares S&P Target Date Retirement Income | TGR | |
iShares S&P Target Date 2010 | TZD | |
iShares S&P Target Date 2015 | TZE | |
iShares S&P Target Date 2020 | TZG | |
iShares S&P Target Date 2025 | TZI | |
iShares S&P Target Date 2030 | TZL | |
iShares S&P Target Date 2035 | TZO | |
iShares S&P Target Date 2040 | TZV | |
| iShares Global Index Funds | ||
iShares MSCI ACWI | ACWI | |
iShares S&P Global 100 | IOO | |
iShares MSCI Kokusai | TOK | |
| iShares Global Sector Index Funds | ||
iShares S&P Global Consumer Discretionary Sector | RXI | |
iShares S&P Global Consumer Staples Sector | KXI | |
iShares S&P Global Energy Sector | IXC | |
iShares S&P Global Financials Sector | IXG | |
iShares S&P Global Healthcare Sector | IXJ | |
iShares S&P Global Industrials Sector | EXI | |
iShares S&P Global Materials Sector | MXI | |
iShares S&P Global Technology Sector | IXN | |
iShares S&P Global Telecommunications Sector | IXP | |
iShares S&P Global Utilities Sector | JXI | |
| iShares Global Theme Based Index Funds | ||
iShares S&P Global Clean Energy | ICLN | |
iShares S&P Global Infrastructure | IGF | |
iShares S&P Global Nuclear Energy | NUCL | |
iShares S&P Global Timber & Forestry | WOOD | |
| iShares U.S. Multisector Bond Funds | ||
iShares Barclays Aggregate | AGG | |
iShares Barclays Government/Credit | GBF | |
iShares Barclays Intermediate Government/Credit | GVI | |
| iShares U.S. Government Bond Funds | ||
iShares Barclays Short Treasury | SHV | |
iShares Barclays 1-3 Year Treasury | SHY | |
iShares Barclays 3-7 Year Treasury | IEI | |
iShares Barclays 7-10 Year Treasury | IEF | |
iShares Barclays 10-20 Year Treasury | TLH | |
iShares Barclays 20+ Year Treasury | TLT | |
iShares Barclays TIPS | TIP | |
iShares Barclays Agency | AGZ | |
| iShares U.S. Credit Bond Funds | ||
iShares Barclays Credit | CFT | |
iShares Barclays 1-3 Year Credit | CSJ | |
iShares Barclays Intermediate Credit | CIU | |
iShares iBoxx $ Investment Grade Corporate | LQD | |
iShares iBoxx $ High Yield Corporate | HYG | |
| iShares U.S. Securitized Bond Funds | ||
iShares Barclays MBS | MBB | |
iSHARES FAMILYOF FUNDS | 41 |
Table of Contents
The iShares® Family of Funds (Continued)
Trading Symbol | ||
| iShares AMT-Free Municipal Bond Funds | ||
iShares S&P National AMT-Free Municipal | MUB | |
iShares S&P Short Term National AMT-Free Municipal | SUB | |
iShares S&P California AMT-Free Municipal | CMF | |
iShares S&P New York AMT-Free Municipal | NYF |
Trading Symbol | ||
| iShares International Bond Funds | ||
iShares JPMorgan USD Emerging Markets | EMB | |
iShares S&P/Citigroup International Treasury | IGOV | |
iShares S&P/Citigroup 1-3 Year International Treasury | ISHG |
iShares® is a registered trademark of Barclays Global Investors, N.A. (“BGI”). The iShares Funds are not sponsored, endorsed, issued, sold or promoted by Cohen & Steers Capital Management, Inc., Dow Jones & Company, Inc., European Public Real Estate Association (“EPRA®”), FTSE International Limited (“FTSE”), FTSE/Xinhua Index Limited (“FXI”), iBoxx®, J.P. Morgan Securities Inc., MSCI Inc., Morningstar Inc., The NASDAQ OMX Group, Inc., National Association of Real Estate Investment Trusts (“NAREIT”), New York Stock Exchange, Inc., Frank Russell Company or Standard & Poor’s, nor are they sponsored or endorsed by Barclays Capital. None of these companies make any representation regarding the advisability of investing in the iShares Funds. Neither SEI nor BGI, nor any of their affiliates, are affiliated with the companies listed above except Barclays Capital, which is an affiliate of BGI. FXI does not make any warranty regarding the FTSE/Xinhua Index. All rights in the FTSE/Xinhua Index vest in FXI. Neither FTSE nor NAREIT makes any warranty regarding the FTSE NAREIT Real Estate 50/Residential/Retail/Mortgage REITs or Industrial/Office Index; all rights vest in NAREIT. Neither FTSE nor NAREIT makes any warranty regarding the FTSE EPRA/NAREIT Global Real Estate ex-US/North America/Europe/Asia Index; all rights vest in FTSE, NAREIT, and EPRA. All rights in the FTSE Developed Small Cap ex-North America Index vest in FTSE. “FTSE” is a trade- and servicemark of London Stock Exchange and The Financial Times Limited; “Xinhua” is a trade- and servicemark of Xinhua Financial Network Limited. “NAREIT®” is a trademark of NAREIT; “EPRA®” is a trademark of EPRA.
An investment in the Fund(s) is not a deposit of a bank and it is not insured or guaranteed by the Federal Deposit Insurance Corporation or any other government agency.
This advertising section does not constitute part of the 2009 Annual Report.
iS-1437-1009
| 42 | 2009 iSHARES ANNUAL REPORTTO SHAREHOLDERS |
Table of Contents

Table of Contents
Table of Contents

Table of Contents
| 1 | ||
| 4 | ||
| 5 | ||
| 12 | ||
| 15 | ||
| 16 | ||
| 23 | ||
| 24 | ||
Board Review and Approval of Current Investment Advisory Contract (Unaudited) | 25 | |
Board Review and Approval of New Investment Advisory Agreements (Unaudited) | 28 | |
| 34 | ||
| 35 | ||
| 40 |
Table of Contents
Management’s Discussion of Fund Performance
iSHARES® MSCI EMERGING MARKETS INDEX FUND
(TICKER: EEM)
INVESTMENT OBJECTIVE
The iShares MSCI Emerging Markets Index Fund (the “Fund”) seeks to provide investment results that correspond generally to the price and yield performance, before fees and expenses, of the MSCI Emerging Markets IndexSM (the “Index”). The Index is designed to measure equity market performance in the global emerging markets. The Fund invests in a representative sample of securities included in the Index that collectively has an investment profile similar to the Index. Due to the use of representative sampling, the Fund may or may not hold all of the securities that are included in the Index. For the 12-month period ended August 31, 2009 (the “reporting period”), the total return for the Fund was (9.47)%, while the total return for the Index was (9.95)%.
MARKET OVERVIEW AND DISCUSSION OF PERFORMANCE
Emerging markets stocks declined overall for the reporting period in a volatile investment environment. Stock markets in developing countries retracted during the first two months of the reporting period amid one of the worst global economic downturns since World War II and a credit crisis that led to the near-collapse of some of the world’s largest financial institutions. The global economic slowdown began in the U.S., and then spread to the larger nations in Europe and Asia. Emerging market countries felt the effects of the global slowdown as commodity prices declined and exports to developed countries slowed. As investors grew increasingly risk-averse, emerging markets declined during the first two months of the reporting period.
Emerging markets continued to trend lower in late 2008 and early 2009 amid uncertainty about the efforts of governments around the world to arrest the economic downturn and ease the credit crunch. However, in the last six months of the reporting period, emerging markets enjoyed a tremendous recovery. Initial signs of economic stabilization, mainly in the U.S., appeared to boost investor confidence and revive hope of a rebound in exports. In addition, countries such as China were able to maintain their healthy economic growth rate by implementing domestic stimulus plans to offset the drop in exports.
Every region represented in the Index experienced an equity market decline during the reporting period, but markets in Asia generally held up the best. China, the largest country weighting in the Index, posted a modestly positive return, reflecting the country’s efforts to stimulate economic growth. Other positive performers included markets in the Philippines and Indonesia, while Taiwan and South Korea declined modestly.
In Latin America, the two largest markets, Brazil and Mexico, experienced larger market declines. Brazil fell as the prices of oil and other commodities declined during the reporting period, while Mexico declined as U.S. exports weakened and the H1N1 virus outbreak had a negative effect on the tourism industry.
Eastern European markets experienced the largest market declines. Many Eastern European countries were hit hard by the global economic downturn as exports to developed European countries contracted, leading to rising fiscal deficits in several countries. Markets in Russia, which came under pressure as commodity prices slumped, and Hungary declined the most. In the Middle East/Africa, Israel and South Africa held up well as both markets posted small declines.
Seven of the Fund’s ten largest holdings as of August 31, 2009 generated negative returns for the reporting period, led by energy producers OAO Gazprom of Russia and Petroleo Brasileiro SA of Brazil. Other notable decliners included Chinese wireless provider China Mobile Ltd. and South Korean steel producer POSCO. On the positive side, the best performer was South Korean electronics manufacturer Samsung Electronics Co. Ltd., the Fund’s largest holding as of August 31, 2009. The other two positive performers were Taiwan Semiconductor Manufacturing Co. Ltd. and Brazilian commercial bank Itau Unibanco Holding SA.
| MANAGEMENT’S DISCUSSIONOF FUND PERFORMANCE | 1 |
Table of Contents
Management’s Discussion of Fund Performance (Continued)
iSHARES® MSCI EMERGING MARKETS INDEX FUND
Performance as of August 31, 2009
| Average Annual Total Returns | ||||||||||||||||
| Year Ended 8/31/09 | Five Years Ended 8/31/09 | Inception to 8/31/09 | ||||||||||||||
| NAV | MARKET | INDEX | NAV | MARKET | INDEX | NAV | MARKET | INDEX | ||||||||
| (9.47)% | (9.72)% | (9.95)% | 16.47% | 16.44% | 16.59% | 21.31% | 21.23% | 21.15% | ||||||||
| Cumulative Total Returns | ||||||||||||||||
| Year Ended 8/31/09 | Five Years Ended 8/31/09 | Inception to 8/31/09 | ||||||||||||||
| NAV | MARKET | INDEX | NAV | MARKET | INDEX | NAV | MARKET | INDEX | ||||||||
| (9.47)% | (9.72)% | (9.95)% | 114.35% | 114.09% | 115.43% | 244.55% | 242.97% | 242.09% | ||||||||
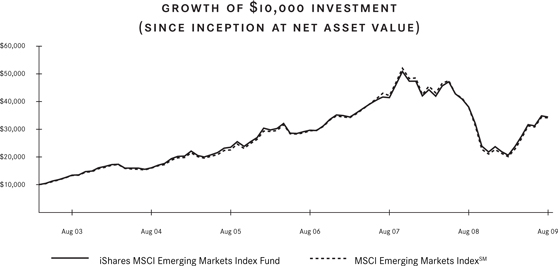
Total returns for the period since inception are calculated from the inception date of the Fund (4/7/03). “Average Annual Total Returns” represent the average annual change in value of an investment over the period(s) indicated. “Cumulative Total Returns” represent the total change in value of an investment over the period(s) indicated.
The Fund’s per share net asset value or ”NAV” is the value of one share of the Fund as calculated in accordance with the standard formula for valuing mutual fund shares. The NAV return is based on the NAV of the Fund and the market return is based on the market price per share of the Fund. The price used to calculate market return (“Market Price”) is determined by using the midpoint between the highest bid and the lowest offer on the primary stock exchange on which the shares of the Fund are listed for trading, as of the time that the Fund’s NAV is calculated. Since shares of the Fund did not trade in the secondary market until after the Fund’s inception, for the period from inception to the first day of secondary market trading in shares of the Fund (4/11/03), the NAV of the Fund is used as a proxy for the Market Price to calculate market returns. Market and NAV returns assume that dividends and capital gain distributions have been reinvested in the Fund at Market Price and NAV, respectively.
An index is a statistical composite that tracks a specified financial market or sector. Unlike the Fund, an index does not actually hold a portfolio of securities and therefore does not incur the expenses incurred by the Fund. These expenses negatively impact the performance of the Fund. Also, market returns do not include brokerage commissions that may be payable on secondary market transactions. If brokerage commissions were included, market returns would be lower. The performance shown in the table(s) and chart(s) above assumes reinvestment of all dividends and capital gain distributions and does not reflect the deduction of taxes that a shareholder would pay on fund distributions or the redemption or sale of fund shares. The investment return and principal value of shares of the Fund will vary with changes in market conditions. Shares of the Fund may be worth more or less than their original cost when they are redeemed or sold in the market. The Fund’s past performance is no guarantee of future results.
| 2 | 2009 iSHARES ANNUAL REPORTTO SHAREHOLDERS |
Table of Contents
Management’s Discussion of Fund Performance (Continued)
iSHARES® MSCI EMERGING MARKETS INDEX FUND
| PORTFOLIO ALLOCATION As of 8/31/09 | |||
| Sector/Investment Type | Percentage of Net Assets | ||
Financial | 23.86 | % | |
Energy | 14.86 | ||
Communications | 13.26 | ||
Basic Materials | 13.03 | ||
Technology | 12.60 | ||
Industrial | 6.80 | ||
Consumer Non-Cyclical | 5.55 | ||
Utilities | 4.16 | ||
Consumer Cyclical | 3.25 | ||
Diversified | 1.73 | ||
Exchange-Traded Funds | 0.45 | ||
Short-Term and Other Net Assets | 0.45 | ||
TOTAL | 100.00 | % | |
| TEN LARGEST FUND HOLDINGS As of 8/31/09 | |||
| Security | Percentage of Net Assets | ||
Samsung Electronics Co. Ltd. SP GDR (South Korea) | 4.28 | % | |
Taiwan Semiconductor Manufacturing Co. Ltd. SP ADR (Taiwan) | 3.36 | ||
Petroleo Brasileiro SA Preferred SP ADR (Brazil) | 2.43 | ||
Itau Unibanco Holding SA SP ADR (Brazil) | 2.43 | ||
POSCO SP ADR (South Korea) | 2.30 | ||
Petroleo Brasileiro SA SP ADR (Brazil) | 2.19 | ||
China Mobile Ltd. (China) | 2.10 | ||
Chunghwa Telecom Co. Ltd. SP ADR (Taiwan) | 2.03 | ||
OAO Gazprom SP ADR (Russia) | 1.78 | ||
KB Financial Group Inc. SP ADR (South Korea) | 1.69 | ||
TOTAL | 24.59 | % | |
| MANAGEMENT’S DISCUSSIONOF FUND PERFORMANCE | 3 |
Table of Contents
Shareholder Expenses (Unaudited)
iSHARES® MSCI EMERGING MARKETS INDEX FUND
As a shareholder of the Fund, you incur two types of costs: (1) transaction costs, including brokerage commissions on purchases and sales of Fund shares and (2) ongoing costs, including management fees and other Fund expenses. The following Example is intended to help you understand your ongoing costs (in dollars and cents) of investing in the Fund and to compare these costs with the ongoing costs of investing in other Funds.
The Example is based on an investment of $1,000 invested at the beginning of the period and held for the entire period from March 1, 2009 to August 31, 2009.
ACTUAL EXPENSES
The first line in the table below provides information about actual account values and actual expenses. You may use the information in this line, together with the amount you invested, to estimate the expenses that you paid over the period. Simply divide your account value by $1,000 (for example, an $8,600 account value divided by $1,000 = 8.6), then multiply the result by the number in the first line under the heading entitled “Expenses Paid During Period” to estimate the expenses you paid on your account during this period.
HYPOTHETICAL EXAMPLE FOR COMPARISON PURPOSES
The second line in the table below provides information about hypothetical account values and hypothetical expenses based on the Fund’s actual expense ratio and an assumed rate of return of 5% per year before expenses, which is not the Fund’s actual return. The hypothetical account values and expenses may not be used to estimate the actual ending account balance or expenses you paid for the period. You may use this information to compare the ongoing costs of investing in your Fund and other Funds. To do so, compare this 5% hypothetical example with the 5% hypothetical examples that appear in the shareholder reports of the other Funds.
Please note that the expenses shown in the table are meant to highlight your ongoing costs only and do not reflect any transactional costs, such as brokerage commissions paid on purchases and sales of Fund shares. Therefore, the second line in the table is useful in comparing ongoing costs only and will not help you determine the relative total costs of owning different Funds. In addition, if these transactional costs were included, your costs would have been higher.
| Beginning Account Value (3/1/09) | Ending Account Value (8/31/09) | Annualized Expense Ratio | Expenses Paid During Perioda (3/1/09 to 8/31/09) | ||||||
Actual | $1,000.00 | $1,671.40 | 0.71 | % | $4.78 | ||||
Hypothetical (5% return before expenses) | 1,000.00 | 1,021.60 | 0.71 | 3.62 |
| a | Expenses are calculated using the Fund’s annualized expense ratio (as disclosed in the table), multiplied by the average account value for the period, multiplied by the number of days in the period (184 days) and divided by the number of days in the year (365 days). |
| 4 | 2009 iSHARES ANNUAL REPORTTO SHAREHOLDERS |
Table of Contents
iSHARES® MSCI EMERGING MARKETS INDEX FUND
August 31, 2009
| Security | Shares | Value | |||
COMMON STOCKS – 91.58% | |||||
BRAZIL – 7.04% | |||||
Aracruz Celulose SA SP ADRa,b | 1,880,055 | $ | 39,706,762 | ||
BRF – Brasil Foods SA SP ADRa,b | 282,915 | 12,499,185 | |||
Centrais Eletricas Brasileiras SA SP ADR | 1,006,776 | 14,487,507 | |||
Companhia de Saneamento Basico do Estado de Sao Paulo SP ADR | 747,024 | 27,341,078 | |||
Companhia Siderurgica Nacional SA SP ADRb | 4,605,384 | 120,154,469 | |||
CPFL Energia SA SP ADRb | 379,200 | 19,847,328 | |||
Empresa Brasileira de Aeronautica SA SP ADR | 4,669,848 | 99,187,571 | |||
Itau Unibanco Holding SA SP ADR | 43,870,596 | 734,832,483 | |||
Petroleo Brasileiro SA SP ADR | 16,751,160 | 664,015,982 | |||
TIM Participacoes SA SP ADRb | 180,335 | 3,833,922 | |||
Vale SA SP ADRb | 17,837,568 | 342,659,681 | |||
Vivo Participacoes SA SP ADR | 948,000 | 21,576,480 | |||
Votorantim Celulose e Papel SA SP ADRa,b | 1,935,854 | 30,605,852 | |||
| 2,130,748,300 | |||||
CHILE – 2.55% | |||||
Banco Santander Chile SA SP ADR | 3,608,088 | 184,625,863 | |||
Empresa Nacional de Electricidad SA SP ADR | 58,776 | 2,710,161 | |||
Enersis SA SP ADR | 10,167,252 | 175,995,132 | |||
LAN Airlines SA SP ADR | 4,809,161 | 56,988,558 | |||
Sociedad Quimica y Minera de Chile SA Series B SP ADR | 10,072,336 | 350,819,463 | |||
| 771,139,177 | |||||
CHINA – 18.23% | |||||
Agile Property Holdings Ltd.b | 37,920,000 | 43,102,862 | |||
Air China Ltd. Class Ha,b | 49,296,000 | 29,002,698 | |||
Aluminum Corp. of China Ltd. Class Hb | 45,504,000 | 48,259,550 | |||
Angang New Steel Co. Ltd. Class Hb | 26,545,320 | 50,346,255 | |||
| Security | Shares | Value | |||
Anhui Conch Cement Co. Ltd. Class Hb | 3,792,000 | $ | 23,997,678 | ||
Bank of China Ltd. Class H | 426,600,000 | 207,502,856 | |||
Bank of Communications Co. Ltd. Class H | 89,218,000 | 105,210,856 | |||
Beijing Capital International Airport Co. Ltd. Class Ha,b | 30,340,000 | 16,871,540 | |||
Beijing Enterprises Holdings Ltd.b | 7,584,000 | 37,378,646 | |||
Belle International Holdings Ltd.b | 30,336,000 | 27,358,820 | |||
Chaoda Modern Agriculture (Holdings) Ltd. | 11,729,942 | 6,961,704 | |||
China Agri-Industries Holdings Ltd. | 26,544,000 | 18,630,613 | |||
China CITIC Bank Class Hb | 26,544,000 | 15,993,559 | |||
China Coal Energy Co. Class H | 32,232,000 | 40,796,052 | |||
China Communications Construction Co. Ltd. Class Hb | 53,088,000 | 60,686,482 | |||
China Construction Bank Class Hb | 426,309,000 | 321,767,550 | |||
China COSCO Holdings Co. Ltd. Class Hb | 43,608,000 | 52,831,584 | |||
China Everbright Ltd.b | 41,940,000 | 98,807,765 | |||
China High Speed Transmission Equipment Group Co. Ltd.b | 3,792,000 | 8,180,248 | |||
China Life Insurance Co. Ltd. Class H | 96,696,000 | 407,960,520 | |||
China Mengniu Dairy Co. Ltd.a | 13,272,000 | 31,439,159 | |||
China Merchants Bank Co. Ltd. Class Hb | 39,489,900 | 86,004,337 | |||
China Merchants Holdings (International) Co. Ltd.b | 15,168,000 | 49,218,478 | |||
China Mobile Ltd. | 65,412,000 | 636,342,087 | |||
China National Building Material Co. Ltd. Class Hb | 22,752,000 | 48,083,420 | |||
| SCHEDULEOF INVESTMENTS | 5 |
Table of Contents
Schedule of Investments (Continued)
iSHARES® MSCI EMERGING MARKETS INDEX FUND
August 31, 2009
| Security | Shares | Value | |||
China Overseas Land & Investment Ltd.b | 55,028,960 | $ | 111,894,669 | ||
China Petroleum & Chemical Corp. Class H | 235,104,000 | 196,257,460 | |||
China Railway Construction Corp. Class Hb | 18,012,000 | 26,632,285 | |||
China Railway Group Ltd. Class Ha,b | 37,920,000 | 32,730,777 | |||
China Resources Enterprise Ltd. | 26,558,000 | 62,294,703 | |||
China Resources Land Ltd.b | 56,880,000 | 119,034,352 | |||
China Resources Power Holdings Co. Ltd. | 20,986,999 | 51,231,061 | |||
China Shenhua Energy Co. Ltd. Class H | 26,544,000 | 107,023,282 | |||
China Shipping Container Lines Co. Ltd. Class Ha,b | 89,112,000 | 32,307,577 | |||
China Shipping Development Co. Ltd. Class Hb | 34,146,000 | 42,778,046 | |||
China Telecom Corp. Ltd. Class H | 53,088,000 | 27,192,475 | |||
China Travel International Investment Hong Kong Ltd.b | 170,640,951 | 33,464,837 | |||
China Unicom (Hong Kong) Ltd.b | 45,504,000 | 63,993,807 | |||
China Yurun Food Group Ltd.b | 3,792,000 | 6,546,155 | |||
CITIC Pacific Ltd.b | 26,544,000 | 70,892,222 | |||
CNOOC Ltd. | 218,040,000 | 286,382,072 | |||
COSCO Pacific Ltd.b | 11,376,000 | 17,113,940 | |||
Datang International Power Generation Co. Ltd. Class Hb | 30,352,000 | 16,134,162 | |||
Denway Motors Ltd.b | 75,840,000 | 33,758,201 | |||
Dongfang Electric Corp. Ltd. Class H | 7,584,000 | 36,987,246 | |||
Dongfeng Motor Group Co. Ltd. Class Hb | 30,336,000 | 31,390,234 | |||
Fosun International Ltd. | 9,480,000 | 7,289,814 | |||
GOME Electrical Appliances Holdings Ltd.a | 77,141,200 | 20,502,909 | |||
Guangdong Investment Ltd. | 26,548,110 | 13,598,343 | |||
| Security | Shares | Value | |||
Guangshen Railway Co. Ltd. Class Hb | 121,414,363 | $ | 52,791,237 | ||
Guangzhou R&F Properties Co. Ltd. Class Hb | 16,684,800 | 27,253,142 | |||
Harbin Power Equipment Co. Ltd. Class Hb | 11,376,000 | 11,301,658 | |||
Hengan International Group Co. Ltd.b | 3,792,000 | 20,988,794 | |||
Huaneng Power International Inc. Class Hb | 41,712,000 | 29,222,860 | |||
Industrial and Commercial Bank of China Ltd. Class H | 494,856,000 | 337,750,800 | |||
Jiangsu Expressway Co. Ltd. Class H | 11,382,000 | 8,987,355 | |||
Jiangxi Copper Co. Ltd. Class Hb | 37,938,000 | 79,198,111 | |||
Lenovo Group Ltd.b | 94,800,000 | 39,996,129 | |||
Li Ning Co. Ltd.b | 7,584,000 | 21,086,644 | |||
Maanshan Iron & Steel Co. Ltd. Class Ha,b | 53,088,000 | 32,740,562 | |||
Parkson Retail Group Ltd. | 4,740,000 | 6,910,646 | |||
PetroChina Co. Ltd. Class H | 208,560,000 | 230,338,565 | |||
PICC Property and Casualty Co. Ltd. Class Ha,b | 26,544,000 | 16,678,508 | |||
Ping An Insurance (Group) Co. of China Ltd. Class H | 21,222,500 | 158,813,132 | |||
Shanghai Industrial Holdings Ltd.b | 7,588,000 | 36,321,444 | |||
Shimao Property Holdings Ltd.b | 21,804,000 | 32,464,136 | |||
Shui On Land Ltd.b | 58,776,450 | 32,532,880 | |||
Sinofert Holdings Ltd.b | 62,166,000 | 28,152,821 | |||
Sino-Ocean Land Holdings Ltd.b | 50,244,000 | 45,507,523 | |||
Sinopec Shanghai Petrochemical Co. Ltd. Class Ha,b | 45,528,000 | 19,384,490 | |||
Tencent Holdings Ltd.b | 9,480,000 | 141,026,108 | |||
Tingyi (Cayman Islands) Holding Corp. | 3,792,000 | 6,790,780 | |||
| 6 | 2009 iSHARES ANNUAL REPORTTO SHAREHOLDERS |
Table of Contents
Schedule of Investments (Continued)
iSHARES® MSCI EMERGING MARKETS INDEX FUND
August 31, 2009
| Security | Shares | Value | |||
Yanzhou Coal Mining Co. Ltd. Class Hb | 41,712,800 | $ | 59,307,936 | ||
Zhejiang Expressway Co. Ltd. Class Hb | 41,712,000 | 39,663,440 | |||
Zijin Mining Group Co. Ltd. Class Hb | 98,592,000 | 82,428,720 | |||
| 5,517,804,369 | |||||
COLOMBIA – 0.40% | |||||
Bancolombia SA SP ADR | 3,379,170 | 120,095,702 | |||
| 120,095,702 | |||||
CZECH REPUBLIC – 1.44% | |||||
CEZ ASb | 6,432,697 | 336,743,873 | |||
Komercni Banka AS | 523,296 | 100,070,425 | |||
| 436,814,298 | |||||
EGYPT – 0.58% | |||||
Orascom Construction Industries Co. SP GDRb | 2,702,690 | 112,107,581 | |||
Orascom Telecom Holding SAE SP GDRb,c | 1,924,676 | 63,706,776 | |||
| 175,814,357 | |||||
HUNGARY – 1.27% | |||||
Magyar Telekom Telecommunications PLC | 4,621,875 | 18,751,785 | |||
MOL Hungarian Oil and Gas Nyrta,b | 1,062,930 | 83,558,190 | |||
OTP Bank Nyrta,b | 4,829,136 | 124,842,831 | |||
Richter Gedeon Nyrtb | 781,152 | 156,815,253 | |||
| 383,968,059 | |||||
INDIA – 6.46% | |||||
HDFC Bank Ltd. SP ADRb | 4,806,360 | 473,474,524 | |||
ICICI Bank Ltd. SP ADR | 11,241,384 | 343,087,040 | |||
Infosys Technologies Ltd. SP ADRb | 9,023,525 | 390,086,986 | |||
Mahanagar Telephone Nigam Ltd. SP ADRb | 6,872,700 | 26,528,622 | |||
Reliance Industries Ltd. SP GDRa,b,d | 4,535,232 | 385,494,720 | |||
Tata Communications Ltd. SP ADRb | 8,028,372 | 163,698,505 | |||
Wipro Ltd. SP ADRb | 10,993,008 | 173,139,876 | |||
| 1,955,510,273 | |||||
| Security | Shares | Value | |||
INDONESIA – 2.31% | |||||
PT Aneka Tambang Tbk | 239,844,000 | $ | 54,131,457 | ||
PT Astra Agro Lestari Tbk | 4,740,000 | 10,110,119 | |||
PT Astra International Tbk | 30,336,000 | 90,737,143 | |||
PT Bank Central Asia Tbk | 170,710,000 | 71,975,942 | |||
PT Bank Danamon Indonesia Tbk | 38,868,487 | 18,123,203 | |||
PT Bank Mandiri Tbk | 103,332,000 | 42,029,881 | |||
PT Bank Rakyat Indonesia Tbk | 87,216,061 | 65,758,141 | |||
PT Bumi Resources Tbk | 362,136,000 | 104,185,951 | |||
PT Indofood Sukses Makmur Tbk | 53,088,000 | 13,166,666 | |||
PT Indosat Tbk | 1,960,060 | 1,020,865 | |||
PT International Nickel Indonesia Tbka | 14,220,000 | 5,960,268 | |||
PT Perusahaan Gas Negara Tbk | 180,122,500 | 62,095,802 | |||
PT Semen Gresik (Persero) Tbk | 13,272,000 | 7,834,167 | |||
PT Telekomunikasi Indonesia Tbk | 117,552,500 | 97,960,416 | |||
PT Unilever Indonesia Tbk | 948,000 | 949,881 | |||
PT United Tractors Tbk | 40,935,150 | 54,823,862 | |||
| 700,863,764 | |||||
ISRAEL – 3.60% | |||||
Bank Hapoalim Ltd.a | 20,277,720 | 65,317,012 | |||
Bank Leumi le-Israela | 26,894,760 | 92,241,038 | |||
Check Point Software Technologies Ltd.a | 1,708,296 | 47,610,209 | |||
Discount Investment Corp. Ltd. | 111,864 | 2,601,743 | |||
Elbit Systems Ltd.b | 1,351,848 | 88,124,428 | |||
Israel Chemicals Ltd.b | 11,504,928 | 128,642,561 | |||
Israel Corp. Ltd. (The)b | 32,232 | 19,317,925 | |||
Israel Discount Bank Ltd. Class A | 31,564,608 | 55,420,368 | |||
Makhteshim-Agan Industries Ltd.b | 5,543,904 | 25,469,024 | |||
Mizrahi Tefahot Bank Ltd.a,b | 10,063,968 | 76,712,015 | |||
NICE Systems Ltd.a | 293,880 | 8,116,131 | |||
Teva Pharmaceutical Industries Ltd. | 8,921,635 | 460,273,922 | |||
| SCHEDULEOF INVESTMENTS | 7 |
Table of Contents
Schedule of Investments (Continued)
iSHARES® MSCI EMERGING MARKETS INDEX FUND
August 31, 2009
| Security | Shares | Value | |||
Teva Pharmaceutical Industries Ltd. SP ADR | 390,576 | $ | 20,114,664 | ||
| 1,089,961,040 | |||||
MALAYSIA – 0.34% | |||||
AMMB Holdings Bhd | 9,752,175 | 11,381,922 | |||
Bumiputra-Commerce Holdings Bhd | 2,034,000 | 5,747,068 | |||
Bursa Malaysia Bhd | 2,930,800 | 6,491,620 | |||
Gamuda Bhd | 12,166,000 | 10,606,168 | |||
Genting Bhd | 3,359,400 | 6,372,509 | |||
Genting Malaysia Bhd | 19,905,500 | 15,770,650 | |||
IGB Corp. Bhd | 4,577,800 | 2,352,923 | |||
IJM Corp. Bhd | 3,701,200 | 6,285,156 | |||
IOI Corp. Bhd | 5,265,000 | 7,639,969 | |||
MMC Corp. Bhd | 3,896,000 | 2,599,915 | |||
Sime Darby Bhd | 1,501,673 | 3,518,047 | |||
SP Setia Bhd | 4,821,300 | 6,133,586 | |||
Tenaga Nasional Bhd | 3,152,700 | 7,180,081 | |||
YTL Corp. Bhd | 4,480,400 | 9,364,119 | |||
YTL Power International Bhd | 306,160 | 192,138 | |||
| 101,635,871 | |||||
MEXICO – 4.97% | |||||
Alfa SAB de CV Series Ab | 7,801,700 | 34,056,051 | |||
America Movil SAB de CV Series L | 181,068,000 | 409,066,490 | |||
Cemex SAB de CV CPOa | 93,323,371 | 123,810,358 | |||
Desarrolladora Homex SAB de CVa | 1,928,300 | 11,398,426 | |||
Fomento Economico Mexicano SAB de CV BD Units | 34,317,600 | 124,939,310 | |||
Grupo Bimbo SAB de CV Series Ab | 568,800 | 3,315,699 | |||
Grupo Carso SAB de CV Series A1b | 1,708,041 | 5,510,534 | |||
Grupo Financiero Banorte SAB de CV Series O | 20,108,856 | 59,168,783 | |||
Grupo Mexico SAB de CV Series Ba | 62,256,363 | 90,447,117 | |||
Grupo Modelo SAB de CV Series Ca | 23,320,898 | 84,938,885 | |||
Grupo Televisa SA CPO | 36,972,000 | 129,523,237 | |||
Industrias Penoles SAB de CV | 1,896,088 | 29,482,791 | |||
| Security | Shares | Value | |||
Kimberly-Clark de Mexico SAB de CV Series A | 13,471,300 | $ | 58,167,833 | ||
Telefonos de Mexico SAB de CV Series L | 81,338,400 | 75,787,472 | |||
Telmex Internacional SAB de CV Series Lb | 86,855,200 | 56,473,373 | |||
Urbi Desarrollos Urbanos SAB de CVa | 6,491,800 | 12,472,842 | |||
Wal-Mart de Mexico SAB de CV Series Vb | 55,552,800 | 197,411,509 | |||
| 1,505,970,710 | |||||
PERU – 0.77% | |||||
Compania de Minas Buenaventura SA SP ADR | 5,746,776 | 145,221,030 | |||
Southern Copper Corp.b | 3,094,272 | 87,444,127 | |||
| 232,665,157 | |||||
PHILIPPINE ISLANDS – 1.37% | |||||
Ayala Corp. | 8,247,603 | 51,975,365 | |||
Ayala Land Inc. | 64,876,200 | 14,292,840 | |||
Bank of the Philippine Islands | 52,708,840 | 48,609,444 | |||
Globe Telecom Inc. | 872,160 | 18,052,702 | |||
Jollibee Foods Corp.e | 68,445,600 | 72,239,951 | |||
Manila Electric Co. | 17,174,202 | 70,745,253 | |||
Metropolitan Bank & Trust Co. | 948,040 | 757,732 | |||
Philippine Long Distance Telephone Co. | 1,086,050 | 56,088,657 | |||
SM Investments Corp. | 3,641,611 | 24,814,749 | |||
SM Prime Holdings Inc. | 262,104,820 | 56,401,283 | |||
| 413,977,976 | |||||
RUSSIA – 5.70% | |||||
JSC MMC Norilsk Nickel SP ADRa | 8,066,465 | 89,537,761 | |||
LUKOIL SP ADR | 5,475,648 | 277,067,789 | |||
Mechel OAO SP ADR | 3,380,568 | 41,276,735 | |||
Mobile TeleSystems SP ADR | 2,155,752 | 93,516,522 | |||
Novolipetsk Steel SP GDRa,c | 1,061,760 | 25,482,240 | |||
OAO Gazprom SP ADR | 25,377,960 | 538,012,752 | |||
OAO NovaTek SP GDRc | 906,288 | 35,879,942 | |||
OAO Tatneft SP ADR | 2,853,482 | 71,337,050 | |||
OJSC Comstar United Telesystems SP GDR | 426,640 | 2,111,868 | |||
OJSC Rosneft Oil Co. SP GDR | 11,677,602 | 75,320,533 | |||
| 8 | 2009 iSHARES ANNUAL REPORTTO SHAREHOLDERS |
Table of Contents
Schedule of Investments (Continued)
iSHARES® MSCI EMERGING MARKETS INDEX FUND
August 31, 2009
| Security | Shares | Value | |||
Polyus Gold SP ADR | 2,277,894 | $ | 45,831,227 | ||
Rostelecom SP ADR | 1,357,539 | 41,024,829 | |||
Sberbank GDRb,c | 743,378 | 126,573,993 | |||
Surgutneftegaz SP ADR | 6,455,880 | 55,520,568 | |||
Uralkali SP GDRa,c | 1,875,713 | 35,826,118 | |||
Vimpel-Communications SP ADRa | 6,772,512 | 104,567,585 | |||
VTB Bank OJSC SP GDRb,c | 12,895,474 | 36,107,327 | |||
Wimm-Bill-Dann Foods OJSC SP ADRa,b | 480,221 | 30,402,791 | |||
| 1,725,397,630 | |||||
SOUTH AFRICA – 8.85% | |||||
Absa Group Ltd. | 621,888 | 10,120,145 | |||
African Bank Investments Ltd. | 19,665,323 | 72,840,608 | |||
African Rainbow Minerals Ltd. | 472,104 | 9,758,661 | |||
Anglo Platinum Ltd.a | 800,847 | 70,945,574 | |||
AngloGold Ashanti Ltd. | 2,244,864 | 85,902,503 | |||
ArcelorMittal South Africa Ltd. | 5,365,374 | 80,458,050 | |||
Aveng Ltd. | 2,844,000 | 15,043,659 | |||
Bidvest Group Ltd. | 4,247,381 | 61,620,657 | |||
Exxaro Resources Ltd. | 2,756,784 | 32,704,037 | |||
FirstRand Ltd. | 49,497,430 | 100,915,949 | |||
Foschini Ltd. | 9,294,248 | 72,777,905 | |||
Gold Fields Ltd. | 7,233,240 | 87,972,528 | |||
Harmony Gold Mining Co. Ltd.a | 4,279,272 | 40,101,435 | |||
Impala Platinum Holdings Ltd. | 6,827,496 | 159,360,980 | |||
Imperial Holdings Ltd. | 5,278,464 | 50,217,193 | |||
Investec Ltd. | 6,437,397 | 48,209,089 | |||
Kumba Iron Ore Ltd. | 705,312 | 22,773,441 | |||
Liberty Holdings Ltd. | 1,356,774 | 11,235,538 | |||
Massmart Holdings Ltd. | 802,008 | 7,980,077 | |||
MTN Group Ltd. | 17,324,642 | 283,596,661 | |||
Murray & Roberts Holdings Ltd. | 3,579,648 | 25,277,241 | |||
Naspers Ltd. Class N | 6,095,640 | 199,174,510 | |||
Nedbank Group Ltd.b | 5,419,103 | 80,199,260 | |||
Netcare Ltd.a | 30,004,210 | 39,831,751 | |||
Northam Platinum Ltd. | 485,557 | 2,497,341 | |||
Pick’n Pay Stores Ltd. | 8,583,692 | 41,547,236 | |||
Pretoria Portland Cement Co. Ltd. | 6,386,214 | 26,343,948 | |||
Remgro Ltd. | 1,551,101 | 17,126,365 | |||
Reunert Ltd. | 2,677,750 | 17,464,671 | |||
| Security | Shares | Value | |||
Sanlam Ltd. | 30,277,663 | $ | 79,689,825 | ||
Sappi Ltd. | 1,722,347 | 6,678,120 | |||
Sasol Ltd. | 7,630,189 | 287,041,306 | |||
Shoprite Holdings Ltd. | 18,990,336 | 141,387,957 | |||
Standard Bank Group Ltd. | 15,042,876 | 194,099,134 | |||
Steinhoff International Holdings Ltd.b | 3,187,176 | 7,128,216 | |||
Tiger Brands Ltd. | 3,226,992 | 64,408,504 | |||
Truworths International Ltd. | 15,793,771 | 79,791,611 | |||
Woolworths Holdings Ltd. | 21,357,039 | 43,186,525 | |||
| 2,677,408,211 | |||||
SOUTH KOREA – 12.28% | |||||
Daewoo Shipbuilding & Marine Engineering Co. Ltd. | 29,030 | 464,889 | |||
Doosan Corp. | 21,770 | 1,452,031 | |||
Doosan Heavy Industries & Construction Co. Ltd. | 231,790 | 11,766,744 | |||
GS Engineering & Construction Corp. | 132,720 | 10,169,993 | |||
Hanjin Heavy Industries & Construction Co. Ltd. | 24,190 | 534,586 | |||
Hynix Semiconductor Inc.a | 1,367,100 | 24,027,420 | |||
Hyundai Engineering & Construction Co. Inc. | 325,410 | 15,685,549 | |||
Hyundai Heavy Industries Co. Ltd. | 375,500 | 57,276,603 | |||
Hyundai Mipo Dockyard Co. Ltd. | 9,675 | 956,732 | |||
Hyundai Motor Co. Ltd. | 60,955 | 5,173,537 | |||
KB Financial Group Inc. SP ADRa,b | 12,577,396 | 512,780,435 | |||
Korea Electric Power Corp. SP ADRa,b | 25,336,248 | 312,902,663 | |||
KT Corp. SP ADRb | 14,392,720 | 224,094,650 | |||
LG Corp. | 151,680 | 9,242,412 | |||
LG Display Co. Ltd. SP ADRb | 12,447,240 | 180,236,035 | |||
NHN Corp.a | 187,575 | 25,532,669 | |||
POSCO SP ADRb | 7,619,712 | 696,898,859 | |||
Samsung C&T Corp. | 417,120 | 18,703,435 | |||
Samsung Electronics Co. Ltd. SP GDRb,c | 4,218,600 | 1,295,110,200 | |||
Samsung Engineering Co. Ltd. | 187,990 | 12,222,586 | |||
| SCHEDULEOF INVESTMENTS | 9 |
Table of Contents
Schedule of Investments (Continued)
iSHARES® MSCI EMERGING MARKETS INDEX FUND
August 31, 2009
| Security | Shares | Value | |||
Samsung Heavy Industries Co. Ltd. | 2,036,070 | $ | 47,849,031 | ||
Shinhan Financial Group Co. Ltd. SP ADR | 682,369 | 44,572,343 | |||
SK Telecom Co. Ltd. SP ADR | 13,105,152 | 203,916,165 | |||
STX Offshore & Shipbuilding Co. Ltd. | 60,670 | 721,394 | |||
STX Pan Ocean Co. Ltd. | 72,570 | 644,989 | |||
Taihan Electric Wire Co. Ltd. | 272,080 | 4,978,003 | |||
| 3,717,913,953 | |||||
TAIWAN – 10.29% | |||||
Asia Cement Corp. | 3,331,081 | 3,552,047 | |||
AU Optronics Corp. SP ADRb | 26,352,207 | 259,832,761 | |||
Catcher Technology Co. Ltd. | 3,521,100 | 9,092,507 | |||
Cheng Shin Rubber Industry Co. Ltd. | 3,859,515 | 7,363,406 | |||
Chunghwa Telecom Co. Ltd. SP ADR | 35,941,836 | 614,605,396 | |||
CMC Magnetics Corp.a | 8,136,000 | 1,767,272 | |||
Compal Communications Inc.a | 2,598,750 | 2,309,281 | |||
Epistar Corp. | 2,314,345 | 6,798,936 | |||
Evergreen Marine Corp. Ltd.a | 10,170,000 | 6,148,375 | |||
Far Eastern Textile Ltd. | 5,290,434 | 5,271,710 | |||
Foxconn Technology Co. Ltd. | 165,272 | 421,760 | |||
HannStar Display Corp.a | 11,767,963 | 2,466,816 | |||
Hon Hai Precision Industry Co. Ltd. | 74,893,762 | 252,554,420 | |||
HTC Corp. | 4,266,990 | 42,907,772 | |||
Macronix International Co. Ltd. | 23,056,276 | 10,962,001 | |||
MediaTek Inc. | 3,182,802 | 46,219,354 | |||
MiTAC International Corp. | 7,403,728 | 3,013,989 | |||
Siliconware Precision Industries Co. SP ADRb | 48,894,397 | 308,034,701 | |||
Synnex Technology International Corp. | 4,922,280 | 8,598,457 | |||
Taiwan Cement Corp. | 7,190,190 | 7,798,210 | |||
Taiwan Semiconductor Manufacturing Co. Ltd. SP ADR | 94,942,434 | 1,015,884,044 | |||
Tatung Co. Ltd.a | 14,763,000 | 3,143,974 | |||
| Security | Shares | Value | |||
U-Ming Marine Transport Corp. | 2,034,000 | $ | 3,293,552 | ||
Uni-President Enterprises Co. | 6,689,012 | 6,929,513 | |||
United Microelectronics Corp. SP ADRa,b | 139,822,416 | 454,422,852 | |||
Yang Ming Marine Transport Corp. | 16,238,978 | 6,043,397 | |||
Yuanta Financial Holding Co. Ltd. | 38,829,000 | 24,005,291 | |||
| 3,113,441,794 | |||||
THAILAND – 1.65% | |||||
Bangkok Bank PCL | 7,972,800 | 25,903,981 | |||
Banpu PCL | 2,511,000 | 29,458,659 | |||
IRPC PCL | 137,270,400 | 15,498,922 | |||
Kasikornbank PCL | 16,172,200 | 35,901,238 | |||
Krung Thai Bank PCL | 66,170,400 | 16,732,297 | |||
PTT Aromatics & Refining PCL | 39,065,286 | 24,925,513 | |||
PTT Chemical PCL | 12,012,768 | 23,312,046 | |||
PTT Exploration and Production PCL | 29,061,800 | 118,349,288 | |||
PTT PCL | 16,892,000 | 121,189,297 | |||
Ratchaburi Electricity Generating Holding PCL | 61,639,900 | 68,418,296 | |||
Siam Cement PCL | 2,544,600 | 14,776,786 | |||
Thai Oil PCL NVDR | 2,654,400 | 3,160,929 | |||
TMB Bank PCL NVDRa | 26,164,800 | 815,486 | |||
| 498,442,738 | |||||
TURKEY – 1.48% | |||||
Akbank TASb | 8,365,625 | 47,946,934 | |||
Anadolu Efes Biracilik ve Malt Sanayii ASb | 398,683 | 4,357,482 | |||
Asya Katilim Bankasi ASa,b | 20,503,344 | 37,986,869 | |||
BIM Birlesik Magazalar ASb | 144,118 | 5,378,613 | |||
Enka Insaat ve Sanayi ASb | 283,420 | 1,142,744 | |||
Eregli Demir ve Celik Fabrikalari TASa,b | 7,212,869 | 28,601,512 | |||
Migros TASa | 1 | 8 | |||
Petkim Petrokimya Holding ASa,b | 4,599,485 | 21,916,906 | |||
Turk Sise ve Cam Fabrikalari ASa,b | 25,858,759 | 27,401,151 | |||
Turkcell Iletisim Hizmetleri ASb | 3,365,408 | 21,867,863 | |||
Turkiye Garanti Bankasi ASa,b | 26,547,967 | 98,194,746 | |||
Turkiye Is Bankasi ASb | 8,123,369 | 32,211,960 | |||
| 10 | 2009 iSHARES ANNUAL REPORTTO SHAREHOLDERS |
Table of Contents
Schedule of Investments (Continued)
iSHARES® MSCI EMERGING MARKETS INDEX FUND
August 31, 2009
| Security | Shares | Value | |||
Turkiye Petrol Rafinerileri ASb | 1,401,779 | $ | 21,019,678 | ||
Turkiye Vakiflar Bankasi TAOa,b | 28,017,429 | 61,991,246 | |||
Yapi ve Kredi Bankasi ASa,b | 18,202,770 | 38,334,391 | |||
| 448,352,103 | |||||
TOTAL COMMON STOCKS | 27,717,925,482 | ||||
PREFERRED STOCKS – 7.52% | |||||
BRAZIL – 7.52% | |||||
Banco Bradesco SA SP ADR | 29,803,224 | 483,110,261 | |||
Brasil Telecom Participacoes SA SP ADR | 1,055,250 | 45,945,585 | |||
Centrais Eletricas Brasileiras SA SP ADR | 240,792 | 3,111,033 | |||
Companhia Brasileira de Distribuicao Grupo Pao de Acucar Class A SP ADRb | 2,049,576 | 99,957,821 | |||
Companhia de Bebidas das Americas SP ADRb | 3,238,368 | 241,485,102 | |||
Companhia Energetica de Minas Gerais SP ADR | 3,587,232 | 52,409,459 | |||
Companhia Paranaense de Energia SP ADR | 568,800 | 8,765,208 | |||
Gerdau SA SP ADR | 7,817,208 | 91,852,194 | |||
Net Servicos de Comunicacao SA SP ADRb | 2,844,084 | 30,033,527 | |||
Petroleo Brasileiro SA SP ADR | 22,183,200 | 736,482,240 | |||
Tele Norte Leste Participacoes SA SP ADR | 3,372,984 | 53,765,365 | |||
Vale SA SP ADR | 25,004,448 | 430,326,550 | |||
| 2,277,244,345 | |||||
TOTAL PREFERRED STOCKS | 2,277,244,345 | ||||
EXCHANGE-TRADED FUNDS – 0.45% | |||||
iShares MSCI Malaysia Index Fundb,e | 1,158,614 | 11,215,383 | |||
iShares MSCI South Korea Index Fundb,e | 1,317,976 | 54,814,622 | |||
| Security | Shares | Value | ||||
iShares MSCI Taiwan Index Funde | 6,425,952 | $ | 69,657,320 | |||
TOTAL EXCHANGE-TRADED FUNDS | 135,687,325 | |||||
SHORT-TERM INVESTMENTS – 4.44% |
| |||||
MONEY MARKET FUNDS – 4.44% | ||||||
Barclays Global Investors Funds Institutional Money Market Fund, SL Agency Shares 0.26%e,f,g | 1,129,160,428 | 1,129,160,428 | ||||
Barclays Global Investors Funds Prime Money Market Fund, SL Agency Shares 0.21%e,f,g | 159,285,868 | 159,285,868 | ||||
Barclays Global Investors Funds Treasury Money Market Fund, SL Agency Shares 0.08%e,f | 56,273,131 | 56,273,131 | ||||
| 1,344,719,427 | ||||||
TOTAL SHORT-TERM INVESTMENTS | 1,344,719,427 | |||||
TOTAL INVESTMENTS IN | 31,475,576,579 | |||||
Other Assets, Less Liabilities – (3.99)% | (1,207,455,171 | ) | ||||
NET ASSETS – 100.00% | $ | 30,268,121,408 | ||||
GDR – Global Depositary Receipts
NVDR – Non-Voting Depositary Receipts
SP ADR – Sponsored American Depositary Receipts
SP GDR – Sponsored Global Depositary Receipts
| a | Non-income earning security. |
| b | All or a portion of this security represents a security on loan. See Note 5. |
| c | This security may be resold to qualified foreign investors and foreign institutional buyers under Regulation S of the Securities Act of 1933. |
| d | This security may be resold to qualified institutional buyers under Rule 144A of the Securities Act of 1933. |
| e | Affiliated issuer. See Note 2. |
| f | The rate quoted is the annualized seven-day yield of the fund at period end. |
| g | All or a portion of this security represents an investment of securities lending collateral. See Note 5. |
See notes to financial statements.
| SCHEDULEOF INVESTMENTS | 11 |
Table of Contents
Statement of Assets and Liabilities
iSHARES®, INC.
August 31, 2009
| iShares MSCI Emerging Markets Index Fund | ||||
ASSETS | ||||
Investments, at cost: | ||||
Unaffiliated issuers | $ | 32,432,779,270 | ||
Affiliated issuers (Note 2) | 1,566,756,498 | |||
Total cost of investments | $ | 33,999,535,768 | ||
Investments in securities, at fair value (including securities on loana) (Note 1): | ||||
Unaffiliated issuers | $ | 29,922,929,876 | ||
Affiliated issuers (Note 2) | 1,552,646,703 | |||
Total fair value of investments | 31,475,576,579 | |||
Foreign currencies, at valueb | 47,018,397 | |||
Cash | 3,066,445 | |||
Receivables: | ||||
Investment securities sold | 22,705,246 | |||
Dividends and interest | 94,181,769 | |||
Interest from affiliate (Note 2) | 960,499 | |||
Total Assets | 31,643,508,935 | |||
LIABILITIES | ||||
Payables: | ||||
Investment securities purchased | 68,279,796 | |||
Collateral for securities on loan (Note 5) | 1,288,446,296 | |||
Foreign taxes (Note 1) | 141,467 | |||
Investment advisory fees (Note 2) | 18,519,968 | |||
Total Liabilities | 1,375,387,527 | |||
NET ASSETS | $ | 30,268,121,408 | ||
Net assets consist of: | ||||
Paid-in capital | $ | 34,349,923,645 | ||
Undistributed net investment income | 199,251,752 | |||
Accumulated net realized loss | (1,757,320,600 | ) | ||
Net unrealized depreciation on investments and translation of assets and liabilities in foreign currencies | (2,523,733,389 | ) | ||
NET ASSETS | $ | 30,268,121,408 | ||
Shares outstandingc | 853,200,000 | |||
Net asset value per share | $ | 35.48 | ||
| a | Securities on loan with a value of $1,227,267,702. See Note 5. |
| b | Cost of foreign currencies: $46,736,399. |
| c | $0.001 par value, number of shares authorized: 1,500,000,000. |
See notes to financial statements.
| 12 | 2009 iSHARES ANNUAL REPORTTO SHAREHOLDERS |
Table of Contents
Statement of Operations
iSHARES®, INC.
Year ended August 31, 2009
| iShares MSCI Emerging Markets Index Fund | ||||
NET INVESTMENT INCOME | ||||
Dividends from unaffiliated issuersa | $ | 653,900,077 | ||
Dividends from affiliated issuers (Note 2)b | 4,507,754 | |||
Interest from unaffiliated issuers | 10,208 | |||
Interest from affiliated issuers (Note 2) | 88,918 | |||
Securities lending income from affiliated issuers (Note 2) | 18,160,629 | |||
Interest from affiliate (Note 2) | 960,499 | |||
Total investment income | 677,628,085 | |||
EXPENSES | ||||
Investment advisory fees (Note 2) | 160,371,985 | |||
Foreign taxes (Note 1) | 835,824 | |||
Total expenses | 161,207,809 | |||
Less investment advisory fees waived (Note 2) | (567,958 | ) | ||
Net expenses | 160,639,851 | |||
Net investment income | 516,988,234 | |||
NET REALIZED AND UNREALIZED GAIN (LOSS) | ||||
Net realized gain (loss) from: | ||||
Investments in unaffiliated issuers | (1,449,883,182 | ) | ||
Investments in affiliated issuers (Note 2) | (14,467,033 | ) | ||
In-kind redemptions | 966,166,288 | |||
Foreign currency transactions | 1,848,096 | |||
Net realized loss | (496,335,831 | ) | ||
Net change in unrealized appreciation (depreciation) on: | ||||
Investments | 806,846,178 | |||
Translation of assets and liabilities in foreign currencies | 1,061,271 | |||
Net change in unrealized appreciation (depreciation) | 807,907,449 | |||
Net realized and unrealized gain | 311,571,618 | |||
NET INCREASE IN NET ASSETS RESULTING FROM OPERATIONS | $ | 828,559,852 | ||
| a | Net of foreign withholding tax of $75,401,049. |
| b | Net of foreign withholding tax of $269,575. |
See notes to financial statements.
| FINANCIAL STATEMENTS | 13 |
Table of Contents
Statements of Changes in Net Assets
iSHARES®, INC.
| iShares MSCI Emerging Markets Index Fund | ||||||||
| Year ended August 31, 2009 | Year ended August 31, 2008 | |||||||
INCREASE (DECREASE) IN NET ASSETS | ||||||||
OPERATIONS: | ||||||||
Net investment income | $ | 516,988,234 | $ | 564,087,379 | ||||
Net realized gain (loss) | (496,335,831 | ) | 4,192,101,297 | |||||
Net change in unrealized appreciation (depreciation) | 807,907,449 | (7,412,430,109 | ) | |||||
Net increase (decrease) in net assets resulting from operations | 828,559,852 | (2,656,241,433 | ) | |||||
DISTRIBUTIONS TO SHAREHOLDERS: | ||||||||
From net investment income | (487,478,088 | ) | (602,951,708 | ) | ||||
Total distributions to shareholders | (487,478,088 | ) | (602,951,708 | ) | ||||
CAPITAL SHARE TRANSACTIONS: | ||||||||
Proceeds from shares sold | 18,716,077,957 | 19,099,692,233 | ||||||
Cost of shares redeemed | (9,091,794,756 | ) | (13,736,113,781 | ) | ||||
Net increase in net assets from capital share transactions | 9,624,283,201 | 5,363,578,452 | ||||||
INCREASE IN NET ASSETS | 9,965,364,965 | 2,104,385,311 | ||||||
NET ASSETS | ||||||||
Beginning of year | 20,302,756,443 | 18,198,371,132 | ||||||
End of year | $ | 30,268,121,408 | $ | 20,302,756,443 | ||||
Undistributed net investment income included in net assets at end of year | $ | 199,251,752 | $ | 167,889,884 | ||||
SHARES ISSUED AND REDEEMED | ||||||||
Shares sold | 691,200,000 | 393,300,000 | ||||||
Shares redeemed | (344,700,000 | ) | (292,950,000 | ) | ||||
Net increase in shares outstanding | 346,500,000 | 100,350,000 | ||||||
See notes to financial statements.
| 14 | 2009 iSHARES ANNUAL REPORTTO SHAREHOLDERS |
Table of Contents
iSHARES®, INC.
(For a share outstanding throughout each period)
| iShares MSCI Emerging Markets Index Fund | ||||||||||||||||||||
| Year ended Aug. 31, 2009 | Year ended Aug. 31, 2008a | Year ended Aug. 31, 2007a | Year ended Aug. 31, 2006a | Year ended Aug. 31, 2005a | ||||||||||||||||
Net asset value, beginning of year | $ | 40.07 | $ | 44.78 | $ | 32.48 | $ | 25.97 | $ | 17.99 | ||||||||||
Income from investment operations: | ||||||||||||||||||||
Net investment incomeb | 0.66 | 1.10 | 0.63 | 0.55 | 0.55 | |||||||||||||||
Net realized and unrealized gain (loss)c | (4.66 | ) | (4.64 | ) | 12.19 | 6.29 | 8.23 | |||||||||||||
Total from investment operations | (4.00 | ) | (3.54 | ) | 12.82 | 6.84 | 8.78 | |||||||||||||
Less distributions from: | ||||||||||||||||||||
Net investment income | (0.59 | ) | (1.17 | ) | (0.52 | ) | (0.33 | ) | (0.80 | ) | ||||||||||
Total distributions | (0.59 | ) | (1.17 | ) | (0.52 | ) | (0.33 | ) | (0.80 | ) | ||||||||||
Net asset value, end of year | $ | 35.48 | $ | 40.07 | $ | 44.78 | $ | 32.48 | $ | 25.97 | ||||||||||
Total return | (9.47 | )% | (8.36 | )% | 39.86 | % | 26.44 | % | 46.17 | % | ||||||||||
Ratios/Supplemental data: | ||||||||||||||||||||
Net assets, end of year (000s) | $ | 30,268,121 | $ | 20,302,756 | $ | 18,198,371 | $ | 11,969,380 | $ | 7,000,858 | ||||||||||
Ratio of expenses to average net assets prior to waived fees | 0.72 | % | 0.72 | % | 0.74 | % | 0.77 | % | 0.78 | % | ||||||||||
Ratio of expenses to average net assets after waived fees | 0.72 | % | 0.72 | % | 0.74 | % | 0.77 | % | 0.77 | % | ||||||||||
Ratio of expenses to average net assets after waived fees and exclusive of foreign taxes | 0.72 | % | 0.72 | % | 0.74 | % | 0.75 | % | 0.74 | % | ||||||||||
Ratio of net investment income to average net assets | 2.32 | % | 2.32 | % | 1.63 | % | 1.77 | % | 2.40 | % | ||||||||||
Portfolio turnover rated | 5 | % | 11 | % | 5 | % | 12 | % | 9 | % | ||||||||||
| a | Per share amounts were adjusted to reflect a three-for-one stock split effective July 24, 2008. |
| b | Based on average shares outstanding throughout each period. |
| c | The amounts reported may not accord with the change in aggregate gains and losses in securities due to the timing of capital share transactions. |
| d | Portfolio turnover rates exclude portfolio securities received or delivered as a result of processing capital share transactions in Creation Units. |
See notes to financial statements.
| FINANCIAL HIGHLIGHTS | 15 |
Table of Contents
iSHARES®, INC.
iShares, Inc. (the “Company”) is registered under the Investment Company Act of 1940, as amended (the “1940 Act”), as an open-end management investment company. The Company was incorporated under the laws of the State of Maryland on September 1, 1994 pursuant to amended and restated Articles of Incorporation.
These financial statements relate only to the iShares MSCI Emerging Markets Index Fund (the “Fund”).
The Fund’s investment objective is to seek investment results that correspond generally to the price and yield performance, before fees and expenses, of publicly traded equity securities in the aggregate in global emerging markets, as measured by the MSCI Emerging Markets Index compiled by MSCI Inc. (“MSCI”). The investment adviser uses a “passive” or index approach to achieve the Fund’s investment objective. The Fund is classified as a non-diversified fund under the 1940 Act. Non-diversified funds generally hold securities of fewer companies than diversified funds and may be more susceptible to the risks associated with these particular companies, or to a single economic, political or regulatory occurrence affecting these companies.
The Fund invests in the securities of foreign issuers of certain emerging markets, which may involve certain considerations and risks not typically associated with securities of U.S. issuers. Such risks include, but are not limited to: generally less liquid and less efficient securities markets; generally greater price volatility; exchange rate fluctuations and exchange controls; imposition of restrictions on the expatriation of funds or other assets of the Fund; less publicly available information about issuers; the imposition of withholding or other taxes; higher transaction and custody costs; settlement delays and risk of loss attendant in settlement procedures; difficulties in enforcing contractual obligations; less regulation of securities markets; different accounting, disclosure and reporting requirements; more substantial governmental involvement in the economy; higher inflation rates; greater social, economic and political uncertainties; the risk of nationalization or expropriation of assets and the risk of war.
Pursuant to the Company’s organizational documents, the Fund’s officers and directors are indemnified against certain liabilities that may arise out of the performance of their duties to the Fund. Additionally, in the normal course of business, the Fund enters into contracts with service providers that contain general indemnification clauses. The Fund’s maximum exposure under these arrangements is unknown as this would involve future claims that may be made against the Fund that have not yet occurred.
1. SIGNIFICANT ACCOUNTING POLICIES
The following significant accounting policies are consistently followed by the Company in the preparation of its financial statements in conformity with accounting principles generally accepted in the United States of America (“U.S. GAAP”). The preparation of financial statements in conformity with U.S. GAAP requires management to make certain estimates and assumptions that affect the reported amounts of assets and liabilities and disclosures of contingent assets and liabilities at the date of the financial statements and the reported amounts of revenue and expenses during the reporting period. Actual results could differ from those estimates.
SECURITY VALUATION
The securities and other assets of the Fund are valued pursuant to the pricing policy and procedures approved by the Board of Directors of the Company (the “Board”). Effective September 1, 2008, the Fund adopted Accounting Standards Board (“FASB”) Statement of Financial Accounting Standards No. 157 (“FAS 157”), “Fair Value Measurements.” This standard establishes a fair value hierarchy that prioritizes the inputs to valuation techniques used to measure fair value into three broad levels. Inputs may be based on independent market data (“observable inputs”) or they may be internally developed (“unobservable inputs”). The hierarchy gives the highest priority to
| 16 | 2009 iSHARES ANNUAL REPORTTO SHAREHOLDERS |
Table of Contents
Notes to Financial Statements (Continued)
iSHARES®, INC.
unadjusted quoted prices in active markets for identical assets or liabilities (Level 1 measurements) and the lowest priority to unobservable inputs (Level 3 measurements). The three levels of the fair value hierarchy under FAS 157 are as follows:
| • | Level 1 – Inputs that reflect unadjusted quoted prices in active markets for identical assets or liabilities that the Fund has the ability to access at the measurement date (a “Level 1 Price”); |
| • | Level 2 – Inputs other than quoted prices included within Level 1 that are observable for the asset or liability either directly or indirectly, including quoted prices for similar assets or liabilities in active markets, quoted prices for identical or similar assets or liabilities in markets that are not considered to be active, inputs other than quoted prices that are observable for the asset or liability, and inputs that are derived principally from or corroborated by observable market data by correlation or other means (a “Level 2 Price”); |
| • | Level 3 – Inputs that are unobservable for the asset or liability (a “Level 3 Price”). |
The availability of observable inputs can vary from security to security and is affected by a wide variety of factors, including, for example, the type of security, whether the security is new and not yet established in the marketplace, the liquidity of markets, and other characteristics particular to the security. Inputs may include price information, volatility statistics, specific and broad credit data, liquidity statistics, and other factors. To the extent that valuation is based on models or inputs that are less observable or unobservable in the market, the determination of fair value requires more judgment. Accordingly, the degree of judgment exercised in determining fair value is greatest for instruments categorized in Level 3 of the fair value hierarchy.
The level of a value determined for a financial instrument within the fair value hierarchy is based on the lowest level of any input that is significant to the fair value measurement in its entirety. The categorization of a value determined for a financial instrument within the hierarchy is based upon the pricing transparency of the instrument and does not necessarily correspond to the Fund’s perceived risk of that instrument.
Investments whose values are based on quoted market prices in active markets, and whose values are therefore classified as Level 1 Prices, include active listed equities. The Fund does not adjust the quoted price for such instruments, even in situations where the Fund holds a large position and a sale could reasonably impact the quoted price.
Investments that trade in markets that are not considered to be active, but whose values are based on inputs such as market prices, dealer quotations or valuations provided by alternative pricing sources supported by observable inputs are classified within Level 2. These generally include U.S. government and sovereign obligations, most government agency securities, investment-grade corporate bonds, certain mortgage products, less liquid listed equities, and state, municipal and provincial obligations. As Level 2 investments include positions that are not traded in active markets and/or are subject to transfer restrictions, valuations may be adjusted to reflect illiquidity and/or non-transferability, which are generally based on available market information.
Investments whose values are classified as Level 3 Prices have significant unobservable inputs, as they may trade infrequently or not at all. Investments whose values are classified as Level 3 Prices may include unlisted securities related to corporate actions, securities whose trading have been suspended or which have been de-listed from their primary trading exchange, less liquid corporate debt securities (including distressed debt instruments), collateralized debt obligations, and less liquid mortgage securities (backed by either commercial or residential real estate). When observable prices are not available for these securities, the Fund uses one or more valuation techniques (e.g., the market approach or the income approach) for which sufficient and reliable data is available. Within Level 3 of the fair value hierarchy, the use of the market approach generally consists of using comparable market transactions, while the use of the income approach generally consists of the net present value of estimated future cash flows, adjusted as appropriate for liquidity, credit, market and/or other risk factors.
| NOTESTO FINANCIAL STATEMENTS | 17 |
Table of Contents
Notes to Financial Statements (Continued)
iSHARES®, INC.
The inputs used by the Fund in estimating the value of Level 3 Prices may include the original transaction price, recent transactions in the same or similar instruments, completed or pending third-party transactions in the underlying investment or comparable issuers, and changes in financial ratios or cash flows. Level 3 Prices may also be adjusted to reflect illiquidity and/or non-transferability, with the amount of such discount estimated by the Fund in the absence of market information. The fair value measurement of Level 3 Prices does not include transaction costs that may have been capitalized as part of the security’s cost basis. Assumptions used by the Fund due to the lack of observable inputs may significantly impact the resulting fair value and therefore the Fund’s results of operations.
Fair value pricing could result in a difference between the prices used to calculate the Fund’s net asset value and the prices used by the Fund’s underlying index, which in turn could result in a difference between the Fund’s performance and the performance of the Fund’s underlying index.
As of August 31, 2009, the value of each of the Fund’s investments was classified as a Level 1 Price. The breakdown of the Fund’s investments into major categories is disclosed in the Schedule of Investments.
SECURITY TRANSACTIONS AND INCOME RECOGNITION
Security transactions are accounted for on trade date. Dividend income is recognized on the ex-dividend date, net of any foreign taxes withheld at source, and interest income is accrued daily. Non-cash dividends received in the form of stock in an elective dividend, if any, are recorded as dividend income at fair value. Distributions received by the Fund may include a return of capital that is estimated by management. Such amounts are recorded as a reduction of the cost of investments or reclassified to capital gains. Realized gains and losses on investment transactions are determined using the specific identification method.
FOREIGN CURRENCY TRANSLATION
The accounting records of the Fund are maintained in U.S. dollars. Foreign currencies, as well as investment securities and other assets and liabilities denominated in foreign currencies are translated into U.S. dollars using exchange rates deemed appropriate by the investment adviser. Any use of a rate different from the rates used by MSCI may adversely affect the Fund’s ability to track its underlying index. Purchases and sales of securities, income receipts and expense payments are translated into U.S. dollars on the respective dates of such transactions.
The Fund does not isolate the effect of fluctuations in foreign exchange rates from the effect of fluctuations in the market prices of securities. Such fluctuations are reflected by the Fund as a component of realized and unrealized gains and losses from investments for financial reporting purposes.
FOREIGN TAXES
The Fund may be subject to foreign taxes (a portion of which may be reclaimable) on income, corporate events, capital gains on investments or currency repatriation. All foreign taxes are recorded in accordance with the applicable foreign tax regulations and rates that exist in the foreign markets in which the Fund invests. These foreign taxes, if any, are paid by the Fund and are disclosed in the Statement of Operations. Foreign taxes payable as of August 31, 2009, if any, are reflected in the Fund’s Statement of Assets and Liabilities.
DISTRIBUTIONS TO SHAREHOLDERS
Distributions to shareholders from net investment income, if any, including any net foreign currency gains, are declared and distributed at least annually by the Fund. Distributions of net realized capital gains, if any, generally are declared and distributed once a year. Distributions are determined on a tax basis and may differ from net investment income and net realized capital gains for financial reporting purposes. Dividends and distributions are paid in U.S. dollars and cannot be automatically reinvested in additional shares of the Fund.
| 18 | 2009 iSHARES ANNUAL REPORTTO SHAREHOLDERS |
Table of Contents
Notes to Financial Statements (Continued)
iSHARES®, INC.
As of August 31, 2009, the tax year-end of the Fund, the components of net accumulated losses on a tax basis consisted of undistributed ordinary income of $198,291,253, unrealized depreciation of $2,801,110,332, and capital and other losses of $1,479,943,657, for net accumulated losses of $4,082,762,736.
For the years ended August 31, 2009 and August 31, 2008, the tax characterization of distributions paid for the Fund represents ordinary income. The total distributions and distributions per share are disclosed in the accompanying Statements of Changes in Net Assets and the Financial Highlights for the Fund.
FEDERAL INCOME TAXES
It is the policy of the Fund to qualify as a regulated investment company by complying with the provisions applicable to regulated investment companies, as defined under Subchapter M of the Internal Revenue Code of 1986, as amended, and to annually distribute substantially all of its ordinary income and any net capital gains (taking into account any capital loss carryforwards) sufficient to relieve it from all, or substantially all, federal income and excise taxes. Accordingly, no provision for federal income taxes was required for the year ended August 31, 2009.
From November 1, 2008 to August 31, 2009, the Fund incurred net realized capital losses of $1,175,552,001. As permitted by tax regulations, the Fund has elected to defer those losses and treat them as arising in the year ending August 31, 2010.
As of August 31, 2009, the tax year-end of the Fund, the Fund had tax basis net capital loss carryforwards of $840,778, $20,296,564, $11,239,258, $29,973,301, $13,844,901 and $228,196,854 expiring in 2012, 2013, 2014, 2015, 2016 and 2017, respectively. Such losses may be applied against any net realized taxable gains in each succeeding year or until their respective expiration dates, whichever occurs first.
The Fund may own shares in certain foreign investment entities, referred to, under U.S. tax law, as “passive foreign investment companies.” The Fund may elect to mark-to-market annually the shares of each passive foreign investment company and would be required to distribute to shareholders any such marked-to-market gains.
The Fund reclassifies at the end of its tax year certain amounts to paid-in-capital from accumulated net realized gain (loss) on investments and foreign currency transactions and accumulated net investment income (loss), respectively, as a result of permanent book and tax differences primarily attributed to net investment loss, return of capital, passive foreign investment companies, realized foreign currency gains and losses and gains and losses on in-kind redemptions. These reclassifications have no effect on net assets or net asset value per share.
As of August 31, 2009, the cost of investments for federal income tax purposes was $34,276,912,711. Net unrealized depreciation was $2,801,336,132, of which $1,259,877,211 represented gross unrealized appreciation on securities and $4,061,213,343 represented gross unrealized depreciation on securities.
Management has reviewed the tax positions as of August 31, 2009, inclusive of the prior three open tax return years, and has determined that no provision for income tax is required in the Fund’s financial statements.
2. AGREEMENTS AND OTHER TRANSACTIONS WITH AFFILIATES
Pursuant to an Investment Advisory Agreement with the Company, Barclays Global Fund Advisors (“BGFA”) manages the investment of the Fund’s assets. BGFA is a California corporation indirectly owned by Barclays Bank PLC. Under the Investment Advisory Agreement, BGFA is responsible for all expenses (“Covered Expenses”) of the Company, including the cost of transfer agency, custody, fund
| NOTESTO FINANCIAL STATEMENTS | 19 |
Table of Contents
Notes to Financial Statements (Continued)
iSHARES®, INC.
administration, legal, audit and other services, except interest, taxes, brokerage commissions and other expenses connected with the execution of portfolio transactions, distribution fees and extraordinary expenses.
For its investment advisory services to the Fund, BGFA is entitled to an annual investment advisory fee based on the Fund’s allocable portion of the aggregate of the average daily net assets of the Fund and certain other iShares Funds as follows:
| Investment Advisory Fee | Aggregate Average Daily Net Assets | |
| 0.75% | First $14 billion | |
| 0.68 | Over $14 billion, up to and including $28 billion | |
| 0.61 | Over $28 billion |
Effective August 11, 2008, BGFA has contractually agreed to waive a portion of its investment advisory fees for the Fund through December 31, 2009 in an amount equal to the investment advisory fees payable on the amount of the Fund’s investment in other iShares Funds. Prior to August 11, 2008, the investment advisory fee waiver was voluntary.
Under the terms of the Investment Advisory Agreement, the Fund is required to remit payment of accrued fees to BGFA on a quarterly basis. BGFA has determined that in certain cases such payments to BGFA by the Fund were made earlier than provided for under the Investment Advisory Agreement. BGFA will reimburse the Fund for interest that would have been earned had such payments been made on a quarterly basis. The amount to be reimbursed is included under receivables and investment income as “Interest from affiliate” in the Statement of Assets and Liabilities and Statement of Operations, respectively. The reimbursement does not have a material effect on net asset value per share or the total return shown in the Financial Highlights.
State Street Bank and Trust Company (“State Street”) serves as administrator, custodian and transfer agent for the Company. As compensation for its services, State Street receives certain out-of-pocket costs, transaction fees and asset-based fees which are accrued daily and paid monthly. These fees and expenses are Covered Expenses as defined above.
SEI Investments Distribution Co. (“SEI”) serves as the Fund’s underwriter and distributor of the shares of the Fund, pursuant to a Distribution Agreement with the Company. SEI does not receive a fee from the Fund for its distribution services.
Pursuant to an exemptive order issued by the U.S. Securities and Exchange Commission (“SEC”), the Fund is permitted to lend portfolio securities to Barclays Capital Inc. (“BarCap”). Pursuant to the same exemptive order, Barclays Global Investors, N.A. (“BGI”) serves as securities lending agent for the Fund. BarCap and BGI are affiliates of BGFA, the Fund’s investment adviser. As securities lending agent, BGI receives, as fees, a share of the income earned on investment of the cash collateral received for the loan of securities. For the year ended August 31, 2009, BGI earned securities lending agent fees of $18,160,629.
The Fund may invest in certain money market funds managed by BGFA, the Fund’s investment adviser, including the Government Money Market Fund (“GMMF”), Institutional Money Market Fund (“IMMF”), Prime Money Market Fund (“PMMF”) and Treasury Money Market Fund (“TMMF”) of Barclays Global Investors Funds. These money market funds seek to achieve their investment objectives by investing in high-quality, short-term money market instruments that, at the time of investment, have remaining maturities of 397 calendar days or less from the date of acquisition. The GMMF, IMMF, PMMF and TMMF are feeder funds in a master/feeder fund structure that invest substantially all of their assets in the Government Money Market Master Portfolio, Money Market Master Portfolio, Prime Money Market Master Portfolio and Treasury Money Market Master Portfolio (collectively, the “Money Market Master Portfolios”), respectively, which are also managed by BGFA. While the GMMF, IMMF, PMMF and TMMF do not directly charge an investment advisory fee, the Money Market Master Portfolios in which they invest do charge an investment advisory fee. Income distributions from the GMMF, IMMF, PMMF and TMMF are declared daily and paid monthly from net investment income. Income distributions earned by the Fund from temporary cash investments are
| 20 | 2009 iSHARES ANNUAL REPORTTO SHAREHOLDERS |
Table of Contents
Notes to Financial Statements (Continued)
iSHARES®, INC.
recorded as interest from affiliated issuers in the accompanying Statement of Operations. Income distributions earned by the Fund from the investment of securities lending collateral, if any, are included in securities lending income in the accompanying Statement of Operations.
The Fund, in order to improve its portfolio liquidity and its ability to track the MSCI Emerging Markets Index, may invest in shares of other iShares Funds that invest in securities in the Fund’s underlying index. As of August 31, 2009, the Fund held shares of the iShares MSCI Malaysia, iShares MSCI South Korea and iShares MSCI Taiwan Index Funds.
For the year ended August 31, 2009, the Fund had direct investment (exclusive of short-term investments) in issuers of which BGFA is an affiliate or issuers of which the Fund owns 5% or more of the outstanding voting securities as follows:
| Name of Affiliated Issuer | Number of Shares Held Beginning of Year (in 000s) | Gross Additions (in 000s) | Gross Reductions (in 000s) | Number of Shares Held End of Year (in 000s) | Value at End of Year | Dividend Income | Net Realized Gain (Loss) | ||||||||||||
iShares MSCI Malaysia | |||||||||||||||||||
Index Fund | 1,209 | 302 | 352 | 1,159 | $ | 11,215,383 | $ | 283,125 | $ | (392,131 | ) | ||||||||
iShares MSCI South Korea | |||||||||||||||||||
Index Fund | 750 | 1,085 | 517 | 1,318 | 54,814,622 | 445,564 | (5,832,590 | ) | |||||||||||
iShares MSCI Taiwan | |||||||||||||||||||
Index Fund | 3,464 | 5,869 | 2,907 | 6,426 | 69,657,320 | 2,970,339 | (9,238,227 | ) | |||||||||||
Jollibee Foods Corp. | 40,673 | 55,450 | 27,677 | 68,446 | 72,239,951 | 808,726 | a | 995,915 | |||||||||||
| $ | 207,927,276 | $ | 4,507,754 | $ | (14,467,033 | ) | |||||||||||||
| a | Net of foreign withholding tax of $269,575. |
Certain directors and officers of the Company are also officers of BGI and/or BGFA.
3. INVESTMENT PORTFOLIO TRANSACTIONS
Purchases and sales of investments (excluding in-kind transactions and short-term investments) for the year ended August 31, 2009, aggregated $1,635,848,910 and $1,143,079,011, respectively.
In-kind purchases and sales (see Note 4) for the year ended August 31, 2009, aggregated $17,885,220,023 and $8,718,277,689, respectively.
4. CAPITAL SHARE TRANSACTIONS
The Company issues and redeems capital shares of the Fund only in aggregations of a specified number of shares (each, a “Creation Unit”) at net asset value. Except when aggregated in Creation Units, shares of the Fund are not redeemable. Transactions in capital shares for the Fund are disclosed in detail in the Statements of Changes in Net Assets.
| NOTESTO FINANCIAL STATEMENTS | 21 |
Table of Contents
Notes to Financial Statements (Continued)
iSHARES®, INC.
The consideration for the purchase of Creation Units of the Fund generally consists of the in-kind deposit of a designated portfolio of equity securities, which constitutes an optimized representation of the securities involved in the Fund’s underlying Index and an amount of cash. Investors purchasing and redeeming Creation Units pay a purchase transaction fee and a redemption transaction fee directly to State Street, the administrator, to offset transfer and other transaction costs associated with the issuance and redemption of Creation Units.
5. LOANS OF PORTFOLIO SECURITIES
The Fund may lend its investment securities to approved borrowers, such as brokers, dealers and other financial institutions. The borrower pledges and maintains with the Fund collateral consisting of cash, an irrevocable letter of credit issued by a bank, or securities issued or guaranteed by the U.S. government. The initial collateral received by the Fund is required to have a value of at least 102% of the market value of the loaned securities for securities traded on U.S. exchanges and a value of at least 105% for all other securities. The collateral is maintained thereafter, at a value equal to at least 100% of the current market value of the securities on loan. The risks to the Fund of securities lending include the risk that the borrower may not provide additional collateral when required or may not return the securities when due. Any securities lending cash collateral may be reinvested in certain short-term instruments either directly on behalf of the Fund or through one or more joint accounts or money market funds, including those managed by BGFA; such reinvestments are subject to investment risk.
As of August 31, 2009, the Fund had loaned securities which were collateralized by cash. The cash collateral received was invested in money market funds managed by BGFA. The market value of the securities on loan as of August 31, 2009 and the value of the related collateral are disclosed in the Statement of Assets and Liabilities. Securities lending income, as disclosed in the Fund’s Statement of Operations, represents the income earned from the investment of the cash collateral, net of rebates paid to, or fees paid by, borrowers and less the fees paid to BGI as securities lending agent.
6. BLACKROCK TRANSACTION
On June 16, 2009, Barclays PLC, the ultimate parent company of BGI and BGFA, accepted a binding offer and entered into an agreement to sell its interests in BGFA, BGI and certain affiliated companies, to BlackRock, Inc., (the “BlackRock Transaction”). The BlackRock Transaction is subject to certain regulatory approvals, as well as other conditions to closing.
Under the 1940 Act, completion of the BlackRock Transaction will cause the automatic termination of the Fund’s current investment advisory agreement with BGFA. In order for the management of the Fund to continue uninterrupted, the Board approved a new investment advisory agreement for the Fund subject to shareholder approval. A special meeting of shareholders of the Fund is scheduled to be held on November 4, 2009. Each shareholder of record as of the close of business on August 25, 2009 will receive notice of and be entitled to vote at the meeting.
7. REVIEW OF SUBSEQUENT EVENTS
In connection with the preparation of the financial statements of the Fund as of and for the year ended August 31, 2009, events and transactions through October 23, 2009, the date the financial statements are available to be issued, have been evaluated by the Fund’s management for possible adjustment and/or disclosure. No subsequent events requiring financial statement disclosure have been identified.
| 22 | 2009 iSHARES ANNUAL REPORTTO SHAREHOLDERS |
Table of Contents
Report of Independent Registered Public Accounting Firm
To the Shareholders and Board of Directors of
iShares, Inc.:
In our opinion, the accompanying statement of assets and liabilities, including the schedule of investments, and the related statements of operations and of changes in net assets and the financial highlights present fairly, in all material respects, the financial position of the iShares MSCI Emerging Markets Index Fund, a portfolio of the iShares MSCI Series (the “Fund”), at August 31, 2009, the results of its operations, the changes in its net assets and its financial highlights for each of the periods presented, in conformity with accounting principles generally accepted in the United States of America. These financial statements and financial highlights (hereafter referred to as “financial statements”) are the responsibility of the Fund’s management; our responsibility is to express an opinion on these financial statements based on our audits. We conducted our audits of these financial statements in accordance with the standards of the Public Company Accounting Oversight Board (United States). Those standards require that we plan and perform the audit to obtain reasonable assurance about whether the financial statements are free of material misstatement. An audit includes examining, on a test basis, evidence supporting the amounts and disclosures in the financial statements, assessing the accounting principles used and significant estimates made by management, and evaluating the overall financial statement presentation. We believe that our audits, which included confirmation of securities at August 31, 2009 by correspondence with the custodian, transfer agent and brokers, provide a reasonable basis for our opinion.
PricewaterhouseCoopers LLP
San Francisco, California
October 23, 2009
| REPORT OF INDEPENDENT REGISTERED PUBLIC ACCOUNTING FIRM | 23 |
Table of Contents
iSHARES®, INC.
For corporate shareholders, 0.42% of the income dividends paid by the Fund during the fiscal year ended August 31, 2009 qualified for the dividends-received deduction.
For the fiscal year ended August 31, 2009, the Fund earned foreign source income of $728,311,699 and paid foreign taxes of $74,298,254 which it intends to pass through to its shareholders pursuant to Section 853 of the Internal Revenue Code (the “Code”).
Under Section 854(b)(2) of the Code, the Fund hereby designates the maximum amount of $487,478,088 as qualified dividend income for purposes of the maximum rate under Section 1(h)(11) of the Code for the fiscal year ended August 31, 2009.
In January 2010, shareholders will receive Form 1099-DIV which will include their share of qualified dividend income distributed during the calendar year 2009. Shareholders are advised to check with their tax advisers for information on the treatment of these amounts on their income tax returns.
| 24 | 2009 iSHARES ANNUAL REPORTTO SHAREHOLDERS |
Table of Contents
Board Review and Approval of Current Investment Advisory Contract (Unaudited)
iSHARES® INC.
Under Section 15(c) of the Investment Company Act of 1940 (the “1940 Act”), the Company’s Board of Directors (the “Board”), including a majority of Directors who are not “interested persons” of the Company (as that term is defined in the 1940 Act) (the “Independent Directors”), is required annually to consider the Investment Advisory Contract between the Company and BGFA (the “Advisory Contract”) on behalf of the Fund. As required by Section 15(c), the Board requested and BGFA provided such information as the Board deemed reasonably necessary to evaluate the terms of the Advisory Contract. At a meeting held on June 16-17, 2009, the Board approved the selection of BGFA and the continuance of the Advisory Contract, based on its review of qualitative and quantitative information provided by BGFA. In selecting BGFA and approving the Advisory Contract for the Fund, the Board, including the Independent Directors, advised by their independent counsel, considered the following factors, no one of which was controlling, and made the following conclusions:
NATURE, EXTENT AND QUALITY OF SERVICES PROVIDED BY BGFA
Based on management’s representations, the Board expected that there will be no diminution in the scope of services required of or provided by BGFA under the Advisory Contract for the coming year as compared to the scope of services provided by BGFA over the past year. In reviewing the scope of these services, the Board considered BGFA’s investment philosophy and experience, noting that BGFA and its affiliates have committed significant resources over time, including over the past year, including investment in technology and increasing the number of their employees supporting the Fund. The Board also considered BGFA’s compliance program and its compliance record with respect to the Fund. In that regard, the Board noted that BGFA reports to the Board about portfolio management and compliance matters on a periodic basis in connection with regularly scheduled meetings of the Board, and has made appropriate officers available as needed to provide further assistance with these matters. The Board also reviewed the background and experience of the persons responsible for the day-to-day management of the Fund. In addition to the above considerations, the Board considered BGFA’s investment processes and strategies, and matters related to BGFA’s portfolio transaction policies and procedures. The Board further noted that BGFA does not serve as investment adviser for any other series of registered investment companies with substantially similar investment objectives and strategies as the Fund; therefore, directly comparable performance information was generally not available. However, the Board also noted that the Fund had met its investment objective consistently since its inception date. Based on review of this information, the Board concluded that the nature, extent and quality of services to be provided by BGFA to the Fund under the Advisory Contract were appropriate and mitigated in favor of the Board’s approval of the Advisory Contract for the coming year.
FUND’S EXPENSES AND PERFORMANCE OF THE FUND
The Board reviewed statistical information prepared by Lipper Inc. (“Lipper”), an independent provider of investment company data, regarding the expense ratio components, including advisory fees, waivers/reimbursements, and gross and net total expenses of the Fund in comparison with the same information for other registered investment companies objectively selected by Lipper as comprising the Fund’s peer group pursuant to Lipper’s proprietary methodology and any registered investment companies that would otherwise have been excluded from Lipper’s comparison group due to certain differentiating factors, but were nonetheless included at the request of BGFA (the “Lipper Group”). Because there are few, if any, exchange traded funds or index funds that track indexes similar to that tracked by the Fund, the Lipper Group included in part mutual funds, closed-end funds, exchange traded funds, or funds with differing investment objective classifications, investment focuses and other characteristics (e.g., actively managed funds and funds sponsored by “at cost” service providers). In support of its review of the statistical information, the Board was provided with a detailed description of the methodology used by Lipper to determine the Lipper Group and to prepare this information. The Board further noted that due to the limitations in providing comparable funds in the Lipper Group, the statistical information may or may not provide meaningful direct comparisons to the Fund. In addition, the Board reviewed statistical information prepared by Lipper regarding the performance of the Fund for the one-, three-, and five-year periods, and “last quarter” period ended March 31, 2009 and a comparison of the Fund’s performance to its performance benchmark index for the same periods. To the extent that any of the comparison funds included in the Lipper Group track the same index as the Fund, Lipper also provided, and the Board reviewed, a comparison of the Fund’s performance to that of such relevant comparison
| BOARD REVIEWAND APPROVALOF CURRENT INVESTMENT ADVISORY CONTRACT | 25 |
Table of Contents
Board Review and Approval of Current Investment Advisory Contract (Unaudited) (Continued)
iSHARES® INC.
funds. The Board noted that the Fund generally performed in line with its performance benchmark index over relevant periods. In considering this information, the Board noted that the Lipper Group includes funds that may have different investment objectives and/or benchmarks from the Fund. In addition, the Board noted that the Fund seeks to track its benchmark index and that during the prior year the Board received periodic reports on the Fund’s performance in comparison with its relevant benchmark index. Such comparative performance information was also considered by the Board.
The Board also noted that the investment advisory fees and overall expenses for the Fund were generally lower than the median or average investment advisory fee rates and overall expenses of the funds in the Lipper Group. Based on this review, the Board concluded that the investment advisory fees and expense levels and the historical performance of the Fund, as managed by BGFA, as compared to the investment advisory fees and expense levels and performance of the funds in its Lipper Group, were satisfactory for the purposes of approving the Advisory Contract for the coming year.
COSTS OF SERVICES PROVIDED TO THE FUND AND PROFITS REALIZED BY BGFA AND AFFILIATES
The Board reviewed information about the profitability to BGFA of the Fund based on the fees payable to BGFA and its affiliates (including fees under the Advisory Contract), and all other sources of revenue and expense to BGFA and its affiliates from the Fund’s operations for the last calendar year. The Board discussed the sources of direct and ancillary revenue with management, including the revenues to BGI from securities lending by the Company (including any securities lending by the Fund). The Board also discussed BGFA’s profit margin as reflected in the Fund’s profitability analysis and reviewed information regarding economies of scale (as discussed below). Based on this review, the Board concluded that the profits realized by BGFA and its affiliates under the Advisory Contract and from other relationships between the Fund and BGFA and/or its affiliates, if any, were within the range the Board considered reasonable and appropriate.
ECONOMIES OF SCALE
In connection with its review of the Fund’s profitability analysis, the Board reviewed information regarding economies of scale or other efficiencies that may result from increases in the Fund’s assets. The Board noted that the Advisory Contract already provided for breakpoints in the Fund’s investment advisory fee rates as the assets of the Fund, on an aggregated basis with the assets of certain other iShares funds, increase. The Board also reviewed BGFA’s historic profitability as investment adviser to the iShares fund complex and noted that BGFA had continued to make significant investments in the iShares fund complex, that expenses had grown at a pace similar to the growth in revenue, and that BGFA had incurred operating losses during earlier years when the iShares funds, including the Fund, had not yet reached scale. Based on this review, as well as the discussions described above in connection with the Lipper Group and performance benchmark comparisons, the Board, recognizing its responsibility to consider this issue at least annually, concluded that the structure of the investment advisory fees reflects appropriate sharing of economies of scale with the Fund’s shareholders.
FEES AND SERVICES PROVIDED FOR OTHER COMPARABLE FUNDS/ACCOUNTS MANAGED BY BGFA AND ITS AFFILIATES
The Board received and considered certain information regarding the Fund’s annual investment advisory fee rates under the Advisory Contract in comparison to the investment advisory/management fee rates for other funds/accounts for which BGFA or BGI, an affiliate of BGFA, provides investment advisory/management services, including other funds registered under the 1940 Act, collective funds and separate accounts (together, the “Other Accounts”). The Board noted that directly comparable investment advisory/management fee information was not available for the Fund, as BGFA and its affiliates do not manage any Other Accounts with substantially similar investment objectives and strategies as the Fund. However, the Board noted that BGFA provided the Board with general information regarding how the level of services provided to the Other Accounts differed from the level of services provided to the Fund. Based on this
| 26 | 2009 iSHARES ANNUAL REPORTTO SHAREHOLDERS |
Table of Contents
Board Review and Approval of Current Investment Advisory Contract (Unaudited) (Continued)
iSHARES® INC.
review, the Board determined that the investment advisory fee rates under the Advisory Contract, do not constitute fees that are so disproportionately large as to bear no reasonable relationship to the services rendered and that could not have been the product of arm’s-length bargaining, and concluded that the investment advisory fee rates under the Advisory Contract are fair and reasonable.
OTHER BENEFITS TO BGFA AND/OR ITS AFFILIATES
The Board reviewed any ancillary revenue received by BGFA and/or its affiliates in connection with the services provided to the Fund by BGFA, such as any payment of revenue to BGI, the Company’s securities lending agent, for loaning any portfolio securities, and payment of advisory fees and/or administration fees to BGFA and BGI in connection with any investments by the Fund in other funds for which BGFA provides investment advisory services and/or BGI provides administration services. The Board noted that while revenue to BGI in connection with securities lending agency services to the iShares funds increased overall as against the previous year, overall revenue increased by approximately the same percentage as overall expenses. The Board noted that BGFA does not use soft dollars or consider the value of research or other services that may be provided to BGFA (including its affiliates) in selecting brokers for portfolio transactions for the Fund. The Board further noted that any portfolio transactions on behalf of the Fund placed through a BGFA affiliate or purchased from an underwriting syndicate in which a BGFA affiliate participates, are reported to the Board pursuant to Rule 17e-1 or Rule 10f-3, as applicable, under the 1940 Act. The Board concluded that any such ancillary benefits would not be disadvantageous to the Fund’s shareholders.
Based on this analysis, the Board determined that the Advisory Contract, including the investment advisory fee rates thereunder, is fair and reasonable in light of all relevant circumstances, and concluded that it is in the best interest of the Fund and its shareholders to approve the Advisory Contract for the coming year.
| BOARD REVIEWAND APPROVALOF CURRENT INVESTMENT ADVISORY CONTRACT | 27 |
Table of Contents
Board Review and Approval of New Investment Advisory Agreements (Unaudited)
iSHARES®, INC.
On June 16, 2009, Barclays Bank PLC (“Barclays”) entered into an agreement to sell its interest in the Barclays Global Investors asset management business, which includes BGI and BGI’s business of advising, sponsoring and distributing exchange-traded funds, to BlackRock, Inc. (“BlackRock”). Assuming receipt of the requisite regulatory approvals and the satisfaction of other conditions to the closing, the subsidiaries of Barclays operating the BGI business, including BGFA (the “Adviser”), will be sold to BlackRock (the “Transaction”) for cash and BlackRock stock.
The Adviser currently serves as the investment adviser to each Fund pursuant to an investment advisory agreement with the Company (the “Current Advisory Agreement”). Under the 1940 Act, the Transaction, if consummated, will result in the automatic termination of the Current Advisory Agreement. In order for the management of each Fund to continue uninterrupted, the Board approved interim and new investment advisory agreements (the “New Advisory Agreements”) with the Company, subject to shareholder approval.
BOARD CONSIDERATIONS IN APPROVING THE NEW ADVISORY AGREEMENTS
At an in-person Board meeting held on August 13, 2009, the Board, including the Independent Directors, unanimously approved the New Advisory Agreements between the Adviser and the Company, on behalf of its Funds after consideration of all factors determined to be relevant to the Board’s deliberations, including those discussed below.
The Approval Process – At telephonic and in-person meetings held in June, July and August of this year, the Board, including the Independent Directors, discussed the Transaction and the New Advisory Agreements for the Funds.
In preparation for their consideration of the New Advisory Agreements, the Directors received, in response to a written due diligence request prepared by the Board and its independent counsel and provided to BlackRock, BGI and the Adviser, comprehensive written information covering a range of issues and received, in response to their additional requests, further information in advance of and at the August 13, 2009 in-person Board meeting. To assist the Board in its consideration of the New Advisory Agreements, BlackRock provided materials and information about itself, including its history, management, investment, risk management and compliance capabilities and processes, and financial condition, and the Adviser provided materials and information about the Transaction. In addition, the Independent Directors consulted with their independent legal counsel and Fund counsel on numerous occasions, discussing, among other things, the legal standards and certain other considerations relevant to the Board’s deliberations.
In June 2009, the Board had performed a full annual review of, or initially approved, as applicable, the current Investment Advisory Agreement between the Adviser and the Company, on behalf of its Funds for each Fund as required by the 1940 Act and, after reviewing, among other things, the investment capabilities, resources and personnel of the Adviser, determined that the nature, extent and quality of the services provided by the Adviser under the Current Advisory Agreements were appropriate. The Board also determined that the advisory fees paid by each Fund, taking into account any applicable agreed-upon fee waivers and breakpoints, were fair and reasonable in light of the services provided, the costs to the Adviser of providing those services, economies of scale, the fees and other expenses paid by similar funds (including information provided by Lipper, Inc. (“Lipper”)), and such other circumstances as the Directors considered relevant in the exercise of their reasonable judgment. The Board approved the Current Advisory Agreements on June 17, 2009.
In advance of the June 2009 Board meeting, the Board requested and received materials specifically relating to each Fund’s Current Advisory Agreement. These materials were prepared for each Fund, and included information (i) compiled by Lipper on the fees and expenses and the investment performance of the Fund as compared to a comparable group of funds as classified by Lipper; (ii) prepared by the Adviser discussing market conditions generally; (iii) on the profitability to the Adviser of the Current Advisory Agreements and other payments received by the Adviser and its affiliates from the Funds; and (iv) provided by the Adviser concerning services related to the valuation and pricing of Fund portfolio holdings, and direct and indirect benefits to the Adviser and its affiliates from their relationship with the Fund.
| 28 | 2009 iSHARES ANNUAL REPORTTO SHAREHOLDERS |
Table of Contents
Board Review and Approval of New Investment Advisory Agreements (Unaudited) (Continued)
iSHARES®, INC.
At the June 17, July 29 and August 13, 2009 Board meetings, the Directors discussed with representatives of BGI, the Adviser and BlackRock, the management, investment, risk management and compliance capabilities and processes, and financial condition of BlackRock, the Transaction and its rationale, and BlackRock’s general plans and intentions regarding the Adviser and the Funds. At these Board meetings, representatives of BGI, the Adviser and BlackRock made various presentations to, and responded to questions from, the Board. The Board also inquired about the plans for, and anticipated roles and responsibilities of, the employees and officers of the Adviser in connection with the Transaction, including the anticipated senior management structure of the Adviser following the completion of the Transaction. The Independent Directors also conferred separately and with their independent legal counsel about the Transaction and other matters related to the Transaction on a number of occasions. After the presentations and after reviewing the written materials provided, the Independent Directors met in executive sessions with their independent legal counsel at the June, July and August 2009 Board meetings to consider the Transaction, its expected impact on the Adviser and the Funds, and the New Advisory Agreements.
In connection with the Board’s review of the New Advisory Agreements, BGI, the Adviser and/or BlackRock, as applicable, provided the Board with information about a variety of matters. The Board considered, among other things, the following information:
| • | the reputation, financial strength and resources of BlackRock and its investment advisory subsidiaries and the anticipated financial strength and resources of the combined company; |
| • | that there is not expected to be any diminution in the nature, quality and extent of services provided to the Funds and their shareholders by the Adviser, including portfolio management and compliance services; |
| • | that the Adviser and BlackRock have no present intention to alter the advisory fee rates and expense arrangements currently in effect for the Funds for a period of two years from the date of the closing of the Transaction; |
| • | that it is expected that substantially all of the current employees of the Adviser will remain employees of the Adviser and will continue to provide services to the Funds following the Transaction; |
| • | that the Funds may benefit from having direct access to BlackRock’s state of the art technology and risk management analytic tools, including investment tools, provided under the BlackRock Solutions® brand name; |
| • | that the Funds are expected to continue to be sold through existing distribution channels; |
| • | that the Funds will have access to greater distribution resources through BlackRock’s relationships with third party brokers and retirement plan platforms; |
| • | that the parties to the Transaction Agreement have agreed to conduct their respective businesses in compliance with the conditions of Section 15(f) of the 1940 Act in relation to the Funds; |
| • | that Barclays or one of its affiliates has agreed to pay all expenses of the Funds in connection with the Board’s consideration of the New Advisory Agreements and all costs of seeking shareholder approval of the New Advisory Agreements; and |
| • | that Barclays and BlackRock would derive benefits from the Transaction and that, as a result, they may have a different financial interest in the matters that were being considered than do Fund shareholders. |
The Board did not identify any particular information that was all-important or controlling, and each Director may have attributed different weights to the various factors discussed below. The Directors evaluated all information available to them on a Fund-by-Fund basis, and their determinations were made separately in respect of each Fund. In their deliberations, the Directors considered information received
| BOARD REVIEWAND APPROVALOF NEW INVESTMENT ADVISORY AGREEMENTS | 29 |
Table of Contents
Board Review and Approval of New Investment Advisory Agreements (Unaudited) (Continued)
iSHARES®, INC.
in connection with their most recent approval or continuation of each Current Advisory Agreement at the June 2009 Board meeting, in addition to information provided by BGI, the Adviser and BlackRock regarding BlackRock and the Transaction, in connection with their evaluation of the terms and conditions of the New Advisory Agreements. The Directors, including a majority of the Independent Directors, concluded that the terms of the New Advisory Agreements are appropriate, that the fees to be paid are reasonable in light of the services to be provided to each Fund, and that the New Advisory Agreements should be approved and recommended to Fund shareholders. In voting to approve the New Advisory Agreements in respect of each Fund, the Board considered in particular the following factors:
The nature, extent and quality of services to be provided by the Adviser and its affiliates – In connection with their consideration of the New Advisory Agreements, the Board considered representations by the Adviser, BGI and BlackRock that there would be no diminution in the scope of services required of or provided by the Adviser under the New Advisory Agreements for each Fund as compared to the scope of services provided by the Adviser under the Current Advisory Agreement. In reviewing the scope of these services at the June and August 2009 Board meetings, the Board considered the Adviser’s investment philosophy and experience, noting that the Adviser and its affiliates have committed significant resources over time, including over the past year, including investments in technology and increasing the number of their employees supporting the Funds. The Board also considered the Adviser’s compliance program and its compliance record with respect to the Funds. In that regard, the Board noted that the Adviser reports to the Board about portfolio management and compliance matters on a periodic basis in connection with regularly scheduled meetings of the Board, and has made appropriate officers available as needed to provide further assistance with these matters. The Board noted that it expects that these reports and discussions will continue following the consummation of the Transaction. In addition to the above considerations, the Board considered the Adviser’s investment processes and strategies, and matters related to the Adviser’s portfolio transaction policies and procedures. The Board further took into account that, with respect to most of the Funds, the Adviser does not serve as investment adviser for other series of registered investment companies with substantially similar investment objectives and strategies; therefore, directly comparable performance information was generally not available for most Funds. The Board also considered each Fund’s record of performing in accordance with its investment objective.
In connection with the investment advisory services to be provided under the New Advisory Agreements, the Board took into account detailed discussions with representatives of the Adviser at the June 2009 Board meeting and at prior Board meetings regarding the management of each Fund. In addition to the investment advisory services to be provided to the Funds, the Board, at the August 2009 Board meeting, considered that the Adviser also will continue to provide management and administrative services, shareholder services, oversight of Fund accounting, marketing services, assistance in meeting legal and regulatory requirements and other services necessary for the operation of the Funds, and that these services were expected to be consistent with the services the Adviser currently performs under the Current Advisory Agreements.
The Board noted the representations of the Adviser, BGI and BlackRock that the Transaction was not expected to have any adverse effect on the resources and strengths of the Adviser in managing the Funds. The Board also considered that the Funds and their shareholders may benefit from having direct access to BlackRock’s state of the art technology and risk management analytic tools, including the investment tools provided under the BlackRock Solutions® brand name. The Board discussed BlackRock’s current financial condition, its anticipated financial condition following the completion of the Transaction and its lines of business. The Board also discussed the Adviser’s anticipated financial condition following the completion of the Transaction. The Board discussed BlackRock’s current ownership structure and expected ownership structure following the completion of the Transaction. The Board was advised that BlackRock operates as an independent firm, with its own Board of Directors and no majority shareholder. The Board was also advised that while BlackRock’s largest shareholders, Merrill Lynch, a wholly owned subsidiary of Bank of America, and PNC, are important clients and strategic partners of BlackRock, they are not involved in the firm’s day-to-day management or operations.
| 30 | 2009 iSHARES ANNUAL REPORTTO SHAREHOLDERS |
Table of Contents
Board Review and Approval of New Investment Advisory Agreements (Unaudited) (Continued)
iSHARES®, INC.
Based on the discussions held and the materials presented at the June, July and August 2009 Board meetings and prior Board meetings, the Board determined that the Transaction would not likely cause an adverse change in the nature, extent and quality of the services to be provided by the Adviser under the New Advisory Agreements compared with the services provided by the Adviser under the Current Advisory Agreements and that the Board expects that the quality of such services will continue to be appropriate.
Funds’ expenses and performance of the Funds – The Board received and reviewed statistical information prepared by Lipper at the June 2009 meeting and also received information at prior meetings regarding the expense ratio components of the Funds, including advisory fees, waivers and reimbursements, and gross and net total expenses, in comparison with the same information for other registered investment companies objectively selected by Lipper as comprising a Fund’s peer group pursuant to Lipper’s proprietary methodology and, for certain Funds, registered investment companies that would otherwise have been excluded from Lipper’s comparison group due to certain differentiating factors, but were nonetheless included at the request of the Adviser (the “Lipper Group”). Because there are few, if any, exchange traded funds or index funds that track indexes similar to those tracked by most of the Funds, the Lipper Groups sometimes included mutual funds, closed-end funds, exchange traded funds, or funds with differing investment objective classifications, investment focuses and other characteristics (e.g., actively managed funds and funds sponsored by “at cost” service providers). In support of its review of the statistical information, the Board was provided with a detailed description of the methodology used by Lipper to determine the applicable Lipper Groups and to prepare this information. The Board further noted that due to the limitations in providing comparable funds in the various Lipper Groups, the statistical information may or may not provide meaningful direct comparisons to certain Funds.
The Board noted that the investment advisory fees and overall expenses for the Funds were generally lower than the median or average investment advisory fee rates and overall expenses of the Funds in their Lipper Groups with respect to the Current and New Advisory Agreements. The Board took into account that the fee rates for each Fund under the New Advisory Agreements are identical to the fee rates under the respective Current Advisory Agreements. Further, the Board noted that representatives of the Adviser and BlackRock had confirmed that there is no present intention to alter the advisory fee rates, expense waivers or expense reimbursements currently in effect for the Funds for a period of two years from the date of the closing of the Transaction.
In addition to reviewing the fees and expenses, the Board noted that it regularly reviews each Fund’s performance and at the June 2009 meeting reviewed statistical information prepared by Lipper regarding the performance of each Fund for the quarter-end, one-, three-, five- and ten-year periods, as applicable, and a comparison of each Fund’s performance to its performance benchmark index for the same periods. To the extent that any of the comparison funds included in the Lipper Groups track the same index as any particular Fund, Lipper also provided, and the Board reviewed, a comparison of the Fund’s performance to that of the relevant comparison funds for the same periods. The Board noted that the Funds generally performed in line with their performance benchmark indices over the relevant periods. In considering this information, the Board took into account that the Lipper Groups include funds that may have different investment objectives and/or benchmarks from the Funds. In addition, the Board noted that each Fund seeks to track its benchmark index and that during the prior year the Board received periodic reports on the Funds’ performance in comparison with their relevant benchmark indices. This comparative performance information was also considered by the Board. The Board considered the Adviser’s substantial investment advisory experience and capabilities, as well as the possibility of additional resources and support from BlackRock following the completion of the Transaction, but noted that the effect, if any, the consummation of the Transaction would have on the future performance of the Funds could not be predicted.
Based on this review, the Board had concluded that the investment advisory fee rates and expense levels and the historical performance of each Fund, as compared to the investment advisory fee rates and expense levels and performance of the funds in the relevant Lipper Group, were satisfactory for the purposes of approving the Current Advisory Agreements and concluded that these comparisons continued to be satisfactory for the purpose of approving the New Advisory Agreements.
| BOARD REVIEWAND APPROVALOF NEW INVESTMENT ADVISORY AGREEMENTS | 31 |
Table of Contents
Board Review and Approval of New Investment Advisory Agreements (Unaudited) (Continued)
iSHARES®, INC.
Cost of services provided and profits realized by the Adviser from the relationship with each Fund – The Board considered that at the June 2009 Board meeting and at prior meetings, it had reviewed information about the profitability of the Adviser with respect to the Funds based on the fees payable to the Adviser and its affiliates (including fees under the Current Advisory Agreements), and all other sources of revenue and expense to the Adviser and its affiliates from the Funds’ operations for the last calendar year. The Board discussed the sources of direct and ancillary revenue with management, including the revenues to BGI from securities lending by the Companies (including any securities lending by the Funds). The Board also discussed the Adviser’s profit margin as reflected in the Funds’ profitability analysis and reviewed information regarding economies of scale (as discussed below).
In evaluating the costs of the services to be provided by the Adviser under the New Advisory Agreements, the Board considered, among other things, whether advisory fee rates or other expenses would change as a result of the Transaction. The Board noted that the New Advisory Agreements are similar to the Current Advisory Agreements, including the fact that the fee rates under the Agreements are identical and that representatives of the Adviser and BlackRock represented that there is no present intention due to the Transaction to alter the advisory fee rates, expense waiver or expense reimbursements currently in effect for the Funds for a period of two years from the date of the closing of the Transaction. It was noted that it was not possible to predict how the Transaction would affect the Adviser’s profitability from its relationship with the Funds. Potential cost savings had been described by BlackRock representatives that may be achieved by BlackRock immediately following the Transaction, but even if all of such savings were realized by the Adviser in connection with the management of the Funds, the Adviser’s profitability in respect of the Funds was not expected to increase in a significant respect. The Adviser, BlackRock and the Board discussed how profitability will be calculated and presented to the Board following the Transaction, and the Board reviewed BlackRock’s 2008 profitability methodology with respect to its registered funds. The Board expects to receive profitability information from the Adviser on at least an annual basis following the completion of the Transaction and thus be in a position to evaluate whether any adjustments in Fund fees would be appropriate.
The extent to which economies of scale would be realized as a Fund grows and whether fee levels would reflect such economies of scale – In connection with its review of the Funds’ profitability analysis at the June 2009 meeting, the Board reviewed information regarding potential economies of scale or other efficiencies that may result from increases in the Funds’ assets. At the June 2009 Board meeting, the Board also reviewed the Adviser’s historic profitability as investment adviser to the iShares fund complex and noted that the Adviser had continued to make significant investments in the iShares fund complex, that expenses had grown at a pace similar to the growth in revenue, and that the Adviser had incurred operating losses during earlier years when the iShares funds, including the Funds, had not yet reached scale. The Board further noted that the Current and New Advisory Agreements provide for breakpoints in certain Funds’ investment advisory fee rates as the assets of the Funds, on an aggregated basis with the assets of certain other Funds, increase and that breakpoints were implemented the previous year for certain Funds. The Board noted that for certain other Funds, the Current and New Advisory Agreements do not provide for any breakpoints in the Funds’ investment advisory fee rates as the assets of the Funds increase; however, the Board further noted that possible future economies of scale for those Funds had, in many cases, been taken into consideration by fixing the investment advisory fees at rates at the lower end of the marketplace, effectively giving Fund shareholders, from inception, the benefits of the lower average fee shareholders may have received from a fee structure with declining breakpoints where the initial fee was higher. At the June 2009 Board meeting, the Board, recognizing its responsibility to consider this issue at least annually, concluded that the structure of the investment advisory fee rates, with the breakpoints for certain Funds, reflected appropriate sharing of economies of scale with the Funds’ shareholders.
The Board noted representations from the Adviser and BlackRock that the Adviser will continue to make significant investments in the iShares fund complex and the infrastructure supporting the Funds. The Board determined that changes to the fee structure were not currently necessary and that the Funds appropriately participate in economies of scale. It was noted that it was not possible to evaluate how the Transaction would create opportunities for additional economies of scale. The Board expects to consider economies of scale on at least an annual basis following completion of the Transaction and thus be in a position to evaluate additional economies of scale, if any.
| 32 | 2009 iSHARES ANNUAL REPORTTO SHAREHOLDERS |
Table of Contents
Board Review and Approval of New Investment Advisory Agreements (Unaudited) (Continued)
iSHARES®, INC.
Fees and services provided for other comparable funds/accounts managed by the Adviser and its Affiliates – At the June 2009 Board meeting, the Board received and considered certain information regarding the Funds’ annual investment advisory fee rates under the Current Advisory Agreements in comparison to the investment advisory/management fee rates for other funds/accounts for which the Adviser or BGI provides investment advisory/management services, including other funds registered under the 1940 Act, collective funds and separate accounts (together, the “Other Accounts”). The Board noted that directly comparable investment advisory/management fee information was not available for many of the Funds, as the Adviser and its affiliates do not manage any Other Accounts with substantially similar investment objectives and strategies as many of the Funds. The Board noted, however, that the Adviser provided the Board with general information regarding how the level of services provided to the Other Accounts differed from the level of services provided to the Funds. Furthermore, in reviewing the comparative investment advisory/management fee information for the Funds for which such information was available, the Board considered the general structure of investment advisory/management fees in relation to the nature and extent of services provided to the Funds in comparison with the nature and extent of services provided to the Other Accounts, including, among other things, the level of complexity in managing the Funds and the Other Accounts under differing regulatory requirements and client guidelines. The Board noted that the investment advisory fee rates under the Current Advisory Agreements for the Funds were generally higher than the investment advisory/management fee rates for the Other Accounts for which the Adviser or BGI provides investment advisory/management services, but that the differences appeared to be attributable to, among other things, the type and level of services provided and/or the asset levels of the Other Accounts. Based on this review, the Board determined that the investment advisory fee rates under the Current and New Advisory Agreements do not constitute fees that are so disproportionately large as to bear no reasonable relationship to the services rendered and that could not have been the product of arm’s-length bargaining, and concluded that the investment advisory fee rates under the Current and New Advisory Agreements are fair and reasonable.
Other benefits to the Adviser and its affiliates, including fall-out benefits – In evaluating the fall-out and any other ancillary benefits received by the Adviser under the Current Advisory Agreements, the Board reviewed any ancillary revenue received by the Adviser and/or its affiliates in connection with the services provided to the Funds by the Adviser or its affiliates, such as any payment of revenue to BGI, the Company’s current securities lending agent, for loaning any portfolio securities, and payment of advisory fees and/or administration fees to the Adviser and BGI in connection with any investments by the Funds in other funds for which the Adviser provides investment advisory services and/or BGI provides administration services. The Board noted that while revenue to BGI in connection with securities lending agency services to the Funds increased overall as against the previous year, overall revenue increased by approximately the same percentage as overall expenses. The Board noted that the Adviser does not use soft dollars or consider the value of research or other services that may be provided to the Adviser (including its affiliates) in selecting brokers for portfolio transactions for the Funds. The Board further noted that any portfolio transactions on behalf of the Funds placed through an affiliate of the Adviser or purchased from an underwriting syndicate in which an Adviser affiliate participates, are reported to the Board pursuant to Rule 17e-1 or Rule 10f-3, as applicable, under the 1940 Act. Any fall-out or ancillary benefits as a result of the Transaction were difficult to quantify with certainty at this time, and the Board indicated that it would continue to evaluate them going forward.
Conclusion – The Board examined the totality of the information they were provided at the June, July and August 2009 Board meetings, and information they received at other meetings held during the past year, and did not identify any single factor discussed previously as controlling. Based on this analysis, the Board determined that the New Advisory Agreements, including the investment advisory fee rates thereunder, are fair and reasonable in light of all relevant circumstances and concluded that it is in the best interest of the Funds and their shareholders to unanimously approve the New Advisory Agreements.
| BOARD REVIEWAND APPROVALOF NEW INVESTMENT ADVISORY AGREEMENTS | 33 |
Table of Contents
Supplemental Information (Unaudited)
iSHARES®, INC.
The table that follows presents information about the differences between the daily market price on secondary markets for shares of the Fund and the Fund’s net asset value. Net asset value, or “NAV,” is the price per share at which the Fund issues and redeems shares. It is calculated in accordance with the standard formula for valuing mutual fund shares. The “Market Price” of the Fund generally is determined using the midpoint between the highest bid and the lowest offer on the primary stock exchange on which the shares of the Fund is listed for trading, as of the time that the Fund’s NAV is calculated. The Fund’s Market Price may be at, above or below its NAV. The NAV of the Fund will fluctuate with changes in the market value of its portfolio holdings. The Market Price of the Fund will fluctuate in accordance with changes in its NAV, as well as market supply and demand.
Premiums or discounts are the differences (expressed as a percentage) between the NAV and Market Price of the Fund on a given day, generally at the time NAV is calculated. A premium is the amount that the Fund is trading above the reported NAV, expressed as a percentage of the NAV. A discount is the amount that the Fund is trading below the reported NAV, expressed as a percentage of the NAV.
The following information shows the frequency distributions of premiums and discounts for the Fund. The information shown for the Fund is for five calendar years through the date of the most recent calendar quarter-end.
Each line in the table shows the number of trading days in which the Fund traded within the premium/discount range indicated. The number of trading days in each premium/discount range is also shown as a percentage of the total number of trading days in the period covered by the table. All data presented here represents past performance, which cannot be used to predict future results.
iShares MSCI Emerging Markets Index Fund
Period Covered: January 1, 2004 through June 30, 2009
Premium/Discount Range | Number of Days | Percentage of Total Days | |||
Greater than 4.0% | 4 | 0.29 | % | ||
Greater than 3.5% and Less than 4.0% | 3 | 0.22 | |||
Greater than 3.0% and Less than 3.5% | 1 | 0.07 | |||
Greater than 2.5% and Less than 3.0% | 8 | 0.58 | |||
Greater than 2.0% and Less than 2.5% | 10 | 0.72 | |||
Greater than 1.5% and Less than 2.0% | 31 | 2.24 | |||
Greater than 1.0% and Less than 1.5% | 74 | 5.35 | |||
Greater than 0.5% and Less than 1.0% | 273 | 19.75 | |||
Between 0.5% and –0.5% | 691 | 50.02 | |||
Less than –0.5% and Greater than –1.0% | 157 | 11.36 | |||
Less than –1.0% and Greater than –1.5% | 73 | 5.28 | |||
Less than –1.5% and Greater than –2.0% | 31 | 2.24 | |||
Less than ���2.0% and Greater than –2.5% | 12 | 0.87 | |||
Less than –2.5% and Greater than –3.0% | 2 | 0.14 | |||
Less than –3.0% and Greater than –3.5% | 4 | 0.29 | |||
Less than –3.5% and Greater than –4.0% | 1 | 0.07 | |||
Less than –4.0% and Greater than –4.5% | 4 | 0.29 | |||
Less than –4.5% | 3 | 0.22 | |||
| 1,382 | 100.00 | % | |||
| 34 | 2009 iSHARES ANNUAL REPORTTO SHAREHOLDERS |
Table of Contents
Director and Officer Information (Unaudited)
iSHARES®, INC.
The Board of Directors has responsibility for the overall management and operations of the Company, including general supervision of the duties performed by BGFA and other service providers. Each Director serves until his or her successor is duly elected or appointed and qualified. Each Officer serves until he or she resigns, is removed, dies, retires or becomes disqualified.
iShares, Inc., iShares Trust, Barclays Global Investors Funds (“BGIF”) and Master Investment Portfolio (“MIP”) are considered to be members of the same fund complex, as defined in Form N-1A under the 1940 Act. Each Director of iShares, Inc. also serves as a Trustee for iShares Trust and oversees 183 portfolios within the fund complex. In addition, Lee T. Kranefuss serves as a Trustee for BGIF and MIP and oversees an additional 26 portfolios within the fund complex.
The address of each Director and Officer is c/o Barclays Global Investors, N.A., 400 Howard Street, San Francisco, California 94105. The Board has designated George G.C. Parker as its Lead Independent Director. Additional information about the Funds’ Directors and Officers may be found in the Funds’ combined Statement of Additional Information, which is available without charge, upon request, by calling toll-free 1-800-474-2737.
Interested Directors and Officers
| Name, Age | Position(s), Length of Service | Principal Occupation(s) During Past 5 Years | Other Directorships Held | |||
*Lee T. Kranefuss, 48 | Director and Chairman (since 2003). | Non-Executive Chairman (since 2009), iShares; Global Chief Executive Officer (2008-2009) of iShares/Intermediary Groups of BGI; Chief Executive Officer (2005-2008) of iShares Intermediary Index and Market Group of BGI; Chief Executive Officer (2003-2005) of the Intermediary Invest or and Exchange Traded Products Business of BGI; Director (since 2005) of BGFA; Director, President and Chief Executive Officer (since 2005) of Barclays Global Investors International, Inc.; Director and Chairman (since 2005) of Barclays Global Investors Services. | Trustee (since 2003) of iShares Trust; Trustee (since 2001) of BGlF and MIP. |
| * | Lee T. Kranefuss is deemed to be an “interested person” (as defined in the 1940 Act) of the Company due to his affiliations with BGFA, the Funds’ investment adviser; BGI, the parent company of BGFA; and Barclays Global Investors Services, an affiliate of BGFA and BGI. |
| DIRECTORAND OFFICER INFORMATION | 35 |
Table of Contents
Director and Officer Information (Unaudited) (Continued)
iSHARES®, INC.
Independent Directors
| Name, Age | Position(s), Length of Service | Principal Occupation(s) During Past 5 Years | Other Directorships Held | |||
George G.C. Parker, 70 | Director (since 2002); Lead Independent Director (since 2006). | Dean Witter Distinguished Professor of Finance (since 1994), Emeritus, Stanford University: Graduate School of Business. | Trustee (since 2000) of iShares Trust; Lead Independent Trustee (since 2006) of iShares Trust; Director (since 1995) of Community First Financial Group; Director (since 1999) of Tejon Ranch Company; Director (since 2004) of Threshold Pharmaceuticals; Director (since 2007) of NETGEAR, Inc. | |||
J. Darrell Duffie, 55 | Director (since 2008). | Professor (since 1984) of Stanford University: Graduate School of Business. | Trustee (since 2008) of iShares Trust; Director (since 2008) of Moody’s Corp. | |||
Cecilia H. Herbert, 60 | Director (since 2005). | Chair (1994-2005) of Investment Committee, Archdiocese of San Francisco; Director (since 1998) and President (since 2007) of the Board of Directors, Catholic Charities CYO; Trustee (2004-2005) of Pacific Select Funds; Trustee (since 2002) and Chair (2006-2007) of the Finance and Investment Committees (since 2006) of the Thacher School. | Trustee (since 2005) of iShares Trust; Advisory Board Member (since 2009) of Forward Funds. | |||
Charles A. Hurty, 66 | Director (since 2005). | Retired; Partner, KPMG LLP (1968-2001). | Trustee (since 2005) of iShares Trust; Director (since 2002) of ProMark Absolute Return Strategies Fund LLC (1 portfolio); Director (since 2002) of Citigroup Alternative Investments Multi- Adviser Hedge Fund Portfolios LLC (1 portfolio); Director (since 2005) of CSFB Alternative Investments Fund (6 portfolios). | |||
John E. Kerrigan, 54 | Director (since 2005). | Chief Investment Officer (since 2002) of Santa Clara University. | Trustee (since 2005) of iShares Trust. | |||
*John E. Martinez, 48 | Director (since 2003). | Director (since 2005) of EquityRock Capital Management; Director (since 2003) of Larkin Street Youth Services. | Trustee (since 2003) of iShares Trust; Chairman (since 2007) of Independent Review Committee, Canadian iShares Funds. | |||
| 36 | 2009 iSHARES ANNUAL REPORTTO SHAREHOLDERS |
Table of Contents
Director and Officer Information (Unaudited) (Continued)
iSHARES®, INC.
Independent Directors (Continued)
| Name, Age | Position(s), Length of Service | Principal Occupation(s) During Past 5 Years | Other Directorships Held | |||
Robert H. Silver, 54 | Director (since 2007). | President and Co-Founder (since 2006) of The Bravitas Group, Inc.; Member (since 2006) of Non-Investor Advisory Board of Russia Partners II, LP; Director and member (2006-2009) of the Audit and Compensation Committee of EPAM Systems, Inc.; President and Chief Operating Officer (2003-2005) and Director (1999-2005) of UBS Financial Services, Inc.; President and Chief Executive Officer (1999-2005) of UBS Services USA, LLC; Managing Director (2000-2005) of UBS America, Inc.; Director and Vice Chairman (since 2001) of the YMCA of Greater NYC; Broadway Producer (since 2006); Co- Founder and Vice President (since 2008) of Parentgiving Inc. | Trustee (since 2007) of iShares Trust. | |||
| * | Prior to August 13, 2009, John E. Martinez was deemed to be an “interested person” (as defined in the 1940 Act) of the Trust due to his affiliations with BGFA, the Funds’ investment adviser; BGI, the parent company of BGFA; and Barclays Global Investors Services, an affiliate of BGFA and BGI. Effective August 13, 2009, John E. Martinez is a non-interested person notwithstanding his former affiliation with BGFA and its affiliates prior to 2002. |
Officers
| ||||||
| Name, Age | Position(s), Length of Service | Principal Occupation(s) During Past 5 Years | Other Directorships Held | |||
Michael A. Latham, 44 | President (since 2007). | Head (since 2007) of Americas iShares, BGI; Chief Operating Officer (2003-2007) of the Intermediary Investor and Exchange Traded Products Business of BGI; Director and Chief Financial Officer (since 2005) of Barclays Global Investors International, Inc. | None. | |||
| DIRECTORAND OFFICER INFORMATION | 37 |
Table of Contents
Director and Officer Information (Unaudited) (Continued)
iSHARES®, INC.
Officers (Continued)
| Name, Age | Position(s), Length of Service | Principal Occupation(s) During Past 5 Years | Other Directorships Held | |||
Geoffrey D. Flynn, 52 | Executive Vice President and Chief Operating Officer (since 2008). | Chief Operating Officer (since 2008) of U.S. iShares, BGI; Director (2007-2008) of Mutual Fund Operations of BGI; President (2003-2007) of Van Kampen Investors Services; Managing Director (2002-2007) of Morgan Stanley; President (2002-2007) of Morgan Stanley Trust, FSB. | None. | |||
Jack Gee, 50 | Treasurer and Chief Financial Officer (since 2008). | Senior Director (since 2009) of Fund Administration of Intermediary Investor Business of BGI; Director (2004-2009) of Fund Administration of Intermediary Investor Business of BGI; Treasurer and Chief Financial Officer (2004) of Parnassus Investments. | None. | |||
Eilleen M. Clavere, 57 | Secretary (since 2007). | Director (since 2006) of Legal Administration of Intermediary Investors Business of BGI; Legal Counsel and Vice President (2005-2006) of Atlas Funds, Atlas Advisers, Inc. and Atlas Securities, Inc.; Counsel (2001-2005) of Kirkpatrick & Lockhart LLP. | None. | |||
Ira P. Shapiro, 46 | Vice President and Chief Legal Officer (since 2007). | Associate General Counsel (since 2004) of BGI; First Vice President (1993-2004) of Merrill Lynch Investment Managers. | None. | |||
Amy Schioldager, 47 | Executive Vice President (since 2007). | Global Head (since 2008) of Index Equity, BGI; Global Head (2006-2008) of U.S. Indexing, BGI; Head (2001-2006) of Domestic Equity Portfolio Management, BGI. | None. | |||
Patrick O’Connor, 42 | Vice President (since 2007). | Head (since 2006) of iShares Portfolio Management, BGI; Senior Portfolio Manager (1999-2006) of BGI. | None. | |||
| 38 | 2009 iSHARES ANNUAL REPORTTO SHAREHOLDERS |
Table of Contents
Director and Officer Information (Unaudited) (Continued)
iSHARES®, INC.
Officers (Continued)
| Name, Age | Position(s), Length of Service | Principal Occupation(s) During Past 5 Years | Other Directorships Held | |||
Lee Sterne, 44 | Vice President (since 2007). | Head (since 2007) of U.S. Fixed Income Index and iShares, BGI; Senior Portfolio Manager (2004-2007) of BGI; Portfolio Manager (2001-2004) of BGI. | None. | |||
Matt Tucker, 37 | Vice President (since 2007). | Director (since 2009) of Fixed Income Investment Strategy, BGI; Head (2005-2008) of U.S. Fixed Income Investment Solutions, BGI; Fixed Income Investment Strategist (2003-2005) of BGI. | None. | |||
| DIRECTORAND OFFICER INFORMATION | 39 |
Table of Contents
The following is a list of iShares Funds being offered, along with their respective exchange trading symbols. Please call 1-800-iShares (1-800-474-2737) to obtain a prospectus for any iShares Fund. The prospectus contains more complete information, including charges, expenses, investment objectives and risk factors that should be carefully considered to determine if the Fund(s) are an appropriate investment for you. Read the prospectus(es) carefully before investing. Investing involves risk, including possible loss of principal.
| iShares Russell Domestic Index Funds | Trading Symbol | |
iShares Russell 3000 | IWV | |
iShares Russell 3000 Growth | IWZ | |
iShares Russell 3000 Value | IWW | |
iShares Russell Top 200 | IWL | |
iShares Russell Top 200 Growth | IWY | |
iShares Russell Top 200 Value | IWX | |
iShares Russell 1000 | IWB | |
iShares Russell 1000 Growth | IWF | |
iShares Russell 1000 Value | IWD | |
iShares Russell Midcap | IWR | |
iShares Russell Midcap Growth | IWP | |
iShares Russell Midcap Value | IWS | |
iShares Russell 2000 | IWM | |
iShares Russell 2000 Growth | IWO | |
iShares Russell 2000 Value | IWN | |
iShares Russell Microcap | IWC | |
| iShares S&P Domestic Index Funds | ||
iShares S&P 1500 | ISI | |
iShares S&P 100 | OEF | |
iShares S&P 500 | IVV | |
iShares S&P 500 Growth | IVW | |
iShares S&P 500 Value | IVE | |
iShares S&P MidCap 400 | IJH | |
iShares S&P MidCap 400 Growth | IJK | |
iShares S&P MidCap 400 Value | IJJ | |
iShares S&P SmallCap 600 | IJR | |
iShares S&P SmallCap 600 Growth | IJT | |
iShares S&P SmallCap 600 Value | IJS | |
| iShares Morningstar Domestic Index Funds | ||
iShares Morningstar Large Core | JKD | |
iShares Morningstar Large Growth | JKE | |
iShares Morningstar Large Value | JKF | |
iShares Morningstar Mid Core | JKG | |
iShares Morningstar Mid Growth | JKH | |
iShares Morningstar Mid Value | JKI | |
iShares Morningstar Small Core | JKJ | |
iShares Morningstar Small Growth | JKK | |
iShares Morningstar Small Value | JKL | |
| iShares Dow Jones Domestic Index Funds | ||
iShares Dow Jones U.S. | IYY | |
| iShares KLD Socially Responsible Index Funds | ||
iShares FTSE KLD 400 Social | DSI | |
iShares FTSE KLD Select Social | KLD | |
| iShares NYSE Domestic Index Funds | ||
iShares NYSE Composite | NYC | |
iShares NYSE 100 | NY | |
| iShares Domestic Specialty Index Funds | Trading Symbol | |
iShares S&P U.S. Preferred Stock | PFF | |
iShares Dow Jones Select Dividend | DVY | |
| iShares North American Sector/Subsector Index Funds | ||
iShares S&P North American Technology Sector | IGM | |
iShares S&P North American Technology-Multimedia Networking | IGN | |
iShares S&P North American Technology-Semiconductors | IGW | |
iShares S&P North American Technology-Software | IGV | |
iShares S&P North American Natural Resources Sector | IGE | |
| iShares Domestic Sector Index Funds | ||
iShares Dow Jones U.S. Basic Materials Sector | IYM | |
iShares Dow Jones U.S. Consumer Goods Sector | IYK | |
iShares Dow Jones U.S. Consumer Services Sector | IYC | |
iShares Dow Jones U.S. Energy Sector | IYE | |
iShares Dow Jones U.S. Financial Sector | IYF | |
iShares Dow Jones U.S. Healthcare Sector | IYH | |
iShares Dow Jones U.S. Industrial Sector | IYJ | |
iShares Dow Jones U.S. Technology Sector | IYW | |
iShares Dow Jones U.S. Telecommunications Sector | IYZ | |
iShares Dow Jones U.S. Utilities Sector | IDU | |
| iShares Domestic Subsector Index Funds | ||
iShares Dow Jones Transportation Average | IYT | |
iShares Dow Jones U.S. Aerospace & Defense | ITA | |
iShares Dow Jones U.S. Broker-Dealers | IAI | |
iShares Dow Jones U.S. Financial Services | IYG | |
iShares Dow Jones U.S. Healthcare Providers | IHF | |
iShares Dow Jones U.S. Home Construction | ITB | |
iShares Dow Jones U.S. Insurance | IAK | |
iShares Dow Jones U.S. Medical Devices | IHI | |
iShares Dow Jones U.S. Oil & Gas Exploration & Production | IEO | |
iShares Dow Jones U.S. Oil Equipment & Services | IEZ | |
iShares Dow Jones U.S. Pharmaceuticals | IHE | |
iShares Dow Jones U.S. Regional Banks | IAT | |
iShares Nasdaq Biotechnology | IBB | |
| iShares Domestic Real Estate Index Funds | ||
iShares Cohen & Steers Realty Majors | ICF | |
iShares Dow Jones U.S. Real Estate | IYR | |
iShares FTSE NAREIT Real Estate 50 | FTY | |
iShares FTSE NAREIT Industrial/Office Capped | FIO | |
iShares FTSE NAREIT Mortgage Plus Capped | REM | |
iShares FTSE NAREIT Residential Plus Capped | REZ | |
iShares FTSE NAREIT Retail Capped | RTL | |
| iShares Target Risk Index Funds | ||
iShares S&P Conservative Allocation | AOK | |
iShares S&P Moderate Allocation | AOM | |
iShares S&P Growth Allocation | AOR | |
iShares S&P Aggressive Allocation | AOA | |
| 40 | 2009 iSHARES ANNUAL REPORTTO SHAREHOLDERS |
Table of Contents
The iShares® Family of Funds (Continued)
| iShares International Country Index Funds | Trading Symbol | |
iShares FTSE China (HK Listed) | FCHI | |
iShares FTSE/Xinhua China 25 | FXI | |
iShares MSCI Australia | EWA | |
iShares MSCI Austria Investable Market | EWO | |
iShares MSCI Belgium Investable Market | EWK | |
iShares MSCI Brazil | EWZ | |
iShares MSCI Canada | EWC | |
iShares MSCI Chile Investable Market | ECH | |
iShares MSCI France | EWQ | |
iShares MSCI Germany | EWG | |
iShares MSCI Hong Kong | EWH | |
iShares MSCI Israel Capped Investable Market | EIS | |
iShares MSCI Italy | EWI | |
iShares MSCI Japan | EWJ | |
iShares MSCI Japan Small Cap | SCJ | |
iShares S&P/TOPIX 150 | ITF | |
iShares MSCI Malaysia | EWM | |
iShares MSCI Mexico Investable Market | EWW | |
iShares MSCI Netherlands Investable Market | EWN | |
iShares MSCI All Peru Capped | EPU | |
iShares MSCI Singapore | EWS | |
iShares MSCI South Africa | EZA | |
iShares MSCI South Korea | EWY | |
iShares MSCI Spain | EWP | |
iShares MSCI Sweden | EWD | |
iShares MSCI Switzerland | EWL | |
iShares MSCI Taiwan | EWT | |
iShares MSCI Thailand Investable Market | THD | |
iShares MSCI Turkey Investable Market | TUR | |
iShares MSCI United Kingdom | EWU | |
| iShares International Index Funds | ||
iShares MSCI ACWI ex US | ACWX | |
iShares MSCI EAFE | EFA | |
iShares MSCI EAFE Growth | EFG | |
iShares MSCI EAFE Value | EFV | |
iShares MSCI EAFE Small Cap | SCZ | |
iShares FTSE Developed Small Cap ex-North America | IFSM | |
iShares MSCI Emerging Markets | EEM | |
iShares MSCI Emerging Markets Eastern Europe | ESR | |
iShares S&P Emerging Markets Infrastructure | EMIF | |
iShares MSCI BRIC | BKF | |
iShares MSCI EMU | EZU | |
iShares MSCI All Country Asia ex Japan | AAXJ | |
iShares MSCI Pacific ex-Japan | EPP | |
iShares S&P Asia 50 | AIA | |
iShares S&P Europe 350 | IEV | |
iShares S&P Latin America 40 | ILF | |
| iShares International/Global Real Estate Index Funds | ||
iShares S&P Developed ex-U.S. Property | WPS | |
iShares FTSE EPRA/NAREIT Developed Real Estate ex-U.S. | IFGL | |
iShares FTSE EPRA/NAREIT Developed Asia | IFAS | |
iShares FTSE EPRA/NAREIT Developed Europe | IFEU | |
iShares FTSE EPRA/NAREIT North America | IFNA | |
| iShares International Specialty Index Funds | ||
iShares Dow Jones International Select Dividend | IDV | |
| iShares Target Date Index Funds | Trading Symbol | |
iShares S&P Target Date Retirement Income | TGR | |
iShares S&P Target Date 2010 | TZD | |
iShares S&P Target Date 2015 | TZE | |
iShares S&P Target Date 2020 | TZG | |
iShares S&P Target Date 2025 | TZI | |
iShares S&P Target Date 2030 | TZL | |
iShares S&P Target Date 2035 | TZO | |
iShares S&P Target Date 2040 | TZV | |
| iShares Global Index Funds | ||
iShares MSCI ACWI | ACWI | |
iShares S&P Global 100 | IOO | |
iShares MSCI Kokusai | TOK | |
| iShares Global Sector Index Funds | ||
iShares S&P Global Consumer Discretionary Sector | RXI | |
iShares S&P Global Consumer Staples Sector | KXI | |
iShares S&P Global Energy Sector | IXC | |
iShares S&P Global Financials Sector | IXG | |
iShares S&P Global Healthcare Sector | IXJ | |
iShares S&P Global Industrials Sector | EXI | |
iShares S&P Global Materials Sector | MXI | |
iShares S&P Global Technology Sector | IXN | |
iShares S&P Global Telecommunications Sector | IXP | |
iShares S&P Global Utilities Sector | JXI | |
| iShares Global Theme Based Index Funds | ||
iShares S&P Global Clean Energy | ICLN | |
iShares S&P Global Infrastructure | IGF | |
iShares S&P Global Nuclear Energy | NUCL | |
iShares S&P Global Timber & Forestry | WOOD | |
| iShares U.S. Multi sector Bond Funds | ||
iShares Barclays Aggregate | AGG | |
iShares Barclays Government/Credit | GBF | |
iShares Barclays Intermediate Government/Credit | GVI | |
| iShares U.S. Government Bond Funds | ||
iShares Barclays Short Treasury | SHV | |
iShares Barclays 1-3 Year Treasury | SHY | |
iShares Barclays 3-7 Year Treasury | IEI | |
iShares Barclays 7-10 Year Treasury | IEF | |
iShares Barclays 10-20 Year Treasury | TLH | |
iShares Barclays 20+ Year Treasury | TLT | |
iShares Barclays TIPS | TIP | |
iShares Barclays Agency | AGZ | |
| iShares U.S. Credit Bond Funds | ||
iShares Barclays Credit | CFT | |
iShares Barclays 1-3 Year Credit | CSJ | |
iShares Barclays Intermediate Credit | CIU | |
iShares iBoxx $ Investment Grade Corporate | LQD | |
iShares iBoxx $ High Yield Corporate | HYG | |
| iShares U.S. Securitized Bond Funds | ||
iShares Barclays MBS | MBB | |
| ISHARES FAMILYOF FUNDS | 41 |
Table of Contents
The iShares® Family of Funds (Continued)
| iShares AMT-Free Municipal Bond Funds | Trading Symbol | |
iShares S&P National AMT-Free Municipal | MUB | |
iShares S&P Short Term National AMT-Free Municipal | SUB | |
iShares S&P California AMT-Free Municipal | CMF | |
iShares S&P New York AMT-Free Municipal | NYF |
| iShares International Bond Funds | Trading Symbol | |
iShares JPMorgan USD Emerging Markets | EMB | |
iShares S&P/Citigroup International Treasury | IGOV | |
iShares S&P/Citigroup 1-3 Year International Treasury | ISHG |
iShares® is a registered trademark of Barclays Global Investors, N.A. (“BGI”). The iShares Funds are not sponsored, endorsed, issued, sold or promoted by Cohen & Steers Capital Management, Inc., Dow Jones & Company, Inc., European Public Real Estate Association (“EPRA®”), FTSE International Limited (“FTSE”), FTSE/Xinhua Index Limited (“FXI”), iBoxx®, J.P. Morgan Securities Inc., MSCI Inc., Morningstar Inc., The NASDAQ OMX Group, Inc., National Association of Real Estate Investment Trusts (“NAREIT”), New York Stock Exchange, Inc., Frank Russell Company or Standard & Poor’s, nor are they sponsored or endorsed by Barclays Capital. None of these companies make any representation regarding the advisability of investing in the iShares Funds. Neither SEI nor BGI, nor any of their affiliates, are affiliated with the companies listed above except Barclays Capital, which is an affiliate of BGI. FXI does not make any warranty regarding the FTSE/Xinhua Index. All rights in the FTSE/Xinhua Index vest in FXI. Neither FTSE nor NAREIT makes any warranty regarding the FTSENAREIT Real Estate 50/Residential/Retail/Mortgage REITs or Industrial/Office Index; all rights vest in NAREIT. Neither FTSE nor NAREIT makes any warranty regarding the FTSEEPRA/NAREIT Global Real Estate ex-US/North America/Europe/Asia Index; all rights vest in FTSE, NAREIT, and EPRA. All rights in the FTSE Developed Small Cap ex-North America Index vest in FTSE. “FTSE” is a trade- and service mark of London Stock Exchange and The Financial Times Limited; “Xinhua” is a trade- and service mark of Xinhua Financial Network Limited. “NAREIT®” is a trade mark of NAREIT; “EPRA®” is a trademark of EPRA.
An investment in the Fund(s) is not a deposit of a bank and it is not insured or guaranteed by the Federal Deposit Insurance Corporation or any other government agency.
This advertising section does not constitute part of the 2009 Annual Report.
iS-1437-1009
| 42 | 2009 iSHARES ANNUAL REPORTTO SHAREHOLDERS |
Table of Contents
Table of Contents
| Item 2. | Code of Ethics. |
iShares, Inc. (the “Registrant”) has adopted a code of ethics that applies to persons appointed by the Registrant’s Board of Directors as the President and/or Chief Financial Officer, and any persons performing similar functions. For the fiscal year ended August 31, 2009, there were no amendments to any provision of this code of ethics, nor were there any waivers granted from any provision of this code of ethics. A copy of this code of ethics is filed with this Form N-CSR under Item 12(a)(1).
| Item 3. | Audit Committee Financial Expert. |
The Registrant’s Board of Directors has determined that the Registrant has more than one audit committee financial expert, as that term is defined under Item 3(b) and 3(c), serving on its audit committee. The audit committee financial experts serving on the Registrant’s audit committee are Charles A. Hurty, John E. Kerrigan, George G.C. Parker and Robert H. Silver, all of whom are independent, as that term is defined under Item 3(a)(2).
| Item 4. | Principal Accountant Fees and Services. |
| (a) | Audit Fees – The aggregate fees billed for each of the last two fiscal years for professional services rendered by the principal accountant for the audit of the Registrant’s annual financial statements or services that are normally provided by the accountant in connection with statutory and regulatory filings or engagements for those fiscal years, were $476,772 for the fiscal year ended August 31, 2008 and $471,522 for the fiscal year ended August 31, 2009. |
| (b) | Audit-Related Fees – There were no fees billed for the fiscal years ended August 31, 2008 and August 31, 2009 for assurance and related services by the principal accountant that were reasonably related to the performance of the audit of the Registrant’s financial statements and are not reported under (a) of this Item. |
| (c) | Tax Fees – The aggregate fees billed in each of the last two fiscal years for professional services rendered by the principal accountant for the review of the Registrant’s tax returns and excise tax calculations, were $107,520 for the fiscal year ended August 31, 2008 and $136,950 for the fiscal year ended August 31, 2009. |
| (d) | All Other Fees – There were no other fees billed for the fiscal years ended August 31, 2008 and August 31, 2009 for products and services provided by the principal accountant, other than the services reported in (a) through (c) of this Item. |
| (e) | (1) The Registrant’s audit committee charter, as amended, provides that the audit committee is responsible for the approval, prior to appointment, of the engagement of the principal accountant to annually audit and provide their opinion on the Registrant’s financial statements. The audit committee must also approve, prior to appointment, the engagement of the principal accountant to provide non-audit services to the Registrant or to any entity controlling, controlled by or under common control with the Registrant’s investment adviser (“Adviser Affiliate”) that provides ongoing services to the Registrant, if the engagement relates directly to the operations and financial reporting of the Registrant. |
(2) There were no services described in (b) through (d) above (including services required by the audit committee pursuant to paragraph (c)(7)(ii) of Rule 2-01 of Regulation S-X) that were approved by the audit committee pursuant to paragraph (c)(7)(i)(C) of Rule 2-01 of Regulation S-X.
| (f) | None of the hours expended on the principal accountant’s engagement to audit the Registrant’s financial statements for the fiscal year ended August 31, 2009 were attributable to work performed by persons other than the principal accountant’s full-time, permanent employees. |
| (g) | The aggregate non-audit fees billed by the Registrant’s principal accountant for services rendered to the Registrant’s, and rendered to the Registrant’s investment adviser, and any Adviser Affiliate that provides ongoing services to the Registrant for the last two fiscal years, were $2,833,229 for the fiscal year ended August 31, 2008 and $3,697,425 for the fiscal year ended August 31, 2009. |
| (h) | The Registrant’s audit committee has considered whether the provision of non-audit services rendered to the Registrant’s investment adviser and any Adviser Affiliate that were not pre-approved pursuant to paragraph (c)(7)(ii) of Rule 2-01 of Regulation S-X, if any, are compatible with maintaining the principal accountant’s independence, and has determined that the provision of these services do not compromise the principal accountant’s independence. |
| Item 5. | Audit Committee of Listed Registrants. |
The Registrant is a listed issuer as defined in Rule 10A-3 under the Exchange Act and has a separately-designated standing audit committee established in accordance with Section 3(a)(58)(A) of the Exchange Act. The Registrant’s audit committee members are George G.C. Parker, Cecilia H. Herbert, Charles A. Hurty, John E. Kerrigan, Robert H. Silver and J. Darrell Duffie.
Table of Contents
| Item 6. | Schedule of Investments. |
(a) Schedules of investments are included as part of the reports to shareholders filed under Item 1 of this Form.
(b) Not applicable.
| Item 7. | Disclosure of Proxy Voting Policies and Procedures for Closed-End Management Investment Companies. |
Not applicable to the Registrant.
| Item 8. | Portfolio Managers of Closed-End Management Investment Companies. |
Not applicable to the Registrant.
| Item 9. | Purchases of Equity Securities by Closed-End Management Investment Company and Affiliated Purchasers. |
Not applicable to the Registrant.
| Item 10. | Submission of Matters to a Vote of Security Holders. |
There were no material changes to the procedures by which shareholders may recommend nominees to the Registrant’s Board of Directors.
| Item 11. | Controls and Procedures. |
(a) The President (the Registrant’s Principal Executive Officer) and Chief Financial Officer (the Registrant’s Principal Financial Officer) have concluded that, based on their evaluation as of a date within 90 days of the filing date of this report, the disclosure controls and procedures of the Registrant (as defined in Rule 30a-3(c) under the Investment Company Act of 1940) are reasonably designed to achieve the purposes described in Section 4(a) of the attached certification.
(b) There were no changes in the Registrant’s internal control over financial reporting (as defined in Rule 30a-3(d) under the Investment Company Act of 1940) that occurred during the Registrant’s second fiscal quarter of the period covered by this report that have materially affected, or are reasonably likely to materially affect, the Registrant’s internal control over financial reporting.
| Item 12. | Exhibits. |
(a) (1) Code of Ethics for Senior Officers that is the subject of Item 2 is attached.
(a) (2) Section 302 Certifications are attached.
(a) (3) Not applicable to the Registrant.
(b) Section 906 Certifications are attached.
Table of Contents
SIGNATURES
Pursuant to the requirements of the Securities Exchange Act of 1934 and the Investment Company Act of 1940, the Registrant has duly caused this report to be signed on its behalf by the undersigned, thereunto duly authorized.
| iShares, Inc. | ||
| By: | /s/ Michael A. Latham | |
Michael A. Latham, President (Principal Executive Officer) | ||
| Date: November 4, 2009 | ||
Pursuant to the requirements of the Securities Exchange Act of 1934 and the Investment Company Act of 1940, this report has been signed below by the following persons on behalf of the Registrant and in the capacities and on the dates indicated.
| By: | /s/ Michael A. Latham | |
Michael A. Latham, President (Principal Executive Officer) | ||
| Date: November 4, 2009 | ||
| By: | /s/ Jack Gee | |
Jack Gee, Treasurer and Chief Financial Officer (Principal Financial Officer) | ||
| Date: November 4, 2009 | ||