Table of Contents
UNITED STATES
SECURITIES AND EXCHANGE COMMISSION
Washington, D.C. 20549
FORM N-CSR
CERTIFIED SHAREHOLDER REPORT OF REGISTERED
MANAGEMENT INVESTMENT COMPANIES
Investment Company Act file number 811-09102
iShares, Inc.
(Exact name of Registrant as specified in charter)
c/o: State Street Bank and Trust Company
1 Iron Street, Boston, MA 02210
(Address of principal executive offices) (Zip code)
The Corporation Trust Incorporated
351 West Camden Street, Baltimore, MD 21201
(Name and address of agent for service)
Registrant’s telephone number, including area code: (415) 670-2000
Date of fiscal year end: August 31, 2015
Date of reporting period: August 31, 2015
Table of Contents
| Item 1. | Reports to Stockholders. |
Table of Contents
AUGUST 31, 2015
2015 ANNUAL REPORT |  |
iShares, Inc.
| Ø | iShares MSCI Austria Capped ETF | EWO | NYSE Arca |
| Ø | iShares MSCI Belgium Capped ETF | EWK | NYSE Arca |
| Ø | iShares MSCI France ETF | EWQ | NYSE Arca |
| Ø | iShares MSCI Netherlands ETF | EWN | NYSE Arca |
| Ø | iShares MSCI Sweden ETF | EWD | NYSE Arca |
Table of Contents
| 5 | ||||
| 16 | ||||
| 16 | ||||
| 17 | ||||
| 17 | ||||
| 19 | ||||
| 21 | ||||
| 23 | ||||
| 25 | ||||
| 27 | ||||
| 34 | ||||
| 39 | ||||
| 50 | ||||
| 51 | ||||
| 52 | ||||
| 65 | ||||
| 69 |
Table of Contents
Management’s Discussion of Fund Performance
iSHARES®, INC.
GLOBAL MARKET OVERVIEW
Global equity markets delivered a negative return for the 12 months ended August 31, 2015 (the “reporting period”). The MSCI ACWI, a broad global equity index that includes both developed and emerging markets, returned -6.29% for the reporting period.
The reporting period was characterized by a continued divergence in economic growth and central bank policy between the U.S. and the rest of the world. Despite a slowdown in early 2015, the U.S. economy remained one of the strongest economies among developed countries, which motivated the U.S. Federal Reserve Bank (the “Fed”) to scale back its economic stimulus measures. The Fed ended a two-year quantitative easing program in October 2014 and signaled its intent to raise its short-term interest rate target sometime in 2015. In contrast, weaker economic growth in most other regions of the globe led many of the world’s central banks to take more aggressive actions to stimulate economic activity.
This divergence contributed to a notably stronger U.S. dollar. For the reporting period, the euro, Japanese yen, British pound and Australian dollar declined by 15%, 14%, 7%, and 24% against the U.S. dollar, respectively. Weaker foreign currencies decrease the value of foreign investments measured in U.S. dollars, thereby decreasing returns for U.S. investors, while increasing foreign currencies relative to the U.S. dollar have the opposite effect. Currency performance had a meaningful impact on non-U.S. equity returns for U.S. investors. For example, the MSCI ACWI returned 0.59% in local currency terms for the reporting period.
A number of other factors influenced global markets during the reporting period. Energy prices fell sharply amid growing supply — primarily from increased production in the U.S. — and declining global demand. Lower energy prices contributed to historically low and declining inflation rates in most of the world. Consumer prices were nearly unchanged in the U.S., the European Union, and Japan, while prices in China and India rose at a relatively slow rate. Low inflation and tepid demand kept the Fed’s zero interest rate policy intact, while central banks throughout the world took aggressive measures to stimulate demand.
Global markets advanced for most of the reporting period, then declined sharply in the last few months of the reporting period. The volatility began in China, as slowing economic growth led to a steep drop in China’s equity markets. Plummeting commodity prices amid already subdued inflation also raised concerns about global demand. Currency devaluations in Asia, including China, Vietnam, Pakistan, and Kazakhstan, led to speculation that Asian countries were weakening their currencies to compete for demand. These global events led to further uncertainty about the timing of an expected interest rate hike from the Fed.
On a regional basis, U.S. stocks advanced by less than 1% for the reporting period as declining interest rates, ongoing economic growth, and low inflation provided a favorable environment for U.S. equity market performance. After generating its fastest quarterly growth rate in 11 years in the third quarter of 2014, the U.S. economy slowed over the next two quarters. Economic activity improved over the last several months of the reporting period, boosted by an increase in consumer spending.
European stocks declined by about 8% in U.S. dollar terms for the reporting period, though they advanced more than 3% when measured in local currencies. The European Central Bank initiated quantitative easing measures in early 2015, and signs of economic improvement emerged in the latter half of the reporting period. A tentative agreement on Greece’s debt repayment helped alleviate ongoing concerns about Europe’s sovereign debt levels.
Stock markets in the Asia/Pacific region (excluding Japan) declined by approximately 19% in U.S. dollar terms, which equated to an 8% decline when measured in local currencies. China’s economic slowdown weighed heavily on the region, as China is the largest trading partner of many countries in the region. On the bright side, Japanese stocks performed relatively well, as ongoing economic stimulus and reform measures led to a 4% gain in U.S. dollar terms (22% when measured in Japanese yen).
Emerging markets stocks fell by approximately 23% in U.S. dollar terms for the reporting period, though the decline was about 10% when measured in local currencies. Many of the largest emerging economies — including China, Russia, and Brazil — experienced slowing economic growth during the reporting period. Latin American stocks posted some of the biggest declines, as the region struggled with slow growth and declining commodity prices.
MANAGEMENT’S DISCUSSIONSOF FUND PERFORMANCE | 5 |
Table of Contents
Management’s Discussion of Fund Performance
iSHARES® MSCI AUSTRIA CAPPED ETF
Performance as of August 31, 2015
| Average Annual Total Returns | Cumulative Total Returns | |||||||||||||||||||||||||
| NAV | MARKET | INDEX | NAV | MARKET | INDEX | |||||||||||||||||||||
1 Year | (9.76)% | (9.73)% | (9.78)% | (9.76)% | (9.73)% | (9.78)% | ||||||||||||||||||||
5 Years | 0.45% | 0.60% | 0.59% | 2.29% | 3.03% | 2.99% | ||||||||||||||||||||
10 Years | (2.54)% | (2.64)% | (2.99)% | (22.68)% | (23.49)% | (26.16)% | ||||||||||||||||||||
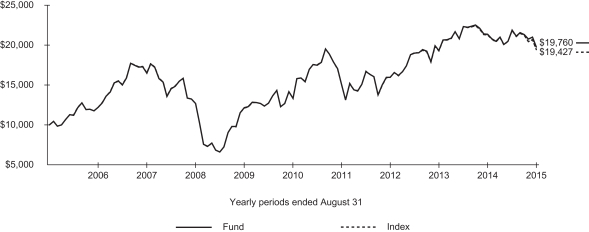
GROWTH OF $10,000 INVESTMENT
(AT NET ASSET VALUE)
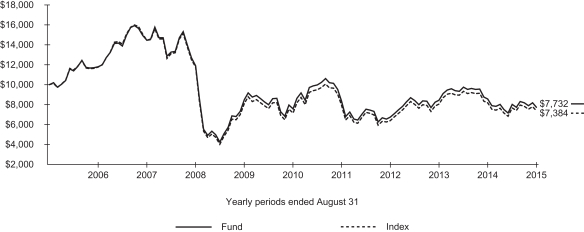
Index performance through January 31, 2008 reflects the performance of the MSCI Austria Index. Index performance beginning on February 1, 2008 through February 11, 2013 reflects the performance of the MSCI Austria Investable Market Index. Index performance beginning on February 12, 2013 reflects the performance of the MSCI Austria Investable Market Index 25/50.
Past performance is no guarantee of future results. Performance results do not reflect the deduction of taxes that a shareholder would pay on fund distributions or on the redemption or sale of fund shares. See “About Fund Performance” on page 16 for more information.
| Shareholder Expenses | ||||||||||||||||||||||||||
| Actual | Hypothetical 5% Return | |||||||||||||||||||||||||
| Beginning Account Value (3/1/15) | Ending Account Value (8/31/15) | Expenses Paid During Period a | Beginning Account Value (3/1/15) | Ending Account Value (8/31/15) | Expenses Paid During Period a | Annualized Expense Ratio | ||||||||||||||||||||
| $ | 1,000.00 | $ | 963.90 | $ | 2.33 | $ | 1,000.00 | $ | 1,022.80 | $ | 2.40 | 0.47% | ||||||||||||||
| a | Expenses are calculated using the Fund’s annualized expense ratio (as disclosed in the table), multiplied by the average account value for the period, multiplied by the number of days in the period (184 days) and divided by the number of days in the year (365 days). See “Shareholder Expenses” on page 16 for more information. |
| 6 | 2015 iSHARES ANNUAL REPORTTO SHAREHOLDERS |
Table of Contents
Management’s Discussion of Fund Performance (Continued)
iSHARES® MSCI AUSTRIA CAPPED ETF
The iShares MSCI Austria Capped ETF (the “Fund”) seeks to track the investment results of a broad-based index composed of Austrian equities, as represented by the MSCI Austria Investable Market Index 25/50 (the “Index”). The Fund invests in a representative sample of securities included in the Index that collectively has an investment profile similar to the Index. Due to the use of representative sampling, the Fund may or may not hold all of the securities that are included in the Index. For the 12-month reporting period ended August 31, 2015, the total return for the Fund was -9.76%, net of fees, while the total return for the Index was -9.78%.
Austrian stocks, as represented by the Index, produced a negative return during the reporting period and underperformed broad international developed markets. The decline was mainly due to global market reactions to a decelerating Chinese economy and the extreme volatility of Chinese stocks late in the reporting period. Additionally, Austria’s currency, the euro, depreciated by 15% relative to the U.S. dollar during the reporting period, which detracted meaningfully from the performance of the dollar-denominated Index.
In local currency terms, Austrian stock prices were essentially flat for the reporting period. The Austrian economy began to show modest signs of improvement during the reporting period. Economic growth, albeit slow, reflected improvements in both government consumption and exports. Low interest rates, coupled with a weak euro and income-tax reform, also helped create a more hospitable environment for investment to recover and private consumption to increase.
The energy sector, while just an 11% average weighting in the Index, was the reporting period’s largest detractor in U.S. dollar terms, driven lower by decreasing global demand for energy and a sharp decline in oil and gas prices beginning in late 2014.
Austria’s financials sector also experienced difficulties during the reporting period. At an average weighting of nearly 42%, financials represented the largest segment of the Index. During the reporting period, Austrian banks continued to struggle in the wake of nonperforming loans to still-developing eastern European countries. Investors also grew more concerned about the financial scandal at one particular banking company, its eventual bail-out by the Austrian government, and the government’s subsequent suggestion that investors might be held responsible for the bank’s bad loans.
ALLOCATION BY SECTOR
As of 8/31/15
| Sector | Percentage of Total Investments* |
Financials | 43.01 | % | ||
Industrials | 25.27 | |||
Materials | 15.92 | |||
Energy | 9.98 | |||
Information Technology | 2.46 | |||
Consumer Discretionary | 1.89 | |||
Utilities | 1.47 | |||
|
| |||
TOTAL | 100.00 | % | ||
|
|
TEN LARGEST FUND HOLDINGS
As of 8/31/15
| Security | Percentage of Total Investments* |
Erste Group Bank AG | 19.79 | % | ||
Voestalpine AG | 9.10 | |||
Andritz AG | 8.03 | |||
OMV AG | 8.01 | |||
Wienerberger AG | 4.48 | |||
IMMOFINANZ AG | 4.46 | |||
CA Immobilien Anlagen AG | 4.03 | |||
Raiffeisen Bank International AG | 4.02 | |||
Oesterreichische Post AG | 3.70 | |||
BUWOG AG | 3.45 | |||
|
| |||
TOTAL | 69.07 | % | ||
|
|
| * | Excludes money market funds. |
MANAGEMENT’S DISCUSSIONSOF FUND PERFORMANCE | 7 |
Table of Contents
Management’s Discussion of Fund Performance
iSHARES® MSCI BELGIUM CAPPED ETF
Performance as of August 31, 2015
| Average Annual Total Returns | Cumulative Total Returns | |||||||||||||||||||||||||
| NAV | MARKET | INDEX | NAV | MARKET | INDEX | |||||||||||||||||||||
1 Year | 1.95% | 1.72% | 2.12% | 1.95% | 1.72% | 2.12% | ||||||||||||||||||||
5 Years | 11.40% | 11.48% | 12.83% | 71.57% | 72.20% | 82.85% | ||||||||||||||||||||
10 Years | 2.60% | 2.50% | 2.96% | 29.27% | 28.04% | 33.81% | ||||||||||||||||||||
GROWTH OF $10,000 INVESTMENT
(AT NET ASSET VALUE)
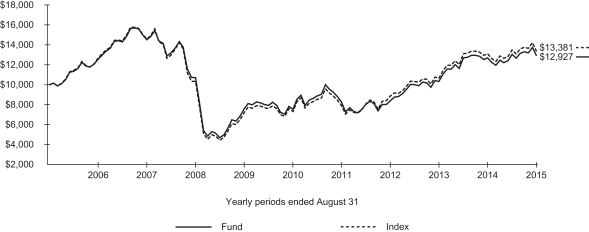
Index performance through November 30, 2007 reflects the performance of the MSCI Belgium Index. Index performance beginning on December 1, 2007 through November 8, 2012 reflects the performance of the MSCI Belgium Investable Market Index. Index performance beginning on November 9, 2012 reflects the performance of the MSCI Belgium Investable Market Index 25/50.
Past performance is no guarantee of future results. Performance results do not reflect the deduction of taxes that a shareholder would pay on fund distributions or on the redemption or sale of fund shares. See “About Fund Performance” on page16 for more information.
| Shareholder Expenses | ||||||||||||||||||||||||||
| Actual | Hypothetical 5% Return | |||||||||||||||||||||||||
| Beginning Account Value (3/1/15) | Ending Account Value (8/31/15) | Expenses Paid During Period a | Beginning Account Value (3/1/15) | Ending Account Value (8/31/15) | Expenses Paid During Period a | Annualized Expense Ratio | ||||||||||||||||||||
| $ | 1,000.00 | $ | 991.60 | $ | 2.36 | $ | 1,000.00 | $ | 1,022.80 | $ | 2.40 | 0.47% | ||||||||||||||
| a | Expenses are calculated using the Fund’s annualized expense ratio (as disclosed in the table), multiplied by the average account value for the period, multiplied by the number of days in the period (184 days) and divided by the number of days in the year (365 days). See “Shareholder Expenses” on page 16 for more information. |
| 8 | 2015 iSHARES ANNUAL REPORTTO SHAREHOLDERS |
Table of Contents
Management’s Discussion of Fund Performance (Continued)
iSHARES® MSCI BELGIUM CAPPED ETF
The iShares MSCI Belgium Capped ETF (the “Fund”) seeks to track the investment results of a broad-based index composed of Belgian equities, as represented by the MSCI Belgium Investable Market Index 25/50 (the “Index”). The Fund invests in a representative sample of securities included in the Index that collectively has an investment profile similar to the Index. Due to the use of representative sampling, the Fund may or may not hold all of the securities that are included in the Index. For the 12-month reporting period ended August 31, 2015, the total return for the Fund was 1.95%, net of fees, while the total return for the Index was 2.12%.
Stocks of Belgium, as represented by the Index, rose slightly in the reporting period.
After hitting a low in October 2014, Belgian stocks began an upward move that continued for much of the reporting period. In August 2015, however, Belgian stocks fell sharply along with stock markets worldwide amid worries about an economic slowdown in China. Belgium’s currency, the euro, depreciated 15% against the U.S. dollar for the reporting period, which meaningfully detracted from the Index’s performance as Belgian stocks were valued lower when translated back into U.S. dollars.
Amid continued low interest rates, Belgium’s economy grew in 2015’s second quarter, at the strongest rate since 2011 but still well below the country’s long-term average. Unemployment in Belgium fell in July 2015, continuing a three-month downtrend. Retail sales in July 2015 rose above Belgium’s long-term average but below gains earlier in the reporting period. Business confidence, as well as consumer confidence, remained in negative territory during the reporting period, although both improved somewhat in the second half. Most of the improvement in business confidence was in retail and wholesale trade, including autos, food, and clothing. During the reporting period, the Belgian government came under pressure from the European Union for budgetary reforms to deal with high and rising public debt.
From a sector standpoint, a planned merger by a large supermarket chain boosted the consumer staples sector, the Index’s largest sector weighting at approximately 31% on average. The financials sector, the Index’s second-largest weighting at approximately 26% on average, detracted from the Index’s performance for the reporting period, largely as a result of balance sheet weakening for firms within the banking industry.
ALLOCATION BY SECTOR
As of 8/31/15
| Sector | Percentage of Total Investments* |
Consumer Staples | 31.62 | % | ||
Financials | 27.43 | |||
Health Care | 11.60 | |||
Materials | 10.06 | |||
Telecommunication Services | 4.41 | |||
Consumer Discretionary | 4.20 | |||
Information Technology | 3.64 | |||
Industrials | 3.48 | |||
Energy | 2.34 | |||
Utilities | 1.22 | |||
|
| |||
TOTAL | 100.00 | % | ||
|
|
TEN LARGEST FUND HOLDINGS
As of 8/31/15
| Security | Percentage of Total Investments* |
Anheuser-Busch InBev SA/NV | 22.56 | % | ||
KBC Groep NV | 8.93 | |||
UCB SA | 5.34 | |||
Delhaize Group | 5.26 | |||
Ageas | 4.54 | |||
Solvay SA | 3.87 | |||
Groupe Bruxelles Lambert SA | 3.62 | |||
Proximus | 3.51 | |||
Umicore SA | 2.70 | |||
Ackermans & van Haaren NV | 2.57 | |||
|
| |||
TOTAL | 62.90 | % | ||
|
|
| * | Excludes money market funds. |
MANAGEMENT’S DISCUSSIONSOF FUND PERFORMANCE | 9 |
Table of Contents
Management’s Discussion of Fund Performance
iSHARES® MSCI FRANCE ETF
Performance as of August 31, 2015
| Average Annual Total Returns | Cumulative Total Returns | |||||||||||||||||||||||||
| NAV | MARKET | INDEX | NAV | MARKET | INDEX | |||||||||||||||||||||
1 Year | (7.17)% | (6.89)% | (7.17)% | (7.17)% | (6.89)% | (7.17)% | ||||||||||||||||||||
5 Years | 6.49% | 6.67% | 6.49% | 36.95% | 38.12% | 36.96% | ||||||||||||||||||||
10 Years | 2.76% | 2.72% | 2.85% | 31.24% | 30.72% | 32.49% | ||||||||||||||||||||
GROWTH OF $10,000 INVESTMENT
(AT NET ASSET VALUE)
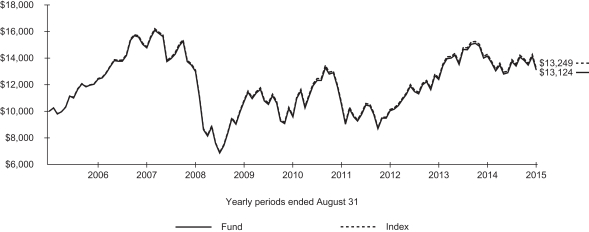
Past performance is no guarantee of future results. Performance results do not reflect the deduction of taxes that a shareholder would pay on fund distributions or on the redemption or sale of fund shares. See “About Fund Performance” on page 16 for more information.
| Shareholder Expenses | ||||||||||||||||||||||||||
| Actual | Hypothetical 5% Return | |||||||||||||||||||||||||
| Beginning Account Value (3/1/15) | Ending Account Value (8/31/15) | Expenses Paid During Period a | Beginning Account Value (3/1/15) | Ending Account Value (8/31/15) | Expenses Paid During Period a | Annualized Expense Ratio | ||||||||||||||||||||
| $ | 1,000.00 | $ | 956.10 | $ | 2.32 | $ | 1,000.00 | $ | 1,022.80 | $ | 2.40 | 0.47% | ||||||||||||||
| a | Expenses are calculated using the Fund’s annualized expense ratio (as disclosed in the table), multiplied by the average account value for the period, multiplied by the number of days in the period (184 days) and divided by the number of days in the year (365 days). See “Shareholder Expenses” on page 16 for more information. |
| 10 | 2015 iSHARES ANNUAL REPORTTO SHAREHOLDERS |
Table of Contents
Management’s Discussion of Fund Performance (Continued)
iSHARES® MSCI FRANCE ETF
The iShares MSCI France ETF (the “Fund”) seeks to track the investment results of an index composed of French equities, as represented by the MSCI France Index (the “Index”). The Fund invests in a representative sample of securities included in the Index that collectively has an investment profile similar to the Index. Due to the use of representative sampling, the Fund may or may not hold all of the securities that are included in the Index. For the 12-month reporting period ended August 31, 2015, the total return for the Fund was -7.17%, net of fees, while the total return for the Index was -7.17%.
French stocks, as represented by the Index, declined moderately during the reporting period, falling along with most global equity prices as investor concerns over China’s slowing economy and its volatile stock market weighed heavily on equity valuations late in the reporting period. The decline in French stock prices also reflected a slowdown in manufacturing and construction during the second half of the reporting period, erasing earlier gains made in anticipation of improving economic growth in the eurozone. In addition, France’s currency, the euro, depreciated 15% relative to the U.S. dollar, which meaningfully detracted from Index performance as French investments were lower when translated back into U.S. dollars. For the period as a whole, the Index performed in line with broad international developed markets.
All but two of the sectors represented in the Index finished the reporting period in negative territory from the perspective of U.S. investors, as economic growth slowed and investors grew more concerned about geopolitical tensions, including the Greek debt crisis and the decline of China’s stock market. The largest detractor from the Index’s performance was the energy sector, which fell sharply due to falling oil and gas prices amid expanding global energy supplies and diminishing demand. Similarly, slowing economic growth, principally in emerging markets, weighed on global demand for materials, sending that sector down sharply as well. The industrials, utilities, and consumer staples sectors also produced notable declines during the reporting period.
Contrary to the overall trend of French stocks during the reporting period, the consumer discretionary and information technology sectors each delivered modestly positive results.
ALLOCATION BY SECTOR
As of 8/31/15
| Sector | Percentage of Total Investments* |
Financials | 18.61 | % | ||
Industrials | 18.36 | |||
Consumer Discretionary | 17.57 | |||
Health Care | 11.44 | |||
Consumer Staples | 10.10 | |||
Energy | 8.48 | |||
Materials | 4.55 | |||
Information Technology | 4.06 | |||
Utilities | 3.79 | |||
Telecommunication Services | 3.04 | |||
|
| |||
TOTAL | 100.00 | % | ||
|
|
TEN LARGEST FUND HOLDINGS
As of 8/31/15
| Security | Percentage of Total Investments* |
Sanofi | 9.45 | % | ||
Total SA | 8.02 | |||
BNP Paribas SA | 5.43 | |||
AXA SA | 4.02 | |||
LVMH Moet Hennessy Louis Vuitton SE | 3.78 | |||
L’Oreal SA | 3.50 | |||
Air Liquide SA | 3.35 | |||
Airbus Group SE | 3.12 | |||
Danone SA | 2.92 | |||
Societe Generale SA | 2.87 | |||
|
| |||
TOTAL | 46.46 | % | ||
|
|
| * | Excludes money market funds. |
MANAGEMENT’S DISCUSSIONSOF FUND PERFORMANCE | 11 |
Table of Contents
Management’s Discussion of Fund Performance
iSHARES® MSCI NETHERLANDS ETF
Performance as of August 31, 2015
| Average Annual Total Returns | Cumulative Total Returns | |||||||||||||||||||||||||
| NAV | MARKET | INDEX | NAV | MARKET | INDEX | |||||||||||||||||||||
1 Year | 0.87% | 1.11% | (0.12)% | 0.87% | 1.11% | (0.12)% | ||||||||||||||||||||
5 Years | 8.77% | 8.93% | 9.03% | 52.23% | 53.34% | 54.08% | ||||||||||||||||||||
10 Years | 5.37% | 5.31% | 5.82% | 68.78% | 67.69% | 76.06% | ||||||||||||||||||||
GROWTH OF $10,000 INVESTMENT
(AT NET ASSET VALUE)
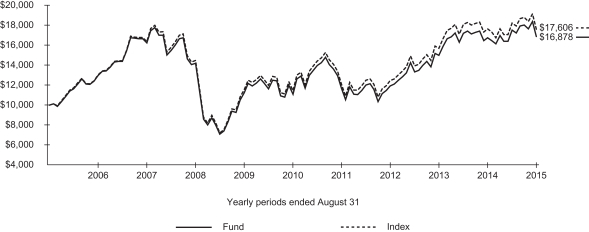
Index performance through January 31, 2008 reflects the performance of the MSCI Netherlands Index. Index performance beginning on February 1, 2008 reflects the performance of the MSCI Netherlands Investable Market Index.
Past performance is no guarantee of future results. Performance results do not reflect the deduction of taxes that a shareholder would pay on fund distributions or on the redemption or sale of fund shares. See “About Fund Performance” on page 16 for more information.
| Shareholder Expenses | ||||||||||||||||||||||||||
| Actual | Hypothetical 5% Return | |||||||||||||||||||||||||
| Beginning Account Value (3/1/15) | Ending Account Value (8/31/15) | Expenses Paid During Period a | Beginning Account Value (3/1/15) | Ending Account Value (8/31/15) | Expenses Paid During Period a | Annualized Expense Ratio | ||||||||||||||||||||
| $ | 1,000.00 | $ | 964.10 | $ | 2.33 | $ | 1,000.00 | $ | 1,022.80 | $ | 2.40 | 0.47% | ||||||||||||||
| a | Expenses are calculated using the Fund’s annualized expense ratio (as disclosed in the table), multiplied by the average account value for the period, multiplied by the number of days in the period (184 days) and divided by the number of days in the year (365 days). See “Shareholder Expenses” on page 16 for more information. |
| 12 | 2015 iSHARES ANNUAL REPORTTO SHAREHOLDERS |
Table of Contents
Management’s Discussion of Fund Performance (Continued)
iSHARES® MSCI NETHERLANDS ETF
The iShares MSCI Netherlands ETF (the “Fund”) seeks to track the investment results of a broad-based index composed of Dutch equities, as represented by the MSCI Netherlands Investable Market Index (the “Index”). The Fund invests in a representative sample of securities included in the Index that collectively has an investment profile similar to the Index. Due to the use of representative sampling, the Fund may or may not hold all of the securities that are included in the Index. For the 12-month reporting period ended August 31, 2015, the total return for the Fund was 0.87%, net of fees, while the total return for the Index was -0.12%.
Netherlands stocks, as represented by the Index, posted a flat return during the reporting period amidst an environment of significant volatility.
After a choppy start to the reporting period, the Index began a prolonged uptrend in January 2015. But in the final month of the period, Netherlands stocks fell sharply as markets worldwide pulled back amid fears of an economic slowdown in China. The declining euro relative to the U.S. dollar detracted from Index performance in U.S. dollar terms during the reporting period.
After several years of little or no growth, the Netherlands economy accelerated during the reporting period. Amid continued low interest rates, the country’s gross domestic product (GDP) rose 1.6% in the second quarter of 2015 after a 2.5% jump in the first quarter. Both GDP numbers were higher than any quarter since 2011. Rising retail sales and a rebounding housing market helped drive the gains. In August 2015, Netherlands retail sales showed their strongest growth since the 2008 financial crisis, along with the largest increase in construction spending in a decade. Online retail sales also recorded a notable increase in the reporting period.
Consumer confidence continued to rise during the reporting period, with the June 2015 figure well above the 20-year average. Household spending also rose, boosted by higher durable goods purchases. Unemployment in the Netherlands continued to decline, reaching 6.8% in June 2015, the lowest since early 2013.
ALLOCATION BY SECTOR
As of 8/31/15
| Sector | Percentage of Total Investments* |
Consumer Staples | 29.59 | % | ||
Financials | 22.69 | |||
Industrials | 14.25 | |||
Information Technology | 10.69 | |||
Consumer Discretionary | 9.87 | |||
Materials | 7.86 | |||
Telecommunication Services | 3.33 | |||
Energy | 1.72 | |||
|
| |||
TOTAL | 100.00 | % | ||
|
|
TEN LARGEST FUND HOLDINGS
As of 8/31/15
| Security | Percentage of Total Investments* |
Unilever NV CVA | 17.45 | % | ||
ING Groep NV CVA | 15.82 | |||
ASML Holding NV | 8.49 | |||
Koninklijke Philips NV | 6.43 | |||
Heineken NV | 4.87 | |||
Koninklijke Ahold NV | 4.72 | |||
Akzo Nobel NV | 4.44 | |||
RELX NV | 4.20 | |||
Koninklijke KPN NV | 3.33 | |||
Aegon NV | 2.98 | |||
|
| |||
TOTAL | 72.73 | % | ||
|
|
| * | Excludes money market funds. |
MANAGEMENT’S DISCUSSIONSOF FUND PERFORMANCE | 13 |
Table of Contents
Management’s Discussion of Fund Performance
iSHARES® MSCI SWEDEN ETF
Performance as of August 31, 2015
| Average Annual Total Returns | Cumulative Total Returns | |||||||||||||||||||||||||
| NAV | MARKET | INDEX | NAV | MARKET | INDEX | |||||||||||||||||||||
1 Year | (7.46)% | (7.20)% | (8.69)% | (7.46)% | (7.20)% | (8.69)% | ||||||||||||||||||||
5 Years | 8.18% | 8.37% | 7.81% | 48.13% | 49.44% | 45.68% | ||||||||||||||||||||
10 Years | 7.05% | 6.96% | 6.87% | 97.60% | 96.03% | 94.27% | ||||||||||||||||||||
GROWTH OF $10,000 INVESTMENT
(AT NET ASSET VALUE)
Past performance is no guarantee of future results. Performance results do not reflect the deduction of taxes that a shareholder would pay on fund distributions or on the redemption or sale of fund shares. See “About Fund Performance” on page 16 for more information.
| Shareholder Expenses | ||||||||||||||||||||||||||
| Actual | Hypothetical 5% Return | |||||||||||||||||||||||||
| Beginning Account Value (3/1/15) | Ending Account Value (8/31/15) | Expenses Paid During Period a | Beginning Account Value (3/1/15) | Ending Account Value (8/31/15) | Expenses Paid During Period a | Annualized Expense Ratio b | ||||||||||||||||||||
| $ | 1,000.00 | $ | 902.70 | $ | 6.33 | $ | 1,000.00 | $ | 1,018.50 | $ | 6.72 | 1.32% | ||||||||||||||
| a | Expenses are calculated using the Fund’s annualized expense ratio (as disclosed in the table), multiplied by the average account value for the period, multiplied by the number of days in the period (184 days) and divided by the number of days in the year (365 days). See “Shareholder Expenses” on page 16 for more information. |
| b | Excluding the effect of the non-recurring professional fees for foreign withholding tax claims (See Note 7), the annualized expense ratio would have been 0.48%. |
| 14 | 2015 iSHARES ANNUAL REPORTTO SHAREHOLDERS |
Table of Contents
Management’s Discussion of Fund Performance (Continued)
iSHARES® MSCI SWEDEN ETF
The iShares MSCI Sweden ETF (the “Fund”) seeks to track the investment results of an index composed of Swedish equities, as represented by the MSCI Sweden Index (the “Index”). The Fund invests in a representative sample of securities included in the Index that collectively has an investment profile similar to the Index. Due to the use of representative sampling, the Fund may or may not hold all of the securities that are included in the Index. For the 12-month reporting period ended August 31, 2015, the total return for the Fund was -7.46%, net of fees, while the total return for the Index was -8.69%.
Stocks of Sweden, as represented by the Index, declined in the reporting period.
Swedish stocks moved higher in early 2015 after a choppy start at the beginning of the reporting period. In the summer of 2015, Swedish markets began a downward trend that accelerated in the reporting period’s final month, as stocks worldwide declined on fears of an economic slowdown in China. The weak Swedish krona relative to the U.S. dollar hindered the Index’s performance in U.S. dollar terms. On a local currency basis, the Index delivered a positive return in the reporting period.
The largest Nordic economy continued its recovery during the reporting period. Sweden’s gross domestic product (GDP) grew at a 3% annualized rate in the second quarter of 2015, continuing a multi-year upward trend. Late in the reporting period, the Swedish government raised its economic growth forecasts for 2015 and beyond, although it warned of risk from slowing growth in emerging markets and China.
Sweden’s benchmark interest rate reached negative territory in the reporting period, as the country’s central bank cut rates to spur inflation amid falling oil and commodity prices worldwide. Weakness in the krona, along with interest rate cuts, helped Swedish exporting companies during the reporting period. In the domestic market, business confidence improved in the construction, retail and service industries. Consumer spending also remained relatively strong during the reporting period, as retail sales grew at nearly 6% on an annual basis as of July 2015.
ALLOCATION BY SECTOR
As of 8/31/15
| Sector | Percentage of Total Investments* |
Financials | 33.93 | % | ||
Industrials | 26.28 | |||
Consumer Discretionary | 12.74 | |||
Information Technology | 10.52 | |||
Consumer Staples | 7.08 | |||
Telecommunication Services | 6.16 | |||
Materials | 1.26 | |||
Health Care | 1.24 | |||
Energy | 0.79 | |||
|
| |||
TOTAL | 100.00 | % | ||
|
|
TEN LARGEST FUND HOLDINGS
As of 8/31/15
| Security | Percentage of Total Investments* |
Hennes & Mauritz AB Class B | 10.11 | % | ||
Nordea Bank AB | 9.94 | |||
Telefonaktiebolaget LM Ericsson Class B | 8.20 | |||
Svenska Handelsbanken AB Class A | 6.19 | |||
Swedbank AB Class A | 5.72 | |||
Assa Abloy AB | 4.90 | |||
Skandinaviska Enskilda Banken AB Class A | 4.83 | |||
Atlas Copco AB Class A | 4.70 | |||
Svenska Cellulosa AB SCA Class B | 4.65 | |||
Volvo AB Class B | 4.63 | |||
|
| |||
TOTAL | 63.87 | % | ||
|
|
| * | Excludes money market funds. |
MANAGEMENT’S DISCUSSIONSOF FUND PERFORMANCE | 15 |
Table of Contents
Past performance is no guarantee of future results. Current performance may be lower or higher than the performance data quoted. Performance data current to the most recent month-end is available at www.ishares.com. Performance results assume reinvestment of all dividends and capital gain distributions and do not reflect the deduction of taxes that a shareholder would pay on fund distributions or on the redemption or sale of fund shares. The investment return and principal value of shares will vary with changes in market conditions. Shares may be worth more or less than their original cost when they are redeemed or sold in the market. Performance for certain funds may reflect a waiver of a portion of investment advisory fees. Without such a waiver, performance would have been lower.
Net asset value or “NAV” is the value of one share of a fund as calculated in accordance with the standard formula for valuing mutual fund shares. The price used to calculate market return (“Market Price”) is determined by using the midpoint between the highest bid and the lowest offer on the primary stock exchange on which shares of a fund are listed for trading, as of the time that such fund’s NAV is calculated. Certain funds may have a NAV which is determined prior to the opening of regular trading on its listed exchange and their market returns are calculated using the midpoint of the bid/ask spread as of the opening of regular trading on the exchange. Market and NAV returns assume that dividends and capital gain distributions have been reinvested at Market Price and NAV, respectively.
An index is a statistical composite that tracks a specified financial market or sector. Unlike a fund, an index does not actually hold a portfolio of securities and therefore does not incur the expenses incurred by a fund. These expenses negatively impact fund performance. Also, market returns do not include brokerage commissions that may be payable on secondary market transactions. If brokerage commissions were included, market returns would be lower.
As a shareholder of a Fund, you incur two types of costs: (1) transaction costs, including brokerage commissions on purchases and sales of fund shares and (2) ongoing costs, including management fees and other fund expenses. The expense example, which is based on an investment of $1,000 invested on March 1, 2015 and held through August 31, 2015, is intended to help you understand your ongoing costs (in dollars and cents) of investing in a Fund and to compare these costs with the ongoing costs of investing in other funds.
Actual Expenses — The table provides information about actual account values and actual expenses. Annualized expense ratios reflect contractual and voluntary fee waivers, if any. To estimate the expenses that you paid on your account over the period, simply divide your account value by $1,000 (for example, an $8,600 account value divided by $1,000 = 8.6), then multiply the result by the number corresponding to your Fund under the heading entitled “Expenses Paid During Period.”
Hypothetical Example for Comparison Purposes — The table also provides information about hypothetical account values and hypothetical expenses based on each Fund’s actual expense ratio and an assumed rate of return of 5% per year before expenses. You may use this information to compare the ongoing costs of investing in your Fund and other funds. To do so, compare this 5% hypothetical example with the 5% hypothetical examples that appear in the shareholder reports of the other funds.
Please note that the expenses shown in the table are meant to highlight your ongoing costs only and do not reflect any transactional costs, such as brokerage commissions paid on purchases and sales of fund shares. Therefore, the hypothetical examples are useful in comparing ongoing costs only and will not help you determine the relative total costs of owning different funds. In addition, if these transactional costs were included, your costs would have been higher.
| 16 | 2015 iSHARES ANNUAL REPORTTO SHAREHOLDERS |
Table of Contents
iSHARES® MSCI AUSTRIA CAPPED ETF
August 31, 2015
| Security | Shares | Value | ||||||
COMMON STOCKS — 98.33% |
| |||||||
AEROSPACE & DEFENSE — 0.86% |
| |||||||
FACC AGa,b | 67,772 | $ | 482,210 | |||||
|
| |||||||
| 482,210 | ||||||||
AIR FREIGHT & LOGISTICS — 3.64% |
| |||||||
Oesterreichische Post AG | 53,082 | 2,042,190 | ||||||
|
| |||||||
| 2,042,190 | ||||||||
BANKS — 23.41% |
| |||||||
Erste Group Bank AGa | 367,055 | 10,921,673 | ||||||
Raiffeisen Bank International AGa,b | 164,217 | 2,220,942 | ||||||
|
| |||||||
| 13,142,615 | ||||||||
BUILDING PRODUCTS — 4.40% |
| |||||||
Wienerberger AG | 138,915 | 2,470,232 | ||||||
|
| |||||||
| 2,470,232 | ||||||||
CHEMICALS — 1.85% |
| |||||||
Lenzing AG | 14,961 | 1,039,188 | ||||||
|
| |||||||
| 1,039,188 | ||||||||
CONSTRUCTION & ENGINEERING — 0.97% |
| |||||||
Porr AG | 20,492 | 547,167 | ||||||
|
| |||||||
| 547,167 | ||||||||
CONSTRUCTION MATERIALS — 1.71% |
| |||||||
RHI AG | 46,053 | 961,352 | ||||||
|
| |||||||
| 961,352 | ||||||||
CONTAINERS & PACKAGING — 3.14% |
| |||||||
Mayr Melnhof Karton AG | 15,006 | 1,762,971 | ||||||
|
| |||||||
| 1,762,971 | ||||||||
ELECTRIC UTILITIES — 1.45% |
| |||||||
EVN AG | 73,336 | 813,512 | ||||||
|
| |||||||
| 813,512 | ||||||||
ELECTRICAL EQUIPMENT — 2.49% |
| |||||||
Zumtobel Group AG | 48,479 | 1,394,956 | ||||||
|
| |||||||
| 1,394,956 | ||||||||
ELECTRONIC EQUIPMENT, INSTRUMENTS & COMPONENTS — 2.42% |
| |||||||
Austria Technologie & Systemtechnik AG | 54,087 | 860,584 | ||||||
Kapsch TrafficCom AGa | 16,265 | 497,358 | ||||||
|
| |||||||
| 1,357,942 | ||||||||
ENERGY EQUIPMENT & SERVICES — 1.94% |
| |||||||
Schoeller-Bleckmann Oilfield Equipment AG | 19,922 | 1,087,110 | ||||||
|
| |||||||
| 1,087,110 | ||||||||
| Security | Shares | Value | ||||||
HOTELS, RESTAURANTS & LEISURE — 1.86% |
| |||||||
DO & CO AG | 11,088 | $ | 1,043,624 | |||||
|
| |||||||
| 1,043,624 | ||||||||
INSURANCE — 2.98% |
| |||||||
UNIQA Insurance Group AG | 200,352 | 1,672,258 | ||||||
|
| |||||||
| 1,672,258 | ||||||||
MACHINERY — 10.82% |
| |||||||
Andritz AG | 92,624 | 4,433,702 | ||||||
Palfinger AG | 30,251 | 821,983 | ||||||
Semperit AG Holding | 20,844 | 815,114 | ||||||
|
| |||||||
| 6,070,799 | ||||||||
METALS & MINING — 8.95% |
| |||||||
Voestalpine AG | 137,547 | 5,024,357 | ||||||
|
| |||||||
| 5,024,357 | ||||||||
OIL, GAS & CONSUMABLE FUELS — 7.87% |
| |||||||
OMV AG | 172,699 | 4,419,749 | ||||||
|
| |||||||
| 4,419,749 | ||||||||
REAL ESTATE MANAGEMENT & DEVELOPMENT — 15.90% |
| |||||||
BUWOG AG | 90,000 | 1,902,440 | ||||||
CA Immobilien Anlagen AG | 119,504 | 2,222,140 | ||||||
Conwert Immobilien Invest SEa | 110,053 | 1,427,980 | ||||||
IMMOEAST AG Escrowa | 998,769 | 11 | ||||||
IMMOFINANZ AGa | 989,411 | 2,462,278 | ||||||
IMMOFINANZ AG Escrowa | 897,599 | 10 | ||||||
S IMMO AG | 105,215 | 908,133 | ||||||
|
| |||||||
| 8,922,992 | ||||||||
TRANSPORTATION INFRASTRUCTURE — 1.67% |
| |||||||
Flughafen Wien AG | 10,243 | 936,546 | ||||||
|
| |||||||
| 936,546 | ||||||||
|
| |||||||
TOTAL COMMON STOCKS |
| |||||||
(Cost: $78,916,918) |
| 55,191,770 | ||||||
SHORT-TERM INVESTMENTS — 4.60% |
| |||||||
MONEY MARKET FUNDS — 4.60% |
| |||||||
BlackRock Cash Funds: Institutional, |
| |||||||
0.18%c,d,e | 2,440,506 | 2,440,506 | ||||||
BlackRock Cash Funds: Prime, |
| |||||||
0.18%c,d,e | 140,146 | 140,146 | ||||||
SCHEDULESOF INVESTMENTS | 17 |
Table of Contents
Schedule of Investments (Continued)
iSHARES® MSCI AUSTRIA CAPPED ETF
August 31, 2015
| Security | Shares | Value | ||||||
BlackRock Cash Funds: Treasury, |
| |||||||
0.03%c,d | 186 | $ | 186 | |||||
|
| |||||||
| 2,580,838 | ||||||||
|
| |||||||
TOTAL SHORT-TERM INVESTMENTS |
| |||||||
(Cost: $2,580,838) |
| 2,580,838 | ||||||
|
| |||||||
TOTAL INVESTMENTS |
| |||||||
(Cost: $81,497,756) | 57,772,608 | |||||||
Other Assets, Less Liabilities — (2.93)% |
| (1,642,609 | ) | |||||
|
| |||||||
NET ASSETS — 100.00% |
| $ | 56,129,999 | |||||
|
| |||||||
| a | Non-income earning security. |
| b | All or a portion of this security represents a security on loan. See Note 1. |
| c | Affiliated issuer. See Note 2. |
| d | The rate quoted is the annualized seven-day yield of the fund at period end. |
| e | All or a portion of this security represents an investment of securities lending collateral. See Note 1. |
See notes to financial statements.
| 18 | 2015 iSHARES ANNUAL REPORTTO SHAREHOLDERS |
Table of Contents
Schedule of Investments
iSHARES® MSCI BELGIUM CAPPED ETF
August 31, 2015
| Security | Shares | Value | ||||||
COMMON STOCKS — 99.85% |
| |||||||
AIR FREIGHT & LOGISTICS — 1.55% |
| |||||||
bpost SA | 97,503 | $ | 2,375,140 | |||||
|
| |||||||
| 2,375,140 | ||||||||
BANKS — 8.91% |
| |||||||
KBC Groep NV | 206,537 | 13,693,396 | ||||||
|
| |||||||
| 13,693,396 | ||||||||
BEVERAGES — 22.53% |
| |||||||
Anheuser-Busch InBev SA/NV | 316,965 | 34,613,813 | ||||||
|
| |||||||
| 34,613,813 | ||||||||
BIOTECHNOLOGY — 3.13% |
| |||||||
Ablynx NVa,b | 135,140 | 1,907,189 | ||||||
Galapagos NVa | 48,106 | 2,910,210 | ||||||
|
| |||||||
| 4,817,399 | ||||||||
CAPITAL MARKETS — 1.92% |
| |||||||
BHF Kleinwort Benson Groupa | 230,968 | 1,425,209 | ||||||
Gimv NV | 32,325 | 1,532,113 | ||||||
|
| |||||||
| 2,957,322 | ||||||||
CHEMICALS — 7.93% |
| |||||||
Solvay SA | 50,494 | 5,935,086 | ||||||
Tessenderlo Chemie NVa | 59,858 | 2,114,409 | ||||||
Umicore SA | 103,596 | 4,138,807 | ||||||
|
| |||||||
| 12,188,302 | ||||||||
COMMUNICATIONS EQUIPMENT — 0.57% |
| |||||||
EVS Broadcast Equipment SA | 31,211 | 873,948 | ||||||
|
| |||||||
| 873,948 | ||||||||
CONSTRUCTION & ENGINEERING — 1.32% |
| |||||||
Cie. d’Entreprises CFE | 16,139 | 2,025,379 | ||||||
|
| |||||||
| 2,025,379 | ||||||||
DISTRIBUTORS — 0.97% |
| |||||||
D’ieteren SA/NV | 40,296 | 1,486,844 | ||||||
|
| |||||||
| 1,486,844 | ||||||||
DIVERSIFIED FINANCIAL SERVICES — 7.61% |
| |||||||
Ackermans & van Haaren NV | 26,654 | 3,948,258 | ||||||
Groupe Bruxelles Lambert SA | 71,596 | 5,555,463 | ||||||
KBC Ancora | 54,719 | 2,190,700 | ||||||
|
| |||||||
| 11,694,421 | ||||||||
DIVERSIFIED TELECOMMUNICATION SERVICES — 3.51% |
| |||||||
Proximus | 149,953 | 5,392,675 | ||||||
|
| |||||||
| 5,392,675 | ||||||||
ELECTRIC UTILITIES — 1.22% |
| |||||||
Elia System Operator SA/NV | 41,529 | 1,876,918 | ||||||
|
| |||||||
| 1,876,918 | ||||||||
| Security | Shares | Value | ||||||
ELECTRONIC EQUIPMENT, INSTRUMENTS & COMPONENTS — 0.85% |
| |||||||
Barco NV | 21,166 | $ | 1,311,285 | |||||
|
| |||||||
| 1,311,285 | ||||||||
FOOD & STAPLES RETAILING — 7.59% |
| |||||||
Colruyt SA | 73,512 | 3,583,514 | ||||||
Delhaize Group | 90,187 | 8,075,266 | ||||||
|
| |||||||
| 11,658,780 | ||||||||
HEALTH CARE EQUIPMENT & SUPPLIES — 1.24% |
| |||||||
Ion Beam Applications | 61,338 | 1,900,706 | ||||||
|
| |||||||
| 1,900,706 | ||||||||
HEALTH CARE PROVIDERS & SERVICES — 0.80% |
| |||||||
Fagron | 46,265 | 1,228,606 | ||||||
|
| |||||||
| 1,228,606 | ||||||||
HEALTH CARE TECHNOLOGY — 1.08% |
| |||||||
AGFA-Gevaert NVa | 545,864 | 1,661,215 | ||||||
|
| |||||||
| 1,661,215 | ||||||||
INSURANCE — 4.54% |
| |||||||
Ageas | 170,450 | 6,971,105 | ||||||
|
| |||||||
| 6,971,105 | ||||||||
IT SERVICES — 0.86% |
| |||||||
Econocom Group SA/NV | 149,400 | 1,316,957 | ||||||
|
| |||||||
| 1,316,957 | ||||||||
MARINE — 0.61% |
| |||||||
Cie. Maritime Belge SAa | 62,081 | 939,083 | ||||||
|
| |||||||
| 939,083 | ||||||||
MEDIA — 3.23% |
| |||||||
Kinepolis Group NV | 44,162 | 1,825,694 | ||||||
Telenet Group Holding NVa | 55,709 | 3,136,077 | ||||||
|
| |||||||
| 4,961,771 | ||||||||
METALS & MINING — 2.11% |
| |||||||
Bekaert SA | 56,986 | 1,651,872 | ||||||
Nyrstar NVa,b | 634,537 | 1,593,347 | ||||||
|
| |||||||
| 3,245,219 | ||||||||
OIL, GAS & CONSUMABLE FUELS — 2.33% |
| |||||||
Euronav NV | 182,740 | 2,437,669 | ||||||
Exmar NV | 100,894 | 1,148,040 | ||||||
|
| |||||||
| 3,585,709 | ||||||||
PERSONAL PRODUCTS — 1.46% |
| |||||||
Ontex Group NV | 71,941 | 2,247,403 | ||||||
|
| |||||||
| 2,247,403 | ||||||||
PHARMACEUTICALS — 5.33% |
| |||||||
UCB SA | 108,209 | 8,189,100 | ||||||
|
| |||||||
| 8,189,100 | ||||||||
SCHEDULESOF INVESTMENTS | 19 |
Table of Contents
Schedule of Investments (Continued)
iSHARES® MSCI BELGIUM CAPPED ETF
August 31, 2015
| Security | Shares | Value | ||||||
REAL ESTATE INVESTMENT TRUSTS (REITS) — 4.40% |
| |||||||
Befimmo SA | 27,196 | $ | 1,676,021 | |||||
Cofinimmo SA | 24,016 | 2,517,961 | ||||||
Intervest Offices & Warehouses NV | 35,877 | 899,077 | ||||||
Warehouses De Pauw CVA | 20,921 | 1,666,959 | ||||||
|
| |||||||
| 6,760,018 | ||||||||
SEMICONDUCTORS & SEMICONDUCTOR EQUIPMENT — 1.36% |
| |||||||
Melexis NV | 41,923 | 2,086,382 | ||||||
|
| |||||||
| 2,086,382 | ||||||||
WIRELESS TELECOMMUNICATION SERVICES — 0.89% |
| |||||||
Mobistar SAa | 65,872 | 1,370,643 | ||||||
|
| |||||||
| 1,370,643 | ||||||||
|
| |||||||
TOTAL COMMON STOCKS |
| |||||||
(Cost: $164,825,699) |
| 153,429,539 | ||||||
SHORT-TERM INVESTMENTS — 1.39% |
| |||||||
MONEY MARKET FUNDS — 1.39% |
| |||||||
BlackRock Cash Funds: Institutional, |
| |||||||
0.18%c,d,e | 2,003,672 | 2,003,672 | ||||||
BlackRock Cash Funds: Prime, |
| |||||||
0.18%c,d,e | 115,061 | 115,061 | ||||||
BlackRock Cash Funds: Treasury, |
| |||||||
0.03%c,d | 19,869 | 19,869 | ||||||
|
| |||||||
| 2,138,602 | ||||||||
|
| |||||||
TOTAL SHORT-TERM INVESTMENTS |
| |||||||
(Cost: $2,138,602) |
| 2,138,602 | ||||||
|
| |||||||
TOTAL INVESTMENTS |
| |||||||
(Cost: $166,964,301) | 155,568,141 | |||||||
Other Assets, Less Liabilities — (1.24)% |
| (1,909,368 | ) | |||||
|
| |||||||
NET ASSETS — 100.00% |
| $ | 153,658,773 | |||||
|
| |||||||
| a | Non-income earning security. |
| b | All or a portion of this security represents a security on loan. See Note 1. |
| c | Affiliated issuer. See Note 2. |
| d | The rate quoted is the annualized seven-day yield of the fund at period end. |
| e | All or a portion of this security represents an investment of securities lending collateral. See Note 1. |
See notes to financial statements.
| 20 | 2015 iSHARES ANNUAL REPORTTO SHAREHOLDERS |
Table of Contents
Schedule of Investments
August 31, 2015
| Security | Shares | Value | ||||||
COMMON STOCKS — 99.88% |
| |||||||
AEROSPACE & DEFENSE — 6.04% |
| |||||||
Airbus Group SE | 167,466 | $ | 10,900,333 | |||||
Safran SA | 83,023 | 6,476,557 | ||||||
Thales SA | 29,643 | 2,039,731 | ||||||
Zodiac Aerospace | 57,526 | 1,747,130 | ||||||
|
| |||||||
| 21,163,751 | ||||||||
AIR FREIGHT & LOGISTICS — 0.38% |
| |||||||
Bollore SA | 246,975 | 1,333,311 | ||||||
|
| |||||||
| 1,333,311 | ||||||||
AUTO COMPONENTS — 2.27% |
| |||||||
Cie. Generale des Etablissements Michelin Class B | 52,990 | 5,123,493 | ||||||
Valeo SA | 22,628 | 2,839,722 | ||||||
|
| |||||||
| 7,963,215 | ||||||||
AUTOMOBILES — 1.90% |
| |||||||
Peugeot SAa | 123,269 | 2,127,092 | ||||||
Renault SA | 54,685 | 4,539,830 | ||||||
|
| |||||||
| 6,666,922 | ||||||||
BANKS — 9.91% |
| |||||||
BNP Paribas SA | 301,126 | 18,986,149 | ||||||
Credit Agricole SA | 293,261 | 3,971,117 | ||||||
Natixis SA | 266,875 | 1,692,529 | ||||||
Societe Generale SA | 206,242 | 10,042,194 | ||||||
|
| |||||||
| 34,691,989 | ||||||||
BEVERAGES — 1.92% |
| |||||||
Pernod Ricard SA | 60,316 | 6,320,461 | ||||||
Remy Cointreau SA | 6,981 | 413,482 | ||||||
|
| |||||||
| 6,733,943 | ||||||||
BUILDING PRODUCTS — 1.78% |
| |||||||
Cie. de Saint-Gobain | 135,835 | 6,234,999 | ||||||
|
| |||||||
| 6,234,999 | ||||||||
CHEMICALS — 3.72% |
| |||||||
Air Liquide SA | 97,765 | 11,704,953 | ||||||
Arkema SA | 18,697 | 1,317,963 | ||||||
|
| |||||||
| 13,022,916 | ||||||||
COMMERCIAL SERVICES & SUPPLIES — 0.73% |
| |||||||
Edenred | 58,736 | 1,244,208 | ||||||
Societe BIC SA | 8,202 | 1,299,973 | ||||||
|
| |||||||
| 2,544,181 | ||||||||
COMMUNICATIONS EQUIPMENT — 0.75% |
| |||||||
Alcatel-Lucenta | 781,732 | 2,622,536 | ||||||
|
| |||||||
| 2,622,536 | ||||||||
| Security | Shares | Value | ||||||
CONSTRUCTION & ENGINEERING — 3.12% |
| |||||||
Bouygues SA | 57,557 | $ | 2,188,879 | |||||
Vinci SA | 135,761 | 8,733,218 | ||||||
|
| |||||||
| 10,922,097 | ||||||||
CONSTRUCTION MATERIALS — 0.20% |
| |||||||
Imerys SA | 10,143 | 698,621 | ||||||
|
| |||||||
| 698,621 | ||||||||
DIVERSIFIED FINANCIAL SERVICES — 0.51% |
| |||||||
Eurazeo SA | 11,449 | 742,776 | ||||||
Wendel SA | 8,219 | 1,053,093 | ||||||
|
| |||||||
| 1,795,869 | ||||||||
DIVERSIFIED TELECOMMUNICATION SERVICES — 3.03% |
| |||||||
Iliad SA | 7,502 | 1,692,125 | ||||||
Orange SA | 564,829 | 8,917,430 | ||||||
|
| |||||||
| 10,609,555 | ||||||||
ELECTRIC UTILITIES — 0.42% |
| |||||||
Electricite de France SA | 68,611 | 1,482,988 | ||||||
|
| |||||||
| 1,482,988 | ||||||||
ELECTRICAL EQUIPMENT — 4.64% | ||||||||
Alstom SAa | 61,833 | 1,917,084 | ||||||
Legrand SA | 75,665 | 4,360,369 | ||||||
Schneider Electric SE | 157,864 | 9,964,020 | ||||||
|
| |||||||
| 16,241,473 | ||||||||
ELECTRONIC EQUIPMENT, INSTRUMENTS & COMPONENTS — 0.55% |
| |||||||
Ingenico Group | 15,560 | 1,924,821 | ||||||
|
| |||||||
| 1,924,821 | ||||||||
ENERGY EQUIPMENT & SERVICES — 0.46% |
| |||||||
Technip SA | 29,711 | 1,616,619 | ||||||
|
| |||||||
| 1,616,619 | ||||||||
FOOD & STAPLES RETAILING — 1.75% |
| |||||||
Carrefour SA | 156,797 | 5,091,525 | ||||||
Casino Guichard Perrachon SA | 16,220 | 1,025,042 | ||||||
|
| |||||||
| 6,116,567 | ||||||||
FOOD PRODUCTS — 2.92% |
| |||||||
Danone SA | 164,714 | 10,222,888 | ||||||
|
| |||||||
| 10,222,888 | ||||||||
HEALTH CARE EQUIPMENT & SUPPLIES — 1.99% |
| |||||||
Essilor International SA | 58,323 | 6,953,336 | ||||||
|
| |||||||
| 6,953,336 | ||||||||
HOTELS, RESTAURANTS & LEISURE — 1.48% |
| |||||||
Accor SA | 59,477 | 2,817,707 | ||||||
Sodexo SA | 26,767 | 2,352,305 | ||||||
|
| |||||||
| 5,170,012 | ||||||||
SCHEDULESOF INVESTMENTS | 21 |
Table of Contents
Schedule of Investments (Continued)
iSHARES® MSCI FRANCE ETF
August 31, 2015
| Security | Shares | Value | ||||||
INSURANCE — 4.67% |
| |||||||
AXA SA | 557,775 | $ | 14,046,576 | |||||
CNP Assurances | 49,207 | 758,126 | ||||||
SCOR SE | 43,816 | 1,543,572 | ||||||
|
| |||||||
| 16,348,274 | ||||||||
IT SERVICES — 1.67% | ||||||||
Atos | 24,597 | 1,866,702 | ||||||
Cap Gemini SA | 44,225 | 3,970,274 | ||||||
|
| |||||||
| 5,836,976 | ||||||||
MEDIA — 5.48% | ||||||||
Eutelsat Communications SA | 48,572 | 1,462,669 | ||||||
JCDecaux SA | 21,288 | 764,018 | ||||||
Lagardere SCA | 33,832 | 919,287 | ||||||
Numericable-SFR SASa | 27,784 | 1,427,245 | ||||||
Publicis Groupe SA | 53,631 | 3,817,140 | ||||||
SES SA | 89,948 | 2,668,328 | ||||||
Vivendi SA | 329,216 | 8,132,101 | ||||||
|
| |||||||
| 19,190,788 | ||||||||
METALS & MINING — 0.63% | ||||||||
ArcelorMittal | 281,564 | 2,189,202 | ||||||
|
| |||||||
| 2,189,202 | ||||||||
MULTI-UTILITIES — 3.36% | ||||||||
Engie | 415,476 | 7,441,668 | ||||||
Suez Environnement Co. | 84,804 | 1,528,443 | ||||||
Veolia Environnement SA | 128,102 | 2,806,173 | ||||||
|
| |||||||
| 11,776,284 | ||||||||
OIL, GAS & CONSUMABLE FUELS — 8.01% |
| |||||||
Total SA | 613,138 | 28,033,888 | ||||||
|
| |||||||
| 28,033,888 | ||||||||
PERSONAL PRODUCTS — 3.50% |
| |||||||
L’Oreal SA | 71,594 | 12,249,755 | ||||||
|
| |||||||
| 12,249,755 | ||||||||
PHARMACEUTICALS — 9.44% |
| |||||||
Sanofi | 334,611 | 33,057,711 | ||||||
|
| |||||||
| 33,057,711 | ||||||||
PROFESSIONAL SERVICES — 0.49% |
| |||||||
Bureau Veritas SA | 75,638 | 1,725,134 | ||||||
|
| |||||||
| 1,725,134 | ||||||||
REAL ESTATE INVESTMENT TRUSTS (REITS) — 3.50% |
| |||||||
Fonciere des Regions | 8,591 | 715,902 | ||||||
Gecina SA | 9,896 | 1,246,343 | ||||||
ICADE | 9,538 | 682,386 | ||||||
Klepierre | 53,510 | 2,351,550 | ||||||
| Security | Shares | Value | ||||||
Unibail-Rodamco SE | 28,001 | $ | 7,255,494 | |||||
|
| |||||||
| 12,251,675 | ||||||||
SEMICONDUCTORS & SEMICONDUCTOR EQUIPMENT — 0.37% |
| |||||||
STMicroelectronics NV | 179,663 | 1,303,095 | ||||||
|
| |||||||
| 1,303,095 | ||||||||
SOFTWARE — 0.72% |
| |||||||
Dassault Systemes | 36,348 | 2,520,651 | ||||||
|
| |||||||
| 2,520,651 | ||||||||
TEXTILES, APPAREL & LUXURY GOODS — 6.41% |
| |||||||
Christian Dior SE | 15,523 | 2,876,888 | ||||||
Hermes International | 7,497 | 2,659,982 | ||||||
Kering | 21,560 | 3,690,130 | ||||||
LVMH Moet Hennessy Louis Vuitton SE | 79,401 | 13,225,211 | ||||||
|
| |||||||
| 22,452,211 | ||||||||
TRADING COMPANIES & DISTRIBUTORS — 0.37% |
| |||||||
Rexel SA | 83,700 | 1,282,521 | ||||||
|
| |||||||
| 1,282,521 | ||||||||
TRANSPORTATION INFRASTRUCTURE — 0.79% |
| |||||||
Aeroports de Paris | 8,447 | 968,728 | ||||||
Groupe Eurotunnel SE Registered | 133,294 | 1,801,979 | ||||||
|
| |||||||
| 2,770,707 | ||||||||
|
| |||||||
TOTAL COMMON STOCKS |
| |||||||
(Cost: $410,521,987) |
| 349,721,481 | ||||||
SHORT-TERM INVESTMENTS — 0.04% |
| |||||||
MONEY MARKET FUNDS — 0.04% |
| |||||||
BlackRock Cash Funds: Treasury, |
| |||||||
0.03%b,c | 124,496 | 124,496 | ||||||
|
| |||||||
| 124,496 | ||||||||
|
| |||||||
TOTAL SHORT-TERM INVESTMENTS |
| |||||||
(Cost: $124,496) |
| 124,496 | ||||||
|
| |||||||
TOTAL INVESTMENTS |
| |||||||
(Cost: $410,646,483) | 349,845,977 | |||||||
Other Assets, Less Liabilities — 0.08% |
| 293,017 | ||||||
|
| |||||||
NET ASSETS — 100.00% |
| $ | 350,138,994 | |||||
|
| |||||||
| a | Non-income earning security. |
| b | Affiliated issuer. See Note 2. |
| c | The rate quoted is the annualized seven-day yield of the fund at period end. |
See notes to financial statements.
| 22 | 2015 iSHARES ANNUAL REPORTTO SHAREHOLDERS |
Table of Contents
Schedule of Investments
August 31, 2015
| Security | Shares | Value | ||||||
COMMON STOCKS — 99.65% |
| |||||||
AIR FREIGHT & LOGISTICS — 1.56% |
| |||||||
PostNL NVa | 207,517 | $ | 782,904 | |||||
TNT Express NV | 232,225 | 1,960,928 | ||||||
|
| |||||||
| 2,743,832 | ||||||||
BANKS — 15.77% |
| |||||||
ING Groep NV CVA | 1,817,752 | 27,792,006 | ||||||
|
| |||||||
| 27,792,006 | ||||||||
BEVERAGES — 6.72% |
| |||||||
Heineken Holding NV | 47,339 | 3,299,295 | ||||||
Heineken NV | 108,263 | 8,552,260 | ||||||
|
| |||||||
| 11,851,555 | ||||||||
CAPITAL MARKETS — 0.13% |
| |||||||
BinckBank NV | 26,602 | 223,855 | ||||||
|
| |||||||
| 223,855 | ||||||||
CHEMICALS — 7.83% |
| |||||||
Akzo Nobel NV | 115,415 | 7,803,317 | ||||||
Koninklijke DSM NV | 85,239 | 4,480,387 | ||||||
Koninklijke Ten Cate NV | 12,873 | 346,830 | ||||||
OCI NVa | 39,615 | 1,166,532 | ||||||
|
| |||||||
| 13,797,066 | ||||||||
CONSTRUCTION & ENGINEERING — 2.07% |
| |||||||
Arcadis NV | 31,178 | 782,542 | ||||||
Boskalis Westminster NV | 40,474 | 2,105,652 | ||||||
Grontmij NVa | 33,037 | 164,471 | ||||||
Koninklijke BAM Groep NVa | 108,120 | 598,231 | ||||||
|
| |||||||
| 3,650,896 | ||||||||
DIVERSIFIED FINANCIAL SERVICES — 0.00% |
| |||||||
SNS REAAL NVa,b | 68,952 | 1 | ||||||
|
| |||||||
| 1 | ||||||||
DIVERSIFIED TELECOMMUNICATION SERVICES — 3.32% |
| |||||||
Koninklijke KPN NV | 1,505,378 | 5,856,485 | ||||||
|
| |||||||
| 5,856,485 | ||||||||
ELECTRICAL EQUIPMENT — 0.45% |
| |||||||
Kendrion NV | 5,150 | 138,465 | ||||||
TKH Group NV | 16,877 | 654,309 | ||||||
|
| |||||||
| 792,774 | ||||||||
ENERGY EQUIPMENT & SERVICES — 0.95% |
| |||||||
Fugro NV CVAa,b | 31,894 | 665,784 | ||||||
SBM Offshore NVa | 83,953 | 1,001,838 | ||||||
|
| |||||||
| 1,667,622 | ||||||||
| Security | Shares | Value | ||||||
FOOD & STAPLES RETAILING — 4.81% |
| |||||||
Amsterdam Commodities NV | 7,868 | $ | 189,414 | |||||
Koninklijke Ahold NV | 420,323 | 8,296,168 | ||||||
|
| |||||||
| 8,485,582 | ||||||||
FOOD PRODUCTS — 0.56% |
| |||||||
Corbion NV | 27,747 | 609,374 | ||||||
Wessanen | 35,754 | 377,387 | ||||||
|
| |||||||
| 986,761 | ||||||||
HOUSEHOLD DURABLES — 0.27% |
| |||||||
TomTom NVa,b | 47,772 | 479,134 | ||||||
|
| |||||||
| 479,134 | ||||||||
INDUSTRIAL CONGLOMERATES — 6.40% |
| |||||||
Koninklijke Philips NV | 439,488 | 11,286,866 | ||||||
|
| |||||||
| 11,286,866 | ||||||||
INSURANCE — 5.16% |
| |||||||
Aegon NV | 851,512 | 5,234,296 | ||||||
Delta Lloyd NV | 103,114 | 1,093,810 | ||||||
NN Group NV | 90,673 | 2,766,034 | ||||||
|
| |||||||
| 9,094,140 | ||||||||
LEISURE PRODUCTS — 0.12% |
| |||||||
Accell Group | 10,157 | 217,831 | ||||||
|
| |||||||
| 217,831 | ||||||||
MACHINERY — 0.82% |
| |||||||
Aalberts Industries NV | 46,767 | 1,452,071 | ||||||
|
| |||||||
| 1,452,071 | ||||||||
MEDIA — 9.44% |
| |||||||
Altice NV Class Aa,b | 122,421 | 3,487,616 | ||||||
Altice NV Class Ba,b | 40,759 | 1,277,859 | ||||||
RELX NV | 479,114 | 7,373,594 | ||||||
Wolters Kluwer NV | 142,015 | 4,495,359 | ||||||
|
| |||||||
| 16,634,428 | ||||||||
OIL, GAS & CONSUMABLE FUELS — 0.77% |
| |||||||
Koninklijke Vopak NV | 33,037 | 1,359,299 | ||||||
|
| |||||||
| 1,359,299 | ||||||||
PERSONAL PRODUCTS — 17.39% |
| |||||||
Unilever NV CVA | 765,704 | 30,659,596 | ||||||
|
| |||||||
| 30,659,596 | ||||||||
PROFESSIONAL SERVICES — 2.50% |
| |||||||
Brunel International NV | 9,297 | 162,510 | ||||||
Randstad Holding NV | 60,216 | 3,802,047 | ||||||
USG People NV | 30,464 | 449,898 | ||||||
|
| |||||||
| 4,414,455 | ||||||||
SCHEDULESOF INVESTMENTS | 23 |
Table of Contents
Schedule of Investments (Continued)
iSHARES® MSCI NETHERLANDS ETF
August 31, 2015
| Security | Shares | Value | ||||||
REAL ESTATE INVESTMENT TRUSTS (REITS) — 1.56% |
| |||||||
Eurocommercial Properties NV | 22,456 | $ | 995,155 | |||||
NSI NV | 60,495 | 254,802 | ||||||
VastNed Retail NV | 9,012 | 410,936 | ||||||
Wereldhave NV | 18,886 | 1,080,096 | ||||||
|
| |||||||
| 2,740,989 | ||||||||
SEMICONDUCTORS & SEMICONDUCTOR EQUIPMENT — 9.12% |
| |||||||
ASM International NV | 23,742 | 894,257 | ||||||
ASML Holding NV | 162,882 | 14,907,353 | ||||||
BE Semiconductor Industries NV | 14,159 | 278,116 | ||||||
|
| |||||||
| 16,079,726 | ||||||||
SOFTWARE — 1.54% |
| |||||||
Gemalto NVb | 37,614 | 2,705,804 | ||||||
|
| |||||||
| 2,705,804 | ||||||||
TRADING COMPANIES & DISTRIBUTORS — 0.39% |
| |||||||
IMCD Group NV | 18,533 | 689,438 | ||||||
|
| |||||||
| 689,438 | ||||||||
|
| |||||||
TOTAL COMMON STOCKS |
| |||||||
(Cost: $197,090,350) |
| 175,662,212 | ||||||
SHORT-TERM INVESTMENTS — 2.70% |
| |||||||
MONEY MARKET FUNDS — 2.70% |
| |||||||
BlackRock Cash Funds: Institutional, |
| |||||||
0.18%c,d,e | 4,495,660 | 4,495,660 | ||||||
BlackRock Cash Funds: Prime, |
| |||||||
0.18%c,d,e | 258,163 | 258,163 | ||||||
BlackRock Cash Funds: Treasury, |
| |||||||
0.03%c,d | 2,192 | 2,192 | ||||||
|
| |||||||
| 4,756,015 | ||||||||
|
| |||||||
TOTAL SHORT-TERM INVESTMENTS |
| |||||||
(Cost: $4,756,015) |
| 4,756,015 | ||||||
|
| |||||||
TOTAL INVESTMENTS |
| |||||||
(Cost: $201,846,365) | 180,418,227 | |||||||
Other Assets, Less Liabilities — (2.35)% |
| (4,135,986 | ) | |||||
|
| |||||||
NET ASSETS — 100.00% |
| $ | 176,282,241 | |||||
|
| |||||||
| a | Non-income earning security. |
| b | All or a portion of this security represents a security on loan. See Note 1. |
| c | Affiliated issuer. See Note 2. |
| d | The rate quoted is the annualized seven-day yield of the fund at period end. |
| e | All or a portion of this security represents an investment of securities lending collateral. See Note 1. |
See notes to financial statements.
| 24 | 2015 iSHARES ANNUAL REPORTTO SHAREHOLDERS |
Table of Contents
Schedule of Investments
August 31, 2015
| Security | Shares | Value | ||||||
COMMON STOCKS — 98.84% |
| |||||||
BANKS — 26.37% |
| |||||||
Nordea Bank AB | 2,755,733 | $ | 32,541,698 | |||||
Skandinaviska Enskilda Banken AB Class A | 1,360,969 | 15,806,664 | ||||||
Svenska Handelsbanken AB Class A | 1,360,641 | 20,284,740 | ||||||
Swedbank AB Class A | 822,364 | 18,743,726 | ||||||
|
| |||||||
| 87,376,828 | ||||||||
BUILDING PRODUCTS — 4.84% |
| |||||||
Assa Abloy AB | 840,239 | 16,051,706 | ||||||
|
| |||||||
| 16,051,706 | ||||||||
COMMERCIAL SERVICES & SUPPLIES ��� 1.11% |
| |||||||
Securitas AB Class B | 288,674 | 3,674,234 | ||||||
|
| |||||||
| 3,674,234 | ||||||||
COMMUNICATIONS EQUIPMENT — 8.11% |
| |||||||
Telefonaktiebolaget LM Ericsson Class B | 2,762,132 | 26,871,807 | ||||||
|
| |||||||
| 26,871,807 | ||||||||
CONSTRUCTION & ENGINEERING — 2.07% |
| |||||||
Skanska AB Class B | 351,265 | 6,871,924 | ||||||
|
| |||||||
| 6,871,924 | ||||||||
DIVERSIFIED FINANCIAL SERVICES — 7.17% |
| |||||||
Industrivarden AB Class C | 152,295 | 2,767,613 | ||||||
Investment AB Kinnevik Class B | 214,417 | 6,046,963 | ||||||
Investor AB Class B | 415,727 | 14,938,294 | ||||||
|
| |||||||
| 23,752,870 | ||||||||
DIVERSIFIED TELECOMMUNICATION SERVICES — 4.01% |
| |||||||
TeliaSonera AB | 2,360,412 | 13,291,357 | ||||||
|
| |||||||
| 13,291,357 | ||||||||
ELECTRONIC EQUIPMENT, INSTRUMENTS & COMPONENTS — 2.29% |
| |||||||
Hexagon AB Class B | 235,706 | 7,577,926 | ||||||
|
| |||||||
| 7,577,926 | ||||||||
FOOD & STAPLES RETAILING — 0.79% |
| |||||||
ICA Gruppen AB | 70,859 | 2,626,341 | ||||||
|
| |||||||
| 2,626,341 | ||||||||
HEALTH CARE EQUIPMENT & SUPPLIES — 1.22% |
| |||||||
Getinge AB Class B | 182,522 | 4,048,277 | ||||||
|
| |||||||
| 4,048,277 | ||||||||
HOUSEHOLD DURABLES — 2.60% |
| |||||||
Electrolux AB Class B | 218,743 | 6,163,808 | ||||||
| Security | Shares | Value | ||||||
Husqvarna AB Class B | 380,655 | $ | 2,467,343 | |||||
|
| |||||||
| 8,631,151 | ||||||||
HOUSEHOLD PRODUCTS — 4.60% |
| |||||||
Svenska Cellulosa AB SCA Class B | 535,236 | 15,227,126 | ||||||
|
| |||||||
| 15,227,126 | ||||||||
MACHINERY — 17.95% |
| |||||||
Alfa Laval AB | 270,115 | 4,545,820 | ||||||
Atlas Copco AB Class A | 611,716 | 15,391,576 | ||||||
Atlas Copco AB Class B | 355,188 | 8,087,248 | ||||||
Sandvik AB | 970,868 | 9,359,418 | ||||||
SKF AB Class B | 363,280 | 6,931,444 | ||||||
Volvo AB Class B | 1,397,304 | 15,166,518 | ||||||
|
| |||||||
| 59,482,024 | ||||||||
METALS & MINING — 1.25% |
| |||||||
Boliden AB | 250,488 | 4,129,904 | ||||||
|
| |||||||
| 4,129,904 | ||||||||
OIL, GAS & CONSUMABLE FUELS — 0.78% |
| |||||||
Lundin Petroleum ABa | 198,976 | 2,593,529 | ||||||
|
| |||||||
| 2,593,529 | ||||||||
SPECIALTY RETAIL — 9.99% |
| |||||||
Hennes & Mauritz AB Class B | 862,145 | 33,102,954 | ||||||
|
| |||||||
| 33,102,954 | ||||||||
TOBACCO — 1.61% |
| |||||||
Swedish Match AB | 180,853 | 5,334,846 | ||||||
|
| |||||||
| 5,334,846 | ||||||||
WIRELESS TELECOMMUNICATION SERVICES — 2.08% |
| |||||||
Millicom International Cellular SA SDR | 60,382 | 4,020,604 | ||||||
Tele2 AB Class B | 291,504 | 2,873,729 | ||||||
|
| |||||||
| 6,894,333 | ||||||||
|
| |||||||
TOTAL COMMON STOCKS |
| |||||||
(Cost: $386,521,516) | 327,539,137 | |||||||
SHORT-TERM INVESTMENTS — 0.66% |
| |||||||
MONEY MARKET FUNDS — 0.66% |
| |||||||
BlackRock Cash Funds: Institutional, |
| |||||||
0.18%b,c,d | 2,077,890 | 2,077,890 | ||||||
BlackRock Cash Funds: Prime, | ||||||||
0.18%b,c,d | 119,323 | 119,323 | ||||||
SCHEDULESOF INVESTMENTS | 25 |
Table of Contents
Schedule of Investments (Continued)
iSHARES® MSCI SWEDEN ETF
August 31, 2015
| Security | Shares | Value | ||||||
BlackRock Cash Funds: Treasury, | ||||||||
0.03%b,c | 9,417 | $ | 9,417 | |||||
|
| |||||||
| 2,206,630 | ||||||||
|
| |||||||
TOTAL SHORT-TERM INVESTMENTS |
| |||||||
(Cost: $2,206,630) |
| 2,206,630 | ||||||
|
| |||||||
TOTAL INVESTMENTS |
| |||||||
(Cost: $388,728,146) |
| 329,745,767 | ||||||
Other Assets, Less Liabilities — 0.50% |
| 1,641,168 | ||||||
|
| |||||||
NET ASSETS — 100.00% |
| $ | 331,386,935 | |||||
|
| |||||||
SDR — Swedish Depositary Receipts
| a | Non-income earning security. |
| b | Affiliated issuer. See Note 2. |
| c | The rate quoted is the annualized seven-day yield of the fund at period end. |
| d | All or a portion of this security represents an investment of securities lending collateral. See Note 1. |
See notes to financial statements.
| 26 | 2015 iSHARES ANNUAL REPORTTO SHAREHOLDERS |
Table of Contents
Statements of Assets and Liabilities
iSHARES®, INC.
August 31, 2015
iShares MSCI Austria Capped ETF | iShares MSCI Belgium Capped ETF | iShares MSCI France ETF | ||||||||||
ASSETS | ||||||||||||
Investments, at cost: | ||||||||||||
Unaffiliated | $ | 78,916,918 | $ | 164,825,699 | $ | 410,521,987 | ||||||
Affiliated (Note 2) | 2,580,838 | 2,138,602 | 124,496 | |||||||||
|
|
|
|
|
| |||||||
Total cost of investments | $ | 81,497,756 | $ | 166,964,301 | $ | 410,646,483 | ||||||
|
|
|
|
|
| |||||||
Investments in securities, at fair value (including securities on loana) (Note 1): | ||||||||||||
Unaffiliated | $ | 55,191,770 | $ | 153,429,539 | $ | 349,721,481 | ||||||
Affiliated (Note 2) | 2,580,838 | 2,138,602 | 124,496 | |||||||||
|
|
|
|
|
| |||||||
Total fair value of investments | 57,772,608 | 155,568,141 | 349,845,977 | |||||||||
Foreign currency, at valueb | 2,033 | 248,879 | 166,760 | |||||||||
Receivables: | ||||||||||||
Investment securities sold | 877,805 | 2,727,899 | 2,515,054 | |||||||||
Dividends, reclaims and interest | 923,827 | 160,694 | 9,888 | |||||||||
|
|
|
|
|
| |||||||
Total Assets | 59,576,273 | 158,705,613 | 352,537,679 | |||||||||
|
|
|
|
|
| |||||||
LIABILITIES | ||||||||||||
Payables: | ||||||||||||
Investment securities purchased | 713,319 | 2,858,241 | 2,253,686 | |||||||||
Collateral for securities on loan (Note 1) | 2,580,652 | 2,118,733 | — | |||||||||
Capital shares redeemed | — | 3,036 | — | |||||||||
Securities related to in-kind transactions (Note 4) | 128,135 | — | — | |||||||||
Investment advisory fees (Note 2) | 24,168 | 66,830 | 144,999 | |||||||||
|
|
|
|
|
| |||||||
Total Liabilities | 3,446,274 | 5,046,840 | 2,398,685 | |||||||||
|
|
|
|
|
| |||||||
NET ASSETS | $ | 56,129,999 | $ | 153,658,773 | $ | 350,138,994 | ||||||
|
|
|
|
|
| |||||||
Net assets consist of: | ||||||||||||
Paid-in capital | $ | 157,674,313 | $ | 219,824,310 | $ | 463,424,658 | ||||||
Undistributed (distributions in excess of) net investment income | (8,898 | ) | (33,754 | ) | 178,273 | |||||||
Accumulated net realized loss | (77,640,785 | ) | (54,739,873 | ) | (52,668,767 | ) | ||||||
Net unrealized depreciation | (23,894,631 | ) | (11,391,910 | ) | (60,795,170 | ) | ||||||
|
|
|
|
|
| |||||||
NET ASSETS | $ | 56,129,999 | $ | 153,658,773 | $ | 350,138,994 | ||||||
|
|
|
|
|
| |||||||
Shares outstandingc | 3,600,000 | 9,040,000 | 14,000,000 | |||||||||
|
|
|
|
|
| |||||||
Net asset value per share | $ | 15.59 | $ | 17.00 | $ | 25.01 | ||||||
|
|
|
|
|
| |||||||
| a | Securities on loan with values of $2,367,648, $1,976,621 and $ —, respectively. See Note 1. |
| b | Cost of foreign currency: $1,982, $245,383 and $161,722, respectively. |
| c | $0.001 par value, number of shares authorized: 100 million, 136.2 million and 340.2 million, respectively. |
See notes to financial statements.
FINANCIAL STATEMENTS | 27 |
Table of Contents
Statements of Assets and Liabilities (Continued)
iSHARES®, INC.
August 31, 2015
| iShares MSCI Netherlands ETF | iShares MSCI | |||||||
ASSETS | ||||||||
Investments, at cost: | ||||||||
Unaffiliated | $ | 197,090,350 | $ | 386,521,516 | ||||
Affiliated (Note 2) | 4,756,015 | 2,206,630 | ||||||
|
|
|
| |||||
Total cost of investments | $ | 201,846,365 | $ | 388,728,146 | ||||
|
|
|
| |||||
Investments in securities, at fair value (including securities on loana) (Note 1): | ||||||||
Unaffiliated | $ | 175,662,212 | $ | 327,539,137 | ||||
Affiliated (Note 2) | 4,756,015 | 2,206,630 | ||||||
|
|
|
| |||||
Total fair value of investments | 180,418,227 | 329,745,767 | ||||||
Foreign currency, at valueb | 245,478 | 171,773 | ||||||
Receivables: | ||||||||
Investment securities sold | 370,049 | 3,997,179 | ||||||
Dividends, reclaims and interest | 442,362 | 6,072 | ||||||
Foreign withholding tax claims (Note 7) | — | 10,687,615 | ||||||
|
|
|
| |||||
Total Assets | 181,476,116 | 344,608,406 | ||||||
|
|
|
| |||||
LIABILITIES | ||||||||
Payables: | ||||||||
Investment securities purchased | 166,037 | 928,010 | ||||||
Collateral for securities on loan (Note 1) | 4,753,823 | 2,197,213 | ||||||
Securities related to in-kind transactions (Note 4) | 195,085 | — | ||||||
IRS compliance fee for foreign withholding tax claims (Note 7) | — | 8,773,929 | ||||||
Professional fees (Note 7) | — | 1,180,411 | ||||||
Investment advisory fees (Note 2) | 78,930 | 141,908 | ||||||
|
|
|
| |||||
Total Liabilities | 5,193,875 | 13,221,471 | ||||||
|
|
|
| |||||
NET ASSETS | $ | 176,282,241 | $ | 331,386,935 | ||||
|
|
|
| |||||
Net assets consist of: | ||||||||
Paid-in capital | $ | 240,685,110 | $ | 436,560,700 | ||||
Undistributed (distributions in excess of) net investment income | 932,094 | (364,097 | ) | |||||
Accumulated net realized loss | (43,913,162 | ) | (45,827,453 | ) | ||||
Net unrealized depreciation | (21,421,801 | ) | (58,982,215 | ) | ||||
|
|
|
| |||||
NET ASSETS | $ | 176,282,241 | $ | 331,386,935 | ||||
|
|
|
| |||||
Shares outstandingc | 7,200,000 | 10,950,000 | ||||||
|
|
|
| |||||
Net asset value per share | $ | 24.48 | $ | 30.26 | ||||
|
|
|
| |||||
| a | Securities on loan with values of $4,521,737 and $ —, respectively. See Note 1. |
| b | Cost of foreign currency: $245,338 and $171,533, respectively. |
| c | $0.001 par value, number of shares authorized: 255 million and 63.6 million, respectively. |
See notes to financial statements.
| 28 | 2015 iSHARES ANNUAL REPORTTO SHAREHOLDERS |
Table of Contents
Statements of Operations
iSHARES®, INC.
Year ended August 31, 2015
| iShares MSCI Austria Capped ETF | iShares MSCI Belgium Capped ETF | iShares MSCI France ETF | ||||||||||
NET INVESTMENT INCOME |
| |||||||||||
Dividends — unaffiliateda | $ | 1,198,225 | $ | 4,035,501 | $ | 10,957,581 | ||||||
Interest — affiliated (Note 2) | 3 | 5 | 14 | |||||||||
Securities lending income — affiliated — net (Note 2) | 36,280 | 52,649 | 17,784 | |||||||||
|
|
|
|
|
| |||||||
Total investment income | 1,234,508 | 4,088,155 | 10,975,379 | |||||||||
|
|
|
|
|
| |||||||
EXPENSES | ||||||||||||
Investment advisory fees (Note 2) | 292,186 | 784,484 | 1,578,364 | |||||||||
|
|
|
|
|
| |||||||
Total expenses | 292,186 | 784,484 | 1,578,364 | |||||||||
|
|
|
|
|
| |||||||
Net investment income | 942,322 | 3,303,671 | 9,397,015 | |||||||||
|
|
|
|
|
| |||||||
NET REALIZED AND UNREALIZED GAIN (LOSS) | ||||||||||||
Net realized gain (loss) from: | ||||||||||||
Investments — unaffiliated | (5,723,219 | ) | (2,451,548 | ) | (12,077,752 | ) | ||||||
In-kind redemptions — unaffiliated | 159,327 | 19,898,997 | 2,356,096 | |||||||||
Foreign currency transactions | (1,967 | ) | 1,800 | (27,181 | ) | |||||||
|
|
|
|
|
| |||||||
Net realized gain (loss) | (5,565,859 | ) | 17,449,249 | (9,748,837 | ) | |||||||
|
|
|
|
|
| |||||||
Net change in unrealized appreciation/depreciation on: | ||||||||||||
Investments | (2,282,419 | ) | (19,230,279 | ) | (18,688,629 | ) | ||||||
Translation of assets and liabilities in foreign currencies | (137,435 | ) | 5,262 | 10,396 | ||||||||
|
|
|
|
|
| |||||||
Net change in unrealized appreciation/depreciation | (2,419,854 | ) | (19,225,017 | ) | (18,678,233 | ) | ||||||
|
|
|
|
|
| |||||||
Net realized and unrealized loss | (7,985,713 | ) | (1,775,768 | ) | (28,427,070 | ) | ||||||
|
|
|
|
|
| |||||||
NET INCREASE (DECREASE) IN NET ASSETS RESULTING FROM OPERATIONS | $ | (7,043,391 | ) | $ | 1,527,903 | $ | (19,030,055 | ) | ||||
|
|
|
|
|
| |||||||
| a | Net of foreign withholding tax of $188,685, $707,058 and $1,817,039, respectively. |
See notes to financial statements.
FINANCIAL STATEMENTS | 29 |
Table of Contents
Statements of Operations (Continued)
iSHARES®, INC.
Year ended August 31, 2015
| iShares MSCI Netherlands ETF | iShares MSCI | |||||||
NET INVESTMENT INCOME |
| |||||||
Dividends — unaffiliateda | $ | 3,997,276 | $ | 11,548,699 | ||||
Interest — affiliated (Note 2) | 5 | 10 | ||||||
Securities lending income — affiliated — net (Note 2) | 114,211 | 21,864 | ||||||
Other income | — | 117,511 | ||||||
Foreign withholding tax claims (Note 7) | — | 15,358,761 | ||||||
|
|
|
| |||||
| 4,111,492 | 27,046,845 | |||||||
Less: IRS compliance fee for foreign withholding tax claims (Note 7) | — | (8,773,929 | ) | |||||
|
|
|
| |||||
Total investment income | 4,111,492 | 18,272,916 | ||||||
|
|
|
| |||||
EXPENSES | ||||||||
Investment advisory fees (Note 2) | 789,963 | 1,789,253 | ||||||
Professional fees (Note 7) | — | 1,647,526 | ||||||
|
|
|
| |||||
Total expenses | 789,963 | 3,436,779 | ||||||
|
|
|
| |||||
Net investment income | 3,321,529 | 14,836,137 | ||||||
|
|
|
| |||||
NET REALIZED AND UNREALIZED GAIN (LOSS) | ||||||||
Net realized gain (loss) from: | ||||||||
Investments — unaffiliated | (2,766,667 | ) | (5,337,220 | ) | ||||
In-kind redemptions — unaffiliated | 6,979,786 | 24,373,448 | ||||||
Foreign currency transactions | (18,367 | ) | (94,691 | ) | ||||
|
|
|
| |||||
Net realized gain | 4,194,752 | 18,941,537 | ||||||
|
|
|
| |||||
Net change in unrealized appreciation/depreciation on: | ||||||||
Investments | (11,194,318 | ) | (66,315,999 | ) | ||||
Translation of assets and liabilities in foreign currencies | 12,662 | 3,263 | ||||||
|
|
|
| |||||
Net change in unrealized appreciation/depreciation | (11,181,656 | ) | (66,312,736 | ) | ||||
|
|
|
| |||||
Net realized and unrealized loss | (6,986,904 | ) | (47,371,199 | ) | ||||
|
|
|
| |||||
NET DECREASE IN NET ASSETS RESULTING FROM OPERATIONS | $ | (3,665,375 | ) | $ | (32,535,062 | ) | ||
|
|
|
| |||||
| a | Net of foreign withholding tax of $658,785 and $1,900,090, respectively. |
See notes to financial statements.
| 30 | 2015 iSHARES ANNUAL REPORTTO SHAREHOLDERS |
Table of Contents
Statements of Changes in Net Assets
iSHARES®, INC.
| iShares MSCI Austria Capped ETF | iShares MSCI Belgium Capped ETF | |||||||||||||||
| Year ended August 31, 2015 | Year ended August 31, 2014 | Year ended August 31, 2015 | Year ended August 31, 2014 | |||||||||||||
INCREASE (DECREASE) IN NET ASSETS | ||||||||||||||||
OPERATIONS: | ||||||||||||||||
Net investment income | $ | 942,322 | $ | 2,320,187 | $ | 3,303,671 | $ | 1,594,797 | ||||||||
Net realized gain (loss) | (5,565,859 | ) | (6,160,727 | ) | 17,449,249 | 3,217,627 | ||||||||||
Net change in unrealized appreciation/depreciation | (2,419,854 | ) | 7,652,437 | (19,225,017 | ) | 8,276,454 | ||||||||||
|
|
|
|
|
|
|
| |||||||||
Net increase (decrease) in net assets resulting from operations | (7,043,391 | ) | 3,811,897 | 1,527,903 | 13,088,878 | |||||||||||
|
|
|
|
|
|
|
| |||||||||
DISTRIBUTIONS TO SHAREHOLDERS: | ||||||||||||||||
From net investment income | (1,034,120 | ) | (2,505,599 | ) | (3,622,114 | ) | (2,704,438 | ) | ||||||||
|
|
|
|
|
|
|
| |||||||||
Total distributions to shareholders | (1,034,120 | ) | (2,505,599 | ) | (3,622,114 | ) | (2,704,438 | ) | ||||||||
|
|
|
|
|
|
|
| |||||||||
CAPITAL SHARE TRANSACTIONS: | ||||||||||||||||
Proceeds from shares sold | 18,333,036 | 99,089,245 | 165,245,124 | 110,895,731 | ||||||||||||
Cost of shares redeemed | (17,295,697 | ) | (119,448,599 | ) | (174,257,196 | ) | (27,730,866 | ) | ||||||||
|
|
|
|
|
|
|
| |||||||||
Net increase (decrease) in net assets from capital share transactions | 1,037,339 | (20,359,354 | ) | (9,012,072 | ) | 83,164,865 | ||||||||||
|
|
|
|
|
|
|
| |||||||||
INCREASE (DECREASE) IN NET ASSETS | (7,040,172 | ) | (19,053,056 | ) | (11,106,283 | ) | 93,549,305 | |||||||||
NET ASSETS | ||||||||||||||||
Beginning of year | 63,170,171 | 82,223,227 | 164,765,056 | 71,215,751 | ||||||||||||
|
|
|
|
|
|
|
| |||||||||
End of year | $ | 56,129,999 | $ | 63,170,171 | $ | 153,658,773 | $ | 164,765,056 | ||||||||
|
|
|
|
|
|
|
| |||||||||
Distributions in excess of net investment income included in net assets at end of year | $ | (8,898 | ) | $ | (28 | ) | $ | (33,754 | ) | $ | (626,047 | ) | ||||
|
|
|
|
|
|
|
| |||||||||
SHARES ISSUED AND REDEEMED | ||||||||||||||||
Shares sold | 1,100,000 | 5,000,000 | 9,600,000 | 6,520,000 | ||||||||||||
Shares redeemed | (1,100,000 | ) | (6,000,000 | ) | (10,240,000 | ) | (1,800,000 | ) | ||||||||
|
|
|
|
|
|
|
| |||||||||
Net increase (decrease) in shares outstanding | — | (1,000,000 | ) | (640,000 | ) | 4,720,000 | ||||||||||
|
|
|
|
|
|
|
| |||||||||
See notes to financial statements.
FINANCIAL STATEMENTS | 31 |
Table of Contents
Statements of Changes in Net Assets (Continued)
iSHARES®, INC.
| iShares MSCI France ETF | iShares MSCI Netherlands ETF | |||||||||||||||
| Year ended August 31, 2015 | Year ended August 31, 2014 | Year ended August 31, 2015 | Year ended August 31, 2014 | |||||||||||||
INCREASE (DECREASE) IN NET ASSETS | ||||||||||||||||
OPERATIONS: | ||||||||||||||||
Net investment income | $ | 9,397,015 | $ | 10,478,223 | $ | 3,321,529 | $ | 4,710,761 | ||||||||
Net realized gain (loss) | (9,748,837 | ) | 47,950,371 | 4,194,752 | 28,496,610 | |||||||||||
Net change in unrealized appreciation/depreciation | (18,678,233 | ) | 9,095,863 | (11,181,656 | ) | (1,266,653 | ) | |||||||||
|
|
|
|
|
|
|
| |||||||||
Net increase (decrease) in net assets resulting from operations | (19,030,055 | ) | 67,524,457 | (3,665,375 | ) | 31,940,718 | ||||||||||
|
|
|
|
|
|
|
| |||||||||
DISTRIBUTIONS TO SHAREHOLDERS: | ||||||||||||||||
From net investment income | (9,469,883 | ) | (10,305,702 | ) | (2,772,645 | ) | (5,077,158 | ) | ||||||||
|
|
|
|
|
|
|
| |||||||||
Total distributions to shareholders | (9,469,883 | ) | (10,305,702 | ) | (2,772,645 | ) | (5,077,158 | ) | ||||||||
|
|
|
|
|
|
|
| |||||||||
CAPITAL SHARE TRANSACTIONS: | ||||||||||||||||
Proceeds from shares sold | 212,178,798 | 84,933,809 | 119,225,740 | 53,331,509 | ||||||||||||
Cost of shares redeemed | (115,462,686 | ) | (387,069,111 | ) | (101,596,983 | ) | (168,493,467 | ) | ||||||||
|
|
|
|
|
|
|
| |||||||||
Net increase (decrease) in net assets from capital share transactions | 96,716,112 | (302,135,302 | ) | 17,628,757 | (115,161,958 | ) | ||||||||||
|
|
|
|
|
|
|
| |||||||||
INCREASE (DECREASE) IN NET ASSETS | 68,216,174 | (244,916,547 | ) | 11,190,737 | (88,298,398 | ) | ||||||||||
NET ASSETS | ||||||||||||||||
Beginning of year | 281,922,820 | 526,839,367 | 165,091,504 | 253,389,902 | ||||||||||||
|
|
|
|
|
|
|
| |||||||||
End of year | $ | 350,138,994 | $ | 281,922,820 | $ | 176,282,241 | $ | 165,091,504 | ||||||||
|
|
|
|
|
|
|
| |||||||||
Undistributed net investment income included in net assets at end of year | $ | 178,273 | $ | 275,842 | $ | 932,094 | $ | 401,577 | ||||||||
|
|
|
|
|
|
|
| |||||||||
SHARES ISSUED AND REDEEMED | ||||||||||||||||
Shares sold | 8,200,000 | 3,000,000 | 4,600,000 | 2,200,000 | ||||||||||||
Shares redeemed | (4,400,000 | ) | (14,000,000 | ) | (4,100,000 | ) | (6,750,000 | ) | ||||||||
|
|
|
|
|
|
|
| |||||||||
Net increase (decrease) in shares outstanding | 3,800,000 | (11,000,000 | ) | 500,000 | (4,550,000 | ) | ||||||||||
|
|
|
|
|
|
|
| |||||||||
See notes to financial statements.
| 32 | 2015 iSHARES ANNUAL REPORTTO SHAREHOLDERS |
Table of Contents
Statements of Changes in Net Assets (Continued)
iSHARES®, INC.
| iShares MSCI Sweden ETF | ||||||||
| Year ended August 31, 2015 | Year ended August 31, 2014 | |||||||
INCREASE (DECREASE) IN NET ASSETS | ||||||||
OPERATIONS: | ||||||||
Net investment income | $ | 14,836,137 | $ | 14,699,921 | ||||
Net realized gain | 18,941,537 | 30,778,353 | ||||||
Net change in unrealized appreciation/depreciation | (66,312,736 | ) | 1,730,036 | |||||
|
|
|
| |||||
Net increase (decrease) in net assets resulting from operations | (32,535,062 | ) | 47,208,310 | |||||
|
|
|
| |||||
DISTRIBUTIONS TO SHAREHOLDERS: | ||||||||
From net investment income | (16,981,496 | ) | (17,174,445 | ) | ||||
|
|
|
| |||||
Total distributions to shareholders | (16,981,496 | ) | (17,174,445 | ) | ||||
|
|
|
| |||||
CAPITAL SHARE TRANSACTIONS: | ||||||||
Proceeds from shares sold | 177,749,987 | 101,532,730 | ||||||
Cost of shares redeemed | (201,102,502 | ) | (161,316,482 | ) | ||||
|
|
|
| |||||
Net decrease in net assets from capital share transactions | (23,352,515 | ) | (59,783,752 | ) | ||||
|
|
|
| |||||
DECREASE IN NET ASSETS | (72,869,073 | ) | (29,749,887 | ) | ||||
NET ASSETS | ||||||||
Beginning of year | 404,256,008 | 434,005,895 | ||||||
|
|
|
| |||||
End of year | $ | 331,386,935 | $ | 404,256,008 | ||||
|
|
|
| |||||
Distributions in excess of net investment income included in net assets at end of year | $ | (364,097 | ) | $ | (1,954,836 | ) | ||
|
|
|
| |||||
SHARES ISSUED AND REDEEMED | ||||||||
Shares sold | 5,250,000 | 2,850,000 | ||||||
Shares redeemed | (6,150,000 | ) | (4,575,000 | ) | ||||
|
|
|
| |||||
Net decrease in shares outstanding | (900,000 | ) | (1,725,000 | ) | ||||
|
|
|
| |||||
See notes to financial statements.
FINANCIAL STATEMENTS | 33 |
Table of Contents
iSHARES®, INC.
(For a share outstanding throughout each period)
| iShares MSCI Austria Capped ETF | ||||||||||||||||||||
| Year ended Aug. 31, 2015 | Year ended Aug. 31, 2014 | Year ended Aug. 31, 2013 | Year ended Aug. 31, 2012 | Year ended Aug. 31, 2011 | ||||||||||||||||
Net asset value, beginning of year | $ | 17.55 | $ | 17.87 | $ | 14.53 | $ | 18.76 | $ | 17.27 | ||||||||||
|
|
|
|
|
|
|
|
|
| |||||||||||
Income from investment operations: | ||||||||||||||||||||
Net investment incomea | 0.25 | 0.52 | 0.32 | 0.35 | 0.42 | |||||||||||||||
Net realized and unrealized gain (loss)b | (1.96 | ) | (0.18 | ) | 3.36 | (4.09 | ) | 1.53 | ||||||||||||
|
|
|
|
|
|
|
|
|
| |||||||||||
Total from investment operations | (1.71 | ) | 0.34 | 3.68 | (3.74 | ) | 1.95 | |||||||||||||
|
|
|
|
|
|
|
|
|
| |||||||||||
Less distributions from: | ||||||||||||||||||||
Net investment income | (0.25 | ) | (0.66 | ) | (0.34 | ) | (0.49 | ) | (0.46 | ) | ||||||||||
|
|
|
|
|
|
|
|
|
| |||||||||||
Total distributions | (0.25 | ) | (0.66 | ) | (0.34 | ) | (0.49 | ) | (0.46 | ) | ||||||||||
|
|
|
|
|
|
|
|
|
| |||||||||||
Net asset value, end of year | $ | 15.59 | $ | 17.55 | $ | 17.87 | $ | 14.53 | $ | 18.76 | ||||||||||
|
|
|
|
|
|
|
|
|
| |||||||||||
Total return | (9.76 | )% | 1.56 | % | 25.49 | % | (19.81 | )% | 10.92 | % | ||||||||||
|
|
|
|
|
|
|
|
|
| |||||||||||
Ratios/Supplemental data: | ||||||||||||||||||||
Net assets, end of year (000s) | $ | 56,130 | $ | 63,170 | $ | 82,223 | $ | 53,757 | $ | 136,974 | ||||||||||
Ratio of expenses to average net assets | 0.48 | % | 0.48 | % | 0.51 | % | 0.52 | % | 0.52 | % | ||||||||||
Ratio of net investment income to average net assets | 1.54 | % | 2.64 | % | 1.82 | % | 2.32 | % | 1.95 | % | ||||||||||
Portfolio turnover ratec | 18 | % | 30 | % | 26 | % | 13 | % | 12 | % | ||||||||||
| a | Based on average shares outstanding throughout each period. |
| b | The amounts reported for a share outstanding may not accord with the change in aggregate gains and losses in securities for the fiscal period due to the timing of capital share transactions in relation to the fluctuating market values of the Fund’s underlying securities. |
| c | Portfolio turnover rates exclude portfolio securities received or delivered as a result of processing capital share transactions in Creation Units. |
See notes to financial statements.
| 34 | 2015 iSHARES ANNUAL REPORTTO SHAREHOLDERS |
Table of Contents
Financial Highlights (Continued)
iSHARES®, INC.
(For a share outstanding throughout each period)
| iShares MSCI Belgium Capped ETF | ||||||||||||||||||||
| Year ended Aug. 31, 2015 | Year ended Aug. 31, 2014 | Year ended Aug. 31, 2013 | Year ended Aug. 31, 2012 | Year ended Aug. 31, 2011 | ||||||||||||||||
Net asset value, beginning of year | $ | 17.02 | $ | 14.36 | $ | 11.97 | $ | 12.60 | $ | 11.78 | ||||||||||
|
|
|
|
|
|
|
|
|
| |||||||||||
Income from investment operations: | ||||||||||||||||||||
Net investment incomea | 0.34 | 0.32 | 0.42 | 0.38 | 0.35 | |||||||||||||||
Net realized and unrealized gain (loss)b | (0.00 | )c | 2.95 | 2.36 | (0.33 | ) | 0.80 | |||||||||||||
|
|
|
|
|
|
|
|
|
| |||||||||||
Total from investment operations | 0.34 | 3.27 | 2.78 | 0.05 | 1.15 | |||||||||||||||
|
|
|
|
|
|
|
|
|
| |||||||||||
Less distributions from: | ||||||||||||||||||||
Net investment income | (0.36 | ) | (0.61 | ) | (0.39 | ) | (0.67 | ) | (0.33 | ) | ||||||||||
Return of capital | — | — | — | (0.01 | ) | — | ||||||||||||||
|
|
|
|
|
|
|
|
|
| |||||||||||
Total distributions | (0.36 | ) | (0.61 | ) | (0.39 | ) | (0.68 | ) | (0.33 | ) | ||||||||||
|
|
|
|
|
|
|
|
|
| |||||||||||
Net asset value, end of year | $ | 17.00 | $ | 17.02 | $ | 14.36 | $ | 11.97 | $ | 12.60 | ||||||||||
|
|
|
|
|
|
|
|
|
| |||||||||||
Total return | 1.95 | % | 23.05 | % | 23.43 | % | 1.11 | % | 9.59 | % | ||||||||||
|
|
|
|
|
|
|
|
|
| |||||||||||
Ratios/Supplemental data: | ||||||||||||||||||||
Net assets, end of year (000s) | $ | 153,659 | $ | 164,765 | $ | 71,216 | $ | 25,386 | $ | 31,256 | ||||||||||
Ratio of expenses to average net assets | 0.48 | % | 0.48 | % | 0.50 | % | 0.53 | % | 0.52 | % | ||||||||||
Ratio of net investment income to average net assets | 2.01 | % | 1.90 | % | 3.01 | % | 3.35 | % | 2.56 | % | ||||||||||
Portfolio turnover rated | 7 | % | 13 | % | 24 | % | 19 | % | 12 | % | ||||||||||
| a | Based on average shares outstanding throughout each period. |
| b | The amounts reported for a share outstanding may not accord with the change in aggregate gains and losses in securities for the fiscal period due to the timing of capital share transactions in relation to the fluctuating market values of the Fund’s underlying securities. |
| c | Rounds to less than $0.01. |
| d | Portfolio turnover rates exclude portfolio securities received or delivered as a result of processing capital share transactions in Creation Units. |
See notes to financial statements.
FINANCIAL HIGHLIGHTS | 35 |
Table of Contents
Financial Highlights (Continued)
iSHARES®, INC.
(For a share outstanding throughout each period)
| iShares MSCI France ETF | ||||||||||||||||||||
| Year ended Aug. 31, 2015 | Year ended Aug. 31, 2014 | Year ended Aug. 31, 2013 | Year ended Aug. 31, 2012 | Year ended Aug. 31, 2011 | ||||||||||||||||
Net asset value, beginning of year | $ | 27.64 | $ | 24.85 | $ | 20.70 | $ | 22.60 | $ | 21.03 | ||||||||||
|
|
|
|
|
|
|
|
|
| |||||||||||
Income from investment operations: | ||||||||||||||||||||
Net investment incomea | 0.74 | 0.66 | 0.69 | 0.59 | 0.86 | |||||||||||||||
Net realized and unrealized gain (loss)b | (2.69 | ) | 2.86 | 4.14 | (1.80 | ) | 1.38 | |||||||||||||
|
|
|
|
|
|
|
|
|
| |||||||||||
Total from investment operations | (1.95 | ) | 3.52 | 4.83 | (1.21 | ) | 2.24 | |||||||||||||
|
|
|
|
|
|
|
|
|
| |||||||||||
Less distributions from: | ||||||||||||||||||||
Net investment income | (0.68 | ) | (0.73 | ) | (0.68 | ) | (0.69 | ) | (0.67 | ) | ||||||||||
Return of capital | — | — | — | (0.00 | )c | — | ||||||||||||||
|
|
|
|
|
|
|
|
|
| |||||||||||
Total distributions | (0.68 | ) | (0.73 | ) | (0.68 | ) | (0.69 | ) | (0.67 | ) | ||||||||||
|
|
|
|
|
|
|
|
|
| |||||||||||
Net asset value, end of year | $ | 25.01 | $ | 27.64 | $ | 24.85 | $ | 20.70 | $ | 22.60 | ||||||||||
|
|
|
|
|
|
|
|
|
| |||||||||||
Total return | (7.17 | )% | 14.07 | % | 23.56 | % | (5.05 | )% | 10.24 | % | ||||||||||
|
|
|
|
|
|
|
|
|
| |||||||||||
Ratios/Supplemental data: | ||||||||||||||||||||
Net assets, end of year (000s) | $ | 350,139 | $ | 281,923 | $ | 526,839 | $ | 401,626 | $ | 357,137 | ||||||||||
Ratio of expenses to average net assets | 0.48 | % | 0.48 | % | 0.51 | % | 0.53 | % | 0.52 | % | ||||||||||
Ratio of net investment income to average net assets | 2.85 | % | 2.36 | % | 2.94 | % | 2.91 | % | 3.38 | % | ||||||||||
Portfolio turnover rated | 6 | % | 6 | % | 5 | % | 6 | % | 6 | % | ||||||||||
| a | Based on average shares outstanding throughout each period. |
| b | The amounts reported for a share outstanding may not accord with the change in aggregate gains and losses in securities for the fiscal period due to the timing of capital share transactions in relation to the fluctuating market values of the Fund’s underlying securities. |
| c | Rounds to less than $0.01. |
| d | Portfolio turnover rates exclude portfolio securities received or delivered as a result of processing capital share transactions in Creation Units. |
See notes to financial statements.
| 36 | 2015 iSHARES ANNUAL REPORTTO SHAREHOLDERS |
Table of Contents
Financial Highlights (Continued)
iSHARES®, INC.
(For a share outstanding throughout each period)
| iShares MSCI Netherlands ETF | ||||||||||||||||||||
| Year ended Aug. 31, 2015 | Year ended Aug. 31, 2014 | Year ended Aug. 31, 2013 | Year ended Aug. 31, 2012 | Year ended Aug. 31, 2011 | ||||||||||||||||
Net asset value, beginning of year | $ | 24.64 | $ | 22.52 | $ | 18.23 | $ | 18.45 | $ | 17.89 | ||||||||||
|
|
|
|
|
|
|
|
|
| |||||||||||
Income from investment operations: | ||||||||||||||||||||
Net investment incomea | 0.50 | 0.45 | 0.44 | 0.39 | 0.48 | |||||||||||||||
Net realized and unrealized gain (loss)b | (0.27 | ) | 2.22 | 4.19 | (0.08 | ) | 0.55 | |||||||||||||
|
|
|
|
|
|
|
|
|
| |||||||||||
Total from investment operations | 0.23 | 2.67 | 4.63 | 0.31 | 1.03 | |||||||||||||||
|
|
|
|
|
|
|
|
|
| |||||||||||
Less distributions from: | ||||||||||||||||||||
Net investment income | (0.39 | ) | (0.55 | ) | (0.34 | ) | (0.53 | ) | (0.47 | ) | ||||||||||
|
|
|
|
|
|
|
|
|
| |||||||||||
Total distributions | (0.39 | ) | (0.55 | ) | (0.34 | ) | (0.53 | ) | (0.47 | ) | ||||||||||
|
|
|
|
|
|
|
|
|
| |||||||||||
Net asset value, end of year | $ | 24.48 | $ | 24.64 | $ | 22.52 | $ | 18.23 | $ | 18.45 | ||||||||||
|
|
|
|
|
|
|
|
|
| |||||||||||
Total return | 0.87 | % | 11.80 | % | 25.57 | % | 1.96 | % | 5.44 | % | ||||||||||
|
|
|
|
|
|
|
|
|
| |||||||||||
Ratios/Supplemental data: | ||||||||||||||||||||
Net assets, end of year (000s) | $ | 176,282 | $ | 165,092 | $ | 253,390 | $ | 78,397 | $ | 121,740 | ||||||||||
Ratio of expenses to average net assets | 0.48 | % | 0.48 | % | 0.50 | % | 0.53 | % | 0.52 | % | ||||||||||
Ratio of net investment income to average net assets | 2.01 | % | 1.78 | % | 2.09 | % | 2.21 | % | 2.26 | % | ||||||||||
Portfolio turnover ratec | 6 | % | 7 | % | 11 | % | 10 | % | 6 | % | ||||||||||
| a | Based on average shares outstanding throughout each period. |
| b | The amounts reported for a share outstanding may not accord with the change in aggregate gains and losses in securities for the fiscal period due to the timing of capital share transactions in relation to the fluctuating market values of the Fund’s underlying securities. |
| c | Portfolio turnover rates exclude portfolio securities received or delivered as a result of processing capital share transactions in Creation Units. |
See notes to financial statements.
FINANCIAL HIGHLIGHTS | 37 |
Table of Contents
Financial Highlights (Continued)
iSHARES®, INC.
(For a share outstanding throughout each period)
| iShares MSCI Sweden ETF | ||||||||||||||||||||
| Year ended Aug. 31, 2015 | Year ended Aug. 31, 2014 | Year ended Aug. 31, 2013 | Year ended Aug. 31, 2012 | Year ended Aug. 31, 2011 | ||||||||||||||||
Net asset value, beginning of year | $ | 34.11 | $ | 31.97 | $ | 27.32 | $ | 26.82 | $ | 24.46 | ||||||||||
|
|
|
|
|
|
|
|
|
| |||||||||||
Income from investment operations: | ||||||||||||||||||||
Net investment incomea | 1.30 | b | 1.04 | 0.97 | 0.83 | 1.18 | ||||||||||||||
Net realized and unrealized gain (loss)c | (3.75 | ) | 2.33 | 4.70 | 0.58 | 2.22 | ||||||||||||||
|
|
|
|
|
|
|
|
|
| |||||||||||
Total from investment operations | (2.45 | ) | 3.37 | 5.67 | 1.41 | 3.40 | ||||||||||||||
|
|
|
|
|
|
|
|
|
| |||||||||||
Less distributions from: | ||||||||||||||||||||
Net investment income | (1.40 | ) | (1.23 | ) | (1.02 | ) | (0.86 | ) | (1.04 | ) | ||||||||||
Return of capital | — | — | — | (0.05 | ) | — | ||||||||||||||
|
|
|
|
|
|
|
|
|
| |||||||||||
Total distributions | (1.40 | ) | (1.23 | ) | (1.02 | ) | (0.91 | ) | (1.04 | ) | ||||||||||
|
|
|
|
|
|
|
|
|
| |||||||||||
Net asset value, end of year | $ | 30.26 | $ | 34.11 | $ | 31.97 | $ | 27.32 | $ | 26.82 | ||||||||||
|
|
|
|
|
|
|
|
|
| |||||||||||
Total return | (7.46 | )%b | 10.49 | % | 21.02 | % | 5.57 | % | 13.40 | % | ||||||||||
|
|
|
|
|
|
|
|
|
| |||||||||||
Ratios/Supplemental data: | ||||||||||||||||||||
Net assets, end of year (000s) | $ | 331,387 | $ | 404,256 | $ | 434,006 | $ | 370,832 | $ | 329,887 | ||||||||||
Ratio of expenses to average net assets | 0.92 | % | 0.48 | % | 0.51 | % | 0.53 | % | 0.51 | % | ||||||||||
Ratio of expenses to average net assets excluding the non-recurring professional fees for foreign withholding tax claims (Note 7) | 0.48 | % | n/a | n/a | n/a | n/a | ||||||||||||||
Ratio of net investment income to average net assets | 3.97 | %b | 2.97 | % | 3.13 | % | 3.17 | % | 3.80 | % | ||||||||||
Portfolio turnover rated | 4 | % | 7 | % | 7 | % | 7 | % | 9 | % | ||||||||||
| a | Based on average shares outstanding throughout each period. |
| b | Reflects the one-time, positive effect of foreign withholding tax claims, net of the associated IRS compliance fees and professional fees (See Note 7), which resulted in the following increases: |
• Net investment income per share by $0.42 |
• Total return by 1.14% |
• Ratio of net investment income to average net assets by 1.31% |
| c | The amounts reported for a share outstanding may not accord with the change in aggregate gains and losses in securities for the fiscal period due to the timing of capital share transactions in relation to the fluctuating market values of the Fund’s underlying securities. |
| d | Portfolio turnover rates exclude portfolio securities received or delivered as a result of processing capital share transactions in Creation Units. |
See notes to financial statements.
| 38 | 2015 iSHARES ANNUAL REPORTTO SHAREHOLDERS |
Table of Contents
iSHARES® , INC.
iShares, Inc. (the “Company”) is registered under the Investment Company Act of 1940, as amended (the “1940 Act”), as an open-end management investment company. The Company was incorporated under the laws of the State of Maryland on September 1, 1994 pursuant to Articles of Incorporation as subsequently amended and restated.
These financial statements relate only to the following funds (each, a “Fund,” and collectively, the “Funds”):
| iShares ETF | Diversification Classification | |
MSCI Austria Capped | Non-diversified | |
MSCI Belgium Capped | Non-diversified | |
MSCI France | Non-diversified | |
MSCI Netherlands | Non-diversified | |
MSCI Sweden | Non-diversified |
The investment objective of each Fund is to seek investment results that correspond generally to the price and yield performance, before fees and expenses, of its underlying index. The investment adviser uses a “passive” or index approach to try to achieve each Fund’s investment objective.
Pursuant to the Company’s organizational documents, the Funds’ officers and directors are indemnified against certain liabilities that may arise out of the performance of their duties to the Funds. Additionally, in the normal course of business, the Funds enter into contracts with service providers that contain general indemnification clauses. The Funds’ maximum exposure under these arrangements is unknown as this would involve future claims that may be made against the Funds that have not yet occurred.
| 1. | SIGNIFICANT ACCOUNTING POLICIES |
The following significant accounting policies are consistently followed by the Funds in the preparation of their financial statements in conformity with accounting principles generally accepted in the United States of America (“U.S. GAAP”). The preparation of financial statements in conformity with U.S. GAAP requires management to make certain estimates and assumptions that affect the reported amounts of assets and liabilities and disclosures of contingent assets and liabilities at the date of the financial statements and the reported amounts of revenue and expenses during the reporting period. Actual results could differ from those estimates. Each Fund is considered an investment company under U.S. GAAP and follows the accounting and reporting guidance applicable to investment companies.
SECURITY VALUATION
Each Fund’s investments are valued at fair value each day that the Fund’s listing exchange is open and, for financial reporting purposes, as of the report date should the reporting period end on a day that the Fund’s listing exchange is not open. U.S. GAAP defines fair value as the price a fund would receive to sell an asset or pay to transfer a liability in an orderly transaction between market participants at the measurement date. The BlackRock Global Valuation Methodologies Committee (the “Global Valuation Committee”) provides oversight of the valuation of investments for the Funds. The investments of each Fund are valued pursuant to policies and procedures developed by the Global Valuation Committee and approved by the Board of Directors of the Company (the “Board”).
| • | Equity investments traded on a recognized securities exchange are valued at that day’s last reported trade price or the official closing price, as applicable, on the exchange where the stock is primarily traded. Equity investments traded on a recognized exchange for which there were no sales on that day are valued at the last traded price. |
NOTESTO FINANCIAL STATEMENTS | 39 |
Table of Contents
Notes to Financial Statements (Continued)
iSHARES®, INC.
| • | Open-end U.S. mutual funds are valued at that day’s published net asset value (“NAV”). |
In the event that application of these methods of valuation results in a price for an investment which is deemed not to be representative of the fair value of such investment or if a price is not available, the investment will be valued based upon other available factors deemed relevant by the Global Valuation Committee, in accordance with policies approved by the Board. These factors include but are not limited to (i) attributes specific to the investment; (ii) the principal market for the investment; (iii) the customary participants in the principal market for the investment; (iv) data assumptions by market participants for the investment, if reasonably available; (v) quoted prices for similar investments in active markets; and (vi) other factors, such as future cash flows, interest rates, yield curves, volatilities, prepayment speeds, loss severities, credit risks and/or default rates. Valuations based on such factors are reported to the Board on a quarterly basis.
The Global Valuation Committee employs various methods for calibrating valuation approaches for investments where an active market does not exist, including regular due diligence of the Company’s pricing vendors, a regular review of key inputs and assumptions, transactional back-testing or disposition analysis to compare unrealized gains and losses to realized gains and losses, reviews of missing or stale prices, reviews of large movements in market values, and reviews of market related activity.
Fair value pricing could result in a difference between the prices used to calculate a Fund’s NAV and the prices used by the Fund’s underlying index, which in turn could result in a difference between the Fund’s performance and the performance of the Fund’s underlying index.
Various inputs are used in determining the fair value of financial instruments. Inputs may be based on independent market data (“observable inputs”) or they may be internally developed (“unobservable inputs”). These inputs are categorized into a disclosure hierarchy consisting of three broad levels for financial reporting purposes. The level of a value determined for a financial instrument within the fair value hierarchy is based on the lowest level of any input that is significant to the fair value measurement in its entirety. The categorization of a value determined for a financial instrument within the hierarchy is based upon the pricing transparency of the instrument and is not necessarily an indication of the risk associated with investing in the instrument. The three levels of the fair value hierarchy are as follows:
| • | Level 1 — Unadjusted quoted prices in active markets for identical assets or liabilities; |
| • | Level 2 — Inputs other than quoted prices included within Level 1 that are observable for the asset or liability either directly or indirectly, including quoted prices for similar assets or liabilities in active markets, quoted prices for identical or similar assets or liabilities in markets that are not considered to be active, inputs other than quoted prices that are observable for the asset or liability (such as exchange rates, financing terms, interest rates, yield curves, volatilities, prepayment speeds, loss severities, credit risks and default rates) or other market-corroborated inputs; and |
| • | Level 3 — Unobservable inputs for the asset or liability, including the Global Valuation Committee’s assumptions used in determining the fair value of investments. |
Changes in valuation techniques may result in transfers in or out of an assigned level within the disclosure hierarchy. In accordance with the Company’s policy, transfers between different levels of the fair value hierarchy are deemed to have occurred as of the beginning of the reporting period.
| 40 | 2015 iSHARES ANNUAL REPORTTO SHAREHOLDERS |
Table of Contents
Notes to Financial Statements (Continued)
iSHARES®, INC.
The following table summarizes the value of each of the Funds’ investments according to the fair value hierarchy as of August 31, 2015. The breakdown of each Fund’s investments into major categories is disclosed in its respective schedule of investments.
| iShares ETF | Level 1 | Level 2 | Level 3 | Total | ||||||||||||
MSCI Austria Capped | ||||||||||||||||
Investments: | ||||||||||||||||
Assets: | ||||||||||||||||
Common Stocks | $ | 55,191,749 | $ | — | $ | 21 | $ | 55,191,770 | ||||||||
Money Market Funds | 2,580,838 | — | — | 2,580,838 | ||||||||||||
|
|
|
|
|
|
|
| |||||||||
Total | $ | 57,772,587 | $ | — | $ | 21 | $ | 57,772,608 | ||||||||
|
|
|
|
|
|
|
| |||||||||
MSCI Belgium Capped | ||||||||||||||||
Investments: | ||||||||||||||||
Assets: | ||||||||||||||||
Common Stocks | $ | 153,429,539 | $ | — | $ | — | $ | 153,429,539 | ||||||||
Money Market Funds | 2,138,602 | — | — | 2,138,602 | ||||||||||||
|
|
|
|
|
|
|
| |||||||||
Total | $ | 155,568,141 | $ | — | $ | — | $ | 155,568,141 | ||||||||
|
|
|
|
|
|
|
| |||||||||
MSCI France | ||||||||||||||||
Investments: | ||||||||||||||||
Assets: | ||||||||||||||||
Common Stocks | $ | 349,721,481 | $ | — | $ | — | $ | 349,721,481 | ||||||||
Money Market Funds | 124,496 | — | — | 124,496 | ||||||||||||
|
|
|
|
|
|
|
| |||||||||
Total | $ | 349,845,977 | $ | — | $ | — | $ | 349,845,977 | ||||||||
|
|
|
|
|
|
|
| |||||||||
MSCI Netherlands | ||||||||||||||||
Investments: | ||||||||||||||||
Assets: | ||||||||||||||||
Common Stocks | $ | 175,662,211 | $ | — | $ | 1 | $ | 175,662,212 | ||||||||
Money Market Funds | 4,756,015 | — | — | 4,756,015 | ||||||||||||
|
|
|
|
|
|
|
| |||||||||
Total | $ | 180,418,226 | $ | — | $ | 1 | $ | 180,418,227 | ||||||||
|
|
|
|
|
|
|
| |||||||||
MSCI Sweden | ||||||||||||||||
Investments: | ||||||||||||||||
Assets: | ||||||||||||||||
Common Stocks | $ | 327,539,137 | $ | — | $ | — | $ | 327,539,137 | ||||||||
Money Market Funds | 2,206,630 | — | — | 2,206,630 | ||||||||||||
|
|
|
|
|
|
|
| |||||||||
Total | $ | 329,745,767 | $ | — | $ | — | $ | 329,745,767 | ||||||||
|
|
|
|
|
|
|
| |||||||||
SECURITY TRANSACTIONS AND INCOME RECOGNITION
Security transactions are accounted for on trade date. Dividend income and capital gain distributions, if any, are recognized on the ex-dividend date, net of any foreign taxes withheld at source. Any taxes withheld that are reclaimable from foreign tax authorities as of August 31, 2015 are reflected in dividends receivable. Non-cash dividends received in the form of stock in an elective dividend, if any, are recorded as dividend income at fair value. Distributions received by the Funds may include a return of capital that is estimated by management. Such amounts are recorded as a reduction of the cost of investments or reclassified
NOTESTO FINANCIAL STATEMENTS | 41 |
Table of Contents
Notes to Financial Statements (Continued)
iSHARES®, INC.
to capital gains. Interest income is accrued daily. Realized gains and losses on investment transactions are determined using the specific identification method.
FOREIGN CURRENCY TRANSLATION
The accounting records of the Funds are maintained in U.S. dollars. Foreign currencies, as well as investment securities and other assets and liabilities denominated in foreign currencies, are translated into U.S. dollars using exchange rates deemed appropriate by the investment adviser. Purchases and sales of securities, income receipts and expense payments are translated into U.S. dollars on the respective dates of such transactions.
Each Fund does not isolate the effect of fluctuations in foreign exchange rates from the effect of fluctuations in the market prices of securities. Such fluctuations are reflected by the Funds as a component of realized and unrealized gains and losses from investments for financial reporting purposes.
FOREIGN TAXES
The Funds may be subject to foreign taxes (a portion of which may be reclaimable) on income, stock dividends, capital gains on investments, or certain foreign currency transactions. All foreign taxes are recorded in accordance with the applicable foreign tax regulations and rates that exist in the foreign jurisdictions in which the Funds invest. These foreign taxes, if any, are paid by the Funds and are reflected in their statements of operations as follows: foreign taxes withheld at source are presented as a reduction of income, foreign taxes on securities lending income are presented as a reduction of securities lending income, foreign taxes on stock dividends are presented as “other foreign taxes,” and foreign taxes on capital gains from sales of investments and foreign taxes on foreign currency transactions are included in their respective net realized gain (loss) categories. Foreign taxes payable or deferred as of August 31, 2015, if any, are disclosed in the Funds’ statements of assets and liabilities.
DISTRIBUTIONS TO SHAREHOLDERS
Dividends and distributions paid by each Fund are recorded on the ex-dividend dates. Distributions are determined on a tax basis and may differ from net investment income and net realized capital gains for financial reporting purposes. Dividends and distributions are paid in U.S. dollars and cannot be automatically reinvested in additional shares of the Funds.
LOANS OF PORTFOLIO SECURITIES
Each Fund may lend its investment securities to approved borrowers, such as brokers, dealers and other financial institutions. The borrower pledges and maintains with the Fund collateral consisting of cash, an irrevocable letter of credit issued by a bank, or securities issued or guaranteed by the U.S. government. The initial collateral received by each Fund is required to have a value of at least 102% of the current value of the loaned securities for securities traded on U.S. exchanges and a value of at least 105% for all other securities. The collateral is maintained thereafter at a value equal to at least 100% of the current value of the securities on loan. The market value of the loaned securities is determined at the close of each business day of the Funds. Any additional required collateral is delivered to the Funds and any excess collateral is returned by the Funds on the next business day. During the term of the loan, each Fund is entitled to all distributions made on or in respect of the loaned securities. Loans of securities are terminable at any time and the borrower, after notice, is required to return borrowed securities within the standard time period for settlement of securities transactions.
Any cash received as collateral for securities on loan may be reinvested in certain short-term instruments either directly on behalf of a fund or through one or more joint accounts or money market funds, including those managed by BlackRock Fund Advisors (“BFA”), the Funds’ investment adviser, or its affiliates. As of August 31, 2015, any securities on loan were collateralized by cash.
| 42 | 2015 iSHARES ANNUAL REPORTTO SHAREHOLDERS |
Table of Contents
Notes to Financial Statements (Continued)
iSHARES®, INC.
The cash collateral received was invested in money market funds managed by BFA and is disclosed in the schedules of investments. The securities on loan for each Fund are also disclosed in its schedule of investments. The total value of any securities on loan as of August 31, 2015 and the total value of the related collateral are disclosed in the statements of assets and liabilities. Income earned by the Funds from securities lending is disclosed in the statements of operations.
The risks of securities lending include the risk that the borrower may not provide additional collateral when required or may not return the securities when due. To mitigate these risks, the Funds benefit from a borrower default indemnity provided by BlackRock, Inc. (“BlackRock”). BlackRock’s indemnity allows for full replacement of securities lent. Each Fund could suffer a loss if the value of the investments purchased with cash collateral falls below the value of the cash collateral received.
Securities lending transactions are entered into by the Funds under Master Securities Lending Agreements (“MSLA”) which provide the right, in the event of default (including bankruptcy or insolvency) for the non-defaulting party to liquidate the collateral and calculate a net exposure to the defaulting party or request additional collateral. In the event that a borrower defaults, a Fund, as lender, would offset the market value of the collateral received against the market value of the securities loaned. The value of the collateral is typically greater than that of the market value of the securities loaned, leaving the lender with a net amount payable to the defaulting party. However, bankruptcy or insolvency laws of a particular jurisdiction may impose restrictions on or prohibitions against such a right of offset in the event of an MSLA counterparty’s bankruptcy or insolvency. Under the MSLA, the borrower can resell or re-pledge the loaned securities, and a Fund can reinvest cash collateral, or, upon an event of default, resell or re-pledge the collateral.
The following table is a summary of securities lending agreements which are subject to offset under an MSLA as of August 31, 2015:
| iShares ETF | Market Value of Securities on Loan | Cash Collateral Received a | Net Amount | |||||||||
MSCI Austria Capped | $ | 2,367,648 | $ | 2,367,648 | $ | — | ||||||
MSCI Belgium Capped | 1,976,621 | 1,976,621 | — | |||||||||
MSCI Netherlands | 4,521,737 | 4,521,737 | — | |||||||||
MSCI Sweden | — | 2,197,213 | b | 2,197,213 | b | |||||||
| a | Collateral received in excess of the market value of securities on loan is not presented for financial reporting purposes. The total collateral received is disclosed in each Fund’s statement of assets and liabilities. |
| b | The Fund did not have any securities on loan as of August 31, 2015 and the cash collateral amount was returned by the Fund on the next business day. |
| 2. | INVESTMENT ADVISORY AGREEMENT AND OTHER TRANSACTIONS WITH AFFILIATES |
Pursuant to an Investment Advisory Agreement with the Company, BFA manages the investment of each Fund’s assets. BFA is a California corporation indirectly owned by BlackRock. Under the Investment Advisory Agreement, BFA is responsible for substantially all expenses of the Funds, except interest, taxes, brokerage commissions and other expenses connected with the execution of portfolio transactions, distribution fees, litigation expenses and any extraordinary expenses.
NOTESTO FINANCIAL STATEMENTS | 43 |
Table of Contents
Notes to Financial Statements (Continued)
iSHARES®, INC.
For its investment advisory services to each Fund, BFA is entitled to an annual investment advisory fee based on each Fund’s allocable portion of the aggregate of the average daily net assets of the Fund and certain other iShares funds, as follows:
| Investment Advisory Fee | Aggregate Average Daily Net Assets | ||||
| 0.59 | % | First $7 billion | |||
| 0.54 | Over $7 billion, up to and including $11 billion | ||||
| 0.49 | Over $11 billion, up to and including $24 billion | ||||
| 0.44 | Over $24 billion, up to and including $48 billion | ||||
| 0.40 | Over $48 billion, up to and including $72 billion | ||||
| 0.36 | Over $72 billion | ||||
The U.S. Securities and Exchange Commission has issued an exemptive order which permits BlackRock Institutional Trust Company, N.A. (“BTC”), an affiliate of BFA, to serve as securities lending agent for the Funds, subject to applicable conditions. As securities lending agent, BTC bears all operational costs directly related to securities lending. Each Fund is responsible for fees in connection with the investment of cash collateral received for securities on loan in a money market fund managed by BFA, however, BTC has agreed to reduce the amount of securities lending income it receives in order to effectively limit the collateral investment fees each Fund bears to an annual rate of 0.04% (the “collateral investment fees”). Securities lending income is equal to the total of income earned from the reinvestment of cash collateral, net of fees and other payments to and from borrowers of securities, and less the collateral investment fees. The Funds retain a portion of securities lending income and remit the remaining portion to BTC as compensation for its services as securities lending agent.
Pursuant to a securities lending agreement, each Fund retains 80% of securities lending income and the amount retained can never be less than 70% of the total of securities lending income plus the collateral investment fees. In addition, commencing the business day following the date that the aggregate securities lending income plus the collateral investment fees generated across all 1940 Act iShares exchange-traded funds (the “iShares ETF Complex”) in a given calendar year exceeds the aggregate securities lending income generated across the iShares ETF Complex in the calendar year 2013, each Fund, pursuant to a securities lending agreement, will retain for the remainder of that calendar year 85% of securities lending income and the amount retained can never be less than 70% of the total of securities lending income plus the collateral investment fees.
Prior to January 1, 2015, each Fund retained 75% of securities lending income and the amount retained was never less than 65% of the total of securities lending income plus the collateral investment fees. In addition, commencing the business day following the date that the aggregate securities lending income plus the collateral investment fees generated across the iShares ETF Complex in the calendar year 2014 exceeded the aggregate securities lending income generated across the iShares ETF Complex in the calendar year 2013 and pursuant to a securities lending agreement, each Fund retained for the remainder of the calendar year 2014, 80% of securities lending income and the amount retained was never less than 65% of the total of securities lending income plus the collateral investment fees.
For the year ended August 31, 2015, the total of securities lending agent services and collateral investment fees paid were as follows:
| iShares ETF | Fees Paid to BTC | |||
MSCI Austria Capped | $ | 9,744 | ||
MSCI Belgium Capped | 15,730 | |||
MSCI France | 5,659 | |||
MSCI Netherlands | 24,309 | |||
MSCI Sweden | 7,006 | |||
| 44 | 2015 iSHARES ANNUAL REPORTTO SHAREHOLDERS |
Table of Contents
Notes to Financial Statements (Continued)
iSHARES®, INC.
BlackRock Investments, LLC, an affiliate of BFA, is the distributor for each Fund. Pursuant to the distribution agreement, BFA is responsible for any fees or expenses for distribution services provided to the Funds.
Cross trades for the year ended August 31, 2015, if any, were executed by the Funds pursuant to Rule 17a-7 under the 1940 Act. Cross trading is the buying or selling of portfolio securities between funds to which BFA (or an affiliate) serves as investment adviser. At its regularly scheduled quarterly meetings, the Board reviews such transactions as of the most recent calendar quarter for compliance with the requirements and restrictions set forth by Rule 17a-7.
Each Fund may invest its positive cash balances in certain money market funds managed by BFA or an affiliate. The income earned on these temporary cash investments is included in “Interest – affiliated” in the statements of operations.
The PNC Financial Services Group, Inc. is the largest stockholder of BlackRock and is considered to be an affiliate of the Funds for 1940 Act purposes.
Certain directors and officers of the Company are also officers of BTC and/or BFA.
| 3. | INVESTMENT PORTFOLIO TRANSACTIONS |
Purchases and sales of investments (excluding in-kind transactions and short-term investments) for the year ended August 31, 2015 were as follows:
| iShares ETF | Purchases | Sales | ||||||
MSCI Austria Capped | $ | 10,841,175 | $ | 10,977,352 | ||||
MSCI Belgium Capped | 12,380,259 | 10,909,969 | ||||||
MSCI France | 29,974,873 | 20,815,907 | ||||||
MSCI Netherlands | 13,240,058 | 10,368,980 | ||||||
MSCI Sweden | 22,457,117 | 15,822,891 | ||||||
In-kind transactions (see Note 4) for the year ended August 31, 2015 were as follows:
| iShares ETF | In-kind Purchases | In-kind Sales | ||||||
MSCI Austria Capped | $ | 18,017,057 | $ | 17,026,205 | ||||
MSCI Belgium Capped | 162,070,513 | 173,692,585 | ||||||
MSCI France | 201,385,545 | 114,282,354 | ||||||
MSCI Netherlands | 117,136,303 | 101,266,496 | ||||||
MSCI Sweden | 165,007,326 | 200,763,902 | ||||||
| 4. | CAPITAL SHARE TRANSACTIONS |
Capital shares are issued and redeemed by each Fund only in aggregations of a specified number of shares or multiples thereof (“Creation Units”) at NAV. Except when aggregated in Creation Units, shares of each Fund are not redeemable. Transactions in capital shares for each Fund are disclosed in detail in the statements of changes in net assets.
The consideration for the purchase of Creation Units of a fund in the Company generally consists of the in-kind deposit of a designated portfolio of securities and a specified amount of cash. Certain funds in the Company may be offered in Creation Units solely or partially for cash in U.S. dollars. Investors purchasing and redeeming Creation Units may pay a purchase transaction fee
NOTESTO FINANCIAL STATEMENTS | 45 |
Table of Contents
Notes to Financial Statements (Continued)
iSHARES®, INC.
and a redemption transaction fee directly to State Street Bank and Trust Company, the Company’s administrator, to offset transfer and other transaction costs associated with the issuance and redemption of Creation Units, including Creation Units for cash. Investors transacting in Creation Units for cash may also pay an additional variable charge to compensate the relevant fund for certain transaction costs (i.e., stamp taxes, taxes on currency or other financial transactions, and brokerage costs) and market impact expenses relating to investing in portfolio securities. Such variable charges, if any, are included in “Proceeds from shares sold” in the statements of changes in net assets.
From time to time, settlement of securities related to in-kind contributions or in-kind redemptions may be delayed. In such cases, securities related to in-kind contributions are reflected as “Due from custodian” and securities related to in-kind redemptions are reflected as “Securities related to in-kind transactions” in the statements of assets and liabilities.
| 5. | PRINCIPAL RISKS |
In the normal course of business, each Fund’s investment activities expose it to various types of risk associated with the financial instruments and markets in which it invests. The significant types of financial risks each Fund is exposed to include market risk and credit risk. Each Fund’s prospectus provides details of these and other types of risk.
BFA uses a “passive” or index approach to try to achieve each Fund’s investment objective following the securities included in its underlying index during upturns as well as downturns. BFA does not take steps to reduce market exposure or to lessen the effects of a declining market. Divergence from the underlying index and the composition of the portfolio is monitored by BFA.
MARKET RISK
Market risk arises mainly from uncertainty about future values of financial instruments influenced by price, currency and interest rate movements. It represents the potential loss each Fund may suffer through holding market positions in the face of market movements. Each Fund is exposed to market risk by virtue of its investment in equity instruments. The fair value of securities held by the Funds may decline due to general market conditions, economic trends or events that are not specifically related to the issuers of the securities including local, regional or global political, social or economic instability or to factors that affect a particular industry or group of industries. The extent of each Fund’s exposure to market risk is the market value of the investments held as shown in the Fund’s schedule of investments.
A diversified portfolio, where this is appropriate and consistent with a fund’s objectives, minimizes the risk that a price change of a particular investment will have a material impact on the NAV of a fund. The investment concentrations within each Fund’s portfolio are disclosed in its schedule of investments.
Each Fund invests a substantial amount of its assets in securities of non-U.S. issuers that trade in non-U.S. markets. This involves certain considerations and risks not typically associated with securities of U.S. issuers. Such risks include, but are not limited to: generally less liquid and less efficient securities markets; generally greater price volatility; exchange rate fluctuations and exchange controls; imposition of restrictions on the expatriation of funds or other assets of the Fund; less publicly available information about issuers; the imposition of withholding or other taxes; higher transaction and custody costs; settlement delays and risk of loss attendant in settlement procedures; difficulties in enforcing contractual obligations; less regulation of securities markets; different accounting, disclosure and reporting requirements; more substantial governmental involvement in the economy; higher inflation rates; greater social, economic and political uncertainties; the risk of nationalization or expropriation of assets; and the risk of war. These risks are heightened for investments in issuers from countries with less developed markets.
Each Fund invests all or substantially all of its assets in issuers located in a single country. When a fund concentrates its investments in this manner, it assumes the risk that economic, political and social conditions in that country may have a significant impact on its investment performance.
| 46 | 2015 iSHARES ANNUAL REPORTTO SHAREHOLDERS |
Table of Contents
Notes to Financial Statements (Continued)
iSHARES®, INC.
CREDIT RISK
Credit risk is the risk that an issuer or guarantor of debt instruments or the counterparty to a financial transaction, including derivatives contracts, repurchase agreements or loans of portfolio securities, is unable or unwilling to make timely interest and/or principal payments or to otherwise honor its obligations. BFA and its affiliates manage counterparty credit risk by entering into transactions only with counterparties that they believe have the financial resources to honor their obligations and by monitoring the financial stability of those counterparties. Financial assets, which potentially expose the Funds to issuer and counterparty credit risks, consist principally of financial instruments and receivables due from counterparties. The extent of each Fund’s exposure to credit and counterparty risks with respect to those financial assets is approximated by their value recorded in its statement of assets and liabilities.
| 6. | INCOME TAX INFORMATION |
Each Fund is treated as an entity separate from the Company’s other funds for federal income tax purposes. It is the policy of each Fund to qualify as a regulated investment company by complying with the provisions applicable to regulated investment companies, as defined under Subchapter M of the Internal Revenue Code of 1986, as amended, and to annually distribute substantially all of its ordinary income and any net capital gains (taking into account any capital loss carryforwards) sufficient to relieve it from all, or substantially all, federal income and excise taxes. Accordingly, no provision for federal income taxes is required.
U.S. GAAP requires that certain components of net assets be adjusted to reflect permanent differences between financial and tax reporting. These reclassifications have no effect on net assets or NAV per share. The following permanent differences as of August 31, 2015, attributable to passive foreign investment companies, the expiration of capital loss carryforwards, distributions paid in excess of taxable income, foreign currency transactions and realized gains (losses) from in-kind redemptions, were reclassified to the following accounts:
| iShares ETF | Paid-in Capital | Undistributed Income/Distributions in Excess of Net Investment Income | Undistributed Net Realized Gain/Accumulated Net Realized Loss | |||||||||
MSCI Austria Capped | $ | (12,345,714 | ) | $ | 82,928 | $ | 12,262,786 | |||||
MSCI Belgium Capped | 15,646,141 | 910,736 | (16,556,877 | ) | ||||||||
MSCI France | (954,291 | ) | (24,701 | ) | 978,992 | |||||||
MSCI Netherlands | 4,871,407 | (18,367 | ) | (4,853,040 | ) | |||||||
MSCI Sweden | 17,703,642 | 3,736,098 | (21,439,740 | ) | ||||||||
NOTESTO FINANCIAL STATEMENTS | 47 |
Table of Contents
Notes to Financial Statements (Continued)
iSHARES®, INC.
The tax character of distributions paid during the years ended August 31, 2015 and August 31, 2014 was as follows:
| iShares ETF | 2015 | 2014 | ||||||
MSCI Austria Capped | ||||||||
Ordinary income | $ | 1,034,120 | $ | 2,505,599 | ||||
|
|
|
| |||||
MSCI Belgium Capped | ||||||||
Ordinary income | $ | 3,622,114 | $ | 2,704,438 | ||||
|
|
|
| |||||
MSCI France | ||||||||
Ordinary income | $ | 9,469,883 | $ | 10,305,702 | ||||
|
|
|
| |||||
MSCI Netherlands | ||||||||
Ordinary income | $ | 2,772,645 | $ | 5,077,158 | ||||
|
|
|
| |||||
MSCI Sweden | ||||||||
Ordinary income | $ | 16,981,496 | $ | 17,174,445 | ||||
|
|
|
| |||||
As of August 31, 2015, the tax components of accumulated net earnings (losses) were as follows:
| iShares ETF | Undistributed Ordinary Income | Capital Loss Carryforwards | Net Unrealized Gains (Losses) a | Qualified Late-Year Losses b | Total | |||||||||||||||
MSCI Austria Capped | $ | — | $ | (70,213,934 | ) | $ | (29,096,277 | ) | $ | (2,234,103 | ) | $ | (101,544,314 | ) | ||||||
MSCI Belgium Capped | 255,889 | (49,678,711 | ) | (14,945,945 | ) | (1,796,770 | ) | (66,165,537 | ) | |||||||||||
MSCI France | 178,273 | (37,327,969 | ) | (72,862,960 | ) | (3,273,008 | ) | (113,285,664 | ) | |||||||||||
MSCI Netherlands | 932,094 | (40,642,817 | ) | (24,031,454 | ) | (660,692 | ) | (64,402,869 | ) | |||||||||||
MSCI Sweden | — | (39,290,800 | ) | (63,038,211 | ) | (2,844,754 | ) | (105,173,765 | ) | |||||||||||
| a | The difference between book-basis and tax-basis unrealized gains (losses) was attributable primarily to the tax deferral of losses on wash sales, foreign withholding tax claims and the realization for tax purposes of unrealized gains on investments in passive foreign investment companies. |
| b | The Funds have elected to defer certain qualified late-year losses and recognize such losses in the next taxable year. |
As of August 31, 2015, the following Funds had capital loss carryforwards available to offset future realized capital gains through the indicated expiration dates as follows:
| iShares ETF | Non- Expiring a | Expiring 2016 | Expiring 2017 | Expiring 2018 | Expiring 2019 | Total | ||||||||||||||||||
MSCI Austria Capped | $ | 30,039,704 | $ | 2,587,916 | $ | 7,102,366 | $ | 16,657,011 | $ | 13,826,937 | $ | 70,213,934 | ||||||||||||
MSCI Belgium Capped | 12,177,456 | 1,698,444 | 5,953,120 | 10,826,174 | 19,023,517 | 49,678,711 | ||||||||||||||||||
MSCI France | 23,716,456 | 335,795 | 3,408,374 | 7,008,530 | 2,858,814 | 37,327,969 | ||||||||||||||||||
MSCI Netherlands | 9,043,327 | 1,195,162 | 5,819,153 | 22,256,170 | 2,329,005 | 40,642,817 | ||||||||||||||||||
MSCI Sweden | 11,775,552 | 100,015 | 13,686,746 | 8,483,510 | 5,244,977 | 39,290,800 | ||||||||||||||||||
| a | Must be utililized prior to losses subject to expiration. |
The Funds may own shares in certain foreign investment entities, referred to, under U.S. tax law, as “passive foreign investment companies.” The Funds may elect to mark-to-market annually the shares of each passive foreign investment company and would be required to distribute to shareholders any such marked-to-market gains.
| 48 | 2015 iSHARES ANNUAL REPORTTO SHAREHOLDERS |
Table of Contents
Notes to Financial Statements (Continued)
iSHARES®, INC.
As of August 31, 2015, gross unrealized appreciation and gross unrealized depreciation based on cost for federal income tax purposes were as follows:
| iShares ETF | Tax Cost | Gross Unrealized Appreciation | Gross Unrealized Depreciation | Net Unrealized Appreciation (Depreciation) | ||||||||||||
MSCI Austria Capped | $ | 86,699,402 | $ | 848,585 | $ | (29,775,379 | ) | $ | (28,926,794 | ) | ||||||
MSCI Belgium Capped | 170,518,336 | 6,030,508 | (20,980,703 | ) | (14,950,195 | ) | ||||||||||
MSCI France | 422,714,273 | 4,814,925 | (77,683,221 | ) | (72,868,296 | ) | ||||||||||
MSCI Netherlands | 204,456,018 | 2,155,030 | (26,192,821 | ) | (24,037,791 | ) | ||||||||||
MSCI Sweden | 393,529,066 | 3,721,003 | (67,504,302 | ) | (63,783,299 | ) | ||||||||||
Management has analyzed tax laws and regulations and their application to the Funds as of August 31, 2015, inclusive of the open tax return years, and does not believe there are any uncertain tax positions that require recognition of a tax liability in the Funds’ financial statements.
| 7. | FOREIGN WITHHOLDING TAX CLAIMS |
In 2010 the iShares MSCI Sweden ETF (the “Fund”) filed claims to recover taxes withheld by Sweden on dividend income received during calendar years 2005 through 2009 on the basis that Sweden had purportedly violated certain provisions in the Treaty on the Functioning of the European Union. In March 2015, the Fund received a favorable ruling from the Swedish Administrative Court. The Swedish Tax Authority did not appeal the ruling and the Fund successfully recovered taxes withheld by Sweden during calendar years 2005 through 2009. As a result of the favorable ruling, the Fund has recorded a receivable for claims on all taxes that have been withheld by Sweden since January 1, 2010. Swedish tax claims are disclosed in the statement of assets and liabilities and statement of operations as “Foreign withholding tax claims”. Professional fees associated with the filing of claims in Sweden resulting in the recovery of foreign withholding taxes were approved by the Board as appropriate expenses of the Fund. The Fund has accrued estimated professional fees associated with the recovery of Swedish taxes withheld since January 1, 2010.
The Fund, under the approval of the Board, is seeking a closing agreement with the Internal Revenue Service (“IRS”) to address any prior years’ U.S. income tax liabilities attributable to Fund shareholders resulting from the recovery of foreign taxes. The closing agreement would result in the Fund paying a compliance fee to the IRS, on behalf of its shareholders, representing the estimated tax savings generated from foreign tax credits claimed by Fund shareholders on their tax returns in prior years. The Fund has accrued a liability for the estimated IRS compliance fee related to foreign withholding tax claims from calendar years 2005 through 2014. Such amounts are disclosed in the statement of assets and liabilities and the statement of operations as “IRS compliance fee for foreign withholding tax claims”. The actual IRS compliance fee may differ from the estimate and that difference may be material.
| 8. | SUBSEQUENT EVENTS |
Management has evaluated the impact of all subsequent events on the Funds through the date the financial statements were available to be issued and has determined that there were no subsequent events requiring adjustment or disclosure in the financial statements.
NOTESTO FINANCIAL STATEMENTS | 49 |
Table of Contents
Report of Independent Registered Public Accounting Firm
To the Shareholders and Board of Directors of
iShares, Inc.:
In our opinion, the accompanying statements of assets and liabilities, including the schedules of investments, and the related statements of operations and of changes in net assets and the financial highlights present fairly, in all material respects, the financial position of iShares MSCI Austria Capped ETF, iShares MSCI Belgium Capped ETF, iShares MSCI France ETF, iShares MSCI Netherlands ETF and iShares MSCI Sweden ETF (the “Funds”) at August 31, 2015, the results of each of their operations, the changes in each of their net assets and their financial highlights for each of the periods presented, in conformity with accounting principles generally accepted in the United States of America. These financial statements and financial highlights (hereafter referred to as “financial statements”) are the responsibility of the Funds’ management. Our responsibility is to express an opinion on these financial statements based on our audits. We conducted our audits of these financial statements in accordance with the standards of the Public Company Accounting Oversight Board (United States). Those standards require that we plan and perform the audit to obtain reasonable assurance about whether the financial statements are free of material misstatement. An audit includes examining, on a test basis, evidence supporting the amounts and disclosures in the financial statements, assessing the accounting principles used and significant estimates made by management, and evaluating the overall financial statement presentation. We believe that our audits, which included confirmation of securities at August 31, 2015 by correspondence with the custodian, transfer agent and brokers, provide a reasonable basis for our opinion.
PricewaterhouseCoopers LLP
San Francisco, California
October 22, 2015
| 50 | 2015 iSHARES ANNUAL REPORTTO SHAREHOLDERS |
Table of Contents
iSHARES®, INC.
Under Section 854(b)(2) of the Internal Revenue Code (the “Code”), the following maximum amounts are hereby designated as qualified dividend income for purposes of the maximum rate under Section 1(h)(11) of the Code for the fiscal year ended August 31, 2015:
| iShares ETF | Qualified Dividend Income | |||
MSCI Austria Capped | $ | 1,376,391 | ||
MSCI Belgium Capped | 4,261,485 | |||
MSCI France | 12,766,886 | |||
MSCI Netherlands | 4,606,756 | |||
MSCI Sweden | 12,546,797 | |||
In February 2016, shareholders will receive Form 1099-DIV which will include their share of qualified dividend income distributed during the calendar year 2015. Shareholders are advised to check with their tax advisers for information on the treatment of these amounts on their income tax returns.
For the fiscal year ended August 31, 2015, the following Funds earned foreign source income and paid foreign taxes which they intend to pass through to their shareholders pursuant to Section 853 of the Code:
| iShares ETF | Foreign Source Income Earned | Foreign Taxes Paid | ||||||
MSCI Austria Capped | $ | 1,386,910 | $ | 188,685 | ||||
MSCI Belgium Capped | 4,742,559 | 706,350 | ||||||
MSCI France | 12,774,620 | 1,816,696 | ||||||
MSCI Netherlands | 4,656,061 | 658,769 | ||||||
MSCI Sweden | 13,566,300 | 26,569 | ||||||
TAX INFORMATION | 51 |
Table of Contents
Board Review and Approval of Investment Advisory
Contract
iSHARES® , INC.
I. iShares MSCI Austria Capped ETF
Under Section 15(c) of the Investment Company Act of 1940 (the “1940 Act”), the Company’s Board of Directors (the “Board”), including a majority of Directors who are not “interested persons” of the Company (as that term is defined in the 1940 Act) (the “Independent Directors”), is required annually to consider and approve the Investment Advisory Contract between the Company and BFA (the “Advisory Contract”) on behalf of the Fund. The Independent Directors requested, and BFA provided, such information as the Independent Directors, with advice from independent counsel, deemed reasonably necessary to evaluate the Advisory Contract. A committee of Independent Directors (the “15(c) Committee”), with independent counsel, met with management on May 1, 2015 and May 6, 2015, to discuss the types of information the Independent Directors required and the manner in which management would organize and present such information. At a meeting held on May 21, 2015, management presented preliminary information to the Board relating to the continuance of the Advisory Contract, and the Board, including the Independent Directors, reviewed and discussed such information at length. The Independent Directors requested from management certain additional information, which management agreed to provide. At a meeting held on June 24-25, 2015, the Board, including the Independent Directors, reviewed the additional information provided by management in response to these requests. After extensive discussions, the Board, including all of the Independent Directors, approved the continuance of the Advisory Contract for the Fund, based on a review of qualitative and quantitative information provided by BFA, including the additional information management provided at the request of the Independent Directors. The Board noted its satisfaction with the extent and quality of information provided and its frequent interactions with management, as well as the detailed responses and other information provided by BFA. The Board also noted that the Board and BFA agreed to discuss potential enhancements and adjustments to the 15(c) process for the coming year. The Independent Directors were advised by their independent counsel throughout the process, including about the legal standards applicable to their review. In approving the Advisory Contract for the Fund, the Board, including the Independent Directors, considered the following factors, no one of which was controlling, and reached the following conclusions:
Expenses and Performance of the Fund — The Board reviewed statistical information prepared by Lipper Inc. (“Lipper”), an independent provider of investment company data, regarding the expense ratio components, including actual advisory fees, waivers/reimbursements, and gross and net total expenses of the Fund in comparison with the same information for other exchange traded funds (including, where applicable, funds sponsored by an “at cost” service provider) and, in the limited instances where no comparable ETFs existed and the comparison group would not otherwise be reasonable in Lipper’s judgment, pure index institutional mutual funds, objectively selected by Lipper as comprising the Fund’s applicable peer group pursuant to Lipper’s proprietary ETF methodology (the “Lipper Group”). The Board was provided with a detailed description of Lipper’s proprietary ETF methodology used by Lipper to determine the Fund’s Lipper Group. The Board further noted that due to the limitations in providing comparable funds in the Lipper Group, the statistical information provided in Lipper’s report may or may not provide meaningful direct comparisons to the Fund in all instances.
The Board also noted that the investment advisory fee rate and overall expenses (net of waivers and reimbursements) for the Fund were within range of the median of the investment advisory fee rates and overall expenses (net of waivers and reimbursements) of the funds in its Lipper Group.
In addition, the Board reviewed statistical information prepared by Lipper regarding the performance of the Fund for the one-, three-, five-, ten-year, and since inception periods, as applicable, and the “last quarter” period ended December 31, 2014, and a comparison of the Fund’s performance to its performance benchmark index for the same periods. To the extent that any of the comparison funds included in the Lipper Group track the same index as the Fund, Lipper also provided, and the Board reviewed, a comparison of the Fund’s performance to that of such relevant comparison funds for the same periods. The Board noted that the Fund generally performed in line with its performance benchmark index over the relevant periods. In considering this information, the Board noted that the Lipper Group may include funds that have a different investment objective and/or
| 52 | 2015 iSHARES ANNUAL REPORTTO SHAREHOLDERS |
Table of Contents
Board Review and Approval of Investment Advisory
Contract (Continued)
iSHARES®, INC.
benchmark from the Fund. In addition, the Board noted that the Fund seeks to track its own benchmark index and that, during the prior year, the Board received periodic reports on the Fund’s performance in comparison with its benchmark index. Such periodic comparative performance information, including detailed information on certain specific iShares funds requested by the Boards, was also considered.
Based on this review, the other factors considered at the meeting, and their general knowledge of ETF pricing, the Board concluded that the investment advisory fee rate and expense level and the historical performance of the Fund supported the Board’s approval of the continuance of the Advisory Contract for the coming year.
Nature, Extent and Quality of Services Provided by BFA — Based on management’s representations, including information about recent and proposed enhancements to the iShares business, including with respect to shareholder servicing and support, the Board expected that there would be no diminution in the scope of services required of or provided by BFA under the Advisory Contract for the coming year as compared to the scope of services provided by BFA during prior years. In reviewing the scope of these services, the Board considered BFA’s investment philosophy and experience, noting that BFA and its affiliates have committed significant resources over time, including during the past year, to supporting the iShares funds and their shareholders. The Board acknowledged that resources to support the iShares funds and their shareholders have been added or enhanced in recent years. The Board also considered BFA’s compliance program and its compliance record with respect to the Fund. In that regard, the Board noted that BFA reports to the Board about portfolio management and compliance matters on a periodic basis in connection with regularly scheduled meetings of the Board, and on other occasions as necessary and appropriate, and has provided information and made appropriate officers available as needed to provide further assistance with these matters. The Board also reviewed the background and experience of the persons responsible for the day-to-day management of the Fund, as well as the resources available to them in managing the Fund. In addition to the above considerations, the Board reviewed and considered detailed presentations regarding BFA’s investment performance, investment and risk management processes and strategies provided at the June 24-25, 2015 meeting and throughout the previous year, and matters related to BFA’s portfolio compliance policies and procedures. The Board noted that the Fund had met its investment objective consistently since its inception date.
Based on review of this information, and the performance information discussed above, the Board concluded that the nature, extent and quality of services provided by BFA to the Fund under the Advisory Contract supported the Board’s approval of the continuance of the Advisory Contract for the coming year.
Costs of Services Provided to the Fund and Profits Realized by BFA and Affiliates — The Board reviewed information about the profitability to BlackRock of the Fund based on the fees payable to BFA and its affiliates (including fees under the Advisory Contract), and all other sources of revenue and expense to BFA and its affiliates from the Fund’s operations for the last calendar year. The Board reviewed BlackRock’s profitability methodology for the iShares funds, noting that the 15(c) Committee had focused on the methodology and proposed presentation during its meetings. The Board discussed the sources of direct and ancillary revenue with management, including the revenues to BTC from securities lending by the Fund. The Board also discussed BFA’s profit margin as reflected in the Fund’s profitability analysis and reviewed information regarding potential economies of scale (as discussed below). Based on this review, the Board concluded that the profits realized by BFA and its affiliates under the Advisory Contract and from other relationships between the Fund and BFA and/or its affiliates, if any, were within a reasonable range in light of the factors considered.
Economies of Scale — The Board reviewed information regarding potential economies of scale or other efficiencies that may result from increases in the Fund’s assets, noting that the issue of economies of scale had been focused on extensively by the 15(c) Committee during its meetings and addressed by management. The Board and the 15(c) Committee reviewed information provided by BFA regarding scale benefits shared with the iShares funds through relatively low fee rates established at inception,
BOARD REVIEWAND APPROVALOF INVESTMENT ADVISORY CONTRACT | 53 |
Table of Contents
Board Review and Approval of Investment Advisory
Contract (Continued)
iSHARES®, INC.
breakpoints, waivers, or other fee reductions, as well as through additional investment in the iShares business and the provision of improved or additional infrastructure and services to the iShares funds and their shareholders. The Board and the 15(c) Committee received information regarding BlackRock’s historical profitability, including BFA’s and its affiliates’ costs in providing services. The cost information distinguished between fixed and variable costs, and explained how the level of fixed and variable costs, as well as the nature of such costs, may impact the existence or size of scale benefits. The Board noted that the Advisory Contract for the Fund already provided for breakpoints in the Fund’s investment advisory fee rate as the assets of the Fund, on an aggregated basis with the assets of certain other iShares funds, increase. The Board noted that it would continue to monitor the sharing of economies of scale to determine the appropriateness of adding new or revised breakpoints in the future.
Based on this review, as well as the other factors considered at the meeting, the Board, recognizing its responsibility to consider this issue periodically, determined to approve the continuance of the Advisory Contract for the coming year.
Fees and Services Provided for Other Comparable Funds/Accounts Managed by BFA and its Affiliates — The Board received and considered information regarding the investment advisory/management fee rates for other funds/accounts in the U.S. for which BFA (or its affiliates) provides investment advisory/management services, including open-end and closed-end funds registered under the 1940 Act (including sub-advised funds), collective trust funds, separately managed accounts, and institutional separate accounts (together, the “Other Accounts”), and acknowledged BFA’s assertion that the iShares funds are fundamentally different investment vehicles from the Other Accounts. The Board noted that BFA and its affiliates do not manage Other Accounts with substantially the same investment objective and strategy as the Fund or that track the same index or a similar index as the Fund. The Board further noted that BFA provided the Board with detailed information regarding how the Other Accounts (particularly institutional clients) generally differ from the Fund, including in terms of the different, generally more extensive services provided to the Fund, as well as other significant differences in the approach of BFA and its affiliates to the Fund, on one hand, and Other Accounts, on the other. In that regard, the Board considered that the pricing of services to institutional clients is typically based on a number of factors beyond the nature and extent of the specific services to be provided and often depends on the overall relationship between the client and its affiliates and the adviser and its affiliates. In addition, the Board considered the relative complexity and inherent risks and challenges of managing and providing other services to the Fund, as a publicly traded exchange traded fund, as compared to the Other Accounts that are institutional clients in light of differing regulatory requirements and client-imposed mandates. The Board also considered the “all-inclusive” nature of the Fund’s advisory fee structure, and the Fund expenses borne by BFA under this arrangement. The Board noted that the investment advisory fee rate under the Advisory Contract for the Fund was generally higher than the investment advisory/management fee rates for the Other Accounts that are institutional clients of BFA (or its affiliates) and concluded that the differences appeared to be consistent with the factors discussed.
Other Benefits to BFA and/or its Affiliates — The Board reviewed the “fallout” benefits or ancillary revenue received by BFA and/or its affiliates in connection with the services provided to the Fund by BFA, such as payment of revenue to BTC, the Fund’s securities lending agent, for loaning portfolio securities (which was included in the profit margins reviewed by the Board pursuant to BFA’s profitability methodology), and payment of advisory fees and/or administration fees to BFA and BTC (or their affiliates) in connection with any investments by the Fund in other funds for which BFA (or its affiliates) provides investment advisory services and/or administration services. The Board noted that BFA generally does not use soft dollars or consider the value of research or other services that may be provided to BFA (including its affiliates) in selecting brokers for portfolio transactions for the Fund. The Board further noted that any portfolio transactions on behalf of the Fund placed through a BFA affiliate or purchased from an underwriting syndicate in which a BFA affiliate participates, are reported to the Board pursuant to Rule 17e-1 or Rule 10f-3, as applicable, under the 1940 Act. The Board concluded that any such ancillary benefits would not be disadvantageous to the Fund’s shareholders and thus would not alter the Board’s conclusion with respect to the appropriateness of approving the continuance of the Advisory Contract for the coming year.
| 54 | 2015 iSHARES ANNUAL REPORTTO SHAREHOLDERS |
Table of Contents
Board Review and Approval of Investment Advisory
Contract (Continued)
iSHARES®, INC.
Based on the considerations described above, the Board determined that the Fund’s investment advisory fee rate under the Advisory Contract does not constitute a fee that is so disproportionately large as to bear no reasonable relationship to the services rendered and that could not have been the product of arm’s-length bargaining, and concluded that it is in the best interest of the Fund and its shareholders to approve the continuance of the Advisory Contract for the coming year.
II. iShares MSCI Belgium Capped ETF
Under Section 15(c) of the Investment Company Act of 1940 (the “1940 Act”), the Company’s Board of Directors (the “Board”), including a majority of Directors who are not “interested persons” of the Company (as that term is defined in the 1940 Act) (the “Independent Directors”), is required annually to consider and approve the Investment Advisory Contract between the Company and BFA (the “Advisory Contract”) on behalf of the Fund. The Independent Directors requested, and BFA provided, such information as the Independent Directors, with advice from independent counsel, deemed reasonably necessary to evaluate the Advisory Contract. A committee of Independent Directors (the “15(c) Committee”), with independent counsel, met with management on May 1, 2015 and May 6, 2015, to discuss the types of information the Independent Directors required and the manner in which management would organize and present such information. At a meeting held on May 21, 2015, management presented preliminary information to the Board relating to the continuance of the Advisory Contract, and the Board, including the Independent Directors, reviewed and discussed such information at length. The Independent Directors requested from management certain additional information, which management agreed to provide. At a meeting held on June 24-25, 2015, the Board, including the Independent Directors, reviewed the additional information provided by management in response to these requests. After extensive discussions, the Board, including all of the Independent Directors, approved the continuance of the Advisory Contract for the Fund, based on a review of qualitative and quantitative information provided by BFA, including the additional information management provided at the request of the Independent Directors. The Board noted its satisfaction with the extent and quality of information provided and its frequent interactions with management, as well as the detailed responses and other information provided by BFA. The Board also noted that the Board and BFA agreed to discuss potential enhancements and adjustments to the 15(c) process for the coming year. The Independent Directors were advised by their independent counsel throughout the process, including about the legal standards applicable to their review. In approving the Advisory Contract for the Fund, the Board, including the Independent Directors, considered the following factors, no one of which was controlling, and reached the following conclusions:
Expenses and Performance of the Fund — The Board reviewed statistical information prepared by Lipper Inc. (“Lipper”), an independent provider of investment company data, regarding the expense ratio components, including actual advisory fees, waivers/reimbursements, and gross and net total expenses of the Fund in comparison with the same information for other exchange traded funds (including, where applicable, funds sponsored by an “at cost” service provider) and, in the limited instances where no comparable ETFs existed and the comparison group would not otherwise be reasonable in Lipper’s judgment, pure index institutional mutual funds, objectively selected by Lipper as comprising the Fund’s applicable peer group pursuant to Lipper’s proprietary ETF methodology (the “Lipper Group”). The Board was provided with a detailed description of Lipper’s proprietary ETF methodology used by Lipper to determine the Fund’s Lipper Group. The Board further noted that due to the limitations in providing comparable funds in the Lipper Group, the statistical information provided in Lipper’s report may or may not provide meaningful direct comparisons to the Fund in all instances.
The Board also noted that the investment advisory fee rate and overall expenses (net of waivers and reimbursements) for the Fund were lower than the median of the investment advisory fee rates and overall expenses (net of waivers and reimbursements) of the funds in its Lipper Group.
In addition, the Board reviewed statistical information prepared by Lipper regarding the performance of the Fund for the one-, three-, five-, ten-year, and since inception periods, as applicable, and the “last quarter” period ended December 31, 2014, and a
BOARD REVIEWAND APPROVALOF INVESTMENT ADVISORY CONTRACT | 55 |
Table of Contents
Board Review and Approval of Investment Advisory
Contract (Continued)
iSHARES®, INC.
comparison of the Fund’s performance to its performance benchmark index for the same periods. To the extent that any of the comparison funds included in the Lipper Group track the same index as the Fund, Lipper also provided, and the Board reviewed, a comparison of the Fund’s performance to that of such relevant comparison funds for the same periods. The Board noted that the Fund generally performed in line with its performance benchmark index over the relevant periods. In considering this information, the Board noted that the Lipper Group may include funds that have a different investment objective and/or benchmark from the Fund. In addition, the Board noted that the Fund seeks to track its own benchmark index and that, during the prior year, the Board received periodic reports on the Fund’s performance in comparison with its benchmark index. Such periodic comparative performance information, including detailed information on certain specific iShares funds requested by the Boards, was also considered.
Based on this review, the other factors considered at the meeting, and their general knowledge of ETF pricing, the Board concluded that the investment advisory fee rate and expense level and the historical performance of the Fund supported the Board’s approval of the continuance of the Advisory Contract for the coming year.
Nature, Extent and Quality of Services Provided by BFA — Based on management’s representations, including information about recent and proposed enhancements to the iShares business, including with respect to shareholder servicing and support, the Board expected that there would be no diminution in the scope of services required of or provided by BFA under the Advisory Contract for the coming year as compared to the scope of services provided by BFA during prior years. In reviewing the scope of these services, the Board considered BFA’s investment philosophy and experience, noting that BFA and its affiliates have committed significant resources over time, including during the past year, to supporting the iShares funds and their shareholders. The Board acknowledged that resources to support the iShares funds and their shareholders have been added or enhanced in recent years. The Board also considered BFA’s compliance program and its compliance record with respect to the Fund. In that regard, the Board noted that BFA reports to the Board about portfolio management and compliance matters on a periodic basis in connection with regularly scheduled meetings of the Board, and on other occasions as necessary and appropriate, and has provided information and made appropriate officers available as needed to provide further assistance with these matters. The Board also reviewed the background and experience of the persons responsible for the day-to-day management of the Fund, as well as the resources available to them in managing the Fund. In addition to the above considerations, the Board reviewed and considered detailed presentations regarding BFA’s investment performance, investment and risk management processes and strategies provided at the June 24-25, 2015 meeting and throughout the previous year, and matters related to BFA’s portfolio compliance policies and procedures. The Board noted that the Fund had met its investment objective consistently since its inception date.
Based on review of this information, and the performance information discussed above, the Board concluded that the nature, extent and quality of services provided by BFA to the Fund under the Advisory Contract supported the Board’s approval of the continuance of the Advisory Contract for the coming year.
Costs of Services Provided to the Fund and Profits Realized by BFA and Affiliates — The Board reviewed information about the profitability to BlackRock of the Fund based on the fees payable to BFA and its affiliates (including fees under the Advisory Contract), and all other sources of revenue and expense to BFA and its affiliates from the Fund’s operations for the last calendar year. The Board reviewed BlackRock’s profitability methodology for the iShares funds, noting that the 15(c) Committee had focused on the methodology and proposed presentation during its meetings. The Board discussed the sources of direct and ancillary revenue with management, including the revenues to BTC from securities lending by the Fund. The Board also discussed BFA’s profit margin as reflected in the Fund’s profitability analysis and reviewed information regarding potential economies of scale (as discussed below). Based on this review, the Board concluded that the profits realized by BFA and its affiliates under the Advisory Contract and from other relationships between the Fund and BFA and/or its affiliates, if any, were within a reasonable range in light of the factors considered.
| 56 | 2015 iSHARES ANNUAL REPORTTO SHAREHOLDERS |
Table of Contents
Board Review and Approval of Investment Advisory
Contract (Continued)
iSHARES®, INC.
Economies of Scale — The Board reviewed information regarding potential economies of scale or other efficiencies that may result from increases in the Fund’s assets, noting that the issue of economies of scale had been focused on extensively by the 15(c) Committee during its meetings and addressed by management. The Board and the 15(c) Committee reviewed information provided by BFA regarding scale benefits shared with the iShares funds through relatively low fee rates established at inception, breakpoints, waivers, or other fee reductions, as well as through additional investment in the iShares business and the provision of improved or additional infrastructure and services to the iShares funds and their shareholders. The Board and the 15(c) Committee received information regarding BlackRock’s historical profitability, including BFA’s and its affiliates’ costs in providing services. The cost information distinguished between fixed and variable costs, and explained how the level of fixed and variable costs, as well as the nature of such costs, may impact the existence or size of scale benefits. The Board noted that the Advisory Contract for the Fund already provided for breakpoints in the Fund’s investment advisory fee rate as the assets of the Fund, on an aggregated basis with the assets of certain other iShares funds, increase. The Board noted that it would continue to monitor the sharing of economies of scale to determine the appropriateness of adding new or revised breakpoints in the future.
Based on this review, as well as the other factors considered at the meeting, the Board, recognizing its responsibility to consider this issue periodically, determined to approve the continuance of the Advisory Contract for the coming year.
Fees and Services Provided for Other Comparable Funds/Accounts Managed by BFA and its Affiliates — The Board received and considered information regarding the investment advisory/management fee rates for other funds/accounts in the U.S. for which BFA (or its affiliates) provides investment advisory/management services, including open-end and closed-end funds registered under the 1940 Act (including sub-advised funds), collective trust funds, separately managed accounts, and institutional separate accounts (together, the “Other Accounts”), and acknowledged BFA’s assertion that the iShares funds are fundamentally different investment vehicles from the Other Accounts. The Board noted that BFA and its affiliates do not manage Other Accounts with substantially the same investment objective and strategy as the Fund or that track the same index or a similar index as the Fund. The Board further noted that BFA provided the Board with detailed information regarding how the Other Accounts (particularly institutional clients) generally differ from the Fund, including in terms of the different, generally more extensive services provided to the Fund, as well as other significant differences in the approach of BFA and its affiliates to the Fund, on one hand, and Other Accounts, on the other. In that regard, the Board considered that the pricing of services to institutional clients is typically based on a number of factors beyond the nature and extent of the specific services to be provided and often depends on the overall relationship between the client and its affiliates and the adviser and its affiliates. In addition, the Board considered the relative complexity and inherent risks and challenges of managing and providing other services to the Fund, as a publicly traded exchange traded fund, as compared to the Other Accounts that are institutional clients in light of differing regulatory requirements and client-imposed mandates. The Board also considered the “all-inclusive” nature of the Fund’s advisory fee structure, and the Fund expenses borne by BFA under this arrangement. The Board noted that the investment advisory fee rate under the Advisory Contract for the Fund was generally higher than the investment advisory/management fee rates for the Other Accounts that are institutional clients of BFA (or its affiliates) and concluded that the differences appeared to be consistent with the factors discussed.
Other Benefits to BFA and/or its Affiliates — The Board reviewed the “fallout” benefits or ancillary revenue received by BFA and/or its affiliates in connection with the services provided to the Fund by BFA, such as payment of revenue to BTC, the Fund’s securities lending agent, for loaning portfolio securities (which was included in the profit margins reviewed by the Board pursuant to BFA’s profitability methodology), and payment of advisory fees and/or administration fees to BFA and BTC (or their affiliates) in connection with any investments by the Fund in other funds for which BFA (or its affiliates) provides investment advisory services and/or administration services. The Board noted that BFA generally does not use soft dollars or consider the value of research or other services that may be provided to BFA (including its affiliates) in selecting brokers for portfolio transactions for the Fund. The Board further noted that any portfolio transactions on behalf of the Fund placed through a BFA affiliate or purchased from an underwriting syndicate in which a BFA affiliate participates, are reported to the Board pursuant to Rule 17e-1 or Rule 10f-3, as
BOARD REVIEWAND APPROVALOF INVESTMENT ADVISORY CONTRACT | 57 |
Table of Contents
Board Review and Approval of Investment Advisory
Contract (Continued)
iSHARES®, INC.
applicable, under the 1940 Act. The Board concluded that any such ancillary benefits would not be disadvantageous to the Fund’s shareholders and thus would not alter the Board’s conclusion with respect to the appropriateness of approving the continuance of the Advisory Contract for the coming year.
Based on the considerations described above, the Board determined that the Fund’s investment advisory fee rate under the Advisory Contract does not constitute a fee that is so disproportionately large as to bear no reasonable relationship to the services rendered and that could not have been the product of arm’s-length bargaining, and concluded that it is in the best interest of the Fund and its shareholders to approve the continuance of the Advisory Contract for the coming year.
III. iShares MSCI France ETF and iShares MSCI Netherlands ETF
Under Section 15(c) of the Investment Company Act of 1940 (the “1940 Act”), the Company’s Board of Directors (the “Board”), including a majority of Directors who are not “interested persons” of the Company (as that term is defined in the 1940 Act) (the “Independent Directors”), is required annually to consider and approve the Investment Advisory Contract between the Company and BFA (the “Advisory Contract”) on behalf of the Funds. The Independent Directors requested, and BFA provided, such information as the Independent Directors, with advice from independent counsel, deemed reasonably necessary to evaluate the Advisory Contract. A committee of Independent Directors (the “15(c) Committee”), with independent counsel, met with management on May 1, 2015 and May 6, 2015, to discuss the types of information the Independent Directors required and the manner in which management would organize and present such information. At a meeting held on May 21, 2015, management presented preliminary information to the Board relating to the continuance of the Advisory Contract, and the Board, including the Independent Directors, reviewed and discussed such information at length. The Independent Directors requested from management certain additional information, which management agreed to provide. At a meeting held on June 24-25, 2015, the Board, including the Independent Directors, reviewed the additional information provided by management in response to these requests. After extensive discussions, the Board, including all of the Independent Directors, approved the continuance of the Advisory Contract for the Funds, based on a review of qualitative and quantitative information provided by BFA, including the additional information management provided at the request of the Independent Directors. The Board noted its satisfaction with the extent and quality of information provided and its frequent interactions with management, as well as the detailed responses and other information provided by BFA. The Board also noted that the Board and BFA agreed to discuss potential enhancements and adjustments to the 15(c) process for the coming year. The Independent Directors were advised by their independent counsel throughout the process, including about the legal standards applicable to their review. In approving the Advisory Contract for the Funds, the Board, including the Independent Directors, considered the following factors, no one of which was controlling, and reached the following conclusions:
Expenses and Performance of the Funds — The Board reviewed statistical information prepared by Lipper Inc. (“Lipper”), an independent provider of investment company data, regarding the expense ratio components, including actual advisory fees, waivers/reimbursements, and gross and net total expenses of each Fund in comparison with the same information for other exchange traded funds (including, where applicable, funds sponsored by an “at cost” service provider) and, in the limited instances where no comparable ETFs existed and the comparison group would not otherwise be reasonable in Lipper’s judgment, pure index institutional mutual funds, objectively selected by Lipper as comprising such Fund’s applicable peer group pursuant to Lipper’s proprietary ETF methodology (the “Lipper Group”). The Board was provided with a detailed description of Lipper’s proprietary ETF methodology used by Lipper to determine the applicable Lipper Groups. The Board further noted that due to the limitations in providing comparable funds in the various Lipper Groups, the statistical information provided in Lipper’s report may or may not provide meaningful direct comparisons to the Funds in all instances.
| 58 | 2015 iSHARES ANNUAL REPORTTO SHAREHOLDERS |
Table of Contents
Board Review and Approval of Investment Advisory
Contract (Continued)
iSHARES®, INC.
The Board also noted that the investment advisory fee rates and overall expenses (net of waivers and reimbursements) for the Funds were within range of the median of the investment advisory fee rates and overall expenses (net of waivers and reimbursements) of the funds in their respective Lipper Group.
In addition, the Board reviewed statistical information prepared by Lipper regarding the performance of each Fund for the one-, three-, five-, ten-year, and since inception periods, as applicable, and the “last quarter” period ended December 31, 2014, and a comparison of each Fund’s performance to its performance benchmark index for the same periods. To the extent that any of the comparison funds included in the Lipper Group track the same index as any particular Fund, Lipper also provided, and the Board reviewed, a comparison of such Fund’s performance to that of such relevant comparison funds for the same periods. The Board noted that the Funds generally performed in line with their respective performance benchmark indexes over the relevant periods. In considering this information, the Board noted that the Lipper Group may include funds that have different investment objectives and/or benchmarks from the Funds. In addition, the Board noted that each Fund seeks to track its own benchmark index and that, during the prior year, the Board received periodic reports on the Funds’ performance in comparison with their relevant benchmark indexes. Such periodic comparative performance information, including detailed information on certain specific iShares funds requested by the Boards, was also considered.
Based on this review, the other factors considered at the meeting, and their general knowledge of ETF pricing, the Board concluded that the investment advisory fee rate and expense level and the historical performance of each Fund supported the Board’s approval of the continuance of the Advisory Contract for the coming year.
Nature, Extent and Quality of Services Provided by BFA — Based on management’s representations, including information about recent and proposed enhancements to the iShares business, including with respect to shareholder servicing and support, the Board expected that there would be no diminution in the scope of services required of or provided by BFA under the Advisory Contract for the coming year as compared to the scope of services provided by BFA during prior years. In reviewing the scope of these services, the Board considered BFA’s investment philosophy and experience, noting that BFA and its affiliates have committed significant resources over time, including during the past year, to supporting the iShares funds and their shareholders. The Board acknowledged that resources to support the iShares funds and their shareholders have been added or enhanced in recent years. The Board also considered BFA’s compliance program and its compliance record with respect to the Funds. In that regard, the Board noted that BFA reports to the Board about portfolio management and compliance matters on a periodic basis in connection with regularly scheduled meetings of the Board, and on other occasions as necessary and appropriate, and has provided information and made appropriate officers available as needed to provide further assistance with these matters. The Board also reviewed the background and experience of the persons responsible for the day-to-day management of the Funds, as well as the resources available to them in managing the Funds. In addition to the above considerations, the Board reviewed and considered detailed presentations regarding BFA’s investment performance, investment and risk management processes and strategies provided at the June 24-25, 2015 meeting and throughout the previous year, and matters related to BFA’s portfolio compliance policies and procedures. The Board noted that each Fund had met its investment objective consistently since its respective inception date.
Based on review of this information, and the performance information discussed above, the Board concluded that the nature, extent and quality of services provided by BFA to the Funds under the Advisory Contract supported the Board’s approval of the continuance of the Advisory Contract for the coming year.
Costs of Services Provided to Funds and Profits Realized by BFA and Affiliates — The Board reviewed information about the profitability to BlackRock of the Funds based on the fees payable to BFA and its affiliates (including fees under the Advisory Contract), and all other sources of revenue and expense to BFA and its affiliates from the Funds’ operations for the last calendar year. The Board reviewed BlackRock’s profitability methodology for the iShares funds, noting that the 15(c) Committee had
BOARD REVIEWAND APPROVALOF INVESTMENT ADVISORY CONTRACT | 59 |
Table of Contents
Board Review and Approval of Investment Advisory
Contract (Continued)
iSHARES®, INC.
focused on the methodology and proposed presentation during its meetings. The Board discussed the sources of direct and ancillary revenue with management, including the revenues to BTC from securities lending by the Funds. The Board also discussed BFA’s profit margin as reflected in the Funds’ profitability analyses and reviewed information regarding potential economies of scale (as discussed below). Based on this review, the Board concluded that the profits realized by BFA and its affiliates under the Advisory Contract and from other relationships between the Funds and BFA and/or its affiliates, if any, were within a reasonable range in light of the factors considered.
Economies of Scale — The Board reviewed information regarding potential economies of scale or other efficiencies that may result from increases in the Funds’ assets, noting that the issue of economies of scale had been focused on extensively by the 15(c) Committee during its meetings and addressed by management. The Board and the 15(c) Committee reviewed information provided by BFA regarding scale benefits shared with the iShares funds through relatively low fee rates established at inception, breakpoints, waivers, or other fee reductions, as well as through additional investment in the iShares business and the provision of improved or additional infrastructure and services to the iShares funds and their shareholders. The Board and the 15(c) Committee received information regarding BlackRock’s historical profitability, including BFA’s and its affiliates’ costs in providing services. The cost information distinguished between fixed and variable costs, and explained how the level of fixed and variable costs, as well as the nature of such costs, may impact the existence or size of scale benefits. The Board noted that the Advisory Contract for the Funds already provided for breakpoints in the Funds’ investment advisory fee rates as the assets of the Funds, on an aggregated basis with the assets of certain other iShares funds, increase. The Board noted that it would continue to monitor the sharing of economies of scale to determine the appropriateness of adding new or revised breakpoints in the future.
Based on this review, as well as the other factors considered at the meeting, the Board, recognizing its responsibility to consider this issue periodically, determined to approve the continuance of the Advisory Contract for the coming year.
Fees and Services Provided for Other Comparable Funds/Accounts Managed by BFA and its Affiliates — The Board received and considered information regarding the investment advisory/management fee rates for other funds/accounts in the U.S. for which BFA (or its affiliates) provides investment advisory/management services, including open-end and closed-end funds registered under the 1940 Act (including sub-advised funds), collective trust funds, separately managed accounts, and institutional separate accounts (together, the “Other Accounts”), and acknowledged BFA’s assertion that the iShares funds are fundamentally different investment vehicles from the Other Accounts. The Board noted that BFA and its affiliates do not manage Other Accounts with substantially the same investment objectives and strategies as the Funds or that track the same index or a similar index as the Funds. The Board further noted that BFA provided the Board with detailed information regarding how the Other Accounts (particularly institutional clients) generally differ from the Funds, including in terms of the different, generally more extensive services provided to the Funds, as well as other significant differences in the approach of BFA and its affiliates to the Funds, on one hand, and Other Accounts, on the other. In that regard, the Board considered that the pricing of services to institutional clients is typically based on a number of factors beyond the nature and extent of the specific services to be provided and often depends on the overall relationship between the client and its affiliates and the adviser and its affiliates. In addition, the Board considered the relative complexity and inherent risks and challenges of managing and providing other services to the Funds, as publicly traded exchange traded funds, as compared to the Other Accounts that are institutional clients in light of differing regulatory requirements and client-imposed mandates. The Board also considered the “all-inclusive” nature of the Funds’ advisory fee structure, and the Fund expenses borne by BFA under this arrangement. The Board noted that the investment advisory fee rates under the Advisory Contract for the Funds were generally higher than the investment advisory/management fee rates for the Other Accounts that are institutional clients of BFA (or its affiliates) and concluded that the differences appeared to be consistent with the factors discussed.
Other Benefits to BFA and/or its Affiliates — The Board reviewed the “fallout” benefits or ancillary revenue received by BFA and/or its affiliates in connection with the services provided to the Funds by BFA, such as payment of revenue to BTC, the Funds’
| 60 | 2015 iSHARES ANNUAL REPORTTO SHAREHOLDERS |
Table of Contents
Board Review and Approval of Investment Advisory
Contract (Continued)
iSHARES®, INC.
securities lending agent, for loaning portfolio securities (which was included in the profit margins reviewed by the Board pursuant to BFA’s profitability methodology), and payment of advisory fees and/or administration fees to BFA and BTC (or their affiliates) in connection with any investments by the Funds in other funds for which BFA (or its affiliates) provides investment advisory services and/or administration services. The Board noted that BFA generally does not use soft dollars or consider the value of research or other services that may be provided to BFA (including its affiliates) in selecting brokers for portfolio transactions for the Funds. The Board further noted that any portfolio transactions on behalf of the Funds placed through a BFA affiliate or purchased from an underwriting syndicate in which a BFA affiliate participates, are reported to the Board pursuant to Rule 17e-1 or Rule 10f-3, as applicable, under the 1940 Act. The Board concluded that any such ancillary benefits would not be disadvantageous to the Funds’ shareholders and thus would not alter the Board’s conclusion with respect to the appropriateness of approving the continuance of the Advisory Contract for the coming year.
Based on the considerations described above, the Board determined that each Fund’s investment advisory fee rate under the Advisory Contract does not constitute a fee that is so disproportionately large as to bear no reasonable relationship to the services rendered and that could not have been the product of arm’s-length bargaining, and concluded that it is in the best interest of each Fund and its shareholders to approve the continuance of the Advisory Contract for the coming year.
IV. iShares MSCI Sweden ETF
Under Section 15(c) of the Investment Company Act of 1940 (the “1940 Act”), the Company’s Board of Directors (the “Board”), including a majority of Directors who are not “interested persons” of the Company (as that term is defined in the 1940 Act) (the “Independent Directors”), is required annually to consider and approve the Investment Advisory Contract between the Company and BFA (the “Advisory Contract”) on behalf of the Fund. The Independent Directors requested, and BFA provided, such information as the Independent Directors, with advice from independent counsel, deemed reasonably necessary to evaluate the Advisory Contract. A committee of Independent Directors (the “15(c) Committee”), with independent counsel, met with management on May 1, 2015 and May 6, 2015, to discuss the types of information the Independent Directors required and the manner in which management would organize and present such information. At a meeting held on May 21, 2015, management presented preliminary information to the Board relating to the continuance of the Advisory Contract, and the Board, including the Independent Directors, reviewed and discussed such information at length. The Independent Directors requested from management certain additional information, which management agreed to provide. At a meeting held on June 24-25, 2015, the Board, including the Independent Directors, reviewed the additional information provided by management in response to these requests. After extensive discussions, the Board, including all of the Independent Directors, approved the continuance of the Advisory Contract for the Fund, based on a review of qualitative and quantitative information provided by BFA, including the additional information management provided at the request of the Independent Directors. The Board noted its satisfaction with the extent and quality of information provided and its frequent interactions with management, as well as the detailed responses and other information provided by BFA. The Board also noted that the Board and BFA agreed to discuss potential enhancements and adjustments to the 15(c) process for the coming year. The Independent Directors were advised by their independent counsel throughout the process, including about the legal standards applicable to their review. In approving the Advisory Contract for the Fund, the Board, including the Independent Directors, considered the following factors, no one of which was controlling, and reached the following conclusions:
Expenses and Performance of the Fund — The Board reviewed statistical information prepared by Lipper Inc. (“Lipper”), an independent provider of investment company data, regarding the expense ratio components, including actual advisory fees, waivers/reimbursements, and gross and net total expenses of the Fund in comparison with the same information for other exchange traded funds (including, where applicable, funds sponsored by an “at cost” service provider) and, in the limited instances where no comparable ETFs existed and the comparison group would not otherwise be reasonable in Lipper’s judgment, pure index institutional mutual funds, objectively selected by Lipper as comprising the Fund’s applicable peer group pursuant to
BOARD REVIEWAND APPROVALOF INVESTMENT ADVISORY CONTRACT | 61 |
Table of Contents
Board Review and Approval of Investment Advisory
Contract (Continued)
iSHARES®, INC.
Lipper’s proprietary ETF methodology (the “Lipper Group”). The Board was provided with a detailed description of Lipper’s proprietary ETF methodology used by Lipper to determine the Fund’s Lipper Group. The Board further noted that due to the limitations in providing comparable funds in the Lipper Group, the statistical information provided in Lipper’s report may or may not provide meaningful direct comparisons to the Fund in all instances.
The Board also noted that the investment advisory fee rate and overall expenses (net of waivers and reimbursements) for the Fund were within range of the median of the investment advisory fee rates and overall expenses (net of waivers and reimbursements) of the funds in its Lipper Group.
In addition, the Board reviewed statistical information prepared by Lipper regarding the performance of the Fund for the one-, three-, five-, ten-year, and since inception periods, as applicable, and the “last quarter” period ended December 31, 2014, and a comparison of the Fund’s performance to its performance benchmark index for the same periods. To the extent that any of the comparison funds included in the Lipper Group track the same index as the Fund, Lipper also provided, and the Board reviewed, a comparison of the Fund’s performance to that of such relevant comparison funds for the same periods. The Board noted that the Fund generally performed in line with its performance benchmark index over the relevant periods. In considering this information, the Board noted that the Lipper Group may include funds that have a different investment objective and/or benchmark from the Fund. In addition, the Board noted that the Fund seeks to track its own benchmark index and that, during the prior year, the Board received periodic reports on the Fund’s performance in comparison with its benchmark index. Such periodic comparative performance information, including detailed information on certain specific iShares funds requested by the Boards, was also considered.
Based on this review, the other factors considered at the meeting, and their general knowledge of ETF pricing, the Board concluded that the investment advisory fee rate and expense level and the historical performance of the Fund supported the Board’s approval of the continuance of the Advisory Contract for the coming year.
Nature, Extent and Quality of Services Provided by BFA — Based on management’s representations, including information about recent and proposed enhancements to the iShares business, including with respect to shareholder servicing and support, the Board expected that there would be no diminution in the scope of services required of or provided by BFA under the Advisory Contract for the coming year as compared to the scope of services provided by BFA during prior years. In reviewing the scope of these services, the Board considered BFA’s investment philosophy and experience, noting that BFA and its affiliates have committed significant resources over time, including during the past year, to supporting the iShares funds and their shareholders. The Board acknowledged that resources to support the iShares funds and their shareholders have been added or enhanced in recent years. The Board also considered BFA’s compliance program and its compliance record with respect to the Fund. In that regard, the Board noted that BFA reports to the Board about portfolio management and compliance matters on a periodic basis in connection with regularly scheduled meetings of the Board, and on other occasions as necessary and appropriate, and has provided information and made appropriate officers available as needed to provide further assistance with these matters. The Board also reviewed the background and experience of the persons responsible for the day-to-day management of the Fund, as well as the resources available to them in managing the Fund. In addition to the above considerations, the Board reviewed and considered detailed presentations regarding BFA’s investment performance, investment and risk management processes and strategies provided at the June 24-25, 2015 meeting and throughout the previous year, and matters related to BFA’s portfolio compliance policies and procedures. The Board noted that the Fund had met its investment objective consistently since its inception date.
| 62 | 2015 iSHARES ANNUAL REPORTTO SHAREHOLDERS |
Table of Contents
Board Review and Approval of Investment Advisory
Contract (Continued)
iSHARES®, INC.
Based on review of this information, and the performance information discussed above, the Board concluded that the nature, extent and quality of services provided by BFA to the Fund under the Advisory Contract supported the Board’s approval of the continuance of the Advisory Contract for the coming year.
Costs of Services Provided to the Fund and Profits Realized by BFA and Affiliates — The Board reviewed information about the profitability to BlackRock of the Fund based on the fees payable to BFA and its affiliates (including fees under the Advisory Contract), and all other sources of revenue and expense to BFA and its affiliates from the Fund’s operations for the last calendar year. The Board reviewed BlackRock’s profitability methodology for the iShares funds, noting that the 15(c) Committee had focused on the methodology and proposed presentation during its meetings. The Board discussed the sources of direct and ancillary revenue with management, including the revenues to BTC from securities lending by the Fund. The Board also discussed BFA’s profit margin as reflected in the Fund’s profitability analysis and reviewed information regarding potential economies of scale (as discussed below). Based on this review, the Board concluded that the profits realized by BFA and its affiliates under the Advisory Contract and from other relationships between the Fund and BFA and/or its affiliates, if any, were within a reasonable range in light of the factors considered.
Economies of Scale — The Board reviewed information regarding potential economies of scale or other efficiencies that may result from increases in the Fund’s assets, noting that the issue of economies of scale had been focused on extensively by the 15(c) Committee during its meetings and addressed by management. The Board and the 15(c) Committee reviewed information provided by BFA regarding scale benefits shared with the iShares funds through relatively low fee rates established at inception, breakpoints, waivers, or other fee reductions, as well as through additional investment in the iShares business and the provision of improved or additional infrastructure and services to the iShares funds and their shareholders. The Board and the 15(c) Committee received information regarding BlackRock’s historical profitability, including BFA’s and its affiliates’ costs in providing services. The cost information distinguished between fixed and variable costs, and explained how the level of fixed and variable costs, as well as the nature of such costs, may impact the existence or size of scale benefits. The Board noted that the Advisory Contract for the Fund already provided for breakpoints in the Fund’s investment advisory fee rate as the assets of the Fund, on an aggregated basis with the assets of certain other iShares funds, increase. The Board noted that it would continue to monitor the sharing of economies of scale to determine the appropriateness of adding new or revised breakpoints in the future.
Based on this review, as well as the other factors considered at the meeting, the Board, recognizing its responsibility to consider this issue periodically, determined to approve the continuance of the Advisory Contract for the coming year.
Fees and Services Provided for Other Comparable Funds/Accounts Managed by BFA and its Affiliates — The Board received and considered information regarding the investment advisory/management fee rates for other funds/accounts in the U.S. for which BFA (or its affiliates) provides investment advisory/management services, including open-end and closed-end funds registered under the 1940 Act (including sub-advised funds), collective trust funds, separately managed accounts, and institutional separate accounts (together, the “Other Accounts”), and acknowledged BFA’s assertion that the iShares funds are fundamentally different investment vehicles from the Other Accounts. The Board noted that BFA and its affiliates do manage Other Accounts with substantially the same investment objective and strategy as the Fund or that track the same index or a similar index as the Fund. The Board further noted that BFA provided the Board with detailed information regarding how the Other Accounts (particularly institutional clients) generally differ from the Fund, including in terms of the different, generally more extensive services provided to the Fund, as well as other significant differences in the approach of BFA and its affiliates to the Fund, on one hand, and Other Accounts, on the other. In that regard, the Board considered that the pricing of services to institutional clients is typically based on a number of factors beyond the nature and extent of the specific services to be provided and often depends on the overall relationship between the client and its affiliates and the adviser and its affiliates. In addition, the Board considered the relative complexity and inherent risks and challenges of managing and providing other services to the Fund, as a publicly traded exchange traded fund, as compared to the Other Accounts that are institutional clients in light of differing
BOARD REVIEWAND APPROVALOF INVESTMENT ADVISORY CONTRACT | 63 |
Table of Contents
Board Review and Approval of Investment Advisory
Contract (Continued)
iSHARES®, INC.
regulatory requirements and client-imposed mandates. The Board also considered the “all-inclusive” nature of the Fund’s advisory fee structure, and the Fund expenses borne by BFA under this arrangement. The Board noted that the investment advisory fee rate under the Advisory Contract for the Fund was generally higher than the investment advisory/management fee rates for the Other Accounts that are institutional clients of BFA (or its affiliates) and concluded that the differences appeared to be consistent with the factors discussed.
Other Benefits to BFA and/or its Affiliates — The Board reviewed the “fallout” benefits or ancillary revenue received by BFA and/or its affiliates in connection with the services provided to the Fund by BFA, such as payment of revenue to BTC, the Fund’s securities lending agent, for loaning portfolio securities (which was included in the profit margins reviewed by the Board pursuant to BFA’s profitability methodology), and payment of advisory fees and/or administration fees to BFA and BTC (or their affiliates) in connection with any investments by the Fund in other funds for which BFA (or its affiliates) provides investment advisory services and/or administration services. The Board noted that BFA generally does not use soft dollars or consider the value of research or other services that may be provided to BFA (including its affiliates) in selecting brokers for portfolio transactions for the Fund. The Board further noted that any portfolio transactions on behalf of the Fund placed through a BFA affiliate or purchased from an underwriting syndicate in which a BFA affiliate participates, are reported to the Board pursuant to Rule 17e-1 or Rule 10f-3, as applicable, under the 1940 Act. The Board concluded that any such ancillary benefits would not be disadvantageous to the Fund’s shareholders and thus would not alter the Board’s conclusion with respect to the appropriateness of approving the continuance of the Advisory Contract for the coming year.
Based on the considerations described above, the Board determined that the Fund’s investment advisory fee rate under the Advisory Contract does not constitute a fee that is so disproportionately large as to bear no reasonable relationship to the services rendered and that could not have been the product of arm’s-length bargaining, and concluded that it is in the best interest of the Fund and its shareholders to approve the continuance of the Advisory Contract for the coming year.
| 64 | 2015 iSHARES ANNUAL REPORTTO SHAREHOLDERS |
Table of Contents
Supplemental Information (Unaudited)
iSHARES®, INC.
Section 19(a) Notices
The amounts and sources of distributions reported are estimates and are provided pursuant to regulatory requirements and are not being provided for tax reporting purposes. The actual amounts and sources for tax reporting purposes will depend upon each Fund’s investment experience during the year and may be subject to changes based on the tax regulations. Shareholders will receive a Form 1099-DIV each calendar year that will inform them how to report these distributions for federal income tax purposes.
| Total Cumulative Distributions for the Fiscal Year | % Breakdown of the Total Cumulative Distributions for the Fiscal Year | |||||||||||||||||||||||||||||||
| iShares ETF | Net Investment Income | Net Realized Capital Gains | Return of Capital | Total Per Share | Net Investment Income | Net Realized Capital Gains | Return of Capital | Total Per Share | ||||||||||||||||||||||||
MSCI Austria Capped ETF | $ | 0.198622 | $ | — | $ | 0.054509 | $ | 0.253131 | 78 | % | — | % | 22 | % | 100 | % | ||||||||||||||||
MSCI France ETF | 0.675321 | — | — | 0.675321 | 100 | — | — | 100 | ||||||||||||||||||||||||
MSCI Sweden ETF | 1.397452 | — | — | 1.397452 | 100 | — | — | 100 | ||||||||||||||||||||||||
Premium/Discount Information
The Premium/Discount Information section is intended to present information about the differences between the daily market price on secondary markets for shares of a fund and that fund’s NAV. NAV is the price at which a fund issues and redeems shares. It is calculated in accordance with the standard formula for valuing mutual fund shares. The “Market Price” of a fund generally is determined using the midpoint between the highest bid and the lowest offer on the primary stock exchange on which the shares of such fund are listed for trading, as of the time that the fund’s NAV is calculated. A fund’s Market Price may be at, above or below its NAV. The NAV of a fund will fluctuate with changes in the fair value of its portfolio holdings. The Market Price of a fund will fluctuate in accordance with changes in its NAV, as well as market supply and demand.
Premiums or discounts are the differences (expressed as a percentage) between the NAV and Market Price of a fund on a given day, generally at the time the NAV is calculated. A premium is the amount that a fund is trading above the reported NAV, expressed as a percentage of the NAV. A discount is the amount that a fund is trading below the reported NAV, expressed as a percentage of the NAV.
The following information shows the frequency of distributions of premiums and discounts for each of the Funds. The information shown for each Fund is for five calendar years (or from the inception date of such Fund if less than five years) through the date of the most recent calendar quarter-end. The specific periods covered for each Fund are disclosed in the table for such Fund.
SUPPLEMENTAL INFORMATION | 65 |
Table of Contents
Supplemental Information (Unaudited) (Continued)
iSHARES®, INC.
Each line in the table shows the number of trading days in which the Fund traded within the premium/discount range indicated. The number of trading days in each premium/discount range is also shown as a percentage of the total number of trading days in the period covered by each table. All data presented here represents past performance, which cannot be used to predict future results.
iShares MSCI Austria Capped ETF
Period Covered: January 1, 2010 through June 30, 2015
Premium/Discount Range | Number of Days | Percentage of Total Days | ||||||
Greater than 3.0% | 2 | 0.14 | % | |||||
Greater than 2.5% and Less than 3.0% | 2 | 0.14 | ||||||
Greater than 2.0% and Less than 2.5% | 6 | 0.43 | ||||||
Greater than 1.5% and Less than 2.0% | 13 | 0.94 | ||||||
Greater than 1.0% and Less than 1.5% | 39 | 2.82 | ||||||
Greater than 0.5% and Less than 1.0% | 175 | 12.67 | ||||||
Between 0.5% and –0.5% | 913 | 66.07 | ||||||
Less than –0.5% and Greater than –1.0% | 135 | 9.77 | ||||||
Less than –1.0% and Greater than –1.5% | 49 | 3.55 | ||||||
Less than –1.5% and Greater than –2.0% | 27 | 1.95 | ||||||
Less than –2.0% and Greater than –2.5% | 11 | 0.80 | ||||||
Less than –2.5% and Greater than –3.0% | 6 | 0.43 | ||||||
Less than –3.0% | 4 | 0.29 | ||||||
|
|
|
| |||||
| 1,382 | 100.00 | % | ||||||
|
|
|
| |||||
iShares MSCI Belgium Capped ETF
Period Covered: January 1, 2010 through June 30, 2015
Premium/Discount Range | Number of Days | Percentage of Total Days | ||||||
Greater than 3.0% | 3 | 0.22 | % | |||||
Greater than 2.5% and Less than 3.0% | 1 | 0.07 | ||||||
Greater than 2.0% and Less than 2.5% | 4 | 0.29 | ||||||
Greater than 1.5% and Less than 2.0% | 16 | 1.16 | ||||||
Greater than 1.0% and Less than 1.5% | 36 | 2.60 | ||||||
Greater than 0.5% and Less than 1.0% | 168 | 12.17 | ||||||
Between 0.5% and –0.5% | 977 | 70.69 | ||||||
Less than –0.5% and Greater than –1.0% | 112 | 8.10 | ||||||
Less than –1.0% and Greater than –1.5% | 47 | 3.40 | ||||||
Less than –1.5% and Greater than –2.0% | 9 | 0.65 | ||||||
Less than –2.0% and Greater than –2.5% | 6 | 0.43 | ||||||
Less than –2.5% | 3 | 0.22 | ||||||
|
|
|
| |||||
| 1,382 | 100.00 | % | ||||||
|
|
|
| |||||
| 66 | 2015 iSHARES ANNUAL REPORTTO SHAREHOLDERS |
Table of Contents
Supplemental Information (Unaudited) (Continued)
iSHARES®, INC.
iShares MSCI France ETF
Period Covered: January 1, 2010 through June 30, 2015
Premium/Discount Range | Number of Days | Percentage of Total Days | ||||||
Greater than 3.0% and Less than 3.5% | 2 | 0.14 | % | |||||
Greater than 2.5% and Less than 3.0% | 2 | 0.14 | ||||||
Greater than 2.0% and Less than 2.5% | 5 | 0.36 | ||||||
Greater than 1.5% and Less than 2.0% | 15 | 1.09 | ||||||
Greater than 1.0% and Less than 1.5% | 52 | 3.76 | ||||||
Greater than 0.5% and Less than 1.0% | 200 | 14.47 | ||||||
Between 0.5% and –0.5% | 932 | 67.45 | ||||||
Less than –0.5% and Greater than –1.0% | 105 | 7.60 | ||||||
Less than –1.0% and Greater than –1.5% | 39 | 2.82 | ||||||
Less than –1.5% and Greater than –2.0% | 18 | 1.30 | ||||||
Less than –2.0% and Greater than –2.5% | 7 | 0.51 | ||||||
Less than –2.5% and Greater than –3.0% | 3 | 0.22 | ||||||
Less than –3.0% | 2 | 0.14 | ||||||
|
|
|
| |||||
| 1,382 | 100.00 | % | ||||||
|
|
|
| |||||
iShares MSCI Netherlands ETF
Period Covered: January 1, 2010 through June 30, 2015
Premium/Discount Range | Number of Days | Percentage of Total Days | ||||||
Greater than 3.0% | 2 | 0.14 | % | |||||
Greater than 2.5% and Less than 3.0% | 1 | 0.07 | ||||||
Greater than 2.0% and Less than 2.5% | 3 | 0.22 | ||||||
Greater than 1.5% and Less than 2.0% | 15 | 1.09 | ||||||
Greater than 1.0% and Less than 1.5% | 41 | 2.97 | ||||||
Greater than 0.5% and Less than 1.0% | 158 | 11.43 | ||||||
Between 0.5% and –0.5% | 984 | 71.20 | ||||||
Less than –0.5% and Greater than –1.0% | 113 | 8.18 | ||||||
Less than –1.0% and Greater than –1.5% | 45 | 3.26 | ||||||
Less than –1.5% and Greater than –2.0% | 11 | 0.80 | ||||||
Less than –2.0% and Greater than –2.5% | 5 | 0.36 | ||||||
Less than –2.5% and Greater than –3.0% | 2 | 0.14 | ||||||
Less than –3.0% | 2 | 0.14 | ||||||
|
|
|
| |||||
| 1,382 | 100.00 | % | ||||||
|
|
|
| |||||
SUPPLEMENTAL INFORMATION | 67 |
Table of Contents
Supplemental Information (Unaudited) (Continued)
iSHARES®, INC.
iShares MSCI Sweden ETF
Period Covered: January 1, 2010 through June 30, 2015
Premium/Discount Range | Number of Days | Percentage of Total Days | ||||||
Greater than 3.0% | 2 | 0.14 | % | |||||
Greater than 2.5% and Less than 3.0% | 1 | 0.07 | ||||||
Greater than 2.0% and Less than 2.5% | 4 | 0.29 | ||||||
Greater than 1.5% and Less than 2.0% | 23 | 1.66 | ||||||
Greater than 1.0% and Less than 1.5% | 53 | 3.84 | ||||||
Greater than 0.5% and Less than 1.0% | 188 | 13.61 | ||||||
Between 0.5% and –0.5% | 879 | 63.61 | ||||||
Less than –0.5% and Greater than –1.0% | 134 | 9.70 | ||||||
Less than –1.0% and Greater than –1.5% | 54 | 3.91 | ||||||
Less than –1.5% and Greater than –2.0% | 23 | 1.66 | ||||||
Less than –2.0% and Greater than –2.5% | 10 | 0.72 | ||||||
Less than –2.5% and Greater than –3.0% | 6 | 0.43 | ||||||
Less than –3.0% and Greater than –3.5% | 3 | 0.22 | ||||||
Less than –3.5% and Greater than –4.0% | 1 | 0.07 | ||||||
Less than –4.0% | 1 | 0.07 | ||||||
|
|
|
| |||||
| 1,382 | 100.00 | % | ||||||
|
|
|
| |||||
| 68 | 2015 iSHARES ANNUAL REPORTTO SHAREHOLDERS |
Table of Contents
Director and Officer Information
iSHARES® , INC.
The Board of Directors has responsibility for the overall management and operations of the Company, including general supervision of the duties performed by BFA and other service providers. Each Director serves until he or she resigns, is removed, dies, retires or becomes incapacitated. Each officer shall hold office until his or her successor is elected and qualifies or until his or her death, or his or her resignation or removal. Directors who are not “interested persons” (as defined in the 1940 Act) of the Company are referred to as independent directors (“Independent Directors”).
The registered investment companies advised by BFA or its affiliates are organized into one complex of closed-end funds, two complexes of open-end funds and one complex of exchange-traded funds (“Exchange-Traded Fund Complex”) (each, a “BlackRock Fund Complex”). Each Fund is included in the BlackRock Fund Complex referred to as the Exchange-Traded Fund Complex. Each Director also serves as a Trustee of iShares Trust and a Trustee of iShares U.S. ETF Trust and, as a result, oversees a total of 319 funds (as of August 31, 2015) within the Exchange-Traded Fund Complex. With the exception of Robert S. Kapito and Mark Wiedman, the address of each Director and officer is c/o BlackRock, Inc., 400 Howard Street, San Francisco, CA 94105. The address of Mr. Kapito and Mr. Wiedman is c/o BlackRock, Inc., Park Avenue Plaza, 55 East 52nd Street, New York, NY 10055. The Board has designated Robert H. Silver as its Independent Chairman. Additional information about the Funds’ Directors and officers may be found in the Funds’ combined Statement of Additional Information, which is available without charge, upon request, by calling toll-free 1-800-iShares (1-800-474-2737).
Interested Directors
| Name (Age) | Position(s) | Principal Occupation(s) During the Past 5 Years | Other Directorships Held by Director | |||
Robert S. Kapitoa (58) | Director (since 2009). | President and Director, BlackRock, Inc. (since 2006); Vice Chairman of BlackRock, Inc. and Head of BlackRock, Inc.’s Portfolio Management Group (since its formation in 1998) and BlackRock, Inc.’s predecessor entities (since 1988); Trustee, University of Pennsylvania (since 2009); President of Board of Directors, Hope & Heroes Children’s Cancer Fund (since 2002); President of the Board of Directors, Periwinkle Theatre for Youth (since 1983). | Trustee of iShares Trust (since 2009); Trustee of iShares U.S. ETF Trust (since 2011); Director of BlackRock, Inc. (since 2006). | |||
Mark Wiedmanb (44) | Director (since 2013). | Managing Director, BlackRock, Inc. (since 2007); Global Head of iShares (since 2011); Head of Corporate Strategy, BlackRock, Inc. (2009-2011). | Trustee of iShares Trust (since 2013); Trustee of iShares U.S. ETF Trust (since 2013); Director of PennyMac Financial Services, Inc. (since 2008). | |||
| a | Robert S. Kapito is deemed to be an “interested person” (as defined in the 1940 Act) of the Company due to his affiliations with BlackRock, Inc. |
| b | Mark Wiedman is deemed to be an “interested person” (as defined in the 1940 Act) of the Company due to his affiliations with BlackRock, Inc. and its affiliates. |
DIRECTORAND OFFICER INFORMATION | 69 |
Table of Contents
Director and Officer Information (Continued)
iSHARES®, INC.
Independent Directors
| Name (Age) | Position(s) | Principal Occupation(s) During the Past 5 Years | Other Directorships Held by Director | |||
Robert H. Silver (60) | Director (since 2007); Independent Chairman (since 2012). | President and Co-Founder of The Bravitas Group, Inc. (since 2006); Director and Vice Chairman of the YMCA of Greater NYC (2001-2011); Broadway Producer (2006-2011); Co-Founder and Vice President of Parentgiving Inc. (since 2008); Director and Member of the Audit and Compensation Committee of EPAM Systems, Inc. (2006-2009); President and Chief Operating Officer of UBS Financial Services Inc. (formerly Paine Webber Inc.) (2003-2005) and various executive positions with UBS and its affiliates (1988-2005); CPA and Audit Manager of KPMG, LLP (formerly Peat Marwick Mitchell) (1977-1983). | Trustee of iShares Trust (since 2007); Trustee of iShares U.S. ETF Trust (since 2011); Independent Chairman of iShares Trust and iShares U.S. ETF Trust (since 2012). | |||
Jane D. Carlin (59) | Director (since 2015). | Managing Director and Global Head of Financial Holding Company Governance & Assurance and the Global Head of Operational Risk Management of Morgan Stanley (2006-2012). | Trustee of iShares Trust (since 2015); Trustee of iShares U.S. ETF Trust (since 2015); Director of PHH Corporation (mortgage solutions) (since 2012). | |||
Cecilia H. Herbert (66) | Director (since 2005); Nominating and Governance Committee Chair and Equity Plus Committee Chair (since 2012). | Director (1998-2013) and President (2007-2011) of the Board of Directors, Catholic Charities CYO; Trustee (2002-2011) and Chair of the Finance and Investment Committee (2006-2010) of the Thacher School; Member (since 1992) and Chair (1994-2005) of the Investment Committee, Archdiocese of San Francisco; Trustee and Member of the Investment Committee, WNET, the New York public broadcasting/media company (since 2011). | Trustee of iShares Trust (since 2005); Trustee of iShares U.S. ETF Trust (since 2011); Director of Forward Funds (34 portfolios) (since 2009). | |||
Charles A. Hurty (71) | Director (since 2005); Audit Committee Chair (since 2006). | Retired; Partner, KPMG LLP (1968-2001). | Trustee of iShares Trust (since 2005); Trustee of iShares U.S. ETF Trust (since 2011); Director of GMAM Absolute Return Strategy Fund (1 portfolio) (since 2002); Director of SkyBridge Alternative Investments Multi-Adviser Hedge Fund Portfolios LLC (2 portfolios) (since 2002). | |||
| 70 | 2015 iSHARES ANNUAL REPORTTO SHAREHOLDERS |
Table of Contents
Director and Officer Information (Continued)
iSHARES®, INC.
Independent Directors (Continued)
| Name (Age) | Position(s) | Principal Occupation(s) During the Past 5 Years | Other Directorships Held by Director | |||
John E. Kerrigan (60) | Director (since 2005); Fixed Income Plus Committee Chair (since 2012). | Chief Investment Officer, Santa Clara University (since 2002). | Trustee of iShares Trust (since 2005); Trustee of iShares U.S. ETF Trust (since 2011). | |||
John E. Martinez (54) | Director (since 2003); Securities Lending Committee Chair (since 2012). | Director of FirstREX Agreement Corp. (formerly EquityRock, Inc.) (since 2005). | Trustee of iShares Trust (since 2003); Trustee of iShares U.S. ETF Trust (since 2011). | |||
Madhav V. Rajan (51) | Director (since 2011); 15(c) Committee Chair (since 2012). | Robert K. Jaedicke Professor of Accounting and Senior Associate Dean for Academic Affairs and Head of MBA Program, Stanford University Graduate School of Business (since 2001); Professor of Law (by courtesy), Stanford Law School (since 2005); Visiting Professor, University of Chicago (2007-2008). | Trustee of iShares Trust (since 2011); Trustee of iShares U.S. ETF Trust (since 2011); Director, Cavium, Inc. (since 2013). | |||
DIRECTORAND OFFICER INFORMATION | 71 |
Table of Contents
Director and Officer Information (Continued)
iSHARES®, INC.
Officers
| Name (Age) | Position(s) | Principal Occupation(s) During the Past 5 Years | ||
Manish Mehta (44) | President (since 2013). | Managing Director, BlackRock, Inc. (since 2009); Chief Operating Officer for iShares (since 2009); Head of Strategy and Corporate Development, BGI (2005-2009); Chief of Staff to the CEO, BGI (2005-2009). | ||
Jack Gee (55) | Treasurer and Chief Financial (since 2008). | Managing Director, BlackRock, Inc. (since 2009); Senior Director of Fund Administration of Intermediary Investor Business, BGI (2009); Director of Fund Administration of Intermediary Investor Business, BGI (2004-2009). | ||
Benjamin Archibald (40) | Secretary (since 2015). | Managing Director, BlackRock, Inc. (since 2014); Secretary of the BlackRock-advised Mutual Funds (since 2012); Director, BlackRock, Inc. (2010-2013). | ||
Charles Park (47) | Chief Compliance Officer (since 2006). | Chief Compliance Officer of BlackRock Advisors, LLC and the BlackRock-advised Funds in the Equity-Bond Complex, the Equity-Liquidity Complex and the Closed-End Complex (since 2014); Chief Compliance Officer, BFA (since 2006). | ||
Scott Radell (46) | Executive (since 2012). | Managing Director, BlackRock, Inc. (since 2009); Head of Portfolio Solutions, BlackRock, Inc. (since 2009); Head of Portfolio Solutions, BGI (2007-2009); Credit Portfolio Manager, BGI (2005-2007); Credit Research Analyst, BGI (2003-2005). | ||
Amy Schioldager (52) | Executive (since 2007). | Senior Managing Director, BlackRock, Inc. (since 2009); Global Head of Index Equity, BGI (2008-2009); Global Head of U.S. Indexing, BGI (2006-2008); Head of Domestic Equity Portfolio Management, BGI (2001-2006). | ||
| 72 | 2015 iSHARES ANNUAL REPORTTO SHAREHOLDERS |
Table of Contents
Notes:
NOTES | 73 |
Table of Contents
Notes:
| 74 | 2015 iSHARES ANNUAL REPORTTO SHAREHOLDERS |
Table of Contents
For more information visit www.iShares.com or call 1-800-474-2737
This report is intended for the Funds’ shareholders. It may not be distributed to prospective investors unless it is preceded or accompanied by the current prospectus.
Investing involves risk, including possible loss of principal.
The iShares Funds are distributed by BlackRock Investments, LLC (together with its affiliates, “BlackRock”).
The iShares Funds are not sponsored, endorsed, issued, sold or promoted by MSCI Inc., nor does this company make any representation regarding the advisability of investing in the iShares Funds. BlackRock is not affiliated with the company listed above.
A description of the policies that the Funds use to determine how to vote proxies relating to portfolio securities and information about how the Funds voted proxies relating to portfolio securities during the most recent twelve-month period ending June 30 is available without charge, upon request, by calling toll-free 1-800-474-2737; on the Funds’ website at www.iShares.com; and on the U.S. Securities and Exchange Commission (SEC) website at www.sec.gov.
The Funds file their complete schedules of portfolio holdings with the SEC for the first and third quarters of each fiscal year on Form N-Q. The Funds’ Forms N-Q are available on the SEC’s website or may be reviewed and copied at the SEC’s Public Reference Room in Washington, D.C. Information on the operation of the Public Reference Room may be obtained by calling 1-800-SEC-0330. The Funds also disclose their complete schedules of portfolio holdings on a daily basis on the Funds’ website.
©2015 BlackRock, Inc. All rights reserved. iSHARES and BLACKROCK are registered trademarks of BlackRock, Inc. or its subsidiaries. All other marks are the property of their respective owners.
iS-AR-82-0815
 |  |
Table of Contents
AUGUST 31, 2015
2015 ANNUAL REPORT |  |
iShares, Inc.
| Ø | iShares MSCI Hong Kong ETF | EWH | NYSE Arca |
| Ø | iShares MSCI Japan Small-Cap ETF | SCJ | NYSE Arca |
| Ø | iShares MSCI Malaysia ETF | EWM | NYSE Arca |
| Ø | iShares MSCI Pacific ex Japan ETF | EPP | NYSE Arca |
| Ø | iShares MSCI Singapore ETF | EWS | NYSE Arca |
| Ø | iShares MSCI Taiwan ETF | EWT | NYSE Arca |
| Ø | iShares MSCI Thailand Capped ETF | THD | NYSE Arca |
Table of Contents
| 5 | ||||
| 20 | ||||
| 20 | ||||
| 21 | ||||
| 21 | ||||
| 23 | ||||
| 34 | ||||
| 36 | ||||
| 39 | ||||
| 41 | ||||
| 44 | ||||
| 48 | ||||
| 58 | ||||
| 65 | ||||
| 79 | ||||
| 80 | ||||
| 81 | ||||
| 94 | ||||
| 101 |
Table of Contents
Management’s Discussion of Fund Performance
iSHARES®, INC.
GLOBAL MARKET OVERVIEW
Global equity markets delivered a negative return for the 12 months ended August 31, 2015 (the “reporting period”). The MSCI ACWI, a broad global equity index that includes both developed and emerging markets, returned -6.29% for the reporting period.
The reporting period was characterized by a continued divergence in economic growth and central bank policy between the U.S. and the rest of the world. Despite a slowdown in early 2015, the U.S. economy remained one of the strongest economies among developed countries, which motivated the U.S. Federal Reserve Bank (the “Fed”) to scale back its economic stimulus measures. The Fed ended a two-year quantitative easing program in October 2014 and signaled its intent to raise its short-term interest rate target sometime in 2015. In contrast, weaker economic growth in most other regions of the globe led many of the world’s central banks to take more aggressive actions to stimulate economic activity.
This divergence contributed to a notably stronger U.S. dollar. For the reporting period, the euro, Japanese yen, British pound and Australian dollar declined by 15%, 14%, 7%, and 24% against the U.S. dollar, respectively. Weaker foreign currencies decrease the value of foreign investments measured in U.S. dollars, thereby decreasing returns for U.S. investors, while increasing foreign currencies relative to the U.S. dollar have the opposite effect. Currency performance had a meaningful impact on non-U.S. equity returns for U.S. investors. For example, the MSCI ACWI returned 0.59% in local currency terms for the reporting period.
A number of other factors influenced global markets during the reporting period. Energy prices fell sharply amid growing supply —primarily from increased production in the U.S. — and declining global demand. Lower energy prices contributed to historically low and declining inflation rates in most of the world. Consumer prices were nearly unchanged in the U.S., the European Union, and Japan, while prices in China and India rose at a relatively slow rate. Low inflation and tepid demand kept the Fed’s zero interest rate policy intact, while central banks throughout the world took aggressive measures to stimulate demand.
Global markets advanced for most of the reporting period, then declined sharply in the last few months of the reporting period. The volatility began in China, as slowing economic growth led to a steep drop in China’s equity markets. Plummeting commodity prices amid already subdued inflation also raised concerns about global demand. Currency devaluations in Asia, including China, Vietnam, Pakistan, and Kazakhstan, led to speculation that Asian countries were weakening their currencies to compete for demand. These global events led to further uncertainty about the timing of an expected interest rate hike from the Fed.
On a regional basis, U.S. stocks advanced by less than 1% for the reporting period as declining interest rates, ongoing economic growth, and low inflation provided a favorable environment for U.S. equity market performance. After generating its fastest quarterly growth rate in 11 years in the third quarter of 2014, the U.S. economy slowed over the next two quarters. Economic activity improved over the last several months of the reporting period, boosted by an increase in consumer spending.
European stocks declined by about 8% in U.S. dollar terms for the reporting period, though they advanced more than 3% when measured in local currencies. The European Central Bank initiated quantitative easing measures in early 2015, and signs of economic improvement emerged in the latter half of the reporting period. A tentative agreement on Greece’s debt repayment helped alleviate ongoing concerns about Europe’s sovereign debt levels.
Stock markets in the Asia/Pacific region (excluding Japan) declined by approximately 19% in U.S. dollar terms, which equated to an 8% decline when measured in local currencies. China’s economic slowdown weighed heavily on the region, as China is the largest trading partner of many countries in the region. On the bright side, Japanese stocks performed relatively well, as ongoing economic stimulus and reform measures led to a 4% gain in U.S. dollar terms (22% when measured in Japanese yen).
Emerging markets stocks fell by approximately 23% in U.S. dollar terms for the reporting period, though the decline was about 10% when measured in local currencies. Many of the largest emerging economies — including China, Russia, and Brazil —experienced slowing economic growth during the reporting period. Latin American stocks posted some of the biggest declines, as the region struggled with slow growth and declining commodity prices.
MANAGEMENT’S DISCUSSIONSOF FUND PERFORMANCE | 5 |
Table of Contents
Management’s Discussion of Fund Performance
iSHARES® MSCI HONG KONG ETF
Performance as of August 31, 2015
| Average Annual Total Returns | Cumulative Total Returns | |||||||||||||||||||||||||
| NAV | MARKET | INDEX | NAV | MARKET | INDEX | |||||||||||||||||||||
1 Year | (9.29)% | (9.78)% | (8.38)% | (9.29)% | (9.78)% | (8.38)% | ||||||||||||||||||||
5 Years | 6.96% | 6.83% | 7.58% | 39.97% | 39.15% | 44.07% | ||||||||||||||||||||
10 Years | 7.28% | 7.16% | 7.90% | 101.95% | 99.60% | 113.87% | ||||||||||||||||||||
GROWTH OF $10,000 INVESTMENT
(AT NET ASSET VALUE)
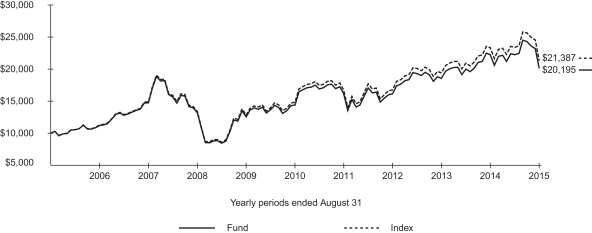
Past performance is no guarantee of future results. Performance results do not reflect the deduction of taxes that a shareholder would pay on fund distributions or on the redemption or sale of fund shares. See “About Fund Performance” on page 20 for more information.
| Shareholder Expenses | ||||||||||||||||||||||||||
| Actual | Hypothetical 5% Return | |||||||||||||||||||||||||
| Beginning Account Value (3/1/15) | Ending Account Value (8/31/15) | Expenses Paid During Period a | Beginning Account Value (3/1/15) | Ending Account Value (8/31/15) | Expenses Paid During Period a | Annualized Expense Ratio | ||||||||||||||||||||
| $ | 1,000.00 | $ | 906.70 | $ | 2.26 | $ | 1,000.00 | $ | 1,022.80 | $ | 2.40 | 0.47% | ||||||||||||||
| a | Expenses are calculated using the Fund’s annualized expense ratio (as disclosed in the table), multiplied by the average account value for the period, multiplied by the number of days in the period (184 days) and divided by the number of days in the year (365 days). See “Shareholder Expenses” on page 20 for more information. |
| 6 | 2015 iSHARES ANNUAL REPORTTO SHAREHOLDERS |
Table of Contents
Management’s Discussion of Fund Performance (Continued)
iSHARES® MSCI HONG KONG ETF
The iShares MSCI Hong Kong ETF (the “Fund”) seeks to track the investment results of an index composed of Hong Kong equities, as represented by the MSCI Hong Kong Index (the “Index”). The Fund invests in a representative sample of securities included in the Index that collectively has an investment profile similar to the Index. Due to the use of representative sampling, the Fund may or may not hold all of the securities that are included in the Index. For the 12-month reporting period ended August 31, 2015, the total return for the Fund was -9.29%, net of fees, while the total return for the Index was -8.38%.
Hong Kong equities, as represented by the Index, delivered negative results for the reporting period in an environment of high volatility. A slowdown in China’s GDP growth and unexpected devaluation of the Chinese currency late in the period accelerated declines, making the final month of the reporting period the worst for Hong Kong equities in nearly four years.
Within the Index, sector performance reflected the concerns regarding market turmoil and economic slowdown in China and around the world. The consumer discretionary sector declined substantially on an absolute basis and was the most significant detractor from returns. Retail sales declined for the fifth consecutive month in July 2015, as declining tourist traffic and volatility in equity markets curbed consumption. Consumer staples shares also detracted modestly for the reporting period.
The financials sector represented 63% of the Index on average during the reporting period. The sector’s absolute decline was modest, but, due to the large exposure to the sector, its impact on Index performance was meaningful. Within the sector, the real estate industry detracted most. Real estate property sales declined to their lowest level in 17 months in August 2015 as China’s equity market volatility and economic uncertainty largely dampened investor interest. The information technology, telecommunication services, and utilities sectors also detracted modestly during the reporting period.
At the other end of the spectrum, the industrials sector contributed positively to Index results. Manufacturing levels were generally positive for the reporting period. Levels declined sharply in August 2015, however, as the cooling economy in China, Hong Kong’s largest export partner by far, meant reduced export demand from Hong Kong.
ALLOCATION BY SECTOR
As of 8/31/15
| Sector | Percentage of Total Investments* |
Financials | 62.34 | % | ||
Industrials | 12.86 | |||
Utilities | 12.54 | |||
Consumer Discretionary | 9.56 | |||
Telecommunication Services | 1.40 | |||
Consumer Staples | 0.82 | |||
Information Technology | 0.48 | |||
|
| |||
TOTAL | 100.00 | % | ||
|
|
TEN LARGEST FUND HOLDINGS
As of 8/31/15
| Security | Percentage of Total Investments* |
AIA Group Ltd. | 18.33 | % | ||
CK Hutchison Holdings Ltd. | 9.92 | |||
Hong Kong Exchanges and Clearing Ltd. | 7.25 | |||
Sun Hung Kai Properties Ltd. | 6.12 | |||
Cheung Kong Property Holdings Ltd. | 5.17 | |||
CLP Holdings Ltd. | 4.29 | |||
Hang Seng Bank Ltd. | 3.69 | |||
Hong Kong & China Gas Co. Ltd. | 3.65 | |||
BOC Hong Kong Holdings Ltd. | 3.38 | |||
Link REIT (The) | 3.29 | |||
|
| |||
TOTAL | 65.09 | % | ||
|
|
| * | Excludes money market funds. |
MANAGEMENT’S DISCUSSIONSOF FUND PERFORMANCE | 7 |
Table of Contents
Management’s Discussion of Fund Performance
iSHARES® MSCI JAPAN SMALL-CAP ETF
Performance as of August 31, 2015
| Average Annual Total Returns | Cumulative Total Returns | |||||||||||||||||||||||||
| NAV | MARKET | INDEX | NAV | MARKET | INDEX | |||||||||||||||||||||
1 Year | 2.63% | 2.42% | 3.21% | 2.63% | 2.42% | 3.21% | ||||||||||||||||||||
5 Years | 9.35% | 9.28% | 9.85% | 56.38% | 55.86% | 59.94% | ||||||||||||||||||||
Since Inception | 4.10% | 4.03% | 4.50% | 36.24% | 35.51% | 40.35% | ||||||||||||||||||||
GROWTH OF $10,000 INVESTMENT
(SINCE INCEPTION AT NET ASSET VALUE)
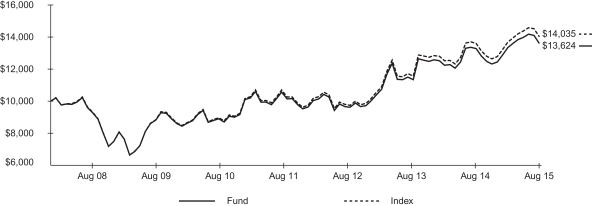
The inception date of the Fund was 12/20/07. The first day of secondary market trading was 12/21/07.
Past performance is no guarantee of future results. Performance results do not reflect the deduction of taxes that a shareholder would pay on fund distributions or on the redemption or sale of fund shares. See “About Fund Performance” on page 20 for more information.
| Shareholder Expenses | ||||||||||||||||||||||||||
| Actual | Hypothetical 5% Return | |||||||||||||||||||||||||
| Beginning Account Value (3/1/15) | Ending Account Value (8/31/15) | Expenses Paid During Period a | Beginning Account Value (3/1/15) | Ending Account Value (8/31/15) | Expenses Paid During Period a | Annualized Expense Ratio | ||||||||||||||||||||
| $ | 1,000.00 | $ | 1,021.00 | $ | 2.39 | $ | 1,000.00 | $ | 1,022.80 | $ | 2.40 | 0.47% | ||||||||||||||
| a | Expenses are calculated using the Fund’s annualized expense ratio (as disclosed in the table), multiplied by the average account value for the period, multiplied by the number of days in the period (184 days) and divided by the number of days in the year (365 days). See “Shareholder Expenses” on page 20 for more information. |
| 8 | 2015 iSHARES ANNUAL REPORTTO SHAREHOLDERS |
Table of Contents
Management’s Discussion of Fund Performance (Continued)
iSHARES® MSCI JAPAN SMALL-CAP ETF
The iShares MSCI Japan Small-Cap ETF (the “Fund”) seeks to track the investment results of an index composed of small-capitalization Japanese equities, as represented by the MSCI Japan Small Cap Index (the “Index”). The Fund invests in a representative sample of securities included in the Index that collectively has an investment profile similar to the Index. Due to the use of representative sampling, the Fund may or may not hold all of the securities that are included in the Index. For the 12-month reporting period ended August 31, 2015, the total return for the Fund was 2.63%, net of fees, while the total return for the Index was 3.21%.
As represented by the Index, Japanese small-cap stocks delivered a positive return for the reporting period while slightly trailing large-cap Japanese stocks. However, the Japanese yen depreciated by 14% relative to the U.S. dollar, which meaningfully detracted from the Index’s performance. In addition, like most global equity markets, Japan declined late in the reporting period, sparked by a sharp correction in China’s equity market.
Japan’s economy shrank in 2015’s second quarter, the first quarterly contraction since the third quarter of 2014. Several areas of the economy have shown signs of weakness, including automobile registrations and industrial production. In addition, slowing growth in China muted expectations for exports, despite a weaker Japanese yen, which tends to make the country’s exports less expensive. Nonetheless, the Japanese economy grew modestly overall for the 12 months ended June 30, 2015, due in part to the Bank of Japan’s aggressive economic stimulus measures. These efforts provided a favorable environment for equity market performance in Japan.
In U.S. dollar terms, consumer-based stocks generated the majority of the Index’s positive return during the reporting period. Retail sales were relatively weak in the first half of the reporting period until lower oil prices and improving sentiment helped spending in the second half of the reporting period. Within consumer sectors, the general retail and food retail industries delivered solid contributions to the Index’s return. On the downside, the financials sector was a modest detractor from performance during the reporting period. The energy sector declined sharply due to declining oil and gas prices, although the negative impact was limited by the sector’s less than 1% weight on average.
ALLOCATION BY SECTOR
As of 8/31/15
| Sector | Percentage of Total Investments* |
Industrials | 24.85 | % | ||
Financials | 19.16 | |||
Consumer Discretionary | 17.59 | |||
Consumer Staples | 10.52 | |||
Materials | 10.39 | |||
Information Technology | 10.34 | |||
Health Care | 5.78 | |||
Energy | 0.72 | |||
Utilities | 0.56 | |||
Telecommunication Services | 0.09 | |||
|
| |||
TOTAL | 100.00 | % | ||
|
|
TEN LARGEST FUND HOLDINGS
As of 8/31/15
| Security | Percentage of Total Investments* |
Haseko Corp. | 0.56 | % | ||
MISUMI Group Inc. | 0.56 | |||
OBIC Co. Ltd. | 0.55 | |||
Kaken Pharmaceutical Co. Ltd. | 0.54 | |||
Orix JREIT Inc. | 0.49 | |||
Nissan Chemical Industries Ltd. | 0.49 | |||
Advance Residence Investment Corp. | 0.48 | |||
Pigeon Corp. | 0.47 | |||
Sohgo Security Services Co. Ltd. | 0.46 | |||
Sojitz Corp. | 0.46 | |||
|
| |||
TOTAL | 5.06 | % | ||
|
|
| * | Excludes money market funds. |
MANAGEMENT’S DISCUSSIONSOF FUND PERFORMANCE | 9 |
Table of Contents
Management’s Discussion of Fund Performance
iSHARES® MSCI MALAYSIA ETF
Performance as of August 31, 2015
| Average Annual Total Returns | Cumulative Total Returns | |||||||||||||||||||||||||
| NAV | MARKET | INDEX | NAV | MARKET | INDEX | |||||||||||||||||||||
1 Year | (34.62)% | (34.32)% | (34.49)% | (34.62)% | (34.32)% | (34.49)% | ||||||||||||||||||||
5 Years | (1.65)% | (1.53)% | (1.23)% | (7.97)% | (7.44)% | (6.01)% | ||||||||||||||||||||
10 Years | 7.05% | 6.98% | 7.54% | 97.66% | 96.26% | 106.96% | ||||||||||||||||||||
GROWTH OF $10,000 INVESTMENT
(AT NET ASSET VALUE)
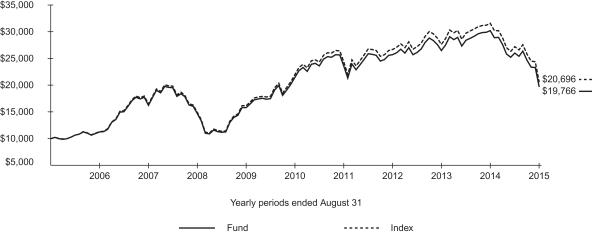
Past performance is no guarantee of future results. Performance results do not reflect the deduction of taxes that a shareholder would pay on fund distributions or on the redemption or sale of fund shares. See “About Fund Performance” on page 20 for more information.
| Shareholder Expenses | ||||||||||||||||||||||||||
| Actual | Hypothetical 5% Return | |||||||||||||||||||||||||
| Beginning Account Value (3/1/15) | Ending Account Value (8/31/15) | Expenses Paid During Period a | Beginning Account Value (3/1/15) | Ending Account Value (8/31/15) | Expenses Paid During Period a | Annualized Expense Ratio | ||||||||||||||||||||
| $ | 1,000.00 | $ | 759.60 | $ | 2.08 | $ | 1,000.00 | $ | 1,022.80 | $ | 2.40 | 0.47% | ||||||||||||||
| a | Expenses are calculated using the Fund’s annualized expense ratio (as disclosed in the table), multiplied by the average account value for the period, multiplied by the number of days in the period (184 days) and divided by the number of days in the year (365 days). See “Shareholder Expenses” on page 20 for more information. |
| 10 | 2015 iSHARES ANNUAL REPORTTO SHAREHOLDERS |
Table of Contents
Management’s Discussion of Fund Performance (Continued)
iSHARES® MSCI MALAYSIA ETF
The iShares MSCI Malaysia ETF (the “Fund”) seeks to track the investment results of an index composed of Malaysian equities, as represented by the MSCI Malaysia Index (the “Index”). The Fund invests in a representative sample of securities included in the Index that collectively has an investment profile similar to the Index. Due to the use of representative sampling, the Fund may or may not hold all of the securities that are included in the Index. For the 12-month reporting period ended August 31, 2015, the total return for the Fund was -34.62%, net of fees, while the total return for the Index was -34.49%.
Malaysian equities, as represented by the Index, declined significantly for the reporting period in an environment of high volatility. A slowdown in China’s GDP growth and unexpected devaluation of the Chinese currency late in the reporting period accelerated declines. The Malaysian ringgit depreciated 25% relative to the U.S. dollar, meaningfully detracting from performance in dollar terms.
As with many countries that rely on trade with China for their economic livelihood, Malaysia was affected by the cooling of the Chinese economy. Internal political turmoil also caused concern for investors, as corruption allegations created doubts about both the country’s leadership and the independence of its central bank.
Other negative factors affecting Malaysia’s equity market performance included delays in the Trans-Pacific Partnership (TPP), in which Malaysia joined negotiations. The TPP is an agreement among a number of countries that seeks to lower trade barriers among member countries. Completing the agreement would help Malaysia to attract foreign investment, where flows are positive but lower than in previous years.
From the perspective of U.S. investors, most sectors within the Index experienced double-digit declines, and impact on Index results was largely a factor of Index weighting. The financials sector, the largest sector weighting in the Index at an average 33%, detracted the most from performance. The industrials, utilities, consumer discretionary, and consumer staples sectors also detracted meaningfully. The energy sector declined the most on absolute terms, as oil prices plummeted. Because it accounted for only an average 4% of the Index, however, its impact on performance was not as severe as some other sectors.
ALLOCATION BY SECTOR
As of 8/31/15
| Sector | Percentage of Total Investments* |
Financials | 31.75 | % | ||
Industrials | 14.25 | |||
Utilities | 13.88 | |||
Telecommunication Services | 11.98 | |||
Consumer Staples | 8.84 | |||
Consumer Discretionary | 8.62 | |||
Materials | 4.58 | |||
Health Care | 3.22 | |||
Energy | 2.88 | |||
|
| |||
TOTAL | 100.00 | % | ||
|
|
TEN LARGEST FUND HOLDINGS
As of 8/31/15
| Security | Percentage of Total Investments* |
Public Bank Bhd | 10.13 | % | ||
Malayan Banking Bhd | 9.32 | |||
Tenaga Nasional Bhd | 8.44 | |||
CIMB Group Holdings Bhd | 5.68 | |||
Sime Darby Bhd | 5.16 | |||
DiGi.Com Bhd | 4.08 | |||
Petronas Chemicals Group Bhd | 3.79 | |||
Axiata Group Bhd | 3.54 | |||
Genting Bhd | 3.43 | |||
Petronas Gas Bhd | 3.29 | |||
|
| |||
TOTAL | 56.86 | % | ||
|
|
| * | Excludes money market funds. |
MANAGEMENT’S DISCUSSIONSOF FUND PERFORMANCE | 11 |
Table of Contents
Management’s Discussion of Fund Performance
iSHARES® MSCI PACIFIC ex JAPAN ETF
Performance as of August 31, 2015
| Average Annual Total Returns | Cumulative Total Returns | |||||||||||||||||||||||||
| NAV | MARKET | INDEX | NAV | MARKET | INDEX | |||||||||||||||||||||
1 Year | (22.19)% | (22.43)% | (21.85)% | (22.19)% | (22.43)% | (21.85)% | ||||||||||||||||||||
5 Years | 3.69% | 3.55% | 4.13% | 19.86% | 19.06% | 22.41% | ||||||||||||||||||||
10 Years | 5.91% | 5.72% | 6.11% | 77.62% | 74.42% | 80.98% | ||||||||||||||||||||
GROWTH OF $10,000 INVESTMENT
(AT NET ASSET VALUE)
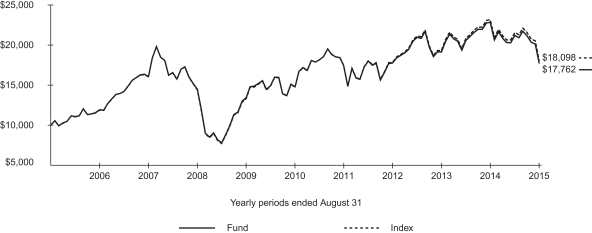
Past performance is no guarantee of future results. Performance results do not reflect the deduction of taxes that a shareholder would pay on fund distributions or on the redemption or sale of fund shares. See “About Fund Performance” on page 20 for more information.
| Shareholder Expenses | ||||||||||||||||||||||||||
| Actual | Hypothetical 5% Return | |||||||||||||||||||||||||
| Beginning Account Value (3/1/15) | Ending Account Value (8/31/15) | Expenses Paid During Period a | Beginning Account Value (3/1/15) | Ending Account Value (8/31/15) | Expenses Paid During Period a | Annualized Expense Ratio | ||||||||||||||||||||
| $ | 1,000.00 | $ | 837.60 | $ | 2.27 | $ | 1,000.00 | $ | 1,022.70 | $ | 2.50 | 0.49% | ||||||||||||||
| a | Expenses are calculated using the Fund’s annualized expense ratio (as disclosed in the table), multiplied by the average account value for the period, multiplied by the number of days in the period (184 days) and divided by the number of days in the year (365 days). See “Shareholder Expenses” on page 20 for more information. |
| 12 | 2015 iSHARES ANNUAL REPORTTO SHAREHOLDERS |
Table of Contents
Management’s Discussion of Fund Performance (Continued)
iSHARES® MSCI PACIFIC ex JAPAN ETF
The iShares MSCI Pacific ex Japan ETF (the “Fund”) seeks to track the investment results of an index composed of Pacific region developed market equities, excluding Japan, as represented by the MSCI Pacific ex Japan Index (the “Index”). The Fund invests in a representative sample of securities included in the Index that collectively has an investment profile similar to the Index. Due to the use of representative sampling, the Fund may or may not hold all of the securities that are included in the Index. For the 12-month reporting period ended August 31, 2015, the total return for the Fund was -22.19%, net of fees, while the total return for the Index was -21.85%.
Countries represented in the Index collectively declined for the reporting period in an environment of high volatility. The Australian and Singaporean dollars depreciated 24% and 12%, respectively, relative to the U.S. dollar. As a result, returns on Australian and Singaporean investments were lower when translated back into U.S. dollars. The Hong Kong dollar is pegged to the U.S. dollar and therefore has no currency fluctuation versus the U.S. dollar.
The economies of countries included in the Index are dependent on China’s economic well-being for their own economic livelihood. As China’s economy cooled, so too did its demand for goods and services from its trading partners.
In U.S. dollar terms, Australia detracted from Index results as the country’s GDP growth slowed. Demand weakened for Australia’s top exports, leading to weak mining and manufacturing activity. In response, the Reserve Bank of Australia lowered interest rates twice in the reporting period.
Hong Kong detracted from Index returns, reflecting concerns regarding market turmoil and an economic slowdown in China. Retail sales declined for the fifth consecutive month in July 2015, as less tourist traffic and volatility in equity markets curbed consumption. Real estate property sales declined to their lowest level in 17 months in August 2015, affected by weakness in mainland China’s economy and financial markets.
Singapore detracted from Index performance. Government regulations put in place in previous reporting periods to cool the real estate market continued to have an effect, as the housing market experienced its seventh consecutive quarterly decline in the second quarter of 2015. Singapore’s industrial production levels fell as non-oil exports to China sank, leading to slower economic growth.
ALLOCATION BY SECTOR
As of 8/31/15
| Sector | Percentage of Total Investments* |
Financials | 55.49 | % | ||
Industrials | 9.50 | |||
Materials | 9.25 | |||
Consumer Staples | 5.34 | |||
Utilities | 5.14 | |||
Consumer Discretionary | 4.69 | |||
Telecommunication Services | 3.87 | |||
Health Care | 3.75 | |||
Energy | 2.58 | |||
Information Technology | 0.39 | |||
|
| |||
TOTAL | 100.00 | % | ||
|
|
ALLOCATION BY COUNTRY
As of 8/31/15
| Country | Percentage of Total Investments* |
Australia | 59.52 | % | ||
Hong Kong | 27.40 | |||
Singapore | 11.77 | |||
New Zealand | 1.31 | |||
|
| |||
TOTAL | 100.00 | % | ||
|
|
| * | Excludes money market funds. |
MANAGEMENT’S DISCUSSIONSOF FUND PERFORMANCE | 13 |
Table of Contents
Management’s Discussion of Fund Performance
iSHARES® MSCI SINGAPORE ETF
Performance as of August 31, 2015
| Average Annual Total Returns | Cumulative Total Returns | |||||||||||||||||||||||||
| NAV | MARKET | INDEX | NAV | MARKET | INDEX | |||||||||||||||||||||
1 Year | (21.27)% | (21.71)% | (21.15)% | (21.27)% | (21.71)% | (21.15)% | ||||||||||||||||||||
5 Years | 1.10% | 1.00% | 1.43% | 5.64% | 5.08% | 7.35% | ||||||||||||||||||||
10 Years | 7.24% | 7.10% | 7.51% | 101.16% | 98.60% | 106.28% | ||||||||||||||||||||
GROWTH OF $10,000 INVESTMENT
(AT NET ASSET VALUE)
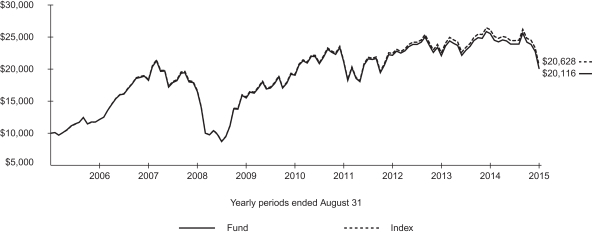
Past performance is no guarantee of future results. Performance results do not reflect the deduction of taxes that a shareholder would pay on fund distributions or on the redemption or sale of fund shares. See “About Fund Performance” on page 20 for more information.
| Shareholder Expenses | ||||||||||||||||||||||||||
| Actual | Hypothetical 5% Return | |||||||||||||||||||||||||
| Beginning Account Value (3/1/15) | Ending Account Value (8/31/15) | Expenses Paid During Period a | Beginning Account Value (3/1/15) | Ending Account Value (8/31/15) | Expenses Paid During Period a | Annualized Expense Ratio | ||||||||||||||||||||
| $ | 1,000.00 | $ | 842.20 | $ | 2.18 | $ | 1,000.00 | $ | 1,022.80 | $ | 2.40 | 0.47% | ||||||||||||||
| a | Expenses are calculated using the Fund’s annualized expense ratio (as disclosed in the table), multiplied by the average account value for the period, multiplied by the number of days in the period (184 days) and divided by the number of days in the year (365 days). See “Shareholder Expenses” on page 20 for more information. |
| 14 | 2015 iSHARES ANNUAL REPORTTO SHAREHOLDERS |
Table of Contents
Management’s Discussion of Fund Performance (Continued)
iSHARES® MSCI SINGAPORE ETF
The iShares MSCI Singapore ETF (the “Fund”) seeks to track the investment results of an index composed of Singaporean equities, as represented by the MSCI Singapore Index (the “Index”). The Fund invests in a representative sample of securities included in the Index that collectively has an investment profile similar to the Index. Due to the use of representative sampling, the Fund may or may not hold all of the securities that are included in the Index. For the 12-month reporting period ended August 31, 2015, the total return for the Fund was -21.27%, net of fees, while the total return for the Index was -21.15%.
Singaporean equities, as represented by the Index, delivered negative results for the reporting period in an environment of high volatility. A slowdown in China’s GDP growth and unexpected devaluation of the Chinese currency in the final weeks of the reporting period accelerated declines. In addition, the Singaporean dollar depreciated 12% relative to the U.S. dollar. As a result, returns on Singaporean investments were lower when translated back into U.S. dollars.
In U.S. dollar terms, every sector within the Index experienced double-digit declines for the reporting period. The financials sector’s decline was one of the least severe relative to other sectors, but, because it accounted for more than half of the Index on average during the reporting period, it was the largest detractor from Index results by a wide margin.
The financials sector in Singapore has significant exposure to real estate. Government regulations put in place in previous reporting periods to cool the real estate market continued to have an effect, as the housing market experienced its seventh consecutive quarterly decline in the second quarter of 2015.
The industrials sector declined substantially on an absolute basis and detracted significantly from Index performance, as it was affected by China’s economic slowdown. As China’s economy cooled, so too did its demand for trade with neighboring countries, including Singapore. Singapore’s industrial production levels fell throughout the second half of the reporting period as non-oil exports to China sank, leading to slower economic growth during the reporting period.
The slowing economy led to a rise in unemployment levels in the final months of the reporting period. Against this background, the consumer discretionary and consumer staples sectors both detracted meaningfully from Index results. Telecommunications shares also detracted from Index performance.
ALLOCATION BY SECTOR
As of 8/31/15
| Sector | Percentage of Total Investments* |
Financials | 55.40 | % | ||
Industrials | 19.56 | |||
Telecommunication Services | 14.25 | |||
Consumer Discretionary | 6.86 | |||
Consumer Staples | 3.93 | |||
|
| |||
TOTAL | 100.00 | % | ||
|
|
TEN LARGEST FUND HOLDINGS
As of 8/31/15
| Security | Percentage of Total Investments* |
DBS Group Holdings Ltd. | 13.37 | % | ||
Singapore Telecommunications Ltd. | 12.80 | |||
Oversea-Chinese Banking Corp. Ltd. | 11.22 | |||
United Overseas Bank Ltd. | 10.62 | |||
Keppel Corp. Ltd. | 4.69 | |||
CapitaLand Ltd. | 3.43 | |||
Global Logistic Properties Ltd. | 3.28 | |||
Singapore Press Holdings Ltd. | 3.10 | |||
Wilmar International Ltd. | 2.85 | |||
ComfortDelGro Corp. Ltd. | 2.85 | |||
|
| |||
TOTAL | 68.21 | % | ||
|
|
| * | Excludes money market funds. |
MANAGEMENT’S DISCUSSIONSOF FUND PERFORMANCE | 15 |
Table of Contents
Management’s Discussion of Fund Performance
iSHARES® MSCI TAIWAN ETF
Performance as of August 31, 2015
| Average Annual Total Returns | Cumulative Total Returns | |||||||||||||||||||||||||
| NAV | MARKET | INDEX | NAV | MARKET | INDEX | |||||||||||||||||||||
1 Year | (15.79)% | (17.48)% | (15.27)% | (15.79)% | (17.48)% | (15.27)% | ||||||||||||||||||||
5 Years | 4.66% | 4.36% | 5.10% | 25.59% | 23.77% | 28.22% | ||||||||||||||||||||
10 Years | 4.46% | 4.32% | 5.09% | 54.64% | 52.67% | 64.33% | ||||||||||||||||||||
GROWTH OF $10,000 INVESTMENT
(AT NET ASSET VALUE)
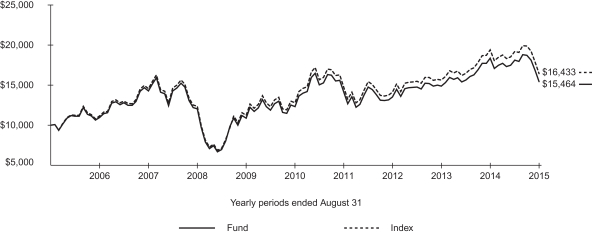
Past performance is no guarantee of future results. Performance results do not reflect the deduction of taxes that a shareholder would pay on fund distributions or on the redemption or sale of fund shares. See “About Fund Performance” on page 20 for more information.
| Shareholder Expenses | ||||||||||||||||||||||||||
| Actual | Hypothetical 5% Return | |||||||||||||||||||||||||
| Beginning Account Value (3/1/15) | Ending Account Value (8/31/15) | Expenses Paid During Period a | Beginning Account Value (3/1/15) | Ending Account Value (8/31/15) | Expenses Paid During Period a | Annualized Expense Ratio | ||||||||||||||||||||
| $ | 1,000.00 | $ | 853.00 | $ | 2.90 | $ | 1,000.00 | $ | 1,022.10 | $ | 3.16 | 0.62% | ||||||||||||||
| a | Expenses are calculated using the Fund’s annualized expense ratio (as disclosed in the table), multiplied by the average account value for the period, multiplied by the number of days in the period (184 days) and divided by the number of days in the year (365 days). See “Shareholder Expenses” on page 20 for more information. |
| 16 | 2015 iSHARES ANNUAL REPORTTO SHAREHOLDERS |
Table of Contents
Management’s Discussion of Fund Performance (Continued)
iSHARES® MSCI TAIWAN ETF
The iShares MSCI Taiwan ETF (the “Fund”) seeks to track the investment results of an index composed of Taiwanese equities, as represented by the MSCI Taiwan Index (the “Index”). The Fund invests in a representative sample of securities included in the Index that collectively has an investment profile similar to the Index. Due to the use of representative sampling, the Fund may or may not hold all of the securities that are included in the Index. For the 12-month reporting period ended August 31, 2015, the total return for the Fund was -15.79%, net of fees, while the total return for the Index was -15.27%.
Taiwanese equities, as represented by the Index, declined for the reporting period in an environment of high volatility. A slowdown in China’s GDP growth and unexpected devaluation of the Chinese currency late in the reporting period accelerated declines. In addition, the new Taiwanese dollar declined in value relative to the U.S. dollar during the reporting period, meaningfully detracting from Index performance.
As a key exporter of electronics, Taiwan’s economy was adversely affected by slowing global demand for electronic goods during the reporting period. Indeed, in June 2015, the global electronics industry fell into decline for the first time since March 2013. Mainland China further crimped Taiwan’s export levels with an aggressive plan to build its own semiconductor chip-making companies. Taiwan’s GDP growth levels fell during the reporting period, sinking to 0.52% in the second quarter of 2015 compared with the same quarter of the previous year, as annual manufacturing production levels slipped into negative territory.
In U.S. dollar terms, every sector within the Index declined for the reporting period. The information technology sector represented 58% of the Index on average, with more than half comprised of semiconductor companies. The sector registered double-digit declines and was the most significant detractor from Index results by a wide margin for the reporting period. The materials and financials sectors also detracted meaningfully. The industrials and consumer discretionary sectors detracted modestly for the reporting period. No sector contributed positively to performance when viewed from the perspective of U.S. investors.
ALLOCATION BY SECTOR
As of 8/31/15
| Sector | Percentage of Total Investments* |
Information Technology | 56.79 | % | ||
Financials | 18.58 | |||
Materials | 9.11 | |||
Telecommunication Services | 4.84 | |||
Consumer Discretionary | 4.50 | |||
Consumer Staples | 3.08 | |||
Industrials | 2.51 | |||
Energy | 0.59 | |||
|
| |||
TOTAL | 100.00 | % | ||
|
|
TEN LARGEST FUND HOLDINGS As of 8/31/15
| Security | Percentage of Total Investments* |
Taiwan Semiconductor Manufacturing Co. Ltd. | 23.00 | % | ||
Hon Hai Precision Industry Co. Ltd. | 8.91 | |||
Cathay Financial Holding Co. Ltd. | 2.74 | |||
Chunghwa Telecom Co. Ltd. | 2.72 | |||
MediaTek Inc. | 2.71 | |||
Fubon Financial Holding Co. Ltd. | 2.69 | |||
Largan Precision Co. Ltd. | 2.20 | |||
Delta Electronics Inc. | 2.14 | |||
Formosa Plastics Corp. | 2.14 | |||
CTBC Financial Holding Co. Ltd. | 2.14 | |||
|
| |||
TOTAL | 51.39 | % | ||
|
|
| * | Excludes money market funds. |
MANAGEMENT’S DISCUSSIONSOF FUND PERFORMANCE | 17 |
Table of Contents
Management’s Discussion of Fund Performance
iSHARES® MSCI THAILAND CAPPED ETF
Performance as of August 31, 2015
| Average Annual Total Returns | Cumulative Total Returns | |||||||||||||||||||||||||
| NAV | MARKET | INDEX | NAV | MARKET | INDEX | |||||||||||||||||||||
1 Year | (19.92)% | (20.59)% | (19.88)% | (19.92)% | (20.59)% | (19.88)% | ||||||||||||||||||||
5 Years | 6.07% | 5.83% | 6.33% | 34.28% | 32.74% | 35.90% | ||||||||||||||||||||
Since Inception | 6.45% | 6.35% | 6.76% | 59.14% | 58.00% | 62.54% | ||||||||||||||||||||
GROWTH OF $10,000 INVESTMENT
(SINCE INCEPTION AT NET ASSET VALUE)
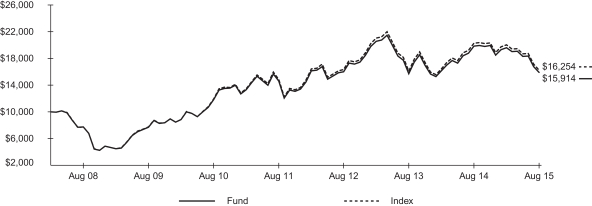
The inception date of the Fund was 3/26/08. The first day of secondary market trading was 3/28/08.
Index performance through February 11, 2013 reflects the performance of the MSCI Thailand Investable Market Index. Index performance beginning on February 12, 2013 reflects the performance of the MSCI Thailand Investable Market Index 25/50.
Past performance is no guarantee of future results. Performance results do not reflect the deduction of taxes that a shareholder would pay on fund distributions or on the redemption or sale of fund shares. See “About Fund Performance” on page 20 for more information.
| Shareholder Expenses | ||||||||||||||||||||||||||
| Actual | Hypothetical 5% Return | |||||||||||||||||||||||||
| Beginning Account Value (3/1/15) | Ending Account Value (8/31/15) | Expenses Paid During Period a | Beginning Account Value (3/1/15) | Ending Account Value (8/31/15) | Expenses Paid During Period a | Annualized Expense Ratio | ||||||||||||||||||||
| $ | 1,000.00 | $ | 810.70 | $ | 2.83 | $ | 1,000.00 | $ | 1,022.10 | $ | 3.16 | 0.62% | ||||||||||||||
| a | Expenses are calculated using the Fund’s annualized expense ratio (as disclosed in the table), multiplied by the average account value for the period, multiplied by the number of days in the period (184 days) and divided by the number of days in the year (365 days). See “Shareholder Expenses” on page 20 for more information. |
| 18 | 2015 iSHARES ANNUAL REPORTTO SHAREHOLDERS |
Table of Contents
Management’s Discussion of Fund Performance (Continued)
iSHARES® MSCI THAILAND CAPPED ETF
The iShares MSCI Thailand Capped ETF (the “Fund”) seeks to track the investment results of a broad-based index composed of Thai equities, as represented by the MSCI Thailand Investable Market Index 25/50 (the “Index”). The Fund invests in a representative sample of securities included in the Index that collectively has an investment profile similar to the Index. Due to the use of representative sampling, the Fund may or may not hold all of the securities that are included in the Index. For the 12-month reporting period ended August 31, 2015, the total return for the Fund was -19.92%, net of fees, while the total return for the Index was -19.88%.
Thai equities, as represented by the Index, declined for the reporting period in an environment of high volatility. A slowdown in China’s GDP growth and unexpected devaluation of the Chinese currency late in the reporting period accelerated declines. In addition, the value of the Thai baht declined relative to the U.S. dollar, which meant returns on Thai investments were lower upon translating back into U.S. dollars.
As a key exporter of manufactured goods, Thailand’s economy was adversely affected by slowing demand from China. Factory output declined more than expected in May 2015 as export levels fell for the fifth straight month. A major manufacturer and exporter for the automobile industry, Thailand experienced an 8.8% decline in automobile production in May 2015 versus a year earlier. Hard drive output declined 20%, and television production sank more than 80% compared with May of the previous year. Domestic demand also remained tepid, and consumer confidence levels declined for the eighth consecutive month in August 2015.
In addition, Thailand suffered its worst drought in a decade during the reporting period. With 8% of total exports and 40% of the population engaged in agricultural products, the drought affected export levels as well as labor market conditions.
Ongoing political uncertainty also contributed to unstable economic conditions. Although the military junta, which seized control in May 2014 following the ouster of the prime minister, promised to restore stability, political conflict continued and foreign investment flagged throughout the reporting period. In August 2015, a deadly bombing created additional unrest and drove down tourism.
ALLOCATION BY SECTOR
As of 8/31/15
| Sector | Percentage of Total Investments* |
Financials | 28.85 | % | ||
Energy | 14.73 | |||
Telecommunication Services | 9.89 | |||
Consumer Staples | 9.86 | |||
Industrials | 9.73 | |||
Materials | 9.32 | |||
Consumer Discretionary | 5.80 | |||
Health Care | 5.33 | |||
Information Technology | 3.65 | |||
Utilities | 2.84 | |||
|
| |||
TOTAL | 100.00 | % | ||
|
|
TEN LARGEST FUND HOLDINGS
As of 8/31/15
| Security | Percentage of Total Investments* |
PTT PCL NVDR | 7.21 | % | ||
Advanced Info Service PCL NVDR | 6.59 | |||
CP ALL PCL NVDR | 5.93 | |||
Siam Commercial Bank PCL (The) NVDR | 5.86 | |||
Kasikornbank PCL Foreign | 5.58 | |||
Siam Cement PCL (The) Foreign | 3.67 | |||
Airports of Thailand PCL NVDR | 3.34 | |||
Kasikornbank PCL NVDR | 2.91 | |||
PTT Exploration & Production PCL NVDR | 2.81 | |||
Bumrungrad Hospital PCL NVDR | 2.62 | |||
|
| |||
TOTAL | 46.52 | % | ||
|
|
| * | Excludes money market funds. |
MANAGEMENT’S DISCUSSIONSOF FUND PERFORMANCE | 19 |
Table of Contents
Past performance is no guarantee of future results. Current performance may be lower or higher than the performance data quoted. Performance data current to the most recent month-end is available at www.ishares.com. Performance results assume reinvestment of all dividends and capital gain distributions and do not reflect the deduction of taxes that a shareholder would pay on fund distributions or on the redemption or sale of fund shares. The investment return and principal value of shares will vary with changes in market conditions. Shares may be worth more or less than their original cost when they are redeemed or sold in the market. Performance for certain funds may reflect a waiver of a portion of investment advisory fees. Without such a waiver, performance would have been lower.
Net asset value or “NAV” is the value of one share of a fund as calculated in accordance with the standard formula for valuing mutual fund shares. The price used to calculate market return (“Market Price”) is determined by using the midpoint between the highest bid and the lowest offer on the primary stock exchange on which shares of a fund are listed for trading, as of the time that such fund’s NAV is calculated. Certain funds may have a NAV which is determined prior to the opening of regular trading on its listed exchange and their market returns are calculated using the midpoint of the bid/ask spread as of the opening of regular trading on the exchange. Market and NAV returns assume that dividends and capital gain distributions have been reinvested at Market Price and NAV, respectively.
An index is a statistical composite that tracks a specified financial market or sector. Unlike a fund, an index does not actually hold a portfolio of securities and therefore does not incur the expenses incurred by a fund. These expenses negatively impact fund performance. Also, market returns do not include brokerage commissions that may be payable on secondary market transactions. If brokerage commissions were included, market returns would be lower.
As a shareholder of a Fund, you incur two types of costs: (1) transaction costs, including brokerage commissions on purchases and sales of fund shares and (2) ongoing costs, including management fees and other fund expenses. The expense example, which is based on an investment of $1,000 invested on March 1, 2015 and held through August 31, 2015, is intended to help you understand your ongoing costs (in dollars and cents) of investing in a Fund and to compare these costs with the ongoing costs of investing in other funds.
Actual Expenses — The table provides information about actual account values and actual expenses. Annualized expense ratios reflect contractual and voluntary fee waivers, if any. To estimate the expenses that you paid on your account over the period, simply divide your account value by $1,000 (for example, an $8,600 account value divided by $1,000 = 8.6), then multiply the result by the number corresponding to your Fund under the heading entitled “Expenses Paid During Period.”
Hypothetical Example for Comparison Purposes — The table also provides information about hypothetical account values and hypothetical expenses based on each Fund’s actual expense ratio and an assumed rate of return of 5% per year before expenses. You may use this information to compare the ongoing costs of investing in your Fund and other funds. To do so, compare this 5% hypothetical example with the 5% hypothetical examples that appear in the shareholder reports of the other funds.
Please note that the expenses shown in the table are meant to highlight your ongoing costs only and do not reflect any transactional costs, such as brokerage commissions paid on purchases and sales of fund shares. Therefore, the hypothetical examples are useful in comparing ongoing costs only and will not help you determine the relative total costs of owning different funds. In addition, if these transactional costs were included, your costs would have been higher.
| 20 | 2015 iSHARES ANNUAL REPORTTO SHAREHOLDERS |
Table of Contents
August 31, 2015
| Security | Shares | Value | ||||||
COMMON STOCKS — 99.43% |
| |||||||
AIRLINES — 0.62% | ||||||||
Cathay Pacific Airways Ltd. | 9,345,000 | $ | 16,881,181 | |||||
|
| |||||||
| 16,881,181 | ||||||||
BANKS — 8.12% |
| |||||||
Bank of East Asia Ltd. (The) | 8,597,410 | 29,563,806 | ||||||
BOC Hong Kong Holdings Ltd. | 27,100,500 | 91,616,583 | ||||||
Hang Seng Bank Ltd. | 5,607,000 | 99,767,782 | ||||||
|
| |||||||
| 220,948,171 | ||||||||
DIVERSIFIED FINANCIAL SERVICES — 7.66% |
| |||||||
First Pacific Co. Ltd./Hong Kong | 18,690,999 | 12,179,218 | ||||||
Hong Kong Exchanges and Clearing Ltd. | 8,346,900 | 196,231,660 | ||||||
|
| |||||||
| 208,410,878 | ||||||||
DIVERSIFIED TELECOMMUNICATION SERVICES — 1.40% |
| |||||||
HKT Trust & HKT Ltd. | 18,690,500 | 21,632,607 | ||||||
PCCW Ltd.a | 31,024,169 | 16,372,649 | ||||||
|
| |||||||
| 38,005,256 | ||||||||
ELECTRIC UTILITIES — 8.84% |
| |||||||
Cheung Kong Infrastructure Holdings Ltd. | 4,390,000 | 36,196,024 | ||||||
CLP Holdings Ltd. | 14,017,700 | 116,029,633 | ||||||
Power Assets Holdings Ltd. | 10,279,500 | 88,469,449 | ||||||
|
| |||||||
| 240,695,106 | ||||||||
FOOD PRODUCTS — 0.81% |
| |||||||
WH Group Ltd.a,b,c | 42,052,500 | 22,084,203 | ||||||
|
| |||||||
| 22,084,203 | ||||||||
GAS UTILITIES — 3.63% |
| |||||||
Hong Kong & China Gas Co. Ltd. | 52,332,466 | 98,722,028 | ||||||
|
| |||||||
| 98,722,028 | ||||||||
HOTELS, RESTAURANTS & LEISURE — 6.29% |
| |||||||
Galaxy Entertainment Group Ltd.a | 17,445,000 | 55,936,187 | ||||||
MGM China Holdings Ltd.a | 6,728,688 | 11,130,480 | ||||||
Sands China Ltd.a | 17,942,400 | 62,277,090 | ||||||
Shangri-La Asia Ltd. | 11,248,000 | 11,044,739 | ||||||
SJM Holdings Ltd.a | 14,952,000 | 13,524,238 | ||||||
Wynn Macau Ltd.a | 11,214,000 | 17,305,623 | ||||||
|
| |||||||
| 171,218,357 | ||||||||
HOUSEHOLD DURABLES — 1.37% |
| |||||||
Techtronic Industries Co. Ltd. | 10,279,647 | 37,205,450 | ||||||
|
| |||||||
| 37,205,450 | ||||||||
| Security | Shares | Value | ||||||
INDUSTRIAL CONGLOMERATES — 10.38% |
| |||||||
CK Hutchison Holdings Ltd. | 20,144,267 | $ | 268,501,852 | |||||
NWS Holdings Ltd. | 11,214,000 | 14,136,784 | ||||||
|
| |||||||
| 282,638,636 | ||||||||
INSURANCE — 18.22% |
| |||||||
AIA Group Ltd. | 89,712,000 | 496,017,342 | ||||||
|
| |||||||
| 496,017,342 | ||||||||
REAL ESTATE INVESTMENT TRUSTS (REITS) — 3.28% |
| |||||||
Link REIT | 16,821,000 | 89,204,986 | ||||||
|
| |||||||
| 89,204,986 | ||||||||
REAL ESTATE MANAGEMENT & DEVELOPMENT — 24.71% |
| |||||||
Cheung Kong Property Holdings Ltd.c | 19,966,767 | 139,895,284 | ||||||
Hang Lung Properties Ltd. | 16,821,000 | 37,982,658 | ||||||
Henderson Land Development Co. Ltd. | 8,331,061 | 51,329,754 | ||||||
Hysan Development Co. Ltd.a | 5,390,000 | 21,698,957 | ||||||
Kerry Properties Ltd. | 4,672,500 | 13,987,265 | ||||||
New World Development Co. Ltd. | 39,249,066 | 39,907,180 | ||||||
Sino Land Co. Ltd. | 22,428,000 | 33,337,922 | ||||||
Sun Hung Kai Properties Ltd. | 13,083,000 | 165,773,201 | ||||||
Swire Pacific Ltd. Class A | 4,672,500 | 51,276,589 | ||||||
Swire Properties Ltd. | 8,597,400 | 26,291,234 | ||||||
Wharf Holdings Ltd. (The) | 10,291,150 | 58,094,827 | ||||||
Wheelock & Co. Ltd. | 7,292,357 | 33,074,154 | ||||||
|
| |||||||
| 672,649,025 | ||||||||
ROAD & RAIL — 1.78% |
| |||||||
MTR Corp. Ltd. | 10,898,083 | 48,584,044 | ||||||
|
| |||||||
| 48,584,044 | ||||||||
SEMICONDUCTORS & SEMICONDUCTOR |
| |||||||
ASM Pacific Technology Ltd.a | 1,682,100 | 13,033,478 | ||||||
|
| |||||||
| 13,033,478 | ||||||||
TEXTILES, APPAREL & LUXURY GOODS — 1.84% |
| |||||||
Li & Fung Ltd.a | 45,744,000 | 30,161,333 | ||||||
Yue Yuen Industrial Holdings Ltd. | 5,607,000 | 20,076,548 | ||||||
|
| |||||||
| 50,237,881 | ||||||||
|
| |||||||
TOTAL COMMON STOCKS |
| 2,706,536,022 | ||||||
SCHEDULESOF INVESTMENTS | 21 |
Table of Contents
Schedule of Investments (Continued)
iSHARES® MSCI HONG KONG ETF
August 31, 2015
| Security | Shares | Value | ||||||
SHORT-TERM INVESTMENTS — 3.57% |
| |||||||
MONEY MARKET FUNDS — 3.57% |
| |||||||
BlackRock Cash Funds: Institutional, |
| |||||||
0.18%d,e,f | 91,880,154 | $ | 91,880,154 | |||||
BlackRock Cash Funds: Prime, | ||||||||
0.18%d,e,f | 5,276,210 | 5,276,210 | ||||||
BlackRock Cash Funds: Treasury, |
| |||||||
0.03%d,e | 77,746 | 77,746 | ||||||
|
| |||||||
| 97,234,110 | ||||||||
|
| |||||||
TOTAL SHORT-TERM INVESTMENTS (Cost: $97,234,110) |
| 97,234,110 | ||||||
|
| |||||||
TOTAL INVESTMENTS |
| |||||||
(Cost: $3,143,454,535) |
| 2,803,770,132 | ||||||
Other Assets, Less Liabilities — (3.00)% |
| (81,546,270 | ) | |||||
|
| |||||||
NET ASSETS — 100.00% |
| $ | 2,722,223,862 | |||||
|
| |||||||
| a | All or a portion of this security represents a security on loan. See Note 1. |
| b | This security may be resold to qualified institutional buyers under Rule 144A of the Securities Act of 1933. |
| c | Non-income earning security. |
| d | Affiliated issuer. See Note 2. |
| e | The rate quoted is the annualized seven-day yield of the fund at period end. |
| f | All or a portion of this security represents an investment of securities lending collateral. See Note 1. |
Open futures contracts as of August 31, 2015 were as follows:
| Issue | Number of Contracts Purchased (Sold) | Expiration | Exchange | Notional Value | Unrealized Appreciation (Depreciation) | |||||||||||||||
| Hang Seng Index | 111 | Sep. 2015 | Hong Kong Futures | $ | 15,370,894 | $ | 241,933 | |||||||||||||
See notes to financial statements.
| 22 | 2015 iSHARES ANNUAL REPORTTO SHAREHOLDERS |
Table of Contents
Schedule of Investments
iSHARES® MSCI JAPAN SMALL-CAP ETF
August 31, 2015
| Security | Shares | Value | ||||||
COMMON STOCKS — 99.50% |
| |||||||
AEROSPACE & DEFENSE — 0.07% |
| |||||||
Jamco Corp. | 2,800 | $ | 110,211 | |||||
|
| |||||||
| 110,211 | ||||||||
AIR FREIGHT & LOGISTICS — 0.26% |
| |||||||
Kintetsu World Express Inc. | 5,600 | 210,026 | ||||||
Konoike Transport Co. Ltd. | 5,600 | 63,447 | ||||||
Mitsui-Soko Holdings Co. Ltd. | 28,000 | 85,258 | ||||||
Yusen Logistics Co. Ltd. | 5,600 | 58,733 | ||||||
|
| |||||||
| 417,464 | ||||||||
AUTO COMPONENTS — 3.64% |
| |||||||
Aisan Industry Co. Ltd. | 8,400 | 77,911 | ||||||
Akebono Brake Industry Co. Ltd.a | 19,600 | 58,710 | ||||||
Calsonic Kansei Corp. | 28,000 | 195,932 | ||||||
Eagle Industry Co. Ltd. | 5,600 | 114,879 | ||||||
Exedy Corp. | 8,400 | 192,351 | ||||||
FCC Co. Ltd. | 8,400 | 128,234 | ||||||
Futaba Industrial Co. Ltd. | 14,000 | 52,564 | ||||||
G-Tekt Corp. | 5,600 | 57,809 | ||||||
Keihin Corp. | 11,200 | 155,267 | ||||||
KYB Co. Ltd. | 56,000 | 165,433 | ||||||
Mitsuba Corp. | 8,400 | 145,632 | ||||||
Musashi Seimitsu Industry Co. Ltd. | 5,600 | 104,250 | ||||||
Nifco Inc./Japan | 14,000 | 547,592 | ||||||
Nippon Seiki Co. Ltd. | 8,000 | 160,086 | ||||||
Nissan Shatai Co. Ltd. | 22,400 | 263,029 | ||||||
Nissin Kogyo Co. Ltd. | 11,200 | 154,805 | ||||||
Pacific Industrial Co. Ltd. | 11,200 | 115,433 | ||||||
Piolax Inc. | 2,800 | 132,162 | ||||||
Press Kogyo Co. Ltd. | 28,000 | 110,212 | ||||||
Riken Corp. | 28,000 | 95,424 | ||||||
Sanden Holdings Corp. | 28,000 | 104,897 | ||||||
Showa Corp. | 14,000 | 118,414 | ||||||
Sumitomo Riko Co. Ltd. | 8,400 | 70,632 | ||||||
Tachi-S Co. Ltd. | 5,600 | 70,147 | ||||||
Taiho Kogyo Co. Ltd. | 5,600 | 68,622 | ||||||
Takata Corp.a,b | 8,400 | 87,892 | ||||||
Tokai Rika Co. Ltd. | 14,000 | 298,172 | ||||||
Topre Corp. | 11,200 | 217,651 | ||||||
Toyo Tire & Rubber Co. Ltd. | 25,200 | 564,367 | ||||||
Toyota Boshoku Corp. | 19,600 | 327,031 | ||||||
TPR Co. Ltd. | 5,600 | 135,535 | ||||||
TS Tech Co. Ltd. | 14,000 | 376,037 | ||||||
Unipres Corp. | 11,200 | 209,980 | ||||||
| Security | Shares | Value | ||||||
Yorozu Corp. | 5,600 | $ | 111,598 | |||||
|
| |||||||
| 5,788,690 | ||||||||
BANKS — 5.96% |
| |||||||
77 Bank Ltd. (The) | 84,000 | 498,378 | ||||||
Aichi Bank Ltd. (The) | 2,800 | 149,259 | ||||||
Ashikaga Holdings Co. Ltd. | 28,000 | 115,526 | ||||||
Awa Bank Ltd. (The) | 56,000 | 319,776 | ||||||
Bank of Iwate Ltd. (The) | 2,800 | 123,844 | ||||||
Bank of Nagoya Ltd. (The) | 56,000 | 214,416 | ||||||
Bank of Saga Ltd. (The) | 28,000 | 63,308 | ||||||
Bank of the Ryukyus Ltd. | 11,200 | 159,148 | ||||||
Chiba Kogyo Bank Ltd. (The) | 11,200 | 63,401 | ||||||
Daishi Bank Ltd. (The) | 84,000 | 359,747 | ||||||
Eighteenth Bank Ltd. (The) | 56,000 | 162,660 | ||||||
Higashi-Nippon Bank Ltd. (The) | 28,000 | 102,818 | ||||||
Higo Bank Ltd. (The) | 56,000 | 322,086 | ||||||
Hokkoku Bank Ltd. (The) | 84,000 | 322,317 | ||||||
Hokuetsu Bank Ltd. (The) | 56,000 | 111,829 | ||||||
Hyakugo Bank Ltd. (The) | 56,000 | 270,330 | ||||||
Hyakujushi Bank Ltd. (The) | 56,000 | 194,545 | ||||||
Jimoto Holdings Inc. | 42,000 | 73,128 | ||||||
Juroku Bank Ltd. (The) | 84,000 | 343,805 | ||||||
Kagoshima Bank Ltd. (The) | 56,000 | 356,744 | ||||||
Kansai Urban Banking Corp. | 5,600 | 62,292 | ||||||
Keiyo Bank Ltd. (The) | 56,000 | 294,822 | ||||||
Kiyo Bank Ltd. (The) | 19,600 | 300,668 | ||||||
Mie Bank Ltd. (The) | 28,000 | 63,077 | ||||||
Minato Bank Ltd. (The) | 56,000 | 108,132 | ||||||
Miyazaki Bank Ltd. (The) | 56,000 | 186,228 | ||||||
Musashino Bank Ltd. (The) | 8,400 | 295,631 | ||||||
Nanto Bank Ltd. (The) | 56,000 | 178,834 | ||||||
Nishi-Nippon City Bank Ltd. (The) | 196,000 | 545,051 | ||||||
North Pacific Bank Ltd. | 98,000 | 394,636 | ||||||
Ogaki Kyoritsu Bank Ltd. (The) | 84,000 | 298,057 | ||||||
Oita Bank Ltd. (The) | 56,000 | 235,673 | ||||||
San-in Godo Bank Ltd. (The) | 28,000 | 249,998 | ||||||
Senshu Ikeda Holdings Inc. | 61,600 | 270,423 | ||||||
Shiga Bank Ltd. (The) | 56,000 | 286,504 | ||||||
Tochigi Bank Ltd. (The) | 28,000 | 149,953 | ||||||
Toho Bank Ltd. (The) | 56,000 | 226,893 | ||||||
Tokyo TY Financial Group Inc. | 6,130 | 169,962 | ||||||
TOMONY Holdings Inc. | 42,000 | 167,050 | ||||||
Towa Bank Ltd. (The) | 84,000 | 78,326 | ||||||
Tsukuba Bank Ltd. | 22,400 | 82,624 | ||||||
Yamagata Bank Ltd. (The) | 56,000 | 231,514 | ||||||
SCHEDULESOF INVESTMENTS | 23 |
Table of Contents
Schedule of Investments (Continued)
iSHARES® MSCI JAPAN SMALL-CAP ETF
August 31, 2015
| Security | Shares | Value | ||||||
Yamanashi Chuo Bank Ltd. (The) | 56,000 | $ | 274,489 | |||||
|
| |||||||
| 9,477,902 | ||||||||
BEVERAGES — 1.10% | ||||||||
Coca-Cola East Japan Co. Ltd. | 16,866 | 305,351 | ||||||
Coca-Cola West Co. Ltd. | 19,600 | 403,532 | ||||||
Ito EN Ltd. | 16,800 | 397,733 | ||||||
Sapporo Holdings Ltd. | 84,000 | 327,862 | ||||||
Takara Holdings Inc. | 47,600 | 320,908 | ||||||
|
| |||||||
| 1,755,386 | ||||||||
BIOTECHNOLOGY — 0.47% | ||||||||
3-D Matrix Ltd.a,b | 5,600 | 55,221 | ||||||
GNI Group Ltd.a,b | 28,000 | 49,676 | ||||||
Japan Tissue Engineering Co. Ltd.b | 5,600 | 50,785 | ||||||
NanoCarrier Co. Ltd.b | 8,400 | 70,633 | ||||||
OncoTherapy Science Inc.a,b | 33,600 | 94,269 | ||||||
PeptiDream Inc.b | 8,400 | 217,304 | ||||||
ReproCELL Inc.a,b | 14,000 | 63,308 | ||||||
Takara Bio Inc. | 14,000 | 140,942 | ||||||
|
| |||||||
| 742,138 | ||||||||
BUILDING PRODUCTS — 1.70% |
| |||||||
Aica Kogyo Co. Ltd. | 14,000 | 298,634 | ||||||
Bunka Shutter Co. Ltd. | 14,000 | 106,515 | ||||||
Central Glass Co. Ltd. | 56,000 | 231,976 | ||||||
Maeda Kosen Co. Ltd. | 5,600 | 43,992 | ||||||
Nichias Corp. | 28,000 | 179,296 | ||||||
Nichiha Corp. | 5,600 | 78,835 | ||||||
Nippon Sheet Glass Co. Ltd.a,b | 224,000 | 203,326 | ||||||
Nitto Boseki Co. Ltd. | 56,000 | 265,709 | ||||||
Noritz Corp. | 8,400 | 126,501 | ||||||
Okabe Co. Ltd. | 11,200 | 93,992 | ||||||
Sankyo Tateyama Inc. | 8,400 | 129,273 | ||||||
Sanwa Holdings Corp. | 56,000 | 427,446 | ||||||
Sekisui Jushi Corp. | 8,400 | 110,974 | ||||||
Takara Standard Co. Ltd. | 28,000 | 192,004 | ||||||
Takasago Thermal Engineering Co. Ltd. | 14,000 | 212,914 | ||||||
|
| |||||||
| 2,701,387 | ||||||||
CAPITAL MARKETS — 1.49% |
| |||||||
Ichigo Inc. | 47,600 | 103,696 | ||||||
Ichiyoshi Securities Co. Ltd. | 11,200 | 97,319 | ||||||
IwaiCosmo Holdings Inc. | 5,600 | 68,622 | ||||||
Jafco Co. Ltd. | 8,400 | 367,372 | ||||||
kabu.com Securities Co. Ltd. | 44,800 | 146,764 | ||||||
Kyokuto Securities Co. Ltd. | 5,600 | 82,347 | ||||||
| Security | Shares | Value | ||||||
Marusan Securities Co. Ltd. | 16,800 | $ | 183,409 | |||||
Matsui Securities Co. Ltd. | 30,800 | 267,881 | ||||||
Mito Securities Co. Ltd. | 16,800 | 57,532 | ||||||
Monex Group Inc. | 44,800 | 116,450 | ||||||
Okasan Securities Group Inc. | 56,000 | 346,578 | ||||||
Sawada Holdings Co. Ltd. | 5,600 | 54,713 | ||||||
SPARX Group Co. Ltd. | 28,000 | 85,258 | ||||||
Tokai Tokyo Financial Holdings Inc. | 58,800 | 393,019 | ||||||
|
| |||||||
| 2,370,960 | ||||||||
CHEMICALS — 6.34% |
| |||||||
Achilles Corp. | 56,000 | 70,702 | ||||||
ADEKA Corp. | 25,200 | 317,326 | ||||||
C Uyemura & Co. Ltd. | 2,800 | 136,090 | ||||||
Chugoku Marine Paints Ltd. | 28,000 | 189,462 | ||||||
Dainichiseika Color & Chemicals Manufacturing Co. Ltd. | 28,000 | 133,317 | ||||||
Daiso Co. Ltd. | 28,000 | 97,504 | ||||||
Denki Kagaku Kogyo KK | 112,000 | 477,815 | ||||||
DIC Corp. | 224,000 | 541,585 | ||||||
Fujimi Inc. | 5,600 | 86,506 | ||||||
Fujimori Kogyo Co. Ltd. | 2,800 | 77,633 | ||||||
Ihara Chemical Industry Co. Ltd. | 8,400 | 90,665 | ||||||
Ishihara Sangyo Kaisha Ltd.b | 84,000 | 76,247 | ||||||
JSP Corp. | 5,600 | 92,005 | ||||||
Konishi Co. Ltd. | 5,600 | 100,923 | ||||||
Kumiai Chemical Industry Co. Ltd.a | 11,200 | 88,909 | ||||||
Kureha Corp. | 56,000 | 197,780 | ||||||
Lintec Corp. | 14,000 | 323,241 | ||||||
Nihon Nohyaku Co. Ltd. | 11,200 | 87,522 | ||||||
Nihon Parkerizing Co. Ltd. | 22,400 | 190,941 | ||||||
Nippon Kayaku Co. Ltd. | 28,000 | 287,197 | ||||||
Nippon Shokubai Co. Ltd. | 31,000 | 478,871 | ||||||
Nippon Soda Co. Ltd. | 28,000 | 160,812 | ||||||
Nippon Synthetic Chemical Industry Co. Ltd. (The) | 9,000 | 64,909 | ||||||
Nissan Chemical Industries Ltd. | 33,600 | 774,670 | ||||||
NOF Corp. | 28,000 | 208,871 | ||||||
Okamoto Industries Inc. | 28,000 | 252,077 | ||||||
Sakai Chemical Industry Co. Ltd. | 28,000 | 81,330 | ||||||
Sakata INX Corp. | 11,200 | 87,153 | ||||||
Sanyo Chemical Industries Ltd. | 6,000 | 44,907 | ||||||
Shin-Etsu Polymer Co. Ltd. | 14,000 | 69,316 | ||||||
Showa Denko KK | 420,000 | 481,743 | ||||||
Sumitomo Bakelite Co. Ltd. | 56,000 | 216,264 | ||||||
Taiyo Holdings Co. Ltd. | 5,600 | 200,784 | ||||||
| 24 | 2015 iSHARES ANNUAL REPORTTO SHAREHOLDERS |
Table of Contents
Schedule of Investments (Continued)
iSHARES® MSCI JAPAN SMALL-CAP ETF
August 31, 2015
| Security | Shares | Value | ||||||
Takasago International Corp. | 28,000 | $ | 159,657 | |||||
Tenma Corp. | 5,600 | 93,391 | ||||||
Toagosei Co. Ltd. | 28,000 | 205,867 | ||||||
Tokai Carbon Co. Ltd. | 56,000 | 137,245 | ||||||
Tokuyama Corp.a,b | 84,000 | 142,097 | ||||||
Tokyo Ohka Kogyo Co. Ltd. | 11,200 | 315,617 | ||||||
Tosoh Corp. | 140,000 | 661,963 | ||||||
Toyo Ink SC Holdings Co. Ltd. | 56,000 | 213,030 | ||||||
Toyobo Co. Ltd. | 252,000 | 361,827 | ||||||
Ube Industries Ltd. | 308,000 | 533,729 | ||||||
Zeon Corp. | 56,000 | 465,800 | ||||||
|
| |||||||
| 10,075,300 | ||||||||
COMMERCIAL SERVICES & SUPPLIES — 2.13% |
| |||||||
Aeon Delight Co. Ltd. | 5,600 | 177,910 | ||||||
Asukanet Co. Ltd.a | 2,800 | 39,187 | ||||||
Daiseki Co. Ltd. | 11,260 | 196,517 | ||||||
Duskin Co. Ltd. | 14,000 | 278,995 | ||||||
Itoki Corp. | 11,200 | 78,465 | ||||||
Kokuyo Co. Ltd. | 22,400 | 226,800 | ||||||
Kyodo Printing Co. Ltd. | 28,000 | 76,016 | ||||||
Matsuda Sangyo Co. Ltd. | 5,660 | 62,165 | ||||||
Mitsubishi Pencil Co. Ltd. | 5,600 | 245,839 | ||||||
Moshi Moshi Hotline Inc. | 11,200 | 114,509 | ||||||
Nippon Parking Development Co. Ltd.a | 47,600 | 65,596 | ||||||
Nissha Printing Co. Ltd. | 8,400 | 144,315 | ||||||
Okamura Corp. | 19,600 | 175,807 | ||||||
Oyo Corp. | 5,600 | 71,626 | ||||||
Pilot Corp. | 8,400 | 408,268 | ||||||
Sato Holdings Corp. | 5,600 | 117,559 | ||||||
Sohgo Security Services Co. Ltd. | 16,800 | 734,745 | ||||||
Toppan Forms Co. Ltd. | 14,000 | 171,440 | ||||||
|
| |||||||
| 3,385,759 | ||||||||
COMMUNICATIONS EQUIPMENT — 0.11% |
| |||||||
Denki Kogyo Co. Ltd. | 28,000 | 123,150 | ||||||
Icom Inc. | 2,800 | 58,849 | ||||||
|
| |||||||
| 181,999 | ||||||||
CONSTRUCTION & ENGINEERING — 4.74% |
| |||||||
Chiyoda Corp. | 56,000 | 404,340 | ||||||
Chudenko Corp. | 8,400 | 166,912 | ||||||
COMSYS Holdings Corp. | 28,000 | 348,888 | ||||||
Fudo Tetra Corp. | 47,600 | 67,559 | ||||||
Hazama Ando Corp. | 47,600 | 312,266 | ||||||
Hibiya Engineering Ltd. | 5,600 | 69,177 | ||||||
Kandenko Co. Ltd. | 28,000 | 186,921 | ||||||
| Security | Shares | Value | ||||||
Kinden Corp. | 28,000 | $ | 352,123 | |||||
Kumagai Gumi Co. Ltd. | 112,000 | 365,986 | ||||||
Kyowa Exeo Corp. | 22,400 | 230,497 | ||||||
Kyudenko Corp. | 9,000 | 177,200 | ||||||
Maeda Corp. | 28,000 | 224,813 | ||||||
Maeda Road Construction Co. Ltd. | 28,000 | 500,920 | ||||||
MIRAIT Holdings Corp. | 16,800 | 157,485 | ||||||
Nippo Corp. | 14,000 | 238,561 | ||||||
Nippon Densetsu Kogyo Co. Ltd. | 8,400 | 155,128 | ||||||
Nippon Koei Co. Ltd. | 28,000 | 112,060 | ||||||
Nippon Road Co. Ltd. (The) | 28,000 | 146,949 | ||||||
Nishimatsu Construction Co. Ltd. | 84,000 | 377,770 | ||||||
Okumura Corp. | 56,000 | 306,837 | ||||||
OSJB Holdings Corp. | 25,200 | 48,036 | ||||||
Penta-Ocean Construction Co. Ltd. | 78,400 | 377,816 | ||||||
Raito Kogyo Co. Ltd. | 14,000 | 137,938 | ||||||
Sanki Engineering Co. Ltd. | 11,200 | 86,228 | ||||||
SHO-BOND Holdings Co. Ltd. | 5,600 | 232,438 | ||||||
Sumitomo Densetsu Co. Ltd. | 5,600 | 77,356 | ||||||
Sumitomo Mitsui Construction Co. Ltd. | 210,000 | 277,262 | ||||||
Taikisha Ltd. | 8,400 | 190,410 | ||||||
Tekken Corp.a | 28,000 | 79,482 | ||||||
Toa Corp./Tokyo | 56,000 | 116,912 | ||||||
Toda Corp. | 56,000 | 285,580 | ||||||
Tokyu Construction Co. Ltd. | 19,640 | 185,890 | ||||||
Toshiba Plant Systems & Services Corp. | 11,200 | 122,457 | ||||||
Totetsu Kogyo Co. Ltd. | 5,600 | 119,361 | ||||||
Toyo Construction Co. Ltd.a | 19,600 | 86,529 | ||||||
Toyo Engineering Corp. | 28,000 | 71,626 | ||||||
Yahagi Construction Co. Ltd. | 8,400 | 65,295 | ||||||
Yokogawa Bridge Holdings Corp. | 8,400 | 71,742 | ||||||
|
| |||||||
| 7,534,750 | ||||||||
CONSTRUCTION MATERIALS — 0.27% |
| |||||||
Sumitomo Osaka Cement Co. Ltd. | 112,000 | 435,301 | ||||||
|
| |||||||
| 435,301 | ||||||||
CONSUMER FINANCE — 0.79% |
| |||||||
Aiful Corp.a,b | 86,800 | 335,926 | ||||||
Hitachi Capital Corp. | 14,000 | 337,451 | ||||||
J Trust Co. Ltd. | 22,400 | 190,386 | ||||||
Jaccs Co. Ltd. | 56,000 | 226,431 | ||||||
Orient Corp.b | 98,000 | 160,119 | ||||||
|
| |||||||
| 1,250,313 | ||||||||
SCHEDULESOF INVESTMENTS | 25 |
Table of Contents
Schedule of Investments (Continued)
iSHARES® MSCI JAPAN SMALL-CAP ETF
August 31, 2015
| Security | Shares | Value | ||||||
CONTAINERS & PACKAGING — 0.53% |
| |||||||
FP Corp. | 8,400 | $ | 291,818 | |||||
Fuji Seal International Inc. | 5,600 | 191,542 | ||||||
Pack Corp. (The) | 5,600 | 127,679 | ||||||
Rengo Co. Ltd. | 56,000 | 225,045 | ||||||
|
| |||||||
| 836,084 | ||||||||
DISTRIBUTORS — 0.34% |
| |||||||
Canon Marketing Japan Inc. | 14,000 | 206,098 | ||||||
Chori Co. Ltd. | 2,800 | 41,058 | ||||||
Doshisha Co. Ltd. | 5,600 | 105,775 | ||||||
Happinet Corp. | 2,800 | 26,155 | ||||||
PALTAC Corp. | 8,400 | 158,525 | ||||||
|
| |||||||
| 537,611 | ||||||||
DIVERSIFIED CONSUMER SERVICES — 0.02% |
| |||||||
Meiko Network Japan Co. Ltd. | 2,800 | 29,413 | ||||||
|
| |||||||
| 29,413 | ||||||||
DIVERSIFIED FINANCIAL SERVICES — 1.03% |
| |||||||
Century Tokyo Leasing Corp. | 11,280 | 348,588 | ||||||
Financial Products Group Co. Ltd. | 19,600 | 136,990 | ||||||
Fuyo General Lease Co. Ltd. | 5,600 | 219,037 | ||||||
IBJ Leasing Co. Ltd. | 5,600 | 115,849 | ||||||
Japan Securities Finance Co. Ltd. | 28,000 | 152,263 | ||||||
Ricoh Leasing Co. Ltd. | 5,600 | 156,884 | ||||||
Zenkoku Hosho Co. Ltd. | 14,000 | 505,426 | ||||||
|
| |||||||
| 1,635,037 | ||||||||
ELECTRIC UTILITIES — 0.47% |
| |||||||
Hokkaido Electric Power Co. Inc.b | 50,400 | 553,970 | ||||||
Okinawa Electric Power Co. Inc. (The) | 8,400 | 197,826 | ||||||
|
| |||||||
| 751,796 | ||||||||
ELECTRICAL EQUIPMENT — 1.43% |
| |||||||
Chiyoda Integre Co. Ltd. | 2,800 | 65,827 | ||||||
Cosel Co. Ltd. | 5,600 | 63,077 | ||||||
Daihen Corp. | 28,000 | 135,396 | ||||||
Fujikura Ltd. | 84,000 | 416,586 | ||||||
Furukawa Electric Co. Ltd. | 196,000 | 317,003 | ||||||
Futaba Corp. | 8,400 | 115,064 | ||||||
GS Yuasa Corp. | 112,000 | 418,666 | ||||||
Idec Corp./Japan | 8,400 | 69,939 | ||||||
Nissin Electric Co. Ltd. | 11,200 | 64,602 | ||||||
Nitto Kogyo Corp. | 8,400 | 158,941 | ||||||
Tatsuta Electric Wire and Cable Co. Ltd. | 11,200 | 42,883 | ||||||
Toyo Tanso Co. Ltd. | 2,800 | 38,054 | ||||||
| Security | Shares | Value | ||||||
Ushio Inc. | 30,800 | $ | 360,903 | |||||
|
| |||||||
| 2,266,941 | ||||||||
ELECTRONIC EQUIPMENT, INSTRUMENTS & COMPONENTS — 3.40% |
| |||||||
Ai Holdings Corp. | 11,200 | 247,133 | ||||||
Amano Corp. | 16,800 | 213,076 | ||||||
Anritsu Corp. | 39,200 | 261,689 | ||||||
Azbil Corp. | 16,800 | 427,677 | ||||||
Canon Electronics Inc. | 5,600 | 98,844 | ||||||
CONEXIO Corp. | 2,800 | 30,014 | ||||||
Daiwabo Holdings Co. Ltd. | 56,000 | 98,428 | ||||||
Elematec Corp. | 2,800 | 63,516 | ||||||
Enplas Corp. | 2,800 | 99,583 | ||||||
HORIBA Ltd. | 8,400 | 296,324 | ||||||
Hosiden Corp. | 16,800 | 90,665 | ||||||
Iriso Electronics Co. Ltd. | 2,800 | 126,847 | ||||||
Japan Aviation Electronics Industry Ltd. | 28,000 | 512,935 | ||||||
Japan Cash Machine Co. Ltd.a | 5,600 | 67,467 | ||||||
Japan Display Inc.b | 100,800 | 317,742 | ||||||
Kaga Electronics Co. Ltd. | 5,600 | 73,937 | ||||||
Kanematsu Electronics Ltd. | 2,800 | 42,306 | ||||||
Koa Corp. | 8,400 | 74,583 | ||||||
Macnica Fuji Electronics Holdings Inc.b | 8,400 | 93,576 | ||||||
Maruwa Co. Ltd./Aichi | 2,800 | 58,202 | ||||||
Mitsumi Electric Co. Ltd.a | 22,400 | 127,910 | ||||||
Nichicon Corp. | 14,000 | 102,587 | ||||||
Nippon Ceramic Co. Ltd. | 5,600 | 79,713 | ||||||
Nippon Chemi-Con Corp. | 28,000 | 67,236 | ||||||
Nippon Signal Co. Ltd. | 16,800 | 155,405 | ||||||
Nohmi Bosai Ltd. | 5,600 | 65,988 | ||||||
Oki Electric Industry Co. Ltd. | 196,000 | 342,881 | ||||||
Ryosan Co. Ltd. | 8,400 | 202,471 | ||||||
Ryoyo Electro Corp. | 5,600 | 71,349 | ||||||
SIIX Corp. | 2,800 | 76,247 | ||||||
Tabuchi Electric Co. Ltd. | 5,600 | 41,127 | ||||||
Taiyo Yuden Co. Ltd. | 28,000 | 342,419 | ||||||
Topcon Corp. | 19,600 | 311,827 | ||||||
Toyo Corp./Chuo-ku | 8,400 | 72,781 | ||||||
UKC Holdings Corp. | 2,800 | 54,597 | ||||||
|
| |||||||
| 5,409,082 | ||||||||
ENERGY EQUIPMENT & SERVICES — 0.13% |
| |||||||
Modec Inc.a | 5,600 | 74,538 | ||||||
Shinko Plantech Co. Ltd. | 11,200 | 91,219 | ||||||
| 26 | 2015 iSHARES ANNUAL REPORTTO SHAREHOLDERS |
Table of Contents
Schedule of Investments (Continued)
iSHARES® MSCI JAPAN SMALL-CAP ETF
August 31, 2015
| Security | Shares | Value | ||||||
Toyo Kanetsu KK | 28,000 | $ | 49,676 | |||||
|
| |||||||
| 215,433 | ||||||||
FOOD & STAPLES RETAILING — 3.78% |
| |||||||
Ain Pharmaciez Inc. | 5,600 | 257,392 | ||||||
Arcs Co. Ltd. | 8,400 | 165,941 | ||||||
Belc Co. Ltd. | 2,800 | 90,341 | ||||||
Cawachi Ltd. | 5,600 | 90,480 | ||||||
Cocokara fine Inc. | 5,600 | 224,813 | ||||||
Cosmos Pharmaceutical Corp. | 2,800 | 359,285 | ||||||
CREATE SD HOLDINGS Co. Ltd. | 2,800 | 159,888 | ||||||
Heiwado Co. Ltd. | 8,400 | 177,864 | ||||||
Kato Sangyo Co. Ltd. | 5,600 | 126,293 | ||||||
Kobe Bussan Co. Ltd.a | 1,300 | 121,649 | ||||||
Kusuri No Aoki Co. Ltd. | 2,800 | 131,468 | ||||||
Matsumotokiyoshi Holdings Co. Ltd. | 11,200 | 538,813 | ||||||
Ministop Co. Ltd. | 5,600 | 115,433 | ||||||
Mitsubishi Shokuhin Co. Ltd. | 2,800 | 60,651 | ||||||
San-A Co. Ltd. | 5,600 | 260,626 | ||||||
Sugi Holdings Co. Ltd. | 11,200 | 541,585 | ||||||
Sundrug Co. Ltd. | 8,400 | 472,732 | ||||||
Tsuruha Holdings Inc. | 8,400 | 683,451 | ||||||
United Super Markets Holdings Inc. | 14,000 | 120,725 | ||||||
UNY Group Holdings Co. Ltd. | 56,000 | 348,426 | ||||||
Valor Co. Ltd. | 11,200 | 315,155 | ||||||
Welcia Holdings Co. Ltd. | 5,600 | 268,944 | ||||||
Yaoko Co. Ltd. | 5,600 | 292,511 | ||||||
Yokohama Reito Co. Ltd. | 11,200 | 92,790 | ||||||
|
| |||||||
| 6,017,256 | ||||||||
FOOD PRODUCTS — 3.53% |
| |||||||
Ariake Japan Co. Ltd. | 5,600 | 233,824 | ||||||
Dydo Drinco Inc. | 2,800 | 124,999 | ||||||
Ezaki Glico Co. Ltd. | 11,200 | 561,918 | ||||||
Fuji Oil Co. Ltd./Osaka | 16,800 | 232,900 | ||||||
Fujiya Co. Ltd.b | 28,000 | 44,824 | ||||||
Hokuto Corp. | 5,600 | 101,663 | ||||||
House Foods Group Inc. | 16,800 | 307,761 | ||||||
Itoham Foods Inc. | 28,000 | 173,982 | ||||||
J-Oil Mills Inc. | 28,000 | 91,265 | ||||||
Kagome Co. Ltd. | 22,400 | 379,294 | ||||||
Kameda Seika Co. Ltd. | 2,800 | 117,836 | ||||||
Kewpie Corp. | 28,000 | 618,294 | ||||||
KEY Coffee Inc. | 5,600 | 104,851 | ||||||
Marudai Food Co. Ltd. | 28,000 | 118,530 | ||||||
Maruha Nichiro Corp. | 11,200 | 168,391 | ||||||
MEGMILK SNOW BRAND Co. Ltd. | 11,200 | 212,752 | ||||||
| Security | Shares | Value | ||||||
Mitsui Sugar Co. Ltd. | 28,000 | $ | 115,757 | |||||
Morinaga & Co. Ltd./Japan | 56,000 | 298,981 | ||||||
Morinaga Milk Industry Co. Ltd. | 56,000 | 272,179 | ||||||
Nichirei Corp. | 56,000 | 342,881 | ||||||
Nippon Beet Sugar Manufacturing Co. Ltd. | 28,000 | 44,131 | ||||||
Nippon Flour Mills Co. Ltd. | 28,000 | 178,603 | ||||||
Nippon Suisan Kaisha Ltd. | 67,200 | 210,719 | ||||||
Nisshin OilliO Group Ltd. (The) | 28,000 | 105,591 | ||||||
Prima Meat Packers Ltd. | 28,000 | 79,713 | ||||||
S Foods Inc. | 2,800 | 58,110 | ||||||
Sakata Seed Corp. | 8,400 | 136,066 | ||||||
Showa Sangyo Co. Ltd. | 28,000 | 110,905 | ||||||
Warabeya Nichiyo Co. Ltd. | 2,800 | 65,572 | ||||||
|
| |||||||
| 5,612,292 | ||||||||
GAS UTILITIES — 0.09% |
| |||||||
K&O Energy Group Inc. | 2,800 | 39,163 | ||||||
Shizuoka Gas Co. Ltd. | 14,000 | 96,811 | ||||||
|
| |||||||
| 135,974 | ||||||||
HEALTH CARE EQUIPMENT & SUPPLIES — 1.69% |
| |||||||
Asahi Intecc Co. Ltd. | 14,000 | 567,810 | ||||||
Eiken Chemical Co. Ltd. | 5,600 | 105,313 | ||||||
Fukuda Denshi Co. Ltd. | 2,800 | 143,252 | ||||||
Hogy Medical Co. Ltd. | 2,800 | 136,089 | ||||||
JEOL Ltd. | 28,000 | 169,823 | ||||||
Mani Inc. | 8,400 | 189,301 | ||||||
Nagaileben Co. Ltd. | 5,600 | 113,585 | ||||||
Nakanishi Inc. | 5,600 | 220,423 | ||||||
Nihon Kohden Corp. | 19,600 | 391,563 | ||||||
Nikkiso Co. Ltd. | 16,800 | 132,670 | ||||||
Nipro Corp. | 30,800 | 352,516 | ||||||
Paramount Bed Holdings Co. Ltd. | 5,600 | 167,744 | ||||||
|
| |||||||
| 2,690,089 | ||||||||
HEALTH CARE PROVIDERS & SERVICES — 0.73% |
| |||||||
AS ONE Corp. | 2,800 | 93,345 | ||||||
BML Inc. | 2,800 | 85,258 | ||||||
Message Co. Ltd. | 2,800 | 101,085 | ||||||
Nichii Gakkan Co.a | 14,000 | 107,670 | ||||||
Ship Healthcare Holdings Inc. | 11,200 | 246,393 | ||||||
Toho Holdings Co. Ltd. | 14,000 | 308,223 | ||||||
Tokai Corp./Gifu | 2,800 | 85,374 | ||||||
Tsukui Corp. | 8,400 | 77,079 | ||||||
Vital KSK Holdings Inc. | 8,400 | 57,948 | ||||||
|
| |||||||
| 1,162,375 | ||||||||
SCHEDULESOF INVESTMENTS | 27 |
Table of Contents
Schedule of Investments (Continued)
iSHARES® MSCI JAPAN SMALL-CAP ETF
August 31, 2015
| Security | Shares | Value | ||||||
HEALTH CARE TECHNOLOGY — 0.03% |
| |||||||
FINDEX Inc. | 5,600 | $ | 47,966 | |||||
|
| |||||||
| 47,966 | ||||||||
HOTELS, RESTAURANTS & LEISURE — 3.35% |
| |||||||
Accordia Golf Co. Ltd. | 16,800 | 169,268 | ||||||
Atom Corp. | 14,000 | 102,125 | ||||||
Colowide Co. Ltd.a | 16,800 | 254,388 | ||||||
Create Restaurants Holdings Inc. | 5,600 | 124,814 | ||||||
Doutor Nichires Holdings Co. Ltd. | 8,400 | 129,412 | ||||||
Fuji Kyuko Co. Ltd. | 28,000 | 283,963 | ||||||
Fujita Kanko Inc. | 28,000 | 89,879 | ||||||
Hiday Hidaka Corp. | 2,800 | 69,778 | ||||||
Hiramatsu Inc. | 8,400 | 47,204 | ||||||
HIS Co. Ltd. | 11,200 | 384,008 | ||||||
Ichibanya Co. Ltd. | 2,800 | 123,613 | ||||||
Kappa Create Holdings Co. Ltd.a,b | 8,400 | 94,200 | ||||||
Kisoji Co. Ltd. | 5,600 | 97,966 | ||||||
Koshidaka Holdings Co. Ltd. | 2,800 | 58,317 | ||||||
Kura Corp. | 2,800 | 77,980 | ||||||
Kyoritsu Maintenance Co. Ltd. | 2,840 | 173,655 | ||||||
MOS Food Services Inc. | 8,400 | 186,181 | ||||||
Ohsho Food Service Corp. | 2,800 | 93,807 | ||||||
Plenus Co. Ltd. | 5,600 | 91,681 | ||||||
Resorttrust Inc. | 19,600 | 522,408 | ||||||
Ringer Hut Co. Ltd. | 5,600 | 124,583 | ||||||
Round One Corp. | 19,600 | 88,470 | ||||||
Royal Holdings Co. Ltd. | 8,400 | 153,465 | ||||||
Saizeriya Co. Ltd. | 8,400 | 195,262 | ||||||
Skylark Co. Ltd. | 30,800 | 476,036 | ||||||
St. Marc Holdings Co. Ltd. | 5,600 | 172,827 | ||||||
Tokyo Dome Corp. | 56,000 | 229,203 | ||||||
Tokyotokeiba Co. Ltd. | 28,000 | 73,012 | ||||||
Toridoll.corp. | 5,600 | 80,221 | ||||||
Tosho Co. Ltd. | 2,800 | 79,135 | ||||||
WATAMI Co. Ltd.a,b | 5,600 | 47,550 | ||||||
Yoshinoya Holdings Co. Ltd. | 14,000 | 166,704 | ||||||
Zensho Holdings Co. Ltd.a,b | 28,000 | 267,558 | ||||||
|
| |||||||
| 5,328,673 | ||||||||
HOUSEHOLD DURABLES — 2.12% |
| |||||||
Alpine Electronics Inc. | 11,200 | 157,855 | ||||||
Chofu Seisakusho Co. Ltd. | 5,600 | 121,256 | ||||||
Clarion Co. Ltd. | 28,000 | 70,240 | ||||||
Cleanup Corp. | 2,800 | 19,593 | ||||||
Foster Electric Co. Ltd. | 5,600 | 110,165 | ||||||
Fujitsu General Ltd. | 28,000 | 347,040 | ||||||
| Security | Shares | Value | ||||||
Funai Electric Co. Ltd. | 5,600 | $ | 56,561 | |||||
Haseko Corp. | 75,600 | 890,219 | ||||||
JVC Kenwood Corp.a | 39,200 | 86,044 | ||||||
Misawa Homes Co. Ltd. | 8,400 | 60,235 | ||||||
Pioneer Corp.b | 81,200 | 147,411 | ||||||
Pressance Corp. | 2,800 | 104,782 | ||||||
Sangetsu Co. Ltd. | 16,800 | 293,066 | ||||||
Starts Corp. Inc. | 5,600 | 93,668 | ||||||
Sumitomo Forestry Co. Ltd. | 39,200 | 439,922 | ||||||
Takamatsu Construction Group Co. Ltd. | 2,800 | 59,334 | ||||||
Tamron Co. Ltd. | 5,600 | 112,384 | ||||||
Token Corp. | 2,820 | 195,004 | ||||||
|
| |||||||
| 3,364,779 | ||||||||
HOUSEHOLD PRODUCTS — 0.84% |
| |||||||
Earth Chemical Co. Ltd. | 2,800 | 106,399 | ||||||
Lion Corp.a | 56,000 | 490,754 | ||||||
Pigeon Corp. | 28,000 | 742,831 | ||||||
|
| |||||||
| 1,339,984 | ||||||||
INDUSTRIAL CONGLOMERATES — 0.36% |
| |||||||
Katakura Industries Co. Ltd. | 5,600 | 61,552 | ||||||
Nisshinbo Holdings Inc. | 34,000 | 409,622 | ||||||
TOKAI Holdings Corp. | 25,200 | 103,765 | ||||||
|
| |||||||
| 574,939 | ||||||||
INTERNET & CATALOG RETAIL — 0.60% |
| |||||||
ASKUL Corp.a | 5,600 | 194,083 | ||||||
Belluna Co. Ltd. | 14,000 | 77,980 | ||||||
Ikyu Corp.a | 5,600 | 110,212 | ||||||
Senshukai Co. Ltd. | 8,400 | 56,839 | ||||||
Start Today Co. Ltd. | 16,800 | 512,935 | ||||||
|
| |||||||
| 952,049 | ||||||||
INTERNET SOFTWARE & SERVICES — 1.35% |
| |||||||
Ateam Inc. | 2,800 | 43,091 | ||||||
COOKPAD Inc.a | 14,000 | 290,779 | ||||||
CROOZ Inc.a | 2,800 | 80,637 | ||||||
Dena Co. Ltd. | 28,000 | 512,010 | ||||||
Dip Corp. | 8,400 | 147,989 | ||||||
F@N Communications Inc.a | 11,200 | 84,750 | ||||||
GMO Internet Inc. | 19,600 | 279,804 | ||||||
Gree Inc. | 30,800 | 145,378 | ||||||
Gurunavi Inc. | 8,400 | 135,373 | ||||||
Infomart Corp. | 11,200 | 128,557 | ||||||
Internet Initiative Japan Inc.a | 8,400 | 148,820 | ||||||
NIFTY Corp. | 2,800 | 31,977 | ||||||
| 28 | 2015 iSHARES ANNUAL REPORTTO SHAREHOLDERS |
Table of Contents
Schedule of Investments (Continued)
iSHARES® MSCI JAPAN SMALL-CAP ETF
August 31, 2015
| Security | Shares | Value | ||||||
SMS Co. Ltd. | 5,600 | $ | 86,321 | |||||
UNITED Inc./Japana | 2,800 | 32,763 | ||||||
|
| |||||||
| 2,148,249 | ||||||||
IT SERVICES — 2.05% |
| |||||||
Digital Garage Inc. | 8,400 | 119,292 | ||||||
DTS Corp. | 5,600 | 126,940 | ||||||
Future Architect Inc. | 2,800 | 16,382 | ||||||
GMO Payment Gateway Inc. | 5,674 | 191,732 | ||||||
Ines Corp. | 8,400 | 74,029 | ||||||
IT Holdings Corp. | 22,448 | 526,630 | ||||||
NEC Networks & System Integration Corp. | 5,600 | 102,263 | ||||||
NET One Systems Co. Ltd. | 22,400 | 136,043 | ||||||
Nihon Unisys Ltd. | 16,800 | 178,418 | ||||||
NS Solutions Corp. | 5,600 | 216,957 | ||||||
OBIC Co. Ltd. | 19,600 | 874,993 | ||||||
SCSK Corp. | 14,056 | 508,607 | ||||||
Transcosmos Inc. | 8,400 | 192,836 | ||||||
|
| |||||||
| 3,265,122 | ||||||||
LEISURE PRODUCTS — 0.43% |
| |||||||
Fields Corp.a | 2,800 | 37,870 | ||||||
Heiwa Corp. | 14,016 | 276,075 | ||||||
Mars Engineering Corp. | 2,800 | 47,966 | ||||||
Mizuno Corp. | 28,000 | 128,927 | ||||||
Tomy Co. Ltd. | 16,800 | 84,149 | ||||||
Universal Entertainment Corp. | 5,600 | 109,796 | ||||||
|
| |||||||
| 684,783 | ||||||||
LIFE SCIENCES TOOLS & SERVICES — 0.08% |
| |||||||
CMIC Holdings Co. Ltd.a | 2,800 | 37,870 | ||||||
EPS Holdings Inc. | 8,400 | 97,596 | ||||||
|
| |||||||
| 135,466 | ||||||||
MACHINERY — 7.03% |
| |||||||
Aichi Corp. | 8,400 | 54,135 | ||||||
Aida Engineering Ltd. | 14,000 | 129,620 | ||||||
Asahi Diamond Industrial Co. Ltd. | 14,000 | 131,122 | ||||||
Bando Chemical Industries Ltd. | 28,000 | 113,677 | ||||||
CKD Corp. | 16,800 | 153,880 | ||||||
Daifuku Co. Ltd. | 25,200 | 367,857 | ||||||
Daiwa Industries Ltd. | 8,400 | 57,740 | ||||||
DMG Mori Co. Ltd. | 30,800 | 442,995 | ||||||
Ebara Corp. | 140,000 | 559,145 | ||||||
Fuji Machine Manufacturing Co. Ltd. | 19,600 | 175,969 | ||||||
Fujitec Co. Ltd. | 19,600 | 174,028 | ||||||
Fukushima Industries Corp. | 2,800 | 60,466 | ||||||
| Security | Shares | Value | ||||||
Furukawa Co. Ltd. | 84,000 | $ | 204,481 | |||||
Giken Ltd. | 2,800 | 36,783 | ||||||
Glory Ltd. | 16,800 | 439,460 | ||||||
Harmonic Drive Systems Inc. | 5,600 | 87,199 | ||||||
Hitachi Koki Co. Ltd. | 14,000 | 105,360 | ||||||
Hitachi Zosen Corp. | 44,800 | 232,900 | ||||||
Hoshizaki Electric Co. Ltd. | 11,200 | 718,109 | ||||||
Iseki & Co. Ltd.a | 56,000 | 89,648 | ||||||
Japan Steel Works Ltd. (The) | 84,000 | 279,342 | ||||||
Juki Corp. | 11,200 | 136,228 | ||||||
Kitz Corp. | 25,200 | 107,924 | ||||||
Komori Corp. | 14,000 | 160,234 | ||||||
Kyokuto Kaihatsu Kogyo Co. Ltd. | 8,400 | 86,783 | ||||||
Makino Milling Machine Co. Ltd. | 28,000 | 217,420 | ||||||
Max Co. Ltd. | 4,000 | 42,679 | ||||||
Meidensha Corp. | 56,000 | 180,682 | ||||||
METAWATER Co. Ltd. | 2,800 | 66,566 | ||||||
Mitsubishi Nichiyu Forklift Co. Ltd. | 2,800 | 12,269 | ||||||
Mitsui Engineering & Shipbuilding Co. Ltd. | 224,000 | 349,350 | ||||||
Miura Co. Ltd. | 22,400 | 251,015 | ||||||
Morita Holdings Corp. | 5,600 | 57,208 | ||||||
Nachi-Fujikoshi Corp. | 56,000 | 258,778 | ||||||
Namura Shipbuilding Co. Ltd. | 14,000 | 102,356 | ||||||
Nippon Sharyo Ltd.a | 28,000 | 79,251 | ||||||
Nippon Thompson Co. Ltd. | 28,000 | 125,461 | ||||||
Nitta Corp. | 5,600 | 134,287 | ||||||
Nitto Kohki Co. Ltd. | 2,800 | 55,799 | ||||||
Noritake Co. Ltd./Nagoya Japan | 28,000 | 62,384 | ||||||
NTN Corp. | 112,000 | 584,099 | ||||||
Obara Group Inc. | 2,800 | 115,064 | ||||||
Oiles Corp. | 8,496 | 132,924 | ||||||
OKUMA Corp. | 28,000 | 222,041 | ||||||
OSG Corp. | 22,400 | 454,525 | ||||||
Ryobi Ltd. | 28,000 | 111,829 | ||||||
Shibuya Kogyo Co. Ltd. | 2,800 | 50,415 | ||||||
Shima Seiki Manufacturing Ltd.a | 8,400 | 119,431 | ||||||
ShinMaywa Industries Ltd. | 28,000 | 293,436 | ||||||
Sintokogio Ltd. | 14,000 | 114,255 | ||||||
Sodick Co. Ltd. | 11,200 | 76,340 | ||||||
Star Micronics Co. Ltd. | 11,200 | 160,073 | ||||||
Tadano Ltd. | 28,000 | 381,004 | ||||||
Takeuchi Manufacturing Co. Ltd. | 8,400 | 145,978 | ||||||
Takuma Co. Ltd. | 28,000 | 218,806 | ||||||
Teikoku Sen-I Co. Ltd. | 5,600 | 64,694 | ||||||
SCHEDULESOF INVESTMENTS | 29 |
Table of Contents
Schedule of Investments (Continued)
iSHARES® MSCI JAPAN SMALL-CAP ETF
August 31, 2015
| Security | Shares | Value | ||||||
Tocalo Co. Ltd. | 5,600 | $ | 110,443 | |||||
Toshiba Machine Co. Ltd. | 28,000 | 100,508 | ||||||
Tsubakimoto Chain Co. | 28,000 | 216,033 | ||||||
Tsugami Corp. | 28,000 | 118,992 | ||||||
Tsukishima Kikai Co. Ltd. | 2,800 | 23,729 | ||||||
Tsurumi Manufacturing Co. Ltd. | 2,800 | 43,137 | ||||||
Union Tool Co. | 2,800 | 80,522 | ||||||
YAMABIKO Corp. | 2,800 | 97,504 | ||||||
Yushin Precision Equipment Co. Ltd. | 2,800 | 48,105 | ||||||
|
| |||||||
| 11,184,477 | ||||||||
MARINE — 0.47% |
| |||||||
Iino Kaiun Kaisha Ltd. | 25,200 | 119,777 | ||||||
Kawasaki Kisen Kaisha Ltd. | 252,000 | 561,456 | ||||||
NS United Kaiun Kaisha Ltd. | 28,000 | 59,842 | ||||||
|
| |||||||
| 741,075 | ||||||||
MEDIA — 1.69% |
| |||||||
Adways Inc.a | 8,400 | 57,948 | ||||||
Asatsu-DK Inc. | 8,400 | 173,774 | ||||||
Avex Group Holdings Inc. | 8,400 | 107,162 | ||||||
CyberAgent Inc. | 14,000 | 555,679 | ||||||
Daiichikosho Co. Ltd. | 11,200 | 424,673 | ||||||
Kadokawa Dwangob | 14,008 | 165,874 | ||||||
Next Co. Ltd. | 14,000 | 83,641 | ||||||
Shochiku Co. Ltd. | 28,000 | 223,658 | ||||||
SKY Perfect JSAT Holdings Inc. | 50,400 | 229,157 | ||||||
Toei Co. Ltd. | 28,000 | 208,871 | ||||||
Tohokushinsha Film Corp. | 5,600 | 40,850 | ||||||
Tokyo Broadcasting System Holdings Inc. | 11,200 | 153,696 | ||||||
TV Asahi Holdings Corp. | 5,600 | 83,548 | ||||||
USEN Corp.b | 28,080 | 75,770 | ||||||
Zenrin Co. Ltd. | 8,400 | 109,033 | ||||||
|
| |||||||
| 2,693,334 | ||||||||
METALS & MINING — 2.52% |
| |||||||
Aichi Steel Corp. | 28,000 | 109,288 | ||||||
Asahi Holdings Inc. | 8,400 | 124,768 | ||||||
Daido Steel Co. Ltd. | 84,000 | 311,920 | ||||||
Dowa Holdings Co. Ltd. | 56,000 | 488,443 | ||||||
Godo Steel Ltd. | 56,000 | 91,034 | ||||||
Kurimoto Ltd. | 28,000 | 47,135 | ||||||
Kyoei Steel Ltd. | 5,600 | 97,735 | ||||||
Mitsubishi Steel Manufacturing Co. Ltd. | 28,000 | 54,297 | ||||||
Mitsui Mining & Smelting Co. Ltd. | 168,000 | 345,191 | ||||||
Neturen Co. Ltd. | 8,400 | 59,265 | ||||||
| Security | Shares | Value | ||||||
Nippon Denko Co. Ltd. | 28,000 | $ | 56,608 | |||||
Nippon Light Metal Holdings Co. Ltd. | 142,800 | 220,354 | ||||||
Nippon Yakin Kogyo Co. Ltd.b | 36,400 | 55,868 | ||||||
Nisshin Steel Co. Ltd. | 25,200 | 237,475 | ||||||
Nittetsu Mining Co. Ltd. | 28,000 | 131,468 | ||||||
Osaka Steel Co. Ltd. | 2,800 | 43,230 | ||||||
OSAKA Titanium Technologies Co. Ltd. | 5,600 | 146,487 | ||||||
Pacific Metals Co. Ltd.a,b | 56,000 | 147,873 | ||||||
Sanyo Special Steel Co. Ltd. | 28,000 | 111,829 | ||||||
Toho Titanium Co. Ltd.a,b | 11,200 | 147,503 | ||||||
Toho Zinc Co. Ltd. | 28,000 | 73,012 | ||||||
Tokyo Rope Manufacturing Co. Ltd.b | 56,000 | 91,034 | ||||||
Tokyo Steel Manufacturing Co. Ltd. | 28,000 | 181,376 | ||||||
TOPY Industries Ltd. | 56,000 | 123,382 | ||||||
Toyo Kohan Co. Ltd. | 8,400 | 31,608 | ||||||
UACJ Corp. | 56,140 | 104,233 | ||||||
Yamato Kogyo Co. Ltd. | 11,200 | 252,493 | ||||||
Yodogawa Steel Works Ltd. | 28,000 | 119,685 | ||||||
|
| |||||||
| 4,004,594 | ||||||||
MULTILINE RETAIL — 0.96% |
| |||||||
Fuji Co. Ltd./Ehime | 5,600 | 136,598 | ||||||
H2O Retailing Corp. | 22,535 | 449,640 | ||||||
Izumi Co. Ltd. | 11,200 | 480,588 | ||||||
Matsuya Co. Ltd. | 8,400 | 138,007 | ||||||
Parco Co. Ltd. | 5,600 | 51,109 | ||||||
Seria Co. Ltd. | 5,600 | 270,330 | ||||||
|
| |||||||
| 1,526,272 | ||||||||
OIL, GAS & CONSUMABLE FUELS — 0.58% |
| |||||||
Cosmo Oil Co. Ltd.b | 168,000 | 262,013 | ||||||
ITOCHU Enex Co. Ltd. | 14,000 | 121,071 | ||||||
Japan Petroleum Exploration Co. Ltd. | 8,400 | 247,456 | ||||||
Nippon Coke & Engineering Co. Ltd. | 22,400 | 19,408 | ||||||
Nippon Gas Co. Ltd. | 8,400 | 276,569 | ||||||
|
| |||||||
| 926,517 | ||||||||
PAPER & FOREST PRODUCTS — 0.68% |
| |||||||
Daio Paper Corp. | 28,000 | 350,505 | ||||||
Hokuetsu Kishu Paper Co. Ltd. | 36,400 | 216,865 | ||||||
Mitsubishi Paper Mills Ltd.b | 84,000 | 58,918 | ||||||
Nippon Paper Industries Co. Ltd. | 28,000 | 459,100 | ||||||
|
| |||||||
| 1,085,388 | ||||||||
PERSONAL PRODUCTS — 1.21% |
| |||||||
Aderans Co. Ltd. | 5,600 | 41,312 | ||||||
Artnature Inc. | 5,600 | 48,197 | ||||||
| 30 | 2015 iSHARES ANNUAL REPORTTO SHAREHOLDERS |
Table of Contents
Schedule of Investments (Continued)
iSHARES® MSCI JAPAN SMALL-CAP ETF
August 31, 2015
| Security | Shares | Value | ||||||
Dr. Ci:Labo Co. Ltd. | 5,600 | $ | 100,600 | |||||
Euglena Co. Ltd.a,b | 16,800 | 221,532 | ||||||
Fancl Corp. | 11,200 | 156,561 | ||||||
Kobayashi Pharmaceutical Co. Ltd. | 8,400 | 653,645 | ||||||
Mandom Corp. | 5,600 | 204,481 | ||||||
Milbon Co. Ltd. | 2,800 | 100,508 | ||||||
Noevir Holdings Co. Ltd. | 2,800 | 63,123 | ||||||
Pola Orbis Holdings Inc. | 5,600 | 335,487 | ||||||
|
| |||||||
| 1,925,446 | ||||||||
PHARMACEUTICALS — 2.75% |
| |||||||
ASKA Pharmaceutical Co. Ltd. | 5,600 | 66,497 | ||||||
JCR Pharmaceuticals Co. Ltd. | 2,800 | 68,946 | ||||||
Kaken Pharmaceutical Co. Ltd. | 18,000 | 851,095 | ||||||
Kissei Pharmaceutical Co. Ltd. | 5,600 | 142,790 | ||||||
KYORIN Holdings Inc. | 14,000 | 248,381 | ||||||
Mochida Pharmaceutical Co. Ltd. | 2,800 | 180,451 | ||||||
Nichi-Iko Pharmaceutical Co. Ltd. | 11,250 | 339,770 | ||||||
Nippon Shinyaku Co. Ltd. | 13,000 | 447,333 | ||||||
Rohto Pharmaceutical Co. Ltd. | 25,200 | 436,064 | ||||||
Sawai Pharmaceutical Co. Ltd. | 8,400 | 530,957 | ||||||
Seikagaku Corp. | 11,200 | 158,409 | ||||||
Sosei Group Corp. | 2,800 | 118,529 | ||||||
Torii Pharmaceutical Co. Ltd. | 2,800 | 69,893 | ||||||
Towa Pharmaceutical Co. Ltd. | 2,800 | 218,113 | ||||||
Tsumura & Co. | 16,800 | 374,165 | ||||||
ZERIA Pharmaceutical Co. Ltd. | 8,400 | 117,628 | ||||||
|
| |||||||
| 4,369,021 | ||||||||
PROFESSIONAL SERVICES — 1.19% |
| |||||||
Benefit One Inc.a | 5,600 | 100,739 | ||||||
en-japan Inc. | 2,800 | 71,626 | ||||||
Meitec Corp. | 8,400 | 324,050 | ||||||
Nihon M&A Center Inc. | 8,400 | 343,112 | ||||||
Nomura Co. Ltd. | 11,200 | 169,684 | ||||||
TechnoPro Holdings Inc. | 11,200 | 326,707 | ||||||
Temp Holdings Co. Ltd. | 11,200 | 500,920 | ||||||
Yumeshin Holdings Co. Ltd.a | 8,400 | 55,314 | ||||||
|
| |||||||
| 1,892,152 | ||||||||
REAL ESTATE INVESTMENT TRUSTS (REITS) — 8.42% |
| |||||||
Activia Properties Inc. | 56 | 459,331 | ||||||
Advance Residence Investment Corp. | 364 | 758,427 | ||||||
AEON REIT Investment Corp. | 252 | 282,599 | ||||||
Comforia Residential REIT Inc. | 112 | 205,174 | ||||||
Daiwa House REIT Investment Corp. | 84 | 306,375 | ||||||
| Security | Shares | Value | ||||||
Daiwa House Residential Investment Corp. | 196 | $ | 365,847 | |||||
Daiwa Office Investment Corp. | 84 | 395,098 | ||||||
Frontier Real Estate Investment Corp. | 112 | 449,627 | ||||||
Fukuoka REIT Corp. | 196 | 305,196 | ||||||
Global One Real Estate Investment Corp. | 56 | 169,130 | ||||||
GLP J-REIT | 588 | 551,197 | ||||||
Hankyu REIT Inc. | 140 | 139,671 | ||||||
Heiwa Real Estate REIT Inc. | 224 | 158,039 | ||||||
Hulic Reit Inc. | 196 | 227,239 | ||||||
Ichigo Real Estate Investment Corp. | 280 | 195,701 | ||||||
Industrial & Infrastructure Fund Investment Corp. | 84 | 349,350 | ||||||
Invesco Office J-Reit Inc. | 140 | 112,291 | ||||||
Invincible Investment Corp. | 700 | 397,987 | ||||||
Japan Excellent Inc. | 336 | 363,491 | ||||||
Japan Hotel REIT Investment Corp. | 812 | 502,538 | ||||||
Japan Logistics Fund Inc. | 224 | 405,912 | ||||||
Japan Rental Housing Investments Inc. | 420 | 268,944 | ||||||
Kenedix Office Investment Corp. | 112 | 500,920 | ||||||
Kenedix Residential Investment Corp. | 112 | 271,440 | ||||||
Kenedix Retail REIT Corp.b | 84 | 178,002 | ||||||
MCUBS MidCity Investment Corp. | 84 | 209,333 | ||||||
Mori Hills REIT Investment Corp. | 364 | 419,913 | ||||||
MORI TRUST Sogo REIT Inc. | 280 | 484,053 | ||||||
Nippon Accommodations Fund Inc. | 140 | 467,302 | ||||||
NIPPON REIT Investment Corp. | 112 | 242,512 | ||||||
Nomura Real Estate Master Fund Inc. | 448 | 484,284 | ||||||
Nomura Real Estate Office Fund Inc. | 112 | 442,233 | ||||||
Nomura Real Estate Residential Fund Inc. | 56 | 272,641 | ||||||
Orix JREIT Inc. | 616 | 777,720 | ||||||
Premier Investment Corp. | 56 | 280,959 | ||||||
Sekisui House Reit Inc.b | 196 | 197,156 | ||||||
Sekisui House SI Residential Investment Corp. | 280 | 246,994 | ||||||
TOKYU REIT Inc. | 280 | 328,094 | ||||||
Top REIT Inc. | 56 | 219,730 | ||||||
|
| |||||||
| 13,392,450 | ||||||||
SCHEDULESOF INVESTMENTS | 31 |
Table of Contents
Schedule of Investments (Continued)
iSHARES® MSCI JAPAN SMALL-CAP ETF
August 31, 2015
| Security | Shares | Value | ||||||
REAL ESTATE MANAGEMENT & DEVELOPMENT — 1.38% |
| |||||||
Ardepro Co. Ltd.a,b | 25,200 | $ | 19,963 | |||||
Daibiru Corp. | 14,000 | 119,223 | ||||||
Daikyo Inc. | 84,000 | 131,699 | ||||||
Goldcrest Co. Ltd. | 5,600 | 100,877 | ||||||
Heiwa Real Estate Co. Ltd. | 11,200 | 142,882 | ||||||
Kenedix Inc. | 67,200 | 237,891 | ||||||
Leopalace21 Corp.b | 70,000 | 340,801 | ||||||
Open House Co. Ltd. | 8,400 | 155,059 | ||||||
Raysum Co. Ltd. | 5,600 | 51,617 | ||||||
Relo Holdings Inc. | 2,800 | 293,667 | ||||||
Sumitomo Real Estate Sales Co. Ltd. | 5,600 | 147,642 | ||||||
Sun Frontier Fudousan Co. Ltd. | 5,600 | 42,144 | ||||||
Takara Leben Co. Ltd. | 25,200 | 115,410 | ||||||
TOC Co. Ltd. | 16,800 | 113,400 | ||||||
Tosei Corp. | 8,400 | 54,066 | ||||||
Unizo Holdings Co. Ltd. | 2,800 | 127,541 | ||||||
|
| |||||||
| 2,193,882 | ||||||||
ROAD & RAIL — 2.23% |
| |||||||
Fukuyama Transporting Co. Ltd. | 28,000 | 154,343 | ||||||
Hitachi Transport System Ltd. | 14,000 | 236,828 | ||||||
Nankai Electric Railway Co. Ltd. | 140,000 | 723,192 | ||||||
Nippon Konpo Unyu Soko Co. Ltd. | 16,800 | 297,502 | ||||||
Nishi-Nippon Railroad Co. Ltd. | 84,000 | 426,291 | ||||||
Sankyu Inc. | 56,000 | 281,883 | ||||||
Seino Holdings Co. Ltd. | 39,200 | 435,717 | ||||||
Senko Co. Ltd. | 28,000 | 197,549 | ||||||
Sotetsu Holdings Inc. | 112,000 | 638,627 | ||||||
Trancom Co. Ltd. | 2,800 | 153,187 | ||||||
|
| |||||||
| 3,545,119 | ||||||||
SEMICONDUCTORS & SEMICONDUCTOR |
| |||||||
Advantest Corp. | 42,000 | 337,913 | ||||||
DISCO Corp. | 8,400 | 634,930 | ||||||
Megachips Corp. | 5,600 | 58,687 | ||||||
Micronics Japan Co. Ltd. | 5,600 | 107,763 | ||||||
Mimasu Semiconductor Industry Co. Ltd. | 5,600 | 54,574 | ||||||
Mitsui High-Tec Inc. | 8,400 | 49,699 | ||||||
Sanken Electric Co. Ltd. | 28,000 | 107,670 | ||||||
SCREEN Holdings Co. Ltd. | 56,000 | 268,944 | ||||||
Shindengen Electric Manufacturing Co. Ltd. | 28,000 | 107,208 | ||||||
Shinko Electric Industries Co. Ltd. | 16,800 | 107,578 | ||||||
| Security | Shares | Value | ||||||
Sumco Corp. | 53,200 | $ | 490,361 | |||||
Tokyo Seimitsu Co. Ltd. | 11,200 | 215,433 | ||||||
ULVAC Inc. | 11,200 | 178,649 | ||||||
|
| |||||||
| 2,719,409 | ||||||||
SOFTWARE — 1.08% |
| |||||||
Broadleaf Co. Ltd. | 5,600 | 56,053 | ||||||
Capcom Co. Ltd. | 14,000 | 329,249 | ||||||
Fuji Soft Inc. | 5,600 | 93,946 | ||||||
Justsystems Corp.b | 11,200 | 85,119 | ||||||
KLab Inc.b | 8,400 | 99,814 | ||||||
Koei Tecmo Holdings Co. Ltd. | 8,400 | 152,009 | ||||||
Marvelous Inc.a | 8,400 | 74,168 | ||||||
NSD Co. Ltd. | 8,400 | 104,597 | ||||||
OBIC Business Consultants Ltd. | 2,800 | 136,089 | ||||||
Square Enix Holdings Co. Ltd. | 22,400 | 585,023 | ||||||
|
| |||||||
| 1,716,067 | ||||||||
SPECIALTY RETAIL — 3.20% |
| |||||||
Adastria Co. Ltd. | 2,800 | 150,646 | ||||||
Alpen Co. Ltd. | 5,600 | 81,469 | ||||||
AOKI Holdings Inc. | 11,200 | 135,304 | ||||||
Aoyama Trading Co. Ltd. | 14,000 | 523,332 | ||||||
Arcland Sakamoto Co. Ltd. | 2,800 | 60,536 | ||||||
Autobacs Seven Co. Ltd. | 19,600 | 360,833 | ||||||
BIC Camera Inc. | 22,400 | 216,634 | ||||||
Chiyoda Co. Ltd. | 5,600 | 156,653 | ||||||
DCM Holdings Co. Ltd. | 25,200 | 198,797 | ||||||
EDION Corp.a | 22,400 | 163,030 | ||||||
Geo Holdings Corp. | 11,200 | 170,146 | ||||||
Gulliver International Co. Ltd.a | 16,800 | 148,474 | ||||||
Jin Co. Ltd. | 2,800 | 130,775 | ||||||
Joshin Denki Co. Ltd. | 7,000 | 55,279 | ||||||
Joyful Honda Co. Ltd. | 8,400 | 166,149 | ||||||
K’s Holdings Corp. | 11,200 | 357,668 | ||||||
Keiyo Co. Ltd. | 8,400 | 37,846 | ||||||
Kohnan Shoji Co. Ltd. | 8,400 | 109,865 | ||||||
Komeri Co. Ltd. | 8,400 | 187,429 | ||||||
Laox Co. Ltd.a,b | 84,000 | 291,125 | ||||||
Nishimatsuya Chain Co. Ltd. | 14,000 | 125,346 | ||||||
Nojima Corp. | 5,600 | 60,304 | ||||||
Pal Co. Ltd. | 2,800 | 83,410 | ||||||
Sac’s Bar Holdings Inc. | 2,800 | 48,128 | ||||||
Shimachu Co. Ltd. | 14,000 | 342,072 | ||||||
T-Gaia Corp. | 8,400 | 137,938 | ||||||
Tsutsumi Jewelry Co. Ltd. | 2,800 | 59,219 | ||||||
United Arrows Ltd. | 5,600 | 221,348 | ||||||
| 32 | 2015 iSHARES ANNUAL REPORTTO SHAREHOLDERS |
Table of Contents
Schedule of Investments (Continued)
iSHARES® MSCI JAPAN SMALL-CAP ETF
August 31, 2015
| Security | Shares | Value | ||||||
VT Holdings Co. Ltd. | 22,400 | $ | 136,413 | |||||
Xebio Co. Ltd. | 5,600 | 106,191 | ||||||
Yellow Hat Ltd. | 2,800 | 61,113 | ||||||
|
| |||||||
| 5,083,472 | ||||||||
TECHNOLOGY HARDWARE, STORAGE & |
| |||||||
Eizo Corp. | 5,600 | 127,910 | ||||||
Elecom Co. Ltd. | 2,800 | 59,611 | ||||||
Hitachi Maxell Ltd. | 11,200 | 173,474 | ||||||
Japan Digital Laboratory Co. Ltd. | 5,600 | 81,746 | ||||||
Melco Holdings Inc. | 2,800 | 45,633 | ||||||
Riso Kagaku Corp. | 5,600 | 109,472 | ||||||
Roland DG Corp. | 2,800 | 63,147 | ||||||
Toshiba TEC Corp. | 28,000 | 104,204 | ||||||
Wacom Co. Ltd.a | 42,000 | 151,801 | ||||||
|
| |||||||
| 916,998 | ||||||||
TEXTILES, APPAREL & LUXURY GOODS — 1.16% |
| |||||||
Descente Ltd. | 11,200 | 156,006 | ||||||
Fujibo Holdings Inc. | 28,000 | 52,911 | ||||||
Gunze Ltd. | 56,000 | 175,137 | ||||||
Kurabo Industries Ltd. | 56,000 | 109,519 | ||||||
Onward Holdings Co. Ltd. | 28,000 | 176,524 | ||||||
Sanyo Shokai Ltd. | 28,000 | 95,424 | ||||||
Seiko Holdings Corp. | 28,000 | 166,588 | ||||||
Seiren Co. Ltd. | 14,000 | 157,577 | ||||||
TSI Holdings Co. Ltd. | 22,400 | 173,381 | ||||||
Unitika Ltd.b | 168,000 | 92,883 | ||||||
Wacoal Holdings Corp. | 28,000 | 360,210 | ||||||
Yondoshi Holdings Inc. | 5,600 | 121,810 | ||||||
|
| |||||||
| 1,837,970 | ||||||||
TRADING COMPANIES & DISTRIBUTORS — 3.03% |
| |||||||
Gecoss Corp. | 2,800 | 25,185 | ||||||
Hanwa Co. Ltd. | 56,000 | 235,211 | ||||||
Inaba Denki Sangyo Co. Ltd. | 5,600 | 181,376 | ||||||
Inabata & Co. Ltd. | 11,200 | 121,995 | ||||||
Iwatani Corp. | 56,000 | 335,487 | ||||||
Japan Pulp & Paper Co. Ltd. | 28,000 | 79,020 | ||||||
Kamei Corp. | 8,400 | 89,001 | ||||||
Kanamoto Co. Ltd. | 8,400 | 222,503 | ||||||
Kanematsu Corp. | 112,000 | 172,827 | ||||||
Kuroda Electric Co. Ltd. | 8,400 | 155,821 | ||||||
MISUMI Group Inc. | 75,600 | 877,742 | ||||||
MonotaRO Co. Ltd. | 8,400 | 425,597 | ||||||
Nagase & Co. Ltd. | 30,800 | 372,594 | ||||||
Nippon Steel & Sumikin Bussan Corp. | 29,440 | 98,145 | ||||||
| Security | Shares | Value | ||||||
Nishio Rent All Co. Ltd. | 5,600 | $ | 143,714 | |||||
Sojitz Corp. | 341,600 | 724,439 | ||||||
Trusco Nakayama Corp. | 5,600 | 217,651 | ||||||
Wakita & Co. Ltd. | 11,200 | 102,864 | ||||||
Yamazen Corp. | 14,000 | 109,750 | ||||||
Yuasa Trading Co. Ltd. | 5,600 | 120,147 | ||||||
|
| |||||||
| 4,811,069 | ||||||||
TRANSPORTATION INFRASTRUCTURE — 0.09% |
| |||||||
Sumitomo Warehouse Co. Ltd. (The) | 28,000 | 142,328 | ||||||
|
| |||||||
| 142,328 | ||||||||
WIRELESS TELECOMMUNICATION SERVICES — 0.09% |
| |||||||
Japan Communications Inc.a,b | 33,600 | 83,456 | ||||||
WirelessGate Inc. | 2,800 | 53,835 | ||||||
|
| |||||||
| 137,291 | ||||||||
|
| |||||||
TOTAL COMMON STOCKS |
| |||||||
(Cost: $174,025,441) |
| 158,213,284 | ||||||
SHORT-TERM INVESTMENTS — 4.30% |
| |||||||
MONEY MARKET FUNDS — 4.30% |
| |||||||
BlackRock Cash Funds: Institutional, |
| |||||||
0.18%c,d,e | 6,410,406 | 6,410,406 | ||||||
BlackRock Cash Funds: Prime, | ||||||||
0.18%c,d,e | 368,117 | 368,117 | ||||||
BlackRock Cash Funds: Treasury, | ||||||||
0.03%c,d | 51,026 | 51,026 | ||||||
|
| |||||||
| 6,829,549 | ||||||||
|
| |||||||
TOTAL SHORT-TERM INVESTMENTS |
| |||||||
(Cost: $6,829,549) |
| 6,829,549 | ||||||
|
| |||||||
TOTAL INVESTMENTS |
| |||||||
(Cost: $180,854,990) |
| 165,042,833 | ||||||
Other Assets, Less Liabilities — (3.80)% |
| (6,038,686 | ) | |||||
|
| |||||||
NET ASSETS — 100.00% |
| $ | 159,004,147 | |||||
|
| |||||||
| a | All or a portion of this security represents a security on loan. See Note 1. |
| b | Non-income earning security. |
| c | Affiliated issuer. See Note 2. |
| d | The rate quoted is the annualized seven-day yield of the fund at period end. |
| e | All or a portion of this security represents an investment of securities lending collateral. See Note 1. |
See notes to financial statements.
SCHEDULESOF INVESTMENTS | 33 |
Table of Contents
Schedule of Investments
August 31, 2015
| Security | Shares | Value | ||||||
COMMON STOCKS — 99.44% |
| |||||||
AIRLINES — 0.24% |
| |||||||
AirAsia Bhda | 3,076,500 | $ | 637,275 | |||||
|
| |||||||
| 637,275 | ||||||||
AUTOMOBILES — 1.10% |
| |||||||
UMW Holdings Bhd | 1,434,000 | 2,902,143 | ||||||
|
| |||||||
| 2,902,143 | ||||||||
BANKS — 30.96% |
| |||||||
Alliance Financial Group Bhd | 2,658,300 | 2,379,811 | ||||||
AMMB Holdings Bhd | 4,810,237 | 5,382,884 | ||||||
CIMB Group Holdings Bhda | 12,506,564 | 14,888,767 | ||||||
Hong Leong Bank Bhd | 1,384,640 | 4,312,165 | ||||||
Hong Leong Financial Group Bhd | 516,600 | 1,717,080 | ||||||
Malayan Banking Bhda | 11,703,720 | 24,410,616 | ||||||
Public Bank Bhda | 6,195,380 | 26,551,628 | ||||||
RHB Capital Bhd | 1,270,700 | 1,960,509 | ||||||
|
| |||||||
| 81,603,460 | ||||||||
CHEMICALS — 3.77% |
| |||||||
Petronas Chemicals Group Bhd | 6,874,600 | 9,935,434 | ||||||
|
| |||||||
| 9,935,434 | ||||||||
CONSTRUCTION & ENGINEERING — 5.05% |
| |||||||
Dialog Group Bhd | 9,322,454 | 3,484,822 | ||||||
Gamuda Bhd | 4,102,200 | 4,238,940 | ||||||
IJM Corp. Bhd | 3,721,240 | 5,581,860 | ||||||
|
| |||||||
| 13,305,622 | ||||||||
CONSTRUCTION MATERIALS — 0.79% |
| |||||||
Lafarge Malaysia Bhd | 938,760 | 2,078,683 | ||||||
|
| |||||||
| 2,078,683 | ||||||||
DIVERSIFIED TELECOMMUNICATION SERVICES — 1.61% |
| |||||||
Telekom Malaysia Bhd | 2,739,400 | 4,233,025 | ||||||
|
| |||||||
| 4,233,025 | ||||||||
ELECTRIC UTILITIES — 8.40% |
| |||||||
Tenaga Nasional Bhd | 8,313,512 | 22,129,777 | ||||||
|
| |||||||
| 22,129,777 | ||||||||
ENERGY EQUIPMENT & SERVICES — 1.70% |
| |||||||
Bumi Armada Bhdb | 5,760,900 | 1,172,754 | ||||||
Sapurakencana Petroleum Bhda | 8,091,500 | 3,313,662 | ||||||
|
| |||||||
| 4,486,416 | ||||||||
FOOD PRODUCTS — 7.02% |
| |||||||
Felda Global Ventures Holdings Bhd | 3,134,700 | 910,556 | ||||||
Genting Plantations Bhd | 569,800 | 1,339,030 | ||||||
IOI Corp. Bhd | 7,135,930 | 6,796,124 | ||||||
| Security | Shares | Value | ||||||
Kuala Lumpur Kepong Bhd | 1,048,200 | $ | 5,196,077 | |||||
PPB Group Bhd | 1,163,966 | 4,251,247 | ||||||
|
| |||||||
| 18,493,034 | ||||||||
GAS UTILITIES — 3.27% |
| |||||||
Petronas Gas Bhd | 1,700,300 | 8,631,047 | ||||||
|
| |||||||
| 8,631,047 | ||||||||
HEALTH CARE PROVIDERS & SERVICES — 3.20% |
| |||||||
IHH Healthcare Bhd | 6,051,600 | 8,429,014 | ||||||
|
| |||||||
| 8,429,014 | ||||||||
HOTELS, RESTAURANTS & LEISURE — 6.46% |
| |||||||
Berjaya Sports Toto Bhd | 1,658,576 | 1,164,952 | ||||||
Genting Bhd | 5,513,900 | 8,992,908 | ||||||
Genting Malaysia Bhd | 7,289,600 | 6,873,052 | ||||||
|
| |||||||
| 17,030,912 | ||||||||
INDUSTRIAL CONGLOMERATES — 5.13% |
| |||||||
Sime Darby Bhd | 7,625,025 | 13,525,342 | ||||||
|
| |||||||
| 13,525,342 | ||||||||
MARINE — 2.01% |
| |||||||
MISC Bhd | 2,739,820 | 5,283,938 | ||||||
|
| |||||||
| 5,283,938 | ||||||||
MEDIA — 1.00% |
| |||||||
Astro Malaysia Holdings Bhd | 3,831,500 | 2,645,559 | ||||||
|
| |||||||
| 2,645,559 | ||||||||
MULTI-UTILITIES — 2.13% |
| |||||||
YTL Corp. Bhd | 10,600,712 | 3,937,407 | ||||||
YTL Power International Bhd | 4,553,300 | 1,680,385 | ||||||
|
| |||||||
| 5,617,792 | ||||||||
OIL, GAS & CONSUMABLE FUELS — 1.17% |
| |||||||
Petronas Dagangan Bhd | 609,500 | 3,070,719 | ||||||
|
| |||||||
| 3,070,719 | ||||||||
REAL ESTATE MANAGEMENT & DEVELOPMENT — 0.61% |
| |||||||
IOI Properties Group Bhd | 3,711,009 | 1,616,940 | ||||||
|
| |||||||
| 1,616,940 | ||||||||
TOBACCO — 1.77% |
| |||||||
British American Tobacco Malaysia Bhd | 315,400 | 4,669,422 | ||||||
|
| |||||||
| 4,669,422 | ||||||||
TRANSPORTATION INFRASTRUCTURE — 1.74% |
| |||||||
Malaysia Airports Holdings Bhd | 2,027,500 | 2,085,429 | ||||||
Westports Holdings Bhd | 2,511,400 | 2,511,400 | ||||||
|
| |||||||
| 4,596,829 | ||||||||
| 34 | 2015 iSHARES ANNUAL REPORTTO SHAREHOLDERS |
Table of Contents
Schedule of Investments (Continued)
iSHARES® MSCI MALAYSIA ETF
August 31, 2015
| Security | Shares | Value | ||||||
WIRELESS TELECOMMUNICATION SERVICES — 10.31% |
| |||||||
Axiata Group Bhd | 6,339,400 | $ | 9,267,599 | |||||
DiGi.Com Bhda | 8,589,900 | 10,696,471 | ||||||
Maxis Bhda | 4,608,800 | 7,209,480 | ||||||
|
| |||||||
| 27,173,550 | ||||||||
|
| |||||||
TOTAL COMMON STOCKS |
| |||||||
(Cost: $136,260,957) |
| 262,095,933 | ||||||
SHORT-TERM INVESTMENTS — 9.33% |
| |||||||
MONEY MARKET FUNDS — 9.33% |
| |||||||
BlackRock Cash Funds: Institutional, |
| |||||||
0.18%c,d,e | 23,196,839 | 23,196,839 | ||||||
BlackRock Cash Funds: Prime, |
| |||||||
0.18%c,d,e | 1,332,077 | 1,332,077 | ||||||
BlackRock Cash Funds: Treasury, |
| |||||||
0.03%c,d | 60,821 | 60,821 | ||||||
|
| |||||||
| 24,589,737 | ||||||||
|
| |||||||
TOTAL SHORT-TERM INVESTMENTS |
| |||||||
(Cost: $24,589,737) |
| 24,589,737 | ||||||
|
| |||||||
TOTAL INVESTMENTS |
| |||||||
(Cost: $160,850,694) |
| 286,685,670 | ||||||
Other Assets, Less Liabilities — (8.77)% |
| (23,106,905 | ) | |||||
|
| |||||||
NET ASSETS — 100.00% | $ | 263,578,765 | ||||||
|
| |||||||
| a | All or a portion of this security represents a security on loan. See Note 1. |
| b | Non-income earning security. |
| c | Affiliated issuer. See Note 2. |
| d | The rate quoted is the annualized seven-day yield of the fund at period end. |
| e | All or a portion of this security represents an investment of securities lending collateral. See Note 1. |
See notes to financial statements.
SCHEDULESOF INVESTMENTS | 35 |
Table of Contents
Schedule of Investments
iSHARES® MSCI PACIFIC ex JAPAN ETF
August 31, 2015
| Security | Shares | Value | ||||||
COMMON STOCKS — 99.08% |
| |||||||
AUSTRALIA — 58.97% |
| |||||||
AGL Energy Ltd. | 1,006,242 | $ | 12,048,906 | |||||
Alumina Ltd. | 3,735,954 | 3,469,671 | ||||||
Amcor Ltd./Australia | 1,766,220 | 17,179,655 | ||||||
AMP Ltd. | 4,379,580 | 18,474,170 | ||||||
APA Group | 1,661,178 | 10,328,358 | ||||||
Aristocrat Leisure Ltd. | 797,094 | 4,769,441 | ||||||
Asciano Ltd. | 1,448,376 | 8,717,752 | ||||||
ASX Ltd. | 287,274 | 8,032,463 | ||||||
Aurizon Holdings Ltd. | 3,146,442 | 11,064,121 | ||||||
AusNet Services | 2,641,668 | 2,444,017 | ||||||
Australia & New Zealand Banking Group Ltd. | 4,100,136 | 81,186,668 | ||||||
Bank of Queensland Ltd. | 541,488 | 4,863,859 | ||||||
Bendigo & Adelaide Bank Ltd. | 667,116 | 5,188,281 | ||||||
BHP Billiton Ltd. | 4,762,554 | 85,018,053 | ||||||
Boral Ltd. | 1,157,274 | 4,627,334 | ||||||
Brambles Ltd. | 2,323,074 | 16,205,919 | ||||||
Caltex Australia Ltd. | 400,896 | 9,060,779 | ||||||
CIMIC Group Ltd. | 150,162 | 2,492,166 | ||||||
Coca-Cola Amatil Ltd. | 850,686 | 5,065,987 | ||||||
Cochlear Ltd. | 84,564 | 5,121,668 | ||||||
Commonwealth Bank of Australia | 2,520,894 | 134,182,032 | ||||||
Computershare Ltd. | 698,958 | 4,905,709 | ||||||
Crown Resorts Ltd. | 538,704 | 4,369,098 | ||||||
CSL Ltd. | 692,824 | 45,124,474 | ||||||
Dexus Property Group | 1,425,060 | 7,445,882 | ||||||
Federation Centres | 4,997,628 | 10,026,881 | ||||||
Flight Centre Travel Group Ltd.a | 82,128 | 2,154,894 | ||||||
Fortescue Metals Group Ltd.a | 2,295,582 | 3,108,434 | ||||||
Goodman Group | 2,600,430 | 11,245,804 | ||||||
GPT Group (The) | 2,616,786 | 8,329,714 | ||||||
Harvey Norman Holdings Ltd. | 820,236 | 2,523,737 | ||||||
Healthscope Ltd. | 1,678,056 | 3,164,489 | ||||||
Iluka Resources Ltd. | 619,614 | 3,263,815 | ||||||
Incitec Pivot Ltd. | 2,476,716 | 6,163,095 | ||||||
Insurance Australia Group Ltd. | 3,473,388 | 12,484,662 | ||||||
James Hardie Industries PLC | 666,072 | 8,296,759 | ||||||
Lend Lease Group | 818,148 | 8,085,561 | ||||||
Macquarie Group Ltd. | 445,436 | 23,978,070 | ||||||
Medibank Pvt Ltd.b | 4,087,086 | 6,751,266 | ||||||
Mirvac Group | 5,489,526 | 6,810,648 | ||||||
National Australia Bank Ltd. | 3,875,502 | 85,640,715 | ||||||
Newcrest Mining Ltd.b | 1,137,960 | 9,035,674 | ||||||
| Security | Shares | Value | ||||||
Orica Ltd. | 551,928 | $ | 6,205,848 | |||||
Origin Energy Ltd. | 1,639,950 | 9,603,425 | ||||||
Platinum Asset Management Ltd. | 344,868 | 1,655,225 | ||||||
Qantas Airways Ltd.b | 814,668 | 1,940,597 | ||||||
QBE Insurance Group Ltd. | 2,022,924 | 18,930,802 | ||||||
Ramsay Health Care Ltd. | 209,670 | 9,284,399 | ||||||
REA Group Ltd. | 77,604 | 2,272,767 | ||||||
Rio Tinto Ltd. | 628,136 | 22,394,988 | ||||||
Santos Ltd. | 1,457,946 | 5,302,422 | ||||||
Scentre Group | 7,906,212 | 21,355,461 | ||||||
Seek Ltd. | 483,894 | 4,233,318 | ||||||
Sonic Healthcare Ltd. | 567,240 | 8,332,439 | ||||||
South32 Ltd.b | 7,898,904 | 8,511,889 | ||||||
Stockland | 3,500,532 | 9,703,453 | ||||||
Suncorp Group Ltd. | 1,907,388 | 17,349,271 | ||||||
Sydney Airport | 1,607,238 | 6,551,844 | ||||||
Tabcorp Holdings Ltd. | 1,229,136 | 4,034,563 | ||||||
Tatts Group Ltd. | 2,144,028 | 5,593,631 | ||||||
Telstra Corp. Ltd. | 6,348,042 | 25,967,559 | ||||||
TPG Telecom Ltd. | 411,684 | 2,740,597 | ||||||
Transurban Group | 2,837,592 | 19,473,357 | ||||||
Treasury Wine Estates Ltd. | 964,308 | 4,074,530 | ||||||
Wesfarmers Ltd. | 1,667,790 | 48,075,550 | ||||||
Westfield Corp. | 2,928,246 | 20,240,801 | ||||||
Westpac Banking Corp. | 4,625,964 | 101,994,829 | ||||||
Woodside Petroleum Ltd. | 1,100,376 | 25,166,394 | ||||||
Woolworths Ltd. | 1,874,154 | 35,077,184 | ||||||
WorleyParsons Ltd. | 305,718 | 1,627,708 | ||||||
|
| |||||||
| 1,170,145,532 | ||||||||
HONG KONG — 27.15% |
| |||||||
AIA Group Ltd. | 17,852,414 | 98,705,936 | ||||||
ASM Pacific Technology Ltd. | 365,400 | 2,831,242 | ||||||
Bank of East Asia Ltd. (The) | 1,740,120 | 5,983,729 | ||||||
BOC Hong Kong Holdings Ltd. | 5,481,000 | 18,529,197 | ||||||
Cathay Pacific Airways Ltd. | 1,740,000 | 3,143,205 | ||||||
Cheung Kong Infrastructure Holdings Ltd. | 936,208 | 7,719,136 | ||||||
Cheung Kong Property Holdings Ltd.b | 4,002,232 | 28,041,264 | ||||||
CK Hutchison Holdings Ltd. | 4,012,732 | 53,485,489 | ||||||
CLP Holdings Ltd. | 2,809,500 | 23,255,260 | ||||||
First Pacific Co. Ltd./Hong Kong | 3,480,500 | 2,267,924 | ||||||
Galaxy Entertainment Group Ltd. | 3,480,000 | 11,158,380 | ||||||
Hang Lung Properties Ltd. | 3,306,736 | 7,466,775 | ||||||
Hang Seng Bank Ltd. | 1,131,000 | 20,124,373 | ||||||
| 36 | 2015 iSHARES ANNUAL REPORTTO SHAREHOLDERS |
Table of Contents
Schedule of Investments (Continued)
iSHARES® MSCI PACIFIC ex JAPAN ETF
August 31, 2015
| Security | Shares | Value | ||||||
Henderson Land Development Co. Ltd. | 1,710,655 | $ | 10,539,774 | |||||
HKT Trust & HKT Ltd. | 4,002,338 | 4,632,354 | ||||||
Hong Kong & China Gas Co. Ltd. | 10,266,320 | 19,366,791 | ||||||
Hong Kong Exchanges and Clearing Ltd. | 1,660,600 | 39,039,918 | ||||||
Hysan Development Co. Ltd.a | 951,830 | 3,831,859 | ||||||
Kerry Properties Ltd. | 957,000 | 2,864,807 | ||||||
Li & Fung Ltd.a | 8,701,200 | 5,737,141 | ||||||
Link REIT | 3,393,086 | 17,994,185 | ||||||
MGM China Holdings Ltd. | 1,392,000 | 2,302,623 | ||||||
MTR Corp. Ltd. | 2,175,286 | 9,697,503 | ||||||
New World Development Co. Ltd. | 8,004,921 | 8,139,145 | ||||||
NWS Holdings Ltd. | 2,262,000 | 2,851,561 | ||||||
PCCW Ltd.a | 5,916,867 | 3,122,559 | ||||||
Power Assets Holdings Ltd. | 2,058,500 | 17,716,266 | ||||||
Sands China Ltd. | 3,619,200 | 12,562,045 | ||||||
Shangri-La Asia Ltd.a | 1,761,000 | 1,729,177 | ||||||
Sino Land Co. Ltd. | 4,524,800 | 6,725,853 | ||||||
SJM Holdings Ltd.a | 2,958,000 | 2,675,541 | ||||||
Sun Hung Kai Properties Ltd. | 2,561,000 | 32,450,139 | ||||||
Swire Pacific Ltd. Class A | 870,000 | 9,547,487 | ||||||
Swire Properties Ltd. | 1,705,200 | 5,214,578 | ||||||
Techtronic Industries Co. Ltd. | 2,001,207 | 7,243,031 | ||||||
WH Group Ltd.b,c | 8,700,000 | 4,568,874 | ||||||
Wharf Holdings Ltd. (The) | 2,032,600 | 11,474,281 | ||||||
Wheelock & Co. Ltd. | 1,392,000 | 6,313,353 | ||||||
Wynn Macau Ltd.a | 2,296,800 | 3,544,458 | ||||||
Yue Yuen Industrial Holdings Ltd. | 1,131,000 | 4,049,684 | ||||||
|
| |||||||
| 538,646,897 | ||||||||
NEW ZEALAND — 1.30% |
| |||||||
Auckland International Airport Ltd. | 1,413,750 | 4,431,524 | ||||||
Contact Energy Ltd. | 1,090,110 | 3,582,720 | ||||||
Fletcher Building Ltd. | 1,018,596 | 4,644,187 | ||||||
Meridian Energy Ltd. | 1,922,700 | 2,690,785 | ||||||
Mighty River Power Ltd. | 1,048,002 | 1,838,303 | ||||||
Ryman Healthcare Ltd. | 555,582 | 2,691,441 | ||||||
Spark New Zealand Ltd. | 2,714,922 | 5,810,979 | ||||||
|
| |||||||
| 25,689,939 | ||||||||
SINGAPORE — 11.66% |
| |||||||
Ascendas REIT | 3,045,013 | 4,814,847 | ||||||
CapitaLand Commercial Trust | 3,027,600 | 2,855,214 | ||||||
| Security | Shares | Value | ||||||
CapitaLand Ltd. | 3,810,600 | $ | 7,619,579 | |||||
CapitaLand Mall Trust | 3,584,400 | 4,879,847 | ||||||
City Developments Ltd. | 609,000 | 3,795,724 | ||||||
ComfortDelGro Corp. Ltd. | 3,184,200 | 6,344,467 | ||||||
DBS Group Holdings Ltd.a | 2,604,900 | 32,803,676 | ||||||
Genting Singapore PLC | 8,943,600 | 4,883,055 | ||||||
Global Logistic Properties Ltd.a | 4,663,200 | 7,340,498 | ||||||
Golden Agri-Resources Ltd. | 10,458,387 | 2,335,951 | ||||||
Hutchison Port Holdings Trusta | 8,404,200 | 4,412,205 | ||||||
Jardine Cycle & Carriage Ltd.a | 174,600 | 3,540,779 | ||||||
Keppel Corp. Ltd.a | 2,157,600 | 10,464,429 | ||||||
Noble Group Ltd.a | 7,047,008 | 2,723,264 | ||||||
Oversea-Chinese Banking Corp. Ltd.a | 4,454,424 | 28,205,351 | ||||||
SembCorp Industries Ltd.a | 1,444,240 | 3,502,305 | ||||||
Sembcorp Marine Ltda | 1,218,000 | 2,064,114 | ||||||
Singapore Airlines Ltd. | 800,400 | 5,629,985 | ||||||
Singapore Exchange Ltd.a | 1,183,200 | 6,090,925 | ||||||
Singapore Press Holdings Ltd.a | 2,513,117 | 7,020,975 | ||||||
Singapore Technologies Engineering Ltd. | 2,314,200 | 5,037,647 | ||||||
Singapore Telecommunications Ltd. | 11,866,828 | 31,469,855 | ||||||
StarHub Ltd. | 904,800 | 2,348,130 | ||||||
Suntec REITa | 3,480,000 | 3,775,367 | ||||||
United Overseas Bank Ltd.a | 1,914,000 | 26,301,723 | ||||||
UOL Group Ltd.a | 696,000 | 3,089,385 | ||||||
Wilmar International Ltd. | 2,853,600 | 5,766,688 | ||||||
Yangzijiang Shipbuilding Holdings Ltd.a | 2,871,000 | 2,239,311 | ||||||
|
| |||||||
| 231,355,296 | ||||||||
|
| |||||||
TOTAL COMMON STOCKS |
| |||||||
(Cost: $2,375,409,685) |
| 1,965,837,664 | ||||||
SHORT-TERM INVESTMENTS — 3.53% |
| |||||||
MONEY MARKET FUNDS — 3.53% |
| |||||||
BlackRock Cash Funds: Institutional, |
| |||||||
0.18%d,e,f | 65,414,188 | 65,414,188 | ||||||
BlackRock Cash Funds: Prime, | ||||||||
0.18%d,e,f | 3,756,404 | 3,756,404 | ||||||
SCHEDULESOF INVESTMENTS | 37 |
Table of Contents
Schedule of Investments (Continued)
iSHARES® MSCI PACIFIC ex JAPAN ETF
August 31, 2015
| Security | Shares | Value | ||||||
BlackRock Cash Funds: Treasury, |
| |||||||
0.03%d,e | 894,968 | $ | 894,968 | |||||
|
| |||||||
| 70,065,560 | ||||||||
|
| |||||||
TOTAL SHORT-TERM INVESTMENTS |
| |||||||
(Cost: $70,065,560) |
| 70,065,560 | ||||||
|
| |||||||
TOTAL INVESTMENTS |
| |||||||
(Cost: $2,445,475,245) |
| 2,035,903,224 | ||||||
Other Assets, Less Liabilities — (2.61)% |
| (51,698,610 | ) | |||||
|
| |||||||
NET ASSETS — 100.00% |
| $ | 1,984,204,614 | |||||
|
| |||||||
| a | All or a portion of this security represents a security on loan. See Note 1. |
| b | Non-income earning security. |
| c | This security may be resold to qualified institutional buyers under Rule 144A of the Securities Act of 1933. |
| d | Affiliated issuer. See Note 2. |
| e | The rate quoted is the annualized seven-day yield of the fund at period end. |
| f | All or a portion of this security represents an investment of securities lending collateral. See Note 1. |
See notes to financial statements.
| 38 | 2015 iSHARES ANNUAL REPORTTO SHAREHOLDERS |
Table of Contents
Schedule of Investments
August 31, 2015
| Security | Shares | Value | ||||||
COMMON STOCKS — 99.29% |
| |||||||
AEROSPACE & DEFENSE — 2.38% |
| |||||||
Singapore Technologies Engineering Ltd. | 6,658,400 | $ | 14,494,284 | |||||
|
| |||||||
| 14,494,284 | ||||||||
AIRLINES — 2.58% |
| |||||||
Singapore Airlines Ltd. | 2,238,667 | 15,746,704 | ||||||
|
| |||||||
| 15,746,704 | ||||||||
BANKS — 34.96% |
| |||||||
DBS Group Holdings Ltd. | 6,428,800 | 80,958,298 | ||||||
Oversea-Chinese Banking Corp. Ltd. | 10,733,850 | 67,966,589 | ||||||
United Overseas Bank Ltd. | 4,680,400 | 64,316,920 | ||||||
|
| |||||||
| 213,241,807 | ||||||||
DISTRIBUTORS — 1.53% |
| |||||||
Jardine Cycle & Carriage Ltd. | 459,244 | 9,313,180 | ||||||
|
| |||||||
| 9,313,180 | ||||||||
DIVERSIFIED FINANCIAL SERVICES — 2.63% |
| |||||||
Singapore Exchange Ltd. | 3,119,200 | 16,057,145 | ||||||
|
| |||||||
| 16,057,145 | ||||||||
DIVERSIFIED TELECOMMUNICATION SERVICES — 12.70% |
| |||||||
Singapore Telecommunications Ltd. | 29,216,668 | 77,480,209 | ||||||
|
| |||||||
| 77,480,209 | ||||||||
FOOD PRODUCTS — 3.90% |
| |||||||
Golden Agri-Resources Ltd. | 29,101,828 | 6,500,089 | ||||||
Wilmar International Ltd. | 8,552,600 | 17,283,493 | ||||||
|
| |||||||
| 23,783,582 | ||||||||
HOTELS, RESTAURANTS & LEISURE — 2.21% |
| |||||||
Genting Singapore PLC | 24,682,000 | 13,475,956 | ||||||
|
| |||||||
| 13,475,956 | ||||||||
INDUSTRIAL CONGLOMERATES — 6.28% |
| |||||||
Keppel Corp. Ltd.a | 5,854,800 | 28,395,967 | ||||||
SembCorp Industries Ltd.a | 4,075,400 | 9,882,910 | ||||||
|
| |||||||
| 38,278,877 | ||||||||
MACHINERY — 2.06% |
| |||||||
Sembcorp Marine Ltda | 3,616,200 | 6,128,283 | ||||||
Yangzijiang Shipbuilding Holdings Ltd. | 8,265,600 | 6,446,969 | ||||||
|
| |||||||
| 12,575,252 | ||||||||
MEDIA — 3.08% |
| |||||||
Singapore Press Holdings Ltd.a | 6,722,200 | 18,780,024 | ||||||
|
| |||||||
| 18,780,024 | ||||||||
| Security | Shares | Value | ||||||
REAL ESTATE INVESTMENT TRUSTS (REITS) — 7.53% |
| |||||||
Ascendas REIT | 8,380,435 | $ | 13,251,344 | |||||
CapitaLand Commercial Trust | 8,724,800 | 8,228,025 | ||||||
CapitaLand Mall Trust | 10,045,000 | 13,675,388 | ||||||
Suntec REITa | 9,930,200 | 10,773,031 | ||||||
|
| |||||||
| 45,927,788 | ||||||||
REAL ESTATE MANAGEMENT & DEVELOPMENT — 9.89% |
| |||||||
CapitaLand Ltd. | 10,389,400 | 20,774,380 | ||||||
City Developments Ltd. | 1,722,000 | 10,732,738 | ||||||
Global Logistic Properties Ltd.a | 12,628,000 | 19,878,153 | ||||||
UOL Group Ltd.a | 2,009,000 | 8,917,493 | ||||||
|
| |||||||
| 60,302,764 | ||||||||
ROAD & RAIL — 2.83% |
| |||||||
ComfortDelGro Corp. Ltd. | 8,667,400 | 17,269,655 | ||||||
|
| |||||||
| 17,269,655 | ||||||||
TRADING COMPANIES & DISTRIBUTORS — 1.16% |
| |||||||
Noble Group Ltd.a | 18,368,099 | 7,098,216 | ||||||
|
| |||||||
| 7,098,216 | ||||||||
TRANSPORTATION INFRASTRUCTURE — 2.13% |
| |||||||
Hutchison Port Holdings Trusta | 24,739,400 | 12,988,185 | ||||||
|
| |||||||
| 12,988,185 | ||||||||
WIRELESS TELECOMMUNICATION SERVICES — 1.44% |
| |||||||
StarHub Ltd. | 3,386,600 | 8,788,879 | ||||||
|
| |||||||
| 8,788,879 | ||||||||
|
| |||||||
TOTAL COMMON STOCKS |
| |||||||
(Cost: $750,972,070) |
| 605,602,507 | ||||||
SHORT-TERM INVESTMENTS — 8.56% |
| |||||||
MONEY MARKET FUNDS — 8.56% |
| |||||||
BlackRock Cash Funds: Institutional, |
| |||||||
0.18%b,c,d | 49,324,969 | 49,324,969 | ||||||
BlackRock Cash Funds: Prime, | ||||||||
0.18%b,c,d | 2,832,482 | 2,832,482 | ||||||
BlackRock Cash Funds: Treasury, | ||||||||
0.03%b,c | 57,765 | 57,765 | ||||||
|
| |||||||
| 52,215,216 | ||||||||
|
| |||||||
TOTAL SHORT-TERM INVESTMENTS |
| |||||||
(Cost: $52,215,216) |
| 52,215,216 | ||||||
|
| |||||||
SCHEDULESOF INVESTMENTS | 39 |
Table of Contents
Schedule of Investments (Continued)
iSHARES® MSCI SINGAPORE ETF
August 31, 2015
| Value | ||||||
TOTAL INVESTMENTS | ||||||
(Cost: $803,187,286) | $ | 657,817,723 | ||||
Other Assets, Less Liabilities — (7.85)% | (47,890,799 | ) | ||||
|
| |||||
NET ASSETS — 100.00% | $ | 609,926,924 | ||||
|
| |||||
| a | All or a portion of this security represents a security on loan. See Note 1. |
| b | Affiliated issuer. See Note 2. |
| c | The rate quoted is the annualized seven-day yield of the fund at period end. |
| d | All or a portion of this security represents an investment of securities lending collateral. See Note 1. |
Open futures contracts as of August 31, 2015 were as follows:
| Issue | Number of Contracts Purchased (Sold) | Expiration | Exchange | Notional Value | Unrealized Appreciation (Depreciation) | |||||||||||||||
| MSCI Singapore Index | 135 | Sep. 2015 | Singapore | $ | 6,183,791 | $ | 159,699 | |||||||||||||
See notes to financial statements.
| 40 | 2015 iSHARES ANNUAL REPORTTO SHAREHOLDERS |
Table of Contents
Schedule of Investments
August 31, 2015
| Security | Shares | Value | ||||||
COMMON STOCKS — 98.70% |
| |||||||
AIRLINES — 0.51% |
| |||||||
China Airlines Ltd.a | 21,720,761 | $ | 7,810,829 | |||||
EVA Airways Corp.a | 14,472,089 | 8,740,360 | ||||||
|
| |||||||
| 16,551,189 | ||||||||
AUTO COMPONENTS — 0.59% |
| |||||||
Cheng Shin Rubber Industry Co. Ltd.b | 12,060,670 | 19,349,862 | ||||||
|
| |||||||
| 19,349,862 | ||||||||
AUTOMOBILES — 0.24% |
| |||||||
China Motor Corp. | 3,622,000 | 2,460,236 | ||||||
Yulon Motor Co. Ltd.b | 6,030,362 | 5,458,388 | ||||||
|
| |||||||
| 7,918,624 | ||||||||
BANKS — 10.27% |
| |||||||
Chang Hwa Commercial Bank Ltd. | 34,974,878 | 16,984,360 | ||||||
China Development Financial Holding Corp.b | 104,922,508 | 30,280,951 | ||||||
CTBC Financial Holding Co. Ltd. | 114,570,783 | 69,018,585 | ||||||
E.Sun Financial Holding Co. Ltd. | 54,270,105 | 32,609,441 | ||||||
First Financial Holding Co. Ltd. | 61,506,038 | 29,773,781 | ||||||
Hua Nan Financial Holdings Co. Ltd. | 48,849,237 | 23,121,419 | ||||||
Mega Financial Holding Co. Ltd. | 75,978,271 | 56,979,069 | ||||||
SinoPac Financial Holdings Co. Ltd. | 73,574,113 | 25,326,711 | ||||||
Taishin Financial Holding Co. Ltd. | 60,300,676 | 21,128,211 | ||||||
Taiwan Business Banka | 32,562,652 | 8,206,733 | ||||||
Taiwan Cooperative Financial Holding Co. Ltd. | 54,462,174 | 23,099,913 | ||||||
|
| |||||||
| 336,529,174 | ||||||||
BUILDING PRODUCTS — 0.09% |
| |||||||
Taiwan Glass Industry Corp.a,b | 7,236,693 | 2,913,717 | ||||||
|
| |||||||
| 2,913,717 | ||||||||
CAPITAL MARKETS — 0.83% |
| |||||||
Yuanta Financial Holding Co. Ltd.b | 67,536,248 | 27,088,384 | ||||||
|
| |||||||
| 27,088,384 | ||||||||
| Security | Shares | Value | ||||||
CHEMICALS — 5.93% |
| |||||||
Formosa Chemicals & Fibre Corp. | 24,120,610 | $ | 51,598,061 | |||||
Formosa Plastics Corp. | 31,356,518 | 69,100,766 | ||||||
Nan Ya Plastics Corp. | 36,180,938 | 65,943,269 | ||||||
Taiwan Fertilizer Co. Ltd.b | 6,030,000 | 7,626,461 | ||||||
|
| |||||||
| 194,268,557 | ||||||||
CONSTRUCTION & ENGINEERING — 0.19% |
| |||||||
CTCI Corp. | 4,824,000 | 6,227,195 | ||||||
|
| |||||||
| 6,227,195 | ||||||||
CONSTRUCTION MATERIALS — 1.42% |
| |||||||
Asia Cement Corp. | 18,090,136 | 19,432,334 | ||||||
Taiwan Cement Corp. | 25,326,504 | 27,127,750 | ||||||
|
| |||||||
| 46,560,084 | ||||||||
DIVERSIFIED FINANCIAL SERVICES — 3.07% |
| |||||||
Chailease Holding Co. Ltd.b | 8,442,937 | 13,571,599 | ||||||
Fubon Financial Holding Co. Ltd. | 50,652,515 | 87,025,934 | ||||||
|
| |||||||
| 100,597,533 | ||||||||
DIVERSIFIED TELECOMMUNICATION SERVICES — 2.80% |
| |||||||
Asia Pacific Telecom Co. Ltd.a | 14,472,000 | 3,954,271 | ||||||
Chunghwa Telecom Co. Ltd. | 28,944,648 | 87,894,360 | ||||||
|
| |||||||
| 91,848,631 | ||||||||
ELECTRICAL EQUIPMENT — 0.33% |
| |||||||
Teco Electric and Machinery Co. Ltd. | 14,472,092 | 10,897,659 | ||||||
Ya Hsin Industrial Co. Ltd.a | 6,845,461 | 2 | ||||||
|
| |||||||
| 10,897,661 | ||||||||
ELECTRONIC EQUIPMENT, INSTRUMENTS & |
| |||||||
AU Optronics Corp.b | 67,536,830 | 21,795,418 | ||||||
Delta Electronics Inc. | 13,806,180 | 69,166,684 | ||||||
Hon Hai Precision Industry Co. Ltd.b | 101,304,194 | 288,008,330 | ||||||
Innolux Corp.b | 63,918,873 | 22,592,445 | ||||||
Largan Precision Co. Ltd. | 773,794 | 71,823,761 | ||||||
Pacific Electric Wire & Cable Co. Ltd.a | 197 | — | ||||||
Simplo Technology Co. Ltd. | 2,099,835 | 6,970,192 | ||||||
Synnex Technology International Corp.b | 9,648,538 | 10,260,612 | ||||||
TPK Holding Co. Ltd.b | 2,189,466 | 5,484,433 | ||||||
WPG Holdings Ltd.b | 10,854,744 | 10,258,895 | ||||||
SCHEDULESOF INVESTMENTS | 41 |
Table of Contents
Schedule of Investments (Continued)
iSHARES® MSCI TAIWAN ETF
August 31, 2015
| Security | Shares | Value | ||||||
Zhen Ding Technology Holding Ltd.b | 3,070,072 | $ | 8,709,358 | |||||
|
| |||||||
| 515,070,128 | ||||||||
FOOD & STAPLES RETAILING — 0.88% |
| |||||||
President Chain Store Corp. | 4,305,215 | 28,779,945 | ||||||
|
| |||||||
| 28,779,945 | ||||||||
FOOD PRODUCTS — 2.16% |
| |||||||
Standard Foods Corp. | 2,667,144 | 6,057,964 | ||||||
Uni-President Enterprises Corp. | 36,385,189 | 64,861,730 | ||||||
|
| |||||||
| 70,919,694 | ||||||||
INDUSTRIAL CONGLOMERATES — 0.68% |
| |||||||
Far Eastern New Century Corp. | 24,631,843 | 22,333,396 | ||||||
|
| |||||||
| 22,333,396 | ||||||||
INSURANCE — 3.74% |
| |||||||
Cathay Financial Holding Co. Ltd. | 61,506,483 | 88,660,365 | ||||||
China Life Insurance Co. Ltd./Taiwan | 24,120,378 | 18,422,397 | ||||||
Shin Kong Financial Holding Co. Ltd. | 65,124,205 | 15,452,411 | ||||||
|
| |||||||
| 122,535,173 | ||||||||
LEISURE PRODUCTS — 0.73% |
| |||||||
Giant Manufacturing Co. Ltd.b | 2,150,590 | 15,566,263 | ||||||
Merida Industry Co. Ltd. | 1,529,100 | 8,318,500 | ||||||
|
| |||||||
| 23,884,763 | ||||||||
MACHINERY — 0.23% |
| |||||||
Hiwin Technologies Corp.b | 1,496,973 | 7,683,627 | ||||||
|
| |||||||
| 7,683,627 | ||||||||
MARINE — 0.44% |
| |||||||
Evergreen Marine Corp. Taiwan Ltd. | 13,274,673 | 5,813,988 | ||||||
U-Ming Marine Transport Corp. | 3,618,800 | 3,586,991 | ||||||
Wan Hai Lines Ltd. | 2,412,000 | 1,660,585 | ||||||
Yang Ming Marine Transport Corp.a | 10,854,635 | 3,486,324 | ||||||
|
| |||||||
| 14,547,888 | ||||||||
METALS & MINING — 1.63% |
| |||||||
China Steel Corp.b | 89,244,977 | 53,487,727 | ||||||
|
| |||||||
| 53,487,727 | ||||||||
OIL, GAS & CONSUMABLE FUELS — 0.58% |
| |||||||
Formosa Petrochemical Corp. | 8,442,950 | 18,917,232 | ||||||
|
| |||||||
| 18,917,232 | ||||||||
| Security | Shares | Value | ||||||
REAL ESTATE MANAGEMENT & DEVELOPMENT — 0.43% |
| |||||||
Highwealth Construction Corp. | 4,824,300 | $ | 7,458,271 | |||||
Ruentex Development Co. Ltd.b | 6,038,773 | 6,458,975 | ||||||
|
| |||||||
| 13,917,246 | ||||||||
SEMICONDUCTORS & SEMICONDUCTOR EQUIPMENT — 31.52% |
| |||||||
Advanced Semiconductor Engineering Inc.b | 48,248,448 | 49,826,269 | ||||||
Epistar Corp.b | 8,442,047 | 6,824,002 | ||||||
Hermes Microvision Inc. | 298,000 | 12,639,538 | ||||||
Inotera Memories Inc.a,b | 19,296,000 | 11,624,103 | ||||||
Kinsus Interconnect Technology Corp.b | 1,996,043 | 3,558,228 | ||||||
MediaTek Inc.b | 11,362,175 | 87,653,863 | ||||||
Novatek Microelectronics Corp.b | 4,445,544 | 14,893,173 | ||||||
Phison Electronics Corp. | 1,206,698 | 8,400,452 | ||||||
Powertech Technology Inc. | 4,824,036 | 8,302,986 | ||||||
Radiant Opto-Electronics Corp.b | 3,310,583 | 9,646,032 | ||||||
Realtek Semiconductor Corp.b | 3,618,063 | 6,494,188 | ||||||
Siliconware Precision Industries Co. Ltd.b | 22,914,214 | 28,170,895 | ||||||
Taiwan Semiconductor Manufacturing Co. Ltd.b | 187,545,882 | 743,589,148 | ||||||
Transcend Information Inc. | 1,206,905 | 3,253,184 | ||||||
United Microelectronics Corp.b | 94,068,501 | 31,080,515 | ||||||
Vanguard International Semiconductor Corp.b | 6,030,000 | 6,857,328 | ||||||
|
| |||||||
| 1,032,813,904 | ||||||||
SPECIALTY RETAIL — 0.63% |
| |||||||
Hotai Motor Co. Ltd.b | 1,886,000 | 20,752,028 | ||||||
|
| |||||||
| 20,752,028 | ||||||||
TECHNOLOGY HARDWARE, STORAGE & PERIPHERALS — 8.83% |
| |||||||
Acer Inc.a,b | 21,708,737 | 8,006,660 | ||||||
Advantech Co. Ltd.b | 2,412,444 | 15,348,410 | ||||||
Asustek Computer Inc.b | 5,357,857 | 48,743,720 | ||||||
Casetek Holdings Ltd.b | 1,206,000 | 4,503,596 | ||||||
Catcher Technology Co. Ltd.b | 4,989,743 | 50,915,747 | ||||||
Chicony Electronics Co. Ltd.b | 3,652,887 | 9,071,591 | ||||||
Compal Electronics Inc. | 31,356,554 | 18,311,255 | ||||||
Foxconn Technology Co. Ltd.b | 7,236,871 | 20,352,028 | ||||||
HTC Corp.b | 4,824,884 | 6,828,924 | ||||||
Inventec Corp. | 18,090,868 | 8,284,785 | ||||||
Lite-On Technology Corp. | 15,761,702 | 14,436,285 | ||||||
| 42 | 2015 iSHARES ANNUAL REPORTTO SHAREHOLDERS |
Table of Contents
Schedule of Investments (Continued)
iSHARES® MSCI TAIWAN ETF
August 31, 2015
| Security | Shares | Value | ||||||
Pegatron Corp.b | 14,472,037 | $ | 37,452,228 | |||||
Quanta Computer Inc.b | 20,502,240 | 37,682,379 | ||||||
Wistron Corp.b | 18,680,005 | 9,243,539 | ||||||
|
| |||||||
| 289,181,147 | ||||||||
TEXTILES, APPAREL & LUXURY GOODS — 2.25% |
| |||||||
Eclat Textile Co. Ltd.b | 1,396,080 | 21,003,846 | ||||||
Feng TAY Enterprise Co. Ltd.b | 2,412,140 | 14,308,552 | ||||||
Formosa Taffeta Co. Ltd. | 6,030,515 | 5,245,378 | ||||||
Pou Chen Corp. | 16,884,103 | 27,296,040 | ||||||
Ruentex Industries Ltd. | 3,618,262 | 5,771,692 | ||||||
|
| |||||||
| 73,625,508 | ||||||||
WIRELESS TELECOMMUNICATION SERVICES — 1.98% |
| |||||||
Far EasTone Telecommunications Co. Ltd. | 12,060,259 | 26,466,142 | ||||||
Taiwan Mobile Co. Ltd. | 12,735,609 | 38,281,980 | ||||||
|
| |||||||
| 64,748,122 | ||||||||
|
| |||||||
TOTAL COMMON STOCKS |
| |||||||
(Cost: $2,322,207,032) |
| 3,233,948,139 | ||||||
SHORT-TERM INVESTMENTS — 8.39% |
| |||||||
MONEY MARKET FUNDS — 8.39% |
| |||||||
BlackRock Cash Funds: Institutional, |
| |||||||
0.18%c,d,e | 233,091,787 | 233,091,787 | ||||||
| Security | Shares | Value | ||||||
BlackRock Cash Funds: Prime, |
| |||||||
0.18%c,d,e | 13,385,206 | $ | 13,385,206 | |||||
BlackRock Cash Funds: Treasury, |
| |||||||
0.03%c,d | 28,276,302 | 28,276,302 | ||||||
|
| |||||||
| 274,753,295 | ||||||||
|
| |||||||
TOTAL SHORT-TERM INVESTMENTS |
| 274,753,295 | ||||||
|
| |||||||
TOTAL INVESTMENTS |
| 3,508,701,434 | ||||||
Other Assets, Less Liabilities — (7.09)% |
| (232,291,627 | ) | |||||
|
| |||||||
NET ASSETS — 100.00% |
| $ | 3,276,409,807 | |||||
|
| |||||||
| a | Non-income earning security. |
| b | All or a portion of this security represents a security on loan. See Note 1. |
| c | Affiliated issuer. See Note 2. |
| d | The rate quoted is the annualized seven-day yield of the fund at period end. |
| e | All or a portion of this security represents an investment of securities lending collateral. See Note 1. |
Open futures contracts as of August 31, 2015 were as follows:
| Issue | Number of Contracts Purchased (Sold) | Expiration | Exchange | Notional Value | Unrealized Appreciation (Depreciation) | |||||||||||||||
| MSCI Taiwan Index | 1,390 | Sep. 2015 | Singapore | $ | 41,839,000 | $ | 1,461,334 | |||||||||||||
See notes to financial statements.
SCHEDULESOF INVESTMENTS | 43 |
Table of Contents
Schedule of Investments
iSHARES® MSCI THAILAND CAPPED ETF
August 31, 2015
| Security | Shares | Value | ||||||
COMMON STOCKS — 99.37% |
| |||||||
AIRLINES — 0.58% |
| |||||||
Bangkok Airways Co. Ltd. | 1,016,100 | $ | 581,114 | |||||
Nok Airlines PCL NVDRa,b | 591,100 | 119,556 | ||||||
Thai Airways International PCL NVDRa,b | 2,355,966 | 670,410 | ||||||
|
| |||||||
| 1,371,080 | ||||||||
AUTO COMPONENTS — 0.59% |
| |||||||
PCS Machine Group Holding PCL | 773,500 | 135,948 | ||||||
Somboon Advance Technology PCL NVDR | 997,725 | 439,784 | ||||||
Sri Trang Agro-Industry PCL NVDR | 2,518,671 | 822,107 | ||||||
|
| |||||||
| 1,397,839 | ||||||||
BANKS — 21.42% |
| |||||||
Bangkok Bank PCL Foreign | 532,900 | 2,445,587 | ||||||
Bangkok Bank PCL NVDR | 668,300 | 3,066,965 | ||||||
Kasikornbank PCL Foreign | 2,608,600 | 13,172,175 | ||||||
Kasikornbank PCL NVDR | 1,361,900 | 6,857,942 | ||||||
Kiatnakin Bank PCL NVDRb | 1,244,573 | 1,119,751 | ||||||
Krung Thai Bank PCL NVDRb | 9,214,100 | 4,678,382 | ||||||
LH Financial Group PCL NVDR | 18,950,819 | 840,614 | ||||||
Siam Commercial Bank PCL (The) NVDR | 3,489,300 | 13,822,865 | ||||||
Thanachart Capital PCL NVDR | 1,952,800 | 1,607,131 | ||||||
Tisco Financial Group PCL NVDR | 1,314,310 | 1,448,326 | ||||||
TMB Bank PCL NVDR | 26,974,200 | 1,775,955 | ||||||
|
| |||||||
| 50,835,693 | ||||||||
BEVERAGES — 0.16% |
| |||||||
Carabao Group PCL | 348,900 | 374,743 | ||||||
|
| |||||||
| 374,743 | ||||||||
BUILDING PRODUCTS — 0.41% |
| |||||||
Dynasty Ceramic PCL NVDR | 9,753,540 | 974,130 | ||||||
|
| |||||||
| 974,130 | ||||||||
CAPITAL MARKETS — 0.14% |
| |||||||
AIRA Capital Co. Ltd.b | 2,628,440 | 155,455 | ||||||
Asia Plus Group Holdings PCL NVDRb | 1,710,000 | 180,327 | ||||||
|
| |||||||
| 335,782 | ||||||||
CHEMICALS — 3.72% |
| |||||||
Eastern Polymer Group PCL | 941,200 | 236,317 | ||||||
| Security | Shares | Value | ||||||
Indorama Ventures PCL NVDR | 3,854,810 | $ | 2,344,396 | |||||
PTT Global Chemical PCL NVDR | 3,429,007 | 5,739,724 | ||||||
Siamgas & Petrochemicals PCL NVDRb | 1,590,100 | 496,837 | ||||||
|
| |||||||
| 8,817,274 | ||||||||
COMMERCIAL SERVICES & SUPPLIES — 0.13% |
| |||||||
Inter Far East Engineering PCL | 1,147,200 | 316,844 | ||||||
|
| |||||||
| 316,844 | ||||||||
CONSTRUCTION & ENGINEERING — 2.13% |
| |||||||
CH Karnchang PCL NVDRb | 1,762,400 | 1,302,932 | ||||||
Italian-Thai Development PCL NVDRa,b | 6,660,748 | 1,421,529 | ||||||
Sino-Thai Engineering & Construction PCL NVDRb | 2,352,928 | 1,673,864 | ||||||
Sriracha Construction PCL NVDR | 227,800 | 156,337 | ||||||
TTCL PCL NVDR | 259,400 | 173,681 | ||||||
Unique Engineering & Construction PCL | 586,400 | 320,643 | ||||||
|
| |||||||
| 5,048,986 | ||||||||
CONSTRUCTION MATERIALS — 5.03% |
| |||||||
Siam Cement PCL (The) Foreign | 651,700 | 8,654,183 | ||||||
Siam Cement PCL (The) NVDR | 197,600 | 2,646,060 | ||||||
Superblock PCLa,b | 12,253,850 | 646,109 | ||||||
|
| |||||||
| 11,946,352 | ||||||||
CONSUMER FINANCE — 0.71% |
| |||||||
Krungthai Card PCL NVDRb | 153,500 | 376,845 | ||||||
Muangthai Leasing PCL | 955,600 | 453,207 | ||||||
Srisawad Power 1979 PCL NVDR | 837,218 | 858,355 | ||||||
|
| |||||||
| 1,688,407 | ||||||||
CONTAINERS & PACKAGING — 0.17% |
| |||||||
Polyplex Thailand PCL NVDR | 1,931,550 | 412,229 | ||||||
|
| |||||||
| 412,229 | ||||||||
DISTRIBUTORS — 0.23% |
| |||||||
Energy Earth PCL NVDR | 4,065,500 | 539,874 | ||||||
|
| |||||||
| 539,874 | ||||||||
DIVERSIFIED TELECOMMUNICATION SERVICES — 3.28% |
| |||||||
Jasmine International PCL NVDRb | 10,280,868 | 1,620,502 | ||||||
Samart Telcoms PCL NVDRb | 390,400 | 193,866 | ||||||
Thaicom PCL NVDRb | 766,700 | 673,764 | ||||||
True Corp. PCL NVDRa | 19,549,172 | 5,290,193 | ||||||
|
| |||||||
| 7,778,325 | ||||||||
| 44 | 2015 iSHARES ANNUAL REPORTTO SHAREHOLDERS |
Table of Contents
Schedule of Investments (Continued)
iSHARES® MSCI THAILAND CAPPED ETF
August 31, 2015
| Security | Shares | Value | ||||||
ELECTRIC UTILITIES — 0.07% |
| |||||||
Thai Solar Energy PCLa | 1,022,000 | $ | 161,091 | |||||
|
| |||||||
| 161,091 | ||||||||
ELECTRICAL EQUIPMENT — 0.16% |
| |||||||
Gunkul Engineering PCL NVDRb | 649,782 | 371,615 | ||||||
|
| |||||||
| 371,615 | ||||||||
ELECTRONIC EQUIPMENT, INSTRUMENTS & |
| |||||||
Cal-Comp Electronics Thailand PCL NVDR | 11,019,312 | 989,878 | ||||||
Delta Electronics Thailand PCL NVDR | 1,498,844 | 3,637,869 | ||||||
Hana Microelectronics PCL NVDR | 1,965,300 | 1,398,107 | ||||||
KCE Electronics PCL NVDRb | 467,300 | 681,167 | ||||||
Loxley PCL NVDR | 1,642,705 | 128,319 | ||||||
Samart Corp. PCL NVDR | 1,793,137 | 925,458 | ||||||
Samart I-Mobile PCL | 2,796,200 | 127,153 | ||||||
SVI PCL NVDRb | 2,047,615 | 273,053 | ||||||
|
| |||||||
| 8,161,004 | ||||||||
FOOD & STAPLES RETAILING — 5.89% |
| |||||||
CP ALL PCL NVDRb | 9,825,800 | 13,980,075 | ||||||
|
| |||||||
| 13,980,075 | ||||||||
FOOD PRODUCTS — 3.61% |
| |||||||
Charoen Pokphand Foods PCL NVDRb | 7,112,300 | 3,769,946 | ||||||
GFPT PCL NVDRb | 2,479,600 | 601,828 | ||||||
Ichitan Group PCL NVDRb | 617,900 | 284,429 | ||||||
Kaset Thai International Sugar Corp. PCL | 751,600 | 159,357 | ||||||
Khon Kaen Sugar Industry PCL NVDR | 5,381,380 | 534,460 | ||||||
Thai Union Frozen Products PCL NVDR | 4,028,200 | 1,955,382 | ||||||
Thai Vegetable Oil PCL NVDR | 1,636,653 | 1,255,627 | ||||||
|
| |||||||
| 8,561,029 | ||||||||
GAS UTILITIES — 0.05% |
| |||||||
Scan Inter PCLa | 431,000 | 129,859 | ||||||
|
| |||||||
| 129,859 | ||||||||
HEALTH CARE PROVIDERS & SERVICES — 5.21% |
| |||||||
Bangkok Chain Hospital PCL NVDR | 3,649,125 | 671,899 | ||||||
Bangkok Dusit Medical Services PCL NVDR | 8,674,000 | 4,718,733 | ||||||
| Security | Shares | Value | ||||||
Bumrungrad Hospital PCL NVDR | 957,376 | $ | 6,169,727 | |||||
Chularat Hospital PCL NVDR | 6,500,500 | 348,193 | ||||||
Vibhavadi Medical Center PCL NVDR | 11,306,500 | 460,524 | ||||||
|
| |||||||
| 12,369,076 | ||||||||
HOTELS, RESTAURANTS & LEISURE — 1.25% |
| |||||||
Erawan Group PCL (The) NVDRb | 1,493,200 | 156,631 | ||||||
Minor International PCL NVDR | 3,804,010 | 2,812,282 | ||||||
|
| |||||||
| 2,968,913 | ||||||||
HOUSEHOLD PRODUCTS — 0.06% |
| |||||||
DSG International Thailand PCL NVDR | 913,380 | 129,955 | ||||||
|
| |||||||
| 129,955 | ||||||||
INDEPENDENT POWER AND RENEWABLE ELECTRICITY PRODUCERS — 1.97% |
| |||||||
CK Power PCL NVDR | 3,165,660 | 226,087 | ||||||
Glow Energy PCL NVDR | 1,447,700 | 3,988,293 | ||||||
SPCG PCL NVDR | 697,200 | 466,810 | ||||||
|
| |||||||
| 4,681,190 | ||||||||
INSURANCE — 0.16% |
| |||||||
Thai Reinsurance PCL NVDRa,b | 4,646,140 | 370,706 | ||||||
|
| |||||||
| 370,706 | ||||||||
INTERNET & CATALOG RETAIL — 0.08% |
| |||||||
OfficeMate PCL NVDR | 160,600 | 185,937 | ||||||
|
| |||||||
| 185,937 | ||||||||
MACHINERY — 0.08% |
| |||||||
BJC Heavy Industries PCL NVDR | 903,550 | 180,231 | ||||||
|
| |||||||
| 180,231 | ||||||||
MARINE — 0.59% |
| |||||||
Precious Shipping PCL NVDRb | 2,098,800 | 421,575 | ||||||
Thoresen Thai Agencies PCL NVDRb | 3,438,789 | 978,537 | ||||||
|
| |||||||
| 1,400,112 | ||||||||
MEDIA — 2.34% |
| |||||||
BEC World PCL NVDR | 2,649,200 | 2,734,563 | ||||||
E for L Aim PCL | 4,842,900 | 140,511 | ||||||
Major Cineplex Group PCL NVDR | 1,828,700 | 1,658,048 | ||||||
Plan B Media PCLa | 1,237,600 | 201,980 | ||||||
RS PCL NVDR | 818,300 | 239,703 | ||||||
VGI Global Media PCL NVDRb | 3,378,440 | 390,200 | ||||||
Workpoint Entertainment PCL | 178,500 | 197,946 | ||||||
|
| |||||||
| 5,562,951 | ||||||||
SCHEDULESOF INVESTMENTS | 45 |
Table of Contents
Schedule of Investments (Continued)
iSHARES® MSCI THAILAND CAPPED ETF
August 31, 2015
| Security | Shares | Value | ||||||
METALS & MINING — 0.34% |
| |||||||
STP & I PCL NVDRb | 2,055,010 | $ | 796,893 | |||||
|
| |||||||
| 796,893 | ||||||||
OIL, GAS & CONSUMABLE FUELS — 14.64% |
| |||||||
Bangchak Petroleum PCL (The) NVDR | 1,299,100 | 1,268,475 | ||||||
Banpu PCL NVDRb | 3,166,200 | 1,819,604 | ||||||
Energy Absolute PCL NVDR | 2,235,800 | 1,272,432 | ||||||
Esso Thailand PCL NVDRa | 4,135,400 | 576,845 | ||||||
IRPC PCL NVDR | 28,452,400 | 3,016,296 | ||||||
PTT Exploration & Production PCL NVDR | 2,983,684 | 6,617,461 | ||||||
PTT PCL NVDR | 2,274,500 | 17,005,608 | ||||||
Thai Oil PCL NVDR | 2,205,500 | 3,168,733 | ||||||
|
| |||||||
| 34,745,454 | ||||||||
PERSONAL PRODUCTS — 0.08% |
| |||||||
Beauty Community PCL | 1,610,400 | 196,779 | ||||||
|
| |||||||
| 196,779 | ||||||||
PHARMACEUTICALS — 0.08% |
| |||||||
Mega Lifesciences PCL NVDR | 402,100 | 196,311 | ||||||
|
| |||||||
| 196,311 | ||||||||
REAL ESTATE MANAGEMENT & DEVELOPMENT — 6.23% |
| |||||||
Amata Corp. PCL NVDR | 2,140,300 | 704,576 | ||||||
Ananda Development PCL NVDRb | 2,907,000 | 253,029 | ||||||
AP Thailand PCL NVDRb | 4,467,986 | 685,561 | ||||||
Bangkok Land PCL NVDRb | 28,264,900 | 1,127,600 | ||||||
Central Pattana PCL NVDR | 3,159,100 | 3,965,951 | ||||||
Country Group Development PCL NVDRa | 4,921,000 | 175,725 | ||||||
Golden Land Property Development PCL NVDRa,b | 947,900 | 154,700 | ||||||
LPN Development PCL NVDRb | 1,861,547 | 810,159 | ||||||
MBK PCL NVDR | 1,116,000 | 442,104 | ||||||
Quality Houses PCL NVDRb | 16,515,231 | 1,087,347 | ||||||
Rojana Industrial Park PCL NVDRb | 1,074,283 | 176,824 | ||||||
Sansiri PCL NVDRb | 15,874,637 | 699,733 | ||||||
SC Asset Corp. PCL NVDRb | 7,566,104 | 620,570 | ||||||
Siam Future Development PCL NVDR | 4,106,028 | 618,567 | ||||||
Supalai PCL NVDRb | 2,182,800 | 1,023,045 | ||||||
TICON Industrial Connection PCL NVDRb | 2,347,591 | 772,816 | ||||||
| Security | Shares | Value | ||||||
U City PCL NVDRa,b | 232,235,500 | $ | 259,155 | |||||
Univentures PCL NVDRb | 803,000 | 137,772 | ||||||
WHA Corp. PCL NVDRa | 11,144,540 | 1,075,746 | ||||||
|
| |||||||
| 14,790,980 | ||||||||
ROAD & RAIL — 1.46% |
| |||||||
BTS Group Holdings PCL NVDR | 12,756,600 | 3,469,852 | ||||||
|
| |||||||
| 3,469,852 | ||||||||
SOFTWARE — 0.06% |
| |||||||
Mono Technology PCL NVDRb | 1,789,820 | 139,810 | ||||||
|
| |||||||
| 139,810 | ||||||||
SPECIALTY RETAIL — 1.20% |
| |||||||
Home Product Center PCL NVDR | 8,476,571 | 1,726,293 | ||||||
PTG Energy PCLb | 570,000 | 219,445 | ||||||
Siam Global House PCL NVDRb | 3,103,733 | 909,170 | ||||||
|
| |||||||
| 2,854,908 | ||||||||
TEXTILES, APPAREL & LUXURY GOODS — 0.07% |
| |||||||
MC Group PCL NVDRb | 463,500 | 164,220 | ||||||
|
| |||||||
| 164,220 | ||||||||
TRANSPORTATION INFRASTRUCTURE — 4.27% |
| |||||||
Airports of Thailand PCL NVDR | 1,024,100 | 7,885,384 | ||||||
Bangkok Aviation Fuel Services PCL NVDR | 485,700 | 348,913 | ||||||
Bangkok Expressway PCL NVDR | 1,323,800 | 1,301,826 | ||||||
Bangkok Metro PCL NVDRa,b | 8,097,541 | 399,850 | ||||||
Namyong Terminal PCL NVDR | 475,700 | 203,047 | ||||||
|
| |||||||
| 10,139,020 | ||||||||
WATER UTILITIES — 0.73% |
| |||||||
Eastern Water Resources Development and Management PCL NVDR | 606,000 | 194,420 | ||||||
TTW PCL NVDR | 4,824,566 | 1,534,386 | ||||||
|
| |||||||
| 1,728,806 | ||||||||
WIRELESS TELECOMMUNICATION SERVICES — 6.55% |
| |||||||
Advanced Info Service PCL NVDR | 2,340,119 | 15,537,685 | ||||||
|
| |||||||
| 15,537,685 | ||||||||
|
| |||||||
TOTAL COMMON STOCKS |
| |||||||
(Cost: $341,412,656) |
| 235,812,020 | ||||||
| 46 | 2015 iSHARES ANNUAL REPORTTO SHAREHOLDERS |
Table of Contents
Schedule of Investments (Continued)
iSHARES® MSCI THAILAND CAPPED ETF
August 31, 2015
| Security | Shares | Value | ||||||
RIGHTS — 0.00% |
| |||||||
CONSTRUCTION MATERIALS — 0.00% |
| |||||||
Jay Mart PCLa | 151,200 | $ | — | |||||
|
| |||||||
| — | ||||||||
ELECTRICAL EQUIPMENT — 0.00% |
| |||||||
Gunkul Engineering PCLa,b | 108,296 | — | ||||||
|
| |||||||
| — | ||||||||
|
| |||||||
TOTAL RIGHTS |
| |||||||
(Cost: $0) |
| — | ||||||
SHORT-TERM INVESTMENTS — 11.80% |
| |||||||
MONEY MARKET FUNDS — 11.80% |
| |||||||
BlackRock Cash Funds: Institutional, |
| |||||||
0.18%c,d,e | 25,862,056 | 25,862,056 | ||||||
BlackRock Cash Funds: Prime, |
| |||||||
0.18%c,d,e | 1,485,126 | 1,485,126 | ||||||
BlackRock Cash Funds: Treasury, |
| |||||||
0.03%c,d | 653,634 | 653,634 | ||||||
|
| |||||||
| 28,000,816 | ||||||||
|
| |||||||
TOTAL SHORT-TERM INVESTMENTS |
| |||||||
(Cost: $28,000,816) |
| 28,000,816 | ||||||
|
| |||||||
TOTAL INVESTMENTS |
| |||||||
(Cost: $369,413,472) |
| 263,812,836 | ||||||
Other Assets, Less Liabilities — (11.17)% |
| (26,509,327 | ) | |||||
|
| |||||||
NET ASSETS — 100.00% |
| $ | 237,303,509 | |||||
|
| |||||||
NVDR — Non-Voting Depositary Receipts
| a | Non-income earning security. |
| b | All or a portion of this security represents a security on loan. See Note 1. |
| c | Affiliated issuer. See Note 2. |
| d | The rate quoted is the annualized seven-day yield of the fund at period end. |
| e | All or a portion of this security represents an investment of securities lending collateral. See Note 1. |
See notes to financial statements.
SCHEDULESOF INVESTMENTS | 47 |
Table of Contents
Statements of Assets and Liabilities
iSHARES® , INC.
August 31, 2015
iShares MSCI ETF | iShares MSCI Japan Small-Cap ETF | iShares MSCI Malaysia ETF | ||||||||||
ASSETS | ||||||||||||
Investments, at cost: | ||||||||||||
Unaffiliated | $ | 3,046,220,425 | $ | 174,025,441 | $ | 136,260,957 | ||||||
Affiliated (Note 2) | 97,234,110 | 6,829,549 | 24,589,737 | |||||||||
|
|
|
|
|
| |||||||
Total cost of investments | $ | 3,143,454,535 | $ | 180,854,990 | $ | 160,850,694 | ||||||
|
|
|
|
|
| |||||||
Investments in securities, at fair value (including securities on loana) (Note 1): | ||||||||||||
Unaffiliated | $ | 2,706,536,022 | $ | 158,213,284 | $ | 262,095,933 | ||||||
Affiliated (Note 2) | 97,234,110 | 6,829,549 | 24,589,737 | |||||||||
|
|
|
|
|
| |||||||
Total fair value of investments | 2,803,770,132 | 165,042,833 | 286,685,670 | |||||||||
Foreign currency, at valueb | 6,406,730 | 364,199 | 631,158 | |||||||||
Foreign currency pledged to broker, at valueb | 1,207,981 | — | — | |||||||||
Receivables: | ||||||||||||
Investment securities sold | 5,855,898 | 6,598,563 | 7,555,625 | |||||||||
Dividends and interest | 8,062,016 | 422,092 | 915,359 | |||||||||
Capital shares sold | — | — | 3,059,523 | |||||||||
Futures variation margin | 241,933 | — | — | |||||||||
|
|
|
|
|
| |||||||
Total Assets | 2,825,544,690 | 172,427,687 | 298,847,335 | |||||||||
|
|
|
|
|
| |||||||
LIABILITIES | ||||||||||||
Payables: | ||||||||||||
Investment securities purchased | 4,268,111 | 3,611,796 | 5,505,286 | |||||||||
Collateral for securities on loan (Note 1) | 97,156,364 | 6,778,523 | 24,528,916 | |||||||||
Capital shares redeemed | 617,958 | 2,909,539 | 5,103,198 | |||||||||
Investment advisory fees (Note 2) | 1,278,395 | 123,682 | 131,170 | |||||||||
|
|
|
|
|
| |||||||
Total Liabilities | 103,320,828 | 13,423,540 | 35,268,570 | |||||||||
|
|
|
|
|
| |||||||
NET ASSETS | $ | 2,722,223,862 | $ | 159,004,147 | $ | 263,578,765 | ||||||
|
|
|
|
|
| |||||||
Net assets consist of: | ||||||||||||
Paid-in capital | $ | 3,506,781,082 | $ | 179,176,845 | $ | 99,358,963 | ||||||
Undistributed net investment income | 7,704,071 | 217,281 | 3,673,177 | |||||||||
Undistributed net realized gain (accumulated net realized loss) | (452,822,412 | ) | (4,595,421 | ) | 34,736,152 | |||||||
Net unrealized appreciation (depreciation) | (339,438,879 | ) | (15,794,558 | ) | 125,810,473 | |||||||
|
|
|
|
|
| |||||||
NET ASSETS | $ | 2,722,223,862 | $ | 159,004,147 | $ | 263,578,765 | ||||||
|
|
|
|
|
| |||||||
Shares outstandingc | 140,175,000 | 2,800,000 | 25,875,000 | |||||||||
|
|
|
|
|
| |||||||
Net asset value per share | $ | 19.42 | $ | 56.79 | $ | 10.19 | ||||||
|
|
|
|
|
| |||||||
| a | Securities on loan with values of $90,691,423, $6,433,748 and $23,432,267, respectively. See Note 1. |
| b | Cost of foreign currency including currency pledged to broker: $7,614,013, $355,279 and $631,158, respectively. |
| c | $0.001 par value, number of shares authorized: 375 million, 500 million and 300 million, respectively. |
See notes to financial statements.
| 48 | 2015 iSHARES ANNUAL REPORTTO SHAREHOLDERS |
Table of Contents
Statements of Assets and Liabilities (Continued)
iSHARES®, INC.
August 31, 2015
iShares MSCI ETF | iShares MSCI ETF | iShares MSCI Taiwan ETF | ||||||||||
ASSETS | ||||||||||||
Investments, at cost: | ||||||||||||
Unaffiliated | $ | 2,375,409,685 | $ | 750,972,070 | $ | 2,322,207,032 | ||||||
Affiliated (Note 2) | 70,065,560 | 52,215,216 | 274,753,295 | |||||||||
|
|
|
|
|
| |||||||
Total cost of investments | $ | 2,445,475,245 | $ | 803,187,286 | $ | 2,596,960,327 | ||||||
|
|
|
|
|
| |||||||
Investments in securities, at fair value (including securities on loana) (Note 1): | ||||||||||||
Unaffiliated | $ | 1,965,837,664 | $ | 605,602,507 | $ | 3,233,948,139 | ||||||
Affiliated (Note 2) | 70,065,560 | 52,215,216 | 274,753,295 | |||||||||
|
|
|
|
|
| |||||||
Total fair value of investments | 2,035,903,224 | 657,817,723 | 3,508,701,434 | |||||||||
Foreign currency, at valueb | 4,821,574 | 5,982,464 | 3,406,987 | |||||||||
Cash | — | — | 3,089,982 | |||||||||
Foreign currency pledged to broker, at valueb | — | 161,482 | — | |||||||||
Cash pledged to broker | — | — | 2,838,000 | |||||||||
Receivables: | ||||||||||||
Investment securities sold | 2,660,757 | 15,200,976 | 40,126,478 | |||||||||
Dividends and interest | 13,753,103 | 4,336,961 | 23,479,473 | |||||||||
Futures variation margin | — | 159,699 | 630,864 | |||||||||
|
|
|
|
|
| |||||||
Total Assets | 2,057,138,658 | 683,659,305 | 3,582,273,218 | |||||||||
|
|
|
|
|
| |||||||
LIABILITIES | ||||||||||||
Payables: | ||||||||||||
Investment securities purchased | 2,848,712 | 19,510,845 | 16,806,886 | |||||||||
Collateral for securities on loan (Note 1) | 69,170,592 | 52,157,451 | 246,476,993 | |||||||||
Capital shares redeemed | — | 1,782,165 | 35,318,499 | |||||||||
Due to custodian | — | — | 3,089,982 | |||||||||
Foreign taxes (Note 1) | — | — | 2,313,298 | |||||||||
Investment advisory fees (Note 2) | 914,740 | 281,920 | 1,857,753 | |||||||||
|
|
|
|
|
| |||||||
Total Liabilities | 72,934,044 | 73,732,381 | 305,863,411 | |||||||||
|
|
|
|
|
| |||||||
NET ASSETS | $ | 1,984,204,614 | $ | 609,926,924 | $ | 3,276,409,807 | ||||||
|
|
|
|
|
| |||||||
Net assets consist of: | ||||||||||||
Paid-in capital | $ | 2,907,998,237 | $ | 983,620,948 | $ | 3,438,242,450 | ||||||
Undistributed (distributions in excess of) net investment income | 11,524,396 | (1,115,300 | ) | 71,038,580 | ||||||||
Accumulated net realized loss | (525,449,225 | ) | (227,285,882 | ) | (1,145,572,212 | ) | ||||||
Net unrealized appreciation (depreciation) | (409,868,794 | ) | (145,292,842 | ) | 912,700,989 | |||||||
|
|
|
|
|
| |||||||
NET ASSETS | $ | 1,984,204,614 | $ | 609,926,924 | $ | 3,276,409,807 | ||||||
|
|
|
|
|
| |||||||
Shares outstandingc | 52,200,000 | 57,400,000 | 241,200,000 | |||||||||
|
|
|
|
|
| |||||||
Net asset value per share | $ | 38.01 | $ | 10.63 | $ | 13.58 | ||||||
|
|
|
|
|
| |||||||
| a | Securities on loan with values of $64,808,545, $49,335,032 and $232,867,346, respectively. See Note 1. |
| b | Cost of foreign currency including currency at broker, if any: $4,848,622, $6,168,027 and $3,406,987, respectively. |
| c | $0.001 par value, number of shares authorized: 1 billion, 300 million and 900 million, respectively. |
See notes to financial statements.
FINANCIAL STATEMENTS | 49 |
Table of Contents
Statements of Assets and Liabilities (Continued)
iSHARES®, INC.
August 31, 2015
iShares MSCI ETF | ||||
ASSETS | ||||
Investments, at cost: | ||||
Unaffiliated | $ | 341,412,656 | ||
Affiliated (Note 2) | 28,000,816 | |||
|
| |||
Total cost of investments | $ | 369,413,472 | ||
|
| |||
Investments in securities, at fair value (including securities on loana) (Note 1): | ||||
Unaffiliated | $ | 235,812,020 | ||
Affiliated (Note 2) | 28,000,816 | |||
|
| |||
Total fair value of investments | 263,812,836 | |||
Foreign currency, at valueb | 39 | |||
Receivables: | ||||
Investment securities sold | 540,730 | |||
Dividends and interest | 1,046,391 | |||
Capital shares sold | 26,754 | |||
|
| |||
Total Assets | 265,426,750 | |||
|
| |||
LIABILITIES | ||||
Payables: | ||||
Investment securities purchased | 638,249 | |||
Collateral for securities on loan (Note 1) | 27,347,182 | |||
Investment advisory fees (Note 2) | 137,810 | |||
|
| |||
Total Liabilities | 28,123,241 | |||
|
| |||
NET ASSETS | $ | 237,303,509 | ||
|
| |||
Net assets consist of: | ||||
Paid-in capital | $ | 364,215,477 | ||
Undistributed net investment income | 1,078,328 | |||
Accumulated net realized loss | (22,380,522 | ) | ||
Net unrealized depreciation | (105,609,774 | ) | ||
|
| |||
NET ASSETS | $ | 237,303,509 | ||
|
| |||
Shares outstandingc | 3,650,000 | |||
|
| |||
Net asset value per share | $ | 65.01 | ||
|
| |||
| a | Securities on loan with a value of $15,046,469. See Note 1. |
| b | Cost of foreign currency: $39. |
| c | $0.001 par value, number of shares authorized: 200 million. |
See notes to financial statements.
| 50 | 2015 iSHARES ANNUAL REPORTTO SHAREHOLDERS |
Table of Contents
Statements of Operations
iSHARES® , INC.
Year ended August 31, 2015
iShares MSCI ETF | iShares MSCI ETF | iShares MSCI Malaysia ETF | ||||||||||
NET INVESTMENT INCOME | ||||||||||||
Dividends — unaffiliateda | $ | 91,448,352 | $ | 2,404,344 | $ | 15,843,726 | ||||||
Interest — affiliated (Note 2) | 224 | 8 | 20 | |||||||||
Securities lending income — affiliated — net (Note 2) | 486,160 | 148,129 | 100,529 | |||||||||
|
|
|
|
|
| |||||||
Total investment income | 91,934,736 | 2,552,481 | 15,944,275 | |||||||||
|
|
|
|
|
| |||||||
EXPENSES | ||||||||||||
Investment advisory fees (Note 2) | 15,472,269 | 701,139 | 2,476,145 | |||||||||
|
|
|
|
|
| |||||||
Total expenses | 15,472,269 | 701,139 | 2,476,145 | |||||||||
|
|
|
|
|
| |||||||
Net investment income | 76,462,467 | 1,851,342 | 13,468,130 | |||||||||
|
|
|
|
|
| |||||||
NET REALIZED AND UNREALIZED GAIN (LOSS) | ||||||||||||
Net realized gain (loss) from: | ||||||||||||
Investments — unaffiliated | (54,477,854 | ) | (543,413 | ) | 89,460,638 | |||||||
In-kind redemptions — unaffiliated | 150,278,137 | 19,402,442 | — | |||||||||
Futures contracts | (1,319,015 | ) | — | — | ||||||||
Foreign currency transactions | 15,879 | (136,831 | ) | (1,693,821 | ) | |||||||
|
|
|
|
|
| |||||||
Net realized gain | 94,497,147 | 18,722,198 | 87,766,817 | |||||||||
|
|
|
|
|
| |||||||
Net change in unrealized appreciation/depreciation on: | ||||||||||||
Investments | (536,247,142 | ) | (32,011,158 | ) | (328,366,164 | ) | ||||||
Futures contracts | 517,953 | — | — | |||||||||
Translation of assets and liabilities in foreign currencies | 3,380 | 24,683 | (34,753 | ) | ||||||||
|
|
|
|
|
| |||||||
Net change in unrealized appreciation/depreciation | (535,725,809 | ) | (31,986,475 | ) | (328,400,917 | ) | ||||||
|
|
|
|
|
| |||||||
Net realized and unrealized loss | (441,228,662 | ) | (13,264,277 | ) | (240,634,100 | ) | ||||||
|
|
|
|
|
| |||||||
NET DECREASE IN NET ASSETS RESULTING FROM OPERATIONS | $ | (364,766,195 | ) | $ | (11,412,935 | ) | $ | (227,165,970 | ) | |||
|
|
|
|
|
| |||||||
| a | Net of foreign withholding tax of $ —, $261,862 and $ —, respectively. |
See notes to financial statements.
FINANCIAL STATEMENTS | 51 |
Table of Contents
Statements of Operations (Continued)
iSHARES®, INC.
Year ended August 31, 2015
iShares MSCI ETF | iShares MSCI Singapore ETF | iShares MSCI Taiwan ETF | ||||||||||
NET INVESTMENT INCOME | ||||||||||||
Dividends — unaffiliateda | $ | 130,977,719 | $ | 29,540,349 | $ | 108,739,680 | ||||||
Interest — affiliated (Note 2) | 106 | 39 | 1,388 | |||||||||
Securities lending income — affiliated — net (Note 2) | 490,502 | 753,050 | 1,993,866 | b | ||||||||
|
|
|
|
|
| |||||||
| 131,468,327 | 30,293,438 | 110,734,934 | ||||||||||
Less: Other foreign taxes (Note 1) | — | — | (2,928,781 | ) | ||||||||
|
|
|
|
|
| |||||||
Total investment income | 131,468,327 | 30,293,438 | 107,806,153 | |||||||||
|
|
|
|
|
| |||||||
EXPENSES | ||||||||||||
Investment advisory fees (Note 2) | 13,450,529 | 3,991,035 | 22,392,457 | |||||||||
|
|
|
|
|
| |||||||
Total expenses | 13,450,529 | 3,991,035 | 22,392,457 | |||||||||
|
|
|
|
|
| |||||||
Net investment income | 118,017,798 | 26,302,403 | 85,413,696 | |||||||||
|
|
|
|
|
| |||||||
NET REALIZED AND UNREALIZED GAIN (LOSS) | ||||||||||||
Net realized gain (loss) from: | ||||||||||||
Investments — unaffiliated | (57,066,025 | ) | (14,920,487 | ) | (108,615,185 | ) | ||||||
In-kind redemptions — unaffiliated | 129,535,963 | 12,445,650 | — | |||||||||
Futures contracts | — | (1,846,594 | ) | (10,006,583 | ) | |||||||
Foreign currency transactions | (4,616,451 | ) | (897,320 | ) | (1,875,452 | ) | ||||||
|
|
|
|
|
| |||||||
Net realized gain (loss) | 67,853,487 | (5,218,751 | ) | (120,497,220 | ) | |||||||
|
|
|
|
|
| |||||||
Net change in unrealized appreciation/depreciation on: | ||||||||||||
Investments | (853,511,736 | ) | (209,403,433 | ) | (618,245,316 | ) | ||||||
Futures contracts | — | 202,425 | 1,182,109 | |||||||||
Translation of assets and liabilities in foreign currencies | (332,979 | ) | (91,891 | ) | (563,304 | ) | ||||||
|
|
|
|
|
| |||||||
Net change in unrealized appreciation/depreciation | (853,844,715 | ) | (209,292,899 | ) | (617,626,511 | ) | ||||||
|
|
|
|
|
| |||||||
Net realized and unrealized loss | (785,991,228 | ) | (214,511,650 | ) | (738,123,731 | ) | ||||||
|
|
|
|
|
| |||||||
NET DECREASE IN NET ASSETS RESULTING FROM OPERATIONS | $ | (667,973,430 | ) | $ | (188,209,247 | ) | $ | (652,710,035 | ) | |||
|
|
|
|
|
| |||||||
| a | Net of foreign withholding tax of $1,760,821, $270,575 and $24,592,777, respectively. |
| b | Net of foreign tax paid of $473,115. |
See notes to financial statements.
| 52 | 2015 iSHARES ANNUAL REPORTTO SHAREHOLDERS |
Table of Contents
Statements of Operations (Continued)
iSHARES®, INC.
Year ended August 31, 2015
iShares MSCI ETF | ||||
NET INVESTMENT INCOME | ||||
Dividends — unaffiliateda | $ | 11,040,846 | ||
Interest — affiliated (Note 2) | 57 | |||
Securities lending income — affiliated — net (Note 2) | 787,999 | |||
|
| |||
Total investment income | 11,828,902 | |||
|
| |||
EXPENSES | ||||
Investment advisory fees (Note 2) | 2,698,099 | |||
|
| |||
Total expenses | 2,698,099 | |||
|
| |||
Net investment income | 9,130,803 | |||
|
| |||
NET REALIZED AND UNREALIZED GAIN (LOSS) | ||||
Net realized gain (loss) from: | ||||
Investments — unaffiliated | (9,216,902 | ) | ||
In-kind redemptions — unaffiliated | (5,900,789 | ) | ||
Foreign currency transactions | (171,184 | ) | ||
|
| |||
Net realized loss | (15,288,875 | ) | ||
|
| |||
Net change in unrealized appreciation/depreciation on: | ||||
Investments | (81,356,807 | ) | ||
Translation of assets and liabilities in foreign currencies | (9,572 | ) | ||
|
| |||
Net change in unrealized appreciation/depreciation | (81,366,379 | ) | ||
|
| |||
Net realized and unrealized loss | (96,655,254 | ) | ||
|
| |||
NET DECREASE IN NET ASSETS RESULTING FROM OPERATIONS | $ | (87,524,451 | ) | |
|
| |||
| a | Net of foreign withholding tax of $1,213,936. |
See notes to financial statements.
FINANCIAL STATEMENTS | 53 |
Table of Contents
Statements of Changes in Net Assets
iSHARES® , INC.
| iShares MSCI Hong Kong ETF | iShares MSCI Japan Small-Cap ETF | |||||||||||||||
| Year ended August 31, 2015 | Year ended August 31, 2014 | Year ended August 31, 2015 | Year ended August 31, 2014 | |||||||||||||
INCREASE (DECREASE) IN NET ASSETS | ||||||||||||||||
OPERATIONS: | ||||||||||||||||
Net investment income | $ | 76,462,467 | $ | 70,834,799 | $ | 1,851,342 | $ | 1,791,679 | ||||||||
Net realized gain | 94,497,147 | 65,800,683 | 18,722,198 | 1,795,819 | ||||||||||||
Net change in unrealized appreciation/depreciation | (535,725,809 | ) | 218,838,568 | (31,986,475 | ) | 15,636,594 | ||||||||||
|
|
|
|
|
|
|
| |||||||||
Net increase (decrease) in net assets resulting from operations | (364,766,195 | ) | 355,474,050 | (11,412,935 | ) | 19,224,092 | ||||||||||
|
|
|
|
|
|
|
| |||||||||
DISTRIBUTIONS TO SHAREHOLDERS: | ||||||||||||||||
From net investment income | (74,964,011 | ) | (69,523,487 | ) | (2,993,420 | ) | (2,956,269 | ) | ||||||||
|
|
|
|
|
|
|
| |||||||||
Total distributions to shareholders | (74,964,011 | ) | (69,523,487 | ) | (2,993,420 | ) | (2,956,269 | ) | ||||||||
|
|
|
|
|
|
|
| |||||||||
CAPITAL SHARE TRANSACTIONS: | ||||||||||||||||
Proceeds from shares sold | 1,076,021,470 | 1,440,373,193 | 249,704,421 | 80,604,743 | ||||||||||||
Cost of shares redeemed | (1,135,379,620 | ) | (629,867,957 | ) | (246,130,624 | ) | (16,023,548 | ) | ||||||||
|
|
|
|
|
|
|
| |||||||||
Net increase (decrease) in net assets from capital share transactions | (59,358,150 | ) | 810,505,236 | 3,573,797 | 64,581,195 | |||||||||||
|
|
|
|
|
|
|
| |||||||||
INCREASE (DECREASE) IN NET ASSETS | (499,088,356 | ) | 1,096,455,799 | (10,832,558 | ) | 80,849,018 | ||||||||||
NET ASSETS | ||||||||||||||||
Beginning of year | 3,221,312,218 | 2,124,856,419 | 169,836,705 | 88,987,687 | ||||||||||||
|
|
|
|
|
|
|
| |||||||||
End of year | $ | 2,722,223,862 | $ | 3,221,312,218 | $ | 159,004,147 | $ | 169,836,705 | ||||||||
|
|
|
|
|
|
|
| |||||||||
Undistributed (distributions in excess of) net investment income included in net assets at end of year | $ | 7,704,071 | $ | 6,189,736 | $ | 217,281 | $ | (1,026,401 | ) | |||||||
|
|
|
|
|
|
|
| |||||||||
SHARES ISSUED AND REDEEMED | ||||||||||||||||
Shares sold | 47,625,000 | 66,525,000 | 4,300,000 | 1,500,000 | ||||||||||||
Shares redeemed | (54,600,000 | ) | (31,725,000 | ) | (4,500,000 | ) | (300,000 | ) | ||||||||
|
|
|
|
|
|
|
| |||||||||
Net increase (decrease) in shares outstanding | (6,975,000 | ) | 34,800,000 | (200,000 | ) | 1,200,000 | ||||||||||
|
|
|
|
|
|
|
| |||||||||
See notes to financial statements.
| 54 | 2015 iSHARES ANNUAL REPORTTO SHAREHOLDERS |
Table of Contents
Statements of Changes in Net Assets (Continued)
iSHARES®, INC.
| iShares MSCI Malaysia ETF | iShares MSCI Pacific ex Japan ETF | |||||||||||||||
| Year ended August 31, 2015 | Year ended August 31, 2014 | Year ended August 31, 2015 | Year ended August 31, 2014 | |||||||||||||
INCREASE (DECREASE) IN NET ASSETS | ||||||||||||||||
OPERATIONS: | ||||||||||||||||
Net investment income | $ | 13,468,130 | $ | 27,863,132 | $ | 118,017,798 | $ | 123,772,601 | ||||||||
Net realized gain | 87,766,817 | 41,437,464 | 67,853,487 | 126,373,389 | ||||||||||||
Net change in unrealized appreciation/depreciation | (328,400,917 | ) | 33,268,903 | (853,844,715 | ) | 262,536,520 | ||||||||||
|
|
|
|
|
|
|
| |||||||||
Net increase (decrease) in net assets resulting from operations | (227,165,970 | ) | 102,569,499 | (667,973,430 | ) | 512,682,510 | ||||||||||
|
|
|
|
|
|
|
| |||||||||
DISTRIBUTIONS TO SHAREHOLDERS: | ||||||||||||||||
From net investment income | (15,389,546 | ) | (26,722,876 | ) | (121,558,328 | ) | (118,670,244 | ) | ||||||||
From net realized gain | (1,987,267 | ) | — | — | — | |||||||||||
|
|
|
|
|
|
|
| |||||||||
Total distributions to shareholders | (17,376,813 | ) | (26,722,876 | ) | (121,558,328 | ) | (118,670,244 | ) | ||||||||
|
|
|
|
|
|
|
| |||||||||
CAPITAL SHARE TRANSACTIONS: | ||||||||||||||||
Proceeds from shares sold | 107,286,599 | 52,163,306 | 27,284,262 | 752,794,621 | ||||||||||||
Cost of shares redeemed | (385,625,950 | ) | (150,687,467 | ) | (725,596,210 | ) | (682,826,053 | ) | ||||||||
|
|
|
|
|
|
|
| |||||||||
Net increase (decrease) in net assets from capital share transactions | (278,339,351 | ) | (98,524,161 | ) | (698,311,948 | ) | 69,968,568 | |||||||||
|
|
|
|
|
|
|
| |||||||||
INCREASE (DECREASE) IN NET ASSETS | (522,882,134 | ) | (22,677,538 | ) | (1,487,843,706 | ) | 463,980,834 | |||||||||
NET ASSETS | ||||||||||||||||
Beginning of year | 786,460,899 | 809,138,437 | 3,472,048,320 | 3,008,067,486 | ||||||||||||
|
|
|
|
|
|
|
| |||||||||
End of year | $ | 263,578,765 | $ | 786,460,899 | $ | 1,984,204,614 | $ | 3,472,048,320 | ||||||||
|
|
|
|
|
|
|
| |||||||||
Undistributed net investment income included in net assets at end of year | $ | 3,673,177 | $ | 3,466,057 | $ | 11,524,396 | $ | 12,734,661 | ||||||||
|
|
|
|
|
|
|
| |||||||||
SHARES ISSUED AND REDEEMED | ||||||||||||||||
Shares sold | 8,250,000 | 3,225,000 | 600,000 | 15,300,000 | ||||||||||||
Shares redeemed | (31,125,000 | ) | (9,900,000 | ) | (16,200,000 | ) | (15,000,000 | ) | ||||||||
|
|
|
|
|
|
|
| |||||||||
Net increase (decrease) in shares outstanding | (22,875,000 | ) | (6,675,000 | ) | (15,600,000 | ) | 300,000 | |||||||||
|
|
|
|
|
|
|
| |||||||||
See notes to financial statements.
FINANCIAL STATEMENTS | 55 |
Table of Contents
Statements of Changes in Net Assets (Continued)
iSHARES®, INC.
| iShares MSCI Singapore ETF | iShares MSCI Taiwan ETF | |||||||||||||||
Year ended August 31, 2015 | Year ended August 31, 2014 | Year ended August 31, 2015 | Year ended August 31, 2014 | |||||||||||||
INCREASE (DECREASE) IN NET ASSETS | ||||||||||||||||
OPERATIONS: | ||||||||||||||||
Net investment income | $ | 26,302,403 | $ | 32,110,843 | $ | 85,413,696 | $ | 57,916,427 | ||||||||
Net realized gain (loss) | (5,218,751 | ) | 32,530,341 | (120,497,220 | ) | (20,870,934 | ) | |||||||||
Net change in unrealized appreciation/depreciation | (209,292,899 | ) | 84,170,334 | (617,626,511 | ) | 581,209,729 | ||||||||||
|
|
|
|
|
|
|
| |||||||||
Net increase (decrease) in net assets resulting from operations | (188,209,247 | ) | 148,811,518 | (652,710,035 | ) | 618,255,222 | ||||||||||
|
|
|
|
|
|
|
| |||||||||
DISTRIBUTIONS TO SHAREHOLDERS: | ||||||||||||||||
From net investment income | (27,289,993 | ) | (36,850,739 | ) | (61,969,914 | ) | (51,978,221 | ) | ||||||||
|
|
|
|
|
|
|
| |||||||||
Total distributions to shareholders | (27,289,993 | ) | (36,850,739 | ) | (61,969,914 | ) | (51,978,221 | ) | ||||||||
|
|
|
|
|
|
|
| |||||||||
CAPITAL SHARE TRANSACTIONS: | ||||||||||||||||
Proceeds from shares sold | 32,838,329 | 45,906,815 | 1,059,504,564 | 299,500,305 | ||||||||||||
Cost of shares redeemed | (191,867,107 | ) | (308,890,044 | ) | (367,078,617 | ) | (209,110,415 | ) | ||||||||
|
|
|
|
|
|
|
| |||||||||
Net increase (decrease) in net assets from capital share transactions | (159,028,778 | ) | (262,983,229 | ) | 692,425,947 | 90,389,890 | ||||||||||
|
|
|
|
|
|
|
| |||||||||
INCREASE (DECREASE) IN NET ASSETS | (374,528,018 | ) | (151,022,450 | ) | (22,254,002 | ) | 656,666,891 | |||||||||
NET ASSETS | ||||||||||||||||
Beginning of year | 984,454,942 | 1,135,477,392 | 3,298,663,809 | 2,641,996,918 | ||||||||||||
|
|
|
|
|
|
|
| |||||||||
End of year | $ | 609,926,924 | $ | 984,454,942 | $ | 3,276,409,807 | $ | 3,298,663,809 | ||||||||
|
|
|
|
|
|
|
| |||||||||
Undistributed (distributions in excess of) net investment income included in net assets at end of year | $ | (1,115,300 | ) | $ | (2,353,314 | ) | $ | 71,038,580 | $ | 49,428,800 | ||||||
|
|
|
|
|
|
|
| |||||||||
SHARES ISSUED AND REDEEMED | ||||||||||||||||
Shares sold | 2,500,000 | 3,400,000 | 66,600,000 | 21,000,000 | ||||||||||||
Shares redeemed | (15,600,000 | ) | (23,800,000 | ) | (26,000,000 | ) | (14,600,000 | ) | ||||||||
|
|
|
|
|
|
|
| |||||||||
Net increase (decrease) in shares outstanding | (13,100,000 | ) | (20,400,000 | ) | 40,600,000 | 6,400,000 | ||||||||||
|
|
|
|
|
|
|
| |||||||||
See notes to financial statements.
| 56 | 2015 iSHARES ANNUAL REPORTTO SHAREHOLDERS |
Table of Contents
Statements of Changes in Net Assets (Continued)
iSHARES®, INC.
| iShares MSCI Thailand Capped ETF | ||||||||
Year ended August 31, 2015 | Year ended August 31, 2014 | |||||||
INCREASE (DECREASE) IN NET ASSETS | ||||||||
OPERATIONS: | ||||||||
Net investment income | $ | 9,130,803 | $ | 12,286,557 | ||||
Net realized gain (loss) | (15,288,875 | ) | 9,219,384 | |||||
Net change in unrealized appreciation/depreciation | (81,366,379 | ) | 95,854,036 | |||||
|
|
|
| |||||
Net increase (decrease) in net assets resulting from operations | (87,524,451 | ) | 117,359,977 | |||||
|
|
|
| |||||
DISTRIBUTIONS TO SHAREHOLDERS: | ||||||||
From net investment income | (9,842,483 | ) | (12,909,951 | ) | ||||
|
|
|
| |||||
Total distributions to shareholders | (9,842,483 | ) | (12,909,951 | ) | ||||
|
|
|
| |||||
CAPITAL SHARE TRANSACTIONS: | ||||||||
Proceeds from shares sold | 232,829,500 | 341,398,189 | ||||||
Cost of shares redeemed | (469,528,663 | ) | (416,351,403 | ) | ||||
|
|
|
| |||||
Net decrease in net assets from capital share transactions | (236,699,163 | ) | (74,953,214 | ) | ||||
|
|
|
| |||||
INCREASE (DECREASE) IN NET ASSETS | (334,066,097 | ) | 29,496,812 | |||||
NET ASSETS | ||||||||
Beginning of year | 571,369,606 | 541,872,794 | ||||||
|
|
|
| |||||
End of year | $ | 237,303,509 | $ | 571,369,606 | ||||
|
|
|
| |||||
Undistributed net investment income included in net assets at end of year | $ | 1,078,328 | $ | 1,958,625 | ||||
|
|
|
| |||||
SHARES ISSUED AND REDEEMED | ||||||||
Shares sold | 2,900,000 | 4,550,000 | ||||||
Shares redeemed | (6,100,000 | ) | (5,700,000 | ) | ||||
|
|
|
| |||||
Net decrease in shares outstanding | (3,200,000 | ) | (1,150,000 | ) | ||||
|
|
|
| |||||
See notes to financial statements.
FINANCIAL STATEMENTS | 57 |
Table of Contents
iSHARES® , INC.
(For a share outstanding throughout each period)
| iShares MSCI Hong Kong ETF | ||||||||||||||||||||
| Year ended Aug. 31, 2015 | Year ended Aug. 31, 2014 | Year ended Aug. 31, 2013 | Year ended Aug. 31, 2012 | Year ended Aug. 31, 2011 | ||||||||||||||||
Net asset value, beginning of year | $ | 21.89 | $ | 18.91 | $ | 16.94 | $ | 17.59 | $ | 16.02 | ||||||||||
|
|
|
|
|
|
|
|
|
| |||||||||||
Income from investment operations: | ||||||||||||||||||||
Net investment incomea | 0.52 | 0.66 | 0.48 | 0.54 | 0.42 | |||||||||||||||
Net realized and unrealized gain (loss)b | (2.50 | ) | 3.04 | 2.05 | (0.65 | ) | 1.56 | |||||||||||||
|
|
|
|
|
|
|
|
|
| |||||||||||
Total from investment operations | (1.98 | ) | 3.70 | 2.53 | (0.11 | ) | 1.98 | |||||||||||||
|
|
|
|
|
|
|
|
|
| |||||||||||
Less distributions from: | ||||||||||||||||||||
Net investment income | (0.49 | ) | (0.72 | ) | (0.56 | ) | (0.54 | ) | (0.41 | ) | ||||||||||
|
|
|
|
|
|
|
|
|
| |||||||||||
Total distributions | (0.49 | ) | (0.72 | ) | (0.56 | ) | (0.54 | ) | (0.41 | ) | ||||||||||
|
|
|
|
|
|
|
|
|
| |||||||||||
Net asset value, end of year | $ | 19.42 | $ | 21.89 | $ | 18.91 | $ | 16.94 | $ | 17.59 | ||||||||||
|
|
|
|
|
|
|
|
|
| |||||||||||
Total return | (9.29 | )% | 19.87 | % | 15.04 | % | (0.33 | )% | 12.27 | % | ||||||||||
|
|
|
|
|
|
|
|
|
| |||||||||||
Ratios/Supplemental data: | ||||||||||||||||||||
Net assets, end of year (000s) | $ | 2,722,224 | $ | 3,221,312 | $ | 2,124,856 | $ | 1,865,974 | $ | 1,607,982 | ||||||||||
Ratio of expenses to average net assets | 0.48 | % | 0.48 | % | 0.51 | % | 0.53 | % | 0.52 | % | ||||||||||
Ratio of net investment income to average net assets | 2.36 | % | 3.24 | % | 2.47 | % | 3.26 | % | 2.25 | % | ||||||||||
Portfolio turnover ratec | 7 | % | 6 | % | 12 | % | 11 | % | 15 | % | ||||||||||
| a | Based on average shares outstanding throughout each period. |
| b | The amounts reported for a share outstanding may not accord with the change in aggregate gains and losses in securities for the fiscal period due to the timing of capital share transactions in relation to the fluctuating market values of the Fund’s underlying securities. |
| c | Portfolio turnover rates exclude portfolio securities received or delivered as a result of processing capital share transactions in Creation Units. |
See notes to financial statements.
| 58 | 2015 iSHARES ANNUAL REPORTTO SHAREHOLDERS |
Table of Contents
Financial Highlights (Continued)
iSHARES®, INC.
(For a share outstanding throughout each period)
| iShares MSCI Japan Small-Cap ETF | ||||||||||||||||||||
| Year ended Aug. 31, 2015 | Year ended Aug. 31, 2014 | Year ended Aug. 31, 2013 | Year ended Aug. 31, 2012 | Year ended Aug. 31, 2011 | ||||||||||||||||
Net asset value, beginning of year | $ | 56.61 | $ | 49.44 | $ | 42.82 | $ | 46.49 | $ | 40.74 | ||||||||||
|
|
|
|
|
|
|
|
|
| |||||||||||
Income from investment operations: | ||||||||||||||||||||
Net investment incomea | 0.70 | 0.70 | 0.65 | 0.82 | 0.78 | |||||||||||||||
Net realized and unrealized gain (loss)b | 0.71 | 7.61 | 6.97 | (3.25 | ) | 5.87 | ||||||||||||||
|
|
|
|
|
|
|
|
|
| |||||||||||
Total from investment operations | 1.41 | 8.31 | 7.62 | (2.43 | ) | 6.65 | ||||||||||||||
|
|
|
|
|
|
|
|
|
| |||||||||||
Less distributions from: | ||||||||||||||||||||
Net investment income | (1.23 | ) | (1.14 | ) | (1.00 | ) | (1.24 | ) | (0.90 | ) | ||||||||||
|
|
|
|
|
|
|
|
|
| |||||||||||
Total distributions | (1.23 | ) | (1.14 | ) | (1.00 | ) | (1.24 | ) | (0.90 | ) | ||||||||||
|
|
|
|
|
|
|
|
|
| |||||||||||
Net asset value, end of year | $ | 56.79 | $ | 56.61 | $ | 49.44 | $ | 42.82 | $ | 46.49 | ||||||||||
|
|
|
|
|
|
|
|
|
| |||||||||||
Total return | 2.63 | % | 16.94 | % | 18.07 | % | (5.18 | )% | 16.38 | % | ||||||||||
|
|
|
|
|
|
|
|
|
| |||||||||||
Ratios/Supplemental data: | ||||||||||||||||||||
Net assets, end of year (000s) | $ | 159,004 | $ | 169,837 | $ | 88,988 | $ | 42,817 | $ | 74,387 | ||||||||||
Ratio of expenses to average net assets | 0.48 | % | 0.48 | % | 0.50 | % | 0.53 | % | 0.51 | % | ||||||||||
Ratio of net investment income to average net assets | 1.26 | % | 1.31 | % | 1.36 | % | 1.84 | % | 1.72 | % | ||||||||||
Portfolio turnover ratec | 10 | % | 14 | % | 17 | % | 7 | % | 10 | % | ||||||||||
| a | Based on average shares outstanding throughout each period. |
| b | The amounts reported for a share outstanding may not accord with the change in aggregate gains and losses in securities for the fiscal period due to the timing of capital share transactions in relation to the fluctuating market values of the Fund’s underlying securities. |
| c | Portfolio turnover rates exclude portfolio securities received or delivered as a result of processing capital share transactions in Creation Units. |
See notes to financial statements.
FINANCIAL HIGHLIGHTS | 59 |
Table of Contents
Financial Highlights (Continued)
iSHARES®, INC.
(For a share outstanding throughout each period)
| iShares MSCI Malaysia ETF | ||||||||||||||||||||
| Year ended Aug. 31, 2015 | Year ended Aug. 31, 2014 | Year ended Aug. 31, 2013 | Year ended Aug. 31, 2012 | Year ended Aug. 31, 2011 | ||||||||||||||||
Net asset value, beginning of year | $ | 16.13 | $ | 14.60 | $ | 14.52 | $ | 13.92 | $ | 12.98 | ||||||||||
|
|
|
|
|
|
|
|
|
| |||||||||||
Income from investment operations: | ||||||||||||||||||||
Net investment incomea | 0.36 | 0.54 | 0.41 | 0.38 | 0.41 | |||||||||||||||
Net realized and unrealized gain (loss)b | (5.86 | ) | 1.51 | 0.04 | 0.76 | 0.92 | ||||||||||||||
|
|
|
|
|
|
|
|
|
| |||||||||||
Total from investment operations | (5.50 | ) | 2.05 | 0.45 | 1.14 | 1.33 | ||||||||||||||
|
|
|
|
|
|
|
|
|
| |||||||||||
Less distributions from: | ||||||||||||||||||||
Net investment income | (0.39 | ) | (0.52 | ) | (0.37 | ) | (0.52 | ) | (0.39 | ) | ||||||||||
Net realized gain | (0.05 | ) | — | — | — | — | ||||||||||||||
Return of capital | — | — | — | (0.02 | ) | — | ||||||||||||||
|
|
|
|
|
|
|
|
|
| |||||||||||
Total distributions | (0.44 | ) | (0.52 | ) | (0.37 | ) | (0.54 | ) | (0.39 | ) | ||||||||||
|
|
|
|
|
|
|
|
|
| |||||||||||
Net asset value, end of year | $ | 10.19 | $ | 16.13 | $ | 14.60 | $ | 14.52 | $ | 13.92 | ||||||||||
|
|
|
|
|
|
|
|
|
| |||||||||||
Total return | (34.62 | )% | 14.17 | % | 3.02 | % | 8.61 | % | 10.19 | % | ||||||||||
|
|
|
|
|
|
|
|
|
| |||||||||||
Ratios/Supplemental data: | ||||||||||||||||||||
Net assets, end of year (000s) | $ | 263,579 | $ | 786,461 | $ | 809,138 | $ | 936,692 | $ | 978,402 | ||||||||||
Ratio of expenses to average net assets | 0.48 | % | 0.48 | % | 0.51 | % | 0.53 | % | 0.52 | % | ||||||||||
Ratio of net investment income to average net assets | 2.61 | % | 3.48 | % | 2.71 | % | 2.73 | % | 2.84 | % | ||||||||||
Portfolio turnover ratec | 24 | % | 16 | % | 17 | % | 24 | % | 49 | % | ||||||||||
| a | Based on average shares outstanding throughout each period. |
| b | The amounts reported for a share outstanding may not accord with the change in aggregate gains and losses in securities for the fiscal period due to the timing of capital share transactions in relation to the fluctuating market values of the Fund’s underlying securities. |
| c | Portfolio turnover rates include portfolio transactions that are executed as a result of the Fund processing capital share transactions in Creation Units solely for cash in U.S. dollars. Excluding such cash transactions, the portfolio turnover rates for the years ended August 31, 2015, August 31, 2014, August 31, 2013, August 31, 2012, and August 31, 2011 were 5%, 10%, 8%, 14% and 14%, respectively. See Note 4. |
See notes to financial statements.
| 60 | 2015 iSHARES ANNUAL REPORTTO SHAREHOLDERS |
Table of Contents
Financial Highlights (Continued)
iSHARES®, INC.
(For a share outstanding throughout each period)
| iShares MSCI Pacific ex Japan ETF | ||||||||||||||||||||
| Year ended Aug. 31, 2015 | Year ended Aug. 31, 2014 | Year ended Aug. 31, 2013 | Year ended Aug. 31, 2012 | Year ended Aug. 31, 2011 | ||||||||||||||||
Net asset value, beginning of year | $ | 51.21 | $ | 44.56 | $ | 43.21 | $ | 44.47 | $ | 39.25 | ||||||||||
|
|
|
|
|
|
|
|
|
| |||||||||||
Income from investment operations: | ||||||||||||||||||||
Net investment incomea | 1.97 | 1.88 | 1.69 | 1.73 | 1.64 | |||||||||||||||
Net realized and unrealized gain (loss)b | (13.09 | ) | 6.51 | 1.71 | (1.14 | ) | 5.31 | |||||||||||||
|
|
|
|
|
|
|
|
|
| |||||||||||
Total from investment operations | (11.12 | ) | 8.39 | 3.40 | 0.59 | 6.95 | ||||||||||||||
|
|
|
|
|
|
|
|
|
| |||||||||||
Less distributions from: | ||||||||||||||||||||
Net investment income | (2.08 | ) | (1.74 | ) | (2.05 | ) | (1.85 | ) | (1.73 | ) | ||||||||||
|
|
|
|
|
|
|
|
|
| |||||||||||
Total distributions | (2.08 | ) | (1.74 | ) | (2.05 | ) | (1.85 | ) | (1.73 | ) | ||||||||||
|
|
|
|
|
|
|
|
|
| |||||||||||
Net asset value, end of year | $ | 38.01 | $ | 51.21 | $ | 44.56 | $ | 43.21 | $ | 44.47 | ||||||||||
|
|
|
|
|
|
|
|
|
| |||||||||||
Total return | (22.19 | )% | 19.25 | % | 7.87 | % | 1.82 | % | 17.61 | % | ||||||||||
|
|
|
|
|
|
|
|
|
| |||||||||||
Ratios/Supplemental data: | ||||||||||||||||||||
Net assets, end of year (000s) | $ | 1,984,205 | $ | 3,472,048 | $ | 3,008,067 | $ | 3,188,582 | $ | 3,548,867 | ||||||||||
Ratio of expenses to average net assets | 0.49 | % | 0.49 | % | 0.50 | % | 0.50 | % | 0.50 | % | ||||||||||
Ratio of net investment income to average net assets | 4.31 | % | 3.90 | % | 3.59 | % | 4.16 | % | 3.53 | % | ||||||||||
Portfolio turnover ratec | 7 | % | 8 | % | 8 | % | 7 | % | 10 | % | ||||||||||
| a | Based on average shares outstanding throughout each period. |
| b | The amounts reported for a share outstanding may not accord with the change in aggregate gains and losses in securities for the fiscal period due to the timing of capital share transactions in relation to the fluctuating market values of the Fund’s underlying securities. |
| c | Portfolio turnover rates exclude portfolio securities received or delivered as a result of processing capital share transactions in Creation Units. |
See notes to financial statements.
FINANCIAL HIGHLIGHTS | 61 |
Table of Contents
Financial Highlights (Continued)
iSHARES®, INC.
(For a share outstanding throughout each period)
| iShares MSCI Singapore ETF | ||||||||||||||||||||
| Year ended Aug. 31, 2015 | Year ended Aug. 31, 2014 | Year ended Aug. 31, 2013 | Year ended Aug. 31, 2012 | Year ended Aug. 31, 2011 | ||||||||||||||||
Net asset value, beginning of year | $ | 13.96 | $ | 12.49 | $ | 13.10 | $ | 13.05 | $ | 12.17 | ||||||||||
|
|
|
|
|
|
|
|
|
| |||||||||||
Income from investment operations: | ||||||||||||||||||||
Net investment incomea | 0.41 | 0.40 | 0.44 | 0.41 | 0.45 | |||||||||||||||
Net realized and unrealized gain (loss)b | (3.31 | ) | 1.52 | (0.47 | ) | 0.11 | 0.92 | |||||||||||||
|
|
|
|
|
|
|
|
|
| |||||||||||
Total from investment operations | (2.90 | ) | 1.92 | (0.03 | ) | 0.52 | 1.37 | |||||||||||||
|
|
|
|
|
|
|
|
|
| |||||||||||
Less distributions from: | ||||||||||||||||||||
Net investment income | (0.43 | ) | (0.45 | ) | (0.58 | ) | (0.47 | ) | (0.49 | ) | ||||||||||
|
|
|
|
|
|
|
|
|
| |||||||||||
Total distributions | (0.43 | ) | (0.45 | ) | (0.58 | ) | (0.47 | ) | (0.49 | ) | ||||||||||
|
|
|
|
|
|
|
|
|
| |||||||||||
Net asset value, end of year | $ | 10.63 | $ | 13.96 | $ | 12.49 | $ | 13.10 | $ | 13.05 | ||||||||||
|
|
|
|
|
|
|
|
|
| |||||||||||
Total return | (21.27 | )% | 15.65 | % | (0.38 | )% | 4.67 | % | 11.27 | % | ||||||||||
|
|
|
|
|
|
|
|
|
| |||||||||||
Ratios/Supplemental data: | ||||||||||||||||||||
Net assets, end of year (000s) | $ | 609,927 | $ | 984,455 | $ | 1,135,477 | $ | 1,512,687 | $ | 1,713,199 | ||||||||||
Ratio of expenses to average net assets | 0.48 | % | 0.48 | % | 0.51 | % | 0.53 | % | 0.52 | % | ||||||||||
Ratio of net investment income to average net assets | 3.15 | % | 2.99 | % | 3.23 | % | 3.32 | % | 3.34 | % | ||||||||||
Portfolio turnover ratec | 10 | % | 4 | % | 10 | % | 3 | % | 10 | % | ||||||||||
| a | Based on average shares outstanding throughout each period. |
| b | The amounts reported for a share outstanding may not accord with the change in aggregate gains and losses in securities for the fiscal period due to the timing of capital share transactions in relation to the fluctuating market values of the Fund’s underlying securities. |
| c | Portfolio turnover rates exclude portfolio securities received or delivered as a result of processing capital share transactions in Creation Units. |
See notes to financial statements.
| 62 | 2015 iSHARES ANNUAL REPORTTO SHAREHOLDERS |
Table of Contents
Financial Highlights (Continued)
iSHARES®, INC.
(For a share outstanding throughout each period)
| iShares MSCI Taiwan ETF | ||||||||||||||||||||
| Year ended Aug. 31, 2015 | Year ended Aug. 31, 2014 | Year ended Aug. 31, 2013 | Year ended Aug. 31, 2012 | Year ended Aug. 31, 2011 | ||||||||||||||||
Net asset value, beginning of year | $ | 16.44 | $ | 13.60 | $ | 12.58 | $ | 13.78 | $ | 12.19 | ||||||||||
|
|
|
|
|
|
|
|
|
| |||||||||||
Income from investment operations: | ||||||||||||||||||||
Net investment incomea | 0.37 | 0.29 | 0.24 | 0.28 | 0.39 | |||||||||||||||
Net realized and unrealized gain (loss)b | (2.94 | ) | 2.81 | 1.05 | (1.01 | ) | 1.49 | |||||||||||||
|
|
|
|
|
|
|
|
|
| |||||||||||
Total from investment operations | (2.57 | ) | 3.10 | 1.29 | (0.73 | ) | 1.88 | |||||||||||||
|
|
|
|
|
|
|
|
|
| |||||||||||
Less distributions from: | ||||||||||||||||||||
Net investment income | (0.29 | ) | (0.26 | ) | (0.27 | ) | (0.47 | ) | (0.29 | ) | ||||||||||
|
|
|
|
|
|
|
|
|
| |||||||||||
Total distributions | (0.29 | ) | (0.26 | ) | (0.27 | ) | (0.47 | ) | (0.29 | ) | ||||||||||
|
|
|
|
|
|
|
|
|
| |||||||||||
Net asset value, end of year | $ | 13.58 | $ | 16.44 | $ | 13.60 | $ | 12.58 | $ | 13.78 | ||||||||||
|
|
|
|
|
|
|
|
|
| |||||||||||
Total return | (15.79 | )% | 23.24 | % | 10.30 | % | (4.80 | )% | 15.24 | % | ||||||||||
|
|
|
|
|
|
|
|
|
| |||||||||||
Ratios/Supplemental data: | ||||||||||||||||||||
Net assets, end of year (000s) | $ | 3,276,410 | $ | 3,298,664 | $ | 2,641,997 | $ | 2,247,128 | $ | 2,857,512 | ||||||||||
Ratio of expenses to average net assets | 0.62 | % | 0.62 | % | 0.61 | % | 0.61 | % | 0.59 | % | ||||||||||
Ratio of net investment income to average net assets | 2.36 | % | 1.98 | % | 1.80 | % | 2.25 | % | 2.64 | % | ||||||||||
Portfolio turnover ratec | 14 | % | 11 | % | 21 | % | 22 | % | 23 | % | ||||||||||
| a | Based on average shares outstanding throughout each period. |
| b | The amounts reported for a share outstanding may not accord with the change in aggregate gains and losses in securities for the fiscal period due to the timing of capital share transactions in relation to the fluctuating market values of the Fund’s underlying securities. |
| c | Portfolio turnover rates include portfolio transactions that are executed as a result of the Fund processing capital share transactions in Creation Units solely for cash in U.S. dollars. Excluding such cash transactions, the portfolio turnover rates for the years ended August 31, 2015, August 31, 2014, August 31, 2013, August 31, 2012 and August 31, 2011 were 4%, 4%, 6%, 7% and 8%, respectively. See Note 4. |
See notes to financial statements.
FINANCIAL HIGHLIGHTS | 63 |
Table of Contents
Financial Highlights (Continued)
iSHARES®, INC.
(For a share outstanding throughout each period)
| iShares MSCI Thailand Capped ETF | ||||||||||||||||||||
| Year ended Aug. 31, 2015 | Year ended Aug. 31, 2014 | Year ended Aug. 31, 2013 | Year ended Aug. 31, 2012 | Year ended Aug. 31, 2011 | ||||||||||||||||
Net asset value, beginning of year | $ | 83.41 | $ | 67.73 | $ | 70.53 | $ | 66.27 | $ | 55.06 | ||||||||||
|
|
|
|
|
|
|
|
|
| |||||||||||
Income from investment operations: | ||||||||||||||||||||
Net investment incomea | 1.66 | 1.67 | 1.84 | 1.76 | 1.65 | |||||||||||||||
Net realized and unrealized gain (loss)b | (17.98 | ) | 15.84 | (2.75 | ) | 4.37 | 11.10 | |||||||||||||
|
|
|
|
|
|
|
|
|
| |||||||||||
Total from investment operations | (16.32 | ) | 17.51 | (0.91 | ) | 6.13 | 12.75 | |||||||||||||
|
|
|
|
|
|
|
|
|
| |||||||||||
Less distributions from: | ||||||||||||||||||||
Net investment income | (2.08 | ) | (1.83 | ) | (1.89 | ) | (1.87 | ) | (1.54 | ) | ||||||||||
|
|
|
|
|
|
|
|
|
| |||||||||||
Total distributions | (2.08 | ) | (1.83 | ) | (1.89 | ) | (1.87 | ) | (1.54 | ) | ||||||||||
|
|
|
|
|
|
|
|
|
| |||||||||||
Net asset value, end of year | $ | 65.01 | $ | 83.41 | $ | 67.73 | $ | 70.53 | $ | 66.27 | ||||||||||
|
|
|
|
| �� |
|
|
|
| |||||||||||
Total return | (19.92 | )% | 26.18 | % | (1.65 | )% | 9.57 | % | 23.33 | % | ||||||||||
|
|
|
|
|
|
|
|
|
| |||||||||||
Ratios/Supplemental data: | ||||||||||||||||||||
Net assets, end of year (000s) | $ | 237,304 | $ | 571,370 | $ | 541,873 | $ | 595,968 | $ | 632,840 | ||||||||||
Ratio of expenses to average net assets | 0.62 | % | 0.62 | % | 0.61 | % | 0.61 | % | 0.59 | % | ||||||||||
Ratio of net investment income to average net assets | 2.09 | % | 2.24 | % | 2.22 | % | 2.66 | % | 2.56 | % | ||||||||||
Portfolio turnover ratec | 13 | % | 9 | % | 24 | % | 12 | % | 22 | % | ||||||||||
| a | Based on average shares outstanding throughout each period. |
| b | The amounts reported for a share outstanding may not accord with the change in aggregate gains and losses in securities for the fiscal period due to the timing of capital share transactions in relation to the fluctuating market values of the Fund’s underlying securities. |
| c | Portfolio turnover rates exclude portfolio securities received or delivered as a result of processing capital share transactions in Creation Units. |
See notes to financial statements.
| 64 | 2015 iSHARES ANNUAL REPORTTO SHAREHOLDERS |
Table of Contents
iSHARES® , INC.
iShares, Inc. (the “Company”) is registered under the Investment Company Act of 1940, as amended (the “1940 Act”), as an open-end management investment company. The Company was incorporated under the laws of the State of Maryland on September 1, 1994 pursuant to Articles of Incorporation as subsequently amended and restated.
These financial statements relate only to the following funds (each, a “Fund,” and collectively, the “Funds”):
| iShares ETF | Diversification Classification | |
MSCI Hong Kong | Non-diversified | |
MSCI Japan Small-Cap | Diversified | |
MSCI Malaysia | Non-diversified | |
MSCI Pacific ex-Japan | Diversified | |
MSCI Singapore | Non-diversified | |
MSCI Taiwan | Non-diversified | |
MSCI Thailand Capped | Non-diversified |
The investment objective of each Fund is to seek investment results that correspond generally to the price and yield performance, before fees and expenses, of its underlying index. The investment adviser uses a “passive” or index approach to try to achieve each Fund’s investment objective.
Pursuant to the Company’s organizational documents, the Funds’ officers and directors are indemnified against certain liabilities that may arise out of the performance of their duties to the Funds. Additionally, in the normal course of business, the Funds enter into contracts with service providers that contain general indemnification clauses. The Funds’ maximum exposure under these arrangements is unknown as this would involve future claims that may be made against the Funds that have not yet occurred.
| 1. | SIGNIFICANT ACCOUNTING POLICIES |
The following significant accounting policies are consistently followed by the Funds in the preparation of their financial statements in conformity with accounting principles generally accepted in the United States of America (“U.S. GAAP”). The preparation of financial statements in conformity with U.S. GAAP requires management to make certain estimates and assumptions that affect the reported amounts of assets and liabilities and disclosures of contingent assets and liabilities at the date of the financial statements and the reported amounts of revenue and expenses during the reporting period. Actual results could differ from those estimates. Each Fund is considered an investment company under U.S. GAAP and follows the accounting and reporting guidance applicable to investment companies.
SECURITY VALUATION
Each Fund’s investments are valued at fair value each day that the Fund’s listing exchange is open and, for financial reporting purposes, as of the report date should the reporting period end on a day that the Fund’s listing exchange is not open. U.S. GAAP defines fair value as the price a fund would receive to sell an asset or pay to transfer a liability in an orderly transaction between market participants at the measurement date. The BlackRock Global Valuation Methodologies Committee (the “Global Valuation Committee”) provides oversight of the valuation of investments for the Funds. The investments of each Fund are valued pursuant to policies and procedures developed by the Global Valuation Committee and approved by the Board of Directors of the Company (the “Board”).
| • | Equity investments traded on a recognized securities exchange are valued at that day’s last reported trade price or the official closing price, as applicable, on the exchange where the stock is primarily traded. Equity investments traded on a recognized exchange for which there were no sales on that day are valued at the last traded price. |
NOTESTO FINANCIAL STATEMENTS | 65 |
Table of Contents
Notes to Financial Statements (Continued)
iSHARES®, INC.
| • | Open-end U.S. mutual funds are valued at that day’s published net asset value (“NAV”). |
| • | Futures contracts are valued at that day’s last reported settlement price on the exchange where the contract is traded. |
In the event that application of these methods of valuation results in a price for an investment which is deemed not to be representative of the fair value of such investment or if a price is not available, the investment will be valued based upon other available factors deemed relevant by the Global Valuation Committee, in accordance with policies approved by the Board. These factors include but are not limited to (i) attributes specific to the investment; (ii) the principal market for the investment; (iii) the customary participants in the principal market for the investment; (iv) data assumptions by market participants for the investment, if reasonably available; (v) quoted prices for similar investments in active markets; and (vi) other factors, such as future cash flows, interest rates, yield curves, volatilities, prepayment speeds, loss severities, credit risks and/or default rates. Valuations based on such factors are reported to the Board on a quarterly basis.
The Global Valuation Committee employs various methods for calibrating valuation approaches for investments where an active market does not exist, including regular due diligence of the Company’s pricing vendors, a regular review of key inputs and assumptions, transactional back-testing or disposition analysis to compare unrealized gains and losses to realized gains and losses, reviews of missing or stale prices, reviews of large movements in market values, and reviews of market related activity.
Fair value pricing could result in a difference between the prices used to calculate a Fund’s NAV and the prices used by the Fund’s underlying index, which in turn could result in a difference between the Fund’s performance and the performance of the Fund’s underlying index.
Various inputs are used in determining the fair value of financial instruments. Inputs may be based on independent market data (“observable inputs”) or they may be internally developed (“unobservable inputs”). These inputs are categorized into a disclosure hierarchy consisting of three broad levels for financial reporting purposes. The level of a value determined for a financial instrument within the fair value hierarchy is based on the lowest level of any input that is significant to the fair value measurement in its entirety. The categorization of a value determined for a financial instrument within the hierarchy is based upon the pricing transparency of the instrument and is not necessarily an indication of the risk associated with investing in the instrument. The three levels of the fair value hierarchy are as follows:
| • | Level 1 — Unadjusted quoted prices in active markets for identical assets or liabilities; |
| • | Level 2 — Inputs other than quoted prices included within Level 1 that are observable for the asset or liability either directly or indirectly, including quoted prices for similar assets or liabilities in active markets, quoted prices for identical or similar assets or liabilities in markets that are not considered to be active, inputs other than quoted prices that are observable for the asset or liability (such as exchange rates, financing terms, interest rates, yield curves, volatilities, prepayment speeds, loss severities, credit risks and default rates) or other market-corroborated inputs; and |
| • | Level 3 — Unobservable inputs for the asset or liability, including the Global Valuation Committee’s assumptions used in determining the fair value of investments. |
Changes in valuation techniques may result in transfers in or out of an assigned level within the disclosure hierarchy. In accordance with the Company’s policy, transfers between different levels of the fair value hierarchy are deemed to have occurred as of the beginning of the reporting period.
| 66 | 2015 iSHARES ANNUAL REPORTTO SHAREHOLDERS |
Table of Contents
Notes to Financial Statements (Continued)
iSHARES®, INC.
The following table summarizes the value of each of the Funds’ investments according to the fair value hierarchy as of August 31, 2015. The breakdown of each Fund’s investments into major categories is disclosed in its respective schedule of investments.
| iShares ETF | Level 1 | Level 2 | Level 3 | Total | ||||||||||||
MSCI Hong Kong | ||||||||||||||||
Investments: | ||||||||||||||||
Assets: | ||||||||||||||||
Common Stocks | $ | 2,706,536,022 | $ | — | $ | — | $ | 2,706,536,022 | ||||||||
Money Market Funds | 97,234,110 | — | — | 97,234,110 | ||||||||||||
|
|
|
|
|
|
|
| |||||||||
Total | $ | 2,803,770,132 | $ | — | $ | — | $ | 2,803,770,132 | ||||||||
|
|
|
|
|
|
|
| |||||||||
Derivative Financial Instruments:a | ||||||||||||||||
Assets: | ||||||||||||||||
Futures Contracts | $ | 241,933 | $ | — | $ | — | $ | 241,933 | ||||||||
|
|
|
|
|
|
|
| |||||||||
Total | $ | 241,933 | $ | — | $ | — | $ | 241,933 | ||||||||
|
|
|
|
|
|
|
| |||||||||
MSCI Japan Small-Cap | ||||||||||||||||
Investments: | ||||||||||||||||
Assets: | ||||||||||||||||
Common Stocks | $ | 158,213,284 | $ | — | $ | — | $ | 158,213,284 | ||||||||
Money Market Funds | 6,829,549 | — | — | 6,829,549 | ||||||||||||
|
|
|
|
|
|
|
| |||||||||
Total | $ | 165,042,833 | $ | — | $ | — | $ | 165,042,833 | ||||||||
|
|
|
|
|
|
|
| |||||||||
MSCI Malaysia | ||||||||||||||||
Investments: | ||||||||||||||||
Assets: | ||||||||||||||||
Common Stocks | $ | 262,095,933 | $ | — | $ | — | $ | 262,095,933 | ||||||||
Money Market Funds | 24,589,737 | — | — | 24,589,737 | ||||||||||||
|
|
|
|
|
|
|
| |||||||||
Total | $ | 286,685,670 | $ | — | $ | — | $ | 286,685,670 | ||||||||
|
|
|
|
|
|
|
| |||||||||
MSCI Pacific ex Japan | ||||||||||||||||
Investments: | ||||||||||||||||
Assets: | ||||||||||||||||
Common Stocks | $ | 1,965,837,664 | $ | — | $ | — | $ | 1,965,837,664 | ||||||||
Money Market Funds | 70,065,560 | — | — | 70,065,560 | ||||||||||||
|
|
|
|
|
|
|
| |||||||||
Total | $ | 2,035,903,224 | $ | — | $ | — | $ | 2,035,903,224 | ||||||||
|
|
|
|
|
|
|
| |||||||||
MSCI Singapore | ||||||||||||||||
Investments: | ||||||||||||||||
Assets: | ||||||||||||||||
Common Stocks | $ | 605,602,507 | $ | — | $ | — | $ | 605,602,507 | ||||||||
Money Market Funds | 52,215,216 | — | — | 52,215,216 | ||||||||||||
|
|
|
|
|
|
|
| |||||||||
Total | $ | 657,817,723 | $ | — | $ | — | $ | 657,817,723 | ||||||||
|
|
|
|
|
|
|
| |||||||||
Derivative Financial Instruments:a | ||||||||||||||||
Assets: | ||||||||||||||||
Futures Contracts | $ | 159,699 | $ | — | $ | — | $ | 159,699 | ||||||||
|
|
|
|
|
|
|
| |||||||||
Total | $ | 159,699 | $ | — | $ | — | $ | 159,699 | ||||||||
|
|
|
|
|
|
|
| |||||||||
NOTESTO FINANCIAL STATEMENTS | 67 |
Table of Contents
Notes to Financial Statements (Continued)
iSHARES®, INC.
| iShares ETF | Level 1 | Level 2 | Level 3 | Total | ||||||||||||
MSCI Taiwan | ||||||||||||||||
Investments: | ||||||||||||||||
Assets: | ||||||||||||||||
Common Stocks | $ | 3,233,948,137 | $ | — | $ | 2 | $ | 3,233,948,139 | ||||||||
Money Market Funds | 274,753,295 | — | — | 274,753,295 | ||||||||||||
|
|
|
|
|
|
|
| |||||||||
Total | $ | 3,508,701,432 | $ | — | $ | 2 | $ | 3,508,701,434 | ||||||||
|
|
|
|
|
|
|
| |||||||||
Derivative Financial Instruments:a | ||||||||||||||||
Assets: | ||||||||||||||||
Futures Contracts | $ | 1,461,334 | $ | — | $ | — | $ | 1,461,334 | ||||||||
|
|
|
|
|
|
|
| |||||||||
Total | $ | 1,461,334 | $ | — | $ | — | $ | 1,461,334 | ||||||||
|
|
|
|
|
|
|
| |||||||||
MSCI Thailand Capped | ||||||||||||||||
Investments: | ||||||||||||||||
Assets: | ||||||||||||||||
Common Stocks | $ | 235,812,020 | $ | — | $ | — | $ | 235,812,020 | ||||||||
Rights | — | 0b | — | 0 | b | |||||||||||
Money Market Funds | 28,000,816 | — | — | 28,000,816 | ||||||||||||
|
|
|
|
|
|
|
| |||||||||
Total | $ | 263,812,836 | $ | 0b | $ | — | $ | 263,812,836 | ||||||||
|
|
|
|
|
|
|
| |||||||||
| a | Shown at the unrealized appreciation (depreciation) on the contracts. |
| b | Rounds to less than $1. |
SECURITY TRANSACTIONS AND INCOME RECOGNITION
Security transactions are accounted for on trade date. Dividend income and capital gain distributions, if any, are recognized on the ex-dividend date, net of any foreign taxes withheld at source. Any taxes withheld that are reclaimable from foreign tax authorities as of August 31, 2015 are reflected in dividends receivable. Non-cash dividends received in the form of stock in an elective dividend, if any, are recorded as dividend income at fair value. Distributions received by the Funds may include a return of capital that is estimated by management. Such amounts are recorded as a reduction of the cost of investments or reclassified to capital gains. Interest income is accrued daily. Realized gains and losses on investment transactions are determined using the specific identification method.
FOREIGN CURRENCY TRANSLATION
The accounting records of the Funds are maintained in U.S. dollars. Foreign currencies, as well as investment securities and other assets and liabilities denominated in foreign currencies, are translated into U.S. dollars using exchange rates deemed appropriate by the investment adviser. Purchases and sales of securities, income receipts and expense payments are translated into U.S. dollars on the respective dates of such transactions.
Each Fund does not isolate the effect of fluctuations in foreign exchange rates from the effect of fluctuations in the market prices of securities. Such fluctuations are reflected by the Funds as a component of realized and unrealized gains and losses from investments for financial reporting purposes.
| 68 | 2015 iSHARES ANNUAL REPORTTO SHAREHOLDERS |
Table of Contents
Notes to Financial Statements (Continued)
iSHARES®, INC.
FOREIGN TAXES
The Funds may be subject to foreign taxes (a portion of which may be reclaimable) on income, stock dividends, capital gains on investments, or certain foreign currency transactions. All foreign taxes are recorded in accordance with the applicable foreign tax regulations and rates that exist in the foreign jurisdictions in which the Funds invest. These foreign taxes, if any, are paid by the Funds and are reflected in their statements of operations as follows: foreign taxes withheld at source are presented as a reduction of income, foreign taxes on securities lending income are presented as a reduction of securities lending income, foreign taxes on stock dividends are presented as “other foreign taxes,” and foreign taxes on capital gains from sales of investments and foreign taxes on foreign currency transactions are included in their respective net realized gain (loss) categories. Foreign taxes payable or deferred as of August 31, 2015, if any, are disclosed in the Funds’ statements of assets and liabilities.
DISTRIBUTIONS TO SHAREHOLDERS
Dividends and distributions paid by each Fund are recorded on the ex-dividend dates. Distributions are determined on a tax basis and may differ from net investment income and net realized capital gains for financial reporting purposes. Dividends and distributions are paid in U.S. dollars and cannot be automatically reinvested in additional shares of the Funds.
LOANS OF PORTFOLIO SECURITIES
Each Fund may lend its investment securities to approved borrowers, such as brokers, dealers and other financial institutions. The borrower pledges and maintains with the Fund collateral consisting of cash, an irrevocable letter of credit issued by a bank, or securities issued or guaranteed by the U.S. government. The initial collateral received by each Fund is required to have a value of at least 102% of the current value of the loaned securities for securities traded on U.S. exchanges and a value of at least 105% for all other securities. The collateral is maintained thereafter at a value equal to at least 100% of the current value of the securities on loan. The market value of the loaned securities is determined at the close of each business day of the Funds. Any additional required collateral is delivered to the Funds and any excess collateral is returned by the Funds on the next business day. During the term of the loan, each Fund is entitled to all distributions made on or in respect of the loaned securities. Loans of securities are terminable at any time and the borrower, after notice, is required to return borrowed securities within the standard time period for settlement of securities transactions.
Any cash received as collateral for securities on loan may be reinvested in certain short-term instruments either directly on behalf of a fund or through one or more joint accounts or money market funds, including those managed by BlackRock Fund Advisors (“BFA”), the Funds’ investment adviser, or its affiliates. As of August 31, 2015, any securities on loan were collateralized by cash. The cash collateral received was invested in money market funds managed by BFA and is disclosed in the schedules of investments. The securities on loan for each Fund are also disclosed in its schedule of investments. The total value of any securities on loan as of August 31, 2015 and the total value of the related collateral are disclosed in the statements of assets and liabilities. Income earned by the Funds from securities lending is disclosed in the statements of operations.
The risks of securities lending include the risk that the borrower may not provide additional collateral when required or may not return the securities when due. To mitigate these risks, the Funds benefit from a borrower default indemnity provided by BlackRock, Inc. (“BlackRock”). BlackRock’s indemnity allows for full replacement of securities lent. Each Fund could suffer a loss if the value of the investments purchased with cash collateral falls below the value of the cash collateral received.
Securities lending transactions are entered into by the Funds under Master Securities Lending Agreements (“MSLA”) which provide the right, in the event of default (including bankruptcy or insolvency) for the non-defaulting party to liquidate the collateral and calculate a net exposure to the defaulting party or request additional collateral. In the event that a borrower defaults, a Fund, as lender, would offset the market value of the collateral received against the market value of the securities loaned. The value of the collateral is typically greater than that of the market value of the securities loaned, leaving the lender with a net amount
NOTESTO FINANCIAL STATEMENTS | 69 |
Table of Contents
Notes to Financial Statements (Continued)
iSHARES®, INC.
payable to the defaulting party. However, bankruptcy or insolvency laws of a particular jurisdiction may impose restrictions on or prohibitions against such a right of offset in the event of an MSLA counterparty’s bankruptcy or insolvency. Under the MSLA, the borrower can resell or re-pledge the loaned securities, and a Fund can reinvest cash collateral, or, upon an event of default, resell or re-pledge the collateral.
The following table is a summary of securities lending agreements which are subject to offset under an MSLA as of August 31, 2015:
| iShares ETF | Market Value of Securities on Loan | Cash Collateral Received a | Net Amount | |||||||||
MSCI Hong Kong | $ | 90,691,423 | $ | 90,691,423 | $ | — | ||||||
MSCI Japan Small-Cap | 6,433,748 | 6,433,748 | — | |||||||||
MSCI Malaysia | 23,432,267 | 23,432,267 | — | |||||||||
MSCI Pacific ex Japan | 64,808,545 | 64,808,545 | — | |||||||||
MSCI Singapore | 49,335,032 | 49,335,032 | — | |||||||||
MSCI Taiwan | 232,867,346 | 232,867,346 | — | |||||||||
MSCI Thailand Capped | 15,046,469 | 15,046,469 | — | |||||||||
| a | Collateral received in excess of the market value of securities on loan is not presented for financial reporting purposes. The total collateral received is disclosed in each Fund’s statement of assets and liabilities. |
| 2. | INVESTMENT ADVISORY AGREEMENT AND OTHER TRANSACTIONS WITH AFFILIATES |
Pursuant to an Investment Advisory Agreement with the Company, BFA manages the investment of each Fund’s assets. BFA is a California corporation indirectly owned by BlackRock. Under the Investment Advisory Agreement, BFA is responsible for substantially all expenses of the Funds, except interest, taxes, brokerage commissions and other expenses connected with the execution of portfolio transactions, distribution fees, litigation expenses and any extraordinary expenses.
For its investment advisory services to each of the iShares MSCI Hong Kong, iShares MSCI Japan Small-Cap, iShares MSCI Malaysia and iShares MSCI Singapore ETFs, BFA is entitled to an annual investment advisory fee based on each Fund’s allocable portion of the aggregate of the average daily net assets of the Fund and certain other iShares funds, as follows:
| Investment Advisory Fee | Aggregate Average Daily Net Assets | ||||
| 0.59 | % | First $7 billion | |||
| 0.54 | Over $7 billion, up to and including $11 billion | ||||
| 0.49 | Over $11 billion, up to and including $24 billion | ||||
| 0.44 | Over $24 billion, up to and including $48 billion | ||||
| 0.40 | Over $48 billion, up to and including $72 billion | ||||
| 0.36 | Over $72 billion | ||||
| 70 | 2015 iSHARES ANNUAL REPORTTO SHAREHOLDERS |
Table of Contents
Notes to Financial Statements (Continued)
iSHARES®, INC.
Effective July 1, 2015, for its investment advisory services to the iShares MSCI Pacific ex Japan ETF, BFA is entitled to an annual investment advisory fee based on the Fund’s allocable portion of the aggregate of the average daily net assets of the Fund and certain other iShares funds, as follows:
| Investment Advisory Fee | Aggregate Average Daily Net Assets | ||||
| 0.5000 | % | First $46 billion | |||
| 0.4750 | a | Over $46 billion, up to and including $81 billion | |||
| 0.4513 | a | Over $81 billion, up to and including $111 billion | |||
| 0.4287 | a | Over $111 billion, up to and including $141 billion | |||
| 0.4073 | a | Over $141 billion | |||
| a | Investment advisory fee level reflects a 5% reduction (rounded to the fourth decimal place) from the investment advisory fee at the prior aggregate average daily net asset level. |
Prior to July 1, 2015, for its investment advisory services to the iShares MSCI Pacific ex Japan ETF, BFA was entitled to an annual investment advisory fee based on the Fund’s allocable portion of the aggregate of the average daily net assets of the Fund and certain other iShares funds, as follows:
| Investment Advisory Fee | Aggregate Average Daily Net Assets | ||||
| 0.5000 | % | First $46 billion | |||
| 0.4750 | a | Over $46 billion, up to and including $81 billion | |||
| 0.4513 | a | Over $81 billion, up to and including $141 billion | |||
| 0.4287 | a | Over $141 billion | |||
| a | Investment advisory fee level reflects a 5% reduction (rounded to the fourth decimal place) from the investment advisory fee at the prior aggregate average daily net asset level. |
For its investment advisory services to each of the iShares MSCI Taiwan and iShares MSCI Thailand Capped ETFs, BFA is entitled to an annual investment advisory fee based on each Fund’s allocable portion of the aggregate of the average daily net assets of the Fund and certain other iShares funds, as follows:
| Investment Advisory Fee | Aggregate Average Daily Net Assets | ||||
| 0.74 | % | First $2 billion | |||
| 0.69 | Over $2 billion, up to and including $4 billion | ||||
| 0.64 | Over $4 billion, up to and including $8 billion | ||||
| 0.57 | Over $8 billion, up to and including $16 billion | ||||
| 0.51 | Over $16 billion, up to and including $32 billion | ||||
| 0.45 | Over $32 billion | ||||
The U.S. Securities and Exchange Commission has issued an exemptive order which permits BlackRock Institutional Trust Company, N.A. (“BTC”), an affiliate of BFA, to serve as securities lending agent for the Funds, subject to applicable conditions. As securities lending agent, BTC bears all operational costs directly related to securities lending. Each Fund is responsible for fees in connection with the investment of cash collateral received for securities on loan in a money market fund managed by BFA, however, BTC has agreed to reduce the amount of securities lending income it receives in order to effectively limit the collateral investment fees each Fund bears to an annual rate of 0.04% (the “collateral investment fees”). Securities lending income is equal to the total of income earned from the reinvestment of cash collateral, net of fees and other payments to and from borrowers of securities, and less the collateral investment fees. The Funds retain a portion of securities lending income and remit the remaining portion to BTC as compensation for its services as securities lending agent.
NOTESTO FINANCIAL STATEMENTS | 71 |
Table of Contents
Notes to Financial Statements (Continued)
iSHARES®, INC.
Pursuant to a securities lending agreement, each Fund retains 80% of securities lending income and the amount retained can never be less than 70% of the total of securities lending income plus the collateral investment fees. In addition, commencing the business day following the date that the aggregate securities lending income plus the collateral investment fees generated across all 1940 Act iShares exchange-traded funds (the “iShares ETF Complex”) in a given calendar year exceeds the aggregate securities lending income generated across the iShares ETF Complex in the calendar year 2013, each Fund, pursuant to a securities lending agreement, will retain for the remainder of that calendar year 85% of securities lending income and the amount retained can never be less than 70% of the total of securities lending income plus the collateral investment fees.
Prior to January 1, 2015, each Fund retained 75% of securities lending income and the amount retained was never less than 65% of the total of securities lending income plus the collateral investment fees. In addition, commencing the business day following the date that the aggregate securities lending income plus the collateral investment fees generated across the iShares ETF Complex in the calendar year 2014 exceeded the aggregate securities lending income generated across the iShares ETF Complex in the calendar year 2013 and pursuant to a securities lending agreement, each Fund retained for the remainder of the calendar year 2014, 80% of securities lending income and the amount retained was never less than 65% of the total of securities lending income plus the collateral investment fees.
For the year ended August 31, 2015, the total of securities lending agent services and collateral investment fees paid were as follows:
| iShares ETF | Fees Paid to BTC | |||
MSCI Hong Kong | $ | 159,073 | ||
MSCI Japan Small-Cap | 44,453 | |||
MSCI Malaysia | 27,038 | |||
MSCI Pacific ex Japan | 146,436 | |||
MSCI Singapore | 220,708 | |||
MSCI Taiwan | 732,344 | |||
MSCI Thailand Capped | 214,296 | |||
For the year ended August 31, 2015, BTC, the Funds’ securities lending agent, has agreed to voluntarily reimburse the iShares MSCI Taiwan ETF in the amount of $101,406, related to the foreign tax on the securities lending income. Such reimbursement is included in “Securities lending income – affiliated – net” in the Fund’s statement of operations.
BlackRock Investments, LLC, an affiliate of BFA, is the distributor for each Fund. Pursuant to the distribution agreement, BFA is responsible for any fees or expenses for distribution services provided to the Funds.
Cross trades for the year ended August 31, 2015, if any, were executed by the Funds pursuant to Rule 17a-7 under the 1940 Act. Cross trading is the buying or selling of portfolio securities between funds to which BFA (or an affiliate) serves as investment adviser. At its regularly scheduled quarterly meetings, the Board reviews such transactions as of the most recent calendar quarter for compliance with the requirements and restrictions set forth by Rule 17a-7.
Each Fund may invest its positive cash balances in certain money market funds managed by BFA or an affiliate. The income earned on these temporary cash investments is included in “Interest – affiliated” in the statements of operations.
The PNC Financial Services Group, Inc. is the largest stockholder of BlackRock and is considered to be an affiliate of the Funds for 1940 Act purposes.
Certain directors and officers of the Company are also officers of BTC and/or BFA.
| 72 | 2015 iSHARES ANNUAL REPORTTO SHAREHOLDERS |
Table of Contents
Notes to Financial Statements (Continued)
iSHARES®, INC.
| 3. | INVESTMENT PORTFOLIO TRANSACTIONS |
Purchases and sales of investments (excluding in-kind transactions and short-term investments) for the year ended August 31, 2015 were as follows:
| iShares ETF | Purchases | Sales | ||||||
MSCI Hong Kong | $ | 275,802,438 | $ | 222,460,107 | ||||
MSCI Japan Small-Cap | 15,347,473 | 17,275,588 | ||||||
MSCI Malaysia | 126,009,242 | 408,500,705 | ||||||
MSCI Pacific ex Japan | 201,809,113 | 228,154,779 | ||||||
MSCI Singapore | 93,993,567 | 86,503,679 | ||||||
MSCI Taiwan | 1,197,805,271 | 496,078,744 | ||||||
MSCI Thailand Capped | 59,573,329 | 56,571,415 | ||||||
In-kind transactions (see Note 4) for the year ended August 31, 2015 were as follows:
| iShares ETF | In-kind Purchases | In-kind Sales | ||||||
MSCI Hong Kong | $ | 961,528,477 | $ | 1,070,610,637 | ||||
MSCI Japan Small-Cap | 245,467,136 | 241,553,321 | ||||||
MSCI Pacific ex Japan | 26,634,367 | 705,133,745 | ||||||
MSCI Singapore | 31,629,855 | 184,030,001 | ||||||
MSCI Thailand Capped | 226,878,084 | 466,593,294 | ||||||
| 4. | CAPITAL SHARE TRANSACTIONS |
Capital shares are issued and redeemed by each Fund only in aggregations of a specified number of shares or multiples thereof (“Creation Units”) at NAV. Except when aggregated in Creation Units, shares of each Fund are not redeemable. Transactions in capital shares for each Fund are disclosed in detail in the statements of changes in net assets.
The consideration for the purchase of Creation Units of a fund in the Company generally consists of the in-kind deposit of a designated portfolio of securities and a specified amount of cash. Certain funds in the Company may be offered in Creation Units solely or partially for cash in U.S. dollars. Investors purchasing and redeeming Creation Units may pay a purchase transaction fee and a redemption transaction fee directly to State Street Bank and Trust Company, the Company’s administrator, to offset transfer and other transaction costs associated with the issuance and redemption of Creation Units, including Creation Units for cash. Investors transacting in Creation Units for cash may also pay an additional variable charge to compensate the relevant fund for certain transaction costs (i.e., stamp taxes, taxes on currency or other financial transactions, and brokerage costs) and market impact expenses relating to investing in portfolio securities. Such variable charges, if any, are included in “Proceeds from shares sold” in the statements of changes in net assets.
| 5. | FUTURES CONTRACTS |
Each Fund may purchase or sell futures contracts in an effort to help such Fund track its underlying index. A futures contract is a standardized, exchange-traded agreement to buy and sell a financial instrument at a set price on a future date. Upon entering into a futures contract, the Fund is required to pledge to the executing broker which holds segregated from its own assets, an amount of cash, U.S. government securities or other high-quality debt and equity securities equal to the minimum initial margin requirements of the exchange on which the contract is traded. Pursuant to the contract, the Fund agrees to receive from or pay to
NOTESTO FINANCIAL STATEMENTS | 73 |
Table of Contents
Notes to Financial Statements (Continued)
iSHARES®, INC.
the broker an amount of cash equal to the daily fluctuation in value of the contract. Such receipts or payments are known as margin variation and are recorded by the Fund as unrealized appreciation or depreciation. When the contract is closed, the Fund records a realized gain or loss equal to the difference between the value of the contract at the time it was opened and the value at the time it was closed. Losses may arise if the value of a futures contract decreases due to an unfavorable change in the market rates or values of the underlying instrument during the term of the contract or if the counterparty does not perform under the contract. The use of futures contracts also involves the risk of an imperfect correlation in the movements in the price of futures contracts and the assets underlying such contracts.
The following table shows the value of futures contracts held as of August 31, 2015 and the related locations in the statements of assets and liabilities, presented by risk exposure category:
| Assets | ||||||||||||
| iShares MSCI Hong Kong ETF | iShares MSCI Singapore ETF | iShares MSCI Taiwan ETF | ||||||||||
Equity contracts: | ||||||||||||
Variation margin/Net assets consist of – net unrealized appreciation (depreciation) a | $ | 241,933 | $ | 159,699 | $ | 1,461,334 | ||||||
|
|
|
|
|
| |||||||
| a | Represents cumulative appreciation of futures contracts as reported in the schedules of investments. Only current day’s variation margin is reported separately within the statements of assets and liabilities for the iShares MSCI Taiwan ETF. |
The following table shows the realized and unrealized gains (losses) on futures contracts held during the year ended August 31, 2015 and the related locations in the statements of operations, presented by risk exposure category:
| Net Realized Gain (Loss) | ||||||||||||
| iShares MSCI Hong Kong ETF | iShares MSCI Singapore ETF | iShares MSCI Taiwan ETF | ||||||||||
Equity contracts: | ||||||||||||
Futures contracts | $ | (1,319,015 | ) | $ | (1,846,594 | ) | $ | (10,006,583 | ) | |||
|
|
|
|
|
| |||||||
| Net Change in Unrealized Appreciation/Depreciation | ||||||||||||
| iShares MSCI Hong Kong ETF | iShares MSCI Singapore ETF | iShares MSCI Taiwan ETF | ||||||||||
Equity contracts: | ||||||||||||
Futures contracts | $ | 517,953 | $ | 202,425 | $ | 1,182,109 | ||||||
|
|
|
|
|
| |||||||
The following table shows the average quarter-end balances of open futures contracts for the year ended August 31, 2015:
| iShares MSCI Hong Kong ETF | iShares MSCI Singapore ETF | iShares MSCI Taiwan ETF | ||||||||||
Average value of contracts purchased | $ | 18,496,001 | $ | 6,458,464 | $ | 18,019,510 | ||||||
| 74 | 2015 iSHARES ANNUAL REPORTTO SHAREHOLDERS |
Table of Contents
Notes to Financial Statements (Continued)
iSHARES®, INC.
| 6. | PRINCIPAL RISKS |
In the normal course of business, each Fund’s investment activities expose it to various types of risk associated with the financial instruments and markets in which it invests. The significant types of financial risks each Fund is exposed to include market risk and credit risk. Each Fund’s prospectus provides details of these and other types of risk.
BFA uses a “passive” or index approach to try to achieve each Fund’s investment objective following the securities included in its underlying index during upturns as well as downturns. BFA does not take steps to reduce market exposure or to lessen the effects of a declining market. Divergence from the underlying index and the composition of the portfolio is monitored by BFA.
MARKET RISK
Market risk arises mainly from uncertainty about future values of financial instruments influenced by price, currency and interest rate movements. It represents the potential loss each Fund may suffer through holding market positions in the face of market movements. Each Fund is exposed to market risk by virtue of its investment in equity and financial derivative instruments. The fair value of securities held by the Funds may decline due to general market conditions, economic trends or events that are not specifically related to the issuers of the securities including local, regional or global political, social or economic instability or to factors that affect a particular industry or group of industries. The extent of each Fund’s exposure to market risk is the market value of the investments held as shown in the Fund’s schedule of investments.
A diversified portfolio, where this is appropriate and consistent with a fund’s objectives, minimizes the risk that a price change of a particular investment will have a material impact on the NAV of a fund. The investment concentrations within each Fund’s portfolio are disclosed in its schedule of investments.
Each Fund invests a substantial amount of its assets in securities of non-U.S. issuers that trade in non-U.S. markets. This involves certain considerations and risks not typically associated with securities of U.S. issuers. Such risks include, but are not limited to: generally less liquid and less efficient securities markets; generally greater price volatility; exchange rate fluctuations and exchange controls; imposition of restrictions on the expatriation of funds or other assets of the Fund; less publicly available information about issuers; the imposition of withholding or other taxes; higher transaction and custody costs; settlement delays and risk of loss attendant in settlement procedures; difficulties in enforcing contractual obligations; less regulation of securities markets; different accounting, disclosure and reporting requirements; more substantial governmental involvement in the economy; higher inflation rates; greater social, economic and political uncertainties; the risk of nationalization or expropriation of assets; and the risk of war. These risks are heightened for investments in issuers from countries with less developed markets.
Each Fund, except for the iShares MSCI Pacific ex Japan ETF, invests all or substantially all of its assets in issuers located in a single country. When a fund concentrates its investments in this manner, it assumes the risk that economic, political and social conditions in that country may have a significant impact on its investment performance.
CREDIT RISK
Credit risk is the risk that an issuer or guarantor of debt instruments or the counterparty to a financial transaction, including derivatives contracts, repurchase agreements or loans of portfolio securities, is unable or unwilling to make timely interest and/or principal payments or to otherwise honor its obligations. BFA and its affiliates manage counterparty credit risk by entering into transactions only with counterparties that they believe have the financial resources to honor their obligations and by monitoring the financial stability of those counterparties. Financial assets, which potentially expose the Funds to issuer and counterparty credit risks, consist principally of financial instruments and receivables due from counterparties. The extent of each Fund’s exposure to credit and counterparty risks with respect to those financial assets is approximated by their value recorded in its statement of assets and liabilities.
NOTESTO FINANCIAL STATEMENTS | 75 |
Table of Contents
Notes to Financial Statements (Continued)
iSHARES®, INC.
| 7. | INCOME TAX INFORMATION |
Each Fund is treated as an entity separate from the Company’s other funds for federal income tax purposes. It is the policy of each Fund to qualify as a regulated investment company by complying with the provisions applicable to regulated investment companies, as defined under Subchapter M of the Internal Revenue Code of 1986, as amended, and to annually distribute substantially all of its ordinary income and any net capital gains (taking into account any capital loss carryforwards) sufficient to relieve it from all, or substantially all, federal income and excise taxes. Accordingly, no provision for federal income taxes is required.
U.S. GAAP requires that certain components of net assets be adjusted to reflect permanent differences between financial and tax reporting. These reclassifications have no effect on net assets or NAV per share. The following permanent differences as of August 31, 2015, attributable to the use of equalization, passive foreign investment companies, the expiration of capital loss carryforwards, distributions paid in excess of taxable income, foreign currency transactions and realized gains (losses) from in-kind redemptions, were reclassified to the following accounts:
| iShares ETF | Paid-in Capital | Undistributed Net Investment Income/Distributions | Undistributed Net Realized Gain/Accumulated Net Realized Loss | |||||||||
MSCI Hong Kong | $ | 130,309,048 | $ | 15,879 | $ | (130,324,927 | ) | |||||
MSCI Japan Small-Cap | 16,120,394 | 2,385,760 | (18,506,154 | ) | ||||||||
MSCI Malaysia | 26,521,350 | 2,128,536 | (28,649,886 | ) | ||||||||
MSCI Pacific ex Japan | 92,751,687 | 2,330,265 | (95,081,952 | ) | ||||||||
MSCI Singapore | 5,072,856 | 2,225,604 | (7,298,460 | ) | ||||||||
MSCI Taiwan | (64,999,586 | ) | (1,834,002 | ) | 66,833,588 | |||||||
MSCI Thailand Capped | (17,792,465 | ) | (168,617 | ) | 17,961,082 | |||||||
The tax character of distributions paid during the years ended August 31, 2015 and August 31, 2014 was as follows:
| iShares ETF | 2015 | 2014 | ||||||
MSCI Hong Kong | ||||||||
Ordinary income | $ | 74,964,011 | $ | 69,523,487 | ||||
|
|
|
| |||||
MSCI Japan Small-Cap | ||||||||
Ordinary income | $ | 2,993,420 | $ | 2,956,269 | ||||
|
|
|
| |||||
MSCI Malaysia | ||||||||
Long-term capital gain | $ | 1,987,267 | $ | — | ||||
Ordinary income | 15,389,546 | 26,722,876 | ||||||
|
|
|
| |||||
| $ | 17,376,813 | $ | 26,722,876 | |||||
|
|
|
| |||||
MSCI Pacific ex Japan | ||||||||
Ordinary income | $ | 121,558,328 | $ | 118,670,244 | ||||
|
|
|
| |||||
MSCI Singapore | ||||||||
Ordinary income | $ | 27,289,993 | $ | 36,850,739 | ||||
|
|
|
| |||||
| 76 | 2015 iSHARES ANNUAL REPORTTO SHAREHOLDERS |
Table of Contents
Notes to Financial Statements (Continued)
iSHARES®, INC.
| iShares ETF | 2015 | 2014 | ||||||
MSCI Taiwan | ||||||||
Ordinary income | $ | 61,969,914 | $ | 51,978,221 | ||||
|
|
|
| |||||
MSCI Thailand Capped | ||||||||
Ordinary income | $ | 9,842,483 | $ | 12,909,951 | ||||
|
|
|
| |||||
As of August 31, 2015, the tax components of accumulated net earnings (losses) were as follows:
| iShares ETF | Undistributed Ordinary Income | Undistributed Long-Term Capital Gains | Capital Loss Carryforwards | Net Unrealized Gains (Losses) a | Qualified Late-Year Losses b | Total | ||||||||||||||||||
MSCI Hong Kong | $ | 7,704,071 | $ | — | $ | (380,625,550 | ) | $ | (386,824,408 | ) | $ | (24,811,333 | ) | $ | (784,557,220 | ) | ||||||||
MSCI Japan Small-Cap | 353,142 | — | (3,690,251 | ) | (16,409,655 | ) | (425,934 | ) | (20,172,698 | ) | ||||||||||||||
MSCI Malaysia | 7,423,786 | 54,983,636 | — | 101,812,380 | — | 164,219,802 | ||||||||||||||||||
MSCI Pacific ex Japan | 14,744,296 | — | (423,538,328 | ) | (466,593,331 | ) | (48,406,260 | ) | (923,793,623 | ) | ||||||||||||||
MSCI Singapore | — | — | (202,028,889 | ) | (158,140,369 | ) | (13,524,766 | ) | (373,694,024 | ) | ||||||||||||||
MSCI Taiwan | 80,626,529 | — | (811,979,048 | ) | 665,094,113 | (95,574,237 | ) | (161,832,643 | ) | |||||||||||||||
MSCI Thailand Capped | 1,079,332 | — | (12,824,102 | ) | (111,094,818 | ) | (4,072,380 | ) | (126,911,968 | ) | ||||||||||||||
| a | The difference between book-basis and tax-basis unrealized gains (losses) was attributable primarily to the tax deferral of losses on wash sales and the realization for tax purposes of unrealized gains on investments in passive foreign investment companies. |
| b | The Funds have elected to defer certain qualified late-year losses and recognize such losses in the next taxable year. |
As of August 31, 2015, the following Funds had capital loss carryforwards available to offset future realized capital gains through the indicated expiration dates as follows:
| iShares ETF | Non- Expiring a | Expiring 2016 | Expiring 2017 | Expiring 2018 | Expiring 2019 | Total | ||||||||||||||||||
MSCI Hong Kong | $ | 198,801,723 | $ | 3,185,408 | $ | 29,235,556 | $ | 114,836,904 | $ | 34,565,959 | $ | 380,625,550 | ||||||||||||
MSCI Japan Small-Cap | 2,813,514 | — | 131,718 | 541,322 | 203,697 | 3,690,251 | ||||||||||||||||||
MSCI Pacific ex Japan | 215,930,010 | — | 66,207,828 | 104,799,503 | 36,600,987 | 423,538,328 | ||||||||||||||||||
MSCI Singapore | 41,531,912 | 807,115 | 15,680,510 | 132,420,824 | 11,588,528 | 202,028,889 | ||||||||||||||||||
MSCI Taiwan | 69,147,354 | 16,734,578 | 343,375,145 | 363,052,013 | 19,669,958 | 811,979,048 | ||||||||||||||||||
MSCI Thailand Capped | 8,642,320 | — | 555,444 | 2,321,428 | 1,304,910 | 12,824,102 | ||||||||||||||||||
| a | Must be utilized prior to losses subject to expiration. |
The Funds may own shares in certain foreign investment entities, referred to, under U.S. tax law, as “passive foreign investment companies.” The Funds may elect to mark-to-market annually the shares of each passive foreign investment company and would be required to distribute to shareholders any such marked-to-market gains.
NOTESTO FINANCIAL STATEMENTS | 77 |
Table of Contents
Notes to Financial Statements (Continued)
iSHARES®, INC.
As of August 31, 2015, gross unrealized appreciation and gross unrealized depreciation based on cost for federal income tax purposes were as follows:
| iShares ETF | Tax Cost | Gross Unrealized Appreciation | Gross Unrealized Depreciation | Net Unrealized Appreciation (Depreciation) | ||||||||||||
MSCI Hong Kong | $ | 3,190,840,064 | $ | 64,973,339 | $ | (452,043,271 | ) | $ | (387,069,932 | ) | ||||||
MSCI Japan Small-Cap | 181,470,087 | 2,775,113 | (19,202,367 | ) | (16,427,254 | ) | ||||||||||
MSCI Malaysia | 184,848,787 | 136,758,470 | (34,921,587 | ) | 101,836,883 | |||||||||||
MSCI Pacific ex Japan | 2,502,199,782 | 120,355,890 | (586,652,448 | ) | (466,296,558 | ) | ||||||||||
MSCI Singapore | 816,034,813 | 6,858,058 | (165,075,148 | ) | (158,217,090 | ) | ||||||||||
MSCI Taiwan | 2,844,567,203 | 1,062,514,942 | (398,380,711 | ) | 664,134,231 | |||||||||||
MSCI Thailand Capped | 374,898,516 | 2,617,619 | (113,703,299 | ) | (111,085,680 | ) | ||||||||||
Management has analyzed tax laws and regulations and their application to the Funds as of August 31, 2015, inclusive of the open tax return years, and does not believe there are any uncertain tax positions that require recognition of a tax liability in the Funds’ financial statements.
| 8. | SUBSEQUENT EVENTS |
Management has evaluated the impact of all subsequent events on the Funds through the date the financial statements were available to be issued and has determined that there were no subsequent events requiring adjustment or disclosure in the financial statements.
| 78 | 2015 iSHARES ANNUAL REPORTTO SHAREHOLDERS |
Table of Contents
Report of Independent Registered Public Accounting Firm
To the Shareholders and Board of Directors of
iShares, Inc.:
In our opinion, the accompanying statements of assets and liabilities, including the schedules of investments, and the related statements of operations and of changes in net assets and the financial highlights present fairly, in all material respects, the financial position of iShares MSCI Hong Kong ETF, iShares MSCI Japan Small-Cap ETF, iShares MSCI Malaysia ETF, iShares MSCI Pacific ex Japan ETF, iShares MSCI Singapore ETF, iShares MSCI Taiwan ETF and iShares MSCI Thailand Capped ETF (the “Funds”) at August 31, 2015, the results of each of their operations, the changes in each of their net assets and their financial highlights for each of the periods presented, in conformity with accounting principles generally accepted in the United States of America. These financial statements and financial highlights (hereafter referred to as “financial statements”) are the responsibility of the Funds’ management. Our responsibility is to express an opinion on these financial statements based on our audits. We conducted our audits of these financial statements in accordance with the standards of the Public Company Accounting Oversight Board (United States). Those standards require that we plan and perform the audit to obtain reasonable assurance about whether the financial statements are free of material misstatement. An audit includes examining, on a test basis, evidence supporting the amounts and disclosures in the financial statements, assessing the accounting principles used and significant estimates made by management, and evaluating the overall financial statement presentation. We believe that our audits, which included confirmation of securities at August 31, 2015 by correspondence with the custodian, transfer agent and brokers, provide a reasonable basis for our opinion.
PricewaterhouseCoopers LLP
San Francisco, California
October 22, 2015
REPORTOF INDEPENDENT REGISTERED PUBLIC ACCOUNTING FIRM | 79 |
Table of Contents
iSHARES® TRUST
Under Section 854(b)(2) of the Internal Revenue Code (the “Code”), the following maximum amounts are hereby designated as qualified dividend income for purposes of the maximum rate under Section 1(h)(11) of the Code for the fiscal year ended August 31, 2015:
| iShares ETF | Qualified Dividend Income | |||
MSCI Japan Small-Cap | $ | 1,947,246 | ||
MSCI Pacific ex Japan | 92,611,914 | |||
MSCI Thailand Capped | 11,909,801 | |||
In February 2016, shareholders will receive Form 1099-DIV which will include their share of qualified dividend income distributed during the calendar year 2015. Shareholders are advised to check with their tax advisers for information on the treatment of these amounts on their income tax returns.
For the fiscal year ended August 31, 2015, the following Funds earned foreign source income and paid foreign taxes which they intend to pass through to their shareholders pursuant to Section 853 of the Code:
| iShares ETF | Foreign Source Income Earned | Foreign Taxes Paid | ||||||
MSCI Hong Kong | $ | 91,448,352 | $ | — | ||||
MSCI Japan Small-Cap | 2,666,206 | 258,833 | ||||||
MSCI Malaysia | 15,843,726 | — | ||||||
MSCI Pacific ex Japan | 132,738,540 | 1,760,821 | ||||||
MSCI Singapore | 29,810,924 | 270,575 | ||||||
MSCI Taiwan | 133,332,457 | 27,988,402 | ||||||
MSCI Thailand Capped | 12,254,782 | 1,209,698 | ||||||
Under Section 852(b)(3)(C) of the Code, the iShares MSCI Malaysia ETF hereby designates $28,508,617 as 20% rate long-term capital gain dividends for the fiscal year ended August 31, 2015.
| 80 | 2015 iSHARES ANNUAL REPORTTO SHAREHOLDERS |
Table of Contents
Board Review and Approval of Investment Advisory
Contract
iSHARES®, INC.
I. iShares MSCI Hong Kong ETF, iShares MSCI Malaysia ETF, iShares MSCI Singapore ETF and iShares MSCI Taiwan ETF
Under Section 15(c) of the Investment Company Act of 1940 (the “1940 Act”), the Company’s Board of Directors (the “Board”), including a majority of Directors who are not “interested persons” of the Company (as that term is defined in the 1940 Act) (the “Independent Directors”), is required annually to consider and approve the Investment Advisory Contract between the Company and BFA (the “Advisory Contract”) on behalf of the Funds. The Independent Directors requested, and BFA provided, such information as the Independent Directors, with advice from independent counsel, deemed reasonably necessary to evaluate the Advisory Contract. A committee of Independent Directors (the “15(c) Committee”), with independent counsel, met with management on May 1, 2015 and May 6, 2015, to discuss the types of information the Independent Directors required and the manner in which management would organize and present such information. At a meeting held on May 21, 2015, management presented preliminary information to the Board relating to the continuance of the Advisory Contract, and the Board, including the Independent Directors, reviewed and discussed such information at length. The Independent Directors requested from management certain additional information, which management agreed to provide. At a meeting held on June 24-25, 2015, the Board, including the Independent Directors, reviewed the additional information provided by management in response to these requests. After extensive discussions, the Board, including all of the Independent Directors, approved the continuance of the Advisory Contract for the Funds, based on a review of qualitative and quantitative information provided by BFA, including the additional information management provided at the request of the Independent Directors. The Board noted its satisfaction with the extent and quality of information provided and its frequent interactions with management, as well as the detailed responses and other information provided by BFA. The Board also noted that the Board and BFA agreed to discuss potential enhancements and adjustments to the 15(c) process for the coming year. The Independent Directors were advised by their independent counsel throughout the process, including about the legal standards applicable to their review. In approving the Advisory Contract for the Funds, the Board, including the Independent Directors, considered the following factors, no one of which was controlling, and reached the following conclusions:
Expenses and Performance of the Funds — The Board reviewed statistical information prepared by Lipper Inc. (“Lipper”), an independent provider of investment company data, regarding the expense ratio components, including actual advisory fees, waivers/reimbursements, and gross and net total expenses of each Fund in comparison with the same information for other exchange traded funds (including, where applicable, funds sponsored by an “at cost” service provider) and, in the limited instances where no comparable ETFs existed and the comparison group would not otherwise be reasonable in Lipper’s judgment, pure index institutional mutual funds, objectively selected by Lipper as comprising such Fund’s applicable peer group pursuant to Lipper’s proprietary ETF methodology (the “Lipper Group”). The Board was provided with a detailed description of Lipper’s proprietary ETF methodology used by Lipper to determine the applicable Lipper Groups. The Board further noted that due to the limitations in providing comparable funds in the various Lipper Groups, the statistical information provided in Lipper’s report may or may not provide meaningful direct comparisons to the Funds in all instances.
The Board also noted that the investment advisory fee rates and overall expenses (net of waivers and reimbursements) for the Funds were lower than the median of the investment advisory fee rates and overall expenses (net of waivers and reimbursements) of the funds in their respective Lipper Group.
In addition, the Board reviewed statistical information prepared by Lipper regarding the performance of each Fund for the one-, three-, five-, ten-year, and since inception periods, as applicable, and the “last quarter” period ended December 31, 2014, and a comparison of each Fund’s performance to its performance benchmark index for the same periods. To the extent that any of the comparison funds included in the Lipper Group track the same index as any particular Fund, Lipper also provided, and the Board reviewed, a comparison of such Fund’s performance to that of such relevant comparison funds for the same periods. The Board noted that the Funds generally performed in line with their respective performance benchmark indexes over the relevant periods.
BOARD REVIEWAND APPROVALOF INVESTMENT ADVISORY CONTRACT | 81 |
Table of Contents
Board Review and Approval of Investment Advisory
Contract (Continued)
iSHARES®, INC.
In considering this information, the Board noted that the Lipper Group may include funds that have different investment objectives and/or benchmarks from the Funds. In addition, the Board noted that each Fund seeks to track its own benchmark index and that, during the prior year, the Board received periodic reports on the Funds’ performance in comparison with their relevant benchmark indexes. Such periodic comparative performance information, including detailed information on certain specific iShares funds requested by the Boards, was also considered.
Based on this review, the other factors considered at the meeting, and their general knowledge of ETF pricing, the Board concluded that the investment advisory fee rate and expense level and the historical performance of each Fund supported the Board’s approval of the continuance of the Advisory Contract for the coming year.
Nature, Extent and Quality of Services Provided by BFA — Based on management’s representations, including information about recent and proposed enhancements to the iShares business, including with respect to shareholder servicing and support, the Board expected that there would be no diminution in the scope of services required of or provided by BFA under the Advisory Contract for the coming year as compared to the scope of services provided by BFA during prior years. In reviewing the scope of these services, the Board considered BFA’s investment philosophy and experience, noting that BFA and its affiliates have committed significant resources over time, including during the past year, to supporting the iShares funds and their shareholders. The Board acknowledged that resources to support the iShares funds and their shareholders have been added or enhanced in recent years. The Board also considered BFA’s compliance program and its compliance record with respect to the Funds. In that regard, the Board noted that BFA reports to the Board about portfolio management and compliance matters on a periodic basis in connection with regularly scheduled meetings of the Board, and on other occasions as necessary and appropriate, and has provided information and made appropriate officers available as needed to provide further assistance with these matters. The Board also reviewed the background and experience of the persons responsible for the day-to-day management of the Funds, as well as the resources available to them in managing the Funds. In addition to the above considerations, the Board reviewed and considered detailed presentations regarding BFA’s investment performance, investment and risk management processes and strategies provided at the June 24-25, 2015 meeting and throughout the previous year, and matters related to BFA’s portfolio compliance policies and procedures. The Board noted that each Fund had met its investment objective consistently since its respective inception date.
Based on review of this information, and the performance information discussed above, the Board concluded that the nature, extent and quality of services provided by BFA to the Funds under the Advisory Contract supported the Board’s approval of the continuance of the Advisory Contract for the coming year.
Costs of Services Provided to Funds and Profits Realized by BFA and Affiliates — The Board reviewed information about the profitability to BlackRock of the Funds based on the fees payable to BFA and its affiliates (including fees under the Advisory Contract), and all other sources of revenue and expense to BFA and its affiliates from the Funds’ operations for the last calendar year. The Board reviewed BlackRock’s profitability methodology for the iShares funds, noting that the 15(c) Committee had focused on the methodology and proposed presentation during its meetings. The Board discussed the sources of direct and ancillary revenue with management, including the revenues to BTC from securities lending by the Funds. The Board also discussed BFA’s profit margin as reflected in the Funds’ profitability analyses and reviewed information regarding potential economies of scale (as discussed below). Based on this review, the Board concluded that the profits realized by BFA and its affiliates under the Advisory Contract and from other relationships between the Funds and BFA and/or its affiliates, if any, were within a reasonable range in light of the factors considered.
Economies of Scale — The Board reviewed information regarding potential economies of scale or other efficiencies that may result from increases in the Funds’ assets, noting that the issue of economies of scale had been focused on extensively by the 15(c) Committee during its meetings and addressed by management. The Board and the 15(c) Committee reviewed information
| 82 | 2015 iSHARES ANNUAL REPORTTO SHAREHOLDERS |
Table of Contents
Board Review and Approval of Investment Advisory
Contract (Continued)
iSHARES®, INC.
provided by BFA regarding scale benefits shared with the iShares funds through relatively low fee rates established at inception, breakpoints, waivers, or other fee reductions, as well as through additional investment in the iShares business and the provision of improved or additional infrastructure and services to the iShares funds and their shareholders. The Board and the 15(c) Committee received information regarding BlackRock’s historical profitability, including BFA’s and its affiliates’ costs in providing services. The cost information distinguished between fixed and variable costs, and explained how the level of fixed and variable costs, as well as the nature of such costs, may impact the existence or size of scale benefits. The Board noted that the Advisory Contract for the Funds already provided for breakpoints in the Funds’ investment advisory fee rates as the assets of the Funds, on an aggregated basis with the assets of certain other iShares funds, increase. The Board noted that it would continue to monitor the sharing of economies of scale to determine the appropriateness of adding new or revised breakpoints in the future.
Based on this review, as well as the other factors considered at the meeting, the Board, recognizing its responsibility to consider this issue periodically, determined to approve the continuance of the Advisory Contract for the coming year.
Fees and Services Provided for Other Comparable Funds/Accounts Managed by BFA and its Affiliates — The Board received and considered information regarding the investment advisory/management fee rates for other funds/accounts in the U.S. for which BFA (or its affiliates) provides investment advisory/management services, including open-end and closed-end funds registered under the 1940 Act (including sub-advised funds), collective trust funds, separately managed accounts, and institutional separate accounts (together, the “Other Accounts”), and acknowledged BFA’s assertion that the iShares funds are fundamentally different investment vehicles from the Other Accounts. The Board noted that BFA and its affiliates do manage Other Accounts with substantially the same investment objectives and strategies as the Funds or that track the same index or a similar index as the Funds. The Board further noted that BFA provided the Board with detailed information regarding how the Other Accounts (particularly institutional clients) generally differ from the Funds, including in terms of the different, generally more extensive services provided to the Funds, as well as other significant differences in the approach of BFA and its affiliates to the Funds, on one hand, and Other Accounts, on the other. In that regard, the Board considered that the pricing of services to institutional clients is typically based on a number of factors beyond the nature and extent of the specific services to be provided and often depends on the overall relationship between the client and its affiliates and the adviser and its affiliates. In addition, the Board considered the relative complexity and inherent risks and challenges of managing and providing other services to the Funds, as publicly traded exchange traded funds, as compared to the Other Accounts that are institutional clients in light of differing regulatory requirements and client-imposed mandates. The Board also considered the “all-inclusive” nature of the Funds’ advisory fee structure, and the Fund expenses borne by BFA under this arrangement. The Board noted that the investment advisory fee rates under the Advisory Contract for the Funds were generally higher than the investment advisory/management fee rates for the Other Accounts that are institutional clients of BFA (or its affiliates) and concluded that the differences appeared to be consistent with the factors discussed.
Other Benefits to BFA and/or its Affiliates — The Board reviewed the “fallout” benefits or ancillary revenue received by BFA and/or its affiliates in connection with the services provided to the Funds by BFA, such as payment of revenue to BTC, the Funds’ securities lending agent, for loaning portfolio securities (which was included in the profit margins reviewed by the Board pursuant to BFA’s profitability methodology), and payment of advisory fees and/or administration fees to BFA and BTC (or their affiliates) in connection with any investments by the Funds in other funds for which BFA (or its affiliates) provides investment advisory services and/or administration services. The Board noted that BFA generally does not use soft dollars or consider the value of research or other services that may be provided to BFA (including its affiliates) in selecting brokers for portfolio transactions for the Funds. The Board further noted that any portfolio transactions on behalf of the Funds placed through a BFA affiliate or purchased from an underwriting syndicate in which a BFA affiliate participates, are reported to the Board pursuant to Rule 17e-1 or Rule 10f-3, as applicable, under the 1940 Act. The Board concluded that any such ancillary benefits would not be disadvantageous to the Funds’ shareholders and thus would not alter the Board’s conclusion with respect to the appropriateness of approving the continuance of the Advisory Contract for the coming year.
BOARD REVIEWAND APPROVALOF INVESTMENT ADVISORY CONTRACT | 83 |
Table of Contents
Board Review and Approval of Investment Advisory
Contract (Continued)
iSHARES®, INC.
Based on the considerations described above, the Board determined that each Fund’s investment advisory fee rate under the Advisory Contract does not constitute a fee that is so disproportionately large as to bear no reasonable relationship to the services rendered and that could not have been the product of arm’s-length bargaining, and concluded that it is in the best interest of each Fund and its shareholders to approve the continuance of the Advisory Contract for the coming year.
II. iShares MSCI Japan Small-Cap ETF
Under Section 15(c) of the Investment Company Act of 1940 (the “1940 Act”), the Company’s Board of Directors (the “Board”), including a majority of Directors who are not “interested persons” of the Company (as that term is defined in the 1940 Act) (the “Independent Directors”), is required annually to consider and approve the Investment Advisory Contract between the Company and BFA (the “Advisory Contract”) on behalf of the Fund. The Independent Directors requested, and BFA provided, such information as the Independent Directors, with advice from independent counsel, deemed reasonably necessary to evaluate the Advisory Contract. A committee of Independent Directors (the “15(c) Committee”), with independent counsel, met with management on May 1, 2015 and May 6, 2015, to discuss the types of information the Independent Directors required and the manner in which management would organize and present such information. At a meeting held on May 21, 2015, management presented preliminary information to the Board relating to the continuance of the Advisory Contract, and the Board, including the Independent Directors, reviewed and discussed such information at length. The Independent Directors requested from management certain additional information, which management agreed to provide. At a meeting held on June 24-25, 2015, the Board, including the Independent Directors, reviewed the additional information provided by management in response to these requests. After extensive discussions, the Board, including all of the Independent Directors, approved the continuance of the Advisory Contract for the Fund, based on a review of qualitative and quantitative information provided by BFA, including the additional information management provided at the request of the Independent Directors. The Board noted its satisfaction with the extent and quality of information provided and its frequent interactions with management, as well as the detailed responses and other information provided by BFA. The Board also noted that the Board and BFA agreed to discuss potential enhancements and adjustments to the 15(c) process for the coming year. The Independent Directors were advised by their independent counsel throughout the process, including about the legal standards applicable to their review. In approving the Advisory Contract for the Fund, the Board, including the Independent Directors, considered the following factors, no one of which was controlling, and reached the following conclusions:
Expenses and Performance of the Fund — The Board reviewed statistical information prepared by Lipper Inc. (“Lipper”), an independent provider of investment company data, regarding the expense ratio components, including actual advisory fees, waivers/reimbursements, and gross and net total expenses of the Fund in comparison with the same information for other exchange traded funds (including, where applicable, funds sponsored by an “at cost” service provider) and, in the limited instances where no comparable ETFs existed and the comparison group would not otherwise be reasonable in Lipper’s judgment, pure index institutional mutual funds, objectively selected by Lipper as comprising the Fund’s applicable peer group pursuant to Lipper’s proprietary ETF methodology (the “Lipper Group”). The Board was provided with a detailed description of Lipper’s proprietary ETF methodology used by Lipper to determine the Fund’s Lipper Group. The Board further noted that due to the limitations in providing comparable funds in the Lipper Group, the statistical information provided in Lipper’s report may or may not provide meaningful direct comparisons to the Fund in all instances.
The Board also noted that the investment advisory fee rate and overall expenses (net of waivers and reimbursements) for the Fund were lower than the median of the investment advisory fee rates and overall expenses (net of waivers and reimbursements) of the funds in its Lipper Group.
In addition, the Board reviewed statistical information prepared by Lipper regarding the performance of the Fund for the one-, three-, five-, ten-year, and since inception periods, as applicable, and the “last quarter” period ended December 31, 2014, and a
| 84 | 2015 iSHARES ANNUAL REPORTTO SHAREHOLDERS |
Table of Contents
Board Review and Approval of Investment Advisory
Contract (Continued)
iSHARES®, INC.
comparison of the Fund’s performance to its performance benchmark index for the same periods. To the extent that any of the comparison funds included in the Lipper Group track the same index as the Fund, Lipper also provided, and the Board reviewed, a comparison of the Fund’s performance to that of such relevant comparison funds for the same periods. The Board noted that the Fund generally performed in line with its performance benchmark index over the relevant periods. In considering this information, the Board noted that the Lipper Group may include funds that have a different investment objective and/or benchmark from the Fund. In addition, the Board noted that the Fund seeks to track its own benchmark index and that, during the prior year, the Board received periodic reports on the Fund’s performance in comparison with its benchmark index. Such periodic comparative performance information, including detailed information on certain specific iShares funds requested by the Boards, was also considered.
Based on this review, the other factors considered at the meeting, and their general knowledge of ETF pricing, the Board concluded that the investment advisory fee rate and expense level and the historical performance of the Fund supported the Board’s approval of the continuance of the Advisory Contract for the coming year.
Nature, Extent and Quality of Services Provided by BFA — Based on management’s representations, including information about recent and proposed enhancements to the iShares business, including with respect to shareholder servicing and support, the Board expected that there would be no diminution in the scope of services required of or provided by BFA under the Advisory Contract for the coming year as compared to the scope of services provided by BFA during prior years. In reviewing the scope of these services, the Board considered BFA’s investment philosophy and experience, noting that BFA and its affiliates have committed significant resources over time, including during the past year, to supporting the iShares funds and their shareholders. The Board acknowledged that resources to support the iShares funds and their shareholders have been added or enhanced in recent years. The Board also considered BFA’s compliance program and its compliance record with respect to the Fund. In that regard, the Board noted that BFA reports to the Board about portfolio management and compliance matters on a periodic basis in connection with regularly scheduled meetings of the Board, and on other occasions as necessary and appropriate, and has provided information and made appropriate officers available as needed to provide further assistance with these matters. The Board also reviewed the background and experience of the persons responsible for the day-to-day management of the Fund, as well as the resources available to them in managing the Fund. In addition to the above considerations, the Board reviewed and considered detailed presentations regarding BFA’s investment performance, investment and risk management processes and strategies provided at the June 24-25, 2015 meeting and throughout the previous year, and matters related to BFA’s portfolio compliance policies and procedures. The Board noted that the Fund had met its investment objective consistently since its inception date.
Based on review of this information, and the performance information discussed above, the Board concluded that the nature, extent and quality of services provided by BFA to the Fund under the Advisory Contract supported the Board’s approval of the continuance of the Advisory Contract for the coming year.
Costs of Services Provided to the Fund and Profits Realized by BFA and Affiliates — The Board reviewed information about the profitability to BlackRock of the Fund based on the fees payable to BFA and its affiliates (including fees under the Advisory Contract), and all other sources of revenue and expense to BFA and its affiliates from the Fund’s operations for the last calendar year. The Board reviewed BlackRock’s profitability methodology for the iShares funds, noting that the 15(c) Committee had focused on the methodology and proposed presentation during its meetings. The Board discussed the sources of direct and ancillary revenue with management, including the revenues to BTC from securities lending by the Fund. The Board also discussed BFA’s profit margin as reflected in the Fund’s profitability analysis and reviewed information regarding potential economies of scale (as discussed below). Based on this review, the Board concluded that the profits realized by BFA and its affiliates under the Advisory Contract and from other relationships between the Fund and BFA and/or its affiliates, if any, were within a reasonable range in light of the factors considered.
BOARD REVIEWAND APPROVALOF INVESTMENT ADVISORY CONTRACT | 85 |
Table of Contents
Board Review and Approval of Investment Advisory
Contract (Continued)
iSHARES®, INC.
Economies of Scale — The Board reviewed information regarding potential economies of scale or other efficiencies that may result from increases in the Fund’s assets, noting that the issue of economies of scale had been focused on extensively by the 15(c) Committee during its meetings and addressed by management. The Board and the 15(c) Committee reviewed information provided by BFA regarding scale benefits shared with the iShares funds through relatively low fee rates established at inception, breakpoints, waivers, or other fee reductions, as well as through additional investment in the iShares business and the provision of improved or additional infrastructure and services to the iShares funds and their shareholders. The Board and the 15(c) Committee received information regarding BlackRock’s historical profitability, including BFA’s and its affiliates’ costs in providing services. The cost information distinguished between fixed and variable costs, and explained how the level of fixed and variable costs, as well as the nature of such costs, may impact the existence or size of scale benefits. The Board noted that the Advisory Contract for the Fund already provided for breakpoints in the Fund’s investment advisory fee rate as the assets of the Fund, on an aggregated basis with the assets of certain other iShares funds, increase. The Board noted that it would continue to monitor the sharing of economies of scale to determine the appropriateness of adding new or revised breakpoints in the future.
Based on this review, as well as the other factors considered at the meeting, the Board, recognizing its responsibility to consider this issue periodically, determined to approve the continuance of the Advisory Contract for the coming year.
Fees and Services Provided for Other Comparable Funds/Accounts Managed by BFA and its Affiliates — The Board received and considered information regarding the investment advisory/management fee rates for other funds/accounts in the U.S. for which BFA (or its affiliates) provides investment advisory/management services, including open-end and closed-end funds registered under the 1940 Act (including sub-advised funds), collective trust funds, separately managed accounts, and institutional separate accounts (together, the “Other Accounts”), and acknowledged BFA’s assertion that the iShares funds are fundamentally different investment vehicles from the Other Accounts. The Board noted that BFA and its affiliates do not manage Other Accounts with substantially the same investment objective and strategy as the Fund or that track the same index or a similar index as the Fund. The Board further noted that BFA provided the Board with detailed information regarding how the Other Accounts (particularly institutional clients) generally differ from the Fund, including in terms of the different, generally more extensive services provided to the Fund, as well as other significant differences in the approach of BFA and its affiliates to the Fund, on one hand, and Other Accounts, on the other. In that regard, the Board considered that the pricing of services to institutional clients is typically based on a number of factors beyond the nature and extent of the specific services to be provided and often depends on the overall relationship between the client and its affiliates and the adviser and its affiliates. In addition, the Board considered the relative complexity and inherent risks and challenges of managing and providing other services to the Fund, as a publicly traded exchange traded fund, as compared to the Other Accounts that are institutional clients in light of differing regulatory requirements and client-imposed mandates. The Board also considered the “all-inclusive” nature of the Fund’s advisory fee structure, and the Fund expenses borne by BFA under this arrangement. The Board noted that the investment advisory fee rate under the Advisory Contract for the Fund was generally higher than the investment advisory/management fee rates for the Other Accounts that are institutional clients of BFA (or its affiliates) and concluded that the differences appeared to be consistent with the factors discussed.
Other Benefits to BFA and/or its Affiliates — The Board reviewed the “fallout” benefits or ancillary revenue received by BFA and/or its affiliates in connection with the services provided to the Fund by BFA, such as payment of revenue to BTC, the Fund’s securities lending agent, for loaning portfolio securities (which was included in the profit margins reviewed by the Board pursuant to BFA’s profitability methodology), and payment of advisory fees and/or administration fees to BFA and BTC (or their affiliates) in connection with any investments by the Fund in other funds for which BFA (or its affiliates) provides investment advisory services and/or administration services. The Board noted that BFA generally does not use soft dollars or consider the value of research or other services that may be provided to BFA (including its affiliates) in selecting brokers for portfolio transactions for the Fund. The Board further noted that any portfolio transactions on behalf of the Fund placed through a BFA affiliate or purchased from an underwriting syndicate in which a BFA affiliate participates, are reported to the Board pursuant to Rule 17e-1 or Rule 10f-3, as
| 86 | 2015 iSHARES ANNUAL REPORTTO SHAREHOLDERS |
Table of Contents
Board Review and Approval of Investment Advisory
Contract (Continued)
iSHARES®, INC.
applicable, under the 1940 Act. The Board concluded that any such ancillary benefits would not be disadvantageous to the Fund’s shareholders and thus would not alter the Board’s conclusion with respect to the appropriateness of approving the continuance of the Advisory Contract for the coming year.
Based on the considerations described above, the Board determined that the Fund’s investment advisory fee rate under the Advisory Contract does not constitute a fee that is so disproportionately large as to bear no reasonable relationship to the services rendered and that could not have been the product of arm’s-length bargaining, and concluded that it is in the best interest of the Fund and its shareholders to approve the continuance of the Advisory Contract for the coming year.
III. iShares MSCI Pacific ex Japan ETF
Under Section 15(c) of the Investment Company Act of 1940 (the “1940 Act”), the Company’s Board of Directors (the “Board”), including a majority of Directors who are not “interested persons” of the Company (as that term is defined in the 1940 Act) (the “Independent Directors”), is required annually to consider and approve the Investment Advisory Contract between the Company and BFA (the “Advisory Contract”) on behalf of the Fund. The Independent Directors requested, and BFA provided, such information as the Independent Directors, with advice from independent counsel, deemed reasonably necessary to evaluate the Advisory Contract. A committee of Independent Directors (the “15(c) Committee”), with independent counsel, met with management on May 1, 2015 and May 6, 2015, to discuss the types of information the Independent Directors required and the manner in which management would organize and present such information. At a meeting held on May 21, 2015, management presented preliminary information to the Board relating to the continuance of the Advisory Contract, and the Board, including the Independent Directors, reviewed and discussed such information at length. The Independent Directors requested from management certain additional information, which management agreed to provide. At a meeting held on June 24-25, 2015, the Board, including the Independent Directors, reviewed the additional information provided by management in response to these requests. After extensive discussions, the Board, including all of the Independent Directors, approved the continuance of the Advisory Contract for the Fund, based on a review of qualitative and quantitative information provided by BFA, including the additional information management provided at the request of the Independent Directors. The Board noted its satisfaction with the extent and quality of information provided and its frequent interactions with management, as well as the detailed responses and other information provided by BFA. The Board also noted that the Board and BFA agreed to discuss potential enhancements and adjustments to the 15(c) process for the coming year. The Independent Directors were advised by their independent counsel throughout the process, including about the legal standards applicable to their review. In approving the Advisory Contract for the Fund, the Board, including the Independent Directors, considered the following factors, no one of which was controlling, and reached the following conclusions:
Expenses and Performance of the Fund — The Board reviewed statistical information prepared by Lipper Inc. (“Lipper”), an independent provider of investment company data, regarding the expense ratio components, including actual advisory fees, waivers/reimbursements, and gross and net total expenses of the Fund in comparison with the same information for other exchange traded funds (including, where applicable, funds sponsored by an “at cost” service provider) and, in the limited instances where no comparable ETFs existed and the comparison group would not otherwise be reasonable in Lipper’s judgment, pure index institutional mutual funds, objectively selected by Lipper as comprising the Fund’s applicable peer group pursuant to Lipper’s proprietary ETF methodology (the “Lipper Group”). The Board was provided with a detailed description of Lipper’s proprietary ETF methodology used by Lipper to determine the Fund’s Lipper Group. The Board further noted that due to the limitations in providing comparable funds in the Lipper Group, the statistical information provided in Lipper’s report may or may not provide meaningful direct comparisons to the Fund in all instances.
BOARD REVIEWAND APPROVALOF INVESTMENT ADVISORY CONTRACT | 87 |
Table of Contents
Board Review and Approval of Investment Advisory
Contract (Continued)
iSHARES®, INC.
The Board also noted that the investment advisory fee rate and overall expenses (net of waivers and reimbursements) for the Fund were within range of the median of the investment advisory fee rates and overall expenses (net of waivers and reimbursements) of the funds in its Lipper Group.
In addition, the Board reviewed statistical information prepared by Lipper regarding the performance of the Fund for the one-, three-, five-, ten-year, and since inception periods, as applicable, and the “last quarter” period ended December 31, 2014, and a comparison of the Fund’s performance to its performance benchmark index for the same periods. To the extent that any of the comparison funds included in the Lipper Group track the same index as the Fund, Lipper also provided, and the Board reviewed, a comparison of the Fund’s performance to that of such relevant comparison funds for the same periods. The Board noted that the Fund generally performed in line with its performance benchmark index over the relevant periods. In considering this information, the Board noted that the Lipper Group may include funds that have a different investment objective and/or benchmark from the Fund. In addition, the Board noted that the Fund seeks to track its own benchmark index and that, during the prior year, the Board received periodic reports on the Fund’s performance in comparison with its benchmark index. Such periodic comparative performance information, including detailed information on certain specific iShares funds requested by the Boards, was also considered.
Based on this review, the other factors considered at the meeting, and their general knowledge of ETF pricing, the Board concluded that the investment advisory fee rate and expense level and the historical performance of the Fund supported the Board’s approval of the continuance of the Advisory Contract for the coming year.
Nature, Extent and Quality of Services Provided by BFA — Based on management’s representations, including information about recent and proposed enhancements to the iShares business, including with respect to shareholder servicing and support, the Board expected that there would be no diminution in the scope of services required of or provided by BFA under the Advisory Contract for the coming year as compared to the scope of services provided by BFA during prior years. In reviewing the scope of these services, the Board considered BFA’s investment philosophy and experience, noting that BFA and its affiliates have committed significant resources over time, including during the past year, to supporting the iShares funds and their shareholders. The Board acknowledged that resources to support the iShares funds and their shareholders have been added or enhanced in recent years. The Board also considered BFA’s compliance program and its compliance record with respect to the Fund. In that regard, the Board noted that BFA reports to the Board about portfolio management and compliance matters on a periodic basis in connection with regularly scheduled meetings of the Board, and on other occasions as necessary and appropriate, and has provided information and made appropriate officers available as needed to provide further assistance with these matters. The Board also reviewed the background and experience of the persons responsible for the day-to-day management of the Fund, as well as the resources available to them in managing the Fund. In addition to the above considerations, the Board reviewed and considered detailed presentations regarding BFA’s investment performance, investment and risk management processes and strategies provided at the June 24-25, 2015 meeting and throughout the previous year, and matters related to BFA’s portfolio compliance policies and procedures. The Board noted that the Fund had met its investment objective consistently since its inception date.
Based on review of this information, and the performance information discussed above, the Board concluded that the nature, extent and quality of services provided by BFA to the Fund under the Advisory Contract supported the Board’s approval of the continuance of the Advisory Contract for the coming year.
Costs of Services Provided to the Fund and Profits Realized by BFA and Affiliates — The Board reviewed information about the profitability to BlackRock of the Fund based on the fees payable to BFA and its affiliates (including fees under the Advisory Contract), and all other sources of revenue and expense to BFA and its affiliates from the Fund’s operations for the last calendar year. The Board reviewed BlackRock’s profitability methodology for the iShares funds, noting that the 15(c) Committee had focused on the methodology and proposed presentation during its meetings. The Board discussed the sources of direct and
| 88 | 2015 iSHARES ANNUAL REPORTTO SHAREHOLDERS |
Table of Contents
Board Review and Approval of Investment Advisory
Contract (Continued)
iSHARES®, INC.
ancillary revenue with management, including the revenues to BTC from securities lending by the Fund. The Board also discussed BFA’s profit margin as reflected in the Fund’s profitability analysis and reviewed information regarding potential economies of scale (as discussed below). Based on this review, the Board concluded that the profits realized by BFA and its affiliates under the Advisory Contract and from other relationships between the Fund and BFA and/or its affiliates, if any, were within a reasonable range in light of the factors considered.
Economies of Scale — The Board reviewed information regarding potential economies of scale or other efficiencies that may result from increases in the Fund’s assets, noting that the issue of economies of scale had been focused on extensively by the 15(c) Committee during its meetings and addressed by management. The Board and the 15(c) Committee reviewed information provided by BFA regarding scale benefits shared with the iShares funds through relatively low fee rates established at inception, breakpoints, waivers, or other fee reductions, as well as through additional investment in the iShares business and the provision of improved or additional infrastructure and services to the iShares funds and their shareholders. The Board and the 15(c) Committee received information regarding BlackRock’s historical profitability, including BFA’s and its affiliates’ costs in providing services. The cost information distinguished between fixed and variable costs, and explained how the level of fixed and variable costs, as well as the nature of such costs, may impact the existence or size of scale benefits. The Board noted that the Advisory Contract for the Fund already provided for breakpoints in the Fund’s investment advisory fee rate, and that, following negotiations, BFA and the Board had agreed to revise the Advisory Contract for the Fund to provide for additional breakpoints, as the assets of the Fund, on an aggregated basis with the assets of certain other iShares funds, increase. The Board noted that the revisions to the Advisory Contract to provide additional breakpoints had been subject to further negotiation after receipt of management’s proposal, and that at the request of the Board, management had modified its initial proposal regarding adding additional breakpoints to the Fund. The Board noted that it would continue to monitor the sharing of economies of scale to determine the appropriateness of adding new or revised breakpoints in the future.
Based on this review, as well as the other factors considered at the meeting, the Board, recognizing its responsibility to consider this issue periodically, determined to approve the continuance of the Advisory Contract for the coming year.
Fees and Services Provided for Other Comparable Funds/Accounts Managed by BFA and its Affiliates — The Board received and considered information regarding the investment advisory/management fee rates for other funds/accounts in the U.S. for which BFA (or its affiliates) provides investment advisory/management services, including open-end and closed-end funds registered under the 1940 Act (including sub-advised funds), collective trust funds, separately managed accounts, and institutional separate accounts (together, the “Other Accounts”), and acknowledged BFA’s assertion that the iShares funds are fundamentally different investment vehicles from the Other Accounts. The Board noted that BFA and its affiliates do manage Other Accounts with substantially the same investment objective and strategy as the Fund or that track the same index or a similar index as the Fund. The Board further noted that BFA provided the Board with detailed information regarding how the Other Accounts (particularly institutional clients) generally differ from the Fund, including in terms of the different, generally more extensive services provided to the Fund, as well as other significant differences in the approach of BFA and its affiliates to the Fund, on one hand, and Other Accounts, on the other. In that regard, the Board considered that the pricing of services to institutional clients is typically based on a number of factors beyond the nature and extent of the specific services to be provided and often depends on the overall relationship between the client and its affiliates and the adviser and its affiliates. In addition, the Board considered the relative complexity and inherent risks and challenges of managing and providing other services to the Fund, as a publicly traded exchange traded fund, as compared to the Other Accounts that are institutional clients in light of differing regulatory requirements and client-imposed mandates. The Board also considered the “all-inclusive” nature of the Fund’s advisory fee structure, and the Fund expenses borne by BFA under this arrangement. The Board noted that the investment advisory fee rate under the Advisory Contract for the Fund was generally higher than the investment advisory/management fee rates for the Other Accounts that are institutional clients of BFA (or its affiliates) and concluded that the differences appeared to be consistent with the factors discussed.
BOARD REVIEWAND APPROVALOF INVESTMENT ADVISORY CONTRACT | 89 |
Table of Contents
Board Review and Approval of Investment Advisory
Contract (Continued)
iSHARES®, INC.
Other Benefits to BFA and/or its Affiliates — The Board reviewed the “fallout” benefits or ancillary revenue received by BFA and/or its affiliates in connection with the services provided to the Fund by BFA, such as payment of revenue to BTC, the Fund’s securities lending agent, for loaning portfolio securities (which was included in the profit margins reviewed by the Board pursuant to BFA’s profitability methodology), and payment of advisory fees and/or administration fees to BFA and BTC (or their affiliates) in connection with any investments by the Fund in other funds for which BFA (or its affiliates) provides investment advisory services and/or administration services. The Board noted that BFA generally does not use soft dollars or consider the value of research or other services that may be provided to BFA (including its affiliates) in selecting brokers for portfolio transactions for the Fund. The Board further noted that any portfolio transactions on behalf of the Fund placed through a BFA affiliate or purchased from an underwriting syndicate in which a BFA affiliate participates, are reported to the Board pursuant to Rule 17e-1 or Rule 10f-3, as applicable, under the 1940 Act. The Board concluded that any such ancillary benefits would not be disadvantageous to the Fund’s shareholders and thus would not alter the Board’s conclusion with respect to the appropriateness of approving the continuance of the Advisory Contract for the coming year.
Based on the considerations described above, the Board determined that the Fund’s investment advisory fee rate under the Advisory Contract does not constitute a fee that is so disproportionately large as to bear no reasonable relationship to the services rendered and that could not have been the product of arm’s-length bargaining, and concluded that it is in the best interest of the Fund and its shareholders to approve the continuance of the Advisory Contract for the coming year.
IV. iShares MSCI Thailand Capped ETF
Under Section 15(c) of the Investment Company Act of 1940 (the “1940 Act”), the Company’s Board of Directors (the “Board”), including a majority of Directors who are not “interested persons” of the Company (as that term is defined in the 1940 Act) (the “Independent Directors”), is required annually to consider and approve the Investment Advisory Contract between the Company and BFA (the “Advisory Contract”) on behalf of the Fund. The Independent Directors requested, and BFA provided, such information as the Independent Directors, with advice from independent counsel, deemed reasonably necessary to evaluate the Advisory Contract. A committee of Independent Directors (the “15(c) Committee”), with independent counsel, met with management on May 1, 2015 and May 6, 2015, to discuss the types of information the Independent Directors required and the manner in which management would organize and present such information. At a meeting held on May 21, 2015, management presented preliminary information to the Board relating to the continuance of the Advisory Contract, and the Board, including the Independent Directors, reviewed and discussed such information at length. The Independent Directors requested from management certain additional information, which management agreed to provide. At a meeting held on June 24-25, 2015, the Board, including the Independent Directors, reviewed the additional information provided by management in response to these requests. After extensive discussions, the Board, including all of the Independent Directors, approved the continuance of the Advisory Contract for the Fund, based on a review of qualitative and quantitative information provided by BFA, including the additional information management provided at the request of the Independent Directors. The Board noted its satisfaction with the extent and quality of information provided and its frequent interactions with management, as well as the detailed responses and other information provided by BFA. The Board also noted that the Board and BFA agreed to discuss potential enhancements and adjustments to the 15(c) process for the coming year. The Independent Directors were advised by their independent counsel throughout the process, including about the legal standards applicable to their review. In approving the Advisory Contract for the Fund, the Board, including the Independent Directors, considered the following factors, no one of which was controlling, and reached the following conclusions:
Expenses and Performance of the Fund — The Board reviewed statistical information prepared by Lipper Inc. (“Lipper”), an independent provider of investment company data, regarding the expense ratio components, including actual advisory fees, waivers/reimbursements, and gross and net total expenses of the Fund in comparison with the same information for other exchange traded funds (including, where applicable, funds sponsored by an “at cost” service provider) and, in the limited
| 90 | 2015 iSHARES ANNUAL REPORTTO SHAREHOLDERS |
Table of Contents
Board Review and Approval of Investment Advisory
Contract (Continued)
iSHARES®, INC.
instances where no comparable ETFs existed and the comparison group would not otherwise be reasonable in Lipper’s judgment, pure index institutional mutual funds, objectively selected by Lipper as comprising the Fund’s applicable peer group pursuant to Lipper’s proprietary ETF methodology (the “Lipper Group”). The Board was provided with a detailed description of Lipper’s proprietary ETF methodology used by Lipper to determine the Fund’s Lipper Group. The Board further noted that due to the limitations in providing comparable funds in the Lipper Group, the statistical information provided in Lipper’s report may or may not provide meaningful direct comparisons to the Fund in all instances.
The Board also noted that the investment advisory fee rate and overall expenses (net of waivers and reimbursements) for the Fund were within range of the median of the investment advisory fee rates and overall expenses (net of waivers and reimbursements) of the funds in its Lipper Group.
In addition, the Board reviewed statistical information prepared by Lipper regarding the performance of the Fund for the one-, three-, five-, ten-year, and since inception periods, as applicable, and the “last quarter” period ended December 31, 2014, and a comparison of the Fund’s performance to its performance benchmark index for the same periods. To the extent that any of the comparison funds included in the Lipper Group track the same index as the Fund, Lipper also provided, and the Board reviewed, a comparison of the Fund’s performance to that of such relevant comparison funds for the same periods. The Board noted that the Fund generally performed in line with its performance benchmark index over the relevant periods. In considering this information, the Board noted that the Lipper Group may include funds that have a different investment objective and/or benchmark from the Fund. In addition, the Board noted that the Fund seeks to track its own benchmark index and that, during the prior year, the Board received periodic reports on the Fund’s performance in comparison with its benchmark index. Such periodic comparative performance information, including detailed information on certain specific iShares funds requested by the Boards, was also considered.
Based on this review, the other factors considered at the meeting, and their general knowledge of ETF pricing, the Board concluded that the investment advisory fee rate and expense level and the historical performance of the Fund supported the Board’s approval of the continuance of the Advisory Contract for the coming year.
Nature, Extent and Quality of Services Provided by BFA — Based on management’s representations, including information about recent and proposed enhancements to the iShares business, including with respect to shareholder servicing and support, the Board expected that there would be no diminution in the scope of services required of or provided by BFA under the Advisory Contract for the coming year as compared to the scope of services provided by BFA during prior years. In reviewing the scope of these services, the Board considered BFA’s investment philosophy and experience, noting that BFA and its affiliates have committed significant resources over time, including during the past year, to supporting the iShares funds and their shareholders. The Board acknowledged that resources to support the iShares funds and their shareholders have been added or enhanced in recent years. The Board also considered BFA’s compliance program and its compliance record with respect to the Fund. In that regard, the Board noted that BFA reports to the Board about portfolio management and compliance matters on a periodic basis in connection with regularly scheduled meetings of the Board, and on other occasions as necessary and appropriate, and has provided information and made appropriate officers available as needed to provide further assistance with these matters. The Board also reviewed the background and experience of the persons responsible for the day-to-day management of the Fund, as well as the resources available to them in managing the Fund. In addition to the above considerations, the Board reviewed and considered detailed presentations regarding BFA’s investment performance, investment and risk management processes and strategies provided at the June 24-25, 2015 meeting and throughout the previous year, and matters related to BFA’s portfolio compliance policies and procedures. The Board noted that the Fund had met its investment objective consistently since its inception date.
BOARD REVIEWAND APPROVALOF INVESTMENT ADVISORY CONTRACT | 91 |
Table of Contents
Board Review and Approval of Investment Advisory
Contract (Continued)
iSHARES®, INC.
Based on review of this information, and the performance information discussed above, the Board concluded that the nature, extent and quality of services provided by BFA to the Fund under the Advisory Contract supported the Board’s approval of the continuance of the Advisory Contract for the coming year.
Costs of Services Provided to the Fund and Profits Realized by BFA and Affiliates — The Board reviewed information about the profitability to BlackRock of the Fund based on the fees payable to BFA and its affiliates (including fees under the Advisory Contract), and all other sources of revenue and expense to BFA and its affiliates from the Fund’s operations for the last calendar year. The Board reviewed BlackRock’s profitability methodology for the iShares funds, noting that the 15(c) Committee had focused on the methodology and proposed presentation during its meetings. The Board discussed the sources of direct and ancillary revenue with management, including the revenues to BTC from securities lending by the Fund. The Board also discussed BFA’s profit margin as reflected in the Fund’s profitability analysis and reviewed information regarding potential economies of scale (as discussed below). Based on this review, the Board concluded that the profits realized by BFA and its affiliates under the Advisory Contract and from other relationships between the Fund and BFA and/or its affiliates, if any, were within a reasonable range in light of the factors considered.
Economies of Scale — The Board reviewed information regarding potential economies of scale or other efficiencies that may result from increases in the Fund’s assets, noting that the issue of economies of scale had been focused on extensively by the 15(c) Committee during its meetings and addressed by management. The Board and the 15(c) Committee reviewed information provided by BFA regarding scale benefits shared with the iShares funds through relatively low fee rates established at inception, breakpoints, waivers, or other fee reductions, as well as through additional investment in the iShares business and the provision of improved or additional infrastructure and services to the iShares funds and their shareholders. The Board and the 15(c) Committee received information regarding BlackRock’s historical profitability, including BFA’s and its affiliates’ costs in providing services. The cost information distinguished between fixed and variable costs, and explained how the level of fixed and variable costs, as well as the nature of such costs, may impact the existence or size of scale benefits. The Board noted that the Advisory Contract for the Fund already provided for breakpoints in the Fund’s investment advisory fee rate as the assets of the Fund, on an aggregated basis with the assets of certain other iShares funds, increase. The Board noted that it would continue to monitor the sharing of economies of scale to determine the appropriateness of adding new or revised breakpoints in the future.
Based on this review, as well as the other factors considered at the meeting, the Board, recognizing its responsibility to consider this issue periodically, determined to approve the continuance of the Advisory Contract for the coming year.
Fees and Services Provided for Other Comparable Funds/Accounts Managed by BFA and its Affiliates — The Board received and considered information regarding the investment advisory/management fee rates for other funds/accounts in the U.S. for which BFA (or its affiliates) provides investment advisory/management services, including open-end and closed-end funds registered under the 1940 Act (including sub-advised funds), collective trust funds, separately managed accounts, and institutional separate accounts (together, the “Other Accounts”), and acknowledged BFA’s assertion that the iShares funds are fundamentally different investment vehicles from the Other Accounts. The Board noted that BFA and its affiliates do manage Other Accounts with substantially the same investment objective and strategy as the Fund or that track the same index or a similar index as the Fund. The Board further noted that BFA provided the Board with detailed information regarding how the Other Accounts (particularly institutional clients) generally differ from the Fund, including in terms of the different, generally more extensive services provided to the Fund, as well as other significant differences in the approach of BFA and its affiliates to the Fund, on one hand, and Other Accounts, on the other. In that regard, the Board considered that the pricing of services to institutional clients is typically based on a number of factors beyond the nature and extent of the specific services to be provided and often depends on the overall relationship between the client and its affiliates and the adviser and its affiliates. In addition, the Board considered the relative complexity and inherent risks and challenges of managing and providing other services to the Fund, as a publicly traded exchange traded fund, as compared to the Other Accounts that are institutional clients in light of differing
| 92 | 2015 iSHARES ANNUAL REPORTTO SHAREHOLDERS |
Table of Contents
Board Review and Approval of Investment Advisory
Contract (Continued)
iSHARES®, INC.
regulatory requirements and client-imposed mandates. The Board also considered the “all-inclusive” nature of the Fund’s advisory fee structure, and the Fund expenses borne by BFA under this arrangement. The Board noted that the investment advisory fee rate under the Advisory Contract for the Fund was generally higher than the investment advisory/management fee rates for the Other Accounts that are institutional clients of BFA (or its affiliates) and concluded that the differences appeared to be consistent with the factors discussed.
Other Benefits to BFA and/or its Affiliates — The Board reviewed the “fallout” benefits or ancillary revenue received by BFA and/or its affiliates in connection with the services provided to the Fund by BFA, such as payment of revenue to BTC, the Fund’s securities lending agent, for loaning portfolio securities (which was included in the profit margins reviewed by the Board pursuant to BFA’s profitability methodology), and payment of advisory fees and/or administration fees to BFA and BTC (or their affiliates) in connection with any investments by the Fund in other funds for which BFA (or its affiliates) provides investment advisory services and/or administration services. The Board noted that BFA generally does not use soft dollars or consider the value of research or other services that may be provided to BFA (including its affiliates) in selecting brokers for portfolio transactions for the Fund. The Board further noted that any portfolio transactions on behalf of the Fund placed through a BFA affiliate or purchased from an underwriting syndicate in which a BFA affiliate participates, are reported to the Board pursuant to Rule 17e-1 or Rule 10f-3, as applicable, under the 1940 Act. The Board concluded that any such ancillary benefits would not be disadvantageous to the Fund’s shareholders and thus would not alter the Board’s conclusion with respect to the appropriateness of approving the continuance of the Advisory Contract for the coming year.
Based on the considerations described above, the Board determined that the Fund’s investment advisory fee rate under the Advisory Contract does not constitute a fee that is so disproportionately large as to bear no reasonable relationship to the services rendered and that could not have been the product of arm’s-length bargaining, and concluded that it is in the best interest of the Fund and its shareholders to approve the continuance of the Advisory Contract for the coming year.
BOARD REVIEWAND APPROVALOF INVESTMENT ADVISORY CONTRACT | 93 |
Table of Contents
Supplemental Information (Unaudited)
iSHARES®, INC.
Section 19(a) Notices
The amounts and sources of distributions reported are estimates and are provided pursuant to regulatory requirements and are not being provided for tax reporting purposes. The actual amounts and sources for tax reporting purposes will depend upon each Fund’s investment experience during the year and may be subject to changes based on the tax regulations. Shareholders will receive a Form 1099-DIV each calendar year that will inform them how to report these distributions for federal income tax purposes.
| Total Cumulative Distributions for the Fiscal Year | % Breakdown of the Total Cumulative Distributions for the Fiscal Year | |||||||||||||||||||||||||||||||
| iShares ETF | Net Investment Income | Net Realized Capital Gains | Return of Capital | Total Per Share | Net Investment Income | Net Realized Capital Gains | Return of Capital | Total Per Share | ||||||||||||||||||||||||
MSCI Malaysia | $ | 0.393275 | $ | 0.044834 | $ | — | $ | 0.438109 | 90 | % | 10 | % | — | % | 100 | % | ||||||||||||||||
MSCI Pacific ex Japan | 2.084004 | — | — | 2.084004 | 100 | — | — | 100 | ||||||||||||||||||||||||
MSCI Singapore | 0.283068 | — | 0.144789 | 0.427857 | 66 | — | 34 | 100 | ||||||||||||||||||||||||
MSCI Taiwan | 0.264670 | — | 0.026542 | 0.291212 | 91 | — | 9 | 100 | ||||||||||||||||||||||||
MSCI Thailand Capped | 2.076272 | — | — | 2.076272 | 100 | — | — | 100 | ||||||||||||||||||||||||
Premium/Discount Information
The Premium/Discount Information section is intended to present information about the differences between the daily market price on secondary markets for shares of a fund and that fund’s NAV. NAV is the price at which a fund issues and redeems shares. It is calculated in accordance with the standard formula for valuing mutual fund shares. The “Market Price” of a fund generally is determined using the midpoint between the highest bid and the lowest offer on the primary stock exchange on which the shares of such fund are listed for trading, as of the time that the fund’s NAV is calculated. A fund’s Market Price may be at, above or below its NAV. The NAV of a fund will fluctuate with changes in the fair value of its portfolio holdings. The Market Price of a fund will fluctuate in accordance with changes in its NAV, as well as market supply and demand.
Premiums or discounts are the differences (expressed as a percentage) between the NAV and Market Price of a fund on a given day, generally at the time the NAV is calculated. A premium is the amount that a fund is trading above the reported NAV, expressed as a percentage of the NAV. A discount is the amount that a fund is trading below the reported NAV, expressed as a percentage of the NAV.
The following information shows the frequency of distributions of premiums and discounts for each of the Funds. The information shown for each Fund is for five calendar years (or from the inception date of such Fund if less than five years) through the date of the most recent calendar quarter-end. The specific periods covered for each Fund are disclosed in the table for such Fund.
| 94 | 2015 iSHARES ANNUAL REPORTTO SHAREHOLDERS |
Table of Contents
Supplemental Information (Unaudited) (Continued)
iSHARES®, INC.
Each line in the table shows the number of trading days in which the Fund traded within the premium/discount range indicated. The number of trading days in each premium/discount range is also shown as a percentage of the total number of trading days in the period covered by each table. All data presented here represents past performance, which cannot be used to predict future results.
iShares MSCI Hong Kong ETF
Period Covered: January 1, 2010 through June 30, 2015
Premium/Discount Range | Number of Days | Percentage of Total Days | ||||||
Greater than 4.5% | 1 | 0.07 | % | |||||
Greater than 4.0% and Less than 4.5% | 2 | 0.14 | ||||||
Greater than 3.5% and Less than 4.0% | 1 | 0.07 | ||||||
Greater than 3.0% and Less than 3.5% | 3 | 0.22 | ||||||
Greater than 2.5% and Less than 3.0% | 1 | 0.07 | ||||||
Greater than 2.0% and Less than 2.5% | 14 | 1.01 | ||||||
Greater than 1.5% and Less than 2.0% | 17 | 1.23 | ||||||
Greater than 1.0% and Less than 1.5% | 54 | 3.91 | ||||||
Greater than 0.5% and Less than 1.0% | 242 | 17.51 | ||||||
Between 0.5% and –0.5% | 790 | 57.17 | ||||||
Less than –0.5% and Greater than –1.0% | 149 | 10.79 | ||||||
Less than –1.0% and Greater than –1.5% | 67 | 4.85 | ||||||
Less than –1.5% and Greater than –2.0% | 18 | 1.30 | ||||||
Less than –2.0% and Greater than –2.5% | 10 | 0.72 | ||||||
Less than –2.5% and Greater than –3.0% | 7 | 0.51 | ||||||
Less than –3.0% and Greater than –3.5% | 4 | 0.29 | ||||||
Less than –3.5% | 2 | 0.14 | ||||||
|
|
|
| |||||
| 1,382 | 100.00 | % | ||||||
|
|
|
| |||||
SUPPLEMENTAL INFORMATION | 95 |
Table of Contents
Supplemental Information (Unaudited) (Continued)
iSHARES®, INC.
iShares MSCI Japan Small-Cap ETF
Period Covered: January 1, 2010 through June 30, 2015
Premium/Discount Range | Number of Days | Percentage of Total Days | ||||||
Greater than 3.0% | 10 | 0.72 | % | |||||
Greater than 2.5% and Less than 3.0% | 4 | 0.29 | ||||||
Greater than 2.0% and Less than 2.5% | 13 | 0.94 | ||||||
Greater than 1.5% and Less than 2.0% | 37 | 2.68 | ||||||
Greater than 1.0% and Less than 1.5% | 100 | 7.24 | ||||||
Greater than 0.5% and Less than 1.0% | 242 | 17.51 | ||||||
Between 0.5% and –0.5% | 664 | 48.04 | ||||||
Less than –0.5% and Greater than –1.0% | 156 | 11.29 | ||||||
Less than –1.0% and Greater than –1.5% | 83 | 6.01 | ||||||
Less than –1.5% and Greater than –2.0% | 37 | 2.68 | ||||||
Less than –2.0% and Greater than –2.5% | 20 | 1.45 | ||||||
Less than –2.5% and Greater than –3.0% | 12 | 0.87 | ||||||
Less than –3.0% and Greater than –3.5% | 2 | 0.14 | ||||||
Less than –3.5% and Greater than –4.0% | 1 | 0.07 | ||||||
Less than –4.0% and Greater than –4.5% | 1 | 0.07 | ||||||
|
|
|
| |||||
| 1,382 | 100.00 | % | ||||||
|
|
|
| |||||
iShares MSCI Malaysia ETF
Period Covered: January 1, 2010 through June 30, 2015
Premium/Discount Range | Number of Days | Percentage of Total Days | ||||||
Greater than 3.0% | 2 | 0.14 | % | |||||
Greater than 2.5% and Less than 3.0% | 1 | 0.07 | ||||||
Greater than 2.0% and Less than 2.5% | 7 | 0.51 | ||||||
Greater than 1.5% and Less than 2.0% | 17 | 1.23 | ||||||
Greater than 1.0% and Less than 1.5% | 78 | 5.64 | ||||||
Greater than 0.5% and Less than 1.0% | 224 | 16.22 | ||||||
Between 0.5% and –0.5% | 739 | 53.48 | ||||||
Less than –0.5% and Greater than –1.0% | 199 | 14.40 | ||||||
Less than –1.0% and Greater than –1.5% | 63 | 4.56 | ||||||
Less than –1.5% and Greater than –2.0% | 32 | 2.32 | ||||||
Less than –2.0% and Greater than –2.5% | 8 | 0.58 | ||||||
Less than –2.5% and Greater than –3.0% | 6 | 0.43 | ||||||
Less than –3.0% and Greater than –3.5% | 2 | 0.14 | ||||||
Less than –3.5% and Greater than –4.0% | 2 | 0.14 | ||||||
Less than –4.0% and Greater than –4.5% | 2 | 0.14 | ||||||
|
|
|
| |||||
| 1,382 | 100.00 | % | ||||||
|
|
|
| |||||
| 96 | 2015 iSHARES ANNUAL REPORTTO SHAREHOLDERS |
Table of Contents
Supplemental Information (Unaudited) (Continued)
iSHARES®, INC.
iShares MSCI Pacific ex Japan ETF
Period Covered: January 1, 2010 through June 30, 2015
Premium/Discount Range | Number of Days | Percentage of Total Days | ||||||
Greater than 4.0% | 3 | 0.22 | % | |||||
Greater than 3.5% and Less than 4.0% | 2 | 0.14 | ||||||
Greater than 3.0% and Less than 3.5% | 1 | 0.07 | ||||||
Greater than 2.5% and Less than 3.0% | 5 | 0.36 | ||||||
Greater than 2.0% and Less than 2.5% | 10 | 0.72 | ||||||
Greater than 1.5% and Less than 2.0% | 21 | 1.52 | ||||||
Greater than 1.0% and Less than 1.5% | 68 | 4.92 | ||||||
Greater than 0.5% and Less than 1.0% | 209 | 15.13 | ||||||
Between 0.5% and –0.5% | 793 | 57.38 | ||||||
Less than –0.5% and Greater than –1.0% | 145 | 10.50 | ||||||
Less than –1.0% and Greater than –1.5% | 69 | 5.00 | ||||||
Less than –1.5% and Greater than –2.0% | 27 | 1.95 | ||||||
Less than –2.0% and Greater than –2.5% | 13 | 0.94 | ||||||
Less than –2.5% and Greater than –3.0% | 8 | 0.58 | ||||||
Less than –3.0% and Greater than –3.5% | 3 | 0.22 | ||||||
Less than –3.5% and Greater than –4.0% | 2 | 0.14 | ||||||
Less than –4.0% and Greater than –4.5% | 1 | 0.07 | ||||||
Less than –4.5% and Greater than –5.0% | 2 | 0.14 | ||||||
|
|
|
| |||||
| 1,382 | 100.00 | % | ||||||
|
|
|
| |||||
iShares MSCI Singapore ETF
Period Covered: January 1, 2010 through June 30, 2015
Premium/Discount Range | Number of Days | Percentage of Total Days | ||||||
Greater than 2.5% | 3 | 0.22 | % | |||||
Greater than 2.0% and Less than 2.5% | 4 | 0.29 | ||||||
Greater than 1.5% and Less than 2.0% | 11 | 0.80 | ||||||
Greater than 1.0% and Less than 1.5% | 42 | 3.04 | ||||||
Greater than 0.5% and Less than 1.0% | 184 | 13.31 | ||||||
Between 0.5% and –0.5% | 926 | 67.01 | ||||||
Less than –0.5% and Greater than –1.0% | 137 | 9.91 | ||||||
Less than –1.0% and Greater than –1.5% | 40 | 2.89 | ||||||
Less than –1.5% and Greater than –2.0% | 17 | 1.23 | ||||||
Less than –2.0% and Greater than –2.5% | 11 | 0.80 | ||||||
Less than –2.5% and Greater than –3.0% | 3 | 0.22 | ||||||
Less than –3.0% and Greater than –3.5% | 1 | 0.07 | ||||||
Less than –3.5% and Greater than –4.0% | 2 | 0.14 | ||||||
Less than –4.0% | 1 | 0.07 | ||||||
|
|
|
| |||||
| 1,382 | 100.00 | % | ||||||
|
|
|
| |||||
SUPPLEMENTAL INFORMATION | 97 |
Table of Contents
Supplemental Information (Unaudited) (Continued)
iSHARES®, INC.
iShares MSCI Taiwan ETF
Period Covered: January 1, 2010 through June 30, 2015
Premium/Discount Range | Number of Days | Percentage of Total Days | ||||||
Greater than 3.5% and Less than 4.0% | 5 | 0.36 | % | |||||
Greater than 3.0% and Less than 3.5% | 3 | 0.22 | ||||||
Greater than 2.5% and Less than 3.0% | 6 | 0.43 | ||||||
Greater than 2.0% and Less than 2.5% | 8 | 0.58 | ||||||
Greater than 1.5% and Less than 2.0% | 22 | 1.59 | ||||||
Greater than 1.0% and Less than 1.5% | 78 | 5.64 | ||||||
Greater than 0.5% and Less than 1.0% | 222 | 16.06 | ||||||
Between 0.5% and –0.5% | 695 | 50.29 | ||||||
Less than –0.5% and Greater than –1.0% | 193 | 13.97 | ||||||
Less than –1.0% and Greater than –1.5% | 76 | 5.50 | ||||||
Less than –1.5% and Greater than –2.0% | 37 | 2.68 | ||||||
Less than –2.0% and Greater than –2.5% | 12 | 0.87 | ||||||
Less than –2.5% and Greater than –3.0% | 11 | 0.80 | ||||||
Less than –3.0% and Greater than –3.5% | 8 | 0.58 | ||||||
Less than –3.5% and Greater than –4.0% | 3 | 0.22 | ||||||
Less than –4.0% and Greater than –4.5% | 2 | 0.14 | ||||||
Less than –4.5% and Greater than –5.0% | 1 | 0.07 | ||||||
|
|
|
| |||||
| 1,382 | 100.00 | % | ||||||
|
|
|
| |||||
iShares MSCI Thailand ETF
Period Covered: January 1, 2010 through June 30, 2015
Premium/Discount Range | Number of Days | Percentage of Total Days | ||||||
Greater than 3.0% | 5 | 0.36 | % | |||||
Greater than 2.5% and Less than 3.0% | 8 | 0.58 | ||||||
Greater than 2.0% and Less than 2.5% | 15 | 1.09 | ||||||
Greater than 1.5% and Less than 2.0% | 39 | 2.82 | ||||||
Greater than 1.0% and Less than 1.5% | 113 | 8.18 | ||||||
Greater than 0.5% and Less than 1.0% | 252 | 18.23 | ||||||
Between 0.5% and –0.5% | 601 | 43.50 | ||||||
Less than –0.5% and Greater than –1.0% | 180 | 13.02 | ||||||
Less than –1.0% and Greater than –1.5% | 91 | 6.58 | ||||||
Less than –1.5% and Greater than –2.0% | 34 | 2.46 | ||||||
Less than –2.0% and Greater than –2.5% | 28 | 2.03 | ||||||
Less than –2.5% and Greater than –3.0% | 8 | 0.58 | ||||||
Less than –3.0% and Greater than –3.5% | 5 | 0.36 | ||||||
Less than –3.5% and Greater than –4.0% | 1 | 0.07 | ||||||
Less than –4.0% | 2 | 0.14 | ||||||
|
|
|
| |||||
| 1,382 | 100.00 | % | ||||||
|
|
|
| |||||
| 98 | 2015 iSHARES ANNUAL REPORTTO SHAREHOLDERS |
Table of Contents
Supplemental Information (Unaudited) (Continued)
iSHARES®, INC.
Regulation under the Alternative Investment Fund Managers Directive (“AIFMD” or, the “Directive”)
The Directive imposes detailed and prescriptive obligations on fund managers established in the European Union (the “EU”). These do not currently apply to managers established outside the EU, such as BFA. Rather, non-EU managers are only required to comply with certain disclosure, reporting and transparency obligations of the Directive if such managers market a fund to EU investors.
BFA has registered the iShares MSCI Hong Kong ETF, iShares MSCI Japan Small-Cap ETF, iShares MSCI Malaysia ETF, iShares MSCI Taiwan ETF and iShares MSCI Thailand Capped ETF (each a “Fund”, collectively the “Funds”) to be marketed to EU investors in the United Kingdom, the Netherlands, Finland, Sweden and Luxembourg.
Report on Remuneration
BFA is required under the Directive to make quantitative disclosures of remuneration. These disclosures are made in line with BlackRock’s interpretation of currently available regulatory guidance on quantitative remuneration disclosures. As market or regulatory practice develops, BlackRock may consider it appropriate to make changes to the way in which quantitative remuneration disclosures are calculated. Where such changes are made, this may result in disclosures in relation to a fund not being comparable to the disclosures made in the prior year, or in relation to other BlackRock fund disclosures in that same year.
Disclosures are provided in relation to both (a) the staff of BFA; (b) staff who are senior management; and (c) staff who have the ability to materially affect the risk profile of the Fund.
All individuals included in the aggregated figures disclosed are rewarded in line with BlackRock’s remuneration policy for their responsibilities across the relevant BlackRock business area. As all individuals have a number of areas of responsibilities, only the portion of remuneration for those individuals’ services attributable to the Fund is included in the aggregate figures disclosed.
BlackRock has a clear and well defined pay-for-performance philosophy, and compensation programs which support that philosophy. For senior management, a significant percentage of variable remuneration is deferred over time. All employees are subject to a claw-back policy.
Compensation decisions for employees are made based on BlackRock’s full-year financial results and other non-financial goals and objectives. Alongside financial performance, individual compensation is also based on strategic and operating results and other considerations such as management and leadership capabilities. No set formulas are established and no fixed benchmarks are used in determining annual incentive awards.
Bonus pools are reviewed by BlackRock’s independent compensation committee, taking into account both actual and projected financial information together with information provided by the Operational Risk and Regulatory Compliance departments in relation to any activities, incidents or events that warrant consideration in making compensation decisions.
Functions such as Finance, Operational Risk, Legal & Compliance, and Human Resources each have their own organizational structures which are independent of the business units. Functional bonus pools are determined with reference to the performance of each individual function and the remuneration of the senior members of control functions is directly overseen by BlackRock’s independent compensation committee. No individual is involved in setting his or her own remuneration.
Members of staff and senior management of BFA typically provide both AIFMD and non-AIFMD related services in respect of multiple funds, clients and functions of BFA and across the broader BlackRock group. Therefore, the figures disclosed are a sum of each individual’s portion of remuneration attributable to the Fund according to an objective apportionment methodology which
SUPPLEMENTAL INFORMATION | 99 |
Table of Contents
Supplemental Information (Unaudited) (Continued)
iSHARES®, INC.
acknowledges the multiple-service nature of BFA. Accordingly, the figures are not representative of any individual’s actual remuneration or their remuneration structure.
The amount of the total remuneration awarded by BFA to its staff which has been attributed to the iShares MSCI Hong Kong ETF in respect of BFA’s financial year ending December 31, 2014 was USD 469.2 thousand. This figure is comprised of fixed remuneration of USD 189.6 thousand and variable remuneration of USD 279.6 thousand. There were a total of 499 beneficiaries of the remuneration described above.
The amount of the aggregate remuneration awarded by BFA, which has been attributed to the iShares MSCI Hong Kong ETF in respect of BFA’s financial year ending December 31, 2014, to its senior management was USD 64.9 thousand, and to members of its staff whose actions have a material impact on the risk profile of the Fund was USD 12.0 thousand.
The amount of the total remuneration awarded by BFA to its staff which has been attributed to the iShares MSCI Japan Small-Cap ETF in respect of BFA’s financial year ending December 31, 2014 was USD 21.4 thousand. This figure is comprised of fixed remuneration of USD 8.7 thousand and variable remuneration of USD 12.8 thousand. There were a total of 499 beneficiaries of the remuneration described above.
The amount of the aggregate remuneration awarded by BFA, which has been attributed to the iShares MSCI Japan Small-Cap ETF in respect of BFA’s financial year ending December 31, 2014, to its senior management was USD 3.0 thousand, and to members of its staff whose actions have a material impact on the risk profile of the Fund was USD 0.5 thousand.
The amount of the total remuneration awarded by BFA to its staff which has been attributed to the iShares MSCI Malaysia ETF in respect of BFA’s financial year ending December 31, 2014 was USD 90.5 thousand. This figure is comprised of fixed remuneration of USD 36.6 thousand and variable remuneration of USD 53.9 thousand. There were a total of 499 beneficiaries of the remuneration described above.
The amount of the aggregate remuneration awarded by BFA, which has been attributed to the iShares MSCI Malaysia ETF in respect of BFA’s financial year ending December 31, 2014, to its senior management was USD 12.5 thousand, and to members of its staff whose actions have a material impact on the risk profile of the Fund was USD 2.3 thousand.
The amount of the total remuneration awarded by BFA to its staff which has been attributed to the iShares MSCI Taiwan ETF in respect of BFA’s financial year ending December 31, 2014 was USD 558.5 thousand. This figure is comprised of fixed remuneration of USD 225.7 thousand and variable remuneration of USD 332.8 thousand. There were a total of 499 beneficiaries of the remuneration described above.
The amount of the aggregate remuneration awarded by BFA, which has been attributed to the iShares MSCI Taiwan ETF in respect of BFA’s financial year ending December 31, 2014, to its senior management was USD 77.3 thousand, and to members of its staff whose actions have a material impact on the risk profile of the Fund was USD 14.3 thousand.
The amount of the total remuneration awarded by BFA to its staff which has been attributed to the iShares MSCI Thailand Capped ETF in respect of BFA’s financial year ending December 31, 2014 was USD 80.5 thousand. This figure is comprised of fixed remuneration of USD 32.5 thousand and variable remuneration of USD 48.0 thousand. There were a total of 499 beneficiaries of the remuneration described above.
The amount of the aggregate remuneration awarded by BFA, which has been attributed to the iShares MSCI Thailand Capped ETF in respect of BFA’s financial year ending December 31, 2014, to its senior management was USD 11.1 thousand, and to members of its staff whose actions have a material impact on the risk profile of the Fund was USD 2.1 thousand.
| 100 | 2015 iSHARES ANNUAL REPORTTO SHAREHOLDERS |
Table of Contents
Director and Officer Information
iSHARES® , INC.
The Board of Directors has responsibility for the overall management and operations of the Company, including general supervision of the duties performed by BFA and other service providers. Each Director serves until he or she resigns, is removed, dies, retires or becomes incapacitated. Each officer shall hold office until his or her successor is elected and qualifies or until his or her death, or his or her resignation or removal. Directors who are not “interested persons” (as defined in the 1940 Act) of the Company are referred to as independent directors (“Independent Directors”).
The registered investment companies advised by BFA or its affiliates are organized into one complex of closed-end funds, two complexes of open-end funds and one complex of exchange-traded funds (“Exchange-Traded Fund Complex”) (each, a “BlackRock Fund Complex”). Each Fund is included in the BlackRock Fund Complex referred to as the Exchange-Traded Fund Complex. Each Director also serves as a Trustee of iShares Trust and a Trustee of iShares U.S. ETF Trust and, as a result, oversees a total of 319 funds (as of August 31, 2015) within the Exchange-Traded Fund Complex. With the exception of Robert S. Kapito and Mark Wiedman, the address of each Director and officer is c/o BlackRock, Inc., 400 Howard Street, San Francisco, CA 94105. The address of Mr. Kapito and Mr. Wiedman is c/o BlackRock, Inc., Park Avenue Plaza, 55 East 52nd Street, New York, NY 10055. The Board has designated Robert H. Silver as its Independent Chairman. Additional information about the Funds’ Directors and officers may be found in the Funds’ combined Statement of Additional Information, which is available without charge, upon request, by calling toll-free 1-800-iShares (1-800-474-2737).
Interested Directors
| Name (Age) | Position(s) | Principal Occupation(s) During the Past 5 Years | Other Directorships Held by Director | |||
Robert S. Kapitoa (58) | Director (since 2009). | President and Director, BlackRock, Inc. (since 2006); Vice Chairman of BlackRock, Inc. and Head of BlackRock, Inc.’s Portfolio Management Group (since its formation in 1998) and BlackRock, Inc.’s predecessor entities (since 1988); Trustee, University of Pennsylvania (since 2009); President of Board of Directors, Hope & Heroes Children’s Cancer Fund (since 2002); President of the Board of Directors, Periwinkle Theatre for Youth (since 1983). | Trustee of iShares Trust (since 2009); Trustee of iShares U.S. ETF Trust (since 2011); Director of BlackRock, Inc. (since 2006). | |||
Mark Wiedmanb (44) | Director (since 2013). | Managing Director, BlackRock, Inc. (since 2007); Global Head of iShares (since 2011); Head of Corporate Strategy, BlackRock, Inc. (2009-2011). | Trustee of iShares Trust (since 2013); Trustee of iShares U.S. ETF Trust (since 2013); Director of PennyMac Financial Services, Inc. (since 2008). | |||
| a | Robert S. Kapito is deemed to be an “interested person” (as defined in the 1940 Act) of the Company due to his affiliations with BlackRock, Inc. |
| b | Mark Wiedman is deemed to be an “interested person” (as defined in the 1940 Act) of the Company due to his affiliations with BlackRock, Inc. and its affiliates. |
DIRECTORAND OFFICER INFORMATION | 101 |
Table of Contents
Director and Officer Information (Continued)
iSHARES®, INC.
Independent Directors
| Name (Age) | Position(s) | Principal Occupation(s) During the Past 5 Years | Other Directorships Held by Director | |||
Robert H. Silver (60) | Director (since 2007); Independent Chairman (since 2012). | President and Co-Founder of The Bravitas Group, Inc. (since 2006); Director and Vice Chairman of the YMCA of Greater NYC (2001-2011); Broadway Producer (2006-2011); Co-Founder and Vice President of Parentgiving Inc. (since 2008); Director and Member of the Audit and Compensation Committee of EPAM Systems, Inc. (2006-2009); President and Chief Operating Officer of UBS Financial Services Inc. (formerly Paine Webber Inc.) (2003-2005) and various executive positions with UBS and its affiliates (1988-2005); CPA and Audit Manager of KPMG, LLP (formerly Peat Marwick Mitchell) (1977-1983). | Trustee of iShares Trust (since 2007); Trustee of iShares U.S. ETF Trust (since 2011); Independent Chairman of iShares Trust and iShares U.S. ETF Trust (since 2012). | |||
Jane D. Carlin (59) | Director (since 2015). | Managing Director and Global Head of Financial Holding Company Governance & Assurance and the Global Head of Operational Risk Management of Morgan Stanley (2006-2012). | Trustee of iShares Trust (since 2015); Trustee of iShares U.S. ETF Trust (since 2015); Director of PHH Corporation (mortgage solutions) (since 2012). | |||
Cecilia H. Herbert (66) | Director (since 2005); Nominating and Governance Committee Chair and Equity Plus Committee Chair (since 2012). | Director (1998-2013) and President (2007-2011) of the Board of Directors, Catholic Charities CYO; Trustee (2002-2011) and Chair of the Finance and Investment Committee (2006-2010) of the Thacher School; Member (since 1992) and Chair (1994-2005) of the Investment Committee, Archdiocese of San Francisco; Trustee and Member of the Investment Committee, WNET, the New York public broadcasting/media company (since 2011). | Trustee of iShares Trust (since 2005); Trustee of iShares U.S. ETF Trust (since 2011); Director of Forward Funds (34 portfolios) (since 2009). | |||
Charles A. Hurty (71) | Director (since 2005); Audit Committee Chair (since 2006). | Retired; Partner, KPMG LLP (1968-2001). | Trustee of iShares Trust (since 2005); Trustee of iShares U.S. ETF Trust (since 2011); Director of GMAM Absolute Return Strategy Fund (1 portfolio) (since 2002); Director of SkyBridge Alternative Investments Multi-Adviser Hedge Fund Portfolios LLC (2 portfolios) (since 2002). | |||
| 102 | 2015 iSHARES ANNUAL REPORTTO SHAREHOLDERS |
Table of Contents
Director and Officer Information (Continued)
iSHARES®, INC.
Independent Directors (Continued)
| Name (Age) | Position(s) | Principal Occupation(s) During the Past 5 Years | Other Directorships Held by Director | |||
John E. Kerrigan (60) | Director (since 2005); Fixed Income Plus Committee Chair (since 2012). | Chief Investment Officer, Santa Clara University (since 2002). | Trustee of iShares Trust (since 2005); Trustee of iShares U.S. ETF Trust (since 2011). | |||
John E. Martinez (54) | Director (since 2003); Securities Lending Committee Chair (since 2012). | Director of FirstREX Agreement Corp. (formerly EquityRock, Inc.) (since 2005). | Trustee of iShares Trust (since 2003); Trustee of iShares U.S. ETF Trust (since 2011). | |||
Madhav V. Rajan (51) | Director (since 2011); 15(c) Committee Chair (since 2012). | Robert K. Jaedicke Professor of Accounting and Senior Associate Dean for Academic Affairs and Head of MBA Program, Stanford University Graduate School of Business (since 2001); Professor of Law (by courtesy), Stanford Law School (since 2005); Visiting Professor, University of Chicago (2007-2008). | Trustee of iShares Trust (since 2011); Trustee of iShares U.S. ETF Trust (since 2011); Director, Cavium, Inc. (since 2013). | |||
DIRECTORAND OFFICER INFORMATION | 103 |
Table of Contents
Director and Officer Information (Continued)
iSHARES®, INC.
Officers
| Name (Age) | Position(s) | Principal Occupation(s) During the Past 5 Years | ||
Manish Mehta (44) | President (since 2013). | Managing Director, BlackRock, Inc. (since 2009); Chief Operating Officer for iShares (since 2009); Head of Strategy and Corporate Development, BGI (2005-2009); Chief of Staff to the CEO, BGI (2005-2009). | ||
Jack Gee (55) | Treasurer and Chief Financial Officer (since 2008). | Managing Director, BlackRock, Inc. (since 2009); Senior Director of Fund Administration of Intermediary Investor Business, BGI (2009); Director of Fund Administration of Intermediary Investor Business, BGI (2004-2009). | ||
Benjamin Archibald (40) | Secretary (since 2015). | Managing Director, BlackRock, Inc. (since 2014); Secretary of the BlackRock-advised Mutual Funds (since 2012); Director, BlackRock, Inc. (2010-2013). | ||
Charles Park (47) | Chief Compliance Officer (since 2006). | Chief Compliance Officer of BlackRock Advisors, LLC and the BlackRock-advised Funds in the Equity-Bond Complex, the Equity-Liquidity Complex and the Closed-End Complex (since 2014); Chief Compliance Officer, BFA (since 2006). | ||
Scott Radell (46) | Executive Vice President (since 2012). | Managing Director, BlackRock, Inc. (since 2009); Head of Portfolio Solutions, BlackRock, Inc. (since 2009); Head of Portfolio Solutions, BGI (2007-2009); Credit Portfolio Manager, BGI (2005-2007); Credit Research Analyst, BGI (2003-2005). | ||
Amy Schioldager (52) | Executive Vice President (since 2007). | Senior Managing Director, BlackRock, Inc. (since 2009); Global Head of Index Equity, BGI (2008-2009); Global Head of U.S. Indexing, BGI (2006-2008); Head of Domestic Equity Portfolio Management, BGI (2001-2006). | ||
| 104 | 2015 iSHARES ANNUAL REPORTTO SHAREHOLDERS |
Table of Contents
Notes:
NOTES | 105 |
Table of Contents
Notes:
| 106 | 2015 iSHARES ANNUAL REPORTTO SHAREHOLDERS |
Table of Contents
For more information visit www.iShares.com or call 1-800-474-2737
This report is intended for the Funds’ shareholders. It may not be distributed to prospective investors unless it is preceded or accompanied by the current prospectus.
Investing involves risk, including possible loss of principal.
The iShares Funds are distributed by BlackRock Investments, LLC (together with its affiliates, “BlackRock”).
The iShares Funds are not sponsored, endorsed, issued, sold or promoted by MSCI Inc., nor does this company make any representation regarding the advisability of investing in the iShares Funds. BlackRock is not affiliated with the company listed above.
A description of the policies that the Funds use to determine how to vote proxies relating to portfolio securities and information about how the Funds voted proxies relating to portfolio securities during the most recent twelve-month period ending June 30 is available without charge, upon request, by calling toll-free 1-800-474-2737; on the Funds’ website at www.iShares.com; and on the U.S. Securities and Exchange Commission (SEC) website at www.sec.gov.
The Funds file their complete schedules of portfolio holdings with the SEC for the first and third quarters of each fiscal year on Form N-Q. The Funds’ Forms N-Q are available on the SEC’s website or may be reviewed and copied at the SEC’s Public Reference Room in Washington, D.C. Information on the operation of the Public Reference Room may be obtained by calling 1-800-SEC-0330. The Funds also disclose their complete schedules of portfolio holdings on a daily basis on the Funds’ website.
Certain financial information required by regulations or listing exchange rules in jurisdictions outside the U.S. in which iShares Funds are cross-listed may be publicly filed in those jurisdictions. This information is available upon request by calling 1-800-474-2737.
©2015 BlackRock, Inc. All rights reserved. iSHARES and BLACKROCK are registered trademarks of BlackRock, Inc. or its subsidiaries. All other marks are the property of their respective owners.
iS-AR-83-0815
 |  |
Table of Contents
AUGUST 31, 2015
2015 ANNUAL REPORT
|  |
iShares, Inc.
| Ø | iShares MSCI Brazil Capped ETF | EWZ | NYSE Arca |
| Ø | iShares MSCI Chile Capped ETF | ECH | NYSE Arca |
| Ø | iShares MSCI Colombia Capped ETF | ICOL | NYSE Arca |
| Ø | iShares MSCI Israel Capped ETF | EIS | NYSE Arca |
| Ø | iShares MSCI Russia Capped ETF | ERUS | NYSE Arca |
| Ø | iShares MSCI South Africa ETF | EZA | NYSE Arca |
| Ø | iShares MSCI Turkey ETF | TUR | NYSE Arca |
| Ø | iShares MSCI USA Equal Weighted ETF | EUSA | NYSE Arca |
Table of Contents
| 5 | ||||
| 22 | ||||
| 22 | ||||
| 23 | ||||
| 23 | ||||
| 26 | ||||
| 28 | ||||
| 29 | ||||
| 31 | ||||
| 32 | ||||
| 34 | ||||
| 37 | ||||
| 47 | ||||
| 57 | ||||
| 65 | ||||
| 79 | ||||
| 80 | ||||
| 81 | ||||
| 94 | ||||
| 101 |
Table of Contents
Management’s Discussion of Fund Performance
iSHARES®, INC.
GLOBAL MARKET OVERVIEW
Global equity markets delivered a negative return for the 12 months ended August 31, 2015 (the “reporting period”). The MSCI ACWI, a broad global equity index that includes both developed and emerging markets, returned -6.29% for the reporting period.
The reporting period was characterized by a continued divergence in economic growth and central bank policy between the U.S. and the rest of the world. Despite a slowdown in early 2015, the U.S. economy remained one of the strongest economies among developed countries, which motivated the U.S. Federal Reserve Bank (the “Fed”) to scale back its economic stimulus measures. The Fed ended a two-year quantitative easing program in October 2014 and signaled its intent to raise its short-term interest rate target sometime in 2015. In contrast, weaker economic growth in most other regions of the globe led many of the world’s central banks to take more aggressive actions to stimulate economic activity.
This divergence contributed to a notably stronger U.S. dollar. For the reporting period, the euro, Japanese yen, British pound and Australian dollar declined by 15%, 14%, 7%, and 24% against the U.S. dollar, respectively. Weaker foreign currencies decrease the value of foreign investments measured in U.S. dollars, thereby decreasing returns for U.S. investors, while increasing foreign currencies relative to the U.S. dollar have the opposite effect. Currency performance had a meaningful impact on non-U.S. equity returns for U.S. investors. For example, the MSCI ACWI returned 0.59% in local currency terms for the reporting period.
A number of other factors influenced global markets during the reporting period. Energy prices fell sharply amid growing supply — primarily from increased production in the U.S. — and declining global demand. Lower energy prices contributed to historically low and declining inflation rates in most of the world. Consumer prices were nearly unchanged in the U.S., the European Union, and Japan, while prices in China and India rose at a relatively slow rate. Low inflation and tepid demand kept the Fed’s zero interest rate policy intact, while central banks throughout the world took aggressive measures to stimulate demand.
Global markets advanced for most of the reporting period, then declined sharply in the last few months of the reporting period. The volatility began in China, as slowing economic growth led to a steep drop in China’s equity markets. Plummeting commodity prices amid already subdued inflation also raised concerns about global demand. Currency devaluations in Asia, including China, Vietnam, Pakistan, and Kazakhstan, led to speculation that Asian countries were weakening their currencies to compete for demand. These global events led to further uncertainty about the timing of an expected interest rate hike from the Fed.
On a regional basis, U.S. stocks advanced by less than 1% for the reporting period as declining interest rates, ongoing economic growth, and low inflation provided a favorable environment for U.S. equity market performance. After generating its fastest quarterly growth rate in 11 years in the third quarter of 2014, the U.S. economy slowed over the next two quarters. Economic activity improved over the last several months of the reporting period, boosted by an increase in consumer spending.
European stocks declined by about 8% in U.S. dollar terms for the reporting period, though they advanced more than 3% when measured in local currencies. The European Central Bank initiated quantitative easing measures in early 2015, and signs of economic improvement emerged in the latter half of the reporting period. A tentative agreement on Greece’s debt repayment helped alleviate ongoing concerns about Europe’s sovereign debt levels.
Stock markets in the Asia/Pacific region (excluding Japan) declined by approximately 19% in U.S. dollar terms, which equated to an 8% decline when measured in local currencies. China’s economic slowdown weighed heavily on the region, as China is the largest trading partner of many countries in the region. On the bright side, Japanese stocks performed relatively well, as ongoing economic stimulus and reform measures led to a 4% gain in U.S. dollar terms (22% when measured in Japanese yen).
Emerging markets stocks fell by approximately 23% in U.S. dollar terms for the reporting period, though the decline was about 10% when measured in local currencies. Many of the largest emerging economies — including China, Russia, and Brazil — experienced slowing economic growth during the reporting period. Latin American stocks posted some of the biggest declines, as the region struggled with slow growth and declining commodity prices.
MANAGEMENT’S DISCUSSIONSOF FUND PERFORMANCE | 5 |
Table of Contents
Management’s Discussion of Fund Performance
iSHARES® MSCI BRAZIL CAPPED ETF
Performance as of August 31, 2015
| Average Annual Total Returns | Cumulative Total Returns | |||||||||||||||||||||||||
| NAV | MARKET | INDEX | NAV | MARKET | INDEX | |||||||||||||||||||||
1 Year | (52.49)% | (52.26)% | (52.28)% | (52.49)% | (52.26)% | (52.28)% | ||||||||||||||||||||
5 Years | (15.53)% | (15.36)% | (15.09)% | (57.00)% | (56.56)% | (55.86)% | ||||||||||||||||||||
10 Years | 1.90% | 1.96% | 2.60% | 20.67% | 21.45% | 29.27% | ||||||||||||||||||||
GROWTH OF $10,000 INVESTMENT (AT NET ASSET VALUE)
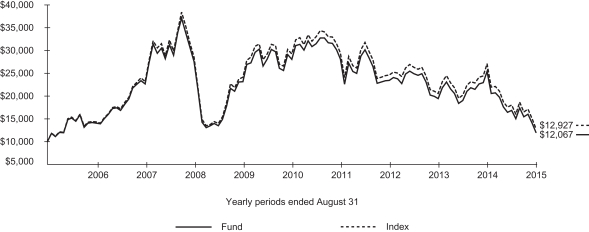
Index performance through February 11, 2013 reflects the performance of the MSCI Brazil Index. Index performance beginning on February 12, 2013 reflects the performance of the MSCI Brazil 25/50 Index.
Past performance is no guarantee of future results. Performance results do not reflect the deduction of taxes that a shareholder would pay on fund distributions or on the redemption or sale of fund shares. See “About Fund Performance” on page 22 for more information.
| Shareholder Expenses | ||||||||||||||||||||||||||
| Actual | Hypothetical 5% Return | |||||||||||||||||||||||||
| Beginning Account Value (3/1/15) | Ending Account Value (8/31/15) | Expenses Paid During Period a | Beginning Account Value (3/1/15) | Ending Account Value (8/31/15) | Expenses Paid During Period a | Annualized Expense Ratio | ||||||||||||||||||||
| $ | 1,000.00 | $ | 714.30 | $ | 2.68 | $ | 1,000.00 | $ | 1,022.10 | $ | 3.16 | 0.62% | ||||||||||||||
| a | Expenses are calculated using the Fund’s annualized expense ratio (as disclosed in the table), multiplied by the average account value for the period, multiplied by the number of days in the period (184 days) and divided by the number of days in the year (365 days). See “Shareholder Expenses” on page 22 for more information. |
| 6 | 2015 iSHARES ANNUAL REPORTTO SHAREHOLDERS |
Table of Contents
Management’s Discussion of Fund Performance (Continued)
iSHARES® MSCI BRAZIL CAPPED ETF
The iShares MSCI Brazil Capped ETF (the “Fund”) seeks to track the investment results of an index composed of Brazilian equities, as represented by the MSCI Brazil 25/50 Index (the “Index”). The Fund invests in a representative sample of securities included in the Index that collectively has an investment profile similar to the Index. Due to the use of representative sampling, the Fund may or may not hold all of the securities that are included in the Index. For the 12-month reporting period ended August 31, 2015, the total return for the Fund was -52.49%, net of fees, while the total return for the Index was -52.28%.
Brazilian equities, as represented by the Index, declined significantly for the reporting period in an environment of high volatility. The Brazilian real depreciated 38% relative to the U.S. dollar. As a result, returns on Brazilian investments were significantly lower when translated back into U.S. dollars. A slowdown in China’s economic growth and an unexpected devaluation of the Chinese currency late in the reporting period accelerated declines.
Brazil’s economy remained in recession throughout the reporting period, registering its fifth consecutive quarter of contraction in 2015’s second quarter. Manufacturing continued a long-term decline throughout the reporting period, and unemployment levels climbed. Falling commodity prices largely fueled the economic slowdown as oil prices fell precipitously and demand waned for steel and other metals. Prices for sugar and coffee beans, two key Brazilian exports, also declined. Economic cooling in China, Brazil’s largest export partner, affected Brazil’s economy as its demand for Brazilian exports weakened. The revelation of a decade-long corruption scandal surrounding Brazil’s state-owned oil company negatively impacted markets, unsettled the economy, and created political uncertainty.
Within the Index, all sectors experienced substantial declines in U.S. dollars, and their effect on the Index’s performance was largely a factor of weighting. The financials sector, the largest weighting at an average 33% of the Index during the reporting period, detracted the most from the Index’s return. The energy sector experienced the sharpest absolute decline and detracted substantially from the Index’s performance, reflecting lower oil prices and the oil company scandal. The materials sector also detracted meaningfully as commodities prices declined. The consumer staples and consumer discretionary sectors detracted, reflecting higher unemployment.
ALLOCATION BY SECTOR
As of 8/31/15
| Sector | Percentage of Total Investments* |
Financials | 31.10 | % | ||
Consumer Staples | 22.43 | |||
Energy | 10.83 | |||
Materials | 10.55 | |||
Consumer Discretionary | 5.86 | |||
Industrials | 5.64 | |||
Utilities | 5.36 | |||
Information Technology | 4.63 | |||
Telecommunication Services | 2.87 | |||
Health Care | 0.73 | |||
|
| |||
TOTAL | 100.00 | % | ||
|
|
TEN LARGEST FUND HOLDINGS
As of 8/31/15
| Security | Percentage of Total Investments* |
Ambev SA | 10.40 | % | ||
Itau Unibanco Holding SA (Preferred) | 9.36 | |||
Banco Bradesco SA (Preferred) | 6.66 | |||
BRF SA (Brazil) | 5.21 | |||
Petroleo Brasileiro SA (Preferred) | 4.19 | |||
Cielo SA (Brazil) | 4.05 | |||
Petroleo Brasileiro SA | 3.44 | |||
Ultrapar Participacoes SA | 2.87 | |||
Vale SA (Preferred) | 2.76 | |||
Itausa-Investimentos Itau SA (Preferred) | 2.71 | |||
|
| |||
TOTAL | 51.65 | % | ||
|
|
| * | Excludes money market funds. |
MANAGEMENT’S DISCUSSIONSOF FUND PERFORMANCE | 7 |
Table of Contents
Management’s Discussion of Fund Performance
iSHARES® MSCI CHILE CAPPED ETF
Performance as of August 31, 2015
| Average Annual Total Returns | Cumulative Total Returns | |||||||||||||||||||||||||
| NAV | MARKET | INDEX | NAV | MARKET | INDEX | |||||||||||||||||||||
1 Year | (18.85)% | (18.10)% | (18.72)% | (18.85)% | (18.10)% | (18.72)% | ||||||||||||||||||||
5 Years | (11.11)% | (11.06)% | (10.46)% | (44.50)% | (44.35)% | (42.45)% | ||||||||||||||||||||
Since Inception | (2.90)% | (2.82)% | (2.33)% | (20.52)% | (20.02)% | (16.82)% | ||||||||||||||||||||
GROWTH OF $10,000 INVESTMENT (SINCE INCEPTION AT NET ASSET VALUE)
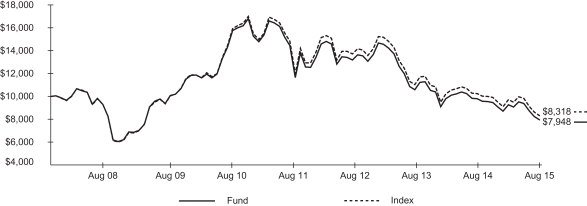
The inception date of the Fund was 11/12/07. The first day of secondary market trading was 11/16/07.
Index performance through February 11, 2013 reflects the performance of the MSCI Chile Investable Market Index. Index performance beginning on February 12, 2013 reflects the performance of the MSCI Chile Investable Market Index 25/50.
Past performance is no guarantee of future results. Performance results do not reflect the deduction of taxes that a shareholder would pay on fund distributions or on the redemption or sale of fund shares. See “About Fund Performance” on page 22 for more information.
| Shareholder Expenses | ||||||||||||||||||||||||||
| Actual | Hypothetical 5% Return | |||||||||||||||||||||||||
| Beginning Account Value (3/1/15) | Ending Account Value (8/31/15) | Expenses Paid During Period a | Beginning Account Value (3/1/15) | Ending Account Value (8/31/15) | Expenses Paid During Period a | Annualized Expense Ratio | ||||||||||||||||||||
| $ | 1,000.00 | $ | 857.40 | $ | 2.90 | $ | 1,000.00 | $ | 1,022.10 | $ | 3.16 | 0.62% | ||||||||||||||
| a | Expenses are calculated using the Fund’s annualized expense ratio (as disclosed in the table), multiplied by the average account value for the period, multiplied by the number of days in the period (184 days) and divided by the number of days in the year (365 days). See “Shareholder Expenses” on page 22 for more information. |
| 8 | 2015 iSHARES ANNUAL REPORTTO SHAREHOLDERS |
Table of Contents
Management’s Discussion of Fund Performance (Continued)
iSHARES® MSCI CHILE CAPPED ETF
The iShares MSCI Chile Capped ETF (the “Fund”) seeks to track the investment results of a broad-based index composed of Chilean equities, as represented by the MSCI Chile Investable Market Index 25/50 (the “Index”). The Fund invests in a representative sample of securities included in the Index that collectively has an investment profile similar to the Index. Due to the use of representative sampling, the Fund may or may not hold all of the securities that are included in the Index. For the 12-month reporting period ended August 31, 2015, the total return for the Fund was -18.85%, net of fees, while the total return for the Index was -18.72%.
Chilean equities, as represented by the Index, declined significantly for the reporting period in an environment of high volatility. A slowdown in China’s economic growth and an unexpected devaluation of the Chinese currency late in the reporting period accelerated declines. The Chilean peso depreciated 15% relative to the U.S. dollar, hitting a multi-year low in August 2015. As a result, returns on Chilean investments were lower when translated back into U.S. dollars.
As a major copper exporter, Chile’s economy was adversely affected by slowing demand from China and around the world. A brief upswing in copper prices in the first quarter of 2015 benefited economic activity temporarily, but prices then resumed their downward spiral, dragging down mining activity and economic growth. Following a healthy January, industrial production contracted for five of the six months through July 2015. For the second quarter of 2015, the mining sector grew slightly but slowed markedly from the first quarter’s advance. Copper production slowed from the first quarter to the second quarter. Economic growth was positive throughout the reporting period, but more muted than in previous years. In July 2015, the government reduced plans for an ambitious reform agenda, citing limited fiscal resources due to the economic slowdown.
In U.S. dollar terms, the industrials sector detracted substantially from the Index’s performance for the reporting period, reflecting the decline in industrial production. The utilities and financials sectors also detracted meaningfully from the Index’s return. Weakening consumer confidence levels were evidenced in the consumer discretionary and consumer staples sectors, which both detracted from the Index’s performance. The energy sector also declined, reflecting a global decline in oil prices.
ALLOCATION BY SECTOR
As of 8/31/15
| Sector | Percentage of Total Investments* |
Utilities | 31.51 | % | ||
Financials | 19.52 | |||
Consumer Staples | 12.80 | |||
Materials | 10.19 | |||
Energy | 8.59 | |||
Consumer Discretionary | 7.12 | |||
Industrials | 5.64 | |||
Telecommunication Services | 2.39 | |||
Information Technology | 1.77 | |||
Health Care | 0.47 | |||
|
| |||
TOTAL | 100.00 | % | ||
|
|
TEN LARGEST FUND HOLDINGS
As of 8/31/15
| Security | Percentage of Total Investments* |
Enersis SA | 10.62 | % | ||
Empresas COPEC SA | 8.59 | |||
Empresa Nacional de Electricidad SA/Chile | 7.82 | |||
Empresas CMPC SA | 6.47 | |||
Banco Santander Chile | 6.02 | |||
SACI Falabella | 5.78 | |||
Cencosud SA | 4.71 | |||
Colbun SA | 4.49 | |||
Banco de Chile | 4.14 | |||
LATAM Airlines Group SA | 3.55 | |||
|
| |||
TOTAL | 62.19 | % | ||
|
|
| * | Excludes money market funds. |
MANAGEMENT’S DISCUSSIONSOF FUND PERFORMANCE | 9 |
Table of Contents
Management’s Discussion of Fund Performance
iSHARES® MSCI COLOMBIA CAPPED ETF
Performance as of August 31, 2015
| Average Annual Total Returns | Cumulative Total Returns | |||||||||||||||||||||||||
| NAV | MARKET | INDEX | NAV | MARKET | INDEX | |||||||||||||||||||||
1 Year | (56.73)% | (56.66)% | (56.66)% | (56.73)% | (56.66)% | (56.66)% | ||||||||||||||||||||
Since Inception | (27.26)% | (27.02)% | (26.83)% | (50.45)% | (50.08)% | (49.70)% | ||||||||||||||||||||
GROWTH OF $10,000 INVESTMENT (SINCE INCEPTION AT NET ASSET VALUE)
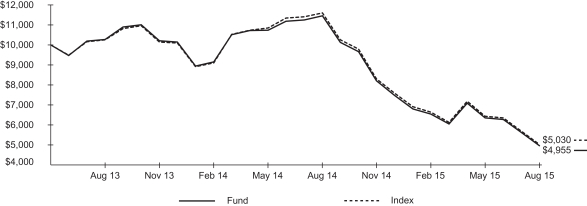
The inception date of the Fund was 6/18/13. The first day of secondary market trading was 6/20/13.
Past performance is no guarantee of future results. Performance results do not reflect the deduction of taxes that a shareholder would pay on fund distributions or on the redemption or sale of fund shares. See “About Fund Performance” on page 22 for more information.
| Shareholder Expenses | ||||||||||||||||||||||||||
| Actual | Hypothetical 5% Return | |||||||||||||||||||||||||
| Beginning Account Value (3/1/15) | Ending Account Value (8/31/15) | Expenses Paid During Period a | Beginning Account Value (3/1/15) | Ending Account Value (8/31/15) | Expenses Paid During Period a | Annualized Expense Ratio | ||||||||||||||||||||
| $ | 1,000.00 | $ | 756.20 | $ | 2.70 | $ | 1,000.00 | $ | 1,022.10 | $ | 3.11 | 0.61% | ||||||||||||||
| a | Expenses are calculated using the Fund’s annualized expense ratio (as disclosed in the table), multiplied by the average account value for the period, multiplied by the number of days in the period (184 days) and divided by the number of days in the year (365 days). See “Shareholder Expenses” on page 22 for more information. |
| 10 | 2015 iSHARES ANNUAL REPORTTO SHAREHOLDERS |
Table of Contents
Management’s Discussion of Fund Performance (Continued)
iSHARES® MSCI COLOMBIA CAPPED ETF
The iShares MSCI Colombia Capped ETF (the “Fund”) seeks to track the investment results of a broad-based index composed of Colombian equities, as represented by the MSCI All Colombia Capped Index (the “Index”). The Fund invests in a representative sample of securities included in the Index that collectively has an investment profile similar to the Index. Due to the use of representative sampling, the Fund may or may not hold all of the securities that are included in the Index. For the 12-month reporting period ended August 31, 2015, the total return for the Fund was -56.73%, net of fees, while the total return for the Index was -56.66%.
Colombian equities, as represented by the Index, declined significantly for the reporting period in an environment of high volatility. A slowdown in China’s economic growth and an unexpected devaluation of the Chinese currency late in the reporting period accelerated equity market declines. The Colombian peso depreciated 38% relative to the U.S. dollar for the reporting period. As a result, returns on Colombian investments were lower when translated back into U.S. dollars.
During the reporting period, Colombia’s economy was severely affected by the sharp decline in the price of oil, Colombia’s leading export. Falling oil prices sparked a sharp decline in exports, which shrank significantly from September 2014 to July 2015. The reduction in the flow of capital to the country, in turn, caused Colombia’s current account deficit to widen to historically high levels in the first quarter of 2015. That level, in turn, depressed the value of the peso, which depreciated severely, making borrowing costs more expensive. The depreciating peso also caused a spike in the price of imported goods, triggering a rise in inflation, even as growth levels for the country slowed. Economic growth declined in the reporting period, dipping in the first quarter of 2015 (the most recent period for which data is available) to its slowest pace since the fourth quarter of 2012. In an effort to keep inflation from rising further, Colombia’s central bank kept interest rates unchanged throughout the reporting period.
ALLOCATION BY SECTOR
As of 8/31/15
| Sector | Percentage of Total Investments* |
Financials | 39.35 | % | ||
Utilities | 16.08 | |||
Materials | 15.95 | |||
Energy | 15.55 | |||
Consumer Staples | 8.57 | |||
Industrials | 4.50 | |||
|
| |||
TOTAL | 100.00 | % | ||
|
|
TEN LARGEST FUND HOLDINGS
As of 8/31/15
| Security | Percentage of Total Investments* |
Bancolombia SA (Preferred) | 12.15 | % | ||
Grupo de Inversiones Suramericana SA | 8.54 | |||
Ecopetrol SA | 8.08 | |||
Pacific Exploration and Production Corp. | 4.90 | |||
Bancolombia SA | 4.68 | |||
Grupo Nutresa SA | 4.54 | |||
Grupo Argos SA/Colombia | 4.51 | |||
Empresa de Energia de Bogota SA ESP | 4.49 | |||
Banco Davivienda SA (Preferred) | 4.44 | |||
Isagen SA ESP | 4.43 | |||
|
| |||
TOTAL | 60.76 | % | ||
|
|
| * | Excludes money market funds. |
MANAGEMENT’S DISCUSSIONSOF FUND PERFORMANCE | 11 |
Table of Contents
Management’s Discussion of Fund Performance
iSHARES® MSCI ISRAEL CAPPED ETF
Performance as of August 31, 2015
| Average Annual Total Returns | Cumulative Total Returns | |||||||||||||||||||||||||
| NAV | MARKET | INDEX | NAV | MARKET | INDEX | |||||||||||||||||||||
1 Year | 1.80% | 1.13% | 2.37% | 1.80% | 1.13% | 2.37% | ||||||||||||||||||||
5 Years | 2.95% | 2.89% | 3.17% | 15.67% | 15.33% | 16.90% | ||||||||||||||||||||
Since Inception | 2.55% | 2.50% | 3.02% | 20.55% | 20.18% | 24.72% | ||||||||||||||||||||
GROWTH OF $10,000 INVESTMENT (SINCE INCEPTION AT NET ASSET VALUE)

The inception date of the Fund was 3/26/08. The first day of secondary market trading was 3/28/08.
Past performance is no guarantee of future results. Performance results do not reflect the deduction of taxes that a shareholder would pay on fund distributions or on the redemption or sale of fund shares. See “About Fund Performance” on page 22 for more information.
| Shareholder Expenses | ||||||||||||||||||||||||||
| Actual | Hypothetical 5% Return | |||||||||||||||||||||||||
| Beginning Account Value (3/1/15) | Ending Account Value (8/31/15) | Expenses Paid During Period a | Beginning Account Value (3/1/15) | Ending Account Value (8/31/15) | Expenses Paid During Period a | Annualized Expense Ratio | ||||||||||||||||||||
| $ | 1,000.00 | $ | 1,074.80 | $ | 3.24 | $ | 1,000.00 | $ | 1,022.10 | $ | 3.16 | 0.62% | ||||||||||||||
| a | Expenses are calculated using the Fund’s annualized expense ratio (as disclosed in the table), multiplied by the average account value for the period, multiplied by the number of days in the period (184 days) and divided by the number of days in the year (365 days). See “Shareholder Expenses” on page 22 for more information. |
| 12 | 2015 iSHARES ANNUAL REPORTTO SHAREHOLDERS |
Table of Contents
Management’s Discussion of Fund Performance (Continued)
iSHARES® MSCI ISRAEL CAPPED ETF
The iShares MSCI Israel Capped ETF (the “Fund”) seeks to track the investment results of a broad-based index composed of Israeli equities, as represented by the MSCI Israel Capped Investable Market Index (the “Index”). The Fund invests in a representative sample of securities included in the Index that collectively has an investment profile similar to the Index. Due to the use of representative sampling, the Fund may or may not hold all of the securities that are included in the Index. For the 12-month reporting period ended August 31, 2015, the total return for the Fund was 1.80%, net of fees, while the total return for the Index was 2.37%.
Israeli equities, as represented by the Index, achieved a moderately positive return for the reporting period, outperforming most international equity indexes. A slowdown in China’s economic growth and an unexpected devaluation of the Chinese currency late in the reporting period created market volatility and trimmed Index gains. The Israeli shekel depreciated 9% relative to the U.S. dollar. As a result, returns on Israeli investments were lower when translated back into U.S. dollars.
The reporting period opened shortly after a cease-fire was reached in the Israel-Gaza conflict of 2014. Economic conditions early in the reporting period reflected the impact of the conflict: Tourism levels, in particular, suffered, and economic growth for the third quarter of 2014 was tepid. Economic conditions subsequently improved for much of the reporting period. The economy expanded in fourth-quarter 2014 and first-quarter 2015 as exports climbed and tourism improved. Late in the reporting period, however, economic growth slowed as exports contracted. In response, the government announced cuts to corporate taxes and the value added tax to support domestic demand and reinvigorate the economy.
In U.S. dollar terms, the healthcare sector contributed significantly to the Index’s return for the reporting period, largely due to innovation and merger activity in the pharmaceuticals industry. The information technology sector also contributed meaningfully to the Index’s performance. Financing deals among high-technology companies accelerated during 2015’s first half.
The financials sector declined modestly, but, because it represented an average 36% of the Index, it detracted meaningfully from the Index’s return for the reporting period. The materials and energy sectors also detracted, reflecting lower commodity prices.
ALLOCATION BY SECTOR
As of 8/31/15
| Sector | Percentage of Total Investments* |
Financials | 38.27 | % | ||
Health Care | 24.73 | |||
Materials | 8.84 | |||
Information Technology | 8.57 | |||
Telecommunication Services | 6.41 | |||
Industrials | 4.36 | |||
Energy | 4.18 | |||
Consumer Staples | 2.93 | |||
Consumer Discretionary | 1.26 | |||
Utilities | 0.45 | |||
|
| |||
TOTAL | 100.00 | % | ||
|
|
TEN LARGEST FUND HOLDINGS
As of 8/31/15
| Security | Percentage of Total Investments* |
Teva Pharmaceutical Industries Ltd. | 24.73 | % | ||
Bank Hapoalim BM | 8.92 | |||
Bank Leumi le-Israel BM | 8.54 | |||
NICE-Systems Ltd. | 5.00 | |||
Israel Chemicals Ltd. | 4.81 | |||
Bezeq The Israeli Telecommunication Corp. Ltd. | 4.75 | |||
Israel Discount Bank Ltd. Class A | 3.29 | |||
Elbit Systems Ltd. | 3.07 | |||
Mizrahi Tefahot Bank Ltd. | 2.72 | |||
Frutarom Industries Ltd. | 2.46 | |||
|
| |||
TOTAL | 68.29 | % | ||
|
|
| * | Excludes money market funds. |
MANAGEMENT’S DISCUSSIONSOF FUND PERFORMANCE | 13 |
Table of Contents
Management’s Discussion of Fund Performance
iSHARES® MSCI RUSSIA CAPPED ETF
Performance as of August 31, 2015
| Average Annual Total Returns | Cumulative Total Returns | |||||||||||||||||||||||||
| NAV | MARKET | INDEX | NAV | MARKET | INDEX | |||||||||||||||||||||
1 Year | (27.57)% | (24.79)% | (27.19)% | (27.57)% | (24.79)% | (27.19)% | ||||||||||||||||||||
Since Inception | (10.99)% | (10.31)% | (10.53)% | (42.90)% | (40.76)% | (41.43)% | ||||||||||||||||||||
GROWTH OF $10,000 INVESTMENT (SINCE INCEPTION AT NET ASSET VALUE)
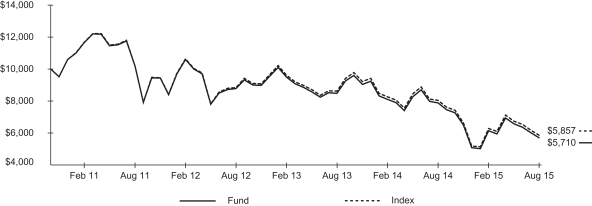
The inception date of the Fund was 11/9/10. The first day of secondary market trading was 11/10/10.
Past performance is no guarantee of future results. Performance results do not reflect the deduction of taxes that a shareholder would pay on fund distributions or on the redemption or sale of fund shares. See “About Fund Performance” on page 22 for more information.
| Shareholder Expenses | ||||||||||||||||||||||||||
| Actual | Hypothetical 5% Return | |||||||||||||||||||||||||
| Beginning Account Value (3/1/15) | Ending Account Value (8/31/15) | Expenses Paid During Period a | Beginning Account Value (3/1/15) | Ending Account Value (8/31/15) | Expenses Paid During Period a | Annualized Expense Ratio | ||||||||||||||||||||
| $ | 1,000.00 | $ | 930.40 | $ | 3.02 | $ | 1,000.00 | $ | 1,022.10 | $ | 3.16 | 0.62% | ||||||||||||||
| a | Expenses are calculated using the Fund’s annualized expense ratio (as disclosed in the table), multiplied by the average account value for the period, multiplied by the number of days in the period (184 days) and divided by the number of days in the year (365 days). See “Shareholder Expenses” on page 22 for more information. |
| 14 | 2015 iSHARES ANNUAL REPORTTO SHAREHOLDERS |
Table of Contents
Management’s Discussion of Fund Performance (Continued)
iSHARES® MSCI RUSSIA CAPPED ETF
The iShares MSCI Russia Capped ETF (the “Fund”) seeks to track the investment results of an index composed of Russian equities, as represented by the MSCI Russia 25/50 Index (the “Index”). The Fund invests in a representative sample of securities included in the Index that collectively has an investment profile similar to the Index. Due to the use of representative sampling, the Fund may or may not hold all of the securities that are included in the Index. For the 12-month reporting period ended August 31, 2015, the total return for the Fund was -27.57%, net of fees, while the total return for the Index was -27.19%.
Russian equities, as represented by the Index, declined sharply for the reporting period in an environment of high volatility. The Russian ruble depreciated 43% relative to the U.S. dollar. As a result, returns on Russian investments were significantly lower when translated back into U.S. dollars.
Russia’s economy sank into recession during the reporting period after contracting in the first and second quarters of 2015. Because Russia relies on oil, petroleum products, and natural gas for more than 60% of its exports, its economy was severely affected by the precipitous drop in the price of oil during the reporting period. Industrial production contracted for a seventh consecutive month in August 2015 versus a year earlier, falling to its lowest level since 2009. In June 2015, ongoing conflict in Ukraine led the European Council to extend economic sanctions against Russia until January 2016.
In U.S. dollar terms, the energy sector, which accounted for an average 53% of the Index during the reporting period, was the most significant sector detractor from the Index’s return as the price of oil collapsed. The telecommunication services sector endured a severe absolute decline and also detracted substantially from the Index’s performance. Worldwide telecommunications spending declined as the U.S. dollar appreciated against most currencies during the reporting period. The financials sector detracted meaningfully from the Index’s return, reflecting weakness in the banking sector. The slowing Russian economy also fueled declines in the utilities sector for the reporting period.
ALLOCATION BY SECTOR
As of 8/31/15
| Sector | Percentage of Total Investments* |
Energy | 52.96 | % | ||
Materials | 14.39 | |||
Financials | 14.27 | |||
Telecommunication Services | 8.86 | |||
Consumer Staples | 7.64 | |||
Utilities | 1.88 | |||
|
| |||
TOTAL | 100.00 | % | ||
|
|
TEN LARGEST FUND HOLDINGS
As of 8/31/15
| Security | Percentage of Total Investments* |
Gazprom PAO | 8.90 | % | ||
Gazprom PAO ADR | 8.80 | |||
Magnit PJSC GDR | 7.64 | |||
Lukoil PJSC | 6.26 | |||
Lukoil PJSC ADR (London) | 6.19 | |||
Sberbank of Russia | 5.29 | |||
Tatneft OAO Class S | 4.73 | |||
NOVATEK OAO GDR | 4.69 | |||
AK Transneft OAO (Preferred) | 4.58 | |||
MMC Norilsk Nickel PJSC | 4.45 | |||
|
| |||
TOTAL | 61.53 | % | ||
|
|
| * | Excludes money market funds. |
MANAGEMENT’S DISCUSSIONSOF FUND PERFORMANCE | 15 |
Table of Contents
Management’s Discussion of Fund Performance
iSHARES® MSCI SOUTH AFRICA ETF
Performance as of August 31, 2015
| Average Annual Total Returns | Cumulative Total Returns | |||||||||||||||||||||||||
| NAV | MARKET | INDEX | NAV | MARKET | INDEX | |||||||||||||||||||||
1 Year | (17.07)% | (16.79)% | (16.52)% | (17.07)% | (16.79)% | (16.52)% | ||||||||||||||||||||
5 Years | 2.40% | 2.52% | 3.05% | 12.58% | 13.26% | 16.22% | ||||||||||||||||||||
10 Years | 6.46% | 6.26% | 7.37% | 87.06% | 83.50% | 103.64% | ||||||||||||||||||||
GROWTH OF $10,000 INVESTMENT ( AT NET ASSET VALUE)
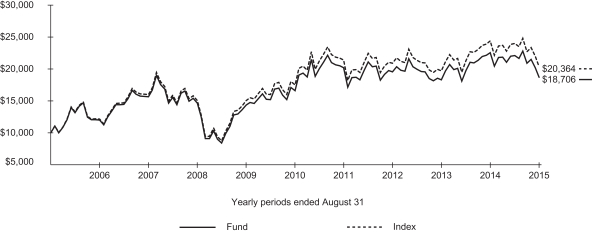
Past performance is no guarantee of future results. Performance results do not reflect the deduction of taxes that a shareholder would pay on fund distributions or on the redemption or sale of fund shares. See “About Fund Performance” on page 22 for more information.
| Shareholder Expenses | ||||||||||||||||||||||||||
| Actual | Hypothetical 5% Return | |||||||||||||||||||||||||
| Beginning Account Value (3/1/15) | Ending Account Value (8/31/15) | Expenses Paid During Period a | Beginning Account Value (3/1/15) | Ending Account Value (8/31/15) | Expenses Paid During Period a | Annualized Expense Ratio | ||||||||||||||||||||
| $ | 1,000.00 | $ | 845.70 | $ | 2.88 | $ | 1,000.00 | $ | 1,022.10 | $ | 3.16 | 0.62% | ||||||||||||||
| a | Expenses are calculated using the Fund’s annualized expense ratio (as disclosed in the table), multiplied by the average account value for the period, multiplied by the number of days in the period (184 days) and divided by the number of days in the year (365 days). See “Shareholder Expenses” on page 22 for more information. |
| 16 | 2015 iSHARES ANNUAL REPORTTO SHAREHOLDERS |
Table of Contents
Management’s Discussion of Fund Performance (Continued)
iSHARES® MSCI SOUTH AFRICA ETF
The iShares MSCI South Africa ETF (the “Fund”) seeks to track the investment results of an index composed of South African equities, as represented by the MSCI South Africa Index (the “Index”). The Fund invests in a representative sample of securities included in the Index that collectively has an investment profile similar to the Index. Due to the use of representative sampling, the Fund may or may not hold all of the securities that are included in the Index. For the 12-month reporting period ended August 31, 2015, the total return for the Fund was -17.07%, net of fees, while the total return for the Index was -16.52%.
South African equities, as represented by the Index, declined for the reporting period in an environment of high volatility. The South African rand depreciated 20% relative to the U.S. dollar. As a result, returns on South African investments were lower when translated back into U.S. dollars. A slowdown in China’s economic growth and an unexpected devaluation of the Chinese currency late in the reporting period accelerated declines.
South Africa’s economy grew at the slowest rate since 2009’s recession in the second quarter of 2015. Unemployment remained high throughout the reporting period as ongoing power shortages caused by the country’s major state-owned power company hindered manufacturing activity. Tourism, which had been a bright spot for the economy, weakened as new visa regulations made entry to the country more difficult. The possibility of labor strikes in the mining sector created another area of concern for the economy: Following five months of platinum mine strikes in the previous reporting period, potential strikes among gold and coal mines threatened to disrupt mining activity yet again.
In U.S. dollar terms, sector performance was generally negative for the reporting period. Reflecting the hurdles facing the South African economy, the energy and materials sectors both experienced substantial absolute declines and detracted meaningfully from the Index’s return. The telecommunication services sector registered a significant decline and also detracted from the Index’s performance. The financials sector declined modestly, but, as the largest sector at an average 29% of the Index, its negative impact on the Index’s return was meaningful.
ALLOCATION BY SECTOR
As of 8/31/15
| Sector | Percentage of Total Investments* |
Financials | 31.47 | % | ||
Consumer Discretionary | 30.77 | |||
Telecommunication Services | 9.83 | |||
Energy | 6.65 | |||
Health Care | 6.61 | |||
Materials | 5.75 | |||
Consumer Staples | 5.65 | |||
Industrials | 3.27 | |||
|
| |||
TOTAL | 100.00 | % | ||
|
|
TEN LARGEST FUND HOLDINGS
As of 8/31/15
| Security | Percentage of Total Investments* |
Naspers Ltd. Class N | 18.60 | % | ||
MTN Group Ltd. | 7.99 | |||
Sasol Ltd. | 6.39 | |||
Steinhoff International Holdings Ltd. | 4.97 | |||
FirstRand Ltd. | 4.84 | |||
Standard Bank Group Ltd. | 4.82 | |||
Remgro Ltd. | 3.31 | |||
Aspen Pharmacare Holdings Ltd. | 3.19 | |||
Sanlam Ltd. | 3.00 | |||
Bidvest Group Ltd. (The) | 2.76 | |||
|
| |||
TOTAL | 59.87 | % | ||
|
|
| * | Excludes money market funds. |
MANAGEMENT’S DISCUSSIONSOF FUND PERFORMANCE | 17 |
Table of Contents
Management’s Discussion of Fund Performance
iSHARES® MSCI TURKEY ETF
Performance as of August 31, 2015
| Average Annual Total Returns | Cumulative Total Returns | |||||||||||||||||||||||||
| NAV | MARKET | INDEX | NAV | MARKET | INDEX | |||||||||||||||||||||
1 Year | (29.69)% | (29.39)% | (29.51)% | (29.69)% | (29.39)% | (29.51)% | ||||||||||||||||||||
5 Years | (6.94)% | (6.86)% | (6.50)% | (30.21)% | (29.90)% | (28.52)% | ||||||||||||||||||||
Since Inception | (1.56)% | (1.56)% | (1.16)% | (11.01)% | (11.04)% | (8.32)% | ||||||||||||||||||||
GROWTH OF $10,000 INVESTMENT (SINCE INCEPTION AT NET ASSET VALUE)
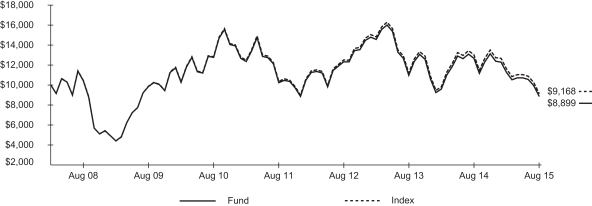
The inception date of the Fund was 3/26/08. The first day of secondary market trading was 3/28/08.
Past performance is no guarantee of future results. Performance results do not reflect the deduction of taxes that a shareholder would pay on fund distributions or on the redemption or sale of fund shares. See “About Fund Performance” on page 22 for more information.
| Shareholder Expenses | ||||||||||||||||||||||||||
| Actual | Hypothetical 5% Return | |||||||||||||||||||||||||
| Beginning Account Value (3/1/15) | Ending Account Value (8/31/15) | Expenses Paid During Period a | Beginning Account Value (3/1/15) | Ending Account Value (8/31/15) | Expenses Paid During Period a | Annualized Expense Ratio | ||||||||||||||||||||
| $ | 1,000.00 | $ | 790.10 | $ | 2.80 | $ | 1,000.00 | $ | 1,022.10 | $ | 3.16 | 0.62% | ||||||||||||||
| a | Expenses are calculated using the Fund’s annualized expense ratio (as disclosed in the table), multiplied by the average account value for the period, multiplied by the number of days in the period (184 days) and divided by the number of days in the year (365 days). See “Shareholder Expenses” on page 22 for more information. |
| 18 | 2015 iSHARES ANNUAL REPORTTO SHAREHOLDERS |
Table of Contents
Management’s Discussion of Fund Performance (Continued)
iSHARES® MSCI TURKEY ETF
The iShares MSCI Turkey ETF (the “Fund”) seeks to track the investment results of a broad-based index composed of Turkish equities, as represented by the MSCI Turkey Investable Market Index (the “Index”). The Fund invests in a representative sample of securities included in the Index that collectively has an investment profile similar to the Index. Due to the use of representative sampling, the Fund may or may not hold all of the securities that are included in the Index. For the 12-month reporting period ended August 31, 2015, the total return for the Fund was -29.69%, net of fees, while the total return for the Index was -29.51%.
Turkish equities, as represented by the Index, declined sharply for the reporting period in an environment of high volatility. The Turkish lira depreciated 26% relative to the U.S. dollar. As a result, returns on Turkish investments were significantly lower when translated back into U.S. dollars. A slowdown in China’s economic growth and an unexpected devaluation of the Chinese currency late in the reporting period accelerated declines.
The Turkish economy lost ground for much of the reporting period. Driving down economic activity, export demand from Europe, Russia, and the Middle East declined amid a fall in commodity prices and a rise in the U.S. dollar. Civil unrest in neighboring countries also weighed on the country’s economy. In July 2015, President Recep Tayyip Erdogan estimated the cost of hosting Syrian and Iraqi refugees at $6 billion. Uncertainty regarding political leadership added to economic weakness: Elections in early June failed to provide a clear majority, sending the lira to record lows against the U.S. dollar and consumer confidence to its weakest level since 2009. The country also remained mired in a corruption scandal alleging financial crimes, including a gold-for-oil exchange with Iran.
Within the Index, sector performance was largely negative in U.S. dollar terms. The financials sector, the largest weighting at an average of 46% of the Index, was the most significant detractor from the Index’s return. The consumer staples sector detracted meaningfully, reflecting the downturn in consumer confidence. The industrials and materials sectors also detracted as economic activity cooled and commodity prices collapsed. Conversely, the energy and healthcare sectors contributed slightly to the Index’s performance for the reporting period.
ALLOCATION BY SECTOR
As of 8/31/15
| Sector | Percentage of Total Investments* |
Financials | 42.83 | % | ||
Industrials | 14.91 | |||
Consumer Staples | 13.22 | |||
Materials | 8.21 | |||
Telecommunication Services | 7.82 | |||
Consumer Discretionary | 6.46 | |||
Energy | 5.87 | |||
Utilities | 0.50 | |||
Health Care | 0.18 | |||
|
| |||
TOTAL | 100.00 | % | ||
|
|
TEN LARGEST FUND HOLDINGS
As of 8/31/15
| Security | Percentage of Total Investments* |
Turkiye Garanti Bankasi AS | 10.39 | % | ||
Akbank TAS | 9.15 | |||
BIM Birlesik Magazalar AS | 6.54 | |||
Turkcell Iletisim Hizmetleri AS | 6.12 | |||
Tupras Turkiye Petrol Rafinerileri AS | 5.73 | |||
Haci Omer Sabanci Holding AS | 4.87 | |||
Turkiye Is Bankasi Class C | 4.68 | |||
KOC Holding AS | 4.39 | |||
Turkiye Halk Bankasi AS | 4.25 | |||
Eregli Demir ve Celik Fabrikalari TAS | 3.38 | |||
|
| |||
TOTAL | 59.50 | % | ||
|
|
| * | Excludes money market funds. |
MANAGEMENT’S DISCUSSIONSOF FUND PERFORMANCE | 19 |
Table of Contents
Management’s Discussion of Fund Performance
iSHARES® MSCI USA EQUAL WEIGHTED ETF
Performance as of August 31, 2015
| Average Annual Total Returns | Cumulative Total Returns | |||||||||||||||||||||||||||||||||
| NAV | MARKET | INDEX 1 | INDEX 2 | NAV | MARKET | INDEX 1 | INDEX 2 | |||||||||||||||||||||||||||
1 Year | 0.48% | 0.46% | 0.53% | (0.49)% | 0.48% | 0.46% | 0.53% | (0.49)% | ||||||||||||||||||||||||||
5 Years | 15.82% | 15.83% | 16.01% | 16.70% | 108.41% | 108.46% | 110.12% | 116.48% | ||||||||||||||||||||||||||
Since Inception | 12.68% | 12.68% | 12.87% | 13.44% | 88.89% | 88.84% | 90.46% | 97.66% | ||||||||||||||||||||||||||
| 1 | MSCI USA Index |
| 2 | MSCI USA Equal Weighted Index |
GROWTH OF $10,000 INVESTMENT (SINCE INCEPTION AT NET ASSET VALUE)
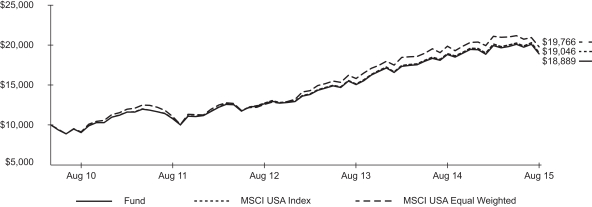
The inception date of the Fund was 5/5/10. The first day of secondary market trading was 5/7/10.
Effective September 1, 2015, the Fund changed its investment objective to track a new underlying index, the MSCI USA Equal Weighted Index. Index performance through August 31, 2015 reflects the performance of the former underlying index, the MSCI USA Index.
Past performance is no guarantee of future results. Performance results do not reflect the deduction of taxes that a shareholder would pay on fund distributions or on the redemption or sale of fund shares. See “About Fund Performance” on page 22 for more information.
| Shareholder Expenses | ||||||||||||||||||||||||||
| Actual | Hypothetical 5% Return | |||||||||||||||||||||||||
| Beginning Account Value (3/1/15) | Ending Account Value (8/31/15) | Expenses Paid During Period a | Beginning Account Value (3/1/15) | Ending Account Value (8/31/15) | Expenses Paid During Period a | Annualized Expense Ratio | ||||||||||||||||||||
| $ | 1,000.00 | $ | 947.40 | $ | 0.74 | $ | 1,000.00 | $ | 1,024.40 | $ | 0.77 | 0.15% | ||||||||||||||
| a | Expenses are calculated using the Fund’s annualized expense ratio (as disclosed in the table), multiplied by the average account value for the period, multiplied by the number of days in the period (184 days) and divided by the number of days in the year (365 days). See “Shareholder Expenses” on page 22 for more information. |
| 20 | 2015 iSHARES ANNUAL REPORTTO SHAREHOLDERS |
Table of Contents
Management’s Discussion of Fund Performance (Continued)
iSHARES® MSCI USA EQUAL WEIGHTED ETF
The iShares MSCI USA Equal Weighted ETF (the “Fund”) (formerly known as the iShares MSCI USA ETF prior to September 1, 2015) seeks to track the investment results of an index composed of equal weighted U.S. equities, as represented by the MSCI USA Equal Weighted Index (the “Index”). The Fund invests in a representative sample of securities included in the Index that collectively has an investment profile similar to the Index. Due to the use of representative sampling, the Fund may or may not hold all of the securities that are included in the Index. For the 12-month reporting period ended August 31, 2015, the total return for the Fund was 0.48%, net of fees, while the total return for the Index was 0.53%.*
| * | Effective September 1, 2015, the Fund changed its investment objective to track a new underlying index, the MSCI USA Equal Weighted Index. Index performance through August 31, 2015 reflects the performance of the former underlying index, the MSCI USA Index. |
U.S. stocks, as represented by the Index, delivered slightly positive results for the reporting period, outperforming broad global indexes in a volatile market environment. A slowdown in China’s economic growth and an unexpected devaluation of the Chinese currency late in the reporting period created volatility and trimmed the Index’s gains.
The U.S. economy was one of the strongest global economies during the reporting period, as evidenced by improving data for housing, unemployment, and consumer spending. Unlike most international economies, whose central banks were easing monetary policies in an effort to bolster economic activity, the U.S. Federal Reserve began to taper its easing measures. The opposing monetary postures triggered an increase in the U.S. dollar, which appreciated solidly against most major currencies. Countering the positive economic data, sinking oil prices negatively affected energy producers, while slowing demand from China and the strengthening U.S. dollar hampered manufacturing output. Late in the reporting period, a plunge in China’s stock market and concerns regarding collapsing oil prices reverberated through global markets, including the U.S.
Within the Index, sector performance was mixed. The healthcare sector was a meaningful contributor to the Index’s return, reflecting the strong pace of innovation and acquisitions in the sector. The consumer discretionary and consumer staples sectors both contributed to the Index’s performance as improving unemployment data led to increased consumer spending. On the other side of the performance spectrum, the energy sector experienced significant absolute declines and detracted substantially from the Index’s return as oil prices dropped sharply in the reporting period.
ALLOCATION BY SECTOR
As of 8/31/15
| Sector | Percentage of Total Investments* |
Financials | 18.92 | % | ||
Consumer Discretionary | 16.55 | |||
Information Technology | 15.02 | |||
Industrials | 11.97 | |||
Health Care | 11.08 | |||
Energy | 8.47 | |||
Consumer Staples | 6.56 | |||
Materials | 5.44 | |||
Utilities | 4.73 | |||
Telecommunication Services | 1.26 | |||
|
| |||
TOTAL | 100.00 | % | ||
|
|
TEN LARGEST FUND HOLDINGS
As of 8/31/15
| Security | Percentage of Total Investments* |
Cameron International Corp. | 0.24 | % | ||
Whiting Petroleum Corp. | 0.20 | |||
Chesapeake Energy Corp. | 0.19 | |||
Freeport-McMoRan Inc. | 0.19 | |||
Weatherford International PLC | 0.19 | |||
Nabors Industries Ltd. | 0.19 | |||
CONSOL Energy Inc. | 0.19 | |||
Marathon Oil Corp. | 0.18 | |||
Continental Resources Inc./OK | 0.18 | |||
FMC Technologies Inc. | 0.18 | |||
|
| |||
TOTAL | 1.93 | % | ||
|
|
| * | Excludes money market funds. |
MANAGEMENT’S DISCUSSIONSOF FUND PERFORMANCE | 21 |
Table of Contents
Past performance is no guarantee of future results. Current performance may be lower or higher than the performance data quoted. Performance data current to the most recent month-end is available at www.ishares.com. Performance results assume reinvestment of all dividends and capital gain distributions and do not reflect the deduction of taxes that a shareholder would pay on fund distributions or on the redemption or sale of fund shares. The investment return and principal value of shares will vary with changes in market conditions. Shares may be worth more or less than their original cost when they are redeemed or sold in the market. Performance for certain funds may reflect a waiver of a portion of investment advisory fees. Without such a waiver, performance would have been lower.
Net asset value or “NAV” is the value of one share of a fund as calculated in accordance with the standard formula for valuing mutual fund shares. The price used to calculate market return (“Market Price”) is determined by using the midpoint between the highest bid and the lowest offer on the primary stock exchange on which shares of a fund are listed for trading, as of the time that such fund’s NAV is calculated. Certain funds may have a NAV which is determined prior to the opening of regular trading on its listed exchange and their market returns are calculated using the midpoint of the bid/ask spread as of the opening of regular trading on the exchange. Market and NAV returns assume that dividends and capital gain distributions have been reinvested at Market Price and NAV, respectively.
An index is a statistical composite that tracks a specified financial market or sector. Unlike a fund, an index does not actually hold a portfolio of securities and therefore does not incur the expenses incurred by a fund. These expenses negatively impact fund performance. Also, market returns do not include brokerage commissions that may be payable on secondary market transactions. If brokerage commissions were included, market returns would be lower.
As a shareholder of a Fund, you incur two types of costs: (1) transaction costs, including brokerage commissions on purchases and sales of fund shares and (2) ongoing costs, including management fees and other fund expenses. The expense example, which is based on an investment of $1,000 invested on March 1, 2015 and held through August 31, 2015, is intended to help you understand your ongoing costs (in dollars and cents) of investing in a Fund and to compare these costs with the ongoing costs of investing in other funds.
Actual Expenses — The table provides information about actual account values and actual expenses. Annualized expense ratios reflect contractual and voluntary fee waivers, if any. To estimate the expenses that you paid on your account over the period, simply divide your account value by $1,000 (for example, an $8,600 account value divided by $1,000 = 8.6), then multiply the result by the number corresponding to your Fund under the heading entitled “Expenses Paid During Period.”
Hypothetical Example for Comparison Purposes — The table also provides information about hypothetical account values and hypothetical expenses based on each Fund’s actual expense ratio and an assumed rate of return of 5% per year before expenses. You may use this information to compare the ongoing costs of investing in your Fund and other funds. To do so, compare this 5% hypothetical example with the 5% hypothetical examples that appear in the shareholder reports of the other funds.
Please note that the expenses shown in the table are meant to highlight your ongoing costs only and do not reflect any transactional costs, such as brokerage commissions paid on purchases and sales of fund shares. Therefore, the hypothetical examples are useful in comparing ongoing costs only and will not help you determine the relative total costs of owning different funds. In addition, if these transactional costs were included, your costs would have been higher.
| 22 | 2015 iSHARES ANNUAL REPORTTO SHAREHOLDERS |
Table of Contents
iSHARES® MSCI BRAZIL CAPPED ETF
August 31, 2015
| Security | Shares | Value | ||||||
COMMON STOCKS — 65.33% |
| |||||||
AEROSPACE & DEFENSE — 1.94% |
| |||||||
Embraer SA | 6,108,632 | $ | 38,541,111 | |||||
|
| |||||||
| 38,541,111 | ||||||||
BANKS — 4.27% |
| |||||||
Banco Bradesco SA | 5,241,064 | 36,218,706 | ||||||
Banco do Brasil SA | 6,847,397 | 33,520,238 | ||||||
Banco Santander Brasil SA Units | 3,836,100 | 15,198,002 | ||||||
|
| |||||||
| 84,936,946 | ||||||||
BEVERAGES — 10.35% |
| |||||||
Ambev SA | 39,266,560 | 205,806,474 | ||||||
|
| |||||||
| 205,806,474 | ||||||||
CAPITAL MARKETS — 0.94% |
| |||||||
CETIP SA – Mercados Organizados | 2,085,303 | 18,733,232 | ||||||
|
| |||||||
| 18,733,232 | ||||||||
CONTAINERS & PACKAGING — 1.28% |
| |||||||
Klabin SA Units | 4,594,820 | 25,558,667 | ||||||
|
| |||||||
| 25,558,667 | ||||||||
DIVERSIFIED CONSUMER SERVICES — 1.97% |
| |||||||
Estacio Participacoes SA | 2,880,800 | 9,863,018 | ||||||
Kroton Educacional SA | 12,329,464 | 29,382,867 | ||||||
|
| |||||||
| 39,245,885 | ||||||||
DIVERSIFIED FINANCIAL SERVICES — 2.41% |
| |||||||
BM&FBovespa SA-Bolsa de Valores Mercadorias e Futuros | 16,165,900 | 47,846,359 | ||||||
|
| |||||||
| 47,846,359 | ||||||||
ELECTRIC UTILITIES — 1.59% |
| |||||||
CPFL Energia SA | 2,503,931 | 10,793,250 | ||||||
EDP – Energias do Brasil SA | 3,018,400 | 9,289,935 | ||||||
Equatorial Energia SA | 554,400 | 5,380,751 | ||||||
Transmissora Alianca de Energia Eletrica SA Units | 1,207,700 | 6,134,244 | ||||||
|
| |||||||
| 31,598,180 | ||||||||
FOOD & STAPLES RETAILING — 1.20% |
| |||||||
Raia Drogasil SA | 2,192,700 | 23,900,114 | ||||||
|
| |||||||
| 23,900,114 | ||||||||
FOOD PRODUCTS — 6.91% |
| |||||||
BRF SA | 5,403,750 | 103,141,932 | ||||||
JBS SA | 7,135,322 | 27,720,449 | ||||||
M. Dias Branco SA | 385,100 | 6,692,794 | ||||||
|
| |||||||
| 137,555,175 | ||||||||
| Security | Shares | Value | ||||||
HEALTH CARE PROVIDERS & SERVICES — 0.72% |
| |||||||
Odontoprev SA | 1,785,300 | $ | 4,793,804 | |||||
Qualicorp SA | 2,049,500 | 9,605,317 | ||||||
|
| |||||||
| 14,399,121 | ||||||||
HOUSEHOLD DURABLES — 0.35% |
| |||||||
Cyrela Brazil Realty | 3,014,000 | 6,951,088 | ||||||
|
| |||||||
| 6,951,088 | ||||||||
INDEPENDENT POWER AND RENEWABLE ELECTRICITY PRODUCERS — 0.78% |
| |||||||
Tractebel Energia SA | 1,680,200 | 15,472,279 | ||||||
|
| |||||||
| 15,472,279 | ||||||||
INSURANCE — 3.30% |
| |||||||
BB Seguridade Participacoes SA | 5,567,200 | 43,868,114 | ||||||
Porto Seguro SA | 1,274,900 | 11,649,028 | ||||||
Sul America SA | 2,118,350 | 10,178,084 | ||||||
|
| |||||||
| 65,695,226 | ||||||||
INTERNET & CATALOG RETAIL — 0.27% |
| |||||||
B2W Cia. Digitala | 1,239,200 | 5,307,576 | ||||||
|
| |||||||
| 5,307,576 | ||||||||
IT SERVICES — 4.03% |
| |||||||
Cielo SA | 7,614,296 | 80,172,490 | ||||||
|
| |||||||
| 80,172,490 | ||||||||
MACHINERY — 1.26% |
| |||||||
WEG SA | 5,458,360 | 25,101,937 | ||||||
|
| |||||||
| 25,101,937 | ||||||||
METALS & MINING — 2.59% |
| |||||||
Cia. Siderurgica Nacional SA | 7,442,054 | 7,151,401 | ||||||
Vale SA | 9,033,600 | 44,445,634 | ||||||
|
| |||||||
| 51,597,035 | ||||||||
MULTILINE RETAIL — 2.01% |
| |||||||
Lojas Americanas SA | 2,071,750 | 7,081,690 | ||||||
Lojas Renner SA | 1,215,500 | 32,878,320 | ||||||
|
| |||||||
| 39,960,010 | ||||||||
OIL, GAS & CONSUMABLE FUELS — 6.61% |
| |||||||
Cosan SA Industria e Comercio | 1,352,390 | 6,739,207 | ||||||
Petroleo Brasileiro SAa | 23,306,744 | 67,957,340 | ||||||
Ultrapar Participacoes SA | 3,255,700 | 56,733,964 | ||||||
|
| |||||||
| 131,430,511 | ||||||||
SCHEDULESOF INVESTMENTS | 23 |
Table of Contents
Schedule of Investments (Continued)
iSHARES® MSCI BRAZIL CAPPED ETF
August 31, 2015
| Security | Shares | Value | ||||||
PAPER & FOREST PRODUCTS — 1.84% |
| |||||||
Duratex SA | 1,892,411 | $ | 2,852,450 | |||||
Fibria Celulose SA | 2,401,726 | 33,774,839 | ||||||
|
| |||||||
| 36,627,289 | ||||||||
PERSONAL PRODUCTS — 1.37% |
| |||||||
Hypermarcas SAa | 3,510,500 | 15,874,236 | ||||||
Natura Cosmeticos SA | 1,753,100 | 11,402,550 | ||||||
|
| |||||||
| 27,276,786 | ||||||||
REAL ESTATE MANAGEMENT & DEVELOPMENT — 1.15% |
| |||||||
BR Malls Participacoes SA | 4,240,300 | 13,039,017 | ||||||
Multiplan Empreendimentos Imobiliarios SA | 866,500 | 9,796,821 | ||||||
|
| |||||||
| 22,835,838 | ||||||||
ROAD & RAIL — 0.48% |
| |||||||
Localiza Rent A Car SA | 1,548,940 | 9,530,303 | ||||||
|
| |||||||
| 9,530,303 | ||||||||
SOFTWARE — 0.58% |
| |||||||
TOTVS SA | 1,317,900 | 11,470,226 | ||||||
|
| |||||||
| 11,470,226 | ||||||||
SPECIALTY RETAIL — 0.14% |
| |||||||
Via Varejo SA | 1,477,800 | 2,763,077 | ||||||
|
| |||||||
| 2,763,077 | ||||||||
TOBACCO — 1.34% |
| |||||||
Souza Cruz SA | 3,670,400 | 26,745,121 | ||||||
|
| |||||||
| 26,745,121 | ||||||||
TRANSPORTATION INFRASTRUCTURE — 1.93% |
| |||||||
CCR SA | 8,180,400 | 33,420,098 | ||||||
EcoRodovias Infraestrutura e Logistica SA | 2,578,300 | 4,948,127 | ||||||
|
| |||||||
| 38,368,225 | ||||||||
WATER UTILITIES — 0.74% | ||||||||
Cia. de Saneamento Basico do Estado de Sao Paulo | 3,415,400 | 14,750,290 | ||||||
|
| |||||||
| 14,750,290 | ||||||||
WIRELESS TELECOMMUNICATION SERVICES — 0.98% |
| |||||||
TIM Participacoes SA | 8,036,390 | 19,416,633 | ||||||
|
| |||||||
| 19,416,633 | ||||||||
|
| |||||||
TOTAL COMMON STOCKS | ||||||||
(Cost: $1,180,524,880) | 1,299,593,204 | |||||||
| Security | Shares | Value | ||||||
PREFERRED STOCKS — 34.10% |
| |||||||
BANKS — 18.86% |
| |||||||
Banco Bradesco SA | 20,801,723 | $ | 131,643,823 | |||||
Banco do Estado do Rio Grande do Sul SA Class B | 2,212,010 | 4,694,581 | ||||||
Itau Unibanco Holding SA | 25,409,862 | 185,223,924 | ||||||
Itausa – Investimentos Itau SA | 26,796,052 | 53,558,997 | ||||||
|
| |||||||
| 375,121,325 | ||||||||
CHEMICALS — 0.35% |
| |||||||
Braskem SA Class A | 1,814,936 | 7,011,092 | ||||||
|
| |||||||
| 7,011,092 | ||||||||
DIVERSIFIED TELECOMMUNICATION SERVICES — 1.88% |
| |||||||
Oi SA | 3,111,769 | 2,306,755 | ||||||
Telefonica Brasil SA | 3,165,674 | 35,105,106 | ||||||
|
| |||||||
| 37,411,861 | ||||||||
ELECTRIC UTILITIES — 1.52% |
| |||||||
Centrais Eletricas Brasileiras SA Class B | 2,718,951 | 5,606,238 | ||||||
Cia. Energetica de Minas Gerais | 7,097,990 | 14,654,921 | ||||||
Cia. Paranaense de Energia Class B | 1,161,600 | 9,886,636 | ||||||
|
| |||||||
| 30,147,795 | ||||||||
FOOD & STAPLES RETAILING — 1.12% |
| |||||||
Cia. Brasileira de Distribuicao | 1,279,464 | 22,306,532 | ||||||
|
| |||||||
| 22,306,532 | ||||||||
INDEPENDENT POWER AND RENEWABLE ELECTRICITY PRODUCERS — 0.70% |
| |||||||
AES Tiete SA | 1,331,300 | 5,486,392 | ||||||
Cia. Energetica de Sao Paulo Class B | 1,921,770 | 8,510,715 | ||||||
|
| |||||||
| 13,997,107 | ||||||||
METALS & MINING — 3.54% |
| |||||||
Gerdau SA | 8,313,646 | 11,983,428 | ||||||
Usinas Siderurgicas de Minas Gerais SA Class A | 4,671,500 | 3,822,107 | ||||||
Vale SA | 14,044,100 | 54,560,784 | ||||||
|
| |||||||
| 70,366,319 | ||||||||
MULTILINE RETAIL — 1.09% |
| |||||||
Lojas Americanas SA | 4,849,506 | 21,702,779 | ||||||
|
| |||||||
| 21,702,779 | ||||||||
| 24 | 2015 iSHARES ANNUAL REPORTTO SHAREHOLDERS |
Table of Contents
Schedule of Investments (Continued)
iSHARES® MSCI BRAZIL CAPPED ETF
August 31, 2015
| Security | Shares | Value | ||||||
OIL, GAS & CONSUMABLE FUELS — 4.16% |
| |||||||
Petroleo Brasileiro SA | 32,809,578 | $ | 82,784,000 | |||||
|
| |||||||
| 82,784,000 | ||||||||
PAPER & FOREST PRODUCTS — 0.88% |
| |||||||
Suzano Papel e Celulose SA Class A | 3,622,100 | 17,482,742 | ||||||
|
| |||||||
| 17,482,742 | ||||||||
|
| |||||||
TOTAL PREFERRED STOCKS | ||||||||
(Cost: $788,879,743) | 678,331,552 | |||||||
SHORT-TERM INVESTMENTS — 0.12% |
| |||||||
MONEY MARKET FUNDS — 0.12% |
| |||||||
BlackRock Cash Funds: Treasury, | ||||||||
0.03%b,c | 2,312,655 | 2,312,655 | ||||||
|
| |||||||
| 2,312,655 | ||||||||
|
| |||||||
TOTAL SHORT-TERM INVESTMENTS |
| |||||||
(Cost: $2,312,655) | 2,312,655 | |||||||
|
| |||||||
TOTAL INVESTMENTS | ||||||||
(Cost: $1,971,717,278) | 1,980,237,411 | |||||||
Other Assets, Less Liabilities — 0.45% |
| 8,897,638 | ||||||
|
| |||||||
NET ASSETS — 100.00% |
| $ | 1,989,135,049 | |||||
|
| |||||||
| a | Non-income earning security. |
| b | Affiliated issuer. See Note 2. |
| c | The rate quoted is the annualized seven-day yield of the fund at period end. |
See notes to financial statements.
SCHEDULESOF INVESTMENTS | 25 |
Table of Contents
Schedule of Investments
iSHARES® MSCI CHILE CAPPED ETF
August 31, 2015
| Security | Shares | Value | ||||||
COMMON STOCKS — 93.18% |
| |||||||
AIRLINES — 3.53% | ||||||||
LATAM Airlines Group SAa | 1,480,793 | $ | 8,289,217 | |||||
|
| |||||||
| 8,289,217 | ||||||||
BANKS — 16.31% |
| |||||||
Banco de Chile | 93,599,496 | 9,675,099 | ||||||
Banco de Credito e Inversiones | 166,934 | 7,293,301 | ||||||
Banco Santander Chile | 291,354,581 | 14,086,411 | ||||||
CorpBanca SA | 770,520,840 | 7,190,509 | ||||||
|
| |||||||
| 38,245,320 | ||||||||
BEVERAGES — 5.20% |
| |||||||
Cia. Cervecerias Unidas SA | 732,860 | 8,122,529 | ||||||
Vina Concha y Toro SA | 2,421,978 | 4,064,718 | ||||||
|
| |||||||
| 12,187,247 | ||||||||
CONSTRUCTION & ENGINEERING — 0.91% |
| |||||||
Besalco SA | 2,741,179 | 1,004,376 | ||||||
SalfaCorp SA | 2,060,855 | 1,128,848 | ||||||
|
| |||||||
| 2,133,224 | ||||||||
DIVERSIFIED FINANCIAL SERVICES — 0.95% |
| |||||||
Inversiones La Construccion SA | 207,101 | 2,227,828 | ||||||
|
| |||||||
| 2,227,828 | ||||||||
ELECTRIC UTILITIES — 12.23% |
| |||||||
E.CL SA | 2,735,795 | 3,837,174 | ||||||
Enersis SA | 89,482,090 | 24,837,902 | ||||||
|
| |||||||
| 28,675,076 | ||||||||
FOOD & STAPLES RETAILING — 4.70% |
| |||||||
Cencosud SA | 5,419,284 | 11,020,390 | ||||||
|
| |||||||
| 11,020,390 | ||||||||
INDEPENDENT POWER AND RENEWABLE ELECTRICITY PRODUCERS — 15.03% |
| |||||||
AES Gener SA | 12,839,697 | 6,459,330 | ||||||
Colbun SA | 38,648,639 | 10,501,338 | ||||||
Empresa Nacional de Electricidad SA/Chile | 14,752,953 | 18,295,934 | ||||||
|
| |||||||
| �� | 35,256,602 | |||||||
IT SERVICES — 1.76% |
| |||||||
SONDA SA | 2,529,440 | 4,133,328 | ||||||
|
| |||||||
| 4,133,328 | ||||||||
MARINE — 0.34% | ||||||||
Cia. Sud Americana de Vapores SAa | 29,049,011 | 810,642 | ||||||
|
| |||||||
| 810,642 | ||||||||
| Security | Shares | Value | ||||||
METALS & MINING — 0.51% |
| |||||||
CAP SA | 492,974 | $ | 1,200,836 | |||||
|
| |||||||
| 1,200,836 | ||||||||
MULTILINE RETAIL — 6.44% |
| |||||||
Ripley Corp. SA | 4,780,929 | 1,588,650 | ||||||
SACI Falabella | 2,189,423 | 13,519,374 | ||||||
|
| |||||||
| 15,108,024 | ||||||||
OIL, GAS & CONSUMABLE FUELS — 8.57% |
| |||||||
Empresas COPEC SA | 2,054,820 | 20,094,031 | ||||||
|
| |||||||
| 20,094,031 | ||||||||
PAPER & FOREST PRODUCTS — 6.45% |
| |||||||
Empresas CMPC SA | 5,527,858 | 15,128,432 | ||||||
|
| |||||||
| 15,128,432 | ||||||||
REAL ESTATE MANAGEMENT & DEVELOPMENT — 2.21% |
| |||||||
Parque Arauco SA | 2,959,889 | 5,173,865 | ||||||
|
| |||||||
| 5,173,865 | ||||||||
TEXTILES, APPAREL & LUXURY GOODS — 0.66% |
| |||||||
Forus SA | 578,046 | 1,541,417 | ||||||
|
| |||||||
| 1,541,417 | ||||||||
TRANSPORTATION INFRASTRUCTURE — 0.83% |
| |||||||
Sociedad Matriz SAAM SA | 28,721,446 | 1,956,275 | ||||||
|
| |||||||
| 1,956,275 | ||||||||
WATER UTILITIES — 4.16% |
| |||||||
Aguas Andinas SA Series A | 12,983,311 | 6,730,068 | ||||||
Inversiones Aguas Metropolitanas SA | 2,137,886 | 3,026,214 | ||||||
|
| |||||||
| 9,756,282 | ||||||||
WIRELESS TELECOMMUNICATION SERVICES — 2.39% |
| |||||||
Empresa Nacional de Telecomunicaciones SA | 598,124 | 5,599,317 | ||||||
|
| |||||||
| 5,599,317 | ||||||||
|
| |||||||
TOTAL COMMON STOCKS | ||||||||
(Cost: $210,427,308) | 218,537,353 | |||||||
PREFERRED STOCKS — 6.54% |
| |||||||
BEVERAGES — 2.87% |
| |||||||
Coca-Cola Embonor SA | 1,206,723 | 2,001,682 | ||||||
Embotelladora Andina SA Class B | 1,377,930 | 4,729,299 | ||||||
|
| |||||||
| 6,730,981 | ||||||||
CHEMICALS — 3.20% |
| |||||||
Sociedad Quimica y Minera de Chile SA Series B | 477,489 | 7,497,214 | ||||||
|
| |||||||
| 7,497,214 | ||||||||
| 26 | 2015 iSHARES ANNUAL REPORTTO SHAREHOLDERS |
Table of Contents
Schedule of Investments (Continued)
iSHARES® MSCI CHILE CAPPED ETF
August 31, 2015
| Security | Shares | Value | ||||||
HEALTH CARE PROVIDERS & SERVICES — 0.47% |
| |||||||
Bupa Chile SA | 1,422,372 | $ | 1,099,654 | |||||
|
| |||||||
| 1,099,654 | ||||||||
|
| |||||||
TOTAL PREFERRED STOCKS | ||||||||
(Cost: $17,040,175) | 15,327,849 | |||||||
SHORT-TERM INVESTMENTS — 0.20% |
| |||||||
MONEY MARKET FUNDS — 0.20% |
| |||||||
BlackRock Cash Funds: Treasury, | ||||||||
0.03%b,c | 478,553 | 478,553 | ||||||
|
| |||||||
| 478,553 | ||||||||
|
| |||||||
TOTAL SHORT-TERM INVESTMENTS |
| |||||||
(Cost: $478,553) |
| 478,553 | ||||||
|
| |||||||
TOTAL INVESTMENTS |
| |||||||
(Cost: $227,946,036) |
| 234,343,755 | ||||||
Other Assets, Less Liabilities — 0.08% |
| 192,620 | ||||||
|
| |||||||
NET ASSETS — 100.00% |
| $ | 234,536,375 | |||||
|
| |||||||
| a | Non-income earning security. |
| b | Affiliated issuer. See Note 2. |
| c | The rate quoted is the annualized seven-day yield of the fund at period end. |
See notes to financial statements.
SCHEDULESOF INVESTMENTS | 27 |
Table of Contents
Schedule of Investments
iSHARES® MSCI COLOMBIA CAPPED ETF
August 31, 2015
| Security | Shares | Value | ||||||
COMMON STOCKS — 73.43% | ||||||||
BANKS — 5.52% | ||||||||
Banco de Bogota SA | 4,073 | $ | 76,365 | |||||
Bancolombia SA | 82,449 | 665,242 | ||||||
Grupo Aval Acciones y Valores SA | 125,800 | 45,342 | ||||||
|
| |||||||
| 786,949 | ||||||||
CONSTRUCTION & ENGINEERING — 2.28% |
| |||||||
Construcciones El Condor SA | 173,328 | 66,115 | ||||||
Constructora Conconcreto SA | 697,776 | 259,396 | ||||||
|
| |||||||
| 325,511 | ||||||||
CONSTRUCTION MATERIALS — 12.00% |
| |||||||
Cementos Argos SA | 155,233 | 489,761 | ||||||
Cemex Latam Holdings SAa | 152,884 | 578,226 | ||||||
Grupo Argos SA/Colombia | 118,173 | 641,767 | ||||||
|
| |||||||
| 1,709,754 | ||||||||
DIVERSIFIED FINANCIAL SERVICES — 11.85% |
| |||||||
Bolsa de Valores de Colombia | 47,925,000 | 244,776 | ||||||
Corp. Financiera Colombiana SA | 19,300 | 228,967 | ||||||
Grupo de Inversiones Suramericana SA | 106,541 | 1,215,742 | ||||||
|
| |||||||
| 1,689,485 | ||||||||
ELECTRIC UTILITIES — 11.57% |
| |||||||
Celsia SA ESP | 371,861 | 414,715 | ||||||
Interconexion Electrica SA ESP | 281,232 | 603,647 | ||||||
Isagen SA ESP | 662,967 | 630,070 | ||||||
|
| |||||||
| 1,648,432 | ||||||||
FOOD & STAPLES RETAILING — 4.01% |
| |||||||
Almacenes Exito SA | 105,504 | 572,283 | ||||||
|
| |||||||
| 572,283 | ||||||||
FOOD PRODUCTS — 4.54% |
| |||||||
Grupo Nutresa SA | 100,483 | 646,391 | ||||||
|
| |||||||
| 646,391 | ||||||||
GAS UTILITIES — 4.48% |
| |||||||
Empresa de Energia de Bogota SA ESP | 1,169,745 | 639,040 | ||||||
|
| |||||||
| 639,040 | ||||||||
METALS & MINING — 1.65% |
| |||||||
Mineros SA | 378,264 | 234,772 | ||||||
|
| |||||||
| 234,772 | ||||||||
OIL, GAS & CONSUMABLE FUELS — 15.53% |
| |||||||
Canacol Energy Ltd.a | 196,176 | 365,664 | ||||||
Ecopetrol SA | 2,231,018 | 1,150,307 | ||||||
| Security | Shares | Value | ||||||
Pacific Exploration and Production Corp. | 207,816 | $ | 696,625 | |||||
|
| |||||||
| 2,212,596 | ||||||||
|
| |||||||
TOTAL COMMON STOCKS | ||||||||
(Cost: $15,409,651) | 10,465,213 | |||||||
PREFERRED STOCKS — 26.41% |
| |||||||
AIRLINES — 2.21% |
| |||||||
Avianca Holdings SA | 434,952 | 314,949 | ||||||
|
| |||||||
| 314,949 | ||||||||
BANKS — 19.14% |
| |||||||
Banco Davivienda SA | 82,001 | 631,939 | ||||||
Bancolombia SA | 202,654 | 1,728,144 | ||||||
Grupo Aval Acciones y Valores SA | 962,592 | 367,176 | ||||||
|
| |||||||
| 2,727,259 | ||||||||
CONSTRUCTION MATERIALS — 2.29% |
| |||||||
Cementos Argos SA | 45,144 | 133,236 | ||||||
Grupo Argos SA/Colombia | 37,200 | 192,403 | ||||||
|
| |||||||
| 325,639 | ||||||||
DIVERSIFIED FINANCIAL SERVICES — 2.77% |
| |||||||
Grupo de Inversiones Suramericana SA | 34,872 | 395,445 | ||||||
|
| |||||||
| 395,445 | ||||||||
|
| |||||||
TOTAL PREFERRED STOCKS | ||||||||
(Cost: $5,112,449) | 3,763,292 | |||||||
SHORT-TERM INVESTMENTS — 0.14% |
| |||||||
MONEY MARKET FUNDS — 0.14% |
| |||||||
BlackRock Cash Funds: Treasury, | ||||||||
0.03%b,c | 19,541 | 19,541 | ||||||
|
| |||||||
| 19,541 | ||||||||
|
| |||||||
TOTAL SHORT-TERM INVESTMENTS |
| |||||||
(Cost: $19,541) |
| 19,541 | ||||||
|
| |||||||
TOTAL INVESTMENTS |
| |||||||
(Cost: $20,541,641) |
| 14,248,046 | ||||||
Other Assets, Less Liabilities — 0.02% |
| 2,610 | ||||||
|
| |||||||
NET ASSETS — 100.00% |
| $ | 14,250,656 | |||||
|
| |||||||
| a | Non-income earning security. |
| b | Affiliated issuer. See Note 2. |
| c | The rate quoted is the annualized seven-day yield of the fund at period end. |
See notes to financial statements.
| 28 | 2015 iSHARES ANNUAL REPORTTO SHAREHOLDERS |
Table of Contents
Schedule of Investments
iSHARES® MSCI ISRAEL CAPPED ETF
August 31, 2015
| Security | Shares | Value | ||||||
COMMON STOCKS — 99.57% |
| |||||||
AEROSPACE & DEFENSE — 3.05% |
| |||||||
Elbit Systems Ltd. | 50,302 | $ | 3,856,156 | |||||
|
| |||||||
| 3,856,156 | ||||||||
BANKS — 24.34% |
| |||||||
Bank Hapoalim BM | 2,216,850 | 11,218,779 | ||||||
Bank Leumi le-Israel BMa | 2,951,821 | 10,736,623 | ||||||
First International Bank of Israel Ltd. | 97,306 | 1,211,919 | ||||||
Israel Discount Bank Ltd. Class Aa | 2,242,101 | 4,143,121 | ||||||
Mizrahi Tefahot Bank Ltd. | 294,886 | 3,426,127 | ||||||
|
| |||||||
| 30,736,569 | ||||||||
CHEMICALS — 8.80% |
| |||||||
Frutarom Industries Ltd. | 81,530 | 3,087,747 | ||||||
Israel Chemicals Ltd. | 1,075,715 | 6,042,652 | ||||||
Israel Corp. Ltd. (The) | 6,550 | 1,979,526 | ||||||
|
| |||||||
| 11,109,925 | ||||||||
COMMUNICATIONS EQUIPMENT — 0.70% |
| |||||||
Ituran Location and Control Ltd. | 36,700 | 890,856 | ||||||
|
| |||||||
| 890,856 | ||||||||
CONSTRUCTION & ENGINEERING — 1.12% |
| |||||||
Electra Ltd./Israel | 3,900 | 507,939 | ||||||
Shikun & Binui Ltd.b | 447,400 | 909,754 | ||||||
|
| |||||||
| 1,417,693 | ||||||||
DIVERSIFIED TELECOMMUNICATION SERVICES — 5.09% |
| |||||||
B Communications Ltd. | 24,500 | 447,062 | ||||||
Bezeq The Israeli Telecommunication Corp. Ltd. | 3,334,865 | 5,976,777 | ||||||
|
| |||||||
| 6,423,839 | ||||||||
FOOD & STAPLES RETAILING — 0.83% |
| |||||||
Rami Levy Chain Stores Hashikma Marketing 2006 Ltd. | 13,700 | 609,392 | ||||||
Shufersal Ltd.a,b | 167,202 | 437,740 | ||||||
|
| |||||||
| 1,047,132 | ||||||||
FOOD PRODUCTS — 2.08% |
| |||||||
Osem Investments Ltd. | 72,800 | 1,371,344 | ||||||
Strauss Group Ltd.a,b | 92,650 | 1,259,903 | ||||||
|
| |||||||
| 2,631,247 | ||||||||
INDEPENDENT POWER AND RENEWABLE ELECTRICITY PRODUCERS — 0.45% |
| |||||||
Kenon Holdings Ltd./Singaporea | 40,800 | 570,376 | ||||||
|
| |||||||
| 570,376 | ||||||||
| Security | Shares | Value | ||||||
INSURANCE — 3.24% |
| |||||||
Clal Insurance Enterprises Holdings Ltd.a | 42,700 | $ | 687,563 | |||||
Harel Insurance Investments & Financial Services Ltd.b | 233,433 | 1,064,444 | ||||||
IDI Insurance Co. Ltd. | 11,900 | 588,308 | ||||||
Menorah Mivtachim Holdings Ltd. | 54,906 | 522,648 | ||||||
Migdal Insurance & Financial Holding Ltd.b | 831,900 | 852,146 | ||||||
Phoenix Holdings Ltd. (The) | 133,301 | 373,720 | ||||||
|
| |||||||
| 4,088,829 | ||||||||
IT SERVICES — 0.40% |
| |||||||
Matrix IT Ltd. | 81,800 | 501,082 | ||||||
|
| |||||||
| 501,082 | ||||||||
MACHINERY — 0.16% |
| |||||||
Plasson Industries Ltd.a | 6,950 | 209,511 | ||||||
|
| |||||||
| 209,511 | ||||||||
OIL, GAS & CONSUMABLE FUELS — 4.16% |
| |||||||
Delek Group Ltd. | 10,002 | 2,351,617 | ||||||
Naphtha Israel Petroleum Corp. Ltd.a | 71,751 | 410,342 | ||||||
Oil Refineries Ltd.a,b | 2,441,400 | 887,387 | ||||||
Paz Oil Co. Ltd. | 11,050 | 1,600,940 | ||||||
|
| |||||||
| 5,250,286 | ||||||||
PHARMACEUTICALS — 24.63% |
| |||||||
Teva Pharmaceutical Industries Ltd. | 476,109 | 31,101,230 | ||||||
|
| |||||||
| 31,101,230 | ||||||||
REAL ESTATE INVESTMENT TRUSTS (REITS) — 0.79% |
| |||||||
REIT 1 Ltd. | 351,150 | 998,759 | ||||||
|
| |||||||
| 998,759 | ||||||||
REAL ESTATE MANAGEMENT & DEVELOPMENT — 9.74% |
| |||||||
Africa Israel Properties Ltd. | 26,975 | 396,297 | ||||||
Airport City Ltd.a | 71,350 | 709,102 | ||||||
Alony Hetz Properties & Investments Ltd. | 194,400 | 1,491,755 | ||||||
Amot Investments Ltd. | 241,804 | 749,828 | ||||||
Azrieli Group | 77,850 | 3,063,145 | ||||||
Bayside Land Corp. | 1,600 | 489,242 | ||||||
Gazit-Globe Ltd. | 191,318 | 1,961,687 | ||||||
Jerusalem Oil Explorationa | 18,800 | 755,505 | ||||||
Melisron Ltd. | 33,751 | 1,243,908 | ||||||
Nitsba Holdings 1995 Ltd.a,b | 54,386 | 977,614 | ||||||
Norstar Holdings Inc. | 22,150 | 466,618 | ||||||
|
| |||||||
| 12,304,701 | ||||||||
SCHEDULESOF INVESTMENTS | 29 |
Table of Contents
Schedule of Investments (Continued)
iSHARES® MSCI ISRAEL CAPPED ETF
August 31, 2015
| Security | Shares | Value | ||||||
SEMICONDUCTORS & SEMICONDUCTOR EQUIPMENT — 2.45% |
| |||||||
EZchip Semiconductor Ltd.a | 63,100 | $ | 1,411,400 | |||||
Tower Semiconductor Ltd.a | 138,401 | 1,686,101 | ||||||
|
| |||||||
| 3,097,501 | ||||||||
SOFTWARE — 4.98% |
| |||||||
NICE-Systems Ltd. | 100,700 | 6,288,871 | ||||||
|
| |||||||
| 6,288,871 | ||||||||
SPECIALTY RETAIL — 0.72% |
| |||||||
Delek Automotive Systems Ltd. | 86,150 | 906,335 | ||||||
|
| |||||||
| 906,335 | ||||||||
TEXTILES, APPAREL & LUXURY GOODS — 0.54% |
| |||||||
Delta-Galil Industries Ltd. | 21,300 | 681,622 | ||||||
|
| |||||||
| 681,622 | ||||||||
WIRELESS TELECOMMUNICATION SERVICES — 1.30% |
| |||||||
Cellcom Israel Ltd.a | 128,314 | 833,629 | ||||||
Partner Communications Co. Ltd.a | 184,602 | 803,301 | ||||||
|
| |||||||
| 1,636,930 | ||||||||
|
| |||||||
TOTAL COMMON STOCKS | ||||||||
(Cost: $152,702,128) | 125,749,450 | |||||||
SHORT-TERM INVESTMENTS — 3.45% |
| |||||||
MONEY MARKET FUNDS — 3.45% |
| |||||||
BlackRock Cash Funds: Institutional, | ||||||||
0.18%c,d,e | 4,096,945 | 4,096,945 | ||||||
BlackRock Cash Funds: Prime, | ||||||||
0.18%c,d,e | 235,267 | 235,267 | ||||||
BlackRock Cash Funds: Treasury, | ||||||||
0.03%c,d | 20,259 | 20,259 | ||||||
|
| |||||||
| 4,352,471 | ||||||||
|
| |||||||
TOTAL SHORT-TERM INVESTMENTS |
| |||||||
(Cost: $4,352,471) |
| 4,352,471 | ||||||
|
| |||||||
TOTAL INVESTMENTS | ||||||||
(Cost: $157,054,599) | 130,101,921 | |||||||
Other Assets, Less Liabilities — (3.02)% |
| (3,817,053 | ) | |||||
|
| |||||||
NET ASSETS — 100.00% |
| $ | 126,284,868 | |||||
|
| |||||||
| a | Non-income earning security. |
| b | All or a portion of this security represents a security on loan. See Note 1. |
| c | Affiliated issuer. See Note 2. |
| d | The rate quoted is the annualized seven-day yield of the fund at period end. |
| e | All or a portion of this security represents an investment of securities lending collateral. See Note 1. |
See notes to financial statements.
| 30 | 2015 iSHARES ANNUAL REPORTTO SHAREHOLDERS |
Table of Contents
Schedule of Investments
iSHARES® MSCI RUSSIA CAPPED ETF
August 31, 2015
| Security | Shares | Value | ||||||
COMMON STOCKS — 93.32% |
| |||||||
BANKS — 11.76% | ||||||||
Sberbank of Russia | 10,063,950 | $ | 11,201,273 | |||||
Sberbank of Russia ADR | 957,525 | 4,643,996 | ||||||
VTB Bank JSC | 5,905,005,000 | 6,063,428 | ||||||
VTB Bank JSC GDRa | 1,388,819 | 2,888,743 | ||||||
|
| |||||||
| 24,797,440 | ||||||||
CHEMICALS — 3.47% |
| |||||||
Uralkali PJSCb | 1,167,995 | 3,571,208 | ||||||
Uralkali PJSC GDRa,b | 242,579 | 3,750,271 | ||||||
|
| |||||||
| 7,321,479 | ||||||||
DIVERSIFIED FINANCIAL SERVICES — 2.56% |
| |||||||
Moscow Exchange MICEX-RTS PJSC | 4,888,620 | 5,407,376 | ||||||
|
| |||||||
| 5,407,376 | ||||||||
DIVERSIFIED TELECOMMUNICATION SERVICES — 2.02% |
| |||||||
Rostelecom PJSC | 3,562,720 | 4,263,303 | ||||||
|
| |||||||
| 4,263,303 | ||||||||
ELECTRIC UTILITIES — 1.88% |
| |||||||
RusHydro PJSC | 501,128,000 | 3,973,272 | ||||||
|
| |||||||
| 3,973,272 | ||||||||
FOOD & STAPLES RETAILING — 7.66% |
| |||||||
Magnit PJSC GDRa | 323,189 | 16,157,834 | ||||||
|
| |||||||
| 16,157,834 | ||||||||
METALS & MINING — 10.97% |
| |||||||
Alrosa PAO | 6,315,300 | 6,207,395 | ||||||
MMC Norilsk Nickel PJSC | 60,083 | 9,410,482 | ||||||
Severstal PAO | 689,405 | 7,511,952 | ||||||
|
| |||||||
| 23,129,829 | ||||||||
OIL, GAS & CONSUMABLE FUELS — 46.13% |
| |||||||
Gazprom PAO | 8,508,677 | 18,838,456 | ||||||
Gazprom PAO ADR | 4,221,873 | 18,618,460 | ||||||
Lukoil PJSC | 350,018 | 13,256,827 | ||||||
Lukoil PJSC ADR (London) | 347,252 | 13,098,345 | ||||||
NOVATEK OAO GDRa | 103,624 | 9,927,179 | ||||||
Rosneft OAO | 1,449,490 | 5,282,426 | ||||||
Rosneft OAO GDRa | 1,037,805 | 3,910,449 | ||||||
Surgutneftegas OAO | 4,425,900 | 2,263,697 | ||||||
Surgutneftegas OAO ADR | 401,021 | 2,093,330 | ||||||
Tatneft PAO Class S | 2,093,395 | 10,002,613 | ||||||
|
| |||||||
| 97,291,782 | ||||||||
| Security | Shares | Value | ||||||
WIRELESS TELECOMMUNICATION SERVICES — 6.87% |
| |||||||
MegaFon PJSC GDRa | 368,612 | $ | 4,736,664 | |||||
Mobile TeleSystems PJSC ADR | 927,642 | 7,077,909 | ||||||
Sistema JSFC GDRa | 362,148 | 2,672,652 | ||||||
|
| |||||||
| 14,487,225 | ||||||||
|
| |||||||
TOTAL COMMON STOCKS | ||||||||
(Cost: $322,349,916) | 196,829,540 | |||||||
PREFERRED STOCKS — 7.01% |
| |||||||
OIL, GAS & CONSUMABLE FUELS — 7.01% |
| |||||||
AK Transneft OAO | 4,196 | 9,685,012 | ||||||
Surgutneftegas OAO | 8,441,600 | 5,086,216 | ||||||
|
| |||||||
| 14,771,228 | ||||||||
|
| |||||||
TOTAL PREFERRED STOCKS | ||||||||
(Cost: $15,968,462) | 14,771,228 | |||||||
SHORT-TERM INVESTMENTS — 0.15% |
| |||||||
MONEY MARKET FUNDS — 0.15% |
| |||||||
BlackRock Cash Funds: Treasury, | ||||||||
0.03%c,d | 313,635 | 313,635 | ||||||
|
| |||||||
| 313,635 | ||||||||
|
| |||||||
TOTAL SHORT-TERM INVESTMENTS |
| |||||||
(Cost: $313,635) |
| 313,635 | ||||||
|
| |||||||
TOTAL INVESTMENTS |
| |||||||
(Cost: $338,632,013) |
| 211,914,403 | ||||||
Other Assets, Less Liabilities — (0.48)% |
| (1,002,098 | ) | |||||
|
| |||||||
NET ASSETS — 100.00% |
| $ | 210,912,305 | |||||
|
| |||||||
ADR | — American Depositary Receipts | |
GDR | — Global Depositary Receipts |
| a | This security may be resold to qualified foreign investors and foreign institutional buyers under Regulation S of the Securities Act of 1933. |
| b | Non-income earning security. |
| c | Affiliated issuer. See Note 2. |
| d | The rate quoted is the annualized seven-day yield of the fund at period end. |
See notes to financial statements.
SCHEDULESOF INVESTMENTS | 31 |
Table of Contents
Schedule of Investments
iSHARES® MSCI SOUTH AFRICA ETF
August 31, 2015
| Security | Shares | Value | ||||||
COMMON STOCKS — 99.69% |
| |||||||
BANKS — 8.12% | ||||||||
African Bank Investments Ltd.a,b | 2,626,522 | $ | 1,980 | |||||
Barclays Africa Group Ltd. | 454,885 | 5,958,936 | ||||||
Capitec Bank Holdings Ltd. | 46,532 | 1,693,875 | ||||||
Nedbank Group Ltd. | 265,477 | 4,723,016 | ||||||
Standard Bank Group Ltd. | 1,627,689 | 17,930,747 | ||||||
|
| |||||||
| 30,308,554 | ||||||||
CAPITAL MARKETS — 2.50% |
| |||||||
Brait SEa | 454,166 | 4,970,942 | ||||||
Coronation Fund Managers Ltd. | 305,004 | 1,698,370 | ||||||
Investec Ltd. | 325,819 | 2,650,914 | ||||||
|
| |||||||
| 9,320,226 | ||||||||
CONTAINERS & PACKAGING — 0.50% |
| |||||||
Nampak Ltd. | 800,980 | 1,863,524 | ||||||
|
| |||||||
| 1,863,524 | ||||||||
DISTRIBUTORS — 0.93% |
| |||||||
Imperial Holdings Ltd. | 250,896 | 3,489,855 | ||||||
|
| |||||||
| 3,489,855 | ||||||||
DIVERSIFIED FINANCIAL SERVICES — 9.88% |
| |||||||
FirstRand Ltd. | 4,514,897 | 18,009,552 | ||||||
PSG Group Ltd. | 119,002 | 1,776,383 | ||||||
Remgro Ltd. | 645,379 | 12,308,874 | ||||||
RMB Holdings Ltd. | 946,862 | 4,793,470 | ||||||
|
| |||||||
| 36,888,279 | ||||||||
DIVERSIFIED TELECOMMUNICATION SERVICES — 0.40% |
| |||||||
Telkom SA SOC Ltd. | 314,372 | 1,504,994 | ||||||
|
| |||||||
| 1,504,994 | ||||||||
FOOD & STAPLES RETAILING — 3.61% |
| |||||||
Massmart Holdings Ltd. | 145,638 | 1,258,278 | ||||||
Pick n Pay Stores Ltd. | 326,858 | 1,542,591 | ||||||
Shoprite Holdings Ltd. | 614,782 | 7,525,654 | ||||||
SPAR Group Ltd. (The) | 220,782 | 3,162,529 | ||||||
|
| |||||||
| 13,489,052 | ||||||||
FOOD PRODUCTS — 2.02% |
| |||||||
Pioneer Foods Ltd. | 171,552 | 2,573,749 | ||||||
Tiger Brands Ltd. | 219,004 | 4,949,952 | ||||||
|
| |||||||
| 7,523,701 | ||||||||
HEALTH CARE PROVIDERS & SERVICES — 3.42% |
| |||||||
Life Healthcare Group Holdings Ltd. | 1,258,262 | 3,610,415 | ||||||
Mediclinic International Ltd. | 656,684 | 5,274,562 | ||||||
Netcare Ltd. | 1,290,082 | 3,876,787 | ||||||
|
| |||||||
| 12,761,764 | ||||||||
| Security | Shares | Value | ||||||
HOTELS, RESTAURANTS & LEISURE — 0.23% |
| |||||||
Tsogo Sun Holdings Ltd. | 492,597 | $ | 872,724 | |||||
|
| |||||||
| 872,724 | ||||||||
HOUSEHOLD DURABLES — 4.95% |
| |||||||
Steinhoff International Holdings Ltd. | 3,087,896 | 18,498,160 | ||||||
|
| |||||||
| 18,498,160 | ||||||||
INDUSTRIAL CONGLOMERATES — 2.75% |
| |||||||
Bidvest Group Ltd. (The) | 427,123 | 10,268,920 | ||||||
|
| |||||||
| 10,268,920 | ||||||||
INSURANCE — 6.29% |
| |||||||
Discovery Ltd. | 477,670 | 4,825,946 | ||||||
Liberty Holdings Ltd. | 153,570 | 1,491,212 | ||||||
MMI Holdings Ltd./South Africa | 1,476,082 | 3,128,158 | ||||||
Rand Merchant Insurance Holdings Ltd. | 896,837 | 2,838,398 | ||||||
Sanlam Ltd. | 2,324,965 | 11,181,146 | ||||||
|
| |||||||
| 23,464,860 | ||||||||
MEDIA — 18.54% |
| |||||||
Naspers Ltd. Class N | 534,222 | 69,233,286 | ||||||
|
| |||||||
| 69,233,286 | ||||||||
METALS & MINING — 3.62% |
| |||||||
African Rainbow Minerals Ltd. | 145,851 | 781,141 | ||||||
Anglo American Platinum Ltd.a | 72,353 | 1,746,552 | ||||||
AngloGold Ashanti Ltd.a | 542,981 | 4,371,520 | ||||||
Gold Fields Ltd. | 1,043,665 | 3,351,090 | ||||||
Impala Platinum Holdings Ltd.a | 720,869 | 2,691,252 | ||||||
Kumba Iron Ore Ltd.b | 86,412 | 588,534 | ||||||
|
| |||||||
| 13,530,089 | ||||||||
MULTILINE RETAIL — 2.60% |
| |||||||
Woolworths Holdings Ltd./South Africa | 1,295,396 | 9,717,240 | ||||||
|
| |||||||
| 9,717,240 | ||||||||
OIL, GAS & CONSUMABLE FUELS — 6.63% |
| |||||||
Exxaro Resources Ltd.b | 192,157 | 982,497 | ||||||
Sasol Ltd. | 742,280 | 23,778,367 | ||||||
|
| |||||||
| 24,760,864 | ||||||||
PAPER & FOREST PRODUCTS — 1.61% |
| |||||||
Mondi Ltd. | 158,711 | 3,679,456 | ||||||
Sappi Ltd.a | 726,321 | 2,327,753 | ||||||
|
| |||||||
| 6,007,209 | ||||||||
PHARMACEUTICALS — 3.18% |
| |||||||
Aspen Pharmacare Holdings Ltd. | 459,125 | 11,855,544 | ||||||
|
| |||||||
| 11,855,544 | ||||||||
| 32 | 2015 iSHARES ANNUAL REPORTTO SHAREHOLDERS |
Table of Contents
Schedule of Investments (Continued)
iSHARES® MSCI SOUTH AFRICA ETF
August 31, 2015
| Security | Shares | Value | ||||||
REAL ESTATE INVESTMENT TRUSTS (REITS) — 4.59% |
| |||||||
Growthpoint Properties Ltd. | 3,089,994 | $ | 6,094,144 | |||||
Hyprop Investments Ltd. | 326,315 | 3,050,535 | ||||||
Redefine Properties Ltd. | 5,553,534 | 4,806,496 | ||||||
Resilient Property Income Fund Ltd. | 379,040 | 3,200,519 | ||||||
|
| |||||||
| 17,151,694 | ||||||||
SPECIALTY RETAIL — 3.41% |
| |||||||
Foschini Group Ltd. (The) | 274,729 | 3,104,728 | ||||||
Mr. Price Group Ltd. | 322,651 | 5,804,884 | ||||||
Truworths International Ltd. | 573,917 | 3,802,388 | ||||||
|
| |||||||
| 12,712,000 | ||||||||
TRADING COMPANIES & DISTRIBUTORS — 0.51% |
| |||||||
Barloworld Ltd. | 294,752 | 1,893,275 | ||||||
|
| |||||||
| 1,893,275 | ||||||||
WIRELESS TELECOMMUNICATION SERVICES — 9.40% |
| |||||||
MTN Group Ltd. | 2,230,382 | 29,757,484 | ||||||
Vodacom Group Ltd. | 499,003 | 5,322,874 | ||||||
|
| |||||||
| 35,080,358 | ||||||||
|
| |||||||
TOTAL COMMON STOCKS | ||||||||
(Cost: $501,389,723) | 372,196,172 | |||||||
SHORT-TERM INVESTMENTS — 0.27% |
| |||||||
MONEY MARKET FUNDS — 0.27% |
| |||||||
BlackRock Cash Funds: Institutional, | ||||||||
0.18%c,d,e | 872,010 | 872,010 | ||||||
BlackRock Cash Funds: Prime, | ||||||||
0.18%c,d,e | 50,075 | 50,075 | ||||||
BlackRock Cash Funds: Treasury, | ||||||||
0.03%c,d | 66,403 | 66,403 | ||||||
|
| |||||||
| 988,488 | ||||||||
|
| |||||||
TOTAL SHORT-TERM INVESTMENTS |
| |||||||
(Cost: $988,488) |
| 988,488 | ||||||
|
| |||||||
TOTAL INVESTMENTS |
| |||||||
(Cost: $502,378,211) |
| 373,184,660 | ||||||
Other Assets, Less Liabilities — 0.04% |
| 161,611 | ||||||
|
| |||||||
NET ASSETS — 100.00% |
| $ | 373,346,271 | |||||
|
| |||||||
| a | Non-income earning security. |
| b | All or a portion of this security represents a security on loan. See Note 1. |
| c | Affiliated issuer. See Note 2. |
| d | The rate quoted is the annualized seven-day yield of the fund at period end. |
| e | All or a portion of this security represents an investment of securities lending collateral. See Note 1. |
See notes to financial statements.
SCHEDULESOF INVESTMENTS | 33 |
Table of Contents
Schedule of Investments
August 31, 2015
| Security | Shares | Value | ||||||
COMMON STOCKS — 99.88% |
| |||||||
AIRLINES — 3.11% |
| |||||||
Pegasus Hava Tasimaciligi ASa,b | 234,934 | $ | 1,489,018 | |||||
Turk Hava Yollari AOa | 3,632,924 | 10,046,389 | ||||||
|
| |||||||
| 11,535,407 | ||||||||
AUTO COMPONENTS — 0.13% |
| |||||||
Goodyear Lastikleri TASb | 23,474 | 499,155 | ||||||
|
| |||||||
| 499,155 | ||||||||
AUTOMOBILES — 2.63% |
| |||||||
Ford Otomotiv Sanayi AS | 460,999 | 4,671,752 | ||||||
Tofas Turk Otomobil Fabrikasi AS | 822,673 | 5,101,081 | ||||||
|
| |||||||
| 9,772,833 | ||||||||
BANKS — 33.30% |
| |||||||
Akbank TAS | 14,479,046 | 33,922,052 | ||||||
Albaraka Turk Katilim Bankasi AS | 1,772,190 | 821,868 | ||||||
Sekerbank TASa,b | 2,562,393 | 1,205,935 | ||||||
Turkiye Garanti Bankasi AS | 15,202,998 | 38,542,812 | ||||||
Turkiye Halk Bankasi AS | 4,113,365 | 15,755,417 | ||||||
Turkiye Is Bankasi Class C | 10,365,612 | 17,341,302 | ||||||
Turkiye Sinai Kalkinma Bankasi ASb | 4,593,190 | 2,445,704 | ||||||
Turkiye Vakiflar Bankasi Tao Class Db | 4,936,038 | 6,528,254 | ||||||
Yapi ve Kredi Bankasi ASb | 5,721,924 | 7,056,581 | ||||||
|
| |||||||
| 123,619,925 | ||||||||
BEVERAGES — 4.41% |
| |||||||
Anadolu Efes Biracilik ve Malt Sanayii AS | 1,363,905 | 10,167,206 | ||||||
Coca-Cola Icecek ASb | 502,234 | 6,211,070 | ||||||
|
| |||||||
| 16,378,276 | ||||||||
BUILDING PRODUCTS — 0.33% |
| |||||||
Trakya Cam Sanayii ASb | 2,056,911 | 1,229,483 | ||||||
|
| |||||||
| 1,229,483 | ||||||||
CHEMICALS — 1.27% |
| |||||||
Gubre Fabrikalari TAS | 547,374 | 1,165,826 | ||||||
Petkim Petrokimya Holding ASa,b | 2,632,554 | 3,563,127 | ||||||
|
| |||||||
| 4,728,953 | ||||||||
CONSTRUCTION & ENGINEERING — 0.31% |
| |||||||
Tekfen Holding ASb | 847,198 | 1,164,133 | ||||||
|
| |||||||
| 1,164,133 | ||||||||
CONSTRUCTION MATERIALS — 1.45% |
| |||||||
Adana Cimento Sanayii TAS Class A | 352,304 | 778,192 | ||||||
| Security | Shares | Value | ||||||
Akcansa Cimento ASb | 318,011 | $ | 1,540,349 | |||||
Baticim Bati Anadolu Cimento Sanayii AS | 293,522 | 618,100 | ||||||
Cimsa Cimento Sanayi VE Ticaret AS | 354,088 | 1,812,405 | ||||||
Konya Cimento Sanayii ASb | 6,320 | 624,184 | ||||||
|
| |||||||
| 5,373,230 | ||||||||
CONTAINERS & PACKAGING — 0.14% |
| |||||||
Anadolu Cam Sanayii ASa,b | 717,024 | 500,020 | ||||||
|
| |||||||
| 500,020 | ||||||||
DISTRIBUTORS — 0.42% |
| |||||||
Dogus Otomotiv Servis ve Ticaret AS | 361,209 | 1,551,052 | ||||||
|
| |||||||
| 1,551,052 | ||||||||
DIVERSIFIED FINANCIAL SERVICES — 4.87% |
| |||||||
Haci Omer Sabanci Holding AS | 6,042,907 | 18,060,217 | ||||||
|
| |||||||
| 18,060,217 | ||||||||
DIVERSIFIED TELECOMMUNICATION SERVICES — 1.70% |
| |||||||
Turk Telekomunikasyon AS | 2,994,530 | 6,295,611 | ||||||
|
| |||||||
| 6,295,611 | ||||||||
FOOD & STAPLES RETAILING — 6.68% |
| |||||||
BIM Birlesik Magazalar AS | 1,398,676 | 24,240,194 | ||||||
Bizim Toptan Satis Magazalari ASb | 142,590 | 551,060 | ||||||
|
| |||||||
| 24,791,254 | ||||||||
FOOD PRODUCTS — 1.91% |
| |||||||
Pinar SUT Mamulleri Sanayii AS | 119,892 | 862,844 | ||||||
Ulker Biskuvi Sanayi ASb | 1,012,875 | 6,228,259 | ||||||
|
| |||||||
| 7,091,103 | ||||||||
HEALTH CARE PROVIDERS & SERVICES — 0.17% |
| |||||||
Selcuk Ecza Deposu Ticaret ve Sanayi AS | 820,426 | 648,224 | ||||||
|
| |||||||
| 648,224 | ||||||||
HOTELS, RESTAURANTS & LEISURE — 0.35% |
| |||||||
NET Holding ASa,b | 1,219,290 | 1,306,831 | ||||||
|
| |||||||
| 1,306,831 | ||||||||
HOUSEHOLD DURABLES — 2.20% |
| |||||||
Arcelik AS | 1,556,530 | 7,298,741 | ||||||
Vestel Elektronik Sanayi ve Ticaret ASa,b | 551,299 | 859,807 | ||||||
|
| |||||||
| 8,158,548 | ||||||||
| 34 | 2015 iSHARES ANNUAL REPORTTO SHAREHOLDERS |
Table of Contents
Schedule of Investments (Continued)
iSHARES® MSCI TURKEY ETF
August 31, 2015
| Security | Shares | Value | ||||||
INDEPENDENT POWER AND RENEWABLE ELECTRICITY PRODUCERS — 0.50% |
| |||||||
Akenerji Elektrik Uretim ASa,b | 1,422,602 | $ | 454,490 | |||||
Aksa Enerji Uretim ASa,b | 1,005,150 | 980,634 | ||||||
Zorlu Enerji Elektrik Uretim ASa,b | 820,965 | 417,392 | ||||||
|
| |||||||
| 1,852,516 | ||||||||
INDUSTRIAL CONGLOMERATES — 8.41% |
| |||||||
Akfen Holding ASb | 432,138 | 1,218,775 | ||||||
Alarko Holding ASb | 437,257 | 471,655 | ||||||
Dogan Sirketler Grubu Holding ASa,b | 6,843,522 | 1,222,477 | ||||||
Enka Insaat ve Sanayi ASb | 3,422,320 | 5,842,985 | ||||||
KOC Holding ASb | 4,172,429 | 16,268,318 | ||||||
Turkiye Sise ve Cam Fabrikalari AS | 4,374,760 | 4,268,059 | ||||||
Yazicilar Holding ASb | 318,160 | 1,934,535 | ||||||
|
| |||||||
| 31,226,804 | ||||||||
INSURANCE — 0.75% |
| |||||||
Aksigorta AS | 597,714 | 361,380 | ||||||
Anadolu Anonim Turk Sigorta Sirketi | 1,314,933 | 659,499 | ||||||
Anadolu Hayat Emeklilik ASb | 545,790 | 965,585 | ||||||
AvivaSA Emeklilik ve Hayat ASb | 47,142 | 811,341 | ||||||
|
| |||||||
| 2,797,805 | ||||||||
MACHINERY — 0.39% |
| |||||||
Otokar Otomotiv Ve Savunma Sanayi ASb | 55,305 | 1,458,145 | ||||||
|
| |||||||
| 1,458,145 | ||||||||
MEDIA — 0.28% |
| |||||||
Besiktas Futbol Yatirimlari Sanayi ve Ticaret ASa,b | 703,056 | 490,280 | ||||||
Fenerbahce Futbol ASa,b | 40,934 | 544,193 | ||||||
|
| |||||||
| 1,034,473 | ||||||||
METALS & MINING — 5.35% |
| |||||||
Borusan Mannesmann Boru Sanayi ve Ticaret ASb | 279,072 | 567,539 | ||||||
Eregli Demir ve Celik Fabrikalari TASb | 9,213,936 | 12,534,246 | ||||||
Izmir Demir Celik Sanayi ASa,b | 615,368 | 388,965 | ||||||
Kardemir Karabuk Demir Celik Sanayi ve Ticaret AS Class Ab | 865,434 | 472,704 | ||||||
Kardemir Karabuk Demir Celik Sanayi ve Ticaret AS Class Db | 4,620,621 | 2,015,867 | ||||||
Koza Altin Isletmeleri ASb | 300,572 | 2,519,394 | ||||||
Koza Anadolu Metal Madencilik Isletmeleri ASa,b | 1,147,218 | 922,188 | ||||||
| Security | Shares | Value | ||||||
Park Elektrik Uretim Madencilik Sanayi ve Ticaret ASa,b | 339,694 | $ | 431,765 | |||||
|
| |||||||
| 19,852,668 | ||||||||
OIL, GAS & CONSUMABLE FUELS — 5.87% |
| |||||||
Ipek Dogal Enerji Kaynaklari Arastirma Ve Uretim ASa,b | 681,976 | 513,063 | ||||||
Tupras Turkiye Petrol Rafinerileri ASa | 824,053 | 21,259,492 | ||||||
|
| |||||||
| 21,772,555 | ||||||||
PERSONAL PRODUCTS — 0.21% |
| |||||||
EIS Eczacibasi Ilac ve Sinai ve Finansal Yatirimlar Sanayi ve Ticaret AS | 895,356 | 762,790 | ||||||
|
| |||||||
| 762,790 | ||||||||
REAL ESTATE INVESTMENT TRUSTS (REITS) — 3.85% |
| |||||||
Akmerkez Gayrimenkul Yatirim Ortakligi AS | 135,462 | 807,374 | ||||||
Dogus Gayrimenkul Yatirim Ortakligi ASa,b | 447,558 | 487,378 | ||||||
Emlak Konut Gayrimenkul Yatirim Ortakligi AS | 12,504,631 | 10,696,163 | ||||||
Halk Gayrimenkul Yatirim Ortakligi ASb | 1,207,500 | 389,918 | ||||||
Is Gayrimenkul Yatirim Ortakligi ASb | 2,209,371 | 1,085,332 | ||||||
Torunlar Gayrimenkul Yatirim Ortakligi ASb | 822,929 | 842,435 | ||||||
|
| |||||||
| 14,308,600 | ||||||||
TEXTILES, APPAREL & LUXURY GOODS — 0.44% |
| |||||||
Aksa Akrilik Kimya Sanayii AS | 486,008 | 1,636,166 | ||||||
|
| |||||||
| 1,636,166 | ||||||||
TRANSPORTATION INFRASTRUCTURE — 2.34% |
| |||||||
TAV Havalimanlari Holding ASb | 1,075,902 | 8,685,571 | ||||||
|
| |||||||
| 8,685,571 | ||||||||
WIRELESS TELECOMMUNICATION SERVICES — 6.11% |
| |||||||
Turkcell Iletisim Hizmetleri AS | 5,791,618 | 22,681,019 | ||||||
|
| |||||||
| 22,681,019 | ||||||||
|
| |||||||
TOTAL COMMON STOCKS | ||||||||
(Cost: $616,151,120) | 370,773,367 | |||||||
SCHEDULESOF INVESTMENTS | 35 |
Table of Contents
Schedule of Investments (Continued)
iSHARES® MSCI TURKEY ETF
August 31, 2015
| Security | Shares | Value | ||||||
SHORT-TERM INVESTMENTS — 16.44% |
| |||||||
MONEY MARKET FUNDS — 16.44% |
| |||||||
BlackRock Cash Funds: Institutional, |
| |||||||
0.18%c,d,e | 57,552,465 | $ | 57,552,465 | |||||
BlackRock Cash Funds: Prime, | ||||||||
0.18%c,d,e | 3,304,945 | 3,304,945 | ||||||
BlackRock Cash Funds: Treasury, | ||||||||
0.03%c,d | 167,903 | 167,903 | ||||||
|
| |||||||
| 61,025,313 | ||||||||
|
| |||||||
TOTAL SHORT-TERM INVESTMENTS |
| |||||||
(Cost: $61,025,313) |
| 61,025,313 | ||||||
|
| |||||||
TOTAL INVESTMENTS |
| |||||||
(Cost: $677,176,433) |
| 431,798,680 | ||||||
Other Assets, Less Liabilities — (16.32)% |
| (60,574,132 | ) | |||||
|
| |||||||
NET ASSETS — 100.00% |
| $ | 371,224,548 | |||||
|
| |||||||
| a | Non-income earning security. |
| b | All or a portion of this security represents a security on loan. See Note 1. |
| c | Affiliated issuer. See Note 2. |
| d | The rate quoted is the annualized seven-day yield of the fund at period end. |
| e | All or a portion of this security represents an investment of securities lending collateral. See Note 1. |
See notes to financial statements.
| 36 | 2015 iSHARES ANNUAL REPORTTO SHAREHOLDERS |
Table of Contents
Schedule of Investments
iSHARES® MSCI USA EQUAL WEIGHTED ETF
August 31, 2015
| Security | Shares | Value | ||||||
COMMON STOCKS — 99.62% |
| |||||||
AEROSPACE & DEFENSE — 2.00% |
| |||||||
B/E Aerospace Inc. | 1,437 | $ | 70,054 | |||||
Boeing Co. (The) | 531 | 69,391 | ||||||
General Dynamics Corp. | 480 | 68,174 | ||||||
Honeywell International Inc. | 710 | 70,482 | ||||||
L-3 Communications Holdings Inc. | 639 | 67,395 | ||||||
Lockheed Martin Corp. | 335 | 67,395 | ||||||
Northrop Grumman Corp. | 417 | 68,279 | ||||||
Precision Castparts Corp. | 292 | 67,233 | ||||||
Raytheon Co. | 662 | 67,895 | ||||||
Rockwell Collins Inc. | 836 | 68,427 | ||||||
Textron Inc. | 1,801 | 69,879 | ||||||
TransDigm Group Inc.a | 302 | 69,409 | ||||||
United Technologies Corp. | 751 | 68,799 | ||||||
|
| |||||||
| 892,812 | ||||||||
AIR FREIGHT & LOGISTICS — 0.62% |
| |||||||
CH Robinson Worldwide Inc. | 1,039 | 70,060 | ||||||
Expeditors International of Washington Inc. | 1,403 | 68,705 | ||||||
FedEx Corp. | 460 | 69,280 | ||||||
United Parcel Service Inc. Class B | 706 | 68,941 | ||||||
|
| |||||||
| 276,986 | ||||||||
AIRLINES — 0.63% |
| |||||||
American Airlines Group Inc. | 1,777 | 69,267 | ||||||
Delta Air Lines Inc. | 1,611 | 70,530 | ||||||
Southwest Airlines Co. | 1,825 | 66,977 | ||||||
United Continental Holdings Inc.a | 1,279 | 72,865 | ||||||
|
| |||||||
| 279,639 | ||||||||
AUTO COMPONENTS — 0.95% |
| |||||||
Autoliv Inc.b | 688 | 70,279 | ||||||
BorgWarner Inc. | 1,545 | 67,424 | ||||||
Delphi Automotive PLC | 949 | 71,668 | ||||||
Goodyear Tire & Rubber Co. (The) | 2,395 | 71,299 | ||||||
Johnson Controls Inc. | 1,711 | 70,391 | ||||||
Lear Corp. | 701 | 72,056 | ||||||
|
| |||||||
| 423,117 | ||||||||
AUTOMOBILES — 0.65% |
| |||||||
Ford Motor Co. | 5,167 | 71,666 | ||||||
General Motors Co. | 2,444 | 71,952 | ||||||
Harley-Davidson Inc. | 1,253 | 70,231 | ||||||
Tesla Motors Inc.a,b | 303 | 75,465 | ||||||
|
| |||||||
| 289,314 | ||||||||
| Security | Shares | Value | ||||||
BANKS — 2.87% |
| |||||||
Bank of America Corp. | 4,368 | $ | 71,373 | |||||
BB&T Corp. | 1,917 | 70,776 | ||||||
CIT Group Inc. | 1,586 | 68,896 | ||||||
Citigroup Inc. | 1,336 | 71,449 | ||||||
Citizens Financial Group Inc. | 2,885 | 71,606 | ||||||
Comerica Inc. | 1,649 | 72,556 | ||||||
Fifth Third Bancorp | 3,656 | 72,828 | ||||||
First Republic Bank/CA | 1,178 | 71,045 | ||||||
Huntington Bancshares Inc./OH | 6,528 | 71,220 | ||||||
JPMorgan Chase & Co. | 1,113 | 71,343 | ||||||
KeyCorp | 5,260 | 72,272 | ||||||
M&T Bank Corp. | 590 | 69,762 | ||||||
People’s United Financial Inc. | 4,534 | 70,277 | ||||||
PNC Financial Services Group Inc. (The)c | 776 | 70,709 | ||||||
Regions Financial Corp. | 7,600 | 72,884 | ||||||
SunTrust Banks Inc. | 1,771 | 71,495 | ||||||
U.S. Bancorp | 1,677 | 71,021 | ||||||
Wells Fargo & Co. | 1,333 | 71,089 | ||||||
|
| |||||||
| 1,282,601 | ||||||||
BEVERAGES — 1.23% |
| |||||||
Brown-Forman Corp. Class B | 679 | 66,610 | ||||||
Coca-Cola Co. (The) | 1,755 | 69,007 | ||||||
Coca-Cola Enterprises Inc. | 1,323 | 68,121 | ||||||
Constellation Brands Inc. Class A | 555 | 71,040 | ||||||
Dr Pepper Snapple Group Inc. | 888 | 68,136 | ||||||
Molson Coors Brewing Co. Class B | 1,022 | 69,588 | ||||||
Monster Beverage Corp.a | 496 | 68,676 | ||||||
PepsiCo Inc. | 744 | 69,140 | ||||||
|
| |||||||
| 550,318 | ||||||||
BIOTECHNOLOGY — 2.52% |
| |||||||
Alexion Pharmaceuticals Inc.a | 403 | 69,393 | ||||||
Alkermes PLCa | 1,159 | 69,030 | ||||||
Alnylam Pharmaceuticals Inc.a | 696 | 71,625 | ||||||
Amgen Inc. | 459 | 69,667 | ||||||
Baxalta Inc.a | 1,919 | 67,453 | ||||||
Biogen Inc.a | 237 | 70,460 | ||||||
BioMarin Pharmaceutical Inc.a | 550 | 71,082 | ||||||
Celgene Corp.a | 591 | 69,785 | ||||||
Gilead Sciences Inc. | 650 | 68,296 | ||||||
Incyte Corp.a | 656 | 76,221 | ||||||
Isis Pharmaceuticals Inc.a,b | 1,435 | 72,008 | ||||||
Medivation Inc.a | 774 | 68,158 | ||||||
Puma Biotechnology Inc.a,b | 823 | 75,650 | ||||||
SCHEDULESOF INVESTMENTS | 37 |
Table of Contents
Schedule of Investments (Continued)
iSHARES® MSCI USA EQUAL WEIGHTED ETF
August 31, 2015
| Security | Shares | Value | ||||||
Regeneron Pharmaceuticals Inc.a | 134 | $ | 68,809 | |||||
United Therapeutics Corp.a | 437 | 65,821 | ||||||
Vertex Pharmaceuticals Inc.a | 550 | 70,136 | ||||||
|
| |||||||
| 1,123,594 | ||||||||
BUILDING PRODUCTS — 0.31% |
| |||||||
Fortune Brands Home & Security Inc. | 1,439 | 68,856 | ||||||
Masco Corp. | 2,678 | 70,244 | ||||||
|
| |||||||
| 139,100 | ||||||||
CAPITAL MARKETS — 2.84% |
| |||||||
Affiliated Managers Group Inc.a | 371 | 69,169 | ||||||
Ameriprise Financial Inc. | 621 | 69,968 | ||||||
Bank of New York Mellon Corp. (The) | 1,764 | 70,207 | ||||||
BlackRock Inc.c | 226 | 68,358 | ||||||
Charles Schwab Corp. (The) | 2,315 | 70,330 | ||||||
E*TRADE Financial Corp.a | 2,761 | 72,587 | ||||||
Eaton Vance Corp. NVS | 2,016 | 69,895 | ||||||
Franklin Resources Inc. | 1,716 | 69,635 | ||||||
Goldman Sachs Group Inc. (The) | 374 | 70,536 | ||||||
Invesco Ltd. | 2,080 | 70,949 | ||||||
Legg Mason Inc. | 1,551 | 68,756 | ||||||
Morgan Stanley | 2,099 | 72,310 | ||||||
Northern Trust Corp. | 1,021 | 71,307 | ||||||
Raymond James Financial Inc. | 1,330 | 70,477 | ||||||
SEI Investments Co. | 1,412 | 71,419 | ||||||
State Street Corp. | 979 | 70,410 | ||||||
T Rowe Price Group Inc. | 975 | 70,083 | ||||||
TD Ameritrade Holding Corp. | 2,163 | 72,374 | ||||||
|
| |||||||
| 1,268,770 | ||||||||
CHEMICALS — 3.32% |
| |||||||
Air Products & Chemicals Inc. | 494 | 68,928 | ||||||
Airgas Inc. | 720 | 69,494 | ||||||
Albemarle Corp. | 1,557 | 70,392 | ||||||
Ashland Inc. | 674 | 70,750 | ||||||
Axalta Coating Systems Ltd.a | 2,413 | 70,436 | ||||||
Celanese Corp. Series A | 1,223 | 74,163 | ||||||
CF Industries Holdings Inc. | 1,195 | 68,569 | ||||||
Dow Chemical Co. (The) | 1,692 | 74,042 | ||||||
Eastman Chemical Co. | 983 | 71,228 | ||||||
Ecolab Inc. | 638 | 69,631 | ||||||
EI du Pont de Nemours & Co. | 1,359 | 69,989 | ||||||
FMC Corp. | 1,655 | 70,023 | ||||||
International Flavors & Fragrances Inc. | 623 | 68,250 | ||||||
LyondellBasell Industries NV Class A | 858 | 73,256 | ||||||
Monsanto Co. | 745 | 72,749 | ||||||
Mosaic Co. (The) | 1,774 | 72,433 | ||||||
| Security | Shares | Value | ||||||
PPG Industries Inc. | 732 | $ | 69,752 | |||||
Praxair Inc. | 647 | 68,420 | ||||||
Sherwin-Williams Co. (The) | 268 | 68,557 | ||||||
Sigma-Aldrich Corp. | 479 | 66,777 | ||||||
Westlake Chemical Corp. | 1,306 | 72,130 | ||||||
|
| |||||||
| 1,479,969 | ||||||||
COMMERCIAL SERVICES & SUPPLIES — 0.93% |
| |||||||
ADT Corp. (The) | 2,132 | 69,887 | ||||||
Cintas Corp. | 821 | 69,777 | ||||||
Republic Services Inc. | 1,681 | 68,887 | ||||||
Stericycle Inc.a | 491 | 69,300 | ||||||
Tyco International PLC | 1,918 | 69,604 | ||||||
Waste Management Inc. | 1,369 | 68,532 | ||||||
|
| |||||||
| 415,987 | ||||||||
COMMUNICATIONS EQUIPMENT — 1.09% |
| |||||||
Cisco Systems Inc. | 2,708 | 70,083 | ||||||
F5 Networks Inc.a,b | 567 | 68,840 | ||||||
Harris Corp. | 904 | 69,445 | ||||||
Juniper Networks Inc. | 2,679 | 68,877 | ||||||
Motorola Solutions Inc. | 1,103 | 71,496 | ||||||
Palo Alto Networks Inc.a | 421 | 69,137 | ||||||
QUALCOMM Inc. | 1,237 | 69,989 | ||||||
|
| |||||||
| 487,867 | ||||||||
CONSTRUCTION & ENGINEERING — 0.66% |
| |||||||
Chicago Bridge & Iron Co. NVb | 1,691 | 74,877 | ||||||
Fluor Corp. | 1,561 | 71,213 | ||||||
Jacobs Engineering Group Inc.a | 1,799 | 72,698 | ||||||
Quanta Services Inc.a,b | 3,053 | 74,005 | ||||||
|
| |||||||
| 292,793 | ||||||||
CONSTRUCTION MATERIALS — 0.33% |
| |||||||
Martin Marietta Materials Inc. | 432 | 72,490 | ||||||
Vulcan Materials Co. | 775 | 72,555 | ||||||
|
| |||||||
| 145,045 | ||||||||
CONSUMER FINANCE — 0.94% |
| |||||||
Ally Financial Inc.a | 3,206 | 70,083 | ||||||
American Express Co. | 907 | 69,585 | ||||||
Capital One Financial Corp. | 923 | 71,763 | ||||||
Discover Financial Services | 1,331 | 71,515 | ||||||
Navient Corp. | 5,536 | 70,806 | ||||||
Synchrony Financiala | 2,020 | 66,559 | ||||||
|
| |||||||
| 420,311 | ||||||||
CONTAINERS & PACKAGING — 0.93% |
| |||||||
Avery Dennison Corp. | 1,192 | 69,231 | ||||||
Ball Corp. | 1,048 | 69,074 | ||||||
| 38 | 2015 iSHARES ANNUAL REPORTTO SHAREHOLDERS |
Table of Contents
Schedule of Investments (Continued)
iSHARES® MSCI USA EQUAL WEIGHTED ETF
August 31, 2015
| Security | Shares | Value | ||||||
Crown Holdings Inc.a,b | 1,382 | $ | 68,506 | |||||
Packaging Corp. of America | 1,045 | 70,130 | ||||||
Sealed Air Corp. | 1,330 | 68,429 | ||||||
WestRock Co. | 1,201 | 71,279 | ||||||
|
| |||||||
| 416,649 | ||||||||
DISTRIBUTORS — 0.31% |
| |||||||
Genuine Parts Co. | 838 | 69,965 | ||||||
LKQ Corp.a | 2,340 | 70,176 | ||||||
|
| |||||||
| 140,141 | ||||||||
DIVERSIFIED CONSUMER SERVICES — 0.16% |
| |||||||
H&R Block Inc. | 2,062 | 70,149 | ||||||
|
| |||||||
| 70,149 | ||||||||
DIVERSIFIED FINANCIAL SERVICES — 1.25% |
| |||||||
Berkshire Hathaway Inc. Class Ba | 522 | 69,969 | ||||||
CME Group Inc./IL | 748 | 70,641 | ||||||
Intercontinental Exchange Inc. | 300 | 68,523 | ||||||
Leucadia National Corp. | 3,262 | 70,003 | ||||||
McGraw Hill Financial Inc. | 715 | 69,348 | ||||||
Moody’s Corp. | 674 | 68,957 | ||||||
NASDAQ OMX Group Inc. (The) | 1,365 | 69,874 | ||||||
Voya Financial Inc. | 1,681 | 72,417 | ||||||
|
| |||||||
| 559,732 | ||||||||
DIVERSIFIED TELECOMMUNICATION SERVICES — 0.78% |
| |||||||
AT&T Inc. | 2,096 | 69,587 | ||||||
CenturyLink Inc. | 2,648 | 71,602 | ||||||
Frontier Communications Corp. | 13,547 | 68,683 | ||||||
Level 3 Communications Inc.a | 1,545 | 69,108 | ||||||
Verizon Communications Inc. | 1,532 | 70,488 | ||||||
|
| |||||||
| 349,468 | ||||||||
ELECTRIC UTILITIES — 2.12% |
| |||||||
American Electric Power Co. Inc. | 1,257 | 68,242 | ||||||
Duke Energy Corp. | 949 | 67,294 | ||||||
Edison International | 1,159 | 67,778 | ||||||
Entergy Corp. | 1,048 | 68,466 | ||||||
Eversource Energy | 1,411 | 66,656 | ||||||
Exelon Corp. | 2,193 | 67,457 | ||||||
FirstEnergy Corp. | 2,101 | 67,148 | ||||||
NextEra Energy Inc. | 663 | 65,246 | ||||||
OGE Energy Corp. | 2,428 | 68,081 | ||||||
Pepco Holdings Inc. | 2,961 | 68,044 | ||||||
Pinnacle West Capital Corp. | 1,118 | 66,554 | ||||||
PPL Corp. | 2,182 | 67,620 | ||||||
Southern Co. (The) | 1,568 | 68,067 | ||||||
Xcel Energy Inc. | 2,015 | 67,966 | ||||||
|
| |||||||
| 944,619 | ||||||||
| Security | Shares | Value | ||||||
ELECTRICAL EQUIPMENT — 0.95% |
| |||||||
Acuity Brands Inc. | 358 | $ | 69,763 | |||||
AMETEK Inc. | 1,294 | 69,643 | ||||||
Eaton Corp. PLC | 1,265 | 72,181 | ||||||
Emerson Electric Co. | 1,476 | 70,435 | ||||||
Rockwell Automation Inc. | 644 | 72,019 | ||||||
Sensata Technologies Holding NVa,b | 1,491 | 70,673 | ||||||
|
| |||||||
| 424,714 | ||||||||
ELECTRONIC EQUIPMENT, INSTRUMENTS & |
| |||||||
Amphenol Corp. Class A | 1,344 | 70,372 | ||||||
Arrow Electronics Inc.a | 1,312 | 73,367 | ||||||
Avnet Inc. | 1,725 | 73,140 | ||||||
Corning Inc. | 4,173 | 71,817 | ||||||
Flextronics International Ltd.a | 6,732 | 70,753 | ||||||
FLIR Systems Inc. | 2,463 | 70,516 | ||||||
TE Connectivity Ltd. | 1,221 | 72,393 | ||||||
Trimble Navigation Ltd.a | 3,736 | 70,611 | ||||||
|
| |||||||
| 572,969 | ||||||||
ENERGY EQUIPMENT & SERVICES — 2.17% |
| |||||||
Baker Hughes Inc. | 1,396 | 78,176 | ||||||
Cameron International Corp.a | 1,569 | 104,746 | ||||||
Core Laboratories NV | 665 | 76,927 | ||||||
Ensco PLC Class A | 4,432 | 80,264 | ||||||
FMC Technologies Inc.a | 2,320 | 80,690 | ||||||
Halliburton Co. | 1,992 | 78,385 | ||||||
Helmerich & Payne Inc. | 1,309 | 77,244 | ||||||
Nabors Industries Ltd. | 7,206 | 83,157 | ||||||
National Oilwell Varco Inc. | 1,784 | 75,517 | ||||||
Oceaneering International Inc. | 1,798 | 78,788 | ||||||
Schlumberger Ltd. | 919 | 71,103 | ||||||
Weatherford International PLCa | 8,331 | 84,560 | ||||||
|
| |||||||
| 969,557 | ||||||||
FOOD & STAPLES RETAILING — 1.25% |
| |||||||
Costco Wholesale Corp. | 502 | 70,305 | ||||||
CVS Health Corp. | 667 | 68,301 | ||||||
Kroger Co. (The) | 1,980 | 68,310 | ||||||
Rite Aid Corp.a | 8,600 | 70,950 | ||||||
Sysco Corp. | 1,740 | 69,374 | ||||||
Wal-Mart Stores Inc. | 1,056 | 68,355 | ||||||
Walgreens Boots Alliance Inc. | 823 | 71,231 | ||||||
Whole Foods Market Inc. | 2,110 | 69,123 | ||||||
|
| |||||||
| 555,949 | ||||||||
SCHEDULESOF INVESTMENTS | 39 |
Table of Contents
Schedule of Investments (Continued)
iSHARES® MSCI USA EQUAL WEIGHTED ETF
August 31, 2015
| Security | Shares | Value | ||||||
FOOD PRODUCTS — 2.51% |
| |||||||
Archer-Daniels-Midland Co. | 1,550 | $ | 69,734 | |||||
Bunge Ltd. | 967 | 70,059 | ||||||
Campbell Soup Co. | 1,444 | 69,298 | ||||||
ConAgra Foods Inc. | 1,652 | 68,855 | ||||||
General Mills Inc. | 1,216 | 69,020 | ||||||
Hershey Co. (The) | 783 | 70,094 | ||||||
Hormel Foods Corp. | 1,134 | 69,287 | ||||||
JM Smucker Co. (The) | 624 | 73,457 | ||||||
Kellogg Co. | 1,024 | 67,871 | ||||||
Keurig Green Mountain Inc. | 1,283 | 72,618 | ||||||
Kraft Heinz Co. (The) | 949 | 68,954 | ||||||
McCormick & Co. Inc./MD | 877 | 69,529 | ||||||
Mead Johnson Nutrition Co. | 884 | 69,253 | ||||||
Mondelez International Inc. Class A | 1,614 | 68,369 | ||||||
Tyson Foods Inc. Class A | 1,677 | 70,904 | ||||||
WhiteWave Foods Co. (The)a | 1,583 | 73,040 | ||||||
|
| |||||||
| 1,120,342 | ||||||||
HEALTH CARE EQUIPMENT & SUPPLIES — 2.48% |
| |||||||
Abbott Laboratories | 1,554 | 70,381 | ||||||
Baxter International Inc. | 1,803 | 69,325 | ||||||
Becton Dickinson and Co. | 484 | 68,254 | ||||||
Boston Scientific Corp.a | 4,224 | 70,710 | ||||||
Cooper Companies Inc. (The) | 425 | 69,028 | ||||||
CR Bard Inc. | 362 | 70,152 | ||||||
DENTSPLY International Inc. | 1,305 | 68,395 | ||||||
Edwards Lifesciences Corp.a | 491 | 69,172 | ||||||
Hologic Inc.a | 1,754 | 68,073 | ||||||
Intuitive Surgical Inc.a | 135 | 68,978 | ||||||
Medtronic PLC | 954 | 68,965 | ||||||
ResMed Inc. | 1,319 | 68,509 | ||||||
St. Jude Medical Inc. | 976 | 69,110 | ||||||
Stryker Corp. | 698 | 68,858 | ||||||
Varian Medical Systems Inc.a | 864 | 70,200 | ||||||
Zimmer Biomet Holdings Inc. | 680 | 70,421 | ||||||
|
| |||||||
| 1,108,531 | ||||||||
HEALTH CARE PROVIDERS & SERVICES — 2.77% |
| |||||||
Aetna Inc. | 603 | 69,056 | ||||||
AmerisourceBergen Corp. | 684 | 68,427 | ||||||
Anthem Inc. | 483 | 68,127 | ||||||
Cardinal Health Inc. | 839 | 69,025 | ||||||
Centene Corp.a | 1,100 | 67,892 | ||||||
Cigna Corp. | 498 | 70,113 | ||||||
DaVita HealthCare Partners Inc.a | 897 | 67,849 | ||||||
Envision Healthcare Holdings Inc.a | 1,652 | 67,683 | ||||||
| Security | Shares | Value | ||||||
Express Scripts Holding Co.a | 824 | $ | 68,886 | |||||
HCA Holdings Inc.a | 802 | 69,469 | ||||||
Henry Schein Inc.a | 504 | 68,952 | ||||||
Humana Inc. | 380 | 69,460 | ||||||
Laboratory Corp. of America Holdingsa | 581 | 68,448 | ||||||
McKesson Corp. | 354 | 69,943 | ||||||
Patterson Companies Inc. | 1,410 | 64,620 | ||||||
Quest Diagnostics Inc. | 1,021 | 69,224 | ||||||
UnitedHealth Group Inc. | 606 | 70,114 | ||||||
Universal Health Services Inc. Class B | 504 | 69,119 | ||||||
|
| |||||||
| 1,236,407 | ||||||||
HEALTH CARE TECHNOLOGY — 0.15% |
| |||||||
Cerner Corp.a | 1,106 | 68,307 | ||||||
|
| |||||||
| 68,307 | ||||||||
HOTELS, RESTAURANTS & LEISURE — 2.48% |
| |||||||
Aramark | 2,185 | 68,478 | ||||||
Carnival Corp. | 1,408 | 69,316 | ||||||
Chipotle Mexican Grill Inc.a | 97 | 68,871 | ||||||
Darden Restaurants Inc. | 997 | 67,806 | ||||||
Hilton Worldwide Holdings Inc. | 2,831 | 70,294 | ||||||
Las Vegas Sands Corp. | 1,490 | 68,883 | ||||||
Marriott International Inc./MD Class A | 1,001 | 70,731 | ||||||
McDonald’s Corp. | 731 | 69,460 | ||||||
MGM Resorts Internationala | 3,470 | 70,892 | ||||||
Norwegian Cruise Line Holdings Ltd.a | 1,216 | 70,041 | ||||||
Royal Caribbean Cruises Ltd. | 784 | 69,117 | ||||||
Starbucks Corp. | 1,305 | 71,396 | ||||||
Starwood Hotels & Resorts Worldwide Inc. | 957 | 68,397 | ||||||
Wyndham Worldwide Corp. | 898 | 68,679 | ||||||
Wynn Resorts Ltd. | 880 | 66,044 | ||||||
Yum! Brands Inc. | 876 | 69,878 | ||||||
|
| |||||||
| 1,108,283 | ||||||||
HOUSEHOLD DURABLES — 1.72% |
| |||||||
DR Horton Inc. | 2,357 | 71,582 | ||||||
Garmin Ltd. | 1,816 | 68,300 | ||||||
Harman International Industries Inc. | 714 | 69,786 | ||||||
Jarden Corp.a | 1,362 | 69,925 | ||||||
Leggett & Platt Inc. | 1,514 | 67,252 | ||||||
Lennar Corp. Class A | 1,383 | 70,395 | ||||||
Mohawk Industries Inc.a | 352 | 69,333 | ||||||
Newell Rubbermaid Inc. | 1,691 | 71,242 | ||||||
PulteGroup Inc. | 3,525 | 72,932 | ||||||
Toll Brothers Inc.a | 1,900 | 70,243 | ||||||
Whirlpool Corp. | 400 | 67,240 | ||||||
|
| |||||||
| 768,230 | ||||||||
| 40 | 2015 iSHARES ANNUAL REPORTTO SHAREHOLDERS |
Table of Contents
Schedule of Investments (Continued)
iSHARES® MSCI USA EQUAL WEIGHTED ETF
August 31, 2015
| Security | Shares | Value | ||||||
HOUSEHOLD PRODUCTS — 0.77% |
| |||||||
Church & Dwight Co. Inc. | 803 | $ | 69,283 | |||||
Clorox Co. (The) | 620 | 68,925 | ||||||
Colgate-Palmolive Co. | 1,104 | 69,342 | ||||||
Kimberly-Clark Corp. | 645 | 68,712 | ||||||
Procter & Gamble Co. (The) | 974 | 68,833 | ||||||
|
| |||||||
| 345,095 | ||||||||
INDEPENDENT POWER AND RENEWABLE ELECTRICITY PRODUCERS — 0.47% |
| |||||||
AES Corp./VA | 5,877 | 70,524 | ||||||
Calpine Corp.a | 4,402 | 70,168 | ||||||
NRG Energy Inc. | 3,526 | 70,238 | ||||||
|
| |||||||
| 210,930 | ||||||||
INDUSTRIAL CONGLOMERATES — 0.63% |
| |||||||
3M Co. | 484 | 68,796 | ||||||
Danaher Corp. | 801 | 69,703 | ||||||
General Electric Co. | 2,865 | 71,109 | ||||||
Roper Technologies Inc. | 432 | 70,023 | ||||||
|
| |||||||
| 279,631 | ||||||||
INSURANCE — 4.65% |
| |||||||
ACE Ltd. | 668 | 68,243 | ||||||
Aflac Inc. | 1,207 | 70,730 | ||||||
Alleghany Corp.a | 147 | 69,059 | ||||||
Allstate Corp. (The) | 1,170 | 68,188 | ||||||
American International Group Inc. | 1,177 | 71,020 | ||||||
Aon PLC | 746 | 69,706 | ||||||
Arch Capital Group Ltd.a | 999 | 68,212 | ||||||
Arthur J Gallagher & Co. | 1,564 | 68,378 | ||||||
Assurant Inc. | 925 | 68,774 | ||||||
Axis Capital Holdings Ltd. | 1,250 | 70,000 | ||||||
Chubb Corp. (The) | 559 | 67,533 | ||||||
Cincinnati Financial Corp. | 1,309 | 68,500 | ||||||
Everest Re Group Ltd. | 397 | 69,797 | ||||||
FNF Group | 1,837 | 66,885 | ||||||
Hartford Financial Services Group Inc. (The) | 1,491 | 68,511 | ||||||
Lincoln National Corp. | 1,410 | 71,614 | ||||||
Loews Corp. | 1,885 | 68,708 | ||||||
Marsh & McLennan Companies Inc. | 1,285 | 69,043 | ||||||
MetLife Inc. | 1,431 | 71,693 | ||||||
PartnerRe Ltd. | 483 | 66,852 | ||||||
Principal Financial Group Inc. | 1,367 | 68,828 | ||||||
Progressive Corp. (The) | 2,334 | 69,927 | ||||||
Prudential Financial Inc. | 898 | 72,469 | ||||||
RenaissanceRe Holdings Ltd. | 671 | 68,408 | ||||||
| Security | Shares | Value | ||||||
Torchmark Corp. | 1,198 | $ | 70,035 | |||||
Travelers Companies Inc. (The) | 682 | 67,893 | ||||||
Unum Group | 2,095 | 70,266 | ||||||
Willis Group Holdings PLC | 1,556 | 67,048 | ||||||
WR Berkley Corp. | 1,283 | 69,641 | ||||||
XL Group PLC | 1,819 | 67,831 | ||||||
|
| |||||||
| 2,073,792 | ||||||||
INTERNET & CATALOG RETAIL — 0.96% |
| |||||||
Amazon.com Inc.a | 143 | 73,343 | ||||||
Expedia Inc. | 615 | 70,719 | ||||||
Liberty Interactive Corp. QVC Group Series Aa | 2,504 | 67,708 | ||||||
Netflix Inc.a | 657 | 75,575 | ||||||
Priceline Group Inc. (The)a | 57 | 71,172 | ||||||
TripAdvisor Inc.a | 1,002 | 70,040 | ||||||
|
| |||||||
| 428,557 | ||||||||
INTERNET SOFTWARE & SERVICES — 1.59% |
| |||||||
Akamai Technologies Inc.a | 1,016 | 72,451 | ||||||
eBay Inc.a | 2,642 | 71,625 | ||||||
Facebook Inc. Class Aa | 803 | 71,812 | ||||||
Google Inc. Class Aa | 54 | 34,982 | ||||||
Google Inc. Class Ca | 58 | 35,859 | ||||||
LinkedIn Corp. Class Aa | 392 | 70,795 | ||||||
Rackspace Hosting Inc.a | 2,328 | 70,794 | ||||||
Twitter Inc.a,b | 2,734 | 75,978 | ||||||
VeriSign Inc.a,b | 1,011 | 69,698 | ||||||
Yahoo! Inc.a | 2,100 | 67,704 | ||||||
Zillow Group Inc. Class Aa,b | 912 | 23,147 | ||||||
Zillow Group Inc. Class Ca,b | 1,788 | 44,092 | ||||||
|
| |||||||
| 708,937 | ||||||||
IT SERVICES — 2.99% |
| |||||||
Accenture PLC Class A | 723 | 68,157 | ||||||
Alliance Data Systems Corp.a | 269 | 69,184 | ||||||
Automatic Data Processing Inc. | 907 | 70,129 | ||||||
Cognizant Technology Solutions Corp. Class Aa | 1,130 | 71,122 | ||||||
Computer Sciences Corp. | 1,113 | 68,995 | ||||||
Fidelity National Information Services Inc. | 1,020 | 70,441 | ||||||
Fiserv Inc.a | 832 | 70,945 | ||||||
FleetCor Technologies Inc.a | 466 | 69,509 | ||||||
Gartner Inc.a | 806 | 68,921 | ||||||
International Business Machines Corp. | 473 | 69,952 | ||||||
MasterCard Inc. Class A | 768 | 70,940 | ||||||
Paychex Inc. | 1,553 | 69,357 | ||||||
SCHEDULESOF INVESTMENTS | 41 |
Table of Contents
Schedule of Investments (Continued)
iSHARES® MSCI USA EQUAL WEIGHTED ETF
August 31, 2015
| Security | Shares | Value | ||||||
PayPal Holdings Inc.a | 2,039 | $ | 71,365 | |||||
Teradata Corp.a | 2,406 | 70,327 | ||||||
Total System Services Inc. | 1,563 | 71,632 | ||||||
Vantiv Inc. Class Aa | 1,614 | 71,081 | ||||||
Visa Inc. Class A | 995 | 70,944 | ||||||
Western Union Co. (The) | 3,742 | 69,002 | ||||||
Xerox Corp. | 6,900 | 70,173 | ||||||
|
| |||||||
| 1,332,176 | ||||||||
LEISURE PRODUCTS — 0.48% |
| |||||||
Hasbro Inc. | 932 | 69,518 | ||||||
Mattel Inc. | 3,109 | 72,844 | ||||||
Polaris Industries Inc. | 542 | 70,389 | ||||||
|
| |||||||
| 212,751 | ||||||||
LIFE SCIENCES TOOLS & SERVICES — 0.94% |
| |||||||
Agilent Technologies Inc. | 1,940 | 70,441 | ||||||
Illumina Inc.a | 352 | 69,559 | ||||||
Mettler-Toledo International Inc.a | 232 | 68,800 | ||||||
Quintiles Transnational Holdings Inc.a | 939 | 69,965 | ||||||
Thermo Fisher Scientific Inc. | 555 | 69,580 | ||||||
Waters Corp.a | 570 | 69,187 | ||||||
|
| |||||||
| 417,532 | ||||||||
MACHINERY — 2.53% |
| |||||||
AGCO Corp. | 1,440 | 70,618 | ||||||
Caterpillar Inc. | 925 | 70,707 | ||||||
Cummins Inc. | 580 | 70,615 | ||||||
Deere & Co. | 843 | 68,941 | ||||||
Dover Corp. | 1,190 | 73,720 | ||||||
Flowserve Corp. | 1,564 | 70,583 | ||||||
Illinois Tool Works Inc. | 832 | 70,329 | ||||||
Ingersoll-Rand PLC | 1,227 | 67,841 | ||||||
PACCAR Inc. | 1,192 | 70,292 | ||||||
Parker-Hannifin Corp. | 664 | 71,486 | ||||||
Pentair PLC | 1,258 | 69,555 | ||||||
Snap-on Inc. | 440 | 70,299 | ||||||
Stanley Black & Decker Inc. | 704 | 71,470 | ||||||
WABCO Holdings Inc.a | 606 | 69,884 | ||||||
Wabtec Corp./DE | 733 | 70,192 | ||||||
Xylem Inc./NY | 2,188 | 71,001 | ||||||
|
| |||||||
| 1,127,533 | ||||||||
MEDIA — 2.96% |
| |||||||
Cablevision Systems Corp. Class A | 2,950 | 74,251 | ||||||
CBS Corp. Class B NVS | 1,540 | 69,670 | ||||||
Charter Communications Inc. Class Aa,b | 389 | 70,646 | ||||||
Comcast Corp. Class A | 1,039 | 58,527 | ||||||
| Security | Shares | Value | ||||||
Comcast Corp. Class A Special NVS | 196 | $ | 11,219 | |||||
Discovery Communications Inc. Class Aa,b | 947 | 25,190 | ||||||
Discovery Communications Inc. Class C NVSa,b | 1,742 | 44,177 | ||||||
DISH Network Corp. Class Aa | 1,153 | 68,338 | ||||||
Interpublic Group of Companies Inc. (The) | 3,605 | 68,062 | ||||||
Liberty Global PLC Series Aa | 434 | 20,884 | ||||||
Liberty Global PLC Series C NVSa | 1,066 | 47,831 | ||||||
Liberty Media Corp. Class Aa | 608 | 22,648 | ||||||
Liberty Media Corp. Class Ca | 1,317 | 47,702 | ||||||
News Corp. Class Aa | 5,151 | 70,208 | ||||||
Omnicom Group Inc. | 1,007 | 67,449 | ||||||
Scripps Networks Interactive Inc. Class A | 1,297 | 68,858 | ||||||
Sirius XM Holdings Inc.a | 18,361 | 70,047 | ||||||
TEGNA Inc. | 2,973 | 70,728 | ||||||
Time Warner Cable Inc. | 369 | 68,641 | ||||||
Time Warner Inc. | 957 | 68,043 | ||||||
Twenty-First Century Fox Inc. Class A | 1,846 | 50,562 | ||||||
Twenty-First Century Fox Inc. Class B | 644 | 17,813 | ||||||
Viacom Inc. Class B NVS | 1,728 | 70,451 | ||||||
Walt Disney Co. (The) | 695 | 70,807 | ||||||
|
| |||||||
| 1,322,752 | ||||||||
METALS & MINING — 0.68% |
| |||||||
Alcoa Inc. | 8,218 | 77,660 | ||||||
Freeport-McMoRan Inc. | 8,089 | 86,067 | ||||||
Newmont Mining Corp. | 4,122 | 70,362 | ||||||
Nucor Corp. | 1,644 | 71,169 | ||||||
|
| |||||||
| 305,258 | ||||||||
MULTI-UTILITIES — 1.97% |
| |||||||
Alliant Energy Corp. | 1,188 | 67,324 | ||||||
Ameren Corp. | 1,676 | 67,526 | ||||||
CenterPoint Energy Inc. | 3,719 | 69,248 | ||||||
CMS Energy Corp. | 2,036 | 66,740 | ||||||
Consolidated Edison Inc. | 1,072 | 67,439 | ||||||
Dominion Resources Inc./VA | 949 | 66,193 | ||||||
DTE Energy Co. | 871 | 67,990 | ||||||
MDU Resources Group Inc. | 4,064 | 72,786 | ||||||
PG&E Corp. | 1,362 | 67,528 | ||||||
Public Service Enterprise Group Inc. | 1,671 | 67,258 | ||||||
SCANA Corp. | 1,277 | 67,541 | ||||||
Sempra Energy | 686 | 65,067 | ||||||
WEC Energy Group Inc. | 1,416 | 67,472 | ||||||
|
| |||||||
| 880,112 | ||||||||
| 42 | 2015 iSHARES ANNUAL REPORTTO SHAREHOLDERS |
Table of Contents
Schedule of Investments (Continued)
iSHARES® MSCI USA EQUAL WEIGHTED ETF
August 31, 2015
| Security | Shares | Value | ||||||
MULTILINE RETAIL — 0.92% |
| |||||||
Dollar General Corp. | 900 | $ | 67,041 | |||||
Dollar Tree Inc.a | 911 | 69,473 | ||||||
Kohl’s Corp. | 1,355 | 69,146 | ||||||
Macy’s Inc. | 1,174 | 68,808 | ||||||
Nordstrom Inc. | 934 | 68,070 | ||||||
Target Corp. | 902 | 70,094 | ||||||
|
| |||||||
| 412,632 | ||||||||
OIL, GAS & CONSUMABLE FUELS — 6.27% |
| |||||||
Anadarko Petroleum Corp. | 1,042 | 74,586 | ||||||
Antero Resources Corp.a,b | 3,084 | 79,691 | ||||||
Apache Corp. | 1,713 | 77,496 | ||||||
Cabot Oil & Gas Corp. | 3,129 | 74,063 | ||||||
Cheniere Energy Inc.a | 1,142 | 70,975 | ||||||
Chesapeake Energy Corp.b | 11,053 | 86,324 | ||||||
Chevron Corp. | 952 | 77,103 | ||||||
Cimarex Energy Co. | 672 | 74,263 | ||||||
Cobalt International Energy Inc.a,b | 8,394 | 67,236 | ||||||
Columbia Pipeline Group Inc. | 2,846 | 72,175 | ||||||
Concho Resources Inc.a | 720 | 77,875 | ||||||
ConocoPhillips | 1,580 | 77,657 | ||||||
CONSOL Energy Inc. | 5,445 | 82,927 | ||||||
Continental Resources Inc./OKa,b | 2,526 | 81,085 | ||||||
Devon Energy Corp. | 1,820 | 77,641 | ||||||
Energen Corp. | 1,509 | 78,468 | ||||||
EOG Resources Inc. | 975 | 76,352 | ||||||
EQT Corp. | 936 | 72,840 | ||||||
Exxon Mobil Corp. | 970 | 72,983 | ||||||
Hess Corp. | 1,335 | 79,366 | ||||||
HollyFrontier Corp. | 1,478 | 69,259 | ||||||
Kinder Morgan Inc./DE | 2,227 | 72,177 | ||||||
Marathon Oil Corp. | 4,747 | 82,076 | ||||||
Marathon Petroleum Corp. | 1,523 | 72,053 | ||||||
Murphy Oil Corp. | 2,478 | 76,818 | ||||||
Noble Energy Inc. | 2,171 | 72,533 | ||||||
Occidental Petroleum Corp. | 1,014 | 74,032 | ||||||
ONEOK Inc. | 2,107 | 75,873 | ||||||
Phillips 66 | 945 | 74,721 | ||||||
Pioneer Natural Resources Co. | 622 | 76,543 | ||||||
Range Resources Corp. | 1,972 | 76,159 | ||||||
Southwestern Energy Co.a,b | 4,509 | 73,226 | ||||||
Spectra Energy Corp. | 2,551 | 74,158 | ||||||
Tesoro Corp. | 752 | 69,192 | ||||||
Valero Energy Corp. | 1,157 | 68,656 | ||||||
Whiting Petroleum Corp.a | 4,528 | 87,526 | ||||||
| Security | Shares | Value | ||||||
Williams Companies Inc. (The) | 1,492 | $ | 71,914 | |||||
|
| |||||||
| 2,798,022 | ||||||||
PAPER & FOREST PRODUCTS — 0.16% |
| |||||||
International Paper Co. | 1,638 | 70,663 | ||||||
|
| |||||||
| 70,663 | ||||||||
PERSONAL PRODUCTS — 0.31% |
| |||||||
Edgewell Personal Care Co. | 797 | 70,184 | ||||||
Estee Lauder Companies Inc. (The) Class A | 881 | 70,277 | ||||||
|
| |||||||
| 140,461 | ||||||||
PHARMACEUTICALS — 2.18% |
| |||||||
AbbVie Inc. | 1,098 | 68,526 | ||||||
Allergan PLCa | 229 | 69,557 | ||||||
Bristol-Myers Squibb Co. | 1,152 | 68,509 | ||||||
Eli Lilly & Co. | 852 | 70,162 | ||||||
Endo International PLCa | 912 | 70,224 | ||||||
Hospira Inc.a | 742 | 66,758 | ||||||
Jazz Pharmaceuticals PLCa | 415 | 70,060 | ||||||
Johnson & Johnson | 735 | 69,075 | ||||||
Mallinckrodt PLCa | 847 | 73,045 | ||||||
Merck & Co. Inc. | 1,303 | 70,167 | ||||||
Mylan NVa | 1,357 | 67,294 | ||||||
Perrigo Co. PLC | 374 | 68,431 | ||||||
Pfizer Inc. | 2,127 | 68,532 | ||||||
Zoetis Inc. | 1,566 | 70,266 | ||||||
|
| |||||||
| 970,606 | ||||||||
PROFESSIONAL SERVICES — 1.24% |
| |||||||
Dun & Bradstreet Corp. (The) | 659 | 69,834 | ||||||
Equifax Inc. | 719 | 70,390 | ||||||
IHS Inc. Class Aa | 593 | 68,800 | ||||||
ManpowerGroup Inc. | 808 | 70,215 | ||||||
Nielsen Holdings PLC | 1,557 | 70,423 | ||||||
Robert Half International Inc. | 1,322 | 67,462 | ||||||
Towers Watson & Co. Class A | 555 | 65,895 | ||||||
Verisk Analytics Inc. Class Aa | 942 | 68,842 | ||||||
|
| |||||||
| 551,861 | ||||||||
REAL ESTATE INVESTMENT TRUSTS (REITS) — 5.52% |
| |||||||
American Capital Agency Corp. | 3,493 | 66,821 | ||||||
American Tower Corp. | 745 | 68,682 | ||||||
Annaly Capital Management Inc. | 6,746 | 67,865 | ||||||
AvalonBay Communities Inc. | 410 | 67,675 | ||||||
Boston Properties Inc. | 613 | 69,502 | ||||||
Brixmor Property Group Inc.b | 2,908 | 66,361 | ||||||
Camden Property Trust | 933 | 67,204 | ||||||
SCHEDULESOF INVESTMENTS | 43 |
Table of Contents
Schedule of Investments (Continued)
iSHARES® MSCI USA EQUAL WEIGHTED ETF
August 31, 2015
| Security | Shares | Value | ||||||
Communications Sales & Leasing Inc./CSL Capital LLCa,b | 3,373 | $ | 67,797 | |||||
Crown Castle International Corp. | 838 | 69,881 | ||||||
Digital Realty Trust Inc.b | 1,078 | 68,259 | ||||||
Duke Realty Corp.b | 3,785 | 68,357 | ||||||
Equinix Inc. | 265 | 71,489 | ||||||
Equity Residential | 967 | 68,899 | ||||||
Essex Property Trust Inc. | 318 | 68,249 | ||||||
Extra Space Storage Inc. | 952 | 69,953 | ||||||
Federal Realty Investment Trust | 533 | 68,800 | ||||||
General Growth Properties Inc. | 2,675 | 67,892 | ||||||
HCP Inc. | 1,811 | 67,116 | ||||||
Health Care REIT Inc. | 1,061 | 67,214 | ||||||
Host Hotels & Resorts Inc. | 3,921 | 69,519 | ||||||
Iron Mountain Inc. | 2,513 | 71,218 | ||||||
Kimco Realty Corp. | 2,949 | 67,974 | ||||||
Liberty Property Trust | 2,206 | 67,812 | ||||||
Macerich Co. (The) | 916 | 69,781 | ||||||
Plum Creek Timber Co. Inc.b | 1,749 | 67,319 | ||||||
Prologis Inc. | 1,829 | 69,502 | ||||||
Public Storage | 338 | 68,029 | ||||||
Realty Income Corp. | 1,499 | 66,990 | ||||||
Regency Centers Corp.b | 1,167 | 69,215 | ||||||
Simon Property Group Inc. | 376 | 67,424 | ||||||
SL Green Realty Corp.b | 654 | 67,696 | ||||||
UDR Inc. | 2,140 | 69,122 | ||||||
Ventas Inc. | 1,213 | 66,739 | ||||||
VEREIT Inc. | 8,490 | 69,109 | ||||||
Vornado Realty Trust | 786 | 68,531 | ||||||
Weyerhaeuser Co. | 2,478 | 69,235 | ||||||
|
| |||||||
| 2,463,231 | ||||||||
REAL ESTATE MANAGEMENT & DEVELOPMENT — 0.46% |
| |||||||
CBRE Group Inc. Class Aa | 2,111 | 67,594 | ||||||
Jones Lang LaSalle Inc. | 450 | 66,991 | ||||||
Realogy Holdings Corp.a | 1,702 | 68,591 | ||||||
|
| |||||||
| 203,176 | ||||||||
ROAD & RAIL — 0.96% |
| |||||||
CSX Corp. | 2,634 | 72,119 | ||||||
Hertz Global Holdings Inc.a | 4,062 | 74,863 | ||||||
JB Hunt Transport Services Inc. | 921 | 67,030 | ||||||
Kansas City Southern | 770 | 71,410 | ||||||
Norfolk Southern Corp. | 916 | 71,365 | ||||||
Union Pacific Corp. | 827 | 70,907 | ||||||
|
| |||||||
| 427,694 | ||||||||
| Security | Shares | Value | ||||||
SEMICONDUCTORS & SEMICONDUCTOR EQUIPMENT — 3.28% |
| |||||||
Altera Corp. | 1,432 | $ | 69,524 | |||||
Analog Devices Inc. | 1,317 | 73,568 | ||||||
Applied Materials Inc. | 4,491 | 72,238 | ||||||
Avago Technologies Ltd.b | 614 | 77,345 | ||||||
Broadcom Corp. Class A | 1,413 | 73,010 | ||||||
Freescale Semiconductor Ltd.a | 1,943 | 69,423 | ||||||
Intel Corp. | 2,577 | 73,548 | ||||||
KLA-Tencor Corp. | 1,439 | 72,108 | ||||||
Lam Research Corp. | 989 | 71,969 | ||||||
Linear Technology Corp. | 1,782 | 71,779 | ||||||
Marvell Technology Group Ltd. | 6,421 | 72,365 | ||||||
Maxim Integrated Products Inc. | 2,170 | 73,064 | ||||||
Microchip Technology Inc. | 1,684 | 71,570 | ||||||
Micron Technology Inc.a | 4,671 | 76,651 | ||||||
NVIDIA Corp. | 3,287 | 73,892 | ||||||
Qorvo Inc.a | 1,338 | 74,272 | ||||||
Skyworks Solutions Inc. | 827 | 72,238 | ||||||
SunEdison Inc.a,b | 7,574 | 78,770 | ||||||
Texas Instruments Inc. | 1,532 | 73,291 | ||||||
Xilinx Inc. | 1,719 | 72,009 | ||||||
|
| |||||||
| 1,462,634 | ||||||||
SOFTWARE — 3.57% |
| |||||||
Activision Blizzard Inc. | 2,546 | 72,892 | ||||||
Adobe Systems Inc.a | 894 | 70,242 | ||||||
ANSYS Inc.a | 777 | 68,842 | ||||||
Autodesk Inc.a | 1,384 | 64,702 | ||||||
CA Inc. | 2,607 | 71,145 | ||||||
CDK Global Inc. | 1,488 | 73,716 | ||||||
Citrix Systems Inc.a | 1,007 | 68,587 | ||||||
Electronic Arts Inc.a | 1,049 | 69,391 | ||||||
FireEye Inc.a,b | 1,824 | 68,911 | ||||||
Intuit Inc. | 834 | 71,516 | ||||||
Microsoft Corp. | 1,647 | 71,677 | ||||||
NetSuite Inc.a,b | 766 | 68,059 | ||||||
Nuance Communications Inc.a | 4,179 | 68,828 | ||||||
Oracle Corp. | 1,880 | 69,729 | ||||||
Red Hat Inc.a | 967 | 69,827 | ||||||
salesforce.com inc.a | 1,023 | 70,955 | ||||||
ServiceNow Inc.a | 971 | 68,902 | ||||||
Splunk Inc.a | 1,127 | 69,840 | ||||||
Symantec Corp. | 3,351 | 68,662 | ||||||
Synopsys Inc.a | 1,482 | 69,550 | ||||||
Tableau Software Inc. Class Aa | 703 | 66,202 | ||||||
| 44 | 2015 iSHARES ANNUAL REPORTTO SHAREHOLDERS |
Table of Contents
Schedule of Investments (Continued)
iSHARES® MSCI USA EQUAL WEIGHTED ETF
August 31, 2015
| Security | Shares | Value | ||||||
VMware Inc. Class Aa | 821 | $ | 64,982 | |||||
Workday Inc. Class Aa | 952 | 66,888 | ||||||
|
| |||||||
| 1,594,045 | ||||||||
SPECIALTY RETAIL — 3.44% |
| |||||||
Advance Auto Parts Inc. | 389 | 68,172 | ||||||
AutoNation Inc.a | 1,154 | 69,055 | ||||||
AutoZone Inc.a,b | 96 | 68,735 | ||||||
Bed Bath & Beyond Inc.a | 1,110 | 68,942 | ||||||
Best Buy Co. Inc. | 2,023 | 74,325 | ||||||
CarMax Inc.a,b | 1,166 | 71,126 | ||||||
Dick’s Sporting Goods Inc. | 1,418 | 71,084 | ||||||
Foot Locker Inc. | 981 | 69,445 | ||||||
GameStop Corp. Class Ab | 1,519 | 64,527 | ||||||
Gap Inc. (The) | 2,102 | 68,967 | ||||||
Home Depot Inc. (The) | 601 | 69,993 | ||||||
L Brands Inc. | 856 | 71,819 | ||||||
Lowe’s Companies Inc. | 995 | 68,824 | ||||||
O’Reilly Automotive Inc.a | 288 | 69,140 | ||||||
Ross Stores Inc. | 1,411 | 68,603 | ||||||
Signet Jewelers Ltd. | 567 | 78,246 | ||||||
Staples Inc. | 5,034 | 71,533 | ||||||
Tiffany & Co. | 814 | 66,952 | ||||||
TJX Companies Inc. (The) | 968 | 68,070 | ||||||
Tractor Supply Co. | 803 | 68,504 | ||||||
Ulta Salon Cosmetics & Fragrance Inc.a | 435 | 68,769 | ||||||
Urban Outfitters Inc.a | 2,313 | 71,379 | ||||||
|
| |||||||
| 1,536,210 | ||||||||
TECHNOLOGY HARDWARE, STORAGE & PERIPHERALS — 1.16% |
| |||||||
Apple Inc. | 643 | 72,505 | ||||||
EMC Corp./MA | 2,940 | 73,118 | ||||||
Hewlett-Packard Co. | 2,595 | 72,816 | ||||||
NetApp Inc. | 2,293 | 73,284 | ||||||
SanDisk Corp. | 1,445 | 78,839 | ||||||
Seagate Technology PLC | 1,439 | 73,965 | ||||||
Western Digital Corp. | 887 | 72,698 | ||||||
|
| |||||||
| 517,225 | ||||||||
TEXTILES, APPAREL & LUXURY GOODS — 1.45% |
| |||||||
Coach Inc. | 2,347 | 70,997 | ||||||
Hanesbrands Inc. | 2,360 | 71,060 | ||||||
lululemon athletica Inc.a,b | 1,135 | 72,651 | ||||||
Michael Kors Holdings Ltd.a | 1,692 | 73,534 | ||||||
NIKE Inc. Class B | 644 | 71,967 | ||||||
PVH Corp. | 610 | 72,578 | ||||||
Ralph Lauren Corp. | 635 | 70,606 | ||||||
| Security | Shares | Value | ||||||
Under Armour Inc. Class Aa,b | 766 | $ | 73,176 | |||||
VF Corp. | 964 | 69,822 | ||||||
|
| |||||||
| 646,391 | ||||||||
THRIFTS & MORTGAGE FINANCE — 0.32% |
| |||||||
Hudson City Bancorp Inc. | 7,506 | 69,806 | ||||||
New York Community Bancorp Inc. | 4,003 | 70,693 | ||||||
|
| |||||||
| 140,499 | ||||||||
TOBACCO — 0.46% |
| |||||||
Altria Group Inc. | 1,286 | 68,904 | ||||||
Philip Morris International Inc. | 861 | 68,708 | ||||||
Reynolds American Inc. | 813 | 68,088 | ||||||
|
| |||||||
| 205,700 | ||||||||
TRADING COMPANIES & DISTRIBUTORS — 0.48% |
| |||||||
Fastenal Co. | 1,801 | 69,411 | ||||||
United Rentals Inc.a | 1,096 | 75,986 | ||||||
WW Grainger Inc. | 312 | 69,713 | ||||||
|
| |||||||
| 215,110 | ||||||||
WATER UTILITIES — 0.15% |
| |||||||
American Water Works Co. Inc. | 1,298 | 67,418 | ||||||
|
| |||||||
| 67,418 | ||||||||
WIRELESS TELECOMMUNICATION SERVICES — 0.47% |
| |||||||
SBA Communications Corp. Class Aa | 586 | 69,265 | ||||||
Sprint Corp.a,b | 14,489 | 73,315 | ||||||
T-Mobile U.S. Inc.a | 1,748 | 69,238 | ||||||
|
| |||||||
| 211,818 | ||||||||
|
| |||||||
TOTAL COMMON STOCKS |
| |||||||
(Cost: $44,240,680) |
| 44,462,722 | ||||||
SHORT-TERM INVESTMENTS — 1.70% |
| |||||||
MONEY MARKET FUNDS — 1.70% |
| |||||||
BlackRock Cash Funds: Institutional, | ||||||||
0.18%c,d,e | 635,649 | 635,649 | ||||||
BlackRock Cash Funds: Prime, | ||||||||
0.18%c,d,e | 36,502 | 36,502 | ||||||
BlackRock Cash Funds: Treasury, | ||||||||
0.03%c,d | 86,406 | 86,406 | ||||||
|
| |||||||
| 758,557 | ||||||||
|
| |||||||
TOTAL SHORT-TERM INVESTMENTS |
| |||||||
(Cost: $758,557) |
| 758,557 | ||||||
|
| |||||||
SCHEDULESOF INVESTMENTS | 45 |
Table of Contents
Schedule of Investments (Continued)
iSHARES® MSCI USA EQUAL WEIGHTED ETF
August 31, 2015
| Value | ||||||
TOTAL INVESTMENTS | ||||||
(Cost: $44,999,237) | $ | 45,221,279 | ||||
Other Assets, Less Liabilities — (1.32)% | (589,414 | ) | ||||
|
| |||||
NET ASSETS — 100.00% | $ | 44,631,865 | ||||
|
| |||||
NVS | — Non-Voting Shares |
| a | Non-income earning security. |
| b | All or a portion of this security represents a security on loan. See Note 1. |
| c | Affiliated issuer. See Note 2. |
| d | The rate quoted is the annualized seven-day yield of the fund at period end. |
| e | All or a portion of this security represents an investment of securities lending collateral. See Note 1. |
See notes to financial statements.
| 46 | 2015 iSHARES ANNUAL REPORTTO SHAREHOLDERS |
Table of Contents
Statements of Assets and Liabilities
iSHARES® , INC.
August 31, 2015
| iShares MSCI Brazil Capped ETF | iShares MSCI Chile Capped ETF | iShares MSCI Colombia Capped ETF | ||||||||||
ASSETS | ||||||||||||
Investments, at cost: | ||||||||||||
Unaffiliated | $ | 1,969,404,623 | $ | 227,467,483 | $ | 20,522,100 | ||||||
Affiliated (Note 2) | 2,312,655 | 478,553 | 19,541 | |||||||||
|
|
|
|
|
| |||||||
Total cost of investments | $ | 1,971,717,278 | $ | 227,946,036 | $ | 20,541,641 | ||||||
|
|
|
|
|
| |||||||
Investments in securities, at fair value (Note 1): | ||||||||||||
Unaffiliated | $ | 1,977,924,756 | $ | 233,865,202 | $ | 14,228,505 | ||||||
Affiliated (Note 2) | 2,312,655 | 478,553 | 19,541 | |||||||||
|
|
|
|
|
| |||||||
Total fair value of investments | 1,980,237,411 | 234,343,755 | 14,248,046 | |||||||||
Foreign currency, at valuea | 4,170,158 | 24,917 | 8,655 | |||||||||
Receivables: | ||||||||||||
Investment securities sold | 5,499,874 | 5,409,820 | 253,736 | |||||||||
Dividends and interest | 7,843,920 | 26,009 | 4,855 | |||||||||
Capital shares sold | 75,291,536 | 10,418,811 | — | |||||||||
|
|
|
|
|
| |||||||
Total Assets | 2,073,042,899 | 250,223,312 | 14,515,292 | |||||||||
|
|
|
|
|
| |||||||
LIABILITIES | ||||||||||||
Payables: | ||||||||||||
Investment securities purchased | 82,723,144 | 15,571,483 | 257,025 | |||||||||
Investment advisory fees (Note 2) | 1,184,706 | 115,454 | 7,611 | |||||||||
|
|
|
|
|
| |||||||
Total Liabilities | 83,907,850 | 15,686,937 | 264,636 | |||||||||
|
|
|
|
|
| |||||||
NET ASSETS | $ | 1,989,135,049 | $ | 234,536,375 | $ | 14,250,656 | ||||||
|
|
|
|
|
| |||||||
Net assets consist of: | ||||||||||||
Paid-in capital | $ | 4,509,413,407 | $ | 408,620,425 | $ | 27,739,161 | ||||||
Undistributed (distributions in excess of) net investment income | (3,041,915 | ) | 433,024 | (84,898 | ) | |||||||
Accumulated net realized loss | (2,524,324,750 | ) | (180,914,897 | ) | (7,109,221 | ) | ||||||
Net unrealized appreciation (depreciation) | 7,088,307 | 6,397,823 | (6,294,386 | ) | ||||||||
|
|
|
|
|
| |||||||
NET ASSETS | $ | 1,989,135,049 | $ | 234,536,375 | $ | 14,250,656 | ||||||
|
|
|
|
|
| |||||||
Shares outstandingb | 80,500,000 | 6,750,000 | 1,200,000 | |||||||||
|
|
|
|
|
| |||||||
Net asset value per share | $ | 24.71 | $ | 34.75 | $ | 11.88 | ||||||
|
|
|
|
|
| |||||||
| a | Cost of foreign currency: $4,249,020, $24,963 and $9,213, respectively. |
| b | $0.001 par value, number of shares authorized: 500 million, 200 million and 25 million, respectively. |
See notes to financial statements.
FINANCIAL STATEMENTS | 47 |
Table of Contents
Statements of Assets and Liabilities (Continued)
iSHARES®, INC.
August 31, 2015
| iShares MSCI Israel Capped ETF | iShares MSCI Russia Capped ETF | iShares MSCI South Africa ETF | ||||||||||
ASSETS | ||||||||||||
Investments, at cost: | ||||||||||||
Unaffiliated | $ | 152,702,128 | $ | 338,318,378 | $ | 501,389,723 | ||||||
Affiliated (Note 2) | 4,352,471 | 313,635 | 988,488 | |||||||||
|
|
|
|
|
| |||||||
Total cost of investments | $ | 157,054,599 | $ | 338,632,013 | $ | 502,378,211 | ||||||
|
|
|
|
|
| |||||||
Investments in securities, at fair value (including securities on loana) (Note 1): | ||||||||||||
Unaffiliated | $ | 125,749,450 | $ | 211,600,768 | $ | 372,196,172 | ||||||
Affiliated (Note 2) | 4,352,471 | 313,635 | 988,488 | |||||||||
|
|
|
|
|
| |||||||
Total fair value of investments | 130,101,921 | 211,914,403 | 373,184,660 | |||||||||
Foreign currency, at valueb | 84,728 | — | 983,175 | |||||||||
Cash | — | 166,197 | — | |||||||||
Receivables: | ||||||||||||
Investment securities sold | 2,509,454 | 3,612,618 | 2,774,559 | |||||||||
Dividends and interest | 366,950 | 22,416 | 95,498 | |||||||||
Capital shares sold | — | — | 44,084 | |||||||||
|
|
|
|
|
| |||||||
Total Assets | 133,063,053 | 215,715,634 | 377,081,976 | |||||||||
|
|
|
|
|
| |||||||
LIABILITIES | ||||||||||||
Payables: | ||||||||||||
Investment securities purchased | 2,179,557 | 4,682,502 | 2,615,137 | |||||||||
Collateral for securities on loan (Note 1) | 4,332,212 | — | 922,085 | |||||||||
Securities related to in-kind transactions (Note 4) | 178,526 | — | — | |||||||||
Investment advisory fees (Note 2) | 87,890 | 120,827 | 198,483 | |||||||||
|
|
|
|
|
| |||||||
Total Liabilities | 6,778,185 | 4,803,329 | 3,735,705 | |||||||||
|
|
|
|
|
| |||||||
NET ASSETS | $ | 126,284,868 | $ | 210,912,305 | $ | 373,346,271 | ||||||
|
|
|
|
|
| |||||||
Net assets consist of: | ||||||||||||
Paid-in capital | $ | 191,408,180 | $ | 387,667,617 | $ | 598,593,305 | ||||||
Undistributed net investment income | 396,916 | 5,010,420 | 301,134 | |||||||||
Accumulated net realized loss | (38,563,016 | ) | (55,040,152 | ) | (96,341,155 | ) | ||||||
Net unrealized depreciation | (26,957,212 | ) | (126,725,580 | ) | (129,207,013 | ) | ||||||
|
|
|
|
|
| |||||||
NET ASSETS | $ | 126,284,868 | $ | 210,912,305 | $ | 373,346,271 | ||||||
|
|
|
|
|
| |||||||
Shares outstandingc | 2,500,000 | 16,850,000 | 6,500,000 | |||||||||
|
|
|
|
|
| |||||||
Net asset value per share | $ | 50.51 | $ | 12.52 | $ | 57.44 | ||||||
|
|
|
|
|
| |||||||
| a | Securities on loan with values of $4,047,917, $ — and $877,856, respectively. See Note 1. |
| b | Cost of foreign currency: $86,094, $ — and $996,045, respectively. |
| c | $0.001 par value, number of shares authorized: 500 million, 1 billion and 400 million, respectively. |
See notes to financial statements.
| 48 | 2015 iSHARES ANNUAL REPORTTO SHAREHOLDERS |
Table of Contents
Statements of Assets and Liabilities (Continued)
iSHARES®, INC.
August 31, 2015
| iShares MSCI Turkey ETF | iShares MSCI USA Equal Weighted ETF | |||||||
ASSETS | ||||||||
Investments, at cost: | ||||||||
Unaffiliated | $ | 616,151,120 | $ | 44,105,570 | ||||
Affiliated (Note 2) | 61,025,313 | 893,667 | ||||||
|
|
|
| |||||
Total cost of investments | $ | 677,176,433 | $ | 44,999,237 | ||||
|
|
|
| |||||
Investments in securities, at fair value (including securities on loana) (Note 1): | ||||||||
Unaffiliated | $ | 370,773,367 | $ | 44,323,655 | ||||
Affiliated (Note 2) | 61,025,313 | 897,624 | ||||||
|
|
|
| |||||
Total fair value of investments | 431,798,680 | 45,221,279 | ||||||
Foreign currency, at valueb | 207,291 | — | ||||||
Cash | — | 33,326 | ||||||
Receivables: | ||||||||
Investment securities sold | 64,724 | 17,306,324 | ||||||
Dividends and interest | 219,610 | 104,517 | ||||||
Capital shares sold | — | 49,534 | ||||||
|
|
|
| |||||
Total Assets | 432,290,305 | 62,714,980 | ||||||
|
|
|
| |||||
LIABILITIES | ||||||||
Payables: | ||||||||
Investment securities purchased | — | 17,305,381 | ||||||
Collateral for securities on loan (Note 1) | 60,857,410 | 672,151 | ||||||
Capital shares redeemed | — | 99,171 | ||||||
Investment advisory fees (Note 2) | 208,347 | 6,412 | ||||||
|
|
|
| |||||
Total Liabilities | 61,065,757 | 18,083,115 | ||||||
|
|
|
| |||||
NET ASSETS | $ | 371,224,548 | $ | 44,631,865 | ||||
|
|
|
| |||||
Net assets consist of: | ||||||||
Paid-in capital | $ | 684,909,817 | $ | 46,378,266 | ||||
Undistributed (distributions in excess of) net investment income | (229,909 | ) | 144,655 | |||||
Accumulated net realized loss | (68,072,784 | ) | (2,113,098 | ) | ||||
Net unrealized appreciation (depreciation) | (245,382,576 | ) | 222,042 | |||||
|
|
|
| |||||
NET ASSETS | $ | 371,224,548 | $ | 44,631,865 | ||||
|
|
|
| |||||
Shares outstandingc | 9,700,000 | 1,050,000 | ||||||
|
|
|
| |||||
Net asset value per share | $ | 38.27 | $ | 42.51 | ||||
|
|
|
| |||||
| a | Securities on loan with values of $57,691,030 and $590,425, respectively. See Note 1. |
| b | Cost of foreign currency: $207,487 and $ — , respectively. |
| c | $0.001 par value, number of shares authorized: 200 million and 500 million, respectively. |
See notes to financial statements.
FINANCIAL STATEMENTS | 49 |
Table of Contents
Statements of Operations
iSHARES® , INC.
Year ended August 31, 2015
| iShares MSCI Brazil Capped ETF | iShares MSCI Chile Capped ETF | iShares MSCI Colombia Capped ETF | ||||||||||
NET INVESTMENT INCOME | ||||||||||||
Dividends — unaffiliateda | $ | 124,364,904 | $ | 6,248,986 | $ | 544,760 | b | |||||
Interest — affiliated (Note 2) | 151 | 48 | 4 | |||||||||
Securities lending income — affiliated — net (Note 2) | — | — | 4,573 | |||||||||
|
|
|
|
|
| |||||||
Total investment income | 124,365,055 | 6,249,034 | 549,337 | |||||||||
|
|
|
|
|
| |||||||
EXPENSES | ||||||||||||
Investment advisory fees (Note 2) | 22,930,693 | 1,705,573 | 104,511 | |||||||||
Commitment fees (Note 7) | — | — | 43 | |||||||||
|
|
|
|
|
| |||||||
Total expenses | 22,930,693 | 1,705,573 | 104,554 | |||||||||
|
|
|
|
|
| |||||||
Net investment income | 101,434,362 | 4,543,461 | 444,783 | |||||||||
|
|
|
|
|
| |||||||
NET REALIZED AND UNREALIZED GAIN (LOSS) | ||||||||||||
Net realized gain (loss) from: | ||||||||||||
Investments — unaffiliated | (716,656,393 | ) | (29,627,717 | ) | (7,025,739 | ) | ||||||
In-kind redemptions — unaffiliated | — | — | 53,461 | |||||||||
Foreign currency transactions | (6,711,011 | ) | (32,882 | ) | (90,904 | ) | ||||||
|
|
|
|
|
| |||||||
Net realized loss | (723,367,404 | ) | (29,660,599 | ) | (7,063,182 | ) | ||||||
|
|
|
|
|
| |||||||
Net change in unrealized appreciation/depreciation on: | ||||||||||||
Investments | (2,273,496,737 | ) | (38,552,002 | ) | (8,758,145 | ) | ||||||
Translation of assets and liabilities in foreign currencies | (565,854 | ) | 279 | (752 | ) | |||||||
|
|
|
|
|
| |||||||
Net change in unrealized appreciation/depreciation | (2,274,062,591 | ) | (38,551,723 | ) | (8,758,897 | ) | ||||||
|
|
|
|
|
| |||||||
Net realized and unrealized loss | (2,997,429,995 | ) | (68,212,322 | ) | (15,822,079 | ) | ||||||
|
|
|
|
|
| |||||||
NET DECREASE IN NET ASSETS RESULTING FROM OPERATIONS | $ | (2,895,995,633 | ) | $ | (63,668,861 | ) | $ | (15,377,296 | ) | |||
|
|
|
|
|
| |||||||
| a | Net of foreign withholding tax of $9,416,042, $1,610,985 and $4,343, respectively. |
| b | Includes $125,018 related to a distribution from Ecopetrol SA. |
See notes to financial statements.
| 50 | 2015 iSHARES ANNUAL REPORTTO SHAREHOLDERS |
Table of Contents
Statements of Operations (Continued)
iSHARES®, INC.
Year ended August 31, 2015
| iShares MSCI Israel Capped ETF | iShares MSCI Russia Capped ETF | iShares MSCI South Africa ETF | ||||||||||
NET INVESTMENT INCOME | ||||||||||||
Dividends — unaffiliateda | $ | 3,758,451 | $ | 10,192,876 | $ | 11,539,661 | ||||||
Interest — affiliated (Note 2) | 4 | 613 | 13 | |||||||||
Securities lending income — affiliated — net (Note 2) | 104,676 | — | 9,553 | |||||||||
|
|
|
|
|
| |||||||
Total investment income | 3,863,131 | 10,193,489 | 11,549,227 | |||||||||
|
|
|
|
|
| |||||||
EXPENSES | ||||||||||||
Investment advisory fees (Note 2) | 778,200 | 1,596,025 | 2,791,571 | |||||||||
|
|
|
|
|
| |||||||
Total expenses | 778,200 | 1,596,025 | 2,791,571 | |||||||||
|
|
|
|
|
| |||||||
Net investment income | 3,084,931 | 8,597,464 | 8,757,656 | |||||||||
|
|
|
|
|
| |||||||
NET REALIZED AND UNREALIZED GAIN (LOSS) | ||||||||||||
Net realized gain (loss) from: | ||||||||||||
Investments — unaffiliated | (6,778,392 | ) | (33,492,242 | ) | (26,526,073 | ) | ||||||
In-kind redemptions — unaffiliated | 10,357,264 | 4,468,617 | 25,191,811 | |||||||||
Foreign currency transactions | (27,600 | ) | (466,252 | ) | (226,091 | ) | ||||||
|
|
|
|
|
| |||||||
Net realized gain (loss) | 3,551,272 | (29,489,877 | ) | (1,560,353 | ) | |||||||
|
|
|
|
|
| |||||||
Net change in unrealized appreciation/depreciation on: | ||||||||||||
Investments | (10,070,580 | ) | (57,253,799 | ) | (101,916,291 | ) | ||||||
Translation of assets and liabilities in foreign currencies | (2,452 | ) | (727 | ) | (18,521 | ) | ||||||
|
|
|
|
|
| |||||||
Net change in unrealized appreciation/depreciation | (10,073,032 | ) | (57,254,526 | ) | (101,934,812 | ) | ||||||
|
|
|
|
|
| |||||||
Net realized and unrealized loss | (6,521,760 | ) | (86,744,403 | ) | (103,495,165 | ) | ||||||
|
|
|
|
|
| |||||||
NET DECREASE IN NET ASSETS RESULTING FROM OPERATIONS | $ | (3,436,829 | ) | $ | (78,146,939 | ) | $ | (94,737,509 | ) | |||
|
|
|
|
|
| |||||||
| a | Net of foreign withholding tax of $850,330, $1,605,054 and $1,932,415, respectively. |
See notes to financial statements.
FINANCIAL STATEMENTS | 51 |
Table of Contents
Statements of Operations (Continued)
iSHARES®, INC.
Year ended August 31, 2015
| iShares MSCI Turkey ETF | iShares MSCI USA Equal Weighted ETF | |||||||
NET INVESTMENT INCOME | ||||||||
Dividends — unaffiliateda | $ | 12,438,889 | b | $ | 1,030,310 | |||
Dividends — affiliated (Note 2) | — | 5,848 | ||||||
Interest — affiliated (Note 2) | 19 | 6 | ||||||
Securities lending income — affiliated — net (Note 2) | 1,426,620 | 3,279 | ||||||
|
|
|
| |||||
Total investment income | 13,865,528 | 1,039,443 | ||||||
|
|
|
| |||||
EXPENSES | ||||||||
Investment advisory fees (Note 2) | 2,927,726 | 79,043 | ||||||
|
|
|
| |||||
Total expenses | 2,927,726 | 79,043 | ||||||
|
|
|
| |||||
Net investment income | 10,937,802 | 960,400 | ||||||
|
|
|
| |||||
NET REALIZED AND UNREALIZED GAIN (LOSS) | ||||||||
Net realized gain (loss) from: | ||||||||
Investments — unaffiliated | (25,213,091 | ) | (1,969,621 | ) | ||||
Investments — affiliated (Note 2) | — | (3,589 | ) | |||||
In-kind redemptions — unaffiliated | 223,582 | 5,143,298 | ||||||
In-kind redemptions — affiliated (Note 2) | — | 20,981 | ||||||
Foreign currency transactions | (276,391 | ) | — | |||||
|
|
|
| |||||
Net realized gain (loss) | (25,265,900 | ) | 3,191,069 | |||||
|
|
|
| |||||
Net change in unrealized appreciation/depreciation on: | ||||||||
Investments | (161,937,010 | ) | (3,583,310 | ) | ||||
Translation of assets and liabilities in foreign currencies | 905 | — | ||||||
|
|
|
| |||||
Net change in unrealized appreciation/depreciation | (161,936,105 | ) | (3,583,310 | ) | ||||
|
|
|
| |||||
Net realized and unrealized loss | (187,202,005 | ) | (392,241 | ) | ||||
|
|
|
| |||||
NET INCREASE (DECREASE) IN NET ASSETS RESULTING FROM OPERATIONS | $ | (176,264,203 | ) | $ | 568,159 | |||
|
|
|
| |||||
| a | Net of foreign withholding tax of $1,385,926 and $244, respectively. |
| b | Includes $3,578,333 related to a special distribution from Turkcell Iletisim Hizmetleri AS. |
See notes to financial statements.
| 52 | 2015 iSHARES ANNUAL REPORTTO SHAREHOLDERS |
Table of Contents
Statements of Changes in Net Assets
iSHARES® , INC.
| iShares MSCI Brazil Capped ETF | iShares MSCI Chile Capped ETF | |||||||||||||||
| Year ended August 31, 2015 | Year ended August 31, 2014 | Year ended August 31, 2015 | Year ended August 31, 2014 | |||||||||||||
INCREASE (DECREASE) IN NET ASSETS | ||||||||||||||||
OPERATIONS: | ||||||||||||||||
Net investment income | $ | 101,434,362 | $ | 158,393,234 | $ | 4,543,461 | $ | 5,077,041 | ||||||||
Net realized loss | (723,367,404 | ) | (24,456,910 | ) | (29,660,599 | ) | (41,001,966 | ) | ||||||||
Net change in unrealized appreciation/depreciation | (2,274,062,591 | ) | 1,185,606,681 | (38,551,723 | ) | (2,259,337 | ) | |||||||||
|
|
|
|
|
|
|
| |||||||||
Net increase (decrease) in net assets resulting from operations | (2,895,995,633 | ) | 1,319,543,005 | (63,668,861 | ) | (38,184,262 | ) | |||||||||
|
|
|
|
|
|
|
| |||||||||
DISTRIBUTIONS TO SHAREHOLDERS: | ||||||||||||||||
From net investment income | (96,651,627 | ) | (151,885,117 | ) | (4,099,138 | ) | (4,758,168 | ) | ||||||||
|
|
|
|
|
|
|
| |||||||||
Total distributions to shareholders | (96,651,627 | ) | (151,885,117 | ) | (4,099,138 | ) | (4,758,168 | ) | ||||||||
|
|
|
|
|
|
|
| |||||||||
CAPITAL SHARE TRANSACTIONS: | ||||||||||||||||
Proceeds from shares sold | 2,005,630,203 | 2,103,462,834 | 172,176,839 | 306,288,062 | ||||||||||||
Cost of shares redeemed | (2,473,533,229 | ) | (2,805,065,721 | ) | (222,371,918 | ) | (275,735,795 | ) | ||||||||
|
|
|
|
|
|
|
| |||||||||
Net increase (decrease) in net assets from capital share transactions | (467,903,026 | ) | (701,602,887 | ) | (50,195,079 | ) | 30,552,267 | |||||||||
|
|
|
|
|
|
|
| |||||||||
INCREASE (DECREASE) IN NET ASSETS | (3,460,550,286 | ) | 466,055,001 | (117,963,078 | ) | (12,390,163 | ) | |||||||||
NET ASSETS | ||||||||||||||||
Beginning of year | 5,449,685,335 | 4,983,630,334 | 352,499,453 | 364,889,616 | ||||||||||||
|
|
|
|
|
|
|
| |||||||||
End of year | $ | 1,989,135,049 | $ | 5,449,685,335 | $ | 234,536,375 | $ | 352,499,453 | ||||||||
|
|
|
|
|
|
|
| |||||||||
Undistributed (distributions in excess of) net investment income included in net assets at end of year | $ | (3,041,915 | ) | $ | (3,286,174 | ) | $ | 433,024 | $ | 21,583 | ||||||
|
|
|
|
|
|
|
| |||||||||
SHARES ISSUED AND REDEEMED | ||||||||||||||||
Shares sold | 49,050,000 | 45,450,000 | 4,200,000 | 6,450,000 | ||||||||||||
Shares redeemed | (70,200,000 | ) | (61,000,000 | ) | (5,550,000 | ) | (6,000,000 | ) | ||||||||
|
|
|
|
|
|
|
| |||||||||
Net increase (decrease) in shares outstanding | (21,150,000 | ) | (15,550,000 | ) | (1,350,000 | ) | 450,000 | |||||||||
|
|
|
|
|
|
|
| |||||||||
See notes to financial statements.
FINANCIAL STATEMENTS | 53 |
Table of Contents
Statements of Changes in Net Assets (Continued)
iSHARES®, INC.
| iShares MSCI Colombia Capped ETF | iShares MSCI Israel Capped ETF | |||||||||||||||
| Year ended August 31, 2015 | Year ended August 31, 2014 | Year ended August 31, 2015 | Year ended August 31, 2014 | |||||||||||||
INCREASE (DECREASE) IN NET ASSETS | ||||||||||||||||
OPERATIONS: | ||||||||||||||||
Net investment income | $ | 444,783 | $ | 537,807 | $ | 3,084,931 | $ | 1,855,705 | ||||||||
Net realized gain (loss) | (7,063,182 | ) | (126,286 | ) | 3,551,272 | 10,422,925 | ||||||||||
Net change in unrealized appreciation/depreciation | (8,758,897 | ) | 2,091,159 | (10,073,032 | ) | 4,245,175 | ||||||||||
|
|
|
|
|
|
|
| |||||||||
Net increase (decrease) in net assets resulting from operations | (15,377,296 | ) | 2,502,680 | (3,436,829 | ) | 16,523,805 | ||||||||||
|
|
|
|
|
|
|
| |||||||||
DISTRIBUTIONS TO SHAREHOLDERS: | ||||||||||||||||
From net investment income | (438,777 | ) | (523,757 | ) | (2,707,351 | ) | (2,015,418 | ) | ||||||||
From net realized gain | — | (24,565 | ) | — | — | |||||||||||
Return of capital | (7,256 | ) | (10,400 | ) | — | — | ||||||||||
|
|
|
|
|
|
|
| |||||||||
Total distributions to shareholders | (446,033 | ) | (558,722 | ) | (2,707,351 | ) | (2,015,418 | ) | ||||||||
|
|
|
|
|
|
|
| |||||||||
CAPITAL SHARE TRANSACTIONS: | ||||||||||||||||
Proceeds from shares sold | 11,677,734 | 5,263,753 | 155,183,874 | 124,975,600 | ||||||||||||
Cost of shares redeemed | (6,999,421 | ) | — | (144,400,134 | ) | (88,548,464 | ) | |||||||||
|
|
|
|
|
|
|
| |||||||||
Net increase in net assets from capital share transactions | 4,678,313 | 5,263,753 | 10,783,740 | 36,427,136 | ||||||||||||
|
|
|
|
|
|
|
| |||||||||
INCREASE (DECREASE) IN NET ASSETS | (11,145,016 | ) | 7,207,711 | 4,639,560 | 50,935,523 | |||||||||||
NET ASSETS | ||||||||||||||||
Beginning of year | 25,395,672 | 18,187,961 | 121,645,308 | 70,709,785 | ||||||||||||
|
|
|
|
|
|
|
| |||||||||
End of year | $ | 14,250,656 | $ | 25,395,672 | $ | 126,284,868 | $ | 121,645,308 | ||||||||
|
|
|
|
|
|
|
| |||||||||
Undistributed (distributions in excess of) net investment income included in net assets at end of year | $ | (84,898 | ) | $ | — | $ | 396,916 | $ | (29,486 | ) | ||||||
|
|
|
|
|
|
|
| |||||||||
SHARES ISSUED AND REDEEMED | ||||||||||||||||
Shares sold | 750,000 | 200,000 | 2,900,000 | 2,500,000 | ||||||||||||
Shares redeemed | (450,000 | ) | — | (2,800,000 | ) | (1,750,000 | ) | |||||||||
|
|
|
|
|
|
|
| |||||||||
Net increase in shares outstanding | 300,000 | 200,000 | 100,000 | 750,000 | ||||||||||||
|
|
|
|
|
|
|
| |||||||||
See notes to financial statements.
| 54 | 2015 iSHARES ANNUAL REPORTTO SHAREHOLDERS |
Table of Contents
Statements of Changes in Net Assets (Continued)
iSHARES®, INC.
| iShares MSCI Russia Capped ETF | iShares MSCI South Africa ETF | |||||||||||||||
| Year ended August 31, 2015 | Year ended August 31, 2014 | Year ended August 31, 2015 | Year ended August 31, 2014 | |||||||||||||
INCREASE (DECREASE) IN NET ASSETS | ||||||||||||||||
OPERATIONS: | ||||||||||||||||
Net investment income | $ | 8,597,464 | $ | 9,621,213 | $ | 8,757,656 | $ | 13,130,204 | ||||||||
Net realized gain (loss) | (29,489,877 | ) | (22,363,897 | ) | (1,560,353 | ) | 38,061,399 | |||||||||
Net change in unrealized appreciation/depreciation | (57,254,526 | ) | (21,103,770 | ) | (101,934,812 | ) | 57,102,013 | |||||||||
|
|
|
|
|
|
|
| |||||||||
Net increase (decrease) in net assets resulting from operations | (78,146,939 | ) | (33,846,454 | ) | (94,737,509 | ) | 108,293,616 | |||||||||
|
|
|
|
|
|
|
| |||||||||
DISTRIBUTIONS TO SHAREHOLDERS: | ||||||||||||||||
From net investment income | (10,822,184 | ) | (2,160,831 | ) | (9,092,367 | ) | (12,294,677 | ) | ||||||||
|
|
|
|
|
|
|
| |||||||||
Total distributions to shareholders | (10,822,184 | ) | (2,160,831 | ) | (9,092,367 | ) | (12,294,677 | ) | ||||||||
|
|
|
|
|
|
|
| |||||||||
CAPITAL SHARE TRANSACTIONS: | ||||||||||||||||
Proceeds from shares sold | 110,271,226 | 333,077,754 | 193,254,026 | 281,249,453 | ||||||||||||
Cost of shares redeemed | (100,165,085 | ) | (317,805,980 | ) | (303,473,517 | ) | (337,422,079 | ) | ||||||||
|
|
|
|
|
|
|
| |||||||||
Net increase (decrease) in net assets from capital share transactions | 10,106,141 | 15,271,774 | (110,219,491 | ) | (56,172,626 | ) | ||||||||||
|
|
|
|
|
|
|
| |||||||||
INCREASE (DECREASE) IN NET ASSETS | (78,862,982 | ) | (20,735,511 | ) | (214,049,367 | ) | 39,826,313 | |||||||||
NET ASSETS | ||||||||||||||||
Beginning of year | 289,775,287 | 310,510,798 | 587,395,638 | 547,569,325 | ||||||||||||
|
|
|
|
|
|
|
| |||||||||
End of year | $ | 210,912,305 | $ | 289,775,287 | $ | 373,346,271 | $ | 587,395,638 | ||||||||
|
|
|
|
|
|
|
| |||||||||
Undistributed net investment income included in net assets at end of year | $ | 5,010,420 | $ | 7,650,856 | $ | 301,134 | $ | 836,307 | ||||||||
|
|
|
|
|
|
|
| |||||||||
SHARES ISSUED AND REDEEMED | ||||||||||||||||
Shares sold | 8,450,000 | 16,800,000 | 2,900,000 | 4,300,000 | ||||||||||||
Shares redeemed | (7,400,000 | ) | (16,650,000 | ) | (4,700,000 | ) | (5,300,000 | ) | ||||||||
|
|
|
|
|
|
|
| |||||||||
Net increase (decrease) in shares outstanding | 1,050,000 | 150,000 | (1,800,000 | ) | (1,000,000 | ) | ||||||||||
|
|
|
|
|
|
|
| |||||||||
See notes to financial statements.
FINANCIAL STATEMENTS | 55 |
Table of Contents
Statements of Changes in Net Assets (Continued)
iSHARES®, INC.
| iShares MSCI Turkey ETF | iShares MSCI USA Equal Weighted ETF | |||||||||||||||
| Year ended August 31, 2015 | Year ended August 31, 2014 | Year ended August 31, 2015 | Year ended August 31, 2014 | |||||||||||||
INCREASE (DECREASE) IN NET ASSETS | ||||||||||||||||
OPERATIONS: | ||||||||||||||||
Net investment income | $ | 10,937,802 | $ | 8,452,557 | $ | 960,400 | $ | 2,391,477 | ||||||||
Net realized gain (loss) | (25,265,900 | ) | 4,401,805 | 3,191,069 | 56,924,794 | |||||||||||
Net change in unrealized appreciation/depreciation | (161,936,105 | ) | 93,555,911 | (3,583,310 | ) | (29,707,398 | ) | |||||||||
|
|
|
|
|
|
|
| |||||||||
Net increase (decrease) in net assets resulting from operations | (176,264,203 | ) | 106,410,273 | 568,159 | 29,608,873 | |||||||||||
|
|
|
|
|
|
|
| |||||||||
DISTRIBUTIONS TO SHAREHOLDERS: | ||||||||||||||||
From net investment income | (10,891,320 | ) | (8,703,391 | ) | (949,728 | ) | (2,876,350 | ) | ||||||||
|
|
|
|
|
|
|
| |||||||||
Total distributions to shareholders | (10,891,320 | ) | (8,703,391 | ) | (949,728 | ) | (2,876,350 | ) | ||||||||
|
|
|
|
|
|
|
| |||||||||
CAPITAL SHARE TRANSACTIONS: | ||||||||||||||||
Proceeds from shares sold | 224,563,809 | 364,224,026 | 32,136,610 | 48,587,993 | ||||||||||||
Cost of shares redeemed | (181,550,574 | ) | (382,640,118 | ) | (34,514,668 | ) | (207,759,194 | ) | ||||||||
|
|
|
|
|
|
|
| |||||||||
Net increase (decrease) in net assets from capital share transactions | 43,013,235 | (18,416,092 | ) | (2,378,058 | ) | (159,171,201 | ) | |||||||||
|
|
|
|
|
|
|
| |||||||||
INCREASE (DECREASE) IN NET ASSETS | (144,142,288 | ) | 79,290,790 | (2,759,627 | ) | (132,438,678 | ) | |||||||||
NET ASSETS | ||||||||||||||||
Beginning of year | 515,366,836 | 436,076,046 | 47,391,492 | 179,830,170 | ||||||||||||
|
|
|
|
|
|
|
| |||||||||
End of year | $ | 371,224,548 | $ | 515,366,836 | $ | 44,631,865 | $ | 47,391,492 | ||||||||
|
|
|
|
|
|
|
| |||||||||
Undistributed (distributions in excess of) net investment income included in net assets at end of year | $ | (229,909 | ) | $ | — | $ | 144,655 | $ | 133,983 | |||||||
|
|
|
|
|
|
|
| |||||||||
SHARES ISSUED AND REDEEMED | ||||||||||||||||
Shares sold | 4,150,000 | 7,500,000 | 750,000 | 1,250,000 | ||||||||||||
Shares redeemed | (3,700,000 | ) | (7,150,000 | ) | (800,000 | ) | (5,250,000 | ) | ||||||||
|
|
|
|
|
|
|
| |||||||||
Net increase (decrease) in shares outstanding | 450,000 | 350,000 | (50,000 | ) | (4,000,000 | ) | ||||||||||
|
|
|
|
|
|
|
| |||||||||
See notes to financial statements.
| 56 | 2015 iSHARES ANNUAL REPORTTO SHAREHOLDERS |
Table of Contents
iSHARES® , INC.
(For a share outstanding throughout each period)
| iShares MSCI Brazil Capped ETF | ||||||||||||||||||||
| Year ended Aug. 31, 2015 | Year ended Aug. 31, 2014 | Year ended Aug. 31, 2013 | Year ended Aug. 31, 2012 | Year ended Aug. 31, 2011 | ||||||||||||||||
Net asset value, beginning of year | $ | 53.61 | $ | 42.52 | $ | 52.61 | $ | 65.00 | $ | 68.07 | ||||||||||
|
|
|
|
|
|
|
|
|
| |||||||||||
Income from investment operations: | ||||||||||||||||||||
Net investment incomea | 1.00 | 1.56 | 1.59 | 1.73 | 2.24 | |||||||||||||||
Net realized and unrealized gain (loss)b | (28.87 | ) | 11.08 | (10.32 | ) | (12.64 | ) | (1.69 | ) | |||||||||||
|
|
|
|
|
|
|
|
|
| |||||||||||
Total from investment operations | (27.87 | ) | 12.64 | (8.73 | ) | (10.91 | ) | 0.55 | ||||||||||||
|
|
|
|
|
|
|
|
|
| |||||||||||
Less distributions from: | ||||||||||||||||||||
Net investment income | (1.03 | ) | (1.55 | ) | (1.36 | ) | (0.56 | ) | (3.62 | ) | ||||||||||
Return of capital | — | — | — | (0.92 | ) | — | ||||||||||||||
|
|
|
|
|
|
|
|
|
| |||||||||||
Total distributions | (1.03 | ) | (1.55 | ) | (1.36 | ) | (1.48 | ) | (3.62 | ) | ||||||||||
|
|
|
|
|
|
|
|
|
| |||||||||||
Net asset value, end of year | $ | 24.71 | $ | 53.61 | $ | 42.52 | $ | 52.61 | $ | 65.00 | ||||||||||
|
|
|
|
|
|
|
|
|
| |||||||||||
Total return | (52.49 | )% | 30.33 | % | (16.85 | )% | (16.79 | )% | 0.36 | % | ||||||||||
|
|
|
|
|
|
|
|
|
| |||||||||||
Ratios/Supplemental data: | ||||||||||||||||||||
Net assets, end of year (000s) | $ | 1,989,135 | $ | 5,449,685 | $ | 4,983,630 | $ | 7,370,617 | $ | 11,332,121 | ||||||||||
Ratio of expenses to average net assets | 0.62 | % | 0.62 | % | 0.61 | % | 0.61 | % | 0.59 | % | ||||||||||
Ratio of net investment income to average net assets | 2.73 | % | 3.37 | % | 3.02 | % | 2.92 | % | 3.08 | % | ||||||||||
Portfolio turnover ratec | 63 | % | 54 | % | 56 | % | 7 | % | 11 | % | ||||||||||
| a | Based on average shares outstanding throughout each period. |
| b | The amounts reported for a share outstanding may not accord with the change in aggregate gains and losses in securities for the fiscal period due to the timing of capital share transactions in relation to the fluctuating market values of the Fund’s underlying securities. |
| c | Portfolio turnover rates include portfolio transactions that are executed as a result of the Fund processing capital share transactions in Creation Units solely for cash in U.S. dollars. Excluding such cash transactions, the portfolio turnover rates for the years ended August 31, 2015, August 31, 2014, August 31, 2013, August 31, 2012, and August 31, 2011 were 48%, 11%, 20%, 6%, and 11%, respectively. See Note 4. |
See notes to financial statements.
FINANCIAL HIGHLIGHTS | 57 |
Table of Contents
Financial Highlights (Continued)
iSHARES®, INC.
(For a share outstanding throughout each period)
| iShares MSCI Chile Capped ETF | ||||||||||||||||||||
| Year ended Aug. 31, 2015 | Year ended Aug. 31, 2014 | Year ended Aug. 31, 2013 | Year ended Aug. 31, 2012 | Year ended Aug. 31, 2011 | ||||||||||||||||
Net asset value, beginning of year | $ | 43.52 | $ | 47.70 | $ | 60.31 | $ | 67.11 | $ | 67.37 | ||||||||||
|
|
|
|
|
|
|
|
|
| |||||||||||
Income from investment operations: | ||||||||||||||||||||
Net investment incomea | 0.66 | 0.69 | 0.68 | 0.97 | 0.95 | |||||||||||||||
Net realized and unrealized lossb | (8.81 | ) | (4.18 | ) | (12.58 | ) | (6.80 | ) | (0.23 | ) | ||||||||||
|
|
|
|
|
|
|
|
|
| |||||||||||
Total from investment operations | (8.15 | ) | (3.49 | ) | (11.90 | ) | (5.83 | ) | 0.72 | |||||||||||
|
|
|
|
|
|
|
|
|
| |||||||||||
Less distributions from: | ||||||||||||||||||||
Net investment income | (0.62 | ) | (0.69 | ) | (0.68 | ) | (0.92 | ) | (0.98 | ) | ||||||||||
Return of capital | — | — | (0.03 | ) | (0.05 | ) | (0.00 | )c | ||||||||||||
|
|
|
|
|
|
|
|
|
| |||||||||||
Total distributions | (0.62 | ) | (0.69 | ) | (0.71 | ) | (0.97 | ) | (0.98 | ) | ||||||||||
|
|
|
|
|
|
|
|
|
| |||||||||||
Net asset value, end of year | $ | 34.75 | $ | 43.52 | $ | 47.70 | $ | 60.31 | $ | 67.11 | ||||||||||
|
|
|
|
|
|
|
|
|
| |||||||||||
Total return | (18.85 | )% | (7.40 | )% | (19.87 | )% | (8.68 | )% | 0.93 | % | ||||||||||
|
|
|
|
|
|
|
|
|
| |||||||||||
Ratios/Supplemental data: | ||||||||||||||||||||
Net assets, end of year (000s) | $ | 234,536 | $ | 352,499 | $ | 364,890 | $ | 548,797 | $ | 708,018 | ||||||||||
Ratio of expenses to average net assets | 0.62 | % | 0.62 | % | 0.61 | % | 0.61 | % | 0.59 | % | ||||||||||
Ratio of net investment income to average net assets | 1.64 | % | 1.49 | % | 1.12 | % | 1.55 | % | 1.30 | % | ||||||||||
Portfolio turnover rated | 71 | % | 91 | % | 34 | % | 48 | % | 38 | % | ||||||||||
| a | Based on average shares outstanding throughout each period. |
| b | The amounts reported for a share outstanding may not accord with the change in aggregate gains and losses in securities for the fiscal period due to the timing of capital share transactions in relation to the fluctuating market values of the Fund’s underlying securities. |
| c | Rounds to less than $0.01. |
| d | Portfolio turnover rates include portfolio transactions that are executed as a result of the Fund processing capital share transactions in Creation Units solely for cash in U.S. dollars. Excluding such cash transactions, the portfolio turnover rates for the years ended August 31, 2015, August 31, 2014, August 31, 2013, August 31, 2012, and August 31, 2011 were 10%, 11%, 16%, 20%, and 12%, respectively. See Note 4. |
See notes to financial statements.
| 58 | 2015 iSHARES ANNUAL REPORTTO SHAREHOLDERS |
Table of Contents
Financial Highlights (Continued)
iSHARES®, INC.
(For a share outstanding throughout each period)
iShares MSCI Colombia Capped ETF | ||||||
| Year ended Aug. 31, 2015 | Year ended Aug. 31, 2014 | Period from to Aug. 31, 2013 | ||||||||||
Net asset value, beginning of period | $ | 28.22 | $ | 25.98 | $ | 25.28 | ||||||
|
|
|
|
|
| |||||||
Income from investment operations: | ||||||||||||
Net investment incomeb | 0.46 | c | 0.67 | 0.03 | ||||||||
Net realized and unrealized gain (loss)d | (16.34 | ) | 2.24 | 0.67 | ||||||||
|
|
|
|
|
| |||||||
Total from investment operations | (15.88 | ) | 2.91 | 0.70 | ||||||||
|
|
|
|
|
| |||||||
Less distributions from: | ||||||||||||
Net investment income | (0.45 | ) | (0.63 | ) | — | |||||||
Net realized gain | — | (0.03 | ) | — | ||||||||
Return of capital | (0.01 | ) | (0.01 | ) | — | |||||||
|
|
|
|
|
| |||||||
Total distributions | (0.46 | ) | (0.67 | ) | — | |||||||
|
|
|
|
|
| |||||||
Net asset value, end of period | $ | 11.88 | $ | 28.22 | $ | 25.98 | ||||||
|
|
|
|
|
| |||||||
Total return | (56.73 | )% | 11.44 | % | 2.77 | %e | ||||||
|
|
|
|
|
| |||||||
Ratios/Supplemental data: | ||||||||||||
Net assets, end of period (000s) | $ | 14,251 | $ | 25,396 | $ | 18,188 | ||||||
Ratio of expenses to average net assetsf | 0.61 | % | 0.61 | % | 0.61 | % | ||||||
Ratio of net investment income to average net assetsf | 2.60 | %c | 2.54 | % | 0.61 | % | ||||||
Portfolio turnover rateg | 86 | % | 34 | % | 2 | % | ||||||
| a | Commencement of operations. |
| b | Based on average shares outstanding throughout each period. |
| c | Includes a distribution from Ecopetrol SA. Excluding such distribution, the net investment income would have been $0.33 per share and 1.87% of average net assets. |
| d | The amounts reported for a share outstanding may not accord with the change in aggregate gains and losses in securities for the fiscal period due to the timing of capital share transactions in relation to the fluctuating market values of the Fund’s underlying securities. |
| e | Not annualized. |
| f | Annualized for periods of less than one year. |
| g | Portfolio turnover rates include portfolio transactions that are executed as a result of the Fund processing capital share transactions in Creation Units solely for cash in U.S. dollars. Excluding such cash transactions, the portfolio turnover rates for the years ended August 31, 2015, August 31, 2014 and for the period ended August 31, 2013 were 49%, 33% and 2%, respectively. See Note 4. |
See notes to financial statements.
FINANCIAL HIGHLIGHTS | 59 |
Table of Contents
Financial Highlights (Continued)
iSHARES®, INC.
(For a share outstanding throughout each period)
| iShares MSCI Israel Capped ETF | ||||||||||||||||||||
| Year ended Aug. 31, 2015 | Year ended Aug. 31, 2014 | Year ended Aug. 31, 2013 | Year ended Aug. 31, 2012 | Year ended Aug. 31, 2011 | ||||||||||||||||
Net asset value, beginning of year | $ | 50.69 | $ | 42.85 | $ | 37.25 | $ | 45.89 | $ | 49.41 | ||||||||||
|
|
|
|
|
|
|
|
|
| |||||||||||
Income from investment operations: | ||||||||||||||||||||
Net investment incomea | 1.23 | 0.87 | 0.95 | 1.12 | 1.39 | |||||||||||||||
Net realized and unrealized gain (loss)b | (0.34 | ) | 7.95 | 5.68 | (8.66 | ) | (3.18 | ) | ||||||||||||
|
|
|
|
|
|
|
|
|
| |||||||||||
Total from investment operations | 0.89 | 8.82 | 6.63 | (7.54 | ) | (1.79 | ) | |||||||||||||
|
|
|
|
|
|
|
|
|
| |||||||||||
Less distributions from: | ||||||||||||||||||||
Net investment income | (1.07 | ) | (0.98 | ) | (1.03 | ) | (1.07 | ) | (1.73 | ) | ||||||||||
Return of capital | — | — | — | (0.03 | ) | — | ||||||||||||||
|
|
|
|
|
|
|
|
|
| |||||||||||
Total distributions | (1.07 | ) | (0.98 | ) | (1.03 | ) | (1.10 | ) | (1.73 | ) | ||||||||||
|
|
|
|
|
|
|
|
|
| |||||||||||
Net asset value, end of year | $ | 50.51 | $ | 50.69 | $ | 42.85 | $ | 37.25 | $ | 45.89 | ||||||||||
|
|
|
|
|
|
|
|
|
| |||||||||||
Total return | 1.80 | % | 20.67 | % | 17.82 | % | (16.52 | )% | (4.26 | )% | ||||||||||
|
|
|
|
|
|
|
|
|
| |||||||||||
Ratios/Supplemental data: | ||||||||||||||||||||
Net assets, end of year (000s) | $ | 126,285 | $ | 121,645 | $ | 70,710 | $ | 68,912 | $ | 78,018 | ||||||||||
Ratio of expenses to average net assets | 0.62 | % | 0.62 | % | 0.61 | % | 0.61 | % | 0.59 | % | ||||||||||
Ratio of net investment income to average net assets | 2.45 | % | 1.74 | % | 2.20 | % | 2.75 | % | 2.49 | % | ||||||||||
Portfolio turnover ratec | 14 | % | 15 | % | 14 | % | 20 | % | 17 | % | ||||||||||
| a | Based on average shares outstanding throughout each period. |
| b | The amounts reported for a share outstanding may not accord with the change in aggregate gains and losses in securities for the fiscal period due to the timing of capital share transactions in relation to the fluctuating market values of the Fund’s underlying securities. |
| c | Portfolio turnover rates exclude portfolio securities received or delivered as a result of processing capital share transactions in Creation Units. |
See notes to financial statements.
| 60 | 2015 iSHARES ANNUAL REPORTTO SHAREHOLDERS |
Table of Contents
Financial Highlights (Continued)
iSHARES®, INC.
(For a share outstanding throughout each period)
| iShares MSCI Russia Capped ETF | ||||||||||||||||||||
| Year ended Aug. 31, 2015 | Year ended Aug. 31, 2014 | Year ended Aug. 31, 2013 | Year ended Aug. 31, 2012 | Period from to Aug. 31, 2011 | ||||||||||||||||
Net asset value, beginning of period | $ | 18.34 | $ | 19.84 | $ | 21.15 | $ | 25.13 | $ | 25.00 | ||||||||||
|
|
|
|
|
|
|
|
|
| |||||||||||
Income from investment operations: | ||||||||||||||||||||
Net investment incomeb | 0.47 | 0.63 | 0.62 | 0.50 | 0.45 | |||||||||||||||
Net realized and unrealized gain (loss)c | (5.63 | ) | (2.00 | ) | (1.35 | ) | (4.00 | ) | 0.03 | |||||||||||
|
|
|
|
|
|
|
|
|
| |||||||||||
Total from investment operations | (5.16 | ) | (1.37 | ) | (0.73 | ) | (3.50 | ) | 0.48 | |||||||||||
|
|
|
|
|
|
|
|
|
| |||||||||||
Less distributions from: | ||||||||||||||||||||
Net investment income | (0.66 | ) | (0.13 | ) | (0.58 | ) | (0.48 | ) | (0.35 | ) | ||||||||||
|
|
|
|
|
|
|
|
|
| |||||||||||
Total distributions | (0.66 | ) | (0.13 | ) | (0.58 | ) | (0.48 | ) | (0.35 | ) | ||||||||||
|
|
|
|
|
|
|
|
|
| |||||||||||
Net asset value, end of period | $ | 12.52 | $ | 18.34 | $ | 19.84 | $ | 21.15 | $ | 25.13 | ||||||||||
|
|
|
|
|
|
|
|
|
| |||||||||||
Total return | (27.57 | )% | (7.00 | )% | (3.40 | )% | (13.75 | )% | 1.76 | %d | ||||||||||
|
|
|
|
|
|
|
|
|
| |||||||||||
Ratios/Supplemental data: | ||||||||||||||||||||
Net assets, end of period (000s) | $ | 210,912 | $ | 289,775 | $ | 310,511 | $ | 147,026 | $ | 111,835 | ||||||||||
Ratio of expenses to average net assetse | 0.62 | % | 0.62 | % | 0.61 | % | 0.61 | % | 0.58 | % | ||||||||||
Ratio of net investment income to average net assetse | 3.33 | % | 3.14 | % | 2.87 | % | 2.22 | % | 1.99 | % | ||||||||||
Portfolio turnover ratef | 19 | % | 15 | % | 14 | % | 16 | % | 22 | % | ||||||||||
| a | Commencement of operations. |
| b | Based on average shares outstanding throughout each period. |
| c | The amounts reported for a share outstanding may not accord with the change in aggregate gains and losses in securities for the fiscal period due to the timing of capital share transactions in relation to the fluctuating market values of the Fund’s underlying securities. |
| d | Not annualized. |
| e | Annualized for periods of less than one year. |
| f | Portfolio turnover rates exclude portfolio securities received or delivered as a result of processing capital share transactions in Creation Units. |
See notes to financial statements.
FINANCIAL HIGHLIGHTS | 61 |
Table of Contents
Financial Highlights (Continued)
iSHARES®, INC.
(For a share outstanding throughout each period)
| iShares MSCI South Africa ETF | ||||||||||||||||||||
| Year ended Aug. 31, 2015 | Year ended Aug. 31, 2014 | Year ended Aug. 31, 2013 | Year ended Aug. 31, 2012 | Year ended Aug. 31, 2011 | ||||||||||||||||
Net asset value, beginning of year | $ | 70.77 | $ | 58.88 | $ | 64.65 | $ | 69.06 | $ | 58.74 | ||||||||||
|
|
|
|
|
|
|
|
|
| |||||||||||
Income from investment operations: | ||||||||||||||||||||
Net investment incomea | 1.28 | 1.57 | 1.32 | 2.10 | 1.65 | |||||||||||||||
Net realized and unrealized gain (loss)b | (13.24 | ) | 11.86 | (5.31 | ) | (4.41 | ) | 11.08 | ||||||||||||
|
|
|
|
|
|
|
|
|
| |||||||||||
Total from investment operations | (11.96 | ) | 13.43 | (3.99 | ) | (2.31 | ) | 12.73 | ||||||||||||
|
|
|
|
|
|
|
|
|
| |||||||||||
Less distributions from: | ||||||||||||||||||||
Net investment income | (1.37 | ) | (1.54 | ) | (1.78 | ) | (2.10 | ) | (2.41 | ) | ||||||||||
|
|
|
|
|
|
|
|
|
| |||||||||||
Total distributions | (1.37 | ) | (1.54 | ) | (1.78 | ) | (2.10 | ) | (2.41 | ) | ||||||||||
|
|
|
|
|
|
|
|
|
| |||||||||||
Net asset value, end of year | $ | 57.44 | $ | 70.77 | $ | 58.88 | $ | 64.65 | $ | 69.06 | ||||||||||
|
|
|
|
|
|
|
|
|
| |||||||||||
Total return | (17.07 | )% | 23.13 | % | (6.35 | )% | (3.17 | )% | 21.58 | % | ||||||||||
|
|
|
|
|
|
|
|
|
| |||||||||||
Ratios/Supplemental data: | ||||||||||||||||||||
Net assets, end of year (000s) | $ | 373,346 | $ | 587,396 | $ | 547,569 | $ | 471,922 | $ | 504,102 | ||||||||||
Ratio of expenses to average net assets | 0.62 | % | 0.62 | % | 0.61 | % | 0.61 | % | 0.59 | % | ||||||||||
Ratio of net investment income to average net assets | 1.94 | % | 2.40 | % | 2.08 | % | 3.26 | % | 2.38 | % | ||||||||||
Portfolio turnover ratec | 9 | % | 6 | % | 5 | % | 4 | % | 4 | % | ||||||||||
| a | Based on average shares outstanding throughout each period. |
| b | The amounts reported for a share outstanding may not accord with the change in aggregate gains and losses in securities for the fiscal period due to the timing of capital share transactions in relation to the fluctuating market values of the Fund’s underlying securities. |
| c | Portfolio turnover rates exclude portfolio securities received or delivered as a result of processing capital share transactions in Creation Units. |
See notes to financial statements.
| 62 | 2015 iSHARES ANNUAL REPORTTO SHAREHOLDERS |
Table of Contents
Financial Highlights (Continued)
iSHARES®, INC.
(For a share outstanding throughout each period)
| iShares MSCI Turkey ETF | ||||||||||||||||||||
| Year ended Aug. 31, 2015 | Year ended Aug. 31, 2014 | Year ended Aug. 31, 2013 | Year ended Aug. 31, 2012 | Year ended Aug. 31, 2011 | ||||||||||||||||
Net asset value, beginning of year | $ | 55.72 | $ | 49.00 | $ | 56.13 | $ | 47.73 | $ | 60.81 | ||||||||||
|
|
|
|
|
|
|
|
|
| |||||||||||
Income from investment operations: | ||||||||||||||||||||
Net investment incomea | 1.13 | b | 0.85 | 1.07 | 0.86 | 0.84 | ||||||||||||||
Net realized and unrealized gain (loss)c | (17.49 | ) | 6.75 | (7.08 | ) | 8.70 | (12.59 | ) | ||||||||||||
|
|
|
|
|
|
|
|
|
| |||||||||||
Total from investment operations | (16.36 | ) | 7.60 | (6.01 | ) | 9.56 | (11.75 | ) | ||||||||||||
|
|
|
|
|
|
|
|
|
| |||||||||||
Less distributions from: | ||||||||||||||||||||
Net investment income | (1.09 | ) | (0.88 | ) | (1.12 | ) | (1.16 | ) | (1.33 | ) | ||||||||||
|
|
|
|
|
|
|
|
|
| |||||||||||
Total distributions | (1.09 | ) | (0.88 | ) | (1.12 | ) | (1.16 | ) | (1.33 | ) | ||||||||||
|
|
|
|
|
|
|
|
|
| |||||||||||
Net asset value, end of year | $ | 38.27 | $ | 55.72 | $ | 49.00 | $ | 56.13 | $ | 47.73 | ||||||||||
|
|
|
|
|
|
|
|
|
| |||||||||||
Total return | (29.69 | )% | 15.52 | % | (11.05 | )% | 20.37 | % | (19.74 | )% | ||||||||||
|
|
|
|
|
|
|
|
|
| |||||||||||
Ratios/Supplemental data: | ||||||||||||||||||||
Net assets, end of year (000s) | $ | 371,225 | $ | 515,367 | $ | 436,076 | $ | 561,284 | $ | 448,677 | ||||||||||
Ratio of expenses to average net assets | 0.62 | % | 0.62 | % | 0.61 | % | 0.61 | % | 0.59 | % | ||||||||||
Ratio of net investment income to average net assets | 2.31 | %b | 1.64 | % | 1.67 | % | 1.75 | % | 1.30 | % | ||||||||||
Portfolio turnover rated | 6 | % | 8 | % | 9 | % | 9 | % | 12 | % | ||||||||||
| a | Based on average shares outstanding throughout each period. |
| b | Includes a special distribution from Turkcell Iletisim Hizmetleri AS. Excluding such special distribution, the net investment income would have been $0.76 per share and 1.55% of average net assets. |
| c | The amounts reported for a share outstanding may not accord with the change in aggregate gains and losses in securities for the fiscal period due to the timing of capital share transactions in relation to the fluctuating market values of the Fund’s underlying securities. |
| d | Portfolio turnover rates exclude portfolio securities received or delivered as a result of processing capital share transactions in Creation Units. |
See notes to financial statements.
FINANCIAL HIGHLIGHTS | 63 |
Table of Contents
Financial Highlights (Continued)
iSHARES®, INC.
(For a share outstanding throughout each period)
| iShares MSCI USA Equal Weighted ETF | ||||||||||||||||||||
| Year ended Aug. 31, 2015 | Year ended Aug. 31, 2014 | Year ended Aug. 31, 2013 | Year ended Aug. 31, 2012 | Year ended Aug. 31, 2011 | ||||||||||||||||
Net asset value, beginning of year | $ | 43.08 | $ | 35.26 | $ | 30.31 | $ | 26.17 | $ | 22.44 | ||||||||||
|
|
|
|
|
|
|
|
|
| |||||||||||
Income from investment operations: | ||||||||||||||||||||
Net investment incomea | 0.80 | 0.71 | 0.69 | 0.59 | 0.51 | |||||||||||||||
Net realized and unrealized gain (loss)b | (0.57 | ) | 8.01 | 4.96 | 3.94 | 3.73 | ||||||||||||||
|
|
|
|
|
|
|
|
|
| |||||||||||
Total from investment operations | 0.23 | 8.72 | 5.65 | 4.53 | 4.24 | |||||||||||||||
|
|
|
|
|
|
|
|
|
| |||||||||||
Less distributions from: | ||||||||||||||||||||
Net investment income | (0.80 | ) | (0.90 | ) | (0.70 | ) | (0.39 | ) | (0.51 | ) | ||||||||||
|
|
|
|
|
|
|
|
|
| |||||||||||
Total distributions | (0.80 | ) | (0.90 | ) | (0.70 | ) | (0.39 | ) | (0.51 | ) | ||||||||||
|
|
|
|
|
|
|
|
|
| |||||||||||
Net asset value, end of year | $ | 42.51 | $ | 43.08 | $ | 35.26 | $ | 30.31 | $ | 26.17 | ||||||||||
|
|
|
|
|
|
|
|
|
| |||||||||||
Total return | 0.48 | % | 24.98 | % | 18.85 | % | 17.44 | % | 18.89 | % | ||||||||||
|
|
|
|
|
|
|
|
|
| |||||||||||
Ratios/Supplemental data: | ||||||||||||||||||||
Net assets, end of year (000s) | $ | 44,632 | $ | 47,391 | $ | 179,830 | $ | 145,470 | $ | 5,233 | ||||||||||
Ratio of expenses to average net assets | 0.15 | % | 0.15 | % | 0.15 | % | 0.15 | % | 0.15 | % | ||||||||||
Ratio of net investment income to average net assets | 1.82 | % | 1.82 | % | 2.10 | % | 2.04 | % | 1.90 | % | ||||||||||
Portfolio turnover ratec | 39 | % | 6 | % | 5 | % | 6 | % | 8 | % | ||||||||||
| a | Based on average shares outstanding throughout each period. |
| b | The amounts reported for a share outstanding may not accord with the change in aggregate gains and losses in securities for the fiscal period due to the timing of capital share transactions in relation to the fluctuating market values of the Fund’s underlying securities. |
| c | Portfolio turnover rates exclude portfolio securities received or delivered as a result of processing capital share transactions in Creation Units. |
See notes to financial statements.
| 64 | 2015 iSHARES ANNUAL REPORTTO SHAREHOLDERS |
Table of Contents
iSHARES® , INC.
iShares, Inc. (the “Company”) is registered under the Investment Company Act of 1940, as amended (the “1940 Act”), as an open-end management investment company. The Company was incorporated under the laws of the State of Maryland on September 1, 1994 pursuant to Articles of Incorporation as subsequently amended and restated.
These financial statements relate only to the following funds (each, a “Fund,” and collectively, the “Funds”):
| iShares ETF | Diversification Classification | |||
MSCI Brazil Capped | Non-diversified | |||
MSCI Chile Capped | Non-diversified | |||
MSCI Colombia Capped | Non-diversified | |||
MSCI Israel Capped | Non-diversified | |||
| iShares ETF | Diversification Classification | |||
MSCI Russia Capped | Non-diversified | |||
MSCI South Africa | Non-diversified | |||
MSCI Turkey | Non-diversified | |||
MSCI USA Equal Weighteda | Diversified | |||
| a | Formerly the iShares MSCI USA ETF. |
The investment objective of each Fund is to seek investment results that correspond generally to the price and yield performance, before fees and expenses, of its underlying index. The investment adviser uses a “passive” or index approach to try to achieve each Fund’s investment objective.
Pursuant to the Company’s organizational documents, the Funds’ officers and directors are indemnified against certain liabilities that may arise out of the performance of their duties to the Funds. Additionally, in the normal course of business, the Funds enter into contracts with service providers that contain general indemnification clauses. The Funds’ maximum exposure under these arrangements is unknown as this would involve future claims that may be made against the Funds that have not yet occurred.
FUND REORGANIZATION
On January 26, 2015, the iShares MSCI Russia Capped ETF, a series of iShares, Inc. (the “Successor Fund”), acquired all the net assets of the iShares MSCI Russia Capped ETF, which operated as a series of iShares MSCI Russia Capped ETF, Inc. (the “Predecessor Fund”), pursuant to a plan of reorganization approved by the shareholders of the Predecessor Fund on January 16, 2015 (the “Reorganization”). The U.S. Securities and Exchange Commission (“SEC”) staff expressed the view that, as a result of the Predecessor Fund being a series of iShares MSCI Russia Capped ETF Inc., the Predecessor Fund was not covered by the iShares exemptive relief that permits various iShares funds to operate as exchange-traded funds. The purpose of the Reorganization was to address the SEC staff’s concerns on a going forward basis. The Successor Fund has the same investment objective, investment strategy, index methodology, risks, policies and expenses as the Predecessor Fund.
Each shareholder of the Predecessor Fund received shares of the Successor Fund in an amount equal to the aggregate net asset value of such shareholder’s Predecessor Fund shares, as determined before market open of business on January 26, 2015. The Reorganization was accomplished by a tax-free exchange of 19,900,000 shares of the Successor Fund for 19,900,000 shares of the Predecessor Fund at a conversion rate of 1.0.
The Predecessor Fund’s fair value and cost of investments prior to the Reorganization was $246,211,923 and $398,080,360, respectively. Prior to the Reorganization, the Successor Fund had not yet commenced operations and had no assets or liabilities. As a result of the Reorganization, the Successor Fund assumed the performance and accounting history of the Predecessor Fund. The aggregate net assets of the Successor Fund immediately after the Reorganization amounted to $246,588,913.
Since this was a non-taxable merger, for financial reporting purposes, assets received and shares issued by the Successor Fund were recorded at fair value; however, the cost basis of the investments received from the Predecessor Fund was carried forward. The Successor Fund retained, without limitation, all the loss carryforwards of the Predecessor Fund.
NOTESTO FINANCIAL STATEMENTS | 65 |
Table of Contents
Notes to Financial Statements (Continued)
iSHARES®, INC.
| 1. | SIGNIFICANT ACCOUNTING POLICIES |
The following significant accounting policies are consistently followed by the Funds in the preparation of their financial statements in conformity with accounting principles generally accepted in the United States of America (“U.S. GAAP”). The preparation of financial statements in conformity with U.S. GAAP requires management to make certain estimates and assumptions that affect the reported amounts of assets and liabilities and disclosures of contingent assets and liabilities at the date of the financial statements and the reported amounts of revenue and expenses during the reporting period. Actual results could differ from those estimates. Each Fund is considered an investment company under U.S. GAAP and follows the accounting and reporting guidance applicable to investment companies.
SECURITY VALUATION
Each Fund’s investments are valued at fair value each day that the Fund’s listing exchange is open and, for financial reporting purposes, as of the report date should the reporting period end on a day that the Fund’s listing exchange is not open. U.S. GAAP defines fair value as the price a fund would receive to sell an asset or pay to transfer a liability in an orderly transaction between market participants at the measurement date. The BlackRock Global Valuation Methodologies Committee (the “Global Valuation Committee”) provides oversight of the valuation of investments for the Funds. The investments of each Fund are valued pursuant to policies and procedures developed by the Global Valuation Committee and approved by the Board of Directors of the Company (the “Board”).
| • | Equity investments traded on a recognized securities exchange are valued at that day’s last reported trade price or the official closing price, as applicable, on the exchange where the stock is primarily traded. Equity investments traded on a recognized exchange for which there were no sales on that day are valued at the last traded price. |
| • | Open-end U.S. mutual funds are valued at that day’s published net asset value (“NAV”). |
In the event that application of these methods of valuation results in a price for an investment which is deemed not to be representative of the fair value of such investment or if a price is not available, the investment will be valued based upon other available factors deemed relevant by the Global Valuation Committee, in accordance with policies approved by the Board. These factors include but are not limited to (i) attributes specific to the investment; (ii) the principal market for the investment; (iii) the customary participants in the principal market for the investment; (iv) data assumptions by market participants for the investment, if reasonably available; (v) quoted prices for similar investments in active markets; and (vi) other factors, such as future cash flows, interest rates, yield curves, volatilities, prepayment speeds, loss severities, credit risks and/or default rates. Valuations based on such factors are reported to the Board on a quarterly basis.
The Global Valuation Committee employs various methods for calibrating valuation approaches for investments where an active market does not exist, including regular due diligence of the Company’s pricing vendors, a regular review of key inputs and assumptions, transactional back-testing or disposition analysis to compare unrealized gains and losses to realized gains and losses, reviews of missing or stale prices, reviews of large movements in market values, and reviews of market related activity.
Fair value pricing could result in a difference between the prices used to calculate a Fund’s NAV and the prices used by the Fund’s underlying index, which in turn could result in a difference between the Fund’s performance and the performance of the Fund’s underlying index.
Various inputs are used in determining the fair value of financial instruments. Inputs may be based on independent market data (“observable inputs”) or they may be internally developed (“unobservable inputs”). These inputs are categorized into a disclosure hierarchy consisting of three broad levels for financial reporting purposes. The level of a value determined for a financial instrument within the fair value hierarchy is based on the lowest level of any input that is significant to the fair value measurement
| 66 | 2015 iSHARES ANNUAL REPORTTO SHAREHOLDERS |
Table of Contents
Notes to Financial Statements (Continued)
iSHARES®, INC.
in its entirety. The categorization of a value determined for a financial instrument within the hierarchy is based upon the pricing transparency of the instrument and is not necessarily an indication of the risk associated with investing in the instrument. The three levels of the fair value hierarchy are as follows:
| • | Level 1 — Unadjusted quoted prices in active markets for identical assets or liabilities; |
| • | Level 2 — Inputs other than quoted prices included within Level 1 that are observable for the asset or liability either directly or indirectly, including quoted prices for similar assets or liabilities in active markets, quoted prices for identical or similar assets or liabilities in markets that are not considered to be active, inputs other than quoted prices that are observable for the asset or liability (such as exchange rates, financing terms, interest rates, yield curves, volatilities, prepayment speeds, loss severities, credit risks and default rates) or other market-corroborated inputs; and |
| • | Level 3 — Unobservable inputs for the asset or liability, including the Global Valuation Committee’s assumptions used in determining the fair value of investments. |
Changes in valuation techniques may result in transfers in or out of an assigned level within the disclosure hierarchy. In accordance with the Company’s policy, transfers between different levels of the fair value hierarchy are deemed to have occurred as of the beginning of the reporting period.
The following table summarizes the value of each of the Funds’ investments according to the fair value hierarchy as of August 31, 2015. The breakdown of each Fund’s investments into major categories is disclosed in its respective schedule of investments.
| iShares ETF | Level 1 | Level 2 | Level 3 | Total | ||||||||||||
MSCI Brazil Capped | ||||||||||||||||
Investments: | ||||||||||||||||
Assets: | ||||||||||||||||
Common Stocks | $ | 1,299,593,204 | $ | — | $ | — | $ | 1,299,593,204 | ||||||||
Preferred Stocks | 678,331,552 | — | — | 678,331,552 | ||||||||||||
Money Market Funds | 2,312,655 | — | — | 2,312,655 | ||||||||||||
|
|
|
|
|
|
|
| |||||||||
Total | $ | 1,980,237,411 | $ | — | $ | — | $ | 1,980,237,411 | ||||||||
|
|
|
|
|
|
|
| |||||||||
MSCI Chile Capped | ||||||||||||||||
Investments: | ||||||||||||||||
Assets: | ||||||||||||||||
Common Stocks | $ | 218,537,353 | $ | — | $ | — | $ | 218,537,353 | ||||||||
Preferred Stocks | 15,327,849 | — | — | 15,327,849 | ||||||||||||
Money Market Funds | 478,553 | — | — | 478,553 | ||||||||||||
|
|
|
|
|
|
|
| |||||||||
Total | $ | 234,343,755 | $ | — | $ | — | $ | 234,343,755 | ||||||||
|
|
|
|
|
|
|
| |||||||||
MSCI Colombia Capped | ||||||||||||||||
Investments: | ||||||||||||||||
Assets: | ||||||||||||||||
Common Stocks | $ | 10,465,213 | $ | — | $ | — | $ | 10,465,213 | ||||||||
Preferred Stocks | 3,763,292 | — | — | �� | 3,763,292 | |||||||||||
Money Market Funds | 19,541 | — | — | 19,541 | ||||||||||||
|
|
|
|
|
|
|
| |||||||||
Total | $ | 14,248,046 | $ | — | $ | — | $ | 14,248,046 | ||||||||
|
|
|
|
|
|
|
| |||||||||
NOTESTO FINANCIAL STATEMENTS | 67 |
Table of Contents
Notes to Financial Statements (Continued)
iSHARES®, INC.
| iShares ETF | Level 1 | Level 2 | Level 3 | Total | ||||||||||||
MSCI Israel Capped | ||||||||||||||||
Investments: | ||||||||||||||||
Assets: | ||||||||||||||||
Common Stocks | $ | 125,749,450 | $ | — | $ | — | $ | 125,749,450 | ||||||||
Money Market Funds | 4,352,471 | — | — | 4,352,471 | ||||||||||||
|
|
|
|
|
|
|
| |||||||||
Total | $ | 130,101,921 | $ | — | $ | — | $ | 130,101,921 | ||||||||
|
|
|
|
|
|
|
| |||||||||
MSCI Russia Capped | ||||||||||||||||
Investments: | ||||||||||||||||
Assets: | ||||||||||||||||
Common Stocks | $ | 196,829,540 | $ | — | $ | — | $ | 196,829,540 | ||||||||
Preferred Stocks | 14,771,228 | — | — | 14,771,228 | ||||||||||||
Money Market Funds | 313,635 | — | — | 313,635 | ||||||||||||
|
|
|
|
|
|
|
| |||||||||
Total | $ | 211,914,403 | $ | — | $ | — | $ | 211,914,403 | ||||||||
|
|
|
|
|
|
|
| |||||||||
MSCI South Africa | ||||||||||||||||
Investments: | ||||||||||||||||
Assets: | ||||||||||||||||
Common Stocks | $ | 372,194,192 | $ | — | $ | 1,980 | $ | 372,196,172 | ||||||||
Money Market Funds | 988,488 | — | — | 988,488 | ||||||||||||
|
|
|
|
|
|
|
| |||||||||
Total | $ | 373,182,680 | $ | — | $ | 1,980 | $ | 373,184,660 | ||||||||
|
|
|
|
|
| �� |
| |||||||||
MSCI Turkey | ||||||||||||||||
Investments: | ||||||||||||||||
Assets: | ||||||||||||||||
Common Stocks | $ | 370,773,367 | $ | — | $ | — | $ | 370,773,367 | ||||||||
Money Market Funds | 61,025,313 | — | — | 61,025,313 | ||||||||||||
|
|
|
|
|
|
|
| |||||||||
Total | $ | 431,798,680 | $ | — | $ | — | $ | 431,798,680 | ||||||||
|
|
|
|
|
|
|
| |||||||||
MSCI USA Equal Weighted | ||||||||||||||||
Investments: | ||||||||||||||||
Assets: | ||||||||||||||||
Common Stocks | $ | 44,462,722 | $ | — | $ | — | $ | 44,462,722 | ||||||||
Money Market Funds | 758,557 | — | — | 758,557 | ||||||||||||
|
|
|
|
|
|
|
| |||||||||
Total | $ | 45,221,279 | $ | — | $ | — | $ | 45,221,279 | ||||||||
|
|
|
|
|
|
|
| |||||||||
SECURITY TRANSACTIONS AND INCOME RECOGNITION
Security transactions are accounted for on trade date. Dividend income and capital gain distributions, if any, are recognized on the ex-dividend date, net of any foreign taxes withheld at source. Any taxes withheld that are reclaimable from foreign tax authorities as of August 31, 2015 are reflected in dividends receivable. Non-cash dividends received in the form of stock in an elective dividend, if any, are recorded as dividend income at fair value. Distributions received by the Funds may include a return of capital that is estimated by management. Such amounts are recorded as a reduction of the cost of investments or reclassified to capital gains. Interest income is accrued daily. Realized gains and losses on investment transactions are determined using the specific identification method.
| 68 | 2015 iSHARES ANNUAL REPORTTO SHAREHOLDERS |
Table of Contents
Notes to Financial Statements (Continued)
iSHARES®, INC.
FOREIGN CURRENCY TRANSLATION
The accounting records of the Funds are maintained in U.S. dollars. Foreign currencies, as well as investment securities and other assets and liabilities denominated in foreign currencies, are translated into U.S. dollars using exchange rates deemed appropriate by the investment adviser. Purchases and sales of securities, income receipts and expense payments are translated into U.S. dollars on the respective dates of such transactions.
Each Fund does not isolate the effect of fluctuations in foreign exchange rates from the effect of fluctuations in the market prices of securities. Such fluctuations are reflected by the Funds as a component of realized and unrealized gains and losses from investments for financial reporting purposes.
FOREIGN TAXES
The Funds may be subject to foreign taxes (a portion of which may be reclaimable) on income, stock dividends, capital gains on investments, or certain foreign currency transactions. All foreign taxes are recorded in accordance with the applicable foreign tax regulations and rates that exist in the foreign jurisdictions in which the Funds invest. These foreign taxes, if any, are paid by the Funds and are reflected in their statements of operations as follows: foreign taxes withheld at source are presented as a reduction of income, foreign taxes on securities lending income are presented as a reduction of securities lending income, foreign taxes on stock dividends are presented as “other foreign taxes,” and foreign taxes on capital gains from sales of investments and foreign taxes on foreign currency transactions are included in their respective net realized gain (loss) categories. Foreign taxes payable or deferred as of August 31, 2015, if any, are disclosed in the Funds’ statements of assets and liabilities.
DISTRIBUTIONS TO SHAREHOLDERS
Dividends and distributions paid by each Fund are recorded on the ex-dividend dates. Distributions are determined on a tax basis and may differ from net investment income and net realized capital gains for financial reporting purposes. Dividends and distributions are paid in U.S. dollars and cannot be automatically reinvested in additional shares of the Funds.
LOANS OF PORTFOLIO SECURITIES
Each Fund may lend its investment securities to approved borrowers, such as brokers, dealers and other financial institutions. The borrower pledges and maintains with the Fund collateral consisting of cash, an irrevocable letter of credit issued by a bank, or securities issued or guaranteed by the U.S. government. The initial collateral received by each Fund is required to have a value of at least 102% of the current value of the loaned securities for securities traded on U.S. exchanges and a value of at least 105% for all other securities. The collateral is maintained thereafter, at a value equal to at least 100% of the current value of the securities on loan. The market value of the loaned securities is determined at the close of each business day of the Funds. Any additional required collateral is delivered to the Funds and any excess collateral is returned by the Funds on the next business day. During the term of the loan, each Fund is entitled to all distributions made on or in respect of the loaned securities. Loans of securities are terminable at any time and the borrower, after notice, is required to return borrowed securities within the standard time period for settlement of securities transactions.
Any cash received as collateral for securities on loan may be reinvested in certain short-term instruments either directly on behalf of a fund or through one or more joint accounts or money market funds, including those managed by BlackRock Fund Advisors (“BFA”), the Funds’ investment adviser, or its affiliates. As of August 31, 2015, any securities on loan were collateralized by cash. The cash collateral received was invested in money market funds managed by BFA and is disclosed in the schedules of investments. The securities on loan for each Fund are also disclosed in its schedule of investments. The total value of any
NOTESTO FINANCIAL STATEMENTS | 69 |
Table of Contents
Notes to Financial Statements (Continued)
iSHARES®, INC.
securities on loan as of August 31, 2015 and the total value of the related collateral are disclosed in the statements of assets and liabilities. Income earned by the Funds from securities lending is disclosed in the statements of operations.
The risks of securities lending include the risk that the borrower may not provide additional collateral when required or may not return the securities when due. To mitigate these risks, the Funds benefit from a borrower default indemnity provided by BlackRock, Inc. (“BlackRock”). BlackRock’s indemnity allows for full replacement of securities lent. Each Fund could suffer a loss if the value of the investments purchased with cash collateral falls below the value of the cash collateral received.
Securities lending transactions are entered into by the Funds under Master Securities Lending Agreements (“MSLA”) which provide the right, in the event of default (including bankruptcy or insolvency) for the non-defaulting party to liquidate the collateral and calculate a net exposure to the defaulting party or request additional collateral. In the event that a borrower defaults, a Fund, as lender, would offset the market value of the collateral received against the market value of the securities loaned. The value of the collateral is typically greater than that of the market value of the securities loaned, leaving the lender with a net amount payable to the defaulting party. However, bankruptcy or insolvency laws of a particular jurisdiction may impose restrictions on or prohibitions against such a right of offset in the event of an MSLA counterparty’s bankruptcy or insolvency. Under the MSLA, the borrower can resell or re-pledge the loaned securities, and a Fund can reinvest cash collateral, or, upon an event of default, resell or re-pledge the collateral.
The following table is a summary of securities lending agreements which are subject to offset under an MSLA as of August 31, 2015:
| iShares ETF | Market Value of Securities on Loan | Cash Collateral Received a | Net Amount | |||||||||
MSCI Israel Capped | $ | 4,047,917 | $ | 4,047,917 | $ | — | ||||||
MSCI South Africa | 877,856 | 877,856 | — | |||||||||
MSCI Turkey | 57,691,030 | 57,691,030 | — | |||||||||
MSCI USA Equal Weighted | 590,425 | 590,425 | — | |||||||||
| a | Collateral received in excess of the market value of securities on loan is not presented for financial reporting purposes. The total collateral received is disclosed in each Fund’s statement of assets and liabilities. |
| 2. | INVESTMENT ADVISORY AGREEMENT AND OTHER TRANSACTIONS WITH AFFILIATES |
Pursuant to an Investment Advisory Agreement with the Company, BFA manages the investment of each Fund’s assets. BFA is a California corporation indirectly owned by BlackRock. Under the Investment Advisory Agreement, BFA is responsible for substantially all expenses of the Funds, except interest, taxes, brokerage commissions and other expenses connected with the execution of portfolio transactions, distribution fees, litigation expenses and any extraordinary expenses.
For its investment advisory services to each of the iShares MSCI Brazil Capped, iShares MSCI Chile Capped, iShares MSCI Israel Capped, iShares MSCI Russia Capped, iShares MSCI South Africa and iShares MSCI Turkey ETFs, BFA is entitled to an
| 70 | 2015 iSHARES ANNUAL REPORTTO SHAREHOLDERS |
Table of Contents
Notes to Financial Statements (Continued)
iSHARES®, INC.
annual investment advisory fee based on each Fund’s allocable portion of the aggregate of the average daily net assets of the Fund and certain other iShares funds, as follows:
| Investment Advisory Fee | Aggregate Average Daily Net Assets | ||||
| 0.74 | % | First $2 billion | |||
| 0.69 | Over $2 billion, up to and including $4 billion | ||||
| 0.64 | Over $4 billion, up to and including $8 billion | ||||
| 0.57 | Over $8 billion, up to and including $16 billion | ||||
| 0.51 | Over $16 billion, up to and including $32 billion | ||||
| 0.45 | Over $32 billion | ||||
For its investment advisory services to each of the following Funds, BFA is entitled to an annual investment advisory fee based on the average daily net assets of each Fund as follows:
| iShares ETF | Investment Advisory Fee | |||
MSCI Colombia Capped | 0.61 | % | ||
MSCI USA Equal Weighted | 0.15 | |||
The U.S. Securities and Exchange Commission has issued an exemptive order which permits BlackRock Institutional Trust Company, N.A. (“BTC”), an affiliate of BFA, to serve as securities lending agent for the Funds, subject to applicable conditions. As securities lending agent, BTC bears all operational costs directly related to securities lending. Each Fund is responsible for fees in connection with the investment of cash collateral received for securities on loan in a money market fund managed by BFA, however, BTC has agreed to reduce the amount of securities lending income it receives in order to effectively limit the collateral investment fees each Fund bears to an annual rate of 0.04% (the “collateral investment fees”). Securities lending income is equal to the total of income earned from the reinvestment of cash collateral, net of fees and other payments to and from borrowers of securities, and less the collateral investment fees. The Funds retain a portion of securities lending income and remit the remaining portion to BTC as compensation for its services as securities lending agent.
Pursuant to a securities lending agreement, the iShares MSCI USA Equal Weighted ETF (the “Group 1 Fund”), retains 71.5% of securities lending income and the amount retained can never be less than 65% of the total of securities lending income plus the collateral investment fees.
Pursuant to a securities lending agreement, the iShares MSCI Brazil Capped, iShares MSCI Chile Capped, iShares MSCI Colombia Capped, iShares MSCI Israel Capped, iShares Russia Capped, iShares MSCI South Africa and iShares MSCI Turkey ETFs (the “Group 2 Funds”), retain 80% of securities lending income and the amount retained can never be less than 70% of the total of securities lending income plus the collateral investment fees.
In addition, commencing the business day following the date that the aggregate securities lending income plus the collateral investment fees generated across all 1940 Act iShares exchange-traded funds (the “iShares ETF Complex”) in a given calendar year exceeds the aggregate securities lending income generated across the iShares ETF Complex in the calendar year 2013, the Group 1 Fund, pursuant to a securities lending agreement, will retain for the remainder of that calendar year 75% of securities lending income and the amount retained can never be less than 65% of the total of securities lending income plus the collateral investment fees. Each Group 2 Fund will receive for the remainder of that calendar year 85% of securities lending income and the amount retained can never be less than 70% of the total of securities lending income plus the collateral investment fees.
NOTESTO FINANCIAL STATEMENTS | 71 |
Table of Contents
Notes to Financial Statements (Continued)
iSHARES®, INC.
Prior to January 1, 2015, the Group 1 Fund retained 70% of securities lending income and each Group 2 Fund retained 75% of securities lending income, and the amount retained was never less than 65% of the total of securities lending income plus the collateral investment fees. In addition, commencing the business day following the date that the aggregate securities lending income plus the collateral investment fees generated across the iShares ETF Complex in the calendar year 2014 exceeded the aggregate securities lending income generated across the iShares ETF Complex in the calendar year 2013 and pursuant to a securities lending agreement, the Group 1 Fund retained for the remainder of the calendar year 2014, 75% of securities lending income and each Group 2 Fund retained 80% of securities lending income, and the amount retained was never less than 65% of the total of securities lending income plus the collateral investment fees.
For the year ended August 31, 2015, the total of securities lending agent services and collateral investment fees paid were as follows:
| iShares ETF | Fees Paid to BTC | |||
MSCI Colombia Capped | $ | 1,220 | ||
MSCI Israel Capped | 27,932 | |||
MSCI South Africa | 3,110 | |||
MSCI Turkey | 399,698 | |||
MSCI USA Equal Weighted | 1,560 | |||
BlackRock Investments, LLC, an affiliate of BFA, is the distributor for each Fund. Pursuant to the distribution agreement, BFA is responsible for any fees or expenses for distribution services provided to the Funds.
Cross trades for the year ended August 31, 2015, if any, were executed by the Funds pursuant to Rule 17a-7 under the 1940 Act. Cross trading is the buying or selling of portfolio securities between funds to which BFA (or an affiliate) serves as investment adviser. At its regularly scheduled quarterly meetings, the Board reviews such transactions as of the most recent calendar quarter for compliance with the requirements and restrictions set forth by Rule 17a-7.
Each Fund may invest its positive cash balances in certain money market funds managed by BFA or an affiliate. The income earned on these temporary cash investments is included in “Interest – affiliated” in the statements of operations.
The PNC Financial Services Group, Inc. is the largest stockholder of BlackRock and is considered to be an affiliate of the Funds for 1940 Act purposes.
Investments in issuers considered to be affiliates of the Funds (excluding money market funds) during the year ended August 31, 2015, for purposes of Section 2(a)(3) of the 1940 Act, were as follows:
| iShares ETF and Name of Affiliated Issuer | Shares Held at Beginning of Year | Shares Purchased | Shares Sold | Shares Held at End of Year | Value at End of Year | Dividend Income | Net Realized Gain (Loss) | |||||||||||||||||||||
MSCI USA Equal Weighted | ||||||||||||||||||||||||||||
BlackRock Inc. | 338 | 225 | (337 | ) | 226 | $ | 68,358 | $ | 3,058 | $ | 5,252 | |||||||||||||||||
PNC Financial Services Group Inc. (The) | 1,343 | 926 | (1,493 | ) | 776 | 70,709 | 2,790 | 12,140 | ||||||||||||||||||||
|
|
|
|
|
| |||||||||||||||||||||||
| $ | 139,067 | $ | 5,848 | $ | 17,392 | |||||||||||||||||||||||
|
|
|
|
|
| |||||||||||||||||||||||
| 72 | 2015 iSHARES ANNUAL REPORTTO SHAREHOLDERS |
Table of Contents
Notes to Financial Statements (Continued)
iSHARES®, INC.
Certain directors and officers of the Company are also officers of BTC and/or BFA.
| 3. | INVESTMENT PORTFOLIO TRANSACTIONS |
Purchases and sales of investments (excluding in-kind transactions and short-term investments) for the year ended August 31, 2015 were as follows:
| iShares ETF | Purchases | Sales | ||||||
MSCI Brazil Capped | $ | 2,352,284,666 | $ | 2,817,862,121 | ||||
MSCI Chile Capped | 199,991,925 | 249,623,276 | ||||||
MSCI Colombia Capped | 19,706,159 | 15,128,559 | ||||||
MSCI Israel Capped | 19,080,782 | 17,696,508 | ||||||
MSCI Russia Capped | 59,165,287 | 48,624,677 | ||||||
MSCI South Africa | 39,669,933 | 39,909,493 | ||||||
MSCI Turkey | 29,145,325 | 29,684,653 | ||||||
MSCI USA Equal Weighted | 20,797,298 | 20,599,587 | ||||||
In-kind transactions (see Note 4) for the year ended August 31, 2015 were as follows:
| iShares ETF | In-kind Purchases | In-kind Sales | ||||||
MSCI Colombia Capped | $ | 950,697 | $ | 466,142 | ||||
MSCI Israel Capped | 153,612,682 | 144,062,182 | ||||||
MSCI Russia Capped | 80,047,954 | 82,061,190 | ||||||
MSCI South Africa | 192,826,938 | 302,469,725 | ||||||
MSCI Turkey | 224,252,540 | 180,980,620 | ||||||
MSCI USA Equal Weighted | 32,011,446 | 34,292,007 | ||||||
| 4. | CAPITAL SHARE TRANSACTIONS |
Capital shares are issued and redeemed by each Fund only in aggregations of a specified number of shares or multiples thereof (“Creation Units”) at NAV. Except when aggregated in Creation Units, shares of each Fund are not redeemable. Transactions in capital shares for each Fund are disclosed in detail in the statements of changes in net assets.
The consideration for the purchase of Creation Units of a fund in the Company generally consists of the in-kind deposit of a designated portfolio of securities and a specified amount of cash. Certain funds in the Company may be offered in Creation Units solely or partially for cash in U.S. dollars. Investors purchasing and redeeming Creation Units may pay a purchase transaction fee and a redemption transaction fee directly to State Street Bank and Trust Company, the Company’s administrator, to offset transfer and other transaction costs associated with the issuance and redemption of Creation Units, including Creation Units for cash. Investors transacting in Creation Units for cash may also pay an additional variable charge to compensate the relevant fund for certain transaction costs (i.e., stamp taxes, taxes on currency or other financial transactions, and brokerage costs) and market impact expenses relating to investing in portfolio securities. Such variable charges, if any, are included in “Proceeds from shares sold” in the statements of changes in net assets.
From time to time, settlement of securities related to in-kind contributions or in-kind redemptions may be delayed. In such cases, securities related to in-kind contributions are reflected as “Due from custodian” and securities related to in-kind redemptions are reflected as “Securities related to in-kind transactions” in the statements of assets and liabilities.
NOTESTO FINANCIAL STATEMENTS | 73 |
Table of Contents
Notes to Financial Statements (Continued)
iSHARES®, INC.
| 5. | PRINCIPAL RISKS |
In the normal course of business, each Fund’s investment activities expose it to various types of risk associated with the financial instruments and markets in which it invests. The significant types of financial risks each Fund is exposed to include market risk and credit risk. Each Fund’s prospectus provides details of these and other types of risk.
BFA uses a “passive” or index approach to try to achieve each Fund’s investment objective following the securities included in its underlying index during upturns as well as downturns. BFA does not take steps to reduce market exposure or to lessen the effects of a declining market. Divergence from the underlying index and the composition of the portfolio is monitored by BFA.
MARKET RISK
Market risk arises mainly from uncertainty about future values of financial instruments influenced by price, currency and interest rate movements. It represents the potential loss each Fund may suffer through holding market positions in the face of market movements. Each Fund is exposed to market risk by virtue of its investment in equity instruments. The fair value of securities held by the Funds may decline due to general market conditions, economic trends or events that are not specifically related to the issuers of the securities including local, regional or global political, social or economic instability or to factors that affect a particular industry or group of industries. The extent of each Fund’s exposure to market risk is the market value of the investments held as shown in the Fund’s schedule of investments.
A diversified portfolio, where this is appropriate and consistent with a fund’s objectives, minimizes the risk that a price change of a particular investment will have a material impact on the NAV of a fund. The investment concentrations within each Fund’s portfolio are disclosed in its schedule of investments.
Each Fund, except for the iShares MSCI USA Equal Weighted ETF, each invests a substantial amount of its assets in securities of non-U.S. issuers that trade in non-U.S. markets. This involves certain considerations and risks not typically associated with securities of U.S. issuers. Such risks include, but are not limited to: generally less liquid and less efficient securities markets; generally greater price volatility; exchange rate fluctuations and exchange controls; imposition of restrictions on the expatriation of funds or other assets of the Fund; less publicly available information about issuers; the imposition of withholding or other taxes; higher transaction and custody costs; settlement delays and risk of loss attendant in settlement procedures; difficulties in enforcing contractual obligations; less regulation of securities markets; different accounting, disclosure and reporting requirements; more substantial governmental involvement in the economy; higher inflation rates; greater social, economic and political uncertainties; the risk of nationalization or expropriation of assets; and the risk of war. These risks are heightened for investments in issuers from countries with less developed markets.
Each Fund, except for the iShares MSCI USA Equal Weighted ETF, each invests all or substantially all of its assets in issuers located in a single country. When a fund concentrates its investments in this manner, it assumes the risk that economic, political and social conditions in that country may have a significant impact on its investment performance.
The United States and the European Union, along with the regulatory bodies of a number of countries including Japan, Australia and Canada (collectively, “Sanctioning Bodies”), have imposed sectorial economic sanctions on certain Russian individuals and Russian corporate entities which include prohibitions on transacting in or dealing in new debt of longer than 30 or 90 days maturity or new equity of such issuers. Securities held by the iShares MSCI Russia Capped ETF issued prior to the date of the sanctions being imposed are not currently subject to any restrictions under the sanctions. However, compliance with each of these sanctions may impair the ability of a Fund to buy, sell, hold, receive or deliver the affected securities or other securities of such issuers. The Sanctioning Bodies could also institute broader sanctions on Russia. These sanctions, or even the threat of further sanctions, may result in the decline of the value and liquidity of Russian securities, a weakening of the ruble or other adverse consequences to the Russian economy. Current or future sanctions may result in Russia taking counter measures or
| 74 | 2015 iSHARES ANNUAL REPORTTO SHAREHOLDERS |
Table of Contents
Notes to Financial Statements (Continued)
iSHARES®, INC.
retaliatory actions, which may further impair the value and liquidity of Russian securities. These retaliatory measures may include the immediate freeze of Russian assets held by a Fund.
CREDIT RISK
Credit risk is the risk that an issuer or guarantor of debt instruments or the counterparty to a financial transaction, including derivatives contracts, repurchase agreements or loans of portfolio securities, is unable or unwilling to make timely interest and/or principal payments or to otherwise honor its obligations. BFA and its affiliates manage counterparty credit risk by entering into transactions only with counterparties that they believe have the financial resources to honor their obligations and by monitoring the financial stability of those counterparties. Financial assets, which potentially expose the Funds to issuer and counterparty credit risks, consist principally of financial instruments and receivables due from counterparties. The extent of each Fund’s exposure to credit and counterparty risks with respect to those financial assets is approximated by their value recorded in its statement of assets and liabilities.
| 6. | INCOME TAX INFORMATION |
Each Fund is treated as an entity separate from the Company’s other funds for federal income tax purposes. It is the policy of each Fund to qualify as a regulated investment company by complying with the provisions applicable to regulated investment companies, as defined under Subchapter M of the Internal Revenue Code of 1986, as amended, and to annually distribute substantially all of its ordinary income and any net capital gains (taking into account any capital loss carryforwards) sufficient to relieve it from all, or substantially all, federal income and excise taxes. Accordingly, no provision for federal income taxes is required.
U.S. GAAP requires that certain components of net assets be adjusted to reflect permanent differences between financial and tax reporting. These reclassifications have no effect on net assets or NAV per share. The following permanent differences as of August 31, 2015, attributable to passive foreign investment companies, the expiration of capital loss carryforwards, foreign currency transactions and realized gains (losses) from in-kind redemptions, were reclassified to the following accounts:
| iShares ETF | Paid-in Capital | Undistributed Net Investment Income/Distributions in Excess of Net Investment Income | Undistributed Net Realized Gain/Accumulated Net Realized Loss | |||||||||
MSCI Brazil Capped | $ | — | $ | (4,538,476 | ) | $ | 4,538,476 | |||||
MSCI Chile Capped | — | (32,882 | ) | 32,882 | ||||||||
MSCI Colombia Capped | (20,786 | ) | (90,904 | ) | 111,690 | |||||||
MSCI Israel Capped | 7,527,678 | 48,822 | (7,576,500 | ) | ||||||||
MSCI Russia Capped | (4,903,001 | ) | (415,716 | ) | 5,318,717 | |||||||
MSCI South Africa | 13,193,993 | (200,462 | ) | (12,993,531 | ) | |||||||
MSCI Turkey | (13,519,010 | ) | (276,391 | ) | 13,795,401 | |||||||
MSCI USA Equal Weighted | 5,044,802 | — | (5,044,802 | ) | ||||||||
NOTESTO FINANCIAL STATEMENTS | 75 |
Table of Contents
Notes to Financial Statements (Continued)
iSHARES®, INC.
The tax character of distributions paid during the years ended August 31, 2015 and August 31, 2014 was as follows:
| iShares ETF | 2015 | 2014 | ||||||
MSCI Brazil Capped | ||||||||
Ordinary income | $ | 96,651,627 | $ | 151,885,117 | ||||
|
|
|
| |||||
MSCI Chile Capped | ||||||||
Ordinary income | $ | 4,099,138 | $ | 4,758,168 | ||||
|
|
|
| |||||
MSCI Colombia Capped | ||||||||
Ordinary income | $ | 438,777 | $ | 548,322 | ||||
Return of Capital | 7,256 | 10,400 | ||||||
|
|
|
| |||||
| $ | 446,033 | $ | 558,722 | |||||
|
|
|
| |||||
MSCI Israel Capped | ||||||||
Ordinary income | $ | 2,707,351 | $ | 2,015,418 | ||||
|
|
|
| |||||
MSCI Russia Capped | ||||||||
Ordinary income | $ | 10,822,184 | $ | 2,160,831 | ||||
|
|
|
| |||||
MSCI South Africa | ||||||||
Ordinary income | $ | 9,092,367 | $ | 12,294,677 | ||||
|
|
|
| |||||
MSCI Turkey | ||||||||
Ordinary income | $ | 10,891,320 | $ | 8,703,391 | ||||
|
|
|
| |||||
MSCI USA Equal Weighted | ||||||||
Ordinary income | $ | 949,728 | $ | 2,876,350 | ||||
|
|
|
| |||||
As of August 31, 2015, the tax components of accumulated net earnings (losses) were as follows:
| iShares ETF | Undistributed Ordinary Income | Capital Loss Carryforwards | Net Unrealized Gains (Losses) a | Qualified Late-Year Losses b | Total | |||||||||||||||
MSCI Brazil Capped | $ | 683,072 | $ | (1,251,329,016 | ) | $ | (564,687,744 | ) | $ | (704,944,670 | ) | $ | (2,520,278,358 | ) | ||||||
MSCI Chile Capped | 433,024 | (104,872,743 | ) | (23,992,090 | ) | (45,652,241 | ) | (174,084,050 | ) | |||||||||||
MSCI Colombia Capped | — | (67,112 | ) | (10,845,258 | ) | (2,576,135 | ) | (13,488,505 | ) | |||||||||||
MSCI Israel Capped | 397,261 | (33,335,594 | ) | (27,801,403 | ) | (4,383,576 | ) | (65,123,312 | ) | |||||||||||
MSCI Russia Capped | 5,028,663 | (20,431,060 | ) | (140,031,505 | ) | (21,321,410 | ) | (176,755,312 | ) | |||||||||||
MSCI South Africa | 1,801,926 | (70,652,777 | ) | (139,232,676 | ) | (17,163,507 | ) | (225,247,034 | ) | |||||||||||
MSCI Turkey | — | (40,436,025 | ) | (259,310,083 | ) | (13,939,161 | ) | (313,685,269 | ) | |||||||||||
MSCI USA Equal Weighted | 144,655 | (169,304 | ) | (313,537 | ) | (1,408,215 | ) | (1,746,401 | ) | |||||||||||
| a | The difference between book-basis and tax-basis unrealized gains (losses) was attributable primarily to the tax deferral of losses on wash sales and the realization for tax purposes of unrealized gains on investments in passive foreign investment companies. |
| b | The Funds have elected to defer certain qualified late-year losses and recognize such losses in the year ending next taxable year. |
| 76 | 2015 iSHARES ANNUAL REPORTTO SHAREHOLDERS |
Table of Contents
Notes to Financial Statements (Continued)
iSHARES®, INC.
As of August 31, 2015, the following Funds had capital loss carryforwards available to offset future realized capital gains through the indicated expiration dates as follows:
| iShares ETF | Non- Expiring a | Expiring 2016 | Expiring 2017 | Expiring 2018 | Expiring 2019 | Total | ||||||||||||||||||
MSCI Brazil Capped | $ | 1,053,102,706 | $ | — | $ | — | $ | 198,226,310 | $ | — | $ | 1,251,329,016 | ||||||||||||
MSCI Chile Capped | 90,296,781 | — | 1,886,881 | 11,712,090 | 976,991 | 104,872,743 | ||||||||||||||||||
MSCI Colombia Capped | 67,112 | — | — | — | — | 67,112 | ||||||||||||||||||
MSCI Israel Capped | 14,619,675 | — | 784,479 | 10,801,191 | 7,130,249 | 33,335,594 | ||||||||||||||||||
MSCI Russia Capped | 20,431,060 | — | — | — | — | 20,431,060 | ||||||||||||||||||
MSCI South Africa | 33,347,782 | 972,024 | 15,339,464 | 14,856,365 | 6,137,142 | 70,652,777 | ||||||||||||||||||
MSCI Turkey | 29,873,468 | — | 720,636 | 5,982,737 | 3,859,184 | 40,436,025 | ||||||||||||||||||
MSCI USA Equal Weighted | 169,304 | — | — | — | — | 169,304 | ||||||||||||||||||
| a | Must be utilized prior to losses subject to expiration. |
The Funds may own shares in certain foreign investment entities, referred to, under U.S. tax law, as “passive foreign investment companies.” The Funds may elect to mark-to-market annually the shares of each passive foreign investment company and would be required to distribute to shareholders any such marked-to-market gains.
As of August 31, 2015, gross unrealized appreciation and gross unrealized depreciation based on cost for federal income tax purposes were as follows:
| iShares ETF | Tax Cost | Gross Unrealized Appreciation | Gross Unrealized Depreciation | Net Unrealized Appreciation (Depreciation) | ||||||||||||
MSCI Brazil Capped | $ | 2,544,185,775 | $ | 486,403,770 | $ | (1,050,352,134 | ) | $ | (563,948,364 | ) | ||||||
MSCI Chile Capped | 258,335,949 | 25,817,520 | (49,809,714 | ) | (23,992,194 | ) | ||||||||||
MSCI Colombia Capped | 25,092,512 | — | (10,844,466 | ) | (10,844,466 | ) | ||||||||||
MSCI Israel Capped | 157,898,790 | 50,182 | (27,847,051 | ) | (27,796,869 | ) | ||||||||||
MSCI Russia Capped | 351,937,938 | 502,273 | (140,525,808 | ) | (140,023,535 | ) | ||||||||||
MSCI South Africa | 512,403,874 | 10,940,288 | (150,159,502 | ) | (139,219,214 | ) | ||||||||||
MSCI Turkey | 691,103,940 | 474,284 | (259,779,544 | ) | (259,305,260 | ) | ||||||||||
MSCI USA Equal Weighted | 45,534,816 | 1,655,361 | (1,968,898 | ) | (313,537 | ) | ||||||||||
Management has analyzed tax laws and regulations and their application to the Funds as of August 31, 2015, inclusive of the open tax return years, and does not believe there are any uncertain tax positions that require recognition of a tax liability in the Funds’ financial statements.
| 7. | LINE OF CREDIT |
The iShares MSCI Colombia Capped ETF, along with certain other iShares funds, are parties to a $150 million credit agreement with State Street Bank and Trust Company, which expires on October 28, 2015. The line of credit may be used for temporary or emergency purposes, including redemptions, settlement of trades and rebalancing of portfolio holdings. The credit agreement has the following terms: a commitment fee of 0.08% per annum on the unused portion of the credit agreement and interest at a rate equal to the higher of (a) the one-month LIBOR plus 1.00% per annum or (b) the U.S. Federal Funds rate plus 1.00% per annum on amounts borrowed. The commitment fee is allocated to each fund participating in the credit agreement based on each fund’s pro-rata share of the aggregate average daily value of assets invested in local securities of certain foreign markets.
NOTESTO FINANCIAL STATEMENTS | 77 |
Table of Contents
Notes to Financial Statements (Continued)
iSHARES®, INC.
On September 17, 2015, the Board amended the terms of the credit agreement as follows: (i) increased the maximum borrowing amount to $250 million; (ii) increased the commitment fee to 0.20% per annum on the unused portion of the credit agreement and interest at a rate equal to the higher of (a) the one-month LIBOR (not less than zero) plus 1.00% per annum or (b) the U.S. Federal Funds rate (not less than zero) plus 1.00% per annum on amounts borrowed; and (iii) extended the expiration date to October 28, 2016. These changes are expected to be effective on or around October 28, 2015.
The Fund did not borrow under the credit agreement during the year ended August 31, 2015.
| 8. | SUBSEQUENT EVENTS |
Management has evaluated the impact of all subsequent events on the Funds through the date the financial statements were available to be issued and has determined that there were no subsequent events requiring adjustment or disclosure in the financial statements.
| 78 | 2015 iSHARES ANNUAL REPORTTO SHAREHOLDERS |
Table of Contents
Report of Independent Registered Public Accounting Firm
To the Shareholders and Board of Directors of
iShares, Inc.:
In our opinion, the accompanying statements of assets and liabilities, including the schedules of investments, and the related statements of operations and of changes in net assets and the financial highlights present fairly, in all material respects, the financial position of iShares MSCI Brazil Capped ETF, iShares MSCI Chile Capped ETF, iShares MSCI Colombia Capped ETF, iShares MSCI Israel Capped ETF, iShares MSCI Russia Capped ETF, iShares MSCI South Africa ETF, iShares MSCI Turkey ETF and iShares MSCI USA Equal Weighted ETF (the “Funds”) at August 31, 2015, the results of each of their operations, the changes in each of their net assets and their financial highlights for each of the periods presented, in conformity with accounting principles generally accepted in the United States of America. These financial statements and financial highlights (hereafter referred to as “financial statements”) are the responsibility of the Funds’ management. Our responsibility is to express an opinion on these financial statements based on our audits. We conducted our audits of these financial statements in accordance with the standards of the Public Company Accounting Oversight Board (United States). Those standards require that we plan and perform the audit to obtain reasonable assurance about whether the financial statements are free of material misstatement. An audit includes examining, on a test basis, evidence supporting the amounts and disclosures in the financial statements, assessing the accounting principles used and significant estimates made by management, and evaluating the overall financial statement presentation. We believe that our audits, which included confirmation of securities at August 31, 2015 by correspondence with the custodian, transfer agent and brokers, provide a reasonable basis for our opinion.
PricewaterhouseCoopers LLP
San Francisco, California
October 22, 2015
REPORTOF INDEPENDENT REGISTERED PUBLIC ACCOUNTING FIRM | 79 |
Table of Contents
iSHARES®, INC.
Under Section 854(b)(2) of the Internal Revenue Code (the “Code”), the following maximum amounts are hereby designated as qualified dividend income for purposes of the maximum rate under Section 1(h)(11) of the Code for the fiscal year ended August 31, 2015:
| iShares ETF | Qualified Dividend Income | |||
MSCI Chile Capped | $ | 34,593 | ||
MSCI Colombia Capped | 37,567 | |||
MSCI Israel Capped | 4,129,003 | |||
MSCI Russia Capped | 10,461,428 | |||
| iShares ETF | Qualified Dividend Income | |||
MSCI South Africa | $ | 13,273,111 | ||
MSCI Turkey | 13,532,038 | |||
MSCI USA Equal Weighted | 1,015,286 | |||
In February 2016, shareholders will receive Form 1099-DIV which will include their share of qualified dividend income distributed during the calendar year 2015. Shareholders are advised to check with their tax advisers for information on the treatment of these amounts on their income tax returns.
For corporate shareholders, the percentage of income dividends paid by the iShares MSCI USA Equal Weighted ETF during the fiscal year ended August 31, 2015 that qualified for the dividends-received deduction was 100.00%.
For the fiscal year ended August 31, 2015, the following Funds earned foreign source income and paid foreign taxes which they intend to pass through to their shareholders pursuant to Section 853 of the Code:
| iShares ETF | Foreign Source Income Earned | Foreign Taxes Paid | ||||||
MSCI Brazil Capped | $ | 133,780,946 | $ | 9,409,746 | ||||
MSCI Chile Capped | 7,859,971 | 1,608,540 | ||||||
MSCI Colombia Capped | 549,103 | 4,343 | ||||||
MSCI Israel Capped | 4,608,781 | 849,959 | ||||||
| iShares ETF | Foreign Source Income Earned | Foreign Taxes Paid | ||||||
MSCI Russia Capped | $ | 11,797,930 | $ | 1,604,177 | ||||
MSCI South Africa | 13,472,076 | 1,931,403 | ||||||
MSCI Turkey | 13,824,815 | 1,385,436 | ||||||
| 80 | 2015 iSHARES ANNUAL REPORTTO SHAREHOLDERS |
Table of Contents
Board Review and Approval of Investment Advisory
Contract
iSHARES® , INC.
I. iShares MSCI Brazil Capped ETF and iShares MSCI Chile Capped ETF
Under Section 15(c) of the Investment Company Act of 1940 (the “1940 Act”), the Company’s Board of Directors (the “Board”), including a majority of Directors who are not “interested persons” of the Company (as that term is defined in the 1940 Act) (the “Independent Directors”), is required annually to consider and approve the Investment Advisory Contract between the Company and BFA (the “Advisory Contract”) on behalf of the Funds. The Independent Directors requested, and BFA provided, such information as the Independent Directors, with advice from independent counsel, deemed reasonably necessary to evaluate the Advisory Contract. A committee of Independent Directors (the “15(c) Committee”), with independent counsel, met with management on May 1, 2015 and May 6, 2015, to discuss the types of information the Independent Directors required and the manner in which management would organize and present such information. At a meeting held on May 21, 2015, management presented preliminary information to the Board relating to the continuance of the Advisory Contract, and the Board, including the Independent Directors, reviewed and discussed such information at length. The Independent Directors requested from management certain additional information, which management agreed to provide. At a meeting held on June 24-25, 2015, the Board, including the Independent Directors, reviewed the additional information provided by management in response to these requests. After extensive discussions, the Board, including all of the Independent Directors, approved the continuance of the Advisory Contract for the Funds, based on a review of qualitative and quantitative information provided by BFA, including the additional information management provided at the request of the Independent Directors. The Board noted its satisfaction with the extent and quality of information provided and its frequent interactions with management, as well as the detailed responses and other information provided by BFA. The Board also noted that the Board and BFA agreed to discuss potential enhancements and adjustments to the 15(c) process for the coming year. The Independent Directors were advised by their independent counsel throughout the process, including about the legal standards applicable to their review. In approving the Advisory Contract for the Funds, the Board, including the Independent Directors, considered the following factors, no one of which was controlling, and reached the following conclusions:
Expenses and Performance of the Funds — The Board reviewed statistical information prepared by Lipper Inc. (“Lipper”), an independent provider of investment company data, regarding the expense ratio components, including actual advisory fees, waivers/reimbursements, and gross and net total expenses of each Fund in comparison with the same information for other exchange traded funds (including, where applicable, funds sponsored by an “at cost” service provider) and, in the limited instances where no comparable ETFs existed and the comparison group would not otherwise be reasonable in Lipper’s judgment, pure index institutional mutual funds, objectively selected by Lipper as comprising such Fund’s applicable peer group pursuant to Lipper’s proprietary ETF methodology (the “Lipper Group”). The Board was provided with a detailed description of Lipper’s proprietary ETF methodology used by Lipper to determine the applicable Lipper Groups. The Board further noted that due to the limitations in providing comparable funds in the various Lipper Groups, the statistical information provided in Lipper’s report may or may not provide meaningful direct comparisons to the Funds in all instances.
The Board also noted that the investment advisory fee rates and overall expenses (net of waivers and reimbursements) for the Funds were within range of the median of the investment advisory fee rates and overall expenses (net of waivers and reimbursements) of the funds in their respective Lipper Group.
In addition, the Board reviewed statistical information prepared by Lipper regarding the performance of each Fund for the one-, three-, five-, ten-year, and since inception periods, as applicable, and the “last quarter” period ended December 31, 2014, and a comparison of each Fund’s performance to its performance benchmark index for the same periods. To the extent that any of the comparison funds included in the Lipper Group track the same index as any particular Fund, Lipper also provided, and the Board reviewed, a comparison of such Fund’s performance to that of such relevant comparison funds for the same periods. The Board noted that the Funds generally performed in line with their respective performance benchmark indexes over the relevant periods. In considering this information, the Board noted that the Lipper Group may include funds that have different investment objectives
BOARD REVIEWAND APPROVALOF INVESTMENT ADVISORY CONTRACT | 81 |
Table of Contents
Board Review and Approval of Investment Advisory
Contract (Continued)
iSHARES®, INC.
and/or benchmarks from the Funds. In addition, the Board noted that each Fund seeks to track its own benchmark index and that, during the prior year, the Board received periodic reports on the Funds’ performance in comparison with their relevant benchmark indexes. Such periodic comparative performance information, including detailed information on certain specific iShares funds requested by the Boards, was also considered.
Based on this review, the other factors considered at the meeting, and their general knowledge of ETF pricing, the Board concluded that the investment advisory fee rate and expense level and the historical performance of each Fund supported the Board’s approval of the continuance of the Advisory Contract for the coming year.
Nature, Extent and Quality of Services Provided by BFA — Based on management’s representations, including information about recent and proposed enhancements to the iShares business, including with respect to shareholder servicing and support, the Board expected that there would be no diminution in the scope of services required of or provided by BFA under the Advisory Contract for the coming year as compared to the scope of services provided by BFA during prior years. In reviewing the scope of these services, the Board considered BFA’s investment philosophy and experience, noting that BFA and its affiliates have committed significant resources over time, including during the past year, to supporting the iShares funds and their shareholders. The Board acknowledged that resources to support the iShares funds and their shareholders have been added or enhanced in recent years. The Board also considered BFA’s compliance program and its compliance record with respect to the Funds. In that regard, the Board noted that BFA reports to the Board about portfolio management and compliance matters on a periodic basis in connection with regularly scheduled meetings of the Board, and on other occasions as necessary and appropriate, and has provided information and made appropriate officers available as needed to provide further assistance with these matters. The Board also reviewed the background and experience of the persons responsible for the day-to-day management of the Funds, as well as the resources available to them in managing the Funds. In addition to the above considerations, the Board reviewed and considered detailed presentations regarding BFA’s investment performance, investment and risk management processes and strategies provided at the June 24-25, 2015 meeting and throughout the previous year, and matters related to BFA’s portfolio compliance policies and procedures. The Board noted that each Fund had met its investment objective consistently since its respective inception date.
Based on review of this information, and the performance information discussed above, the Board concluded that the nature, extent and quality of services provided by BFA to the Funds under the Advisory Contract supported the Board’s approval of the continuance of the Advisory Contract for the coming year.
Costs of Services Provided to Funds and Profits Realized by BFA and Affiliates — The Board reviewed information about the profitability to BlackRock of the Funds based on the fees payable to BFA and its affiliates (including fees under the Advisory Contract), and all other sources of revenue and expense to BFA and its affiliates from the Funds’ operations for the last calendar year. The Board reviewed BlackRock’s profitability methodology for the iShares funds, noting that the 15(c) Committee had focused on the methodology and proposed presentation during its meetings. The Board discussed the sources of direct and ancillary revenue with management, including the revenues to BTC from securities lending by the Funds. The Board also discussed BFA’s profit margin as reflected in the Funds’ profitability analyses and reviewed information regarding potential economies of scale (as discussed below). Based on this review, the Board concluded that the profits realized by BFA and its affiliates under the Advisory Contract and from other relationships between the Funds and BFA and/or its affiliates, if any, were within a reasonable range in light of the factors considered.
Economies of Scale — The Board reviewed information regarding potential economies of scale or other efficiencies that may result from increases in the Funds’ assets, noting that the issue of economies of scale had been focused on extensively by the 15(c) Committee during its meetings and addressed by management. The Board and the 15(c) Committee reviewed information provided by BFA regarding scale benefits shared with the iShares funds through relatively low fee rates established at inception,
| 82 | 2015 iSHARES ANNUAL REPORTTO SHAREHOLDERS |
Table of Contents
Board Review and Approval of Investment Advisory
Contract (Continued)
iSHARES®, INC.
breakpoints, waivers, or other fee reductions, as well as through additional investment in the iShares business and the provision of improved or additional infrastructure and services to the iShares funds and their shareholders. The Board and the 15(c) Committee received information regarding BlackRock’s historical profitability, including BFA’s and its affiliates’ costs in providing services. The cost information distinguished between fixed and variable costs, and explained how the level of fixed and variable costs, as well as the nature of such costs, may impact the existence or size of scale benefits. The Board noted that the Advisory Contract for the Funds already provided for breakpoints in the Funds’ investment advisory fee rates as the assets of the Funds, on an aggregated basis with the assets of certain other iShares funds, increase. The Board noted that it would continue to monitor the sharing of economies of scale to determine the appropriateness of adding new or revised breakpoints in the future.
Based on this review, as well as the other factors considered at the meeting, the Board, recognizing its responsibility to consider this issue periodically, determined to approve the continuance of the Advisory Contract for the coming year.
Fees and Services Provided for Other Comparable Funds/Accounts Managed by BFA and its Affiliates — The Board received and considered information regarding the investment advisory/management fee rates for other funds/accounts in the U.S. for which BFA (or its affiliates) provides investment advisory/management services, including open-end and closed-end funds registered under the 1940 Act (including sub-advised funds), collective trust funds, separately managed accounts, and institutional separate accounts (together, the “Other Accounts”), and acknowledged BFA’s assertion that the iShares funds are fundamentally different investment vehicles from the Other Accounts. The Board noted that BFA and its affiliates do manage Other Accounts with substantially the same investment objectives and strategies as the Funds or that track the same index or a similar index as the Funds. The Board further noted that BFA provided the Board with detailed information regarding how the Other Accounts (particularly institutional clients) generally differ from the Funds, including in terms of the different, generally more extensive services provided to the Funds, as well as other significant differences in the approach of BFA and its affiliates to the Funds, on one hand, and Other Accounts, on the other. In that regard, the Board considered that the pricing of services to institutional clients is typically based on a number of factors beyond the nature and extent of the specific services to be provided and often depends on the overall relationship between the client and its affiliates and the adviser and its affiliates. In addition, the Board considered the relative complexity and inherent risks and challenges of managing and providing other services to the Funds, as publicly traded exchange traded funds, as compared to the Other Accounts that are institutional clients in light of differing regulatory requirements and client-imposed mandates. The Board also considered the “all-inclusive” nature of the Funds’ advisory fee structure, and the Fund expenses borne by BFA under this arrangement. The Board noted that the investment advisory fee rates under the Advisory Contract for the Funds were generally higher than the investment advisory/management fee rates for the Other Accounts that are institutional clients of BFA (or its affiliates) and concluded that the differences appeared to be consistent with the factors discussed.
Other Benefits to BFA and/or its Affiliates — The Board reviewed the “fallout” benefits or ancillary revenue received by BFA and/or its affiliates in connection with the services provided to the Funds by BFA, such as payment of revenue to BTC, the Funds’ securities lending agent, for loaning portfolio securities (which was included in the profit margins reviewed by the Board pursuant to BFA’s profitability methodology), and payment of advisory fees and/or administration fees to BFA and BTC (or their affiliates) in connection with any investments by the Funds in other funds for which BFA (or its affiliates) provides investment advisory services and/or administration services. The Board noted that BFA generally does not use soft dollars or consider the value of research or other services that may be provided to BFA (including its affiliates) in selecting brokers for portfolio transactions for the Funds. The Board further noted that any portfolio transactions on behalf of the Funds placed through a BFA affiliate or purchased from an underwriting syndicate in which a BFA affiliate participates, are reported to the Board pursuant to Rule 17e-1 or Rule 10f-3, as applicable, under the 1940 Act. The Board concluded that any such ancillary benefits would not be disadvantageous to the Funds’ shareholders and thus would not alter the Board’s conclusion with respect to the appropriateness of approving the continuance of the Advisory Contract for the coming year.
BOARD REVIEWAND APPROVALOF INVESTMENT ADVISORY CONTRACT | 83 |
Table of Contents
Board Review and Approval of Investment Advisory
Contract (Continued)
iSHARES®, INC.
Based on the considerations described above, the Board determined that each Fund’s investment advisory fee rate under the Advisory Contract does not constitute a fee that is so disproportionately large as to bear no reasonable relationship to the services rendered and that could not have been the product of arm’s-length bargaining, and concluded that it is in the best interest of each Fund and its shareholders to approve the continuance of the Advisory Contract for the coming year.
II. iShares MSCI Colombia Capped ETF and iShares MSCI USA Equal Weighted ETF
Under Section 15(c) of the Investment Company Act of 1940 (the “1940 Act”), the Company’s Board of Directors (the “Board”), including a majority of Directors who are not “interested persons” of the Company (as that term is defined in the 1940 Act) (the “Independent Directors”), is required annually to consider and approve the Investment Advisory Contract between the Company and BFA (the “Advisory Contract”) on behalf of the Funds. The Independent Directors requested, and BFA provided, such information as the Independent Directors, with advice from independent counsel, deemed reasonably necessary to evaluate the Advisory Contract. A committee of Independent Directors (the “15(c) Committee”), with independent counsel, met with management on May 1, 2015 and May 6, 2015, to discuss the types of information the Independent Directors required and the manner in which management would organize and present such information. At a meeting held on May 21, 2015, management presented preliminary information to the Board relating to the continuance of the Advisory Contract, and the Board, including the Independent Directors, reviewed and discussed such information at length. The Independent Directors requested from management certain additional information, which management agreed to provide. At a meeting held on June 24-25, 2015, the Board, including the Independent Directors, reviewed the additional information provided by management in response to these requests. After extensive discussions, the Board, including all of the Independent Directors, approved the continuance of the Advisory Contract for the Funds, based on a review of qualitative and quantitative information provided by BFA, including the additional information management provided at the request of the Independent Directors. The Board noted its satisfaction with the extent and quality of information provided and its frequent interactions with management, as well as the detailed responses and other information provided by BFA. The Board also noted that the Board and BFA agreed to discuss potential enhancements and adjustments to the 15(c) process for the coming year. The Independent Directors were advised by their independent counsel throughout the process, including about the legal standards applicable to their review. In approving the Advisory Contract for the Funds, the Board, including the Independent Directors, considered the following factors, no one of which was controlling, and reached the following conclusions:
Expenses and Performance of the Funds — The Board reviewed statistical information prepared by Lipper Inc. (“Lipper”), an independent provider of investment company data, regarding the expense ratio components, including actual advisory fees, waivers/reimbursements, and gross and net total expenses of each Fund in comparison with the same information for other exchange traded funds (including, where applicable, funds sponsored by an “at cost” service provider) and, in the limited instances where no comparable ETFs existed and the comparison group would not otherwise be reasonable in Lipper’s judgment, pure index institutional mutual funds, objectively selected by Lipper as comprising such Fund’s applicable peer group pursuant to Lipper’s proprietary ETF methodology (the “Lipper Group”). The Board was provided with a detailed description of Lipper’s proprietary ETF methodology used by Lipper to determine the applicable Lipper Groups. The Board further noted that due to the limitations in providing comparable funds in the various Lipper Groups, the statistical information provided in Lipper’s report may or may not provide meaningful direct comparisons to the Funds in all instances.
The Board also noted that the investment advisory fee rate and overall expenses (net of waivers and reimbursements) for iShares MSCI USA Equal Weighted ETF were lower than the median of the investment advisory fee rates and overall expenses (net of waivers and reimbursements) of the funds in its Lipper Group and the investment advisory fee rate and overall expenses (net of waivers and reimbursements) for iShares MSCI Colombia Capped ETF were within range of the median of the investment advisory fee rates and overall expenses (net of waivers and reimbursements) of the funds in its Lipper Group.
| 84 | 2015 iSHARES ANNUAL REPORTTO SHAREHOLDERS |
Table of Contents
Board Review and Approval of Investment Advisory
Contract (Continued)
iSHARES®, INC.
In addition, the Board reviewed statistical information prepared by Lipper regarding the performance of each Fund for the one-, three-, five-, ten-year, and since inception periods, as applicable, and the “last quarter” period ended December 31, 2014, and a comparison of each Fund’s performance to its performance benchmark index for the same periods. To the extent that any of the comparison funds included in the Lipper Group track the same index as any particular Fund, Lipper also provided, and the Board reviewed, a comparison of such Fund’s performance to that of such relevant comparison funds for the same periods. The Board noted that the Funds generally performed in line with their respective performance benchmark indexes over the relevant periods. In considering this information, the Board noted that the Lipper Group may include funds that have different investment objectives and/or benchmarks from the Funds. In addition, the Board noted that each Fund seeks to track its own benchmark index and that, during the prior year, the Board received periodic reports on the Funds’ performance in comparison with their relevant benchmark indexes. Such periodic comparative performance information, including detailed information on certain specific iShares funds requested by the Boards, was also considered.
Based on this review, the other factors considered at the meeting, and their general knowledge of ETF pricing, the Board concluded that the investment advisory fee rate and expense level and the historical performance of each Fund supported the Board’s approval of the continuance of the Advisory Contract for the coming year.
Nature, Extent and Quality of Services Provided by BFA — Based on management’s representations, including information about recent and proposed enhancements to the iShares business, including with respect to shareholder servicing and support, the Board expected that there would be no diminution in the scope of services required of or provided by BFA under the Advisory Contract for the coming year as compared to the scope of services provided by BFA during prior years. In reviewing the scope of these services, the Board considered BFA’s investment philosophy and experience, noting that BFA and its affiliates have committed significant resources over time, including during the past year, to supporting the iShares funds and their shareholders. The Board acknowledged that resources to support the iShares funds and their shareholders have been added or enhanced in recent years. The Board also considered BFA’s compliance program and its compliance record with respect to the Funds. In that regard, the Board noted that BFA reports to the Board about portfolio management and compliance matters on a periodic basis in connection with regularly scheduled meetings of the Board, and on other occasions as necessary and appropriate, and has provided information and made appropriate officers available as needed to provide further assistance with these matters. The Board also reviewed the background and experience of the persons responsible for the day-to-day management of the Funds, as well as the resources available to them in managing the Funds. In addition to the above considerations, the Board reviewed and considered detailed presentations regarding BFA’s investment performance, investment and risk management processes and strategies provided at the June 24-25, 2015 meeting and throughout the previous year, and matters related to BFA’s portfolio compliance policies and procedures. The Board noted that each Fund had met its investment objective consistently since its respective inception date.
Based on review of this information, and the performance information discussed above, the Board concluded that the nature, extent and quality of services provided by BFA to the Funds under the Advisory Contract supported the Board’s approval of the continuance of the Advisory Contract for the coming year.
Costs of Services Provided to Funds and Profits Realized by BFA and Affiliates — The Board reviewed information about the profitability to BlackRock of the Funds based on the fees payable to BFA and its affiliates (including fees under the Advisory Contract), and all other sources of revenue and expense to BFA and its affiliates from the Funds’ operations for the last calendar year. The Board reviewed BlackRock’s profitability methodology for the iShares funds, noting that the 15(c) Committee had focused on the methodology and proposed presentation during its meetings. The Board discussed the sources of direct and ancillary revenue with management, including the revenues to BTC from securities lending by the Funds. The Board also discussed BFA’s profit margin as reflected in the Funds’ profitability analyses and reviewed information regarding potential economies of scale (as discussed below). Based on this review, the Board concluded that the profits realized by BFA and its
BOARD REVIEWAND APPROVALOF INVESTMENT ADVISORY CONTRACT | 85 |
Table of Contents
Board Review and Approval of Investment Advisory
Contract (Continued)
iSHARES®, INC.
affiliates under the Advisory Contract and from other relationships between the Funds and BFA and/or its affiliates, if any, were within a reasonable range in light of the factors considered.
Economies of Scale — The Board reviewed information regarding potential economies of scale or other efficiencies that may result from increases in the Funds’ assets, noting that the issue of economies of scale had been focused on extensively by the 15(c) Committee during its meetings and addressed by management. The Board and the 15(c) Committee reviewed information provided by BFA regarding scale benefits shared with the iShares funds through relatively low fee rates established at inception, breakpoints, waivers, or other fee reductions, as well as through additional investment in the iShares business and the provision of improved or additional infrastructure and services to the iShares funds and their shareholders. The Board and the 15(c) Committee received information regarding BlackRock’s historical profitability, including BFA’s and its affiliates’ costs in providing services. The cost information distinguished between fixed and variable costs, and explained how the level of fixed and variable costs, as well as the nature of such costs, may impact the existence or size of scale benefits. The Board noted that the Advisory Contract for the Funds did not provide for any breakpoints in the Funds’ investment advisory fee rates as the assets of the Funds increase. However, the Board noted that should material economies of scale exist in the future, a breakpoint structure for the Funds may be appropriate, and that it would continue to monitor the sharing of economies of scale to determine the appropriateness of adding breakpoints in the future.
Based on this review, as well as the other factors considered at the meeting, the Board, recognizing its responsibility to consider this issue periodically, determined to approve the continuance of the Advisory Contract for the coming year.
Fees and Services Provided for Other Comparable Funds/Accounts Managed by BFA and its Affiliates — The Board received and considered information regarding the investment advisory/management fee rates for other funds/accounts in the U.S. for which BFA (or its affiliates) provides investment advisory/management services, including open-end and closed-end funds registered under the 1940 Act (including sub-advised funds), collective trust funds, separately managed accounts, and institutional separate accounts (together, the “Other Accounts”), and acknowledged BFA’s assertion that the iShares funds are fundamentally different investment vehicles from the Other Accounts. The Board noted that BFA and its affiliates do manage Other Accounts with substantially the same investment objectives and strategies as the Funds or that track the same index or a similar index as the Funds. The Board further noted that BFA provided the Board with detailed information regarding how the Other Accounts (particularly institutional clients) generally differ from the Funds, including in terms of the different, generally more extensive services provided to the Funds, as well as other significant differences in the approach of BFA and its affiliates to the Funds, on one hand, and Other Accounts, on the other. In that regard, the Board considered that the pricing of services to institutional clients is typically based on a number of factors beyond the nature and extent of the specific services to be provided and often depends on the overall relationship between the client and its affiliates and the adviser and its affiliates. In addition, the Board considered the relative complexity and inherent risks and challenges of managing and providing other services to the Funds, as publicly traded exchange traded funds, as compared to the Other Accounts that are institutional clients in light of differing regulatory requirements and client-imposed mandates. The Board also considered the “all-inclusive” nature of the Funds’ advisory fee structure, and the Fund expenses borne by BFA under this arrangement. The Board noted that the investment advisory fee rates under the Advisory Contract for the Funds were generally higher than the investment advisory/management fee rates for the Other Accounts that are institutional clients of BFA (or its affiliates) and concluded that the differences appeared to be consistent with the factors discussed.
Other Benefits to BFA and/or its Affiliates — The Board reviewed the “fallout” benefits or ancillary revenue received by BFA and/or its affiliates in connection with the services provided to the Funds by BFA, such as payment of revenue to BTC, the Funds’ securities lending agent, for loaning portfolio securities (which was included in the profit margins reviewed by the Board pursuant to BFA’s profitability methodology), and payment of advisory fees and/or administration fees to BFA and BTC (or their affiliates) in connection with any investments by the Funds in other funds for which BFA (or its affiliates) provides investment advisory
| 86 | 2015 iSHARES ANNUAL REPORTTO SHAREHOLDERS |
Table of Contents
Board Review and Approval of Investment Advisory
Contract (Continued)
iSHARES®, INC.
services and/or administration services. The Board noted that BFA generally does not use soft dollars or consider the value of research or other services that may be provided to BFA (including its affiliates) in selecting brokers for portfolio transactions for the Funds. The Board further noted that any portfolio transactions on behalf of the Funds placed through a BFA affiliate or purchased from an underwriting syndicate in which a BFA affiliate participates, are reported to the Board pursuant to Rule 17e-1 or Rule 10f-3, as applicable, under the 1940 Act. The Board concluded that any such ancillary benefits would not be disadvantageous to the Funds’ shareholders and thus would not alter the Board’s conclusion with respect to the appropriateness of approving the continuance of the Advisory Contract for the coming year.
Based on the considerations described above, the Board determined that each Fund’s investment advisory fee rate under the Advisory Contract does not constitute a fee that is so disproportionately large as to bear no reasonable relationship to the services rendered and that could not have been the product of arm’s-length bargaining, and concluded that it is in the best interest of each Fund and its shareholders to approve the continuance of the Advisory Contract for the coming year.
III. iShares MSCI Israel Capped ETF
Under Section 15(c) of the Investment Company Act of 1940 (the “1940 Act”), the Company’s Board of Directors (the “Board”), including a majority of Directors who are not “interested persons” of the Company (as that term is defined in the 1940 Act) (the “Independent Directors”), is required annually to consider and approve the Investment Advisory Contract between the Company and BFA (the “Advisory Contract”) on behalf of the Fund. The Independent Directors requested, and BFA provided, such information as the Independent Directors, with advice from independent counsel, deemed reasonably necessary to evaluate the Advisory Contract. A committee of Independent Directors (the “15(c) Committee”), with independent counsel, met with management on May 1, 2015 and May 6, 2015, to discuss the types of information the Independent Directors required and the manner in which management would organize and present such information. At a meeting held on May 21, 2015, management presented preliminary information to the Board relating to the continuance of the Advisory Contract, and the Board, including the Independent Directors, reviewed and discussed such information at length. The Independent Directors requested from management certain additional information, which management agreed to provide. At a meeting held on June 24-25, 2015, the Board, including the Independent Directors, reviewed the additional information provided by management in response to these requests. After extensive discussions, the Board, including all of the Independent Directors, approved the continuance of the Advisory Contract for the Fund, based on a review of qualitative and quantitative information provided by BFA, including the additional information management provided at the request of the Independent Directors. The Board noted its satisfaction with the extent and quality of information provided and its frequent interactions with management, as well as the detailed responses and other information provided by BFA. The Board also noted that the Board and BFA agreed to discuss potential enhancements and adjustments to the 15(c) process for the coming year. The Independent Directors were advised by their independent counsel throughout the process, including about the legal standards applicable to their review. In approving the Advisory Contract for the Fund, the Board, including the Independent Directors, considered the following factors, no one of which was controlling, and reached the following conclusions:
Expenses and Performance of the Fund — The Board reviewed statistical information prepared by Lipper Inc. (“Lipper”), an independent provider of investment company data, regarding the expense ratio components, including actual advisory fees, waivers/reimbursements, and gross and net total expenses of the Fund in comparison with the same information for other exchange traded funds (including, where applicable, funds sponsored by an “at cost” service provider) and, in the limited instances where no comparable ETFs existed and the comparison group would not otherwise be reasonable in Lipper’s judgment, pure index institutional mutual funds, objectively selected by Lipper as comprising the Fund’s applicable peer group pursuant to Lipper’s proprietary ETF methodology (the “Lipper Group”). The Board was provided with a detailed description of Lipper’s proprietary ETF methodology used by Lipper to determine the Fund’s Lipper Group. The Board further noted that due to the
BOARD REVIEWAND APPROVALOF INVESTMENT ADVISORY CONTRACT | 87 |
Table of Contents
Board Review and Approval of Investment Advisory
Contract (Continued)
iSHARES®, INC.
limitations in providing comparable funds in the Lipper Group, the statistical information provided in Lipper’s report may or may not provide meaningful direct comparisons to the Fund in all instances.
The Board also noted that the investment advisory fee rate and overall expenses (net of waivers and reimbursements) for the Fund were lower than the median of the investment advisory fee rates and overall expenses (net of waivers and reimbursements) of the funds in its Lipper Group.
In addition, the Board reviewed statistical information prepared by Lipper regarding the performance of the Fund for the one-, three-, five-, ten-year, and since inception periods, as applicable, and the “last quarter” period ended December 31, 2014, and a comparison of the Fund’s performance to its performance benchmark index for the same periods. To the extent that any of the comparison funds included in the Lipper Group track the same index as the Fund, Lipper also provided, and the Board reviewed, a comparison of the Fund’s performance to that of such relevant comparison funds for the same periods. The Board noted that the Fund generally performed in line with its performance benchmark index over the relevant periods. In considering this information, the Board noted that the Lipper Group may include funds that have a different investment objective and/or benchmark from the Fund. In addition, the Board noted that the Fund seeks to track its own benchmark index and that, during the prior year, the Board received periodic reports on the Fund’s performance in comparison with its benchmark index. Such periodic comparative performance information, including detailed information on certain specific iShares funds requested by the Boards, was also considered.
Based on this review, the other factors considered at the meeting, and their general knowledge of ETF pricing, the Board concluded that the investment advisory fee rate and expense level and the historical performance of the Fund supported the Board’s approval of the continuance of the Advisory Contract for the coming year.
Nature, Extent and Quality of Services Provided by BFA — Based on management’s representations, including information about recent and proposed enhancements to the iShares business, including with respect to shareholder servicing and support, the Board expected that there would be no diminution in the scope of services required of or provided by BFA under the Advisory Contract for the coming year as compared to the scope of services provided by BFA during prior years. In reviewing the scope of these services, the Board considered BFA’s investment philosophy and experience, noting that BFA and its affiliates have committed significant resources over time, including during the past year, to supporting the iShares funds and their shareholders. The Board acknowledged that resources to support the iShares funds and their shareholders have been added or enhanced in recent years. The Board also considered BFA’s compliance program and its compliance record with respect to the Fund. In that regard, the Board noted that BFA reports to the Board about portfolio management and compliance matters on a periodic basis in connection with regularly scheduled meetings of the Board, and on other occasions as necessary and appropriate, and has provided information and made appropriate officers available as needed to provide further assistance with these matters. The Board also reviewed the background and experience of the persons responsible for the day-to-day management of the Fund, as well as the resources available to them in managing the Fund. In addition to the above considerations, the Board reviewed and considered detailed presentations regarding BFA’s investment performance, investment and risk management processes and strategies provided at the June 24-25, 2015 meeting and throughout the previous year, and matters related to BFA’s portfolio compliance policies and procedures. The Board noted that the Fund had met its investment objective consistently since its inception date.
Based on review of this information, and the performance information discussed above, the Board concluded that the nature, extent and quality of services provided by BFA to the Fund under the Advisory Contract supported the Board’s approval of the continuance of the Advisory Contract for the coming year.
| 88 | 2015 iSHARES ANNUAL REPORTTO SHAREHOLDERS |
Table of Contents
Board Review and Approval of Investment Advisory
Contract (Continued)
iSHARES®, INC.
Costs of Services Provided to the Fund and Profits Realized by BFA and Affiliates — The Board reviewed information about the profitability to BlackRock of the Fund based on the fees payable to BFA and its affiliates (including fees under the Advisory Contract), and all other sources of revenue and expense to BFA and its affiliates from the Fund’s operations for the last calendar year. The Board reviewed BlackRock’s profitability methodology for the iShares funds, noting that the 15(c) Committee had focused on the methodology and proposed presentation during its meetings. The Board discussed the sources of direct and ancillary revenue with management, including the revenues to BTC from securities lending by the Fund. The Board also discussed BFA’s profit margin as reflected in the Fund’s profitability analysis and reviewed information regarding potential economies of scale (as discussed below). Based on this review, the Board concluded that the profits realized by BFA and its affiliates under the Advisory Contract and from other relationships between the Fund and BFA and/or its affiliates, if any, were within a reasonable range in light of the factors considered.
Economies of Scale — The Board reviewed information regarding potential economies of scale or other efficiencies that may result from increases in the Fund’s assets, noting that the issue of economies of scale had been focused on extensively by the 15(c) Committee during its meetings and addressed by management. The Board and the 15(c) Committee reviewed information provided by BFA regarding scale benefits shared with the iShares funds through relatively low fee rates established at inception, breakpoints, waivers, or other fee reductions, as well as through additional investment in the iShares business and the provision of improved or additional infrastructure and services to the iShares funds and their shareholders. The Board and the 15(c) Committee received information regarding BlackRock’s historical profitability, including BFA’s and its affiliates’ costs in providing services. The cost information distinguished between fixed and variable costs, and explained how the level of fixed and variable costs, as well as the nature of such costs, may impact the existence or size of scale benefits. The Board noted that the Advisory Contract for the Fund already provided for breakpoints in the Fund’s investment advisory fee rate as the assets of the Fund, on an aggregated basis with the assets of certain other iShares funds, increase. The Board noted that it would continue to monitor the sharing of economies of scale to determine the appropriateness of adding new or revised breakpoints in the future.
Based on this review, as well as the other factors considered at the meeting, the Board, recognizing its responsibility to consider this issue periodically, determined to approve the continuance of the Advisory Contract for the coming year.
Fees and Services Provided for Other Comparable Funds/Accounts Managed by BFA and its Affiliates — The Board received and considered information regarding the investment advisory/management fee rates for other funds/accounts in the U.S. for which BFA (or its affiliates) provides investment advisory/management services, including open-end and closed-end funds registered under the 1940 Act (including sub-advised funds), collective trust funds, separately managed accounts, and institutional separate accounts (together, the “Other Accounts”), and acknowledged BFA’s assertion that the iShares funds are fundamentally different investment vehicles from the Other Accounts. The Board noted that BFA and its affiliates do not manage Other Accounts with substantially the same investment objective and strategy as the Fund or that track the same index or a similar index as the Fund. The Board further noted that BFA provided the Board with detailed information regarding how the Other Accounts (particularly institutional clients) generally differ from the Fund, including in terms of the different, generally more extensive services provided to the Fund, as well as other significant differences in the approach of BFA and its affiliates to the Fund, on one hand, and Other Accounts, on the other. In that regard, the Board considered that the pricing of services to institutional clients is typically based on a number of factors beyond the nature and extent of the specific services to be provided and often depends on the overall relationship between the client and its affiliates and the adviser and its affiliates. In addition, the Board considered the relative complexity and inherent risks and challenges of managing and providing other services to the Fund, as a publicly traded exchange traded fund, as compared to the Other Accounts that are institutional clients in light of differing regulatory requirements and client-imposed mandates. The Board also considered the “all-inclusive” nature of the Fund’s advisory fee structure, and the Fund expenses borne by BFA under this arrangement. The Board noted that the investment advisory fee rate under the Advisory Contract for the Fund was generally higher than the investment advisory/management fee rates for the Other Accounts that are institutional clients of BFA (or its affiliates) and concluded that the differences appeared to be consistent with the factors discussed.
BOARD REVIEWAND APPROVALOF INVESTMENT ADVISORY CONTRACT | 89 |
Table of Contents
Board Review and Approval of Investment Advisory
Contract (Continued)
iSHARES®, INC.
Other Benefits to BFA and/or its Affiliates — The Board reviewed the “fallout” benefits or ancillary revenue received by BFA and/or its affiliates in connection with the services provided to the Fund by BFA, such as payment of revenue to BTC, the Fund’s securities lending agent, for loaning portfolio securities (which was included in the profit margins reviewed by the Board pursuant to BFA’s profitability methodology), and payment of advisory fees and/or administration fees to BFA and BTC (or their affiliates) in connection with any investments by the Fund in other funds for which BFA (or its affiliates) provides investment advisory services and/or administration services. The Board noted that BFA generally does not use soft dollars or consider the value of research or other services that may be provided to BFA (including its affiliates) in selecting brokers for portfolio transactions for the Fund. The Board further noted that any portfolio transactions on behalf of the Fund placed through a BFA affiliate or purchased from an underwriting syndicate in which a BFA affiliate participates, are reported to the Board pursuant to Rule 17e-1 or Rule 10f-3, as applicable, under the 1940 Act. The Board concluded that any such ancillary benefits would not be disadvantageous to the Fund’s shareholders and thus would not alter the Board’s conclusion with respect to the appropriateness of approving the continuance of the Advisory Contract for the coming year.
Based on the considerations described above, the Board determined that the Fund’s investment advisory fee rate under the Advisory Contract does not constitute a fee that is so disproportionately large as to bear no reasonable relationship to the services rendered and that could not have been the product of arm’s-length bargaining, and concluded that it is in the best interest of the Fund and its shareholders to approve the continuance of the Advisory Contract for the coming year.
IV. iShares MSCI Russia Capped ETF, iShares MSCI South Africa ETF and iShares MSCI Turkey ETF
Under Section 15(c) of the Investment Company Act of 1940 (the “1940 Act”), the Company’s Board of Directors (the “Board”), including a majority of Directors who are not “interested persons” of the Company (as that term is defined in the 1940 Act) (the “Independent Directors”), is required annually to consider and approve the Investment Advisory Contract between the Company and BFA (the “Advisory Contract”) on behalf of the Funds. The Independent Directors requested, and BFA provided, such information as the Independent Directors, with advice from independent counsel, deemed reasonably necessary to evaluate the Advisory Contract. A committee of Independent Directors (the “15(c) Committee”), with independent counsel, met with management on May 1, 2015 and May 6, 2015, to discuss the types of information the Independent Directors required and the manner in which management would organize and present such information. At a meeting held on May 21, 2015, management presented preliminary information to the Board relating to the continuance of the Advisory Contract, and the Board, including the Independent Directors, reviewed and discussed such information at length. The Independent Directors requested from management certain additional information, which management agreed to provide. At a meeting held on June 24-25, 2015, the Board, including the Independent Directors, reviewed the additional information provided by management in response to these requests. After extensive discussions, the Board, including all of the Independent Directors, approved the continuance of the Advisory Contract for the Funds, based on a review of qualitative and quantitative information provided by BFA, including the additional information management provided at the request of the Independent Directors. The Board noted its satisfaction with the extent and quality of information provided and its frequent interactions with management, as well as the detailed responses and other information provided by BFA. The Board also noted that the Board and BFA agreed to discuss potential enhancements and adjustments to the 15(c) process for the coming year. The Independent Directors were advised by their independent counsel throughout the process, including about the legal standards applicable to their review. In approving the Advisory Contract for the Funds, the Board, including the Independent Directors, considered the following factors, no one of which was controlling, and reached the following conclusions:
Expenses and Performance of the Funds — The Board reviewed statistical information prepared by Lipper Inc. (“Lipper”), an independent provider of investment company data, regarding the expense ratio components, including actual advisory fees, waivers/reimbursements, and gross and net total expenses of each Fund in comparison with the same information for other exchange traded funds (including, where applicable, funds sponsored by an “at cost” service provider) and, in the limited
| 90 | 2015 iSHARES ANNUAL REPORTTO SHAREHOLDERS |
Table of Contents
Board Review and Approval of Investment Advisory
Contract (Continued)
iSHARES®, INC.
instances where no comparable ETFs existed and the comparison group would not otherwise be reasonable in Lipper’s judgment, pure index institutional mutual funds, objectively selected by Lipper as comprising such Fund’s applicable peer group pursuant to Lipper’s proprietary ETF methodology (the “Lipper Group”). The Board was provided with a detailed description of Lipper’s proprietary ETF methodology used by Lipper to determine the applicable Lipper Groups. The Board further noted that due to the limitations in providing comparable funds in the various Lipper Groups, the statistical information provided in Lipper’s report may or may not provide meaningful direct comparisons to the Funds in all instances.
The Board also noted that the investment advisory fee rates and overall expenses (net of waivers and reimbursements) for the Funds were lower than the median of the investment advisory fee rates and overall expenses (net of waivers and reimbursements) of the funds in their respective Lipper Group.
In addition, the Board reviewed statistical information prepared by Lipper regarding the performance of each Fund for the one-, three-, five-, ten-year, and since inception periods, as applicable, and the “last quarter” period ended December 31, 2014, and a comparison of each Fund’s performance to its performance benchmark index for the same periods. To the extent that any of the comparison funds included in the Lipper Group track the same index as any particular Fund, Lipper also provided, and the Board reviewed, a comparison of such Fund’s performance to that of such relevant comparison funds for the same periods. The Board noted that the Funds generally performed in line with their respective performance benchmark indexes over the relevant periods. In considering this information, the Board noted that the Lipper Group may include funds that have different investment objectives and/or benchmarks from the Funds. In addition, the Board noted that each Fund seeks to track its own benchmark index and that, during the prior year, the Board received periodic reports on the Funds’ performance in comparison with their relevant benchmark indexes. Such periodic comparative performance information, including detailed information on certain specific iShares funds requested by the Boards, was also considered.
Based on this review, the other factors considered at the meeting, and their general knowledge of ETF pricing, the Board concluded that the investment advisory fee rate and expense level and the historical performance of each Fund supported the Board’s approval of the continuance of the Advisory Contract for the coming year.
Nature, Extent and Quality of Services Provided by BFA — Based on management’s representations, including information about recent and proposed enhancements to the iShares business, including with respect to shareholder servicing and support, the Board expected that there would be no diminution in the scope of services required of or provided by BFA under the Advisory Contract for the coming year as compared to the scope of services provided by BFA during prior years. In reviewing the scope of these services, the Board considered BFA’s investment philosophy and experience, noting that BFA and its affiliates have committed significant resources over time, including during the past year, to supporting the iShares funds and their shareholders. The Board acknowledged that resources to support the iShares funds and their shareholders have been added or enhanced in recent years. The Board also considered BFA’s compliance program and its compliance record with respect to the Funds. In that regard, the Board noted that BFA reports to the Board about portfolio management and compliance matters on a periodic basis in connection with regularly scheduled meetings of the Board, and on other occasions as necessary and appropriate, and has provided information and made appropriate officers available as needed to provide further assistance with these matters. The Board also reviewed the background and experience of the persons responsible for the day-to-day management of the Funds, as well as the resources available to them in managing the Funds. In addition to the above considerations, the Board reviewed and considered detailed presentations regarding BFA’s investment performance, investment and risk management processes and strategies provided at the June 24-25, 2015 meeting and throughout the previous year, and matters related to BFA’s portfolio compliance policies and procedures. The Board noted that each Fund had met its investment objective consistently since its respective inception date.
BOARD REVIEWAND APPROVALOF INVESTMENT ADVISORY CONTRACT | 91 |
Table of Contents
Board Review and Approval of Investment Advisory
Contract (Continued)
iSHARES®, INC.
Based on review of this information, and the performance information discussed above, the Board concluded that the nature, extent and quality of services provided by BFA to the Funds under the Advisory Contract supported the Board’s approval of the continuance of the Advisory Contract for the coming year.
Costs of Services Provided to Funds and Profits Realized by BFA and Affiliates — The Board reviewed information about the profitability to BlackRock of the Funds based on the fees payable to BFA and its affiliates (including fees under the Advisory Contract), and all other sources of revenue and expense to BFA and its affiliates from the Funds’ operations for the last calendar year. The Board reviewed BlackRock’s profitability methodology for the iShares funds, noting that the 15(c) Committee had focused on the methodology and proposed presentation during its meetings. The Board discussed the sources of direct and ancillary revenue with management, including the revenues to BTC from securities lending by the Funds. The Board also discussed BFA’s profit margin as reflected in the Funds’ profitability analyses and reviewed information regarding potential economies of scale (as discussed below). Based on this review, the Board concluded that the profits realized by BFA and its affiliates under the Advisory Contract and from other relationships between the Funds and BFA and/or its affiliates, if any, were within a reasonable range in light of the factors considered.
Economies of Scale — The Board reviewed information regarding potential economies of scale or other efficiencies that may result from increases in the Funds’ assets, noting that the issue of economies of scale had been focused on extensively by the 15(c) Committee during its meetings and addressed by management. The Board and the 15(c) Committee reviewed information provided by BFA regarding scale benefits shared with the iShares funds through relatively low fee rates established at inception, breakpoints, waivers, or other fee reductions, as well as through additional investment in the iShares business and the provision of improved or additional infrastructure and services to the iShares funds and their shareholders. The Board and the 15(c) Committee received information regarding BlackRock’s historical profitability, including BFA’s and its affiliates’ costs in providing services. The cost information distinguished between fixed and variable costs, and explained how the level of fixed and variable costs, as well as the nature of such costs, may impact the existence or size of scale benefits. The Board noted that the Advisory Contract for the Funds already provided for breakpoints in the Funds’ investment advisory fee rates as the assets of the Funds, on an aggregated basis with the assets of certain other iShares funds, increase. The Board noted that it would continue to monitor the sharing of economies of scale to determine the appropriateness of adding new or revised breakpoints in the future.
Based on this review, as well as the other factors considered at the meeting, the Board, recognizing its responsibility to consider this issue periodically, determined to approve the continuance of the Advisory Contract for the coming year.
Fees and Services Provided for Other Comparable Funds/Accounts Managed by BFA and its Affiliates — The Board received and considered information regarding the investment advisory/management fee rates for other funds/accounts in the U.S. for which BFA (or its affiliates) provides investment advisory/management services, including open-end and closed-end funds registered under the 1940 Act (including sub-advised funds), collective trust funds, separately managed accounts, and institutional separate accounts (together, the “Other Accounts”), and acknowledged BFA’s assertion that the iShares funds are fundamentally different investment vehicles from the Other Accounts. The Board noted that BFA and its affiliates do manage Other Accounts with substantially the same investment objectives and strategies as the Funds or that track the same index or a similar index as the Funds. The Board further noted that BFA provided the Board with detailed information regarding how the Other Accounts (particularly institutional clients) generally differ from the Funds, including in terms of the different, generally more extensive services provided to the Funds, as well as other significant differences in the approach of BFA and its affiliates to the Funds, on one hand, and Other Accounts, on the other. In that regard, the Board considered that the pricing of services to institutional clients is typically based on a number of factors beyond the nature and extent of the specific services to be provided and often depends on the overall relationship between the client and its affiliates and the adviser and its affiliates. In addition, the Board considered the relative complexity and inherent risks and challenges of managing and providing other services to the Funds, as publicly traded exchange traded funds, as compared to the Other Accounts that are institutional clients in light of
| 92 | 2015 iSHARES ANNUAL REPORTTO SHAREHOLDERS |
Table of Contents
Board Review and Approval of Investment Advisory
Contract (Continued)
iSHARES®, INC.
differing regulatory requirements and client-imposed mandates. The Board also considered the “all-inclusive” nature of the Funds’ advisory fee structure, and the Fund expenses borne by BFA under this arrangement. The Board noted that the investment advisory fee rates under the Advisory Contract for the Funds were generally higher than the investment advisory/management fee rates for the Other Accounts that are institutional clients of BFA (or its affiliates) and concluded that the differences appeared to be consistent with the factors discussed.
Other Benefits to BFA and/or its Affiliates — The Board reviewed the “fallout” benefits or ancillary revenue received by BFA and/or its affiliates in connection with the services provided to the Funds by BFA, such as payment of revenue to BTC, the Funds’ securities lending agent, for loaning portfolio securities (which was included in the profit margins reviewed by the Board pursuant to BFA’s profitability methodology), and payment of advisory fees and/or administration fees to BFA and BTC (or their affiliates) in connection with any investments by the Funds in other funds for which BFA (or its affiliates) provides investment advisory services and/or administration services. The Board noted that BFA generally does not use soft dollars or consider the value of research or other services that may be provided to BFA (including its affiliates) in selecting brokers for portfolio transactions for the Funds. The Board further noted that any portfolio transactions on behalf of the Funds placed through a BFA affiliate or purchased from an underwriting syndicate in which a BFA affiliate participates, are reported to the Board pursuant to Rule 17e-1 or Rule 10f-3, as applicable, under the 1940 Act. The Board concluded that any such ancillary benefits would not be disadvantageous to the Funds’ shareholders and thus would not alter the Board’s conclusion with respect to the appropriateness of approving the continuance of the Advisory Contract for the coming year.
Based on the considerations described above, the Board determined that each Fund’s investment advisory fee rate under the Advisory Contract does not constitute a fee that is so disproportionately large as to bear no reasonable relationship to the services rendered and that could not have been the product of arm’s-length bargaining, and concluded that it is in the best interest of each Fund and its shareholders to approve the continuance of the Advisory Contract for the coming year.
BOARD REVIEWAND APPROVALOF INVESTMENT ADVISORY CONTRACT | 93 |
Table of Contents
Supplemental Information (Unaudited)
iSHARES®, INC.
Section 19(a) Notices
The amounts and sources of distributions reported are estimates and are provided pursuant to regulatory requirements and are not being provided for tax reporting purposes. The actual amounts and sources for tax reporting purposes will depend upon each Fund’s investment experience during the year and may be subject to changes based on the tax regulations. Shareholders will receive a Form 1099-DIV each calendar year that will inform them how to report these distributions for federal income tax purposes.
| Total Cumulative Distributions for the Fiscal Year | % Breakdown of the Total Cumulative Distributions for the Fiscal Year | |||||||||||||||||||||||||||||||
| iShares ETF | Net Investment Income | Net Realized Capital Gains | Return of Capital | Total Per Share | Net Investment Income | Net Realized Capital Gains | Return of Capital | Total Per Share | ||||||||||||||||||||||||
MSCI Brazil Capped | $ | 1.029425 | $ | — | $ | — | $ | 1.029425 | 100 | % | — | % | — | % | 100 | % | ||||||||||||||||
MSCI Chile Capped | 0.621475 | — | — | 0.621475 | 100 | — | — | 100 | ||||||||||||||||||||||||
MSCI Colombia Capped | 0.456867 | — | — | 0.456867 | 100 | — | — | 100 | ||||||||||||||||||||||||
MSCI Israel Capped | 1.047968 | — | 0.022693 | 1.070661 | 98 | — | 2 | 100 | ||||||||||||||||||||||||
MSCI Russia Capped | 0.659175 | — | — | 0.659175 | 100 | — | — | 100 | ||||||||||||||||||||||||
MSCI South Africa | 1.374115 | — | — | 1.374115 | 100 | — | — | 100 | ||||||||||||||||||||||||
MSCI USA Equal Weighted | 0.796632 | — | 0.006688 | 0.803320 | 99 | — | 1 | 100 | ||||||||||||||||||||||||
Premium/Discount Information
The Premium/Discount Information section is intended to present information about the differences between the daily market price on secondary markets for shares of a fund and that fund’s NAV. NAV is the price at which a fund issues and redeems shares. It is calculated in accordance with the standard formula for valuing mutual fund shares. The “Market Price” of a fund generally is determined using the midpoint between the highest bid and the lowest offer on the primary stock exchange on which the shares of such fund are listed for trading, as of the time that the fund’s NAV is calculated. A fund’s Market Price may be at, above or below its NAV. The NAV of a fund will fluctuate with changes in the fair value of its portfolio holdings. The Market Price of a fund will fluctuate in accordance with changes in its NAV, as well as market supply and demand.
Premiums or discounts are the differences (expressed as a percentage) between the NAV and Market Price of a fund on a given day, generally at the time the NAV is calculated. A premium is the amount that a fund is trading above the reported NAV, expressed as a percentage of the NAV. A discount is the amount that a fund is trading below the reported NAV, expressed as a percentage of the NAV.
The following information shows the frequency of distributions of premiums and discounts for each of the Funds. The information shown for each Fund is for five calendar years (or from the inception date of such Fund if less than five years) through the date of the most recent calendar quarter-end. The specific periods covered for each Fund are disclosed in the table for such Fund.
| 94 | 2015 iSHARES ANNUAL REPORTTO SHAREHOLDERS |
Table of Contents
Supplemental Information (Unaudited) (Continued)
iSHARES®, INC.
Each line in the table shows the number of trading days in which the Fund traded within the premium/discount range indicated. The number of trading days in each premium/discount range is also shown as a percentage of the total number of trading days in the period covered by each table. All data presented here represents past performance, which cannot be used to predict future results.
iShares MSCI Brazil ETF
Period Covered: January 1, 2010 through June 30, 2015
Premium/Discount Range | Number of Days | Percentage of Total Days | ||||||
Greater than 3.0% and Less than 3.5% | 2 | 0.14 | % | |||||
Greater than 2.5% and Less than 3.0% | 8 | 0.58 | ||||||
Greater than 2.0% and Less than 2.5% | 26 | 1.88 | ||||||
Greater than 1.5% and Less than 2.0% | 60 | 4.34 | ||||||
Greater than 1.0% and Less than 1.5% | 88 | 6.37 | ||||||
Greater than 0.5% and Less than 1.0% | 162 | 11.73 | ||||||
Between 0.5% and –0.5% | 862 | 62.38 | ||||||
Less than –0.5% and Greater than –1.0% | 132 | 9.55 | ||||||
Less than –1.0% and Greater than –1.5% | 36 | 2.60 | ||||||
Less than –1.5% and Greater than –2.0% | 4 | 0.29 | ||||||
Less than –2.0% and Greater than –2.5% | 2 | 0.14 | ||||||
|
|
|
| |||||
| 1,382 | 100.00 | % | ||||||
|
|
|
| |||||
Shares MSCI Chile Capped ETF
Period Covered: January 1, 2010 through June 30, 2015
Premium/Discount Range | Number of Days | Percentage of Total Days | ||||||
Greater than 3.0% | 2 | 0.14 | % | |||||
Greater than 2.5% and Less than 3.0% | 1 | 0.07 | ||||||
Greater than 2.0% and Less than 2.5% | 1 | 0.07 | ||||||
Greater than 1.5% and Less than 2.0% | 3 | 0.22 | ||||||
Greater than 1.0% and Less than 1.5% | 15 | 1.09 | ||||||
Greater than 0.5% and Less than 1.0% | 154 | 11.15 | ||||||
Between 0.5% and –0.5% | 921 | 66.64 | ||||||
Less than –0.5% and Greater than –1.0% | 235 | 17.01 | ||||||
Less than –1.0% and Greater than –1.5% | 30 | 2.17 | ||||||
Less than –1.5% and Greater than –2.0% | 14 | 1.01 | ||||||
Less than –2.0% and Greater than –2.5% | 4 | 0.29 | ||||||
Less than –2.5% | 2 | 0.14 | ||||||
|
|
|
| |||||
| 1,382 | 100.00 | % | ||||||
|
|
|
| |||||
SUPPLEMENTAL INFORMATION | 95 |
Table of Contents
Supplemental Information (Unaudited) (Continued)
iSHARES®, INC.
iShares MSCI Colombia Capped ETF
Period Covered: June 18, 2013 through June 30, 2015
Premium/Discount Range | Number of Days | Percentage of Total Days | ||||||
Greater than 3.5% and Less than 4.0% | 1 | 0.19 | % | |||||
Greater than 3.0% and Less than 3.5% | 1 | 0.19 | ||||||
Greater than 2.5% and Less than 3.0% | 1 | 0.19 | ||||||
Greater than 2.0% and Less than 2.5% | 11 | 2.14 | ||||||
Greater than 1.5% and Less than 2.0% | 25 | 4.88 | ||||||
Greater than 1.0% and Less than 1.5% | 65 | 12.68 | ||||||
Greater than 0.5% and Less than 1.0% | 147 | 28.66 | ||||||
Between 0.5% and –0.5% | 246 | 47.96 | ||||||
Less than –0.5% and Greater than –1.0% | 15 | 2.92 | ||||||
Less than –1.0% and Greater than –1.5% | 1 | 0.19 | ||||||
|
|
|
| |||||
| 513 | 100.00 | % | ||||||
|
|
|
| |||||
iShares MSCI Israel Capped ETF
Period Covered: January 1, 2010 through June 30, 2015
Premium/Discount Range | Number of Days | Percentage of Total Days | ||||||
Greater than 2.5% and Less than 3.0% | 2 | 0.14 | % | |||||
Greater than 2.0% and Less than 2.5% | 7 | 0.51 | ||||||
Greater than 1.5% and Less than 2.0% | 20 | 1.45 | ||||||
Greater than 1.0% and Less than 1.5% | 54 | 3.91 | ||||||
Greater than 0.5% and Less than 1.0% | 186 | 13.46 | ||||||
Between 0.5% and –0.5% | 793 | 57.38 | ||||||
Less than –0.5% and Greater than –1.0% | 189 | 13.67 | ||||||
Less than –1.0% and Greater than –1.5% | 70 | 5.07 | ||||||
Less than –1.5% and Greater than –2.0% | 35 | 2.53 | ||||||
Less than –2.0% and Greater than –2.5% | 11 | 0.80 | ||||||
Less than –2.5% and Greater than –3.0% | 8 | 0.58 | ||||||
Less than –3.0% and Greater than –3.5% | 3 | 0.22 | ||||||
Less than –3.5% and Greater than –4.0% | 2 | 0.14 | ||||||
Less than –4.0% | 2 | 0.14 | ||||||
|
|
|
| |||||
| 1,382 | 100.00 | % | ||||||
|
|
|
| |||||
| 96 | 2015 iSHARES ANNUAL REPORTTO SHAREHOLDERS |
Table of Contents
Supplemental Information (Unaudited) (Continued)
iSHARES®, INC.
iShares MSCI Russia Capped ETF
Period Covered: November 9, 2010 through June 30, 2015
Premium/Discount Range | Number of Days | Percentage of Total Days | ||||||
Greater than 5.0% | 4 | 0.34 | % | |||||
Greater than 4.5% and Less than 5.0% | 1 | 0.09 | ||||||
Greater than 4.0% and Less than 4.5% | 3 | 0.26 | ||||||
Greater than 3.5% and Less than 4.0% | 5 | 0.43 | ||||||
Greater than 3.0% and Less than 3.5% | 6 | 0.51 | ||||||
Greater than 2.5% and Less than 3.0% | 8 | 0.69 | ||||||
Greater than 2.0% and Less than 2.5% | 15 | 1.29 | ||||||
Greater than 1.5% and Less than 2.0% | 32 | 2.74 | ||||||
Greater than 1.0% and Less than 1.5% | 76 | 6.51 | ||||||
Greater than 0.5% and Less than 1.0% | 207 | 17.73 | ||||||
Between 0.5% and –0.5% | 572 | 49.00 | ||||||
Less than –0.5% and Greater than –1.0% | 120 | 10.28 | ||||||
Less than –1.0% and Greater than –1.5% | 60 | 5.14 | ||||||
Less than –1.5% and Greater than –2.0% | 28 | 2.40 | ||||||
Less than –2.0% and Greater than –2.5% | 10 | 0.86 | ||||||
Less than –2.5% and Greater than –3.0% | 6 | 0.51 | ||||||
Less than –3.0% and Greater than –3.5% | 8 | 0.69 | ||||||
Less than –3.5% and Greater than –4.0% | 1 | 0.09 | ||||||
Less than –4.0% and Greater than –4.5% | 2 | 0.17 | ||||||
Less than –4.5% and Greater than –5.0% | 1 | 0.09 | ||||||
Less than –5.0% and Greater than –5.5% | 1 | 0.09 | ||||||
Less than –5.5% | 1 | 0.09 | ||||||
|
|
|
| |||||
| 1,167 | 100.00 | % | ||||||
|
|
|
| |||||
SUPPLEMENTAL INFORMATION | 97 |
Table of Contents
Supplemental Information (Unaudited) (Continued)
iSHARES®, INC.
iShares MSCI South Africa ETF
Period Covered: January 1, 2010 through June 30, 2015
Premium/Discount Range | Number of Days | Percentage of Total Days | ||||||
Greater than 5.0% | 2 | 0.14 | % | |||||
Greater than 4.5% and Less than 5.0% | 1 | 0.07 | ||||||
Greater than 4.0% and Less than 4.5% | 1 | 0.07 | ||||||
Greater than 3.5% and Less than 4.0% | 3 | 0.22 | ||||||
Greater than 3.0% and Less than 3.5% | 3 | 0.22 | ||||||
Greater than 2.5% and Less than 3.0% | 3 | 0.22 | ||||||
Greater than 2.0% and Less than 2.5% | 12 | 0.87 | ||||||
Greater than 1.5% and Less than 2.0% | 29 | 2.10 | ||||||
Greater than 1.0% and Less than 1.5% | 105 | 7.60 | ||||||
Greater than 0.5% and Less than 1.0% | 261 | 18.89 | ||||||
Between 0.5% and –0.5% | 648 | 46.88 | ||||||
Less than –0.5% and Greater than –1.0% | 173 | 12.52 | ||||||
Less than –1.0% and Greater than –1.5% | 67 | 4.85 | ||||||
Less than –1.5% and Greater than –2.0% | 40 | 2.89 | ||||||
Less than –2.0% and Greater than –2.5% | 21 | 1.52 | ||||||
Less than –2.5% and Greater than –3.0% | 2 | 0.14 | ||||||
Less than –3.0% and Greater than –3.5% | 7 | 0.51 | ||||||
Less than –3.5% and Greater than –4.0% | 3 | 0.22 | ||||||
Less than –4.0% | 1 | 0.07 | ||||||
|
|
|
| |||||
| 1,382 | 100.00 | % | ||||||
|
|
|
| |||||
iShares MSCI Turkey ETF
Period Covered: January 1, 2010 through June 30, 2015
Premium/Discount Range | Number of Days | Percentage of Total Days | ||||||
Greater than 4.0% | 1 | 0.07 | % | |||||
Greater than 3.5% and Less than 4.0% | 1 | 0.07 | ||||||
Greater than 3.0% and Less than 3.5% | 4 | 0.29 | ||||||
Greater than 2.5% and Less than 3.0% | 9 | 0.65 | ||||||
Greater than 2.0% and Less than 2.5% | 9 | 0.65 | ||||||
Greater than 1.5% and Less than 2.0% | 34 | 2.46 | ||||||
Greater than 1.0% and Less than 1.5% | 90 | 6.51 | ||||||
Greater than 0.5% and Less than 1.0% | 244 | 17.67 | ||||||
Between 0.5% and –0.5% | 696 | 50.37 | ||||||
Less than –0.5% and Greater than –1.0% | 153 | 11.07 | ||||||
Less than –1.0% and Greater than –1.5% | 76 | 5.50 | ||||||
Less than –1.5% and Greater than –2.0% | 29 | 2.10 | ||||||
Less than –2.0% and Greater than –2.5% | 18 | 1.30 | ||||||
Less than –2.5% and Greater than –3.0% | 9 | 0.65 | ||||||
Less than –3.0% and Greater than –3.5% | 4 | 0.29 | ||||||
Less than –3.5% and Greater than –4.0% | 2 | 0.14 | ||||||
Less than –4.0% and Greater than –4.5% | 2 | 0.14 | ||||||
Less than –4.5% and Greater than –5.0% | 1 | 0.07 | ||||||
|
|
|
| |||||
| 1,382 | 100.00 | % | ||||||
|
|
|
| |||||
| 98 | 2015 iSHARES ANNUAL REPORTTO SHAREHOLDERS |
Table of Contents
Supplemental Information (Unaudited) (Continued)
iSHARES®, INC.
iShares MSCI USA Equal Weighted ETF
Period Covered: May 5, 2010 through June 30, 2015
Premium/Discount Range | Number of Days | Percentage of Total Days | ||||||
Greater than 1.5% | 1 | 0.08 | % | |||||
Greater than 1.0% and Less than 1.5% | 3 | 0.23 | ||||||
Greater than 0.5% and Less than 1.0% | 7 | 0.54 | ||||||
Between 0.5% and –0.5% | 1,274 | 98.15 | ||||||
Less than –0.5% and Greater than –1.0% | 13 | 1.00 | ||||||
|
|
|
| |||||
| 1,298 | 100.00 | % | ||||||
|
|
|
| |||||
Regulation under the Alternative Investment Fund Managers Directive (“AIFMD” or, the “Directive”)
The Directive imposes detailed and prescriptive obligations on fund managers established in the European Union (the “EU”). These do not currently apply to managers established outside the EU, such as BFA. Rather, non-EU managers are only required to comply with certain disclosure, reporting and transparency obligations of the Directive if such managers market a fund to EU investors.
BFA has registered the iShares MSCI Brazil Capped ETF and iShares MSCI USA Equal Weighted ETF (each a “Fund”, collectively the “Funds”) to be marketed to EU investors in the United Kingdom, the Netherlands, Finland, Sweden and Luxembourg.
Report on Remuneration
BFA is required under the Directive to make quantitative disclosures of remuneration. These disclosures are made in line with BlackRock’s interpretation of currently available regulatory guidance on quantitative remuneration disclosures. As market or regulatory practice develops, BlackRock may consider it appropriate to make changes to the way in which quantitative remuneration disclosures are calculated. Where such changes are made, this may result in disclosures in relation to a fund not being comparable to the disclosures made in the prior year, or in relation to other BlackRock fund disclosures in that same year.
Disclosures are provided in relation to both (a) the staff of BFA; (b) staff who are senior management; and (c) staff who have the ability to materially affect the risk profile of the Fund.
All individuals included in the aggregated figures disclosed are rewarded in line with BlackRock’s remuneration policy for their responsibilities across the relevant BlackRock business area. As all individuals have a number of areas of responsibilities, only the portion of remuneration for those individuals’ services attributable to the Fund is included in the aggregate figures disclosed.
BlackRock has a clear and well defined pay-for-performance philosophy, and compensation programs which support that philosophy. For senior management, a significant percentage of variable remuneration is deferred over time. All employees are subject to a claw-back policy.
Compensation decisions for employees are made based on BlackRock’s full-year financial results and other non-financial goals and objectives. Alongside financial performance, individual compensation is also based on strategic and operating results and other considerations such as management and leadership capabilities. No set formulas are established and no fixed benchmarks are used in determining annual incentive awards.
SUPPLEMENTAL INFORMATION | 99 |
Table of Contents
Supplemental Information (Unaudited) (Continued)
iSHARES®, INC.
Bonus pools are reviewed by BlackRock’s independent compensation committee, taking into account both actual and projected financial information together with information provided by the Operational Risk and Regulatory Compliance departments in relation to any activities, incidents or events that warrant consideration in making compensation decisions.
Functions such as Finance, Operational Risk, Legal & Compliance, and Human Resources each have their own organizational structures which are independent of the business units. Functional bonus pools are determined with reference to the performance of each individual function and the remuneration of the senior members of control functions is directly overseen by BlackRock’s independent compensation committee. No individual is involved in setting his or her own remuneration.
Members of staff and senior management of BFA typically provide both AIFMD and non-AIFMD related services in respect of multiple funds, clients and functions of BFA and across the broader BlackRock group. Therefore, the figures disclosed are a sum of each individual’s portion of remuneration attributable to the Fund according to an objective apportionment methodology which acknowledges the multiple-service nature of BFA. Accordingly, the figures are not representative of any individual’s actual remuneration or their remuneration structure.
The amount of the total remuneration awarded by BFA to its staff which has been attributed to the iShares MSCI Brazil Capped ETF in respect of BFA’s financial year ending December 31, 2014 was USD 682.8 thousand. This figure is comprised of fixed remuneration of USD 275.9 thousand and variable remuneration of USD 406.9 thousand. There were a total of 499 beneficiaries of the remuneration described above.
The amount of the aggregate remuneration awarded by BFA, which has been attributed to the iShares MSCI Brazil Capped ETF in respect of BFA’s financial year ending December 31, 2014, to its senior management was USD 94.5 thousand, and to members of its staff whose actions have a material impact on the risk profile of the Fund was USD 17.5 thousand.
The amount of the total remuneration awarded by BFA to its staff which has been attributed to the iShares MSCI USA Equal Weighted ETF in respect of BFA’s financial year ending December 31, 2014 was USD 10.5 thousand. This figure is comprised of fixed remuneration of USD 4.3 thousand and variable remuneration of USD 6.3 thousand. There were a total of 499 beneficiaries of the remuneration described above.
The amount of the aggregate remuneration awarded by BFA, which has been attributed to the iShares MSCI USA Equal Weighted ETF in respect of BFA’s financial year ending December 31, 2014, to its senior management was USD 1.5 thousand, and to members of its staff whose actions have a material impact on the risk profile of the Fund was USD 0.3 thousand.
| 100 | 2015 iSHARES ANNUAL REPORTTO SHAREHOLDERS |
Table of Contents
Director and Officer Information
iSHARES® , INC.
The Board of Directors has responsibility for the overall management and operations of the Company, including general supervision of the duties performed by BFA and other service providers. Each Director serves until he or she resigns, is removed, dies, retires or becomes incapacitated. Each officer shall hold office until his or her successor is elected and qualifies or until his or her death, or his or her resignation or removal. Directors who are not “interested persons” (as defined in the 1940 Act) of the Company are referred to as independent directors (“Independent Directors”).
The registered investment companies advised by BFA or its affiliates are organized into one complex of closed-end funds, two complexes of open-end funds and one complex of exchange-traded funds (“Exchange-Traded Fund Complex”) (each, a “BlackRock Fund Complex”). Each Fund is included in the BlackRock Fund Complex referred to as the Exchange-Traded Fund Complex. Each Director also serves as a Trustee of iShares Trust and a Trustee of iShares U.S. ETF Trust and, as a result, oversees a total of 319 funds (as of August 31, 2015) within the Exchange-Traded Fund Complex. With the exception of Robert S. Kapito and Mark Wiedman, the address of each Director and officer is c/o BlackRock, Inc., 400 Howard Street, San Francisco, CA 94105. The address of Mr. Kapito and Mr. Wiedman is c/o BlackRock, Inc., Park Avenue Plaza, 55 East 52nd Street, New York, NY 10055. The Board has designated Robert H. Silver as its Independent Chairman. Additional information about the Funds’ Directors and officers may be found in the Funds’ combined Statement of Additional Information, which is available without charge, upon request, by calling toll-free 1-800-iShares (1-800-474-2737).
Interested Directors
| Name (Age) | Position(s) | Principal Occupation(s) During the Past 5 Years | Other Directorships Held by Director | |||
Robert S. Kapitoa (58) | Director (since 2009). | President and Director, BlackRock, Inc. (since 2006); Vice Chairman of BlackRock, Inc. and Head of BlackRock, Inc.’s Portfolio Management Group (since its formation in 1998) and BlackRock, Inc.’s predecessor entities (since 1988); Trustee, University of Pennsylvania (since 2009); President of Board of Directors, Hope & Heroes Children’s Cancer Fund (since 2002); President of the Board of Directors, Periwinkle Theatre for Youth (since 1983). | Trustee of iShares Trust (since 2009); Trustee of iShares U.S. ETF Trust (since 2011); Director of BlackRock, Inc. (since 2006). | |||
Mark Wiedmanb (44) | Director (since 2013). | Managing Director, BlackRock, Inc. (since 2007); Global Head of iShares (since 2011); Head of Corporate Strategy, BlackRock, Inc. (2009-2011). | Trustee of iShares Trust (since 2013); Trustee of iShares U.S. ETF Trust (since 2013); Director of PennyMac Financial Services, Inc. (since 2008). | |||
| a | Robert S. Kapito is deemed to be an “interested person” (as defined in the 1940 Act) of the Company due to his affiliations with BlackRock, Inc. |
| b | Mark Wiedman is deemed to be an “interested person” (as defined in the 1940 Act) of the Company due to his affiliations with BlackRock, Inc. and its affiliates. |
DIRECTORAND OFFICER INFORMATION | 101 |
Table of Contents
Director and Officer Information (Continued)
iSHARES®, INC.
Independent Directors
| Name (Age) | Position(s) | Principal Occupation(s) During the Past 5 Years | Other Directorships Held by Director | |||
Robert H. Silver (60) | Director (since 2007); Independent Chairman (since 2012). | President and Co-Founder of The Bravitas Group, Inc. (since 2006); Director and Vice Chairman of the YMCA of Greater NYC (2001-2011); Broadway Producer (2006-2011); Co-Founder and Vice President of Parentgiving Inc. (since 2008); Director and Member of the Audit and Compensation Committee of EPAM Systems, Inc. (2006-2009); President and Chief Operating Officer of UBS Financial Services Inc. (formerly Paine Webber Inc.) (2003-2005) and various executive positions with UBS and its affiliates (1988-2005); CPA and Audit Manager of KPMG, LLP (formerly Peat Marwick Mitchell) (1977-1983). | Trustee of iShares Trust (since 2007); Trustee of iShares U.S. ETF Trust (since 2011); Independent Chairman of iShares Trust and iShares U.S. ETF Trust (since 2012). | |||
Jane D. Carlin (59) | Director (since 2015). | Managing Director and Global Head of Financial Holding Company Governance & Assurance and the Global Head of Operational Risk Management of Morgan Stanley (2006-2012). | Trustee of iShares Trust (since 2015); Trustee of iShares U.S. ETF Trust (since 2015); Director of PHH Corporation (mortgage solutions) (since 2012). | |||
Cecilia H. Herbert (66) | Director (since 2005); Nominating and Governance Committee Chair and Equity Plus Committee Chair (since 2012). | Director (1998-2013) and President (2007-2011) of the Board of Directors, Catholic Charities CYO; Trustee (2002-2011) and Chair of the Finance and Investment Committee (2006-2010) of the Thacher School; Member (since 1992) and Chair (1994-2005) of the Investment Committee, Archdiocese of San Francisco; Trustee and Member of the Investment Committee, WNET, the New York public broadcasting/media company (since 2011). | Trustee of iShares Trust (since 2005); Trustee of iShares U.S. ETF Trust (since 2011); Director of Forward Funds (34 portfolios) (since 2009). | |||
Charles A. Hurty (71) | Director (since 2005); Audit Committee Chair (since 2006). | Retired; Partner, KPMG LLP (1968-2001). | Trustee of iShares Trust (since 2005); Trustee of iShares U.S. ETF Trust (since 2011); Director of GMAM Absolute Return Strategy Fund (1 portfolio) (since 2002); Director of SkyBridge Alternative Investments Multi-Adviser Hedge Fund Portfolios LLC (2 portfolios) (since 2002). | |||
| 102 | 2015 iSHARES ANNUAL REPORTTO SHAREHOLDERS |
Table of Contents
Director and Officer Information (Continued)
iSHARES®, INC.
Independent Directors (Continued)
| Name (Age) | Position(s) | Principal Occupation(s) During the Past 5 Years | Other Directorships Held by Director | |||
John E. Kerrigan (60) | Director (since 2005); Fixed Income Plus Committee Chair (since 2012). | Chief Investment Officer, Santa Clara University (since 2002). | Trustee of iShares Trust (since 2005); Trustee of iShares U.S. ETF Trust (since 2011). | |||
John E. Martinez (54) | Director (since 2003); Securities Lending Committee Chair (since 2012). | Director of FirstREX Agreement Corp. (formerly EquityRock, Inc.) (since 2005). | Trustee of iShares Trust (since 2003); Trustee of iShares U.S. ETF Trust (since 2011). | |||
Madhav V. Rajan (51) | Director (since 2011); 15(c) Committee Chair (since 2012). | Robert K. Jaedicke Professor of Accounting and Senior Associate Dean for Academic Affairs and Head of MBA Program, Stanford University Graduate School of Business (since 2001); Professor of Law (by courtesy), Stanford Law School (since 2005); Visiting Professor, University of Chicago (2007-2008). | Trustee of iShares Trust (since 2011); Trustee of iShares U.S. ETF Trust (since 2011); Director, Cavium, Inc. (since 2013). | |||
DIRECTORAND OFFICER INFORMATION | 103 |
Table of Contents
Director and Officer Information (Continued)
iSHARES®, INC.
Officers
| Name (Age) | Position(s) | Principal Occupation(s) During the Past 5 Years | ||
Manish Mehta (44) | President (since 2013). | Managing Director, BlackRock, Inc. (since 2009); Chief Operating Officer for iShares (since 2009); Head of Strategy and Corporate Development, BGI (2005-2009); Chief of Staff to the CEO, BGI (2005-2009). | ||
Jack Gee (55) | Treasurer and Chief Financial Officer (since 2008). | Managing Director, BlackRock, Inc. (since 2009); Senior Director of Fund Administration of Intermediary Investor Business, BGI (2009); Director of Fund Administration of Intermediary Investor Business, BGI (2004-2009). | ||
Benjamin Archibald (40) | Secretary (since 2015). | Managing Director, BlackRock, Inc. (since 2014); Secretary of the BlackRock-advised Mutual Funds (since 2012); Director, BlackRock, Inc. (2010-2013). | ||
Charles Park (47) | Chief Compliance Officer (since 2006). | Chief Compliance Officer of BlackRock Advisors, LLC and the BlackRock-advised Funds in the Equity-Bond Complex, the Equity-Liquidity Complex and the Closed-End Complex (since 2014); Chief Compliance Officer, BFA (since 2006). | ||
Scott Radell (46) | Executive Vice President (since 2012). | Managing Director, BlackRock, Inc. (since 2009); Head of Portfolio Solutions, BlackRock, Inc. (since 2009); Head of Portfolio Solutions, BGI (2007-2009); Credit Portfolio Manager, BGI (2005-2007); Credit Research Analyst, BGI (2003-2005). | ||
Amy Schioldager (52) | Executive Vice President (since 2007). | Senior Managing Director, BlackRock, Inc. (since 2009); Global Head of Index Equity, BGI (2008-2009); Global Head of U.S. Indexing, BGI (2006-2008); Head of Domestic Equity Portfolio Management, BGI (2001-2006). | ||
| 104 | 2015 iSHARES ANNUAL REPORTTO SHAREHOLDERS |
Table of Contents
Notes:
NOTES | 105 |
Table of Contents
Notes:
| 106 | 2015 iSHARES ANNUAL REPORTTO SHAREHOLDERS |
Table of Contents
For more information visit www.iShares.com or call 1-800-474-2737
This report is intended for the Funds’ shareholders. It may not be distributed to prospective investors unless it is preceded or accompanied by the current prospectus.
Investing involves risk, including possible loss of principal.
The iShares Funds are distributed by BlackRock Investments, LLC (together with its affiliates, “BlackRock”).
The iShares Funds are not sponsored, endorsed, issued, sold or promoted by MSCI Inc., nor does this company make any representation regarding the advisability of investing in the iShares Funds. BlackRock is not affiliated with the company listed above.
A description of the policies that the Funds use to determine how to vote proxies relating to portfolio securities and information about how the Funds voted proxies relating to portfolio securities during the most recent twelve-month period ending June 30 is available without charge, upon request, by calling toll-free 1-800-474-2737; on the Funds’ website at www.iShares.com; and on the U.S. Securities and Exchange Commission (SEC) website at www.sec.gov.
The Funds file their complete schedules of portfolio holdings with the SEC for the first and third quarters of each fiscal year on Form N-Q. The Funds’ Forms N-Q are available on the SEC’s website or may be reviewed and copied at the SEC’s Public Reference Room in Washington, D.C. Information on the operation of the Public Reference Room may be obtained by calling 1-800-SEC-0330. The Funds also disclose their complete schedules of portfolio holdings on a daily basis on the Funds’ website.
©2015 BlackRock, Inc. All rights reserved. iSHARES and BLACKROCK are registered trademarks of BlackRock, Inc. or its subsidiaries. All other marks are the property of their respective owners.
iS-AR-84-0815
 |  |
Table of Contents
AUGUST 31, 2015
2015 ANNUAL REPORT |  |
iShares, Inc.
| Ø | iShares Currency Hedged MSCI Emerging Markets ETF | HEEM | NYSE Arca |
| Ø | iShares MSCI Emerging Markets ETF | EEM | NYSE Arca |
Table of Contents
| 5 | ||||
| 10 | ||||
| 10 | ||||
| 11 | ||||
| 11 | ||||
| 13 | ||||
| 27 | ||||
| 30 | ||||
| 32 | ||||
| 47 | ||||
| 48 | ||||
| 49 | ||||
| 56 | ||||
| 59 |
Table of Contents
Management’s Discussion of Fund Performance
iSHARES®, INC.
GLOBAL MARKET OVERVIEW
Global equity markets delivered a negative return for the 12 months ended August 31, 2015 (the “reporting period”). The MSCI ACWI, a broad global equity index that includes both developed and emerging markets, returned -6.29% for the reporting period.
The reporting period was characterized by a continued divergence in economic growth and central bank policy between the U.S. and the rest of the world. Despite a slowdown in early 2015, the U.S. economy remained one of the strongest economies among developed countries, which motivated the U.S. Federal Reserve Bank (the “Fed”) to scale back its economic stimulus measures. The Fed ended a two-year quantitative easing program in October 2014 and signaled its intent to raise its short-term interest rate target sometime in 2015. In contrast, weaker economic growth in most other regions of the globe led many of the world’s central banks to take more aggressive actions to stimulate economic activity.
This divergence contributed to a notably stronger U.S. dollar. For the reporting period, the euro, Japanese yen, British pound and Australian dollar declined by 15%, 14%, 7%, and 24% against the U.S. dollar, respectively. Weaker foreign currencies decrease the value of foreign investments measured in U.S. dollars, thereby decreasing returns for U.S. investors, while increasing foreign currencies relative to the U.S. dollar have the opposite effect. Currency performance had a meaningful impact on non-U.S. equity returns for U.S. investors. For example, the MSCI ACWI returned 0.59% in local currency terms for the reporting period.
A number of other factors influenced global markets during the reporting period. Energy prices fell sharply amid growing supply — primarily from increased production in the U.S. — and declining global demand. Lower energy prices contributed to historically low and declining inflation rates in most of the world. Consumer prices were nearly unchanged in the U.S., the European Union, and Japan, while prices in China and India rose at a relatively slow rate. Low inflation and tepid demand kept the Fed’s zero interest rate policy intact, while central banks throughout the world took aggressive measures to stimulate demand.
Global markets advanced for most of the reporting period, then declined sharply in the last few months of the reporting period. The volatility began in China, as slowing economic growth led to a steep drop in China’s equity markets. Plummeting commodity prices amid already subdued inflation also raised concerns about global demand. Currency devaluations in Asia, including China, Vietnam, Pakistan, and Kazakhstan, led to speculation that Asian countries were weakening their currencies to compete for demand. These global events led to further uncertainty about the timing of an expected interest rate hike from the Fed.
On a regional basis, U.S. stocks advanced by less than 1% for the reporting period as declining interest rates, ongoing economic growth, and low inflation provided a favorable environment for U.S. equity market performance. After generating its fastest quarterly growth rate in 11 years in the third quarter of 2014, the U.S. economy slowed over the next two quarters. Economic activity improved over the last several months of the reporting period, boosted by an increase in consumer spending.
European stocks declined by about 8% in U.S. dollar terms for the reporting period, though they advanced more than 3% when measured in local currencies. The European Central Bank initiated quantitative easing measures in early 2015, and signs of economic improvement emerged in the latter half of the reporting period. A tentative agreement on Greece’s debt repayment helped alleviate ongoing concerns about Europe’s sovereign debt levels.
Stock markets in the Asia/Pacific region (excluding Japan) declined by approximately 19% in U.S. dollar terms, which equated to an 8% decline when measured in local currencies. China’s economic slowdown weighed heavily on the region, as China is the largest trading partner of many countries in the region. On the bright side, Japanese stocks performed relatively well, as ongoing economic stimulus and reform measures led to a 4% gain in U.S. dollar terms (22% when measured in Japanese yen).
Emerging markets stocks fell by approximately 23% in U.S. dollar terms for the reporting period, though the decline was about 10% when measured in local currencies. Many of the largest emerging economies — including China, Russia, and Brazil — experienced slowing economic growth during the reporting period. Latin American stocks posted some of the biggest declines, as the region struggled with slow growth and declining commodity prices.
MANAGEMENT’S DISCUSSIONSOF FUND PERFORMANCE | 5 |
Table of Contents
Management’s Discussion of Fund Performance
iSHARES® CURRENCY HEDGED MSCI EMERGING MARKETS ETF
Performance as of August 31, 2015
| Cumulative Total Returns | ||||||||||||
| NAV | MARKET | INDEX | ||||||||||
Since Inception | (10.01)% | (10.02)% | (9.41)% | |||||||||
GROWTH OF $10,000 INVESTMENT
(SINCE INCEPTION AT NET ASSET VALUE)
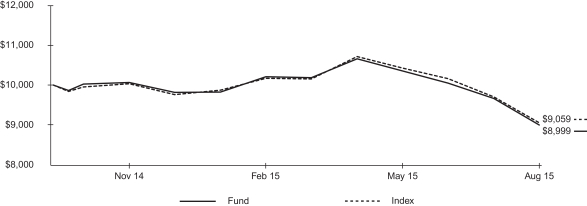
The inception date of the Fund was 9/23/14. The first day of secondary market trading was 9/25/14.
Past performance is no guarantee of future results. Performance results do not reflect the deduction of taxes that a shareholder would pay on fund distributions or on the redemption or sale of fund shares. See “About Fund Performance” on page 10 for more information.
| Shareholder Expenses | ||||||||||||||||||||||||||
| Actual | Hypothetical 5% Return | |||||||||||||||||||||||||
| Beginning Account Value (3/1/15) | Ending Account Value (8/31/15) | Expenses Paid During Period a,b | Beginning Account Value (3/1/15) | Ending Account Value (8/31/15) | Expenses Paid During Period a,b | Annualized Expense Ratio a | ||||||||||||||||||||
| $ | 1,000.00 | $ | 881.60 | $ | 0.05 | $ | 1,000.00 | $ | 1,025.20 | $ | 0.05 | 0.01% | ||||||||||||||
| a | Annualized expense ratio and expenses paid during the period do not include fees and expenses of the underlying fund in which the Fund invests. |
| b | Expenses are calculated using the Fund’s annualized expense ratio (as disclosed in the table), multiplied by the average account value for the period, multiplied by the number of days in the period (184 days) and divided by the number of days in the year (365 days). See “Shareholder Expenses” on page 10 for more information. |
The iShares Currency Hedged MSCI Emerging Markets ETF (the “Fund”) seeks to track the investment results of an index composed of large- and mid-capitalization emerging market equities while mitigating exposure to fluctuations between the value of the component currencies and the U.S. dollar, as represented by the MSCI Emerging Markets 100% Hedged to USD Index (the “Index”).
The Index applies a one-month forward rate to the total value of the non-U.S. dollar denominated securities included in the Index to effectively create a “hedge” against fluctuations in the relative value of the component currencies in relation to the U.S. dollar. In order to replicate the “hedging” component of the Index, the Fund enters into foreign currency forward contracts designed to offset the Fund’s exposure to the component currencies.
| 6 | 2015 iSHARES ANNUAL REPORTTO SHAREHOLDERS |
Table of Contents
Management’s Discussion of Fund Performance (Continued)
iSHARES® CURRENCY HEDGED MSCI EMERGING MARKETS ETF
The Fund invests in a representative sample of securities included in the Index that collectively has an investment profile similar to the Index. Due to the use of representative sampling, the Fund may or may not hold all of the securities that are included in the Index. The Fund currently seeks to achieve its investment objective by investing a substantial portion of its assets in one underlying fund, the iShares MSCI Emerging Markets ETF. For the period from September 23, 2014 (inception date of the Fund) through August 31, 2015 (the “reporting period”), the total return for the Fund was -10.01%, net of fees, while the total return for the Index was -9.41%.
As represented by the Index, currency-hedged emerging market equities had negative returns for the reporting period. Many key emerging market currencies depreciated relative to the U.S. dollar during the reporting period, which had a meaningful negative impact on international equity returns. However, the Index’s implementation of foreign currency hedging helped offset the impact of currency fluctuations, resulting in an Index return close to that of emerging market equity returns measured in local currencies.
The Index declined amid volatility caused largely by events in China, including signs of economic weakness, a precipitous drop in the country’s stock market, and an unanticipated devaluation of the Chinese yuan. In addition, South Korea’s economy grew at its slowest annual rate in almost two years during the second quarter of 2015 as personal consumption expenditures declined. It was a similar story for Taiwan, whose economy expanded by just 0.5% for the 12 months ended June 2015 as manufacturing activity shrank. China, South Korea, and Taiwan together accounted for more than half of the Index on average during the reporting period.
Slower Chinese economic growth also weighed on commodity prices, which hurt many export-oriented, resource-rich emerging economies. Russia was a prime example — fossil fuels account for more than half the country’s exports. In addition, Russia was subject to economic sanctions because of its role in the ongoing conflict in Ukraine. Brazil was the leading detractor in the Index for the reporting period as its economy contracted on a year-over-year basis for the fifth straight quarter. No country produced a meaningful positive contribution to Index performance during the period.
ALLOCATION BY SECTOR1 As of 8/31/15
| Sector | Percentage of Total Investments 2 | |||
Financials | 28.70 | % | ||
Information Technology | 17.45 | |||
Consumer Discretionary | 9.36 | |||
Consumer Staples | 8.75 | |||
Energy | 8.02 | |||
Telecommunication Services | 7.49 | |||
Industrials | 7.22 | |||
Materials | 6.72 | |||
Utilities | 3.35 | |||
Health Care | 2.94 | |||
|
| |||
TOTAL | 100.00 | % | ||
|
| |||
TEN LARGEST COUNTRIES1 As of 8/31/15
| Country | Percentage of Total Investments 2 | |||
China | 23.29 | % | ||
South Korea | 14.69 | |||
Taiwan | 12.49 | |||
India | 8.55 | |||
South Africa | 8.16 | |||
Brazil | 6.71 | |||
Mexico | 4.81 | |||
Russia | 3.90 | |||
Malaysia | 3.14 | |||
Indonesia | 2.40 | |||
|
| |||
TOTAL | 88.14 | % | ||
|
| |||
| 1 | Reflects the portfolio allocation and ten largest countries of the iShares MSCI Emerging Markets ETF, the underlying fund in which the Fund invests. |
| 2 | Excludes money market funds. |
MANAGEMENT’S DISCUSSIONSOF FUND PERFORMANCE | 7 |
Table of Contents
Management’s Discussion of Fund Performance
iSHARES® MSCI EMERGING MARKETS ETF
Performance as of August 31, 2015
| Average Annual Total Returns | Cumulative Total Returns | |||||||||||||||||||||||||
| NAV | MARKET | INDEX | NAV | MARKET | INDEX | |||||||||||||||||||||
1 Year | (23.46)% | (23.34)% | (22.95)% | (23.46)% | (23.34)% | (22.95)% | ||||||||||||||||||||
5 Years | (1.51)% | (1.44)% | (0.92)% | (7.33)% | (6.98)% | (4.51)% | ||||||||||||||||||||
10 Years | 4.57% | 4.53% | 5.52% | 56.29% | 55.81% | 71.14% | ||||||||||||||||||||
GROWTH OF $10,000 INVESTMENT
(AT NET ASSET VALUE)
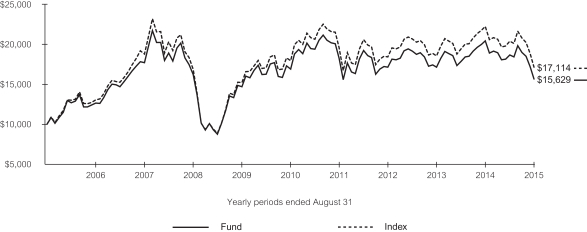
Past performance is no guarantee of future results. Performance results do not reflect the deduction of taxes that a shareholder would pay on fund distributions or on the redemption or sale of fund shares. See “About Fund Performance” on page 10 for more information.
| Shareholder Expenses | ||||||||||||||||||||||||||
| Actual | Hypothetical 5% Return | |||||||||||||||||||||||||
| Beginning Account Value (3/1/15) | Ending Account Value (8/31/15) | Expenses Paid During Period a | Beginning Account Value (3/1/15) | Ending Account Value (8/31/15) | Expenses Paid During Period a | Annualized Expense Ratio | ||||||||||||||||||||
| $ | 1,000.00 | $ | 837.40 | $ | 3.20 | $ | 1,000.00 | $ | 1,021.70 | $ | 3.52 | 0.69% | ||||||||||||||
| a | Expenses are calculated using the Fund’s annualized expense ratio (as disclosed in the table), multiplied by the average account value for the period, multiplied by the number of days in the period (184 days) and divided by the number of days in the year (365 days). See “Shareholder Expenses” on page 10 for more information. |
| 8 | 2015 iSHARES ANNUAL REPORTTO SHAREHOLDERS |
Table of Contents
Management’s Discussion of Fund Performance (Continued)
iSHARES® MSCI EMERGING MARKETS ETF
The iShares MSCI Emerging Markets ETF (the “Fund”) seeks to track the investment results of an index composed of large- and mid-capitalization emerging market equities, as represented by the MSCI Emerging Markets Index (the “Index”). The Fund invests in a representative sample of securities included in the Index that collectively has an investment profile similar to the Index. Due to the use of representative sampling, the Fund may or may not hold all of the securities that are included in the Index. For the 12-month reporting period ended August 31, 2015, the total return for the Fund was -23.46%, net of fees, while the total return for the Index was -22.95%.
As represented by the Index, emerging markets stocks declined sharply for the reporting period. One factor behind this decline was the depreciation of many emerging market currencies against the U.S. dollar. For the reporting period, the Taiwanese dollar depreciated 8%, the South Korean won depreciated 14%, and the Brazilian real depreciated 38% against the U.S. dollar. These three countries comprised approximately 36% of the Index on average during the reporting period. The stronger dollar had a meaningful impact on the Index’s performance; when measured in local currencies, the Index returned -9.53% for the reporting period.
The Index experienced substantial volatility during the reporting period as geopolitical conflicts, global economic weakness, and declining demand for commodities (a primary driver of growth in many emerging economies) buffeted emerging markets. Events in China late in the reporting period — including signs of economic weakness, a precipitous drop in the country’s stock market, and an unexpected devaluation of the Chinese yuan — put additional downward pressure on emerging markets stocks.
In U.S. dollars, Brazil had the most significant negative impact on the Index’s performance for the reporting period. Brazil’s economy remained in recession throughout the reporting period, domestic inflation accelerated, and several government officials faced corruption allegations. South Korea also detracted meaningfully from the Index’s performance as declining exports and an outbreak of Middle East Respiratory Syndrome led to weaker economic output.
The only country that contributed to the Index’s return was Hungary, a relatively small component of the Index. The Hungarian stock market benefited from economic and tax reforms that led to an improving economy.
ALLOCATION BY SECTOR As of 8/31/15
| Sector | Percentage of Total Investments* | |||
Financials | 28.70 | % | ||
Information Technology | 17.45 | |||
Consumer Discretionary | 9.36 | |||
Consumer Staples | 8.75 | |||
Energy | 8.02 | |||
Telecommunication Services | 7.49 | |||
Industrials | 7.22 | |||
Materials | 6.72 | |||
Utilities | 3.35 | |||
Health Care | 2.94 | |||
|
| |||
TOTAL | 100.00 | % | ||
|
| |||
TEN LARGEST COUNTRIES As of 8/31/15
| Country | Percentage of Total Investments* | |||
China | 23.29 | % | ||
South Korea | 14.69 | |||
Taiwan | 12.49 | |||
India | 8.55 | |||
South Africa | 8.16 | |||
Brazil | 6.71 | |||
Mexico | 4.81 | |||
Russia | 3.90 | |||
Malaysia | 3.14 | |||
Indonesia | 2.40 | |||
|
| |||
TOTAL | 88.14 | % | ||
|
| |||
| * | Excludes money market funds. |
MANAGEMENT’S DISCUSSIONSOF FUND PERFORMANCE | 9 |
Table of Contents
Past performance is no guarantee of future results. Current performance may be lower or higher than the performance data quoted. Performance data current to the most recent month-end is available at www.ishares.com. Performance results assume reinvestment of all dividends and capital gain distributions and do not reflect the deduction of taxes that a shareholder would pay on fund distributions or on the redemption or sale of fund shares. The investment return and principal value of shares will vary with changes in market conditions. Shares may be worth more or less than their original cost when they are redeemed or sold in the market. Performance for certain funds may reflect a waiver of a portion of investment advisory fees. Without such a waiver, performance would have been lower.
Net asset value or “NAV” is the value of one share of a fund as calculated in accordance with the standard formula for valuing mutual fund shares. The price used to calculate market return (“Market Price”) is determined by using the midpoint between the highest bid and the lowest offer on the primary stock exchange on which shares of a fund are listed for trading, as of the time that such fund’s NAV is calculated. Certain funds may have a NAV which is determined prior to the opening of regular trading on its listed exchange and their market returns are calculated using the midpoint of the bid/ask spread as of the opening of regular trading on the exchange. Market and NAV returns assume that dividends and capital gain distributions have been reinvested at Market Price and NAV, respectively.
An index is a statistical composite that tracks a specified financial market or sector. Unlike a fund, an index does not actually hold a portfolio of securities and therefore does not incur the expenses incurred by a fund. These expenses negatively impact fund performance. Also, market returns do not include brokerage commissions that may be payable on secondary market transactions. If brokerage commissions were included, market returns would be lower.
As a shareholder of a Fund, you incur two types of costs: (1) transaction costs, including brokerage commissions on purchases and sales of fund shares and (2) ongoing costs, including management fees and other fund expenses. The expense example, which is based on an investment of $1,000 invested on March 1, 2015 and held through August 31, 2015, is intended to help you understand your ongoing costs (in dollars and cents) of investing in a Fund and to compare these costs with the ongoing costs of investing in other funds.
Actual Expenses — The table provides information about actual account values and actual expenses. Annualized expense ratios reflect contractual and voluntary fee waivers, if any. To estimate the expenses that you paid on your account over the period, simply divide your account value by $1,000 (for example, an $8,600 account value divided by $1,000 = 8.6), then multiply the result by the number corresponding to your Fund under the heading entitled “Expenses Paid During Period.”
Hypothetical Example for Comparison Purposes — The table also provides information about hypothetical account values and hypothetical expenses based on each Fund’s actual expense ratio and an assumed rate of return of 5% per year before expenses. You may use this information to compare the ongoing costs of investing in your Fund and other funds. To do so, compare this 5% hypothetical example with the 5% hypothetical examples that appear in the shareholder reports of the other funds.
Please note that the expenses shown in the table are meant to highlight your ongoing costs only and do not reflect any transactional costs, such as brokerage commissions paid on purchases and sales of fund shares. Therefore, the hypothetical examples are useful in comparing ongoing costs only and will not help you determine the relative total costs of owning different funds. In addition, if these transactional costs were included, your costs would have been higher.
| 10 | 2015 iSHARES ANNUAL REPORTTO SHAREHOLDERS |
Table of Contents
iSHARES® CURRENCY HEDGED MSCI EMERGING MARKETS ETF
August 31, 2015
| Security | Shares | Value | ||||||
INVESTMENT COMPANIES — 99.72% |
| |||||||
EXCHANGE-TRADED FUNDS — 99.72% |
| |||||||
iShares MSCI Emerging Markets ETFa | 6,243,211 | $ | 211,270,260 | |||||
|
| |||||||
TOTAL INVESTMENT COMPANIES |
| |||||||
(Cost: $245,221,518) | 211,270,260 | |||||||
SHORT-TERM INVESTMENTS — 0.05% |
| |||||||
MONEY MARKET FUNDS — 0.05% |
| |||||||
BlackRock Cash Funds: Treasury, |
| |||||||
0.03%a,b | 108,774 | 108,774 | ||||||
|
| |||||||
| 108,774 | ||||||||
|
| |||||||
TOTAL SHORT-TERM INVESTMENTS |
| |||||||
(Cost: $108,774) | 108,774 | |||||||
|
| |||||||
TOTAL INVESTMENTS |
| |||||||
(Cost: $245,330,292) | 211,379,034 | |||||||
Other Assets, Less Liabilities — 0.23% |
| 485,871 | ||||||
|
| |||||||
NET ASSETS — 100.00% | $ | 211,864,905 | ||||||
|
| |||||||
| a | Affiliated issuer. See Note 2. |
| b | The rate quoted is the annualized seven-day yield of the fund at period end. |
Forward currency contracts as of August 31, 2015 were as follows:
| Currency Purchased | Currency Sold | Settlement Date | Counter- party | Unrealized Appreciation (Depreciation) | ||||||||||||||||
| EUR | 185,000 | USD | 201,613 | 09/04/2015 | BNP | $ | 5,991 | |||||||||||||
| EUR | 1,000 | USD | 1,087 | 09/04/2015 | CITI | 35 | ||||||||||||||
| EUR | 271,000 | USD | 296,293 | 09/04/2015 | MS | 7,818 | ||||||||||||||
| HKD | 20,362,000 | USD | 2,626,518 | 09/04/2015 | BBP | 802 | ||||||||||||||
| HKD | 16,765,000 | USD | 2,162,208 | 09/04/2015 | BNP | 989 | ||||||||||||||
| HKD | 109,000 | USD | 14,060 | 09/04/2015 | CITI | 4 | ||||||||||||||
| HKD | 3,002,000 | USD | 387,249 | 09/04/2015 | HSBC | 101 | ||||||||||||||
| HKD | 20,998,000 | USD | 2,707,567 | 09/04/2015 | MS | 1,816 | ||||||||||||||
| MXN | 234,563,000 | USD | 14,011,848 | 09/04/2015 | MS | 25,273 | ||||||||||||||
| RUB | 404,754,000 | USD | 6,123,359 | 09/04/2015 | JPM | 176,171 | ||||||||||||||
| RUB | 4,171,000 | USD | 64,652 | 09/04/2015 | MS | 265 | ||||||||||||||
| TRY | 8,993,000 | USD | 3,079,305 | 09/04/2015 | HSBC | 7,967 | ||||||||||||||
| USD | 3,659,249 | BRL | 12,835,000 | 09/04/2015 | BOA | 122,970 | ||||||||||||||
| USD | 88,262 | BRL | 314,000 | 09/04/2015 | GS | 1,749 | ||||||||||||||
| USD | 13,547,123 | BRL | 46,342,000 | 09/04/2015 | JPM | 779,049 | ||||||||||||||
| USD | 1,267,521 | EUR | 1,115,000 | 09/04/2015 | BOA | 16,288 | ||||||||||||||
| USD | 31,262 | EUR | 27,000 | 09/04/2015 | JPM | 963 | ||||||||||||||
| USD | 4,639,449 | INR | 306,395,000 | 09/04/2015 | BOA | 29,678 | ||||||||||||||
| USD | 15,504,879 | INR | 999,083,000 | 09/04/2015 | JPM | 473,486 | ||||||||||||||
| USD | 42,929 | INR | 2,764,000 | 09/04/2015 | UBS | 1,344 | ||||||||||||||
| USD | 626,866 | KRW | 729,703,000 | 09/04/2015 | JPM | 9,887 | ||||||||||||||
| USD | 33,319,945 | KRW | 39,153,601,000 | 09/04/2015 | RBS | 214,797 | ||||||||||||||
| USD | 265,467 | MXN | 4,263,000 | 09/04/2015 | BBP | 10,353 | ||||||||||||||
| Currency Purchased | Currency Sold | Settlement Date | Counter- party | Unrealized Appreciation (Depreciation) | |||||||||||||||||
| USD | 11,761,957 | MXN | 192,940,000 | 09/04/2015 | SCB | $ | 215,711 | ||||||||||||||
| USD | 5,525,719 | RUB | 332,878,000 | 09/04/2015 | JPM | 344,857 | |||||||||||||||
| USD | 20,583 | RUB | 1,282,000 | 09/04/2015 | UBS | 630 | |||||||||||||||
| USD | 2,727,108 | TRY | 7,644,000 | 09/04/2015 | BNP | 102,944 | |||||||||||||||
| USD | 715 | TRY | 2,000 | 09/04/2015 | CITI | 28 | |||||||||||||||
| USD | 34,259,187 | TWD | 1,082,419,000 | 09/04/2015 | RBC | 971,545 | |||||||||||||||
| USD | 304,951 | TWD | 9,670,000 | 09/04/2015 | UBS | 7,569 | |||||||||||||||
| USD | 4,274,625 | ZAR | 55,537,000 | 09/04/2015 | BOA | 87,783 | |||||||||||||||
| USD | 316,859 | ZAR | 4,020,000 | 09/04/2015 | BBP | 13,798 | |||||||||||||||
| USD | 103,868 | ZAR | 1,368,000 | 09/04/2015 | GS | 737 | |||||||||||||||
| USD | 14,603,620 | ZAR | 186,140,000 | 09/04/2015 | RBC | 570,833 | |||||||||||||||
| EUR | 207,000 | USD | 232,049 | 10/05/2015 | BBP | 349 | |||||||||||||||
| EUR | 22,000 | USD | 24,689 | 10/05/2015 | BNP | 10 | |||||||||||||||
| HKD | 10,984,000 | USD | 1,417,229 | 10/05/2015 | HSBC | 15 | |||||||||||||||
| INR | 23,649,000 | USD | 354,013 | 10/05/2015 | JPM | 93 | |||||||||||||||
| KRW | 1,009,459,000 | USD | 852,512 | 10/05/2015 | JPM | 220 | |||||||||||||||
| RUB | 2,174,000 | USD | 33,456 | 10/05/2015 | JPM | 40 | |||||||||||||||
| TWD | 55,677,000 | USD | 1,713,297 | 10/05/2015 | JPM | 446 | |||||||||||||||
| USD | 15,095,256 | BRL | 54,345,000 | 10/05/2015 | BNP | 282,908 | |||||||||||||||
| USD | 73,043 | BRL | 265,000 | 10/05/2015 | CITI | 814 | |||||||||||||||
| USD | 5,152,712 | EUR | 4,589,000 | 10/05/2015 | GS | 662 | |||||||||||||||
| USD | 88,012 | INR | 5,874,000 | 10/05/2015 | CITI | 58 | |||||||||||||||
| USD | 18,091,050 | INR | 1,204,683,000 | 10/05/2015 | JPM | 52,823 | |||||||||||||||
| USD | 190,850 | KRW | 225,585,000 | 10/05/2015 | CITI | 289 | |||||||||||||||
| USD | 40,005,604 | KRW | 47,186,610,000 | 10/05/2015 | JPM | 145,109 | |||||||||||||||
| USD | 182,386 | TWD | 5,902,000 | 10/05/2015 | CITI | 722 | |||||||||||||||
| USD | 39,242,391 | TWD | 1,267,942,000 | 10/05/2015 | JPM | 215,039 | |||||||||||||||
| USD | 16,939,640 | ZAR | 225,379,000 | 10/05/2015 | BBP | 40,470 | |||||||||||||||
| ZAR | 157,000 | USD | 11,759 | 10/05/2015 | HSBC | 13 | |||||||||||||||
|
| ||||||||||||||||||||
| 4,944,311 | |||||||||||||||||||||
|
| ||||||||||||||||||||
| BRL | 56,237,000 | USD | 15,799,991 | 09/04/2015 | BNP | (305,662) | |||||||||||||||
| BRL | 14,000 | USD | 3,968 | 09/04/2015 | CITI | (111) | |||||||||||||||
| BRL | 2,755,000 | USD | 786,934 | 09/04/2015 | MS | (27,880) | |||||||||||||||
| BRL | 485,000 | USD | 140,172 | 09/04/2015 | UBS | (6,545) | |||||||||||||||
| EUR | 4,589,000 | USD | 5,150,348 | 09/04/2015 | GS | (655) | |||||||||||||||
| HKD | 411,753,000 | USD | 53,128,802 | 09/04/2015 | HSBC | (98) | |||||||||||||||
| INR | 49,339,000 | USD | 769,959 | 09/04/2015 | BNP | (27,645) | |||||||||||||||
| INR | 320,000 | USD | 4,997 | 09/04/2015 | CITI | (183) | |||||||||||||||
| INR | 1,204,683,000 | USD | 18,205,879 | 09/04/2015 | JPM | (81,195) | |||||||||||||||
| INR | 61,524,000 | USD | 957,967 | 09/04/2015 | MS | (32,327) | |||||||||||||||
| KRW | 1,919,378,000 | USD | 1,640,941 | 09/04/2015 | BNP | (18,069) | |||||||||||||||
| KRW | 12,484,000 | USD | 10,614 | 09/04/2015 | CITI | (59) | |||||||||||||||
| KRW | 47,186,610,000 | USD | 40,056,545 | 09/04/2015 | JPM | (159,328) | |||||||||||||||
| KRW | 2,386,927,000 | USD | 2,037,176 | 09/04/2015 | MS | (18,982) | |||||||||||||||
| KRW | 156,588,000 | USD | 134,186 | 09/04/2015 | UBS | (1,788) | |||||||||||||||
| MXN | 9,584,000 | USD | 588,091 | 09/04/2015 | BNP | (14,548) | |||||||||||||||
| MXN | 63,000 | USD | 3,842 | 09/04/2015 | CITI | (72) | |||||||||||||||
| MXN | 607,000 | USD | 37,532 | 09/04/2015 | HSBC | (1,206) | |||||||||||||||
| MXN | 11,974,000 | USD | 734,460 | 09/04/2015 | MS | (17,892) | |||||||||||||||
| RUB | 16,558,000 | USD | 259,853 | 09/04/2015 | BNP | (2,147) | |||||||||||||||
| RUB | 108,000 | USD | 1,686 | 09/04/2015 | CITI | (5) | |||||||||||||||
| RUB | 16,558,000 | USD | 259,864 | 09/04/2015 | MS | (2,158) | |||||||||||||||
| TRY | 89,000 | USD | 31,921 | 09/04/2015 | BBP | (1,368) | |||||||||||||||
| TRY | 368,000 | USD | 131,244 | 09/04/2015 | BNP | (4,911) | |||||||||||||||
| TRY | 2,000 | USD | 711 | 09/04/2015 | CITI | (24) | |||||||||||||||
| TRY | 458,000 | USD | 163,383 | 09/04/2015 | MS | (6,153) | |||||||||||||||
| TWD | 51,960,000 | USD | 1,640,426 | 09/04/2015 | BNP | (42,500) | |||||||||||||||
| TWD | 336,000 | USD | 10,601 | 09/04/2015 | CITI | (268) | |||||||||||||||
| TWD | 1,283,988,000 | USD | 39,741,981 | 09/04/2015 | JPM | (255,487) | |||||||||||||||
| TWD | 64,424,000 | USD | 2,025,302 | 09/04/2015 | MS | (44,071) | |||||||||||||||
| USD | 4,281,178 | EUR | 3,904,000 | 09/04/2015 | BBP | (99,820) | |||||||||||||||
| USD | 12,893,381 | HKD | 99,954,000 | 09/04/2015 | BOA | (3,736) | |||||||||||||||
SCHEDULESOF INVESTMENTS | 11 |
Table of Contents
Schedule of Investments (Continued)
iSHARES® CURRENCY HEDGED MSCI EMERGING MARKETS ETF
August 31, 2015
| Currency Purchased | Currency Sold | Settlement Date | Counter- party | Unrealized Appreciation (Depreciation) | ||||||||||||||||
| USD | 315,228 | HKD | 2,445,000 | 09/04/2015 | HSBC | $ | (251) | |||||||||||||
| USD | 47,805,617 | HKD | 370,590,000 | 09/04/2015 | RBC | (11,805) | ||||||||||||||
| USD | 113,368 | INR | 7,624,000 | 09/04/2015 | HSBC | (1,336) | ||||||||||||||
| USD | 9,626,644 | KRW | 11,497,601,000 | 09/04/2015 | BOA | (94,807) | ||||||||||||||
| USD | 235,807 | KRW | 281,082,000 | 09/04/2015 | HSBC | (1,853) | ||||||||||||||
| USD | 3,420,708 | MXN | 58,164,000 | 09/04/2015 | BOA | (60,042) | ||||||||||||||
| USD | 83,426 | MXN | 1,424,000 | 09/04/2015 | HSBC | (1,791) | ||||||||||||||
| USD | 1,517,923 | RUB | 105,400,000 | 09/04/2015 | BOA | (122,507) | ||||||||||||||
| USD | 36,547 | RUB | 2,589,000 | 09/04/2015 | HSBC | (3,747) | ||||||||||||||
| USD | 754,331 | TRY | 2,210,000 | 09/04/2015 | BOA | (4,357) | ||||||||||||||
| USD | 18,335 | TRY | 54,000 | 09/04/2015 | UBS | (203) | ||||||||||||||
| USD | 9,224,640 | TWD | 301,300,000 | 09/04/2015 | BOA | (41,241) | ||||||||||||||
| USD | 223,140 | TWD | 7,319,000 | 09/04/2015 | HSBC | (1,941) | ||||||||||||||
| ZAR | 225,379,000 | USD | 17,031,944 | 09/04/2015 | BBP | (40,995) | ||||||||||||||
| ZAR | 9,242,000 | USD | 722,332 | 09/04/2015 | BNP | (25,593) | ||||||||||||||
| ZAR | 61,000 | USD | 4,743 | 09/04/2015 | CITI | (145) | ||||||||||||||
| ZAR | 842,000 | USD | 66,088 | 09/04/2015 | HSBC | (2,611) | ||||||||||||||
| ZAR | 11,541,000 | USD | 901,309 | 09/04/2015 | MS | (31,252) | ||||||||||||||
| BRL | 1,745,000 | USD | 476,175 | 10/05/2015 | BNP | (555) | ||||||||||||||
| BRL | 262,000 | USD | 71,473 | 10/05/2015 | JPM | (62) | ||||||||||||||
| EUR | 42,000 | USD | 47,210 | 10/05/2015 | HSBC | (57) | ||||||||||||||
| HKD | 1,904,000 | USD | 245,676 | 10/05/2015 | BNP | (7) | ||||||||||||||
| HKD | 18,829,000 | USD | 2,429,570 | 10/05/2015 | JPM | (103) | ||||||||||||||
| KRW | 230,461,000 | USD | 194,753 | 10/05/2015 | JPM | (73) | ||||||||||||||
| MXN | 1,174,000 | USD | 70,120 | 10/05/2015 | BNP | (24) | ||||||||||||||
| MXN | 4,526,000 | USD | 270,239 | 10/05/2015 | HSBC | (7) | ||||||||||||||
| RUB | 1,374,000 | USD | 21,175 | 10/05/2015 | JPM | (5) | ||||||||||||||
| TRY | 45,000 | USD | 15,319 | 10/05/2015 | BNP | (14) | ||||||||||||||
| TRY | 218,000 | USD | 74,208 | 10/05/2015 | HSBC | (67) | ||||||||||||||
| TWD | 6,043,000 | USD | 186,030 | 10/05/2015 | JPM | (26) | ||||||||||||||
| USD | 23,504 | EUR | 21,000 | 10/05/2015 | BNP | (72) | ||||||||||||||
| USD | 247,701 | HKD | 1,920,000 | 10/05/2015 | BNP | (33) | ||||||||||||||
| USD | 53,124,484 | HKD | 411,753,000 | 10/05/2015 | HSBC | (3,171) | ||||||||||||||
| USD | 44,720 | KRW | 52,964,000 | 10/05/2015 | JPM | (21) | ||||||||||||||
| USD | 69,752 | MXN | 1,172,000 | 10/05/2015 | BNP | (224) | ||||||||||||||
| USD | 321,902 | MXN | 5,415,000 | 10/05/2015 | JPM | (1,409) | ||||||||||||||
| USD | 13,979,907 | MXN | 234,563,000 | 10/05/2015 | MS | (25,052) | ||||||||||||||
| USD | 31,932 | RUB | 2,137,000 | 10/05/2015 | CITI | (995) | ||||||||||||||
| USD | 6,544,809 | RUB | 437,451,000 | 10/05/2015 | JPM | (195,387) | ||||||||||||||
| USD | 15,208 | TRY | 45,000 | 10/05/2015 | BNP | (96) | ||||||||||||||
| USD | 3,050,453 | TRY | 8,993,000 | 10/05/2015 | HSBC | (8,035) | ||||||||||||||
| USD | 56,778 | TRY | 167,000 | 10/05/2015 | JPM | (18) | ||||||||||||||
| USD | 83,518 | ZAR | 1,119,000 | 10/05/2015 | BNP | (386) | ||||||||||||||
| USD | 273,287 | ZAR | 3,646,000 | 10/05/2015 | JPM | (94) | ||||||||||||||
| ZAR | 1,141,000 | USD | 85,563 | 10/05/2015 | BNP | (10) | ||||||||||||||
|
| |||||||||||||||||||
| (1,859,373) | ||||||||||||||||||||
|
| |||||||||||||||||||
| Net Unrealized Appreciation | $ | 3,084,938 | ||||||||||||||||||
|
| |||||||||||||||||||
Counterparties:
BBP — Barclays Bank PLC Wholesale
BNP — BNP Paribas SA
BOA — Bank of America N.A
CITI — Citibank N.A. London
GS — Goldman Sachs Group Inc.
HSBC — HSBC Bank PLC
JPM — J.P. Morgan Chase Bank N.A.
MS — Morgan Stanley and Co. International PLC
RBC — Royal Bank of Canada
RBS — Royal Bank of Scotland PLC
SCB — Standard Chartered Bank, London
UBS — UBS AG London
Currency abbreviations:
BRL — Brazilian Real
EUR — Euro
HKD — Hong Kong Dollar
INR — Indian Rupee
KRW — South Korean Won
MXN — Mexican Peso
RUB — New Russian Ruble
TRY — Turkish Lira
TWD — Taiwan Dollar
USD — United States Dollar
ZAR — South African Rand
See notes to financial statements.
| 12 | 2015 iSHARES ANNUAL REPORTTO SHAREHOLDERS |
Table of Contents
Consolidated Schedule of Investments
iSHARES® MSCI EMERGING MARKETS ETF
August 31, 2015
| Security | Shares | Value | ||||||
COMMON STOCKS — 96.04% |
| |||||||
BRAZIL — 4.35% |
| |||||||
Ambev SA | 28,944,615 | $ | 151,706,418 | |||||
B2W Cia. Digitala | 680,500 | 2,914,627 | ||||||
Banco Bradesco SA | 4,792,008 | 33,115,476 | ||||||
Banco do Brasil SA | 5,273,074 | 25,813,415 | ||||||
Banco Santander Brasil SA Units | 2,408,800 | 9,543,272 | ||||||
BB Seguridade Participacoes SA | 4,342,400 | 34,217,003 | ||||||
BM&FBovespa SA-Bolsa de Valores Mercadorias e Futuros | 10,677,000 | 31,600,813 | ||||||
BR Malls Participacoes SA | 2,735,300 | 8,411,108 | ||||||
BRF SA | 4,021,685 | 76,762,315 | ||||||
CCR SA | 5,378,500 | 21,973,253 | ||||||
CETIP SA – Mercados Organizados | 1,379,429 | 12,392,042 | ||||||
Cia. de Saneamento Basico do Estado de Sao Paulo | 2,183,624 | 9,430,546 | ||||||
Cia. Siderurgica Nacional SA | 3,958,828 | 3,804,214 | ||||||
Cielo SA | 5,247,248 | 55,249,354 | ||||||
Cosan SA Industria e Comercio | 724,700 | 3,611,313 | ||||||
CPFL Energia SA | 1,375,568 | 5,929,417 | ||||||
Cyrela Brazil Realty SA Empreendimentos e Participacoes | 1,590,300 | 3,667,656 | ||||||
Duratex SA | 2,012,255 | 3,033,092 | ||||||
EcoRodovias Infraestrutura e Logistica SA | 1,156,300 | 2,219,105 | ||||||
EDP – Energias do Brasil SA | 1,649,500 | 5,076,778 | ||||||
Embraer SA | 4,136,600 | 26,098,996 | ||||||
Equatorial Energia SA | 680,800 | 6,607,531 | ||||||
Estacio Participacoes SA | 1,776,400 | 6,081,875 | ||||||
Fibria Celulose SA | 1,592,261 | 22,391,546 | ||||||
Hypermarcas SAa | 2,197,800 | 9,938,298 | ||||||
JBS SA | 4,573,565 | 17,768,123 | ||||||
Klabin SA Units | 3,314,400 | 18,436,336 | ||||||
Kroton Educacional SA | 8,465,880 | 20,175,397 | ||||||
Localiza Rent A Car SA | 863,289 | 5,311,636 | ||||||
Lojas Americanas SA | 828,775 | 2,832,933 | ||||||
Lojas Renner SA | 824,900 | 22,312,897 | ||||||
M. Dias Branco SA | 161,700 | 2,810,244 | ||||||
Multiplan Empreendimentos Imobiliarios SA | 524,000 | 5,924,448 | ||||||
| Security | Shares | Value | ||||||
Natura Cosmeticos SA | 1,080,600 | $ | 7,028,461 | |||||
Odontoprev SA | 1,907,600 | 5,122,199 | ||||||
Petroleo Brasileiro SAa | 18,743,274 | 54,651,265 | ||||||
Porto Seguro SA | 775,700 | 7,087,733 | ||||||
Qualicorp SA | 1,327,000 | 6,219,202 | ||||||
Raia Drogasil SA | 1,324,900 | 14,441,219 | ||||||
Souza Cruz SA | 2,395,100 | 17,452,386 | ||||||
Sul America SA | 993,265 | 4,772,363 | ||||||
TIM Participacoes SA | 5,135,076 | 12,406,800 | ||||||
TOTVS SA | 822,600 | 7,159,426 | ||||||
Tractebel Energia SA | 1,066,400 | 9,820,044 | ||||||
Transmissora Alianca de Energia Eletrica SA Units | 416,400 | 2,115,011 | ||||||
Ultrapar Participacoes SA | 2,246,300 | 39,144,117 | ||||||
Vale SA | 8,248,948 | 40,585,119 | ||||||
Via Varejo SA | 509,100 | 951,876 | ||||||
WEG SA | 3,625,720 | 16,673,982 | ||||||
|
| |||||||
| 912,792,680 | ||||||||
CHILE — 1.24% |
| |||||||
AES Gener SA | 16,610,669 | 8,356,413 | ||||||
Aguas Andinas SA Series A | 15,839,721 | 8,210,733 | ||||||
Banco de Chile | 149,550,750 | 15,458,558 | ||||||
Banco de Credito e Inversiones | 228,928 | 10,001,802 | ||||||
Banco Santander Chile | 427,064,600 | 20,647,909 | ||||||
Cencosud SA | 7,720,197 | 15,699,413 | ||||||
Cia. Cervecerias Unidas SA | 853,476 | 9,459,355 | ||||||
Colbun SA | 46,092,271 | 12,523,859 | ||||||
CorpBanca SA | 961,283,519 | 8,970,573 | ||||||
Empresa Nacional de Electricidad SA/Chile | 20,620,080 | 25,572,078 | ||||||
Empresa Nacional de Telecomunicaciones SA | 765,074 | 7,162,214 | ||||||
Empresas CMPC SA | 8,102,793 | 22,175,412 | ||||||
Empresas COPEC SA | 2,795,177 | 27,333,964 | ||||||
Enersis SA | 123,279,291 | 34,219,133 | ||||||
LATAM Airlines Group SAa | 1,821,287 | 10,195,242 | ||||||
SACI Falabella | 3,111,540 | 19,213,315 | ||||||
SONDA SA | 1,589,961 | 2,598,136 | ||||||
Vina Concha y Toro SA | 2,159,896 | 3,624,876 | ||||||
|
| |||||||
| 261,422,985 | ||||||||
CHINA — 23.18% |
| |||||||
AAC Technologies Holdings Inc.b | 4,607,500 | 25,950,462 | ||||||
SCHEDULESOF INVESTMENTS | 13 |
Table of Contents
Consolidated Schedule of Investments (Continued)
iSHARES® MSCI EMERGING MARKETS ETF
August 31, 2015
| Security | Shares | Value | ||||||
Agricultural Bank of China Ltd. Class H | 137,662,000 | $ | 55,597,326 | |||||
Air China Ltd. Class H | 13,170,000 | 9,516,326 | ||||||
Alibaba Health Information Technology Ltd.a,b | 15,030,000 | 10,394,875 | ||||||
Alibaba Pictures Group Ltd.a,b | 62,520,000 | 14,601,351 | ||||||
Aluminum Corp. of China Ltd. Class Ha,b | 24,750,000 | 8,271,237 | ||||||
Anhui Conch Cement Co. Ltd. Class H | 7,631,500 | 23,091,293 | ||||||
Anta Sports Products Ltd. | 6,529,402 | 16,445,562 | ||||||
AviChina Industry & Technology Co. Ltd. Class H | 13,660,000 | 9,500,248 | ||||||
Bank of China Ltd. Class H | 485,708,000 | 221,857,449 | ||||||
Bank of Communications Co. Ltd. Class H | 53,965,600 | 40,665,428 | ||||||
BBMG Corp. Class H | 7,251,500 | 4,678,357 | ||||||
Beijing Capital International Airport Co. Ltd. Class H | 10,560,000 | 11,363,849 | ||||||
Beijing Enterprises Holdings Ltd. | 3,360,000 | 19,617,938 | ||||||
Beijing Enterprises Water Group Ltd.b | 26,618,000 | 19,061,800 | ||||||
Belle International Holdings Ltd. | 28,567,000 | 26,134,029 | ||||||
Brilliance China Automotive Holdings Ltd. | 18,760,000 | 22,657,093 | ||||||
Byd Co. Ltd. Class Hb | 4,033,500 | 16,472,187 | ||||||
CGN Power Co. Ltd. Class Hc | 44,760,000 | 17,730,621 | ||||||
China Agri-Industries Holdings Ltd.a,b | 15,300,600 | 5,804,319 | ||||||
China Cinda Asset Management Co. Ltd. Class H | 52,631,000 | 19,558,233 | ||||||
China CITIC Bank Corp. Ltd. Class Ha | 50,361,800 | 30,866,711 | ||||||
China Coal Energy Co. Ltd. Class Hb | 17,572,000 | 8,207,772 | ||||||
China Communications Construction Co. Ltd. Class H | 27,486,000 | 32,699,263 | ||||||
China Communications Services Corp. Ltd. Class H | 13,118,000 | 4,824,008 | ||||||
China Conch Venture Holdings Ltd.b | 6,548,000 | 14,430,854 | ||||||
| Security | Shares | Value | ||||||
China Construction Bank Corp. Class H | 514,766,760 | $ | 361,994,934 | |||||
China COSCO Holdings Co. Ltd. Class Ha,b | 17,337,500 | 9,877,099 | ||||||
China Everbright Bank Co. Ltd. Class H | 18,956,000 | 8,658,556 | ||||||
China Everbright International Ltd.b | 15,914,000 | 20,821,538 | ||||||
China Everbright Ltd. | 5,930,000 | 12,395,533 | ||||||
China Galaxy Securities Co. Ltd. Class H | 20,657,500 | 14,153,628 | ||||||
China Gas Holdings Ltd.b | 11,168,000 | 16,312,380 | ||||||
China Huishan Dairy Holdings Co. Ltd.b | 35,945,000 | 13,172,018 | ||||||
China International Marine Containers Group Co. Ltd. Class H | 2,766,600 | 4,926,301 | ||||||
China Life Insurance Co. Ltd. Class H | 45,804,000 | 158,392,165 | ||||||
China Longyuan Power Group Corp. Ltd. | 18,597,000 | 19,748,687 | ||||||
China Medical System Holdings Ltd.b | 6,596,000 | 7,166,189 | ||||||
China Mengniu Dairy Co. Ltd. | 8,540,000 | 29,862,259 | ||||||
China Merchants Bank Co. Ltd. Class H | 28,157,467 | 67,068,837 | ||||||
China Merchants Holdings International Co. Ltd.b | 7,466,000 | 24,950,729 | ||||||
China Minsheng Banking Corp. Ltd. Class H | 35,116,040 | 34,028,356 | ||||||
China Mobile Ltd. | 37,752,000 | 457,405,152 | ||||||
China National Building Material Co. Ltd. Class H | 17,908,000 | 10,444,340 | ||||||
China Oilfield Services Ltd. Class H | 11,044,000 | 11,884,692 | ||||||
China Overseas Land & Investment Ltd. | 24,432,960 | 71,564,466 | ||||||
China Pacific Insurance Group Co. Ltd. Class H | 16,255,000 | 59,146,844 | ||||||
China Petroleum & Chemical Corp. Class H | 156,006,800 | 103,869,664 | ||||||
China Power International Development Ltd. | 17,972,000 | 11,965,796 | ||||||
China Railway Construction Corp. Ltd. Class H | 12,352,500 | 16,193,625 | ||||||
| 14 | 2015 iSHARES ANNUAL REPORTTO SHAREHOLDERS |
Table of Contents
Consolidated Schedule of Investments (Continued)
iSHARES® MSCI EMERGING MARKETS ETF
August 31, 2015
| Security | Shares | Value | ||||||
China Railway Group Ltd. Class H | 24,792,000 | $ | 22,232,682 | |||||
China Resources Cement Holdings Ltd. | 12,948,000 | 6,365,363 | ||||||
China Resources Enterprise Ltd. | 7,742,000 | 24,324,708 | ||||||
China Resources Gas Group Ltd.b | 5,698,000 | 15,035,271 | ||||||
China Resources Land Ltd. | 16,741,333 | 41,777,457 | ||||||
China Resources Power Holdings Co. Ltd. | 12,172,999 | 29,811,875 | ||||||
China Shenhua Energy Co. Ltd. Class H | 20,695,000 | 35,888,904 | ||||||
China Shipping Container Lines Co. Ltd. Class Ha,b | 24,822,000 | 8,902,521 | ||||||
China Southern Airlines Co. Ltd. Class H | 11,058,000 | 7,205,489 | ||||||
China State Construction International Holdings Ltd. | 11,290,000 | 14,917,272 | ||||||
China Taiping Insurance Holdings Co. Ltd.a | 9,988,860 | 28,226,403 | ||||||
China Telecom Corp. Ltd. Class H | 85,014,000 | 44,536,079 | ||||||
China Unicom Hong Kong Ltd. | 36,544,000 | 48,002,003 | ||||||
China Vanke Co. Ltd. Class Hb | 8,022,931 | 18,240,404 | ||||||
Chongqing Changan Automobile Co. Ltd. Class B | 5,140,175 | 8,224,227 | ||||||
Chongqing Rural Commercial Bank Co. Ltd. Class H | 16,495,000 | 9,641,531 | ||||||
CITIC Ltd. | 24,616,000 | 45,102,574 | ||||||
CITIC Securities Co. Ltd. Class H | 13,351,500 | 26,771,738 | ||||||
CNOOC Ltd. | 109,858,000 | 136,223,041 | ||||||
COSCO Pacific Ltd. | 11,732,000 | 13,800,285 | ||||||
Country Garden Holdings Co. Ltd.b | 34,339,939 | 12,052,133 | ||||||
CRRC Corp. Ltd. Class Ha | 26,628,300 | 31,129,141 | ||||||
CSPC Pharmaceutical Group Ltd. | 25,490,000 | 23,351,978 | ||||||
Dalian Wanda Commercial Properties Co. Ltd. Class Hc | 3,618,100 | 22,221,993 | ||||||
Datang International Power Generation Co. Ltd. Class H | 17,718,000 | 7,155,740 | ||||||
Dongfeng Motor Group Co. Ltd. Class H | 16,726,000 | 16,833,801 | ||||||
| Security | Shares | Value | ||||||
ENN Energy Holdings Ltd. | 5,084,000 | $ | 25,944,633 | |||||
Evergrande Real Estate Group Ltd.b | 33,989,388 | 22,367,066 | ||||||
Far East Horizon Ltd. | 10,010,000 | 7,969,200 | ||||||
Fosun International Ltd. | 11,685,500 | 19,601,357 | ||||||
Franshion Properties China Ltd. | 21,628,000 | 5,413,942 | ||||||
GCL-Poly Energy Holdings Ltd.a,b | 65,670,000 | 10,507,132 | ||||||
Geely Automobile Holdings Ltd.b | 33,455,000 | 12,950,239 | ||||||
GF Securities Co. Ltd.a,b | 5,591,000 | 9,580,387 | ||||||
Goldin Properties Holdings Ltd.a,b | 7,370,105 | 7,037,216 | ||||||
GOME Electrical Appliances Holding Ltd.b | 76,860,200 | 12,198,379 | ||||||
Great Wall Motor Co. Ltd. Class H | 6,809,500 | 18,187,837 | ||||||
Guangdong Investment Ltd. | 16,986,110 | 22,969,456 | ||||||
Guangzhou Automobile Group Co. Ltd. Class H | 13,770,742 | 9,683,879 | ||||||
Guangzhou R&F Properties Co. Ltd. Class Ha | 6,156,000 | 5,623,768 | ||||||
Haier Electronics Group Co. Ltd. | 7,069,000 | 12,678,512 | ||||||
Haitian International Holdings Ltd.b | 3,497,000 | 6,344,194 | ||||||
Haitong Securities Co. Ltd. Class H | 19,906,400 | 28,716,402 | ||||||
Hanergy Thin Film Power Group Ltd.a,b | 98,422,000 | 127 | ||||||
Hengan International Group Co. Ltd. | 4,460,000 | 43,765,266 | ||||||
Huadian Power International Corp. Ltd. Class H | 10,046,000 | 8,179,336 | ||||||
Huaneng Power International Inc. Class H | 22,010,000 | 25,361,036 | ||||||
Huaneng Renewables Corp. Ltd. Class H | 21,980,000 | 8,026,193 | ||||||
Huatai Securities Co. Ltd.a,c | 4,495,600 | 8,179,039 | ||||||
Industrial & Commercial Bank of China Ltd. Class H | 451,015,085 | 266,533,647 | ||||||
Inner Mongolia Yitai Coal Co. Ltd. Class B | 6,576,254 | 5,563,511 | ||||||
Jiangsu Expressway Co. Ltd. Class H | 7,698,000 | 9,098,481 | ||||||
SCHEDULESOF INVESTMENTS | 15 |
Table of Contents
Consolidated Schedule of Investments (Continued)
iSHARES® MSCI EMERGING MARKETS ETF
August 31, 2015
| Security | Shares | Value | ||||||
Jiangxi Copper Co. Ltd. Class H | 8,243,000 | $ | 10,412,703 | |||||
Kingsoft Corp. Ltd.b | 5,320,000 | 11,216,547 | ||||||
Kunlun Energy Co. Ltd.b | 20,054,000 | 14,180,027 | ||||||
Lenovo Group Ltd.b | 41,064,000 | 33,698,755 | ||||||
Longfor Properties Co. Ltd. | 9,610,500 | 11,619,330 | ||||||
Luye Pharma Group Ltd.a | 7,469,500 | 6,361,082 | ||||||
New China Life Insurance Co. Ltd. Class H | 4,842,200 | 18,931,318 | ||||||
New World China Land Ltd. | 11,838,000 | 7,179,128 | ||||||
Nine Dragons Paper Holdings Ltd. | 10,612,000 | 5,956,374 | ||||||
People’s Insurance Co. Group of China Ltd. (The) Class H | 40,146,000 | 19,010,951 | ||||||
PetroChina Co. Ltd. Class H | 129,112,000 | 107,287,215 | ||||||
PICC Property & Casualty Co. Ltd. Class H | 21,632,128 | 41,086,822 | ||||||
Ping An Insurance Group Co. of China Ltd. Class H | 32,046,500 | 156,923,462 | ||||||
Semiconductor Manufacturing International Corp.a | 155,705,000 | 13,661,770 | ||||||
Shandong Weigao Group Medical Polymer Co. Ltd. Class H | 11,116,000 | 7,773,978 | ||||||
Shanghai Electric Group Co. Ltd. Class Hb | 17,238,000 | 9,519,763 | ||||||
Shanghai Fosun Pharmaceutical Group Co. Ltd. Class H | 2,356,000 | 6,885,556 | ||||||
Shanghai Industrial Holdings Ltd. | 3,877,000 | 9,454,816 | ||||||
Shanghai Pharmaceuticals Holding Co. Ltd. Class H | 4,406,000 | 9,187,161 | ||||||
Shenzhou International Group Holdings Ltd. | 3,428,000 | 17,316,817 | ||||||
Shimao Property Holdings Ltd. | 8,701,500 | 12,215,704 | ||||||
Shui On Land Ltd. | 30,237,100 | 6,632,611 | ||||||
Sihuan Pharmaceutical Holdings Group Ltd. | 33,336,000 | 6,452,087 | ||||||
Sino Biopharmaceutical Ltd. | 19,956,000 | 23,689,550 | ||||||
Sino-Ocean Land Holdings Ltd. | 23,590,500 | 12,327,859 | ||||||
Sinopec Engineering Group Co. Ltd. Class H | 6,472,000 | 5,586,761 | ||||||
| Security | Shares | Value | ||||||
Sinopec Shanghai Petrochemical Co. Ltd. Class Ha | 22,217,000 | $ | 8,112,736 | |||||
Sinopharm Group Co. Ltd. Class H | 7,276,800 | 27,557,768 | ||||||
Sinotrans Ltd. Class H | 11,048,000 | 5,074,920 | ||||||
SOHO China Ltd.b | 14,992,500 | 6,403,207 | ||||||
Sun Art Retail Group Ltd.b | 14,816,500 | 12,350,190 | ||||||
Sunac China Holdings Ltd. | 9,522,000 | 5,147,990 | ||||||
Tencent Holdings Ltd. | 31,691,300 | 538,953,083 | ||||||
Tingyi Cayman Islands Holding Corp.b | 11,960,000 | 18,395,133 | ||||||
Tsingtao Brewery Co. Ltd. Class H | 2,728,000 | 13,411,113 | ||||||
Want Want China Holdings Ltd.b | 36,591,000 | 29,508,681 | ||||||
Weichai Power Co. Ltd. Class H | 5,795,400 | 6,236,558 | ||||||
Yanzhou Coal Mining Co. Ltd. Class Hb | 11,652,800 | 5,503,093 | ||||||
Yuexiu Property Co. Ltd.b | 46,957,420 | 7,391,959 | ||||||
Zhejiang Expressway Co. Ltd. Class H | 9,998,000 | 10,733,268 | ||||||
Zhuzhou CSR Times Electric Co. Ltd. Class H | 3,339,000 | 22,123,425 | ||||||
Zijin Mining Group Co. Ltd. Class H | 36,464,000 | 9,410,004 | ||||||
ZTE Corp. Class H | 5,081,400 | 10,241,414 | ||||||
|
| |||||||
| 4,867,579,916 | ||||||||
COLOMBIA — 0.36% |
| |||||||
Almacenes Exito SA | 1,285,885 | 6,974,996 | ||||||
Cementos Argos SA | 2,667,788 | 8,416,878 | ||||||
Corp. Financiera Colombiana SA | 589,009 | 6,987,758 | ||||||
Ecopetrol SA | 29,080,933 | 14,994,048 | ||||||
Grupo Argos SA/Colombia | 1,754,725 | 9,529,458 | ||||||
Grupo de Inversiones Suramericana SA | 1,565,855 | 17,868,008 | ||||||
Interconexion Electrica SA ESP | 2,184,762 | 4,689,452 | ||||||
Isagen SA ESP | 5,352,786 | 5,087,180 | ||||||
|
| |||||||
| 74,547,778 | ||||||||
CZECH REPUBLIC — 0.22% |
| |||||||
CEZ AS | 979,188 | 22,348,980 | ||||||
Komercni Banka AS | 102,171 | 23,243,294 | ||||||
Pegas Nonwovens SA | 20,000 | 762,374 | ||||||
|
| |||||||
| 46,354,648 | ||||||||
| 16 | 2015 iSHARES ANNUAL REPORTTO SHAREHOLDERS |
Table of Contents
Consolidated Schedule of Investments (Continued)
iSHARES® MSCI EMERGING MARKETS ETF
August 31, 2015
| Security | Shares | Value | ||||||
EGYPT — 0.21% |
| |||||||
Commercial International Bank Egypt SAE | 3,574,839 | $ | 22,882,476 | |||||
Global Telecom Holding SAEa | 16,169,071 | 4,336,504 | ||||||
Global Telecom Holding SAE GDRa | 8,557,240 | 11,124,412 | ||||||
Talaat Moustafa Group | 5,139,562 | 4,850,718 | ||||||
|
| |||||||
| 43,194,110 | ||||||||
GREECE — 0.25% |
| |||||||
Alpha Bank AEa | 28,536,863 | 2,685,946 | ||||||
Eurobank Ergasias SAa | 56,902,970 | 2,295,351 | ||||||
FF Group | 214,590 | 4,568,513 | ||||||
Hellenic Telecommunications Organization SA | 1,505,596 | 13,749,211 | ||||||
JUMBO SA | 647,211 | 5,438,998 | ||||||
National Bank of Greece SAa | 9,771,217 | 5,693,296 | ||||||
OPAP SA | 1,380,226 | 10,825,799 | ||||||
Piraeus Bank SAa | 13,504,141 | 1,301,299 | ||||||
Titan Cement Co. SA | 298,682 | 6,265,080 | ||||||
|
| |||||||
| 52,823,493 | ||||||||
HUNGARY — 0.24% |
| |||||||
MOL Hungarian Oil & Gas PLC | 235,396 | 11,659,347 | ||||||
OTP Bank PLC | 1,366,096 | 26,299,054 | ||||||
Richter Gedeon Nyrt | 781,404 | 11,929,406 | ||||||
|
| |||||||
| 49,887,807 | ||||||||
INDIA — 8.51% |
| |||||||
ACC Ltd. | 243,144 | 4,882,449 | ||||||
Adani Ports & Special Economic Zone Ltd. | 4,330,991 | 23,158,342 | ||||||
Aditya Birla Nuvo Ltd. | 222,347 | 6,841,832 | ||||||
Ambuja Cements Ltd. | 4,438,849 | 13,835,720 | ||||||
Apollo Hospitals Enterprise Ltd. | 477,088 | 9,618,553 | ||||||
Asian Paints Ltd. | 1,886,269 | 24,079,547 | ||||||
Aurobindo Pharma Ltd. | 1,717,939 | 19,460,069 | ||||||
Bajaj Auto Ltd. | 529,873 | 17,796,878 | ||||||
Bharat Forge Ltd. | 640,580 | 11,254,357 | ||||||
Bharat Heavy Electricals Ltd. | 3,747,721 | 12,766,776 | ||||||
Bharat Petroleum Corp. Ltd. | 1,154,699 | 15,341,559 | ||||||
Bharti Airtel Ltd. | 7,285,885 | 38,832,479 | ||||||
Bharti Infratel Ltd. | 2,826,926 | 16,999,830 | ||||||
Bosch Ltd. | 47,259 | 16,500,980 | ||||||
Cairn India Ltd. | 2,744,136 | 6,148,764 | ||||||
Cipla Ltd. | 2,262,872 | 23,221,033 | ||||||
Coal India Ltd. | 4,216,331 | 23,236,598 | ||||||
| Security | Shares | Value | ||||||
Container Corp. of India Ltd. | 308,936 | $ | 6,622,779 | |||||
Dabur India Ltd. | 3,044,513 | 12,505,518 | ||||||
Divi’s Laboratories Ltd. | 283,121 | 10,068,843 | ||||||
DLF Ltd. | 1,558,697 | 2,600,369 | ||||||
Dr. Reddy’s Laboratories Ltd. | 734,063 | 47,512,842 | ||||||
Eicher Motors Ltd. | 66,589 | 19,047,409 | ||||||
GAIL (India) Ltd. | 2,224,105 | 9,906,845 | ||||||
GlaxoSmithKline Consumer Healthcare Ltd. | 48,577 | 4,467,257 | ||||||
Glenmark Pharmaceuticals Ltd. | 623,225 | 10,826,630 | ||||||
Godrej Consumer Products Ltd. | 760,717 | 15,246,954 | ||||||
HCL Technologies Ltd. | 3,465,994 | 50,630,364 | ||||||
Hero Motocorp Ltd. | 295,025 | 10,639,096 | ||||||
Hindalco Industries Ltd. | 6,899,828 | 8,308,856 | ||||||
Hindustan Unilever Ltd. | 4,710,342 | 61,002,383 | ||||||
Housing Development Finance Corp. Ltd. | 9,287,459 | 165,721,241 | ||||||
ICICI Bank Ltd. | 6,932,970 | 28,983,413 | ||||||
Idea Cellular Ltd. | 6,536,145 | 15,323,929 | ||||||
Indiabulls Housing Finance Ltd. | 961,931 | 10,926,002 | ||||||
Infosys Ltd. | 11,379,051 | 187,337,095 | ||||||
ITC Ltd. | 13,903,084 | 68,004,329 | ||||||
JSW Steel Ltd. | 561,128 | 7,766,315 | ||||||
Larsen & Toubro Ltd. | 1,976,351 | 47,655,405 | ||||||
LIC Housing Finance Ltd. | 1,926,498 | 12,838,490 | ||||||
Lupin Ltd. | 1,373,535 | 39,993,165 | ||||||
Mahindra & Mahindra Financial Services Ltd. | 1,681,684 | 6,391,538 | ||||||
Mahindra & Mahindra Ltd. | 2,256,761 | 41,448,357 | ||||||
Marico Ltd. | 1,042,241 | 6,358,493 | ||||||
Motherson Sumi Systems Ltd. | 1,979,703 | 9,038,584 | ||||||
Nestle India Ltd. | 127,694 | 11,459,132 | ||||||
NTPC Ltd. | 7,926,051 | 14,480,916 | ||||||
Oil & Natural Gas Corp. Ltd. | 5,155,401 | 18,558,668 | ||||||
Oil India Ltd. | 660,293 | 4,464,365 | ||||||
Piramal Enterprises Ltd. | 345,149 | 5,056,387 | ||||||
Power Finance Corp. Ltd. | 1,648,167 | 5,557,527 | ||||||
Reliance Communications Ltd.a | 4,631,618 | 4,208,345 | ||||||
Reliance Industries Ltd. | 8,015,654 | 103,205,690 | ||||||
Rural Electrification Corp. Ltd. | 1,909,781 | 7,275,698 | ||||||
Shree Cement Ltd. | 34,815 | 5,645,660 | ||||||
Shriram Transport Finance Co. Ltd. | 904,415 | 11,061,822 | ||||||
Siemens Ltd. | 439,436 | 8,361,348 | ||||||
State Bank of India | 9,356,606 | 34,815,442 | ||||||
SCHEDULESOF INVESTMENTS | 17 |
Table of Contents
Consolidated Schedule of Investments (Continued)
iSHARES® MSCI EMERGING MARKETS ETF
August 31, 2015
| Security | Shares | Value | ||||||
Sun Pharmaceuticals Industries Ltd. | 5,915,234 | $ | 79,992,472 | |||||
Tata Consultancy Services Ltd. | 2,921,914 | 112,703,025 | ||||||
Tata Motors Ltd.a | 5,057,042 | 25,876,688 | ||||||
Tata Power Co. Ltd. | 6,885,903 | 6,272,154 | ||||||
Tata Steel Ltd. | 1,913,064 | 6,486,719 | ||||||
Tech Mahindra Ltd. | 1,555,041 | 12,047,328 | ||||||
Ultratech Cement Ltd. | 241,583 | 10,502,092 | ||||||
United Breweries Ltd. | 439,158 | 5,647,450 | ||||||
United Spirits Ltd.a | 347,487 | 17,289,144 | ||||||
UPL Ltd. | 1,705,516 | 12,893,675 | ||||||
Vedanta Ltd. | 5,576,509 | 8,275,632 | ||||||
Wipro Ltd. | 3,916,032 | 33,684,650 | ||||||
Zee Entertainment Enterprises Ltd. | 3,466,808 | 20,068,112 | ||||||
|
| |||||||
| 1,787,038,408 | ||||||||
INDONESIA — 2.38% |
| |||||||
Adaro Energy Tbk PT | 83,826,400 | 3,549,944 | ||||||
Astra Agro Lestari Tbk PT | 2,503,300 | 3,051,175 | ||||||
Astra International Tbk PT | 125,125,900 | 52,766,616 | ||||||
Bank Central Asia Tbk PT | 78,620,700 | 72,185,554 | ||||||
Bank Danamon Indonesia Tbk PT | 24,757,316 | 6,228,976 | ||||||
Bank Mandiri Persero Tbk PT | 59,036,900 | 38,237,423 | ||||||
Bank Negara Indonesia Persero Tbk PT | 48,820,976 | 17,200,273 | ||||||
Bank Rakyat Indonesia Persero Tbk PT | 69,376,622 | 52,464,527 | ||||||
Bumi Serpong Damai Tbk PT | 44,745,000 | 5,111,439 | ||||||
Charoen Pokphand Indonesia Tbk PT | 48,966,045 | 6,517,189 | ||||||
Global Mediacom Tbk PT | 38,115,700 | 3,201,176 | ||||||
Gudang Garam Tbk PT | 3,215,300 | 10,183,690 | ||||||
Indocement Tunggal Prakarsa Tbk PT | 8,700,900 | 12,153,392 | ||||||
Indofood CBP Sukses Makmur Tbk PT | 5,743,400 | 5,211,982 | ||||||
Indofood Sukses Makmur Tbk PT | 29,848,500 | 11,259,577 | ||||||
Jasa Marga Persero Tbk PT | 11,741,700 | 4,303,897 | ||||||
Kalbe Farma Tbk PT | 142,511,615 | 16,989,819 | ||||||
Lippo Karawaci Tbk PT | 124,391,100 | 9,473,201 | ||||||
Matahari Department Store Tbk PT | 13,395,800 | 16,708,996 | ||||||
| Security | Shares | Value | ||||||
Media Nusantara Citra Tbk PT | 26,929,700 | $ | 3,632,155 | |||||
Perusahaan Gas Negara Persero Tbk PT | 67,245,800 | 13,305,575 | ||||||
Semen Indonesia Persero Tbk PT | 18,186,100 | 11,973,055 | ||||||
Summarecon Agung Tbk PT | 39,937,200 | 4,604,859 | ||||||
Surya Citra Media Tbk PT | 27,052,300 | 5,256,426 | ||||||
Tambang Batubara Bukit Asam Persero Tbk PT | 4,271,700 | 1,778,608 | ||||||
Telekomunikasi Indonesia Persero Tbk PT | 310,846,900 | 63,496,840 | ||||||
Tower Bersama Infrastructure Tbk PTa | 9,498,100 | 4,850,453 | ||||||
Unilever Indonesia Tbk PT | 9,484,800 | 26,817,344 | ||||||
United Tractors Tbk PT | 10,818,153 | 14,725,778 | ||||||
XL Axiata Tbk PTa | 15,054,000 | 3,214,377 | ||||||
|
| |||||||
| 500,454,316 | ||||||||
MALAYSIA — 3.13% |
| |||||||
AirAsia Bhdb | 7,804,500 | 1,616,646 | ||||||
Alliance Financial Group Bhdb | 6,305,000 | 5,644,476 | ||||||
AMMB Holdings Bhdb | 13,207,175 | 14,779,458 | ||||||
Astro Malaysia Holdings Bhdb | 7,098,600 | 4,901,414 | ||||||
Axiata Group Bhdb | 15,311,600 | 22,384,101 | ||||||
Berjaya Sports Toto Bhdb | 6,762,463 | 4,749,825 | ||||||
British American Tobacco Malaysia Bhdb | 903,500 | 13,376,102 | ||||||
Bumi Armada Bhda,b | 11,417,900 | 2,324,358 | ||||||
CIMB Group Holdings Bhdb | 30,949,900 | 36,845,119 | ||||||
Dialog Group Bhdb | 19,378,712 | 7,243,947 | ||||||
DiGi.Com Bhdb | 20,163,000 | 25,107,736 | ||||||
Felda Global Ventures Holdings Bhdb | 7,189,900 | 2,088,495 | ||||||
Gamuda Bhdb | 11,035,900 | 11,403,763 | ||||||
Genting Bhdb | 13,794,500 | 22,498,173 | ||||||
Genting Malaysia Bhdb | 20,412,800 | 19,246,354 | ||||||
Genting Plantations Bhdb | 2,516,000 | 5,912,600 | ||||||
Hong Leong Bank Bhdb | 3,039,800 | 9,466,806 | ||||||
Hong Leong Financial Group Bhdb | 719,400 | 2,391,149 | ||||||
IHH Healthcare Bhd | 14,797,700 | 20,611,082 | ||||||
IJM Corp. Bhdb | 9,268,220 | 13,902,330 | ||||||
IOI Corp. Bhdb | 18,698,420 | 17,808,019 | ||||||
IOI Properties Group Bhdb | 13,626,685 | 5,937,341 | ||||||
Kuala Lumpur Kepong Bhdb | 2,886,200 | 14,307,306 | ||||||
Lafarge Malaysia Bhdb | 2,485,900 | 5,504,493 | ||||||
| 18 | 2015 iSHARES ANNUAL REPORTTO SHAREHOLDERS |
Table of Contents
Consolidated Schedule of Investments (Continued)
iSHARES® MSCI EMERGING MARKETS ETF
August 31, 2015
| Security | Shares | Value | ||||||
Malayan Banking Bhdb | 28,177,300 | $ | 58,769,797 | |||||
Malaysia Airports Holdings Bhdb | 4,143,100 | 4,261,474 | ||||||
Maxis Bhdb | 11,353,400 | 17,759,961 | ||||||
MISC Bhdb | 6,895,000 | 13,297,500 | ||||||
Petronas Chemicals Group Bhdb | 16,541,100 | 23,905,828 | ||||||
Petronas Dagangan Bhdb | 1,466,500 | 7,388,367 | ||||||
Petronas Gas Bhdb | 4,113,100 | 20,878,879 | ||||||
PPB Group Bhdb | 3,354,100 | 12,250,451 | ||||||
Public Bank Bhdb | 15,695,230 | 67,265,272 | ||||||
RHB Capital Bhdb | 2,897,100 | 4,469,811 | ||||||
Sapurakencana Petroleum Bhdb | 20,158,100 | 8,255,222 | ||||||
Sime Darby Bhdb | 18,442,873 | 32,714,144 | ||||||
Telekom Malaysia Bhd | 6,955,800 | 10,748,367 | ||||||
Tenaga Nasional Bhdb | 20,906,450 | 55,650,979 | ||||||
UMW Holdings Bhdb | 3,951,800 | 7,997,691 | ||||||
Westports Holdings Bhd | 3,813,000 | 3,813,000 | ||||||
YTL Corp. Bhdb | 28,181,462 | 10,467,400 | ||||||
YTL Power International Bhd | 17,172,743 | 6,337,560 | ||||||
|
| |||||||
| 656,282,796 | ||||||||
MEXICO — 4.79% |
| |||||||
Alfa SAB de CV | 17,435,200 | 34,693,762 | ||||||
America Movil SAB de CV | 200,134,600 | 182,124,871 | ||||||
Arca Continental SAB de CV | 2,682,836 | 15,276,816 | ||||||
Cemex SAB de CV CPOa | 78,617,182 | 61,516,305 | ||||||
Coca-Cola Femsa SAB de CV Series L | 2,834,293 | 20,353,534 | ||||||
Controladora Comercial Mexicana SAB de CV BC Units | 2,478,800 | 7,065,614 | ||||||
El Puerto de Liverpool SAB de CV Series C1 | 1,302,100 | 15,510,355 | ||||||
Fibra Uno Administracion SA de CV | 14,211,200 | 30,395,707 | ||||||
Fomento Economico Mexicano SAB de CV | 11,396,000 | 101,429,833 | ||||||
Gentera SAB de CVb | 7,118,600 | 11,352,428 | ||||||
Gruma SAB de CV Series B | 1,156,100 | 15,510,205 | ||||||
Grupo Aeroportuario del Pacifico SAB de CV Series B | 1,779,400 | 14,886,304 | ||||||
Grupo Aeroportuario del Sureste SAB de CV Series B | 1,387,600 | 20,160,720 | ||||||
| Security | Shares | Value | ||||||
Grupo Bimbo SAB de CVa | 9,789,900 | $ | 25,134,022 | |||||
Grupo Carso SAB de CV Series A1 | 3,141,441 | 14,246,940 | ||||||
Grupo Comercial Chedraui SA de CVb | 1,303,800 | 3,243,183 | ||||||
Grupo Financiero Banorte SAB de CV | 15,421,856 | 73,901,755 | ||||||
Grupo Financiero Inbursa SAB de CV Series O | 14,564,500 | 30,682,662 | ||||||
Grupo Financiero Santander Mexico SAB de CV Series B | 11,394,700 | 17,737,161 | ||||||
Grupo Lala SAB de CV | 2,912,600 | 6,569,840 | ||||||
Grupo Mexico SAB de CV Series B | 23,605,388 | 59,716,849 | ||||||
Grupo Televisa SAB | 15,240,500 | 93,050,609 | ||||||
Industrias Penoles SAB de CV | 868,248 | 12,336,573 | ||||||
Kimberly-Clark de Mexico SAB de CV Series A | 9,980,400 | 22,333,970 | ||||||
Mexichem SAB de CVb | 6,388,492 | 16,340,529 | ||||||
OHL Mexico SAB de CVa | 4,493,400 | 5,966,207 | ||||||
Promotora y Operadora de Infraestructura SAB de CVa | 1,594,900 | 16,743,599 | ||||||
Wal-Mart de Mexico SAB de CV | 32,362,600 | 77,396,373 | ||||||
|
| |||||||
| 1,005,676,726 | ||||||||
PERU — 0.37% |
| |||||||
Cia. de Minas Buenaventura SA ADR | 1,184,842 | 7,488,202 | ||||||
Credicorp Ltd. | 411,207 | 45,224,546 | ||||||
Southern Copper Corp. | 970,708 | 25,879,075 | ||||||
|
| |||||||
| 78,591,823 | ||||||||
PHILIPPINES — 1.46% |
| |||||||
Aboitiz Equity Ventures Inc. | 13,092,280 | 15,433,989 | ||||||
Aboitiz Power Corp. | 5,470,364 | 5,061,901 | ||||||
Alliance Global Group Inc. | 13,191,480 | 5,588,175 | ||||||
Ayala Corp. | 1,529,826 | 24,155,147 | ||||||
Ayala Land Inc. | 44,291,200 | 34,066,509 | ||||||
Bank of the Philippine Islands | 6,385,992 | 11,558,727 | ||||||
BDO Unibank Inc. | 8,966,006 | 18,894,985 | ||||||
DMCI Holdings Inc. | 15,743,700 | 3,833,190 | ||||||
Energy Development Corp. | 49,692,200 | 6,378,973 | ||||||
Globe Telecom Inc. | 256,000 | 14,109,029 | ||||||
GT Capital Holdings Inc. | 404,640 | 10,994,711 | ||||||
International Container Terminal Services Inc. | 4,651,620 | 9,250,494 | ||||||
JG Summit Holdings Inc. | 14,119,714 | 21,448,432 | ||||||
SCHEDULESOF INVESTMENTS | 19 |
Table of Contents
Consolidated Schedule of Investments (Continued)
iSHARES® MSCI EMERGING MARKETS ETF
August 31, 2015
| Security | Shares | Value | ||||||
Jollibee Foods Corp. | 3,239,579 | $ | 13,272,986 | |||||
Megaworld Corp. | 59,102,000 | 5,475,217 | ||||||
Metro Pacific Investments Corp. | 51,973,800 | 5,559,884 | ||||||
Metropolitan Bank & Trust Co. | 2,174,846 | 3,896,948 | ||||||
Philippine Long Distance Telephone Co. | 594,108 | 32,006,075 | ||||||
SM Investments Corp. | 1,137,795 | 21,373,214 | ||||||
SM Prime Holdings Inc. | 48,265,425 | 20,136,410 | ||||||
Universal Robina Corp. | �� | 5,669,210 | 23,530,739 | |||||
|
| |||||||
| 306,025,735 | ||||||||
POLAND — 1.58% |
| |||||||
Alior Bank SAa | 294,830 | 6,863,072 | ||||||
Bank Handlowy w Warszawie SA | 231,745 | 5,370,619 | ||||||
Bank Millennium SAa | 3,409,104 | 5,376,637 | ||||||
Bank Pekao SA | 821,438 | 35,044,450 | ||||||
Bank Zachodni WBK SAa | 209,162 | 16,798,825 | ||||||
CCC SA | 97,707 | 4,426,100 | ||||||
Cyfrowy Polsat SAa | 1,393,147 | 8,353,010 | ||||||
ENEA SA | 1,120,493 | 4,217,460 | ||||||
Energa SA | 1,187,759 | 6,155,007 | ||||||
Eurocash SA | 507,832 | 5,599,727 | ||||||
Grupa Azoty SAa | 214,328 | 5,112,989 | ||||||
Grupa Lotos SAa | 519,280 | 4,115,535 | ||||||
KGHM Polska Miedz SA | 862,945 | 17,962,724 | ||||||
LPP SA | 6,686 | 13,823,387 | ||||||
mBank SAa,b | 102,495 | 9,916,286 | ||||||
Orange Polska SA | 4,148,832 | 7,807,962 | ||||||
PGE Polska Grupa Energetyczna SA | 5,201,062 | 21,520,305 | ||||||
Polski Koncern Naftowy Orlen SA | 2,014,850 | 39,430,208 | ||||||
Polskie Gornictwo Naftowe i Gazownictwo SA | 11,422,945 | 20,558,970 | ||||||
Powszechna Kasa Oszczednosci Bank Polski SA | 5,470,027 | 43,120,513 | ||||||
Powszechny Zaklad Ubezpieczen SA | 343,735 | 39,251,200 | ||||||
Synthos SA | 4,014,979 | 4,203,721 | ||||||
Tauron Polska Energia SA | 7,324,360 | 6,795,027 | ||||||
|
| |||||||
| 331,823,734 | ||||||||
QATAR — 1.08% |
| |||||||
Barwa Real Estate Co. | 796,189 | 9,621,355 | ||||||
Commercial Bank QSC (The) | 710,346 | 11,198,226 | ||||||
Doha Bank QSC | 542,952 | 7,888,320 | ||||||
| Security | Shares | Value | ||||||
Ezdan Holding Group QSC | 4,116,337 | $ | 21,468,578 | |||||
Gulf International Services QSC | 296,916 | 4,892,741 | ||||||
Industries Qatar QSC | 967,570 | 35,342,839 | ||||||
Masraf Al Rayan QSC | 2,455,380 | 29,401,710 | ||||||
Ooredoo QSC | 447,428 | 8,540,344 | ||||||
Qatar Electricity & Water Co. QSC | 195,547 | 11,761,499 | ||||||
Qatar Insurance Co. SAQ | 443,969 | 11,949,400 | ||||||
Qatar Islamic Bank SAQ | 338,348 | 10,500,487 | ||||||
Qatar National Bank SAQ | 1,122,042 | 55,160,671 | ||||||
Vodafone Qatar QSC | 2,503,359 | 9,728,524 | ||||||
|
| |||||||
| 227,454,694 | ||||||||
RUSSIA — 3.65% |
| |||||||
Alrosa PAO | 10,759,700 | 10,575,856 | ||||||
Gazprom PAO | 37,438,989 | 82,890,999 | ||||||
Gazprom PAO ADR | 18,051,843 | 79,608,628 | ||||||
Lukoil PJSC | 1,571,588 | 59,523,424 | ||||||
Lukoil PJSC ADR (London) | 1,585,816 | 59,816,979 | ||||||
Magnit PJSC GDRd | 1,601,058 | 80,044,895 | ||||||
MegaFon PJSC GDRd | 597,512 | 7,678,029 | ||||||
MMC Norilsk Nickel PJSC | 343,329 | 53,773,802 | ||||||
Mobile TeleSystems PJSC ADR | 3,155,490 | 24,076,389 | ||||||
Moscow Exchange MICEX-RTS PJSC | 7,143,720 | 7,901,777 | ||||||
NOVATEK OAO GDRd | 555,784 | 53,244,107 | ||||||
Rosneft OAO | 7,309,767 | 26,639,236 | ||||||
Rostelecom PJSC | 5,212,610 | 6,237,632 | ||||||
RusHydro PJSC | 752,517,100 | 5,966,450 | ||||||
Sberbank of Russia | 67,187,111 | 74,779,899 | ||||||
Severstal PAO | 1,344,973 | 14,655,206 | ||||||
Sistema JSFC GDRd | 1,059,799 | 7,821,317 | ||||||
Surgutneftegas OAO | 22,838,660 | 11,681,194 | ||||||
Surgutneftegas OAO ADR | 2,206,480 | 11,517,826 | ||||||
Tatneft PAO Class S | 8,825,810 | 42,171,286 | ||||||
Uralkali PJSCa | 2,481,815 | 7,588,283 | ||||||
Uralkali PJSC GDRa,d | 324,536 | 5,017,327 | ||||||
VTB Bank JSC | 32,452,582,000 | 33,323,237 | ||||||
|
| |||||||
| 766,533,778 | ||||||||
SOUTH AFRICA — 8.12% |
| |||||||
African Bank Investments Ltd.a,b | 14,665,413 | 11,056 | ||||||
African Rainbow Minerals Ltd. | 532,587 | 2,852,403 | ||||||
| 20 | 2015 iSHARES ANNUAL REPORTTO SHAREHOLDERS |
Table of Contents
Consolidated Schedule of Investments (Continued)
iSHARES® MSCI EMERGING MARKETS ETF
August 31, 2015
| Security | Shares | Value | ||||||
Anglo American Platinum Ltd.a | 330,934 | $ | 7,988,522 | |||||
AngloGold Ashanti Ltd.a | 2,522,151 | 20,305,747 | ||||||
Aspen Pharmacare Holdings Ltd. | 2,109,185 | 54,463,460 | ||||||
Barclays Africa Group Ltd. | 2,124,558 | 27,831,441 | ||||||
Barloworld Ltd. | 1,439,619 | 9,247,077 | ||||||
Bidvest Group Ltd. (The) | 2,035,009 | 48,925,825 | ||||||
Brait SEa | 2,074,781 | 22,708,913 | ||||||
Capitec Bank Holdings Ltd. | 207,846 | 7,566,085 | ||||||
Coronation Fund Managers Ltd. | 1,237,384 | 6,890,188 | ||||||
Discovery Ltd. | 2,170,884 | 21,932,651 | ||||||
Exxaro Resources Ltd.b | 905,266 | 4,628,618 | ||||||
FirstRand Ltd. | 21,058,710 | 84,001,458 | ||||||
Foschini Group Ltd. (The) | 1,294,059 | 14,624,230 | ||||||
Gold Fields Ltd. | 4,907,340 | 15,756,911 | ||||||
Growthpoint Properties Ltd. | 13,875,424 | 27,365,369 | ||||||
Hyprop Investments Ltd. | 1,370,861 | 12,815,407 | ||||||
Impala Platinum Holdings Ltd.a | 3,252,401 | 12,142,330 | ||||||
Imperial Holdings Ltd. | 1,171,845 | 16,299,859 | ||||||
Investec Ltd. | 1,855,688 | 15,098,166 | ||||||
Kumba Iron Ore Ltd.b | 380,890 | 2,594,161 | ||||||
Liberty Holdings Ltd. | 841,730 | 8,173,461 | ||||||
Life Healthcare Group Holdings Ltd. | 5,768,370 | 16,551,570 | ||||||
Massmart Holdings Ltd. | 561,970 | 4,855,289 | ||||||
Mediclinic International Ltd. | 2,836,082 | 22,779,741 | ||||||
MMI Holdings Ltd./South Africa | 6,300,261 | 13,351,704 | ||||||
Mondi Ltd. | 663,116 | 15,373,263 | ||||||
Mr. Price Group Ltd. | 1,490,934 | 26,823,717 | ||||||
MTN Group Ltd. | 10,254,132 | 136,809,374 | ||||||
Nampak Ltd. | 3,189,541 | 7,420,641 | ||||||
Naspers Ltd. Class N | 2,457,070 | 318,427,603 | ||||||
Nedbank Group Ltd. | 1,349,233 | 24,003,770 | ||||||
Netcare Ltd. | 6,572,200 | 19,749,921 | ||||||
Pick n Pay Stores Ltd. | 1,854,324 | 8,751,394 | ||||||
Pioneer Foods Ltd. | 517,603 | 7,765,460 | ||||||
PSG Group Ltd. | 388,322 | 5,796,615 | ||||||
Rand Merchant Insurance Holdings Ltd. | 3,675,391 | 11,632,238 | ||||||
Redefine Properties Ltd. | 24,804,797 | 21,468,162 | ||||||
Remgro Ltd. | 3,028,952 | 57,769,137 | ||||||
Resilient Property Income Fund Ltd. | 1,531,533 | 12,931,881 | ||||||
RMB Holdings Ltd. | 4,064,673 | 20,577,326 | ||||||
Sanlam Ltd. | 10,879,714 | 52,322,367 | ||||||
| Security | Shares | Value | ||||||
Sappi Ltd.a | 3,091,623 | $ | 9,908,204 | |||||
Sasol Ltd. | 3,412,425 | 109,314,398 | ||||||
Shoprite Holdings Ltd. | 2,867,242 | 35,098,410 | ||||||
SPAR Group Ltd. (The) | 1,158,522 | 16,594,921 | ||||||
Standard Bank Group Ltd. | 7,571,337 | 83,406,432 | ||||||
Steinhoff International Holdings Ltd. | 14,182,373 | 84,960,051 | ||||||
Telkom SA SOC Ltd. | 1,422,455 | 6,809,725 | ||||||
Tiger Brands Ltd. | 1,029,251 | 23,263,241 | ||||||
Truworths International Ltd. | 2,503,551 | 16,586,845 | ||||||
Tsogo Sun Holdings Ltd. | 1,232,675 | 2,183,905 | ||||||
Vodacom Group Ltd. | 2,245,923 | 23,957,302 | ||||||
Woolworths Holdings Ltd./South Africa | 5,967,827 | 44,766,857 | ||||||
|
| |||||||
| 1,706,234,802 | ||||||||
SOUTH KOREA — 13.96% |
| |||||||
AmorePacific Corp. | 200,943 | 64,305,158 | ||||||
AmorePacific Group | 177,803 | 25,856,788 | ||||||
BGF retail Co. Ltd. | 27,781 | 4,732,929 | ||||||
BNK Financial Group Inc. | 1,289,087 | 15,149,701 | ||||||
Celltrion Inc.a,b | 386,444 | 23,198,076 | ||||||
Cheil Industries Inc.a,b | 183,090 | 27,554,445 | ||||||
Cheil Worldwide Inc.a,b | 519,740 | 7,646,143 | ||||||
CJ CheilJedang Corp. | 51,101 | 16,979,660 | ||||||
CJ Corp. | 93,910 | 22,827,415 | ||||||
CJ Korea Express Co. Ltd.a | 40,172 | 6,045,754 | ||||||
Coway Co. Ltd. | 353,268 | 25,208,894 | ||||||
Daelim Industrial Co. Ltd. | 174,703 | 9,940,826 | ||||||
Daewoo Engineering & Construction Co. Ltd.a,b | 553,859 | 2,982,948 | ||||||
Daewoo International Corp.b | 265,070 | 4,885,670 | ||||||
Daewoo Securities Co. Ltd. | 1,091,831 | 11,446,801 | ||||||
Daewoo Shipbuilding & Marine Engineering Co. Ltd.b | 609,920 | 3,470,523 | ||||||
Daum Kakao Corp.b | 158,560 | 18,084,755 | ||||||
DGB Financial Group Inc. | 1,060,700 | 9,326,806 | ||||||
Dongbu Insurance Co. Ltd.b | 261,070 | 11,742,908 | ||||||
Dongsuh Cos. Inc. | 102,830 | 3,894,977 | ||||||
Doosan Corp. | 53,362 | 4,647,040 | ||||||
Doosan Heavy Industries & Construction Co. Ltd.b | 296,170 | 4,607,506 | ||||||
Doosan Infracore Co. Ltd.a,b | 790,482 | 4,464,527 | ||||||
E-Mart Co. Ltd. | 131,187 | 25,344,519 | ||||||
GS Engineering & Construction Corp.a,b | 297,410 | 6,122,962 | ||||||
SCHEDULESOF INVESTMENTS | 21 |
Table of Contents
Consolidated Schedule of Investments (Continued)
iSHARES® MSCI EMERGING MARKETS ETF
August 31, 2015
| Security | Shares | Value | ||||||
GS Holdings Corp. | 320,586 | $ | 12,590,336 | |||||
Hana Financial Group Inc. | 1,802,478 | 41,452,041 | ||||||
Hankook Tire Co. Ltd. | 453,355 | 14,163,151 | ||||||
Hanmi Pharm Co. Ltd.a,b | 31,574 | 11,612,505 | ||||||
Hanmi Science Co. Ltd.a | 37,774 | 5,109,989 | ||||||
Hanon Systemsb | 216,181 | 6,643,990 | ||||||
Hanssem Co. Ltd. | 61,918 | 16,673,754 | ||||||
Hanwha Chemical Corp. | 623,176 | 9,563,005 | ||||||
Hanwha Corp. | 271,261 | 9,667,006 | ||||||
Hanwha Life Insurance Co. Ltd. | 1,455,574 | 9,783,820 | ||||||
Hotel Shilla Co. Ltd.b | 206,413 | 21,029,606 | ||||||
Hyosung Corp. | 140,284 | 15,181,866 | ||||||
Hyundai Department Store Co. Ltd. | 92,935 | 11,825,591 | ||||||
Hyundai Development Co. Engineering & Construction | 347,468 | 17,597,407 | ||||||
Hyundai Engineering & Construction Co. Ltd. | 462,050 | 12,969,825 | ||||||
Hyundai Glovis Co. Ltd. | 113,593 | 16,519,126 | ||||||
Hyundai Heavy Industries Co. Ltd.a,b | 256,595 | 19,850,723 | ||||||
Hyundai Marine & Fire Insurance Co. Ltd. | 423,993 | 10,037,459 | ||||||
Hyundai Merchant Marine Co. Ltd.a,b | 473,969 | 3,406,245 | ||||||
Hyundai Mobis Co. Ltd. | 418,774 | 73,115,055 | ||||||
Hyundai Motor Co. | 952,308 | 119,969,471 | ||||||
Hyundai Steel Co. | 437,482 | 19,566,940 | ||||||
Hyundai Wia Corp. | 100,000 | 8,835,341 | ||||||
Industrial Bank of Korea | 1,647,916 | 18,391,453 | ||||||
Kangwon Land Inc. | 701,932 | 25,252,341 | ||||||
KB Financial Group Inc. | 2,507,440 | 75,896,303 | ||||||
KCC Corp. | 36,266 | 12,035,007 | ||||||
KEPCO Plant Service & Engineering Co. Ltd. | 124,245 | 13,235,992 | ||||||
Kia Motors Corp. | 1,622,327 | 66,799,683 | ||||||
Korea Aerospace Industries Ltd. | 292,559 | 22,830,857 | ||||||
Korea Electric Power Corp. | 1,598,951 | 64,890,846 | ||||||
Korea Gas Corp. | 179,184 | 6,097,786 | ||||||
Korea Investment Holdings Co. Ltd. | 229,246 | 13,528,954 | ||||||
Korea Zinc Co. Ltd. | 53,960 | 23,404,337 | ||||||
Korean Air Lines Co. Ltd.a | 201,836 | 5,682,637 | ||||||
KT Corp.a | 161,682 | 3,943,797 | ||||||
KT&G Corp. | 686,097 | 64,099,530 | ||||||
| Security | Shares | Value | ||||||
Kumho Petrochemical Co. Ltd.b | 89,755 | $ | 4,158,591 | |||||
LG Chem Ltd. | 286,920 | 56,765,403 | ||||||
LG Corp. | 602,945 | 29,669,329 | ||||||
LG Display Co. Ltd. | 1,429,377 | 27,856,385 | ||||||
LG Electronics Inc.b | 648,446 | 24,397,250 | ||||||
LG Household & Health Care Ltd.b | 58,881 | 39,926,072 | ||||||
LG Innotek Co. Ltd.b | 81,487 | 6,331,562 | ||||||
LG Uplus Corp. | 1,331,350 | 12,382,033 | ||||||
Lotte Chemical Corp. | 97,863 | 20,437,253 | ||||||
Lotte Confectionery Co. Ltd. | 3,629 | 5,976,996 | ||||||
Lotte Shopping Co. Ltd. | 65,970 | 14,920,292 | ||||||
LS Industrial Systems Co. Ltd. | 104,851 | 3,829,688 | ||||||
Mirae Asset Securities Co. Ltd. | 145,006 | 4,787,558 | ||||||
NAVER Corp. | 172,192 | 72,137,929 | ||||||
NCsoft Corp. | 96,154 | 17,763,390 | ||||||
NH Investment & Securities Co. Ltd.b | 833,603 | 6,843,615 | ||||||
OCI Co. Ltd.b | 100,404 | 6,935,537 | ||||||
Orion Corp./Republic of Korea | 22,034 | 17,381,291 | ||||||
Paradise Co. Ltd.a,b | 266,610 | 5,139,470 | ||||||
POSCO | 419,253 | 67,349,880 | ||||||
S-1 Corp. | 125,416 | 9,956,933 | ||||||
S-Oil Corp. | 279,651 | 14,186,481 | ||||||
Samsung C&T Corp. | 786,444 | 31,983,053 | ||||||
Samsung Card Co. Ltd. | 228,588 | 7,005,973 | ||||||
Samsung Electro-Mechanics Co. Ltd.b | 368,525 | 18,913,099 | ||||||
Samsung Electronics Co. Ltd. | 681,020 | 627,039,341 | ||||||
Samsung Fire & Marine Insurance Co. Ltd. | 217,640 | 49,591,190 | ||||||
Samsung Heavy Industries Co. Ltd.b | 898,159 | 8,543,047 | ||||||
Samsung Life Insurance Co. Ltd. | 494,782 | 41,122,021 | ||||||
Samsung SDI Co. Ltd. | 338,421 | 24,178,038 | ||||||
Samsung SDS Co. Ltd. | 188,223 | 40,819,446 | ||||||
Samsung Securities Co. Ltd. | 352,170 | 13,458,537 | ||||||
Shinhan Financial Group Co. Ltd. | 2,738,942 | 91,587,534 | ||||||
Shinsegae Co. Ltd. | 42,933 | 9,092,975 | ||||||
SK Holdings Co. Ltd. | 229,510 | 52,392,898 | ||||||
SK Hynix Inc. | 3,595,554 | 108,831,818 | ||||||
SK Innovation Co. Ltd.a | 391,147 | 33,037,908 | ||||||
SK Networks Co. Ltd. | 653,081 | 3,627,768 | ||||||
SK Telecom Co. Ltd. | 53,888 | 11,117,034 | ||||||
Woori Bank | 1,961,422 | 15,124,218 | ||||||
| 22 | 2015 iSHARES ANNUAL REPORTTO SHAREHOLDERS |
Table of Contents
Consolidated Schedule of Investments (Continued)
iSHARES® MSCI EMERGING MARKETS ETF
August 31, 2015
| Security | Shares | Value | ||||||
Yuhan Corp. | 58,628 | $ | 12,317,952 | |||||
|
| |||||||
| 2,932,638,294 | ||||||||
TAIWAN — 12.44% | ||||||||
Acer Inc.a,b | 17,825,121 | 6,574,301 | ||||||
Advanced Semiconductor Engineering Inc.b | 38,608,701 | 39,871,292 | ||||||
Advantech Co. Ltd.b | 2,188,370 | 13,922,811 | ||||||
Asia Cement Corp.b | 14,809,077 | 15,907,833 | ||||||
Asia Pacific Telecom Co. Ltd.a | 9,533,000 | 2,604,757 | ||||||
Asustek Computer Inc.b | 4,367,968 | 39,738,091 | ||||||
AU Optronics Corp.b | 53,287,000 | 17,196,751 | ||||||
Casetek Holdings Ltd.b | 764,000 | 2,853,024 | ||||||
Catcher Technology Co. Ltd. | 4,098,210 | 41,818,469 | ||||||
Cathay Financial Holding Co. Ltd. | 50,440,644 | 72,709,190 | ||||||
Chailease Holding Co. Ltd.b | 6,340,932 | 10,192,732 | ||||||
Chang Hwa Commercial Bank Ltd.b | 31,075,845 | 15,090,925 | ||||||
Cheng Shin Rubber Industry Co. Ltd.b | 9,772,128 | 15,678,174 | ||||||
Chicony Electronics Co. Ltd.b | 3,644,143 | 9,049,876 | ||||||
China Airlines Ltd.a | 15,114,347 | 5,435,144 | ||||||
China Development Financial Holding Corp.b | 87,579,848 | 25,275,841 | ||||||
China Life Insurance Co. Ltd./Taiwanb | 19,119,983 | 14,603,257 | ||||||
China Motor Corp. | 3,232,000 | 2,195,328 | ||||||
China Steel Corp.b | 72,811,313 | 43,638,450 | ||||||
Chunghwa Telecom Co. Ltd. | 22,977,410 | 69,774,038 | ||||||
Compal Electronics Inc.b | 26,237,908 | 15,322,113 | ||||||
CTBC Financial Holding Co. Ltd.b | 92,342,715 | 55,628,142 | ||||||
CTCI Corp.b | 2,730,000 | 3,524,096 | ||||||
Delta Electronics Inc.b | 11,183,000 | 56,024,988 | ||||||
E.Sun Financial Holding Co. Ltd.b | 42,494,144 | 25,533,579 | ||||||
Eclat Textile Co. Ltd.b | 1,257,360 | 18,916,822 | ||||||
Epistar Corp.b | 5,985,345 | 4,838,166 | ||||||
EVA Airways Corp.a | 11,054,360 | 6,676,241 | ||||||
Evergreen Marine Corp. Taiwan Ltd. | 10,812,808 | 4,735,755 | ||||||
Far Eastern New Century Corp. | 20,438,038 | 18,530,923 | ||||||
Far EasTone Telecommunications Co. Ltd. | 9,841,000 | 21,595,998 | ||||||
Feng TAY Enterprise Co. Ltd.b | 1,798,830 | 10,670,463 | ||||||
| Security | Shares | Value | ||||||
First Financial Holding Co. Ltd. | 48,381,211 | $ | 23,420,337 | |||||
Formosa Chemicals & Fibre Corp. | 20,269,090 | 43,359,007 | ||||||
Formosa Petrochemical Corp.b | 6,393,000 | 14,324,124 | ||||||
Formosa Plastics Corp. | 25,746,280 | 56,737,407 | ||||||
Formosa Taffeta Co. Ltd. | 5,806,000 | 5,050,092 | ||||||
Foxconn Technology Co. Ltd.b | 5,651,205 | 15,892,711 | ||||||
Fubon Financial Holding Co. Ltd.b | 41,029,969 | 70,493,462 | ||||||
Giant Manufacturing Co. Ltd.b | 1,857,203 | 13,442,688 | ||||||
Hermes Microvision Inc.b | 277,000 | 11,748,832 | ||||||
Highwealth Construction Corp. | 4,050,900 | 6,262,610 | ||||||
Hiwin Technologies Corp.b | 1,386,542 | 7,116,810 | ||||||
Hon Hai Precision Industry Co. Ltd.b | 81,201,812 | 230,857,131 | ||||||
Hotai Motor Co. Ltd.b | 1,606,000 | 17,671,134 | ||||||
HTC Corp.b | 4,125,708 | 5,839,343 | ||||||
Hua Nan Financial Holdings Co. Ltd.b | 36,388,155 | 17,223,309 | ||||||
Innolux Corp.b | 51,228,002 | 18,106,775 | ||||||
Inotera Memories Inc.a,b | 13,849,000 | 8,342,771 | ||||||
Inventec Corp.b | 14,632,281 | 6,700,916 | ||||||
Kinsus Interconnect Technology Corp.b | 1,636,000 | 2,916,400 | ||||||
Largan Precision Co. Ltd.b | 630,000 | 58,476,764 | ||||||
Lite-On Technology Corp.b | 12,877,387 | 11,794,509 | ||||||
MediaTek Inc.b | 9,160,338 | 70,667,717 | ||||||
Mega Financial Holding Co. Ltd. | 60,623,162 | 45,463,645 | ||||||
Merida Industry Co. Ltd.b | 1,376,500 | 7,488,336 | ||||||
Nan Ya Plastics Corp. | 29,666,160 | 54,069,440 | ||||||
Novatek Microelectronics Corp.b | 3,700,000 | 12,395,500 | ||||||
Pegatron Corp. | 10,385,414 | 26,876,440 | ||||||
Phison Electronics Corp. | 1,119,535 | 7,793,665 | ||||||
Pou Chen Corp. | 13,784,220 | 22,284,546 | ||||||
Powertech Technology Inc.b | 4,126,300 | 7,102,065 | ||||||
President Chain Store Corp.b | 3,658,000 | 24,453,375 | ||||||
Quanta Computer Inc.b | 16,526,000 | 30,374,195 | ||||||
Radiant Opto-Electronics Corp.b | 2,755,240 | 8,027,931 | ||||||
Realtek Semiconductor Corp.b | 2,776,637 | 4,983,883 | ||||||
Ruentex Development Co. Ltd.b | 4,897,025 | 5,237,782 | ||||||
Ruentex Industries Ltd.b | 3,311,598 | 5,282,516 | ||||||
Shin Kong Financial Holding Co. Ltd.b | 46,506,866 | 11,034,946 | ||||||
Siliconware Precision Industries Co. Ltd.b | 18,197,190 | 22,371,761 | ||||||
SCHEDULESOF INVESTMENTS | 23 |
Table of Contents
Consolidated Schedule of Investments (Continued)
iSHARES® MSCI EMERGING MARKETS ETF
August 31, 2015
| Security | Shares | Value | ||||||
Simplo Technology Co. Ltd.b | 2,027,202 | $ | 6,729,094 | |||||
SinoPac Financial Holdings Co. Ltd.b | 53,879,925 | 18,547,306 | ||||||
Standard Foods Corp. | 2,721,972 | 6,182,497 | ||||||
Synnex Technology International Corp.b | 8,231,985 | 8,754,201 | ||||||
Taishin Financial Holding Co. Ltd.b | 47,163,025 | 16,525,033 | ||||||
Taiwan Business Banka,b | 22,101,149 | 5,570,120 | ||||||
Taiwan Cement Corp. | 20,549,296 | 22,010,787 | ||||||
Taiwan Cooperative Financial Holding Co. Ltd. | 39,343,943 | 16,687,559 | ||||||
Taiwan Fertilizer Co. Ltd.b | 4,344,000 | 5,494,087 | ||||||
Taiwan Glass Industry Corp.a,b | 3,838,176 | 1,545,368 | ||||||
Taiwan Mobile Co. Ltd. | 10,343,600 | 31,091,839 | ||||||
Taiwan Semiconductor Manufacturing Co. Ltd. | 151,276,000 | 599,784,977 | ||||||
Teco Electric and Machinery Co. Ltd. | 11,796,000 | 8,882,530 | ||||||
TPK Holding Co. Ltd.b | 1,757,827 | 4,403,212 | ||||||
Transcend Information Inc.b | 1,093,000 | 2,946,155 | ||||||
U-Ming Marine Transport Corp. | 2,775,000 | 2,750,607 | ||||||
Uni-President Enterprises Corp. | 30,033,839 | 53,539,546 | ||||||
United Microelectronics Corp.b | 73,176,000 | 24,177,588 | ||||||
Vanguard International Semiconductor Corp.b | 5,207,000 | 5,921,410 | ||||||
Wan Hai Lines Ltd. | 2,737,000 | 1,884,337 | ||||||
Wistron Corp.b | 14,179,272 | 7,016,421 | ||||||
WPG Holdings Ltd.b | 8,257,532 | 7,804,251 | ||||||
Yang Ming Marine Transport Corp.a | 8,954,075 | 2,875,894 | ||||||
Yuanta Financial Holding Co. Ltd.b | 54,329,635 | 21,791,300 | ||||||
Yulon Motor Co. Ltd.b | 5,947,000 | 5,382,934 | ||||||
Zhen Ding Technology Holding Ltd.b | 1,881,075 | 5,336,342 | ||||||
|
| |||||||
| 2,611,447,840 | ||||||||
THAILAND — 2.28% |
| |||||||
Advanced Info Service PCL NVDR | 6,401,600 | 42,504,695 | ||||||
Airports of Thailand PCL NVDR | 2,726,600 | 20,994,326 | ||||||
Bangkok Bank PCL Foreign | 1,613,200 | 7,403,303 | ||||||
| Security | Shares | Value | ||||||
Bangkok Bank PCL NVDR | 1,889,000 | $ | 8,669,005 | |||||
Bangkok Dusit Medical Services PCL NVDR | 22,510,800 | 12,246,076 | ||||||
Banpu PCL NVDRb | 6,985,800 | 4,014,716 | ||||||
BEC World PCL NVDR | 6,590,900 | 6,803,272 | ||||||
BTS Group Holdings PCL NVDR | 31,187,100 | 8,483,030 | ||||||
Bumrungrad Hospital PCL NVDR | 1,739,400 | 11,209,413 | ||||||
Central Pattana PCL NVDR | 8,872,400 | 11,138,457 | ||||||
Charoen Pokphand Foods PCL NVDRb | 17,962,400 | 9,521,149 | ||||||
CP ALL PCL NVDR | 27,482,800 | 39,102,324 | ||||||
Delta Electronics Thailand PCL NVDR | 2,181,400 | 5,294,513 | ||||||
Energy Absolute PCL NVDR | 5,802,400 | 3,302,245 | ||||||
Glow Energy PCL NVDR | 3,695,500 | 10,180,796 | ||||||
Home Product Center PCL NVDRb | 17,910,914 | 3,647,640 | ||||||
Indorama Ventures PCL NVDR | 8,797,480 | 5,350,399 | ||||||
IRPC PCL NVDR | 64,631,300 | 6,851,693 | ||||||
Kasikornbank PCL Foreign | 7,199,100 | 36,351,991 | ||||||
Kasikornbank PCL NVDRb | 3,917,300 | 19,725,838 | ||||||
Krung Thai Bank PCL NVDRb | 22,623,300 | 11,486,792 | ||||||
Minor International PCL NVDRb | 10,168,520 | 7,517,528 | ||||||
PTT Exploration & Production PCL NVDR | 8,763,039 | 19,435,391 | ||||||
PTT Global Chemical PCL NVDR | 10,283,330 | 17,212,995 | ||||||
PTT PCL NVDR | 6,187,400 | 46,260,935 | ||||||
Siam Cement PCL (The) Foreign | 1,900,200 | 25,233,511 | ||||||
Siam Cement PCL (The) NVDR | 662,100 | 8,866,174 | ||||||
Siam Commercial Bank PCL (The) NVDRb | 9,706,100 | 38,450,724 | ||||||
Thai Oil PCL NVDR | 5,468,700 | 7,857,108 | ||||||
Thai Union Frozen Products PCL NVDR | 10,086,100 | 4,896,028 | ||||||
TMB Bank PCL NVDR | 77,760,100 | 5,119,650 | ||||||
True Corp. PCL NVDRa,b | 54,277,221 | 14,687,935 | ||||||
|
| |||||||
| 479,819,652 | ||||||||
TURKEY — 1.43% |
| |||||||
Akbank TAS | 13,497,802 | 31,623,157 | ||||||
Anadolu Efes Biracilik ve Malt Sanayii AS | 1,148,995 | 8,565,164 | ||||||
Arcelik AS | 1,217,263 | 5,707,880 | ||||||
| 24 | 2015 iSHARES ANNUAL REPORTTO SHAREHOLDERS |
Table of Contents
Consolidated Schedule of Investments (Continued)
iSHARES® MSCI EMERGING MARKETS ETF
August 31, 2015
| Security | Shares | Value | ||||||
BIM Birlesik Magazalar AS | 1,345,184 | $ | 23,313,134 | |||||
Coca-Cola Icecek ASb | 376,924 | 4,661,375 | ||||||
Emlak Konut Gayrimenkul Yatirim Ortakligi AS | 12,347,488 | 10,561,747 | ||||||
Enka Insaat ve Sanayi AS | 2,772,971 | 4,734,340 | ||||||
Eregli Demir ve Celik Fabrikalari TAS | 8,968,496 | 12,200,358 | ||||||
Ford Otomotiv Sanayi AS | 486,352 | 4,928,679 | ||||||
Haci Omer Sabanci Holding AS | 5,836,365 | 17,442,932 | ||||||
KOC Holding ASb | 4,017,780 | 15,665,339 | ||||||
Petkim Petrokimya Holding ASa,b | 1,675,145 | 2,267,287 | ||||||
TAV Havalimanlari Holding AS | 1,105,985 | 8,928,426 | ||||||
Tofas Turk Otomobil Fabrikasi AS | 711,221 | 4,410,010 | ||||||
Tupras Turkiye Petrol Rafinerileri ASa | 800,622 | 20,655,002 | ||||||
Turk Hava Yollari AOa,b | 3,489,667 | 9,650,230 | ||||||
Turk Telekomunikasyon AS | 2,684,340 | 5,643,477 | ||||||
Turkcell Iletisim Hizmetleri AS | 5,329,038 | 20,869,472 | ||||||
Turkiye Garanti Bankasi AS | 14,042,028 | 35,599,508 | ||||||
Turkiye Halk Bankasi AS | 3,861,653 | 14,791,285 | ||||||
Turkiye Is Bankasi Class C | 9,742,976 | 16,299,654 | ||||||
Turkiye Sise ve Cam Fabrikalari AS | 3,980,708 | 3,883,617 | ||||||
Turkiye Vakiflar Bankasi Tao Class Db | 4,681,783 | 6,191,984 | ||||||
Ulker Biskuvi Sanayi ASb | 858,066 | 5,276,325 | ||||||
Yapi ve Kredi Bankasi ASb | 5,594,200 | 6,899,065 | ||||||
|
| |||||||
| 300,769,447 | ||||||||
UNITED ARAB EMIRATES — 0.81% |
| |||||||
Abu Dhabi Commercial Bank PJSC | 10,543,784 | 22,964,640 | ||||||
Aldar Properties PJSC | 21,683,858 | 13,755,160 | ||||||
Arabtec Holding PJSCa | 14,259,649 | 7,648,006 | ||||||
DP World Ltd. | 1,048,206 | 23,374,994 | ||||||
Dubai Financial Market PJSC | 13,015,925 | 6,095,041 | ||||||
Dubai Islamic Bank PJSC | 6,942,305 | 13,230,458 | ||||||
Emaar Malls Group PJSCa | 8,252,219 | 6,403,078 | ||||||
Emaar Properties PJSC | 23,065,666 | 42,388,001 | ||||||
First Gulf Bank PJSC | 5,860,928 | 22,897,678 | ||||||
National Bank of Abu Dhabi PJSC | 4,156,933 | 11,770,083 | ||||||
|
| |||||||
| 170,527,139 | ||||||||
|
| |||||||
TOTAL COMMON STOCKS |
| |||||||
(Cost: $23,421,543,491) |
| 20,169,922,601 | ||||||
| Security | Shares | Value | ||||||
PREFERRED STOCKS — 3.49% |
| |||||||
BRAZIL — 2.33% |
| |||||||
AES Tiete SA | 691,000 | $ | 2,847,665 | |||||
Banco Bradesco SA | 15,393,909 | 97,420,441 | ||||||
Banco do Estado do Rio Grande do Sul SA Class B | 1,204,100 | 2,555,479 | ||||||
Braskem SA Class A | 1,016,700 | 3,927,509 | ||||||
Centrais Eletricas Brasileiras SA Class B | 1,492,037 | 3,076,449 | ||||||
Cia. Brasileira de Distribuicao | 922,986 | 16,091,595 | ||||||
Cia. Energetica de Minas Gerais | 4,745,302 | 9,797,425 | ||||||
Cia. Energetica de Sao Paulo Class B | 1,191,100 | 5,274,883 | ||||||
Cia. Paranaense de Energia Class B | 686,075 | 5,839,337 | ||||||
Gerdau SA | 5,248,485 | 7,565,254 | ||||||
Itau Unibanco Holding SA | 18,640,167 | 135,876,569 | ||||||
Itausa – Investimentos Itau SA | 21,830,964 | 43,634,956 | ||||||
Lojas Americanas SA | 3,189,670 | 14,274,589 | ||||||
Oi SA | 1,816,176 | 1,346,331 | ||||||
Petroleo Brasileiro SA | 23,883,427 | 60,261,842 | ||||||
Suzano Papel e Celulose SA Class A | 2,250,400 | 10,861,976 | ||||||
Telefonica Brasil SA | 2,045,367 | 22,681,687 | ||||||
Usinas Siderurgicas de Minas Gerais SA Class A | 2,340,800 | 1,915,185 | ||||||
Vale SA | 11,511,851 | 44,723,095 | ||||||
|
| |||||||
| 489,972,267 | ||||||||
CHILE — 0.07% |
| |||||||
Embotelladora Andina SA Class B | 1,455,146 | 4,994,318 | ||||||
Sociedad Quimica y Minera de Chile SA Series B | 595,230 | 9,345,905 | ||||||
|
| |||||||
| 14,340,223 | ||||||||
COLOMBIA — 0.20% |
| |||||||
Banco Davivienda SA | 638,342 | 4,919,371 | ||||||
Bancolombia SA | 2,797,034 | 23,851,869 | ||||||
Grupo Aval Acciones y Valores SA | 18,258,093 | 6,964,458 | ||||||
Grupo de Inversiones Suramericana SA | 509,286 | 5,775,255 | ||||||
|
| |||||||
| 41,510,953 | ||||||||
SCHEDULESOF INVESTMENTS | 25 |
Table of Contents
Consolidated Schedule of Investments (Continued)
iSHARES® MSCI EMERGING MARKETS ETF
August 31, 2015
| Security | Shares | Value | ||||||
RUSSIA — 0.23% |
| |||||||
AK Transneft OAO | 9,749 | $ | 22,502,188 | |||||
Surgutneftegas OAO | 42,953,100 | 25,880,016 | ||||||
|
| |||||||
| 48,382,204 | ||||||||
SOUTH KOREA — 0.66% |
| |||||||
AmorePacific Corp. | 36,822 | 5,681,687 | ||||||
Hyundai Motor Co. | 133,759 | 10,969,878 | ||||||
Hyundai Motor Co. Series 2 | 233,141 | 19,711,773 | ||||||
LG Chem Ltd. | 49,725 | 7,273,240 | ||||||
Samsung Electronics Co. Ltd. | 127,921 | 94,095,346 | ||||||
|
| |||||||
| 137,731,924 | ||||||||
|
| |||||||
TOTAL PREFERRED STOCKS |
| |||||||
(Cost: $1,256,457,709) |
| 731,937,571 | ||||||
SHORT-TERM INVESTMENTS — 4.09% |
| |||||||
MONEY MARKET FUNDS — 4.09% |
| |||||||
BlackRock Cash Funds: Institutional, |
| |||||||
0.18%e,f,g | 812,916,830 | 812,916,830 | ||||||
BlackRock Cash Funds: Prime, |
| |||||||
0.18%e,f,g | 46,681,681 | 46,681,681 | ||||||
|
| |||||||
| 859,598,511 | ||||||||
|
| |||||||
TOTAL SHORT-TERM INVESTMENTS |
| |||||||
(Cost: $859,598,511) |
| 859,598,511 | ||||||
|
| |||||||
| Value | ||||||
TOTAL INVESTMENTS | ||||||
(Cost: $25,537,599,711) | $ | 21,761,458,683 | ||||
Other Assets, Less Liabilities — (3.62)% | (760,593,685 | ) | ||||
|
| |||||
NET ASSETS — 100.00% | $ | 21,000,864,998 | ||||
|
| |||||
ADR — American Depositary Receipts
CPO — Certificates of Participation (Ordinary)
GDR — Global Depositary Receipts
NVDR — Non-Voting Depositary Receipts
| a | Non-income earning security. |
| b | All or a portion of this security represents a security on loan. See Note 1. |
| c | This security may be resold to qualified institutional buyers under Rule 144A of the Securities Act of 1933. |
| d | This security may be resold to qualified foreign investors and foreign institutional buyers under Regulation S of the Securities Act of 1933. |
| e | Affiliated issuer. See Note 2. |
| f | The rate quoted is the annualized seven-day yield of the fund at period end. |
| g | All or a portion of this security represents an investment of securities lending collateral. See Note 1. |
Open futures contracts as of August 31, 2015 were as follows:
| Issue | Number of Contracts Purchased (Sold) | Expiration | Exchange | Notional Value | Unrealized Appreciation (Depreciation) | |||||||||||||||
| MSCI Emerging Markets Mini Index | 2,060 | Sep. 2015 | NYSE LIFFE | $ | 84,202,500 | $ | (9,577,921) | |||||||||||||
See notes to financial statements.
| 26 | 2015 iSHARES ANNUAL REPORTTO SHAREHOLDERS |
Table of Contents
Statements of Assets and Liabilities
iSHARES® , INC.
August 31, 2015
| iShares Currency Hedged MSCI Emerging Markets ETF | iShares MSCI Emerging Markets ETF (Consolidated) | |||||||
ASSETS | ||||||||
Investments, at cost: | ||||||||
Unaffiliated | $ | — | $ | 24,678,001,200 | ||||
Affiliated (Note 2) | 245,330,292 | 859,598,511 | ||||||
|
|
|
| |||||
Total cost of investments | $ | 245,330,292 | $ | 25,537,599,711 | ||||
|
|
|
| |||||
Investments in securities, at fair value (including securities on loana) (Note 1): | ||||||||
Unaffiliated | $ | — | $ | 20,901,860,172 | ||||
Affiliated (Note 2) | 211,379,034 | 859,598,511 | ||||||
|
|
|
| |||||
Total fair value of investments | 211,379,034 | 21,761,458,683 | ||||||
Foreign currency, at valueb | — | 23,433,978 | ||||||
Cash | — | 149,057,369 | ||||||
Cash pledged to broker | — | 3,071,010 | ||||||
Receivables: | ||||||||
Investment securities sold | — | 148,841,091 | ||||||
Dividends and interest | 3 | 36,726,071 | ||||||
Unrealized appreciation on forward currency contracts (Note 1) | 4,944,311 | — | ||||||
Capital shares sold | 15,327 | — | ||||||
Futures variation margin | — | 178,505 | ||||||
|
|
|
| |||||
Total Assets | 216,338,675 | 22,122,766,707 | ||||||
|
|
|
| |||||
LIABILITIES | ||||||||
Payables: | ||||||||
Investment securities purchased | 2,596,708 | 98,805,685 | ||||||
Collateral for securities on loan (Note 1) | — | 859,598,511 | ||||||
Capital shares redeemed | 16,240 | 122,686,429 | ||||||
Line of credit (Note 9) | — | 25,000,832 | ||||||
Foreign taxes (Note 1) | — | 1,784,375 | ||||||
Securities related to in-kind transactions (Note 4) | — | 131,729 | ||||||
Unrealized depreciation on forward currency contracts (Note 1) | 1,859,373 | — | ||||||
Investment advisory fees (Note 2) | 1,449 | 13,894,148 | ||||||
|
|
|
| |||||
Total Liabilities | 4,473,770 | 1,121,901,709 | ||||||
|
|
|
| |||||
NET ASSETS | $ | 211,864,905 | $ | 21,000,864,998 | ||||
|
|
|
| |||||
Net assets consist of: | ||||||||
Paid-in capital | $ | 237,958,953 | $ | 34,538,178,846 | ||||
Undistributed net investment income | — | 92,311,084 | ||||||
Undistributed net realized gain (accumulated net realized loss) | 4,772,272 | (9,841,987,412 | ) | |||||
Net unrealized depreciation | (30,866,320 | ) | (3,787,637,520 | ) | ||||
|
|
|
| |||||
NET ASSETS | $ | 211,864,905 | $ | 21,000,864,998 | ||||
|
|
|
| |||||
Shares outstandingc | 9,900,000 | 621,450,000 | ||||||
|
|
|
| |||||
Net asset value per share | $ | 21.40 | $ | 33.79 | ||||
|
|
|
| |||||
| a | Securities on loan with values of $ — and $802,422,761, respectively. See Note 1. |
| b | Cost of foreign currency: $ — and $23,518,338, respectively. |
| c | $0.001 par value, number of shares authorized: 250 million and 2 billion, respectively. |
See notes to financial statements.
FINANCIAL STATEMENTS | 27 |
Table of Contents
Statements of Operations
iSHARES® , INC.
Year ended August 31, 2015
| iShares Currency Hedged MSCI Emerging Markets ETFa | iShares MSCI Emerging Markets ETF (Consolidated) | |||||||
NET INVESTMENT INCOME | ||||||||
Dividends — unaffiliatedb | $ | — | $ | 778,832,138 | ||||
Dividends — affiliated (Note 2) | 1,478,109 | — | ||||||
Interest — unaffiliated | — | 10,366 | ||||||
Interest — affiliated (Note 2) | 7 | 10,494 | ||||||
Securities lending income — affiliated — net (Note 2)c | — | 26,410,748 | ||||||
|
|
|
| |||||
| 1,478,116 | 805,263,746 | |||||||
Less: Other foreign taxes (Note 1) | — | (2,522,613 | ) | |||||
|
|
|
| |||||
Total investment income | 1,478,116 | 802,741,133 | ||||||
|
|
|
| |||||
EXPENSES | ||||||||
Investment advisory fees (Note 2) | 629,603 | 221,482,303 | ||||||
Mauritius income taxes (Note 1) | — | 1,157,704 | ||||||
Commitment fees (Note 9) | — | 109,177 | ||||||
Interest expense (Note 9) | — | 15,782 | ||||||
|
|
|
| |||||
Total expenses | 629,603 | 222,764,966 | ||||||
Less investment advisory fees waived (Note 2) | (617,304 | ) | — | |||||
|
|
|
| |||||
Net expenses | 12,299 | 222,764,966 | ||||||
|
|
|
| |||||
Net investment income | 1,465,817 | 579,976,167 | ||||||
|
|
|
| |||||
NET REALIZED AND UNREALIZED GAIN (LOSS) | ||||||||
Net realized gain (loss) from: | ||||||||
Investments — unaffiliated | — | (2,091,782,449 | ) | |||||
Investments — affiliated (Note 2) | (268,271 | ) | — | |||||
In-kind redemptions — unaffiliated | — | 595,875,704 | ||||||
In-kind redemptions — affiliated (Note 2) | (1,030,779 | ) | — | |||||
Futures contracts | — | (29,867,869 | ) | |||||
Foreign currency transactions | 5,164,162 | (24,262,792 | ) | |||||
|
|
|
| |||||
Net realized gain (loss) | 3,865,112 | (1,550,037,406 | ) | |||||
|
|
|
| |||||
Net change in unrealized appreciation/depreciation on: | ||||||||
Investments | (33,951,258 | ) | (7,689,887,253 | ) | ||||
Forward currency contracts | 3,084,938 | — | ||||||
Futures contracts | — | (15,877,447 | ) | |||||
Translation of assets and liabilities in foreign currencies | — | (1,944,959 | ) | |||||
|
|
|
| |||||
Net change in unrealized appreciation/depreciation | (30,866,320 | ) | (7,707,709,659 | ) | ||||
|
|
|
| |||||
Net realized and unrealized loss | (27,001,208 | ) | (9,257,747,065 | ) | ||||
|
|
|
| |||||
NET DECREASE IN NET ASSETS RESULTING FROM OPERATIONS | $ | (25,535,391 | ) | $ | (8,677,770,898 | ) | ||
|
|
|
| |||||
| a | For the period from September 23, 2014 (commencement of operations) to August 31, 2015. |
| b | Net of foreign withholding tax of $ — and $90,362,825, respectively. |
| c | Net of securities lending income tax paid of $ — and $777,105, respectively. |
See notes to financial statements.
| 28 | 2015 iSHARES ANNUAL REPORTTO SHAREHOLDERS |
Table of Contents
Statements of Changes in Net Assets
iSHARES® , INC.
| iShares Currency Hedged MSCI Emerging Markets ETF | iShares MSCI Emerging Markets ETF (Consolidated) | |||||||||||
Period from to | Year ended August 31, 2015 | Year ended August 31, 2014 | ||||||||||
INCREASE (DECREASE) IN NET ASSETS | ||||||||||||
OPERATIONS: | ||||||||||||
Net investment income | $ | 1,465,817 | $ | 579,976,167 | $ | 758,783,170 | ||||||
Net realized gain (loss) | 3,865,112 | (1,550,037,406 | ) | (970,499,346 | ) | |||||||
Net change in unrealized appreciation/depreciation | (30,866,320 | ) | (7,707,709,659 | ) | 6,267,266,623 | |||||||
|
|
|
|
|
| |||||||
Net increase (decrease) in net assets resulting from operations | (25,535,391 | ) | (8,677,770,898 | ) | 6,055,550,447 | |||||||
|
|
|
|
|
| |||||||
DISTRIBUTIONS TO SHAREHOLDERS: | ||||||||||||
From net investment income | (1,468,085 | ) | (661,275,094 | ) | (673,353,625 | ) | ||||||
|
|
|
|
|
| |||||||
Total distributions to shareholders | (1,468,085 | ) | (661,275,094 | ) | (673,353,625 | ) | ||||||
|
|
|
|
|
| |||||||
CAPITAL SHARE TRANSACTIONS: | ||||||||||||
Proceeds from shares sold | 260,396,098 | 1,756,006,247 | 16,425,662,994 | |||||||||
Cost of shares redeemed | (21,527,717 | ) | (15,752,495,900 | ) | (12,275,651,505 | ) | ||||||
|
|
|
|
|
| |||||||
Net increase (decrease) in net assets from capital share transactions | 238,868,381 | (13,996,489,653 | ) | 4,150,011,489 | ||||||||
|
|
|
|
|
| |||||||
INCREASE (DECREASE) IN NET ASSETS | 211,864,905 | (23,335,535,645 | ) | 9,532,208,311 | ||||||||
NET ASSETS | ||||||||||||
Beginning of period | — | 44,336,400,643 | 34,804,192,332 | |||||||||
|
|
|
|
|
| |||||||
End of period | $ | 211,864,905 | $ | 21,000,864,998 | $ | 44,336,400,643 | ||||||
|
|
|
|
|
| |||||||
Undistributed net investment income included in net assets at end of period | $ | — | $ | 92,311,084 | $ | 173,862,959 | ||||||
|
|
|
|
|
| |||||||
SHARES ISSUED AND REDEEMED | ||||||||||||
Shares sold | 10,850,000 | 40,950,000 | 388,800,000 | |||||||||
Shares redeemed | (950,000 | ) | (402,300,000 | ) | (311,400,000 | ) | ||||||
|
|
|
|
|
| |||||||
Net increase (decrease) in shares outstanding | 9,900,000 | (361,350,000 | ) | 77,400,000 | ||||||||
|
|
|
|
|
| |||||||
| a | Commencement of operations. |
See notes to financial statements.
FINANCIAL STATEMENTS | 29 |
Table of Contents
iSHARES® , INC.
(For a share outstanding throughout the period)
iShares Currency Hedged MSCI Emerging Markets ETF
Period from to | ||||
Net asset value, beginning of period | $ | 24.44 | ||
|
| |||
Income from investment operations: | ||||
Net investment incomeb | 0.41 | |||
Net realized and unrealized lossc | (2.80 | ) | ||
|
| |||
Total from investment operations | (2.39 | ) | ||
|
| |||
Less distributions from: | ||||
Net investment income | (0.65 | ) | ||
|
| |||
Total distributions | (0.65 | ) | ||
|
| |||
Net asset value, end of period | $ | 21.40 | ||
|
| |||
Total return | (10.01 | )%d | ||
|
| |||
Ratios/Supplemental data: | ||||
Net assets, end of period (000s) | $ | 211,865 | ||
Ratio of expenses to average net assetse,f | 0.02 | % | ||
Ratio of expenses to average net assets prior to waived feese,f | 0.78 | % | ||
Ratio of net investment income to average net assetse | 1.82 | % | ||
Portfolio turnover rateg,h | 7 | % | ||
| a | Commencement of operations. |
| b | Based on average shares outstanding throughout the period. |
| c | The amount reported for a share outstanding may not accord with the change in aggregate gains and losses in securities for the fiscal period due to the timing of capital share transactions in relation to the fluctuating market values of the Fund’s underlying securities. |
| d | Not annualized. |
| e | Annualized for periods of less than one year. |
| f | The Fund indirectly bears its proportionate share of fees and expenses incurred by the underlying fund in which the Fund is invested. This ratio does not include these indirect fees and expenses. |
| g | Portfolio turnover rate excludes portfolio securities received or delivered as a result of processing capital share transactions in Creation Units. |
| h | Portfolio turnover rate excludes the portfolio activity of the underlying fund in which the Fund is invested. See page 31 for the portfolio turnover rates of the underlying fund. |
See notes to financial statements.
| 30 | 2015 iSHARES ANNUAL REPORTTO SHAREHOLDERS |
Table of Contents
Consolidated Financial Highlights (Continued)
iSHARES®, INC.
(For a share outstanding throughout each period)
| iShares MSCI Emerging Markets ETF | ||||||||||||||||||||
| Year ended Aug. 31, 2015 | Year ended Aug. 31, 2014 | Year ended Aug. 31, 2013 | Year ended Aug. 31, 2012 | Year ended Aug. 31, 2011 | ||||||||||||||||
Net asset value, beginning of year | $ | 45.11 | $ | 38.44 | $ | 39.22 | $ | 42.71 | $ | 40.19 | ||||||||||
|
|
|
|
|
|
|
|
|
| |||||||||||
Income from investment operations: | ||||||||||||||||||||
Net investment incomea | 0.73 | 0.83 | 0.75 | 0.86 | 0.81 | |||||||||||||||
Net realized and unrealized gain (loss)b | (11.21 | ) | 6.55 | (0.76 | ) | (3.53 | ) | 2.56 | ||||||||||||
|
|
|
|
|
|
|
|
|
| |||||||||||
Total from investment operations | (10.48 | ) | 7.38 | (0.01 | ) | (2.67 | ) | 3.37 | ||||||||||||
|
|
|
|
|
|
|
|
|
| |||||||||||
Less distributions from: | ||||||||||||||||||||
Net investment income | (0.84 | ) | (0.71 | ) | (0.77 | ) | (0.82 | ) | (0.85 | ) | ||||||||||
|
|
|
|
|
|
|
|
|
| |||||||||||
Total distributions | (0.84 | ) | (0.71 | ) | (0.77 | ) | (0.82 | ) | (0.85 | ) | ||||||||||
|
|
|
|
|
|
|
|
|
| |||||||||||
Net asset value, end of year | $ | 33.79 | $ | 45.11 | $ | 38.44 | $ | 39.22 | $ | 42.71 | ||||||||||
|
|
|
|
|
|
|
|
|
| |||||||||||
Total return | (23.46 | )% | 19.34 | % | (0.08 | )% | (6.18 | )% | 8.23 | % | ||||||||||
|
|
|
|
|
|
|
|
|
| |||||||||||
Ratios/Supplemental data: | ||||||||||||||||||||
Net assets, end of year (000s) | $ | 21,000,865 | $ | 44,336,401 | $ | 34,804,192 | $ | 34,256,628 | $ | 33,496,549 | ||||||||||
Ratio of expenses to average net assets | 0.69 | % | 0.67 | % | 0.67 | % | 0.68 | % | 0.67 | % | ||||||||||
Ratio of expenses to average net assets prior to waived fees | 0.69 | % | 0.68 | % | 0.67 | % | 0.69 | % | 0.67 | % | ||||||||||
Ratio of net investment income to average net assets | 1.79 | % | 1.98 | % | 1.78 | % | 2.13 | % | 1.76 | % | ||||||||||
Portfolio turnover ratec | 10 | % | 22 | % | 24 | % | 15 | % | 17 | % | ||||||||||
| a | Based on average shares outstanding throughout each period. |
| b | The amounts reported for a share outstanding may not accord with the change in aggregate gains and losses in securities for the fiscal period due to the timing of capital share transactions in relation to the fluctuating market values of the Fund’s underlying securities. |
| c | Portfolio turnover rates exclude portfolio securities received or delivered in Creation Units but include portfolio transactions that are executed as a result of the Fund processing capital share transactions in Creation Units partially for cash in U.S. dollars. Excluding such cash transactions, the portfolio turnover rates for the years ended August 31, 2015, August 31, 2014, August 31, 2013, August 31, 2012 and August 31, 2011 were 7%, 7%, 9%, 10% and 15%, respectively. See Note 4. |
See notes to financial statements.
FINANCIAL HIGHLIGHTS | 31 |
Table of Contents
iSHARES® , INC.
iShares, Inc. (the “Company”) is registered under the Investment Company Act of 1940, as amended (the “1940 Act”), as an open-end management investment company. The Company was incorporated under the laws of the State of Maryland on September 1, 1994 pursuant to Articles of Incorporation as subsequently amended and restated.
These financial statements relate only to the following funds (each, a “Fund,” and collectively, the “Funds”):
| iShares ETF | Diversification Classification | |
Currency Hedged MSCI Emerging Marketsa | Non-diversified | |
MSCI Emerging Markets | Diversified |
| a | The Fund commenced operation on September 23, 2014. |
The investment objective of each Fund is to seek investment results that correspond generally to the price and yield performance, before fees and expenses, of its underlying index. The investment adviser uses a “passive” or index approach to try to achieve each Fund’s investment objective. Currently the iShares Currency Hedged MSCI Emerging Markets ETF seeks to achieve its investment objective by investing a substantial portion of its assets in the iShares MSCI Emerging Markets ETF. The financial statements and schedule of investments for the iShares MSCI Emerging Markets ETF are included in this report and should be read in conjunction with the financial statements of the iShares Currency Hedged MSCI Emerging Markets ETF.
The iShares MSCI Emerging Markets ETF carries out its investment strategies associated with investment in Indian securities by investing in a wholly-owned subsidiary in the Republic of Mauritius (the “Subsidiary”), which in turn invests in Indian securities included in the underlying index. The investment adviser of the Fund also serves as the investment adviser to the Subsidiary. Through this investment structure, the Fund expects to obtain certain benefits under a current tax treaty between Mauritius and India. The accompanying consolidated financial statements for the Fund include the accounts of the Subsidiary. Intercompany accounts and transactions, if any, have been eliminated.
Pursuant to the Company’s organizational documents, the Funds’ officers and directors are indemnified against certain liabilities that may arise out of the performance of their duties to the Funds. Additionally, in the normal course of business, the Funds enter into contracts with service providers that contain general indemnification clauses. The Funds’ maximum exposure under these arrangements is unknown as this would involve future claims that may be made against the Funds that have not yet occurred.
| 1. | SIGNIFICANT ACCOUNTING POLICIES |
The following significant accounting policies are consistently followed by the Funds in the preparation of their financial statements in conformity with accounting principles generally accepted in the United States of America (“U.S. GAAP”). The preparation of financial statements in conformity with U.S. GAAP requires management to make certain estimates and assumptions that affect the reported amounts of assets and liabilities and disclosures of contingent assets and liabilities at the date of the financial statements and the reported amounts of revenue and expenses during the reporting period. Actual results could differ from those estimates. Each Fund is considered an investment company under U.S. GAAP and follows the accounting and reporting guidance applicable to investment companies.
SECURITY VALUATION
Each Fund’s investments are valued at fair value each day that the Fund’s listing exchange is open and, for financial reporting purposes, as of the report date should the reporting period end on a day that the Fund’s listing exchange is not open. U.S. GAAP defines fair value as the price a fund would receive to sell an asset or pay to transfer a liability in an orderly transaction between market participants at the measurement date. The BlackRock Global Valuation Methodologies Committee (the “Global Valuation
| 32 | 2015 iSHARES ANNUAL REPORTTO SHAREHOLDERS |
Table of Contents
Notes to Financial Statements (Continued)
iSHARES®, INC.
Committee”) provides oversight of the valuation of investments for the Funds. The investments of each Fund are valued pursuant to policies and procedures developed by the Global Valuation Committee and approved by the Board of Directors of the Company (the “Board”).
| • | Equity investments traded on a recognized securities exchange are valued at that day’s last reported trade price or the official closing price, as applicable, on the exchange where the stock is primarily traded. Equity investments traded on a recognized exchange for which there were no sales on that day are valued at the last traded price. |
| • | Exchange-traded funds and closed-end funds traded on a recognized securities exchange are valued at that day’s last reported trade price or the official closing price, as applicable, on the exchange where the fund is primarily traded. Funds traded on a recognized exchange for which there were no sales on that day are valued at the last traded price. |
| • | Open-end U.S. mutual funds are valued at that day’s published net asset value (“NAV”). |
| • | Futures contracts are valued at that day’s last reported settlement price on the exchange where the contract is traded. |
| • | Forward currency contracts are valued based on that day’s prevailing forward exchange rate for the underlying currencies. |
In the event that application of these methods of valuation results in a price for an investment which is deemed not to be representative of the fair value of such investment or if a price is not available, the investment will be valued based upon other available factors deemed relevant by the Global Valuation Committee, in accordance with policies approved by the Board. These factors include but are not limited to (i) attributes specific to the investment; (ii) the principal market for the investment; (iii) the customary participants in the principal market for the investment; (iv) data assumptions by market participants for the investment, if reasonably available; (v) quoted prices for similar investments in active markets; and (vi) other factors, such as future cash flows, interest rates, yield curves, volatilities, prepayment speeds, loss severities, credit risks and/or default rates. Valuations based on such factors are reported to the Board on a quarterly basis.
The Global Valuation Committee employs various methods for calibrating valuation approaches for investments where an active market does not exist, including regular due diligence of the Company’s pricing vendors, a regular review of key inputs and assumptions, transactional back-testing or disposition analysis to compare unrealized gains and losses to realized gains and losses, reviews of missing or stale prices, reviews of large movements in market values, and reviews of market related activity.
Fair value pricing could result in a difference between the prices used to calculate a Fund’s NAV and the prices used by the Fund’s underlying index, which in turn could result in a difference between the Fund’s performance and the performance of the Fund’s underlying index.
Various inputs are used in determining the fair value of financial instruments. Inputs may be based on independent market data (“observable inputs”) or they may be internally developed (“unobservable inputs”). These inputs are categorized into a disclosure hierarchy consisting of three broad levels for financial reporting purposes. The level of a value determined for a financial instrument within the fair value hierarchy is based on the lowest level of any input that is significant to the fair value measurement in its entirety. The categorization of a value determined for a financial instrument within the hierarchy is based upon the pricing transparency of the instrument and is not necessarily an indication of the risk associated with investing in the instrument. The three levels of the fair value hierarchy are as follows:
| • | Level 1 — Unadjusted quoted prices in active markets for identical assets or liabilities; |
| • | Level 2 — Inputs other than quoted prices included within Level 1 that are observable for the asset or liability either directly or indirectly, including quoted prices for similar assets or liabilities in active markets, quoted prices for identical or similar assets or liabilities in markets that are not considered to be active, inputs other than quoted prices that are observable for |
NOTESTO FINANCIAL STATEMENTS | 33 |
Table of Contents
Notes to Financial Statements (Continued)
iSHARES®, INC.
the asset or liability (such as exchange rates, financing terms, interest rates, yield curves, volatilities, prepayment speeds, loss severities, credit risks and default rates) or other market-corroborated inputs; and |
| • | Level 3 — Unobservable inputs for the asset or liability, including the Global Valuation Committee’s assumptions used in determining the fair value of investments. |
Changes in valuation techniques may result in transfers in or out of an assigned level within the disclosure hierarchy. In accordance with the Company’s policy, transfers between different levels of the fair value hierarchy are deemed to have occurred as of the beginning of the reporting period.
The following table summarizes the value of each of the Funds’ investments according to the fair value hierarchy as of August 31, 2015. The breakdown of each Fund’s investments into major categories is disclosed in its respective schedule of investments.
| iShares ETF | Level 1 | Level 2 | Level 3 | Total | ||||||||||||
Currency Hedged MSCI Emerging Markets | ||||||||||||||||
Investments: | ||||||||||||||||
Assets: | ||||||||||||||||
Exchange-Traded Funds | $ | 211,270,260 | $ | — | $ | — | $ | 211,270,260 | ||||||||
Money Market Funds | 108,774 | — | — | 108,774 | ||||||||||||
|
|
|
|
|
|
|
| |||||||||
Total | $ | 211,379,034 | $ | — | $ | — | $ | 211,379,034 | ||||||||
|
|
|
|
|
|
|
| |||||||||
Derivative Financial Instruments:a | ||||||||||||||||
Assets: | ||||||||||||||||
Forward Currency Contracts | $ | — | $ | 4,944,311 | $ | — | $ | 4,944,311 | ||||||||
Liabilities: | ||||||||||||||||
Forward Currency Contracts | — | (1,859,373 | ) | — | (1,859,373 | ) | ||||||||||
|
|
|
|
|
|
|
| |||||||||
Total | $ | — | $ | 3,084,938 | $ | — | $ | 3,084,938 | ||||||||
|
|
|
|
|
|
|
| |||||||||
MSCI Emerging Markets | ||||||||||||||||
Investments: | ||||||||||||||||
Assets: | ||||||||||||||||
Common Stocks | $ | 20,098,896,373 | $ | 31,983,053 | $ | 39,043,175 | $ | 20,169,922,601 | ||||||||
Preferred Stocks | 731,937,571 | — | — | 731,937,571 | ||||||||||||
Money Market Funds | 859,598,511 | — | — | 859,598,511 | ||||||||||||
|
|
|
|
|
|
|
| |||||||||
Total | $ | 21,690,432,455 | $ | 31,983,053 | $ | 39,043,175 | $ | 21,761,458,683 | ||||||||
|
|
|
|
|
|
|
| |||||||||
Derivative Financial Instruments:a | ||||||||||||||||
Liabilities: | ||||||||||||||||
Futures Contracts | $ | (9,577,921 | ) | $ | — | $ | — | $ | (9,577,921 | ) | ||||||
|
|
|
|
|
|
|
| |||||||||
Total | $ | (9,577,921 | ) | $ | — | $ | — | $ | (9,577,921 | ) | ||||||
|
|
|
|
|
|
|
| |||||||||
| a | Shown at the unrealized appreciation (depreciation) on the contracts. |
SECURITY TRANSACTIONS AND INCOME RECOGNITION
Security transactions are accounted for on trade date. Dividend income and capital gain distributions, if any, are recognized on the ex-dividend date, net of any foreign taxes withheld at source. Any taxes withheld that are reclaimable from foreign tax authorities as of August 31, 2015 are reflected in dividends receivable. Non-cash dividends received in the form of stock in an
| 34 | 2015 iSHARES ANNUAL REPORTTO SHAREHOLDERS |
Table of Contents
Notes to Financial Statements (Continued)
iSHARES®, INC.
elective dividend, if any, are recorded as dividend income at fair value. Distributions received by the Funds may include a return of capital that is estimated by management. Such amounts are recorded as a reduction of the cost of investments or reclassified to capital gains. Interest income is accrued daily. Realized gains and losses on investment transactions are determined using the specific identification method.
FOREIGN CURRENCY TRANSLATION
The accounting records of the Funds are maintained in U.S. dollars. Foreign currencies, as well as investment securities and other assets and liabilities denominated in foreign currencies, are translated into U.S. dollars using exchange rates deemed appropriate by the investment adviser. Purchases and sales of securities, income receipts and expense payments are translated into U.S. dollars on the respective dates of such transactions.
Each Fund does not isolate the effect of fluctuations in foreign exchange rates from the effect of fluctuations in the market prices of securities. Such fluctuations are reflected by the Funds as a component of realized and unrealized gains and losses from investments for financial reporting purposes. Each Fund reports realized currency gains (losses) on foreign currency related transactions as components of net realized gain (loss) for financial reporting purposes, whereas such components are generally treated as ordinary income for federal income tax purposes. The iShares Currency Hedged MSCI Emerging Markets ETF has elected to treat realized gains (losses) from certain foreign currency contracts as capital gain (loss) for federal income tax purposes.
FOREIGN TAXES
The Funds may be subject to foreign taxes (a portion of which may be reclaimable) on income, stock dividends, capital gains on investments, or certain foreign currency transactions. All foreign taxes are recorded in accordance with the applicable foreign tax regulations and rates that exist in the foreign jurisdictions in which the Funds invest. These foreign taxes, if any, are paid by the Funds and are reflected in their statements of operations as follows: foreign taxes withheld at source are presented as a reduction of income, foreign taxes on securities lending income are presented as a reduction of securities lending income, foreign taxes on stock dividends are presented as “other foreign taxes,” and foreign taxes on capital gains from sales of investments and foreign taxes on foreign currency transactions are included in their respective net realized gain (loss) categories. Foreign taxes payable or deferred as of August 31, 2015, if any, are disclosed in the Funds’ statements of assets and liabilities.
The iShares MSCI Emerging Markets ETF conducts its investment activities in India through its Subsidiary and expects to obtain benefits under the Double Tax Avoidance Agreement (“DTAA”) between India and Mauritius. In order to be eligible to claim benefits under the DTAA, the Subsidiary must, on an annual basis, satisfy certain tests and conditions, including the establishment and maintenance of valid tax residence in Mauritius and related requirements. The Fund has obtained a current tax residence certificate issued by the Mauritian Revenue Authorities.
Based upon current interpretation and practice of the current tax laws in India and Mauritius and the DTAA, the Subsidiary is subject to tax in Mauritius on its net income at the rate of 15%. However, a system of tax credits effectively reduces the Mauritius income tax rate to a maximum of 3%. These income taxes, if any, are paid by the Fund and are disclosed in the consolidated statement of operations. Any dividends paid by the Subsidiary to the Fund are not subject to tax in Mauritius. Further, the Subsidiary is also exempt from tax in Mauritius on any gains from the sale of securities.
However, there can be no assurance that any future changes to the India-Mauritius treaty will not adversely affect the tax position of the Fund’s investments in India. If the DTAA is interpreted, amended, terminated, renegotiated, or possibly overridden by the General Anti-Avoidance Rules provisions (which are due to take effect April 1, 2017, the details of which are pending further authoritative guidance), in a manner that would adversely affect the tax position in India of the Fund, such an interpretation, amendment, or override renegotiation may cause the Fund to incur capital gains tax in India. Tax laws in India also include
NOTESTO FINANCIAL STATEMENTS | 35 |
Table of Contents
Notes to Financial Statements (Continued)
iSHARES®, INC.
provisions that impose Indian tax on the transfer of shares of an Indian company. However, until more definitive authoritative guidance on the final applicability of this provision to the Fund is available, the impact to the Fund, if any, cannot be determined at this time.
DISTRIBUTIONS TO SHAREHOLDERS
Dividends and distributions paid by each Fund are recorded on the ex-dividend dates. Distributions are determined on a tax basis and may differ from net investment income and net realized capital gains for financial reporting purposes. Dividends and distributions are paid in U.S. dollars and cannot be automatically reinvested in additional shares of the Funds.
LOANS OF PORTFOLIO SECURITIES
Each Fund may lend its investment securities to approved borrowers, such as brokers, dealers and other financial institutions. The borrower pledges and maintains with the Fund collateral consisting of cash, an irrevocable letter of credit issued by a bank, or securities issued or guaranteed by the U.S. government. The initial collateral received by each Fund is required to have a value of at least 102% of the current value of the loaned securities for securities traded on U.S. exchanges and a value of at least 105% for all other securities. The collateral is maintained thereafter, at a value equal to at least 100% of the current value of the securities on loan. The market value of the loaned securities is determined at the close of each business day of the Funds. Any additional required collateral is delivered to the Funds and any excess collateral is returned by the Funds on the next business day. During the term of the loan, each Fund is entitled to all distributions made on or in respect of the loaned securities. Loans of securities are terminable at any time and the borrower, after notice, is required to return borrowed securities within the standard time period for settlement of securities transactions.
Any cash received as collateral for securities on loan may be reinvested in certain short-term instruments either directly on behalf of a fund or through one or more joint accounts or money market funds, including those managed by BlackRock Fund Advisors (“BFA”), the Funds’ investment adviser, or its affiliates. As of August 31, 2015, any securities on loan were collateralized by cash. The cash collateral received was invested in money market funds managed by BFA and is disclosed in the schedules of investments. The securities on loan for each Fund are also disclosed in its schedule of investments. The total value of any securities on loan as of August 31, 2015 and the total value of the related collateral are disclosed in the statements of assets and liabilities. Income earned by the Funds from securities lending is disclosed in the statements of operations.
The risks of securities lending include the risk that the borrower may not provide additional collateral when required or may not return the securities when due. To mitigate these risks, the Funds benefit from a borrower default indemnity provided by BlackRock, Inc. (“BlackRock”). BlackRock’s indemnity allows for full replacement of securities lent. Each Fund could suffer a loss if the value of the investments purchased with cash collateral falls below the value of the cash collateral received.
Securities lending transactions are entered into by the Funds under Master Securities Lending Agreements (“MSLA”) which provide the right, in the event of default (including bankruptcy or insolvency) for the non-defaulting party to liquidate the collateral and calculate a net exposure to the defaulting party or request additional collateral. In the event that a borrower defaults, a Fund, as lender, would offset the market value of the collateral received against the market value of the securities loaned. The value of the collateral is typically greater than that of the market value of the securities loaned, leaving the lender with a net amount payable to the defaulting party. However, bankruptcy or insolvency laws of a particular jurisdiction may impose restrictions on or prohibitions against such a right of offset in the event of an MSLA counterparty’s bankruptcy or insolvency. Under the MSLA, the borrower can resell or re-pledge the loaned securities, and a Fund can reinvest cash collateral, or, upon an event of default, resell or re-pledge the collateral.
| 36 | 2015 iSHARES ANNUAL REPORTTO SHAREHOLDERS |
Table of Contents
Notes to Financial Statements (Continued)
iSHARES®, INC.
The following table is a summary of securities lending agreements which are subject to offset under an MSLA as of August 31, 2015:
| iShares ETF | Market Value of Securities on Loan | Cash Collateral Received a | Net Amount | |||||||||
MSCI Emerging Markets | $ | 802,422,761 | $ | 802,422,761 | $ | — | ||||||
| a | Collateral received in excess of the market value of securities on loan is not presented for financial reporting purposes. The total collateral received is disclosed in the Fund’s consolidated statement of assets and liabilities. |
| 2. | INVESTMENT ADVISORY AGREEMENT AND OTHER TRANSACTIONS WITH AFFILIATES |
Pursuant to an Investment Advisory Agreement with the Company, BFA manages the investment of each Fund’s assets. BFA is a California corporation indirectly owned by BlackRock. Under the Investment Advisory Agreement, BFA is responsible for substantially all expenses of the Funds, except interest, taxes, brokerage commissions and other expenses connected with the execution of portfolio transactions, distribution fees, litigation expenses and any extraordinary expenses.
With respect to the iShares MSCI Emerging Markets ETF, the Subsidiary has entered into a separate contract with BFA under which BFA provides investment advisory services to the Subsidiary but does not receive separate compensation from the Subsidiary for providing it with such services. The Subsidiary has also entered into separate arrangements that provide for the provision of other services to the Subsidiary (including administrative, custody, transfer agency and other services), and BFA pays the costs and expenses related to the provision of those services.
For its investment advisory services to the iShares Currency Hedged MSCI Emerging Markets ETF, BFA is entitled to an annual investment advisory fee of 0.78% based on the average daily net assets of the Fund. In addition, the Fund indirectly pays its pro rata share of fees and expenses attributable to its investments in other investment companies (“acquired fund fees and expenses”). BFA has contractually agreed to waive a portion of its investment advisory fees for the Fund through December 31, 2020 on assets attributable to the Fund’s investments in the iShares MSCI Emerging Markets ETF (“EEM”) (and those assets used by the Fund to hedge the Fund’s exposure to the securities in EEM’s portfolio against the U.S. dollar) such that the Fund’s total annual investment advisory fee is equal to EEM’s net total expense ratio. Prior to May 22, 2015, BFA waived a portion of its investment advisory fees on assets attributable to the Fund’s investments in EEM (and those assets used by the Fund to hedge the Fund’s exposure to the securities in EEM’s portfolio against the U.S. dollar) such that the Fund’s total annual investment advisory fee was equal to EEM’s net total expense ratio plus 0.03%.
For its investment advisory services to the iShares MSCI Emerging Markets ETF, BFA is entitled to an annual investment advisory fee based on the Fund’s allocable portion of the aggregate of the average daily net assets of the Fund and certain other iShares funds, as follows:
| Investment Advisory Fee | Aggregate Average Daily Net Assets | ||||
| 0.75 | % | First $14 billion | |||
| 0.68 | Over $14 billion, up to and including $28 billion | ||||
| 0.61 | Over $28 billion, up to and including $42 billion | ||||
| 0.54 | Over $42 billion, up to and including $56 billion | ||||
| 0.47 | Over $56 billion, up to and including $70 billion | ||||
| 0.41 | Over $70 billion, up to and including $84 billion | ||||
| 0.35 | Over $84 billion | ||||
NOTESTO FINANCIAL STATEMENTS | 37 |
Table of Contents
Notes to Financial Statements (Continued)
iSHARES®, INC.
BFA has contractually agreed to waive a portion of its investment advisory fees for the iShares MSCI Emerging Markets ETF through December 31, 2015 in an amount equal to the acquired fund fees and expenses attributable to the Fund’s investments in other iShares funds, if any.
The U.S. Securities and Exchange Commission has issued an exemptive order which permits BlackRock Institutional Trust Company, N.A. (“BTC”), an affiliate of BFA, to serve as securities lending agent for the Funds, subject to applicable conditions. As securities lending agent, BTC bears all operational costs directly related to securities lending. Each Fund is responsible for fees in connection with the investment of cash collateral received for securities on loan in a money market fund managed by BFA, however, BTC has agreed to reduce the amount of securities lending income it receives in order to effectively limit the collateral investment fees each Fund bears to an annual rate of 0.04% (the “collateral investment fees”). Securities lending income is equal to the total of income earned from the reinvestment of cash collateral, net of fees and other payments to and from borrowers of securities, and less the collateral investment fees. The Funds retain a portion of securities lending income and remit the remaining portion to BTC as compensation for its services as securities lending agent.
Pursuant to a securities lending agreement, each Fund retains 80% of securities lending income and the amount retained can never be less than 70% of the total of securities lending income plus the collateral investment fees. In addition, commencing the business day following the date that the aggregate securities lending income plus the collateral investment fees generated across all 1940 Act iShares exchange-traded funds (the “iShares ETF Complex”) in a given calendar year exceeds the aggregate securities lending income generated across the iShares ETF Complex in the calendar year 2013, each Fund, pursuant to a securities lending agreement, will retain for the remainder of that calendar year 85% of securities lending income and the amount retained can never be less than 70% of the total of securities lending income plus the collateral investment fees.
Prior to January 1, 2015, each Fund retained 75% of securities lending income and the amount retained was never less than 65% of the total of securities lending income plus the collateral investment fees. In addition, commencing the business day following the date that the aggregate securities lending income plus the collateral investment fees generated across the iShares ETF Complex in the calendar year 2014 exceeded the aggregate securities lending income generated across the iShares ETF Complex in the calendar year 2013 and pursuant to a securities lending agreement, each Fund retained for the remainder of the calendar year 2014, 80% of securities lending income and the amount retained was never less than 65% of the total of securities lending income plus the collateral investment fees.
For the year ended August 31, 2015, the iShares MSCI Emerging Markets ETF paid to BTC securities lending agent services and collateral investment fees in the amount of $7,730,625.
For the year ended August 31, 2015, BTC, the Funds’ securities lending agent, has agreed to voluntarily reimburse the iShares MSCI Emerging Markets ETF in the amount of $169,005, related to the foreign tax on the securities lending income. Such reimbursement is included in “Securities lending income – affiliated – net” in the Fund’s consolidated statement of operations.
BlackRock Investments, LLC, an affiliate of BFA, is the distributor for each Fund. Pursuant to the distribution agreement, BFA is responsible for any fees or expenses for distribution services provided to the Funds.
Cross trades for the period ended August 31, 2015, if any, were executed by the Funds pursuant to Rule 17a-7 under the 1940 Act. Cross trading is the buying or selling of portfolio securities between funds to which BFA (or an affiliate) serves as investment adviser. At its regularly scheduled quarterly meetings, the Board reviews such transactions as of the most recent calendar quarter for compliance with the requirements and restrictions set forth by Rule 17a-7.
Each Fund may invest its positive cash balances in certain money market funds managed by BFA or an affiliate. The income earned on these temporary cash investments is included in “Interest – affiliated” in the statements of operations.
| 38 | 2015 iSHARES ANNUAL REPORTTO SHAREHOLDERS |
Table of Contents
Notes to Financial Statements (Continued)
iSHARES®, INC.
The PNC Financial Services Group, Inc. is the largest stockholder of BlackRock and is considered to be an affiliate of the Funds for 1940 Act purposes.
Each Fund, in order to improve its portfolio liquidity and its ability to track its underlying index, may invest in shares of other iShares funds that invest in securities in each Fund’s respective underlying index.
Investments in issuers considered to be affiliates of the Funds (excluding money market funds) during the year ended August 31, 2015, for purposes of Section 2(a)(3) of the 1940 Act, were as follows:
| iShares ETF and Name of Affiliated Issuer | Shares Held at Beginning of Year | Shares Purchased | Shares Sold | Shares Held at End of Year | Value at End of Year | Dividend Income | Net Realized Gain (Loss) | |||||||||||||||||||||
Currency Hedged MSCI Emerging Markets | ||||||||||||||||||||||||||||
iShares MSCI Emerging Markets ETF | — | 6,980,255 | (737,044 | ) | 6,243,211 | $ | 211,270,260 | $ | 1,478,109 | $ | (1,299,050 | ) | ||||||||||||||||
|
|
|
|
|
| |||||||||||||||||||||||
Certain directors and officers of the Company are also officers of BTC and/or BFA.
| 3. | INVESTMENT PORTFOLIO TRANSACTIONS |
Purchases and sales of investments (excluding in-kind transactions and short-term investments) for the year ended August 31, 2015 were as follows:
| iShares ETF | Purchases | Sales | ||||||
Currency Hedged MSCI Emerging Markets | $ | 14,623,310 | $ | 6,248,527 | ||||
MSCI Emerging Markets | 3,135,531,291 | 10,592,196,300 | ||||||
In-kind transactions (see Note 4) for the year ended August 31, 2015 were as follows:
| iShares ETF | In-kind Purchases | In-kind Sales | ||||||
Currency Hedged MSCI Emerging Markets | $ | 259,575,270 | $ | 21,429,484 | ||||
MSCI Emerging Markets | 834,327,016 | 7,447,259,662 | ||||||
| 4. | CAPITAL SHARE TRANSACTIONS |
Capital shares are issued and redeemed by each Fund only in aggregations of a specified number of shares or multiples thereof (“Creation Units”) at NAV. Except when aggregated in Creation Units, shares of each Fund are not redeemable. Transactions in capital shares for each Fund are disclosed in detail in the statements of changes in net assets.
The consideration for the purchase of Creation Units of a fund in the Company generally consists of the in-kind deposit of a designated portfolio of securities and a specified amount of cash. Certain funds in the Company may be offered in Creation Units solely or partially for cash in U.S. dollars. Investors purchasing and redeeming Creation Units may pay a purchase transaction fee and a redemption transaction fee directly to State Street Bank and Trust Company, the Company’s administrator, to offset transfer and other transaction costs associated with the issuance and redemption of Creation Units, including Creation Units for
NOTESTO FINANCIAL STATEMENTS | 39 |
Table of Contents
Notes to Financial Statements (Continued)
iSHARES®, INC.
cash. Investors transacting in Creation Units for cash may also pay an additional variable charge to compensate the relevant fund for certain transaction costs (i.e., stamp taxes, taxes on currency or other financial transactions, and brokerage costs) and market impact expenses relating to investing in portfolio securities. Such variable charges, if any, are included in “Proceeds from shares sold” in the statements of changes in net assets.
From time to time, settlement of securities related to in-kind contributions or in-kind redemptions may be delayed. In such cases, securities related to in-kind contributions are reflected as “Due from custodian” and securities related to in-kind redemptions are reflected as “Securities related to in-kind transactions” in the statement of assets and liabilities.
| 5. | FUTURES CONTRACTS |
Each Fund may purchase or sell futures contracts in an effort to help such Fund track its underlying index. A futures contract is a standardized, exchange-traded agreement to buy and sell a financial instrument at a set price on a future date. Upon entering into a futures contract, the Fund is required to pledge to the executing broker which holds segregated from its own assets, an amount of cash, U.S. government securities or other high-quality debt and equity securities equal to the minimum initial margin requirements of the exchange on which the contract is traded. Pursuant to the contract, the Fund agrees to receive from or pay to the broker an amount of cash equal to the daily fluctuation in value of the contract. Such receipts or payments are known as margin variation and are recorded by the Fund as unrealized appreciation or depreciation. When the contract is closed, the Fund records a realized gain or loss equal to the difference between the value of the contract at the time it was opened and the value at the time it was closed. Losses may arise if the value of a futures contract decreases due to an unfavorable change in the market rates or values of the underlying instrument during the term of the contract or if the counterparty does not perform under the contract. The use of futures contracts also involves the risk of an imperfect correlation in the movements in the price of futures contracts and the assets underlying such contracts.
The following table shows the value of futures contracts held by the iShares MSCI Emerging Markets ETF as of August 31, 2015 and the related locations in the consolidated statement of assets and liabilities, presented by risk exposure category:
| Liabilities | ||||
Equity contracts: | ||||
Variation margin/Net assets consist of – net unrealized depreciationa | $ | 9,577,921 | ||
|
| |||
| a | Represents cumulative depreciation of futures contracts as reported in the consolidated schedule of investments. Only current day’s variation margin is reported separately within the consolidated statement of assets and liabilities. |
The following table shows the realized and unrealized gains (losses) on futures contracts held by the iShares MSCI Emerging Markets ETF during the year ended August 31, 2015 and the related locations in the consolidated statement of operations, presented by risk exposure category:
| Net Realized Gain (Loss) | Net Change in Unrealized Appreciation/Depreciation | |||||||
Equity contracts: | ||||||||
Futures contracts | $ | (29,867,869 | ) | $ | (15,877,447 | ) | ||
|
|
|
| |||||
| 40 | 2015 iSHARES ANNUAL REPORTTO SHAREHOLDERS |
Table of Contents
Notes to Financial Statements (Continued)
iSHARES®, INC.
The following table shows the average quarter-end balances of open futures contracts held by the iShares MSCI Emerging Markets ETF for the year ended August 31, 2015:
Average value of contracts purchased | $ | 126,441,115 |
| 6. | FORWARD CURRENCY CONTRACTS |
Each Fund may enter into forward currency contracts for the purpose of hedging against the effects of foreign currencies on the value of such Fund’s assets that are denominated in a non-U.S. currency. A forward currency contract is an obligation to purchase or sell a currency against another currency at a specified future date at an agreed upon price and quantity. Forward currency contracts are traded over-the-counter (“OTC”) and not on an organized exchange. The contract is marked-to-market daily and the change in market value is recorded as unrealized appreciation or depreciation. When the contract is closed, a realized gain or loss equal to the difference between the value at the time it was opened and the value at the time it was closed is recorded. Losses may arise if there are unfavorable movements in the value of a foreign currency relative to the U.S. dollar or if the counterparties do not meet the terms of the agreement. The Fund’s use of forward currency contracts also involves the risks of imperfect correlation between the value of its currency positions and its other investments or the Fund failing to close out its position due to an illiquid market.
The following table shows the value of forward currency contracts held by the iShares Currency Hedged MSCI Emerging Markets ETF as of August 31, 2015 and the related locations in the statement of assets and liabilities, presented by risk exposure category:
| Assets | ||||
Forward currency contracts: | ||||
Unrealized appreciation on forward currency contracts/Net assets consist of – net unrealized appreciation | $ | 4,944,311 | ||
|
| |||
| Liabilities | ||||
Forward currency contracts: | ||||
Unrealized depreciation on forward currency contracts/Net assets consist of – net unrealized appreciation | $ | 1,859,373 | ||
|
| |||
The following table shows the realized and unrealized gains (losses) on forward currency contracts held by the iShares Currency Hedged MSCI Emerging Markets ETF during the year ended August 31, 2015 and the related locations in the statement of operations, presented by risk exposure category:
| Net Realized Gain (Loss) | Net Change in Unrealized Appreciation/Depreciation | |||||||
Forward currency contracts: | ||||||||
Foreign currency transactions/Forward currency contracts | $ | 5,164,162 | $ | 3,084,938 | ||||
|
|
|
| |||||
NOTESTO FINANCIAL STATEMENTS | 41 |
Table of Contents
Notes to Financial Statements (Continued)
iSHARES®, INC.
The following table shows the average quarter-end balances of outstanding forward currency contracts held by the iShares Currency Hedged MSCI Emerging Markets ETF for the year ended August 31, 2015:
Average amounts purchased in U.S. dollars | $ | 117,820,532 | ||
Average amounts sold in U.S. dollars | $ | 226,355,561 |
The Fund’s risk of loss from counterparty credit risk on OTC derivatives is generally limited to the aggregate unrealized gain netted against any collateral held by the Fund. In order to better define its contractual rights and to secure rights that will help the Fund to mitigate its counterparty risk, the Fund may enter into an International Swaps and Derivatives Association, Inc. master agreement (“ISDA Master Agreement”) or similar agreement with its derivative contract counterparties. An ISDA Master Agreement is a bilateral agreement between the Fund and a counterparty that governs OTC derivatives and foreign exchange contracts and typically contains, among other things, collateral posting terms and netting provisions in the event of a default and/or termination event. The provisions of the ISDA Master Agreement typically permit a single net payment in the event of default including the bankruptcy or insolvency of the counterparty. However, bankruptcy or insolvency laws of a particular jurisdiction may impose restrictions on or prohibitions against the right of offset in bankruptcy or insolvency.
The collateral requirements under an ISDA Master Agreement are typically calculated by netting the mark-to-market amount for each transaction under such agreement, and comparing that amount to the value of any collateral currently pledged by the parties. Forward currency contracts held by the Fund generally do not require collateral. To the extent amounts due to the Fund from the counterparty are not fully collateralized, contractually or otherwise, the Fund bears the risk of loss from counterparty non-performance. The Fund attempts to mitigate counterparty risk by only entering into agreements with counterparties that it believes have the financial resources to honor their obligations and by monitoring the financial stability of those counterparties.
For financial reporting purposes, the Fund does not offset financial assets and financial liabilities that are subject to netting arrangements in the statement of assets and liabilities.
The following table presents the exposure of the open forward currency contracts held by the iShares Currency Hedged MSCI Emerging Markets ETF that are subject to potential offset on the statement of assets and liabilities as of August 31, 2015:
| Derivative Assets Subject to Offsetting | Derivatives Available for Offset | Net Amount of Derivative Assets | ||||||||||
Forward currency contracts | $ | 4,944,311 | $ | (1,474,666 | ) | $ | 3,469,645 | |||||
|
|
|
|
|
| |||||||
| Derivative Liabilities Subject to Offsetting | Derivatives Available for Offset | Net Amount of Derivative Liabilities | ||||||||||
Forward currency contracts | $ | 1,859,373 | $ | (1,474,666 | ) | $ | 384,707 | |||||
|
|
|
|
|
| |||||||
| 42 | 2015 iSHARES ANNUAL REPORTTO SHAREHOLDERS |
Table of Contents
Notes to Financial Statements (Continued)
iSHARES®, INC.
| 7. | PRINCIPAL RISKS |
In the normal course of business, each Fund’s investment activities expose it to various types of risk associated with the financial instruments and markets in which it invests. The significant types of financial risks each Fund is exposed to include market risk and credit risk. Each Fund’s prospectus provides details of these and other types of risk.
BFA uses a “passive” or index approach to try to achieve each Fund’s investment objective following the securities included in its underlying index during upturns as well as downturns. BFA does not take steps to reduce market exposure or to lessen the effects of a declining market. Divergence from the underlying index and the composition of the portfolio is monitored by BFA.
MARKET RISK
Market risk arises mainly from uncertainty about future values of financial instruments influenced by price, currency and interest rate movements. It represents the potential loss each Fund may suffer through holding market positions in the face of market movements. Each Fund is exposed to market risk by virtue of its direct or indirect investment in equity and financial derivative instruments. The fair value of securities held by the Funds may decline due to general market conditions, economic trends or events that are not specifically related to the issuers of the securities including local, regional or global political, social or economic instability or to factors that affect a particular industry or group of industries. The extent of each Fund’s exposure to market risk is the market value of the investments held as shown in the Fund’s schedule of investments.
A diversified portfolio, where this is appropriate and consistent with a fund’s objectives, minimizes the risk that a price change of a particular investment will have a material impact on the NAV of a fund. The investment concentrations within each Fund’s portfolio are disclosed in its schedule of investments.
Each Fund invests a substantial amount of its assets, with the iShares Currency Hedged MSCI Emerging Markets ETF investing indirectly, in securities of non-U.S. issuers that trade in non-U.S. markets. This involves certain considerations and risks not typically associated with securities of U.S. issuers. Such risks include, but are not limited to: generally less liquid and less efficient securities markets; generally greater price volatility; exchange rate fluctuations and exchange controls; imposition of restrictions on the expatriation of funds or other assets of the Fund; less publicly available information about issuers; the imposition of withholding or other taxes; higher transaction and custody costs; settlement delays and risk of loss attendant in settlement procedures; difficulties in enforcing contractual obligations; less regulation of securities markets; different accounting, disclosure and reporting requirements; more substantial governmental involvement in the economy; higher inflation rates; greater social, economic and political uncertainties; the risk of nationalization or expropriation of assets; and the risk of war. These risks are heightened for investments in issuers from countries with less developed markets.
The United States and the European Union, along with the regulatory bodies of a number of countries including Japan, Australia and Canada (collectively, “Sanctioning Bodies”), have imposed sectorial economic sanctions on certain Russian individuals and Russian corporate entities which include prohibitions on transacting in or dealing in new debt of longer than 30 or 90 days maturity or new equity of such issuers. Securities held by the iShares MSCI Emerging Markets ETF issued prior to the date of the sanctions being imposed are not currently subject to any restrictions under the sanctions. However, compliance with each of these sanctions may impair the ability of a Fund to buy, sell, hold, receive or deliver the affected securities or other securities of such issuers. The Sanctioning Bodies could also institute broader sanctions on Russia. These sanctions, or even the threat of further sanctions, may result in the decline of the value and liquidity of Russian securities, a weakening of the ruble or other adverse consequences to the Russian economy. Current or future sanctions may result in Russia taking counter measures or retaliatory actions, which may further impair the value and liquidity of Russian securities. These retaliatory measures may include the immediate freeze of Russian assets held by a Fund.
NOTESTO FINANCIAL STATEMENTS | 43 |
Table of Contents
Notes to Financial Statements (Continued)
iSHARES®, INC.
CREDIT RISK
Credit risk is the risk that an issuer or guarantor of debt instruments or the counterparty to a financial transaction, including derivatives contracts, repurchase agreements or loans of portfolio securities, is unable or unwilling to make timely interest and/or principal payments or to otherwise honor its obligations. BFA and its affiliates manage counterparty credit risk by entering into transactions only with counterparties that they believe have the financial resources to honor their obligations and by monitoring the financial stability of those counterparties. Financial assets, which potentially expose the Funds to issuer and counterparty credit risks, consist principally of financial instruments and receivables due from counterparties. The extent of each Fund’s exposure to credit and counterparty risks with respect to those financial assets is approximated by their value recorded in its statement of assets and liabilities.
| 8. | INCOME TAX INFORMATION |
Each Fund is treated as an entity separate from the Company’s other funds for federal income tax purposes. It is the policy of each Fund to qualify as a regulated investment company by complying with the provisions applicable to regulated investment companies, as defined under Subchapter M of the Internal Revenue Code of 1986, as amended, and to annually distribute substantially all of its ordinary income and any net capital gains (taking into account any capital loss carryforwards) sufficient to relieve it from all, or substantially all, federal income and excise taxes. Accordingly, no provision for federal income taxes is required.
U.S. GAAP requires that certain components of net assets be adjusted to reflect permanent differences between financial and tax reporting. These reclassifications have no effect on net assets or NAV per share. The following permanent differences as of August 31, 2015, attributable to the use of equalization, passive foreign investment companies, the expiration of capital loss carryforwards, foreign currency transactions and realized gains (losses) from in-kind redemptions, were reclassified to the following accounts:
| iShares ETF | Paid-in Capital | Undistributed Net Investment Income/Distributions in Excess of Net Investment Income | Undistributed Net Realized Gain/Accumulated Net Realized Loss | |||||||||
Currency Hedged MSCI Emerging Markets | $ | (909,428 | ) | $ | 2,268 | $ | 907,160 | |||||
MSCI Emerging Markets | 391,951,262 | (252,948 | ) | (391,698,314 | ) | |||||||
The tax character of distributions paid during the years ended August 31, 2015 and August 31, 2014 was as follows:
| iShares ETF | 2015 | 2014 | ||||||
Currency Hedged MSCI Emerging Markets | ||||||||
Ordinary income | $ | 1,468,085 | N/A | |||||
|
|
|
| |||||
MSCI Emerging Markets | ||||||||
Ordinary income | $ | 661,275,094 | $ | 673,353,625 | ||||
|
|
|
| |||||
| 44 | 2015 iSHARES ANNUAL REPORTTO SHAREHOLDERS |
Table of Contents
Notes to Financial Statements (Continued)
iSHARES®, INC.
As of August 31, 2015, the tax components of accumulated net earnings (losses) were as follows:
| iShares ETF | Undistributed Ordinary Income | Undistributed Long-Term Capital Gains | Capital Loss Carryforwards | Net Unrealized Gains (Losses) a | Qualified Late-Year Losses b | Total | ||||||||||||||||||
Currency Hedged MSCI Emerging Markets | $ | 3,108,288 | $ | 4,214,422 | $ | — | $ | (33,416,758 | ) | $ | — | $ | (26,094,048 | ) | ||||||||||
MSCI Emerging Markets | 147,435,024 | — | (7,134,479,897 | ) | (4,928,527,642 | ) | (1,621,741,333 | ) | (13,537,313,848 | ) | ||||||||||||||
| a | The difference between book-basis and tax-basis unrealized gains (losses) was attributable primarily to the tax deferral of losses on wash sales, the realization for tax purposes of unrealized gains (losses) on certain futures and foreign currency contracts, and the realization for tax purposes of unrealized gains on investments in passive foreign investment companies. |
| b | The Funds have elected to defer certain qualified late-year losses and recognize such losses in the year ending next taxable year. |
As of August 31, 2015, the following Fund had capital loss carryforwards available to offset future realized capital gains through the indicated expiration dates as follows:
| iShares ETF | Non- Expiring a | Expiring 2016 | Expiring 2017 | Expiring 2018 | Expiring 2019 | Total | ||||||||||||||||||
MSCI Emerging Markets | $ | 4,817,904,318 | $ | 13,844,901 | $ | 228,196,854 | $ | 1,201,366,175 | $ | 873,167,649 | $ | 7,134,479,897 | ||||||||||||
| a | Must be utilized prior to losses subject to expiration. |
The Funds may own shares in certain foreign investment entities, referred to, under U.S. tax law, as “passive foreign investment companies.” The Funds may elect to mark-to-market annually the shares of each passive foreign investment company and would be required to distribute to shareholders any such marked-to-market gains.
As of August 31, 2015, gross unrealized appreciation and gross unrealized depreciation based on cost for federal income tax purposes were as follows:
| iShares ETF | Tax Cost | Gross Unrealized Appreciation | Gross Unrealized Depreciation | Net Unrealized Appreciation (Depreciation) | ||||||||||||
Currency Hedged MSCI Emerging Markets | $ | 245,590,103 | $ | — | $ | (34,211,069 | ) | $ | (34,211,069 | ) | ||||||
MSCI Emerging Markets | 26,687,703,880 | 2,717,407,736 | (7,643,652,933 | ) | (4,926,245,197 | ) | ||||||||||
Management has analyzed tax laws and regulations and their application to the Funds as of August 31, 2015, inclusive of the open tax return years, and does not believe there are any uncertain tax positions that require recognition of a tax liability in the Funds’ financial statements.
NOTESTO FINANCIAL STATEMENTS | 45 |
Table of Contents
Notes to Financial Statements (Continued)
iSHARES®, INC.
| 9. | LINE OF CREDIT |
The iShares MSCI Emerging Markets ETF, along with certain other iShares funds, are parties to a $150 million credit agreement with State Street Bank and Trust Company, which expires on October 28, 2015. The line of credit may be used for temporary or emergency purposes, including redemptions, settlement of trades and rebalancing of portfolio holdings. The credit agreement has the following terms: a commitment fee of 0.08% per annum on the unused portion of the credit agreement and interest at a rate equal to the higher of (a) the one-month LIBOR plus 1.00% per annum or (b) the U.S. Federal Funds rate plus 1.00% per annum on amounts borrowed. The commitment fee is allocated to each fund participating in the credit agreement based on each fund’s pro-rata share of the aggregate average daily value of assets invested in local securities of certain foreign markets.
On September 17, 2015, the Board amended the terms of the credit agreement as follows: (i) increased the maximum borrowing amount to $250 million; (ii) increased the commitment fee to 0.20% per annum on the unused portion of the credit agreement and interest at a rate equal to the higher of (a) the one-month LIBOR (not less than zero) plus 1.00% per annum or (b) the U.S. Federal Funds rate (not less than zero) plus 1.00% per annum on amounts borrowed; and (iii) extended the expiration date to October 28, 2016. These changes are expected to be effective on or around October 28, 2015.
For the year ended August 31, 2015, the Fund’s maximum amount borrowed, the average borrowings and the weighted average interest rate under the credit agreement were $75,750,000, $1,313,699 and 1.18%, respectively.
| 10. | LEGAL PROCEEDINGS |
On January 18, 2013, a lawsuit was filed in the United States District Court for the Middle District of Tennessee by Laborers’ Local 265 Pension Fund and Plumbers and Pipefitters Local No. 572 Pension Fund (the “Plaintiffs”) against BFA, BTC, and the current members of the iShares Trust Board of Trustees and the Board of Directors of iShares, Inc. (collectively, “Defendants”) for alleged violations of, among other things, Sections 36(a) and 36(b) of the 1940 Act. The complaint purports to be brought derivatively on behalf of iShares Trust and iShares, Inc., as well as the following eight funds: iShares Russell Mid-Cap ETF; iShares MSCI EAFE ETF; iShares MSCI Emerging Markets ETF; iShares Russell 2000 Growth ETF; iShares Russell 2000 Value ETF; iShares Core S&P Mid-Cap ETF; iShares Core S&P Small-Cap ETF; and iShares U.S. Real Estate ETF. The complaint alleges, among other things, that BFA and BTC breached their fiduciary duties under the 1940 Act by charging allegedly excessive fees in connection with the provision of securities lending services to the above eight funds, that the individual defendants breached their fiduciary duties under the 1940 Act by approving those fee arrangements, and that the securities lending contracts are unenforceable under Section 47(b) of the 1940 Act. The Plaintiffs sought injunctive relief, rescission of the securities lending contracts, and monetary damages of an unspecified amount. The Defendants believe that the claims are without merit and intend to vigorously defend themselves against the allegations in the lawsuit. The Court dismissed the complaint with prejudice on October 24, 2013. The Plaintiffs filed a notice of appeal on November 8, 2013. On February 13, 2014, the Plaintiffs filed an appeal brief with the United States Court of Appeals for the Sixth Circuit (the “Sixth Circuit”). Oral argument of the Plaintiffs’ appeal was heard by the Sixth Circuit on July 30, 2014. On September 30, 2014, the Sixth Circuit affirmed the dismissal of the lawsuit. On December 29, 2014, the Plaintiffs filed a petition for a writ of certiorari asking the U.S. Supreme Court to hear their appeal of the Sixth Circuit’s ruling. On March 2, 2015, the U.S. Supreme Court denied the Plaintiffs’ petition, which concluded the lawsuit.
| 11. | SUBSEQUENT EVENTS |
Management has evaluated the impact of all subsequent events on the Funds through the date the financial statements were available to be issued and has determined that there were no subsequent events requiring adjustment or disclosure in the financial statements.
| 46 | 2015 iSHARES ANNUAL REPORTTO SHAREHOLDERS |
Table of Contents
Report of Independent Registered Public Accounting Firm
To the Shareholders and Board of Directors of
iShares, Inc.:
In our opinion, the accompanying statements of assets and liabilities, including the schedules of investments, and the related statements of operations and of changes in net assets and the financial highlights present fairly, in all material respects, the financial position of iShares Currency Hedged MSCI Emerging Markets ETF and iShares MSCI Emerging Markets ETF and its subsidiary (the “Funds”) at August 31, 2015, the results of each of their operations, the changes in each of their net assets and their financial highlights for each of the periods presented, in conformity with accounting principles generally accepted in the United States of America. These financial statements and financial highlights (consolidated financial statements and consolidated financial highlights for iShares MSCI Emerging Markets ETF) (hereafter referred to as “financial statements”) are the responsibility of the Funds’ management. Our responsibility is to express an opinion on these financial statements based on our audits. We conducted our audits of these financial statements in accordance with the standards of the Public Company Accounting Oversight Board (United States). Those standards require that we plan and perform the audit to obtain reasonable assurance about whether the financial statements are free of material misstatement. An audit includes examining, on a test basis, evidence supporting the amounts and disclosures in the financial statements, assessing the accounting principles used and significant estimates made by management, and evaluating the overall financial statement presentation. We believe that our audits, which included confirmation of securities at August 31, 2015 by correspondence with the custodian, transfer agent and brokers, provide a reasonable basis for our opinion.
PricewaterhouseCoopers LLP
San Francisco, California
October 22, 2015
REPORTOF INDEPENDENT REGISTERED PUBLIC ACCOUNTING FIRM | 47 |
Table of Contents
iSHARES®, INC.
Under Section 854(b)(2) of the Internal Revenue Code (the “Code”), the following maximum amounts are hereby designated as qualified dividend income for purposes of the maximum rate under Section 1(h)(11) of the Code for the fiscal year ended August 31, 2015:
| iShares ETF | Qualified Income | |||
Currency Hedged MSCI Emerging Markets | $ | 1,258,807 | ||
MSCI Emerging Markets | 500,975,310 | |||
In February 2016, shareholders will receive Form 1099-DIV which will include their share of qualified dividend income distributed during the calendar year 2015. Shareholders are advised to check with their tax advisers for information on the treatment of these amounts on their income tax returns.
For the fiscal year ended August 31, 2015, the iShares Currency Hedged MSCI Emerging Markets ETF intends to pass through to its shareholders foreign source income earned of $1,739,750 and foreign taxes paid of $261,641 by the underlying fund pursuant to Section 852(g)(1) of the Code.
For the fiscal year ended August 31, 2015, the iShares MSCI Emerging Markets ETF earned foreign source income of $868,547,881 and paid foreign taxes of $94,819,662 which it intends to pass through to its shareholders pursuant to Section 853 of the Code.
Under Section 871(k)(2)(C) of the Code, the iShares Currency Hedged MSCI Emerging Markets ETF hereby designates $2,268 as short-term capital gain dividends for the fiscal year ended August 31, 2015.
| 48 | 2015 iSHARES ANNUAL REPORTTO SHAREHOLDERS |
Table of Contents
Board Review and Approval of Investment Advisory
Contract
iSHARES®, INC.
I. iShares Currency Hedged MSCI Emerging Markets ETF
Under Section 15(c) of the Investment Company Act of 1940 (the “1940 Act”), the Company’s Board of Directors (the “Board”), including a majority of Directors who are not “interested persons” of the Company (as that term is defined in the 1940 Act) (the “Independent Directors”), is required annually to consider and approve the Investment Advisory Contract between the Company and BFA (the “Advisory Contract”) on behalf of the Fund. The Independent Directors requested, and BFA provided, such information as the Independent Directors, with advice from independent counsel, deemed reasonably necessary to evaluate the Advisory Contract. A committee of Independent Directors (the “15(c) Committee”), with independent counsel, met with management on May 1, 2015 and May 6, 2015, to discuss the types of information the Independent Directors required and the manner in which management would organize and present such information. At a meeting held on May 21, 2015, management presented preliminary information to the Board relating to the continuance of the Advisory Contract, and the Board, including the Independent Directors, reviewed and discussed such information at length. The Independent Directors requested from management certain additional information, which management agreed to provide. At a meeting held on June 24-25, 2015, the Board, including the Independent Directors, reviewed the additional information provided by management in response to these requests. After extensive discussions, the Board, including all of the Independent Directors, approved the continuance of the Advisory Contract for the Fund, based on a review of qualitative and quantitative information provided by BFA, including the additional information management provided at the request of the Independent Directors. The Board noted its satisfaction with the extent and quality of information provided and its frequent interactions with management, as well as the detailed responses and other information provided by BFA. The Board also noted that the Board and BFA agreed to discuss potential enhancements and adjustments to the 15(c) process for the coming year. The Independent Directors were advised by their independent counsel throughout the process, including about the legal standards applicable to their review. In approving the Advisory Contract for the Fund, the Board, including the Independent Directors, considered the following factors, no one of which was controlling, and reached the following conclusions:
Expenses and Performance of the Fund — The Board reviewed statistical information prepared by Lipper Inc. (“Lipper”), an independent provider of investment company data, regarding the expense ratio components, including actual advisory fees, waivers/reimbursements, and gross and net total expenses of the Fund in comparison with the same information for other exchange traded funds (including, where applicable, funds sponsored by an “at cost” service provider) and, in the limited instances where no comparable ETFs existed and the comparison group would not otherwise be reasonable in Lipper’s judgment, pure index institutional mutual funds, objectively selected by Lipper as comprising the Fund’s applicable peer group pursuant to Lipper’s proprietary ETF methodology (the “Lipper Group”). The Board was provided with a detailed description of Lipper’s proprietary ETF methodology used by Lipper to determine the Fund’s Lipper Group. The Board further noted that due to the limitations in providing comparable funds in the Lipper Group, the statistical information provided in Lipper’s report may or may not provide meaningful direct comparisons to the Fund in all instances.
The Board also noted that the investment advisory fee rate and overall expenses (net of waivers and reimbursements) for the Fund were higher than the median of the investment advisory fee rates and overall expenses (net of waivers and reimbursements) of the funds in its Lipper Group, and in the 5th Lipper quintile. The Board further noted that the Fund’s pricing reflects the additional complexity associated with the Fund’s currency hedging strategy, as compared to many of the competitor funds as determined by Lipper, which are not currency hedged.
In addition, the Board reviewed statistical information prepared by Lipper regarding the performance of the Fund for the one-, three-, five-, ten-year, and since inception periods, as applicable, and the “last quarter” period ended December 31, 2014, and a comparison of the Fund’s performance to its performance benchmark index for the same periods. To the extent that any of the comparison funds included in the Lipper Group track the same index as the Fund, Lipper also provided, and the Board reviewed, a comparison of the Fund’s performance to that of such relevant comparison funds for the same periods. The Board noted that
BOARD REVIEWAND APPROVALOF INVESTMENT ADVISORY CONTRACT | 49 |
Table of Contents
Board Review and Approval of Investment Advisory
Contract (Continued)
iSHARES®, INC.
the Fund generally performed in line with its performance benchmark index over the relevant periods. In considering this information, the Board noted that the Lipper Group may include funds that have a different investment objective and/or benchmark from the Fund. In addition, the Board noted that the Fund seeks to track its own benchmark index and that, during the prior year, the Board received periodic reports on the Fund’s performance in comparison with its benchmark index. Such periodic comparative performance information, including detailed information on certain specific iShares funds requested by the Boards, was also considered.
Based on this review, the other factors considered at the meeting, and their general knowledge of ETF pricing, the Board concluded that the investment advisory fee rate and expense level and the historical performance of the Fund supported the Board’s approval of the continuance of the Advisory Contract for the coming year.
Nature, Extent and Quality of Services Provided by BFA — Based on management’s representations, including information about recent and proposed enhancements to the iShares business, including with respect to shareholder servicing and support, the Board expected that there would be no diminution in the scope of services required of or provided by BFA under the Advisory Contract for the coming year as compared to the scope of services provided by BFA during prior years. In reviewing the scope of these services, the Board considered BFA’s investment philosophy and experience, noting that BFA and its affiliates have committed significant resources over time, including during the past year, to supporting the iShares funds and their shareholders. The Board acknowledged that resources to support the iShares funds and their shareholders have been added or enhanced in recent years. The Board also considered BFA’s compliance program and its compliance record with respect to the Fund. In that regard, the Board noted that BFA reports to the Board about portfolio management and compliance matters on a periodic basis in connection with regularly scheduled meetings of the Board, and on other occasions as necessary and appropriate, and has provided information and made appropriate officers available as needed to provide further assistance with these matters. The Board also reviewed the background and experience of the persons responsible for the day-to-day management of the Fund, as well as the resources available to them in managing the Fund. In addition to the above considerations, the Board reviewed and considered detailed presentations regarding BFA’s investment performance, investment and risk management processes and strategies provided at the June 24-25, 2015 meeting and throughout the previous year, and matters related to BFA’s portfolio compliance policies and procedures. The Board noted that the Fund had met its investment objective consistently since its inception date.
Based on review of this information, and the performance information discussed above, the Board concluded that the nature, extent and quality of services provided by BFA to the Fund under the Advisory Contract supported the Board’s approval of the continuance of the Advisory Contract for the coming year.
Costs of Services Provided to the Fund and Profits Realized by BFA and Affiliates — The Board reviewed information about the profitability to BlackRock of the Fund based on the fees payable to BFA and its affiliates (including fees under the Advisory Contract), and all other sources of revenue and expense to BFA and its affiliates from the Fund’s operations for the last calendar year. The Board reviewed BlackRock’s profitability methodology for the iShares funds, noting that the 15(c) Committee had focused on the methodology and proposed presentation during its meetings. The Board discussed the sources of direct and ancillary revenue with management, including the revenues to BTC from securities lending by the Fund. The Board also discussed BFA’s profit margin as reflected in the Fund’s profitability analysis and reviewed information regarding potential economies of scale (as discussed below). Based on this review, the Board concluded that the profits realized by BFA and its affiliates under the Advisory Contract and from other relationships between the Fund and BFA and/or its affiliates, if any, were within a reasonable range in light of the factors considered.
Economies of Scale — The Board reviewed information regarding potential economies of scale or other efficiencies that may result from increases in the Fund’s assets, noting that the issue of economies of scale had been focused on extensively by the
| 50 | 2015 iSHARES ANNUAL REPORTTO SHAREHOLDERS |
Table of Contents
Board Review and Approval of Investment Advisory
Contract (Continued)
iSHARES®, INC.
15(c) Committee during its meetings and addressed by management. The Board and the 15(c) Committee reviewed information provided by BFA regarding scale benefits shared with the iShares funds through relatively low fee rates established at inception, breakpoints, waivers, or other fee reductions, as well as through additional investment in the iShares business and the provision of improved or additional infrastructure and services to the iShares funds and their shareholders. The Board and the 15(c) Committee received information regarding BlackRock’s historical profitability, including BFA’s and its affiliates’ costs in providing services. The cost information distinguished between fixed and variable costs, and explained how the level of fixed and variable costs, as well as the nature of such costs, may impact the existence or size of scale benefits. The Board noted that the Advisory Contract for the Fund did not provide for any breakpoints in the Fund’s investment advisory fee rate as the assets of the Fund increase. However, the Board noted that to the extent that the Fund invests in the unhedged iShares MSCI Emerging Markets ETF (“EEM”), Fund shareholders would benefit from breakpoints in EEM’s investment advisory fee rate as the assets of EEM, on an aggregated basis with the assets of other iShares funds, increase. The Board further noted that should material economies of scale exist in the future, a breakpoint structure for the Fund may be appropriate, and that it would continue to monitor the sharing of economies of scale to determine the appropriateness of adding breakpoints in the future.
Based on this review, as well as the other factors considered at the meeting, the Board, recognizing its responsibility to consider this issue periodically, determined to approve the continuance of the Advisory Contract for the coming year.
Fees and Services Provided for Other Comparable Funds/Accounts Managed by BFA and its Affiliates — The Board received and considered information regarding the investment advisory/management fee rates for other funds/accounts in the U.S. for which BFA (or its affiliates) provides investment advisory/management services, including open-end and closed-end funds registered under the 1940 Act (including sub-advised funds), collective trust funds, separately managed accounts, and institutional separate accounts (together, the “Other Accounts”), and acknowledged BFA’s assertion that the iShares funds are fundamentally different investment vehicles from the Other Accounts. The Board noted that BFA and its affiliates do manage Other Accounts with substantially the same investment objective and strategy as the Fund or that track the same index or a similar index as the Fund. The Board further noted that BFA provided the Board with detailed information regarding how the Other Accounts (particularly institutional clients) generally differ from the Fund, including in terms of the different, generally more extensive services provided to the Fund, as well as other significant differences in the approach of BFA and its affiliates to the Fund, on one hand, and Other Accounts, on the other. In that regard, the Board considered that the pricing of services to institutional clients is typically based on a number of factors beyond the nature and extent of the specific services to be provided and often depends on the overall relationship between the client and its affiliates and the adviser and its affiliates. In addition, the Board considered the relative complexity and inherent risks and challenges of managing and providing other services to the Fund, as a publicly traded exchange traded fund, as compared to the Other Accounts that are institutional clients in light of differing regulatory requirements and client-imposed mandates. The Board also considered the “all-inclusive” nature of the Fund’s advisory fee structure, and the Fund expenses borne by BFA under this arrangement. The Board noted that the investment advisory fee rate under the Advisory Contract for the Fund was generally higher than the investment advisory/management fee rates for the Other Accounts that are institutional clients of BFA (or its affiliates) and concluded that the differences appeared to be consistent with the factors discussed.
Other Benefits to BFA and/or its Affiliates — The Board reviewed the “fallout” benefits or ancillary revenue received by BFA and/or its affiliates in connection with the services provided to the Fund by BFA, such as payment of revenue to BTC, the Fund’s securities lending agent, for loaning portfolio securities (which was included in the profit margins reviewed by the Board pursuant to BFA’s profitability methodology), and payment of advisory fees and/or administration fees to BFA and BTC (or their affiliates) in connection with any investments by the Fund in other funds for which BFA (or its affiliates) provides investment advisory services and/or administration services. The Board noted that BFA generally does not use soft dollars or consider the value of research or other services that may be provided to BFA (including its affiliates) in selecting brokers for portfolio transactions for the Fund. The Board further noted that any portfolio transactions on behalf of the Fund placed through a BFA affiliate or purchased from an
BOARD REVIEWAND APPROVALOF INVESTMENT ADVISORY CONTRACT | 51 |
Table of Contents
Board Review and Approval of Investment Advisory
Contract (Continued)
iSHARES®, INC.
underwriting syndicate in which a BFA affiliate participates, are reported to the Board pursuant to Rule 17e-1 or Rule 10f-3, as applicable, under the 1940 Act. The Board concluded that any such ancillary benefits would not be disadvantageous to the Fund’s shareholders and thus would not alter the Board’s conclusion with respect to the appropriateness of approving the continuance of the Advisory Contract for the coming year.
Based on the considerations described above, the Board determined that the Fund’s investment advisory fee rate under the Advisory Contract does not constitute a fee that is so disproportionately large as to bear no reasonable relationship to the services rendered and that could not have been the product of arm’s-length bargaining, and concluded that it is in the best interest of the Fund and its shareholders to approve the continuance of the Advisory Contract for the coming year.
II. iShares MSCI Emerging Markets ETF
Under Section 15(c) of the Investment Company Act of 1940 (the “1940 Act”), the Company’s Board of Directors (the “Board”), including a majority of Directors who are not “interested persons” of the Company (as that term is defined in the 1940 Act) (the “Independent Directors”), is required annually to consider and approve the Investment Advisory Contract between the Company and BFA (the “Advisory Contract”) on behalf of the Fund. The Independent Directors requested, and BFA provided, such information as the Independent Directors, with advice from independent counsel, deemed reasonably necessary to evaluate the Advisory Contract. A committee of Independent Directors (the “15(c) Committee”), with independent counsel, met with management on May 1, 2015 and May 6, 2015, to discuss the types of information the Independent Directors required and the manner in which management would organize and present such information. At a meeting held on May 21, 2015, management presented preliminary information to the Board relating to the continuance of the Advisory Contract, and the Board, including the Independent Directors, reviewed and discussed such information at length. The Independent Directors requested from management certain additional information, which management agreed to provide. At a meeting held on June 24-25, 2015, the Board, including the Independent Directors, reviewed the additional information provided by management in response to these requests. After extensive discussions, the Board, including all of the Independent Directors, approved the continuance of the Advisory Contract for the Fund, based on a review of qualitative and quantitative information provided by BFA, including the additional information management provided at the request of the Independent Directors. The Board noted its satisfaction with the extent and quality of information provided and its frequent interactions with management, as well as the detailed responses and other information provided by BFA. The Board also noted that the Board and BFA agreed to discuss potential enhancements and adjustments to the 15(c) process for the coming year. The Independent Directors were advised by their independent counsel throughout the process, including about the legal standards applicable to their review. In approving the Advisory Contract for the Fund, the Board, including the Independent Directors, considered the following factors, no one of which was controlling, and reached the following conclusions:
Expenses and Performance of the Fund — The Board reviewed statistical information prepared by Lipper Inc. (“Lipper”), an independent provider of investment company data, regarding the expense ratio components, including actual advisory fees, waivers/reimbursements, and gross and net total expenses of the Fund in comparison with the same information for other exchange traded funds (including, where applicable, funds sponsored by an “at cost” service provider) and, in the limited instances where no comparable ETFs existed and the comparison group would not otherwise be reasonable in Lipper’s judgment, pure index institutional mutual funds, objectively selected by Lipper as comprising the Fund’s applicable peer group pursuant to Lipper’s proprietary ETF methodology (the “Lipper Group”). The Board was provided with a detailed description of Lipper’s proprietary ETF methodology used by Lipper to determine the Fund’s Lipper Group. The Board further noted that due to the limitations in providing comparable funds in the Lipper Group, the statistical information provided in Lipper’s report may or may not provide meaningful direct comparisons to the Fund in all instances.
| 52 | 2015 iSHARES ANNUAL REPORTTO SHAREHOLDERS |
Table of Contents
Board Review and Approval of Investment Advisory
Contract (Continued)
iSHARES®, INC.
The Board also noted that the investment advisory fee rate and overall expenses (net of waivers and reimbursements) for the Fund were higher than the median of the investment advisory fee rates and overall expenses (net of waivers and reimbursements) of the funds in its Lipper Group. The Board further noted management’s assertion that the Fund’s pricing reflects its capital markets ecosystem (i.e., linkage with other capital market instruments, such as options, futures and structured products) and its greater liquidity as compared to its competitor funds as determined by Lipper. In addition, the Board noted that the Fund’s investment advisory fee rate and overall expenses (net of waivers and reimbursements) were 3.8 basis points higher than those of a competitor fund in the Lipper Group ranked in the 3rd Lipper quintile.
In addition, the Board reviewed statistical information prepared by Lipper regarding the performance of the Fund for the one-, three-, five-, ten-year, and since inception periods, as applicable, and the “last quarter” period ended December 31, 2014, and a comparison of the Fund’s performance to its performance benchmark index for the same periods. To the extent that any of the comparison funds included in the Lipper Group track the same index as the Fund, Lipper also provided, and the Board reviewed, a comparison of the Fund’s performance to that of such relevant comparison funds for the same periods. The Board noted that the Fund generally performed in line with its performance benchmark index over the relevant periods. In considering this information, the Board noted that the Lipper Group may include funds that have a different investment objective and/or benchmark from the Fund. In addition, the Board noted that the Fund seeks to track its own benchmark index and that, during the prior year, the Board received periodic reports on the Fund’s performance in comparison with its benchmark index. Such periodic comparative performance information, including detailed information on certain specific iShares funds requested by the Boards, was also considered.
Based on this review, the other factors considered at the meeting, and their general knowledge of ETF pricing, the Board concluded that the investment advisory fee rate and expense level and the historical performance of the Fund supported the Board’s approval of the continuance of the Advisory Contract for the coming year.
Nature, Extent and Quality of Services Provided by BFA — Based on management’s representations, including information about recent and proposed enhancements to the iShares business, including with respect to shareholder servicing and support, the Board expected that there would be no diminution in the scope of services required of or provided by BFA under the Advisory Contract for the coming year as compared to the scope of services provided by BFA during prior years. In reviewing the scope of these services, the Board considered BFA’s investment philosophy and experience, noting that BFA and its affiliates have committed significant resources over time, including during the past year, to supporting the iShares funds and their shareholders. The Board acknowledged that resources to support the iShares funds and their shareholders have been added or enhanced in recent years. The Board also considered BFA’s compliance program and its compliance record with respect to the Fund. In that regard, the Board noted that BFA reports to the Board about portfolio management and compliance matters on a periodic basis in connection with regularly scheduled meetings of the Board, and on other occasions as necessary and appropriate, and has provided information and made appropriate officers available as needed to provide further assistance with these matters. The Board also reviewed the background and experience of the persons responsible for the day-to-day management of the Fund, as well as the resources available to them in managing the Fund. In addition to the above considerations, the Board reviewed and considered detailed presentations regarding BFA’s investment performance, investment and risk management processes and strategies provided at the June 24-25, 2015 meeting and throughout the previous year, and matters related to BFA’s portfolio compliance policies and procedures. The Board noted that the Fund had met its investment objective consistently since its inception date.
Based on review of this information, and the performance information discussed above, the Board concluded that the nature, extent and quality of services provided by BFA to the Fund under the Advisory Contract supported the Board’s approval of the continuance of the Advisory Contract for the coming year.
BOARD REVIEWAND APPROVALOF INVESTMENT ADVISORY CONTRACT | 53 |
Table of Contents
Board Review and Approval of Investment Advisory
Contract (Continued)
iSHARES®, INC.
Costs of Services Provided to the Fund and Profits Realized by BFA and Affiliates — The Board reviewed information about the profitability to BlackRock of the Fund based on the fees payable to BFA and its affiliates (including fees under the Advisory Contract), and all other sources of revenue and expense to BFA and its affiliates from the Fund’s operations for the last calendar year. The Board reviewed BlackRock’s profitability methodology for the iShares funds, noting that the 15(c) Committee had focused on the methodology and proposed presentation during its meetings. The Board discussed the sources of direct and ancillary revenue with management, including the revenues to BTC from securities lending by the Fund. The Board also discussed BFA’s profit margin as reflected in the Fund’s profitability analysis and reviewed information regarding potential economies of scale (as discussed below). Based on this review, the Board concluded that the profits realized by BFA and its affiliates under the Advisory Contract and from other relationships between the Fund and BFA and/or its affiliates, if any, were within a reasonable range in light of the factors considered.
Economies of Scale — The Board reviewed information regarding potential economies of scale or other efficiencies that may result from increases in the Fund’s assets, noting that the issue of economies of scale had been focused on extensively by the 15(c) Committee during its meetings and addressed by management. The Board and the 15(c) Committee reviewed information provided by BFA regarding scale benefits shared with the iShares funds through relatively low fee rates established at inception, breakpoints, waivers, or other fee reductions, as well as through additional investment in the iShares business and the provision of improved or additional infrastructure and services to the iShares funds and their shareholders. The Board and the 15(c) Committee received information regarding BlackRock’s historical profitability, including BFA’s and its affiliates’ costs in providing services. The cost information distinguished between fixed and variable costs, and explained how the level of fixed and variable costs, as well as the nature of such costs, may impact the existence or size of scale benefits. The Board noted that the Advisory Contract for the Fund already provided for breakpoints in the Fund’s investment advisory fee rate as the assets of the Fund, on an aggregated basis with the assets of certain other iShares funds, increase. The Board noted that it would continue to monitor the sharing of economies of scale to determine the appropriateness of adding new or revised breakpoints in the future.
Based on this review, as well as the other factors considered at the meeting, the Board, recognizing its responsibility to consider this issue periodically, determined to approve the continuance of the Advisory Contract for the coming year.
Fees and Services Provided for Other Comparable Funds/Accounts Managed by BFA and its Affiliates — The Board received and considered information regarding the investment advisory/management fee rates for other funds/accounts in the U.S. for which BFA (or its affiliates) provides investment advisory/management services, including open-end and closed-end funds registered under the 1940 Act (including sub-advised funds), collective trust funds, separately managed accounts, and institutional separate accounts (together, the “Other Accounts”), and acknowledged BFA’s assertion that the iShares funds are fundamentally different investment vehicles from the Other Accounts. The Board noted that BFA and its affiliates do manage Other Accounts with substantially the same investment objective and strategy as the Fund or that track the same index or a similar index as the Fund. The Board further noted that BFA provided the Board with detailed information regarding how the Other Accounts (particularly institutional clients) generally differ from the Fund, including in terms of the different, generally more extensive services provided to the Fund, as well as other significant differences in the approach of BFA and its affiliates to the Fund, on one hand, and Other Accounts, on the other. In that regard, the Board considered that the pricing of services to institutional clients is typically based on a number of factors beyond the nature and extent of the specific services to be provided and often depends on the overall relationship between the client and its affiliates and the adviser and its affiliates. In addition, the Board considered the relative complexity and inherent risks and challenges of managing and providing other services to the Fund, as a publicly traded exchange traded fund, as compared to the Other Accounts that are institutional clients in light of differing regulatory requirements and client-imposed mandates. The Board also considered the “all-inclusive” nature of the Fund’s advisory fee structure, and the Fund expenses borne by BFA under this arrangement. The Board noted that the investment advisory fee rate under the Advisory Contract for the Fund was generally higher than the investment advisory/management fee rates for the
| 54 | 2015 iSHARES ANNUAL REPORTTO SHAREHOLDERS |
Table of Contents
Board Review and Approval of Investment Advisory
Contract (Continued)
iSHARES®, INC.
Other Accounts that are institutional clients of BFA (or its affiliates) and concluded that the differences appeared to be consistent with the factors discussed.
Other Benefits to BFA and/or its Affiliates — The Board reviewed the “fallout” benefits or ancillary revenue received by BFA and/or its affiliates in connection with the services provided to the Fund by BFA, such as payment of revenue to BTC, the Fund’s securities lending agent, for loaning portfolio securities (which was included in the profit margins reviewed by the Board pursuant to BFA’s profitability methodology), and payment of advisory fees and/or administration fees to BFA and BTC (or their affiliates) in connection with any investments by the Fund in other funds for which BFA (or its affiliates) provides investment advisory services and/or administration services. The Board noted that BFA generally does not use soft dollars or consider the value of research or other services that may be provided to BFA (including its affiliates) in selecting brokers for portfolio transactions for the Fund. The Board further noted that any portfolio transactions on behalf of the Fund placed through a BFA affiliate or purchased from an underwriting syndicate in which a BFA affiliate participates, are reported to the Board pursuant to Rule 17e-1 or Rule 10f-3, as applicable, under the 1940 Act. The Board concluded that any such ancillary benefits would not be disadvantageous to the Fund’s shareholders and thus would not alter the Board’s conclusion with respect to the appropriateness of approving the continuance of the Advisory Contract for the coming year.
Based on the considerations described above, the Board determined that the Fund’s investment advisory fee rate under the Advisory Contract does not constitute a fee that is so disproportionately large as to bear no reasonable relationship to the services rendered and that could not have been the product of arm’s-length bargaining, and concluded that it is in the best interest of the Fund and its shareholders to approve the continuance of the Advisory Contract for the coming year.
BOARD REVIEWAND APPROVALOF INVESTMENT ADVISORY CONTRACT | 55 |
Table of Contents
Supplemental Information (Unaudited)
iSHARES®, INC.
Section 19(a) Notices
The amounts and sources of distributions reported are estimates and are provided pursuant to regulatory requirements and are not being provided for tax reporting purposes. The actual amounts and sources for tax reporting purposes will depend upon each Fund’s investment experience during the year and may be subject to changes based on the tax regulations. Shareholders will receive a Form 1099-DIV each calendar year that will inform them how to report these distributions for federal income tax purposes.
| Total Cumulative Distributions for the Fiscal Year | % Breakdown of the Total Cumulative Distributions for the Fiscal Year | |||||||||||||||||||||||||||||||
| iShares ETF | Net Investment Income | Net Realized Capital Gains | Return of Capital | Total Per Share | Net Investment Income | Net Realized Capital Gains | Return of Capital | Total Per Share | ||||||||||||||||||||||||
Currency Hedged MSCI Emerging Markets | $ | 0.653937 | $ | — | $ | — | $ | 0.653937 | 100 | % | — | % | — | % | 100 | % | ||||||||||||||||
MSCI Emerging Markets | 0.820134 | — | 0.016139 | 0.836273 | 98 | — | 2 | 100 | ||||||||||||||||||||||||
Premium/Discount Information
The Premium/Discount Information section is intended to present information about the differences between the daily market price on secondary markets for shares of a fund and that fund’s NAV. NAV is the price at which a fund issues and redeems shares. It is calculated in accordance with the standard formula for valuing mutual fund shares. The “Market Price” of a fund generally is determined using the midpoint between the highest bid and the lowest offer on the primary stock exchange on which the shares of such fund are listed for trading, as of the time that a fund’s NAV is calculated. A fund’s Market Price may be at, above or below its NAV. The NAV of a fund will fluctuate with changes in the fair value of its portfolio holdings. The Market Price of a fund will fluctuate in accordance with changes in its NAV, as well as market supply and demand.
Premiums or discounts are the differences (expressed as a percentage) between the NAV and Market Price of a fund on a given day, generally at the time the NAV is calculated. A premium is the amount that a fund is trading above the reported NAV, expressed as a percentage of the NAV. A discount is the amount that a fund is trading below the reported NAV, expressed as a percentage of the NAV.
The following information shows the frequency of distributions of premiums and discounts for each of the Funds. The information shown for each Fund is for five calendar years (or from the inception date of such Fund if less than five years) through the date of the most recent calendar quarter-end. The specific periods covered for each Fund are disclosed in the table for such Fund.
| 56 | 2015 iSHARES ANNUAL REPORTTO SHAREHOLDERS |
Table of Contents
Supplemental Information (Unaudited) (Continued)
iSHARES®, INC.
Each line in the table shows the number of trading days in which the Fund traded within the premium/discount range indicated. The number of trading days in each premium/discount range is also shown as a percentage of the total number of trading days in the period covered by each table. All data presented here represents past performance, which cannot be used to predict future results.
iShares Currency Hedged MSCI Emerging Markets ETF
Period Covered: September 23, 2014 through June 30, 2015
Premium/Discount Range | Number of Days | Percentage of Total Days | ||||||
Greater than 0.5% and Less than 1.0% | 6 | 3.09 | % | |||||
Between 0.5% and –0.5% | 188 | 96.91 | ||||||
|
|
|
| |||||
| 194 | 100.00 | % | ||||||
|
|
|
| |||||
iShares MSCI Emerging Markets ETF
Period Covered: January 1, 2010 through June 30, 2015
Premium/Discount Range | Number of Days | Percentage of Total Days | ||||||
Greater than 4.0% and Less than 4.5% | 1 | 0.07 | % | |||||
Greater than 3.5% and Less than 4.0% | 1 | 0.07 | ||||||
Greater than 3.0% and Less than 3.5% | 1 | 0.07 | ||||||
Greater than 2.5% and Less than 3.0% | 4 | 0.29 | ||||||
Greater than 2.0% and Less than 2.5% | 7 | 0.51 | ||||||
Greater than 1.5% and Less than 2.0% | 17 | 1.23 | ||||||
Greater than 1.0% and Less than 1.5% | 50 | 3.62 | ||||||
Greater than 0.5% and Less than 1.0% | 239 | 17.30 | ||||||
Between 0.5% and –0.5% | 756 | 54.71 | ||||||
Less than –0.5% and Greater than –1.0% | 196 | 14.18 | ||||||
Less than –1.0% and Greater than –1.5% | 70 | 5.07 | ||||||
Less than –1.5% and Greater than –2.0% | 22 | 1.59 | ||||||
Less than –2.0% and Greater than –2.5% | 9 | 0.65 | ||||||
Less than –2.5% and Greater than –3.0% | 5 | 0.36 | ||||||
Less than –3.0% and Greater than –3.5% | 2 | 0.14 | ||||||
Less than –3.5% and Greater than –4.0% | 1 | 0.07 | ||||||
Less than –4.0% and Greater than –4.5% | 1 | 0.07 | ||||||
|
|
|
| |||||
| 1,382 | 100.00 | % | ||||||
|
|
|
| |||||
Regulation under the Alternative Investment Fund Managers Directive (“AIFMD” or, the “Directive”)
The Directive imposes detailed and prescriptive obligations on fund managers established in the European Union (the “EU”). These do not currently apply to managers established outside the EU, such as BFA. Rather, non-EU managers are only required to comply with certain disclosure, reporting and transparency obligations of the Directive if such managers market a fund to EU investors.
BFA has registered the iShares MSCI Emerging Markets ETF (the “Fund”) to be marketed to EU investors in the United Kingdom, the Netherlands, Finland, Sweden and Luxembourg.
SUPPLEMENTAL INFORMATION | 57 |
Table of Contents
Supplemental Information (Unaudited) (Continued)
iSHARES®, INC.
Report on Remuneration
BFA is required under the Directive to make quantitative disclosures of remuneration. These disclosures are made in line with BlackRock’s interpretation of currently available regulatory guidance on quantitative remuneration disclosures. As market or regulatory practice develops, BlackRock may consider it appropriate to make changes to the way in which quantitative remuneration disclosures are calculated. Where such changes are made, this may result in disclosures in relation to a fund not being comparable to the disclosures made in the prior year, or in relation to other BlackRock fund disclosures in that same year.
Disclosures are provided in relation to both (a) the staff of BFA; (b) staff who are senior management; and (c) staff who have the ability to materially affect the risk profile of the Fund.
All individuals included in the aggregated figures disclosed are rewarded in line with BlackRock’s remuneration policy for their responsibilities across the relevant BlackRock business area. As all individuals have a number of areas of responsibilities, only the portion of remuneration for those individuals’ services attributable to the Fund is included in the aggregate figures disclosed.
BlackRock has a clear and well defined pay-for-performance philosophy, and compensation programs which support that philosophy. For senior management, a significant percentage of variable remuneration is deferred over time. All employees are subject to a claw-back policy.
Compensation decisions for employees are made based on BlackRock’s full-year financial results and other non-financial goals and objectives. Alongside financial performance, individual compensation is also based on strategic and operating results and other considerations such as management and leadership capabilities. No set formulas are established and no fixed benchmarks are used in determining annual incentive awards.
Bonus pools are reviewed by BlackRock’s independent compensation committee, taking into account both actual and projected financial information together with information provided by the Operational Risk and Regulatory Compliance departments in relation to any activities, incidents or events that warrant consideration in making compensation decisions.
Functions such as Finance, Operational Risk, Legal & Compliance, and Human Resources each have their own organizational structures which are independent of the business units. Functional bonus pools are determined with reference to the performance of each individual function and the remuneration of the senior members of control functions is directly overseen by BlackRock’s independent compensation committee. No individual is involved in setting his or her own remuneration.
Members of staff and senior management of BFA typically provide both AIFMD and non-AIFMD related services in respect of multiple funds, clients and functions of BFA and across the broader BlackRock group. Therefore, the figures disclosed are a sum of each individual’s portion of remuneration attributable to the Fund according to an objective apportionment methodology which acknowledges the multiple-service nature of BFA. Accordingly, the figures are not representative of any individual’s actual remuneration or their remuneration structure.
The amount of the total remuneration awarded by BFA to its staff which has been attributed to the iShares MSCI Emerging Markets ETF in respect of BFA’s financial year ending December 31, 2014 was USD 5.50 million. This figure is comprised of fixed remuneration of USD 2.22 million and variable remuneration of USD 3.28 million. There were a total of 499 beneficiaries of the remuneration described above.
The amount of the aggregate remuneration awarded by BFA, which has been attributed to the iShares MSCI Emerging Markets ETF in respect of BFA’s financial year ending December 31, 2014, to its senior management was USD 0.76 million, and to members of its staff whose actions have a material impact on the risk profile of the Fund was USD 0.14 million.
| 58 | 2015 iSHARES ANNUAL REPORTTO SHAREHOLDERS |
Table of Contents
Director and Officer Information
iSHARES® , INC.
The Board of Directors has responsibility for the overall management and operations of the Company, including general supervision of the duties performed by BFA and other service providers. Each Director serves until he or she resigns, is removed, dies, retires or becomes incapacitated. Each officer shall hold office until his or her successor is elected and qualifies or until his or her death, or his or her resignation or removal. Directors who are not “interested persons” (as defined in the 1940 Act) of the Company are referred to as independent directors (“Independent Directors”).
The registered investment companies advised by BFA or its affiliates are organized into one complex of closed-end funds, two complexes of open-end funds and one complex of exchange-traded funds (“Exchange-Traded Fund Complex”) (each, a “BlackRock Fund Complex”). Each Fund is included in the BlackRock Fund Complex referred to as the Exchange-Traded Fund Complex. Each Director also serves as a Trustee of iShares Trust and a Trustee of iShares U.S. ETF Trust and, as a result, oversees a total of 319 funds (as of August 31, 2015) within the Exchange-Traded Fund Complex. With the exception of Robert S. Kapito and Mark Wiedman, the address of each Director and officer is c/o BlackRock, Inc., 400 Howard Street, San Francisco, CA 94105. The address of Mr. Kapito and Mr. Wiedman is c/o BlackRock, Inc., Park Avenue Plaza, 55 East 52nd Street, New York, NY 10055. The Board has designated Robert H. Silver as its Independent Chairman. Additional information about the Funds’ Directors and officers may be found in the Funds’ combined Statement of Additional Information, which is available without charge, upon request, by calling toll-free 1-800-iShares (1-800-474-2737).
Interested Directors
| Name (Age) | Position(s) | Principal Occupation(s) During the Past 5 Years | Other Directorships Held by Director | |||
Robert S. Kapitoa (58) | Director (since 2009). | President and Director, BlackRock, Inc. (since 2006); Vice Chairman of BlackRock, Inc. and Head of BlackRock, Inc.’s Portfolio Management Group (since its formation in 1998) and BlackRock, Inc.’s predecessor entities (since 1988); Trustee, University of Pennsylvania (since 2009); President of Board of Directors, Hope & Heroes Children’s Cancer Fund (since 2002); President of the Board of Directors, Periwinkle Theatre for Youth (since 1983). | Trustee of iShares Trust (since 2009); Trustee of iShares U.S. ETF Trust (since 2011); Director of BlackRock, Inc. (since 2006). | |||
Mark Wiedmanb (44) | Director (since 2013). | Managing Director, BlackRock, Inc. (since 2007); Global Head of iShares (since 2011); Head of Corporate Strategy, BlackRock, Inc. (2009-2011). | Trustee of iShares Trust (since 2013); Trustee of iShares U.S. ETF Trust (since 2013); Director of PennyMac Financial Services, Inc. (since 2008). | |||
| a | Robert S. Kapito is deemed to be an “interested person” (as defined in the 1940 Act) of the Company due to his affiliations with BlackRock, Inc. |
| b | Mark Wiedman is deemed to be an “interested person” (as defined in the 1940 Act) of the Company due to his affiliations with BlackRock, Inc. and its affiliates. |
DIRECTORAND OFFICER INFORMATION | 59 |
Table of Contents
Director and Officer Information (Continued)
iSHARES®, INC.
Independent Directors
| Name (Age) | Position(s) | Principal Occupation(s) During the Past 5 Years | Other Directorships Held by Director | |||
Robert H. Silver (60) | Director (since 2007); Independent Chairman (since 2012). | President and Co-Founder of The Bravitas Group, Inc. (since 2006); Director and Vice Chairman of the YMCA of Greater NYC (2001-2011); Broadway Producer (2006-2011); Co-Founder and Vice President of Parentgiving Inc. (since 2008); Director and Member of the Audit and Compensation Committee of EPAM Systems, Inc. (2006-2009); President and Chief Operating Officer of UBS Financial Services Inc. (formerly Paine Webber Inc.) (2003-2005) and various executive positions with UBS and its affiliates (1988-2005); CPA and Audit Manager of KPMG, LLP (formerly Peat Marwick Mitchell) (1977-1983). | Trustee of iShares Trust (since 2007); Trustee of iShares U.S. ETF Trust (since 2011); Independent Chairman of iShares Trust and iShares U.S. ETF Trust (since 2012). | |||
Jane D. Carlin (59) | Director (since 2015). | Managing Director and Global Head of Financial Holding Company Governance & Assurance and the Global Head of Operational Risk Management of Morgan Stanley (2006-2012). | Trustee of iShares Trust (since 2015); Trustee of iShares U.S. ETF Trust (since 2015); Director of PHH Corporation (mortgage solutions) (since 2012). | |||
Cecilia H. Herbert (66) | Director (since 2005); Nominating and Governance Committee Chair and Equity Plus Committee Chair (since 2012). | Director (1998-2013) and President (2007-2011) of the Board of Directors, Catholic Charities CYO; Trustee (2002-2011) and Chair of the Finance and Investment Committee (2006-2010) of the Thacher School; Member (since 1992) and Chair (1994-2005) of the Investment Committee, Archdiocese of San Francisco; Trustee and Member of the Investment Committee, WNET, the New York public broadcasting/media company (since 2011). | Trustee of iShares Trust (since 2005); Trustee of iShares U.S. ETF Trust (since 2011); Director of Forward Funds (34 portfolios) (since 2009). | |||
Charles A. Hurty (71) | Director (since 2005); Audit Committee Chair (since 2006). | Retired; Partner, KPMG LLP (1968-2001). | Trustee of iShares Trust (since 2005); Trustee of iShares U.S. ETF Trust (since 2011); Director of GMAM Absolute Return Strategy Fund (1 portfolio) (since 2002); Director of SkyBridge Alternative Investments Multi-Adviser Hedge Fund Portfolios LLC (2 portfolios) (since 2002). | |||
| 60 | 2015 iSHARES ANNUAL REPORTTO SHAREHOLDERS |
Table of Contents
Director and Officer Information (Continued)
iSHARES®, INC.
Independent Directors (Continued)
| Name (Age) | Position(s) | Principal Occupation(s) During the Past 5 Years | Other Directorships Held by Director | |||
John E. Kerrigan (60) | Director (since 2005); Fixed Income Plus Committee Chair (since 2012). | Chief Investment Officer, Santa Clara University (since 2002). | Trustee of iShares Trust (since 2005); Trustee of iShares U.S. ETF Trust (since 2011). | |||
John E. Martinez (54) | Director (since 2003); Securities Lending Committee Chair (since 2012). | Director of FirstREX Agreement Corp. (formerly EquityRock, Inc.) (since 2005). | Trustee of iShares Trust (since 2003); Trustee of iShares U.S. ETF Trust (since 2011). | |||
Madhav V. Rajan (51) | Director (since 2011); 15(c) Committee Chair (since 2012). | Robert K. Jaedicke Professor of Accounting and Senior Associate Dean for Academic Affairs and Head of MBA Program, Stanford University Graduate School of Business (since 2001); Professor of Law (by courtesy), Stanford Law School (since 2005); Visiting Professor, University of Chicago (2007-2008). | Trustee of iShares Trust (since 2011); Trustee of iShares U.S. ETF Trust (since 2011); Director, Cavium, Inc. (since 2013). | |||
DIRECTORAND OFFICER INFORMATION | 61 |
Table of Contents
Director and Officer Information (Continued)
iSHARES®, INC.
Officers
| Name (Age) | Position(s) | Principal Occupation(s) During the Past 5 Years | ||
Manish Mehta (44) | President (since 2013). | Managing Director, BlackRock, Inc. (since 2009); Chief Operating Officer for iShares (since 2009); Head of Strategy and Corporate Development, BGI (2005-2009); Chief of Staff to the CEO, BGI (2005-2009). | ||
Jack Gee (55) | Treasurer and Chief Financial Officer (since 2008). | Managing Director, BlackRock, Inc. (since 2009); Senior Director of Fund Administration of Intermediary Investor Business, BGI (2009); Director of Fund Administration of Intermediary Investor Business, BGI (2004-2009). | ||
Benjamin Archibald (40) | Secretary (since 2015). | Managing Director, BlackRock, Inc. (since 2014); Secretary of the BlackRock-advised Mutual Funds (since 2012); Director, BlackRock, Inc. (2010-2013). | ||
Charles Park (47) | Chief Compliance Officer (since 2006). | Chief Compliance Officer of BlackRock Advisors, LLC and the BlackRock-advised Funds in the Equity-Bond Complex, the Equity-Liquidity Complex and the Closed-End Complex (since 2014); Chief Compliance Officer, BFA (since 2006). | ||
Scott Radell (46) | Executive Vice President (since 2012). | Managing Director, BlackRock, Inc. (since 2009); Head of Portfolio Solutions, BlackRock, Inc. (since 2009); Head of Portfolio Solutions, BGI (2007-2009); Credit Portfolio Manager, BGI (2005-2007); Credit Research Analyst, BGI (2003-2005). | ||
Amy Schioldager (52) | Executive Vice President (since 2007). | Senior Managing Director, BlackRock, Inc. (since 2009); Global Head of Index Equity, BGI (2008-2009); Global Head of U.S. Indexing, BGI (2006-2008); Head of Domestic Equity Portfolio Management, BGI (2001-2006). | ||
| 62 | 2015 iSHARES ANNUAL REPORTTO SHAREHOLDERS |
Table of Contents
For more information visit www.iShares.com or call 1-800-474-2737
This report is intended for the Funds’ shareholders. It may not be distributed to prospective investors unless it is preceded or accompanied by the current prospectus.
Investing involves risk, including possible loss of principal.
The iShares Funds are distributed by BlackRock Investments, LLC (together with its affiliates, “BlackRock”).
The iShares Funds are not sponsored, endorsed, issued, sold or promoted by MSCI Inc., nor does this company make any representation regarding the advisability of investing in the iShares Funds. BlackRock is not affiliated with the company listed above.
A description of the policies that the Funds use to determine how to vote proxies relating to portfolio securities and information about how the Funds voted proxies relating to portfolio securities during the most recent twelve-month period ending June 30 is available without charge, upon request, by calling toll-free 1-800-474-2737; on the Funds’ website at www.iShares.com; and on the U.S. Securities and Exchange Commission (SEC) website at www.sec.gov.
The Funds file their complete schedules of portfolio holdings with the SEC for the first and third quarters of each fiscal year on Form N-Q. The Funds’ Forms N-Q are available on the SEC’s website or may be reviewed and copied at the SEC’s Public Reference Room in Washington, D.C. Information on the operation of the Public Reference Room may be obtained by calling 1-800-SEC-0330. The Funds also disclose their complete schedules of portfolio holdings on a daily basis on the Funds’ website.
Certain financial information required by regulations or listing exchange rules in jurisdictions outside the U.S. in which iShares Funds are cross-listed may be publicly filed in those jurisdictions. This information is available upon request by calling 1-800-474-2737.
©2015 BlackRock, Inc. All rights reserved. iSHARES and BLACKROCK are registered trademarks of BlackRock, Inc. or its subsidiaries. All other marks are the property of their respective owners.
iS-AR-85-0815
 |  |
Table of Contents
AUGUST 31, 2015
2015 ANNUAL REPORT |  |
iShares, Inc.
| Ø | iShares MSCI Eurozone ETF | EZU | NYSE Arca |
| Ø | iShares MSCI Germany ETF | EWG | NYSE Arca |
| Ø | iShares MSCI Italy Capped ETF | EWI | NYSE Arca |
| Ø | iShares MSCI Spain Capped ETF | EWP | NYSE Arca |
| Ø | iShares MSCI Switzerland Capped ETF | EWL | NYSE Arca |
Table of Contents
| 5 | ||||
| 16 | ||||
| 16 | ||||
| 17 | ||||
| 17 | ||||
| 21 | ||||
| 24 | ||||
| 26 | ||||
| 27 | ||||
| 29 | ||||
| 36 | ||||
| 41 | ||||
| 53 | ||||
| 54 | ||||
| 55 | ||||
| 65 | ||||
| 70 |
Table of Contents
Management’s Discussion of Fund Performance
iSHARES®, INC.
GLOBAL MARKET OVERVIEW
Global equity markets delivered a negative return for the 12 months ended August 31, 2015 (the “reporting period”). The MSCI ACWI, a broad global equity index that includes both developed and emerging markets, returned -6.29% for the reporting period.
The reporting period was characterized by a continued divergence in economic growth and central bank policy between the U.S. and the rest of the world. Despite a slowdown in early 2015, the U.S. economy remained one of the strongest economies among developed countries, which motivated the U.S. Federal Reserve Bank (the “Fed”) to scale back its economic stimulus measures. The Fed ended a two-year quantitative easing program in October 2014 and signaled its intent to raise its short-term interest rate target sometime in 2015. In contrast, weaker economic growth in most other regions of the globe led many of the world’s central banks to take more aggressive actions to stimulate economic activity.
This divergence contributed to a notably stronger U.S. dollar. For the reporting period, the euro, Japanese yen, British pound and Australian dollar declined by 15%, 14%, 7%, and 24% against the U.S. dollar, respectively. Weaker foreign currencies decrease the value of foreign investments measured in U.S. dollars, thereby decreasing returns for U.S. investors, while increasing foreign currencies relative to the U.S. dollar have the opposite effect. Currency performance had a meaningful impact on non-U.S. equity returns for U.S. investors. For example, the MSCI ACWI returned 0.59% in local currency terms for the reporting period.
A number of other factors influenced global markets during the reporting period. Energy prices fell sharply amid growing supply —primarily from increased production in the U.S. — and declining global demand. Lower energy prices contributed to historically low and declining inflation rates in most of the world. Consumer prices were nearly unchanged in the U.S., the European Union, and Japan, while prices in China and India rose at a relatively slow rate. Low inflation and tepid demand kept the Fed’s zero interest rate policy intact, while central banks throughout the world took aggressive measures to stimulate demand.
Global markets advanced for most of the reporting period, then declined sharply in the last few months of the reporting period. The volatility began in China, as slowing economic growth led to a steep drop in China’s equity markets. Plummeting commodity prices amid already subdued inflation also raised concerns about global demand. Currency devaluations in Asia, including China, Vietnam, Pakistan, and Kazakhstan, led to speculation that Asian countries were weakening their currencies to compete for demand. These global events led to further uncertainty about the timing of an expected interest rate hike from the Fed.
On a regional basis, U.S. stocks advanced by less than 1% for the reporting period as declining interest rates, ongoing economic growth, and low inflation provided a favorable environment for U.S. equity market performance. After generating its fastest quarterly growth rate in 11 years in the third quarter of 2014, the U.S. economy slowed over the next two quarters. Economic activity improved over the last several months of the reporting period, boosted by an increase in consumer spending.
European stocks declined by about 8% in U.S. dollar terms for the reporting period, though they advanced more than 3% when measured in local currencies. The European Central Bank initiated quantitative easing measures in early 2015, and signs of economic improvement emerged in the latter half of the reporting period. A tentative agreement on Greece’s debt repayment helped alleviate ongoing concerns about Europe’s sovereign debt levels.
Stock markets in the Asia/Pacific region (excluding Japan) declined by approximately 19% in U.S. dollar terms, which equated to an 8% decline when measured in local currencies. China’s economic slowdown weighed heavily on the region, as China is the largest trading partner of many countries in the region. On the bright side, Japanese stocks performed relatively well, as ongoing economic stimulus and reform measures led to a 4% gain in U.S. dollar terms (22% when measured in Japanese yen).
Emerging markets stocks fell by approximately 23% in U.S. dollar terms for the reporting period, though the decline was about 10% when measured in local currencies. Many of the largest emerging economies — including China, Russia, and Brazil —experienced slowing economic growth during the reporting period. Latin American stocks posted some of the biggest declines, as the region struggled with slow growth and declining commodity prices.
MANAGEMENT’S DISCUSSIONSOF FUND PERFORMANCE | 5 |
Table of Contents
Management’s Discussion of Fund Performance
iSHARES® MSCI EUROZONE ETF
Performance as of August 31, 2015
| Average Annual Total Returns | Cumulative Total Returns | |||||||||||||||||||||||||
| NAV | MARKET | INDEX | NAV | MARKET | INDEX | |||||||||||||||||||||
1 Year | (7.62)% | (7.44)% | (7.43)% | (7.62)% | (7.44)% | (7.43)% | ||||||||||||||||||||
5 Years | 6.27% | 6.42% | 6.38% | 35.54% | 36.52% | 36.24% | ||||||||||||||||||||
10 Years | 2.77% | 2.68% | 2.91% | 31.44% | 30.32% | 33.18% | ||||||||||||||||||||
GROWTH OF $10,000 INVESTMENT
(AT NET ASSET VALUE)
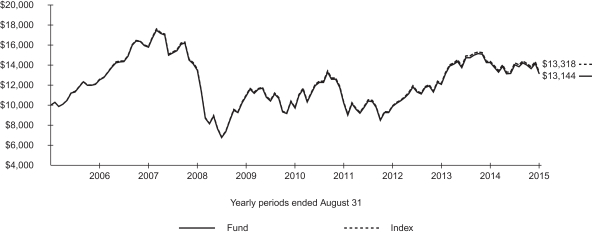
Past performance is no guarantee of future results. Performance results do not reflect the deduction of taxes that a shareholder would pay on fund distributions or on the redemption or sale of fund shares. See “About Fund Performance” on page 16 for more information.
| Shareholder Expenses | ||||||||||||||||||||||||||
| Actual | Hypothetical 5% Return | |||||||||||||||||||||||||
| Beginning Account Value (3/1/15) | Ending Account Value (8/31/15) | Expenses Paid During Period a | Beginning Account Value (3/1/15) | Ending Account Value (8/31/15) | Expenses Paid During Period a | Annualized Expense Ratio | ||||||||||||||||||||
| $ | 1,000.00 | $ | 937.80 | $ | 2.30 | $ | 1,000.00 | $ | 1,022.80 | $ | 2.40 | 0.47% | ||||||||||||||
| a | Expenses are calculated using the Fund’s annualized expense ratio (as disclosed in the table), multiplied by the average account value for the period, multiplied by the number of days in the period (184 days) and divided by the number of days in the year (365 days). See “Shareholder Expenses” on page 16 for more information. |
| 6 | 2015 iSHARES ANNUAL REPORTTO SHAREHOLDERS |
Table of Contents
Management’s Discussion of Fund Performance (Continued)
iSHARES® MSCI EUROZONE ETF
The iShares MSCI Eurozone ETF (the “Fund”) (formerly the iShares MSCI EMU ETF) seeks to track the investment results of an index composed of large- and mid-capitalization equities from developed market countries that use the euro as their official currency, as represented by the MSCI EMU Index (the “Index”). The Fund invests in a representative sample of securities included in the Index that collectively has an investment profile similar to the Index. Due to the use of representative sampling, the Fund may or may not hold all of the securities that are included in the Index. For the 12-month reporting period ended August 31, 2015, the total return for the Fund was -7.62%, net of fees, while the total return for the Index was -7.43%.
Eurozone equities, as represented by the Index, produced a negative return for the reporting period and slightly underperformed the broad international developed markets. Stocks in the eurozone performed well in the early months of 2015 as investors grew more optimistic about the ongoing efforts of the European Central Bank to stimulate economic growth in the eurozone. Later in the reporting period, however, the momentum slowed, as worries about the Greek debt crisis and a weakening of the region’s euro currency took hold. The euro depreciated by 15% relative to the U.S. dollar, which meaningfully detracted from Index performance in U.S. dollar terms. The steep decline in the Chinese stock market near the end of the reporting period put further pressure on eurozone stocks.
Equities in France, Germany, and Spain, which together accounted for nearly 75% of the Index, were especially hard hit by the euro’s weakness and extreme volatility in the Chinese markets toward the end of the reporting period, with each country producing negative returns in U.S. dollar terms.
French stocks posted a moderate decline, as early enthusiasm about economic improvements in the eurozone were offset by geopolitical tensions and falling energy prices, as well as a slowdown in manufacturing and construction during the second half of the reporting period. Similarly, German equities declined by a similar amount, with weakness in the materials, industrials, and utilities sectors as the most significant detractors during the reporting period. Stocks in Spain also fell during the reporting period, mainly due to poor performance in the financials sector.
ALLOCATION BY SECTOR
As of 8/31/15
| Sector | Percentage of Total Investments* | |||
Financials | 24.06 | % | ||
Consumer Discretionary | 14.55 | |||
Industrials | 13.18 | |||
Consumer Staples | 10.44 | |||
Health Care | 8.85 | |||
Materials | 7.69 | |||
Information Technology | 5.66 | |||
Utilities | 5.43 | |||
Telecommunication Services | 5.27 | |||
Energy | 4.87 | |||
|
| |||
TOTAL | 100.00 | % | ||
|
| |||
| * | Excludes money market funds. |
TEN LARGEST COUNTRIES
As of 8/31/15
| Country | Percentage of Total Investments* | |||
France | 32.58 | % | ||
Germany | 29.28 | |||
Spain | 11.51 | |||
Netherlands | 9.45 | |||
Italy | 7.89 | |||
Belgium | 4.25 | |||
Finland | 2.73 | |||
Ireland | 1.27 | |||
Austria | 0.57 | |||
Portugal | 0.47 | |||
|
| |||
TOTAL | 100.00 | % | ||
|
| |||
MANAGEMENT’S DISCUSSIONSOF FUND PERFORMANCE | 7 |
Table of Contents
Management’s Discussion of Fund Performance
iSHARES® MSCI GERMANY ETF
Performance as of August 31, 2015
| Average Annual Total Returns | Cumulative Total Returns | |||||||||||||||||||||||||
| NAV | MARKET | INDEX | NAV | MARKET | INDEX | |||||||||||||||||||||
1 Year | (7.50)% | (7.31)% | (7.34)% | (7.50)% | (7.31)% | (7.34)% | ||||||||||||||||||||
5 Years | 8.60% | 8.77% | 8.74% | 51.06% | 52.24% | 52.05% | ||||||||||||||||||||
10 Years | 5.74% | 5.63% | 5.87% | 74.69% | 73.00% | 76.88% | ||||||||||||||||||||
GROWTH OF $10,000 INVESTMENT
(AT NET ASSET VALUE)
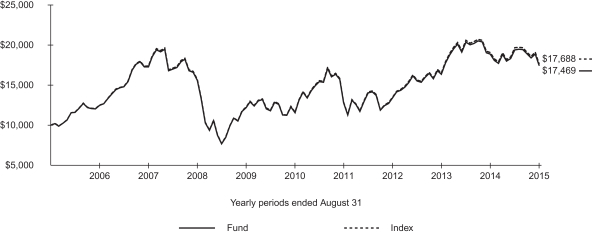
Past performance is no guarantee of future results. Performance results do not reflect the deduction of taxes that a shareholder would pay on fund distributions or on the redemption or sale of fund shares. See “About Fund Performance” on page 16 for more information.
| Shareholder Expenses | ||||||||||||||||||||||||||
| Actual | Hypothetical 5% Return | |||||||||||||||||||||||||
| Beginning Account Value (3/1/15) | Ending Account Value (8/31/15) | Expenses Paid During Period a | Beginning Account Value (3/1/15) | Ending Account Value (8/31/15) | Expenses Paid During Period a | Annualized Expense Ratio | ||||||||||||||||||||
| $ | 1,000.00 | $ | 899.50 | $ | 2.25 | $ | 1,000.00 | $ | 1,022.80 | $ | 2.40 | 0.47% | ||||||||||||||
| a | Expenses are calculated using the Fund’s annualized expense ratio (as disclosed in the table), multiplied by the average account value for the period, multiplied by the number of days in the period (184 days) and divided by the number of days in the year (365 days). See “Shareholder Expenses” on page 16 for more information. |
| 8 | 2015 iSHARES ANNUAL REPORTTO SHAREHOLDERS |
Table of Contents
Management’s Discussion of Fund Performance (Continued)
iSHARES® MSCI GERMANY ETF
The iShares MSCI Germany ETF (the “Fund”) seeks to track the investment results of an index composed of German equities, as represented by the MSCI Germany Index (the “Index”). The Fund invests in a representative sample of securities included in the Index that collectively has an investment profile similar to the Index. Due to the use of representative sampling, the Fund may or may not hold all of the securities that are included in the Index. For the 12-month reporting period ended August 31, 2015, the total return for the Fund was -7.50%, net of fees, while the total return for the Index was -7.34%.
German stocks, as represented by the Index, produced a negative return during the reporting period and slightly underperformed the broad international developed markets. Germany’s currency, the euro, depreciated 15% relative to the U.S. dollar, which meaningfully detracted from Index performance as German stocks were valued lower when translated back into U.S. dollars.
German stock market performance was uneven during the reporting period. Stock prices surged early in 2015, as investors grew more optimistic about the European Central Bank’s ongoing efforts to stimulate economic growth in the eurozone. By mid-year 2015, however, German stocks had begun to retreat. Among the factors influencing the decline in German stocks were worries about a bond market sell-off, a weakening of the euro against other world currencies, and nagging doubts over the intractable Greek debt crisis. Late in the reporting period, the further slowing of the Chinese economy and the extreme volatility of its stock market delivered a major blow to the world’s capital markets, putting additional downward pressure on the performance of German stocks.
With the exception of the healthcare and telecommunication services sectors, which turned in positive results from the perspective of U.S. investors, all other sectors of the Index produced negative returns during the reporting period. Materials, industrials, and utilities were the most notable sector detractors, due in part to a slump in industrial output and exports during 2015’s second quarter. A decline in the consumer discretionary sector, which at an average weighting of 21% made up the largest segment of the Index, also detracted meaningfully from the Index’s performance during the reporting period.
ALLOCATION BY SECTOR
As of 8/31/15
| Sector | Percentage of Total Investments* | |||
Consumer Discretionary | 20.49 | % | ||
Financials | 18.43 | |||
Health Care | 15.73 | |||
Materials | 13.78 | |||
Industrials | 12.20 | |||
Information Technology | 7.64 | |||
Telecommunication Services | 5.24 | |||
Consumer Staples | 3.77 | |||
Utilities | 2.72 | |||
|
| |||
TOTAL | 100.00 | % | ||
|
| |||
| * | Excludes money market funds. |
TEN LARGEST FUND HOLDINGS
As of 8/31/15
| Security | Percentage of Total Investments* | |||
Bayer AG Registered | 10.15 | % | ||
Siemens AG Registered | 7.12 | |||
Daimler AG Registered | 7.00 | |||
BASF SE | 6.69 | |||
Allianz SE Registered | 6.60 | |||
SAP SE | 5.98 | |||
Deutsche Telekom AG Registered | 4.91 | |||
Deutsche Bank AG Registered | 3.68 | |||
Linde AG | 2.92 | |||
Volkswagen AG (Preferred) | 2.80 | |||
|
| |||
TOTAL | 57.85 | % | ||
|
| |||
MANAGEMENT’S DISCUSSIONSOF FUND PERFORMANCE | 9 |
Table of Contents
Management’s Discussion of Fund Performance
iSHARES® MSCI ITALY CAPPED ETF
Performance as of August 31, 2015
| Average Annual Total Returns | Cumulative Total Returns | |||||||||||||||||||||||||
| NAV | MARKET | INDEX | NAV | MARKET | INDEX | |||||||||||||||||||||
1 Year | (5.66)% | (5.10)% | (5.52)% | (5.66)% | (5.10)% | (5.52)% | ||||||||||||||||||||
5 Years | 2.40% | 2.65% | 2.34% | 12.57% | 13.99% | 12.27% | ||||||||||||||||||||
10 Years | (2.29)% | (2.30)% | (2.31)% | (20.64)% | (20.78)% | (20.86)% | ||||||||||||||||||||
GROWTH OF $10,000 INVESTMENT
(AT NET ASSET VALUE)
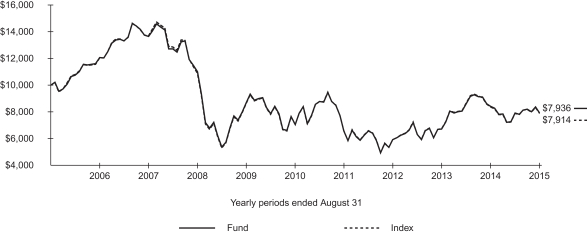
Index performance through February 11, 2013 reflects the performance of the MSCI Italy Index. Index performance beginning on February 12, 2013 reflects the performance of the MSCI Italy 25/50 Index.
Past performance is no guarantee of future results. Performance results do not reflect the deduction of taxes that a shareholder would pay on fund distributions or on the redemption or sale of fund shares. See “About Fund Performance” on page 16 for more information.
| Shareholder Expenses | ||||||||||||||||||||||||||
| Actual | Hypothetical 5% Return | |||||||||||||||||||||||||
| Beginning Account Value (3/1/15) | Ending Account Value (8/31/15) | Expenses Paid During Period a | Beginning Account Value (3/1/15) | Ending Account Value (8/31/15) | Expenses Paid During Period a | Annualized Expense Ratio | ||||||||||||||||||||
| $ | 1,000.00 | $ | 1,003.90 | $ | 2.37 | $ | 1,000.00 | $ | 1,022.80 | $ | 2.40 | 0.47% | ||||||||||||||
| a | Expenses are calculated using the Fund’s annualized expense ratio (as disclosed in the table), multiplied by the average account value for the period, multiplied by the number of days in the period (184 days) and divided by the number of days in the year (365 days). See “Shareholder Expenses” on page 16 for more information. |
| 10 | 2015 iSHARES ANNUAL REPORTTO SHAREHOLDERS |
Table of Contents
Management’s Discussion of Fund Performance (Continued)
iSHARES® MSCI ITALY CAPPED ETF
The iShares MSCI Italy Capped ETF (the “Fund”) seeks to track the investment results of an index composed of Italian equities, as represented by the MSCI Italy 25/50 Index (the “Index”). The Fund invests in a representative sample of securities included in the Index that collectively has an investment profile similar to the Index. Due to the use of representative sampling, the Fund may or may not hold all of the securities that are included in the Index. For the 12-month reporting period ended August 31, 2015, the total return for the Fund was -5.66%, net of fees, while the total return for the Index was -5.52%.
Italian stock prices, as measured by the Index, receded during the reporting period, but outperformed broad international developed markets. Italy’s currency, the euro, depreciated by 15% relative to the U.S. dollar, which meaningfully detracted from the Index’s performance as Italian stocks were valued lower when translated back into U.S. dollars.
After a long recession, the Italian economy began a gradual recovery during most of the reporting period. The recovery was driven mainly by domestic consumption, but also helped to a lesser extent by exports, which were supported by the decline in the value of the euro. Tax and labor reforms in Italy, coupled with the European Central Bank’s more accommodative monetary policy, helped boost corporate profits and spur the recovery’s momentum. However, volatility in the Chinese stock market late in the reporting period detracted appreciably from that gathering momentum among Italian stocks while also negatively affecting most world equity markets.
Energy prices declined considerably during the reporting period, affecting the stocks of several large Italian energy companies and making energy the most meaningful detractor in the Index from the perspective of U.S. investors. The utilities sector also posted a significant loss for the reporting period, while the financials sector, the Index’s single largest weighting at about 38% on average, struggled as well.
On the upside, robust domestic consumption drove strong performance within the consumer discretionary sector during the reporting period. The industrials sector also contributed to the Index’s performance, albeit to a lesser extent.
ALLOCATION BY SECTOR
As of 8/31/15
| Sector | Percentage of Total Investments* |
Financials | 41.39 | % | ||
Utilities | 16.49 | |||
Energy | 15.52 | |||
Industrials | 11.71 | |||
Consumer Discretionary | 10.60 | |||
Telecommunication Services | 4.29 | |||
|
| |||
TOTAL | 100.00 | % | ||
|
|
TEN LARGEST FUND HOLDINGS
As of 8/31/15
| Security | Percentage of Total Investments* |
Intesa Sanpaolo SpA | 13.55 | % | ||
Eni SpA | 12.02 | |||
Enel SpA | 8.89 | |||
UniCredit SpA | 8.73 | |||
Assicurazioni Generali SpA | 4.38 | |||
Luxottica Group SpA | 4.35 | |||
Atlantia SpA | 4.23 | |||
Fiat Chrysler Automobiles NV | 4.18 | |||
Snam SpA | 3.97 | |||
Telecom Italia SpA | 3.16 | |||
|
| |||
TOTAL | 67.46 | % | ||
|
|
| * | Excludes money market funds. |
MANAGEMENT’S DISCUSSIONSOF FUND PERFORMANCE | 11 |
Table of Contents
Management’s Discussion of Fund Performance
iSHARES® MSCI SPAIN CAPPED ETF
Performance as of August 31, 2015
| Average Annual Total Returns | Cumulative Total Returns | |||||||||||||||||||||||||
| NAV | MARKET | INDEX | NAV | MARKET | INDEX | |||||||||||||||||||||
1 Year | (17.63)% | (17.29)% | (17.16)% | (17.63)% | (17.29)% | (17.16)% | ||||||||||||||||||||
5 Years | 2.34% | 2.51% | 1.75% | 12.28% | 13.20% | 9.04% | ||||||||||||||||||||
10 Years | 3.41% | 3.37% | 3.24% | 39.89% | 39.32% | 37.62% | ||||||||||||||||||||
GROWTH OF $10,000 INVESTMENT
(AT NET ASSET VALUE)
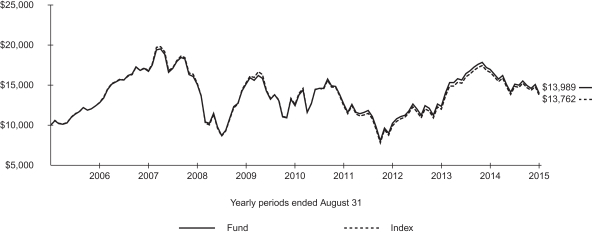
Index performance through February 11, 2013 reflects the performance of the MSCI Spain Index. Index performance beginning on February 12, 2013 reflects the performance of the MSCI Spain 25/50 Index.
Past performance is no guarantee of future results. Performance results do not reflect the deduction of taxes that a shareholder would pay on fund distributions or on the redemption or sale of fund shares. See “About Fund Performance” on page 16 for more information.
| Shareholder Expenses | ||||||||||||||||||||||||||
| Actual | Hypothetical 5% Return | |||||||||||||||||||||||||
| Beginning Account Value (3/1/15) | Ending Account Value (8/31/15) | Expenses Paid During Period a | Beginning Account Value (3/1/15) | Ending Account Value (8/31/15) | Expenses Paid During Period a | Annualized Expense Ratio | ||||||||||||||||||||
| $ | 1,000.00 | $ | 926.00 | $ | 2.28 | $ | 1,000.00 | $ | 1,022.80 | $ | 2.40 | 0.47% | ||||||||||||||
| a | Expenses are calculated using the Fund’s annualized expense ratio (as disclosed in the table), multiplied by the average account value for the period, multiplied by the number of days in the period (184 days) and divided by the number of days in the year (365 days). See “Shareholder Expenses” on page 16 for more information. |
| 12 | 2015 iSHARES ANNUAL REPORTTO SHAREHOLDERS |
Table of Contents
Management’s Discussion of Fund Performance (Continued)
iSHARES® MSCI SPAIN CAPPED ETF
The iShares MSCI Spain Capped ETF (the “Fund”) seeks to track the investment results of an index composed of Spanish equities, as represented by the MSCI Spain 25/50 Index (the “Index”). The Fund invests in a representative sample of securities included in the Index that collectively has an investment profile similar to the Index. Due to the use of representative sampling, the Fund may or may not hold all of the securities that are included in the Index. For the 12-month reporting period ended August 31, 2015, the total return for the Fund was -17.63%, net of fees, while the total return for the Index was -17.16%.
Spanish stocks, as represented by the Index, produced a negative return during the reporting period and widely underperformed the broad international developed markets. The decline was mainly attributable to global market reactions to a decelerating Chinese economy and the extreme volatility of Chinese stocks late in the reporting period. Additionally, Spain’s currency, the euro, depreciated by 15% relative to the U.S. dollar, which detracted meaningfully from the performance of the dollar-denominated Index because Spanish stocks were valued lower when translated back into U.S. dollars.
Despite the negative performance of Spanish stocks, the economy of Spain continued its recovery for most of the reporting period. The country’s economy grew in 2014, the first year of economic expansion since Spain’s real-estate market collapsed in 2007, and was on track to grow even more quickly during 2015. Low inflation, the weak euro, falling energy prices, and improving financial stability in the eurozone all contributed to an accelerating Spanish economy. Like most other eurozone markets, however, Spanish equities were vulnerable to geopolitical tensions in Greece, as well as the economic crisis in China, and stock prices declined on news of these events.
The financials sector, the largest segment of the Index, was the most significant detractor from Index performance during the reporting period from the perspective of U.S. investors. Many Spanish bank stocks declined in the wake of the real-estate collapse, which left banks holding large amounts of nonperforming assets. Energy stocks also performed poorly. On the upside, equities in the consumer discretionary and information technology sectors delivered positive results.
ALLOCATION BY SECTOR
As of 8/31/15
| Sector | Percentage of Total Investments* |
Financials | 42.84 | % | ||
Industrials | 14.83 | |||
Utilities | 12.95 | |||
Telecommunication Services | 11.86 | |||
Information Technology | 4.66 | |||
Consumer Discretionary | 4.64 | |||
Energy | 4.29 | |||
Health Care | 2.23 | |||
Consumer Staples | 1.70 | |||
|
| |||
TOTAL | 100.00 | % | ||
|
|
TEN LARGEST FUND HOLDINGS
As of 8/31/15
| Security | Percentage of Total Investments* |
Banco Santander SA | 17.34 | % | ||
Telefonica SA | 11.86 | |||
Banco Bilbao Vizcaya Argentaria SA | 10.75 | |||
Iberdrola SA | 5.10 | |||
Amadeus IT Holding SA Class A | 4.66 | |||
Industria de Diseno Textil SA | 4.64 | |||
Repsol SA | 4.28 | |||
CaixaBank SA | 3.42 | |||
Ferrovial SA | 3.42 | |||
Banco de Sabadell SA | 3.19 | |||
|
| |||
TOTAL | 68.66 | % | ||
|
|
| * | Excludes money market funds. |
MANAGEMENT’S DISCUSSIONSOF FUND PERFORMANCE | 13 |
Table of Contents
Management’s Discussion of Fund Performance
iSHARES® MSCI SWITZERLAND CAPPED ETF
Performance as of August 31, 2015
| Average Annual Total Returns | Cumulative Total Returns | |||||||||||||||||||||||||
| NAV | MARKET | INDEX | NAV | MARKET | INDEX | |||||||||||||||||||||
1 Year | (2.92)% | (3.12)% | (2.89)% | (2.92)% | (3.12)% | (2.89)% | ||||||||||||||||||||
5 Years | 10.60% | 10.59% | 10.49% | 65.49% | 65.42% | 64.65% | ||||||||||||||||||||
10 Years | 8.18% | 8.10% | 7.72% | 119.47% | 117.93% | 110.33% | ||||||||||||||||||||
GROWTH OF $10,000 INVESTMENT
(AT NET ASSET VALUE)
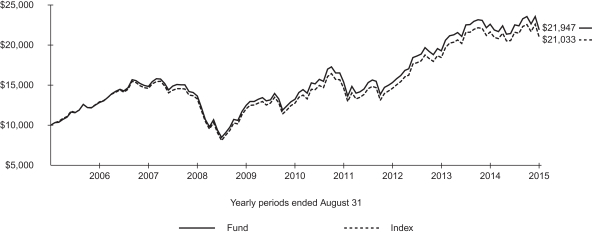
Index performance through February 11, 2013 reflects the performance of the MSCI Switzerland Index. Index performance beginning on February 12, 2013 reflects the performance of the MSCI Switzerland 25/50 Index.
Past performance is no guarantee of future results. Performance results do not reflect the deduction of taxes that a shareholder would pay on fund distributions or on the redemption or sale of fund shares. See “About Fund Performance” on page 16 for more information.
| Shareholder Expenses | ||||||||||||||||||||||||||
| Actual | Hypothetical 5% Return | |||||||||||||||||||||||||
| Beginning Account Value (3/1/15) | Ending Account Value (8/31/15) | Expenses Paid During Period a | Beginning Account Value (3/1/15) | Ending Account Value (8/31/15) | Expenses Paid During Period a | Annualized Expense Ratio | ||||||||||||||||||||
| $ | 1,000.00 | $ | 974.90 | $ | 2.34 | $ | 1,000.00 | $ | 1,022.80 | $ | 2.40 | 0.47% | ||||||||||||||
| a | Expenses are calculated using the Fund’s annualized expense ratio (as disclosed in the table), multiplied by the average account value for the period, multiplied by the number of days in the period (184 days) and divided by the number of days in the year (365 days). See “Shareholder Expenses” on page 16 for more information. |
| 14 | 2015 iSHARES ANNUAL REPORTTO SHAREHOLDERS |
Table of Contents
Management’s Discussion of Fund Performance (Continued)
iSHARES® MSCI SWITZERLAND CAPPED ETF
The iShares MSCI Switzerland Capped ETF (the “Fund”) seeks to track the investment results of an index composed of Swiss equities, as represented by the MSCI Switzerland 25/50 Index (the “Index”). The Fund invests in a representative sample of securities included in the Index that collectively has an investment profile similar to the Index. Due to the use of representative sampling, the Fund may or may not hold all of the securities that are included in the Index. For the 12-month reporting period ended August 31, 2015, the total return for the Fund was -2.92%, net of fees, while the total return for the Index was -2.89%.
Swiss stocks, as represented by the Index, produced a negative return during the reporting period but outperformed the broad international developed markets. The decline was mainly due to global market reactions to a decelerating Chinese economy and the extreme volatility of Chinese stocks late in the reporting period. Additionally, Switzerland’s currency, the Swiss franc, depreciated by approximately 5% relative to the U.S. dollar during the reporting period, which detracted from the performance of the dollar-denominated Index as Swiss stocks were valued lower when translated back into U.S. dollars.
Swiss stock prices declined in U.S. dollar terms during the reporting period, as the Swiss economy had difficulty establishing a sustained growth trajectory. The Swiss economy began to struggle in early 2015 when the Swiss central bank decided to allow the Swiss franc to float freely relative to the euro, ending a period when the Swiss franc was artificially pegged to the euro. This currency-exchange decision led to an abrupt appreciation of the Swiss franc. GDP in Switzerland declined 0.2% during the first quarter of 2015, but returned to modest growth in the second quarter, growing by 0.2% or an annualized rate of 1%, as the Swiss economy adjusted to the currency appreciation. Solid private consumption and fixed investment spending by businesses and the Swiss government during the latter portion of the reporting period helped offset the Swiss franc’s negative effects on demand for Swiss exports.
ALLOCATION BY SECTOR
As of 8/31/15
| Sector | Percentage of Total Investments* |
Health Care | 31.91 | % | ||
Financials | 20.05 | |||
Consumer Staples | 19.78 | |||
Industrials | 10.85 | |||
Materials | 9.11 | |||
Consumer Discretionary | 6.17 | |||
Telecommunication Services | 1.48 | |||
Energy | 0.65 | |||
|
| |||
TOTAL | 100.00 | % | ||
|
|
TEN LARGEST FUND HOLDINGS
As of 8/31/15
| Security | Percentage of Total Investments* |
Nestle SA Registered | 16.79 | % | ||
Novartis AG Registered | 15.53 | |||
Roche Holding AG | 12.96 | |||
UBS Group AG | 4.46 | |||
ABB Ltd. Registered | 3.88 | |||
Credit Suisse Group AG Registered | 3.81 | |||
Zurich Insurance Group AG | 3.78 | |||
Cie. Financiere Richemont SA Class A Registered | 3.60 | |||
Syngenta AG Registered | 3.02 | |||
Swiss Re AG | 2.90 | |||
|
| |||
TOTAL | 70.73 | % | ||
|
|
| * | Excludes money market funds. |
MANAGEMENT’S DISCUSSIONSOF FUND PERFORMANCE | 15 |
Table of Contents
Past performance is no guarantee of future results. Current performance may be lower or higher than the performance data quoted. Performance data current to the most recent month-end is available at www.ishares.com. Performance results assume reinvestment of all dividends and capital gain distributions and do not reflect the deduction of taxes that a shareholder would pay on fund distributions or on the redemption or sale of fund shares. The investment return and principal value of shares will vary with changes in market conditions. Shares may be worth more or less than their original cost when they are redeemed or sold in the market. Performance for certain funds may reflect a waiver of a portion of investment advisory fees. Without such a waiver, performance would have been lower.
Net asset value or “NAV” is the value of one share of a fund as calculated in accordance with the standard formula for valuing mutual fund shares. The price used to calculate market return (“Market Price”) is determined by using the midpoint between the highest bid and the lowest offer on the primary stock exchange on which shares of a fund are listed for trading, as of the time that such fund’s NAV is calculated. Certain funds may have a NAV which is determined prior to the opening of regular trading on its listed exchange and their market returns are calculated using the midpoint of the bid/ask spread as of the opening of regular trading on the exchange. Market and NAV returns assume that dividends and capital gain distributions have been reinvested at Market Price and NAV, respectively.
An index is a statistical composite that tracks a specified financial market or sector. Unlike a fund, an index does not actually hold a portfolio of securities and therefore does not incur the expenses incurred by a fund. These expenses negatively impact fund performance. Also, market returns do not include brokerage commissions that may be payable on secondary market transactions. If brokerage commissions were included, market returns would be lower.
As a shareholder of a Fund, you incur two types of costs: (1) transaction costs, including brokerage commissions on purchases and sales of fund shares and (2) ongoing costs, including management fees and other fund expenses. The expense example, which is based on an investment of $1,000 invested on March 1, 2015 and held through August 31, 2015, is intended to help you understand your ongoing costs (in dollars and cents) of investing in a Fund and to compare these costs with the ongoing costs of investing in other funds.
Actual Expenses — The table provides information about actual account values and actual expenses. Annualized expense ratios reflect contractual and voluntary fee waivers, if any. To estimate the expenses that you paid on your account over the period, simply divide your account value by $1,000 (for example, an $8,600 account value divided by $1,000 = 8.6), then multiply the result by the number corresponding to your Fund under the heading entitled “Expenses Paid During Period.”
Hypothetical Example for Comparison Purposes — The table also provides information about hypothetical account values and hypothetical expenses based on each Fund’s actual expense ratio and an assumed rate of return of 5% per year before expenses. You may use this information to compare the ongoing costs of investing in your Fund and other funds. To do so, compare this 5% hypothetical example with the 5% hypothetical examples that appear in the shareholder reports of the other funds.
Please note that the expenses shown in the table are meant to highlight your ongoing costs only and do not reflect any transactional costs, such as brokerage commissions paid on purchases and sales of fund shares. Therefore, the hypothetical examples are useful in comparing ongoing costs only and will not help you determine the relative total costs of owning different funds. In addition, if these transactional costs were included, your costs would have been higher.
| 16 | 2015 iSHARES ANNUAL REPORTTO SHAREHOLDERS |
Table of Contents
August 31, 2015
| Security | Shares | Value | ||||||
COMMON STOCKS — 98.05% |
| |||||||
AUSTRIA — 0.57% | ||||||||
Andritz AG | 209,525 | $ | 10,029,489 | |||||
Erste Group Bank AGa | 749,223 | 22,293,032 | ||||||
IMMOEAST AG Escrowa | 105,078 | 1 | ||||||
IMMOFINANZ AG Escrowa | 68,575 | 1 | ||||||
OMV AG | 392,965 | 10,056,844 | ||||||
Raiffeisen Bank International AGa,b | 320,185 | 4,330,320 | ||||||
Voestalpine AG | 299,061 | 10,924,186 | ||||||
|
| |||||||
| 57,633,873 | ||||||||
BELGIUM — 4.24% | ||||||||
Ageas | 538,932 | 22,041,369 | ||||||
Anheuser-Busch InBev SA/NV | 2,152,270 | 235,036,270 | ||||||
Colruyt SA | 190,123 | 9,267,990 | ||||||
Delhaize Group | 275,874 | 24,701,517 | ||||||
Groupe Bruxelles Lambert SA | 213,794 | 16,589,260 | ||||||
KBC Groep NV | 673,974 | 44,684,452 | ||||||
Proximus | 409,611 | 14,730,609 | ||||||
Solvay SA | 159,107 | 18,701,503 | ||||||
Telenet Group Holding NVa | 141,988 | 7,993,059 | ||||||
UCB SA | 338,759 | 25,636,789 | ||||||
Umicore SA | 255,718 | 10,216,296 | ||||||
|
| |||||||
| 429,599,114 | ||||||||
FINLAND — 2.72% | ||||||||
Elisa OYJ | 382,740 | 12,737,143 | ||||||
Fortum OYJ | 1,211,293 | 19,693,747 | ||||||
Kone OYJ Class B | 903,552 | 35,718,520 | ||||||
Metso OYJ | 301,798 | 7,439,620 | ||||||
Neste OYJ | 343,942 | 8,817,652 | ||||||
Nokia OYJ | 9,864,922 | 61,679,320 | ||||||
Nokian Renkaat OYJb | 304,353 | 8,215,351 | ||||||
Orion OYJ Class B | 270,879 | 10,738,531 | ||||||
Sampo OYJ Class A | 1,196,443 | 57,686,619 | ||||||
Stora Enso OYJ Class R | 1,471,741 | 13,085,492 | ||||||
UPM-Kymmene OYJ | 1,428,144 | 23,795,492 | ||||||
Wartsila OYJ Abp | 396,502 | 16,402,831 | ||||||
|
| |||||||
| 276,010,318 | ||||||||
FRANCE — 32.52% | ||||||||
Accor SA | 562,578 | 26,651,978 | ||||||
Aeroports de Paris | 78,500 | 9,002,626 | ||||||
Air Liquide SA | 924,162 | 110,645,654 | ||||||
Airbus Group SE | 1,580,077 | 102,846,935 | ||||||
Alcatel-Lucenta | 7,379,912 | 24,757,951 | ||||||
| Security | Shares | Value | ||||||
Alstom SAa | 579,878 | $ | 17,978,668 | |||||
ArcelorMittal | 2,670,951 | 20,767,037 | ||||||
Arkema SA | 176,384 | 12,433,420 | ||||||
Atos | 231,161 | 17,543,142 | ||||||
AXA SA | 5,252,742 | 132,281,008 | ||||||
BNP Paribas SA | 2,837,019 | 178,875,510 | ||||||
Bollore SA | 2,325,865 | 12,556,339 | ||||||
Bouygues SA | 539,188 | 20,505,189 | ||||||
Bureau Veritas SA | 710,099 | 16,195,775 | ||||||
Cap Gemini SA | 416,009 | 37,346,972 | ||||||
Carrefour SA | 1,475,994 | 47,928,595 | ||||||
Casino Guichard Perrachon SA | 150,349 | 9,501,483 | ||||||
Christian Dior SE | 145,422 | 26,951,153 | ||||||
Cie. de Saint-Gobain | 1,278,293 | 58,675,270 | ||||||
Cie. Generale des Etablissements | 497,755 | 48,126,893 | ||||||
CNP Assurances | 462,344 | 7,123,274 | ||||||
Credit Agricole SA | 2,763,104 | 37,415,850 | ||||||
Danone SA | 1,554,420 | 96,474,262 | ||||||
Dassault Systemes | 342,355 | 23,741,540 | ||||||
Edenred | 551,769 | 11,688,148 | ||||||
Electricite de France SA | 655,382 | 14,165,714 | ||||||
Engie | 3,936,242 | 70,502,766 | ||||||
Essilor International SA | 549,632 | 65,527,766 | ||||||
Eurazeo SA | 108,170 | 7,017,738 | ||||||
Eutelsat Communications SA | 454,197 | 13,677,429 | ||||||
Fonciere des Regions | 81,924 | 6,826,855 | ||||||
Gecina SA | 93,174 | 11,734,721 | ||||||
Groupe Eurotunnel SE Registered | 1,253,190 | 16,941,660 | ||||||
Hermes International | 71,223 | 25,270,363 | ||||||
ICADE | 91,811 | 6,568,517 | ||||||
Iliad SA | 71,332 | 16,089,402 | ||||||
Imerys SA | 96,325 | 6,634,588 | ||||||
Ingenico Group | 146,841 | 18,164,696 | ||||||
JCDecaux SA | 203,217 | 7,293,378 | ||||||
Kering | 203,302 | 34,796,423 | ||||||
Klepierre | 505,275 | 22,204,813 | ||||||
L’Oreal SA | 676,675 | 115,779,294 | ||||||
Lagardere SCA | 317,416 | 8,624,865 | ||||||
Legrand SA | 709,341 | 40,877,405 | ||||||
LVMH Moet Hennessy Louis Vuitton SE | 748,568 | 124,683,188 | ||||||
Natixis SA | 2,523,582 | 16,004,628 | ||||||
SCHEDULESOF INVESTMENTS | 17 |
Table of Contents
Schedule of Investments (Continued)
iSHARES® MSCI EUROZONE ETF
August 31, 2015
| Security | Shares | Value | ||||||
Numericable-SFR SASa | 261,818 | $ | 13,449,409 | |||||
Orange SA | 5,326,278 | 84,090,425 | ||||||
Pernod Ricard SA | 569,334 | 59,660,013 | ||||||
Peugeot SAa | 1,159,258 | 20,003,802 | ||||||
Publicis Groupe SA | 503,550 | 35,839,737 | ||||||
Remy Cointreau SA | 66,728 | 3,952,274 | ||||||
Renault SA | 514,898 | 42,745,709 | ||||||
Rexel SA | 779,880 | 11,949,971 | ||||||
Safran SA | 782,023 | 61,004,978 | ||||||
Sanofi | 3,150,029 | 311,205,397 | ||||||
Schneider Electric SE | 1,487,246 | 93,871,614 | ||||||
SCOR SE | 409,398 | 14,422,481 | ||||||
SES SA | 862,037 | 25,572,524 | ||||||
Societe BIC SA | 77,876 | 12,342,931 | ||||||
Societe Generale SA | 1,941,419 | 94,530,239 | ||||||
Sodexo SA | 252,320 | 22,174,080 | ||||||
STMicroelectronics NV | 1,708,423 | 12,391,182 | ||||||
Suez Environnement Co. | 812,400 | 14,642,078 | ||||||
Technip SA | 280,808 | 15,279,174 | ||||||
Thales SA | 276,481 | 19,024,625 | ||||||
Total SA | 5,771,451 | 263,882,215 | ||||||
Unibail-Rodamco SE | 262,524 | 68,024,049 | ||||||
Valeo SA | 212,583 | 26,678,308 | ||||||
Veolia Environnement SA | 1,225,758 | 26,851,171 | ||||||
Vinci SA | 1,278,633 | 82,251,757 | ||||||
Vivendi SA | 3,100,310 | 76,582,044 | ||||||
Wendel SA | 77,876 | 9,978,185 | ||||||
Zodiac Aerospace | 539,090 | 16,372,780 | ||||||
|
| |||||||
| 3,296,174,033 | ||||||||
GERMANY — 27.45% |
| |||||||
adidas AG | 561,804 | 42,000,319 | ||||||
Allianz SE Registered | 1,225,013 | 195,256,140 | ||||||
Axel Springer SE | 119,834 | 7,246,765 | ||||||
BASF SE | 2,464,462 | 198,325,818 | ||||||
Bayer AG Registered | 2,213,358 | 299,964,088 | ||||||
Bayerische Motoren Werke AG | 887,024 | 81,719,287 | ||||||
Beiersdorf AG | 271,141 | 22,415,352 | ||||||
Brenntag AG | 414,103 | 23,005,232 | ||||||
Commerzbank AGa | 2,857,862 | 31,996,716 | ||||||
Continental AG | 295,046 | 62,631,969 | ||||||
Daimler AG Registered | 2,583,435 | 207,436,927 | ||||||
Deutsche Annington Immobilien SE | 1,247,681 | 40,801,393 | ||||||
Deutsche Bank AG Registered | 3,694,677 | 108,775,460 | ||||||
Deutsche Boerse AG | 518,300 | 46,338,439 | ||||||
| Security | Shares | Value | ||||||
Deutsche Lufthansa AG Registereda | 629,350 | $ | 7,654,799 | |||||
Deutsche Post AG Registered | 2,603,048 | 71,619,922 | ||||||
Deutsche Telekom AG Registered | 8,519,593 | 145,531,834 | ||||||
Deutsche Wohnen AG Bearer | 904,582 | 23,758,405 | ||||||
E.ON SE | 5,392,163 | 61,053,569 | ||||||
Evonik Industries AG | 374,935 | 13,949,903 | ||||||
Fraport AG Frankfurt Airport Services Worldwide | 112,233 | 6,775,789 | ||||||
Fresenius Medical Care | 585,245 | 44,729,855 | ||||||
Fresenius SE & Co. KGaA | 1,018,845 | 71,978,855 | ||||||
GEA Group AG | 491,378 | 19,160,493 | ||||||
Hannover Rueck SE | 161,729 | 16,421,911 | ||||||
HeidelbergCement AG | 377,237 | 28,472,663 | ||||||
Henkel AG & Co. KGaA | 277,510 | 25,441,917 | ||||||
HUGO BOSS AG | 180,269 | 20,582,919 | ||||||
Infineon Technologies AG | 3,028,890 | 33,103,810 | ||||||
K+S AG Registered | 513,764 | 19,190,039 | ||||||
Kabel Deutschland | 58,679 | 7,945,863 | ||||||
Lanxess AG | 245,823 | 12,477,640 | ||||||
Linde AG | 498,600 | 86,539,707 | ||||||
MAN SE | 95,272 | 9,981,335 | ||||||
Merck KGaA | 347,125 | 33,166,060 | ||||||
METRO AG | 477,050 | 13,913,929 | ||||||
Muenchener Rueckversicherungs- | 446,465 | 81,943,223 | ||||||
Osram Licht AG | 239,522 | 12,657,004 | ||||||
ProSiebenSat.1 Media SE Registered | 587,485 | 28,572,502 | ||||||
QIAGEN NVa | 596,367 | 15,746,817 | ||||||
RTL Group SAa | 103,497 | 9,002,623 | ||||||
RWE AG | 1,322,048 | 19,842,741 | ||||||
SAP SE | 2,638,116 | 177,330,924 | ||||||
Siemens AG Registered | 2,127,737 | 210,900,013 | ||||||
Symrise AG | 331,243 | 19,964,571 | ||||||
Telefonica Deutschland Holding AG | 1,600,073 | 9,722,795 | ||||||
ThyssenKrupp AG | 987,123 | 21,374,822 | ||||||
United Internet AG Registeredc | 330,294 | 16,041,738 | ||||||
Volkswagen AG | 94,638 | 17,677,176 | ||||||
|
| |||||||
| 2,782,142,071 | ||||||||
| 18 | 2015 iSHARES ANNUAL REPORTTO SHAREHOLDERS |
Table of Contents
Schedule of Investments (Continued)
iSHARES® MSCI EUROZONE ETF
August 31, 2015
| Security | Shares | Value | ||||||
IRELAND — 1.27% | ||||||||
Bank of Irelanda | 74,247,527 | $ | 29,533,987 | |||||
CRH PLC | 2,197,677 | 65,724,027 | ||||||
Irish Bank Resolution | 446,666 | 5 | ||||||
Kerry Group PLC Class A | 426,102 | 31,678,618 | ||||||
Ryanair Holdings PLC | 43,520 | 599,311 | ||||||
Ryanair Holdings PLC ADR | 9,599 | 700,247 | ||||||
|
| |||||||
| 128,236,195 | ||||||||
ITALY — 7.88% |
| |||||||
Assicurazioni Generali SpA | 3,153,243 | 57,697,282 | ||||||
Atlantia SpA | 1,123,315 | 30,031,963 | ||||||
Banca Monte dei Paschi di Siena SpAa | 6,768,726 | 14,205,497 | ||||||
Banco Popolare SCa | 789,013 | 13,544,240 | ||||||
CNH Industrial NV | 2,562,676 | 20,215,202 | ||||||
Enel Green Power SpA | 4,681,105 | 8,916,800 | ||||||
Enel SpA | 18,955,437 | 85,298,075 | ||||||
Eni SpA | 6,827,097 | 111,915,986 | ||||||
EXOR SpA | 272,977 | 12,531,520 | ||||||
Finmeccanica SpAa | 1,022,484 | 13,828,514 | ||||||
Intesa Sanpaolo SpA | 33,879,724 | 123,529,061 | ||||||
Intesa Sanpaolo SpA RSP | 2,494,160 | 8,227,613 | ||||||
Luxottica Group SpA | 456,748 | 30,911,873 | ||||||
Mediobanca SpA | 1,559,760 | 15,642,009 | ||||||
Pirelli & C. SpA | 719,589 | 12,046,111 | ||||||
Prysmian SpA | 540,358 | 11,546,331 | ||||||
Saipem SpAa,b | 718,020 | 6,906,986 | ||||||
Snam SpA | 5,620,068 | 27,468,754 | ||||||
Telecom Italia SpAa | 27,187,193 | 32,991,689 | ||||||
Telecom Italia SpA RSP | 16,200,887 | 16,219,784 | ||||||
Tenaris SA | 1,272,859 | 16,515,837 | ||||||
Terna Rete Elettrica Nazionale SpA | 4,032,905 | 18,780,418 | ||||||
UniCredit SpA | 12,786,789 | 83,529,865 | ||||||
Unione di Banche Italiane SpA | 2,411,375 | 18,805,536 | ||||||
UnipolSai SpA | 2,982,264 | 6,823,600 | ||||||
|
| |||||||
| 798,130,546 | ||||||||
NETHERLANDS — 9.44% | ||||||||
Aegon NV | 4,836,863 | 29,732,493 | ||||||
Akzo Nobel NV | 658,458 | 44,518,970 | ||||||
Altice NV Class Aa | 697,012 | 19,856,968 | ||||||
Altice NV Class Ba | 226,176 | 7,090,975 | ||||||
ASML Holding NV | 927,388 | 84,876,786 | ||||||
Boskalis Westminster NV | 231,316 | 12,034,168 | ||||||
| Security | Shares | Value | ||||||
Delta Lloyd NV | 587,737 | $ | 6,234,579 | |||||
Fiat Chrysler Automobiles NVa | 2,417,676 | 33,970,924 | ||||||
Gemalto NVb | 214,552 | 15,434,029 | ||||||
Heineken Holding NV | 270,535 | 18,854,958 | ||||||
Heineken NV | 619,493 | 48,936,989 | ||||||
ING Groep NV CVA | 10,344,718 | 158,162,646 | ||||||
Koninklijke Ahold NV | 2,400,532 | 47,380,744 | ||||||
Koninklijke DSM NV | 487,153 | 25,606,047 | ||||||
Koninklijke KPN NV | 8,598,003 | 33,449,454 | ||||||
Koninklijke Philips NV | 2,507,359 | 64,393,623 | ||||||
Koninklijke Vopak NV | 188,767 | 7,766,771 | ||||||
NN Group NV | 513,955 | 15,678,507 | ||||||
OCI NVa | 225,587 | 6,642,800 | ||||||
Randstad Holding NV | 339,800 | 21,455,025 | ||||||
RELX NV | 2,737,153 | 42,124,957 | ||||||
TNT Express NV | 1,328,561 | 11,218,483 | ||||||
Unilever NV CVA | 4,372,922 | 175,096,411 | ||||||
Wolters Kluwer NV | 808,547 | 25,593,840 | ||||||
|
| |||||||
| 956,111,147 | ||||||||
PORTUGAL — 0.47% | ||||||||
Banco Comercial Portugues SA Registereda,b | 102,490,227 | 7,234,936 | ||||||
EDP – Energias de Portugal SA | 5,838,059 | 20,448,864 | ||||||
Galp Energia SGPS SA | 1,036,124 | 10,909,697 | ||||||
Jeronimo Martins SGPS SA | 673,974 | 9,326,567 | ||||||
|
| |||||||
| 47,920,064 | ||||||||
SPAIN — 11.49% | ||||||||
Abertis Infraestructuras SA | 1,292,736 | 21,380,011 | ||||||
ACS Actividades de Construccion y Servicios SA | 529,909 | 17,180,528 | ||||||
Aena SAa,d | 182,399 | 20,948,747 | ||||||
Amadeus IT Holding SA Class A | 1,206,641 | 50,444,643 | ||||||
Banco Bilbao Vizcaya Argentaria SA | 16,875,790 | 156,247,685 | ||||||
Banco de Sabadell SA | 13,541,381 | 28,828,914 | ||||||
Banco Popular Espanol SA | 4,595,990 | 19,677,406 | ||||||
Banco Santander SA | 38,317,593 | 234,424,279 | ||||||
Bankia SA | 12,646,100 | 15,261,037 | ||||||
Bankinter SA | 1,846,661 | 13,904,910 | ||||||
CaixaBank SA | 6,987,977 | 30,223,900 | ||||||
Distribuidora Internacional de Alimentacion SA | 1,693,536 | 10,182,556 | ||||||
Enagas SA | 391,608 | 10,715,414 | ||||||
SCHEDULESOF INVESTMENTS | 19 |
Table of Contents
Schedule of Investments (Continued)
iSHARES® MSCI EUROZONE ETF
August 31, 2015
| Security | Shares | Value | ||||||
Endesa SA | 799,155 | $ | 16,565,879 | |||||
Ferrovial SA | 1,184,440 | 28,295,149 | ||||||
Gas Natural SDG SA | 952,535 | 19,318,404 | ||||||
Grifols SA | 405,221 | 16,597,797 | ||||||
Iberdrola SA | 14,456,269 | 98,080,370 | ||||||
Industria de Diseno Textil SA | 2,938,848 | 97,933,171 | ||||||
International Consolidated Airlines Group SAa | 2,247,829 | 18,736,547 | ||||||
Mapfre SA | 3,040,366 | 8,959,697 | ||||||
Red Electrica Corp. SA | 208,608 | 16,652,007 | ||||||
Repsol SA | 2,874,302 | 41,079,447 | ||||||
Telefonica SA | 11,895,653 | 167,813,055 | ||||||
Zardoya Otis SA | 481,010 | 5,136,399 | ||||||
Zardoya Otis SA Newa | 17,881 | 190,940 | ||||||
|
| |||||||
| 1,164,778,892 | ||||||||
|
| |||||||
TOTAL COMMON STOCKS | ||||||||
(Cost: $10,959,451,063) | 9,936,736,253 | |||||||
PREFERRED STOCKS — 1.78% |
| |||||||
GERMANY — 1.78% | ||||||||
Bayerische Motoren Werke AG | 147,569 | 10,732,934 | ||||||
Fuchs Petrolub SE | 187,754 | 8,089,045 | ||||||
Henkel AG & Co. KGaA | 479,428 | 50,120,658 | ||||||
Porsche Automobil Holding SE | 409,599 | 28,505,729 | ||||||
Volkswagen AG | 436,004 | 82,807,925 | ||||||
|
| |||||||
| 180,256,291 | ||||||||
|
| |||||||
TOTAL PREFERRED STOCKS |
| |||||||
(Cost: $224,254,615) | 180,256,291 | |||||||
SHORT-TERM INVESTMENTS — 0.26% |
| |||||||
MONEY MARKET FUNDS — 0.26% |
| |||||||
BlackRock Cash Funds: Institutional, |
| |||||||
0.18%e,f,g | 19,595,068 | 19,595,068 | ||||||
BlackRock Cash Funds: Prime, |
| |||||||
0.18%e,f,g | 1,125,245 | 1,125,245 | ||||||
BlackRock Cash Funds: Treasury, |
| |||||||
0.03%e,f | 5,629,272 | 5,629,272 | ||||||
|
| |||||||
| 26,349,585 | ||||||||
|
| |||||||
TOTAL SHORT-TERM INVESTMENTS |
| |||||||
(Cost: $26,349,585) | 26,349,585 | |||||||
|
| |||||||
| Value | ||||||
TOTAL INVESTMENTS | ||||||
(Cost: $11,210,055,263) | $ | 10,143,342,129 | ||||
Other Assets, Less Liabilities — (0.09)% | (8,726,301 | ) | ||||
|
| |||||
NET ASSETS — 100.00% | $ | 10,134,615,828 | ||||
|
| |||||
ADR — American Depositary Receipts
| a | Non-income earning security. |
| b | All or a portion of this security represents a security on loan. See Note 1. |
| c | This security may be resold to qualified foreign investors and foreign institutional buyers under Regulation S of the Securities Act of 1933. |
| d | This security may be resold to qualified institutional buyers under Rule 144A of the Securities Act of 1933. |
| e | Affiliated issuer. See Note 2. |
| f | The rate quoted is the annualized seven-day yield of the fund at period end. |
| g | All or a portion of this security represents an investment of securities lending collateral. See Note 1. |
See notes to financial statements.
| 20 | 2015 iSHARES ANNUAL REPORTTO SHAREHOLDERS |
Table of Contents
Schedule of Investments
August 31, 2015
| Security | Shares | Value | ||||||
COMMON STOCKS — 93.49% |
| |||||||
AIR FREIGHT & LOGISTICS — 2.40% |
| |||||||
Deutsche Post AG Registered | 5,771,868 | $ | 158,806,420 | |||||
|
| |||||||
| 158,806,420 | ||||||||
AIRLINES — 0.25% |
| |||||||
Deutsche Lufthansa AG Registereda | 1,379,932 | 16,784,146 | ||||||
|
| |||||||
| 16,784,146 | ||||||||
AUTO COMPONENTS — 2.10% |
| |||||||
Continental AG | 655,278 | 139,101,535 | ||||||
|
| |||||||
| 139,101,535 | ||||||||
AUTOMOBILES — 10.32% |
| |||||||
Bayerische Motoren Werke AG | 1,972,295 | 181,702,571 | ||||||
Daimler AG Registered | 5,735,569 | 460,537,542 | ||||||
Volkswagen AG | 210,938 | 39,400,538 | ||||||
|
| |||||||
| 681,640,651 | ||||||||
BANKS — 1.07% |
| |||||||
Commerzbank AGa | 6,341,078 | 70,994,916 | ||||||
|
| |||||||
| 70,994,916 | ||||||||
CAPITAL MARKETS — 3.66% |
| |||||||
Deutsche Bank AG Registered | 8,216,113 | 241,891,638 | ||||||
|
| |||||||
| 241,891,638 | ||||||||
CHEMICALS — 11.77% |
| |||||||
BASF SE | 5,471,232 | 440,293,484 | ||||||
Evonik Industries AG | 828,160 | 30,812,679 | ||||||
K+S AG Registered | 1,140,144 | 42,586,495 | ||||||
Lanxess AG | 545,188 | 27,672,998 | ||||||
Linde AG | 1,106,385 | 192,030,151 | ||||||
Symrise AG | 734,371 | 44,261,771 | ||||||
|
| |||||||
| 777,657,578 | ||||||||
CONSTRUCTION MATERIALS — 0.96% |
| |||||||
HeidelbergCement AG | 839,543 | 63,366,067 | ||||||
|
| |||||||
| 63,366,067 | ||||||||
DIVERSIFIED FINANCIAL SERVICES — 1.56% |
| |||||||
Deutsche Boerse AG | 1,149,657 | 102,784,702 | ||||||
|
| |||||||
| 102,784,702 | ||||||||
DIVERSIFIED TELECOMMUNICATION SERVICES — 5.22% |
| |||||||
Deutsche Telekom AG Registered | 18,914,177 | 323,092,297 | ||||||
Telefonica Deutschland Holding AG | 3,546,848 | 21,552,314 | ||||||
|
| |||||||
| 344,644,611 | ||||||||
| Security | Shares | Value | ||||||
ELECTRICAL EQUIPMENT — 0.42% |
| |||||||
Osram Licht AG | 530,076 | $ | 28,010,681 | |||||
|
| |||||||
| 28,010,681 | ||||||||
FOOD & STAPLES RETAILING — 0.47% |
| |||||||
METRO AG | 1,061,869 | 30,971,115 | ||||||
|
| |||||||
| 30,971,115 | ||||||||
HEALTH CARE PROVIDERS & SERVICES — 3.92% |
| |||||||
Fresenius Medical Care AG & Co. KGaA | 1,297,683 | 99,180,979 | ||||||
Fresenius SE & Co. KGaA | 2,259,836 | 159,651,771 | ||||||
|
| |||||||
| 258,832,750 | ||||||||
HOUSEHOLD PRODUCTS — 0.86% |
| |||||||
Henkel AG & Co. KGaA | 619,028 | 56,752,042 | ||||||
|
| |||||||
| 56,752,042 | ||||||||
INDUSTRIAL CONGLOMERATES — 7.09% |
| |||||||
Siemens AG Registered | 4,723,182 | 468,158,963 | ||||||
|
| |||||||
| 468,158,963 | ||||||||
INSURANCE — 9.88% |
| |||||||
Allianz SE Registered | 2,722,277 | 433,906,659 | ||||||
Hannover Rueck SE | 359,193 | 36,472,342 | ||||||
Muenchener Rueckversicherungs-Gesellschaft AG in Muenchen Registered | 993,868 | 182,412,389 | ||||||
|
| |||||||
| 652,791,390 | ||||||||
INTERNET SOFTWARE & SERVICES — 0.54% |
| |||||||
United Internet AG Registeredb | 732,694 | 35,585,524 | ||||||
|
| |||||||
| 35,585,524 | ||||||||
LIFE SCIENCES TOOLS & SERVICES — 0.52% |
| |||||||
QIAGEN NVa,c | 1,312,496 | 34,655,898 | ||||||
|
| |||||||
| 34,655,898 | ||||||||
MACHINERY — 0.98% |
| |||||||
GEA Group AG | 1,089,331 | 42,476,706 | ||||||
MAN SE | 209,715 | 21,971,152 | ||||||
|
| |||||||
| 64,447,858 | ||||||||
MEDIA — 1.77% |
| |||||||
Axel Springer SE | 265,218 | 16,038,625 | ||||||
Kabel Deutschland Holding AGa | 131,586 | 17,818,374 | ||||||
ProSiebenSat.1 Media SE Registered | 1,303,340 | 63,388,316 | ||||||
RTL Group SAa | 230,265 | 20,029,460 | ||||||
|
| |||||||
| 117,274,775 | ||||||||
SCHEDULESOF INVESTMENTS | 21 |
Table of Contents
Schedule of Investments (Continued)
iSHARES® MSCI GERMANY ETF
August 31, 2015
| Security | Shares | Value | ||||||
METALS & MINING — 0.72% | ||||||||
ThyssenKrupp AG | 2,191,281 | $ | 47,449,244 | |||||
|
| |||||||
| 47,449,244 | ||||||||
MULTI-UTILITIES — 2.70% |
| |||||||
E.ON SE | 11,921,693 | 134,985,145 | ||||||
RWE AG | 2,915,180 | 43,754,208 | ||||||
|
| |||||||
| 178,739,353 | ||||||||
PERSONAL PRODUCTS — 0.75% |
| |||||||
Beiersdorf AG | 600,319 | 49,628,650 | ||||||
|
| |||||||
| 49,628,650 | ||||||||
PHARMACEUTICALS — 11.22% |
| |||||||
Bayer AG Registered | 4,925,906 | 667,580,618 | ||||||
Merck KGaA | 769,739 | 73,544,717 | ||||||
|
| |||||||
| 741,125,335 | ||||||||
REAL ESTATE MANAGEMENT & DEVELOPMENT — 2.17% |
| |||||||
Deutsche Annington Immobilien SE | 2,775,893 | 90,776,649 | ||||||
Deutsche Wohnen AG Bearer | 2,003,445 | 52,619,505 | ||||||
|
| |||||||
| 143,396,154 | ||||||||
SEMICONDUCTORS & SEMICONDUCTOR EQUIPMENT — 1.11% |
| |||||||
Infineon Technologies AG | 6,718,658 | 73,430,589 | ||||||
|
| |||||||
| 73,430,589 | ||||||||
SOFTWARE — 5.96% |
| |||||||
SAP SE | 5,854,407 | 393,526,062 | ||||||
|
| |||||||
| 393,526,062 | ||||||||
TEXTILES, APPAREL & LUXURY GOODS — 2.10% |
| |||||||
adidas AG | 1,246,272 | 93,170,967 | ||||||
HUGO BOSS AG | 398,397 | 45,488,537 | ||||||
|
| |||||||
| 138,659,504 | ||||||||
TRADING COMPANIES & DISTRIBUTORS — 0.77% |
| |||||||
Brenntag AG | 920,231 | 51,122,856 | ||||||
|
| |||||||
| 51,122,856 | ||||||||
TRANSPORTATION INFRASTRUCTURE — 0.23% |
| |||||||
Fraport AG Frankfurt Airport Services Worldwide | 247,532 | 14,944,131 | ||||||
|
| |||||||
| 14,944,131 | ||||||||
|
| |||||||
TOTAL COMMON STOCKS |
| |||||||
(Cost: $6,922,089,082) |
| 6,177,175,138 | ||||||
| Security | Shares | Value | ||||||
PREFERRED STOCKS — 6.05% |
| |||||||
AUTOMOBILES — 4.10% |
| |||||||
Bayerische Motoren Werke AG | 324,647 | $ | 23,612,106 | |||||
Porsche Automobil Holding SE | 912,011 | 63,470,707 | ||||||
Volkswagen AG | 968,450 | 183,932,567 | ||||||
|
| |||||||
| 271,015,380 | ||||||||
CHEMICALS — 0.27% |
| |||||||
Fuchs Petrolub SE | 414,002 | 17,836,536 | ||||||
|
| |||||||
| 17,836,536 | ||||||||
HOUSEHOLD PRODUCTS — 1.68% |
| |||||||
Henkel AG & Co. KGaA | 1,061,291 | 110,950,139 | ||||||
|
| |||||||
| 110,950,139 | ||||||||
|
| |||||||
TOTAL PREFERRED STOCKS |
| |||||||
(Cost: $474,327,669) |
| 399,802,055 | ||||||
SHORT-TERM INVESTMENTS — 0.04% |
| |||||||
MONEY MARKET FUNDS — 0.04% |
| |||||||
BlackRock Cash Funds: Institutional, |
| |||||||
SL Agency Shares | ||||||||
0.18%d,e,f | 2,010,636 | 2,010,636 | ||||||
BlackRock Cash Funds: Prime, | ||||||||
SL Agency Shares | ||||||||
0.18%d,e,f | 115,461 | 115,461 | ||||||
BlackRock Cash Funds: Treasury, |
| |||||||
SL Agency Shares | ||||||||
0.03%d,e | 138,221 | 138,221 | ||||||
|
| |||||||
| 2,264,318 | ||||||||
|
| |||||||
TOTAL SHORT-TERM INVESTMENTS |
| |||||||
(Cost: $2,264,318) |
| 2,264,318 | ||||||
|
| |||||||
TOTAL INVESTMENTS |
| |||||||
(Cost: $7,398,681,069) |
| 6,579,241,511 | ||||||
Other Assets, Less Liabilities — 0.42% |
| 27,814,809 | ||||||
|
| |||||||
NET ASSETS — 100.00% |
| $ | 6,607,056,320 | |||||
|
| |||||||
| a | Non-income earning security. |
| b | This security may be resold to qualified foreign investors and foreign institutional buyers under Regulation S of the Securities Act of 1933. |
| c | All or a portion of this security represents a security on loan. See Note 1. |
| d | Affiliated issuer. See Note 2. |
| e | The rate quoted is the annualized seven-day yield of the fund at period end. |
| f | All or a portion of this security represents an investment of securities lending collateral. See Note 1. |
| 22 | 2015 iSHARES ANNUAL REPORTTO SHAREHOLDERS |
Table of Contents
Schedule of Investments (Continued)
iSHARES® MSCI GERMANY ETF
August 31, 2015
Open futures contracts as of August 31, 2015 were as follows:
| Issue | Number of Contracts Purchased (Sold) | Expiration | Exchange | Notional Value | Unrealized Appreciation (Depreciation) | |||||||||||||||
| DAX Index | 104 | Sep. 2015 | Eurex | $ | 29,852,576 | $ | (2,345,063) | |||||||||||||
See notes to financial statements.
SCHEDULESOF INVESTMENTS | 23 |
Table of Contents
Schedule of Investments
iSHARES® MSCI ITALY CAPPED ETF
August 31, 2015
| Security | Shares | Value | ||||||
COMMON STOCKS — 99.95% |
| |||||||
AEROSPACE & DEFENSE — 2.41% |
| |||||||
Finmeccanica SpAa | 1,917,494 | $ | 25,933,015 | |||||
|
| |||||||
| 25,933,015 | ||||||||
AUTO COMPONENTS — 2.07% |
| |||||||
Pirelli & C. SpA | 1,332,822 | 22,311,793 | ||||||
|
| |||||||
| 22,311,793 | ||||||||
AUTOMOBILES — 4.17% |
| |||||||
Fiat Chrysler Automobiles NVa,b | 3,199,786 | 44,960,403 | ||||||
|
| |||||||
| 44,960,403 | ||||||||
BANKS — 30.94% |
| |||||||
Banca Monte dei Paschi di Siena SpAa | 12,371,013 | 25,962,994 | ||||||
Banco Popolare SCa | 1,650,593 | 28,334,170 | ||||||
Intesa Sanpaolo SpA | 40,007,036 | 145,869,889 | ||||||
Intesa Sanpaolo SpA RSP | 2,316,640 | 7,642,018 | ||||||
UniCredit SpA | 14,396,943 | 94,048,217 | ||||||
Unione di Banche Italiane SpA | 4,035,385 | 31,470,666 | ||||||
|
| |||||||
| 333,327,954 | ||||||||
CAPITAL MARKETS — 2.49% |
| |||||||
Mediobanca SpA | 2,672,271 | 26,798,795 | ||||||
|
| |||||||
| 26,798,795 | ||||||||
DIVERSIFIED FINANCIAL SERVICES — 2.12% |
| |||||||
EXOR SpA | 497,411 | 22,834,583 | ||||||
|
| |||||||
| 22,834,583 | ||||||||
DIVERSIFIED TELECOMMUNICATION SERVICES — 4.28% |
| |||||||
Telecom Italia SpAa,b | 27,992,124 | 33,968,474 | ||||||
Telecom Italia SpA RSP | 12,179,511 | 12,193,718 | ||||||
|
| |||||||
| 46,162,192 | ||||||||
ELECTRIC UTILITIES — 11.82% |
| |||||||
Enel SpA | 21,267,265 | 95,701,132 | ||||||
Terna Rete Elettrica Nazionale SpA | 6,794,528 | 31,640,734 | ||||||
|
| |||||||
| 127,341,866 | ||||||||
ELECTRICAL EQUIPMENT — 2.00% |
| |||||||
Prysmian SpA | 1,007,432 | 21,526,735 | ||||||
|
| |||||||
| 21,526,735 | ||||||||
ENERGY EQUIPMENT & SERVICES — 3.49% |
| |||||||
Saipem SpAa,b | 910,878 | 8,762,181 | ||||||
Tenaris SA | 2,224,031 | 28,857,661 | ||||||
|
| |||||||
| 37,619,842 | ||||||||
| Security | Shares | Value | ||||||
GAS UTILITIES — 3.97% |
| |||||||
Snam SpA | 8,755,289 | $ | 42,792,521 | |||||
|
| |||||||
| 42,792,521 | ||||||||
INDEPENDENT POWER AND RENEWABLE ELECTRICITY PRODUCERS — 0.70% |
| |||||||
Enel Green Power SpA | 3,935,689 | 7,496,895 | ||||||
|
| |||||||
| 7,496,895 | ||||||||
INSURANCE — 5.82% |
| |||||||
Assicurazioni Generali SpA | 2,578,603 | 47,182,657 | ||||||
UnipolSai SpA | 6,811,230 | 15,584,505 | ||||||
|
| |||||||
| 62,767,162 | ||||||||
MACHINERY — 3.07% |
| |||||||
CNH Industrial NV | 4,195,564 | 33,095,941 | ||||||
|
| |||||||
| 33,095,941 | ||||||||
OIL, GAS & CONSUMABLE FUELS — 12.02% |
| |||||||
Eni SpA | 7,898,001 | 129,471,219 | ||||||
|
| |||||||
| 129,471,219 | ||||||||
TEXTILES, APPAREL & LUXURY GOODS — 4.35% |
| |||||||
Luxottica Group SpA | 692,151 | 46,843,519 | ||||||
|
| |||||||
| 46,843,519 | ||||||||
TRANSPORTATION INFRASTRUCTURE — 4.23% |
| |||||||
Atlantia SpA | 1,705,101 | 45,586,083 | ||||||
|
| |||||||
| 45,586,083 | ||||||||
|
| |||||||
TOTAL COMMON STOCKS |
| |||||||
(Cost: $1,192,051,281) |
| 1,076,870,518 | ||||||
SHORT-TERM INVESTMENTS — 3.93% |
| |||||||
MONEY MARKET FUNDS — 3.93% |
| |||||||
BlackRock Cash Funds: Institutional, |
| |||||||
0.18%c,d,e | 39,977,821 | 39,977,821 | ||||||
BlackRock Cash Funds: Prime, |
| |||||||
0.18%c,d,e | 2,295,723 | 2,295,723 | ||||||
BlackRock Cash Funds: Treasury, |
| |||||||
0.03%c,d | 76,754 | 76,754 | ||||||
|
| |||||||
| 42,350,298 | ||||||||
|
| |||||||
TOTAL SHORT-TERM INVESTMENTS |
| |||||||
(Cost: $42,350,298) |
| 42,350,298 | ||||||
|
| |||||||
| 24 | 2015 iSHARES ANNUAL REPORTTO SHAREHOLDERS |
Table of Contents
Schedule of Investments (Continued)
iSHARES® MSCI ITALY CAPPED ETF
August 31, 2015
| Value | ||||||
TOTAL INVESTMENTS | ||||||
(Cost: $1,234,401,579) | $ | 1,119,220,816 | ||||
Other Assets, Less Liabilities — (3.88)% | (41,783,572 | ) | ||||
|
| |||||
NET ASSETS — 100.00% | $ | 1,077,437,244 | ||||
|
| |||||
| a | Non-income earning security. |
| b | All or a portion of this security represents a security on loan. See Note 1. |
| c | Affiliated issuer. See Note 2. |
| d | The rate quoted is the annualized seven-day yield of the fund at period end. |
| e | All or a portion of this security represents an investment of securities lending collateral. See Note 1. |
See notes to financial statements.
SCHEDULESOF INVESTMENTS | 25 |
Table of Contents
Schedule of Investments
iSHARES® MSCI SPAIN CAPPED ETF
August 31, 2015
| Security | Shares | Value | ||||||
COMMON STOCKS — 99.77% |
| |||||||
AIRLINES — 2.39% |
| |||||||
International Consolidated Airlines Group SAa | 4,767,100 | $ | 39,735,671 | |||||
|
| |||||||
| 39,735,671 | ||||||||
BANKS — 41.17% |
| |||||||
Banco Bilbao Vizcaya Argentaria SA | 19,300,534 | 178,697,635 | ||||||
Banco de Sabadell SA | 24,900,092 | 53,011,034 | ||||||
Banco Popular Espanol SA | 9,525,593 | 40,783,152 | ||||||
Banco Santander SA | 47,118,079 | 288,265,020 | ||||||
Bankia SA | 29,103,048 | 35,120,922 | ||||||
Bankinter SA | 4,410,147 | 33,207,339 | ||||||
CaixaBank SA | 13,140,308 | 56,833,522 | ||||||
|
| |||||||
| 685,918,624 | ||||||||
BIOTECHNOLOGY — 2.22% |
| |||||||
Grifols SA | 904,871 | 37,063,394 | ||||||
|
| |||||||
| 37,063,394 | ||||||||
CONSTRUCTION & ENGINEERING — 5.66% |
| |||||||
ACS Actividades de Construccion y Servicios SA | 1,159,357 | 37,588,276 | ||||||
Ferrovial SA | 2,376,116 | 56,763,160 | ||||||
|
| |||||||
| 94,351,436 | ||||||||
DIVERSIFIED TELECOMMUNICATION SERVICES — 11.83% |
| |||||||
Telefonica SA | 13,975,642 | 197,155,648 | ||||||
|
| |||||||
| 197,155,648 | ||||||||
ELECTRIC UTILITIES — 8.95% |
| |||||||
Endesa SA | 1,324,527 | 27,456,443 | ||||||
Iberdrola SA | 12,492,630 | 84,757,815 | ||||||
Red Electrica Corp. SA | 462,036 | 36,881,744 | ||||||
|
| |||||||
| 149,096,002 | ||||||||
FOOD & STAPLES RETAILING — 1.70% |
| |||||||
Distribuidora Internacional de Alimentacion SA | 4,707,196 | 28,302,492 | ||||||
|
| |||||||
| 28,302,492 | ||||||||
GAS UTILITIES — 3.97% |
| |||||||
Enagas SA | 968,946 | 26,512,883 | ||||||
Gas Natural SDG SA | 1,957,355 | 39,697,203 | ||||||
|
| |||||||
| 66,210,086 | ||||||||
INSURANCE — 1.58% |
| |||||||
Mapfre SA | 8,913,150 | 26,266,287 | ||||||
|
| |||||||
| 26,266,287 | ||||||||
| Security | Shares | Value | ||||||
IT SERVICES — 4.65% |
| |||||||
Amadeus IT Holding SA Class A | 1,853,381 | $ | 77,482,153 | |||||
|
| |||||||
| 77,482,153 | ||||||||
MACHINERY — 1.31% |
| |||||||
Zardoya Otis SA | 1,976,369 | 21,104,383 | ||||||
Zardoya Otis SA Newa | 69,285 | 739,850 | ||||||
|
| |||||||
| 21,844,233 | ||||||||
OIL, GAS & CONSUMABLE FUELS — 4.28% |
| |||||||
Repsol SA | 4,983,181 | 71,219,489 | ||||||
|
| |||||||
| 71,219,489 | ||||||||
SPECIALTY RETAIL — 4.63% |
| |||||||
Industria de Diseno Textil SA | 2,314,746 | 77,135,808 | ||||||
|
| |||||||
| 77,135,808 | ||||||||
TRANSPORTATION INFRASTRUCTURE — 5.43% |
| |||||||
Abertis Infraestructuras SA | 2,832,663 | 46,848,209 | ||||||
Aena SAa,b | 380,224 | 43,669,188 | ||||||
|
| |||||||
| 90,517,397 | ||||||||
|
| |||||||
TOTAL COMMON STOCKS |
| |||||||
(Cost: $2,002,447,463) |
| 1,662,298,720 | ||||||
SHORT-TERM INVESTMENTS — 0.01% |
| |||||||
MONEY MARKET FUNDS — 0.01% |
| |||||||
BlackRock Cash Funds: Treasury, |
| |||||||
0.03%c,d | 57,404 | 57,404 | ||||||
|
| |||||||
| 57,404 | ||||||||
|
| |||||||
TOTAL SHORT-TERM INVESTMENTS |
| |||||||
(Cost: $57,404) |
| 57,404 | ||||||
|
| |||||||
TOTAL INVESTMENTS |
| |||||||
(Cost: $2,002,504,867) | 1,662,356,124 | |||||||
Other Assets, Less Liabilities — 0.22% |
| 3,734,476 | ||||||
|
| |||||||
NET ASSETS — 100.00% |
| $ | 1,666,090,600 | |||||
|
| |||||||
| a | Non-income earning security. |
| b | This security may be resold to qualified institutional buyers under Rule 144A of the Securities Act of 1933. |
| c | Affiliated issuer. See Note 2. |
| d | The rate quoted is the annualized seven-day yield of the fund at period end. |
See notes to financial statements.
| 26 | 2015 iSHARES ANNUAL REPORTTO SHAREHOLDERS |
Table of Contents
iSHARES® MSCI SWITZERLAND CAPPED ETF
August 31, 2015
| Security | Shares | Value | ||||||
COMMON STOCKS — 99.33% |
| |||||||
BIOTECHNOLOGY — 1.53% |
| |||||||
Actelion Ltd. Registered | 134,167 | $ | 18,313,473 | |||||
|
| |||||||
| 18,313,473 | ||||||||
BUILDING PRODUCTS — 1.35% |
| |||||||
Geberit AG Registered | 50,875 | 16,166,576 | ||||||
|
| |||||||
| 16,166,576 | ||||||||
CAPITAL MARKETS — 10.30% |
| |||||||
Credit Suisse Group AG Registered | 1,693,504 | 45,443,802 | ||||||
Julius Baer Group Ltd. | 309,971 | 15,087,467 | ||||||
Partners Group Holding AG | 30,903 | 9,978,245 | ||||||
UBS Group AG | 2,566,716 | 53,163,044 | ||||||
|
| |||||||
| 123,672,558 | ||||||||
CHEMICALS — 6.30% |
| |||||||
EMS-Chemie Holding AG Registered | 18,802 | 8,476,989 | ||||||
Givaudan SA Registered | 11,691 | 20,128,757 | ||||||
Sika AG Bearer | 3,326 | 11,009,282 | ||||||
Syngenta AG Registered | 104,023 | 36,035,060 | ||||||
|
| |||||||
| 75,650,088 | ||||||||
CONSTRUCTION MATERIALS — 2.75% |
| |||||||
LafargeHolcim Ltd. Registered | 518,694 | 32,986,589 | ||||||
|
| |||||||
| 32,986,589 | ||||||||
DIVERSIFIED FINANCIAL SERVICES — 0.43% |
| |||||||
Pargesa Holding SA Bearer | 84,246 | 5,166,008 | ||||||
|
| |||||||
| 5,166,008 | ||||||||
DIVERSIFIED TELECOMMUNICATION SERVICES — 1.46% |
| |||||||
Swisscom AG Registered | 32,513 | 17,566,871 | ||||||
|
| |||||||
| 17,566,871 | ||||||||
ELECTRICAL EQUIPMENT — 3.86% |
| |||||||
ABB Ltd. Registered | 2,397,120 | 46,279,128 | ||||||
|
| |||||||
| 46,279,128 | ||||||||
ENERGY EQUIPMENT & SERVICES — 0.65% |
| |||||||
Transocean Ltd.a | 567,021 | 7,751,427 | ||||||
|
| |||||||
| 7,751,427 | ||||||||
FOOD PRODUCTS — 19.65% |
| |||||||
Aryzta AG | 144,747 | 7,421,081 | ||||||
Barry Callebaut AG Registered | 5,944 | 6,521,467 | ||||||
Chocoladefabriken Lindt & Sprungli AG Participation Certificates | 1,765 | 9,965,255 | ||||||
| Security | Shares | Value | ||||||
Chocoladefabriken Lindt & Sprungli AG Registered | 174 | $ | 11,710,656 | |||||
Nestle SA Registered | 2,714,890 | 200,167,165 | ||||||
|
| |||||||
| 235,785,624 | ||||||||
HEALTH CARE EQUIPMENT & SUPPLIES — 0.88% |
| |||||||
Sonova Holding AG Registered | 80,747 | 10,512,432 | ||||||
|
| |||||||
| 10,512,432 | ||||||||
INSURANCE — 8.43% |
| |||||||
Baloise Holding AG Registered | 79,447 | 9,727,031 | ||||||
Swiss Life Holding AG Registered | 50,253 | 11,764,934 | ||||||
Swiss Re AG | 403,131 | 34,620,784 | ||||||
Zurich Insurance Group AG | 163,848 | 45,017,748 | ||||||
|
| |||||||
| 101,130,497 | ||||||||
LIFE SCIENCES TOOLS & SERVICES — 1.00% |
| |||||||
Lonza Group AG Registered | 87,620 | 12,014,283 | ||||||
|
| |||||||
| 12,014,283 | ||||||||
MACHINERY — 2.03% |
| |||||||
Schindler Holding AG Participation Certificates | 71,376 | 10,945,723 | ||||||
Schindler Holding AG Registered | 47,175 | 7,346,626 | ||||||
Sulzer AG Registered | 59,823 | 6,102,620 | ||||||
|
| |||||||
| 24,394,969 | ||||||||
MARINE — 0.94% |
| |||||||
Kuehne + Nagel International AG Registered | 85,136 | 11,339,141 | ||||||
|
| |||||||
| 11,339,141 | ||||||||
PHARMACEUTICALS — 28.29% |
| |||||||
Novartis AG Registered | 1,889,962 | 185,077,712 | ||||||
Roche Holding AG | 565,949 | 154,501,356 | ||||||
|
| |||||||
| 339,579,068 | ||||||||
PROFESSIONAL SERVICES — 2.60% |
| |||||||
Adecco SA Registered | 229,380 | 18,015,005 | ||||||
SGS SA Registered | 7,453 | 13,148,046 | ||||||
|
| |||||||
| 31,163,051 | ||||||||
REAL ESTATE MANAGEMENT & DEVELOPMENT — 0.75% |
| |||||||
Swiss Prime Site AG Registered | 115,216 | 9,036,899 | ||||||
|
| |||||||
| 9,036,899 | ||||||||
SPECIALTY RETAIL — 0.68% |
| |||||||
Dufry AG Registereda,b | 60,301 | 8,106,230 | ||||||
|
| |||||||
| 8,106,230 | ||||||||
TEXTILES, APPAREL & LUXURY GOODS — 5.45% |
| |||||||
Cie. Financiere Richemont SA Class A Registered | 572,830 | 42,856,368 | ||||||
Swatch Group AG (The) Bearer | 40,155 | 15,376,037 | ||||||
SCHEDULESOF INVESTMENTS | 27 |
Table of Contents
Schedule of Investments (Continued)
iSHARES® MSCI SWITZERLAND CAPPED ETF
August 31, 2015
| Security | Shares | Value | ||||||
Swatch Group AG (The) Registered | 97,439 | $ | 7,214,345 | |||||
|
| |||||||
| 65,446,750 | ||||||||
|
| |||||||
TOTAL COMMON STOCKS | ||||||||
(Cost: $1,242,842,528) | 1,192,061,662 | |||||||
SHORT-TERM INVESTMENTS — 1.01% |
| |||||||
MONEY MARKET FUNDS — 1.01% |
| |||||||
BlackRock Cash Funds: Institutional, |
| |||||||
0.18%c,d,e | 9,806,595 | 9,806,595 | ||||||
BlackRock Cash Funds: Prime, |
| |||||||
0.18%c,d,e | 563,143 | 563,143 | ||||||
BlackRock Cash Funds: Treasury, |
| |||||||
0.03%c,d | 1,766,868 | 1,766,868 | ||||||
|
| |||||||
| 12,136,606 | ||||||||
|
| |||||||
TOTAL SHORT-TERM INVESTMENTS |
| |||||||
(Cost: $12,136,606) | 12,136,606 | |||||||
|
| |||||||
TOTAL INVESTMENTS |
| 1,204,198,268 | ||||||
Other Assets, Less Liabilities — (0.34)% |
| (4,034,330 | ) | |||||
|
| |||||||
NET ASSETS — 100.00% | $ | 1,200,163,938 | ||||||
|
| |||||||
| a | All or a portion of this security represents a security on loan. See Note 1. |
| b | Non-income earning security. |
| c | Affiliated issuer. See Note 2. |
| d | The rate quoted is the annualized seven-day yield of the fund at period end. |
| e | All or a portion of this security represents an investment of securities lending collateral. See Note 1. |
See notes to financial statements.
| 28 | 2015 iSHARES ANNUAL REPORTTO SHAREHOLDERS |
Table of Contents
Statements of Assets and Liabilities
iSHARES®, INC.
August 31, 2015
| iShares MSCI Eurozone ETF | iShares MSCI Germany ETF | iShares MSCI Italy Capped ETF | ||||||||||
ASSETS | ||||||||||||
Investments, at cost: | ||||||||||||
Unaffiliated | $ | 11,183,705,678 | $ | 7,396,416,751 | $ | 1,192,051,281 | ||||||
Affiliated (Note 2) | 26,349,585 | 2,264,318 | 42,350,298 | |||||||||
|
|
|
|
|
| |||||||
Total cost of investments | $ | 11,210,055,263 | $ | 7,398,681,069 | $ | 1,234,401,579 | ||||||
|
|
|
|
|
| |||||||
Investments in securities, at fair value (including securities on loana) (Note 1): | ||||||||||||
Unaffiliated | $ | 10,116,992,544 | $ | 6,576,977,193 | $ | 1,076,870,518 | ||||||
Affiliated (Note 2) | 26,349,585 | 2,264,318 | 42,350,298 | |||||||||
|
|
|
|
|
| |||||||
Total fair value of investments | 10,143,342,129 | 6,579,241,511 | 1,119,220,816 | |||||||||
Foreign currency, at valueb | 5,722,499 | 9,245,191 | 861,868 | |||||||||
Foreign currency pledged to broker, at valueb | — | 5,214,954 | — | |||||||||
Receivables: | ||||||||||||
Investment securities sold | 29,305,287 | 7,551,625 | 64,087,844 | |||||||||
Dividends, reclaims and interest | 11,465,370 | 20,278,238 | 36,753 | |||||||||
Capital shares sold | — | — | 3,814,576 | |||||||||
|
|
|
|
|
| |||||||
Total Assets | 10,189,835,285 | 6,621,531,519 | 1,188,021,857 | |||||||||
|
|
|
|
|
| |||||||
LIABILITIES | ||||||||||||
Payables: | ||||||||||||
Investment securities purchased | 29,256,576 | 6,805,931 | 67,885,558 | |||||||||
Collateral for securities on loan (Note 1) | 20,720,313 | 2,126,097 | 42,273,544 | |||||||||
Capital shares redeemed | 975,635 | 265,016 | — | |||||||||
Futures variation margin | — | 2,345,063 | — | |||||||||
Investment advisory fees (Note 2) | 4,266,933 | 2,933,092 | 425,511 | |||||||||
|
|
|
|
|
| |||||||
Total Liabilities | 55,219,457 | 14,475,199 | 110,584,613 | |||||||||
|
|
|
|
|
| |||||||
NET ASSETS | $ | 10,134,615,828 | $ | 6,607,056,320 | $ | 1,077,437,244 | ||||||
|
|
|
|
|
| |||||||
Net assets consist of: | ||||||||||||
Paid-in capital | $ | 11,632,469,786 | $ | 7,669,547,317 | $ | 1,335,139,165 | ||||||
Undistributed (distributions in excess of) net investment income | 5,210,075 | (4,090,809 | ) | (60,827 | ) | |||||||
Accumulated net realized loss | (436,296,808 | ) | (236,140,546 | ) | (142,467,495 | ) | ||||||
Net unrealized depreciation | (1,066,767,225 | ) | (822,259,642 | ) | (115,173,599 | ) | ||||||
|
|
|
|
|
| |||||||
NET ASSETS | $ | 10,134,615,828 | $ | 6,607,056,320 | $ | 1,077,437,244 | ||||||
|
|
|
|
|
| |||||||
Shares outstandingc | 281,200,000 | 250,800,000 | 73,050,000 | |||||||||
|
|
|
|
|
| |||||||
Net asset value per share | $ | 36.04 | $ | 26.34 | $ | 14.75 | ||||||
|
|
|
|
|
| |||||||
| a | Securities on loan with values of $19,638,033, $2,015,752 and $39,557,850, respectively. See Note 1. |
| b | Cost of foreign currency including currency pledged to broker: $5,631,836, $14,326,717 and $854,696, respectively. |
| c | $0.001 par value, number of shares authorized: 1 billion, 482.2 million and 295.4 million, respectively. |
See notes to financial statements.
FINANCIAL STATEMENTS | 29 |
Table of Contents
Statements of Assets and Liabilities (Continued)
iSHARES®, INC.
August 31, 2015
iShares MSCI Spain Capped ETF | iShares MSCI Switzerland Capped ETF | |||||||
ASSETS | ||||||||
Investments, at cost: | ||||||||
Unaffiliated | $ | 2,002,447,463 | $ | 1,242,842,528 | ||||
Affiliated (Note 2) | 57,404 | 12,136,606 | ||||||
|
|
|
| |||||
Total cost of investments | $ | 2,002,504,867 | $ | 1,254,979,134 | ||||
|
|
|
| |||||
Investments in securities, at fair value (including securities on loana) (Note 1): | ||||||||
Unaffiliated | $ | 1,662,298,720 | $ | 1,192,061,662 | ||||
Affiliated (Note 2) | 57,404 | 12,136,606 | ||||||
|
|
|
| |||||
Total fair value of investments | 1,662,356,124 | 1,204,198,268 | ||||||
Foreign currency, at valueb | 2,147,803 | 1,058,923 | ||||||
Receivables: | ||||||||
Investment securities sold | 72,221,237 | 5,077,854 | ||||||
Dividends, reclaims and interest | 127,472 | 7,581,789 | ||||||
Capital shares sold | 2,334,317 | — | ||||||
|
|
|
| |||||
Total Assets | 1,739,186,953 | 1,217,916,834 | ||||||
|
|
|
| |||||
LIABILITIES | ||||||||
Payables: | ||||||||
Investment securities purchased | 72,410,747 | 6,904,230 | ||||||
Collateral for securities on loan (Note 1) | — | 10,369,738 | ||||||
Investment advisory fees (Note 2) | 685,606 | 478,928 | ||||||
|
|
|
| |||||
Total Liabilities | 73,096,353 | 17,752,896 | ||||||
|
|
|
| |||||
NET ASSETS | $ | 1,666,090,600 | $ | 1,200,163,938 | ||||
|
|
|
| |||||
Net assets consist of: | ||||||||
Paid-in capital | $ | 2,115,562,219 | $ | 1,307,374,476 | ||||
Undistributed (distributions in excess of) net investment income | 9,904,643 | (258,980 | ) | |||||
Accumulated net realized loss | (119,247,626 | ) | (55,825,597 | ) | ||||
Net unrealized depreciation | (340,128,636 | ) | (51,125,961 | ) | ||||
|
|
|
| |||||
NET ASSETS | $ | 1,666,090,600 | $ | 1,200,163,938 | ||||
|
|
|
| |||||
Shares outstandingc | 52,125,000 | 37,625,000 | ||||||
|
|
|
| |||||
Net asset value per share | $ | 31.96 | $ | 31.90 | ||||
|
|
|
| |||||
| a | Securities on loan with values of $ — and $9,814,925, respectively. See Note 1. |
| b | Cost of foreign currency: $2,130,341 and $1,066,639, respectively. |
| c | $0.001 par value, number of shares authorized: 127.8 million and 318.625 million, respectively. |
See notes to financial statements.
| 30 | 2015 iSHARES ANNUAL REPORTTO SHAREHOLDERS |
Table of Contents
Statements of Operations
iSHARES®, INC.
Year ended August 31, 2015
iShares MSCI Eurozone ETF | iShares MSCI Germany ETF | iShares MSCI Italy Capped ETF | ||||||||||
NET INVESTMENT INCOME | ||||||||||||
Dividends — unaffiliateda | $ | 268,195,579 | $ | 149,846,088 | $ | 28,849,466 | ||||||
Interest — affiliated (Note 2) | 449 | 174 | 56 | |||||||||
Securities lending income — affiliated — net (Note 2) | 676,485 | 8,095 | 328,782 | |||||||||
|
|
|
|
|
| |||||||
Total investment income | 268,872,513 | 149,854,357 | 29,178,304 | |||||||||
|
|
|
|
|
| |||||||
EXPENSES | ||||||||||||
Investment advisory fees (Note 2) | 43,090,544 | �� | 28,550,112 | 4,950,493 | ||||||||
|
|
|
|
|
| |||||||
Total expenses | 43,090,544 | 28,550,112 | 4,950,493 | |||||||||
|
|
|
|
|
| |||||||
Net investment income | 225,781,969 | 121,304,245 | 24,227,811 | |||||||||
|
|
|
|
|
| |||||||
NET REALIZED AND UNREALIZED GAIN (LOSS) | ||||||||||||
Net realized gain (loss) from: | ||||||||||||
Investments — unaffiliated | (114,260,938 | ) | (41,273,379 | ) | (73,442,443 | ) | ||||||
In-kind redemptions — unaffiliated | 165,941,699 | 171,847,704 | 28,772,957 | |||||||||
Futures contracts | — | 748,453 | — | |||||||||
Foreign currency transactions | (2,812,648 | ) | (4,406,601 | ) | (194,854 | ) | ||||||
|
|
|
|
|
| |||||||
Net realized gain (loss) | 48,868,113 | 126,916,177 | (44,864,340 | ) | ||||||||
|
|
|
|
|
| |||||||
Net change in unrealized appreciation/depreciation on: | ||||||||||||
Investments | (1,146,060,055 | ) | (856,791,369 | ) | (76,935,536 | ) | ||||||
Futures contracts | — | (1,154,890 | ) | — | ||||||||
Translation of assets and liabilities in foreign currencies | 461,363 | 250,445 | 37,949 | |||||||||
|
|
|
|
|
| |||||||
Net change in unrealized appreciation/depreciation | (1,145,598,692 | ) | (857,695,814 | ) | (76,897,587 | ) | ||||||
|
|
|
|
|
| |||||||
Net realized and unrealized loss | (1,096,730,579 | ) | (730,779,637 | ) | (121,761,927 | ) | ||||||
|
|
|
|
|
| |||||||
NET DECREASE IN NET ASSETS RESULTING FROM OPERATIONS | $ | (870,948,610 | ) | $ | (609,475,392 | ) | $ | (97,534,116 | ) | |||
|
|
|
|
|
| |||||||
| a | Net of foreign withholding tax of $38,766,661, $22,795,634 and $4,405,111, respectively. |
See notes to financial statements.
FINANCIAL STATEMENTS | 31 |
Table of Contents
Statements of Operations (Continued)
iSHARES®, INC.
Year ended August 31, 2015
iShares MSCI Spain Capped ETF | iShares MSCI Switzerland Capped ETF | |||||||
NET INVESTMENT INCOME | ||||||||
Dividends — unaffiliateda | $ | 73,539,235 | $ | 33,423,166 | ||||
Interest — affiliated (Note 2) | 97 | 29 | ||||||
Securities lending income — affiliated — net (Note 2) | 20,627 | 427,861 | ||||||
|
|
|
| |||||
Total investment income | 73,559,959 | 33,851,056 | ||||||
|
|
|
| |||||
EXPENSES | ||||||||
Investment advisory fees (Note 2) | 8,425,166 | 5,453,148 | ||||||
|
|
|
| |||||
Total expenses | 8,425,166 | 5,453,148 | ||||||
|
|
|
| |||||
Net investment income | 65,134,793 | 28,397,908 | ||||||
|
|
|
| |||||
NET REALIZED AND UNREALIZED GAIN (LOSS) | ||||||||
Net realized gain (loss) from: | ||||||||
Investments — unaffiliated | (68,947,351 | ) | (3,886,856 | ) | ||||
In-kind redemptions — unaffiliated | 39,553,586 | 177,977,076 | ||||||
Foreign currency transactions | (382,454 | ) | (306,209 | ) | ||||
|
|
|
| |||||
Net realized gain (loss) | (29,776,219 | ) | 173,784,011 | |||||
|
|
|
| |||||
Net change in unrealized appreciation/depreciation on: | ||||||||
Investments | (436,192,700 | ) | (251,572,102 | ) | ||||
Translation of assets and liabilities in foreign currencies | 34,613 | (267,380 | ) | |||||
|
|
|
| |||||
Net change in unrealized appreciation/depreciation | (436,158,087 | ) | (251,839,482 | ) | ||||
|
|
|
| |||||
Net realized and unrealized loss | (465,934,306 | ) | (78,055,471 | ) | ||||
|
|
|
| |||||
NET DECREASE IN NET ASSETS RESULTING FROM OPERATIONS | $ | (400,799,513 | ) | $ | (49,657,563 | ) | ||
|
|
|
| |||||
| a | Net of foreign withholding tax of $3,914,116 and $3,229,797, respectively. |
See notes to financial statements.
| 32 | 2015 iSHARES ANNUAL REPORTTO SHAREHOLDERS |
Table of Contents
Statements of Changes in Net Assets
iSHARES®, INC.
| iShares MSCI Eurozone ETF | iShares MSCI Germany ETF | |||||||||||||||
Year ended August 31, 2015 | Year ended August 31, 2014 | Year ended August 31, 2015 | Year ended August 31, 2014 | |||||||||||||
INCREASE (DECREASE) IN NET ASSETS | ||||||||||||||||
OPERATIONS: | ||||||||||||||||
Net investment income | $ | 225,781,969 | $ | 255,301,280 | $ | 121,304,245 | $ | 109,217,597 | ||||||||
Net realized gain | 48,868,113 | 272,213,942 | 126,916,177 | 503,529,812 | ||||||||||||
Net change in unrealized appreciation/depreciation | (1,145,598,692 | ) | 323,453,444 | (857,695,814 | ) | 181,241,179 | ||||||||||
|
|
|
|
|
|
|
| |||||||||
Net increase (decrease) in net assets resulting from operations | (870,948,610 | ) | 850,968,666 | (609,475,392 | ) | 793,988,588 | ||||||||||
|
|
|
|
|
|
|
| |||||||||
DISTRIBUTIONS TO SHAREHOLDERS: | ||||||||||||||||
From net investment income | (233,277,080 | ) | (243,559,586 | ) | (127,874,456 | ) | (111,913,888 | ) | ||||||||
|
|
|
|
|
|
|
| |||||||||
Total distributions to shareholders | (233,277,080 | ) | (243,559,586 | ) | (127,874,456 | ) | (111,913,888 | ) | ||||||||
|
|
|
|
|
|
|
| |||||||||
CAPITAL SHARE TRANSACTIONS: | ||||||||||||||||
Proceeds from shares sold | 5,243,729,213 | 6,832,263,291 | 3,934,318,439 | 1,689,588,472 | ||||||||||||
Cost of shares redeemed | (2,707,524,817 | ) | (2,277,014,968 | ) | (1,387,346,200 | ) | (2,230,103,855 | ) | ||||||||
|
|
|
|
|
|
|
| |||||||||
Net increase (decrease) in net assets from capital share transactions | 2,536,204,396 | 4,555,248,323 | 2,546,972,239 | (540,515,383 | ) | |||||||||||
|
|
|
|
|
|
|
| |||||||||
INCREASE IN NET ASSETS | 1,431,978,706 | 5,162,657,403 | 1,809,622,391 | 141,559,317 | ||||||||||||
NET ASSETS | ||||||||||||||||
Beginning of year | 8,702,637,122 | 3,539,979,719 | 4,797,433,929 | 4,655,874,612 | ||||||||||||
|
|
|
|
|
|
|
| |||||||||
End of year | $ | 10,134,615,828 | $ | 8,702,637,122 | $ | 6,607,056,320 | $ | 4,797,433,929 | ||||||||
|
|
|
|
|
|
|
| |||||||||
Undistributed (distributions in excess of) net investment income included in net assets at end of year | $ | 5,210,075 | $ | 14,544,730 | $ | (4,090,809 | ) | $ | — | |||||||
|
|
|
|
|
|
|
| |||||||||
SHARES ISSUED AND REDEEMED | ||||||||||||||||
Shares sold | 136,000,000 | 172,200,000 | 135,600,000 | 57,000,000 | ||||||||||||
Shares redeemed | (72,500,000 | ) | (56,700,000 | ) | (50,400,000 | ) | (73,200,000 | ) | ||||||||
|
|
|
|
|
|
|
| |||||||||
Net increase (decrease) in shares outstanding | 63,500,000 | 115,500,000 | 85,200,000 | (16,200,000 | ) | |||||||||||
|
|
|
|
|
|
|
| |||||||||
See notes to financial statements.
FINANCIAL STATEMENTS | 33 |
Table of Contents
Statements of Changes in Net Assets (Continued)
iSHARES®, INC.
| iShares MSCI Italy Capped ETF | iShares MSCI Spain Capped ETF | |||||||||||||||
| Year ended August 31, 2015 | Year ended August 31, 2014 | Year ended August 31, 2015 | Year ended August 31, 2014 | |||||||||||||
INCREASE (DECREASE) IN NET ASSETS | ||||||||||||||||
OPERATIONS: | ||||||||||||||||
Net investment income | $ | 24,227,811 | $ | 30,016,510 | $ | 65,134,793 | $ | 67,503,910 | ||||||||
Net realized gain (loss) | (44,864,340 | ) | 118,669,234 | (29,776,219 | ) | 29,271,436 | ||||||||||
Net change in unrealized appreciation/depreciation | (76,897,587 | ) | (43,114,144 | ) | (436,158,087 | ) | 128,772,813 | |||||||||
|
|
|
|
|
|
|
| |||||||||
Net increase (decrease) in net assets resulting from operations | (97,534,116 | ) | 105,571,600 | (400,799,513 | ) | 225,548,159 | ||||||||||
|
|
|
|
|
|
|
| |||||||||
DISTRIBUTIONS TO SHAREHOLDERS: | ||||||||||||||||
From net investment income | (24,941,571 | ) | (31,039,889 | ) | (77,875,309 | ) | (48,486,263 | ) | ||||||||
|
|
|
|
|
|
|
| |||||||||
Total distributions to shareholders | (24,941,571 | ) | (31,039,889 | ) | (77,875,309 | ) | (48,486,263 | ) | ||||||||
|
|
|
|
|
|
|
| |||||||||
CAPITAL SHARE TRANSACTIONS: | ||||||||||||||||
Proceeds from shares sold | 342,752,870 | 1,348,720,763 | 635,385,021 | 2,068,530,441 | ||||||||||||
Cost of shares redeemed | (699,700,191 | ) | (583,513,961 | ) | (963,657,247 | ) | (190,332,570 | ) | ||||||||
|
|
|
|
|
|
|
| |||||||||
Net increase (decrease) in net assets from capital share transactions | (356,947,321 | ) | 765,206,802 | (328,272,226 | ) | 1,878,197,871 | ||||||||||
|
|
|
|
|
|
|
| |||||||||
INCREASE (DECREASE) IN NET ASSETS | (479,423,008 | ) | 839,738,513 | (806,947,048 | ) | 2,055,259,767 | ||||||||||
NET ASSETS | ||||||||||||||||
Beginning of year | 1,556,860,252 | 717,121,739 | 2,473,037,648 | 417,777,881 | ||||||||||||
|
|
|
|
|
|
|
| |||||||||
End of year | $ | 1,077,437,244 | $ | 1,556,860,252 | $ | 1,666,090,600 | $ | 2,473,037,648 | ||||||||
|
|
|
|
|
|
|
| |||||||||
Undistributed (distributions in excess of) net investment income included in net assets at end of year | $ | (60,827 | ) | $ | — | $ | 9,904,643 | $ | 23,027,613 | |||||||
|
|
|
|
|
|
|
| |||||||||
SHARES ISSUED AND REDEEMED | ||||||||||||||||
Shares sold | 23,100,000 | 79,050,000 | 18,075,000 | 51,825,000 | ||||||||||||
Shares redeemed | (47,250,000 | ) | (36,750,000 | ) | (26,850,000 | ) | (4,650,000 | ) | ||||||||
|
|
|
|
|
|
|
| |||||||||
Net increase (decrease) in shares outstanding | (24,150,000 | ) | 42,300,000 | (8,775,000 | ) | 47,175,000 | ||||||||||
|
|
|
|
|
|
|
| |||||||||
See notes to financial statements.
| 34 | 2015 iSHARES ANNUAL REPORTTO SHAREHOLDERS |
Table of Contents
Statements of Changes in Net Assets (Continued)
iSHARES®, INC.
| iShares MSCI Switzerland Capped ETF | ||||||||
| Year ended August 31, 2015 | Year ended August 31, 2014 | |||||||
INCREASE (DECREASE) IN NET ASSETS | ||||||||
OPERATIONS: | ||||||||
Net investment income | $ | 28,397,908 | $ | 25,455,124 | ||||
Net realized gain | 173,784,011 | 33,351,910 | ||||||
Net change in unrealized appreciation/depreciation | (251,839,482 | ) | 97,427,932 | |||||
|
|
|
| |||||
Net increase (decrease) in net assets resulting from operations | (49,657,563 | ) | 156,234,966 | |||||
|
|
|
| |||||
DISTRIBUTIONS TO SHAREHOLDERS: | ||||||||
From net investment income | (28,746,817 | ) | (26,005,188 | ) | ||||
|
|
|
| |||||
Total distributions to shareholders | (28,746,817 | ) | (26,005,188 | ) | ||||
|
|
|
| |||||
CAPITAL SHARE TRANSACTIONS: | ||||||||
Proceeds from shares sold | 875,666,580 | 135,490,352 | ||||||
Cost of shares redeemed | (669,255,531 | ) | (96,423,300 | ) | ||||
|
|
|
| |||||
Net increase in net assets from capital share transactions | 206,411,049 | 39,067,052 | ||||||
|
|
|
| |||||
INCREASE IN NET ASSETS | 128,006,669 | 169,296,830 | ||||||
NET ASSETS | ||||||||
Beginning of year | 1,072,157,269 | 902,860,439 | ||||||
|
|
|
| |||||
End of year | $ | 1,200,163,938 | $ | 1,072,157,269 | ||||
|
|
|
| |||||
Distributions in excess of net investment income included in net assets at end of year | $ | (258,980 | ) | $ | (640,142 | ) | ||
|
|
|
| |||||
SHARES ISSUED AND REDEEMED | ||||||||
Shares sold | 25,875,000 | 4,000,000 | ||||||
Shares redeemed | (20,125,000 | ) | (2,875,000 | ) | ||||
|
|
|
| |||||
Net increase in shares outstanding | 5,750,000 | 1,125,000 | ||||||
|
|
|
| |||||
See notes to financial statements.
FINANCIAL STATEMENTS | 35 |
Table of Contents
iSHARES® , INC.
(For a share outstanding throughout each period)
| iShares MSCI Eurozone ETF | ||||||||||||||||||||
| Year ended Aug. 31, 2015 | Year ended Aug. 31, 2014 | Year ended Aug. 31, 2013 | Year ended Aug. 31, 2012 | Year ended Aug. 31, 2011 | ||||||||||||||||
Net asset value, beginning of year | $ | 39.98 | $ | 34.64 | $ | 29.09 | $ | 31.55 | $ | 30.75 | ||||||||||
|
|
|
|
|
|
|
|
|
| |||||||||||
Income from investment operations: | ||||||||||||||||||||
Net investment incomea | 0.96 | 1.18 | 0.92 | 1.02 | 1.23 | |||||||||||||||
Net realized and unrealized gain (loss)b | (3.95 | ) | 5.10 | 5.55 | (2.38 | ) | 0.71 | |||||||||||||
|
|
|
|
|
|
|
|
|
| |||||||||||
Total from investment operations | (2.99 | ) | 6.28 | 6.47 | (1.36 | ) | 1.94 | |||||||||||||
|
|
|
|
|
|
|
|
|
| |||||||||||
Less distributions from: | ||||||||||||||||||||
Net investment income | (0.95 | ) | (0.94 | ) | (0.92 | ) | (1.10 | ) | (1.14 | ) | ||||||||||
|
|
|
|
|
|
|
|
|
| |||||||||||
Total distributions | (0.95 | ) | (0.94 | ) | (0.92 | ) | (1.10 | ) | (1.14 | ) | ||||||||||
|
|
|
|
|
|
|
|
|
| |||||||||||
Net asset value, end of year | $ | 36.04 | $ | 39.98 | $ | 34.64 | $ | 29.09 | $ | 31.55 | ||||||||||
|
|
|
|
|
|
|
|
|
| |||||||||||
Total return | (7.62 | )% | 18.02 | % | 22.43 | % | (3.99 | )% | 5.78 | % | ||||||||||
|
|
|
|
|
|
|
|
|
| |||||||||||
Ratios/Supplemental data: | ||||||||||||||||||||
Net assets, end of year (000s) | $ | 10,134,616 | $ | 8,702,637 | $ | 3,539,980 | $ | 794,226 | $ | 738,233 | ||||||||||
Ratio of expenses to average net assets | 0.48 | % | 0.48 | % | 0.50 | % | 0.53 | % | 0.52 | % | ||||||||||
Ratio of net investment income to average net assets | 2.50 | % | 2.89 | % | 2.74 | % | 3.55 | % | 3.38 | % | ||||||||||
Portfolio turnover ratec | 5 | % | 7 | % | 5 | % | 7 | % | 8 | % | ||||||||||
| a | Based on average shares outstanding throughout each period. |
| b | The amounts reported for a share outstanding may not accord with the change in aggregate gains and losses in securities for the fiscal period due to the timing of capital share transactions in relation to the fluctuating market values of the Fund’s underlying securities. |
| c | Portfolio turnover rates exclude portfolio securities received or delivered as a result of processing capital share transactions in Creation Units. |
See notes to financial statements.
| 36 | 2015 iSHARES ANNUAL REPORTTO SHAREHOLDERS |
Table of Contents
Financial Highlights (Continued)
iSHARES®, INC.
(For a share outstanding throughout each period)
| iShares MSCI Germany ETF | ||||||||||||||||||||
| Year ended Aug. 31, 2015 | Year ended Aug. 31, 2014 | Year ended Aug. 31, 2013 | Year ended Aug. 31, 2012 | Year ended Aug. 31, 2011 | ||||||||||||||||
Net asset value, beginning of year | $ | 28.97 | $ | 25.61 | $ | 21.34 | $ | 21.02 | $ | 19.45 | ||||||||||
|
|
|
|
|
|
|
|
|
| |||||||||||
Income from investment operations: | ||||||||||||||||||||
Net investment incomea | 0.58 | 0.59 | 0.46 | 0.56 | 0.86 | |||||||||||||||
Net realized and unrealized gain (loss)b | (2.70 | ) | 3.40 | 4.24 | 0.34 | 1.38 | ||||||||||||||
|
|
|
|
|
|
|
|
|
| |||||||||||
Total from investment operations | (2.12 | ) | 3.99 | 4.70 | 0.90 | 2.24 | ||||||||||||||
|
|
|
|
|
|
|
|
|
| |||||||||||
Less distributions from: | ||||||||||||||||||||
Net investment income | (0.51 | ) | (0.63 | ) | (0.43 | ) | (0.58 | ) | (0.67 | ) | ||||||||||
|
|
|
|
|
|
|
|
|
| |||||||||||
Total distributions | (0.51 | ) | (0.63 | ) | (0.43 | ) | (0.58 | ) | (0.67 | ) | ||||||||||
|
|
|
|
|
|
|
|
|
| |||||||||||
Net asset value, end of year | $ | 26.34 | $ | 28.97 | $ | 25.61 | $ | 21.34 | $ | 21.02 | ||||||||||
|
|
|
|
|
|
|
|
|
| |||||||||||
Total return | (7.50 | )% | 15.41 | % | 22.11 | % | 4.55 | % | 10.84 | % | ||||||||||
|
|
|
|
|
|
|
|
|
| |||||||||||
Ratios/Supplemental data: | ||||||||||||||||||||
Net assets, end of year (000s) | $ | 6,607,056 | $ | 4,797,434 | $ | 4,655,875 | $ | 2,797,029 | $ | 2,768,171 | ||||||||||
Ratio of expenses to average net assets | 0.48 | % | 0.48 | % | 0.51 | % | 0.53 | % | 0.51 | % | ||||||||||
Ratio of net investment income to average net assets | 2.03 | % | 1.95 | % | 1.88 | % | 2.72 | % | 3.45 | % | ||||||||||
Portfolio turnover ratec | 3 | % | 6 | % | 4 | % | 4 | % | 13 | % | ||||||||||
| a | Based on average shares outstanding throughout each period. |
| b | The amounts reported for a share outstanding may not accord with the change in aggregate gains and losses in securities for the fiscal period due to the timing of capital share transactions in relation to the fluctuating market values of the Fund’s underlying securities. |
| c | Portfolio turnover rates exclude portfolio securities received or delivered as a result of processing capital share transactions in Creation Units. |
See notes to financial statements.
FINANCIAL HIGHLIGHTS | 37 |
Table of Contents
Financial Highlights (Continued)
iSHARES®, INC.
(For a share outstanding throughout each period)
| iShares MSCI Italy Capped ETF | ||||||||||||||||||||
| Year ended Aug. 31, 2015 | Year ended Aug. 31, 2014 | Year ended Aug. 31, 2013 | Year ended Aug. 31, 2012 | Year ended Aug. 31, 2011 | ||||||||||||||||
Net asset value, beginning of year | $ | 16.02 | $ | 13.06 | $ | 11.78 | $ | 13.58 | $ | 15.00 | ||||||||||
|
|
|
|
|
|
|
|
|
| |||||||||||
Income from investment operations: | ||||||||||||||||||||
Net investment incomea | 0.35 | 0.41 | 0.36 | 0.41 | 0.54 | |||||||||||||||
Net realized and unrealized gain (loss)b | (1.25 | ) | 2.89 | 1.23 | (1.79 | ) | (1.47 | ) | ||||||||||||
|
|
|
|
|
|
|
|
|
| |||||||||||
Total from investment operations | (0.90 | ) | 3.30 | 1.59 | (1.38 | ) | (0.93 | ) | ||||||||||||
|
|
|
|
|
|
|
|
|
| |||||||||||
Less distributions from: | ||||||||||||||||||||
Net investment income | (0.37 | ) | (0.34 | ) | (0.30 | ) | (0.42 | ) | (0.49 | ) | ||||||||||
Return of capital | — | — | (0.01 | ) | (0.00 | )c | — | |||||||||||||
|
|
|
|
|
|
|
|
|
| |||||||||||
Total distributions | (0.37 | ) | (0.34 | ) | (0.31 | ) | (0.42 | ) | (0.49 | ) | ||||||||||
|
|
|
|
|
|
|
|
|
| |||||||||||
Net asset value, end of year | $ | 14.75 | $ | 16.02 | $ | 13.06 | $ | 11.78 | $ | 13.58 | ||||||||||
|
|
|
|
|
|
|
|
|
| |||||||||||
Total return | (5.66 | )% | 25.20 | % | 13.58 | % | (9.98 | )% | (6.80 | )% | ||||||||||
|
|
|
|
|
|
|
|
|
| |||||||||||
Ratios/Supplemental data: | ||||||||||||||||||||
Net assets, end of year (000s) | $ | 1,077,437 | $ | 1,556,860 | $ | 717,122 | $ | 196,212 | $ | 144,612 | ||||||||||
Ratio of expenses to average net assets | 0.48 | % | 0.48 | % | 0.50 | % | 0.53 | % | 0.51 | % | ||||||||||
Ratio of net investment income to average net assets | 2.34 | % | 2.49 | % | 2.78 | % | 3.41 | % | 3.15 | % | ||||||||||
Portfolio turnover rated | 22 | % | 24 | % | 45 | % | 14 | % | 16 | % | ||||||||||
| a | Based on average shares outstanding throughout each period. |
| b | The amounts reported for a share outstanding may not accord with the change in aggregate gains and losses in securities for the fiscal period due to the timing of capital share transactions in relation to the fluctuating market values of the Fund’s underlying securities. |
| c | Rounds to less than $0.01. |
| d | Portfolio turnover rates exclude portfolio securities received or delivered as a result of processing capital share transactions in Creation Units. |
See notes to financial statements.
| 38 | 2015 iSHARES ANNUAL REPORTTO SHAREHOLDERS |
Table of Contents
Financial Highlights (Continued)
iSHARES®, INC.
(For a share outstanding throughout each period)
| iShares MSCI Spain Capped ETF | ||||||||||||||||||||
| Year ended Aug. 31, 2015 | Year ended Aug. 31, 2014 | Year ended Aug. 31, 2013 | Year ended Aug. 31, 2012 | Year ended Aug. 31, 2011 | ||||||||||||||||
Net asset value, beginning of year | $ | 40.61 | $ | 30.44 | $ | 26.28 | $ | 35.89 | $ | 37.02 | ||||||||||
|
|
|
|
|
|
|
|
|
| |||||||||||
Income from investment operations: | ||||||||||||||||||||
Net investment incomea | 1.32 | 1.80 | 1.33 | 2.12 | 2.14 | |||||||||||||||
Net realized and unrealized gain (loss)b | (8.35 | ) | 9.53 | 4.07 | (8.93 | ) | (1.36 | ) | ||||||||||||
|
|
|
|
|
|
|
|
|
| |||||||||||
Total from investment operations | (7.03 | ) | 11.33 | 5.40 | (6.81 | ) | 0.78 | |||||||||||||
|
|
|
|
|
|
|
|
|
| |||||||||||
Less distributions from: | ||||||||||||||||||||
Net investment income | (1.62 | ) | (1.16 | ) | (1.24 | ) | (2.80 | ) | (1.91 | ) | ||||||||||
|
|
|
|
|
|
|
|
|
| |||||||||||
Total distributions | (1.62 | ) | (1.16 | ) | (1.24 | ) | (2.80 | ) | (1.91 | ) | ||||||||||
|
|
|
|
|
|
|
|
|
| |||||||||||
Net asset value, end of year | $ | 31.96 | $ | 40.61 | $ | 30.44 | $ | 26.28 | $ | 35.89 | ||||||||||
|
|
|
|
|
|
|
|
|
| |||||||||||
Total return | (17.63 | )% | 37.39 | % | 20.88 | % | (19.36 | )% | 1.78 | % | ||||||||||
|
|
|
|
|
|
|
|
|
| |||||||||||
Ratios/Supplemental data: | ||||||||||||||||||||
Net assets, end of year (000s) | $ | 1,666,091 | $ | 2,473,038 | $ | 417,778 | $ | 195,093 | $ | 180,360 | ||||||||||
Ratio of expenses to average net assets | 0.48 | % | 0.48 | % | 0.51 | % | 0.53 | % | 0.52 | % | ||||||||||
Ratio of net investment income to average net assets | 3.70 | % | 4.48 | % | 4.45 | % | 7.60 | % | 5.31 | % | ||||||||||
Portfolio turnover ratec | 15 | % | 15 | % | 24 | % | 17 | % | 14 | % | ||||||||||
| a | Based on average shares outstanding throughout each period. |
| b | The amounts reported for a share outstanding may not accord with the change in aggregate gains and losses in securities for the fiscal period due to the timing of capital share transactions in relation to the fluctuating market values of the Fund’s underlying securities. |
| c | Portfolio turnover rates exclude portfolio securities received or delivered as a result of processing capital share transactions in Creation Units. |
See notes to financial statements.
FINANCIAL HIGHLIGHTS | 39 |
Table of Contents
Financial Highlights (Continued)
iSHARES®, INC.
(For a share outstanding throughout each period)
| iShares MSCI Switzerland Capped ETF | ||||||||||||||||||||
| Year ended Aug. 31, 2015 | Year ended Aug. 31, 2014 | Year ended Aug. 31, 2013 | Year ended Aug. 31, 2012 | Year ended Aug. 31, 2011 | ||||||||||||||||
Net asset value, beginning of year | $ | 33.64 | $ | 29.36 | $ | 23.85 | $ | 24.67 | $ | 21.64 | ||||||||||
|
|
|
|
|
|
|
|
|
| |||||||||||
Income from investment operations: | ||||||||||||||||||||
Net investment incomea | 0.83 | 0.80 | 0.67 | 0.63 | 0.59 | |||||||||||||||
Net realized and unrealized gain (loss)b | (1.77 | ) | 4.27 | 5.44 | (0.80 | ) | 2.97 | |||||||||||||
|
|
|
|
|
|
|
|
|
| |||||||||||
Total from investment operations | (0.94 | ) | 5.07 | 6.11 | (0.17 | ) | 3.56 | |||||||||||||
|
|
|
|
|
|
|
|
|
| |||||||||||
Less distributions from: | ||||||||||||||||||||
Net investment income | (0.80 | ) | (0.79 | ) | (0.60 | ) | (0.65 | ) | (0.53 | ) | ||||||||||
|
|
|
|
|
|
|
|
|
| |||||||||||
Total distributions | (0.80 | ) | (0.79 | ) | (0.60 | ) | (0.65 | ) | (0.53 | ) | ||||||||||
|
|
|
|
|
|
|
|
|
| |||||||||||
Net asset value, end of year | $ | 31.90 | $ | 33.64 | $ | 29.36 | $ | 23.85 | $ | 24.67 | ||||||||||
|
|
|
|
|
|
|
|
|
| |||||||||||
Total return | (2.92 | )% | 17.21 | % | 25.71 | % | (0.53 | )% | 16.30 | % | ||||||||||
|
|
|
|
|
|
|
|
|
| |||||||||||
Ratios/Supplemental data: | ||||||||||||||||||||
Net assets, end of year (000s) | $ | 1,200,164 | $ | 1,072,157 | $ | 902,860 | $ | 554,570 | $ | 524,159 | ||||||||||
Ratio of expenses to average net assets | 0.48 | % | 0.48 | % | 0.51 | % | 0.53 | % | 0.52 | % | ||||||||||
Ratio of net investment income to average net assets | 2.49 | % | 2.41 | % | 2.38 | % | 2.73 | % | 2.35 | % | ||||||||||
Portfolio turnover ratec | 7 | % | 5 | % | 13 | % | 8 | % | 7 | % | ||||||||||
| a | Based on average shares outstanding throughout each period. |
| b | The amounts reported for a share outstanding may not accord with the change in aggregate gains and losses in securities for the fiscal period due to the timing of capital share transactions in relation to the fluctuating market values of the Fund’s underlying securities. |
| c | Portfolio turnover rates exclude portfolio securities received or delivered as a result of processing capital share transactions in Creation Units. |
See notes to financial statements.
| 40 | 2015 iSHARES ANNUAL REPORTTO SHAREHOLDERS |
Table of Contents
iSHARES®, INC.
iShares, Inc. (the “Company”) is registered under the Investment Company Act of 1940, as amended (the “1940 Act”), as an open-end management investment company. The Company was incorporated under the laws of the State of Maryland on September 1, 1994 pursuant to Articles of Incorporation as subsequently amended and restated.
These financial statements relate only to the following funds (each, a “Fund,” and collectively, the “Funds”):
| iShares ETF | Diversification Classification | |
MSCI Eurozonea | Diversified | |
MSCI Germany | Non-diversified | |
MSCI Italy Capped | Non-diversified | |
MSCI Spain Capped | Non-diversified | |
MSCI Switzerland Capped | Non-diversified |
| a | Formerly the iShares MSCI EMU ETF. |
The investment objective of each Fund is to seek investment results that correspond generally to the price and yield performance, before fees and expenses, of its underlying index. The investment adviser uses a “passive” or index approach to try to achieve each Fund’s investment objective.
Pursuant to the Company’s organizational documents, the Funds’ officers and directors are indemnified against certain liabilities that may arise out of the performance of their duties to the Funds. Additionally, in the normal course of business, the Funds enter into contracts with service providers that contain general indemnification clauses. The Funds’ maximum exposure under these arrangements is unknown as this would involve future claims that may be made against the Funds that have not yet occurred.
| 1. | SIGNIFICANT ACCOUNTING POLICIES |
The following significant accounting policies are consistently followed by the Funds in the preparation of their financial statements in conformity with accounting principles generally accepted in the United States of America (“U.S. GAAP”). The preparation of financial statements in conformity with U.S. GAAP requires management to make certain estimates and assumptions that affect the reported amounts of assets and liabilities and disclosures of contingent assets and liabilities at the date of the financial statements and the reported amounts of revenue and expenses during the reporting period. Actual results could differ from those estimates. Each Fund is considered an investment company under U.S. GAAP and follows the accounting and reporting guidance applicable to investment companies.
SECURITY VALUATION
Each Fund’s investments are valued at fair value each day that the Fund’s listing exchange is open and, for financial reporting purposes, as of the report date should the reporting period end on a day that the Fund’s listing exchange is not open. U.S. GAAP defines fair value as the price a fund would receive to sell an asset or pay to transfer a liability in an orderly transaction between market participants at the measurement date. The BlackRock Global Valuation Methodologies Committee (the “Global Valuation Committee”) provides oversight of the valuation of investments for the Funds. The investments of each Fund are valued pursuant to policies and procedures developed by the Global Valuation Committee and approved by the Board of Directors of the Company (the “Board”).
| • | Equity investments traded on a recognized securities exchange are valued at that day’s last reported trade price or the official closing price, as applicable, on the exchange where the stock is primarily traded. Equity investments traded on a recognized exchange for which there were no sales on that day are valued at the last traded price. |
NOTESTO FINANCIAL STATEMENTS | 41 |
Table of Contents
Notes to Financial Statements (Continued)
iSHARES®, INC.
| • | Open-end U.S. mutual funds are valued at that day’s published net asset value (“NAV”). |
| • | Futures contracts are valued at that day’s last reported settlement price on the exchange where the contract is traded. |
In the event that application of these methods of valuation results in a price for an investment which is deemed not to be representative of the fair value of such investment or if a price is not available, the investment will be valued based upon other available factors deemed relevant by the Global Valuation Committee, in accordance with policies approved by the Board. These factors include but are not limited to (i) attributes specific to the investment; (ii) the principal market for the investment; (iii) the customary participants in the principal market for the investment; (iv) data assumptions by market participants for the investment, if reasonably available; (v) quoted prices for similar investments in active markets; and (vi) other factors, such as future cash flows, interest rates, yield curves, volatilities, prepayment speeds, loss severities, credit risks and/or default rates. Valuations based on such factors are reported to the Board on a quarterly basis.
The Global Valuation Committee employs various methods for calibrating valuation approaches for investments where an active market does not exist, including regular due diligence of the Company’s pricing vendors, a regular review of key inputs and assumptions, transactional back-testing or disposition analysis to compare unrealized gains and losses to realized gains and losses, reviews of missing or stale prices, reviews of large movements in market values, and reviews of market related activity.
Fair value pricing could result in a difference between the prices used to calculate a Fund’s NAV and the prices used by the Fund’s underlying index, which in turn could result in a difference between the Fund’s performance and the performance of the Fund’s underlying index.
Various inputs are used in determining the fair value of financial instruments. Inputs may be based on independent market data (“observable inputs”) or they may be internally developed (“unobservable inputs”). These inputs are categorized into a disclosure hierarchy consisting of three broad levels for financial reporting purposes. The level of a value determined for a financial instrument within the fair value hierarchy is based on the lowest level of any input that is significant to the fair value measurement in its entirety. The categorization of a value determined for a financial instrument within the hierarchy is based upon the pricing transparency of the instrument and is not necessarily an indication of the risk associated with investing in the instrument. The three levels of the fair value hierarchy are as follows:
| • | Level 1 — Unadjusted quoted prices in active markets for identical assets or liabilities; |
| • | Level 2 — Inputs other than quoted prices included within Level 1 that are observable for the asset or liability either directly or indirectly, including quoted prices for similar assets or liabilities in active markets, quoted prices for identical or similar assets or liabilities in markets that are not considered to be active, inputs other than quoted prices that are observable for the asset or liability (such as exchange rates, financing terms, interest rates, yield curves, volatilities, prepayment speeds, loss severities, credit risks and default rates) or other market-corroborated inputs; and |
| • | Level 3 — Unobservable inputs for the asset or liability, including the Global Valuation Committee’s assumptions used in determining the fair value of investments. |
Changes in valuation techniques may result in transfers in or out of an assigned level within the disclosure hierarchy. In accordance with the Company’s policy, transfers between different levels of the fair value hierarchy are deemed to have occurred as of the beginning of the reporting period.
| 42 | 2015 iSHARES ANNUAL REPORTTO SHAREHOLDERS |
Table of Contents
Notes to Financial Statements (Continued)
iSHARES®, INC.
The following table summarizes the value of each of the Funds’ investments according to the fair value hierarchy as of August 31, 2015. The breakdown of each Fund’s investments into major categories is disclosed in its respective schedule of investments.
| iShares ETF | Level 1 | Level 2 | Level 3 | Total | ||||||||||||
MSCI Eurozone | ||||||||||||||||
Investments: | ||||||||||||||||
Assets: | ||||||||||||||||
Common Stocks | $ | 9,936,545,306 | $ | 190,940 | $ | 7 | $ | 9,936,736,253 | ||||||||
Preferred Stocks | 180,256,291 | — | — | 180,256,291 | ||||||||||||
Money Market Funds | 26,349,585 | — | — | 26,349,585 | ||||||||||||
|
|
|
|
|
|
|
| |||||||||
Total | $ | 10,143,151,182 | $ | 190,940 | $ | 7 | $ | 10,143,342,129 | ||||||||
|
|
|
|
|
|
|
| |||||||||
MSCI Germany | ||||||||||||||||
Investments: | ||||||||||||||||
Assets: | ||||||||||||||||
Common Stocks | $ | 6,177,175,138 | $ | — | $ | — | $ | 6,177,175,138 | ||||||||
Preferred Stocks | 399,802,055 | — | — | 399,802,055 | ||||||||||||
Money Market Funds | 2,264,318 | — | — | 2,264,318 | ||||||||||||
|
|
|
|
|
|
|
| |||||||||
Total | $ | 6,579,241,511 | $ | — | $ | — | $ | 6,579,241,511 | ||||||||
|
|
|
|
|
|
|
| |||||||||
Derivative Financial Instruments:a | ||||||||||||||||
Liabilities: | ||||||||||||||||
Futures Contracts | $ | (2,345,063 | ) | $ | — | $ | — | $ | (2,345,063 | ) | ||||||
|
|
|
|
|
|
|
| |||||||||
Total | $ | (2,345,063 | ) | $ | — | $ | — | $ | (2,345,063 | ) | ||||||
|
|
|
|
|
|
|
| |||||||||
MSCI Italy Capped | ||||||||||||||||
Investments: | ||||||||||||||||
Assets: | ||||||||||||||||
Common Stocks | $ | 1,076,870,518 | $ | — | $ | — | $ | 1,076,870,518 | ||||||||
Money Market Funds | 42,350,298 | — | — | 42,350,298 | ||||||||||||
|
|
|
|
|
|
|
| |||||||||
Total | $ | 1,119,220,816 | $ | — | $ | — | $ | 1,119,220,816 | ||||||||
|
|
|
|
|
|
|
| |||||||||
MSCI Spain Capped | ||||||||||||||||
Investments: | ||||||||||||||||
Assets: | ||||||||||||||||
Common Stocks | $ | 1,661,558,870 | $ | 739,850 | $ | — | $ | 1,662,298,720 | ||||||||
Money Market Funds | 57,404 | — | — | 57,404 | ||||||||||||
|
|
|
|
|
|
|
| |||||||||
Total | $ | 1,661,616,274 | $ | 739,850 | $ | — | $ | 1,662,356,124 | ||||||||
|
|
|
|
|
|
|
| |||||||||
MSCI Switzerland Capped | ||||||||||||||||
Investments: | ||||||||||||||||
Assets: | ||||||||||||||||
Common Stocks | $ | 1,192,061,662 | $ | — | $ | — | $ | 1,192,061,662 | ||||||||
Money Market Funds | 12,136,606 | — | — | 12,136,606 | ||||||||||||
|
|
|
|
|
|
|
| |||||||||
Total | $ | 1,204,198,268 | $ | — | $ | — | $ | 1,204,198,268 | ||||||||
|
|
|
|
|
|
|
| |||||||||
| a | Shown at the unrealized appreciation (depreciation) on the contracts. |
NOTESTO FINANCIAL STATEMENTS | 43 |
Table of Contents
Notes to Financial Statements (Continued)
iSHARES®, INC.
SECURITY TRANSACTIONS AND INCOME RECOGNITION
Security transactions are accounted for on trade date. Dividend income and capital gain distributions, if any, are recognized on the ex-dividend date, net of any foreign taxes withheld at source. Any taxes withheld that are reclaimable from foreign tax authorities as of August 31, 2015 are reflected in dividends receivable. Non-cash dividends received in the form of stock in an elective dividend, if any, are recorded as dividend income at fair value. Distributions received by the Funds may include a return of capital that is estimated by management. Such amounts are recorded as a reduction of the cost of investments or reclassified to capital gains. Interest income is accrued daily. Realized gains and losses on investment transactions are determined using the specific identification method.
FOREIGN CURRENCY TRANSLATION
The accounting records of the Funds are maintained in U.S. dollars. Foreign currencies, as well as investment securities and other assets and liabilities denominated in foreign currencies, are translated into U.S. dollars using exchange rates deemed appropriate by the investment adviser. Purchases and sales of securities, income receipts and expense payments are translated into U.S. dollars on the respective dates of such transactions.
Each Fund does not isolate the effect of fluctuations in foreign exchange rates from the effect of fluctuations in the market prices of securities. Such fluctuations are reflected by the Funds as a component of realized and unrealized gains and losses from investments for financial reporting purposes.
FOREIGN TAXES
The Funds may be subject to foreign taxes (a portion of which may be reclaimable) on income, stock dividends, capital gains on investments, or certain foreign currency transactions. All foreign taxes are recorded in accordance with the applicable foreign tax regulations and rates that exist in the foreign jurisdictions in which the Funds invest. These foreign taxes, if any, are paid by the Funds and are reflected in their statements of operations as follows: foreign taxes withheld at source are presented as a reduction of income, foreign taxes on securities lending income are presented as a reduction of securities lending income, foreign taxes on stock dividends are presented as “other foreign taxes,” and foreign taxes on capital gains from sales of investments and foreign taxes on foreign currency transactions are included in their respective net realized gain (loss) categories. Foreign taxes payable or deferred as of August 31, 2015, if any, are disclosed in the Funds’ statements of assets and liabilities.
DISTRIBUTIONS TO SHAREHOLDERS
Dividends and distributions paid by each Fund are recorded on the ex-dividend dates. Distributions are determined on a tax basis and may differ from net investment income and net realized capital gains for financial reporting purposes. Dividends and distributions are paid in U.S. dollars and cannot be automatically reinvested in additional shares of the Funds.
LOANS OF PORTFOLIO SECURITIES
Each Fund may lend its investment securities to approved borrowers, such as brokers, dealers and other financial institutions. The borrower pledges and maintains with the Fund collateral consisting of cash, an irrevocable letter of credit issued by a bank, or securities issued or guaranteed by the U.S. government. The initial collateral received by each Fund is required to have a value of at least 102% of the current value of the loaned securities for securities traded on U.S. exchanges and a value of at least 105% for all other securities. The collateral is maintained thereafter at a value equal to at least 100% of the current value of the securities on loan. The market value of the loaned securities is determined at the close of each business day of the Funds. Any additional required collateral is delivered to the Funds and any excess collateral is returned by the Funds on the next business
| 44 | 2015 iSHARES ANNUAL REPORTTO SHAREHOLDERS |
Table of Contents
Notes to Financial Statements (Continued)
iSHARES®, INC.
day. During the term of the loan, each Fund is entitled to all distributions made on or in respect of the loaned securities. Loans of securities are terminable at any time and the borrower, after notice, is required to return borrowed securities within the standard time period for settlement of securities transactions.
Any cash received as collateral for securities on loan may be reinvested in certain short-term instruments either directly on behalf of a fund or through one or more joint accounts or money market funds, including those managed by BlackRock Fund Advisors (“BFA”), the Funds’ investment adviser, or its affiliates. As of August 31, 2015, any securities on loan were collateralized by cash. The cash collateral received was invested in money market funds managed by BFA and is disclosed in the schedules of investments. The securities on loan for each Fund are also disclosed in its schedule of investments. The total value of any securities on loan as of August 31, 2015 and the total value of the related collateral are disclosed in the statements of assets and liabilities. Income earned by the Funds from securities lending is disclosed in the statements of operations.
The risks of securities lending include the risk that the borrower may not provide additional collateral when required or may not return the securities when due. To mitigate these risks, the Funds benefit from a borrower default indemnity provided by BlackRock, Inc. (“BlackRock”). BlackRock’s indemnity allows for full replacement of securities lent. Each Fund could suffer a loss if the value of the investments purchased with cash collateral falls below the value of the cash collateral received.
Securities lending transactions are entered into by the Funds under Master Securities Lending Agreements (“MSLA”) which provide the right, in the event of default (including bankruptcy or insolvency) for the non-defaulting party to liquidate the collateral and calculate a net exposure to the defaulting party or request additional collateral. In the event that a borrower defaults, a Fund, as lender, would offset the market value of the collateral received against the market value of the securities loaned. The value of the collateral is typically greater than that of the market value of the securities loaned, leaving the lender with a net amount payable to the defaulting party. However, bankruptcy or insolvency laws of a particular jurisdiction may impose restrictions on or prohibitions against such a right of offset in the event of an MSLA counterparty’s bankruptcy or insolvency. Under the MSLA, the borrower can resell or re-pledge the loaned securities, and a Fund can reinvest cash collateral, or, upon an event of default, resell or re-pledge the collateral.
The following table is a summary of securities lending agreements which are subject to offset under an MSLA as of August 31, 2015:
| iShares ETF | Market Value of Securities on Loan | Cash Collateral Received a | Net Amount | |||||||||
MSCI Eurozone | $ | 19,638,033 | $ | 19,638,033 | $ | — | ||||||
MSCI Germany | 2,015,752 | 2,015,752 | — | |||||||||
MSCI Italy Capped | 39,557,850 | 39,557,850 | — | |||||||||
MSCI Switzerland Capped | 9,814,925 | 9,814,925 | — | |||||||||
| a | Collateral received in excess of the market value of securities on loan is not presented for financial reporting purposes. The total collateral received is disclosed in each Fund’s statement of assets and liabilities. |
| 2. | INVESTMENT ADVISORY AGREEMENT AND OTHER TRANSACTIONS WITH AFFILIATES |
Pursuant to an Investment Advisory Agreement with the Company, BFA manages the investment of each Fund’s assets. BFA is a California corporation indirectly owned by BlackRock. Under the Investment Advisory Agreement, BFA is responsible for substantially all expenses of the Funds, except interest, taxes, brokerage commissions and other expenses connected with the execution of portfolio transactions, distribution fees, litigation expenses and any extraordinary expenses.
NOTESTO FINANCIAL STATEMENTS | 45 |
Table of Contents
Notes to Financial Statements (Continued)
iSHARES®, INC.
For its investment advisory services to each Fund, BFA is entitled to an annual investment advisory fee based on each Fund’s allocable portion of the aggregate of the average daily net assets of the Fund and certain other iShares funds, as follows:
| Investment Advisory Fee | Aggregate Average Daily Net Assets | ||||
| 0.59 | % | First $7 billion | |||
| 0.54 | Over $7 billion, up to and including $11 billion | ||||
| 0.49 | Over $11 billion, up to and including $24 billion | ||||
| 0.44 | Over $24 billion, up to and including $48 billion | ||||
| 0.40 | Over $48 billion, up to and including $72 billion | ||||
| 0.36 | Over $72 billion | ||||
The U.S. Securities and Exchange Commission has issued an exemptive order which permits BlackRock Institutional Trust Company, N.A. (“BTC”), an affiliate of BFA, to serve as securities lending agent for the Funds, subject to applicable conditions. As securities lending agent, BTC bears all operational costs directly related to securities lending. Each Fund is responsible for fees in connection with the investment of cash collateral received for securities on loan in a money market fund managed by BFA, however, BTC has agreed to reduce the amount of securities lending income it receives in order to effectively limit the collateral investment fees each Fund bears to an annual rate of 0.04% (the “collateral investment fees”). Securities lending income is equal to the total of income earned from the reinvestment of cash collateral, net of fees and other payments to and from borrowers of securities, and less the collateral investment fees. The Funds retain a portion of securities lending income and remit the remaining portion to BTC as compensation for its services as securities lending agent.
Pursuant to a securities lending agreement, each Fund retains 80% of securities lending income and the amount retained can never be less than 70% of the total of securities lending income plus the collateral investment fees. In addition, commencing the business day following the date that the aggregate securities lending income plus the collateral investment fees generated across all 1940 Act iShares exchange-traded funds (the “iShares ETF Complex”) in a given calendar year exceeds the aggregate securities lending income generated across the iShares ETF Complex in the calendar year 2013, each Fund, pursuant to a securities lending agreement, will retain for the remainder of that calendar year 85% of securities lending income and the amount retained can never be less than 70% of the total of securities lending income plus the collateral investment fees.
Prior to January 1, 2015, each Fund retained 75% of securities lending income and the amount retained was never less than 65% of the total of securities lending income plus the collateral investment fees. In addition, commencing the business day following the date that the aggregate securities lending income plus the collateral investment fees generated across the iShares ETF Complex in the calendar year 2014 exceeded the aggregate securities lending income generated across the iShares ETF Complex in the calendar year 2013 and pursuant to a securities lending agreement, each Fund retained for the remainder of the calendar year 2014, 80% of securities lending income and the amount retained was never less than 65% of the total of securities lending income plus the collateral investment fees.
For the year ended August 31, 2015, the total of securities lending agent services and collateral investment fees paid were as follows:
| iShares ETF | Fees Paid to BTC | |||
MSCI Eurozone | $ | 196,882 | ||
MSCI Germany | 3,416 | |||
MSCI Italy Capped | 94,724 | |||
MSCI Spain Capped | 6,660 | |||
MSCI Switzerland Capped | 114,106 | |||
| 46 | 2015 iSHARES ANNUAL REPORTTO SHAREHOLDERS |
Table of Contents
Notes to Financial Statements (Continued)
iSHARES®, INC.
BlackRock Investments, LLC, an affiliate of BFA, is the distributor for each Fund. Pursuant to the distribution agreement, BFA is responsible for any fees or expenses for distribution services provided to the Funds.
Cross trades for the year ended August 31, 2015, if any, were executed by the Funds pursuant to Rule 17a-7 under the 1940 Act. Cross trading is the buying or selling of portfolio securities between funds to which BFA (or an affiliate) serves as investment adviser. At its regularly scheduled quarterly meetings, the Board reviews such transactions as of the most recent calendar quarter for compliance with the requirements and restrictions set forth by Rule 17a-7.
Each Fund may invest its positive cash balances in certain money market funds managed by BFA or an affiliate. The income earned on these temporary cash investments is included in “Interest – affiliated” in the statements of operations.
The PNC Financial Services Group, Inc. is the largest stockholder of BlackRock and is considered to be an affiliate of the Funds for 1940 Act purposes.
Certain directors and officers of the Company are also officers of BTC and/or BFA.
| 3. | INVESTMENT PORTFOLIO TRANSACTIONS |
Purchases and sales of investments (excluding in-kind transactions and short-term investments) for the year ended August 31, 2015 were as follows:
| iShares ETF | Purchases | Sales | ||||||
MSCI Eurozone | $ | 490,988,217 | $ | 422,311,176 | ||||
MSCI Germany | 295,430,997 | 179,771,710 | ||||||
MSCI Italy Capped | 236,252,195 | 233,455,026 | ||||||
MSCI Spain Capped | 263,456,049 | 320,785,774 | ||||||
MSCI Switzerland Capped | 107,720,510 | 75,338,476 | ||||||
In-kind transactions (see Note 4) for the year ended August 31, 2015 were as follows:
| iShares ETF | In-kind Purchases | In-kind Sales | ||||||
MSCI Eurozone | $ | 5,087,212,548 | $ | 2,670,644,018 | ||||
MSCI Germany | 3,791,136,177 | 1,379,673,366 | ||||||
MSCI Italy Capped | 292,919,952 | 670,660,259 | ||||||
MSCI Spain Capped | 575,969,326 | 910,039,148 | ||||||
MSCI Switzerland Capped | 829,240,149 | 655,334,586 | ||||||
| 4. | CAPITAL SHARE TRANSACTIONS |
Capital shares are issued and redeemed by each Fund only in aggregations of a specified number of shares or multiples thereof (“Creation Units”) at NAV. Except when aggregated in Creation Units, shares of each Fund are not redeemable. Transactions in capital shares for each Fund are disclosed in detail in the statements of changes in net assets.
The consideration for the purchase of Creation Units of a fund in the Company generally consists of the in-kind deposit of a designated portfolio of securities and a specified amount of cash. Certain funds in the Company may be offered in Creation Units solely or partially for cash in U.S. dollars. Investors purchasing and redeeming Creation Units may pay a purchase transaction fee
NOTESTO FINANCIAL STATEMENTS | 47 |
Table of Contents
Notes to Financial Statements (Continued)
iSHARES®, INC.
and a redemption transaction fee directly to State Street Bank and Trust Company, the Company’s administrator, to offset transfer and other transaction costs associated with the issuance and redemption of Creation Units, including Creation Units for cash. Investors transacting in Creation Units for cash may also pay an additional variable charge to compensate the relevant fund for certain transaction costs (i.e., stamp taxes, taxes on currency or other financial transactions, and brokerage costs) and market impact expenses relating to investing in portfolio securities. Such variable charges, if any, are included in “Proceeds from shares sold” in the statements of changes in net assets.
| 5. | FUTURES CONTRACTS |
Each Fund may purchase or sell futures contracts in an effort to help such Fund track its underlying index. A futures contract is a standardized, exchange-traded agreement to buy and sell a financial instrument at a set price on a future date. Upon entering into a futures contract, the Fund is required to pledge to the executing broker which holds segregated from its own assets, an amount of cash, U.S. government securities or other high-quality debt and equity securities equal to the minimum initial margin requirements of the exchange on which the contract is traded. Pursuant to the contract, the Fund agrees to receive from or pay to the broker an amount of cash equal to the daily fluctuation in value of the contract. Such receipts or payments are known as margin variation and are recorded by the Fund as unrealized appreciation or depreciation. When the contract is closed, the Fund records a realized gain or loss equal to the difference between the value of the contract at the time it was opened and the value at the time it was closed. Losses may arise if the value of a futures contract decreases due to an unfavorable change in the market rates or values of the underlying instrument during the term of the contract or if the counterparty does not perform under the contract. The use of futures contracts also involves the risk of an imperfect correlation in the movements in the price of futures contracts and the assets underlying such contracts.
The following table shows the value of futures contracts held by the iShares MSCI Germany ETF as of August 31, 2015 and the related locations in the statement of assets and liabilities, presented by risk exposure category:
| Liabilities | ||||
Equity contracts: | ||||
Variation margin / Net assets consist of – net unrealized depreciationa | $ | 2,345,063 | ||
|
| |||
| a | Represents cumulative depreciation of futures contracts as reported in the schedule of investments. |
The following table shows the realized and unrealized gains (losses) on futures contracts held by the iShares MSCI Germany ETF during the year ended August 31, 2015 and the related locations in the statement of operations, presented by risk exposure category:
| Net Realized Gain (Loss) | Net Change in Unrealized Appreciation/Depreciation | |||||||
Equity contracts: | ||||||||
Futures contracts | $ | 748,453 | $ | (1,154,890 | ) | |||
|
|
|
| |||||
| 48 | 2015 iSHARES ANNUAL REPORTTO SHAREHOLDERS |
Table of Contents
Notes to Financial Statements (Continued)
iSHARES®, INC.
The following table shows the average quarter-end balances of open futures contracts for the iShares MSCI Germany ETF for the year ended August 31, 2015:
Average value of contracts purchased | $ | 34,056,659 | ||
| 6. | PRINCIPAL RISKS |
In the normal course of business, each Fund’s investment activities expose it to various types of risk associated with the financial instruments and markets in which it invests. The significant types of financial risks each Fund is exposed to include market risk and credit risk. Each Fund’s prospectus provides details of these and other types of risk.
BFA uses a “passive” or index approach to try to achieve each Fund’s investment objective following the securities included in its underlying index during upturns as well as downturns. BFA does not take steps to reduce market exposure or to lessen the effects of a declining market. Divergence from the underlying index and the composition of the portfolio is monitored by BFA.
MARKET RISK
Market risk arises mainly from uncertainty about future values of financial instruments influenced by price, currency and interest rate movements. It represents the potential loss each Fund may suffer through holding market positions in the face of market movements. Each Fund is exposed to market risk by virtue of its investment in equity and financial derivative instruments. The fair value of securities held by the Funds may decline due to general market conditions, economic trends or events that are not specifically related to the issuers of the securities including local, regional or global political, social or economic instability or to factors that affect a particular industry or group of industries. The extent of each Fund’s exposure to market risk is the market value of the investments held as shown in the Fund’s schedule of investments.
A diversified portfolio, where this is appropriate and consistent with a fund’s objectives, minimizes the risk that a price change of a particular investment will have a material impact on the NAV of a fund. The investment concentrations within each Fund’s portfolio are disclosed in its schedule of investments.
Each Fund invests a substantial amount of its assets in securities of non-U.S. issuers that trade in non-U.S. markets. This involves certain considerations and risks not typically associated with securities of U.S. issuers. Such risks include, but are not limited to: generally less liquid and less efficient securities markets; generally greater price volatility; exchange rate fluctuations and exchange controls; imposition of restrictions on the expatriation of funds or other assets of the Fund; less publicly available information about issuers; the imposition of withholding or other taxes; higher transaction and custody costs; settlement delays and risk of loss attendant in settlement procedures; difficulties in enforcing contractual obligations; less regulation of securities markets; different accounting, disclosure and reporting requirements; more substantial governmental involvement in the economy; higher inflation rates; greater social, economic and political uncertainties; the risk of nationalization or expropriation of assets; and the risk of war. These risks are heightened for investments in issuers from countries with less developed markets.
Each Fund, except for the iShares MSCI Eurozone ETF, invests all or substantially all of its assets in issuers located in a single country. When a fund concentrates its investments in this manner, it assumes the risk that economic, political and social conditions in that country may have a significant impact on its investment performance.
CREDIT RISK
Credit risk is the risk that an issuer or guarantor of debt instruments or the counterparty to a financial transaction, including derivatives contracts, repurchase agreements or loans of portfolio securities, is unable or unwilling to make timely interest and/or
NOTESTO FINANCIAL STATEMENTS | 49 |
Table of Contents
Notes to Financial Statements (Continued)
iSHARES®, INC.
principal payments or to otherwise honor its obligations. BFA and its affiliates manage counterparty credit risk by entering into transactions only with counterparties that they believe have the financial resources to honor their obligations and by monitoring the financial stability of those counterparties. Financial assets, which potentially expose the Funds to issuer and counterparty credit risks, consist principally of financial instruments and receivables due from counterparties. The extent of each Fund’s exposure to credit and counterparty risks with respect to those financial assets is approximated by their value recorded in its statement of assets and liabilities.
| 7. | INCOME TAX INFORMATION |
Each Fund is treated as an entity separate from the Company’s other funds for federal income tax purposes. It is the policy of each Fund to qualify as a regulated investment company by complying with the provisions applicable to regulated investment companies, as defined under Subchapter M of the Internal Revenue Code of 1986, as amended, and to annually distribute substantially all of its ordinary income and any net capital gains (taking into account any capital loss carryforwards) sufficient to relieve it from all, or substantially all, federal income and excise taxes. Accordingly, no provision for federal income taxes is required.
U.S. GAAP requires that certain components of net assets be adjusted to reflect permanent differences between financial and tax reporting. These reclassifications have no effect on net assets or NAV per share. The following permanent differences as of August 31, 2015, attributable to passive foreign investment companies, the expiration of capital loss carryforwards, distributions paid in excess of taxable income, foreign currency transactions and realized gains (losses) from in-kind redemptions, were reclassified to the following accounts:
| iShares ETF | Paid-in Capital | Undistributed Net Investment Income/Distributions in Excess of Net Investment Income | Undistributed Net Realized Gain/Accumulated Net Realized Loss | |||||||||
MSCI Eurozone | $ | 119,235,410 | $ | (1,839,544 | ) | $ | (117,395,866 | ) | ||||
MSCI Germany | 140,292,970 | 2,479,402 | (142,772,372 | ) | ||||||||
MSCI Italy Capped | 9,038,556 | 652,933 | (9,691,489 | ) | ||||||||
MSCI Spain Capped | (16,972,478 | ) | (382,454 | ) | 17,354,932 | |||||||
MSCI Switzerland Capped | 171,868,457 | 730,071 | (172,598,528 | ) | ||||||||
| 50 | 2015 iSHARES ANNUAL REPORTTO SHAREHOLDERS |
Table of Contents
Notes to Financial Statements (Continued)
iSHARES®, INC.
The tax character of distributions paid during the years ended August 31, 2015 and August 31, 2014 was as follows:
| iShares ETF | 2015 | 2014 | ||||||
MSCI Eurozone | ||||||||
Ordinary income | $ | 233,277,080 | $ | 243,559,586 | ||||
|
|
|
| |||||
MSCI Germany | ||||||||
Ordinary income | $ | 127,874,456 | $ | 111,913,888 | ||||
|
|
|
| |||||
MSCI Italy Capped | ||||||||
Ordinary income | $ | 24,941,571 | $ | 31,039,889 | ||||
|
|
|
| |||||
MSCI Spain Capped | ||||||||
Ordinary income | $ | 77,875,309 | $ | 48,486,263 | ||||
|
|
|
| |||||
MSCI Switzerland Capped | ||||||||
Ordinary income | $ | 28,746,817 | $ | 26,005,188 | ||||
|
|
|
| |||||
As of August 31, 2015, the tax components of accumulated net earnings (losses) were as follows:
| iShares ETF | Undistributed Ordinary Income | Capital Loss Carryforwards | Net Unrealized Gains (Losses) a | Qualified Late-Year Losses b | Total | |||||||||||||||
MSCI Eurozone | $ | 5,766,561 | $ | (195,087,241 | ) | $ | (1,282,951,456 | ) | $ | (25,581,822 | ) | $ | (1,497,853,958 | ) | ||||||
MSCI Germany | — | (121,319,015 | ) | (923,562,510 | ) | (17,609,472 | ) | (1,062,490,997 | ) | |||||||||||
MSCI Italy Capped | — | (66,427,843 | ) | (157,582,027 | ) | (33,692,051 | ) | (257,701,921 | ) | |||||||||||
MSCI Spain Capped | 9,904,643 | (54,478,988 | ) | (379,957,033 | ) | (24,940,241 | ) | (449,471,619 | ) | |||||||||||
MSCI Switzerland Capped | — | (44,564,021 | ) | (58,888,882 | ) | (3,757,635 | ) | (107,210,538 | ) | |||||||||||
| a | The difference between book-basis and tax-basis unrealized gains (losses) was attributable primarily to the tax deferral of losses on wash sales, the realization for tax purposes of unrealized gains (losses) on certain futures contracts, and the realization for tax purposes of unrealized gains on investments in passive foreign investment companies. |
| b | The Funds have elected to defer certain qualified late-year losses and recognize such losses in the next taxable year. |
As of August 31, 2015, the following Funds had capital loss carryforwards available to offset future realized capital gains through the indicated expiration dates as follows:
| iShares ETF | Non- Expiring a | Expiring 2016 | Expiring 2017 | Expiring 2018 | Expiring 2019 | Total | ||||||||||||||||||
MSCI Eurozone | $ | 70,176,760 | $ | — | $ | 26,644,200 | $ | 68,035,542 | $ | 30,230,739 | $ | 195,087,241 | ||||||||||||
MSCI Germany | 29,427,327 | 3,394,735 | 27,790,050 | 28,490,949 | 32,215,954 | 121,319,015 | ||||||||||||||||||
MSCI Italy Capped | 35,582,636 | 472,268 | 2,743,650 | 18,169,627 | 9,459,662 | 66,427,843 | ||||||||||||||||||
MSCI Spain Capped | 24,791,486 | — | 5,946,927 | 15,120,672 | 8,619,903 | 54,478,988 | ||||||||||||||||||
MSCI Switzerland Capped | 12,201,097 | — | 2,837,786 | 22,569,380 | 6,955,758 | 44,564,021 | ||||||||||||||||||
| a | Must be utilized prior to losses subject to expiration. |
NOTESTO FINANCIAL STATEMENTS | 51 |
Table of Contents
Notes to Financial Statements (Continued)
iSHARES®, INC.
The Funds may own shares in certain foreign investment entities, referred to, under U.S. tax law, as “passive foreign investment companies.” The Funds may elect to mark-to-market annually the shares of each passive foreign investment company and would be required to distribute to shareholders any such marked-to-market gains.
As of August 31, 2015, gross unrealized appreciation and gross unrealized depreciation based on cost for federal income tax purposes were as follows:
| iShares ETF | Tax Cost | Gross Unrealized Appreciation | Gross Unrealized | Net Unrealized Appreciation (Depreciation) | ||||||||||||
MSCI Eurozone | $ | 11,426,239,567 | $ | 207,374,881 | $ | (1,490,272,319 | ) | $ | (1,282,897,438 | ) | ||||||
MSCI Germany | 7,502,329,000 | 112,504,269 | (1,035,591,758 | ) | (923,087,489 | ) | ||||||||||
MSCI Italy Capped | 1,276,810,007 | 40,188,111 | (197,777,302 | ) | (157,589,191 | ) | ||||||||||
MSCI Spain Capped | 2,042,333,264 | 29,745,678 | (409,722,818 | ) | (379,977,140 | ) | ||||||||||
MSCI Switzerland Capped | 1,262,742,055 | 37,366,511 | (95,910,298 | ) | (58,543,787 | ) | ||||||||||
Management has analyzed tax laws and regulations and their application to the Funds as of August 31, 2015, inclusive of the open tax return years, and does not believe there are any uncertain tax positions that require recognition of a tax liability in the Funds’ financial statements.
| 8. | SUBSEQUENT EVENTS |
Management has evaluated the impact of all subsequent events on the Funds through the date the financial statements were available to be issued and has determined that there were no subsequent events requiring adjustment or disclosure in the financial statements.
| 52 | 2015 iSHARES ANNUAL REPORTTO SHAREHOLDERS |
Table of Contents
Report of Independent Registered Public Accounting Firm
To the Shareholders and Board of Directors of
iShares, Inc.:
In our opinion, the accompanying statements of assets and liabilities, including the schedules of investments, and the related statements of operations and of changes in net assets and the financial highlights present fairly, in all material respects, the financial position of iShares MSCI Eurozone ETF, iShares MSCI Germany ETF, iShares MSCI Italy Capped ETF, iShares MSCI Spain Capped ETF and iShares MSCI Switzerland Capped ETF (the “Funds”) at August 31, 2015, the results of each of their operations, the changes in each of their net assets and their financial highlights for each of the periods presented, in conformity with accounting principles generally accepted in the United States of America. These financial statements and financial highlights (hereafter referred to as “financial statements”) are the responsibility of the Funds’ management. Our responsibility is to express an opinion on these financial statements based on our audits. We conducted our audits of these financial statements in accordance with the standards of the Public Company Accounting Oversight Board (United States). Those standards require that we plan and perform the audit to obtain reasonable assurance about whether the financial statements are free of material misstatement. An audit includes examining, on a test basis, evidence supporting the amounts and disclosures in the financial statements, assessing the accounting principles used and significant estimates made by management, and evaluating the overall financial statement presentation. We believe that our audits, which included confirmation of securities at August 31, 2015 by correspondence with the custodian, transfer agent and brokers, provide a reasonable basis for our opinion.
PricewaterhouseCoopers LLP
San Francisco, California
October 22, 2015
REPORTOF INDEPENDENT REGISTERED PUBLIC ACCOUNTING FIRM | 53 |
Table of Contents
iSHARES®, INC.
Under Section 854(b)(2) of the Internal Revenue Code (the “Code”), the following maximum amounts are hereby designated as qualified dividend income for purposes of the maximum rate under Section 1(h)(11) of the Code for the fiscal year ended August 31, 2015:
| iShares ETF | Qualified Dividend Income | |||
MSCI Eurozone | $ | 303,046,357 | ||
MSCI Germany | 172,407,351 | |||
MSCI Italy Capped | 31,935,208 | |||
MSCI Spain Capped | 77,149,651 | |||
MSCI Switzerland Capped | 35,650,796 | |||
In February 2016, shareholders will receive Form 1099-DIV which will include their share of qualified dividend income distributed during the calendar year 2015. Shareholders are advised to check with their tax advisers for information on the treatment of these amounts on their income tax returns.
For the fiscal year ended August 31, 2015, the following Funds earned foreign source income and paid foreign taxes which they intend to pass through to their shareholders pursuant to Section 853 of the Code:
| iShares ETF | Foreign Source Income Earned | Foreign Taxes Paid | ||||||
MSCI Eurozone | $ | 306,962,240 | $ | 38,743,620 | ||||
MSCI Germany | 172,641,722 | 22,795,634 | ||||||
MSCI Italy Capped | 33,254,577 | 4,405,111 | ||||||
MSCI Spain Capped | 77,453,351 | 3,914,116 | ||||||
MSCI Switzerland Capped | 36,652,963 | 3,226,806 | ||||||
| 54 | 2015 iSHARES ANNUAL REPORTTO SHAREHOLDERS |
Table of Contents
Board Review and Approval of Investment Advisory
Contract
iSHARES® , INC.
I. iShares MSCI Eurozone ETF and iShares MSCI Switzerland Capped ETF
Under Section 15(c) of the Investment Company Act of 1940 (the “1940 Act”), the Company’s Board of Directors (the “Board”), including a majority of Directors who are not “interested persons” of the Company (as that term is defined in the 1940 Act) (the “Independent Directors”), is required annually to consider and approve the Investment Advisory Contract between the Company and BFA (the “Advisory Contract”) on behalf of the Funds. The Independent Directors requested, and BFA provided, such information as the Independent Directors, with advice from independent counsel, deemed reasonably necessary to evaluate the Advisory Contract. A committee of Independent Directors (the “15(c) Committee”), with independent counsel, met with management on May 1, 2015 and May 6, 2015, to discuss the types of information the Independent Directors required and the manner in which management would organize and present such information. At a meeting held on May 21, 2015, management presented preliminary information to the Board relating to the continuance of the Advisory Contract, and the Board, including the Independent Directors, reviewed and discussed such information at length. The Independent Directors requested from management certain additional information, which management agreed to provide. At a meeting held on June 24-25, 2015, the Board, including the Independent Directors, reviewed the additional information provided by management in response to these requests. After extensive discussions, the Board, including all of the Independent Directors, approved the continuance of the Advisory Contract for the Funds, based on a review of qualitative and quantitative information provided by BFA, including the additional information management provided at the request of the Independent Directors. The Board noted its satisfaction with the extent and quality of information provided and its frequent interactions with management, as well as the detailed responses and other information provided by BFA. The Board also noted that the Board and BFA agreed to discuss potential enhancements and adjustments to the 15(c) process for the coming year. The Independent Directors were advised by their independent counsel throughout the process, including about the legal standards applicable to their review. In approving the Advisory Contract for the Funds, the Board, including the Independent Directors, considered the following factors, no one of which was controlling, and reached the following conclusions:
Expenses and Performance of the Funds — The Board reviewed statistical information prepared by Lipper Inc. (“Lipper”), an independent provider of investment company data, regarding the expense ratio components, including actual advisory fees, waivers/reimbursements, and gross and net total expenses of each Fund in comparison with the same information for other exchange traded funds (including, where applicable, funds sponsored by an “at cost” service provider) and, in the limited instances where no comparable ETFs existed and the comparison group would not otherwise be reasonable in Lipper’s judgment, pure index institutional mutual funds, objectively selected by Lipper as comprising such Fund’s applicable peer group pursuant to Lipper’s proprietary ETF methodology (the “Lipper Group”). The Board was provided with a detailed description of Lipper’s proprietary ETF methodology used by Lipper to determine the applicable Lipper Groups. The Board further noted that due to the limitations in providing comparable funds in the various Lipper Groups, the statistical information provided in Lipper’s report may or may not provide meaningful direct comparisons to the Funds in all instances.
The Board also noted that the investment advisory fee rates and overall expenses (net of waivers and reimbursements) for the Funds were lower than the median of the investment advisory fee rates and overall expenses (net of waivers and reimbursements) of the funds in their respective Lipper Group.
In addition, the Board reviewed statistical information prepared by Lipper regarding the performance of each Fund for the one-, three-, five-, ten-year, and since inception periods, as applicable, and the “last quarter” period ended December 31, 2014, and a comparison of each Fund’s performance to its performance benchmark index for the same periods. To the extent that any of the comparison funds included in the Lipper Group track the same index as any particular Fund, Lipper also provided, and the Board reviewed, a comparison of such Fund’s performance to that of such relevant comparison funds for the same periods. The Board noted that the Funds generally performed in line with their respective performance benchmark indexes over the relevant periods. In considering this information, the Board noted that the Lipper Group may include funds that have different investment objectives
BOARD REVIEWAND APPROVALOF INVESTMENT ADVISORY CONTRACT | 55 |
Table of Contents
Board Review and Approval of Investment Advisory
Contract (Continued)
iSHARES®, INC.
and/or benchmarks from the Funds. In addition, the Board noted that each Fund seeks to track its own benchmark index and that, during the prior year, the Board received periodic reports on the Funds’ performance in comparison with their relevant benchmark indexes. Such periodic comparative performance information, including detailed information on certain specific iShares funds requested by the Boards, was also considered.
Based on this review, the other factors considered at the meeting, and their general knowledge of ETF pricing, the Board concluded that the investment advisory fee rate and expense level and the historical performance of each Fund supported the Board’s approval of the continuance of the Advisory Contract for the coming year.
Nature, Extent and Quality of Services Provided by BFA — Based on management’s representations, including information about recent and proposed enhancements to the iShares business, including with respect to shareholder servicing and support, the Board expected that there would be no diminution in the scope of services required of or provided by BFA under the Advisory Contract for the coming year as compared to the scope of services provided by BFA during prior years. In reviewing the scope of these services, the Board considered BFA’s investment philosophy and experience, noting that BFA and its affiliates have committed significant resources over time, including during the past year, to supporting the iShares funds and their shareholders. The Board acknowledged that resources to support the iShares funds and their shareholders have been added or enhanced in recent years. The Board also considered BFA’s compliance program and its compliance record with respect to the Funds. In that regard, the Board noted that BFA reports to the Board about portfolio management and compliance matters on a periodic basis in connection with regularly scheduled meetings of the Board, and on other occasions as necessary and appropriate, and has provided information and made appropriate officers available as needed to provide further assistance with these matters. The Board also reviewed the background and experience of the persons responsible for the day-to-day management of the Funds, as well as the resources available to them in managing the Funds. In addition to the above considerations, the Board reviewed and considered detailed presentations regarding BFA’s investment performance, investment and risk management processes and strategies provided at the June 24-25, 2015 meeting and throughout the previous year, and matters related to BFA’s portfolio compliance policies and procedures. The Board noted that each Fund had met its investment objective consistently since its respective inception date.
Based on review of this information, and the performance information discussed above, the Board concluded that the nature, extent and quality of services provided by BFA to the Funds under the Advisory Contract supported the Board’s approval of the continuance of the Advisory Contract for the coming year.
Costs of Services Provided to Funds and Profits Realized by BFA and Affiliates — The Board reviewed information about the profitability to BlackRock of the Funds based on the fees payable to BFA and its affiliates (including fees under the Advisory Contract), and all other sources of revenue and expense to BFA and its affiliates from the Funds’ operations for the last calendar year. The Board reviewed BlackRock’s profitability methodology for the iShares funds, noting that the 15(c) Committee had focused on the methodology and proposed presentation during its meetings. The Board discussed the sources of direct and ancillary revenue with management, including the revenues to BTC from securities lending by the Funds. The Board also discussed BFA’s profit margin as reflected in the Funds’ profitability analyses and reviewed information regarding potential economies of scale (as discussed below). Based on this review, the Board concluded that the profits realized by BFA and its affiliates under the Advisory Contract and from other relationships between the Funds and BFA and/or its affiliates, if any, were within a reasonable range in light of the factors considered.
Economies of Scale — The Board reviewed information regarding potential economies of scale or other efficiencies that may result from increases in the Funds’ assets, noting that the issue of economies of scale had been focused on extensively by the 15(c) Committee during its meetings and addressed by management. The Board and the 15(c) Committee reviewed information provided by BFA regarding scale benefits shared with the iShares funds through relatively low fee rates established at inception,
| 56 | 2015 iSHARES ANNUAL REPORTTO SHAREHOLDERS |
Table of Contents
Board Review and Approval of Investment Advisory
Contract (Continued)
iSHARES®, INC.
breakpoints, waivers, or other fee reductions, as well as through additional investment in the iShares business and the provision of improved or additional infrastructure and services to the iShares funds and their shareholders. The Board and the 15(c) Committee received information regarding BlackRock’s historical profitability, including BFA’s and its affiliates’ costs in providing services. The cost information distinguished between fixed and variable costs, and explained how the level of fixed and variable costs, as well as the nature of such costs, may impact the existence or size of scale benefits. The Board noted that the Advisory Contract for the Funds already provided for breakpoints in the Funds’ investment advisory fee rates as the assets of the Funds, on an aggregated basis with the assets of certain other iShares funds, increase. The Board noted that it would continue to monitor the sharing of economies of scale to determine the appropriateness of adding new or revised breakpoints in the future.
Based on this review, as well as the other factors considered at the meeting, the Board, recognizing its responsibility to consider this issue periodically, determined to approve the continuance of the Advisory Contract for the coming year.
Fees and Services Provided for Other Comparable Funds/Accounts Managed by BFA and its Affiliates — The Board received and considered information regarding the investment advisory/management fee rates for other funds/accounts in the U.S. for which BFA (or its affiliates) provides investment advisory/management services, including open-end and closed-end funds registered under the 1940 Act (including sub-advised funds), collective trust funds, separately managed accounts, and institutional separate accounts (together, the “Other Accounts”), and acknowledged BFA’s assertion that the iShares funds are fundamentally different investment vehicles from the Other Accounts. The Board noted that BFA and its affiliates do manage Other Accounts with substantially the same investment objectives and strategies as the Funds or that track the same index or a similar index as the Funds. The Board further noted that BFA provided the Board with detailed information regarding how the Other Accounts (particularly institutional clients) generally differ from the Funds, including in terms of the different, generally more extensive services provided to the Funds, as well as other significant differences in the approach of BFA and its affiliates to the Funds, on one hand, and Other Accounts, on the other. In that regard, the Board considered that the pricing of services to institutional clients is typically based on a number of factors beyond the nature and extent of the specific services to be provided and often depends on the overall relationship between the client and its affiliates and the adviser and its affiliates. In addition, the Board considered the relative complexity and inherent risks and challenges of managing and providing other services to the Funds, as publicly traded exchange traded funds, as compared to the Other Accounts that are institutional clients in light of differing regulatory requirements and client-imposed mandates. The Board also considered the “all-inclusive” nature of the Funds’ advisory fee structure, and the Fund expenses borne by BFA under this arrangement. The Board noted that the investment advisory fee rates under the Advisory Contract for the Funds were generally higher than the investment advisory/management fee rates for the Other Accounts that are institutional clients of BFA (or its affiliates) and concluded that the differences appeared to be consistent with the factors discussed.
Other Benefits to BFA and/or its Affiliates — The Board reviewed the “fallout” benefits or ancillary revenue received by BFA and/or its affiliates in connection with the services provided to the Funds by BFA, such as payment of revenue to BTC, the Funds’ securities lending agent, for loaning portfolio securities (which was included in the profit margins reviewed by the Board pursuant to BFA’s profitability methodology), and payment of advisory fees and/or administration fees to BFA and BTC (or their affiliates) in connection with any investments by the Funds in other funds for which BFA (or its affiliates) provides investment advisory services and/or administration services. The Board noted that BFA generally does not use soft dollars or consider the value of research or other services that may be provided to BFA (including its affiliates) in selecting brokers for portfolio transactions for the Funds. The Board further noted that any portfolio transactions on behalf of the Funds placed through a BFA affiliate or purchased from an underwriting syndicate in which a BFA affiliate participates, are reported to the Board pursuant to Rule 17e-1 or Rule 10f-3, as applicable, under the 1940 Act. The Board concluded that any such ancillary benefits would not be disadvantageous to the Funds’ shareholders and thus would not alter the Board’s conclusion with respect to the appropriateness of approving the continuance of the Advisory Contract for the coming year.
BOARD REVIEWAND APPROVALOF INVESTMENT ADVISORY CONTRACT | 57 |
Table of Contents
Board Review and Approval of Investment Advisory
Contract (Continued)
iSHARES®, INC.
Based on the considerations described above, the Board determined that each Fund’s investment advisory fee rate under the Advisory Contract does not constitute a fee that is so disproportionately large as to bear no reasonable relationship to the services rendered and that could not have been the product of arm’s-length bargaining, and concluded that it is in the best interest of each Fund and its shareholders to approve the continuance of the Advisory Contract for the coming year.
II. iShares MSCI Germany ETF
Under Section 15(c) of the Investment Company Act of 1940 (the “1940 Act”), the Company’s Board of Directors (the “Board”), including a majority of Directors who are not “interested persons” of the Company (as that term is defined in the 1940 Act) (the “Independent Directors”), is required annually to consider and approve the Investment Advisory Contract between the Company and BFA (the “Advisory Contract”) on behalf of the Fund. The Independent Directors requested, and BFA provided, such information as the Independent Directors, with advice from independent counsel, deemed reasonably necessary to evaluate the Advisory Contract. A committee of Independent Directors (the “15(c) Committee”), with independent counsel, met with management on May 1, 2015 and May 6, 2015, to discuss the types of information the Independent Directors required and the manner in which management would organize and present such information. At a meeting held on May 21, 2015, management presented preliminary information to the Board relating to the continuance of the Advisory Contract, and the Board, including the Independent Directors, reviewed and discussed such information at length. The Independent Directors requested from management certain additional information, which management agreed to provide. At a meeting held on June 24-25, 2015, the Board, including the Independent Directors, reviewed the additional information provided by management in response to these requests. After extensive discussions, the Board, including all of the Independent Directors, approved the continuance of the Advisory Contract for the Fund, based on a review of qualitative and quantitative information provided by BFA, including the additional information management provided at the request of the Independent Directors. The Board noted its satisfaction with the extent and quality of information provided and its frequent interactions with management, as well as the detailed responses and other information provided by BFA. The Board also noted that the Board and BFA agreed to discuss potential enhancements and adjustments to the 15(c) process for the coming year. The Independent Directors were advised by their independent counsel throughout the process, including about the legal standards applicable to their review. In approving the Advisory Contract for the Fund, the Board, including the Independent Directors, considered the following factors, no one of which was controlling, and reached the following conclusions:
Expenses and Performance of the Fund — The Board reviewed statistical information prepared by Lipper Inc. (“Lipper”), an independent provider of investment company data, regarding the expense ratio components, including actual advisory fees, waivers/reimbursements, and gross and net total expenses of the Fund in comparison with the same information for other exchange traded funds (including, where applicable, funds sponsored by an “at cost” service provider) and, in the limited instances where no comparable ETFs existed and the comparison group would not otherwise be reasonable in Lipper’s judgment, pure index institutional mutual funds, objectively selected by Lipper as comprising the Fund’s applicable peer group pursuant to Lipper’s proprietary ETF methodology (the “Lipper Group”). The Board was provided with a detailed description of Lipper’s proprietary ETF methodology used by Lipper to determine the Fund’s Lipper Group. The Board further noted that due to the limitations in providing comparable funds in the Lipper Group, the statistical information provided in Lipper’s report may or may not provide meaningful direct comparisons to the Fund in all instances.
The Board also noted that the investment advisory fee rate and overall expenses (net of waivers and reimbursements) for the Fund were within range of the median of the investment advisory fee rates and overall expenses (net of waivers and reimbursements) of the funds in its Lipper Group.
In addition, the Board reviewed statistical information prepared by Lipper regarding the performance of the Fund for the one-, three-, five-, ten-year, and since inception periods, as applicable, and the “last quarter” period ended December 31, 2014, and a
| 58 | 2015 iSHARES ANNUAL REPORTTO SHAREHOLDERS |
Table of Contents
Board Review and Approval of Investment Advisory
Contract (Continued)
iSHARES®, INC.
comparison of the Fund’s performance to its performance benchmark index for the same periods. To the extent that any of the comparison funds included in the Lipper Group track the same index as the Fund, Lipper also provided, and the Board reviewed, a comparison of the Fund’s performance to that of such relevant comparison funds for the same periods. The Board noted that the Fund generally performed in line with its performance benchmark index over the relevant periods. In considering this information, the Board noted that the Lipper Group may include funds that have a different investment objective and/or benchmark from the Fund. In addition, the Board noted that the Fund seeks to track its own benchmark index and that, during the prior year, the Board received periodic reports on the Fund’s performance in comparison with its benchmark index. Such periodic comparative performance information, including detailed information on certain specific iShares funds requested by the Boards, was also considered.
Based on this review, the other factors considered at the meeting, and their general knowledge of ETF pricing, the Board concluded that the investment advisory fee rate and expense level and the historical performance of the Fund supported the Board’s approval of the continuance of the Advisory Contract for the coming year.
Nature, Extent and Quality of Services Provided by BFA — Based on management’s representations, including information about recent and proposed enhancements to the iShares business, including with respect to shareholder servicing and support, the Board expected that there would be no diminution in the scope of services required of or provided by BFA under the Advisory Contract for the coming year as compared to the scope of services provided by BFA during prior years. In reviewing the scope of these services, the Board considered BFA’s investment philosophy and experience, noting that BFA and its affiliates have committed significant resources over time, including during the past year, to supporting the iShares funds and their shareholders. The Board acknowledged that resources to support the iShares funds and their shareholders have been added or enhanced in recent years. The Board also considered BFA’s compliance program and its compliance record with respect to the Fund. In that regard, the Board noted that BFA reports to the Board about portfolio management and compliance matters on a periodic basis in connection with regularly scheduled meetings of the Board, and on other occasions as necessary and appropriate, and has provided information and made appropriate officers available as needed to provide further assistance with these matters. The Board also reviewed the background and experience of the persons responsible for the day-to-day management of the Fund, as well as the resources available to them in managing the Fund. In addition to the above considerations, the Board reviewed and considered detailed presentations regarding BFA’s investment performance, investment and risk management processes and strategies provided at the June 24-25, 2015 meeting and throughout the previous year, and matters related to BFA’s portfolio compliance policies and procedures. The Board noted that the Fund had met its investment objective consistently since its inception date.
Based on review of this information, and the performance information discussed above, the Board concluded that the nature, extent and quality of services provided by BFA to the Fund under the Advisory Contract supported the Board’s approval of the continuance of the Advisory Contract for the coming year.
Costs of Services Provided to the Fund and Profits Realized by BFA and Affiliates — The Board reviewed information about the profitability to BlackRock of the Fund based on the fees payable to BFA and its affiliates (including fees under the Advisory Contract), and all other sources of revenue and expense to BFA and its affiliates from the Fund’s operations for the last calendar year. The Board reviewed BlackRock’s profitability methodology for the iShares funds, noting that the 15(c) Committee had focused on the methodology and proposed presentation during its meetings. The Board discussed the sources of direct and ancillary revenue with management, including the revenues to BTC from securities lending by the Fund. The Board also discussed BFA’s profit margin as reflected in the Fund’s profitability analysis and reviewed information regarding potential economies of scale (as discussed below). Based on this review, the Board concluded that the profits realized by BFA and its affiliates under the Advisory Contract and from other relationships between the Fund and BFA and/or its affiliates, if any, were within a reasonable range in light of the factors considered.
BOARD REVIEWAND APPROVALOF INVESTMENT ADVISORY CONTRACT | 59 |
Table of Contents
Board Review and Approval of Investment Advisory
Contract (Continued)
iSHARES®, INC.
Economies of Scale — The Board reviewed information regarding potential economies of scale or other efficiencies that may result from increases in the Fund’s assets, noting that the issue of economies of scale had been focused on extensively by the 15(c) Committee during its meetings and addressed by management. The Board and the 15(c) Committee reviewed information provided by BFA regarding scale benefits shared with the iShares funds through relatively low fee rates established at inception, breakpoints, waivers, or other fee reductions, as well as through additional investment in the iShares business and the provision of improved or additional infrastructure and services to the iShares funds and their shareholders. The Board and the 15(c) Committee received information regarding BlackRock’s historical profitability, including BFA’s and its affiliates’ costs in providing services. The cost information distinguished between fixed and variable costs, and explained how the level of fixed and variable costs, as well as the nature of such costs, may impact the existence or size of scale benefits. The Board noted that the Advisory Contract for the Fund already provided for breakpoints in the Fund’s investment advisory fee rate as the assets of the Fund, on an aggregated basis with the assets of certain other iShares funds, increase. The Board noted that it would continue to monitor the sharing of economies of scale to determine the appropriateness of adding new or revised breakpoints in the future.
Based on this review, as well as the other factors considered at the meeting, the Board, recognizing its responsibility to consider this issue periodically, determined to approve the continuance of the Advisory Contract for the coming year.
Fees and Services Provided for Other Comparable Funds/Accounts Managed by BFA and its Affiliates — The Board received and considered information regarding the investment advisory/management fee rates for other funds/accounts in the U.S. for which BFA (or its affiliates) provides investment advisory/management services, including open-end and closed-end funds registered under the 1940 Act (including sub-advised funds), collective trust funds, separately managed accounts, and institutional separate accounts (together, the “Other Accounts”), and acknowledged BFA’s assertion that the iShares funds are fundamentally different investment vehicles from the Other Accounts. The Board noted that BFA and its affiliates do not manage Other Accounts with substantially the same investment objective and strategy as the Fund or that track the same index or a similar index as the Fund. The Board further noted that BFA provided the Board with detailed information regarding how the Other Accounts (particularly institutional clients) generally differ from the Fund, including in terms of the different, generally more extensive services provided to the Fund, as well as other significant differences in the approach of BFA and its affiliates to the Fund, on one hand, and Other Accounts, on the other. In that regard, the Board considered that the pricing of services to institutional clients is typically based on a number of factors beyond the nature and extent of the specific services to be provided and often depends on the overall relationship between the client and its affiliates and the adviser and its affiliates. In addition, the Board considered the relative complexity and inherent risks and challenges of managing and providing other services to the Fund, as a publicly traded exchange traded fund, as compared to the Other Accounts that are institutional clients in light of differing regulatory requirements and client-imposed mandates. The Board also considered the “all-inclusive” nature of the Fund’s advisory fee structure, and the Fund expenses borne by BFA under this arrangement. The Board noted that the investment advisory fee rate under the Advisory Contract for the Fund was generally higher than the investment advisory/management fee rates for the Other Accounts that are institutional clients of BFA (or its affiliates) and concluded that the differences appeared to be consistent with the factors discussed.
Other Benefits to BFA and/or its Affiliates — The Board reviewed the “fallout” benefits or ancillary revenue received by BFA and/or its affiliates in connection with the services provided to the Fund by BFA, such as payment of revenue to BTC, the Fund’s securities lending agent, for loaning portfolio securities (which was included in the profit margins reviewed by the Board pursuant to BFA’s profitability methodology), and payment of advisory fees and/or administration fees to BFA and BTC (or their affiliates) in connection with any investments by the Fund in other funds for which BFA (or its affiliates) provides investment advisory services and/or administration services. The Board noted that BFA generally does not use soft dollars or consider the value of research or other services that may be provided to BFA (including its affiliates) in selecting brokers for portfolio transactions for the Fund. The Board further noted that any portfolio transactions on behalf of the Fund placed through a BFA affiliate or purchased from an underwriting syndicate in which a BFA affiliate participates, are reported to the Board pursuant to Rule 17e-1 or Rule 10f-3, as
| 60 | 2015 iSHARES ANNUAL REPORTTO SHAREHOLDERS |
Table of Contents
Board Review and Approval of Investment Advisory
Contract (Continued)
iSHARES®, INC.
applicable, under the 1940 Act. The Board concluded that any such ancillary benefits would not be disadvantageous to the Fund’s shareholders and thus would not alter the Board’s conclusion with respect to the appropriateness of approving the continuance of the Advisory Contract for the coming year.
Based on the considerations described above, the Board determined that the Fund’s investment advisory fee rate under the Advisory Contract does not constitute a fee that is so disproportionately large as to bear no reasonable relationship to the services rendered and that could not have been the product of arm’s-length bargaining, and concluded that it is in the best interest of the Fund and its shareholders to approve the continuance of the Advisory Contract for the coming year.
III. iShares MSCI Italy Capped ETF and iShares MSCI Spain Capped ETF
Under Section 15(c) of the Investment Company Act of 1940 (the “1940 Act”), the Company’s Board of Directors (the “Board”), including a majority of Directors who are not “interested persons” of the Company (as that term is defined in the 1940 Act) (the “Independent Directors”), is required annually to consider and approve the Investment Advisory Contract between the Company and BFA (the “Advisory Contract”) on behalf of the Funds. The Independent Directors requested, and BFA provided, such information as the Independent Directors, with advice from independent counsel, deemed reasonably necessary to evaluate the Advisory Contract. A committee of Independent Directors (the “15(c) Committee”), with independent counsel, met with management on May 1, 2015 and May 6, 2015, to discuss the types of information the Independent Directors required and the manner in which management would organize and present such information. At a meeting held on May 21, 2015, management presented preliminary information to the Board relating to the continuance of the Advisory Contract, and the Board, including the Independent Directors, reviewed and discussed such information at length. The Independent Directors requested from management certain additional information, which management agreed to provide. At a meeting held on June 24-25, 2015, the Board, including the Independent Directors, reviewed the additional information provided by management in response to these requests. After extensive discussions, the Board, including all of the Independent Directors, approved the continuance of the Advisory Contract for the Funds, based on a review of qualitative and quantitative information provided by BFA, including the additional information management provided at the request of the Independent Directors. The Board noted its satisfaction with the extent and quality of information provided and its frequent interactions with management, as well as the detailed responses and other information provided by BFA. The Board also noted that the Board and BFA agreed to discuss potential enhancements and adjustments to the 15(c) process for the coming year. The Independent Directors were advised by their independent counsel throughout the process, including about the legal standards applicable to their review. In approving the Advisory Contract for the Funds, the Board, including the Independent Directors, considered the following factors, no one of which was controlling, and reached the following conclusions:
Expenses and Performance of the Funds — The Board reviewed statistical information prepared by Lipper Inc. (“Lipper”), an independent provider of investment company data, regarding the expense ratio components, including actual advisory fees, waivers/reimbursements, and gross and net total expenses of each Fund in comparison with the same information for other exchange traded funds (including, where applicable, funds sponsored by an “at cost” service provider) and, in the limited instances where no comparable ETFs existed and the comparison group would not otherwise be reasonable in Lipper’s judgment, pure index institutional mutual funds, objectively selected by Lipper as comprising such Fund’s applicable peer group pursuant to Lipper’s proprietary ETF methodology (the “Lipper Group”). The Board was provided with a detailed description of Lipper’s proprietary ETF methodology used by Lipper to determine the applicable Lipper Groups. The Board further noted that due to the limitations in providing comparable funds in the various Lipper Groups, the statistical information provided in Lipper’s report may or may not provide meaningful direct comparisons to the Funds in all instances.
BOARD REVIEWAND APPROVALOF INVESTMENT ADVISORY CONTRACT | 61 |
Table of Contents
Board Review and Approval of Investment Advisory
Contract (Continued)
iSHARES®, INC.
The Board also noted that the investment advisory fee rates and overall expenses (net of waivers and reimbursements) for the Funds were lower than the median of the investment advisory fee rates and overall expenses (net of waivers and reimbursements) of the funds in their respective Lipper Group.
In addition, the Board reviewed statistical information prepared by Lipper regarding the performance of each Fund for the one-, three-, five-, ten-year, and since inception periods, as applicable, and the “last quarter” period ended December 31, 2014, and a comparison of each Fund’s performance to its performance benchmark index for the same periods. To the extent that any of the comparison funds included in the Lipper Group track the same index as any particular Fund, Lipper also provided, and the Board reviewed, a comparison of such Fund’s performance to that of such relevant comparison funds for the same periods. The Board noted that the Funds generally performed in line with their respective performance benchmark indexes over the relevant periods. In considering this information, the Board noted that the Lipper Group may include funds that have different investment objectives and/or benchmarks from the Funds. In addition, the Board noted that each Fund seeks to track its own benchmark index and that, during the prior year, the Board received periodic reports on the Funds’ performance in comparison with their relevant benchmark indexes. Such periodic comparative performance information, including detailed information on certain specific iShares funds requested by the Boards, was also considered.
Based on this review, the other factors considered at the meeting, and their general knowledge of ETF pricing, the Board concluded that the investment advisory fee rate and expense level and the historical performance of each Fund supported the Board’s approval of the continuance of the Advisory Contract for the coming year.
Nature, Extent and Quality of Services Provided by BFA — Based on management’s representations, including information about recent and proposed enhancements to the iShares business, including with respect to shareholder servicing and support, the Board expected that there would be no diminution in the scope of services required of or provided by BFA under the Advisory Contract for the coming year as compared to the scope of services provided by BFA during prior years. In reviewing the scope of these services, the Board considered BFA’s investment philosophy and experience, noting that BFA and its affiliates have committed significant resources over time, including during the past year, to supporting the iShares funds and their shareholders. The Board acknowledged that resources to support the iShares funds and their shareholders have been added or enhanced in recent years. The Board also considered BFA’s compliance program and its compliance record with respect to the Funds. In that regard, the Board noted that BFA reports to the Board about portfolio management and compliance matters on a periodic basis in connection with regularly scheduled meetings of the Board, and on other occasions as necessary and appropriate, and has provided information and made appropriate officers available as needed to provide further assistance with these matters. The Board also reviewed the background and experience of the persons responsible for the day-to-day management of the Funds, as well as the resources available to them in managing the Funds. In addition to the above considerations, the Board reviewed and considered detailed presentations regarding BFA’s investment performance, investment and risk management processes and strategies provided at the June 24-25, 2015 meeting and throughout the previous year, and matters related to BFA’s portfolio compliance policies and procedures. The Board noted that each Fund had met its investment objective consistently since its respective inception date.
Based on review of this information, and the performance information discussed above, the Board concluded that the nature, extent and quality of services provided by BFA to the Funds under the Advisory Contract supported the Board’s approval of the continuance of the Advisory Contract for the coming year.
Costs of Services Provided to Funds and Profits Realized by BFA and Affiliates — The Board reviewed information about the profitability to BlackRock of the Funds based on the fees payable to BFA and its affiliates (including fees under the Advisory Contract), and all other sources of revenue and expense to BFA and its affiliates from the Funds’ operations for the last calendar year. The Board reviewed BlackRock’s profitability methodology for the iShares funds, noting that the 15(c) Committee had
| 62 | 2015 iSHARES ANNUAL REPORTTO SHAREHOLDERS |
Table of Contents
Board Review and Approval of Investment Advisory
Contract (Continued)
iSHARES®, INC.
focused on the methodology and proposed presentation during its meetings. The Board discussed the sources of direct and ancillary revenue with management, including the revenues to BTC from securities lending by the Funds. The Board also discussed BFA’s profit margin as reflected in the Funds’ profitability analyses and reviewed information regarding potential economies of scale (as discussed below). Based on this review, the Board concluded that the profits realized by BFA and its affiliates under the Advisory Contract and from other relationships between the Funds and BFA and/or its affiliates, if any, were within a reasonable range in light of the factors considered.
Economies of Scale — The Board reviewed information regarding potential economies of scale or other efficiencies that may result from increases in the Funds’ assets, noting that the issue of economies of scale had been focused on extensively by the 15(c) Committee during its meetings and addressed by management. The Board and the 15(c) Committee reviewed information provided by BFA regarding scale benefits shared with the iShares funds through relatively low fee rates established at inception, breakpoints, waivers, or other fee reductions, as well as through additional investment in the iShares business and the provision of improved or additional infrastructure and services to the iShares funds and their shareholders. The Board and the 15(c) Committee received information regarding BlackRock’s historical profitability, including BFA’s and its affiliates’ costs in providing services. The cost information distinguished between fixed and variable costs, and explained how the level of fixed and variable costs, as well as the nature of such costs, may impact the existence or size of scale benefits. The Board noted that the Advisory Contract for the Funds already provided for breakpoints in the Funds’ investment advisory fee rates as the assets of the Funds, on an aggregated basis with the assets of certain other iShares funds, increase. The Board noted that it would continue to monitor the sharing of economies of scale to determine the appropriateness of adding new or revised breakpoints in the future.
Based on this review, as well as the other factors considered at the meeting, the Board, recognizing its responsibility to consider this issue periodically, determined to approve the continuance of the Advisory Contract for the coming year.
Fees and Services Provided for Other Comparable Funds/Accounts Managed by BFA and its Affiliates — The Board received and considered information regarding the investment advisory/management fee rates for other funds/accounts in the U.S. for which BFA (or its affiliates) provides investment advisory/management services, including open-end and closed-end funds registered under the 1940 Act (including sub-advised funds), collective trust funds, separately managed accounts, and institutional separate accounts (together, the “Other Accounts”), and acknowledged BFA’s assertion that the iShares funds are fundamentally different investment vehicles from the Other Accounts. The Board noted that BFA and its affiliates do not manage Other Accounts with substantially the same investment objectives and strategies as the Funds or that track the same index or a similar index as the Funds. The Board further noted that BFA provided the Board with detailed information regarding how the Other Accounts (particularly institutional clients) generally differ from the Funds, including in terms of the different, generally more extensive services provided to the Funds, as well as other significant differences in the approach of BFA and its affiliates to the Funds, on one hand, and Other Accounts, on the other. In that regard, the Board considered that the pricing of services to institutional clients is typically based on a number of factors beyond the nature and extent of the specific services to be provided and often depends on the overall relationship between the client and its affiliates and the adviser and its affiliates. In addition, the Board considered the relative complexity and inherent risks and challenges of managing and providing other services to the Funds, as publicly traded exchange traded funds, as compared to the Other Accounts that are institutional clients in light of differing regulatory requirements and client-imposed mandates. The Board also considered the “all-inclusive” nature of the Funds’ advisory fee structure, and the Fund expenses borne by BFA under this arrangement. The Board noted that the investment advisory fee rates under the Advisory Contract for the Funds were generally higher than the investment advisory/management fee rates for the Other Accounts that are institutional clients of BFA (or its affiliates) and concluded that the differences appeared to be consistent with the factors discussed.
Other Benefits to BFA and/or its Affiliates — The Board reviewed the “fallout” benefits or ancillary revenue received by BFA and/or its affiliates in connection with the services provided to the Funds by BFA, such as payment of revenue to BTC, the Funds’
BOARD REVIEWAND APPROVALOF INVESTMENT ADVISORY CONTRACT | 63 |
Table of Contents
Board Review and Approval of Investment Advisory
Contract (Continued)
iSHARES®, INC.
securities lending agent, for loaning portfolio securities (which was included in the profit margins reviewed by the Board pursuant to BFA’s profitability methodology), and payment of advisory fees and/or administration fees to BFA and BTC (or their affiliates) in connection with any investments by the Funds in other funds for which BFA (or its affiliates) provides investment advisory services and/or administration services. The Board noted that BFA generally does not use soft dollars or consider the value of research or other services that may be provided to BFA (including its affiliates) in selecting brokers for portfolio transactions for the Funds. The Board further noted that any portfolio transactions on behalf of the Funds placed through a BFA affiliate or purchased from an underwriting syndicate in which a BFA affiliate participates, are reported to the Board pursuant to Rule 17e-1 or Rule 10f-3, as applicable, under the 1940 Act. The Board concluded that any such ancillary benefits would not be disadvantageous to the Funds’ shareholders and thus would not alter the Board’s conclusion with respect to the appropriateness of approving the continuance of the Advisory Contract for the coming year.
Based on the considerations described above, the Board determined that each Fund’s investment advisory fee rate under the Advisory Contract does not constitute a fee that is so disproportionately large as to bear no reasonable relationship to the services rendered and that could not have been the product of arm’s-length bargaining, and concluded that it is in the best interest of each Fund and its shareholders to approve the continuance of the Advisory Contract for the coming year.
| 64 | 2015 iSHARES ANNUAL REPORTTO SHAREHOLDERS |
Table of Contents
Supplemental Information (Unaudited)
iSHARES®, INC.
Section 19(a) Notices
The amounts and sources of distributions reported are estimates and are provided pursuant to regulatory requirements and are not being provided for tax reporting purposes. The actual amounts and sources for tax reporting purposes will depend upon each Fund’s investment experience during the year and may be subject to changes based on the tax regulations. Shareholders will receive a Form 1099-DIV each calendar year that will inform them how to report these distributions for federal income tax purposes.
| Total Cumulative Distributions for the Fiscal Year | % Breakdown of the Total Cumulative Distributions for the Fiscal Year | |||||||||||||||||||||||||||||||
| iShares ETF | Net Investment Income | Net Realized Capital Gains | Return of Capital | Total Per Share | Net Investment Income | Net Realized Capital Gains | Return of Capital | Total Per Share | ||||||||||||||||||||||||
MSCI Eurozone | $ | 0.949270 | �� | $ | — | $ | — | $ | 0.949270 | 100 | % | — | % | — | % | 100 | % | |||||||||||||||
MSCI Spain Capped | 1.617115 | — | — | 1.617115 | 100 | — | — | 100 | ||||||||||||||||||||||||
Premium/Discount Information
The Premium/Discount Information section is intended to present information about the differences between the daily market price on secondary markets for shares of a fund and that fund’s NAV. NAV is the price at which a fund issues and redeems shares. It is calculated in accordance with the standard formula for valuing mutual fund shares. The “Market Price” of a fund generally is determined using the midpoint between the highest bid and the lowest offer on the primary stock exchange on which the shares of such fund are listed for trading, as of the time that the fund’s NAV is calculated. A fund’s Market Price may be at, above or below its NAV. The NAV of a fund will fluctuate with changes in the fair value of its portfolio holdings. The Market Price of a fund will fluctuate in accordance with changes in its NAV, as well as market supply and demand.
Premiums or discounts are the differences (expressed as a percentage) between the NAV and Market Price of a fund on a given day, generally at the time the NAV is calculated. A premium is the amount that a fund is trading above the reported NAV, expressed as a percentage of the NAV. A discount is the amount that a fund is trading below the reported NAV, expressed as a percentage of the NAV.
The following information shows the frequency of distributions of premiums and discounts for each of the Funds. The information shown for each Fund is for five calendar years (or from the inception date of such Fund if less than five years) through the date of the most recent calendar quarter-end. The specific periods covered for each Fund are disclosed in the table for such Fund.
SUPPLEMENTAL INFORMATION | 65 |
Table of Contents
Supplemental Information (Unaudited) (Continued)
iSHARES®, INC.
Each line in the table shows the number of trading days in which the Fund traded within the premium/discount range indicated. The number of trading days in each premium/discount range is also shown as a percentage of the total number of trading days in the period covered by each table. All data presented here represents past performance, which cannot be used to predict future results.
iShares MSCI Eurozone ETF
Period Covered: January 1, 2010 through June 30, 2015
Premium/Discount Range | Number of Days | Percentage of Total Days | ||||||
Greater than 3.0% | 2 | 0.14 | % | |||||
Greater than 2.5% and Less than 3.0% | 3 | 0.22 | ||||||
Greater than 2.0% and Less than 2.5% | 5 | 0.36 | ||||||
Greater than 1.5% and Less than 2.0% | 16 | 1.16 | ||||||
Greater than 1.0% and Less than 1.5% | 44 | 3.18 | ||||||
Greater than 0.5% and Less than 1.0% | 191 | 13.82 | ||||||
Between 0.5% and –0.5% | 947 | 68.53 | ||||||
Less than –0.5% and Greater than –1.0% | 103 | 7.45 | ||||||
Less than –1.0% and Greater than –1.5% | 41 | 2.97 | ||||||
Less than –1.5% and Greater than –2.0% | 18 | 1.30 | ||||||
Less than –2.0% and Greater than –2.5% | 7 | 0.51 | ||||||
Less than –2.5% and Greater than –3.0% | 3 | 0.22 | ||||||
Less than –3.0% | 2 | 0.14 | ||||||
|
|
|
| |||||
| 1,382 | 100.00 | % | ||||||
|
|
|
| |||||
iShares MSCI Germany ETF
Period Covered: January 1, 2010 through June 30, 2015
Premium/Discount Range | Number of Days | Percentage of Total Days | ||||||
Greater than 2.0% and Less than 2.5% | 6 | 0.43 | % | |||||
Greater than 1.5% and Less than 2.0% | 16 | 1.16 | ||||||
Greater than 1.0% and Less than 1.5% | 40 | 2.89 | ||||||
Greater than 0.5% and Less than 1.0% | 164 | 11.87 | ||||||
Between 0.5% and –0.5% | 987 | 71.43 | ||||||
Less than –0.5% and Greater than –1.0% | 105 | 7.60 | ||||||
Less than –1.0% and Greater than –1.5% | 41 | 2.97 | ||||||
Less than –1.5% and Greater than –2.0% | 14 | 1.01 | ||||||
Less than –2.0% and Greater than –2.5% | 4 | 0.29 | ||||||
Less than –2.5% and Greater than –3.0% | 2 | 0.14 | ||||||
Less than –3.0% and Greater than –3.5% | 2 | 0.14 | ||||||
Less than –3.5% | 1 | 0.07 | ||||||
|
|
|
| |||||
| 1,382 | 100.00 | % | ||||||
|
|
|
| |||||
| 66 | 2015 iSHARES ANNUAL REPORTTO SHAREHOLDERS |
Table of Contents
Supplemental Information (Unaudited) (Continued)
iSHARES®, INC.
iShares MSCI Italy Capped ETF
Period Covered: January 1, 2010 through June 30, 2015
Premium/Discount Range | Number of Days | Percentage of Total Days | ||||||
Greater than 4.0% | 1 | 0.07 | % | |||||
Greater than 3.5% and Less than 4.0% | 1 | 0.07 | ||||||
Greater than 3.0% and Less than 3.5% | 3 | 0.22 | ||||||
Greater than 2.5% and Less than 3.0% | 4 | 0.29 | ||||||
Greater than 2.0% and Less than 2.5% | 6 | 0.43 | ||||||
Greater than 1.5% and Less than 2.0% | 21 | 1.52 | ||||||
Greater than 1.0% and Less than 1.5% | 72 | 5.21 | ||||||
Greater than 0.5% and Less than 1.0% | 235 | 17.01 | ||||||
Between 0.5% and –0.5% | 825 | 59.70 | ||||||
Less than –0.5% and Greater than –1.0% | 122 | 8.83 | ||||||
Less than –1.0% and Greater than –1.5% | 55 | 3.98 | ||||||
Less than –1.5% and Greater than –2.0% | 19 | 1.37 | ||||||
Less than –2.0% and Greater than –2.5% | 10 | 0.72 | ||||||
Less than –2.5% and Greater than –3.0% | 5 | 0.36 | ||||||
Less than –3.0% | 3 | 0.22 | ||||||
|
|
|
| |||||
| 1,382 | 100.00 | % | ||||||
|
|
|
| |||||
iShares MSCI Spain Capped ETF
Period Covered: January 1, 2010 through June 30, 2015
Premium/Discount Range | Number of Days | Percentage of Total Days | ||||||
Greater than 3.5% | 1 | 0.07 | % | |||||
Greater than 3.0% and Less than 3.5% | 3 | 0.22 | ||||||
Greater than 2.5% and Less than 3.0% | 2 | 0.14 | ||||||
Greater than 2.0% and Less than 2.5% | 10 | 0.72 | ||||||
Greater than 1.5% and Less than 2.0% | 23 | 1.66 | ||||||
Greater than 1.0% and Less than 1.5% | 60 | 4.34 | ||||||
Greater than 0.5% and Less than 1.0% | 206 | 14.92 | ||||||
Between 0.5% and –0.5% | 834 | 60.36 | ||||||
Less than –0.5% and Greater than –1.0% | 136 | 9.84 | ||||||
Less than –1.0% and Greater than –1.5% | 61 | 4.41 | ||||||
Less than –1.5% and Greater than –2.0% | 27 | 1.95 | ||||||
Less than –2.0% and Greater than –2.5% | 10 | 0.72 | ||||||
Less than –2.5% and Greater than –3.0% | 6 | 0.43 | ||||||
Less than –3.0% | 3 | 0.22 | ||||||
|
|
|
| |||||
| 1,382 | 100.00 | % | ||||||
|
|
|
| |||||
SUPPLEMENTAL INFORMATION | 67 |
Table of Contents
Supplemental Information (Unaudited) (Continued)
iSHARES®, INC.
iShares MSCI Switzerland Capped ETF
Period Covered: January 1, 2010 through June 30, 2015
Premium/Discount Range | Number of Days | Percentage of Total Days | ||||||
Greater than 3.0% | 1 | 0.07 | % | |||||
Greater than 2.5% and Less than 3.0% | 1 | 0.07 | ||||||
Greater than 2.0% and Less than 2.5% | 2 | 0.14 | ||||||
Greater than 1.5% and Less than 2.0% | 11 | 0.80 | ||||||
Greater than 1.0% and Less than 1.5% | 29 | 2.10 | ||||||
Greater than 0.5% and Less than 1.0% | 152 | 11.00 | ||||||
Between 0.5% and –0.5% | 1,050 | 75.99 | ||||||
Less than –0.5% and Greater than –1.0% | 90 | 6.51 | ||||||
Less than –1.0% and Greater than –1.5% | 31 | 2.24 | ||||||
Less than –1.5% and Greater than –2.0% | 10 | 0.72 | ||||||
Less than –2.0% and Greater than –2.5% | 3 | 0.22 | ||||||
Less than –2.5% and Greater than –3.0% | 2 | 0.14 | ||||||
|
|
|
| |||||
| 1,382 | 100.00 | % | ||||||
|
|
|
| |||||
Regulation under the Alternative Investment Fund Managers Directive (“AIFMD” or, the “Directive”)
The Directive imposes detailed and prescriptive obligations on fund managers established in the European Union (the “EU”). These do not currently apply to managers established outside the EU, such as BFA. Rather, non-EU managers are only required to comply with certain disclosure, reporting and transparency obligations of the Directive if such managers market a fund to EU investors.
BFA has registered the iShares MSCI Germany ETF (the “Fund”) to be marketed to EU investors in the United Kingdom, the Netherlands, Finland, Sweden and Luxembourg.
Report on Remuneration
BFA is required under the Directive to make quantitative disclosures of remuneration. These disclosures are made in line with BlackRock’s interpretation of currently available regulatory guidance on quantitative remuneration disclosures. As market or regulatory practice develops, BlackRock may consider it appropriate to make changes to the way in which quantitative remuneration disclosures are calculated. Where such changes are made, this may result in disclosures in relation to a fund not being comparable to the disclosures made in the prior year, or in relation to other BlackRock fund disclosures in that same year.
Disclosures are provided in relation to both (a) the staff of BFA; (b) staff who are senior management; and (c) staff who have the ability to materially affect the risk profile of the Fund.
All individuals included in the aggregated figures disclosed are rewarded in line with BlackRock’s remuneration policy for their responsibilities across the relevant BlackRock business area. As all individuals have a number of areas of responsibilities, only the portion of remuneration for those individuals’ services attributable to the Fund is included in the aggregate figures disclosed.
BlackRock has a clear and well defined pay-for-performance philosophy, and compensation programs which support that philosophy. For senior management, a significant percentage of variable remuneration is deferred over time. All employees are subject to a claw-back policy.
| 68 | 2015 iSHARES ANNUAL REPORTTO SHAREHOLDERS |
Table of Contents
Supplemental Information (Unaudited) (Continued)
iSHARES®, INC.
Compensation decisions for employees are made based on BlackRock’s full-year financial results and other non-financial goals and objectives. Alongside financial performance, individual compensation is also based on strategic and operating results and other considerations such as management and leadership capabilities. No set formulas are established and no fixed benchmarks are used in determining annual incentive awards.
Bonus pools are reviewed by BlackRock’s independent compensation committee, taking into account both actual and projected financial information together with information provided by the Operational Risk and Regulatory Compliance departments in relation to any activities, incidents or events that warrant consideration in making compensation decisions.
Functions such as Finance, Operational Risk, Legal & Compliance, and Human Resources each have their own organizational structures which are independent of the business units. Functional bonus pools are determined with reference to the performance of each individual function and the remuneration of the senior members of control functions is directly overseen by BlackRock’s independent compensation committee. No individual is involved in setting his or her own remuneration.
Members of staff and senior management of BFA typically provide both AIFMD and non-AIFMD related services in respect of multiple funds, clients and functions of BFA and across the broader BlackRock group. Therefore, the figures disclosed are a sum of each individual’s portion of remuneration attributable to the Fund according to an objective apportionment methodology which acknowledges the multiple-service nature of BFA. Accordingly, the figures are not representative of any individual’s actual remuneration or their remuneration structure.
The amount of the total remuneration awarded by BFA to its staff which has been attributed to the iShares MSCI Germany ETF in respect of BFA’s financial year ending December 31, 2014 was USD 775.6 thousand. This figure is comprised of fixed remuneration of USD 313.4 thousand and variable remuneration of USD 462.2 thousand. There were a total of 499 beneficiaries of the remuneration described above.
The amount of the aggregate remuneration awarded by BFA, which has been attributed to the iShares MSCI Germany ETF in respect of BFA’s financial year ending December 31, 2014, to its senior management was USD 107.4 thousand, and to members of its staff whose actions have a material impact on the risk profile of the Fund was USD 19.9 thousand.
SUPPLEMENTAL INFORMATION | 69 |
Table of Contents
Director and Officer Information
iSHARES® , INC.
The Board of Directors has responsibility for the overall management and operations of the Company, including general supervision of the duties performed by BFA and other service providers. Each Director serves until he or she resigns, is removed, dies, retires or becomes incapacitated. Each officer shall hold office until his or her successor is elected and qualifies or until his or her death, or his or her resignation or removal. Directors who are not “interested persons” (as defined in the 1940 Act) of the Company are referred to as independent directors (“Independent Directors”).
The registered investment companies advised by BFA or its affiliates are organized into one complex of closed-end funds, two complexes of open-end funds and one complex of exchange-traded funds (“Exchange-Traded Fund Complex”) (each, a “BlackRock Fund Complex”). Each Fund is included in the BlackRock Fund Complex referred to as the Exchange-Traded Fund Complex. Each Director also serves as a Trustee of iShares Trust and a Trustee of iShares U.S. ETF Trust and, as a result, oversees a total of 319 funds (as of August 31, 2015) within the Exchange-Traded Fund Complex. With the exception of Robert S. Kapito and Mark Wiedman, the address of each Director and officer is c/o BlackRock, Inc., 400 Howard Street, San Francisco, CA 94105. The address of Mr. Kapito and Mr. Wiedman is c/o BlackRock, Inc., Park Avenue Plaza, 55 East 52nd Street, New York, NY 10055. The Board has designated Robert H. Silver as its Independent Chairman. Additional information about the Funds’ Directors and officers may be found in the Funds’ combined Statement of Additional Information, which is available without charge, upon request, by calling toll-free 1-800-iShares (1-800-474-2737).
Interested Directors
| Name (Age) | Position(s) | Principal Occupation(s) During the Past 5 Years | Other Directorships Held by Director | |||
Robert S. Kapitoa (58) | Director (since 2009). | President and Director, BlackRock, Inc. (since 2006); Vice Chairman of BlackRock, Inc. and Head of BlackRock, Inc.’s Portfolio Management Group (since its formation in 1998) and BlackRock, Inc.’s predecessor entities (since 1988); Trustee, University of Pennsylvania (since 2009); President of Board of Directors, Hope & Heroes Children’s Cancer Fund (since 2002); President of the Board of Directors, Periwinkle Theatre for Youth (since 1983). | Trustee of iShares Trust (since 2009); Trustee of iShares U.S. ETF Trust (since 2011); Director of BlackRock, Inc. (since 2006). | |||
Mark Wiedmanb (44) | Director (since 2013). | Managing Director, BlackRock, Inc. (since 2007); Global Head of iShares (since 2011); Head of Corporate Strategy, BlackRock, Inc. (2009-2011). | Trustee of iShares Trust (since 2013); Trustee of iShares U.S. ETF Trust (since 2013); Director of PennyMac Financial Services, Inc. (since 2008). | |||
| a | Robert S. Kapito is deemed to be an “interested person” (as defined in the 1940 Act) of the Company due to his affiliations with BlackRock, Inc. |
| b | Mark Wiedman is deemed to be an “interested person” (as defined in the 1940 Act) of the Company due to his affiliations with BlackRock, Inc. and its affiliates. |
| 70 | 2015 iSHARES ANNUAL REPORTTO SHAREHOLDERS |
Table of Contents
Director and Officer Information (Continued)
iSHARES®, INC.
Independent Directors
| Name (Age) | Position(s) | Principal Occupation(s) During the Past 5 Years | Other Directorships Held by Director | |||
Robert H. Silver (60) | Director (since 2007); Independent Chairman (since 2012). | President and Co-Founder of The Bravitas Group, Inc. (since 2006); Director and Vice Chairman of the YMCA of Greater NYC (2001-2011); Broadway Producer (2006-2011); Co-Founder and Vice President of Parentgiving Inc. (since 2008); Director and Member of the Audit and Compensation Committee of EPAM Systems, Inc. (2006-2009); President and Chief Operating Officer of UBS Financial Services Inc. (formerly Paine Webber Inc.) (2003-2005) and various executive positions with UBS and its affiliates (1988-2005); CPA and Audit Manager of KPMG, LLP (formerly Peat Marwick Mitchell) (1977-1983). | Trustee of iShares Trust (since 2007); Trustee of iShares U.S. ETF Trust (since 2011); Independent Chairman of iShares Trust and iShares U.S. ETF Trust (since 2012). | |||
Jane D. Carlin (59) | Director (since 2015). | Managing Director and Global Head of Financial Holding Company Governance & Assurance and the Global Head of Operational Risk Management of Morgan Stanley (2006-2012). | Trustee of iShares Trust (since 2015); Trustee of iShares U.S. ETF Trust (since 2015); Director of PHH Corporation (mortgage solutions) (since 2012). | |||
Cecilia H. Herbert (66) | Director (since 2005); Nominating and Governance Committee Chair and Equity Plus Committee Chair (since 2012). | Director (1998-2013) and President (2007-2011) of the Board of Directors, Catholic Charities CYO; Trustee (2002-2011) and Chair of the Finance and Investment Committee (2006-2010) of the Thacher School; Member (since 1992) and Chair (1994-2005) of the Investment Committee, Archdiocese of San Francisco; Trustee and Member of the Investment Committee, WNET, the New York public broadcasting/media company (since 2011). | Trustee of iShares Trust (since 2005); Trustee of iShares U.S. ETF Trust (since 2011); Director of Forward Funds (34 portfolios) (since 2009). | |||
Charles A. Hurty (71) | Director (since 2005); Audit Committee Chair (since 2006). | Retired; Partner, KPMG LLP (1968-2001). | Trustee of iShares Trust (since 2005); Trustee of iShares U.S. ETF Trust (since 2011); Director of GMAM Absolute Return Strategy Fund (1 portfolio) (since 2002); Director of SkyBridge Alternative Investments Multi-Adviser Hedge Fund Portfolios LLC (2 portfolios) (since 2002). | |||
DIRECTORAND OFFICER INFORMATION | 71 |
Table of Contents
Director and Officer Information (Continued)
iSHARES®, INC.
Independent Directors (Continued)
| Name (Age) | Position(s) | Principal Occupation(s) During the Past 5 Years | Other Directorships Held by Director | |||
John E. Kerrigan (60) | Director (since 2005); Fixed Income Plus Committee Chair (since 2012). | Chief Investment Officer, Santa Clara University (since 2002). | Trustee of iShares Trust (since 2005); Trustee of iShares U.S. ETF Trust (since 2011). | |||
John E. Martinez (54) | Director (since 2003); Securities Lending Committee Chair (since 2012). | Director of FirstREX Agreement Corp. (formerly EquityRock, Inc.) (since 2005). | Trustee of iShares Trust (since 2003); Trustee of iShares U.S. ETF Trust (since 2011). | |||
Madhav V. Rajan (51) | Director (since 2011); 15(c) Committee Chair (since 2012). | Robert K. Jaedicke Professor of Accounting and Senior Associate Dean for Academic Affairs and Head of MBA Program, Stanford University Graduate School of Business (since 2001); Professor of Law (by courtesy), Stanford Law School (since 2005); Visiting Professor, University of Chicago (2007-2008). | Trustee of iShares Trust (since 2011); Trustee of iShares U.S. ETF Trust (since 2011); Director, Cavium, Inc. (since 2013). | |||
| 72 | 2015 iSHARES ANNUAL REPORTTO SHAREHOLDERS |
Table of Contents
Director and Officer Information (Continued)
iSHARES®, INC.
Officers
| Name (Age) | Position(s) | Principal Occupation(s) During the Past 5 Years | ||
Manish Mehta (44) | President (since 2013). | Managing Director, BlackRock, Inc. (since 2009); Chief Operating Officer for iShares (since 2009); Head of Strategy and Corporate Development, BGI (2005-2009); Chief of Staff to the CEO, BGI (2005-2009). | ||
Jack Gee (55) | Treasurer and Chief Financial Officer (since 2008). | Managing Director, BlackRock, Inc. (since 2009); Senior Director of Fund Administration of Intermediary Investor Business, BGI (2009); Director of Fund Administration of Intermediary Investor Business, BGI (2004-2009). | ||
Benjamin Archibald (40) | Secretary (since 2015). | Managing Director, BlackRock, Inc. (since 2014); Secretary of the BlackRock-advised Mutual Funds (since 2012); Director, BlackRock, Inc. (2010-2013). | ||
Charles Park (47) | Chief Compliance Officer (since 2006). | Chief Compliance Officer of BlackRock Advisors, LLC and the BlackRock-advised Funds in the Equity-Bond Complex, the Equity-Liquidity Complex and the Closed-End Complex (since 2014); Chief Compliance Officer, BFA (since 2006). | ||
Scott Radell (46) | Executive Vice President (since 2012). | Managing Director, BlackRock, Inc. (since 2009); Head of Portfolio Solutions, BlackRock, Inc. (since 2009); Head of Portfolio Solutions, BGI (2007-2009); Credit Portfolio Manager, BGI (2005-2007); Credit Research Analyst, BGI (2003-2005). | ||
Amy Schioldager (52) | Executive Vice President (since 2007). | Senior Managing Director, BlackRock, Inc. (since 2009); Global Head of Index Equity, BGI (2008-2009); Global Head of U.S. Indexing, BGI (2006-2008); Head of Domestic Equity Portfolio Management, BGI (2001-2006). | ||
DIRECTORAND OFFICER INFORMATION | 73 |
Table of Contents
Notes:
| 74 | 2015 iSHARES ANNUAL REPORTTO SHAREHOLDERS |
Table of Contents
For more information visit www.iShares.com or call 1-800-474-2737
This report is intended for the Funds’ shareholders. It may not be distributed to prospective investors unless it is preceded or accompanied by the current prospectus.
Investing involves risk, including possible loss of principal.
The iShares Funds are distributed by BlackRock Investments, LLC (together with its affiliates, “BlackRock”).
The iShares Funds are not sponsored, endorsed, issued, sold or promoted by MSCI Inc., nor does this company make any representation regarding the advisability of investing in the iShares Funds. BlackRock is not affiliated with the company listed above.
A description of the policies that the Funds use to determine how to vote proxies relating to portfolio securities and information about how the Funds voted proxies relating to portfolio securities during the most recent twelve-month period ending June 30 is available without charge, upon request, by calling toll-free 1-800-474-2737; on the Funds’ website at www.iShares.com; and on the U.S. Securities and Exchange Commission (SEC) website at www.sec.gov.
The Funds file their complete schedules of portfolio holdings with the SEC for the first and third quarters of each fiscal year on Form N-Q. The Funds’ Forms N-Q are available on the SEC’s website or may be reviewed and copied at the SEC’s Public Reference Room in Washington, D.C. Information on the operation of the Public Reference Room may be obtained by calling 1-800-SEC-0330. The Funds also disclose their complete schedules of portfolio holdings on a daily basis on the Funds’ website.
©2015 BlackRock, Inc. All rights reserved. iSHARES and BLACKROCK are registered trademarks of BlackRock, Inc. or its subsidiaries. All other marks are the property of their respective owners.
iS-AR-87-0815
 |  |
Table of Contents
AUGUST 31, 2015
2015 ANNUAL REPORT |  |
iShares, Inc.
| Ø | iShares Core MSCI Emerging Markets ETF | IEMG | NYSE Arca |
| Ø | iShares MSCI BRIC ETF | BKF | NYSE Arca |
| Ø | iShares MSCI Emerging Markets Asia ETF | EEMA | NASDAQ |
| Ø | iShares MSCI Emerging Markets Minimum Volatility ETF | EEMV | NYSE Arca |
| Ø | iShares MSCI Emerging Markets Small-Cap ETF | EEMS | NYSE Arca |
Table of Contents
| 5 | ||||
| 16 | ||||
| 16 | ||||
| 17 | ||||
| 17 | ||||
| 45 | ||||
| 50 | ||||
| 58 | ||||
| 63 | ||||
| 75 | ||||
| 82 | ||||
| 87 | ||||
| 102 | ||||
| 103 | ||||
| 104 | ||||
| 114 | ||||
| 120 |
Table of Contents
Management’s Discussion of Fund Performance
iSHARES®, INC.
GLOBAL MARKET OVERVIEW
Global equity markets delivered a negative return for the 12 months ended August 31, 2015 (the “reporting period”). The MSCI ACWI, a broad global equity index that includes both developed and emerging markets, returned -6.29% for the reporting period.
The reporting period was characterized by a continued divergence in economic growth and central bank policy between the U.S. and the rest of the world. Despite a slowdown in early 2015, the U.S. economy remained one of the strongest economies among developed countries, which motivated the U.S. Federal Reserve Bank (the “Fed”) to scale back its economic stimulus measures. The Fed ended a two-year quantitative easing program in October 2014 and signaled its intent to raise its short-term interest rate target sometime in 2015. In contrast, weaker economic growth in most other regions of the globe led many of the world’s central banks to take more aggressive actions to stimulate economic activity.
This divergence contributed to a notably stronger U.S. dollar. For the reporting period, the euro, Japanese yen, British pound and Australian dollar declined by 15%, 14%, 7%, and 24% against the U.S. dollar, respectively. Weaker foreign currencies decrease the value of foreign investments measured in U.S. dollars, thereby decreasing returns for U.S. investors, while increasing foreign currencies relative to the U.S. dollar have the opposite effect. Currency performance had a meaningful impact on non-U.S. equity returns for U.S. investors. For example, the MSCI ACWI returned 0.59% in local currency terms for the reporting period.
A number of other factors influenced global markets during the reporting period. Energy prices fell sharply amid growing supply —primarily from increased production in the U.S. — and declining global demand. Lower energy prices contributed to historically low and declining inflation rates in most of the world. Consumer prices were nearly unchanged in the U.S., the European Union, and Japan, while prices in China and India rose at a relatively slow rate. Low inflation and tepid demand kept the Fed’s zero interest rate policy intact, while central banks throughout the world took aggressive measures to stimulate demand.
Global markets advanced for most of the reporting period, then declined sharply in the last few months of the reporting period. The volatility began in China, as slowing economic growth led to a steep drop in China’s equity markets. Plummeting commodity prices amid already subdued inflation also raised concerns about global demand. Currency devaluations in Asia, including China, Vietnam, Pakistan, and Kazakhstan, led to speculation that Asian countries were weakening their currencies to compete for demand. These global events led to further uncertainty about the timing of an expected interest rate hike from the Fed.
On a regional basis, U.S. stocks advanced by less than 1% for the reporting period as declining interest rates, ongoing economic growth, and low inflation provided a favorable environment for U.S. equity market performance. After generating its fastest quarterly growth rate in 11 years in the third quarter of 2014, the U.S. economy slowed over the next two quarters. Economic activity improved over the last several months of the reporting period, boosted by an increase in consumer spending.
European stocks declined by about 8% in U.S. dollar terms for the reporting period, though they advanced more than 3% when measured in local currencies. The European Central Bank initiated quantitative easing measures in early 2015, and signs of economic improvement emerged in the latter half of the reporting period. A tentative agreement on Greece’s debt repayment helped alleviate ongoing concerns about Europe’s sovereign debt levels.
Stock markets in the Asia/Pacific region (excluding Japan) declined by approximately 19% in U.S. dollar terms, which equated to an 8% decline when measured in local currencies. China’s economic slowdown weighed heavily on the region, as China is the largest trading partner of many countries in the region. On the bright side, Japanese stocks performed relatively well, as ongoing economic stimulus and reform measures led to a 4% gain in U.S. dollar terms (22% when measured in Japanese yen).
Emerging markets stocks fell by approximately 23% in U.S. dollar terms for the reporting period, though the decline was about 10% when measured in local currencies. Many of the largest emerging economies — including China, Russia, and Brazil —experienced slowing economic growth during the reporting period. Latin American stocks posted some of the biggest declines, as the region struggled with slow growth and declining commodity prices.
MANAGEMENT’S DISCUSSIONSOF FUND PERFORMANCE | 5 |
Table of Contents
Management’s Discussion of Fund Performance
iSHARES® CORE MSCI EMERGING MARKETS ETF
Performance as of August 31, 2015
| Average Annual Total Returns | Cumulative Total Returns | |||||||||||||||||||||||||
| NAV | MARKET | INDEX | NAV | MARKET | INDEX | |||||||||||||||||||||
1 Year | (22.61)% | (22.71)% | (22.43)% | (22.61)% | (22.71)% | (22.43)% | ||||||||||||||||||||
Since Inception | (4.52)% | (4.54)% | (4.45)% | (12.43)% | (12.48)% | (12.25)% | ||||||||||||||||||||
GROWTH OF $10,000 INVESTMENT
(SINCE INCEPTION AT NET ASSET VALUE)
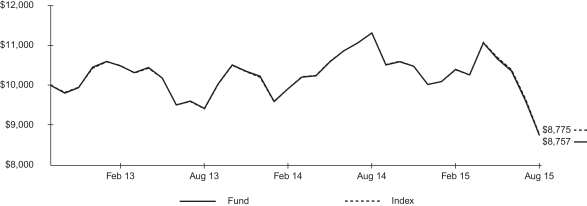
The inception date of the Fund was 10/18/12. The first day of secondary market trading was 10/22/12.
Past performance is no guarantee of future results. Performance results do not reflect the deduction of taxes that a shareholder would pay on fund distributions or on the redemption or sale of fund shares. See “About Fund Performance” on page 16 for more information.
| Shareholder Expenses | ||||||||||||||||||||||||||
| Actual | Hypothetical 5% Return | |||||||||||||||||||||||||
| Beginning Account Value (3/1/15) | Ending Account Value (8/31/15) | Expenses Paid During Period a | Beginning Account Value (3/1/15) | Ending Account Value (8/31/15) | Expenses Paid During Period a | Annualized Expense Ratio | ||||||||||||||||||||
| $ | 1,000.00 | $ | 842.20 | $ | 0.84 | $ | 1,000.00 | $ | 1,024.30 | $ | 0.92 | 0.18% | ||||||||||||||
| a | Expenses are calculated using the Fund’s annualized expense ratio (as disclosed in the table), multiplied by the average account value for the period, multiplied by the number of days in the period (184 days) and divided by the number of days in the year (365 days). See “Shareholder Expenses” on page 16 for more information. |
| 6 | 2015 iSHARES ANNUAL REPORTTO SHAREHOLDERS |
Table of Contents
Management’s Discussion of Fund Performance (Continued)
iSHARES® CORE MSCI EMERGING MARKETS ETF
The iShares Core MSCI Emerging Markets ETF (the “Fund”) seeks to track the investment results of an index composed of large-, mid- and small-capitalization emerging market equities, as represented by the MSCI Emerging Markets Investable Market Index (the “Index”). The Fund invests in a representative sample of securities included in the Index that collectively has an investment profile similar to the Index. Due to the use of representative sampling, the Fund may or may not hold all of the securities that are included in the Index. For the 12-month reporting period ended August 31, 2015, the total return for the Fund was -22.61%, net of fees, while the total return for the Index was -22.43%.
As represented by the Index, emerging markets stocks declined sharply for the reporting period. One factor behind this decline was the depreciation of many emerging markets currencies relative to the U.S. dollar. For the reporting period, the Taiwanese dollar depreciated by 8%, the South Korean won depreciated by 14%, and the Brazilian real depreciated by 38% against the U.S. dollar. These three countries comprised approximately 35% of the Index on average during the reporting period. The currency fluctuations had a meaningful impact on the Index’s performance; when measured in local currencies, the Index returned -9.34% for the reporting period.
The Index experienced substantial volatility during the reporting period as geopolitical conflicts, global economic weakness, and declining demand for commodities (a primary driver of growth in many emerging economies) buffeted emerging markets. Events in China late in the reporting period — including signs of economic weakness, a precipitous drop in the country’s stock market, and an unexpected devaluation of the Chinese yuan — put additional downward pressure on emerging markets stocks.
In U.S. dollar terms, Brazil had the most significant negative impact on the Index’s performance for the reporting period. Brazil’s economy remained in recession throughout the reporting period, domestic inflation accelerated, and several government officials faced corruption allegations. South Korea also detracted meaningfully from the Index’s performance as declining exports and an outbreak of Middle East Respiratory Syndrome led to weaker economic output.
The only country that contributed to the Index’s return was Hungary, which benefited from economic and tax reforms that led to an improving domestic economy.
ALLOCATION BY SECTOR
As of 8/31/15
| Sector | Percentage of Total Investments* | |||
Financials | 27.42 | % | ||
Information Technology | 17.12 | |||
Consumer Discretionary | 10.41 | |||
Consumer Staples | 8.76 | |||
Industrials | 8.34 | |||
Materials | 7.33 | |||
Energy | 7.12 | |||
Telecommunication Services | 6.58 | |||
Health Care | 3.61 | |||
Utilities | 3.31 | |||
|
| |||
TOTAL | 100.00 | % | ||
|
| |||
TEN LARGEST COUNTRIES
As of 8/31/15
| Country | Percentage of Total Investments* | |||
China | 22.99 | % | ||
South Korea | 15.54 | |||
Taiwan | 13.03 | |||
India | 8.92 | |||
South Africa | 7.88 | |||
Brazil | 6.15 | |||
Mexico | 4.57 | |||
Russia | 3.42 | |||
Malaysia | 3.18 | |||
Thailand | 2.52 | |||
|
| |||
TOTAL | 88.20 | % | ||
|
| |||
| * | Excludes money market funds. |
MANAGEMENT’S DISCUSSIONSOF FUND PERFORMANCE | 7 |
Table of Contents
Management’s Discussion of Fund Performance
iSHARES® MSCI BRIC ETF
Performance as of August 31, 2015
| Average Annual Total Returns | Cumulative Total Returns | |||||||||||||||||||||||||
| NAV | MARKET | INDEX | NAV | MARKET | INDEX | |||||||||||||||||||||
1 Year | (23.19)% | (23.61)% | (23.05)% | (23.19)% | (23.61)% | (23.05)% | ||||||||||||||||||||
5 Years | (4.25)% | (4.43)% | (3.49)% | (19.50)% | (20.27)% | (16.28)% | ||||||||||||||||||||
Since Inception | (5.64)% | (5.71)% | (5.25)% | (36.44)% | (36.77)% | (34.33)% | ||||||||||||||||||||
GROWTH OF $10,000 INVESTMENT
(SINCE INCEPTION AT NET ASSET VALUE)
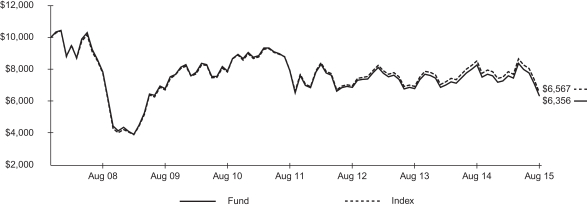
The inception date of the Fund was 11/12/07. The first day of secondary market trading was 11/16/07.
Past performance is no guarantee of future results. Performance results do not reflect the deduction of taxes that a shareholder would pay on fund distributions or on the redemption or sale of fund shares. See “About Fund Performance” on page 16 for more information.
| Shareholder Expenses | ||||||||||||||||||||||||||
| Actual | Hypothetical 5% Return | |||||||||||||||||||||||||
| Beginning Account Value (3/1/15) | Ending Account Value (8/31/15) | Expenses Paid During Period a | Beginning Account Value (3/1/15) | Ending Account Value (8/31/15) | Expenses Paid During Period a | Annualized Expense Ratio | ||||||||||||||||||||
| $ | 1,000.00 | $ | 836.10 | $ | 3.24 | $ | 1,000.00 | $ | 1,021.70 | $ | 3.57 | 0.70% | ||||||||||||||
| a | Expenses are calculated using the Fund’s annualized expense ratio (as disclosed in the table), multiplied by the average account value for the period, multiplied by the number of days in the period (184 days) and divided by the number of days in the year (365 days). See “Shareholder Expenses” on page 16 for more information. |
| 8 | 2015 iSHARES ANNUAL REPORTTO SHAREHOLDERS |
Table of Contents
Management’s Discussion of Fund Performance (Continued)
iSHARES® MSCI BRIC ETF
The iShares MSCI BRIC ETF (the “Fund”) seeks to track the investment results of an index composed of Chinese equities that are available to international investors, and Brazilian, Russian, and Indian equities, as represented by the MSCI BRIC Index (the “Index”). The Fund invests in a representative sample of securities included in the Index that collectively has an investment profile similar to the Index. Due to the use of representative sampling, the Fund may or may not hold all of the securities that are included in the Index. For the 12-month reporting period ended August 31, 2015, the total return for the Fund was -23.19%, net of fees, while the total return for the Index was -23.05%.
As represented by the Index, emerging markets stocks in Brazil, Russia, India, and China declined sharply for the reporting period.
One factor behind the Index’s decline was the depreciation of the currencies represented in the Index relative to the U.S. dollar. For the reporting period, the Russian ruble depreciated by 43%, the Brazilian real depreciated by 38%, the Indian rupee depreciated by 9%, and the Chinese yuan depreciated by 3% against the U.S. dollar. The currency fluctuations had a meaningful impact on the Index’s performance; when measured in local currencies, the Index returned -9.87% for the reporting period.
In U.S. dollar terms, all four countries represented in the Index detracted from the Index’s performance during the reporting period, with Brazil having the most significant negative impact. While Brazil’s economy remained in recession throughout the reporting period, its central bank was forced to raise interest rates to combat accelerating domestic inflation. In addition, several Brazilian government officials faced allegations of corruption.
China was the largest country weight in the Index on average for the reporting period. Increasing signs of weakness in the Chinese economy led to a precipitous drop in the country’s stock market late in the reporting period, as well as an unexpected devaluation of the Chinese yuan.
Russia and India detracted modestly from the Index’s performance. Russia’s economy faced a recession because of declining global demand for energy and economic sanctions related to the country’s actions in Ukraine. India’s equity market held up best as the Indian economy performed better than the other three countries represented in the Index.
ALLOCATION BY SECTOR
As of 8/31/15
| Sector | Percentage of Total Investments* | |||
Financials | 31.69 | % | ||
Energy | 13.83 | |||
Information Technology | 12.61 | |||
Consumer Staples | 9.11 | |||
Telecommunication Services | 8.14 | |||
Industrials | 6.83 | |||
Materials | 5.07 | |||
Consumer Discretionary | 4.80 | |||
Health Care | 4.28 | |||
Utilities | 3.64 | |||
|
| |||
TOTAL | 100.00 | % | ||
|
| |||
ALLOCATION BY COUNTRY
As of 8/31/15
| Country | Percentage of Total Investments* | |||
China | 54.88 | % | ||
India | 20.17 | |||
Brazil | 15.83 | |||
Russia | 9.12 | |||
|
| |||
TOTAL | 100.00 | % | ||
|
| |||
| * | Excludes money market funds. |
MANAGEMENT’S DISCUSSIONSOF FUND PERFORMANCE | 9 |
Table of Contents
Management’s Discussion of Fund Performance
iSHARES® MSCI EMERGING MARKETS ASIA ETF
Performance as of August 31, 2015
| Average Annual Total Returns | Cumulative Total Returns | |||||||||||||||||||||||||
| NAV | MARKET | INDEX | NAV | MARKET | INDEX | |||||||||||||||||||||
1 Year | (16.86)% | (18.00)% | (16.82)% | (16.86)% | (18.00)% | (16.82)% | ||||||||||||||||||||
Since Inception | (0.30)% | (0.63)% | (0.03)% | (1.07)% | (2.22)% | (0.12)% | ||||||||||||||||||||
GROWTH OF $10,000 INVESTMENT
(SINCE INCEPTION AT NET ASSET VALUE)
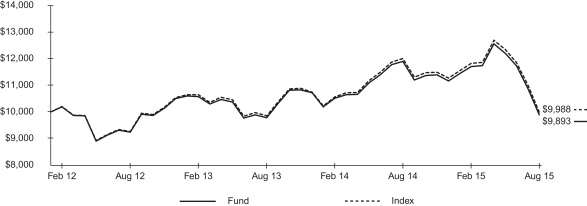
The inception date of the Fund was 2/8/12. The first day of secondary market trading was 2/9/12.
Past performance is no guarantee of future results. Performance results do not reflect the deduction of taxes that a shareholder would pay on fund distributions or on the redemption or sale of fund shares. See “About Fund Performance” on page 16 for more information.
| Shareholder Expenses | ||||||||||||||||||||||||||
| Actual | Hypothetical 5% Return | |||||||||||||||||||||||||
| Beginning Account Value (3/1/15) | Ending Account Value (8/31/15) | Expenses Paid During Period a | Beginning Account Value (3/1/15) | Ending Account Value (8/31/15) | Expenses Paid During Period a | Annualized Expense Ratio | ||||||||||||||||||||
| $ | 1,000.00 | $ | 845.00 | $ | 2.28 | $ | 1,000.00 | $ | 1,022.70 | $ | 2.50 | 0.49% | ||||||||||||||
| a | Expenses are calculated using the Fund’s annualized expense ratio (as disclosed in the table), multiplied by the average account value for the period, multiplied by the number of days in the period (184 days) and divided by the number of days in the year (365 days). See “Shareholder Expenses” on page 16 for more information. |
| 10 | 2015 iSHARES ANNUAL REPORTTO SHAREHOLDERS |
Table of Contents
Management’s Discussion of Fund Performance (Continued)
iSHARES® MSCI EMERGING MARKETS ASIA ETF
The iShares MSCI Emerging Markets Asia ETF (the “Fund”) seeks to track the investment results of an index composed of Asian emerging market equities, as represented by the MSCI Emerging Markets Asia Index (the “Index”). The Fund invests in a representative sample of securities included in the Index that collectively has an investment profile similar to the Index. Due to the use of representative sampling, the Fund may or may not hold all of the securities that are included in the Index. For the 12-month reporting period ended August 31, 2015, the total return for the Fund was -16.86%, net of fees, while the total return for the Index was -16.82%.
As represented by the Index, emerging markets stocks in Asia declined sharply for the reporting period, but they outperformed the MSCI Emerging Markets Index, a broad measure of emerging market equity performance.
One factor behind the Index’s overall decline was the depreciation of many Asian emerging markets currencies relative to the U.S. dollar. For the reporting period, the Taiwanese dollar depreciated by 8%, the Indian rupee depreciated by 9%, and the South Korean won depreciated by 14% against the U.S. dollar. These three countries comprised approximately 51% of the Index on average during the reporting period. The currency fluctuations had a meaningful impact on the Index’s performance; when measured in local currencies, the Index returned -9.26% for the reporting period.
China, the Index’s largest country weighting, had a significant impact on equity market performance across Asia. Signs of weakness in the Chinese economy led to reduced demand for exports from many emerging Asian economies. A precipitous drop in China’s stock market late in the reporting period, along with an unexpected devaluation of the Chinese yuan, put additional downward pressure on Asian emerging markets stocks.
In U.S. dollar terms, every country represented in the Index declined for the reporting period, with South Korea having the most significant negative impact on the Index’s performance. The South Korean economy slowed amid a decline in exports and an outbreak of Middle East Respiratory Syndrome that restrained domestic consumption.
China and Taiwan were also noteworthy detractors from the Index’s performance, while the Philippines and Thailand detracted the least from the Index’s return during the reporting period.
ALLOCATION BY SECTOR
As of 8/31/15
| Sector | Percentage of Total Investments* | |||
Financials | 27.21 | % | ||
Information Technology | 25.06 | |||
Industrials | 8.08 | |||
Consumer Discretionary | 8.08 | |||
Telecommunication Services | 7.36 | |||
Consumer Staples | 6.68 | |||
Energy | 5.50 | |||
Materials | 5.46 | |||
Health Care | 3.35 | |||
Utilities | 3.22 | |||
|
| |||
TOTAL | 100.00 | % | ||
|
| |||
ALLOCATION BY COUNTRY
As of 8/31/15
| Country | Percentage of Total Investments* | |||
China | 34.05 | % | ||
South Korea | 21.54 | |||
Taiwan | 18.28 | |||
India | 12.53 | |||
Malaysia | 4.60 | |||
Indonesia | 3.50 | |||
Thailand | 3.37 | |||
Philippines | 2.13 | |||
|
| |||
TOTAL | 100.00 | % | ||
|
| |||
| * | Excludes money market funds. |
MANAGEMENT’S DISCUSSIONSOF FUND PERFORMANCE | 11 |
Table of Contents
Management’s Discussion of Fund Performance
iSHARES® MSCI EMERGING MARKETS MINIMUM VOLATILITY ETF
Performance as of August 31, 2015
| Average Annual Total Returns | Cumulative Total Returns | |||||||||||||||||||||||||
| NAV | MARKET | INDEX | NAV | MARKET | INDEX | |||||||||||||||||||||
1 Year | (16.32)% | (16.71)% | (16.31)% | (16.32)% | (16.71)% | (16.31)% | ||||||||||||||||||||
Since Inception | 3.38% | 3.30% | 3.56% | 13.71% | 13.39% | 14.48% | ||||||||||||||||||||
GROWTH OF $10,000 INVESTMENT
(SINCE INCEPTION AT NET ASSET VALUE)
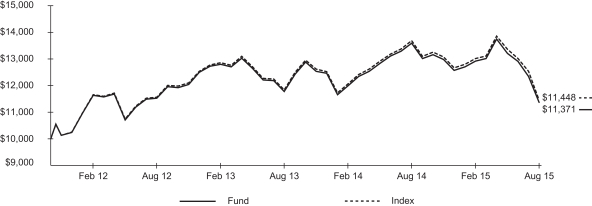
The inception date of the Fund was 10/18/11. The first day of secondary market trading was 10/20/11.
Past performance is no guarantee of future results. Performance results do not reflect the deduction of taxes that a shareholder would pay on fund distributions or on the redemption or sale of fund shares. See “About Fund Performance” on page 16 for more information.
| Shareholder Expenses | ||||||||||||||||||||||||||
| Actual | Hypothetical 5% Return | |||||||||||||||||||||||||
| Beginning Account Value (3/1/15) | Ending Account Value (8/31/15) | Expenses Paid During Period a | Beginning Account Value (3/1/15) | Ending Account Value (8/31/15) | Expenses Paid During Period a | Annualized Expense Ratio | ||||||||||||||||||||
| $ | 1,000.00 | $ | 880.60 | $ | 1.19 | $ | 1,000.00 | $ | 1,023.90 | $ | 1.28 | 0.25% | ||||||||||||||
| a | Expenses are calculated using the Fund’s annualized expense ratio (as disclosed in the table), multiplied by the average account value for the period, multiplied by the number of days in the period (184 days) and divided by the number of days in the year (365 days). See “Shareholder Expenses” on page 16 for more information. |
| 12 | 2015 iSHARES ANNUAL REPORTTO SHAREHOLDERS |
Table of Contents
Management’s Discussion of Fund Performance (Continued)
iSHARES® MSCI EMERGING MARKETS MINIMUM VOLATILITY ETF
The iShares MSCI Emerging Markets Minimum Volatility ETF (the “Fund”) seeks to track the investment results of an index composed of emerging market equities that, in the aggregate, have lower volatility characteristics relative to the broader emerging equity markets, as represented by the MSCI Emerging Markets Minimum Volatility (USD) Index (the “Index”). The Fund invests in a representative sample of securities included in the Index that collectively has an investment profile similar to the Index. Due to the use of representative sampling, the Fund may or may not hold all of the securities that are included in the Index. For the 12-month reporting period ended August 31, 2015, the total return for the Fund was -16.32%, net of fees, while the total return for the Index was -16.31%.
As represented by the Index, lower-volatility stocks in emerging markets declined sharply for the reporting period.
One factor behind the Index’s decline was the depreciation of many emerging markets currencies relative to the U.S. dollar. For the reporting period, the Taiwanese dollar depreciated by 8%, the South Korean won depreciated by 14%, and the Malaysian ringgit depreciated by 25% against the U.S. dollar. These three countries comprised approximately 36% of the Index on average during the reporting period. The currency fluctuations had a meaningful impact on the Index’s performance; when measured in local currencies, the Index returned -4.21% for the reporting period.
Although the Index experienced less volatility than broad emerging markets, it still fluctuated significantly during the reporting period as geopolitical conflicts, global economic weakness, and declining commodities demand buffeted emerging markets. Events in China late in the reporting period — including signs of economic weakness, a precipitous drop in the country’s stock market, and an unexpected Chinese yuan devaluation — put additional downward pressure on emerging markets stocks.
The developments in China weighed on Taiwanese stocks, which had the most significant negative impact on the Index’s performance for the reporting period in U.S. dollar terms. Brazil and Malaysia also detracted meaningfully from the Index’s performance as both countries faced weaker economies and allegations of government corruption.
India contributed to the Index’s return for the reporting period amid optimism about economic reforms implemented by the country’s prime minister. As a major oil importer, India also benefited from a sharp decline in energy prices.
ALLOCATION BY SECTOR
As of 8/31/15
| Sector | Percentage of Total Investments* | |||
Financials | 28.84 | % | ||
Consumer Staples | 13.29 | |||
Telecommunication Services | 12.26 | |||
Information Technology | 11.05 | |||
Utilities | 8.53 | |||
Industrials | 8.25 | |||
Health Care | 7.42 | |||
Consumer Discretionary | 4.75 | |||
Energy | 3.33 | |||
Materials | 2.28 | |||
|
| |||
TOTAL | 100.00 | % | ||
|
| |||
TEN LARGEST COUNTRIES
As of 8/31/15
| Country | Percentage of Total Investments* | |||
China | 18.31 | % | ||
Taiwan | 16.86 | |||
South Korea | 11.85 | |||
Malaysia | 7.93 | |||
Indonesia | 6.64 | |||
South Africa | 5.95 | |||
Philippines | 4.01 | |||
Chile | 3.96 | |||
Thailand | 3.92 | |||
Qatar | 3.67 | |||
|
| |||
TOTAL | 83.10 | % | ||
|
| |||
| * | Excludes money market funds. |
MANAGEMENT’S DISCUSSIONSOF FUND PERFORMANCE | 13 |
Table of Contents
Management’s Discussion of Fund Performance
iSHARES® MSCI EMERGING MARKETS SMALL-CAP ETF
Performance as of August 31, 2015
| Average Annual Total Returns | Cumulative Total Returns | |||||||||||||||||||||||||
| NAV | MARKET | INDEX | NAV | MARKET | INDEX | |||||||||||||||||||||
1 Year | (19.77)% | (20.31)% | (18.91)% | (19.77)% | (20.31)% | (18.91)% | ||||||||||||||||||||
Since Inception | (2.81)% | (2.89)% | (1.96)% | (10.88)% | (11.18)% | (7.69)% | ||||||||||||||||||||
GROWTH OF $10,000 INVESTMENT
(SINCE INCEPTION AT NET ASSET VALUE)
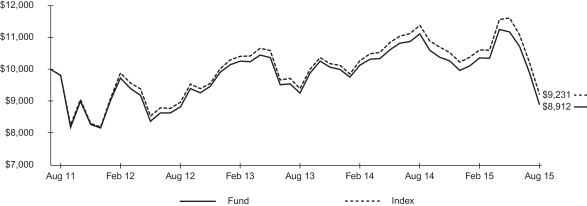
The inception date of the Fund was 8/16/11. The first day of secondary market trading was 8/18/11.
Past performance is no guarantee of future results. Performance results do not reflect the deduction of taxes that a shareholder would pay on fund distributions or on the redemption or sale of fund shares. See “About Fund Performance” on page 16 for more information.
| Shareholder Expenses | ||||||||||||||||||||||||||
| Actual | Hypothetical 5% Return | |||||||||||||||||||||||||
| Beginning Account Value (3/1/15) | Ending Account Value (8/31/15) | Expenses Paid During Period a | Beginning Account Value (3/1/15) | Ending Account Value (8/31/15) | Expenses Paid During Period a | Annualized Expense Ratio | ||||||||||||||||||||
| $ | 1,000.00 | $ | 860.20 | $ | 3.24 | $ | 1,000.00 | $ | 1,021.70 | $ | 3.52 | 0.69% | ||||||||||||||
| a | Expenses are calculated using the Fund’s annualized expense ratio (as disclosed in the table), multiplied by the average account value for the period, multiplied by the number of days in the period (184 days) and divided by the number of days in the year (365 days). See “Shareholder Expenses” on page 16 for more information. |
| 14 | 2015 iSHARES ANNUAL REPORTTO SHAREHOLDERS |
Table of Contents
Management’s Discussion of Fund Performance (Continued)
iSHARES® MSCI EMERGING MARKETS SMALL-CAP ETF
The iShares MSCI Emerging Markets Small-Cap ETF (the “Fund”) seeks to track the investment results of an index composed of small-capitalization emerging market equities, as represented by the MSCI Emerging Markets Small Cap Index (the “Index”). The Fund invests in a representative sample of securities included in the Index that collectively has an investment profile similar to the Index. Due to the use of representative sampling, the Fund may or may not hold all of the securities that are included in the Index. For the 12-month reporting period ended August 31, 2015, the total return for the Fund was -19.77%, net of fees, while the total return for the Index was -18.91%.
As represented by the Index, emerging markets small-capitalization stocks declined sharply for the reporting period.
One factor behind the Index’s decline was the depreciation of many emerging markets currencies relative to the U.S. dollar. For the reporting period, the Taiwanese dollar depreciated by 8%, the Indian rupee depreciated by 9%, and the South Korean won depreciated by 14% against the U.S. dollar. These three countries comprised approximately 45% of the Index on average during the reporting period. The currency fluctuations had a meaningful impact on the Index’s performance; when measured in local currencies, the Index returned -8.00% for the reporting period.
The Index experienced substantial volatility during the reporting period as geopolitical conflicts, global economic weakness, and declining demand for commodities (a primary growth driver in many emerging economies) buffeted emerging markets. Events in China late in the reporting period — including signs of economic weakness, a precipitous drop in the country’s stock market, and an unexpected devaluation of the Chinese yuan — put additional downward pressure on emerging markets stocks.
The developments in China weighed on Taiwanese stocks, which had the most significant negative impact on the Index’s performance in U.S. dollar terms for the reporting period. Brazil also detracted meaningfully from the Index’s performance as the country’s economy remained in recession, domestic inflation accelerated, and several government officials faced corruption allegations.
Among the few contributors to the Index’s return, South Korea generated the largest contribution during the reporting period. South Korean small-cap stocks benefited from stronger domestic demand and government efforts to promote entrepreneurship.
ALLOCATION BY SECTOR
As of 8/31/15
| Sector | Percentage of Total Investments* | |||
Financials | 18.61 | % | ||
Consumer Discretionary | 17.71 | |||
Industrials | 15.67 | |||
Information Technology | 14.97 | |||
Materials | 11.22 | |||
Consumer Staples | 8.42 | |||
Health Care | 7.63 | |||
Utilities | 3.05 | |||
Energy | 1.46 | |||
Telecommunication Services | 1.26 | |||
|
| |||
TOTAL | 100.00 | % | ||
|
| |||
TEN LARGEST COUNTRIES
As of 8/31/15
| Country | Percentage of Total Investments* | |||
China | 21.20 | % | ||
South Korea | 20.68 | |||
Taiwan | 16.48 | |||
India | 11.32 | |||
South Africa | 6.16 | |||
Thailand | 3.88 | |||
Malaysia | 3.52 | |||
Mexico | 3.07 | |||
Brazil | 2.57 | |||
Indonesia | 2.47 | |||
|
| |||
TOTAL | 91.35 | % | ||
|
| |||
| * | Excludes money market funds. |
MANAGEMENT’S DISCUSSIONSOF FUND PERFORMANCE | 15 |
Table of Contents
Past performance is no guarantee of future results. Current performance may be lower or higher than the performance data quoted. Performance data current to the most recent month-end is available at www.ishares.com. Performance results assume reinvestment of all dividends and capital gain distributions and do not reflect the deduction of taxes that a shareholder would pay on fund distributions or on the redemption or sale of fund shares. The investment return and principal value of shares will vary with changes in market conditions. Shares may be worth more or less than their original cost when they are redeemed or sold in the market. Performance for certain funds may reflect a waiver of a portion of investment advisory fees. Without such a waiver, performance would have been lower.
Net asset value or “NAV” is the value of one share of a fund as calculated in accordance with the standard formula for valuing mutual fund shares. The price used to calculate market return (“Market Price”) is determined by using the midpoint between the highest bid and the lowest offer on the primary stock exchange on which shares of a fund are listed for trading, as of the time that such fund’s NAV is calculated. Certain funds may have a NAV which is determined prior to the opening of regular trading on its listed exchange and their market returns are calculated using the midpoint of the bid/ask spread as of the opening of regular trading on the exchange. Market and NAV returns assume that dividends and capital gain distributions have been reinvested at Market Price and NAV, respectively.
An index is a statistical composite that tracks a specified financial market or sector. Unlike a fund, an index does not actually hold a portfolio of securities and therefore does not incur the expenses incurred by a fund. These expenses negatively impact fund performance. Also, market returns do not include brokerage commissions that may be payable on secondary market transactions. If brokerage commissions were included, market returns would be lower.
As a shareholder of a Fund, you incur two types of costs: (1) transaction costs, including brokerage commissions on purchases and sales of fund shares and (2) ongoing costs, including management fees and other fund expenses. The expense example, which is based on an investment of $1,000 invested on March 1, 2015 and held through August 31, 2015, is intended to help you understand your ongoing costs (in dollars and cents) of investing in a Fund and to compare these costs with the ongoing costs of investing in other funds.
Actual Expenses — The table provides information about actual account values and actual expenses. Annualized expense ratios reflect contractual and voluntary fee waivers, if any. To estimate the expenses that you paid on your account over the period, simply divide your account value by $1,000 (for example, an $8,600 account value divided by $1,000 = 8.6), then multiply the result by the number corresponding to your Fund under the heading entitled “Expenses Paid During Period.”
Hypothetical Example for Comparison Purposes — The table also provides information about hypothetical account values and hypothetical expenses based on each Fund’s actual expense ratio and an assumed rate of return of 5% per year before expenses. You may use this information to compare the ongoing costs of investing in your Fund and other funds. To do so, compare this 5% hypothetical example with the 5% hypothetical examples that appear in the shareholder reports of the other funds.
Please note that the expenses shown in the table are meant to highlight your ongoing costs only and do not reflect any transactional costs, such as brokerage commissions paid on purchases and sales of fund shares. Therefore, the hypothetical examples are useful in comparing ongoing costs only and will not help you determine the relative total costs of owning different funds. In addition, if these transactional costs were included, your costs would have been higher.
| 16 | 2015 iSHARES ANNUAL REPORTTO SHAREHOLDERS |
Table of Contents
Consolidated Schedule of Investments
iSHARES® CORE MSCI EMERGING MARKETS ETF
August 31, 2015
| Security | Shares | Value | ||||||
COMMON STOCKS — 96.32% |
| |||||||
BRAZIL — 4.06% | ||||||||
Aliansce Shopping Centers SA | 219,100 | $ | 667,722 | |||||
Alupar Investimento SA Units | 158,800 | 636,988 | ||||||
Ambev SA | 8,314,400 | 43,577,980 | ||||||
Arezzo Industria e Comercio SA | 131,600 | 790,557 | ||||||
B2W Cia. Digitala | 227,251 | 973,331 | ||||||
Banco ABC Brasil SAa | 7,045 | 17,563 | ||||||
Banco Bradesco SA | 1,324,452 | 9,152,710 | ||||||
Banco do Brasil SA | 1,531,900 | 7,499,149 | ||||||
Banco Santander Brasil SA Units | 750,800 | 2,974,547 | ||||||
BB Seguridade Participacoes SA | 1,248,400 | 9,837,073 | ||||||
BM&FBovespa SA-Bolsa de Valores Mercadorias e Futuros | 3,074,900 | 9,100,809 | ||||||
BR Malls Participacoes SA | 826,600 | 2,541,813 | ||||||
BRF SA | 1,159,400 | 22,129,587 | ||||||
CCR SA | 1,591,500 | 6,501,893 | ||||||
CETIP SA – | 412,417 | 3,704,931 | ||||||
Cia. de Saneamento Basico do Estado de Sao Paulo | 633,300 | 2,735,070 | ||||||
Cia. Siderurgica Nacional SA | 1,176,100 | 1,130,167 | ||||||
Cielo SA | 1,517,592 | 15,979,039 | ||||||
Cosan SA Industria e Comercio | 246,800 | 1,229,850 | ||||||
CPFL Energia SA | 386,305 | 1,665,176 | ||||||
Cyrela Brazil Realty | 515,300 | 1,188,419 | ||||||
Duratex SA | 608,229 | 916,790 | ||||||
EDP – Energias do Brasil SA | 516,100 | 1,588,436 | ||||||
Embraer SA | 1,198,600 | 7,562,311 | ||||||
Equatorial Energia SA | 320,776 | 3,113,304 | ||||||
Estacio Participacoes SA | 534,400 | 1,829,630 | ||||||
EZ TEC Empreendimentos e Participacoes SA | 143,957 | 520,929 | ||||||
Fibria Celulose SA | 457,900 | 6,439,327 | ||||||
Fleury SA | 162,900 | 742,437 | ||||||
Gafisa SAa | 1,087,600 | 680,823 | ||||||
Hypermarcas SAa | 618,400 | 2,796,362 | ||||||
Iguatemi Empresa de Shopping Centers SA | 172,900 | 977,896 | ||||||
| Security | Shares | Value | ||||||
JBS SA | 1,378,900 | $ | 5,356,973 | |||||
JSL SA | 155,400 | 413,860 | ||||||
Klabin SA Units | 1,006,900 | 5,600,877 | ||||||
Kroton Educacional SA | 2,459,956 | 5,862,425 | ||||||
Light SA | 222,700 | 714,768 | ||||||
Linx SA | 71,600 | 856,900 | ||||||
Localiza Rent A Car SA | 293,935 | 1,808,520 | ||||||
Lojas Americanas SA | 260,425 | 890,189 | ||||||
Lojas Renner SA | 233,000 | 6,302,467 | ||||||
LPS Brasil Consultoria de Imoveis SA | 283,800 | 248,561 | ||||||
M. Dias Branco SA | 66,700 | 1,159,204 | ||||||
Magnesita Refratarios SAa | 555,900 | 434,983 | ||||||
Marfrig Global Foods SAa | 561,800 | 987,170 | ||||||
Mills Estruturas e Servicos de Engenharia SAa | 248,600 | 334,447 | ||||||
Minerva SA/Brazila | 249,900 | 798,637 | ||||||
MRV Engenharia e Participacoes SA | 607,100 | 1,061,769 | ||||||
Multiplan Empreendimentos Imobiliarios SA | 153,900 | 1,740,024 | ||||||
Multiplus SA | 103,900 | 1,076,298 | ||||||
Natura Cosmeticos SA | 316,500 | 2,058,586 | ||||||
Odontoprev SA | 576,800 | 1,548,796 | ||||||
Petroleo Brasileiro SAa | 5,419,900 | 15,803,236 | ||||||
Porto Seguro SA | 227,200 | 2,075,974 | ||||||
Qualicorp SA | 425,200 | 1,992,769 | ||||||
Raia Drogasil SA | 410,300 | 4,472,211 | ||||||
Restoque Comercio e | 232,700 | 266,417 | ||||||
Sao Martinho SA | 110,300 | 921,829 | ||||||
SLC Agricola SA | 143,700 | 634,809 | ||||||
Smiles SA | 95,700 | 1,256,994 | ||||||
Somos Educacao SA | 181,800 | 643,893 | ||||||
Sonae Sierra Brasil SA | 67,500 | 298,373 | ||||||
Souza Cruz SA | 684,100 | 4,984,835 | ||||||
Sul America SA | 350,489 | 1,684,002 | ||||||
Tegma Gestao Logisticaa | 186,200 | 270,948 | ||||||
TIM Participacoes SA | 1,513,900 | 3,657,717 | ||||||
TOTVS SA | 236,300 | 2,056,616 | ||||||
Tractebel Energia SA | 285,300 | 2,627,212 | ||||||
Transmissora Alianca de Energia Eletrica | 158,200 | 803,542 | ||||||
Ultrapar Participacoes SA | 650,000 | 11,326,927 | ||||||
Vale SA | 2,442,200 | 12,015,711 | ||||||
CONSOLIDATED SCHEDULESOF INVESTMENTS | 17 |
Table of Contents
Consolidated Schedule of Investments (Continued)
iSHARES® CORE MSCI EMERGING MARKETS ETF
August 31, 2015
| Security | Shares | Value | ||||||
Valid Solucoes e Servicos de Seguranca em Meios de Pagamento e Identificacao SA | 137,300 | $ | 1,769,850 | |||||
Via Varejo SA | 251,900 | 470,983 | ||||||
WEG SA | 1,046,460 | 4,812,466 | ||||||
|
| |||||||
| 285,305,387 | ||||||||
CHILE — 1.19% | ||||||||
AES Gener SA | 4,703,670 | 2,366,299 | ||||||
Aguas Andinas SA Series A | 4,561,989 | 2,364,768 | ||||||
Banco de Chile | 38,856,155 | 4,016,430 | ||||||
Banco de Credito e Inversiones | 63,359 | 2,768,137 | ||||||
Banco Santander Chile | 115,820,868 | 5,599,759 | ||||||
Besalco SA | 709,538 | 259,977 | ||||||
Cencosud SA | 2,196,457 | 4,466,607 | ||||||
Cia. Cervecerias Unidas SA | 290,380 | 3,218,377 | ||||||
Cia. Sud Americana de Vapores SAa | 23,983,511 | 669,286 | ||||||
Colbun SA | 15,207,118 | 4,131,968 | ||||||
CorpBanca SA | 284,460,841 | 2,654,552 | ||||||
E.CL SA | 1,130,004 | 1,584,922 | ||||||
Empresa Nacional de Electricidad SA/Chile | 5,724,379 | 7,099,113 | ||||||
Empresa Nacional de Telecomunicaciones SA | 230,695 | 2,159,643 | ||||||
Empresas CMPC SA | 2,262,845 | 6,192,867 | ||||||
Empresas COPEC SA | 774,108 | 7,569,982 | ||||||
Enersis SA | 34,617,930 | 9,609,039 | ||||||
Inversiones Aguas Metropolitanas SA | 812,034 | 1,149,448 | ||||||
Inversiones La Construccion SA | 80,695 | 868,053 | ||||||
LATAM Airlines Group SAa | 520,657 | 2,914,546 | ||||||
Parque Arauco SA | 1,178,624 | 2,060,227 | ||||||
SACI Falabella | 816,248 | 5,040,215 | ||||||
SalfaCorp SA | 1,075,423 | 589,070 | ||||||
Sociedad Matriz SAAM SA | 11,885,057 | 809,518 | ||||||
SONDA SA | 1,022,580 | 1,670,986 | ||||||
Vina Concha y Toro SA | 865,717 | 1,452,902 | ||||||
|
| |||||||
| 83,286,691 | ||||||||
CHINA — 22.84% | ||||||||
361 Degrees International Ltd. | 2,355,000 | 720,170 | ||||||
AAC Technologies Holdings Inc. | 1,339,500 | 7,544,361 | ||||||
Agile Property Holdings Ltd. | 2,786,500 | 1,366,275 | ||||||
Agricultural Bank of China Ltd. Class H | 39,784,000 | 16,067,499 | ||||||
| Security | Shares | Value | ||||||
AGTech Holdings Ltd.a,b | 4,488,000 | $ | 729,657 | |||||
Air China Ltd. Class H | 3,438,000 | 2,484,216 | ||||||
Ajisen (China) Holdings Ltd.b | 1,744,000 | 679,593 | ||||||
Alibaba Health Information Technology Ltd.a,b | 4,506,000 | 3,116,388 | ||||||
Alibaba Pictures Group Ltd.a,b | 18,340,000 | 4,283,250 | ||||||
Aluminum Corp. of China Ltd. Class Ha,b | 7,398,000 | 2,472,348 | ||||||
Anhui Conch Cement Co. Ltd. Class H | 2,217,000 | 6,708,170 | ||||||
Anhui Expressway Co. Ltd. Class H | 1,184,000 | 905,945 | ||||||
Anta Sports Products Ltd. | 1,879,000 | 4,732,625 | ||||||
APT Satellite Holdings Ltd.b | 930,500 | 677,160 | ||||||
Asia Cement China Holdings Corp. | 1,203,000 | 380,301 | ||||||
AVIC International Holding HK Ltd.a,b | 6,878,000 | 745,482 | ||||||
AviChina Industry & Technology Co. Ltd. Class H | 4,049,000 | 2,815,996 | ||||||
Bank of China Ltd. Class H | 140,628,000 | 64,234,827 | ||||||
Bank of Communications Co. Ltd. Class H | 15,634,000 | 11,780,900 | ||||||
Baoxin Auto Group Ltd.b | 1,801,000 | 608,850 | ||||||
BBMG Corp. Class H | 2,230,500 | 1,439,023 | ||||||
Beijing Capital International Airport Co. Ltd. Class H | 2,858,000 | 3,075,557 | ||||||
Beijing Capital Land Ltd. Class H | 2,406,000 | 962,394 | ||||||
Beijing Enterprises Holdings Ltd. | 939,000 | 5,482,513 | ||||||
Beijing Enterprises Medical & Health Group Ltd.a,b | 6,564,000 | 601,343 | ||||||
Beijing Enterprises Water Group Ltd.b | 8,112,000 | 5,809,201 | ||||||
Beijing Tong Ren Tang Chinese Medicine Co. Ltd. | 845,000 | 928,949 | ||||||
Belle International Holdings Ltd. | 8,353,000 | 7,641,598 | ||||||
Biostime International Holdings Ltd.b | 382,000 | 629,926 | ||||||
Boer Power Holdings Ltd.b | 693,000 | 1,133,830 | ||||||
Bosideng International Holdings Ltd.b | 7,094,000 | 659,051 | ||||||
Brilliance China Automotive Holdings Ltd. | 5,484,000 | 6,623,214 | ||||||
| 18 | 2015 iSHARES ANNUAL REPORTTO SHAREHOLDERS |
Table of Contents
Consolidated Schedule of Investments (Continued)
iSHARES® CORE MSCI EMERGING MARKETS ETF
August 31, 2015
| Security | Shares | Value | ||||||
Byd Co. Ltd. Class Hb | 1,167,500 | $ | 4,767,889 | |||||
BYD Electronic International Co. Ltd.a,b | 1,636,000 | 945,707 | ||||||
C C Land Holdings Ltd. | 3,701,000 | 883,459 | ||||||
Carnival Group International Holdings Ltd.a,b | 7,897,000 | 988,392 | ||||||
Central China Securities Co. Ltd. Class Hb | 2,284,000 | 1,261,349 | ||||||
CGN Power Co. Ltd. Class Hc | 14,141,000 | 5,601,625 | ||||||
Chaowei Power Holdings Ltd.a,b | 1,571,000 | 770,292 | ||||||
China Aerospace International Holdings Ltd.b | 4,928,000 | 693,095 | ||||||
China Agri-Industries Holdings Ltd.a,b | 4,557,200 | 1,728,785 | ||||||
China Aircraft Leasing Group Holdings Ltd.b | 515,500 | 499,533 | ||||||
China Animal Healthcare Ltd.a,b | 1,237,000 | 79,806 | ||||||
China Aoyuan Property Group Ltd. | 3,427,000 | 636,755 | ||||||
China BlueChemical Ltd. Class H | 3,974,000 | 1,128,096 | ||||||
China Cinda Asset Management Co. Ltd. Class H | 15,222,000 | 5,656,655 | ||||||
China CITIC Bank Corp. Ltd. Class Ha | 14,524,000 | 8,901,749 | ||||||
China Coal Energy Co. Ltd. Class Hb | 4,714,000 | 2,201,880 | ||||||
China Communications Construction Co. Ltd. Class H | 7,952,000 | 9,460,254 | ||||||
China Communications Services Corp. Ltd. Class H | 4,652,000 | 1,710,724 | ||||||
China Conch Venture Holdings Ltd. | 2,192,500 | 4,831,956 | ||||||
China Construction Bank Corp. Class H | 148,926,000 | 104,727,931 | ||||||
China COSCO Holdings Co. Ltd. Class Ha,b | 4,551,000 | 2,592,685 | ||||||
China Datang Corp. Renewable Power Co. Ltd. Class Ha | 5,904,000 | 746,566 | ||||||
China Dongxiang Group Co. Ltd. | 6,335,000 | 1,577,609 | ||||||
China Dynamics Holdings Ltd.a,b | 8,490,000 | 438,191 | ||||||
China Electronics Corp. Holdings Co. Ltd.b | 2,120,000 | 626,422 | ||||||
| Security | Shares | Value | ||||||
China Everbright Bank Co. Ltd. Class H | 6,234,000 | $ | 2,847,512 | |||||
China Everbright International Ltd.b | 4,663,000 | 6,100,970 | ||||||
China Everbright Ltd. | 1,780,000 | 3,720,750 | ||||||
China Fiber Optic Network System Group Ltd.a,b | 3,624,800 | 620,061 | ||||||
China Foods Ltd.a | 1,946,000 | 903,943 | ||||||
China Galaxy Securities Co. Ltd. Class H | 6,001,000 | 4,111,626 | ||||||
China Gas Holdings Ltd. | 3,250,000 | 4,747,066 | ||||||
China Harmony New Energy Auto Holding Ltd.b | 1,668,500 | 740,594 | ||||||
China High Speed Transmission Equipment Group Co. Ltd.a | 2,166,000 | 1,489,639 | ||||||
China Huarong Energy Co. Ltd.a,b | 10,170,000 | 406,797 | ||||||
China Huishan Dairy Holdings Co. Ltd.b | 11,975,000 | 4,388,230 | ||||||
China Huiyuan Juice Group Ltd.a | 1,822,500 | 604,361 | ||||||
China Innovationpay Group Ltd.a,b | 9,492,000 | 575,640 | ||||||
China International Marine Containers Group Co. Ltd. Class H | 959,000 | 1,707,628 | ||||||
China Lesso Group Holdings Ltd.b | 2,365,000 | 1,660,067 | ||||||
China Life Insurance Co. Ltd. Class H | 13,260,000 | 45,853,640 | ||||||
China Lilang Ltd.b | 1,308,000 | 1,125,717 | ||||||
China Longyuan Power Group Corp. Ltd. | 5,808,000 | 6,167,682 | ||||||
China LotSynergy Holdings Ltd.b | 17,060,000 | 704,408 | ||||||
China Lumena New Materials Corp.a,b | 2,584,000 | 41,677 | ||||||
China Medical System Holdings Ltd. | 2,178,000 | 2,366,276 | ||||||
China Mengniu Dairy Co. Ltd. | 2,480,000 | 8,671,944 | ||||||
China Merchants Bank Co. Ltd. Class H | 8,183,464 | 19,492,358 | ||||||
China Merchants Holdings International Co. Ltd. | 2,066,000 | 6,904,394 | ||||||
China Merchants Land Ltd.b | 2,872,000 | 452,105 | ||||||
CONSOLIDATED SCHEDULESOF INVESTMENTS | 19 |
Table of Contents
Consolidated Schedule of Investments (Continued)
iSHARES® CORE MSCI EMERGING MARKETS ETF
August 31, 2015
| Security | Shares | Value | ||||||
China Metal Recycling Holdings Ltd.a | 62,400 | $ | — | |||||
China Minsheng Banking Corp. Ltd. Class H | 10,550,100 | 10,223,321 | ||||||
China Mobile Ltd. | 10,906,000 | 132,137,651 | ||||||
China Modern Dairy Holdings Ltd.b | 4,045,000 | 1,054,303 | ||||||
China National Building Material Co. Ltd. Class H | 5,188,000 | 3,025,756 | ||||||
China National Materials Co. Ltd. Class H | 2,713,000 | 602,107 | ||||||
China New Town Development Co. Ltd.a | 10,607,500 | 362,706 | ||||||
China Oceanwide Holdings Ltd.a,b | 7,640,000 | 1,104,096 | ||||||
China Oil and Gas Group Ltd.a,b | 15,588,000 | 985,558 | ||||||
China Oilfield Services Ltd. Class H | 3,164,000 | 3,404,850 | ||||||
China Overseas Grand Oceans Group Ltd.b | 2,262,000 | 715,079 | ||||||
China Overseas Land & Investment Ltd. | 7,080,000 | 20,737,415 | ||||||
China Pacific Insurance Group Co. Ltd. Class H | 4,728,800 | 17,206,619 | ||||||
China Petroleum & Chemical Corp. Class H | 44,946,200 | 29,925,277 | ||||||
China Power International Development Ltd. | 5,972,000 | 3,976,171 | ||||||
China Power New Energy Development Co. Ltd.b | 11,460,000 | 591,480 | ||||||
China Precious Metal Resources Holdings Co. Ltd.a,b | 9,118,000 | 341,188 | ||||||
China Railway Construction Corp. Ltd. Class H | 3,577,000 | 4,689,301 | ||||||
China Railway Group Ltd. Class H | 7,249,000 | 6,500,674 | ||||||
China Rare Earth Holdings Ltd.a,b | 7,057,200 | 610,102 | ||||||
China Regenerative Medicine International Ltd.a,b | 22,690,000 | 1,200,366 | ||||||
China Resources and Transportation Group Ltd.a,b | 49,700,000 | 384,772 | ||||||
China Resources Cement Holdings Ltd.b | 3,738,000 | 1,837,637 | ||||||
| Security | Shares | Value | ||||||
China Resources Enterprise Ltd. | 2,156,000 | $ | 6,773,969 | |||||
China Resources Gas Group Ltd. | 1,658,000 | 4,374,952 | ||||||
China Resources Land Ltd. | 5,019,777 | 12,526,692 | ||||||
China Resources Power Holdings Co. Ltd. | 3,444,000 | 8,434,413 | ||||||
China SCE Property Holdings Ltd. | 4,509,200 | 930,926 | ||||||
China Shanshui Cement Group Ltd.a,b | 3,521,000 | 2,121,218 | ||||||
China Shenhua Energy Co. Ltd. Class H | 5,927,000 | 10,278,499 | ||||||
China Shineway Pharmaceutical Group Ltd.b | 962,000 | 1,154,393 | ||||||
China Shipping Container Lines Co. Ltd. Class Ha,b | 6,554,000 | 2,350,621 | ||||||
China Singyes Solar Technologies Holdings Ltd.b | 1,313,000 | 814,902 | ||||||
China Southern Airlines Co. Ltd. Class H | 3,454,000 | 2,250,656 | ||||||
China State Construction International Holdings Ltd. | 3,390,000 | 4,479,145 | ||||||
China Suntien Green Energy Corp. Ltd. Class Hb | 4,380,000 | 706,447 | ||||||
China Taiping Insurance Holdings Co. Ltd.a | 2,971,508 | 8,396,852 | ||||||
China Telecom Corp. Ltd. Class H | 24,680,000 | 12,929,052 | ||||||
China Traditional Chinese Medicine Co. Ltd.a,b | 3,390,000 | 2,366,423 | ||||||
China Travel International Investment Hong Kong Ltd.b | 4,950,000 | 1,724,505 | ||||||
China Unicom Hong Kong Ltd. | 10,678,000 | 14,025,979 | ||||||
China Vanke Co. Ltd. Class Hb | 2,388,787 | 5,430,988 | ||||||
China Water Affairs Group Ltd.b | 2,386,000 | 1,040,597 | ||||||
China Yurun Food Group Ltd.a,b | 3,373,000 | 779,049 | ||||||
China ZhengTong Auto Services Holdings Ltd.b | 2,080,000 | 823,943 | ||||||
Chinasoft International Ltd.a,b | 2,958,000 | 969,454 | ||||||
Chongqing Changan Automobile Co. Ltd. Class B | 1,579,800 | 2,527,664 | ||||||
Chongqing Rural Commercial Bank Co. Ltd. Class H | 4,932,000 | 2,882,815 | ||||||
CIFI Holdings Group Co. Ltd.b | 6,164,000 | 1,153,257 | ||||||
| 20 | 2015 iSHARES ANNUAL REPORTTO SHAREHOLDERS |
Table of Contents
Consolidated Schedule of Investments (Continued)
iSHARES® CORE MSCI EMERGING MARKETS ETF
August 31, 2015
| Security | Shares | Value | ||||||
CIMC Enric Holdings Ltd.b | 1,254,000 | $ | 660,166 | |||||
CITIC Ltd. | 6,975,000 | 12,779,918 | ||||||
CITIC Resources Holdings Ltd.a,b | 5,864,000 | 900,402 | ||||||
CITIC Securities Co. Ltd. Class H | 3,889,000 | 7,798,022 | ||||||
CNOOC Ltd. | 31,387,000 | 38,919,629 | ||||||
Cogobuy Groupa,b,c | 840,000 | 740,279 | ||||||
Colour Life Services Group Co. Ltd. | 776,000 | 573,736 | ||||||
Comba Telecom Systems Holdings Ltd.b | 3,007,265 | 585,928 | ||||||
Coolpad Group Ltd. | 5,208,000 | 967,674 | ||||||
COSCO International Holdings Ltd.b | 1,970,000 | 977,721 | ||||||
COSCO Pacific Ltd. | 2,916,000 | 3,430,074 | ||||||
Country Garden Holdings Co. Ltd. | 9,900,733 | 3,474,816 | ||||||
CPMC Holdings Ltd.b | 1,471,000 | 778,201 | ||||||
Credit China Holdings Ltd.b | 3,708,000 | 909,052 | ||||||
CRRC Corp. Ltd. Class Ha | 7,845,750 | 9,171,876 | ||||||
CSPC Pharmaceutical Group Ltd. | 7,696,000 | 7,050,484 | ||||||
CT Environmental Group Ltd.b | 5,528,000 | 1,811,746 | ||||||
Dah Chong Hong Holdings Ltd.b | 1,989,000 | 718,602 | ||||||
Dalian Wanda Commercial Properties Co. Ltd. Class Hc | 1,060,700 | 6,514,709 | ||||||
Daphne International Holdings Ltd. | 2,876,000 | 552,931 | ||||||
Datang International Power Generation Co. Ltd. Class H | 4,974,000 | 2,008,841 | ||||||
Dawnrays Pharmaceutical Holdings Ltd.b | 1,132,000 | 893,909 | ||||||
Dazhong Transportation Group Co. Ltd. Class B | 1,016,700 | 900,796 | ||||||
Digital China Holdings Ltd. | 1,760,000 | 1,539,706 | ||||||
Dongfeng Motor Group Co. Ltd. Class H | 4,722,000 | 4,752,434 | ||||||
Dongjiang Environmental Co. Ltd. Class Hb | 427,300 | 639,568 | ||||||
Dongyue Group Ltd. | 3,584,000 | 860,154 | ||||||
ENN Energy Holdings Ltd. | 1,390,000 | 7,093,438 | ||||||
EverChina International Holdings Co. Ltd.a,b | 13,015,000 | 436,629 | ||||||
| Security | Shares | Value | ||||||
Evergrande Real Estate Group Ltd.b | 10,070,000 | $ | 6,626,667 | |||||
Fantasia Holdings Group Co. Ltd.b | 4,356,000 | 460,890 | ||||||
Far East Horizon Ltd. | 3,453,000 | 2,749,016 | ||||||
FDG Electric Vehicles Ltd.a,b | 21,165,000 | 1,310,856 | ||||||
First Tractor Co. Ltd. Class Hb | 1,064,000 | 610,938 | ||||||
Fosun International Ltd. | 3,518,500 | 5,901,962 | ||||||
Franshion Properties China Ltd. | 6,406,000 | 1,603,556 | ||||||
Fufeng Group Ltd.b | 2,234,400 | 994,662 | ||||||
Fullshare Holdings Ltd.a | 7,487,500 | 1,120,702 | ||||||
GCL-Poly Energy Holdings Ltd.a,b | 20,229,000 | 3,236,619 | ||||||
Geely Automobile Holdings Ltd. | 9,940,000 | 3,847,717 | ||||||
GF Securities Co. Ltd.a | 1,645,000 | 2,818,769 | ||||||
Glorious Property Holdings Ltd.a | 5,525,000 | 598,835 | ||||||
Golden Eagle Retail Group Ltd.b | 1,057,000 | 1,177,013 | ||||||
Goldin Properties Holdings Ltd.a,b | 2,370,000 | 2,262,953 | ||||||
GOME Electrical Appliances Holding Ltd. | 21,396,000 | 3,395,730 | ||||||
Goodbaby International Holdings Ltd.a,b | 2,379,000 | 933,176 | ||||||
Great Wall Motor Co. Ltd. Class H | 1,832,000 | 4,893,181 | ||||||
Greatview Aseptic Packaging Co. Ltd.b | 2,285,000 | 1,052,567 | ||||||
Guangdong Investment Ltd. | 5,162,000 | 6,980,311 | ||||||
Guangdong Land Holdings Ltd.a | 2,376,000 | 554,907 | ||||||
Guangzhou Automobile Group Co. Ltd. Class H | 3,840,000 | 2,700,370 | ||||||
Guangzhou R&F Properties Co. Ltd. Class Ha | 1,890,800 | 1,727,326 | ||||||
Haier Electronics Group Co. Ltd. | 2,300,000 | 4,125,135 | ||||||
Haitian International Holdings Ltd. | 1,286,000 | 2,333,038 | ||||||
Haitong Securities Co. Ltd. Class H | 5,746,000 | 8,289,015 | ||||||
Hanergy Thin Film Power Group Ltd.a,b | 20,984,000 | 27 | ||||||
Hangzhou Steam Turbine Co. Class B | 831,400 | 1,096,192 | ||||||
Harbin Electric Co. Ltd. Class Hb | 1,776,000 | 930,389 | ||||||
HC International Inc.a,b | 876,000 | 376,395 | ||||||
CONSOLIDATED SCHEDULESOF INVESTMENTS | 21 |
Table of Contents
Consolidated Schedule of Investments (Continued)
iSHARES® CORE MSCI EMERGING MARKETS ETF
August 31, 2015
| Security | Shares | Value | ||||||
Hengan International Group Co. Ltd. | 1,313,000 | $ | 12,884,259 | |||||
Hengdeli Holdings Ltd.b | 6,190,800 | 862,712 | ||||||
Hi Sun Technology (China) Ltd.a,b | 4,152,000 | 685,745 | ||||||
Hisense Kelon Electrical Holdings Co. Ltd. Class Ha | 851,000 | 439,223 | ||||||
Honbridge Holdings Ltd.a,b | 6,406,000 | 843,107 | ||||||
Honghua Group Ltd.a,b | 7,651,000 | 533,099 | ||||||
Hopson Development Holdings Ltd.a,b | 1,310,000 | 1,007,426 | ||||||
Hua Han Bio-Pharmaceutical Holdings Ltd. Class Hb | 9,508,288 | 1,214,599 | ||||||
Huabao International Holdings Ltd.b | 3,940,000 | 1,311,630 | ||||||
Huadian Power International Corp. Ltd. Class H | 3,072,000 | 2,501,186 | ||||||
Huaneng Power International Inc. Class H | 6,344,000 | 7,309,878 | ||||||
Huaneng Renewables Corp. Ltd. Class H | 7,668,000 | 2,800,039 | ||||||
Huatai Securities Co. Ltd.a,c | 1,610,800 | 2,930,598 | ||||||
Imperial Pacific International Holdings Ltd.a,b | 66,850,000 | 1,638,893 | ||||||
Industrial & Commercial Bank of China Ltd. Class H | 130,451,000 | 77,091,836 | ||||||
Inner Mongolia Yitai Coal Co. Ltd. Class B | 2,022,700 | 1,711,204 | ||||||
Intime Retail Group Co. Ltd.b | 2,024,500 | 2,128,977 | ||||||
Jiangnan Group Ltd. | 4,816,000 | 975,622 | ||||||
Jiangsu Expressway Co. Ltd. Class H | 2,296,000 | 2,713,706 | ||||||
Jiangsu Future Land Co. Ltd. Class B | 1,214,800 | 1,969,191 | ||||||
Jiangxi Copper Co. Ltd. Class H | 2,408,000 | 3,041,828 | ||||||
Ju Teng International Holdings Ltd.b | 2,138,000 | 816,573 | ||||||
Kaisa Group Holdings Ltd.a,b | 2,773,000 | 178,902 | ||||||
Kingboard Chemical Holdings Ltd. | 1,240,200 | 1,609,849 | ||||||
Kingboard Laminates Holdings Ltd.b | 2,237,500 | 889,220 | ||||||
Kingdee International Software Group Co. Ltd.b | 3,998,000 | 1,372,208 | ||||||
Kingsoft Corp. Ltd. | 1,586,000 | 3,343,880 | ||||||
| Security | Shares | Value | ||||||
Konka Group Co. Ltd. Class B | 577,800 | $ | 763,705 | |||||
Kunlun Energy Co. Ltd. | 5,852,000 | 4,137,904 | ||||||
KWG Property Holding Ltd. | 2,347,000 | 1,483,900 | ||||||
Lao Feng Xiang Co. Ltd. Class B | 422,106 | 1,565,591 | ||||||
Launch Tech Co. Ltd.a | 319,500 | 373,091 | ||||||
Lee & Man Paper Manufacturing Ltd. | 2,839,000 | 1,626,462 | ||||||
Lenovo Group Ltd.b | 11,982,000 | 9,832,907 | ||||||
Leyou Technologies Holdings Ltd.a,b | 5,480,000 | 494,965 | ||||||
Li Ning Co. Ltd.a,b | 2,873,500 | 1,327,363 | ||||||
Lianhua Supermarket Holdings Co. Ltd. Class Ha | 1,098,000 | 570,956 | ||||||
Lifetech Scientific Corp.a,b | 3,872,000 | 539,578 | ||||||
Livzon Pharmaceutical Group Inc. Class H | 159,770 | 723,240 | ||||||
Longfor Properties Co. Ltd. | 2,656,000 | 3,211,169 | ||||||
Lonking Holdings Ltd. | 6,939,000 | 949,070 | ||||||
Luthai Textile Co. Ltd. Class B | 713,169 | 870,521 | ||||||
Luye Pharma Group Ltd.a | 2,564,000 | 2,183,521 | ||||||
Microport Scientific Corp.a,b | 1,984,000 | 727,035 | ||||||
MIE Holdings Corp.a | 2,836,000 | 332,999 | ||||||
Minth Group Ltd. | 1,290,000 | 2,243,753 | ||||||
MMG Ltd.a,b | 4,116,000 | 849,749 | ||||||
National Agricultural Holdings Ltd.a,b | 1,568,000 | 631,242 | ||||||
NetDragon Websoft Inc.b | 369,500 | 882,027 | ||||||
New China Life Insurance Co. Ltd. Class H | 1,424,600 | 5,569,691 | ||||||
New World China Land Ltd. | 4,636,000 | 2,811,492 | ||||||
New World Department Store China Ltd. | 2,851,000 | 511,337 | ||||||
Nexteer Automotive Group Ltd. | 1,545,000 | 1,455,281 | ||||||
Nine Dragons Paper (Holdings) Ltd. | 3,130,000 | 1,756,827 | ||||||
North Mining Shares Co. Ltd.a,b | 33,030,000 | 460,286 | ||||||
NVC Lighting Holdings Ltd.b | 1,831,000 | 274,398 | ||||||
Parkson Retail Group Ltd.b | 4,141,500 | 593,166 | ||||||
PAX Global Technology Ltd.b | 1,568,000 | 1,460,760 | ||||||
People’s Insurance Co. Group of China Ltd. (The) Class H | 12,061,000 | 5,711,430 | ||||||
PetroChina Co. Ltd. Class H | 37,234,000 | 30,940,053 | ||||||
Phoenix Healthcare Group Co. Ltd.b | 781,500 | 1,133,420 | ||||||
| 22 | 2015 iSHARES ANNUAL REPORTTO SHAREHOLDERS |
Table of Contents
Consolidated Schedule of Investments (Continued)
iSHARES® CORE MSCI EMERGING MARKETS ETF
August 31, 2015
| Security | Shares | Value | ||||||
Phoenix Satellite Television Holdings Ltd.b | 3,842,000 | $ | 822,926 | |||||
PICC Property & Casualty Co. Ltd. Class H | 6,255,360 | 11,881,072 | ||||||
Ping An Insurance Group Co. of China Ltd. Class H | 9,318,500 | 45,630,296 | ||||||
Poly Property Group Co. Ltd.b | 4,339,000 | 1,158,925 | ||||||
Real Nutriceutical Group Ltd.b | 3,314,000 | 590,102 | ||||||
Renhe Commercial Holdings Co. Ltd.a,b | 28,772,000 | 1,596,372 | ||||||
REXLot Holdings Ltd.b | 19,550,000 | 252,256 | ||||||
Road King Infrastructure Ltd.b | 1,135,000 | 1,003,187 | ||||||
Sany Heavy Equipment International Holdings Co. Ltd.a,b | 2,984,000 | 639,149 | ||||||
Semiconductor Manufacturing International Corp.a,b | 48,744,000 | 4,276,865 | ||||||
Shandong Airlines Co. Ltd. Class B | 340,200 | 657,131 | ||||||
Shandong Luoxin Pharmaceutical Group Stock Co. Ltd. Class H | 394,000 | 657,849 | ||||||
Shandong Weigao Group Medical Polymer Co. Ltd. Class H | 3,568,000 | 2,495,282 | ||||||
Shanghai Baosight Software Co. Ltd. Class B | 267,000 | 777,237 | ||||||
Shanghai Electric Group Co. Ltd. Class Hb | 5,142,000 | 2,839,693 | ||||||
Shanghai Fosun Pharmaceutical Group Co. Ltd. Class H | 758,500 | 2,216,763 | ||||||
Shanghai Industrial Holdings Ltd. | 976,000 | 2,380,165 | ||||||
Shanghai Industrial Urban Development Group Ltd.b | 3,994,000 | 633,882 | ||||||
Shanghai Jin Jiang International Hotels Group Co. Ltd. Class H | 2,600,000 | 795,092 | ||||||
Shanghai Jinqiao Export Processing Zone Development Co. Ltd. Class B | 626,300 | 920,661 | ||||||
Shanghai Pharmaceuticals Holding Co. Ltd. Class H | 1,295,000 | 2,700,266 | ||||||
| Security | Shares | Value | ||||||
Shenzhen Expressway Co. Ltd. Class Hb | 1,554,000 | $ | 1,014,605 | |||||
Shenzhen International Holdings Ltd. | 2,220,250 | 3,071,087 | ||||||
Shenzhen Investment Ltd.b | 5,826,000 | 2,059,760 | ||||||
Shenzhou International Group Holdings Ltd. | 1,061,000 | 5,359,727 | ||||||
Shimao Property Holdings Ltd. | 2,486,000 | 3,490,001 | ||||||
Shougang Concord International Enterprises Co. Ltd.a,b | 15,716,000 | 638,775 | ||||||
Shougang Fushan Resources Group Ltd.b | 6,318,000 | 798,916 | ||||||
Shui On Land Ltd. | 7,284,666 | 1,597,916 | ||||||
Shunfeng International Clean Energy Ltd.a | 2,388,000 | 573,116 | ||||||
Sihuan Pharmaceutical Holdings Group Ltd. | 6,629,000 | 1,283,024 | ||||||
Sino Biopharmaceutical Ltd. | 5,592,000 | 6,638,202 | ||||||
Sino Oil And Gas Holdings Ltd.a,b | 28,525,000 | 666,193 | ||||||
Sino-Ocean Land Holdings Ltd. | 6,284,500 | 3,284,137 | ||||||
Sinofert Holdings Ltd.b | 5,216,000 | 800,903 | ||||||
Sinolink Worldwide Holdings Ltd.a,b | 5,114,000 | 488,301 | ||||||
Sinopec Engineering Group Co. Ltd. Class H | 2,342,000 | 2,021,662 | ||||||
Sinopec Kantons Holdings Ltd.b | 2,092,000 | 1,109,428 | ||||||
Sinopec Shanghai Petrochemical Co. Ltd. Class Ha | 6,599,000 | 2,409,684 | ||||||
Sinopharm Group Co. Ltd. Class H | 2,167,200 | 8,207,343 | ||||||
Sinosoft Technology Group Ltd.b | 1,244,000 | 539,331 | ||||||
Sinotrans Ltd. Class H | 3,517,000 | 1,615,541 | ||||||
Sinotrans Shipping Ltd.b | 4,055,500 | 753,533 | ||||||
Skyworth Digital Holdings Ltd.b | 3,902,000 | 2,250,558 | ||||||
SOHO China Ltd. | 3,757,500 | 1,604,806 | ||||||
Sound Global Ltd.a,b | 1,007,000 | 757,529 | ||||||
SSY Group Ltd.b | 4,892,000 | 1,407,625 | ||||||
Sun Art Retail Group Ltd.b | 4,247,500 | 3,540,474 | ||||||
Sunac China Holdings Ltd. | 3,599,000 | 1,945,769 | ||||||
Sunny Optical Technology Group Co. Ltd.b | 1,402,000 | 2,337,255 | ||||||
CONSOLIDATED SCHEDULESOF INVESTMENTS | 23 |
Table of Contents
Consolidated Schedule of Investments (Continued)
iSHARES® CORE MSCI EMERGING MARKETS ETF
August 31, 2015
| Security | Shares | Value | ||||||
Superb Summit International Group Ltd.a,b | 6,035,000 | $ | 155,741 | |||||
TCC International Holdings Ltd. | 3,408,000 | 646,416 | ||||||
TCL Communication Technology Holdings Ltd.b | 1,207,000 | 816,083 | ||||||
TCL Multimedia Technology Holdings Ltd.b | 1,412,000 | 634,029 | ||||||
Tech Pro Technology Development Ltd.a,b | 10,704,000 | 2,610,378 | ||||||
Technovator International Ltd.a,b | 1,006,000 | 556,866 | ||||||
Tencent Holdings Ltd. | 9,175,500 | 156,041,690 | ||||||
Tiangong International Co. Ltd.b | 5,336,000 | 481,958 | ||||||
Tianjin Development Holdings Ltd.b | 1,356,000 | 874,833 | ||||||
Tianjin Port Development Holdings Ltd.b | 4,458,000 | 701,771 | ||||||
Tianneng Power International Ltd.a,b | 1,988,000 | 792,630 | ||||||
Tibet 5100 Water Resources Holdings Ltd.b | 3,769,000 | 1,016,408 | ||||||
Tingyi Cayman Islands Holding Corp. | 3,552,000 | 5,463,170 | ||||||
Tong Ren Tang Technologies Co. Ltd. Class Hb | 1,346,000 | 1,740,237 | ||||||
Tongda Group Holdings Ltd.b | 6,360,000 | 984,768 | ||||||
Towngas China Co. Ltd.b | 2,253,000 | 1,433,189 | ||||||
Tsingtao Brewery Co. Ltd. Class H | 658,000 | 3,234,792 | ||||||
Universal Health International Group Holding Ltd.b | 2,508,000 | 873,749 | ||||||
V1 Group Ltd.a,b | 10,494,000 | 704,109 | ||||||
Vinda International Holdings Ltd.b | 519,000 | 1,000,492 | ||||||
Viva China Holdings Ltd.a,b | 5,624,000 | 645,849 | ||||||
Wanda Hotel Development Co. Ltd.a,b | 3,161,000 | 469,049 | ||||||
Want Want China Holdings Ltd.b | 10,619,000 | 8,563,654 | ||||||
Wasion Group Holdings Ltd.b | 1,270,000 | 1,224,108 | ||||||
Weichai Power Co. Ltd. Class H | 1,806,000 | 1,943,477 | ||||||
Weiqiao Textile Co. Class H | 1,299,500 | 558,362 | ||||||
Welling Holding Ltd.b | 3,544,000 | 571,609 | ||||||
West China Cement Ltd.a,b | 5,382,000 | 881,948 | ||||||
Wisdom Holdings Groupb | 1,574,000 | 639,751 | ||||||
Wumart Stores Inc. Class Ha | 880,000 | 474,629 | ||||||
| Security | Shares | Value | ||||||
Xiamen International Port Co. Ltd. Class H | 2,208,000 | $ | 541,313 | |||||
Xingda International Holdings Ltd. | 3,379,000 | 680,156 | ||||||
Xinhua Winshare Publishing and Media Co. Ltd. Class H | 1,157,000 | 836,020 | ||||||
Xinyi Solar Holdings Ltd.b | 5,330,000 | 1,781,240 | ||||||
XTEP International Holdings Ltd. | 1,951,500 | 841,028 | ||||||
Yanchang Petroleum International Ltd.a | 21,350,000 | 641,873 | ||||||
Yanzhou Coal Mining Co. Ltd. Class Hb | 3,212,000 | 1,516,883 | ||||||
Yingde Gases Group Co. Ltd. | 2,660,000 | 1,108,612 | ||||||
Yuanda China Holdings Ltd. | 8,172,000 | 411,234 | ||||||
YuanShengTai Dairy Farm Ltd.a,b | 8,616,000 | 589,219 | ||||||
Yuexiu Property Co. Ltd.b | 13,094,880 | 2,061,374 | ||||||
Yuexiu Transport Infrastructure Ltd.b | 1,658,000 | 990,515 | ||||||
Yuxing InfoTech Investment Holdings Ltd.b | 2,190,000 | 904,252 | ||||||
Yuzhou Properties Co. Ltd.b | 4,203,400 | 900,335 | ||||||
Yuexiu REITb | 2,507,000 | 1,319,806 | ||||||
Zhaojin Mining Industry Co. Ltd. Class Hb | 1,884,500 | 938,597 | ||||||
Zhejiang Expressway Co. Ltd. Class H | 2,750,000 | 2,952,239 | ||||||
Zhonglu Co. Ltd. Class Ba | 204,000 | 460,428 | ||||||
Zhongsheng Group Holdings Ltd. | 1,457,000 | 609,116 | ||||||
Zhuzhou CSR Times Electric Co. Ltd. Class H | 964,000 | 6,387,236 | ||||||
Zijin Mining Group Co. Ltd. Class H | 10,346,000 | 2,669,918 | ||||||
ZTE Corp. Class H | 1,387,640 | 2,796,748 | ||||||
|
| |||||||
| 1,604,585,834 | ||||||||
COLOMBIA — 0.30% | ||||||||
Almacenes Exito SA | 363,495 | 1,971,697 | ||||||
Cementos Argos SA | 786,030 | 2,479,926 | ||||||
Corp. Financiera Colombiana SA | 163,987 | 1,945,474 | ||||||
Ecopetrol SA | 8,207,805 | 4,231,921 | ||||||
Grupo Argos SA/Colombia | 482,477 | 2,620,208 | ||||||
| 24 | 2015 iSHARES ANNUAL REPORTTO SHAREHOLDERS |
Table of Contents
Consolidated Schedule of Investments (Continued)
iSHARES® CORE MSCI EMERGING MARKETS ETF
August 31, 2015
| Security | Shares | Value | ||||||
Grupo de Inversiones Suramericana SA | 427,919 | $ | 4,882,994 | |||||
Interconexion Electrica SA ESP | 716,474 | 1,537,866 | ||||||
Isagen SA ESP | 1,702,941 | 1,618,441 | ||||||
|
| |||||||
| 21,288,527 | ||||||||
CZECH REPUBLIC — 0.20% | ||||||||
CEZ AS | 263,433 | 6,012,593 | ||||||
Komercni Banka AS | 28,184 | 6,411,692 | ||||||
Pegas Nonwovens SAb | 31,220 | 1,190,066 | ||||||
Philip Morris CR AS | 654 | 299,839 | ||||||
|
| |||||||
| 13,914,190 | ||||||||
EGYPT — 0.28% | ||||||||
Commercial International Bank Egypt SAE | 1,432,776 | 9,171,172 | ||||||
Egypt Kuwait Holding Co. SAE | 1,248,177 | 773,870 | ||||||
Egyptian Financial Group-Hermes Holding Co.a | 1,103,008 | 1,210,061 | ||||||
Ezz Steela | 607,862 | 714,990 | ||||||
Global Telecom Holding SAEa | 4,440,144 | 1,190,836 | ||||||
Global Telecom Holding SAE GDRa | 211,538 | 274,999 | ||||||
Juhayna Food Industries | 939,105 | 985,874 | ||||||
Orascom Telecom Media And Technology Holding SAEa | 7,074,736 | 632,476 | ||||||
Orascom Telecom Media And Technology Holding SAE GDRa | 50,000 | 33,500 | ||||||
Palm Hills Developments SAEa | 3,611,079 | 954,647 | ||||||
Pioneers Holding For Financial Investments SAEa | 739,048 | 729,605 | ||||||
Six of October Development & Investmenta | 587,972 | 712,620 | ||||||
South Valley Cement | 959,291 | 475,354 | ||||||
Talaat Moustafa Group | 2,032,300 | 1,918,084 | ||||||
|
| |||||||
| 19,778,088 | ||||||||
GREECE — 0.30% | ||||||||
Alpha Bank AEa | 9,334,110 | 878,545 | ||||||
Athens Water Supply & Sewage Co. SA (The) | 43,842 | 243,660 | ||||||
Eurobank Ergasias SAa | 18,236,567 | 735,626 | ||||||
FF Group | 72,403 | 1,541,423 | ||||||
Hellenic Exchanges – Athens Stock Exchange SA Holding | 214,980 | 1,038,214 | ||||||
Hellenic Telecommunications Organization SA | 477,592 | 4,361,405 | ||||||
| Security | Shares | Value | ||||||
Intralot SA-Integrated Lottery Systems & Servicesa | 270,680 | $ | 461,011 | |||||
JUMBO SA | 212,913 | 1,789,267 | ||||||
Metka SA | 62,306 | 470,545 | ||||||
Motor Oil Hellas Corinth Refineries SAa | 130,661 | 1,361,572 | ||||||
Mytilineos Holdings SAa | 190,549 | 969,336 | ||||||
National Bank of Greece SAa | 2,795,526 | 1,628,841 | ||||||
OPAP SA | 412,271 | 3,233,647 | ||||||
Piraeus Bank SAa | 4,685,198 | 451,480 | ||||||
Piraeus Port Authority SA | 15,225 | 242,417 | ||||||
Titan Cement Co. SA | 91,871 | 1,927,063 | ||||||
|
| |||||||
| 21,334,052 | ||||||||
HUNGARY — 0.23% | ||||||||
Magyar Telekom Telecommunications PLCa | 885,601 | 1,259,601 | ||||||
MOL Hungarian Oil & Gas PLC | 60,742 | 3,008,599 | ||||||
OTP Bank PLC | 406,462 | 7,824,901 | ||||||
Richter Gedeon Nyrt | 255,926 | 3,907,128 | ||||||
|
| |||||||
| 16,000,229 | ||||||||
INDIA — 8.86% | ||||||||
ACC Ltd. | 96,539 | 1,938,550 | ||||||
Adani Enterprises Ltd. | 586,352 | 662,871 | ||||||
Adani Ports & Special Economic Zone Ltd. | 1,322,675 | 7,072,506 | ||||||
Adani Power Ltd.a | 1,959,596 | 663,271 | ||||||
Adani Transmissions Ltd.a | 340,421 | 159,520 | ||||||
Aditya Birla Nuvo Ltd. | 80,758 | 2,485,002 | ||||||
AIA Engineering Ltd. | 80,979 | 1,117,260 | ||||||
Ajanta Pharma Ltd. | 54,390 | 1,227,140 | ||||||
Alstom T&D India Ltd. | 154,709 | 1,228,130 | ||||||
Amara Raja Batteries Ltd. | 109,276 | 1,657,099 | ||||||
Ambuja Cements Ltd. | 1,314,100 | 4,095,999 | ||||||
Apollo Hospitals Enterprise Ltd. | 153,655 | 3,097,833 | ||||||
Apollo Tyres Ltd. | 512,159 | 1,386,816 | ||||||
Arvind Infrastructure Ltd.a | 27,551 | 18,941 | ||||||
Arvind Ltd. | 315,738 | 1,289,075 | ||||||
Ashok Leyland Ltd. | 2,322,938 | 3,155,492 | ||||||
Asian Paints Ltd. | 548,974 | 7,008,038 | ||||||
Aurobindo Pharma Ltd. | 511,953 | 5,799,182 | ||||||
Bajaj Auto Ltd. | 155,616 | 5,226,684 | ||||||
Balkrishna Industries Ltd. | 92,226 | 890,420 | ||||||
Bayer CropScience Ltd./India | 20,694 | 1,200,314 | ||||||
Berger Paints India Ltd. | 375,737 | 1,201,115 | ||||||
Bharat Forge Ltd. | 206,248 | 3,623,573 | ||||||
CONSOLIDATED SCHEDULESOF INVESTMENTS | 25 |
Table of Contents
Consolidated Schedule of Investments (Continued)
iSHARES® CORE MSCI EMERGING MARKETS ETF
August 31, 2015
| Security | Shares | Value | ||||||
Bharat Heavy Electricals Ltd. | 1,109,129 | $ | 3,778,297 | |||||
Bharat Petroleum Corp. Ltd. | 342,622 | 4,552,144 | ||||||
Bharti Airtel Ltd. | 2,157,457 | 11,498,864 | ||||||
Bharti Infratel Ltd. | 894,150 | 5,377,006 | ||||||
Biocon Ltd. | 137,765 | 919,746 | ||||||
Blue Dart Express Ltd. | 10,921 | 1,121,548 | ||||||
Bosch Ltd. | 14,456 | 5,047,465 | ||||||
Cairn India Ltd. | 830,013 | 1,859,803 | ||||||
Century Textiles & Industries Ltd. | 82,571 | 680,256 | ||||||
CESC Ltd. | 158,332 | 1,247,959 | ||||||
Cipla Ltd. | 660,579 | 6,778,698 | ||||||
Coal India Ltd. | 1,276,927 | 7,037,265 | ||||||
Container Corp. of India Ltd. | 86,483 | 1,853,969 | ||||||
Credit Analysis & Research Ltd. | 48,955 | 901,884 | ||||||
CRISIL Ltd. | 42,181 | 1,228,309 | ||||||
Crompton Greaves Ltd. | 743,911 | 1,913,074 | ||||||
Dabur India Ltd. | 1,054,021 | 4,329,454 | ||||||
DCB Bank Ltd.a | 756,108 | 1,470,131 | ||||||
Dewan Housing Finance Corp. Ltd. | 174,709 | 1,206,603 | ||||||
Dish TV India Ltd.a | 856,397 | 1,343,696 | ||||||
Divi’s Laboratories Ltd. | 84,305 | 2,998,202 | ||||||
DLF Ltd. | 470,025 | 784,141 | ||||||
Dr. Reddy’s Laboratories Ltd. | 214,941 | 13,912,236 | ||||||
Eicher Motors Ltd. | 21,663 | 6,196,579 | ||||||
Federal Bank Ltd. | 2,576,737 | 2,380,017 | ||||||
Finolex Cables Ltd. | 234,296 | 841,316 | ||||||
GAIL (India) Ltd. | 709,836 | 3,161,827 | ||||||
Gateway Distriparks Ltd. | 212,150 | 1,151,466 | ||||||
GlaxoSmithKline Consumer Healthcare Ltd. | 20,895 | 1,921,554 | ||||||
Glenmark Pharmaceuticals Ltd. | 239,306 | 4,157,210 | ||||||
GMR Infrastructure Ltd. | 3,568,211 | 625,343 | ||||||
Godrej Consumer Products Ltd. | 229,526 | 4,600,361 | ||||||
Godrej Industries Ltd. | 267,867 | 1,488,128 | ||||||
GRUH Finance Ltd. | 256,640 | 929,849 | ||||||
Gujarat Pipavav Port Ltd.a | 379,484 | 973,900 | ||||||
Havells India Ltd. | 517,492 | 2,025,206 | ||||||
HCL Technologies Ltd. | 1,016,603 | 14,850,280 | ||||||
Hero Motocorp Ltd. | 93,934 | 3,387,418 | ||||||
Hexaware Technologies Ltd. | 248,202 | 913,465 | ||||||
Hindalco Industries Ltd. | 2,178,778 | 2,623,711 | ||||||
Hindustan Unilever Ltd. | 1,363,494 | 17,658,247 | ||||||
| Security | Shares | Value | ||||||
Housing Development & Infrastructure Ltd.a | 670,481 | $ | 604,668 | |||||
Housing Development Finance Corp. Ltd. | 2,679,195 | 47,806,350 | ||||||
ICICI Bank Ltd. | 2,020,007 | 8,444,678 | ||||||
Idea Cellular Ltd. | 2,005,245 | 4,701,278 | ||||||
IFCI Ltd. | 1,886,209 | 566,076 | ||||||
Indiabulls Housing Finance Ltd. | 374,454 | 4,253,200 | ||||||
Indian Hotels Co. Ltd.a | 868,140 | 1,136,189 | ||||||
Infosys Ltd. | 3,277,998 | 53,966,770 | ||||||
IRB Infrastructure Developers Ltd. | 343,025 | 1,205,425 | ||||||
ITC Ltd. | 4,006,351 | 19,596,315 | ||||||
Jain Irrigation Systems Ltd. | 1,035,302 | 910,318 | ||||||
Jammu & Kashmir Bank Ltd. (The) | 548,908 | 795,597 | ||||||
JSW Steel Ltd. | 183,495 | 2,539,670 | ||||||
Jubilant Foodworks Ltd. | 40,611 | 1,018,528 | ||||||
Just Dial Ltd. | 64,123 | 814,668 | ||||||
Kajaria Ceramics Ltd. | 98,408 | 1,016,722 | ||||||
Karur Vysya Bank Ltd. (The) | 172,719 | 1,209,358 | ||||||
KPIT Technologies Ltd. | 472,215 | 728,479 | ||||||
Larsen & Toubro Ltd. | 576,487 | 13,900,730 | ||||||
LIC Housing Finance Ltd. | 564,650 | 3,762,918 | ||||||
Lupin Ltd. | 403,684 | 11,754,051 | ||||||
Mahindra & Mahindra Financial Services Ltd. | 552,448 | 2,099,676 | ||||||
Mahindra & Mahindra Ltd. | 674,860 | 12,394,683 | ||||||
Marico Ltd. | 465,141 | 2,837,727 | ||||||
MAX India Ltd. | 259,433 | 1,954,675 | ||||||
MindTree Ltd. | 102,425 | 2,150,732 | ||||||
Motherson Sumi Systems Ltd. | 636,614 | 2,906,542 | ||||||
Mphasis Ltd. | 182,782 | 1,162,958 | ||||||
MRF Ltd. | 2,692 | 1,635,740 | ||||||
NCC Ltd./India | 742,071 | 800,399 | ||||||
Nestle India Ltd. | 45,742 | 4,104,841 | ||||||
NIIT Technologies Ltd. | 103,086 | 723,192 | ||||||
NTPC Ltd. | 2,081,686 | 3,803,246 | ||||||
Oil & Natural Gas Corp. Ltd. | 1,519,516 | 5,470,029 | ||||||
Oil India Ltd. | 214,428 | 1,449,788 | ||||||
Page Industries Ltd. | 11,224 | 2,397,943 | ||||||
Persistent Systems Ltd. | 91,751 | 967,543 | ||||||
PI Industries Ltd. | 126,892 | 1,374,862 | ||||||
Piramal Enterprises Ltd. | 139,976 | 2,050,630 | ||||||
Power Finance Corp. Ltd. | 500,993 | 1,689,320 | ||||||
| 26 | 2015 iSHARES ANNUAL REPORTTO SHAREHOLDERS |
Table of Contents
Consolidated Schedule of Investments (Continued)
iSHARES® CORE MSCI EMERGING MARKETS ETF
August 31, 2015
| Security | Shares | Value | ||||||
PTC India Ltd. | 970,976 | $ | 875,668 | |||||
Rajesh Exports Ltd. | 164,681 | 1,254,771 | ||||||
Rallis India Ltd. | 231,588 | 746,586 | ||||||
Ramco Cements Ltd. (The) | 184,781 | 903,266 | ||||||
Raymond Ltd. | 124,045 | 732,980 | ||||||
Redington India Ltd. | 650,122 | 1,060,635 | ||||||
Reliance Capital Ltd. | 235,991 | 1,116,497 | ||||||
Reliance Communications Ltd.a | 1,768,008 | 1,606,434 | ||||||
Reliance Industries Ltd. | 2,317,109 | 29,833,977 | ||||||
Reliance Infrastructure Ltd. | 237,758 | 1,221,606 | ||||||
Rural Electrification Corp. Ltd. | 561,398 | 2,138,760 | ||||||
Shree Cement Ltd. | 17,356 | 2,814,479 | ||||||
Shree Renuka Sugars Ltd.a | 5,878,424 | 658,808 | ||||||
Shriram Transport Finance Co. Ltd. | 282,760 | 3,458,413 | ||||||
Siemens Ltd. | 152,533 | 2,902,315 | ||||||
SKS Microfinance Ltd.a | 237,143 | 1,649,210 | ||||||
Sobha Ltd. | 154,243 | 656,649 | ||||||
State Bank of India | 2,720,372 | 10,122,362 | ||||||
Sun Pharma Advanced Research Co. Ltd.a | 148,913 | 835,458 | ||||||
Sun Pharmaceuticals Industries Ltd. | 1,661,481 | 22,468,422 | ||||||
Sundaram Finance Ltd. | 67,370 | 1,471,347 | ||||||
Suzlon Energy Ltd.a | 3,843,657 | 1,277,846 | ||||||
Tata Consultancy Services Ltd. | 836,384 | 32,260,705 | ||||||
Tata Global Beverages Ltd. | 843,025 | 1,516,747 | ||||||
Tata Motors Ltd.a | 1,481,723 | 7,581,919 | ||||||
Tata Power Co. Ltd. | 2,321,768 | 2,114,826 | ||||||
Tata Steel Ltd. | 607,643 | 2,060,365 | ||||||
Tech Mahindra Ltd. | 437,643 | 3,390,540 | ||||||
Thermax Ltd. | 79,297 | 1,133,240 | ||||||
Torrent Pharmaceuticals Ltd. | 90,831 | 2,195,794 | ||||||
TTK Prestige Ltd. | 11,758 | 696,203 | ||||||
Tube Investments of India Ltd. | 173,705 | 1,051,245 | ||||||
TV18 Broadcast Ltd.a | 1,419,599 | 686,576 | ||||||
TVS Motor Co. Ltd. | 271,555 | 913,626 | ||||||
Ultratech Cement Ltd. | 71,641 | 3,114,376 | ||||||
United Breweries Ltd. | 142,242 | 1,829,193 | ||||||
United Spirits Ltd.a | 109,042 | 5,425,362 | ||||||
UPL Ltd. | 533,025 | 4,029,661 | ||||||
VA Tech Wabag Ltd. | 77,124 | 805,176 | ||||||
Vedanta Ltd. | 1,671,951 | 2,481,203 | ||||||
Vijaya Bank | 1,100,672 | 596,077 | ||||||
Voltas Ltd. | 271,112 | 1,113,201 | ||||||
| Security | Shares | Value | ||||||
Wipro Ltd. | 1,109,254 | $ | 9,541,503 | |||||
Wockhardt Ltd. | 61,228 | 1,236,396 | ||||||
Zee Entertainment Enterprises Ltd. | 1,104,932 | 6,396,056 | ||||||
|
| |||||||
| 622,614,451 | ||||||||
INDONESIA — 2.38% | ||||||||
Ace Hardware Indonesia Tbk PT | 19,429,300 | 822,807 | ||||||
Adaro Energy Tbk PT | 26,114,100 | 1,105,900 | ||||||
Alam Sutera Realty Tbk PT | 25,739,700 | 648,530 | ||||||
Aneka Tambang Persero Tbk PTa | 12,865,300 | 457,840 | ||||||
Arwana Citramulia Tbk PT | 12,907,000 | 436,358 | ||||||
Astra Agro Lestari Tbk PT | 786,700 | 958,878 | ||||||
Astra International Tbk PT | 35,695,500 | 15,053,084 | ||||||
Bank Bukopin Tbk | 14,728,800 | 712,853 | ||||||
Bank Central Asia Tbk PT | 22,116,200 | 20,305,977 | ||||||
Bank Danamon Indonesia Tbk PT | 6,689,600 | 1,683,113 | ||||||
Bank Mandiri Persero Tbk PT | 16,994,300 | 11,006,984 | ||||||
Bank Negara Indonesia Persero Tbk PT | 13,740,200 | 4,840,853 | ||||||
Bank Pembangunan Daerah Jawa Barat Dan Banten Tbk PT | 9,012,800 | 445,829 | ||||||
Bank Rakyat Indonesia Persero Tbk PT | 19,928,400 | 15,070,409 | ||||||
Bank Tabungan Negara Persero Tbk PT | 11,053,976 | 837,899 | ||||||
Bumi Serpong Damai Tbk PT | 16,094,200 | 1,838,519 | ||||||
Charoen Pokphand Indonesia Tbk PT | 14,422,200 | 1,919,538 | ||||||
Ciputra Development Tbk PT | 21,977,500 | 1,353,063 | ||||||
Ciputra Property Tbk PT | 11,454,000 | 297,559 | ||||||
Eagle High Plantations Tbk PT | 25,029,200 | 459,611 | ||||||
Energi Mega Persada Tbk PTa | 93,718,500 | 373,540 | ||||||
Gudang Garam Tbk PT | 904,700 | 2,865,420 | ||||||
Hanson International Tbk PTa | 32,133,600 | 1,646,704 | ||||||
Indocement Tunggal Prakarsa Tbk PT | 2,635,100 | 3,680,700 | ||||||
Indofood CBP Sukses Makmur Tbk PT | 2,222,300 | 2,016,678 | ||||||
Indofood Sukses Makmur Tbk PT | 8,050,900 | 3,036,994 | ||||||
Jasa Marga Persero Tbk PT | 4,279,400 | 1,568,606 | ||||||
CONSOLIDATED SCHEDULESOF INVESTMENTS | 27 |
Table of Contents
Consolidated Schedule of Investments (Continued)
iSHARES® CORE MSCI EMERGING MARKETS ETF
August 31, 2015
| Security | Shares | Value | ||||||
Kalbe Farma Tbk PT | 40,679,700 | $ | 4,849,715 | |||||
Kawasan Industri Jababeka Tbk PT | 55,213,713 | 774,171 | ||||||
Krakatau Steel Persero Tbk PTa | 4,350,100 | 99,077 | ||||||
Link Net Tbk PTa | 2,215,000 | 760,667 | ||||||
Lippo Cikarang Tbk PTa | 1,665,200 | 838,526 | ||||||
Lippo Karawaci Tbk PT | 34,321,800 | 2,613,831 | ||||||
Matahari Department Store Tbk PT | 4,140,900 | 5,165,073 | ||||||
Media Nusantara Citra Tbk PT | 10,270,000 | 1,385,171 | ||||||
Mitra Adiperkasa Tbk PTa | 1,815,300 | 516,811 | ||||||
Modernland Realty Tbk PT | 28,149,900 | 721,279 | ||||||
Multipolar Tbk PT | 15,589,354 | 454,921 | ||||||
Pakuwon Jati Tbk PT | 53,744,800 | 1,453,596 | ||||||
Panin Financial Tbk PTa | 37,460,200 | 693,214 | ||||||
Pembangunan Perumahan Persero Tbk PT | 5,367,100 | 1,264,420 | ||||||
Perusahaan Gas Negara Persero Tbk PT | 19,905,100 | 3,938,518 | ||||||
Perusahaan Perkebunan London Sumatra Indonesia Tbk PT | 8,157,300 | 627,038 | ||||||
Ramayana Lestari Sentosa Tbk PT | 10,688,900 | 460,269 | ||||||
Salim Ivomas Pratama Tbk PT | 5,851,700 | 195,751 | ||||||
Semen Indonesia Persero Tbk PT | 5,439,600 | 3,581,231 | ||||||
Sugih Energy Tbk PTa | 41,472,600 | 1,163,004 | ||||||
Summarecon Agung Tbk PT | 21,025,200 | 2,424,258 | ||||||
Surya Citra Media Tbk PT | 11,730,400 | 2,279,288 | ||||||
Tambang Batubara Bukit Asam Persero Tbk PT | 1,734,800 | 722,319 | ||||||
Telekomunikasi Indonesia Persero Tbk PT | 88,611,200 | 18,100,651 | ||||||
Timah Persero Tbk PT | 11,987,752 | 516,199 | ||||||
Tower Bersama Infrastructure Tbk PTa | 3,850,700 | 1,966,461 | ||||||
Unilever Indonesia Tbk PT | 2,789,200 | 7,886,190 | ||||||
United Tractors Tbk PT | 3,106,700 | 4,228,871 | ||||||
Wijaya Karya Persero Tbk PT | 5,873,300 | 1,155,849 | ||||||
XL Axiata Tbk PTa | 6,034,700 | 1,288,548 | ||||||
|
| |||||||
| 167,569,163 | ||||||||
MALAYSIA — 3.16% | ||||||||
AEON Credit Service M Bhd | 219,300 | 635,970 | ||||||
AirAsia Bhdb | 2,725,700 | 564,609 | ||||||
| Security | Shares | Value | ||||||
Alliance Financial Group Bhd | 2,215,800 | $ | 1,983,669 | |||||
AMMB Holdings Bhd | 3,503,200 | 3,920,248 | ||||||
Astro Malaysia Holdings Bhd | 3,350,100 | 2,313,164 | ||||||
Axiata Group Bhd | 4,637,500 | 6,779,583 | ||||||
Berjaya Corp. Bhdb | 6,894,700 | 590,974 | ||||||
Berjaya Sports Toto Bhd | 1,172,545 | 823,573 | ||||||
British American Tobacco Malaysia Bhd | 242,600 | 3,591,635 | ||||||
Bumi Armada Bhda,b | 5,079,200 | 1,033,980 | ||||||
Bursa Malaysia Bhd | 957,600 | 1,878,720 | ||||||
Cahya Mata Sarawak Bhd | 1,363,800 | 1,607,336 | ||||||
CapitaMalls Malaysia Trustb | 2,730,900 | 864,785 | ||||||
Carlsberg Brewery Malaysia Bhd | 386,900 | 1,077,793 | ||||||
CIMB Group Holdings Bhdb | 9,059,800 | 10,785,476 | ||||||
Dialog Group Bhdb | 7,971,996 | 2,980,008 | ||||||
DiGi.Com Bhdb | 6,320,600 | 7,870,652 | ||||||
DRB-Hicom Bhdb | 1,518,700 | 470,074 | ||||||
Eastern & Oriental Bhd | 1,975,890 | 719,788 | ||||||
Gamuda Bhdb | 2,931,600 | 3,029,320 | ||||||
Genting Bhdb | 3,997,800 | 6,520,221 | ||||||
Genting Malaysia Bhdb | 5,400,000 | 5,091,429 | ||||||
Genting Plantations Bhd | 562,800 | 1,322,580 | ||||||
Hartalega Holdings Bhdb | 859,700 | 1,682,556 | ||||||
Hong Leong Bank Bhd | 970,400 | 3,022,103 | ||||||
Hong Leong Financial Group Bhd | 460,700 | 1,531,279 | ||||||
IHH Healthcare Bhd | 4,647,200 | 6,472,886 | ||||||
IJM Corp. Bhdb | 2,695,400 | 4,043,100 | ||||||
IOI Corp. Bhdb | 5,185,100 | 4,938,190 | ||||||
IOI Properties Group Bhd | 2,871,573 | 1,251,185 | ||||||
KNM Group Bhda,b | 4,861,300 | 555,577 | ||||||
KPJ Healthcare Bhdb | 1,235,550 | 1,235,550 | ||||||
Kuala Lumpur Kepong Bhdb | 781,300 | 3,873,016 | ||||||
Lafarge Malaysia Bhdb | 786,400 | 1,741,314 | ||||||
Magnum Bhd | 1,185,400 | 733,819 | ||||||
Mah Sing Group Bhd | 2,991,423 | 990,019 | ||||||
Malayan Banking Bhdb | 8,083,900 | 16,860,706 | ||||||
Malaysia Airports Holdings Bhd | 1,646,900 | 1,693,954 | ||||||
Malaysia Building Society Bhdb | 2,022,000 | 659,557 | ||||||
Malaysian Resources Corp. Bhd | 2,676,900 | 544,940 | ||||||
Maxis Bhdb | 3,289,000 | 5,144,936 | ||||||
Media Prima Bhd | 3,032,700 | 758,175 | ||||||
MISC Bhd | 2,047,200 | 3,948,171 | ||||||
OSK Holdings Bhd | 1,448,300 | 562,078 | ||||||
| 28 | 2015 iSHARES ANNUAL REPORTTO SHAREHOLDERS |
Table of Contents
Consolidated Schedule of Investments (Continued)
iSHARES® CORE MSCI EMERGING MARKETS ETF
August 31, 2015
| Security | Shares | Value | ||||||
Parkson Holdings Bhda,b | 1,251,816 | $ | 312,954 | |||||
Pavilion REIT | 2,478,300 | 891,008 | ||||||
Petronas Chemicals Group Bhdb | 5,164,100 | 7,463,354 | ||||||
Petronas Dagangan Bhd | 476,200 | 2,399,141 | ||||||
Petronas Gas Bhd | 1,231,500 | 6,251,329 | ||||||
POS Malaysia Bhdb | 1,138,500 | 1,024,650 | ||||||
PPB Group Bhd | 871,700 | 3,183,780 | ||||||
Public Bank Bhdb | 4,429,560 | 18,983,829 | ||||||
QL Resources Bhd | 1,630,250 | 1,498,277 | ||||||
RHB Capital Bhd | 1,086,600 | 1,676,469 | ||||||
Sapurakencana Petroleum Bhdb | 6,359,400 | 2,604,326 | ||||||
Sime Darby Bhdb | 5,466,600 | 9,696,707 | ||||||
Sunway Bhd | 1,351,000 | 1,093,667 | ||||||
Sunway Construction Group Bhda | 3,074,070 | 819,752 | ||||||
Sunway REIT | 3,212,400 | 1,139,637 | ||||||
Supermax Corp. Bhdb | 1,316,800 | 639,589 | ||||||
Ta Ann Holdings Bhd | 695,800 | 538,417 | ||||||
TA Enterprise Bhd | 3,250,900 | 456,674 | ||||||
Telekom Malaysia Bhdb | 2,039,100 | 3,150,895 | ||||||
Tenaga Nasional Bhd | 6,027,700 | 16,045,163 | ||||||
TIME dotCom Bhd | 935,000 | 1,340,167 | ||||||
Top Glove Corp. Bhdb | 1,009,000 | 1,854,638 | ||||||
TSH Resources Bhd | 1,837,900 | 765,792 | ||||||
UMW Holdings Bhdb | 1,068,500 | 2,162,440 | ||||||
UOA Development Bhd | 1,145,100 | 515,295 | ||||||
WCT Holdings Bhd | 2,699,552 | 758,446 | ||||||
Westports Holdings Bhdb | 2,221,000 | 2,221,000 | ||||||
YTL Corp. Bhd | 7,354,500 | 2,731,671 | ||||||
YTL Power International Bhdb | 3,324,535 | 1,226,912 | ||||||
|
| |||||||
| 222,144,677 | ||||||||
MEXICO — 4.54% | ||||||||
Alfa SAB de CV | 5,122,500 | 10,193,103 | ||||||
Alsea SAB de CVb | 1,029,100 | 3,165,801 | ||||||
America Movil SAB de CV | 56,725,600 | 51,620,972 | ||||||
Arca Continental SAB de CV | 699,700 | 3,984,287 | ||||||
Axtel SAB de CV CPOa,b | 2,104,300 | 851,502 | ||||||
Banregio Grupo Financiero SAB de CVb | 538,900 | 2,821,678 | ||||||
Bolsa Mexicana de Valores SAB de CV | 1,015,800 | 1,533,386 | ||||||
Cemex SAB de CV CPOa | 22,290,023 | 17,441,478 | ||||||
Coca-Cola Femsa SAB de CV Series L | 836,200 | 6,004,893 | ||||||
| Security | Shares | Value | ||||||
Concentradora Fibra Hotelera Mexicana SA de CV | 1,137,400 | $ | 1,082,496 | |||||
Consorcio ARA SAB de CVa | 2,487,300 | 859,734 | ||||||
Controladora Comercial Mexicana SAB de CV BC Units | 760,700 | 2,168,312 | ||||||
Controladora Vuela Cia. de Aviacion SAB de CV Class Aa | 1,015,500 | 1,341,089 | ||||||
Corp Inmobiliaria Vesta SAB de CVb | 1,106,800 | 1,712,308 | ||||||
El Puerto de Liverpool SAB de CV Series C1 | 340,300 | 4,053,586 | ||||||
Fibra Uno Administracion SA de CV | 3,911,400 | 8,365,921 | ||||||
Fomento Economico Mexicano SAB de CV | 3,238,300 | 28,822,414 | ||||||
Gentera SAB de CVb | 2,012,700 | 3,209,765 | ||||||
Gruma SAB de CV Series B | 380,000 | 5,098,069 | ||||||
Grupo Aeromexico SAB de CVa,b | 892,900 | 1,332,965 | ||||||
Grupo Aeroportuario del Centro Norte SAB de CV | 492,400 | 2,575,270 | ||||||
Grupo Aeroportuario del Pacifico SAB de CV Series B | 601,300 | 5,030,423 | ||||||
Grupo Aeroportuario del Sureste SAB de CV Series B | 398,900 | 5,795,699 | ||||||
Grupo Bimbo SAB de CVa | 2,934,700 | 7,534,379 | ||||||
Grupo Carso SAB de CV Series A1 | 1,085,200 | 4,921,557 | ||||||
Grupo Comercial Chedraui SA de CV | 654,400 | 1,627,810 | ||||||
Grupo Famsa SAB de CV Series Aa,b | 755,453 | 450,210 | ||||||
Grupo Financiero Banorte SAB de CV | 4,457,300 | 21,359,445 | ||||||
Grupo Financiero Inbursa SAB de CV Series Ob | 4,204,800 | 8,858,145 | ||||||
Grupo Financiero Santander Mexico SAB de CV Series B | 3,153,000 | 4,908,007 | ||||||
Grupo Herdez SAB de CV | 651,600 | 1,591,333 | ||||||
Grupo Lala SAB de CV | 1,306,600 | 2,947,247 | ||||||
Grupo Mexico SAB de CV Series B | 6,753,300 | 17,084,481 | ||||||
Grupo Simec SAB de CV Series Ba,b | 339,000 | 930,533 | ||||||
CONSOLIDATED SCHEDULESOF INVESTMENTS | 29 |
Table of Contents
Consolidated Schedule of Investments (Continued)
iSHARES® CORE MSCI EMERGING MARKETS ETF
August 31, 2015
| Security | Shares | Value | ||||||
Grupo Televisa SAB | 4,381,100 | $ | 26,748,730 | |||||
Industrias Bachoco SAB de CV Series B | 9,600 | 45,368 | ||||||
Industrias CH SAB de CV Series Ba,b | 381,400 | 1,294,214 | ||||||
Industrias Penoles SAB de CV | 241,195 | 3,427,039 | ||||||
Kimberly-Clark de Mexico SAB de CV Series A | 2,781,400 | 6,224,170 | ||||||
Mexichem SAB de CV | 1,917,900 | 4,905,618 | ||||||
Mexico Real Estate Management SA de CV | 1,459,400 | 1,979,496 | ||||||
OHL Mexico SAB de CVa | 1,441,000 | 1,913,318 | ||||||
PLA Administradora Industrial S. de RL de CV | 1,252,100 | 2,337,054 | ||||||
Promotora y Operadora de Infraestructura SAB de CVa | 483,600 | 5,076,935 | ||||||
Qualitas Controladora SAB de CVa | 672,200 | 953,418 | ||||||
TV Azteca SAB de CV CPOb | 3,618,000 | 519,629 | ||||||
Urbi Desarrollos Urbanos SAB de CVa,b | 558,900 | — | ||||||
Wal-Mart de Mexico SAB de CV | 9,302,900 | 22,248,235 | ||||||
|
| |||||||
| 318,951,522 | ||||||||
PERU — 0.34% | ||||||||
Cia. de Minas Buenaventura SA ADR | 358,748 | 2,267,287 | ||||||
Credicorp Ltd. | 121,682 | 13,382,587 | ||||||
Southern Copper Corp. | 296,194 | 7,896,532 | ||||||
|
| |||||||
| 23,546,406 | ||||||||
PHILIPPINES — 1.46% | ||||||||
Aboitiz Equity Ventures Inc. | 3,275,860 | 3,861,786 | ||||||
Aboitiz Power Corp. | 2,416,100 | 2,235,694 | ||||||
Alliance Global Group Inc. | 3,783,700 | 1,602,851 | ||||||
Ayala Corp. | 378,280 | 5,972,842 | ||||||
Ayala Land Inc. | 13,119,300 | 10,090,690 | ||||||
Bank of the Philippine Islands | 1,298,495 | 2,350,293 | ||||||
BDO Unibank Inc. | 2,860,730 | 6,028,710 | ||||||
Belle Corp. | 9,926,900 | 656,271 | ||||||
Cebu Air Inc. | 501,720 | 960,181 | ||||||
Cosco Capital Inc. | 3,789,400 | 563,464 | ||||||
D&L Industries Inc. | 5,932,000 | 1,446,829 | ||||||
DMCI Holdings Inc. | 7,597,000 | 1,849,676 | ||||||
East West Banking Corp.a | 1,377,200 | 612,875 | ||||||
Energy Development Corp. | 17,567,700 | 2,255,160 | ||||||
Filinvest Land Inc. | 21,235,000 | 813,236 | ||||||
| Security | Shares | Value | ||||||
First Gen Corp. | 2,435,900 | $ | 1,216,908 | |||||
First Philippine Holdings Corp. | 352,250 | 527,546 | ||||||
Globe Telecom Inc. | 60,200 | 3,317,826 | ||||||
GT Capital Holdings Inc. | 155,060 | 4,213,226 | ||||||
International Container Terminal Services Inc. | 819,630 | 1,629,966 | ||||||
JG Summit Holdings Inc. | 4,599,153 | 6,986,304 | ||||||
Jollibee Foods Corp. | 751,470 | 3,078,873 | ||||||
Lopez Holdings Corp. | 4,793,000 | 693,211 | ||||||
Manila Water Co. Inc. | 2,188,900 | 1,058,390 | ||||||
Megaworld Corp. | 21,937,200 | 2,032,265 | ||||||
Melco Crown Philippines Resorts Corp.a | 4,175,500 | 536,901 | ||||||
Metro Pacific Investments Corp. | 24,043,500 | 2,572,048 | ||||||
Metropolitan Bank & Trust Co. | 592,682 | 1,061,984 | ||||||
Nickel Asia Corp. | 3,711,324 | 639,199 | ||||||
Philippine Long Distance Telephone Co. | 165,195 | 8,899,465 | ||||||
Philippine National Banka | 453,406 | 582,036 | ||||||
Rizal Commercial Banking Corp. | 655,190 | 490,622 | ||||||
Security Bank Corp. | 917,400 | 2,588,897 | ||||||
SM Investments Corp. | 279,845 | 5,256,823 | ||||||
SM Prime Holdings Inc. | 15,129,296 | 6,311,966 | ||||||
Universal Robina Corp. | 1,610,810 | 6,685,861 | ||||||
Vista Land & Lifescapes Inc. | 8,173,400 | 1,019,489 | ||||||
|
| |||||||
| 102,700,364 | ||||||||
POLAND — 1.53% | ||||||||
Alior Bank SAa | 102,960 | 2,396,710 | ||||||
Asseco Poland SA | 141,744 | 1,968,369 | ||||||
Bank Handlowy w Warszawie SA | 55,282 | 1,281,143 | ||||||
Bank Millennium SAa | 1,166,993 | 1,840,512 | ||||||
Bank Pekao SA | 225,613 | 9,625,174 | ||||||
Bank Zachodni WBK SAa | 63,568 | 5,105,458 | ||||||
Budimex SA | 28,813 | 1,495,773 | ||||||
CCC SA | 45,501 | 2,061,183 | ||||||
Ciech SAa | 73,915 | 1,419,660 | ||||||
Cyfrowy Polsat SAa | 354,980 | 2,128,384 | ||||||
ENEA SA | 368,437 | 1,386,772 | ||||||
Energa SA | 351,601 | 1,822,008 | ||||||
Eurocash SA | 160,759 | 1,772,646 | ||||||
Getin Holding SAa | 747,762 | 307,219 | ||||||
Getin Noble Bank SAa,b | 2,513,429 | 586,277 | ||||||
Globe Trade Centre SAa,b | 538,952 | 842,860 | ||||||
| 30 | 2015 iSHARES ANNUAL REPORTTO SHAREHOLDERS |
Table of Contents
Consolidated Schedule of Investments (Continued)
iSHARES® CORE MSCI EMERGING MARKETS ETF
August 31, 2015
| Security | Shares | Value | ||||||
Grupa Azoty SAa | 85,358 | $ | 2,036,293 | |||||
Grupa Lotos SAa | 175,281 | 1,389,183 | ||||||
Kernel Holding SA | 99,486 | 1,100,170 | ||||||
KGHM Polska Miedz SA | 253,885 | 5,284,771 | ||||||
LPP SA | 2,325 | 4,806,966 | ||||||
Lubelski Wegiel Bogdanka SA | 74,530 | 923,562 | ||||||
mBank SAa | 26,659 | 2,579,231 | ||||||
Netia SA | 653,936 | 948,148 | ||||||
Orange Polska SA | 1,109,765 | 2,088,540 | ||||||
PGE Polska Grupa Energetyczna SA | 1,448,633 | 5,993,973 | ||||||
Polski Koncern Naftowy Orlen SA | 588,099 | 11,508,979 | ||||||
Polskie Gornictwo Naftowe i Gazownictwo SA | 3,266,277 | 5,878,632 | ||||||
Powszechna Kasa Oszczednosci Bank Polski SA | 1,543,561 | 12,167,973 | ||||||
Powszechny Zaklad Ubezpieczen SA | 95,338 | 10,886,674 | ||||||
Synthos SA | 1,063,124 | 1,113,101 | ||||||
Tauron Polska Energia SA | 1,756,586 | 1,629,637 | ||||||
Warsaw Stock Exchange | 82,324 | 964,936 | ||||||
|
| |||||||
| 107,340,917 | ||||||||
QATAR — 1.02% | ||||||||
Al Khalij Commercial Bank QSC | 175,159 | 993,390 | ||||||
Al Meera Consumer Goods Co. QSC | 13,444 | 948,919 | ||||||
Barwa Real Estate Co. | 171,219 | 2,069,055 | ||||||
Commercial Bank QSC (The) | 199,939 | 3,151,932 | ||||||
Doha Bank QSC | 188,020 | 2,731,663 | ||||||
Ezdan Holding Group QSC | 1,270,878 | 6,628,209 | ||||||
Gulf International Services QSC | 89,532 | 1,475,356 | ||||||
Industries Qatar QSC | 269,186 | 9,832,671 | ||||||
Masraf Al Rayan QSC | 654,649 | 7,839,031 | ||||||
Mazaya Qatar Real Estate Development QSC | 144,811 | 638,328 | ||||||
Medicare Group | 18,882 | 860,842 | ||||||
Ooredoo QSC | 129,404 | 2,470,017 | ||||||
Qatar Electricity & Water Co. QSC | 50,394 | 3,031,031 | ||||||
Qatar Industrial Manufacturing Co. QSC | 43,731 | 526,055 | ||||||
Qatar Insurance Co. SAQ | 168,409 | 4,532,719 | ||||||
Qatar Islamic Bank SAQ | 105,638 | 3,278,431 | ||||||
Qatar National Bank SAQ | 305,442 | 15,015,824 | ||||||
| Security | Shares | Value | ||||||
Qatar National Cement Co. QSC | 25,404 | $ | 724,912 | |||||
Qatari Investors Group QSC | 68,011 | 895,643 | ||||||
Salam International Investment Co. | 288,220 | 1,005,299 | ||||||
United Development Co. QSC | 145,282 | 933,274 | ||||||
Vodafone Qatar QSC | 620,463 | 2,411,236 | ||||||
|
| |||||||
| 71,993,837 | ||||||||
RUSSIA — 3.23% | ||||||||
Alrosa PAO | 3,451,100 | 3,392,133 | ||||||
Gazprom PAO | 9,487,090 | 21,004,690 | ||||||
Gazprom PAO ADR | 5,838,771 | 25,748,980 | ||||||
Inter RAO UES PJSC | 53,951,000 | 907,270 | ||||||
LSR Group PJSC GDRd | 510,525 | 1,021,050 | ||||||
Lukoil PJSC | 411,859 | 15,599,036 | ||||||
Lukoil PJSC ADR (London) | 514,255 | 19,397,699 | ||||||
M Video OJSC | 252,270 | 767,548 | ||||||
Magnit PJSC GDRd | 471,953 | 23,595,290 | ||||||
Mechel ADRa | 400,939 | 457,070 | ||||||
MegaFon PJSC GDRd | 185,836 | 2,387,993 | ||||||
MMC Norilsk Nickel PJSC | 102,197 | 16,006,574 | ||||||
Mobile TeleSystems PJSC ADR | 953,052 | 7,271,787 | ||||||
Moscow Exchange MICEX-RTS PJSC | 2,299,770 | 2,543,810 | ||||||
NOVATEK OAO GDRd | 166,131 | 15,915,350 | ||||||
Rosneft OAO | 1,206,660 | 4,397,473 | ||||||
Rosneft OAO GDRd | 695,300 | 2,619,890 | ||||||
Rostelecom PJSC | 1,692,250 | 2,025,019 | ||||||
RusHydro PJSC | 229,484,000 | 1,819,500 | ||||||
Sberbank of Russia | 12,641,030 | 14,069,588 | ||||||
Sberbank of Russia ADR | 1,223,689 | 5,934,892 | ||||||
Severstal PAO | 438,210 | 4,774,860 | ||||||
Sistema JSFC GDRd | 321,774 | 2,374,692 | ||||||
Surgutneftegas OAO | 5,994,950 | 3,066,212 | ||||||
Surgutneftegas OAO ADR | 750,632 | 3,918,299 | ||||||
Tatneft PAO Class S | 2,597,030 | 12,409,070 | ||||||
Uralkali PJSCa | 731,620 | 2,236,968 | ||||||
Uralkali PJSC GDRa,d | 143,677 | 2,221,246 | ||||||
VTB Bank JSC | 5,421,870,000 | 5,567,331 | ||||||
VTB Bank JSC GDRd | 1,550,901 | 3,225,874 | ||||||
|
| |||||||
| 226,677,194 | ||||||||
SOUTH AFRICA — 7.83% | ||||||||
Adcock Ingram Holdings Ltd.a | 128,332 | 492,362 | ||||||
Adcorp Holdings Ltd. | 368,108 | 807,580 | ||||||
CONSOLIDATED SCHEDULESOF INVESTMENTS | 31 |
Table of Contents
Consolidated Schedule of Investments (Continued)
iSHARES® CORE MSCI EMERGING MARKETS ETF
August 31, 2015
| Security | Shares | Value | ||||||
Advtech Ltd. | 1,084,485 | $ | 1,004,013 | |||||
Aeci Ltd. | 239,313 | 1,757,467 | ||||||
African Oxygen Ltd. | 348,541 | 334,503 | ||||||
Anglo American Platinum Ltd.a | 91,306 | 2,204,065 | ||||||
AngloGold Ashanti Ltd.a | 715,974 | 5,764,281 | ||||||
Aspen Pharmacare Holdings Ltd. | 608,769 | 15,719,658 | ||||||
Astral Foods Ltd. | 91,534 | 1,227,998 | ||||||
Attacq Ltd.a | 891,839 | 1,499,369 | ||||||
AVI Ltd. | 621,679 | 3,796,370 | ||||||
Barclays Africa Group Ltd. | 576,682 | 7,554,461 | ||||||
Barloworld Ltd. | 424,395 | 2,726,008 | ||||||
Bidvest Group Ltd. (The) | 554,973 | 13,342,699 | ||||||
Blue Label Telecoms Ltd. | 1,219,979 | 935,385 | ||||||
Brait SEa | 632,766 | 6,925,757 | ||||||
Capital Property Funda | 2,802,378 | 3,295,859 | ||||||
Capitec Bank Holdings Ltd. | 70,589 | 2,569,606 | ||||||
Cashbuild Ltd. | 54,800 | 1,292,304 | ||||||
City Lodge Hotels Ltd. | 106,316 | 1,138,163 | ||||||
Clicks Group Ltd.b | 486,503 | 3,357,482 | ||||||
Clover Industries Ltd. | 606,808 | 800,584 | ||||||
Coronation Fund Managers Ltd. | 422,259 | 2,351,286 | ||||||
DataTec Ltd. | 363,383 | 2,054,675 | ||||||
Discovery Ltd. | 660,380 | 6,671,883 | ||||||
Emira Property Fund Ltd. | 932,100 | 1,235,375 | ||||||
EOH Holdings Ltd. | 222,546 | 2,659,294 | ||||||
Famous Brands Ltd. | 138,646 | 1,434,098 | ||||||
FirstRand Ltd. | 5,973,605 | 23,828,218 | ||||||
Foschini Group Ltd. (The) | 375,025 | 4,238,178 | ||||||
Gold Fields Ltd. | 1,386,794 | 4,452,838 | ||||||
Grindrod Ltd. | 935,900 | 1,001,925 | ||||||
Group Five Ltd./South Africa | 417,416 | 701,764 | ||||||
Growthpoint Properties Ltd. | 3,840,893 | 7,575,080 | ||||||
Harmony Gold Mining Co. Ltd.a,b | 949,996 | 807,882 | ||||||
Hosken Consolidated Investments Ltd. | 93,399 | 992,979 | ||||||
Hudaco Industries Ltd. | 118,503 | 1,009,544 | ||||||
Hyprop Investments Ltd. | 450,983 | 4,215,986 | ||||||
Impala Platinum Holdings Ltd.a | 906,354 | 3,383,731 | ||||||
Imperial Holdings Ltd. | 327,186 | 4,551,016 | ||||||
Investec Ltd. | 419,268 | 3,411,230 | ||||||
JSE Ltd. | 196,624 | 2,040,469 | ||||||
Lewis Group Ltd. | 181,511 | 855,948 | ||||||
Liberty Holdings Ltd. | 208,609 | 2,025,658 | ||||||
| Security | Shares | Value | ||||||
Life Healthcare Group Holdings Ltd. | 1,666,949 | $ | 4,783,088 | |||||
Massmart Holdings Ltd. | 191,455 | 1,654,126 | ||||||
Mediclinic International Ltd. | 876,321 | 7,038,712 | ||||||
Metair Investments Ltd. | 349,125 | 863,321 | ||||||
MMI Holdings Ltd./South Africa | 1,897,388 | 4,021,002 | ||||||
Mondi Ltd. | 218,882 | 5,074,422 | ||||||
Mpact Ltd. | 434,158 | 1,564,563 | ||||||
Mr. Price Group Ltd. | 433,311 | 7,795,792 | ||||||
MTN Group Ltd. | 2,931,476 | 39,111,394 | ||||||
Murray & Roberts Holdings Ltd. | 1,133,367 | 1,072,338 | ||||||
Nampak Ltd. | 1,076,318 | 2,504,112 | ||||||
Naspers Ltd. Class N | 707,841 | 91,733,696 | ||||||
Nedbank Group Ltd. | 337,364 | 6,001,934 | ||||||
Netcare Ltd. | 1,764,385 | 5,302,100 | ||||||
Northam Platinum Ltd.a | 618,949 | 1,759,660 | ||||||
Omnia Holdings Ltd.b | 123,410 | 1,535,060 | ||||||
Pick n Pay Holdings Ltd. | 585,294 | 1,207,278 | ||||||
Pick n Pay Stores Ltd.b | 444,411 | 2,097,377 | ||||||
Pioneer Foods Ltd. | 151,648 | 2,275,134 | ||||||
PPC Ltd. | 1,109,360 | 1,814,887 | ||||||
PSG Group Ltd. | 186,265 | 2,780,441 | ||||||
Rand Merchant Insurance Holdings Ltd. | 1,299,309 | 4,112,181 | ||||||
Redefine Properties Ltd. | 7,117,501 | 6,160,085 | ||||||
Remgro Ltd. | 845,780 | 16,130,985 | ||||||
Resilient Property Income Fund Ltd. | 528,624 | 4,463,568 | ||||||
Reunert Ltd. | 321,792 | 1,558,469 | ||||||
RMB Holdings Ltd. | 1,259,101 | 6,374,174 | ||||||
Royal Bafokeng Platinum Ltd.a | 165,350 | 411,248 | ||||||
SA Corporate Real Estate Fund Nominees Pty Ltd. | 3,253,494 | 1,250,943 | ||||||
Sanlam Ltd. | 3,091,368 | 14,866,907 | ||||||
Sappi Ltd.a | 980,098 | 3,141,072 | ||||||
Sasol Ltd. | 977,397 | 31,310,158 | ||||||
Shoprite Holdings Ltd. | 806,580 | 9,873,487 | ||||||
Sibanye Gold Ltd. | 1,344,470 | 1,540,678 | ||||||
SPAR Group Ltd. (The) | 306,833 | 4,395,143 | ||||||
Standard Bank Group Ltd. | 2,126,365 | 23,424,201 | ||||||
Steinhoff International Holdings Ltd. | 4,082,823 | 24,458,308 | ||||||
Sun International Ltd./ | 197,214 | 1,542,564 | ||||||
Super Group Ltd./South Africaa | 671,097 | 1,674,169 | ||||||
| 32 | 2015 iSHARES ANNUAL REPORTTO SHAREHOLDERS |
Table of Contents
Consolidated Schedule of Investments (Continued)
iSHARES® CORE MSCI EMERGING MARKETS ETF
August 31, 2015
| Security | Shares | Value | ||||||
Telkom SA SOC Ltd. | 428,278 | $ | 2,050,297 | |||||
Tiger Brands Ltd. | 289,332 | 6,539,513 | ||||||
Tongaat Hulett Ltd. | 194,605 | 1,686,917 | ||||||
Trencor Ltd.b | 306,294 | 1,246,951 | ||||||
Truworths International Ltd. | 772,993 | 5,121,332 | ||||||
Tsogo Sun Holdings Ltd. | 648,793 | 1,149,453 | ||||||
Vodacom Group Ltd. | 649,292 | 6,926,010 | ||||||
Vukile Property Fund Ltd. | 952,118 | 1,313,588 | ||||||
Wilson Bayly Holmes-Ovcon Ltd. | 138,628 | 992,869 | ||||||
Woolworths Holdings Ltd./South Africa | 1,711,692 | 12,840,029 | ||||||
Zeder Investments Ltd. | 2,229,464 | 1,307,668 | ||||||
|
| |||||||
| 549,898,435 | ||||||||
SOUTH KOREA — 14.87% | ||||||||
Ahnlab Inc.b | 22,718 | 864,350 | ||||||
Amicogen Inc.b | 15,279 | 1,121,300 | ||||||
AmorePacific Corp.b | 58,317 | 18,662,426 | ||||||
AmorePacific Group | 51,871 | 7,543,278 | ||||||
Asiana Airlines Inc.a | 206,904 | 886,919 | ||||||
ATLASBX Co. Ltd.b | 25,495 | 833,128 | ||||||
BGF retail Co. Ltd. | 19,116 | 3,256,710 | ||||||
Binggrae Co. Ltd. | 14,350 | 875,984 | ||||||
Bioland Ltd.b | 26,557 | 602,879 | ||||||
BNK Financial Group Inc. | 385,719 | 4,533,075 | ||||||
Bukwang Pharmaceutical Co. Ltd. | 52,838 | 1,101,210 | ||||||
Cell Biotech Co. Ltd.b | 16,372 | 759,943 | ||||||
Celltrion Inc.a,b | 113,340 | 6,803,754 | ||||||
Chabiotech Co. Ltd.a,b | 81,342 | 1,010,972 | ||||||
Cheil Industries Inc.a,b | 56,112 | 8,444,672 | ||||||
Cheil Worldwide Inc.a | 141,591 | 2,083,013 | ||||||
Chong Kun Dang Pharmaceutical Corp. | 16,005 | 975,659 | ||||||
CJ CGV Co. Ltd.b | 27,384 | 2,639,422 | ||||||
CJ CheilJedang Corp. | 14,643 | 4,865,524 | ||||||
CJ Corp. | 27,483 | 6,680,501 | ||||||
CJ E&M Corp.a | 37,548 | 2,622,249 | ||||||
CJ Freshway Corp.b | 17,914 | 1,363,145 | ||||||
CJ Hellovision Co. Ltd. | 74,568 | 731,337 | ||||||
CJ Korea Express Co. Ltd.a | 12,993 | 1,955,404 | ||||||
CJ O Shopping Co. Ltd. | 6,132 | 1,032,758 | ||||||
Com2uSCorp.a,b | 17,273 | 1,545,114 | ||||||
Cosmax Inc. | 13,359 | 2,445,338 | ||||||
COSON Co. Ltd.a,b | 32,651 | 817,138 | ||||||
| Security | Shares | Value | ||||||
Coway Co. Ltd. | 96,258 | $ | 6,868,886 | |||||
Daeduck Electronics Co. | 115,097 | 709,412 | ||||||
Daeduck GDS Co. Ltd.b | 66,920 | 506,957 | ||||||
Daekyo Co. Ltd. | 94,599 | 759,831 | ||||||
Daelim Industrial Co. Ltd. | 48,738 | 2,773,255 | ||||||
Daesang Corp. | 42,227 | 1,124,625 | ||||||
Daewoo Engineering & Construction Co. Ltd.a,b | 211,446 | 1,138,796 | ||||||
Daewoo International Corp. | 86,978 | 1,603,146 | ||||||
Daewoo Securities Co. Ltd. | 341,536 | 3,580,678 | ||||||
Daewoo Shipbuilding & Marine Engineering Co. Ltd.b | 201,971 | 1,149,241 | ||||||
Daewoong Pharmaceutical Co. Ltd.b | 10,527 | 676,434 | ||||||
Daishin Securities Co. Ltd. | 95,397 | 826,734 | ||||||
Daou Technology Inc.b | 59,791 | 1,511,521 | ||||||
Daum Kakao Corp.b | 49,724 | 5,671,332 | ||||||
DGB Financial Group Inc. | 293,301 | 2,579,015 | ||||||
Dong-A Socio Holdings Co. Ltd.b | 5,790 | 802,841 | ||||||
Dong-A ST Co. Ltd.b | 9,704 | 968,144 | ||||||
Dongbu Insurance Co. Ltd. | 75,177 | 3,381,455 | ||||||
Dongkuk Steel Mill Co. Ltd.a,b | 141,947 | 714,086 | ||||||
Dongsuh Cos. Inc. | 66,676 | 2,525,542 | ||||||
Dongwon Industries Co. Ltd.b | 3,340 | 977,079 | ||||||
Doosan Corp. | 13,902 | 1,210,658 | ||||||
Doosan Engine Co. Ltd.a,b | 120,934 | 467,274 | ||||||
Doosan Heavy Industries & Construction Co. Ltd. | 85,622 | 1,332,018 | ||||||
Doosan Infracore Co. Ltd.a | 238,295 | 1,345,856 | ||||||
DuzonBIzon Co. Ltd. | 57,672 | 1,087,369 | ||||||
DY Corp.b | 113,761 | 545,360 | ||||||
E-Mart Co. Ltd. | 37,106 | 7,168,650 | ||||||
E1 Corp.b | 5,221 | 298,847 | ||||||
EO Technics Co. Ltd.b | 16,628 | 1,516,940 | ||||||
Fila Korea Ltd. | 19,543 | 1,734,952 | ||||||
Gamevil Inc.a,b | 10,637 | 651,126 | ||||||
GemVax & Kael Co. Ltd.a,b | 46,163 | 1,319,222 | ||||||
Global & Yuasa Battery Co. Ltd.b | 20,127 | 668,773 | ||||||
GOLFZON Co. Ltd.a,b | 5,167 | 406,283 | ||||||
GOLFZONYUWONHOLDINGS Co. Ltd.b | 52,525 | 417,447 | ||||||
Grand Korea Leisure Co. Ltd.b | 59,700 | 1,579,886 | ||||||
Green Cross Cell Corp.a | 16,167 | 619,205 | ||||||
CONSOLIDATED SCHEDULESOF INVESTMENTS | 33 |
Table of Contents
Consolidated Schedule of Investments (Continued)
iSHARES® CORE MSCI EMERGING MARKETS ETF
August 31, 2015
| Security | Shares | Value | ||||||
Green Cross Corp./South Korea | 11,314 | $ | 1,889,254 | |||||
Green Cross Holdings Corp.b | 49,545 | 1,818,011 | ||||||
GS Engineering & Construction Corp.a,b | 94,801 | 1,951,726 | ||||||
GS Holdings Corp. | 88,470 | 3,474,472 | ||||||
GS Home Shopping Inc. | 6,092 | 1,030,142 | ||||||
Gwangju Shinsegae Co. Ltd.b | 2,813 | 743,236 | ||||||
Halla Holdings Corp.b | 16,163 | 688,747 | ||||||
Hana Financial Group Inc. | 509,651 | 11,720,573 | ||||||
Hana Tour Service Inc. | 18,642 | 2,482,448 | ||||||
Hancom Inc.b | 45,427 | 985,164 | ||||||
Handsome Co. Ltd. | 33,994 | 1,123,792 | ||||||
Hanil Cement Co. Ltd. | 6,617 | 724,499 | ||||||
Hanjin Heavy Industries & Construction Co. Ltd.a,b | 148,361 | 500,495 | ||||||
Hanjin Kal Corp.b | 76,850 | 1,595,153 | ||||||
Hanjin Shipping Co. Ltd.a,b | 267,823 | 1,247,689 | ||||||
Hanjin Transportation Co. Ltd.b | 18,959 | 769,420 | ||||||
Hankook Shell Oil Co. Ltd. | 2,055 | 830,514 | ||||||
Hankook Tire Co. Ltd.b | 130,632 | 4,081,042 | ||||||
Hankook Tire Worldwide Co. Ltd.b | 48,454 | 704,636 | ||||||
Hanmi Pharm Co. Ltd.a,b | 9,786 | 3,599,163 | ||||||
Hanmi Science Co. Ltd.a | 22,269 | 3,012,505 | ||||||
Hanon Systems | 68,864 | 2,116,429 | ||||||
Hansae Co. Ltd. | 37,247 | 1,977,689 | ||||||
Hansol Chemical Co. Ltd.b | 22,662 | 1,509,842 | ||||||
Hansol Holdings Co. Ltd.a | 101,735 | 654,579 | ||||||
Hanssem Co. Ltd. | 17,941 | 4,831,290 | ||||||
Hanwha Chemical Corp. | 195,441 | 2,999,158 | ||||||
Hanwha Corp. | 85,084 | 3,032,163 | ||||||
Hanwha General Insurance Co. Ltd.a,b | 141,908 | 855,467 | ||||||
Hanwha Investment & Securities Co. Ltd.b | 162,049 | 665,185 | ||||||
Hanwha Life Insurance Co. Ltd. | 396,718 | 2,666,589 | ||||||
Hanwha Techwin Co. Ltd.a,b | 65,723 | 1,739,277 | ||||||
Hite Jinro Co. Ltd.b | 52,664 | 984,041 | ||||||
HLB Inc.a,b | 58,187 | 1,116,757 | ||||||
HMC Investment Securities Co. Ltd.b | 81,493 | 716,573 | ||||||
Hotel Shilla Co. Ltd. | 59,185 | 6,029,839 | ||||||
Huchems Fine Chemical Corp. | 57,562 | 951,458 | ||||||
Hwa Shin Co. Ltd.b | 117,715 | 578,249 | ||||||
Hy-Lok Corp. | 27,944 | 805,657 | ||||||
| Security | Shares | Value | ||||||
Hyosung Corp. | 40,471 | $ | 4,379,867 | |||||
Hyundai Corp.b | 28,438 | 785,035 | ||||||
Hyundai Department Store Co. Ltd. | 26,921 | 3,425,585 | ||||||
Hyundai Development Co. Engineering & Construction | 100,282 | 5,078,750 | ||||||
Hyundai Elevator Co. Ltd.a,b | 18,705 | 1,048,524 | ||||||
Hyundai Engineering & Construction Co. Ltd. | 138,061 | 3,875,396 | ||||||
Hyundai Glovis Co. Ltd. | 34,147 | 4,965,786 | ||||||
Hyundai Greenfood Co. Ltd. | 86,529 | 1,997,245 | ||||||
Hyundai Heavy Industries Co. Ltd.a,b | 74,711 | 5,779,798 | ||||||
Hyundai Home Shopping Network Corp. | 11,622 | 1,262,673 | ||||||
Hyundai Livart Furniture Co. Ltd.b | 21,967 | 1,071,652 | ||||||
Hyundai Marine & Fire Insurance Co. Ltd. | 110,589 | 2,618,044 | ||||||
Hyundai Merchant Marine Co. Ltd.a,b | 165,258 | 1,187,650 | ||||||
Hyundai Mipo Dockyard Co. Ltd.a | 22,848 | 1,041,224 | ||||||
Hyundai Mobis Co. Ltd. | 120,996 | 21,125,068 | ||||||
Hyundai Motor Co. | 273,100 | 34,404,481 | ||||||
Hyundai Securities Co. Ltd. | 270,335 | 1,682,237 | ||||||
Hyundai Steel Co. | 141,103 | 6,311,011 | ||||||
Hyundai Wia Corp. | 28,835 | 2,547,671 | ||||||
Ilyang Pharmaceutical Co. Ltd.a,b | 32,426 | 1,304,991 | ||||||
iMarketKorea Inc. | 36,913 | 995,582 | ||||||
Industrial Bank of Korea | 491,463 | 5,484,939 | ||||||
Interpark Holdings Corp. | 87,514 | 984,093 | ||||||
iNtRON Biotechnology Inc.a,b | 25,385 | 1,062,403 | ||||||
IS Dongseo Co. Ltd.b | 23,455 | 1,233,482 | ||||||
JB Financial Group Co. Ltd.b | 206,582 | 1,114,346 | ||||||
Kangwon Land Inc. | 216,064 | 7,773,006 | ||||||
KB Capital Co. Ltd.b | 46,207 | 918,085 | ||||||
KB Financial Group Inc. | 680,216 | 20,589,079 | ||||||
KB Insurance Co. Ltd. | 77,483 | 1,601,741 | ||||||
KCC Corp.b | 10,577 | 3,510,017 | ||||||
KCP Co. Ltd.a,b | 24,515 | 724,413 | ||||||
KEPCO Plant Service & Engineering Co. Ltd. | 43,155 | 4,597,362 | ||||||
Kia Motors Corp. | 466,959 | 19,227,143 | ||||||
| 34 | 2015 iSHARES ANNUAL REPORTTO SHAREHOLDERS |
Table of Contents
Consolidated Schedule of Investments (Continued)
iSHARES® CORE MSCI EMERGING MARKETS ETF
August 31, 2015
| Security | Shares | Value | ||||||
KISWIRE Ltd.b | 17,012 | $ | 670,268 | |||||
KIWOOM Securities Co. Ltd.b | 23,832 | 1,148,530 | ||||||
Koh Young Technology Inc.b | 33,088 | 1,063,068 | ||||||
Kolon Corp.b | 13,316 | 944,589 | ||||||
Kolon Industries Inc. | 32,822 | 1,537,382 | ||||||
Kolon Life Science Inc.b | 8,858 | 1,470,904 | ||||||
Komipharm International Co. Ltd.a,b | 64,284 | 1,016,369 | ||||||
Korea Aerospace Industries Ltd. | 84,905 | 6,625,856 | ||||||
Korea Electric Power Corp. | 453,951 | 18,422,869 | ||||||
Korea Gas Corp. | 46,626 | 1,586,723 | ||||||
Korea Investment Holdings Co. Ltd. | 72,332 | 4,268,674 | ||||||
Korea Kolmar Co. Ltd.b | 27,742 | 2,439,373 | ||||||
Korea Petro Chemical Ind.b | 7,022 | 863,835 | ||||||
Korea Zinc Co. Ltd. | 15,871 | 6,883,807 | ||||||
Korean Air Lines Co. Ltd.a | 65,948 | 1,856,748 | ||||||
Korean Reinsurance Co. | 189,668 | 2,229,030 | ||||||
KT Corp.a | 50,177 | 1,223,933 | ||||||
KT Skylife Co. Ltd. | 53,949 | 896,299 | ||||||
KT&G Corp. | 195,830 | 18,295,680 | ||||||
Kukdo Chemical Co. Ltd.b | 14,316 | 865,436 | ||||||
Kumho Petrochemical Co. Ltd. | 25,238 | 1,169,345 | ||||||
Kumho Tire Co. Inc.a,b | 194,729 | 1,047,116 | ||||||
Kwang Dong Pharmaceutical Co. Ltd. | 97,618 | 1,019,304 | ||||||
Kwangju Banka,b | 102,617 | 678,474 | ||||||
LF Corp. | 44,505 | 1,230,449 | ||||||
LG Chem Ltd. | 83,604 | 16,540,550 | ||||||
LG Corp. | 170,990 | 8,413,966 | ||||||
LG Display Co. Ltd. | 406,747 | 7,926,881 | ||||||
LG Electronics Inc.b | 184,899 | 6,956,673 | ||||||
LG Hausys Ltd.b | 12,556 | 1,666,702 | ||||||
LG Household & Health Care Ltd. | 16,708 | 11,329,373 | ||||||
LG Innotek Co. Ltd.b | 26,249 | 2,039,554 | ||||||
LG International Corp. | 58,241 | 1,295,065 | ||||||
LG Life Sciences Ltd.a,b | 27,682 | 1,376,201 | ||||||
LG Uplus Corp. | 397,240 | 3,694,475 | ||||||
Lotte Chemical Corp. | 28,745 | 6,002,972 | ||||||
Lotte Chilsung Beverage Co. Ltd. | 1,185 | 2,289,347 | ||||||
Lotte Confectionery Co. Ltd. | 1,359 | 2,238,285 | ||||||
Lotte Food Co. Ltd.b | 1,584 | 1,475,855 | ||||||
LOTTE Himart Co. Ltd. | 16,964 | 930,851 | ||||||
| Security | Shares | Value | ||||||
Lotte Shopping Co. Ltd. | 19,518 | $ | 4,414,344 | |||||
LS Corp. | 32,152 | 846,785 | ||||||
LS Industrial Systems Co. Ltd. | 32,126 | 1,173,404 | ||||||
Maeil Dairy Industry Co. Ltd.b | 23,831 | 690,097 | ||||||
Mando Corp.b | 13,813 | 1,366,410 | ||||||
Medipost Co. Ltd.a,b | 14,463 | 1,068,752 | ||||||
Medy-Tox Inc. | 7,729 | 3,326,852 | ||||||
MegaStudy Co. Ltd. | 14,427 | 523,288 | ||||||
Meritz Fire & Marine Insurance Co. Ltd.b | 116,227 | 1,518,247 | ||||||
Meritz Securities Co. Ltd.b | 439,800 | 1,810,886 | ||||||
Mirae Asset Securities Co. Ltd. | 48,424 | 1,598,780 | ||||||
Modetour Network Inc.b | 35,062 | 1,258,408 | ||||||
Muhak Co. Ltd.a,b | 30,282 | 1,300,635 | ||||||
Namhae Chemical Corp. | 87,534 | 773,393 | ||||||
Namyang Dairy Products Co. Ltd.b | 1,372 | 944,247 | ||||||
NAVER Corp. | 49,706 | 20,823,778 | ||||||
NCsoft Corp.b | 27,231 | 5,030,626 | ||||||
Neowiz Games Corp.a,b | 43,416 | 735,989 | ||||||
Nexen Corp. | 8,382 | 582,541 | ||||||
Nexen Tire Corp.b | 73,334 | 886,642 | ||||||
NH Investment & Securities Co. Ltd. | 258,794 | 2,124,616 | ||||||
NHN Entertainment Corp.a,b | 28,664 | 1,378,974 | ||||||
NICE Holdings Co. Ltd.b | 51,000 | 1,077,996 | ||||||
Nong Shim Holdings Co. Ltd.b | 6,040 | 674,090 | ||||||
NongShim Co. Ltd. | 6,219 | 1,934,975 | ||||||
OCI Co. Ltd.b | 31,193 | 2,154,697 | ||||||
OCI Materials Co. Ltd.b | 15,264 | 1,415,735 | ||||||
Orion Corp./Republic of Korea | 6,356 | 5,013,864 | ||||||
Osstem Implant Co. Ltd.a,b | 24,380 | 1,335,721 | ||||||
Ottogi Corp.b | 2,428 | 2,139,062 | ||||||
Paradise Co. Ltd.a,b | 87,282 | 1,682,545 | ||||||
Partron Co. Ltd.b | 96,061 | 633,503 | ||||||
Poongsan Corp. | 49,350 | 1,024,344 | ||||||
POSCO | 120,335 | 19,330,924 | ||||||
POSCO Chemtech Co. Ltd.b | 66,928 | 679,041 | ||||||
POSCO ICT Co. Ltd.b | 170,864 | 735,318 | ||||||
Pyeong Hwa Automotive Co. Ltd.b | 49,956 | 494,175 | ||||||
S&T Dynamics Co. Ltd. | 72,823 | 800,422 | ||||||
S-1 Corp. | 33,256 | 2,640,235 | ||||||
S-Oil Corp. | 82,847 | 4,202,765 | ||||||
Samchully Co. Ltd.b | 6,965 | 677,214 | ||||||
CONSOLIDATED SCHEDULESOF INVESTMENTS | 35 |
Table of Contents
Consolidated Schedule of Investments (Continued)
iSHARES® CORE MSCI EMERGING MARKETS ETF
August 31, 2015
| Security | Shares | Value | ||||||
Samkwang Glassb | 10,551 | $ | 880,477 | |||||
Samlip General Foods Co. Ltd. | 4,798 | 1,484,733 | ||||||
Samsung C&T Corp. | 216,197 | 8,792,286 | ||||||
Samsung Card Co. Ltd. | 60,670 | 1,859,469 | ||||||
Samsung Electro-Mechanics Co. Ltd. | 106,009 | 5,440,496 | ||||||
Samsung Electronics Co. Ltd. | 195,832 | 180,309,489 | ||||||
Samsung Fine Chemicals Co. Ltd. | 37,816 | 1,136,638 | ||||||
Samsung Fire & Marine Insurance Co. Ltd. | 63,806 | 14,538,759 | ||||||
Samsung Heavy Industries Co. Ltd.b | 263,862 | 2,509,784 | ||||||
Samsung Life Insurance Co. Ltd. | 142,114 | 11,811,292 | ||||||
Samsung SDI Co. Ltd. | 96,047 | 6,861,950 | ||||||
Samsung SDS Co. Ltd. | 55,597 | 12,057,181 | ||||||
Samsung Securities Co. Ltd. | 101,551 | 3,880,875 | ||||||
Sansung Life & Science Co. Ltd.a,b | 24,162 | 1,068,419 | ||||||
SeAH Besteel Corp. | 29,576 | 797,696 | ||||||
Sebang Co. Ltd.b | 41,223 | 655,246 | ||||||
Seegene Inc.a,b | 32,948 | 1,300,927 | ||||||
Seobu T&Da,b | 40,782 | 770,643 | ||||||
Seoul Semiconductor Co. Ltd.a,b | 76,044 | 909,763 | ||||||
SFA Engineering Corp.b | 23,992 | 883,409 | ||||||
Shinhan Financial Group Co. Ltd. | 756,814 | 25,307,118 | ||||||
Shinsegae Co. Ltd. | 12,115 | 2,565,891 | ||||||
Shinsegae Food Co. Ltd.b | 4,711 | 930,052 | ||||||
Shinsegae International Co. Ltd.b | 6,311 | 784,373 | ||||||
SIMMTECH Co. Ltd.a,b | 60,349 | 602,087 | ||||||
Sindoh Co. Ltd. | 15,835 | 772,504 | ||||||
SK Chemicals Co. Ltd.b | 27,603 | 1,598,652 | ||||||
SK Gas Ltd.b | 8,935 | 667,811 | ||||||
SK Holdings Co. Ltd. | 64,101 | 14,633,075 | ||||||
SK Hynix Inc. | 1,037,045 | 31,389,737 | ||||||
SK Innovation Co. Ltd.a | 116,213 | 9,815,835 | ||||||
SK Networks Co. Ltd. | 222,264 | 1,234,643 | ||||||
SK Securities Co. Ltd.a,b | 732,996 | 743,686 | ||||||
SK Telecom Co. Ltd. | 16,847 | 3,475,517 | ||||||
SKC Co. Ltd.b | 43,922 | 1,424,146 | ||||||
SL Corp.b | 38,275 | 503,214 | ||||||
SM Entertainment Co.a,b | 35,044 | 1,303,687 | ||||||
| Security | Shares | Value | ||||||
Soulbrain Co. Ltd. | 23,886 | $ | 875,467 | |||||
Ssangyong Motor Co.a,b | 92,059 | 671,714 | ||||||
Sung Kwang Bend Co. Ltd.b | 68,834 | 602,352 | ||||||
Sungwoo Hitech Co. Ltd.b | 92,406 | 611,743 | ||||||
Suprema Inc.a,b | 44,827 | 839,500 | ||||||
Taekwang Industrial Co. Ltd.b | 681 | 684,599 | ||||||
Taewoong Co. Ltd.a,b | 51,116 | 648,269 | ||||||
Taeyoung Engineering & Construction Co. Ltd.a | 170,645 | 934,923 | ||||||
Taihan Electric Wire Co. Ltd.a,b | 200,343 | 203,265 | ||||||
Tera Resource Co. Ltd.a | 49,111 | — | ||||||
TK Corp.a,b | 81,787 | 722,616 | ||||||
Tongyang Life Insurance | 85,547 | 1,084,933 | ||||||
ViroMed Co. Ltd.a,b | 23,557 | 3,146,908 | ||||||
Webzen Inc.a,b | 27,205 | 717,646 | ||||||
WeMade Entertainment Co. Ltd.a,b | 19,347 | 844,054 | ||||||
Wonik IPS Co. Ltd.a,b | 100,471 | 942,911 | ||||||
Woori Bank | 575,648 | 4,438,732 | ||||||
YG Entertainment Inc.b | 22,838 | 1,123,798 | ||||||
Youlchon Chemical Co. Ltd.b | 67,008 | 691,184 | ||||||
Youngone Corp.b | 42,077 | 2,180,782 | ||||||
Youngone Holdings Co. Ltd.b | 13,155 | 934,280 | ||||||
Yuanta Securities Korea Co. Ltd.a,b | 189,014 | 666,403 | ||||||
Yuhan Corp. | 13,919 | 2,924,432 | ||||||
Yungjin Pharmaceutical Co. Ltd.a,b | 374,652 | 684,209 | ||||||
|
| |||||||
| 1,044,518,791 | ||||||||
TAIWAN — 12.94% | ||||||||
A-DATA Technology Co. Ltd.b | 775,820 | 679,582 | ||||||
Ability Enterprise Co. Ltd.b | 1,461,000 | 646,619 | ||||||
AcBel Polytech Inc.b | 1,266,000 | 657,592 | ||||||
Accton Technology Corp.b | 2,265,000 | 957,209 | ||||||
Acer Inc.a,b | 5,303,872 | 1,956,186 | ||||||
Advanced Semiconductor Engineering Inc.b | 11,115,000 | 11,478,485 | ||||||
Advantech Co. Ltd. | 569,302 | 3,622,004 | ||||||
Airtac International Groupb | 235,190 | 1,120,434 | ||||||
ALI Corp.b | 1,750,000 | 677,711 | ||||||
Alpha Networks Inc.b | 1,393,000 | 494,503 | ||||||
Altek Corp.b | 836,000 | 528,024 | ||||||
Ambassador Hotel (The) | 971,000 | 826,675 | ||||||
AmTRAN Technology Co. Ltd.b | 1,746,000 | 794,222 | ||||||
Ardentec Corp.b | 1,299,912 | 815,042 | ||||||
| 36 | 2015 iSHARES ANNUAL REPORTTO SHAREHOLDERS |
Table of Contents
Consolidated Schedule of Investments (Continued)
iSHARES® CORE MSCI EMERGING MARKETS ETF
August 31, 2015
| Security | Shares | Value | ||||||
Asia Cement Corp. | 3,234,050 | $ | 3,473,999 | |||||
Asia Optical Co. Inc.a,b | 741,000 | 638,832 | ||||||
Asia Pacific Telecom Co. Ltd.a | 3,605,000 | 985,015 | ||||||
Asia Polymer Corp. | 1,443,850 | 743,315 | ||||||
Asustek Computer Inc.b | 1,241,000 | 11,290,140 | ||||||
AU Optronics Corp.b | 14,932,000 | 4,818,847 | ||||||
Bank of Kaohsiung Co. Ltd. | 3,833,043 | 987,242 | ||||||
BES Engineering Corp.b | 4,373,000 | 1,008,037 | ||||||
Bizlink Holding Inc.b | 229,583 | 966,710 | ||||||
Brogent Technologies Inc.b | 71,800 | 550,593 | ||||||
Capital Securities Corp.b | 2,827,000 | 719,436 | ||||||
Career Technology MFG. Co. Ltd.b | 958,000 | 736,108 | ||||||
Casetek Holdings Ltd.b | 277,000 | 1,034,408 | ||||||
Catcher Technology Co. Ltd. | 1,173,000 | 11,969,388 | ||||||
Cathay Financial Holding Co. Ltd. | 14,359,078 | 20,698,327 | ||||||
Cathay Real Estate Development Co. Ltd.b | 1,497,000 | 579,733 | ||||||
Chailease Holding Co. Ltd. | 1,828,945 | 2,939,938 | ||||||
Chang Hwa Commercial Bank Ltd. | 7,014,290 | 3,406,251 | ||||||
Cheng Loong Corp. | 1,587,000 | 560,933 | ||||||
Cheng Shin Rubber Industry Co. Ltd.b | 2,515,650 | 4,036,050 | ||||||
Cheng Uei Precision Industry Co. Ltd.b | 762,000 | 1,059,765 | ||||||
Chia Hsin Cement Corp.b | 894,000 | 267,354 | ||||||
Chicony Electronics Co. Ltd. | 849,302 | 2,109,159 | ||||||
Chin-Poon Industrial Co. Ltd.b | 792,000 | 1,117,310 | ||||||
China Airlines Ltd.a | 4,766,000 | 1,713,862 | ||||||
China Bills Finance Corp.b | 2,720,000 | 932,137 | ||||||
China Development Financial Holding Corp. | 24,250,000 | 6,998,632 | ||||||
China Life Insurance Co. Ltd./Taiwan | 5,624,048 | 4,295,476 | ||||||
China Man-Made Fiber Corp.a,b | 2,322,000 | 674,419 | ||||||
China Metal Products | 1,041,146 | 732,796 | ||||||
China Motor Corp. | 445,000 | 302,265 | ||||||
China Petrochemical Development Corp.a,b | 3,987,900 | 981,776 | ||||||
China Steel Chemical Corp.b | 301,000 | 925,129 | ||||||
China Steel Corp.b | 20,194,529 | 12,103,311 | ||||||
China Synthetic Rubber Corp. | 1,188,100 | 874,570 | ||||||
Chipbond Technology Corp.b | 1,079,000 | 1,571,939 | ||||||
| Security | Shares | Value | ||||||
Chong Hong Construction Co. Ltd. | 407,450 | $ | 568,547 | |||||
Chroma ATE Inc.b | 654,000 | 1,081,424 | ||||||
Chung Hung Steel Corp.a | 4,631,000 | 590,689 | ||||||
Chunghwa Telecom Co. Ltd. | 6,318,000 | 19,185,468 | ||||||
Clevo Co.b | 611,175 | 563,537 | ||||||
CMC Magnetics Corp.a | 10,675,000 | 869,460 | ||||||
Compal Electronics Inc. | 7,413,000 | 4,328,959 | ||||||
Compeq Manufacturing Co. Ltd. | 2,124,000 | 1,413,345 | ||||||
Continental Holdings Corp.a,b | 2,117,600 | 587,065 | ||||||
Coretronic Corp.b | 1,006,750 | 801,415 | ||||||
Coxon Precise Industrial Co. Ltd.b | 494,000 | 784,970 | ||||||
CSBC Corp. Taiwan | 2,060,000 | 762,939 | ||||||
CTBC Financial Holding Co. Ltd.b | 26,198,047 | 15,781,956 | ||||||
CTCI Corp. | 1,207,000 | 1,558,089 | ||||||
Cyberlink Corp.b | 525,540 | 1,014,381 | ||||||
CyberTAN Technology Inc.b | 1,770,000 | 794,259 | ||||||
D-Link Corp.b | 2,586,991 | 746,614 | ||||||
Darwin Precisions Corp.b | 1,314,000 | 450,304 | ||||||
Delta Electronics Inc. | 3,204,000 | 16,051,512 | ||||||
Depo Auto Parts Ind. Co. Ltd.b | 232,000 | 657,438 | ||||||
Dynapack International Technology Corp.b | 565,000 | 823,987 | ||||||
E Ink Holdings Inc.a,b | 1,742,000 | 631,780 | ||||||
E.Sun Financial Holding Co. Ltd. | 12,302,438 | 7,392,201 | ||||||
Eclat Textile Co. Ltd. | 339,062 | 5,101,145 | ||||||
Elan Microelectronics Corp.b | 923,000 | 923,397 | ||||||
Elite Material Co. Ltd.b | 777,000 | 1,695,568 | ||||||
Elite Semiconductor Memory Technology Inc.b | 945,000 | 781,304 | ||||||
Epistar Corp.b | 1,804,694 | 1,458,798 | ||||||
Eternal Materials Co. Ltd. | 1,265,030 | 1,131,435 | ||||||
EVA Airways Corp.a | 3,611,279 | 2,181,019 | ||||||
Evergreen Marine Corp. Taiwan Ltd. | 3,088,870 | 1,352,852 | ||||||
Everlight Chemical Industrial Corp.b | 1,584,601 | 793,859 | ||||||
Everlight Electronics Co. Ltd.b | 740,000 | 889,292 | ||||||
Far Eastern Department Stores Ltd.b | 1,354,167 | 651,362 | ||||||
Far Eastern International Bankb | 2,782,587 | 906,547 | ||||||
Far Eastern New Century Corp. | 4,944,916 | 4,483,496 | ||||||
CONSOLIDATED SCHEDULESOF INVESTMENTS | 37 |
Table of Contents
Consolidated Schedule of Investments (Continued)
iSHARES® CORE MSCI EMERGING MARKETS ETF
August 31, 2015
| Security | Shares | Value | ||||||
Far EasTone Telecommunications Co. Ltd. | 2,783,000 | $ | 6,107,272 | |||||
Faraday Technology Corp. | 1,050,000 | 911,682 | ||||||
Farglory Land Development Co. Ltd. | 526,782 | 488,960 | ||||||
Federal Corp. | 2,170,264 | 917,173 | ||||||
Feng Hsin Iron & Steel Co. | 787,000 | 834,506 | ||||||
Feng TAY Enterprise Co. Ltd. | 574,024 | 3,405,048 | ||||||
Firich Enterprises Co. Ltd.b | 402,731 | 922,162 | ||||||
First Financial Holding Co. Ltd. | 12,352,549 | 5,979,612 | ||||||
FLEXium Interconnect Inc.b | 483,734 | 1,378,232 | ||||||
Formosa Chemicals & Fibre Corp. | 5,544,210 | 11,860,002 | ||||||
Formosa Petrochemical Corp. | 2,029,000 | 4,546,167 | ||||||
Formosa Plastics Corp. | 6,948,800 | 15,313,160 | ||||||
Formosa Taffeta Co. Ltd. | 1,283,000 | 1,115,961 | ||||||
Formosan Rubber Group Inc. | 1,297,000 | 753,421 | ||||||
Foxconn Technology Co. Ltd. | 1,636,787 | 4,603,086 | ||||||
Fubon Financial Holding Co. Ltd. | 11,833,000 | 20,330,240 | ||||||
Gemtek Technology Corp.b | 1,703,000 | 758,959 | ||||||
Getac Technology Corp.b | 1,360,000 | 813,007 | ||||||
Giant Manufacturing Co. Ltd.b | 515,000 | 3,727,640 | ||||||
Gigabyte Technology Co. Ltd.b | 907,000 | 768,006 | ||||||
Gigasolar Materials Corp.b | 56,800 | 815,269 | ||||||
Gigastorage Corp.a,b | 1,183,000 | 581,756 | ||||||
Ginko International Co. Ltd.b | 88,000 | 897,959 | ||||||
Gintech Energy Corp.a,b | 1,554,019 | 616,143 | ||||||
Global Mixed Mode Technology Inc.b | 574,000 | 926,205 | ||||||
Gloria Material Technology Corp.b | 2,055,200 | 991,721 | ||||||
Gourmet Master Co. Ltd. | 145,000 | 757,622 | ||||||
Grand Pacific Petrochemical | 1,987,000 | 1,001,561 | ||||||
Grape King Bio Ltd.b | 262,000 | 1,340,761 | ||||||
Great Wall Enterprise Co. Ltd. | 1,229,500 | 648,080 | ||||||
Greatek Electronics Inc.b | 638,000 | 517,679 | ||||||
HannStar Display Corp.b | 6,237,640 | 728,517 | ||||||
Hermes Microvision Inc. | 74,000 | 3,138,677 | ||||||
Hey Song Corp. | 672,000 | 684,682 | ||||||
Highwealth Construction Corp. | 1,157,100 | 1,788,853 | ||||||
Hiwin Technologies Corp.b | 389,263 | 1,998,000 | ||||||
Ho Tung Chemical Corp.a,b | 3,477,177 | 767,339 | ||||||
Holy Stone Enterprise Co. Ltd.b | 850,900 | 808,114 | ||||||
| Security | Shares | Value | ||||||
Hon Hai Precision Industry Co. Ltd. | 23,441,568 | $ | 66,644,487 | |||||
Hotai Motor Co. Ltd.b | 433,000 | 4,764,384 | ||||||
HTC Corp.b | 1,207,000 | 1,708,334 | ||||||
Hua Nan Financial Holdings Co. Ltd. | 9,885,211 | 4,678,886 | ||||||
Huaku Development Co. Ltd.b | 517,000 | 834,230 | ||||||
Hung Sheng Construction Ltd.b | 1,460,000 | 668,613 | ||||||
Ichia Technologies Inc.b | 1,022,000 | 518,287 | ||||||
IEI Integration Corp.b | 697,582 | 801,868 | ||||||
Innolux Corp.b | 14,520,241 | 5,132,246 | ||||||
Inotera Memories Inc.a,b | 4,075,000 | 2,454,819 | ||||||
Inventec Corp. | 3,979,000 | 1,822,200 | ||||||
ITEQ Corp.b | 1,057,000 | 639,996 | ||||||
KEE TAI Properties Co. Ltd.b | 1,662,000 | 837,743 | ||||||
Kenda Rubber Industrial Co. Ltd.b | 901,689 | 1,213,855 | ||||||
Kerry TJ Logistics Co. Ltd.b | 685,000 | 760,035 | ||||||
Kindom Construction Corp.b | 1,180,000 | 536,759 | ||||||
King Slide Works Co. Ltd. | 117,000 | 1,485,155 | ||||||
King Yuan Electronics Co. Ltd.b | 1,931,000 | 1,240,408 | ||||||
King’s Town Bank Co. Ltd.b | 1,753,000 | 1,206,885 | ||||||
Kinpo Electronicsa | 2,577,000 | 782,541 | ||||||
Kinsus Interconnect Technology Corp.b | 510,000 | 909,147 | ||||||
Kuoyang Construction Co. Ltd. | 2,452,023 | 813,925 | ||||||
Largan Precision Co. Ltd. | 181,000 | 16,800,467 | ||||||
LCY Chemical Corp.a,b | 1,136,000 | 651,168 | ||||||
Lealea Enterprise Co. Ltd.b | 3,704,173 | 949,496 | ||||||
Lien Hwa Industrial Corp.b | 1,079,400 | 605,454 | ||||||
Lite-On Technology Corp. | 3,419,889 | 3,132,305 | ||||||
Long Bon International Co. Ltd.b | 955,000 | 660,422 | ||||||
Macronix Internationala,b | 6,736,000 | 941,997 | ||||||
Makalot Industrial Co. Ltd.b | 336,526 | 2,834,034 | ||||||
Masterlink Securities Corp.b | 2,979,603 | 750,945 | ||||||
MediaTek Inc.b | 2,627,572 | 20,270,487 | ||||||
Mega Financial Holding Co. Ltd. | 17,097,958 | 12,822,417 | ||||||
Merida Industry Co. Ltd. | 398,850 | 2,169,795 | ||||||
Merry Electronics Co. Ltd.b | 441,070 | 488,029 | ||||||
Micro-Star International Co. Ltd.b | 1,265,000 | 977,832 | ||||||
Microbio Co. Ltd.a,b | 1,257,141 | 948,574 | ||||||
MIN AIK Technology Co. Ltd.b | 415,000 | 626,913 | ||||||
Mitac Holdings Corp.b | 1,400,000 | 869,191 | ||||||
Motech Industries Inc.a,b | 725,000 | 579,358 | ||||||
| 38 | 2015 iSHARES ANNUAL REPORTTO SHAREHOLDERS |
Table of Contents
Consolidated Schedule of Investments (Continued)
iSHARES® CORE MSCI EMERGING MARKETS ETF
August 31, 2015
| Security | Shares | Value | ||||||
Nan Kang Rubber Tire Co. Ltd.a,b | 1,051,000 | $ | 807,567 | |||||
Nan Ya Plastics Corp. | 8,139,440 | 14,834,915 | ||||||
Nan Ya Printed Circuit Board Corp.b | 552,000 | 532,727 | ||||||
National Petroleum Co. Ltd.b | 817,000 | 860,040 | ||||||
Neo Solar Power Corp.b | 1,376,806 | 649,557 | ||||||
Novatek Microelectronics Corp.b | 1,014,000 | 3,397,037 | ||||||
OptoTech Corp.b | 3,119,000 | 845,512 | ||||||
Oriental Union Chemical Corp.b | 1,202,000 | 930,981 | ||||||
Pan-International Industrial Corp.b | 1,841,366 | 636,691 | ||||||
Parade Technologies Ltd.b | 134,000 | 914,310 | ||||||
PChome Online Inc.b | 155,413 | 1,647,943 | ||||||
Pegatron Corp. | 2,992,000 | 7,743,005 | ||||||
PharmaEngine Inc.b | 130,000 | 621,312 | ||||||
Phison Electronics Corp.b | 261,000 | 1,816,957 | ||||||
Pixart Imaging Inc.b | 380,000 | 675,068 | ||||||
Pou Chen Corp. | 4,041,000 | 6,532,967 | ||||||
Powertech Technology Inc. | 1,216,000 | 2,092,943 | ||||||
Poya International Co. Ltd.b | 114,060 | 1,104,281 | ||||||
President Chain Store Corp. | 983,000 | 6,571,260 | ||||||
President Securities Corp.b | 1,918,000 | 686,768 | ||||||
Primax Electronics Ltd.b | 821,000 | 971,493 | ||||||
Prince Housing & Development Corp.b | 2,178,995 | 618,150 | ||||||
Qisda Corp.b | 2,841,000 | 846,991 | ||||||
Quanta Computer Inc. | 4,514,000 | 8,296,570 | ||||||
Radiant Opto-Electronics Corp.b | 806,940 | 2,351,178 | ||||||
Radium Life Tech Co. Ltd.b | 1,772,196 | 558,305 | ||||||
Realtek Semiconductor Corp.b | 810,110 | 1,454,095 | ||||||
Rich Development Co. Ltd.b | 2,910,770 | 816,798 | ||||||
Richtek Technology Corp.b | 297,000 | 1,538,127 | ||||||
Ritek Corp.a,b | 7,209,000 | 640,337 | ||||||
Ruentex Development Co. Ltd.b | 1,373,822 | 1,469,419 | ||||||
Ruentex Industries Ltd. | 858,906 | 1,370,089 | ||||||
Sampo Corp. | 2,869,000 | 1,062,560 | ||||||
Sanyang Motor Co. Ltd.a,b | 925,000 | 581,394 | ||||||
ScinoPharm Taiwan Ltd.b | 554,700 | 632,511 | ||||||
Sercomm Corp.b | 520,000 | 1,128,350 | ||||||
Shih Wei Navigation Co. Ltd. | 1,626,675 | 649,950 | ||||||
Shihlin Paper Corp.a,b | 126,000 | 103,206 | ||||||
Shin Kong Financial Holding Co. Ltd. | 13,013,443 | 3,087,773 | ||||||
Shin Zu Shing Co. Ltd.b | 422,000 | 1,001,303 | ||||||
| Security | Shares | Value | ||||||
Shining Building Business Co. Ltd.a | 1,623,601 | $ | 568,879 | |||||
Shinkong Synthetic Fibers Corp. | 3,286,000 | 854,425 | ||||||
Shinkong Textile Co. Ltd. | 364,000 | 435,198 | ||||||
Sigurd Microelectronics Corp.b | 1,371,000 | 851,186 | ||||||
Silergy Corp.b | 99,000 | 876,322 | ||||||
Siliconware Precision Industries Co. Ltd.b | 5,230,000 | 6,429,801 | ||||||
Simplo Technology Co. Ltd.b | 501,000 | 1,663,019 | ||||||
Sino-American Silicon Products Inc.b | 993,000 | 909,497 | ||||||
SinoPac Financial Holdings Co. Ltd. | 16,244,243 | 5,591,822 | ||||||
Sinyi Realty Inc.b | 503,877 | 449,116 | ||||||
Soft-World International Corp.b | 430,000 | 598,691 | ||||||
Solar Applied Materials Technology Co. | 1,421,000 | 788,328 | ||||||
Sonix Technology Co. Ltd.b | 808,000 | 864,224 | ||||||
St. Shine Optical Co. Ltd.b | 98,000 | 972,892 | ||||||
Standard Foods Corp. | 763,648 | 1,734,497 | ||||||
Swancor Ind Co. Ltd.b | 151,000 | 812,177 | ||||||
Synnex Technology International Corp. | 2,107,000 | 2,240,663 | ||||||
TA Chen Stainless Pipeb | 1,579,254 | 708,664 | ||||||
Ta Chong Bank Ltd.a,b | 3,850,168 | 1,621,198 | ||||||
Taichung Commercial Bank Co. Ltd.b | 3,240,341 | 941,149 | ||||||
Taiflex Scientific Co. Ltd.b | 720,000 | 688,222 | ||||||
Taigen Biopharmaceuticals Holdings Ltd.a,b | 687,000 | 449,751 | ||||||
Tainan Spinning Co. Ltd.b | 1,971,894 | 821,218 | ||||||
Taishin Financial Holding Co. Ltd. | 13,477,316 | 4,722,197 | ||||||
Taiwan Acceptance Corp.b | 326,000 | 762,497 | ||||||
Taiwan Building Materials Co. Ltd.b | 2,351,000 | 614,197 | ||||||
Taiwan Business Banka | 6,441,518 | 1,623,446 | ||||||
Taiwan Cement Corp.b | 5,372,000 | 5,754,063 | ||||||
Taiwan Cogeneration Corp.b | 1,287,000 | 870,236 | ||||||
Taiwan Cooperative Financial Holding Co. Ltd. | 10,869,131 | 4,610,094 | ||||||
Taiwan Fertilizer Co. Ltd. | 1,304,000 | 1,649,238 | ||||||
Taiwan Glass Industry Corp.a | 1,689,000 | 680,044 | ||||||
Taiwan Hon Chuan Enterprise Co. Ltd.b | 645,674 | 956,525 | ||||||
CONSOLIDATED SCHEDULESOF INVESTMENTS | 39 |
Table of Contents
Consolidated Schedule of Investments (Continued)
iSHARES® CORE MSCI EMERGING MARKETS ETF
August 31, 2015
| Security | Shares | Value | ||||||
Taiwan Land Development Corp.b | 1,905,322 | $ | 647,093 | |||||
Taiwan Life Insurance Co. Ltd.a,b | 1,119,674 | 1,054,770 | ||||||
Taiwan Liposome Co. Ltd.a | 135,000 | 495,835 | ||||||
Taiwan Mobile Co. Ltd. | 2,826,000 | 8,494,677 | ||||||
Taiwan Paiho Ltd.b | 577,000 | 1,324,745 | ||||||
Taiwan PCB Techvest Co. Ltd.b | 805,042 | 791,780 | ||||||
Taiwan Secom Co. Ltd.b | 597,185 | 1,672,103 | ||||||
Taiwan Semiconductor Manufacturing Co. Ltd.b | 43,704,000 | 173,279,321 | ||||||
Taiwan Sogo Shin Kong SECb | 991,770 | 1,112,602 | ||||||
Taiwan Surface Mounting Technology Corp.b | 903,261 | 757,900 | ||||||
Taiwan TEA Corp.b | 1,521,000 | 614,739 | ||||||
Tatung Co. Ltd.a,b | 4,296,000 | 681,318 | ||||||
Teco Electric and Machinery Co. Ltd. | 3,446,000 | 2,594,880 | ||||||
Test Research Inc.b | 550,400 | 877,974 | ||||||
Test Rite International Co. Ltd.b | 1,149,000 | 686,871 | ||||||
Ton Yi Industrial Corp.b | 1,508,000 | 688,278 | ||||||
Tong Hsing Electronic Industries Ltd.b | 295,000 | 660,069 | ||||||
Tong Yang Industry Co. Ltd.b | 824,400 | 691,730 | ||||||
Topco Scientific Co. Ltd.b | 687,371 | 985,550 | ||||||
TPK Holding Co. Ltd.b | 534,000 | 1,337,626 | ||||||
Transcend Information Inc. | 363,000 | 978,458 | ||||||
Tripod Technology Corp.b | 785,000 | 1,100,197 | ||||||
TSRC Corp. | 1,449,900 | 909,084 | ||||||
TTY Biopharm Co. Ltd.b | 458,124 | 1,103,913 | ||||||
Tung Ho Steel Enterprise Corp. | 1,280,000 | 684,534 | ||||||
TWi Pharmaceuticals Inc.a | 98,000 | 612,952 | ||||||
TXC Corp.b | 902,000 | 892,685 | ||||||
U-Ming Marine Transport Corp. | 671,000 | 665,102 | ||||||
Uni-President Enterprises Corp. | 8,516,369 | 15,181,627 | ||||||
Unimicron Technology Corp.b | 2,541,000 | 984,036 | ||||||
Union Bank of Taiwanb | 2,732,681 | 771,023 | ||||||
Unitech Printed Circuit Board Corp.b | 2,487,000 | 787,316 | ||||||
United Microelectronics Corp.b | 19,328,000 | 6,386,034 | ||||||
Unity Opto Technology Co. Ltd.b | 1,194,000 | 554,137 | ||||||
UPC Technology Corp. | 2,489,146 | 684,714 | ||||||
USI Corp. | 1,649,000 | 648,734 | ||||||
Vanguard International Semiconductor Corp. | 1,478,000 | 1,680,784 | ||||||
| Security | Shares | Value | ||||||
Visual Photonics Epitaxy Co. Ltd.b | 891,000 | $ | 1,015,985 | |||||
Voltronic Power Technology Corp.b | 96,451 | 1,234,689 | ||||||
Wah Lee Industrial Corp.b | 654,000 | 848,254 | ||||||
Walsin Lihwa Corp.a | 5,737,000 | 1,281,903 | ||||||
Wan Hai Lines Ltd. | 840,000 | 578,313 | ||||||
Waterland Financial Holdings Co. Ltd.b | 3,085,581 | 736,875 | ||||||
Win Semiconductors Corp. | 1,085,669 | 1,014,394 | ||||||
Winbond Electronics Corp.a,b | 4,953,000 | 1,024,517 | ||||||
Wistron Corp.b | 4,435,087 | 2,194,643 | ||||||
Wistron NeWeb Corp.b | 554,623 | 1,041,538 | ||||||
Wowprime Corp.b | 139,260 | 751,172 | ||||||
WPG Holdings Ltd. | 2,287,000 | 2,161,460 | ||||||
WT Microelectronics Co. Ltd.b | 914,896 | 927,943 | ||||||
Yageo Corp.b | 861,078 | 1,218,731 | ||||||
Yang Ming Marine Transport Corp.a | 2,813,000 | 903,487 | ||||||
YC Co. Ltd.b | 2,721,467 | 1,049,742 | ||||||
Yeong Guan Energy Technology Group Co. Ltd.b | 148,000 | 818,785 | ||||||
YFY Inc.b | 1,316,000 | 393,959 | ||||||
Yieh Phui Enterprise Co. Ltd. | 1,934,510 | 476,849 | ||||||
Youngtek Electronics Corp.b | 636,855 | 953,247 | ||||||
Yuanta Financial Holding Co. Ltd. | 14,964,255 | 6,002,075 | ||||||
Yulon Motor Co. Ltd.b | 1,060,000 | 959,460 | ||||||
YungShin Global Holding Corp.b | 622,650 | 824,816 | ||||||
Yungtay Engineering Co. Ltd.b | 745,000 | 1,085,352 | ||||||
Zhen Ding Technology Holding Ltd. | 623,950 | 1,770,057 | ||||||
Zinwell Corp.b | 958,000 | 898,051 | ||||||
|
| |||||||
| 909,360,228 | ||||||||
THAILAND — 2.51% | ||||||||
Advanced Info Service PCL NVDR | 1,874,900 | 12,448,771 | ||||||
Airports of Thailand PCL NVDR | 841,300 | 6,477,857 | ||||||
Amata Corp. PCL NVDR | 2,346,500 | 772,456 | ||||||
AP Thailand PCL NVDRb | 4,561,590 | 699,923 | ||||||
Bangchak Petroleum PCL (The) NVDR | 1,053,800 | 1,028,958 | ||||||
Bangkok Bank PCL Foreign | 941,900 | 4,322,571 | ||||||
Bangkok Chain Hospital PCL NVDRb | 4,753,950 | 875,326 | ||||||
| 40 | 2015 iSHARES ANNUAL REPORTTO SHAREHOLDERS |
Table of Contents
Consolidated Schedule of Investments (Continued)
iSHARES® CORE MSCI EMERGING MARKETS ETF
August 31, 2015
| Security | Shares | Value | ||||||
Bangkok Dusit Medical Services PCL NVDR | 7,514,000 | $ | 4,087,683 | |||||
Bangkok Expressway PCL NVDR | 865,900 | 851,527 | ||||||
Bangkok Land PCL NVDRb | 22,812,100 | 910,066 | ||||||
Banpu PCL NVDRb | 2,283,100 | 1,312,090 | ||||||
BEC World PCL NVDR | 2,064,600 | 2,131,126 | ||||||
BTS Group Holdings PCL NVDR | 10,499,000 | 2,855,775 | ||||||
Bumrungrad Hospital PCL NVDR | 711,200 | 4,583,267 | ||||||
Central Pattana PCL NVDR | 2,842,800 | 3,568,866 | ||||||
Charoen Pokphand Foods PCL NVDR | 5,658,000 | 2,999,079 | ||||||
CP ALL PCL NVDR | 8,022,900 | 11,414,923 | ||||||
Delta Electronics Thailand PCL NVDR | 1,029,900 | 2,499,687 | ||||||
Dynasty Ceramic PCL NVDR | 10,296,220 | 1,028,329 | ||||||
Energy Absolute PCL NVDR | 2,426,600 | 1,381,019 | ||||||
Esso Thailand PCL NVDRa,b | 5,167,600 | 720,826 | ||||||
Glow Energy PCL NVDR | 1,055,300 | 2,907,264 | ||||||
Hana Microelectronics PCL NVDRb | 1,286,700 | 915,354 | ||||||
Home Product Center PCL NVDRb | 8,600,374 | 1,751,506 | ||||||
Indorama Ventures PCL NVDR | 3,010,100 | 1,830,665 | ||||||
IRPC PCL NVDRb | 21,363,900 | 2,264,830 | ||||||
Jasmine International PCL NVDR | 7,926,700 | 1,249,431 | ||||||
Kasikornbank PCL Foreign | 2,080,300 | 10,504,514 | ||||||
Kasikornbank PCL NVDRb | 1,146,300 | 5,772,274 | ||||||
Khon Kaen Sugar Industry PCL NVDR | 4,371,960 | 434,208 | ||||||
Kiatnakin Bank PCL NVDRb | 834,000 | 750,356 | ||||||
Krung Thai Bank PCL NVDRb | 6,448,100 | 3,273,969 | ||||||
LPN Development PCL NVDRb | 1,875,600 | 816,274 | ||||||
Major Cineplex Group PCL NVDRb | 757,200 | 686,539 | ||||||
Minor International PCL NVDRb | 3,587,260 | 2,652,040 | ||||||
Polyplex Thailand PCL NVDR | 1,325,200 | 282,823 | ||||||
PTT Exploration & Production PCL NVDR | 2,439,101 | 5,409,640 | ||||||
PTT Global Chemical PCL NVDR | 2,958,300 | 4,951,820 | ||||||
PTT PCL NVDR | 1,808,000 | 13,517,757 | ||||||
| Security | Shares | Value | ||||||
Quality Houses PCL NVDR | 15,307,217 | $ | 1,007,812 | |||||
Samart Corp. PCL NVDRb | 1,369,800 | 706,969 | ||||||
Siam Cement PCL (The) Foreign | 546,000 | 7,250,551 | ||||||
Siam Cement PCL (The) NVDR | 200,600 | 2,686,232 | ||||||
Siam Commercial Bank PCL (The) NVDRb | 2,832,300 | 11,220,159 | ||||||
Siam Global House PCL NVDRb | 3,155,722 | 924,399 | ||||||
Sino-Thai Engineering & Construction PCL NVDRb | 2,041,828 | 1,452,549 | ||||||
Sri Trang Agro-Industry PCL NVDR | 1,973,400 | 644,128 | ||||||
Srisawad Power 1979 PCL NVDRb | 1,170,000 | 1,199,540 | ||||||
Supalai PCL NVDRb | 1,738,400 | 814,761 | ||||||
Superblock PCLa,b | 15,798,700 | 833,018 | ||||||
Thai Airways International PCL NVDRa,b | 1,659,000 | 472,083 | ||||||
Thai Oil PCL NVDR | 1,630,200 | 2,342,176 | ||||||
Thai Union Frozen Products PCL NVDR | 4,108,100 | 1,994,168 | ||||||
Thai Vegetable Oil PCL NVDR | 1,658,800 | 1,272,618 | ||||||
Thaicom PCL NVDR | 1,123,600 | 987,401 | ||||||
Thanachart Capital PCL NVDR | 1,428,700 | 1,175,803 | ||||||
Thoresen Thai Agencies PCL NVDRb | 2,530,523 | 720,082 | ||||||
TICON Industrial Connection PCL NVDRb | 2,109,860 | 694,556 | ||||||
Tisco Financial Group PCL NVDRb | 1,048,150 | 1,155,026 | ||||||
TMB Bank PCL NVDR | 28,293,400 | 1,862,810 | ||||||
True Corp. PCL NVDRa,b | 16,129,518 | 4,364,802 | ||||||
TTW PCL NVDRb | 3,624,800 | 1,152,817 | ||||||
VGI Global Media PCL NVDRb | 7,959,900 | 919,347 | ||||||
WHA Corp. PCL NVDRa | 13,532,500 | 1,306,248 | ||||||
|
| |||||||
| 176,101,444 | ||||||||
TURKEY — 1.42% | ||||||||
Akbank TAS | 3,991,255 | 9,350,862 | ||||||
Akfen Holding ASb | 238,291 | 672,061 | ||||||
Akmerkez Gayrimenkul Yatirim Ortakligi AS | 38,118 | 227,189 | ||||||
Aksa Akrilik Kimya Sanayii AS | 210,609 | 709,024 | ||||||
Albaraka Turk Katilim Bankasi AS | 1,158,320 | 537,180 | ||||||
CONSOLIDATED SCHEDULESOF INVESTMENTS | 41 |
Table of Contents
Consolidated Schedule of Investments (Continued)
iSHARES® CORE MSCI EMERGING MARKETS ETF
August 31, 2015
| Security | Shares | Value | ||||||
Anadolu Efes Biracilik ve Malt Sanayii AS | 381,554 | $ | 2,844,288 | |||||
Arcelik AS | 463,215 | 2,172,066 | ||||||
BIM Birlesik Magazalar AS | 384,231 | 6,659,036 | ||||||
Cimsa Cimento Sanayi VE Ticaret AS | 150,973 | 772,758 | ||||||
Coca-Cola Icecek AS | 153,884 | 1,903,066 | ||||||
Dogus Otomotiv Servis ve Ticaret AS | 147,007 | 631,256 | ||||||
Emlak Konut Gayrimenkul Yatirim Ortakligi AS | 3,614,585 | 3,091,830 | ||||||
Enka Insaat ve Sanayi AS | 1,021,351 | 1,743,770 | ||||||
Eregli Demir ve Celik Fabrikalari TAS | 2,614,345 | 3,556,443 | ||||||
Ford Otomotiv Sanayi AS | 149,686 | 1,516,914 | ||||||
Haci Omer Sabanci Holding AS | 1,674,289 | 5,003,887 | ||||||
Is Gayrimenkul Yatirim Ortakligi ASb | 1,805,571 | 886,969 | ||||||
Kardemir Karabuk Demir Celik Sanayi ve Ticaret AS Class Db | 2,202,805 | 961,031 | ||||||
KOC Holding AS | 1,178,358 | 4,594,422 | ||||||
Koza Altin Isletmeleri ASb | 95,034 | 796,575 | ||||||
Sekerbank TASa,b | 959,103 | 451,381 | ||||||
TAV Havalimanlari Holding ASb | 324,847 | 2,622,434 | ||||||
Tofas Turk Otomobil Fabrikasi AS | 273,444 | 1,695,522 | ||||||
Trakya Cam Sanayii ASb | 1,164,225 | 695,895 | ||||||
Tupras Turkiye Petrol Rafinerileri ASa | 243,212 | 6,274,552 | ||||||
Turk Hava Yollari AOa | 1,059,621 | 2,930,247 | ||||||
Turk Telekomunikasyon AS | 829,840 | 1,744,631 | ||||||
Turkcell Iletisim Hizmetleri AS | 1,539,789 | 6,030,091 | ||||||
Turkiye Garanti Bankasi AS | 4,202,545 | 10,654,339 | ||||||
Turkiye Halk Bankasi AS | 1,159,195 | 4,440,063 | ||||||
Turkiye Is Bankasi Class C | 2,844,316 | 4,758,440 | ||||||
Turkiye Sinai Kalkinma Bankasi ASb | 1,840,540 | 980,020 | ||||||
Turkiye Sise ve Cam Fabrikalari AS | 1,494,088 | 1,457,647 | ||||||
Turkiye Vakiflar Bankasi Tao Class D | 1,483,750 | 1,962,363 | ||||||
Ulker Biskuvi Sanayi ASb | 305,355 | 1,877,655 | ||||||
Yapi ve Kredi Bankasi ASb | 1,580,444 | 1,949,088 | ||||||
Yazicilar Holding AS | 98,985 | 601,867 | ||||||
|
| |||||||
| 99,756,862 | ||||||||
| Security | Shares | Value | ||||||
UNITED ARAB EMIRATES — 0.83% |
| |||||||
Abu Dhabi Commercial Bank PJSC | 3,564,624 | $ | 7,763,845 | |||||
Agthia Group PJSC | 303,093 | 645,291 | ||||||
Air Arabia PJSC | 3,997,637 | 1,545,485 | ||||||
Al Waha Capital PJSC | 1,738,204 | 1,078,969 | ||||||
Aldar Properties PJSC | 5,739,880 | 3,641,094 | ||||||
Arabtec Holding PJSCa | 4,227,354 | 2,267,295 | ||||||
Dana Gas PJSCa | 6,529,488 | 959,944 | ||||||
Deyaar Development PJSCa | 3,483,124 | 630,614 | ||||||
DP World Ltd. | 296,172 | 6,604,636 | ||||||
Dubai Financial Market PJSC | 3,911,448 | 1,831,636 | ||||||
Dubai Islamic Bank PJSC | 1,799,443 | 3,429,330 | ||||||
Dubai Parks & Resorts PJSCa | 5,166,481 | 1,603,514 | ||||||
Emaar Malls Group PJSCa | 3,426,280 | 2,658,526 | ||||||
Emaar Properties PJSC | 6,272,528 | 11,527,086 | ||||||
Eshraq Properties Co. PJSCa | 2,896,475 | 496,802 | ||||||
First Gulf Bank PJSC | 1,575,529 | 6,155,332 | ||||||
National Bank of Abu Dhabi PJSC | 1,203,645 | 3,408,042 | ||||||
Orascom Construction Ltd.a | 109,553 | 1,258,764 | ||||||
Union Properties PJSC | 2,188,669 | 589,914 | ||||||
|
| |||||||
| 58,096,119 | ||||||||
|
| |||||||
TOTAL COMMON STOCKS | ||||||||
(Cost: $7,912,697,068) | 6,766,763,408 | |||||||
PREFERRED STOCKS — 3.04% |
| |||||||
BRAZIL — 2.05% | ||||||||
AES Tiete SA | 188,800 | 778,060 | ||||||
Banco ABC Brasil SA | 210,230 | 524,096 | ||||||
Banco Bradesco SA | 4,481,404 | 28,360,591 | ||||||
Banco Daycoval SA | 137,100 | 325,599 | ||||||
Banco Industrial e Comercial SA | 108,300 | 242,335 | ||||||
Braskem SA Class A | 306,500 | 1,184,008 | ||||||
Centrais Eletricas Brasileiras SA Class B | 418,600 | 863,116 | ||||||
Cia. Brasileira de Distribuicao | 271,100 | 4,726,433 | ||||||
Cia. Energetica de Minas Gerais | 1,365,520 | 2,819,332 | ||||||
Cia. Energetica de Sao Paulo Class B | 352,400 | 1,560,632 | ||||||
Cia. Energetica do Ceara Class A | 22,800 | 237,875 | ||||||
| 42 | 2015 iSHARES ANNUAL REPORTTO SHAREHOLDERS |
Table of Contents
Consolidated Schedule of Investments (Continued)
iSHARES® CORE MSCI EMERGING MARKETS ETF
August 31, 2015
| Security | Shares | Value | ||||||
Cia. Ferro Ligas da Bahia-Ferbasa | 172,000 | $ | 340,010 | |||||
Cia. Paranaense de Energia Class B | 188,200 | 1,601,812 | ||||||
Eletropaulo Metropolitana Eletricidade de Sao Paulo SA | 217,800 | 698,443 | ||||||
Gerdau SA | 1,492,800 | 2,151,747 | ||||||
GOL Linhas Aereas Inteligentes SA | 208,800 | 238,481 | ||||||
Itau Unibanco Holding SA | 5,373,912 | 39,172,864 | ||||||
Itausa – Investimentos Itau SA | 6,292,987 | 12,578,199 | ||||||
Lojas Americanas SA | 910,275 | 4,073,713 | ||||||
Marcopolo SA | 1,061,900 | 583,101 | ||||||
Oi SA | 650,600 | 482,290 | ||||||
Petroleo Brasileiro SA | 6,825,400 | 17,221,615 | ||||||
Suzano Papel e Celulose SA Class A | 699,600 | 3,376,750 | ||||||
Telefonica Brasil SA | 593,200 | 6,578,172 | ||||||
Usinas Siderurgicas de Minas Gerais SA Class A | 771,900 | 631,550 | ||||||
Vale SA | 3,193,900 | 12,408,178 | ||||||
|
| |||||||
| 143,759,002 | ||||||||
CHILE — 0.08% | ||||||||
Bupa Chile SA | 1,145,631 | 885,702 | ||||||
Embotelladora Andina SA Class B | 518,359 | 1,779,100 | ||||||
Sociedad Quimica y Minera de Chile SA Series B | 172,280 | 2,705,026 | ||||||
|
| |||||||
| 5,369,828 | ||||||||
COLOMBIA — 0.17% | ||||||||
Avianca Holdings SA | 1,007,790 | 729,740 | ||||||
Banco Davivienda SA | 191,886 | 1,478,766 | ||||||
Bancolombia SA | 749,594 | 6,392,206 | ||||||
Grupo Aval Acciones y Valores SA | 4,916,624 | 1,875,421 | ||||||
Grupo de Inversiones Suramericana SA | 131,371 | 1,489,735 | ||||||
|
| |||||||
| 11,965,868 | ||||||||
RUSSIA — 0.17% | ||||||||
AK Transneft OAO | 2,068 | 4,773,262 | ||||||
Surgutneftegas OAO | 12,593,100 | 7,587,569 | ||||||
|
| |||||||
| 12,360,831 | ||||||||
SOUTH KOREA — 0.57% | ||||||||
AmorePacific Corp. | 16,154 | 2,492,585 | ||||||
| Security | Shares | Value | ||||||
Hyundai Motor Co. | 41,519 | $ | 3,405,067 | |||||
Hyundai Motor Co. Series 2 | 66,705 | 5,639,822 | ||||||
LG Chem Ltd. | 12,973 | 1,897,552 | ||||||
Samsung Electronics Co. Ltd. | 36,348 | 26,736,639 | ||||||
|
| |||||||
| 40,171,665 | ||||||||
|
| |||||||
TOTAL PREFERRED STOCKS | ||||||||
(Cost: $374,538,471) | 213,627,194 | |||||||
RIGHTS — 0.00% | ||||||||
EGYPT — 0.00% | ||||||||
Pioneers Holding For Financial Investments SAEa | 220,764 | — | ||||||
|
| |||||||
| — | ||||||||
|
| |||||||
TOTAL RIGHTS | ||||||||
(Cost: $0) | — | |||||||
WARRANTS — 0.00% | ||||||||
MALAYSIA — 0.00% | ||||||||
WCT Holdings Bhd (Expires 08/27/20)a | 537,990 | 1 | ||||||
|
| |||||||
| 1 | ||||||||
|
| |||||||
TOTAL WARRANTS | ||||||||
(Cost: $0) | 1 | |||||||
SHORT-TERM INVESTMENTS — 6.37% |
| |||||||
MONEY MARKET FUNDS — 6.37% |
| |||||||
BlackRock Cash Funds: Institutional, |
| |||||||
0.18%e,f,g | 423,498,006 | 423,498,006 | ||||||
BlackRock Cash Funds: Prime, |
| |||||||
0.18%e,f,g | 24,319,338 | 24,319,338 | ||||||
|
| |||||||
| 447,817,344 | ||||||||
|
| |||||||
TOTAL SHORT-TERM INVESTMENTS |
| |||||||
(Cost: $447,817,344) | 447,817,344 | |||||||
|
| |||||||
CONSOLIDATED SCHEDULESOF INVESTMENTS | 43 |
Table of Contents
Consolidated Schedule of Investments (Continued)
iSHARES® CORE MSCI EMERGING MARKETS ETF
August 31, 2015
| Value | ||||||
TOTAL INVESTMENTS | ||||||
(Cost: $8,735,052,883) | $ | 7,428,207,947 | ||||
Other Assets, Less Liabilities — (5.73)% | (402,877,119 | ) | ||||
|
| |||||
NET ASSETS — 100.00% | $ | 7,025,330,828 | ||||
|
| |||||
ADR — American Depositary Receipts
CPO — Certificates of Participation (Ordinary)
GDR — Global Depositary Receipts
NVDR — Non-Voting Depositary Receipts
| a | Non-income earning security. |
| b | All or a portion of this security represents a security on loan. See Note 1. |
| c | This security may be resold to qualified institutional buyers under Rule 144A of the Securities Act of 1933. |
| d | This security may be resold to qualified foreign investors and foreign institutional buyers under Regulation S of the Securities Act of 1933. |
| e | Affiliated issuer. See Note 2. |
| f | The rate quoted is the annualized seven-day yield of the fund at period end. |
| g | All or a portion of this security represents an investment of securities lending collateral. See Note 1. |
Open futures contracts as of August 31, 2015 were as follows:
| Issue | Number of Contracts Purchased (Sold) | Expiration | Exchange | Notional Value | Unrealized Appreciation (Depreciation) | |||||||||||||||
| MSCI Emerging Markets Mini Index | 967 | Sep. 2015 | NYSE LIFFE | $ | 39,526,125 | $ | (4,522,127) | |||||||||||||
See notes to consolidated financial statements.
| 44 | 2015 iSHARES ANNUAL REPORTTO SHAREHOLDERS |
Table of Contents
Consolidated Schedule of Investments
August 31, 2015
| Security | Shares | Value | ||||||
COMMON STOCKS — 93.51% |
| |||||||
BRAZIL — 10.10% |
| |||||||
Ambev SA | 627,265 | $ | 3,287,663 | |||||
B2W Cia. Digitala | 12,800 | 54,823 | ||||||
Banco Bradesco SA | 95,788 | 661,949 | ||||||
Banco do Brasil SA | 115,289 | 564,377 | ||||||
Banco Santander Brasil SA Units | 64,000 | 253,558 | ||||||
BB Seguridade Participacoes SA | 102,400 | 806,886 | ||||||
BM&FBovespa SA-Bolsa de Valores Mercadorias e Futuros | 243,269 | 720,005 | ||||||
BR Malls Participacoes SA | 64,000 | 196,801 | ||||||
BRF SA | 89,600 | 1,710,204 | ||||||
CCR SA | 115,200 | 470,637 | ||||||
CETIP SA – | 26,160 | 235,007 | ||||||
Cia. de Saneamento Basico do Estado de Sao Paulo | 51,200 | 221,120 | ||||||
Cia. Siderurgica Nacional SA | 102,400 | 98,401 | ||||||
Cielo SA | 124,401 | 1,309,844 | ||||||
Cosan SA Industria e Comercio | 12,800 | 63,785 | ||||||
CPFL Energia SA | 27,037 | 116,544 | ||||||
Cyrela Brazil Realty SA Empreendimentos e Participacoes | 25,600 | 59,040 | ||||||
Duratex SA | 38,448 | 57,953 | ||||||
EcoRodovias Infraestrutura e Logistica SA | 25,600 | 49,130 | ||||||
EDP – Energias do Brasil SA | 25,600 | 78,791 | ||||||
Embraer SA | 89,600 | 565,312 | ||||||
Equatorial Energia SA | 12,800 | 124,231 | ||||||
Estacio Participacoes SA | 38,400 | 131,470 | ||||||
Fibria Celulose SA | 38,441 | 540,586 | ||||||
Hypermarcas SAa | 51,200 | 231,523 | ||||||
JBS SA | 102,452 | 398,022 | ||||||
Klabin SA Units | 76,800 | 427,200 | ||||||
Kroton Educacional SA | 192,064 | 457,716 | ||||||
Localiza Rent A Car SA | 12,860 | 79,125 | ||||||
Lojas Renner SA | 12,800 | 346,230 | ||||||
Multiplan Empreendimentos Imobiliarios SA | 12,800 | 144,719 | ||||||
Natura Cosmeticos SA | 25,600 | 166,508 | ||||||
Odontoprev SA | 38,400 | 103,110 | ||||||
Petroleo Brasileiro SAa | 409,600 | 1,194,304 | ||||||
Porto Seguro SA | 12,800 | 116,956 | ||||||
Qualicorp SA | 25,600 | 119,979 | ||||||
| Security | Shares | Value | ||||||
Raia Drogasil SA | 38,450 | $ | 419,099 | |||||
Souza Cruz SA | 51,200 | 373,079 | ||||||
Sul America SA | 25,672 | 123,347 | ||||||
TIM Participacoes SA | 115,269 | 278,500 | ||||||
TOTVS SA | 12,800 | 111,404 | ||||||
Tractebel Energia SA | 25,600 | 235,740 | ||||||
Ultrapar Participacoes SA | 51,200 | 892,213 | ||||||
Vale SA | 179,200 | 881,670 | ||||||
Via Varejo SA | 26,900 | 50,296 | ||||||
WEG SA | 74,240 | 341,415 | ||||||
|
| |||||||
| 19,870,272 | ||||||||
CHINA — 54.70% |
| |||||||
AAC Technologies Holdings Inc. | 128,000 | 720,924 | ||||||
Agricultural Bank of China Ltd. Class H | 3,072,000 | 1,240,684 | ||||||
Air China Ltd. Class H | 274,000 | 197,986 | ||||||
Alibaba Health Information Technology Ltd.a,b | 334,000 | 230,997 | ||||||
Alibaba Pictures Group Ltd.a,b | 1,350,000 | 315,288 | ||||||
Aluminum Corp. of China Ltd. Class Ha | 512,000 | 171,106 | ||||||
Anhui Conch Cement Co. Ltd. Class H | 192,000 | 580,951 | ||||||
Anta Sports Products Ltd. | 128,040 | 322,494 | ||||||
AviChina Industry & Technology Co. Ltd. Class H | 256,000 | 178,043 | ||||||
Bank of China Ltd. Class H | 10,880,000 | 4,969,671 | ||||||
Bank of Communications Co. Ltd. Class H | 1,156,200 | 871,247 | ||||||
BBMG Corp. Class H | 192,000 | 123,870 | ||||||
Beijing Capital International Airport Co. Ltd. Class H | 256,000 | 275,487 | ||||||
Beijing Enterprises Holdings Ltd. | 64,000 | 373,675 | ||||||
Beijing Enterprises Water Group Ltd. | 512,000 | 366,656 | ||||||
Belle International Holdings Ltd. | 640,000 | 585,493 | ||||||
Brilliance China Automotive Holdings Ltd. | 512,000 | 618,360 | ||||||
Byd Co. Ltd. Class H | 64,000 | 261,366 | ||||||
CGN Power Co. Ltd. Class Hc | 1,152,000 | 456,338 | ||||||
China Agri-Industries Holdings Ltd.a,b | 271,800 | 103,108 | ||||||
China Cinda Asset Management Co. Ltd. Class H | 1,024,000 | 380,529 | ||||||
China CITIC Bank Corp. Ltd. Class Ha | 1,152,000 | 706,060 | ||||||
CONSOLIDATED SCHEDULESOF INVESTMENTS | 45 |
Table of Contents
Consolidated Schedule of Investments (Continued)
iSHARES® MSCI BRIC ETF
August 31, 2015
| Security | Shares | Value | ||||||
China Coal Energy Co. Ltd. Class Hb | 256,000 | $ | 119,576 | |||||
China Communications Construction Co. Ltd. Class H | 650,000 | 773,285 | ||||||
China Communications Services Corp. Ltd. Class H | 256,800 | 94,436 | ||||||
China Conch Venture | 128,000 | 282,094 | ||||||
China Construction Bank Corp. Class H | 11,520,370 | 8,101,369 | ||||||
China COSCO Holdings Co. Ltd. Class Ha,b | 384,000 | 218,763 | ||||||
China Everbright Bank Co. Ltd. Class H | 384,000 | 175,400 | ||||||
China Everbright International Ltd. | 384,000 | 502,417 | ||||||
China Galaxy Securities Co. Ltd. Class H | 448,000 | 306,950 | ||||||
China Gas Holdings Ltd.b | 256,000 | 373,923 | ||||||
China Huishan Dairy Holdings Co. Ltd.b | 768,000 | 281,433 | ||||||
China International Marine Containers Group Co. Ltd. Class H | 76,800 | 136,753 | ||||||
China Life Insurance Co. Ltd. Class H | 1,024,000 | 3,541,035 | ||||||
China Longyuan Power Group Corp. Ltd. | 384,000 | 407,781 | ||||||
China Medical System Holdings Ltd. | 128,000 | 139,065 | ||||||
China Mengniu Dairy Co. Ltd. | 128,000 | 447,584 | ||||||
China Merchants Bank Co. Ltd. Class H | 640,456 | 1,525,515 | ||||||
China Merchants Holdings International Co. Ltd.b | 256,000 | 855,530 | ||||||
China Minsheng Banking Corp. Ltd. Class H | 768,000 | 744,212 | ||||||
China Mobile Ltd. | 832,000 | 10,080,554 | ||||||
China National Building Material Co. Ltd. Class H | 512,000 | 298,610 | ||||||
China Oilfield Services Ltd. Class H | 256,000 | 275,487 | ||||||
China Overseas Land & Investment Ltd. | 512,800 | 1,501,998 | ||||||
China Pacific Insurance Group Co. Ltd. Class H | 358,400 | 1,304,105 | ||||||
| Security | Shares | Value | ||||||
China Petroleum & Chemical Corp. Class H | 3,328,600 | $ | 2,216,189 | |||||
China Power International Development Ltd. | 384,000 | 255,668 | ||||||
China Railway Construction Corp. Ltd. Class H | 268,000 | 351,337 | ||||||
China Railway Group Ltd. Class H | 512,000 | 459,145 | ||||||
China Resources Cement Holdings Ltd. | 256,000 | 125,852 | ||||||
China Resources Enterprise Ltd. | 276,000 | 867,169 | ||||||
China Resources Gas Group Ltd. | 171,000 | 451,216 | ||||||
China Resources Land Ltd. | 284,444 | 709,821 | ||||||
China Resources Power Holdings Co. Ltd. | 256,200 | 627,438 | ||||||
China Shenhua Energy Co. Ltd. Class H | 448,000 | 776,914 | ||||||
China Shipping Container Lines Co. Ltd. Class Ha | 512,000 | 183,631 | ||||||
China Southern Airlines Co. Ltd. Class H | 256,000 | 166,812 | ||||||
China State Construction International Holdings Ltd. | 256,000 | 338,248 | ||||||
China Taiping Insurance Holdings Co. Ltd.a | 206,840 | 584,486 | ||||||
China Telecom Corp. Ltd. Class H | 2,048,000 | 1,072,881 | ||||||
China Unicom Hong Kong Ltd. | 769,900 | 1,011,294 | ||||||
China Vanke Co. Ltd. Class H | 192,301 | 437,203 | ||||||
Chongqing Changan Automobile Co. Ltd. Class B | 130,000 | 207,999 | ||||||
Chongqing Rural Commercial Bank Co. Ltd. Class H | 384,000 | 224,453 | ||||||
CITIC Ltd. | 512,000 | 938,110 | ||||||
CITIC Securities Co. Ltd. Class H | 256,000 | 513,318 | ||||||
CNOOC Ltd. | 2,432,000 | 3,015,661 | ||||||
COSCO Pacific Ltd. | 256,000 | 301,131 | ||||||
Country Garden Holdings Co. Ltd. | 768,046 | 269,558 | ||||||
CRRC Corp. Ltd. Class Ha | 587,400 | 686,685 | ||||||
CSPC Pharmaceutical Group Ltd. | 512,000 | 469,055 | ||||||
Dalian Wanda Commercial Properties Co. Ltd. Class Hc | 76,800 | 471,698 | ||||||
Datang International Power Generation Co. Ltd. Class H | 256,000 | 103,390 | ||||||
Dongfeng Motor Group Co. Ltd. Class H | 256,000 | 257,650 | ||||||
ENN Energy Holdings Ltd. | 124,000 | 632,796 | ||||||
| 46 | 2015 iSHARES ANNUAL REPORTTO SHAREHOLDERS |
Table of Contents
Consolidated Schedule of Investments (Continued)
iSHARES® MSCI BRIC ETF
August 31, 2015
| Security | Shares | Value | ||||||
Evergrande Real Estate Group Ltd.b | 768,000 | $ | 505,390 | |||||
Far East Horizon Ltd. | 256,000 | 203,808 | ||||||
Fosun International Ltd. | 256,000 | 429,417 | ||||||
Franshion Properties China Ltd.b | 548,000 | 137,176 | ||||||
GCL-Poly Energy Holdings Ltd.a,b | 1,280,000 | 204,799 | ||||||
Geely Automobile Holdings Ltd. | 640,000 | 247,740 | ||||||
GF Securities Co. Ltd.a | 128,000 | 219,333 | ||||||
Goldin Properties Holdings Ltd.a,b | 169,728 | 162,062 | ||||||
GOME Electrical Appliances Holding Ltd. | 1,572,400 | 249,553 | ||||||
Great Wall Motor Co. Ltd. Class H | 164,500 | 439,371 | ||||||
Guangdong Investment Ltd. | 256,000 | 346,176 | ||||||
Guangzhou Automobile Group Co. Ltd. Class H | 256,454 | 180,344 | ||||||
Guangzhou R&F Properties Co. Ltd. Class Ha | 153,600 | 140,320 | ||||||
Haier Electronics Group Co. Ltd. | 148,000 | 265,443 | ||||||
Haitian International Holdings Ltd. | 128,000 | 232,215 | ||||||
Haitong Securities Co. Ltd. Class H | 409,600 | 590,877 | ||||||
Hanergy Thin Film Power Group Ltd.a,b | 2,030,000 | 3 | ||||||
Hengan International Group Co. Ltd. | 128,000 | 1,256,043 | ||||||
Huadian Power International Corp. Ltd. Class H | 256,000 | 208,432 | ||||||
Huaneng Power International Inc. Class H | 512,000 | 589,952 | ||||||
Huaneng Renewables Corp. Ltd. Class H | 512,000 | 186,961 | ||||||
Huatai Securities Co. Ltd.a,c | 128,000 | 232,876 | ||||||
Industrial & Commercial Bank of China Ltd. Class H | 10,112,050 | 5,975,857 | ||||||
Inner Mongolia Yitai Coal Co. Ltd. Class B | 166,470 | 140,834 | ||||||
Jiangxi Copper Co. Ltd. Class H | 128,000 | 161,692 | ||||||
Kingsoft Corp. Ltd. | 128,000 | 269,872 | ||||||
Kunlun Energy Co. Ltd. | 512,000 | 362,031 | ||||||
Lenovo Group Ltd.b | 1,024,000 | 840,335 | ||||||
Longfor Properties Co. Ltd. | 192,000 | 232,133 | ||||||
Luye Pharma Group Ltd.a | 192,000 | 163,509 | ||||||
New China Life Insurance Co. Ltd. Class H | 102,200 | 399,566 | ||||||
New World China Land Ltd. | 256,000 | 155,251 | ||||||
| Security | Shares | Value | ||||||
Nine Dragons Paper (Holdings) Ltd. | 256,000 | $ | 143,689 | |||||
People’s Insurance Co. Group of China Ltd. (The) Class H | 896,000 | 424,297 | ||||||
PetroChina Co. Ltd. Class H | 2,816,000 | 2,339,990 | ||||||
PICC Property & Casualty Co. Ltd. Class H | 513,548 | 975,404 | ||||||
Ping An Insurance Group Co. of China Ltd. Class H | 640,000 | 3,133,915 | ||||||
Semiconductor Manufacturing International Corp.a | 3,968,000 | 348,158 | ||||||
Shandong Weigao Group Medical Polymer Co. Ltd. Class H | 408,000 | 285,335 | ||||||
Shanghai Electric Group Co. Ltd. Class Hb | 256,000 | 141,377 | ||||||
Shanghai Fosun Pharmaceutical Group Co. Ltd. Class H | 67,500 | 197,273 | ||||||
Shanghai Pharmaceuticals Holding Co. Ltd. Class H | 102,400 | 213,519 | ||||||
Shenzhou International Group Holdings Ltd. | 128,000 | 646,602 | ||||||
Shimao Property Holdings Ltd. | 192,000 | 269,541 | ||||||
Shui On Land Ltd. | 320,333 | 70,266 | ||||||
Sihuan Pharmaceutical Holdings Group Ltd. | 722,000 | 139,741 | ||||||
Sino Biopharmaceutical Ltd. | 512,000 | 607,790 | ||||||
Sino-Ocean Land Holdings Ltd. | 448,000 | 234,115 | ||||||
Sinopec Engineering Group Co. Ltd. Class H | 128,000 | 110,492 | ||||||
Sinopec Shanghai Petrochemical Co. Ltd. Class Ha | 513,000 | 187,327 | ||||||
Sinopharm Group Co. Ltd. Class H | 153,600 | 581,694 | ||||||
Sinotrans Ltd. Class H | 256,000 | 117,594 | ||||||
SOHO China Ltd. | 256,000 | 109,336 | ||||||
Sun Art Retail Group Ltd.b | 320,000 | 266,734 | ||||||
Sunac China Holdings Ltd. | 256,000 | 138,404 | ||||||
Tencent Holdings Ltd. | 704,000 | 11,972,465 | ||||||
Tingyi Cayman Islands Holding Corp. | 256,000 | 393,742 | ||||||
Tsingtao Brewery Co. Ltd. Class H | 40,000 | 196,644 | ||||||
Want Want China Holdings Ltd.b | 896,000 | 722,576 | ||||||
Weichai Power Co. Ltd. Class H | 168,550 | 181,380 | ||||||
Yanzhou Coal Mining Co. Ltd. Class Hb | 256,000 | 120,897 | ||||||
CONSOLIDATED SCHEDULESOF INVESTMENTS | 47 |
Table of Contents
Consolidated Schedule of Investments (Continued)
iSHARES® MSCI BRIC ETF
August 31, 2015
| Security | Shares | Value | ||||||
Yuexiu Property Co. Ltd. | 1,025,920 | $ | 161,499 | |||||
Zhejiang Expressway Co. Ltd. Class H | 256,000 | 274,827 | ||||||
Zhuzhou CSR Times Electric Co. Ltd. Class H | 70,000 | 463,803 | ||||||
Zijin Mining Group Co. Ltd. Class H | 799,000 | 206,192 | ||||||
ZTE Corp. Class H | 125,648 | 253,240 | ||||||
|
| |||||||
| 107,624,245 | ||||||||
INDIA — 20.10% |
| |||||||
ACC Ltd. | 5,888 | 118,234 | ||||||
Adani Ports & Special Economic Zone Ltd. | 102,785 | 549,604 | ||||||
Aditya Birla Nuvo Ltd. | 4,992 | 153,609 | ||||||
Ambuja Cements Ltd. | 90,752 | 282,871 | ||||||
Apollo Hospitals Enterprise Ltd. | 11,136 | 224,513 | ||||||
Asian Paints Ltd. | 39,296 | 501,641 | ||||||
Aurobindo Pharma Ltd. | 35,690 | 404,281 | ||||||
Bajaj Auto Ltd. | 11,904 | 399,820 | ||||||
Bharat Forge Ltd. | 13,568 | 238,376 | ||||||
Bharat Heavy Electricals Ltd. | 84,096 | 286,477 | ||||||
Bharat Petroleum Corp. Ltd. | 25,472 | 338,426 | ||||||
Bharti Airtel Ltd. | 163,584 | 871,874 | ||||||
Bharti Infratel Ltd. | 63,744 | 383,327 | ||||||
Bosch Ltd. | 1,024 | 357,540 | ||||||
Cairn India Ltd. | 69,376 | 155,450 | ||||||
Cipla Ltd. | 49,792 | 510,953 | ||||||
Coal India Ltd. | 94,720 | 522,011 | ||||||
Container Corp. of India Ltd. | 4,506 | 96,597 | ||||||
Dabur India Ltd. | 64,896 | 266,564 | ||||||
Divi’s Laboratories Ltd. | 5,760 | 204,847 | ||||||
DLF Ltd. | 30,592 | 51,037 | ||||||
Dr. Reddy’s Laboratories Ltd. | 15,973 | 1,033,866 | ||||||
Eicher Motors Ltd. | 1,408 | 402,751 | ||||||
GAIL (India) Ltd. | 50,304 | 224,069 | ||||||
GlaxoSmithKline Consumer Healthcare Ltd. | 1,408 | 129,483 | ||||||
Glenmark Pharmaceuticals Ltd. | 16,896 | 293,516 | ||||||
Godrej Consumer Products Ltd. | 16,256 | 325,817 | ||||||
HCL Technologies Ltd. | 75,904 | 1,108,786 | ||||||
Hero Motocorp Ltd. | 7,168 | 258,490 | ||||||
Hindalco Industries Ltd. | 173,313 | 208,706 | ||||||
Hindustan Unilever Ltd. | 104,263 | 1,350,282 | ||||||
Housing Development Finance Corp. Ltd. | 203,904 | 3,638,371 | ||||||
| Security | Shares | Value | ||||||
ICICI Bank Ltd. | 154,112 | $ | 644,268 | |||||
Idea Cellular Ltd. | 150,016 | 351,711 | ||||||
Indiabulls Housing Finance Ltd. | 26,112 | 296,591 | ||||||
Infosys Ltd. | 250,240 | 4,119,784 | ||||||
ITC Ltd. | 309,248 | 1,512,629 | ||||||
JSW Steel Ltd. | 10,752 | 148,814 | ||||||
Larsen & Toubro Ltd. | 43,264 | 1,043,217 | ||||||
LIC Housing Finance Ltd. | 40,192 | 267,846 | ||||||
Lupin Ltd. | 29,184 | 849,749 | ||||||
Mahindra & Mahindra Financial Services Ltd. | 38,105 | 144,825 | ||||||
Mahindra & Mahindra Ltd. | 49,408 | 907,442 | ||||||
Marico Ltd. | 26,880 | 163,989 | ||||||
Motherson Sumi Systems Ltd. | 46,080 | 210,384 | ||||||
Nestle India Ltd. | 3,200 | 287,165 | ||||||
NTPC Ltd. | 167,425 | 305,886 | ||||||
Oil & Natural Gas Corp. Ltd. | 114,304 | 411,477 | ||||||
Oil India Ltd. | 17,024 | 115,103 | ||||||
Piramal Enterprises Ltd. | 9,600 | 140,639 | ||||||
Power Finance Corp. Ltd. | 38,148 | 128,633 | ||||||
Reliance Communications Ltd.a | 123,008 | 111,767 | ||||||
Reliance Industries Ltd. | 177,408 | 2,284,220 | ||||||
Rural Electrification Corp. Ltd. | 41,737 | 159,006 | ||||||
Shree Cement Ltd. | 1,024 | 166,054 | ||||||
Shriram Transport Finance Co. Ltd. | 21,169 | 258,916 | ||||||
Siemens Ltd. | 9,987 | 190,027 | ||||||
State Bank of India | 205,322 | 763,992 | ||||||
Sun Pharmaceuticals Industries Ltd. | 125,824 | 1,701,534 | ||||||
Tata Consultancy Services Ltd. | 64,128 | 2,473,522 | ||||||
Tata Motors Ltd.a | 109,621 | 560,926 | ||||||
Tata Power Co. Ltd. | 171,755 | 156,446 | ||||||
Tata Steel Ltd. | 42,496 | 144,093 | ||||||
Tech Mahindra Ltd. | 32,768 | 253,863 | ||||||
Ultratech Cement Ltd. | 4,992 | 217,012 | ||||||
United Breweries Ltd. | 9,472 | 121,807 | ||||||
United Spirits Ltd.a | 7,552 | 375,748 | ||||||
UPL Ltd. | 36,480 | 275,788 | ||||||
Vedanta Ltd. | 134,912 | 200,212 | ||||||
Wipro Ltd. | 86,016 | 739,886 | ||||||
Zee Entertainment Enterprises Ltd. | 77,440 | 448,273 | ||||||
|
| |||||||
| 39,545,433 | ||||||||
| 48 | 2015 iSHARES ANNUAL REPORTTO SHAREHOLDERS |
Table of Contents
Consolidated Schedule of Investments (Continued)
iSHARES® MSCI BRIC ETF
August 31, 2015
| Security | Shares | Value | ||||||
RUSSIA — 8.61% |
| |||||||
Alrosa PAO | 260,000 | $ | 255,558 | |||||
Gazprom PAO | 826,884 | 1,830,745 | ||||||
Gazprom PAO ADR | 394,291 | 1,738,823 | ||||||
Lukoil PJSC | 36,361 | 1,377,162 | ||||||
Lukoil PJSC ADR (London) | 33,541 | 1,265,167 | ||||||
Magnit PJSC GDRd | 35,456 | 1,772,623 | ||||||
MegaFon PJSC GDRd | 12,672 | 162,835 | ||||||
MMC Norilsk Nickel PJSC | 7,552 | 1,182,830 | ||||||
Mobile TeleSystems PJSC ADR | 70,272 | 536,175 | ||||||
Moscow Exchange MICEX-RTS PJSC | 159,820 | 176,779 | ||||||
NOVATEK OAO GDRd | 12,416 | 1,189,453 | ||||||
Rosneft OAO | 162,262 | 591,337 | ||||||
Rostelecom PJSC | 119,680 | 143,214 | ||||||
RusHydro PJSC | 16,640,200 | 131,934 | ||||||
Sberbank of Russia | 1,479,680 | 1,646,898 | ||||||
Severstal PAO | 28,160 | 306,839 | ||||||
Sistema JSFC GDRd | 23,424 | 172,869 | ||||||
Surgutneftegas OAO | 495,210 | 253,283 | ||||||
Surgutneftegas OAO ADR | 51,857 | 270,694 | ||||||
Tatneft PAO Class S | 194,563 | 929,657 | ||||||
Uralkali PJSCa | 49,920 | 152,633 | ||||||
Uralkali PJSC GDRa,d | 9,602 | 148,447 | ||||||
VTB Bank JSC | 700,166,001 | 718,950 | ||||||
|
| |||||||
| 16,954,905 | ||||||||
|
| |||||||
TOTAL COMMON STOCKS | ||||||||
(Cost: $211,853,627) | 183,994,855 | |||||||
PREFERRED STOCKS — 6.16% |
| |||||||
BRAZIL — 5.68% | ||||||||
AES Tiete SA | 12,800 | 52,750 | ||||||
Banco Bradesco SA | 357,769 | 2,264,143 | ||||||
Banco do Estado do Rio Grande do Sul SA Class B | 25,600 | 54,331 | ||||||
Braskem SA Class A | 25,600 | 98,893 | ||||||
Centrais Eletricas Brasileiras SA Class B | 25,682 | 52,954 | ||||||
Cia. Brasileira de Distribuicao | 25,656 | 447,294 | ||||||
Cia. Energetica de Minas Gerais | 102,432 | 211,487 | ||||||
Cia. Energetica de Sao Paulo Class B | 25,600 | 113,372 | ||||||
Cia. Paranaense de Energia Class B | 12,800 | 108,944 | ||||||
Gerdau SA | 128,000 | 184,501 | ||||||
Itau Unibanco Holding SA | 422,429 | 3,079,275 | ||||||
| Security | Shares | Value | ||||||
Itausa – Investimentos Itau SA | 486,445 | $ | 972,289 | |||||
Lojas Americanas SA | 76,887 | 344,089 | ||||||
Oi SA | 52,929 | 39,236 | ||||||
Petroleo Brasileiro SA | 550,414 | 1,388,786 | ||||||
Suzano Papel e Celulose SA Class A | 51,200 | 247,126 | ||||||
Telefonica Brasil SA | 38,464 | 426,539 | ||||||
Usinas Siderurgicas de Minas Gerais SA Class A | 64,000 | 52,363 | ||||||
Vale SA | 268,800 | 1,044,278 | ||||||
|
| |||||||
| 11,182,650 | ||||||||
RUSSIA — 0.48% | ||||||||
AK Transneft OAO | 158 | 364,688 | ||||||
Surgutneftegas OAO | 947,200 | 570,705 | ||||||
|
| |||||||
| 935,393 | ||||||||
|
| |||||||
TOTAL PREFERRED STOCKS |
| |||||||
(Cost: $23,678,286) |
| 12,118,043 | ||||||
SHORT-TERM INVESTMENTS — 2.43% |
| |||||||
MONEY MARKET FUNDS — 2.43% |
| |||||||
BlackRock Cash Funds: Institutional, |
| |||||||
0.18%e,f,g | 4,521,395 | 4,521,395 | ||||||
BlackRock Cash Funds: Prime, | ||||||||
0.18%e,f,g | 259,641 | 259,641 | ||||||
|
| |||||||
| 4,781,036 | ||||||||
|
| |||||||
TOTAL SHORT-TERM INVESTMENTS |
| |||||||
(Cost: $4,781,036) |
| 4,781,036 | ||||||
|
| |||||||
TOTAL INVESTMENTS |
| |||||||
(Cost: $240,312,949) |
| 200,893,934 | ||||||
Other Assets, Less Liabilities — (2.10)% |
| (4,135,912 | ) | |||||
|
| |||||||
NET ASSETS — 100.00% |
| $ | 196,758,022 | |||||
|
| |||||||
ADR — American Depositary Receipts
GDR — Global Depositary Receipts
| a | Non-income earning security. |
| b | All or a portion of this security represents a security on loan. See Note 1. |
| c | This security may be resold to qualified institutional buyers under Rule 144A of the Securities Act of 1933. |
| d | This security may be resold to qualified foreign investors and foreign institutional buyers under Regulation S of the Securities Act of 1933. |
| e | Affiliated issuer. See Note 2. |
| f | The rate quoted is the annualized seven-day yield of the fund at period end. |
| g | All or a portion of this security represents an investment of securities lending collateral. See Note 1. |
See notes to consolidated financial statements.
CONSOLIDATED SCHEDULESOF INVESTMENTS | 49 |
Table of Contents
Consolidated Schedule of Investments
iSHARES® MSCI EMERGING MARKETS ASIA ETF
August 31, 2015
| Security | Shares | Value | ||||||
COMMON STOCKS — 98.58% |
| |||||||
CHINA — 33.91% |
| |||||||
AAC Technologies Holdings Inc. | 39,000 | $ | 219,657 | |||||
Agricultural Bank of China Ltd. Class H | 1,209,000 | 488,277 | ||||||
Air China Ltd. Class H | 102,000 | 73,703 | ||||||
Alibaba Health Information Technology Ltd.a,b | 128,000 | 88,526 | ||||||
Alibaba Pictures Group Ltd.a,b | 540,000 | 126,115 | ||||||
Aluminum Corp. of China Ltd. Class Ha,b | 210,000 | 70,180 | ||||||
Anhui Conch Cement Co. Ltd. Class H | 65,000 | 196,676 | ||||||
Anta Sports Products Ltd. | 53,000 | 133,491 | ||||||
AviChina Industry & Technology Co. Ltd. Class H | 116,000 | 80,676 | ||||||
Bank of China Ltd. Class H | 4,228,000 | 1,931,229 | ||||||
Bank of Communications Co. Ltd. Class H | 465,000 | 350,398 | ||||||
BBMG Corp. Class H | 61,000 | 39,355 | ||||||
Beijing Capital International Airport Co. Ltd. Class H | 76,000 | 81,785 | ||||||
Beijing Enterprises Holdings Ltd. | 28,500 | 166,402 | ||||||
Beijing Enterprises Water Group Ltd.b | 226,000 | 161,844 | ||||||
Belle International Holdings Ltd. | 251,000 | 229,623 | ||||||
Brilliance China Automotive Holdings Ltd. | 160,000 | 193,237 | ||||||
Byd Co. Ltd. Class Hb | 33,500 | 136,809 | ||||||
CGN Power Co. Ltd. Class Hc | 449,000 | 177,861 | ||||||
China Agri-Industries Holdings Ltd.a | 118,800 | 45,067 | ||||||
China Cinda Asset Management Co. Ltd. Class H | 472,000 | 175,400 | ||||||
China CITIC Bank Corp. Ltd. Class Ha | 436,000 | 267,224 | ||||||
China Coal Energy Co. Ltd. Class Hb | 151,000 | 70,531 | ||||||
China Communications Construction Co. Ltd. Class H | 236,000 | 280,762 | ||||||
China Communications Services Corp. Ltd. Class H | 132,000 | 48,542 | ||||||
China Conch Venture Holdings Ltd.b | 70,500 | 155,372 | ||||||
China Construction Bank Corp. Class H | 4,490,000 | 3,157,463 | ||||||
| Security | Shares | Value | ||||||
China COSCO Holdings Co. Ltd. Class Ha,b | 165,500 | $ | 94,285 | |||||
China Everbright Bank Co. Ltd. Class H | 168,000 | 76,738 | ||||||
China Everbright International Ltd. | 129,000 | 168,781 | ||||||
China Everbright Ltd. | 52,000 | 108,696 | ||||||
China Galaxy Securities Co. Ltd. Class H | 180,500 | 123,671 | ||||||
China Gas Holdings Ltd. | 92,000 | 134,378 | ||||||
China Huishan Dairy Holdings Co. Ltd.b | 333,000 | 122,028 | ||||||
China International Marine Containers Group Co. Ltd. Class H | 25,500 | 45,406 | ||||||
China Life Insurance Co. Ltd. Class H | 397,000 | 1,372,843 | ||||||
China Longyuan Power Group Corp. Ltd. | 168,000 | 178,404 | ||||||
China Medical System Holdings Ltd. | 58,000 | 63,014 | ||||||
China Mengniu Dairy Co. Ltd. | 73,000 | 255,263 | ||||||
China Merchants Bank Co. Ltd. Class H | 247,331 | 589,123 | ||||||
China Merchants Holdings International Co. Ltd.b | 62,000 | 207,199 | ||||||
China Minsheng Banking Corp. Ltd. Class H | 317,800 | 307,956 | ||||||
China Mobile Ltd. | 328,000 | 3,974,065 | ||||||
China National Building Material Co. Ltd. Class H | 150,000 | 87,483 | ||||||
China Oilfield Services Ltd. Class H | 98,000 | 105,460 | ||||||
China Overseas Land & Investment Ltd.b | 208,000 | 609,235 | ||||||
China Pacific Insurance Group Co. Ltd. Class H | 140,200 | 510,144 | ||||||
China Petroleum & Chemical Corp. Class H | 1,352,600 | 900,564 | ||||||
China Power International Development Ltd. | 170,000 | 113,186 | ||||||
China Railway Construction Corp. Ltd. Class H | 110,000 | 144,205 | ||||||
China Railway Group Ltd. Class H | 210,000 | 188,321 | ||||||
China Resources Cement Holdings Ltd.b | 110,000 | 54,077 | ||||||
China Resources Enterprise Ltd. | 64,000 | 201,083 | ||||||
China Resources Gas Group Ltd. | 48,000 | 126,657 | ||||||
| 50 | 2015 iSHARES ANNUAL REPORTTO SHAREHOLDERS |
Table of Contents
Consolidated Schedule of Investments (Continued)
iSHARES® MSCI EMERGING MARKETS ASIA ETF
August 31, 2015
| Security | Shares | Value | ||||||
China Resources Land Ltd. | 147,777 | $ | 368,773 | |||||
China Resources Power Holdings Co. Ltd. | 104,000 | 254,698 | ||||||
China Shenhua Energy Co. Ltd. Class H | 182,500 | 316,488 | ||||||
China Shipping Container Lines Co. Ltd. Class Ha,b | 243,000 | 87,153 | ||||||
China Southern Airlines Co. Ltd. Class H | 92,000 | 59,948 | ||||||
China State Construction International Holdings Ltd. | 96,000 | 126,843 | ||||||
China Taiping Insurance Holdings Co. Ltd.a,b | 87,700 | 247,822 | ||||||
China Telecom Corp. Ltd. Class H | 744,000 | 389,757 | ||||||
China Unicom Hong Kong Ltd. | 318,000 | 417,706 | ||||||
China Vanke Co. Ltd. Class Hb | 71,500 | 162,558 | ||||||
Chongqing Changan Automobile Co. Ltd. Class B | 46,000 | 73,600 | ||||||
Chongqing Rural Commercial Bank Co. Ltd. Class H | 140,000 | 81,832 | ||||||
CITIC Ltd. | 222,000 | 406,759 | ||||||
CITIC Securities Co. Ltd. Class H | 117,500 | 235,605 | ||||||
CNOOC Ltd. | 957,000 | 1,186,672 | ||||||
COSCO Pacific Ltd. | 114,000 | 134,098 | ||||||
Country Garden Holdings Co. Ltd.b | 280,828 | 98,561 | ||||||
CRRC Corp. Ltd. Class Ha | 230,750 | 269,752 | ||||||
CSPC Pharmaceutical Group Ltd. | 216,000 | 197,883 | ||||||
Dalian Wanda Commercial Properties Co. Ltd. Class Hc | 31,600 | 194,084 | ||||||
Datang International Power Generation Co. Ltd. Class H | 164,000 | 66,234 | ||||||
Dongfeng Motor Group Co. Ltd. Class H | 152,000 | 152,980 | ||||||
ENN Energy Holdings Ltd. | 40,000 | 204,128 | ||||||
Evergrande Real Estate Group Ltd.b | 298,000 | 196,102 | ||||||
Far East Horizon Ltd. | 101,000 | 80,408 | ||||||
Fosun International Ltd. | 97,000 | 162,709 | ||||||
Franshion Properties China Ltd.b | 166,000 | 41,553 | ||||||
GCL-Poly Energy Holdings Ltd.a,b | 595,000 | 95,199 | ||||||
Geely Automobile Holdings Ltd.b | 295,000 | 114,193 | ||||||
GF Securities Co. Ltd.a | 49,600 | 84,991 | ||||||
Goldin Properties Holdings Ltd.a,b | 67,031 | 64,003 | ||||||
GOME Electrical Appliances Holding Ltd.b | 634,000 | 100,621 | ||||||
Great Wall Motor Co. Ltd. Class H | 55,500 | 148,238 | ||||||
| Security | Shares | Value | ||||||
Guangdong Investment Ltd. | 154,000 | $ | 208,246 | |||||
Guangzhou Automobile Group Co. Ltd. Class H | 124,000 | 87,199 | ||||||
Guangzhou R&F Properties Co. Ltd. Class Ha | 58,800 | 53,716 | ||||||
Haier Electronics Group Co. Ltd. | 65,000 | 116,580 | ||||||
Haitian International Holdings Ltd. | 34,000 | 61,682 | ||||||
Haitong Securities Co. Ltd. Class H | 168,000 | 242,352 | ||||||
Hanergy Thin Film Power Group Ltd.a,b | 776,000 | 1 | ||||||
Hengan International Group Co. Ltd. | 39,500 | 387,607 | ||||||
Huadian Power International Corp. Ltd. Class H | 94,000 | 76,534 | ||||||
Huaneng Power International Inc. Class H | 190,000 | 218,928 | ||||||
Huaneng Renewables Corp. Ltd. Class H | 212,000 | 77,414 | ||||||
Huatai Securities Co. Ltd.a,c | 44,400 | 80,779 | ||||||
Industrial & Commercial Bank of China Ltd. Class H | 3,936,000 | 2,326,034 | ||||||
Inner Mongolia Yitai Coal Co. Ltd. Class B | 53,100 | 44,923 | ||||||
Jiangsu Expressway Co. Ltd. Class H | 68,000 | 80,371 | ||||||
Jiangxi Copper Co. Ltd. Class H | 72,000 | 90,952 | ||||||
Kingsoft Corp. Ltd.b | 46,000 | 96,985 | ||||||
Kunlun Energy Co. Ltd. | 178,000 | 125,862 | ||||||
Lenovo Group Ltd.b | 360,000 | 295,430 | ||||||
Longfor Properties Co. Ltd. | 82,500 | 99,745 | ||||||
Luye Pharma Group Ltd.a,b | 73,000 | 62,167 | ||||||
New China Life Insurance Co. Ltd. Class H | 40,200 | 157,168 | ||||||
New World China Land Ltd. | 144,000 | 87,328 | ||||||
Nine Dragons Paper (Holdings) Ltd. | 91,000 | 51,077 | ||||||
People’s Insurance Co. Group of China Ltd. (The) Class H | 345,000 | 163,373 | ||||||
PetroChina Co. Ltd. Class H | 1,120,000 | 930,678 | ||||||
PICC Property & Casualty Co. Ltd. Class H | 185,160 | 351,682 | ||||||
Ping An Insurance Group Co. of China Ltd. Class H | 277,000 | 1,356,398 | ||||||
Semiconductor Manufacturing International Corp.a,b | 1,405,000 | 123,277 | ||||||
Shandong Weigao Group Medical Polymer Co. Ltd. Class H | 96,000 | 67,138 | ||||||
CONSOLIDATED SCHEDULESOF INVESTMENTS | 51 |
Table of Contents
Consolidated Schedule of Investments (Continued)
iSHARES® MSCI EMERGING MARKETS ASIA ETF
August 31, 2015
| Security | Shares | Value | ||||||
Shanghai Electric Group Co. Ltd. Class Hb | 150,000 | $ | 82,838 | |||||
Shanghai Fosun Pharmaceutical Group Co. Ltd. Class H | 20,000 | 58,451 | ||||||
Shanghai Industrial Holdings Ltd. | 29,000 | 70,722 | ||||||
Shanghai Pharmaceuticals Holding Co. Ltd. Class H | 39,100 | 81,529 | ||||||
Shenzhou International Group Holdings Ltd. | 30,000 | 151,547 | ||||||
Shimao Property Holdings Ltd. | 73,000 | 102,482 | ||||||
Shui On Land Ltd. | 200,000 | 43,871 | ||||||
Sihuan Pharmaceutical Holdings Group Ltd. | 220,000 | 42,580 | ||||||
Sino Biopharmaceutical Ltd. | 156,000 | 185,186 | ||||||
Sino-Ocean Land Holdings Ltd. | 186,500 | 97,461 | ||||||
Sinopec Engineering Group Co. Ltd. Class H | 74,000 | 63,878 | ||||||
Sinopec Shanghai Petrochemical Co. Ltd. Class Ha | 177,000 | 64,633 | ||||||
Sinopharm Group Co. Ltd. Class H | 64,400 | 243,887 | ||||||
Sinotrans Ltd. Class H | 99,000 | 45,476 | ||||||
SOHO China Ltd.b | 102,000 | 43,564 | ||||||
Sun Art Retail Group Ltd.b | 119,500 | 99,608 | ||||||
Sunac China Holdings Ltd.b | 98,000 | 52,983 | ||||||
Tencent Holdings Ltd. | 274,900 | 4,675,043 | ||||||
Tingyi Cayman Islands Holding Corp.b | 102,000 | 156,882 | ||||||
Tsingtao Brewery Co. Ltd. Class H | 20,000 | 98,322 | ||||||
Want Want China Holdings Ltd.b | 316,000 | 254,837 | ||||||
Weichai Power Co. Ltd. Class H | 51,600 | 55,528 | ||||||
Yanzhou Coal Mining Co. Ltd. Class Hb | 108,000 | 51,004 | ||||||
Yuexiu Property Co. Ltd.b | 352,140 | 55,433 | ||||||
Zhejiang Expressway Co. Ltd. Class H | 82,000 | 88,030 | ||||||
Zhuzhou CSR Times Electric Co. Ltd. Class H | 27,500 | 182,208 | ||||||
Zijin Mining Group Co. Ltd. Class H | 296,000 | 76,387 | ||||||
ZTE Corp. Class H | 41,760 | 84,166 | ||||||
|
| |||||||
| 42,260,583 | ||||||||
INDIA — 12.47% | ||||||||
ACC Ltd. | 2,202 | 44,217 | ||||||
Adani Ports & Special Economic Zone Ltd. | 42,844 | 229,092 | ||||||
Aditya Birla Nuvo Ltd. | 2,144 | 65,973 | ||||||
| Security | Shares | Value | ||||||
Ambuja Cements Ltd. | 37,767 | $ | 117,718 | |||||
Apollo Hospitals Enterprise Ltd. | 4,202 | 84,716 | ||||||
Asian Paints Ltd. | 15,630 | 199,528 | ||||||
Aurobindo Pharma Ltd. | 14,534 | 164,635 | ||||||
Bajaj Auto Ltd. | 4,500 | 151,142 | ||||||
Bharat Forge Ltd. | 5,778 | 101,514 | ||||||
Bharat Heavy Electricals Ltd. | 31,852 | 108,505 | ||||||
Bharat Petroleum Corp. Ltd. | 9,066 | 120,453 | ||||||
Bharti Airtel Ltd. | 63,948 | 340,832 | ||||||
Bharti Infratel Ltd. | 25,169 | 151,355 | ||||||
Bosch Ltd. | 399 | 139,315 | ||||||
Cairn India Ltd. | 23,949 | 53,662 | ||||||
Cipla Ltd. | 18,233 | 187,103 | ||||||
Coal India Ltd. | 36,745 | 202,505 | ||||||
Container Corp. of India Ltd. | 1,766 | 37,858 | ||||||
Dabur India Ltd. | 28,925 | 118,811 | ||||||
Divi’s Laboratories Ltd. | 1,920 | 68,282 | ||||||
DLF Ltd. | 13,129 | 21,903 | ||||||
Dr. Reddy’s Laboratories Ltd. | 6,214 | 402,206 | ||||||
Eicher Motors Ltd. | 652 | 186,501 | ||||||
GAIL (India) Ltd. | 19,659 | 87,567 | ||||||
GlaxoSmithKline Consumer Healthcare Ltd. | 482 | 44,326 | ||||||
Glenmark Pharmaceuticals Ltd. | 7,035 | 122,212 | ||||||
Godrej Consumer Products Ltd. | 6,278 | 125,829 | ||||||
HCL Technologies Ltd. | 30,125 | 440,058 | ||||||
Hero Motocorp Ltd. | 2,855 | 102,956 | ||||||
Hindalco Industries Ltd. | 59,561 | 71,724 | ||||||
Hindustan Unilever Ltd. | 40,481 | 524,259 | ||||||
Housing Development Finance Corp. Ltd. | 80,143 | 1,430,036 | ||||||
ICICI Bank Ltd. | 59,706 | 249,602 | ||||||
Idea Cellular Ltd. | 59,755 | 140,095 | ||||||
Indiabulls Housing Finance Ltd. | 11,103 | 126,112 | ||||||
Infosys Ltd. | 98,355 | 1,619,251 | ||||||
ITC Ltd. | 119,454 | 584,287 | ||||||
JSW Steel Ltd. | 4,333 | 59,971 | ||||||
Larsen & Toubro Ltd. | 17,003 | 409,990 | ||||||
LIC Housing Finance Ltd. | 15,201 | 101,302 | ||||||
Lupin Ltd. | 11,807 | 343,784 | ||||||
Mahindra & Mahindra Financial Services Ltd. | 14,969 | 56,892 | ||||||
Mahindra & Mahindra Ltd. | 19,873 | 364,994 | ||||||
Marico Ltd. | 11,590 | 70,708 | ||||||
Motherson Sumi Systems Ltd. | 16,878 | 77,059 | ||||||
| 52 | 2015 iSHARES ANNUAL REPORTTO SHAREHOLDERS |
Table of Contents
Consolidated Schedule of Investments (Continued)
iSHARES® MSCI EMERGING MARKETS ASIA ETF
August 31, 2015
| Security | Shares | Value | ||||||
Nestle India Ltd. | 1,233 | $ | 110,648 | |||||
NTPC Ltd. | 63,900 | 116,746 | ||||||
Oil & Natural Gas Corp. Ltd. | 45,493 | 163,768 | ||||||
Oil India Ltd. | 6,442 | 43,556 | ||||||
Piramal Enterprises Ltd. | 3,922 | 57,457 | ||||||
Power Finance Corp. Ltd. | 15,002 | 50,586 | ||||||
Reliance Communications Ltd.a | 49,678 | 45,138 | ||||||
Reliance Industries Ltd. | 69,088 | 889,544 | ||||||
Rural Electrification Corp. Ltd. | 17,791 | 67,779 | ||||||
Shree Cement Ltd. | 414 | 67,135 | ||||||
Shriram Transport Finance Co. Ltd. | 7,917 | 96,832 | ||||||
Siemens Ltd. | 3,734 | 71,049 | ||||||
State Bank of India | 80,854 | 300,854 | ||||||
Sun Pharmaceuticals Industries Ltd. | 50,852 | 687,678 | ||||||
Tata Consultancy Services Ltd. | 25,179 | 971,195 | ||||||
Tata Motors Ltd.a | 43,419 | 222,173 | ||||||
Tata Power Co. Ltd. | 60,851 | 55,427 | ||||||
Tata Steel Ltd. | 16,942 | 57,446 | ||||||
Tech Mahindra Ltd. | 12,398 | 96,051 | ||||||
Ultratech Cement Ltd. | 2,009 | 87,335 | ||||||
United Breweries Ltd. | 3,491 | 44,893 | ||||||
United Spirits Ltd.a | 3,086 | 153,543 | ||||||
UPL Ltd. | 14,465 | 109,355 | ||||||
Vedanta Ltd. | 48,162 | 71,473 | ||||||
Wipro Ltd. | 33,631 | 289,285 | ||||||
Zee Entertainment Enterprises Ltd. | 29,312 | 169,677 | ||||||
|
| |||||||
| 15,547,463 | ||||||||
INDONESIA — 3.48% | ||||||||
Adaro Energy Tbk PT | 782,100 | 33,121 | ||||||
Astra Agro Lestari Tbk PT | 23,300 | 28,399 | ||||||
Astra International Tbk PT | 1,093,000 | 460,927 | ||||||
Bank Central Asia Tbk PT | 666,200 | 611,671 | ||||||
Bank Danamon Indonesia Tbk PT | 194,800 | 49,012 | ||||||
Bank Mandiri Persero Tbk PT | 504,600 | 326,823 | ||||||
Bank Negara Indonesia Persero Tbk PT | 393,300 | 138,565 | ||||||
Bank Rakyat Indonesia Persero Tbk PT | 598,100 | 452,300 | ||||||
Bumi Serpong Damai Tbk PT | 413,800 | 47,270 | ||||||
Charoen Pokphand Indonesia Tbk PT | 384,000 | 51,109 | ||||||
Global Mediacom Tbk PT | 309,100 | 25,960 | ||||||
Gudang Garam Tbk PT | 27,700 | 87,733 | ||||||
Indocement Tunggal Prakarsa Tbk PT | 77,900 | 108,810 | ||||||
| Security | Shares | Value | ||||||
Indofood CBP Sukses Makmur Tbk PT | 59,300 | $ | 53,813 | |||||
Indofood Sukses Makmur Tbk PT | 245,100 | 92,458 | ||||||
Jasa Marga Persero Tbk PT | 94,400 | 34,602 | ||||||
Kalbe Farma Tbk PT | 1,113,800 | 132,784 | ||||||
Lippo Karawaci Tbk PT | 1,017,500 | 77,489 | ||||||
Matahari Department Store Tbk PT | 122,800 | 153,172 | ||||||
Media Nusantara Citra Tbk PT | 284,800 | 38,413 | ||||||
Perusahaan Gas Negara Persero Tbk PT | 588,400 | 116,424 | ||||||
Semen Indonesia Persero Tbk PT | 157,000 | 103,363 | ||||||
Summarecon Agung Tbk PT | 510,500 | 58,862 | ||||||
Surya Citra Media Tbk PT | 293,000 | 56,932 | ||||||
Tambang Batubara Bukit Asam Persero Tbk PT | 31,800 | 13,241 | ||||||
Telekomunikasi Indonesia Persero Tbk PT | 2,709,400 | 553,450 | ||||||
Tower Bersama Infrastructure Tbk PTa | 102,800 | 52,497 | ||||||
Unilever Indonesia Tbk PT | 81,800 | 231,281 | ||||||
United Tractors Tbk PT | 87,300 | 118,834 | ||||||
XL Axiata Tbk PTa | 159,400 | 34,036 | ||||||
|
| |||||||
| 4,343,351 | ||||||||
MALAYSIA — 4.58% | ||||||||
AirAsia Bhdb | 61,400 | 12,719 | ||||||
Alliance Financial Group Bhdb | 61,000 | 54,610 | ||||||
AMMB Holdings Bhdb | 103,900 | 116,269 | ||||||
Astro Malaysia Holdings Bhdb | 80,900 | 55,859 | ||||||
Axiata Group Bhdb | 139,100 | 203,351 | ||||||
Berjaya Sports Toto Bhd | 32,937 | 23,134 | ||||||
British American Tobacco Malaysia Bhdb | 7,300 | 108,075 | ||||||
Bumi Armada Bhda | 98,600 | 20,072 | ||||||
CIMB Group Holdings Bhdb | 277,900 | 330,833 | ||||||
Dialog Group Bhd | 202,878 | 75,838 | ||||||
DiGi.Com Bhdb | 185,800 | 231,365 | ||||||
Felda Global Ventures Holdings Bhdb | 69,000 | 20,043 | ||||||
Gamuda Bhdb | 83,100 | 85,870 | ||||||
Genting Bhdb | 114,800 | 187,233 | ||||||
Genting Malaysia Bhdb | 152,300 | 143,597 | ||||||
Genting Plantations Bhd | 9,100 | 21,385 | ||||||
Hong Leong Bank Bhdb | 28,900 | 90,003 | ||||||
Hong Leong Financial Group Bhd | 15,200 | 50,522 | ||||||
IHH Healthcare Bhd | 132,700 | 184,832 | ||||||
CONSOLIDATED SCHEDULESOF INVESTMENTS | 53 |
Table of Contents
Consolidated Schedule of Investments (Continued)
iSHARES® MSCI EMERGING MARKETS ASIA ETF
August 31, 2015
| Security | Shares | Value | ||||||
IJM Corp. Bhdb | 79,100 | $ | 118,650 | |||||
IOI Corp. Bhdb | 161,800 | 154,095 | ||||||
IOI Properties Group Bhdb | 88,515 | 38,567 | ||||||
Kuala Lumpur Kepong Bhdb | 23,300 | 115,501 | ||||||
Lafarge Malaysia Bhdb | 25,700 | 56,907 | ||||||
Malayan Banking Bhdb | 251,900 | 525,391 | ||||||
Malaysia Airports Holdings Bhdb | 40,600 | 41,760 | ||||||
Maxis Bhdb | 102,300 | 160,026 | ||||||
MISC Bhd | 58,900 | 113,593 | ||||||
Petronas Chemicals Group Bhdb | 151,500 | 218,954 | ||||||
Petronas Dagangan Bhdb | 12,700 | 63,984 | ||||||
Petronas Gas Bhdb | 39,200 | 198,987 | ||||||
PPB Group Bhdb | 26,800 | 97,884 | ||||||
Public Bank Bhd | 134,910 | 578,186 | ||||||
RHB Capital Bhdb | 32,400 | 49,989 | ||||||
Sapurakencana Petroleum Bhdb | 179,100 | 73,346 | ||||||
Sime Darby Bhdb | 165,200 | 293,033 | ||||||
Telekom Malaysia Bhd | 55,600 | 85,915 | ||||||
Tenaga Nasional Bhdb | 182,200 | 484,999 | ||||||
UMW Holdings Bhd | 29,400 | 59,500 | ||||||
Westports Holdings Bhd | 47,300 | 47,300 | ||||||
YTL Corp. Bhdb | 221,253 | 82,180 | ||||||
YTL Power International Bhd | 80,315 | 29,640 | ||||||
|
| |||||||
| 5,703,997 | ||||||||
PHILIPPINES — 2.12% | ||||||||
Aboitiz Equity Ventures Inc. | 98,350 | 115,941 | ||||||
Aboitiz Power Corp. | 71,600 | 66,254 | ||||||
Alliance Global Group Inc. | 104,900 | 44,438 | ||||||
Ayala Corp. | 11,780 | 186,000 | ||||||
Ayala Land Inc. | 392,000 | 301,506 | ||||||
Bank of the Philippine Islands | 47,510 | 85,994 | ||||||
BDO Unibank Inc. | 87,070 | 183,492 | ||||||
DMCI Holdings Inc. | 186,200 | 45,335 | ||||||
Energy Development Corp. | 498,200 | 63,954 | ||||||
Globe Telecom Inc. | 1,675 | 92,315 | ||||||
GT Capital Holdings Inc. | 4,275 | 116,158 | ||||||
International Container Terminal Services Inc. | 28,440 | 56,557 | ||||||
JG Summit Holdings Inc. | 132,496 | 201,267 | ||||||
Jollibee Foods Corp. | 21,140 | 86,613 | ||||||
Megaworld Corp. | 533,600 | 49,433 | ||||||
Metro Pacific Investments Corp. | 715,100 | 76,498 | ||||||
Metropolitan Bank & Trust Co. | 20,086 | 35,991 | ||||||
Philippine Long Distance Telephone Co. | 5,250 | 282,830 | ||||||
| Security | Shares | Value | ||||||
SM Investments Corp. | 8,363 | $ | 157,097 | |||||
SM Prime Holdings Inc. | 468,150 | 195,313 | ||||||
Universal Robina Corp. | 47,500 | 197,154 | ||||||
|
| |||||||
| 2,640,140 | ||||||||
SOUTH KOREA — 20.47% | ||||||||
AmorePacific Corp. | 1,721 | 550,749 | ||||||
AmorePacific Group | 1,504 | 218,717 | ||||||
BGF retail Co. Ltd. | 463 | 78,879 | ||||||
BNK Financial Group Inc. | 11,334 | 133,200 | ||||||
Celltrion Inc.a,b | 3,553 | 213,285 | ||||||
Cheil Industries Inc.a | 1,679 | 252,684 | ||||||
Cheil Worldwide Inc.a | 4,317 | 63,509 | ||||||
CJ CheilJedang Corp. | 405 | 134,572 | ||||||
CJ Corp. | 783 | 190,330 | ||||||
CJ Korea Express Co. Ltd.a | 340 | 51,169 | ||||||
Coway Co. Ltd. | 2,842 | 202,803 | ||||||
Daelim Industrial Co. Ltd. | 1,468 | 83,531 | ||||||
Daewoo Engineering & Construction Co. Ltd.a | 5,046 | 27,177 | ||||||
Daewoo International Corp. | 2,440 | 44,973 | ||||||
Daewoo Securities Co. Ltd. | 9,679 | 101,475 | ||||||
Daewoo Shipbuilding & Marine Engineering Co. Ltd. | 6,076 | 34,573 | ||||||
Daum Kakao Corp. | 1,578 | 179,981 | ||||||
DGB Financial Group Inc. | 8,520 | 74,917 | ||||||
Dongbu Insurance Co. Ltd. | 2,298 | 103,364 | ||||||
Dongsuh Cos. Inc. | 1,897 | 71,854 | ||||||
Doosan Corp. | 334 | 29,086 | ||||||
Doosan Heavy Industries & Construction Co. Ltd. | 2,555 | 39,748 | ||||||
Doosan Infracore Co. Ltd.a | 7,278 | 41,105 | ||||||
E-Mart Co. Ltd. | 1,123 | 216,957 | ||||||
GS Engineering & Construction Corp.a | 2,873 | 59,148 | ||||||
GS Holdings Corp. | 2,737 | 107,490 | ||||||
Hana Financial Group Inc. | 15,643 | 359,746 | ||||||
Hankook Tire Co. Ltd. | 3,910 | 122,151 | ||||||
Hanmi Pharm Co. Ltd.a | 288 | 105,923 | ||||||
Hanmi Science Co. Ltd.a | 600 | 81,167 | ||||||
Hanon Systems | 2,151 | 66,108 | ||||||
Hanssem Co. Ltd. | 516 | 138,952 | ||||||
Hanwha Chemical Corp. | 5,755 | 88,314 | ||||||
Hanwha Corp. | 2,515 | 89,628 | ||||||
Hanwha Life Insurance Co. Ltd. | 12,238 | 82,259 | ||||||
Hotel Shilla Co. Ltd. | 1,764 | 179,718 | ||||||
| 54 | 2015 iSHARES ANNUAL REPORTTO SHAREHOLDERS |
Table of Contents
Consolidated Schedule of Investments (Continued)
iSHARES® MSCI EMERGING MARKETS ASIA ETF
August 31, 2015
| Security | Shares | Value | ||||||
Hyosung Corp. | 1,187 | $ | 128,460 | |||||
Hyundai Department Store Co. Ltd. | 815 | 103,705 | ||||||
Hyundai Development Co. Engineering & Construction | 2,975 | 150,668 | ||||||
Hyundai Engineering & Construction Co. Ltd. | 3,807 | 106,863 | ||||||
Hyundai Glovis Co. Ltd. | 1,024 | 148,914 | ||||||
Hyundai Heavy Industries Co. Ltd.a | 2,189 | 169,346 | ||||||
Hyundai Marine & Fire Insurance Co. Ltd. | 2,815 | 66,641 | ||||||
Hyundai Merchant Marine Co. Ltd.a | 5,181 | 37,234 | ||||||
Hyundai Mobis Co. Ltd. | 3,630 | 633,773 | ||||||
Hyundai Motor Co. | 8,233 | 1,037,174 | ||||||
Hyundai Steel Co. | 4,042 | 180,784 | ||||||
Hyundai Wia Corp. | 860 | 75,984 | ||||||
Industrial Bank of Korea | 15,013 | 167,552 | ||||||
Kangwon Land Inc. | 6,352 | 228,516 | ||||||
KB Financial Group Inc. | 20,645 | 624,892 | ||||||
KCC Corp. | 324 | 107,521 | ||||||
KEPCO Plant Service & Engineering Co. Ltd. | 1,265 | 134,762 | ||||||
Kia Motors Corp. | 13,857 | 570,565 | ||||||
Korea Aerospace Industries Ltd. | 2,364 | 184,483 | ||||||
Korea Electric Power Corp. | 13,860 | 562,486 | ||||||
Korea Gas Corp. | 1,660 | 56,491 | ||||||
Korea Investment Holdings Co. Ltd. | 2,091 | 123,400 | ||||||
Korea Zinc Co. Ltd. | 456 | 197,783 | ||||||
Korean Air Lines Co. Ltd.a | 1,934 | 54,451 | ||||||
KT Corp.a | 1,694 | 41,321 | ||||||
KT&G Corp. | 5,932 | 554,205 | ||||||
Kumho Petrochemical Co. Ltd. | 740 | 34,286 | ||||||
LG Chem Ltd. | 2,509 | 496,391 | ||||||
LG Corp. | 5,124 | 252,138 | ||||||
LG Display Co. Ltd. | 12,420 | 242,047 | ||||||
LG Electronics Inc. | 5,740 | 215,963 | ||||||
LG Household & Health Care Ltd. | 508 | 344,465 | ||||||
LG Innotek Co. Ltd. | 775 | 60,218 | ||||||
LG Uplus Corp. | 10,902 | 101,393 | ||||||
Lotte Chemical Corp. | 815 | 170,201 | ||||||
Lotte Confectionery Co. Ltd. | 33 | 54,351 | ||||||
Lotte Shopping Co. Ltd. | 596 | 134,796 | ||||||
LS Industrial Systems Co. Ltd. | 805 | 29,403 | ||||||
Mirae Asset Securities Co. Ltd. | 1,547 | 51,076 | ||||||
NAVER Corp. | 1,492 | 625,057 | ||||||
NCsoft Corp. | 809 | 149,454 | ||||||
| Security | Shares | Value | ||||||
NH Investment & Securities Co. Ltd. | 6,888 | $ | 56,548 | |||||
OCI Co. Ltd.b | 967 | 66,797 | ||||||
Orion Corp./Republic of Korea | 193 | 152,246 | ||||||
Paradise Co. Ltd.a | 2,508 | 48,347 | ||||||
POSCO | 3,727 | 598,715 | ||||||
S-1 Corp. | 902 | 71,611 | ||||||
S-Oil Corp. | 2,381 | 120,786 | ||||||
Samsung C&T Corp. | 6,747 | 274,387 | ||||||
Samsung Card Co. Ltd. | 1,985 | 60,838 | ||||||
Samsung Electro-Mechanics Co. Ltd. | 3,172 | 162,790 | ||||||
Samsung Electronics Co. Ltd. | 5,905 | 5,436,944 | ||||||
Samsung Fire & Marine Insurance Co. Ltd. | 1,906 | 434,299 | ||||||
Samsung Heavy Industries Co. Ltd.b | 7,950 | 75,618 | ||||||
Samsung Life Insurance Co. Ltd. | 4,250 | 353,223 | ||||||
Samsung SDI Co. Ltd. | 2,896 | 206,901 | ||||||
Samsung SDS Co. Ltd. | 1,670 | 362,169 | ||||||
Samsung Securities Co. Ltd. | 3,063 | 117,056 | ||||||
Shinhan Financial Group Co. Ltd. | 22,844 | 763,881 | ||||||
Shinsegae Co. Ltd. | 374 | 79,211 | ||||||
SK Holdings Co. Ltd. | 1,916 | 437,387 | ||||||
SK Hynix Inc. | 31,184 | 943,891 | ||||||
SK Innovation Co. Ltd.a | 3,536 | 298,665 | ||||||
SK Networks Co. Ltd. | 5,749 | 31,935 | ||||||
SK Telecom Co. Ltd. | 520 | 107,275 | ||||||
Woori Bank | 17,107 | 131,909 | ||||||
Yuhan Corp. | 423 | 88,874 | ||||||
|
| |||||||
| 25,510,758 | ||||||||
TAIWAN — 18.19% | ||||||||
Acer Inc.a | 157,062 | 57,928 | ||||||
Advanced Semiconductor Engineering Inc. | 331,434 | 342,273 | ||||||
Advantech Co. Ltd. | 15,894 | 101,121 | ||||||
Asia Cement Corp. | 121,229 | 130,224 | ||||||
Asia Pacific Telecom Co. Ltd.a | 103,000 | 28,143 | ||||||
Asustek Computer Inc. | 37,000 | 336,612 | ||||||
AU Optronics Corp. | 474,000 | 152,969 | ||||||
Casetek Holdings Ltd. | 7,000 | 26,140 | ||||||
Catcher Technology Co. Ltd. | 35,000 | 357,143 | ||||||
Cathay Financial Holding Co. Ltd. | 435,944 | 628,405 | ||||||
Chailease Holding Co. Ltd. | 54,496 | 87,600 | ||||||
Chang Hwa Commercial Bank Ltd. | 274,580 | 133,340 | ||||||
Cheng Shin Rubber Industry Co. Ltd. | 87,776 | 140,826 | ||||||
CONSOLIDATED SCHEDULESOF INVESTMENTS | 55 |
Table of Contents
Consolidated Schedule of Investments (Continued)
iSHARES® MSCI EMERGING MARKETS ASIA ETF
August 31, 2015
| Security | Shares | Value | ||||||
Chicony Electronics Co. Ltd. | 28,741 | $ | 71,375 | |||||
China Airlines Ltd.a | 133,000 | 47,827 | ||||||
China Development Financial Holding Corp. | 730,200 | 210,738 | ||||||
China Life Insurance Co. Ltd./Taiwan | 172,726 | 131,923 | ||||||
China Motor Corp. | 25,000 | 16,981 | ||||||
China Steel Corp. | 638,867 | 382,896 | ||||||
Chunghwa Telecom Co. Ltd. | 202,000 | 613,401 | ||||||
Compal Electronics Inc. | 227,000 | 132,561 | ||||||
CTBC Financial Holding Co. Ltd. | 807,098 | 486,204 | ||||||
CTCI Corp. | 32,000 | 41,308 | ||||||
Delta Electronics Inc. | 99,000 | 495,974 | ||||||
E.Sun Financial Holding Co. Ltd. | 364,834 | 219,219 | ||||||
Eclat Textile Co. Ltd. | 9,200 | 138,413 | ||||||
Epistar Corp. | 60,000 | 48,500 | ||||||
EVA Airways Corp.a | 92,426 | 55,820 | ||||||
Evergreen Marine Corp. Taiwan Ltd. | 100,050 | 43,820 | ||||||
Far Eastern New Century Corp. | 179,460 | 162,714 | ||||||
Far EasTone Telecommunications Co. Ltd. | 85,000 | 186,532 | ||||||
Feng TAY Enterprise Co. Ltd. | 15,450 | 91,648 | ||||||
First Financial Holding Co. Ltd. | 424,737 | 205,606 | ||||||
Formosa Chemicals & Fibre Corp. | 170,950 | 365,691 | ||||||
Formosa Petrochemical Corp. | 62,000 | 138,917 | ||||||
Formosa Plastics Corp. | 220,400 | 485,698 | ||||||
Formosa Taffeta Co. Ltd. | 35,000 | 30,443 | ||||||
Foxconn Technology Co. Ltd. | 47,843 | 134,547 | ||||||
Fubon Financial Holding Co. Ltd. | 350,396 | 602,014 | ||||||
Giant Manufacturing Co. Ltd. | 16,000 | 115,810 | ||||||
Hermes Microvision Inc. | 2,000 | 84,829 | ||||||
Highwealth Construction Corp. | 33,800 | 52,254 | ||||||
Hiwin Technologies Corp. | 11,688 | 59,992 | ||||||
Hon Hai Precision Industry Co. Ltd. | 711,528 | 2,022,877 | ||||||
Hotai Motor Co. Ltd. | 13,000 | 143,042 | ||||||
HTC Corp. | 33,000 | 46,707 | ||||||
Hua Nan Financial Holdings Co. Ltd. | 366,968 | 173,694 | ||||||
Innolux Corp. | 450,620 | 159,274 | ||||||
Inotera Memories Inc.a | 130,000 | 78,313 | ||||||
Inventec Corp. | 134,980 | 61,815 | ||||||
Kinsus Interconnect Technology Corp. | 17,000 | 30,305 | ||||||
Largan Precision Co. Ltd. | 5,000 | 464,101 | ||||||
Lite-On Technology Corp. | 116,253 | 106,477 | ||||||
MediaTek Inc. | 80,176 | 618,520 | ||||||
| Security | Shares | Value | ||||||
Mega Financial Holding Co. Ltd. | 526,542 | $ | 394,874 | |||||
Merida Industry Co. Ltd. | 11,350 | 61,745 | ||||||
Nan Ya Plastics Corp. | 254,090 | 463,104 | ||||||
Novatek Microelectronics Corp. | 31,000 | 103,854 | ||||||
Pegatron Corp. | 102,000 | 263,966 | ||||||
Phison Electronics Corp. | 7,000 | 48,731 | ||||||
Pou Chen Corp. | 121,000 | 195,617 | ||||||
Powertech Technology Inc. | 33,000 | 56,799 | ||||||
President Chain Store Corp. | 30,000 | 200,547 | ||||||
Quanta Computer Inc. | 148,000 | 272,019 | ||||||
Radiant Opto-Electronics Corp. | 23,363 | 68,073 | ||||||
Realtek Semiconductor Corp. | 24,140 | 43,330 | ||||||
Ruentex Development Co. Ltd. | 42,888 | 45,872 | ||||||
Ruentex Industries Ltd. | 29,855 | 47,623 | ||||||
Shin Kong Financial Holding Co. Ltd. | 431,138 | 102,299 | ||||||
Siliconware Precision Industries Co. Ltd. | 161,000 | 197,935 | ||||||
Simplo Technology Co. Ltd. | 16,200 | 53,774 | ||||||
SinoPac Financial Holdings Co. Ltd. | 518,499 | 178,485 | ||||||
Standard Foods Corp. | 19,913 | 45,229 | ||||||
Synnex Technology International Corp. | 69,000 | 73,377 | ||||||
Taishin Financial Holding Co. Ltd. | 393,067 | 137,723 | ||||||
Taiwan Business Banka | 179,045 | 45,124 | ||||||
Taiwan Cement Corp. | 177,000 | 189,588 | ||||||
Taiwan Cooperative Financial Holding Co. Ltd. | 435,463 | 184,700 | ||||||
Taiwan Fertilizer Co. Ltd. | 42,000 | 53,120 | ||||||
Taiwan Glass Industry Corp.a | 53,450 | 21,521 | ||||||
Taiwan Mobile Co. Ltd. | 89,000 | 267,525 | ||||||
Taiwan Semiconductor Manufacturing Co. Ltd. | 1,316,000 | 5,217,728 | ||||||
Teco Electric and Machinery Co. Ltd. | 103,000 | 77,560 | ||||||
TPK Holding Co. Ltd. | 16,591 | 41,559 | ||||||
Transcend Information Inc. | 12,000 | 32,346 | ||||||
U-Ming Marine Transport Corp. | 22,000 | 21,807 | ||||||
Uni-President Enterprises Corp. | 266,650 | 475,341 | ||||||
United Microelectronics Corp. | 664,000 | 219,388 | ||||||
Vanguard International Semiconductor Corp. | 43,000 | 48,900 | ||||||
Wan Hai Lines Ltd. | 22,000 | 15,146 | ||||||
Wistron Corp. | 109,736 | 54,301 | ||||||
WPG Holdings Ltd. | 75,000 | 70,883 | ||||||
| 56 | 2015 iSHARES ANNUAL REPORTTO SHAREHOLDERS |
Table of Contents
Consolidated Schedule of Investments (Continued)
iSHARES® MSCI EMERGING MARKETS ASIA ETF
August 31, 2015
| Security | Shares | Value | ||||||
Yang Ming Marine Transport Corp.a | 79,000 | $ | 25,373 | |||||
Yuanta Financial Holding Co. Ltd. | 475,893 | 190,878 | ||||||
Yulon Motor Co. Ltd. | 42,000 | 38,016 | ||||||
Zhen Ding Technology Holding Ltd. | 18,455 | 52,354 | ||||||
|
| |||||||
| 22,679,638 | ||||||||
THAILAND — 3.36% | ||||||||
Advanced Info Service PCL NVDR | 55,000 | 365,183 | ||||||
Airports of Thailand PCL NVDR | 23,600 | 181,716 | ||||||
Bangkok Bank PCL Foreign | 11,900 | 54,611 | ||||||
Bangkok Bank PCL NVDRb | 17,300 | 79,393 | ||||||
Bangkok Dusit Medical Services PCL NVDR | 204,800 | 111,413 | ||||||
Banpu PCL NVDRb | 49,500 | 28,447 | ||||||
BEC World PCL NVDR | 52,100 | 53,779 | ||||||
BTS Group Holdings PCL NVDR | 313,200 | 85,192 | ||||||
Bumrungrad Hospital PCL NVDR | 18,700 | 120,511 | ||||||
Central Pattana PCL NVDR | 71,800 | 90,138 | ||||||
Charoen Pokphand Foods PCL NVDR | 168,600 | 89,368 | ||||||
CP ALL PCL NVDR | 231,900 | 329,946 | ||||||
Delta Electronics Thailand PCL NVDRb | 26,400 | 64,076 | ||||||
Energy Absolute PCL NVDR | 60,300 | 34,318 | ||||||
Glow Energy PCL NVDR | 27,700 | 76,311 | ||||||
Home Product Center PCL NVDR | 198,445 | 40,414 | ||||||
Indorama Ventures PCL NVDR | 74,400 | 45,248 | ||||||
IRPC PCL NVDR | 486,700 | 51,596 | ||||||
Kasikornbank PCL Foreign | 61,800 | 312,060 | ||||||
Kasikornbank PCL NVDR | 34,500 | 173,727 | ||||||
Krung Thai Bank PCL NVDRb | 188,550 | 95,735 | ||||||
Minor International PCL NVDRb | 89,780 | 66,374 | ||||||
PTT Exploration & Production PCL NVDR | 75,610 | 167,694 | ||||||
PTT Global Chemical PCL NVDR | 88,200 | 147,636 | ||||||
PTT PCL NVDR | 54,000 | 403,738 | ||||||
Siam Cement PCL (The) Foreign | 17,000 | 225,750 | ||||||
Siam Cement PCL (The) NVDR | 5,800 | 77,668 | ||||||
Siam Commercial Bank PCL (The) NVDR | 84,300 | 333,954 | ||||||
Thai Oil PCL NVDR | 40,900 | 58,763 | ||||||
Thai Union Frozen Products PCL NVDR | 96,400 | 46,795 | ||||||
| Security | Shares | Value | ||||||
TMB Bank PCL NVDR | 736,900 | $ | 48,517 | |||||
True Corp. PCL NVDRa | 471,390 | 127,563 | ||||||
|
| |||||||
| 4,187,634 | ||||||||
|
| |||||||
TOTAL COMMON STOCKS |
| |||||||
(Cost: $140,084,477) |
| 122,873,564 | ||||||
PREFERRED STOCKS — 0.98% |
| |||||||
SOUTH KOREA — 0.98% | ||||||||
AmorePacific Corp. | 484 | 74,682 | ||||||
Hyundai Motor Co. | 1,283 | 105,222 | ||||||
Hyundai Motor Co. Series 2 | 2,070 | 175,016 | ||||||
LG Chem Ltd. | 402 | 58,800 | ||||||
Samsung Electronics Co. Ltd. | 1,104 | 812,073 | ||||||
|
| |||||||
| 1,225,793 | ||||||||
|
| |||||||
TOTAL PREFERRED STOCKS |
| |||||||
(Cost: $1,455,086) |
| 1,225,793 | ||||||
SHORT-TERM INVESTMENTS — 4.95% |
| |||||||
MONEY MARKET FUNDS — 4.95% |
| |||||||
BlackRock Cash Funds: Institutional, |
| |||||||
0.18%d,e,f | 5,828,714 | 5,828,714 | ||||||
BlackRock Cash Funds: Prime, | ||||||||
0.18%d,e,f | 334,713 | 334,713 | ||||||
|
| |||||||
| 6,163,427 | ||||||||
|
| |||||||
TOTAL SHORT-TERM INVESTMENTS |
| |||||||
(Cost: $6,163,427) |
| 6,163,427 | ||||||
|
| |||||||
TOTAL INVESTMENTS |
| |||||||
(Cost: $147,702,990) |
| 130,262,784 | ||||||
Other Assets, Less Liabilities — (4.51)% |
| (5,625,748 | ) | |||||
|
| |||||||
NET ASSETS — 100.00% |
| $ | 124,637,036 | |||||
|
| |||||||
NVDR — Non-Voting Depositary Receipts
| a | Non-income earning security. |
| b | All or a portion of this security represents a security on loan. See Note 1. |
| c | This security may be resold to qualified institutional buyers under Rule 144A of the Securities Act of 1933. |
| d | Affiliated issuer. See Note 2. |
| e | The rate quoted is the annualized seven-day yield of the fund at period end. |
| f | All or a portion of this security represents an investment of securities lending collateral. See Note 1. |
See notes to consolidated financial statements.
CONSOLIDATED SCHEDULESOF INVESTMENTS | 57 |
Table of Contents
Consolidated Schedule of Investments
iSHARES® MSCI EMERGING MARKETS MINIMUM VOLATILITY ETF
August 31, 2015
| Security | Shares | Value | ||||||
COMMON STOCKS — 98.34% |
| |||||||
BRAZIL — 2.35% |
| |||||||
Ambev SA | 2,028,600 | $ | 10,632,432 | |||||
BRF SA | 193,200 | 3,687,628 | ||||||
Cielo SA | 1,806,948 | 19,025,727 | ||||||
Souza Cruz SA | 531,300 | 3,871,426 | ||||||
TOTVS SA | 728,100 | 6,336,954 | ||||||
Tractebel Energia SA | 289,800 | 2,668,650 | ||||||
Transmissora Alianca de Energia Eletrica SA Units | 821,100 | 4,170,595 | ||||||
Ultrapar Participacoes SA | 435,100 | 7,582,071 | ||||||
|
| |||||||
| 57,975,483 | ||||||||
CHILE — 3.94% | ||||||||
AES Gener SA | 7,666,176 | 3,856,662 | ||||||
Aguas Andinas SA Series A | 29,762,460 | 15,427,772 | ||||||
Banco de Chile | 284,587,003 | 29,416,800 | ||||||
Banco de Credito e Inversiones | 60,142 | 2,627,587 | ||||||
Cia. Cervecerias Unidas SA | 391,230 | 4,336,131 | ||||||
Colbun SA | 64,232,721 | 17,452,850 | ||||||
Empresa Nacional de Electricidad SA/Chile | 10,992,114 | 13,631,916 | ||||||
Empresas COPEC SA | 226,527 | 2,215,202 | ||||||
SACI Falabella | 318,780 | 1,968,421 | ||||||
Vina Concha y Toro SA | 3,569,853 | 5,991,156 | ||||||
|
| |||||||
| 96,924,497 | ||||||||
CHINA — 18.21% |
| |||||||
AAC Technologies Holdings Inc.a | 1,449,000 | 8,161,089 | ||||||
Agricultural Bank of China Ltd. Class H | 19,320,000 | 7,802,737 | ||||||
Bank of China Ltd. Class H | 50,715,000 | 23,165,154 | ||||||
Bank of Communications Co. Ltd. Class H | 3,381,000 | 2,547,731 | ||||||
Beijing Enterprises Holdings Ltd. | 2,415,000 | 14,100,393 | ||||||
Beijing Enterprises Water Group Ltd.a | 11,592,000 | 8,301,314 | ||||||
China CITIC Bank Corp. Ltd. Class Hb | 5,313,000 | 3,256,334 | ||||||
China Communications Services Corp. Ltd. Class H | 16,422,000 | 6,039,019 | ||||||
China Construction Bank Corp. Class H | 27,048,000 | 19,020,729 | ||||||
China Everbright Bank Co. Ltd. Class H | 14,973,000 | 6,839,236 | ||||||
China Gas Holdings Ltd.a | 966,000 | 1,410,974 | ||||||
| Security | Shares | Value | ||||||
China Life Insurance Co. Ltd. Class H | 974,000 | $ | 3,368,133 | |||||
China Medical System Holdings Ltd.a | 5,796,000 | 6,297,033 | ||||||
China Mengniu Dairy Co. Ltd. | 3,395,000 | 11,871,472 | ||||||
China Merchants Holdings International Co. Ltd.a | 966,000 | 3,228,289 | ||||||
China Minsheng Banking Corp. Ltd. Class H | 1,449,100 | 1,404,215 | ||||||
China Mobile Ltd. | 2,430,000 | 29,442,004 | ||||||
China Petroleum & Chemical Corp. Class H | 16,884,000 | 11,241,404 | ||||||
China Resources Gas Group Ltd.a | 4,830,000 | 12,744,885 | ||||||
China Resources Power Holdings Co. Ltd. | 2,898,000 | 7,097,250 | ||||||
CSPC Pharmaceutical Group Ltd. | 11,592,000 | 10,619,699 | ||||||
Dalian Wanda Commercial Properties Co. Ltd. Class Hc | 1,159,200 | 7,119,686 | ||||||
ENN Energy Holdings Ltd. | 412,000 | 2,102,515 | ||||||
Guangdong Investment Ltd. | 15,456,000 | 20,900,366 | ||||||
Haier Electronics Group Co. Ltd. | 1,502,000 | 2,693,892 | ||||||
Hanergy Thin Film Power Group Ltd.a,b | 39,762,000 | 51 | ||||||
Hengan International Group Co. Ltd.a | 2,184,500 | 21,436,149 | ||||||
Industrial & Commercial Bank of China Ltd. Class H | 24,633,000 | 14,557,214 | ||||||
Inner Mongolia Yitai Coal Co. Ltd. Class B | 6,134,119 | 5,189,465 | ||||||
Jiangsu Expressway Co. Ltd. Class H | 15,524,000 | 18,348,248 | ||||||
Lenovo Group Ltd.a | 12,786,000 | 10,492,701 | ||||||
Luye Pharma Group Ltd.b | 2,415,000 | 2,056,632 | ||||||
PetroChina Co. Ltd. Class H | 4,830,000 | 4,013,548 | ||||||
Semiconductor Manufacturing International Corp.a,b | 27,531,000 | 2,415,608 | ||||||
Shandong Weigao Group Medical Polymer Co. Ltd. Class H | 1,932,000 | 1,351,145 | ||||||
Shanghai Pharmaceuticals Holding Co. Ltd. Class H | 2,125,200 | 4,431,356 | ||||||
Shenzhou International Group Holdings Ltd.a | 4,830,000 | 24,399,133 | ||||||
Sihuan Pharmaceutical Holdings Group Ltd. | 10,904,000 | 2,110,438 | ||||||
Sino Biopharmaceutical Ltd. | 15,504,000 | 18,404,630 | ||||||
| 58 | 2015 iSHARES ANNUAL REPORTTO SHAREHOLDERS |
Table of Contents
Consolidated Schedule of Investments (Continued)
iSHARES® MSCI EMERGING MARKETS MINIMUM VOLATILITY ETF
August 31, 2015
| Security | Shares | Value | ||||||
Sinopharm Group Co. Ltd. Class H | 579,600 | $ | 2,194,987 | |||||
SOHO China Ltd.a | 21,010,500 | 8,973,459 | ||||||
Sun Art Retail Group Ltd.a | 17,629,500 | 14,694,946 | ||||||
Tencent Holdings Ltd. | 1,255,800 | 21,356,564 | ||||||
Tingyi Cayman Islands Holding Corp. | 6,016,000 | 9,252,936 | ||||||
Tsingtao Brewery Co. Ltd. Class H | 1,240,000 | 6,095,961 | ||||||
Want Want China Holdings Ltd.a | 2,415,000 | 1,947,568 | ||||||
Zhejiang Expressway Co. Ltd. Class H | 17,388,000 | 18,666,739 | ||||||
ZTE Corp. Class H | 2,634,120 | 5,308,992 | ||||||
|
| |||||||
| 448,474,023 | ||||||||
COLOMBIA — 0.66% | ||||||||
Almacenes Exito SA | 551,103 | 2,989,335 | ||||||
Corp. Financiera Colombiana SA | 293,181 | 3,478,178 | ||||||
Ecopetrol SA | 8,987,664 | 4,634,015 | ||||||
Isagen SA ESP | 5,419,743 | 5,150,814 | ||||||
|
| |||||||
| 16,252,342 | ||||||||
CZECH REPUBLIC — 0.36% | ||||||||
CEZ AS | 291,249 | 6,647,465 | ||||||
Komercni Banka AS | 9,660 | 2,197,592 | ||||||
|
| |||||||
| 8,845,057 | ||||||||
EGYPT — 0.61% | ||||||||
Commercial International Bank Egypt SAE | 2,333,648 | 14,937,636 | ||||||
|
| |||||||
| 14,937,636 | ||||||||
HUNGARY — 0.08% | ||||||||
Richter Gedeon Nyrt | 134,757 | 2,057,285 | ||||||
|
| |||||||
| 2,057,285 | ||||||||
INDIA — 3.02% | ||||||||
Cipla Ltd. | 211,071 | 2,165,958 | ||||||
Coal India Ltd. | 310,569 | 1,711,575 | ||||||
Dabur India Ltd. | 4,235,427 | 17,397,267 | ||||||
Divi’s Laboratories Ltd. | 258,405 | 9,189,850 | ||||||
Dr. Reddy’s Laboratories Ltd. | 165,669 | 10,723,065 | ||||||
HCL Technologies Ltd. | 113,440 | 1,657,103 | ||||||
Hindustan Unilever Ltd. | 336,168 | 4,353,622 | ||||||
Infosys Ltd. | 103,362 | 1,701,683 | ||||||
Sun Pharmaceuticals Industries Ltd. | 944,838 | 12,777,166 | ||||||
Tata Consultancy Services Ltd. | 78,246 | 3,018,077 | ||||||
| Security | Shares | Value | ||||||
Tech Mahindra Ltd. | 244,398 | $ | 1,893,418 | |||||
Wipro Ltd. | 912,387 | 7,848,107 | ||||||
|
| |||||||
| 74,436,891 | ||||||||
INDONESIA — 6.60% | ||||||||
Astra Agro Lestari Tbk PT | 2,415,000 | 2,943,550 | ||||||
Bank Central Asia Tbk PT | 37,674,000 | 34,590,363 | ||||||
Bank Danamon Indonesia Tbk PT | 20,672,400 | 5,201,205 | ||||||
Bank Mandiri Persero Tbk PT | 18,305,700 | 11,856,361 | ||||||
Bank Negara Indonesia Persero Tbk PT | 11,012,400 | 3,879,814 | ||||||
Bank Rakyat Indonesia Persero Tbk PT | 14,345,100 | 10,848,163 | ||||||
Gudang Garam Tbk PT | 531,300 | 1,682,765 | ||||||
Indocement Tunggal Prakarsa Tbk PT | 775,800 | 1,083,635 | ||||||
Indofood CBP Sukses Makmur Tbk PT | 2,946,300 | 2,673,689 | ||||||
Indofood Sukses Makmur Tbk PT | 29,076,600 | 10,968,397 | ||||||
Jasa Marga Persero Tbk PT | 27,917,400 | 10,233,068 | ||||||
Kalbe Farma Tbk PT | 134,032,500 | 15,978,963 | ||||||
Perusahaan Gas Negara Persero Tbk PT | 6,810,300 | 1,347,518 | ||||||
Tambang Batubara Bukit Asam Persero Tbk PT | 2,656,500 | 1,106,087 | ||||||
Telekomunikasi Indonesia Persero Tbk PT | 98,773,500 | 20,176,509 | ||||||
Tower Bersama Infrastructure Tbk PTb | 14,973,000 | 7,646,354 | ||||||
Unilever Indonesia Tbk PT | 7,196,700 | 20,347,965 | ||||||
|
| |||||||
| 162,564,406 | ||||||||
MALAYSIA — 7.89% | ||||||||
Astro Malaysia Holdings Bhd | 1,551,400 | 1,071,205 | ||||||
Axiata Group Bhd | 13,330,800 | 19,488,360 | ||||||
Berjaya Sports Toto Bhd | 1,690,597 | 1,187,443 | ||||||
DiGi.Com Bhda | 2,318,400 | 2,886,960 | ||||||
Hong Leong Bank Bhda | 5,409,600 | 16,847,040 | ||||||
IHH Healthcare Bhd | 22,556,100 | 31,417,425 | ||||||
Malayan Banking Bhda | 13,717,200 | 28,610,160 | ||||||
Maxis Bhda | 14,007,000 | 21,910,950 | ||||||
Petronas Chemicals Group Bhda | 4,781,700 | 6,910,695 | ||||||
Petronas Dagangan Bhd | 386,400 | 1,946,720 | ||||||
Petronas Gas Bhda | 2,366,700 | 12,013,820 | ||||||
Public Bank Bhda | 7,293,380 | 31,257,343 | ||||||
Sime Darby Bhda | 3,381,000 | 5,997,250 | ||||||
CONSOLIDATED SCHEDULESOF INVESTMENTS | 59 |
Table of Contents
Consolidated Schedule of Investments (Continued)
iSHARES® MSCI EMERGING MARKETS MINIMUM VOLATILITY ETF
August 31, 2015
| Security | Shares | Value | ||||||
Telekom Malaysia Bhd | 5,023,200 | $ | 7,762,040 | |||||
Tenaga Nasional Bhd | 1,835,400 | 4,885,660 | ||||||
|
| |||||||
| 194,193,071 | ||||||||
MEXICO — 3.39% | ||||||||
America Movil SAB de CV | 9,128,700 | 8,307,226 | ||||||
Arca Continental SAB de CV | 2,223,400 | 12,660,660 | ||||||
Coca-Cola Femsa SAB de CV Series L | 386,400 | 2,774,803 | ||||||
El Puerto de Liverpool SAB de CV Series C1 | 2,270,100 | 27,040,976 | ||||||
Fibra Uno Administracion SA de CV | 966,000 | 2,066,135 | ||||||
Gruma SAB de CV Series B | 434,700 | 5,831,923 | ||||||
Grupo Aeroportuario del Pacifico SAB de CV Series B | 1,014,300 | 8,485,544 | ||||||
Grupo Aeroportuario del Sureste SAB de CV Series B | 338,100 | 4,912,323 | ||||||
Grupo Bimbo SAB de CVb | 531,300 | 1,364,029 | ||||||
Wal-Mart de Mexico SAB de CV | 4,153,800 | 9,933,969 | ||||||
|
| |||||||
| 83,377,588 | ||||||||
PERU — 1.05% | ||||||||
Cia. de Minas Buenaventura SA ADR | 357,903 | 2,261,947 | ||||||
Credicorp Ltd. | 213,969 | 23,532,311 | ||||||
|
| |||||||
| 25,794,258 | ||||||||
PHILIPPINES — 3.98% | ||||||||
Aboitiz Power Corp. | 14,586,600 | 13,497,442 | ||||||
Bank of the Philippine Islands | 10,674,304 | 19,320,627 | ||||||
BDO Unibank Inc. | 6,158,250 | 12,977,913 | ||||||
International Container Terminal Services Inc. | 4,873,470 | 9,691,678 | ||||||
Jollibee Foods Corp. | 2,337,730 | 9,577,991 | ||||||
Metropolitan Bank & Trust Co. | 4,402,141 | 7,887,876 | ||||||
Philippine Long Distance Telephone Co. | 466,099 | 25,109,912 | ||||||
|
| |||||||
| 98,063,439 | ||||||||
POLAND — 1.58% | ||||||||
Bank Pekao SA | 235,704 | 10,055,679 | ||||||
Bank Zachodni WBK SAb | 58,926 | 4,732,636 | ||||||
PGE Polska Grupa Energetyczna SA | 3,975,573 | 16,449,630 | ||||||
Powszechny Zaklad Ubezpieczen SA | 66,364 | 7,578,124 | ||||||
|
| |||||||
| 38,816,069 | ||||||||
| Security | Shares | Value | ||||||
QATAR — 3.65% | ||||||||
Commercial Bank QSC (The) | 1,518,440 | $ | 23,937,397 | |||||
Doha Bank QSC | 355,005 | 5,157,717 | ||||||
Industries Qatar QSC | 114,954 | 4,198,974 | ||||||
Masraf Al Rayan QSC | 104,811 | 1,255,049 | ||||||
Ooredoo QSC | 207,690 | 3,964,312 | ||||||
Qatar Electricity & Water Co. QSC | 369,495 | 22,223,890 | ||||||
Qatar Insurance Co. SAQ | 222,663 | 5,992,962 | ||||||
Qatar Islamic Bank SAQ | 437,115 | 13,565,679 | ||||||
Qatar National Bank SAQ | 173,880 | 8,548,109 | ||||||
Vodafone Qatar QSC | 272,412 | 1,058,644 | ||||||
|
| |||||||
| 89,902,733 | ||||||||
RUSSIA — 0.21% | ||||||||
Rosneft OAO | 906,120 | 3,302,204 | ||||||
Rosneft OAO GDRd | 534,949 | 2,015,688 | ||||||
|
| |||||||
| 5,317,892 | ||||||||
SOUTH AFRICA — 5.92% | ||||||||
Aspen Pharmacare Holdings Ltd. | 197,064 | 5,088,595 | ||||||
Bidvest Group Ltd. (The) | 268,681 | 6,459,647 | ||||||
Discovery Ltd. | 633,505 | 6,400,362 | ||||||
Foschini Group Ltd. (The) | 239,085 | 2,701,912 | ||||||
Liberty Holdings Ltd. | 497,490 | 4,830,783 | ||||||
Life Healthcare Group Holdings Ltd. | 2,938,089 | 8,430,455 | ||||||
Mediclinic International Ltd. | 218,015 | 1,751,122 | ||||||
Mr. Price Group Ltd. | 213,969 | 3,849,563 | ||||||
MTN Group Ltd. | 80,178 | 1,069,725 | ||||||
Nedbank Group Ltd. | 555,450 | 9,881,832 | ||||||
Netcare Ltd. | 1,200,255 | 3,606,850 | ||||||
Pick n Pay Stores Ltd. | 1,231,650 | 5,812,714 | ||||||
Rand Merchant Insurance Holdings Ltd. | 2,403,891 | 7,608,070 | ||||||
Redefine Properties Ltd. | 12,799,752 | 11,077,984 | ||||||
Sasol Ltd. | 146,832 | 4,703,650 | ||||||
Shoprite Holdings Ltd. | 776,181 | 9,501,367 | ||||||
SPAR Group Ltd. (The) | 566,076 | 8,108,596 | ||||||
Standard Bank Group Ltd. | 2,387,469 | 26,300,542 | ||||||
Tiger Brands Ltd. | 173,397 | 3,919,138 | ||||||
Tsogo Sun Holdings Ltd. | 579,117 | 1,026,010 | ||||||
Vodacom Group Ltd. | 1,278,501 | 13,637,794 | ||||||
|
| |||||||
| 145,766,711 | ||||||||
| 60 | 2015 iSHARES ANNUAL REPORTTO SHAREHOLDERS |
Table of Contents
Consolidated Schedule of Investments (Continued)
iSHARES® MSCI EMERGING MARKETS MINIMUM VOLATILITY ETF
August 31, 2015
| Security | Shares | Value | ||||||
SOUTH KOREA — 11.74% | ||||||||
AmorePacific Corp. | 46,034 | $ | 14,731,658 | |||||
AmorePacific Group | 72,118 | 10,487,674 | ||||||
Cheil Worldwide Inc.b | 128,824 | 1,895,191 | ||||||
CJ CheilJedang Corp. | 16,905 | 5,617,134 | ||||||
Coway Co. Ltd. | 50,048 | 3,571,381 | ||||||
Dongbu Insurance Co. Ltd. | 337,617 | 15,185,986 | ||||||
E-Mart Co. Ltd. | 18,837 | 3,639,192 | ||||||
Hyundai Marine & Fire Insurance Co. Ltd.a | 658,329 | 15,585,045 | ||||||
Hyundai Wia Corp. | 16,560 | 1,463,133 | ||||||
Kangwon Land Inc. | 515,844 | 18,557,736 | ||||||
KEPCO Plant Service & Engineering Co. Ltd. | 110,607 | 11,783,117 | ||||||
Kia Motors Corp. | 161,514 | 6,650,376 | ||||||
Korea Electric Power Corp. | 246,330 | 9,996,906 | ||||||
KT Corp.b | 232,323 | 5,666,894 | ||||||
KT&G Corp. | 363,033 | 33,916,843 | ||||||
LG Display Co. Ltd. | 52,385 | 1,020,904 | ||||||
Lotte Shopping Co. Ltd. | 12,075 | 2,730,977 | ||||||
NAVER Corp. | 3,659 | 1,532,897 | ||||||
Orion Corp./Republic of Korea | 11,109 | 8,763,219 | ||||||
S-1 Corp.a | 213,486 | 16,948,920 | ||||||
Samsung Electronics Co. Ltd. | 9,241 | 8,508,517 | ||||||
Samsung Fire & Marine Insurance Co. Ltd. | 65,688 | 14,967,589 | ||||||
Samsung Life Insurance Co. Ltd. | 198,513 | 16,498,692 | ||||||
SK Holdings Co. Ltd. | 57,477 | 13,120,938 | ||||||
SK Hynix Inc. | 269,633 | 8,161,371 | ||||||
SK Telecom Co. Ltd. | 76,797 | 15,843,135 | ||||||
Yuhan Corp.a | 105,777 | 22,224,126 | ||||||
|
| |||||||
| 289,069,551 | ||||||||
TAIWAN — 16.77% | ||||||||
Advanced Semiconductor Engineering Inc. | 1,941,000 | 2,004,475 | ||||||
Advantech Co. Ltd. | 1,932,481 | 12,294,799 | ||||||
Asia Cement Corp. | 13,199,125 | 14,178,431 | ||||||
Asustek Computer Inc. | 1,103,000 | 10,034,669 | ||||||
Chicony Electronics Co. Ltd. | 4,381,579 | 10,881,226 | ||||||
China Airlines Ltd.b | 25,116,828 | 9,032,053 | ||||||
China Steel Corp. | 23,667,517 | 14,184,798 | ||||||
Chunghwa Telecom Co. Ltd. | 13,524,000 | 41,067,470 | ||||||
Delta Electronics Inc. | 1,936,000 | 9,699,041 | ||||||
EVA Airways Corp.b | 3,949,899 | 2,385,527 | ||||||
| Security | Shares | Value | ||||||
Far EasTone Telecommunications Co. Ltd. | 13,617,000 | $ | 29,882,401 | |||||
First Financial Holding Co. Ltd. | 36,422,946 | 17,631,590 | ||||||
Formosa Chemicals & Fibre Corp. | 483,300 | 1,033,860 | ||||||
Formosa Petrochemical Corp. | 4,830,000 | 10,822,074 | ||||||
Formosa Plastics Corp. | 4,023,840 | 8,867,388 | ||||||
Formosa Taffeta Co. Ltd. | 6,792,000 | 5,907,721 | ||||||
Foxconn Technology Co. Ltd. | 4,391,328 | 12,349,598 | ||||||
Hon Hai Precision Industry Co. Ltd. | 2,415,000 | 6,865,856 | ||||||
HTC Corp. | 3,864,000 | 5,468,933 | ||||||
Hua Nan Financial Holdings Co. Ltd. | 32,825,175 | 15,536,873 | ||||||
Kinsus Interconnect Technology Corp. | 2,898,000 | 5,166,093 | ||||||
Lite-On Technology Corp. | 16,018,548 | 14,671,525 | ||||||
MediaTek Inc. | 483,000 | 3,726,119 | ||||||
Novatek Microelectronics Corp. | 200,000 | 670,027 | ||||||
President Chain Store Corp. | 1,940,000 | 12,968,711 | ||||||
Quanta Computer Inc. | 966,000 | 1,775,473 | ||||||
Standard Foods Corp. | 1,140,340 | 2,590,089 | ||||||
Synnex Technology International Corp. | 9,660,000 | 10,272,805 | ||||||
Taiwan Business Bankb | 9,846,921 | 2,481,705 | ||||||
Taiwan Cement Corp. | 6,762,000 | 7,242,922 | ||||||
Taiwan Cooperative Financial Holding Co. Ltd. | 63,900,375 | 27,103,060 | ||||||
Taiwan Mobile Co. Ltd. | 10,189,000 | 30,627,127 | ||||||
Taiwan Semiconductor Manufacturing Co. Ltd. | 9,177,000 | 36,385,327 | ||||||
Transcend Information Inc. | 2,898,000 | 7,811,489 | ||||||
U-Ming Marine Transport Corp. | 5,796,000 | 5,745,052 | ||||||
United Microelectronics Corp. | 5,313,000 | 1,755,432 | ||||||
WPG Holdings Ltd. | 1,932,000 | 1,825,947 | ||||||
|
| |||||||
| 412,947,686 | ||||||||
THAILAND — 3.90% | ||||||||
Advanced Info Service PCL NVDR | 1,305,800 | 8,670,119 | ||||||
Bangkok Bank PCL NVDRa | 1,110,900 | 5,098,146 | ||||||
Bangkok Dusit Medical Services PCL NVDR | 16,101,700 | 8,759,469 | ||||||
BTS Group Holdings PCL NVDR | 79,501,800 | 21,624,844 | ||||||
CP ALL PCL NVDR | 10,995,400 | 15,644,173 | ||||||
Delta Electronics Thailand PCL NVDR | 3,042,900 | 7,385,474 | ||||||
CONSOLIDATED SCHEDULESOF INVESTMENTS | 61 |
Table of Contents
Consolidated Schedule of Investments (Continued)
iSHARES® MSCI EMERGING MARKETS MINIMUM VOLATILITY ETF
August 31, 2015
| Security | Shares | Value | ||||||
Glow Energy PCL NVDR | 2,511,600 | $ | 6,919,250 | |||||
Kasikornbank PCL NVDRa | 1,034,000 | 5,206,779 | ||||||
PTT Exploration & Production PCL NVDR | 1,143,100 | 2,535,262 | ||||||
PTT PCL NVDR | 1,555,300 | 11,628,411 | ||||||
Thai Oil PCL NVDR | 1,738,800 | 2,498,206 | ||||||
|
| |||||||
| 95,970,133 | ||||||||
UNITED ARAB EMIRATES — 2.43% |
| |||||||
Abu Dhabi Commercial Bank PJSC | 1,757,637 | 3,828,180 | ||||||
DP World Ltd. | 771,351 | 17,201,127 | ||||||
First Gulf Bank PJSC | 4,571,595 | 17,860,467 | ||||||
National Bank of Abu Dhabi PJSC | 7,406,842 | 20,971,987 | ||||||
|
| |||||||
| 59,861,761 | ||||||||
|
| |||||||
TOTAL COMMON STOCKS |
| 2,421,548,512 | ||||||
PREFERRED STOCKS — 1.11% |
| |||||||
COLOMBIA — 0.89% | ||||||||
Banco Davivienda SA | 913,836 | 7,042,460 | ||||||
Grupo de Inversiones Suramericana SA | 1,310,862 | 14,865,052 | ||||||
|
| |||||||
| 21,907,512 | ||||||||
RUSSIA — 0.18% |
| |||||||
AK Transneft OAO | 1,899 | 4,383,183 | ||||||
|
| |||||||
| 4,383,183 | ||||||||
SOUTH KOREA — 0.04% |
| |||||||
Samsung Electronics Co. Ltd. | 1,449 | 1,065,847 | ||||||
|
| |||||||
| 1,065,847 | ||||||||
|
| |||||||
TOTAL PREFERRED STOCKS |
| 27,356,542 | ||||||
SHORT-TERM INVESTMENTS — 3.12% |
| |||||||
MONEY MARKET FUNDS — 3.12% |
| |||||||
BlackRock Cash Funds: Institutional, |
| |||||||
0.18%e,f,g | 72,529,174 | 72,529,174 | ||||||
BlackRock Cash Funds: Prime, |
| |||||||
0.18%e,f,g | 4,164,982 | 4,164,982 | ||||||
|
| |||||||
| 76,694,156 | ||||||||
|
| |||||||
TOTAL SHORT-TERM INVESTMENTS |
| 76,694,156 | ||||||
|
| |||||||
| Value | ||||||
TOTAL INVESTMENTS | $ | 2,525,599,210 | ||||
Other Assets, Less Liabilities — (2.57)% | (63,242,222 | ) | ||||
|
| |||||
NET ASSETS — 100.00% | $ | 2,462,356,988 | ||||
|
| |||||
ADR — American Depositary Receipts
GDR — Global Depositary Receipts
NVDR — Non-Voting Depositary Receipts
| a | All or a portion of this security represents a security on loan. See Note 1. |
| b | Non-income earning security. |
| c | This security may be resold to qualified institutional buyers under Rule 144A of the Securities Act of 1933. |
| d | This security may be resold to qualified foreign investors and foreign institutional buyers under Regulation S of the Securities Act of 1933. |
| e | Affiliated issuer. See Note 2. |
| f | The rate quoted is the annualized seven-day yield of the fund at period end. |
| g | All or a portion of this security represents an investment of securities lending collateral. See Note 1. |
See notes to consolidated financial statements.
| 62 | 2015 iSHARES ANNUAL REPORTTO SHAREHOLDERS |
Table of Contents
Consolidated Schedule of Investments
iSHARES® MSCI EMERGING MARKETS SMALL-CAP ETF
August 31, 2015
| Security | Shares | Value | ||||||
COMMON STOCKS — 98.97% | ||||||||
BRAZIL — 2.15% | ||||||||
Aliansce Shopping Centers SA | 12,500 | $ | 38,095 | |||||
Alupar Investimento SA Units | 10,900 | 43,723 | ||||||
Arezzo Industria e Comercio SA | 7,600 | 45,655 | ||||||
Banco ABC Brasil SAa | 262 | 653 | ||||||
BR Properties SA | 24,200 | 67,107 | ||||||
Cia. de Saneamento de Minas Gerais-COPASA | 9,600 | 25,039 | ||||||
Cia. Hering | 19,900 | 75,945 | ||||||
Direcional Engenharia SA | 28,300 | 26,185 | ||||||
Even Construtora e Incorporadora SA | 41,000 | 39,286 | ||||||
EZ TEC Empreendimentos e Participacoes SA | 9,098 | 32,922 | ||||||
Fleury SA | 12,000 | 54,692 | ||||||
Gafisa SAa | 69,300 | 43,381 | ||||||
Helbor Empreendimentos SA | 20,740 | 11,389 | ||||||
Iguatemi Empresa de Shopping Centers SA | 12,300 | 69,567 | ||||||
Iochpe-Maxion SA | 16,700 | 68,730 | ||||||
JSL SA | 12,700 | 33,823 | ||||||
Light SA | 12,900 | 41,403 | ||||||
Linx SA | 5,600 | 67,020 | ||||||
LPS Brasil Consultoria de Imoveis SA | 35,000 | 30,654 | ||||||
Marfrig Global Foods SAa | 45,000 | 79,072 | ||||||
Marisa Lojas SA | 8,800 | 20,609 | ||||||
Mills Estruturas e Servicos de Engenharia SAa | 23,500 | 31,615 | ||||||
MRV Engenharia e Participacoes SA | 36,400 | 63,661 | ||||||
Multiplus SA | 6,400 | 66,298 | ||||||
PDG Realty SA Empreendimentos e Participacoesa | 330,700 | 8,172 | ||||||
Restoque Comercio e Confeccoes de Roupas SA | 23,900 | 27,363 | ||||||
Rumo Logistica Operadora Multimodal SAa | 21,697 | 46,941 | ||||||
Santos Brasil Participacoes SA Units | 7,500 | 24,710 | ||||||
Sao Martinho SA | 9,000 | 75,217 | ||||||
SLC Agricola SA | 10,700 | 47,268 | ||||||
Smiles SA | 10,800 | 141,855 | ||||||
Tecnisa SA | 25,600 | 21,086 | ||||||
Tegma Gestao Logisticaa | 15,400 | 22,409 | ||||||
| Security | Shares | Value | ||||||
Valid Solucoes e Servicos de Seguranca em Meios de Pagamento e Identificacao SA | 11,200 | $ | 144,372 | |||||
|
| |||||||
| 1,635,917 | ||||||||
CHILE — 0.99% | ||||||||
Administradora de Fondos de Pensiones Habitat SA | 57,695 | 68,817 | ||||||
Besalco SA | 140,022 | 51,304 | ||||||
Cia. Sud Americana de Vapores SAa | 1,887,421 | 52,670 | ||||||
E.CL SA | 76,993 | 107,989 | ||||||
Inversiones Aguas Metropolitanas SA | 55,181 | 78,110 | ||||||
Inversiones La Construccion SA | 2,987 | 32,132 | ||||||
Parque Arauco SA | 108,115 | 188,984 | ||||||
Ripley Corp. SA | 80,011 | 26,587 | ||||||
SalfaCorp SA | 104,395 | 57,183 | ||||||
Sociedad Matriz SAAM SA | 1,312,051 | 89,367 | ||||||
|
| |||||||
| 753,143 | ||||||||
CHINA — 21.08% | ||||||||
361 Degrees International Ltd. | 254,000 | 77,674 | ||||||
Agile Property Holdings Ltd. | 236,000 | 115,715 | ||||||
AGTech Holdings Ltd.a | 304,000 | 49,424 | ||||||
Ajisen China Holdings Ltd. | 195,000 | 75,987 | ||||||
Anhui Expressway Co. Ltd. Class H | 136,000 | 104,061 | ||||||
Anton Oilfield Services Group/Hong Konga,b | 322,000 | 42,379 | ||||||
Anxin-China Holdings Ltd.a | 1,084,000 | 41,348 | ||||||
Asia Cement China Holdings Corp. | 176,500 | 55,796 | ||||||
AVIC International Holding HK Ltd.a,b | 580,000 | 62,864 | ||||||
Baoxin Auto Group Ltd.b | 171,000 | 57,809 | ||||||
Beijing Capital Land Ltd. Class H | 264,000 | 105,599 | ||||||
Beijing Enterprises Medical & Health Group Ltd.a | 708,000 | 64,862 | ||||||
Beijing Tong Ren Tang Chinese Medicine Co. Ltd. | 112,000 | 123,127 | ||||||
Biostime International Holdings Ltd.b | 32,000 | 52,769 | ||||||
Boshiwa International Holding Ltd.a,b | 32,000 | 619 | ||||||
Bosideng International Holdings Ltd.b | 692,000 | 64,289 | ||||||
BYD Electronic International Co. Ltd.a,b | 147,000 | 84,975 | ||||||
C C Land Holdings Ltd. | 496,000 | 118,399 | ||||||
Carnival Group International Holdings Ltd.a,b | 692,000 | 86,611 | ||||||
CONSOLIDATED SCHEDULESOF INVESTMENTS | 63 |
Table of Contents
Consolidated Schedule of Investments (Continued)
iSHARES® MSCI EMERGING MARKETS SMALL-CAP ETF
August 31, 2015
| Security | Shares | Value | ||||||
Central China Securities Co. Ltd. Class Hb | 190,000 | $ | 104,928 | |||||
China Animal Healthcare Ltd.a,b | 126,000 | 8,129 | ||||||
China BlueChemical Ltd. Class H | 384,000 | 109,006 | ||||||
China Datang Corp. Renewable Power Co. Ltd. Class Ha | 726,000 | 91,803 | ||||||
China Dongxiang Group Co. Ltd. | 669,000 | 166,602 | ||||||
China Electronics Corp. Holdings Co. Ltd.b | 214,000 | 63,233 | ||||||
China Foods Ltd.a | 206,000 | 95,690 | ||||||
China Harmony New Energy Auto Holding Ltd.b | 142,000 | 63,029 | ||||||
China High Speed Transmission Equipment Group Co. Ltd.a | 196,000 | 134,797 | ||||||
China Huarong Energy Co. Ltd.a,b | 1,140,000 | 45,600 | ||||||
China Huiyuan Juice Group Ltd.a | 179,500 | 59,524 | ||||||
China Innovationpay Group Ltd.a,b | 804,000 | 48,758 | ||||||
China Jicheng Holdings Ltd.a,c | 450,000 | 119,032 | ||||||
China Lesso Group Holdings Ltd.b | 264,000 | 185,310 | ||||||
China Lilang Ltd.b | 176,000 | 151,473 | ||||||
China LotSynergy Holdings Ltd.b | 1,540,000 | 63,587 | ||||||
China Lumena New Materials Corp.a,b | 210,000 | 3,387 | ||||||
China Merchants Land Ltd.b | 264,000 | 41,558 | ||||||
China Metal Recycling Holdings Ltd.a | 12,000 | — | ||||||
China Modern Dairy Holdings Ltd.b | 355,000 | 92,528 | ||||||
China Oceanwide Holdings Ltd.a,b | 716,000 | 103,473 | ||||||
China Oil & Gas Group Ltd.a,b | 1,470,000 | 92,941 | ||||||
China Overseas Grand Oceans Group Ltd.b | 266,000 | 84,090 | ||||||
China Power New Energy Development Co. Ltd.b | 1,080,000 | 55,742 | ||||||
China Precious Metal Resources Holdings Co. Ltd.a,b | 882,000 | 33,004 | ||||||
China Rare Earth Holdings Ltd.a | 761,600 | 65,841 | ||||||
China Regenerative Medicine International Ltd.a,b | 1,900,000 | 100,516 | ||||||
China Resources and Transportation Group Ltd.a,b | 4,000,000 | 30,968 | ||||||
China Shanshui Cement Group Ltd.a,b | 253,000 | 152,419 | ||||||
China Shineway Pharmaceutical Group Ltd. | 93,000 | 111,599 | ||||||
| Security | Shares | Value | ||||||
China Singyes Solar Technologies Holdings Ltd.b | 152,000 | $ | 94,337 | |||||
China Suntien Green Energy Corp. Ltd. Class Hb | 422,000 | 68,064 | ||||||
China Traditional Chinese Medicine Co. Ltd.a | 306,000 | 213,606 | ||||||
China Travel International Investment Hong Kong Ltd. | 476,000 | 165,831 | ||||||
China Vanadium Titano-Magnetite Mining Co. Ltd.a,b | 1,286,000 | 56,418 | ||||||
China Water Affairs Group Ltd.b | 276,000 | 120,371 | ||||||
China Yurun Food Group Ltd.a,b | 313,000 | 72,292 | ||||||
China ZhengTong Auto Services Holdings Ltd.b | 189,000 | 74,868 | ||||||
Chinasoft International Ltd.a,b | 270,000 | 88,490 | ||||||
Chongqing Machinery & Electric Co. Ltd. Class H | 558,000 | 72,000 | ||||||
CIFI Holdings Group Co. Ltd. | 380,000 | 71,096 | ||||||
CIMC Enric Holdings Ltd.b | 112,000 | 58,962 | ||||||
CITIC Dameng Holdings Ltd.a,b | 394,000 | 33,045 | ||||||
CITIC Resources Holdings Ltd.a,b | 550,000 | 84,451 | ||||||
Cogobuy Groupa,b,c | 75,000 | 66,096 | ||||||
Colour Life Services Group Co. Ltd.b | 79,000 | 58,409 | ||||||
Comba Telecom Systems Holdings Ltd.b | 305,030 | 59,431 | ||||||
Coolpad Group Ltd. | 492,000 | 91,416 | ||||||
COSCO International Holdings Ltd.b | 230,000 | 114,150 | ||||||
Cosmo Lady China Holdings Co. Ltd.c | 76,000 | 81,589 | ||||||
CT Environmental Group Ltd.b | 528,000 | 173,047 | ||||||
Dah Chong Hong Holdings Ltd.b | 212,000 | 76,593 | ||||||
Dazhong Transportation Group Co. Ltd. Class B | 92,700 | 82,132 | ||||||
Digital China Holdings Ltd. | 159,000 | 139,099 | ||||||
Dongyue Group Ltd. | 327,000 | 78,480 | ||||||
EverChina International Holdings Co. Ltd.a | 1,445,000 | 48,477 | ||||||
Fantasia Holdings Group Co. Ltd.b | 466,500 | 49,358 | ||||||
FDG Electric Vehicles Ltd.a,b | 1,980,000 | 122,632 | ||||||
First Tractor Co. Ltd. Class H | 112,000 | 64,309 | ||||||
Fufeng Group Ltd.b | 224,400 | 99,894 | ||||||
Fullshare Holdings Ltd.a | 750,000 | 112,257 | ||||||
Golden Eagle Retail Group Ltd.b | 117,000 | 130,284 | ||||||
Greatview Aseptic Packaging Co. Ltd.b | 257,000 | 118,385 | ||||||
| 64 | 2015 iSHARES ANNUAL REPORTTO SHAREHOLDERS |
Table of Contents
Consolidated Schedule of Investments (Continued)
iSHARES® MSCI EMERGING MARKETS SMALL-CAP ETF
August 31, 2015
| Security | Shares | Value | ||||||
Greenland Hong Kong Holdings Ltd.a | 114,000 | $ | 50,160 | |||||
Hangzhou Steam Turbine Co. Class B | 95,780 | 126,285 | ||||||
Harbin Electric Co. Ltd. Class Hb | 174,000 | 91,153 | ||||||
HC International Inc.a,b | 78,000 | 33,515 | ||||||
Hengdeli Holdings Ltd. | 709,600 | 98,886 | ||||||
Hi Sun Technology China Ltd.a,b | 366,000 | 60,449 | ||||||
Hisense Kelon Electrical Holdings Co. Ltd. Class Ha | 88,000 | 45,419 | ||||||
Honbridge Holdings Ltd.a,b | 540,000 | 71,071 | ||||||
Hopewell Highway Infrastructure Ltd. | 302,500 | 144,809 | ||||||
Hopson Development Holdings Ltd.a,b | 124,000 | 95,359 | ||||||
Hua Han Bio-Pharmaceutical Holdings Ltd. Class H | 824,400 | 105,310 | ||||||
Huabao International Holdings Ltd.b | 330,000 | 109,857 | ||||||
Imperial Pacific International Holdings Ltd.a,b | 6,880,000 | 168,670 | ||||||
Intime Retail Group Co. Ltd.b | 167,000 | 175,618 | ||||||
Jiangsu Future Land Co. Ltd. Class B | 89,900 | 145,728 | ||||||
Ju Teng International Holdings Ltd.b | 210,000 | 80,206 | ||||||
Kaisa Group Holdings Ltd.a,b | 276,000 | 17,806 | ||||||
Kingboard Chemical Holdings Ltd.b | 97,000 | 125,911 | ||||||
Kingdee International Software Group Co. Ltd.b | 362,000 | 124,247 | ||||||
KWG Property Holding Ltd. | 214,500 | 135,619 | ||||||
Lao Feng Xiang Co. Ltd. Class B | 44,900 | 166,534 | ||||||
Launch Tech Co. Ltd.a | 28,000 | 32,697 | ||||||
Lee & Man Paper Manufacturing Ltd. | 246,000 | 140,933 | ||||||
Leyou Technologies Holdings Ltd.a,b | 485,000 | 43,806 | ||||||
Li Ning Co. Ltd.a,b | 251,500 | 116,176 | ||||||
Lifetech Scientific Corp.a,b | 362,000 | 50,446 | ||||||
Lonking Holdings Ltd. | 769,000 | 105,179 | ||||||
Luthai Textile Co. Ltd. Class B | 96,000 | 117,181 | ||||||
MIE Holdings Corp.a | 368,000 | 43,210 | ||||||
Minth Group Ltd.b | 126,000 | 219,157 | ||||||
MMG Ltd.a,b | 368,000 | 75,974 | ||||||
National Agricultural Holdings Ltd.a,b | 144,000 | 57,971 | ||||||
NetDragon Websoft Inc. | 38,000 | 90,709 | ||||||
New World Department Store China Ltd. | 271,000 | 48,605 | ||||||
| Security | Shares | Value | ||||||
Nexteer Automotive Group Ltd. | 150,000 | $ | 141,289 | |||||
North Mining Shares Co. Ltd.a,b | 2,660,000 | 37,068 | ||||||
NVC Lighting Holding Ltd. | 108,000 | 16,185 | ||||||
PAX Global Technology Ltd.b | 132,000 | 122,972 | ||||||
Peak Sport Products Co. Ltd.b | 387,000 | 92,879 | ||||||
Phoenix Healthcare Group Co. Ltd.b | 86,500 | 125,452 | ||||||
Phoenix Satellite Television Holdings Ltd.b | 428,000 | 91,674 | ||||||
Poly Property Group Co. Ltd.b | 395,000 | 105,503 | ||||||
Renhe Commercial Holdings Co. Ltd.a,b | 2,450,000 | 135,935 | ||||||
REXLot Holdings Ltd.b | 1,500,000 | 19,355 | ||||||
Shandong Luoxin Pharmaceutical Group Stock Co. Ltd. Class H | 48,000 | 80,144 | ||||||
Shanghai Baosight Software Co. Ltd. Class B | 27,900 | 81,217 | ||||||
Shanghai Jinqiao Export Processing Zone Development Co. Ltd. Class B | 75,600 | 111,132 | ||||||
Shenguan Holdings Group Ltd. | 386,000 | 54,787 | ||||||
Shenzhen Expressway Co. Ltd. Class Hb | 174,000 | 113,604 | ||||||
Shenzhen International Holdings Ltd. | 205,000 | 283,560 | ||||||
Shenzhen Investment Ltd.b | 578,000 | 204,350 | ||||||
Shougang Concord International Enterprises Co. Ltd.a,b | 1,450,000 | 58,935 | ||||||
Shougang Fushan Resources Group Ltd.b | 568,000 | 71,824 | ||||||
Shunfeng International Clean Energy Ltd.a | 304,000 | 72,960 | ||||||
Sino Oil And Gas Holdings Ltd.a,b | 3,335,000 | 77,888 | ||||||
Sinopec Kantons Holdings Ltd.b | 210,000 | 111,367 | ||||||
Sinotrans Shipping Ltd.b | 435,000 | 80,825 | ||||||
Skyworth Digital Holdings Ltd.b | 366,000 | 211,098 | ||||||
SMI Holdings Group Ltd. | 608,000 | 40,010 | ||||||
Sound Global Ltd.a | 80,000 | 60,181 | ||||||
Springland International Holdings Ltd.b | 349,000 | 92,316 | ||||||
SSY Group Ltd. | 460,000 | 132,360 | ||||||
Sunny Optical Technology Group Co. Ltd.b | 120,000 | 200,050 | ||||||
Superb Summit International Group Ltd.a,b | 238,250 | 6,148 | ||||||
CONSOLIDATED SCHEDULESOF INVESTMENTS | 65 |
Table of Contents
Consolidated Schedule of Investments (Continued)
iSHARES® MSCI EMERGING MARKETS SMALL-CAP ETF
August 31, 2015
| Security | Shares | Value | ||||||
TCL Communication Technology Holdings Ltd.b | 129,000 | $ | 87,220 | |||||
Tech Pro Technology Development Ltd.a,b | 1,078,400 | 262,989 | ||||||
Texhong Textile Group Ltd. | 70,500 | 60,038 | ||||||
Tianjin Development Holdings Ltd. | 174,000 | 112,257 | ||||||
Tianjin Port Development Holdings Ltd.b | 424,000 | 66,745 | ||||||
Tianneng Power International Ltd.a | 278,000 | 110,841 | ||||||
Tibet 5100 Water Resources Holdings Ltd.b | 421,000 | 113,533 | ||||||
Tong Ren Tang Technologies Co. Ltd. Class Hb | 140,000 | 181,005 | ||||||
Towngas China Co. Ltd.b | 185,000 | 117,683 | ||||||
V1 Group Ltd.a,b | 1,038,000 | 69,646 | ||||||
Vinda International Holdings Ltd. | 64,000 | 123,375 | ||||||
Wasion Group Holdings Ltd.b | 134,000 | 129,158 | ||||||
West China Cement Ltd.a | 554,000 | 90,784 | ||||||
Wisdom Holdings Groupb | 144,000 | 58,529 | ||||||
Xiamen International Port Co. Ltd. Class H | 202,000 | 49,522 | ||||||
Xingda International Holdings Ltd.b | 359,000 | 72,263 | ||||||
Xinjiang Xinxin Mining Industry Co. Ltd. Class Ha | 348,000 | 39,515 | ||||||
Xinyi Solar Holdings Ltd.b | 486,000 | 162,417 | ||||||
XTEP International Holdings Ltd. | 207,500 | 89,425 | ||||||
Yanchang Petroleum International Ltd.a,b | 2,880,000 | 86,585 | ||||||
Yingde Gases Group Co. Ltd. | 202,500 | 84,396 | ||||||
Yip’s Chemical Holdings Ltd.b | 210,000 | 92,128 | ||||||
Yuexiu REIT | 320,000 | 168,463 | ||||||
Yuexiu Transport Infrastructure Ltd.b | 196,000 | 117,093 | ||||||
Yuxing InfoTech Investment Holdings Ltd.b | 206,000 | 85,058 | ||||||
Zhaojin Mining Industry Co. Ltd. Class Hb | 189,000 | 94,134 | ||||||
Zhongsheng Group Holdings Ltd. | 171,000 | 71,489 | ||||||
|
| |||||||
| 16,046,758 | ||||||||
CZECH REPUBLIC — 0.03% | ||||||||
Philip Morris CR AS | 42 | 19,256 | ||||||
|
| |||||||
| 19,256 | ||||||||
EGYPT — 0.78% | ||||||||
Egypt Kuwait Holding Co. SAE | 98,192 | 60,879 | ||||||
Egyptian Financial Group-Hermes Holding Co.a | 96,854 | 106,254 | ||||||
| Security | Shares | Value | ||||||
Medinet Nasr Housinga | 38,220 | $ | 103,921 | |||||
Orascom Telecom Media And Technology Holding SAE GDRa | 379,722 | 254,414 | ||||||
Palm Hills Developments SAEa | 271,385 | 71,745 | ||||||
|
| |||||||
| 597,213 | ||||||||
GREECE — 0.65% | ||||||||
Aegean Airlines SA | 7,239 | 52,723 | ||||||
Ellaktor SAa | 17,260 | 23,981 | ||||||
Grivalia Properties REIC AE | 5,610 | 49,031 | ||||||
Hellenic Exchanges – Athens Stock Exchange SA Holding | 14,870 | 71,813 | ||||||
Intralot SA-Integrated Lottery Systems & Servicesa | 30,690 | 52,270 | ||||||
Metka SA | 3,912 | 29,544 | ||||||
Motor Oil Hellas Corinth Refineries SAa | 7,821 | 81,500 | ||||||
Mytilineos Holdings SAa | 8,895 | 45,249 | ||||||
Public Power Corp. SA | 19,190 | 87,300 | ||||||
|
| |||||||
| 493,411 | ||||||||
HUNGARY — 0.13% | ||||||||
Magyar Telekom Telecommunications PLCa | 68,423 | 97,319 | ||||||
|
| |||||||
| 97,319 | ||||||||
INDIA — 11.26% | ||||||||
Adani Enterprises Ltd. | 64,706 | 73,150 | ||||||
AIA Engineering Ltd. | 9,207 | 127,028 | ||||||
Ajanta Pharma Ltd. | 6,266 | 141,373 | ||||||
Alembic Pharmaceuticals Ltd. | 4,500 | 48,398 | ||||||
Alstom T&D India Ltd. | 16,764 | 133,078 | ||||||
Amara Raja Batteries Ltd. | 13,596 | 206,175 | ||||||
Amtek Auto Ltd. | 24,573 | 19,000 | ||||||
Andhra Bank | 52,100 | 52,864 | ||||||
Apollo Tyres Ltd. | 46,695 | 126,440 | ||||||
Arvind Infrastructure Ltd.a | 2,842 | 1,954 | ||||||
Arvind Ltd. | 31,150 | 127,177 | ||||||
Ashok Leyland Ltd. | 218,427 | 296,712 | ||||||
Balkrishna Industries Ltd. | 10,406 | 100,467 | ||||||
Bayer CropScience Ltd./India | 2,252 | 130,623 | ||||||
Berger Paints India Ltd. | 37,742 | 120,650 | ||||||
Biocon Ltd. | 17,061 | 113,903 | ||||||
Blue Dart Express Ltd. | 1,179 | 121,079 | ||||||
Ceat Ltd. | 2,812 | 46,426 | ||||||
CESC Ltd. | 15,154 | 119,442 | ||||||
Cox & Kings Ltd. | 24,510 | 88,011 | ||||||
CRISIL Ltd. | 4,464 | 129,992 | ||||||
| 66 | 2015 iSHARES ANNUAL REPORTTO SHAREHOLDERS |
Table of Contents
Consolidated Schedule of Investments (Continued)
iSHARES® MSCI EMERGING MARKETS SMALL-CAP ETF
August 31, 2015
| Security | Shares | Value | ||||||
Crompton Greaves Ltd. | 67,390 | $ | 173,303 | |||||
Cyient Ltd. | 20,621 | 180,525 | ||||||
Dewan Housing Finance Corp. Ltd. | 16,413 | 113,354 | ||||||
Dish TV India Ltd.a | 92,017 | 144,376 | ||||||
EID Parry India Ltd. | 42,490 | 85,300 | ||||||
Federal Bank Ltd. | 245,760 | 226,998 | ||||||
Gillette India Ltd. | 1,856 | 139,280 | ||||||
Gujarat Fluorochemicals Ltd. | 10,560 | 104,909 | ||||||
Gujarat Gas Ltd. | 7,043 | 78,731 | ||||||
Gujarat Mineral Development Corp. Ltd. | 53,092 | 59,821 | ||||||
Gujarat Pipavav Port Ltd.a | 47,261 | 121,290 | ||||||
Gujarat State Petronet Ltd. | 56,826 | 105,317 | ||||||
GVK Power & Infrastructure Ltd.a | 398,947 | 44,111 | ||||||
Havells India Ltd. | 48,069 | 188,118 | ||||||
Hexaware Technologies Ltd. | 29,686 | 109,254 | ||||||
Housing Development & Infrastructure Ltd.a | 57,488 | 51,845 | ||||||
IIFL Holdings Ltd. | 55,374 | 157,771 | ||||||
Indian Hotels Co. Ltd.a | 86,460 | 113,156 | ||||||
Indraprastha Gas Ltd. | 20,001 | 143,670 | ||||||
IRB Infrastructure Developers Ltd. | 33,228 | 116,767 | ||||||
Jaiprakash Associates Ltd.a | 330,703 | 48,007 | ||||||
Jammu & Kashmir Bank Ltd. (The) | 49,166 | 71,262 | ||||||
Jindal Saw Ltd. | 53,220 | 53,040 | ||||||
Jubilant Foodworks Ltd. | 4,707 | 118,052 | ||||||
Just Dial Ltd. | 6,432 | 81,717 | ||||||
Kansai Nerolac Paints Ltd. | 42,925 | 166,147 | ||||||
Manappuram Finance Ltd. | 163,650 | 57,114 | ||||||
Marksans Pharma Ltd. | 31,692 | 43,122 | ||||||
MAX India Ltd. | 25,879 | 194,983 | ||||||
MindTree Ltd. | 10,048 | 210,989 | ||||||
MRF Ltd. | 330 | 200,518 | ||||||
NCC Ltd./India | 66,600 | 71,835 | ||||||
Page Industries Ltd. | 1,062 | 226,890 | ||||||
Persistent Systems Ltd. | 10,382 | 109,482 | ||||||
PI Industries Ltd. | 13,785 | 149,359 | ||||||
PTC India Ltd. | 109,712 | 98,943 | ||||||
Rajesh Exports Ltd. | 10,412 | 79,333 | ||||||
Redington India Ltd. | 82,651 | 134,840 | ||||||
Reliance Capital Ltd. | 20,196 | 95,549 | ||||||
Reliance Infrastructure Ltd. | 18,599 | 95,562 | ||||||
SKS Microfinance Ltd.a | 23,397 | 162,714 | ||||||
Strides Arcolab Ltd. | 4,066 | 75,023 | ||||||
Sundaram Finance Ltd. | 8,415 | 183,782 | ||||||
| Security | Shares | Value | ||||||
Suzlon Energy Ltd.a | 345,308 | $ | 114,800 | |||||
Syndicate Bank | 36,247 | 46,648 | ||||||
Tata Global Beverages Ltd. | 84,285 | 151,643 | ||||||
Thermax Ltd. | 9,226 | 131,850 | ||||||
Torrent Pharmaceuticals Ltd. | 11,286 | 272,833 | ||||||
TVS Motor Co. Ltd. | 31,581 | 106,252 | ||||||
Voltas Ltd. | 29,742 | 122,122 | ||||||
Wockhardt Ltd. | 5,724 | 115,587 | ||||||
|
| |||||||
| 8,571,836 | ||||||||
INDONESIA — 2.45% | ||||||||
Ace Hardware Indonesia Tbk PT | 1,809,900 | 76,647 | ||||||
Agung Podomoro Land Tbk PT | 2,052,600 | 47,188 | ||||||
Alam Sutera Realty Tbk PT | 2,478,700 | 62,453 | ||||||
Arwana Citramulia Tbk PT | 1,978,700 | 66,896 | ||||||
Bank Bukopin Tbk | 1,249,600 | 60,479 | ||||||
Bank Pembangunan Daerah Jawa Barat Dan Banten Tbk PT | 696,300 | 34,443 | ||||||
Bank Tabungan Negara Persero Tbk PT | 949,423 | 71,967 | ||||||
Ciputra Development Tbk PT | 2,001,600 | 123,230 | ||||||
Eagle High Plantations Tbk PT | 2,165,300 | 39,761 | ||||||
Gajah Tunggal Tbk PT | 986,800 | 35,117 | ||||||
Hanson International Tbk PTa | 2,647,100 | 135,652 | ||||||
Japfa Comfeed Indonesia Tbk PTa | 1,343,200 | 35,181 | ||||||
Kawasan Industri Jababeka Tbk PT | 6,868,894 | 96,311 | ||||||
Link Net Tbk PTa | 196,800 | 67,584 | ||||||
Mitra Adiperkasa Tbk PTa | 162,100 | 46,150 | ||||||
MNC Investama Tbk PT | 3,570,800 | 65,825 | ||||||
Multipolar Tbk PT | 1,237,713 | 36,118 | ||||||
Pakuwon Jati Tbk PT | 5,226,600 | 141,360 | ||||||
Pembangunan Perumahan Persero Tbk PT | 627,000 | 147,713 | ||||||
Perusahaan Perkebunan London Sumatra Indonesia Tbk PT | 646,000 | 49,657 | ||||||
Ramayana Lestari Sentosa Tbk PT | 949,400 | 40,882 | ||||||
Sampoerna Agro PT | 422,400 | 39,985 | ||||||
Sentul City Tbk PTa | 6,489,700 | 28,176 | ||||||
Sugih Energy Tbk PTa | 3,554,600 | 99,681 | ||||||
Surya Semesta Internusa Tbk PT | 1,193,450 | 59,035 | ||||||
Timah Persero Tbk PT | 989,696 | 42,617 | ||||||
Wijaya Karya Persero Tbk PT | 596,000 | 117,291 | ||||||
|
| |||||||
| 1,867,399 | ||||||||
MALAYSIA — 3.50% | ||||||||
Bursa Malaysia Bhd | 92,700 | 181,868 | ||||||
Cahya Mata Sarawak Bhdb | 128,500 | 151,446 | ||||||
CONSOLIDATED SCHEDULESOF INVESTMENTS | 67 |
Table of Contents
Consolidated Schedule of Investments (Continued)
iSHARES® MSCI EMERGING MARKETS SMALL-CAP ETF
August 31, 2015
| Security | Shares | Value | ||||||
Carlsberg Brewery Malaysia Bhd | 35,800 | $ | 99,728 | |||||
DRB-Hicom Bhd | 151,900 | 47,017 | ||||||
Eastern & Oriental Bhd | 176,550 | 64,315 | ||||||
Hartalega Holdings Bhd | 89,800 | 175,751 | ||||||
IGB REIT | 438,000 | 136,614 | ||||||
KNM Group Bhda,b | 346,000 | 39,543 | ||||||
Kossan Rubber Industries | 102,100 | 167,493 | ||||||
KPJ Healthcare Bhd | 141,250 | 141,250 | ||||||
Magnum Bhd | 121,400 | 75,152 | ||||||
Mah Sing Group Bhd | 330,557 | 109,399 | ||||||
Malaysia Building Society Bhdb | 117,900 | 38,458 | ||||||
Malaysian Pacific Industries Bhd | 48,500 | 76,330 | ||||||
Malaysian Resources Corp. Bhd | 280,200 | 57,041 | ||||||
Media Prima Bhd | 241,600 | 60,400 | ||||||
OSK Holdings Bhd | 152,287 | 59,102 | ||||||
POS Malaysia Bhd | 102,700 | 92,430 | ||||||
QL Resources Bhd | 164,500 | 151,183 | ||||||
Sunway Bhd | 162,400 | 131,467 | ||||||
Sunway Construction Group Bhda | 212,820 | 56,752 | ||||||
Sunway REIT | 364,300 | 129,240 | ||||||
TIME dotCom Bhd | 96,400 | 138,173 | ||||||
Top Glove Corp. Bhd | 95,000 | 174,619 | ||||||
Wah Seong Corp. Bhd | 138,310 | 41,164 | ||||||
WCT Holdings Bhd | 238,265 | 66,941 | ||||||
|
| |||||||
| 2,662,876 | ||||||||
MEXICO — 3.05% | ||||||||
Alsea SAB de CVb | 86,459 | 265,972 | ||||||
Axtel SAB de CV CPOa,b | 242,900 | 98,289 | ||||||
Banregio Grupo Financiero SAB de CVb | 45,800 | 239,809 | ||||||
Bolsa Mexicana de Valores SAB de CV | 79,000 | 119,253 | ||||||
Concentradora Fibra Hotelera Mexicana SA de CV | 87,400 | 83,181 | ||||||
Consorcio ARA SAB de CVa,b | 184,600 | 63,807 | ||||||
Controladora Vuela Cia. de Aviacion SAB de CV Class Aa | 82,500 | 108,951 | ||||||
Corp GEO SAB de CVa | 38,700 | — | ||||||
Corp Inmobiliaria Vesta SAB de CVb | 72,200 | 111,699 | ||||||
Empresas ICA SAB de CVa,b | 102,300 | 40,359 | ||||||
Genomma Lab Internacional SAB de CV Series Ba | 133,100 | 107,638 | ||||||
Grupo Aeromexico SAB de CVa,b | 80,200 | 119,726 | ||||||
Grupo Aeroportuario del Centro Norte SAB de CV | 36,200 | 189,327 | ||||||
| Security | Shares | Value | ||||||
Grupo Herdez SAB de CV | 57,700 | $ | 140,915 | |||||
Industrias Bachoco SAB de CV Series B | 28,400 | 134,215 | ||||||
Industrias CH SAB de CV Series Ba,b | 22,000 | 74,653 | ||||||
Mexico Real Estate Management SA de CV | 92,600 | 125,601 | ||||||
PLA Administradora Industrial S. de RL de CV | 97,000 | 181,051 | ||||||
Prologis Property Mexico SA de CV | 53,700 | 83,334 | ||||||
TV Azteca SAB de CV CPOb | 229,000 | 32,890 | ||||||
Urbi Desarrollos Urbanos SAB de CVa,b | 124,600 | — | ||||||
|
| |||||||
| 2,320,670 | ||||||||
PHILIPPINES — 1.48% | ||||||||
Belle Corp. | 1,033,933 | 68,354 | ||||||
Cebu Air Inc. | 54,230 | 103,784 | ||||||
Cosco Capital Inc. | 374,000 | 55,612 | ||||||
EEI Corp. | 526,172 | 93,775 | ||||||
Filinvest Land Inc. | 2,432,000 | 93,138 | ||||||
First Gen Corp. | 228,500 | 114,152 | ||||||
First Philippine Holdings Corp. | 24,370 | 36,498 | ||||||
Manila Water Co. Inc. | 179,900 | 86,986 | ||||||
Melco Crown Philippines Resorts Corp.a | 325,400 | 41,841 | ||||||
Nickel Asia Corp. | 335,600 | 57,800 | ||||||
Philippine National Banka | 29,733 | 38,168 | ||||||
Security Bank Corp. | 80,600 | 227,453 | ||||||
Vista Land & Lifescapes Inc. | 850,300 | 106,060 | ||||||
|
| |||||||
| 1,123,621 | ||||||||
POLAND — 1.15% | ||||||||
Asseco Poland SA | 12,977 | 180,209 | ||||||
Budimex SA | 2,981 | 154,753 | ||||||
Getin Noble Bank SAa | 179,246 | 41,810 | ||||||
Globe Trade Centre SAa | 48,639 | 76,066 | ||||||
Kernel Holding SA | 8,023 | 88,723 | ||||||
Lubelski Wegiel Bogdanka SA | 5,918 | 73,335 | ||||||
Netia SA | 57,558 | 83,454 | ||||||
PKP Cargo SA | 4,173 | 77,926 | ||||||
Warsaw Stock Exchange | 8,303 | 97,321 | ||||||
|
| |||||||
| 873,597 | ||||||||
QATAR — 0.58% | ||||||||
Al Khalij Commercial Bank QSC | 16,845 | 95,534 | ||||||
Qatar National Cement Co. QSC | 3,233 | 92,255 | ||||||
Qatari Investors Group QSC | 7,183 | 94,594 | ||||||
| 68 | 2015 iSHARES ANNUAL REPORTTO SHAREHOLDERS |
Table of Contents
Consolidated Schedule of Investments (Continued)
iSHARES® MSCI EMERGING MARKETS SMALL-CAP ETF
August 31, 2015
| Security | Shares | Value | ||||||
Salam International Investment Co. | 24,627 | $ | 85,898 | |||||
United Development Co. QSC | 11,525 | 74,035 | ||||||
|
| |||||||
| 442,316 | ||||||||
RUSSIA — 0.50% | ||||||||
Acron JSC | 1,857 | 77,152 | ||||||
Aeroflot – Russian Airlines PJSCa | 90,156 | 53,767 | ||||||
DIXY Group OJSCa | 11,960 | 56,466 | ||||||
LSR Group PJSC GDRd | 40,010 | 80,020 | ||||||
M Video OJSC | 19,300 | 58,721 | ||||||
TMK PAO GDRd | 14,988 | 52,458 | ||||||
|
| |||||||
| 378,584 | ||||||||
SOUTH AFRICA — 6.12% | ||||||||
Adcock Ingram Holdings Ltd.a | 15,057 | 57,768 | ||||||
Aeci Ltd. | 15,477 | 113,660 | ||||||
Alexander Forbes Group Holdings Ltd. | 132,650 | 88,805 | ||||||
ArcelorMittal South Africa Ltd.a | 31,489 | 23,645 | ||||||
Astral Foods Ltd. | 8,017 | 107,554 | ||||||
Attacq Ltd.a | 79,811 | 134,179 | ||||||
Aveng Ltd.a | 102,558 | 37,191 | ||||||
AVI Ltd. | 48,193 | 294,297 | ||||||
Capital Property Funda | 226,002 | 265,800 | ||||||
Cashbuild Ltd. | 2,508 | 59,144 | ||||||
City Lodge Hotels Ltd. | 11,586 | 124,034 | ||||||
Clicks Group Ltd. | 40,033 | 276,278 | ||||||
Clover Industries Ltd. | 69,915 | 92,241 | ||||||
DataTec Ltd. | 27,847 | 157,455 | ||||||
Emira Property Fund Ltd. | 64,448 | 85,417 | ||||||
EOH Holdings Ltd. | 22,449 | 268,252 | ||||||
Famous Brands Ltd. | 10,767 | 111,369 | ||||||
Grindrod Ltd. | 75,617 | 80,952 | ||||||
Group Five Ltd./South Africa | 41,365 | 69,543 | ||||||
Harmony Gold Mining Co. Ltd.a,b | 65,384 | 55,603 | ||||||
Hosken Consolidated Investments Ltd. | 6,706 | 71,295 | ||||||
Illovo Sugar Ltd. | 35,454 | 39,719 | ||||||
JSE Ltd. | 16,671 | 173,004 | ||||||
Lewis Group Ltd. | 18,709 | 88,226 | ||||||
Mpact Ltd. | 42,485 | 153,102 | ||||||
Murray & Roberts Holdings Ltd. | 66,645 | 63,056 | ||||||
Northam Platinum Ltd.a | 49,612 | 141,046 | ||||||
Omnia Holdings Ltd. | 7,599 | 94,522 | ||||||
Pick n Pay Holdings Ltd. | 51,549 | 106,329 | ||||||
PPC Ltd. | 84,930 | 138,944 | ||||||
Reunert Ltd. | 21,877 | 105,952 | ||||||
| Security | Shares | Value | ||||||
Royal Bafokeng Platinum Ltd.a | 9,927 | $ | 24,690 | |||||
SA Corporate Real Estate Fund Nominees Pty Ltd. | 226,305 | 87,013 | ||||||
Sibanye Gold Ltd. | 98,637 | 113,032 | ||||||
Sun International Ltd./South Africa | 14,246 | 111,429 | ||||||
Super Group Ltd./South Africaa | 56,161 | 140,103 | ||||||
Tongaat Hulett Ltd. | 13,826 | 119,849 | ||||||
Trencor Ltd. | 23,441 | 95,431 | ||||||
Vukile Property Fund Ltd. | 77,028 | 106,272 | ||||||
Wilson Bayly Holmes-Ovcon Ltd. | 7,763 | 55,599 | ||||||
Zeder Investments Ltd. | 220,398 | 129,272 | ||||||
|
| |||||||
| 4,661,072 | ||||||||
SOUTH KOREA — 20.57% | ||||||||
Able C&C Co. Ltd.b | 3,107 | 76,969 | ||||||
Ahnlab Inc. | 3,050 | 116,043 | ||||||
Amicogen Inc. | 532 | 39,043 | ||||||
Asiana Airlines Inc.a | 17,976 | 77,056 | ||||||
Binggrae Co. Ltd. | 1,699 | 103,714 | ||||||
Chabiotech Co. Ltd.a,b | 8,088 | 100,523 | ||||||
Chong Kun Dang Pharmaceutical Corp. | 1,840 | 112,166 | ||||||
CJ CGV Co. Ltd. | 2,517 | 242,602 | ||||||
CJ E&M Corp.a | 3,278 | 228,927 | ||||||
CJ O Shopping Co. Ltd. | 594 | 100,042 | ||||||
Com2uSCorp.a,b | 1,491 | 133,374 | ||||||
Cosmax Inc.b | 1,251 | 228,993 | ||||||
Crown Confectionery Co. Ltd. | 76 | 48,000 | ||||||
CrucialTec Co. Ltd.a,b | 5,676 | 75,824 | ||||||
D.I Corp.b | 11,049 | 78,191 | ||||||
Daesang Corp. | 3,844 | 102,377 | ||||||
Daishin Securities Co. Ltd. | 11,271 | 97,677 | ||||||
Daou Technology Inc. | 3,078 | 77,812 | ||||||
Dong-A Socio Holdings Co. Ltd.b | 667 | 92,486 | ||||||
Dong-A ST Co. Ltd. | 1,032 | 102,960 | ||||||
Doosan Engine Co. Ltd.a | 16,771 | 64,801 | ||||||
DY Corp. | 15,728 | 75,399 | ||||||
EO Technics Co. Ltd.b | 1,432 | 130,639 | ||||||
Fila Korea Ltd.b | 1,975 | 175,333 | ||||||
Gamevil Inc.a,b | 966 | 59,132 | ||||||
GemVax & Kael Co. Ltd.a | 4,049 | 115,710 | ||||||
Grand Korea Leisure Co. Ltd. | 5,412 | 143,222 | ||||||
Green Cross Cell Corp.a | 1,459 | 55,881 | ||||||
Green Cross Corp./South Korea | 1,217 | 203,219 | ||||||
Green Cross Holdings Corp. | 4,785 | 175,581 | ||||||
GS Home Shopping Inc. | 564 | 95,371 | ||||||
CONSOLIDATED SCHEDULESOF INVESTMENTS | 69 |
Table of Contents
Consolidated Schedule of Investments (Continued)
iSHARES® MSCI EMERGING MARKETS SMALL-CAP ETF
August 31, 2015
| Security | Shares | Value | ||||||
Halla Holdings Corp. | 1,545 | $ | 65,836 | |||||
Hana Tour Service Inc. | 2,087 | 277,914 | ||||||
Handsome Co. Ltd. | 4,419 | 146,086 | ||||||
Hanjin Heavy Industries & Construction Co. Ltd.a,b | 14,405 | 48,595 | ||||||
Hanjin Kal Corp.b | 6,630 | 137,617 | ||||||
Hanjin Shipping Co. Ltd.a,b | 24,078 | 112,171 | ||||||
Hankook Tire Worldwide Co. Ltd. | 4,661 | 67,782 | ||||||
Hansae Co. Ltd. | 4,164 | 221,094 | ||||||
Hansol Chemical Co. Ltd. | 2,357 | 157,034 | ||||||
Hansol Holdings Co. Ltd.a | 14,006 | 90,117 | ||||||
Hanwha Investment & Securities Co. Ltd. | 19,646 | 80,644 | ||||||
Hanwha Techwin Co. Ltd.a,b | 6,196 | 163,969 | ||||||
HLB Inc.a,b | 5,205 | 99,897 | ||||||
Huchems Fine Chemical Corp. | 6,930 | 114,548 | ||||||
Huons Co. Ltd. | 722 | 64,524 | ||||||
Hwa Shin Co. Ltd. | 16,169 | 79,427 | ||||||
Hyundai Corp.b | 3,540 | 97,722 | ||||||
Hyundai Elevator Co. Ltd.a | 760 | 42,602 | ||||||
Hyundai Greenfood Co. Ltd. | 8,376 | 193,333 | ||||||
Hyundai Home Shopping Network Corp. | 1,028 | 111,687 | ||||||
Hyundai Livart Furniture Co. Ltd.b | 2,156 | 105,180 | ||||||
Hyundai Securities Co. Ltd. | 24,254 | 150,927 | ||||||
Ilyang Pharmaceutical Co. Ltd.a,b | 3,732 | 150,195 | ||||||
iNtRON Biotechnology Inc.a | 2,471 | 103,415 | ||||||
IS Dongseo Co. Ltd. | 2,277 | 119,746 | ||||||
KB Insurance Co. Ltd. | 8,002 | 165,419 | ||||||
KIWOOM Securities Co. Ltd. | 2,458 | 118,458 | ||||||
Kolao Holdingsb | 4,757 | 72,195 | ||||||
Kolon Corp. | 684 | 48,520 | ||||||
Kolon Industries Inc. | 2,962 | 138,740 | ||||||
Kolon Life Science Inc. | 570 | 94,651 | ||||||
Komipharm International Co. Ltd.a,b | 5,643 | 89,219 | ||||||
KONA I Co. Ltd. | 1,216 | 43,746 | ||||||
Korea Kolmar Co. Ltd. | 2,703 | 237,677 | ||||||
Korea Kolmar Holdings Co. Ltd. | 608 | 37,989 | ||||||
Korea Petro Chemical Ind. | 765 | 94,109 | ||||||
Korean Reinsurance Co. | 20,100 | 236,221 | ||||||
KT Skylife Co. Ltd. | 4,998 | 83,036 | ||||||
Kumho Tire Co. Inc.a,b | 19,633 | 105,573 | ||||||
LF Corp. | 4,584 | 126,736 | ||||||
LG Hausys Ltd. | 1,159 | 153,847 | ||||||
LG International Corp. | 6,079 | 135,175 | ||||||
| Security | Shares | Value | ||||||
LG Life Sciences Ltd.a | 3,101 | $ | 154,165 | |||||
Lock&Lock Co. Ltd.b | 6,157 | 79,647 | ||||||
Loen Entertainment Inc. | 608 | 49,144 | ||||||
Lotte Chilsung Beverage Co. Ltd. | 113 | 218,309 | ||||||
Lotte Food Co. Ltd. | 178 | 165,847 | ||||||
LOTTE Himart Co. Ltd. | 1,878 | 103,050 | ||||||
Lumens Co. Ltd.b | 19,990 | 67,436 | ||||||
Mando Corp. | 1,193 | 118,014 | ||||||
Medipost Co. Ltd.a | 1,443 | 106,631 | ||||||
Medy-Tox Inc. | 697 | 300,015 | ||||||
MegaStudy Co. Ltd. | 3,091 | 112,115 | ||||||
Meritz Financial Group Inc. | 13,355 | 184,051 | ||||||
Meritz Fire & Marine Insurance Co. Ltd.b | 13,716 | 179,169 | ||||||
Meritz Securities Co. Ltd.b | 43,979 | 181,085 | ||||||
Muhak Co. Ltd.a | 3,149 | 135,252 | ||||||
Namhae Chemical Corp.b | 12,375 | 109,337 | ||||||
Namyang Dairy Products Co. Ltd. | 177 | 121,816 | ||||||
Naturalendo Tech Co. Ltd.a,b | 3,465 | 81,150 | ||||||
Nexen Tire Corp. | 7,272 | 87,922 | ||||||
NHN Entertainment Corp.a,b | 2,037 | 97,996 | ||||||
NICE Information Service Co. Ltd. | 3,762 | 44,689 | ||||||
NongShim Co. Ltd. | 646 | 200,996 | ||||||
OCI Materials Co. Ltd. | 1,622 | 150,440 | ||||||
Osstem Implant Co. Ltd.a | 2,756 | 150,995 | ||||||
Ottogi Corp. | 275 | 242,274 | ||||||
Partron Co. Ltd.b | 8,786 | 57,942 | ||||||
Poongsan Corp. | 5,499 | 114,141 | ||||||
POSCO Chemtech Co. Ltd. | 7,871 | 79,858 | ||||||
POSCO ICT Co. Ltd. | 23,062 | 99,248 | ||||||
S&T Dynamics Co. Ltd. | 8,778 | 96,482 | ||||||
Samlip General Foods Co. Ltd. | 469 | 145,131 | ||||||
Samsung Engineering Co. Ltd.a,b | 5,255 | 117,296 | ||||||
Samsung Fine Chemicals Co. Ltd. | 4,194 | 126,059 | ||||||
Samyang Holdings Corp.b | 702 | 106,242 | ||||||
Sansung Life & Science Co. Ltd.a,b | 2,146 | 94,894 | ||||||
SeAH Besteel Corp. | 3,307 | 89,193 | ||||||
Seegene Inc.a,b | 3,707 | 146,368 | ||||||
Seoul Semiconductor Co. Ltd.a,b | 6,802 | 81,377 | ||||||
SFA Engineering Corp.b | 3,174 | 116,870 | ||||||
SK Chemicals Co. Ltd.b | 2,506 | 145,137 | ||||||
SK Securities Co. Ltd.a,b | 73,710 | 74,785 | ||||||
SKC Co. Ltd. | 4,887 | 158,458 | ||||||
SM Entertainment Co.a,b | 3,815 | 141,923 | ||||||
Soulbrain Co. Ltd. | 2,992 | 109,662 | ||||||
| 70 | 2015 iSHARES ANNUAL REPORTTO SHAREHOLDERS |
Table of Contents
Consolidated Schedule of Investments (Continued)
iSHARES® MSCI EMERGING MARKETS SMALL-CAP ETF
August 31, 2015
| Security | Shares | Value | ||||||
Sung Kwang Bend Co. Ltd. | 7,908 | $ | 69,201 | |||||
Sungwoo Hitech Co. Ltd. | 9,771 | 64,686 | ||||||
Suprema Inc.a,b | 6,144 | 115,062 | ||||||
Taekwang Industrial Co. Ltd. | 99 | 99,523 | ||||||
Taewoong Co. Ltd.a | 6,473 | 82,093 | ||||||
Taihan Electric Wire Co. Ltd.a | 9,521 | 9,660 | ||||||
TK Corp.a,b | 10,693 | 94,476 | ||||||
Tongyang Life Insurance | 12,129 | 153,824 | ||||||
ViroMed Co. Ltd.a | 2,013 | 268,911 | ||||||
Webzen Inc.a,b | 2,759 | 72,780 | ||||||
WeMade Entertainment Co. Ltd.a | 912 | 39,788 | ||||||
Wonik IPS Co. Ltd.a | 7,047 | 66,135 | ||||||
Woongjin Thinkbig Co. Ltd.a,b | 10,454 | 73,185 | ||||||
YESCO Co. Ltd. | 4,175 | 143,314 | ||||||
Youngone Corp.b | 3,684 | 190,936 | ||||||
Yuanta Securities Korea Co. Ltd.a,b | 16,698 | 58,872 | ||||||
|
| |||||||
| 15,657,497 | ||||||||
TAIWAN — 16.38% | ||||||||
Ability Enterprise Co. Ltd. | 112,000 | 49,570 | ||||||
Airtac International Group | 20,850 | 99,328 | ||||||
ALI Corp. | 149,000 | 57,702 | ||||||
Altek Corp. | 73,793 | 46,608 | ||||||
Ambassador Hotel (The) | 136,000 | 115,786 | ||||||
AmTRAN Technology Co. Ltd. | 78,312 | 35,623 | ||||||
Asia Optical Co. Inc.a | 81,000 | 69,832 | ||||||
Asia Polymer Corp. | 130,620 | 67,245 | ||||||
BES Engineering Corp. | 301,000 | 69,385 | ||||||
Career Technology MFG. Co. Ltd. | 98,000 | 75,301 | ||||||
Cathay Real Estate Development Co. Ltd. | 179,000 | 69,320 | ||||||
Cheng Loong Corp. | 219,000 | 77,407 | ||||||
Cheng Uei Precision Industry Co. Ltd. | 64,000 | 89,009 | ||||||
Chin-Poon Industrial Co. Ltd. | 88,000 | 124,146 | ||||||
China Bills Finance Corp. | 120,000 | 41,124 | ||||||
China Man-Made Fiber Corp.a | 251,000 | 72,902 | ||||||
China Petrochemical Development Corp.a | 346,000 | 85,181 | ||||||
China Steel Chemical Corp. | 22,000 | 67,617 | ||||||
China Synthetic Rubber Corp. | 102,460 | 75,422 | ||||||
Chipbond Technology Corp. | 107,000 | 155,883 | ||||||
Chong Hong Construction Co. Ltd. | 35,642 | 49,734 | ||||||
Chroma ATE Inc. | 51,000 | 84,331 | ||||||
Chung Hung Steel Corp.a | 682,000 | 86,990 | ||||||
Compeq Manufacturing Co. Ltd. | 220,000 | 146,392 | ||||||
| Security | Shares | Value | ||||||
Coretronic Corp. | 101,000 | $ | 80,400 | |||||
CSBC Corp. Taiwan | 258,420 | 95,708 | ||||||
Cyberlink Corp. | 53,125 | 102,540 | ||||||
CyberTAN Technology Inc. | 223,000 | 100,068 | ||||||
D-Link Corp. | 204,246 | 58,946 | ||||||
Dynapack International Technology Corp. | 65,000 | 94,795 | ||||||
Elan Microelectronics Corp. | 79,000 | 79,034 | ||||||
Elite Advanced Laser Corp. | 28,000 | 98,107 | ||||||
Elite Material Co. Ltd. | 38,000 | 82,923 | ||||||
Ennoconn Corp. | 12,000 | 100,320 | ||||||
Eternal Materials Co. Ltd. | 97,440 | 87,150 | ||||||
Everlight Electronics Co. Ltd. | 62,000 | 74,508 | ||||||
Far Eastern Department Stores Ltd. | 99,000 | 47,620 | ||||||
Far Eastern International Bank | 203,000 | 66,136 | ||||||
Faraday Technology Corp. | 110,000 | 95,510 | ||||||
Feng Hsin Iron & Steel Co. | 60,000 | 63,622 | ||||||
Firich Enterprises Co. Ltd. | 39,198 | 89,754 | ||||||
FLEXium Interconnect Inc. | 51,667 | 147,207 | ||||||
Formosan Rubber Group Inc. | 104,000 | 60,413 | ||||||
Gemtek Technology Corp. | 171,000 | 76,208 | ||||||
Genius Electronic Optical Co. Ltd.a | 18,357 | 25,587 | ||||||
Gigabyte Technology Co. Ltd. | 77,000 | 65,200 | ||||||
Gigastorage Corp.a | 115,400 | 56,749 | ||||||
Gintech Energy Corp.a | 133,584 | 52,964 | ||||||
Global Unichip Corp. | 42,000 | 74,225 | ||||||
Gloria Material Technology Corp. | 201,818 | 97,386 | ||||||
Grand Pacific Petrochemical | 191,000 | 96,275 | ||||||
Great Wall Enterprise Co. Ltd. | 113,128 | 59,631 | ||||||
Greatek Electronics Inc. | 92,000 | 74,650 | ||||||
Green Energy Technology Inc.a | 165,125 | 58,618 | ||||||
HannStar Display Corp. | 370,320 | 43,251 | ||||||
HannsTouch Solution Inc.a | 396,000 | 43,329 | ||||||
Hey Song Corp. | 86,500 | 88,132 | ||||||
Ho Tung Chemical Corp.a | 298,548 | 65,883 | ||||||
Holy Stone Enterprise Co. Ltd. | 79,500 | 75,502 | ||||||
Hota Industrial Manufacturing Co. Ltd. | 38,000 | 114,575 | ||||||
Huaku Development Co. Ltd. | 53,080 | 85,650 | ||||||
Huang Hsiang Construction Corp. | 37,000 | 27,748 | ||||||
Hung Sheng Construction Ltd. | 148,000 | 67,777 | ||||||
ITEQ Corp. | 89,600 | 54,251 | ||||||
Jih Sun Financial Holdings Co. Ltd. | 203,197 | 46,715 | ||||||
Kenda Rubber Industrial Co. Ltd. | 104,158 | 140,218 | ||||||
Kerry TJ Logistics Co. Ltd. | 85,000 | 94,311 | ||||||
CONSOLIDATED SCHEDULESOF INVESTMENTS | 71 |
Table of Contents
Consolidated Schedule of Investments (Continued)
iSHARES® MSCI EMERGING MARKETS SMALL-CAP ETF
August 31, 2015
| Security | Shares | Value | ||||||
Kindom Construction Corp. | 88,000 | $ | 40,029 | |||||
King Slide Works Co. Ltd. | 11,000 | 139,630 | ||||||
King Yuan Electronics Co. Ltd. | 169,000 | 108,560 | ||||||
King’s Town Bank Co. Ltd. | 132,000 | 90,878 | ||||||
Kinpo Electronicsa | 248,000 | 75,309 | ||||||
Lealea Enterprise Co. Ltd. | 415,590 | 106,529 | ||||||
Lien Hwa Industrial Corp. | 82,160 | 46,085 | ||||||
Macronix Internationala | 570,000 | 79,712 | ||||||
Makalot Industrial Co. Ltd. | 33,358 | 280,922 | ||||||
Masterlink Securities Corp. | 260,605 | 65,680 | ||||||
Medigen Biotechnology Corp.a | 10,397 | 26,587 | ||||||
Mercuries & Associates Holding Ltd. | 155,548 | 86,532 | ||||||
Merry Electronics Co. Ltd. | 36,000 | 39,833 | ||||||
Micro-Star International Co. Ltd. | 101,000 | 78,072 | ||||||
Microbio Co. Ltd.a | 121,727 | 91,849 | ||||||
MIN AIK Technology Co. Ltd. | 14,000 | 21,149 | ||||||
Mitac Holdings Corp. | 152,000 | 94,369 | ||||||
Motech Industries Inc.a | 64,000 | 51,143 | ||||||
Nan Kang Rubber Tire Co. Ltd.a | 98,000 | 75,301 | ||||||
Neo Solar Power Corp. | 110,364 | 52,068 | ||||||
Pan-International Industrial Corp. | 215,722 | 74,590 | ||||||
PChome Online Inc. | 14,731 | 156,202 | ||||||
Pixart Imaging Inc. | 36,635 | 65,082 | ||||||
Poya International Co. Ltd. | 14,140 | 136,898 | ||||||
President Securities Corp. | 154,510 | 55,325 | ||||||
Primax Electronics Ltd. | 79,000 | 93,481 | ||||||
Prince Housing & Development Corp. | 200,917 | 56,997 | ||||||
Qisda Corp. | 257,000 | 76,620 | ||||||
Radium Life Tech Co. Ltd. | 139,707 | 44,013 | ||||||
Richtek Technology Corp. | 31,000 | 160,545 | ||||||
Ritek Corp.a | 805,000 | 71,504 | ||||||
Sanyang Motor Co. Ltd.a | 82,820 | 52,055 | ||||||
Senao International Co. Ltd. | 33,000 | 40,063 | ||||||
Shining Building Business Co. Ltd.a | 217,008 | 76,035 | ||||||
Shinkong Synthetic Fibers Corp. | 230,135 | 59,840 | ||||||
Shinkong Textile Co. Ltd. | 91,000 | 108,799 | ||||||
Silergy Corp. | 11,000 | 97,369 | ||||||
Sino-American Silicon Products Inc. | 68,000 | 62,282 | ||||||
Sinyi Realty Inc. | 53,105 | 47,334 | ||||||
Soft-World International Corp. | 37,140 | 51,710 | ||||||
Solar Applied Materials Technology Co. | 130,799 | 72,563 | ||||||
Solartech Energy Corp. | 155,744 | 55,766 | ||||||
St. Shine Optical Co. Ltd. | 8,000 | 79,420 | ||||||
| Security | Shares | Value | ||||||
Swancor Ind Co. Ltd. | 16,000 | $ | 86,058 | |||||
TA Chen Stainless Pipe | 161,976 | 72,684 | ||||||
Ta Chong Bank Ltd.a | 325,676 | 137,133 | ||||||
Taichung Commercial Bank Co. Ltd. | 184,810 | 53,678 | ||||||
Taiflex Scientific Co. Ltd. | 69,000 | 65,955 | ||||||
Tainan Spinning Co. Ltd. | 120,190 | 50,055 | ||||||
Taiwan Building Materials Co. Ltd. | 255,000 | 66,618 | ||||||
Taiwan Hon Chuan Enterprise Co. Ltd. | 76,004 | 112,595 | ||||||
Taiwan Life Insurance Co. Ltd.a | 141,599 | 133,391 | ||||||
Taiwan Paiho Ltd. | 68,050 | 156,237 | ||||||
Taiwan Secom Co. Ltd. | 68,450 | 191,658 | ||||||
Taiwan Sogo Shin Kong SEC | 115,640 | 129,729 | ||||||
Taiwan Surface Mounting Technology Corp. | 81,633 | 68,496 | ||||||
Taiwan TEA Corp. | 91,000 | 36,779 | ||||||
Tatung Co. Ltd.a | 290,000 | 45,992 | ||||||
Ton Yi Industrial Corp. | 109,000 | 49,749 | ||||||
Tong Hsing Electronic Industries Ltd. | 33,000 | 73,838 | ||||||
Tong Yang Industry Co. Ltd. | 71,133 | 59,686 | ||||||
Tripod Technology Corp. | 69,000 | 96,705 | ||||||
TSRC Corp. | 91,000 | 57,057 | ||||||
TTY Biopharm Co. Ltd. | 50,450 | 121,566 | ||||||
Tung Ho Steel Enterprise Corp. | 87,000 | 46,527 | ||||||
TXC Corp. | 99,000 | 97,978 | ||||||
Unimicron Technology Corp. | 165,000 | 63,898 | ||||||
Union Bank of Taiwan | 259,218 | 73,138 | ||||||
Unity Opto Technology Co. Ltd. | 113,679 | 52,759 | ||||||
UPC Technology Corp. | 199,661 | 54,923 | ||||||
USI Corp. | 126,950 | 49,943 | ||||||
Visual Photonics Epitaxy Co. Ltd. | 99,900 | 113,913 | ||||||
Voltronic Power Technology Corp. | 11,550 | 147,854 | ||||||
Wah Lee Industrial Corp. | 62,000 | 80,416 | ||||||
Walsin Lihwa Corp.a | 396,000 | 88,484 | ||||||
Waterland Financial Holdings Co. Ltd. | 238,780 | 57,024 | ||||||
Win Semiconductors Corp. | 126,431 | 118,131 | ||||||
Winbond Electronics Corp.a | 444,000 | 91,840 | ||||||
Wistron NeWeb Corp. | 67,320 | 126,422 | ||||||
WT Microelectronics Co. Ltd. | 84,637 | 85,844 | ||||||
Yageo Corp. | 96,467 | 136,535 | ||||||
Yeong Guan Energy Technology Group Co. Ltd. | 15,000 | 82,985 | ||||||
YFY Inc. | 186,000 | 55,681 | ||||||
Yieh Phui Enterprise Co. Ltd. | 157,625 | 38,854 | ||||||
| 72 | 2015 iSHARES ANNUAL REPORTTO SHAREHOLDERS |
Table of Contents
Consolidated Schedule of Investments (Continued)
iSHARES® MSCI EMERGING MARKETS SMALL-CAP ETF
August 31, 2015
| Security | Shares | Value | ||||||
YungShin Global Holding Corp. | 67,200 | $ | 89,019 | |||||
Yungtay Engineering Co. Ltd. | 56,000 | 81,583 | ||||||
Zinwell Corp. | 113,000 | 105,929 | ||||||
|
| |||||||
| 12,471,503 | ||||||||
THAILAND — 3.86% | ||||||||
Amata Corp. PCL NVDRb | 280,500 | 92,339 | ||||||
Bangchak Petroleum PCL (The) NVDR | 53,200 | 51,946 | ||||||
Bangkok Airways Co. Ltd. | 122,000 | 69,773 | ||||||
Bangkok Expressway PCL NVDR | 90,200 | 88,703 | ||||||
Bangkok Land PCL NVDRb | 2,253,400 | 89,897 | ||||||
CH Karnchang PCL NVDRb | 141,900 | 104,906 | ||||||
Esso Thailand PCL NVDRa | 753,300 | 105,077 | ||||||
Hana Microelectronics PCL NVDRb | 125,400 | 89,209 | ||||||
Inter Far East Engineering PCL | 239,900 | 66,258 | ||||||
Italian-Thai Development PCL NVDRa,b | 524,700 | 111,981 | ||||||
Jasmine International PCL NVDR | 744,200 | 117,303 | ||||||
KCE Electronics PCL NVDRb | 92,400 | 134,688 | ||||||
Khon Kaen Sugar Industry PCL NVDR | 814,400 | 80,883 | ||||||
Kiatnakin Bank PCL NVDRb | 65,632 | 59,050 | ||||||
LPN Development PCL NVDRb | 188,100 | 81,862 | ||||||
Major Cineplex Group PCL NVDRb | 51,000 | 46,241 | ||||||
Quality Houses PCL NVDR | 1,518,067 | 99,948 | ||||||
Samart Corp. PCL NVDRb | 128,700 | 66,424 | ||||||
Siam Global House PCL NVDRb | 377,385 | 110,547 | ||||||
Sino-Thai Engineering & Construction PCL NVDRb | 217,728 | 154,891 | ||||||
Sri Trang Agro-Industry PCL NVDR | 210,400 | 68,676 | ||||||
Srisawad Power 1979 PCL NVDRb | 129,000 | 132,257 | ||||||
Supalai PCL NVDRb | 224,900 | 105,407 | ||||||
Superblock PCLa | 1,442,700 | 76,069 | ||||||
Thai Airways International PCL NVDRa | 90,200 | 25,667 | ||||||
Thai Vegetable Oil PCL NVDR | 151,600 | 116,306 | ||||||
Thaicom PCL NVDRb | 108,900 | 95,700 | ||||||
Thanachart Capital PCL NVDR | 78,100 | 64,275 | ||||||
Tisco Financial Group PCL NVDR | 99,540 | 109,690 | ||||||
TTW PCL NVDR | 321,200 | 102,153 | ||||||
VGI Global Media PCL NVDRb | 769,800 | 88,910 | ||||||
WHA Corp. PCL NVDRa | 1,372,100 | 132,444 | ||||||
|
| |||||||
| 2,939,480 | ||||||||
TURKEY — 1.32% | ||||||||
Akcansa Cimento AS | 14,460 | 70,040 | ||||||
| Security | Shares | Value | ||||||
Aksa Akrilik Kimya Sanayii AS | 19,209 | $ | 64,668 | |||||
Bizim Toptan Satis Magazalari AS | 19,261 | 74,437 | ||||||
Cimsa Cimento Sanayi VE Ticaret AS | 15,960 | 81,691 | ||||||
Dogan Sirketler Grubu Holding ASa,b | 170,000 | 30,368 | ||||||
Dogus Otomotiv Servis ve Ticaret AS | 17,789 | 76,387 | ||||||
Kardemir Karabuk Demir Celik Sanayi ve Ticaret AS Class Db | 154,075 | 67,219 | ||||||
Koza Altin Isletmeleri ASb | 8,371 | 70,166 | ||||||
Koza Anadolu Metal Madencilik Isletmeleri ASa | 47,425 | 38,122 | ||||||
NET Holding ASa,b | 56,336 | 60,381 | ||||||
Otokar Otomotiv Ve Savunma Sanayi ASb | 2,542 | 67,021 | ||||||
Sekerbank TASa | 83,916 | 39,493 | ||||||
Tekfen Holding ASb | 33,559 | 46,113 | ||||||
Trakya Cam Sanayii ASb | 101,763 | 60,827 | ||||||
Turkiye Sinai Kalkinma Bankasi ASb | 136,770 | 72,825 | ||||||
Vestel Elektronik Sanayi ve Ticaret ASa,b | 21,588 | 33,669 | ||||||
Yazicilar Holding AS | 9,079 | 55,204 | ||||||
|
| |||||||
| 1,008,631 | ||||||||
UNITED ARAB EMIRATES — 0.94% |
| |||||||
Air Arabia PJSC | 370,701 | 143,313 | ||||||
Al Waha Capital PJSC | 162,850 | 101,087 | ||||||
Dana Gas PJSCa | 500,800 | 73,626 | ||||||
Deyaar Development PJSCa | 333,062 | 60,300 | ||||||
Dubai Parks & Resorts PJSCa | 474,260 | 147,196 | ||||||
Eshraq Properties Co. PJSCa | 219,936 | 37,723 | ||||||
Orascom Construction Ltd.a | 9,280 | 106,627 | ||||||
Union Properties PJSC | 173,622 | 46,797 | ||||||
|
| |||||||
| 716,669 | ||||||||
|
| |||||||
TOTAL COMMON STOCKS | 75,338,768 | |||||||
PREFERRED STOCKS — 0.47% |
| |||||||
BRAZIL — 0.41% | ||||||||
Banco ABC Brasil SA | 10,183 | 25,386 | ||||||
Banco Daycoval SA | 6,000 | 14,249 | ||||||
Bradespar SA | 22,800 | 58,655 | ||||||
Cia. Ferro Ligas da Bahia-Ferbasa | 15,000 | 29,652 | ||||||
Eletropaulo Metropolitana Eletricidade de Sao Paulo SA | 18,300 | 58,685 | ||||||
CONSOLIDATED SCHEDULESOF INVESTMENTS | 73 |
Table of Contents
Consolidated Schedule of Investments (Continued)
iSHARES® MSCI EMERGING MARKETS SMALL-CAP ETF
August 31, 2015
| Security | Shares | Value | ||||||
GOL Linhas Aereas Inteligentes SA | 10,100 | $ | 11,536 | |||||
Marcopolo SA | 67,100 | 36,845 | ||||||
Metalurgica Gerdau SA | 52,000 | 42,974 | ||||||
Randon Participacoes SA | 35,325 | 29,872 | ||||||
|
| |||||||
| 307,854 | ||||||||
COLOMBIA — 0.06% | ||||||||
Avianca Holdings SA | 64,001 | 46,343 | ||||||
|
| |||||||
| 46,343 | ||||||||
|
| |||||||
TOTAL PREFERRED STOCKS |
| 354,197 | ||||||
WARRANTS — 0.00% | ||||||||
MALAYSIA — 0.00% | ||||||||
WCT Holdings Bhd (Expires 08/27/20)a | 47,653 | — | ||||||
|
| |||||||
| — | ||||||||
|
| |||||||
TOTAL WARRANTS |
| — | ||||||
SHORT-TERM INVESTMENTS — 18.38% |
| |||||||
MONEY MARKET FUNDS — 18.38% |
| |||||||
BlackRock Cash Funds: Institutional, |
| |||||||
0.18%e,f,g | 13,231,337 | 13,231,337 | ||||||
BlackRock Cash Funds: Prime, |
| |||||||
0.18%e,f,g | 759,808 | 759,808 | ||||||
|
| |||||||
| 13,991,145 | ||||||||
|
| |||||||
TOTAL SHORT-TERM INVESTMENTS |
| 13,991,145 | ||||||
|
| |||||||
TOTAL INVESTMENTS |
| 89,684,110 | ||||||
Other Assets, Less Liabilities — (17.82)% |
| (13,564,049 | ) | |||||
|
| |||||||
NET ASSETS — 100.00% |
| $ | 76,120,061 | |||||
|
| |||||||
CPO — Certificates of Participation (Ordinary)
GDR — Global Depositary Receipts
NVDR — Non-Voting Depositary Receipts
| a | Non-income earning security. |
| b | All or a portion of this security represents a security on loan. See Note 1. |
| c | This security may be resold to qualified institutional buyers under Rule 144A of the Securities Act of 1933. |
| d | This security may be resold to qualified foreign investors and foreign institutional buyers under Regulation S of the Securities Act of 1933. |
| e | Affiliated issuer. See Note 2. |
| f | The rate quoted is the annualized seven-day yield of the fund at period end. |
| g | All or a portion of this security represents an investment of securities lending collateral. See Note 1. |
See notes to consolidated financial statements.
| 74 | 2015 iSHARES ANNUAL REPORTTO SHAREHOLDERS |
Table of Contents
Consolidated Statements of Assets and Liabilities
iSHARES®, INC.
August 31, 2015
| iShares Core MSCI Emerging Markets ETF | iShares MSCI BRIC ETF | iShares MSCI Asia ETF | ||||||||||
ASSETS | ||||||||||||
Investments, at cost: | ||||||||||||
Unaffiliated | $ | 8,287,235,539 | $ | 235,531,913 | $ | 141,539,563 | ||||||
Affiliated (Note 2) | 447,817,344 | 4,781,036 | 6,163,427 | |||||||||
|
|
|
|
|
| |||||||
Total cost of investments | $ | 8,735,052,883 | $ | 240,312,949 | $ | 147,702,990 | ||||||
|
|
|
|
|
| |||||||
Investments in securities, at fair value (including securities on loana) (Note 1): | ||||||||||||
Unaffiliated | $ | 6,980,390,603 | $ | 196,112,898 | $ | 124,099,357 | ||||||
Affiliated (Note 2) | 447,817,344 | 4,781,036 | 6,163,427 | |||||||||
|
|
|
|
|
| |||||||
Total fair value of investments | 7,428,207,947 | 200,893,934 | 130,262,784 | |||||||||
Foreign currency, at valueb | 41,847,754 | 433,817 | 135,187 | |||||||||
Cash | 92,287,054 | 1,072,590 | 672,940 | |||||||||
Cash pledged to broker | 6,242,822 | — | — | |||||||||
Receivables: | ||||||||||||
Investment securities sold | 22,296,073 | 2,239,467 | 1,047,031 | |||||||||
Due from custodian (Note 4) | 27,153 | — | — | |||||||||
Dividends and interest | 12,627,283 | 160,329 | 240,651 | |||||||||
Capital shares sold | 730,243 | — | — | |||||||||
Prepaid expenses | 8,059 | — | — | |||||||||
|
|
|
|
|
| |||||||
Total Assets | 7,604,274,388 | 204,800,137 | 132,358,593 | |||||||||
|
|
|
|
|
| |||||||
LIABILITIES | ||||||||||||
Payables: | ||||||||||||
Investment securities purchased | 124,962,364 | 2,333,672 | 1,133,124 | |||||||||
Collateral for securities on loan (Note 1) | 447,817,344 | 4,781,036 | 6,163,427 | |||||||||
Futures variation margin | 4,522,127 | — | — | |||||||||
Line of credit (Note 8) | — | 800,027 | 349,012 | |||||||||
Foreign taxes (Note 1) | 571,737 | — | 16,492 | |||||||||
Investment advisory fees (Note 2) | 1,069,988 | 127,380 | 59,502 | |||||||||
|
|
|
|
|
| |||||||
Total Liabilities | 578,943,560 | 8,042,115 | 7,721,557 | |||||||||
|
|
|
|
|
| |||||||
NET ASSETS | $ | 7,025,330,828 | $ | 196,758,022 | $ | 124,637,036 | ||||||
|
|
|
|
|
| |||||||
Net assets consist of: | ||||||||||||
Paid-in capital | $ | 8,513,218,683 | $ | 441,760,204 | $ | 157,586,451 | ||||||
Undistributed net investment income | 49,180,838 | 1,722,422 | 1,232,476 | |||||||||
Accumulated net realized loss | (225,551,158 | ) | (207,279,915 | ) | (16,735,300 | ) | ||||||
Net unrealized depreciation | (1,311,517,535 | ) | (39,444,689 | ) | (17,446,591 | ) | ||||||
|
|
|
|
|
| |||||||
NET ASSETS | $ | 7,025,330,828 | $ | 196,758,022 | $ | 124,637,036 | ||||||
|
|
|
|
|
| |||||||
Shares outstandingc | 172,400,000 | 6,400,000 | 2,450,000 | |||||||||
|
|
|
|
|
| |||||||
Net asset value per share | $ | 40.75 | $ | 30.74 | $ | 50.87 | ||||||
|
|
|
|
|
| |||||||
| a | Securities on loan with values of $412,076,435, $4,517,829 and $5,797,387, respectively. See Note 1. |
| b | Cost of foreign currency: $41,859,165, $437,359 and $136,073, respectively. |
| c | $0.001 par value, number of shares authorized: 450 million, 500 million and 500 million, respectively. |
See notes to consolidated financial statements.
CONSOLIDATED FINANCIAL STATEMENTS | 75 |
Table of Contents
Consolidated Statements of Assets and Liabilities (Continued)
iSHARES®, INC.
August 31, 2015
| iShares MSCI Emerging Markets Minimum Volatility ETF | iShares MSCI Emerging Markets Small-Cap ETF | |||||||
ASSETS | ||||||||
Investments, at cost: | ||||||||
Unaffiliated | $ | 2,741,897,664 | $ | 92,119,045 | ||||
Affiliated (Note 2) | 76,694,156 | 13,991,145 | ||||||
|
|
|
| |||||
Total cost of investments | $ | 2,818,591,820 | $ | 106,110,190 | ||||
|
|
|
| |||||
Investments in securities, at fair value (including securities on loana) (Note 1): | ||||||||
Unaffiliated | $ | 2,448,905,054 | $ | 75,692,965 | ||||
Affiliated (Note 2) | 76,694,156 | 13,991,145 | ||||||
|
|
|
| |||||
Total fair value of investments | 2,525,599,210 | 89,684,110 | ||||||
Foreign currency, at valueb | 2,111,953 | 303,404 | ||||||
Cash | 9,852,310 | 369,240 | ||||||
Receivables: | ||||||||
Investment securities sold | 10,019,760 | 1,787,336 | ||||||
Dividends and interest | 5,503,542 | 222,732 | ||||||
|
|
|
| |||||
Total Assets | 2,553,086,775 | 92,366,822 | ||||||
|
|
|
| |||||
LIABILITIES | ||||||||
Payables: | ||||||||
Investment securities purchased | 13,013,223 | 1,812,582 | ||||||
Collateral for securities on loan (Note 1) | 76,694,156 | 13,991,145 | ||||||
Line of credit (Note 8) | — | 190,006 | ||||||
Due to custodian | — | 195,870 | ||||||
Foreign taxes (Note 1) | 488,045 | 8,543 | ||||||
Investment advisory fees (Note 2) | 534,363 | 48,615 | ||||||
|
|
|
| |||||
Total Liabilities | 90,729,787 | 16,246,761 | ||||||
|
|
|
| |||||
NET ASSETS | $ | 2,462,356,988 | $ | 76,120,061 | ||||
|
|
|
| |||||
Net assets consist of: | ||||||||
Paid-in capital | $ | 2,946,889,122 | $ | 98,520,580 | ||||
Undistributed net investment income | 18,688,160 | 253,958 | ||||||
Accumulated net realized loss | (210,092,622 | ) | (6,223,376 | ) | ||||
Net unrealized depreciation | (293,127,672 | ) | (16,431,101 | ) | ||||
|
|
|
| |||||
NET ASSETS | $ | 2,462,356,988 | $ | 76,120,061 | ||||
|
|
|
| |||||
Shares outstandingc | 48,300,000 | 1,900,000 | ||||||
|
|
|
| |||||
Net asset value per share | $ | 50.98 | $ | 40.06 | ||||
|
|
|
| |||||
| a | Securities on loan with values of $65,191,365 and $12,250,426, respectively. See Note 1. |
| b | Cost of foreign currency: $2,140,621 and $305,331, respectively. |
| c | $0.001 par value, number of shares authorized: 500 million and 500 million, respectively. |
See notes to consolidated financial statements.
| 76 | 2015 iSHARES ANNUAL REPORTTO SHAREHOLDERS |
Table of Contents
Consolidated Statements of Operations
iSHARES®, INC.
Year ended August 31, 2015
| iShares Core MSCI Emerging Markets ETF | iShares MSCI BRIC ETF | iShares MSCI Emerging Markets Asia ETF | ||||||||||
NET INVESTMENT INCOME | ||||||||||||
Dividends — unaffiliateda | $ | 170,591,032 | $ | 7,962,114 | $ | 3,276,816 | ||||||
Interest — unaffiliated | 2,592 | 298 | 97 | |||||||||
Interest — affiliated (Note 2) | 3,151 | 96 | 24 | |||||||||
Securities lending income — affiliated — net (Note 2)b | 8,209,001 | 296,295 | 126,567 | |||||||||
|
|
|
|
|
| |||||||
| 178,805,776 | 8,258,803 | 3,403,504 | ||||||||||
Less: Other foreign taxes (Note 1) | (688,290 | ) | — | (21,143 | ) | |||||||
|
|
|
|
|
| |||||||
Total investment income | 178,117,486 | 8,258,803 | 3,382,361 | |||||||||
|
|
|
|
|
| |||||||
EXPENSES | ||||||||||||
Investment advisory fees (Note 2) | 11,987,656 | 2,041,675 | 887,511 | |||||||||
Mauritius income taxes (Note 1) | 165,591 | 26,280 | — | |||||||||
Commitment fees (Note 8) | 18,534 | 2,468 | 482 | |||||||||
Interest expense (Note 8) | 4,934 | 1,050 | 367 | |||||||||
|
|
|
|
|
| |||||||
Total expenses | 12,176,715 | 2,071,473 | 888,360 | |||||||||
Less investment advisory fees waived (Note 2) | — | — | (247,981 | ) | ||||||||
|
|
|
|
|
| |||||||
Net expenses | 12,176,715 | 2,071,473 | 640,379 | |||||||||
|
|
|
|
|
| |||||||
Net investment income | 165,940,771 | 6,187,330 | 2,741,982 | |||||||||
|
|
|
|
|
| |||||||
NET REALIZED AND UNREALIZED GAIN (LOSS) | ||||||||||||
Net realized gain (loss) from: | ||||||||||||
Investments — unaffiliated | (160,290,804 | ) | (17,272,227 | ) | (6,407,695 | ) | ||||||
In-kind redemptions — unaffiliated | — | 6,024,141 | 95,100 | |||||||||
Futures contracts | (3,937,423 | ) | — | — | ||||||||
Foreign currency transactions | (3,980,788 | ) | (245,760 | ) | (60,375 | ) | ||||||
|
|
|
|
|
| |||||||
Net realized loss | (168,209,015 | ) | (11,493,846 | ) | (6,372,970 | ) | ||||||
|
|
|
|
|
| |||||||
Net change in unrealized appreciation/depreciation on: | ||||||||||||
Investments | (1,740,604,265 | ) | (66,263,346 | ) | (23,771,760 | ) | ||||||
Futures contracts | (4,892,657 | ) | — | — | ||||||||
Translation of assets and liabilities in foreign currencies | 47,518 | (29,599 | ) | (6,812 | ) | |||||||
|
|
|
|
|
| |||||||
Net change in unrealized appreciation/depreciation | (1,745,449,404 | ) | (66,292,945 | ) | (23,778,572 | ) | ||||||
|
|
|
|
|
| |||||||
Net realized and unrealized loss | (1,913,658,419 | ) | (77,786,791 | ) | (30,151,542 | ) | ||||||
|
|
|
|
|
| |||||||
NET DECREASE IN NET ASSETS RESULTING FROM OPERATIONS | $ | (1,747,717,648 | ) | $ | (71,599,461 | ) | $ | (27,409,560 | ) | |||
|
|
|
|
|
| |||||||
| a | Net of foreign withholding tax of $19,505,707, $625,124 and $442,756, respectively. |
| b | Net of securities lending income tax paid of $199,406, $ — and $ —, respectively. |
See notes to consolidated financial statements.
CONSOLIDATED FINANCIAL STATEMENTS | 77 |
Table of Contents
Consolidated Statements of Operations (Continued)
iSHARES®, INC.
Year ended August 31, 2015
| iShares MSCI Emerging Markets Minimum Volatility ETF | iShares MSCI Emerging Markets Small-Cap ETF | |||||||
NET INVESTMENT INCOME | ||||||||
Dividends — unaffiliateda | $ | 64,332,717 | $ | 1,590,354 | ||||
Interest — unaffiliated | 185 | 2 | ||||||
Interest — affiliated (Note 2) | 504 | 17 | ||||||
Securities lending income — affiliated — net (Note 2) | 3,249,371 | 238,933 | ||||||
|
|
|
| |||||
| 67,582,777 | 1,829,306 | |||||||
Less: Other foreign taxes (Note 1) | (495,622 | ) | (9,849 | ) | ||||
|
|
|
| |||||
Total investment income | 67,087,155 | 1,819,457 | ||||||
|
|
|
| |||||
EXPENSES | ||||||||
Investment advisory fees (Note 2) | 15,586,950 | 432,881 | ||||||
Mauritius income taxes (Note 1) | 6,422 | — | ||||||
Commitment fees (Note 8) | 2,046 | 189 | ||||||
Interest expense (Note 8) | 4,241 | 388 | ||||||
|
|
|
| |||||
Total expenses | 15,599,659 | 433,458 | ||||||
Less investment advisory fees waived (Note 2) | (9,914,710 | ) | — | |||||
|
|
|
| |||||
Net expenses | 5,684,949 | 433,458 | ||||||
|
|
|
| |||||
Net investment income | 61,402,206 | 1,385,999 | ||||||
|
|
|
| |||||
NET REALIZED AND UNREALIZED GAIN (LOSS) | ||||||||
Net realized gain (loss) from: | ||||||||
Investments — unaffiliated | (71,929,174 | ) | 2,038,152 | |||||
In-kind redemptions — unaffiliated | 7,795,576 | — | ||||||
Foreign currency transactions | (1,467,421 | ) | (30,202 | ) | ||||
|
|
|
| |||||
Net realized gain (loss) | (65,601,019 | ) | 2,007,950 | |||||
|
|
|
| |||||
Net change in unrealized appreciation/depreciation on: | ||||||||
Investments | (459,078,197 | ) | (18,769,352 | ) | ||||
Translation of assets and liabilities in foreign currencies | (145,213 | ) | (5,181 | ) | ||||
|
|
|
| |||||
Net change in unrealized appreciation/depreciation | (459,223,410 | ) | (18,774,533 | ) | ||||
|
|
|
| |||||
Net realized and unrealized loss | (524,824,429 | ) | (16,766,583 | ) | ||||
|
|
|
| |||||
NET DECREASE IN NET ASSETS RESULTING FROM OPERATIONS | $ | (463,422,223 | ) | $ | (15,380,584 | ) | ||
|
|
|
| |||||
| a | Net of foreign withholding tax of $8,378,867 and $177,843, respectively. |
See notes to consolidated financial statements.
| 78 | 2015 iSHARES ANNUAL REPORTTO SHAREHOLDERS |
Table of Contents
Consolidated Statements of Changes in Net Assets
iSHARES®, INC.
| iShares Core MSCI Emerging Markets ETF | iShares MSCI BRIC ETF | |||||||||||||||
| Year ended August 31, 2015 | Year ended August 31, 2014 | Year ended August 31, 2015 | Year ended August 31, 2014 | |||||||||||||
INCREASE (DECREASE) IN NET ASSETS | ||||||||||||||||
OPERATIONS: | ||||||||||||||||
Net investment income | $ | 165,940,771 | $ | 95,944,162 | $ | 6,187,330 | $ | 10,441,817 | ||||||||
Net realized loss | (168,209,015 | ) | (50,781,092 | ) | (11,493,846 | ) | (15,454,106 | ) | ||||||||
Net change in unrealized appreciation/depreciation | (1,745,449,404 | ) | 584,785,351 | (66,292,945 | ) | 84,789,618 | ||||||||||
|
|
|
|
|
|
|
| |||||||||
Net increase (decrease) in net assets resulting from operations | (1,747,717,648 | ) | 629,948,421 | (71,599,461 | ) | 79,777,329 | ||||||||||
|
|
|
|
|
|
|
| |||||||||
DISTRIBUTIONS TO SHAREHOLDERS: | ||||||||||||||||
From net investment income | (149,835,315 | ) | (69,107,942 | ) | (7,526,071 | ) | (7,905,401 | ) | ||||||||
|
|
|
|
|
|
|
| |||||||||
Total distributions to shareholders | (149,835,315 | ) | (69,107,942 | ) | (7,526,071 | ) | (7,905,401 | ) | ||||||||
|
|
|
|
|
|
|
| |||||||||
CAPITAL SHARE TRANSACTIONS: | ||||||||||||||||
Proceeds from shares sold | 3,253,716,865 | 3,243,361,038 | 124,399 | 38,350,012 | ||||||||||||
Cost of shares redeemed | — | — | (135,405,344 | ) | (173,918,382 | ) | ||||||||||
|
|
|
|
|
|
|
| |||||||||
Net increase (decrease) in net assets from capital share transactions | 3,253,716,865 | 3,243,361,038 | (135,280,945 | ) | (135,568,370 | ) | ||||||||||
|
|
|
|
|
|
|
| |||||||||
INCREASE (DECREASE) IN NET ASSETS | 1,356,163,902 | 3,804,201,517 | (214,406,477 | ) | (63,696,442 | ) | ||||||||||
NET ASSETS | ||||||||||||||||
Beginning of year | 5,669,166,926 | 1,864,965,409 | 411,164,499 | 474,860,941 | ||||||||||||
|
|
|
|
|
|
|
| |||||||||
End of year | $ | 7,025,330,828 | $ | 5,669,166,926 | $ | 196,758,022 | $ | 411,164,499 | ||||||||
|
|
|
|
|
|
|
| |||||||||
Undistributed net investment income included in net assets at end of year | $ | 47,648,015 | $ | 35,140,187 | $ | 1,722,422 | $ | 2,756,022 | ||||||||
|
|
|
|
|
|
|
| |||||||||
SHARES ISSUED AND REDEEMED | ||||||||||||||||
Shares sold | 67,200,000 | 64,400,000 | — | 950,000 | ||||||||||||
Shares redeemed | — | — | (3,600,000 | ) | (4,750,000 | ) | ||||||||||
|
|
|
|
|
|
|
| |||||||||
Net increase (decrease) in shares outstanding | 67,200,000 | 64,400,000 | (3,600,000 | ) | (3,800,000 | ) | ||||||||||
|
|
|
|
|
|
|
| |||||||||
See notes to consolidated financial statements.
CONSOLIDATED FINANCIAL STATEMENTS | 79 |
Table of Contents
Consolidated Statements of Changes in Net Assets (Continued)
iSHARES®, INC.
| iShares MSCI Emerging Markets Asia ETF | iShares MSCI Emerging Markets Minimum Volatility ETF | |||||||||||||||
| Year ended August 31, 2015 | Year ended August 31, 2014 | Year ended August 31, 2015 | Year ended August 31, 2014 | |||||||||||||
INCREASE (DECREASE) IN NET ASSETS | ||||||||||||||||
OPERATIONS: | ||||||||||||||||
Net investment income | $ | 2,741,982 | $ | 1,029,865 | $ | 61,402,206 | $ | 57,548,609 | ||||||||
Net realized loss | (6,372,970 | ) | (135,653 | ) | (65,601,019 | ) | (80,037,690 | ) | ||||||||
Net change in unrealized appreciation/depreciation | (23,778,572 | ) | 7,842,979 | (459,223,410 | ) | 311,606,077 | ||||||||||
|
|
|
|
|
|
|
| |||||||||
Net increase (decrease) in net assets resulting from operations | (27,409,560 | ) | 8,737,191 | (463,422,223 | ) | 289,116,996 | ||||||||||
|
|
|
|
|
|
|
| |||||||||
DISTRIBUTIONS TO SHAREHOLDERS: | ||||||||||||||||
From net investment income | (1,886,156 | ) | (898,216 | ) | (56,113,327 | ) | (58,169,702 | ) | ||||||||
|
|
|
|
|
|
|
| |||||||||
Total distributions to shareholders | (1,886,156 | ) | (898,216 | ) | (56,113,327 | ) | (58,169,702 | ) | ||||||||
|
|
|
|
|
|
|
| |||||||||
CAPITAL SHARE TRANSACTIONS: | ||||||||||||||||
Proceeds from shares sold | 87,597,450 | 59,268,915 | 1,088,475,713 | 323,291,843 | ||||||||||||
Cost of shares redeemed | (14,370,934 | ) | (17,742,448 | ) | (186,946,485 | ) | (929,603,299 | ) | ||||||||
|
|
|
|
|
|
|
| |||||||||
Net increase (decrease) in net assets from capital share transactions | 73,226,516 | 41,526,467 | 901,529,228 | (606,311,456 | ) | |||||||||||
|
|
|
|
|
|
|
| |||||||||
INCREASE (DECREASE) IN NET ASSETS | 43,930,800 | 49,365,442 | 381,993,678 | (375,364,162 | ) | |||||||||||
NET ASSETS | ||||||||||||||||
Beginning of year | 80,706,236 | 31,340,794 | 2,080,363,310 | 2,455,727,472 | ||||||||||||
|
|
|
|
|
|
|
| |||||||||
End of year | $ | 124,637,036 | $ | 80,706,236 | $ | 2,462,356,988 | $ | 2,080,363,310 | ||||||||
|
|
|
|
|
|
|
| |||||||||
Undistributed net investment income included in net assets at end of year | $ | 1,232,476 | $ | 433,762 | $ | 18,688,160 | $ | 14,508,908 | ||||||||
|
|
|
|
|
|
|
| |||||||||
SHARES ISSUED AND REDEEMED | ||||||||||||||||
Shares sold | 1,450,000 | 1,000,000 | 18,300,000 | 5,300,000 | ||||||||||||
Shares redeemed | (300,000 | ) | (300,000 | ) | (3,300,000 | ) | (16,200,000 | ) | ||||||||
|
|
|
|
|
|
|
| |||||||||
Net increase (decrease) in shares outstanding | 1,150,000 | 700,000 | 15,000,000 | (10,900,000 | ) | |||||||||||
|
|
|
|
|
|
|
| |||||||||
See notes to consolidated financial statements.
| 80 | 2015 iSHARES ANNUAL REPORTTO SHAREHOLDERS |
Table of Contents
Consolidated Statements of Changes in Net Assets (Continued)
iSHARES®, INC.
| iShares MSCI Emerging Markets Small-Cap ETF | ||||||||
| Year ended August 31, 2015 | Year ended August 31, 2014 | |||||||
INCREASE (DECREASE) IN NET ASSETS | ||||||||
OPERATIONS: | ||||||||
Net investment income | $ | 1,385,999 | $ | 706,744 | ||||
Net realized gain | 2,007,950 | 338,522 | ||||||
Net change in unrealized appreciation/depreciation | (18,774,533 | ) | 5,681,431 | |||||
|
|
|
| |||||
Net increase (decrease) in net assets resulting from operations | (15,380,584 | ) | 6,726,697 | |||||
|
|
|
| |||||
DISTRIBUTIONS TO SHAREHOLDERS: | ||||||||
From net investment income | (1,449,168 | ) | (736,376 | ) | ||||
|
|
|
| |||||
Total distributions to shareholders | (1,449,168 | ) | (736,376 | ) | ||||
|
|
|
| |||||
CAPITAL SHARE TRANSACTIONS: | ||||||||
Proceeds from shares sold | 49,283,928 | 7,031,811 | ||||||
|
|
|
| |||||
Net increase in net assets from capital share transactions | 49,283,928 | 7,031,811 | ||||||
|
|
|
| |||||
INCREASE IN NET ASSETS | 32,454,176 | 13,022,132 | ||||||
NET ASSETS | ||||||||
Beginning of year | 43,665,885 | 30,643,753 | ||||||
|
|
|
| |||||
End of year | $ | 76,120,061 | $ | 43,665,885 | ||||
|
|
|
| |||||
Undistributed net investment income included in net assets at end of year | $ | 233,983 | $ | 262,193 | ||||
|
|
|
| |||||
SHARES ISSUED | ||||||||
Shares sold | 1,050,000 | 150,000 | ||||||
|
|
|
| |||||
Net increase in shares outstanding | 1,050,000 | 150,000 | ||||||
|
|
|
| |||||
See notes to consolidated financial statements.
CONSOLIDATED FINANCIAL STATEMENTS | 81 |
Table of Contents
Consolidated Financial Highlights
iSHARES®, INC.
(For a share outstanding throughout each period)
| iShares Core MSCI Emerging Markets ETF | ||||||
| Year ended Aug. 31, 2015 | Year ended Aug. 31, 2014 | Period from to | ||||||||||
Net asset value, beginning of period | $ | 53.89 | $ | 45.71 | $ | 49.06 | ||||||
|
|
|
|
|
| |||||||
Income from investment operations: | ||||||||||||
Net investment incomeb | 1.21 | 1.31 | 1.33 | |||||||||
Net realized and unrealized gain (loss)c | (13.26 | ) | 7.78 | (4.14 | ) | |||||||
|
|
|
|
|
| |||||||
Total from investment operations | (12.05 | ) | 9.09 | (2.81 | ) | |||||||
|
|
|
|
|
| |||||||
Less distributions from: | ||||||||||||
Net investment income | (1.09 | ) | (0.91 | ) | (0.54 | ) | ||||||
|
|
|
|
|
| |||||||
Total distributions | (1.09 | ) | (0.91 | ) | (0.54 | ) | ||||||
|
|
|
|
|
| |||||||
Net asset value, end of period | $ | 40.75 | $ | 53.89 | $ | 45.71 | ||||||
|
|
|
|
|
| |||||||
Total return | (22.61 | )% | 20.05 | % | (5.75 | )%d | ||||||
|
|
|
|
|
| |||||||
Ratios/Supplemental data: | ||||||||||||
Net assets, end of period (000s) | $ | 7,025,331 | $ | 5,669,167 | $ | 1,864,965 | ||||||
Ratio of expenses to average net assetse | 0.18 | % | 0.17 | % | 0.05 | % | ||||||
Ratio of expenses to average net assets prior to waived feese | 0.18 | % | 0.18 | % | 0.18 | % | ||||||
Ratio of net investment income to average net assetse | 2.49 | % | 2.61 | % | 3.17 | % | ||||||
Portfolio turnover ratef | 7 | % | 8 | % | 15 | % | ||||||
| a | Commencement of operations. |
| b | Based on average shares outstanding throughout each period. |
| c | The amounts reported for a share outstanding may not accord with the change in aggregate gains and losses in securities for the fiscal period due to the timing of capital share transactions in relation to the fluctuating market values of the Fund’s underlying securities. |
| d | Not annualized. |
| e | Annualized for periods of less than one year. |
| f | Portfolio turnover rates exclude portfolio securities received or delivered in Creation Units but include portfolio transactions that are executed as a result of the Fund processing capital share transactions in Creation Units partially for cash in U.S. dollars. Excluding such cash transactions, the portfolio turnover rates for the years ended August 31, 2015, August 31, 2014 and the period ended August 31, 2013 were 7%, 8% and 15%, respectively. See Note 4. |
See notes to consolidated financial statements.
| 82 | 2015 iSHARES ANNUAL REPORTTO SHAREHOLDERS |
Table of Contents
Consolidated Financial Highlights (Continued)
iSHARES®, INC.
(For a share outstanding throughout each period)
| iShares MSCI BRIC ETF | ||||||||||||||||||||
| Year ended Aug. 31, 2015 | Year ended Aug. 31, 2014 | Year ended Aug. 31, 2013 | Year ended Aug. 31, 2012 | Year ended Aug. 31, 2011 | ||||||||||||||||
Net asset value, beginning of year | $ | 41.12 | $ | 34.41 | $ | 35.68 | $ | 42.25 | $ | 42.94 | ||||||||||
|
|
|
|
|
|
|
|
|
| |||||||||||
Income from investment operations: | ||||||||||||||||||||
Net investment incomea | 0.77 | 0.89 | 0.84 | 0.98 | 0.89 | |||||||||||||||
Net realized and unrealized gain (loss)b | (10.20 | ) | 6.53 | (1.25 | ) | (6.62 | ) | (0.58 | ) | |||||||||||
|
|
|
|
|
|
|
|
|
| |||||||||||
Total from investment operations | (9.43 | ) | 7.42 | (0.41 | ) | (5.64 | ) | 0.31 | ||||||||||||
|
|
|
|
|
|
|
|
|
| |||||||||||
Less distributions from: | ||||||||||||||||||||
Net investment income | (0.95 | ) | (0.71 | ) | (0.86 | ) | (0.93 | ) | (1.00 | ) | ||||||||||
|
|
|
|
|
|
|
|
|
| |||||||||||
Total distributions | (0.95 | ) | (0.71 | ) | (0.86 | ) | (0.93 | ) | (1.00 | ) | ||||||||||
|
|
|
|
|
|
|
|
|
| |||||||||||
Net asset value, end of year | $ | 30.74 | $ | 41.12 | $ | 34.41 | $ | 35.68 | $ | 42.25 | ||||||||||
|
|
|
|
|
|
|
|
|
| |||||||||||
Total return | (23.19 | )% | 21.73 | % | (1.17 | )% | (13.33 | )% | 0.49 | % | ||||||||||
|
|
|
|
|
|
|
|
|
| |||||||||||
Ratios/Supplemental data: | ||||||||||||||||||||
Net assets, end of year (000s) | $ | 196,758 | $ | 411,164 | $ | 474,861 | $ | 685,149 | $ | 866,194 | ||||||||||
Ratio of expenses to average net assets | 0.69 | % | 0.68 | % | 0.67 | % | 0.69 | % | 0.67 | % | ||||||||||
Ratio of expenses to average net assets prior to | n/a | n/a | n/a | n/a | 0.67 | % | ||||||||||||||
Ratio of net investment income to average net assets | 2.07 | % | 2.38 | % | 2.18 | % | 2.55 | % | 1.86 | % | ||||||||||
Portfolio turnover ratec | 9 | % | 10 | % | 10 | % | 32 | % | 13 | % | ||||||||||
| a | Based on average shares outstanding throughout each period. |
| b | The amounts reported for a share outstanding may not accord with the change in aggregate gains and losses in securities for the fiscal period due to the timing of capital share transactions in relation to the fluctuating market values of the Fund’s underlying securities. |
| c | Portfolio turnover rates exclude portfolio securities received or delivered in Creation Units but include portfolio transactions that are executed as a result of the Fund processing capital share transactions in Creation Units partially for cash in U.S. dollars. Excluding such cash transactions, the portfolio turnover rates for the years ended August 31, 2015, August 31, 2014, August 31, 2013, August 31, 2012 and August 31, 2011 were 9%, 6%, 9%, 20% and 10%, respectively. See Note 4. |
See notes to consolidated financial statements.
CONSOLIDATED FINANCIAL HIGHLIGHTS | 83 |
Table of Contents
Consolidated Financial Highlights (Continued)
iSHARES®, INC.
(For a share outstanding throughout each period)
| iShares MSCI Emerging Markets Asia ETF | ||||||||
| Year ended Aug. 31, 2015 | Year ended Aug. 31, 2014 | Year ended Aug. 31, 2013 | Period from to Aug. 31, 2012 | |||||||||||||
Net asset value, beginning of period | $ | 62.08 | $ | 52.23 | $ | 50.18 | $ | 54.71 | ||||||||
|
|
|
|
|
|
|
| |||||||||
Income from investment operations: | ||||||||||||||||
Net investment incomeb | 1.25 | 1.36 | 1.15 | 0.87 | ||||||||||||
Net realized and unrealized gain (loss)c | (11.61 | ) | 9.75 | 1.82 | (4.99 | ) | ||||||||||
|
|
|
|
|
|
|
| |||||||||
Total from investment operations | (10.36 | ) | 11.11 | 2.97 | (4.12 | ) | ||||||||||
|
|
|
|
|
|
|
| |||||||||
Less distributions from: | ||||||||||||||||
Net investment income | (0.85 | ) | (1.26 | ) | (0.92 | ) | (0.41 | ) | ||||||||
|
|
|
|
|
|
|
| |||||||||
Total distributions | (0.85 | ) | (1.26 | ) | (0.92 | ) | (0.41 | ) | ||||||||
|
|
|
|
|
|
|
| |||||||||
Net asset value, end of period | $ | 50.87 | $ | 62.08 | $ | 52.23 | $ | 50.18 | ||||||||
|
|
|
|
|
|
|
| |||||||||
Total return | (16.86 | )% | 21.54 | %d | 5.88 | % | (7.52 | )%e | ||||||||
|
|
|
|
|
|
|
| |||||||||
Ratios/Supplemental data: | ||||||||||||||||
Net assets, end of period (000s) | $ | 124,637 | $ | 80,706 | $ | 31,341 | $ | 20,071 | ||||||||
Ratio of expenses to average net assetsf | 0.49 | % | 0.49 | % | 0.49 | % | 0.49 | % | ||||||||
Ratio of expenses to average net assets prior to waived feesf | 0.68 | % | 0.68 | % | 0.68 | % | 0.68 | % | ||||||||
Ratio of net investment income to average net assetsf | 2.10 | % | 2.36 | % | 2.09 | % | 3.05 | % | ||||||||
Portfolio turnover rateg | 16 | % | 33 | % | 174 | % | 3 | % | ||||||||
| a | Commencement of operations. |
| b | Based on average shares outstanding throughout each period. |
| c | The amounts reported for a share outstanding may not accord with the change in aggregate gains and losses in securities for the fiscal period due to the timing of capital share transactions in relation to the fluctuating market values of the Fund’s underlying securities. |
| d | Includes payment from an affiliate. Not including these proceeds, the Fund’s total return would have been 21.46%. |
| e | Not annualized. |
| f | Annualized for periods of less than one year. |
| g | Portfolio turnover rates exclude portfolio securities received or delivered in Creation Units but include portfolio transactions that are executed as a result of the Fund processing capital share transactions in Creation Units partially for cash in U.S. dollars. Excluding such cash transactions, the portfolio turnover rates for the years ended August 31, 2015, August 31, 2014, August 31, 2013 and the period ended August 31, 2012 were 10%, 33%, 21% and 3%, respectively. See Note 4. |
See notes to consolidated financial statements.
| 84 | 2015 iSHARES ANNUAL REPORTTO SHAREHOLDERS |
Table of Contents
Consolidated Financial Highlights (Continued)
iSHARES®, INC.
(For a share outstanding throughout each period)
iShares MSCI Emerging Markets Minimum Volatility ETF | ||||||||
| Year ended Aug. 31, 2015 | Year ended Aug. 31, 2014 | Year ended Aug. 31, 2013 | Period from to Aug. 31, 2012 | |||||||||||||
Net asset value, beginning of period | $ | 62.47 | $ | 55.56 | $ | 55.32 | $ | 49.30 | ||||||||
|
|
|
|
|
|
|
| |||||||||
Income from investment operations: | ||||||||||||||||
Net investment incomeb | 1.58 | 1.51 | 1.85 | 1.93 | ||||||||||||
Net realized and unrealized gain (loss)c | (11.65 | ) | 6.94 | (0.60 | ) | 5.41 | ||||||||||
|
|
|
|
|
|
|
| |||||||||
Total from investment operations | (10.07 | ) | 8.45 | 1.25 | 7.34 | |||||||||||
|
|
|
|
|
|
|
| |||||||||
Less distributions from: | ||||||||||||||||
Net investment income | (1.42 | ) | (1.54 | ) | (1.01 | ) | (1.32 | ) | ||||||||
|
|
|
|
|
|
|
| |||||||||
Total distributions | (1.42 | ) | (1.54 | ) | (1.01 | ) | (1.32 | ) | ||||||||
|
|
|
|
|
|
|
| |||||||||
Net asset value, end of period | $ | 50.98 | $ | 62.47 | $ | 55.56 | $ | 55.32 | ||||||||
|
|
|
|
|
|
|
| |||||||||
Total return | (16.32 | )% | 15.44 | % | 2.22 | % | 15.16 | %d | ||||||||
|
|
|
|
|
|
|
| |||||||||
Ratios/Supplemental data: | ||||||||||||||||
Net assets, end of period (000s) | $ | 2,462,357 | $ | 2,080,363 | $ | 2,455,727 | $ | 387,227 | ||||||||
Ratio of expenses to average net assetse | 0.25 | % | 0.25 | % | 0.25 | % | 0.25 | % | ||||||||
Ratio of expenses to average net assets prior to | 0.69 | % | 0.67 | % | 0.67 | % | 0.69 | % | ||||||||
Ratio of net investment income to average net assetse | 2.71 | % | 2.58 | % | 3.13 | % | 4.08 | % | ||||||||
Portfolio turnover ratef | 28 | % | 34 | % | 23 | % | 31 | % | ||||||||
| a | Commencement of operations. |
| b | Based on average shares outstanding throughout each period. |
| c | The amounts reported for a share outstanding may not accord with the change in aggregate gains and losses in securities for the fiscal period due to the timing of capital share transactions in relation to the fluctuating market values of the Fund’s underlying securities. |
| d | Not annualized. |
| e | Annualized for periods of less than one year. |
| f | Portfolio turnover rates exclude portfolio securities received or delivered in Creation Units but include portfolio transactions that are executed as a result of the Fund processing capital share transactions in Creation Units partially for cash in U.S. dollars. Excluding such cash transactions, the portfolio turnover rates for the years ended August 31, 2015, August 31, 2014, August 31, 2013 and the period ended August 31, 2012 were 24%, 26%, 23% and 16%, respectively. See Note 4. |
See notes to consolidated financial statements.
CONSOLIDATED FINANCIAL HIGHLIGHTS | 85 |
Table of Contents
Consolidated Financial Highlights (Continued)
iSHARES®, INC.
(For a share outstanding throughout each period)
| iShares MSCI Emerging Markets Small-Cap ETF | ||||||||||||||||||||
| Year ended Aug. 31, 2015 | Year ended Aug. 31, 2014 | Year ended Aug. 31, 2013 | Year ended Aug. 31, 2012 | Period from to Aug. 31, 2011 | ||||||||||||||||
Net asset value, beginning of period | $ | 51.37 | $ | 43.78 | $ | 43.44 | $ | 49.60 | $ | 50.54 | ||||||||||
|
|
|
|
|
|
|
|
|
| |||||||||||
Income from investment operations: | ||||||||||||||||||||
Net investment incomeb | 1.04 | 0.93 | 1.07 | 0.50 | 0.07 | |||||||||||||||
Net realized and unrealized gain (loss)c | (11.06 | ) | 7.67 | 1.13 | (5.52 | ) | (1.01 | ) | ||||||||||||
|
|
|
|
|
|
|
|
|
| |||||||||||
Total from investment operations | (10.02 | ) | 8.60 | 2.20 | (5.02 | ) | (0.94 | ) | ||||||||||||
|
|
|
|
|
|
|
|
|
| |||||||||||
Less distributions from: | ||||||||||||||||||||
Net investment income | (1.29 | ) | (1.01 | ) | (1.86 | ) | (1.14 | ) | — | |||||||||||
|
|
|
|
|
|
|
|
|
| |||||||||||
Total distributions | (1.29 | ) | (1.01 | ) | (1.86 | ) | (1.14 | ) | — | |||||||||||
|
|
|
|
|
|
|
|
|
| |||||||||||
Net asset value, end of period | $ | 40.06 | $ | 51.37 | $ | 43.78 | $ | 43.44 | $ | 49.60 | ||||||||||
|
|
|
|
|
|
|
|
|
| |||||||||||
Total return | (19.77 | )% | 19.92 | %d | 4.85 | % | (9.98 | )% | (1.86 | )%e | ||||||||||
|
|
|
|
|
|
|
|
|
| |||||||||||
Ratios/Supplemental data: | ||||||||||||||||||||
Net assets, end of period (000s) | $ | 76,120 | $ | 43,666 | $ | 30,644 | $ | 8,689 | $ | 69,443 | ||||||||||
Ratio of expenses to average net assetsf | 0.69 | % | 0.67 | % | 0.67 | % | 0.69 | % | 0.69 | % | ||||||||||
Ratio of net investment income to average net assetsf | 2.20 | % | 1.93 | % | 2.26 | % | 1.13 | % | 3.33 | % | ||||||||||
Portfolio turnover rateg | 23 | % | 20 | % | 21 | % | 32 | % | 2 | % | ||||||||||
| a | Commencement of operations. |
| b | Based on average shares outstanding throughout each period. |
| c | The amounts reported for a share outstanding may not accord with the change in aggregate gains and losses in securities for the fiscal period due to the timing of capital share transactions in relation to the fluctuating market values of the Fund’s underlying securities. |
| d | Includes payment from an affiliate. Not including these proceeds, the Fund’s total return would have been 19.73%. |
| e | Not annualized. |
| f | Annualized for periods of less than one year. |
| g | Portfolio turnover rates exclude portfolio securities received or delivered in Creation Units but include portfolio transactions that are executed as a result of the Fund processing capital share transactions in Creation Units partially for cash in U.S. dollars. Excluding such cash transactions, the portfolio turnover rates for the years ended August 31, 2015, August 31, 2014, August 31, 2013, August 31, 2012 and the period ended August 31, 2011 were 23%, 20%, 21%, 17% and 2%, respectively. See Note 4. |
See notes to consolidated financial statements.
| 86 | 2015 iSHARES ANNUAL REPORTTO SHAREHOLDERS |
Table of Contents
Notes to Consolidated Financial Statements
iSHARES®, INC.
iShares, Inc. (the “Company”) is registered under the Investment Company Act of 1940, as amended (the “1940 Act”), as an open-end management investment company. The Company was incorporated under the laws of the State of Maryland on September 1, 1994 pursuant to Articles of Incorporation as subsequently amended and restated.
These consolidated financial statements relate only to the following funds (each, a “Fund,” and collectively, the “Funds”):
| iShares ETF | Diversification Classification | |
Core MSCI Emerging Markets | Diversified | |
MSCI BRIC | Diversified | |
MSCI Emerging Markets Asia | Diversified | |
MSCI Emerging Markets Minimum Volatility | Diversified | |
MSCI Emerging Markets Small-Cap | Diversified |
The investment objective of each Fund is to seek investment results that correspond generally to the price and yield performance, before fees and expenses, of its underlying index. The investment adviser uses a “passive” or index approach to try to achieve each Fund’s investment objective.
Each Fund carries out its investment strategies associated with investment in Indian securities by investing in a wholly-owned subsidiary in the Republic of Mauritius (each, a “Subsidiary”), which in turn invests in Indian securities included in the underlying index. The investment adviser of each Fund also serves as the investment adviser to each Subsidiary. Through this investment structure, each Fund expects to obtain certain benefits under a current tax treaty between Mauritius and India. The accompanying consolidated financial statements for each Fund include the accounts of its Subsidiary. Intercompany accounts and transactions, if any, have been eliminated.
Pursuant to the Company’s organizational documents, the Funds’ officers and directors are indemnified against certain liabilities that may arise out of the performance of their duties to the Funds. Additionally, in the normal course of business, the Funds enter into contracts with service providers that contain general indemnification clauses. The Funds’ maximum exposure under these arrangements is unknown as this would involve future claims that may be made against the Funds that have not yet occurred.
| 1. | SIGNIFICANT ACCOUNTING POLICIES |
The following significant accounting policies are consistently followed by the Funds in the preparation of their financial statements in conformity with accounting principles generally accepted in the United States of America (“U.S. GAAP”). The preparation of financial statements in conformity with U.S. GAAP requires management to make certain estimates and assumptions that affect the reported amounts of assets and liabilities and disclosures of contingent assets and liabilities at the date of the financial statements and the reported amounts of revenue and expenses during the reporting period. Actual results could differ from those estimates. Each Fund is considered an investment company under U.S. GAAP and follows the accounting and reporting guidance applicable to investment companies.
SECURITY VALUATION
Each Fund’s investments are valued at fair value each day that the Fund’s listing exchange is open and, for financial reporting purposes, as of the report date should the reporting period end on a day that the Fund’s listing exchange is not open. U.S. GAAP defines fair value as the price a fund would receive to sell an asset or pay to transfer a liability in an orderly transaction between market participants at the measurement date. The BlackRock Global Valuation Methodologies Committee (the “Global Valuation Committee”) provides oversight of the valuation of investments for the Funds. The investments of each Fund are valued pursuant
NOTESTO CONSOLIDATED FINANCIAL STATEMENTS | 87 |
Table of Contents
Notes to Consolidated Financial Statements (Continued)
iSHARES®, INC.
to policies and procedures developed by the Global Valuation Committee and approved by the Board of Directors of the Company (the “Board”).
| • | Equity investments traded on a recognized securities exchange are valued at that day’s last reported trade price or the official closing price, as applicable, on the exchange where the stock is primarily traded. Equity investments traded on a recognized exchange for which there were no sales on that day are valued at the last traded price. |
| • | Open-end U.S. mutual funds are valued at that day’s published net asset value (“NAV”). |
| • | Futures contracts are valued at that day’s last reported settlement price on the exchange where the contract is traded. |
In the event that application of these methods of valuation results in a price for an investment which is deemed not to be representative of the fair value of such investment or if a price is not available, the investment will be valued based upon other available factors deemed relevant by the Global Valuation Committee, in accordance with policies approved by the Board. These factors include but are not limited to (i) attributes specific to the investment; (ii) the principal market for the investment; (iii) the customary participants in the principal market for the investment; (iv) data assumptions by market participants for the investment, if reasonably available; (v) quoted prices for similar investments in active markets; and (vi) other factors, such as future cash flows, interest rates, yield curves, volatilities, prepayment speeds, loss severities, credit risks and/or default rates. Valuations based on such factors are reported to the Board on a quarterly basis.
The Global Valuation Committee employs various methods for calibrating valuation approaches for investments where an active market does not exist, including regular due diligence of the Company’s pricing vendors, a regular review of key inputs and assumptions, transactional back-testing or disposition analysis to compare unrealized gains and losses to realized gains and losses, reviews of missing or stale prices, reviews of large movements in market values, and reviews of market related activity.
Fair value pricing could result in a difference between the prices used to calculate a Fund’s NAV and the prices used by the Fund’s underlying index, which in turn could result in a difference between the Fund’s performance and the performance of the Fund’s underlying index.
Various inputs are used in determining the fair value of financial instruments. Inputs may be based on independent market data (“observable inputs”) or they may be internally developed (“unobservable inputs”). These inputs are categorized into a disclosure hierarchy consisting of three broad levels for financial reporting purposes. The level of a value determined for a financial instrument within the fair value hierarchy is based on the lowest level of any input that is significant to the fair value measurement in its entirety. The categorization of a value determined for a financial instrument within the hierarchy is based upon the pricing transparency of the instrument and is not necessarily an indication of the risk associated with investing in the instrument. The three levels of the fair value hierarchy are as follows:
| • | Level 1 — Unadjusted quoted prices in active markets for identical assets or liabilities; |
| • | Level 2 — Inputs other than quoted prices included within Level 1 that are observable for the asset or liability either directly or indirectly, including quoted prices for similar assets or liabilities in active markets, quoted prices for identical or similar assets or liabilities in markets that are not considered to be active, inputs other than quoted prices that are observable for the asset or liability (such as exchange rates, financing terms, interest rates, yield curves, volatilities, prepayment speeds, loss severities, credit risks and default rates) or other market-corroborated inputs; and |
| • | Level 3 — Unobservable inputs for the asset or liability, including the Global Valuation Committee’s assumptions used in determining the fair value of investments. |
| 88 | 2015 iSHARES ANNUAL REPORTTO SHAREHOLDERS |
Table of Contents
Notes to Consolidated Financial Statements (Continued)
iSHARES®, INC.
Changes in valuation techniques may result in transfers in or out of an assigned level within the disclosure hierarchy. In accordance with the Company’s policy, transfers between different levels of the fair value hierarchy are deemed to have occurred as of the beginning of the reporting period.
The following table summarizes the value of each of the Funds’ investments according to the fair value hierarchy as of August 31, 2015. The breakdown of each Fund’s investments into major categories is disclosed in its respective consolidated schedule of investments.
| iShares ETF | Level 1 | Level 2 | Level 3 | Total | ||||||||||||
Core MSCI Emerging Markets | ||||||||||||||||
Investments: | ||||||||||||||||
Assets: | ||||||||||||||||
Common Stocks | $ | 6,740,051,417 | $ | 9,013,114 | $ | 17,698,877 | $ | 6,766,763,408 | ||||||||
Preferred Stocks | 213,627,194 | — | — | 213,627,194 | ||||||||||||
Rights | — | 0 | a | — | 0 | a | ||||||||||
Warrants | — | 1 | — | 1 | ||||||||||||
Money Market Funds | 447,817,344 | — | — | 447,817,344 | ||||||||||||
|
|
|
|
|
|
|
| |||||||||
Total | $ | 7,401,495,955 | $ | 9,013,115 | $ | 17,698,877 | $ | 7,428,207,947 | ||||||||
|
|
|
|
|
|
|
| |||||||||
Derivative Financial Instruments:b | ||||||||||||||||
Liabilities: | ||||||||||||||||
Futures Contracts | $ | (4,522,127 | ) | $ | — | $ | — | $ | (4,522,127 | ) | ||||||
|
|
|
|
|
|
|
| |||||||||
Total | $ | (4,522,127 | ) | $ | — | $ | — | $ | (4,522,127 | ) | ||||||
|
|
|
|
|
|
|
| |||||||||
MSCI BRIC | ||||||||||||||||
Investments: | ||||||||||||||||
Assets: | ||||||||||||||||
Common Stocks | $ | 183,151,586 | $ | — | $ | 843,269 | $ | 183,994,855 | ||||||||
Preferred Stocks | 12,118,043 | — | — | 12,118,043 | ||||||||||||
Money Market Funds | 4,781,036 | — | — | 4,781,036 | ||||||||||||
|
|
|
|
|
|
|
| |||||||||
Total | $ | 200,050,665 | $ | — | $ | 843,269 | $ | 200,893,934 | ||||||||
|
|
|
|
|
|
|
| |||||||||
MSCI Emerging Markets Asia | ||||||||||||||||
Investments: | ||||||||||||||||
Assets: | ||||||||||||||||
Common Stocks | $ | 122,241,060 | $ | 274,387 | $ | 358,117 | $ | 122,873,564 | ||||||||
Preferred Stocks | 1,225,793 | — | — | 1,225,793 | ||||||||||||
Money Market Funds | 6,163,427 | — | — | 6,163,427 | ||||||||||||
|
|
|
|
|
|
|
| |||||||||
Total | $ | 129,630,280 | $ | 274,387 | $ | 358,117 | $ | 130,262,784 | ||||||||
|
|
|
|
|
|
|
| |||||||||
MSCI Emerging Markets Minimum Volatility | ||||||||||||||||
Investments: | ||||||||||||||||
Assets: | ||||||||||||||||
Common Stocks | $ | 2,419,438,023 | $ | — | $ | 2,110,489 | $ | 2,421,548,512 | ||||||||
Preferred Stocks | 27,356,542 | — | — | 27,356,542 | ||||||||||||
Money Market Funds | 76,694,156 | — | — | 76,694,156 | ||||||||||||
|
|
|
|
|
|
|
| |||||||||
Total | $ | 2,523,488,721 | $ | — | $ | 2,110,489 | $ | 2,525,599,210 | ||||||||
|
|
|
|
|
|
|
| |||||||||
NOTESTO CONSOLIDATED FINANCIAL STATEMENTS | 89 |
Table of Contents
Notes to Consolidated Financial Statements (Continued)
iSHARES®, INC.
| iShares ETF | Level 1 | Level 2 | Level 3 | Total | ||||||||||||
MSCI Emerging Markets Small-Cap | ||||||||||||||||
Investments: | ||||||||||||||||
Assets: | ||||||||||||||||
Common Stocks | $ | 74,683,712 | $ | 89,044 | $ | 566,012 | $ | 75,338,768 | ||||||||
Preferred Stocks | 354,197 | — | — | 354,197 | ||||||||||||
Warrants | — | 0 | a | — | 0 | a | ||||||||||
Money Market Funds | 13,991,145 | — | — | 13,991,145 | ||||||||||||
|
|
|
|
|
|
|
| |||||||||
Total | $ | 89,029,054 | $ | 89,044 | $ | 566,012 | $ | 89,684,110 | ||||||||
|
|
|
|
|
|
|
| |||||||||
| a | Rounds to less than $1. |
| b | Shown at the unrealized appreciation (depreciation) on the contracts. |
The iShares MSCI Emerging Markets Small-Cap ETF had transfers from Level 2 to Level 1 during the year ended August 31, 2015 in the amount of $584,909 resulting from the resumption of trading after a temporary suspension and transfers from Level 1 to Level 2 in the amount of $20,236, resulting from a temporary suspension of trading.
The following table includes a rollforward for the year ended August 31, 2015 of investments whose values are classified as Level 3 as of the beginning or end of the year.
| iShares MSCI Emerging Markets Small-Cap ETF | Common Stocks | |||
Balance at beginning of year | $ | 56,797 | ||
Realized gain (loss) and change in unrealized appreciation/depreciation | (388,674 | ) | ||
Purchases | 608,917 | |||
Sales | (180,284 | ) | ||
Transfers ina | 469,256 | b | ||
Transfers out | — | |||
|
| |||
Balance at end of year | $ | 566,012 | ||
|
| |||
Net change in unrealized appreciation/depreciation on investments still held at end of year | $ | (381,212 | ) | |
|
| |||
| a | Represents the value as of the beginning of the reporting period. |
| b | Transfers in to Level 3 resulted from a suspension of trading. |
The following table summarizes the valuation techniques used and unobservable inputs developed by the Global Valuation Committee to determine the fair value of certain of the iShares MSCI Emerging Markets Small-Cap ETF’s Level 3 investments as of August 31, 2015:
| Value | Valuation Techniques | Unobservable inputs | Range of Unobservable Inputs a | Weighted Average of Unobservable Inputs b | ||||||||||||||||
Assets: | ||||||||||||||||||||
Common stocks | $ | 516,717 | c | Last trade with adjustment | Discount rate | 14%-86 | % | 25 | % | |||||||||||
| a | A decrease in the unobservable input may result in a significant increase to value, while an increase in the unobservable input may result in a significant decrease to value. |
| b | Unobservable inputs are weighted based on the fair value of the investments included in the range. |
| c | Does not include Level 3 investments with values derived utilizing prices from prior transactions or third party pricing information without adjustment for which such inputs are unobservable. |
| 90 | 2015 iSHARES ANNUAL REPORTTO SHAREHOLDERS |
Table of Contents
Notes to Consolidated Financial Statements (Continued)
iSHARES®, INC.
SECURITY TRANSACTIONS AND INCOME RECOGNITION
Security transactions are accounted for on trade date. Dividend income and capital gain distributions, if any, are recognized on the ex-dividend date, net of any foreign taxes withheld at source. Any taxes withheld that are reclaimable from foreign tax authorities as of August 31, 2015 are reflected in dividends receivable. Non-cash dividends received in the form of stock in an elective dividend, if any, are recorded as dividend income at fair value. Distributions received by the Funds may include a return of capital that is estimated by management. Such amounts are recorded as a reduction of the cost of investments or reclassified to capital gains. Interest income is accrued daily. Realized gains and losses on investment transactions are determined using the specific identification method.
FOREIGN CURRENCY TRANSLATION
The accounting records of the Funds are maintained in U.S. dollars. Foreign currencies, as well as investment securities and other assets and liabilities denominated in foreign currencies, are translated into U.S. dollars using exchange rates deemed appropriate by the investment adviser. Purchases and sales of securities, income receipts and expense payments are translated into U.S. dollars on the respective dates of such transactions.
Each Fund does not isolate the effect of fluctuations in foreign exchange rates from the effect of fluctuations in the market prices of securities. Such fluctuations are reflected by the Funds as a component of realized and unrealized gains and losses from investments for financial reporting purposes.
FOREIGN TAXES
The Funds may be subject to foreign taxes (a portion of which may be reclaimable) on income, stock dividends, capital gains on investments, or certain foreign currency transactions. All foreign taxes are recorded in accordance with the applicable foreign tax regulations and rates that exist in the foreign jurisdictions in which the Funds invest. These foreign taxes, if any, are paid by the Funds and are reflected in their consolidated statements of operations as follows: foreign taxes withheld at source are presented as a reduction of income, foreign taxes on securities lending income are presented as a reduction of securities lending income, foreign taxes on stock dividends are presented as “other foreign taxes,” and foreign taxes on capital gains from sales of investments and foreign taxes on foreign currency transactions are included in their respective net realized gain (loss) categories. Foreign taxes payable or deferred as of August 31, 2015, if any, are disclosed in the Funds’ consolidated statements of assets and liabilities.
Each Fund conducts its investment activities in India through its Subsidiary and expects to obtain benefits under the Double Tax Avoidance Agreement (“DTAA”) between India and Mauritius. In order to be eligible to claim benefits under the DTAA, each Subsidiary must, on an annual basis, satisfy certain tests and conditions, including the establishment and maintenance of valid tax residence in Mauritius and related requirements. Each Fund has obtained a current tax residence certificate issued by the Mauritian Revenue Authorities.
Based upon current interpretation and practice of the current tax laws in India and Mauritius and the DTAA, each Subsidiary is subject to tax in Mauritius on its net income at the rate of 15%. However, a system of tax credits effectively reduces the Mauritius income tax rate to a maximum of 3%. These income taxes, if any, are paid by the Funds and are disclosed in the consolidated statements of operations. Any dividends paid by a Subsidiary to its Fund are not subject to tax in Mauritius. Further, each Subsidiary is also exempt from tax in Mauritius on any gains from the sale of securities.
However, there can be no assurance that any future changes to the India-Mauritius treaty will not adversely affect the tax position of the Funds’ investments in India. If the DTAA is interpreted, amended, terminated, renegotiated, or possibly overridden by the General Anti-Avoidance Rules provisions (which are due to take effect April 1, 2017, the details of which are pending further authoritative guidance), in a manner that would adversely affect the tax position in India of each Fund, such an interpretation, amendment, or
NOTESTO CONSOLIDATED FINANCIAL STATEMENTS | 91 |
Table of Contents
Notes to Consolidated Financial Statements (Continued)
iSHARES®, INC.
override renegotiation may cause the Funds to incur capital gains tax in India. Tax laws in India also include provisions that impose Indian tax on the transfer of shares of an Indian company. However, until more definitive authoritative guidance on the final applicability of this provision to the Funds is available, the impact to the Funds, if any, cannot be determined at this time.
DISTRIBUTIONS TO SHAREHOLDERS
Dividends and distributions paid by each Fund are recorded on the ex-dividend dates. Distributions are determined on a tax basis and may differ from net investment income and net realized capital gains for financial reporting purposes. Dividends and distributions are paid in U.S. dollars and cannot be automatically reinvested in additional shares of the Funds.
LOANS OF PORTFOLIO SECURITIES
Each Fund may lend its investment securities to approved borrowers, such as brokers, dealers and other financial institutions. The borrower pledges and maintains with the Fund collateral consisting of cash, an irrevocable letter of credit issued by a bank, or securities issued or guaranteed by the U.S. government. The initial collateral received by each Fund is required to have a value of at least 102% of the current value of the loaned securities for securities traded on U.S. exchanges and a value of at least 105% for all other securities. The collateral is maintained thereafter, at a value equal to at least 100% of the current value of the securities on loan. The market value of the loaned securities is determined at the close of each business day of the Funds. Any additional required collateral is delivered to the Funds and any excess collateral is returned by the Funds on the next business day. During the term of the loan, each Fund is entitled to all distributions made on or in respect of the loaned securities. Loans of securities are terminable at any time and the borrower, after notice, is required to return borrowed securities within the standard time period for settlement of securities transactions.
Any cash received as collateral for securities on loan may be reinvested in certain short-term instruments either directly on behalf of a fund or through one or more joint accounts or money market funds, including those managed by BlackRock Fund Advisors (“BFA”), the Funds’ investment adviser, or its affiliates. As of August 31, 2015, any securities on loan were collateralized by cash. The cash collateral received was invested in money market funds managed by BFA and is disclosed in the consolidated schedules of investments. The securities on loan for each Fund are also disclosed in its consolidated schedule of investments. The total value of any securities on loan as of August 31, 2015 and the total value of the related collateral are disclosed in the consolidated statements of assets and liabilities. Income earned by the Funds from securities lending is disclosed in the consolidated statements of operations.
The risks of securities lending include the risk that the borrower may not provide additional collateral when required or may not return the securities when due. To mitigate these risks, the Funds benefit from a borrower default indemnity provided by BlackRock, Inc. (“BlackRock”). BlackRock’s indemnity allows for full replacement of securities lent. Each Fund could suffer a loss if the value of the investments purchased with cash collateral falls below the value of the cash collateral received.
Securities lending transactions are entered into by the Funds under Master Securities Lending Agreements (“MSLA”) which provide the right, in the event of default (including bankruptcy or insolvency) for the non-defaulting party to liquidate the collateral and calculate a net exposure to the defaulting party or request additional collateral. In the event that a borrower defaults, a Fund, as lender, would offset the market value of the collateral received against the market value of the securities loaned. The value of the collateral is typically greater than that of the market value of the securities loaned, leaving the lender with a net amount payable to the defaulting party. However, bankruptcy or insolvency laws of a particular jurisdiction may impose restrictions on or prohibitions against such a right of offset in the event of an MSLA counterparty’s bankruptcy or insolvency. Under the MSLA, the borrower can resell or re-pledge the loaned securities, and a Fund can reinvest cash collateral, or, upon an event of default, resell or re-pledge the collateral.
| 92 | 2015 iSHARES ANNUAL REPORTTO SHAREHOLDERS |
Table of Contents
Notes to Consolidated Financial Statements (Continued)
iSHARES®, INC.
The following table is a summary of securities lending agreements which are subject to offset under an MSLA as of August 31, 2015:
| iShares ETF | Market Value of Securities on Loan | Cash Collateral Received a | Net Amount | |||||||||
Core MSCI Emerging Markets | $ | 412,076,435 | $ | 412,076,435 | $ | — | ||||||
MSCI BRIC | 4,517,829 | 4,517,829 | — | |||||||||
MSCI Emerging Markets Asia | 5,797,387 | 5,797,387 | — | |||||||||
MSCI Emerging Markets Minimum Volatility | 65,191,365 | 65,191,365 | — | |||||||||
MSCI Emerging Markets Small-Cap | 12,250,426 | 12,250,426 | — | |||||||||
| a | Collateral received in excess of the market value of securities on loan is not presented for financial reporting purposes. The total collateral received is disclosed in each Fund’s consolidated statement of assets and liabilities. |
| 2. | INVESTMENT ADVISORY AGREEMENT AND OTHER TRANSACTIONS WITH AFFILIATES |
Pursuant to an Investment Advisory Agreement with the Company, BFA manages the investment of each Fund’s assets. BFA is a California corporation indirectly owned by BlackRock. Under the Investment Advisory Agreement, BFA is responsible for substantially all expenses of the Funds, except interest, taxes, brokerage commissions and other expenses connected with the execution of portfolio transactions, distribution fees, litigation expenses and any extraordinary expenses.
Each Subsidiary has entered into a separate contract with BFA under which BFA provides investment advisory services to the Subsidiary but does not receive separate compensation from the Subsidiary for providing it with such services. Each Subsidiary has also entered into separate arrangements that provide for the provision of other services to the Subsidiary (including administrative, custody, transfer agency and other services), and BFA pays the costs and expenses related to the provision of those services.
For its investment advisory services to the iShares Core MSCI Emerging Markets ETF, BFA is entitled to an annual investment advisory fee of 0.18% based on the average daily net assets of the Fund. In addition, the Fund indirectly pays its pro rata share of fees and expenses attributable to its investments in other investment companies (“acquired fund fees and expenses”). BFA has contractually agreed to waive a portion of its investment advisory fees for the Fund through December 31, 2015 in an amount equal to the acquired fund fees and expenses attributable to the Fund’s investments in other iShares funds, if any.
For its investment advisory services to each of the iShares MSCI BRIC, iShares MSCI Emerging Markets Minimum Volatility and iShares MSCI Emerging Markets Small-Cap ETFs, BFA is entitled to an annual investment advisory fee based on each Fund’s allocable portion of the aggregate of the average daily net assets of the Fund and certain other iShares funds, as follows:
| Investment Advisory Fee | Aggregate Average Daily Net Assets | ||||
| 0.75 | % | First $14 billion | |||
| 0.68 | Over $14 billion, up to and including $28 billion | ||||
| 0.61 | Over $28 billion, up to and including $42 billion | ||||
| 0.54 | Over $42 billion, up to and including $56 billion | ||||
| 0.47 | Over $56 billion, up to and including $70 billion | ||||
| 0.41 | Over $70 billion, up to and including $84 billion | ||||
| 0.35 | Over $84 billion | ||||
The total of the investment advisory fee and any other fund expenses is a fund’s total annual operating expense. For the iShares MSCI Emerging Markets Minimum Volatility ETF, BFA has contractually agreed to waive a portion of its investment advisory fees
NOTESTO CONSOLIDATED FINANCIAL STATEMENTS | 93 |
Table of Contents
Notes to Consolidated Financial Statements (Continued)
iSHARES®, INC.
for the Fund through December 31, 2015 in order to limit total annual operating expenses after fee waiver to 0.25% of average daily net assets.
For its investment advisory services to the iShares MSCI Emerging Markets Asia ETF, BFA is entitled to an annual investment advisory fee of 0.68% based on the average daily net assets of the Fund. BFA has contractually agreed to waive a portion of its investment advisory fees for the Fund through December 31, 2015 in order to limit total annual operating expenses after fee waiver to 0.49% of average daily net assets.
The U.S. Securities and Exchange Commission has issued an exemptive order which permits BlackRock Institutional Trust Company, N.A. (“BTC”), an affiliate of BFA, to serve as securities lending agent for the Funds, subject to applicable conditions. As securities lending agent, BTC bears all operational costs directly related to securities lending. Each Fund is responsible for fees in connection with the investment of cash collateral received for securities on loan in a money market fund managed by BFA, however, BTC has agreed to reduce the amount of securities lending income it receives in order to effectively limit the collateral investment fees each Fund bears to an annual rate of 0.04% (the “collateral investment fees”). Securities lending income is equal to the total of income earned from the reinvestment of cash collateral, net of fees and other payments to and from borrowers of securities, and less the collateral investment fees. The Funds retain a portion of securities lending income and remit the remaining portion to BTC as compensation for its services as securities lending agent.
Pursuant to a securities lending agreement, each Fund retains 80% of securities lending income and the amount retained can never be less than 70% of the total of securities lending income plus the collateral investment fees. In addition, commencing the business day following the date that the aggregate securities lending income plus the collateral investment fees generated across all 1940 Act iShares exchange-traded funds (the “iShares ETF Complex”) in a given calendar year exceeds the aggregate securities lending income generated across the iShares ETF Complex in the calendar year 2013, each Fund, pursuant to a securities lending agreement, will retain for the remainder of that calendar year 85% of securities lending income and the amount retained can never be less than 70% of the total of securities lending income plus the collateral investment fees.
Prior to January 1, 2015, each Fund retained 75% of securities lending income and the amount retained was never less than 65% of the total of securities lending income plus the collateral investment fees. In addition, commencing the business day following the date that the aggregate securities lending income plus the collateral investment fees generated across the iShares ETF Complex in the calendar year 2014 exceeded the aggregate securities lending income generated across the iShares ETF Complex in the calendar year 2013 and pursuant to a securities lending agreement, each Fund retained for the remainder of the calendar year 2014, 80% of securities lending income and the amount retained was never less than 65% of the total of securities lending income plus the collateral investment fees.
For the year ended August 31, 2015, the total of securities lending agent services and collateral investment fees paid were as follows:
| iShares ETF | Fees Paid to BTC | |||
Core MSCI Emerging Markets | $ | 2,285,543 | ||
MSCI BRIC | 83,658 | |||
MSCI Emerging Markets Asia | 34,758 | |||
MSCI Emerging Markets Minimum Volatility | 875,781 | |||
MSCI Emerging Markets Small-Cap | 64,670 | |||
For the year ended August 31, 2015, BTC, the Funds’ securities lending agent, has agreed to voluntarily reimburse the iShares Core MSCI Emerging Markets ETF in the amount of $39,878, related to the foreign tax on the securities lending income. Such reimbursement is included in “Securities lending income – affiliated – net” in the Fund’s consolidated statement of operations.
| 94 | 2015 iSHARES ANNUAL REPORTTO SHAREHOLDERS |
Table of Contents
Notes to Consolidated Financial Statements (Continued)
iSHARES®, INC.
BlackRock Investments, LLC, an affiliate of BFA, is the distributor for each Fund. Pursuant to the distribution agreement, BFA is responsible for any fees or expenses for distribution services provided to the Funds.
Cross trades for the year ended August 31, 2015, if any, were executed by the Funds pursuant to Rule 17a-7 under the 1940 Act. Cross trading is the buying or selling of portfolio securities between funds to which BFA (or an affiliate) serves as investment adviser. At its regularly scheduled quarterly meetings, the Board reviews such transactions as of the most recent calendar quarter for compliance with the requirements and restrictions set forth by Rule 17a-7.
Each Fund may invest its positive cash balances in certain money market funds managed by BFA or an affiliate. The income earned on these temporary cash investments is included in “Interest – affiliated” in the consolidated statements of operations.
The PNC Financial Services Group, Inc. is the largest stockholder of BlackRock and is considered to be an affiliate of the Funds for 1940 Act purposes.
Certain Funds, in order to improve their portfolio liquidity and their ability to track their respective underlying index, may invest in shares of other iShares funds that invest in securities in each Fund’s respective underlying index.
Certain directors and officers of the Company are also officers of BTC and/or BFA.
| 3. | INVESTMENT PORTFOLIO TRANSACTIONS |
Purchases and sales of investments (excluding in-kind transactions and short-term investments) for the year ended August 31, 2015 were as follows:
| iShares ETF | Purchases | Sales | ||||||
Core MSCI Emerging Markets | $ | 3,548,333,200 | $ | 464,687,049 | ||||
MSCI BRIC | 26,370,580 | 83,728,829 | ||||||
MSCI Emerging Markets Asia | 92,919,382 | 20,263,993 | ||||||
MSCI Emerging Markets Minimum Volatility | 1,139,500,400 | 641,150,537 | ||||||
MSCI Emerging Markets Small-Cap | 63,663,643 | 14,755,774 | ||||||
In-kind transactions (see Note 4) for the year ended August 31, 2015 were as follows:
| iShares ETF | In-kind Purchases | In-kind Sales | ||||||
Core MSCI Emerging Markets | $ | 158,694,060 | $ | — | ||||
MSCI BRIC | — | 79,417,004 | ||||||
MSCI Emerging Markets Asia | 6,566,676 | 5,546,131 | ||||||
MSCI Emerging Markets Minimum Volatility | 487,592,530 | 83,239,261 | ||||||
| 4. | CAPITAL SHARE TRANSACTIONS |
Capital shares are issued and redeemed by each Fund only in aggregations of a specified number of shares or multiples thereof (“Creation Units”) at NAV. Except when aggregated in Creation Units, shares of each Fund are not redeemable. Transactions in capital shares for each Fund are disclosed in detail in the consolidated statements of changes in net assets.
The consideration for the purchase of Creation Units of a fund in the Company generally consists of the in-kind deposit of a designated portfolio of securities and a specified amount of cash. Certain funds in the Company may be offered in Creation Units
NOTESTO CONSOLIDATED FINANCIAL STATEMENTS | 95 |
Table of Contents
Notes to Consolidated Financial Statements (Continued)
iSHARES®, INC.
solely or partially for cash in U.S. dollars. Investors purchasing and redeeming Creation Units may pay a purchase transaction fee and a redemption transaction fee directly to State Street Bank and Trust Company, the Company’s administrator, to offset transfer and other transaction costs associated with the issuance and redemption of Creation Units, including Creation Units for cash. Investors transacting in Creation Units for cash may also pay an additional variable charge to compensate the relevant fund for certain transaction costs (i.e., stamp taxes, taxes on currency or other financial transactions, and brokerage costs) and market impact expenses relating to investing in portfolio securities. Such variable charges, if any, are included in “Proceeds from shares sold” in the consolidated statements of changes in net assets.
From time to time, settlement of securities related to in-kind contributions or in-kind redemptions may be delayed. In such cases, securities related to in-kind contributions are reflected as “Due from custodian” and securities related to in-kind redemptions are reflected as “Securities related to in-kind transactions” in the consolidated statements of assets and liabilities.
| 5. | FUTURES CONTRACTS |
Each Fund may purchase or sell futures contracts in an effort to help such Fund track its underlying index. A futures contract is a standardized, exchange-traded agreement to buy and sell a financial instrument at a set price on a future date. Upon entering into a futures contract, the Fund is required to pledge to the executing broker which holds segregated from its own assets, an amount of cash, U.S. government securities or other high-quality debt and equity securities equal to the minimum initial margin requirements of the exchange on which the contract is traded. Pursuant to the contract, the Fund agrees to receive from or pay to the broker an amount of cash equal to the daily fluctuation in value of the contract. Such receipts or payments are known as margin variation and are recorded by the Fund as unrealized appreciation or depreciation. When the contract is closed, the Fund records a realized gain or loss equal to the difference between the value of the contract at the time it was opened and the value at the time it was closed. Losses may arise if the value of a futures contract decreases due to an unfavorable change in the market rates or values of the underlying instrument during the term of the contract or if the counterparty does not perform under the contract. The use of futures contracts also involves the risk of an imperfect correlation in the movements in the price of futures contracts and the assets underlying such contracts.
The following table shows the value of futures contracts held by the iShares Core MSCI Emerging Markets ETF as of August 31, 2015 and the related locations in the consolidated statements of assets and liabilities, presented by risk exposure category:
| Liabilities | ||||
Equity contracts: | ||||
Variation margin / Net assets consist of – net unrealized depreciationa | $ | 4,522,127 | ||
|
| |||
| a | Represents cumulative depreciation of futures contracts as reported in the consolidated schedule of investments. |
The following table shows the realized and unrealized gains (losses) on futures contracts held by the iShares Core MSCI Emerging Markets ETF during the year ended August 31, 2015 and the related locations in the consolidated statements of operations, presented by risk exposure category:
| Net Realized Gain (Loss) | Net Change in Unrealized Appreciation/Depreciation | |||||||
Equity contracts: | ||||||||
Futures contracts | $ | (3,937,423 | ) | $ | (4,892,657 | ) | ||
|
|
|
| |||||
| 96 | 2015 iSHARES ANNUAL REPORTTO SHAREHOLDERS |
Table of Contents
Notes to Consolidated Financial Statements (Continued)
iSHARES®, INC.
The following table shows the average quarter-end balances of open futures contracts for the iShares Core MSCI Emerging Markets ETF for the year ended August 31, 2015:
Average value of contracts purchased | $ | 29,029,135 | ||
| 6. | PRINCIPAL RISKS |
In the normal course of business, each Fund’s investment activities expose it to various types of risk associated with the financial instruments and markets in which it invests. The significant types of financial risks each Fund is exposed to include market risk and credit risk. Each Fund’s prospectus provides details of these and other types of risk.
BFA uses a “passive” or index approach to try to achieve each Fund’s investment objective following the securities included in its underlying index during upturns as well as downturns. BFA does not take steps to reduce market exposure or to lessen the effects of a declining market. Divergence from the underlying index and the composition of the portfolio is monitored by BFA.
MARKET RISK
Market risk arises mainly from uncertainty about future values of financial instruments influenced by price, currency and interest rate movements. It represents the potential loss each Fund may suffer through holding market positions in the face of market movements. Each Fund is exposed to market risk by virtue of its investment in equity and financial derivative instruments. The fair value of securities held by the Funds may decline due to general market conditions, economic trends or events that are not specifically related to the issuers of the securities including local, regional or global political, social or economic instability or to factors that affect a particular industry or group of industries. The extent of each Fund’s exposure to market risk is the market value of the investments held as shown in the Fund’s consolidated schedule of investments.
A diversified portfolio, where this is appropriate and consistent with a fund’s objectives, minimizes the risk that a price change of a particular investment will have a material impact on the NAV of a fund. The investment concentrations within each Fund’s portfolio are disclosed in its consolidated schedule of investments.
Each Fund invests a substantial amount of its assets in securities of non-U.S. issuers that trade in non-U.S. markets. This involves certain considerations and risks not typically associated with securities of U.S. issuers. Such risks include, but are not limited to: generally less liquid and less efficient securities markets; generally greater price volatility; exchange rate fluctuations and exchange controls; imposition of restrictions on the expatriation of funds or other assets of the Fund; less publicly available information about issuers; the imposition of withholding or other taxes; higher transaction and custody costs; settlement delays and risk of loss attendant in settlement procedures; difficulties in enforcing contractual obligations; less regulation of securities markets; different accounting, disclosure and reporting requirements; more substantial governmental involvement in the economy; higher inflation rates; greater social, economic and political uncertainties; the risk of nationalization or expropriation of assets; and the risk of war. These risks are heightened for investments in issuers from countries with less developed markets.
The United States and the European Union, along with the regulatory bodies of a number of countries including Japan, Australia and Canada (collectively, “Sanctioning Bodies”), have imposed sectorial economic sanctions on certain Russian individuals and Russian corporate entities which include prohibitions on transacting in or dealing in new debt of longer than 30 or 90 days maturity or new equity of such issuers. Securities held by the iShares Core MSCI Emerging Markets ETF, iShares MSCI BRIC ETF, iShares MSCI Emerging Markets Minimum Volatility ETF and iShares MSCI Emerging Markets Small-Cap ETF issued prior to the date of the sanctions being imposed are not currently subject to any restrictions under the sanctions. However, compliance with each of these sanctions may impair the ability of a Fund to buy, sell, hold, receive or deliver the affected securities or other securities of such issuers. The Sanctioning Bodies could also institute broader sanctions on Russia. These sanctions, or even the threat of further sanctions, may result in the decline of the value and liquidity of Russian securities, a weakening of the ruble or
NOTESTO CONSOLIDATED FINANCIAL STATEMENTS | 97 |
Table of Contents
Notes to Consolidated Financial Statements (Continued)
iSHARES®, INC.
other adverse consequences to the Russian economy. Current or future sanctions may result in Russia taking counter measures or retaliatory actions, which may further impair the value and liquidity of Russian securities. These retaliatory measures may include the immediate freeze of Russian assets held by a Fund.
CREDIT RISK
Credit risk is the risk that an issuer or guarantor of debt instruments or the counterparty to a financial transaction, including derivatives contracts, repurchase agreements or loans of portfolio securities, is unable or unwilling to make timely interest and/or principal payments or to otherwise honor its obligations. BFA and its affiliates manage counterparty credit risk by entering into transactions only with counterparties that they believe have the financial resources to honor their obligations and by monitoring the financial stability of those counterparties. Financial assets, which potentially expose the Funds to issuer and counterparty credit risks, consist principally of financial instruments and receivables due from counterparties. The extent of each Fund’s exposure to credit and counterparty risks with respect to those financial assets is approximated by their value recorded in its consolidated statement of assets and liabilities.
| 7. | INCOME TAX INFORMATION |
Each Fund is treated as an entity separate from the Company’s other funds for federal income tax purposes. It is the policy of each Fund to qualify as a regulated investment company by complying with the provisions applicable to regulated investment companies, as defined under Subchapter M of the Internal Revenue Code of 1986, as amended, and to annually distribute substantially all of its ordinary income and any net capital gains (taking into account any capital loss carryforwards) sufficient to relieve it from all, or substantially all, federal income and excise taxes. Accordingly, no provision for federal income taxes is required.
U.S. GAAP requires that certain components of net assets be adjusted to reflect permanent differences between financial and tax reporting. These reclassifications have no effect on net assets or NAV per share. The following permanent differences as of August 31, 2015, attributable to the characterization of corporate actions, passive foreign investment companies, foreign currency transactions and realized gains (losses) from in-kind redemptions, were reclassified to the following accounts:
| iShares ETF | Paid-in Capital | Undistributed Net Investment Income/Distributions in Excess of Net Investment Income | Undistributed Net Realized Gain/Accumulated Net Realized Loss | |||||||||
Core MSCI Emerging Markets | $ | — | $ | (2,064,805 | ) | $ | 2,064,805 | |||||
MSCI BRIC | 5,374,516 | 305,141 | (5,679,657 | ) | ||||||||
MSCI Emerging Markets Asia | (10,183 | ) | (57,112 | ) | 67,295 | |||||||
MSCI Emerging Markets Minimum Volatility | 6,657,634 | (1,109,627 | ) | (5,548,007 | ) | |||||||
MSCI Emerging Markets Small-Cap | — | 54,934 | (54,934 | ) | ||||||||
The tax character of distributions paid during the years ended August 31, 2015 and August 31, 2014 was as follows:
| iShares ETF | 2015 | 2014 | ||||||
Core MSCI Emerging Markets | ||||||||
Ordinary income | $ | 149,835,315 | $ | 69,107,942 | ||||
|
|
|
| |||||
| 98 | 2015 iSHARES ANNUAL REPORTTO SHAREHOLDERS |
Table of Contents
Notes to Consolidated Financial Statements (Continued)
iSHARES®, INC.
| iShares ETF | 2015 | 2014 | ||||||
MSCI BRIC | ||||||||
Ordinary income | $ | 7,526,071 | $ | 7,905,401 | ||||
|
|
|
| |||||
MSCI Emerging Markets Asia | ||||||||
Ordinary income | $ | 1,886,156 | $ | 898,216 | ||||
|
|
|
| |||||
MSCI Emerging Markets Minimum Volatility | ||||||||
Ordinary income | $ | 56,113,327 | $ | 58,169,702 | ||||
|
|
|
| |||||
MSCI Emerging Markets Small-Cap | ||||||||
Ordinary income | $ | 1,449,168 | $ | 736,376 | ||||
|
|
|
| |||||
As of August 31, 2015, the tax components of accumulated net earnings (losses) were as follows:
| iShares ETF | Undistributed Ordinary Income | Capital Loss Carryforwards | Net Unrealized Gains (Losses) a | Qualified Late-Year Losses b | Total | |||||||||||||||
Core MSCI Emerging Markets | $ | 59,081,485 | $ | (34,205,998 | ) | $ | (1,408,130,373 | ) | $ | (104,632,969 | ) | $ | (1,487,887,855 | ) | ||||||
MSCI BRIC | 1,946,769 | (181,073,552 | ) | (49,328,601 | ) | (16,546,798 | ) | (245,002,182 | ) | |||||||||||
MSCI Emerging Markets Asia | 1,309,389 | (9,350,259 | ) | (19,719,781 | ) | (5,188,764 | ) | (32,949,415 | ) | |||||||||||
MSCI Emerging Markets | 18,688,666 | (112,910,321 | ) | (339,042,382 | ) | (51,268,097 | ) | (484,532,134 | ) | |||||||||||
MSCI Emerging Markets Small-Cap | 691,120 | (5,947,880 | ) | (17,143,759 | ) | — | (22,400,519 | ) | ||||||||||||
| a | The difference between book-basis and tax-basis unrealized gains (losses) was attributable primarily to the corporate actions, the tax deferral of losses on wash sales, the realization for tax purposes of unrealized gains (losses) on certain futures contracts, and the realization for tax purposes of unrealized gains on investments in passive foreign investment companies. |
| b | The Funds have elected to defer certain qualified late-year losses and recognize such losses in the next taxable year. |
As of August 31, 2015, the following Funds had capital loss carryforwards available to offset future realized capital gains through the indicated expiration dates as follows:
| iShares ETF | Non- Expiring a | Expiring 2017 | Expiring 2018 | Expiring 2019 | Total | |||||||||||||||
Core MSCI Emerging Markets | $ | 34,205,998 | $ | — | $ | — | $ | — | $ | 34,205,998 | ||||||||||
MSCI BRIC | 160,504,168 | 1,540,740 | 11,268,086 | 7,760,558 | 181,073,552 | |||||||||||||||
MSCI Emerging Markets Asia | 9,350,259 | — | — | — | 9,350,259 | |||||||||||||||
MSCI Emerging Markets Minimum Volatility | 112,910,321 | — | — | — | 112,910,321 | |||||||||||||||
MSCI Emerging Markets Small-Cap | 5,947,880 | — | — | — | 5,947,880 | |||||||||||||||
| a | Must be utilized prior to losses subject to expiration. |
For the year ended August 31, 2015, the iShares MSCI Emerging Markets Small-Cap ETF utilized $2,132,398 of its capital loss carryforwards.
The Funds may own shares in certain foreign investment entities, referred to, under U.S. tax law, as “passive foreign investment companies.” The Funds may elect to mark-to-market annually the shares of each passive foreign investment company and would be required to distribute to shareholders any such marked-to-market gains.
NOTESTO CONSOLIDATED FINANCIAL STATEMENTS | 99 |
Table of Contents
Notes to Consolidated Financial Statements (Continued)
iSHARES®, INC.
As of August 31, 2015, gross unrealized appreciation and gross unrealized depreciation based on cost for federal income tax purposes were as follows:
| iShares ETF | Tax Cost | Gross Unrealized Appreciation | Gross Unrealized Depreciation | Net Unrealized Appreciation (Depreciation) | ||||||||||||
Core MSCI Emerging Markets | $ | 8,836,185,376 | $ | 348,855,492 | $ | (1,756,832,921 | ) | $ | (1,407,977,429 | ) | ||||||
MSCI BRIC | 250,196,610 | 28,460,924 | (77,763,600 | ) | (49,302,676 | ) | ||||||||||
MSCI Emerging Markets Asia | 149,975,978 | 5,229,202 | (24,942,396 | ) | (19,713,194 | ) | ||||||||||
MSCI Emerging Markets Minimum Volatility | 2,864,506,202 | 126,498,731 | (465,405,723 | ) | (338,906,992 | ) | ||||||||||
MSCI Emerging Markets Small-Cap | 106,822,350 | 5,217,473 | (22,355,713 | ) | (17,138,240 | ) | ||||||||||
Management has analyzed tax laws and regulations and their application to the Funds as of August 31, 2015, inclusive of the open tax return years, and does not believe there are any uncertain tax positions that require recognition of a tax liability in the Funds’ consolidated financial statements.
| 8. | LINE OF CREDIT |
The Funds, along with certain other iShares funds, are parties to a $150 million credit agreement with State Street Bank and Trust Company, which expires on October 28, 2015. The line of credit may be used for temporary or emergency purposes, including redemptions, settlement of trades and rebalancing of portfolio holdings. The credit agreement has the following terms: a commitment fee of 0.08% per annum on the unused portion of the credit agreement and interest at a rate equal to the higher of (a) the one-month LIBOR plus 1.00% per annum or (b) the U.S. Federal Funds rate plus 1.00% per annum on amounts borrowed. The commitment fee is allocated to each fund participating in the credit agreement based on each fund’s pro-rata share of the aggregate average daily value of assets invested in local securities of certain foreign markets.
On September 17, 2015, the Board amended the terms of the credit agreement as follows: (i) increased the maximum borrowing amount to $250 million; (ii) increased the commitment fee to 0.20% per annum on the unused portion of the credit agreement and interest at a rate equal to the higher of (a) the one-month LIBOR (not less than zero) plus 1.00% per annum or (b) the U.S. Federal Funds rate (not less than zero) plus 1.00% per annum on amounts borrowed; and (iii) extended the expiration date to October 28, 2016. These changes are expected to be effective on or around October 28, 2015.
For the year ended August 31, 2015, the maximum amounts borrowed, the average borrowings and the weighted average interest rates, if any, under the credit agreement were as follows:
| iShares ETF | Maximum Amount Borrowed | Average Borrowings | Weighted Average Interest Rates | |||||||||
Core MSCI Emerging Markets | $ | 25,000,000 | $ | 410,959 | 1.18 | % | ||||||
MSCI BRIC | 4,000,000 | 87,806 | 1.18 | |||||||||
MSCI Emerging Markets Asia | 1,800,000 | 30,545 | 1.18 | |||||||||
MSCI Emerging Markets Minimum Volatility | 11,704,000 | 380,625 | 1.16 | |||||||||
MSCI Emerging Markets Small-Cap | 1,250,000 | 32,575 | 1.17 | |||||||||
| 100 | 2015 iSHARES ANNUAL REPORTTO SHAREHOLDERS |
Table of Contents
Notes to Consolidated Financial Statements (Continued)
iSHARES®, INC.
| 9. | SUBSEQUENT EVENTS |
Management has evaluated the impact of all subsequent events on the Funds through the date the consolidated financial statements were available to be issued and has determined that there were no subsequent events requiring adjustment or disclosure in the consolidated financial statements.
NOTESTO CONSOLIDATED FINANCIAL STATEMENTS | 101 |
Table of Contents
Report of Independent Registered Public Accounting Firm
To the Shareholders and Board of Directors of
iShares, Inc.:
In our opinion, the accompanying consolidated statements of assets and liabilities, including the consolidated schedules of investments, and the related consolidated statements of operations and of changes in net assets and the consolidated financial highlights present fairly, in all material respects, the financial position of iShares Core MSCI Emerging Markets ETF, iShares MSCI BRIC ETF, iShares MSCI Emerging Markets Asia ETF, iShares MSCI Emerging Markets Minimum Volatility ETF, iShares MSCI Emerging Markets Small-Cap ETF and their subsidiaries (the “Funds”) at August 31, 2015, the results of each of their operations, the changes in each of their net assets and their financial highlights for each of the periods presented, in conformity with accounting principles generally accepted in the United States of America. These consolidated financial statements and consolidated financial highlights (hereafter referred to as “financial statements”) are the responsibility of the Funds’ management. Our responsibility is to express an opinion on these financial statements based on our audits. We conducted our audits of these financial statements in accordance with the standards of the Public Company Accounting Oversight Board (United States). Those standards require that we plan and perform the audit to obtain reasonable assurance about whether the financial statements are free of material misstatement. An audit includes examining, on a test basis, evidence supporting the amounts and disclosures in the financial statements, assessing the accounting principles used and significant estimates made by management, and evaluating the overall financial statement presentation. We believe that our audits, which included confirmation of securities at August 31, 2015 by correspondence with the custodian, transfer agent and brokers, provide a reasonable basis for our opinion.
PricewaterhouseCoopers LLP
San Francisco, California
October 22, 2015
| 102 | 2015 iSHARES ANNUAL REPORTTO SHAREHOLDERS |
Table of Contents
iSHARES®, INC.
Under Section 854(b)(2) of the Internal Revenue Code (the “Code”), the following maximum amounts are hereby designated as qualified dividend income for purposes of the maximum rate under Section 1(h)(11) of the Code for the fiscal year ended August 31, 2015:
| iShares ETF | Qualified Dividend Income | |||
Core MSCI Emerging Markets | $ | 95,619,839 | ||
MSCI BRIC | 5,074,047 | |||
MSCI Emerging Markets Asia | 2,201,368 | |||
MSCI Emerging Markets Minimum Volatility | 29,185,561 | |||
MSCI Emerging Markets Small-Cap | 591,203 | |||
In February 2016, shareholders will receive Form 1099-DIV which will include their share of qualified dividend income distributed during the calendar year 2015. Shareholders are advised to check with their tax advisers for information on the treatment of these amounts on their income tax returns.
For the fiscal year ended August 31, 2015, the following Funds earned foreign source income and paid foreign taxes which they intend to pass through to their shareholders pursuant to Section 853 of the Code:
| iShares ETF | Foreign Source Income Earned | Foreign Taxes Paid | ||||||
Core MSCI Emerging Markets | $ | 192,374,106 | $ | 20,542,033 | ||||
MSCI BRIC | 8,587,238 | 651,404 | ||||||
MSCI Emerging Markets Asia | 3,719,572 | 463,899 | ||||||
MSCI Emerging Markets Minimum Volatility | 72,711,584 | 8,879,276 | ||||||
MSCI Emerging Markets Small-Cap | 1,905,012 | 186,347 | ||||||
TAX INFORMATION | 103 |
Table of Contents
Board Review and Approval of Investment Advisory
Contract
iSHARES®, INC.
I. iShares Core MSCI Emerging Markets ETF and iShares MSCI Emerging Markets Asia ETF
Under Section 15(c) of the Investment Company Act of 1940 (the “1940 Act”), the Company’s Board of Directors (the “Board”), including a majority of Directors who are not “interested persons” of the Company (as that term is defined in the 1940 Act) (the “Independent Directors”), is required annually to consider and approve the Investment Advisory Contract between the Company and BFA (the “Advisory Contract”) on behalf of the Funds. The Independent Directors requested, and BFA provided, such information as the Independent Directors, with advice from independent counsel, deemed reasonably necessary to evaluate the Advisory Contract. A committee of Independent Directors (the “15(c) Committee”), with independent counsel, met with management on May 1, 2015 and May 6, 2015, to discuss the types of information the Independent Directors required and the manner in which management would organize and present such information. At a meeting held on May 21, 2015, management presented preliminary information to the Board relating to the continuance of the Advisory Contract, and the Board, including the Independent Directors, reviewed and discussed such information at length. The Independent Directors requested from management certain additional information, which management agreed to provide. At a meeting held on June 24-25, 2015, the Board, including the Independent Directors, reviewed the additional information provided by management in response to these requests. After extensive discussions, the Board, including all of the Independent Directors, approved the continuance of the Advisory Contract for the Funds, based on a review of qualitative and quantitative information provided by BFA, including the additional information management provided at the request of the Independent Directors. The Board noted its satisfaction with the extent and quality of information provided and its frequent interactions with management, as well as the detailed responses and other information provided by BFA. The Board also noted that the Board and BFA agreed to discuss potential enhancements and adjustments to the 15(c) process for the coming year. The Independent Directors were advised by their independent counsel throughout the process, including about the legal standards applicable to their review. In approving the Advisory Contract for the Funds, the Board, including the Independent Directors, considered the following factors, no one of which was controlling, and reached the following conclusions:
Expenses and Performance of the Funds — The Board reviewed statistical information prepared by Lipper Inc. (“Lipper”), an independent provider of investment company data, regarding the expense ratio components, including actual advisory fees, waivers/reimbursements, and gross and net total expenses of each Fund in comparison with the same information for other exchange traded funds (including, where applicable, funds sponsored by an “at cost” service provider) and, in the limited instances where no comparable ETFs existed and the comparison group would not otherwise be reasonable in Lipper’s judgment, pure index institutional mutual funds, objectively selected by Lipper as comprising such Fund’s applicable peer group pursuant to Lipper’s proprietary ETF methodology (the “Lipper Group”). The Board was provided with a detailed description of Lipper’s proprietary ETF methodology used by Lipper to determine the applicable Lipper Groups. The Board further noted that due to the limitations in providing comparable funds in the various Lipper Groups, the statistical information provided in Lipper’s report may or may not provide meaningful direct comparisons to the Funds in all instances.
The Board also noted that the investment advisory fee rates and overall expenses (net of waivers and reimbursements) for the Funds were lower than the median of the investment advisory fee rates and overall expenses (net of waivers and reimbursements) of the funds in their respective Lipper Group.
In addition, the Board reviewed statistical information prepared by Lipper regarding the performance of each Fund for the one-, three-, five-, ten-year, and since inception periods, as applicable, and the “last quarter” period ended December 31, 2014, and a comparison of each Fund’s performance to its performance benchmark index for the same periods. To the extent that any of the comparison funds included in the Lipper Group track the same index as any particular Fund, Lipper also provided, and the Board reviewed, a comparison of such Fund’s performance to that of such relevant comparison funds for the same periods. The Board noted that the Funds generally performed in line with their respective performance benchmark indexes over the relevant periods. In considering this information, the Board noted that the Lipper Group may include funds that have different investment objectives
| 104 | 2015 iSHARES ANNUAL REPORTTO SHAREHOLDERS |
Table of Contents
Board Review and Approval of Investment Advisory
Contract (Continued)
iSHARES®, INC.
and/or benchmarks from the Funds. In addition, the Board noted that each Fund seeks to track its own benchmark index and that, during the prior year, the Board received periodic reports on the Funds’ performance in comparison with their relevant benchmark indexes. Such periodic comparative performance information, including detailed information on certain specific iShares funds requested by the Boards, was also considered.
Based on this review, the other factors considered at the meeting, and their general knowledge of ETF pricing, the Board concluded that the investment advisory fee rate and expense level and the historical performance of each Fund supported the Board’s approval of the continuance of the Advisory Contract for the coming year.
Nature, Extent and Quality of Services Provided by BFA — Based on management’s representations, including information about recent and proposed enhancements to the iShares business, including with respect to shareholder servicing and support, the Board expected that there would be no diminution in the scope of services required of or provided by BFA under the Advisory Contract for the coming year as compared to the scope of services provided by BFA during prior years. In reviewing the scope of these services, the Board considered BFA’s investment philosophy and experience, noting that BFA and its affiliates have committed significant resources over time, including during the past year, to supporting the iShares funds and their shareholders. The Board acknowledged that resources to support the iShares funds and their shareholders have been added or enhanced in recent years. The Board also considered BFA’s compliance program and its compliance record with respect to the Funds. In that regard, the Board noted that BFA reports to the Board about portfolio management and compliance matters on a periodic basis in connection with regularly scheduled meetings of the Board, and on other occasions as necessary and appropriate, and has provided information and made appropriate officers available as needed to provide further assistance with these matters. The Board also reviewed the background and experience of the persons responsible for the day-to-day management of the Funds, as well as the resources available to them in managing the Funds. In addition to the above considerations, the Board reviewed and considered detailed presentations regarding BFA’s investment performance, investment and risk management processes and strategies provided at the June 24-25, 2015 meeting and throughout the previous year, and matters related to BFA’s portfolio compliance policies and procedures. The Board noted that each Fund had met its investment objective consistently since its respective inception date.
Based on review of this information, and the performance information discussed above, the Board concluded that the nature, extent and quality of services provided by BFA to the Funds under the Advisory Contract supported the Board’s approval of the continuance of the Advisory Contract for the coming year.
Costs of Services Provided to Funds and Profits Realized by BFA and Affiliates — The Board reviewed information about the profitability to BlackRock of the Funds based on the fees payable to BFA and its affiliates (including fees under the Advisory Contract), and all other sources of revenue and expense to BFA and its affiliates from the Funds’ operations for the last calendar year. The Board reviewed BlackRock’s profitability methodology for the iShares funds, noting that the 15(c) Committee had focused on the methodology and proposed presentation during its meetings. The Board discussed the sources of direct and ancillary revenue with management, including the revenues to BTC from securities lending by the Funds. The Board also discussed BFA’s profit margin as reflected in the Funds’ profitability analyses and reviewed information regarding potential economies of scale (as discussed below). Based on this review, the Board concluded that the profits realized by BFA and its affiliates under the Advisory Contract and from other relationships between the Funds and BFA and/or its affiliates, if any, were within a reasonable range in light of the factors considered.
Economies of Scale — The Board reviewed information regarding potential economies of scale or other efficiencies that may result from increases in the Funds’ assets, noting that the issue of economies of scale had been focused on extensively by the 15(c) Committee during its meetings and addressed by management. The Board and the 15(c) Committee reviewed information provided by BFA regarding scale benefits shared with the iShares funds through relatively low fee rates established at inception,
BOARD REVIEWAND APPROVALOF INVESTMENT ADVISORY CONTRACT | 105 |
Table of Contents
Board Review and Approval of Investment Advisory
Contract (Continued)
iSHARES®, INC.
breakpoints, waivers, or other fee reductions, as well as through additional investment in the iShares business and the provision of improved or additional infrastructure and services to the iShares funds and their shareholders. The Board and the 15(c) Committee received information regarding BlackRock’s historical profitability, including BFA’s and its affiliates’ costs in providing services. The cost information distinguished between fixed and variable costs, and explained how the level of fixed and variable costs, as well as the nature of such costs, may impact the existence or size of scale benefits. The Board noted that the Advisory Contract for the Funds did not provide for any breakpoints in the Funds’ investment advisory fee rates as the assets of the Funds increase. However, the Board noted that should material economies of scale exist in the future, a breakpoint structure for the Funds may be appropriate, and that it would continue to monitor the sharing of economies of scale to determine the appropriateness of adding breakpoints in the future.
Based on this review, as well as the other factors considered at the meeting, the Board, recognizing its responsibility to consider this issue periodically, determined to approve the continuance of the Advisory Contract for the coming year.
Fees and Services Provided for Other Comparable Funds/Accounts Managed by BFA and its Affiliates — The Board received and considered information regarding the investment advisory/management fee rates for other funds/accounts in the U.S. for which BFA (or its affiliates) provides investment advisory/management services, including open-end and closed-end funds registered under the 1940 Act (including sub-advised funds), collective trust funds, separately managed accounts, and institutional separate accounts (together, the “Other Accounts”), and acknowledged BFA’s assertion that the iShares funds are fundamentally different investment vehicles from the Other Accounts. The Board noted that BFA and its affiliates do manage Other Accounts with substantially the same investment objectives and strategies as the Funds or that track the same index or a similar index as the Funds. The Board further noted that BFA provided the Board with detailed information regarding how the Other Accounts (particularly institutional clients) generally differ from the Funds, including in terms of the different, generally more extensive services provided to the Funds, as well as other significant differences in the approach of BFA and its affiliates to the Funds, on one hand, and Other Accounts, on the other. In that regard, the Board considered that the pricing of services to institutional clients is typically based on a number of factors beyond the nature and extent of the specific services to be provided and often depends on the overall relationship between the client and its affiliates and the adviser and its affiliates. In addition, the Board considered the relative complexity and inherent risks and challenges of managing and providing other services to the Funds, as publicly traded exchange traded funds, as compared to the Other Accounts that are institutional clients in light of differing regulatory requirements and client-imposed mandates. The Board also considered the “all-inclusive” nature of the Funds’ advisory fee structure, and the Fund expenses borne by BFA under this arrangement. The Board noted that the investment advisory fee rates under the Advisory Contract for the Funds were generally higher than the investment advisory/management fee rates for the Other Accounts that are institutional clients of BFA (or its affiliates) and concluded that the differences appeared to be consistent with the factors discussed.
Other Benefits to BFA and/or its Affiliates — The Board reviewed the “fallout” benefits or ancillary revenue received by BFA and/or its affiliates in connection with the services provided to the Funds by BFA, such as payment of revenue to BTC, the Funds’ securities lending agent, for loaning portfolio securities (which was included in the profit margins reviewed by the Board pursuant to BFA’s profitability methodology), and payment of advisory fees and/or administration fees to BFA and BTC (or their affiliates) in connection with any investments by the Funds in other funds for which BFA (or its affiliates) provides investment advisory services and/or administration services. The Board noted that BFA generally does not use soft dollars or consider the value of research or other services that may be provided to BFA (including its affiliates) in selecting brokers for portfolio transactions for the Funds. The Board further noted that any portfolio transactions on behalf of the Funds placed through a BFA affiliate or purchased from an underwriting syndicate in which a BFA affiliate participates, are reported to the Board pursuant to Rule 17e-1 or Rule 10f-3, as applicable, under the 1940 Act. The Board concluded that any such ancillary benefits would not be disadvantageous to the Funds’ shareholders and thus would not alter the Board’s conclusion with respect to the appropriateness of approving the continuance of the Advisory Contract for the coming year.
| 106 | 2015 iSHARES ANNUAL REPORTTO SHAREHOLDERS |
Table of Contents
Board Review and Approval of Investment Advisory
Contract (Continued)
iSHARES®, INC.
Based on the considerations described above, the Board determined that each Fund’s investment advisory fee rate under the Advisory Contract does not constitute a fee that is so disproportionately large as to bear no reasonable relationship to the services rendered and that could not have been the product of arm’s-length bargaining, and concluded that it is in the best interest of each Fund and its shareholders to approve the continuance of the Advisory Contract for the coming year.
II. iShares MSCI BRIC ETF and iShares MSCI Emerging Markets Small-Cap ETF
Under Section 15(c) of the Investment Company Act of 1940 (the “1940 Act”), the Company’s Board of Directors (the “Board”), including a majority of Directors who are not “interested persons” of the Company (as that term is defined in the 1940 Act) (the “Independent Directors”), is required annually to consider and approve the Investment Advisory Contract between the Company and BFA (the “Advisory Contract”) on behalf of the Funds. The Independent Directors requested, and BFA provided, such information as the Independent Directors, with advice from independent counsel, deemed reasonably necessary to evaluate the Advisory Contract. A committee of Independent Directors (the “15(c) Committee”), with independent counsel, met with management on May 1, 2015 and May 6, 2015, to discuss the types of information the Independent Directors required and the manner in which management would organize and present such information. At a meeting held on May 21, 2015, management presented preliminary information to the Board relating to the continuance of the Advisory Contract, and the Board, including the Independent Directors, reviewed and discussed such information at length. The Independent Directors requested from management certain additional information, which management agreed to provide. At a meeting held on June 24-25, 2015, the Board, including the Independent Directors, reviewed the additional information provided by management in response to these requests. After extensive discussions, the Board, including all of the Independent Directors, approved the continuance of the Advisory Contract for the Funds, based on a review of qualitative and quantitative information provided by BFA, including the additional information management provided at the request of the Independent Directors. The Board noted its satisfaction with the extent and quality of information provided and its frequent interactions with management, as well as the detailed responses and other information provided by BFA. The Board also noted that the Board and BFA agreed to discuss potential enhancements and adjustments to the 15(c) process for the coming year. The Independent Directors were advised by their independent counsel throughout the process, including about the legal standards applicable to their review. In approving the Advisory Contract for the Funds, the Board, including the Independent Directors, considered the following factors, no one of which was controlling, and reached the following conclusions:
Expenses and Performance of the Funds — The Board reviewed statistical information prepared by Lipper Inc. (“Lipper”), an independent provider of investment company data, regarding the expense ratio components, including actual advisory fees, waivers/reimbursements, and gross and net total expenses of each Fund in comparison with the same information for other exchange traded funds (including, where applicable, funds sponsored by an “at cost” service provider) and, in the limited instances where no comparable ETFs existed and the comparison group would not otherwise be reasonable in Lipper’s judgment, pure index institutional mutual funds, objectively selected by Lipper as comprising such Fund’s applicable peer group pursuant to Lipper’s proprietary ETF methodology (the “Lipper Group”). The Board was provided with a detailed description of Lipper’s proprietary ETF methodology used by Lipper to determine the applicable Lipper Groups. The Board further noted that due to the limitations in providing comparable funds in the various Lipper Groups, the statistical information provided in Lipper’s report may or may not provide meaningful direct comparisons to the Funds in all instances.
The Board also noted that the investment advisory fee rates and overall expenses (net of waivers and reimbursements) for the Funds were higher than the median of the investment advisory fee rates and overall expenses (net of waivers and reimbursements) of the funds in their respective Lipper Group. The Board further noted that each Fund’s investment advisory fee rate and overall expenses (net of waivers and reimbursements) were 2 basis points higher than those of a competitor fund in its respective Lipper Group that was ranked in the 3rd Lipper quintile.
BOARD REVIEWAND APPROVALOF INVESTMENT ADVISORY CONTRACT | 107 |
Table of Contents
Board Review and Approval of Investment Advisory
Contract (Continued)
iSHARES®, INC.
In addition, the Board reviewed statistical information prepared by Lipper regarding the performance of each Fund for the one-, three-, five-, ten-year, and since inception periods, as applicable, and the “last quarter” period ended December 31, 2014, and a comparison of each Fund’s performance to its performance benchmark index for the same periods. To the extent that any of the comparison funds included in the Lipper Group track the same index as any particular Fund, Lipper also provided, and the Board reviewed, a comparison of such Fund’s performance to that of such relevant comparison funds for the same periods. The Board noted that the Funds generally performed in line with their respective performance benchmark indexes over the relevant periods. In considering this information, the Board noted that the Lipper Group may include funds that have different investment objectives and/or benchmarks from the Funds. In addition, the Board noted that each Fund seeks to track its own benchmark index and that, during the prior year, the Board received periodic reports on the Funds’ performance in comparison with their relevant benchmark indexes. Such periodic comparative performance information, including detailed information on certain specific iShares funds requested by the Boards, was also considered.
Based on this review, the other factors considered at the meeting, and their general knowledge of ETF pricing, the Board concluded that the investment advisory fee rate and expense level and the historical performance of each Fund supported the Board’s approval of the continuance of the Advisory Contract for the coming year.
Nature, Extent and Quality of Services Provided by BFA — Based on management’s representations, including information about recent and proposed enhancements to the iShares business, including with respect to shareholder servicing and support, the Board expected that there would be no diminution in the scope of services required of or provided by BFA under the Advisory Contract for the coming year as compared to the scope of services provided by BFA during prior years. In reviewing the scope of these services, the Board considered BFA’s investment philosophy and experience, noting that BFA and its affiliates have committed significant resources over time, including during the past year, to supporting the iShares funds and their shareholders. The Board acknowledged that resources to support the iShares funds and their shareholders have been added or enhanced in recent years. The Board also considered BFA’s compliance program and its compliance record with respect to the Funds. In that regard, the Board noted that BFA reports to the Board about portfolio management and compliance matters on a periodic basis in connection with regularly scheduled meetings of the Board, and on other occasions as necessary and appropriate, and has provided information and made appropriate officers available as needed to provide further assistance with these matters. The Board also reviewed the background and experience of the persons responsible for the day-to-day management of the Funds, as well as the resources available to them in managing the Funds. In addition to the above considerations, the Board reviewed and considered detailed presentations regarding BFA’s investment performance, investment and risk management processes and strategies provided at the June 24-25, 2015 meeting and throughout the previous year, and matters related to BFA’s portfolio compliance policies and procedures. The Board noted that each Fund had met its investment objective consistently since its respective inception date.
Based on review of this information, and the performance information discussed above, the Board concluded that the nature, extent and quality of services provided by BFA to the Funds under the Advisory Contract supported the Board’s approval of the continuance of the Advisory Contract for the coming year.
Costs of Services Provided to Funds and Profits Realized by BFA and Affiliates — The Board reviewed information about the profitability to BlackRock of the Funds based on the fees payable to BFA and its affiliates (including fees under the Advisory Contract), and all other sources of revenue and expense to BFA and its affiliates from the Funds’ operations for the last calendar year. The Board reviewed BlackRock’s profitability methodology for the iShares funds, noting that the 15(c) Committee had focused on the methodology and proposed presentation during its meetings. The Board discussed the sources of direct and ancillary revenue with management, including the revenues to BTC from securities lending by the Funds. The Board also discussed BFA’s profit margin as reflected in the Funds’ profitability analyses and reviewed information regarding potential economies of scale (as discussed below). Based on this review, the Board concluded that the profits realized by BFA and its
| 108 | 2015 iSHARES ANNUAL REPORTTO SHAREHOLDERS |
Table of Contents
Board Review and Approval of Investment Advisory
Contract (Continued)
iSHARES®, INC.
affiliates under the Advisory Contract and from other relationships between the Funds and BFA and/or its affiliates, if any, were within a reasonable range in light of the factors considered.
Economies of Scale — The Board reviewed information regarding potential economies of scale or other efficiencies that may result from increases in the Funds’ assets, noting that the issue of economies of scale had been focused on extensively by the 15(c) Committee during its meetings and addressed by management. The Board and the 15(c) Committee reviewed information provided by BFA regarding scale benefits shared with the iShares funds through relatively low fee rates established at inception, breakpoints, waivers, or other fee reductions, as well as through additional investment in the iShares business and the provision of improved or additional infrastructure and services to the iShares funds and their shareholders. The Board and the 15(c) Committee received information regarding BlackRock’s historical profitability, including BFA’s and its affiliates’ costs in providing services. The cost information distinguished between fixed and variable costs, and explained how the level of fixed and variable costs, as well as the nature of such costs, may impact the existence or size of scale benefits. The Board noted that the Advisory Contract for the Funds already provided for breakpoints in the Funds’ investment advisory fee rates as the assets of the Funds, on an aggregated basis with the assets of certain other iShares funds, increase. The Board noted that it would continue to monitor the sharing of economies of scale to determine the appropriateness of adding new or revised breakpoints in the future.
Based on this review, as well as the other factors considered at the meeting, the Board, recognizing its responsibility to consider this issue periodically, determined to approve the continuance of the Advisory Contract for the coming year.
Fees and Services Provided for Other Comparable Funds/Accounts Managed by BFA and its Affiliates — The Board received and considered information regarding the investment advisory/management fee rates for other funds/accounts in the U.S. for which BFA (or its affiliates) provides investment advisory/management services, including open-end and closed-end funds registered under the 1940 Act (including sub-advised funds), collective trust funds, separately managed accounts, and institutional separate accounts (together, the “Other Accounts”), and acknowledged BFA’s assertion that the iShares funds are fundamentally different investment vehicles from the Other Accounts. The Board noted that BFA and its affiliates do manage Other Accounts with substantially the same investment objectives and strategies as the Funds or that track the same index or a similar index as the Funds. The Board further noted that BFA provided the Board with detailed information regarding how the Other Accounts (particularly institutional clients) generally differ from the Funds, including in terms of the different, generally more extensive services provided to the Funds, as well as other significant differences in the approach of BFA and its affiliates to the Funds, on one hand, and Other Accounts, on the other. In that regard, the Board considered that the pricing of services to institutional clients is typically based on a number of factors beyond the nature and extent of the specific services to be provided and often depends on the overall relationship between the client and its affiliates and the adviser and its affiliates. In addition, the Board considered the relative complexity and inherent risks and challenges of managing and providing other services to the Funds, as publicly traded exchange traded funds, as compared to the Other Accounts that are institutional clients in light of differing regulatory requirements and client-imposed mandates. The Board also considered the “all-inclusive” nature of the Funds’ advisory fee structure, and the Fund expenses borne by BFA under this arrangement. The Board noted that the investment advisory fee rates under the Advisory Contract for the Funds were generally higher than the investment advisory/management fee rates for the Other Accounts that are institutional clients of BFA (or its affiliates) and concluded that the differences appeared to be consistent with the factors discussed.
Other Benefits to BFA and/or its Affiliates — The Board reviewed the “fallout” benefits or ancillary revenue received by BFA and/or its affiliates in connection with the services provided to the Funds by BFA, such as payment of revenue to BTC, the Funds’ securities lending agent, for loaning portfolio securities (which was included in the profit margins reviewed by the Board pursuant to BFA’s profitability methodology), and payment of advisory fees and/or administration fees to BFA and BTC (or their affiliates) in connection with any investments by the Funds in other funds for which BFA (or its affiliates) provides investment advisory services and/or administration services. The Board noted that BFA generally does not use soft dollars or consider the value of
BOARD REVIEWAND APPROVALOF INVESTMENT ADVISORY CONTRACT | 109 |
Table of Contents
Board Review and Approval of Investment Advisory
Contract (Continued)
iSHARES®, INC.
research or other services that may be provided to BFA (including its affiliates) in selecting brokers for portfolio transactions for the Funds. The Board further noted that any portfolio transactions on behalf of the Funds placed through a BFA affiliate or purchased from an underwriting syndicate in which a BFA affiliate participates, are reported to the Board pursuant to Rule 17e-1 or Rule 10f-3, as applicable, under the 1940 Act. The Board concluded that any such ancillary benefits would not be disadvantageous to the Funds’ shareholders and thus would not alter the Board’s conclusion with respect to the appropriateness of approving the continuance of the Advisory Contract for the coming year.
Based on the considerations described above, the Board determined that each Fund’s investment advisory fee rate under the Advisory Contract does not constitute a fee that is so disproportionately large as to bear no reasonable relationship to the services rendered and that could not have been the product of arm’s-length bargaining, and concluded that it is in the best interest of each Fund and its shareholders to approve the continuance of the Advisory Contract for the coming year.
III. iShares MSCI Emerging Markets Minimum Volatility ETF
Under Section 15(c) of the Investment Company Act of 1940 (the “1940 Act”), the Company’s Board of Directors (the “Board”), including a majority of Directors who are not “interested persons” of the Company (as that term is defined in the 1940 Act) (the “Independent Directors”), is required annually to consider and approve the Investment Advisory Contract between the Company and BFA (the “Advisory Contract”) on behalf of the Fund. The Independent Directors requested, and BFA provided, such information as the Independent Directors, with advice from independent counsel, deemed reasonably necessary to evaluate the Advisory Contract. A committee of Independent Directors (the “15(c) Committee”), with independent counsel, met with management on May 1, 2015 and May 6, 2015, to discuss the types of information the Independent Directors required and the manner in which management would organize and present such information. At a meeting held on May 21, 2015, management presented preliminary information to the Board relating to the continuance of the Advisory Contract, and the Board, including the Independent Directors, reviewed and discussed such information at length. The Independent Directors requested from management certain additional information, which management agreed to provide. At a meeting held on June 24-25, 2015, the Board, including the Independent Directors, reviewed the additional information provided by management in response to these requests. After extensive discussions, the Board, including all of the Independent Directors, approved the continuance of the Advisory Contract for the Fund, based on a review of qualitative and quantitative information provided by BFA, including the additional information management provided at the request of the Independent Directors. The Board noted its satisfaction with the extent and quality of information provided and its frequent interactions with management, as well as the detailed responses and other information provided by BFA. The Board also noted that the Board and BFA agreed to discuss potential enhancements and adjustments to the 15(c) process for the coming year. The Independent Directors were advised by their independent counsel throughout the process, including about the legal standards applicable to their review. In approving the Advisory Contract for the Fund, the Board, including the Independent Directors, considered the following factors, no one of which was controlling, and reached the following conclusions:
Expenses and Performance of the Fund — The Board reviewed statistical information prepared by Lipper Inc. (“Lipper”), an independent provider of investment company data, regarding the expense ratio components, including actual advisory fees, waivers/reimbursements, and gross and net total expenses of the Fund in comparison with the same information for other exchange traded funds (including, where applicable, funds sponsored by an “at cost” service provider) and, in the limited instances where no comparable ETFs existed and the comparison group would not otherwise be reasonable in Lipper’s judgment, pure index institutional mutual funds, objectively selected by Lipper as comprising the Fund’s applicable peer group pursuant to Lipper’s proprietary ETF methodology (the “Lipper Group”). The Board was provided with a detailed description of Lipper’s proprietary ETF methodology used by Lipper to determine the Fund’s Lipper Group. The Board further noted that due to the limitations in providing comparable funds in the Lipper Group, the statistical information provided in Lipper’s report may or may not provide meaningful direct comparisons to the Fund in all instances.
| 110 | 2015 iSHARES ANNUAL REPORTTO SHAREHOLDERS |
Table of Contents
Board Review and Approval of Investment Advisory
Contract (Continued)
iSHARES®, INC.
The Board also noted that the investment advisory fee rate and overall expenses (net of waivers and reimbursements) for the Fund were lower than the median of the investment advisory fee rates and overall expenses (net of waivers and reimbursements) of the funds in its Lipper Group.
In addition, the Board reviewed statistical information prepared by Lipper regarding the performance of the Fund for the one-, three-, five-, ten-year, and since inception periods, as applicable, and the “last quarter” period ended December 31, 2014, and a comparison of the Fund’s performance to its performance benchmark index for the same periods. To the extent that any of the comparison funds included in the Lipper Group track the same index as the Fund, Lipper also provided, and the Board reviewed, a comparison of the Fund’s performance to that of such relevant comparison funds for the same periods. The Board noted that the Fund generally performed in line with its performance benchmark index over the relevant periods. In considering this information, the Board noted that the Lipper Group may include funds that have a different investment objective and/or benchmark from the Fund. In addition, the Board noted that the Fund seeks to track its own benchmark index and that, during the prior year, the Board received periodic reports on the Fund’s performance in comparison with its benchmark index. Such periodic comparative performance information, including detailed information on certain specific iShares funds requested by the Boards, was also considered.
Based on this review, the other factors considered at the meeting, and their general knowledge of ETF pricing, the Board concluded that the investment advisory fee rate and expense level and the historical performance of the Fund supported the Board’s approval of the continuance of the Advisory Contract for the coming year.
Nature, Extent and Quality of Services Provided by BFA — Based on management’s representations, including information about recent and proposed enhancements to the iShares business, including with respect to shareholder servicing and support, the Board expected that there would be no diminution in the scope of services required of or provided by BFA under the Advisory Contract for the coming year as compared to the scope of services provided by BFA during prior years. In reviewing the scope of these services, the Board considered BFA’s investment philosophy and experience, noting that BFA and its affiliates have committed significant resources over time, including during the past year, to supporting the iShares funds and their shareholders. The Board acknowledged that resources to support the iShares funds and their shareholders have been added or enhanced in recent years. The Board also considered BFA’s compliance program and its compliance record with respect to the Fund. In that regard, the Board noted that BFA reports to the Board about portfolio management and compliance matters on a periodic basis in connection with regularly scheduled meetings of the Board, and on other occasions as necessary and appropriate, and has provided information and made appropriate officers available as needed to provide further assistance with these matters. The Board also reviewed the background and experience of the persons responsible for the day-to-day management of the Fund, as well as the resources available to them in managing the Fund. In addition to the above considerations, the Board reviewed and considered detailed presentations regarding BFA’s investment performance, investment and risk management processes and strategies provided at the June 24-25, 2015 meeting and throughout the previous year, and matters related to BFA’s portfolio compliance policies and procedures. The Board noted that the Fund had met its investment objective consistently since its inception date.
Based on review of this information, and the performance information discussed above, the Board concluded that the nature, extent and quality of services provided by BFA to the Fund under the Advisory Contract supported the Board’s approval of the continuance of the Advisory Contract for the coming year.
Costs of Services Provided to the Fund and Profits Realized by BFA and Affiliates — The Board reviewed information about the profitability to BlackRock of the Fund based on the fees payable to BFA and its affiliates (including fees under the Advisory Contract), and all other sources of revenue and expense to BFA and its affiliates from the Fund’s operations for the last calendar year. The Board reviewed BlackRock’s profitability methodology for the iShares funds, noting that the 15(c) Committee had
BOARD REVIEWAND APPROVALOF INVESTMENT ADVISORY CONTRACT | 111 |
Table of Contents
Board Review and Approval of Investment Advisory
Contract (Continued)
iSHARES®, INC.
focused on the methodology and proposed presentation during its meetings. The Board discussed the sources of direct and ancillary revenue with management, including the revenues to BTC from securities lending by the Fund. The Board also discussed BFA’s profit margin as reflected in the Fund’s profitability analysis and reviewed information regarding potential economies of scale (as discussed below). Based on this review, the Board concluded that the profits realized by BFA and its affiliates under the Advisory Contract and from other relationships between the Fund and BFA and/or its affiliates, if any, were within a reasonable range in light of the factors considered.
Economies of Scale — The Board reviewed information regarding potential economies of scale or other efficiencies that may result from increases in the Fund’s assets, noting that the issue of economies of scale had been focused on extensively by the 15(c) Committee during its meetings and addressed by management. The Board and the 15(c) Committee reviewed information provided by BFA regarding scale benefits shared with the iShares funds through relatively low fee rates established at inception, breakpoints, waivers, or other fee reductions, as well as through additional investment in the iShares business and the provision of improved or additional infrastructure and services to the iShares funds and their shareholders. The Board and the 15(c) Committee received information regarding BlackRock’s historical profitability, including BFA’s and its affiliates’ costs in providing services. The cost information distinguished between fixed and variable costs, and explained how the level of fixed and variable costs, as well as the nature of such costs, may impact the existence or size of scale benefits. The Board noted that the Advisory Contract for the Fund already provided for breakpoints in the Fund’s investment advisory fee rate as the assets of the Fund, on an aggregated basis with the assets of certain other iShares funds, increase. The Board noted that it would continue to monitor the sharing of economies of scale to determine the appropriateness of adding new or revised breakpoints in the future.
Based on this review, as well as the other factors considered at the meeting, the Board, recognizing its responsibility to consider this issue periodically, determined to approve the continuance of the Advisory Contract for the coming year.
Fees and Services Provided for Other Comparable Funds/Accounts Managed by BFA and its Affiliates — The Board received and considered information regarding the investment advisory/management fee rates for other funds/accounts in the U.S. for which BFA (or its affiliates) provides investment advisory/management services, including open-end and closed-end funds registered under the 1940 Act (including sub-advised funds), collective trust funds, separately managed accounts, and institutional separate accounts (together, the “Other Accounts”), and acknowledged BFA’s assertion that the iShares funds are fundamentally different investment vehicles from the Other Accounts. The Board noted that BFA and its affiliates do manage Other Accounts with substantially the same investment objective and strategy as the Fund or that track the same index or a similar index as the Fund. The Board further noted that BFA provided the Board with detailed information regarding how the Other Accounts (particularly institutional clients) generally differ from the Fund, including in terms of the different, generally more extensive services provided to the Fund, as well as other significant differences in the approach of BFA and its affiliates to the Fund, on one hand, and Other Accounts, on the other. In that regard, the Board considered that the pricing of services to institutional clients is typically based on a number of factors beyond the nature and extent of the specific services to be provided and often depends on the overall relationship between the client and its affiliates and the adviser and its affiliates. In addition, the Board considered the relative complexity and inherent risks and challenges of managing and providing other services to the Fund, as a publicly traded exchange traded fund, as compared to the Other Accounts that are institutional clients in light of differing regulatory requirements and client-imposed mandates. The Board also considered the “all-inclusive” nature of the Fund’s advisory fee structure, and the Fund expenses borne by BFA under this arrangement. The Board noted that the investment advisory fee rate under the Advisory Contract for the Fund was generally higher than the investment advisory/management fee rates for the Other Accounts that are institutional clients of BFA (or its affiliates) and concluded that the differences appeared to be consistent with the factors discussed.
Other Benefits to BFA and/or its Affiliates — The Board reviewed the “fallout” benefits or ancillary revenue received by BFA and/or its affiliates in connection with the services provided to the Fund by BFA, such as payment of revenue to BTC, the Fund’s
| 112 | 2015 iSHARES ANNUAL REPORTTO SHAREHOLDERS |
Table of Contents
Board Review and Approval of Investment Advisory
Contract (Continued)
iSHARES®, INC.
securities lending agent, for loaning portfolio securities (which was included in the profit margins reviewed by the Board pursuant to BFA’s profitability methodology), and payment of advisory fees and/or administration fees to BFA and BTC (or their affiliates) in connection with any investments by the Fund in other funds for which BFA (or its affiliates) provides investment advisory services and/or administration services. The Board noted that BFA generally does not use soft dollars or consider the value of research or other services that may be provided to BFA (including its affiliates) in selecting brokers for portfolio transactions for the Fund. The Board further noted that any portfolio transactions on behalf of the Fund placed through a BFA affiliate or purchased from an underwriting syndicate in which a BFA affiliate participates, are reported to the Board pursuant to Rule 17e-1 or Rule 10f-3, as applicable, under the 1940 Act. The Board concluded that any such ancillary benefits would not be disadvantageous to the Fund’s shareholders and thus would not alter the Board’s conclusion with respect to the appropriateness of approving the continuance of the Advisory Contract for the coming year.
Based on the considerations described above, the Board determined that the Fund’s investment advisory fee rate under the Advisory Contract does not constitute a fee that is so disproportionately large as to bear no reasonable relationship to the services rendered and that could not have been the product of arm’s-length bargaining, and concluded that it is in the best interest of the Fund and its shareholders to approve the continuance of the Advisory Contract for the coming year.
BOARD REVIEWAND APPROVALOF INVESTMENT ADVISORY CONTRACT | 113 |
Table of Contents
Supplemental Information (Unaudited)
iSHARES®, INC.
Section 19(a) Notices
The amounts and sources of distributions reported are estimates and are provided pursuant to regulatory requirements and are not being provided for tax reporting purposes. The actual amounts and sources for tax reporting purposes will depend upon each Fund’s investment experience during the year and may be subject to changes based on the tax regulations. Shareholders will receive a Form 1099-DIV each calendar year that will inform them how to report these distributions for federal income tax purposes.
| Total Cumulative Distributions for the Fiscal Year | % Breakdown of the Total Cumulative Distributions for the Fiscal Year | |||||||||||||||||||||||||||||||
| iShares ETF | Net Investment Income | Net Realized Capital Gains | Return of Capital | Total Per Share | Net Investment Income | Net Realized Capital Gains | Return of Capital | Total Per Share | ||||||||||||||||||||||||
Core MSCI Emerging Markets | $ | 1.087643 | $ | — | $ | — | $ | 1.087643 | 100 | % | — | % | — | % | 100 | % | ||||||||||||||||
MSCI BRIC | 0.954159 | — | — | 0.954159 | 100 | — | — | 100 | ||||||||||||||||||||||||
MSCI Emerging Markets Asia | 0.845929 | — | — | 0.845929 | 100 | — | — | 100 | ||||||||||||||||||||||||
MSCI Emerging Markets Minimum Volatility | 1.419028 | — | — | 1.419028 | 100 | — | — | 100 | ||||||||||||||||||||||||
MSCI Emerging Markets | 1.293432 | — | — | 1.293432 | 100 | — | — | 100 | ||||||||||||||||||||||||
Premium/Discount Information
The Premium/Discount Information section is intended to present information about the differences between the daily market price on secondary markets for shares of a fund and that fund’s NAV. NAV is the price at which a fund issues and redeems shares. It is calculated in accordance with the standard formula for valuing mutual fund shares. The “Market Price” of a fund generally is determined using the midpoint between the highest bid and the lowest offer on the primary stock exchange on which the shares of such fund are listed for trading, as of the time that the fund’s NAV is calculated. A fund’s Market Price may be at, above or below its NAV. The NAV of a fund will fluctuate with changes in the fair value of its portfolio holdings. The Market Price of a fund will fluctuate in accordance with changes in its NAV, as well as market supply and demand.
Premiums or discounts are the differences (expressed as a percentage) between the NAV and Market Price of a fund on a given day, generally at the time the NAV is calculated. A premium is the amount that a fund is trading above the reported NAV, expressed as a percentage of the NAV. A discount is the amount that a fund is trading below the reported NAV, expressed as a percentage of the NAV.
The following information shows the frequency of distributions of premiums and discounts for each of the Funds. The information shown for each Fund is for five calendar years (or from the inception date of such Fund if less than five years) through the date of the most recent calendar quarter-end. The specific periods covered for each Fund are disclosed in the table for such Fund.
| 114 | 2015 iSHARES ANNUAL REPORTTO SHAREHOLDERS |
Table of Contents
Supplemental Information (Unaudited) (Continued)
iSHARES®, INC.
Each line in the table shows the number of trading days in which the Fund traded within the premium/discount range indicated. The number of trading days in each premium/discount range is also shown as a percentage of the total number of trading days in the period covered by each table. All data presented here represents past performance, which cannot be used to predict future results.
iShares Core MSCI Emerging Markets ETF
Period Covered: October 18, 2012 through June 30, 2015
Premium/Discount Range | Number of Days | Percentage of Total Days | ||||||
Greater than 2.5% | 1 | 0.15 | % | |||||
Greater than 2.0% and Less than 2.5% | 2 | 0.30 | ||||||
Greater than 1.5% and Less than 2.0% | 9 | 1.33 | ||||||
Greater than 1.0% and Less than 1.5% | 41 | 6.06 | ||||||
Greater than 0.5% and Less than 1.0% | 162 | 23.93 | ||||||
Between 0.5% and –0.5% | 389 | 57.45 | ||||||
Less than –0.5% and Greater than –1.0% | 51 | 7.53 | ||||||
Less than –1.0% and Greater than –1.5% | 17 | 2.51 | ||||||
Less than –1.5% and Greater than –2.0% | 3 | 0.44 | ||||||
Less than –2.0% and Greater than –2.5% | 2 | 0.30 | ||||||
|
|
|
| |||||
| 677 | 100.00 | % | ||||||
|
|
|
| |||||
iShares MSCI BRIC ETF
Period Covered: January 1, 2010 through June 30, 2015
Premium/Discount Range | Number of Days | Percentage of Total Days | ||||||
Greater than 3.5% | 1 | 0.07 | % | |||||
Greater than 3.0% and Less than 3.5% | 1 | 0.07 | ||||||
Greater than 2.5% and Less than 3.0% | 5 | 0.36 | ||||||
Greater than 2.0% and Less than 2.5% | 6 | 0.43 | ||||||
Greater than 1.5% and Less than 2.0% | 27 | 1.95 | ||||||
Greater than 1.0% and Less than 1.5% | 110 | 7.96 | ||||||
Greater than 0.5% and Less than 1.0% | 154 | 11.15 | ||||||
Between 0.5% and –0.5% | 725 | 52.47 | ||||||
Less than –0.5% and Greater than –1.0% | 228 | 16.50 | ||||||
Less than –1.0% and Greater than –1.5% | 82 | 5.94 | ||||||
Less than –1.5% and Greater than –2.0% | 31 | 2.24 | ||||||
Less than –2.0% and Greater than –2.5% | 6 | 0.43 | ||||||
Less than –2.5% and Greater than –3.0% | 5 | 0.36 | ||||||
Less than –3.0% and Greater than –3.5% | 1 | 0.07 | ||||||
|
|
|
| |||||
| 1,382 | 100.00 | % | ||||||
|
|
|
| |||||
SUPPLEMENTAL INFORMATION | 115 |
Table of Contents
Supplemental Information (Unaudited) (Continued)
iSHARES®, INC.
iShares MSCI Emerging Markets Asia ETF
Period Covered: February 8, 2012 through June 30, 2015
Premium/Discount Range | Number of Days | Percentage of Total Days | ||||||
Greater than 3.0% | 1 | 0.12 | % | |||||
Greater than 2.5% and Less than 3.0% | 2 | 0.23 | ||||||
Greater than 2.0% and Less than 2.5% | 5 | 0.59 | ||||||
Greater than 1.5% and Less than 2.0% | 27 | 3.17 | ||||||
Greater than 1.0% and Less than 1.5% | 81 | 9.50 | ||||||
Greater than 0.5% and Less than 1.0% | 188 | 22.04 | ||||||
Between 0.5% and –0.5% | 405 | 47.49 | ||||||
Less than –0.5% and Greater than –1.0% | 96 | 11.25 | ||||||
Less than –1.0% and Greater than –1.5% | 31 | 3.63 | ||||||
Less than –1.5% and Greater than –2.0% | 13 | 1.52 | ||||||
Less than –2.0% and Greater than –2.5% | 2 | 0.23 | ||||||
Less than –2.5% and Greater than –3.0% | 2 | 0.23 | ||||||
|
|
|
| |||||
| 853 | 100.00 | % | ||||||
|
|
|
| |||||
iShares MSCI Emerging Markets Minimum Volatility ETF
Period Covered: October 18, 2011 through June 30, 2015
Premium/Discount Range | Number of Days | Percentage of Total Days | ||||||
Greater than 3.0% | 2 | 0.22 | % | |||||
Greater than 2.5% and Less than 3.0% | 2 | 0.22 | ||||||
Greater than 2.0% and Less than 2.5% | 4 | 0.43 | ||||||
Greater than 1.5% and Less than 2.0% | 23 | 2.47 | ||||||
Greater than 1.0% and Less than 1.5% | 49 | 5.27 | ||||||
Greater than 0.5% and Less than 1.0% | 205 | 22.04 | ||||||
Between 0.5% and –0.5% | 524 | 56.33 | ||||||
Less than –0.5% and Greater than –1.0% | 82 | 8.82 | ||||||
Less than –1.0% and Greater than –1.5% | 27 | 2.90 | ||||||
Less than –1.5% and Greater than –2.0% | 8 | 0.86 | ||||||
Less than –2.0% and Greater than –2.5% | 2 | 0.22 | ||||||
Less than –2.5% and Greater than –3.0% | 2 | 0.22 | ||||||
|
|
|
| |||||
| 930 | 100.00 | % | ||||||
|
|
|
| |||||
| 116 | 2015 iSHARES ANNUAL REPORTTO SHAREHOLDERS |
Table of Contents
Supplemental Information (Unaudited) (Continued)
iSHARES®, INC.
iShares MSCI Emerging Markets Small-Cap ETF
Period Covered: August 16, 2011 through June 30, 2015
Premium/Discount Range | Number of Days | Percentage of Total Days | ||||||
Greater than 5.5% | 1 | 0.10 | % | |||||
Greater than 5.0% and Less than 5.5% | 1 | 0.10 | ||||||
Greater than 4.5% and Less than 5.0% | 2 | 0.21 | ||||||
Greater than 4.0% and Less than 4.5% | 3 | 0.31 | ||||||
Greater than 3.5% and Less than 4.0% | 2 | 0.21 | ||||||
Greater than 3.0% and Less than 3.5% | 5 | 0.51 | ||||||
Greater than 2.5% and Less than 3.0% | 5 | 0.51 | ||||||
Greater than 2.0% and Less than 2.5% | 19 | 1.95 | ||||||
Greater than 1.5% and Less than 2.0% | 46 | 4.72 | ||||||
Greater than 1.0% and Less than 1.5% | 98 | 10.06 | ||||||
Greater than 0.5% and Less than 1.0% | 196 | 20.12 | ||||||
Between 0.5% and –0.5% | 411 | 42.21 | ||||||
Less than –0.5% and Greater than –1.0% | 114 | 11.70 | ||||||
Less than –1.0% and Greater than –1.5% | 35 | 3.59 | ||||||
Less than –1.5% and Greater than –2.0% | 18 | 1.85 | ||||||
Less than –2.0% and Greater than –2.5% | 12 | 1.23 | ||||||
Less than –2.5% and Greater than –3.0% | 4 | 0.41 | ||||||
Less than –3.0% | 2 | 0.21 | ||||||
|
|
|
| |||||
| 974 | 100.00 | % | ||||||
|
|
|
| |||||
Regulation under the Alternative Investment Fund Managers Directive (“AIFMD” or, the “Directive”)
The Directive imposes detailed and prescriptive obligations on fund managers established in the European Union (the “EU”). These do not currently apply to managers established outside the EU, such as BFA. Rather, non-EU managers are only required to comply with certain disclosure, reporting and transparency obligations of the Directive if such managers market a fund to EU investors.
BFA has registered the iShares Core MSCI Emerging Markets ETF, iShares MSCI BRIC ETF and iShares MSCI Emerging Markets Minimum Volatility ETF (each a “Fund”, collectively the “Funds”) to be marketed to EU investors in the United Kingdom, the Netherlands, Finland, Sweden and Luxembourg.
Report on Remuneration
BFA is required under the Directive to make quantitative disclosures of remuneration. These disclosures are made in line with BlackRock’s interpretation of currently available regulatory guidance on quantitative remuneration disclosures. As market or regulatory practice develops, BlackRock may consider it appropriate to make changes to the way in which quantitative remuneration disclosures are calculated. Where such changes are made, this may result in disclosures in relation to a fund not being comparable to the disclosures made in the prior year, or in relation to other BlackRock fund disclosures in that same year.
Disclosures are provided in relation to both (a) the staff of BFA; (b) staff who are senior management; and (c) staff who have the ability to materially affect the risk profile of the Fund.
SUPPLEMENTAL INFORMATION | 117 |
Table of Contents
Supplemental Information (Unaudited) (Continued)
iSHARES®, INC.
All individuals included in the aggregated figures disclosed are rewarded in line with BlackRock’s remuneration policy for their responsibilities across the relevant BlackRock business area. As all individuals have a number of areas of responsibilities, only the portion of remuneration for those individuals’ services attributable to the Fund is included in the aggregate figures disclosed.
BlackRock has a clear and well defined pay-for-performance philosophy, and compensation programs which support that philosophy. For senior management, a significant percentage of variable remuneration is deferred over time. All employees are subject to a claw-back policy.
Compensation decisions for employees are made based on BlackRock’s full-year financial results and other non-financial goals and objectives. Alongside financial performance, individual compensation is also based on strategic and operating results and other considerations such as management and leadership capabilities. No set formulas are established and no fixed benchmarks are used in determining annual incentive awards.
Bonus pools are reviewed by BlackRock’s independent compensation committee, taking into account both actual and projected financial information together with information provided by the Operational Risk and Regulatory Compliance departments in relation to any activities, incidents or events that warrant consideration in making compensation decisions.
Functions such as Finance, Operational Risk, Legal & Compliance, and Human Resources each have their own organizational structures which are independent of the business units. Functional bonus pools are determined with reference to the performance of each individual function and the remuneration of the senior members of control functions is directly overseen by BlackRock’s independent compensation committee. No individual is involved in setting his or her own remuneration.
Members of staff and senior management of BFA typically provide both AIFMD and non-AIFMD related services in respect of multiple funds, clients and functions of BFA and across the broader BlackRock group. Therefore, the figures disclosed are a sum of each individual’s portion of remuneration attributable to the Fund according to an objective apportionment methodology which acknowledges the multiple-service nature of BFA. Accordingly, the figures are not representative of any individual’s actual remuneration or their remuneration structure.
The amount of the total remuneration awarded by BFA to its staff which has been attributed to the iShares Core MSCI Emerging Markets ETF in respect of BFA’s financial year ending December 31, 2014 was USD 1.04 million. This figure is comprised of fixed remuneration of USD 0.42 million and variable remuneration of USD 0.62 million. There were a total of 499 beneficiaries of the remuneration described above.
The amount of the aggregate remuneration awarded by BFA, which has been attributed to the iShares Core MSCI Emerging Markets ETF in respect of BFA’s financial year ending December 31, 2014, to its senior management was USD 0.14 million, and to members of its staff whose actions have a material impact on the risk profile of the Fund was USD 0.03 million.
The amount of the total remuneration awarded by BFA to its staff which has been attributed to the iShares MSCI BRIC ETF in respect of BFA’s financial year ending December 31, 2014 was USD 51.7 thousand. This figure is comprised of fixed remuneration of USD 20.9 thousand and variable remuneration of USD 30.8 thousand. There were a total of 499 beneficiaries of the remuneration described above.
The amount of the aggregate remuneration awarded by BFA, which has been attributed to the iShares MSCI BRIC ETF in respect of BFA’s financial year ending December 31, 2014, to its senior management was USD 7.2 thousand, and to members of its staff whose actions have a material impact on the risk profile of the Fund was 1.3 thousand.
The amount of the total remuneration awarded by BFA to its staff which has been attributed to the iShares MSCI Emerging Markets Minimum Volatility ETF in respect of BFA’s financial year ending December 31, 2014 was USD 325.8 thousand. This
| 118 | 2015 iSHARES ANNUAL REPORTTO SHAREHOLDERS |
Table of Contents
Supplemental Information (Unaudited) (Continued)
iSHARES®, INC.
figure is comprised of fixed remuneration of USD 131.6 thousand and variable remuneration of USD 194.1 thousand. There were a total of 499 beneficiaries of the remuneration described above.
The amount of the aggregate remuneration awarded by BFA, which has been attributed to the iShares MSCI Emerging Markets Minimum Volatility ETF in respect of BFA’s financial year ending December 31, 2014, to its senior management was USD 45.1 thousand, and to members of its staff whose actions have a material impact on the risk profile of the Fund was USD 8.4 thousand.
SUPPLEMENTAL INFORMATION | 119 |
Table of Contents
Director and Officer Information
iSHARES®, INC.
The Board of Directors has responsibility for the overall management and operations of the Company, including general supervision of the duties performed by BFA and other service providers. Each Director serves until he or she resigns, is removed, dies, retires or becomes incapacitated. Each officer shall hold office until his or her successor is elected and qualifies or until his or her death, or his or her resignation or removal. Directors who are not “interested persons” (as defined in the 1940 Act) of the Company are referred to as independent directors (“Independent Directors”).
The registered investment companies advised by BFA or its affiliates are organized into one complex of closed-end funds, two complexes of open-end funds and one complex of exchange-traded funds (“Exchange-Traded Fund Complex”) (each, a “BlackRock Fund Complex”). Each Fund is included in the BlackRock Fund Complex referred to as the Exchange-Traded Fund Complex. Each Director also serves as a Trustee of iShares Trust and a Trustee of iShares U.S. ETF Trust and, as a result, oversees a total of 319 funds (as of August 31, 2015) within the Exchange-Traded Fund Complex. With the exception of Robert S. Kapito and Mark Wiedman, the address of each Director and officer is c/o BlackRock, Inc., 400 Howard Street, San Francisco, CA 94105. The address of Mr. Kapito and Mr. Wiedman is c/o BlackRock, Inc., Park Avenue Plaza, 55 East 52nd Street, New York, NY 10055. The Board has designated Robert H. Silver as its Independent Chairman. Additional information about the Funds’ Directors and officers may be found in the Funds’ combined Statement of Additional Information, which is available without charge, upon request, by calling toll-free 1-800-iShares (1-800-474-2737).
Interested Directors
| Name (Age) | Position(s) | Principal Occupation(s) During the Past 5 Years | Other Directorships Held by Director | |||
Robert S. Kapitoa (58) | Director (since 2009). | President and Director, BlackRock, Inc. (since 2006); Vice Chairman of BlackRock, Inc. and Head of BlackRock, Inc.’s Portfolio Management Group (since its formation in 1998) and BlackRock, Inc.’s predecessor entities (since 1988); Trustee, University of Pennsylvania (since 2009); President of Board of Directors, Hope & Heroes Children’s Cancer Fund (since 2002); President of the Board of Directors, Periwinkle Theatre for Youth (since 1983). | Trustee of iShares Trust (since 2009); Trustee of iShares U.S. ETF Trust (since 2011); Director of BlackRock, Inc. (since 2006). | |||
Mark Wiedmanb (44) | Director (since 2013). | Managing Director, BlackRock, Inc. (since 2007); Global Head of iShares (since 2011); Head of Corporate Strategy, BlackRock, Inc. (2009-2011). | Trustee of iShares Trust (since 2013); Trustee of iShares U.S. ETF Trust (since 2013); Director of PennyMac Financial Services, Inc. (since 2008). | |||
| a | Robert S. Kapito is deemed to be an “interested person” (as defined in the 1940 Act) of the Company due to his affiliations with BlackRock, Inc. |
| b | Mark Wiedman is deemed to be an “interested person” (as defined in the 1940 Act) of the Company due to his affiliations with BlackRock, Inc. and its affiliates. |
| 120 | 2015 iSHARES ANNUAL REPORTTO SHAREHOLDERS |
Table of Contents
Director and Officer Information (Continued)
iSHARES®, INC.
Independent Directors
| Name (Age) | Position(s) | Principal Occupation(s) During the Past 5 Years | Other Directorships Held by Director | |||
Robert H. Silver (60) | Director (since 2007); Independent Chairman (since 2012). | President and Co-Founder of The Bravitas Group, Inc. (since 2006); Director and Vice Chairman of the YMCA of Greater NYC (2001-2011); Broadway Producer (2006-2011); Co-Founder and Vice President of Parentgiving Inc. (since 2008); Director and Member of the Audit and Compensation Committee of EPAM Systems, Inc. (2006-2009); President and Chief Operating Officer of UBS Financial Services Inc. (formerly Paine Webber Inc.) (2003-2005) and various executive positions with UBS and its affiliates (1988-2005); CPA and Audit Manager of KPMG, LLP (formerly Peat Marwick Mitchell) (1977-1983). | Trustee of iShares Trust (since 2007); Trustee of iShares U.S. ETF Trust (since 2011); Independent Chairman of iShares Trust and iShares U.S. ETF Trust (since 2012). | |||
Jane D. Carlin (59) | Director (since 2015). | Managing Director and Global Head of Financial Holding Company Governance & Assurance and the Global Head of Operational Risk Management of Morgan Stanley (2006-2012). | Trustee of iShares Trust (since 2015); Trustee of iShares U.S. ETF Trust (since 2015); Director of PHH Corporation (mortgage solutions) (since 2012). | |||
Cecilia H. Herbert (66) | Director (since 2005); Nominating and Governance Committee Chair and Equity Plus Committee Chair (since 2012). | Director (1998-2013) and President (2007-2011) of the Board of Directors, Catholic Charities CYO; Trustee (2002-2011) and Chair of the Finance and Investment Committee (2006-2010) of the Thacher School; Member (since 1992) and Chair (1994-2005) of the Investment Committee, Archdiocese of San Francisco; Trustee and Member of the Investment Committee, WNET, the New York public broadcasting/media company (since 2011). | Trustee of iShares Trust (since 2005); Trustee of iShares U.S. ETF Trust (since 2011); Director of Forward Funds (34 portfolios) (since 2009). | |||
Charles A. Hurty (71) | Director (since 2005); Audit Committee Chair (since 2006). | Retired; Partner, KPMG LLP (1968-2001). | Trustee of iShares Trust (since 2005); Trustee of iShares U.S. ETF Trust (since 2011); Director of GMAM Absolute Return Strategy Fund (1 portfolio) (since 2002); Director of SkyBridge Alternative Investments Multi-Adviser Hedge Fund Portfolios LLC (2 portfolios) (since 2002). | |||
DIRECTORAND OFFICER INFORMATION | 121 |
Table of Contents
Director and Officer Information (Continued)
iSHARES®, INC.
Independent Directors (Continued)
| Name (Age) | Position(s) | Principal Occupation(s) During the Past 5 Years | Other Directorships Held by Director | |||
John E. Kerrigan (60) | Director (since 2005); Fixed Income Plus Committee Chair (since 2012). | Chief Investment Officer, Santa Clara University (since 2002). | Trustee of iShares Trust (since 2005); Trustee of iShares U.S. ETF Trust (since 2011). | |||
John E. Martinez (54) | Director (since 2003); Securities Lending Committee Chair (since 2012). | Director of FirstREX Agreement Corp. (formerly EquityRock, Inc.) (since 2005). | Trustee of iShares Trust (since 2003); Trustee of iShares U.S. ETF Trust (since 2011). | |||
Madhav V. Rajan (51) | Director (since 2011); 15(c) Committee Chair (since 2012). | Robert K. Jaedicke Professor of Accounting and Senior Associate Dean for Academic Affairs and Head of MBA Program, Stanford University Graduate School of Business (since 2001); Professor of Law (by courtesy), Stanford Law School (since 2005); Visiting Professor, University of Chicago (2007-2008). | Trustee of iShares Trust (since 2011); Trustee of iShares U.S. ETF Trust (since 2011); Director, Cavium, Inc. (since 2013). | |||
| 122 | 2015 iSHARES ANNUAL REPORTTO SHAREHOLDERS |
Table of Contents
Director and Officer Information (Continued)
iSHARES®, INC.
Officers
| Name (Age) | Position(s) | Principal Occupation(s) During the Past 5 Years | ||
Manish Mehta (44) | President (since 2013). | Managing Director, BlackRock, Inc. (since 2009); Chief Operating Officer for iShares (since 2009); Head of Strategy and Corporate Development, BGI (2005-2009); Chief of Staff to the CEO, BGI (2005-2009). | ||
Jack Gee (55) | Treasurer and Chief Financial Officer (since 2008). | Managing Director, BlackRock, Inc. (since 2009); Senior Director of Fund Administration of Intermediary Investor Business, BGI (2009); Director of Fund Administration of Intermediary Investor Business, BGI (2004-2009). | ||
Benjamin Archibald (40) | Secretary (since 2015). | Managing Director, BlackRock, Inc. (since 2014); Secretary of the BlackRock-advised Mutual Funds (since 2012); Director, BlackRock, Inc. (2010-2013). | ||
Charles Park (47) | Chief Compliance Officer (since 2006). | Chief Compliance Officer of BlackRock Advisors, LLC and the BlackRock-advised Funds in the Equity-Bond Complex, the Equity-Liquidity Complex and the Closed-End Complex (since 2014); Chief Compliance Officer, BFA (since 2006). | ||
Scott Radell (46) | Executive Vice President (since 2012). | Managing Director, BlackRock, Inc. (since 2009); Head of Portfolio Solutions, BlackRock, Inc. (since 2009); Head of Portfolio Solutions, BGI (2007-2009); Credit Portfolio Manager, BGI (2005-2007); Credit Research Analyst, BGI (2003-2005). | ||
Amy Schioldager (52) | Executive Vice President (since 2007). | Senior Managing Director, BlackRock, Inc. (since 2009); Global Head of Index Equity, BGI (2008-2009); Global Head of U.S. Indexing, BGI (2006-2008); Head of Domestic Equity Portfolio Management, BGI (2001-2006). | ||
DIRECTORAND OFFICER INFORMATION | 123 |
Table of Contents
Notes:
| 124 | 2015 iSHARES ANNUAL REPORTTO SHAREHOLDERS |
Table of Contents
Notes:
NOTES | 125 |
Table of Contents
Notes:
| 126 | 2015 iSHARES ANNUAL REPORTTO SHAREHOLDERS |
Table of Contents
For more information visit www.iShares.com or call 1-800-474-2737
This report is intended for the Funds’ shareholders. It may not be distributed to prospective investors unless it is preceded or accompanied by the current prospectus.
Investing involves risk, including possible loss of principal.
The iShares Funds are distributed by BlackRock Investments, LLC (together with its affiliates, “BlackRock”).
The iShares Funds are not sponsored, endorsed, issued, sold or promoted by MSCI Inc., nor does this company make any representation regarding the advisability of investing in the iShares Funds. BlackRock is not affiliated with the company listed above.
A description of the policies that the Funds use to determine how to vote proxies relating to portfolio securities and information about how the Funds voted proxies relating to portfolio securities during the most recent twelve-month period ending June 30 is available without charge, upon request, by calling toll-free 1-800-474-2737; on the Funds’ website at www.iShares.com; and on the U.S. Securities and Exchange Commission (SEC) website at www.sec.gov.
The Funds file their complete schedules of portfolio holdings with the SEC for the first and third quarters of each fiscal year on Form N-Q. The Funds’ Forms N-Q are available on the SEC’s website or may be reviewed and copied at the SEC’s Public Reference Room in Washington, D.C. Information on the operation of the Public Reference Room may be obtained by calling 1-800-SEC-0330. The Funds also disclose their complete schedules of portfolio holdings on a daily basis on the Funds’ website.
Certain financial information required by regulations or listing exchange rules in jurisdictions outside the U.S. in which iShares Funds are cross-listed may be publicly filed in those jurisdictions. This information is available upon request by calling 1-800-474-2737.
©2015 BlackRock, Inc. All rights reserved. iSHARES and BLACKROCK are registered trademarks of BlackRock, Inc. or its subsidiaries. All other marks are the property of their respective owners.
iS-AR-810-0815
 |  |
Table of Contents
AUGUST 31, 2015
2015 ANNUAL REPORT
|  |
iShares, Inc.
| Ø | iShares MSCI All Country World Minimum Volatility ETF | ACWV | NYSE Arca |
| Ø | iShares MSCI Emerging Markets Horizon ETF | EMHZ | BATS |
| Ø | iShares MSCI Frontier 100 ETF | FM | NYSE Arca |
| Ø | iShares MSCI World ETF | URTH | NYSE Arca |
Table of Contents
| 5 | ||||
| 14 | ||||
| 14 | ||||
| 15 | ||||
| 15 | ||||
| 21 | ||||
| 25 | ||||
| 28 | ||||
| 43 | ||||
| 49 | ||||
| 53 | ||||
| 65 | ||||
| 66 | ||||
| 67 | ||||
| 77 | ||||
| 81 |
Table of Contents
Management’s Discussion of Fund Performance
iSHARES®, INC.
GLOBAL MARKET OVERVIEW
Global equity markets delivered a negative return for the 12 months ended August 31, 2015 (the “reporting period”). The MSCI ACWI, a broad global equity index that includes both developed and emerging markets, returned -6.29% for the reporting period.
The reporting period was characterized by a continued divergence in economic growth and central bank policy between the U.S. and the rest of the world. Despite a slowdown in early 2015, the U.S. economy remained one of the strongest economies among developed countries, which motivated the U.S. Federal Reserve Bank (the “Fed”) to scale back its economic stimulus measures. The Fed ended a two-year quantitative easing program in October 2014 and signaled its intent to raise its short-term interest rate target sometime in 2015. In contrast, weaker economic growth in most other regions of the globe led many of the world’s central banks to take more aggressive actions to stimulate economic activity.
This divergence contributed to a notably stronger U.S. dollar. For the reporting period, the euro, Japanese yen, British pound and Australian dollar declined by 15%, 14%, 7%, and 24% against the U.S. dollar, respectively. Weaker foreign currencies decrease the value of foreign investments measured in U.S. dollars, thereby decreasing returns for U.S. investors, while increasing foreign currencies relative to the U.S. dollar have the opposite effect. Currency performance had a meaningful impact on non-U.S. equity returns for U.S. investors. For example, the MSCI ACWI returned 0.59% in local currency terms for the reporting period.
A number of other factors influenced global markets during the reporting period. Energy prices fell sharply amid growing supply — primarily from increased production in the U.S. — and declining global demand. Lower energy prices contributed to historically low and declining inflation rates in most of the world. Consumer prices were nearly unchanged in the U.S., the European Union, and Japan, while prices in China and India rose at a relatively slow rate. Low inflation and tepid demand kept the Fed’s zero interest rate policy intact, while central banks throughout the world took aggressive measures to stimulate demand.
Global markets advanced for most of the reporting period, then declined sharply in the last few months of the reporting period. The volatility began in China, as slowing economic growth led to a steep drop in China’s equity markets. Plummeting commodity prices amid already subdued inflation also raised concerns about global demand. Currency devaluations in Asia, including China, Vietnam, Pakistan, and Kazakhstan, led to speculation that Asian countries were weakening their currencies to compete for demand. These global events led to further uncertainty about the timing of an expected interest rate hike from the Fed.
On a regional basis, U.S. stocks advanced by less than 1% for the reporting period as declining interest rates, ongoing economic growth, and low inflation provided a favorable environment for U.S. equity market performance. After generating its fastest quarterly growth rate in 11 years in the third quarter of 2014, the U.S. economy slowed over the next two quarters. Economic activity improved over the last several months of the reporting period, boosted by an increase in consumer spending.
European stocks declined by about 8% in U.S. dollar terms for the reporting period, though they advanced more than 3% when measured in local currencies. The European Central Bank initiated quantitative easing measures in early 2015, and signs of economic improvement emerged in the latter half of the reporting period. A tentative agreement on Greece’s debt repayment helped alleviate ongoing concerns about Europe’s sovereign debt levels.
Stock markets in the Asia/Pacific region (excluding Japan) declined by approximately 19% in U.S. dollar terms, which equated to an 8% decline when measured in local currencies. China’s economic slowdown weighed heavily on the region, as China is the largest trading partner of many countries in the region. On the bright side, Japanese stocks performed relatively well, as ongoing economic stimulus and reform measures led to a 4% gain in U.S. dollar terms (22% when measured in Japanese yen).
Emerging markets stocks fell by approximately 23% in U.S. dollar terms for the reporting period, though the decline was about 10% when measured in local currencies. Many of the largest emerging economies — including China, Russia, and Brazil — experienced slowing economic growth during the reporting period. Latin American stocks posted some of the biggest declines, as the region struggled with slow growth and declining commodity prices.
MANAGEMENT’S DISCUSSIONSOF FUND PERFORMANCE | 5 |
Table of Contents
Management’s Discussion of Fund Performance
iSHARES® MSCI ALL COUNTRY WORLD MINIMUM VOLATILITY ETF
Performance as of August 31, 2015
| Average Annual Total Returns | Cumulative Total Returns | |||||||||||||||||||||||||
| NAV | MARKET | INDEX | NAV | MARKET | INDEX | |||||||||||||||||||||
1 Year | 1.15% | 1.14% | 0.88% | 1.15% | 1.14% | 0.88% | ||||||||||||||||||||
Since Inception | 10.44% | 10.38% | 10.15% | 46.87% | 46.58% | 45.35% | ||||||||||||||||||||
GROWTH OF $10,000 INVESTMENT
(SINCE INCEPTION AT NET ASSET VALUE)
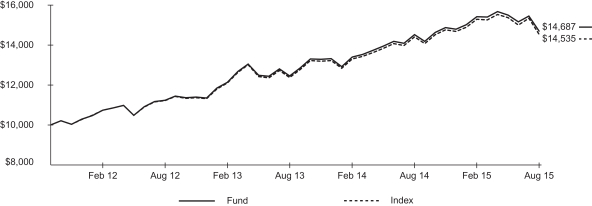
The inception date of the Fund was 10/18/11. The first day of secondary market trading was 10/20/11.
Past performance is no guarantee of future results. Performance results do not reflect the deduction of taxes that a shareholder would pay on fund distributions or on the redemption or sale of fund shares. See “About Fund Performance” on page 14 for more information.
| Shareholder Expenses | ||||||||||||||||||||||||||
| Actual | Hypothetical 5% Return | |||||||||||||||||||||||||
| Beginning Account Value (3/1/15) | Ending Account Value (8/31/15) | Expenses Paid During Period a | Beginning Account Value (3/1/15) | Ending Account Value (8/31/15) | Expenses Paid During Period a | Annualized Expense Ratio | ||||||||||||||||||||
| $ | 1,000.00 | $ | 952.70 | $ | 0.98 | $ | 1,000.00 | $ | 1,024.20 | $ | 1.02 | 0.20% | ||||||||||||||
| a | Expenses are calculated using the Fund’s annualized expense ratio (as disclosed in the table), multiplied by the average account value for the period, multiplied by the number of days in the period (184 days) and divided by the number of days in the year (365 days). See “Shareholder Expenses” on page 14 for more information. |
| 6 | 2015 iSHARES ANNUAL REPORTTO SHAREHOLDERS |
Table of Contents
Management’s Discussion of Fund Performance (Continued)
iSHARES® MSCI ALL COUNTRY WORLD MINIMUM VOLATILITY ETF
The iShares MSCI All Country World Minimum Volatility ETF (the “Fund”) seeks to track the investment results of an index composed of developed and emerging market equities that, in the aggregate, have lower volatility characteristics relative to the broader developed and emerging equity markets, as represented by the MSCI ACWI Minimum Volatility (USD) Index (the “Index”). The Fund invests in a representative sample of securities included in the Index that collectively has an investment profile similar to the Index. Due to the use of representative sampling, the Fund may or may not hold all of the securities that are included in the Index. For the 12-month reporting period ended August 31, 2015, the total return for the Fund was 1.15%, net of fees, while the total return for the Index was 0.88%.
As represented by the Index, lower-volatility global stocks advanced modestly for the reporting period. The Index generated a positive return despite the negative impact of currency fluctuations relative to the U.S. dollar. The U.S. comprised more than half of the Index as of the end of the reporting period; the top country weights in the remainder of the Index included Canada, China, Japan, Switzerland, and Taiwan. For the reporting period, the Swiss franc depreciated by 5%, the Taiwanese dollar depreciated by 8%, the Japanese yen depreciated by 14%, and the Canadian dollar depreciated by 18% against the U.S. dollar. The currency fluctuations had a meaningful impact on the Index’s performance in U.S. dollar terms. When measured in local currencies, the Index returned 6.57% for the reporting period.
Global equity markets experienced substantial volatility during the reporting period in an environment of geopolitical conflicts, declining commodity prices, and global economic weakness. In addition, events in China late in the reporting period — including signs of economic weakness, a precipitous drop in the country’s stock market, and an unexpected devaluation of the Chinese yuan — led to sharp declines in stock markets around the globe.
In this environment, the Index outpaced the decline of the MSCI All Country World Index (ACWI), a broad measure of global equity market performance. The Index also experienced less volatility than the MSCI ACWI during the reporting period.
ALLOCATION BY SECTOR
As of 8/31/15
| Sector | Percentage of Total Investments* |
Financials | 18.15 | % | ||
Health Care | 17.51 | |||
Consumer Staples | 14.84 | |||
Consumer Discretionary | 9.81 | |||
Telecommunication Services | 8.74 | |||
Information Technology | 8.42 | |||
Utilities | 8.37 | |||
Industrials | 7.96 | |||
Materials | 3.96 | |||
Energy | 2.24 | |||
|
| |||
TOTAL | 100.00 | % | ||
|
|
TEN LARGEST COUNTRIES
As of 8/31/15
| Country | Percentage of Total Investments* |
United States | 55.63 | % | ||
Japan | 13.65 | |||
Canada | 5.79 | |||
China | 4.52 | |||
Switzerland | 3.73 | |||
Taiwan | 3.62 | |||
Hong Kong | 3.42 | |||
United Kingdom | 2.38 | |||
Singapore | 1.30 | |||
Malaysia | 0.93 | |||
|
| |||
TOTAL | 94.97 | % | ||
|
|
| * | Excludes money market funds. |
MANAGEMENT’S DISCUSSIONSOF FUND PERFORMANCE | 7 |
Table of Contents
Management’s Discussion of Fund Performance
iSHARES® MSCI EMERGING MARKETS HORIZON ETF
Performance as of August 31, 2015
| Cumulative Total Returns | ||||||||||||
| NAV | MARKET | INDEX | ||||||||||
Since Inception | (20.64)% | (22.81)% | (20.57)% | |||||||||
GROWTH OF $10,000 INVESTMENT
(SINCE INCEPTION AT NET ASSET VALUE)
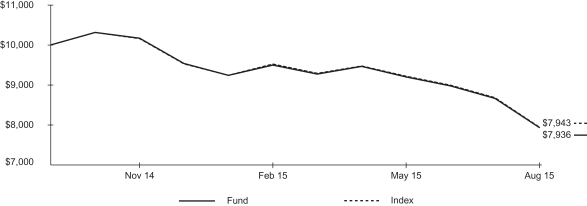
The inception date of the Fund was 10/14/14. The first day of secondary market trading was 10/16/14.
Past performance is no guarantee of future results. Performance results do not reflect the deduction of taxes that a shareholder would pay on fund distributions or on the redemption or sale of fund shares. See “About Fund Performance” on page 14 for more information.
| Shareholder Expenses | ||||||||||||||||||||||||||
| Actual | Hypothetical 5% Return | |||||||||||||||||||||||||
| Beginning Account Value (3/1/15) | Ending Account Value (8/31/15) | Expenses Paid During Period a | Beginning Account Value (3/1/15) | Ending Account Value (8/31/15) | Expenses Paid During Period a | Annualized Expense Ratio | ||||||||||||||||||||
| $ | 1,000.00 | $ | 835.80 | $ | 2.31 | $ | 1,000.00 | $ | 1,022.70 | $ | 2.55 | 0.50% | ||||||||||||||
| a | Expenses are calculated using the Fund’s annualized expense ratio (as disclosed in the table), multiplied by the average account value for the period, multiplied by the number of days in the period (184 days) and divided by the number of days in the year (365 days). See “Shareholder Expenses” on page 14 for more information. |
| 8 | 2015 iSHARES ANNUAL REPORTTO SHAREHOLDERS |
Table of Contents
Management’s Discussion of Fund Performance (Continued)
iSHARES® MSCI EMERGING MARKETS HORIZON ETF
The iShares MSCI Emerging Markets Horizon ETF (the “Fund”) seeks to track the investment results of an index that takes the smallest 25% of countries by market capitalization from the universe of an index of emerging markets countries, and then excludes Brazil, China, India, and Russia, as represented by the MSCI Emerging Markets Horizon Index (the “Index”). The Fund invests in a representative sample of securities included in the Index that collectively has an investment profile similar to the Index. Due to the use of representative sampling, the Fund may or may not hold all of the securities that are included in the Index. For the period from October 14, 2014 (inception date of the Fund) through August 31, 2015 (the “reporting period”), the total return for the Fund was -20.64%, net of fees, while the total return for the Index was -20.57%.
As represented by the Index, stocks in smaller emerging market countries declined sharply for the reporting period.
One factor behind the Index’s decline was the depreciation of many emerging market currencies relative to the U.S. dollar. For the reporting period, the Malaysian ringgit depreciated by 25%, the Mexican peso depreciated by 22%, the Indonesian rupiah depreciated by 16%, and the Thai baht depreciated by 11% against the U.S. dollar. These four countries comprised approximately 58% of the Index on average during the reporting period. The currency fluctuations had a meaningful impact on the Index’s performance; when measured in local currencies, the Index returned -6.20% for the reporting period.
The Index experienced substantial volatility during the reporting period as geopolitical conflicts, global economic weakness, and declining demand for commodities buffeted emerging markets. Events in China late in the reporting period — including signs of economic weakness, a precipitous drop in the country’s stock market, and an unexpected Chinese yuan devaluation — put additional downward pressure on emerging markets stocks.
From a country perspective, Malaysia had the most significant negative impact on the Index’s performance for the reporting period in U.S. dollar terms. Malaysia’s economy slowed as exports contracted, and the country’s prime minister faced corruption allegations. Mexico, the Index’s largest country weight, also detracted meaningfully from the Index’s performance as the Mexican economy was adversely affected by the lack of demand for commodities.
Hungary and the Philippines were the only two countries that contributed to the Index’s return for the reporting period. Encouraging economic news aided equity market performance in both countries.
ALLOCATION BY SECTOR
As of 8/31/15
| Sector | Percentage of Total Investments* |
Financials | 36.99 | % | ||
Consumer Staples | 12.81 | |||
Telecommunication Services | 11.51 | |||
Industrials | 9.55 | |||
Materials | 8.66 | |||
Consumer Discretionary | 7.43 | |||
Utilities | 5.87 | |||
Energy | 5.19 | |||
Health Care | 1.99 | |||
|
| |||
TOTAL | 100.00 | % | ||
|
|
TEN LARGEST COUNTRIES
As of 8/31/15
| Country | Percentage of Total Investments* |
Mexico | 21.73 | % | ||
Malaysia | 14.19 | |||
Indonesia | 10.89 | |||
Thailand | 10.36 | |||
Poland | 7.11 | |||
Philippines | 6.67 | |||
Turkey | 6.42 | |||
Chile | 5.95 | |||
Qatar | 4.75 | |||
United Arab Emirates | 3.57 | |||
|
| |||
TOTAL | 91.64 | % | ||
|
|
| * | Excludes money market funds. |
MANAGEMENT’S DISCUSSIONSOF FUND PERFORMANCE | 9 |
Table of Contents
Management’s Discussion of Fund Performance
iSHARES® MSCI FRONTIER 100 ETF
Performance as of August 31, 2015
| Average Annual Total Returns | Cumulative Total Returns | |||||||||||||||||||||||||
| NAV | MARKET | INDEX | NAV | MARKET | INDEX | |||||||||||||||||||||
1 Year | (21.70)% | (21.56)% | (20.57)% | (21.70)% | (21.56)% | (20.57)% | ||||||||||||||||||||
Since Inception | 6.73% | 7.14% | 7.61% | 21.35% | 22.73% | 24.29% | ||||||||||||||||||||
GROWTH OF $10,000 INVESTMENT
(SINCE INCEPTION AT NET ASSET VALUE)
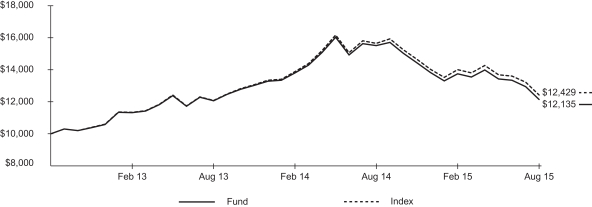
The inception date of the Fund was 9/12/12. The first day of secondary market trading was 9/13/12.
Past performance is no guarantee of future results. Performance results do not reflect the deduction of taxes that a shareholder would pay on fund distributions or on the redemption or sale of fund shares. See “About Fund Performance” on page 14 for more information.
| Shareholder Expenses | ||||||||||||||||||||||||||
| Actual | Hypothetical 5% Return | |||||||||||||||||||||||||
| Beginning Account Value (3/1/15) | Ending Account Value (8/31/15) | Expenses Paid During Period a | Beginning Account Value (3/1/15) | Ending Account Value (8/31/15) | Expenses Paid During Period a | Annualized Expense Ratio | ||||||||||||||||||||
| $ | 1,000.00 | $ | 882.50 | $ | 3.75 | $ | 1,000.00 | $ | 1,021.20 | $ | 4.02 | 0.79% | ||||||||||||||
| a | Expenses are calculated using the Fund’s annualized expense ratio (as disclosed in the table), multiplied by the average account value for the period, multiplied by the number of days in the period (184 days) and divided by the number of days in the year (365 days). See “Shareholder Expenses” on page 14 for more information. |
| 10 | 2015 iSHARES ANNUAL REPORTTO SHAREHOLDERS |
Table of Contents
Management’s Discussion of Fund Performance (Continued)
iSHARES® MSCI FRONTIER 100 ETF
The iShares MSCI Frontier 100 ETF (the “Fund”) seeks to track the investment results of an index composed of frontier market equities, as represented by the MSCI Frontier Markets 100 Index (the “Index”). The Fund invests in a representative sample of securities included in the Index that collectively has an investment profile similar to the Index. Due to the use of representative sampling, the Fund may or may not hold all of the securities that are included in the Index. For the 12-month reporting period ended August 31, 2015, the total return for the Fund was -21.70%, net of fees, while the total return for the Index was -20.57%.
As represented by the Index, frontier market stocks declined sharply for the reporting period. One factor behind this decline was the depreciation of many world currencies relative to the U.S. dollar. For the reporting period, the Kuwaiti dinar, the Argentine peso, and the Nigerian naira depreciated by 6%, 10%, and 23% against the U.S. dollar, respectively. These three countries comprised approximately half of the Index on average during the reporting period. The currency fluctuations had a meaningful impact on the Index’s performance; when measured in local currencies, the Index returned -14.68% for the reporting period.
Frontier markets were also buffeted by geopolitical conflicts, global economic weakness, and declining demand for commodities. Events in China late in the reporting period — including signs of economic weakness, a precipitous drop in the country’s stock market, and an unexpected devaluation of the Chinese yuan — put additional downward pressure on stocks in frontier markets.
Kuwait and Nigeria, the two largest country weights on average in the Index, had the most significant negative impact on the Index’s performance for the reporting period in U.S. dollar terms. The Nigerian economy is heavily dependent on oil exports, but falling energy prices led to reduced oil production and weaker economic growth. Falling oil prices also adversely affected the Kuwait stock market during the reporting period.
Qatar and Bangladesh were the primary positive contributors to the Index’s return for the reporting period. Although Qatar is also a major energy producer, the country embarked on a series of infrastructure development projects that helped aid economic growth. Bangladesh continued to benefit from stable economic growth driven in large part by garment exports.
ALLOCATION BY SECTOR
As of 8/31/15
| Sector | Percentage of Total Investments* |
Financials | 51.69 | % | ||
Telecommunication Services | 14.32 | |||
Energy | 12.50 | |||
Consumer Staples | 6.95 | |||
Materials | 6.08 | |||
Industrials | 4.71 | |||
Utilities | 2.36 | |||
Health Care | 1.39 | |||
|
| |||
TOTAL | 100.00 | % | ||
|
|
TEN LARGEST COUNTRIES
As of 8/31/15
| Country | Percentage of Total Investments* |
Kuwait | 25.64 | % | ||
Argentina | 13.18 | |||
Nigeria | 13.11 | |||
Pakistan | 11.02 | |||
Kenya | 5.90 | |||
Oman | 5.67 | |||
Morocco | 5.48 | |||
Romania | 4.55 | |||
Bangladesh | 3.53 | |||
Vietnam | 3.43 | |||
|
| |||
TOTAL | 91.51 | % | ||
|
|
| * | Excludes money market funds. |
MANAGEMENT’S DISCUSSIONSOF FUND PERFORMANCE | 11 |
Table of Contents
Management’s Discussion of Fund Performance
iSHARES® MSCI WORLD ETF
Performance as of August 31, 2015
| Average Annual Total Returns | Cumulative Total Returns | |||||||||||||||||||||||||
| NAV | MARKET | INDEX | NAV | MARKET | INDEX | |||||||||||||||||||||
1 Year | (3.97)% | (3.89)% | (4.13)% | (3.97)% | (3.89)% | (4.13)% | ||||||||||||||||||||
Since Inception | 11.29% | 11.36% | 11.18% | 47.64% | 47.96% | 47.06% | ||||||||||||||||||||
GROWTH OF $10,000 INVESTMENT
(SINCE INCEPTION AT NET ASSET VALUE)
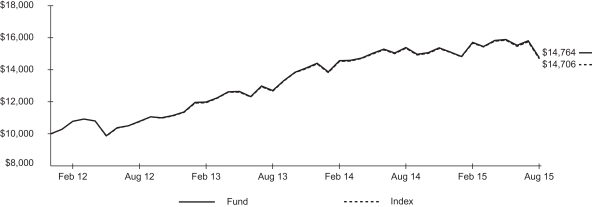
The inception date of the Fund was 1/10/12. The first day of secondary market trading was 1/12/12.
Past performance is no guarantee of future results. Performance results do not reflect the deduction of taxes that a shareholder would pay on fund distributions or on the redemption or sale of fund shares. See “About Fund Performance” on page 14 for more information.
| Shareholder Expenses | ||||||||||||||||||||||||||
| Actual | Hypothetical 5% Return | |||||||||||||||||||||||||
| Beginning Account Value (3/1/15) | Ending Account Value (8/31/15) | Expenses Paid During Period a | Beginning Account Value (3/1/15) | Ending Account Value (8/31/15) | Expenses Paid During Period a | Annualized Expense Ratio | ||||||||||||||||||||
| $ | 1,000.00 | $ | 940.30 | $ | 1.17 | $ | 1,000.00 | $ | 1,024.00 | $ | 1.22 | 0.24% | ||||||||||||||
| a | Expenses are calculated using the Fund’s annualized expense ratio (as disclosed in the table), multiplied by the average account value for the period, multiplied by the number of days in the period (184 days) and divided by the number of days in the year (365 days). See “Shareholder Expenses” on page 14 for more information. |
| 12 | 2015 iSHARES ANNUAL REPORTTO SHAREHOLDERS |
Table of Contents
Management’s Discussion of Fund Performance (Continued)
iSHARES® MSCI WORLD ETF
The iShares MSCI World ETF (the “Fund”) seeks to track the investment results of an index composed of developed market equities, as represented by the MSCI World Index (the “Index”). The Fund invests in a representative sample of securities included in the Index that collectively has an investment profile similar to the Index. Due to the use of representative sampling, the Fund may or may not hold all of the securities that are included in the Index. For the 12-month reporting period ended August 31, 2015, the total return for the Fund was -3.97%, net of fees, while the total return for the Index was -4.13%.
As represented by the Index, global stocks declined modestly for the reporting period. One factor behind this decline was the depreciation of many world currencies relative to the U.S. dollar. For the reporting period, the euro depreciated by 15%, the Japanese yen depreciated by 14%, and the British pound depreciated by 7% against the U.S. dollar. Countries using these currencies comprised approximately 28% of the Index on average during the reporting period. The currency fluctuations had a meaningful impact on the Index’s performance; when measured in local currencies, the Index returned 1.85% for the reporting period.
Canada and Australia were among the largest detractors from the Index’s performance during the reporting period in U.S. dollar terms. Slowing global economic growth, particularly in Europe and China, led to reduced demand for commodities, which are a significant component of both the Canadian and Australian economies. The U.K. also detracted from the Index’s return as a British economic recovery began to stall during the last half of the reporting period.
Japan produced the greatest contribution to the Index’s performance for the reporting period. The Bank of Japan implemented a series of aggressive measures in an effort to revive the Japanese economy, inject liquidity into the capital markets, and keep deflation at bay. These efforts provided a favorable environment for equity market performance in Japan. Other noteworthy contributors to the Index’s return included Denmark and the Netherlands.
The U.S., the largest country weight at approximately 57% of the Index on average for the reporting period, posted a relatively flat return.
ALLOCATION BY SECTOR
As of 8/31/15
| Sector | Percentage of Total Investments* |
Financials | 20.84 | % | ||
Health Care | 13.81 | |||
Information Technology | 13.43 | |||
Consumer Discretionary | 13.20 | |||
Industrials | 10.63 | |||
Consumer Staples | 9.99 | |||
Energy | 6.77 | |||
Materials | 4.69 | |||
Telecommunication Services | 3.50 | |||
Utilities | 3.14 | |||
|
| |||
TOTAL | 100.00 | % | ||
|
|
TEN LARGEST COUNTRIES
As of 8/31/15
| Country | Percentage of Total Investments* |
United States | 57.31 | % | ||
Japan | 8.88 | |||
United Kingdom | 7.80 | |||
France | 3.81 | |||
Switzerland | 3.77 | |||
Germany | 3.45 | |||
Canada | 3.36 | |||
Australia | 2.50 | |||
Spain | 1.38 | |||
Hong Kong | 1.19 | |||
|
| |||
TOTAL | 93.45 | % | ||
|
|
| * | Excludes money market funds. |
MANAGEMENT’S DISCUSSIONSOF FUND PERFORMANCE | 13 |
Table of Contents
Past performance is no guarantee of future results. Current performance may be lower or higher than the performance data quoted. Performance data current to the most recent month-end is available at www.ishares.com. Performance results assume reinvestment of all dividends and capital gain distributions and do not reflect the deduction of taxes that a shareholder would pay on fund distributions or on the redemption or sale of fund shares. The investment return and principal value of shares will vary with changes in market conditions. Shares may be worth more or less than their original cost when they are redeemed or sold in the market. Performance for certain funds may reflect a waiver of a portion of investment advisory fees. Without such a waiver, performance would have been lower.
Net asset value or “NAV” is the value of one share of a fund as calculated in accordance with the standard formula for valuing mutual fund shares. The price used to calculate market return (“Market Price”) is determined by using the midpoint between the highest bid and the lowest offer on the primary stock exchange on which shares of a fund are listed for trading, as of the time that such fund’s NAV is calculated. Certain funds may have a NAV which is determined prior to the opening of regular trading on its listed exchange and their market returns are calculated using the midpoint of the bid/ask spread as of the opening of regular trading on the exchange. Market and NAV returns assume that dividends and capital gain distributions have been reinvested at Market Price and NAV, respectively.
An index is a statistical composite that tracks a specified financial market or sector. Unlike a fund, an index does not actually hold a portfolio of securities and therefore does not incur the expenses incurred by a fund. These expenses negatively impact fund performance. Also, market returns do not include brokerage commissions that may be payable on secondary market transactions. If brokerage commissions were included, market returns would be lower.
As a shareholder of a Fund, you incur two types of costs: (1) transaction costs, including brokerage commissions on purchases and sales of fund shares and (2) ongoing costs, including management fees and other fund expenses. The expense example, which is based on an investment of $1,000 invested on March 1, 2015 and held through August 31, 2015, is intended to help you understand your ongoing costs (in dollars and cents) of investing in a Fund and to compare these costs with the ongoing costs of investing in other funds.
Actual Expenses — The table provides information about actual account values and actual expenses. Annualized expense ratios reflect contractual and voluntary fee waivers, if any. To estimate the expenses that you paid on your account over the period, simply divide your account value by $1,000 (for example, an $8,600 account value divided by $1,000 = 8.6), then multiply the result by the number corresponding to your Fund under the heading entitled “Expenses Paid During Period.”
Hypothetical Example for Comparison Purposes — The table also provides information about hypothetical account values and hypothetical expenses based on each Fund’s actual expense ratio and an assumed rate of return of 5% per year before expenses. You may use this information to compare the ongoing costs of investing in your Fund and other funds. To do so, compare this 5% hypothetical example with the 5% hypothetical examples that appear in the shareholder reports of the other funds.
Please note that the expenses shown in the table are meant to highlight your ongoing costs only and do not reflect any transactional costs, such as brokerage commissions paid on purchases and sales of fund shares. Therefore, the hypothetical examples are useful in comparing ongoing costs only and will not help you determine the relative total costs of owning different funds. In addition, if these transactional costs were included, your costs would have been higher.
| 14 | 2015 iSHARES ANNUAL REPORTTO SHAREHOLDERS |
Table of Contents
iSHARES® MSCI ALL COUNTRY WORLD MINIMUM VOLATILITY ETF
August 31, 2015
| Security | Shares | Value | ||||||
COMMON STOCKS — 99.36% |
| |||||||
CANADA — 5.75% |
| |||||||
Agnico Eagle Mines Ltd. | 189,052 | $ | 4,578,174 | |||||
Bank of Montreal | 107,672 | 5,745,744 | ||||||
Bank of Nova Scotia (The) | 163,699 | 7,409,210 | ||||||
Barrick Gold Corp. | 98,595 | 678,049 | ||||||
BCE Inc. | 159,004 | 6,357,770 | ||||||
Canadian Imperial Bank of Commerce/Canada | 77,311 | 5,618,339 | ||||||
Dollarama Inc. | 144,293 | 8,146,780 | ||||||
Eldorado Gold Corp. | 241,636 | 713,739 | ||||||
Enbridge Inc. | 105,168 | 4,297,621 | ||||||
Fairfax Financial Holdings Ltd. | 9,703 | 4,461,411 | ||||||
First Capital Realty Inc. | 113,619 | 1,485,032 | ||||||
Franco-Nevada Corp. | 181,853 | 7,790,771 | ||||||
Goldcorp Inc. | 713,327 | 9,784,455 | ||||||
H&R REIT | 61,661 | 957,008 | ||||||
Intact Financial Corp. | 153,057 | 10,474,137 | ||||||
RioCan REIT | 112,367 | 2,053,094 | ||||||
Rogers Communications Inc. Class B | 63,226 | 2,134,145 | ||||||
Royal Bank of Canada | 89,518 | 4,934,423 | ||||||
Shaw Communications Inc. Class B | 443,834 | 8,816,635 | ||||||
Silver Wheaton Corp. | 350,247 | 4,246,136 | ||||||
TELUS Corp. | 214,776 | 6,947,733 | ||||||
Thomson Reuters Corp. | 165,577 | 6,369,208 | ||||||
Toronto-Dominion Bank (The) | 22,223 | 876,560 | ||||||
TransCanada Corp. | 199,068 | 6,867,509 | ||||||
|
| |||||||
| 121,743,683 | ||||||||
CHILE — 0.38% |
| |||||||
Aguas Andinas SA Series A | 2,551,263 | 1,322,481 | ||||||
Banco de Chile | 26,355,245 | 2,724,253 | ||||||
Empresa Nacional de Electricidad SA/Chile | 741,810 | 919,959 | ||||||
Empresas COPEC SA | 314,878 | 3,079,184 | ||||||
|
| |||||||
| 8,045,877 | ||||||||
CHINA — 4.50% |
| |||||||
Agricultural Bank of China Ltd. Class H | 5,008,000 | 2,022,573 | ||||||
Bank of China Ltd. Class H | 11,894,000 | 5,432,837 | ||||||
Beijing Capital International Airport Co. Ltd. Class H | 1,878,000 | 2,020,957 | ||||||
| Security | Shares | Value | ||||||
Beijing Enterprises Holdings Ltd. | 626,000 | $ | 3,655,009 | |||||
China Coal Energy Co. Ltd. Class Ha | 2,191,000 | 1,023,402 | ||||||
China Communications Services Corp. Ltd. Class H | 3,130,000 | 1,151,025 | ||||||
China Construction Bank Corp. Class H | 14,085,000 | 9,904,872 | ||||||
China Medical System Holdings Ltd.a | 1,252,000 | 1,360,229 | ||||||
China Mengniu Dairy Co. Ltd. | 626,000 | 2,188,966 | ||||||
China Merchants Holdings International Co. Ltd.a | 626,000 | 2,092,038 | ||||||
China Mobile Ltd. | 782,500 | 9,480,810 | ||||||
China Petroleum & Chemical Corp. Class H | 1,878,000 | 1,250,376 | ||||||
China Resources Gas Group Ltd.a | 626,000 | 1,651,822 | ||||||
China Unicom Hong Kong Ltd. | 1,252,000 | 1,644,552 | ||||||
CITIC Ltd. | 2,817,000 | 5,161,438 | ||||||
COSCO Pacific Ltd. | 1,252,000 | 1,472,720 | ||||||
CSPC Pharmaceutical Group Ltd. | 1,252,000 | 1,146,986 | ||||||
Dalian Wanda Commercial Properties Co. Ltd. Class H | 688,600 | 4,229,309 | ||||||
Geely Automobile Holdings Ltd.a | 1,565,000 | 605,803 | ||||||
Guangdong Investment Ltd. | 3,130,000 | 4,232,540 | ||||||
Hanergy Thin Film Power Group Ltd.a,b | 11,018,000 | 11 | ||||||
Hengan International Group Co. Ltd.a | 469,500 | 4,607,128 | ||||||
Industrial & Commercial Bank of China Ltd. Class H | 2,817,000 | 1,664,745 | ||||||
Inner Mongolia Yitai Coal Co. Ltd. Class B | 1,283,336 | 1,085,702 | ||||||
Jiangsu Expressway Co. Ltd. Class H | 1,252,000 | 1,479,774 | ||||||
Lenovo Group Ltd.a | 3,756,000 | 3,082,323 | ||||||
Luye Pharma Group Ltd.a,b | 1,565,000 | 1,332,766 | ||||||
Shandong Weigao Group Medical Polymer Co. Ltd. Class H | 2,504,000 | 1,751,173 | ||||||
Shenzhou International Group Holdings Ltd.a | 626,000 | 3,162,289 | ||||||
Sihuan Pharmaceutical Holdings Group Ltd. | 4,767,000 | 922,639 | ||||||
SCHEDULESOF INVESTMENTS | 15 |
Table of Contents
Schedule of Investments (Continued)
iSHARES® MSCI ALL COUNTRY WORLD MINIMUM VOLATILITY ETF
August 31, 2015
| Security | Shares | Value | ||||||
Sino Biopharmaceutical Ltd. | 3,756,000 | $ | 4,458,707 | |||||
SOHO China Ltd.a | 2,034,500 | 868,923 | ||||||
Sun Art Retail Group Ltd.a | 2,817,000 | 2,348,091 | ||||||
Tingyi Cayman Islands Holding Corp.a | 1,878,000 | 2,888,466 | ||||||
Zhejiang Expressway Co. Ltd. Class H | 1,878,000 | 2,016,111 | ||||||
Zijin Mining Group Co. Ltd. Class H | 6,886,000 | 1,777,021 | ||||||
|
| |||||||
| 95,174,133 | ||||||||
COLOMBIA — 0.05% |
| |||||||
Corp. Financiera Colombiana SA | 84,823 | 1,006,305 | ||||||
|
| |||||||
| 1,006,305 | ||||||||
EGYPT — 0.06% |
| |||||||
Commercial International Bank Egypt SAE | 197,503 | 1,264,213 | ||||||
|
| |||||||
| 1,264,213 | ||||||||
GERMANY — 0.55% |
| |||||||
Fresenius Medical Care AG & Co. KGaA | 47,576 | 3,636,199 | ||||||
Kabel Deutschland Holding AGb | 26,918 | 3,645,031 | ||||||
MAN SE | 41,629 | 4,361,334 | ||||||
|
| |||||||
| 11,642,564 | ||||||||
HONG KONG — 3.40% |
| |||||||
Bank of East Asia Ltd. (The) | 688,600 | 2,367,880 | ||||||
Cheung Kong Infrastructure Holdings Ltd. | 626,000 | 5,161,438 | ||||||
CLP Holdings Ltd. | 2,034,500 | 16,840,301 | ||||||
Haier Electronics Group Co. Ltd. | 626,000 | 1,122,754 | ||||||
Hang Seng Bank Ltd.a | 907,700 | 16,151,100 | ||||||
HKT Trust & HKT Ltd.a | 2,191,000 | 2,535,889 | ||||||
Hong Kong & China Gas Co. Ltd. | 2,755,860 | 5,198,763 | ||||||
Link REIT | 939,000 | 4,979,697 | ||||||
MTR Corp. Ltd. | 1,721,500 | 7,674,508 | ||||||
Power Assets Holdings Ltd.a | 782,500 | 6,734,505 | ||||||
Sun Hung Kai Properties Ltd. | 30,000 | 380,127 | ||||||
Swire Pacific Ltd. Class A | 156,500 | 1,717,450 | ||||||
Yue Yuen Industrial Holdings Ltd. | 313,000 | 1,120,735 | ||||||
|
| |||||||
| 71,985,147 | ||||||||
INDONESIA — 0.72% |
| |||||||
Bank Central Asia Tbk PT | 7,199,000 | 6,609,758 | ||||||
Indofood Sukses Makmur Tbk PT | 3,380,400 | 1,275,169 | ||||||
| Security | Shares | Value | ||||||
Jasa Marga Persero Tbk PT | 2,378,800 | $ | 871,944 | |||||
Kalbe Farma Tbk PT | 14,617,100 | 1,742,608 | ||||||
Telekomunikasi Indonesia Persero Tbk PT | 9,922,100 | 2,026,792 | ||||||
Tower Bersama Infrastructure Tbk PTb | 1,721,500 | 879,129 | ||||||
Unilever Indonesia Tbk PT | 626,000 | 1,769,954 | ||||||
|
| |||||||
| 15,175,354 | ||||||||
IRELAND — 0.20% |
| |||||||
Kerry Group PLC Class A | 33,804 | 2,513,163 | ||||||
Ryanair Holdings PLC ADR | 23,688 | 1,728,040 | ||||||
|
| |||||||
| 4,241,203 | ||||||||
ISRAEL — 0.67% |
| |||||||
Bank Leumi le-Israel BMa,b | 400,327 | 1,456,105 | ||||||
Mizrahi Tefahot Bank Ltd. | 161,508 | 1,876,477 | ||||||
NICE-Systems Ltd. | 41,629 | 2,599,795 | ||||||
Teva Pharmaceutical Industries Ltd. | 127,391 | 8,321,659 | ||||||
|
| |||||||
| 14,254,036 | ||||||||
JAPAN — 13.57% |
| |||||||
ABC-Mart Inc. | 31,300 | 1,900,961 | ||||||
Ajinomoto Co. Inc. | 54,000 | 1,190,420 | ||||||
ANA Holdings Inc. | 1,252,000 | 3,676,914 | ||||||
Aozora Bank Ltd. | 939,000 | 3,440,327 | ||||||
Astellas Pharma Inc. | 313,000 | 4,649,090 | ||||||
Benesse Holdings Inc. | 93,900 | 2,495,012 | ||||||
Calbee Inc. | 31,300 | 1,199,724 | ||||||
Canon Inc. | 563,400 | 17,234,177 | ||||||
Chugai Pharmaceutical Co. Ltd. | 31,300 | 1,171,312 | ||||||
East Japan Railway Co. | 32,100 | 2,968,028 | ||||||
Eisai Co. Ltd. | 62,600 | 4,274,064 | ||||||
ITOCHU Techno-Solutions Corp. | 62,600 | 1,379,230 | ||||||
Japan Airlines Co. Ltd. | 125,200 | 4,457,961 | ||||||
Japan Prime Realty Investment Corp. | 939 | 3,049,028 | ||||||
Japan Real Estate Investment Corp. | 939 | 3,951,727 | ||||||
Japan Retail Fund Investment Corp. | 2,817 | 5,197,683 | ||||||
Kakaku.com Inc. | 156,500 | 2,489,846 | ||||||
Kintetsu Group Holdings Co. Ltd. | 313,000 | 1,118,364 | ||||||
Kyowa Hakko Kirin Co. Ltd. | 313,000 | 5,266,386 | ||||||
Lawson Inc. | 93,900 | 6,710,187 | ||||||
M3 Inc. | 219,100 | 5,084,038 | ||||||
| 16 | 2015 iSHARES ANNUAL REPORTTO SHAREHOLDERS |
Table of Contents
Schedule of Investments (Continued)
iSHARES® MSCI ALL COUNTRY WORLD MINIMUM VOLATILITY ETF
August 31, 2015
| Security | Shares | Value | ||||||
McDonald’s Holdings Co. Japan Ltd.a | 93,900 | $ | 2,068,845 | |||||
Miraca Holdings Inc. | 62,600 | 2,691,307 | ||||||
Mitsubishi Tanabe Pharma Corp. | 250,400 | 4,487,922 | ||||||
Nagoya Railroad Co. Ltd. | 626,000 | 2,495,012 | ||||||
Nippon Building Fund Inc. | 939 | 3,951,727 | ||||||
Nippon Prologis REIT Inc. | 1,565 | 2,847,568 | ||||||
Nippon Telegraph & Telephone Corp. | 281,700 | 10,761,482 | ||||||
Nissin Foods Holdings Co. Ltd. | 62,600 | 2,975,418 | ||||||
Nitori Holdings Co. Ltd. | 93,900 | 7,477,287 | ||||||
Nomura Research Institute Ltd. | 125,200 | 5,088,171 | ||||||
NTT DOCOMO Inc. | 1,095,500 | 22,947,780 | ||||||
Oracle Corp. Japan | 31,300 | 1,309,494 | ||||||
Oriental Land Co. Ltd./Japan | 156,500 | 8,640,851 | ||||||
Osaka Gas Co. Ltd. | 626,000 | 2,544,602 | ||||||
Otsuka Corp. | 62,600 | 3,306,020 | ||||||
Otsuka Holdings Co. Ltd. | 375,600 | 12,817,542 | ||||||
Park24 Co. Ltd. | 125,200 | 2,458,852 | ||||||
Recruit Holdings Co. Ltd. | 156,500 | 4,816,974 | ||||||
Sankyo Co. Ltd. | 31,300 | 1,204,889 | ||||||
Santen Pharmaceutical Co. Ltd. | 438,200 | 6,852,242 | ||||||
Secom Co. Ltd. | 156,500 | 10,025,246 | ||||||
Shimadzu Corp. | 50,000 | 736,477 | ||||||
Shimamura Co. Ltd. | 31,300 | 2,895,350 | ||||||
Showa Shell Sekiyu KK | 125,200 | 1,071,357 | ||||||
Suntory Beverage & Food Ltd. | 156,500 | 6,624,954 | ||||||
Taisho Pharmaceutical Holdings Co. Ltd. | 31,300 | 2,030,103 | ||||||
Takeda Pharmaceutical Co. Ltd. | 563,400 | 27,717,876 | ||||||
Tobu Railway Co. Ltd. | 1,252,000 | 5,589,240 | ||||||
Toho Co. Ltd./Tokyo | 93,900 | 2,119,985 | ||||||
TonenGeneral Sekiyu KK | 313,000 | 3,125,222 | ||||||
Unicharm Corp. | 125,200 | 2,532,204 | ||||||
United Urban Investment Corp. | 3,130 | 4,127,359 | ||||||
USS Co. Ltd. | 250,400 | 4,450,729 | ||||||
West Japan Railway Co. | 156,500 | 10,574,097 | ||||||
Yamato Holdings Co. Ltd. | 406,900 | 7,945,941 | ||||||
Yamazaki Baking Co. Ltd. | 48,000 | 810,001 | ||||||
|
| |||||||
| 287,024,605 | ||||||||
MALAYSIA — 0.92% |
| |||||||
Axiata Group Bhda | 3,005,400 | 4,393,609 | ||||||
Hong Leong Bank Bhda | 281,700 | 877,294 | ||||||
IHH Healthcare Bhd | 907,700 | 1,264,297 | ||||||
| Security | Shares | Value | ||||||
Malayan Banking Bhda | 1,533,700 | $ | 3,198,860 | |||||
Maxis Bhda | 2,034,500 | 3,182,539 | ||||||
Public Bank Bhda | 1,064,260 | 4,561,114 | ||||||
Telekom Malaysia Bhda | 1,314,600 | 2,031,370 | ||||||
|
| |||||||
| 19,509,083 | ||||||||
NEW ZEALAND — 0.14% |
| |||||||
Auckland International Airport Ltd. | 971,552 | 3,045,415 | ||||||
|
| |||||||
| 3,045,415 | ||||||||
PERU — 0.07% |
| |||||||
Cia. de Minas Buenaventura SA ADR | 221,917 | 1,402,515 | ||||||
|
| |||||||
| 1,402,515 | ||||||||
PHILIPPINES — 0.38% |
| |||||||
Bank of the Philippine Islands | 917,099 | 1,659,961 | ||||||
BDO Unibank Inc. | 1,878,000 | 3,957,702 | ||||||
International Container Terminal Services Inc. | 594,700 | 1,182,656 | ||||||
Philippine Long Distance Telephone Co. | 23,475 | 1,264,657 | ||||||
|
| |||||||
| 8,064,976 | ||||||||
QATAR — 0.29% |
| |||||||
Ooredoo QSC | 44,446 | 848,369 | ||||||
Qatar Insurance Co. SAQ | 43,820 | 1,179,413 | ||||||
Qatar National Bank SAQ | 81,380 | 4,000,720 | ||||||
|
| |||||||
| 6,028,502 | ||||||||
SINGAPORE — 1.30% |
| |||||||
Oversea-Chinese Banking Corp. Ltd. | 782,500 | 4,954,779 | ||||||
Singapore Airlines Ltd. | 688,600 | 4,843,588 | ||||||
Singapore Press Holdings Ltd.a | 1,182,500 | 3,303,588 | ||||||
Singapore Technologies Engineering Ltd.a | 563,400 | 1,226,433 | ||||||
Singapore Telecommunications Ltd. | 4,162,900 | 11,039,669 | ||||||
StarHub Ltd.a | 782,500 | 2,030,738 | ||||||
|
| |||||||
| 27,398,795 | ||||||||
SOUTH KOREA — 0.59% |
| |||||||
Dongbu Insurance Co. Ltd. | 48,202 | 2,168,122 | ||||||
Kia Motors Corp. | 27,857 | 1,147,018 | ||||||
S-1 Corp. | 21,597 | 1,714,613 | ||||||
Samsung Fire & Marine Insurance Co. Ltd. | 19,406 | 4,421,828 | ||||||
Samsung Life Insurance Co. Ltd. | 14,711 | 1,222,652 | ||||||
SCHEDULESOF INVESTMENTS | 17 |
Table of Contents
Schedule of Investments (Continued)
iSHARES® MSCI ALL COUNTRY WORLD MINIMUM VOLATILITY ETF
August 31, 2015
| Security | Shares | Value | ||||||
Yuhan Corp. | 9,039 | $ | 1,899,126 | |||||
|
| |||||||
| 12,573,359 | ||||||||
SWITZERLAND — 3.70% |
| |||||||
Chocoladefabriken Lindt & Sprungli AG Registered | 96 | 6,461,052 | ||||||
Givaudan SA Registered | 626 | 1,077,803 | ||||||
Kuehne + Nagel International AG Registered | 10,016 | 1,334,017 | ||||||
Nestle SA Registered | 308,931 | 22,777,292 | ||||||
Novartis AG Registered | 159,004 | 15,570,734 | ||||||
Roche Holding AG | 32,239 | 8,801,092 | ||||||
Schindler Holding AG Registered | 24,727 | 3,850,769 | ||||||
Swiss Prime Site AG Registered | 54,620 | 4,284,088 | ||||||
Swisscom AG Registered | 26,292 | 14,205,646 | ||||||
|
| |||||||
| 78,362,493 | ||||||||
TAIWAN — 3.60% |
| |||||||
Advanced Semiconductor Engineering Inc. | 1,252,000 | 1,292,943 | ||||||
Asia Cement Corp. | 2,817,000 | 3,026,007 | ||||||
Asustek Computer Inc. | 313,000 | 2,847,554 | ||||||
Chang Hwa Commercial Bank Ltd. | 6,028,482 | 2,927,527 | ||||||
Cheng Shin Rubber Industry Co. Ltd. | 939,000 | 1,506,510 | ||||||
Chicony Electronics Co. Ltd. | 630,064 | 1,564,703 | ||||||
Chunghwa Telecom Co. Ltd. | 4,382,000 | 13,306,540 | ||||||
Delta Electronics Inc. | 313,000 | 1,568,078 | ||||||
Far EasTone Telecommunications Co. Ltd. | 1,878,000 | 4,121,256 | ||||||
First Financial Holding Co. Ltd. | 8,667,217 | 4,195,619 | ||||||
Foxconn Technology Co. Ltd. | 632,462 | 1,778,654 | ||||||
HTC Corp. | 616,000 | 871,859 | ||||||
Hua Nan Financial Holdings Co. Ltd. | 7,645,391 | 3,618,731 | ||||||
Lite-On Technology Corp. | 2,516,782 | 2,305,142 | ||||||
Mega Financial Holding Co. Ltd. | 5,947,000 | 4,459,884 | ||||||
Quanta Computer Inc. | 626,000 | 1,150,566 | ||||||
SinoPac Financial Holdings Co. Ltd. | 9,073,347 | 3,123,355 | ||||||
Synnex Technology International Corp. | 1,565,000 | 1,664,280 | ||||||
Taiwan Business Bankb | 5,038,593 | 1,269,869 | ||||||
Taiwan Cooperative Financial Holding Co. Ltd. | 8,545,316 | 3,624,458 | ||||||
| Security | Shares | Value | ||||||
Taiwan Fertilizer Co. Ltd. | 939,000 | $ | 1,187,603 | |||||
Taiwan Mobile Co. Ltd. | 1,878,000 | 5,645,082 | ||||||
Taiwan Semiconductor Manufacturing Co. Ltd. | 1,878,000 | 7,445,968 | ||||||
WPG Holdings Ltd. | 939,000 | 887,455 | ||||||
Yulon Motor Co. Ltd. | 939,000 | 849,937 | ||||||
|
| |||||||
| 76,239,580 | ||||||||
THAILAND — 0.60% |
| |||||||
Advanced Info Service PCL NVDR | 507,600 | 3,370,311 | ||||||
BTS Group Holdings PCL NVDR | 6,812,300 | 1,852,976 | ||||||
CP ALL PCL NVDR | 2,222,300 | 3,161,872 | ||||||
PTT PCL NVDR | 573,800 | 4,290,094 | ||||||
|
| |||||||
| 12,675,253 | ||||||||
UNITED ARAB EMIRATES — 0.24% |
| |||||||
DP World Ltd. | 61,035 | 1,361,080 | ||||||
First Gulf Bank PJSC | 391,563 | 1,529,772 | ||||||
National Bank of Abu Dhabi PJSC | 769,980 | 2,180,148 | ||||||
|
| |||||||
| 5,071,000 | ||||||||
UNITED KINGDOM — 2.37% |
| |||||||
Capita PLC | 65,417 | 1,243,556 | ||||||
Compass Group PLC | 332,406 | 5,291,339 | ||||||
Fresnillo PLC | 256,035 | 2,443,416 | ||||||
G4S PLC | 579,676 | 2,286,805 | ||||||
GlaxoSmithKline PLC | 363,706 | 7,498,487 | ||||||
Inmarsat PLC | 340,857 | 5,142,776 | ||||||
Randgold Resources Ltd. | 107,046 | 6,517,969 | ||||||
Reckitt Benckiser Group PLC | 82,319 | 7,288,744 | ||||||
Royal Dutch Shell PLC Class B | 39,869 | 1,046,401 | ||||||
Sky PLC | 577,798 | 9,268,655 | ||||||
SSE PLC | 93,587 | 2,117,311 | ||||||
|
| |||||||
| 50,145,459 | ||||||||
UNITED STATES — 55.31% |
| |||||||
Abbott Laboratories | 370,592 | 16,784,112 | ||||||
Accenture PLC Class A | 22,849 | 2,153,975 | ||||||
Adobe Systems Inc.b | 18,154 | 1,426,360 | ||||||
Airgas Inc. | 10,903 | 1,052,358 | ||||||
Alleghany Corp.b | 15,024 | 7,058,125 | ||||||
Allergan PLCb | 3,756 | 1,140,847 | ||||||
Altria Group Inc. | 225,047 | 12,058,018 | ||||||
American Capital Agency Corp. | 401,241 | 7,675,740 | ||||||
American Tower Corp. | 61,035 | 5,626,817 | ||||||
| 18 | 2015 iSHARES ANNUAL REPORTTO SHAREHOLDERS |
Table of Contents
Schedule of Investments (Continued)
iSHARES® MSCI ALL COUNTRY WORLD MINIMUM VOLATILITY ETF
August 31, 2015
| Security | Shares | Value | ||||||
American Water Works Co. Inc. | 56,027 | $ | 2,910,042 | |||||
AmerisourceBergen Corp. | 216,283 | 21,636,951 | ||||||
Annaly Capital Management Inc. | 1,076,465 | 10,829,238 | ||||||
Arch Capital Group Ltd.b | 147,110 | 10,044,671 | ||||||
AT&T Inc. | 412,534 | 13,696,129 | ||||||
Automatic Data Processing Inc. | 379,669 | 29,356,007 | ||||||
AutoZone Inc.b | 28,796 | 20,617,648 | ||||||
AvalonBay Communities Inc. | 34,430 | 5,683,016 | ||||||
Axis Capital Holdings Ltd. | 116,749 | 6,537,944 | ||||||
Baxalta Inc.b | 145,858 | 5,126,909 | ||||||
Baxter International Inc. | 144,919 | 5,572,136 | ||||||
Becton Dickinson and Co. | 86,701 | 12,226,575 | ||||||
Berkshire Hathaway Inc. Class Bb | 93,873 | 12,582,737 | ||||||
Bristol-Myers Squibb Co. | 213,153 | 12,676,209 | ||||||
Campbell Soup Co. | 47,263 | 2,268,151 | ||||||
Cardinal Health Inc. | 39,125 | 3,218,814 | ||||||
CH Robinson Worldwide Inc. | 22,849 | 1,540,708 | ||||||
Chevron Corp. | 9,703 | 785,846 | ||||||
Chipotle Mexican Grill Inc.b | 5,947 | 4,222,429 | ||||||
Chubb Corp. (The) | 143,980 | 17,394,224 | ||||||
Church & Dwight Co. Inc. | 153,683 | 13,259,769 | ||||||
Clorox Co. (The) | 128,643 | 14,301,242 | ||||||
Coca-Cola Co. (The) | 259,164 | 10,190,328 | ||||||
Colgate-Palmolive Co. | 312,374 | 19,620,211 | ||||||
Consolidated Edison Inc. | 327,711 | 20,616,299 | ||||||
Costco Wholesale Corp. | 15,650 | 2,191,783 | ||||||
CR Bard Inc. | 67,608 | 13,101,754 | ||||||
Crown Castle International Corp. | 73,555 | 6,133,751 | ||||||
CVS Health Corp. | 35,486 | 3,633,766 | ||||||
DaVita HealthCare Partners Inc.b | 68,547 | 5,184,895 | ||||||
Dollar General Corp. | 71,051 | 5,292,589 | ||||||
Dollar Tree Inc.b | 151,049 | 11,518,997 | ||||||
Dominion Resources Inc./VA | 218,787 | 15,260,393 | ||||||
Duke Energy Corp. | 226,299 | 16,046,862 | ||||||
eBay Inc.b | 71,990 | 1,951,649 | ||||||
Ecolab Inc. | 116,123 | 12,673,664 | ||||||
Eli Lilly & Co. | 248,522 | 20,465,787 | ||||||
Equity Residential | 15,337 | 1,092,761 | ||||||
Everest Re Group Ltd. | 51,019 | 8,969,650 | ||||||
Express Scripts Holding Co.b | 73,868 | 6,175,365 | ||||||
Exxon Mobil Corp. | 231,187 | 17,394,510 | ||||||
Facebook Inc. Class Ab | 89,518 | 8,005,595 | ||||||
Federal Realty Investment Trust | 72,929 | 9,413,675 | ||||||
| Security | Shares | Value | ||||||
Gartner Inc.b | 34,743 | $ | 2,970,874 | |||||
General Mills Inc. | 526,779 | 29,899,976 | ||||||
Genuine Parts Co. | 25,040 | 2,090,590 | ||||||
Health Care REIT Inc. | 131,773 | 8,347,820 | ||||||
Henry Schein Inc.b | 98,282 | 13,445,960 | ||||||
Hershey Co. (The) | 96,717 | 8,658,106 | ||||||
Hormel Foods Corp. | 50,706 | 3,098,137 | ||||||
Intel Corp. | 55,088 | 1,572,212 | ||||||
International Business Machines Corp. | 55,714 | 8,239,543 | ||||||
Intuit Inc. | 110,802 | 9,501,271 | ||||||
JB Hunt Transport Services Inc. | 45,072 | 3,280,340 | ||||||
JM Smucker Co. (The) | 50,393 | 5,932,264 | ||||||
Johnson & Johnson | 292,968 | 27,533,133 | ||||||
Kellogg Co. | 241,636 | 16,015,634 | ||||||
Kimberly-Clark Corp. | 184,357 | 19,639,551 | ||||||
Kinder Morgan Inc./DE | 24,414 | 791,258 | ||||||
Laboratory Corp. of America Holdingsb | 100,160 | 11,799,850 | ||||||
Marsh & McLennan Companies Inc. | 310,809 | 16,699,768 | ||||||
McCormick & Co. Inc./MD | 133,338 | 10,571,037 | ||||||
McDonald’s Corp. | 297,037 | 28,224,456 | ||||||
McKesson Corp. | 34,430 | 6,802,679 | ||||||
Merck & Co. Inc. | 337,101 | 18,152,889 | ||||||
Microsoft Corp. | 163,386 | 7,110,559 | ||||||
Motorola Solutions Inc. | 100,160 | 6,492,371 | ||||||
Newmont Mining Corp. | 418,794 | 7,148,814 | ||||||
NextEra Energy Inc. | 25,040 | 2,464,186 | ||||||
O’Reilly Automotive Inc.b | 29,422 | 7,063,340 | ||||||
Occidental Petroleum Corp. | 15,024 | 1,096,902 | ||||||
OGE Energy Corp. | 39,125 | 1,097,065 | ||||||
PartnerRe Ltd. | 50,080 | 6,931,573 | ||||||
Patterson Companies Inc. | 97,656 | 4,475,574 | ||||||
Paychex Inc. | 367,775 | 16,424,831 | ||||||
PayPal Holdings Inc.b | 71,990 | 2,519,650 | ||||||
People’s United Financial Inc. | 340,231 | 5,273,580 | ||||||
Pepco Holdings Inc. | 296,098 | 6,804,332 | ||||||
PepsiCo Inc. | 203,763 | 18,935,696 | ||||||
Pfizer Inc. | 255,721 | 8,239,331 | ||||||
PG&E Corp. | 250,713 | 12,430,351 | ||||||
Procter & Gamble Co. (The) | 327,085 | 23,115,097 | ||||||
Public Storage | 52,643 | 10,595,457 | ||||||
QUALCOMM Inc. | 62,287 | 3,524,198 | ||||||
RenaissanceRe Holdings Ltd. | 51,332 | 5,233,297 | ||||||
SCHEDULESOF INVESTMENTS | 19 |
Table of Contents
Schedule of Investments (Continued)
iSHARES® MSCI ALL COUNTRY WORLD MINIMUM VOLATILITY ETF
August 31, 2015
| Security | Shares | Value | ||||||
Republic Services Inc. | 152,431 | $ | 6,246,622 | |||||
Reynolds American Inc. | 23,475 | 1,966,031 | ||||||
Ross Stores Inc. | 42,568 | 2,069,656 | ||||||
SBA Communications Corp. Class Ab | 92,648 | 10,950,994 | ||||||
SCANA Corp. | 27,544 | 1,456,802 | ||||||
Sherwin-Williams Co. (The) | 7,825 | 2,001,713 | ||||||
Sigma-Aldrich Corp. | 108,924 | 15,185,095 | ||||||
Southern Co. (The) | 651,040 | 28,261,646 | ||||||
Starbucks Corp. | 189,991 | 10,394,408 | ||||||
Stericycle Inc.b | 95,465 | 13,473,930 | ||||||
Synopsys Inc.b | 176,845 | 8,299,336 | ||||||
Sysco Corp. | 46,011 | 1,834,459 | ||||||
Target Corp. | 200,633 | 15,591,190 | ||||||
TJX Companies Inc. (The) | 123,009 | 8,649,993 | ||||||
Travelers Companies Inc. (The) | 81,380 | 8,101,379 | ||||||
Union Pacific Corp. | 31,613 | 2,710,499 | ||||||
United Parcel Service Inc. Class B | 105,481 | 10,300,220 | ||||||
UnitedHealth Group Inc. | 61,661 | 7,134,178 | ||||||
Varian Medical Systems Inc.b | 116,749 | 9,485,856 | ||||||
Verisk Analytics Inc. Class Ab | 37,560 | 2,744,885 | ||||||
Verizon Communications Inc. | 473,256 | 21,774,509 | ||||||
VF Corp. | 21,597 | 1,564,271 | ||||||
Visa Inc. Class A | 97,338 | 6,940,199 | ||||||
Wal-Mart Stores Inc. | 242,888 | 15,722,140 | ||||||
Waste Management Inc. | 291,403 | 14,587,634 | ||||||
Waters Corp.b | 9,390 | 1,139,758 | ||||||
WEC Energy Group Inc. | 234,124 | 11,156,009 | ||||||
Wells Fargo & Co. | 95,465 | 5,091,148 | ||||||
WR Berkley Corp. | 117,375 | 6,371,115 | ||||||
Xcel Energy Inc. | 320,199 | 10,800,312 | ||||||
Yum! Brands Inc. | 18,154 | 1,448,145 | ||||||
|
| |||||||
| 1,170,095,715 | ||||||||
|
| |||||||
TOTAL COMMON STOCKS |
| |||||||
(Cost: $2,014,850,820) |
| 2,102,169,265 | ||||||
PREFERRED STOCKS — 0.07% |
| |||||||
COLOMBIA — 0.07% |
| |||||||
Grupo Aval Acciones y Valores SA | 3,664,291 | 1,397,726 | ||||||
|
| |||||||
| 1,397,726 | ||||||||
|
| |||||||
TOTAL PREFERRED STOCKS |
| |||||||
(Cost: $2,142,429) |
| 1,397,726 | ||||||
| Security | Shares | Value | ||||||
SHORT-TERM INVESTMENTS — 2.87% |
| |||||||
MONEY MARKET FUNDS — 2.87% |
| |||||||
BlackRock Cash Funds: Institutional, |
| |||||||
0.18%c,d,e | 53,179,112 | $ | 53,179,112 | |||||
BlackRock Cash Funds: Prime, |
| |||||||
0.18%c,d,e | 3,053,806 | 3,053,806 | ||||||
BlackRock Cash Funds: Treasury, |
| |||||||
0.03%c,d | 4,392,763 | 4,392,763 | ||||||
|
| |||||||
| 60,625,681 | ||||||||
|
| |||||||
TOTAL SHORT-TERM INVESTMENTS |
| |||||||
(Cost: $60,625,681) |
| 60,625,681 | ||||||
|
| |||||||
TOTAL INVESTMENTS |
| |||||||
(Cost: $2,077,618,930) |
| 2,164,192,672 | ||||||
Other Assets, Less Liabilities — (2.30)% |
| (48,560,698 | ) | |||||
|
| |||||||
NET ASSETS — 100.00% |
| $ | 2,115,631,974 | |||||
|
| |||||||
ADR — American Depositary Receipts
NVDR — Non-Voting Depositary Receipts
| a | All or a portion of this security represents a security on loan. See Note 1. |
| b | Non-income earning security. |
| c | Affiliated issuer. See Note 2. |
| d | The rate quoted is the annualized seven-day yield of the fund at period end. |
| e | All or a portion of this security represents an investment of securities lending collateral. See Note 1. |
See notes to financial statements.
| 20 | 2015 iSHARES ANNUAL REPORTTO SHAREHOLDERS |
Table of Contents
iSHARES® MSCI EMERGING MARKETS HORIZON ETF
August 31, 2015
| Security | Shares | Value | ||||||
COMMON STOCKS — 98.91% |
| |||||||
CHILE — 5.68% |
| |||||||
Banco de Chile | 33,054 | $ | 3,417 | |||||
Banco de Credito e Inversiones | 50 | 2,184 | ||||||
Banco Santander Chile | 98,531 | 4,764 | ||||||
Cencosud SA | 1,931 | 3,927 | ||||||
Cia. Cervecerias Unidas SA | 284 | 3,148 | ||||||
Colbun SA | 14,176 | 3,852 | ||||||
CorpBanca SA | 239,597 | 2,236 | ||||||
Empresa Nacional de | 4,511 | 5,594 | ||||||
Empresas CMPC SA | 1,723 | 4,715 | ||||||
Empresas COPEC SA | 619 | 6,053 | ||||||
Enersis SA | 25,873 | 7,182 | ||||||
LATAM Airlines Group SAa | 462 | 2,586 | ||||||
SACI Falabella | 616 | 3,804 | ||||||
|
| |||||||
| 53,462 | ||||||||
COLOMBIA — 2.04% |
| |||||||
Almacenes Exito SA | 322 | 1,747 | ||||||
Cementos Argos SA | 732 | 2,309 | ||||||
Corp. Financiera Colombiana SA | 157 | 1,863 | ||||||
Ecopetrol SA | 6,520 | 3,362 | ||||||
Grupo Argos SA/Colombia | 697 | 3,785 | ||||||
Grupo de Inversiones Suramericana SA | 368 | 4,199 | ||||||
Interconexion Electrica SA ESP | 897 | 1,925 | ||||||
|
| |||||||
| 19,190 | ||||||||
CZECH REPUBLIC — 0.96% |
| |||||||
CEZ AS | 204 | 4,656 | ||||||
Komercni Banka AS | 19 | 4,323 | ||||||
|
| |||||||
| 8,979 | ||||||||
EGYPT — 0.96% |
| |||||||
Commercial International Bank Egypt SAE | 140 | 896 | ||||||
Commercial International Bank Egypt SAE GDR | 1,200 | 6,720 | ||||||
Global Telecom Holding SAE GDRa | 1,120 | 1,456 | ||||||
|
| |||||||
| 9,072 | ||||||||
GREECE — 0.95% |
| |||||||
Alpha Bank AEa | 7,901 | 744 | ||||||
Eurobank Ergasias SAa | 15,637 | 631 | ||||||
Hellenic Telecommunications Organization SA | 307 | 2,803 | ||||||
National Bank of Greece SAa | 2,631 | 1,533 | ||||||
| Security | Shares | Value | ||||||
OPAP SA | 408 | $ | 3,200 | |||||
|
| |||||||
| 8,911 | ||||||||
HUNGARY — 1.14% |
| |||||||
MOL Hungarian Oil & Gas PLC | 46 | 2,278 | ||||||
OTP Bank PLC | 294 | 5,660 | ||||||
Richter Gedeon Nyrt | 184 | 2,809 | ||||||
|
| |||||||
| 10,747 | ||||||||
INDONESIA — 10.86% |
| |||||||
Astra International Tbk PT | 26,800 | 11,302 | ||||||
Bank Central Asia Tbk PT | 15,300 | 14,048 | ||||||
Bank Mandiri Persero Tbk PT | 13,300 | 8,614 | ||||||
Bank Negara Indonesia Persero Tbk PT | 12,400 | 4,369 | ||||||
Bank Rakyat Indonesia Persero Tbk PT | 15,000 | 11,343 | ||||||
Charoen Pokphand Indonesia Tbk PT | 11,400 | 1,517 | ||||||
Gudang Garam Tbk PT | 800 | 2,534 | ||||||
Indocement Tunggal Prakarsa Tbk PT | 2,600 | 3,632 | ||||||
Indofood Sukses Makmur Tbk PT | 8,300 | 3,131 | ||||||
Kalbe Farma Tbk PT | 37,600 | 4,483 | ||||||
Lippo Karawaci Tbk PT | 25,400 | 1,934 | ||||||
Matahari Department Store Tbk PT | 2,900 | 3,617 | ||||||
Perusahaan Gas Negara Persero Tbk PT | 15,500 | 3,067 | ||||||
Semen Indonesia Persero Tbk PT | 4,800 | 3,160 | ||||||
Telekomunikasi Indonesia Persero Tbk PT | 67,700 | 13,829 | ||||||
Unilever Indonesia Tbk PT | 2,300 | 6,503 | ||||||
United Tractors Tbk PT | 2,800 | 3,811 | ||||||
XL Axiata Tbk PTa | 5,800 | 1,239 | ||||||
|
| |||||||
| 102,133 | ||||||||
MALAYSIA — 14.15% |
| |||||||
Alliance Financial Group Bhd | 2,100 | 1,880 | ||||||
AMMB Holdings Bhd | 2,900 | 3,245 | ||||||
Astro Malaysia Holdings Bhd | 3,000 | 2,072 | ||||||
Axiata Group Bhd | 3,300 | 4,824 | ||||||
British American Tobacco Malaysia Bhd | 200 | 2,961 | ||||||
CIMB Group Holdings Bhd | 6,600 | 7,857 | ||||||
Dialog Group Bhd | 7,300 | 2,729 | ||||||
DiGi.Com Bhd | 4,500 | 5,604 | ||||||
Gamuda Bhd | 2,000 | 2,067 | ||||||
Genting Bhd | 3,100 | 5,056 | ||||||
Genting Malaysia Bhd | 4,300 | 4,054 | ||||||
Hong Leong Bank Bhd | 400 | 1,246 | ||||||
IHH Healthcare Bhd | 3,100 | 4,318 | ||||||
IJM Corp. Bhd | 1,900 | 2,850 | ||||||
IOI Corp. Bhd | 4,100 | 3,905 | ||||||
SCHEDULESOF INVESTMENTS | 21 |
Table of Contents
Schedule of Investments (Continued)
iSHARES® MSCI EMERGING MARKETS HORIZON ETF
August 31, 2015
| Security | Shares | Value | ||||||
Kuala Lumpur Kepong Bhd | 600 | $ | 2,974 | |||||
Malayan Banking Bhd | 6,000 | 12,514 | ||||||
Maxis Bhd | 2,600 | 4,067 | ||||||
MISC Bhd | 1,500 | 2,893 | ||||||
Petronas Chemicals Group Bhd | 4,000 | 5,781 | ||||||
Petronas Gas Bhd | 1,000 | 5,076 | ||||||
PPB Group Bhd | 900 | 3,287 | ||||||
Public Bank Bhd | 3,200 | 13,714 | ||||||
Sapurakencana Petroleum Bhd | 5,400 | 2,212 | ||||||
Sime Darby Bhd | 3,900 | 6,918 | ||||||
Telekom Malaysia Bhd | 1,400 | 2,163 | ||||||
Tenaga Nasional Bhd | 4,400 | 11,712 | ||||||
UMW Holdings Bhd | 1,100 | 2,226 | ||||||
YTL Corp. Bhd | 7,800 | 2,897 | ||||||
|
| |||||||
| 133,102 | ||||||||
MEXICO — 21.67% |
| |||||||
Alfa SAB de CV | 3,700 | 7,362 | ||||||
America Movil SAB de CV | 40,000 | 36,400 | ||||||
Arca Continental SAB de CV | 500 | 2,847 | ||||||
Cemex SAB de CV CPOa | 14,864 | 11,631 | ||||||
Coca-Cola Femsa SAB de CV Series L | 600 | 4,309 | ||||||
Controladora Comercial Mexicana SAB de CV BC Units | 600 | 1,710 | ||||||
El Puerto de Liverpool SAB de CV Series C1 | 300 | 3,574 | ||||||
Fibra Uno Administracion SA de CV | 3,100 | 6,630 | ||||||
Fomento Economico Mexicano SAB de CV | 2,300 | 20,471 | ||||||
Gentera SAB de CV | 1,400 | 2,233 | ||||||
Gruma SAB de CV Series B | 300 | 4,025 | ||||||
Grupo Aeroportuario del Pacifico SAB de CV Series B | 400 | 3,346 | ||||||
Grupo Aeroportuario del Sureste SAB de CV Series B | 300 | 4,359 | ||||||
Grupo Bimbo SAB de CVa | 2,200 | 5,648 | ||||||
Grupo Carso SAB de CV Series A1 | 800 | 3,628 | ||||||
Grupo Financiero Banorte SAB de CV | 3,200 | 15,334 | ||||||
Grupo Financiero Inbursa SAB de CV Series Ob | 3,000 | 6,320 | ||||||
Grupo Financiero Santander Mexico SAB de CV Series B | 2,400 | 3,736 | ||||||
Grupo Mexico SAB de CV Series B | 4,500 | 11,384 | ||||||
Grupo Televisa SAB | 3,100 | 18,927 | ||||||
Industrias Penoles SAB de CV | 205 | 2,913 | ||||||
| Security | Shares | Value | ||||||
Kimberly-Clark de Mexico SAB de CV Series A | 2,000 | $ | 4,476 | |||||
Mexichem SAB de CV | 1,200 | 3,069 | ||||||
OHL Mexico SAB de CVa | 1,100 | 1,461 | ||||||
Promotora y Operadora de Infraestructura SAB de CVa | 300 | 3,149 | ||||||
Wal-Mart de Mexico SAB de CV | 6,200 | 14,828 | ||||||
|
| |||||||
| 203,770 | ||||||||
PERU — 1.73% |
| |||||||
Cia. de Minas Buenaventura SA ADR | 240 | 1,517 | ||||||
Credicorp Ltd. | 85 | 9,348 | ||||||
Southern Copper Corp. | 204 | 5,439 | ||||||
|
| |||||||
| 16,304 | ||||||||
PHILIPPINES — 6.65% |
| |||||||
Aboitiz Equity Ventures Inc. | 2,440 | 2,876 | ||||||
Ayala Corp. | 270 | 4,263 | ||||||
Ayala Land Inc. | 10,300 | 7,922 | ||||||
Bank of the Philippine Islands | 1,480 | 2,679 | ||||||
BDO Unibank Inc. | 2,480 | 5,226 | ||||||
Energy Development Corp. | 16,200 | 2,080 | ||||||
Globe Telecom Inc. | 45 | 2,480 | ||||||
GT Capital Holdings Inc. | 115 | 3,125 | ||||||
JG Summit Holdings Inc. | 3,540 | 5,377 | ||||||
Jollibee Foods Corp. | 790 | 3,237 | ||||||
Philippine Long Distance Telephone Co. | 140 | 7,542 | ||||||
SM Investments Corp. | 270 | 5,072 | ||||||
SM Prime Holdings Inc. | 11,600 | 4,840 | ||||||
Universal Robina Corp. | 1,400 | 5,811 | ||||||
|
| |||||||
| 62,530 | ||||||||
POLAND — 7.09% |
| |||||||
Bank Pekao SA | 189 | 8,063 | ||||||
Bank Zachodni WBK SAa | 51 | 4,096 | ||||||
Cyfrowy Polsat SAa | 350 | 2,098 | ||||||
KGHM Polska Miedz SA | 216 | 4,496 | ||||||
LPP SA | 2 | 4,135 | ||||||
mBank SAa | 27 | 2,612 | ||||||
Orange Polska SA | 1,171 | 2,204 | ||||||
PGE Polska Grupa Energetyczna SA | 1,152 | 4,767 | ||||||
Polski Koncern Naftowy Orlen SA | 447 | 8,748 | ||||||
Polskie Gornictwo Naftowe i Gazownictwo SA | 3,144 | 5,659 | ||||||
Powszechna Kasa Oszczednosci Bank Polski SA | 1,085 | 8,553 | ||||||
Powszechny Zaklad Ubezpieczen SA | 79 | 9,021 | ||||||
| 22 | 2015 iSHARES ANNUAL REPORTTO SHAREHOLDERS |
Table of Contents
Schedule of Investments (Continued)
iSHARES® MSCI EMERGING MARKETS HORIZON ETF
August 31, 2015
| Security | Shares | Value | ||||||
Tauron Polska Energia SA | 2,391 | $ | 2,218 | |||||
|
| |||||||
| 66,670 | ||||||||
QATAR — 4.74% |
| |||||||
Ezdan Holding Group QSC | 906 | 4,725 | ||||||
Industries Qatar QSC | 235 | 8,584 | ||||||
Masraf Al Rayan QSC | 545 | 6,526 | ||||||
Ooredoo QSC | 138 | 2,634 | ||||||
Qatar Insurance Co. SAQ | 149 | 4,010 | ||||||
Qatar Islamic Bank SAQ | 109 | 3,383 | ||||||
Qatar National Bank SAQ | 250 | 12,290 | ||||||
Vodafone Qatar QSC | 618 | 2,402 | ||||||
|
| |||||||
| 44,554 | ||||||||
THAILAND — 10.33% |
| |||||||
Advanced Info Service PCL NVDR | 1,500 | 9,960 | ||||||
Airports of Thailand PCL NVDR | 700 | 5,390 | ||||||
Bangkok Bank PCL Foreign | 600 | 2,754 | ||||||
Bangkok Dusit Medical Services PCL NVDR | 5,800 | 3,155 | ||||||
BTS Group Holdings PCL NVDR | 4,200 | 1,142 | ||||||
Bumrungrad Hospital PCL NVDR | 600 | 3,867 | ||||||
Central Pattana PCL NVDR | 3,000 | 3,766 | ||||||
Charoen Pokphand Foods PCL NVDR | 4,600 | 2,438 | ||||||
CP ALL PCL NVDR | 6,400 | 9,106 | ||||||
Kasikornbank PCL Foreign | 1,200 | 6,059 | ||||||
Kasikornbank PCL NVDR | 800 | 4,029 | ||||||
Krung Thai Bank PCL NVDRb | 6,000 | 3,046 | ||||||
Minor International PCL NVDR | 3,280 | 2,425 | ||||||
PTT Exploration & Production PCL NVDR | 2,300 | 5,101 | ||||||
PTT Global Chemical PCL NVDR | 2,600 | 4,352 | ||||||
PTT PCL NVDR | 1,400 | 10,467 | ||||||
Siam Cement PCL (The) Foreign | 600 | 7,968 | ||||||
Siam Commercial Bank PCL (The) NVDR | 2,200 | 8,715 | ||||||
True Corp. PCL NVDRa | 12,700 | 3,437 | ||||||
|
| |||||||
| 97,177 | ||||||||
TURKEY — 6.40% |
| |||||||
Akbank TAS | 2,780 | 6,513 | ||||||
Anadolu Efes Biracilik ve Malt Sanayii AS | 324 | 2,415 | ||||||
BIM Birlesik Magazalar AS | 288 | 4,991 | ||||||
Coca-Cola Icecek AS | 111 | 1,373 | ||||||
Emlak Konut Gayrimenkul Yatirim Ortakligi AS | 3,369 | 2,882 | ||||||
Eregli Demir ve Celik Fabrikalari TAS | 2,012 | 2,737 | ||||||
Haci Omer Sabanci Holding AS | 1,518 | 4,537 | ||||||
KOC Holding AS | 926 | 3,610 | ||||||
| Security | Shares | Value | ||||||
Tupras Turkiye Petrol Rafinerileri ASa | 187 | $ | 4,824 | |||||
Turk Hava Yollari AOa | 1,065 | 2,945 | ||||||
Turkcell Iletisim Hizmetleri AS | 1,250 | 4,895 | ||||||
Turkiye Garanti Bankasi AS | 3,165 | 8,024 | ||||||
Turkiye Halk Bankasi AS | 839 | 3,214 | ||||||
Turkiye Is Bankasi Class C | 1,889 | 3,160 | ||||||
Turkiye Vakiflar Bankasi Tao Class D | 1,518 | 2,008 | ||||||
Yapi ve Kredi Bankasi AS | 1,649 | 2,034 | ||||||
|
| |||||||
| 60,162 | ||||||||
UNITED ARAB EMIRATES — 3.56% |
| |||||||
Abu Dhabi Commercial Bank PJSC | 2,357 | 5,134 | ||||||
Aldar Properties PJSC | 4,958 | 3,145 | ||||||
Arabtec Holding PJSCa | 3,272 | 1,755 | ||||||
DP World Ltd. | 253 | 5,642 | ||||||
Dubai Financial Market PJSC | 1,477 | 692 | ||||||
Emaar Properties PJSC | 4,759 | 8,746 | ||||||
First Gulf Bank PJSC | 1,336 | 5,219 | ||||||
National Bank of Abu Dhabi PJSC | 1,107 | 3,134 | ||||||
|
| |||||||
| 33,467 | ||||||||
|
| |||||||
TOTAL COMMON STOCKS |
| |||||||
(Cost: $1,182,613) |
| 930,230 | ||||||
PREFERRED STOCKS — 0.79% |
| |||||||
CHILE — 0.25% |
| |||||||
Sociedad Quimica y Minera de Chile SA Series B | 148 | 2,324 | ||||||
|
| |||||||
| 2,324 | ||||||||
COLOMBIA — 0.54% | ||||||||
Bancolombia SA | 603 | 5,142 | ||||||
|
| |||||||
| 5,142 | ||||||||
|
| |||||||
TOTAL PREFERRED STOCKS |
| |||||||
(Cost: $11,882) |
| 7,466 | ||||||
SHORT-TERM INVESTMENTS — 1.08% |
| |||||||
MONEY MARKET FUNDS — 1.08% |
| |||||||
BlackRock Cash Funds: Institutional, | ||||||||
0.18%c,d,e | 9,348 | 9,348 | ||||||
BlackRock Cash Funds: Prime, | ||||||||
0.18%c,d,e | 537 | 537 | ||||||
SCHEDULESOF INVESTMENTS | 23 |
Table of Contents
Schedule of Investments (Continued)
iSHARES® MSCI EMERGING MARKETS HORIZON ETF
August 31, 2015
| Security | Shares | Value | ||||||
BlackRock Cash Funds: Treasury, | ||||||||
0.03%c,d | 261 | $ | 261 | |||||
|
| |||||||
| 10,146 | ||||||||
|
| |||||||
TOTAL SHORT-TERM INVESTMENTS |
| |||||||
(Cost: $10,146) |
| 10,146 | ||||||
|
| |||||||
TOTAL INVESTMENTS |
| |||||||
(Cost: $1,204,641) |
| 947,842 | ||||||
Other Assets, Less Liabilities — (0.78)% |
| (7,354 | ) | |||||
|
| |||||||
NET ASSETS — 100.00% |
| $ | 940,488 | |||||
|
| |||||||
ADR — American Depositary Receipts
CPO — Certificates of Participation (Ordinary)
GDR — Global Depositary Receipts
NVDR — Non-Voting Depositary Receipts
| a | Non-income earning security. |
| b | All or a portion of this security represents a security on loan. See Note 1. |
| c | Affiliated issuer. See Note 2. |
| d | The rate quoted is the annualized seven-day yield of the fund at period end. |
| e | All or a portion of this security represents an investment of securities lending collateral. See Note 1. |
See notes to financial statements.
| 24 | 2015 iSHARES ANNUAL REPORTTO SHAREHOLDERS |
Table of Contents
Schedule of Investments
iSHARES® MSCI FRONTIER 100 ETF
August 31, 2015
| Security | Shares | Value | ||||||
COMMON STOCKS — 99.77% |
| |||||||
ARGENTINA — 13.16% |
| |||||||
Banco Macro SA ADRa | 217,568 | $ | 9,738,344 | |||||
BBVA Banco Frances SA ADR | 257,124 | 4,255,402 | ||||||
Cresud SACIF y A ADRa | 174,520 | 1,825,479 | ||||||
Empresa Distribuidora y Comercializadora Norte SA ADRa | 126,360 | 1,656,580 | ||||||
Grupo Financiero Galicia SA ADR | 497,176 | 9,525,892 | ||||||
IRSA Inversiones y Representaciones SA ADR | 120,220 | 1,812,917 | ||||||
Pampa Energia SA ADRa | 241,600 | 3,851,104 | ||||||
Petrobras Argentina SA ADR | 405,648 | 2,279,742 | ||||||
Telecom Argentina SA ADR | 497,952 | 7,997,109 | ||||||
Transportadora de Gas del Sur SA ADR | 317,512 | 1,349,426 | ||||||
YPF SA ADR | 1,015,676 | 21,877,661 | ||||||
|
| |||||||
| 66,169,656 | ||||||||
BANGLADESH — 3.52% |
| |||||||
GrameenPhone Ltd. | 998,400 | 4,061,310 | ||||||
Islami Bank Bangladesh Ltd. | 1 | — | ||||||
Lafarge Surma Cement Ltd. | 2,995,200 | 4,328,046 | ||||||
Olympic Industries Ltd. | 192,365 | 681,944 | ||||||
Square Pharmaceuticals Ltd. | 2,145,719 | 6,970,038 | ||||||
Titas Gas Transmission & Distribution Co. Ltd. | 1,728,400 | 1,653,918 | ||||||
|
| |||||||
| 17,695,256 | ||||||||
JORDAN — 1.32% |
| |||||||
Arab Bank PLC | 453,960 | 4,483,556 | ||||||
Jordan Petroleum Refinery Co. | 344,385 | 2,171,994 | ||||||
|
| |||||||
| 6,655,550 | ||||||||
KAZAKHSTAN — 2.70% |
| |||||||
Halyk Savings Bank of Kazakhstan JSC GDRb | 368,640 | 2,359,296 | ||||||
KazMunaiGas Exploration Production JSC GDRb | 1,126,192 | 9,291,084 | ||||||
KCell JSC GDRb | 328,864 | 1,940,298 | ||||||
|
| |||||||
| 13,590,678 | ||||||||
KENYA — 5.89% |
| |||||||
Co-operative Bank of Kenya Ltd. (The) | 11,331,072 | 1,991,257 | ||||||
East African Breweries Ltd. | 2,611,242 | 6,914,700 | ||||||
Equity Group Holdings Ltd./Kenya | 13,478,400 | 5,256,381 | ||||||
| Security | Shares | Value | ||||||
Kenya Commercial Bank Ltd. | 14,822,460 | $ | 6,280,099 | |||||
Safaricom Ltd. | 66,316,800 | 9,195,589 | ||||||
|
| |||||||
| 29,638,026 | ||||||||
KUWAIT — 25.59% |
| |||||||
Agility Public Warehousing Co. KSC | 4,197,896 | 8,197,116 | ||||||
ALAFCO Aviation Lease & Finance Co. KSCP | 1,666,254 | 1,224,254 | ||||||
Boubyan Bank KSCP | 2,021,624 | 2,676,318 | ||||||
Burgan Bank SAK | 4,333,700 | 5,665,436 | ||||||
Commercial Real Estate Co. KSC | 8,406,532 | 2,309,258 | ||||||
Jazeera Airways Co. KSC | 1,137,812 | 1,675,745 | ||||||
Kuwait Finance House KSCP | 13,325,902 | 25,580,087 | ||||||
Kuwait International Bank KSCP | 2,855,750 | 2,173,829 | ||||||
Kuwait Projects Co. Holding KSCP | 3,434,232 | 6,819,590 | ||||||
Mabanee Co. SAK | 2,548,248 | 7,337,335 | ||||||
Mobile Telecommunications Co. KSC | 14,455,185 | 17,701,203 | ||||||
National Bank of Kuwait SAKP | 13,673,532 | 35,298,213 | ||||||
National Industries Group Holding SAK | 5,901,724 | 2,929,865 | ||||||
National Real Estate Co. KSCa | 3,326,506 | 891,766 | ||||||
Qurain Petrochemical Industries Co. KSC | 1,893,962 | 1,103,218 | ||||||
VIVA Kuwait Telecom Co.a | 1,859,128 | 5,168,517 | ||||||
Warba Bank KSCPa | 2,875,944 | 1,979,799 | ||||||
|
| |||||||
| 128,731,549 | ||||||||
MAURITIUS — 1.46% |
| |||||||
MCB Group Ltd. | 921,608 | 5,476,715 | ||||||
SBM Holdings Ltd. | 77,176,320 | 1,843,279 | ||||||
|
| |||||||
| 7,319,994 | ||||||||
MOROCCO — 5.47% |
| |||||||
Attijariwafa Bank | 261,120 | 9,000,756 | ||||||
Banque Centrale Populaire | 179,712 | 3,975,663 | ||||||
Douja Promotion Groupe Addoha SA | 1,029,504 | 2,976,655 | ||||||
Maroc Telecom | 1,011,456 | 11,572,997 | ||||||
|
| |||||||
| 27,526,071 | ||||||||
NIGERIA — 13.09% |
| |||||||
Access Bank PLC | 81,093,120 | 2,091,938 | ||||||
Afriland Properties PLC | 7,291 | 80 | ||||||
Dangote Cement PLC | 5,324,928 | 4,609,236 | ||||||
SCHEDULESOF INVESTMENTS | 25 |
Table of Contents
Schedule of Investments (Continued)
iSHARES® MSCI FRONTIER 100 ETF
August 31, 2015
| Security | Shares | Value | ||||||
Diamond Bank PLC | 76,337,664 | $ | 1,218,338 | |||||
Ecobank Transnational Inc.a | 39,976,320 | 3,701,697 | ||||||
FBN Holdings PLC | 124,826,880 | 3,846,610 | ||||||
Guaranty Trust Bank PLC | 95,824,512 | 11,022,825 | ||||||
Lafarge Africa PLC | 7,343,232 | 3,684,699 | ||||||
Nestle Nigeria PLC | 1,856,256 | 7,825,621 | ||||||
Nigerian Breweries PLC | 21,999,744 | 13,414,047 | ||||||
Oando PLC | 28,744,320 | 1,601,315 | ||||||
SEPLAT Petroleum Development Co. PLC | 993,024 | 1,219,488 | ||||||
Transnational Corp. of Nigeria PLC | 145,346,688 | 1,692,368 | ||||||
United Bank for Africa PLC | 119,308,416 | 1,981,987 | ||||||
Zenith Bank PLC | 103,567,872 | 7,900,786 | ||||||
|
| |||||||
| 65,811,035 | ||||||||
OMAN — 5.61% |
| |||||||
Bank Muscat SAOG | 6,549,504 | 8,569,445 | ||||||
Bank Sohar SAOG | 4,341,303 | 1,994,835 | ||||||
Oman Cables Industry | 411,872 | 2,079,676 | ||||||
Oman Telecommunications Co. SAOG | 2,280,856 | 10,125,295 | ||||||
OMINVEST | 94,584 | 115,897 | ||||||
Ooredoo QSC | 2,220,956 | 4,151,320 | ||||||
Raysut Cement Co. SAOG | 388,760 | 1,200,998 | ||||||
|
| |||||||
| 28,237,466 | ||||||||
PAKISTAN — 11.00% |
| |||||||
Bank Al Habib Ltd. | 4,268,000 | 1,803,525 | ||||||
Engro Corp. Ltd./Pakistan | 1,550,461 | 4,788,002 | ||||||
Fauji Fertilizer Co. Ltd. | 3,848,350 | 5,094,421 | ||||||
Habib Bank Ltd. | 3,878,500 | 8,300,828 | ||||||
Hub Power Co. Ltd. (The) | 3,002,030 | 2,943,647 | ||||||
Lucky Cement Ltd. | 1,132,298 | 5,749,627 | ||||||
MCB Bank Ltd. | 3,220,466 | 7,894,588 | ||||||
National Bank of Pakistan | 3,967,126 | 2,018,519 | ||||||
Oil & Gas Development Co. Ltd. | 4,416,200 | 6,098,067 | ||||||
Pakistan Oilfields Ltd. | 571,000 | 1,904,851 | ||||||
Pakistan Petroleum Ltd. | 1,162,150 | 1,558,202 | ||||||
Pakistan State Oil Co. Ltd. | 968,000 | 3,093,881 | ||||||
United Bank Ltd./Pakistan | 2,599,667 | 4,093,305 | ||||||
|
| |||||||
| 55,341,463 | ||||||||
ROMANIA — 4.54% |
| |||||||
Banca Transilvaniaa | 13,954,177 | 7,624,269 | ||||||
BRD-Groupe Societe Generale SAa | 1,231,829 | 3,190,734 | ||||||
| Security | Shares or Principal | Value | ||||||
Electrica SA | 1,039,872 | $ | 3,393,203 | |||||
OMV Petrom SA | 29,754,624 | 2,596,652 | ||||||
Societatea Nationala de Gaze Naturale ROMGAZ SA | 446,592 | 3,535,864 | ||||||
Transgaz SA Medias | 37,248 | 2,510,963 | ||||||
|
| |||||||
| 22,851,685 | ||||||||
SLOVENIA — 0.31% |
| |||||||
Zavarovalnica Triglav DD | 59,904 | 1,543,815 | ||||||
|
| |||||||
| 1,543,815 | ||||||||
SRI LANKA — 2.68% |
| |||||||
Commercial Bank of Ceylon PLC | 3,327,744 | 4,301,839 | ||||||
Hatton National Bank PLC | 1,008,384 | 1,663,159 | ||||||
John Keells Holdings PLC | 5,613,696 | 7,532,195 | ||||||
|
| |||||||
| 13,497,193 | ||||||||
VIETNAM — 3.43% |
| |||||||
Bank for Foreign Trade of Vietnam JSC | 1,470,720 | 2,780,313 | ||||||
Masan Group Corp.a | 1,693,440 | 6,063,738 | ||||||
Saigon Thuong Tin Commercial JSBa | 2,553,606 | 1,885,544 | ||||||
Vingroup JSC | 3,521,285 | 6,500,159 | ||||||
|
| |||||||
| 17,229,754 | ||||||||
|
| |||||||
TOTAL COMMON STOCKS |
| |||||||
(Cost: $586,812,221) |
| 501,839,191 | ||||||
CONVERTIBLE BONDS — 0.05% |
| |||||||
OMAN — 0.05% |
| |||||||
Bank Muscat SAOG | ||||||||
4.50%, 03/20/17 | $ | 540,521 | 1,445 | |||||
3.50%, 03/19/18 | 1,026,177 | 250,417 | ||||||
|
| |||||||
| 251,862 | ||||||||
|
| |||||||
TOTAL CONVERTIBLE BONDS |
| |||||||
(Cost: $0) |
| 251,862 | ||||||
SHORT-TERM INVESTMENTS — 0.41% |
| |||||||
MONEY MARKET FUNDS — 0.41% |
| |||||||
BlackRock Cash Funds: Treasury, |
| |||||||
0.03%c,d | 2,041,402 | 2,041,402 | ||||||
|
| |||||||
| 2,041,402 | ||||||||
|
| |||||||
TOTAL SHORT-TERM INVESTMENTS |
| |||||||
(Cost: $2,041,402) |
| 2,041,402 | ||||||
|
| |||||||
| 26 | 2015 iSHARES ANNUAL REPORTTO SHAREHOLDERS |
Table of Contents
Schedule of Investments (Continued)
iSHARES® MSCI FRONTIER 100 ETF
August 31, 2015
| Value | ||||||
TOTAL INVESTMENTS | ||||||
(Cost: $588,853,623) | $ | 504,132,455 | ||||
Other Assets, Less Liabilities — (0.23)% | (1,139,954 | ) | ||||
|
| |||||
NET ASSETS — 100.00% | $ | 502,992,501 | ||||
|
| |||||
ADR — American Depositary Receipts
GDR — Global Depositary Receipts
| a | Non-income earning security. |
| b | This security may be resold to qualified foreign investors and foreign institutional buyers under Regulation S of the Securities Act of 1933. |
| c | Affiliated issuer. See Note 2. |
| d | The rate quoted is the annualized seven-day yield of the fund at period end. |
See notes to financial statements.
SCHEDULESOF INVESTMENTS | 27 |
Table of Contents
Schedule of Investments
August 31, 2015
| Security | Shares | Value | ||||||
COMMON STOCKS — 99.37% |
| |||||||
AUSTRALIA — 2.49% |
| |||||||
AGL Energy Ltd. | 5,000 | $ | 59,871 | |||||
Amcor Ltd./Australia | 9,480 | 92,210 | ||||||
AMP Ltd. | 20,400 | 86,052 | ||||||
APA Group | 9,434 | 58,656 | ||||||
Asciano Ltd. | 8,940 | 53,810 | ||||||
ASX Ltd. | 1,803 | 50,414 | ||||||
Aurizon Holdings Ltd. | 15,180 | 53,379 | ||||||
Australia & New Zealand Banking Group Ltd. | 17,190 | 340,379 | ||||||
Bendigo & Adelaide Bank Ltd. | 5,010 | 38,964 | ||||||
BHP Billiton Ltd. | 20,940 | 373,808 | ||||||
Brambles Ltd. | 11,190 | 78,062 | ||||||
Cochlear Ltd. | 600 | 36,339 | ||||||
Commonwealth Bank of Australia | 10,547 | 561,395 | ||||||
Computershare Ltd. | 4,290 | 30,110 | ||||||
Crown Resorts Ltd. | 4,440 | 36,010 | ||||||
CSL Ltd. | 3,210 | 209,071 | ||||||
Dexus Property Group | 9,403 | 49,130 | ||||||
Federation Centres | 22,075 | 44,290 | ||||||
Goodman Group | 15,300 | 66,166 | ||||||
GPT Group (The) | 17,940 | 57,106 | ||||||
Iluka Resources Ltd. | 4,710 | 24,810 | ||||||
Incitec Pivot Ltd. | 18,330 | 45,613 | ||||||
Insurance Australia Group Ltd. | 16,110 | 57,905 | ||||||
James Hardie Industries PLC | 4,448 | 55,405 | ||||||
Lend Lease Group | 6,330 | 62,558 | ||||||
Macquarie Group Ltd. | 2,140 | 115,197 | ||||||
Mirvac Group | 40,680 | 50,470 | ||||||
National Australia Bank Ltd. | 15,876 | 350,827 | ||||||
Newcrest Mining Ltd.a | 6,510 | 51,691 | ||||||
Orica Ltd.b | 2,850 | 32,045 | ||||||
Origin Energy Ltd. | 8,760 | 51,298 | ||||||
QBE Insurance Group Ltd. | 9,570 | 89,557 | ||||||
Ramsay Health Care Ltd. | 1,230 | 54,466 | ||||||
Rio Tinto Ltd. | 3,120 | 111,238 | ||||||
Santos Ltd. | 8,130 | 29,568 | ||||||
Scentre Group | 43,461 | 117,393 | ||||||
Sonic Healthcare Ltd. | 3,062 | 44,979 | ||||||
South32 Ltd.a | 39,304 | 42,354 | ||||||
Stockland | 18,546 | 51,409 | ||||||
Suncorp Group Ltd. | 8,087 | 73,558 | ||||||
Sydney Airport | 5,869 | 23,925 | ||||||
| Security | Shares | Value | ||||||
Tatts Group Ltd. | 14,820 | $ | 38,665 | |||||
Telstra Corp. Ltd. | 25,853 | 105,755 | ||||||
Transurban Group | 12,318 | 84,534 | ||||||
Wesfarmers Ltd. | 6,634 | 191,231 | ||||||
Westfield Corp. | 15,870 | 109,698 | ||||||
Westpac Banking Corp. | 19,410 | 427,958 | ||||||
Woodside Petroleum Ltd. | 5,190 | 118,699 | ||||||
Woolworths Ltd. | 8,310 | 155,532 | ||||||
|
| |||||||
| 5,143,560 | ||||||||
AUSTRIA — 0.07% |
| |||||||
Andritz AG | 870 | 41,645 | ||||||
Erste Group Bank AGa | 2,460 | 73,197 | ||||||
OMV AG | 1,170 | 29,943 | ||||||
|
| |||||||
| 144,785 | ||||||||
BELGIUM — 0.51% |
| |||||||
Ageas | 2,100 | 85,886 | ||||||
Anheuser-Busch InBev SA/NV | 5,250 | 573,321 | ||||||
Colruyt SA | 630 | 30,711 | ||||||
Groupe Bruxelles Lambert SA | 510 | 39,573 | ||||||
KBC Groep NV | 2,055 | 136,246 | ||||||
Proximus | 990 | 35,603 | ||||||
Solvay SA | 420 | 49,367 | ||||||
UCB SA | 870 | 65,840 | ||||||
Umicore SA | 1,110 | 44,346 | ||||||
|
| |||||||
| 1,060,893 | ||||||||
CANADA — 3.35% |
| |||||||
Agnico Eagle Mines Ltd. | 1,920 | 46,496 | ||||||
Agrium Inc. | 1,050 | 107,809 | ||||||
Alimentation Couche-Tard Inc. Class B | 3,150 | 131,990 | ||||||
ARC Resources Ltd. | 2,520 | 37,464 | ||||||
Bank of Montreal | 4,260 | 227,328 | ||||||
Bank of Nova Scotia (The) | 7,770 | 351,679 | ||||||
Barrick Gold Corp. | 7,530 | 51,785 | ||||||
BCE Inc. | 1,290 | 51,581 | ||||||
BlackBerry Ltd.a,b | 3,120 | 23,403 | ||||||
Brookfield Asset Management Inc. Class A | 6,300 | 196,079 | ||||||
Cameco Corp. | 2,880 | 40,067 | ||||||
Canadian Imperial Bank of Commerce/Canada | 2,730 | 198,394 | ||||||
Canadian National Railway Co. | 5,640 | 310,338 | ||||||
Canadian Natural Resources Ltd. | 7,200 | 160,451 | ||||||
Canadian Oil Sands Ltd. | 4,470 | 25,869 | ||||||
| 28 | 2015 iSHARES ANNUAL REPORTTO SHAREHOLDERS |
Table of Contents
Schedule of Investments (Continued)
iSHARES® MSCI WORLD ETF
August 31, 2015
| Security | Shares | Value | ||||||
Canadian Pacific Railway Ltd. | 1,170 | $ | 168,039 | |||||
Canadian Tire Corp. Ltd. Class A | 570 | 53,209 | ||||||
Canadian Utilities Ltd. Class A | 960 | 26,242 | ||||||
Cenovus Energy Inc. | 5,580 | 79,978 | ||||||
CGI Group Inc. Class Aa | 1,800 | 65,750 | ||||||
CI Financial Corp. | 1,620 | 38,293 | ||||||
Crescent Point Energy Corp. | 3,360 | 42,628 | ||||||
Enbridge Inc. | 5,310 | 216,990 | ||||||
Encana Corp. | 6,600 | 48,762 | ||||||
Fairfax Financial Holdings Ltd. | 210 | 96,557 | ||||||
Finning International Inc. | 1,590 | 26,661 | ||||||
First Quantum Minerals Ltd. | 4,898 | 25,254 | ||||||
Fortis Inc./Canada | 2,040 | 54,722 | ||||||
Franco-Nevada Corp. | 1,500 | 64,262 | ||||||
George Weston Ltd. | 510 | 41,789 | ||||||
Gildan Activewear Inc. | 2,280 | 70,773 | ||||||
Goldcorp Inc. | 5,760 | 79,008 | ||||||
Great-West Lifeco Inc. | 1,410 | 35,639 | ||||||
Husky Energy Inc. | 2,340 | 41,207 | ||||||
IGM Financial Inc. | 870 | 24,619 | ||||||
Imperial Oil Ltd. | 1,980 | 69,125 | ||||||
Intact Financial Corp. | 1,110 | 75,961 | ||||||
Inter Pipeline Ltd. | 2,596 | 55,022 | ||||||
Loblaw Companies Ltd. | 1,830 | 96,582 | ||||||
Magna International Inc. Class A | 2,760 | 134,671 | ||||||
Manulife Financial Corp. | 11,550 | 185,599 | ||||||
Metro Inc. | 2,880 | 75,198 | ||||||
National Bank of Canada | 2,700 | 87,869 | ||||||
Onex Corp. | 840 | 50,570 | ||||||
Open Text Corp. | 960 | 43,054 | ||||||
Pembina Pipeline Corp. | 2,280 | 62,548 | ||||||
Potash Corp. of Saskatchewan Inc. | 5,610 | 144,456 | ||||||
Power Corp. of Canada | 2,040 | 44,158 | ||||||
Power Financial Corp. | 1,080 | 26,251 | ||||||
Restaurant Brands International Inc. | 1,590 | 60,326 | ||||||
RioCan REIT | 2,010 | 36,725 | ||||||
Rogers Communications Inc. Class B | 2,400 | 81,010 | ||||||
Royal Bank of Canada | 8,910 | 491,138 | ||||||
Saputo Inc. | 2,160 | 49,191 | ||||||
Shaw Communications Inc. Class B | 2,556 | 50,774 | ||||||
Silver Wheaton Corp. | 3,900 | 47,281 | ||||||
SNC-Lavalin Group Inc. | 1,230 | 36,516 | ||||||
Sun Life Financial Inc. | 3,750 | 117,869 | ||||||
Suncor Energy Inc. | 10,050 | 281,445 | ||||||
| Security | Shares | Value | ||||||
TELUS Corp. | 64 | $ | 2,070 | |||||
Thomson Reuters Corp. | 2,280 | 87,704 | ||||||
Toronto-Dominion Bank (The) | 11,580 | 456,759 | ||||||
Tourmaline Oil Corp.a,b | 1,410 | 35,290 | ||||||
TransCanada Corp. | 4,440 | 153,173 | ||||||
Valeant Pharmaceuticals International Inc.a | 2,130 | 488,259 | ||||||
Vermilion Energy Inc. | 1,140 | 39,054 | ||||||
|
| |||||||
| 6,926,763 | ||||||||
DENMARK — 0.74% |
| |||||||
AP Moeller – Maersk A/S Class A | 90 | 150,111 | ||||||
Carlsberg A/S Class B | 900 | 67,827 | ||||||
Coloplast A/S Class B | 960 | 65,301 | ||||||
Danske Bank A/S | 5,190 | 160,506 | ||||||
DSV A/S | 2,520 | 89,889 | ||||||
Novo Nordisk A/S Class B | 12,240 | 678,423 | ||||||
Novozymes A/S Class B | 2,070 | 90,059 | ||||||
Pandora A/S | 810 | 93,452 | ||||||
Vestas Wind Systems A/S | 1,590 | 84,858 | ||||||
William Demant Holding A/Sa,b | 570 | 46,252 | ||||||
|
| |||||||
| 1,526,678 | ||||||||
FINLAND — 0.31% |
| |||||||
Elisa OYJ | 1,170 | 38,936 | ||||||
Fortum OYJ | 2,640 | 42,922 | ||||||
Kone OYJ Class Bb | 2,340 | 92,503 | ||||||
Metso OYJ | 1,080 | 26,623 | ||||||
Nokia OYJ | 24,870 | 155,497 | ||||||
Sampo OYJ Class A | 2,520 | 121,502 | ||||||
Stora Enso OYJ Class R | 4,860 | 43,211 | ||||||
UPM-Kymmene OYJ | 3,990 | 66,481 | ||||||
Wartsila OYJ Abp | 1,320 | 54,607 | ||||||
|
| |||||||
| 642,282 | ||||||||
FRANCE — 3.79% |
| |||||||
Accor SA | 1,560 | 73,905 | ||||||
Air Liquide SA | 2,204 | 263,875 | ||||||
Airbus Group SE | 4,038 | 262,833 | ||||||
Alcatel-Lucenta,b | 22,710 | 76,187 | ||||||
Alstom SAa | 1,530 | 47,436 | ||||||
ArcelorMittal | 6,000 | 46,651 | ||||||
Atos | 600 | 45,535 | ||||||
AXA SA | 11,130 | 280,289 | ||||||
BNP Paribas SA | 6,780 | 427,482 | ||||||
Bollore SA | 7,770 | 41,947 | ||||||
Bouygues SA | 1,380 | 52,481 | ||||||
SCHEDULESOF INVESTMENTS | 29 |
Table of Contents
Schedule of Investments (Continued)
iSHARES® MSCI WORLD ETF
August 31, 2015
| Security | Shares | Value | ||||||
Bureau Veritas SA | 1,920 | $ | 43,791 | |||||
Cap Gemini SA | 1,110 | 99,650 | ||||||
Carrefour SA | 4,110 | 133,460 | ||||||
Casino Guichard Perrachon SAb | 480 | 30,334 | ||||||
Christian Dior SE | 420 | 77,839 | ||||||
Cie. de Saint-Gobain | 2,910 | 133,573 | ||||||
Cie. Generale des Etablissements Michelin Class B | 1,290 | 124,727 | ||||||
Credit Agricole SA | 6,540 | 88,560 | ||||||
Danone SA | 3,780 | 234,604 | ||||||
Dassault Systemes | 960 | 66,574 | ||||||
Edenred | 1,650 | 34,952 | ||||||
Electricite de France SA | 1,470 | 31,773 | ||||||
Engie | 9,030 | 161,738 | ||||||
Essilor International SA | 1,350 | 160,949 | ||||||
Eutelsat Communications SA | 1,140 | 34,329 | ||||||
Groupe Eurotunnel SE Registered | 5,670 | 76,652 | ||||||
Hermes International | 189 | 67,058 | ||||||
Iliad SA | 240 | 54,134 | ||||||
Kering | 540 | 92,424 | ||||||
Klepierre | 2,064 | 90,705 | ||||||
L’Oreal SA | 1,560 | 266,916 | ||||||
Lagardere SCA | 1,170 | 31,791 | ||||||
Legrand SA | 1,890 | 108,916 | ||||||
LVMH Moet Hennessy Louis Vuitton SE | 1,740 | 289,818 | ||||||
Numericable-SFR SASa | 810 | 41,609 | ||||||
Orange SA | 12,540 | 197,980 | ||||||
Pernod Ricard SA | 1,440 | 150,896 | ||||||
Peugeot SAa | 3,570 | 61,603 | ||||||
Publicis Groupe SA | 1,260 | 89,679 | ||||||
Renault SA | 1,304 | 108,255 | ||||||
Safran SA | 1,860 | 145,097 | ||||||
Sanofi | 7,650 | 755,778 | ||||||
Schneider Electric SE | 3,589 | 226,530 | ||||||
SCOR SE | 1,320 | 46,502 | ||||||
SES SA | 2,520 | 74,756 | ||||||
Societe BIC SA | 300 | 47,548 | ||||||
Societe Generale SA | 4,927 | 239,902 | ||||||
Sodexo SA | 750 | 65,911 | ||||||
STMicroelectronics NV | 4,710 | 34,162 | ||||||
Suez Environnement Co. | 2,130 | 38,389 | ||||||
Technip SA | 840 | 45,706 | ||||||
Thales SA | 930 | 63,993 | ||||||
Total SA | 13,830 | 632,335 | ||||||
| Security | Shares | Value | ||||||
Unibail-Rodamco SE | 630 | $ | 163,243 | |||||
Veolia Environnement SA | 3,150 | 69,003 | ||||||
Vinci SA | 3,090 | 198,773 | ||||||
Vivendi SA | 7,770 | 191,930 | ||||||
|
| |||||||
| 7,843,468 | ||||||||
GERMANY — 3.25% |
| |||||||
adidas AG | 1,650 | 123,354 | ||||||
Allianz SE Registered | 2,850 | 454,265 | ||||||
BASF SE | 6,060 | 487,674 | ||||||
Bayer AG Registered | 5,370 | 727,766 | ||||||
Bayerische Motoren Werke AG | 2,190 | 201,759 | ||||||
Beiersdorf AG | 810 | 66,963 | ||||||
Brenntag AG | 1,620 | 89,998 | ||||||
Commerzbank AGa | 7,980 | 89,344 | ||||||
Continental AG | 798 | 169,398 | ||||||
Daimler AG Registered | 6,240 | 501,041 | ||||||
Deutsche Annington Immobilien SE | 3,160 | 103,338 | ||||||
Deutsche Bank AG Registered | 8,912 | 262,379 | ||||||
Deutsche Boerse AG | 1,470 | 131,425 | ||||||
Deutsche Post AG Registered | 6,870 | 189,020 | ||||||
Deutsche Telekom AG Registered | 20,160 | 344,373 | ||||||
E.ON SE | 11,970 | 135,532 | ||||||
Fresenius Medical Care AG & Co. KGaA | 1,770 | 135,280 | ||||||
Fresenius SE & Co. KGaA | 2,700 | 190,748 | ||||||
GEA Group AG | 1,830 | 71,358 | ||||||
Hannover Rueck SE | 600 | 60,924 | ||||||
HeidelbergCement AG | 1,080 | 81,515 | ||||||
Henkel AG & Co. KGaA | 870 | 79,761 | ||||||
Infineon Technologies AG | 8,910 | 97,381 | ||||||
Kabel Deutschland Holding AGa | 450 | 60,936 | ||||||
Lanxess AG | 930 | 47,206 | ||||||
Linde AG | 1,320 | 229,106 | ||||||
MAN SE | 540 | 56,574 | ||||||
Merck KGaA | 900 | 85,991 | ||||||
Muenchener Rueckversicherungs-Gesellschaft AG in Muenchen Registered | 1,170 | 214,739 | ||||||
Osram Licht AG | 1,080 | 57,070 | ||||||
QIAGEN NVa | 2,850 | 75,253 | ||||||
RWE AG | 3,540 | 53,132 | ||||||
SAP SE | 6,210 | 417,429 | ||||||
Siemens AG Registered | 5,280 | 523,350 | ||||||
ThyssenKrupp AG | 3,671 | 79,491 | ||||||
| 30 | 2015 iSHARES ANNUAL REPORTTO SHAREHOLDERS |
Table of Contents
Schedule of Investments (Continued)
iSHARES® MSCI WORLD ETF
August 31, 2015
| Security | Shares | Value | ||||||
Volkswagen AG | 150 | $ | 28,018 | |||||
|
| |||||||
| 6,722,891 | ||||||||
HONG KONG — 1.18% |
| |||||||
AIA Group Ltd.b | 90,000 | 497,610 | ||||||
Bank of East Asia Ltd. (The)b | 30,000 | 103,161 | ||||||
BOC Hong Kong Holdings Ltd.b | 45,000 | 152,128 | ||||||
Cheung Kong Property Holdings Ltd.a | 16,500 | 115,606 | ||||||
CK Hutchison Holdings Ltd. | 30,000 | 399,868 | ||||||
CLP Holdings Ltd.b | 15,000 | 124,160 | ||||||
Galaxy Entertainment Group Ltd.b | 30,000 | 96,193 | ||||||
Hang Seng Bank Ltd.b | 12,000 | 213,521 | ||||||
Hong Kong & China Gas Co. Ltd.b | 60,610 | 114,337 | ||||||
Hong Kong Exchanges and Clearing Ltd. | 7,300 | 171,619 | ||||||
Li & Fung Ltd.b | 68,000 | 44,836 | ||||||
Link REITb | 15,000 | 79,548 | ||||||
Michael Kors Holdings Ltd.a | 1,380 | 59,975 | ||||||
MTR Corp. Ltd. | 30,000 | 133,741 | ||||||
New World Development Co. Ltd. | 60,333 | 61,345 | ||||||
Sands China Ltd.b | 24,000 | 83,303 | ||||||
|
| |||||||
| 2,450,951 | ||||||||
IRELAND — 0.65% |
| |||||||
Bank of Irelanda | 191,700 | 76,254 | ||||||
CRH PLC | 5,100 | 152,521 | ||||||
Endo International PLCa | 1,410 | 108,570 | ||||||
Jazz Pharmaceuticals PLCa | 360 | 60,775 | ||||||
Kerry Group PLC Class A | 1,320 | 98,135 | ||||||
Medtronic PLC | 8,880 | 641,935 | ||||||
Pentair PLC | 1,530 | 84,594 | ||||||
Tyco International PLC | 3,330 | 120,846 | ||||||
|
| |||||||
| 1,343,630 | ||||||||
ISRAEL — 0.24% |
| |||||||
Bank Hapoalim BM | 20,820 | 105,364 | ||||||
Teva Pharmaceutical Industries Ltd. | 6,120 | 399,781 | ||||||
|
| |||||||
| 505,145 | ||||||||
ITALY — 0.94% |
| |||||||
Assicurazioni Generali SpA | 8,160 | 149,310 | ||||||
Atlantia SpA | 3,540 | 94,642 | ||||||
Banca Monte dei Paschi di Siena SpAa | 16,950 | 35,573 | ||||||
Banco Popolare SCa | 1,377 | 23,638 | ||||||
CNH Industrial NV | 7,920 | 62,475 | ||||||
| Security | Shares | Value | ||||||
Enel SpA | 44,060 | $ | 198,267 | |||||
Eni SpA | 16,050 | 263,106 | ||||||
Finmeccanica SpAa | 3,996 | 54,044 | ||||||
Intesa Sanpaolo SpA | 94,242 | 343,616 | ||||||
Luxottica Group SpA | 1,320 | 89,335 | ||||||
Saipem SpAa,b | 3,330 | 32,033 | ||||||
Snam SpA | 14,010 | 68,476 | ||||||
Telecom Italia SpAa,b | 83,610 | 101,461 | ||||||
Telecom Italia SpA RSP | 34,530 | 34,570 | ||||||
Tenaris SA | 3,360 | 43,597 | ||||||
Terna Rete Elettrica Nazionale SpA | 10,980 | 51,132 | ||||||
UniCredit SpA | 34,860 | 227,723 | ||||||
Unione di Banche Italiane SpA | 9,072 | 70,750 | ||||||
|
| |||||||
| 1,943,748 | ||||||||
JAPAN — 8.84% |
| |||||||
Aeon Co. Ltd. | 9,000 | 135,240 | ||||||
Aisin Seiki Co. Ltd. | 3,000 | 108,429 | ||||||
ANA Holdings Inc. | 30,000 | 88,105 | ||||||
Asahi Group Holdings Ltd. | 6,000 | 198,168 | ||||||
Astellas Pharma Inc. | 18,000 | 267,360 | ||||||
Bridgestone Corp. | 6,000 | 201,386 | ||||||
Canon Inc. | 9,000 | 275,306 | ||||||
Casio Computer Co. Ltd. | 3,300 | 63,557 | ||||||
Chubu Electric Power Co. Inc. | 9,000 | 139,510 | ||||||
Chugai Pharmaceutical Co. Ltd. | 3,000 | 112,266 | ||||||
Chugoku Electric Power Co. Inc. (The) | 6,000 | 87,833 | ||||||
Dai-ichi Life Insurance Co. Ltd. (The) | 9,000 | 164,278 | ||||||
Daiichi Sankyo Co. Ltd. | 6,900 | 133,092 | ||||||
Daikin Industries Ltd. | 3,000 | 179,181 | ||||||
Daiwa House Industry Co. Ltd. | 6,000 | 147,593 | ||||||
Denso Corp. | 6,000 | 268,796 | ||||||
Dentsu Inc. | 3,000 | 153,979 | ||||||
East Japan Railway Co. | 3,000 | 277,386 | ||||||
Eisai Co. Ltd. | 3,000 | 204,827 | ||||||
FANUC Corp. | 1,100 | 178,954 | ||||||
Fast Retailing Co. Ltd. | 200 | 81,305 | ||||||
Fuji Heavy Industries Ltd. | 6,000 | 211,437 | ||||||
FUJIFILM Holdings Corp. | 3,000 | 123,505 | ||||||
Hakuhodo DY Holdings Inc. | 6,000 | 60,106 | ||||||
Hitachi Ltd. | 30,000 | 168,783 | ||||||
Honda Motor Co. Ltd. | 12,000 | 378,661 | ||||||
Hoya Corp. | 6,000 | 235,153 | ||||||
SCHEDULESOF INVESTMENTS | 31 |
Table of Contents
Schedule of Investments (Continued)
iSHARES® MSCI WORLD ETF
August 31, 2015
| Security | Shares | Value | ||||||
Iida Group Holdings Co. Ltd. | 3,000 | $ | 53,175 | |||||
INPEX Corp. | 9,000 | 90,754 | ||||||
ITOCHU Corp. | 15,000 | 180,158 | ||||||
Japan Airlines Co. Ltd. | 3,000 | 106,820 | ||||||
Japan Exchange Group Inc. | 3,000 | 93,576 | ||||||
Japan Retail Fund Investment Corp. | 60 | 110,707 | ||||||
Japan Tobacco Inc. | 9,000 | 321,537 | ||||||
JFE Holdings Inc. | 6,000 | 93,205 | ||||||
JTEKT Corp. | 3,000 | 42,307 | ||||||
JX Holdings Inc. | 27,000 | 104,471 | ||||||
Kansai Electric Power Co. Inc. (The)a | 9,000 | 112,403 | ||||||
Kao Corp. | 6,000 | 274,886 | ||||||
KDDI Corp. | 15,000 | 373,561 | ||||||
Kirin Holdings Co. Ltd. | 9,000 | 132,343 | ||||||
Kobe Steel Ltd. | 60,000 | 80,703 | ||||||
Komatsu Ltd. | 9,000 | 149,610 | ||||||
Konica Minolta Inc. | 6,000 | 65,949 | ||||||
Kuraray Co. Ltd. | 9,000 | 106,573 | ||||||
Kyocera Corp. | 3,000 | 147,419 | ||||||
Kyushu Electric Power Co. Inc.a | 6,000 | 71,593 | ||||||
Marubeni Corp. | 15,000 | 82,337 | ||||||
Marui Group Co. Ltd. | 3,000 | 36,341 | ||||||
Mazda Motor Corp. | 6,000 | 103,503 | ||||||
Mitsubishi Chemical Holdings Corp. | 18,000 | 102,592 | ||||||
Mitsubishi Corp. | 12,000 | 223,295 | ||||||
Mitsubishi Electric Corp. | 8,000 | 79,944 | ||||||
Mitsubishi Estate Co. Ltd. | 5,000 | 107,645 | ||||||
Mitsubishi Heavy Industries Ltd. | 30,000 | 143,434 | ||||||
Mitsubishi Motors Corp. | 6,000 | 46,095 | ||||||
Mitsubishi UFJ Financial Group Inc. | 93,600 | 617,975 | ||||||
Mitsubishi UFJ Lease & Finance Co. Ltd. | 21,000 | 101,547 | ||||||
Mitsui & Co. Ltd. | 15,100 | 196,686 | ||||||
Mitsui Fudosan Co. Ltd. | 4,000 | 110,905 | ||||||
Mizuho Financial Group Inc. | 189,000 | 387,872 | ||||||
MS&AD Insurance Group Holdings Inc. | 4,900 | 154,701 | ||||||
Murata Manufacturing Co. Ltd. | 800 | 115,856 | ||||||
Nagoya Railroad Co. Ltd. | 30,000 | 119,569 | ||||||
NEC Corp. | 30,000 | 94,814 | ||||||
Nidec Corp. | 3,000 | 235,326 | ||||||
Nikon Corp.b | 6,000 | 76,990 | ||||||
Nintendo Co. Ltd. | 500 | 103,189 | ||||||
| Security | Shares | Value | ||||||
Nippon Paint Holdings Co. Ltd. | 3,000 | $ | 61,790 | |||||
Nippon Steel & Sumitomo Metal Corp. | 60,470 | 124,598 | ||||||
Nippon Telegraph & Telephone Corp. | 6,000 | 229,212 | ||||||
Nissan Motor Co. Ltd. | 21,000 | 190,098 | ||||||
Nitto Denko Corp. | 3,000 | 202,302 | ||||||
Nomura Holdings Inc. | 33,000 | 208,617 | ||||||
NTT DOCOMO Inc. | 12,000 | 251,368 | ||||||
Olympus Corp. | 3,000 | 109,667 | ||||||
Omron Corp. | 3,000 | 112,885 | ||||||
Oriental Land Co. Ltd./Japan | 3,000 | 165,639 | ||||||
ORIX Corp. | 12,000 | 161,802 | ||||||
Otsuka Holdings Co. Ltd. | 3,000 | 102,377 | ||||||
Panasonic Corp. | 18,000 | 198,663 | ||||||
Rakuten Inc. | 9,000 | 128,778 | ||||||
Resona Holdings Inc. | 27,000 | 136,755 | ||||||
Ricoh Co. Ltd. | 6,000 | 58,695 | ||||||
Sekisui House Ltd. | 9,000 | 134,608 | ||||||
Seven & I Holdings Co. Ltd. | 6,000 | 261,914 | ||||||
Seven Bank Ltd. | 18,000 | 76,940 | ||||||
Shin-Etsu Chemical Co. Ltd. | 3,000 | 165,194 | ||||||
Shionogi & Co. Ltd. | 3,000 | 117,836 | ||||||
Shiseido Co. Ltd. | 3,000 | 62,990 | ||||||
SoftBank Group Corp. | 6,000 | 349,697 | ||||||
Sompo Japan Nipponkoa Holdings Inc. | 3,000 | 99,592 | ||||||
Sony Corp.a | 9,000 | 234,831 | ||||||
Sumitomo Corp. | 12,000 | 127,491 | ||||||
Sumitomo Electric Industries Ltd. | 9,000 | 123,802 | ||||||
Sumitomo Mitsui Financial Group Inc. | 9,000 | 368,659 | ||||||
Sumitomo Mitsui Trust Holdings Inc. | 30,000 | 124,075 | ||||||
Sumitomo Realty & Development Co. Ltd. | 2,000 | 67,682 | ||||||
Suzuki Motor Corp. | 3,000 | 102,228 | ||||||
Sysmex Corp. | 3,000 | 182,201 | ||||||
T&D Holdings Inc. | 9,000 | 121,389 | ||||||
Takeda Pharmaceutical Co. Ltd. | 6,000 | 295,185 | ||||||
Tohoku Electric Power Co. Inc. | 6,000 | 82,436 | ||||||
Tokio Marine Holdings Inc. | 6,000 | 241,416 | ||||||
Tokyo Electric Power Co. Inc.a,b | 15,000 | 102,735 | ||||||
Tokyo Electron Ltd. | 3,000 | 157,891 | ||||||
Tokyu Fudosan Holdings Corp. | 9,000 | 61,938 | ||||||
| 32 | 2015 iSHARES ANNUAL REPORTTO SHAREHOLDERS |
Table of Contents
Schedule of Investments (Continued)
iSHARES® MSCI WORLD ETF
August 31, 2015
| Security | Shares | Value | ||||||
Toshiba Corp. | 30,000 | $ | 95,061 | |||||
Toyota Motor Corp. | 18,000 | 1,068,251 | ||||||
Unicharm Corp. | 3,000 | 60,676 | ||||||
USS Co. Ltd. | 6,000 | 106,647 | ||||||
Yahoo Japan Corp. | 18,100 | 73,335 | ||||||
Yamada Denki Co. Ltd. | 12,000 | 46,243 | ||||||
Yamato Holdings Co. Ltd. | 3,000 | 58,584 | ||||||
Yokogawa Electric Corp. | 6,000 | 70,603 | ||||||
|
| |||||||
| 18,281,938 | ||||||||
NETHERLANDS — 1.18% |
| |||||||
Aegon NV | 12,480 | 76,715 | ||||||
Akzo Nobel NV | 1,620 | 109,530 | ||||||
Altice NV Class Aa,b | 2,007 | 57,177 | ||||||
Altice NV Class Ba,b | 669 | 20,974 | ||||||
ASML Holding NV | 2,280 | 208,671 | ||||||
Fiat Chrysler Automobiles NVa,b | 6,630 | 93,159 | ||||||
Gemalto NVb | 623 | 44,816 | ||||||
Heineken Holding NV | 720 | 50,180 | ||||||
Heineken NV | 1,470 | 116,123 | ||||||
ING Groep NV CVA | 26,370 | 403,177 | ||||||
Koninklijke Ahold NV | 6,252 | 123,399 | ||||||
Koninklijke DSM NV | 1,351 | 71,012 | ||||||
Koninklijke KPN NV | 21,341 | 83,025 | ||||||
Koninklijke Philips NV | 6,675 | 171,426 | ||||||
Mylan NVa | 2,610 | 129,430 | ||||||
Randstad Holding NV | 1,035 | 65,350 | ||||||
RELX NV | 6,831 | 105,130 | ||||||
Unilever NV CVA | 10,200 | 408,419 | ||||||
Wolters Kluwer NV | 3,030 | 95,912 | ||||||
|
| |||||||
| 2,433,625 | ||||||||
NEW ZEALAND — 0.03% |
| |||||||
Fletcher Building Ltd. | 7,320 | 33,375 | ||||||
Spark New Zealand Ltd. | 18,330 | 39,233 | ||||||
|
| |||||||
| 72,608 | ||||||||
NORWAY — 0.21% |
| |||||||
DNB ASA | 6,810 | 96,155 | ||||||
Norsk Hydro ASA | 9,330 | 31,888 | ||||||
Orkla ASA | 6,780 | 49,321 | ||||||
Statoil ASA | 6,990 | 103,282 | ||||||
Telenor ASA | 4,590 | 90,372 | ||||||
Yara International ASA | 1,350 | 59,455 | ||||||
|
| |||||||
| 430,473 | ||||||||
| Security | Shares | Value | ||||||
PORTUGAL — 0.07% |
| |||||||
Banco Comercial Portugues SA Registereda,b | 274,920 | $ | 19,407 | |||||
EDP – Energias de Portugal SA | 22,440 | 78,600 | ||||||
Galp Energia SGPS SA | 3,990 | 42,012 | ||||||
|
| |||||||
| 140,019 | ||||||||
SINGAPORE — 0.44% |
| |||||||
Ascendas REITb | 60,000 | 94,873 | ||||||
CapitaLand Ltd.b | 54,000 | 107,977 | ||||||
CapitaLand Mall Trustb | 84,000 | 114,359 | ||||||
Genting Singapore PLC | 120,000 | 65,518 | ||||||
Global Logistic Properties Ltd.b | 60,000 | 94,448 | ||||||
Hutchison Port Holdings Trustb | 120,000 | 63,000 | ||||||
Noble Group Ltd.b | 60,000 | 23,186 | ||||||
Oversea-Chinese Banking Corp. Ltd.b | 18,000 | 113,976 | ||||||
Singapore Press Holdings Ltd.b | 7,000 | 19,556 | ||||||
Singapore Telecommunications Ltd.b | 78,000 | 206,850 | ||||||
|
| |||||||
| 903,743 | ||||||||
SPAIN — 1.37% |
| |||||||
Abertis Infraestructuras SA | 3,962 | 65,526 | ||||||
ACS Actividades de Construccion y Servicios SA | 1,632 | 52,912 | ||||||
Amadeus IT Holding SA Class A | 3,120 | 130,434 | ||||||
Banco Bilbao Vizcaya Argentaria SA | 40,425 | 374,283 | ||||||
Banco de Sabadell SAb | 39,453 | 83,993 | ||||||
Banco Popular Espanol SA | 14,490 | 62,038 | ||||||
Banco Santander SA | 92,370 | 565,113 | ||||||
Bankia SA | 40,740 | 49,164 | ||||||
Bankinter SA | 8,520 | 64,154 | ||||||
CaixaBank SA | 17,971 | 77,727 | ||||||
Distribuidora Internacional de Alimentacion SA | 5,730 | 34,452 | ||||||
Endesa SA | 2,040 | 42,288 | ||||||
Ferrovial SA | 3,715 | 88,748 | ||||||
Gas Natural SDG SA | 2,490 | 50,500 | ||||||
Grifols SA | 1,260 | 51,609 | ||||||
Iberdrola SA | 30,461 | 206,666 | ||||||
Industria de Diseno Textil SA | 6,900 | 229,933 | ||||||
International Consolidated Airlines Group SAa | 12,600 | 105,026 | ||||||
Red Electrica Corp. SA | 112 | 8,940 | ||||||
Repsol SA | 7,596 | 108,562 | ||||||
SCHEDULESOF INVESTMENTS | 33 |
Table of Contents
Schedule of Investments (Continued)
iSHARES® MSCI WORLD ETF
August 31, 2015
| Security | Shares | Value | ||||||
Telefonica SA | 27,338 | $ | 385,660 | |||||
|
| |||||||
| 2,837,728 | ||||||||
SWEDEN — 1.13% |
| |||||||
Alfa Laval AB | 2,790 | 46,953 | ||||||
Assa Abloy AB | 8,280 | 158,179 | ||||||
Atlas Copco AB Class A | 3,930 | 98,884 | ||||||
Atlas Copco AB Class B | 3,360 | 76,504 | ||||||
Boliden AB | 2,704 | 44,582 | ||||||
Electrolux AB Class B | 1,710 | 48,185 | ||||||
Hennes & Mauritz AB Class B | 6,000 | 230,376 | ||||||
Hexagon AB Class B | 1,740 | 55,941 | ||||||
Investment AB Kinnevik Class B | 1,920 | 54,148 | ||||||
Investor AB Class B | 3,690 | 132,593 | ||||||
Lundin Petroleum ABa,b | 2,250 | 29,327 | ||||||
Millicom International Cellular SA SDR | 420 | 27,966 | ||||||
Nordea Bank AB | 18,390 | 217,162 | ||||||
Sandvik AB | 7,835 | 75,531 | ||||||
Skandinaviska Enskilda Banken AB Class A | 9,480 | 110,103 | ||||||
Skanska AB Class B | 3,360 | 65,733 | ||||||
SKF AB Class B | 3,000 | 57,241 | ||||||
Svenska Cellulosa AB SCA Class B | 3,660 | 104,125 | ||||||
Svenska Handelsbanken AB Class A | 10,020 | 149,380 | ||||||
Swedbank AB Class A | 5,970 | 136,071 | ||||||
Swedish Match AB | 1,590 | 46,902 | ||||||
Telefonaktiebolaget LM Ericsson Class B | 19,710 | 191,752 | ||||||
TeliaSonera AB | 11,850 | 66,727 | ||||||
Volvo AB Class B | 10,511 | 114,088 | ||||||
|
| |||||||
| 2,338,453 | ||||||||
SWITZERLAND — 3.75% |
| |||||||
ABB Ltd. Registered | 14,970 | 289,013 | ||||||
Actelion Ltd. Registered | 750 | 102,373 | ||||||
Adecco SA Registered | 1,080 | 84,821 | ||||||
Aryzta AG | 840 | 43,066 | ||||||
Baloise Holding AG Registered | 570 | 69,788 | ||||||
Cie. Financiere Richemont SA Class A Registered | 3,510 | 262,601 | ||||||
Credit Suisse Group AG Registered | 10,200 | 273,709 | ||||||
Geberit AG Registered | 360 | 114,397 | ||||||
Givaudan SA Registered | 90 | 154,956 | ||||||
Julius Baer Group Ltd. | 1,770 | 86,153 | ||||||
| Security | Shares | Value | ||||||
Kuehne + Nagel International AG Registered | 450 | $ | 59,935 | |||||
LafargeHolcim Ltd. Registered | 3,088 | 196,383 | ||||||
Nestle SA Registered | 20,490 | 1,510,715 | ||||||
Novartis AG Registered | 14,610 | 1,430,709 | ||||||
Partners Group Holding AG | 240 | 77,493 | ||||||
Roche Holding AG | 4,440 | 1,212,099 | ||||||
Schindler Holding AG Participation Certificates | 360 | 55,207 | ||||||
Schindler Holding AG Registered | 270 | 42,047 | ||||||
SGS SA Registered | 60 | 105,848 | ||||||
Sonova Holding AG Registered | 390 | 50,774 | ||||||
Swatch Group AG (The) Bearer | 300 | 114,875 | ||||||
Swiss Life Holding AG Registered | 270 | 63,211 | ||||||
Swiss Prime Site AG Registered | 390 | 30,589 | ||||||
Swiss Re AG | 2,160 | 185,500 | ||||||
Swisscom AG Registered | 150 | 81,045 | ||||||
Syngenta AG Registered | 630 | 218,241 | ||||||
Transocean Ltd.b | 2,670 | 36,500 | ||||||
UBS Group AG | 23,740 | 491,714 | ||||||
Weatherford International PLCa | 5,790 | 58,769 | ||||||
Zurich Insurance Group AG | 930 | 255,520 | ||||||
|
| |||||||
| 7,758,051 | ||||||||
UNITED KINGDOM — 7.77% |
| |||||||
3i Group PLC | 8,970 | 67,848 | ||||||
Aberdeen Asset Management PLC | 8,010 | 39,286 | ||||||
Admiral Group PLC | 1,890 | 45,056 | ||||||
Aggreko PLC | 1,935 | 31,754 | ||||||
Amec Foster Wheeler PLC | 2,820 | 34,979 | ||||||
Anglo American PLC | 9,000 | 102,569 | ||||||
Antofagasta PLC | 4,680 | 43,835 | ||||||
ARM Holdings PLC | 9,540 | 136,968 | ||||||
Associated British Foods PLC | 2,790 | 137,398 | ||||||
AstraZeneca PLC | 8,310 | 526,568 | ||||||
Aviva PLC | 24,882 | 185,143 | ||||||
Babcock International Group PLC | 3,990 | 59,464 | ||||||
BAE Systems PLC | 22,350 | 155,441 | ||||||
Barclays PLC | 104,580 | 420,527 | ||||||
BG Group PLC | 22,440 | 343,264 | ||||||
BHP Billiton PLC | 13,740 | 239,216 | ||||||
BP PLC | 118,140 | 655,026 | ||||||
British American Tobacco PLC | 12,210 | 653,321 | ||||||
British Land Co. PLC (The) | 8,070 | 101,776 | ||||||
BT Group PLC | 56,460 | 379,775 | ||||||
| 34 | 2015 iSHARES ANNUAL REPORTTO SHAREHOLDERS |
Table of Contents
Schedule of Investments (Continued)
iSHARES® MSCI WORLD ETF
August 31, 2015
| Security | Shares | Value | ||||||
Bunzl PLC | 3,270 | $ | 87,459 | |||||
Burberry Group PLC | 3,780 | 82,030 | ||||||
Capita PLC | 4,590 | 87,254 | ||||||
Carnival PLC | 1,380 | 70,465 | ||||||
Centrica PLC | 33,000 | 123,434 | ||||||
Cobham PLC | 10,530 | 45,606 | ||||||
Compass Group PLC | 11,770 | 187,358 | ||||||
Croda International PLC | 1,170 | 52,040 | ||||||
Diageo PLC | 16,140 | 429,443 | ||||||
Experian PLC | 7,080 | 120,759 | ||||||
G4S PLC | 14,640 | 57,754 | ||||||
GKN PLC | 14,010 | 62,854 | ||||||
GlaxoSmithKline PLC | 30,600 | 630,877 | ||||||
Glencore PLC | 67,954 | 154,993 | ||||||
Hammerson PLC | 8,250 | 79,684 | ||||||
HSBC Holdings PLC | 123,090 | 981,964 | ||||||
ICAP PLC | 4,800 | 33,523 | ||||||
IMI PLC | 2,520 | 40,230 | ||||||
Imperial Tobacco Group PLC | 6,390 | 310,461 | ||||||
Inmarsat PLC | 5,850 | 88,264 | ||||||
InterContinental Hotels Group PLC | 2,103 | 79,437 | ||||||
Intertek Group PLC | 1,290 | 50,315 | ||||||
Intu Properties PLC | 9,229 | 45,847 | ||||||
Investec PLC | 4,830 | 39,706 | ||||||
ITV PLC | 27,450 | 105,630 | ||||||
J Sainsbury PLC | 9,734 | 36,334 | ||||||
Johnson Matthey PLC | 1,650 | 68,645 | ||||||
Kingfisher PLC | 15,480 | 84,805 | ||||||
Land Securities Group PLC | 6,780 | 130,554 | ||||||
Legal & General Group PLC | 37,590 | 146,095 | ||||||
Lloyds Banking Group PLC | 378,420 | 450,359 | ||||||
London Stock Exchange Group PLC | 2,314 | 89,685 | ||||||
Marks & Spencer Group PLC | 11,160 | 89,511 | ||||||
Meggitt PLC | 7,800 | 57,271 | ||||||
National Grid PLC | 21,960 | 290,494 | ||||||
Next PLC | 1,110 | 135,635 | ||||||
Nielsen Holdings PLC | 2,100 | 94,983 | ||||||
Old Mutual PLC | 29,670 | 91,356 | ||||||
Pearson PLC | 5,160 | 89,916 | ||||||
Petrofac Ltd. | 1,830 | 25,106 | ||||||
Prudential PLC | 15,810 | 344,798 | ||||||
Randgold Resources Ltd. | 840 | 51,147 | ||||||
Reckitt Benckiser Group PLC | 3,930 | 347,973 | ||||||
RELX PLC | 8,160 | 131,148 | ||||||
| Security | Shares | Value | ||||||
Rexam PLC | 5,811 | $ | 48,127 | |||||
Rio Tinto PLC | 8,670 | 318,427 | ||||||
Rolls-Royce Holdings PLC | 12,780 | 146,140 | ||||||
Royal Bank of Scotland Group PLCa | 22,530 | 116,705 | ||||||
Royal Dutch Shell PLC Class A | 25,290 | 659,288 | ||||||
Royal Dutch Shell PLC Class B | 15,630 | 410,225 | ||||||
RSA Insurance Group PLC | 8,807 | 69,622 | ||||||
SABMiller PLC | 6,180 | 290,278 | ||||||
Sage Group PLC (The) | 9,482 | 75,177 | ||||||
SEGRO PLC | 9,750 | 62,921 | ||||||
Severn Trent PLC | 2,040 | 65,166 | ||||||
Shire PLC | 4,080 | 315,321 | ||||||
Sky PLC | 6,570 | 105,392 | ||||||
Smith & Nephew PLC | 6,270 | 112,151 | ||||||
Smiths Group PLC | 3,240 | 56,259 | ||||||
SSE PLC | 6,168 | 139,545 | ||||||
Standard Chartered PLC | 16,500 | 194,134 | ||||||
Standard Life PLC | 12,175 | 77,915 | ||||||
Tate & Lyle PLC | 4,110 | 34,261 | ||||||
Tesco PLC | 51,840 | 152,563 | ||||||
Tullow Oil PLCa | 7,530 | 25,849 | ||||||
Unilever PLC | 8,220 | 331,609 | ||||||
United Utilities Group PLC | 4,620 | 60,753 | ||||||
Vodafone Group PLC | 168,543 | 587,650 | ||||||
Weir Group PLC (The) | 1,710 | 36,925 | ||||||
Whitbread PLC | 1,560 | 115,093 | ||||||
Wolseley PLC | 1,961 | 126,884 | ||||||
WPP PLC | 8,190 | 170,175 | ||||||
|
| |||||||
| 16,066,971 | ||||||||
UNITED STATES — 57.06% |
| |||||||
3M Co. | 4,020 | 571,403 | ||||||
Abbott Laboratories | 9,570 | 433,425 | ||||||
AbbVie Inc. | 10,690 | 667,163 | ||||||
Accenture PLC Class A | 3,990 | 376,137 | ||||||
ACE Ltd. | 2,010 | 205,342 | ||||||
Activision Blizzard Inc. | 3,450 | 98,773 | ||||||
Adobe Systems Inc.a | 3,270 | 256,924 | ||||||
ADT Corp. (The) | 1,200 | 39,336 | ||||||
Advance Auto Parts Inc. | 510 | 89,377 | ||||||
AES Corp./VA | 4,410 | 52,920 | ||||||
Aetna Inc. | 2,250 | 257,670 | ||||||
Affiliated Managers Group Inc.a | 540 | 100,678 | ||||||
Aflac Inc. | 2,310 | 135,366 | ||||||
AGCO Corp. | 840 | 41,194 | ||||||
SCHEDULESOF INVESTMENTS | 35 |
Table of Contents
Schedule of Investments (Continued)
iSHARES® MSCI WORLD ETF
August 31, 2015
| Security | Shares | Value | ||||||
Agilent Technologies Inc. | 2,250 | $ | 81,698 | |||||
Air Products & Chemicals Inc. | 1,380 | 192,551 | ||||||
Airgas Inc. | 540 | 52,121 | ||||||
Akamai Technologies Inc.a | 1,290 | 91,990 | ||||||
Albemarle Corp. | 720 | 32,551 | ||||||
Alcoa Inc. | 8,220 | 77,679 | ||||||
Alexion Pharmaceuticals Inc.a | 1,470 | 253,119 | ||||||
Alleghany Corp.a | 120 | 56,375 | ||||||
Allergan PLCa | 2,490 | 756,313 | ||||||
Alliance Data Systems Corp.a | 390 | 100,304 | ||||||
Alliant Energy Corp. | 990 | 56,103 | ||||||
Allstate Corp. (The) | 2,730 | 159,104 | ||||||
Alnylam Pharmaceuticals Inc.a | 570 | 58,659 | ||||||
Altera Corp. | 2,070 | 100,498 | ||||||
Altria Group Inc. | 12,540 | 671,893 | ||||||
Amazon.com Inc.a | 2,550 | 1,307,869 | ||||||
Ameren Corp. | 1,860 | 74,939 | ||||||
American Airlines Group Inc. | 1,560 | 60,809 | ||||||
American Capital Agency Corp. | 2,280 | 43,616 | ||||||
American Electric Power Co. Inc. | 3,180 | 172,642 | ||||||
American Express Co. | 5,880 | 451,114 | ||||||
American International Group Inc. | 8,580 | 517,717 | ||||||
American Tower Corp. | 2,700 | 248,913 | ||||||
American Water Works Co. Inc. | 1,410 | 73,235 | ||||||
Ameriprise Financial Inc. | 1,320 | 148,724 | ||||||
AmerisourceBergen Corp. | 1,620 | 162,065 | ||||||
AMETEK Inc. | 2,010 | 108,178 | ||||||
Amgen Inc. | 4,860 | 737,651 | ||||||
Amphenol Corp. Class A | 2,040 | 106,814 | ||||||
Anadarko Petroleum Corp. | 3,240 | 231,919 | ||||||
Analog Devices Inc. | 2,073 | 115,798 | ||||||
Annaly Capital Management Inc. | 6,180 | 62,171 | ||||||
ANSYS Inc.a | 750 | 66,450 | ||||||
Anthem Inc. | 1,800 | 253,890 | ||||||
Aon PLC | 1,920 | 179,405 | ||||||
Apache Corp. | 2,370 | 107,219 | ||||||
Apple Inc. | 37,410 | 4,218,352 | ||||||
Applied Materials Inc. | 8,160 | 131,254 | ||||||
Arch Capital Group Ltd.a | 990 | 67,597 | ||||||
Archer-Daniels-Midland Co. | 4,200 | 188,958 | ||||||
Arrow Electronics Inc.a | 810 | 45,295 | ||||||
Assurant Inc. | 600 | 44,610 | ||||||
AT&T Inc. | 37,740 | 1,252,968 | ||||||
Autodesk Inc.a | 1,620 | 75,735 | ||||||
| Security | Shares | Value | ||||||
Autoliv Inc.b | 660 | $ | 67,419 | |||||
Automatic Data Processing Inc. | 3,060 | 236,599 | ||||||
AutoZone Inc.a | 210 | 150,358 | ||||||
Avago Technologies Ltd. | 1,740 | 219,188 | ||||||
AvalonBay Communities Inc. | 810 | 133,699 | ||||||
Avery Dennison Corp. | 960 | 55,757 | ||||||
Avnet Inc. | 1,050 | 44,520 | ||||||
Axis Capital Holdings Ltd.b | 720 | 40,320 | ||||||
Baker Hughes Inc. | 2,790 | 156,240 | ||||||
Ball Corp. | 1,260 | 83,047 | ||||||
Bank of America Corp. | 67,260 | 1,099,028 | ||||||
Bank of New York Mellon Corp. (The) | 7,350 | 292,530 | ||||||
Baxalta Inc.a | 3,536 | 124,290 | ||||||
Baxter International Inc. | 3,120 | 119,964 | ||||||
BB&T Corp. | 4,350 | 160,602 | ||||||
Becton Dickinson and Co. | 1,238 | 174,583 | ||||||
Bed Bath & Beyond Inc.a | 1,500 | 93,165 | ||||||
Berkshire Hathaway Inc. Class Ba | 7,350 | 985,194 | ||||||
Best Buy Co. Inc. | 2,250 | 82,665 | ||||||
Biogen Inc.a | 1,530 | 454,869 | ||||||
BioMarin Pharmaceutical Inc.a | 1,170 | 151,211 | ||||||
BlackRock Inc.c | 810 | 245,001 | ||||||
Boeing Co. (The) | 4,320 | 564,538 | ||||||
BorgWarner Inc. | 1,470 | 64,151 | ||||||
Boston Properties Inc. | 1,140 | 129,253 | ||||||
Boston Scientific Corp.a | 9,780 | 163,717 | ||||||
Bristol-Myers Squibb Co. | 10,650 | 633,355 | ||||||
Broadcom Corp. Class A | 3,450 | 178,261 | ||||||
Brown-Forman Corp. Class B | 990 | 97,119 | ||||||
Bunge Ltd. | 1,050 | 76,073 | ||||||
CA Inc. | 2,310 | 63,040 | ||||||
Cabot Oil & Gas Corp. | 3,060 | 72,430 | ||||||
Calpine Corp.a | 2,820 | 44,951 | ||||||
Cameron International Corp.a | 1,620 | 108,151 | ||||||
Campbell Soup Co. | 1,350 | 64,787 | ||||||
Capital One Financial Corp. | 3,510 | 272,902 | ||||||
Cardinal Health Inc. | 2,160 | 177,703 | ||||||
CarMax Inc.a | 1,530 | 93,330 | ||||||
Carnival Corp. | 2,370 | 116,675 | ||||||
Caterpillar Inc. | 3,810 | 291,236 | ||||||
CBRE Group Inc. Class Aa | 2,670 | 85,493 | ||||||
CBS Corp. Class B NVS | 3,240 | 146,578 | ||||||
CDK Global Inc. | 1,140 | 56,476 | ||||||
| 36 | 2015 iSHARES ANNUAL REPORTTO SHAREHOLDERS |
Table of Contents
Schedule of Investments (Continued)
iSHARES® MSCI WORLD ETF
August 31, 2015
| Security | Shares | Value | ||||||
Celanese Corp. Series A | 1,170 | $ | 70,949 | |||||
Celgene Corp.a | 5,250 | 619,920 | ||||||
CenterPoint Energy Inc. | 2,820 | 52,508 | ||||||
CenturyLink Inc. | 3,630 | 98,155 | ||||||
Cerner Corp.a | 2,040 | 125,990 | ||||||
CF Industries Holdings Inc. | 1,800 | 103,284 | ||||||
CH Robinson Worldwide Inc. | 1,140 | 76,870 | ||||||
Charles Schwab Corp. (The) | 8,160 | 247,901 | ||||||
Charter Communications Inc. Class Aa,b | 570 | 103,518 | ||||||
Cheniere Energy Inc.a | 1,680 | 104,412 | ||||||
Chesapeake Energy Corp.b | 4,020 | 31,396 | ||||||
Chevron Corp. | 11,670 | 945,153 | ||||||
Chipotle Mexican Grill Inc.a | 240 | 170,402 | ||||||
Chubb Corp. (The) | 1,410 | 170,342 | ||||||
Church & Dwight Co. Inc. | 930 | 80,240 | ||||||
Cigna Corp. | 1,740 | 244,975 | ||||||
Cimarex Energy Co. | 660 | 72,937 | ||||||
Cincinnati Financial Corp. | 840 | 43,957 | ||||||
Cintas Corp. | 1,050 | 89,240 | ||||||
Cisco Systems Inc. | 32,280 | 835,406 | ||||||
CIT Group Inc. | 1,230 | 53,431 | ||||||
Citigroup Inc. | 19,290 | 1,031,629 | ||||||
Citrix Systems Inc.a | 1,290 | 87,862 | ||||||
Clorox Co. (The) | 690 | 76,707 | ||||||
CME Group Inc./IL | 2,070 | 195,491 | ||||||
CMS Energy Corp. | 2,070 | 67,855 | ||||||
Coach Inc. | 1,800 | 54,450 | ||||||
Coca-Cola Co. (The) | 26,730 | 1,051,024 | ||||||
Coca-Cola Enterprises Inc. | 1,890 | 97,316 | ||||||
Cognizant Technology Solutions Corp. Class Aa | 4,020 | 253,019 | ||||||
Colgate-Palmolive Co. | 5,310 | 333,521 | ||||||
Columbia Pipeline Group Inc. | 2,190 | 55,538 | ||||||
Comcast Corp. Class A | 13,920 | 784,114 | ||||||
Comcast Corp. Class A Special NVS | 2,100 | 120,204 | ||||||
Comerica Inc. | 1,230 | 54,120 | ||||||
Communications Sales & Leasing Inc./CSL Capital LLCa | 822 | 16,522 | ||||||
Computer Sciences Corp. | 1,080 | 66,949 | ||||||
ConAgra Foods Inc. | 2,940 | 122,539 | ||||||
Concho Resources Inc.a | 810 | 87,610 | ||||||
ConocoPhillips | 7,530 | 370,099 | ||||||
| Security | Shares | Value | ||||||
CONSOL Energy Inc. | 1,800 | $ | 27,414 | |||||
Consolidated Edison Inc. | 1,740 | 109,463 | ||||||
Constellation Brands Inc. Class A | 1,140 | 145,920 | ||||||
Continental Resources Inc./OKa,b | 938 | 30,110 | ||||||
Core Laboratories NV | 330 | 38,174 | ||||||
Corning Inc. | 9,000 | 154,890 | ||||||
Costco Wholesale Corp. | 2,820 | 394,941 | ||||||
CR Bard Inc. | 540 | 104,647 | ||||||
Crown Castle International Corp. | 2,100 | 175,119 | ||||||
Crown Holdings Inc.a | 1,260 | 62,458 | ||||||
CSX Corp. | 6,840 | 187,279 | ||||||
Cummins Inc. | 1,230 | 149,752 | ||||||
CVS Health Corp. | 7,380 | 755,712 | ||||||
Danaher Corp. | 3,930 | 341,989 | ||||||
Darden Restaurants Inc. | 1,050 | 71,411 | ||||||
DaVita HealthCare Partners Inc.a | 1,200 | 90,768 | ||||||
Deere & Co. | 2,130 | 174,191 | ||||||
Delphi Automotive PLC | 1,830 | 138,202 | ||||||
DENTSPLY International Inc. | 1,110 | 58,175 | ||||||
Devon Energy Corp. | 2,400 | 102,384 | ||||||
Dick’s Sporting Goods Inc. | 750 | 37,598 | ||||||
Digital Realty Trust Inc.b | 1,050 | 66,486 | ||||||
Discover Financial Services | 3,180 | 170,861 | ||||||
Discovery Communications Inc. Class Aa,b | 1,020 | 27,132 | ||||||
Discovery Communications Inc. Class C NVSa | 2,280 | 57,821 | ||||||
DISH Network Corp. Class Aa | 1,530 | 90,683 | ||||||
Dollar General Corp. | 2,070 | 154,194 | ||||||
Dollar Tree Inc.a | 1,734 | 132,235 | ||||||
Dominion Resources Inc./VA | 3,570 | 249,007 | ||||||
Dover Corp. | 1,350 | 83,633 | ||||||
Dow Chemical Co. (The) | 7,290 | 319,010 | ||||||
DR Horton Inc. | 2,370 | 71,977 | ||||||
Dr. Pepper Snapple Group Inc. | 1,560 | 119,699 | ||||||
DTE Energy Co. | 1,170 | 91,330 | ||||||
Duke Energy Corp. | 4,170 | 295,695 | ||||||
Duke Realty Corp. | 3,720 | 67,183 | ||||||
Dun & Bradstreet Corp. (The) | 420 | 44,507 | ||||||
Eastman Chemical Co. | 1,140 | 82,604 | ||||||
Eaton Corp. PLC | 2,940 | 167,756 | ||||||
Eaton Vance Corp. NVS | 1,200 | 41,604 | ||||||
eBay Inc.a | 7,170 | 194,379 | ||||||
Ecolab Inc. | 1,890 | 206,275 | ||||||
SCHEDULESOF INVESTMENTS | 37 |
Table of Contents
Schedule of Investments (Continued)
iSHARES® MSCI WORLD ETF
August 31, 2015
| Security | Shares | Value | ||||||
Edgewell Personal Care Co. | 420 | $ | 36,985 | |||||
Edison International | 2,370 | 138,598 | ||||||
Edwards Lifesciences Corp.a | 810 | 114,113 | ||||||
EI du Pont de Nemours & Co. | 5,850 | 301,275 | ||||||
Electronic Arts Inc.a | 2,190 | 144,868 | ||||||
Eli Lilly & Co. | 6,180 | 508,923 | ||||||
EMC Corp./MA | 12,690 | 315,600 | ||||||
Emerson Electric Co. | 4,230 | 201,856 | ||||||
Energen Corp. | 630 | 32,760 | ||||||
Ensco PLC Class A | 1,560 | 28,252 | ||||||
Entergy Corp. | 1,350 | 88,196 | ||||||
EOG Resources Inc. | 3,600 | 281,916 | ||||||
EQT Corp. | 1,110 | 86,380 | ||||||
Equifax Inc. | 1,020 | 99,858 | ||||||
Equinix Inc. | 367 | 99,006 | ||||||
Equity Residential | 2,220 | 158,175 | ||||||
Essex Property Trust Inc. | 480 | 103,018 | ||||||
Estee Lauder Companies Inc. (The) Class A | 1,500 | 119,655 | ||||||
Everest Re Group Ltd. | 270 | 47,469 | ||||||
Eversource Energy | 2,070 | 97,787 | ||||||
Exelon Corp. | 5,790 | 178,100 | ||||||
Expedia Inc. | 810 | 93,142 | ||||||
Expeditors International of Washington Inc. | 1,560 | 76,393 | ||||||
Express Scripts Holding Co.a | 4,740 | 396,264 | ||||||
Exxon Mobil Corp. | 26,910 | 2,024,708 | ||||||
F5 Networks Inc.a | 570 | 69,204 | ||||||
Facebook Inc. Class Aa | 13,560 | 1,212,671 | ||||||
Fastenal Co.b | 2,070 | 79,778 | ||||||
Federal Realty Investment Trust | 750 | 96,810 | ||||||
FedEx Corp. | 1,860 | 280,135 | ||||||
Fidelity National Information Services Inc. | 1,890 | 130,523 | ||||||
Fifth Third Bancorp | 5,340 | 106,373 | ||||||
First Republic Bank/CA | 1,200 | 72,372 | ||||||
FirstEnergy Corp. | 2,970 | 94,921 | ||||||
Fiserv Inc.a | 1,920 | 163,718 | ||||||
FleetCor Technologies Inc.a | 510 | 76,072 | ||||||
Flextronics International Ltd.a | 5,190 | 54,547 | ||||||
FLIR Systems Inc. | 1,320 | 37,792 | ||||||
Flowserve Corp. | 1,350 | 60,926 | ||||||
Fluor Corp. | 1,290 | 58,850 | ||||||
FMC Corp. | 1,110 | 46,964 | ||||||
| Security | Shares | Value | ||||||
FMC Technologies Inc.a | 1,590 | $ | 55,300 | |||||
FNF Group | 1,920 | 69,907 | ||||||
Ford Motor Co. | 21,690 | 300,840 | ||||||
Franklin Resources Inc. | 2,940 | 119,305 | ||||||
Freeport-McMoRan Inc. | 6,480 | 68,947 | ||||||
Frontier Communications Corp. | 7,890 | 40,002 | ||||||
Gap Inc. (The) | 1,830 | 60,042 | ||||||
Garmin Ltd. | 810 | 30,464 | ||||||
General Dynamics Corp. | 1,980 | 281,219 | ||||||
General Electric Co. | 63,210 | 1,568,872 | ||||||
General Growth Properties Inc. | 3,510 | 89,084 | ||||||
General Mills Inc. | 3,660 | 207,742 | ||||||
General Motors Co. | 9,185 | 270,406 | ||||||
Genuine Parts Co. | 990 | 82,655 | ||||||
Gilead Sciences Inc. | 9,540 | 1,002,368 | ||||||
Goldman Sachs Group Inc. (The) | 2,460 | 463,956 | ||||||
Google Inc. Class Aa | 1,860 | 1,204,945 | ||||||
Google Inc. Class Ca | 1,980 | 1,224,135 | ||||||
H&R Block Inc. | 2,370 | 80,627 | ||||||
Halliburton Co. | 5,850 | 230,197 | ||||||
Hanesbrands Inc. | 2,640 | 79,490 | ||||||
Harley-Davidson Inc. | 1,230 | 68,942 | ||||||
Harman International Industries Inc. | 510 | 49,847 | ||||||
Harris Corp. | 900 | 69,138 | ||||||
Hartford Financial Services Group Inc. (The) | 2,790 | 128,200 | ||||||
Hasbro Inc. | 750 | 55,943 | ||||||
HCA Holdings Inc.a | 2,100 | 181,902 | ||||||
HCP Inc. | 3,120 | 115,627 | ||||||
Health Care REIT Inc. | 2,040 | 129,234 | ||||||
Helmerich & Payne Inc. | 990 | 58,420 | ||||||
Henry Schein Inc.a | 690 | 94,399 | ||||||
Hershey Co. (The) | 1,110 | 99,367 | ||||||
Hertz Global Holdings Inc.a | 3,489 | 64,302 | ||||||
Hess Corp. | 1,800 | 107,010 | ||||||
Hewlett-Packard Co. | 11,730 | 329,144 | ||||||
HollyFrontier Corp. | 1,320 | 61,855 | ||||||
Hologic Inc.a | 2,070 | 80,337 | ||||||
Home Depot Inc. (The) | 8,460 | 985,252 | ||||||
Honeywell International Inc. | 4,560 | 452,671 | ||||||
Hormel Foods Corp. | 1,260 | 76,986 | ||||||
Hospira Inc.a | 1,200 | 107,964 | ||||||
Host Hotels & Resorts Inc. | 6,000 | 106,380 | ||||||
Humana Inc. | 960 | 175,478 | ||||||
| 38 | 2015 iSHARES ANNUAL REPORTTO SHAREHOLDERS |
Table of Contents
Schedule of Investments (Continued)
iSHARES® MSCI WORLD ETF
August 31, 2015
| Security | Shares | Value | ||||||
IHS Inc. Class Aa | 540 | $ | 62,651 | |||||
Illinois Tool Works Inc. | 2,580 | 218,087 | ||||||
Illumina Inc.a | 990 | 195,634 | ||||||
Incyte Corp.a | 1,110 | 128,971 | ||||||
Ingersoll-Rand PLC | 2,190 | 121,085 | ||||||
Intel Corp. | 29,850 | 851,919 | ||||||
Intercontinental Exchange Inc. | 750 | 171,307 | ||||||
International Business Machines Corp. | 6,000 | 887,340 | ||||||
International Flavors & Fragrances Inc. | 690 | 75,590 | ||||||
International Paper Co. | 2,640 | 113,890 | ||||||
Interpublic Group of Companies Inc. (The) | 3,330 | 62,870 | ||||||
Intuit Inc. | 1,890 | 162,067 | ||||||
Intuitive Surgical Inc.a | 218 | 111,387 | ||||||
Invesco Ltd. | 3,150 | 107,446 | ||||||
Iron Mountain Inc. | 1,219 | 34,546 | ||||||
Isis Pharmaceuticals Inc.a,b | 870 | 43,657 | ||||||
Jacobs Engineering Group Inc.a | 1,200 | 48,492 | ||||||
JB Hunt Transport Services Inc. | 780 | 56,768 | ||||||
JM Smucker Co. (The) | 660 | 77,695 | ||||||
Johnson & Johnson | 17,820 | 1,674,724 | ||||||
Johnson Controls Inc. | 3,990 | 164,149 | ||||||
JPMorgan Chase & Co. | 23,790 | 1,524,939 | ||||||
Juniper Networks Inc. | 3,000 | 77,130 | ||||||
Kansas City Southern | 810 | 75,119 | ||||||
Kellogg Co. | 1,590 | 105,385 | ||||||
Keurig Green Mountain Inc. | 840 | 47,544 | ||||||
KeyCorp | 5,790 | 79,555 | ||||||
Kimberly-Clark Corp. | 2,250 | 239,692 | ||||||
Kimco Realty Corp. | 2,250 | 51,863 | ||||||
Kinder Morgan Inc./DE | 11,490 | 372,391 | ||||||
KLA-Tencor Corp. | 1,260 | 63,139 | ||||||
Kohl’s Corp. | 1,440 | 73,483 | ||||||
Kraft Heinz Co. (The) | 3,570 | 259,396 | ||||||
Kroger Co. (The) | 6,720 | 231,840 | ||||||
L Brands Inc. | 1,590 | 133,401 | ||||||
L-3 Communications Holdings Inc. | 750 | 79,103 | ||||||
Laboratory Corp. of America Holdingsa | 660 | 77,755 | ||||||
Lam Research Corp. | 1,200 | 87,324 | ||||||
Las Vegas Sands Corp. | 2,730 | 126,208 | ||||||
Legg Mason Inc. | 1,140 | 50,536 | ||||||
| Security | Shares | Value | ||||||
Leggett & Platt Inc. | 1,140 | $ | 50,639 | |||||
Leucadia National Corp. | 2,340 | 50,216 | ||||||
Level 3 Communications Inc.a | 2,160 | 96,617 | ||||||
Liberty Global PLC Series Aa | 1,860 | 89,503 | ||||||
Liberty Global PLC Series C NVSa | 3,570 | 160,186 | ||||||
Liberty Interactive Corp. QVC Group Series Aa | 3,600 | 97,344 | ||||||
Liberty Media Corp. Class Aa | 780 | 29,055 | ||||||
Liberty Media Corp. Class Ca | 1,144 | 41,436 | ||||||
Liberty Property Trust | 930 | 28,588 | ||||||
Lincoln National Corp. | 2,010 | 102,088 | ||||||
Linear Technology Corp. | 1,500 | 60,420 | ||||||
LinkedIn Corp. Class Aa | 750 | 135,450 | ||||||
LKQ Corp.a | 2,580 | 77,374 | ||||||
Lockheed Martin Corp. | 1,800 | 362,124 | ||||||
Loews Corp. | 2,100 | 76,545 | ||||||
Lowe’s Companies Inc. | 6,600 | 456,522 | ||||||
lululemon athletica Inc.a | 772 | 49,416 | ||||||
LyondellBasell Industries NV Class A | 2,580 | 220,280 | ||||||
M&T Bank Corp. | 720 | 85,133 | ||||||
Macerich Co. (The) | 1,140 | 86,845 | ||||||
Macy’s Inc. | 2,460 | 144,181 | ||||||
Mallinckrodt PLCa | 810 | 69,854 | ||||||
ManpowerGroup Inc. | 600 | 52,140 | ||||||
Marathon Oil Corp. | 4,050 | 70,025 | ||||||
Marathon Petroleum Corp. | 3,600 | 170,316 | ||||||
Marriott International Inc./MD Class A | 1,710 | 120,829 | ||||||
Marsh & McLennan Companies Inc. | 3,000 | 161,190 | ||||||
Martin Marietta Materials Inc. | 420 | 70,476 | ||||||
Marvell Technology Group Ltd. | 3,600 | 40,572 | ||||||
Masco Corp. | 2,760 | 72,395 | ||||||
MasterCard Inc. Class A | 6,570 | 606,871 | ||||||
Mattel Inc. | 2,100 | 49,203 | ||||||
Maxim Integrated Products Inc. | 2,250 | 75,758 | ||||||
McCormick & Co. Inc./MD | 1,020 | 80,866 | ||||||
McDonald’s Corp. | 5,850 | 555,867 | ||||||
McGraw Hill Financial Inc. | 1,770 | 171,672 | ||||||
McKesson Corp. | 1,530 | 302,297 | ||||||
MDU Resources Group Inc. | 1,890 | 33,850 | ||||||
Mead Johnson Nutrition Co. | 1,350 | 105,759 | ||||||
Medivation Inc.a | 660 | 58,120 | ||||||
Merck & Co. Inc. | 18,120 | 975,762 | ||||||
SCHEDULESOF INVESTMENTS | 39 |
Table of Contents
Schedule of Investments (Continued)
iSHARES® MSCI WORLD ETF
August 31, 2015
| Security | Shares | Value | ||||||
MetLife Inc. | 5,910 | $ | 296,091 | |||||
MGM Resorts Internationala | 3,150 | 64,355 | ||||||
Microchip Technology Inc.b | 1,560 | 66,300 | ||||||
Micron Technology Inc.a | 6,630 | 108,798 | ||||||
Microsoft Corp. | 50,010 | 2,176,435 | ||||||
Mohawk Industries Inc.a | 450 | 88,637 | ||||||
Molson Coors Brewing Co. Class B | 1,140 | 77,623 | ||||||
Mondelez International Inc. Class A | 10,770 | 456,217 | ||||||
Monsanto Co. | 3,240 | 316,386 | ||||||
Monster Beverage Corp.a | 990 | 137,075 | ||||||
Moody’s Corp. | 1,410 | 144,257 | ||||||
Morgan Stanley | 9,630 | 331,753 | ||||||
Mosaic Co. (The) | 2,010 | 82,068 | ||||||
Motorola Solutions Inc. | 1,560 | 101,119 | ||||||
Murphy Oil Corp. | 1,170 | 36,270 | ||||||
Nabors Industries Ltd. | 2,790 | 32,197 | ||||||
NASDAQ OMX Group Inc. (The) | 1,050 | 53,750 | ||||||
National Oilwell Varco Inc. | 2,730 | 115,561 | ||||||
Navient Corp. | 3,360 | 42,974 | ||||||
NetApp Inc. | 2,400 | 76,704 | ||||||
Netflix Inc.a | 2,520 | 289,876 | ||||||
New York Community Bancorp Inc. | 3,360 | 59,338 | ||||||
Newell Rubbermaid Inc. | 1,950 | 82,154 | ||||||
Newmont Mining Corp. | 3,180 | 54,283 | ||||||
News Corp. Class Aa | 2,553 | 34,797 | ||||||
NextEra Energy Inc. | 2,898 | 285,192 | ||||||
NIKE Inc. Class B | 4,680 | 522,990 | ||||||
Noble Energy Inc. | 2,850 | 95,218 | ||||||
Nordstrom Inc. | 1,050 | 76,524 | ||||||
Norfolk Southern Corp. | 2,100 | 163,611 | ||||||
Northern Trust Corp. | 1,500 | 104,760 | ||||||
Northrop Grumman Corp. | 1,380 | 225,961 | ||||||
NRG Energy Inc. | 2,550 | 50,796 | ||||||
Nucor Corp. | 2,100 | 90,909 | ||||||
NVIDIA Corp. | 3,240 | 72,835 | ||||||
O’Reilly Automotive Inc.a | 780 | 187,255 | ||||||
Occidental Petroleum Corp. | 4,860 | 354,829 | ||||||
Omnicom Group Inc. | 1,710 | 114,536 | ||||||
ONEOK Inc. | 1,472 | 53,007 | ||||||
Oracle Corp. | 22,530 | 835,638 | ||||||
PACCAR Inc. | 2,370 | 139,759 | ||||||
Palo Alto Networks Inc.a | 510 | 83,752 | ||||||
Parker-Hannifin Corp. | 1,080 | 116,273 | ||||||
PartnerRe Ltd. | 360 | 49,828 | ||||||
| Security | Shares | Value | ||||||
Patterson Companies Inc. | 840 | $ | 38,497 | |||||
Paychex Inc. | 2,280 | 101,825 | ||||||
PayPal Holdings Inc.a | 7,170 | 250,950 | ||||||
People’s United Financial Inc. | 2,580 | 39,990 | ||||||
Pepco Holdings Inc. | 2,040 | 46,879 | ||||||
PepsiCo Inc. | 9,450 | 878,188 | ||||||
Perrigo Co. PLC | 960 | 175,651 | ||||||
Pfizer Inc. | 38,790 | 1,249,814 | ||||||
PG&E Corp. | 3,270 | 162,127 | ||||||
Philip Morris International Inc. | 9,540 | 761,292 | ||||||
Phillips 66 | 3,540 | 279,908 | ||||||
Pinnacle West Capital Corp. | 930 | 55,363 | ||||||
Pioneer Natural Resources Co. | 990 | 121,829 | ||||||
Plum Creek Timber Co. Inc. | 1,140 | 43,879 | ||||||
PNC Financial Services Group Inc. (The)c | 3,270 | 297,962 | ||||||
PPG Industries Inc. | 2,010 | 191,533 | ||||||
PPL Corp. | 4,638 | 143,732 | ||||||
Praxair Inc. | 1,710 | 180,832 | ||||||
Precision Castparts Corp. | 930 | 214,132 | ||||||
Priceline Group Inc. (The)a | 330 | 412,051 | ||||||
Principal Financial Group Inc. | 2,010 | 101,203 | ||||||
Procter & Gamble Co. (The) | 17,430 | 1,231,778 | ||||||
Progressive Corp. (The) | 3,270 | 97,969 | ||||||
Prologis Inc. | 3,660 | 139,080 | ||||||
Prudential Financial Inc. | 2,850 | 229,995 | ||||||
Public Service Enterprise Group Inc. | 3,900 | 156,975 | ||||||
Public Storage | 990 | 199,257 | ||||||
PulteGroup Inc. | 2,700 | 55,863 | ||||||
Puma Biotechnology Inc.a,b | 180 | 16,546 | ||||||
PVH Corp. | 600 | 71,388 | ||||||
Qorvo Inc.a | 1,033 | 57,342 | ||||||
QUALCOMM Inc. | 10,260 | 580,511 | ||||||
Quanta Services Inc.a,b | 1,890 | 45,814 | ||||||
Quest Diagnostics Inc. | 1,080 | 73,224 | ||||||
Rackspace Hosting Inc.a | 780 | 23,720 | ||||||
Ralph Lauren Corp. | 390 | 43,364 | ||||||
Range Resources Corp. | 1,080 | 41,710 | ||||||
Raytheon Co. | 2,130 | 218,453 | ||||||
Realty Income Corp. | 1,440 | 64,354 | ||||||
Red Hat Inc.a | 1,350 | 97,483 | ||||||
Regency Centers Corp. | 990 | 58,717 | ||||||
Regeneron Pharmaceuticals Inc.a | 510 | 261,885 | ||||||
Regions Financial Corp. | 9,180 | 88,036 | ||||||
| 40 | 2015 iSHARES ANNUAL REPORTTO SHAREHOLDERS |
Table of Contents
Schedule of Investments (Continued)
iSHARES® MSCI WORLD ETF
August 31, 2015
| Security | Shares | Value | ||||||
RenaissanceRe Holdings Ltd. | 390 | $ | 39,761 | |||||
Republic Services Inc. | 2,040 | 83,599 | ||||||
Reynolds American Inc. | 2,823 | 236,426 | ||||||
Rite Aid Corp.a | 7,020 | 57,915 | ||||||
Robert Half International Inc. | 1,260 | 64,298 | ||||||
Rockwell Automation Inc. | 1,020 | 114,067 | ||||||
Rockwell Collins Inc. | 1,080 | 88,398 | ||||||
Roper Technologies Inc. | 810 | 131,293 | ||||||
Ross Stores Inc. | 3,000 | 145,860 | ||||||
Royal Caribbean Cruises Ltd. | 1,110 | 97,858 | ||||||
salesforce.com inc.a | 4,020 | 278,827 | ||||||
SanDisk Corp. | 1,440 | 78,566 | ||||||
SBA Communications Corp. Class Aa | 1,020 | 120,564 | ||||||
SCANA Corp. | 990 | 52,361 | ||||||
Schlumberger Ltd. | 8,160 | 631,339 | ||||||
Scripps Networks Interactive Inc. Class A | 660 | 35,039 | ||||||
Seagate Technology PLC | 2,370 | 121,818 | ||||||
SEI Investments Co. | 1,620 | 81,940 | ||||||
Sempra Energy | 1,530 | 145,120 | ||||||
ServiceNow Inc.a | 1,110 | 78,766 | ||||||
Sherwin-Williams Co. (The) | 630 | 161,160 | ||||||
Sigma-Aldrich Corp. | 840 | 117,104 | ||||||
Signet Jewelers Ltd. | 660 | 91,080 | ||||||
Simon Property Group Inc. | 2,013 | 360,971 | ||||||
Sirius XM Holdings Inc.a | 27,240 | 103,921 | ||||||
Skyworks Solutions Inc. | 1,260 | 110,061 | ||||||
SL Green Realty Corp. | 630 | 65,211 | ||||||
Southern Co. (The) | 5,160 | 223,996 | ||||||
Southwestern Energy Co.a | 2,340 | 38,002 | ||||||
Spectra Energy Corp. | 4,380 | 127,327 | ||||||
Splunk Inc.a | 840 | 52,055 | ||||||
Sprint Corp.a,b | 7,416 | 37,525 | ||||||
St. Jude Medical Inc. | 2,070 | 146,577 | ||||||
Stanley Black & Decker Inc. | 1,140 | 115,733 | ||||||
Staples Inc. | 4,530 | 64,371 | ||||||
Starbucks Corp. | 9,720 | 531,781 | ||||||
Starwood Hotels & Resorts Worldwide Inc. | 1,320 | 94,340 | ||||||
State Street Corp. | 2,880 | 207,130 | ||||||
Stericycle Inc.a | 660 | 93,152 | ||||||
Stryker Corp. | 1,920 | 189,408 | ||||||
SunEdison Inc.a,b | 1,740 | 18,096 | ||||||
SunTrust Banks Inc. | 3,510 | 141,699 | ||||||
| Security | Shares | Value | ||||||
Symantec Corp. | 4,710 | $ | 96,508 | |||||
Synopsys Inc.a | 1,680 | 78,842 | ||||||
Sysco Corp. | 3,480 | 138,748 | ||||||
T Rowe Price Group Inc. | 1,740 | 125,071 | ||||||
T-Mobile U.S. Inc.a | 2,130 | 84,369 | ||||||
Target Corp. | 3,720 | 289,081 | ||||||
TD Ameritrade Holding Corp. | 1,830 | 61,232 | ||||||
TE Connectivity Ltd. | 2,640 | 156,526 | ||||||
Teradata Corp.a,b | 1,290 | 37,707 | ||||||
Tesla Motors Inc.a,b | 600 | 149,436 | ||||||
Tesoro Corp. | 780 | 71,768 | ||||||
Texas Instruments Inc. | 6,030 | 288,475 | ||||||
Textron Inc. | 2,190 | 84,972 | ||||||
Thermo Fisher Scientific Inc. | 2,460 | 308,410 | ||||||
Tiffany & Co. | 840 | 69,090 | ||||||
Time Warner Cable Inc. | 1,830 | 340,417 | ||||||
Time Warner Inc. | 5,550 | 394,605 | ||||||
TJX Companies Inc. (The) | 4,650 | 326,988 | ||||||
Toll Brothers Inc.a | 1,860 | 68,764 | ||||||
Torchmark Corp. | 941 | 55,011 | ||||||
Total System Services Inc. | 1,590 | 72,870 | ||||||
Tractor Supply Co. | 1,020 | 87,016 | ||||||
TransDigm Group Inc.a | 450 | 103,423 | ||||||
Travelers Companies Inc. (The) | 2,040 | 203,082 | ||||||
Trimble Navigation Ltd.a | 1,800 | 34,020 | ||||||
TripAdvisor Inc.a,b | 810 | 56,619 | ||||||
Twenty-First Century Fox Inc. Class A | 9,660 | 264,587 | ||||||
Twenty-First Century Fox Inc. Class B | 1,800 | 49,788 | ||||||
Twitter Inc.a | 3,390 | 94,208 | ||||||
Tyson Foods Inc. Class A | 2,310 | 97,667 | ||||||
U.S. Bancorp | 11,250 | 476,437 | ||||||
UDR Inc. | 2,370 | 76,551 | ||||||
Ulta Salon Cosmetics & Fragrance Inc.a | 480 | 75,883 | ||||||
Under Armour Inc. Class Aa | 1,350 | 128,965 | ||||||
Union Pacific Corp. | 5,700 | 488,718 | ||||||
United Parcel Service Inc. Class B | 4,410 | 430,636 | ||||||
United Rentals Inc.a | 750 | 51,998 | ||||||
United Technologies Corp. | 5,220 | 478,204 | ||||||
UnitedHealth Group Inc. | 6,090 | 704,613 | ||||||
Universal Health Services Inc. Class B | 600 | 82,284 | ||||||
Unum Group | 1,650 | 55,341 | ||||||
SCHEDULESOF INVESTMENTS | 41 |
Table of Contents
Schedule of Investments (Continued)
iSHARES® MSCI WORLD ETF
August 31, 2015
| Security | Shares | Value | ||||||
Urban Outfitters Inc.a | 870 | $ | 26,848 | |||||
Valero Energy Corp. | 3,390 | 201,163 | ||||||
Varian Medical Systems Inc.a | 780 | 63,375 | ||||||
Ventas Inc. | 2,018 | 111,030 | ||||||
VEREIT Inc. | 5,820 | 47,375 | ||||||
VeriSign Inc.a,b | 1,200 | 82,728 | ||||||
Verisk Analytics Inc. Class Aa | 1,110 | 81,119 | ||||||
Verizon Communications Inc. | 25,890 | 1,191,199 | ||||||
Vertex Pharmaceuticals Inc.a | 1,650 | 210,408 | ||||||
VF Corp. | 2,520 | 182,524 | ||||||
Viacom Inc. Class B NVS | 2,400 | 97,848 | ||||||
Visa Inc. Class Ab | 12,600 | 898,380 | ||||||
VMware Inc. Class Aa | 570 | 45,116 | ||||||
Vornado Realty Trust | 1,260 | 109,859 | ||||||
Vulcan Materials Co. | 930 | 87,067 | ||||||
Wal-Mart Stores Inc. | 9,930 | 642,769 | ||||||
Walgreens Boots Alliance Inc. | 5,670 | 490,738 | ||||||
Walt Disney Co. (The) | 10,380 | 1,057,514 | ||||||
Waste Management Inc. | 2,730 | 136,664 | ||||||
Waters Corp.a | 570 | 69,187 | ||||||
WEC Energy Group Inc. | 2,432 | 115,885 | ||||||
Wells Fargo & Co. | 31,140 | 1,660,696 | ||||||
Western Digital Corp. | 1,470 | 120,481 | ||||||
Western Union Co. (The) | 4,050 | 74,682 | ||||||
WestRock Co. | 2,288 | 135,793 | ||||||
Weyerhaeuser Co. | 4,200 | 117,348 | ||||||
Whirlpool Corp. | 570 | 95,817 | ||||||
WhiteWave Foods Co. (The)a | 1,530 | 70,594 | ||||||
Whiting Petroleum Corp.a | 1,560 | 30,155 | ||||||
Whole Foods Market Inc. | 2,340 | 76,658 | ||||||
Williams Companies Inc. (The) | 4,500 | 216,900 | ||||||
Willis Group Holdings PLC | 1,020 | 43,952 | ||||||
WR Berkley Corp. | 660 | 35,825 | ||||||
WW Grainger Inc. | 450 | 100,548 | ||||||
Wyndham Worldwide Corp. | 1,170 | 89,482 | ||||||
Wynn Resorts Ltd. | 618 | 46,381 | ||||||
Xcel Energy Inc. | 3,060 | 103,214 | ||||||
Xerox Corp. | 8,490 | 86,343 | ||||||
Xilinx Inc. | 1,950 | 81,686 | ||||||
XL Group PLC | 1,890 | 70,478 | ||||||
Xylem Inc./NY | 1,560 | 50,622 | ||||||
Yahoo! Inc.a | 5,910 | 190,538 | ||||||
Yum! Brands Inc. | 2,880 | 229,738 | ||||||
Zillow Group Inc. Class Aa,b | 360 | 9,137 | ||||||
Zillow Group Inc. Class Ca,b | 768 | 18,939 | ||||||
| Security | Shares | Value | ||||||
Zimmer Biomet Holdings Inc. | 1,292 | $ | 133,800 | |||||
Zoetis Inc. | 3,600 | 161,532 | ||||||
|
| |||||||
| 118,022,352 | ||||||||
|
| |||||||
TOTAL COMMON STOCKS |
| |||||||
(Cost: $220,952,276) |
| 205,540,755 | ||||||
PREFERRED STOCKS — 0.19% |
| |||||||
GERMANY — 0.19% |
| |||||||
Henkel AG & Co. KGaA | 1,170 | 122,315 | ||||||
Porsche Automobil Holding SE | 990 | 68,898 | ||||||
Volkswagen AG | 1,080 | 205,119 | ||||||
|
| |||||||
| 396,332 | ||||||||
|
| |||||||
TOTAL PREFERRED STOCKS |
| |||||||
(Cost: $509,815) |
| 396,332 | ||||||
SHORT-TERM INVESTMENTS — 2.10% |
| |||||||
MONEY MARKET FUNDS — 2.10% |
| |||||||
BlackRock Cash Funds: Institutional, |
| |||||||
0.18%c,d,e | 3,900,885 | 3,900,885 | ||||||
BlackRock Cash Funds: Prime, | ||||||||
0.18%c,d,e | 224,008 | 224,008 | ||||||
BlackRock Cash Funds: Treasury, | ||||||||
0.03%c,d | 209,080 | 209,080 | ||||||
|
| |||||||
| 4,333,973 | ||||||||
|
| |||||||
TOTAL SHORT-TERM INVESTMENTS |
| |||||||
(Cost: $4,333,973) |
| 4,333,973 | ||||||
|
| |||||||
TOTAL INVESTMENTS |
| |||||||
(Cost: $225,796,064) |
| 210,271,060 | ||||||
Other Assets, Less Liabilities — (1.66)% |
| (3,428,570 | ) | |||||
|
| |||||||
NET ASSETS — 100.00% |
| $ | 206,842,490 | |||||
|
| |||||||
NVS — Non-Voting Shares
SDR — Swedish Depositary Receipts
| a | Non-income earning security. |
| b | All or a portion of this security represents a security on loan. See Note 1. |
| c | Affiliated issuer. See Note 2. |
| d | The rate quoted is the annualized seven-day yield of the fund at period end. |
| e | All or a portion of this security represents an investment of securities lending collateral. See Note 1. |
See notes to financial statements.
| 42 | 2015 iSHARES ANNUAL REPORTTO SHAREHOLDERS |
Table of Contents
Statements of Assets and Liabilities
iSHARES® , INC.
August 31, 2015
| iShares MSCI All Country World Minimum Volatility ETF | iShares MSCI Emerging Markets Horizon ETF | iShares 100 ETF | ||||||||||
ASSETS | ||||||||||||
Investments, at cost: | ||||||||||||
Unaffiliated | $ | 2,016,993,249 | $ | 1,194,495 | $ | 586,812,221 | ||||||
Affiliated (Note 2) | 60,625,681 | 10,146 | 2,041,402 | |||||||||
|
|
|
|
|
| |||||||
Total cost of investments | $ | 2,077,618,930 | $ | 1,204,641 | $ | 588,853,623 | ||||||
|
|
|
|
|
| |||||||
Investments in securities, at fair value (including securities on loana) (Note 1): | ||||||||||||
Unaffiliated | $ | 2,103,566,991 | $ | 937,696 | $ | 502,091,053 | ||||||
Affiliated (Note 2) | 60,625,681 | 10,146 | 2,041,402 | |||||||||
|
|
|
|
|
| |||||||
Total fair value of investments | 2,164,192,672 | 947,842 | 504,132,455 | |||||||||
Foreign currency, at valueb | 1,887,887 | 1,581 | 2,163,272 | |||||||||
Receivables: | ||||||||||||
Investment securities sold | 2,175,865 | — | 102,796 | |||||||||
Dividends and interest | 6,674,626 | 1,360 | 483,755 | |||||||||
|
|
|
|
|
| |||||||
Total Assets | 2,174,931,050 | 950,783 | 506,882,278 | |||||||||
|
|
|
|
|
| |||||||
LIABILITIES | ||||||||||||
Payables: | ||||||||||||
Investment securities purchased | 2,521,553 | — | — | |||||||||
Deposit for capital contribution | — | — | 325,713 | |||||||||
Collateral for securities on loan (Note 1) | 56,232,918 | 9,885 | — | |||||||||
Deferred foreign capital gains taxes (Note 1) | 172,408 | — | 3,199,586 | |||||||||
Investment advisory fees (Note 2) | 372,197 | 410 | 364,478 | |||||||||
|
|
|
|
|
| |||||||
Total Liabilities | 59,299,076 | 10,295 | 3,889,777 | |||||||||
|
|
|
|
|
| |||||||
NET ASSETS | $ | 2,115,631,974 | $ | 940,488 | $ | 502,992,501 | ||||||
|
|
|
|
|
| |||||||
Net assets consist of: | ||||||||||||
Paid-in capital | $ | 2,050,453,070 | $ | 1,291,183 | $ | 635,112,547 | ||||||
Undistributed (distributions in excess of) net investment income | 10,644,923 | 939 | (615,861 | ) | ||||||||
Accumulated net realized loss | (31,953,427 | ) | (94,826 | ) | (45,228,543 | ) | ||||||
Net unrealized appreciation (depreciation) | 86,487,408 | (256,808 | ) | (86,275,642 | ) | |||||||
|
|
|
|
|
| |||||||
NET ASSETS | $ | 2,115,631,974 | $ | 940,488 | $ | 502,992,501 | ||||||
|
|
|
|
|
| |||||||
Shares outstandingc | 31,300,000 | 50,000 | 19,200,000 | |||||||||
|
|
|
|
|
| |||||||
Net asset value per share | $ | 67.59 | $ | 18.81 | $ | 26.20 | ||||||
|
|
|
|
|
| |||||||
| a | Securities on loan with values of $52,986,424, $9,214 and $ —, respectively. See Note 1. |
| b | Cost of foreign currency: $1,928,675, $1,588 and $2,163,338, respectively. |
| c | $0.001 par value, number of shares authorized: 500 million, 25 million and 500 million, respectively. |
See notes to financial statements.
FINANCIAL STATEMENTS | 43 |
Table of Contents
Statements of Assets and Liabilities (Continued)
iSHARES®, INC.
August 31, 2015
| iShares MSCI World ETF | ||||
ASSETS | ||||
Investments, at cost: | ||||
Unaffiliated | $ | 220,897,772 | ||
Affiliated (Note 2) | 4,898,292 | |||
|
| |||
Total cost of investments | $ | 225,796,064 | ||
|
| |||
Investments in securities, at fair value (including securities on loana) (Note 1): | ||||
Unaffiliated | $ | 205,394,124 | ||
Affiliated (Note 2) | 4,876,936 | |||
|
| |||
Total fair value of investments | 210,271,060 | |||
Foreign currency, at valueb | 216,186 | |||
Cash | 122,112 | |||
Receivables: | ||||
Investment securities sold | 724,277 | |||
Dividends and interest | 595,284 | |||
|
| |||
Total Assets | 211,928,919 | |||
|
| |||
LIABILITIES | ||||
Payables: | ||||
Investment securities purchased | 915,902 | |||
Collateral for securities on loan (Note 1) | 4,124,893 | |||
Investment advisory fees (Note 2) | 45,634 | |||
|
| |||
Total Liabilities | 5,086,429 | |||
|
| |||
NET ASSETS | $ | 206,842,490 | ||
|
| |||
Net assets consist of: | ||||
Paid-in capital | $ | 222,222,809 | ||
Undistributed net investment income | 1,111,968 | |||
Accumulated net realized loss | (960,226 | ) | ||
Net unrealized depreciation | (15,532,061 | ) | ||
|
| |||
NET ASSETS | $ | 206,842,490 | ||
|
| |||
Shares outstandingc | 3,000,000 | |||
|
| |||
Net asset value per share | $ | 68.95 | ||
|
| |||
| a | Securities on loan with a value of $3,893,841. See Note 1. |
| b | Cost of foreign currency: $218,004. |
| c | $0.001 par value, number of shares authorized: 500 million. |
See notes to financial statements.
| 44 | 2015 iSHARES ANNUAL REPORTTO SHAREHOLDERS |
Table of Contents
Statements of Operations
iSHARES® , INC.
Year ended August 31, 2015
| iShares MSCI All Country World Minimum Volatility ETF | iShares MSCI Emerging Markets Horizon ETFa | iShares 100 ETF | ||||||||||
NET INVESTMENT INCOME | ||||||||||||
Dividends — unaffiliatedb | $ | 47,221,175 | $ | 46,784 | $ | 19,910,524 | ||||||
Interest — unaffiliated | — | — | 6,557 | |||||||||
Interest — affiliated (Note 2) | 300 | — | 188 | |||||||||
Securities lending income — affiliated — net (Note 2) | 938,111 | 7 | — | |||||||||
|
|
|
|
|
| |||||||
| 48,159,586 | 46,791 | 19,917,269 | ||||||||||
Less: Other foreign taxes (Note 1) | (170,651 | ) | — | — | ||||||||
|
|
|
|
|
| |||||||
Total investment income | 47,988,935 | 46,791 | 19,917,269 | |||||||||
|
|
|
|
|
| |||||||
EXPENSES | ||||||||||||
Investment advisory fees (Note 2) | 6,025,786 | 8,951 | 4,883,454 | |||||||||
Commitment fees (Note 7) | — | — | 2,649 | |||||||||
Interest expense (Note 7) | — | — | 451 | |||||||||
|
|
|
|
|
| |||||||
Total expenses | 6,025,786 | 8,951 | 4,886,554 | |||||||||
Less investment advisory fees waived (Note 2) | (2,346,015 | ) | — | — | ||||||||
|
|
|
|
|
| |||||||
Net expenses | 3,679,771 | 8,951 | 4,886,554 | |||||||||
|
|
|
|
|
| |||||||
Net investment income | 44,309,164 | 37,840 | 15,030,715 | |||||||||
|
|
|
|
|
| |||||||
NET REALIZED AND UNREALIZED GAIN (LOSS) | ||||||||||||
Net realized gain (loss) from: | ||||||||||||
Investments — unaffiliatedc | (12,037,412 | ) | (95,360 | ) | (11,604,654 | ) | ||||||
In-kind redemptions — unaffiliated | 55,814,025 | (50,181 | ) | 7,082,860 | ||||||||
Foreign currency transactions | (479,786 | ) | (1,317 | ) | (1,187,247 | ) | ||||||
|
|
|
|
|
| |||||||
Net realized gain (loss) | 43,296,827 | (146,858 | ) | (5,709,041 | ) | |||||||
|
|
|
|
|
| |||||||
Net change in unrealized appreciation/depreciation on: | ||||||||||||
Investmentsd | (88,791,842 | ) | (256,799 | ) | (166,711,130 | ) | ||||||
Translation of assets and liabilities in foreign currencies | (62,589 | ) | (9 | ) | 2,442 | |||||||
|
|
|
|
|
| |||||||
Net change in unrealized appreciation/depreciation | (88,854,431 | ) | (256,808 | ) | (166,708,688 | ) | ||||||
|
|
|
|
|
| |||||||
Net realized and unrealized loss | (45,557,604 | ) | (403,666 | ) | (172,417,729 | ) | ||||||
|
|
|
|
|
| |||||||
NET DECREASE IN NET ASSETS RESULTING FROM OPERATIONS | $ | (1,248,440 | ) | $ | (365,826 | ) | $ | (157,387,014 | ) | |||
|
|
|
|
|
| |||||||
| a | For the period from October 14, 2014 (commencement of operations) to August 31, 2015. |
| b | Net of foreign withholding tax of $2,834,170, $4,092 and $2,330,990, respectively. |
| c | Net of foreign capital gains taxes of $ —, $ — and $1,289,799, respectively. |
| d | Net of deferred foreign capital gains taxes of $ —, $ — and $1,552,356, respectively. |
See notes to financial statements.
FINANCIAL STATEMENTS | 45 |
Table of Contents
Statements of Operations (Continued)
iSHARES®, INC.
Year ended August 31, 2015
| iShares MSCI World ETF | ||||
NET INVESTMENT INCOME | ||||
Dividends — unaffiliateda | $ | 5,306,668 | ||
Dividends — affiliated (Note 2) | 13,739 | |||
Interest — affiliated (Note 2) | 18 | |||
Securities lending income — affiliated — net (Note 2) | 17,292 | |||
|
| |||
Total investment income | 5,337,717 | |||
|
| |||
EXPENSES | ||||
Investment advisory fees (Note 2) | 513,995 | |||
|
| |||
Total expenses | 513,995 | |||
|
| |||
Net investment income | 4,823,722 | |||
|
| |||
NET REALIZED AND UNREALIZED GAIN (LOSS) | ||||
Net realized gain (loss) from: | ||||
Investments — unaffiliated | (461,775 | ) | ||
Investments — affiliated (Note 2) | (2,611 | ) | ||
In-kind redemptions — unaffiliated | 13,618,959 | |||
In-kind redemptions — affiliated (Note 2) | 58,874 | |||
Foreign currency transactions | (42,806 | ) | ||
|
| |||
Net realized gain | 13,170,641 | |||
|
| |||
Net change in unrealized appreciation/depreciation on: | ||||
Investments | (28,755,094 | ) | ||
Translation of assets and liabilities in foreign currencies | (4,429 | ) | ||
|
| |||
Net change in unrealized appreciation/depreciation | (28,759,523 | ) | ||
|
| |||
Net realized and unrealized loss | (15,588,882 | ) | ||
|
| |||
NET DECREASE IN NET ASSETS RESULTING FROM OPERATIONS | $ | (10,765,160 | ) | |
|
| |||
| a | Net of foreign withholding tax of $254,097. |
See notes to financial statements.
| 46 | 2015 iSHARES ANNUAL REPORTTO SHAREHOLDERS |
Table of Contents
Statements of Changes in Net Assets
iSHARES® , INC.
| iShares MSCI All Country World Minimum Volatility ETF | iShares MSCI Emerging Markets Horizon ETF | |||||||||||
| Year ended August 31, 2015 | Year ended August 31, 2014 | Period from to August 31, 2015 | ||||||||||
INCREASE (DECREASE) IN NET ASSETS | ||||||||||||
OPERATIONS: | ||||||||||||
Net investment income | $ | 44,309,164 | $ | 30,124,824 | $ | 37,840 | ||||||
Net realized gain (loss) | 43,296,827 | 15,721,199 | (146,858 | ) | ||||||||
Net change in unrealized appreciation/depreciation | (88,854,431 | ) | 127,042,867 | (256,808 | ) | |||||||
|
|
|
|
|
| |||||||
Net increase (decrease) in net assets resulting from operations | (1,248,440 | ) | 172,888,890 | (365,826 | ) | |||||||
|
|
|
|
|
| |||||||
DISTRIBUTIONS TO SHAREHOLDERS: | ||||||||||||
From net investment income | (39,259,118 | ) | (29,115,840 | ) | (35,584 | ) | ||||||
|
|
|
|
|
| |||||||
Total distributions to shareholders | (39,259,118 | ) | (29,115,840 | ) | (35,584 | ) | ||||||
|
|
|
|
|
| |||||||
CAPITAL SHARE TRANSACTIONS: | ||||||||||||
Proceeds from shares sold | 1,101,077,585 | 261,249,242 | 2,439,470 | |||||||||
Cost of shares redeemed | (227,950,517 | ) | (129,769,428 | ) | (1,097,572 | ) | ||||||
|
|
|
|
|
| |||||||
Net increase in net assets from capital share transactions | 873,127,068 | 131,479,814 | 1,341,898 | |||||||||
|
|
|
|
|
| |||||||
INCREASE IN NET ASSETS | 832,619,510 | 275,252,864 | 940,488 | |||||||||
NET ASSETS | ||||||||||||
Beginning of period | 1,283,012,464 | 1,007,759,600 | — | |||||||||
|
|
|
|
|
| |||||||
End of period | $ | 2,115,631,974 | $ | 1,283,012,464 | $ | 940,488 | ||||||
|
|
|
|
|
| |||||||
Undistributed net investment income included in net assets at end of period | $ | 10,644,923 | $ | 5,984,087 | $ | 939 | ||||||
|
|
|
|
|
| |||||||
SHARES ISSUED AND REDEEMED | ||||||||||||
Shares sold | 15,700,000 | 4,000,000 | 100,000 | |||||||||
Shares redeemed | (3,200,000 | ) | (2,000,000 | ) | (50,000 | ) | ||||||
|
|
|
|
|
| |||||||
Net increase in shares outstanding | 12,500,000 | 2,000,000 | 50,000 | |||||||||
|
|
|
|
|
| |||||||
| a | Commencement of operations. |
See notes to financial statements.
FINANCIAL STATEMENTS | 47 |
Table of Contents
Statements of Changes in Net Assets (Continued)
iSHARES®, INC.
| iShares MSCI Frontier 100 ETF | iShares MSCI World ETF | |||||||||||||||
| Year ended August 31, 2015 | Year ended August 31, 2014 | Year ended August 31, 2015 | Year ended August 31, 2014 | |||||||||||||
INCREASE (DECREASE) IN NET ASSETS | ||||||||||||||||
OPERATIONS: | ||||||||||||||||
Net investment income | $ | 15,030,715 | $ | 17,022,836 | $ | 4,823,722 | $ | 3,214,395 | ||||||||
Net realized gain (loss) | (5,709,041 | ) | 20,048,604 | 13,170,641 | 3,038,160 | |||||||||||
Net change in unrealized appreciation/depreciation | (166,708,688 | ) | 81,912,759 | (28,759,523 | ) | 13,581,244 | ||||||||||
|
|
|
|
|
|
|
| |||||||||
Net increase (decrease) in net assets resulting from operations | (157,387,014 | ) | 118,984,199 | (10,765,160 | ) | 19,833,799 | ||||||||||
|
|
|
|
|
|
|
| |||||||||
DISTRIBUTIONS TO SHAREHOLDERS: | ||||||||||||||||
From net investment income | (14,489,117 | ) | (15,334,501 | ) | (4,706,418 | ) | (2,735,328 | ) | ||||||||
From net realized gain | (47,428,840 | ) | — | — | — | |||||||||||
|
|
|
|
|
|
|
| |||||||||
Total distributions to shareholders | (61,917,957 | ) | (15,334,501 | ) | (4,706,418 | ) | (2,735,328 | ) | ||||||||
|
|
|
|
|
|
|
| |||||||||
CAPITAL SHARE TRANSACTIONS: | ||||||||||||||||
Proceeds from shares sold | 114,382,787 | 581,098,884 | 147,539,726 | 148,427,324 | ||||||||||||
Cost of shares redeemed | (191,434,078 | ) | (165,483,378 | ) | (93,954,071 | ) | (21,501,639 | ) | ||||||||
|
|
|
|
|
|
|
| |||||||||
Net increase (decrease) in net assets from capital share transactions | (77,051,291 | ) | 415,615,506 | 53,585,655 | 126,925,685 | |||||||||||
|
|
|
|
|
|
|
| |||||||||
INCREASE (DECREASE) IN NET ASSETS | (296,356,262 | ) | 519,265,204 | 38,114,077 | 144,024,156 | |||||||||||
NET ASSETS | ||||||||||||||||
Beginning of year | 799,348,763 | 280,083,559 | 168,728,413 | 24,704,257 | ||||||||||||
|
|
|
|
|
|
|
| |||||||||
End of year | $ | 502,992,501 | $ | 799,348,763 | $ | 206,842,490 | $ | 168,728,413 | ||||||||
|
|
|
|
|
|
|
| |||||||||
Undistributed (distributions in excess of) net investment income included in net assets at end of year | $ | (615,861 | ) | $ | (169,855 | ) | $ | 1,111,968 | $ | 568,421 | ||||||
|
|
|
|
|
|
|
| |||||||||
SHARES ISSUED AND REDEEMED | ||||||||||||||||
Shares sold | 3,750,000 | 16,150,000 | 2,000,000 | 2,200,000 | ||||||||||||
Shares redeemed | (5,700,000 | ) | (4,300,000 | ) | (1,300,000 | ) | (300,000 | ) | ||||||||
|
|
|
|
|
|
|
| |||||||||
Net increase (decrease) in shares outstanding | (1,950,000 | ) | 11,850,000 | 700,000 | 1,900,000 | |||||||||||
|
|
|
|
|
|
|
| |||||||||
See notes to financial statements.
| 48 | 2015 iSHARES ANNUAL REPORTTO SHAREHOLDERS |
Table of Contents
iSHARES® , INC.
(For a share outstanding throughout each period)
| iShares MSCI All Country World Minimum Volatility ETF | ||||||||||||||||
| Year ended Aug. 31, 2015 | Year ended Aug. 31, 2014 | Year ended Aug. 31, 2013 | Period from to Aug. 31, 2012 | |||||||||||||
Net asset value, beginning of period | $ | 68.25 | $ | 59.99 | $ | 55.65 | $ | 50.02 | ||||||||
|
|
|
|
|
|
|
| |||||||||
Income from investment operations: | ||||||||||||||||
Net investment incomeb | 1.70 | 1.72 | 1.68 | 1.49 | ||||||||||||
Net realized and unrealized gain (loss)c | (0.89 | ) | 8.18 | 4.20 | 4.67 | |||||||||||
|
|
|
|
|
|
|
| |||||||||
Total from investment operations | 0.81 | 9.90 | 5.88 | 6.16 | ||||||||||||
|
|
|
|
|
|
|
| |||||||||
Less distributions from: | ||||||||||||||||
Net investment income | (1.47 | ) | (1.64 | ) | (1.54 | ) | (0.53 | ) | ||||||||
|
|
|
|
|
|
|
| |||||||||
Total distributions | (1.47 | ) | (1.64 | ) | (1.54 | ) | (0.53 | ) | ||||||||
|
|
|
|
|
|
|
| |||||||||
Net asset value, end of period | $ | 67.59 | $ | 68.25 | $ | 59.99 | $ | 55.65 | ||||||||
|
|
|
|
|
|
|
| |||||||||
Total return | 1.15 | % | 16.70 | % | 10.69 | % | 12.41 | %d | ||||||||
|
|
|
|
|
|
|
| |||||||||
Ratios/Supplemental data: | ||||||||||||||||
Net assets, end of period (000s) | $ | 2,115,632 | $ | 1,283,012 | $ | 1,007,760 | $ | 578,776 | ||||||||
Ratio of expenses to average net assetse | 0.20 | % | 0.20 | % | 0.20 | % | 0.23 | % | ||||||||
Ratio of expenses to average net assets prior to waived feese | 0.33 | % | 0.33 | % | 0.34 | % | 0.34 | % | ||||||||
Ratio of net investment income to average net assetse | 2.41 | % | 2.67 | % | 2.83 | % | 3.17 | % | ||||||||
Portfolio turnover ratef | 22 | % | 24 | % | 13 | % | 22 | % | ||||||||
| a | Commencement of operations. |
| b | Based on average shares outstanding throughout each period. |
| c | The amounts reported for a share outstanding may not accord with the change in aggregate gains and losses in securities for the fiscal period due to the timing of capital share transactions in relation to the fluctuating market values of the Fund’s underlying securities. |
| d | Not annualized. |
| e | Annualized for periods of less than one year. |
| f | Portfolio turnover rates exclude portfolio securities received or delivered in Creation Units but include portfolio transactions that are executed as a result of the Fund processing capital share transactions in Creation Units partially for cash in U.S. dollars. Excluding such cash transactions, the portfolio turnover rates for the years ended August 31, 2015, August 31, 2014, August 31, 2013 and the period ended August 31, 2012 were 22%, 23%, 13% and 22%, respectively. See Note 4. |
See notes to financial statements.
FINANCIAL HIGHLIGHTS | 49 |
Table of Contents
Financial Highlights (Continued)
iSHARES®, INC.
(For a share outstanding throughout the period)
| iShares MSCI Emerging Markets Horizon ETF | ||||
Period from to | ||||
Net asset value, beginning of period | $ | 24.39 | ||
|
| |||
Income from investment operations: | ||||
Net investment incomeb | 0.42 | |||
Net realized and unrealized lossc | (5.37 | ) | ||
|
| |||
Total from investment operations | (4.95 | ) | ||
|
| |||
Less distributions from: | ||||
Net investment income | (0.63 | ) | ||
|
| |||
Total distributions | (0.63 | ) | ||
|
| |||
Net asset value, end of period | $ | 18.81 | ||
|
| |||
Total return | (20.64 | )%d | ||
|
| |||
Ratios/Supplemental data: | ||||
Net assets, end of period (000s) | $ | 940 | ||
Ratio of expenses to average net assetse | 0.50 | % | ||
Ratio of net investment income to average net assetse | 2.11 | % | ||
Portfolio turnover ratef | 28 | % | ||
| a | Commencement of operations. |
| b | Based on average shares outstanding throughout the period. |
| c | The amount reported for a share outstanding may not accord with the change in aggregate gains and losses in securities for the fiscal period due to the timing of capital share transactions in relation to the fluctuating market values of the Fund’s underlying securities. |
| d | Not annualized. |
| e | Annualized for periods of less than one year. |
| f | Portfolio turnover rate excludes portfolio securities received or delivered in Creation Units but includes portfolio transactions that are executed as a result of the Fund processing capital share transactions in Creation Units partially for cash in U.S. dollars. Excluding such cash transactions, the portfolio turnover rate for the period ended August 31, 2015 was 9%. See Note 4. |
See notes to financial statements.
| 50 | 2015 iSHARES ANNUAL REPORTTO SHAREHOLDERS |
Table of Contents
Financial Highlights (Continued)
iSHARES®, INC.
(For a share outstanding throughout each period)
| iShares MSCI Frontier 100 ETF | ||||||||||||
| Year ended Aug. 31, 2015 | Year ended Aug. 31, 2014 | Period from to Aug. 31, 2013 | ||||||||||
Net asset value, beginning of period | $ | 37.79 | $ | 30.12 | $ | 25.25 | ||||||
|
|
|
|
|
| |||||||
Income from investment operations: | ||||||||||||
Net investment incomeb | 0.77 | 1.09 | 0.67 | |||||||||
Net realized and unrealized gain (loss)c | (8.78 | ) | 7.47 | 4.51 | ||||||||
|
|
|
|
|
| |||||||
Total from investment operations | (8.01 | ) | 8.56 | 5.18 | ||||||||
|
|
|
|
|
| |||||||
Less distributions from: | ||||||||||||
Net investment income | (0.76 | ) | (0.89 | ) | (0.28 | ) | ||||||
Net realized gain | (2.82 | ) | — | — | ||||||||
Return of capital | — | — | (0.03 | ) | ||||||||
|
|
|
|
|
| |||||||
Total distributions | (3.58 | ) | (0.89 | ) | (0.31 | ) | ||||||
|
|
|
|
|
| |||||||
Net asset value, end of period | $ | 26.20 | $ | 37.79 | $ | 30.12 | ||||||
|
|
|
|
|
| |||||||
Total return | (21.70 | )% | 28.56 | % | 20.54 | %d | ||||||
|
|
|
|
|
| |||||||
Ratios/Supplemental data: | ||||||||||||
Net assets, end of period (000s) | $ | 502,993 | $ | 799,349 | $ | 280,084 | ||||||
Ratio of expenses to average net assetse | 0.79 | % | 0.79 | % | 0.79 | % | ||||||
Ratio of net investment income to average net assetse | 2.43 | % | 3.07 | % | 2.32 | % | ||||||
Portfolio turnover ratef | 47 | % | 61 | % | 18 | % | ||||||
| a | Commencement of operations. |
| b | Based on average shares outstanding throughout each period. |
| c | The amounts reported for a share outstanding may not accord with the change in aggregate gains and losses in securities for the fiscal period due to the timing of capital share transactions in relation to the fluctuating market values of the Fund’s underlying securities. |
| d | Not annualized. |
| e | Annualized for periods of less than one year. |
| f | Portfolio turnover rates exclude portfolio securities received or delivered in Creation Units but include portfolio transactions that are executed as a result of the Fund processing capital share transactions in Creation Units partially for cash in U.S. dollars. Excluding such cash transactions, the portfolio turnover rates for the years ended August 31, 2015, August 31, 2014 and the period ended August 31, 2013 were 45%, 42% and 10%, respectively. See Note 4. |
See notes to financial statements.
FINANCIAL HIGHLIGHTS | 51 |
Table of Contents
Financial Highlights (Continued)
iSHARES®, INC.
(For a share outstanding throughout each period)
| iShares MSCI World ETF | ||||||||||||||||
| Year ended Aug. 31, 2015 | Year ended Aug. 31, 2014 | Year ended Aug. 31, 2013 | Period from to Aug. 31, 2012 | |||||||||||||
Net asset value, beginning of period | $ | 73.36 | $ | 61.76 | $ | 53.45 | $ | 50.32 | ||||||||
|
|
|
|
|
|
|
| |||||||||
Income from investment operations: | ||||||||||||||||
Net investment incomeb | 1.64 | 1.81 | 1.40 | 0.98 | ||||||||||||
Net realized and unrealized gain (loss)c | (4.49 | ) | 11.16 | 8.03 | 2.89 | |||||||||||
|
|
|
|
|
|
|
| |||||||||
Total from investment operations | (2.85 | ) | 12.97 | 9.43 | 3.87 | |||||||||||
|
|
|
|
|
|
|
| |||||||||
Less distributions from: | ||||||||||||||||
Net investment income | (1.56 | ) | (1.37 | ) | (1.12 | ) | (0.74 | ) | ||||||||
|
|
|
|
|
|
|
| |||||||||
Total distributions | (1.56 | ) | (1.37 | ) | (1.12 | ) | (0.74 | ) | ||||||||
|
|
|
|
|
|
|
| |||||||||
Net asset value, end of period | $ | 68.95 | $ | 73.36 | $ | 61.76 | $ | 53.45 | ||||||||
|
|
|
|
|
|
|
| |||||||||
Total return | (3.97 | )% | 21.07 | % | 17.84 | % | 7.76 | %d | ||||||||
|
|
|
|
|
|
|
| |||||||||
Ratios/Supplemental data: | ||||||||||||||||
Net assets, end of period (000s) | $ | 206,842 | $ | 168,728 | $ | 24,704 | $ | 10,689 | ||||||||
Ratio of expenses to average net assetse | 0.24 | % | 0.24 | % | 0.24 | % | 0.24 | % | ||||||||
Ratio of net investment income to average net assetse | 2.25 | % | 2.57 | % | 2.34 | % | 2.91 | % | ||||||||
Portfolio turnover ratef | 5 | % | 5 | % | 5 | % | 3 | % | ||||||||
| a | Commencement of operations. |
| b | Based on average shares outstanding throughout each period. |
| c | The amounts reported for a share outstanding may not accord with the change in aggregate gains and losses in securities for the fiscal period due to the timing of capital share transactions in relation to the fluctuating market values of the Fund’s underlying securities. |
| d | Not annualized. |
| e | Annualized for periods of less than one year. |
| f | Portfolio turnover rates exclude portfolio securities received or delivered as a result of processing capital share transactions in Creation Units. |
See notes to financial statements.
| 52 | 2015 iSHARES ANNUAL REPORTTO SHAREHOLDERS |
Table of Contents
iSHARES® , INC.
iShares, Inc. (the “Company”) is registered under the Investment Company Act of 1940, as amended (the “1940 Act”), as an open-end management investment company. The Company was incorporated under the laws of the State of Maryland on September 1, 1994 pursuant to Articles of Incorporation as subsequently amended and restated.
These financial statements relate only to the following funds (each, a “Fund,” and collectively, the “Funds”):
| iShares ETF | Diversification Classification | |
MSCI All Country World Minimum Volatility | Diversified | |
MSCI Emerging Markets Horizona | Non-diversified | |
MSCI Frontier 100 | Non-diversified | |
MSCI World | Diversified |
| a | The Fund commenced operations on October 14, 2014. |
The investment objective of each Fund is to seek investment results that correspond generally to the price and yield performance, before fees and expenses, of its underlying index. The investment adviser uses a “passive” or index approach to try to achieve each Fund’s investment objective.
Pursuant to the Company’s organizational documents, the Funds’ officers and directors are indemnified against certain liabilities that may arise out of the performance of their duties to the Funds. Additionally, in the normal course of business, the Funds enter into contracts with service providers that contain general indemnification clauses. The Funds’ maximum exposure under these arrangements is unknown as this would involve future claims that may be made against the Funds that have not yet occurred.
| 1. | SIGNIFICANT ACCOUNTING POLICIES |
The following significant accounting policies are consistently followed by the Funds in the preparation of their financial statements in conformity with accounting principles generally accepted in the United States of America (“U.S. GAAP”). The preparation of financial statements in conformity with U.S. GAAP requires management to make certain estimates and assumptions that affect the reported amounts of assets and liabilities and disclosures of contingent assets and liabilities at the date of the financial statements and the reported amounts of revenue and expenses during the reporting period. Actual results could differ from those estimates. Each Fund is considered an investment company under U.S. GAAP and follows the accounting and reporting guidance applicable to investment companies.
SECURITY VALUATION
Each Fund’s investments are valued at fair value each day that the Fund’s listing exchange is open and, for financial reporting purposes, as of the report date should the reporting period end on a day that the Fund’s listing exchange is not open. U.S. GAAP defines fair value as the price a fund would receive to sell an asset or pay to transfer a liability in an orderly transaction between market participants at the measurement date. The BlackRock Global Valuation Methodologies Committee (the “Global Valuation Committee”) provides oversight of the valuation of investments for the Funds. The investments of each Fund are valued pursuant to policies and procedures developed by the Global Valuation Committee and approved by the Board of Directors of the Company (the “Board”).
| • | Equity investments traded on a recognized securities exchange are valued at that day’s last reported trade price or the official closing price, as applicable, on the exchange where the stock is primarily traded. Equity investments traded on a recognized exchange for which there were no sales on that day are valued at the last traded price. |
NOTESTO FINANCIAL STATEMENTS | 53 |
Table of Contents
Notes to Financial Statements (Continued)
iSHARES®, INC.
| • | Fixed income investments are valued at the last available bid price received from independent pricing services. In determining the value of a fixed income investment, pricing services may use certain information with respect to transactions in such investments, quotations from dealers, pricing matrixes, market transactions in comparable investments, various relationships observed in the market between investments, and calculated yield measures. |
| • | Open-end U.S. mutual funds are valued at that day’s published net asset value (“NAV”). |
In the event that application of these methods of valuation results in a price for an investment which is deemed not to be representative of the fair value of such investment or if a price is not available, the investment will be valued based upon other available factors deemed relevant by the Global Valuation Committee, in accordance with policies approved by the Board. These factors include but are not limited to (i) attributes specific to the investment; (ii) the principal market for the investment; (iii) the customary participants in the principal market for the investment; (iv) data assumptions by market participants for the investment, if reasonably available; (v) quoted prices for similar investments in active markets; and (vi) other factors, such as future cash flows, interest rates, yield curves, volatilities, prepayment speeds, loss severities, credit risks and/or default rates. Valuations based on such factors are reported to the Board on a quarterly basis.
The Global Valuation Committee employs various methods for calibrating valuation approaches for investments where an active market does not exist, including regular due diligence of the Company’s pricing vendors, a regular review of key inputs and assumptions, transactional back-testing or disposition analysis to compare unrealized gains and losses to realized gains and losses, reviews of missing or stale prices, reviews of large movements in market values, and reviews of market related activity.
Fair value pricing could result in a difference between the prices used to calculate a Fund’s NAV and the prices used by the Fund’s underlying index, which in turn could result in a difference between the Fund’s performance and the performance of the Fund’s underlying index.
Various inputs are used in determining the fair value of financial instruments. Inputs may be based on independent market data (“observable inputs”) or they may be internally developed (“unobservable inputs”). These inputs are categorized into a disclosure hierarchy consisting of three broad levels for financial reporting purposes. The level of a value determined for a financial instrument within the fair value hierarchy is based on the lowest level of any input that is significant to the fair value measurement in its entirety. The categorization of a value determined for a financial instrument within the hierarchy is based upon the pricing transparency of the instrument and is not necessarily an indication of the risk associated with investing in the instrument. The three levels of the fair value hierarchy are as follows:
| • | Level 1 — Unadjusted quoted prices in active markets for identical assets or liabilities; |
| • | Level 2 — Inputs other than quoted prices included within Level 1 that are observable for the asset or liability either directly or indirectly, including quoted prices for similar assets or liabilities in active markets, quoted prices for identical or similar assets or liabilities in markets that are not considered to be active, inputs other than quoted prices that are observable for the asset or liability (such as exchange rates, financing terms, interest rates, yield curves, volatilities, prepayment speeds, loss severities, credit risks and default rates) or other market-corroborated inputs; and |
| • | Level 3 — Unobservable inputs for the asset or liability, including the Global Valuation Committee’s assumptions used in determining the fair value of investments. |
Changes in valuation techniques may result in transfers in or out of an assigned level within the disclosure hierarchy. In accordance with the Company’s policy, transfers between different levels of the fair value hierarchy are deemed to have occurred as of the beginning of the reporting period.
| 54 | 2015 iSHARES ANNUAL REPORTTO SHAREHOLDERS |
Table of Contents
Notes to Financial Statements (Continued)
iSHARES®, INC.
The following table summarizes the value of each of the Funds’ investments according to the fair value hierarchy as of August 31, 2015. The breakdown of each Fund’s investments into major categories is disclosed in its respective schedule of investments.
| iShares ETF | Level 1 | Level 2 | Level 3 | Total | ||||||||||||
MSCI All Country World Minimum Volatility | ||||||||||||||||
Investments: | ||||||||||||||||
Assets: | ||||||||||||||||
Common Stocks | $ | 2,099,773,895 | $ | — | $ | 2,395,370 | $ | 2,102,169,265 | ||||||||
Preferred Stocks | 1,397,726 | — | — | 1,397,726 | ||||||||||||
Money Market Funds | 60,625,681 | — | — | 60,625,681 | ||||||||||||
|
|
|
|
|
|
|
| |||||||||
Total | $ | 2,161,797,302 | $ | — | $ | 2,395,370 | $ | 2,164,192,672 | ||||||||
|
|
|
|
|
|
|
| |||||||||
MSCI Emerging Markets Horizon | ||||||||||||||||
Investments: | ||||||||||||||||
Assets: | ||||||||||||||||
Common Stocks | $ | 930,230 | $ | — | $ | — | $ | 930,230 | ||||||||
Preferred Stocks | 7,466 | — | — | 7,466 | ||||||||||||
Money Market Funds | 10,146 | — | — | 10,146 | ||||||||||||
|
|
|
|
|
|
|
| |||||||||
Total | $ | 947,842 | $ | — | $ | — | $ | 947,842 | ||||||||
|
|
|
|
|
|
|
| |||||||||
MSCI Frontier 100 | ||||||||||||||||
Investments: | ||||||||||||||||
Assets: | ||||||||||||||||
Common Stocks | $ | 501,839,111 | $ | 80 | $ | — | $ | 501,839,191 | ||||||||
Convertible Bonds | — | 251,862 | — | 251,862 | ||||||||||||
Money Market Funds | 2,041,402 | — | — | 2,041,402 | ||||||||||||
|
|
|
|
|
|
|
| |||||||||
Total | $ | 503,880,513 | $ | 251,942 | $ | — | $ | 504,132,455 | ||||||||
|
|
|
|
|
|
|
| |||||||||
MSCI World | ||||||||||||||||
Investments: | ||||||||||||||||
Assets: | ||||||||||||||||
Common Stocks | $ | 205,540,755 | $ | — | $ | — | $ | 205,540,755 | ||||||||
Preferred Stocks | 396,332 | — | — | 396,332 | ||||||||||||
Money Market Funds | 4,333,973 | — | — | 4,333,973 | ||||||||||||
|
|
|
|
|
|
|
| |||||||||
Total | $ | 210,271,060 | $ | — | $ | — | $ | 210,271,060 | ||||||||
|
|
|
|
|
|
|
| |||||||||
SECURITY TRANSACTIONS AND INCOME RECOGNITION
Security transactions are accounted for on trade date. Dividend income and capital gain distributions, if any, are recognized on the ex-dividend date, net of any foreign taxes withheld at source. Any taxes withheld that are reclaimable from foreign tax authorities as of August 31, 2015 are reflected in dividends receivable. Non-cash dividends received in the form of stock in an elective dividend, if any, are recorded as dividend income at fair value. Distributions received by the Funds may include a return of capital that is estimated by management. Such amounts are recorded as a reduction of the cost of investments or reclassified to capital gains. Interest income is accrued daily. Realized gains and losses on investment transactions are determined using the specific identification method.
NOTESTO FINANCIAL STATEMENTS | 55 |
Table of Contents
Notes to Financial Statements (Continued)
iSHARES®, INC.
FOREIGN CURRENCY TRANSLATION
The accounting records of the Funds are maintained in U.S. dollars. Foreign currencies, as well as investment securities and other assets and liabilities denominated in foreign currencies, are translated into U.S. dollars using exchange rates deemed appropriate by the investment adviser. Purchases and sales of securities, income receipts and expense payments are translated into U.S. dollars on the respective dates of such transactions.
Each Fund does not isolate the effect of fluctuations in foreign exchange rates from the effect of fluctuations in the market prices of securities. Such fluctuations are reflected by the Funds as a component of realized and unrealized gains and losses from investments for financial reporting purposes.
FOREIGN TAXES
The Funds may be subject to foreign taxes (a portion of which may be reclaimable) on income, stock dividends, capital gains on investments, or certain foreign currency transactions. All foreign taxes are recorded in accordance with the applicable foreign tax regulations and rates that exist in the foreign jurisdictions in which the Funds invest. These foreign taxes, if any, are paid by the Funds and are reflected in their statements of operations as follows: foreign taxes withheld at source are presented as a reduction of income, foreign taxes on securities lending income are presented as a reduction of securities lending income, foreign taxes on stock dividends are presented as “other foreign taxes,” and foreign taxes on capital gains from sales of investments and foreign taxes on foreign currency transactions are included in their respective net realized gain (loss) categories. Foreign taxes payable or deferred as of August 31, 2015, if any, are disclosed in the Funds’ statements of assets and liabilities.
DISTRIBUTIONS TO SHAREHOLDERS
Dividends and distributions paid by each Fund are recorded on the ex-dividend dates. Distributions are determined on a tax basis and may differ from net investment income and net realized capital gains for financial reporting purposes. Dividends and distributions are paid in U.S. dollars and cannot be automatically reinvested in additional shares of the Funds.
LOANS OF PORTFOLIO SECURITIES
Each Fund may lend its investment securities to approved borrowers, such as brokers, dealers and other financial institutions. The borrower pledges and maintains with the Fund collateral consisting of cash, an irrevocable letter of credit issued by a bank, or securities issued or guaranteed by the U.S. government. The initial collateral received by each Fund is required to have a value of at least 102% of the current value of the loaned securities for securities traded on U.S. exchanges and a value of at least 105% for all other securities. The collateral is maintained thereafter at a value equal to at least 100% of the current value of the securities on loan. The market value of the loaned securities is determined at the close of each business day of the Funds. Any additional required collateral is delivered to the Funds and any excess collateral is returned by the Funds on the next business day. During the term of the loan, each Fund is entitled to all distributions made on or in respect of the loaned securities. Loans of securities are terminable at any time and the borrower, after notice, is required to return borrowed securities within the standard time period for settlement of securities transactions.
Any cash received as collateral for securities on loan may be reinvested in certain short-term instruments either directly on behalf of a fund or through one or more joint accounts or money market funds, including those managed by BlackRock Fund Advisors (“BFA”), the Funds’ investment adviser, or its affiliates. As of August 31, 2015, any securities on loan were collateralized by cash. The cash collateral received was invested in money market funds managed by BFA and is disclosed in the schedules of investments. The securities on loan for each Fund are also disclosed in its schedule of investments. The total value of any securities on loan as of August 31, 2015 and the total value of the related collateral are disclosed in the statements of assets and liabilities. Income earned by the Funds from securities lending is disclosed in the statements of operations.
| 56 | 2015 iSHARES ANNUAL REPORTTO SHAREHOLDERS |
Table of Contents
Notes to Financial Statements (Continued)
iSHARES®, INC.
The risks of securities lending include the risk that the borrower may not provide additional collateral when required or may not return the securities when due. To mitigate these risks, the Funds benefit from a borrower default indemnity provided by BlackRock, Inc. (“BlackRock”). BlackRock’s indemnity allows for full replacement of securities lent. Each Fund could suffer a loss if the value of the investments purchased with cash collateral falls below the value of the cash collateral received.
Securities lending transactions are entered into by the Funds under Master Securities Lending Agreements (“MSLA”) which provide the right, in the event of default (including bankruptcy or insolvency) for the non-defaulting party to liquidate the collateral and calculate a net exposure to the defaulting party or request additional collateral. In the event that a borrower defaults, a Fund, as lender, would offset the market value of the collateral received against the market value of the securities loaned. The value of the collateral is typically greater than that of the market value of the securities loaned, leaving the lender with a net amount payable to the defaulting party. However, bankruptcy or insolvency laws of a particular jurisdiction may impose restrictions on or prohibitions against such a right of offset in the event of an MSLA counterparty’s bankruptcy or insolvency. Under the MSLA, the borrower can resell or re-pledge the loaned securities, and a Fund can reinvest cash collateral, or, upon an event of default, resell or re-pledge the collateral.
The following table is a summary of securities lending agreements which are subject to offset under an MSLA as of August 31, 2015:
| iShares ETF | Market Value of Securities on Loan | Cash Collateral Received a | Net Amount | |||||||||
MSCI All Country World Minimum Volatility | $ | 52,986,424 | $ | 52,986,424 | $ | — | ||||||
MSCI Emerging Markets Horizon | 9,214 | 9,214 | — | |||||||||
MSCI World | 3,893,841 | 3,893,841 | — | |||||||||
| a | Collateral received in excess of the market value of securities on loan is not presented for financial reporting purposes. The total collateral received is disclosed in each Fund’s statement of assets and liabilities. |
| 2. | INVESTMENT ADVISORY AGREEMENT AND OTHER TRANSACTIONS WITH AFFILIATES |
Pursuant to an Investment Advisory Agreement with the Company, BFA manages the investment of each Fund’s assets. BFA is a California corporation indirectly owned by BlackRock. Under the Investment Advisory Agreement, BFA is responsible for substantially all expenses of the Funds, except interest, taxes, brokerage commissions and other expenses connected with the execution of portfolio transactions, distribution fees, litigation expenses and any extraordinary expenses.
For its investment advisory services to the iShares MSCI All Country World Minimum Volatility ETF, BFA is entitled to an annual investment advisory fee based on the Fund’s allocable portion of the aggregate of the average daily net asset of the Fund and certain other iShares funds, as follows:
| Investment Advisory Fee | Aggregate Average Daily Net Assets | ||||
| 0.350 | % | First $30 billion | |||
| 0.320 | Over $30 billion, up to and including $60 billion | ||||
| 0.280 | Over $60 billion, up to and including $90 billion | ||||
| 0.252 | Over $90 billion | ||||
In addition, the iShares MSCI All Country World Minimum Volatility ETF indirectly pays its pro rata share of fees and expenses attributable to its investments in other investment companies (“acquired fund fees and expenses”). The total of the investment advisory fee and acquired fund fees and expenses is a fund’s total annual operating expense. BFA has contractually agreed to waive a portion of its investment advisory fees for the Fund through December 31, 2015 in an amount equal to the acquired fund
NOTESTO FINANCIAL STATEMENTS | 57 |
Table of Contents
Notes to Financial Statements (Continued)
iSHARES®, INC.
fees and expenses attributable to the Fund’s investments in other iShares funds, if any. Effective September 12, 2014, BFA has contractually agreed to waive an additional portion of its investment advisory fees for the Fund through December 31, 2015 in order to limit total annual operating expenses after fee waiver to 0.20% of average daily net assets.
For its investment advisory services to each of the following Funds, BFA is entitled to an annual investment advisory fee based on the average daily net assets of each Fund as follows:
| iShares ETF | Investment Advisory Fee | |||
MSCI Emerging Markets Horizon | 0.50 | % | ||
MSCI Frontier 100 | 0.79 | |||
MSCI World | 0.24 | |||
The U.S. Securities and Exchange Commission has issued an exemptive order which permits BlackRock Institutional Trust Company, N.A. (“BTC”), an affiliate of BFA, to serve as securities lending agent for the Funds, subject to applicable conditions. As securities lending agent, BTC bears all operational costs directly related to securities lending. Each Fund is responsible for fees in connection with the investment of cash collateral received for securities on loan in a money market fund managed by BFA, however, BTC has agreed to reduce the amount of securities lending income it receives in order to effectively limit the collateral investment fees each Fund bears to an annual rate of 0.04% (the “collateral investment fees”). Securities lending income is equal to the total of income earned from the reinvestment of cash collateral, net of fees and other payments to and from borrowers of securities, and less the collateral investment fees. The Funds retain a portion of securities lending income and remit the remaining portion to BTC as compensation for its services as securities lending agent.
Pursuant to a securities lending agreement, each Fund retains 80% of securities lending income and the amount retained can never be less than 70% of the total of securities lending income plus the collateral investment fees. In addition, commencing the business day following the date that the aggregate securities lending income plus the collateral investment fees generated across all 1940 Act iShares exchange-traded funds (the “iShares ETF Complex”) in a given calendar year exceeds the aggregate securities lending income generated across the iShares ETF Complex in the calendar year 2013, each Fund, pursuant to a securities lending agreement, will retain for the remainder of that calendar year 85% of securities lending income and the amount retained can never be less than 70% of the total of securities lending income plus the collateral investment fees.
Prior to January 1, 2015, each Fund retained 75% of securities lending income and the amount retained was never less than 65% of the total of securities lending income plus the collateral investment fees. In addition, commencing the business day following the date that the aggregate securities lending income plus the collateral investment fees generated across the iShares ETF Complex in the calendar year 2014 exceeded the aggregate securities lending income generated across the iShares ETF Complex in the calendar year 2013 and pursuant to a securities lending agreement, each Fund retained for the remainder of the calendar year 2014, 80% of securities lending income and the amount retained was never less than 65% of the total of securities lending income plus the collateral investment fees.
For the year ended August 31, 2015, the total of securities lending agent services and collateral investment fees paid were as follows:
| iShares ETF | Fees Paid to BTC | |||
MSCI All Country World Minimum Volatility | $ | 256,370 | ||
MSCI Emerging Markets Horizon | 2 | |||
MSCI World | 5,895 | |||
| 58 | 2015 iSHARES ANNUAL REPORTTO SHAREHOLDERS |
Table of Contents
Notes to Financial Statements (Continued)
iSHARES®, INC.
BlackRock Investments, LLC, an affiliate of BFA, is the distributor for each Fund. Pursuant to the distribution agreement, BFA is responsible for any fees or expenses for distribution services provided to the Funds.
Cross trades for the year ended August 31, 2015, if any, were executed by the Funds pursuant to Rule 17a-7 under the 1940 Act. Cross trading is the buying or selling of portfolio securities between funds to which BFA (or an affiliate) serves as investment adviser. At its regularly scheduled quarterly meetings, the Board reviews such transactions as of the most recent calendar quarter for compliance with the requirements and restrictions set forth by Rule 17a-7.
Each Fund may invest its positive cash balances in certain money market funds managed by BFA or an affiliate. The income earned on these temporary cash investments is included in “Interest – affiliated” in the statements of operations.
The PNC Financial Services Group, Inc. is the largest stockholder of BlackRock and is considered to be an affiliate of the Funds for 1940 Act purposes.
Certain Funds, in order to improve their portfolio liquidity and their ability to track their respective underlying index, may invest in shares of other iShares funds that invest in securities in each Fund’s respective underlying index.
Investments in issuers considered to be affiliates of the Funds (excluding money market funds) during the year ended August 31, 2015, for purposes of Section 2(a)(3) of the 1940 Act, were as follows:
| iShares ETF and Name of Affiliated Issuer | Shares Held at Beginning of Year | Shares Purchased | Shares Sold | Shares Held at End of Year | Value at End of Year | Dividend Income | Net Realized Gain (Loss) | |||||||||||||||||||||
MSCI World | ||||||||||||||||||||||||||||
BlackRock Inc. | 690 | 594 | (474 | ) | 810 | $ | 245,001 | $ | 7,464 | $ | 26,086 | |||||||||||||||||
PNC Financial Services Group Inc. (The) | 2,507 | 2,180 | (1,417 | ) | 3,270 | 297,962 | 6,275 | 30,177 | ||||||||||||||||||||
|
|
|
|
|
| |||||||||||||||||||||||
| $ | 542,963 | $ | 13,739 | $ | 56,263 | |||||||||||||||||||||||
|
|
|
|
|
| |||||||||||||||||||||||
Certain directors and officers of the Company are also officers of BTC and/or BFA.
| 3. | INVESTMENT PORTFOLIO TRANSACTIONS |
Purchases and sales of investments (excluding in-kind transactions and short-term investments) for the year ended August 31, 2015 were as follows:
| iShares ETF | Purchases | Sales | ||||||
MSCI All Country World Minimum Volatility | $ | 711,656,206 | $ | 400,250,819 | ||||
MSCI Emerging Markets Horizon | 979,437 | 499,788 | ||||||
MSCI Frontier 100 | 293,155,519 | 394,018,083 | ||||||
MSCI World | 11,995,154 | 10,983,574 | ||||||
NOTESTO FINANCIAL STATEMENTS | 59 |
Table of Contents
Notes to Financial Statements (Continued)
iSHARES®, INC.
In-kind transactions (see Note 4) for the year ended August 31, 2015 were as follows:
| iShares ETF | In-kind Purchases | In-kind Sales | ||||||
MSCI All Country World Minimum Volatility | $ | 788,360,480 | $ | 221,134,191 | ||||
MSCI Emerging Markets Horizon | 1,599,734 | 739,347 | ||||||
MSCI Frontier 100 | 5,925,817 | 30,178,197 | ||||||
MSCI World | 145,177,204 | 91,861,484 | ||||||
| 4. | CAPITAL SHARE TRANSACTIONS |
Capital shares are issued and redeemed by each Fund only in aggregations of a specified number of shares or multiples thereof (“Creation Units”) at NAV. Except when aggregated in Creation Units, shares of each Fund are not redeemable. Transactions in capital shares for each Fund are disclosed in detail in the statements of changes in net assets.
The consideration for the purchase of Creation Units of a fund in the Company generally consists of the in-kind deposit of a designated portfolio of securities and a specified amount of cash. Certain funds in the Company may be offered in Creation Units solely or partially for cash in U.S. dollars. Investors purchasing and redeeming Creation Units may pay a purchase transaction fee and a redemption transaction fee directly to State Street Bank and Trust Company, the Company’s administrator, to offset transfer and other transaction costs associated with the issuance and redemption of Creation Units, including Creation Units for cash. Investors transacting in Creation Units for cash may also pay an additional variable charge to compensate the relevant fund for certain transaction costs (i.e., stamp taxes, taxes on currency or other financial transactions, and brokerage costs) and market impact expenses relating to investing in portfolio securities. Such variable charges, if any, are included in “Proceeds from shares sold” in the statements of changes in net assets.
| 5. | PRINCIPAL RISKS |
In the normal course of business, each Fund’s investment activities expose it to various types of risk associated with the financial instruments and markets in which it invests. The significant types of financial risks each Fund is exposed to include market risk and credit risk. Each Fund’s prospectus provides details of these and other types of risk.
BFA uses a “passive” or index approach to try to achieve each Fund’s investment objective following the securities included in its underlying index during upturns as well as downturns. BFA does not take steps to reduce market exposure or to lessen the effects of a declining market. Divergence from the underlying index and the composition of the portfolio is monitored by BFA.
MARKET RISK
Market risk arises mainly from uncertainty about future values of financial instruments influenced by price, currency and interest rate movements. It represents the potential loss each Fund may suffer through holding market positions in the face of market movements. Each Fund is exposed to market risk by virtue of its investment in equity instruments. The fair value of securities held by the Funds may decline due to general market conditions, economic trends or events that are not specifically related to the issuers of the securities including local, regional or global political, social or economic instability or to factors that affect a particular industry or group of industries. The extent of each Fund’s exposure to market risk is the market value of the investments held as shown in the Fund’s schedule of investments.
| 60 | 2015 iSHARES ANNUAL REPORTTO SHAREHOLDERS |
Table of Contents
Notes to Financial Statements (Continued)
iSHARES®, INC.
A diversified portfolio, where this is appropriate and consistent with a fund’s objectives, minimizes the risk that a price change of a particular investment will have a material impact on the NAV of a fund. The investment concentrations within each Fund’s portfolio are disclosed in its schedule of investments.
Each Fund invests a substantial amount of its assets in securities of non-U.S. issuers that trade in non-U.S. markets. This involves certain considerations and risks not typically associated with securities of U.S. issuers. Such risks include, but are not limited to: generally less liquid and less efficient securities markets; generally greater price volatility; exchange rate fluctuations and exchange controls; imposition of restrictions on the expatriation of funds or other assets of the Fund; less publicly available information about issuers; the imposition of withholding or other taxes; higher transaction and custody costs; settlement delays and risk of loss attendant in settlement procedures; difficulties in enforcing contractual obligations; less regulation of securities markets; different accounting, disclosure and reporting requirements; more substantial governmental involvement in the economy; higher inflation rates; greater social, economic and political uncertainties; the risk of nationalization or expropriation of assets; and the risk of war. These risks are heightened for investments in issuers from countries with less developed markets.
The United States and the European Union, along with the regulatory bodies of a number of countries including Japan, Australia and Canada (collectively, “Sanctioning Bodies”), have imposed sectorial economic sanctions on certain Russian individuals and Russian corporate entities which include prohibitions on transacting in or dealing in new debt of longer than 30 or 90 days maturity or new equity of such issuers. Securities held by the iShares MSCI All Country World Minimum Volatility ETF issued prior to the date of the sanctions being imposed are not currently subject to any restrictions under the sanctions. However, compliance with each of these sanctions may impair the ability of a Fund to buy, sell, hold, receive or deliver the affected securities or other securities of such issuers. The Sanctioning Bodies could also institute broader sanctions on Russia. These sanctions, or even the threat of further sanctions, may result in the decline of the value and liquidity of Russian securities, a weakening of the ruble or other adverse consequences to the Russian economy. Current or future sanctions may result in Russia taking counter measures or retaliatory actions, which may further impair the value and liquidity of Russian securities. These retaliatory measures may include the immediate freeze of Russian assets held by a Fund.
CREDIT RISK
Credit risk is the risk that an issuer or guarantor of debt instruments or the counterparty to a financial transaction, including derivatives contracts, repurchase agreements or loans of portfolio securities, is unable or unwilling to make timely interest and/or principal payments or to otherwise honor its obligations. BFA and its affiliates manage counterparty credit risk by entering into transactions only with counterparties that they believe have the financial resources to honor their obligations and by monitoring the financial stability of those counterparties. Financial assets, which potentially expose the Funds to issuer and counterparty credit risks, consist principally of financial instruments and receivables due from counterparties. The extent of each Fund’s exposure to credit and counterparty risks with respect to those financial assets is approximated by their value recorded in its statement of assets and liabilities.
| 6. | INCOME TAX INFORMATION |
Each Fund is treated as an entity separate from the Company’s other funds for federal income tax purposes. It is the policy of each Fund to qualify as a regulated investment company by complying with the provisions applicable to regulated investment companies, as defined under Subchapter M of the Internal Revenue Code of 1986, as amended, and to annually distribute substantially all of its ordinary income and any net capital gains (taking into account any capital loss carryforwards) sufficient to relieve it from all, or substantially all, federal income and excise taxes. Accordingly, no provision for federal income taxes is required.
NOTESTO FINANCIAL STATEMENTS | 61 |
Table of Contents
Notes to Financial Statements (Continued)
iSHARES®, INC.
U.S. GAAP requires that certain components of net assets be adjusted to reflect permanent differences between financial and tax reporting. These reclassifications have no effect on net assets or NAV per share. The following permanent differences as of August 31, 2015, attributable to the use of equalization, the characterization of corporate actions, passive foreign investment companies, foreign currency transactions and realized gains (losses) from in-kind redemptions, were reclassified to the following accounts:
| iShares ETF | Paid-in Capital | Undistributed Net Investment Income/Distributions in Excess of Net Investment Income | Undistributed Net Realized Gain/Accumulated Net Realized Loss | |||||||||
MSCI All Country World Minimum Volatility | $ | 54,985,657 | $ | (389,210 | ) | $ | (54,596,447 | ) | ||||
MSCI Emerging Markets Horizon | (50,715 | ) | (1,317 | ) | 52,032 | |||||||
MSCI Frontier 100 | 5,928,137 | (987,604 | ) | (4,940,533 | ) | |||||||
MSCI World | 13,204,277 | 426,243 | (13,630,520 | ) | ||||||||
The tax character of distributions paid during the years ended August 31, 2015 and August 31, 2014 was as follows:
| iShares ETF | 2015 | 2014 | ||||||
MSCI All Country World Minimum Volatility | ||||||||
Ordinary income | $ | 39,259,118 | $ | 29,115,840 | ||||
|
|
|
| |||||
MSCI Emerging Markets Horizon | ||||||||
Ordinary income | $ | 35,584 | $ | N/A | ||||
|
|
|
| |||||
MSCI Frontier 100 | ||||||||
Ordinary income | $ | 33,889,106 | $ | 15,334,501 | ||||
Long-term capital gain | $ | 28,028,851 | $ | — | ||||
|
|
|
| |||||
| $ | 61,917,957 | $ | 15,334,501 | |||||
|
|
|
| |||||
MSCI World | ||||||||
Ordinary income | $ | 4,706,418 | $ | 2,735,328 | ||||
|
|
|
| |||||
As of August 31, 2015, the tax components of accumulated net earnings (losses) were as follows:
| iShares ETF | Undistributed Ordinary Income | Capital Loss Carryforwards | Net Unrealized Gains (Losses) a | Qualified Late-Year | Total | |||||||||||||||
MSCI All Country World Minimum Volatility | $ | 10,686,979 | $ | (12,815,217 | ) | $ | 73,030,125 | $ | (5,722,983 | ) | $ | 65,178,904 | ||||||||
MSCI Emerging Markets Horizon | 939 | — | (259,480 | ) | (92,154 | ) | (350,695 | ) | ||||||||||||
MSCI Frontier 100 | — | — | (113,256,315 | ) | (18,863,731 | ) | (132,120,046 | ) | ||||||||||||
MSCI World | 1,163,511 | (404,019 | ) | (16,005,395 | ) | (134,416 | ) | (15,380,319 | ) | |||||||||||
| a | The difference between book-basis and tax-basis unrealized gains (losses) was attributable primarily to the tax deferral of losses on wash sales and the realization for tax purposes of unrealized gains on investments in passive foreign investment companies. |
| b | The Funds have elected to defer certain qualified late-year losses and recognize such losses in the next taxable year. |
| 62 | 2015 iSHARES ANNUAL REPORTTO SHAREHOLDERS |
Table of Contents
Notes to Financial Statements (Continued)
iSHARES®, INC.
As of August 31, 2015, the following Funds had non-expiring capital loss carryforwards available to offset future realized capital gains as follows:
| iShares ETF | Non- Expiring | |||
MSCI All Country World Minimum Volatility | $ | 12,815,217 | ||
MSCI World | 404,019 | |||
The Funds may own shares in certain foreign investment entities, referred to, under U.S. tax law, as “passive foreign investment companies.” The Funds may elect to mark-to-market annually the shares of each passive foreign investment company and would be required to distribute to shareholders any such marked-to-market gains.
As of August 31, 2015, gross unrealized appreciation and gross unrealized depreciation based on cost for federal income tax purposes were as follows:
| iShares ETF | Tax Cost | Gross Unrealized Appreciation | Gross Unrealized Depreciation | Net Unrealized Appreciation (Depreciation) | ||||||||||||
MSCI All Country World Minimum Volatility | $ | 2,091,076,213 | $ | 196,090,473 | $ | (122,974,014 | ) | $ | 73,116,459 | |||||||
MSCI Emerging Markets Horizon | 1,207,313 | 16,270 | (275,741 | ) | (259,471 | ) | ||||||||||
MSCI Frontier 100 | 615,834,296 | 29,428,784 | (141,130,625 | ) | (111,701,841 | ) | ||||||||||
MSCI World | 226,269,398 | 7,476,357 | (23,474,695 | ) | (15,998,338 | ) | ||||||||||
Management has analyzed tax laws and regulations and their application to the Funds as of August 31, 2015, inclusive of the open tax return years, and does not believe there are any uncertain tax positions that require recognition of a tax liability in the Funds’ financial statements.
| 7. | LINE OF CREDIT |
The iShares MSCI Frontier 100 ETF, along with certain other iShares funds, is a party to a $150 million credit agreement with State Street Bank and Trust Company, which expires on October 28, 2015. The line of credit may be used for temporary or emergency purposes, including redemptions, settlement of trades and rebalancing of portfolio holdings. The credit agreement has the following terms: a commitment fee of 0.08% per annum on the unused portion of the credit agreement and interest at a rate equal to the higher of (a) the one-month LIBOR plus 1.00% per annum or (b) the U.S. Federal Funds rate plus 1.00% per annum on amounts borrowed. The commitment fee is allocated to each fund participating in the credit agreement based on each fund’s pro-rata share of the aggregate average daily value of assets invested in local securities of certain foreign markets.
On September 17, 2015, the Board amended the terms of the credit agreement as follows: (i) increased the maximum borrowing amount to $250 million; (ii) increased the commitment fee to 0.20% per annum on the unused portion of the credit agreement and interest at a rate equal to the higher of (a) the one-month LIBOR (not less than zero) plus 1.00% per annum or (b) the U.S. Federal Funds rate (not less than zero) plus 1.00% per annum on amounts borrowed; and (iii) extended the expiration date to October 28, 2016. These changes are expected to be effective on or around October 28, 2015.
For the year ended August 31, 2015, the iShares MSCI Frontier 100 ETF’s maximum amount borrowed, the average borrowings and the weighted average interest rate under the credit agreement were $2,000,000, $38,356 and 1.16%, respectively.
NOTESTO FINANCIAL STATEMENTS | 63 |
Table of Contents
Notes to Financial Statements (Continued)
iSHARES®, INC.
| 8. | SUBSEQUENT EVENTS |
Management has evaluated the impact of all subsequent events on the Funds through the date the financial statements were available to be issued and has determined that there were no subsequent events requiring adjustment or disclosure in the financial statements.
| 64 | 2015 iSHARES ANNUAL REPORTTO SHAREHOLDERS |
Table of Contents
Report of Independent Registered Public Accounting Firm
To the Shareholders and Board of Directors of
iShares, Inc.:
In our opinion, the accompanying statements of assets and liabilities, including the schedules of investments, and the related statements of operations and of changes in net assets and the financial highlights present fairly, in all material respects, the financial position of iShares MSCI All Country World Minimum Volatility ETF, iShares MSCI Emerging Markets Horizon ETF, iShares MSCI Frontier 100 ETF and iShares MSCI World ETF (the “Funds”) at August 31, 2015, the results of each of their operations, the changes in each of their net assets and their financial highlights for each of the periods presented, in conformity with accounting principles generally accepted in the United States of America. These financial statements and financial highlights (hereafter referred to as “financial statements”) are the responsibility of the Funds’ management. Our responsibility is to express an opinion on these financial statements based on our audits. We conducted our audits of these financial statements in accordance with the standards of the Public Company Accounting Oversight Board (United States). Those standards require that we plan and perform the audit to obtain reasonable assurance about whether the financial statements are free of material misstatement. An audit includes examining, on a test basis, evidence supporting the amounts and disclosures in the financial statements, assessing the accounting principles used and significant estimates made by management, and evaluating the overall financial statement presentation. We believe that our audits, which included confirmation of securities at August 31, 2015 by correspondence with the custodian, transfer agent and brokers, provide a reasonable basis for our opinion.
PricewaterhouseCoopers LLP
San Francisco, California
October 22, 2015
REPORTOF INDEPENDENT REGISTERED PUBLIC ACCOUNTING FIRM | 65 |
Table of Contents
iSHARES®, INC.
Under Section 854(b)(2) of the Internal Revenue Code (the “Code”), the following maximum amounts are hereby designated as qualified dividend income for purposes of the maximum rate under Section 1(h)(11) of the Code for the fiscal year ended August 31, 2015:
| iShares ETF | Qualified Dividend Income | |||
MSCI All Country World Minimum Volatility | $ | 38,542,020 | ||
MSCI Emerging Markets Horizon | 28,737 | |||
MSCI Frontier 100 | 8,465,590 | |||
MSCI World | 5,216,975 | |||
In February 2016, shareholders will receive Form 1099-DIV which will include their share of qualified dividend income distributed during the calendar year 2015. Shareholders are advised to check with their tax advisers for information on the treatment of these amounts on their income tax returns.
For corporate shareholders, the percentage of income dividends paid during the fiscal year ended August 31, 2015 that qualified for the dividends-received deduction were as follows:
| iShares ETF | Dividends- Received Deduction | |||
MSCI All Country World Minimum Volatility | 46.65 | % | ||
MSCI World | 42.86 | |||
For the fiscal year ended August 31, 2015, the following Funds earned foreign source income and paid foreign taxes which they intend to pass through to their shareholders pursuant to Section 853 of the Code:
| iShares ETF | Foreign Source Income Earned | Foreign Taxes Paid | ||||||
MSCI Emerging Markets Horizon | $ | 50,715 | $ | 4,092 | ||||
MSCI Frontier 100 | 22,241,514 | 3,620,398 | ||||||
Under Section 852(b)(3)(C) of the Code, the iShares MSCI Frontier 100 ETF hereby designates $28,028,851 as 20% rate long-term capital gain dividends for the fiscal year ended August 31, 2015.
Under Section 871(k)(2)(C) of the Code, the iShares MSCI Frontier 100 ETF hereby designates $19,399,989 as short-term capital gain dividends for the fiscal year ended August 31, 2015.
| 66 | 2015 iSHARES ANNUAL REPORTTO SHAREHOLDERS |
Table of Contents
Board Review and Approval of Investment Advisory
Contract
iSHARES® , INC.
I. iShares MSCI All Country World Minimum Volatility ETF
Under Section 15(c) of the Investment Company Act of 1940 (the “1940 Act”), the Company’s Board of Directors (the “Board”), including a majority of Directors who are not “interested persons” of the Company (as that term is defined in the 1940 Act) (the “Independent Directors”), is required annually to consider and approve the Investment Advisory Contract between the Company and BFA (the “Advisory Contract”) on behalf of the Fund. The Independent Directors requested, and BFA provided, such information as the Independent Directors, with advice from independent counsel, deemed reasonably necessary to evaluate the Advisory Contract. A committee of Independent Directors (the “15(c) Committee”), with independent counsel, met with management on May 1, 2015 and May 6, 2015, to discuss the types of information the Independent Directors required and the manner in which management would organize and present such information. At a meeting held on May 21, 2015, management presented preliminary information to the Board relating to the continuance of the Advisory Contract, and the Board, including the Independent Directors, reviewed and discussed such information at length. The Independent Directors requested from management certain additional information, which management agreed to provide. At a meeting held on June 24-25, 2015, the Board, including the Independent Directors, reviewed the additional information provided by management in response to these requests. After extensive discussions, the Board, including all of the Independent Directors, approved the continuance of the Advisory Contract for the Fund, based on a review of qualitative and quantitative information provided by BFA, including the additional information management provided at the request of the Independent Directors. The Board noted its satisfaction with the extent and quality of information provided and its frequent interactions with management, as well as the detailed responses and other information provided by BFA. The Board also noted that the Board and BFA agreed to discuss potential enhancements and adjustments to the 15(c) process for the coming year. The Independent Directors were advised by their independent counsel throughout the process, including about the legal standards applicable to their review. In approving the Advisory Contract for the Fund, the Board, including the Independent Directors, considered the following factors, no one of which was controlling, and reached the following conclusions:
Expenses and Performance of the Fund — The Board reviewed statistical information prepared by Lipper Inc. (“Lipper”), an independent provider of investment company data, regarding the expense ratio components, including actual advisory fees, waivers/reimbursements, and gross and net total expenses of the Fund in comparison with the same information for other exchange traded funds (including, where applicable, funds sponsored by an “at cost” service provider) and, in the limited instances where no comparable ETFs existed and the comparison group would not otherwise be reasonable in Lipper’s judgment, pure index institutional mutual funds, objectively selected by Lipper as comprising the Fund’s applicable peer group pursuant to Lipper’s proprietary ETF methodology (the “Lipper Group”). The Board was provided with a detailed description of Lipper’s proprietary ETF methodology used by Lipper to determine the Fund’s Lipper Group. The Board further noted that due to the limitations in providing comparable funds in the Lipper Group, the statistical information provided in Lipper’s report may or may not provide meaningful direct comparisons to the Fund in all instances.
The Board also noted that the investment advisory fee rate and overall expenses (net of waivers and reimbursements) for the Fund were lower than the median of the investment advisory fee rates and overall expenses (net of waivers and reimbursements) of the funds in its Lipper Group.
In addition, the Board reviewed statistical information prepared by Lipper regarding the performance of the Fund for the one-, three-, five-, ten-year, and since inception periods, as applicable, and the “last quarter” period ended December 31, 2014, and a comparison of the Fund’s performance to its performance benchmark index for the same periods. To the extent that any of the comparison funds included in the Lipper Group track the same index as the Fund, Lipper also provided, and the Board reviewed, a comparison of the Fund’s performance to that of such relevant comparison funds for the same periods. The Board noted that the Fund generally performed in line with its performance benchmark index over the relevant periods. In considering this information, the Board noted that the Lipper Group may include funds that have a different investment objective and/or
BOARD REVIEWAND APPROVALOF INVESTMENT ADVISORY CONTRACT | 67 |
Table of Contents
Board Review and Approval of Investment Advisory
Contract (Continued)
iSHARES®, INC.
benchmark from the Fund. In addition, the Board noted that the Fund seeks to track its own benchmark index and that, during the prior year, the Board received periodic reports on the Fund’s performance in comparison with its benchmark index. Such periodic comparative performance information, including detailed information on certain specific iShares funds requested by the Boards, was also considered.
Based on this review, the other factors considered at the meeting, and their general knowledge of ETF pricing, the Board concluded that the investment advisory fee rate and expense level and the historical performance of the Fund supported the Board’s approval of the continuance of the Advisory Contract for the coming year.
Nature, Extent and Quality of Services Provided by BFA — Based on management’s representations, including information about recent and proposed enhancements to the iShares business, including with respect to shareholder servicing and support, the Board expected that there would be no diminution in the scope of services required of or provided by BFA under the Advisory Contract for the coming year as compared to the scope of services provided by BFA during prior years. In reviewing the scope of these services, the Board considered BFA’s investment philosophy and experience, noting that BFA and its affiliates have committed significant resources over time, including during the past year, to supporting the iShares funds and their shareholders. The Board acknowledged that resources to support the iShares funds and their shareholders have been added or enhanced in recent years. The Board also considered BFA’s compliance program and its compliance record with respect to the Fund. In that regard, the Board noted that BFA reports to the Board about portfolio management and compliance matters on a periodic basis in connection with regularly scheduled meetings of the Board, and on other occasions as necessary and appropriate, and has provided information and made appropriate officers available as needed to provide further assistance with these matters. The Board also reviewed the background and experience of the persons responsible for the day-to-day management of the Fund, as well as the resources available to them in managing the Fund. In addition to the above considerations, the Board reviewed and considered detailed presentations regarding BFA’s investment performance, investment and risk management processes and strategies provided at the June 24-25, 2015 meeting and throughout the previous year, and matters related to BFA’s portfolio compliance policies and procedures. The Board noted that the Fund had met its investment objective consistently since its inception date.
Based on review of this information, and the performance information discussed above, the Board concluded that the nature, extent and quality of services provided by BFA to the Fund under the Advisory Contract supported the Board’s approval of the continuance of the Advisory Contract for the coming year.
Costs of Services Provided to the Fund and Profits Realized by BFA and Affiliates — The Board reviewed information about the profitability to BlackRock of the Fund based on the fees payable to BFA and its affiliates (including fees under the Advisory Contract), and all other sources of revenue and expense to BFA and its affiliates from the Fund’s operations for the last calendar year. The Board reviewed BlackRock’s profitability methodology for the iShares funds, noting that the 15(c) Committee had focused on the methodology and proposed presentation during its meetings. The Board discussed the sources of direct and ancillary revenue with management, including the revenues to BTC from securities lending by the Fund. The Board also discussed BFA’s profit margin as reflected in the Fund’s profitability analysis and reviewed information regarding potential economies of scale (as discussed below). Based on this review, the Board concluded that the profits realized by BFA and its affiliates under the Advisory Contract and from other relationships between the Fund and BFA and/or its affiliates, if any, were within a reasonable range in light of the factors considered.
Economies of Scale — The Board reviewed information regarding potential economies of scale or other efficiencies that may result from increases in the Fund’s assets, noting that the issue of economies of scale had been focused on extensively by the 15(c) Committee during its meetings and addressed by management. The Board and the 15(c) Committee reviewed information provided by BFA regarding scale benefits shared with the iShares funds through relatively low fee rates established at inception,
| 68 | 2015 iSHARES ANNUAL REPORTTO SHAREHOLDERS |
Table of Contents
Board Review and Approval of Investment Advisory
Contract (Continued)
iSHARES®, INC.
breakpoints, waivers, or other fee reductions, as well as through additional investment in the iShares business and the provision of improved or additional infrastructure and services to the iShares funds and their shareholders. The Board and the 15(c) Committee received information regarding BlackRock’s historical profitability, including BFA’s and its affiliates’ costs in providing services. The cost information distinguished between fixed and variable costs, and explained how the level of fixed and variable costs, as well as the nature of such costs, may impact the existence or size of scale benefits. The Board noted that the Advisory Contract for the Fund already provided for breakpoints in the Fund’s investment advisory fee rate as the assets of the Fund, on an aggregated basis with the assets of certain other iShares funds, increase. The Board noted that it would continue to monitor the sharing of economies of scale to determine the appropriateness of adding new or revised breakpoints in the future.
Based on this review, as well as the other factors considered at the meeting, the Board, recognizing its responsibility to consider this issue periodically, determined to approve the continuance of the Advisory Contract for the coming year.
Fees and Services Provided for Other Comparable Funds/Accounts Managed by BFA and its Affiliates — The Board received and considered information regarding the investment advisory/management fee rates for other funds/accounts in the U.S. for which BFA (or its affiliates) provides investment advisory/management services, including open-end and closed-end funds registered under the 1940 Act (including sub-advised funds), collective trust funds, separately managed accounts, and institutional separate accounts (together, the “Other Accounts”), and acknowledged BFA’s assertion that the iShares funds are fundamentally different investment vehicles from the Other Accounts. The Board noted that BFA and its affiliates do manage Other Accounts with substantially the same investment objective and strategy as the Fund or that track the same index or a similar index as the Fund. The Board further noted that BFA provided the Board with detailed information regarding how the Other Accounts (particularly institutional clients) generally differ from the Fund, including in terms of the different, generally more extensive services provided to the Fund, as well as other significant differences in the approach of BFA and its affiliates to the Fund, on one hand, and Other Accounts, on the other. In that regard, the Board considered that the pricing of services to institutional clients is typically based on a number of factors beyond the nature and extent of the specific services to be provided and often depends on the overall relationship between the client and its affiliates and the adviser and its affiliates. In addition, the Board considered the relative complexity and inherent risks and challenges of managing and providing other services to the Fund, as a publicly traded exchange traded fund, as compared to the Other Accounts that are institutional clients in light of differing regulatory requirements and client-imposed mandates. The Board also considered the “all-inclusive” nature of the Fund’s advisory fee structure, and the Fund expenses borne by BFA under this arrangement. The Board noted that the investment advisory fee rate under the Advisory Contract for the Fund was generally higher than the investment advisory/management fee rates for the Other Accounts that are institutional clients of BFA (or its affiliates) and concluded that the differences appeared to be consistent with the factors discussed.
Other Benefits to BFA and/or its Affiliates — The Board reviewed the “fallout” benefits or ancillary revenue received by BFA and/or its affiliates in connection with the services provided to the Fund by BFA, such as payment of revenue to BTC, the Fund’s securities lending agent, for loaning portfolio securities (which was included in the profit margins reviewed by the Board pursuant to BFA’s profitability methodology), and payment of advisory fees and/or administration fees to BFA and BTC (or their affiliates) in connection with any investments by the Fund in other funds for which BFA (or its affiliates) provides investment advisory services and/or administration services. The Board noted that BFA generally does not use soft dollars or consider the value of research or other services that may be provided to BFA (including its affiliates) in selecting brokers for portfolio transactions for the Fund. The Board further noted that any portfolio transactions on behalf of the Fund placed through a BFA affiliate or purchased from an underwriting syndicate in which a BFA affiliate participates, are reported to the Board pursuant to Rule 17e-1 or Rule 10f-3, as applicable, under the 1940 Act. The Board concluded that any such ancillary benefits would not be disadvantageous to the Fund’s shareholders and thus would not alter the Board’s conclusion with respect to the appropriateness of approving the continuance of the Advisory Contract for the coming year.
BOARD REVIEWAND APPROVALOF INVESTMENT ADVISORY CONTRACT | 69 |
Table of Contents
Board Review and Approval of Investment Advisory
Contract (Continued)
iSHARES®, INC.
Based on the considerations described above, the Board determined that the Fund’s investment advisory fee rate under the Advisory Contract does not constitute a fee that is so disproportionately large as to bear no reasonable relationship to the services rendered and that could not have been the product of arm’s-length bargaining, and concluded that it is in the best interest of the Fund and its shareholders to approve the continuance of the Advisory Contract for the coming year.
II. iShares MSCI Frontier 100 ETF
Under Section 15(c) of the Investment Company Act of 1940 (the “1940 Act”), the Company’s Board of Directors (the “Board”), including a majority of Directors who are not “interested persons” of the Company (as that term is defined in the 1940 Act) (the “Independent Directors”), is required annually to consider and approve the Investment Advisory Contract between the Company and BFA (the “Advisory Contract”) on behalf of the Fund. The Independent Directors requested, and BFA provided, such information as the Independent Directors, with advice from independent counsel, deemed reasonably necessary to evaluate the Advisory Contract. A committee of Independent Directors (the “15(c) Committee”), with independent counsel, met with management on May 1, 2015 and May 6, 2015, to discuss the types of information the Independent Directors required and the manner in which management would organize and present such information. At a meeting held on May 21, 2015, management presented preliminary information to the Board relating to the continuance of the Advisory Contract, and the Board, including the Independent Directors, reviewed and discussed such information at length. The Independent Directors requested from management certain additional information, which management agreed to provide. At a meeting held on June 24-25, 2015, the Board, including the Independent Directors, reviewed the additional information provided by management in response to these requests. After extensive discussions, the Board, including all of the Independent Directors, approved the continuance of the Advisory Contract for the Fund, based on a review of qualitative and quantitative information provided by BFA, including the additional information management provided at the request of the Independent Directors. The Board noted its satisfaction with the extent and quality of information provided and its frequent interactions with management, as well as the detailed responses and other information provided by BFA. The Board also noted that the Board and BFA agreed to discuss potential enhancements and adjustments to the 15(c) process for the coming year. The Independent Directors were advised by their independent counsel throughout the process, including about the legal standards applicable to their review. In approving the Advisory Contract for the Fund, the Board, including the Independent Directors, considered the following factors, no one of which was controlling, and reached the following conclusions:
Expenses and Performance of the Fund — The Board reviewed statistical information prepared by Lipper Inc. (“Lipper”), an independent provider of investment company data, regarding the expense ratio components, including actual advisory fees, waivers/reimbursements, and gross and net total expenses of the Fund in comparison with the same information for other exchange traded funds (including, where applicable, funds sponsored by an “at cost” service provider) and, in the limited instances where no comparable ETFs existed and the comparison group would not otherwise be reasonable in Lipper’s judgment, pure index institutional mutual funds, objectively selected by Lipper as comprising the Fund’s applicable peer group pursuant to Lipper’s proprietary ETF methodology (the “Lipper Group”). The Board was provided with a detailed description of Lipper’s proprietary ETF methodology used by Lipper to determine the Fund’s Lipper Group. The Board further noted that due to the limitations in providing comparable funds in the Lipper Group, the statistical information provided in Lipper’s report may or may not provide meaningful direct comparisons to the Fund in all instances.
The Board also noted that the investment advisory fee rate and overall expenses (net of waivers and reimbursements) for the Fund were higher than the median of the investment advisory fee rates and overall expenses (net of waivers and reimbursements) of the funds in its Lipper Group, and in the 5th Lipper quintile. The Board further noted that the Fund’s pricing reflects the additional complexity associated with investing in frontier markets, as compared to several of the competitor funds as determined by Lipper, which invest primarily in emerging markets.
| 70 | 2015 iSHARES ANNUAL REPORTTO SHAREHOLDERS |
Table of Contents
Board Review and Approval of Investment Advisory
Contract (Continued)
iSHARES®, INC.
In addition, the Board reviewed statistical information prepared by Lipper regarding the performance of the Fund for the one-, three-, five-, ten-year, and since inception periods, as applicable, and the “last quarter” period ended December 31, 2014, and a comparison of the Fund’s performance to its performance benchmark index for the same periods. To the extent that any of the comparison funds included in the Lipper Group track the same index as the Fund, Lipper also provided, and the Board reviewed, a comparison of the Fund’s performance to that of such relevant comparison funds for the same periods. The Board noted that the Fund generally performed in line with its performance benchmark index over the relevant periods. In considering this information, the Board noted that the Lipper Group may include funds that have a different investment objective and/or benchmark from the Fund. In addition, the Board noted that the Fund seeks to track its own benchmark index and that, during the prior year, the Board received periodic reports on the Fund’s performance in comparison with its benchmark index. Such periodic comparative performance information, including detailed information on certain specific iShares funds requested by the Boards, was also considered.
Based on this review, the other factors considered at the meeting, and their general knowledge of ETF pricing, the Board concluded that the investment advisory fee rate and expense level and the historical performance of the Fund supported the Board’s approval of the continuance of the Advisory Contract for the coming year.
Nature, Extent and Quality of Services Provided by BFA — Based on management’s representations, including information about recent and proposed enhancements to the iShares business, including with respect to shareholder servicing and support, the Board expected that there would be no diminution in the scope of services required of or provided by BFA under the Advisory Contract for the coming year as compared to the scope of services provided by BFA during prior years. In reviewing the scope of these services, the Board considered BFA’s investment philosophy and experience, noting that BFA and its affiliates have committed significant resources over time, including during the past year, to supporting the iShares funds and their shareholders. The Board acknowledged that resources to support the iShares funds and their shareholders have been added or enhanced in recent years. The Board also considered BFA’s compliance program and its compliance record with respect to the Fund. In that regard, the Board noted that BFA reports to the Board about portfolio management and compliance matters on a periodic basis in connection with regularly scheduled meetings of the Board, and on other occasions as necessary and appropriate, and has provided information and made appropriate officers available as needed to provide further assistance with these matters. The Board also reviewed the background and experience of the persons responsible for the day-to-day management of the Fund, as well as the resources available to them in managing the Fund. In addition to the above considerations, the Board reviewed and considered detailed presentations regarding BFA’s investment performance, investment and risk management processes and strategies provided at the June 24-25, 2015 meeting and throughout the previous year, and matters related to BFA’s portfolio compliance policies and procedures. The Board noted that the Fund had met its investment objective consistently since its inception date.
Based on review of this information, and the performance information discussed above, the Board concluded that the nature, extent and quality of services provided by BFA to the Fund under the Advisory Contract supported the Board’s approval of the continuance of the Advisory Contract for the coming year.
Costs of Services Provided to the Fund and Profits Realized by BFA and Affiliates — The Board reviewed information about the profitability to BlackRock of the Fund based on the fees payable to BFA and its affiliates (including fees under the Advisory Contract), and all other sources of revenue and expense to BFA and its affiliates from the Fund’s operations for the last calendar year. The Board reviewed BlackRock’s profitability methodology for the iShares funds, noting that the 15(c) Committee had focused on the methodology and proposed presentation during its meetings. The Board discussed the sources of direct and ancillary revenue with management, including the revenues to BTC from securities lending by the Fund. The Board also discussed BFA’s profit margin as reflected in the Fund’s profitability analysis and reviewed information regarding potential economies of scale (as discussed below). Based on this review, the Board concluded that the profits realized by BFA and its
BOARD REVIEWAND APPROVALOF INVESTMENT ADVISORY CONTRACT | 71 |
Table of Contents
Board Review and Approval of Investment Advisory
Contract (Continued)
iSHARES®, INC.
affiliates under the Advisory Contract and from other relationships between the Fund and BFA and/or its affiliates, if any, were within a reasonable range in light of the factors considered.
Economies of Scale — The Board reviewed information regarding potential economies of scale or other efficiencies that may result from increases in the Fund’s assets, noting that the issue of economies of scale had been focused on extensively by the 15(c) Committee during its meetings and addressed by management. The Board and the 15(c) Committee reviewed information provided by BFA regarding scale benefits shared with the iShares funds through relatively low fee rates established at inception, breakpoints, waivers, or other fee reductions, as well as through additional investment in the iShares business and the provision of improved or additional infrastructure and services to the iShares funds and their shareholders. The Board and the 15(c) Committee received information regarding BlackRock’s historical profitability, including BFA’s and its affiliates’ costs in providing services. The cost information distinguished between fixed and variable costs, and explained how the level of fixed and variable costs, as well as the nature of such costs, may impact the existence or size of scale benefits. The Board noted that the Advisory Contract for the Fund did not provide for any breakpoints in the Fund’s investment advisory fee rate as the assets of the Fund increase. However, the Board noted that should material economies of scale exist in the future, a breakpoint structure for the Fund may be appropriate, and that it would continue to monitor the sharing of economies of scale to determine the appropriateness of adding breakpoints in the future.
Based on this review, as well as the other factors considered at the meeting, the Board, recognizing its responsibility to consider this issue periodically, determined to approve the continuance of the Advisory Contract for the coming year.
Fees and Services Provided for Other Comparable Funds/Accounts Managed by BFA and its Affiliates — The Board received and considered information regarding the investment advisory/management fee rates for other funds/accounts in the U.S. for which BFA (or its affiliates) provides investment advisory/management services, including open-end and closed-end funds registered under the 1940 Act (including sub-advised funds), collective trust funds, separately managed accounts, and institutional separate accounts (together, the “Other Accounts”), and acknowledged BFA’s assertion that the iShares funds are fundamentally different investment vehicles from the Other Accounts. The Board noted that BFA and its affiliates do manage Other Accounts with substantially the same investment objective and strategy as the Fund or that track the same index or a similar index as the Fund. The Board further noted that BFA provided the Board with detailed information regarding how the Other Accounts (particularly institutional clients) generally differ from the Fund, including in terms of the different, generally more extensive services provided to the Fund, as well as other significant differences in the approach of BFA and its affiliates to the Fund, on one hand, and Other Accounts, on the other. In that regard, the Board considered that the pricing of services to institutional clients is typically based on a number of factors beyond the nature and extent of the specific services to be provided and often depends on the overall relationship between the client and its affiliates and the adviser and its affiliates. In addition, the Board considered the relative complexity and inherent risks and challenges of managing and providing other services to the Fund, as a publicly traded exchange traded fund, as compared to the Other Accounts that are institutional clients in light of differing regulatory requirements and client-imposed mandates. The Board also considered the “all-inclusive” nature of the Fund’s advisory fee structure, and the Fund expenses borne by BFA under this arrangement. The Board noted that the investment advisory fee rate under the Advisory Contract for the Fund was generally higher than the investment advisory/management fee rates for the Other Accounts that are institutional clients of BFA (or its affiliates) and concluded that the differences appeared to be consistent with the factors discussed.
Other Benefits to BFA and/or its Affiliates — The Board reviewed the “fallout” benefits or ancillary revenue received by BFA and/or its affiliates in connection with the services provided to the Fund by BFA, such as payment of revenue to BTC, the Fund’s securities lending agent, for loaning portfolio securities (which was included in the profit margins reviewed by the Board pursuant to BFA’s profitability methodology), and payment of advisory fees and/or administration fees to BFA and BTC (or their affiliates) in connection with any investments by the Fund in other funds for which BFA (or its affiliates) provides investment advisory services
| 72 | 2015 iSHARES ANNUAL REPORTTO SHAREHOLDERS |
Table of Contents
Board Review and Approval of Investment Advisory
Contract (Continued)
iSHARES®, INC.
and/or administration services. The Board noted that BFA generally does not use soft dollars or consider the value of research or other services that may be provided to BFA (including its affiliates) in selecting brokers for portfolio transactions for the Fund. The Board further noted that any portfolio transactions on behalf of the Fund placed through a BFA affiliate or purchased from an underwriting syndicate in which a BFA affiliate participates, are reported to the Board pursuant to Rule 17e-1 or Rule 10f-3, as applicable, under the 1940 Act. The Board concluded that any such ancillary benefits would not be disadvantageous to the Fund’s shareholders and thus would not alter the Board’s conclusion with respect to the appropriateness of approving the continuance of the Advisory Contract for the coming year.
Based on the considerations described above, the Board determined that the Fund’s investment advisory fee rate under the Advisory Contract does not constitute a fee that is so disproportionately large as to bear no reasonable relationship to the services rendered and that could not have been the product of arm’s-length bargaining, and concluded that it is in the best interest of the Fund and its shareholders to approve the continuance of the Advisory Contract for the coming year.
III. iShares MSCI World ETF
Under Section 15(c) of the Investment Company Act of 1940 (the “1940 Act”), the Company’s Board of Directors (the “Board”), including a majority of Directors who are not “interested persons” of the Company (as that term is defined in the 1940 Act) (the “Independent Directors”), is required annually to consider and approve the Investment Advisory Contract between the Company and BFA (the “Advisory Contract”) on behalf of the Fund. The Independent Directors requested, and BFA provided, such information as the Independent Directors, with advice from independent counsel, deemed reasonably necessary to evaluate the Advisory Contract. A committee of Independent Directors (the “15(c) Committee”), with independent counsel, met with management on May 1, 2015 and May 6, 2015, to discuss the types of information the Independent Directors required and the manner in which management would organize and present such information. At a meeting held on May 21, 2015, management presented preliminary information to the Board relating to the continuance of the Advisory Contract, and the Board, including the Independent Directors, reviewed and discussed such information at length. The Independent Directors requested from management certain additional information, which management agreed to provide. At a meeting held on June 24-25, 2015, the Board, including the Independent Directors, reviewed the additional information provided by management in response to these requests. After extensive discussions, the Board, including all of the Independent Directors, approved the continuance of the Advisory Contract for the Fund, based on a review of qualitative and quantitative information provided by BFA, including the additional information management provided at the request of the Independent Directors. The Board noted its satisfaction with the extent and quality of information provided and its frequent interactions with management, as well as the detailed responses and other information provided by BFA. The Board also noted that the Board and BFA agreed to discuss potential enhancements and adjustments to the 15(c) process for the coming year. The Independent Directors were advised by their independent counsel throughout the process, including about the legal standards applicable to their review. In approving the Advisory Contract for the Fund, the Board, including the Independent Directors, considered the following factors, no one of which was controlling, and reached the following conclusions:
Expenses and Performance of the Fund — The Board reviewed statistical information prepared by Lipper Inc. (“Lipper”), an independent provider of investment company data, regarding the expense ratio components, including actual advisory fees, waivers/reimbursements, and gross and net total expenses of the Fund in comparison with the same information for other exchange traded funds (including, where applicable, funds sponsored by an “at cost” service provider) and, in the limited instances where no comparable ETFs existed and the comparison group would not otherwise be reasonable in Lipper’s judgment, pure index institutional mutual funds, objectively selected by Lipper as comprising the Fund’s applicable peer group pursuant to Lipper’s proprietary ETF methodology (the “Lipper Group”). The Board was provided with a detailed description of Lipper’s proprietary ETF methodology used by Lipper to determine the Fund’s Lipper Group. The Board further noted that due to the
BOARD REVIEWAND APPROVALOF INVESTMENT ADVISORY CONTRACT | 73 |
Table of Contents
Board Review and Approval of Investment Advisory
Contract (Continued)
iSHARES®, INC.
limitations in providing comparable funds in the Lipper Group, the statistical information provided in Lipper’s report may or may not provide meaningful direct comparisons to the Fund in all instances.
The Board also noted that the investment advisory fee rate and overall expenses (net of waivers and reimbursements) for the Fund were lower than the median of the investment advisory fee rates and overall expenses (net of waivers and reimbursements) of the funds in its Lipper Group.
In addition, the Board reviewed statistical information prepared by Lipper regarding the performance of the Fund for the one-, three-, five-, ten-year, and since inception periods, as applicable, and the “last quarter” period ended December 31, 2014, and a comparison of the Fund’s performance to its performance benchmark index for the same periods. To the extent that any of the comparison funds included in the Lipper Group track the same index as the Fund, Lipper also provided, and the Board reviewed, a comparison of the Fund’s performance to that of such relevant comparison funds for the same periods. The Board noted that the Fund generally performed in line with its performance benchmark index over the relevant periods. In considering this information, the Board noted that the Lipper Group may include funds that have a different investment objective and/or benchmark from the Fund. In addition, the Board noted that the Fund seeks to track its own benchmark index and that, during the prior year, the Board received periodic reports on the Fund’s performance in comparison with its benchmark index. Such periodic comparative performance information, including detailed information on certain specific iShares funds requested by the Boards, was also considered.
Based on this review, the other factors considered at the meeting, and their general knowledge of ETF pricing, the Board concluded that the investment advisory fee rate and expense level and the historical performance of the Fund supported the Board’s approval of the continuance of the Advisory Contract for the coming year.
Nature, Extent and Quality of Services Provided by BFA — Based on management’s representations, including information about recent and proposed enhancements to the iShares business, including with respect to shareholder servicing and support, the Board expected that there would be no diminution in the scope of services required of or provided by BFA under the Advisory Contract for the coming year as compared to the scope of services provided by BFA during prior years. In reviewing the scope of these services, the Board considered BFA’s investment philosophy and experience, noting that BFA and its affiliates have committed significant resources over time, including during the past year, to supporting the iShares funds and their shareholders. The Board acknowledged that resources to support the iShares funds and their shareholders have been added or enhanced in recent years. The Board also considered BFA’s compliance program and its compliance record with respect to the Fund. In that regard, the Board noted that BFA reports to the Board about portfolio management and compliance matters on a periodic basis in connection with regularly scheduled meetings of the Board, and on other occasions as necessary and appropriate, and has provided information and made appropriate officers available as needed to provide further assistance with these matters. The Board also reviewed the background and experience of the persons responsible for the day-to-day management of the Fund, as well as the resources available to them in managing the Fund. In addition to the above considerations, the Board reviewed and considered detailed presentations regarding BFA’s investment performance, investment and risk management processes and strategies provided at the June 24-25, 2015 meeting and throughout the previous year, and matters related to BFA’s portfolio compliance policies and procedures. The Board noted that the Fund had met its investment objective consistently since its inception date.
Based on review of this information, and the performance information discussed above, the Board concluded that the nature, extent and quality of services provided by BFA to the Fund under the Advisory Contract supported the Board’s approval of the continuance of the Advisory Contract for the coming year.
| 74 | 2015 iSHARES ANNUAL REPORTTO SHAREHOLDERS |
Table of Contents
Board Review and Approval of Investment Advisory
Contract (Continued)
iSHARES®, INC.
Costs of Services Provided to the Fund and Profits Realized by BFA and Affiliates — The Board reviewed information about the profitability to BlackRock of the Fund based on the fees payable to BFA and its affiliates (including fees under the Advisory Contract), and all other sources of revenue and expense to BFA and its affiliates from the Fund’s operations for the last calendar year. The Board reviewed BlackRock’s profitability methodology for the iShares funds, noting that the 15(c) Committee had focused on the methodology and proposed presentation during its meetings. The Board discussed the sources of direct and ancillary revenue with management, including the revenues to BTC from securities lending by the Fund. The Board also discussed BFA’s profit margin as reflected in the Fund’s profitability analysis and reviewed information regarding potential economies of scale (as discussed below). Based on this review, the Board concluded that the profits realized by BFA and its affiliates under the Advisory Contract and from other relationships between the Fund and BFA and/or its affiliates, if any, were within a reasonable range in light of the factors considered.
Economies of Scale — The Board reviewed information regarding potential economies of scale or other efficiencies that may result from increases in the Fund’s assets, noting that the issue of economies of scale had been focused on extensively by the 15(c) Committee during its meetings and addressed by management. The Board and the 15(c) Committee reviewed information provided by BFA regarding scale benefits shared with the iShares funds through relatively low fee rates established at inception, breakpoints, waivers, or other fee reductions, as well as through additional investment in the iShares business and the provision of improved or additional infrastructure and services to the iShares funds and their shareholders. The Board and the 15(c) Committee received information regarding BlackRock’s historical profitability, including BFA’s and its affiliates’ costs in providing services. The cost information distinguished between fixed and variable costs, and explained how the level of fixed and variable costs, as well as the nature of such costs, may impact the existence or size of scale benefits. The Board noted that the Advisory Contract for the Fund did not provide for any breakpoints in the Fund’s investment advisory fee rate as the assets of the Fund increase. However, the Board noted that should material economies of scale exist in the future, a breakpoint structure for the Fund may be appropriate, and that it would continue to monitor the sharing of economies of scale to determine the appropriateness of adding breakpoints in the future.
Based on this review, as well as the other factors considered at the meeting, the Board, recognizing its responsibility to consider this issue periodically, determined to approve the continuance of the Advisory Contract for the coming year.
Fees and Services Provided for Other Comparable Funds/Accounts Managed by BFA and its Affiliates — The Board received and considered information regarding the investment advisory/management fee rates for other funds/accounts in the U.S. for which BFA (or its affiliates) provides investment advisory/management services, including open-end and closed-end funds registered under the 1940 Act (including sub-advised funds), collective trust funds, separately managed accounts, and institutional separate accounts (together, the “Other Accounts”), and acknowledged BFA’s assertion that the iShares funds are fundamentally different investment vehicles from the Other Accounts. The Board noted that BFA and its affiliates do manage Other Accounts with substantially the same investment objective and strategy as the Fund or that track the same index or a similar index as the Fund. The Board further noted that BFA provided the Board with detailed information regarding how the Other Accounts (particularly institutional clients) generally differ from the Fund, including in terms of the different, generally more extensive services provided to the Fund, as well as other significant differences in the approach of BFA and its affiliates to the Fund, on one hand, and Other Accounts, on the other. In that regard, the Board considered that the pricing of services to institutional clients is typically based on a number of factors beyond the nature and extent of the specific services to be provided and often depends on the overall relationship between the client and its affiliates and the adviser and its affiliates. In addition, the Board considered the relative complexity and inherent risks and challenges of managing and providing other services to the Fund, as a publicly traded exchange traded fund, as compared to the Other Accounts that are institutional clients in light of differing regulatory requirements and client-imposed mandates. The Board also considered the “all-inclusive” nature of the Fund’s advisory fee structure, and the Fund expenses borne by BFA under this arrangement. The Board noted that the investment advisory fee rate under the Advisory Contract for the Fund was generally higher than the investment advisory/management fee rates for the
BOARD REVIEWAND APPROVALOF INVESTMENT ADVISORY CONTRACT | 75 |
Table of Contents
Board Review and Approval of Investment Advisory
Contract (Continued)
iSHARES®, INC.
Other Accounts that are institutional clients of BFA (or its affiliates) and concluded that the differences appeared to be consistent with the factors discussed.
Other Benefits to BFA and/or its Affiliates — The Board reviewed the “fallout” benefits or ancillary revenue received by BFA and/or its affiliates in connection with the services provided to the Fund by BFA, such as payment of revenue to BTC, the Fund’s securities lending agent, for loaning portfolio securities (which was included in the profit margins reviewed by the Board pursuant to BFA’s profitability methodology), and payment of advisory fees and/or administration fees to BFA and BTC (or their affiliates) in connection with any investments by the Fund in other funds for which BFA (or its affiliates) provides investment advisory services and/or administration services. The Board noted that BFA generally does not use soft dollars or consider the value of research or other services that may be provided to BFA (including its affiliates) in selecting brokers for portfolio transactions for the Fund. The Board further noted that any portfolio transactions on behalf of the Fund placed through a BFA affiliate or purchased from an underwriting syndicate in which a BFA affiliate participates, are reported to the Board pursuant to Rule 17e-1 or Rule 10f-3, as applicable, under the 1940 Act. The Board concluded that any such ancillary benefits would not be disadvantageous to the Fund’s shareholders and thus would not alter the Board’s conclusion with respect to the appropriateness of approving the continuance of the Advisory Contract for the coming year.
Based on the considerations described above, the Board determined that the Fund’s investment advisory fee rate under the Advisory Contract does not constitute a fee that is so disproportionately large as to bear no reasonable relationship to the services rendered and that could not have been the product of arm’s-length bargaining, and concluded that it is in the best interest of the Fund and its shareholders to approve the continuance of the Advisory Contract for the coming year.
| 76 | 2015 iSHARES ANNUAL REPORTTO SHAREHOLDERS |
Table of Contents
Supplemental Information (Unaudited)
iSHARES®, INC.
Section 19(a) Notices
The amounts and sources of distributions reported are estimates and are provided pursuant to regulatory requirements and are not being provided for tax reporting purposes. The actual amounts and sources for tax reporting purposes will depend upon each Fund’s investment experience during the year and may be subject to changes based on the tax regulations. Shareholders will receive a Form 1099-DIV each calendar year that will inform them how to report these distributions for federal income tax purposes.
| Total Cumulative Distributions for the Fiscal Year | % Breakdown of the Total Cumulative Distributions for the Fiscal Year | |||||||||||||||||||||||||||||||
| iShares ETF | Net Investment Income | Net Realized Capital Gains | Return of Capital | Total Per Share | Net Investment Income | Net Realized Capital Gains | Return of Capital | Total Per Share | ||||||||||||||||||||||||
MSCI All Country World Minimum Volatility | $ | 1.460958 | $ | — | $ | 0.007174 | $ | 1.468132 | 100 | % | — | % | 0 | %a | 100 | % | ||||||||||||||||
MSCI Emerging Markets Horizon | 0.625926 | — | — | 0.625926 | 100 | — | — | 100 | ||||||||||||||||||||||||
MSCI Frontier 100 | 0.758197 | 2.823146 | — | 3.581343 | 21 | 79 | — | 100 | ||||||||||||||||||||||||
MSCI World | 1.558559 | — | 0.004904 | 1.563463 | 100 | — | 0 | a | 100 | |||||||||||||||||||||||
| a | Rounds to less than 1%. |
Premium/Discount Information
The Premium/Discount Information section is intended to present information about the differences between the daily market price on secondary markets for shares of a fund and that fund’s NAV. NAV is the price at which a fund issues and redeems shares. It is calculated in accordance with the standard formula for valuing mutual fund shares. The “Market Price” of a fund generally is determined using the midpoint between the highest bid and the lowest offer on the primary stock exchange on which the shares of such fund are listed for trading, as of the time that the fund’s NAV is calculated. A fund’s Market Price may be at, above or below its NAV. The NAV of a fund will fluctuate with changes in the fair value of its portfolio holdings. The Market Price of a fund will fluctuate in accordance with changes in its NAV, as well as market supply and demand.
Premiums or discounts are the differences (expressed as a percentage) between the NAV and Market Price of a fund on a given day, generally at the time the NAV is calculated. A premium is the amount that a fund is trading above the reported NAV, expressed as a percentage of the NAV. A discount is the amount that a fund is trading below the reported NAV, expressed as a percentage of the NAV.
The following information shows the frequency of distributions of premiums and discounts for each of the Funds. The information shown for each Fund is for five calendar years (or from the inception date of such Fund if less than five years) through the date of the most recent calendar quarter-end. The specific periods covered for each Fund are disclosed in the table for such Fund.
SUPPLEMENTAL INFORMATION | 77 |
Table of Contents
Supplemental Information (Unaudited) (Continued)
iSHARES®, INC.
Each line in the table shows the number of trading days in which the Fund traded within the premium/discount range indicated. The number of trading days in each premium/discount range is also shown as a percentage of the total number of trading days in the period covered by each table. All data presented here represents past performance, which cannot be used to predict future results.
iShares MSCI All Country World Minimum Volatility ETF
Period Covered: October 18, 2011 through June 30, 2015
Premium/Discount Range | Number of Days | Percentage of Total Days | ||||||
Greater than 3.0% | 3 | 0.32 | % | |||||
Greater than 2.5% and Less than 3.0% | 1 | 0.11 | ||||||
Greater than 2.0% and Less than 2.5% | 6 | 0.65 | ||||||
Greater than 1.5% and Less than 2.0% | 4 | 0.43 | ||||||
Greater than 1.0% and Less than 1.5% | 18 | 1.94 | ||||||
Greater than 0.5% and Less than 1.0% | 110 | 11.82 | ||||||
Between 0.5% and –0.5% | 772 | 83.00 | ||||||
Less than –0.5% and Greater than –1.0% | 14 | 1.51 | ||||||
Less than –1.0% and Greater than –1.5% | 2 | 0.22 | ||||||
|
|
|
| |||||
| 930 | 100.00 | % | ||||||
|
|
|
| |||||
iShares MSCI Emerging Markets Horizon ETF
Period Covered: October 14, 2014 through June 30, 2015
Premium/Discount Range | Number of Days | Percentage of Total Days | ||||||
Greater than 1.5% and Less than 2.0% | 3 | 1.68 | % | |||||
Greater than 1.0% and Less than 1.5% | 44 | 24.58 | ||||||
Greater than 0.5% and Less than 1.0% | 75 | 41.90 | ||||||
Between 0.5% and –0.5% | 46 | 25.69 | ||||||
Less than –0.5% and Greater than –1.0% | 3 | 1.68 | ||||||
Less than –1.0% and Greater than –1.5% | 5 | 2.79 | ||||||
Less than –1.5% and Greater than –2.0% | 3 | 1.68 | ||||||
|
|
|
| |||||
| 179 | 100.00 | % | ||||||
|
|
|
| |||||
| 78 | 2015 iSHARES ANNUAL REPORTTO SHAREHOLDERS |
Table of Contents
Supplemental Information (Unaudited) (Continued)
iSHARES®, INC.
iShares MSCI Frontier 100 ETF
Period Covered: September 12, 2012 through June 30, 2015
Premium/Discount Range | Number of Days | Percentage of Total Days | ||||||
Greater than 3.0% and Less than 3.5% | 22 | 3.13 | % | |||||
Greater than 2.5% and Less than 3.0% | 45 | 6.40 | ||||||
Greater than 2.0% and Less than 2.5% | 77 | 10.95 | ||||||
Greater than 1.5% and Less than 2.0% | 167 | 23.76 | ||||||
Greater than 1.0% and Less than 1.5% | 149 | 21.19 | ||||||
Greater than 0.5% and Less than 1.0% | 80 | 11.38 | ||||||
Between 0.5% and –0.5% | 58 | 8.25 | ||||||
Less than –0.5% and Greater than –1.0% | 46 | 6.54 | ||||||
Less than –1.0% and Greater than –1.5% | 38 | 5.41 | ||||||
Less than –1.5% and Greater than –2.0% | 12 | 1.71 | ||||||
Less than –2.0% and Greater than –2.5% | 7 | 1.00 | ||||||
Less than –2.5% and Greater than –3.0% | 2 | 0.28 | ||||||
|
|
|
| |||||
| 703 | 100.00 | % | ||||||
|
|
|
| |||||
iShares MSCI World ETF
Period Covered: January 10, 2012 through June 30, 2015
Premium/Discount Range | Number of Days | Percentage of Total Days | ||||||
Greater than 2.5% and Less than 3.0% | 3 | 0.34 | % | |||||
Greater than 2.0% and Less than 2.5% | 37 | 4.24 | ||||||
Greater than 1.5% and Less than 2.0% | 48 | 5.50 | ||||||
Greater than 1.0% and Less than 1.5% | 79 | 9.05 | ||||||
Greater than 0.5% and Less than 1.0% | 232 | 26.58 | ||||||
Between 0.5% and –0.5% | 474 | 54.29 | ||||||
|
|
|
| |||||
| 873 | 100.00 | % | ||||||
|
|
|
| |||||
Regulation under the Alternative Investment Fund Managers Directive (“AIFMD” or, the “Directive”)
The Directive imposes detailed and prescriptive obligations on fund managers established in the European Union (the “EU”). These do not currently apply to managers established outside the EU, such as BFA. Rather, non-EU managers are only required to comply with certain disclosure, reporting and transparency obligations of the Directive if such managers market a fund to EU investors.
BFA has registered the iShares MSCI Frontier 100 ETF (the “Fund”) to be marketed to EU investors in the United Kingdom, the Netherlands, Finland, Sweden and Luxembourg.
Report on Remuneration
BFA is required under the Directive to make quantitative disclosures of remuneration. These disclosures are made in line with BlackRock’s interpretation of currently available regulatory guidance on quantitative remuneration disclosures. As market or
SUPPLEMENTAL INFORMATION | 79 |
Table of Contents
Supplemental Information (Unaudited) (Continued)
iSHARES®, INC.
regulatory practice develops, BlackRock may consider it appropriate to make changes to the way in which quantitative remuneration disclosures are calculated. Where such changes are made, this may result in disclosures in relation to a fund not being comparable to the disclosures made in the prior year, or in relation to other BlackRock fund disclosures in that same year.
Disclosures are provided in relation to both (a) the staff of BFA; (b) staff who are senior management; and (c) staff who have the ability to materially affect the risk profile of the Fund.
All individuals included in the aggregated figures disclosed are rewarded in line with BlackRock’s remuneration policy for their responsibilities across the relevant BlackRock business area. As all individuals have a number of areas of responsibilities, only the portion of remuneration for those individuals’ services attributable to the Fund is included in the aggregate figures disclosed.
BlackRock has a clear and well defined pay-for-performance philosophy, and compensation programs which support that philosophy. For senior management, a significant percentage of variable remuneration is deferred over time. All employees are subject to a claw-back policy.
Compensation decisions for employees are made based on BlackRock’s full-year financial results and other non-financial goals and objectives. Alongside financial performance, individual compensation is also based on strategic and operating results and other considerations such as management and leadership capabilities. No set formulas are established and no fixed benchmarks are used in determining annual incentive awards.
Bonus pools are reviewed by BlackRock’s independent compensation committee, taking into account both actual and projected financial information together with information provided by the Operational Risk and Regulatory Compliance departments in relation to any activities, incidents or events that warrant consideration in making compensation decisions.
Functions such as Finance, Operational Risk, Legal & Compliance, and Human Resources each have their own organizational structures which are independent of the business units. Functional bonus pools are determined with reference to the performance of each individual function and the remuneration of the senior members of control functions is directly overseen by BlackRock’s independent compensation committee. No individual is involved in setting his or her own remuneration.
Members of staff and senior management of BFA typically provide both AIFMD and non-AIFMD related services in respect of multiple funds, clients and functions of BFA and across the broader BlackRock group. Therefore, the figures disclosed are a sum of each individual’s portion of remuneration attributable to the Fund according to an objective apportionment methodology which acknowledges the multiple-service nature of BFA. Accordingly, the figures are not representative of any individual’s actual remuneration or their remuneration structure.
The amount of the total remuneration awarded by BFA to its staff which has been attributed to the iShares MSCI Frontier 100 ETF in respect of BFA’s financial year ending December 31, 2014 was USD 90.8 thousand. This figure is comprised of fixed remuneration of USD 36.7 thousand and variable remuneration of USD 54.1 thousand. There were a total of 499 beneficiaries of the remuneration described above.
The amount of the aggregate remuneration awarded by BFA, which has been attributed to the iShares MSCI Frontier 100 ETF in respect of BFA’s financial year ending December 31, 2014, to its senior management was USD 12.6 thousand, and to members of its staff whose actions have a material impact on the risk profile of the Fund was USD 2.3 thousand.
| 80 | 2015 iSHARES ANNUAL REPORTTO SHAREHOLDERS |
Table of Contents
Director and Officer Information
iSHARES® , INC.
The Board of Directors has responsibility for the overall management and operations of the Company, including general supervision of the duties performed by BFA and other service providers. Each Director serves until he or she resigns, is removed, dies, retires or becomes incapacitated. Each officer shall hold office until his or her successor is elected and qualifies or until his or her death, or his or her resignation or removal. Directors who are not “interested persons” (as defined in the 1940 Act) of the Company are referred to as independent directors (“Independent Directors”).
The registered investment companies advised by BFA or its affiliates are organized into one complex of closed-end funds, two complexes of open-end funds and one complex of exchange-traded funds (“Exchange-Traded Fund Complex”) (each, a “BlackRock Fund Complex”). Each Fund is included in the BlackRock Fund Complex referred to as the Exchange-Traded Fund Complex. Each Director also serves as a Trustee of iShares Trust and a Trustee of iShares U.S. ETF Trust and, as a result, oversees a total of 319 funds (as of August 31, 2015) within the Exchange-Traded Fund Complex. With the exception of Robert S. Kapito and Mark Wiedman, the address of each Director and officer is c/o BlackRock, Inc., 400 Howard Street, San Francisco, CA 94105. The address of Mr. Kapito and Mr. Wiedman is c/o BlackRock, Inc., Park Avenue Plaza, 55 East 52nd Street, New York, NY 10055. The Board has designated Robert H. Silver as its Independent Chairman. Additional information about the Funds’ Directors and officers may be found in the Funds’ combined Statement of Additional Information, which is available without charge, upon request, by calling toll-free 1-800-iShares (1-800-474-2737).
Interested Directors
| Name (Age) | Position(s) | Principal Occupation(s) During the Past 5 Years | Other Directorships Held by Director | |||
Robert S. Kapitoa (58) | Director (since 2009). | President and Director, BlackRock, Inc. (since 2006); Vice Chairman of BlackRock, Inc. and Head of BlackRock, Inc.’s Portfolio Management Group (since its formation in 1998) and BlackRock, Inc.’s predecessor entities (since 1988); Trustee, University of Pennsylvania (since 2009); President of Board of Directors, Hope & Heroes Children’s Cancer Fund (since 2002); President of the Board of Directors, Periwinkle Theatre for Youth (since 1983). | Trustee of iShares Trust (since 2009); Trustee of iShares U.S. ETF Trust (since 2011); Director of BlackRock, Inc. (since 2006). | |||
Mark Wiedmanb (44) | Director (since 2013). | Managing Director, BlackRock, Inc. (since 2007); Global Head of iShares (since 2011); Head of Corporate Strategy, BlackRock, Inc. (2009-2011). | Trustee of iShares Trust (since 2013); Trustee of iShares U.S. ETF Trust (since 2013); Director of PennyMac Financial Services, Inc. (since 2008). | |||
| a | Robert S. Kapito is deemed to be an “interested person” (as defined in the 1940 Act) of the Company due to his affiliations with BlackRock, Inc. |
| b | Mark Wiedman is deemed to be an “interested person” (as defined in the 1940 Act) of the Company due to his affiliations with BlackRock, Inc. and its affiliates. |
DIRECTORAND OFFICER INFORMATION | 81 |
Table of Contents
Director and Officer Information (Continued)
iSHARES®, INC.
Independent Directors
| Name (Age) | Position(s) | Principal Occupation(s) During the Past 5 Years | Other Directorships Held by Director | |||
Robert H. Silver (60) | Director (since 2007); Independent Chairman (since 2012). | President and Co-Founder of The Bravitas Group, Inc. (since 2006); Director and Vice Chairman of the YMCA of Greater NYC (2001-2011); Broadway Producer (2006-2011); Co-Founder and Vice President of Parentgiving Inc. (since 2008); Director and Member of the Audit and Compensation Committee of EPAM Systems, Inc. (2006-2009); President and Chief Operating Officer of UBS Financial Services Inc. (formerly Paine Webber Inc.) (2003-2005) and various executive positions with UBS and its affiliates (1988-2005); CPA and Audit Manager of KPMG, LLP (formerly Peat Marwick Mitchell) (1977-1983). | Trustee of iShares Trust (since 2007); Trustee of iShares U.S. ETF Trust (since 2011); Independent Chairman of iShares Trust and iShares U.S. ETF Trust (since 2012). | |||
Jane D. Carlin (59) | Director (since 2015). | Managing Director and Global Head of Financial Holding Company Governance & Assurance and the Global Head of Operational Risk Management of Morgan Stanley (2006-2012). | Trustee of iShares Trust (since 2015); Trustee of iShares U.S. ETF Trust (since 2015); Director of PHH Corporation (mortgage solutions) (since 2012). | |||
Cecilia H. Herbert (66) | Director (since 2005); Nominating and Governance Committee Chair and Equity Plus Committee Chair (since 2012). | Director (1998-2013) and President (2007-2011) of the Board of Directors, Catholic Charities CYO; Trustee (2002-2011) and Chair of the Finance and Investment Committee (2006-2010) of the Thacher School; Member (since 1992) and Chair (1994-2005) of the Investment Committee, Archdiocese of San Francisco; Trustee and Member of the Investment Committee, WNET, the New York public broadcasting/media company (since 2011). | Trustee of iShares Trust (since 2005); Trustee of iShares U.S. ETF Trust (since 2011); Director of Forward Funds (34 portfolios) (since 2009). | |||
Charles A. Hurty (71) | Director (since 2005); Audit Committee Chair (since 2006). | Retired; Partner, KPMG LLP (1968-2001). | Trustee of iShares Trust (since 2005); Trustee of iShares U.S. ETF Trust (since 2011); Director of GMAM Absolute Return Strategy Fund (1 portfolio) (since 2002); Director of SkyBridge Alternative Investments Multi-Adviser Hedge Fund Portfolios LLC (2 portfolios) (since 2002). | |||
| 82 | 2015 iSHARES ANNUAL REPORTTO SHAREHOLDERS |
Table of Contents
Director and Officer Information (Continued)
iSHARES®, INC.
Independent Directors (Continued)
| Name (Age) | Position(s) | Principal Occupation(s) During the Past 5 Years | Other Directorships Held by Director | |||
John E. Kerrigan (60) | Director (since 2005); Fixed Income Plus Committee Chair (since 2012). | Chief Investment Officer, Santa Clara University (since 2002). | Trustee of iShares Trust (since 2005); Trustee of iShares U.S. ETF Trust (since 2011). | |||
John E. Martinez (54) | Director (since 2003); Securities Lending Committee Chair (since 2012). | Director of FirstREX Agreement Corp. (formerly EquityRock, Inc.) (since 2005). | Trustee of iShares Trust (since 2003); Trustee of iShares U.S. ETF Trust (since 2011). | |||
Madhav V. Rajan (51) | Director (since 2011); 15(c) Committee Chair (since 2012). | Robert K. Jaedicke Professor of Accounting and Senior Associate Dean for Academic Affairs and Head of MBA Program, Stanford University Graduate School of Business (since 2001); Professor of Law (by courtesy), Stanford Law School (since 2005); Visiting Professor, University of Chicago (2007-2008). | Trustee of iShares Trust (since 2011); Trustee of iShares U.S. ETF Trust (since 2011); Director, Cavium, Inc. (since 2013). | |||
DIRECTORAND OFFICER INFORMATION | 83 |
Table of Contents
Director and Officer Information (Continued)
iSHARES®, INC.
Officers
| Name (Age) | Position(s) | Principal Occupation(s) During the Past 5 Years | ||
Manish Mehta (44) | President (since 2013). | Managing Director, BlackRock, Inc. (since 2009); Chief Operating Officer for iShares (since 2009); Head of Strategy and Corporate Development, BGI (2005-2009); Chief of Staff to the CEO, BGI (2005-2009). | ||
Jack Gee (55) | Treasurer and Chief Financial Officer (since 2008). | Managing Director, BlackRock, Inc. (since 2009); Senior Director of Fund Administration of Intermediary Investor Business, BGI (2009); Director of Fund Administration of Intermediary Investor Business, BGI (2004-2009). | ||
Benjamin Archibald (40) | Secretary (since 2015). | Managing Director, BlackRock, Inc. (since 2014); Secretary of the BlackRock-advised Mutual Funds (since 2012); Director, BlackRock, Inc. (2010-2013). | ||
Charles Park (47) | Chief Compliance Officer (since 2006). | Chief Compliance Officer of BlackRock Advisors, LLC and the BlackRock-advised Funds in the Equity-Bond Complex, the Equity-Liquidity Complex and the Closed-End Complex (since 2014); Chief Compliance Officer, BFA (since 2006). | ||
Scott Radell (46) | Executive Vice President (since 2012). | Managing Director, BlackRock, Inc. (since 2009); Head of Portfolio Solutions, BlackRock, Inc. (since 2009); Head of Portfolio Solutions, BGI (2007-2009); Credit Portfolio Manager, BGI (2005-2007); Credit Research Analyst, BGI (2003-2005). | ||
Amy Schioldager (52) | Executive Vice President (since 2007). | Senior Managing Director, BlackRock, Inc. (since 2009); Global Head of Index Equity, BGI (2008-2009); Global Head of U.S. Indexing, BGI (2006-2008); Head of Domestic Equity Portfolio Management, BGI (2001-2006). | ||
| 84 | 2015 iSHARES ANNUAL REPORTTO SHAREHOLDERS |
Table of Contents
Notes:
NOTES | 85 |
Table of Contents
Notes:
| 86 | 2015 iSHARES ANNUAL REPORTTO SHAREHOLDERS |
Table of Contents
For more information visit www.iShares.com or call 1-800-474-2737
This report is intended for the Funds’ shareholders. It may not be distributed to prospective investors unless it is preceded or accompanied by the current prospectus.
Investing involves risk, including possible loss of principal.
The iShares Funds are distributed by BlackRock Investments, LLC (together with its affiliates, “BlackRock”).
The iShares Funds are not sponsored, endorsed, issued, sold or promoted by MSCI Inc., nor does this company make any representation regarding the advisability of investing in the iShares Funds. BlackRock is not affiliated with the company listed above.
A description of the policies that the Funds use to determine how to vote proxies relating to portfolio securities and information about how the Funds voted proxies relating to portfolio securities during the most recent twelve-month period ending June 30 is available without charge, upon request, by calling toll-free 1-800-474-2737; on the Funds’ website at www.iShares.com; and on the U.S. Securities and Exchange Commission (SEC) website at www.sec.gov.
The Funds file their complete schedules of portfolio holdings with the SEC for the first and third quarters of each fiscal year on Form N-Q. The Funds’ Forms N-Q are available on the SEC’s website or may be reviewed and copied at the SEC’s Public Reference Room in Washington, D.C. Information on the operation of the Public Reference Room may be obtained by calling 1-800-SEC-0330. The Funds also disclose their complete schedules of portfolio holdings on a daily basis on the Funds’ website.
©2015 BlackRock, Inc. All rights reserved. iSHARES and BLACKROCK are registered trademarks of BlackRock, Inc. or its subsidiaries. All other marks are the property of their respective owners.
iS-AR-811-0815
 |  |
Table of Contents
AUGUST 31, 2015
2015 ANNUAL REPORT |  |
iShares, Inc.
| Ø | iShares MSCI Global Agriculture Producers ETF | VEGI | NYSE Arca |
| Ø | iShares MSCI Global Energy Producers ETF | FILL | NYSE Arca |
| Ø | iShares MSCI Global Gold Miners ETF | RING | NYSE Arca |
| Ø | iShares MSCI Global Metals & Mining Producers ETF | PICK | NYSE Arca |
| Ø | iShares MSCI Global Silver Miners ETF | SLVP | NYSE Arca |
Table of Contents
| 5 | ||||
| 16 | ||||
| 16 | ||||
| 17 | ||||
| 17 | ||||
| 20 | ||||
| 24 | ||||
| 25 | ||||
| 29 | ||||
| 30 | ||||
| 37 | ||||
| 42 | ||||
| 53 | ||||
| 54 | ||||
| 55 | ||||
| 59 | ||||
| 63 |
Table of Contents
Management’s Discussion of Fund Performance
iSHARES®, INC.
GLOBAL MARKET OVERVIEW
Global equity markets delivered a negative return for the 12 months ended August 31, 2015 (the “reporting period”). The MSCI ACWI, a broad global equity index that includes both developed and emerging markets, returned -6.29% for the reporting period.
The reporting period was characterized by a continued divergence in economic growth and central bank policy between the U.S. and the rest of the world. Despite a slowdown in early 2015, the U.S. economy remained one of the strongest economies among developed countries, which motivated the U.S. Federal Reserve Bank (the “Fed”) to scale back its economic stimulus measures. The Fed ended a two-year quantitative easing program in October 2014 and signaled its intent to raise its short-term interest rate target sometime in 2015. In contrast, weaker economic growth in most other regions of the globe led many of the world’s central banks to take more aggressive actions to stimulate economic activity.
This divergence contributed to a notably stronger U.S. dollar. For the reporting period, the euro, Japanese yen, British pound and Australian dollar declined by 15%, 14%, 7%, and 24% against the U.S. dollar, respectively. Weaker foreign currencies decrease the value of foreign investments measured in U.S. dollars, thereby decreasing returns for U.S. investors, while increasing foreign currencies relative to the U.S. dollar have the opposite effect. Currency performance had a meaningful impact on non-U.S. equity returns for U.S. investors. For example, the MSCI ACWI returned 0.59% in local currency terms for the reporting period.
A number of other factors influenced global markets during the reporting period. Energy prices fell sharply amid growing supply — primarily from increased production in the U.S. — and declining global demand. Lower energy prices contributed to historically low and declining inflation rates in most of the world. Consumer prices were nearly unchanged in the U.S., the European Union, and Japan, while prices in China and India rose at a relatively slow rate. Low inflation and tepid demand kept the Fed’s zero interest rate policy intact, while central banks throughout the world took aggressive measures to stimulate demand.
Global markets advanced for most of the reporting period, then declined sharply in the last few months of the reporting period. The volatility began in China, as slowing economic growth led to a steep drop in China’s equity markets. Plummeting commodity prices amid already subdued inflation also raised concerns about global demand. Currency devaluations in Asia, including China, Vietnam, Pakistan, and Kazakhstan, led to speculation that Asian countries were weakening their currencies to compete for demand. These global events led to further uncertainty about the timing of an expected interest rate hike from the Fed.
On a regional basis, U.S. stocks advanced by less than 1% for the reporting period as declining interest rates, ongoing economic growth, and low inflation provided a favorable environment for U.S. equity market performance. After generating its fastest quarterly growth rate in 11 years in the third quarter of 2014, the U.S. economy slowed over the next two quarters. Economic activity improved over the last several months of the reporting period, boosted by an increase in consumer spending.
European stocks declined by about 8% in U.S. dollar terms for the reporting period, though they advanced more than 3% when measured in local currencies. The European Central Bank initiated quantitative easing measures in early 2015, and signs of economic improvement emerged in the latter half of the reporting period. A tentative agreement on Greece’s debt repayment helped alleviate ongoing concerns about Europe’s sovereign debt levels.
Stock markets in the Asia/Pacific region (excluding Japan) declined by approximately 19% in U.S. dollar terms, which equated to an 8% decline when measured in local currencies. China’s economic slowdown weighed heavily on the region, as China is the largest trading partner of many countries in the region. On the bright side, Japanese stocks performed relatively well, as ongoing economic stimulus and reform measures led to a 4% gain in U.S. dollar terms (22% when measured in Japanese yen).
Emerging markets stocks fell by approximately 23% in U.S. dollar terms for the reporting period, though the decline was about 10% when measured in local currencies. Many of the largest emerging economies — including China, Russia, and Brazil — experienced slowing economic growth during the reporting period. Latin American stocks posted some of the biggest declines, as the region struggled with slow growth and declining commodity prices.
MANAGEMENT’S DISCUSSIONSOF FUND PERFORMANCE | 5 |
Table of Contents
Management’s Discussion of Fund Performance
iSHARES® MSCI GLOBAL AGRICULTURE PRODUCERS ETF
Performance as of August 31, 2015
| Average Annual Total Returns | Cumulative Total Returns | |||||||||||||||||||||||||
| NAV | MARKET | INDEX | NAV | MARKET | INDEX | |||||||||||||||||||||
1 Year | (10.11)% | (10.80)% | (10.35)% | (10.11)% | (10.80)% | (10.35)% | ||||||||||||||||||||
Since Inception | 0.75% | 0.67% | 0.84% | 2.70% | 2.43% | 3.03% | ||||||||||||||||||||
GROWTH OF $10,000 INVESTMENT
(SINCE INCEPTION AT NET ASSET VALUE)
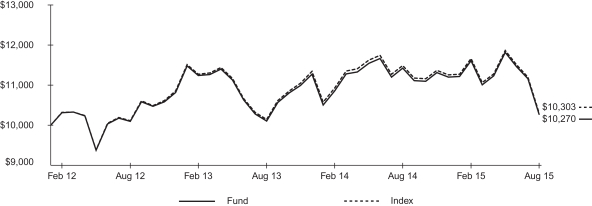
The inception date of the Fund was 1/31/12. The first day of secondary market trading was 2/2/12.
Past performance is no guarantee of future results. Performance results do not reflect the deduction of taxes that a shareholder would pay on fund distributions or on the redemption or sale of fund shares. See “About Fund Performance” on page 16 for more information.
| Shareholder Expenses | ||||||||||||||||||||||||||
| Actual | Hypothetical 5% Return | |||||||||||||||||||||||||
| Beginning Account Value (3/1/15) | Ending Account Value (8/31/15) | Expenses Paid During Period a | Beginning Account Value (3/1/15) | Ending Account Value (8/31/15) | Expenses Paid During Period a | Annualized Expense Ratio | ||||||||||||||||||||
|
|
|
|
|
|
|
|
|
|
|
| |||||||||||||||
| $ | 1,000.00 | $ | 884.80 | $ | 1.81 | $ | 1,000.00 | $ | 1,023.30 | $ | 1.94 | 0.38% | ||||||||||||||
|
|
|
|
|
|
|
|
|
|
|
| |||||||||||||||
| a | Expenses are calculated using the Fund’s annualized expense ratio (as disclosed in the table), multiplied by the average account value for the period, multiplied by the number of days in the period (184 days) and divided by the number of days in the year (365 days). See “Shareholder Expenses” on page 16 for more information. |
| 6 | 2015 iSHARES ANNUAL REPORTTO SHAREHOLDERS |
Table of Contents
Management’s Discussion of Fund Performance (Continued)
iSHARES® MSCI GLOBAL AGRICULTURE PRODUCERS ETF
The iShares MSCI Global Agriculture Producers ETF (the “Fund”) seeks to track the investment results of an index composed of global equities of companies primarily engaged in the business of agriculture, as represented by the MSCI ACWI Select Agriculture Producers Investable Market Index (the “Index”). The Fund invests in a representative sample of securities included in the Index that collectively has an investment profile similar to the Index. Due to the use of representative sampling, the Fund may or may not hold all of the securities that are included in the Index. For the 12-month reporting period ended August 31, 2015, the total return for the Fund was -10.11%, net of fees, while the total return for the Index was -10.35%.
As represented by the Index, global agricultural stocks declined for the reporting period and trailed the MSCI All Country World Index, a broad measure of global equity market performance. One factor behind the Index’s overall decline was the depreciation of many world currencies relative to the U.S. dollar. The U.S. comprised nearly half of the Index on average during the reporting period; the top country weights in the remainder of the Index included Canada, Switzerland, and Japan. For the reporting period, the Canadian dollar, the Japanese yen, and the Swiss franc depreciated by 18%, 14%, and 5% against the U.S. dollar, respectively.
Beyond the currency effects, global agricultural stocks faced declining prices for agricultural commodities because of weaker demand and increased supply. Slowing growth in China and other emerging economies led to reduced demand for many commodities, including agricultural products. At the same time, favorable weather and improved crop yields over the last several years led to higher agricultural product inventories. As a result, many agricultural commodity prices, from wheat to cotton to soybeans, fell during the reporting period.
From a country perspective, agricultural stocks in the U.S., the largest country weight in the Index, detracted the most from the Index’s performance for the reporting period. Canada, Malaysia, and Indonesia were also major detractors from the Index’s return in U.S. dollar terms. In contrast, agricultural stocks in Japan, Germany, and the Netherlands contributed to the Index’s performance.
ALLOCATION BY SECTOR As of 8/31/15
| Sector/Investment Type | Percentage of Total Investments* |
Materials | 52.11 | % | ||
Food, Beverage & Tobacco | 28.83 | |||
Capital Goods | 17.68 | |||
Investment Companies | 1.38 | |||
|
| |||
TOTAL | 100.00 | % | ||
|
|
TEN LARGEST COUNTRIES As of 8/31/15
| Country | Percentage of Total Investments* |
United States | 48.60 | % | ||
Canada | 10.37 | |||
Switzerland | 9.24 | |||
Japan | 7.16 | |||
Norway | 4.34 | |||
Germany | 2.57 | |||
Italy | 2.12 | |||
Malaysia | 1.91 | |||
Singapore | 1.84 | |||
China | 1.59 | |||
|
| |||
TOTAL | 89.74 | % | ||
|
|
| * | Excludes money market funds. |
MANAGEMENT’S DISCUSSIONSOF FUND PERFORMANCE | 7 |
Table of Contents
Management’s Discussion of Fund Performance
iSHARES® MSCI GLOBAL ENERGY PRODUCERS ETF
Performance as of August 31, 2015
| Average Annual Total Returns | Cumulative Total Returns | |||||||||||||||||||||||||
| NAV | MARKET | INDEX | NAV | MARKET | INDEX | |||||||||||||||||||||
1 Year | (35.63)% | (35.09)% | (35.82)% | (35.63)% | (35.09)% | (35.82)% | ||||||||||||||||||||
Since Inception | (6.78)% | (6.61)% | (6.86)% | (22.25)% | (21.73)% | (22.48)% | ||||||||||||||||||||
GROWTH OF $10,000 INVESTMENT
(SINCE INCEPTION AT NET ASSET VALUE)
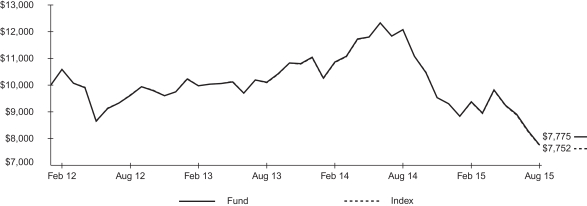
The inception date of the Fund was 1/31/12. The first day of secondary market trading was 2/2/12.
Past performance is no guarantee of future results. Performance results do not reflect the deduction of taxes that a shareholder would pay on fund distributions or on the redemption or sale of fund shares. See “About Fund Performance” on page 16 for more information.
| Shareholder Expenses | ||||||||||||||||||||||||||
| Actual | Hypothetical 5% Return | |||||||||||||||||||||||||
| Beginning Account Value (3/1/15) | Ending Account Value (8/31/15) | Expenses Paid During Period a | Beginning Account Value (3/1/15) | Ending Account Value (8/31/15) | Expenses Paid During Period a | Annualized Expense Ratio | ||||||||||||||||||||
| $ | 1,000.00 | $ | 829.50 | $ | 1.80 | $ | 1,000.00 | $ | 1,023.20 | $ | 1.99 | 0.39% | ||||||||||||||
| a | Expenses are calculated using the Fund’s annualized expense ratio (as disclosed in the table), multiplied by the average account value for the period, multiplied by the number of days in the period (184 days) and divided by the number of days in the year (365 days). See “Shareholder Expenses” on page 16 for more information. |
| 8 | 2015 iSHARES ANNUAL REPORTTO SHAREHOLDERS |
Table of Contents
Management’s Discussion of Fund Performance (Continued)
iSHARES® MSCI GLOBAL ENERGY PRODUCERS ETF
The iShares MSCI Global Energy Producers ETF (the “Fund”) seeks to track the investment results of an index composed of global equities of companies primarily engaged in the business of energy exploration and production, as represented by the MSCI ACWI Select Energy Producers Investable Market Index (the “Index”). The Fund invests in a representative sample of securities included in the Index that collectively has an investment profile similar to the Index. Due to the use of representative sampling, the Fund may or may not hold all of the securities that are included in the Index. For the 12-month reporting period ended August 31, 2015, the total return for the Fund was -35.63%, net of fees, while the total return for the Index was -35.82%.
As represented by the Index, global energy stocks declined significantly for the reporting period. One factor behind the Index’s overall decline was the depreciation of many world currencies relative to the U.S. dollar. For the reporting period, the Canadian dollar, the euro, and the British pound depreciated by 18%, 15%, and 7% against the U.S. dollar, respectively. Countries using these currencies comprised approximately 35% of the Index on average during the reporting period.
Beyond the currency effects, global energy stocks faced a growing supply-and-demand imbalance in the oil and gas markets. Excess supply materialized because of a boom in U.S. shale oil and gas production, driving U.S. oil production to its highest level in more than 40 years. Meanwhile, the Organization of Petroleum Exporting Countries (OPEC) chose to maintain its existing production levels. On the demand side, slowing growth in China, the world’s largest consumer of commodities, and other emerging economies led to reduced global demand for energy. The end result was a decline of approximately 50% in the price of oil for the reporting period, while the price of natural gas fell by approximately 33%.
From a country perspective, energy stocks in the U.S., which comprised about 52% of the Index on average during the reporting period, detracted the most from the Index’s performance in U.S. dollar terms. Canada, the U.K., and Brazil were also major detractors from the Index’s return in U.S. dollar terms. Among the few positive contributors to the Index’s performance were Poland, Finland, and Turkey.
ALLOCATION BY SECTOR
As of 8/31/15
| Sector | Percentage of Total Investments* |
Integrated Oil & Gas | 62.22 | % | ||
Oil & Gas Exploration & Production | 28.58 | |||
Oil & Gas Refining & Marketing | 8.03 | |||
Coal & Consumable Fuels | 1.17 | |||
|
| |||
TOTAL | 100.00 | % | ||
|
|
TEN LARGEST COUNTRIES
As of 8/31/15
| Country | Percentage of Total Investments* |
United States | 52.04 | % | ||
United Kingdom | 17.50 | |||
Canada | 8.20 | |||
France | 5.32 | |||
China | 2.78 | |||
Russia | 2.51 | |||
Italy | 2.30 | |||
Japan | 1.36 | |||
Australia | 1.26 | |||
India | 1.18 | |||
|
| |||
TOTAL | 94.45 | % | ||
|
|
| * | Excludes money market funds. |
MANAGEMENT’S DISCUSSIONSOF FUND PERFORMANCE | 9 |
Table of Contents
Management’s Discussion of Fund Performance
iSHARES® MSCI GLOBAL GOLD MINERS ETF
Performance as of August 31, 2015
| Average Annual Total Returns | Cumulative Total Returns | |||||||||||||||||||||||||
| NAV | MARKET | INDEX | NAV | MARKET | INDEX | |||||||||||||||||||||
1 Year | (50.16)% | (49.72)% | (50.10)% | (50.16)% | (49.72)% | (50.10)% | ||||||||||||||||||||
Since Inception | (33.56)% | (33.47)% | (33.49)% | (76.90)% | (76.78)% | (76.81)% | ||||||||||||||||||||
GROWTH OF $10,000 INVESTMENT
(SINCE INCEPTION AT NET ASSET VALUE)
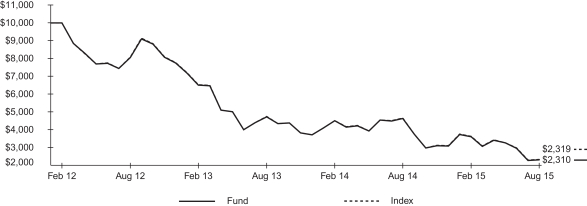
The inception date of the Fund was 1/31/12. The first day of secondary market trading was 2/2/12.
Past performance is no guarantee of future results. Performance results do not reflect the deduction of taxes that a shareholder would pay on fund distributions or on the redemption or sale of fund shares. See “About Fund Performance” on page 16 for more information.
| Shareholder Expenses | ||||||||||||||||||||||||||
| Actual | Hypothetical 5% Return | |||||||||||||||||||||||||
| Beginning Account Value (3/1/15) | Ending Account Value (8/31/15) | Expenses Paid During Period a | Beginning Account Value (3/1/15) | Ending Account Value (8/31/15) | Expenses Paid During Period a | Annualized Expense Ratio | ||||||||||||||||||||
| $ | 1,000.00 | $ | 640.00 | $ | 1.61 | $ | 1,000.00 | $ | 1,023.20 | $ | 1.99 | 0.39% | ||||||||||||||
| a | Expenses are calculated using the Fund’s annualized expense ratio (as disclosed in the table), multiplied by the average account value for the period, multiplied by the number of days in the period (184 days) and divided by the number of days in the year (365 days). See “Shareholder Expenses” on page 16 for more information. |
| 10 | 2015 iSHARES ANNUAL REPORTTO SHAREHOLDERS |
Table of Contents
Management’s Discussion of Fund Performance (Continued)
iSHARES® MSCI GLOBAL GOLD MINERS ETF
The iShares MSCI Global Gold Miners ETF (the “Fund”) seeks to track the investment results of an index composed of global equities of companies primarily engaged in the business of gold mining, as represented by the MSCI ACWI Select Gold Miners Investable Market Index (the “Index”). The Fund invests in a representative sample of securities included in the Index that collectively has an investment profile similar to the Index. Due to the use of representative sampling, the Fund may or may not hold all of the securities that are included in the Index. For the 12-month reporting period ended August 31, 2015, the total return for the Fund was -50.16%, net of fees, while the total return for the Index was -50.10%.
As represented by the Index, global gold mining stocks declined significantly for the reporting period. One factor behind the Index’s overall decline was the depreciation of many world currencies relative to the U.S. dollar. For the reporting period, the British pound, the Canadian dollar, the South African rand, and the Australian dollar depreciated by 7%, 18%, 20%, and 24% against the U.S. dollar, respectively. Together, these four countries comprised approximately 82% of the Index on average during the reporting period.
Beyond the currency effects, global gold mining stocks faced a decline in the price of gold, which fell by approximately 12% for the reporting period. The price of gold is down substantially from its most recent peak in 2011, ending the reporting period near its lowest level in more than five years amid a lack of demand for gold as a hedge against inflation and financial market turmoil. The decline in gold over the past four years has curtailed exploration as the price of gold has fallen below the production costs for many mining operations. At the same time, increasing debt loads are forcing many gold producers to cut costs and take other steps to shore up their balance sheets.
From a country perspective, gold mining stocks in Canada, which comprised approximately 57% of the Index on average during the reporting period, detracted the most from the Index’s performance in U.S. dollar terms. The U.S., Australia, and South Africa were also major detractors from the Index’s return. Hong Kong was the only positive contributor to the Index’s performance for the reporting period.
ALLOCATION BY COUNTRY
As of 8/31/15
| Country | Percentage of Total Investments* |
Canada | 55.83 | % | ||
South Africa | 12.71 | |||
United States | 11.22 | |||
United Kingdom | 7.58 | |||
Australia | 5.43 | |||
Peru | 2.70 | |||
Hong Kong | 1.88 | |||
Turkey | 1.56 | |||
China | 1.09 | |||
|
| |||
TOTAL | 100.00 | % | ||
|
|
TEN LARGEST FUND HOLDINGS
As of 8/31/15
| Security | Percentage of Total Investments* |
Goldcorp Inc. (Canada) | 13.51 | % | ||
Newmont Mining Corp. | 9.92 | |||
Barrick Gold Corp. (Canada) | 8.69 | |||
Newcrest Mining Ltd. (Australia) | 5.43 | |||
Randgold Resources Ltd. (United Kingdom) | 4.88 | |||
AngloGold Ashanti Ltd. (South Africa) | 4.66 | |||
Agnico Eagle Mines Ltd. (Canada) | 4.61 | |||
Gold Fields Ltd. (South Africa) | 4.39 | |||
Kinross Gold Corp. (Canada) | 3.86 | |||
Eldorado Gold Corp. (Canada) | 3.85 | |||
|
| |||
TOTAL | 63.80 | % | ||
|
|
MANAGEMENT’S DISCUSSIONSOF FUND PERFORMANCE | 11 |
Table of Contents
Management’s Discussion of Fund Performance
iSHARES® MSCI GLOBAL METALS & MINING PRODUCERS ETF
Performance as of August 31, 2015
| Average Annual Total Returns | Cumulative Total Returns | |||||||||||||||||||||||||
| NAV | MARKET | INDEX | NAV | MARKET | INDEX | |||||||||||||||||||||
1 Year | (41.94)% | (41.72)% | (41.85)% | (41.94)% | (41.72)% | (41.85)% | ||||||||||||||||||||
Since Inception | (17.43)% | (17.24)% | (17.43)% | (49.67)% | (49.24)% | (49.66)% | ||||||||||||||||||||
GROWTH OF $10,000 INVESTMENT
(SINCE INCEPTION AT NET ASSET VALUE)
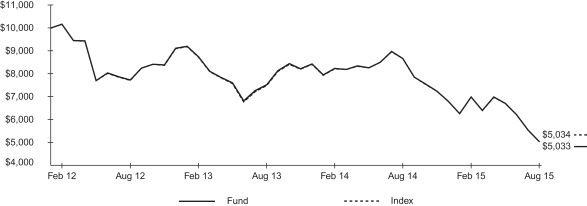
The inception date of the Fund was 1/31/12. The first day of secondary market trading was 2/2/12.
Past performance is no guarantee of future results. Performance results do not reflect the deduction of taxes that a shareholder would pay on fund distributions or on the redemption or sale of fund shares. See “About Fund Performance” on page 16 for more information.
| Shareholder Expenses | ||||||||||||||||||||||||||
| Actual | Hypothetical 5% Return | |||||||||||||||||||||||||
| Beginning Account Value (3/1/15) | Ending Account Value (8/31/15) | Expenses Paid During Period a | Beginning Account Value (3/1/15) | Ending Account Value (8/31/15) | Expenses Paid During Period a | Annualized Expense Ratio | ||||||||||||||||||||
| $ | 1,000.00 | $ | 720.90 | $ | 1.69 | $ | 1,000.00 | $ | 1,023.20 | $ | 1.99 | 0.39% | ||||||||||||||
| a | Expenses are calculated using the Fund’s annualized expense ratio (as disclosed in the table), multiplied by the average account value for the period, multiplied by the number of days in the period (184 days) and divided by the number of days in the year (365 days). See “Shareholder Expenses” on page 16 for more information. |
| 12 | 2015 iSHARES ANNUAL REPORTTO SHAREHOLDERS |
Table of Contents
Management’s Discussion of Fund Performance (Continued)
iSHARES® MSCI GLOBAL METALS & MINING PRODUCERS ETF
The iShares MSCI Global Metals & Mining Producers ETF (the “Fund”) seeks to track the investment results of an index composed of global equities of companies primarily engaged in mining, extraction or production of diversified metals, excluding gold and silver, as represented by the MSCI ACWI Select Metals & Mining Producers ex Gold & Silver Investable Market Index (the “Index”). The Fund invests in a representative sample of securities included in the Index that collectively has an investment profile similar to the Index. Due to the use of representative sampling, the Fund may or may not hold all of the securities that are included in the Index. For the 12-month reporting period ended August 31, 2015, the total return for the Fund was -41.94%, net of fees, while the total return for the Index was -41.85%.
As represented by the Index, global metals and mining stocks declined significantly for the reporting period. One factor behind the Index’s overall decline was the depreciation of many world currencies relative to the U.S. dollar. For the reporting period, the British pound, the Japanese yen, the Canadian dollar, the Australian dollar, and the Brazilian real depreciated by 7%, 14%, 18%, 24%, and 38% against the U.S. dollar, respectively. Together, these five countries comprised approximately 62% of the Index on average during the reporting period.
Beyond the currency effects, global metals and mining stocks faced a decline in global demand for commodities that led to sharply lower prices for precious metals. Although economic growth in Europe and Japan remained sluggish, the most significant impact came from China, the world’s largest consumer of commodities. Slowing economic growth in China dampened the country’s demand for commodities, and the resulting commodity price declines weighed on global metals and mining stocks. Copper, nickel, aluminum, gold, and iron ore were among the metals that experienced price declines for the reporting period.
From a country perspective, metals and mining stocks in the U.K., which comprised approximately 27% of the Index on average during the reporting period, detracted the most from the Index’s performance in U.S. dollar terms. The U.S., Australia, and Brazil were also major detractors from the Index’s return. Although no country within the Index contributed positively to performance, small Index components such as Hong Kong and the Netherlands detracted the least from the Index’s return for the reporting period.
ALLOCATION BY SECTOR
As of 8/31/15
| Sector | Percentage of Total Investments* |
Diversified Metals & Mining | 59.90 | % | ||
Steel | 32.99 | |||
Aluminum | 4.95 | |||
Precious Metals & Minerals | 2.16 | |||
|
| |||
TOTAL | 100.00 | % | ||
|
|
TEN LARGEST COUNTRIES
As of 8/31/15
| Country | Percentage of Total Investments* |
United Kingdom | 26.35 | % | ||
Australia | 18.23 | |||
United States | 13.40 | |||
Japan | 10.53 | |||
South Korea | 4.16 | |||
Canada | 3.65 | |||
Brazil | 3.34 | |||
Russia | 2.53 | |||
Germany | 2.30 | |||
Taiwan | 2.15 | |||
|
| |||
TOTAL | 86.64 | % | ||
|
|
| * | Excludes money market funds. |
MANAGEMENT’S DISCUSSIONSOF FUND PERFORMANCE | 13 |
Table of Contents
Management’s Discussion of Fund Performance
iSHARES® MSCI GLOBAL SILVER MINERS ETF
Performance as of August 31, 2015
| Average Annual Total Returns | Cumulative Total Returns | |||||||||||||||||||||||||
| NAV | MARKET | INDEX | NAV | MARKET | INDEX | |||||||||||||||||||||
1 Year | (50.51)% | (50.71)% | (50.84)% | (50.51)% | (50.71)% | (50.84)% | ||||||||||||||||||||
Since Inception | (31.17)% | (31.08)% | (31.24)% | (73.78)% | (73.66)% | (73.86)% | ||||||||||||||||||||
GROWTH OF $10,000 INVESTMENT
(SINCE INCEPTION AT NET ASSET VALUE)
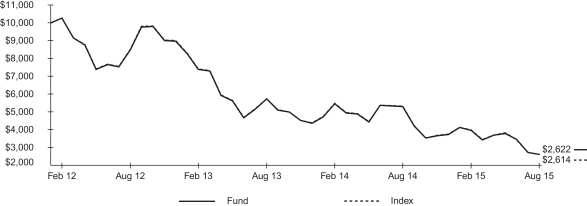
The inception date of the Fund was 1/31/12. The first day of secondary market trading was 2/2/12.
Past performance is no guarantee of future results. Performance results do not reflect the deduction of taxes that a shareholder would pay on fund distributions or on the redemption or sale of fund shares. See “About Fund Performance” on page 16 for more information.
| Shareholder Expenses | ||||||||||||||||||||||||||
| Actual | Hypothetical 5% Return | |||||||||||||||||||||||||
| Beginning Account Value (3/1/15) | Ending Account Value (8/31/15) | Expenses Paid During Period a | Beginning Account Value (3/1/15) | Ending Account Value (8/31/15) | Expenses Paid During Period a | Annualized Expense Ratio | ||||||||||||||||||||
| $ | 1,000.00 | $ | 660.30 | $ | 1.63 | $ | 1,000.00 | $ | 1,023.20 | $ | 1.99 | 0.39% | ||||||||||||||
| a | Expenses are calculated using the Fund’s annualized expense ratio (as disclosed in the table), multiplied by the average account value for the period, multiplied by the number of days in the period (184 days) and divided by the number of days in the year (365 days). See “Shareholder Expenses” on page 16 for more information. |
| 14 | 2015 iSHARES ANNUAL REPORTTO SHAREHOLDERS |
Table of Contents
Management’s Discussion of Fund Performance (Continued)
iSHARES® MSCI GLOBAL SILVER MINERS ETF
The iShares MSCI Global Silver Miners ETF (the “Fund”) seeks to track the investment results of an index composed of global equities of companies primarily engaged in the business of silver mining, as represented by the MSCI ACWI Select Silver Miners Investable Market Index (the “Index”). The Fund invests in a representative sample of securities included in the Index that collectively has an investment profile similar to the Index. Due to the use of representative sampling, the Fund may or may not hold all of the securities that are included in the Index. For the 12-month reporting period ended August 31, 2015, the total return for the Fund was -50.51%, net of fees, while the total return for the Index was -50.84%.
As represented by the Index, global silver mining stocks declined significantly for the reporting period. One factor behind the Index’s overall decline was the depreciation of many world currencies relative to the U.S. dollar. For the reporting period, the British pound, the Canadian dollar, and the Mexican peso depreciated by 7%, 18%, and 22% against the U.S. dollar, respectively. Together, these three countries comprised approximately 78% of the Index on average during the reporting period.
Beyond the currency effects, global silver mining stocks faced a decline in the price of silver, which fell by approximately 26% for the reporting period. The price of silver is down substantially from its most recent peak in 2011, ending the reporting period near its lowest level in six years. Demand for silver as a store of value against inflation and financial market turmoil waned during the reporting period. In addition, demand for industrial uses of silver also fell amid slowing economic growth in China, which is the world’s largest consumer of commodities and accounts for approximately one-third of global industrial demand for silver.
From a country perspective, silver mining stocks in Canada, which comprised approximately 59% of the Index on average during the reporting period, detracted the most from the Index’s performance in U.S. dollar terms. The U.S., the U.K., and Mexico were also major detractors from the Index’s return. Although no country within the Index contributed positively to performance, small Index components such as Hong Kong and China detracted the least from the Index’s return for the reporting period.
ALLOCATION BY COUNTRY
As of 8/31/15
| Country | Percentage of Total Investments* |
Canada | 58.34 | % | ||
United Kingdom | 12.48 | |||
United States | 11.29 | |||
Mexico | 7.43 | |||
Hong Kong | 5.08 | |||
Peru | 4.04 | |||
China | 1.18 | |||
Australia | 0.16 | |||
|
| |||
TOTAL | 100.00 | % | ||
|
|
TEN LARGEST FUND HOLDINGS
As of 8/31/15
| Security | Percentage of Total Investments* |
Silver Wheaton Corp. (Canada) | 21.12 | % | ||
Fresnillo PLC (United Kingdom) | 9.70 | |||
Industrias Penoles SAB de CV (Mexico) | 7.43 | |||
Tahoe Resources Inc. (Canada) | 4.92 | |||
Pan American Silver Corp. (Canada) | 4.67 | |||
Hecla Mining Co. | 4.45 | |||
G-Resources Group Ltd. (Hong Kong) | 4.30 | |||
Cia. de Minas Buenaventura SA ADR (Peru) | 4.04 | |||
Silver Standard Resources Inc. (Canada) | 3.83 | |||
Coeur Mining Inc. | 3.47 | |||
|
| |||
TOTAL | 67.93 | % | ||
|
|
MANAGEMENT’S DISCUSSIONSOF FUND PERFORMANCE | 15 |
Table of Contents
Past performance is no guarantee of future results. Current performance may be lower or higher than the performance data quoted. Performance data current to the most recent month-end is available at www.ishares.com. Performance results assume reinvestment of all dividends and capital gain distributions and do not reflect the deduction of taxes that a shareholder would pay on fund distributions or on the redemption or sale of fund shares. The investment return and principal value of shares will vary with changes in market conditions. Shares may be worth more or less than their original cost when they are redeemed or sold in the market. Performance for certain funds may reflect a waiver of a portion of investment advisory fees. Without such a waiver, performance would have been lower.
Net asset value or “NAV” is the value of one share of a fund as calculated in accordance with the standard formula for valuing mutual fund shares. The price used to calculate market return (“Market Price”) is determined by using the midpoint between the highest bid and the lowest offer on the primary stock exchange on which shares of a fund are listed for trading, as of the time that such fund’s NAV is calculated. Certain funds may have a NAV which is determined prior to the opening of regular trading on its listed exchange and their market returns are calculated using the midpoint of the bid/ask spread as of the opening of regular trading on the exchange. Market and NAV returns assume that dividends and capital gain distributions have been reinvested at Market Price and NAV, respectively.
An index is a statistical composite that tracks a specified financial market or sector. Unlike a fund, an index does not actually hold a portfolio of securities and therefore does not incur the expenses incurred by a fund. These expenses negatively impact fund performance. Also, market returns do not include brokerage commissions that may be payable on secondary market transactions. If brokerage commissions were included, market returns would be lower.
As a shareholder of a Fund, you incur two types of costs: (1) transaction costs, including brokerage commissions on purchases and sales of fund shares and (2) ongoing costs, including management fees and other fund expenses. The expense example, which is based on an investment of $1,000 invested on March 1, 2015 and held through August 31, 2015, is intended to help you understand your ongoing costs (in dollars and cents) of investing in a Fund and to compare these costs with the ongoing costs of investing in other funds.
Actual Expenses — The table provides information about actual account values and actual expenses. Annualized expense ratios reflect contractual and voluntary fee waivers, if any. To estimate the expenses that you paid on your account over the period, simply divide your account value by $1,000 (for example, an $8,600 account value divided by $1,000 = 8.6), then multiply the result by the number corresponding to your Fund under the heading entitled “Expenses Paid During Period.”
Hypothetical Example for Comparison Purposes — The table also provides information about hypothetical account values and hypothetical expenses based on each Fund’s actual expense ratio and an assumed rate of return of 5% per year before expenses. You may use this information to compare the ongoing costs of investing in your Fund and other funds. To do so, compare this 5% hypothetical example with the 5% hypothetical examples that appear in the shareholder reports of the other funds.
Please note that the expenses shown in the table are meant to highlight your ongoing costs only and do not reflect any transactional costs, such as brokerage commissions paid on purchases and sales of fund shares. Therefore, the hypothetical examples are useful in comparing ongoing costs only and will not help you determine the relative total costs of owning different funds. In addition, if these transactional costs were included, your costs would have been higher.
| 16 | 2015 iSHARES ANNUAL REPORTTO SHAREHOLDERS |
Table of Contents
iSHARES® MSCI GLOBAL AGRICULTURE PRODUCERS ETF
August 31, 2015
| Security | Shares | Value | ||||||
COMMON STOCKS — 97.71% | ||||||||
AUSTRALIA — 0.95% | ||||||||
Australian Agricultural Co. Ltd.a,b | 30,843 | $ | 29,082 | |||||
GrainCorp Ltd. Class A | 14,444 | 83,457 | ||||||
Nufarm Ltd./Australia | 13,570 | 68,786 | ||||||
Select Harvests Ltd. | 5,727 | 49,006 | ||||||
Tassal Group Ltd. | 12,328 | 32,862 | ||||||
|
| |||||||
| 263,193 | ||||||||
BRAZIL — 0.18% | ||||||||
Sao Martinho SA | 3,400 | 28,416 | ||||||
SLC Agricola SA | 4,600 | 20,321 | ||||||
Tereos Internacional SAa | 29,900 | 2,052 | ||||||
|
| |||||||
| 50,789 | ||||||||
CANADA — 10.32% | ||||||||
Ag Growth International Inc. | 1,127 | 32,120 | ||||||
Agrium Inc. | 10,741 | 1,102,840 | ||||||
Clearwater Seafoods Inc. | 1,587 | 13,240 | ||||||
Potash Corp. of Saskatchewan Inc. | 65,481 | 1,686,117 | ||||||
Rogers Sugar Inc. | 5,497 | 17,931 | ||||||
|
| |||||||
| 2,852,248 | ||||||||
CHINA — 1.59% | ||||||||
Century Sunshine Group Holdings Ltd. | 186,875 | 14,950 | ||||||
China Agri-Industries Holdings Ltd.a | 184,200 | 69,876 | ||||||
China BlueChemical Ltd. Class H | 138,000 | 39,174 | ||||||
China Huishan Dairy Holdings Co. Ltd.b | 506,000 | 185,423 | ||||||
China Modern Dairy Holdings Ltd.b | 149,000 | 38,836 | ||||||
First Tractor Co. Ltd. Class Hb | 46,000 | 26,413 | ||||||
Hubei Sanonda Co. Ltd. Class B | 15,000 | 11,478 | ||||||
Leyou Technologies Holdings Ltd.a,b | 115,000 | 10,387 | ||||||
Sinofert Holdings Ltd. | 184,000 | 28,253 | ||||||
YuanShengTai Dairy Farm Ltd.a | 207,000 | 14,156 | ||||||
|
| |||||||
| 438,946 | ||||||||
FINLAND — 0.04% | ||||||||
HKScan OYJ Class A | 2,369 | 11,069 | ||||||
|
| |||||||
| 11,069 | ||||||||
FRANCE — 0.25% | ||||||||
Naturex | 458 | 35,338 | ||||||
Vilmorin & Cie SA | 437 | 33,723 | ||||||
|
| |||||||
| 69,061 | ||||||||
GERMANY — 2.56% | ||||||||
K+S AG Registered | 15,157 | 566,142 | ||||||
KWS Saat SE | 138 | 45,090 | ||||||
Suedzucker AGb | 6,601 | 96,153 | ||||||
|
| |||||||
| 707,385 | ||||||||
| Security | Shares | Value | ||||||
HONG KONG — 0.87% |
| |||||||
WH Group Ltd.a,b,c | 460,000 | $ | 241,573 | |||||
|
| |||||||
| 241,573 | ||||||||
INDONESIA — 0.74% | ||||||||
Astra Agro Lestari Tbk PT | 32,200 | 39,247 | ||||||
Charoen Pokphand Indonesia Tbk PT | 586,500 | 78,061 | ||||||
Eagle High Plantations Tbk PT | 878,600 | 16,134 | ||||||
Japfa Comfeed Indonesia Tbk PTa | 397,900 | 10,422 | ||||||
Malindo Feedmill Tbk PT | 71,300 | 5,861 | ||||||
Perusahaan Perkebunan London Sumatra Indonesia Tbk PT | 243,800 | 18,741 | ||||||
PT Bisi International Tbk | 108,100 | 7,809 | ||||||
Salim Ivomas Pratama Tbk PT | 193,200 | 6,463 | ||||||
Sampoerna Agro PT | 52,900 | 5,008 | ||||||
Sawit Sumbermas Sarana Tbk PT | 142,600 | 16,391 | ||||||
|
| |||||||
| 204,137 | ||||||||
IRELAND — 0.21% | ||||||||
Origin Enterprises PLC | 6,440 | 57,605 | ||||||
|
| |||||||
| 57,605 | ||||||||
ISRAEL — 1.07% | ||||||||
Israel Chemicals Ltd. | 39,606 | 222,480 | ||||||
Israel Corp. Ltd. (The) | 241 | 72,834 | ||||||
|
| |||||||
| 295,314 | ||||||||
ITALY — 2.11% | ||||||||
CNH Industrial NV | 73,899 | 582,939 | ||||||
|
| |||||||
| 582,939 | ||||||||
JAPAN — 7.13% | ||||||||
Hokuto Corp. | 2,300 | 41,754 | ||||||
Kubota Corp. | 92,000 | 1,441,284 | ||||||
Kumiai Chemical Industry Co. Ltd.b | 4,600 | 36,516 | ||||||
Maruha Nichiro Corp. | 2,300 | 34,580 | ||||||
Mitsui Sugar Co. Ltd. | 2,000 | 8,268 | ||||||
NH Foods Ltd. | 14,000 | 323,473 | ||||||
Nihon Nohyaku Co. Ltd. | 4,600 | 35,947 | ||||||
Nippon Beet Sugar Manufacturing Co. Ltd. | 7,000 | 11,033 | ||||||
Sakata Seed Corp. | 2,300 | 37,256 | ||||||
|
| |||||||
| 1,970,111 | ||||||||
MALAYSIA — 1.90% | ||||||||
Boustead Plantations Bhd | 46,000 | 14,238 | ||||||
Felda Global Ventures Holdings Bhd | 103,500 | 30,065 | ||||||
Genting Plantations Bhd | 16,100 | 37,835 | ||||||
IOI Corp. Bhd | 227,700 | 216,857 | ||||||
Kuala Lumpur Kepong Bhd | 32,200 | 159,620 | ||||||
QL Resources Bhd | 42,850 | 39,381 | ||||||
TDM Bhd | 48,200 | 6,197 | ||||||
SCHEDULESOF INVESTMENTS | 17 |
Table of Contents
Schedule of Investments (Continued)
iSHARES® MSCI GLOBAL AGRICULTURE PRODUCERS ETF
August 31, 2015
| Security | Shares | Value | ||||||
TSH Resources Bhd | 48,300 | $ | 20,125 | |||||
|
| |||||||
| 524,318 | ||||||||
MEXICO — 0.24% |
| |||||||
Industrias Bachoco SAB de CV Series B | 13,800 | 65,217 | ||||||
|
| |||||||
| 65,217 | ||||||||
NETHERLANDS — 0.72% | ||||||||
OCI NVa | 6,726 | 198,059 | ||||||
|
| |||||||
| 198,059 | ||||||||
NORWAY — 4.32% | ||||||||
Austevoll Seafood ASA | 7,222 | 42,201 | ||||||
Bakkafrost P/F | 3,174 | 95,385 | ||||||
Leroy Seafood Group ASA | 1,702 | 56,629 | ||||||
Marine Harvest ASA | 26,634 | 316,986 | ||||||
Salmar ASA | 4,094 | 61,517 | ||||||
Yara International ASA | 14,099 | 620,928 | ||||||
|
| |||||||
| 1,193,646 | ||||||||
POLAND — 0.47% | ||||||||
Grupa Azoty SAa | 3,542 | 84,497 | ||||||
Kernel Holding SA | 4,163 | 46,037 | ||||||
|
| |||||||
| 130,534 | ||||||||
RUSSIA — 0.74% | ||||||||
Acron JSC | 669 | 27,795 | ||||||
Uralkali PJSCa | 29,440 | 90,014 | ||||||
Uralkali PJSC GDRa,d | 5,704 | 88,184 | ||||||
|
| |||||||
| 205,993 | ||||||||
SINGAPORE — 1.83% | ||||||||
Bumitama Agri Ltd. | 31,900 | 16,965 | ||||||
First Resources Ltd.b | 46,000 | 49,741 | ||||||
Golden Agri-Resources Ltd. | 563,500 | 125,862 | ||||||
Indofood Agri Resources Ltd.b | 46,000 | 15,656 | ||||||
Japfa Ltd.a,b | 29,900 | 6,466 | ||||||
Wilmar International Ltd. | 144,600 | 292,214 | ||||||
|
| |||||||
| 506,904 | ||||||||
SOUTH AFRICA — 0.55% | ||||||||
Astral Foods Ltd. | 3,105 | 41,656 | ||||||
Illovo Sugar Ltd. | 18,078 | 20,253 | ||||||
Oceana Group Ltd. | 2,346 | 17,121 | ||||||
Tongaat Hulett Ltd. | 8,510 | 73,768 | ||||||
|
| |||||||
| 152,798 | ||||||||
SOUTH KOREA — 0.34% | ||||||||
Dongwon Industries Co. Ltd. | 92 | 26,913 | ||||||
Farmscoa | 966 | 15,355 | ||||||
| Security | Shares | Value | ||||||
Harim Co. Ltd.a | 2,150 | $ | 7,353 | |||||
Namhae Chemical Corp. | 1,794 | 15,851 | ||||||
Nong Woo Bio Co. Ltd. | 667 | 12,604 | ||||||
Silla Co. Ltd. | 549 | 8,401 | ||||||
TS Corp./Korea | 322 | 6,997 | ||||||
|
| |||||||
| 93,474 | ||||||||
SPAIN — 0.00% |
| |||||||
Pescanova SAa | 414 | — | ||||||
|
| |||||||
| — | ||||||||
SWEDEN — 0.07% | ||||||||
Scandi Standard AB | 3,381 | 19,126 | ||||||
|
| |||||||
| 19,126 | ||||||||
SWITZERLAND — 9.19% | ||||||||
Syngenta AG Registered | 7,337 | 2,541,642 | ||||||
|
| |||||||
| 2,541,642 | ||||||||
TAIWAN — 0.32% | ||||||||
Taiwan Fertilizer Co. Ltd. | 69,000 | 87,268 | ||||||
|
| |||||||
| 87,268 | ||||||||
THAILAND — 0.56% | ||||||||
Charoen Pokphand Foods PCL NVDR | 231,100 | 122,497 | ||||||
GFPT PCL NVDR | 44,800 | 10,874 | ||||||
Kaset Thai International Sugar Corp. PCL | 64,400 | 13,654 | ||||||
Khon Kaen Sugar Industry PCL NVDR | 92,140 | 9,151 | ||||||
|
| |||||||
| 156,176 | ||||||||
TURKEY — 0.07% | ||||||||
Gubre Fabrikalari TAS | 8,947 | 19,056 | ||||||
|
| |||||||
| 19,056 | ||||||||
UNITED STATES — 48.37% | ||||||||
AGCO Corp. | 6,256 | 306,794 | ||||||
Alico Inc. | 322 | 13,547 | ||||||
American Vanguard Corp. | 2,461 | 32,879 | ||||||
Archer-Daniels-Midland Co. | 49,151 | 2,211,304 | ||||||
Bunge Ltd. | 11,293 | 818,178 | ||||||
Cal-Maine Foods Inc. | 2,323 | 123,398 | ||||||
CF Industries Holdings Inc. | 18,745 | 1,075,588 | ||||||
Darling Ingredients Inc.a | 12,811 | 164,493 | ||||||
Deere & Co. | 25,139 | 2,055,867 | ||||||
FMC Corp. | 10,442 | 441,801 | ||||||
Fresh Del Monte Produce Inc. | 2,852 | 112,911 | ||||||
Ingredion Inc. | 5,497 | 474,611 | ||||||
Intrepid Potash Inc.a | 4,853 | 38,387 | ||||||
Lindsay Corp. | 943 | 71,885 | ||||||
Monsanto Co. | 37,651 | 3,676,620 | ||||||
| 18 | 2015 iSHARES ANNUAL REPORTTO SHAREHOLDERS |
Table of Contents
Schedule of Investments (Continued)
iSHARES® MSCI GLOBAL AGRICULTURE PRODUCERS ETF
August 31, 2015
| Security | Shares | Value | ||||||
Mosaic Co. (The) | 25,990 | $ | 1,061,172 | |||||
Sanderson Farms Inc. | 1,679 | 115,918 | ||||||
Scotts Miracle-Gro Co. (The) Class A | 3,657 | 227,429 | ||||||
Titan International Inc. | 4,163 | 38,216 | ||||||
Toro Co. (The) | 4,324 | 308,301 | ||||||
|
| |||||||
| 13,369,299 | ||||||||
|
| |||||||
TOTAL COMMON STOCKS | 27,007,880 | |||||||
INVESTMENT COMPANIES — 1.37% |
| |||||||
INDIA — 1.37% | ||||||||
iShares India 50 ETFe | 13,844 | 379,602 | ||||||
|
| |||||||
| 379,602 | ||||||||
|
| |||||||
TOTAL INVESTMENT COMPANIES (Cost: $384,865) | 379,602 | |||||||
PREFERRED STOCKS — 0.45% | ||||||||
CHILE — 0.45% | ||||||||
Sociedad Quimica y Minera de Chile SA Series B | 7,843 | 123,146 | ||||||
|
| |||||||
| 123,146 | ||||||||
|
| |||||||
TOTAL PREFERRED STOCKS | 123,146 | |||||||
RIGHTS — 0.00% | ||||||||
SOUTH AFRICA — 0.00% | ||||||||
Oceana Group Ltd.a | 357 | 584 | ||||||
|
| |||||||
| 584 | ||||||||
|
| |||||||
TOTAL RIGHTS | 584 | |||||||
SHORT-TERM INVESTMENTS — 2.43% |
| |||||||
MONEY MARKET FUNDS — 2.43% | ||||||||
BlackRock Cash Funds: Institutional, | ||||||||
0.18%e,f,g | 623,653 | 623,653 | ||||||
BlackRock Cash Funds: Prime, | ||||||||
0.18%e,f,g | 35,813 | 35,813 | ||||||
| Security | Shares | Value | ||||||
BlackRock Cash Funds: Treasury, | ||||||||
0.03%e,f | 10,644 | $ | 10,644 | |||||
|
| |||||||
| 670,110 | ||||||||
|
| |||||||
TOTAL SHORT-TERM INVESTMENTS |
| |||||||
(Cost: $670,110) | 670,110 | |||||||
|
| |||||||
TOTAL INVESTMENTS | ||||||||
(Cost: $32,545,904) | 28,181,322 | |||||||
Other Assets, Less Liabilities — (1.96)% |
| (541,348 | ) | |||||
|
| |||||||
NET ASSETS — 100.00% | $ | 27,639,974 | ||||||
|
| |||||||
GDR — Global Depositary Receipts
NVDR — Non-Voting Depositary Receipts
| a | Non-income earning security. |
| b | All or a portion of this security represents a security on loan. See Note 1. |
| c | This security may be resold to qualified institutional buyers under Rule 144A of the Securities Act of 1933. |
| d | This security may be resold to qualified foreign investors and foreign institutional buyers under Regulation S of the Securities Act of 1933. |
| e | Affiliated issuer. See Note 2. |
| f | The rate quoted is the annualized seven-day yield of the fund at period end. |
| g | All or a portion of this security represents an investment of securities lending collateral. See Note 1. |
See notes to financial statements.
SCHEDULESOF INVESTMENTS | 19 |
Table of Contents
Schedule of Investments
iSHARES® MSCI GLOBAL ENERGY PRODUCERS ETF
August 31, 2015
| Security | Shares | Value | ||||||
COMMON STOCKS — 98.43% |
| |||||||
AUSTRALIA — 1.25% |
| |||||||
AWE Ltd.a,b | 6,566 | $ | 4,329 | |||||
Beach Energy Ltd. | 15,471 | 7,349 | ||||||
Drillsearch Energy Ltd.a,b | 5,684 | 2,518 | ||||||
Karoon Gas Australia Ltd.a,b | 3,668 | 5,006 | ||||||
Santos Ltd. | 13,706 | 49,847 | ||||||
Senex Energy Ltd.a,b | 8,989 | 956 | ||||||
Whitehaven Coal Ltd.a,b | 9,520 | 7,863 | ||||||
Woodside Petroleum Ltd. | 10,080 | 230,537 | ||||||
|
| |||||||
| 308,405 | ||||||||
AUSTRIA — 0.22% |
| |||||||
OMV AG | 2,086 | 53,385 | ||||||
|
| |||||||
| 53,385 | ||||||||
BRAZIL — 0.48% |
| |||||||
Petroleo Brasileiro SAa | 39,200 | 114,299 | ||||||
QGEP Participacoes SA | 2,800 | 4,812 | ||||||
|
| |||||||
| 119,111 | ||||||||
CANADA — 8.13% |
| |||||||
Advantage Oil & Gas Ltd.a | 2,422 | 13,343 | ||||||
ARC Resources Ltd. | 4,443 | 66,052 | ||||||
Bankers Petroleum Ltd.a | 2,954 | 5,218 | ||||||
Baytex Energy Corp. | 2,690 | 15,386 | ||||||
Bellatrix Exploration Ltd.a,b | 3,192 | 5,974 | ||||||
Birchcliff Energy Ltd.a | 1,470 | 7,601 | ||||||
BlackPearl Resources Inc.a | 3,514 | 2,324 | ||||||
Bonavista Energy Corp. | 2,184 | 6,714 | ||||||
Bonterra Energy Corp. | 392 | 6,443 | ||||||
Boulder Energy Ltd.a | 672 | 2,808 | ||||||
Cameco Corp. | 5,026 | 69,922 | ||||||
Canadian Natural Resources Ltd. | 14,630 | 326,027 | ||||||
Canadian Oil Sands Ltd. | 6,174 | 35,731 | ||||||
Cardinal Energy Ltd. | 747 | 6,007 | ||||||
Cenovus Energy Inc. | 10,766 | 154,309 | ||||||
Crescent Point Energy Corp. | 6,104 | 77,441 | ||||||
Crew Energy Inc.a | 2,478 | 8,325 | ||||||
Denison Mines Corp.a,b | 3,766 | 1,812 | ||||||
Encana Corp. | 10,808 | 79,852 | ||||||
Enerplus Corp. | 2,940 | 18,517 | ||||||
Freehold Royalties Ltd. | 715 | 5,868 | ||||||
Husky Energy Inc. | 4,620 | 81,358 | ||||||
Imperial Oil Ltd. | 4,102 | 143,208 | ||||||
Kelt Exploration Ltd.a | 1,771 | 8,386 | ||||||
MEG Energy Corp.a | 2,156 | 19,154 | ||||||
| Security | Shares | Value | ||||||
NuVista Energy Ltd.a | 2,044 | $ | 8,741 | |||||
Painted Pony Petroleum Ltd.a | 1,358 | 7,053 | ||||||
Paramount Resources Ltd. Class Aa,b | 952 | 10,075 | ||||||
Parex Resources Inc.a | 1,400 | 9,544 | ||||||
Pengrowth Energy Corp. | 7,869 | 11,415 | ||||||
Peyto Exploration & Development Corp. | 1,960 | 45,932 | ||||||
PrairieSky Royalty Ltd. | 1,862 | 38,569 | ||||||
Raging River Exploration Inc.a | 2,702 | 17,079 | ||||||
Suncor Energy Inc. | 19,082 | 534,382 | ||||||
Surge Energy Inc. | 3,808 | 8,643 | ||||||
TORC Oil & Gas Ltd. | 1,092 | 5,113 | ||||||
Tourmaline Oil Corp.a,b | 2,450 | 61,319 | ||||||
TransGlobe Energy Corp. | 812 | 2,759 | ||||||
Vermilion Energy Inc. | 1,652 | 56,594 | ||||||
Whitecap Resources Inc. | 3,094 | 26,394 | ||||||
|
| |||||||
| 2,011,392 | ||||||||
CHINA — 2.76% |
| |||||||
China Coal Energy Co. Ltd. Class Hb | 56,000 | 26,157 | ||||||
China Shenhua Energy Co. Ltd. Class H | 42,000 | 72,836 | ||||||
CNOOC Ltd. | 238,000 | 295,118 | ||||||
Inner Mongolia Yitai Coal Co. Ltd. Class B | 100 | 85 | ||||||
Kunlun Energy Co. Ltd. | 56,000 | 39,597 | ||||||
MIE Holdings Corp.a,b | 28,000 | 3,288 | ||||||
PetroChina Co. Ltd. Class H | 280,000 | 232,669 | ||||||
Yanzhou Coal Mining Co. Ltd. Class Hb | 28,000 | 13,223 | ||||||
|
| |||||||
| 682,973 | ||||||||
COLOMBIA — 0.15% |
| |||||||
Ecopetrol SA | 73,332 | 37,810 | ||||||
|
| |||||||
| 37,810 | ||||||||
FINLAND — 0.17% |
| |||||||
Neste OYJ | 1,610 | 41,276 | ||||||
|
| |||||||
| 41,276 | ||||||||
FRANCE — 5.28% |
| |||||||
Etablissements Maurel et Proma,b | 1,036 | 5,449 | ||||||
MPI | 2,492 | 7,623 | ||||||
Total SA | 28,252 | 1,291,738 | ||||||
|
| |||||||
| 1,304,810 | ||||||||
GREECE — 0.01% |
| |||||||
Motor Oil Hellas Corinth Refineries SAa | 176 | 1,834 | ||||||
|
| |||||||
| 1,834 | ||||||||
| 20 | 2015 iSHARES ANNUAL REPORTTO SHAREHOLDERS |
Table of Contents
Schedule of Investments (Continued)
iSHARES® MSCI GLOBAL ENERGY PRODUCERS ETF
August 31, 2015
| Security | Shares | Value | ||||||
HUNGARY — 0.12% |
| |||||||
MOL Hungarian Oil & Gas PLC | 602 | $ | 29,818 | |||||
|
| |||||||
| 29,818 | ||||||||
INDIA — 1.17% |
| |||||||
Reliance Industries Ltd. GDRc | 11,116 | 290,128 | ||||||
|
| |||||||
| 290,128 | ||||||||
INDONESIA — 0.10% |
| |||||||
Adaro Energy Tbk PT | 267,400 | 11,324 | ||||||
Sugih Energy Tbk PTa | 432,600 | 12,131 | ||||||
|
| |||||||
| 23,455 | ||||||||
ISRAEL — 0.07% |
| |||||||
Naphtha Israel Petroleum Corp. Ltd.a | 855 | 4,887 | ||||||
Oil Refineries Ltd.a | 20,371 | 7,404 | ||||||
Paz Oil Co. Ltd. | 28 | 4,057 | ||||||
|
| |||||||
| 16,348 | ||||||||
ITALY — 2.28% |
| |||||||
Eni SpA | 33,096 | 542,540 | ||||||
ERG SpA | 756 | 10,783 | ||||||
Saras SpAa | 4,074 | 10,344 | ||||||
|
| |||||||
| 563,667 | ||||||||
JAPAN — 1.35% |
| |||||||
Cosmo Oil Co. Ltd.a | 14,000 | 21,835 | ||||||
Idemitsu Kosan Co. Ltd. | 1,400 | 24,006 | ||||||
INPEX Corp. | 12,600 | 127,055 | ||||||
Japan Petroleum Exploration Co. Ltd. | 100 | 2,946 | ||||||
JX Holdings Inc. | 33,600 | 130,008 | ||||||
Nippon Coke & Engineering Co. Ltd. | 5,600 | 4,852 | ||||||
Showa Shell Sekiyu KK | 2,800 | 23,960 | ||||||
|
| |||||||
| 334,662 | ||||||||
NORWAY — 0.97% |
| |||||||
Det Norske Oljeselskap ASAa,b | 1,526 | 8,804 | ||||||
DNO ASAa,b | 11,074 | 12,579 | ||||||
Statoil ASA | 14,854 | 219,477 | ||||||
|
| |||||||
| 240,860 | ||||||||
POLAND — 0.42% |
| |||||||
Grupa Lotos SAa | 1,568 | 12,427 | ||||||
Lubelski Wegiel Bogdanka SA | 448 | 5,552 | ||||||
Polski Koncern Naftowy Orlen SA | 4,382 | 85,755 | ||||||
|
| |||||||
| 103,734 | ||||||||
PORTUGAL — 0.22% |
| |||||||
Galp Energia SGPS SA | 5,208 | 54,837 | ||||||
|
| |||||||
| 54,837 | ||||||||
| Security | Shares | Value | ||||||
RUSSIA — 2.27% |
| |||||||
Lukoil PJSC ADR (London) | 3,455 | $ | 130,322 | |||||
Lukoil PJSC | 3,279 | 124,191 | ||||||
NOVATEK OAO GDRd | 1,169 | 111,990 | ||||||
Rosneft OAO | 9,280 | 33,819 | ||||||
Rosneft OAO GDRd | 4,376 | 16,489 | ||||||
Surgutneftegas OAO | 44,800 | 22,914 | ||||||
Surgutneftegas OAO ADR | 4,480 | 23,386 | ||||||
Tatneft PAO Class S | 20,440 | 97,666 | ||||||
|
| |||||||
| 560,777 | ||||||||
SINGAPORE — 0.00% |
| |||||||
Rex International Holding Ltd.a,b | 11,200 | 786 | ||||||
|
| |||||||
| 786 | ||||||||
SOUTH AFRICA — 0.05% |
| |||||||
Exxaro Resources Ltd. | 2,478 | 12,670 | ||||||
|
| |||||||
| 12,670 | ||||||||
SOUTH KOREA — 0.42% |
| |||||||
S-Oil Corp. | 714 | 36,221 | ||||||
SK Innovation Co. Ltd.a | 812 | 68,585 | ||||||
|
| |||||||
| 104,806 | ||||||||
SPAIN — 0.81% |
| |||||||
Repsol SA | 13,944 | 199,287 | ||||||
|
| |||||||
| 199,287 | ||||||||
SWEDEN — 0.16% |
| |||||||
Lundin Petroleum ABa,b | 3,108 | 40,511 | ||||||
|
| |||||||
| 40,511 | ||||||||
THAILAND — 0.42% |
| |||||||
Bangchak Petroleum PCL (The) NVDR | 7,000 | 6,835 | ||||||
Banpu PCL NVDR | 21,000 | 12,069 | ||||||
Esso Thailand PCL NVDRa | 44,800 | 6,249 | ||||||
IRPC PCL NVDR | 208,600 | 22,114 | ||||||
PTT Exploration & Production PCL NVDR | 16,831 | 37,329 | ||||||
Thai Oil PCL NVDR | 14,000 | 20,114 | ||||||
|
| |||||||
| 104,710 | ||||||||
TURKEY — 0.17% |
| |||||||
Ipek Dogal Enerji Kaynaklari Arastirma Ve Uretim ASa | 1,778 | 1,337 | ||||||
Tupras Turkiye Petrol Rafinerileri ASa | 1,596 | 41,175 | ||||||
|
| |||||||
| 42,512 | ||||||||
UNITED KINGDOM — 17.36% |
| |||||||
Amerisur Resources PLCa,b | 18,256 | 7,370 | ||||||
BG Group PLC | 44,758 | 684,661 | ||||||
SCHEDULESOF INVESTMENTS | 21 |
Table of Contents
Schedule of Investments (Continued)
iSHARES® MSCI GLOBAL ENERGY PRODUCERS ETF
August 31, 2015
| Security | Shares | Value | ||||||
BP PLC | 239,400 | $ | 1,327,351 | |||||
Cairn Energy PLCa | 7,742 | 18,051 | ||||||
EnQuest PLCa | 12,362 | 6,417 | ||||||
Faroe Petroleum PLCa | 2,296 | 2,569 | ||||||
Gulf Keystone Petroleum Ltd.a | 13,067 | 6,130 | ||||||
Ophir Energy PLCa | 7,714 | 11,490 | ||||||
Premier Oil PLCa | 7,686 | 12,448 | ||||||
Royal Dutch Shell PLC Class A | 51,310 | 1,337,606 | ||||||
Royal Dutch Shell PLC Class B | 31,698 | 831,945 | ||||||
SOCO International PLC | 3,038 | 7,195 | ||||||
Tullow Oil PLCa | 12,068 | 41,427 | ||||||
|
| |||||||
| 4,294,660 | ||||||||
UNITED STATES — 51.62% |
| |||||||
Abraxas Petroleum Corp.a | 2,744 | 5,351 | ||||||
Anadarko Petroleum Corp. | 6,734 | 482,020 | ||||||
Antero Resources Corp.a | 868 | 22,429 | ||||||
Apache Corp. | 5,124 | 231,810 | ||||||
Bill Barrett Corp.a | 658 | 3,599 | ||||||
Bonanza Creek Energy Inc.a | 574 | 4,391 | ||||||
Cabot Oil & Gas Corp. | 5,572 | 131,889 | ||||||
California Resources Corp. | 4,116 | 15,970 | ||||||
Callon Petroleum Co.a | 1,386 | 12,710 | ||||||
Carrizo Oil & Gas Inc.a | 644 | 23,461 | ||||||
Chesapeake Energy Corp. | 7,154 | 55,873 | ||||||
Chevron Corp. | 24,584 | 1,991,058 | ||||||
Cimarex Energy Co. | 1,302 | 143,884 | ||||||
Clayton Williams Energy Inc.a | 84 | 4,274 | ||||||
Cobalt International Energy Inc.a | 3,780 | 30,278 | ||||||
Concho Resources Inc.a | 1,610 | 174,138 | ||||||
ConocoPhillips | 16,226 | 797,508 | ||||||
CONSOL Energy Inc. | 3,178 | 48,401 | ||||||
Continental Resources Inc./OKa | 1,288 | 41,345 | ||||||
CVR Energy Inc. | 224 | 9,007 | ||||||
Delek U.S. Holdings Inc. | 714 | 21,963 | ||||||
Denbury Resources Inc. | 5,096 | 22,117 | ||||||
Devon Energy Corp. | 5,194 | 221,576 | ||||||
Diamondback Energy Inc.a | 827 | 56,476 | ||||||
Energen Corp. | 994 | 51,688 | ||||||
EOG Resources Inc. | 7,238 | 566,808 | ||||||
EQT Corp. | 2,030 | 157,975 | ||||||
Exxon Mobil Corp. | 54,810 | 4,123,904 | ||||||
Gulfport Energy Corp.a | 1,386 | 49,660 | ||||||
Hess Corp. | 3,472 | 206,410 | ||||||
HollyFrontier Corp. | 2,506 | 117,431 | ||||||
Kosmos Energy Ltd.a | 1,358 | 9,506 | ||||||
| Security | Shares | Value | ||||||
Laredo Petroleum Inc.a | 1,757 | $ | 17,904 | |||||
LinnCo LLC | 1,541 | 4,700 | ||||||
Marathon Oil Corp. | 9,128 | 157,823 | ||||||
Marathon Petroleum Corp. | 7,112 | 336,469 | ||||||
Matador Resources Co.a | 910 | 20,848 | ||||||
Memorial Resource Development Corp.a | 1,008 | 19,565 | ||||||
Murphy Oil Corp. | 2,394 | 74,214 | ||||||
Newfield Exploration Co.a | 2,044 | 68,086 | ||||||
Noble Energy Inc. | 5,692 | 190,170 | ||||||
Northern Oil and Gas Inc.a | 1,190 | 7,176 | ||||||
Oasis Petroleum Inc.a | 1,666 | 18,592 | ||||||
Occidental Petroleum Corp. | 10,080 | 735,941 | ||||||
Parsley Energy Inc. Class Aa | 630 | 10,836 | ||||||
PBF Energy Inc. | 1,078 | 32,254 | ||||||
PDC Energy Inc.a | 532 | 29,888 | ||||||
Penn Virginia Corp.a | 924 | 1,136 | ||||||
Pioneer Natural Resources Co. | 2,002 | 246,366 | ||||||
QEP Resources Inc. | 2,268 | 31,843 | ||||||
Range Resources Corp. | 2,338 | 90,293 | ||||||
Rex Energy Corp.a | 462 | 1,594 | ||||||
RSP Permian Inc.a | 616 | 14,747 | ||||||
Sanchez Energy Corp.a | 705 | 4,540 | ||||||
SM Energy Co. | 966 | 35,452 | ||||||
Southwestern Energy Co.a | 5,096 | 82,759 | ||||||
Stone Energy Corp.a | 756 | 4,286 | ||||||
Synergy Resources Corp.a | 756 | 8,119 | ||||||
Tesoro Corp. | 1,638 | 150,712 | ||||||
Triangle Petroleum Corp.a | 1,414 | 5,713 | ||||||
Ultra Petroleum Corp.a | 2,002 | 17,057 | ||||||
Valero Energy Corp. | 6,692 | 397,103 | ||||||
W&T Offshore Inc. | 840 | 2,999 | ||||||
Western Refining Inc. | 1,064 | 45,773 | ||||||
Whiting Petroleum Corp.a | 2,718 | 52,539 | ||||||
WPX Energy Inc.a | 2,492 | 18,216 | ||||||
|
| |||||||
| 12,770,623 | ||||||||
|
| |||||||
TOTAL COMMON STOCKS |
| |||||||
(Cost: $30,905,529) |
| 24,349,847 | ||||||
PREFERRED STOCKS — 0.76% |
| |||||||
BRAZIL — 0.54% |
| |||||||
Petroleo Brasileiro SA | 53,200 | 134,232 | ||||||
|
| |||||||
| 134,232 | ||||||||
| 22 | 2015 iSHARES ANNUAL REPORTTO SHAREHOLDERS |
Table of Contents
Schedule of Investments (Continued)
iSHARES® MSCI GLOBAL ENERGY PRODUCERS ETF
August 31, 2015
| Security | Shares | Value | ||||||
RUSSIA — 0.22% | ||||||||
Surgutneftegas OAO | 89,600 | $ | 53,986 | |||||
|
| |||||||
| 53,986 | ||||||||
|
| |||||||
TOTAL PREFERRED STOCKS |
| |||||||
(Cost: $268,718) |
| 188,218 | ||||||
WARRANTS — 0.00% |
| |||||||
UNITED STATES — 0.00% |
| |||||||
Magnum Hunter Resources Corp. | ||||||||
(Expires 04/15/16)a | 50 | — | ||||||
|
| |||||||
| — | ||||||||
|
| |||||||
TOTAL WARRANTS | ||||||||
(Cost: $0) |
| — | ||||||
SHORT-TERM INVESTMENTS — 0.98% |
| |||||||
MONEY MARKET FUNDS — 0.98% |
| |||||||
BlackRock Cash Funds: Institutional, | ||||||||
0.18%e,f,g | 211,341 | 211,341 | ||||||
BlackRock Cash Funds: Prime, | ||||||||
0.18%e,f,g | 12,136 | 12,136 | ||||||
BlackRock Cash Funds: Treasury, | ||||||||
0.03%e,f | 18,962 | 18,962 | ||||||
|
| |||||||
| 242,439 | ||||||||
|
| |||||||
TOTAL SHORT-TERM INVESTMENTS |
| |||||||
(Cost: $242,439) |
| 242,439 | ||||||
|
| |||||||
TOTAL INVESTMENTS |
| |||||||
(Cost: $31,416,686) |
| 24,780,504 | ||||||
Other Assets, Less Liabilities — (0.17)% |
| (41,085 | ) | |||||
|
| |||||||
NET ASSETS — 100.00% | $ | 24,739,419 | ||||||
|
| |||||||
ADR — American Depositary Receipts
GDR — Global Depositary Receipts
NVDR — Non-Voting Depositary Receipts
| a | Non-income earning security. |
| b | All or a portion of this security represents a security on loan. See Note 1. |
| c | This security may be resold to qualified institutional buyers under Rule 144A of the Securities Act of 1933. |
| d | This security may be resold to qualified foreign investors and foreign institutional buyers under Regulation S of the Securities Act of 1933. |
| e | Affiliated issuer. See Note 2. |
| f | The rate quoted is the annualized seven-day yield of the fund at period end. |
| g | All or a portion of this security represents an investment of securities lending collateral. See Note 1. |
See notes to financial statements.
SCHEDULESOF INVESTMENTS | 23 |
Table of Contents
Schedule of Investments
iSHARES® MSCI GLOBAL GOLD MINERS ETF
August 31, 2015
| Security | Shares | Value | ||||||
COMMON STOCKS — 99.95% |
| |||||||
AUSTRALIA — 5.43% |
| |||||||
Newcrest Mining Ltd.a | 314,160 | $ | 2,494,505 | |||||
|
| |||||||
| 2,494,505 | ||||||||
CANADA — 55.80% |
| |||||||
Agnico Eagle Mines Ltd. | 87,450 | 2,117,729 | ||||||
Alacer Gold Corp.a | 374,220 | 807,224 | ||||||
Alamos Gold Inc. Class Aa | 297,660 | 1,212,565 | ||||||
Barrick Gold Corp. | 579,645 | 3,986,285 | ||||||
Centerra Gold Inc. | 205,590 | 1,027,564 | ||||||
China Gold International Resources Corp. Ltd.a | 478,335 | 679,484 | ||||||
Eldorado Gold Corp. | 598,950 | 1,769,165 | ||||||
Goldcorp Inc. | 452,100 | 6,201,296 | ||||||
IAMGOLD Corp.a,b | 519,420 | 862,772 | ||||||
Kinross Gold Corp.a | 1,003,530 | 1,772,488 | ||||||
Lake Shore Gold Corp.a | 838,530 | 699,563 | ||||||
New Gold Inc.a | 545,490 | 1,242,266 | ||||||
Primero Mining Corp.a,b | 261,360 | 748,427 | ||||||
SEMAFO Inc.a | 380,655 | 932,683 | ||||||
Yamana Gold Inc. | 843,645 | 1,566,180 | ||||||
|
| |||||||
| 25,625,691 | ||||||||
CHINA — 1.09% |
| |||||||
China Precious Metal Resources Holdings Co. Ltd.a,b | 13,341,000 | 499,208 | ||||||
|
| |||||||
| 499,208 | ||||||||
HONG KONG — 1.88% |
| |||||||
G-Resources Group Ltd. | 32,547,000 | 865,115 | ||||||
|
| |||||||
| 865,115 | ||||||||
PERU — 2.70% |
| |||||||
Cia. de Minas Buenaventura SA ADR | 196,020 | 1,238,846 | ||||||
|
| |||||||
| 1,238,846 | ||||||||
SOUTH AFRICA — 12.70% |
| |||||||
AngloGold Ashanti Ltd.a | 265,485 | 2,137,410 | ||||||
Gold Fields Ltd. | 627,330 | 2,014,285 | ||||||
Harmony Gold Mining Co. Ltd.a | 746,790 | 635,075 | ||||||
Sibanye Gold Ltd. | 912,285 | 1,045,422 | ||||||
|
| |||||||
| 5,832,192 | ||||||||
TURKEY — 1.56% |
| |||||||
Koza Altin Isletmeleri AS | 85,470 | 716,409 | ||||||
|
| |||||||
| 716,409 | ||||||||
| Security | Shares | Value | ||||||
UNITED KINGDOM — 7.58% |
| |||||||
Acacia Mining PLC | 28,050 | $ | 103,236 | |||||
Centamin PLC | 1,228,920 | 1,134,993 | ||||||
Randgold Resources Ltd. | 36,795 | 2,240,426 | ||||||
|
| |||||||
| 3,478,655 | ||||||||
UNITED STATES — 11.21% |
| |||||||
McEwen Mining Inc. | 655,545 | 598,185 | ||||||
Newmont Mining Corp. | 266,640 | 4,551,545 | ||||||
|
| |||||||
| 5,149,730 | ||||||||
|
| |||||||
TOTAL COMMON STOCKS | ||||||||
(Cost: $76,703,730) | 45,900,351 | |||||||
SHORT-TERM INVESTMENTS — 3.43% |
| |||||||
MONEY MARKET FUNDS — 3.43% |
| |||||||
BlackRock Cash Funds: Institutional, |
| |||||||
0.18%c,d,e | 1,462,811 | 1,462,811 | ||||||
BlackRock Cash Funds: Prime, | ||||||||
0.18%c,d,e | 84,002 | 84,002 | ||||||
BlackRock Cash Funds: Treasury, | ||||||||
0.03%c,d | 29,679 | 29,679 | ||||||
|
| |||||||
| 1,576,492 | ||||||||
|
| |||||||
TOTAL SHORT-TERM INVESTMENTS |
| |||||||
(Cost: $1,576,492) | 1,576,492 | |||||||
|
| |||||||
TOTAL INVESTMENTS |
| |||||||
(Cost: $78,280,222) | 47,476,843 | |||||||
Other Assets, Less Liabilities — (3.38)% |
| (1,550,692 | ) | |||||
|
| |||||||
NET ASSETS — 100.00% |
| $ | 45,926,151 | |||||
|
| |||||||
ADR — American Depositary Receipts
| a | Non-income earning security. |
| b | All or a portion of this security represents a security on loan. See Note 1. |
| c | Affiliated issuer. See Note 2. |
| d | The rate quoted is the annualized seven-day yield of the fund at period end. |
| e | All or a portion of this security represents an investment of securities lending collateral. See Note 1. |
See notes to financial statements.
| 24 | 2015 iSHARES ANNUAL REPORTTO SHAREHOLDERS |
Table of Contents
Schedule of Investments
iSHARES® MSCI GLOBAL METALS & MINING PRODUCERS ETF
August 31, 2015
| Security | Shares | Value | ||||||
COMMON STOCKS — 97.40% |
| |||||||
AUSTRALIA — 18.11% |
| |||||||
Alumina Ltd. | 346,450 | $ | 321,757 | |||||
Arrium Ltd. | 442,780 | 34,530 | ||||||
BHP Billiton Ltd. | 434,980 | 7,764,983 | ||||||
BlueScope Steel Ltd. | 78,808 | 240,804 | ||||||
CuDeco Ltd.a,b | 14,986 | 11,740 | ||||||
Fortescue Metals Group Ltd.a | 211,384 | 286,234 | ||||||
Iluka Resources Ltd. | 56,680 | 298,562 | ||||||
Independence Group NL | 32,630 | 76,570 | ||||||
Jacana Minerals Ltd.a,b | 6,808 | — | ||||||
Metals X Ltd.a | 35,100 | 28,492 | ||||||
OZ Minerals Ltd. | 41,990 | 111,931 | ||||||
Rio Tinto Ltd. | 59,150 | 2,108,880 | ||||||
Sandfire Resources NL | 18,850 | 80,984 | ||||||
Sims Metal Management Ltd.a | 24,830 | 202,085 | ||||||
Sirius Resources NLa,b | 36,010 | 69,440 | ||||||
South32 Ltd.b | 734,370 | 791,360 | ||||||
Syrah Resources Ltd.a,b | 24,310 | 51,014 | ||||||
Western Areas Ltd. | 28,340 | 55,453 | ||||||
|
| |||||||
| 12,534,819 | ||||||||
AUSTRIA — 0.81% |
| |||||||
Voestalpine AG | 15,287 | 558,408 | ||||||
|
| |||||||
| 558,408 | ||||||||
BELGIUM — 0.36% |
| |||||||
Bekaert SA | 5,460 | 158,271 | ||||||
Nyrstar NVa,b | 37,468 | 94,083 | ||||||
|
| |||||||
| 252,354 | ||||||||
BRAZIL — 1.38% |
| |||||||
Cia. Siderurgica Nacional SA | 85,400 | 82,065 | ||||||
Paranapanema SAb | 26,200 | 15,538 | ||||||
Vale SA | 174,100 | 856,578 | ||||||
|
| |||||||
| 954,181 | ||||||||
CANADA — 3.63% |
| |||||||
Canam Group Inc. | 5,200 | 53,036 | ||||||
Capstone Mining Corp.b | 51,221 | 23,869 | ||||||
Dominion Diamond Corp. | 11,440 | 134,477 | ||||||
Dundee Precious Metals Inc.b | 17,030 | 29,311 | ||||||
First Quantum Minerals Ltd. | 93,211 | 480,592 | ||||||
HudBay Minerals Inc. | 31,720 | 157,110 | ||||||
Imperial Metals Corp.a,b | 5,982 | 39,430 | ||||||
Ivanhoe Mines Ltd. Class Ab | 64,090 | 38,536 | ||||||
Labrador Iron Ore Royalty Corp. | 8,840 | 96,805 | ||||||
Lucara Diamond Corp. | 39,448 | 50,403 | ||||||
| Security | Shares | Value | ||||||
Lundin Mining Corp.b | 87,490 | $ | 293,935 | |||||
Major Drilling Group International Inc. | 11,727 | 35,608 | ||||||
Nevsun Resources Ltd. | 26,699 | 79,264 | ||||||
Sherritt International Corp. | 38,350 | 34,877 | ||||||
Teck Resources Ltd. Class B | 76,180 | 541,076 | ||||||
Thompson Creek Metals Co. Inc.a,b | 28,730 | 15,331 | ||||||
Turquoise Hill Resources Ltd.b | 138,450 | 409,991 | ||||||
|
| |||||||
| 2,513,651 | ||||||||
CHILE — 0.04% |
| |||||||
CAP SA | 10,706 | 26,079 | ||||||
|
| |||||||
| 26,079 | ||||||||
CHINA — 1.04% |
| |||||||
Aluminum Corp. of China Ltd. Class Ha,b | 520,000 | 173,780 | ||||||
China Metal Recycling Holdings Ltd.b | 132,000 | — | ||||||
China Rare Earth Holdings Ltd.a,b | 261,200 | 22,581 | ||||||
China Vanadium Titano-Magnetite Mining Co. Ltd.b | 390,000 | 17,110 | ||||||
CITIC Dameng Holdings Ltd.a,b | 130,000 | 10,903 | ||||||
Honbridge Holdings Ltd.a,b | 520,000 | 68,438 | ||||||
Inner Mongolia Eerduosi Resourses Co. Ltd. Class B | 62,774 | 50,470 | ||||||
Jiangxi Copper Co. Ltd. Class H | 180,000 | 227,379 | ||||||
MMG Ltd.a,b | 160,000 | 33,032 | ||||||
North Mining Shares Co. Ltd.a,b | 1,440,000 | 20,067 | ||||||
Shougang Concord International Enterprises Co. Ltd.a,b | 798,000 | 32,435 | ||||||
Shougang Fushan Resources Group Ltd.a | 260,000 | 32,877 | ||||||
Tiangong International Co. Ltd. | 164,000 | 14,813 | ||||||
Xinjiang Xinxin Mining Industry Co. Ltd. Class Hb | 130,000 | 14,761 | ||||||
|
| |||||||
| 718,646 | ||||||||
EGYPT — 0.00% |
| |||||||
Ezz Steelb | 967 | 1,137 | ||||||
|
| |||||||
| 1,137 | ||||||||
FINLAND — 0.25% |
| |||||||
Outokumpu OYJa,b | 39,524 | 169,972 | ||||||
|
| |||||||
| 169,972 | ||||||||
FRANCE — 1.90% |
| |||||||
APERAM SAb | 6,313 | 213,166 | ||||||
ArcelorMittal | 136,110 | 1,058,275 | ||||||
Erameta,b | 780 | 44,137 | ||||||
|
| |||||||
| 1,315,578 | ||||||||
SCHEDULESOF INVESTMENTS | 25 |
Table of Contents
Schedule of Investments (Continued)
iSHARES® MSCI GLOBAL METALS & MINING PRODUCERS ETF
August 31, 2015
| Security | Shares | Value | ||||||
GERMANY — 2.28% |
| |||||||
Aurubis AG | 4,940 | $ | 327,688 | |||||
Salzgitter AGa | 5,466 | 170,112 | ||||||
ThyssenKrupp AG | 49,920 | 1,080,951 | ||||||
|
| |||||||
| 1,578,751 | ||||||||
GREECE — 0.06% |
| |||||||
Mytilineos Holdings SAb | 8,031 | 40,854 | ||||||
|
| |||||||
| 40,854 | ||||||||
INDIA — 0.39% |
| |||||||
Tata Steel Ltd. GDRc | 76,050 | 266,935 | ||||||
|
| |||||||
| 266,935 | ||||||||
INDONESIA — 0.26% |
| |||||||
Aneka Tambang Persero Tbk PTb | 832,000 | 29,608 | ||||||
Hanson International Tbk PTb | 2,106,000 | 107,923 | ||||||
Krakatau Steel Persero Tbk PTb | 771,600 | 17,574 | ||||||
Timah Persero Tbk PT | 526,067 | 22,653 | ||||||
|
| |||||||
| 177,758 | ||||||||
JAPAN — 10.46% |
| |||||||
Asahi Holdings Inc. | 4,900 | 72,781 | ||||||
Dowa Holdings Co. Ltd. | 26,000 | 226,777 | ||||||
Hitachi Metals Ltd. | 24,000 | 304,592 | ||||||
JFE Holdings Inc. | 68,300 | 1,060,979 | ||||||
Kobe Steel Ltd. | 520,000 | 699,426 | ||||||
Maruichi Steel Tube Ltd. | 4,600 | 117,292 | ||||||
Mitsubishi Materials Corp. | 145,000 | 466,642 | ||||||
Mitsui Mining & Smelting Co. Ltd. | 67,000 | 137,666 | ||||||
Neturen Co. Ltd. | 1,600 | 11,289 | ||||||
Nippon Denko Co. Ltd. | 65,000 | 131,411 | ||||||
Nippon Light Metal Holdings Co. Ltd. | 130,000 | 200,602 | ||||||
Nippon Steel & Sumitomo Metal Corp. | 1,170,400 | 2,411,593 | ||||||
Nippon Yakin Kogyo Co. Ltd.a,b | 78,000 | 119,718 | ||||||
Nisshin Steel Co. Ltd. | 13,000 | 122,507 | ||||||
OSAKA Titanium Technologies Co. Ltd. | 1,800 | 47,085 | ||||||
Sumitomo Metal Mining Co. Ltd. | 48,000 | 610,373 | ||||||
Toho Titanium Co. Ltd.a,b | 6,200 | 81,654 | ||||||
Tokyo Steel Manufacturing Co. Ltd. | 15,000 | 97,165 | ||||||
TOPY Industries Ltd. | 44,000 | 96,943 | ||||||
UACJ Corp. | 43,386 | 80,553 | ||||||
Yamato Kogyo Co. Ltd. | 6,500 | 146,536 | ||||||
|
| |||||||
| 7,243,584 | ||||||||
MALAYSIA — 0.04% |
| |||||||
Press Metal Bhd | 65,000 | 26,619 | ||||||
|
| |||||||
| 26,619 | ||||||||
| Security | Shares | Value | ||||||
MEXICO — 2.12% |
| |||||||
Grupo Mexico SAB de CV Series B | 520,000 | $ | 1,315,495 | |||||
Grupo Simec SAB de CV Series Ba,b | 13,000 | 35,684 | ||||||
Industrias CH SAB de CV Series Ba,b | 18,900 | 64,134 | ||||||
Minera Frisco SAB de CV Series A1a,b | 91,000 | 50,652 | ||||||
|
| |||||||
| 1,465,965 | ||||||||
NORWAY — 0.90% |
| |||||||
Norsk Hydro ASA | 182,910 | 625,154 | ||||||
|
| |||||||
| 625,154 | ||||||||
PERU — 0.88% |
| |||||||
Southern Copper Corp.a | 22,750 | 606,515 | ||||||
|
| |||||||
| 606,515 | ||||||||
PHILIPPINES — 0.08% |
| |||||||
Atlas Consolidated Mining & Development Corp.b | 130,000 | 12,711 | ||||||
Nickel Asia Corp. | 247,000 | 42,540 | ||||||
|
| |||||||
| 55,251 | ||||||||
POLAND — 0.63% |
| |||||||
Jastrzebska Spolka Weglowa SAa,b | 8,061 | 26,153 | ||||||
KGHM Polska Miedz SA | 19,630 | 408,611 | ||||||
|
| |||||||
| 434,764 | ||||||||
RUSSIA — 2.51% |
| |||||||
Alrosa PAO | 247,000 | 242,780 | ||||||
Mechel ADRb | 21,190 | 24,156 | ||||||
MMC Norilsk Nickel PJSC | 7,410 | 1,160,589 | ||||||
Severstal PAO | 28,600 | 311,634 | ||||||
|
| |||||||
| 1,739,159 | ||||||||
SINGAPORE — 0.04% |
| |||||||
Midas Holdings Ltd.a | 160,800 | 29,645 | ||||||
|
| |||||||
| 29,645 | ||||||||
SOUTH AFRICA — 1.16% |
| |||||||
African Rainbow Minerals Ltd. | 14,950 | 80,068 | ||||||
Anglo American Platinum Ltd.b | 7,109 | 171,606 | ||||||
ArcelorMittal South Africa Ltd.b | 28,860 | 21,671 | ||||||
Assore Ltd. | 4,810 | 31,143 | ||||||
Impala Platinum Holdings Ltd.b | 73,193 | 273,255 | ||||||
Kumba Iron Ore Ltd. | 8,840 | 60,207 | ||||||
Northam Platinum Ltd.b | 48,695 | 138,439 | ||||||
Royal Bafokeng Platinum Ltd.b | 11,440 | 28,453 | ||||||
|
| |||||||
| 804,842 | ||||||||
SOUTH KOREA — 4.13% |
| |||||||
Dongkuk Steel Mill Co. Ltd.a,b | 8,650 | 43,515 | ||||||
Hyundai BNG Steel Co. Ltd. | 1,431 | 12,583 | ||||||
| 26 | 2015 iSHARES ANNUAL REPORTTO SHAREHOLDERS |
Table of Contents
Schedule of Investments (Continued)
iSHARES® MSCI GLOBAL METALS & MINING PRODUCERS ETF
August 31, 2015
| Security | Shares | Value | ||||||
Hyundai Steel Co. | 11,089 | $ | 495,970 | |||||
KISCO Corp. | 656 | 26,761 | ||||||
KISWIRE Ltd. | 871 | 34,317 | ||||||
Korea Zinc Co. Ltd. | 1,170 | 507,470 | ||||||
Poongsan Corp. | 3,135 | 65,072 | ||||||
Poongsan Holdings Corp. | 735 | 25,665 | ||||||
POSCO | 9,416 | 1,512,611 | ||||||
POSCO Chemtech Co. Ltd. | 3,250 | 32,974 | ||||||
SeAH Besteel Corp. | 2,025 | 54,616 | ||||||
SeAH Holdings Corp. | 130 | 21,873 | ||||||
SeAH Steel Corp. | 417 | 24,327 | ||||||
|
| |||||||
| 2,857,754 | ||||||||
SPAIN — 0.42% |
| |||||||
Acerinox SA | 20,410 | 235,440 | ||||||
Tubacex SA | 15,210 | 39,028 | ||||||
Tubos Reunidos SAa | 15,472 | 19,764 | ||||||
|
| |||||||
| 294,232 | ||||||||
SWEDEN — 1.20% |
| |||||||
Boliden AB | 37,310 | 615,146 | ||||||
SSAB AB Class Aa,b | 30,581 | 128,159 | ||||||
SSAB AB Class Bb | 24,960 | 91,042 | ||||||
|
| |||||||
| 834,347 | ||||||||
SWITZERLAND — 0.10% |
| |||||||
Schmolz + Bickenbach AG Registeredb | 82,161 | 67,119 | ||||||
|
| |||||||
| 67,119 | ||||||||
TAIWAN — 2.14% |
| |||||||
China Metal Products | 130,011 | 91,506 | ||||||
China Steel Corp. | 1,690,612 | 1,013,245 | ||||||
Chun Yuan Steel | 41,040 | 11,630 | ||||||
Chung Hung Steel Corp.b | 69,000 | 8,801 | ||||||
Feng Hsin Iron & Steel Co. | 130,000 | 137,847 | ||||||
Gloria Material Technology Corp. | 130,201 | 62,828 | ||||||
TA Chen Stainless Pipe | 32,582 | 14,621 | ||||||
Ton Yi Industrial Corp. | 70,000 | 31,949 | ||||||
Tung Ho Steel Enterprise Corp. | 75,000 | 40,109 | ||||||
Yieh Phui Enterprise Co. Ltd. | 267,440 | 65,923 | ||||||
|
| |||||||
| 1,478,459 | ||||||||
THAILAND — 0.06% |
| |||||||
STP & I PCL NVDRa | 111,160 | 43,106 | ||||||
|
| |||||||
| 43,106 | ||||||||
TURKEY — 0.53% |
| |||||||
Borusan Mannesmann Boru Sanayi ve Ticaret AS | 6,169 | 12,546 | ||||||
Eregli Demir ve Celik Fabrikalari TAS | 190,973 | 259,791 | ||||||
| Security | Shares | Value | ||||||
Izmir Demir Celik Sanayi ASb | 13,856 | $ | 8,758 | |||||
Kardemir Karabuk Demir Celik Sanayi ve Ticaret AS Class A | 14,191 | 7,751 | ||||||
Kardemir Karabuk Demir Celik Sanayi ve Ticaret AS Class D | 112,343 | 49,013 | ||||||
Koza Anadolu Metal Madencilik Isletmeleri ASb | 25,357 | 20,383 | ||||||
Park Elektrik Uretim Madencilik Sanayi ve Ticaret ASb | 7,670 | 9,749 | ||||||
|
| |||||||
| 367,991 | ||||||||
UNITED KINGDOM — 26.18% |
| |||||||
African Minerals Ltd.a,b | 69,505 | 1 | ||||||
Anglo American PLC | 189,020 | 2,154,182 | ||||||
Antofagasta PLC | 54,080 | 506,536 | ||||||
BHP Billiton PLC | 285,350 | 4,967,990 | ||||||
Evraz PLCb | 49,533 | 60,145 | ||||||
Ferrexpo PLC | 24,311 | 23,089 | ||||||
Gem Diamonds Ltd. | 15,600 | 31,191 | ||||||
Glencore PLC | 1,503,970 | 3,430,336 | ||||||
KAZ Minerals PLCa,b | 36,401 | 97,637 | ||||||
Lonmin PLCa,b | 77,870 | 42,037 | ||||||
Petra Diamonds Ltd.a,b | 58,630 | 112,716 | ||||||
Rio Tinto PLC | 172,380 | 6,331,077 | ||||||
Vedanta Ltd. ADR | 44,470 | 271,267 | ||||||
Vedanta Resources PLCa | 10,920 | 91,952 | ||||||
|
| |||||||
| 18,120,156 | ||||||||
UNITED STATES — 13.31% |
| |||||||
AK Steel Holding Corp.a,b | 24,570 | 75,921 | ||||||
Alcoa Inc. | 177,580 | 1,678,131 | ||||||
Allegheny Technologies Inc. | 14,610 | 282,119 | ||||||
Carpenter Technology Corp. | 7,187 | 280,293 | ||||||
Century Aluminum Co.b | 7,280 | 40,768 | ||||||
Cliffs Natural Resources Inc.a | 18,980 | 75,351 | ||||||
Commercial Metals Co. | 16,510 | 259,207 | ||||||
Compass Minerals International Inc. | 4,810 | 389,610 | ||||||
Freeport-McMoRan Inc. | 140,400 | 1,493,856 | ||||||
Globe Specialty Metals Inc. | 9,100 | 125,034 | ||||||
Haynes International Inc. | 1,977 | 75,561 | ||||||
Horsehead Holding Corp.a,b | 7,540 | 61,677 | ||||||
Kaiser Aluminum Corp. | 2,730 | 228,173 | ||||||
Materion Corp. | 2,627 | 81,332 | ||||||
Nucor Corp. | 43,420 | 1,879,652 | ||||||
Reliance Steel & Aluminum Co. | 10,790 | 627,115 | ||||||
Schnitzer Steel Industries Inc. Class A | 3,640 | 63,008 | ||||||
SCHEDULESOF INVESTMENTS | 27 |
Table of Contents
Schedule of Investments (Continued)
iSHARES® MSCI GLOBAL METALS & MINING PRODUCERS ETF
August 31, 2015
| Security | Shares | Value | ||||||
Steel Dynamics Inc. | 32,890 | $ | 640,697 | |||||
Stillwater Mining Co.a,b | 16,180 | 154,519 | ||||||
SunCoke Energy Inc. | 9,360 | 107,453 | ||||||
TimkenSteel Corp. | 4,940 | 88,278 | ||||||
U.S. Steel Corp. | 19,787 | 324,111 | ||||||
Worthington Industries Inc. | 7,020 | 179,642 | ||||||
|
| |||||||
| 9,211,508 | ||||||||
|
| |||||||
TOTAL COMMON STOCKS |
| |||||||
(Cost: $104,076,918) |
| 67,415,293 | ||||||
PREFERRED STOCKS — 1.94% |
| |||||||
BRAZIL — 1.94% |
| |||||||
Bradespar SA | 26,000 | 66,887 | ||||||
Cia. Ferro Ligas da Bahia-Ferbasa | 15,700 | 31,036 | ||||||
Gerdau SA | 110,900 | 159,853 | ||||||
Metalurgica Gerdau SA | 39,000 | 32,230 | ||||||
Usinas Siderurgicas de Minas Gerais SA Class A | 52,000 | 42,545 | ||||||
Vale SA | 260,000 | 1,010,090 | ||||||
|
| |||||||
| 1,342,641 | ||||||||
|
| |||||||
TOTAL PREFERRED STOCKS |
| |||||||
(Cost: $2,236,763) |
| 1,342,641 | ||||||
SHORT-TERM INVESTMENTS — 3.77% |
| |||||||
MONEY MARKET FUNDS — 3.77% |
| |||||||
BlackRock Cash Funds: Institutional, |
| |||||||
0.18%d,e,f | 2,379,387 | 2,379,387 | ||||||
BlackRock Cash Funds: Prime, |
| |||||||
0.18%d,e,f | 136,636 | 136,636 | ||||||
BlackRock Cash Funds: Treasury, |
| |||||||
0.03%d,e | 95,593 | 95,593 | ||||||
|
| |||||||
| 2,611,616 | ||||||||
|
| |||||||
TOTAL SHORT-TERM INVESTMENTS |
| |||||||
(Cost: $2,611,616) |
| 2,611,616 | ||||||
|
| |||||||
TOTAL INVESTMENTS |
| |||||||
(Cost: $108,925,297) |
| 71,369,550 | ||||||
Other Assets, Less Liabilities — (3.11)% |
| (2,150,948 | ) | |||||
|
| |||||||
NET ASSETS — 100.00% |
| $ | 69,218,602 | |||||
|
| |||||||
ADR — American Depositary Receipts
GDR — Global Depositary Receipts
NVDR — Non-Voting Depositary Receipts
| a | All or a portion of this security represents a security on loan. See Note 1. |
| b | Non-income earning security. |
| c | This security may be resold to qualified foreign investors and foreign institutional buyers under Regulation S of the Securities Act of 1933. |
| d | Affiliated issuer. See Note 2. |
| e | The rate quoted is the annualized seven-day yield of the fund at period end. |
| f | All or a portion of this security represents an investment of securities lending collateral. See Note 1. |
See notes to financial statements.
| 28 | 2015 iSHARES ANNUAL REPORTTO SHAREHOLDERS |
Table of Contents
Schedule of Investments
iSHARES® MSCI GLOBAL SILVER MINERS ETF
August 31, 2015
| Security | Shares | Value | ||||||
COMMON STOCKS — 97.65% | ||||||||
AUSTRALIA — 0.15% | ||||||||
Alcyone Resources Ltd.a | 26,593,384 | $ | 18,853 | |||||
|
| |||||||
| 18,853 | ||||||||
CANADA — 56.98% | ||||||||
Alexco Resource Corp.a | 364,640 | 112,366 | ||||||
Americas Silver Corp.a,b | 1,296,970 | 146,220 | ||||||
Dalradian Resources Inc.a | 310,790 | 196,215 | ||||||
Endeavour Silver Corp.a,b | 131,980 | 220,215 | ||||||
Excellon Resources Inc.a | 476,580 | 141,487 | ||||||
First Majestic Silver Corp.a,b | 113,840 | 388,451 | ||||||
Fortuna Silver Mines Inc.a,b | 128,900 | 310,019 | ||||||
GoGold Resources Inc.a,b | 234,740 | 236,416 | ||||||
Great Panther Silver Ltd.a,b | 349,540 | 139,238 | ||||||
MAG Silver Corp.a,b | 55,160 | 401,314 | ||||||
Mandalay Resources Corp. | 393,140 | 245,251 | ||||||
Minco Silver Corp.a | 405,120 | 140,064 | ||||||
Pan American Silver Corp. | 81,525 | 559,431 | ||||||
Silver Standard Resources Inc.a | 72,160 | 459,373 | ||||||
Silver Wheaton Corp. | 208,930 | 2,532,913 | ||||||
Silvercorp Metals Inc.b | 252,900 | 176,773 | ||||||
Tahoe Resources Inc. | 71,365 | 590,015 | ||||||
|
| |||||||
| 6,995,761 | ||||||||
CHINA — 1.15% | ||||||||
China Silver Group Ltd.b | 580,000 | 141,444 | ||||||
|
| |||||||
| 141,444 | ||||||||
HONG KONG — 4.96% | ||||||||
G-Resources Group Ltd. | 19,380,000 | 515,130 | ||||||
Loco Hong Kong Holdings Ltd.a,b | 1,200,000 | 94,451 | ||||||
|
| |||||||
| 609,581 | ||||||||
MEXICO — 7.26% | ||||||||
Industrias Penoles SAB de CV | 62,732 | 891,333 | ||||||
|
| |||||||
| 891,333 | ||||||||
PERU — 3.94% | ||||||||
Cia. de Minas Buenaventura SA ADR | 76,560 | 483,859 | ||||||
|
| |||||||
| 483,859 | ||||||||
UNITED KINGDOM — 12.18% | ||||||||
Arian Silver Corp.a,b | 328,900 | 108,757 | ||||||
Fresnillo PLC | 121,880 | 1,163,136 | ||||||
Hochschild Mining PLCa | 215,040 | 224,071 | ||||||
|
| |||||||
| 1,495,964 | ||||||||
| Security | Shares | Value | ||||||
UNITED STATES — 11.03% | ||||||||
Coeur Mining Inc.a | 123,980 | $ | 416,573 | |||||
Golden Minerals Co.a | 461,400 | 156,876 | ||||||
Hecla Mining Co. | 258,880 | 533,293 | ||||||
McEwen Mining Inc. | 270,760 | 247,068 | ||||||
|
| |||||||
| 1,353,810 | ||||||||
|
| |||||||
TOTAL COMMON STOCKS | 11,990,605 | |||||||
SHORT-TERM INVESTMENTS — 8.09% |
| |||||||
MONEY MARKET FUNDS — 8.09% |
| |||||||
BlackRock Cash Funds: Institutional, |
| |||||||
0.18%c,d,e | 933,788 | 933,788 | ||||||
BlackRock Cash Funds: Prime, | ||||||||
0.18%c,d,e | 53,623 | 53,623 | ||||||
BlackRock Cash Funds: Treasury, | ||||||||
0.03%c,d | 5,674 | 5,674 | ||||||
|
| |||||||
| 993,085 | ||||||||
|
| |||||||
TOTAL SHORT-TERM INVESTMENTS |
| |||||||
(Cost: $993,085) | 993,085 | |||||||
|
| |||||||
TOTAL INVESTMENTS |
| |||||||
(Cost: $19,260,039) | 12,983,690 | |||||||
Other Assets, Less Liabilities — (5.74)% |
| (704,984 | ) | |||||
|
| |||||||
NET ASSETS — 100.00% | $ | 12,278,706 | ||||||
|
| |||||||
ADR — American Depositary Receipts
| a | Non-income earning security. |
| b | All or a portion of this security represents a security on loan. See Note 1. |
| c | Affiliated issuer. See Note 2. |
| d | The rate quoted is the annualized seven-day yield of the fund at period end. |
| e | All or a portion of this security represents an investment of securities lending collateral. See Note 1. |
See notes to financial statements.
SCHEDULESOF INVESTMENTS | 29 |
Table of Contents
Statements of Assets and Liabilities
iSHARES® , INC.
August 31, 2015
iShares MSCI Global Agriculture Producers ETF | iShares MSCI Global Energy Producers ETF | iShares MSCI Global Gold | ||||||||||
ASSETS | ||||||||||||
Investments, at cost: | ||||||||||||
Unaffiliated | $ | 31,490,929 | $ | 31,174,247 | $ | 76,703,730 | ||||||
Affiliated (Note 2) | 1,054,975 | 242,439 | 1,576,492 | |||||||||
|
|
|
|
|
| |||||||
Total cost of investments | $ | 32,545,904 | $ | 31,416,686 | $ | 78,280,222 | ||||||
|
|
|
|
|
| |||||||
Investments in securities, at fair value (including securities on loana) (Note 1): | ||||||||||||
Unaffiliated | $ | 27,131,610 | $ | 24,538,065 | $ | 45,900,351 | ||||||
Affiliated (Note 2) | 1,049,712 | 242,439 | 1,576,492 | |||||||||
|
|
|
|
|
| |||||||
Total fair value of investments | 28,181,322 | 24,780,504 | 47,476,843 | |||||||||
Foreign currency, at valueb | 29,340 | 21,364 | 47,357 | |||||||||
Receivables: | ||||||||||||
Investment securities sold | 89,725 | 2,229 | 2,927,609 | |||||||||
Dividends and interest | 75,463 | 167,256 | 28,715 | |||||||||
|
|
|
|
|
| |||||||
Total Assets | 28,375,850 | 24,971,353 | 50,480,524 | |||||||||
|
|
|
|
|
| |||||||
LIABILITIES | ||||||||||||
Payables: | ||||||||||||
Investment securities purchased | 66,442 | — | 2,966,405 | |||||||||
Collateral for securities on loan (Note 1) | 659,466 | 223,477 | 1,546,813 | |||||||||
Securities related to in-kind transactions (Note 4) | — | — | 25,274 | |||||||||
Investment advisory fees (Note 2) | 9,968 | 8,457 | 15,881 | |||||||||
|
|
|
|
|
| |||||||
Total Liabilities | 735,876 | 231,934 | 4,554,373 | |||||||||
|
|
|
|
|
| |||||||
NET ASSETS | $ | 27,639,974 | $ | 24,739,419 | $ | 45,926,151 | ||||||
|
|
|
|
|
| |||||||
Net assets consist of: | ||||||||||||
Paid-in capital | $ | 33,288,826 | $ | 31,807,310 | $ | 101,308,470 | ||||||
Undistributed net investment income | 96,640 | 182,749 | 114,183 | |||||||||
Undistributed net realized loss | (1,377,396 | ) | (613,781 | ) | (24,692,716 | ) | ||||||
Net unrealized depreciation | (4,368,096 | ) | (6,636,859 | ) | (30,803,786 | ) | ||||||
|
|
|
|
|
| |||||||
NET ASSETS | $ | 27,639,974 | $ | 24,739,419 | $ | 45,926,151 | ||||||
|
|
|
|
|
| |||||||
Shares outstandingc | 1,150,000 | 1,400,000 | 8,250,000 | |||||||||
|
|
|
|
|
| |||||||
Net asset value per share | $ | 24.03 | $ | 17.67 | $ | 5.57 | ||||||
|
|
|
|
|
| |||||||
| a | Securities on loan with values of $615,377, $212,631 and $1,395,165, respectively. See Note 1. |
| b | Cost of foreign currency: $30,012, $21,949 and $48,015, respectively. |
| c | $0.001 par value, number of shares authorized: 500 million, 500 million and 500 million, respectively. |
See notes to financial statements.
| 30 | 2015 iSHARES ANNUAL REPORTTO SHAREHOLDERS |
Table of Contents
Statements of Assets and Liabilities (Continued)
iSHARES®, INC.
August 31, 2015
iShares MSCI Global Metals & Mining Producers ETF | iShares MSCI Global Silver | |||||||
ASSETS | ||||||||
Investments, at cost: | ||||||||
Unaffiliated | $ | 106,313,681 | $ | 18,266,954 | ||||
Affiliated (Note 2) | 2,611,616 | 993,085 | ||||||
|
|
|
| |||||
Total cost of investments | $ | 108,925,297 | $ | 19,260,039 | ||||
|
|
|
| |||||
Investments in securities, at fair value (including securities on loana) (Note 1): | ||||||||
Unaffiliated | $ | 68,757,934 | $ | 11,990,605 | ||||
Affiliated (Note 2) | 2,611,616 | 993,085 | ||||||
|
|
|
| |||||
Total fair value of investments | 71,369,550 | 12,983,690 | ||||||
Foreign currency, at valueb | 339,257 | 12,867 | ||||||
Cash | 60,399 | — | ||||||
Receivables: | ||||||||
Investment securities sold | 13 | 639,041 | ||||||
Due from custodian (Note 4) | 316,285 | — | ||||||
Dividends and interest | 335,283 | 17,082 | ||||||
Capital shares sold | 1,061 | — | ||||||
|
|
|
| |||||
Total Assets | 72,421,848 | 13,652,680 | ||||||
|
|
|
| |||||
LIABILITIES | ||||||||
Payables: | ||||||||
Investment securities purchased | 604,877 | 382,322 | ||||||
Collateral for securities on loan (Note 1) | 2,516,023 | 987,411 | ||||||
Due to custodian | 60,399 | — | ||||||
Foreign taxes (Note 1) | 539 | — | ||||||
Investment advisory fees (Note 2) | 21,408 | 4,241 | ||||||
|
|
|
| |||||
Total Liabilities | 3,203,246 | 1,373,974 | ||||||
|
|
|
| |||||
NET ASSETS | $ | 69,218,602 | $ | 12,278,706 | ||||
|
|
|
| |||||
Net assets consist of: | ||||||||
Paid-in capital | $ | 125,147,041 | $ | 23,149,913 | ||||
Undistributed (distributions in excess of) net investment income | 255,560 | (46,962 | ) | |||||
Undistributed net realized loss | (18,621,320 | ) | (4,547,349 | ) | ||||
Net unrealized depreciation | (37,562,679 | ) | (6,276,896 | ) | ||||
|
|
|
| |||||
NET ASSETS | $ | 69,218,602 | $ | 12,278,706 | ||||
|
|
|
| |||||
Shares outstandingc | 6,500,000 | 2,000,000 | ||||||
|
|
|
| |||||
Net asset value per share | $ | 10.65 | $ | 6.14 | ||||
|
|
|
| |||||
| a | Securities on loan with values of $2,345,760 and $895,647, respectively. See Note 1. |
| b | Cost of foreign currency: $339,681 and $13,049, respectively. |
| c | $0.001 par value, number of shares authorized: 500 million and 500 million, respectively. |
See notes to financial statements.
FINANCIAL STATEMENTS | 31 |
Table of Contents
Statements of Operations
iSHARES® , INC.
Year ended August 31, 2015
iShares MSCI Global Agriculture Producers ETF | iShares MSCI Global Energy Producers ETF | iShares MSCI Global Gold | ||||||||||
NET INVESTMENT INCOME | ||||||||||||
Dividends — unaffiliateda | $ | 858,369 | $ | 763,973 | $ | 678,853 | ||||||
Dividends — affiliated (Note 2) | 2,081 | — | — | |||||||||
Interest — affiliated (Note 2) | 3 | 2 | 3 | |||||||||
Securities lending income — affiliated — net (Note 2) | 15,809 | 1,373 | 23,047 | |||||||||
|
|
|
|
|
| |||||||
Total investment income | 876,262 | 765,348 | 701,903 | |||||||||
|
|
|
|
|
| |||||||
EXPENSES | ||||||||||||
Investment advisory fees (Note 2) | 151,493 | 82,566 | 216,127 | |||||||||
|
|
|
|
|
| |||||||
Total expenses | 151,493 | 82,566 | 216,127 | |||||||||
Less investment advisory fees waived (Note 2) | (3,225 | ) | — | — | ||||||||
|
|
|
|
|
| |||||||
Net expenses | 148,268 | 82,566 | 216,127 | |||||||||
|
|
|
|
|
| |||||||
Net investment income | 727,994 | 682,782 | 485,776 | |||||||||
|
|
|
|
|
| |||||||
NET REALIZED AND UNREALIZED GAIN (LOSS) | ||||||||||||
Net realized gain (loss) from: | ||||||||||||
Investments — unaffiliated | (698,754 | ) | (494,955 | ) | (12,893,120 | ) | ||||||
Investments — affiliated (Note 2) | 1,895 | — | — | |||||||||
In-kind redemptions — unaffiliated | 902,471 | 220,912 | 673,906 | |||||||||
In-kind redemptions — affiliated (Note 2) | 35,289 | — | — | |||||||||
Foreign currency transactions | (14,315 | ) | (9,692 | ) | (3,452 | ) | ||||||
|
|
|
|
|
| |||||||
Net realized gain (loss) | 226,586 | (283,735 | ) | (12,222,666 | ) | |||||||
|
|
|
|
|
| |||||||
Net change in unrealized appreciation/depreciation on: | ||||||||||||
Investments | (4,639,308 | ) | (7,285,409 | ) | (26,921,794 | ) | ||||||
Translation of assets and liabilities in foreign currencies | (2,995 | ) | (606 | ) | (769 | ) | ||||||
|
|
|
|
|
| |||||||
Net change in unrealized appreciation/depreciation | (4,642,303 | ) | (7,286,015 | ) | (26,922,563 | ) | ||||||
|
|
|
|
|
| |||||||
Net realized and unrealized loss | (4,415,717 | ) | (7,569,750 | ) | (39,145,229 | ) | ||||||
|
|
|
|
|
| |||||||
NET DECREASE IN NET ASSETS RESULTING FROM OPERATIONS | $ | (3,687,723 | ) | $ | (6,886,968 | ) | $ | (38,659,453 | ) | |||
|
|
|
|
|
| |||||||
| a | Net of foreign withholding tax of $71,918, $44,685 and $85,439, respectively. |
See notes to financial statements.
| 32 | 2015 iSHARES ANNUAL REPORTTO SHAREHOLDERS |
Table of Contents
Statements of Operations (Continued)
iSHARES®, INC.
Year ended August 31, 2015
iShares MSCI Global Metals & Mining Producers ETF | iShares MSCI Global Silver | |||||||
NET INVESTMENT INCOME | ||||||||
Dividends — unaffiliateda | $ | 8,010,428 | $ | 117,975 | ||||
Interest — affiliated (Note 2) | 16 | 1 | ||||||
Securities lending income — affiliated — net (Note 2) | 84,006 | 10,881 | ||||||
|
|
|
| |||||
| 8,094,450 | 128,857 | |||||||
Less: Other foreign taxes (Note 1) | (559 | ) | — | |||||
|
|
|
| |||||
Total investment income | 8,093,891 | 128,857 | ||||||
|
|
|
| |||||
EXPENSES | ||||||||
Investment advisory fees (Note 2) | 566,461 | 52,280 | ||||||
|
|
|
| |||||
Total expenses | 566,461 | 52,280 | ||||||
|
|
|
| |||||
Net investment income | 7,527,430 | 76,577 | ||||||
|
|
|
| |||||
NET REALIZED AND UNREALIZED GAIN (LOSS) | ||||||||
Net realized gain (loss) from: | ||||||||
Investments — unaffiliated | (13,439,479 | ) | (2,833,317 | ) | ||||
In-kind redemptions — unaffiliated | (4,760,190 | ) | 171,367 | |||||
Foreign currency transactions | (116,760 | ) | (1,979 | ) | ||||
|
|
|
| |||||
Net realized loss | (18,316,429 | ) | (2,663,929 | ) | ||||
|
|
|
| |||||
Net change in unrealized appreciation/depreciation on: | ||||||||
Investments | (46,805,436 | ) | (6,306,655 | ) | ||||
Translation of assets and liabilities in foreign currencies | (3,484 | ) | (507 | ) | ||||
|
|
|
| |||||
Net change in unrealized appreciation/depreciation | (46,808,920 | ) | (6,307,162 | ) | ||||
|
|
|
| |||||
Net realized and unrealized loss | (65,125,349 | ) | (8,971,091 | ) | ||||
|
|
|
| |||||
NET DECREASE IN NET ASSETS RESULTING FROM OPERATIONS | $ | (57,597,919 | ) | $ | (8,894,514 | ) | ||
|
|
|
| |||||
| a | Net of foreign withholding tax of $231,544 and $12,786, respectively. |
See notes to financial statements.
FINANCIAL STATEMENTS | 33 |
Table of Contents
Statements of Changes in Net Assets
iSHARES® , INC.
| iShares MSCI Global Agriculture Producers ETF | iShares MSCI Global Energy Producers ETF | |||||||||||||||
| Year ended August 31, 2015 | Year ended August 31, 2014 | Year ended August 31, 2015 | Year ended August 31, 2014 | |||||||||||||
INCREASE (DECREASE) IN NET ASSETS | ||||||||||||||||
OPERATIONS: | ||||||||||||||||
Net investment income | $ | 727,994 | $ | 903,316 | $ | 682,782 | $ | 143,021 | ||||||||
Net realized gain (loss) | 226,586 | (54,954 | ) | (283,735 | ) | (96,577 | ) | |||||||||
Net change in unrealized appreciation/depreciation | (4,642,303 | ) | 3,654,533 | (7,286,015 | ) | 849,565 | ||||||||||
|
|
|
|
|
|
|
| |||||||||
Net increase (decrease) in net assets resulting from operations | (3,687,723 | ) | 4,502,895 | (6,886,968 | ) | 896,009 | ||||||||||
|
|
|
|
|
|
|
| |||||||||
DISTRIBUTIONS TO SHAREHOLDERS: | ||||||||||||||||
From net investment income | (764,487 | ) | (869,161 | ) | (528,102 | ) | (128,943 | ) | ||||||||
|
|
|
|
|
|
|
| |||||||||
Total distributions to shareholders | (764,487 | ) | (869,161 | ) | (528,102 | ) | (128,943 | ) | ||||||||
|
|
|
|
|
|
|
| |||||||||
CAPITAL SHARE TRANSACTIONS: | ||||||||||||||||
Proceeds from shares sold | 1,262,653 | 12,206,285 | 27,723,504 | 2,840,186 | ||||||||||||
Cost of shares redeemed | (15,565,180 | ) | (5,161,272 | ) | (3,987,605 | ) | — | |||||||||
|
|
|
|
|
|
|
| |||||||||
Net increase (decrease) in net assets from capital share transactions | (14,302,527 | ) | 7,045,013 | 23,735,899 | 2,840,186 | |||||||||||
|
|
|
|
|
|
|
| |||||||||
INCREASE (DECREASE) IN NET ASSETS | (18,754,737 | ) | 10,678,747 | 16,320,829 | 3,607,252 | |||||||||||
NET ASSETS | ||||||||||||||||
Beginning of year | 46,394,711 | 35,715,964 | 8,418,590 | 4,811,338 | ||||||||||||
|
|
|
|
|
|
|
| |||||||||
End of year | $ | 27,639,974 | $ | 46,394,711 | $ | 24,739,419 | $ | 8,418,590 | ||||||||
|
|
|
|
|
|
|
| |||||||||
Undistributed net investment income included in net assets at end of year | $ | 96,640 | $ | 146,167 | $ | 182,749 | $ | 36,482 | ||||||||
|
|
|
|
|
|
|
| |||||||||
SHARES ISSUED AND REDEEMED | ||||||||||||||||
Shares sold | 50,000 | 450,000 | 1,300,000 | 100,000 | ||||||||||||
Shares redeemed | (600,000 | ) | (200,000 | ) | (200,000 | ) | — | |||||||||
|
|
|
|
|
|
|
| |||||||||
Net increase (decrease) in shares outstanding | (550,000 | ) | 250,000 | 1,100,000 | 100,000 | |||||||||||
|
|
|
|
|
|
|
| |||||||||
See notes to financial statements.
| 34 | 2015 iSHARES ANNUAL REPORTTO SHAREHOLDERS |
Table of Contents
Statements of Changes in Net Assets (Continued)
iSHARES®, INC.
| iShares MSCI Global Gold Miners ETF | iShares MSCI Global Metals & Mining Producers ETF | |||||||||||||||
| Year ended August 31, 2015 | Year ended August 31, 2014 | Year ended August 31, 2015 | Year ended August 31, 2014 | |||||||||||||
INCREASE (DECREASE) IN NET ASSETS | ||||||||||||||||
OPERATIONS: | ||||||||||||||||
Net investment income | $ | 485,776 | $ | 419,898 | $ | 7,527,430 | $ | 4,351,654 | ||||||||
Net realized gain (loss) | (12,222,666 | ) | (9,562,667 | ) | (18,316,429 | ) | 5,287,882 | |||||||||
Net change in unrealized appreciation/depreciation | (26,922,563 | ) | 11,792,558 | (46,808,920 | ) | 24,025,906 | ||||||||||
|
|
|
|
|
|
|
| |||||||||
Net increase (decrease) in net assets resulting from operations | (38,659,453 | ) | 2,649,789 | (57,597,919 | ) | 33,665,442 | ||||||||||
|
|
|
|
|
|
|
| |||||||||
DISTRIBUTIONS TO SHAREHOLDERS: | ||||||||||||||||
From net investment income | (425,675 | ) | (410,920 | ) | (7,833,689 | ) | (4,935,233 | ) | ||||||||
|
|
|
|
|
|
|
| |||||||||
Total distributions to shareholders | (425,675 | ) | (410,920 | ) | (7,833,689 | ) | (4,935,233 | ) | ||||||||
|
|
|
|
|
|
|
| |||||||||
CAPITAL SHARE TRANSACTIONS: | ||||||||||||||||
Proceeds from shares sold | 19,671,874 | 33,392,792 | 98,298,863 | 51,854,849 | ||||||||||||
Cost of shares redeemed | (5,637,066 | ) | (2,940,209 | ) | (147,347,875 | ) | (119,693,896 | ) | ||||||||
|
|
|
|
|
|
|
| |||||||||
Net increase (decrease) in net assets from capital share transactions | 14,034,808 | 30,452,583 | (49,049,012 | ) | (67,839,047 | ) | ||||||||||
|
|
|
|
|
|
|
| |||||||||
INCREASE (DECREASE) IN NET ASSETS | (25,050,320 | ) | 32,691,452 | (114,480,620 | ) | (39,108,838 | ) | |||||||||
NET ASSETS | ||||||||||||||||
Beginning of year | 70,976,471 | 38,285,019 | 183,699,222 | 222,808,060 | ||||||||||||
|
|
|
|
|
|
|
| |||||||||
End of year | $ | 45,926,151 | $ | 70,976,471 | $ | 69,218,602 | $ | 183,699,222 | ||||||||
|
|
|
|
|
|
|
| |||||||||
Undistributed net investment income included in net assets at end of year | $ | 114,183 | $ | 57,467 | $ | 255,560 | $ | 517,663 | ||||||||
|
|
|
|
|
|
|
| |||||||||
SHARES ISSUED AND REDEEMED | ||||||||||||||||
Shares sold | 2,700,000 | 3,300,000 | 6,750,000 | 2,650,000 | ||||||||||||
Shares redeemed | (750,000 | ) | (300,000 | ) | (9,350,000 | ) | (5,850,000 | ) | ||||||||
|
|
|
|
|
|
|
| |||||||||
Net increase (decrease) in shares outstanding | 1,950,000 | 3,000,000 | (2,600,000 | ) | (3,200,000 | ) | ||||||||||
|
|
|
|
|
|
|
| |||||||||
See notes to financial statements.
FINANCIAL STATEMENTS | 35 |
Table of Contents
Statements of Changes in Net Assets (Continued)
iSHARES®, INC.
| iShares MSCI Global Silver Miners ETF | ||||||||
| Year ended August 31, 2015 | Year ended August 31, 2014 | |||||||
INCREASE (DECREASE) IN NET ASSETS | ||||||||
OPERATIONS: | ||||||||
Net investment income | $ | 76,577 | $ | 55,868 | ||||
Net realized loss | (2,663,929 | ) | (1,309,004 | ) | ||||
Net change in unrealized appreciation/depreciation | (6,307,162 | ) | 1,092,563 | |||||
|
|
|
| |||||
Net decrease in net assets resulting from operations | (8,894,514 | ) | (160,573 | ) | ||||
|
|
|
| |||||
DISTRIBUTIONS TO SHAREHOLDERS: | ||||||||
From net investment income | (294,253 | ) | (104,622 | ) | ||||
|
|
|
| |||||
Total distributions to shareholders | (294,253 | ) | (104,622 | ) | ||||
|
|
|
| |||||
CAPITAL SHARE TRANSACTIONS: | ||||||||
Proceeds from shares sold | 8,449,898 | 7,281,618 | ||||||
Cost of shares redeemed | (957,750 | ) | — | |||||
|
|
|
| |||||
Net increase in net assets from capital share transactions | 7,492,148 | 7,281,618 | ||||||
|
|
|
| |||||
INCREASE (DECREASE) IN NET ASSETS | (1,696,619 | ) | 7,016,423 | |||||
NET ASSETS | ||||||||
Beginning of year | 13,975,325 | 6,958,902 | ||||||
|
|
|
| |||||
End of year | $ | 12,278,706 | $ | 13,975,325 | ||||
|
|
|
| |||||
Distributions in excess of net investment income included in net assets at end of year | $ | (46,962 | ) | $ | (42,879 | ) | ||
|
|
|
| |||||
SHARES ISSUED AND REDEEMED | ||||||||
Shares sold | 1,000,000 | 600,000 | ||||||
Shares redeemed | (100,000 | ) | — | |||||
|
|
|
| |||||
Net increase in shares outstanding | 900,000 | 600,000 | ||||||
|
|
|
| |||||
See notes to financial statements.
| 36 | 2015 iSHARES ANNUAL REPORTTO SHAREHOLDERS |
Table of Contents
iSHARES®, INC.
(For a share outstanding throughout each period)
| iShares MSCI Global Agriculture Producers ETF | ||||||||
| Year ended Aug. 31, 2015 | Year ended Aug. 31, 2014 | Year ended Aug. 31, 2013 | Period from to Aug. 31, 2012 | |||||||||||||
Net asset value, beginning of period | $ | 27.29 | $ | 24.63 | $ | 24.91 | $ | 24.88 | ||||||||
|
|
|
|
|
|
|
| |||||||||
Income from investment operations: | ||||||||||||||||
Net investment incomeb | 0.50 | 0.58 | 0.50 | 0.28 | ||||||||||||
Net realized and unrealized gain (loss)c | (3.21 | ) | 2.63 | (0.46 | ) | (0.05 | ) | |||||||||
|
|
|
|
|
|
|
| |||||||||
Total from investment operations | (2.71 | ) | 3.21 | 0.04 | 0.23 | |||||||||||
|
|
|
|
|
|
|
| |||||||||
Less distributions from: | ||||||||||||||||
Net investment income | (0.55 | ) | (0.55 | ) | (0.32 | ) | (0.20 | ) | ||||||||
|
|
|
|
|
|
|
| |||||||||
Total distributions | (0.55 | ) | (0.55 | ) | (0.32 | ) | (0.20 | ) | ||||||||
|
|
|
|
|
|
|
| |||||||||
Net asset value, end of period | $ | 24.03 | $ | 27.29 | $ | 24.63 | $ | 24.91 | ||||||||
|
|
|
|
|
|
|
| |||||||||
Total return | (10.11 | )% | 13.05 | % | 0.10 | % | 0.97 | %d�� | ||||||||
|
|
|
|
|
|
|
| |||||||||
Ratios/Supplemental data: | ||||||||||||||||
Net assets, end of period (000s) | $ | 27,640 | $ | 46,395 | $ | 35,716 | $ | 9,965 | ||||||||
Ratio of expenses to average net assetse | 0.38 | % | 0.38 | % | 0.38 | % | 0.38 | % | ||||||||
Ratio of expenses to average net assets prior to waived feese | 0.39 | % | 0.39 | % | 0.39 | % | 0.39 | % | ||||||||
Ratio of net investment income to average net assetse | 1.87 | % | 2.17 | % | 1.87 | % | 1.93 | % | ||||||||
Portfolio turnover ratef | 10 | % | 14 | % | 6 | % | 6 | % | ||||||||
| a | Commencement of operations. |
| b | Based on average shares outstanding throughout each period. |
| c | The amounts reported for a share outstanding may not accord with the change in aggregate gains and losses in securities for the fiscal period due to the timing of capital share transactions in relation to the fluctuating market values of the Fund’s underlying securities. |
| d | Not annualized. |
| e | Annualized for periods of less than one year. |
| f | Portfolio turnover rates exclude portfolio securities received or delivered in Creation Units but include portfolio transactions that are executed as a result of the Fund processing capital share transactions in Creation Units partially for cash in U.S. dollars. Excluding such cash transactions, the portfolio turnover rates for the years ended August 31, 2015, August 31, 2014, August 31, 2013 and the period ended August 31, 2012 were 10%, 13%, 6% and 6%, respectively. See Note 4. |
See notes to financial statements.
FINANCIAL HIGHLIGHTS | 37 |
Table of Contents
Financial Highlights (Continued)
iSHARES®, INC.
(For a share outstanding throughout each period)
| iShares MSCI Global Energy Producers ETF | ||||||||
| Year ended Aug. 31, 2015 | Year ended Aug. 31, 2014 | Year ended Aug. 31, 2013 | Period from to Aug. 31, 2012 | |||||||||||||
Net asset value, beginning of period | $ | 28.06 | $ | 24.06 | $ | 23.51 | $ | 24.79 | ||||||||
|
|
|
|
|
|
|
| |||||||||
Income from investment operations: | ||||||||||||||||
Net investment incomeb | 0.68 | 0.68 | 0.63 | 0.43 | ||||||||||||
Net realized and unrealized gain (loss)c | (10.61 | ) | 3.96 | 0.55 | (1.39 | ) | ||||||||||
|
|
|
|
|
|
|
| |||||||||
Total from investment operations | (9.93 | ) | 4.64 | 1.18 | (0.96 | ) | ||||||||||
|
|
|
|
|
|
|
| |||||||||
Less distributions from: | ||||||||||||||||
Net investment income | (0.46 | ) | (0.64 | ) | (0.63 | ) | (0.32 | ) | ||||||||
|
|
|
|
|
|
|
| |||||||||
Total distributions | (0.46 | ) | (0.64 | ) | (0.63 | ) | (0.32 | ) | ||||||||
|
|
|
|
|
|
|
| |||||||||
Net asset value, end of period | $ | 17.67 | $ | 28.06 | $ | 24.06 | $ | 23.51 | ||||||||
|
|
|
|
|
|
|
| |||||||||
Total return | (35.63 | )% | 19.44 | % | 5.10 | % | (3.77 | )%d | ||||||||
|
|
|
|
|
|
|
| |||||||||
Ratios/Supplemental data: | ||||||||||||||||
Net assets, end of period (000s) | $ | 24,739 | $ | 8,419 | $ | 4,811 | $ | 4,701 | ||||||||
Ratio of expenses to average net assetse | 0.39 | % | 0.39 | % | 0.39 | % | 0.39 | % | ||||||||
Ratio of net investment income to average net assetse | 3.23 | % | 2.57 | % | 2.61 | % | 3.16 | % | ||||||||
Portfolio turnover ratef | 4 | % | 8 | % | 6 | % | 5 | % | ||||||||
| a | Commencement of operations. |
| b | Based on average shares outstanding throughout each period. |
| c | The amounts reported for a share outstanding may not accord with the change in aggregate gains and losses in securities for the fiscal period due to the timing of capital share transactions in relation to the fluctuating market values of the Fund’s underlying securities. |
| d | Not annualized. |
| e | Annualized for periods of less than one year. |
| f | Portfolio turnover rates exclude portfolio securities received or delivered in Creation Units but includes portfolio transactions that are executed as a result of the Fund processing capital share transactions in Creation Units partially for cash in U.S. dollars. Excluding such cash transactions, the portfolio turnover rates for the years ended August 31, 2015, August 31, 2014, August 31, 2013 and the period ended August 31, 2012 were 4%, 8%, 6% and 5%, respectively. See Note 4. |
See notes to financial statements.
| 38 | 2015 iSHARES ANNUAL REPORTTO SHAREHOLDERS |
Table of Contents
Financial Highlights (Continued)
iSHARES®, INC.
(For a share outstanding throughout each period)
| iShares MSCI Global Gold Miners ETF | ||||||||||||||||
| Year ended Aug. 31, 2015 | Year ended Aug. 31, 2014 | Year ended Aug. 31, 2013 | Period from to Aug. 31, 2012 | |||||||||||||
Net asset value, beginning of period | $ | 11.27 | $ | 11.60 | $ | 20.05 | $ | 25.00 | ||||||||
|
|
|
|
|
|
|
| |||||||||
Income from investment operations: | ||||||||||||||||
Net investment incomeb | 0.07 | 0.08 | 0.21 | 0.15 | ||||||||||||
Net realized and unrealized gain (loss)c | (5.71 | ) | (0.33 | ) | (8.47 | ) | (5.02 | ) | ||||||||
|
|
|
|
|
|
|
| |||||||||
Total from investment operations | (5.64 | ) | (0.25 | ) | (8.26 | ) | (4.87 | ) | ||||||||
|
|
|
|
|
|
|
| |||||||||
Less distributions from: | ||||||||||||||||
Net investment income | (0.06 | ) | (0.08 | ) | (0.19 | ) | (0.08 | ) | ||||||||
|
|
|
|
|
|
|
| |||||||||
Total distributions | (0.06 | ) | (0.08 | ) | (0.19 | ) | (0.08 | ) | ||||||||
|
|
|
|
|
|
|
| |||||||||
Net asset value, end of period | $ | 5.57 | $ | 11.27 | $ | 11.60 | $ | 20.05 | ||||||||
|
|
|
|
|
|
|
| |||||||||
Total return | (50.16 | )% | (2.01 | )% | (41.28 | )% | (19.45 | )%d | ||||||||
|
|
|
|
|
|
|
| |||||||||
Ratios/Supplemental data: | ||||||||||||||||
Net assets, end of period (000s) | $ | 45,926 | $ | 70,976 | $ | 38,285 | $ | 32,084 | ||||||||
Ratio of expenses to average net assetse | 0.39 | % | 0.39 | % | 0.39 | % | 0.39 | % | ||||||||
Ratio of net investment income to average net assetse | 0.88 | % | 0.81 | % | 1.37 | % | 1.25 | % | ||||||||
Portfolio turnover ratef | 20 | % | 22 | % | 19 | % | 11 | % | ||||||||
| a | Commencement of operations. |
| b | Based on average shares outstanding throughout each period. |
| c | The amounts reported for a share outstanding may not accord with the change in aggregate gains and losses in securities for the fiscal period due to the timing of capital share transactions in relation to the fluctuating market values of the Fund’s underlying securities. |
| d | Not annualized. |
| e | Annualized for periods of less than one year. |
| f | Portfolio turnover rates exclude portfolio securities received or delivered as a result of processing capital share transactions in Creation Units. |
See notes to financial statements.
FINANCIAL HIGHLIGHTS | 39 |
Table of Contents
Financial Highlights (Continued)
iSHARES®, INC.
(For a share outstanding throughout each period)
| iShares MSCI Global Metals & Mining Producers ETF | ||||||||
| Year ended Aug. 31, 2015 | Year ended Aug. 31, 2014 | Year ended Aug. 31, 2013 | Period from to Aug. 31, 2012 | |||||||||||||
Net asset value, beginning of period | $ | 20.19 | $ | 18.11 | $ | 19.00 | $ | 24.76 | ||||||||
|
|
|
|
|
|
|
| |||||||||
Income from investment operations: | ||||||||||||||||
Net investment incomeb | 0.81 | 0.50 | 0.50 | 0.37 | ||||||||||||
Net realized and unrealized gain (loss)c | (8.96 | ) | 2.23 | (1.00 | ) | (6.00 | ) | |||||||||
|
|
|
|
|
|
|
| |||||||||
Total from investment operations | (8.15 | ) | 2.73 | (0.50 | ) | (5.63 | ) | |||||||||
|
|
|
|
|
|
|
| |||||||||
Less distributions from: | ||||||||||||||||
Net investment income | (1.39 | ) | (0.65 | ) | (0.39 | ) | (0.13 | ) | ||||||||
|
|
|
|
|
|
|
| |||||||||
Total distributions | (1.39 | ) | (0.65 | ) | (0.39 | ) | (0.13 | ) | ||||||||
|
|
|
|
|
|
|
| |||||||||
Net asset value, end of period | $ | 10.65 | $ | 20.19 | $ | 18.11 | $ | 19.00 | ||||||||
|
|
|
|
|
|
|
| |||||||||
Total return | (41.94 | )% | 15.32 | % | (2.68 | )% | (22.76 | )%d | ||||||||
|
|
|
|
|
|
|
| |||||||||
Ratios/Supplemental data: | ||||||||||||||||
Net assets, end of period (000s) | $ | 69,219 | $ | 183,699 | $ | 222,808 | $ | 123,524 | ||||||||
Ratio of expenses to average net assetse | 0.39 | % | 0.39 | % | 0.39 | % | 0.39 | % | ||||||||
Ratio of expenses to average net assets prior to waived feese | 0.39 | % | 0.39 | % | 0.39 | % | 0.39 | % | ||||||||
Ratio of net investment income to average net assetse | 5.18 | % | 2.53 | % | 2.51 | % | 2.98 | % | ||||||||
Portfolio turnover ratef | 17 | % | 18 | % | 11 | % | 1 | % | ||||||||
| a | Commencement of operations. |
| b | Based on average shares outstanding throughout each period. |
| c | The amounts reported for a share outstanding may not accord with the change in aggregate gains and losses in securities for the fiscal period due to the timing of capital share transactions in relation to the fluctuating market values of the Fund’s underlying securities. |
| d | Not annualized. |
| e | Annualized for periods of less than one year. |
| f | Portfolio turnover rates exclude portfolio securities received or delivered in Creation Units but include portfolio transactions that are executed as a result of the Fund processing capital share transactions in Creation Units partially for cash in U.S. dollars. Excluding such cash transactions, the portfolio turnover rates for the years ended August 31, 2015, August 31, 2014, August 31, 2013 and the period ended August 31, 2012 were 10%, 15%, 7% and 1%, respectively. See Note 4. |
See notes to financial statements.
| 40 | 2015 iSHARES ANNUAL REPORTTO SHAREHOLDERS |
Table of Contents
Financial Highlights (Continued)
iSHARES®, INC.
(For a share outstanding throughout each period)
| iShares MSCI Global Silver Miners ETF | ||||||||||||||||
| Year ended Aug. 31, 2015 | Year ended Aug. 31, 2014 | Year ended Aug. 31, 2013 | Period from to Aug. 31, 2012 | |||||||||||||
Net asset value, beginning of period | $ | 12.70 | $ | 13.92 | $ | 20.94 | $ | 24.87 | ||||||||
|
|
|
|
|
|
|
| |||||||||
Income from investment operations: | ||||||||||||||||
Net investment incomeb | 0.05 | 0.08 | 0.16 | 0.11 | ||||||||||||
Net realized and unrealized (loss)c | (6.42 | ) | (1.15 | ) | (6.90 | ) | (3.90 | ) | ||||||||
|
|
|
|
|
|
|
| |||||||||
Total from investment operations | (6.37 | ) | (1.07 | ) | (6.74 | ) | (3.79 | ) | ||||||||
|
|
|
|
|
|
|
| |||||||||
Less distributions from: | ||||||||||||||||
Net investment income | (0.19 | ) | (0.15 | ) | (0.28 | ) | (0.14 | ) | ||||||||
|
|
|
|
|
|
|
| |||||||||
Total distributions | (0.19 | ) | (0.15 | ) | (0.28 | ) | (0.14 | ) | ||||||||
|
|
|
|
|
|
|
| |||||||||
Net asset value, end of period | $ | 6.14 | $ | 12.70 | $ | 13.92 | $ | 20.94 | ||||||||
|
|
|
|
|
|
|
| |||||||||
Total return | (50.51 | )% | (7.48 | )% | (32.49 | )% | (15.18 | )%d | ||||||||
|
|
|
|
|
|
|
| |||||||||
Ratios/Supplemental data: | ||||||||||||||||
Net assets, end of period (000s) | $ | 12,279 | $ | 13,975 | $ | 6,959 | $ | 2,094 | ||||||||
Ratio of expenses to average net assetse | 0.39 | % | 0.39 | % | 0.39 | % | 0.39 | % | ||||||||
Ratio of net investment income to average net assetse | 0.57 | % | 0.63 | % | 1.03 | % | 0.86 | % | ||||||||
Portfolio turnover ratef | 31 | % | 22 | % | 13 | % | 9 | % | ||||||||
| a | Commencement of operations. |
| b | Based on average shares outstanding throughout each period. |
| c | The amounts reported for a share outstanding may not accord with the change in aggregate gains and losses in securities for the fiscal period due to the timing of capital share transactions in relation to the fluctuating market values of the Fund’s underlying securities. |
| d | Not annualized. |
| e | Annualized for periods of less than one year. |
| f | Portfolio turnover rates exclude portfolio securities received or delivered as a result of processing capital share transactions in Creation Units. |
See notes to financial statements.
FINANCIAL HIGHLIGHTS | 41 |
Table of Contents
iSHARES® , INC.
iShares, Inc. (the “Company”) is registered under the Investment Company Act of 1940, as amended (the “1940 Act”), as an open-end management investment company. The Company was incorporated under the laws of the State of Maryland on September 1, 1994 pursuant to Articles of Incorporation as subsequently amended and restated.
These financial statements relate only to the following funds (each, a “Fund,” and collectively, the “Funds”):
| iShares ETF | Diversification Classification | |
MSCI Global Agriculture Producers | Non-diversified | |
MSCI Global Energy Producers | Non-diversified | |
MSCI Global Gold Miners | Non-diversified | |
MSCI Global Metals & Mining Producers | Non-diversified | |
MSCI Global Silver Miners | Non-diversified |
The investment objective of each Fund is to seek investment results that correspond generally to the price and yield performance, before fees and expenses, of its underlying index. The investment adviser uses a “passive” or index approach to try to achieve each Fund’s investment objective.
Pursuant to the Company’s organizational documents, the Funds’ officers and directors are indemnified against certain liabilities that may arise out of the performance of their duties to the Funds. Additionally, in the normal course of business, the Funds enter into contracts with service providers that contain general indemnification clauses. The Funds’ maximum exposure under these arrangements is unknown as this would involve future claims that may be made against the Funds that have not yet occurred.
| 1. | SIGNIFICANT ACCOUNTING POLICIES |
The following significant accounting policies are consistently followed by the Funds in the preparation of their financial statements in conformity with accounting principles generally accepted in the United States of America (“U.S. GAAP”). The preparation of financial statements in conformity with U.S. GAAP requires management to make certain estimates and assumptions that affect the reported amounts of assets and liabilities and disclosures of contingent assets and liabilities at the date of the financial statements and the reported amounts of revenue and expenses during the reporting period. Actual results could differ from those estimates. Each Fund is considered an investment company under U.S. GAAP and follows the accounting and reporting guidance applicable to investment companies.
SECURITY VALUATION
Each Fund’s investments are valued at fair value each day that the Fund’s listing exchange is open and, for financial reporting purposes, as of the report date should the reporting period end on a day that the Fund’s listing exchange is not open. U.S. GAAP defines fair value as the price a fund would receive to sell an asset or pay to transfer a liability in an orderly transaction between market participants at the measurement date. The BlackRock Global Valuation Methodologies Committee (the “Global Valuation Committee”) provides oversight of the valuation of investments for the Funds. The investments of each Fund are valued pursuant to policies and procedures developed by the Global Valuation Committee and approved by the Board of Directors of the Company (the “Board”).
| • | Equity investments traded on a recognized securities exchange are valued at that day’s last reported trade price or the official closing price, as applicable, on the exchange where the stock is primarily traded. Equity investments traded on a recognized exchange for which there were no sales on that day are valued at the last traded price. |
| 42 | 2015 iSHARES ANNUAL REPORTTO SHAREHOLDERS |
Table of Contents
Notes to Financial Statements (Continued)
iSHARES®, INC.
| • | Exchange-traded funds and closed-end funds traded on a recognized securities exchange are valued at that day’s last reported trade price or the official closing price, as applicable, on the exchange where the fund is primarily traded. Funds traded on a recognized exchange for which there were no sales on that day are valued at the last traded price. |
| • | Open-end U.S. mutual funds are valued at that day’s published net asset value (“NAV”). |
In the event that application of these methods of valuation results in a price for an investment which is deemed not to be representative of the fair value of such investment or if a price is not available, the investment will be valued based upon other available factors deemed relevant by the Global Valuation Committee, in accordance with policies approved by the Board. These factors include but are not limited to (i) attributes specific to the investment; (ii) the principal market for the investment; (iii) the customary participants in the principal market for the investment; (iv) data assumptions by market participants for the investment, if reasonably available; (v) quoted prices for similar investments in active markets; and (vi) other factors, such as future cash flows, interest rates, yield curves, volatilities, prepayment speeds, loss severities, credit risks and/or default rates. Valuations based on such factors are reported to the Board on a quarterly basis.
The Global Valuation Committee employs various methods for calibrating valuation approaches for investments where an active market does not exist, including regular due diligence of the Company’s pricing vendors, a regular review of key inputs and assumptions, transactional back-testing or disposition analysis to compare unrealized gains and losses to realized gains and losses, reviews of missing or stale prices, reviews of large movements in market values, and reviews of market related activity.
Fair value pricing could result in a difference between the prices used to calculate a Fund’s NAV and the prices used by the Fund’s underlying index, which in turn could result in a difference between the Fund’s performance and the performance of the Fund’s underlying index.
Various inputs are used in determining the fair value of financial instruments. Inputs may be based on independent market data (“observable inputs”) or they may be internally developed (“unobservable inputs”). These inputs are categorized into a disclosure hierarchy consisting of three broad levels for financial reporting purposes. The level of a value determined for a financial instrument within the fair value hierarchy is based on the lowest level of any input that is significant to the fair value measurement in its entirety. The categorization of a value determined for a financial instrument within the hierarchy is based upon the pricing transparency of the instrument and is not necessarily an indication of the risk associated with investing in the instrument. The three levels of the fair value hierarchy are as follows:
| • | Level 1 — Unadjusted quoted prices in active markets for identical assets or liabilities; |
| • | Level 2 — Inputs other than quoted prices included within Level 1 that are observable for the asset or liability either directly or indirectly, including quoted prices for similar assets or liabilities in active markets, quoted prices for identical or similar assets or liabilities in markets that are not considered to be active, inputs other than quoted prices that are observable for the asset or liability (such as exchange rates, financing terms, interest rates, yield curves, volatilities, prepayment speeds, loss severities, credit risks and default rates) or other market-corroborated inputs; and |
| • | Level 3 — Unobservable inputs for the asset or liability, including the Global Valuation Committee’s assumptions used in determining the fair value of investments. |
Changes in valuation techniques may result in transfers in or out of an assigned level within the disclosure hierarchy. In accordance with the Company’s policy, transfers between different levels of the fair value hierarchy are deemed to have occurred as of the beginning of the reporting period.
NOTESTO FINANCIAL STATEMENTS | 43 |
Table of Contents
Notes to Financial Statements (Continued)
iSHARES®, INC.
The following table summarizes the value of each of the Funds’ investments according to the fair value hierarchy as of August 31, 2015. The breakdown of each Fund’s investments into major categories is disclosed in its respective schedule of investments.
| iShares ETF | Level 1 | Level 2 | Level 3 | Total | ||||||||||||
MSCI Global Agriculture Producers | ||||||||||||||||
Investments: | ||||||||||||||||
Assets: | ||||||||||||||||
Common Stocks | $ | 26,996,402 | $ | — | $ | 11,478 | $ | 27,007,880 | ||||||||
Investment Companies | 379,602 | — | — | 379,602 | ||||||||||||
Preferred Stocks | 123,146 | — | — | 123,146 | ||||||||||||
Rights | 584 | — | — | 584 | ||||||||||||
Money Market Funds | 670,110 | — | — | 670,110 | ||||||||||||
|
|
|
|
|
|
|
| |||||||||
Total | $ | 28,169,844 | $ | — | $ | 11,478 | $ | 28,181,322 | ||||||||
|
|
|
|
|
|
|
| |||||||||
MSCI Global Energy Producers | ||||||||||||||||
Investments: | ||||||||||||||||
Assets: | ||||||||||||||||
Common Stocks | $ | 24,349,847 | $ | — | $ | — | $ | 24,349,847 | ||||||||
Preferred Stocks | 188,218 | — | — | 188,218 | ||||||||||||
Warrants | — | 0a | — | 0 | a | |||||||||||
Money Market Funds | 242,439 | — | — | 242,439 | ||||||||||||
|
|
|
|
|
|
|
| |||||||||
Total | $ | 24,780,504 | $ | 0a | $ | — | $ | 24,780,504 | ||||||||
|
|
|
|
|
|
|
| |||||||||
MSCI Global Gold Miners | ||||||||||||||||
Investments: | ||||||||||||||||
Assets: | ||||||||||||||||
Common Stocks | $ | 45,900,351 | $ | — | $ | — | $ | 45,900,351 | ||||||||
Money Market Funds | 1,576,492 | — | — | 1,576,492 | ||||||||||||
|
|
|
|
|
|
|
| |||||||||
Total | $ | 47,476,843 | $ | — | $ | — | $ | 47,476,843 | ||||||||
|
|
|
|
|
|
|
| |||||||||
MSCI Global Metals & Mining Producers | ||||||||||||||||
Investments: | ||||||||||||||||
Assets: | ||||||||||||||||
Common Stocks | $ | 67,403,552 | $ | 11,740 | $ | 1 | $ | 67,415,293 | ||||||||
Preferred Stocks | 1,342,641 | — | — | 1,342,641 | ||||||||||||
Money Market Funds | 2,611,616 | — | — | 2,611,616 | ||||||||||||
|
|
|
|
|
|
|
| |||||||||
Total | $ | 71,357,809 | $ | 11,740 | $ | 1 | $ | 71,369,550 | ||||||||
|
|
|
|
|
|
|
| |||||||||
MSCI Global Silver Miners | ||||||||||||||||
Investments: | ||||||||||||||||
Assets: | ||||||||||||||||
Common Stocks | $ | 11,971,752 | $ | 18,853 | $ | — | $ | 11,990,605 | ||||||||
Money Market Funds | 993,085 | — | — | 993,085 | ||||||||||||
|
|
|
|
|
|
|
| |||||||||
Total | $ | 12,964,837 | $ | 18,853 | $ | — | $ | 12,983,690 | ||||||||
|
|
|
|
|
|
|
| |||||||||
| a | Rounds to less than $1. |
| 44 | 2015 iSHARES ANNUAL REPORTTO SHAREHOLDERS |
Table of Contents
Notes to Financial Statements (Continued)
iSHARES®, INC.
SECURITY TRANSACTIONS AND INCOME RECOGNITION
Security transactions are accounted for on trade date. Dividend income and capital gain distributions, if any, are recognized on the ex-dividend date, net of any foreign taxes withheld at source. Any taxes withheld that are reclaimable from foreign tax authorities as of August 31, 2015 are reflected in dividends receivable. Non-cash dividends received in the form of stock in an elective dividend, if any, are recorded as dividend income at fair value. Distributions received by the Funds may include a return of capital that is estimated by management. Such amounts are recorded as a reduction of the cost of investments or reclassified to capital gains. Interest income is accrued daily. Realized gains and losses on investment transactions are determined using the specific identification method.
FOREIGN CURRENCY TRANSLATION
The accounting records of the Funds are maintained in U.S. dollars. Foreign currencies, as well as investment securities and other assets and liabilities denominated in foreign currencies, are translated into U.S. dollars using exchange rates deemed appropriate by the investment adviser. Purchases and sales of securities, income receipts and expense payments are translated into U.S. dollars on the respective dates of such transactions.
Each Fund does not isolate the effect of fluctuations in foreign exchange rates from the effect of fluctuations in the market prices of securities. Such fluctuations are reflected by the Funds as a component of realized and unrealized gains and losses from investments for financial reporting purposes.
FOREIGN TAXES
The Funds may be subject to foreign taxes (a portion of which may be reclaimable) on income, stock dividends, capital gains on investments, or certain foreign currency transactions. All foreign taxes are recorded in accordance with the applicable foreign tax regulations and rates that exist in the foreign jurisdictions in which the Funds invest. These foreign taxes, if any, are paid by the Funds and are reflected in their statements of operations as follows: foreign taxes withheld at source are presented as a reduction of income, foreign taxes on securities lending income are presented as a reduction of securities lending income, foreign taxes on stock dividends are presented as “other foreign taxes,” and foreign taxes on capital gains from sales of investments and foreign taxes on foreign currency transactions are included in their respective net realized gain (loss) categories. Foreign taxes payable or deferred as of August 31, 2015, if any, are disclosed in the Funds’ statements of assets and liabilities.
DISTRIBUTIONS TO SHAREHOLDERS
Dividends and distributions paid by each Fund are recorded on the ex-dividend dates. Distributions are determined on a tax basis and may differ from net investment income and net realized capital gains for financial reporting purposes. Dividends and distributions are paid in U.S. dollars and cannot be automatically reinvested in additional shares of the Funds.
LOANS OF PORTFOLIO SECURITIES
Each Fund may lend its investment securities to approved borrowers, such as brokers, dealers and other financial institutions. The borrower pledges and maintains with the Fund collateral consisting of cash, an irrevocable letter of credit issued by a bank, or securities issued or guaranteed by the U.S. government. The initial collateral received by each Fund is required to have a value of at least 102% of the current value of the loaned securities for securities traded on U.S. exchanges and a value of at least 105% for all other securities. The collateral is maintained thereafter at a value equal to at least 100% of the current value of the securities on loan. The market value of the loaned securities is determined at the close of each business day of the Funds. Any additional required collateral is delivered to the Funds and any excess collateral is returned by the Funds on the next business day. During the term of the loan, each Fund is entitled to all distributions made on or in respect of the loaned securities. Loans of
NOTESTO FINANCIAL STATEMENTS | 45 |
Table of Contents
Notes to Financial Statements (Continued)
iSHARES®, INC.
securities are terminable at any time and the borrower, after notice, is required to return borrowed securities within the standard time period for settlement of securities transactions.
Any cash received as collateral for securities on loan may be reinvested in certain short-term instruments either directly on behalf of a fund or through one or more joint accounts or money market funds, including those managed by BlackRock Fund Advisors (“BFA”), the Funds’ investment adviser, or its affiliates. As of August 31, 2015, any securities on loan were collateralized by cash. The cash collateral received was invested in money market funds managed by BFA and is disclosed in the schedules of investments. The securities on loan for each Fund are also disclosed in its schedule of investments. The total value of any securities on loan as of August 31, 2015 and the total value of the related collateral are disclosed in the statements of assets and liabilities. Income earned by the Funds from securities lending is disclosed in the statements of operations.
The risks of securities lending include the risk that the borrower may not provide additional collateral when required or may not return the securities when due. To mitigate these risks, the Funds benefit from a borrower default indemnity provided by BlackRock, Inc. (“BlackRock”). BlackRock’s indemnity allows for full replacement of securities lent. Each Fund could suffer a loss if the value of the investments purchased with cash collateral falls below the value of the cash collateral received.
Securities lending transactions are entered into by the Funds under Master Securities Lending Agreements (“MSLA”) which provide the right, in the event of default (including bankruptcy or insolvency) for the non-defaulting party to liquidate the collateral and calculate a net exposure to the defaulting party or request additional collateral. In the event that a borrower defaults, a Fund, as lender, would offset the market value of the collateral received against the market value of the securities loaned. The value of the collateral is typically greater than that of the market value of the securities loaned, leaving the lender with a net amount payable to the defaulting party. However, bankruptcy or insolvency laws of a particular jurisdiction may impose restrictions on or prohibitions against such a right of offset in the event of an MSLA counterparty’s bankruptcy or insolvency. Under the MSLA, the borrower can resell or re-pledge the loaned securities, and a Fund can reinvest cash collateral, or, upon an event of default, resell or re-pledge the collateral.
The following table is a summary of securities lending agreements which are subject to offset under an MSLA as of August 31, 2015:
| iShares ETF | Market Value of Securities on Loan | Cash Collateral Received a | Net Amount | |||||||||
MSCI Global Agriculture Producers | $ | 615,377 | $ | 615,377 | $ | — | ||||||
MSCI Global Energy Producers | 212,631 | 212,631 | — | |||||||||
MSCI Global Gold Miners | 1,395,165 | 1,395,165 | — | |||||||||
MSCI Global Metals & Mining Producers | 2,345,760 | 2,345,760 | — | |||||||||
MSCI Global Silver Miners | 895,647 | 895,647 | — | |||||||||
| a | Collateral received in excess of the market value of securities on loan is not presented for financial reporting purposes. The total collateral received is disclosed in each Fund’s statement of assets and liabilities. |
| 2. | INVESTMENT ADVISORY AGREEMENT AND OTHER TRANSACTIONS WITH AFFILIATES |
Pursuant to an Investment Advisory Agreement with the Company, BFA manages the investment of each Fund’s assets. BFA is a California corporation indirectly owned by BlackRock. Under the Investment Advisory Agreement, BFA is responsible for substantially all expenses of the Funds, except interest, taxes, brokerage commissions and other expenses connected with the execution of portfolio transactions, distribution fees, litigation expenses and any extraordinary expenses.
For its investment advisory services to each Fund, BFA is entitled to an annual investment advisory fee of 0.39% based on the average daily net assets of each Fund.
| 46 | 2015 iSHARES ANNUAL REPORTTO SHAREHOLDERS |
Table of Contents
Notes to Financial Statements (Continued)
iSHARES®, INC.
In addition, each of the iShares MSCI Global Agriculture Producers and iShares MSCI Global Metals & Mining Producers ETFs indirectly pays its pro rata share of fees and expenses attributable to its investments in other investment companies (“acquired fund fees and expenses”). BFA has contractually agreed to waive a portion of its investment advisory fees for each Fund through December 31, 2015 in an amount equal to the acquired fund fees and expenses attributable to each Fund’s investments in other iShares funds, if any.
The U.S. Securities and Exchange Commission has issued an exemptive order which permits BlackRock Institutional Trust Company, N.A. (“BTC”), an affiliate of BFA, to serve as securities lending agent for the Funds, subject to applicable conditions. As securities lending agent, BTC bears all operational costs directly related to securities lending. Each Fund is responsible for fees in connection with the investment of cash collateral received for securities on loan in a money market fund managed by BFA, however, BTC has agreed to reduce the amount of securities lending income it receives in order to effectively limit the collateral investment fees each Fund bears to an annual rate of 0.04% (the “collateral investment fees”). Securities lending income is equal to the total of income earned from the reinvestment of cash collateral, net of fees and other payments to and from borrowers of securities, and less the collateral investment fees. The Funds retain a portion of securities lending income and remit the remaining portion to BTC as compensation for its services as securities lending agent.
Pursuant to a securities lending agreement, each Fund retains 80% of securities lending income and the amount retained can never be less than 70% of the total of securities lending income plus the collateral investment fees. In addition, commencing the business day following the date that the aggregate securities lending income plus the collateral investment fees generated across all 1940 Act iShares exchange-traded funds (the “iShares ETF Complex”) in a given calendar year exceeds the aggregate securities lending income generated across the iShares ETF Complex in the calendar year 2013, each Fund, pursuant to a securities lending agreement, will retain for the remainder of that calendar year 85% of securities lending income and the amount retained can never be less than 70% of the total of securities lending income plus the collateral investment fees.
Prior to January 1, 2015, each Fund retained 75% of securities lending income and the amount retained was never less than 65% of the total of securities lending income plus the collateral investment fees. In addition, commencing the business day following the date that the aggregate securities lending income plus the collateral investment fees generated across the iShares ETF Complex in the calendar year 2014 exceeded the aggregate securities lending income generated across the iShares ETF Complex in the calendar year 2013 and pursuant to a securities lending agreement, each Fund retained for the remainder of the calendar year 2014, 80% of securities lending income and the amount retained was never less than 65% of the total of securities lending income plus the collateral investment fees.
For the year ended August 31, 2015, the total of securities lending agent services and collateral investment fees paid were as follows:
| iShares ETF | Fees Paid to BTC | |||
MSCI Global Agriculture Producers | $ | 4,754 | ||
MSCI Global Energy Producers | 405 | |||
MSCI Global Gold Miners | 6,754 | |||
MSCI Global Metals & Mining Producers | 24,415 | |||
MSCI Global Silver Miners | 3,320 | |||
BlackRock Investments, LLC, an affiliate of BFA, is the distributor for each Fund. Pursuant to the distribution agreement, BFA is responsible for any fees or expenses for distribution services provided to the Funds.
NOTESTO FINANCIAL STATEMENTS | 47 |
Table of Contents
Notes to Financial Statements (Continued)
iSHARES®, INC.
Cross trades for the year ended August 31, 2015, if any, were executed by the Funds pursuant to Rule 17a-7 under the 1940 Act. Cross trading is the buying or selling of portfolio securities between funds to which BFA (or an affiliate) serves as investment adviser. At its regularly scheduled quarterly meetings, the Board reviews such transactions as of the most recent calendar quarter for compliance with the requirements and restrictions set forth by Rule 17a-7.
Each Fund may invest its positive cash balances in certain money market funds managed by BFA or an affiliate. The income earned on these temporary cash investments is included in “Interest – affiliated” in the statements of operations.
The PNC Financial Services Group, Inc. is the largest stockholder of BlackRock and is considered to be an affiliate of the Funds for 1940 Act purposes.
The iShares MSCI Global Agriculture Producers and iShares MSCI Global Metals & Mining Producers ETFs, in order to improve their portfolio liquidity and their ability to track their underlying index, may invest in shares of other iShares funds that invest in securities in each Fund’s respective underlying index.
Investments in issuers considered to be affiliates of the Funds (excluding money market funds) during the year ended August 31, 2015, for purposes of Section 2(a)(3) of the 1940 Act, were as follows:
| iShares ETF and Name of Affiliated Issuer | Shares Held at Beginning of Year | Shares Purchased | Shares Sold | Shares Held at End of Year | Value at End of Year | Dividend Income | Net Realized Gain (Loss) | |||||||||||||||||||||
MSCI Global Agriculture Producers | ||||||||||||||||||||||||||||
iShares India 50 ETF | 12,183 | 6,858 | (5,197 | ) | 13,844 | $ | 379,602 | $ | 2,081 | $ | 37,184 | |||||||||||||||||
|
|
|
|
|
| |||||||||||||||||||||||
Certain directors and officers of the Company are also officers of BTC and/or BFA.
| 3. | INVESTMENT PORTFOLIO TRANSACTIONS |
Purchases and sales of investments (excluding in-kind transactions and short-term investments) for the year ended August 31, 2015 were as follows:
| iShares ETF | Purchases | Sales | ||||||
MSCI Global Agriculture Producers | $ | 3,724,756 | $ | 4,546,385 | ||||
MSCI Global Energy Producers | 1,512,408 | 889,146 | ||||||
MSCI Global Gold Miners | 11,268,097 | 11,033,591 | ||||||
MSCI Global Metals & Mining Producers | 23,643,772 | 31,477,940 | ||||||
MSCI Global Silver Miners | 4,177,758 | 4,656,034 | ||||||
In-kind transactions (see Note 4) for the year ended August 31, 2015 were as follows:
| iShares ETF | In-kind Purchases | In-kind Sales | ||||||
MSCI Global Agriculture Producers | $ | 1,175,785 | $ | 14,683,364 | ||||
MSCI Global Energy Producers | 26,955,610 | 3,862,158 | ||||||
MSCI Global Gold Miners | 19,528,299 | 5,599,085 | ||||||
MSCI Global Metals & Mining Producers | 84,109,493 | 125,497,904 | ||||||
MSCI Global Silver Miners | 8,422,867 | 955,883 | ||||||
| 48 | 2015 iSHARES ANNUAL REPORTTO SHAREHOLDERS |
Table of Contents
Notes to Financial Statements (Continued)
iSHARES®, INC.
| 4. | CAPITAL SHARE TRANSACTIONS |
Capital shares are issued and redeemed by each Fund only in aggregations of a specified number of shares or multiples thereof (“Creation Units”) at NAV. Except when aggregated in Creation Units, shares of each Fund are not redeemable. Transactions in capital shares for each Fund are disclosed in detail in the statements of changes in net assets.
The consideration for the purchase of Creation Units of a fund in the Company generally consists of the in-kind deposit of a designated portfolio of securities and a specified amount of cash. Certain funds in the Company may be offered in Creation Units solely or partially for cash in U.S. dollars. Investors purchasing and redeeming Creation Units may pay a purchase transaction fee and a redemption transaction fee directly to State Street Bank and Trust Company, the Company’s administrator, to offset transfer and other transaction costs associated with the issuance and redemption of Creation Units, including Creation Units for cash. Investors transacting in Creation Units for cash may also pay an additional variable charge to compensate the relevant fund for certain transaction costs (i.e., stamp taxes, taxes on currency or other financial transactions, and brokerage costs) and market impact expenses relating to investing in portfolio securities. Such variable charges, if any, are included in “Proceeds from shares sold” in the statements of changes in net assets.
From time to time, settlement of securities related to in-kind contributions or in-kind redemptions may be delayed. In such cases, securities related to in-kind contributions are reflected as “Due from custodian” and securities related to in-kind redemptions are reflected as “Securities related to in-kind transactions” in the statements of assets and liabilities.
| 5. | PRINCIPAL RISKS |
In the normal course of business, each Fund’s investment activities expose it to various types of risk associated with the financial instruments and markets in which it invests. The significant types of financial risks each Fund is exposed to include market risk and credit risk. Each Fund’s prospectus provides details of these and other types of risk.
BFA uses a “passive” or index approach to try to achieve each Fund’s investment objective following the securities included in its underlying index during upturns as well as downturns. BFA does not take steps to reduce market exposure or to lessen the effects of a declining market. Divergence from the underlying index and the composition of the portfolio is monitored by BFA.
MARKET RISK
Market risk arises mainly from uncertainty about future values of financial instruments influenced by price, currency and interest rate movements. It represents the potential loss each Fund may suffer through holding market positions in the face of market movements. Each Fund is exposed to market risk by virtue of its direct or indirect investment in equity instruments. The fair value of securities held by the Funds may decline due to general market conditions, economic trends or events that are not specifically related to the issuers of the securities including local, regional or global political, social or economic instability or to factors that affect a particular industry or group of industries. The extent of each Fund’s exposure to market risk is the market value of the investments held as shown in the Fund’s schedule of investments.
A diversified portfolio, where this is appropriate and consistent with a fund’s objectives, minimizes the risk that a price change of a particular investment will have a material impact on the NAV of a fund. The investment concentrations within each Fund’s portfolio are disclosed in its schedule of investments.
Each Fund invests a substantial amount of its assets in securities of non-U.S. issuers that trade in non-U.S. markets. This involves certain considerations and risks not typically associated with securities of U.S. issuers. Such risks include, but are not limited to: generally less liquid and less efficient securities markets; generally greater price volatility; exchange rate fluctuations and exchange controls; imposition of restrictions on the expatriation of funds or other assets of the Fund; less publicly available
NOTESTO FINANCIAL STATEMENTS | 49 |
Table of Contents
Notes to Financial Statements (Continued)
iSHARES®, INC.
information about issuers; the imposition of withholding or other taxes; higher transaction and custody costs; settlement delays and risk of loss attendant in settlement procedures; difficulties in enforcing contractual obligations; less regulation of securities markets; different accounting, disclosure and reporting requirements; more substantial governmental involvement in the economy; higher inflation rates; greater social, economic and political uncertainties; the risk of nationalization or expropriation of assets; and the risk of war. These risks are heightened for investments in issuers from countries with less developed markets.
Each Fund invests all or substantially all of its assets in securities within a single or limited number of market sectors. When a fund concentrates its investments in this manner, it assumes the risk that economic, political and social conditions affecting those market sectors may have a significant impact on its investment performance.
The United States and the European Union, along with the regulatory bodies of a number of countries including Japan, Australia and Canada (collectively, “Sanctioning Bodies”), have imposed sectorial economic sanctions on certain Russian individuals and Russian corporate entities which include prohibitions on transacting in or dealing in new debt of longer than 30 or 90 days maturity or new equity of such issuers. Securities held by the iShares MSCI Global Agriculture Producers ETF, iShares MSCI Global Energy Producers ETF and iShares MSCI Global Metals & Mining Producers ETF issued prior to the date of the sanctions being imposed are not currently subject to any restrictions under the sanctions. However, compliance with each of these sanctions may impair the ability of a Fund to buy, sell, hold, receive or deliver the affected securities or other securities of such issuers. The Sanctioning Bodies could also institute broader sanctions on Russia. These sanctions, or even the threat of further sanctions, may result in the decline of the value and liquidity of Russian securities, a weakening of the ruble or other adverse consequences to the Russian economy. Current or future sanctions may result in Russia taking counter measures or retaliatory actions, which may further impair the value and liquidity of Russian securities. These retaliatory measures may include the immediate freeze of Russian assets held by a Fund.
CREDIT RISK
Credit risk is the risk that an issuer or guarantor of debt instruments or the counterparty to a financial transaction, including derivatives contracts, repurchase agreements or loans of portfolio securities, is unable or unwilling to make timely interest and/or principal payments or to otherwise honor its obligations. BFA and its affiliates manage counterparty credit risk by entering into transactions only with counterparties that they believe have the financial resources to honor their obligations and by monitoring the financial stability of those counterparties. Financial assets, which potentially expose the Funds to issuer and counterparty credit risks, consist principally of financial instruments and receivables due from counterparties. The extent of each Fund’s exposure to credit and counterparty risks with respect to those financial assets is approximated by their value recorded in its statement of assets and liabilities.
| 6. | INCOME TAX INFORMATION |
Each Fund is treated as an entity separate from the Company’s other funds for federal income tax purposes. It is the policy of each Fund to qualify as a regulated investment company by complying with the provisions applicable to regulated investment companies, as defined under Subchapter M of the Internal Revenue Code of 1986, as amended, and to annually distribute substantially all of its ordinary income and any net capital gains (taking into account any capital loss carryforwards) sufficient to relieve it from all, or substantially all, federal income and excise taxes. Accordingly, no provision for federal income taxes is required.
| 50 | 2015 iSHARES ANNUAL REPORTTO SHAREHOLDERS |
Table of Contents
Notes to Financial Statements (Continued)
iSHARES®, INC.
U.S. GAAP requires that certain components of net assets be adjusted to reflect permanent differences between financial and tax reporting. These reclassifications have no effect on net assets or NAV per share. The following permanent differences as of August 31, 2015, attributable to passive foreign investment companies, distributions paid in excess of taxable income, foreign currency transactions and realized gains (losses) from in-kind redemptions, were reclassified to the following accounts:
| iShares ETF | Paid-in Capital | Undistributed Net Investment Income/Distributions | Undistributed Net Realized Gain/Accumulated Net Realized Loss | |||||||||
MSCI Global Agriculture Producers | $ | 660,549 | $ | (13,034 | ) | $ | (647,515 | ) | ||||
MSCI Global Energy Producers | 190,987 | (8,413 | ) | (182,574 | ) | |||||||
MSCI Global Gold Miners | (1,393,370 | ) | (3,385 | ) | 1,396,755 | |||||||
MSCI Global Metals & Mining Producers | (7,903,432 | ) | 44,156 | 7,859,276 | ||||||||
MSCI Global Silver Miners | 43,079 | 213,593 | (256,672 | ) | ||||||||
The tax character of distributions paid during the years ended August 31, 2015 and August 31, 2014 was as follows:
| iShares ETF | 2015 | 2014 | ||||||
MSCI Global Agriculture Producers | ||||||||
Ordinary income | $ | 764,487 | $ | 869,161 | ||||
|
|
|
| |||||
MSCI Global Energy Producers | ||||||||
Ordinary income | $ | 528,102 | $ | 128,943 | ||||
|
|
|
| |||||
MSCI Global Gold Miners | ||||||||
Ordinary income | $ | 425,675 | $ | 410,920 | ||||
|
|
|
| |||||
MSCI Global Metals & Mining Producers | ||||||||
Ordinary income | $ | 7,833,689 | $ | 4,935,233 | ||||
|
|
|
| |||||
MSCI Global Silver Miners | ||||||||
Ordinary income | $ | 294,253 | $ | 104,622 | ||||
|
|
|
| |||||
As of August 31, 2015, the tax components of accumulated net earnings (losses) were as follows:
| iShares ETF | Undistributed Ordinary Income | Capital Loss | Net Unrealized | Qualified Late-Year Losses b | Total | |||||||||||||||
MSCI Global Agriculture Producers | $ | 96,640 | $ | (558,434 | ) | $ | (4,502,967 | ) | $ | (684,091 | ) | $ | (5,648,852 | ) | ||||||
MSCI Global Energy Producers | 184,145 | (127,882 | ) | (6,779,941 | ) | (344,213 | ) | (7,067,891 | ) | |||||||||||
MSCI Global Gold Miners | 114,196 | (4,476,366 | ) | (41,035,338 | ) | (9,984,811 | ) | (55,382,319 | ) | |||||||||||
MSCI Global Metals & Mining Producers | 296,715 | (4,586,250 | ) | (43,632,013 | ) | (8,006,891 | ) | (55,928,439 | ) | |||||||||||
MSCI Global Silver Miners | — | (613,283 | ) | (8,025,768 | ) | (2,232,156 | ) | (10,871,207 | ) | |||||||||||
| a | The difference between book-basis and tax-basis unrealized gains (losses) was attributable primarily to the tax deferral of losses on wash sales and the realization for tax purposes of unrealized gains on investments in passive foreign investment companies. |
| b | The Funds have elected to defer certain qualified late-year losses and recognize such losses in the next taxable year |
NOTESTO FINANCIAL STATEMENTS | 51 |
Table of Contents
Notes to Financial Statements (Continued)
iSHARES®, INC.
As of August 31, 2015, the following Funds had non-expiring capital loss carryforwards available to offset future realized capital gains as follows:
| iShares ETF | Non- Expiring | |||
MSCI Global Agriculture Producers | $ | 558,434 | ||
MSCI Global Energy Producers | 127,882 | |||
MSCI Global Gold Miners | 4,476,366 | |||
MSCI Global Metals & Mining Producers | 4,586,250 | |||
MSCI Global Silver Miners | 613,283 | |||
The Funds may own shares in certain foreign investment entities, referred to, under U.S. tax law, as “passive foreign investment companies.” The Funds may elect to mark-to-market annually the shares of each passive foreign investment company and would be required to distribute to shareholders any such marked-to-market gains.
As of August 31, 2015, gross unrealized appreciation and gross unrealized depreciation based on cost for federal income tax purposes were as follows:
| iShares ETF | Tax Cost | Gross Unrealized Appreciation | Gross Unrealized Depreciation | Net Unrealized Appreciation (Depreciation) | ||||||||||||
MSCI Global Agriculture Producers | $ | 32,680,775 | $ | 1,397,034 | $ | (5,896,487 | ) | $ | (4,499,453 | ) | ||||||
MSCI Global Energy Producers | 31,559,768 | 128,929 | (6,908,193 | ) | (6,779,264 | ) | ||||||||||
MSCI Global Gold Miners | 88,511,761 | 52,725 | (41,087,643 | ) | (41,034,918 | ) | ||||||||||
MSCI Global Metals & Mining Producers | 114,994,631 | 541,836 | (44,166,917 | ) | (43,625,081 | ) | ||||||||||
MSCI Global Silver Miners | 21,008,911 | 14,742 | (8,039,963 | ) | (8,025,221 | ) | ||||||||||
Management has analyzed tax laws and regulations and their application to the Funds as of August 31, 2015, inclusive of the open tax return years, and does not believe there are any uncertain tax positions that require recognition of a tax liability in the Funds’ financial statements.
| 7. | SUBSEQUENT EVENTS |
Management has evaluated the impact of all subsequent events on the Funds through the date the financial statements were available to be issued and has determined that there were no subsequent events requiring adjustment or disclosure in the financial statements.
| 52 | 2015 iSHARES ANNUAL REPORTTO SHAREHOLDERS |
Table of Contents
Report of Independent Registered Public Accounting Firm
To the Shareholders and Board of Directors of
iShares, Inc.:
In our opinion, the accompanying statements of assets and liabilities, including the schedules of investments, and the related statements of operations and of changes in net assets and the financial highlights present fairly, in all material respects, the financial position of iShares MSCI Global Agriculture Producers ETF, iShares MSCI Global Energy Producers ETF, iShares MSCI Global Gold Miners ETF, iShares MSCI Global Metals & Mining Producers ETF and iShares MSCI Global Silver Miners ETF (the “Funds”) at August 31, 2015, the results of each of their operations, the changes in each of their net assets and their financial highlights for each of the periods presented, in conformity with accounting principles generally accepted in the United States of America. These financial statements and financial highlights (hereafter referred to as “financial statements”) are the responsibility of the Funds’ management. Our responsibility is to express an opinion on these financial statements based on our audits. We conducted our audits of these financial statements in accordance with the standards of the Public Company Accounting Oversight Board (United States). Those standards require that we plan and perform the audit to obtain reasonable assurance about whether the financial statements are free of material misstatement. An audit includes examining, on a test basis, evidence supporting the amounts and disclosures in the financial statements, assessing the accounting principles used and significant estimates made by management, and evaluating the overall financial statement presentation. We believe that our audits, which included confirmation of securities at August 31, 2015 by correspondence with the custodian, transfer agent and brokers, provide a reasonable basis for our opinion.
PricewaterhouseCoopers LLP
San Francisco, California
October 22, 2015
REPORTOF INDEPENDENT REGISTERED PUBLIC ACCOUNTING FIRM | 53 |
Table of Contents
iSHARES®, INC.
Under Section 854(b)(2) of the Internal Revenue Code (the “Code”), the following maximum amounts are hereby designated as qualified dividend income for purposes of the maximum rate under Section 1(h)(11) of the Code for the fiscal year ended August 31, 2015:
| iShares ETF | Qualified Dividend Income | |||
MSCI Global Agriculture Producers | $ | 878,303 | ||
MSCI Global Energy Producers | 783,783 | |||
MSCI Global Gold Miners | 641,375 | |||
MSCI Global Metals & Mining Producers | 6,705,723 | |||
MSCI Global Silver Miners | 120,473 | |||
In February 2016, shareholders will receive Form 1099-DIV which will include their share of qualified dividend income distributed during the calendar year 2015. Shareholders are advised to check with their tax advisers for information on the treatment of these amounts on their income tax returns.
For corporate shareholders, the percentage of income dividends paid during the fiscal year ended August 31, 2015 that qualified for the dividends-received deduction were as follows:
| iShares ETF | Dividends- Received Deduction | |||
MSCI Global Agriculture Producers | 48.90 | % | ||
MSCI Global Energy Producers | 47.19 | |||
MSCI Global Gold Miners | 6.16 | |||
MSCI Global Metals & Mining Producers | 5.92 | |||
MSCI Global Silver Miners | 31.88 | |||
For the fiscal year ended August 31, 2015, the following Funds earned foreign source income and paid foreign taxes which they intend to pass through to their shareholders pursuant to Section 853 of the Code:
| iShares ETF | Foreign Source Income Earned | Foreign Taxes Paid | ||||||
MSCI Global Gold Miners | $ | 729,082 | $ | 85,439 | ||||
MSCI Global Metals & Mining Producers | 7,780,636 | 232,073 | ||||||
MSCI Global Silver Miners | 108,084 | 12,786 | ||||||
| 54 | 2015 iSHARES ANNUAL REPORTTO SHAREHOLDERS |
Table of Contents
Board Review and Approval of Investment Advisory
Contract
iSHARES® , INC.
Under Section 15(c) of the Investment Company Act of 1940 (the “1940 Act”), the Company’s Board of Directors (the “Board”), including a majority of Directors who are not “interested persons” of the Company (as that term is defined in the 1940 Act) (the “Independent Directors”), is required annually to consider and approve the Investment Advisory Contract between the Company and BFA (the “Advisory Contract”) on behalf of the Funds. The Independent Directors requested, and BFA provided, such information as the Independent Directors, with advice from independent counsel, deemed reasonably necessary to evaluate the Advisory Contract. A committee of Independent Directors (the “15(c) Committee”), with independent counsel, met with management on May 1, 2015 and May 6, 2015, to discuss the types of information the Independent Directors required and the manner in which management would organize and present such information. At a meeting held on May 21, 2015, management presented preliminary information to the Board relating to the continuance of the Advisory Contract, and the Board, including the Independent Directors, reviewed and discussed such information at length. The Independent Directors requested from management certain additional information, which management agreed to provide. At a meeting held on June 24-25, 2015, the Board, including the Independent Directors, reviewed the additional information provided by management in response to these requests. After extensive discussions, the Board, including all of the Independent Directors, approved the continuance of the Advisory Contract for the Funds, based on a review of qualitative and quantitative information provided by BFA, including the additional information management provided at the request of the Independent Directors. The Board noted its satisfaction with the extent and quality of information provided and its frequent interactions with management, as well as the detailed responses and other information provided by BFA. The Board also noted that the Board and BFA agreed to discuss potential enhancements and adjustments to the 15(c) process for the coming year. The Independent Directors were advised by their independent counsel throughout the process, including about the legal standards applicable to their review. In approving the Advisory Contract for the Funds, the Board, including the Independent Directors, considered the following factors, no one of which was controlling, and reached the following conclusions:
Expenses and Performance of the Funds — The Board reviewed statistical information prepared by Lipper Inc. (“Lipper”), an independent provider of investment company data, regarding the expense ratio components, including actual advisory fees, waivers/reimbursements, and gross and net total expenses of each Fund in comparison with the same information for other exchange traded funds (including, where applicable, funds sponsored by an “at cost” service provider) and, in the limited instances where no comparable ETFs existed and the comparison group would not otherwise be reasonable in Lipper’s judgment, pure index institutional mutual funds, objectively selected by Lipper as comprising such Fund’s applicable peer group pursuant to Lipper’s proprietary ETF methodology (the “Lipper Group”). The Board was provided with a detailed description of Lipper’s proprietary ETF methodology used by Lipper to determine the applicable Lipper Groups. The Board further noted that due to the limitations in providing comparable funds in the various Lipper Groups, the statistical information provided in Lipper’s report may or may not provide meaningful direct comparisons to the Funds in all instances.
The Board also noted that the investment advisory fee rates and overall expenses (net of waivers and reimbursements) for the Funds were lower than the median of the investment advisory fee rates and overall expenses (net of waivers and reimbursements) of the funds in their respective Lipper Group.
In addition, the Board reviewed statistical information prepared by Lipper regarding the performance of each Fund for the one-, three-, five-, ten-year, and since inception periods, as applicable, and the “last quarter” period ended December 31, 2014, and a comparison of each Fund’s performance to its performance benchmark index for the same periods. To the extent that any of the comparison funds included in the Lipper Group track the same index as any particular Fund, Lipper also provided, and the Board reviewed, a comparison of such Fund’s performance to that of such relevant comparison funds for the same periods. The Board noted that the Funds generally performed in line with their respective performance benchmark indexes over the relevant periods. In considering this information, the Board noted that the Lipper Group may include funds that have different investment objectives and/or benchmarks from the Funds. In addition, the Board noted that each Fund seeks to track its own benchmark index and that, during the prior year, the Board received periodic reports on the Funds’ performance in comparison with their relevant benchmark
BOARD REVIEWAND APPROVALOF INVESTMENT ADVISORY CONTRACT | 55 |
Table of Contents
Board Review and Approval of Investment Advisory
Contract (Continued)
iSHARES®, INC.
indexes. Such periodic comparative performance information, including detailed information on certain specific iShares funds requested by the Boards, was also considered.
Based on this review, the other factors considered at the meeting, and their general knowledge of ETF pricing, the Board concluded that the investment advisory fee rate and expense level and the historical performance of each Fund supported the Board’s approval of the continuance of the Advisory Contract for the coming year.
Nature, Extent and Quality of Services Provided by BFA — Based on management’s representations, including information about recent and proposed enhancements to the iShares business, including with respect to shareholder servicing and support, the Board expected that there would be no diminution in the scope of services required of or provided by BFA under the Advisory Contract for the coming year as compared to the scope of services provided by BFA during prior years. In reviewing the scope of these services, the Board considered BFA’s investment philosophy and experience, noting that BFA and its affiliates have committed significant resources over time, including during the past year, to supporting the iShares funds and their shareholders. The Board acknowledged that resources to support the iShares funds and their shareholders have been added or enhanced in recent years. The Board also considered BFA’s compliance program and its compliance record with respect to the Funds. In that regard, the Board noted that BFA reports to the Board about portfolio management and compliance matters on a periodic basis in connection with regularly scheduled meetings of the Board, and on other occasions as necessary and appropriate, and has provided information and made appropriate officers available as needed to provide further assistance with these matters. The Board also reviewed the background and experience of the persons responsible for the day-to-day management of the Funds, as well as the resources available to them in managing the Funds. In addition to the above considerations, the Board reviewed and considered detailed presentations regarding BFA’s investment performance, investment and risk management processes and strategies provided at the June 24-25, 2015 meeting and throughout the previous year, and matters related to BFA’s portfolio compliance policies and procedures. The Board noted that each Fund had met its investment objective consistently since its respective inception date.
Based on review of this information, and the performance information discussed above, the Board concluded that the nature, extent and quality of services provided by BFA to the Funds under the Advisory Contract supported the Board’s approval of the continuance of the Advisory Contract for the coming year.
Costs of Services Provided to Funds and Profits Realized by BFA and Affiliates — The Board reviewed information about the profitability to BlackRock of the Funds based on the fees payable to BFA and its affiliates (including fees under the Advisory Contract), and all other sources of revenue and expense to BFA and its affiliates from the Funds’ operations for the last calendar year. The Board reviewed BlackRock’s profitability methodology for the iShares funds, noting that the 15(c) Committee had focused on the methodology and proposed presentation during its meetings. The Board discussed the sources of direct and ancillary revenue with management, including the revenues to BTC from securities lending by the Funds. The Board also discussed BFA’s profit margin as reflected in the Funds’ profitability analyses and reviewed information regarding potential economies of scale (as discussed below). Based on this review, the Board concluded that the profits realized by BFA and its affiliates under the Advisory Contract and from other relationships between the Funds and BFA and/or its affiliates, if any, were within a reasonable range in light of the factors considered.
Economies of Scale — The Board reviewed information regarding potential economies of scale or other efficiencies that may result from increases in the Funds’ assets, noting that the issue of economies of scale had been focused on extensively by the 15(c) Committee during its meetings and addressed by management. The Board and the 15(c) Committee reviewed information provided by BFA regarding scale benefits shared with the iShares funds through relatively low fee rates established at inception, breakpoints, waivers, or other fee reductions, as well as through additional investment in the iShares business and the provision of improved or additional infrastructure and services to the iShares funds and their shareholders. The Board and the 15(c)
| 56 | 2015 iSHARES ANNUAL REPORTTO SHAREHOLDERS |
Table of Contents
Board Review and Approval of Investment Advisory
Contract (Continued)
iSHARES®, INC.
Committee received information regarding BlackRock’s historical profitability, including BFA’s and its affiliates’ costs in providing services. The cost information distinguished between fixed and variable costs, and explained how the level of fixed and variable costs, as well as the nature of such costs, may impact the existence or size of scale benefits. The Board noted that the Advisory Contract for the Funds did not provide for any breakpoints in the Funds’ investment advisory fee rates as the assets of the Funds increase. However, the Board noted that should material economies of scale exist in the future, a breakpoint structure for the Funds may be appropriate, and that it would continue to monitor the sharing of economies of scale to determine the appropriateness of adding breakpoints in the future.
Based on this review, as well as the other factors considered at the meeting, the Board, recognizing its responsibility to consider this issue periodically, determined to approve the continuance of the Advisory Contract for the coming year.
Fees and Services Provided for Other Comparable Funds/Accounts Managed by BFA and its Affiliates — The Board received and considered information regarding the investment advisory/management fee rates for other funds/accounts in the U.S. for which BFA (or its affiliates) provides investment advisory/management services, including open-end and closed-end funds registered under the 1940 Act (including sub-advised funds), collective trust funds, separately managed accounts, and institutional separate accounts (together, the “Other Accounts”), and acknowledged BFA’s assertion that the iShares funds are fundamentally different investment vehicles from the Other Accounts. The Board noted that BFA and its affiliates do not manage Other Accounts with substantially the same investment objectives and strategies as the Funds or that track the same index or a similar index as the Funds. The Board further noted that BFA provided the Board with detailed information regarding how the Other Accounts (particularly institutional clients) generally differ from the Funds, including in terms of the different, generally more extensive services provided to the Funds, as well as other significant differences in the approach of BFA and its affiliates to the Funds, on one hand, and Other Accounts, on the other. In that regard, the Board considered that the pricing of services to institutional clients is typically based on a number of factors beyond the nature and extent of the specific services to be provided and often depends on the overall relationship between the client and its affiliates and the adviser and its affiliates. In addition, the Board considered the relative complexity and inherent risks and challenges of managing and providing other services to the Funds, as publicly traded exchange traded funds, as compared to the Other Accounts that are institutional clients in light of differing regulatory requirements and client-imposed mandates. The Board also considered the “all-inclusive” nature of the Funds’ advisory fee structure, and the Fund expenses borne by BFA under this arrangement. The Board noted that the investment advisory fee rates under the Advisory Contract for the Funds were generally higher than the investment advisory/management fee rates for the Other Accounts that are institutional clients of BFA (or its affiliates) and concluded that the differences appeared to be consistent with the factors discussed.
Other Benefits to BFA and/or its Affiliates — The Board reviewed the “fallout” benefits or ancillary revenue received by BFA and/or its affiliates in connection with the services provided to the Funds by BFA, such as payment of revenue to BTC, the Funds’ securities lending agent, for loaning portfolio securities (which was included in the profit margins reviewed by the Board pursuant to BFA’s profitability methodology), and payment of advisory fees and/or administration fees to BFA and BTC (or their affiliates) in connection with any investments by the Funds in other funds for which BFA (or its affiliates) provides investment advisory services and/or administration services. The Board noted that BFA generally does not use soft dollars or consider the value of research or other services that may be provided to BFA (including its affiliates) in selecting brokers for portfolio transactions for the Funds. The Board further noted that any portfolio transactions on behalf of the Funds placed through a BFA affiliate or purchased from an underwriting syndicate in which a BFA affiliate participates, are reported to the Board pursuant to Rule 17e-1 or Rule 10f-3, as applicable, under the 1940 Act. The Board concluded that any such ancillary benefits would not be disadvantageous to the Funds’ shareholders and thus would not alter the Board’s conclusion with respect to the appropriateness of approving the continuance of the Advisory Contract for the coming year.
BOARD REVIEWAND APPROVALOF INVESTMENT ADVISORY CONTRACT | 57 |
Table of Contents
Board Review and Approval of Investment Advisory
Contract (Continued)
iSHARES®, INC.
Based on the considerations described above, the Board determined that each Fund’s investment advisory fee rate under the Advisory Contract does not constitute a fee that is so disproportionately large as to bear no reasonable relationship to the services rendered and that could not have been the product of arm’s-length bargaining, and concluded that it is in the best interest of each Fund and its shareholders to approve the continuance of the Advisory Contract for the coming year.
| 58 | 2015 iSHARES ANNUAL REPORTTO SHAREHOLDERS |
Table of Contents
Supplemental Information (Unaudited)
iSHARES®, INC.
Section 19(a) Notices
The amounts and sources of distributions reported are estimates and are provided pursuant to regulatory requirements and are not being provided for tax reporting purposes. The actual amounts and sources for tax reporting purposes will depend upon each Fund’s investment experience during the year and may be subject to changes based on the tax regulations. Shareholders will receive a Form 1099-DIV each calendar year that will inform them how to report these distributions for federal income tax purposes.
| Total Cumulative Distributions for the Fiscal Year | % Breakdown of the Total Cumulative Distributions for the Fiscal Year | |||||||||||||||||||||||||||||||
| iShares ETF | Net Investment Income | Net Realized Capital Gains | Return of Capital | Total Per Share | Net Investment Income | Net Realized Capital Gains | Return of Capital | Total Per Share | ||||||||||||||||||||||||
MSCI Global Agriculture Producers | $ | 0.550039 | $ | — | $ | — | $ | 0.550039 | 100 | % | — | % | — | % | 100 | % | ||||||||||||||||
MSCI Global Energy Producers | 0.459020 | — | — | 0.459020 | 100 | — | — | 100 | ||||||||||||||||||||||||
MSCI Global Gold Miners | 0.060671 | — | — | 0.060671 | 100 | — | — | 100 | ||||||||||||||||||||||||
MSCI Global Metals & Mining Producers | 1.390803 | — | — | 1.390803 | 100 | — | — | 100 | ||||||||||||||||||||||||
Premium/Discount Information
The Premium/Discount Information section is intended to present information about the differences between the daily market price on secondary markets for shares of a fund and that fund’s NAV. NAV is the price at which a fund issues and redeems shares. It is calculated in accordance with the standard formula for valuing mutual fund shares. The “Market Price” of a fund generally is determined using the midpoint between the highest bid and the lowest offer on the primary stock exchange on which the shares of such fund are listed for trading, as of the time that the fund’s NAV is calculated. A fund’s Market Price may be at, above or below its NAV. The NAV of a fund will fluctuate with changes in the fair value of its portfolio holdings. The Market Price of a fund will fluctuate in accordance with changes in its NAV, as well as market supply and demand.
Premiums or discounts are the differences (expressed as a percentage) between the NAV and Market Price of a fund on a given day, generally at the time the NAV is calculated. A premium is the amount that a fund is trading above the reported NAV, expressed as a percentage of the NAV. A discount is the amount that a fund is trading below the reported NAV, expressed as a percentage of the NAV.
The following information shows the frequency of distributions of premiums and discounts for each of the Funds. The information shown for each Fund is for five calendar years (or from the inception date of such Fund if less than five years) through the date of the most recent calendar quarter-end. The specific periods covered for each Fund are disclosed in the table for such Fund.
SUPPLEMENTAL INFORMATION | 59 |
Table of Contents
Supplemental Information (Unaudited) (Continued)
iSHARES®, INC.
Each line in the table shows the number of trading days in which the Fund traded within the premium/discount range indicated. The number of trading days in each premium/discount range is also shown as a percentage of the total number of trading days in the period covered by each table. All data presented here represents past performance, which cannot be used to predict future results.
iShares MSCI Global Agricultural Producers ETF
Period Covered: January 31, 2012 through June 30, 2015
Premium/Discount Range | Number of Days | Percentage of Total Days | ||||||
Greater than 1.5% and Less than 2.0% | 2 | 0.23 | % | |||||
Greater than 1.0% and Less than 1.5% | 17 | 1.98 | ||||||
Greater than 0.5% and Less than 1.0% | 337 | 39.23 | ||||||
Between 0.5% and –0.5% | 477 | 55.53 | ||||||
Less than –0.5% and Greater than –1.0% | 25 | 2.91 | ||||||
Less than –1.0% and Greater than –1.5% | 1 | 0.12 | ||||||
|
|
|
| |||||
| 859 | 100.00 | % | ||||||
|
|
|
| |||||
iShares MSCI Global Energy Producers ETF
Period Covered: January 31, 2012 through June 30, 2015
Premium/Discount Range | Number of Days | Percentage of Total Days | ||||||
Greater than 2.0% and Less than 2.5% | 1 | 0.12 | % | |||||
Greater than 1.5% and Less than 2.0% | 6 | 0.70 | ||||||
Greater than 1.0% and Less than 1.5% | 29 | 3.38 | ||||||
Greater than 0.5% and Less than 1.0% | 109 | 12.69 | ||||||
Between 0.5% and –0.5% | 644 | 74.96 | ||||||
Less than –0.5% and Greater than –1.0% | 60 | 6.98 | ||||||
Less than –1.0% and Greater than –1.5% | 9 | 1.05 | ||||||
Less than –1.5% and Greater than –2.0% | 1 | 0.12 | ||||||
|
|
|
| |||||
| 859 | 100.00 | % | ||||||
|
|
|
| |||||
| 60 | 2015 iSHARES ANNUAL REPORTTO SHAREHOLDERS |
Table of Contents
Supplemental Information (Unaudited) (Continued)
iSHARES®, INC.
iShares MSCI Global Gold Miners ETF
Period Covered: January 31, 2012 through June 30, 2015
Premium/Discount Range | Number of Days | Percentage of Total Days | ||||||
Greater than 2.5% | 4 | 0.47 | % | |||||
Greater than 2.0% and Less than 2.5% | 3 | 0.35 | ||||||
Greater than 1.5% and Less than 2.0% | 5 | 0.58 | ||||||
Greater than 1.0% and Less than 1.5% | 27 | 3.14 | ||||||
Greater than 0.5% and Less than 1.0% | 187 | 21.77 | ||||||
Between 0.5% and –0.5% | 599 | 69.73 | ||||||
Less than –0.5% and Greater than –1.0% | 27 | 3.14 | ||||||
Less than –1.0% and Greater than –1.5% | 5 | 0.58 | ||||||
Less than –1.5% and Greater than –2.0% | 1 | 0.12 | ||||||
Less than –2.0% | 1 | 0.12 | ||||||
|
|
|
| |||||
| 859 | 100.00 | % | ||||||
|
|
|
| |||||
iShares MSCI Global Metals & Mining Producers ETF
Period Covered: January 31, 2012 through June 30, 2015
Premium/Discount Range | Number of Days | Percentage of Total Days | ||||||
Greater than 4.5% | 5 | 0.58 | % | |||||
Greater than 4.0% and Less than 4.5% | 1 | 0.12 | ||||||
Greater than 3.5% and Less than 4.0% | 1 | 0.12 | ||||||
Greater than 3.0% and Less than 3.5% | 1 | 0.12 | ||||||
Greater than 2.5% and Less than 3.0% | 6 | 0.70 | ||||||
Greater than 2.0% and Less than 2.5% | 8 | 0.93 | ||||||
Greater than 1.5% and Less than 2.0% | 39 | 4.54 | ||||||
Greater than 1.0% and Less than 1.5% | 153 | 17.81 | ||||||
Greater than 0.5% and Less than 1.0% | 238 | 27.71 | ||||||
Between 0.5% and –0.5% | 345 | 40.15 | ||||||
Less than –0.5% and Greater than –1.0% | 46 | 5.36 | ||||||
Less than –1.0% and Greater than –1.5% | 14 | 1.63 | ||||||
Less than –1.5% and Greater than –2.0% | 2 | 0.23 | ||||||
|
|
|
| |||||
| 859 | 100.00 | % | ||||||
|
|
|
| |||||
SUPPLEMENTAL INFORMATION | 61 |
Table of Contents
Supplemental Information (Unaudited) (Continued)
iSHARES®, INC.
iShares MSCI Global Silver Miners ETF
Period Covered: January 31, 2012 through June 30, 2015
Premium/Discount Range | Number of Days | Percentage of Total Days | ||||||
Greater than 3.0% and Less than 3.5% | 1 | 0.12 | % | |||||
Greater than 2.5% and Less than 3.0% | 3 | 0.35 | ||||||
Greater than 2.0% and Less than 2.5% | 6 | 0.70 | ||||||
Greater than 1.5% and Less than 2.0% | 18 | 2.10 | ||||||
Greater than 1.0% and Less than 1.5% | 67 | 7.80 | ||||||
Greater than 0.5% and Less than 1.0% | 206 | 23.98 | ||||||
Between 0.5% and –0.5% | 407 | 47.37 | ||||||
Less than –0.5% and Greater than –1.0% | 76 | 8.85 | ||||||
Less than –1.0% and Greater than –1.5% | 37 | 4.31 | ||||||
Less than –1.5% and Greater than –2.0% | 27 | 3.14 | ||||||
Less than –2.0% and Greater than –2.5% | 8 | 0.93 | ||||||
Less than –2.5% and Greater than –3.0% | 3 | 0.35 | ||||||
|
|
|
| |||||
| 859 | 100.00 | % | ||||||
|
|
|
| |||||
| 62 | 2015 iSHARES ANNUAL REPORTTO SHAREHOLDERS |
Table of Contents
Director and Officer Information
iSHARES® , INC.
The Board of Directors has responsibility for the overall management and operations of the Company, including general supervision of the duties performed by BFA and other service providers. Each Director serves until he or she resigns, is removed, dies, retires or becomes incapacitated. Each officer shall hold office until his or her successor is elected and qualifies or until his or her death, or his or her resignation or removal. Directors who are not “interested persons” (as defined in the 1940 Act) of the Company are referred to as independent directors (“Independent Directors”).
The registered investment companies advised by BFA or its affiliates are organized into one complex of closed-end funds, two complexes of open-end funds and one complex of exchange-traded funds (“Exchange-Traded Fund Complex”) (each, a “BlackRock Fund Complex”). Each Fund is included in the BlackRock Fund Complex referred to as the Exchange-Traded Fund Complex. Each Director also serves as a Trustee of iShares Trust and a Trustee of iShares U.S. ETF Trust and, as a result, oversees a total of 319 funds (as of August 31, 2015) within the Exchange-Traded Fund Complex. With the exception of Robert S. Kapito and Mark Wiedman, the address of each Director and officer is c/o BlackRock, Inc., 400 Howard Street, San Francisco, CA 94105. The address of Mr. Kapito and Mr. Wiedman is c/o BlackRock, Inc., Park Avenue Plaza, 55 East 52nd Street, New York, NY 10055. The Board has designated Robert H. Silver as its Independent Chairman. Additional information about the Funds’ Directors and officers may be found in the Funds’ combined Statement of Additional Information, which is available without charge, upon request, by calling toll-free 1-800-iShares (1-800-474-2737).
Interested Directors
| Name (Age) | Position(s) | Principal Occupation(s) During the Past 5 Years | Other Directorships Held by Director | |||
Robert S. Kapitoa (58) | Director (since 2009). | President and Director, BlackRock, Inc. (since 2006); Vice Chairman of BlackRock, Inc. and Head of BlackRock, Inc.’s Portfolio Management Group (since its formation in 1998) and BlackRock, Inc.’s predecessor entities (since 1988); Trustee, University of Pennsylvania (since 2009); President of Board of Directors, Hope & Heroes Children’s Cancer Fund (since 2002); President of the Board of Directors, Periwinkle Theatre for Youth (since 1983). | Trustee of iShares Trust (since 2009); Trustee of iShares U.S. ETF Trust (since 2011); Director of BlackRock, Inc. (since 2006). | |||
Mark Wiedmanb (44) | Director | Managing Director, BlackRock, Inc. (since 2007); Global Head of iShares (since 2011); Head of Corporate Strategy, BlackRock, Inc. (2009-2011). | Trustee of iShares Trust (since 2013); Trustee of iShares U.S. ETF Trust (since 2013); Director of PennyMac Financial Services, Inc. (since 2008). | |||
| a | Robert S. Kapito is deemed to be an “interested person” (as defined in the 1940 Act) of the Company due to his affiliations with BlackRock, Inc. |
| b | Mark Wiedman is deemed to be an “interested person” (as defined in the 1940 Act) of the Company due to his affiliations with BlackRock, Inc. and its affiliates. |
DIRECTORAND OFFICER INFORMATION | 63 |
Table of Contents
Director and Officer Information (Continued)
iSHARES®, INC.
Independent Directors
| Name (Age) | Position(s) | Principal Occupation(s) During the Past 5 Years | Other Directorships Held by Director | |||
Robert H. Silver (60) | Director (since 2007); Independent Chairman (since 2012). | President and Co-Founder of The Bravitas Group, Inc. (since 2006); Director and Vice Chairman of the YMCA of Greater NYC (2001-2011); Broadway Producer (2006-2011); Co-Founder and Vice President of Parentgiving Inc. (since 2008); Director and Member of the Audit and Compensation Committee of EPAM Systems, Inc. (2006-2009); President and Chief Operating Officer of UBS Financial Services Inc. (formerly Paine Webber Inc.) (2003-2005) and various executive positions with UBS and its affiliates (1988-2005); CPA and Audit Manager of KPMG, LLP (formerly Peat Marwick Mitchell) (1977-1983). | Trustee of iShares Trust (since 2007); Trustee of iShares U.S. ETF Trust (since 2011); Independent Chairman of iShares Trust and iShares U.S. ETF Trust (since 2012). | |||
Jane D. Carlin (59) | Director (since 2015). | Managing Director and Global Head of Financial Holding Company Governance & Assurance and the Global Head of Operational Risk Management of Morgan Stanley (2006-2012). | Trustee of iShares Trust (since 2015); Trustee of iShares U.S. ETF Trust (since 2015); Director of PHH Corporation (mortgage solutions) (since 2012). | |||
Cecilia H. Herbert (66) | Director (since 2005); Nominating and Governance Committee Chair and Equity Plus Committee Chair (since 2012). | Director (1998-2013) and President (2007-2011) of the Board of Directors, Catholic Charities CYO; Trustee (2002-2011) and Chair of the Finance and Investment Committee (2006-2010) of the Thacher School; Member (since 1992) and Chair (1994-2005) of the Investment Committee, Archdiocese of San Francisco; Trustee and Member of the Investment Committee, WNET, the New York public broadcasting/media company (since 2011). | Trustee of iShares Trust (since 2005); Trustee of iShares U.S. ETF Trust (since 2011); Director of Forward Funds (34 portfolios) (since 2009). | |||
Charles A. Hurty (71) | Director (since 2005); Audit Committee Chair (since 2006). | Retired; Partner, KPMG LLP (1968-2001). | Trustee of iShares Trust (since 2005); Trustee of iShares U.S. ETF Trust (since 2011); Director of GMAM Absolute Return Strategy Fund (1 portfolio) (since 2002); Director of SkyBridge Alternative Investments Multi-Adviser Hedge Fund Portfolios LLC (2 portfolios) (since 2002). | |||
| 64 | 2015 iSHARES ANNUAL REPORTTO SHAREHOLDERS |
Table of Contents
Director and Officer Information (Continued)
iSHARES®, INC.
Independent Directors (Continued)
| Name (Age) | Position(s) | Principal Occupation(s) During the Past 5 Years | Other Directorships Held by Director | |||
John E. Kerrigan (60) | Director (since 2005); Fixed Income Plus Committee Chair (since 2012). | Chief Investment Officer, Santa Clara University (since 2002). | Trustee of iShares Trust (since 2005); Trustee of iShares U.S. ETF Trust (since 2011). | |||
John E. Martinez (54) | Director (since 2003); Securities Lending Committee Chair (since 2012). | Director of FirstREX Agreement Corp. (formerly EquityRock, Inc.) (since 2005). | Trustee of iShares Trust (since 2003); Trustee of iShares U.S. ETF Trust (since 2011). | |||
Madhav V. Rajan (51) | Director (since 2011); 15(c) Committee Chair (since 2012). | Robert K. Jaedicke Professor of Accounting and Senior Associate Dean for Academic Affairs and Head of MBA Program, Stanford University Graduate School of Business (since 2001); Professor of Law (by courtesy), Stanford Law School (since 2005); Visiting Professor, University of Chicago (2007-2008). | Trustee of iShares Trust (since 2011); Trustee of iShares U.S. ETF Trust (since 2011); Director, Cavium, Inc. (since 2013). | |||
DIRECTORAND OFFICER INFORMATION | 65 |
Table of Contents
Director and Officer Information (Continued)
iSHARES®, INC.
Officers
| Name (Age) | Position(s) | Principal Occupation(s) During the Past 5 Years | ||
Manish Mehta (44) | President (since 2013). | Managing Director, BlackRock, Inc. (since 2009); Chief Operating Officer for iShares (since 2009); Head of Strategy and Corporate Development, BGI (2005-2009); Chief of Staff to the CEO, BGI (2005-2009). | ||
Jack Gee (55) | Treasurer and Chief Financial Officer (since 2008). | Managing Director, BlackRock, Inc. (since 2009); Senior Director of Fund Administration of Intermediary Investor Business, BGI (2009); Director of Fund Administration of Intermediary Investor Business, BGI (2004-2009). | ||
Benjamin Archibald (40) | Secretary (since 2015). | Managing Director, BlackRock, Inc. (since 2014); Secretary of the BlackRock-advised Mutual Funds (since 2012); Director, BlackRock, Inc. (2010-2013). | ||
Charles Park (47) | Chief Compliance Officer (since 2006). | Chief Compliance Officer of BlackRock Advisors, LLC and the BlackRock-advised Funds in the Equity-Bond Complex, the Equity-Liquidity Complex and the Closed-End Complex (since 2014); Chief Compliance Officer, BFA (since 2006). | ||
Scott Radell (46) | Executive Vice President (since 2012). | Managing Director, BlackRock, Inc. (since 2009); Head of Portfolio Solutions, BlackRock, Inc. (since 2009); Head of Portfolio Solutions, BGI (2007-2009); Credit Portfolio Manager, BGI (2005-2007); Credit Research Analyst, BGI (2003-2005). | ||
Amy Schioldager (52) | Executive Vice President (since 2007). | Senior Managing Director, BlackRock, Inc. (since 2009); Global Head of Index Equity, BGI (2008-2009); Global Head of U.S. Indexing, BGI (2006-2008); Head of Domestic Equity Portfolio Management, BGI (2001-2006). | ||
| 66 | 2015 iSHARES ANNUAL REPORTTO SHAREHOLDERS |
Table of Contents
For more information visit www.iShares.com or call 1-800-474-2737
This report is intended for the Funds’ shareholders. It may not be distributed to prospective investors unless it is preceded or accompanied by the current prospectus.
Investing involves risk, including possible loss of principal.
The iShares Funds are distributed by BlackRock Investments, LLC (together with its affiliates, “BlackRock”).
The iShares Funds are not sponsored, endorsed, issued, sold or promoted by MSCI Inc., nor does this company make any representation regarding the advisability of investing in the iShares Funds. BlackRock is not affiliated with the company listed above.
A description of the policies that the Funds use to determine how to vote proxies relating to portfolio securities and information about how the Funds voted proxies relating to portfolio securities during the most recent twelve-month period ending June 30 is available without charge, upon request, by calling toll-free 1-800-474-2737; on the Funds’ website at www.iShares.com; and on the U.S. Securities and Exchange Commission (SEC) website at www.sec.gov.
The Funds file their complete schedules of portfolio holdings with the SEC for the first and third quarters of each fiscal year on Form N-Q. The Funds’ Forms N-Q are available on the SEC’s website or may be reviewed and copied at the SEC’s Public Reference Room in Washington, D.C. Information on the operation of the Public Reference Room may be obtained by calling 1-800-SEC-0330. The Funds also disclose their complete schedules of portfolio holdings on a daily basis on the Funds’ website.
©2015 BlackRock, Inc. All rights reserved. iSHARES and BLACKROCK are registered trademarks of BlackRock, Inc. or its subsidiaries. All other marks are the property of their respective owners.
iS-AR-812-0815
 |  |
Table of Contents
AUGUST 31, 2015
2015 ANNUAL REPORT
|  |
iShares, Inc.
| Ø | iShares MSCI Australia ETF | EWA | NYSE Arca |
| Ø | iShares MSCI Canada ETF | EWC | NYSE Arca |
| Ø | iShares MSCI Japan ETF | EWJ | NYSE Arca |
| Ø | iShares MSCI Mexico Capped ETF | EWW | NYSE Arca |
| Ø | iShares MSCI South Korea Capped ETF | EWY | NYSE Arca |
Table of Contents
| 5 | ||||
| 16 | ||||
| 16 | ||||
| 17 | ||||
| 17 | ||||
| 20 | ||||
| 23 | ||||
| 29 | ||||
| 32 | ||||
| 35 | ||||
| 42 | ||||
| 47 | ||||
| 60 | ||||
| 61 | ||||
| 62 | ||||
| 69 | ||||
| 75 |
Table of Contents
Management’s Discussion of Fund Performance
iSHARES®, INC.
GLOBAL MARKET OVERVIEW
Global equity markets delivered a negative return for the 12 months ended August 31, 2015 (the “reporting period”). The MSCI ACWI, a broad global equity index that includes both developed and emerging markets, returned -6.29% for the reporting period.
The reporting period was characterized by a continued divergence in economic growth and central bank policy between the U.S. and the rest of the world. Despite a slowdown in early 2015, the U.S. economy remained one of the strongest economies among developed countries, which motivated the U.S. Federal Reserve Bank (the “Fed”) to scale back its economic stimulus measures. The Fed ended a two-year quantitative easing program in October 2014 and signaled its intent to raise its short-term interest rate target sometime in 2015. In contrast, weaker economic growth in most other regions of the globe led many of the world’s central banks to take more aggressive actions to stimulate economic activity.
This divergence contributed to a notably stronger U.S. dollar. For the reporting period, the euro, Japanese yen, British pound and Australian dollar declined by 15%, 14%, 7%, and 24% against the U.S. dollar, respectively. Weaker foreign currencies decrease the value of foreign investments measured in U.S. dollars, thereby decreasing returns for U.S. investors, while increasing foreign currencies relative to the U.S. dollar have the opposite effect. Currency performance had a meaningful impact on non-U.S. equity returns for U.S. investors. For example, the MSCI ACWI returned 0.59% in local currency terms for the reporting period.
A number of other factors influenced global markets during the reporting period. Energy prices fell sharply amid growing supply —primarily from increased production in the U.S. — and declining global demand. Lower energy prices contributed to historically low and declining inflation rates in most of the world. Consumer prices were nearly unchanged in the U.S., the European Union, and Japan, while prices in China and India rose at a relatively slow rate. Low inflation and tepid demand kept the Fed’s zero interest rate policy intact, while central banks throughout the world took aggressive measures to stimulate demand.
Global markets advanced for most of the reporting period, then declined sharply in the last few months of the reporting period. The volatility began in China, as slowing economic growth led to a steep drop in China’s equity markets. Plummeting commodity prices amid already subdued inflation also raised concerns about global demand. Currency devaluations in Asia, including China, Vietnam, Pakistan, and Kazakhstan, led to speculation that Asian countries were weakening their currencies to compete for demand. These global events led to further uncertainty about the timing of an expected interest rate hike from the Fed.
On a regional basis, U.S. stocks advanced by less than 1% for the reporting period as declining interest rates, ongoing economic growth, and low inflation provided a favorable environment for U.S. equity market performance. After generating its fastest quarterly growth rate in 11 years in the third quarter of 2014, the U.S. economy slowed over the next two quarters. Economic activity improved over the last several months of the reporting period, boosted by an increase in consumer spending.
European stocks declined by about 8% in U.S. dollar terms for the reporting period, though they advanced more than 3% when measured in local currencies. The European Central Bank initiated quantitative easing measures in early 2015, and signs of economic improvement emerged in the latter half of the reporting period. A tentative agreement on Greece’s debt repayment helped alleviate ongoing concerns about Europe’s sovereign debt levels.
Stock markets in the Asia/Pacific region (excluding Japan) declined by approximately 19% in U.S. dollar terms, which equated to an 8% decline when measured in local currencies. China’s economic slowdown weighed heavily on the region, as China is the largest trading partner of many countries in the region. On the bright side, Japanese stocks performed relatively well, as ongoing economic stimulus and reform measures led to a 4% gain in U.S. dollar terms (22% when measured in Japanese yen).
Emerging markets stocks fell by approximately 23% in U.S. dollar terms for the reporting period, though the decline was about 10% when measured in local currencies. Many of the largest emerging economies — including China, Russia, and Brazil — experienced slowing economic growth during the reporting period. Latin American stocks posted some of the biggest declines, as the region struggled with slow growth and declining commodity prices.
MANAGEMENT’S DISCUSSIONSOF FUND PERFORMANCE | 5 |
Table of Contents
Management’s Discussion of Fund Performance
iSHARES® MSCI AUSTRALIA ETF
Performance as of August 31, 2015
| Average Annual Total Returns | Cumulative Total Returns | |||||||||||||||||||||||||
| NAV | MARKET | INDEX | NAV | MARKET | INDEX | |||||||||||||||||||||
1 Year | (27.31)% | (27.42)% | (27.01)% | (27.31)% | (27.42)% | (27.01)% | ||||||||||||||||||||
5 Years | 2.73% | 2.55% | 3.14% | 14.42% | 13.40% | 16.71% | ||||||||||||||||||||
10 Years | 5.18% | 5.04% | 5.24% | 65.66% | 63.47% | 66.65% | ||||||||||||||||||||
GROWTH OF $10,000 INVESTMENT
(AT NET ASSET VALUE)

Past performance is no guarantee of future results. Performance results do not reflect the deduction of taxes that a shareholder would pay on fund distributions or on the redemption or sale of fund shares. See “About Fund Performance” on page 16 for more information.
| Shareholder Expenses | ||||||||||||||||||||||||||
| Actual | Hypothetical 5% Return | |||||||||||||||||||||||||
| Beginning Account Value (3/1/15) | Ending Account Value (8/31/15) | Expenses Paid During Period a | Beginning Account Value (3/1/15) | Ending Account Value (8/31/15) | Expenses Paid During Period a | Annualized Expense Ratio | ||||||||||||||||||||
| $ | 1,000.00 | $ | 807.00 | $ | 2.14 | $ | 1,000.00 | $ | 1,022.80 | $ | 2.40 | 0.47% | ||||||||||||||
| a | Expenses are calculated using the Fund’s annualized expense ratio (as disclosed in the table), multiplied by the average account value for the period, multiplied by the number of days in the period (184 days) and divided by the number of days in the year (365 days). See “Shareholder Expenses” on page 16 for more information. |
| 6 | 2015 iSHARES ANNUAL REPORTTO SHAREHOLDERS |
Table of Contents
Management’s Discussion of Fund Performance (Continued)
iSHARES® MSCI AUSTRALIA ETF
The iShares MSCI Australia ETF (the “Fund”) seeks to track the investment results of an index composed of Australian equities, as represented by the MSCI Australia Index (the “Index”). The Fund invests in a representative sample of securities included in the Index that collectively has an investment profile similar to the Index. Due to the use of representative sampling, the Fund may or may not hold all of the securities that are included in the Index. For the 12-month reporting period ended August 31, 2015, the total return for the Fund was -27.31%, net of fees, while the total return for the Index was -27.01%.
As represented by the Index, Australian stocks delivered a negative return for the reporting period and significantly underperformed broad international equity indexes. The Australian dollar depreciated by about 24% relative to the U.S. dollar, which meaningfully detracted from the Index’s performance. In addition, like most global equity markets, Australia declined near the end of the reporting period, sparked by a sharp correction in China’s equity market.
Australia’s economy grew more slowly in 2015’s second quarter than in the first. The rate was the slowest in more than two years as exports declined amid an economic slowdown in China, a key export market for Australia. The Australian economy, which relies heavily on resources exports, has been hindered by slackening demand from China, which in turn has contributed to lower metals and oil prices, as well as a weaker currency and falling revenues. The country’s largest exports are iron ore and coal, and data for the second quarter of 2015 indicated a significant decline in mining production. On the positive side, household spending rose, as did government expenditures.
In U.S. dollar terms, every sector of the Index declined for the reporting period. Financials, which represented more than half of the Index on average during the reporting period, significantly hindered the Index’s performance. Within the financials sector, banks were the largest drag on performance. The materials sector was also a significant detractor from the Index’s return, largely due to the metals and mining industry. The utilities and information technology sectors detracted the least from the Index’s return for the reporting period.
ALLOCATION BY SECTOR
As of 8/31/15
| Sector | Percentage of Total Investments* |
Financials | 53.32 | % | ||
Materials | 15.14 | |||
Consumer Staples | 7.89 | |||
Health Care | 6.07 | |||
Industrials | 6.04 | |||
Energy | 4.35 | |||
Telecommunication Services | 2.46 | |||
Consumer Discretionary | 2.21 | |||
Utilities | 2.10 | |||
Information Technology | 0.42 | |||
|
| |||
TOTAL | 100.00 | % | ||
|
|
TEN LARGEST FUND HOLDINGS
As of 8/31/15
| Security | Percentage of Total Investments* |
Commonwealth Bank of Australia | 11.45 | % | ||
Westpac Banking Corp. | 8.72 | |||
National Australia Bank Ltd. | 7.32 | |||
BHP Billiton Ltd. | 7.26 | |||
Australia & New Zealand Banking Group Ltd. | 6.94 | |||
Wesfarmers Ltd. | 4.10 | |||
CSL Ltd. | 3.86 | |||
Woolworths Ltd. | 3.00 | |||
Telstra Corp. Ltd. | 2.22 | |||
Woodside Petroleum Ltd. | 2.15 | |||
|
| |||
TOTAL | 57.02 | % | ||
|
|
| * | Excludes money market funds. |
MANAGEMENT’S DISCUSSIONSOF FUND PERFORMANCE | 7 |
Table of Contents
Management’s Discussion of Fund Performance
iSHARES® MSCI CANADA ETF
Performance as of August 31, 2015
| Average Annual Total Returns | Cumulative Total Returns | |||||||||||||||||||||||||
| NAV | MARKET | INDEX | NAV | MARKET | INDEX | |||||||||||||||||||||
1 Year | (25.48)% | (24.59)% | (25.31)% | (25.48)% | (24.59)% | (25.31)% | ||||||||||||||||||||
5 Years | 0.47% | 0.69% | 0.69% | 2.37% | 3.48% | 3.49% | ||||||||||||||||||||
10 Years | 3.55% | 3.58% | 3.78% | 41.72% | 42.20% | 44.97% | ||||||||||||||||||||
GROWTH OF $10,000 INVESTMENT
(AT NET ASSET VALUE)
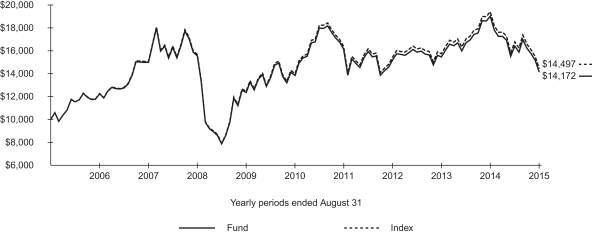
Past performance is no guarantee of future results. Performance results do not reflect the deduction of taxes that a shareholder would pay on fund distributions or on the redemption or sale of fund shares. See “About Fund Performance” on page 16 for more information.
| Shareholder Expenses | ||||||||||||||||||||||||||
| Actual | Hypothetical 5% Return | |||||||||||||||||||||||||
| Beginning Account Value (3/1/15) | Ending Account Value (8/31/15) | Expenses Paid During Period a | Beginning Account Value (3/1/15) | Ending Account Value (8/31/15) | Expenses Paid During Period a | Annualized Expense Ratio | ||||||||||||||||||||
| $ | 1,000.00 | $ | 862.90 | $ | 2.21 | $ | 1,000.00 | $ | 1,022.80 | $ | 2.40 | 0.47% | ||||||||||||||
| a | Expenses are calculated using the Fund’s annualized expense ratio (as disclosed in the table), multiplied by the average account value for the period, multiplied by the number of days in the period (184 days) and divided by the number of days in the year (365 days). See “Shareholder Expenses” on page 16 for more information. |
| 8 | 2015 iSHARES ANNUAL REPORTTO SHAREHOLDERS |
Table of Contents
Management’s Discussion of Fund Performance (Continued)
iSHARES® MSCI CANADA ETF
The iShares MSCI Canada ETF (the “Fund”) seeks to track the investment results of an index composed of Canadian equities, as represented by the MSCI Canada Index (the “Index”). The Fund invests in a representative sample of securities included in the Index that collectively has an investment profile similar to the Index. Due to the use of representative sampling, the Fund may or may not hold all of the securities that are included in the Index. For the 12-month reporting period ended August 31, 2015, the total return for the Fund was -25.48%, net of fees, while the total return for the Index was -25.31%.
As represented by the Index, Canadian stocks delivered a negative return for the reporting period and significantly underperformed broad international equity indexes. The Canadian dollar depreciated by about 18% relative to the U.S. dollar over the reporting period, which meaningfully detracted from the Index’s performance. In addition, like most global equity markets, Canada declined late in the reporting period, sparked by a sharp correction in China’s equity market.
In 2015’s second quarter, Canada’s economy contracted for the second consecutive quarter, putting the country in recession for the first time since the 2008–09 financial crisis. Economic weakness has been concentrated in the energy sector amid a significant decline in oil prices. Oil-exporting provinces have been the hardest hit by reduced demand for energy. The Bank of Canada has twice cut interest rates in 2015 to help support the economy.
In terms of sector performance, energy and financials, which together represented more than 60% of the Index on average during the reporting period, detracted the most from the Index’s performance in U.S. dollar terms. While energy stocks declined across the board, banks were the main drag in the financials sector. The materials sector was also a large detractor from the Index’s return, due largely to the mining and metals industry. In contrast, the healthcare sector contributed positively to the Index’s performance for the reporting period, led by the pharmaceuticals industry. To a lesser extent, the consumer staples sector helped the Index’s return, largely due to the food and staples retailing industry.
ALLOCATION BY SECTOR
As of 8/31/15
| Sector | Percentage of Total Investments* |
Financials | 39.05 | % | ||
Energy | 20.87 | |||
Materials | 8.73 | |||
Industrials | 7.28 | |||
Health Care | 6.89 | |||
Consumer Discretionary | 6.49 | |||
Consumer Staples | 4.72 | |||
Information Technology | 2.36 | |||
Telecommunication Services | 2.28 | |||
Utilities | 1.33 | |||
|
| |||
TOTAL | 100.00 | % | ||
|
|
TEN LARGEST FUND HOLDINGS
As of 8/31/15
| Security | Percentage of Total Investments* |
Royal Bank of Canada | 7.37 | % | ||
Valeant Pharmaceuticals International Inc. | 6.89 | |||
Toronto-Dominion Bank (The) | 6.75 | |||
Bank of Nova Scotia (The) | 4.93 | |||
Canadian National Railway Co. | 4.08 | |||
Suncor Energy Inc. | 3.74 | |||
Enbridge Inc. | 3.23 | |||
Bank of Montreal | 3.21 | |||
Manulife Financial Corp. | 2.93 | |||
Canadian Imperial Bank of Commerce/Canada | 2.68 | |||
|
| |||
TOTAL | 45.81 | % | ||
|
|
| * | Excludes money market funds. |
MANAGEMENT’S DISCUSSIONSOF FUND PERFORMANCE | 9 |
Table of Contents
Management’s Discussion of Fund Performance
iSHARES® MSCI JAPAN ETF
Performance as of August 31, 2015
| Average Annual Total Returns | Cumulative Total Returns | |||||||||||||||||||||||||
| NAV | MARKET | INDEX | NAV | MARKET | INDEX | |||||||||||||||||||||
1 Year | 3.84% | 3.84% | 4.17% | 3.84% | 3.84% | 4.17% | ||||||||||||||||||||
5 Years | 6.84% | 6.86% | 7.35% | 39.18% | 39.37% | 42.60% | ||||||||||||||||||||
10 Years | 2.37% | 2.18% | 2.86% | 26.33% | 24.05% | 32.59% | ||||||||||||||||||||
GROWTH OF $10,000 INVESTMENT
(AT NET ASSET VALUE)
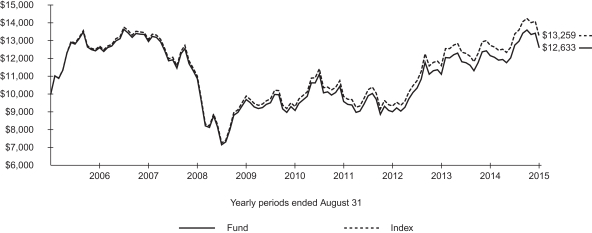
Past performance is no guarantee of future results. Performance results do not reflect the deduction of taxes that a shareholder would pay on fund distributions or on the redemption or sale of fund shares. See “About Fund Performance” on page 16 for more information.
| Shareholder Expenses | ||||||||||||||||||||||||||
| Actual | Hypothetical 5% Return | |||||||||||||||||||||||||
| Beginning Account Value (3/1/15) | Ending Account Value (8/31/15) | Expenses Paid During Period a | Beginning Account Value (3/1/15) | Ending Account Value (8/31/15) | Expenses Paid During Period a | Annualized Expense Ratio | ||||||||||||||||||||
| $ | 1,000.00 | $ | 990.40 | $ | 2.36 | $ | 1,000.00 | $ | 1,022.80 | $ | 2.40 | 0.47% | ||||||||||||||
| a | Expenses are calculated using the Fund’s annualized expense ratio (as disclosed in the table), multiplied by the average account value for the period, multiplied by the number of days in the period (184 days) and divided by the number of days in the year (365 days). See “Shareholder Expenses” on page 16 for more information. |
| 10 | 2015 iSHARES ANNUAL REPORTTO SHAREHOLDERS |
Table of Contents
Management’s Discussion of Fund Performance (Continued)
iSHARES® MSCI JAPAN ETF
The iShares MSCI Japan ETF (the “Fund”) seeks to track the investment results of an index composed of Japanese equities, as represented by the MSCI Japan Index (the “Index”). The Fund invests in a representative sample of securities included in the Index that collectively has an investment profile similar to the Index. Due to the use of representative sampling, the Fund may or may not hold all of the securities that are included in the Index. For the 12-month reporting period ended August 31, 2015, the total return for the Fund was 3.84%, net of fees, while the total return for the Index was 4.17%.
As represented by the Index, Japanese stocks posted a positive return for the reporting period and significantly outperformed broader international equity indexes, most of which declined.
However, the Japanese yen depreciated by 14% relative to the U.S. dollar, which meaningfully detracted from the Index’s performance. In addition, like most global equity markets, Japan declined late in the reporting period, sparked by a sharp correction in China’s equity market. Japan’s economy shrank in 2015’s second quarter, the first quarterly contraction since the third quarter of 2014. Several areas of the economy have shown signs of weakness, including automobile registrations and industrial production. In addition, slowing growth in China has muted expectations for exports, despite a weaker Japanese yen, which tends to make the country’s exports less expensive. Nonetheless, the Japanese economy grew modestly overall for the 12 months ended June 30, 2015, thanks in part to the Bank of Japan’s aggressive economic stimulus measures. These efforts provided a favorable environment for equity market performance in Japan.
In U.S. dollar terms, most sectors helped the Index’s return for the reporting period. The financials and healthcare sectors were the strongest contributors to the Index’s performance. Banks and insurers provided the largest contribution to the financials sector’s return, while the pharmaceuticals industry boosted performance in healthcare. Conversely, the industrials sector detracted the most from the Index’s performance for the reporting period, particularly the capital goods industry. The energy and materials sectors also hindered the Index’s return, largely due to lower commodity prices.
ALLOCATION BY SECTOR
As of 8/31/15
| Sector | Percentage of Total Investments* |
Consumer Discretionary | 21.55 | % | ||
Financials | 19.56 | |||
Industrials | 18.58 | |||
Information Technology | 10.47 | |||
Health Care | 7.96 | |||
Consumer Staples | 7.30 | |||
Telecommunication Services | 5.57 | |||
Materials | 5.39 | |||
Utilities | 2.70 | |||
Energy | 0.92 | |||
|
| |||
TOTAL | 100.00 | % | ||
|
|
TEN LARGEST FUND HOLDINGS
As of 8/31/15
| Security | Percentage of Total Investments* |
Toyota Motor Corp. | 5.71 | % | ||
Mitsubishi UFJ Financial Group Inc. | 2.97 | |||
SoftBank Group Corp. | 1.97 | |||
Sumitomo Mitsui Financial Group Inc. | 1.86 | |||
Honda Motor Co. Ltd. | 1.82 | |||
Mizuho Financial Group Inc. | 1.67 | |||
KDDI Corp. | 1.54 | |||
Japan Tobacco Inc. | 1.38 | |||
Takeda Pharmaceutical Co. Ltd. | 1.35 | |||
Sony Corp. | 1.15 | |||
|
| |||
TOTAL | 21.42 | % | ||
|
|
| * | Excludes money market funds. |
MANAGEMENT’S DISCUSSIONSOF FUND PERFORMANCE | 11 |
Table of Contents
Management’s Discussion of Fund Performance
iSHARES® MSCI MEXICO CAPPED ETF
Performance as of August 31, 2015
| Average Annual Total Returns | Cumulative Total Returns | |||||||||||||||||||||||||
| NAV | MARKET | INDEX | NAV | MARKET | INDEX | |||||||||||||||||||||
1 Year | (25.10)% | (25.17)% | (24.87)% | (25.10)% | (25.17)% | (24.87)% | ||||||||||||||||||||
5 Years | 3.26% | 3.35% | 2.94% | 17.39% | 17.93% | 15.60% | ||||||||||||||||||||
10 Years | 7.79% | 7.75% | 7.31% | 111.76% | 110.91% | 102.50% | ||||||||||||||||||||
GROWTH OF $10,000 INVESTMENT
(AT NET ASSET VALUE)
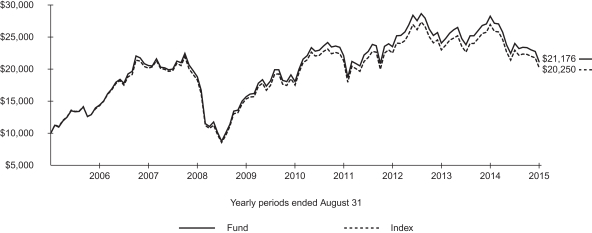
Index performance through November 30, 2007 reflects the performance of the MSCI Mexico Index. Index performance beginning on December 1, 2007 through February 11, 2013 reflects the performance of the MSCI Mexico Investable Market Index. Index performance beginning on February 12, 2013 reflects the performance of the MSCI Mexico Investable Market Index 25/50.
Past performance is no guarantee of future results. Performance results do not reflect the deduction of taxes that a shareholder would pay on fund distributions or on the redemption or sale of fund shares. See “About Fund Performance” on page 16 for more information.
| Shareholder Expenses | ||||||||||||||||||||||||||
| Actual | Hypothetical 5% Return | |||||||||||||||||||||||||
| Beginning Account Value (3/1/15) | Ending Account Value (8/31/15) | Expenses Paid During Period a | Beginning Account Value (3/1/15) | Ending Account Value (8/31/15) | Expenses Paid During Period a | Annualized Expense Ratio | ||||||||||||||||||||
| $ | 1,000.00 | $ | 881.70 | $ | 2.23 | $ | 1,000.00 | $ | 1,022.80 | $ | 2.40 | 0.47% | ||||||||||||||
| a | Expenses are calculated using the Fund’s annualized expense ratio (as disclosed in the table), multiplied by the average account value for the period, multiplied by the number of days in the period (184 days) and divided by the number of days in the year (365 days). See “Shareholder Expenses” on page 16 for more information. |
| 12 | 2015 iSHARES ANNUAL REPORTTO SHAREHOLDERS |
Table of Contents
Management’s Discussion of Fund Performance (Continued)
iSHARES® MSCI MEXICO CAPPED ETF
The iShares MSCI Mexico Capped ETF (the “Fund”) seeks to track the investment results of a broad-based index composed of Mexican equities, as represented by the MSCI Mexico Investable Market Index 25/50 (the “Index”). The Fund invests in a representative sample of securities included in the Index that collectively has an investment profile similar to the Index. Due to the use of representative sampling, the Fund may or may not hold all of the securities that are included in the Index. For the 12-month reporting period ended August 31, 2015, the total return for the Fund was -25.10%, net of fees, while the total return for the Index was -24.87%.
As represented by the Index, Mexican stocks delivered a negative return for the reporting period and significantly underperformed broad international equity indexes. The Mexican peso fell about 22% relative to the U.S. dollar over the reporting period, which meaningfully detracted from the Index’s performance. In addition, like most global equity markets, Mexico declined near the end of the reporting period, sparked by a sharp correction in China’s equity market.
Mexico has benefited from reforms instituted by the government to help make major industries such as oil and telecommunication services more competitive. The reforms have led to lower electricity and telecommunications prices, which has helped keep inflation low, but they have yet to contribute much to economic growth. The country’s economic growth rate was steady but modest during the reporting period, while the Mexican peso fell to record lows against the U.S. dollar late in the reporting period, sparking worries of a peso crisis similar to the one in 1994.
In U.S. dollar terms, every sector of the Index declined for the reporting period, with the financials sector having the most significant negative impact on the Index’s performance. Within the sector, banks detracted the most as they have been pressured by the peso’s depreciation against the U.S. dollar and the prospects of higher interest rates, which can make financing more difficult. The materials sector was also a large detractor from the Index’s return, weighed down by declines in the construction materials and metals and mining industries. The healthcare and consumer discretionary sectors detracted the least from the Index’s return.
ALLOCATION BY SECTOR
As of 8/31/15
| Sector | Percentage of Total Investments* |
Consumer Staples | 26.89 | % | ||
Financials | 19.91 | |||
Telecommunication Services | 15.84 | |||
Materials | 13.31 | |||
Industrials | 12.69 | |||
Consumer Discretionary | 10.88 | |||
Health Care | 0.48 | |||
|
| |||
TOTAL | 100.00 | % | ||
|
|
TEN LARGEST FUND HOLDINGS
As of 8/31/15
| Security | Percentage of Total Investments* |
America Movil SAB de CV | 15.56 | % | ||
Fomento Economico Mexicano SAB de CV | 8.31 | |||
Grupo Televisa SAB | 7.53 | |||
Wal-Mart de Mexico SAB de CV | 6.17 | |||
Grupo Financiero Banorte SAB de CV | 5.88 | |||
Cemex SAB de CV CPO | 4.77 | |||
Grupo Mexico SAB de CV Series B | 4.68 | |||
Alfa SAB de CV | 3.27 | |||
Fibra Uno Administracion SA de CV | 2.93 | |||
Grupo Financiero Inbursa SAB de CV Series O | 2.87 | |||
|
| |||
TOTAL | 61.97 | % | ||
|
|
| * | Excludes money market funds. |
MANAGEMENT’S DISCUSSIONSOF FUND PERFORMANCE | 13 |
Table of Contents
Management’s Discussion of Fund Performance
iSHARES® MSCI SOUTH KOREA CAPPED ETF
Performance as of August 31, 2015
| Average Annual Total Returns | Cumulative Total Returns | |||||||||||||||||||||||||
| NAV | MARKET | INDEX | NAV | MARKET | INDEX | |||||||||||||||||||||
1 Year | (26.58)% | (27.07)% | (26.13)% | (26.58)% | (27.07)% | (26.13)% | ||||||||||||||||||||
5 Years | 1.14% | 0.98% | 1.83% | 5.81% | 5.01% | 9.47% | ||||||||||||||||||||
10 Years | 4.34% | 4.37% | 4.93% | 52.96% | 53.43% | 61.85% | ||||||||||||||||||||
GROWTH OF $10,000 INVESTMENT
(AT NET ASSET VALUE)
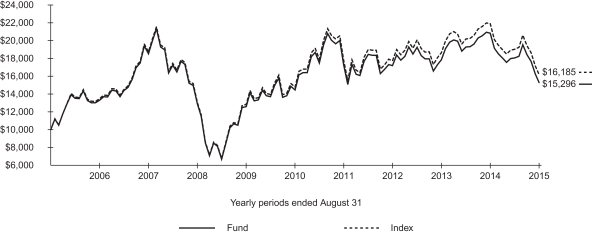
Index performance through February 11, 2013 reflects the performance of the MSCI Korea Index. Index performance beginning on February 12, 2013 reflects the performance of the MSCI Korea 25/50 Index.
Past performance is no guarantee of future results. Performance results do not reflect the deduction of taxes that a shareholder would pay on fund distributions or on the redemption or sale of fund shares. See “About Fund Performance” on page 16 for more information.
| Shareholder Expenses | ||||||||||||||||||||||||||
| Actual | Hypothetical 5% Return | |||||||||||||||||||||||||
| Beginning Account Value (3/1/15) | Ending Account Value (8/31/15) | Expenses Paid During Period a | Beginning Account Value (3/1/15) | Ending Account Value (8/31/15) | Expenses Paid During Period a | Annualized Expense Ratio | ||||||||||||||||||||
| $ | 1,000.00 | $ | 846.20 | $ | 2.89 | $ | 1,000.00 | $ | 1,022.10 | $ | 3.16 | 0.62% | ||||||||||||||
| a | Expenses are calculated using the Fund’s annualized expense ratio (as disclosed in the table), multiplied by the average account value for the period, multiplied by the number of days in the period (184 days) and divided by the number of days in the year (365 days). See “Shareholder Expenses” on page 16 for more information. |
| 14 | 2015 iSHARES ANNUAL REPORTTO SHAREHOLDERS |
Table of Contents
Management’s Discussion of Fund Performance (Continued)
iSHARES® MSCI SOUTH KOREA CAPPED ETF
The iShares MSCI South Korea Capped ETF (the “Fund”) seeks to track the investment results of an index composed of South Korean equities, as represented by the MSCI Korea 25/50 Index (the “Index”). The Fund invests in a representative sample of securities included in the Index that collectively has an investment profile similar to the Index. Due to the use of representative sampling, the Fund may or may not hold all of the securities that are included in the Index. For the 12-month reporting period ended August 31, 2015, the total return for the Fund was -26.58%, net of fees, while the total return for the Index was -26.13%.
As represented by the Index, South Korean stocks delivered a negative return for the reporting period and significantly underperformed broad international equity indexes. The South Korean won depreciated by about 14% relative to the U.S. dollar, which meaningfully detracted from the Index’s performance. In addition, like most global equity markets, South Korea declined near the end of the reporting period, sparked by a sharp correction in China’s equity market.
South Korea’s economic growth slowed during the reporting period, driven primarily by a decline in exports, which account for about half the country’s economy. Exports have dropped in each of the first seven months of 2015, partly due to the South Korean won’s strength compared to the Japanese yen and the euro. Other challenges for the South Korean economy included the recent devaluation of the Chinese yuan, which reduced Chinese tourist visits, and an outbreak of Middle East Respiratory Syndrome that restrained domestic consumption.
In terms of sector performance, information technology, which represented more than one-third of the Index on average during the reporting period, significantly hindered the Index’s return in U.S. dollar terms. Within the sector, the technology hardware and equipment industry struggled amid the decline in exports. The consumer discretionary sector was also a large detractor from the Index’s return, due largely to the autos and components industry. Conversely, the consumer staples and healthcare sectors modestly helped the Index’s performance for the reporting period. Within consumer staples, the household and personal products industry supported the Index’s return, while the pharmaceuticals industry boosted performance in healthcare.
ALLOCATION BY SECTOR
As of 8/31/15
| Sector | Percentage of Total Investments* |
Information Technology | 32.91 | % | ||
Consumer Discretionary | 17.27 | |||
Financials | 14.77 | |||
Industrials | 11.08 | |||
Consumer Staples | 8.94 | |||
Materials | 8.22 | |||
Utilities | 2.34 | |||
Energy | 2.02 | |||
Health Care | 1.40 | |||
Telecommunication Services | 1.05 | |||
|
| |||
TOTAL | 100.00 | % | ||
|
|
TEN LARGEST FUND HOLDINGS
As of 8/31/15
| Security | Percentage of Total Investments* |
Samsung Electronics Co. Ltd. | 19.59 | % | ||
Hyundai Motor Co. | 3.92 | |||
SK Hynix Inc. | 3.56 | |||
Shinhan Financial Group Co. Ltd. | 2.89 | |||
Hyundai Mobis Co. Ltd. | 2.42 | |||
NAVER Corp. | 2.38 | |||
KB Financial Group Inc. | 2.37 | |||
Samsung Electronics Co. Ltd. (Preferred) | 2.25 | |||
POSCO | 2.22 | |||
Kia Motors Corp. | 2.21 | |||
|
| |||
TOTAL | 43.81 | % | ||
|
|
| * | Excludes money market funds. |
MANAGEMENT’S DISCUSSIONSOF FUND PERFORMANCE | 15 |
Table of Contents
Past performance is no guarantee of future results. Current performance may be lower or higher than the performance data quoted. Performance data current to the most recent month-end is available at www.ishares.com. Performance results assume reinvestment of all dividends and capital gain distributions and do not reflect the deduction of taxes that a shareholder would pay on fund distributions or on the redemption or sale of fund shares. The investment return and principal value of shares will vary with changes in market conditions. Shares may be worth more or less than their original cost when they are redeemed or sold in the market. Performance for certain funds may reflect a waiver of a portion of investment advisory fees. Without such a waiver, performance would have been lower.
Net asset value or “NAV” is the value of one share of a fund as calculated in accordance with the standard formula for valuing mutual fund shares. The price used to calculate market return (“Market Price”) is determined by using the midpoint between the highest bid and the lowest offer on the primary stock exchange on which shares of a fund are listed for trading, as of the time that such fund’s NAV is calculated. Certain funds may have a NAV which is determined prior to the opening of regular trading on its listed exchange and their market returns are calculated using the midpoint of the bid/ask spread as of the opening of regular trading on the exchange. Market and NAV returns assume that dividends and capital gain distributions have been reinvested at Market Price and NAV, respectively.
An index is a statistical composite that tracks a specified financial market or sector. Unlike a fund, an index does not actually hold a portfolio of securities and therefore does not incur the expenses incurred by a fund. These expenses negatively impact fund performance. Also, market returns do not include brokerage commissions that may be payable on secondary market transactions. If brokerage commissions were included, market returns would be lower.
As a shareholder of a Fund, you incur two types of costs: (1) transaction costs, including brokerage commissions on purchases and sales of fund shares and (2) ongoing costs, including management fees and other fund expenses. The expense example, which is based on an investment of $1,000 invested on March 1, 2015 and held through August 31, 2015, is intended to help you understand your ongoing costs (in dollars and cents) of investing in a Fund and to compare these costs with the ongoing costs of investing in other funds.
Actual Expenses — The table provides information about actual account values and actual expenses. Annualized expense ratios reflect contractual and voluntary fee waivers, if any. To estimate the expenses that you paid on your account over the period, simply divide your account value by $1,000 (for example, an $8,600 account value divided by $1,000 = 8.6), then multiply the result by the number corresponding to your Fund under the heading entitled “Expenses Paid During Period.”
Hypothetical Example for Comparison Purposes — The table also provides information about hypothetical account values and hypothetical expenses based on each Fund’s actual expense ratio and an assumed rate of return of 5% per year before expenses. You may use this information to compare the ongoing costs of investing in your Fund and other funds. To do so, compare this 5% hypothetical example with the 5% hypothetical examples that appear in the shareholder reports of the other funds.
Please note that the expenses shown in the table are meant to highlight your ongoing costs only and do not reflect any transactional costs, such as brokerage commissions paid on purchases and sales of fund shares. Therefore, the hypothetical examples are useful in comparing ongoing costs only and will not help you determine the relative total costs of owning different funds. In addition, if these transactional costs were included, your costs would have been higher.
| 16 | 2015 iSHARES ANNUAL REPORTTO SHAREHOLDERS |
Table of Contents
August 31, 2015
| Security | Shares | Value | ||||||
COMMON STOCKS — 98.79% |
| |||||||
AIRLINES — 0.16% |
| |||||||
Qantas Airways Ltd.a | 843,882 | $ | 2,010,187 | |||||
|
| |||||||
| 2,010,187 | ||||||||
BANKS — 34.87% |
| |||||||
Australia & New Zealand Banking Group Ltd. | 4,251,119 | 84,176,277 | ||||||
Bank of Queensland Ltd. | 569,774 | 5,117,935 | ||||||
Bendigo & Adelaide Bank Ltd. | 697,102 | 5,421,488 | ||||||
Commonwealth Bank of Australia | 2,610,182 | 138,934,650 | ||||||
National Australia Bank Ltd. | 4,019,267 | 88,817,629 | ||||||
Westpac Banking Corp. | 4,795,496 | 105,732,729 | ||||||
|
| |||||||
| 428,200,708 | ||||||||
BEVERAGES — 0.77% |
| |||||||
Coca-Cola Amatil Ltd. | 880,188 | 5,241,677 | ||||||
Treasury Wine Estates Ltd. | 1,000,938 | 4,229,304 | ||||||
|
| |||||||
| 9,470,981 | ||||||||
BIOTECHNOLOGY — 3.81% |
| |||||||
CSL Ltd. | 718,977 | 46,827,851 | ||||||
|
| |||||||
| 46,827,851 | ||||||||
CAPITAL MARKETS — 2.16% |
| |||||||
Macquarie Group Ltd. | 461,115 | 24,822,080 | ||||||
Platinum Asset Management Ltd. | 360,373 | 1,729,643 | ||||||
|
| |||||||
| 26,551,723 | ||||||||
CHEMICALS — 1.04% |
| |||||||
Incitec Pivot Ltd. | 2,575,315 | 6,408,450 | ||||||
Orica Ltd. | 569,611 | 6,404,674 | ||||||
|
| |||||||
| 12,813,124 | ||||||||
COMMERCIAL SERVICES & SUPPLIES — 1.37% |
| |||||||
Brambles Ltd. | 2,408,296 | 16,800,433 | ||||||
|
| |||||||
| 16,800,433 | ||||||||
CONSTRUCTION & ENGINEERING — 0.21% |
| |||||||
CIMIC Group Ltd. | 156,071 | 2,590,235 | ||||||
|
| |||||||
| 2,590,235 | ||||||||
CONSTRUCTION MATERIALS — 1.09% |
| |||||||
Boral Ltd. | 1,180,888 | 4,721,754 | ||||||
James Hardie Industries PLC | 691,310 | 8,611,129 | ||||||
|
| |||||||
| 13,332,883 | ||||||||
CONTAINERS & PACKAGING — 1.45% |
| |||||||
Amcor Ltd./Australia | 1,832,663 | 17,825,932 | ||||||
|
| |||||||
| 17,825,932 | ||||||||
| Security | Shares | Value | ||||||
DIVERSIFIED FINANCIAL SERVICES — 0.68% |
| |||||||
ASX Ltd. | 297,541 | $ | 8,319,539 | |||||
|
| |||||||
| 8,319,539 | ||||||||
DIVERSIFIED TELECOMMUNICATION SERVICES — 2.43% |
| |||||||
Telstra Corp. Ltd. | 6,576,498 | 26,902,090 | ||||||
TPG Telecom Ltd. | 441,793 | 2,941,033 | ||||||
|
| |||||||
| 29,843,123 | ||||||||
ELECTRIC UTILITIES — 0.20% |
| |||||||
AusNet Services | 2,664,211 | 2,464,874 | ||||||
|
| |||||||
| 2,464,874 | ||||||||
ENERGY EQUIPMENT & SERVICES — 0.14% |
| |||||||
WorleyParsons Ltd. | 319,312 | 1,700,085 | ||||||
|
| |||||||
| 1,700,085 | ||||||||
FOOD & STAPLES RETAILING — 7.02% |
| |||||||
Wesfarmers Ltd. | 1,727,127 | 49,785,992 | ||||||
Woolworths Ltd. | 1,946,636 | 36,433,777 | ||||||
|
| |||||||
| 86,219,769 | ||||||||
GAS UTILITIES — 0.87% |
| |||||||
APA Group | 1,712,615 | 10,648,167 | ||||||
|
| |||||||
| 10,648,167 | ||||||||
HEALTH CARE EQUIPMENT & SUPPLIES — 0.43% |
| |||||||
Cochlear Ltd. | 87,728 | 5,313,298 | ||||||
|
| |||||||
| 5,313,298 | ||||||||
HEALTH CARE PROVIDERS & SERVICES — 1.75% |
| |||||||
Healthscope Ltd. | 1,730,342 | 3,263,090 | ||||||
Ramsay Health Care Ltd. | 217,406 | 9,626,957 | ||||||
Sonic Healthcare Ltd. | 586,929 | 8,621,659 | ||||||
|
| |||||||
| 21,511,706 | ||||||||
HOTELS, RESTAURANTS & LEISURE — 1.77% |
| |||||||
Aristocrat Leisure Ltd. | 828,021 | 4,954,494 | ||||||
Crown Resorts Ltd. | 559,744 | 4,539,740 | ||||||
Flight Centre Travel Group Ltd.b | 85,216 | 2,235,917 | ||||||
Tabcorp Holdings Ltd. | 1,274,732 | 4,184,229 | ||||||
Tatts Group Ltd. | 2,244,879 | 5,856,744 | ||||||
|
| |||||||
| 21,771,124 | ||||||||
INSURANCE — 6.25% |
| |||||||
AMP Ltd. | 4,545,838 | 19,175,489 | ||||||
Insurance Australia Group Ltd. | 3,598,905 | 12,935,817 | ||||||
Medibank Pvt Ltd.a | 4,232,719 | 6,991,830 | ||||||
QBE Insurance Group Ltd. | 2,104,278 | 19,692,124 | ||||||
Suncorp Group Ltd. | 1,977,415 | 17,986,224 | ||||||
|
| |||||||
| 76,781,484 | ||||||||
SCHEDULESOF INVESTMENTS | 17 |
Table of Contents
Schedule of Investments (Continued)
iSHARES® MSCI AUSTRALIA ETF
August 31, 2015
| Security | Shares | Value | ||||||
IT SERVICES — 0.42% |
| |||||||
Computershare Ltd. | 726,617 | $ | 5,099,837 | |||||
|
| |||||||
| 5,099,837 | ||||||||
MEDIA — 0.19% |
| |||||||
REA Group Ltd. | 80,970 | 2,371,346 | ||||||
|
| |||||||
| 2,371,346 | ||||||||
METALS & MINING — 11.38% |
| |||||||
Alumina Ltd. | 3,881,652 | 3,604,985 | ||||||
BHP Billiton Ltd. | 4,936,145 | 88,116,888 | ||||||
Fortescue Metals Group Ltd.b | 2,392,798 | 3,240,074 | ||||||
Iluka Resources Ltd. | 643,507 | 3,389,671 | ||||||
Newcrest Mining Ltd.a | 1,178,075 | 9,354,196 | ||||||
Rio Tinto Ltd. | 652,168 | 23,251,803 | ||||||
South32 Ltd.a | 8,182,263 | 8,817,238 | ||||||
|
| |||||||
| 139,774,855 | ||||||||
MULTI-UTILITIES — 1.01% |
| |||||||
AGL Energy Ltd. | 1,036,959 | 12,416,716 | ||||||
|
| |||||||
| 12,416,716 | ||||||||
MULTILINE RETAIL — 0.22% |
| |||||||
Harvey Norman Holdings Ltd. | 853,436 | 2,625,888 | ||||||
|
| |||||||
| 2,625,888 | ||||||||
OIL, GAS & CONSUMABLE FUELS — 4.16% |
| |||||||
Caltex Australia Ltd. | 414,970 | 9,378,870 | ||||||
Origin Energy Ltd. | 1,705,325 | 9,986,257 | ||||||
Santos Ltd. | 1,542,045 | 5,608,283 | ||||||
Woodside Petroleum Ltd. | 1,139,664 | 26,064,939 | ||||||
|
| |||||||
| 51,038,349 | ||||||||
PROFESSIONAL SERVICES — 0.36% |
| |||||||
Seek Ltd. | 502,353 | 4,394,806 | ||||||
|
| |||||||
| 4,394,806 | ||||||||
REAL ESTATE INVESTMENT TRUSTS (REITS) — 8.03% |
| |||||||
Dexus Property Group | 1,475,727 | 7,710,615 | ||||||
Federation Centres | 5,171,550 | 10,375,826 | ||||||
Goodman Group | 2,694,298 | 11,651,745 | ||||||
GPT Group (The) | 2,731,772 | 8,695,735 | ||||||
Mirvac Group | 5,683,007 | 7,050,692 | ||||||
Scentre Group | 8,183,077 | 22,103,301 | ||||||
Stockland | 3,629,798 | 10,061,778 | ||||||
Westfield Corp. | 3,034,184 | 20,973,072 | ||||||
|
| |||||||
| 98,622,764 | ||||||||
REAL ESTATE MANAGEMENT & DEVELOPMENT — 0.68% |
| |||||||
Lend Lease Group | 847,517 | 8,375,808 | ||||||
|
| |||||||
| 8,375,808 | ||||||||
| Security | Shares | Value | ||||||
ROAD & RAIL — 1.67% |
| |||||||
Asciano Ltd. | 1,499,098 | $ | 9,023,047 | |||||
Aurizon Holdings Ltd. | 3,261,419 | 11,468,426 | ||||||
|
| |||||||
| 20,491,473 | ||||||||
TRANSPORTATION INFRASTRUCTURE — 2.20% |
| |||||||
Sydney Airport | 1,669,024 | 6,803,712 | ||||||
Transurban Group | 2,942,394 | 20,192,575 | ||||||
|
| |||||||
| 26,996,287 | ||||||||
|
| |||||||
TOTAL COMMON STOCKS |
| |||||||
(Cost: $1,644,489,387) |
| 1,213,205,355 | ||||||
SHORT-TERM INVESTMENTS — 0.48% |
| |||||||
MONEY MARKET FUNDS — 0.48% |
| |||||||
BlackRock Cash Funds: Institutional, |
| |||||||
0.18%c,d,e | 5,512,337 | 5,512,337 | ||||||
BlackRock Cash Funds: Prime, |
| |||||||
0.18%c,d,e | 316,546 | 316,546 | ||||||
BlackRock Cash Funds: Treasury, |
| |||||||
0.03%c,d | 111,757 | 111,757 | ||||||
|
| |||||||
| 5,940,640 | ||||||||
|
| |||||||
TOTAL SHORT-TERM INVESTMENTS |
| |||||||
(Cost: $5,940,640) |
| 5,940,640 | ||||||
|
| |||||||
TOTAL INVESTMENTS |
| |||||||
(Cost: $1,650,430,027) | 1,219,145,995 | |||||||
Other Assets, Less Liabilities — 0.73% |
| 8,917,185 | ||||||
|
| |||||||
NET ASSETS — 100.00% |
| $ | 1,228,063,180 | |||||
|
| |||||||
| a | Non-income earning security. |
| b | All or a portion of this security represents a security on loan. See Note 1. |
| c | Affiliated issuer. See Note 2. |
| d | The rate quoted is the annualized seven-day yield of the fund at period end. |
| e | All or a portion of this security represents an investment of securities lending collateral. See Note 1. |
| 18 | 2015 iSHARES ANNUAL REPORTTO SHAREHOLDERS |
Table of Contents
Schedule of Investments (Continued)
iSHARES® MSCI AUSTRALIA ETF
August 31, 2015
Open futures contracts as of August 31, 2015 were as follows:
| Issue | Number of Contracts Purchased (Sold) | Expiration | Exchange | Notional Value | Unrealized Appreciation (Depreciation) | |||||||||||||||
| ASX SPI 200 Index | 161 | Sep. 2015 | Sydney Futures | $ | 14,744,154 | $ | (307,229) | |||||||||||||
See notes to financial statements.
SCHEDULESOF INVESTMENTS | 19 |
Table of Contents
Schedule of Investments
August 31, 2015
| Security | Shares | Value | ||||||
COMMON STOCKS — 99.71% |
| |||||||
AEROSPACE & DEFENSE — 0.44% |
| |||||||
Bombardier Inc. Class Ba | 3,438,232 | $ | 3,333,574 | |||||
CAE Inc. | 474,082 | 5,148,805 | ||||||
|
| |||||||
| 8,482,379 | ||||||||
AUTO COMPONENTS — 1.85% |
| |||||||
Magna International Inc. Class A | 730,847 | 35,660,719 | ||||||
|
| |||||||
| 35,660,719 | ||||||||
BANKS — 25.86% |
| |||||||
Bank of Montreal | 1,158,140 | 61,802,285 | ||||||
Bank of Nova Scotia (The) | 2,095,885 | 94,862,228 | ||||||
Canadian Imperial Bank of Commerce/Canada | 710,167 | 51,609,205 | ||||||
National Bank of Canada | 591,176 | 19,239,324 | ||||||
Royal Bank of Canada | 2,573,026 | 141,830,685 | ||||||
Toronto-Dominion Bank (The) | 3,297,744 | 130,075,615 | ||||||
|
| |||||||
| 499,419,342 | ||||||||
CAPITAL MARKETS — 0.79% |
| |||||||
CI Financial Corp. | 428,358 | 10,125,411 | ||||||
IGM Financial Inc. | 180,608 | 5,110,779 | ||||||
|
| |||||||
| 15,236,190 | ||||||||
CHEMICALS — 3.61% |
| |||||||
Agrium Inc. | 241,948 | 24,842,177 | ||||||
Methanex Corp. | 163,014 | 6,596,523 | ||||||
Potash Corp. of Saskatchewan Inc. | 1,484,383 | 38,222,444 | ||||||
|
| |||||||
| 69,661,144 | ||||||||
CONSTRUCTION & ENGINEERING — 0.42% |
| |||||||
SNC-Lavalin Group Inc. | 271,529 | 8,061,177 | ||||||
|
| |||||||
| 8,061,177 | ||||||||
DIVERSIFIED FINANCIAL SERVICES — 0.48% |
| |||||||
Onex Corp. | 154,217 | 9,284,315 | ||||||
|
| |||||||
| 9,284,315 | ||||||||
DIVERSIFIED TELECOMMUNICATION SERVICES — 1.14% |
| |||||||
BCE Inc. | 257,621 | 10,300,967 | ||||||
TELUS Corp. | 365,271 | 11,816,057 | ||||||
|
| |||||||
| 22,117,024 | ||||||||
ELECTRIC UTILITIES — 0.68% |
| |||||||
Fortis Inc./Canada | 492,940 | 13,222,870 | ||||||
|
| |||||||
| 13,222,870 | ||||||||
FOOD & STAPLES RETAILING — 4.17% |
| |||||||
Alimentation Couche-Tard Inc. Class B | 745,333 | 31,230,601 | ||||||
| Security | Shares | Value | ||||||
Empire Co. Ltd. Class A | 99,945 | $ | 6,622,436 | |||||
George Weston Ltd. | 91,337 | 7,484,073 | ||||||
Jean Coutu Group PJC Inc. (The) Class A | 147,593 | 2,244,124 | ||||||
Loblaw Companies Ltd. | 404,223 | 21,333,739 | ||||||
Metro Inc. | 444,387 | 11,603,160 | ||||||
|
| |||||||
| 80,518,133 | ||||||||
FOOD PRODUCTS — 0.53% |
| |||||||
Saputo Inc. | 454,249 | 10,344,791 | ||||||
|
| |||||||
| 10,344,791 | ||||||||
HOTELS, RESTAURANTS & LEISURE — 0.71% |
| |||||||
Restaurant Brands International Inc. | 360,055 | 13,660,711 | ||||||
|
| |||||||
| 13,660,711 | ||||||||
INDEPENDENT POWER AND RENEWABLE ELECTRICITY PRODUCERS — 0.13% |
| |||||||
TransAlta Corp. | 493,281 | 2,439,526 | ||||||
|
| |||||||
| 2,439,526 | ||||||||
INSURANCE — 8.74% |
| |||||||
Fairfax Financial Holdings Ltd. | 38,312 | 17,615,745 | ||||||
Great-West Lifeco Inc. | 535,086 | 13,524,947 | ||||||
Industrial Alliance Insurance & Financial Services Inc. | 180,639 | 5,704,961 | ||||||
Intact Financial Corp. | 234,794 | 16,067,639 | ||||||
Manulife Financial Corp. | 3,508,797 | 56,383,375 | ||||||
Power Corp. of Canada | 665,208 | 14,399,091 | ||||||
Power Financial Corp. | 447,707 | 10,882,258 | ||||||
Sun Life Financial Inc. | 1,090,196 | 34,266,815 | ||||||
|
| |||||||
| 168,844,831 | ||||||||
IT SERVICES — 0.76% |
| |||||||
CGI Group Inc. Class Aa,b | 400,635 | 14,634,243 | ||||||
|
| |||||||
| 14,634,243 | ||||||||
MEDIA — 1.98% |
| |||||||
Shaw Communications Inc. Class B | 711,450 | 14,132,750 | ||||||
Thomson Reuters Corp. | 628,712 | 24,184,502 | ||||||
|
| |||||||
| 38,317,252 | ||||||||
METALS & MINING — 4.85% |
| |||||||
Agnico Eagle Mines Ltd. | 383,934 | 9,297,522 | ||||||
Barrick Gold Corp. | 2,074,271 | 14,264,998 | ||||||
Eldorado Gold Corp. | 1,275,302 | 3,766,957 | ||||||
First Quantum Minerals Ltd. | 1,227,308 | 6,327,947 | ||||||
Franco-Nevada Corp. | 278,194 | 11,918,120 | ||||||
Goldcorp Inc. | 1,475,446 | 20,238,173 | ||||||
| 20 | 2015 iSHARES ANNUAL REPORTTO SHAREHOLDERS |
Table of Contents
Schedule of Investments (Continued)
iSHARES® MSCI CANADA ETF
August 31, 2015
| Security | Shares | Value | ||||||
Kinross Gold Corp.b | 2,037,015 | $ | 3,597,884 | |||||
Silver Wheaton Corp. | 719,131 | 8,718,213 | ||||||
Teck Resources Ltd. Class B | 1,010,903 | 7,180,033 | ||||||
Turquoise Hill Resources Ltd.b | 1,790,425 | 5,301,973 | ||||||
Yamana Gold Inc. | 1,674,713 | 3,109,012 | ||||||
|
| |||||||
| 93,720,832 | ||||||||
MULTI-UTILITIES — 0.52% |
| |||||||
Atco Ltd./Canada Class I | 136,282 | 4,066,438 | ||||||
Canadian Utilities Ltd. Class A | 219,474 | 5,999,451 | ||||||
|
| |||||||
| 10,065,889 | ||||||||
MULTILINE RETAIL — 1.27% |
| |||||||
Canadian Tire Corp. Ltd. Class A | 131,460 | 12,271,576 | ||||||
Dollarama Inc. | 219,018 | 12,365,751 | ||||||
|
| |||||||
| 24,637,327 | ||||||||
OIL, GAS & CONSUMABLE FUELS — 20.81% |
| |||||||
AltaGas Ltd. | 239,180 | 6,502,173 | ||||||
ARC Resources Ltd. | 603,409 | 8,970,635 | ||||||
Baytex Energy Corp. | 365,360 | 2,089,733 | ||||||
Cameco Corp. | 705,110 | 9,809,535 | ||||||
Canadian Natural Resources Ltd. | 1,947,204 | 43,393,159 | ||||||
Canadian Oil Sands Ltd. | 862,402 | 4,990,977 | ||||||
Cenovus Energy Inc. | 1,474,636 | 21,135,895 | ||||||
Crescent Point Energy Corp. | 884,558 | 11,222,352 | ||||||
Enbridge Inc. | 1,523,815 | 62,269,689 | ||||||
Encana Corp. | 1,495,777 | 11,051,100 | ||||||
Enerplus Corp. | 368,312 | 2,319,770 | ||||||
Husky Energy Inc. | 614,593 | 10,822,934 | ||||||
Imperial Oil Ltd. | 529,487 | 18,485,285 | ||||||
Inter Pipeline Ltd. | 594,831 | 12,607,467 | ||||||
Keyera Corp. | 300,721 | 9,126,730 | ||||||
MEG Energy Corp.b | 278,916 | 2,477,856 | ||||||
Paramount Resources Ltd. Class Aa,b | 113,228 | 1,198,234 | ||||||
Pembina Pipeline Corp. | 605,291 | 16,605,127 | ||||||
Peyto Exploration & Development Corp. | 267,880 | 6,277,714 | ||||||
PrairieSky Royalty Ltd. | 252,456 | 5,229,378 | ||||||
Suncor Energy Inc. | 2,572,100 | 72,030,399 | ||||||
Tourmaline Oil Corp.a,b | 318,374 | 7,968,323 | ||||||
TransCanada Corp. | 1,261,482 | 43,518,996 | ||||||
Veresen Inc. | 512,205 | 5,231,767 | ||||||
Vermilion Energy Inc. | 193,902 | 6,642,655 | ||||||
|
| |||||||
| 401,977,883 | ||||||||
| Security | Shares | Value | ||||||
PAPER & FOREST PRODUCTS — 0.24% |
| |||||||
West Fraser Timber Co. Ltd. | 123,143 | $ | 4,741,538 | |||||
|
| |||||||
| 4,741,538 | ||||||||
PHARMACEUTICALS — 6.87% |
| |||||||
Valeant Pharmaceuticals International Inc.b | 578,667 | 132,647,612 | ||||||
|
| |||||||
| 132,647,612 | ||||||||
REAL ESTATE INVESTMENT TRUSTS (REITS) — 0.46% |
| |||||||
H&R REIT | 241,601 | 3,749,764 | ||||||
RioCan REIT | 276,837 | 5,058,179 | ||||||
|
| |||||||
| 8,807,943 | ||||||||
REAL ESTATE MANAGEMENT & DEVELOPMENT — 2.61% |
| |||||||
Brookfield Asset Management Inc. Class A | 1,536,771 | 47,829,904 | ||||||
First Capital Realty Inc. | 197,550 | 2,582,033 | ||||||
|
| |||||||
| 50,411,937 | ||||||||
ROAD & RAIL — 6.13% |
| |||||||
Canadian National Railway Co. | 1,429,069 | 78,633,703 | ||||||
Canadian Pacific Railway Ltd. | 277,422 | 39,844,096 | ||||||
|
| |||||||
| 118,477,799 | ||||||||
SOFTWARE — 1.25% |
| |||||||
Constellation Software Inc./Canada | 33,932 | 14,338,151 | ||||||
Open Text Corp. | 217,804 | 9,768,030 | ||||||
|
| |||||||
| 24,106,181 | ||||||||
TECHNOLOGY HARDWARE, STORAGE & PERIPHERALS — 0.35% |
| |||||||
BlackBerry Ltd.a,b | 893,905 | 6,705,127 | ||||||
|
| |||||||
| 6,705,127 | ||||||||
TEXTILES, APPAREL & LUXURY GOODS — 0.66% |
| |||||||
Gildan Activewear Inc. | 409,410 | 12,708,480 | ||||||
|
| |||||||
| 12,708,480 | ||||||||
TRADING COMPANIES & DISTRIBUTORS — 0.27% |
| |||||||
Finning International Inc. | 307,414 | 5,154,759 | ||||||
|
| |||||||
| 5,154,759 | ||||||||
WIRELESS TELECOMMUNICATION SERVICES — 1.13% |
| |||||||
Rogers Communications Inc. Class B | 644,387 | 21,750,786 | ||||||
|
| |||||||
| 21,750,786 | ||||||||
|
| |||||||
TOTAL COMMON STOCKS |
| |||||||
(Cost: $2,704,084,804) |
| 1,925,818,740 | ||||||
SCHEDULESOF INVESTMENTS | 21 |
Table of Contents
Schedule of Investments (Continued)
iSHARES® MSCI CANADA ETF
August 31, 2015
| Security | Shares | Value | ||||||
SHORT-TERM INVESTMENTS — 1.12% |
| |||||||
MONEY MARKET FUNDS — 1.12% |
| |||||||
BlackRock Cash Funds: Institutional, |
| |||||||
0.18%c,d,e | 20,353,731 | $ | 20,353,731 | |||||
BlackRock Cash Funds: Prime, |
| |||||||
0.18%c,d,e | 1,168,811 | 1,168,811 | ||||||
BlackRock Cash Funds: Treasury, |
| |||||||
0.03%c,d | 163,293 | 163,293 | ||||||
|
| |||||||
| 21,685,835 | ||||||||
|
| |||||||
TOTAL SHORT-TERM INVESTMENTS |
| |||||||
(Cost: $21,685,835) |
| 21,685,835 | ||||||
|
| |||||||
TOTAL INVESTMENTS |
| |||||||
(Cost: $2,725,770,639) | 1,947,504,575 | |||||||
Other Assets, Less Liabilities — (0.83)% |
| (16,050,483 | ) | |||||
|
| |||||||
NET ASSETS — 100.00% |
| $ | 1,931,454,092 | |||||
|
| |||||||
| a | All or a portion of this security represents a security on loan. See Note 1. |
| b | Non-income earning security. |
| c | Affiliated issuer. See Note 2. |
| d | The rate quoted is the annualized seven-day yield of the fund at period end. |
| e | All or a portion of this security represents an investment of securities lending collateral. See Note 1. |
Open futures contracts as of August 31, 2015 were as follows:
| Issue | Number of Contracts Purchased (Sold) | Expiration | Exchange | Notional Value | Unrealized Appreciation (Depreciation) | |||||||||||||||
| S&P/TSX 60 Index | 43 | Sep. 2015 | Montreal | $ | 5,262,127 | $ | (140,053) | |||||||||||||
See notes to financial statements.
| 22 | 2015 iSHARES ANNUAL REPORTTO SHAREHOLDERS |
Table of Contents
Schedule of Investments
August 31, 2015
| Security | Shares | Value | ||||||
COMMON STOCKS — 99.72% |
| |||||||
AIR FREIGHT & LOGISTICS — 0.27% |
| |||||||
Yamato Holdings Co. Ltd. | 2,626,000 | $ | 51,280,513 | |||||
|
| |||||||
| 51,280,513 | ||||||||
AIRLINES — 0.27% | ||||||||
ANA Holdings Inc. | 7,878,000 | 23,136,363 | ||||||
Japan Airlines Co. Ltd. | 787,800 | 28,050,972 | ||||||
|
| |||||||
| 51,187,335 | ||||||||
AUTO COMPONENTS — 3.16% |
| |||||||
Aisin Seiki Co. Ltd. | 1,313,200 | 47,463,102 | ||||||
Bridgestone Corp. | 4,464,200 | 149,838,128 | ||||||
Denso Corp. | 3,413,800 | 152,935,761 | ||||||
Koito Manufacturing Co. Ltd. | 787,800 | 27,043,347 | ||||||
NGK Spark Plug Co. Ltd. | 1,050,400 | 25,847,199 | ||||||
NHK Spring Co. Ltd. | 1,050,400 | 10,175,926 | ||||||
NOK Corp. | 787,800 | 19,502,414 | ||||||
Stanley Electric Co. Ltd. | 852,600 | 16,624,944 | ||||||
Sumitomo Electric Industries Ltd. | 5,252,000 | 72,245,608 | ||||||
Sumitomo Rubber Industries Ltd. | 1,313,000 | 18,613,970 | ||||||
Toyoda Gosei Co. Ltd. | 525,200 | 10,301,608 | ||||||
Toyota Industries Corp. | 1,050,400 | 52,266,468 | ||||||
Yokohama Rubber Co. Ltd. (The) | 77,000 | 1,513,504 | ||||||
|
| |||||||
| 604,371,979 | ||||||||
AUTOMOBILES — 10.50% | ||||||||
Daihatsu Motor Co. Ltd. | 1,050,400 | 12,854,258 | ||||||
Fuji Heavy Industries Ltd. | 3,939,000 | 138,808,429 | ||||||
Honda Motor Co. Ltd. | 11,029,200 | 348,027,073 | ||||||
Isuzu Motors Ltd. | 3,939,000 | 44,904,307 | ||||||
Mazda Motor Corp. | 3,676,400 | 63,419,682 | ||||||
Mitsubishi Motors Corp. | 4,464,200 | 34,296,078 | ||||||
Nissan Motor Co. Ltd. | 16,806,400 | 152,136,162 | ||||||
Suzuki Motor Corp. | 2,626,000 | 89,483,575 | ||||||
Toyota Motor Corp. | 18,382,000 | 1,090,921,682 | ||||||
Yamaha Motor Co. Ltd. | 1,838,200 | 35,539,898 | ||||||
|
| |||||||
| 2,010,391,144 | ||||||||
BANKS — 9.50% | ||||||||
Aozora Bank Ltd. | 7,878,000 | 28,863,572 | ||||||
Bank of Kyoto Ltd. (The) | 2,626,000 | 28,538,532 | ||||||
Bank of Yokohama Ltd. (The) | 7,878,000 | 48,261,973 | ||||||
Chiba Bank Ltd. (The) | 5,252,000 | 38,354,747 | ||||||
| Security | Shares | Value | ||||||
Chugoku Bank Ltd. (The) | 525,200 | $ | 7,796,632 | |||||
Fukuoka Financial Group Inc. | 5,258,000 | 26,163,090 | ||||||
Gunma Bank Ltd. (The) | 2,626,000 | 17,573,842 | ||||||
Hachijuni Bank Ltd. (The) | 2,626,000 | 18,158,914 | ||||||
Hiroshima Bank Ltd. (The) | 2,626,000 | 14,865,173 | ||||||
Hokuhoku Financial Group Inc. | 7,878,000 | 17,812,204 | ||||||
Iyo Bank Ltd. (The) | 2,100,800 | 23,576,251 | ||||||
Joyo Bank Ltd. (The) | 5,252,000 | 28,126,814 | �� | |||||
Mitsubishi UFJ Financial Group Inc. | 85,870,280 | 566,941,544 | ||||||
Mizuho Financial Group Inc. | 155,459,280 | 319,038,849 | ||||||
Resona Holdings Inc. | 14,705,600 | 74,483,618 | ||||||
Seven Bank Ltd. | 4,201,600 | 17,959,556 | ||||||
Shinsei Bank Ltd. | 10,504,000 | 22,709,477 | ||||||
Shizuoka Bank Ltd. (The) | 3,382,000 | 35,721,913 | ||||||
Sumitomo Mitsui Financial Group Inc. | 8,665,800 | 354,969,932 | ||||||
Sumitomo Mitsui Trust Holdings Inc. | 23,634,320 | 97,747,421 | ||||||
Suruga Bank Ltd. | 1,575,600 | 30,241,743 | ||||||
Yamaguchi Financial Group Inc. | 138,000 | 1,705,855 | ||||||
|
| |||||||
| 1,819,611,652 | ||||||||
BEVERAGES — 1.05% | ||||||||
Asahi Group Holdings Ltd. | 2,626,000 | 86,731,568 | ||||||
Kirin Holdings Co. Ltd. | 5,514,600 | 81,091,036 | ||||||
Suntory Beverage & Food Ltd. | 787,800 | 33,349,127 | ||||||
|
| |||||||
| 201,171,731 | ||||||||
BUILDING PRODUCTS — 1.14% |
| |||||||
Asahi Glass Co. Ltd. | 7,878,000 | 46,870,801 | ||||||
Daikin Industries Ltd. | 1,575,600 | 94,105,647 | ||||||
LIXIL Group Corp. | 1,838,200 | 37,951,697 | ||||||
TOTO Ltd. | 2,626,000 | 38,744,795 | ||||||
|
| |||||||
| 217,672,940 | ||||||||
CAPITAL MARKETS — 1.28% |
| |||||||
Daiwa Securities Group Inc. | 10,504,000 | 72,999,701 | ||||||
Nomura Holdings Inc. | 24,159,200 | 152,728,169 | ||||||
SBI Holdings Inc./Japan | 1,575,610 | 19,190,497 | ||||||
|
| |||||||
| 244,918,367 | ||||||||
CHEMICALS — 3.62% | ||||||||
Air Water Inc. | 143,000 | 2,288,047 | ||||||
Asahi Kasei Corp. | 7,878,000 | 62,953,791 | ||||||
Daicel Corp. | 2,626,000 | 34,714,296 | ||||||
Hitachi Chemical Co. Ltd. | 787,800 | 12,130,501 | ||||||
SCHEDULESOF INVESTMENTS | 23 |
Table of Contents
Schedule of Investments (Continued)
iSHARES® MSCI JAPAN ETF
August 31, 2015
| Security | Shares | Value | ||||||
JSR Corp. | 1,313,000 | $ | 20,672,559 | |||||
Kaneka Corp. | 2,626,000 | 21,300,970 | ||||||
Kansai Paint Co. Ltd. | 398,000 | 6,220,341 | ||||||
Kuraray Co. Ltd. | 2,363,400 | 27,985,964 | ||||||
Mitsubishi Chemical Holdings Corp. | 9,191,000 | 52,384,567 | ||||||
Mitsubishi Gas Chemical Co. Inc. | 2,626,000 | 12,828,254 | ||||||
Mitsui Chemicals Inc. | 5,252,000 | 17,812,205 | ||||||
Nippon Paint Holdings Co. Ltd. | 961,400 | 19,801,579 | ||||||
Nitto Denko Corp. | 1,050,400 | 70,832,766 | ||||||
Shin-Etsu Chemical Co. Ltd. | 2,888,600 | 159,059,519 | ||||||
Sumitomo Chemical Co. Ltd. | 10,504,000 | 52,353,146 | ||||||
Taiyo Nippon Sanso Corp. | 876,800 | 10,751,535 | ||||||
Teijin Ltd. | 5,252,000 | 16,728,737 | ||||||
Toray Industries Inc. | 10,504,000 | 92,918,166 | ||||||
|
| |||||||
| 693,736,943 | ||||||||
COMMERCIAL SERVICES & SUPPLIES — 0.89% |
| |||||||
Dai Nippon Printing Co. Ltd. | 2,626,000 | 27,054,182 | ||||||
Park24 Co. Ltd. | 787,800 | 15,471,915 | ||||||
Secom Co. Ltd. | 1,313,000 | 84,109,576 | ||||||
Toppan Printing Co. Ltd. | 5,252,000 | 43,642,068 | ||||||
|
| |||||||
| 170,277,741 | ||||||||
CONSTRUCTION & ENGINEERING — 1.01% |
| |||||||
JGC Corp. | 860,000 | 12,582,250 | ||||||
Kajima Corp. | 5,252,000 | 29,556,991 | ||||||
Obayashi Corp. | 5,252,000 | 45,505,632 | ||||||
Shimizu Corp. | 5,252,000 | 51,443,033 | ||||||
Taisei Corp. | 7,878,000 | 53,436,614 | ||||||
|
| |||||||
| 192,524,520 | ||||||||
CONSTRUCTION MATERIALS — 0.14% |
| |||||||
Taiheiyo Cement Corp. | 7,878,000 | 26,718,307 | ||||||
|
| |||||||
| 26,718,307 | ||||||||
CONSUMER FINANCE — 0.27% |
| |||||||
Acom Co. Ltd.a | 2,626,000 | 11,896,472 | ||||||
AEON Financial Service Co. Ltd. | 787,870 | 17,917,809 | ||||||
Credit Saison Co. Ltd. | 1,050,400 | 21,062,607 | ||||||
|
| |||||||
| 50,876,888 | ||||||||
CONTAINERS & PACKAGING — 0.09% |
| |||||||
Toyo Seikan Group Holdings Ltd. | 1,050,400 | 17,257,469 | ||||||
|
| |||||||
| 17,257,469 | ||||||||
| Security | Shares | Value | ||||||
DIVERSIFIED CONSUMER SERVICES — 0.07% |
| |||||||
Benesse Holdings Inc. | 525,200 | $ | 13,955,060 | |||||
|
| |||||||
| 13,955,060 | ||||||||
DIVERSIFIED FINANCIAL SERVICES — 1.03% |
| |||||||
Japan Exchange Group Inc. | 1,838,200 | 57,337,096 | ||||||
Mitsubishi UFJ Lease & Finance Co. Ltd. | 3,939,000 | 19,047,357 | ||||||
ORIX Corp. | 8,928,400 | 120,386,233 | ||||||
|
| |||||||
| 196,770,686 | ||||||||
DIVERSIFIED TELECOMMUNICATION SERVICES — 0.99% |
| |||||||
Nippon Telegraph & Telephone Corp. | 4,989,400 | 190,604,673 | ||||||
|
| |||||||
| 190,604,673 | ||||||||
ELECTRIC UTILITIES — 1.75% |
| |||||||
Chubu Electric Power Co. Inc. | 4,464,200 | 69,199,981 | ||||||
Chugoku Electric Power Co. Inc. (The) | 2,100,800 | 30,753,139 | ||||||
Hokuriku Electric Power Co. | 1,050,400 | 15,185,880 | ||||||
Kansai Electric Power Co. Inc. (The)a | 4,726,800 | 59,033,806 | ||||||
Kyushu Electric Power Co. Inc.a | 2,888,600 | 34,467,266 | ||||||
Shikoku Electric Power Co. Inc. | 1,050,400 | 16,442,702 | ||||||
Tohoku Electric Power Co. Inc. | 3,151,200 | 43,295,358 | ||||||
Tokyo Electric Power Co. Inc.a,b | 9,716,200 | 66,546,569 | ||||||
|
| |||||||
| 334,924,701 | ||||||||
ELECTRICAL EQUIPMENT — 1.41% |
| |||||||
Fuji Electric Co. Ltd. | 2,626,000 | 10,444,626 | ||||||
Mabuchi Motor Co. Ltd. | 525,200 | 24,573,041 | ||||||
Mitsubishi Electric Corp. | 13,130,000 | 131,207,905 | ||||||
Nidec Corp. | 1,313,000 | 102,994,414 | ||||||
|
| |||||||
| 269,219,986 | ||||||||
ELECTRONIC EQUIPMENT, INSTRUMENTS & COMPONENTS — 4.71% |
| |||||||
Alps Electric Co. Ltd. | 1,050,400 | 32,980,749 | ||||||
Citizen Holdings Co. Ltd. | 1,838,200 | 13,894,386 | ||||||
Hamamatsu Photonics KK | 1,050,400 | 26,046,557 | ||||||
Hirose Electric Co. Ltd. | 262,660 | 30,040,579 | ||||||
Hitachi High-Technologies Corp. | 525,200 | 11,827,130 | ||||||
Hitachi Ltd. | 34,138,000 | 192,064,104 | ||||||
IBIDEN Co. Ltd. | 787,800 | 11,148,880 | ||||||
Keyence Corp. | 287,626 | 133,838,595 | ||||||
Kyocera Corp. | 2,100,800 | 103,232,776 | ||||||
Murata Manufacturing Co. Ltd. | 1,313,000 | 190,148,533 | ||||||
Nippon Electric Glass Co. Ltd. | 2,626,500 | 11,616,982 | ||||||
| 24 | 2015 iSHARES ANNUAL REPORTTO SHAREHOLDERS |
Table of Contents
Schedule of Investments (Continued)
iSHARES® MSCI JAPAN ETF
August 31, 2015
| Security | Shares | Value | ||||||
Omron Corp. | 1,313,000 | $ | 49,406,115 | |||||
Shimadzu Corp. | 430,000 | 6,333,705 | ||||||
TDK Corp. | 787,800 | 49,081,074 | ||||||
Yaskawa Electric Corp. | 1,838,200 | 21,084,276 | ||||||
Yokogawa Electric Corp. | 1,575,600 | 18,540,295 | ||||||
|
| |||||||
| 901,284,736 | ||||||||
FOOD & STAPLES RETAILING — 1.79% |
| |||||||
Aeon Co. Ltd. | 4,201,600 | 63,135,814 | ||||||
FamilyMart Co. Ltd. | 525,200 | 24,356,348 | ||||||
Lawson Inc. | 525,200 | 37,531,311 | ||||||
Seven & I Holdings Co. Ltd. | 4,989,480 | 217,802,114 | ||||||
|
| |||||||
| 342,825,587 | ||||||||
FOOD PRODUCTS — 1.61% | ||||||||
Ajinomoto Co. Inc. | 3,508,000 | 77,333,185 | ||||||
Calbee Inc. | 525,200 | 20,130,825 | ||||||
Kikkoman Corp. | 736,000 | 23,716,467 | ||||||
MEIJI Holdings Co. Ltd. | 525,228 | 85,598,490 | ||||||
NH Foods Ltd. | 467,000 | 10,790,114 | ||||||
Nisshin Seifun Group Inc. | 1,413,875 | 19,344,017 | ||||||
Nissin Foods Holdings Co. Ltd. | 525,200 | 24,963,089 | ||||||
Toyo Suisan Kaisha Ltd. | 415,000 | 15,581,549 | ||||||
Yakult Honsha Co. Ltd. | 525,200 | 29,383,637 | ||||||
Yamazaki Baking Co. Ltd. | 82,000 | 1,383,752 | ||||||
|
| |||||||
| 308,225,125 | ||||||||
GAS UTILITIES — 0.81% | ||||||||
Osaka Gas Co. Ltd. | 13,130,000 | 53,371,605 | ||||||
Toho Gas Co. Ltd. | 2,626,000 | 15,840,294 | ||||||
Tokyo Gas Co. Ltd. | 15,756,000 | 86,239,673 | ||||||
|
| |||||||
| 155,451,572 | ||||||||
HEALTH CARE EQUIPMENT & SUPPLIES — 1.52% |
| |||||||
Hoya Corp. | 2,888,600 | 113,210,428 | ||||||
Olympus Corp. | 1,575,900 | 57,608,095 | ||||||
Sysmex Corp. | 1,050,400 | 63,794,562 | ||||||
Terumo Corp. | 2,101,800 | 57,494,467 | ||||||
|
| |||||||
| 292,107,552 | ||||||||
HEALTH CARE PROVIDERS & SERVICES — 0.41% |
| |||||||
Alfresa Holdings Corp. | 1,050,400 | 19,190,375 | ||||||
Medipal Holdings Corp. | 1,050,400 | 18,210,921 | ||||||
Miraca Holdings Inc. | 525,200 | 22,579,461 | ||||||
Suzuken Co. Ltd./Aichi Japan | 525,240 | 18,073,613 | ||||||
|
| |||||||
| 78,054,370 | ||||||||
HEALTH CARE TECHNOLOGY — 0.16% |
| |||||||
M3 Inc. | 1,313,000 | 30,467,104 | ||||||
|
| |||||||
| 30,467,104 | ||||||||
| Security | Shares | Value | ||||||
HOTELS, RESTAURANTS & LEISURE — 0.44% |
| |||||||
McDonald’s Holdings Co. Japan Ltd.b | 525,200 | $ | 11,571,432 | |||||
Oriental Land Co. Ltd./Japan | 1,313,000 | 72,494,806 | ||||||
|
| |||||||
| 84,066,238 | ||||||||
HOUSEHOLD DURABLES — 3.04% |
| |||||||
Casio Computer Co. Ltd.b | 1,575,600 | 30,345,756 | ||||||
Iida Group Holdings Co. Ltd. | 1,050,480 | 18,619,722 | ||||||
Nikon Corp. | 2,363,400 | 30,326,253 | ||||||
Panasonic Corp. | 14,968,215 | 165,201,861 | ||||||
Rinnai Corp. | 262,600 | 19,697,438 | ||||||
Sekisui Chemical Co. Ltd. | 2,633,000 | 29,092,602 | ||||||
Sekisui House Ltd. | 3,676,400 | 54,985,972 | ||||||
Sharp Corp./Japana,b | 10,504,000 | 15,341,899 | ||||||
Sony Corp.a | 8,403,200 | 219,259,136 | ||||||
|
| |||||||
| 582,870,639 | ||||||||
HOUSEHOLD PRODUCTS — 0.25% |
| |||||||
Unicharm Corp. | 2,363,400 | 47,800,416 | ||||||
|
| |||||||
| 47,800,416 | ||||||||
INDEPENDENT POWER AND RENEWABLE ELECTRICITY PRODUCERS — 0.13% |
| |||||||
Electric Power Development Co. Ltd. | 787,800 | 24,703,057 | ||||||
|
| |||||||
| 24,703,057 | ||||||||
INDUSTRIAL CONGLOMERATES — 0.61% |
| |||||||
Keihan Electric Railway Co. Ltd. | 2,626,000 | 16,945,431 | ||||||
Seibu Holdings Inc. | 787,800 | 17,305,142 | ||||||
Toshiba Corp. | 26,260,000 | 83,210,298 | ||||||
|
| |||||||
| 117,460,871 | ||||||||
INSURANCE — 3.05% | ||||||||
Dai-ichi Life Insurance Co. Ltd. (The) | 7,352,800 | 134,211,277 | ||||||
MS&AD Insurance Group Holdings Inc. | 3,442,440 | 108,683,215 | ||||||
Sompo Japan Nipponkoa Holdings Inc. | 2,228,050 | 73,964,972 | ||||||
Sony Financial Holdings Inc. | 1,313,000 | 24,638,050 | ||||||
T&D Holdings Inc. | 3,939,000 | 53,127,825 | ||||||
Tokio Marine Holdings Inc. | 4,726,800 | 190,187,538 | ||||||
|
| |||||||
| 584,812,877 | ||||||||
INTERNET & CATALOG RETAIL — 0.47% |
| |||||||
Rakuten Inc. | 6,302,400 | 90,179,161 | ||||||
|
| |||||||
| 90,179,161 | ||||||||
SCHEDULESOF INVESTMENTS | 25 |
Table of Contents
Schedule of Investments (Continued)
iSHARES® MSCI JAPAN ETF
August 31, 2015
| Security | Shares | Value | ||||||
INTERNET SOFTWARE & SERVICES — 0.34% |
| |||||||
Kakaku.com Inc. | 1,050,400 | $ | 16,711,402 | |||||
Mixi Inc.b | 262,600 | 9,036,118 | ||||||
Yahoo Japan Corp. | 9,716,200 | 39,366,705 | ||||||
|
| |||||||
| 65,114,225 | ||||||||
IT SERVICES — 0.81% | ||||||||
Fujitsu Ltd. | 13,130,000 | 65,235,574 | ||||||
ITOCHU Techno-Solutions Corp. | 525,200 | 11,571,432 | ||||||
Nomura Research Institute Ltd. | 787,800 | 32,016,462 | ||||||
NTT Data Corp. | 787,800 | 37,964,699 | ||||||
Otsuka Corp. | 176,900 | 9,342,410 | ||||||
|
| |||||||
| 156,130,577 | ||||||||
LEISURE PRODUCTS — 0.78% |
| |||||||
Bandai Namco Holdings Inc. | 1,313,098 | 30,426,036 | ||||||
Sankyo Co. Ltd. | 262,600 | 10,108,751 | ||||||
Sega Sammy Holdings Inc. | 1,313,000 | 13,857,549 | ||||||
Shimano Inc. | 525,200 | 70,772,092 | ||||||
Yamaha Corp. | 1,050,400 | 24,078,980 | ||||||
|
| |||||||
| 149,243,408 | ||||||||
MACHINERY — 5.04% | ||||||||
Amada Holdings Co. Ltd. | 2,626,000 | 23,034,518 | ||||||
FANUC Corp. | 1,313,000 | 213,605,603 | ||||||
Hino Motors Ltd. | 2,100,800 | 23,160,200 | ||||||
Hitachi Construction Machinery Co. Ltd. | 787,800 | 11,441,416 | ||||||
IHI Corp. | 7,878,000 | 24,443,025 | ||||||
JTEKT Corp. | 1,575,600 | 22,219,750 | ||||||
Kawasaki Heavy Industries Ltd. | 10,504,000 | 39,784,924 | ||||||
Komatsu Ltd. | 6,302,400 | 104,766,966 | ||||||
Kubota Corp. | 7,878,000 | 123,417,775 | ||||||
Kurita Water Industries Ltd. | 787,800 | 16,421,032 | ||||||
Makita Corp. | 787,800 | 44,660,527 | ||||||
Minebea Co. Ltd. | 2,626,000 | 31,485,563 | ||||||
Mitsubishi Heavy Industries Ltd. | 21,008,000 | 100,441,764 | ||||||
Nabtesco Corp. | 787,800 | 15,738,448 | ||||||
NGK Insulators Ltd. | 1,310,000 | 29,543,508 | ||||||
NSK Ltd. | 3,151,200 | 38,848,808 | ||||||
SMC Corp./Japan | 315,900 | 76,808,132 | ||||||
Sumitomo Heavy Industries Ltd. | 2,626,000 | 11,441,416 | ||||||
THK Co. Ltd. | 788,400 | 13,720,639 | ||||||
|
| |||||||
| 964,984,014 | ||||||||
MARINE — 0.26% | ||||||||
Mitsui OSK Lines Ltd. | 7,878,000 | 22,232,751 | ||||||
| Security | Shares | Value | ||||||
Nippon Yusen KK | 10,504,000 | $ | 27,650,089 | |||||
|
| |||||||
| 49,882,840 | ||||||||
MEDIA — 0.54% | ||||||||
Dentsu Inc. | 1,313,000 | 67,391,674 | ||||||
Hakuhodo DY Holdings Inc. | 1,838,200 | 18,414,612 | ||||||
Toho Co. Ltd./Tokyo | 787,800 | 17,786,201 | ||||||
|
| |||||||
| 103,592,487 | ||||||||
METALS & MINING — 1.40% | ||||||||
Hitachi Metals Ltd. | 471,000 | 5,977,621 | ||||||
JFE Holdings Inc. | 3,413,850 | 53,031,090 | ||||||
Kobe Steel Ltd. | 23,634,000 | 31,788,934 | ||||||
Maruichi Steel Tube Ltd. | 262,600 | 6,695,829 | ||||||
Mitsubishi Materials Corp. | 7,878,000 | 25,353,138 | ||||||
Nippon Steel & Sumitomo Metal Corp. | 52,520,705 | 108,218,179 | ||||||
Sumitomo Metal Mining Co. Ltd. | 2,914,000 | 37,054,701 | ||||||
|
| |||||||
| 268,119,492 | ||||||||
MULTILINE RETAIL — 0.90% | ||||||||
Don Quijote Holdings Co. Ltd. | 787,800 | 30,618,790 | ||||||
Isetan Mitsukoshi Holdings Ltd. | 2,363,460 | 37,874,649 | ||||||
J Front Retailing Co. Ltd. | 1,575,600 | 25,600,168 | ||||||
Marui Group Co. Ltd. | 1,575,600 | 19,086,362 | ||||||
Ryohin Keikaku Co. Ltd. | 161,000 | 35,817,634 | ||||||
Takashimaya Co. Ltd. | 2,626,000 | 22,752,816 | ||||||
|
| |||||||
| 171,750,419 | ||||||||
OIL, GAS & CONSUMABLE FUELS — 0.91% |
| |||||||
Idemitsu Kosan Co. Ltd. | 787,800 | 13,508,672 | ||||||
INPEX Corp. | 6,565,000 | 66,199,860 | ||||||
JX Holdings Inc. | 14,968,295 | 57,916,685 | ||||||
Showa Shell Sekiyu KK | 1,313,000 | 11,235,557 | ||||||
TonenGeneral Sekiyu KK | 2,626,000 | 26,219,912 | ||||||
|
| |||||||
| 175,080,686 | ||||||||
PAPER & FOREST PRODUCTS — 0.13% |
| |||||||
Oji Holdings Corp. | 5,252,000 | 24,356,348 | ||||||
|
| |||||||
| 24,356,348 | ||||||||
PERSONAL PRODUCTS — 1.21% |
| |||||||
Kao Corp. | 3,413,800 | 156,400,690 | ||||||
Kose Corp. | 262,600 | 26,024,888 | ||||||
Shiseido Co. Ltd. | 2,363,400 | 49,623,891 | ||||||
|
| |||||||
| 232,049,469 | ||||||||
PHARMACEUTICALS — 5.85% |
| |||||||
Astellas Pharma Inc. | 14,180,450 | 210,626,810 | ||||||
Chugai Pharmaceutical Co. Ltd. | 1,575,600 | 58,962,297 | ||||||
Daiichi Sankyo Co. Ltd. | 4,201,669 | 81,044,694 | ||||||
| 26 | 2015 iSHARES ANNUAL REPORTTO SHAREHOLDERS |
Table of Contents
Schedule of Investments (Continued)
iSHARES® MSCI JAPAN ETF
August 31, 2015
| Security | Shares | Value | ||||||
Eisai Co. Ltd. | 1,838,200 | $ | 125,504,533 | |||||
Hisamitsu Pharmaceutical Co. Inc. | 262,600 | 9,111,961 | ||||||
Kyowa Hakko Kirin Co. Ltd. | 2,626,000 | 44,183,802 | ||||||
Mitsubishi Tanabe Pharma Corp. | 1,313,000 | 23,532,913 | ||||||
Ono Pharmaceutical Co. Ltd. | 525,200 | 67,088,303 | ||||||
Otsuka Holdings Co. Ltd. | 2,626,000 | 89,613,591 | ||||||
Santen Pharmaceutical Co. Ltd. | 2,626,000 | 41,063,415 | ||||||
Shionogi & Co. Ltd. | 2,100,800 | 82,516,879 | ||||||
Sumitomo Dainippon Pharma Co. Ltd. | 1,050,400 | 11,233,390 | ||||||
Taisho Pharmaceutical Holdings Co. Ltd. | 262,600 | 17,032,108 | ||||||
Takeda Pharmaceutical Co. Ltd. | 5,252,000 | 258,385,312 | ||||||
|
| |||||||
| 1,119,900,008 | ||||||||
PROFESSIONAL SERVICES — 0.13% |
| |||||||
Recruit Holdings Co. Ltd. | 787,800 | 24,248,001 | ||||||
|
| |||||||
| 24,248,001 | ||||||||
REAL ESTATE INVESTMENT TRUSTS (REITS) — 0.83% |
| |||||||
Japan Prime Realty Investment Corp. | 5,252 | 17,053,777 | ||||||
Japan Real Estate Investment Corp. | 7,878 | 33,154,103 | ||||||
Japan Retail Fund Investment Corp. | 15,766 | 29,090,049 | ||||||
Nippon Building Fund Inc. | 10,504 | 44,205,471 | ||||||
Nippon Prologis REIT Inc. | 7,902 | 14,377,943 | ||||||
United Urban Investment Corp. | 15,756 | 20,776,572 | ||||||
|
| |||||||
| 158,657,915 | ||||||||
REAL ESTATE MANAGEMENT & DEVELOPMENT — 3.55% |
| |||||||
Aeon Mall Co. Ltd. | 787,800 | 13,294,145 | ||||||
Daito Trust Construction Co. Ltd. | 525,200 | 57,510,451 | ||||||
Daiwa House Industry Co. Ltd. | 3,939,000 | 96,894,492 | ||||||
Hulic Co. Ltd. | 2,100,800 | 19,346,394 | ||||||
Mitsubishi Estate Co. Ltd. | 8,184,000 | 176,193,885 | ||||||
Mitsui Fudosan Co. Ltd. | 5,958,000 | 165,192,722 | ||||||
Nomura Real Estate Holdings Inc. | 787,800 | 14,808,833 | ||||||
NTT Urban Development Corp. | 787,800 | 7,365,412 | ||||||
Sumitomo Realty & Development Co. Ltd. | 2,626,000 | 88,865,998 | ||||||
Tokyo Tatemono Co. Ltd. | 1,270,500 | 15,977,572 | ||||||
| Security | Shares | Value | ||||||
Tokyu Fudosan Holdings Corp. | 3,413,800 | $ | 23,493,908 | |||||
|
| |||||||
| 678,943,812 | ||||||||
ROAD & RAIL — 4.07% | ||||||||
Central Japan Railway Co. | 1,050,400 | 172,357,998 | ||||||
East Japan Railway Co. | 2,363,400 | 218,524,545 | ||||||
Hankyu Hanshin Holdings Inc. | 7,878,000 | 47,325,857 | ||||||
Keikyu Corp. | 2,630,000 | 21,159,797 | ||||||
Keio Corp. | 5,252,000 | 39,438,215 | ||||||
Keisei Electric Railway Co. Ltd. | 656,000 | 7,004,695 | ||||||
Kintetsu Group Holdings Co. Ltd. | 10,771,000 | 38,485,316 | ||||||
Nagoya Railroad Co. Ltd. | 5,252,000 | 20,932,591 | ||||||
Nippon Express Co. Ltd. | 5,252,000 | 25,483,154 | ||||||
Odakyu Electric Railway Co. Ltd. | 2,866,000 | 26,203,969 | ||||||
Tobu Railway Co. Ltd. | 7,878,000 | 35,169,353 | ||||||
Tokyu Corp. | 7,878,000 | 55,971,927 | ||||||
West Japan Railway Co. | 1,050,400 | 70,971,450 | ||||||
|
| |||||||
| 779,028,867 | ||||||||
SEMICONDUCTORS & SEMICONDUCTOR EQUIPMENT — 0.51% |
| |||||||
Rohm Co. Ltd. | 787,800 | 42,840,302 | ||||||
Tokyo Electron Ltd. | 1,050,452 | 55,285,579 | ||||||
|
| |||||||
| 98,125,881 | ||||||||
SOFTWARE — 1.27% | ||||||||
COLOPL Inc.b | 262,600 | 4,743,420 | ||||||
GungHo Online Entertainment Inc.b | 2,888,600 | 8,700,243 | ||||||
Konami Corp. | 787,800 | 17,318,143 | ||||||
Nexon Co. Ltd. | 787,800 | 10,986,360 | ||||||
Nintendo Co. Ltd. | 787,800 | 162,585,122 | ||||||
Oracle Corp. Japan | 262,600 | 10,986,360 | ||||||
Trend Micro Inc./Japan | 787,800 | 28,050,972 | ||||||
|
| |||||||
| 243,370,620 | ||||||||
SPECIALTY RETAIL — 1.42% | ||||||||
ABC-Mart Inc. | 262,600 | 15,948,640 | ||||||
Fast Retailing Co. Ltd. | 334,500 | 135,983,352 | ||||||
Nitori Holdings Co. Ltd. | 525,200 | 41,821,842 | ||||||
Sanrio Co. Ltd.b | 263,400 | 8,705,013 | ||||||
Shimamura Co. Ltd. | 262,600 | 24,291,340 | ||||||
USS Co. Ltd. | 1,575,600 | 28,005,466 | ||||||
Yamada Denki Co. Ltd.b | 4,698,100 | 18,104,656 | ||||||
|
| |||||||
| 272,860,309 | ||||||||
SCHEDULESOF INVESTMENTS | 27 |
Table of Contents
Schedule of Investments (Continued)
iSHARES® MSCI JAPAN ETF
August 31, 2015
| Security | Shares | Value | ||||||
TECHNOLOGY HARDWARE, STORAGE & PERIPHERALS — 2.80% |
| |||||||
Brother Industries Ltd. | 1,575,600 | $ | 21,543,666 | |||||
Canon Inc. | 7,090,250 | 216,887,872 | ||||||
FUJIFILM Holdings Corp. | 3,151,200 | 129,730,056 | ||||||
Konica Minolta Inc. | 3,413,800 | 37,522,644 | ||||||
NEC Corp. | 17,087,000 | 54,002,731 | ||||||
Ricoh Co. Ltd. | 4,726,800 | 46,240,223 | ||||||
Seiko Epson Corp. | 1,838,200 | 29,836,526 | ||||||
|
| |||||||
| 535,763,718 | ||||||||
TEXTILES, APPAREL & LUXURY GOODS — 0.16% |
| |||||||
ASICS Corp. | 1,050,400 | 30,770,475 | ||||||
|
| |||||||
| 30,770,475 | ||||||||
TOBACCO — 1.37% | ||||||||
Japan Tobacco Inc. | 7,352,800 | 262,688,844 | ||||||
|
| |||||||
| 262,688,844 | ||||||||
TRADING COMPANIES & DISTRIBUTORS — 3.25% |
| |||||||
ITOCHU Corp. | 10,504,000 | 126,158,947 | ||||||
Marubeni Corp. | 10,766,600 | 59,099,248 | ||||||
Mitsubishi Corp. | 9,453,600 | 175,911,771 | ||||||
Mitsui & Co. Ltd. | 11,554,400 | 150,502,293 | ||||||
Sumitomo Corp. | 7,615,400 | 80,907,930 | ||||||
Toyota Tsusho Corp. | 1,313,000 | 30,272,080 | ||||||
|
| |||||||
| 622,852,269 | ||||||||
TRANSPORTATION INFRASTRUCTURE — 0.19% |
| |||||||
Japan Airport Terminal Co. Ltd.b | 262,600 | 11,766,457 | ||||||
Kamigumi Co. Ltd. | 2,626,000 | 22,016,058 | ||||||
Mitsubishi Logistics Corp. | 242,000 | 2,921,533 | ||||||
|
| |||||||
| 36,704,048 | ||||||||
WIRELESS TELECOMMUNICATION SERVICES — 4.56% |
| |||||||
KDDI Corp. | 11,817,000 | 294,291,422 | ||||||
NTT DOCOMO Inc. | 9,716,200 | 203,528,273 | ||||||
| Security | Shares | Value | ||||||
SoftBank Group Corp. | 6,435,500 | $ | 375,078,900 | |||||
|
| |||||||
| 872,898,595 | ||||||||
|
| |||||||
TOTAL COMMON STOCKS | 19,094,899,267 | |||||||
SHORT-TERM INVESTMENTS — 0.45% |
| |||||||
MONEY MARKET FUNDS — 0.45% |
| |||||||
BlackRock Cash Funds: Institutional, |
| |||||||
0.18%c,d,e | 81,008,864 | 81,008,864 | ||||||
BlackRock Cash Funds: Prime, |
| |||||||
0.18%c,d,e | 4,651,927 | 4,651,927 | ||||||
BlackRock Cash Funds: Treasury, |
| |||||||
0.03%c,d | 380,471 | 380,471 | ||||||
|
| |||||||
| 86,041,262 | ||||||||
|
| |||||||
TOTAL SHORT-TERM INVESTMENTS |
| |||||||
(Cost: $86,041,262) | 86,041,262 | |||||||
|
| |||||||
TOTAL INVESTMENTS |
| |||||||
(Cost: $20,116,884,459) | 19,180,940,529 | |||||||
Other Assets, Less Liabilities — (0.17)% |
| (33,138,156 | ) | |||||
|
| |||||||
NET ASSETS — 100.00% | $ | 19,147,802,373 | ||||||
|
| |||||||
| a | Non-income earning security. |
| b | All or a portion of this security represents a security on loan. See Note 1. |
| c | Affiliated issuer. See Note 2. |
| d | The rate quoted is the annualized seven-day yield of the fund at period end. |
| e | All or a portion of this security represents an investment of securities lending collateral. See Note 1. |
Open futures contracts as of August 31, 2015 were as follows:
| Issue | Number of Contracts Purchased (Sold) | Expiration | Exchange | Notional Value | Unrealized Appreciation (Depreciation) | |||||||||||||||
| TOPIX Index | 377 | Sep. 2015 | Tokyo Stock | $ | 47,706,358 | $ | (2,857,797) | |||||||||||||
See notes to financial statements.
| 28 | 2015 iSHARES ANNUAL REPORTTO SHAREHOLDERS |
Table of Contents
Schedule of Investments
iSHARES® MSCI MEXICO CAPPED ETF
August 31, 2015
| Security | Shares | Value | ||||||
COMMON STOCKS — 99.62% |
| |||||||
AIRLINES — 0.89% |
| |||||||
Controladora Vuela Cia. de Aviacion SAB de CV Class Aa,b | 4,054,000 | $ | 5,353,792 | |||||
Grupo Aeromexico SAB de CVa,b | 3,632,336 | 5,422,528 | ||||||
|
| |||||||
| 10,776,320 | ||||||||
BANKS — 11.22% | ||||||||
Banregio Grupo Financiero SAB de CVb | 1,828,200 | 9,572,447 | ||||||
Grupo Financiero Banorte SAB de CV | 14,749,278 | 70,678,751 | ||||||
Grupo Financiero Inbursa SAB de CV Series O | 16,386,592 | 34,521,217 | ||||||
Grupo Financiero Santander Mexico SAB de CV Series B | 13,232,550 | 20,597,986 | ||||||
|
| |||||||
| 135,370,401 | ||||||||
BEVERAGES — 11.13% | ||||||||
Arca Continental SAB de CV | 2,980,929 | 16,974,241 | ||||||
Coca-Cola Femsa SAB de CV Series L | 1,972,958 | 14,168,143 | ||||||
Fomento Economico Mexicano SAB de CV | 11,231,010 | 99,961,343 | ||||||
Organizacion Cultiba SAB de CVb | 2,714,100 | 3,207,426 | ||||||
|
| |||||||
| 134,311,153 | ||||||||
BUILDING PRODUCTS — 0.00% |
| |||||||
Corp GEO SAB de CVa,b | 15,588,128 | 9 | ||||||
Urbi Desarrollos Urbanos SAB de CVa,b | 29,674,089 | 18 | ||||||
|
| |||||||
| 27 | ||||||||
CAPITAL MARKETS — 0.38% | ||||||||
Grupo Financiero Interacciones SA de CV Series Ob | 815,200 | 4,627,402 | ||||||
|
| |||||||
| 4,627,402 | ||||||||
CHEMICALS — 1.62% | ||||||||
Mexichem SAB de CV | 7,651,374 | 19,570,737 | ||||||
|
| |||||||
| 19,570,737 | ||||||||
CONSTRUCTION & ENGINEERING — 1.81% |
| |||||||
Empresas ICA SAB de CVa,b | 7,419,688 | 2,927,195 | ||||||
Promotora y Operadora de Infraestructura SAB de CVa | 1,797,500 | 18,870,537 | ||||||
|
| |||||||
| 21,797,732 | ||||||||
| Security | Shares | Value | ||||||
CONSTRUCTION MATERIALS — 4.75% |
| |||||||
Cemex SAB de CV CPOa | 73,234,704 | $ | 57,304,628 | |||||
|
| |||||||
| 57,304,628 | ||||||||
CONSUMER FINANCE — 1.41% |
| |||||||
Credito Real SAB de CV SOFOM ER | 2,078,274 | 4,050,033 | ||||||
Gentera SAB de CVb | 8,134,306 | 12,972,231 | ||||||
|
| |||||||
| 17,022,264 | ||||||||
DIVERSIFIED FINANCIAL SERVICES — 0.45% |
| |||||||
Bolsa Mexicana de Valores SAB de CVb | 3,578,587 | 5,402,003 | ||||||
|
| |||||||
| 5,402,003 | ||||||||
DIVERSIFIED TELECOMMUNICATION SERVICES — 0.28% |
| |||||||
Axtel SAB de CV CPOa,b | 8,302,777 | 3,359,705 | ||||||
|
| |||||||
| 3,359,705 | ||||||||
FOOD & STAPLES RETAILING — 7.59% |
| |||||||
Controladora Comercial Mexicana SAB de CV BC Units | 3,608,055 | 10,284,462 | ||||||
Grupo Comercial Chedraui SA de CVb | 2,883,000 | 7,171,420 | ||||||
Wal-Mart de Mexico SAB de CV | 31,033,433 | 74,217,620 | ||||||
|
| |||||||
| 91,673,502 | ||||||||
FOOD PRODUCTS — 6.03% | ||||||||
Gruma SAB de CV Series B | 1,422,800 | 19,088,244 | ||||||
Grupo Bimbo SAB de CVa | 11,673,704 | 29,970,392 | ||||||
Grupo Herdez SAB de CVb | 2,220,444 | 5,422,753 | ||||||
Grupo Lala SAB de CV | 4,852,400 | 10,945,372 | ||||||
Industrias Bachoco SAB de CV Series B | 1,553,400 | 7,341,157 | ||||||
|
| |||||||
| 72,767,918 | ||||||||
HOTELS, RESTAURANTS & LEISURE — 1.30% |
| |||||||
Alsea SAB de CVb | 3,888,466 | 11,962,015 | ||||||
Hoteles City Express SAB de CVa | 2,947,800 | 3,775,222 | ||||||
|
| |||||||
| 15,737,237 | ||||||||
HOUSEHOLD DURABLES — 0.26% |
| |||||||
Consorcio ARA SAB de CVa | 9,019,319 | 3,117,524 | ||||||
|
| |||||||
| 3,117,524 | ||||||||
HOUSEHOLD PRODUCTS — 2.03% |
| |||||||
Kimberly-Clark de Mexico SAB de CV Series A | 10,950,554 | 24,504,964 | ||||||
|
| |||||||
| 24,504,964 | ||||||||
SCHEDULESOF INVESTMENTS | 29 |
Table of Contents
Schedule of Investments (Continued)
iSHARES® MSCI MEXICO CAPPED ETF
August 31, 2015
| Security | Shares | Value | ||||||
INDUSTRIAL CONGLOMERATES — 4.83% |
| |||||||
Alfa SAB de CV | 19,744,851 | $ | 39,289,665 | |||||
Grupo Carso SAB de CV Series A1 | 4,200,433 | 19,049,639 | ||||||
|
| |||||||
| 58,339,304 | ||||||||
INSURANCE — 0.29% | ||||||||
Qualitas Controladora SAB de CVa,b | 2,431,100 | 3,448,163 | ||||||
|
| |||||||
| 3,448,163 | ||||||||
MACHINERY — 0.27% | ||||||||
Grupo Rotoplas SAB de CVa | 2,106,900 | 3,206,807 | ||||||
|
| |||||||
| 3,206,807 | ||||||||
MEDIA — 7.70% | ||||||||
Grupo Televisa SAB | 14,830,897 | 90,549,785 | ||||||
TV Azteca SAB de CV CPOb | 17,035,139 | 2,446,644 | ||||||
|
| |||||||
| 92,996,429 | ||||||||
METALS & MINING — 6.89% | ||||||||
Grupo Mexico SAB de CV Series B | 22,222,386 | 56,218,134 | ||||||
Grupo Simec SAB de CV Series Ba,b | 1,234,154 | 3,387,672 | ||||||
Industrias CH SAB de CV Series Ba,b | 1,451,483 | 4,925,354 | ||||||
Industrias Penoles SAB de CV | 1,039,993 | 14,776,825 | ||||||
Minera Frisco SAB de CV Series A1a,b | 6,907,903 | 3,845,043 | ||||||
|
| |||||||
| 83,153,028 | ||||||||
MULTILINE RETAIL — 1.57% | ||||||||
El Puerto de Liverpool SAB de CV Series C1 | 1,391,795 | 16,578,784 | ||||||
Grupo Famsa SAB de CV Series Aa,b | 3,897,021 | 2,322,420 | ||||||
|
| |||||||
| 18,901,204 | ||||||||
PHARMACEUTICALS — 0.48% |
| |||||||
Genomma Lab Internacional SAB de CV Series Ba | 7,168,693 | 5,797,328 | ||||||
|
| |||||||
| 5,797,328 | ||||||||
REAL ESTATE INVESTMENT TRUSTS (REITS) — 5.49% |
| |||||||
Concentradora Fibra Hotelera Mexicana SA de CVb | 4,391,100 | 4,179,134 | ||||||
Fibra Shop Portafolios Inmobiliarios SAPI de CVb | 3,928,495 | 3,743,542 | ||||||
| Security | Shares | Value | ||||||
Fibra Uno Administracion SA de CV | 16,477,900 | $ | 35,243,852 | |||||
Mexico Real Estate Management SA de CV | 6,518,300 | 8,841,270 | ||||||
PLA Administradora Industrial S. de RL de CV | 4,900,000 | 9,145,888 | ||||||
Prologis Property Mexico SA de CV | 3,282,400 | 5,093,784 | ||||||
|
| |||||||
| 66,247,470 | ||||||||
REAL ESTATE MANAGEMENT & DEVELOPMENT — 0.60% |
| |||||||
Corp Inmobiliaria Vesta SAB de CVb | 4,686,849 | 7,250,930 | ||||||
|
| |||||||
| 7,250,930 | ||||||||
TRANSPORTATION INFRASTRUCTURE — 4.85% |
| |||||||
Grupo Aeroportuario del Centro Norte SAB de CV | 1,765,592 | 9,234,109 | ||||||
Grupo Aeroportuario del Pacifico SAB de CV Series B | 2,275,049 | 19,032,859 | ||||||
Grupo Aeroportuario del Sureste SAB de CV Series B | 1,497,765 | 21,761,330 | ||||||
OHL Mexico SAB de CVa | 6,382,600 | 8,474,632 | ||||||
|
| |||||||
| 58,502,930 | ||||||||
WIRELESS TELECOMMUNICATION SERVICES — 15.50% |
| |||||||
America Movil SAB de CV | 205,588,018 | 187,087,547 | ||||||
|
| |||||||
| 187,087,547 | ||||||||
|
| |||||||
TOTAL COMMON STOCKS (Cost: $1,654,526,830) | 1,202,274,657 | |||||||
SHORT-TERM INVESTMENTS — 3.71% |
| |||||||
MONEY MARKET FUNDS — 3.71% |
| |||||||
BlackRock Cash Funds: Institutional, |
| |||||||
0.18%c,d,e | 41,442,142 | 41,442,142 | ||||||
BlackRock Cash Funds: Prime, |
| |||||||
0.18%c,d,e | 2,379,811 | 2,379,811 | ||||||
BlackRock Cash Funds: Treasury, |
| |||||||
0.03%c,d | 982,115 | 982,115 | ||||||
|
| |||||||
| 44,804,068 | ||||||||
|
| |||||||
TOTAL SHORT-TERM INVESTMENTS |
| |||||||
(Cost: $44,804,068) | 44,804,068 | |||||||
|
| |||||||
| 30 | 2015 iSHARES ANNUAL REPORTTO SHAREHOLDERS |
Table of Contents
Schedule of Investments (Continued)
iSHARES® MSCI MEXICO CAPPED ETF
August 31, 2015
| Value | ||||||
TOTAL INVESTMENTS |
| |||||
(Cost: $1,699,330,898) | $ | 1,247,078,725 | ||||
Other Assets, Less Liabilities — (3.33)% | (40,136,422 | ) | ||||
|
| |||||
NET ASSETS — 100.00% | $ | 1,206,942,303 | ||||
|
| |||||
CPO — Certificates of Participation (Ordinary)
| a | Non-income earning security. |
| b | All or a portion of this security represents a security on loan. See Note 1. |
| c | Affiliated issuer. See Note 2. |
| d | The rate quoted is the annualized seven-day yield of the fund at period end. |
| e | All or a portion of this security represents an investment of securities lending collateral. See Note 1. |
See notes to financial statements.
SCHEDULESOF INVESTMENTS | 31 |
Table of Contents
Schedule of Investments
iSHARES® MSCI SOUTH KOREA CAPPED ETF
August 31, 2015
| Security | Shares | Value | ||||||
COMMON STOCKS — 96.12% |
| |||||||
AEROSPACE & DEFENSE — 0.72% |
| |||||||
Korea Aerospace Industries Ltd. | 290,877 | $ | 22,699,595 | |||||
|
| |||||||
| 22,699,595 | ||||||||
AIR FREIGHT & LOGISTICS — 0.51% |
| |||||||
Hyundai Glovis Co. Ltd. | 110,034 | 16,001,562 | ||||||
|
| |||||||
| 16,001,562 | ||||||||
AIRLINES — 0.23% | ||||||||
Korean Air Lines Co. Ltd.a | 260,628 | 7,337,909 | ||||||
|
| |||||||
| 7,337,909 | ||||||||
AUTO COMPONENTS — 3.49% |
| |||||||
Hankook Tire Co. Ltd. | 504,596 | 15,763,959 | ||||||
Hanon Systemsb | 270,078 | 8,300,431 | ||||||
Hyundai Mobis Co. Ltd. | 436,580 | 76,223,860 | ||||||
Hyundai Wia Corp. | 112,941 | 9,978,723 | ||||||
|
| |||||||
| 110,266,973 | ||||||||
AUTOMOBILES — 6.12% | ||||||||
Hyundai Motor Co. | 982,065 | 123,718,187 | ||||||
Kia Motors Corp. | 1,690,041 | 69,587,822 | ||||||
|
| |||||||
| 193,306,009 | ||||||||
BANKS — 8.62% | ||||||||
BNK Financial Group Inc. | 1,466,121 | 17,230,253 | ||||||
DGB Financial Group Inc. | 1,169,267 | 10,281,443 | ||||||
Hana Financial Group Inc. | 1,903,657 | 43,778,880 | ||||||
Industrial Bank of Koreab | 1,698,780 | 18,959,117 | ||||||
KB Financial Group Inc. | 2,475,421 | 74,927,138 | ||||||
Shinhan Financial Group Co. Ltd. | 2,725,854 | 91,149,885 | ||||||
Woori Bank | 2,098,661 | 16,182,446 | ||||||
|
| |||||||
| 272,509,162 | ||||||||
BUILDING PRODUCTS — 0.42% |
| |||||||
KCC Corp. | 39,936 | 13,252,911 | ||||||
|
| |||||||
| 13,252,911 | ||||||||
CAPITAL MARKETS — 1.83% | ||||||||
Daewoo Securities Co. Ltd. | 1,233,655 | 12,933,690 | ||||||
Korea Investment Holdings Co. Ltd. | 265,665 | 15,678,222 | ||||||
Mirae Asset Securities Co. Ltd. | 183,568 | 6,060,732 | ||||||
NH Investment & Securities Co. Ltd. | 1,017,291 | 8,351,634 | ||||||
Samsung Securities Co. Ltd. | 390,406 | 14,919,764 | ||||||
|
| |||||||
| 57,944,042 | ||||||||
| Security | Shares | Value | ||||||
CHEMICALS — 4.21% | ||||||||
Hanwha Chemical Corp.b | 738,898 | $ | 11,338,828 | |||||
Hanwha Corp. | 315,029 | 11,226,779 | ||||||
Hyosung Corp. | 154,238 | 16,692,001 | ||||||
Kumho Petrochemical Co. Ltd.b | 106,152 | 4,918,309 | ||||||
LG Chem Ltd. | 298,642 | 59,084,530 | ||||||
Lotte Chemical Corp. | 103,085 | 21,527,791 | ||||||
OCI Co. Ltd.b | 121,331 | 8,381,097 | ||||||
|
| |||||||
| 133,169,335 | ||||||||
COMMERCIAL SERVICES & SUPPLIES — 0.84% |
| |||||||
KEPCO Plant Service & Engineering Co. Ltd. | 148,302 | 15,798,818 | ||||||
S-1 Corp. | 134,994 | 10,717,342 | ||||||
|
| |||||||
| 26,516,160 | ||||||||
CONSTRUCTION & ENGINEERING — 1.79% |
| |||||||
Daelim Industrial Co. Ltd.b | 195,992 | 11,152,198 | ||||||
Daewoo Engineering & Construction Co. Ltd.a,b | 857,568 | 4,618,650 | ||||||
GS Engineering & Construction Corp.a,b | 369,158 | 7,600,082 | ||||||
Hyundai Development Co. Engineering & Constructionb | 379,658 | 19,227,659 | ||||||
Hyundai Engineering & Construction Co. Ltd. | 499,104 | 14,009,938 | ||||||
| �� |
|
| ||||||
| 56,608,527 | ||||||||
CONSUMER FINANCE — 0.25% |
| |||||||
Samsung Card Co. Ltd. | 256,135 | 7,850,259 | ||||||
|
| |||||||
| 7,850,259 | ||||||||
DISTRIBUTORS — 1.09% | ||||||||
Samsung C&T Corp. | 849,106 | 34,531,387 | ||||||
|
| |||||||
| 34,531,387 | ||||||||
DIVERSIFIED TELECOMMUNICATION SERVICES — 0.62% |
| |||||||
KT Corp.a | 242,029 | 5,903,645 | ||||||
LG Uplus Corp. | 1,466,302 | 13,637,136 | ||||||
|
| |||||||
| 19,540,781 | ||||||||
ELECTRIC UTILITIES — 2.12% |
| |||||||
Korea Electric Power Corp. | 1,647,771 | 66,872,127 | ||||||
|
| |||||||
| 66,872,127 | ||||||||
ELECTRICAL EQUIPMENT — 0.32% |
| |||||||
Doosan Heavy Industries & Construction Co. Ltd. | 368,959 | 5,739,882 | ||||||
LS Industrial Systems Co. Ltd. | 120,758 | 4,410,692 | ||||||
|
| |||||||
| 10,150,574 | ||||||||
| 32 | 2015 iSHARES ANNUAL REPORTTO SHAREHOLDERS |
Table of Contents
Schedule of Investments (Continued)
iSHARES® MSCI SOUTH KOREA CAPPED ETF
August 31, 2015
| Security | Shares | Value | ||||||
ELECTRONIC EQUIPMENT, INSTRUMENTS & COMPONENTS — 2.65% |
| |||||||
LG Display Co. Ltd. | 1,527,147 | $ | 29,761,774 | |||||
LG Innotek Co. Ltd.b | 96,547 | 7,501,729 | ||||||
Samsung Electro-Mechanics Co. Ltd.b | 400,597 | 20,559,068 | ||||||
Samsung SDI Co. Ltd. | 363,668 | 25,981,776 | ||||||
|
| |||||||
| 83,804,347 | ||||||||
FOOD & STAPLES RETAILING — 1.05% |
| |||||||
BGF retail Co. Ltd. | 19,910 | 3,391,981 | ||||||
Dongsuh Cos. Inc. | 86,751 | 3,285,939 | ||||||
E-Mart Co. Ltd. | 137,628 | 26,588,880 | ||||||
|
| |||||||
| 33,266,800 | ||||||||
FOOD PRODUCTS — 1.43% | ||||||||
CJ CheilJedang Corp.b | 53,160 | 17,663,817 | ||||||
Lotte Confectionery Co. Ltd. | 5,176 | 8,524,919 | ||||||
Orion Corp./Republic of Korea | 24,062 | 18,981,058 | ||||||
|
| |||||||
| 45,169,794 | ||||||||
GAS UTILITIES — 0.22% | ||||||||
Korea Gas Corp. | 207,250 | 7,052,896 | ||||||
|
| |||||||
| 7,052,896 | ||||||||
HOTELS, RESTAURANTS & LEISURE — 1.09% |
| |||||||
Kangwon Land Inc. | 773,744 | 27,835,813 | ||||||
Paradise Co. Ltd.a,b | 348,995 | 6,727,614 | ||||||
|
| |||||||
| 34,563,427 | ||||||||
HOUSEHOLD DURABLES — 2.09% |
| |||||||
Coway Co. Ltd. | 355,717 | 25,383,652 | ||||||
Hanssem Co. Ltd. | 52,963 | 14,262,283 | ||||||
LG Electronics Inc. | 702,429 | 26,428,316 | ||||||
|
| |||||||
| 66,074,251 | ||||||||
HOUSEHOLD PRODUCTS — 1.30% |
| |||||||
LG Household & Health Care Ltd.b | 60,832 | 41,249,008 | ||||||
|
| |||||||
| 41,249,008 | ||||||||
INDUSTRIAL CONGLOMERATES — 4.17% |
| |||||||
Cheil Industries Inc.a,b | 135,857 | 20,446,033 | ||||||
CJ Corp. | 96,574 | 23,474,974 | ||||||
Doosan Corp. | 60,431 | 5,262,645 | ||||||
LG Corp. | 621,659 | 30,590,195 | ||||||
SK Holdings Co. Ltd. | 227,499 | 51,933,824 | ||||||
|
| |||||||
| 131,707,671 | ||||||||
INSURANCE — 4.04% | ||||||||
Dongbu Insurance Co. Ltd. | 292,574 | 13,159,955 | ||||||
| Security | Shares | Value | ||||||
Hanwha Life Insurance Co. Ltd. | 1,530,346 | $ | 10,286,409 | |||||
Hyundai Marine & Fire Insurance Co. Ltd. | 441,764 | 10,458,163 | ||||||
Samsung Fire & Marine Insurance Co. Ltd. | 222,429 | 50,682,406 | ||||||
Samsung Life Insurance Co. Ltd. | 518,383 | 43,083,533 | ||||||
|
| |||||||
| 127,670,466 | ||||||||
INTERNET SOFTWARE & SERVICES — 3.01% |
| |||||||
Daum Kakao Corp.b | 175,131 | 19,974,781 | ||||||
NAVER Corp. | 179,465 | 75,184,872 | ||||||
|
| |||||||
| 95,159,653 | ||||||||
IT SERVICES — 1.23% | ||||||||
Samsung SDS Co. Ltd. | 178,702 | 38,754,651 | ||||||
|
| |||||||
| 38,754,651 | ||||||||
MACHINERY — 1.32% |
| |||||||
Daewoo Shipbuilding & Marine Engineering Co. Ltd.b | 754,991 | 4,295,996 | ||||||
Doosan Infracore Co. Ltd.a,b | 1,015,878 | 5,737,531 | ||||||
Hyundai Heavy Industries Co. Ltd.a,b | 278,421 | 21,539,228 | ||||||
Samsung Heavy Industries Co. Ltd.b | 1,053,672 | 10,022,245 | ||||||
|
| |||||||
| 41,595,000 | ||||||||
MARINE — 0.15% | ||||||||
Hyundai Merchant Marine Co. Ltd.a,b | 670,299 | 4,817,198 | ||||||
|
| |||||||
| 4,817,198 | ||||||||
MEDIA — 0.27% | ||||||||
Cheil Worldwide Inc.a,b | 580,409 | 8,538,674 | ||||||
|
| |||||||
| 8,538,674 | ||||||||
METALS & MINING — 3.74% | ||||||||
Hyundai Steel Co. | 530,027 | 23,706,133 | ||||||
Korea Zinc Co. Ltd. | 56,248 | 24,396,723 | ||||||
POSCO | 435,673 | 69,987,630 | ||||||
|
| |||||||
| 118,090,486 | ||||||||
MULTILINE RETAIL — 1.29% | ||||||||
Hyundai Department Store Co. Ltd. | 104,981 | 13,358,394 | ||||||
Lotte Shopping Co. Ltd. | 75,042 | 16,972,086 | ||||||
Shinsegae Co. Ltd. | 49,039 | 10,386,193 | ||||||
|
| |||||||
| 40,716,673 | ||||||||
OIL, GAS & CONSUMABLE FUELS — 2.01% |
| |||||||
GS Holdings Corp. | 351,345 | 13,798,330 | ||||||
SCHEDULESOF INVESTMENTS | 33 |
Table of Contents
Schedule of Investments (Continued)
iSHARES® MSCI SOUTH KOREA CAPPED ETF
August 31, 2015
| Security | Shares | Value | ||||||
S-Oil Corp. | 306,902 | $ | 15,568,903 | |||||
SK Innovation Co. Ltd.a | 406,256 | 34,314,077 | ||||||
|
| |||||||
| 63,681,310 | ||||||||
PERSONAL PRODUCTS — 2.94% |
| |||||||
AmorePacific Corp. | 206,699 | 66,147,175 | ||||||
AmorePacific Group | 184,178 | 26,783,865 | ||||||
|
| |||||||
| 92,931,040 | ||||||||
PHARMACEUTICALS — 1.40% |
| |||||||
Celltrion Inc.a,b | 419,105 | 25,158,702 | ||||||
Hanmi Pharm Co. Ltd.a,b | 10,659 | 3,920,241 | ||||||
Hanmi Science Co. Ltd.a | 26,403 | 3,571,744 | ||||||
Yuhan Corp. | 54,666 | 11,485,522 | ||||||
|
| |||||||
| 44,136,209 | ||||||||
ROAD & RAIL — 0.24% | ||||||||
CJ Korea Express Co. Ltd.a,b | 50,757 | 7,638,762 | ||||||
|
| |||||||
| 7,638,762 | ||||||||
SEMICONDUCTORS & SEMICONDUCTOR EQUIPMENT — 3.56% |
| |||||||
SK Hynix Inc. | 3,714,660 | 112,436,971 | ||||||
|
| |||||||
| 112,436,971 | ||||||||
SOFTWARE — 0.60% |
| |||||||
NCsoft Corp. | 103,020 | 19,031,807 | ||||||
|
| |||||||
| 19,031,807 | ||||||||
SPECIALTY RETAIL — 0.71% | ||||||||
Hotel Shilla Co. Ltd.b | 221,587 | 22,575,551 | ||||||
|
| |||||||
| 22,575,551 | ||||||||
TECHNOLOGY HARDWARE, STORAGE & PERIPHERALS — 19.56% |
| |||||||
Samsung Electronics Co. Ltd. | 671,430 | 618,209,486 | ||||||
|
| |||||||
| 618,209,486 | ||||||||
TOBACCO — 2.09% | ||||||||
KT&G Corp. | 705,564 | 65,918,260 | ||||||
|
| |||||||
| 65,918,260 | ||||||||
TRADING COMPANIES & DISTRIBUTORS — 0.35% |
| |||||||
Daewoo International Corp. | 338,820 | 6,245,002 | ||||||
SK Networks Co. Ltd. | 880,497 | 4,891,030 | ||||||
|
| |||||||
| 11,136,032 | ||||||||
WIRELESS TELECOMMUNICATION SERVICES — 0.43% |
| |||||||
SK Telecom Co. Ltd. | 66,462 | 13,711,036 | ||||||
|
| |||||||
| 13,711,036 | ||||||||
|
| |||||||
TOTAL COMMON STOCKS | ||||||||
(Cost: $2,011,298,868) | 3,038,194,772 | |||||||
| Security | Shares | Value | ||||||
PREFERRED STOCKS — 3.71% |
| |||||||
AUTOMOBILES — 1.09% | ||||||||
Hyundai Motor Co.b | 163,466 | $ | 13,406,216 | |||||
Hyundai Motor Co. Series 2 | 249,771 | 21,117,819 | ||||||
|
| |||||||
| 34,524,035 | ||||||||
CHEMICALS — 0.26% | ||||||||
LG Chem Ltd. | 56,196 | 8,219,749 | ||||||
|
| |||||||
| 8,219,749 | ||||||||
PERSONAL PRODUCTS — 0.12% |
| |||||||
AmorePacific Corp. | 23,896 | 3,687,186 | ||||||
|
| |||||||
| 3,687,186 | ||||||||
TECHNOLOGY HARDWARE, STORAGE & PERIPHERALS — 2.24% |
| |||||||
Samsung Electronics Co. Ltd. | 96,425 | 70,927,711 | ||||||
|
| |||||||
| 70,927,711 | ||||||||
|
| |||||||
TOTAL PREFERRED STOCKS |
| |||||||
(Cost: $106,470,398) | 117,358,681 | |||||||
SHORT-TERM INVESTMENTS — 6.41% |
| |||||||
MONEY MARKET FUNDS — 6.41% |
| |||||||
BlackRock Cash Funds: Institutional, |
| |||||||
0.18%c,d,e | 189,155,862 | 189,155,862 | ||||||
BlackRock Cash Funds: Prime, |
| |||||||
0.18%c,d,e | 10,862,260 | 10,862,260 | ||||||
BlackRock Cash Funds: Treasury, |
| |||||||
0.03%c,d | 2,602,779 | 2,602,779 | ||||||
|
| |||||||
| 202,620,901 | ||||||||
|
| |||||||
TOTAL SHORT-TERM INVESTMENTS |
| |||||||
(Cost: $202,620,901) | 202,620,901 | |||||||
|
| |||||||
TOTAL INVESTMENTS |
| |||||||
(Cost: $2,320,390,167) | 3,358,174,354 | |||||||
Other Assets, Less Liabilities — (6.24)% |
| (197,220,045 | ) | |||||
|
| |||||||
NET ASSETS — 100.00% | $ | 3,160,954,309 | ||||||
|
| |||||||
| a | Non-income earning security. |
| b | All or a portion of this security represents a security on loan. See Note 1. |
| c | Affiliated issuer. See Note 2. |
| d | The rate quoted is the annualized seven-day yield of the fund at period end. |
| e | All or a portion of this security represents an investment of securities lending collateral. See Note 1. |
See notes to financial statements.
| 34 | 2015 iSHARES ANNUAL REPORTTO SHAREHOLDERS |
Table of Contents
Statements of Assets and Liabilities
iSHARES® , INC.
August 31, 2015
| iShares MSCI Australia ETF | iShares MSCI Canada ETF | iShares MSCI Japan ETF | ||||||||||
ASSETS | ||||||||||||
Investments, at cost: | ||||||||||||
Unaffiliated | $ | 1,644,489,387 | $ | 2,704,084,804 | $ | 20,030,843,197 | ||||||
Affiliated (Note 2) | 5,940,640 | 21,685,835 | 86,041,262 | |||||||||
|
|
|
|
|
| |||||||
Total cost of investments | $ | 1,650,430,027 | $ | 2,725,770,639 | $ | 20,116,884,459 | ||||||
|
|
|
|
|
| |||||||
Investments in securities, at fair value (including securities on loana) (Note 1): | ||||||||||||
Unaffiliated | $ | 1,213,205,355 | $ | 1,925,818,740 | $ | 19,094,899,267 | ||||||
Affiliated (Note 2) | 5,940,640 | 21,685,835 | 86,041,262 | |||||||||
|
|
|
|
|
| |||||||
Total fair value of investments | 1,219,145,995 | 1,947,504,575 | 19,180,940,529 | |||||||||
Foreign currency, at valueb | 3,659,533 | 6,320,941 | 33,851,587 | |||||||||
Foreign currency pledged to broker, at valueb | 956,683 | 553,141 | 6,058,853 | |||||||||
Receivables: | ||||||||||||
Investment securities sold | 1,675,488 | 4,035,069 | 95,369,867 | |||||||||
Due from custodian (Note 4) | 1,829,619 | — | — | |||||||||
Dividends and interest | 10,774,466 | 2,920,029 | 18,774,384 | |||||||||
Capital shares sold | 180,153 | — | 9,146,132 | |||||||||
|
|
|
|
|
| |||||||
Total Assets | 1,238,221,937 | 1,961,333,755 | 19,344,141,352 | |||||||||
|
|
|
|
|
| |||||||
LIABILITIES | ||||||||||||
Payables: | ||||||||||||
Investment securities purchased | 3,441,924 | 6,933,510 | 95,225,618 | |||||||||
Collateral for securities on loan (Note 1) | 5,828,883 | 21,522,542 | 85,660,791 | |||||||||
Capital shares redeemed | — | 467,090 | 4,608,607 | |||||||||
Futures variation margin | 307,229 | 140,053 | 2,857,797 | |||||||||
Securities related to in-kind transactions (Note 4) | 37,250 | — | — | |||||||||
Investment advisory fees (Note 2) | 543,471 | 816,468 | 7,986,166 | |||||||||
|
|
|
|
|
| |||||||
Total Liabilities | 10,158,757 | 29,879,663 | 196,338,979 | |||||||||
|
|
|
|
|
| |||||||
NET ASSETS | $ | 1,228,063,180 | $ | 1,931,454,092 | $ | 19,147,802,373 | ||||||
|
|
|
|
|
| |||||||
Net assets consist of: | ||||||||||||
Paid-in capital | $ | 1,895,793,902 | $ | 3,125,812,051 | $ | 21,136,782,806 | ||||||
Undistributed (distributions in excess of) net investment income | 6,449,210 | 415,638 | (21,895,543 | ) | ||||||||
Accumulated net realized loss | (242,251,289 | ) | (416,223,279 | ) | (1,029,172,144 | ) | ||||||
Net unrealized depreciation | (431,928,643 | ) | (778,550,318 | ) | (937,912,746 | ) | ||||||
|
|
|
|
|
| |||||||
NET ASSETS | $ | 1,228,063,180 | $ | 1,931,454,092 | $ | 19,147,802,373 | ||||||
|
|
|
|
|
| |||||||
Shares outstandingc | 65,800,000 | 80,400,000 | 1,575,600,000 | |||||||||
|
|
|
|
|
| |||||||
Net asset value per share | $ | 18.66 | $ | 24.02 | $ | 12.15 | ||||||
|
|
|
|
|
| |||||||
| a | Securities on loan with values of $5,481,119, $20,765,824 and $81,205,932, respectively. See Note 1. |
| b | Cost of foreign currency including currency pledged to broker, if any: $4,696,624, $6,985,879 and $39,258,033, respectively. |
| c | $0.001 par value, number of shares authorized: 627.8 million, 340.2 million and 2.5246 billion, respectively. |
See notes to financial statements.
FINANCIAL STATEMENTS | 35 |
Table of Contents
Statements of Assets and Liabilities (Continued)
iSHARES®, INC.
August 31, 2015
| iShares MSCI Mexico Capped ETF | iShares MSCI South Korea Capped ETF | |||||||
ASSETS | ||||||||
Investments, at cost: | ||||||||
Unaffiliated | $ | 1,654,526,830 | $ | 2,117,769,266 | ||||
Affiliated (Note 2) | 44,804,068 | 202,620,901 | ||||||
|
|
|
| |||||
Total cost of investments | $ | 1,699,330,898 | $ | 2,320,390,167 | ||||
|
|
|
| |||||
Investments in securities, at fair value (including securities on loana) (Note 1): | ||||||||
Unaffiliated | $ | 1,202,274,657 | $ | 3,155,553,453 | ||||
Affiliated (Note 2) | 44,804,068 | 202,620,901 | ||||||
|
|
|
| |||||
Total fair value of investments | 1,247,078,725 | 3,358,174,354 | ||||||
Foreign currency, at valueb | 2,577,864 | — | ||||||
Receivables: | ||||||||
Investment securities sold | 67,751,418 | 64,224,549 | ||||||
Due from custodian (Note 4) | 45,713,557 | — | ||||||
Dividends and interest | 504,704 | 1,285,619 | ||||||
Capital shares sold | 94,727 | — | ||||||
|
|
|
| |||||
Total Assets | 1,363,720,995 | 3,423,684,522 | ||||||
|
|
|
| |||||
LIABILITIES | ||||||||
Payables: | ||||||||
Investment securities purchased | 112,424,996 | 40,484,182 | ||||||
Collateral for securities on loan (Note 1) | 43,821,953 | 200,018,122 | ||||||
Capital shares redeemed | 22,760 | 20,377,635 | ||||||
Investment advisory fees (Note 2) | 508,983 | 1,850,274 | ||||||
|
|
|
| |||||
Total Liabilities | 156,778,692 | 262,730,213 | ||||||
|
|
|
| |||||
NET ASSETS | $ | 1,206,942,303 | $ | 3,160,954,309 | ||||
|
|
|
| |||||
Net assets consist of: | ||||||||
Paid-in capital | $ | 1,889,595,830 | $ | 3,393,474,644 | ||||
Undistributed (distributions in excess of) net investment income | 597,098 | (78,505,763 | ) | |||||
Accumulated net realized loss | (230,829,837 | ) | (1,191,742,880 | ) | ||||
Net unrealized appreciation (depreciation) | (452,420,788 | ) | 1,037,728,308 | |||||
|
|
|
| |||||
NET ASSETS | $ | 1,206,942,303 | $ | 3,160,954,309 | ||||
|
|
|
| |||||
Shares outstandingc | 22,900,000 | 65,650,000 | ||||||
|
|
|
| |||||
Net asset value per share | $ | 52.70 | $ | 48.15 | ||||
|
|
|
| |||||
| a | Securities on loan with values of $40,305,767 and $188,300,983, respectively. See Note 1. |
| b | Cost of foreign currency: $2,610,353 and $ —, respectively. |
| c | $0.001 par value, number of shares authorized: 255 million and 200 million, respectively. |
See notes to financial statements.
| 36 | 2015 iSHARES ANNUAL REPORTTO SHAREHOLDERS |
Table of Contents
Statements of Operations
iSHARES® , INC.
Year ended August 31, 2015
| iShares MSCI Australia ETF | iShares MSCI Canada ETF | iShares MSCI Japan ETF | ||||||||||
NET INVESTMENT INCOME | ||||||||||||
Dividends — unaffiliateda | $ | 97,219,669 | $ | 63,881,721 | $ | 274,161,987 | ||||||
Interest — unaffiliated | 4,087 | — | — | |||||||||
Interest — affiliated (Note 2) | 70 | 77 | 862 | |||||||||
Securities lending income — affiliated — net (Note 2) | 89,427 | 61,410 | 2,880,407 | |||||||||
|
|
|
|
|
| |||||||
Total investment income | 97,313,253 | 63,943,208 | 277,043,256 | |||||||||
|
|
|
|
|
| |||||||
EXPENSES | ||||||||||||
Investment advisory fees (Note 2) | 7,960,415 | 12,771,622 | 78,965,332 | |||||||||
|
|
|
|
|
| |||||||
Total expenses | 7,960,415 | 12,771,622 | 78,965,332 | |||||||||
|
|
|
|
|
| |||||||
Net investment income | 89,352,838 | 51,171,586 | 198,077,924 | |||||||||
|
|
|
|
|
| |||||||
NET REALIZED AND UNREALIZED GAIN (LOSS) | ||||||||||||
Net realized gain (loss) from: | ||||||||||||
Investments — unaffiliated | (58,424,950 | ) | (113,825,352 | ) | (132,736,642 | ) | ||||||
In-kind redemptions — unaffiliated | 22,599,887 | 113,934,459 | 562,342,727 | |||||||||
Futures contracts | (1,608,460 | ) | 395,420 | 23,318,919 | ||||||||
Foreign currency transactions | (4,969,706 | ) | (690,125 | ) | (18,933,104 | ) | ||||||
|
|
|
|
|
| |||||||
Net realized gain (loss) | (42,403,229 | ) | (185,598 | ) | 433,991,900 | |||||||
|
|
|
|
|
| |||||||
Net change in unrealized appreciation/depreciation on: | ||||||||||||
Investments | (585,753,661 | ) | (887,129,770 | ) | (334,714,877 | ) | ||||||
Futures contracts | (760,041 | ) | (1,033,143 | ) | (3,764,376 | ) | ||||||
Translation of assets and liabilities in foreign currencies | (354,000 | ) | (14,788 | ) | 1,557,609 | |||||||
|
|
|
|
|
| |||||||
Net change in unrealized appreciation/depreciation | (586,867,702 | ) | (888,177,701 | ) | (336,921,644 | ) | ||||||
|
|
|
|
|
| |||||||
Net realized and unrealized gain (loss) | (629,270,931 | ) | (888,363,299 | ) | 97,070,256 | |||||||
|
|
|
|
|
| |||||||
NET INCREASE (DECREASE) IN NET ASSETS RESULTING FROM OPERATIONS | $ | (539,918,093 | ) | $ | (837,191,713 | ) | $ | 295,148,180 | ||||
|
|
|
|
|
| |||||||
| a | Net of foreign withholding tax of $1,393,004, $11,416,573 and $30,373,104, respectively. |
See notes to financial statements.
FINANCIAL STATEMENTS | 37 |
Table of Contents
Statements of Operations (Continued)
iSHARES®, INC.
Year ended August 31, 2015
| iShares MSCI Mexico Capped ETF | iShares MSCI South Korea Capped ETF | |||||||
NET INVESTMENT INCOME | ||||||||
Dividends — unaffiliateda | $ | 32,463,169 | $ | 53,016,785 | ||||
Interest — unaffiliated | — | 970 | ||||||
Interest — affiliated (Note 2) | 51 | 755 | ||||||
Securities lending income — affiliated — net (Note 2) | 785,455 | 6,746,452 | ||||||
|
|
|
| |||||
| 33,248,675 | 59,764,962 | |||||||
Less: Other foreign taxes (Note 1) | — | (4,442 | ) | |||||
|
|
|
| |||||
Total investment income | 33,248,675 | 59,760,520 | ||||||
|
|
|
| |||||
EXPENSES | ||||||||
Investment advisory fees (Note 2) | 10,089,636 | 25,858,763 | ||||||
|
|
|
| |||||
Total expenses | 10,089,636 | 25,858,763 | ||||||
|
|
|
| |||||
Net investment income | 23,159,039 | 33,901,757 | ||||||
|
|
|
| |||||
NET REALIZED AND UNREALIZED GAIN (LOSS) | ||||||||
Net realized gain (loss) from: | ||||||||
Investments — unaffiliated | (78,777,968 | ) | (284,081,583 | ) | ||||
In-kind redemptions — unaffiliated | (138,503,730 | ) | — | |||||
Foreign currency transactions | (757,154 | ) | (390,021 | ) | ||||
|
|
|
| |||||
Net realized loss | (218,038,852 | ) | (284,471,604 | ) | ||||
|
|
|
| |||||
Net change in unrealized appreciation/depreciation on: | ||||||||
Investments | (502,057,890 | ) | (1,094,073,908 | ) | ||||
Translation of assets and liabilities in foreign currencies | (170,639 | ) | (47,207 | ) | ||||
|
|
|
| |||||
Net change in unrealized appreciation/depreciation | (502,228,529 | ) | (1,094,121,115 | ) | ||||
|
|
|
| |||||
Net realized and unrealized loss | (720,267,381 | ) | (1,378,592,719 | ) | ||||
|
|
|
| |||||
NET DECREASE IN NET ASSETS RESULTING FROM OPERATIONS | $ | (697,108,342 | ) | $ | (1,344,690,962 | ) | ||
|
|
|
| |||||
| a | Net of foreign withholding tax of $512,052 and $10,159,915, respectively. |
See notes to financial statements.
| 38 | 2015 iSHARES ANNUAL REPORTTO SHAREHOLDERS |
Table of Contents
Statements of Changes in Net Assets
iSHARES® , INC.
| iShares MSCI Australia ETF | iShares MSCI Canada ETF | |||||||||||||||
| Year ended August 31, 2015 | Year ended August 31, 2014 | Year ended August 31, 2015 | Year ended August 31, 2014 | |||||||||||||
INCREASE (DECREASE) IN NET ASSETS | ||||||||||||||||
OPERATIONS: | ||||||||||||||||
Net investment income | $ | 89,352,838 | $ | 82,908,446 | $ | 51,171,586 | $ | 66,432,321 | ||||||||
Net realized gain (loss) | (42,403,229 | ) | 35,472,872 | (185,598 | ) | 6,264,667 | ||||||||||
Net change in unrealized appreciation/depreciation | (586,867,702 | ) | 210,426,381 | (888,177,701 | ) | 621,918,423 | ||||||||||
|
|
|
|
|
|
|
| |||||||||
Net increase (decrease) in net assets resulting from operations | (539,918,093 | ) | 328,807,699 | (837,191,713 | ) | 694,615,411 | ||||||||||
|
|
|
|
|
|
|
| |||||||||
DISTRIBUTIONS TO SHAREHOLDERS: | ||||||||||||||||
From net investment income | (88,722,742 | ) | (76,457,082 | ) | (56,091,045 | ) | (71,105,660 | ) | ||||||||
|
|
|
|
|
|
|
| |||||||||
Total distributions to shareholders | (88,722,742 | ) | (76,457,082 | ) | (56,091,045 | ) | (71,105,660 | ) | ||||||||
|
|
|
|
|
|
|
| |||||||||
CAPITAL SHARE TRANSACTIONS: | ||||||||||||||||
Proceeds from shares sold | 286,641,003 | 364,472,393 | 422,191,995 | 537,013,459 | ||||||||||||
Cost of shares redeemed | (477,049,572 | ) | (486,559,346 | ) | (1,384,361,375 | ) | (801,840,234 | ) | ||||||||
|
|
|
|
|
|
|
| |||||||||
Net decrease in net assets from capital share transactions | (190,408,569 | ) | (122,086,953 | ) | (962,169,380 | ) | (264,826,775 | ) | ||||||||
|
|
|
|
|
|
|
| |||||||||
INCREASE (DECREASE) IN NET ASSETS | (819,049,404 | ) | 130,263,664 | (1,855,452,138 | ) | 358,682,976 | ||||||||||
NET ASSETS | ||||||||||||||||
Beginning of year | 2,047,112,584 | 1,916,848,920 | 3,786,906,230 | 3,428,223,254 | ||||||||||||
|
|
|
|
|
|
|
| |||||||||
End of year | $ | 1,228,063,180 | $ | 2,047,112,584 | $ | 1,931,454,092 | $ | 3,786,906,230 | ||||||||
|
|
|
|
|
|
|
| |||||||||
Undistributed net investment income included in net assets at end of year | $ | 6,449,210 | $ | 4,863,922 | $ | 415,638 | $ | 3,649,118 | ||||||||
|
|
|
|
|
|
|
| |||||||||
SHARES ISSUED AND REDEEMED | ||||||||||||||||
Shares sold | 12,800,000 | 13,800,000 | 14,300,000 | 17,400,000 | ||||||||||||
Shares redeemed | (22,400,000 | ) | (19,600,000 | ) | (48,900,000 | ) | (27,800,000 | ) | ||||||||
|
|
|
|
|
|
|
| |||||||||
Net decrease in shares outstanding | (9,600,000 | ) | (5,800,000 | ) | (34,600,000 | ) | (10,400,000 | ) | ||||||||
|
|
|
|
|
|
|
| |||||||||
See notes to financial statements.
FINANCIAL STATEMENTS | 39 |
Table of Contents
Statements of Changes in Net Assets (Continued)
iSHARES®, INC.
| iShares MSCI Japan ETF | iShares MSCI Mexico Capped ETF | |||||||||||||||
| Year ended August 31, 2015 | Year ended August 31, 2014 | Year ended August 31, 2015 | Year ended August 31, 2014 | |||||||||||||
INCREASE (DECREASE) IN NET ASSETS | ||||||||||||||||
OPERATIONS: | ||||||||||||||||
Net investment income | $ | 198,077,924 | $ | 177,693,682 | $ | 23,159,039 | $ | 43,179,073 | ||||||||
Net realized gain (loss) | 433,991,900 | 136,968,307 | (218,038,852 | ) | (49,805,879 | ) | ||||||||||
Net change in unrealized appreciation/depreciation | (336,921,644 | ) | 665,594,417 | (502,228,529 | ) | 416,649,115 | ||||||||||
|
|
|
|
|
|
|
| |||||||||
Net increase (decrease) in net assets resulting from operations | 295,148,180 | 980,256,406 | (697,108,342 | ) | 410,022,309 | |||||||||||
|
|
|
|
|
|
|
| |||||||||
DISTRIBUTIONS TO SHAREHOLDERS: | ||||||||||||||||
From net investment income | (187,336,932 | ) | (199,951,249 | ) | (30,297,965 | ) | (41,504,491 | ) | ||||||||
|
|
|
|
|
|
|
| |||||||||
Total distributions to shareholders | (187,336,932 | ) | (199,951,249 | ) | (30,297,965 | ) | (41,504,491 | ) | ||||||||
|
|
|
|
|
|
|
| |||||||||
CAPITAL SHARE TRANSACTIONS: | ||||||||||||||||
Proceeds from shares sold | 8,592,356,336 | 5,400,567,672 | 862,520,515 | 2,034,431,562 | ||||||||||||
Cost of shares redeemed | (4,281,553,914 | ) | (1,913,626,119 | ) | (2,203,323,997 | ) | (1,344,849,484 | ) | ||||||||
|
|
|
|
|
|
|
| |||||||||
Net increase (decrease) in net assets from capital share transactions | 4,310,802,422 | 3,486,941,553 | (1,340,803,482 | ) | 689,582,078 | |||||||||||
|
|
|
|
|
|
|
| |||||||||
INCREASE (DECREASE) IN NET ASSETS | 4,418,613,670 | 4,267,246,710 | (2,068,209,789 | ) | 1,058,099,896 | |||||||||||
NET ASSETS | ||||||||||||||||
Beginning of year | 14,729,188,703 | 10,461,941,993 | 3,275,152,092 | 2,217,052,196 | ||||||||||||
|
|
|
|
|
|
|
| |||||||||
End of year | $ | 19,147,802,373 | $ | 14,729,188,703 | $ | 1,206,942,303 | $ | 3,275,152,092 | ||||||||
|
|
|
|
|
|
|
| |||||||||
Undistributed (distributions in excess of) net investment income included in net assets at end of year | $ | (21,895,543 | ) | $ | (28,649,511 | ) | $ | 597,098 | $ | 5,791,200 | ||||||
|
|
|
|
|
|
|
| |||||||||
SHARES ISSUED AND REDEEMED | ||||||||||||||||
Shares sold | 697,200,000 | 457,800,000 | 14,400,000 | 31,000,000 | ||||||||||||
Shares redeemed | (366,600,000 | ) | (166,800,000 | ) | (37,300,000 | ) | (21,000,000 | ) | ||||||||
|
|
|
|
|
|
|
| |||||||||
Net increase (decrease) in shares outstanding | 330,600,000 | 291,000,000 | (22,900,000 | ) | 10,000,000 | |||||||||||
|
|
|
|
|
|
|
| |||||||||
See notes to financial statements.
| 40 | 2015 iSHARES ANNUAL REPORTTO SHAREHOLDERS |
Table of Contents
Statements of Changes in Net Assets (Continued)
iSHARES®, INC.
| iShares MSCI South Korea Capped ETF | ||||||||
| Year ended August 31, 2015 | Year ended August 31, 2014 | |||||||
INCREASE (DECREASE) IN NET ASSETS | ||||||||
OPERATIONS: | ||||||||
Net investment income | $ | 33,901,757 | $ | 16,661,091 | ||||
Net realized loss | (284,471,604 | ) | (39,478,146 | ) | ||||
Net change in unrealized appreciation/depreciation | (1,094,121,115 | ) | 623,922,673 | |||||
|
|
|
| |||||
Net increase (decrease) in net assets resulting from operations | (1,344,690,962 | ) | 601,105,618 | |||||
|
|
|
| |||||
DISTRIBUTIONS TO SHAREHOLDERS: | ||||||||
From net investment income | (50,182,957 | ) | (61,830,398 | ) | ||||
|
|
|
| |||||
Total distributions to shareholders | (50,182,957 | ) | (61,830,398 | ) | ||||
|
|
|
| |||||
CAPITAL SHARE TRANSACTIONS: | ||||||||
Proceeds from shares sold | 649,650,453 | 1,151,119,199 | ||||||
Cost of shares redeemed | (985,441,132 | ) | (175,291,957 | ) | ||||
|
|
|
| |||||
Net increase (decrease) in net assets from capital share transactions | (335,790,679 | ) | 975,827,242 | |||||
|
|
|
| |||||
INCREASE (DECREASE) IN NET ASSETS | (1,730,664,598 | ) | 1,515,102,462 | |||||
NET ASSETS | ||||||||
Beginning of year | 4,891,618,907 | 3,376,516,445 | ||||||
|
|
|
| |||||
End of year | $ | 3,160,954,309 | $ | 4,891,618,907 | ||||
|
|
|
| |||||
Distributions in excess of net investment income included in net assets at end of year | $ | (78,505,763 | ) | $ | (61,970,456 | ) | ||
|
|
|
| |||||
SHARES ISSUED AND REDEEMED | ||||||||
Shares sold | 10,650,000 | 18,000,000 | ||||||
Shares redeemed | (18,650,000 | ) | (2,900,000 | ) | ||||
|
|
|
| |||||
Net increase (decrease) in shares outstanding | (8,000,000 | ) | 15,100,000 | |||||
|
|
|
| |||||
See notes to financial statements.
FINANCIAL STATEMENTS | 41 |
Table of Contents
iSHARES® , INC.
(For a share outstanding throughout each period)
| iShares MSCI Australia ETF | ||||||||||||||||||||
| Year ended Aug. 31, 2015 | Year ended Aug. 31, 2014 | Year ended Aug. 31, 2013 | Year ended Aug. 31, 2012 | Year ended Aug. 31, 2011 | ||||||||||||||||
Net asset value, beginning of year | $ | 27.15 | $ | 23.61 | $ | 23.39 | $ | 24.18 | $ | 20.92 | ||||||||||
|
|
|
|
|
|
|
|
|
| |||||||||||
Income from investment operations: | ||||||||||||||||||||
Net investment incomea | 1.23 | 1.10 | 1.02 | 1.04 | 0.99 | |||||||||||||||
Net realized and unrealized gain (loss)b | (8.49 | ) | 3.43 | 0.64 | (0.72 | ) | 3.33 | |||||||||||||
|
|
|
|
|
|
|
|
|
| |||||||||||
Total from investment operations | (7.26 | ) | 4.53 | 1.66 | 0.32 | 4.32 | ||||||||||||||
|
|
|
|
|
|
|
|
|
| |||||||||||
Less distributions from: | ||||||||||||||||||||
Net investment income | (1.23 | ) | (0.99 | ) | (1.44 | ) | (1.11 | ) | (1.06 | ) | ||||||||||
|
|
|
|
|
|
|
|
|
| |||||||||||
Total distributions | (1.23 | ) | (0.99 | ) | (1.44 | ) | (1.11 | ) | (1.06 | ) | ||||||||||
|
|
|
|
|
|
|
|
|
| |||||||||||
Net asset value, end of year | $ | 18.66 | $ | 27.15 | $ | 23.61 | $ | 23.39 | $ | 24.18 | ||||||||||
|
|
|
|
|
|
|
|
|
| |||||||||||
Total return | (27.31 | )% | 19.76 | % | 7.06 | % | 1.84 | % | 20.54 | % | ||||||||||
|
|
|
|
|
|
|
|
|
| |||||||||||
Ratios/Supplemental data: | ||||||||||||||||||||
Net assets, end of year (000s) | $ | 1,228,063 | $ | 2,047,113 | $ | 1,916,849 | $ | 2,493,699 | $ | 3,090,425 | ||||||||||
Ratio of expenses to average net assets | 0.48 | % | 0.48 | % | 0.51 | % | 0.53 | % | 0.52 | % | ||||||||||
Ratio of net investment income to average net assets | 5.37 | % | 4.28 | % | 4.05 | % | 4.61 | % | 3.95 | % | ||||||||||
Portfolio turnover ratec | 9 | % | 6 | % | 6 | % | 9 | % | 9 | % | ||||||||||
| a | Based on average shares outstanding throughout each period. |
| b | The amounts reported for a share outstanding may not accord with the change in aggregate gains and losses in securities for the fiscal period due to the timing of capital share transactions in relation to the fluctuating market values of the Fund’s underlying securities. |
| c | Portfolio turnover rates exclude portfolio securities received or delivered as a result of processing capital share transactions in Creation Units. |
See notes to financial statements.
| 42 | 2015 iSHARES ANNUAL REPORTTO SHAREHOLDERS |
Table of Contents
Financial Highlights (Continued)
iSHARES®, INC.
(For a share outstanding throughout each period)
| iShares MSCI Canada ETF | ||||||||||||||||||||
| Year ended Aug. 31, 2015 | Year ended Aug. 31, 2014 | Year ended Aug. 31, 2013 | Year ended Aug. 31, 2012 | Year ended Aug. 31, 2011 | ||||||||||||||||
Net asset value, beginning of year | $ | 32.93 | $ | 27.34 | $ | 27.52 | $ | 29.89 | $ | 26.10 | ||||||||||
|
|
|
|
|
|
|
|
|
| |||||||||||
Income from investment operations: | ||||||||||||||||||||
Net investment incomea | 0.54 | 0.59 | 0.60 | 0.53 | 0.53 | |||||||||||||||
Net realized and unrealized gain (loss)b | (8.85 | ) | 5.62 | (0.10 | ) | (2.33 | ) | 3.78 | ||||||||||||
|
|
|
|
|
|
|
|
|
| |||||||||||
Total from investment operations | (8.31 | ) | 6.21 | 0.50 | (1.80 | ) | 4.31 | |||||||||||||
|
|
|
|
|
|
|
|
|
| |||||||||||
Less distributions from: | ||||||||||||||||||||
Net investment income | (0.60 | ) | (0.62 | ) | (0.68 | ) | (0.57 | ) | (0.52 | ) | ||||||||||
|
|
|
|
|
|
|
|
|
| |||||||||||
Total distributions | (0.60 | ) | (0.62 | ) | (0.68 | ) | (0.57 | ) | (0.52 | ) | ||||||||||
|
|
|
|
|
|
|
|
|
| |||||||||||
Net asset value, end of year | $ | 24.02 | $ | 32.93 | $ | 27.34 | $ | 27.52 | $ | 29.89 | ||||||||||
|
|
|
|
|
|
|
|
|
| |||||||||||
Total return | (25.48 | )% | 23.00 | % | 1.84 | % | (5.87 | )% | 16.50 | % | ||||||||||
|
|
|
|
|
|
|
|
|
| |||||||||||
Ratios/Supplemental data: | ||||||||||||||||||||
Net assets, end of year (000s) | $ | 1,931,454 | $ | 3,786,906 | $ | 3,428,223 | $ | 4,254,544 | $ | 5,092,547 | ||||||||||
Ratio of expenses to average net assets | 0.48 | % | 0.48 | % | 0.51 | % | 0.53 | % | 0.52 | % | ||||||||||
Ratio of net investment income to average net assets | 1.92 | % | 1.97 | % | 2.12 | % | 1.94 | % | 1.70 | % | ||||||||||
Portfolio turnover ratec | 5 | % | 6 | % | 7 | % | 5 | % | 8 | % | ||||||||||
| a | Based on average shares outstanding throughout each period. |
| b | The amounts reported for a share outstanding may not accord with the change in aggregate gains and losses in securities for the fiscal period due to the timing of capital share transactions in relation to the fluctuating market values of the Fund’s underlying securities. |
| c | Portfolio turnover rates exclude portfolio securities received or delivered as a result of processing capital share transactions in Creation Units. |
See notes to financial statements.
FINANCIAL HIGHLIGHTS | 43 |
Table of Contents
Financial Highlights (Continued)
iSHARES®, INC.
(For a share outstanding throughout each period)
| iShares MSCI Japan ETF | ||||||||||||||||||||
| Year ended Aug. 31, 2015 | Year ended Aug. 31, 2014 | Year ended Aug. 31, 2013 | Year ended Aug. 31, 2012 | Year ended Aug. 31, 2011 | ||||||||||||||||
Net asset value, beginning of year | $ | 11.83 | $ | 10.97 | $ | 9.02 | $ | 9.80 | $ | 9.43 | ||||||||||
|
|
|
|
|
|
|
|
|
| |||||||||||
Income from investment operations: | ||||||||||||||||||||
Net investment incomea | 0.15 | 0.15 | 0.13 | 0.18 | 0.16 | |||||||||||||||
Net realized and unrealized gain (loss)b | 0.30 | 0.88 | 1.97 | (0.77 | ) | 0.37 | ||||||||||||||
|
|
|
|
|
|
|
|
|
| |||||||||||
Total from investment operations | 0.45 | 1.03 | 2.10 | (0.59 | ) | 0.53 | ||||||||||||||
|
|
|
|
|
|
|
|
|
| |||||||||||
Less distributions from: | ||||||||||||||||||||
Net investment income | (0.13 | ) | (0.17 | ) | (0.15 | ) | (0.19 | ) | (0.16 | ) | ||||||||||
|
|
|
|
|
|
|
|
|
| |||||||||||
Total distributions | (0.13 | ) | (0.17 | ) | (0.15 | ) | (0.19 | ) | (0.16 | ) | ||||||||||
|
|
|
|
|
|
|
|
|
| |||||||||||
Net asset value, end of year | $ | 12.15 | $ | 11.83 | $ | 10.97 | $ | 9.02 | $ | 9.80 | ||||||||||
|
|
|
|
|
|
|
|
|
| |||||||||||
Total return | 3.84 | % | 9.39 | % | 23.46 | % | (5.96 | )% | 5.54 | % | ||||||||||
|
|
|
|
|
|
|
|
|
| |||||||||||
Ratios/Supplemental data: | ||||||||||||||||||||
Net assets, end of year (000s) | $ | 19,147,802 | $ | 14,729,189 | $ | 10,461,942 | $ | 4,629,034 | $ | 7,194,509 | ||||||||||
Ratio of expenses to average net assets | 0.48 | % | 0.48 | % | 0.50 | % | 0.53 | % | 0.51 | % | ||||||||||
Ratio of net investment income to average net assets | 1.20 | % | 1.31 | % | 1.18 | % | 1.95 | % | 1.53 | % | ||||||||||
Portfolio turnover ratec | 2 | % | 2 | % | 4 | % | 3 | % | 4 | % | ||||||||||
| a | Based on average shares outstanding throughout each period. |
| b | The amounts reported for a share outstanding may not accord with the change in aggregate gains and losses in securities for the fiscal period due to the timing of capital share transactions in relation to the fluctuating market values of the Fund’s underlying securities. |
| c | Portfolio turnover rates exclude portfolio securities received or delivered as a result of processing capital share transactions in Creation Units. |
See notes to financial statements.
| 44 | 2015 iSHARES ANNUAL REPORTTO SHAREHOLDERS |
Table of Contents
Financial Highlights (Continued)
iSHARES®, INC.
(For a share outstanding throughout each period)
| iShares MSCI Mexico Capped ETF | ||||||||||||||||||||
| Year ended Aug. 31, 2015 | Year ended Aug. 31, 2014 | Year ended Aug. 31, 2013 | Year ended Aug. 31, 2012 | Year ended Aug. 31, 2011 | ||||||||||||||||
Net asset value, beginning of year | $ | 71.51 | $ | 61.93 | $ | 60.96 | $ | 58.39 | $ | 48.17 | ||||||||||
|
|
|
|
|
|
|
|
|
| |||||||||||
Income from investment operations: | ||||||||||||||||||||
Net investment incomea | 0.68 | 1.06 | 0.75 | 0.73 | 0.80 | |||||||||||||||
Net realized and unrealized gain (loss)b | (18.56 | ) | 9.61 | 0.85 | 2.76 | 10.15 | ||||||||||||||
|
|
|
|
|
|
|
|
|
| |||||||||||
Total from investment operations | (17.88 | ) | 10.67 | 1.60 | 3.49 | 10.95 | ||||||||||||||
|
|
|
|
|
|
|
|
|
| |||||||||||
Less distributions from: | ||||||||||||||||||||
Net investment income | (0.93 | ) | (1.09 | ) | (0.63 | ) | (0.92 | ) | (0.73 | ) | ||||||||||
|
|
|
|
|
|
|
|
|
| |||||||||||
Total distributions | (0.93 | ) | (1.09 | ) | (0.63 | ) | (0.92 | ) | (0.73 | ) | ||||||||||
|
|
|
|
|
|
|
|
|
| |||||||||||
Net asset value, end of year | $ | 52.70 | $ | 71.51 | $ | 61.93 | $ | 60.96 | $ | 58.39 | ||||||||||
|
|
|
|
|
|
|
|
|
| |||||||||||
Total return | (25.10 | )% | 17.42 | % | 2.53 | % | 6.13 | % | 22.67 | % | ||||||||||
|
|
|
|
|
|
|
|
|
| |||||||||||
Ratios/Supplemental data: | ||||||||||||||||||||
Net assets, end of year (000s) | $ | 1,206,942 | $ | 3,275,152 | $ | 2,217,052 | $ | 1,182,700 | $ | 1,243,731 | ||||||||||
Ratio of expenses to average net assets | 0.48 | % | 0.48 | % | 0.50 | % | 0.53 | % | 0.52 | % | ||||||||||
Ratio of net investment income to average net assets | 1.10 | % | 1.61 | % | 1.09 | % | 1.26 | % | 1.35 | % | ||||||||||
Portfolio turnover ratec | 13 | % | 19 | % | 32 | % | 10 | % | 5 | % | ||||||||||
| a | Based on average shares outstanding throughout each period. |
| b | The amounts reported for a share outstanding may not accord with the change in aggregate gains and losses in securities for the fiscal period due to the timing of capital share transactions in relation to the fluctuating market values of the Fund’s underlying securities. |
| c | Portfolio turnover rates exclude portfolio securities received or delivered as a result of processing capital share transactions in Creation Units. |
See notes to financial statements.
FINANCIAL HIGHLIGHTS | 45 |
Table of Contents
Financial Highlights (Continued)
iSHARES®, INC.
(For a share outstanding throughout each period)
| iShares MSCI South Korea Capped ETF | ||||||||||||||||||||
| Year ended Aug. 31, 2015 | Year ended Aug. 31, 2014 | Year ended Aug. 31, 2013 | Year ended Aug. 31, 2012 | Year ended Aug. 31, 2011 | ||||||||||||||||
Net asset value, beginning of year | $ | 66.42 | $ | 57.67 | $ | 55.97 | $ | 56.74 | $ | 47.76 | ||||||||||
|
|
|
|
|
|
|
|
|
| |||||||||||
Income from investment operations: | ||||||||||||||||||||
Net investment incomea | 0.46 | 0.25 | 0.23 | 0.23 | 0.29 | |||||||||||||||
Net realized and unrealized gain (loss)b | (18.07 | ) | 9.40 | 1.83 | (0.63 | ) | 9.19 | |||||||||||||
|
|
|
|
|
|
|
|
|
| |||||||||||
Total from investment operations | (17.61 | ) | 9.65 | 2.06 | (0.40 | ) | 9.48 | |||||||||||||
|
|
|
|
|
|
|
|
|
| |||||||||||
Less distributions from: | ||||||||||||||||||||
Net investment income | (0.66 | ) | (0.90 | ) | (0.36 | ) | (0.37 | ) | (0.43 | ) | ||||||||||
Return of capital | — | — | — | — | (0.07 | ) | ||||||||||||||
|
|
|
|
|
|
|
|
|
| |||||||||||
Total distributions | (0.66 | ) | (0.90 | ) | (0.36 | ) | (0.37 | ) | (0.50 | ) | ||||||||||
|
|
|
|
|
|
|
|
|
| |||||||||||
Net asset value, end of year | $ | 48.15 | $ | 66.42 | $ | 57.67 | $ | 55.97 | $ | 56.74 | ||||||||||
|
|
|
|
|
|
|
|
|
| |||||||||||
Total return | (26.58 | )% | 16.83 | % | 3.65 | % | (0.62 | )% | 19.76 | % | ||||||||||
|
|
|
|
|
|
|
|
|
| |||||||||||
Ratios/Supplemental data: | ||||||||||||||||||||
Net assets, end of year (000s) | $ | 3,160,954 | $ | 4,891,619 | $ | 3,376,516 | $ | 2,669,551 | $ | 4,071,225 | ||||||||||
Ratio of expenses to average net assets | 0.62 | % | 0.62 | % | 0.61 | % | 0.61 | % | 0.59 | % | ||||||||||
Ratio of net investment income to average net assets | 0.81 | % | 0.39 | % | 0.40 | % | 0.42 | % | 0.49 | % | ||||||||||
Portfolio turnover ratec | 24 | % | 13 | % | 13 | % | 12 | % | 18 | % | ||||||||||
| a | Based on average shares outstanding throughout each period. |
| b | The amounts reported for a share outstanding may not accord with the change in aggregate gains and losses in securities for the fiscal period due to the timing of capital share transactions in relation to the fluctuating market values of the Fund’s underlying securities. |
| c | Portfolio turnover rates include portfolio transactions that are executed as a result of the Fund processing capital share transactions in Creation Units solely for cash in U.S. dollars. Excluding such cash transactions, the portfolio turnover rates for the years ended August 31, 2015, August 31, 2014, August 31, 2013, August 31, 2012, and August 31, 2011 were 10%, 10%, 11%, 8%, and 6%, respectively. See Note 4. |
See notes to financial statements.
| 46 | 2015 iSHARES ANNUAL REPORTTO SHAREHOLDERS |
Table of Contents
iSHARES® , INC.
iShares, Inc. (the “Company”) is registered under the Investment Company Act of 1940, as amended (the “1940 Act”), as an open-end management investment company. The Company was incorporated under the laws of the State of Maryland on September 1, 1994 pursuant to Articles of Incorporation as subsequently amended and restated.
These financial statements relate only to the following funds (each, a “Fund,” and collectively, the “Funds”):
| iShares ETF | Diversification Classification | |
MSCI Australia | Non-diversified | |
MSCI Canada | Diversified | |
MSCI Japan | Diversified | |
MSCI Mexico Capped | Non-diversified | |
MSCI South Korea Capped | Non-diversified |
The investment objective of each Fund is to seek investment results that correspond generally to the price and yield performance, before fees and expenses, of its underlying index. The investment adviser uses a “passive” or index approach to try to achieve each Fund’s investment objective.
Pursuant to the Company’s organizational documents, the Funds’ officers and directors are indemnified against certain liabilities that may arise out of the performance of their duties to the Funds. Additionally, in the normal course of business, the Funds enter into contracts with service providers that contain general indemnification clauses. The Funds’ maximum exposure under these arrangements is unknown as this would involve future claims that may be made against the Funds that have not yet occurred.
| 1. | SIGNIFICANT ACCOUNTING POLICIES |
The following significant accounting policies are consistently followed by the Funds in the preparation of their financial statements in conformity with accounting principles generally accepted in the United States of America (“U.S. GAAP”). The preparation of financial statements in conformity with U.S. GAAP requires management to make certain estimates and assumptions that affect the reported amounts of assets and liabilities and disclosures of contingent assets and liabilities at the date of the financial statements and the reported amounts of revenue and expenses during the reporting period. Actual results could differ from those estimates. Each Fund is considered an investment company under U.S. GAAP and follows the accounting and reporting guidance applicable to investment companies.
SECURITY VALUATION
Each Fund’s investments are valued at fair value each day that the Fund’s listing exchange is open and, for financial reporting purposes, as of the report date should the reporting period end on a day that the Fund’s listing exchange is not open. U.S. GAAP defines fair value as the price a fund would receive to sell an asset or pay to transfer a liability in an orderly transaction between market participants at the measurement date. The BlackRock Global Valuation Methodologies Committee (the “Global Valuation Committee”) provides oversight of the valuation of investments for the Funds. The investments of each Fund are valued pursuant to policies and procedures developed by the Global Valuation Committee and approved by the Board of Directors of the Company (the “Board”).
| • | Equity investments traded on a recognized securities exchange are valued at that day’s last reported trade price or the official closing price, as applicable, on the exchange where the stock is primarily traded. Equity investments traded on a recognized exchange for which there were no sales on that day are valued at the last traded price. |
NOTESTO FINANCIAL STATEMENTS | 47 |
Table of Contents
Notes to Financial Statements (Continued)
iSHARES®, INC.
| • | Open-end U.S. mutual funds are valued at that day’s published net asset value (“NAV”). |
| • | Futures contracts are valued at that day’s last reported settlement price on the exchange where the contract is traded. |
In the event that application of these methods of valuation results in a price for an investment which is deemed not to be representative of the fair value of such investment or if a price is not available, the investment will be valued based upon other available factors deemed relevant by the Global Valuation Committee, in accordance with policies approved by the Board. These factors include but are not limited to (i) attributes specific to the investment; (ii) the principal market for the investment; (iii) the customary participants in the principal market for the investment; (iv) data assumptions by market participants for the investment, if reasonably available; (v) quoted prices for similar investments in active markets; and (vi) other factors, such as future cash flows, interest rates, yield curves, volatilities, prepayment speeds, loss severities, credit risks and/or default rates. Valuations based on such factors are reported to the Board on a quarterly basis.
The Global Valuation Committee employs various methods for calibrating valuation approaches for investments where an active market does not exist, including regular due diligence of the Company’s pricing vendors, a regular review of key inputs and assumptions, transactional back-testing or disposition analysis to compare unrealized gains and losses to realized gains and losses, reviews of missing or stale prices, reviews of large movements in market values, and reviews of market related activity.
Fair value pricing could result in a difference between the prices used to calculate a Fund’s NAV and the prices used by the Fund’s underlying index, which in turn could result in a difference between the Fund’s performance and the performance of the Fund’s underlying index.
Various inputs are used in determining the fair value of financial instruments. Inputs may be based on independent market data (“observable inputs”) or they may be internally developed (“unobservable inputs”). These inputs are categorized into a disclosure hierarchy consisting of three broad levels for financial reporting purposes. The level of a value determined for a financial instrument within the fair value hierarchy is based on the lowest level of any input that is significant to the fair value measurement in its entirety. The categorization of a value determined for a financial instrument within the hierarchy is based upon the pricing transparency of the instrument and is not necessarily an indication of the risk associated with investing in the instrument. The three levels of the fair value hierarchy are as follows:
| • | Level 1 — Unadjusted quoted prices in active markets for identical assets or liabilities; |
| • | Level 2 — Inputs other than quoted prices included within Level 1 that are observable for the asset or liability either directly or indirectly, including quoted prices for similar assets or liabilities in active markets, quoted prices for identical or similar assets or liabilities in markets that are not considered to be active, inputs other than quoted prices that are observable for the asset or liability (such as exchange rates, financing terms, interest rates, yield curves, volatilities, prepayment speeds, loss severities, credit risks and default rates) or other market-corroborated inputs; and |
| • | Level 3 — Unobservable inputs for the asset or liability, including the Global Valuation Committee’s assumptions used in determining the fair value of investments. |
Changes in valuation techniques may result in transfers in or out of an assigned level within the disclosure hierarchy. In accordance with the Company’s policy, transfers between different levels of the fair value hierarchy are deemed to have occurred as of the beginning of the reporting period.
| 48 | 2015 iSHARES ANNUAL REPORTTO SHAREHOLDERS |
Table of Contents
Notes to Financial Statements (Continued)
iSHARES®, INC.
The following table summarizes the value of each of the Funds’ investments according to the fair value hierarchy as of August 31, 2015. The breakdown of each Fund’s investments into major categories is disclosed in its respective schedule of investments.
| iShares ETF | Level 1 | Level 2 | Level 3 | Total | ||||||||||||
MSCI Australia | ||||||||||||||||
Investments: | ||||||||||||||||
Assets: | ||||||||||||||||
Common Stocks | $ | 1,213,205,355 | $ | — | $ | — | $ | 1,213,205,355 | ||||||||
Money Market Funds | 5,940,640 | — | — | 5,940,640 | ||||||||||||
|
|
|
|
|
|
|
| |||||||||
Total | $ | 1,219,145,995 | $ | — | $ | — | $ | 1,219,145,995 | ||||||||
|
|
|
|
|
|
|
| |||||||||
Derivative Financial Instruments:a | ||||||||||||||||
Liabilities: | ||||||||||||||||
Futures Contracts | $ | (307,229 | ) | $ | — | $ | — | $ | (307,229 | ) | ||||||
|
|
|
|
|
|
|
| |||||||||
Total | $ | (307,229 | ) | $ | — | $ | — | $ | (307,229 | ) | ||||||
|
|
|
|
|
|
|
| |||||||||
MSCI Canada | ||||||||||||||||
Investments: | ||||||||||||||||
Assets: | ||||||||||||||||
Common Stocks | $ | 1,925,818,740 | $ | — | $ | — | $ | 1,925,818,740 | ||||||||
Money Market Funds | 21,685,835 | — | — | 21,685,835 | ||||||||||||
|
|
|
|
|
|
|
| |||||||||
Total | $ | 1,947,504,575 | $ | — | $ | — | $ | 1,947,504,575 | ||||||||
|
|
|
|
|
|
|
| |||||||||
Derivative Financial Instruments:a | ||||||||||||||||
Liabilities: | ||||||||||||||||
Futures Contracts | $ | (140,053 | ) | $ | — | $ | — | $ | (140,053 | ) | ||||||
|
|
|
|
|
|
|
| |||||||||
Total | $ | (140,053 | ) | $ | — | $ | — | $ | (140,053 | ) | ||||||
|
|
|
|
|
|
|
| |||||||||
MSCI Japan | ||||||||||||||||
Investments: | ||||||||||||||||
Assets: | ||||||||||||||||
Common Stocks | $ | 19,094,899,267 | $ | — | $ | — | $ | 19,094,899,267 | ||||||||
Money Market Funds | 86,041,262 | — | — | 86,041,262 | ||||||||||||
|
|
|
|
|
|
|
| |||||||||
Total | $ | 19,180,940,529 | $ | — | $ | — | $ | 19,180,940,529 | ||||||||
|
|
|
|
|
|
|
| |||||||||
Derivative Financial Instruments:a | ||||||||||||||||
Liabilities: | ||||||||||||||||
Futures Contracts | $ | (2,857,797 | ) | $ | — | $ | — | $ | (2,857,797 | ) | ||||||
|
|
|
|
|
|
|
| |||||||||
Total | $ | (2,857,797 | ) | $ | — | $ | — | $ | (2,857,797 | ) | ||||||
|
|
|
|
|
|
|
| |||||||||
MSCI Mexico Capped | ||||||||||||||||
Investments: | ||||||||||||||||
Assets: | ||||||||||||||||
Common Stocks | $ | 1,202,274,630 | $ | — | $ | 27 | $ | 1,202,274,657 | ||||||||
Money Market Funds | 44,804,068 | — | — | 44,804,068 | ||||||||||||
|
|
|
|
|
|
|
| |||||||||
Total | $ | 1,247,078,698 | $ | — | $ | 27 | $ | 1,247,078,725 | ||||||||
|
|
|
|
|
|
|
| |||||||||
NOTESTO FINANCIAL STATEMENTS | 49 |
Table of Contents
Notes to Financial Statements (Continued)
iSHARES®, INC.
| iShares ETF | Level 1 | Level 2 | Level 3 | Total | ||||||||||||
MSCI South Korea Capped | ||||||||||||||||
Investments: | ||||||||||||||||
Assets: | ||||||||||||||||
Common Stocks | $ | 3,003,663,385 | $ | 34,531,387 | $ | — | $ | 3,038,194,772 | ||||||||
Preferred Stocks | 117,358,681 | — | — | 117,358,681 | ||||||||||||
Money Market Funds | 202,620,901 | — | — | 202,620,901 | ||||||||||||
|
|
|
|
|
|
|
| |||||||||
Total | $ | 3,323,642,967 | $ | 34,531,387 | $ | — | $ | 3,358,174,354 | ||||||||
|
|
|
|
|
|
|
| |||||||||
| a | Shown at the unrealized appreciation (depreciation) on the contracts. |
The iShares MSCI South Korea Capped ETF had transfers from Level 1 to Level 2 during the year ended August 31, 2015 in the amount of $70,385,702, resulting from a temporary suspension of trading.
SECURITY TRANSACTIONS AND INCOME RECOGNITION
Security transactions are accounted for on trade date. Dividend income and capital gain distributions, if any, are recognized on the ex-dividend date, net of any foreign taxes withheld at source. Any taxes withheld that are reclaimable from foreign tax authorities as of August 31, 2015 are reflected in dividends receivable. Non-cash dividends received in the form of stock in an elective dividend, if any, are recorded as dividend income at fair value. Distributions received by the Funds may include a return of capital that is estimated by management. Such amounts are recorded as a reduction of the cost of investments or reclassified to capital gains. Interest income is accrued daily. Realized gains and losses on investment transactions are determined using the specific identification method.
FOREIGN CURRENCY TRANSLATION
The accounting records of the Funds are maintained in U.S. dollars. Foreign currencies, as well as investment securities and other assets and liabilities denominated in foreign currencies, are translated into U.S. dollars using exchange rates deemed appropriate by the investment adviser. Purchases and sales of securities, income receipts and expense payments are translated into U.S. dollars on the respective dates of such transactions.
Each Fund does not isolate the effect of fluctuations in foreign exchange rates from the effect of fluctuations in the market prices of securities. Such fluctuations are reflected by the Funds as a component of realized and unrealized gains and losses from investments for financial reporting purposes.
FOREIGN TAXES
The Funds may be subject to foreign taxes (a portion of which may be reclaimable) on income, stock dividends, capital gains on investments, or certain foreign currency transactions. All foreign taxes are recorded in accordance with the applicable foreign tax regulations and rates that exist in the foreign jurisdictions in which the Funds invest. These foreign taxes, if any, are paid by the Funds and are reflected in their statements of operations as follows: foreign taxes withheld at source are presented as a reduction of income, foreign taxes on securities lending income are presented as a reduction of securities lending income, foreign taxes on stock dividends are presented as “other foreign taxes,” and foreign taxes on capital gains from sales of investments and foreign taxes on foreign currency transactions are included in their respective net realized gain (loss) categories. Foreign taxes payable or deferred as of August 31, 2015, if any, are disclosed in the Funds’ statements of assets and liabilities.
| 50 | 2015 iSHARES ANNUAL REPORTTO SHAREHOLDERS |
Table of Contents
Notes to Financial Statements (Continued)
iSHARES®, INC.
DISTRIBUTIONS TO SHAREHOLDERS
Dividends and distributions paid by each Fund are recorded on the ex-dividend dates. Distributions are determined on a tax basis and may differ from net investment income and net realized capital gains for financial reporting purposes. Dividends and distributions are paid in U.S. dollars and cannot be automatically reinvested in additional shares of the Funds.
LOANS OF PORTFOLIO SECURITIES
Each Fund may lend its investment securities to approved borrowers, such as brokers, dealers and other financial institutions. The borrower pledges and maintains with the Fund collateral consisting of cash, an irrevocable letter of credit issued by a bank, or securities issued or guaranteed by the U.S. government. The initial collateral received by each Fund is required to have a value of at least 102% of the current value of the loaned securities for securities traded on U.S. exchanges and a value of at least 105% for all other securities. The collateral is maintained thereafter, at a value equal to at least 100% of the current value of the securities on loan. The market value of the loaned securities is determined at the close of each business day of the Funds. Any additional required collateral is delivered to the Funds and any excess collateral is returned by the Funds on the next business day. During the term of the loan, each Fund is entitled to all distributions made on or in respect of the loaned securities. Loans of securities are terminable at any time and the borrower, after notice, is required to return borrowed securities within the standard time period for settlement of securities transactions.
Any cash received as collateral for securities on loan may be reinvested in certain short-term instruments either directly on behalf of a fund or through one or more joint accounts or money market funds, including those managed by BlackRock Fund Advisors (“BFA”), the Funds’ investment adviser, or its affiliates. As of August 31, 2015, any securities on loan were collateralized by cash. The cash collateral received was invested in money market funds managed by BFA and is disclosed in the schedules of investments. The securities on loan for each Fund are also disclosed in its schedule of investments. The total value of any securities on loan as of August 31, 2015 and the total value of the related collateral are disclosed in the statements of assets and liabilities. Income earned by the Funds from securities lending is disclosed in the statements of operations.
The risks of securities lending include the risk that the borrower may not provide additional collateral when required or may not return the securities when due. To mitigate these risks, the Funds benefit from a borrower default indemnity provided by BlackRock, Inc. (“BlackRock”). BlackRock’s indemnity allows for full replacement of securities lent. Each Fund could suffer a loss if the value of the investments purchased with cash collateral falls below the value of the cash collateral received.
Securities lending transactions are entered into by the Funds under Master Securities Lending Agreements (“MSLA”) which provide the right, in the event of default (including bankruptcy or insolvency) for the non-defaulting party to liquidate the collateral and calculate a net exposure to the defaulting party or request additional collateral. In the event that a borrower defaults, a Fund, as lender, would offset the market value of the collateral received against the market value of the securities loaned. The value of the collateral is typically greater than that of the market value of the securities loaned, leaving the lender with a net amount payable to the defaulting party. However, bankruptcy or insolvency laws of a particular jurisdiction may impose restrictions on or prohibitions against such a right of offset in the event of an MSLA counterparty’s bankruptcy or insolvency. Under the MSLA, the borrower can resell or re-pledge the loaned securities, and a Fund can reinvest cash collateral, or, upon an event of default, resell or re-pledge the collateral.
NOTESTO FINANCIAL STATEMENTS | 51 |
Table of Contents
Notes to Financial Statements (Continued)
iSHARES®, INC.
The following table is a summary of securities lending agreements which are subject to offset under an MSLA as of August 31, 2015:
| iShares ETF | Market Value of Securities on Loan | Cash Collateral Received a | Net Amount | |||||||||
MSCI Australia | $ | 5,481,119 | $ | 5,481,119 | $ | — | ||||||
MSCI Canada | 20,765,824 | 20,765,824 | — | |||||||||
MSCI Japan | 81,205,932 | 81,205,932 | — | |||||||||
MSCI Mexico Capped | 40,305,767 | 40,305,767 | — | |||||||||
MSCI South Korea Capped | 188,300,983 | 188,300,983 | — | |||||||||
| a | Collateral received in excess of the market value of securities on loan is not presented for financial reporting purposes. The total collateral received is disclosed in each Fund’s statement of assets and liabilities. |
| 2. | INVESTMENT ADVISORY AGREEMENT AND OTHER TRANSACTIONS WITH AFFILIATES |
Pursuant to an Investment Advisory Agreement with the Company, BFA manages the investment of each Fund’s assets. BFA is a California corporation indirectly owned by BlackRock. Under the Investment Advisory Agreement, BFA is responsible for substantially all expenses of the Funds, except interest, taxes, brokerage commissions and other expenses connected with the execution of portfolio transactions, distribution fees, litigation expenses and any extraordinary expenses.
For its investment advisory services to each of the iShares MSCI Australia, iShares MSCI Canada, iShares MSCI Japan and iShares MSCI Mexico Capped ETFs, BFA is entitled to an annual investment advisory fee based on each Fund’s allocable portion of the aggregate of the average daily net assets of the Fund and certain other iShares funds, as follows:
| Investment Advisory Fee | Aggregate Average Daily Net Assets | ||||
| 0.59 | % | First $7 billion | |||
| 0.54 | Over $7 billion, up to and including $11 billion | ||||
| 0.49 | Over $11 billion, up to and including $24 billion | ||||
| 0.44 | Over $24 billion, up to and including $48 billion | ||||
| 0.40 | Over $48 billion, up to and including $72 billion | ||||
| 0.36 | Over $72 billion | ||||
For its investment advisory services to the iShares MSCI South Korea Capped ETF, BFA is entitled to an annual investment advisory fee based on the Fund’s allocable portion of the aggregate of the average daily net assets of the Fund and certain other iShares funds, as follows:
| Investment Advisory Fee | Aggregate Average Daily Net Assets | ||||
| 0.74 | % | First $2 billion | |||
| 0.69 | Over $2 billion, up to and including $4 billion | ||||
| 0.64 | Over $4 billion, up to and including $8 billion | ||||
| 0.57 | Over $8 billion, up to and including $16 billion | ||||
| 0.51 | Over $16 billion, up to and including $32 billion | ||||
| 0.45 | Over $32 billion | ||||
The U.S. Securities and Exchange Commission has issued an exemptive order which permits BlackRock Institutional Trust Company, N.A. (“BTC”), an affiliate of BFA, to serve as securities lending agent for the Funds, subject to applicable conditions. As
| 52 | 2015 iSHARES ANNUAL REPORTTO SHAREHOLDERS |
Table of Contents
Notes to Financial Statements (Continued)
iSHARES®, INC.
securities lending agent, BTC bears all operational costs directly related to securities lending. Each Fund is responsible for fees in connection with the investment of cash collateral received for securities on loan in a money market fund managed by BFA, however, BTC has agreed to reduce the amount of securities lending income it receives in order to effectively limit the collateral investment fees each Fund bears to an annual rate of 0.04% (the “collateral investment fees”). Securities lending income is equal to the total of income earned from the reinvestment of cash collateral, net of fees and other payments to and from borrowers of securities, and less the collateral investment fees. The Funds retain a portion of securities lending income and remit the remaining portion to BTC as compensation for its services as securities lending agent.
Pursuant to a securities lending agreement, each Fund retains 80% of securities lending income and the amount retained can never be less than 70% of the total of securities lending income plus the collateral investment fees. In addition, commencing the business day following the date that the aggregate securities lending income plus the collateral investment fees generated across all 1940 Act iShares exchange-traded funds (the “iShares ETF Complex”) in a given calendar year exceeds the aggregate securities lending income generated across the iShares ETF Complex in the calendar year 2013, each Fund, pursuant to a securities lending agreement, will retain for the remainder of that calendar year 85% of securities lending income and the amount retained can never be less than 70% of the total of securities lending income plus the collateral investment fees.
Prior to January 1, 2015, each Fund retained 75% of securities lending income and the amount retained was never less than 65% of the total of securities lending income plus the collateral investment fees. In addition, commencing the business day following the date that the aggregate securities lending income plus the collateral investment fees generated across the iShares ETF Complex in the calendar year 2014 exceeded the aggregate securities lending income generated across the iShares ETF Complex in the calendar year 2013 and pursuant to a securities lending agreement, each Fund retained for the remainder of the calendar year 2014, 80% of securities lending income and the amount retained was never less than 65% of the total of securities lending income plus the collateral investment fees.
For the year ended August 31, 2015, the total of securities lending agent services and collateral investment fees paid were as follows:
| iShares ETF | Fees Paid to BTC | |||
MSCI Australia | $ | 23,418 | ||
MSCI Canada | 27,587 | |||
MSCI Japan | 817,744 | |||
MSCI Mexico Capped | 258,986 | |||
MSCI South Korea Capped | 1,852,064 | |||
BlackRock Investments, LLC, an affiliate of BFA, is the distributor for each Fund. Pursuant to the distribution agreement, BFA is responsible for any fees or expenses for distribution services provided to the Funds.
Cross trades for the year ended August 31, 2015, if any, were executed by the Funds pursuant to Rule 17a-7 under the 1940 Act. Cross trading is the buying or selling of portfolio securities between funds to which BFA (or an affiliate) serves as investment adviser. At its regularly scheduled quarterly meetings, the Board reviews such transactions as of the most recent calendar quarter for compliance with the requirements and restrictions set forth by Rule 17a-7.
Each Fund may invest its positive cash balances in certain money market funds managed by BFA or an affiliate. The income earned on these temporary cash investments is included in “Interest – affiliated” in the statements of operations.
The PNC Financial Services Group, Inc. is the largest stockholder of BlackRock and is considered to be an affiliate of the Funds for 1940 Act purposes.
NOTESTO FINANCIAL STATEMENTS | 53 |
Table of Contents
Notes to Financial Statements (Continued)
iSHARES®, INC.
Certain directors and officers of the Company are also officers of BTC and/or BFA.
| 3. | INVESTMENT PORTFOLIO TRANSACTIONS |
Purchases and sales of investments (excluding in-kind transactions and short-term investments) for the year ended August 31, 2015 were as follows:
| iShares ETF | Purchases | Sales | ||||||
MSCI Australia | $ | 144,805,225 | $ | 157,690,225 | ||||
MSCI Canada | 171,095,220 | 144,978,881 | ||||||
MSCI Japan | 485,566,867 | 352,915,955 | ||||||
MSCI Mexico Capped | 281,880,821 | 276,258,621 | ||||||
MSCI South Korea Capped | 1,017,176,031 | 1,365,896,360 | ||||||
In-kind transactions (see Note 4) for the year ended August 31, 2015 were as follows:
| iShares ETF | In-kind Purchases | In-kind Sales | ||||||
MSCI Australia | $ | 280,664,374 | $ | 467,324,355 | ||||
MSCI Canada | 418,445,991 | 1,370,826,562 | ||||||
MSCI Japan | 8,348,092,364 | 4,174,371,529 | ||||||
MSCI Mexico Capped | 842,247,513 | 2,195,287,492 | ||||||
| 4. | CAPITAL SHARE TRANSACTIONS |
Capital shares are issued and redeemed by each Fund only in aggregations of a specified number of shares or multiples thereof (“Creation Units”) at NAV. Except when aggregated in Creation Units, shares of each Fund are not redeemable. Transactions in capital shares for each Fund are disclosed in detail in the statements of changes in net assets.
The consideration for the purchase of Creation Units of a fund in the Company generally consists of the in-kind deposit of a designated portfolio of securities and a specified amount of cash. Certain funds in the Company may be offered in Creation Units solely or partially for cash in U.S. dollars. Investors purchasing and redeeming Creation Units may pay a purchase transaction fee and a redemption transaction fee directly to State Street Bank and Trust Company, the Company’s administrator, to offset transfer and other transaction costs associated with the issuance and redemption of Creation Units, including Creation Units for cash. Investors transacting in Creation Units for cash may also pay an additional variable charge to compensate the relevant fund for certain transaction costs (i.e., stamp taxes, taxes on currency or other financial transactions, and brokerage costs) and market impact expenses relating to investing in portfolio securities. Such variable charges, if any, are included in “Proceeds from shares sold” in the statements of changes in net assets.
From time to time, settlement of securities related to in-kind contributions or in-kind redemptions may be delayed. In such cases, securities related to in-kind contributions are reflected as “Due from custodian” and securities related to in-kind redemptions are reflected as “Securities related to in-kind transactions” in the statement of assets and liabilities.
| 5. | FUTURES CONTRACTS |
Each Fund may purchase or sell futures contracts in an effort to help such Fund track its underlying index. A futures contract is a standardized, exchange-traded agreement to buy and sell a financial instrument at a set price on a future date. Upon entering into
| 54 | 2015 iSHARES ANNUAL REPORTTO SHAREHOLDERS |
Table of Contents
Notes to Financial Statements (Continued)
iSHARES®, INC.
a futures contract, the Fund is required to pledge to the executing broker which holds segregated from its own assets, an amount of cash, U.S. government securities or other high-quality debt and equity securities equal to the minimum initial margin requirements of the exchange on which the contract is traded. Pursuant to the contract, the Fund agrees to receive from or pay to the broker an amount of cash equal to the daily fluctuation in value of the contract. Such receipts or payments are known as margin variation and are recorded by the Fund as unrealized appreciation or depreciation. When the contract is closed, the Fund records a realized gain or loss equal to the difference between the value of the contract at the time it was opened and the value at the time it was closed. Losses may arise if the value of a futures contract decreases due to an unfavorable change in the market rates or values of the underlying instrument during the term of the contract or if the counterparty does not perform under the contract. The use of futures contracts also involves the risk of an imperfect correlation in the movements in the price of futures contracts and the assets underlying such contracts.
The following table shows the value of futures contracts held as of August 31, 2015 and the related locations in the statements of assets and liabilities, presented by risk exposure category:
| Liabilities | ||||||||||||
| iShares MSCI Australia ETF | iShares MSCI Canada ETF | iShares MSCI Japan ETF | ||||||||||
Equity contracts: | ||||||||||||
Variation margin/Net assets consist of – net unrealized depreciationa | $ | 307,229 | $ | 140,053 | $ | 2,857,797 | ||||||
|
|
|
|
|
| |||||||
| a | Represents cumulative depreciation of futures contracts as reported in the schedules of investments. |
The following table shows the realized and unrealized gains (losses) on futures contracts held during the year ended August 31, 2015 and the related locations in the statements of operations, presented by risk exposure category:
| Net Realized Gain (Loss) | ||||||||||||
| iShares MSCI Australia ETF | iShares MSCI Canada ETF | iShares MSCI Japan ETF | ||||||||||
Equity contracts: | ||||||||||||
Futures contracts | $ | (1,608,460 | ) | $ | 395,420 | $ | 23,318,919 | |||||
|
|
|
|
|
| |||||||
| Net Change in Unrealized Appreciation/Depreciation | ||||||||||||
| iShares MSCI Australia ETF | iShares MSCI Canada ETF | iShares MSCI Japan ETF | ||||||||||
Equity contracts: | ||||||||||||
Futures contracts | $ | (760,041 | ) | $ | (1,033,143 | ) | $ | (3,764,376 | ) | |||
|
|
|
|
|
| |||||||
The following table shows the average quarter-end balances of open futures contracts for the year ended August 31, 2015:
| iShares MSCI Australia ETF | iShares MSCI Canada ETF | iShares MSCI Japan ETF | ||||||||||
Average value of contracts purchased | $ | 18,315,106 | $ | 9,794,047 | $ | 82,790,244 | ||||||
NOTESTO FINANCIAL STATEMENTS | 55 |
Table of Contents
Notes to Financial Statements (Continued)
iSHARES®, INC.
| 6. | PRINCIPAL RISKS |
In the normal course of business, each Fund’s investment activities expose it to various types of risk associated with the financial instruments and markets in which it invests. The significant types of financial risks each Fund is exposed to include market risk and credit risk. Each Fund’s prospectus provides details of these and other types of risk.
BFA uses a “passive” or index approach to try to achieve each Fund’s investment objective following the securities included in its underlying index during upturns as well as downturns. BFA does not take steps to reduce market exposure or to lessen the effects of a declining market. Divergence from the underlying index and the composition of the portfolio is monitored by BFA.
MARKET RISK
Market risk arises mainly from uncertainty about future values of financial instruments influenced by price, currency and interest rate movements. It represents the potential loss each Fund may suffer through holding market positions in the face of market movements. Each Fund is exposed to market risk by virtue of its investment in equity and financial derivative instruments. The fair value of securities held by the Funds may decline due to general market conditions, economic trends or events that are not specifically related to the issuers of the securities including local, regional or global political, social or economic instability or to factors that affect a particular industry or group of industries. The extent of each Fund’s exposure to market risk is the market value of the investments held as shown in the Fund’s schedule of investments.
A diversified portfolio, where this is appropriate and consistent with a fund’s objectives, minimizes the risk that a price change of a particular investment will have a material impact on the NAV of a fund. The investment concentrations within each Fund’s portfolio are disclosed in its schedule of investments.
Each Fund invests a substantial amount of its assets in securities of non-U.S. issuers that trade in non-U.S. markets. This involves certain considerations and risks not typically associated with securities of U.S. issuers. Such risks include, but are not limited to: generally less liquid and less efficient securities markets; generally greater price volatility; exchange rate fluctuations and exchange controls; imposition of restrictions on the expatriation of funds or other assets of the Fund; less publicly available information about issuers; the imposition of withholding or other taxes; higher transaction and custody costs; settlement delays and risk of loss attendant in settlement procedures; difficulties in enforcing contractual obligations; less regulation of securities markets; different accounting, disclosure and reporting requirements; more substantial governmental involvement in the economy; higher inflation rates; greater social, economic and political uncertainties; the risk of nationalization or expropriation of assets; and the risk of war. These risks are heightened for investments in issuers from countries with less developed markets.
Each Fund invests all or substantially all of its assets in issuers located in a single country. When a fund concentrates its investments in this manner, it assumes the risk that economic, political and social conditions in that country may have a significant impact on its investment performance.
CREDIT RISK
Credit risk is the risk that an issuer or guarantor of debt instruments or the counterparty to a financial transaction, including derivatives contracts, repurchase agreements or loans of portfolio securities, is unable or unwilling to make timely interest and/or principal payments or to otherwise honor its obligations. BFA and its affiliates manage counterparty credit risk by entering into transactions only with counterparties that they believe have the financial resources to honor their obligations and by monitoring the financial stability of those counterparties. Financial assets, which potentially expose the Funds to issuer and counterparty credit risks, consist principally of financial instruments and receivables due from counterparties. The extent of each Fund’s exposure to credit and counterparty risks with respect to those financial assets is approximated by their value recorded in its statement of assets and liabilities.
| 56 | 2015 iSHARES ANNUAL REPORTTO SHAREHOLDERS |
Table of Contents
Notes to Financial Statements (Continued)
iSHARES®, INC.
| 7. | INCOME TAX INFORMATION |
Each Fund is treated as an entity separate from the Company’s other funds for federal income tax purposes. It is the policy of each Fund to qualify as a regulated investment company by complying with the provisions applicable to regulated investment companies, as defined under Subchapter M of the Internal Revenue Code of 1986, as amended, and to annually distribute substantially all of its ordinary income and any net capital gains (taking into account any capital loss carryforwards) sufficient to relieve it from all, or substantially all, federal income and excise taxes. Accordingly, no provision for federal income taxes is required.
U.S. GAAP requires that certain components of net assets be adjusted to reflect permanent differences between financial and tax reporting. These reclassifications have no effect on net assets or NAV per share. The following permanent differences as of August 31, 2015, attributable to passive foreign investment companies, the expiration of capital loss carryforwards, foreign currency transactions and realized gains (losses) from in-kind redemptions, were reclassified to the following accounts:
| iShares ETF | Paid-in Capital | Undistributed Net Investment Income/Distributions in Excess of Net Investment Income | Undistributed Net Realized Gain/Accumulated Net Realized Loss | |||||||||
MSCI Australia | $ | (21,778,637 | ) | $ | 955,192 | $ | 20,823,445 | |||||
MSCI Canada | 67,534,983 | 1,685,979 | (69,220,962 | ) | ||||||||
MSCI Japan | 449,885,441 | (3,987,024 | ) | (445,898,417 | ) | |||||||
MSCI Mexico Capped | (211,195,280 | ) | 1,944,824 | 209,250,456 | ||||||||
MSCI South Korea Capped | — | (254,107 | ) | 254,107 | ||||||||
The tax character of distributions paid during the years ended August 31, 2015 and August 31, 2014 was as follows:
| iShares ETF | 2015 | 2014 | ||||||
MSCI Australia | ||||||||
Ordinary income | $ | 88,722,742 | $ | 76,457,082 | ||||
|
|
|
| |||||
MSCI Canada | ||||||||
Ordinary income | $ | 56,091,045 | $ | 71,105,660 | ||||
|
|
|
| |||||
MSCI Japan | ||||||||
Ordinary income | $ | 187,336,932 | $ | 199,951,249 | ||||
|
|
|
| |||||
MSCI Mexico Capped | ||||||||
Ordinary income | $ | 30,297,965 | $ | 41,504,491 | ||||
|
|
|
| |||||
MSCI South Korea Capped | ||||||||
Ordinary income | $ | 50,182,957 | $ | 61,830,398 | ||||
|
|
|
| |||||
NOTESTO FINANCIAL STATEMENTS | 57 |
Table of Contents
Notes to Financial Statements (Continued)
iSHARES®, INC.
As of August 31, 2015, the tax components of accumulated net earnings (losses) were as follows:
| iShares ETF | Undistributed Ordinary Income | Capital Loss Carryforwards | Net Unrealized Gains (Losses) a | Qualified Late-Year Losses b | Total | |||||||||||||||
MSCI Australia | $ | 7,242,413 | $ | (172,721,025 | ) | $ | (478,171,441 | ) | $ | (24,080,669 | ) | $ | (667,730,722 | ) | ||||||
MSCI Canada | 1,882,603 | (290,684,245 | ) | (807,480,587 | ) | (98,075,730 | ) | (1,194,357,959 | ) | |||||||||||
MSCI Japan | 28,632,728 | (797,344,560 | ) | (1,177,383,944 | ) | (42,884,657 | ) | (1,988,980,433 | ) | |||||||||||
MSCI Mexico Capped | 1,525,684 | (140,104,655 | ) | (516,594,236 | ) | (27,480,320 | ) | (682,653,527 | ) | |||||||||||
MSCI South Korea Capped | 13,149,685 | (397,308,550 | ) | 428,856,235 | (277,217,705 | ) | (232,520,335 | ) | ||||||||||||
| a | The difference between book-basis and tax-basis unrealized gains (losses) was attributable primarily to the tax deferral of losses on wash sales and the realization for tax purposes of unrealized gains on investments in passive foreign investment companies. |
| b | The Funds have elected to defer certain qualified late-year losses and recognize such losses in the next taxable year. |
As of August 31, 2015, the following Funds had capital loss carryforwards available to offset future realized capital gains through the indicated expiration dates as follows:
| iShares ETF | Non- Expiring a | Expiring 2016 | Expiring 2017 | Expiring 2018 | Expiring 2019 | Total | ||||||||||||||||||
MSCI Australia | $ | 112,709,424 | $ | 529,868 | $ | 24,006,125 | $ | 23,348,244 | $ | 12,127,364 | $ | 172,721,025 | ||||||||||||
MSCI Canada | 173,857,295 | 5,107,471 | 27,886,883 | 68,928,677 | 14,903,919 | 290,684,245 | ||||||||||||||||||
MSCI Japan | 323,800,260 | 44,443,527 | 116,295,478 | 173,577,101 | 139,228,194 | 797,344,560 | ||||||||||||||||||
MSCI Mexico Capped | 104,624,381 | 853,150 | 8,973,988 | 2,789,471 | 22,863,665 | 140,104,655 | ||||||||||||||||||
MSCI South Korea Capped | 31,222,228 | — | 60,990,953 | 226,591,665 | 78,503,704 | 397,308,550 | ||||||||||||||||||
| a | Must be utilized prior to losses subject to expiration. |
The Funds may own shares in certain foreign investment entities, referred to, under U.S. tax law, as “passive foreign investment companies.” The Funds may elect to mark-to-market annually the shares of each passive foreign investment company and would be required to distribute to shareholders any such marked-to-market gains.
| 58 | 2015 iSHARES ANNUAL REPORTTO SHAREHOLDERS |
Table of Contents
Notes to Financial Statements (Continued)
iSHARES®, INC.
As of August 31, 2015, gross unrealized appreciation and gross unrealized depreciation based on cost for federal income tax purposes were as follows:
| iShares ETF | Tax Cost | Gross Unrealized Appreciation | Gross Unrealized Depreciation | Net Unrealized Appreciation (Depreciation) | ||||||||||||
MSCI Australia | $ | 1,696,672,825 | $ | 26,578,818 | $ | (504,105,648 | ) | $ | (477,526,830 | ) | ||||||
MSCI Canada | 2,754,700,908 | 169,213,479 | (976,409,812 | ) | (807,196,333 | ) | ||||||||||
MSCI Japan | 20,356,355,657 | 1,078,635,405 | (2,254,050,533 | ) | (1,175,415,128 | ) | ||||||||||
MSCI Mexico Capped | 1,763,504,346 | 12,590,645 | (529,016,266 | ) | (516,425,621 | ) | ||||||||||
MSCI South Korea Capped | 2,929,262,240 | 1,170,148,673 | (741,236,559 | ) | 428,912,114 | |||||||||||
Management has analyzed tax laws and regulations and their application to the Funds as of August 31, 2015, inclusive of the open tax return years, and does not believe there are any uncertain tax positions that require recognition of a tax liability in the Funds’ financial statements.
| 8. | SUBSEQUENT EVENTS |
Management has evaluated the impact of all subsequent events on the Funds through the date the financial statements were available to be issued and has determined that there were no subsequent events requiring adjustment or disclosure in the financial statements.
NOTESTO FINANCIAL STATEMENTS | 59 |
Table of Contents
Report of Independent Registered Public Accounting Firm
To the Shareholders and Board of Directors of
iShares, Inc.:
In our opinion, the accompanying statements of assets and liabilities, including the schedules of investments, and the related statements of operations and of changes in net assets and the financial highlights present fairly, in all material respects, the financial position of iShares MSCI Australia ETF, iShares MSCI Canada ETF, iShares MSCI Japan ETF, iShares MSCI Mexico Capped ETF and iShares MSCI South Korea Capped ETF (the “Funds”) at August 31, 2015, the results of each of their operations, the changes in each of their net assets and their financial highlights for each of the periods presented, in conformity with accounting principles generally accepted in the United States of America. These financial statements and financial highlights (hereafter referred to as “financial statements”) are the responsibility of the Funds’ management. Our responsibility is to express an opinion on these financial statements based on our audits. We conducted our audits of these financial statements in accordance with the standards of the Public Company Accounting Oversight Board (United States). Those standards require that we plan and perform the audit to obtain reasonable assurance about whether the financial statements are free of material misstatement. An audit includes examining, on a test basis, evidence supporting the amounts and disclosures in the financial statements, assessing the accounting principles used and significant estimates made by management, and evaluating the overall financial statement presentation. We believe that our audits, which included confirmation of securities at August 31, 2015 by correspondence with the custodian, transfer agent and brokers, provide a reasonable basis for our opinion.
PricewaterhouseCoopers LLP
San Francisco, California
October 22, 2015
| 60 | 2015 iSHARES ANNUAL REPORTTO SHAREHOLDERS |
Table of Contents
iSHARES®, INC.
Under Section 854(b)(2) of the Internal Revenue Code (the “Code”), the following maximum amounts are hereby designated as qualified dividend income for purposes of the maximum rate under Section 1(h)(11) of the Code for the fiscal year ended August 31, 2015:
| iShares ETF | Qualified Dividend Income | |||
MSCI Australia | $ | 90,118,118 | ||
MSCI Canada | 74,699,282 | |||
MSCI Japan | 292,019,346 | |||
MSCI Mexico Capped | 29,390,604 | |||
MSCI South Korea Capped | 63,311,438 | |||
In February 2016, shareholders will receive Form 1099-DIV which will include their share of qualified dividend income distributed during the calendar year 2015. Shareholders are advised to check with their tax advisers for information on the treatment of these amounts on their income tax returns.
For the fiscal year ended August 31, 2015, the Funds earned foreign source income and paid foreign taxes which they intend to pass through to their shareholders pursuant to Section 853 of the Code:
| iShares ETF | Foreign Source Income Earned | Foreign Taxes Paid | ||||||
MSCI Australia | $ | 98,612,673 | $ | 1,392,798 | ||||
MSCI Canada | 75,298,294 | 11,410,760 | ||||||
MSCI Japan | 304,535,091 | 30,371,496 | ||||||
MSCI Mexico Capped | 32,975,221 | 510,956 | ||||||
MSCI South Korea Capped | 63,176,700 | 10,164,357 | ||||||
TAX INFORMATION | 61 |
Table of Contents
Board Review and Approval of Investment Advisory
Contract
iSHARES®, INC.
I. iShares MSCI Australia ETF, iShares MSCI Canada ETF, iShares MSCI Japan ETF and iShares MSCI Mexico Capped ETF
Under Section 15(c) of the Investment Company Act of 1940 (the “1940 Act”), the Company’s Board of Directors (the “Board”), including a majority of Directors who are not “interested persons” of the Company (as that term is defined in the 1940 Act) (the “Independent Directors”), is required annually to consider and approve the Investment Advisory Contract between the Company and BFA (the “Advisory Contract”) on behalf of the Funds. The Independent Directors requested, and BFA provided, such information as the Independent Directors, with advice from independent counsel, deemed reasonably necessary to evaluate the Advisory Contract. A committee of Independent Directors (the “15(c) Committee”), with independent counsel, met with management on May 1, 2015 and May 6, 2015, to discuss the types of information the Independent Directors required and the manner in which management would organize and present such information. At a meeting held on May 21, 2015, management presented preliminary information to the Board relating to the continuance of the Advisory Contract, and the Board, including the Independent Directors, reviewed and discussed such information at length. The Independent Directors requested from management certain additional information, which management agreed to provide. At a meeting held on June 24-25, 2015, the Board, including the Independent Directors, reviewed the additional information provided by management in response to these requests. After extensive discussions, the Board, including all of the Independent Directors, approved the continuance of the Advisory Contract for the Funds, based on a review of qualitative and quantitative information provided by BFA, including the additional information management provided at the request of the Independent Directors. The Board noted its satisfaction with the extent and quality of information provided and its frequent interactions with management, as well as the detailed responses and other information provided by BFA. The Board also noted that the Board and BFA agreed to discuss potential enhancements and adjustments to the 15(c) process for the coming year. The Independent Directors were advised by their independent counsel throughout the process, including about the legal standards applicable to their review. In approving the Advisory Contract for the Funds, the Board, including the Independent Directors, considered the following factors, no one of which was controlling, and reached the following conclusions:
Expenses and Performance of the Funds — The Board reviewed statistical information prepared by Lipper Inc. (“Lipper”), an independent provider of investment company data, regarding the expense ratio components, including actual advisory fees, waivers/reimbursements, and gross and net total expenses of each Fund in comparison with the same information for other exchange traded funds (including, where applicable, funds sponsored by an “at cost” service provider) and, in the limited instances where no comparable ETFs existed and the comparison group would not otherwise be reasonable in Lipper’s judgment, pure index institutional mutual funds, objectively selected by Lipper as comprising such Fund’s applicable peer group pursuant to Lipper’s proprietary ETF methodology (the “Lipper Group”). The Board was provided with a detailed description of Lipper’s proprietary ETF methodology used by Lipper to determine the applicable Lipper Groups. The Board further noted that due to the limitations in providing comparable funds in the various Lipper Groups, the statistical information provided in Lipper’s report may or may not provide meaningful direct comparisons to the Funds in all instances.
The Board also noted that the investment advisory fee rates and overall expenses (net of waivers and reimbursements) for the Funds were lower than the median of the investment advisory fee rates and overall expenses (net of waivers and reimbursements) of the funds in their respective Lipper Group.
In addition, the Board reviewed statistical information prepared by Lipper regarding the performance of each Fund for the one-, three-, five-, ten-year, and since inception periods, as applicable, and the “last quarter” period ended December 31, 2014, and a comparison of each Fund’s performance to its performance benchmark index for the same periods. To the extent that any of the comparison funds included in the Lipper Group track the same index as any particular Fund, Lipper also provided, and the Board reviewed, a comparison of such Fund’s performance to that of such relevant comparison funds for the same periods. The Board noted that the Funds generally performed in line with their respective performance benchmark indexes over the relevant periods. In considering this information, the Board noted that the Lipper Group may include funds that have different investment objectives
| 62 | 2015 iSHARES ANNUAL REPORTTO SHAREHOLDERS |
Table of Contents
Board Review and Approval of Investment Advisory
Contract (Continued)
iSHARES® , INC.
and/or benchmarks from the Funds. In addition, the Board noted that each Fund seeks to track its own benchmark index and that, during the prior year, the Board received periodic reports on the Funds’ performance in comparison with their relevant benchmark indexes. Such periodic comparative performance information, including detailed information on certain specific iShares funds requested by the Boards, was also considered.
Based on this review, the other factors considered at the meeting, and their general knowledge of ETF pricing, the Board concluded that the investment advisory fee rate and expense level and the historical performance of each Fund supported the Board’s approval of the continuance of the Advisory Contract for the coming year.
Nature, Extent and Quality of Services Provided by BFA — Based on management’s representations, including information about recent and proposed enhancements to the iShares business, including with respect to shareholder servicing and support, the Board expected that there would be no diminution in the scope of services required of or provided by BFA under the Advisory Contract for the coming year as compared to the scope of services provided by BFA during prior years. In reviewing the scope of these services, the Board considered BFA’s investment philosophy and experience, noting that BFA and its affiliates have committed significant resources over time, including during the past year, to supporting the iShares funds and their shareholders. The Board acknowledged that resources to support the iShares funds and their shareholders have been added or enhanced in recent years. The Board also considered BFA’s compliance program and its compliance record with respect to the Funds. In that regard, the Board noted that BFA reports to the Board about portfolio management and compliance matters on a periodic basis in connection with regularly scheduled meetings of the Board, and on other occasions as necessary and appropriate, and has provided information and made appropriate officers available as needed to provide further assistance with these matters. The Board also reviewed the background and experience of the persons responsible for the day-to-day management of the Funds, as well as the resources available to them in managing the Funds. In addition to the above considerations, the Board reviewed and considered detailed presentations regarding BFA’s investment performance, investment and risk management processes and strategies provided at the June 24-25, 2015 meeting and throughout the previous year, and matters related to BFA’s portfolio compliance policies and procedures. The Board noted that each Fund had met its investment objective consistently since its respective inception date.
Based on review of this information, and the performance information discussed above, the Board concluded that the nature, extent and quality of services provided by BFA to the Funds under the Advisory Contract supported the Board’s approval of the continuance of the Advisory Contract for the coming year.
Costs of Services Provided to Funds and Profits Realized by BFA and Affiliates — The Board reviewed information about the profitability to BlackRock of the Funds based on the fees payable to BFA and its affiliates (including fees under the Advisory Contract), and all other sources of revenue and expense to BFA and its affiliates from the Funds’ operations for the last calendar year. The Board reviewed BlackRock’s profitability methodology for the iShares funds, noting that the 15(c) Committee had focused on the methodology and proposed presentation during its meetings. The Board discussed the sources of direct and ancillary revenue with management, including the revenues to BTC from securities lending by the Funds. The Board also discussed BFA’s profit margin as reflected in the Funds’ profitability analyses and reviewed information regarding potential economies of scale (as discussed below). Based on this review, the Board concluded that the profits realized by BFA and its affiliates under the Advisory Contract and from other relationships between the Funds and BFA and/or its affiliates, if any, were within a reasonable range in light of the factors considered.
Economies of Scale — The Board reviewed information regarding potential economies of scale or other efficiencies that may result from increases in the Funds’ assets, noting that the issue of economies of scale had been focused on extensively by the 15(c) Committee during its meetings and addressed by management. The Board and the 15(c) Committee reviewed information provided by BFA regarding scale benefits shared with the iShares funds through relatively low fee rates established at inception,
BOARD REVIEWAND APPROVALOF INVESTMENT ADVISORY CONTRACT | 63 |
Table of Contents
Board Review and Approval of Investment Advisory
Contract (Continued)
iSHARES® , INC.
breakpoints, waivers, or other fee reductions, as well as through additional investment in the iShares business and the provision of improved or additional infrastructure and services to the iShares funds and their shareholders. The Board and the 15(c) Committee received information regarding BlackRock’s historical profitability, including BFA’s and its affiliates’ costs in providing services. The cost information distinguished between fixed and variable costs, and explained how the level of fixed and variable costs, as well as the nature of such costs, may impact the existence or size of scale benefits. The Board noted that the Advisory Contract for the Funds already provided for breakpoints in the Funds’ investment advisory fee rates as the assets of the Funds, on an aggregated basis with the assets of certain other iShares funds, increase. The Board noted that it would continue to monitor the sharing of economies of scale to determine the appropriateness of adding new or revised breakpoints in the future.
Based on this review, as well as the other factors considered at the meeting, the Board, recognizing its responsibility to consider this issue periodically, determined to approve the continuance of the Advisory Contract for the coming year.
Fees and Services Provided for Other Comparable Funds/Accounts Managed by BFA and its Affiliates — The Board received and considered information regarding the investment advisory/management fee rates for other funds/accounts in the U.S. for which BFA (or its affiliates) provides investment advisory/management services, including open-end and closed-end funds registered under the 1940 Act (including sub-advised funds), collective trust funds, separately managed accounts, and institutional separate accounts (together, the “Other Accounts”), and acknowledged BFA’s assertion that the iShares funds are fundamentally different investment vehicles from the Other Accounts. The Board noted that BFA and its affiliates do manage Other Accounts with substantially the same investment objectives and strategies as the Funds or that track the same index or a similar index as the Funds. The Board further noted that BFA provided the Board with detailed information regarding how the Other Accounts (particularly institutional clients) generally differ from the Funds, including in terms of the different, generally more extensive services provided to the Funds, as well as other significant differences in the approach of BFA and its affiliates to the Funds, on one hand, and Other Accounts, on the other. In that regard, the Board considered that the pricing of services to institutional clients is typically based on a number of factors beyond the nature and extent of the specific services to be provided and often depends on the overall relationship between the client and its affiliates and the adviser and its affiliates. In addition, the Board considered the relative complexity and inherent risks and challenges of managing and providing other services to the Funds, as publicly traded exchange traded funds, as compared to the Other Accounts that are institutional clients in light of differing regulatory requirements and client-imposed mandates. The Board also considered the “all-inclusive” nature of the Funds’ advisory fee structure, and the Fund expenses borne by BFA under this arrangement. The Board noted that the investment advisory fee rates under the Advisory Contract for the Funds were generally higher than the investment advisory/management fee rates for the Other Accounts that are institutional clients of BFA (or its affiliates) and concluded that the differences appeared to be consistent with the factors discussed.
Other Benefits to BFA and/or its Affiliates — The Board reviewed the “fallout” benefits or ancillary revenue received by BFA and/or its affiliates in connection with the services provided to the Funds by BFA, such as payment of revenue to BTC, the Funds’ securities lending agent, for loaning portfolio securities (which was included in the profit margins reviewed by the Board pursuant to BFA’s profitability methodology), and payment of advisory fees and/or administration fees to BFA and BTC (or their affiliates) in connection with any investments by the Funds in other funds for which BFA (or its affiliates) provides investment advisory services and/or administration services. The Board noted that BFA generally does not use soft dollars or consider the value of research or other services that may be provided to BFA (including its affiliates) in selecting brokers for portfolio transactions for the Funds. The Board further noted that any portfolio transactions on behalf of the Funds placed through a BFA affiliate or purchased from an underwriting syndicate in which a BFA affiliate participates, are reported to the Board pursuant to Rule 17e-1 or Rule 10f-3, as applicable, under the 1940 Act. The Board concluded that any such ancillary benefits would not be disadvantageous to the Funds’ shareholders and thus would not alter the Board’s conclusion with respect to the appropriateness of approving the continuance of the Advisory Contract for the coming year.
| 64 | 2015 iSHARES ANNUAL REPORTTO SHAREHOLDERS |
Table of Contents
Board Review and Approval of Investment Advisory
Contract (Continued)
iSHARES® , INC.
Based on the considerations described above, the Board determined that each Fund’s investment advisory fee rate under the Advisory Contract does not constitute a fee that is so disproportionately large as to bear no reasonable relationship to the services rendered and that could not have been the product of arm’s-length bargaining, and concluded that it is in the best interest of each Fund and its shareholders to approve the continuance of the Advisory Contract for the coming year.
II. iShares MSCI South Korea Capped ETF
Under Section 15(c) of the Investment Company Act of 1940 (the “1940 Act”), the Company’s Board of Directors (the “Board”), including a majority of Directors who are not “interested persons” of the Company (as that term is defined in the 1940 Act) (the “Independent Directors”), is required annually to consider and approve the Investment Advisory Contract between the Company and BFA (the “Advisory Contract”) on behalf of the Fund. The Independent Directors requested, and BFA provided, such information as the Independent Directors, with advice from independent counsel, deemed reasonably necessary to evaluate the Advisory Contract. A committee of Independent Directors (the “15(c) Committee”), with independent counsel, met with management on May 1, 2015 and May 6, 2015, to discuss the types of information the Independent Directors required and the manner in which management would organize and present such information. At a meeting held on May 21, 2015, management presented preliminary information to the Board relating to the continuance of the Advisory Contract, and the Board, including the Independent Directors, reviewed and discussed such information at length. The Independent Directors requested from management certain additional information, which management agreed to provide. At a meeting held on June 24-25, 2015, the Board, including the Independent Directors, reviewed the additional information provided by management in response to these requests. After extensive discussions, the Board, including all of the Independent Directors, approved the continuance of the Advisory Contract for the Fund, based on a review of qualitative and quantitative information provided by BFA, including the additional information management provided at the request of the Independent Directors. The Board noted its satisfaction with the extent and quality of information provided and its frequent interactions with management, as well as the detailed responses and other information provided by BFA. The Board also noted that the Board and BFA agreed to discuss potential enhancements and adjustments to the 15(c) process for the coming year. The Independent Directors were advised by their independent counsel throughout the process, including about the legal standards applicable to their review. In approving the Advisory Contract for the Fund, the Board, including the Independent Directors, considered the following factors, no one of which was controlling, and reached the following conclusions:
Expenses and Performance of the Fund — The Board reviewed statistical information prepared by Lipper Inc. (“Lipper”), an independent provider of investment company data, regarding the expense ratio components, including actual advisory fees, waivers/reimbursements, and gross and net total expenses of the Fund in comparison with the same information for other exchange traded funds (including, where applicable, funds sponsored by an “at cost” service provider) and, in the limited instances where no comparable ETFs existed and the comparison group would not otherwise be reasonable in Lipper’s judgment, pure index institutional mutual funds, objectively selected by Lipper as comprising the Fund’s applicable peer group pursuant to Lipper’s proprietary ETF methodology (the “Lipper Group”). The Board was provided with a detailed description of Lipper’s proprietary ETF methodology used by Lipper to determine the Fund’s Lipper Group. The Board further noted that due to the limitations in providing comparable funds in the Lipper Group, the statistical information provided in Lipper’s report may or may not provide meaningful direct comparisons to the Fund in all instances.
The Board also noted that the investment advisory fee rate and overall expenses (net of waivers and reimbursements) for the Fund were higher than the median of the investment advisory fee rates and overall expenses (net of waivers and reimbursements) of the funds in its Lipper Group. The Board further noted management’s assertion that the Fund’s pricing reflects its greater size and liquidity, as compared to the competitor funds as determined by Lipper.
BOARD REVIEWAND APPROVALOF INVESTMENT ADVISORY CONTRACT | 65 |
Table of Contents
Board Review and Approval of Investment Advisory
Contract (Continued)
iSHARES® , INC.
In addition, the Board reviewed statistical information prepared by Lipper regarding the performance of the Fund for the one-, three-, five-, ten-year, and since inception periods, as applicable, and the “last quarter” period ended December 31, 2014, and a comparison of the Fund’s performance to its performance benchmark index for the same periods. To the extent that any of the comparison funds included in the Lipper Group track the same index as the Fund, Lipper also provided, and the Board reviewed, a comparison of the Fund’s performance to that of such relevant comparison funds for the same periods. The Board noted that the Fund generally performed in line with its performance benchmark index over the relevant periods. In considering this information, the Board noted that the Lipper Group may include funds that have a different investment objective and/or benchmark from the Fund. In addition, the Board noted that the Fund seeks to track its own benchmark index and that, during the prior year, the Board received periodic reports on the Fund’s performance in comparison with its benchmark index. Such periodic comparative performance information, including detailed information on certain specific iShares funds requested by the Boards, was also considered.
Based on this review, the other factors considered at the meeting, and their general knowledge of ETF pricing, the Board concluded that the investment advisory fee rate and expense level and the historical performance of the Fund supported the Board’s approval of the continuance of the Advisory Contract for the coming year.
Nature, Extent and Quality of Services Provided by BFA — Based on management’s representations, including information about recent and proposed enhancements to the iShares business, including with respect to shareholder servicing and support, the Board expected that there would be no diminution in the scope of services required of or provided by BFA under the Advisory Contract for the coming year as compared to the scope of services provided by BFA during prior years. In reviewing the scope of these services, the Board considered BFA’s investment philosophy and experience, noting that BFA and its affiliates have committed significant resources over time, including during the past year, to supporting the iShares funds and their shareholders. The Board acknowledged that resources to support the iShares funds and their shareholders have been added or enhanced in recent years. The Board also considered BFA’s compliance program and its compliance record with respect to the Fund. In that regard, the Board noted that BFA reports to the Board about portfolio management and compliance matters on a periodic basis in connection with regularly scheduled meetings of the Board, and on other occasions as necessary and appropriate, and has provided information and made appropriate officers available as needed to provide further assistance with these matters. The Board also reviewed the background and experience of the persons responsible for the day-to-day management of the Fund, as well as the resources available to them in managing the Fund. In addition to the above considerations, the Board reviewed and considered detailed presentations regarding BFA’s investment performance, investment and risk management processes and strategies provided at the June 24-25, 2015 meeting and throughout the previous year, and matters related to BFA’s portfolio compliance policies and procedures. The Board noted that the Fund had met its investment objective consistently since its inception date.
Based on review of this information, and the performance information discussed above, the Board concluded that the nature, extent and quality of services provided by BFA to the Fund under the Advisory Contract supported the Board’s approval of the continuance of the Advisory Contract for the coming year.
Costs of Services Provided to the Fund and Profits Realized by BFA and Affiliates — The Board reviewed information about the profitability to BlackRock of the Fund based on the fees payable to BFA and its affiliates (including fees under the Advisory Contract), and all other sources of revenue and expense to BFA and its affiliates from the Fund’s operations for the last calendar year. The Board reviewed BlackRock’s profitability methodology for the iShares funds, noting that the 15(c) Committee had focused on the methodology and proposed presentation during its meetings. The Board discussed the sources of direct and ancillary revenue with management, including the revenues to BTC from securities lending by the Fund. The Board also discussed BFA’s profit margin as reflected in the Fund’s profitability analysis and reviewed information regarding potential economies of scale (as discussed below). Based on this review, the Board concluded that the profits realized by BFA and its
| 66 | 2015 iSHARES ANNUAL REPORTTO SHAREHOLDERS |
Table of Contents
Board Review and Approval of Investment Advisory
Contract (Continued)
iSHARES® , INC.
affiliates under the Advisory Contract and from other relationships between the Fund and BFA and/or its affiliates, if any, were within a reasonable range in light of the factors considered.
Economies of Scale — The Board reviewed information regarding potential economies of scale or other efficiencies that may result from increases in the Fund’s assets, noting that the issue of economies of scale had been focused on extensively by the 15(c) Committee during its meetings and addressed by management. The Board and the 15(c) Committee reviewed information provided by BFA regarding scale benefits shared with the iShares funds through relatively low fee rates established at inception, breakpoints, waivers, or other fee reductions, as well as through additional investment in the iShares business and the provision of improved or additional infrastructure and services to the iShares funds and their shareholders. The Board and the 15(c) Committee received information regarding BlackRock’s historical profitability, including BFA’s and its affiliates’ costs in providing services. The cost information distinguished between fixed and variable costs, and explained how the level of fixed and variable costs, as well as the nature of such costs, may impact the existence or size of scale benefits. The Board noted that the Advisory Contract for the Fund already provided for breakpoints in the Fund’s investment advisory fee rate as the assets of the Fund, on an aggregated basis with the assets of certain other iShares funds, increase. The Board noted that it would continue to monitor the sharing of economies of scale to determine the appropriateness of adding new or revised breakpoints in the future.
Based on this review, as well as the other factors considered at the meeting, the Board, recognizing its responsibility to consider this issue periodically, determined to approve the continuance of the Advisory Contract for the coming year.
Fees and Services Provided for Other Comparable Funds/Accounts Managed by BFA and its Affiliates — The Board received and considered information regarding the investment advisory/management fee rates for other funds/accounts in the U.S. for which BFA (or its affiliates) provides investment advisory/management services, including open-end and closed-end funds registered under the 1940 Act (including sub-advised funds), collective trust funds, separately managed accounts, and institutional separate accounts (together, the “Other Accounts”), and acknowledged BFA’s assertion that the iShares funds are fundamentally different investment vehicles from the Other Accounts. The Board noted that BFA and its affiliates do manage Other Accounts with substantially the same investment objective and strategy as the Fund or that track the same index or a similar index as the Fund. The Board further noted that BFA provided the Board with detailed information regarding how the Other Accounts (particularly institutional clients) generally differ from the Fund, including in terms of the different, generally more extensive services provided to the Fund, as well as other significant differences in the approach of BFA and its affiliates to the Fund, on one hand, and Other Accounts, on the other. In that regard, the Board considered that the pricing of services to institutional clients is typically based on a number of factors beyond the nature and extent of the specific services to be provided and often depends on the overall relationship between the client and its affiliates and the adviser and its affiliates. In addition, the Board considered the relative complexity and inherent risks and challenges of managing and providing other services to the Fund, as a publicly traded exchange traded fund, as compared to the Other Accounts that are institutional clients in light of differing regulatory requirements and client-imposed mandates. The Board also considered the “all-inclusive” nature of the Fund’s advisory fee structure, and the Fund expenses borne by BFA under this arrangement. The Board noted that the investment advisory fee rate under the Advisory Contract for the Fund was generally higher than the investment advisory/management fee rates for the Other Accounts that are institutional clients of BFA (or its affiliates) and concluded that the differences appeared to be consistent with the factors discussed.
Other Benefits to BFA and/or its Affiliates — The Board reviewed the “fallout” benefits or ancillary revenue received by BFA and/or its affiliates in connection with the services provided to the Fund by BFA, such as payment of revenue to BTC, the Fund’s securities lending agent, for loaning portfolio securities (which was included in the profit margins reviewed by the Board pursuant to BFA’s profitability methodology), and payment of advisory fees and/or administration fees to BFA and BTC (or their affiliates) in connection with any investments by the Fund in other funds for which BFA (or its affiliates) provides investment advisory services and/or administration services. The Board noted that BFA generally does not use soft dollars or consider the value of research or
BOARD REVIEWAND APPROVALOF INVESTMENT ADVISORY CONTRACT | 67 |
Table of Contents
Board Review and Approval of Investment Advisory
Contract (Continued)
iSHARES® , INC.
other services that may be provided to BFA (including its affiliates) in selecting brokers for portfolio transactions for the Fund. The Board further noted that any portfolio transactions on behalf of the Fund placed through a BFA affiliate or purchased from an underwriting syndicate in which a BFA affiliate participates, are reported to the Board pursuant to Rule 17e-1 or Rule 10f-3, as applicable, under the 1940 Act. The Board concluded that any such ancillary benefits would not be disadvantageous to the Fund’s shareholders and thus would not alter the Board’s conclusion with respect to the appropriateness of approving the continuance of the Advisory Contract for the coming year.
Based on the considerations described above, the Board determined that the Fund’s investment advisory fee rate under the Advisory Contract does not constitute a fee that is so disproportionately large as to bear no reasonable relationship to the services rendered and that could not have been the product of arm’s-length bargaining, and concluded that it is in the best interest of the Fund and its shareholders to approve the continuance of the Advisory Contract for the coming year.
| 68 | 2015 iSHARES ANNUAL REPORTTO SHAREHOLDERS |
Table of Contents
Supplemental Information (Unaudited)
iSHARES®, INC.
Section 19(a) Notices
The amounts and sources of distributions reported are estimates and are provided pursuant to regulatory requirements and are not being provided for tax reporting purposes. The actual amounts and sources for tax reporting purposes will depend upon each Fund’s investment experience during the year and may be subject to changes based on the tax regulations. Shareholders will receive a Form 1099-DIV each calendar year that will inform them how to report these distributions for federal income tax purposes.
| Total Cumulative Distributions for the Fiscal Year | % Breakdown of the Total Cumulative Distributions for the Fiscal Year | |||||||||||||||||||||||||||||||
| iShares ETF | Net Investment Income | Net Realized Capital Gains | Return of Capital | Total Per Share | Net Investment Income | Net Realized Capital Gains | Return of Capital | Total Per Share | ||||||||||||||||||||||||
MSCI Australia | $ | 1.226843 | $ | — | $ | — | $ | 1.226843 | 100 | % | — | % | — | % | 100 | % | ||||||||||||||||
MSCI Canada | 0.529444 | — | 0.067752 | 0.597196 | 89 | — | 11 | 100 | ||||||||||||||||||||||||
MSCI Japan | 0.132010 | — | — | 0.132010 | 100 | — | — | 100 | ||||||||||||||||||||||||
MSCI Mexico Capped | 0.859823 | — | 0.068023 | 0.927846 | 93 | — | 7 | 100 | ||||||||||||||||||||||||
MSCI South Korea Capped | 0.477105 | — | 0.186252 | 0.663357 | 72 | — | 28 | 100 | ||||||||||||||||||||||||
Premium/Discount Information
The Premium/Discount Information section is intended to present information about the differences between the daily market price on secondary markets for shares of a fund and that fund’s NAV. NAV is the price at which a fund issues and redeems shares. It is calculated in accordance with the standard formula for valuing mutual fund shares. The “Market Price” of a fund generally is determined using the midpoint between the highest bid and the lowest offer on the primary stock exchange on which the shares of such fund are listed for trading, as of the time that the fund’s NAV is calculated. A fund’s Market Price may be at, above or below its NAV. The NAV of a fund will fluctuate with changes in the fair value of its portfolio holdings. The Market Price of a fund will fluctuate in accordance with changes in its NAV, as well as market supply and demand.
Premiums or discounts are the differences (expressed as a percentage) between the NAV and Market Price of a fund on a given day, generally at the time the NAV is calculated. A premium is the amount that a fund is trading above the reported NAV, expressed as a percentage of the NAV. A discount is the amount that a fund is trading below the reported NAV, expressed as a percentage of the NAV.
The following information shows the frequency of distributions of premiums and discounts for each of the Funds. The information shown for each Fund is for five calendar years (or from the inception date of such Fund if less than five years) through the date of the most recent calendar quarter-end. The specific periods covered for each Fund are disclosed in the table for such Fund.
SUPPLEMENTAL INFORMATION | 69 |
Table of Contents
Supplemental Information (Unaudited) (Continued)
iSHARES®, INC.
Each line in the table shows the number of trading days in which the Fund traded within the premium/discount range indicated. The number of trading days in each premium/discount range is also shown as a percentage of the total number of trading days in the period covered by each table. All data presented here represents past performance, which cannot be used to predict future results.
iShares MSCI Australia ETF
Period Covered: January 1, 2010 through June 30, 2015
Premium/Discount Range | Number of Days | Percentage of Total Days | ||||||
Greater than 4.0% | 1 | 0.07 | % | |||||
Greater than 3.5% and Less than 4.0% | 1 | 0.07 | ||||||
Greater than 3.0% and Less than 3.5% | 3 | 0.22 | ||||||
Greater than 2.5% and Less than 3.0% | 5 | 0.36 | ||||||
Greater than 2.0% and Less than 2.5% | 11 | 0.80 | ||||||
Greater than 1.5% and Less than 2.0% | 35 | 2.53 | ||||||
Greater than 1.0% and Less than 1.5% | 68 | 4.92 | ||||||
Greater than 0.5% and Less than 1.0% | 255 | 18.45 | ||||||
Between 0.5% and –0.5% | 711 | 51.45 | ||||||
Less than –0.5% and Greater than –1.0% | 153 | 11.07 | ||||||
Less than –1.0% and Greater than –1.5% | 75 | 5.43 | ||||||
Less than –1.5% and Greater than –2.0% | 28 | 2.03 | ||||||
Less than –2.0% and Greater than –2.5% | 20 | 1.45 | ||||||
Less than –2.5% and Greater than –3.0% | 6 | 0.43 | ||||||
Less than –3.0% and Greater than –3.5% | 4 | 0.29 | ||||||
Less than –3.5% and Greater than –4.0% | 3 | 0.22 | ||||||
Less than –4.0% and Greater than –4.5% | 2 | 0.14 | ||||||
Less than –4.5% | 1 | 0.07 | ||||||
|
|
|
| |||||
| 1,382 | 100.00 | % | ||||||
|
|
|
| |||||
iShares MSCI Canada ETF
Period Covered: January 1, 2010 through June 30, 2015
Premium/Discount Range | Number of Days | Percentage of Total Days | ||||||
Greater than 2.5% | 1 | 0.07 | % | |||||
Greater than 2.0% and Less than 2.5% | 1 | 0.07 | ||||||
Greater than 1.5% and Less than 2.0% | 1 | 0.07 | ||||||
Greater than 1.0% and Less than 1.5% | 6 | 0.43 | ||||||
Greater than 0.5% and Less than 1.0% | 54 | 3.91 | ||||||
Between 0.5% and –0.5% | 1,255 | 90.82 | ||||||
Less than –0.5% and Greater than –1.0% | 57 | 4.13 | ||||||
Less than –1.0% and Greater than –1.5% | 6 | 0.43 | ||||||
Less than –1.5% | 1 | 0.07 | ||||||
|
|
|
| |||||
| 1,382 | 100.00 | % | ||||||
|
|
|
| |||||
| 70 | 2015 iSHARES ANNUAL REPORTTO SHAREHOLDERS |
Table of Contents
Supplemental Information (Unaudited) (Continued)
iSHARES®, INC.
iShares MSC Japan ETF
Period Covered: January 1, 2010 through June 30, 2015
Premium/Discount Range | Number of Days | Percentage of Total Days | ||||||
Greater than 4.5% | 3 | 0.22 | % | |||||
Greater than 4.0% and Less than 4.5% | 2 | 0.14 | ||||||
Greater than 3.5% and Less than 4.0% | 3 | 0.22 | ||||||
Greater than 3.0% and Less than 3.5% | 2 | 0.14 | ||||||
Greater than 2.5% and Less than 3.0% | 5 | 0.36 | ||||||
Greater than 2.0% and Less than 2.5% | 11 | 0.80 | ||||||
Greater than 1.5% and Less than 2.0% | 45 | 3.26 | ||||||
Greater than 1.0% and Less than 1.5% | 118 | 8.54 | ||||||
Greater than 0.5% and Less than 1.0% | 279 | 20.19 | ||||||
Between 0.5% and –0.5% | 611 | 44.21 | ||||||
Less than –0.5% and Greater than –1.0% | 155 | 11.22 | ||||||
Less than –1.0% and Greater than –1.5% | 70 | 5.07 | ||||||
Less than –1.5% and Greater than –2.0% | 43 | 3.11 | ||||||
Less than –2.0% and Greater than –2.5% | 19 | 1.37 | ||||||
Less than –2.5% and Greater than –3.0% | 9 | 0.65 | ||||||
Less than –3.0% and Greater than –3.5% | 4 | 0.29 | ||||||
Less than –3.5% and Greater than –4.0% | 2 | 0.14 | ||||||
Less than –4.0% | 1 | 0.07 | ||||||
|
|
|
| |||||
| 1,382 | 100.00 | % | ||||||
|
|
|
| |||||
iShares MSCI Mexico Capped ETF
Period Covered: January 1, 2010 through June 30, 2015
Premium/Discount Range | Number of Days | Percentage of Total Days | ||||||
Greater than 2.5% | 1 | 0.07 | % | |||||
Greater than 2.0% and Less than 2.5% | 2 | 0.14 | ||||||
Greater than 1.5% and Less than 2.0% | 2 | 0.14 | ||||||
Greater than 1.0% and Less than 1.5% | 18 | 1.30 | ||||||
Greater than 0.5% and Less than 1.0% | 89 | 6.45 | ||||||
Between 0.5% and –0.5% | 1,111 | 80.40 | ||||||
Less than –0.5% and Greater than –1.0% | 125 | 9.05 | ||||||
Less than –1.0% and Greater than –1.5% | 27 | 1.95 | ||||||
Less than –1.5% and Greater than –2.0% | 3 | 0.22 | ||||||
Less than –2.0% and Greater than –2.5% | 2 | 0.14 | ||||||
Less than –2.5% and Greater than –3.0% | 1 | 0.07 | ||||||
Less than –3.0% and Greater than –3.5% | 1 | 0.07 | ||||||
|
|
|
| |||||
| 1,382 | 100.00 | % | ||||||
|
|
|
| |||||
SUPPLEMENTAL INFORMATION | 71 |
Table of Contents
Supplemental Information (Unaudited) (Continued)
iSHARES®, INC.
iShares MSCI South Korea Capped ETF
Period Covered: January 1, 2010 through June 30, 2015
Premium/Discount Range | Number of Days | Percentage of Total Days | ||||||
Greater than 5.0% and Less than 5.5% | 1 | 0.07 | % | |||||
Greater than 4.5% and Less than 5.0% | 1 | 0.07 | ||||||
Greater than 4.0% and Less than 4.5% | 2 | 0.14 | ||||||
Greater than 3.5% and Less than 4.0% | 1 | 0.07 | ||||||
Greater than 3.0% and Less than 3.5% | 1 | 0.07 | ||||||
Greater than 2.5% and Less than 3.0% | 9 | 0.65 | ||||||
Greater than 2.0% and Less than 2.5% | 11 | 0.80 | ||||||
Greater than 1.5% and Less than 2.0% | 38 | 2.75 | ||||||
Greater than 1.0% and Less than 1.5% | 65 | 4.70 | ||||||
Greater than 0.5% and Less than 1.0% | 214 | 15.49 | ||||||
Between 0.5% and –0.5% | 631 | 45.67 | ||||||
Less than –0.5% and Greater than –1.0% | 218 | 15.78 | ||||||
Less than –1.0% and Greater than –1.5% | 82 | 5.94 | ||||||
Less than –1.5% and Greater than –2.0% | 48 | 3.47 | ||||||
Less than –2.0% and Greater than –2.5% | 21 | 1.52 | ||||||
Less than –2.5% and Greater than –3.0% | 16 | 1.16 | ||||||
Less than –3.0% and Greater than –3.5% | 4 | 0.29 | ||||||
Less than –3.5% and Greater than –4.0% | 5 | 0.36 | ||||||
Less than –4.0% and Greater than –4.5% | 5 | 0.36 | ||||||
Less than –4.5% and Greater than –5.0% | 4 | 0.29 | ||||||
Less than –5.0% and Greater than –5.5% | 2 | 0.14 | ||||||
Less than –5.5% and Greater than –6.0% | 1 | 0.07 | ||||||
Less than –6.0% | 2 | 0.14 | ||||||
|
|
|
| |||||
| 1,382 | 100.00 | % | ||||||
|
|
|
| |||||
Regulation under the Alternative Investment Fund Managers Directive (“AIFMD” or, the “Directive”)
The Directive imposes detailed and prescriptive obligations on fund managers established in the European Union (the “EU”). These do not currently apply to managers established outside the EU, such as BFA. Rather, non-EU managers are only required to comply with certain disclosure, reporting and transparency obligations of the Directive if such managers market a fund to EU investors.
BFA has registered the iShares MSCI Canada ETF, iShares MSCI Japan ETF, iShares MSCI Mexico Capped ETF and iShares MSCI South Korea Capped ETF (each a “Fund”, collectively the “Funds”) to be marketed to EU investors in the United Kingdom, the Netherlands, Finland, Sweden and Luxembourg.
Report on Remuneration
BFA is required under the Directive to make quantitative disclosures of remuneration. These disclosures are made in line with BlackRock’s interpretation of currently available regulatory guidance on quantitative remuneration disclosures. As market or regulatory practice develops, BlackRock may consider it appropriate to make changes to the way in which quantitative
| 72 | 2015 iSHARES ANNUAL REPORTTO SHAREHOLDERS |
Table of Contents
Supplemental Information (Unaudited) (Continued)
iSHARES®, INC.
remuneration disclosures are calculated. Where such changes are made, this may result in disclosures in relation to a fund not being comparable to the disclosures made in the prior year, or in relation to other BlackRock fund disclosures in that same year.
Disclosures are provided in relation to both (a) the staff of BFA; (b) staff who are senior management; and (c) staff who have the ability to materially affect the risk profile of the Fund.
All individuals included in the aggregated figures disclosed are rewarded in line with BlackRock’s remuneration policy for their responsibilities across the relevant BlackRock business area. As all individuals have a number of areas of responsibilities, only the portion of remuneration for those individuals’ services attributable to the Fund is included in the aggregate figures disclosed.
BlackRock has a clear and well defined pay-for-performance philosophy, and compensation programs which support that philosophy. For senior management, a significant percentage of variable remuneration is deferred over time. All employees are subject to a claw-back policy.
Compensation decisions for employees are made based on BlackRock’s full-year financial results and other non-financial goals and objectives. Alongside financial performance, individual compensation is also based on strategic and operating results and other considerations such as management and leadership capabilities. No set formulas are established and no fixed benchmarks are used in determining annual incentive awards.
Bonus pools are reviewed by BlackRock’s independent compensation committee, taking into account both actual and projected financial information together with information provided by the Operational Risk and Regulatory Compliance departments in relation to any activities, incidents or events that warrant consideration in making compensation decisions.
Functions such as Finance, Operational Risk, Legal & Compliance, and Human Resources each have their own organizational structures which are independent of the business units. Functional bonus pools are determined with reference to the performance of each individual function and the remuneration of the senior members of control functions is directly overseen by BlackRock’s independent compensation committee. No individual is involved in setting his or her own remuneration.
Members of staff and senior management of BFA typically provide both AIFMD and non-AIFMD related services in respect of multiple funds, clients and functions of BFA and across the broader BlackRock group. Therefore, the figures disclosed are a sum of each individual’s portion of remuneration attributable to the Fund according to an objective apportionment methodology which acknowledges the multiple-service nature of BFA. Accordingly, the figures are not representative of any individual’s actual remuneration or their remuneration structure.
The amount of the total remuneration awarded by BFA to its staff which has been attributed to the iShares MSCI Canada ETF in respect of BFA’s financial year ending December 31, 2014 was USD 464.6 thousand. This figure is comprised of fixed remuneration of USD 187.7 thousand and variable remuneration of USD 276.9 thousand. There were a total of 499 beneficiaries of the remuneration described above.
The amount of the aggregate remuneration awarded by BFA, which has been attributed to the iShares MSCI Canada ETF in respect of BFA’s financial year ending December 31, 2014, to its senior management was USD 64.3 thousand, and to members of its staff whose actions have a material impact on the risk profile of the Fund was USD 11.9 thousand.
The amount of the total remuneration awarded by BFA to its staff which has been attributed to the iShares MSCI Japan ETF in respect of BFA’s financial year ending December 31, 2014 was USD 2.48 million. This figure is comprised of fixed remuneration of USD 1.00 million and variable remuneration of USD 1.48 million. There were a total of 499 beneficiaries of the remuneration described above.
SUPPLEMENTAL INFORMATION | 73 |
Table of Contents
Supplemental Information (Unaudited) (Continued)
iSHARES®, INC.
The amount of the aggregate remuneration awarded by BFA, which has been attributed to the iShares MSCI Japan ETF in respect of BFA’s financial year ending December 31, 2014, to its senior management was 0.34 million, and to members of its staff whose actions have a material impact on the risk profile of the Fund was USD 0.06 million.
The amount of the total remuneration awarded by BFA to its staff which has been attributed to the iShares MSCI Mexico Capped ETF in respect of BFA’s financial year ending December 31, 2014 was USD 392.6 thousand. This figure is comprised of fixed remuneration of USD 158.6 thousand and variable remuneration of USD 234.0 thousand. There were a total of 499 beneficiaries of the remuneration described above.
The amount of the aggregate remuneration awarded by BFA, which has been attributed to the iShares MSCI Mexico Capped ETF in respect of BFA’s financial year ending December 31, 2014, to its senior management was USD 54.3 thousand, and to members of its staff whose actions have a material impact on the risk profile of the Fund was USD 10.1 thousand.
The amount of the total remuneration awarded by BFA to its staff which has been attributed to the iShares MSCI South Korea Capped ETF in respect of BFA’s financial year ending December 31, 2014 was USD 715.6 thousand. This figure is comprised of fixed remuneration of USD 289.1 thousand and variable remuneration of USD 426.5 thousand. There were a total of 499 beneficiaries of the remuneration described above.
The amount of the aggregate remuneration awarded by BFA, which has been attributed to the iShares MSCI South Korea Capped ETF in respect of BFA’s financial year ending December 31, 2014, to its senior management was USD 99.1 thousand, and to members of its staff whose actions have a material impact on the risk profile of the Fund was USD 18.4 thousand.
| 74 | 2015 iSHARES ANNUAL REPORTTO SHAREHOLDERS |
Table of Contents
Director and Officer Information
iSHARES® , INC.
The Board of Directors has responsibility for the overall management and operations of the Company, including general supervision of the duties performed by BFA and other service providers. Each Director serves until he or she resigns, is removed, dies, retires or becomes incapacitated. Each officer shall hold office until his or her successor is elected and qualifies or until his or her death, or his or her resignation or removal. Directors who are not “interested persons” (as defined in the 1940 Act) of the Company are referred to as independent directors (“Independent Directors”).
The registered investment companies advised by BFA or its affiliates are organized into one complex of closed-end funds, two complexes of open-end funds and one complex of exchange-traded funds (“Exchange-Traded Fund Complex”) (each, a “BlackRock Fund Complex”). Each Fund is included in the BlackRock Fund Complex referred to as the Exchange-Traded Fund Complex. Each Director also serves as a Trustee of iShares Trust and a Trustee of iShares U.S. ETF Trust and, as a result, oversees a total of 319 funds (as of August 31, 2015) within the Exchange-Traded Fund Complex. With the exception of Robert S. Kapito and Mark Wiedman, the address of each Director and officer is c/o BlackRock, Inc., 400 Howard Street, San Francisco, CA 94105. The address of Mr. Kapito and Mr. Wiedman is c/o BlackRock, Inc., Park Avenue Plaza, 55 East 52nd Street, New York, NY 10055. The Board has designated Robert H. Silver as its Independent Chairman. Additional information about the Funds’ Directors and officers may be found in the Funds’ combined Statement of Additional Information, which is available without charge, upon request, by calling toll-free 1-800-iShares (1-800-474-2737).
Interested Directors
| Name (Age) | Position(s) | Principal Occupation(s) During the Past 5 Years | Other Directorships Held by Director | |||
Robert S. Kapitoa (58) | Director (since 2009). | President and Director, BlackRock, Inc. (since 2006); Vice Chairman of BlackRock, Inc. and Head of BlackRock, Inc.’s Portfolio Management Group (since its formation in 1998) and BlackRock, Inc.’s predecessor entities (since 1988); Trustee, University of Pennsylvania (since 2009); President of Board of Directors, Hope & Heroes Children’s Cancer Fund (since 2002); President of the Board of Directors, Periwinkle Theatre for Youth (since 1983). | Trustee of iShares Trust (since 2009); Trustee of iShares U.S. ETF Trust (since 2011); Director of BlackRock, Inc. (since 2006). | |||
Mark Wiedmanb (44) | Director (since 2013). | Managing Director, BlackRock, Inc. (since 2007); Global Head of iShares (since 2011); Head of Corporate Strategy, BlackRock, Inc. (2009-2011). | Trustee of iShares Trust (since 2013); Trustee of iShares U.S. ETF Trust (since 2013); Director of PennyMac Financial Services, Inc. (since 2008). | |||
| a | Robert S. Kapito is deemed to be an “interested person” (as defined in the 1940 Act) of the Company due to his affiliations with BlackRock, Inc. |
| b | Mark Wiedman is deemed to be an “interested person” (as defined in the 1940 Act) of the Company due to his affiliations with BlackRock, Inc. and its affiliates. |
DIRECTORAND OFFICER INFORMATION | 75 |
Table of Contents
Director and Officer Information (Continued)
iSHARES®, INC.
Independent Directors
| Name (Age) | Position(s) | �� | Principal Occupation(s) During the Past 5 Years | Other Directorships Held by Director | ||
Robert H. Silver (60) | Director (since 2007); Independent Chairman (since 2012). | President and Co-Founder of The Bravitas Group, Inc. (since 2006); Director and Vice Chairman of the YMCA of Greater NYC (2001-2011); Broadway Producer (2006-2011); Co-Founder and Vice President of Parentgiving Inc. (since 2008); Director and Member of the Audit and Compensation Committee of EPAM Systems, Inc. (2006-2009); President and Chief Operating Officer of UBS Financial Services Inc. (formerly Paine Webber Inc.) (2003-2005) and various executive positions with UBS and its affiliates (1988-2005); CPA and Audit Manager of KPMG, LLP (formerly Peat Marwick Mitchell) (1977-1983). | Trustee of iShares Trust (since 2007); Trustee of iShares U.S. ETF Trust (since 2011); Independent Chairman of iShares Trust and iShares U.S. ETF Trust (since 2012). | |||
Jane D. Carlin (59) | Director (since 2015). | Managing Director and Global Head of Financial Holding Company Governance & Assurance and the Global Head of Operational Risk Management of Morgan Stanley (2006-2012). | Trustee of iShares Trust (since 2015); Trustee of iShares U.S. ETF Trust (since 2015); Director of PHH Corporation (mortgage solutions) (since 2012). | |||
Cecilia H. Herbert (66) | Director (since 2005); Nominating and Governance Committee Chair and Equity Plus Committee Chair (since 2012). | Director (1998-2013) and President (2007-2011) of the Board of Directors, Catholic Charities CYO; Trustee (2002-2011) and Chair of the Finance and Investment Committee (2006-2010) of the Thacher School; Member (since 1992) and Chair (1994-2005) of the Investment Committee, Archdiocese of San Francisco; Trustee and Member of the Investment Committee, WNET, the New York public broadcasting/media company (since 2011). | Trustee of iShares Trust (since 2005); Trustee of iShares U.S. ETF Trust (since 2011); Director of Forward Funds (34 portfolios) (since 2009). | |||
Charles A. Hurty (71) | Director (since 2005); Audit Committee Chair (since 2006). | Retired; Partner, KPMG LLP (1968-2001). | Trustee of iShares Trust (since 2005); Trustee of iShares U.S. ETF Trust (since 2011); Director of GMAM Absolute Return Strategy Fund (1 portfolio) (since 2002); Director of SkyBridge Alternative Investments Multi-Adviser Hedge Fund Portfolios LLC (2 portfolios) (since 2002). | |||
| 76 | 2015 iSHARES ANNUAL REPORTTO SHAREHOLDERS |
Table of Contents
Director and Officer Information (Continued)
iSHARES®, INC.
Independent Directors (Continued)
| Name (Age) | Position(s) | Principal Occupation(s) During the Past 5 Years | Other Directorships Held by Director | |||
John E. Kerrigan (60) | Director (since 2005); Fixed Income Plus Committee Chair (since 2012). | Chief Investment Officer, Santa Clara University (since 2002). | Trustee of iShares Trust (since 2005); Trustee of iShares U.S. ETF Trust (since 2011). | |||
John E. Martinez (54) | Director (since 2003); Securities Lending Committee Chair (since 2012). | Director of FirstREX Agreement Corp. (formerly EquityRock, Inc.) (since 2005). | Trustee of iShares Trust (since 2003); Trustee of iShares U.S. ETF Trust (since 2011). | |||
Madhav V. Rajan (51) | Director (since 2011); 15(c) Committee Chair (since 2012). | Robert K. Jaedicke Professor of Accounting and Senior Associate Dean for Academic Affairs and Head of MBA Program, Stanford University Graduate School of Business (since 2001); Professor of Law (by courtesy), Stanford Law School (since 2005); Visiting Professor, University of Chicago (2007-2008). | Trustee of iShares Trust (since 2011); Trustee of iShares U.S. ETF Trust (since 2011); Director, Cavium, Inc. (since 2013). | |||
DIRECTORAND OFFICER INFORMATION | 77 |
Table of Contents
Director and Officer Information (Continued)
iSHARES®, INC.
Officers
| Name (Age) | Position(s) | Principal Occupation(s) During the Past 5 Years | ||
Manish Mehta (44) | President (since 2013). | Managing Director, BlackRock, Inc. (since 2009); Chief Operating Officer for iShares (since 2009); Head of Strategy and Corporate Development, BGI (2005-2009); Chief of Staff to the CEO, BGI (2005-2009). | ||
Jack Gee (55) | Treasurer and Chief Financial Officer (since 2008). | Managing Director, BlackRock, Inc. (since 2009); Senior Director of Fund Administration of Intermediary Investor Business, BGI (2009); Director of Fund Administration of Intermediary Investor Business, BGI (2004-2009). | ||
Benjamin Archibald (40) | Secretary (since 2015). | Managing Director, BlackRock, Inc. (since 2014); Secretary of the BlackRock-advised Mutual Funds (since 2012); Director, BlackRock, Inc. (2010-2013). | ||
Charles Park (47) | Chief Compliance Officer (since 2006). | Chief Compliance Officer, BFA (since 2006). | ||
Scott Radell (46) | Executive Vice President (since 2012). | Managing Director, BlackRock, Inc. (since 2009); Head of Portfolio Solutions, BlackRock, Inc. (since 2009); Head of Portfolio Solutions, BGI (2007-2009); Credit Portfolio Manager, BGI (2005-2007); Credit Research Analyst, BGI (2003-2005). | ||
Amy Schioldager (52) | Executive Vice President (since 2007). | Senior Managing Director, BlackRock, Inc. (since 2009); Global Head of Index Equity, BGI (2008-2009); Global Head of U.S. Indexing, BGI (2006-2008); Head of Domestic Equity Portfolio Management, BGI (2001-2006). | ||
| 78 | 2015 iSHARES ANNUAL REPORTTO SHAREHOLDERS |
Table of Contents
For more information visit www.iShares.com or call 1-800-474-2737
This report is intended for the Funds’ shareholders. It may not be distributed to prospective investors unless it is preceded or accompanied by the current prospectus.
Investing involves risk, including possible loss of principal.
The iShares Funds are distributed by BlackRock Investments, LLC (together with its affiliates, “BlackRock”).
The iShares Funds are not sponsored, endorsed, issued, sold or promoted by MSCI Inc., nor does this company make any representation regarding the advisability of investing in the iShares Funds. BlackRock is not affiliated with the company listed above.
A description of the policies that the Funds use to determine how to vote proxies relating to portfolio securities and information about how the Funds voted proxies relating to portfolio securities during the most recent twelve-month period ending June 30 is available without charge, upon request, by calling toll-free 1-800-474-2737; on the Funds’ website at www.iShares.com; and on the U.S. Securities and Exchange Commission (SEC) website at www.sec.gov.
The Funds file their complete schedules of portfolio holdings with the SEC for the first and third quarters of each fiscal year on Form N-Q. The Funds’ Forms N-Q are available on the SEC’s website or may be reviewed and copied at the SEC’s Public Reference Room in Washington, D.C. Information on the operation of the Public Reference Room may be obtained by calling 1-800-SEC-0330. The Funds also disclose their complete schedules of portfolio holdings on a daily basis on the Funds’ website.
Certain financial information required by regulations or listing exchange rules in jurisdictions outside the U.S. in which iShares Funds are cross-listed may be publicly filed in those jurisdictions. This information is available upon request by calling 1-800-474-2737.
©2015 BlackRock, Inc. All rights reserved. iSHARES and BLACKROCK are registered trademarks of BlackRock, Inc. or its subsidiaries. All other marks are the property of their respective owners.
iS-AR-815-0815
 |  |
Table of Contents
| Item 2. | Code of Ethics. |
iShares, Inc. (the “Registrant”) adopted a new code of ethics on July 1, 2015 that applies to persons appointed by the Registrant’s Board of Directors as the President and/or Chief Financial Officer, and any persons performing similar functions. For the fiscal year ended August 31, 2015, there were no amendments to any provision of the former and new codes of ethics, nor were there any waivers granted from any provision of the former and new codes of ethics. A copy of the new code of ethics is filed with this Form N-CSR under
Item 12(a)(1).
| Item 3. | Audit Committee Financial Expert. |
The Registrant’s Board of Directors has determined that the Registrant has more than one audit committee financial expert, as that term is defined under Item 3(b) and 3(c), serving on its audit committee. The audit committee financial experts serving on the Registrant’s audit committee are Charles A. Hurty, John E. Kerrigan, Robert H. Silver and Madhav V. Rajan, all of whom are independent, as that term is defined under Item 3(a)(2).
| Item 4. | Principal Accountant Fees and Services. |
The principal accountant fees disclosed in items 4(a), 4(b), 4(c), 4(d) and 4(g) are for the fourty-six series of the Registrant for which the fiscal year-end is August 31, 2015 (the “Funds”), and whose annual financial statements are reported in Item 1.
| (a) | Audit Fees – The aggregate fees billed for each of the last two fiscal years for professional services rendered by the principal accountant for the audit of the Funds’ annual financial statements or services that are normally provided by the accountant in connection with statutory and regulatory filings or engagements for those fiscal years were $771,700 for the fiscal year ended August 31, 2014 and $712,460 for the fiscal year ended August 31, 2015. |
| (b) | Audit-Related Fees – There were no fees billed for the fiscal years ended August 31, 2014 and August 31, 2015 for assurance and related services by the principal accountant that were reasonably related to the performance of the audit of the Fund’s financial statements and are not reported under (a) of this Item. |
| (c) | Tax Fees – The aggregate fees billed in each of the last two fiscal years for professional services rendered by the principal accountant for the review of the Funds’ tax returns and excise tax calculations, were $183,850 for the fiscal year ended August 31, 2014 and $171,672 for the fiscal year ended August 31, 2015. |
| (d) | All Other Fees – There were no other fees billed for the fiscal years ended August 31, 2014 and August 31, 2015 for products and services provided by the principal accountant, other than the services reported in (a) through (c) of this Item. |
| (e) | (1) The Registrant’s audit committee charter, as amended, provides that the audit committee is responsible for the approval, prior to appointment, of the engagement of the principal accountant to annually audit and provide their opinion on the Registrant’s financial statements. The audit committee must also approve, prior to appointment, the engagement of the principal accountant to provide non-audit services to the Registrant or to any entity controlling, controlled by or under common control with the Registrant’s investment adviser (“Adviser Affiliate”) that provides ongoing services to the Registrant, if the engagement relates directly to the operations and financial reporting of the Registrant. |
(2) There were no services described in (b) through (d) above (including services required by the audit committee pursuant to paragraph (c)(7)(ii) of Rule 2-01 of Regulation S-X) that were approved by the audit committee pursuant to paragraph (c)(7)(i)(C) of Rule 2-01 of Regulation S-X.
| (f) | None of the hours expended on the principal accountant’s engagement to audit the Funds’ financial statements for the fiscal year ended August 31, 2015 were attributable to work performed by persons other than the principal accountant’s full-time, permanent employees. |
| (g) | The aggregate non-audit fees billed by the Registrant’s principal accountant for services rendered to the Funds, and rendered to the Registrant’s investment adviser, and any Adviser Affiliate that provides ongoing services to the Registrant for the last two fiscal years were $3,442,905 for the fiscal year ended August 31, 2014 and $4,167,972 for the fiscal year ended August 31, 2015. |
| (h) | The Registrant’s audit committee has considered whether the provision of non-audit services rendered to the Registrant’s investment adviser and any Adviser Affiliate that were not pre-approved pursuant to paragraph (c)(7)(ii) of Rule 2-01 of Regulation S-X, if any, are compatible with maintaining the principal accountant’s independence, and has determined that the provision of these services do not compromise the principal accountant’s independence. |
| Item 5. | Audit Committee of Listed Registrants. |
The Registrant is a listed issuer as defined in Rule 10A-3 under the Exchange Act and has a separately-designated standing audit committee established in accordance with Section 3(a)(58)(A) of the Exchange Act. The Registrant’s audit committee members are Jane D. Carlin, Cecilia H. Herbert, Charles A. Hurty, John E. Kerrigan, Robert H. Silver, John E. Martinez and Madhav V. Rajan.
Table of Contents
| Item 6. | Investments. |
| (a) | Schedules of investments are included as part of the reports to shareholders filed under Item 1 of this Form. |
| (b) | Not applicable. |
| Item 7. | Disclosure of Proxy Voting Policies and Procedures for Closed-End Management Investment Companies. |
Not applicable to the Registrant.
| Item 8. | Portfolio Managers of Closed-End Management Investment Companies. |
Not applicable to the Registrant.
| Item 9. | Purchases of Equity Securities by Closed-End Management Investment Company and Affiliated Purchasers. |
Not applicable to the Registrant.
| Item 10. | Submission of Matters to a Vote of Security Holders. |
There were no material changes to the procedures by which shareholders may recommend nominees to the Registrant’s Board of Directors.
| Item 11. | Controls and Procedures. |
(a) The President (the Registrant’s Principal Executive Officer) and Chief Financial Officer (the Registrant’s Principal Financial Officer) have concluded that, based on their evaluation as of a date within 90 days of the filing date of this report, the disclosure controls and procedures of the Registrant (as defined in Rule 30a-3(c) under the Investment Company Act of 1940) are reasonably designed to achieve the purposes described in Section 4(a) of the attached certification.
(b) There were no changes in the Registrant’s internal control over financial reporting (as defined in Rule 30a-3(d) under the Investment Company Act of 1940) that occurred during the second fiscal quarter of the period covered by this report that have materially affected, or are reasonably likely to materially affect, the Registrant’s internal control over financial reporting.
Item 12. Exhibits.
(a) (1) Code of Ethics for Senior Officers that is the subject of Item 2 is attached.
(a) (2) Section 302 Certifications are attached.
(a) (3) Not applicable to the Registrant.
(b) Section 906 Certifications are attached.
Table of Contents
SIGNATURES
Pursuant to the requirements of the Securities Exchange Act of 1934 and the Investment Company Act of 1940, the Registrant has duly caused this report to be signed on its behalf by the undersigned, thereunto duly authorized.
| iShares, Inc. | ||
| By: | /s/ Manish Mehta | |
| Manish Mehta, President (Principal Executive Officer) | ||
| Date: | October 27, 2015 | |
Pursuant to the requirements of the Securities Exchange Act of 1934 and the Investment Company Act of 1940, this report has been signed below by the following persons on behalf of the Registrant and in the capacities and on the dates indicated.
| By: | /s/ Manish Mehta | |
| Manish Mehta, President (Principal Executive Officer) | ||
| Date: | October 27, 2015 | |
| By: | /s/ Jack Gee | |
| Jack Gee, Treasurer and Chief Financial Officer (Principal Financial Officer) | ||
| Date: | October 27, 2015 | |